UNITED STATES
SECURITIES AND EXCHANGE COMMISSION
Washington, D.C. 20549
FORM N-CSR
CERTIFIED SHAREHOLDER REPORT OF REGISTERED
MANAGEMENT INVESTMENT COMPANIES
Investment Company Act file number 811-3785
Fidelity Advisor Series I
(Exact name of registrant as specified in charter)
245 Summer St., Boston, Massachusetts 02210
(Address of principal executive offices) (Zip code)
Marc Bryant, Secretary
245 Summer St.
Boston, Massachusetts 02210
(Name and address of agent for service)
Registrant's telephone number, including area code:
617-563-7000
Date of fiscal year end: | November 30 |
|
|
Date of reporting period: | November 30, 2017 |
This report on Form N-CSR relates solely to the Registrant’s Fidelity Advisor Dividend Growth Fund, Fidelity Advisor Equity Growth Fund, Fidelity Advisor Equity Income Fund, Fidelity Advisor Equity Value Fund, Fidelity Advisor Growth & Income Fund, Fidelity Advisor Growth Opportunities Fund, Fidelity Advisor Large Cap Fund, Fidelity Advisor Series Equity Growth Fund, Fidelity Advisor Series Growth Opportunities Fund, Fidelity Advisor Series Small Cap Fund, Fidelity Advisor Small Cap Fund, Fidelity Advisor Stock Selector Mid Cap Fund, and Fidelity Advisor Value Strategies Fund series (each, a “Fund” and collectively, the “Funds”).
Item 1.
Reports to Stockholders
Fidelity Advisor® Dividend Growth Fund Class A, Class M (formerly Class T), Class C, Class I and Class Z Annual Report November 30, 2017 |
 |
Contents
Board Approval of Investment Advisory Contracts and Management Fees |
To view a fund's proxy voting guidelines and proxy voting record for the 12-month period ended June 30, visit http://www.fidelity.com/proxyvotingresults or visit the Securities and Exchange Commission's (SEC) web site at http://www.sec.gov.
You may also call 1-877-208-0098 to request a free copy of the proxy voting guidelines.
Standard & Poor's, S&P and S&P 500 are registered service marks of The McGraw-Hill Companies, Inc. and have been licensed for use by Fidelity Distributors Corporation.
Other third-party marks appearing herein are the property of their respective owners.
All other marks appearing herein are registered or unregistered trademarks or service marks of FMR LLC or an affiliated company. © 2018 FMR LLC. All rights reserved.
This report and the financial statements contained herein are submitted for the general information of the shareholders of the Fund. This report is not authorized for distribution to prospective investors in the Fund unless preceded or accompanied by an effective prospectus.
A fund files its complete schedule of portfolio holdings with the SEC for the first and third quarters of each fiscal year on Form N-Q. Forms N-Q are available on the SEC’s web site at http://www.sec.gov. A fund's Forms N-Q may be reviewed and copied at the SEC’s Public Reference Room in Washington, DC. Information regarding the operation of the SEC's Public Reference Room may be obtained by calling 1-800-SEC-0330.
For a complete list of a fund's portfolio holdings, view the most recent holdings listing, semiannual report, or annual report on Fidelity's web site at http://www.fidelity.com, http://www.institutional.fidelity.com, or http://www.401k.com, as applicable.
NOT FDIC INSURED •MAY LOSE VALUE •NO BANK GUARANTEE
Neither the Fund nor Fidelity Distributors Corporation is a bank.
Performance: The Bottom Line
Average annual total return reflects the change in the value of an investment, assuming reinvestment of distributions from dividend income and capital gains (the profits earned upon the sale of securities that have grown in value, if any) and assuming a constant rate of performance each year. The hypothetical investment and the average annual total returns do not reflect the deduction of taxes that a shareholder would pay on fund distributions or the redemption of fund shares. During periods of reimbursement by Fidelity, a fund’s total return will be greater than it would be had the reimbursement not occurred. How a fund did yesterday is no guarantee of how it will do tomorrow.
Average Annual Total Returns
| For the periods ended November 30, 2017 | Past 1 year | Past 5 years | Past 10 years |
| Class A (incl. 5.75% sales charge) | 12.93% | 11.89% | 6.67% |
| Class M (incl. 3.50% sales charge) | 15.32% | 12.16% | 6.67% |
| Class C (incl. contingent deferred sales charge) | 17.88% | 12.38% | 6.51% |
| Class I | 20.07% | 13.50% | 7.60% |
| Class Z | 20.21% | 13.66% | 7.68% |
Class C shares' contingent deferred sales charges included in the past one year, past five years and past ten years total return figures are 1%, 0% and 0%, respectively.
The initial offering of Class Z shares took place on August 13, 2013. Returns prior to August 13, 2013, are those of Class I.
$10,000 Over 10 Years
Let's say hypothetically that $10,000 was invested in Fidelity Advisor® Dividend Growth Fund - Class A on November 30, 2007, and the current 5.75% sales charge was paid.
The chart shows how the value of your investment would have changed, and also shows how the S&P 500® Index performed over the same period.
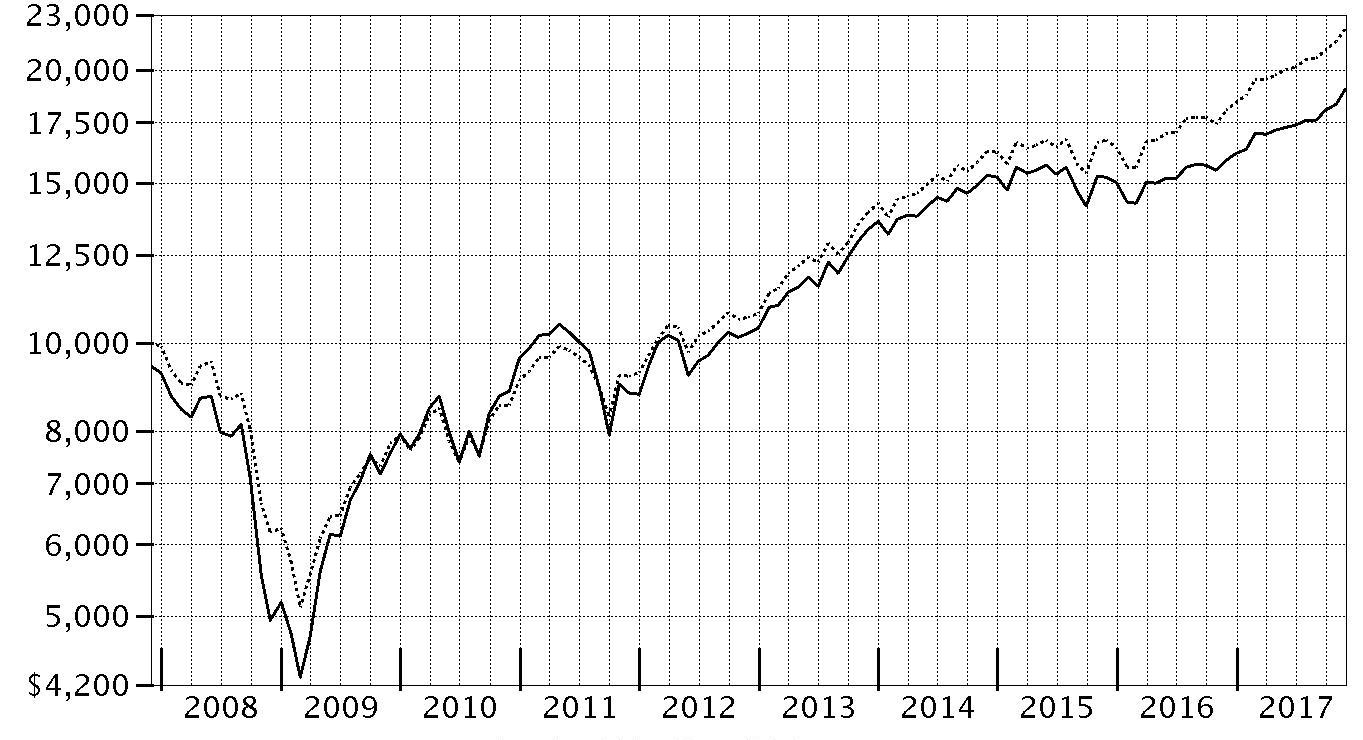
| Period Ending Values | ||
| $19,069 | Fidelity Advisor® Dividend Growth Fund - Class A | |
| $22,199 | S&P 500® Index | |
Management's Discussion of Fund Performance
Market Recap: The U.S. equity bellwether S&P 500® index gained 22.87% for the year ending November 30, 2017, rising steadily and closing the period at an all-time high after a particularly strong three-month finish. Early on, equities rallied on optimism for President Trump’s pro-business agenda but leveled off in March amid fading optimism and stalled efforts by Congress to repeal and replace the Affordable Care Act. Upward momentum soon returned and continued through period end with consumer sentiment and other market indicators staying positive. The lone exception was a brief cooldown in August, when geopolitical tension escalated and uncertainty grew regarding the future of health care, tax reform and the debt ceiling. Sector-wise, info tech (+41%) led by a wide margin, surging amid strong earnings growth from several major index constituents. Utilities and financials each gained about 25%, the latter group riding an uptick in bond yields. Conversely, consumer discretionary (+20%) also rose solidly but lagged the broader market, as many brick-and-mortar retailers continued to suffer from increased online competition. Rising interest rates held back real estate (+16%), while consumer staples (+15%) and telecom (+1%) struggled due to investors’ general preference for risk assets. Lastly, sluggish oil prices pushed energy to a -4% return.Comments from Co-Portfolio Manager Gordon Scott: For the year, the fund’s share classes (excluding sales charges, if applicable) gained about 19% to 20%, trailing the benchmark S&P 500®. Versus the benchmark, stock picking in the consumer discretionary sector and overall positioning in information technology and health care detracted from performance. A cash position of roughly 5%, on average, was a further drag in a strong market. E-tailer Amazon.com, the fund’s largest relative detractor, and social-network provider Facebook were two index constituents we were penalized for avoiding, as investors bid up these stocks to what I thought were excessively high valuations. Overweightings in retailers Foot Locker and AutoZone, and in industrial conglomerate General Electric, also hurt. Conversely, positioning in real estate and telecommunication services added relative value. Activision Blizzard, known for its video-game franchises, proved the fund's top relative contributor for the full 12 months; following a period of strong performance, I exited the position. Ametek, an industrial conglomerate, was another noteworthy contributor that I sold from the fund.The views expressed above reflect those of the portfolio manager(s) only through the end of the period as stated on the cover of this report and do not necessarily represent the views of Fidelity or any other person in the Fidelity organization. Any such views are subject to change at any time based upon market or other conditions and Fidelity disclaims any responsibility to update such views. These views may not be relied on as investment advice and, because investment decisions for a Fidelity fund are based on numerous factors, may not be relied on as an indication of trading intent on behalf of any Fidelity fund.
Note to shareholders: On April 8, 2017, Gordon Scott assumed Co-Manager responsibility, alongside Lead Manager Ramona Persaud, through December 31, 2017, at which time he will be named sole Portfolio Manager.Investment Summary (Unaudited)
Top Ten Stocks as of November 30, 2017
| % of fund's net assets | % of fund's net assets 6 months ago | |
| JPMorgan Chase & Co. | 2.6 | 2.5 |
| Wells Fargo & Co. | 2.4 | 2.3 |
| Bank of America Corp. | 2.3 | 2.3 |
| Johnson & Johnson | 2.2 | 3.2 |
| Microsoft Corp. | 2.2 | 3.4 |
| Exxon Mobil Corp. | 2.1 | 2.2 |
| Apple, Inc. | 1.9 | 5.3 |
| Chevron Corp. | 1.7 | 2.2 |
| Amgen, Inc. | 1.6 | 1.8 |
| Verizon Communications, Inc. | 1.6 | 0.7 |
| 20.6 |
Top Five Market Sectors as of November 30, 2017
| % of fund's net assets | % of fund's net assets 6 months ago | |
| Financials | 15.8 | 17.7 |
| Consumer Discretionary | 14.8 | 8.1 |
| Information Technology | 14.5 | 22.4 |
| Health Care | 13.9 | 11.2 |
| Industrials | 12.4 | 8.6 |
Asset Allocation (% of fund's net assets)
| As of November 30, 2017 * | ||
| Stocks | 93.4% | |
| Convertible Securities | 0.1% | |
| Short-Term Investments and Net Other Assets (Liabilities) | 6.5% | |

* Foreign investments - 8.6%
| As of May 31, 2017 * | ||
| Stocks | 94.9% | |
| Convertible Securities | 0.1% | |
| Short-Term Investments and Net Other Assets (Liabilities) | 5.0% | |

* Foreign investments - 11.9%
Investments November 30, 2017
Showing Percentage of Net Assets
| Common Stocks - 93.4% | |||
| Shares | Value (000s) | ||
| CONSUMER DISCRETIONARY - 14.8% | |||
| Auto Components - 2.1% | |||
| BorgWarner, Inc. | 56,100 | $3,124 | |
| Delphi Automotive PLC | 50,700 | 5,307 | |
| Gentex Corp. | 206,600 | 4,231 | |
| Lear Corp. | 23,700 | 4,287 | |
| Tenneco, Inc. | 38,800 | 2,305 | |
| The Goodyear Tire & Rubber Co. | 102,900 | 3,331 | |
| 22,585 | |||
| Automobiles - 0.6% | |||
| General Motors Co. | 124,400 | 5,360 | |
| Thor Industries, Inc. | 6,400 | 983 | |
| 6,343 | |||
| Distributors - 0.4% | |||
| Genuine Parts Co. | 43,200 | 4,016 | |
| Diversified Consumer Services - 0.7% | |||
| Graham Holdings Co. | 8,000 | 4,665 | |
| H&R Block, Inc. | 129,000 | 3,377 | |
| 8,042 | |||
| Household Durables - 1.0% | |||
| Lennar Corp.: | |||
| Class A | 95,400 | 5,989 | |
| Class B | 1,908 | 98 | |
| Tupperware Brands Corp. | 71,100 | 4,488 | |
| 10,575 | |||
| Leisure Products - 0.1% | |||
| Brunswick Corp. | 20,500 | 1,135 | |
| Media - 4.9% | |||
| CBS Corp. Class B | 33,800 | 1,895 | |
| Cinemark Holdings, Inc. | 100,100 | 3,615 | |
| Comcast Corp. Class A | 406,850 | 15,273 | |
| Interpublic Group of Companies, Inc. | 260,100 | 5,145 | |
| Meredith Corp. (a) | 6,100 | 416 | |
| Omnicom Group, Inc. | 63,600 | 4,544 | |
| Sinclair Broadcast Group, Inc. Class A | 59,000 | 2,009 | |
| Tegna, Inc. | 243,300 | 3,231 | |
| The Walt Disney Co. | 14,700 | 1,541 | |
| Time Warner, Inc. | 47,900 | 4,383 | |
| Twenty-First Century Fox, Inc. Class A | 279,400 | 8,924 | |
| Viacom, Inc. Class B (non-vtg.) | 69,500 | 1,968 | |
| 52,944 | |||
| Multiline Retail - 0.9% | |||
| Dollar General Corp. | 58,300 | 5,135 | |
| Macy's, Inc. | 53,500 | 1,273 | |
| Target Corp. | 68,800 | 4,121 | |
| 10,529 | |||
| Specialty Retail - 2.9% | |||
| AutoZone, Inc. (b) | 3,300 | 2,266 | |
| Bed Bath & Beyond, Inc. | 39,500 | 884 | |
| Best Buy Co., Inc. | 45,200 | 2,694 | |
| Foot Locker, Inc. | 55,091 | 2,360 | |
| Gap, Inc. | 58,500 | 1,890 | |
| L Brands, Inc. | 32,000 | 1,794 | |
| Lowe's Companies, Inc. | 53,600 | 4,469 | |
| Ross Stores, Inc. | 80,800 | 6,143 | |
| TJX Companies, Inc. | 87,800 | 6,633 | |
| Williams-Sonoma, Inc. (a) | 51,100 | 2,614 | |
| 31,747 | |||
| Textiles, Apparel & Luxury Goods - 1.2% | |||
| Carter's, Inc. | 43,000 | 4,658 | |
| Ralph Lauren Corp. | 40,400 | 3,844 | |
| Tapestry, Inc. | 102,500 | 4,273 | |
| 12,775 | |||
| TOTAL CONSUMER DISCRETIONARY | 160,691 | ||
| CONSUMER STAPLES - 8.9% | |||
| Beverages - 0.3% | |||
| Dr. Pepper Snapple Group, Inc. | 41,511 | 3,744 | |
| Food & Staples Retailing - 2.9% | |||
| CVS Health Corp. | 111,300 | 8,526 | |
| Kroger Co. | 201,820 | 5,219 | |
| Wal-Mart Stores, Inc. | 112,700 | 10,958 | |
| Walgreens Boots Alliance, Inc. | 92,300 | 6,716 | |
| 31,419 | |||
| Food Products - 3.0% | |||
| Campbell Soup Co. | 100,700 | 4,965 | |
| ConAgra Foods, Inc. | 154,800 | 5,779 | |
| General Mills, Inc. | 74,300 | 4,202 | |
| Ingredion, Inc. | 24,900 | 3,448 | |
| Mondelez International, Inc. | 49,700 | 2,134 | |
| Sanderson Farms, Inc. | 3,300 | 560 | |
| The J.M. Smucker Co. | 31,100 | 3,628 | |
| The Kraft Heinz Co. | 46,400 | 3,776 | |
| Tyson Foods, Inc. Class A | 52,300 | 4,302 | |
| 32,794 | |||
| Household Products - 0.6% | |||
| Energizer Holdings, Inc. (a) | 72,700 | 3,339 | |
| Kimberly-Clark Corp. | 25,500 | 3,054 | |
| 6,393 | |||
| Tobacco - 2.1% | |||
| Altria Group, Inc. | 236,900 | 16,069 | |
| British American Tobacco PLC (United Kingdom) | 106,211 | 6,754 | |
| 22,823 | |||
| TOTAL CONSUMER STAPLES | 97,173 | ||
| ENERGY - 6.5% | |||
| Energy Equipment & Services - 0.1% | |||
| Ensco PLC Class A | 97,200 | 522 | |
| Oil, Gas & Consumable Fuels - 6.4% | |||
| Chevron Corp. | 159,890 | 19,025 | |
| ConocoPhillips Co. | 58,600 | 2,982 | |
| Exxon Mobil Corp. | 272,922 | 22,732 | |
| Phillips 66 Co. | 86,900 | 8,478 | |
| Suncor Energy, Inc. | 207,480 | 7,197 | |
| Total SA sponsored ADR (a) | 89,531 | 5,063 | |
| Valero Energy Corp. | 53,700 | 4,598 | |
| 70,075 | |||
| TOTAL ENERGY | 70,597 | ||
| FINANCIALS - 15.8% | |||
| Banks - 8.8% | |||
| Bank of America Corp. | 888,703 | 25,035 | |
| JPMorgan Chase & Co. | 271,893 | 28,418 | |
| U.S. Bancorp | 289,617 | 15,972 | |
| Wells Fargo & Co. | 467,190 | 26,382 | |
| 95,807 | |||
| Capital Markets - 0.7% | |||
| Brookfield Asset Management, Inc. Class A (a) | 119,800 | 4,979 | |
| Diamond Hill Investment Group, Inc. | 8,400 | 1,773 | |
| KKR & Co. LP | 32,300 | 643 | |
| 7,395 | |||
| Consumer Finance - 0.0% | |||
| Imperial Holdings, Inc. warrants 4/11/19 (b) | 4,481 | 0 | |
| Diversified Financial Services - 1.3% | |||
| Berkshire Hathaway, Inc. Class B (b) | 72,100 | 13,916 | |
| Insurance - 5.0% | |||
| Allstate Corp. | 74,700 | 7,669 | |
| Chubb Ltd. | 94,800 | 14,420 | |
| First American Financial Corp. | 38,900 | 2,162 | |
| Marsh & McLennan Companies, Inc. | 76,400 | 6,412 | |
| MetLife, Inc. | 157,600 | 8,460 | |
| The Travelers Companies, Inc. | 115,600 | 15,672 | |
| 54,795 | |||
| TOTAL FINANCIALS | 171,913 | ||
| HEALTH CARE - 13.9% | |||
| Biotechnology - 2.3% | |||
| Amgen, Inc. | 101,237 | 17,783 | |
| Gilead Sciences, Inc. | 98,700 | 7,381 | |
| 25,164 | |||
| Health Care Equipment & Supplies - 2.4% | |||
| Becton, Dickinson & Co. | 34,200 | 7,805 | |
| Danaher Corp. | 74,094 | 6,992 | |
| Medtronic PLC | 130,002 | 10,677 | |
| 25,474 | |||
| Health Care Providers & Services - 4.4% | |||
| Aetna, Inc. | 16,900 | 3,045 | |
| AmerisourceBergen Corp. | 42,800 | 3,630 | |
| Anthem, Inc. | 59,400 | 13,957 | |
| Cardinal Health, Inc. | 98,200 | 5,812 | |
| Cigna Corp. | 35,000 | 7,411 | |
| McKesson Corp. | 30,500 | 4,506 | |
| Quest Diagnostics, Inc. | 40,700 | 4,007 | |
| UnitedHealth Group, Inc. | 16,000 | 3,651 | |
| Universal Health Services, Inc. Class B | 17,000 | 1,842 | |
| 47,861 | |||
| Life Sciences Tools & Services - 0.3% | |||
| Thermo Fisher Scientific, Inc. | 17,000 | 3,277 | |
| Pharmaceuticals - 4.5% | |||
| GlaxoSmithKline PLC | 310,187 | 5,367 | |
| Johnson & Johnson | 170,502 | 23,756 | |
| Pfizer, Inc. | 398,900 | 14,464 | |
| Sanofi SA | 58,451 | 5,332 | |
| 48,919 | |||
| TOTAL HEALTH CARE | 150,695 | ||
| INDUSTRIALS - 12.4% | |||
| Aerospace & Defense - 2.1% | |||
| General Dynamics Corp. | 37,700 | 7,810 | |
| Rockwell Collins, Inc. | 45,600 | 6,033 | |
| United Technologies Corp. | 75,000 | 9,109 | |
| 22,952 | |||
| Air Freight & Logistics - 1.3% | |||
| C.H. Robinson Worldwide, Inc. | 51,300 | 4,445 | |
| United Parcel Service, Inc. Class B | 78,200 | 9,497 | |
| 13,942 | |||
| Airlines - 1.4% | |||
| Allegiant Travel Co. | 10,700 | 1,626 | |
| American Airlines Group, Inc. | 61,700 | 3,115 | |
| Delta Air Lines, Inc. | 133,400 | 7,060 | |
| Southwest Airlines Co. | 50,600 | 3,070 | |
| 14,871 | |||
| Building Products - 0.4% | |||
| Johnson Controls International PLC | 123,600 | 4,652 | |
| Commercial Services & Supplies - 0.5% | |||
| Deluxe Corp. | 69,700 | 4,956 | |
| Construction & Engineering - 0.1% | |||
| Fluor Corp. | 33,600 | 1,627 | |
| Electrical Equipment - 0.3% | |||
| Acuity Brands, Inc. | 17,000 | 2,914 | |
| Industrial Conglomerates - 1.9% | |||
| General Electric Co. | 500,200 | 9,149 | |
| Honeywell International, Inc. | 74,300 | 11,588 | |
| 20,737 | |||
| Machinery - 1.1% | |||
| Allison Transmission Holdings, Inc. | 18,700 | 767 | |
| Crane Co. | 56,900 | 4,858 | |
| Snap-On, Inc. | 37,500 | 6,354 | |
| 11,979 | |||
| Professional Services - 0.7% | |||
| Dun & Bradstreet Corp. | 38,700 | 4,764 | |
| Manpower, Inc. | 26,200 | 3,377 | |
| 8,141 | |||
| Road & Rail - 2.1% | |||
| Norfolk Southern Corp. | 56,300 | 7,805 | |
| Union Pacific Corp. | 117,400 | 14,851 | |
| 22,656 | |||
| Trading Companies & Distributors - 0.5% | |||
| W.W. Grainger, Inc. | 23,100 | 5,112 | |
| TOTAL INDUSTRIALS | 134,539 | ||
| INFORMATION TECHNOLOGY - 14.5% | |||
| Communications Equipment - 1.7% | |||
| Cisco Systems, Inc. | 421,479 | 15,721 | |
| Juniper Networks, Inc. | 101,200 | 2,809 | |
| 18,530 | |||
| Electronic Equipment & Components - 0.4% | |||
| Avnet, Inc. | 26,300 | 1,089 | |
| TE Connectivity Ltd. | 31,600 | 2,984 | |
| 4,073 | |||
| IT Services - 2.3% | |||
| Accenture PLC Class A | 39,900 | 5,906 | |
| CSRA, Inc. | 152,000 | 4,397 | |
| Fidelity National Information Services, Inc. | 55,598 | 5,245 | |
| IBM Corp. | 28,900 | 4,450 | |
| Leidos Holdings, Inc. | 54,800 | 3,484 | |
| Paychex, Inc. | 11,500 | 774 | |
| The Western Union Co. | 64,600 | 1,272 | |
| 25,528 | |||
| Semiconductors & Semiconductor Equipment - 2.4% | |||
| Intel Corp. | 303,300 | 13,600 | |
| KLA-Tencor Corp. | 7,100 | 726 | |
| Qualcomm, Inc. | 174,878 | 11,601 | |
| 25,927 | |||
| Software - 3.9% | |||
| CA Technologies, Inc. | 137,500 | 4,547 | |
| Micro Focus International PLC | 108,434 | 3,650 | |
| Microsoft Corp. | 277,763 | 23,379 | |
| Oracle Corp. | 229,500 | 11,259 | |
| 42,835 | |||
| Technology Hardware, Storage & Peripherals - 3.8% | |||
| Apple, Inc. | 122,424 | 21,039 | |
| Hewlett Packard Enterprise Co. | 383,600 | 5,351 | |
| HP, Inc. | 249,100 | 5,343 | |
| NetApp, Inc. | 33,000 | 1,865 | |
| Seagate Technology LLC | 83,900 | 3,235 | |
| Xerox Corp. | 132,300 | 3,924 | |
| 40,757 | |||
| TOTAL INFORMATION TECHNOLOGY | 157,650 | ||
| MATERIALS - 2.5% | |||
| Chemicals - 1.8% | |||
| LyondellBasell Industries NV Class A | 85,200 | 8,920 | |
| Monsanto Co. | 58,700 | 6,947 | |
| PPG Industries, Inc. | 16,500 | 1,928 | |
| The Chemours Co. LLC | 32,300 | 1,660 | |
| 19,455 | |||
| Metals & Mining - 0.7% | |||
| Nucor Corp. | 73,500 | 4,226 | |
| Steel Dynamics, Inc. | 99,600 | 3,835 | |
| 8,061 | |||
| TOTAL MATERIALS | 27,516 | ||
| REAL ESTATE - 0.9% | |||
| Equity Real Estate Investment Trusts (REITs) - 0.9% | |||
| National Retail Properties, Inc. | 71,000 | 2,916 | |
| Spirit Realty Capital, Inc. | 243,700 | 2,081 | |
| Store Capital Corp. | 117,200 | 3,026 | |
| VEREIT, Inc. | 280,200 | 2,186 | |
| 10,209 | |||
| TELECOMMUNICATION SERVICES - 2.0% | |||
| Diversified Telecommunication Services - 2.0% | |||
| AT&T, Inc. | 130,600 | 4,751 | |
| Verizon Communications, Inc. | 335,300 | 17,063 | |
| 21,814 | |||
| UTILITIES - 1.2% | |||
| Electric Utilities - 1.0% | |||
| Exelon Corp. | 180,600 | 7,533 | |
| Great Plains Energy, Inc. | 86,200 | 2,958 | |
| 10,491 | |||
| Independent Power and Renewable Electricity Producers - 0.2% | |||
| The AES Corp. | 228,200 | 2,414 | |
| TOTAL UTILITIES | 12,905 | ||
| TOTAL COMMON STOCKS | |||
| (Cost $833,634) | 1,015,702 | ||
| Principal Amount (000s) | Value (000s) | ||
| Convertible Bonds - 0.1% | |||
| ENERGY - 0.1% | |||
| Oil, Gas & Consumable Fuels - 0.1% | |||
| Amyris, Inc. 9.5% 4/15/19 pay-in-kind (Cost $729) | 989 | 693 | |
| Shares | Value (000s) | ||
| Money Market Funds - 7.0% | |||
| Fidelity Cash Central Fund, 1.13%(c) | 67,914,982 | 67,929 | |
| Fidelity Securities Lending Cash Central Fund 1.13%(c)(d) | 8,362,942 | 8,364 | |
| TOTAL MONEY MARKET FUNDS | |||
| (Cost $76,290) | 76,293 | ||
| TOTAL INVESTMENT IN SECURITIES - 100.5% | |||
| (Cost $910,653) | 1,092,688 | ||
| NET OTHER ASSETS (LIABILITIES) - (0.5)% | (5,866) | ||
| NET ASSETS - 100% | $1,086,822 |
Values shown as $0 may reflect amounts less than $500.
Legend
(a) Security or a portion of the security is on loan at period end.
(b) Non-income producing
(c) Affiliated fund that is generally available only to investment companies and other accounts managed by Fidelity Investments. The rate quoted is the annualized seven-day yield of the fund at period end. A complete unaudited listing of the fund's holdings as of its most recent quarter end is available upon request. In addition, each Fidelity Central Fund's financial statements, which are not covered by the Fund's Report of Independent Registered Public Accounting Firm, are available on the SEC's website or upon request.
(d) Investment made with cash collateral received from securities on loan.
Affiliated Central Funds
Information regarding fiscal year to date income earned by the Fund from investments in Fidelity Central Funds is as follows:
| Fund | Income earned |
| (Amounts in thousands) | |
| Fidelity Cash Central Fund | $430 |
| Fidelity Securities Lending Cash Central Fund | 13 |
| Total | $443 |
Investment Valuation
The following is a summary of the inputs used, as of November 30, 2017, involving the Fund's assets and liabilities carried at fair value. The inputs or methodology used for valuing securities may not be an indication of the risk associated with investing in those securities. For more information on valuation inputs, and their aggregation into the levels used below, please refer to the Investment Valuation section in the accompanying Notes to Financial Statements.
| Valuation Inputs at Reporting Date: | ||||
| Description | Total | Level 1 | Level 2 | Level 3 |
| (Amounts in thousands) | ||||
| Investments in Securities: | ||||
| Equities: | ||||
| Consumer Discretionary | $160,691 | $160,691 | $-- | $-- |
| Consumer Staples | 97,173 | 90,419 | 6,754 | -- |
| Energy | 70,597 | 70,597 | -- | -- |
| Financials | 171,913 | 171,913 | -- | -- |
| Health Care | 150,695 | 139,996 | 10,699 | -- |
| Industrials | 134,539 | 134,539 | -- | -- |
| Information Technology | 157,650 | 157,650 | -- | -- |
| Materials | 27,516 | 27,516 | -- | -- |
| Real Estate | 10,209 | 10,209 | -- | -- |
| Telecommunication Services | 21,814 | 21,814 | -- | -- |
| Utilities | 12,905 | 12,905 | -- | -- |
| Corporate Bonds | 693 | -- | 693 | -- |
| Money Market Funds | 76,293 | 76,293 | -- | -- |
| Total Investments in Securities: | $1,092,688 | $1,074,542 | $18,146 | $-- |
See accompanying notes which are an integral part of the financial statements.
Financial Statements
Statement of Assets and Liabilities
| Amounts in thousands (except per-share amounts) | November 30, 2017 | |
| Assets | ||
| Investment in securities, at value (including securities loaned of $8,046) — See accompanying schedule: Unaffiliated issuers (cost $834,363) | $1,016,395 | |
| Fidelity Central Funds (cost $76,290) | 76,293 | |
| Total Investment in Securities (cost $910,653) | $1,092,688 | |
| Receivable for investments sold | 3,705 | |
| Receivable for fund shares sold | 383 | |
| Dividends receivable | 2,872 | |
| Interest receivable | 12 | |
| Distributions receivable from Fidelity Central Funds | 51 | |
| Prepaid expenses | 2 | |
| Other receivables | 10 | |
| Total assets | 1,099,723 | |
| Liabilities | ||
| Payable for investments purchased | $3,017 | |
| Payable for fund shares redeemed | 597 | |
| Accrued management fee | 305 | |
| Distribution and service plan fees payable | 357 | |
| Other affiliated payables | 200 | |
| Other payables and accrued expenses | 60 | |
| Collateral on securities loaned | 8,365 | |
| Total liabilities | 12,901 | |
| Net Assets | $1,086,822 | |
| Net Assets consist of: | ||
| Paid in capital | $750,757 | |
| Undistributed net investment income | 11,166 | |
| Accumulated undistributed net realized gain (loss) on investments and foreign currency transactions | 142,860 | |
| Net unrealized appreciation (depreciation) on investments and assets and liabilities in foreign currencies | 182,039 | |
| Net Assets | $1,086,822 | |
| Calculation of Maximum Offering Price | ||
| Class A: | ||
| Net Asset Value and redemption price per share ($375,973 ÷ 18,790 shares) | $20.01 | |
| Maximum offering price per share (100/94.25 of $20.01) | $21.23 | |
| Class M: | ||
| Net Asset Value and redemption price per share ($374,299 ÷ 18,812 shares) | $19.90 | |
| Maximum offering price per share (100/96.50 of $19.90) | $20.62 | |
| Class C: | ||
| Net Asset Value and offering price per share ($159,629 ÷ 8,402 shares)(a) | $19.00 | |
| Class I: | ||
| Net Asset Value, offering price and redemption price per share ($169,859 ÷ 8,099 shares) | $20.97 | |
| Class Z: | ||
| Net Asset Value, offering price and redemption price per share ($7,062 ÷ 332 shares) | $21.27 |
(a) Redemption price per share is equal to net asset value less any applicable contingent deferred sales charge.
See accompanying notes which are an integral part of the financial statements.
Statement of Operations
| Amounts in thousands | Year ended November 30, 2017 | |
| Investment Income | ||
| Dividends | $21,920 | |
| Interest | 243 | |
| Income from Fidelity Central Funds | 443 | |
| Total income | 22,606 | |
| Expenses | ||
| Management fee | ||
| Basic fee | $5,600 | |
| Performance adjustment | (2,043) | |
| Transfer agent fees | 2,055 | |
| Distribution and service plan fees | 4,266 | |
| Accounting and security lending fees | 340 | |
| Custodian fees and expenses | 46 | |
| Independent trustees' fees and expenses | 4 | |
| Registration fees | 85 | |
| Audit | 68 | |
| Legal | 8 | |
| Miscellaneous | 9 | |
| Total expenses before reductions | 10,438 | |
| Expense reductions | (54) | 10,384 |
| Net investment income (loss) | 12,222 | |
| Realized and Unrealized Gain (Loss) | ||
| Net realized gain (loss) on: | ||
| Investment securities: | ||
| Unaffiliated issuers | 158,450 | |
| Fidelity Central Funds | 3 | |
| Foreign currency transactions | 33 | |
| Total net realized gain (loss) | 158,486 | |
| Change in net unrealized appreciation (depreciation) on: | ||
| Investment securities: | ||
| Unaffiliated issuers | 13,914 | |
| Fidelity Central Funds | (5) | |
| Assets and liabilities in foreign currencies | 6 | |
| Total change in net unrealized appreciation (depreciation) | 13,915 | |
| Net gain (loss) | 172,401 | |
| Net increase (decrease) in net assets resulting from operations | $184,623 |
See accompanying notes which are an integral part of the financial statements.
Statement of Changes in Net Assets
| Amounts in thousands | Year ended November 30, 2017 | Year ended November 30, 2016 |
| Increase (Decrease) in Net Assets | ||
| Operations | ||
| Net investment income (loss) | $12,222 | $11,303 |
| Net realized gain (loss) | 158,486 | (3,768) |
| Change in net unrealized appreciation (depreciation) | 13,915 | 31,304 |
| Net increase (decrease) in net assets resulting from operations | 184,623 | 38,839 |
| Distributions to shareholders from net investment income | (10,211) | (8,944) |
| Distributions to shareholders from net realized gain | – | (56,257) |
| Total distributions | (10,211) | (65,201) |
| Share transactions - net increase (decrease) | (73,859) | (21,716) |
| Total increase (decrease) in net assets | 100,553 | (48,078) |
| Net Assets | ||
| Beginning of period | 986,269 | 1,034,347 |
| End of period | $1,086,822 | $986,269 |
| Other Information | ||
| Undistributed net investment income end of period | $11,166 | $9,822 |
See accompanying notes which are an integral part of the financial statements.
Financial Highlights
Fidelity Advisor Dividend Growth Fund Class A
| Years ended November 30, | 2017 | 2016 | 2015 | 2014 | 2013 |
| Selected Per–Share Data | |||||
| Net asset value, beginning of period | $16.90 | $17.35 | $19.65 | $17.23 | $13.33 |
| Income from Investment Operations | |||||
| Net investment income (loss)A | .25 | .21 | .20 | .23B | .13 |
| Net realized and unrealized gain (loss) | 3.07 | .46 | (.34)C | 2.29 | 3.87 |
| Total from investment operations | 3.32 | .67 | (.14) | 2.52 | 4.00 |
| Distributions from net investment income | (.21) | (.18) | (.19) | (.09) | (.10) |
| Distributions from net realized gain | – | (.94) | (1.96) | (.01) | – |
| Total distributions | (.21) | (1.12) | (2.16)D | (.10) | (.10) |
| Net asset value, end of period | $20.01 | $16.90 | $17.35 | $19.65 | $17.23 |
| Total ReturnE,F | 19.81% | 4.36% | (.41)%C | 14.70% | 30.26% |
| Ratios to Average Net AssetsG,H | |||||
| Expenses before reductions | .85% | .90% | 1.01% | .94% | .98% |
| Expenses net of fee waivers, if any | .85% | .90% | 1.00% | .94% | .98% |
| Expenses net of all reductions | .84% | .90% | 1.00% | .94% | .97% |
| Net investment income (loss) | 1.36% | 1.33% | 1.13% | 1.29%B | .87% |
| Supplemental Data | |||||
| Net assets, end of period (in millions) | $376 | $355 | $356 | $386 | $369 |
| Portfolio turnover rateI | 73% | 31% | 56% | 106% | 70% |
A Calculated based on average shares outstanding during the period.
B Net Investment income per share reflects a large, non-recurring dividend which amounted to $.04 per share. Excluding this non-recurring dividend, the ratio of net investment income (loss) to average net assets would have been 1.07%.
C Net realized and unrealized gain (loss) per share reflects proceeds received from litigation which amounted to $.02 per share. Excluding these litigation proceeds, the total return would have been (.51)%.
D Total distributions of $2.16 per share is comprised of distributions from net investment income of $.193 and distributions from net realized gain of $1.962 per share.
E Total returns would have been lower if certain expenses had not been reduced during the applicable periods shown.
F Total returns do not include the effect of the sales charges.
G Fees and expenses of any underlying Fidelity Central Funds are not included in the Fund's expense ratio. The Fund indirectly bears its proportionate share of the expenses of any underlying Fidelity Central Funds.
H Expense ratios reflect operating expenses of the class. Expenses before reductions do not reflect amounts reimbursed by the investment adviser or reductions from brokerage service arrangements or reductions from other expense offset arrangements and do not represent the amount paid by the class during periods when reimbursements or reductions occur. Expenses net of fee waivers reflect expenses after reimbursement by the investment adviser but prior to reductions from brokerage service arrangements or other expense offset arrangements. Expenses net of all reductions represent the net expenses paid by the class.
I Amount does not include the portfolio activity of any underlying Fidelity Central Funds.
See accompanying notes which are an integral part of the financial statements.
Fidelity Advisor Dividend Growth Fund Class M
| Years ended November 30, | 2017 | 2016 | 2015 | 2014 | 2013 |
| Selected Per–Share Data | |||||
| Net asset value, beginning of period | $16.81 | $17.25 | $19.55 | $17.15 | $13.26 |
| Income from Investment Operations | |||||
| Net investment income (loss)A | .20 | .17 | .15 | .19B | .10 |
| Net realized and unrealized gain (loss) | 3.05 | .47 | (.34)C | 2.27 | 3.86 |
| Total from investment operations | 3.25 | .64 | (.19) | 2.46 | 3.96 |
| Distributions from net investment income | (.16) | (.14) | (.15) | (.06) | (.07) |
| Distributions from net realized gain | – | (.94) | (1.96) | (.01) | – |
| Total distributions | (.16) | (1.08) | (2.11) | (.06)D | (.07) |
| Net asset value, end of period | $19.90 | $16.81 | $17.25 | $19.55 | $17.15 |
| Total ReturnE,F | 19.50% | 4.15% | (.67)%C | 14.41% | 30.05% |
| Ratios to Average Net AssetsG,H | |||||
| Expenses before reductions | 1.09% | 1.14% | 1.24% | 1.18% | 1.20% |
| Expenses net of fee waivers, if any | 1.09% | 1.14% | 1.24% | 1.18% | 1.20% |
| Expenses net of all reductions | 1.09% | 1.14% | 1.24% | 1.17% | 1.19% |
| Net investment income (loss) | 1.11% | 1.09% | .89% | 1.05%B | .65% |
| Supplemental Data | |||||
| Net assets, end of period (in millions) | $374 | $351 | $372 | $412 | $375 |
| Portfolio turnover rateI | 73% | 31% | 56% | 106% | 70% |
A Calculated based on average shares outstanding during the period.
B Net Investment income per share reflects a large, non-recurring dividend which amounted to $.04 per share. Excluding this non-recurring dividend, the ratio of net investment income (loss) to average net assets would have been .83%.
C Net realized and unrealized gain (loss) per share reflects proceeds received from litigation which amounted to $.02 per share. Excluding these litigation proceeds, the total return would have been (.77)%.
D Total distributions of $.06 per share is comprised of distributions from net investment income of $.055 and distributions from net realized gain of $.007 per share.
E Total returns would have been lower if certain expenses had not been reduced during the applicable periods shown.
F Total returns do not include the effect of the sales charges.
G Fees and expenses of any underlying Fidelity Central Funds are not included in the Fund's expense ratio. The Fund indirectly bears its proportionate share of the expenses of any underlying Fidelity Central Funds.
H Expense ratios reflect operating expenses of the class. Expenses before reductions do not reflect amounts reimbursed by the investment adviser or reductions from brokerage service arrangements or reductions from other expense offset arrangements and do not represent the amount paid by the class during periods when reimbursements or reductions occur. Expenses net of fee waivers reflect expenses after reimbursement by the investment adviser but prior to reductions from brokerage service arrangements or other expense offset arrangements. Expenses net of all reductions represent the net expenses paid by the class.
I Amount does not include the portfolio activity of any underlying Fidelity Central Funds.
See accompanying notes which are an integral part of the financial statements.
Fidelity Advisor Dividend Growth Fund Class C
| Years ended November 30, | 2017 | 2016 | 2015 | 2014 | 2013 |
| Selected Per–Share Data | |||||
| Net asset value, beginning of period | $16.06 | $16.53 | $18.82 | $16.54 | $12.79 |
| Income from Investment Operations | |||||
| Net investment income (loss)A | .10 | .09 | .06 | .09B | .02 |
| Net realized and unrealized gain (loss) | 2.92 | .44 | (.32)C | 2.20 | 3.73 |
| Total from investment operations | 3.02 | .53 | (.26) | 2.29 | 3.75 |
| Distributions from net investment income | (.08) | (.06) | (.06) | – | – |
| Distributions from net realized gain | – | (.94) | (1.96) | (.01) | – |
| Total distributions | (.08) | (1.00) | (2.03)D | (.01) | – |
| Net asset value, end of period | $19.00 | $16.06 | $16.53 | $18.82 | $16.54 |
| Total ReturnE,F | 18.88% | 3.58% | (1.16)%C | 13.83% | 29.36% |
| Ratios to Average Net AssetsG,H | |||||
| Expenses before reductions | 1.61% | 1.66% | 1.76% | 1.69% | 1.72% |
| Expenses net of fee waivers, if any | 1.61% | 1.66% | 1.76% | 1.69% | 1.72% |
| Expenses net of all reductions | 1.61% | 1.66% | 1.76% | 1.69% | 1.71% |
| Net investment income (loss) | .59% | .57% | .37% | .54%B | .13% |
| Supplemental Data | |||||
| Net assets, end of period (in millions) | $160 | $154 | $167 | $179 | $160 |
| Portfolio turnover rateI | 73% | 31% | 56% | 106% | 70% |
A Calculated based on average shares outstanding during the period.
B Net Investment income per share reflects a large, non-recurring dividend which amounted to $.04 per share. Excluding this non-recurring dividend, the ratio of net investment income (loss) to average net assets would have been .32%.
C Net realized and unrealized gain (loss) per share reflects proceeds received from litigation which amounted to $.02 per share. Excluding these litigation proceeds, the total return would have been (1.26)%
D Total distributions of $2.03 per share is comprised of distributions from net investment income of $.064 and distributions from net realized gain of $1.962 per share.
E Total returns would have been lower if certain expenses had not been reduced during the applicable periods shown.
F Total returns do not include the effect of the contingent deferred sales charge.
G Fees and expenses of any underlying Fidelity Central Funds are not included in the Fund's expense ratio. The Fund indirectly bears its proportionate share of the expenses of any underlying Fidelity Central Funds.
H Expense ratios reflect operating expenses of the class. Expenses before reductions do not reflect amounts reimbursed by the investment adviser or reductions from brokerage service arrangements or reductions from other expense offset arrangements and do not represent the amount paid by the class during periods when reimbursements or reductions occur. Expenses net of fee waivers reflect expenses after reimbursement by the investment adviser but prior to reductions from brokerage service arrangements or other expense offset arrangements. Expenses net of all reductions represent the net expenses paid by the class.
I Amount does not include the portfolio activity of any underlying Fidelity Central Funds.
See accompanying notes which are an integral part of the financial statements.
Fidelity Advisor Dividend Growth Fund Class I
| Years ended November 30, | 2017 | 2016 | 2015 | 2014 | 2013 |
| Selected Per–Share Data | |||||
| Net asset value, beginning of period | $17.70 | $18.12 | $20.42 | $17.91 | $13.86 |
| Income from Investment Operations | |||||
| Net investment income (loss)A | .30 | .26 | .25 | .29B | .18 |
| Net realized and unrealized gain (loss) | 3.21 | .49 | (.35)C | 2.37 | 4.02 |
| Total from investment operations | 3.51 | .75 | (.10) | 2.66 | 4.20 |
| Distributions from net investment income | (.24) | (.22) | (.24) | (.14) | (.15) |
| Distributions from net realized gain | – | (.94) | (1.96) | (.01) | – |
| Total distributions | (.24) | (1.17)D | (2.20) | (.15) | (.15) |
| Net asset value, end of period | $20.97 | $17.70 | $18.12 | $20.42 | $17.91 |
| Total ReturnE | 20.07% | 4.60% | (.14)%C | 14.99% | 30.63% |
| Ratios to Average Net AssetsF,G | |||||
| Expenses before reductions | .61% | .67% | .76% | .69% | .70% |
| Expenses net of fee waivers, if any | .61% | .67% | .76% | .69% | .70% |
| Expenses net of all reductions | .60% | .66% | .76% | .69% | .69% |
| Net investment income (loss) | 1.59% | 1.57% | 1.37% | 1.54%B | 1.15% |
| Supplemental Data | |||||
| Net assets, end of period (in millions) | $170 | $123 | $125 | $131 | $135 |
| Portfolio turnover rateH | 73% | 31% | 56% | 106% | 70% |
A Calculated based on average shares outstanding during the period.
B Net Investment income per share reflects a large, non-recurring dividend which amounted to $.04 per share. Excluding this non-recurring dividend, the ratio of net investment income (loss) to average net assets would have been 1.32%.
C Net realized and unrealized gain (loss) per share reflects proceeds received from litigation which amounted to $.02 per share. Excluding these litigation proceeds, the total return would have been (.24)%.
D Total distributions of $1.17 per share is comprised of distributions from net investment income of $.224 and distributions from net realized gain of $.941 per share.
E Total returns would have been lower if certain expenses had not been reduced during the applicable periods shown.
F Fees and expenses of any underlying Fidelity Central Funds are not included in the Fund's expense ratio. The Fund indirectly bears its proportionate share of the expenses of any underlying Fidelity Central Funds.
G Expense ratios reflect operating expenses of the class. Expenses before reductions do not reflect amounts reimbursed by the investment adviser or reductions from brokerage service arrangements or reductions from other expense offset arrangements and do not represent the amount paid by the class during periods when reimbursements or reductions occur. Expenses net of fee waivers reflect expenses after reimbursement by the investment adviser but prior to reductions from brokerage service arrangements or other expense offset arrangements. Expenses net of all reductions represent the net expenses paid by the class.
H Amount does not include the portfolio activity of any underlying Fidelity Central Funds.
See accompanying notes which are an integral part of the financial statements.
Fidelity Advisor Dividend Growth Fund Class Z
| Years ended November 30, | 2017 | 2016 | 2015 | 2014 | 2013 A |
| Selected Per–Share Data | |||||
| Net asset value, beginning of period | $17.95 | $18.36 | $20.44 | $17.92 | $16.59 |
| Income from Investment Operations | |||||
| Net investment income (loss)B | .34 | .29 | .28 | .31C | .06 |
| Net realized and unrealized gain (loss) | 3.24 | .50 | (.35)D | 2.38 | 1.27 |
| Total from investment operations | 3.58 | .79 | (.07) | 2.69 | 1.33 |
| Distributions from net investment income | (.26) | (.26) | (.05) | (.17) | – |
| Distributions from net realized gain | – | (.94) | (1.96) | (.01) | – |
| Total distributions | (.26) | (1.20) | (2.01) | (.17)E | – |
| Net asset value, end of period | $21.27 | $17.95 | $18.36 | $20.44 | $17.92 |
| Total ReturnF,G | 20.21% | 4.80% | (.01)%D | 15.20% | 8.02% |
| Ratios to Average Net AssetsH,I | |||||
| Expenses before reductions | .45% | .49% | .59% | .52% | .54%J |
| Expenses net of fee waivers, if any | .45% | .49% | .59% | .52% | .54%J |
| Expenses net of all reductions | .44% | .49% | .59% | .52% | .52%J |
| Net investment income (loss) | 1.76% | 1.74% | 1.54% | 1.71%C | 1.26%J |
| Supplemental Data | |||||
| Net assets, end of period (in millions) | $7 | $2 | $9 | $– | $7 |
| Portfolio turnover rateK | 73% | 31% | 56% | 106% | 70% |
A For the period August 13, 2013 (commencement of sale of shares) to November 30, 2013.
B Calculated based on average shares outstanding during the period.
C Net Investment income per share reflects a large, non-recurring dividend which amounted to $.04 per share. Excluding this non-recurring dividend, the ratio of net investment income (loss) to average net assets would have been 1.49%.
D Net realized and unrealized gain (loss) per share reflects proceeds received from litigation which amounted to $.02 per share. Excluding these litigation proceeds, the total return would have been (.11)%.
E Total distributions of $.17 per share is comprised of distributions from net investment income of $.166 and distributions from net realized gain of $.007 per share.
F Total returns for periods of less than one year are not annualized.
G Total returns would have been lower if certain expenses had not been reduced during the applicable periods shown.
H Fees and expenses of any underlying Fidelity Central Funds are not included in the Fund's expense ratio. The Fund indirectly bears its proportionate share of the expenses of any underlying Fidelity Central Funds.
I Expense ratios reflect operating expenses of the class. Expenses before reductions do not reflect amounts reimbursed by the investment adviser or reductions from brokerage service arrangements or reductions from other expense offset arrangements and do not represent the amount paid by the class during periods when reimbursements or reductions occur. Expense ratios before reductions for start-up periods may not be representative of longer-term operating periods. Expenses net of fee waivers reflect expenses after reimbursement by the investment adviser but prior to reductions from brokerage service arrangements or other expense offset arrangements. Expenses net of all reductions represent the net expenses paid by the class.
J Annualized
K Amount does not include the portfolio activity of any underlying Fidelity Central Funds.
See accompanying notes which are an integral part of the financial statements.
Notes to Financial Statements
For the period ended November 30, 2017
(Amounts in thousands except percentages)
1. Organization.
Fidelity Advisor Dividend Growth Fund (the Fund) is a fund of Fidelity Advisor Series I (the Trust) and is authorized to issue an unlimited number of shares. The Trust is registered under the Investment Company Act of 1940, as amended (the 1940 Act), as an open-end management investment company organized as a Massachusetts business trust. The Fund offers Class A, Class M (formerly Class T), Class C, Class I and Class Z shares, each of which has equal rights as to assets and voting privileges. Each class has exclusive voting rights with respect to matters that affect that class.
After the close of business on June 24, 2016, all outstanding Class B shares were converted to Class A shares. All prior fiscal period dollar and share amounts for Class B presented in the Notes to Financial Statements are for the period December 1, 2015 through June 24, 2016.
2. Investments in Fidelity Central Funds.
The Fund invests in Fidelity Central Funds, which are open-end investment companies generally available only to other investment companies and accounts managed by the investment adviser and its affiliates. The Fund's Schedule of Investments lists each of the Fidelity Central Funds held as of period end, if any, as an investment of the Fund, but does not include the underlying holdings of each Fidelity Central Fund. As an Investing Fund, the Fund indirectly bears its proportionate share of the expenses of the underlying Fidelity Central Funds.
The Money Market Central Funds seek preservation of capital and current income and are managed by Fidelity Investments Money Management, Inc. (FIMM), an affiliate of the investment adviser. Annualized expenses of the Money Market Central Funds as of their most recent shareholder report date are less than .005%.
A complete unaudited list of holdings for each Fidelity Central Fund is available upon request or at the Securities and Exchange Commission (the SEC) website at www.sec.gov. In addition, the financial statements of the Fidelity Central Funds, which are not covered by the Fund's Report of Independent Registered Public Accounting Firm, are available on the SEC website or upon request.
3. Significant Accounting Policies.
The Fund is an investment company and applies the accounting and reporting guidance of the Financial Accounting Standards Board (FASB) Accounting Standards Codification Topic 946 Financial Services – Investments Companies. The financial statements have been prepared in conformity with accounting principles generally accepted in the United States of America (GAAP), which require management to make certain estimates and assumptions at the date of the financial statements. Actual results could differ from those estimates. Subsequent events, if any, through the date that the financial statements were issued have been evaluated in the preparation of the financial statements. The following summarizes the significant accounting policies of the Fund:
Investment Valuation. Investments are valued as of 4:00 p.m. Eastern time on the last calendar day of the period. The Board of Trustees (the Board) has delegated the day to day responsibility for the valuation of the Fund's investments to the Fair Value Committee (the Committee) established by the Fund's investment adviser. In accordance with valuation policies and procedures approved by the Board, the Fund attempts to obtain prices from one or more third party pricing vendors or brokers to value its investments. When current market prices, quotations or currency exchange rates are not readily available or reliable, investments will be fair valued in good faith by the Committee, in accordance with procedures adopted by the Board. Factors used in determining fair value vary by investment type and may include market or investment specific events, changes in interest rates and credit quality. The frequency with which these procedures are used cannot be predicted and they may be utilized to a significant extent. The Committee oversees the Fund's valuation policies and procedures and reports to the Board on the Committee's activities and fair value determinations. The Board monitors the appropriateness of the procedures used in valuing the Fund's investments and ratifies the fair value determinations of the Committee.
The Fund categorizes the inputs to valuation techniques used to value its investments into a disclosure hierarchy consisting of three levels as shown below:
- Level 1 – quoted prices in active markets for identical investments
- Level 2 – other significant observable inputs (including quoted prices for similar investments, interest rates, prepayment speeds, etc.)
- Level 3 – unobservable inputs (including the Fund's own assumptions based on the best information available)
Valuation techniques used to value the Fund's investments by major category are as follows:
Equity securities, including restricted securities, for which market quotations are readily available, are valued at the last reported sale price or official closing price as reported by a third party pricing vendor on the primary market or exchange on which they are traded and are categorized as Level 1 in the hierarchy. In the event there were no sales during the day or closing prices are not available, securities are valued at the last quoted bid price or may be valued using the last available price and are generally categorized as Level 2 in the hierarchy. For foreign equity securities, when market or security specific events arise, comparisons to the valuation of American Depositary Receipts (ADRs), futures contracts, Exchange-Traded Funds (ETFs) and certain indexes as well as quoted prices for similar securities may be used and would be categorized as Level 2 in the hierarchy. Utilizing these techniques may result in transfers between Level 1 and Level 2. For equity securities, including restricted securities, where observable inputs are limited, assumptions about market activity and risk are used and these securities may be categorized as Level 3 in the hierarchy.
Debt securities, including restricted securities, are valued based on evaluated prices received from third party pricing vendors or from brokers who make markets in such securities. Corporate bonds are valued by pricing vendors who utilize matrix pricing which considers yield or price of bonds of comparable quality, coupon, maturity and type or by broker-supplied prices. When independent prices are unavailable or unreliable, debt securities may be valued utilizing pricing methodologies which consider similar factors that would be used by third party pricing vendors. Debt securities are generally categorized as Level 2 in the hierarchy but may be Level 3 depending on the circumstances.
Investments in open-end mutual funds, including the Fidelity Central Funds, are valued at their closing net asset value (NAV) each business day and are categorized as Level 1 in the hierarchy.
Changes in valuation techniques may result in transfers in or out of an assigned level within the disclosure hierarchy. The aggregate value of investments by input level as of November 30, 2017, is included at the end of the Fund's Schedule of Investments.
Foreign Currency. The Fund may use foreign currency contracts to facilitate transactions in foreign-denominated securities. Gains and losses from these transactions may arise from changes in the value of the foreign currency or if the counterparties do not perform under the contracts' terms.
Foreign-denominated assets, including investment securities, and liabilities are translated into U.S. dollars at the exchange rates at period end. Purchases and sales of investment securities, income and dividends received and expenses denominated in foreign currencies are translated into U.S. dollars at the exchange rate in effect on the transaction date.
The effects of exchange rate fluctuations on investments are included with the net realized and unrealized gain (loss) on investment securities. Other foreign currency transactions resulting in realized and unrealized gain (loss) are disclosed separately.
Investment Transactions and Income. For financial reporting purposes, the Fund's investment holdings and NAV include trades executed through the end of the last business day of the period. The NAV per share for processing shareholder transactions is calculated as of the close of business of the New York Stock Exchange (NYSE), normally 4:00 p.m. Eastern time and includes trades executed through the end of the prior business day. Gains and losses on securities sold are determined on the basis of identified cost and includes proceeds received from litigation. Dividend income is recorded on the ex-dividend date, except for certain dividends from foreign securities where the ex-dividend date may have passed, which are recorded as soon as the Fund is informed of the ex-dividend date. Non-cash dividends included in dividend income, if any, are recorded at the fair market value of the securities received. Income and capital gain distributions from Fidelity Central Funds, if any, are recorded on the ex-dividend date. Certain distributions received by the Fund represent a return of capital or capital gain. The Fund determines the components of these distributions subsequent to the ex-dividend date, based upon receipt of tax filings or other correspondence relating to the underlying investment. These distributions are recorded as a reduction of cost of investments and/or as a realized gain. Interest income is accrued as earned and includes coupon interest and amortization of premium and accretion of discount on debt securities as applicable. Paid in Kind (PIK) income is recorded at the fair market value of the securities received. Investment income is recorded net of foreign taxes withheld where recovery of such taxes is uncertain.
Class Allocations and Expenses. Investment income, realized and unrealized capital gains and losses, common expenses of the Fund, and certain fund-level expense reductions, if any, are allocated daily on a pro-rata basis to each class based on the relative net assets of each class to the total net assets of the Fund. Each class differs with respect to transfer agent and distribution and service plan fees incurred. Certain expense reductions may also differ by class. For the reporting period, the allocated portion of income and expenses to each class as a percent of its average net assets may vary due to the timing of recording these transactions in relation to fluctuating net assets of the classes. Expenses directly attributable to a fund are charged to that fund. Expenses attributable to more than one fund are allocated among the respective funds on the basis of relative net assets or other appropriate methods. Expense estimates are accrued in the period to which they relate and adjustments are made when actual amounts are known.
Income Tax Information and Distributions to Shareholders. Each year, the Fund intends to qualify as a regulated investment company under Subchapter M of the Internal Revenue Code, including distributing substantially all of its taxable income and realized gains. As a result, no provision for U.S. Federal income taxes is required. As of November 30, 2017, the Fund did not have any unrecognized tax benefits in the financial statements; nor is the Fund aware of any tax positions for which it is reasonably possible that the total amounts of unrecognized tax benefits will significantly change in the next twelve months. The Fund files a U.S. federal tax return, in addition to state and local tax returns as required. The Fund's federal income tax returns are subject to examination by the Internal Revenue Service (IRS) for a period of three fiscal years after they are filed. State and local tax returns may be subject to examination for an additional fiscal year depending on the jurisdiction. Foreign taxes are provided for based on the Fund's understanding of the tax rules and rates that exist in the foreign markets in which it invests.
Distributions are declared and recorded on the ex-dividend date. Income dividends and capital gain distributions are declared separately for each class. Income and capital gain distributions are determined in accordance with income tax regulations, which may differ from GAAP. In addition, the Fund claimed a portion of the payment made to redeeming shareholders as a distribution for income tax purposes.
Capital accounts within the financial statements are adjusted for permanent book-tax differences. These adjustments have no impact on net assets or the results of operations. Capital accounts are not adjusted for temporary book-tax differences which will reverse in a subsequent period.
Book-tax differences are primarily due to foreign currency transactions, passive foreign investment companies (PFIC), market discount, partnerships, capital loss carryforwards, and losses deferred due to wash sales.
As of period end, the cost and unrealized appreciation (depreciation) in securities, and derivatives if applicable, for federal income tax purposes were as follows:
| Gross unrealized appreciation | $196,243 |
| Gross unrealized depreciation | (14,605) |
| Net unrealized appreciation (depreciation) | $181,638 |
| Tax Cost | $911,050 |
The tax-based components of distributable earnings as of period end were as follows:
| Undistributed ordinary income | $11,046 |
| Undistributed long-term capital gain | $143,376 |
| Net unrealized appreciation (depreciation) on securities and other investments | $181,641 |
The tax character of distributions paid was as follows:
| November 30, 2017 | November 30, 2016 | |
| Ordinary Income | $10,211 | $ 8,944 |
| Long-term Capital Gains | – | 56,257 |
| Total | $10,211 | $ 65,201 |
4. Purchases and Sales of Investments.
Purchases and sales of securities, other than short-term securities, aggregated $713,188 and $796,727, respectively.
5. Fees and Other Transactions with Affiliates.
Management Fee. Fidelity Management & Research Company (the investment adviser) and its affiliates provide the Fund with investment management related services for which the Fund pays a monthly management fee. The management fee is the sum of an individual fund fee rate that is based on an annual rate of .30% of the Fund's average net assets and an annualized group fee rate that averaged .25% during the period. The group fee rate is based upon the average net assets of all the mutual funds advised by the investment adviser, including any mutual funds previously advised by the investment adviser that are currently advised by Fidelity SelectCo, LLC, an affiliate of the investment adviser. The group fee rate decreases as assets under management increase and increases as assets under management decrease. In addition, the management fee is subject to a performance adjustment (up to a maximum of +/- .20% of the Fund's average net assets over a 36 month performance period). The upward or downward adjustment to the management fee is based on the relative investment performance of Class I of the Fund as compared to its benchmark index, the S&P 500 Index, over the same 36 month performance period. For the reporting period, the total annual management fee rate, including the performance adjustment, was .35% of the Fund's average net assets. The performance adjustment included in the management fee rate may be higher or lower than the maximum performance adjustment rate due to the difference between the average net assets for the reporting and performance periods.
Distribution and Service Plan Fees. In accordance with Rule 12b-1 of the 1940 Act, the Fund has adopted separate Distribution and Service Plans for each class of shares. Certain classes pay Fidelity Distributors Corporation (FDC), an affiliate of the investment adviser, separate Distribution and Service Fees, each of which is based on an annual percentage of each class' average net assets. In addition, FDC may pay financial intermediaries for selling shares of the Fund and providing shareholder support services. For the period, the Distribution and Service Fee rates, total fees and amounts retained by FDC were as follows:
| Distribution Fee | Service Fee | Total Fees | Retained by FDC | |
| Class A | -% | .25% | $909 | $7 |
| Class M | .25% | .25% | 1,792 | 3 |
| Class C | .75% | .25% | 1,565 | 41 |
| $4,266 | $51 |
Sales Load. FDC may receive a front-end sales charge of up to 5.75% for selling Class A shares and 3.50% for selling Class M shares, some of which is paid to financial intermediaries for selling shares of the Fund. Depending on the holding period, FDC may receive contingent deferred sales charges levied on Class A, Class M and Class C redemptions. The deferred sales charges are 1.00% for Class C shares, 1.00% for certain purchases of Class A shares and .25% for certain purchases of Class M shares.
For the period, sales charge amounts retained by FDC were as follows:
| Retained by FDC | |
| Class A | $78 |
| Class M | 16 |
| Class C(a) | 8 |
| $102 |
(a) When Class C shares are initially sold, FDC pays commissions from its own resources to financial intermediaries through which the sales are made.
Transfer Agent Fees. Fidelity Investments Institutional Operations Company, Inc., (FIIOC), an affiliate of the investment adviser, is the transfer, dividend disbursing and shareholder servicing agent for each class of the Fund. FIIOC receives account fees and asset-based fees that vary according to the account size and type of account of the shareholders of the respective classes of the Fund, except for Class Z. FIIOC receives an asset-based fee of Class Z's average net assets. FIIOC pays for typesetting, printing and mailing of shareholder reports, except proxy statements.
For the period, transfer agent fees for each class were as follows:
| Amount | % of Class-Level Average Net Assets | |
| Class A | $717 | .20 |
| Class M | 694 | .19 |
| Class C | 333 | .21 |
| Class I | 310 | .21 |
| Class Z | 1 | .05 |
| $2,055 |
Accounting and Security Lending Fees. Fidelity Service Company, Inc. (FSC), an affiliate of the investment adviser, maintains the Fund's accounting records. The accounting fee is based on the level of average net assets for each month. Under a separate contract, FSC administers the security lending program. The security lending fee is based on the number and duration of lending transactions.
Brokerage Commissions. The Fund placed a portion of its portfolio transactions with brokerage firms which are affiliates of the investment adviser. Brokerage commissions are included in net realized gain (loss) and change in net unrealized appreciation (depreciation) in the Statement of Operations. The commissions paid to these affiliated firms were $18 for the period.
Interfund Trades. The Fund may purchase from or sell securities to other Fidelity Funds under procedures adopted by the Board. The procedures have been designed to ensure these interfund trades are executed in accordance with Rule 17a-7 of the 1940 Act. Interfund trades are included within the respective purchases and sales amounts shown in the Purchases and Sales of Investments note.
6. Committed Line of Credit.
The Fund participates with other funds managed by the investment adviser or an affiliate in a $4.25 billion credit facility (the "line of credit") to be utilized for temporary or emergency purposes to fund shareholder redemptions or for other short-term liquidity purposes. The Fund has agreed to pay commitment fees on its pro-rata portion of the line of credit, which amounted to $3 and is reflected in Miscellaneous expenses on the Statement of Operations. During the period, the Fund did not borrow on this line of credit.
7. Security Lending.
The Fund lends portfolio securities through a lending agent from time to time in order to earn additional income. For equity securities, a lending agent is used and may loan securities to certain qualified borrowers, including Fidelity Capital Markets (FCM), a broker-dealer affiliated with the Fund. On the settlement date of the loan, the Fund receives collateral (in the form of U.S. Treasury obligations, letters of credit and/or cash) against the loaned securities and maintains collateral in an amount not less than 100% of the market value of the loaned securities during the period of the loan. The market value of the loaned securities is determined at the close of business of the Fund and any additional required collateral is delivered to the Fund on the next business day. The Fund or borrower may terminate the loan at any time, and if the borrower defaults on its obligation to return the securities loaned because of insolvency or other reasons, the Fund may apply collateral received from the borrower against the obligation. The Fund may experience delays and costs in recovering the securities loaned. Any cash collateral received is invested in the Fidelity Securities Lending Cash Central Fund. The value of loaned securities and cash collateral at period end are disclosed on the Fund's Statement of Assets and Liabilities. Security lending income represents the income earned on investing cash collateral, less rebates paid to borrowers and any lending agent fees associated with the loan, plus any premium payments received for lending certain types of securities. Security lending income is presented in the Statement of Operations as a component of income from Fidelity Central Funds. Total security lending income during the period amounted to $13. During the period, there were no securities loaned to FCM.
8. Expense Reductions.
Commissions paid to certain brokers with whom the investment adviser, or its affiliates, places trades on behalf of the Fund include an amount in addition to trade execution, which may be rebated back to the Fund to offset certain expenses. This amount totaled $45 for the period.
In addition, during the period the investment adviser reimbursed and/or waived a portion of fund-level operating expenses in the amount of $9.
9. Distributions to Shareholders.
Distributions to shareholders of each class were as follows:
| Year ended November 30, 2017 | Year ended November 30, 2016 | |
| From net investment income | ||
| Class A | $4,338 | $3,750 |
| Class M | 3,360 | 2,967 |
| Class C | 762 | 563 |
| Class I | 1,715 | 1,543 |
| Class Z | 36 | 121 |
| Total | $10,211 | $8,944 |
| From net realized gain | ||
| Class A | $– | $19,280 |
| Class M | – | 20,231 |
| Class B | – | 361 |
| Class C | – | 9,460 |
| Class I | – | 6,482 |
| Class Z | – | 443 |
| Total | $– | $56,257 |
10. Share Transactions.
Share transactions for each class were as follows and may contain automatic conversions between classes or exchanges between affiliated funds:
| Shares | Shares | Dollars | Dollars | |
| Year ended November 30, 2017 | Year ended November 30, 2016 | Year ended November 30, 2017 | Year ended November 30, 2016 | |
| Class A | ||||
| Shares sold | 1,978 | 3,281 | $35,475 | $52,651 |
| Reinvestment of distributions | 236 | 1,348 | 4,055 | 21,238 |
| Shares redeemed | (4,436) | (4,157) | (80,259) | (66,836) |
| Net increase (decrease) | (2,222) | 472 | $(40,729) | $7,053 |
| Class M | ||||
| Shares sold | 2,724 | 3,492 | $48,944 | $55,838 |
| Reinvestment of distributions | 191 | 1,444 | 3,277 | 22,671 |
| Shares redeemed | (5,008) | (5,580) | (90,160) | (89,471) |
| Net increase (decrease) | (2,093) | (644) | $(37,939) | $(10,962) |
| Class B | ||||
| Shares sold | – | 10 | $– | $140 |
| Reinvestment of distributions | – | 22 | – | 337 |
| Shares redeemed | – | (423) | – | (6,401) |
| Net increase (decrease) | – | (391) | $– | $(5,924) |
| Class C | ||||
| Shares sold | 621 | 946 | $10,664 | $14,422 |
| Reinvestment of distributions | 41 | 579 | 674 | 8,736 |
| Shares redeemed | (1,840) | (2,021) | (31,830) | (31,096) |
| Net increase (decrease) | (1,178) | (496) | $(20,492) | $(7,938) |
| Class I | ||||
| Shares sold | 2,821 | 1,496 | $53,367 | $25,131 |
| Reinvestment of distributions | 89 | 451 | 1,608 | 7,424 |
| Shares redeemed | (1,786) | (1,850) | (33,740) | (30,828) |
| Net increase (decrease) | 1,124 | 97 | $21,235 | $1,727 |
| Class Z | ||||
| Shares sold | 343 | 23 | $6,879 | $389 |
| Reinvestment of distributions | 2 | 34 | 36 | 565 |
| Shares redeemed | (150) | (391) | (2,849) | (6,626) |
| Net increase (decrease) | 195 | (334) | $4,066 | $(5,672) |
11. Other.
The Fund's organizational documents provide former and current trustees and officers with a limited indemnification against liabilities arising in connection with the performance of their duties to the Fund. In the normal course of business, the Fund may also enter into contracts that provide general indemnifications. The Fund's maximum exposure under these arrangements is unknown as this would be dependent on future claims that may be made against the Fund. The risk of material loss from such claims is considered remote.
Report of Independent Registered Public Accounting Firm
To the Trustees of Fidelity Advisor Series I and Shareholders of Fidelity Advisor Dividend Growth Fund:
In our opinion, the accompanying statement of assets and liabilities, including the schedule of investments, and the related statements of operations and of changes in net assets and the financial highlights present fairly, in all material respects, the financial position of Fidelity Advisor Dividend Growth Fund (a fund of Fidelity Advisor Series I) as of November 30, 2017, the results of its operations for the year then ended, the changes in its net assets for each of the two years in the period then ended and the financial highlights for each of the periods indicated, in conformity with accounting principles generally accepted in the United States of America. These financial statements and financial highlights (hereafter referred to as “financial statements”) are the responsibility of the Fidelity Advisor Dividend Growth Fund’s management. Our responsibility is to express an opinion on these financial statements based on our audits. We conducted our audits of these financial statements in accordance with the standards of the Public Company Accounting Oversight Board (United States). Those standards require that we plan and perform the audit to obtain reasonable assurance about whether the financial statements are free of material misstatement. An audit includes examining, on a test basis, evidence supporting the amounts and disclosures in the financial statements, assessing the accounting principles used and significant estimates made by management, and evaluating the overall financial statement presentation. Our procedures included confirmation of securities owned as of November 30, 2017 by correspondence with the custodians and brokers; when replies were not received from brokers, we performed other auditing procedures. We believe that our audits provide a reasonable basis for our opinion.
PricewaterhouseCoopers LLP
Boston, Massachusetts
January 16, 2018
Trustees and Officers
The Trustees, Members of the Advisory Board (if any), and officers of the trust and fund, as applicable, are listed below. The Board of Trustees governs the fund and is responsible for protecting the interests of shareholders. The Trustees are experienced executives who meet periodically throughout the year to oversee the fund's activities, review contractual arrangements with companies that provide services to the fund, oversee management of the risks associated with such activities and contractual arrangements, and review the fund's performance. Each of the Trustees oversees 190 funds.
The Trustees hold office without limit in time except that (a) any Trustee may resign; (b) any Trustee may be removed by written instrument, signed by at least two-thirds of the number of Trustees prior to such removal; (c) any Trustee who requests to be retired or who has become incapacitated by illness or injury may be retired by written instrument signed by a majority of the other Trustees; and (d) any Trustee may be removed at any special meeting of shareholders by a two-thirds vote of the outstanding voting securities of the trust. Each Trustee who is not an interested person (as defined in the 1940 Act) of the trust and the fund is referred to herein as an Independent Trustee. Each Independent Trustee shall retire not later than the last day of the calendar year in which his or her 75th birthday occurs. The Independent Trustees may waive this mandatory retirement age policy with respect to individual Trustees. Officers and Advisory Board Members hold office without limit in time, except that any officer or Advisory Board Member may resign or may be removed by a vote of a majority of the Trustees at any regular meeting or any special meeting of the Trustees. Except as indicated, each individual has held the office shown or other offices in the same company for the past five years.
The fund’s Statement of Additional Information (SAI) includes more information about the Trustees. To request a free copy, call Fidelity at 1-877-208-0098.
Experience, Skills, Attributes, and Qualifications of the Trustees. The Governance and Nominating Committee has adopted a statement of policy that describes the experience, qualifications, attributes, and skills that are necessary and desirable for potential Independent Trustee candidates (Statement of Policy). The Board believes that each Trustee satisfied at the time he or she was initially elected or appointed a Trustee, and continues to satisfy, the standards contemplated by the Statement of Policy. The Governance and Nominating Committee also engages professional search firms to help identify potential Independent Trustee candidates who have the experience, qualifications, attributes, and skills consistent with the Statement of Policy. From time to time, additional criteria based on the composition and skills of the current Independent Trustees, as well as experience or skills that may be appropriate in light of future changes to board composition, business conditions, and regulatory or other developments, have also been considered by the professional search firms and the Governance and Nominating Committee. In addition, the Board takes into account the Trustees' commitment and participation in Board and committee meetings, as well as their leadership of standing and ad hoc committees throughout their tenure.
In determining that a particular Trustee was and continues to be qualified to serve as a Trustee, the Board has considered a variety of criteria, none of which, in isolation, was controlling. The Board believes that, collectively, the Trustees have balanced and diverse experience, qualifications, attributes, and skills, which allow the Board to operate effectively in governing the fund and protecting the interests of shareholders. Information about the specific experience, skills, attributes, and qualifications of each Trustee, which in each case led to the Board's conclusion that the Trustee should serve (or continue to serve) as a trustee of the fund, is provided below.
Board Structure and Oversight Function. James C. Curvey is an interested person and currently serves as Chairman. The Trustees have determined that an interested Chairman is appropriate and benefits shareholders because an interested Chairman has a personal and professional stake in the quality and continuity of services provided to the fund. Independent Trustees exercise their informed business judgment to appoint an individual of their choosing to serve as Chairman, regardless of whether the Trustee happens to be independent or a member of management. The Independent Trustees have determined that they can act independently and effectively without having an Independent Trustee serve as Chairman and that a key structural component for assuring that they are in a position to do so is for the Independent Trustees to constitute a substantial majority for the Board. The Independent Trustees also regularly meet in executive session. Ned C. Lautenbach serves as Chairman of the Independent Trustees and as such (i) acts as a liaison between the Independent Trustees and management with respect to matters important to the Independent Trustees and (ii) with management prepares agendas for Board meetings.
Fidelity® funds are overseen by different Boards of Trustees. The fund's Board oversees Fidelity's high income and certain equity funds, and other Boards oversee Fidelity's investment-grade bond, money market, asset allocation, and sector funds. The asset allocation funds may invest in Fidelity® funds overseen by the fund's Board. The use of separate Boards, each with its own committee structure, allows the Trustees of each group of Fidelity® funds to focus on the unique issues of the funds they oversee, including common research, investment, and operational issues. On occasion, the separate Boards establish joint committees to address issues of overlapping consequences for the Fidelity® funds overseen by each Board.
The Trustees operate using a system of committees to facilitate the timely and efficient consideration of all matters of importance to the Trustees, the fund, and fund shareholders and to facilitate compliance with legal and regulatory requirements and oversight of the fund's activities and associated risks. The Board, acting through its committees, has charged FMR and its affiliates with (i) identifying events or circumstances the occurrence of which could have demonstrably adverse effects on the fund's business and/or reputation; (ii) implementing processes and controls to lessen the possibility that such events or circumstances occur or to mitigate the effects of such events or circumstances if they do occur; and (iii) creating and maintaining a system designed to evaluate continuously business and market conditions in order to facilitate the identification and implementation processes described in (i) and (ii) above. Because the day-to-day operations and activities of the fund are carried out by or through FMR, its affiliates, and other service providers, the fund's exposure to risks is mitigated but not eliminated by the processes overseen by the Trustees. While each of the Board's committees has responsibility for overseeing different aspects of the fund's activities, oversight is exercised primarily through the Operations, Audit, and Compliance Committees. In addition, the Independent Trustees have worked with FMR to enhance the Board's oversight of investment and financial risks, legal and regulatory risks, technology risks, and operational risks, including the development of additional risk reporting to the Board. For example, a working group comprised of Independent Trustees and FMR has worked and continues to work to review the Fidelity® funds' valuation-related activities, reporting and risk management. Appropriate personnel, including but not limited to the fund's Chief Compliance Officer (CCO), FMR's internal auditor, the independent accountants, the fund's Treasurer and portfolio management personnel, make periodic reports to the Board's committees, as appropriate, including an annual review of Fidelity's risk management program for the Fidelity® funds. The responsibilities of each standing committee, including their oversight responsibilities, are described further under "Standing Committees of the Trustees."
Interested Trustees*:
Correspondence intended for a Trustee who is an interested person may be sent to Fidelity Investments, 245 Summer Street, Boston, Massachusetts 02210.
Name, Year of Birth; Principal Occupations and Other Relevant Experience+
James C. Curvey (1935)
Year of Election or Appointment: 2007
Trustee
Chairman of the Board of Trustees
Mr. Curvey also serves as Trustee of other Fidelity® funds. Mr. Curvey is a Director of Fidelity Research & Analysis Co. (investment adviser firm, 2009-present), and Vice Chairman (2007-present) and Director of FMR LLC (diversified financial services company). In addition, Mr. Curvey serves as an Overseer for the Boston Symphony Orchestra and a member of the board of Artis-Naples, Naples, Florida, and as a Trustee for Brewster Academy, Wolfeboro, New Hampshire. Previously, Mr. Curvey served as a Director of Fidelity Investments Money Management, Inc. (investment adviser firm, 2009-2014) and a Director of FMR and FMR Co., Inc. (investment adviser firms, 2007-2014).
Charles S. Morrison (1960)
Year of Election or Appointment: 2014
Trustee
Mr. Morrison also serves as Trustee of other funds. He serves as President of Fidelity Management & Research Company (FMR) (investment adviser firm, 2016-present), a Director of Fidelity Investments Money Management, Inc. (FIMM) (investment adviser firm, 2014-present), Director of Fidelity SelectCo, LLC (investment adviser firm, 2014-present), President, Asset Management (2014-present), and is an employee of Fidelity Investments. Previously, Mr. Morrison served as Vice President of Fidelity's Fixed Income and Asset Allocation Funds (2012-2014), President, Fixed Income (2011-2014), Vice President of Fidelity's Money Market Funds (2005-2009), President, Money Market Group Leader of FMR (investment adviser firm, 2009), and Senior Vice President, Money Market Group of FMR (2004-2009). Mr. Morrison also served as Vice President of Fidelity's Bond Funds (2002-2005), certain Balanced Funds (2002-2005), and certain Asset Allocation Funds (2002-2007), and as Senior Vice President (2002-2005) of Fidelity's Bond Division.
* Determined to be an “Interested Trustee” by virtue of, among other things, his or her affiliation with the trust or various entities under common control with FMR.
+ The information includes the Trustee's principal occupation during the last five years and other information relating to the experience, attributes, and skills relevant to the Trustee's qualifications to serve as a Trustee, which led to the conclusion that the Trustee should serve as a Trustee for the fund.
Independent Trustees:
Correspondence intended for an Independent Trustee may be sent to Fidelity Investments, P.O. Box 55235, Boston, Massachusetts 02205-5235.
Name, Year of Birth; Principal Occupations and Other Relevant Experience+
Dennis J. Dirks (1948)
Year of Election or Appointment: 2005
Trustee
Mr. Dirks also serves as Trustee of other Fidelity® funds. Prior to his retirement in May 2003, Mr. Dirks was Chief Operating Officer and a member of the Board of The Depository Trust & Clearing Corporation (DTCC). He also served as President, Chief Operating Officer, and Board member of The Depository Trust Company (DTC) and President and Board member of the National Securities Clearing Corporation (NSCC). In addition, Mr. Dirks served as Chief Executive Officer and Board member of the Government Securities Clearing Corporation, Chief Executive Officer and Board member of the Mortgage-Backed Securities Clearing Corporation, as a Trustee and a member of the Finance Committee of Manhattan College (2005-2008), as a Trustee and a member of the Finance Committee of AHRC of Nassau County (2006-2008), as a member of the Independent Directors Council (IDC) Governing Council (2010-2015), and as a member of the Board of Directors for The Brookville Center for Children’s Services, Inc. (2009-2017). Mr. Dirks is a member of the Finance Committee (2016-present) and Board of Directors (2017-present) of the Asolo Repertory Theatre.
Alan J. Lacy (1953)
Year of Election or Appointment: 2008
Trustee
Mr. Lacy also serves as Trustee of other Fidelity® funds. Mr. Lacy serves as a Director of Bristol-Myers Squibb Company (global pharmaceuticals, 2008-present). He is a Trustee of the California Chapter of The Nature Conservancy (2015-present) and a Director of the Center for Advanced Study in the Behavioral Sciences at Stanford University (2015-present). In addition, Mr. Lacy served as Senior Adviser (2007-2014) of Oak Hill Capital Partners, L.P. (private equity) and also served as Chief Executive Officer (2005) and Vice Chairman (2005-2006) of Sears Holdings Corporation (retail) and Chief Executive Officer and Chairman of the Board of Sears, Roebuck and Co. (retail, 2000-2005). Previously, Mr. Lacy served as Chairman (2014-2017) and a member (2010-2017) of the Board of Directors of Dave & Buster’s Entertainment, Inc. (restaurant and entertainment complexes), as Chairman (2008-2011) and a member (2006-2015) of the Board of Trustees of the National Parks Conservation Association, and as a member of the Board of Directors for The Hillman Companies, Inc. (hardware wholesalers, 2010-2014), Earth Fare, Inc. (retail grocery, 2010-2014), and The Western Union Company (global money transfer, 2006-2011).
Ned C. Lautenbach (1944)
Year of Election or Appointment: 2000
Trustee
Chairman of the Independent Trustees
Mr. Lautenbach also serves as Trustee of other Fidelity® funds. Mr. Lautenbach currently serves as Vice Chair of the Board of Governors, State University System of Florida (2013-present) and is a member of the Council on Foreign Relations (1994-present). He is also a member and has most recently served as Chairman of the Board of Directors of Artis-Naples (2012-present). Previously, Mr. Lautenbach served as a member and then Lead Director of the Board of Directors of Eaton Corporation (diversified industrial, 1997-2016). He was also a Partner and Advisory Partner at Clayton, Dubilier & Rice, LLC (private equity investment, 1998-2010), as well as a Director of Sony Corporation (2006-2007). In addition, Mr. Lautenbach also had a 30-year career with IBM (technology company) during which time he served as Senior Vice President and a member of the Corporate Executive Committee (1968-1998).
Joseph Mauriello (1944)
Year of Election or Appointment: 2008
Trustee
Mr. Mauriello also serves as Trustee of other Fidelity® funds. Prior to his retirement in January 2006, Mr. Mauriello served in numerous senior management positions including Deputy Chairman and Chief Operating Officer (2004-2005), and Vice Chairman of Financial Services (2002-2004) of KPMG LLP US (professional services, 1965-2005). Mr. Mauriello currently serves as a member of the Board of Directors of XL Group plc. (global insurance and re-insurance, 2006-present) and the Independent Directors Council (IDC) Governing Council (2015-present). Previously, Mr. Mauriello served as a Director of the Hamilton Funds of the Bank of New York (2006-2007) and of Arcadia Resources Inc. (health care services and products, 2007-2012).
Cornelia M. Small (1944)
Year of Election or Appointment: 2005
Trustee
Ms. Small also serves as Trustee of other Fidelity® funds. Ms. Small is a member of the Board of Directors (2009-present) and Chair of the Investment Committee (2010-present) of the Teagle Foundation. Ms. Small also serves on the Investment Committee of the Berkshire Taconic Community Foundation (2008-present). Previously, Ms. Small served as Chairperson (2002-2008) and a member of the Investment Committee and Chairperson (2008-2012) and a member of the Board of Trustees of Smith College. In addition, Ms. Small served as Chief Investment Officer, Director of Global Equity Investments, and a member of the Board of Directors of Scudder, Stevens & Clark and Scudder Kemper Investments.
William S. Stavropoulos (1939)
Year of Election or Appointment: 2002
Trustee
Vice Chairman of the Independent Trustees
Mr. Stavropoulos also serves as Trustee of other Fidelity® funds. Mr. Stavropoulos serves as President and Founder of the Michigan Baseball Foundation, the Great Lakes Loons (2007-present). Mr. Stavropoulos is Chairman Emeritus of the Board of Directors of The Dow Chemical Company, where he previously served in numerous senior management positions, including President, CEO (1995-2000; 2002-2004), Chairman of the Executive Committee (2000-2006), and as a member of the Board of Directors (1990-2006). Currently, Mr. Stavropoulos is Chairman of the Board of Directors of Univar Inc. (global distributor of commodity and specialty chemicals), a Director of Teradata Corporation (data warehousing and technology solutions), and a member of the Advisory Board for Metalmark Capital LLC (private equity investment, 2005-present). Mr. Stavropoulos is an operating advisor to Clayton, Dubilier & Rice, LLC (private equity investment). In addition, Mr. Stavropoulos is a member of the University of Notre Dame Advisory Council for the College of Science, a Trustee of the Rollin L. Gerstacker Foundation, and a Director of Artis-Naples in Naples, Florida. Previously, Mr. Stavropoulos served as a Director of Chemical Financial Corporation (bank holding company, 1993-2012) and Tyco International, Ltd. (multinational manufacturing and services, 2007-2012).
David M. Thomas (1949)
Year of Election or Appointment: 2008
Trustee
Mr. Thomas also serves as Trustee of other Fidelity® funds. Mr. Thomas serves as Non-Executive Chairman of the Board of Directors of Fortune Brands Home and Security (home and security products, 2011-present), as a member of the Board of Directors (2004-present) and Presiding Director (2013-present) of Interpublic Group of Companies, Inc. (marketing communication), and as a member of the Board of Trustees of the University of Florida (2013-present). Previously, Mr. Thomas served as Executive Chairman (2005-2006) and Chairman and Chief Executive Officer (2000-2005) of IMS Health, Inc. (pharmaceutical and healthcare information solutions), and a Director of Fortune Brands, Inc. (consumer products, 2000-2011).
+ The information includes the Trustee's principal occupation during the last five years and other information relating to the experience, attributes, and skills relevant to the Trustee's qualifications to serve as a Trustee, which led to the conclusion that the Trustee should serve as a Trustee for the fund.
Advisory Board Members and Officers:
Correspondence intended for an officer or Peter S. Lynch may be sent to Fidelity Investments, 245 Summer Street, Boston, Massachusetts 02210. Officers appear below in alphabetical order.
Name, Year of Birth; Principal Occupation
Peter S. Lynch (1944)
Year of Election or Appointment: 2003
Member of the Advisory Board
Mr. Lynch also serves as Member of the Advisory Board of other Fidelity® funds. Mr. Lynch is Vice Chairman and a Director of FMR (investment adviser firm) and FMR Co., Inc. (investment adviser firm). In addition, Mr. Lynch serves as a Trustee of Boston College and as the Chairman of the Inner-City Scholarship Fund. Previously, Mr. Lynch served on the Special Olympics International Board of Directors (1997-2006).
Elizabeth Paige Baumann (1968)
Year of Election or Appointment: 2017
Anti-Money Laundering (AML) Officer
Ms. Baumann also serves as AML Officer of other funds. She is Chief AML Officer (2012-present) and Senior Vice President (2014-present) of FMR LLC (diversified financial services company) and is an employee of Fidelity Investments. Previously, Ms. Baumann served as AML Officer of the funds (2012-2016), and Vice President (2007-2014) and Deputy Anti-Money Laundering Officer (2007-2012) of FMR LLC.
Marc R. Bryant (1966)
Year of Election or Appointment: 2015
Secretary and Chief Legal Officer (CLO)
Mr. Bryant also serves as Secretary and CLO of other funds. Mr. Bryant serves as CLO, Secretary, and Senior Vice President of Fidelity Management & Research Company (investment adviser firm, 2015-present) and FMR Co., Inc. (investment adviser firm, 2015-present); Secretary of Fidelity SelectCo, LLC (investment adviser firm, 2015-present) and Fidelity Investments Money Management, Inc. (investment adviser firm, 2015-present); and CLO of Fidelity Management & Research (Hong Kong) Limited and FMR Investment Management (UK) Limited (investment adviser firms, 2015-present) and Fidelity Management & Research (Japan) Limited (investment adviser firm, 2016-present). He is Senior Vice President and Deputy General Counsel of FMR LLC (diversified financial services company). Previously, Mr. Bryant served as Secretary and CLO of Fidelity Rutland Square Trust II (2010-2014) and Assistant Secretary of Fidelity's Fixed Income and Asset Allocation Funds (2013-2015). Prior to joining Fidelity Investments, Mr. Bryant served as a Senior Vice President and the Head of Global Retail Legal for AllianceBernstein L.P. (2006-2010), and as the General Counsel for ProFund Advisors LLC (2001-2006).
William C. Coffey (1969)
Year of Election or Appointment: 2009
Assistant Secretary
Mr. Coffey also serves as Assistant Secretary of other funds. He is Senior Vice President and Deputy General Counsel of FMR LLC (diversified financial services company, 2010-present), and is an employee of Fidelity Investments. Previously, Mr. Coffey served as Vice President and Associate General Counsel of FMR LLC (2005-2009).
Jonathan Davis (1968)
Year of Election or Appointment: 2010
Assistant Treasurer
Mr. Davis also serves as Assistant Treasurer of other funds. Mr. Davis serves as Assistant Treasurer of FMR Capital, Inc. (2017-present) and is an employee of Fidelity Investments. Previously, Mr. Davis served as Vice President and Associate General Counsel of FMR LLC (diversified financial services company, 2003-2010).
Adrien E. Deberghes (1967)
Year of Election or Appointment: 2016
Assistant Treasurer
Mr. Deberghes also serves as an officer of other funds. He serves as Assistant Treasurer of FMR Capital, Inc. (2017-present), Executive Vice President of Fidelity Investments Money Management, Inc. (FIMM) (investment adviser firm, 2016-present), and is an employee of Fidelity Investments (2008-present). Prior to joining Fidelity Investments, Mr. Deberghes was Senior Vice President of Mutual Fund Administration at State Street Corporation (2007-2008), Senior Director of Mutual Fund Administration at Investors Bank & Trust (2005-2007), and Director of Finance for Dunkin' Brands (2000-2005). Previously, Mr. Deberghes served in other fund officer roles.
Stephanie J. Dorsey (1969)
Year of Election or Appointment: 2010
Assistant Treasurer
Ms. Dorsey also serves as an officer of other funds. Ms. Dorsey serves as Assistant Treasurer of FMR Capital, Inc. (2017-present), is an employee of Fidelity Investments (2008-present), and has served in other fund officer roles. Prior to joining Fidelity Investments, Ms. Dorsey served as Treasurer (2004-2008) of the JPMorgan Mutual Funds and Vice President (2004-2008) of JPMorgan Chase Bank.
Howard J. Galligan III (1966)
Year of Election or Appointment: 2014
Chief Financial Officer
Mr. Galligan also serves as Chief Financial Officer of other funds. Mr. Galligan serves as President of Fidelity Pricing and Cash Management Services (FPCMS) (2014-present) and as a Director of Strategic Advisers, Inc. (investment adviser firm, 2008-present). Previously, Mr. Galligan served as Chief Administrative Officer of Asset Management (2011-2014) and Chief Operating Officer and Senior Vice President of Investment Support for Strategic Advisers, Inc. (2003-2011).
Thomas C. Hense (1964)
Year of Election or Appointment: 2008, 2010, or 2015
Vice President
Mr. Hense serves as Vice President of Fidelity Advisor® Multi-Asset Income Fund (2015) and other funds (High Income (2008), Small Cap (2008), and Value (2010) funds), and is an employee of Fidelity Investments (1993-present). Previously, Mr. Hense served as a portfolio manager for Fidelity's Institutional Money Management Group (Pyramis) (2003-2008).
Brian B. Hogan (1964)
Year of Election or Appointment: 2009
Vice President
Mr. Hogan also serves as Trustee or Vice President of other funds. Mr. Hogan serves as a Director of FMR Investment Management (UK) Limited (investment adviser firm, 2015-present) and Fidelity SelectCo, LLC (investment adviser firm, 2014-present) and President of the Equity Division of FMR (investment adviser firm, 2009-present). Previously, Mr. Hogan served as Senior Vice President, Equity Research of FMR (2006-2009) and as a portfolio manager. Mr. Brian B. Hogan is not related to Mr. Colm A. Hogan.
Colm A. Hogan (1973)
Year of Election or Appointment: 2016
Deputy Treasurer
Mr. Hogan also serves as an officer of other funds. Mr. Hogan serves as Assistant Treasurer of FMR Capital, Inc. (2017-present) and is an employee of Fidelity Investments (2005-present). Mr. Colm A. Hogan is not related to Mr. Brian B. Hogan.
Chris Maher (1972)
Year of Election or Appointment: 2013
Assistant Treasurer
Mr. Maher serves as Assistant Treasurer of other funds. Mr. Maher is Vice President of Valuation Oversight, serves as Assistant Treasurer of FMR Capital, Inc. (2017-present), and is an employee of Fidelity Investments. Previously, Mr. Maher served as Vice President of Asset Management Compliance (2013), Vice President of the Program Management Group of FMR (investment adviser firm, 2010-2013), and Vice President of Valuation Oversight (2008-2010).
Rieco E. Mello (1969)
Year of Election or Appointment: 2017
Assistant Treasurer
Mr. Mello also serves as Assistant Treasurer of other funds. Mr. Mello serves as Assistant Treasurer of FMR Capital, Inc. (2017-present) and is an employee of Fidelity Investments (1995-present).
Kenneth B. Robins (1969)
Year of Election or Appointment: 2016
Chief Compliance Officer
Mr. Robins also serves as an officer of other funds. Mr. Robins serves as Compliance Officer of Fidelity Management & Research Company and FMR Co., Inc. (investment adviser firms, 2016-present) and is an employee of Fidelity Investments (2004-present). Previously, Mr. Robins served as Executive Vice President of Fidelity Investments Money Management, Inc. (investment adviser firm, 2013-2016) and served in other fund officer roles.
Stacie M. Smith (1974)
Year of Election or Appointment: 2016
President and Treasurer
Ms. Smith also serves as an officer of other funds. Ms. Smith serves as Assistant Treasurer of FMR Capital, Inc. (2017-present), is an employee of Fidelity Investments (2009-present), and has served in other fund officer roles. Prior to joining Fidelity Investments, Ms. Smith served as Senior Audit Manager of Ernst & Young LLP (accounting firm, 1996-2009). Previously, Ms. Smith served as Deputy Treasurer of certain Fidelity® funds (2013-2016).
Marc L. Spector (1972)
Year of Election or Appointment: 2016
Assistant Treasurer
Mr. Spector also serves as an officer of other funds. Mr. Spector serves as Assistant Treasurer of FMR Capital, Inc. (2017-present) and is an employee of Fidelity Investments (2016-present). Prior to joining Fidelity Investments, Mr. Spector served as Director at the Siegfried Group (accounting firm, 2013-2016), and prior to Siegfried Group as audit senior manager at Deloitte & Touche (accounting firm, 2005-2013).
Renee Stagnone (1975)
Year of Election or Appointment: 2016
Assistant Treasurer
Ms. Stagnone also serves as an officer of other funds. Ms. Stagnone serves as Assistant Treasurer of FMR Capital, Inc. (2017-present) and is an employee of Fidelity Investments (1997-present). Previously, Ms. Stagnone served as Deputy Treasurer of certain Fidelity® funds (2013-2016).
Shareholder Expense Example
As a shareholder of the Fund, you incur two types of costs: (1) transaction costs, including sales charges (loads) on purchase payments or redemption proceeds, and (2) ongoing costs, including management fees, distribution and/or service (12b-1) fees and other Fund expenses. This Example is intended to help you understand your ongoing costs (in dollars) of investing in the Fund and to compare these costs with the ongoing costs of investing in other mutual funds.
The Example is based on an investment of $1,000 invested at the beginning of the period and held for the entire period (June 1, 2017 to November 30, 2017).
Actual Expenses
The first line of the accompanying table for each class of the Fund provides information about actual account values and actual expenses. You may use the information in this line, together with the amount you invested, to estimate the expenses that you paid over the period. Simply divide your account value by $1,000.00 (for example, an $8,600 account value divided by $1,000.00 = 8.6), then multiply the result by the number in the first line for a class of the Fund under the heading entitled "Expenses Paid During Period" to estimate the expenses you paid on your account during this period. In addition, the Fund, as a shareholder in the underlying Fidelity Central Funds, will indirectly bear its pro-rata share of the fees and expenses incurred by the underlying Fidelity Central Funds. These fees and expenses are not included in the Fund's annualized expense ratio used to calculate the expense estimate in the table below.
Hypothetical Example for Comparison Purposes
The second line of the accompanying table for each class of the Fund provides information about hypothetical account values and hypothetical expenses based on a Class' actual expense ratio and an assumed rate of return of 5% per year before expenses, which is not the Class' actual return. The hypothetical account values and expenses may not be used to estimate the actual ending account balance or expenses you paid for the period. You may use this information to compare the ongoing costs of investing in the Fund and other funds. To do so, compare this 5% hypothetical example with the 5% hypothetical examples that appear in the shareholder reports of the other funds. In addition, the Fund, as a shareholder in the underlying Fidelity Central Funds, will indirectly bear its pro-rata share of the fees and expenses incurred by the underlying Fidelity Central Funds. These fees and expenses are not included in the Fund's annualized expense ratio used to calculate the expense estimate in the table below.
Please note that the expenses shown in the table are meant to highlight your ongoing costs only and do not reflect any transaction costs. Therefore, the second line of the table is useful in comparing ongoing costs only, and will not help you determine the relative total costs of owning different funds. In addition, if these transactional costs were included, your costs would have been higher.
| Annualized Expense Ratio-A | Beginning Account Value June 1, 2017 | Ending Account Value November 30, 2017 | Expenses Paid During Period-B June 1, 2017 to November 30, 2017 | |
| Class A | .84% | |||
| Actual | $1,000.00 | $1,103.10 | $4.43 | |
| Hypothetical-C | $1,000.00 | $1,020.86 | $4.26 | |
| Class M | 1.09% | |||
| Actual | $1,000.00 | $1,101.90 | $5.74 | |
| Hypothetical-C | $1,000.00 | $1,019.60 | $5.52 | |
| Class C | 1.61% | |||
| Actual | $1,000.00 | $1,098.90 | $8.47 | |
| Hypothetical-C | $1,000.00 | $1,017.00 | $8.14 | |
| Class I | .61% | |||
| Actual | $1,000.00 | $1,104.30 | $3.22 | |
| Hypothetical-C | $1,000.00 | $1,022.01 | $3.09 | |
| Class Z | .45% | |||
| Actual | $1,000.00 | $1,104.90 | $2.37 | |
| Hypothetical-C | $1,000.00 | $1,022.81 | $2.28 |
A Annualized expense ratio reflects expenses net of applicable fee waivers.
B Expenses are equal to each Class' annualized expense ratio, multiplied by the average account value over the period, multiplied by 183/365 (to reflect the one-half year period).
C 5% return per year before expenses
Distributions (Unaudited)
The Board of Trustees of Fidelity Advisor Dividend Growth Fund voted to pay to shareholders of record at the opening of business on record date, the following distributions per share derived from capital gains realized from sales of portfolio securities, and dividends derived from net investment income:
| Pay Date | Record Date | Dividends | Capital Gains | |
| Fidelity Advisor Dividend Growth Fund | ||||
| Class A | 12/27/17 | 12/26/17 | $0.255 | $2.648 |
| Class M | 12/27/17 | 12/26/17 | $0.209 | $2.648 |
| Class C | 12/27/17 | 12/26/17 | $0.115 | $2.648 |
| Class I | 12/27/17 | 12/26/17 | $0.304 | $2.648 |
| Class Z | 12/27/17 | 12/26/17 | $0.340 | $2.648 |
The fund hereby designates as a capital gain dividend with respect to the taxable year ended November 30, 2017, $148,970,787, or, if subsequently determined to be different, the net capital gain of such year.
Class A, Class M, Class C, Class I, and Class Z designate 100% of the dividend distributed in December 2016, during the fiscal year as qualifying for the dividends–received deduction for corporate shareholders.
Class A, Class M, Class C, Class I, and Class Z designate 100% of the dividend distributed during the fiscal year as amounts which may be taken into account as a dividend for purposes of the maximum rate under section 1(h)(11) of the Internal Revenue Code.
The fund will notify shareholders in January 2018 of amounts for use in preparing 2017 income tax returns.
Board Approval of Investment Advisory Contracts and Management Fees
Fidelity Advisor Dividend Growth Fund
Each year, the Board of Trustees, including the Independent Trustees (together, the Board), votes on the renewal of the management contract with Fidelity Management & Research Company (FMR) and the sub-advisory agreements (together, the Advisory Contracts) for the fund. FMR and the sub-advisers are referred to herein as the Investment Advisers. The Board, assisted by the advice of fund counsel and Independent Trustees' counsel, requests and considers a broad range of information relevant to the renewal of the Advisory Contracts throughout the year.
The Board meets regularly and, at each of its meetings, covers an extensive agenda of topics and materials and considers factors that are relevant to its annual consideration of the renewal of the fund's Advisory Contracts, including the services and support provided to the fund and its shareholders. The Board has established various standing committees (Committees), each composed of and chaired by Independent Trustees with varying backgrounds, to which the Board has assigned specific subject matter responsibilities in order to enhance effective decision-making by the Board. The Board, acting directly and through its Committees, requests and receives information concerning the annual consideration of the renewal of the fund's Advisory Contracts. The Board also meets as needed to review matters specifically related to the Board's annual consideration of the renewal of the Advisory Contracts. Members of the Board may also meet with trustees of other Fidelity funds through ad hoc joint committees to discuss certain matters relevant to all of the Fidelity funds.
At its July 2017 meeting, the Board unanimously determined to renew the fund's Advisory Contracts. In reaching its determination, the Board considered all factors it believed relevant, including (i) the nature, extent, and quality of the services to be provided to the fund and its shareholders (including the investment performance of the fund); (ii) the competitiveness of the fund's management fee and total expense ratio relative to peer funds; (iii) the total costs of the services to be provided by and the profits to be realized by Fidelity from its relationships with the fund; and (iv) the extent to which, if any, economies of scale exist and would be realized as the fund grows, and whether any economies of scale are appropriately shared with fund shareholders.
In considering whether to renew the Advisory Contracts for the fund, the Board reached a determination, with the assistance of fund counsel and Independent Trustees' counsel and through the exercise of its business judgment, that the renewal of the Advisory Contracts was in the best interests of the fund and its shareholders and that the compensation payable under the Advisory Contracts was fair and reasonable. The Board's decision to renew the Advisory Contracts was not based on any single factor, but rather was based on a comprehensive consideration of all the information provided to the Board at its meetings throughout the year. The Board, in reaching its determination to renew the Advisory Contracts, was aware that shareholders of the fund have a broad range of investment choices available to them, including a wide choice among funds offered by Fidelity's competitors, and that the fund's shareholders, who have the opportunity to review and weigh the disclosure provided by the fund in its prospectus and other public disclosures, have chosen to invest in this fund, which is part of the Fidelity family of funds.
Amendment to Group Fee Rate. The Board also approved an amendment to the management contract for the fund to add an additional breakpoint to the group fee schedule, effective October 1, 2017. The Board noted that the additional breakpoint would result in lower management fee rates as Fidelity's assets under management increase.
Nature, Extent, and Quality of Services Provided. The Board considered Fidelity's staffing as it relates to the fund, including the backgrounds of investment personnel of Fidelity, and also considered the fund's investment objective, strategies, and related investment philosophy. The Independent Trustees also had discussions with senior management of Fidelity's investment operations and investment groups. The Board considered the structure of the investment personnel compensation program and whether this structure provides appropriate incentives to act in the best interests of the fund. Additionally, the Board considered the portfolio managers' investments, if any, in the funds that they manage.Resources Dedicated to Investment Management and Support Services. The Board and the Fund Oversight and Research Committees reviewed the general qualifications and capabilities of Fidelity's investment staff, including its size, education, experience, and resources, as well as Fidelity's approach to recruiting, training, managing, and compensating investment personnel. The Board noted that Fidelity has continued to increase the resources devoted to non-U.S. offices, including expansion of Fidelity's global investment organization. The Board also noted that Fidelity's analysts have extensive resources, tools and capabilities that allow them to conduct sophisticated quantitative and fundamental analysis, as well as credit analysis of issuers, counterparties and guarantors. Further, the Board considered that Fidelity's investment professionals have sufficient access to global information and data so as to provide competitive investment results over time, and that those professionals also have access to sophisticated tools that permit them to assess portfolio construction and risk and performance attribution characteristics continuously, as well as to transmit new information and research conclusions rapidly around the world. Additionally, in its deliberations, the Board considered Fidelity's trading, risk management, compliance, and technology and operations capabilities and resources, which are integral parts of the investment management process.Shareholder and Administrative Services. The Board considered (i) the nature, extent, quality, and cost of advisory, administrative, and shareholder services performed by the Investment Advisers and their affiliates under the Advisory Contracts and under separate agreements covering transfer agency, pricing and bookkeeping, and securities lending services for the fund; (ii) the nature and extent of the supervision of third party service providers, principally custodians, subcustodians, and pricing vendors; and (iii) the resources devoted to, and the record of compliance with, the fund's compliance policies and procedures. The Board also reviewed the allocation of fund brokerage, including allocations to brokers affiliated with the Investment Advisers, the use of brokerage commissions to pay fund expenses, and the use of "soft" commission dollars to pay for research services.The Board noted that the growth of fund assets over time across the complex allows Fidelity to reinvest in the development of services designed to enhance the value or convenience of the Fidelity funds as investment vehicles. These services include 24-hour access to account information and market information through telephone representatives and over the Internet, investor education materials and asset allocation tools, and the expanded availability of Fidelity Investor Centers.In 2014, the Board formed an ad hoc Committee on Transfer Agency Fees to review the variety of transfer agency fee structures throughout the industry and Fidelity's competitive positioning with respect to industry participants.Investment in a Large Fund Family. The Board considered the benefits to shareholders of investing in a Fidelity fund, including the benefits of investing in a fund that is part of a large family of funds offering a variety of investment disciplines and providing a large variety of mutual fund investor services. The Board noted that Fidelity had taken, or had made recommendations that resulted in the Fidelity funds taking, a number of actions over the previous year that benefited particular funds, including: (i) continuing to dedicate additional resources to Fidelity's investment research process, and to the support of the senior management team that oversees asset management; (ii) continuing efforts to enhance Fidelity's global research capabilities; (iii) launching new funds and making other enhancements to meet client needs; (iv) launching new share classes of existing funds; (v) eliminating purchase minimums and broadening eligibility requirements for certain lower-priced share classes; (vi) reducing management fees and total expenses for certain growth equity funds and index funds; (vii) lowering expense caps for certain existing funds and classes to reduce expenses borne by shareholders; (viii) eliminating short-term redemption fees for certain funds; (ix) introducing a new pricing structure for certain funds of funds that is expected to reduce overall expenses paid by shareholders; (x) rationalizing product lines and gaining increased efficiencies through proposals for fund mergers and share class consolidations; (xi) continuing to develop, acquire and implement systems and technology to improve services to the funds and shareholders, strengthen information security, and increase efficiency; and (xii) implementing enhancements to further strengthen Fidelity's product line to increase investors' probability of success in achieving their investment goals, including retirement income goals.Investment Performance. The Board considered whether the fund has operated in accordance with its investment objective, as well as its record of compliance with its investment restrictions and its performance history.The Board took into account discussions with representatives of the Investment Advisers about fund investment performance that occur at Board meetings throughout the year. In this regard the Board noted that as part of regularly scheduled fund reviews and other reports to the Board on fund performance, the Board considers annualized return information for the fund for different time periods, measured against a securities market index ("benchmark index") and a peer group of funds with similar objectives ("peer group"), if any. In its evaluation of fund investment performance, the Board gave particular attention to information indicating changes in performance of certain Fidelity funds for specific time periods and discussed with the Investment Advisers the reasons for any overperformance or underperformance.In addition to reviewing absolute and relative fund performance, the Independent Trustees periodically consider the appropriateness of fund performance metrics in evaluating the results achieved. In general, the Independent Trustees believe that fund performance should be evaluated based on net performance (after fees and expenses) of both the highest performing and lowest performing fund share classes, where applicable, compared to appropriate benchmark indices, over appropriate time periods that may include full market cycles, and compared to peer groups, as applicable, over the same periods, taking into account relevant factors including the following: general market conditions; issuer-specific information; and fund cash flows and other factors.The Independent Trustees recognize that shareholders evaluate performance on a net basis over their own holding periods, for which one-, three-, and five-year periods are often used as a proxy. For this reason, the performance information reviewed by the Board also included net cumulative calendar year total return information for the fund and an appropriate benchmark index and peer group for the most recent one-, three-, and five-year periods, as shown below. Returns are shown compared to the 25th percentile (top of box, 75% beaten) and 75th percentile (bottom of box, 25% beaten) of the peer universe.Fidelity Advisor Dividend Growth Fund
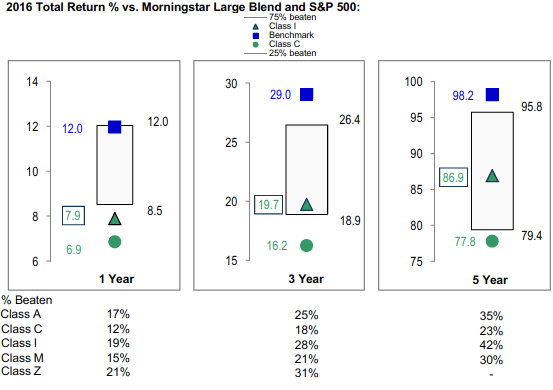
Fidelity Advisor Dividend Growth Fund
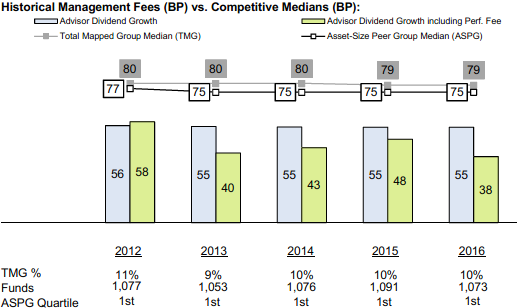
![]()
ADGF-ANN-0118
1.733548.118
Fidelity Advisor® Equity Growth Fund Class A, Class M (formerly Class T), Class C, Class I and Class Z Annual Report November 30, 2017 |
|
Contents
Board Approval of Investment Advisory Contracts and Management Fees |
To view a fund's proxy voting guidelines and proxy voting record for the 12-month period ended June 30, visit http://www.fidelity.com/proxyvotingresults or visit the Securities and Exchange Commission's (SEC) web site at http://www.sec.gov.
You may also call 1-877-208-0098 to request a free copy of the proxy voting guidelines.
Standard & Poor's, S&P and S&P 500 are registered service marks of The McGraw-Hill Companies, Inc. and have been licensed for use by Fidelity Distributors Corporation.
Other third-party marks appearing herein are the property of their respective owners.
All other marks appearing herein are registered or unregistered trademarks or service marks of FMR LLC or an affiliated company. © 2018 FMR LLC. All rights reserved.
This report and the financial statements contained herein are submitted for the general information of the shareholders of the Fund. This report is not authorized for distribution to prospective investors in the Fund unless preceded or accompanied by an effective prospectus.
A fund files its complete schedule of portfolio holdings with the SEC for the first and third quarters of each fiscal year on Form N-Q. Forms N-Q are available on the SEC’s web site at http://www.sec.gov. A fund's Forms N-Q may be reviewed and copied at the SEC’s Public Reference Room in Washington, DC. Information regarding the operation of the SEC's Public Reference Room may be obtained by calling 1-800-SEC-0330.
For a complete list of a fund's portfolio holdings, view the most recent holdings listing, semiannual report, or annual report on Fidelity's web site at http://www.fidelity.com, http://www.institutional.fidelity.com, or http://www.401k.com, as applicable.
NOT FDIC INSURED •MAY LOSE VALUE •NO BANK GUARANTEE
Neither the Fund nor Fidelity Distributors Corporation is a bank.
Performance: The Bottom Line
Average annual total return reflects the change in the value of an investment, assuming reinvestment of distributions from dividend income and capital gains (the profits earned upon the sale of securities that have grown in value, if any) and assuming a constant rate of performance each year. The hypothetical investment and the average annual total returns do not reflect the deduction of taxes that a shareholder would pay on fund distributions or the redemption of fund shares. During periods of reimbursement by Fidelity, a fund’s total return will be greater than it would be had the reimbursement not occurred. How a fund did yesterday is no guarantee of how it will do tomorrow.
Average Annual Total Returns
| For the periods ended November 30, 2017 | Past 1 year | Past 5 years | Past 10 years |
| Class A (incl. 5.75% sales charge) | 27.92% | 15.30% | 7.01% |
| Class M (incl. 3.50% sales charge) | 30.67% | 15.60% | 7.06% |
| Class C (incl. contingent deferred sales charge) | 33.70% | 15.80% | 6.85% |
| Class I | 36.08% | 17.01% | 7.99% |
| Class Z | 36.27% | 17.15% | 8.06% |
Class C shares' contingent deferred sales charges included in the past one year, past five years and past ten years total return figures are 1%, 0% and 0%, respectively.
The initial offering of Class Z shares took place on August 13, 2013. Returns prior to August 13, 2013, are those of Class I.
$10,000 Over 10 Years
Let's say hypothetically that $10,000 was invested in Fidelity Advisor® Equity Growth Fund - Class A on November 30, 2007, and the current 5.75% sales charge was paid.
The chart shows how the value of your investment would have changed, and also shows how the Russell 3000® Growth Index performed over the same period.
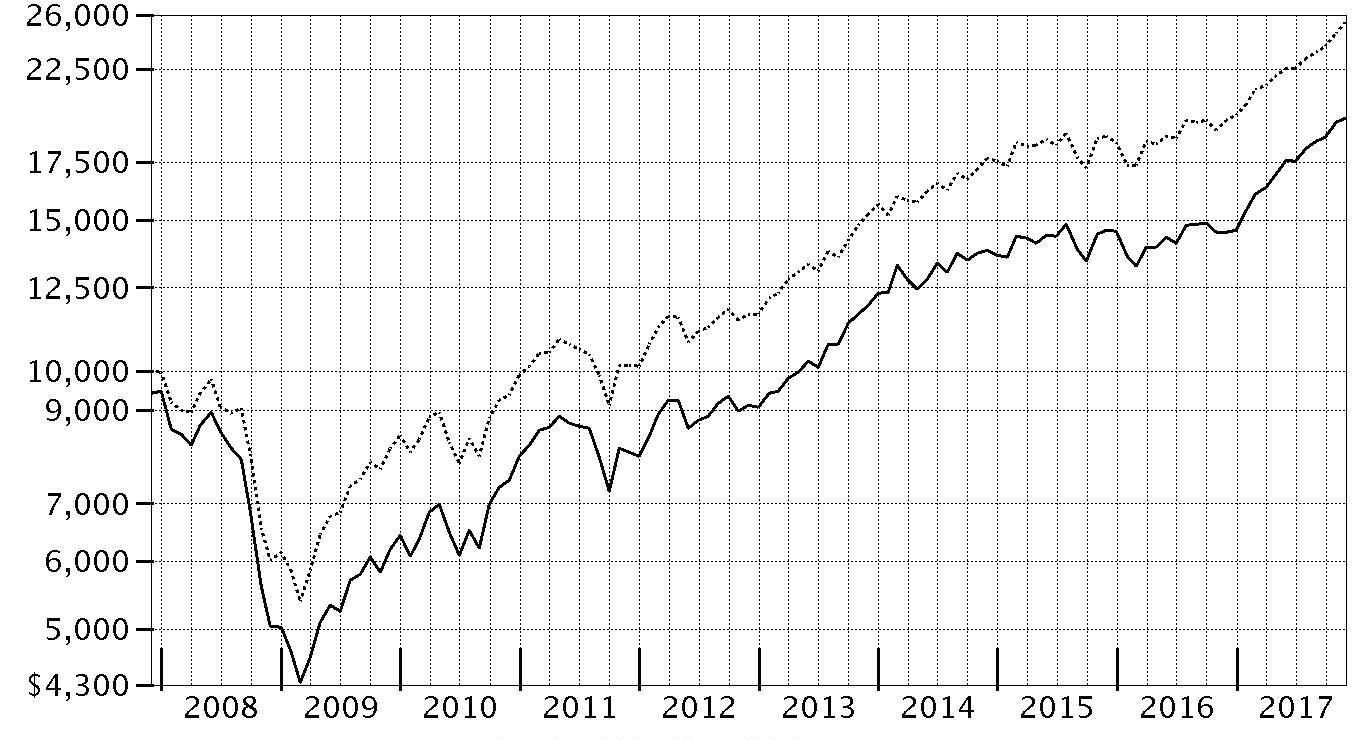
| Period Ending Values | ||
| $19,698 | Fidelity Advisor® Equity Growth Fund - Class A | |
| $25,523 | Russell 3000® Growth Index | |
Management's Discussion of Fund Performance
Market Recap: The U.S. equity bellwether S&P 500® index gained 22.87% for the year ending November 30, 2017, rising steadily and closing the period at an all-time high after a particularly strong three-month finish. Early on, equities rallied on optimism for President Trump’s pro-business agenda but leveled off in March amid fading optimism and stalled efforts by Congress to repeal and replace the Affordable Care Act. Upward momentum soon returned and continued through period end with consumer sentiment and other market indicators staying positive. The lone exception was a brief cooldown in August, when geopolitical tension escalated and uncertainty grew regarding the future of health care, tax reform and the debt ceiling. Sector-wise, info tech (+41%) led by a wide margin, surging amid strong earnings growth from several major index constituents. Utilities and financials each gained about 25%, the latter group riding an uptick in bond yields. Conversely, consumer discretionary (+20%) also rose solidly but lagged the broader market, as many brick-and-mortar retailers continued to suffer from increased online competition. Rising interest rates held back real estate (+16%), while consumer staples (+15%) and telecom (+1%) struggled due to investors’ general preference for risk assets. Lastly, sluggish oil prices pushed energy to a -4% return.Comments from Co-Portfolio Manager Asher Anolic: For the year, the fund’s share classes (excluding sales charges, if applicable) gained about 35% to 36%, well ahead of the 30.25% return of the benchmark Russell 3000® Growth Index. Among industries, stock picking in software & services proved by far the fund's biggest contributor to relative results, especially a large overweighting in social-media giant Facebook (+50%). The stock was propelled by the broader rally and continued strength of the firm's revenue from mobile advertising. Certain payments processors also outperformed this period, including Square (+203%) and PayPal Holdings (+77%), which benefited from industry consolidation and the shift from cash to credit-card and online purchases. In addition, Square rallied after announcing its "Cash" app would begin testing a feature that enables buying and selling of the bitcoin digital currency. Conversely, underweighting major index component Apple (+58%) was the fund's largest individual relative detractor. The stock was aided by better-than-expected iPhone® sales.The views expressed above reflect those of the portfolio manager(s) only through the end of the period as stated on the cover of this report and do not necessarily represent the views of Fidelity or any other person in the Fidelity organization. Any such views are subject to change at any time based upon market or other conditions and Fidelity disclaims any responsibility to update such views. These views may not be relied on as investment advice and, because investment decisions for a Fidelity fund are based on numerous factors, may not be relied on as an indication of trading intent on behalf of any Fidelity fund.
Note to shareholders: On July 1, 2017, Asher Anolic became Co-Portfolio Manager of the fund. Asher will serve as interim manager while Lead Portfolio Manager Jason Weiner is on a leave of absence from January 1, 2018, through mid-June 2018.Investment Summary (Unaudited)
Top Ten Stocks as of November 30, 2017
| % of fund's net assets | % of fund's net assets 6 months ago | |
| Alphabet, Inc. Class A | 6.5 | 6.2 |
| Amazon.com, Inc. | 4.8 | 4.3 |
| Apple, Inc. | 3.2 | 3.0 |
| Facebook, Inc. Class A | 3.1 | 6.8 |
| Home Depot, Inc. | 2.9 | 2.7 |
| Microsoft Corp. | 2.7 | 1.0 |
| Charles Schwab Corp. | 2.3 | 0.3 |
| Adobe Systems, Inc. | 2.3 | 1.9 |
| PayPal Holdings, Inc. | 1.9 | 1.4 |
| JPMorgan Chase & Co. | 1.8 | 1.3 |
| 31.5 |
Top Five Market Sectors as of November 30, 2017
| % of fund's net assets | % of fund's net assets 6 months ago | |
| Information Technology | 40.2 | 41.1 |
| Consumer Discretionary | 12.4 | 16.2 |
| Financials | 11.3 | 7.3 |
| Health Care | 10.6 | 11.2 |
| Industrials | 8.6 | 7.4 |
Asset Allocation (% of fund's net assets)
| As of November 30, 2017* | ||
| Stocks | 96.5% | |
| Convertible Securities | 0.6% | |
| Short-Term Investments and Net Other Assets (Liabilities) | 2.9% | |

* Foreign investments - 12.2%
| As of May 31, 2017* | ||
| Stocks | 96.8% | |
| Convertible Securities | 0.9% | |
| Short-Term Investments and Net Other Assets (Liabilities) | 2.3% | |

* Foreign investments - 10.8%
Investments November 30, 2017
Showing Percentage of Net Assets
| Common Stocks - 96.3% | |||
| Shares | Value (000s) | ||
| CONSUMER DISCRETIONARY - 12.4% | |||
| Diversified Consumer Services - 0.6% | |||
| Grand Canyon Education, Inc. (a) | 189,800 | $18,023 | |
| Hotels, Restaurants & Leisure - 1.1% | |||
| Dave & Buster's Entertainment, Inc. (a) | 387,800 | 20,565 | |
| Marriott International, Inc. Class A | 54,700 | 6,947 | |
| Wingstop, Inc. (b) | 149,500 | 5,859 | |
| 33,371 | |||
| Household Durables - 1.1% | |||
| Gree Electric Appliances, Inc. of Zhuhai Class A | 316,300 | 2,030 | |
| Panasonic Corp. | 2,138,100 | 31,998 | |
| 34,028 | |||
| Internet & Direct Marketing Retail - 5.0% | |||
| Amazon.com, Inc. (a) | 127,400 | 149,918 | |
| Priceline Group, Inc. (a) | 3,200 | 5,567 | |
| 155,485 | |||
| Media - 1.3% | |||
| Charter Communications, Inc. Class A (a) | 103,900 | 33,893 | |
| China Literature Ltd. (a)(c) | 569 | 7 | |
| Sirius XM Holdings, Inc. (b) | 1,595,600 | 8,776 | |
| 42,676 | |||
| Specialty Retail - 2.9% | |||
| Home Depot, Inc. | 511,944 | 92,058 | |
| Textiles, Apparel & Luxury Goods - 0.4% | |||
| Kering SA | 4,500 | 1,996 | |
| LVMH Moet Hennessy - Louis Vuitton SA (b) | 40,002 | 11,653 | |
| 13,649 | |||
| TOTAL CONSUMER DISCRETIONARY | 389,290 | ||
| CONSUMER STAPLES - 4.7% | |||
| Beverages - 1.1% | |||
| Constellation Brands, Inc. Class A (sub. vtg.) | 68,400 | 14,883 | |
| Fever-Tree Drinks PLC | 74,212 | 1,957 | |
| Kweichow Moutai Co. Ltd. (A Shares) | 87,813 | 8,379 | |
| Pernod Ricard SA ADR | 241,700 | 7,547 | |
| 32,766 | |||
| Food Products - 0.5% | |||
| Danone SA | 192,919 | 16,292 | |
| Hostess Brands, Inc. Class A (a) | 57,100 | 803 | |
| 17,095 | |||
| Household Products - 0.2% | |||
| Reckitt Benckiser Group PLC | 65,300 | 5,732 | |
| Personal Products - 2.3% | |||
| Coty, Inc. Class A | 623,800 | 10,748 | |
| Estee Lauder Companies, Inc. Class A | 174,700 | 21,808 | |
| Herbalife Ltd. (a)(b) | 223,200 | 15,655 | |
| Unilever NV (NY Reg.) | 406,000 | 23,442 | |
| 71,653 | |||
| Tobacco - 0.6% | |||
| British American Tobacco PLC sponsored ADR | 315,100 | 20,050 | |
| TOTAL CONSUMER STAPLES | 147,296 | ||
| ENERGY - 2.1% | |||
| Oil, Gas & Consumable Fuels - 2.1% | |||
| Cheniere Energy, Inc. (a) | 998,900 | 48,267 | |
| Reliance Industries Ltd. | 1,195,520 | 17,084 | |
| 65,351 | |||
| FINANCIALS - 11.1% | |||
| Banks - 5.5% | |||
| Bank of America Corp. | 954,500 | 26,888 | |
| Citigroup, Inc. | 346,800 | 26,183 | |
| First Republic Bank | 299,100 | 28,576 | |
| HDFC Bank Ltd. | 68,446 | 1,976 | |
| HDFC Bank Ltd. sponsored ADR | 61,200 | 5,943 | |
| Home Bancshares, Inc. | 270,900 | 6,447 | |
| Huntington Bancshares, Inc. | 1,137,500 | 16,380 | |
| JPMorgan Chase & Co. | 547,800 | 57,256 | |
| Metro Bank PLC (a) | 50,300 | 2,350 | |
| 171,999 | |||
| Capital Markets - 5.6% | |||
| CBOE Holdings, Inc. | 22,454 | 2,771 | |
| Charles Schwab Corp. | 1,502,600 | 73,312 | |
| CME Group, Inc. | 327,054 | 48,908 | |
| Goldman Sachs Group, Inc. | 33,200 | 8,222 | |
| JMP Group, Inc. | 141,100 | 748 | |
| MSCI, Inc. | 140,300 | 18,057 | |
| The Blackstone Group LP | 696,800 | 22,102 | |
| 174,120 | |||
| TOTAL FINANCIALS | 346,119 | ||
| HEALTH CARE - 10.6% | |||
| Biotechnology - 4.1% | |||
| Alexion Pharmaceuticals, Inc. (a) | 106,700 | 11,717 | |
| Amgen, Inc. | 183,800 | 32,286 | |
| Biogen, Inc. (a) | 44,200 | 14,240 | |
| BioMarin Pharmaceutical, Inc. (a) | 84,179 | 7,223 | |
| Cytokinetics, Inc. (a) | 169,810 | 1,460 | |
| Insmed, Inc. (a) | 741,220 | 23,119 | |
| Samsung Biologics Co. Ltd. (a)(c) | 2,090 | 658 | |
| TESARO, Inc. (a) | 108,000 | 9,137 | |
| Vertex Pharmaceuticals, Inc. (a) | 188,064 | 27,136 | |
| 126,976 | |||
| Health Care Equipment & Supplies - 4.5% | |||
| Becton, Dickinson & Co. | 99,100 | 22,616 | |
| Boston Scientific Corp. (a) | 1,357,300 | 35,670 | |
| Danaher Corp. | 286,814 | 27,064 | |
| Intuitive Surgical, Inc. (a) | 112,500 | 44,975 | |
| ResMed, Inc. | 98,000 | 8,369 | |
| Sartorius Stedim Biotech | 49,000 | 3,505 | |
| 142,199 | |||
| Health Care Providers & Services - 0.3% | |||
| National Vision Holdings, Inc. | 10,800 | 352 | |
| OptiNose, Inc. | 13,800 | 263 | |
| UnitedHealth Group, Inc. | 34,300 | 7,826 | |
| 8,441 | |||
| Health Care Technology - 0.1% | |||
| Veeva Systems, Inc. Class A (a) | 51,800 | 3,119 | |
| Pharmaceuticals - 1.6% | |||
| Allergan PLC | 53,100 | 9,230 | |
| Astellas Pharma, Inc. | 580,100 | 7,374 | |
| Johnson & Johnson | 212,900 | 29,663 | |
| Mallinckrodt PLC (a) | 213,600 | 4,661 | |
| 50,928 | |||
| TOTAL HEALTH CARE | 331,663 | ||
| INDUSTRIALS - 8.6% | |||
| Aerospace & Defense - 0.4% | |||
| Axon Enterprise, Inc. (a)(b) | 142,234 | 3,539 | |
| TransDigm Group, Inc. | 33,377 | 9,472 | |
| 13,011 | |||
| Airlines - 0.3% | |||
| Ryanair Holdings PLC sponsored ADR (a) | 75,060 | 9,153 | |
| Commercial Services & Supplies - 0.6% | |||
| Copart, Inc. (a) | 260,100 | 11,226 | |
| KAR Auction Services, Inc. | 13,707 | 690 | |
| Prosegur Compania de Seguridad SA (Reg.) | 809,100 | 6,606 | |
| 18,522 | |||
| Electrical Equipment - 2.4% | |||
| AMETEK, Inc. | 430,600 | 31,300 | |
| Fortive Corp. | 467,407 | 34,892 | |
| Nidec Corp. | 72,800 | 9,945 | |
| 76,137 | |||
| Industrial Conglomerates - 2.1% | |||
| 3M Co. | 213,000 | 51,789 | |
| Roper Technologies, Inc. | 49,569 | 13,245 | |
| 65,034 | |||
| Machinery - 1.2% | |||
| Allison Transmission Holdings, Inc. | 829,700 | 34,051 | |
| Rational AG | 3,600 | 2,355 | |
| 36,406 | |||
| Professional Services - 1.6% | |||
| IHS Markit Ltd. (a) | 515,400 | 22,997 | |
| Robert Half International, Inc. | 173,600 | 9,902 | |
| TransUnion Holding Co., Inc. (a) | 317,300 | 17,616 | |
| 50,515 | |||
| TOTAL INDUSTRIALS | 268,778 | ||
| INFORMATION TECHNOLOGY - 39.6% | |||
| Electronic Equipment & Components - 0.2% | |||
| CDW Corp. | 100,000 | 7,001 | |
| Internet Software & Services - 15.3% | |||
| Alibaba Group Holding Ltd. sponsored ADR (a) | 244,600 | 43,314 | |
| Alphabet, Inc. Class A (a) | 197,950 | 205,107 | |
| CommerceHub, Inc.: | |||
| Series A (a) | 171,749 | 3,926 | |
| Series C (a) | 297,560 | 6,386 | |
| Facebook, Inc. Class A (a) | 539,600 | 95,606 | |
| GoDaddy, Inc. (a) | 331,300 | 16,118 | |
| NetEase, Inc. ADR | 27,200 | 8,941 | |
| Shopify, Inc. Class A (a) | 40,800 | 4,274 | |
| Stamps.com, Inc. (a) | 246,168 | 41,455 | |
| Tencent Holdings Ltd. | 715,600 | 36,640 | |
| VeriSign, Inc. (a)(b) | 168,500 | 19,394 | |
| 481,161 | |||
| IT Services - 8.3% | |||
| Cognizant Technology Solutions Corp. Class A | 448,198 | 32,396 | |
| Fidelity National Information Services, Inc. | 166,600 | 15,715 | |
| Global Payments, Inc. | 263,800 | 26,528 | |
| MasterCard, Inc. Class A | 121,900 | 18,342 | |
| PayPal Holdings, Inc. (a) | 768,500 | 58,199 | |
| Square, Inc. (a) | 1,062,400 | 41,667 | |
| Vantiv, Inc. (a) | 156,500 | 11,738 | |
| Visa, Inc. Class A | 497,732 | 56,040 | |
| 260,625 | |||
| Semiconductors & Semiconductor Equipment - 2.5% | |||
| ASML Holding NV | 74,200 | 13,024 | |
| Broadcom Ltd. | 58,000 | 16,121 | |
| Maxim Integrated Products, Inc. | 273,828 | 14,329 | |
| Monolithic Power Systems, Inc. | 66,832 | 7,910 | |
| Qualcomm, Inc. | 401,400 | 26,629 | |
| 78,013 | |||
| Software - 10.1% | |||
| Activision Blizzard, Inc. | 276,500 | 17,254 | |
| Adobe Systems, Inc. (a) | 395,100 | 71,699 | |
| Autodesk, Inc. (a) | 281,800 | 30,913 | |
| Blackbaud, Inc. | 41,000 | 4,036 | |
| Computer Modelling Group Ltd. | 541,600 | 4,139 | |
| Electronic Arts, Inc. (a) | 241,045 | 25,635 | |
| Intuit, Inc. | 104,300 | 16,398 | |
| Microsoft Corp. | 981,900 | 82,647 | |
| Red Hat, Inc. (a) | 149,600 | 18,963 | |
| Salesforce.com, Inc. (a) | 419,792 | 43,793 | |
| 315,477 | |||
| Technology Hardware, Storage & Peripherals - 3.2% | |||
| Apple, Inc. | 577,800 | 99,295 | |
| TOTAL INFORMATION TECHNOLOGY | 1,241,572 | ||
| MATERIALS - 3.5% | |||
| Chemicals - 2.3% | |||
| CF Industries Holdings, Inc. | 504,800 | 18,915 | |
| Sherwin-Williams Co. | 44,000 | 17,574 | |
| The Chemours Co. LLC | 332,700 | 17,101 | |
| Umicore SA | 357,292 | 16,675 | |
| 70,265 | |||
| Construction Materials - 1.2% | |||
| Eagle Materials, Inc. | 298,800 | 33,445 | |
| Summit Materials, Inc. | 162,800 | 5,008 | |
| 38,453 | |||
| TOTAL MATERIALS | 108,718 | ||
| REAL ESTATE - 3.4% | |||
| Equity Real Estate Investment Trusts (REITs) - 2.2% | |||
| American Tower Corp. | 366,800 | 52,794 | |
| Equinix, Inc. | 18,500 | 8,593 | |
| SBA Communications Corp. Class A (a) | 53,500 | 9,082 | |
| 70,469 | |||
| Real Estate Management & Development - 1.2% | |||
| Realogy Holdings Corp. | 1,335,718 | 37,280 | |
| TOTAL REAL ESTATE | 107,749 | ||
| UTILITIES - 0.3% | |||
| Electric Utilities - 0.3% | |||
| PG&E Corp. | 172,900 | 9,378 | |
| TOTAL COMMON STOCKS | |||
| (Cost $2,118,940) | 3,015,914 | ||
| Preferred Stocks - 0.8% | |||
| Convertible Preferred Stocks - 0.6% | |||
| CONSUMER DISCRETIONARY - 0.0% | |||
| Household Durables - 0.0% | |||
| Blu Homes, Inc. Series A, 5.00% (a)(d)(e) | 875,350 | 18 | |
| INFORMATION TECHNOLOGY - 0.6% | |||
| Internet Software & Services - 0.5% | |||
| Uber Technologies, Inc. Series D, 8.00% (a)(d)(e) | 485,012 | 16,937 | |
| IT Services - 0.1% | |||
| AppNexus, Inc. Series E (a)(d)(e) | 105,425 | 2,441 | |
| TOTAL INFORMATION TECHNOLOGY | 19,378 | ||
| TOTAL CONVERTIBLE PREFERRED STOCKS | 19,396 | ||
| Nonconvertible Preferred Stocks - 0.2% | |||
| FINANCIALS - 0.2% | |||
| Banks - 0.2% | |||
| Itau Unibanco Holding SA sponsored ADR | 475,900 | 5,973 | |
| TOTAL PREFERRED STOCKS | |||
| (Cost $20,155) | 25,369 | ||
| Money Market Funds - 3.9% | |||
| Fidelity Cash Central Fund, 1.13% (f) | 67,225,466 | 67,239 | |
| Fidelity Securities Lending Cash Central Fund 1.13% (f)(g) | 55,310,981 | 55,317 | |
| TOTAL MONEY MARKET FUNDS | |||
| (Cost $122,556) | 122,556 | ||
| TOTAL INVESTMENT IN SECURITIES - 101.0% | |||
| (Cost $2,261,651) | 3,163,839 | ||
| NET OTHER ASSETS (LIABILITIES) - (1.0)% | (31,665) | ||
| NET ASSETS - 100% | $3,132,174 |
Legend
(a) Non-income producing
(b) Security or a portion of the security is on loan at period end.
(c) Security exempt from registration under Rule 144A of the Securities Act of 1933. These securities may be resold in transactions exempt from registration, normally to qualified institutional buyers. At the end of the period, the value of these securities amounted to $665,000 or 0.0% of net assets.
(d) Restricted securities - Investment in securities not registered under the Securities Act of 1933 (excluding 144A issues). At the end of the period, the value of restricted securities (excluding 144A issues) amounted to $19,396,000 or 0.6% of net assets.
(e) Level 3 security
(f) Affiliated fund that is generally available only to investment companies and other accounts managed by Fidelity Investments. The rate quoted is the annualized seven-day yield of the fund at period end. A complete unaudited listing of the fund's holdings as of its most recent quarter end is available upon request. In addition, each Fidelity Central Fund's financial statements, which are not covered by the Fund's Report of Independent Registered Public Accounting Firm, are available on the SEC's website or upon request.
(g) Investment made with cash collateral received from securities on loan.
Additional information on each restricted holding is as follows:
| Security | Acquisition Date | Acquisition Cost (000s) |
| AppNexus, Inc. Series E | 8/1/14 | $2,112 |
| Blu Homes, Inc. Series A, 5.00% | 6/21/13 | $4,044 |
| Uber Technologies, Inc. Series D, 8.00% | 6/6/14 | $7,524 |
Affiliated Central Funds
Information regarding fiscal year to date income earned by the Fund from investments in Fidelity Central Funds is as follows:
| Fund | Income earned |
| (Amounts in thousands) | |
| Fidelity Cash Central Fund | $546 |
| Fidelity Securities Lending Cash Central Fund | 1,664 |
| Total | $2,210 |
Investment Valuation
The following is a summary of the inputs used, as of November 30, 2017, involving the Fund's assets and liabilities carried at fair value. The inputs or methodology used for valuing securities may not be an indication of the risk associated with investing in those securities. For more information on valuation inputs, and their aggregation into the levels used below, please refer to the Investment Valuation section in the accompanying Notes to Financial Statements.
| Valuation Inputs at Reporting Date: | ||||
| Description | Total | Level 1 | Level 2 | Level 3 |
| (Amounts in thousands) | ||||
| Investments in Securities: | ||||
| Equities:�� | ||||
| Consumer Discretionary | $389,308 | $345,639 | $43,651 | $18 |
| Consumer Staples | 147,296 | 125,272 | 22,024 | -- |
| Energy | 65,351 | 65,351 | -- | -- |
| Financials | 352,092 | 350,116 | 1,976 | -- |
| Health Care | 331,663 | 324,289 | 7,374 | -- |
| Industrials | 268,778 | 258,833 | 9,945 | -- |
| Information Technology | 1,260,950 | 1,204,932 | 36,640 | 19,378 |
| Materials | 108,718 | 108,718 | -- | -- |
| Real Estate | 107,749 | 107,749 | -- | -- |
| Utilities | 9,378 | 9,378 | -- | -- |
| Money Market Funds | 122,556 | 122,556 | -- | -- |
| Total Investments in Securities: | $3,163,839 | $3,022,833 | $121,610 | $19,396 |
Other Information
Distribution of investments by country or territory of incorporation, as a percentage of Total Net Assets, is as follows (Unaudited):
| United States of America | 87.8% |
| Cayman Islands | 3.4% |
| Japan | 1.5% |
| France | 1.2% |
| Netherlands | 1.2% |
| Others (Individually Less Than 1%) | 4.9% |
| 100.0% |
See accompanying notes which are an integral part of the financial statements.
Financial Statements
Statement of Assets and Liabilities
| Amounts in thousands (except per-share amounts) | November 30, 2017 | |
| Assets | ||
| Investment in securities, at value (including securities loaned of $53,798) — See accompanying schedule: Unaffiliated issuers (cost $2,139,095) | $3,041,283 | |
| Fidelity Central Funds (cost $122,556) | 122,556 | |
| Total Investment in Securities (cost $2,261,651) | $3,163,839 | |
| Receivable for investments sold | 70,732 | |
| Receivable for fund shares sold | 1,533 | |
| Dividends receivable | 2,811 | |
| Distributions receivable from Fidelity Central Funds | 118 | |
| Prepaid expenses | 6 | |
| Other receivables | 170 | |
| Total assets | 3,239,209 | |
| Liabilities | ||
| Payable for investments purchased | $45,507 | |
| Payable for fund shares redeemed | 3,138 | |
| Accrued management fee | 1,413 | |
| Distribution and service plan fees payable | 903 | |
| Other affiliated payables | 542 | |
| Other payables and accrued expenses | 218 | |
| Collateral on securities loaned | 55,314 | |
| Total liabilities | 107,035 | |
| Net Assets | $3,132,174 | |
| Net Assets consist of: | ||
| Paid in capital | $1,892,356 | |
| Accumulated net investment loss | (162) | |
| Accumulated undistributed net realized gain (loss) on investments and foreign currency transactions | 337,791 | |
| Net unrealized appreciation (depreciation) on investments and assets and liabilities in foreign currencies | 902,189 | |
| Net Assets | $3,132,174 | |
| Calculation of Maximum Offering Price | ||
| Class A: | ||
| Net Asset Value and redemption price per share ($843,402 ÷ 6,879.38 shares) | $122.60 | |
| Maximum offering price per share (100/94.25 of $122.60) | $130.08 | |
| Class M: | ||
| Net Asset Value and redemption price per share ($1,353,082 ÷ 11,226.15 shares) | $120.53 | |
| Maximum offering price per share (100/96.50 of $120.53) | $124.90 | |
| Class C: | ||
| Net Asset Value and offering price per share ($199,879 ÷ 1,879.88 shares)(a) | $106.33 | |
| Class I: | ||
| Net Asset Value, offering price and redemption price per share ($677,074 ÷ 5,084.66 shares) | $133.16 | |
| Class Z: | ||
| Net Asset Value, offering price and redemption price per share ($58,737 ÷ 438.33 shares) | $134.00 |
(a) Redemption price per share is equal to net asset value less any applicable contingent deferred sales charge.
See accompanying notes which are an integral part of the financial statements.
Statement of Operations
| Amounts in thousands | Year ended November 30, 2017 | |
| Investment Income | ||
| Dividends | $23,553 | |
| Interest | 2 | |
| Income from Fidelity Central Funds (including $1,664 from security lending) | 2,210 | |
| Total income | 25,765 | |
| Expenses | ||
| Management fee | $15,500 | |
| Transfer agent fees | 5,268 | |
| Distribution and service plan fees | 10,026 | |
| Accounting and security lending fees | 854 | |
| Custodian fees and expenses | 53 | |
| Independent trustees' fees and expenses | 10 | |
| Appreciation in deferred trustee compensation account | 1 | |
| Registration fees | 115 | |
| Audit | 74 | |
| Legal | 12 | |
| Interest | 6 | |
| Miscellaneous | 23 | |
| Total expenses before reductions | 31,942 | |
| Expense reductions | (95) | 31,847 |
| Net investment income (loss) | (6,082) | |
| Realized and Unrealized Gain (Loss) | ||
| Net realized gain (loss) on: | ||
| Investment securities: | ||
| Unaffiliated issuers | 354,285 | |
| Fidelity Central Funds | 18 | |
| Foreign currency transactions | (163) | |
| Futures contracts | 248 | |
| Total net realized gain (loss) | 354,388 | |
| Change in net unrealized appreciation (depreciation) on: | ||
| Investment securities: | ||
| Unaffiliated issuers | 508,732 | |
| Fidelity Central Funds | (25) | |
| Assets and liabilities in foreign currencies | 7 | |
| Futures contracts | (168) | |
| Total change in net unrealized appreciation (depreciation) | 508,546 | |
| Net gain (loss) | 862,934 | |
| Net increase (decrease) in net assets resulting from operations | $856,852 |
See accompanying notes which are an integral part of the financial statements.
Statement of Changes in Net Assets
| Amounts in thousands | Year ended November 30, 2017 | Year ended November 30, 2016 |
| Increase (Decrease) in Net Assets | ||
| Operations | ||
| Net investment income (loss) | $(6,082) | $(9,439) |
| Net realized gain (loss) | 354,388 | 155,663 |
| Change in net unrealized appreciation (depreciation) | 508,546 | (165,390) |
| Net increase (decrease) in net assets resulting from operations | 856,852 | (19,166) |
| Distributions to shareholders from net realized gain | (153,216) | (69,494) |
| Share transactions - net increase (decrease) | (131,973) | (226,001) |
| Total increase (decrease) in net assets | 571,663 | (314,661) |
| Net Assets | ||
| Beginning of period | 2,560,511 | 2,875,172 |
| End of period | $3,132,174 | $2,560,511 |
| Other Information | ||
| Accumulated net investment loss end of period | $(162) | $(10,392) |
See accompanying notes which are an integral part of the financial statements.
Financial Highlights
Fidelity Advisor Equity Growth Fund Class A
| Years ended November 30, | 2017 | 2016 | 2015 | 2014 | 2013 |
| Selected Per–Share Data | |||||
| Net asset value, beginning of period | $96.05 | $98.79 | $93.78 | $80.87 | $61.77 |
| Income from Investment Operations | |||||
| Net investment income (loss)A | (.13) | (.24) | (.13) | (.07) | (.05) |
| Net realized and unrealized gain (loss) | 32.51 | (.12) | 5.14 | 12.98 | 19.15 |
| Total from investment operations | 32.38 | (.36) | 5.01 | 12.91 | 19.10 |
| Distributions from net investment income | – | – | – | – | – |
| Distributions from net realized gain | (5.83) | (2.38) | – | – | – |
| Total distributions | (5.83) | (2.38) | – | – | – |
| Net asset value, end of period | $122.60 | $96.05 | $98.79 | $93.78 | $80.87 |
| Total ReturnB,C | 35.72% | (.39)% | 5.34% | 15.96% | 30.92% |
| Ratios to Average Net AssetsD,E | |||||
| Expenses before reductions | 1.03% | 1.05% | 1.05% | 1.07% | 1.11% |
| Expenses net of fee waivers, if any | 1.03% | 1.05% | 1.05% | 1.07% | 1.11% |
| Expenses net of all reductions | 1.03% | 1.05% | 1.04% | 1.07% | 1.10% |
| Net investment income (loss) | (.12)% | (.25)% | (.13)% | (.08)% | (.07)% |
| Supplemental Data | |||||
| Net assets, end of period (in millions) | $843 | $803 | $887 | $853 | $772 |
| Portfolio turnover rateF | 48% | 60% | 63% | 49%G | 81% |
A Calculated based on average shares outstanding during the period.
B Total returns would have been lower if certain expenses had not been reduced during the applicable periods shown.
C Total returns do not include the effect of the sales charges.
D Fees and expenses of any underlying Fidelity Central Funds are not included in the Fund's expense ratio. The Fund indirectly bears its proportionate share of the expenses of any underlying Fidelity Central Funds.
E Expense ratios reflect operating expenses of the class. Expenses before reductions do not reflect amounts reimbursed by the investment adviser or reductions from brokerage service arrangements or reductions from other expense offset arrangements and do not represent the amount paid by the class during periods when reimbursements or reductions occur. Expenses net of fee waivers reflect expenses after reimbursement by the investment adviser but prior to reductions from brokerage service arrangements or other expense offset arrangements. Expenses net of all reductions represent the net expenses paid by the class.
F Amount does not include the portfolio activity of any underlying Fidelity Central Funds.
G Portfolio turnover rate excludes securities received or delivered in-kind.
See accompanying notes which are an integral part of the financial statements.
Fidelity Advisor Equity Growth Fund Class M
| Years ended November 30, | 2017 | 2016 | 2015 | 2014 | 2013 |
| Selected Per–Share Data | |||||
| Net asset value, beginning of period | $94.73 | $97.68 | $92.94 | $80.31 | $61.45 |
| Income from Investment Operations | |||||
| Net investment income (loss)A | (.38) | (.44) | (.34) | (.25) | (.17) |
| Net realized and unrealized gain (loss) | 32.01 | (.13) | 5.08 | 12.88 | 19.03 |
| Total from investment operations | 31.63 | (.57) | 4.74 | 12.63 | 18.86 |
| Distributions from net investment income | – | – | – | – | – |
| Distributions from net realized gain | (5.83) | (2.38) | – | – | – |
| Total distributions | (5.83) | (2.38) | – | – | – |
| Net asset value, end of period | $120.53 | $94.73 | $97.68 | $92.94 | $80.31 |
| Total ReturnB,C | 35.41% | (.62)% | 5.10% | 15.73% | 30.69% |
| Ratios to Average Net AssetsD,E | |||||
| Expenses before reductions | 1.26% | 1.28% | 1.27% | 1.28% | 1.29% |
| Expenses net of fee waivers, if any | 1.26% | 1.27% | 1.27% | 1.28% | 1.29% |
| Expenses net of all reductions | 1.26% | 1.27% | 1.27% | 1.28% | 1.28% |
| Net investment income (loss) | (.36)% | (.48)% | (.36)% | (.29)% | (.25)% |
| Supplemental Data | |||||
| Net assets, end of period (in millions) | $1,353 | $1,129 | $1,306 | $1,368 | $1,283 |
| Portfolio turnover rateF | 48% | 60% | 63% | 49%G | 81% |
A Calculated based on average shares outstanding during the period.
B Total returns would have been lower if certain expenses had not been reduced during the applicable periods shown.
C Total returns do not include the effect of the sales charges.
D Fees and expenses of any underlying Fidelity Central Funds are not included in the Fund's expense ratio. The Fund indirectly bears its proportionate share of the expenses of any underlying Fidelity Central Funds.
E Expense ratios reflect operating expenses of the class. Expenses before reductions do not reflect amounts reimbursed by the investment adviser or reductions from brokerage service arrangements or reductions from other expense offset arrangements and do not represent the amount paid by the class during periods when reimbursements or reductions occur. Expenses net of fee waivers reflect expenses after reimbursement by the investment adviser but prior to reductions from brokerage service arrangements or other expense offset arrangements. Expenses net of all reductions represent the net expenses paid by the class.
F Amount does not include the portfolio activity of any underlying Fidelity Central Funds.
G Portfolio turnover rate excludes securities received or delivered in-kind.
See accompanying notes which are an integral part of the financial statements.
Fidelity Advisor Equity Growth Fund Class C
| Years ended November 30, | 2017 | 2016 | 2015 | 2014 | 2013 |
| Selected Per–Share Data | |||||
| Net asset value, beginning of period | $84.66 | $88.01 | $84.18 | $73.13 | $56.27 |
| Income from Investment Operations | |||||
| Net investment income (loss)A | (.83) | (.84) | (.77) | (.66) | (.50) |
| Net realized and unrealized gain (loss) | 28.33 | (.13) | 4.60 | 11.71 | 17.36 |
| Total from investment operations | 27.50 | (.97) | 3.83 | 11.05 | 16.86 |
| Distributions from net investment income | – | – | – | – | – |
| Distributions from net realized gain | (5.83) | (2.38) | – | – | – |
| Total distributions | (5.83) | (2.38) | – | – | – |
| Net asset value, end of period | $106.33 | $84.66 | $88.01 | $84.18 | $73.13 |
| Total ReturnB,C | 34.70% | (1.15)% | 4.55% | 15.11% | 29.96% |
| Ratios to Average Net AssetsD,E | |||||
| Expenses before reductions | 1.79% | 1.81% | 1.81% | 1.81% | 1.84% |
| Expenses net of fee waivers, if any | 1.79% | 1.81% | 1.81% | 1.81% | 1.84% |
| Expenses net of all reductions | 1.79% | 1.81% | 1.80% | 1.81% | 1.83% |
| Net investment income (loss) | (.89)% | (1.01)% | (.89)% | (.83)% | (.79)% |
| Supplemental Data | |||||
| Net assets, end of period (in millions) | $200 | $161 | $183 | $175 | $157 |
| Portfolio turnover rateF | 48% | 60% | 63% | 49%G | 81% |
A Calculated based on average shares outstanding during the period.
B Total returns would have been lower if certain expenses had not been reduced during the applicable periods shown.
C Total returns do not include the effect of the contingent deferred sales charge.
D Fees and expenses of any underlying Fidelity Central Funds are not included in the Fund's expense ratio. The Fund indirectly bears its proportionate share of the expenses of any underlying Fidelity Central Funds.
E Expense ratios reflect operating expenses of the class. Expenses before reductions do not reflect amounts reimbursed by the investment adviser or reductions from brokerage service arrangements or reductions from other expense offset arrangements and do not represent the amount paid by the class during periods when reimbursements or reductions occur. Expenses net of fee waivers reflect expenses after reimbursement by the investment adviser but prior to reductions from brokerage service arrangements or other expense offset arrangements. Expenses net of all reductions represent the net expenses paid by the class.
F Amount does not include the portfolio activity of any underlying Fidelity Central Funds.
G Portfolio turnover rate excludes securities received or delivered in-kind.
See accompanying notes which are an integral part of the financial statements.
Fidelity Advisor Equity Growth Fund Class I
| Years ended November 30, | 2017 | 2016 | 2015 | 2014 | 2013 |
| Selected Per–Share Data | |||||
| Net asset value, beginning of period | $103.57 | $106.06 | $100.40 | $86.32 | $65.92 |
| Income from Investment Operations | |||||
| Net investment income (loss)A | .17 | .02 | .15 | .20 | .20 |
| Net realized and unrealized gain (loss) | 35.25 | (.13) | 5.51 | 13.88 | 20.40 |
| Total from investment operations | 35.42 | (.11) | 5.66 | 14.08 | 20.60 |
| Distributions from net investment income | – | – | – | – | (.20) |
| Distributions from net realized gain | (5.83) | (2.38) | – | – | – |
| Total distributions | (5.83) | (2.38) | – | – | (.20) |
| Net asset value, end of period | $133.16 | $103.57 | $106.06 | $100.40 | $86.32 |
| Total ReturnB | 36.08% | (.12)% | 5.64% | 16.31% | 31.36% |
| Ratios to Average Net AssetsC,D | |||||
| Expenses before reductions | .77% | .78% | .78% | .77% | .78% |
| Expenses net of fee waivers, if any | .76% | .78% | .77% | .77% | .78% |
| Expenses net of all reductions | .76% | .77% | .77% | .77% | .77% |
| Net investment income (loss) | .14% | .02% | .14% | .21% | .27% |
| Supplemental Data | |||||
| Net assets, end of period (in millions) | $677 | $434 | $463 | $432 | $1,266 |
| Portfolio turnover rateE | 48% | 60% | 63% | 49%F | 81% |
A Calculated based on average shares outstanding during the period.
B Total returns would have been lower if certain expenses had not been reduced during the applicable periods shown.
C Fees and expenses of any underlying Fidelity Central Funds are not included in the Fund's expense ratio. The Fund indirectly bears its proportionate share of the expenses of any underlying Fidelity Central Funds.
D Expense ratios reflect operating expenses of the class. Expenses before reductions do not reflect amounts reimbursed by the investment adviser or reductions from brokerage service arrangements or reductions from other expense offset arrangements and do not represent the amount paid by the class during periods when reimbursements or reductions occur. Expenses net of fee waivers reflect expenses after reimbursement by the investment adviser but prior to reductions from brokerage service arrangements or other expense offset arrangements. Expenses net of all reductions represent the net expenses paid by the class.
E Amount does not include the portfolio activity of any underlying Fidelity Central Funds.
F Portfolio turnover rate excludes securities received or delivered in-kind.
See accompanying notes which are an integral part of the financial statements.
Fidelity Advisor Equity Growth Fund Class Z
| Years ended November 30, | 2017 | 2016 | 2015 | 2014 | 2013 A |
| Selected Per–Share Data | |||||
| Net asset value, beginning of period | $104.05 | $106.39 | $100.59 | $86.36 | $78.49 |
| Income from Investment Operations | |||||
| Net investment income (loss)B | .33 | .17 | .29 | .33 | .09 |
| Net realized and unrealized gain (loss) | 35.45 | (.13) | 5.51 | 13.90 | 7.78 |
| Total from investment operations | 35.78 | .04 | 5.80 | 14.23 | 7.87 |
| Distributions from net investment income | – | – | – | – | – |
| Distributions from net realized gain | (5.83) | (2.38) | – | – | – |
| Total distributions | (5.83) | (2.38) | – | – | – |
| Net asset value, end of period | $134.00 | $104.05 | $106.39 | $100.59 | $86.36 |
| Total ReturnC,D | 36.27% | .02% | 5.77% | 16.48% | 10.03% |
| Ratios to Average Net AssetsE,F | |||||
| Expenses before reductions | .63% | .64% | .64% | .64% | .64%G |
| Expenses net of fee waivers, if any | .63% | .63% | .64% | .64% | .64%G |
| Expenses net of all reductions | .63% | .63% | .63% | .64% | .63%G |
| Net investment income (loss) | .28% | .16% | .28% | .35% | .38%G |
| Supplemental Data | |||||
| Net assets, end of period (in millions) | $59 | $33 | $26 | $– | $– |
| Portfolio turnover rateH | 48% | 60% | 63% | 49%I | 81% |
A For the period August 13, 2013 (commencement of sale of shares) to November 30, 2013.
B Calculated based on average shares outstanding during the period.
C Total returns for periods of less than one year are not annualized.
D Total returns would have been lower if certain expenses had not been reduced during the applicable periods shown.
E Fees and expenses of any underlying Fidelity Central Funds are not included in the Fund's expense ratio. The Fund indirectly bears its proportionate share of the expenses of any underlying Fidelity Central Funds.
F Expense ratios reflect operating expenses of the class. Expenses before reductions do not reflect amounts reimbursed by the investment adviser or reductions from brokerage service arrangements or reductions from other expense offset arrangements and do not represent the amount paid by the class during periods when reimbursements or reductions occur. Expense ratios before reductions for start-up periods may not be representative of longer-term operating periods. Expenses net of fee waivers reflect expenses after reimbursement by the investment adviser but prior to reductions from brokerage service arrangements or other expense offset arrangements. Expenses net of all reductions represent the net expenses paid by the class.
G Annualized
H Amount does not include the portfolio activity of any underlying Fidelity Central Funds.
I Portfolio turnover rate excludes securities received or delivered in-kind.
See accompanying notes which are an integral part of the financial statements.
Notes to Financial Statements
For the period ended November 30, 2017
(Amounts in thousands except percentages)
1. Organization.
Fidelity Advisor Equity Growth Fund (the Fund) is a fund of Fidelity Advisor Series I (the Trust) and is authorized to issue an unlimited number of shares. The Trust is registered under the Investment Company Act of 1940, as amended (the 1940 Act), as an open-end management investment company organized as a Massachusetts business trust. The Fund offers Class A, Class M (formerly Class T), Class C, Class I and Class Z shares, each of which has equal rights as to assets and voting privileges. Each class has exclusive voting rights with respect to matters that affect that class.
After the close of business on June 24, 2016, all outstanding Class B shares were converted to Class A shares. All prior fiscal period dollar and share amounts for Class B presented in the Notes to Financial Statements are for the period December 1, 2015 through June 24, 2016.
2. Investments in Fidelity Central Funds.
The Fund invests in Fidelity Central Funds, which are open-end investment companies generally available only to other investment companies and accounts managed by the investment adviser and its affiliates. The Fund's Schedule of Investments lists each of the Fidelity Central Funds held as of period end, if any, as an investment of the Fund, but does not include the underlying holdings of each Fidelity Central Fund. As an Investing Fund, the Fund indirectly bears its proportionate share of the expenses of the underlying Fidelity Central Funds.
The Money Market Central Funds seek preservation of capital and current income and are managed by Fidelity Investments Money Management, Inc. (FIMM), an affiliate of the investment adviser. Annualized expenses of the Money Market Central Funds as of their most recent shareholder report date are less than .005%.
A complete unaudited list of holdings for each Fidelity Central Fund is available upon request or at the Securities and Exchange Commission (the SEC) website at www.sec.gov. In addition, the financial statements of the Fidelity Central Funds, which are not covered by the Fund's Report of Independent Registered Public Accounting Firm, are available on the SEC website or upon request.
3. Significant Accounting Policies.
The Fund is an investment company and applies the accounting and reporting guidance of the Financial Accounting Standards Board (FASB) Accounting Standards Codification Topic 946 Financial Services – Investments Companies. The financial statements have been prepared in conformity with accounting principles generally accepted in the United States of America (GAAP), which require management to make certain estimates and assumptions at the date of the financial statements. Actual results could differ from those estimates. Subsequent events, if any, through the date that the financial statements were issued have been evaluated in the preparation of the financial statements. The following summarizes the significant accounting policies of the Fund:
Investment Valuation. Investments are valued as of 4:00 p.m. Eastern time on the last calendar day of the period. The Board of Trustees (the Board) has delegated the day to day responsibility for the valuation of the Fund's investments to the Fair Value Committee (the Committee) established by the Fund's investment adviser. In accordance with valuation policies and procedures approved by the Board, the Fund attempts to obtain prices from one or more third party pricing vendors or brokers to value its investments. When current market prices, quotations or currency exchange rates are not readily available or reliable, investments will be fair valued in good faith by the Committee, in accordance with procedures adopted by the Board. Factors used in determining fair value vary by investment type and may include market or investment specific events. The frequency with which these procedures are used cannot be predicted and they may be utilized to a significant extent. The Committee oversees the Fund's valuation policies and procedures and reports to the Board on the Committee's activities and fair value determinations. The Board monitors the appropriateness of the procedures used in valuing the Fund's investments and ratifies the fair value determinations of the Committee.
The Fund categorizes the inputs to valuation techniques used to value its investments into a disclosure hierarchy consisting of three levels as shown below:
- Level 1 – quoted prices in active markets for identical investments
- Level 2 – other significant observable inputs (including quoted prices for similar investments, interest rates, prepayment speeds, etc.)
- Level 3 – unobservable inputs (including the Fund's own assumptions based on the best information available)
Valuation techniques used to value the Fund's investments by major category are as follows:
Equity securities, including restricted securities, for which market quotations are readily available, are valued at the last reported sale price or official closing price as reported by a third party pricing vendor on the primary market or exchange on which they are traded and are categorized as Level 1 in the hierarchy. In the event there were no sales during the day or closing prices are not available, securities are valued at the last quoted bid price or may be valued using the last available price and are generally categorized as Level 2 in the hierarchy. For foreign equity securities, when market or security specific events arise, comparisons to the valuation of American Depositary Receipts (ADRs), futures contracts, Exchange-Traded Funds (ETFs) and certain indexes as well as quoted prices for similar securities may be used and would be categorized as Level 2 in the hierarchy. Utilizing these techniques may result in transfers between Level 1 and Level 2. For equity securities, including restricted securities, where observable inputs are limited, assumptions about market activity and risk are used and these securities may be categorized as Level 3 in the hierarchy. The market approach generally consists of using comparable market transactions while the income approach generally consists of using the net present value of estimated future cash flows, adjusted as appropriate for liquidity, credit, market and/or other risk factors.
Investments in open-end mutual funds, including the Fidelity Central Funds, are valued at their closing net asset value (NAV) each business day and are categorized as Level 1 in the hierarchy.
Changes in valuation techniques may result in transfers in or out of an assigned level within the disclosure hierarchy. The aggregate value of investments by input level as of November 30, 2017 is included at the end of the Fund's Schedule of Investments.
Foreign Currency. The Fund may use foreign currency contracts to facilitate transactions in foreign-denominated securities. Gains and losses from these transactions may arise from changes in the value of the foreign currency or if the counterparties do not perform under the contracts' terms.
Foreign-denominated assets, including investment securities, and liabilities are translated into U.S. dollars at the exchange rates at period end. Purchases and sales of investment securities, income and dividends received and expenses denominated in foreign currencies are translated into U.S. dollars at the exchange rate in effect on the transaction date.
The effects of exchange rate fluctuations on investments are included with the net realized and unrealized gain (loss) on investment securities. Other foreign currency transactions resulting in realized and unrealized gain (loss) are disclosed separately.
Investment Transactions and Income. For financial reporting purposes, the Fund's investment holdings and NAV include trades executed through the end of the last business day of the period. The NAV per share for processing shareholder transactions is calculated as of the close of business of the New York Stock Exchange (NYSE), normally 4:00 p.m. Eastern time and includes trades executed through the end of the prior business day. Gains and losses on securities sold are determined on the basis of identified cost and includes proceeds received from litigation. Dividend income is recorded on the ex-dividend date, except for certain dividends from foreign securities where the ex-dividend date may have passed, which are recorded as soon as the Fund is informed of the ex-dividend date. Non-cash dividends included in dividend income, if any, are recorded at the fair market value of the securities received. Income and capital gain distributions from Fidelity Central Funds, if any, are recorded on the ex-dividend date. Certain distributions received by the Fund represent a return of capital or capital gain. The Fund determines the components of these distributions subsequent to the ex-dividend date, based upon receipt of tax filings or other correspondence relating to the underlying investment. These distributions are recorded as a reduction of cost of investments and/or as a realized gain. Interest income is accrued as earned and includes coupon interest and amortization of premium and accretion of discount on debt securities as applicable. Investment income is recorded net of foreign taxes withheld where recovery of such taxes is uncertain.
Class Allocations and Expenses. Investment income, realized and unrealized capital gains and losses, common expenses of the Fund, and certain fund-level expense reductions, if any, are allocated daily on a pro-rata basis to each class based on the relative net assets of each class to the total net assets of the Fund. Each class differs with respect to transfer agent and distribution and service plan fees incurred. Certain expense reductions may also differ by class. For the reporting period, the allocated portion of income and expenses to each class as a percent of its average net assets may vary due to the timing of recording these transactions in relation to fluctuating net assets of the classes. Expenses directly attributable to a fund are charged to that fund. Expenses attributable to more than one fund are allocated among the respective funds on the basis of relative net assets or other appropriate methods. Expense estimates are accrued in the period to which they relate and adjustments are made when actual amounts are known.
Deferred Trustee Compensation. Under a Deferred Compensation Plan (the Plan), independent Trustees may elect to defer receipt of a portion of their annual compensation. Deferred amounts are invested in a cross-section of Fidelity funds, are marked-to-market and remain in the Fund until distributed in accordance with the Plan. The investment of deferred amounts and the offsetting payable to the Trustees are included in the accompanying Statement of Assets and Liabilities.
Income Tax Information and Distributions to Shareholders. Each year, the Fund intends to qualify as a regulated investment company under Subchapter M of the Internal Revenue Code, including distributing substantially all of its taxable income and realized gains. As a result, no provision for U.S. Federal income taxes is required. As of November 30, 2017, the Fund did not have any unrecognized tax benefits in the financial statements; nor is the Fund aware of any tax positions for which it is reasonably possible that the total amounts of unrecognized tax benefits will significantly change in the next twelve months. The Fund files a U.S. federal tax return, in addition to state and local tax returns as required. The Fund's federal income tax returns are subject to examination by the Internal Revenue Service (IRS) for a period of three fiscal years after they are filed. State and local tax returns may be subject to examination for an additional fiscal year depending on the jurisdiction. Foreign taxes are provided for based on the Fund's understanding of the tax rules and rates that exist in the foreign markets in which it invests.
Distributions are declared and recorded on the ex-dividend date. Income dividends and capital gain distributions are declared separately for each class. Income and capital gain distributions are determined in accordance with income tax regulations, which may differ from GAAP.
Capital accounts within the financial statements are adjusted for permanent book-tax differences. These adjustments have no impact on net assets or the results of operations. Capital accounts are not adjusted for temporary book-tax differences which will reverse in a subsequent period.
Book-tax differences are primarily due to futures contracts, foreign currency transactions, passive foreign investment companies (PFIC), market discount, partnerships, deferred trustees compensation, losses deferred due to wash sales and excise tax regulations.
As of period end, the cost and unrealized appreciation (depreciation) in securities, and derivatives if applicable, for federal income tax purposes were as follows:
| Gross unrealized appreciation | $931,592 |
| Gross unrealized depreciation | (29,058) |
| Net unrealized appreciation (depreciation) | $902,534 |
| Tax Cost | $2,261,305 |
The tax-based components of distributable earnings as of period end were as follows:
| Undistributed ordinary income | $15,981 |
| Undistributed long-term capital gain | $321,463 |
| Net unrealized appreciation (depreciation) on securities and other investments | $902,535 |
The tax character of distributions paid was as follows:
| November 30, 2017 | November 30, 2016 | |
| Long-term Capital Gains | $153,216 | $69,494 |
Restricted Securities. The Fund may invest in securities that are subject to legal or contractual restrictions on resale. These securities generally may be resold in transactions exempt from registration or to the public if the securities are registered. Disposal of these securities may involve time-consuming negotiations and expense, and prompt sale at an acceptable price may be difficult. Information regarding restricted securities is included at the end of the Fund's Schedule of Investments.
4. Derivative Instruments.
Risk Exposures and the Use of Derivative Instruments. The Fund's investment objective allows the Fund to enter into various types of derivative contracts, including futures contracts. Derivatives are investments whose value is primarily derived from underlying assets, indices or reference rates and may be transacted on an exchange or over-the-counter (OTC). Derivatives may involve a future commitment to buy or sell a specified asset based on specified terms, to exchange future cash flows at periodic intervals based on a notional principal amount, or for one party to make one or more payments upon the occurrence of specified events in exchange for periodic payments from the other party.
The Fund used derivatives to increase returns and to manage exposure to certain risks as defined below. The success of any strategy involving derivatives depends on analysis of numerous economic factors, and if the strategies for investment do not work as intended, the Fund may not achieve its objectives.
The Fund's use of derivatives increased or decreased its exposure to the following risk:
| Equity Risk | Equity risk relates to the fluctuations in the value of financial instruments as a result of changes in market prices (other than those arising from interest rate risk or foreign exchange risk), whether caused by factors specific to an individual investment, its issuer, or all factors affecting all instruments traded in a market or market segment. |
The Fund is also exposed to additional risks from investing in derivatives, such as liquidity risk and counterparty credit risk. Liquidity risk is the risk that the Fund will be unable to close out the derivative in the open market in a timely manner. Counterparty credit risk is the risk that the counterparty will not be able to fulfill its obligation to the Fund. Counterparty credit risk related to exchange-traded futures contracts may be mitigated by the protection provided by the exchange on which they trade.
Investing in derivatives may involve greater risks than investing in the underlying assets directly and, to varying degrees, may involve risk of loss in excess of any initial investment and collateral received and amounts recognized in the Statement of Assets and Liabilities. In addition, there may be the risk that the change in value of the derivative contract does not correspond to the change in value of the underlying instrument.
Futures Contracts. A futures contract is an agreement between two parties to buy or sell a specified underlying instrument for a fixed price at a specified future date. The Fund used futures contracts to manage its exposure to the stock market.
Upon entering into a futures contract, a fund is required to deposit either cash or securities (initial margin) with a clearing broker in an amount equal to a certain percentage of the face value of the contract. Futures contracts are marked-to-market daily and subsequent daily payments (variation margin) are made or received by a fund depending on the daily fluctuations in the value of the futures contracts and are recorded as unrealized appreciation or (depreciation). This receivable and/or payable, if any, is included in daily variation margin on futures contracts in the Statement of Assets and Liabilities. Realized gain or (loss) is recorded upon the expiration or closing of a futures contract. The net realized gain (loss) and change in net unrealized appreciation (depreciation) on futures contracts during the period is presented in the Statement of Operations.
Any open futures contracts at period end are presented in the Schedule of Investments under the caption "Futures Contracts". The notional amount at value reflects each contract's exposure to the underlying instrument or index at period end.
5. Purchases and Sales of Investments.
Purchases and sales of securities, other than short-term securities, aggregated $1,323,651 and $1,661,588, respectively.
6. Fees and Other Transactions with Affiliates.
Management Fee. Fidelity Management & Research Company (the investment adviser) and its affiliates provide the Fund with investment management related services for which the Fund pays a monthly management fee. The management fee is the sum of an individual fund fee rate that is based on an annual rate of .30% of the Fund's average net assets and an annualized group fee rate that averaged .25% during the period. The group fee rate is based upon the average net assets of all the mutual funds advised by the investment adviser, including any mutual funds previously advised by the investment adviser that are currently advised by Fidelity SelectCo, LLC, an affiliate of the investment adviser. The group fee rate decreases as assets under management increase and increases as assets under management decrease. For the reporting period, the total annual management fee rate was .54% of the Fund's average net assets.
Distribution and Service Plan Fees. In accordance with Rule 12b-1 of the 1940 Act, the Fund has adopted separate Distribution and Service Plans for each class of shares. Certain classes pay Fidelity Distributors Corporation (FDC), an affiliate of the investment adviser, separate Distribution and Service Fees, each of which is based on an annual percentage of each class' average net assets. In addition, FDC may pay financial intermediaries for selling shares of the Fund and providing shareholder support services. For the period, the Distribution and Service Fee rates, total fees and amounts retained by FDC were as follows:
| Distribution Fee | Service Fee | Total Fees | Retained by FDC | |
| Class A | -% | .25% | $1,992 | $26 |
| Class M | .25% | .25% | 6,222 | – |
| Class C | .75% | .25% | 1,812 | 88 |
| $10,026 | $114 |
Sales Load. FDC may receive a front-end sales charge of up to 5.75% for selling Class A shares and 3.50% for selling Class M shares, some of which is paid to financial intermediaries for selling shares of the Fund. Depending on the holding period, FDC may receive contingent deferred sales charges levied on Class A, Class M and Class C redemptions. The deferred sales charges are 1.00% for Class C shares, 1.00% for certain purchases of Class A shares and .25% for certain purchases of Class M shares.
For the period, sales charge amounts retained by FDC were as follows:
| Retained by FDC | |
| Class A | $116 |
| Class M | 31 |
| Class C(a) | 6 |
| $153 |
(a) When Class C shares are initially sold, FDC pays commissions from its own resources to financial intermediaries through which the sales are made.
Transfer Agent Fees. Fidelity Investments Institutional Operations Company, Inc., (FIIOC), an affiliate of the investment adviser, is the transfer, dividend disbursing and shareholder servicing agent for each class of the Fund. FIIOC receives account fees and asset-based fees that vary according to the account size and type of account of the shareholders of the respective classes of the Fund, except for Class Z. FIIOC receives an asset-based fee of Class Z's average net assets. FIIOC pays for typesetting, printing and mailing of shareholder reports, except proxy statements.
For the period, transfer agent fees for each class were as follows:
| Amount | % of Class-Level Average Net Assets | |
| Class A | $1,572 | .20 |
| Class M | 2,242 | .18 |
| Class C | 381 | .21 |
| Class I | 1,051 | .18 |
| Class Z | 22 | .05 |
| $5,268 |
Accounting and Security Lending Fees. Fidelity Service Company, Inc. (FSC), an affiliate of the investment adviser, maintains the Fund's accounting records. The accounting fee is based on the level of average net assets for each month. Under a separate contract, FSC administers the security lending program. The security lending fee is based on the number and duration of lending transactions.
Brokerage Commissions. The Fund placed a portion of its portfolio transactions with brokerage firms which are affiliates of the investment adviser. Brokerage commissions are included in net realized gain (loss) and change in net unrealized appreciation (depreciation) in the Statement of Operations. The commissions paid to these affiliated firms were $44 for the period.
Interfund Lending Program. Pursuant to an Exemptive Order issued by the SEC, the Fund, along with other registered investment companies having management contracts with Fidelity Management & Research Company (FMR) or other affiliated entities of FMR, may participate in an interfund lending program. This program provides an alternative credit facility allowing the funds to borrow from, or lend money to, other participating affiliated funds. At period end, there were no interfund loans outstanding. The Fund's activity in this program during the period for which loans were outstanding was as follows:
| Borrower or Lender | Average Loan Balance | Weighted Average Interest Rate | Interest Expense |
| Borrower | $8,437 | .79% | $5 |
Interfund Trades. The Fund may purchase from or sell securities to other Fidelity Funds under procedures adopted by the Board. The procedures have been designed to ensure these interfund trades are executed in accordance with Rule 17a-7 of the 1940 Act. Interfund trades are included within the respective purchases and sales amounts shown in the Purchases and Sales of Investments note.
7. Committed Line of Credit.
The Fund participates with other funds managed by the investment adviser or an affiliate in a $4.25 billion credit facility (the "line of credit") to be utilized for temporary or emergency purposes to fund shareholder redemptions or for other short-term liquidity purposes. The Fund has agreed to pay commitment fees on its pro-rata portion of the line of credit, which amounted to $9 and is reflected in Miscellaneous expenses on the Statement of Operations. During the period, the Fund did not borrow on this line of credit.
8. Security Lending.
The Fund lends portfolio securities through a lending agent from time to time in order to earn additional income. For equity securities, a lending agent is used and may loan securities to certain qualified borrowers, including Fidelity Capital Markets (FCM), a broker-dealer affiliated with the Fund. On the settlement date of the loan, the Fund receives collateral (in the form of U.S. Treasury obligations, letters of credit and/or cash) against the loaned securities and maintains collateral in an amount not less than 100% of the market value of the loaned securities during the period of the loan. The market value of the loaned securities is determined at the close of business of the Fund and any additional required collateral is delivered to the Fund on the next business day. The Fund or borrower may terminate the loan at any time, and if the borrower defaults on its obligation to return the securities loaned because of insolvency or other reasons, the Fund may apply collateral received from the borrower against the obligation. The Fund may experience delays and costs in recovering the securities loaned. Any cash collateral received is invested in the Fidelity Securities Lending Cash Central Fund. The value of loaned securities and cash collateral at period end are disclosed on the Fund's Statement of Assets and Liabilities. At period end, there were no security loans outstanding with FCM. Security lending income represents the income earned on investing cash collateral, less rebates paid to borrowers and any lending agent fees associated with the loan, plus any premium payments received for lending certain types of securities. Security lending income is presented in the Statement of Operations as a component of income from Fidelity Central Funds. Total security lending income during the period amounted to $1,664, including an amount less than five hundred dollars from securities loaned to FCM.
9. Bank Borrowings.
The Fund is permitted to have bank borrowings for temporary or emergency purposes to fund shareholder redemptions or for other short-term liquidity requirements. The Fund has established borrowing arrangements with certain banks. The interest rate on the borrowings is the bank's base rate, as revised from time to time. The average loan balance during the period for which loans were outstanding amounted to $3,130. The weighted average interest rate was 1.16%. The interest expense amounted to $1 under the bank borrowing program. At period end, there were no bank borrowings outstanding.
10. Expense Reductions.
Commissions paid to certain brokers with whom the investment adviser, or its affiliates, places trades on behalf of the Fund include an amount in addition to trade execution, which may be rebated back to the Fund to offset certain expenses. This amount totaled $70 for the period. In addition, through arrangements with the Fund's custodian, credits realized as a result of certain uninvested cash balances were used to reduce the Fund's expenses. During the period, these credits reduced the Fund's custody expenses by $2.
In addition, during the period the investment adviser reimbursed and/or waived a portion of fund-level operating expenses in the amount of $23.
11. Distributions to Shareholders.
Distributions to shareholders of each class were as follows:
| Year ended November 30, 2017 | Year ended November 30, 2016 | |
| From net realized gain | ||
| Class A | $47,938 | $21,468 |
| Class M | 68,793 | 31,792 |
| Class B | – | 295 |
| Class C | 10,973 | 4,972 |
| Class I | 23,651 | 10,387 |
| Class Z | 1,861 | 579 |
| Total | $153,216 | $69,494 |
12. Share Transactions.
Share transactions for each class were as follows and may contain automatic conversions between classes or exchanges between affiliated funds:
| Shares | Shares | Dollars | Dollars | |
| Year ended November 30, 2017 | Year ended November 30, 2016 | Year ended November 30, 2017 | Year ended November 30, 2016 | |
| Class A | ||||
| Shares sold | 819 | 1,246 | $87,156 | $115,920 |
| Reinvestment of distributions | 485 | 205 | 44,771 | 19,967 |
| Shares redeemed | (2,789) | (2,066) | (287,483) | (193,544) |
| Net increase (decrease) | (1,485) | (615) | $(155,556) | $(57,657) |
| Class M | ||||
| Shares sold | 1,180 | 1,348 | $123,747 | $123,818 |
| Reinvestment of distributions | 734 | 321 | 66,704 | 30,879 |
| Shares redeemed | (2,609) | (3,117) | (271,208) | (288,966) |
| Net increase (decrease) | (695) | (1,448) | $(80,757) | $(134,269) |
| Class B | ||||
| Shares sold | – | 2 | $– | $126 |
| Reinvestment of distributions | – | 3 | – | 278 |
| Shares redeemed | – | (129) | – | (10,265) |
| Net increase (decrease) | – | (124) | $– | $(9,861) |
| Class C | ||||
| Shares sold | 263 | 215 | $24,340 | $17,757 |
| Reinvestment of distributions | 124 | 52 | 10,000 | 4,525 |
| Shares redeemed | (411) | (442) | (38,054) | (36,398) |
| Net increase (decrease) | (24) | (175) | $(3,714) | $(14,116) |
| Class I | ||||
| Shares sold | 2,491 | 822 | $283,237 | $82,756 |
| Reinvestment of distributions | 224 | 95 | 22,400 | 9,952 |
| Shares redeemed | (1,817) | (1,094) | (211,175) | (110,841) |
| Net increase (decrease) | 898 | (177) | $94,462 | $(18,133) |
| Class Z | ||||
| Shares sold | 254 | 111 | $30,128 | $11,539 |
| Reinvestment of distributions | 19 | 6 | 1,861 | 579 |
| Shares redeemed | (153) | (40) | (18,397) | (4,083) |
| Net increase (decrease) | 120 | 77 | $13,592 | $8,035 |
13. Other.
The Fund's organizational documents provide former and current trustees and officers with a limited indemnification against liabilities arising in connection with the performance of their duties to the Fund. In the normal course of business, the Fund may also enter into contracts that provide general indemnifications. The Fund's maximum exposure under these arrangements is unknown as this would be dependent on future claims that may be made against the Fund. The risk of material loss from such claims is considered remote.
Report of Independent Registered Public Accounting Firm
To the Trustees of Fidelity Advisor Series I and Shareholders of Fidelity Advisor Equity Growth Fund:
We have audited the accompanying statement of assets and liabilities of Fidelity Advisor Equity Growth Fund (the Fund), a fund of Fidelity Advisor Series I, including the schedule of investments, as of November 30, 2017, and the related statement of operations for the year then ended, the statement of changes in net assets for each of the two years in the period then ended, and the financial highlights for each of the five years in the period then ended. These financial statements and financial highlights are the responsibility of the Fund's management. Our responsibility is to express an opinion on these financial statements and financial highlights based on our audits.
We conducted our audits in accordance with the standards of the Public Company Accounting Oversight Board (United States). Those standards require that we plan and perform the audit to obtain reasonable assurance about whether the financial statements and financial highlights are free of material misstatement. The Fund is not required to have, nor were we engaged to perform, an audit of its internal control over financial reporting. Our audits included consideration of internal control over financial reporting as a basis for designing audit procedures that are appropriate in the circumstances, but not for the purpose of expressing an opinion on the effectiveness of the Fund's internal control over financial reporting. Accordingly, we express no such opinion. An audit also includes examining, on a test basis, evidence supporting the amounts and disclosures in the financial statements, assessing the accounting principles used and significant estimates made by management, as well as evaluating the overall financial statement presentation. Our procedures included confirmation of securities owned as of November 30, 2017, by correspondence with the custodians and brokers; when replies were not received from brokers, we performed other auditing procedures. We believe that our audits provide a reasonable basis for our opinion.
In our opinion, such financial statements and financial highlights referred to above present fairly, in all material respects, the financial position of Fidelity Advisor Equity Growth Fund as of November 30, 2017, the results of its operations for the year then ended, the changes in its net assets for each of the two years in the period then ended, and the financial highlights for each of the five years in the period then ended, in conformity with accounting principles generally accepted in the United States of America.
DELOITTE & TOUCHE LLP
Boston, Massachusetts
January 17, 2018
Trustees and Officers
The Trustees, Members of the Advisory Board (if any), and officers of the trust and fund, as applicable, are listed below. The Board of Trustees governs the fund and is responsible for protecting the interests of shareholders. The Trustees are experienced executives who meet periodically throughout the year to oversee the fund's activities, review contractual arrangements with companies that provide services to the fund, oversee management of the risks associated with such activities and contractual arrangements, and review the fund's performance. Each of the Trustees oversees 190 funds.
The Trustees hold office without limit in time except that (a) any Trustee may resign; (b) any Trustee may be removed by written instrument, signed by at least two-thirds of the number of Trustees prior to such removal; (c) any Trustee who requests to be retired or who has become incapacitated by illness or injury may be retired by written instrument signed by a majority of the other Trustees; and (d) any Trustee may be removed at any special meeting of shareholders by a two-thirds vote of the outstanding voting securities of the trust. Each Trustee who is not an interested person (as defined in the 1940 Act) of the trust and the fund is referred to herein as an Independent Trustee. Each Independent Trustee shall retire not later than the last day of the calendar year in which his or her 75th birthday occurs. The Independent Trustees may waive this mandatory retirement age policy with respect to individual Trustees. Officers and Advisory Board Members hold office without limit in time, except that any officer or Advisory Board Member may resign or may be removed by a vote of a majority of the Trustees at any regular meeting or any special meeting of the Trustees. Except as indicated, each individual has held the office shown or other offices in the same company for the past five years.
The fund’s Statement of Additional Information (SAI) includes more information about the Trustees. To request a free copy, call Fidelity at 1-877-208-0098.
Experience, Skills, Attributes, and Qualifications of the Trustees. The Governance and Nominating Committee has adopted a statement of policy that describes the experience, qualifications, attributes, and skills that are necessary and desirable for potential Independent Trustee candidates (Statement of Policy). The Board believes that each Trustee satisfied at the time he or she was initially elected or appointed a Trustee, and continues to satisfy, the standards contemplated by the Statement of Policy. The Governance and Nominating Committee also engages professional search firms to help identify potential Independent Trustee candidates who have the experience, qualifications, attributes, and skills consistent with the Statement of Policy. From time to time, additional criteria based on the composition and skills of the current Independent Trustees, as well as experience or skills that may be appropriate in light of future changes to board composition, business conditions, and regulatory or other developments, have also been considered by the professional search firms and the Governance and Nominating Committee. In addition, the Board takes into account the Trustees' commitment and participation in Board and committee meetings, as well as their leadership of standing and ad hoc committees throughout their tenure.
In determining that a particular Trustee was and continues to be qualified to serve as a Trustee, the Board has considered a variety of criteria, none of which, in isolation, was controlling. The Board believes that, collectively, the Trustees have balanced and diverse experience, qualifications, attributes, and skills, which allow the Board to operate effectively in governing the fund and protecting the interests of shareholders. Information about the specific experience, skills, attributes, and qualifications of each Trustee, which in each case led to the Board's conclusion that the Trustee should serve (or continue to serve) as a trustee of the fund, is provided below.
Board Structure and Oversight Function. James C. Curvey is an interested person and currently serves as Chairman. The Trustees have determined that an interested Chairman is appropriate and benefits shareholders because an interested Chairman has a personal and professional stake in the quality and continuity of services provided to the fund. Independent Trustees exercise their informed business judgment to appoint an individual of their choosing to serve as Chairman, regardless of whether the Trustee happens to be independent or a member of management. The Independent Trustees have determined that they can act independently and effectively without having an Independent Trustee serve as Chairman and that a key structural component for assuring that they are in a position to do so is for the Independent Trustees to constitute a substantial majority for the Board. The Independent Trustees also regularly meet in executive session. Ned C. Lautenbach serves as Chairman of the Independent Trustees and as such (i) acts as a liaison between the Independent Trustees and management with respect to matters important to the Independent Trustees and (ii) with management prepares agendas for Board meetings.
Fidelity® funds are overseen by different Boards of Trustees. The fund's Board oversees Fidelity's high income and certain equity funds, and other Boards oversee Fidelity's investment-grade bond, money market, asset allocation, and sector funds. The asset allocation funds may invest in Fidelity® funds overseen by the fund's Board. The use of separate Boards, each with its own committee structure, allows the Trustees of each group of Fidelity® funds to focus on the unique issues of the funds they oversee, including common research, investment, and operational issues. On occasion, the separate Boards establish joint committees to address issues of overlapping consequences for the Fidelity® funds overseen by each Board.
The Trustees operate using a system of committees to facilitate the timely and efficient consideration of all matters of importance to the Trustees, the fund, and fund shareholders and to facilitate compliance with legal and regulatory requirements and oversight of the fund's activities and associated risks. The Board, acting through its committees, has charged FMR and its affiliates with (i) identifying events or circumstances the occurrence of which could have demonstrably adverse effects on the fund's business and/or reputation; (ii) implementing processes and controls to lessen the possibility that such events or circumstances occur or to mitigate the effects of such events or circumstances if they do occur; and (iii) creating and maintaining a system designed to evaluate continuously business and market conditions in order to facilitate the identification and implementation processes described in (i) and (ii) above. Because the day-to-day operations and activities of the fund are carried out by or through FMR, its affiliates, and other service providers, the fund's exposure to risks is mitigated but not eliminated by the processes overseen by the Trustees. While each of the Board's committees has responsibility for overseeing different aspects of the fund's activities, oversight is exercised primarily through the Operations, Audit, and Compliance Committees. In addition, the Independent Trustees have worked with FMR to enhance the Board's oversight of investment and financial risks, legal and regulatory risks, technology risks, and operational risks, including the development of additional risk reporting to the Board. For example, a working group comprised of Independent Trustees and FMR has worked and continues to work to review the Fidelity® funds' valuation-related activities, reporting and risk management. Appropriate personnel, including but not limited to the fund's Chief Compliance Officer (CCO), FMR's internal auditor, the independent accountants, the fund's Treasurer and portfolio management personnel, make periodic reports to the Board's committees, as appropriate, including an annual review of Fidelity's risk management program for the Fidelity® funds. The responsibilities of each standing committee, including their oversight responsibilities, are described further under "Standing Committees of the Trustees."
Interested Trustees*:
Correspondence intended for a Trustee who is an interested person may be sent to Fidelity Investments, 245 Summer Street, Boston, Massachusetts 02210.
Name, Year of Birth; Principal Occupations and Other Relevant Experience+
James C. Curvey (1935)
Year of Election or Appointment: 2007
Trustee
Chairman of the Board of Trustees
Mr. Curvey also serves as Trustee of other Fidelity® funds. Mr. Curvey is a Director of Fidelity Research & Analysis Co. (investment adviser firm, 2009-present), and Vice Chairman (2007-present) and Director of FMR LLC (diversified financial services company). In addition, Mr. Curvey serves as an Overseer for the Boston Symphony Orchestra and a member of the board of Artis-Naples, Naples, Florida, and as a Trustee for Brewster Academy, Wolfeboro, New Hampshire. Previously, Mr. Curvey served as a Director of Fidelity Investments Money Management, Inc. (investment adviser firm, 2009-2014) and a Director of FMR and FMR Co., Inc. (investment adviser firms, 2007-2014).
Charles S. Morrison (1960)
Year of Election or Appointment: 2014
Trustee
Mr. Morrison also serves as Trustee of other funds. He serves as President of Fidelity Management & Research Company (FMR) (investment adviser firm, 2016-present), a Director of Fidelity Investments Money Management, Inc. (FIMM) (investment adviser firm, 2014-present), Director of Fidelity SelectCo, LLC (investment adviser firm, 2014-present), President, Asset Management (2014-present), and is an employee of Fidelity Investments. Previously, Mr. Morrison served as Vice President of Fidelity's Fixed Income and Asset Allocation Funds (2012-2014), President, Fixed Income (2011-2014), Vice President of Fidelity's Money Market Funds (2005-2009), President, Money Market Group Leader of FMR (investment adviser firm, 2009), and Senior Vice President, Money Market Group of FMR (2004-2009). Mr. Morrison also served as Vice President of Fidelity's Bond Funds (2002-2005), certain Balanced Funds (2002-2005), and certain Asset Allocation Funds (2002-2007), and as Senior Vice President (2002-2005) of Fidelity's Bond Division.
* Determined to be an “Interested Trustee” by virtue of, among other things, his or her affiliation with the trust or various entities under common control with FMR.
+ The information includes the Trustee's principal occupation during the last five years and other information relating to the experience, attributes, and skills relevant to the Trustee's qualifications to serve as a Trustee, which led to the conclusion that the Trustee should serve as a Trustee for the fund.
Independent Trustees:
Correspondence intended for an Independent Trustee may be sent to Fidelity Investments, P.O. Box 55235, Boston, Massachusetts 02205-5235.
Name, Year of Birth; Principal Occupations and Other Relevant Experience+
Dennis J. Dirks (1948)
Year of Election or Appointment: 2005
Trustee
Mr. Dirks also serves as Trustee of other Fidelity® funds. Prior to his retirement in May 2003, Mr. Dirks was Chief Operating Officer and a member of the Board of The Depository Trust & Clearing Corporation (DTCC). He also served as President, Chief Operating Officer, and Board member of The Depository Trust Company (DTC) and President and Board member of the National Securities Clearing Corporation (NSCC). In addition, Mr. Dirks served as Chief Executive Officer and Board member of the Government Securities Clearing Corporation, Chief Executive Officer and Board member of the Mortgage-Backed Securities Clearing Corporation, as a Trustee and a member of the Finance Committee of Manhattan College (2005-2008), as a Trustee and a member of the Finance Committee of AHRC of Nassau County (2006-2008), as a member of the Independent Directors Council (IDC) Governing Council (2010-2015), and as a member of the Board of Directors for The Brookville Center for Children’s Services, Inc. (2009-2017). Mr. Dirks is a member of the Finance Committee (2016-present) and Board of Directors (2017-present) of the Asolo Repertory Theatre.
Alan J. Lacy (1953)
Year of Election or Appointment: 2008
Trustee
Mr. Lacy also serves as Trustee of other Fidelity® funds. Mr. Lacy serves as a Director of Bristol-Myers Squibb Company (global pharmaceuticals, 2008-present). He is a Trustee of the California Chapter of The Nature Conservancy (2015-present) and a Director of the Center for Advanced Study in the Behavioral Sciences at Stanford University (2015-present). In addition, Mr. Lacy served as Senior Adviser (2007-2014) of Oak Hill Capital Partners, L.P. (private equity) and also served as Chief Executive Officer (2005) and Vice Chairman (2005-2006) of Sears Holdings Corporation (retail) and Chief Executive Officer and Chairman of the Board of Sears, Roebuck and Co. (retail, 2000-2005). Previously, Mr. Lacy served as Chairman (2014-2017) and a member (2010-2017) of the Board of Directors of Dave & Buster’s Entertainment, Inc. (restaurant and entertainment complexes), as Chairman (2008-2011) and a member (2006-2015) of the Board of Trustees of the National Parks Conservation Association, and as a member of the Board of Directors for The Hillman Companies, Inc. (hardware wholesalers, 2010-2014), Earth Fare, Inc. (retail grocery, 2010-2014), and The Western Union Company (global money transfer, 2006-2011).
Ned C. Lautenbach (1944)
Year of Election or Appointment: 2000
Trustee
Chairman of the Independent Trustees
Mr. Lautenbach also serves as Trustee of other Fidelity® funds. Mr. Lautenbach currently serves as Vice Chair of the Board of Governors, State University System of Florida (2013-present) and is a member of the Council on Foreign Relations (1994-present). He is also a member and has most recently served as Chairman of the Board of Directors of Artis-Naples (2012-present). Previously, Mr. Lautenbach served as a member and then Lead Director of the Board of Directors of Eaton Corporation (diversified industrial, 1997-2016). He was also a Partner and Advisory Partner at Clayton, Dubilier & Rice, LLC (private equity investment, 1998-2010), as well as a Director of Sony Corporation (2006-2007). In addition, Mr. Lautenbach also had a 30-year career with IBM (technology company) during which time he served as Senior Vice President and a member of the Corporate Executive Committee (1968-1998).
Joseph Mauriello (1944)
Year of Election or Appointment: 2008
Trustee
Mr. Mauriello also serves as Trustee of other Fidelity® funds. Prior to his retirement in January 2006, Mr. Mauriello served in numerous senior management positions including Deputy Chairman and Chief Operating Officer (2004-2005), and Vice Chairman of Financial Services (2002-2004) of KPMG LLP US (professional services, 1965-2005). Mr. Mauriello currently serves as a member of the Board of Directors of XL Group plc. (global insurance and re-insurance, 2006-present) and the Independent Directors Council (IDC) Governing Council (2015-present). Previously, Mr. Mauriello served as a Director of the Hamilton Funds of the Bank of New York (2006-2007) and of Arcadia Resources Inc. (health care services and products, 2007-2012).
Cornelia M. Small (1944)
Year of Election or Appointment: 2005
Trustee
Ms. Small also serves as Trustee of other Fidelity® funds. Ms. Small is a member of the Board of Directors (2009-present) and Chair of the Investment Committee (2010-present) of the Teagle Foundation. Ms. Small also serves on the Investment Committee of the Berkshire Taconic Community Foundation (2008-present). Previously, Ms. Small served as Chairperson (2002-2008) and a member of the Investment Committee and Chairperson (2008-2012) and a member of the Board of Trustees of Smith College. In addition, Ms. Small served as Chief Investment Officer, Director of Global Equity Investments, and a member of the Board of Directors of Scudder, Stevens & Clark and Scudder Kemper Investments.
William S. Stavropoulos (1939)
Year of Election or Appointment: 2002
Trustee
Vice Chairman of the Independent Trustees
Mr. Stavropoulos also serves as Trustee of other Fidelity® funds. Mr. Stavropoulos serves as President and Founder of the Michigan Baseball Foundation, the Great Lakes Loons (2007-present). Mr. Stavropoulos is Chairman Emeritus of the Board of Directors of The Dow Chemical Company, where he previously served in numerous senior management positions, including President, CEO (1995-2000; 2002-2004), Chairman of the Executive Committee (2000-2006), and as a member of the Board of Directors (1990-2006). Currently, Mr. Stavropoulos is Chairman of the Board of Directors of Univar Inc. (global distributor of commodity and specialty chemicals), a Director of Teradata Corporation (data warehousing and technology solutions), and a member of the Advisory Board for Metalmark Capital LLC (private equity investment, 2005-present). Mr. Stavropoulos is an operating advisor to Clayton, Dubilier & Rice, LLC (private equity investment). In addition, Mr. Stavropoulos is a member of the University of Notre Dame Advisory Council for the College of Science, a Trustee of the Rollin L. Gerstacker Foundation, and a Director of Artis-Naples in Naples, Florida. Previously, Mr. Stavropoulos served as a Director of Chemical Financial Corporation (bank holding company, 1993-2012) and Tyco International, Ltd. (multinational manufacturing and services, 2007-2012).
David M. Thomas (1949)
Year of Election or Appointment: 2008
Trustee
Mr. Thomas also serves as Trustee of other Fidelity® funds. Mr. Thomas serves as Non-Executive Chairman of the Board of Directors of Fortune Brands Home and Security (home and security products, 2011-present), as a member of the Board of Directors (2004-present) and Presiding Director (2013-present) of Interpublic Group of Companies, Inc. (marketing communication), and as a member of the Board of Trustees of the University of Florida (2013-present). Previously, Mr. Thomas served as Executive Chairman (2005-2006) and Chairman and Chief Executive Officer (2000-2005) of IMS Health, Inc. (pharmaceutical and healthcare information solutions), and a Director of Fortune Brands, Inc. (consumer products, 2000-2011).
+ The information includes the Trustee's principal occupation during the last five years and other information relating to the experience, attributes, and skills relevant to the Trustee's qualifications to serve as a Trustee, which led to the conclusion that the Trustee should serve as a Trustee for the fund.
Advisory Board Members and Officers:
Correspondence intended for an officer or Peter S. Lynch may be sent to Fidelity Investments, 245 Summer Street, Boston, Massachusetts 02210. Officers appear below in alphabetical order.
Name, Year of Birth; Principal Occupation
Peter S. Lynch (1944)
Year of Election or Appointment: 2003
Member of the Advisory Board
Mr. Lynch also serves as Member of the Advisory Board of other Fidelity® funds. Mr. Lynch is Vice Chairman and a Director of FMR (investment adviser firm) and FMR Co., Inc. (investment adviser firm). In addition, Mr. Lynch serves as a Trustee of Boston College and as the Chairman of the Inner-City Scholarship Fund. Previously, Mr. Lynch served on the Special Olympics International Board of Directors (1997-2006).
Elizabeth Paige Baumann (1968)
Year of Election or Appointment: 2017
Anti-Money Laundering (AML) Officer
Ms. Baumann also serves as AML Officer of other funds. She is Chief AML Officer (2012-present) and Senior Vice President (2014-present) of FMR LLC (diversified financial services company) and is an employee of Fidelity Investments. Previously, Ms. Baumann served as AML Officer of the funds (2012-2016), and Vice President (2007-2014) and Deputy Anti-Money Laundering Officer (2007-2012) of FMR LLC.
Marc R. Bryant (1966)
Year of Election or Appointment: 2015
Secretary and Chief Legal Officer (CLO)
Mr. Bryant also serves as Secretary and CLO of other funds. Mr. Bryant serves as CLO, Secretary, and Senior Vice President of Fidelity Management & Research Company (investment adviser firm, 2015-present) and FMR Co., Inc. (investment adviser firm, 2015-present); Secretary of Fidelity SelectCo, LLC (investment adviser firm, 2015-present) and Fidelity Investments Money Management, Inc. (investment adviser firm, 2015-present); and CLO of Fidelity Management & Research (Hong Kong) Limited and FMR Investment Management (UK) Limited (investment adviser firms, 2015-present) and Fidelity Management & Research (Japan) Limited (investment adviser firm, 2016-present). He is Senior Vice President and Deputy General Counsel of FMR LLC (diversified financial services company). Previously, Mr. Bryant served as Secretary and CLO of Fidelity Rutland Square Trust II (2010-2014) and Assistant Secretary of Fidelity's Fixed Income and Asset Allocation Funds (2013-2015). Prior to joining Fidelity Investments, Mr. Bryant served as a Senior Vice President and the Head of Global Retail Legal for AllianceBernstein L.P. (2006-2010), and as the General Counsel for ProFund Advisors LLC (2001-2006).
William C. Coffey (1969)
Year of Election or Appointment: 2009
Assistant Secretary
Mr. Coffey also serves as Assistant Secretary of other funds. He is Senior Vice President and Deputy General Counsel of FMR LLC (diversified financial services company, 2010-present), and is an employee of Fidelity Investments. Previously, Mr. Coffey served as Vice President and Associate General Counsel of FMR LLC (2005-2009).
Jonathan Davis (1968)
Year of Election or Appointment: 2010
Assistant Treasurer
Mr. Davis also serves as Assistant Treasurer of other funds. Mr. Davis serves as Assistant Treasurer of FMR Capital, Inc. (2017-present) and is an employee of Fidelity Investments. Previously, Mr. Davis served as Vice President and Associate General Counsel of FMR LLC (diversified financial services company, 2003-2010).
Adrien E. Deberghes (1967)
Year of Election or Appointment: 2016
Assistant Treasurer
Mr. Deberghes also serves as an officer of other funds. He serves as Assistant Treasurer of FMR Capital, Inc. (2017-present), Executive Vice President of Fidelity Investments Money Management, Inc. (FIMM) (investment adviser firm, 2016-present), and is an employee of Fidelity Investments (2008-present). Prior to joining Fidelity Investments, Mr. Deberghes was Senior Vice President of Mutual Fund Administration at State Street Corporation (2007-2008), Senior Director of Mutual Fund Administration at Investors Bank & Trust (2005-2007), and Director of Finance for Dunkin' Brands (2000-2005). Previously, Mr. Deberghes served in other fund officer roles.
Stephanie J. Dorsey (1969)
Year of Election or Appointment: 2010
Assistant Treasurer
Ms. Dorsey also serves as an officer of other funds. Ms. Dorsey serves as Assistant Treasurer of FMR Capital, Inc. (2017-present), is an employee of Fidelity Investments (2008-present), and has served in other fund officer roles. Prior to joining Fidelity Investments, Ms. Dorsey served as Treasurer (2004-2008) of the JPMorgan Mutual Funds and Vice President (2004-2008) of JPMorgan Chase Bank.
Howard J. Galligan III (1966)
Year of Election or Appointment: 2014
Chief Financial Officer
Mr. Galligan also serves as Chief Financial Officer of other funds. Mr. Galligan serves as President of Fidelity Pricing and Cash Management Services (FPCMS) (2014-present) and as a Director of Strategic Advisers, Inc. (investment adviser firm, 2008-present). Previously, Mr. Galligan served as Chief Administrative Officer of Asset Management (2011-2014) and Chief Operating Officer and Senior Vice President of Investment Support for Strategic Advisers, Inc. (2003-2011).
Brian B. Hogan (1964)
Year of Election or Appointment: 2009
Vice President
Mr. Hogan also serves as Trustee or Vice President of other funds. Mr. Hogan serves as a Director of FMR Investment Management (UK) Limited (investment adviser firm, 2015-present) and Fidelity SelectCo, LLC (investment adviser firm, 2014-present) and President of the Equity Division of FMR (investment adviser firm, 2009-present). Previously, Mr. Hogan served as Senior Vice President, Equity Research of FMR (2006-2009) and as a portfolio manager. Mr. Brian B. Hogan is not related to Mr. Colm A. Hogan.
Colm A. Hogan (1973)
Year of Election or Appointment: 2016
Deputy Treasurer
Mr. Hogan also serves as an officer of other funds. Mr. Hogan serves as Assistant Treasurer of FMR Capital, Inc. (2017-present) and is an employee of Fidelity Investments (2005-present). Mr. Colm A. Hogan is not related to Mr. Brian B. Hogan.
Chris Maher (1972)
Year of Election or Appointment: 2013
Assistant Treasurer
Mr. Maher serves as Assistant Treasurer of other funds. Mr. Maher is Vice President of Valuation Oversight, serves as Assistant Treasurer of FMR Capital, Inc. (2017-present), and is an employee of Fidelity Investments. Previously, Mr. Maher served as Vice President of Asset Management Compliance (2013), Vice President of the Program Management Group of FMR (investment adviser firm, 2010-2013), and Vice President of Valuation Oversight (2008-2010).
Rieco E. Mello (1969)
Year of Election or Appointment: 2017
Assistant Treasurer
Mr. Mello also serves as Assistant Treasurer of other funds. Mr. Mello serves as Assistant Treasurer of FMR Capital, Inc. (2017-present) and is an employee of Fidelity Investments (1995-present).
Melissa M. Reilly (1971)
Year of Election or Appointment: 2014
Vice President of certain Equity Funds
Ms. Reilly also serves as Vice President of other funds. Ms. Reilly is an employee of Fidelity Investments (2004-present).
Kenneth B. Robins (1969)
Year of Election or Appointment: 2016
Chief Compliance Officer
Mr. Robins also serves as an officer of other funds. Mr. Robins serves as Compliance Officer of Fidelity Management & Research Company and FMR Co., Inc. (investment adviser firms, 2016-present) and is an employee of Fidelity Investments (2004-present). Previously, Mr. Robins served as Executive Vice President of Fidelity Investments Money Management, Inc. (investment adviser firm, 2013-2016) and served in other fund officer roles.
Stacie M. Smith (1974)
Year of Election or Appointment: 2016
President and Treasurer
Ms. Smith also serves as an officer of other funds. Ms. Smith serves as Assistant Treasurer of FMR Capital, Inc. (2017-present), is an employee of Fidelity Investments (2009-present), and has served in other fund officer roles. Prior to joining Fidelity Investments, Ms. Smith served as Senior Audit Manager of Ernst & Young LLP (accounting firm, 1996-2009). Previously, Ms. Smith served as Deputy Treasurer of certain Fidelity® funds (2013-2016).
Marc L. Spector (1972)
Year of Election or Appointment: 2016
Assistant Treasurer
Mr. Spector also serves as an officer of other funds. Mr. Spector serves as Assistant Treasurer of FMR Capital, Inc. (2017-present) and is an employee of Fidelity Investments (2016-present). Prior to joining Fidelity Investments, Mr. Spector served as Director at the Siegfried Group (accounting firm, 2013-2016), and prior to Siegfried Group as audit senior manager at Deloitte & Touche (accounting firm, 2005-2013).
Renee Stagnone (1975)
Year of Election or Appointment: 2016
Assistant Treasurer
Ms. Stagnone also serves as an officer of other funds. Ms. Stagnone serves as Assistant Treasurer of FMR Capital, Inc. (2017-present) and is an employee of Fidelity Investments (1997-present). Previously, Ms. Stagnone served as Deputy Treasurer of certain Fidelity® funds (2013-2016).
Shareholder Expense Example
As a shareholder of the Fund, you incur two types of costs: (1) transaction costs, including sales charges (loads) on purchase payments or redemption proceeds, and (2) ongoing costs, including management fees, distribution and/or service (12b-1) fees and other Fund expenses. This Example is intended to help you understand your ongoing costs (in dollars) of investing in the Fund and to compare these costs with the ongoing costs of investing in other mutual funds.
The Example is based on an investment of $1,000 invested at the beginning of the period and held for the entire period (June 1, 2017 to November 30, 2017).
Actual Expenses
The first line of the accompanying table for each class of the Fund provides information about actual account values and actual expenses. You may use the information in this line, together with the amount you invested, to estimate the expenses that you paid over the period. Simply divide your account value by $1,000.00 (for example, an $8,600 account value divided by $1,000.00 = 8.6), then multiply the result by the number in the first line for a class of the Fund under the heading entitled "Expenses Paid During Period" to estimate the expenses you paid on your account during this period. In addition, the Fund, as a shareholder in the underlying Fidelity Central Funds, will indirectly bear its pro-rata share of the fees and expenses incurred by the underlying Fidelity Central Funds. These fees and expenses are not included in the Fund's annualized expense ratio used to calculate the expense estimate in the table below.
Hypothetical Example for Comparison Purposes
The second line of the accompanying table for each class of the Fund provides information about hypothetical account values and hypothetical expenses based on a Class' actual expense ratio and an assumed rate of return of 5% per year before expenses, which is not the Class' actual return. The hypothetical account values and expenses may not be used to estimate the actual ending account balance or expenses you paid for the period. You may use this information to compare the ongoing costs of investing in the Fund and other funds. To do so, compare this 5% hypothetical example with the 5% hypothetical examples that appear in the shareholder reports of the other funds. In addition, the Fund, as a shareholder in the underlying Fidelity Central Funds, will indirectly bear its pro-rata share of the fees and expenses incurred by the underlying Fidelity Central Funds. These fees and expenses are not included in the Fund's annualized expense ratio used to calculate the expense estimate in the table below.
Please note that the expenses shown in the table are meant to highlight your ongoing costs only and do not reflect any transaction costs. Therefore, the second line of the table is useful in comparing ongoing costs only, and will not help you determine the relative total costs of owning different funds. In addition, if these transactional costs were included, your costs would have been higher.
| Annualized Expense Ratio-A | Beginning Account Value June 1, 2017 | Ending Account Value November 30, 2017 | Expenses Paid During Period-B June 1, 2017 to November 30, 2017 | |
| Class A | 1.03% | |||
| Actual | $1,000.00 | $1,120.00 | $5.47 | |
| Hypothetical-C | $1,000.00 | $1,019.90 | $5.22 | |
| Class M | 1.26% | |||
| Actual | $1,000.00 | $1,118.70 | $6.69 | |
| Hypothetical-C | $1,000.00 | $1,018.75 | $6.38 | |
| Class C | 1.79% | |||
| Actual | $1,000.00 | $1,115.90 | $9.49 | |
| Hypothetical-C | $1,000.00 | $1,016.09 | $9.05 | |
| Class I | .76% | |||
| Actual | $1,000.00 | $1,121.50 | $4.04 | |
| Hypothetical-C | $1,000.00 | $1,021.26 | $3.85 | |
| Class Z | .63% | |||
| Actual | $1,000.00 | $1,122.30 | $3.35 | |
| Hypothetical-C | $1,000.00 | $1,021.91 | $3.19 |
A Annualized expense ratio reflects expenses net of applicable fee waivers.
B Expenses are equal to each Class' annualized expense ratio, multiplied by the average account value over the period, multiplied by 183/365 (to reflect the one-half year period).
C 5% return per year before expenses
Distributions (Unaudited)
The Board of Trustees of Fidelity Advisor Equity Growth Fund voted to pay to shareholders of record at the opening of business on record date, the following distributions per share derived from capital gains realized from sales of portfolio securities:
| Pay Date | Record Date | Capital Gains | |
| Fidelity Advisor Equity Growth Fund | |||
| Class A | 12/27/17 | 12/26/17 | $13.378 |
| Class M | 12/27/17 | 12/26/17 | $13.118 |
| Class C | 12/27/17 | 12/26/17 | $12.667 |
| Class I | 12/27/17 | 12/26/17 | $13.714 |
| Class Z | 12/27/17 | 12/26/17 | $13.895 |
The fund hereby designates as a capital gain dividend with respect to the taxable year ended November 30, 2017, $321,527,917, or, if subsequently determined to be different, the net capital gain of such year.
The fund will notify shareholders in January 2018 of amounts for use in preparing 2017 income tax returns.
Board Approval of Investment Advisory Contracts and Management Fees
Fidelity Advisor Equity Growth Fund
Each year, the Board of Trustees, including the Independent Trustees (together, the Board), votes on the renewal of the management contract with Fidelity Management & Research Company (FMR) and the sub-advisory agreements (together, the Advisory Contracts) for the fund. FMR and the sub-advisers are referred to herein as the Investment Advisers. The Board, assisted by the advice of fund counsel and Independent Trustees' counsel, requests and considers a broad range of information relevant to the renewal of the Advisory Contracts throughout the year.
The Board meets regularly and, at each of its meetings, covers an extensive agenda of topics and materials and considers factors that are relevant to its annual consideration of the renewal of the fund's Advisory Contracts, including the services and support provided to the fund and its shareholders. The Board has established various standing committees (Committees), each composed of and chaired by Independent Trustees with varying backgrounds, to which the Board has assigned specific subject matter responsibilities in order to enhance effective decision-making by the Board. The Board, acting directly and through its Committees, requests and receives information concerning the annual consideration of the renewal of the fund's Advisory Contracts. The Board also meets as needed to review matters specifically related to the Board's annual consideration of the renewal of the Advisory Contracts. Members of the Board may also meet with trustees of other Fidelity funds through ad hoc joint committees to discuss certain matters relevant to all of the Fidelity funds.
At its July 2017 meeting, the Board unanimously determined to renew the fund's Advisory Contracts. In reaching its determination, the Board considered all factors it believed relevant, including (i) the nature, extent, and quality of the services to be provided to the fund and its shareholders (including the investment performance of the fund); (ii) the competitiveness of the fund's management fee and total expense ratio relative to peer funds; (iii) the total costs of the services to be provided by and the profits to be realized by Fidelity from its relationships with the fund; and (iv) the extent to which, if any, economies of scale exist and would be realized as the fund grows, and whether any economies of scale are appropriately shared with fund shareholders.
In considering whether to renew the Advisory Contracts for the fund, the Board reached a determination, with the assistance of fund counsel and Independent Trustees' counsel and through the exercise of its business judgment, that the renewal of the Advisory Contracts was in the best interests of the fund and its shareholders and that the compensation payable under the Advisory Contracts was fair and reasonable. The Board's decision to renew the Advisory Contracts was not based on any single factor, but rather was based on a comprehensive consideration of all the information provided to the Board at its meetings throughout the year. The Board, in reaching its determination to renew the Advisory Contracts, was aware that shareholders of the fund have a broad range of investment choices available to them, including a wide choice among funds offered by Fidelity's competitors, and that the fund's shareholders, who have the opportunity to review and weigh the disclosure provided by the fund in its prospectus and other public disclosures, have chosen to invest in this fund, which is part of the Fidelity family of funds.
Amendment to Group Fee Rate. The Board also approved an amendment to the management contract for the fund to add an additional breakpoint to the group fee schedule, effective October 1, 2017. The Board noted that the additional breakpoint would result in lower management fee rates as Fidelity's assets under management increase.
Nature, Extent, and Quality of Services Provided. The Board considered Fidelity's staffing as it relates to the fund, including the backgrounds of investment personnel of Fidelity, and also considered the fund's investment objective, strategies, and related investment philosophy. The Independent Trustees also had discussions with senior management of Fidelity's investment operations and investment groups. The Board considered the structure of the investment personnel compensation program and whether this structure provides appropriate incentives to act in the best interests of the fund. Additionally, the Board considered the portfolio managers' investments, if any, in the funds that they manage.Resources Dedicated to Investment Management and Support Services. The Board and the Fund Oversight and Research Committees reviewed the general qualifications and capabilities of Fidelity's investment staff, including its size, education, experience, and resources, as well as Fidelity's approach to recruiting, training, managing, and compensating investment personnel. The Board noted that Fidelity has continued to increase the resources devoted to non-U.S. offices, including expansion of Fidelity's global investment organization. The Board also noted that Fidelity's analysts have extensive resources, tools and capabilities that allow them to conduct sophisticated quantitative and fundamental analysis, as well as credit analysis of issuers, counterparties and guarantors. Further, the Board considered that Fidelity's investment professionals have sufficient access to global information and data so as to provide competitive investment results over time, and that those professionals also have access to sophisticated tools that permit them to assess portfolio construction and risk and performance attribution characteristics continuously, as well as to transmit new information and research conclusions rapidly around the world. Additionally, in its deliberations, the Board considered Fidelity's trading, risk management, compliance, and technology and operations capabilities and resources, which are integral parts of the investment management process.Shareholder and Administrative Services. The Board considered (i) the nature, extent, quality, and cost of advisory, administrative, and shareholder services performed by the Investment Advisers and their affiliates under the Advisory Contracts and under separate agreements covering transfer agency, pricing and bookkeeping, and securities lending services for the fund; (ii) the nature and extent of the supervision of third party service providers, principally custodians, subcustodians, and pricing vendors; and (iii) the resources devoted to, and the record of compliance with, the fund's compliance policies and procedures. The Board also reviewed the allocation of fund brokerage, including allocations to brokers affiliated with the Investment Advisers, the use of brokerage commissions to pay fund expenses, and the use of "soft" commission dollars to pay for research services.The Board noted that the growth of fund assets over time across the complex allows Fidelity to reinvest in the development of services designed to enhance the value or convenience of the Fidelity funds as investment vehicles. These services include 24-hour access to account information and market information through telephone representatives and over the Internet, investor education materials and asset allocation tools, and the expanded availability of Fidelity Investor Centers.In 2014, the Board formed an ad hoc Committee on Transfer Agency Fees to review the variety of transfer agency fee structures throughout the industry and Fidelity's competitive positioning with respect to industry participants.Investment in a Large Fund Family. The Board considered the benefits to shareholders of investing in a Fidelity fund, including the benefits of investing in a fund that is part of a large family of funds offering a variety of investment disciplines and providing a large variety of mutual fund investor services. The Board noted that Fidelity had taken, or had made recommendations that resulted in the Fidelity funds taking, a number of actions over the previous year that benefited particular funds, including: (i) continuing to dedicate additional resources to Fidelity's investment research process, and to the support of the senior management team that oversees asset management; (ii) continuing efforts to enhance Fidelity's global research capabilities; (iii) launching new funds and making other enhancements to meet client needs; (iv) launching new share classes of existing funds; (v) eliminating purchase minimums and broadening eligibility requirements for certain lower-priced share classes; (vi) reducing management fees and total expenses for certain growth equity funds and index funds; (vii) lowering expense caps for certain existing funds and classes to reduce expenses borne by shareholders; (viii) eliminating short-term redemption fees for certain funds; (ix) introducing a new pricing structure for certain funds of funds that is expected to reduce overall expenses paid by shareholders; (x) rationalizing product lines and gaining increased efficiencies through proposals for fund mergers and share class consolidations; (xi) continuing to develop, acquire and implement systems and technology to improve services to the funds and shareholders, strengthen information security, and increase efficiency; and (xii) implementing enhancements to further strengthen Fidelity's product line to increase investors' probability of success in achieving their investment goals, including retirement income goals.Investment Performance. The Board considered whether the fund has operated in accordance with its investment objective, as well as its record of compliance with its investment restrictions and its performance history. The Board noted that there was a portfolio management change for the fund in June 2017.The Board took into account discussions with representatives of the Investment Advisers about fund investment performance that occur at Board meetings throughout the year. In this regard the Board noted that as part of regularly scheduled fund reviews and other reports to the Board on fund performance, the Board considers annualized return information for the fund for different time periods, measured against a securities market index ("benchmark index") and a peer group of funds with similar objectives ("peer group"), if any. In its evaluation of fund investment performance, the Board gave particular attention to information indicating changes in performance of certain Fidelity funds for specific time periods and discussed with the Investment Advisers the reasons for any overperformance or underperformance.In addition to reviewing absolute and relative fund performance, the Independent Trustees periodically consider the appropriateness of fund performance metrics in evaluating the results achieved. In general, the Independent Trustees believe that fund performance should be evaluated based on net performance (after fees and expenses) of both the highest performing and lowest performing fund share classes, where applicable, compared to appropriate benchmark indices, over appropriate time periods that may include full market cycles, and compared to peer groups, as applicable, over the same periods, taking into account relevant factors including the following: general market conditions; issuer-specific information; and fund cash flows and other factors.The Independent Trustees recognize that shareholders evaluate performance on a net basis over their own holding periods, for which one-, three-, and five-year periods are often used as a proxy. For this reason, the performance information reviewed by the Board also included net cumulative calendar year total return information for the fund and an appropriate benchmark index and peer group for the most recent one-, three-, and five-year periods, as shown below. Returns are shown compared to the 25th percentile (top of box, 75% beaten) and 75th percentile (bottom of box, 25% beaten) of the peer universe.Fidelity Advisor Equity Growth Fund
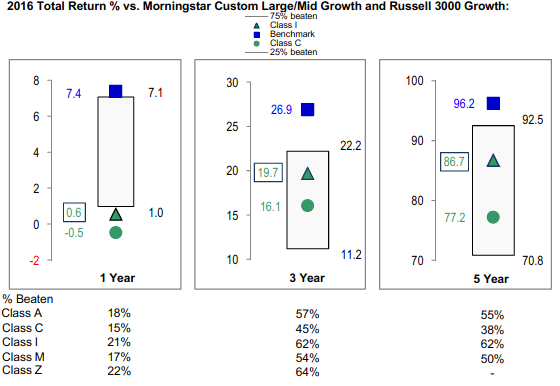
Fidelity Advisor Equity Growth Fund
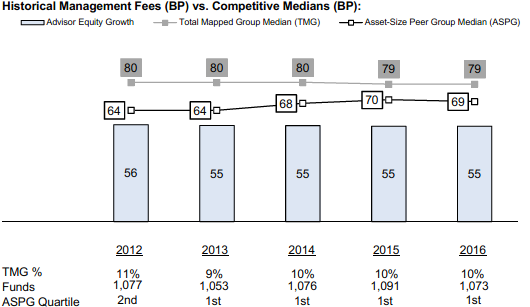
![]()
EPG-ANN-0118
1.539469.120
Fidelity Advisor® Equity Income Fund Class A, Class M (formerly Class T), Class C, Class I and Class Z Annual Report November 30, 2017 |
|
Contents
Board Approval of Investment Advisory Contracts and Management Fees |
To view a fund's proxy voting guidelines and proxy voting record for the 12-month period ended June 30, visit http://www.fidelity.com/proxyvotingresults or visit the Securities and Exchange Commission's (SEC) web site at http://www.sec.gov.
You may also call 1-877-208-0098 to request a free copy of the proxy voting guidelines.
Standard & Poor's, S&P and S&P 500 are registered service marks of The McGraw-Hill Companies, Inc. and have been licensed for use by Fidelity Distributors Corporation.
Other third-party marks appearing herein are the property of their respective owners.
All other marks appearing herein are registered or unregistered trademarks or service marks of FMR LLC or an affiliated company. © 2018 FMR LLC. All rights reserved.
This report and the financial statements contained herein are submitted for the general information of the shareholders of the Fund. This report is not authorized for distribution to prospective investors in the Fund unless preceded or accompanied by an effective prospectus.
A fund files its complete schedule of portfolio holdings with the SEC for the first and third quarters of each fiscal year on Form N-Q. Forms N-Q are available on the SEC’s web site at http://www.sec.gov. A fund's Forms N-Q may be reviewed and copied at the SEC’s Public Reference Room in Washington, DC. Information regarding the operation of the SEC's Public Reference Room may be obtained by calling 1-800-SEC-0330.
For a complete list of a fund's portfolio holdings, view the most recent holdings listing, semiannual report, or annual report on Fidelity's web site at http://www.fidelity.com, http://www.institutional.fidelity.com, or http://www.401k.com, as applicable.
NOT FDIC INSURED •MAY LOSE VALUE •NO BANK GUARANTEE
Neither the Fund nor Fidelity Distributors Corporation is a bank.
Performance: The Bottom Line
Average annual total return reflects the change in the value of an investment, assuming reinvestment of distributions from dividend income and capital gains (the profits earned upon the sale of securities that have grown in value, if any) and assuming a constant rate of performance each year. The hypothetical investment and the average annual total returns do not reflect the deduction of taxes that a shareholder would pay on fund distributions or the redemption of fund shares. During periods of reimbursement by Fidelity, a fund’s total return will be greater than it would be had the reimbursement not occurred. How a fund did yesterday is no guarantee of how it will do tomorrow.
Average Annual Total Returns
| For the periods ended November 30, 2017 | Past 1 year | Past 5 years | Past 10 years |
| Class A (incl. 5.75% sales charge) | 6.08% | 10.31% | 4.65% |
| Class M (incl. 3.50% sales charge) | 8.36% | 10.57% | 4.68% |
| Class C (incl. contingent deferred sales charge) | 10.72% | 10.77% | 4.48% |
| Class I | 12.86% | 11.91% | 5.56% |
| Class Z | 13.02% | 12.06% | 5.63% |
Class C shares' contingent deferred sales charges included in the past one year, past five years and past ten years total return figures are 1%, 0% and 0%, respectively.
The initial offering of Class Z shares took place on August 13, 2013. Returns prior to August 13, 2013, are those of Class I.
$10,000 Over 10 Years
Let's say hypothetically that $10,000 was invested in Fidelity Advisor® Equity Income Fund - Class A on November 30, 2007, and the current 5.75% sales charge was paid.
The chart shows how the value of your investment would have changed, and also shows how the Russell 3000® Value Index performed over the same period.
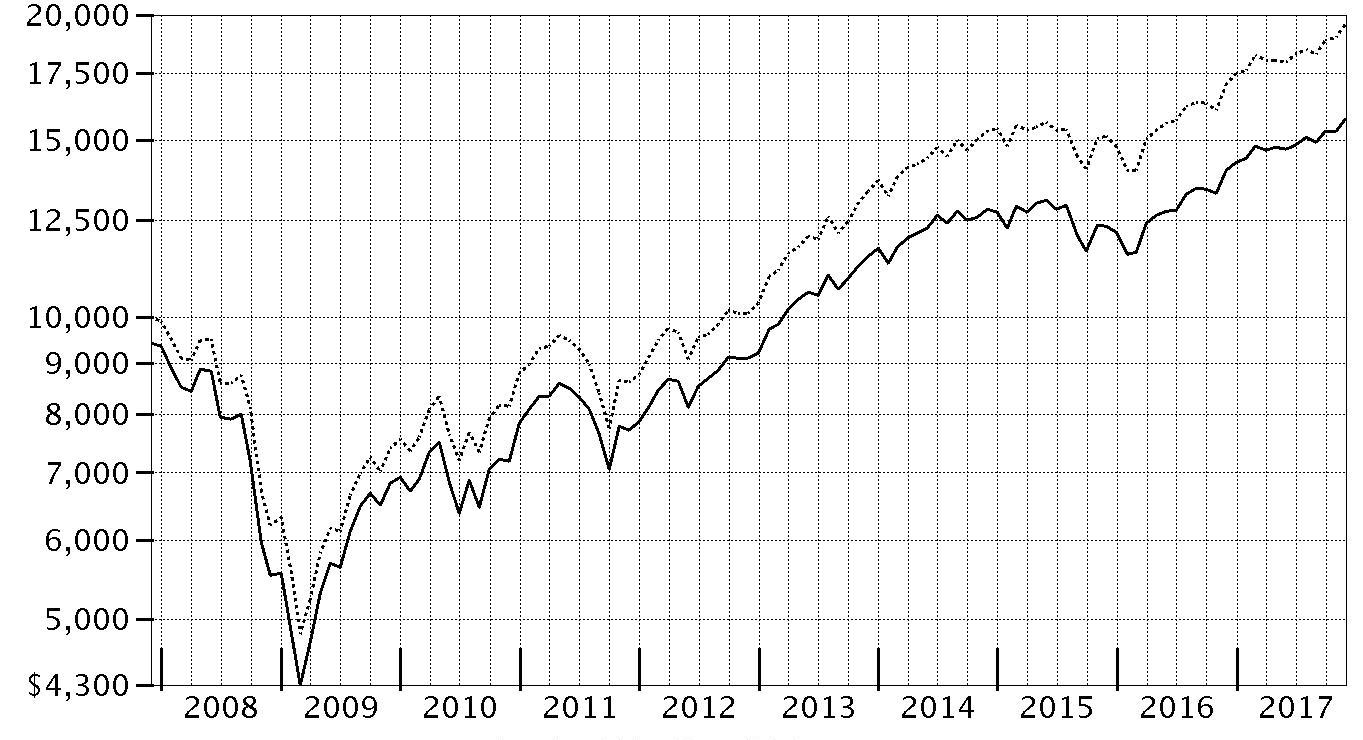
| Period Ending Values | ||
| $15,756 | Fidelity Advisor® Equity Income Fund - Class A | |
| $19,578 | Russell 3000® Value Index | |
Management's Discussion of Fund Performance
Market Recap: The U.S. equity bellwether S&P 500® index gained 22.87% for the year ending November 30, 2017, rising steadily and closing the period at an all-time high after a particularly strong three-month finish. Early on, equities rallied on optimism for President Trump’s pro-business agenda but leveled off in March amid fading optimism and stalled efforts by Congress to repeal and replace the Affordable Care Act. Upward momentum soon returned and continued through period end with consumer sentiment and other market indicators staying positive. The lone exception was a brief cooldown in August, when geopolitical tension escalated and uncertainty grew regarding the future of health care, tax reform and the debt ceiling. Sector-wise, info tech (+41%) led by a wide margin, surging amid strong earnings growth from several major index constituents. Utilities and financials each gained about 25%, the latter group riding an uptick in bond yields. Conversely, consumer discretionary (+20%) also rose solidly but lagged the broader market, as many brick-and-mortar retailers continued to suffer from increased online competition. Rising interest rates held back real estate (+16%), while consumer staples (+15%) and telecom (+1%) struggled due to investors’ general preference for risk assets. Lastly, sluggish oil prices pushed energy to a -4% return.Comments from Co-Portfolio Manager John Sheehy: For the fiscal year, the fund’s share classes (excluding sales charges, if applicable) gained about 12% to 13%, trailing the 14.70% advance of the benchmark Russell 3000® Value Index. Versus the benchmark, stock picks in health care, industrials and consumer staples weighed on fund results. An average cash position of roughly 5% also hurt. Our largest relative detractor was industrial conglomerate General Electric, which struggled to meet its operational and earnings goals. Overweighting natural gas pipeline operator Williams Companies also detracted, as did an out-of-benchmark stake in Israel-based Teva Pharmaceutical Industries, which I sold from the fund. Conversely, positioning in energy and stock selection in financials added value. At the stock level, largely avoiding index name Exxon Mobil made this integrated energy producer our top relative contributor. Automaker Fiat Chrysler, a non-benchmark position, more than doubled in value this period, and overweighting network-equipment maker Cisco Systems also added value.The views expressed above reflect those of the portfolio manager(s) only through the end of the period as stated on the cover of this report and do not necessarily represent the views of Fidelity or any other person in the Fidelity organization. Any such views are subject to change at any time based upon market or other conditions and Fidelity disclaims any responsibility to update such views. These views may not be relied on as investment advice and, because investment decisions for a Fidelity fund are based on numerous factors, may not be relied on as an indication of trading intent on behalf of any Fidelity fund.
Note to shareholders: On April 8, 2017, John Sheehy became the fund’s Co-Manager, a post he will hold through December 31, 2017, at which time he will be named Lead Portfolio Manager. After more than 18 years at Fidelity, James Morrow will be retiring at the end of 2017.Investment Summary (Unaudited)
Top Ten Stocks as of November 30, 2017
| % of fund's net assets | % of fund's net assets 6 months ago | |
| Wells Fargo & Co. | 4.2 | 1.6 |
| Cisco Systems, Inc. | 4.2 | 3.7 |
| Verizon Communications, Inc. | 4.0 | 2.2 |
| Johnson & Johnson | 3.7 | 3.3 |
| JPMorgan Chase & Co. | 3.6 | 4.0 |
| Amgen, Inc. | 3.2 | 1.0 |
| Chubb Ltd. | 2.7 | 2.5 |
| Chevron Corp. | 2.5 | 1.5 |
| Bank of America Corp. | 2.2 | 1.7 |
| United Technologies Corp. | 2.2 | 1.7 |
| 32.5 |
Top Five Market Sectors as of November 30, 2017
| % of fund's net assets | % of fund's net assets 6 months ago | |
| Financials | 21.9 | 24.8 |
| Health Care | 14.3 | 10.0 |
| Information Technology | 12.3 | 10.8 |
| Consumer Staples | 11.8 | 10.3 |
| Energy | 8.4 | 11.3 |
Asset Allocation (% of fund's net assets)
| As of November 30, 2017 * | ||
| Stocks | 98.1% | |
| Bonds | 0.1% | |
| Convertible Securities | 0.2% | |
| Other Investments | 0.2% | |
| Short-Term Investments and Net Other Assets (Liabilities) | 1.4% | |

* Foreign investments - 18.1%
| As of May 31, 2017 *,** | ||
| Stocks | 98.6% | |
| Convertible Securities | 0.3% | |
| Other Investments | 0.2% | |
| Short-Term Investments and Net Other Assets (Liabilities) | 0.9% | |

* Foreign investments - 13.1%
** Written options (0.0%)
Percentages shown as 0.0% may reflect amounts less than 0.05%.
Investments November 30, 2017
Showing Percentage of Net Assets
| Common Stocks - 98.1% | |||
| Shares | Value (000s) | ||
| CONSUMER DISCRETIONARY - 6.0% | |||
| Distributors - 0.5% | |||
| Genuine Parts Co. | 109,600 | $10,190 | |
| Hotels, Restaurants & Leisure - 0.1% | |||
| Cedar Fair LP (depositary unit) | 23,649 | 1,605 | |
| Media - 4.6% | |||
| Comcast Corp. Class A | 531,348 | 19,947 | |
| Informa PLC | 1,774,705 | 18,001 | |
| Interpublic Group of Companies, Inc. | 371,000 | 7,338 | |
| Omnicom Group, Inc. | 260,000 | 18,574 | |
| The Walt Disney Co. | 102,500 | 10,744 | |
| Time Warner, Inc. | 171,300 | 15,676 | |
| 90,280 | |||
| Multiline Retail - 0.2% | |||
| Kohl's Corp. | 62,948 | 3,020 | |
| Textiles, Apparel & Luxury Goods - 0.6% | |||
| Tapestry, Inc. | 289,700 | 12,078 | |
| TOTAL CONSUMER DISCRETIONARY | 117,173 | ||
| CONSUMER STAPLES - 11.8% | |||
| Beverages - 1.3% | |||
| Molson Coors Brewing Co. Class B | 259,805 | 20,291 | |
| The Coca-Cola Co. | 91,600 | 4,193 | |
| 24,484 | |||
| Food & Staples Retailing - 3.4% | |||
| CVS Health Corp. | 383,600 | 29,384 | |
| Wal-Mart Stores, Inc. | 270,550 | 26,306 | |
| Walgreens Boots Alliance, Inc. | 132,544 | 9,644 | |
| 65,334 | |||
| Food Products - 1.8% | |||
| Kellogg Co. | 157,500 | 10,420 | |
| The J.M. Smucker Co. | 214,600 | 25,037 | |
| 35,457 | |||
| Household Products - 1.6% | |||
| Procter & Gamble Co. | 178,517 | 16,065 | |
| Reckitt Benckiser Group PLC | 181,800 | 15,958 | |
| 32,023 | |||
| Personal Products - 1.3% | |||
| Unilever NV (NY Reg.) | 434,600 | 25,094 | |
| Tobacco - 2.4% | |||
| British American Tobacco PLC sponsored ADR | 521,901 | 33,209 | |
| Imperial Tobacco Group PLC | 333,861 | 13,837 | |
| 47,046 | |||
| TOTAL CONSUMER STAPLES | 229,438 | ||
| ENERGY - 8.1% | |||
| Energy Equipment & Services - 0.2% | |||
| Schlumberger Ltd. | 55,600 | 3,494 | |
| Oil, Gas & Consumable Fuels - 7.9% | |||
| Amyris, Inc. (a) | 1 | 0 | |
| Boardwalk Pipeline Partners, LP | 645,900 | 8,681 | |
| Chevron Corp. | 400,669 | 47,676 | |
| ConocoPhillips Co. | 496,400 | 25,257 | |
| Energy Transfer Equity LP | 40,800 | 661 | |
| Suncor Energy, Inc. | 927,500 | 32,171 | |
| The Williams Companies, Inc. | 1,345,950 | 39,100 | |
| 153,546 | |||
| TOTAL ENERGY | 157,040 | ||
| FINANCIALS - 21.8% | |||
| Banks - 11.4% | |||
| Bank of America Corp. | 1,538,700 | 43,345 | |
| Bank of the Ozarks, Inc. | 135,300 | 6,524 | |
| JPMorgan Chase & Co. | 676,657 | 70,724 | |
| SunTrust Banks, Inc. | 306,900 | 18,914 | |
| Wells Fargo & Co. | 1,449,850 | 81,874 | |
| 221,381 | |||
| Capital Markets - 3.9% | |||
| Apollo Global Management LLC Class A | 263,000 | 8,235 | |
| Ares Capital Corp. | 252,842 | 4,101 | |
| KKR & Co. LP | 145,596 | 2,900 | |
| State Street Corp. | 239,399 | 22,827 | |
| The Blackstone Group LP | 1,230,903 | 39,044 | |
| 77,107 | |||
| Consumer Finance - 2.4% | |||
| Capital One Financial Corp. | 345,100 | 31,749 | |
| Discover Financial Services | 208,300 | 14,706 | |
| 46,455 | |||
| Diversified Financial Services - 0.1% | |||
| New Academy Holding Co. LLC unit (a)(b)(c)(d) | 52,800 | 1,647 | |
| Insurance - 4.0% | |||
| Chubb Ltd. | 343,384 | 52,232 | |
| FNF Group | 535,200 | 21,654 | |
| MetLife, Inc. | 66,457 | 3,567 | |
| 77,453 | |||
| TOTAL FINANCIALS | 424,043 | ||
| HEALTH CARE - 14.2% | |||
| Biotechnology - 3.2% | |||
| Amgen, Inc. | 360,249 | 63,281 | |
| Health Care Equipment & Supplies - 1.7% | |||
| Medtronic PLC | 392,682 | 32,251 | |
| Health Care Providers & Services - 1.9% | |||
| Cardinal Health, Inc. | 297,600 | 17,615 | |
| McKesson Corp. | 132,400 | 19,561 | |
| 37,176 | |||
| Pharmaceuticals - 7.4% | |||
| Allergan PLC | 70,100 | 12,185 | |
| GlaxoSmithKline PLC | 1,707,200 | 29,539 | |
| Johnson & Johnson | 511,018 | 71,200 | |
| Pfizer, Inc. | 236,713 | 8,583 | |
| Sanofi SA sponsored ADR | 511,700 | 23,354 | |
| 144,861 | |||
| TOTAL HEALTH CARE | 277,569 | ||
| INDUSTRIALS - 7.5% | |||
| Aerospace & Defense - 2.9% | |||
| General Dynamics Corp. | 61,800 | 12,802 | |
| United Technologies Corp. | 352,707 | 42,836 | |
| 55,638 | |||
| Airlines - 0.1% | |||
| Allegiant Travel Co. | 6,800 | 1,034 | |
| Commercial Services & Supplies - 0.7% | |||
| KAR Auction Services, Inc. | 285,304 | 14,371 | |
| Electrical Equipment - 1.2% | |||
| AMETEK, Inc. | 32,300 | 2,348 | |
| Eaton Corp. PLC | 271,000 | 21,078 | |
| 23,426 | |||
| Industrial Conglomerates - 1.4% | |||
| General Electric Co. | 1,505,654 | 27,538 | |
| Machinery - 0.8% | |||
| Allison Transmission Holdings, Inc. | 99,600 | 4,088 | |
| Andritz AG | 191,600 | 10,731 | |
| 14,819 | |||
| Professional Services - 0.4% | |||
| Nielsen Holdings PLC | 233,500 | 8,574 | |
| TOTAL INDUSTRIALS | 145,400 | ||
| INFORMATION TECHNOLOGY - 12.3% | |||
| Communications Equipment - 4.7% | |||
| Cisco Systems, Inc. | 2,189,353 | 81,663 | |
| Juniper Networks, Inc. | 379,000 | 10,521 | |
| 92,184 | |||
| Electronic Equipment & Components - 0.9% | |||
| Dell Technologies, Inc. (a) | 79,100 | 6,189 | |
| TE Connectivity Ltd. | 122,230 | 11,543 | |
| 17,732 | |||
| IT Services - 1.7% | |||
| Amdocs Ltd. | 218,500 | 14,266 | |
| CSRA, Inc. | 171,100 | 4,950 | |
| First Data Corp. Class A (a) | 351,869 | 5,788 | |
| Paychex, Inc. | 125,678 | 8,459 | |
| 33,463 | |||
| Semiconductors & Semiconductor Equipment - 1.4% | |||
| Qualcomm, Inc. | 415,289 | 27,550 | |
| Software - 2.3% | |||
| Micro Focus International PLC | 174,000 | 5,857 | |
| Microsoft Corp. | 452,238 | 38,065 | |
| 43,922 | |||
| Technology Hardware, Storage & Peripherals - 1.3% | |||
| Apple, Inc. | 142,100 | 24,420 | |
| TOTAL INFORMATION TECHNOLOGY | 239,271 | ||
| MATERIALS - 4.2% | |||
| Chemicals - 2.2% | |||
| DowDuPont, Inc. | 328,000 | 23,603 | |
| LyondellBasell Industries NV Class A | 180,600 | 18,909 | |
| 42,512 | |||
| Containers & Packaging - 2.0% | |||
| Graphic Packaging Holding Co. | 1,397,100 | 21,390 | |
| WestRock Co. | 286,500 | 17,880 | |
| 39,270 | |||
| TOTAL MATERIALS | 81,782 | ||
| REAL ESTATE - 3.0% | |||
| Equity Real Estate Investment Trusts (REITs) - 3.0% | |||
| Brandywine Realty Trust (SBI) | 832,100 | 14,337 | |
| Healthcare Realty Trust, Inc. | 267,600 | 8,769 | |
| Omega Healthcare Investors, Inc. (e) | 280,000 | 7,518 | |
| Public Storage | 38,500 | 8,205 | |
| SL Green Realty Corp. | 37,400 | 3,823 | |
| VEREIT, Inc. | 1,186,700 | 9,256 | |
| WP Carey, Inc. | 85,700 | 6,100 | |
| 58,008 | |||
| TELECOMMUNICATION SERVICES - 4.5% | |||
| Diversified Telecommunication Services - 4.5% | |||
| AT&T, Inc. | 266,827 | 9,707 | |
| Verizon Communications, Inc. | 1,553,090 | 79,037 | |
| 88,744 | |||
| UTILITIES - 4.7% | |||
| Electric Utilities - 3.9% | |||
| Duke Energy Corp. | 83,600 | 7,455 | |
| Entergy Corp. | 91,000 | 7,870 | |
| Exelon Corp. | 686,000 | 28,613 | |
| PPL Corp. | 419,400 | 15,379 | |
| Southern Co. | 219,525 | 11,240 | |
| Xcel Energy, Inc. | 111,900 | 5,775 | |
| 76,332 | |||
| Multi-Utilities - 0.8% | |||
| Public Service Enterprise Group, Inc. | 281,800 | 14,952 | |
| TOTAL UTILITIES | 91,284 | ||
| TOTAL COMMON STOCKS | |||
| (Cost $1,559,384) | 1,909,752 | ||
| Convertible Preferred Stocks - 0.1% | |||
| HEALTH CARE - 0.1% | |||
| Health Care Equipment & Supplies - 0.1% | |||
| Becton, Dickinson & Co. Series A 6.125% | 8,000 | 484 | |
| Pharmaceuticals - 0.0% | |||
| Allergan PLC 5.50% | 225 | 140 | |
| TOTAL HEALTH CARE | 624 | ||
| REAL ESTATE - 0.0% | |||
| Equity Real Estate Investment Trusts (REITs) - 0.0% | |||
| American Tower Corp. 5.50% | 3,400 | 429 | |
| TELECOMMUNICATION SERVICES - 0.0% | |||
| Wireless Telecommunication Services - 0.0% | |||
| T-Mobile U.S., Inc. Series A 5.50% | 5,350 | 526 | |
| UTILITIES - 0.0% | |||
| Independent Power and Renewable Electricity Producers - 0.0% | |||
| Dynegy, Inc. 7.00% | 5,000 | 411 | |
| TOTAL CONVERTIBLE PREFERRED STOCKS | |||
| (Cost $1,786) | 1,990 | ||
| Principal Amount (000s) | Value (000s) | ||
| Corporate Bonds - 0.2% | |||
| Convertible Bonds - 0.1% | |||
| CONSUMER DISCRETIONARY - 0.0% | |||
| Media - 0.0% | |||
| DISH Network Corp. 3.375% 8/15/26 | 560 | 624 | |
| ENERGY - 0.1% | |||
| Oil, Gas & Consumable Fuels - 0.1% | |||
| Amyris, Inc. 9.5% 4/15/19 pay-in-kind | 645 | 452 | |
| Scorpio Tankers, Inc. 2.375% 7/1/19 (f) | 680 | 602 | |
| 1,054 | |||
| INFORMATION TECHNOLOGY - 0.0% | |||
| Internet Software & Services - 0.0% | |||
| Yahoo!, Inc. 0% 12/1/18 | 310 | 420 | |
| Semiconductors & Semiconductor Equipment - 0.0% | |||
| Intel Corp. 3.25% 8/1/39 | 285 | 615 | |
| TOTAL INFORMATION TECHNOLOGY | 1,035 | ||
| TOTAL CONVERTIBLE BONDS | 2,713 | ||
| Nonconvertible Bonds - 0.1% | |||
| FINANCIALS - 0.1% | |||
| Thrifts & Mortgage Finance - 0.1% | |||
| Prime Securities Services Borrower LLC/Prime Finance, Inc. 9.25% 5/15/23 (f) | 530 | 585 | |
| HEALTH CARE - 0.0% | |||
| Pharmaceuticals - 0.0% | |||
| Valeant Pharmaceuticals International, Inc. 5.875% 5/15/23 (f) | 605 | 529 | |
| TOTAL NONCONVERTIBLE BONDS | 1,114 | ||
| TOTAL CORPORATE BONDS | |||
| (Cost $3,806) | 3,827 | ||
| Shares | Value (000s) | ||
| Other - 0.2% | |||
| ENERGY - 0.2% | |||
| Oil, Gas & Consumable Fuels - 0.2% | |||
| Utica Shale Drilling Program (non-operating revenue interest) (c)(d)(g) | |||
| (Cost $5,865) | 5,865,354 | 4,516 | |
| Money Market Funds - 1.4% | |||
| Fidelity Cash Central Fund, 1.13% (h) | 23,039,778 | 23,044 | |
| Fidelity Securities Lending Cash Central Fund 1.13% (h)(i) | 3,659,604 | 3,660 | |
| TOTAL MONEY MARKET FUNDS | |||
| (Cost $26,704) | 26,704 | ||
| TOTAL INVESTMENT IN SECURITIES - 100.0% | |||
| (Cost $1,597,545) | 1,946,789 | ||
| NET OTHER ASSETS (LIABILITIES) - 0.0% | (116) | ||
| NET ASSETS - 100% | $1,946,673 |
Values shown as $0 may reflect amounts less than $500.
Legend
(a) Non-income producing
(b) Investment is owned by an entity that is treated as a U.S. Corporation for tax purposes in which the Fund holds a percentage ownership.
(c) Restricted securities - Investment in securities not registered under the Securities Act of 1933 (excluding 144A issues). At the end of the period, the value of restricted securities (excluding 144A issues) amounted to $6,163,000 or 0.3% of net assets.
(d) Level 3 security
(e) Security or a portion of the security is on loan at period end.
(f) Security exempt from registration under Rule 144A of the Securities Act of 1933. These securities may be resold in transactions exempt from registration, normally to qualified institutional buyers. At the end of the period, the value of these securities amounted to $1,716,000 or 0.1% of net assets.
(g) Investment is owned by a wholly-owned subsidiary (Subsidiary) that is treated as a corporation for U.S. tax purposes.
(h) Affiliated fund that is generally available only to investment companies and other accounts managed by Fidelity Investments. The rate quoted is the annualized seven-day yield of the fund at period end. A complete unaudited listing of the fund's holdings as of its most recent quarter end is available upon request. In addition, each Fidelity Central Fund's financial statements, which are not covered by the Fund's Report of Independent Registered Public Accounting Firm, are available on the SEC's website or upon request.
(i) Investment made with cash collateral received from securities on loan.
Additional information on each restricted holding is as follows:
| Security | Acquisition Date | Acquisition Cost (000s) |
| New Academy Holding Co. LLC unit | 8/1/11 | $5,565 |
| Utica Shale Drilling Program (non-operating revenue interest) | 10/5/16 - 9/1/17 | $5,865 |
Affiliated Central Funds
Information regarding fiscal year to date income earned by the Fund from investments in Fidelity Central Funds is as follows:
| Fund | Income earned |
| (Amounts in thousands) | |
| Fidelity Cash Central Fund | $406 |
| Fidelity Securities Lending Cash Central Fund | 138 |
| Total | $544 |
Investment Valuation
The following is a summary of the inputs used, as of November 30, 2017, involving the Fund's assets and liabilities carried at fair value. The inputs or methodology used for valuing securities may not be an indication of the risk associated with investing in those securities. For more information on valuation inputs, and their aggregation into the levels used below, please refer to the Investment Valuation section in the accompanying Notes to Financial Statements.
| Valuation Inputs at Reporting Date: | ||||
| Description | Total | Level 1 | Level 2 | Level 3 |
| (Amounts in thousands) | ||||
| Investments in Securities: | ||||
| Equities: | ||||
| Consumer Discretionary | $117,173 | $117,173 | $-- | $-- |
| Consumer Staples | 229,438 | 213,480 | 15,958 | -- |
| Energy | 157,040 | 157,040 | -- | -- |
| Financials | 424,043 | 422,396 | -- | 1,647 |
| Health Care | 278,193 | 248,030 | 30,163 | -- |
| Industrials | 145,400 | 145,400 | -- | -- |
| Information Technology | 239,271 | 239,271 | -- | -- |
| Materials | 81,782 | 81,782 | -- | -- |
| Real Estate | 58,437 | 58,008 | 429 | -- |
| Telecommunication Services | 89,270 | 88,744 | 526 | -- |
| Utilities | 91,695 | 91,284 | 411 | -- |
| Corporate Bonds | 3,827 | -- | 3,827 | -- |
| Other | 4,516 | -- | -- | 4,516 |
| Money Market Funds | 26,704 | 26,704 | -- | -- |
| Total Investments in Securities: | $1,946,789 | $1,889,312 | $51,314 | $6,163 |
Other Information
Distribution of investments by country or territory of incorporation, as a percentage of Total Net Assets, is as follows (Unaudited):
| United States of America | 81.9% |
| United Kingdom | 4.6% |
| Ireland | 3.4% |
| Switzerland | 3.3% |
| Netherlands | 2.3% |
| Canada | 1.7% |
| France | 1.2% |
| Others (Individually Less Than 1%) | 1.6% |
| 100.0% |
See accompanying notes which are an integral part of the financial statements.
Financial Statements
Statement of Assets and Liabilities
| Amounts in thousands (except per-share amounts) | November 30, 2017 | |
| Assets | ||
| Investment in securities, at value (including securities loaned of $3,574) — See accompanying schedule: Unaffiliated issuers (cost $1,570,841) | $1,920,085 | |
| Fidelity Central Funds (cost $26,704) | 26,704 | |
| Total Investment in Securities (cost $1,597,545) | $1,946,789 | |
| Cash | 1 | |
| Restricted cash | 27 | |
| Receivable for investments sold | 4,913 | |
| Receivable for fund shares sold | 326 | |
| Dividends receivable | 5,741 | |
| Interest receivable | 26 | |
| Distributions receivable from Fidelity Central Funds | 22 | |
| Prepaid expenses | 4 | |
| Other receivables | 116 | |
| Total assets | 1,957,965 | |
| Liabilities | ||
| Payable for investments purchased | $2,314 | |
| Payable for fund shares redeemed | 3,484 | |
| Accrued management fee | 705 | |
| Distribution and service plan fees payable | 617 | |
| Other affiliated payables | 354 | |
| Other payables and accrued expenses | 158 | |
| Collateral on securities loaned | 3,660 | |
| Total liabilities | 11,292 | |
| Net Assets | $1,946,673 | |
| Net Assets consist of: | ||
| Paid in capital | $1,431,528 | |
| Undistributed net investment income | 11,112 | |
| Accumulated undistributed net realized gain (loss) on investments and foreign currency transactions | 154,770 | |
| Net unrealized appreciation (depreciation) on investments and assets and liabilities in foreign currencies | 349,263 | |
| Net Assets | $1,946,673 | |
| Calculation of Maximum Offering Price | ||
| Class A: | ||
| Net Asset Value and redemption price per share ($685,792 ÷ 19,617.19 shares) | $34.96 | |
| Maximum offering price per share (100/94.25 of $34.96) | $37.09 | |
| Class M: | ||
| Net Asset Value and redemption price per share ($774,844 ÷ 21,732.62 shares) | $35.65 | |
| Maximum offering price per share (100/96.50 of $35.65) | $36.94 | |
| Class C: | ||
| Net Asset Value and offering price per share ($194,733 ÷ 5,540.72 shares)(a) | $35.15 | |
| Class I: | ||
| Net Asset Value, offering price and redemption price per share ($268,786 ÷ 7,384.55 shares) | $36.40 | |
| Class Z: | ||
| Net Asset Value, offering price and redemption price per share ($22,518 ÷ 618.98 shares) | $36.38 |
(a) Redemption price per share is equal to net asset value less any applicable contingent deferred sales charge.
See accompanying notes which are an integral part of the financial statements.
Statement of Operations
| Amounts in thousands | Year ended November 30, 2017 | |
| Investment Income | ||
| Dividends | $57,131 | |
| Interest | 369 | |
| Income from Fidelity Central Funds | 544 | |
| Total income | 58,044 | |
| Expenses | ||
| Management fee | $9,191 | |
| Transfer agent fees | 3,957 | |
| Distribution and service plan fees | 7,686 | |
| Accounting and security lending fees | 627 | |
| Custodian fees and expenses | 41 | |
| Independent trustees' fees and expenses | 8 | |
| Registration fees | 98 | |
| Audit | 73 | |
| Legal | 14 | |
| Interest | 12 | |
| Miscellaneous | 20 | |
| Total expenses before reductions | 21,727 | |
| Expense reductions | (79) | 21,648 |
| Net investment income (loss) | 36,396 | |
| Realized and Unrealized Gain (Loss) | ||
| Net realized gain (loss) on: | ||
| Investment securities: | ||
| Unaffiliated issuers | 165,240 | |
| Fidelity Central Funds | 13 | |
| Foreign currency transactions | (13) | |
| Written options | 2,465 | |
| Total net realized gain (loss) | 167,705 | |
| Change in net unrealized appreciation (depreciation) on: | ||
| Investment securities: | ||
| Unaffiliated issuers | 33,866 | |
| Fidelity Central Funds | (15) | |
| Assets and liabilities in foreign currencies | 25 | |
| Written options | 2,593 | |
| Total change in net unrealized appreciation (depreciation) | 36,469 | |
| Net gain (loss) | 204,174 | |
| Net increase (decrease) in net assets resulting from operations | $240,570 |
See accompanying notes which are an integral part of the financial statements.
Statement of Changes in Net Assets
| Amounts in thousands | Year ended November 30, 2017 | Year ended November 30, 2016 |
| Increase (Decrease) in Net Assets | ||
| Operations | ||
| Net investment income (loss) | $36,396 | $39,372 |
| Net realized gain (loss) | 167,705 | 20,185 |
| Change in net unrealized appreciation (depreciation) | 36,469 | 199,690 |
| Net increase (decrease) in net assets resulting from operations | 240,570 | 259,247 |
| Distributions to shareholders from net investment income | (32,834) | (43,001) |
| Distributions to shareholders from net realized gain | (30,058) | (143,228) |
| Total distributions | (62,892) | (186,229) |
| Share transactions - net increase (decrease) | (373,631) | (70,794) |
| Total increase (decrease) in net assets | (195,953) | 2,224 |
| Net Assets | ||
| Beginning of period | 2,142,626 | 2,140,402 |
| End of period | $1,946,673 | $2,142,626 |
| Other Information | ||
| Undistributed net investment income end of period | $11,112 | $7,460 |
See accompanying notes which are an integral part of the financial statements.
Financial Highlights
Fidelity Advisor Equity Income Fund Class A
| Years ended November 30, | 2017 | 2016 | 2015 | 2014 | 2013 |
| Selected Per–Share Data | |||||
| Net asset value, beginning of period | $32.05 | $31.10 | $34.44 | $31.60 | $25.55 |
| Income from Investment Operations | |||||
| Net investment income (loss)A | .62 | .59 | .92 | .84B | .60 |
| Net realized and unrealized gain (loss) | 3.32 | 3.13 | (2.15) | 2.67 | 6.06 |
| Total from investment operations | 3.94 | 3.72 | (1.23) | 3.51 | 6.66 |
| Distributions from net investment income | (.58)C | (.66) | (.98) | (.64) | (.58) |
| Distributions from net realized gain | (.46)C | (2.11) | (1.14) | (.04) | (.03) |
| Total distributions | (1.03)D | (2.77) | (2.11)E | (.67)F | (.61) |
| Net asset value, end of period | $34.96 | $32.05 | $31.10 | $34.44 | $31.60 |
| Total ReturnG,H | 12.55% | 13.52% | (3.61)% | 11.28% | 26.43% |
| Ratios to Average Net AssetsI,J | |||||
| Expenses before reductions | .94% | .95% | .95% | .96% | .98% |
| Expenses net of fee waivers, if any | .94% | .95% | .95% | .96% | .98% |
| Expenses net of all reductions | .93% | .95% | .94% | .95% | .97% |
| Net investment income (loss) | 1.88% | 2.01% | 2.85% | 2.55%B | 2.07% |
| Supplemental Data | |||||
| Net assets, end of period (in millions) | $686 | $703 | $688 | $794 | $777 |
| Portfolio turnover rateK | 48% | 36% | 53% | 33% | 34% |
A Calculated based on average shares outstanding during the period.
B Net Investment income per share reflects a large, non-recurring dividend which amounted to $.11 per share. Excluding this non-recurring dividend, the ratio of net investment income (loss) to average net assets would have been 2.21%.
C The amounts shown reflect certain reclassifications related to book to tax differences that were made in the year shown.
D Total distributions of $1.03 per share is comprised of distributions from net investment income of $.577 and distributions from net realized gain of $.456 per share.
E Total distributions of $2.11 per share is comprised of distributions from net investment income of $.975 and distributions from net realized gain of $1.136 per share.
F Total distributions of $.67 per share is comprised of distributions from net investment income of $.636 and distributions from net realized gain of $.038 per share.
G Total returns would have been lower if certain expenses had not been reduced during the applicable periods shown.
H Total returns do not include the effect of the sales charges.
I Fees and expenses of any underlying Fidelity Central Funds are not included in the Fund's expense ratio. The Fund indirectly bears its proportionate share of the expenses of any underlying Fidelity Central Funds.
J Expense ratios reflect operating expenses of the class. Expenses before reductions do not reflect amounts reimbursed by the investment adviser or reductions from brokerage service arrangements or reductions from other expense offset arrangements and do not represent the amount paid by the class during periods when reimbursements or reductions occur. Expenses net of fee waivers reflect expenses after reimbursement by the investment adviser but prior to reductions from brokerage service arrangements or other expense offset arrangements. Expenses net of all reductions represent the net expenses paid by the class.
K Amount does not include the portfolio activity of any underlying Fidelity Central Funds.
See accompanying notes which are an integral part of the financial statements.
Fidelity Advisor Equity Income Fund Class M
| Years ended November 30, | 2017 | 2016 | 2015 | 2014 | 2013 |
| Selected Per–Share Data | |||||
| Net asset value, beginning of period | $32.66 | $31.64 | $34.99 | $32.09 | $25.94 |
| Income from Investment Operations | |||||
| Net investment income (loss)A | .56 | .53 | .86 | .78B | .55 |
| Net realized and unrealized gain (loss) | 3.38 | 3.19 | (2.18) | 2.72 | 6.15 |
| Total from investment operations | 3.94 | 3.72 | (1.32) | 3.50 | 6.70 |
| Distributions from net investment income | (.50)C | (.59) | (.89) | (.56) | (.52) |
| Distributions from net realized gain | (.46)C | (2.11) | (1.14) | (.04) | (.03) |
| Total distributions | (.95)D | (2.70) | (2.03) | (.60) | (.55) |
| Net asset value, end of period | $35.65 | $32.66 | $31.64 | $34.99 | $32.09 |
| Total ReturnE,F | 12.29% | 13.24% | (3.83)% | 11.04% | 26.14% |
| Ratios to Average Net AssetsG,H | |||||
| Expenses before reductions | 1.17% | 1.18% | 1.18% | 1.18% | 1.19% |
| Expenses net of fee waivers, if any | 1.17% | 1.18% | 1.18% | 1.18% | 1.19% |
| Expenses net of all reductions | 1.17% | 1.18% | 1.17% | 1.18% | 1.18% |
| Net investment income (loss) | 1.64% | 1.78% | 2.62% | 2.33%B | 1.86% |
| Supplemental Data | |||||
| Net assets, end of period (in millions) | $775 | $787 | $813 | $974 | $984 |
| Portfolio turnover rateI | 48% | 36% | 53% | 33% | 34% |
A Calculated based on average shares outstanding during the period.
B Net Investment income per share reflects a large, non-recurring dividend which amounted to $.11 per share. Excluding this non-recurring dividend, the ratio of net investment income (loss) to average net assets would have been 1.98%.
C The amounts shown reflect certain reclassifications related to book to tax differences that were made in the year shown.
D Total distributions of $.95 per share is comprised of distributions from net investment income of $.495 and distributions from net realized gain of $.456 per share.
E Total returns would have been lower if certain expenses had not been reduced during the applicable periods shown.
F Total returns do not include the effect of the sales charges.
G Fees and expenses of any underlying Fidelity Central Funds are not included in the Fund's expense ratio. The Fund indirectly bears its proportionate share of the expenses of any underlying Fidelity Central Funds.
H Expense ratios reflect operating expenses of the class. Expenses before reductions do not reflect amounts reimbursed by the investment adviser or reductions from brokerage service arrangements or reductions from other expense offset arrangements and do not represent the amount paid by the class during periods when reimbursements or reductions occur. Expenses net of fee waivers reflect expenses after reimbursement by the investment adviser but prior to reductions from brokerage service arrangements or other expense offset arrangements. Expenses net of all reductions represent the net expenses paid by the class.
I Amount does not include the portfolio activity of any underlying Fidelity Central Funds.
See accompanying notes which are an integral part of the financial statements.
Fidelity Advisor Equity Income Fund Class C
| Years ended November 30, | 2017 | 2016 | 2015 | 2014 | 2013 |
| Selected Per–Share Data | |||||
| Net asset value, beginning of period | $32.21 | $31.24 | $34.57 | $31.73 | $25.66 |
| Income from Investment Operations | |||||
| Net investment income (loss)A | .37 | .37 | .68 | .59B | .38 |
| Net realized and unrealized gain (loss) | 3.35 | 3.14 | (2.15) | 2.69 | 6.09 |
| Total from investment operations | 3.72 | 3.51 | (1.47) | 3.28 | 6.47 |
| Distributions from net investment income | (.32)C | (.43) | (.72) | (.40) | (.37) |
| Distributions from net realized gain | (.46)C | (2.11) | (1.14) | (.04) | (.03) |
| Total distributions | (.78) | (2.54) | (1.86) | (.44) | (.40) |
| Net asset value, end of period | $35.15 | $32.21 | $31.24 | $34.57 | $31.73 |
| Total ReturnD,E | 11.72% | 12.63% | (4.34)% | 10.44% | 25.46% |
| Ratios to Average Net AssetsF,G | |||||
| Expenses before reductions | 1.70% | 1.72% | 1.72% | 1.72% | 1.74% |
| Expenses net of fee waivers, if any | 1.70% | 1.72% | 1.71% | 1.72% | 1.74% |
| Expenses net of all reductions | 1.70% | 1.71% | 1.71% | 1.71% | 1.73% |
| Net investment income (loss) | 1.11% | 1.24% | 2.09% | 1.79%B | 1.32% |
| Supplemental Data | |||||
| Net assets, end of period (in millions) | $195 | $198 | $187 | $214 | $195 |
| Portfolio turnover rateH | 48% | 36% | 53% | 33% | 34% |
A Calculated based on average shares outstanding during the period.
B Net Investment income per share reflects a large, non-recurring dividend which amounted to $.11 per share. Excluding this non-recurring dividend, the ratio of net investment income (loss) to average net assets would have been 1.45%.
C The amounts shown reflect certain reclassifications related to book to tax differences that were made in the year shown.
D Total returns would have been lower if certain expenses had not been reduced during the applicable periods shown.
E Total returns do not include the effect of the contingent deferred sales charge.
F Fees and expenses of any underlying Fidelity Central Funds are not included in the Fund's expense ratio. The Fund indirectly bears its proportionate share of the expenses of any underlying Fidelity Central Funds.
G Expense ratios reflect operating expenses of the class. Expenses before reductions do not reflect amounts reimbursed by the investment adviser or reductions from brokerage service arrangements or reductions from other expense offset arrangements and do not represent the amount paid by the class during periods when reimbursements or reductions occur. Expenses net of fee waivers reflect expenses after reimbursement by the investment adviser but prior to reductions from brokerage service arrangements or other expense offset arrangements. Expenses net of all reductions represent the net expenses paid by the class.
H Amount does not include the portfolio activity of any underlying Fidelity Central Funds.
See accompanying notes which are an integral part of the financial statements.
Fidelity Advisor Equity Income Fund Class I
| Years ended November 30, | 2017 | 2016 | 2015 | 2014 | 2013 |
| Selected Per–Share Data | |||||
| Net asset value, beginning of period | $33.31 | $32.21 | $35.59 | $32.62 | $26.36 |
| Income from Investment Operations | |||||
| Net investment income (loss)A | .74 | .69 | 1.04 | .95B | .70 |
| Net realized and unrealized gain (loss) | 3.46 | 3.26 | (2.23) | 2.77 | 6.24 |
| Total from investment operations | 4.20 | 3.95 | (1.19) | 3.72 | 6.94 |
| Distributions from net investment income | (.65)C | (.74) | (1.06) | (.72) | (.65) |
| Distributions from net realized gain | (.46)C | (2.11) | (1.14) | (.04) | (.03) |
| Total distributions | (1.11) | (2.85) | (2.19)D | (.75)E | (.68) |
| Net asset value, end of period | $36.40 | $33.31 | $32.21 | $35.59 | $32.62 |
| Total ReturnF | 12.86% | 13.82% | (3.37)% | 11.59% | 26.72% |
| Ratios to Average Net AssetsG,H | |||||
| Expenses before reductions | .68% | .69% | .69% | .70% | .72% |
| Expenses net of fee waivers, if any | .68% | .69% | .69% | .70% | .72% |
| Expenses net of all reductions | .68% | .68% | .69% | .70% | .71% |
| Net investment income (loss) | 2.14% | 2.27% | 3.11% | 2.81%B | 2.34% |
| Supplemental Data | |||||
| Net assets, end of period (in millions) | $269 | $439 | $428 | $496 | $483 |
| Portfolio turnover rateI | 48% | 36% | 53% | 33% | 34% |
A Calculated based on average shares outstanding during the period.
B Net Investment income per share reflects a large, non-recurring dividend which amounted to $.12 per share. Excluding this non-recurring dividend, the ratio of net investment income (loss) to average net assets would have been 2.46%.
C The amounts shown reflect certain reclassifications related to book to tax differences that were made in the year shown.
D Total distributions of $2.19 per share is comprised of distributions from net investment income of $1.058 and distributions from net realized gain of $1.136 per share.
E Total distributions of $.75 per share is comprised of distributions from net investment income of $.716 and distributions from net realized gain of $.038 per share.
F Total returns would have been lower if certain expenses had not been reduced during the applicable periods shown.
G Fees and expenses of any underlying Fidelity Central Funds are not included in the Fund's expense ratio. The Fund indirectly bears its proportionate share of the expenses of any underlying Fidelity Central Funds.
H Expense ratios reflect operating expenses of the class. Expenses before reductions do not reflect amounts reimbursed by the investment adviser or reductions from brokerage service arrangements or reductions from other expense offset arrangements and do not represent the amount paid by the class during periods when reimbursements or reductions occur. Expenses net of fee waivers reflect expenses after reimbursement by the investment adviser but prior to reductions from brokerage service arrangements or other expense offset arrangements. Expenses net of all reductions represent the net expenses paid by the class.
I Amount does not include the portfolio activity of any underlying Fidelity Central Funds.
See accompanying notes which are an integral part of the financial statements.
Fidelity Advisor Equity Income Fund Class Z
| Years ended November 30, | 2017 | 2016 | 2015 | 2014 | 2013 A |
| Selected Per–Share Data | |||||
| Net asset value, beginning of period | $33.30 | $32.21 | $35.59 | $32.63 | $31.44 |
| Income from Investment Operations | |||||
| Net investment income (loss)B | .79 | .74 | 1.08 | 1.03C | .23 |
| Net realized and unrealized gain (loss) | 3.46 | 3.24 | (2.21) | 2.74 | 1.12 |
| Total from investment operations | 4.25 | 3.98 | (1.13) | 3.77 | 1.35 |
| Distributions from net investment income | (.71)D | (.79) | (1.11) | (.78) | (.16) |
| Distributions from net realized gain | (.46)D | (2.11) | (1.14) | (.04) | – |
| Total distributions | (1.17) | (2.89)E | (2.25) | (.81)F | (.16) |
| Net asset value, end of period | $36.38 | $33.30 | $32.21 | $35.59 | $32.63 |
| Total ReturnG,H | 13.02% | 13.96% | (3.20)% | 11.75% | 4.30% |
| Ratios to Average Net AssetsI,J | |||||
| Expenses before reductions | .54% | .54% | .54% | .54% | .54%K |
| Expenses net of fee waivers, if any | .53% | .54% | .54% | .54% | .54%K |
| Expenses net of all reductions | .53% | .53% | .53% | .54% | .54%K |
| Net investment income (loss) | 2.28% | 2.42% | 3.26% | 2.97%C | 2.37%K |
| Supplemental Data | |||||
| Net assets, end of period (in millions) | $23 | $15 | $14 | $4 | $– |
| Portfolio turnover rateL | 48% | 36% | 53% | 33% | 34% |
A For the period August 13, 2013 (commencement of sale of shares) to November 30, 2013.
B Calculated based on average shares outstanding during the period.
C Net Investment income per share reflects a large, non-recurring dividend which amounted to $.12 per share. Excluding this non-recurring dividend, the ratio of net investment income (loss) to average net assets would have been 2.62%.
D The amounts shown reflect certain reclassifications related to book to tax differences that were made in the year shown.
E Total distributions of $2.89 per share is comprised of distributions from net investment income of $.788 and distributions from net realized gain of $2.106 per share.
F Total distributions of $.81 per share is comprised of distributions from net investment income of $.775 and distributions from net realized gain of $.038 per share.
G Total returns for periods of less than one year are not annualized.
H Total returns would have been lower if certain expenses had not been reduced during the applicable periods shown.
I Fees and expenses of any underlying Fidelity Central Funds are not included in the Fund's expense ratio. The Fund indirectly bears its proportionate share of the expenses of any underlying Fidelity Central Funds.
J Expense ratios reflect operating expenses of the class. Expenses before reductions do not reflect amounts reimbursed by the investment adviser or reductions from brokerage service arrangements or reductions from other expense offset arrangements and do not represent the amount paid by the class during periods when reimbursements or reductions occur. Expense ratios before reductions for start-up periods may not be representative of longer-term operating periods. Expenses net of fee waivers reflect expenses after reimbursement by the investment adviser but prior to reductions from brokerage service arrangements or other expense offset arrangements. Expenses net of all reductions represent the net expenses paid by the class.
K Annualized
L Amount does not include the portfolio activity of any underlying Fidelity Central Funds.
See accompanying notes which are an integral part of the financial statements.
Notes to Financial Statements
For the period ended November 30, 2017
(Amounts in thousands except percentages)
1. Organization.
Fidelity Advisor Equity Income Fund (the Fund) is a fund of Fidelity Advisor Series I (the Trust) and is authorized to issue an unlimited number of shares. The Trust is registered under the Investment Company Act of 1940, as amended (the 1940 Act), as an open-end management investment company organized as a Massachusetts business trust. The Fund offers Class A, Class M (formerly Class T), Class C, Class I and Class Z shares, each of which has equal rights as to assets and voting privileges. Each class has exclusive voting rights with respect to matters that affect that class.
After the close of business on June 24, 2016, all outstanding Class B shares were converted to Class A shares. All prior fiscal period dollar and share amounts for Class B presented in the Notes to Financial Statements are for the period December 1, 2015 through June 24, 2016.
2. Investments in Fidelity Central Funds.
The Fund invests in Fidelity Central Funds, which are open-end investment companies generally available only to other investment companies and accounts managed by the investment adviser and its affiliates. The Fund's Schedule of Investments lists each of the Fidelity Central Funds held as of period end, if any, as an investment of the Fund, but does not include the underlying holdings of each Fidelity Central Fund. As an Investing Fund, the Fund indirectly bears its proportionate share of the expenses of the underlying Fidelity Central Funds.
The Money Market Central Funds seek preservation of capital and current income and are managed by Fidelity Investments Money Management, Inc. (FIMM), an affiliate of the investment adviser. Annualized expenses of the Money Market Central Funds as of their most recent shareholder report date are less than .005%.
A complete unaudited list of holdings for each Fidelity Central Fund is available upon request or at the Securities and Exchange Commission (the SEC) website at www.sec.gov. In addition, the financial statements of the Fidelity Central Funds, which are not covered by the Fund's Report of Independent Registered Public Accounting Firm, are available on the SEC website or upon request.
3. Significant Accounting Policies.
The Fund is an investment company and applies the accounting and reporting guidance of the Financial Accounting Standards Board (FASB) Accounting Standards Codification Topic 946 Financial Services – Investments Companies. The financial statements have been prepared in conformity with accounting principles generally accepted in the United States of America (GAAP), which require management to make certain estimates and assumptions at the date of the financial statements. Actual results could differ from those estimates. Subsequent events, if any, through the date that the financial statements were issued have been evaluated in the preparation of the financial statements. The following summarizes the significant accounting policies of the Fund:
Investment Valuation. Investments are valued as of 4:00 p.m. Eastern time on the last calendar day of the period. The Board of Trustees (the Board) has delegated the day to day responsibility for the valuation of the Fund's investments to the Fair Value Committee (the Committee) established by the Fund's investment adviser. In accordance with valuation policies and procedures approved by the Board, the Fund attempts to obtain prices from one or more third party pricing vendors or brokers to value its investments. When current market prices, quotations or currency exchange rates are not readily available or reliable, investments will be fair valued in good faith by the Committee, in accordance with procedures adopted by the Board. Factors used in determining fair value vary by investment type and may include market or investment specific events, changes in interest rates and credit quality. The frequency with which these procedures are used cannot be predicted and they may be utilized to a significant extent. The Committee oversees the Fund's valuation policies and procedures and reports to the Board on the Committee's activities and fair value determinations. The Board monitors the appropriateness of the procedures used in valuing the Fund's investments and ratifies the fair value determinations of the Committee.
The Fund categorizes the inputs to valuation techniques used to value its investments into a disclosure hierarchy consisting of three levels as shown below:
- Level 1 – quoted prices in active markets for identical investments
- Level 2 – other significant observable inputs (including quoted prices for similar investments, interest rates, prepayment speeds, etc.)
- Level 3 – unobservable inputs (including the Fund's own assumptions based on the best information available)
Valuation techniques used to value the Fund's investments by major category are as follows:
Equity securities, including restricted securities, for which market quotations are readily available, are valued at the last reported sale price or official closing price as reported by a third party pricing vendor on the primary market or exchange on which they are traded and are categorized as Level 1 in the hierarchy. In the event there were no sales during the day or closing prices are not available, securities are valued at the last quoted bid price or may be valued using the last available price and are generally categorized as Level 2 in the hierarchy. For foreign equity securities, when market or security specific events arise, comparisons to the valuation of American Depositary Receipts (ADRs), futures contracts, Exchange-Traded Funds (ETFs) and certain indexes as well as quoted prices for similar securities may be used and would be categorized as Level 2 in the hierarchy. Utilizing these techniques may result in transfers between Level 1 and Level 2. For equity securities, including restricted securities, where observable inputs are limited, assumptions about market activity and risk are used and these securities may be categorized as Level 3 in the hierarchy.
Debt securities, including restricted securities, are valued based on evaluated prices received from third party pricing vendors or from brokers who make markets in such securities. Corporate bonds are valued by pricing vendors who utilize matrix pricing which considers yield or price of bonds of comparable quality, coupon, maturity and type or by broker-supplied prices. When independent prices are unavailable or unreliable, debt securities may be valued utilizing pricing methodologies which consider similar factors that would be used by third party pricing vendors. Debt securities are generally categorized as Level 2 in the hierarchy but may be Level 3 depending on the circumstances.
Changes in valuation techniques may result in transfers in or out of an assigned level within the disclosure hierarchy. The aggregate value of investments by input level as of November 30, 2017 is included at the end of the Fund's Schedule of Investments.
Foreign Currency. The Fund may use foreign currency contracts to facilitate transactions in foreign-denominated securities. Gains and losses from these transactions may arise from changes in the value of the foreign currency or if the counterparties do not perform under the contracts' terms.
Foreign-denominated assets, including investment securities, and liabilities are translated into U.S. dollars at the exchange rates at period end. Purchases and sales of investment securities, income and dividends received and expenses denominated in foreign currencies are translated into U.S. dollars at the exchange rate in effect on the transaction date.
The effects of exchange rate fluctuations on investments are included with the net realized and unrealized gain (loss) on investment securities. Other foreign currency transactions resulting in realized and unrealized gain (loss) are disclosed separately.
Investment Transactions and Income. For financial reporting purposes, the Fund's investment holdings and NAV include trades executed through the end of the last business day of the period. The NAV per share for processing shareholder transactions is calculated as of the close of business of the New York Stock Exchange (NYSE), normally 4:00 p.m. Eastern time and includes trades executed through the end of the prior business day. Gains and losses on securities sold are determined on the basis of identified cost and includes proceeds received from litigation. Dividend income is recorded on the ex-dividend date, except for certain dividends from foreign securities where the ex-dividend date may have passed, which are recorded as soon as the Fund is informed of the ex-dividend date. Non-cash dividends included in dividend income, if any, are recorded at the fair market value of the securities received. Income and capital gain distributions from Fidelity Central Funds, if any, are recorded on the ex-dividend date. Certain distributions received by the Fund represent a return of capital or capital gain. The Fund determines the components of these distributions subsequent to the ex-dividend date, based upon receipt of tax filings or other correspondence relating to the underlying investment. These distributions are recorded as a reduction of cost of investments and/or as a realized gain. Interest income is accrued as earned and includes coupon interest and amortization of premium and accretion of discount on debt securities as applicable. Paid in Kind (PIK) income is recorded at the fair market value of the securities received. Investment income is recorded net of foreign taxes withheld where recovery of such taxes is uncertain. Debt obligations may be placed on non-accrual status and related interest income may be reduced by ceasing current accruals and writing off interest receivables when the collection of all or a portion of interest has become doubtful based on consistently applied procedures. A debt obligation is removed from non-accrual status when the issuer resumes interest payments or when collectability of interest is reasonably assured.
Class Allocations and Expenses. Investment income, realized and unrealized capital gains and losses, common expenses of the Fund, and certain fund-level expense reductions, if any, are allocated daily on a pro-rata basis to each class based on the relative net assets of each class to the total net assets of the Fund. Each class differs with respect to transfer agent and distribution and service plan fees incurred. Certain expense reductions may also differ by class. For the reporting period, the allocated portion of income and expenses to each class as a percent of its average net assets may vary due to the timing of recording these transactions in relation to fluctuating net assets of the classes. Expenses directly attributable to a fund are charged to that fund. Expenses attributable to more than one fund are allocated among the respective funds on the basis of relative net assets or other appropriate methods. Expense estimates are accrued in the period to which they relate and adjustments are made when actual amounts are known.
Deferred Trustee Compensation. Under a Deferred Compensation Plan (the Plan), independent Trustees may elect to defer receipt of a portion of their annual compensation. Deferred amounts are invested in a cross-section of Fidelity funds, are marked-to-market and remain in the Fund until distributed in accordance with the Plan. The investment of deferred amounts and the offsetting payable to the Trustees are included in the accompanying Statement of Assets and Liabilities.
Income Tax Information and Distributions to Shareholders. Each year, the Fund intends to qualify as a regulated investment company under Subchapter M of the Internal Revenue Code, including distributing substantially all of its taxable income and realized gains. As a result, no provision for U.S. Federal income taxes is required. As of November 30, 2017, the Fund did not have any unrecognized tax benefits in the financial statements; nor is the Fund aware of any tax positions for which it is reasonably possible that the total amounts of unrecognized tax benefits will significantly change in the next twelve months. The Fund files a U.S. federal tax return, in addition to state and local tax returns as required. The Fund's federal income tax returns are subject to examination by the Internal Revenue Service (IRS) for a period of three fiscal years after they are filed. State and local tax returns may be subject to examination for an additional fiscal year depending on the jurisdiction. Foreign taxes are provided for based on the Fund's understanding of the tax rules and rates that exist in the foreign markets in which it invests.
Distributions are declared and recorded on the ex-dividend date. Income dividends and capital gain distributions are declared separately for each class. Income and capital gain distributions are determined in accordance with income tax regulations, which may differ from GAAP. These differences resulted in distribution reclassifications. In addition, the Fund claimed a portion of the payment made to redeeming shareholders as a distribution for income tax purposes.
Capital accounts within the financial statements are adjusted for permanent book-tax differences. These adjustments have no impact on net assets or the results of operations. Capital accounts are not adjusted for temporary book-tax differences which will reverse in a subsequent period.
Book-tax differences are primarily due to foreign currency transactions, partnerships, market discount, deferred trustees compensation, contingent interest, equity-debt classifications, certain conversion ratio adjustments and losses deferred due to wash sales.
As of period end, the cost and unrealized appreciation (depreciation) in securities, and derivatives if applicable, for federal income tax purposes were as follows:
| Gross unrealized appreciation | $390,309 |
| Gross unrealized depreciation | (45,916) |
| Net unrealized appreciation (depreciation) | $344,393 |
| Tax Cost | $1,602,396 |
The tax-based components of distributable earnings as of period end were as follows:
| Undistributed ordinary income | $20,902 |
| Undistributed long-term capital gain | $149,938 |
| Net unrealized appreciation (depreciation) on securities and other investments | $344,412 |
The tax character of distributions paid was as follows:
| November 30, 2017 | November 30, 2016 | |
| Ordinary Income | $40,933 | $ 44,080 |
| Long-term Capital Gains | 21,959 | 142,149 |
| Total | $62,892 | $ 186,229 |
Restricted Securities. The Fund may invest in securities that are subject to legal or contractual restrictions on resale. These securities generally may be resold in transactions exempt from registration or to the public if the securities are registered. Disposal of these securities may involve time-consuming negotiations and expense, and prompt sale at an acceptable price may be difficult. Information regarding restricted securities is included at the end of the Fund's Schedule of Investments.
Consolidated Subsidiary. The Fund invests in certain investments through a wholly-owned subsidiary ("Subsidiary"), which may be subject to federal and state taxes upon disposition.
As of period end, the Fund held an investment of $4,543 in this Subsidiary, representing .23% of the Fund's net assets. The financial statements have been consolidated and include accounts of the Fund and the Subsidiary. Accordingly, all inter-company transactions and balances have been eliminated.
Any cash held by the Subsidiary is restricted as to its use and is presented as Restricted cash in the Statement of Assets and Liabilities.
4. Derivative Instruments.
Risk Exposures and the Use of Derivative Instruments. The Fund's investment objective allows the Fund to enter into various types of derivative contracts, including options. Derivatives are investments whose value is primarily derived from underlying assets, indices or reference rates and may be transacted on an exchange or over-the-counter (OTC). Derivatives may involve a future commitment to buy or sell a specified asset based on specified terms, to exchange future cash flows at periodic intervals based on a notional principal amount, or for one party to make one or more payments upon the occurrence of specified events in exchange for periodic payments from the other party.
The Fund used derivatives to increase returns and to manage exposure to certain risks as defined below. The success of any strategy involving derivatives depends on analysis of numerous economic factors, and if the strategies for investment do not work as intended, the Fund may not achieve its objectives.
The Fund's use of derivatives increased or decreased its exposure to the following risk:
| Equity Risk | Equity risk relates to the fluctuations in the value of financial instruments as a result of changes in market prices (other than those arising from interest rate risk or foreign exchange risk), whether caused by factors specific to an individual investment, its issuer, or all factors affecting all instruments traded in a market or market segment. |
The Fund is also exposed to additional risks from investing in derivatives, such as liquidity risk and counterparty credit risk. Liquidity risk is the risk that the Fund will be unable to close out the derivative in the open market in a timely manner. Counterparty credit risk is the risk that the counterparty will not be able to fulfill its obligation to the Fund. Counterparty credit risk related to exchange-traded options may be mitigated by the protection provided by the exchange on which they trade.
Investing in derivatives may involve greater risks than investing in the underlying assets directly and, to varying degrees, may involve risk of loss in excess of any initial investment and collateral received and amounts recognized in the Statement of Assets and Liabilities. In addition, there may be the risk that the change in value of the derivative contract does not correspond to the change in value of the underlying instrument.
Options. Options give the purchaser the right, but not the obligation, to buy (call) or sell (put) an underlying security or financial instrument at an agreed exercise or strike price between or on certain dates. Options obligate the seller (writer) to buy (put) or sell (call) an underlying instrument at the exercise or strike price or cash settle an underlying derivative instrument if the holder exercises the option on or before the expiration date.
The Fund used exchange-traded and OTC written covered call options to manage its exposure to the market. When the Fund writes a covered call option, the Fund holds the underlying instrument which must be delivered to the holder upon the exercise of the option.
Upon entering into a written options contract, the Fund will receive a premium. Premiums received are reflected as a liability on the Statement of Assets and Liabilities. Options are valued daily and any unrealized appreciation (depreciation) is reflected on the Statement of Assets and Liabilities. When a written option is exercised, the premium is added to the proceeds from the sale of the underlying instrument in determining the gain or loss realized on that investment. When an option is closed the Fund will realize a gain or loss depending on whether the proceeds or amount paid for the closing sale transaction are greater or less than the premium received. When an option expires, gains and losses are realized to the extent of premiums received. The net realized gain (loss) on closed and expired written options and the change in net unrealized appreciation (depreciation) on written options are presented in the Statement of Operations.
Writing call options tends to decrease exposure to the underlying instrument and risk of loss is the change in value in excess of the premium received.
Any open options at period end are presented in the Schedule of Investments under the caption "Written Options".
5. Purchases and Sales of Investments.
Purchases and sales of securities, other than short-term securities, aggregated $970,284 and $1,282,862, respectively.
6. Fees and Other Transactions with Affiliates.
Management Fee. Fidelity Management & Research Company (the investment adviser) and its affiliates provide the Fund with investment management related services for which the Fund pays a monthly management fee. The management fee is the sum of an individual fund fee rate that is based on an annual rate of .20% of the Fund's average net assets and an annualized group fee rate that averaged 25% during the period. The group fee rate is based upon the average net assets of all the mutual funds advised by the investment adviser, including any mutual funds previously advised by the investment adviser that are currently advised by Fidelity SelectCo, LLC, an affiliate of the investment adviser. The group fee rate decreases as assets under management increase and increases as assets under management decrease. For the reporting period, the total annual management fee rate was .45% of the Fund's average net assets.
Distribution and Service Plan Fees. In accordance with Rule 12b-1 of the 1940 Act, the Fund has adopted separate Distribution and Service Plans for each class of shares. Certain classes pay Fidelity Distributors Corporation (FDC), an affiliate of the investment adviser, separate Distribution and Service Fees, each of which is based on an annual percentage of each class' average net assets. In addition, FDC may pay financial intermediaries for selling shares of the Fund and providing shareholder support services. For the period, the Distribution and Service Fee rates, total fees and amounts retained by FDC were as follows:
| Distribution Fee | Service Fee | Total Fees | Retained by FDC | |
| Class A | -% | .25% | $1,747 | $18 |
| Class M | .25% | .25% | 3,932 | – |
| Class C | .75% | .25% | 2,007 | 123 |
| $7,686 | $141 |
Sales Load. FDC may receive a front-end sales charge of up to 5.75% for selling Class A shares and 3.50% for selling Class M shares, some of which is paid to financial intermediaries for selling shares of the Fund. Depending on the holding period, FDC may receive contingent deferred sales charges levied on Class A, Class M and Class C redemptions. The deferred sales charges are 1.00% for Class C shares, 1.00% for certain purchases of Class A shares and .25% for certain purchases of Class M shares.
For the period, sales charge amounts retained by FDC were as follows:
| Retained by FDC | |
| Class A | $121 |
| Class M | 47 |
| Class C(a) | 10 |
| $178 |
(a) When Class C shares are initially sold, FDC pays commissions from its own resources to financial intermediaries through which the sales are made.
Transfer Agent Fees. Fidelity Investments Institutional Operations Company, Inc., (FIIOC), an affiliate of the investment adviser, is the transfer, dividend disbursing and shareholder servicing agent for each class of the Fund. FIIOC receives account fees and asset-based fees that vary according to the account size and type of account of the shareholders of the respective classes of the Fund, except for Class Z. FIIOC receives an asset-based fee of Class Z's average net assets. FIIOC pays for typesetting, printing and mailing of shareholder reports, except proxy statements.
For the period, transfer agent fees for each class were as follows:
| Amount | % of Class-Level Average Net Assets | |
| Class A | $1,381 | .20 |
| Class M | 1,445 | .18 |
| Class C | 432 | .22 |
| Class I | 691 | .19 |
| Class Z | 8 | .05 |
| $3,957 |
Accounting and Security Lending Fees. Fidelity Service Company, Inc. (FSC), an affiliate of the investment adviser, maintains the Fund's accounting records. The accounting fee is based on the level of average net assets for each month. Under a separate contract, FSC administers the security lending program. The security lending fee is based on the number and duration of lending transactions.
Brokerage Commissions. The Fund placed a portion of its portfolio transactions with brokerage firms which are affiliates of the investment adviser. Brokerage commissions are included in net realized gain (loss) and change in net unrealized appreciation (depreciation) in the Statement of Operations. The commissions paid to these affiliated firms were $29 for the period.
Interfund Lending Program. Pursuant to an Exemptive Order issued by the SEC, the Fund, along with other registered investment companies having management contracts with Fidelity Management & Research Company (FMR) or other affiliated entities of FMR, may participate in an interfund lending program. This program provides an alternative credit facility allowing the funds to borrow from, or lend money to, other participating affiliated funds. At period end, there were no interfund loans outstanding. The Fund's activity in this program during the period for which loans were outstanding was as follows:
| Borrower or Lender | Average Loan Balance | Weighted Average Interest Rate | Interest Expense |
| Borrower | $36,204 | 1.20% | $12 |
Interfund Trades. The Fund may purchase from or sell securities to other Fidelity Funds under procedures adopted by the Board. The procedures have been designed to ensure these interfund trades are executed in accordance with Rule 17a-7 of the 1940 Act. Interfund trades are included within the respective purchases and sales amounts shown in the Purchases and Sales of Investments note
7. Committed Line of Credit.
The Fund participates with other funds managed by the investment adviser or an affiliate in a $4.25 billion credit facility (the "line of credit") to be utilized for temporary or emergency purposes to fund shareholder redemptions or for other short-term liquidity purposes. The Fund has agreed to pay commitment fees on its pro-rata portion of the line of credit, which amounted to $7 and is reflected in Miscellaneous expenses on the Statement of Operations. During the period, the Fund did not borrow on this line of credit.
8. Security Lending.
The Fund lends portfolio securities through a lending agent from time to time in order to earn additional income. For equity securities, a lending agent is used and may loan securities to certain qualified borrowers, including Fidelity Capital Markets (FCM), a broker-dealer affiliated with the Fund. On the settlement date of the loan, the Fund receives collateral (in the form of U.S. Treasury obligations, letters of credit and/or cash) against the loaned securities and maintains collateral in an amount not less than 100% of the market value of the loaned securities during the period of the loan. The market value of the loaned securities is determined at the close of business of the Fund and any additional required collateral is delivered to the Fund on the next business day. The Fund or borrower may terminate the loan at any time, and if the borrower defaults on its obligation to return the securities loaned because of insolvency or other reasons, the Fund may apply collateral received from the borrower against the obligation. The Fund may experience delays and costs in recovering the securities loaned. Any cash collateral received is invested in the Fidelity Securities Lending Cash Central Fund. The value of loaned securities and cash collateral at period end are disclosed on the Fund's Statement of Assets and Liabilities. At period end, there were no security loans outstanding with FCM. Security lending income represents the income earned on investing cash collateral, less rebates paid to borrowers and any lending agent fees associated with the loan, plus any premium payments received for lending certain types of securities. Security lending income is presented in the Statement of Operations as a component of income from Fidelity Central Funds. Total security lending income during the period amounted to $138, including $5 from securities loaned to FCM.
9. Expense Reductions.
Commissions paid to certain brokers with whom the investment adviser, or its affiliates, places trades on behalf of the Fund include an amount in addition to trade execution, which may be rebated back to the Fund to offset certain expenses. This amount totaled $60 for the period.
In addition, during the period the investment adviser reimbursed and/or waived a portion of fund-level operating expenses in the amount of $19.
10. Distributions to Shareholders.
Distributions to shareholders of each class were as follows:
| Year ended November 30, 2017 | Year ended November 30, 2016 | |
| From net investment income | ||
| Class A | $12,166 | $14,760 |
| Class M | 11,510 | 15,119 |
| Class B | – | 95 |
| Class C | 1,935 | 2,618 |
| Class I | 6,869 | 10,055 |
| Class Z | 354 | 354 |
| Total | $32,834 | $43,001 |
| From net realized gain | ||
| Class A | $10,013 | $46,541 |
| Class M | 10,945 | 54,221 |
| Class B | – | 661 |
| Class C | 2,825 | 12,684 |
| Class I | 6,056 | 28,166 |
| Class Z | 219 | 955 |
| Total | $30,058 | $143,228 |
11. Share Transactions.
Share transactions for each class were as follows and may contain automatic conversions between classes or exchanges between affiliated funds:
| Shares | Shares | Dollars | Dollars | |
| Year ended November 30, 2017 | Year ended November 30, 2016 | Year ended November 30, 2017 | Year ended November 30, 2016 | |
| Class A | ||||
| Shares sold | 1,839 | 2,420 | $60,638 | $70,433 |
| Reinvestment of distributions | 640 | 2,081 | 20,942 | 57,784 |
| Shares redeemed | (4,800) | (4,679) | (159,493) | (136,659) |
| Net increase (decrease) | (2,321) | (178) | $(77,913) | $(8,442) |
| Class M | ||||
| Shares sold | 2,155 | 2,416 | $72,567 | $71,773 |
| Reinvestment of distributions | 657 | 2,392 | 21,912 | 67,591 |
| Shares redeemed | (5,187) | (6,397) | (175,531) | (190,578) |
| Net increase (decrease) | (2,375) | (1,589) | $(81,052) | $(51,214) |
| Class B | ||||
| Shares sold | – | 4 | $– | $155 |
| Reinvestment of distributions | – | 25 | – | 692 |
| Shares redeemed | – | (351) | – | (10,124) |
| Net increase (decrease) | – | (322) | $– | $(9,277) |
| Class C | ||||
| Shares sold | 679 | 806 | $22,478 | $23,799 |
| Reinvestment of distributions | 132 | 494 | 4,349 | 13,767 |
| Shares redeemed | (1,413) | (1,149) | (47,260) | (33,678) |
| Net increase (decrease) | (602) | 151 | $(20,433) | $3,888 |
| Class I | ||||
| Shares sold | 2,331 | 2,077 | $80,541 | $63,265 |
| Reinvestment of distributions | 359 | 1,284 | 12,182 | 37,038 |
| Shares redeemed | (8,490) | (3,464) | (292,840) | (106,411) |
| Net increase (decrease) | (5,800) | (103) | $(200,117) | $(6,108) |
| Class Z | ||||
| Shares sold | 366 | 132 | $12,769 | $3,920 |
| Reinvestment of distributions | 17 | 45 | 567 | 1,309 |
| Shares redeemed | (216) | (168) | (7,452) | (4,870) |
| Net increase (decrease) | 167 | 9 | $5,884 | $359 |
12. Other.
The Fund's organizational documents provide former and current trustees and officers with a limited indemnification against liabilities arising in connection with the performance of their duties to the Fund. In the normal course of business, the Fund may also enter into contracts that provide general indemnifications. The Fund's maximum exposure under these arrangements is unknown as this would be dependent on future claims that may be made against the Fund. The risk of material loss from such claims is considered remote.
Report of Independent Registered Public Accounting Firm
To the Trustees of Fidelity Advisor Series I and Shareholders of Fidelity Advisor Equity Income Fund:
We have audited the accompanying statement of assets and liabilities of Fidelity Advisor Equity Income Fund (the Fund), a fund of Fidelity Advisor Series I, including the schedule of investments, as of November 30, 2017, and the related statement of operations for the year then ended, the statement of changes in net assets for each of the two years in the period then ended, and the financial highlights for each of the five years in the period then ended. These financial statements and financial highlights are the responsibility of the Fund's management. Our responsibility is to express an opinion on these financial statements and financial highlights based on our audits.
We conducted our audits in accordance with the standards of the Public Company Accounting Oversight Board (United States). Those standards require that we plan and perform the audit to obtain reasonable assurance about whether the financial statements and financial highlights are free of material misstatement. The Fund is not required to have, nor were we engaged to perform, an audit of its internal control over financial reporting. Our audits included consideration of internal control over financial reporting as a basis for designing audit procedures that are appropriate in the circumstances, but not for the purpose of expressing an opinion on the effectiveness of the Fund's internal control over financial reporting. Accordingly, we express no such opinion. An audit also includes examining, on a test basis, evidence supporting the amounts and disclosures in the financial statements, assessing the accounting principles used and significant estimates made by management, as well as evaluating the overall financial statement presentation. Our procedures included confirmation of securities owned as of November 30, 2017, by correspondence with the custodians and brokers; when replies were not received from brokers, we performed other auditing procedures. We believe that our audits provide a reasonable basis for our opinion.
In our opinion, such financial statements and financial highlights referred to above present fairly, in all material respects, the financial position of Fidelity Advisor Equity Income Fund as of November 30, 2017, the results of its operations for the year then ended, the changes in its net assets for each of the two years in the period then ended, and the financial highlights for each of the five years in the period then ended, in conformity with accounting principles generally accepted in the United States of America.
DELOITTE & TOUCHE LLP
Boston, Massachusetts
January 18, 2018
Trustees and Officers
The Trustees, Members of the Advisory Board (if any), and officers of the trust and fund, as applicable, are listed below. The Board of Trustees governs the fund and is responsible for protecting the interests of shareholders. The Trustees are experienced executives who meet periodically throughout the year to oversee the fund's activities, review contractual arrangements with companies that provide services to the fund, oversee management of the risks associated with such activities and contractual arrangements, and review the fund's performance. Each of the Trustees oversees 190 funds.
The Trustees hold office without limit in time except that (a) any Trustee may resign; (b) any Trustee may be removed by written instrument, signed by at least two-thirds of the number of Trustees prior to such removal; (c) any Trustee who requests to be retired or who has become incapacitated by illness or injury may be retired by written instrument signed by a majority of the other Trustees; and (d) any Trustee may be removed at any special meeting of shareholders by a two-thirds vote of the outstanding voting securities of the trust. Each Trustee who is not an interested person (as defined in the 1940 Act) of the trust and the fund is referred to herein as an Independent Trustee. Each Independent Trustee shall retire not later than the last day of the calendar year in which his or her 75th birthday occurs. The Independent Trustees may waive this mandatory retirement age policy with respect to individual Trustees. Officers and Advisory Board Members hold office without limit in time, except that any officer or Advisory Board Member may resign or may be removed by a vote of a majority of the Trustees at any regular meeting or any special meeting of the Trustees. Except as indicated, each individual has held the office shown or other offices in the same company for the past five years.
The fund’s Statement of Additional Information (SAI) includes more information about the Trustees. To request a free copy, call Fidelity at 1-877-208-0098.
Experience, Skills, Attributes, and Qualifications of the Trustees. The Governance and Nominating Committee has adopted a statement of policy that describes the experience, qualifications, attributes, and skills that are necessary and desirable for potential Independent Trustee candidates (Statement of Policy). The Board believes that each Trustee satisfied at the time he or she was initially elected or appointed a Trustee, and continues to satisfy, the standards contemplated by the Statement of Policy. The Governance and Nominating Committee also engages professional search firms to help identify potential Independent Trustee candidates who have the experience, qualifications, attributes, and skills consistent with the Statement of Policy. From time to time, additional criteria based on the composition and skills of the current Independent Trustees, as well as experience or skills that may be appropriate in light of future changes to board composition, business conditions, and regulatory or other developments, have also been considered by the professional search firms and the Governance and Nominating Committee. In addition, the Board takes into account the Trustees' commitment and participation in Board and committee meetings, as well as their leadership of standing and ad hoc committees throughout their tenure.
In determining that a particular Trustee was and continues to be qualified to serve as a Trustee, the Board has considered a variety of criteria, none of which, in isolation, was controlling. The Board believes that, collectively, the Trustees have balanced and diverse experience, qualifications, attributes, and skills, which allow the Board to operate effectively in governing the fund and protecting the interests of shareholders. Information about the specific experience, skills, attributes, and qualifications of each Trustee, which in each case led to the Board's conclusion that the Trustee should serve (or continue to serve) as a trustee of the fund, is provided below.
Board Structure and Oversight Function. James C. Curvey is an interested person and currently serves as Chairman. The Trustees have determined that an interested Chairman is appropriate and benefits shareholders because an interested Chairman has a personal and professional stake in the quality and continuity of services provided to the fund. Independent Trustees exercise their informed business judgment to appoint an individual of their choosing to serve as Chairman, regardless of whether the Trustee happens to be independent or a member of management. The Independent Trustees have determined that they can act independently and effectively without having an Independent Trustee serve as Chairman and that a key structural component for assuring that they are in a position to do so is for the Independent Trustees to constitute a substantial majority for the Board. The Independent Trustees also regularly meet in executive session. Ned C. Lautenbach serves as Chairman of the Independent Trustees and as such (i) acts as a liaison between the Independent Trustees and management with respect to matters important to the Independent Trustees and (ii) with management prepares agendas for Board meetings.
Fidelity® funds are overseen by different Boards of Trustees. The fund's Board oversees Fidelity's high income and certain equity funds, and other Boards oversee Fidelity's investment-grade bond, money market, asset allocation, and sector funds. The asset allocation funds may invest in Fidelity® funds overseen by the fund's Board. The use of separate Boards, each with its own committee structure, allows the Trustees of each group of Fidelity® funds to focus on the unique issues of the funds they oversee, including common research, investment, and operational issues. On occasion, the separate Boards establish joint committees to address issues of overlapping consequences for the Fidelity® funds overseen by each Board.
The Trustees operate using a system of committees to facilitate the timely and efficient consideration of all matters of importance to the Trustees, the fund, and fund shareholders and to facilitate compliance with legal and regulatory requirements and oversight of the fund's activities and associated risks. The Board, acting through its committees, has charged FMR and its affiliates with (i) identifying events or circumstances the occurrence of which could have demonstrably adverse effects on the fund's business and/or reputation; (ii) implementing processes and controls to lessen the possibility that such events or circumstances occur or to mitigate the effects of such events or circumstances if they do occur; and (iii) creating and maintaining a system designed to evaluate continuously business and market conditions in order to facilitate the identification and implementation processes described in (i) and (ii) above. Because the day-to-day operations and activities of the fund are carried out by or through FMR, its affiliates, and other service providers, the fund's exposure to risks is mitigated but not eliminated by the processes overseen by the Trustees. While each of the Board's committees has responsibility for overseeing different aspects of the fund's activities, oversight is exercised primarily through the Operations, Audit, and Compliance Committees. In addition, the Independent Trustees have worked with FMR to enhance the Board's oversight of investment and financial risks, legal and regulatory risks, technology risks, and operational risks, including the development of additional risk reporting to the Board. For example, a working group comprised of Independent Trustees and FMR has worked and continues to work to review the Fidelity® funds' valuation-related activities, reporting and risk management. Appropriate personnel, including but not limited to the fund's Chief Compliance Officer (CCO), FMR's internal auditor, the independent accountants, the fund's Treasurer and portfolio management personnel, make periodic reports to the Board's committees, as appropriate, including an annual review of Fidelity's risk management program for the Fidelity® funds. The responsibilities of each standing committee, including their oversight responsibilities, are described further under "Standing Committees of the Trustees."
Interested Trustees*:
Correspondence intended for a Trustee who is an interested person may be sent to Fidelity Investments, 245 Summer Street, Boston, Massachusetts 02210.
Name, Year of Birth; Principal Occupations and Other Relevant Experience+
James C. Curvey (1935)
Year of Election or Appointment: 2007
Trustee
Chairman of the Board of Trustees
Mr. Curvey also serves as Trustee of other Fidelity® funds. Mr. Curvey is a Director of Fidelity Research & Analysis Co. (investment adviser firm, 2009-present), and Vice Chairman (2007-present) and Director of FMR LLC (diversified financial services company). In addition, Mr. Curvey serves as an Overseer for the Boston Symphony Orchestra and a member of the board of Artis-Naples, Naples, Florida, and as a Trustee for Brewster Academy, Wolfeboro, New Hampshire. Previously, Mr. Curvey served as a Director of Fidelity Investments Money Management, Inc. (investment adviser firm, 2009-2014) and a Director of FMR and FMR Co., Inc. (investment adviser firms, 2007-2014).
Charles S. Morrison (1960)
Year of Election or Appointment: 2014
Trustee
Mr. Morrison also serves as Trustee of other funds. He serves as President of Fidelity Management & Research Company (FMR) (investment adviser firm, 2016-present), a Director of Fidelity Investments Money Management, Inc. (FIMM) (investment adviser firm, 2014-present), Director of Fidelity SelectCo, LLC (investment adviser firm, 2014-present), President, Asset Management (2014-present), and is an employee of Fidelity Investments. Previously, Mr. Morrison served as Vice President of Fidelity's Fixed Income and Asset Allocation Funds (2012-2014), President, Fixed Income (2011-2014), Vice President of Fidelity's Money Market Funds (2005-2009), President, Money Market Group Leader of FMR (investment adviser firm, 2009), and Senior Vice President, Money Market Group of FMR (2004-2009). Mr. Morrison also served as Vice President of Fidelity's Bond Funds (2002-2005), certain Balanced Funds (2002-2005), and certain Asset Allocation Funds (2002-2007), and as Senior Vice President (2002-2005) of Fidelity's Bond Division.
* Determined to be an “Interested Trustee” by virtue of, among other things, his or her affiliation with the trust or various entities under common control with FMR.
+ The information includes the Trustee's principal occupation during the last five years and other information relating to the experience, attributes, and skills relevant to the Trustee's qualifications to serve as a Trustee, which led to the conclusion that the Trustee should serve as a Trustee for the fund.
Independent Trustees:
Correspondence intended for an Independent Trustee may be sent to Fidelity Investments, P.O. Box 55235, Boston, Massachusetts 02205-5235.
Name, Year of Birth; Principal Occupations and Other Relevant Experience+
Dennis J. Dirks (1948)
Year of Election or Appointment: 2005
Trustee
Mr. Dirks also serves as Trustee of other Fidelity® funds. Prior to his retirement in May 2003, Mr. Dirks was Chief Operating Officer and a member of the Board of The Depository Trust & Clearing Corporation (DTCC). He also served as President, Chief Operating Officer, and Board member of The Depository Trust Company (DTC) and President and Board member of the National Securities Clearing Corporation (NSCC). In addition, Mr. Dirks served as Chief Executive Officer and Board member of the Government Securities Clearing Corporation, Chief Executive Officer and Board member of the Mortgage-Backed Securities Clearing Corporation, as a Trustee and a member of the Finance Committee of Manhattan College (2005-2008), as a Trustee and a member of the Finance Committee of AHRC of Nassau County (2006-2008), as a member of the Independent Directors Council (IDC) Governing Council (2010-2015), and as a member of the Board of Directors for The Brookville Center for Children’s Services, Inc. (2009-2017). Mr. Dirks is a member of the Finance Committee (2016-present) and Board of Directors (2017-present) of the Asolo Repertory Theatre.
Alan J. Lacy (1953)
Year of Election or Appointment: 2008
Trustee
Mr. Lacy also serves as Trustee of other Fidelity® funds. Mr. Lacy serves as a Director of Bristol-Myers Squibb Company (global pharmaceuticals, 2008-present). He is a Trustee of the California Chapter of The Nature Conservancy (2015-present) and a Director of the Center for Advanced Study in the Behavioral Sciences at Stanford University (2015-present). In addition, Mr. Lacy served as Senior Adviser (2007-2014) of Oak Hill Capital Partners, L.P. (private equity) and also served as Chief Executive Officer (2005) and Vice Chairman (2005-2006) of Sears Holdings Corporation (retail) and Chief Executive Officer and Chairman of the Board of Sears, Roebuck and Co. (retail, 2000-2005). Previously, Mr. Lacy served as Chairman (2014-2017) and a member (2010-2017) of the Board of Directors of Dave & Buster’s Entertainment, Inc. (restaurant and entertainment complexes), as Chairman (2008-2011) and a member (2006-2015) of the Board of Trustees of the National Parks Conservation Association, and as a member of the Board of Directors for The Hillman Companies, Inc. (hardware wholesalers, 2010-2014), Earth Fare, Inc. (retail grocery, 2010-2014), and The Western Union Company (global money transfer, 2006-2011).
Ned C. Lautenbach (1944)
Year of Election or Appointment: 2000
Trustee
Chairman of the Independent Trustees
Mr. Lautenbach also serves as Trustee of other Fidelity® funds. Mr. Lautenbach currently serves as Vice Chair of the Board of Governors, State University System of Florida (2013-present) and is a member of the Council on Foreign Relations (1994-present). He is also a member and has most recently served as Chairman of the Board of Directors of Artis-Naples (2012-present). Previously, Mr. Lautenbach served as a member and then Lead Director of the Board of Directors of Eaton Corporation (diversified industrial, 1997-2016). He was also a Partner and Advisory Partner at Clayton, Dubilier & Rice, LLC (private equity investment, 1998-2010), as well as a Director of Sony Corporation (2006-2007). In addition, Mr. Lautenbach also had a 30-year career with IBM (technology company) during which time he served as Senior Vice President and a member of the Corporate Executive Committee (1968-1998).
Joseph Mauriello (1944)
Year of Election or Appointment: 2008
Trustee
Mr. Mauriello also serves as Trustee of other Fidelity® funds. Prior to his retirement in January 2006, Mr. Mauriello served in numerous senior management positions including Deputy Chairman and Chief Operating Officer (2004-2005), and Vice Chairman of Financial Services (2002-2004) of KPMG LLP US (professional services, 1965-2005). Mr. Mauriello currently serves as a member of the Board of Directors of XL Group plc. (global insurance and re-insurance, 2006-present) and the Independent Directors Council (IDC) Governing Council (2015-present). Previously, Mr. Mauriello served as a Director of the Hamilton Funds of the Bank of New York (2006-2007) and of Arcadia Resources Inc. (health care services and products, 2007-2012).
Cornelia M. Small (1944)
Year of Election or Appointment: 2005
Trustee
Ms. Small also serves as Trustee of other Fidelity® funds. Ms. Small is a member of the Board of Directors (2009-present) and Chair of the Investment Committee (2010-present) of the Teagle Foundation. Ms. Small also serves on the Investment Committee of the Berkshire Taconic Community Foundation (2008-present). Previously, Ms. Small served as Chairperson (2002-2008) and a member of the Investment Committee and Chairperson (2008-2012) and a member of the Board of Trustees of Smith College. In addition, Ms. Small served as Chief Investment Officer, Director of Global Equity Investments, and a member of the Board of Directors of Scudder, Stevens & Clark and Scudder Kemper Investments.
William S. Stavropoulos (1939)
Year of Election or Appointment: 2002
Trustee
Vice Chairman of the Independent Trustees
Mr. Stavropoulos also serves as Trustee of other Fidelity® funds. Mr. Stavropoulos serves as President and Founder of the Michigan Baseball Foundation, the Great Lakes Loons (2007-present). Mr. Stavropoulos is Chairman Emeritus of the Board of Directors of The Dow Chemical Company, where he previously served in numerous senior management positions, including President, CEO (1995-2000; 2002-2004), Chairman of the Executive Committee (2000-2006), and as a member of the Board of Directors (1990-2006). Currently, Mr. Stavropoulos is Chairman of the Board of Directors of Univar Inc. (global distributor of commodity and specialty chemicals), a Director of Teradata Corporation (data warehousing and technology solutions), and a member of the Advisory Board for Metalmark Capital LLC (private equity investment, 2005-present). Mr. Stavropoulos is an operating advisor to Clayton, Dubilier & Rice, LLC (private equity investment). In addition, Mr. Stavropoulos is a member of the University of Notre Dame Advisory Council for the College of Science, a Trustee of the Rollin L. Gerstacker Foundation, and a Director of Artis-Naples in Naples, Florida. Previously, Mr. Stavropoulos served as a Director of Chemical Financial Corporation (bank holding company, 1993-2012) and Tyco International, Ltd. (multinational manufacturing and services, 2007-2012).
David M. Thomas (1949)
Year of Election or Appointment: 2008
Trustee
Mr. Thomas also serves as Trustee of other Fidelity® funds. Mr. Thomas serves as Non-Executive Chairman of the Board of Directors of Fortune Brands Home and Security (home and security products, 2011-present), as a member of the Board of Directors (2004-present) and Presiding Director (2013-present) of Interpublic Group of Companies, Inc. (marketing communication), and as a member of the Board of Trustees of the University of Florida (2013-present). Previously, Mr. Thomas served as Executive Chairman (2005-2006) and Chairman and Chief Executive Officer (2000-2005) of IMS Health, Inc. (pharmaceutical and healthcare information solutions), and a Director of Fortune Brands, Inc. (consumer products, 2000-2011).
+ The information includes the Trustee's principal occupation during the last five years and other information relating to the experience, attributes, and skills relevant to the Trustee's qualifications to serve as a Trustee, which led to the conclusion that the Trustee should serve as a Trustee for the fund.
Advisory Board Members and Officers:
Correspondence intended for an officer or Peter S. Lynch may be sent to Fidelity Investments, 245 Summer Street, Boston, Massachusetts 02210. Officers appear below in alphabetical order.
Name, Year of Birth; Principal Occupation
Peter S. Lynch (1944)
Year of Election or Appointment: 2003
Member of the Advisory Board
Mr. Lynch also serves as Member of the Advisory Board of other Fidelity® funds. Mr. Lynch is Vice Chairman and a Director of FMR (investment adviser firm) and FMR Co., Inc. (investment adviser firm). In addition, Mr. Lynch serves as a Trustee of Boston College and as the Chairman of the Inner-City Scholarship Fund. Previously, Mr. Lynch served on the Special Olympics International Board of Directors (1997-2006).
Elizabeth Paige Baumann (1968)
Year of Election or Appointment: 2017
Anti-Money Laundering (AML) Officer
Ms. Baumann also serves as AML Officer of other funds. She is Chief AML Officer (2012-present) and Senior Vice President (2014-present) of FMR LLC (diversified financial services company) and is an employee of Fidelity Investments. Previously, Ms. Baumann served as AML Officer of the funds (2012-2016), and Vice President (2007-2014) and Deputy Anti-Money Laundering Officer (2007-2012) of FMR LLC.
Marc R. Bryant (1966)
Year of Election or Appointment: 2015
Secretary and Chief Legal Officer (CLO)
Mr. Bryant also serves as Secretary and CLO of other funds. Mr. Bryant serves as CLO, Secretary, and Senior Vice President of Fidelity Management & Research Company (investment adviser firm, 2015-present) and FMR Co., Inc. (investment adviser firm, 2015-present); Secretary of Fidelity SelectCo, LLC (investment adviser firm, 2015-present) and Fidelity Investments Money Management, Inc. (investment adviser firm, 2015-present); and CLO of Fidelity Management & Research (Hong Kong) Limited and FMR Investment Management (UK) Limited (investment adviser firms, 2015-present) and Fidelity Management & Research (Japan) Limited (investment adviser firm, 2016-present). He is Senior Vice President and Deputy General Counsel of FMR LLC (diversified financial services company). Previously, Mr. Bryant served as Secretary and CLO of Fidelity Rutland Square Trust II (2010-2014) and Assistant Secretary of Fidelity's Fixed Income and Asset Allocation Funds (2013-2015). Prior to joining Fidelity Investments, Mr. Bryant served as a Senior Vice President and the Head of Global Retail Legal for AllianceBernstein L.P. (2006-2010), and as the General Counsel for ProFund Advisors LLC (2001-2006).
William C. Coffey (1969)
Year of Election or Appointment: 2009
Assistant Secretary
Mr. Coffey also serves as Assistant Secretary of other funds. He is Senior Vice President and Deputy General Counsel of FMR LLC (diversified financial services company, 2010-present), and is an employee of Fidelity Investments. Previously, Mr. Coffey served as Vice President and Associate General Counsel of FMR LLC (2005-2009).
Jonathan Davis (1968)
Year of Election or Appointment: 2010
Assistant Treasurer
Mr. Davis also serves as Assistant Treasurer of other funds. Mr. Davis serves as Assistant Treasurer of FMR Capital, Inc. (2017-present) and is an employee of Fidelity Investments. Previously, Mr. Davis served as Vice President and Associate General Counsel of FMR LLC (diversified financial services company, 2003-2010).
Adrien E. Deberghes (1967)
Year of Election or Appointment: 2016
Assistant Treasurer
Mr. Deberghes also serves as an officer of other funds. He serves as Assistant Treasurer of FMR Capital, Inc. (2017-present), Executive Vice President of Fidelity Investments Money Management, Inc. (FIMM) (investment adviser firm, 2016-present), and is an employee of Fidelity Investments (2008-present). Prior to joining Fidelity Investments, Mr. Deberghes was Senior Vice President of Mutual Fund Administration at State Street Corporation (2007-2008), Senior Director of Mutual Fund Administration at Investors Bank & Trust (2005-2007), and Director of Finance for Dunkin' Brands (2000-2005). Previously, Mr. Deberghes served in other fund officer roles.
Stephanie J. Dorsey (1969)
Year of Election or Appointment: 2010
Assistant Treasurer
Ms. Dorsey also serves as an officer of other funds. Ms. Dorsey serves as Assistant Treasurer of FMR Capital, Inc. (2017-present), is an employee of Fidelity Investments (2008-present), and has served in other fund officer roles. Prior to joining Fidelity Investments, Ms. Dorsey served as Treasurer (2004-2008) of the JPMorgan Mutual Funds and Vice President (2004-2008) of JPMorgan Chase Bank.
Howard J. Galligan III (1966)
Year of Election or Appointment: 2014
Chief Financial Officer
Mr. Galligan also serves as Chief Financial Officer of other funds. Mr. Galligan serves as President of Fidelity Pricing and Cash Management Services (FPCMS) (2014-present) and as a Director of Strategic Advisers, Inc. (investment adviser firm, 2008-present). Previously, Mr. Galligan served as Chief Administrative Officer of Asset Management (2011-2014) and Chief Operating Officer and Senior Vice President of Investment Support for Strategic Advisers, Inc. (2003-2011).
Thomas C. Hense (1964)
Year of Election or Appointment: 2008, 2010, or 2015
Vice President
Mr. Hense serves as Vice President of Fidelity Advisor® Multi-Asset Income Fund (2015) and other funds (High Income (2008), Small Cap (2008), and Value (2010) funds), and is an employee of Fidelity Investments (1993-present). Previously, Mr. Hense served as a portfolio manager for Fidelity's Institutional Money Management Group (Pyramis) (2003-2008).
Brian B. Hogan (1964)
Year of Election or Appointment: 2009
Vice President
Mr. Hogan also serves as Trustee or Vice President of other funds. Mr. Hogan serves as a Director of FMR Investment Management (UK) Limited (investment adviser firm, 2015-present) and Fidelity SelectCo, LLC (investment adviser firm, 2014-present) and President of the Equity Division of FMR (investment adviser firm, 2009-present). Previously, Mr. Hogan served as Senior Vice President, Equity Research of FMR (2006-2009) and as a portfolio manager. Mr. Brian B. Hogan is not related to Mr. Colm A. Hogan.
Colm A. Hogan (1973)
Year of Election or Appointment: 2016
Deputy Treasurer
Mr. Hogan also serves as an officer of other funds. Mr. Hogan serves as Assistant Treasurer of FMR Capital, Inc. (2017-present) and is an employee of Fidelity Investments (2005-present). Mr. Colm A. Hogan is not related to Mr. Brian B. Hogan.
Chris Maher (1972)
Year of Election or Appointment: 2013
Assistant Treasurer
Mr. Maher serves as Assistant Treasurer of other funds. Mr. Maher is Vice President of Valuation Oversight, serves as Assistant Treasurer of FMR Capital, Inc. (2017-present), and is an employee of Fidelity Investments. Previously, Mr. Maher served as Vice President of Asset Management Compliance (2013), Vice President of the Program Management Group of FMR (investment adviser firm, 2010-2013), and Vice President of Valuation Oversight (2008-2010).
Rieco E. Mello (1969)
Year of Election or Appointment: 2017
Assistant Treasurer
Mr. Mello also serves as Assistant Treasurer of other funds. Mr. Mello serves as Assistant Treasurer of FMR Capital, Inc. (2017-present) and is an employee of Fidelity Investments (1995-present).
Kenneth B. Robins (1969)
Year of Election or Appointment: 2016
Chief Compliance Officer
Mr. Robins also serves as an officer of other funds. Mr. Robins serves as Compliance Officer of Fidelity Management & Research Company and FMR Co., Inc. (investment adviser firms, 2016-present) and is an employee of Fidelity Investments (2004-present). Previously, Mr. Robins served as Executive Vice President of Fidelity Investments Money Management, Inc. (investment adviser firm, 2013-2016) and served in other fund officer roles.
Stacie M. Smith (1974)
Year of Election or Appointment: 2016
President and Treasurer
Ms. Smith also serves as an officer of other funds. Ms. Smith serves as Assistant Treasurer of FMR Capital, Inc. (2017-present), is an employee of Fidelity Investments (2009-present), and has served in other fund officer roles. Prior to joining Fidelity Investments, Ms. Smith served as Senior Audit Manager of Ernst & Young LLP (accounting firm, 1996-2009). Previously, Ms. Smith served as Deputy Treasurer of certain Fidelity® funds (2013-2016).
Marc L. Spector (1972)
Year of Election or Appointment: 2016
Assistant Treasurer
Mr. Spector also serves as an officer of other funds. Mr. Spector serves as Assistant Treasurer of FMR Capital, Inc. (2017-present) and is an employee of Fidelity Investments (2016-present). Prior to joining Fidelity Investments, Mr. Spector served as Director at the Siegfried Group (accounting firm, 2013-2016), and prior to Siegfried Group as audit senior manager at Deloitte & Touche (accounting firm, 2005-2013).
Renee Stagnone (1975)
Year of Election or Appointment: 2016
Assistant Treasurer
Ms. Stagnone also serves as an officer of other funds. Ms. Stagnone serves as Assistant Treasurer of FMR Capital, Inc. (2017-present) and is an employee of Fidelity Investments (1997-present). Previously, Ms. Stagnone served as Deputy Treasurer of certain Fidelity® funds (2013-2016).
Shareholder Expense Example
As a shareholder of the Fund, you incur two types of costs: (1) transaction costs, including sales charges (loads) on purchase payments or redemption proceeds, and (2) ongoing costs, including management fees, distribution and/or service (12b-1) fees and other Fund expenses. This Example is intended to help you understand your ongoing costs (in dollars) of investing in the Fund and to compare these costs with the ongoing costs of investing in other mutual funds.
The Example is based on an investment of $1,000 invested at the beginning of the period and held for the entire period (June 1, 2017 to November 30, 2017).
Actual Expenses
The first line of the accompanying table for each class of the Fund provides information about actual account values and actual expenses. You may use the information in this line, together with the amount you invested, to estimate the expenses that you paid over the period. Simply divide your account value by $1,000.00 (for example, an $8,600 account value divided by $1,000.00 = 8.6), then multiply the result by the number in the first line for a class of the Fund under the heading entitled "Expenses Paid During Period" to estimate the expenses you paid on your account during this period. In addition, the Fund, as a shareholder in the underlying Fidelity Central Funds, will indirectly bear its pro-rata share of the fees and expenses incurred by the underlying Fidelity Central Funds. These fees and expenses are not included in the Fund's annualized expense ratio used to calculate the expense estimate in the table below.
Hypothetical Example for Comparison Purposes
The second line of the accompanying table for each class of the Fund provides information about hypothetical account values and hypothetical expenses based on a Class' actual expense ratio and an assumed rate of return of 5% per year before expenses, which is not the Class' actual return. The hypothetical account values and expenses may not be used to estimate the actual ending account balance or expenses you paid for the period. You may use this information to compare the ongoing costs of investing in the Fund and other funds. To do so, compare this 5% hypothetical example with the 5% hypothetical examples that appear in the shareholder reports of the other funds. In addition, the Fund, as a shareholder in the underlying Fidelity Central Funds, will indirectly bear its pro-rata share of the fees and expenses incurred by the underlying Fidelity Central Funds. These fees and expenses are not included in the Fund's annualized expense ratio used to calculate the expense estimate in the table below.
Please note that the expenses shown in the table are meant to highlight your ongoing costs only and do not reflect any transaction costs. Therefore, the second line of the table is useful in comparing ongoing costs only, and will not help you determine the relative total costs of owning different funds. In addition, if these transactional costs were included, your costs would have been higher.
| Annualized Expense Ratio-A | Beginning Account Value June 1, 2017 | Ending Account Value November 30, 2017 | Expenses Paid During Period-B June 1, 2017 to November 30, 2017 | |
| Class A | .93% | |||
| Actual | $1,000.00 | $1,071.90 | $4.83 | |
| Hypothetical-C | $1,000.00 | $1,020.41 | $4.71 | |
| Class M | 1.17% | |||
| Actual | $1,000.00 | $1,070.70 | $6.07 | |
| Hypothetical-C | $1,000.00 | $1,019.20 | $5.92 | |
| Class C | 1.70% | |||
| Actual | $1,000.00 | $1,068.00 | $8.81 | |
| Hypothetical-C | $1,000.00 | $1,016.55 | $8.59 | |
| Class I | .67% | |||
| Actual | $1,000.00 | $1,073.70 | $3.48 | |
| Hypothetical-C | $1,000.00 | $1,021.71 | $3.40 | |
| Class Z | .53% | |||
| Actual | $1,000.00 | $1,074.10 | $2.76 | |
| Hypothetical-C | $1,000.00 | $1,022.41 | $2.69 |
A Annualized expense ratio reflects expenses net of applicable fee waivers.
B Expenses are equal to each Class' annualized expense ratio, multiplied by the average account value over the period, multiplied by 183/365 (to reflect the one-half year period).
C 5% return per year before expenses
Distributions (Unaudited)
The Board of Trustees of Fidelity Advisor Equity Income Fund voted to pay to shareholders of record at the opening of business on record date, the following distributions per share derived from capital gains realized from sales of portfolio securities, and dividends derived from net investment income:
| Pay Date | Record Date | Dividends | Capital Gains | |
| Fidelity Advisor Equity Income Fund | ||||
| Class A | 12/27/17 | 12/26/17 | $0.257 | $2.952 |
| Class M | 12/27/17 | 12/26/17 | $0.233 | $2.952 |
| Class C | 12/27/17 | 12/26/17 | $0.185 | $2.952 |
| Class I | 12/27/17 | 12/26/17 | $0.279 | $2.952 |
| Class Z | 12/27/17 | 12/26/17 | $0.293 | $2.952 |
The fund hereby designates as a capital gain dividend with respect to the taxable year ended November 30 2017, $152,784,859, or, if subsequently determined to be different, the net capital gain of such year.
A total of 0.09% of the dividends distributed during the fiscal year was derived from interest on U.S. Government securities which is generally exempt from state income tax.
Class A designates 93%, 100%, 100%, and 100%; Class M designates 99%, 100%, 100%, and 100% ; Class I designates 88%, 100%, 100%, and 100%; and Class Z designates 85%, 100%, 100%, and 100%; of the dividends distributed in December, April, July, and October, respectively during the fiscal year as qualifying for the dividends–received deduction for corporate shareholders. Class C designates 100% of the dividends distributed during the year as qualifying for the dividends-received deduction for corporate shareholders.
Class A designates 96%, 100%, 100%, and 100%; Class I designates 91%, 100%, 100%, and 100%; Class Z designates 88%, 100%, 100%, and 100%; of the dividends distributed in December, April, July, and October, respectively during the fiscal year as amounts which may be taken into account as a dividend for purposes of the maximum rate under section 1(h)(11) of the Internal Revenue Code. Class M and C designates 100% of the dividends distributed during the fiscal year as amounts which may be taken into account as a dividend for purposes of the maximum rate under section 1(h)(11) of the Internal Revenue Code.
The fund will notify shareholders in January 2018 of amounts for use in preparing 2017 income tax returns.
Board Approval of Investment Advisory Contracts and Management Fees
Fidelity Advisor Equity Income Fund
Each year, the Board of Trustees, including the Independent Trustees (together, the Board), votes on the renewal of the management contract with Fidelity Management & Research Company (FMR) and the sub-advisory agreements (together, the Advisory Contracts) for the fund. FMR and the sub-advisers are referred to herein as the Investment Advisers. The Board, assisted by the advice of fund counsel and Independent Trustees' counsel, requests and considers a broad range of information relevant to the renewal of the Advisory Contracts throughout the year.
The Board meets regularly and, at each of its meetings, covers an extensive agenda of topics and materials and considers factors that are relevant to its annual consideration of the renewal of the fund's Advisory Contracts, including the services and support provided to the fund and its shareholders. The Board has established various standing committees (Committees), each composed of and chaired by Independent Trustees with varying backgrounds, to which the Board has assigned specific subject matter responsibilities in order to enhance effective decision-making by the Board. The Board, acting directly and through its Committees, requests and receives information concerning the annual consideration of the renewal of the fund's Advisory Contracts. The Board also meets as needed to review matters specifically related to the Board's annual consideration of the renewal of the Advisory Contracts. Members of the Board may also meet with trustees of other Fidelity funds through ad hoc joint committees to discuss certain matters relevant to all of the Fidelity funds.
At its July 2017 meeting, the Board unanimously determined to renew the fund's Advisory Contracts. In reaching its determination, the Board considered all factors it believed relevant, including (i) the nature, extent, and quality of the services to be provided to the fund and its shareholders (including the investment performance of the fund); (ii) the competitiveness of the fund's management fee and total expense ratio relative to peer funds; (iii) the total costs of the services to be provided by and the profits to be realized by Fidelity from its relationships with the fund; and (iv) the extent to which, if any, economies of scale exist and would be realized as the fund grows, and whether any economies of scale are appropriately shared with fund shareholders.
In considering whether to renew the Advisory Contracts for the fund, the Board reached a determination, with the assistance of fund counsel and Independent Trustees' counsel and through the exercise of its business judgment, that the renewal of the Advisory Contracts was in the best interests of the fund and its shareholders and that the compensation payable under the Advisory Contracts was fair and reasonable. The Board's decision to renew the Advisory Contracts was not based on any single factor, but rather was based on a comprehensive consideration of all the information provided to the Board at its meetings throughout the year. The Board, in reaching its determination to renew the Advisory Contracts, was aware that shareholders of the fund have a broad range of investment choices available to them, including a wide choice among funds offered by Fidelity's competitors, and that the fund's shareholders, who have the opportunity to review and weigh the disclosure provided by the fund in its prospectus and other public disclosures, have chosen to invest in this fund, which is part of the Fidelity family of funds.
Amendment to Group Fee Rate. The Board also approved an amendment to the management contract for the fund to add an additional breakpoint to the group fee schedule, effective October 1, 2017. The Board noted that the additional breakpoint would result in lower management fee rates as Fidelity's assets under management increase.
Nature, Extent, and Quality of Services Provided. The Board considered Fidelity's staffing as it relates to the fund, including the backgrounds of investment personnel of Fidelity, and also considered the fund's investment objective, strategies, and related investment philosophy. The Independent Trustees also had discussions with senior management of Fidelity's investment operations and investment groups. The Board considered the structure of the investment personnel compensation program and whether this structure provides appropriate incentives to act in the best interests of the fund. Additionally, the Board considered the portfolio managers' investments, if any, in the funds that they manage.Resources Dedicated to Investment Management and Support Services. The Board and the Fund Oversight and Research Committees reviewed the general qualifications and capabilities of Fidelity's investment staff, including its size, education, experience, and resources, as well as Fidelity's approach to recruiting, training, managing, and compensating investment personnel. The Board noted that Fidelity has continued to increase the resources devoted to non-U.S. offices, including expansion of Fidelity's global investment organization. The Board also noted that Fidelity's analysts have extensive resources, tools and capabilities that allow them to conduct sophisticated quantitative and fundamental analysis, as well as credit analysis of issuers, counterparties and guarantors. Further, the Board considered that Fidelity's investment professionals have sufficient access to global information and data so as to provide competitive investment results over time, and that those professionals also have access to sophisticated tools that permit them to assess portfolio construction and risk and performance attribution characteristics continuously, as well as to transmit new information and research conclusions rapidly around the world. Additionally, in its deliberations, the Board considered Fidelity's trading, risk management, compliance, and technology and operations capabilities and resources, which are integral parts of the investment management process.Shareholder and Administrative Services. The Board considered (i) the nature, extent, quality, and cost of advisory, administrative, and shareholder services performed by the Investment Advisers and their affiliates under the Advisory Contracts and under separate agreements covering transfer agency, pricing and bookkeeping, and securities lending services for the fund; (ii) the nature and extent of the supervision of third party service providers, principally custodians, subcustodians, and pricing vendors; and (iii) the resources devoted to, and the record of compliance with, the fund's compliance policies and procedures. The Board also reviewed the allocation of fund brokerage, including allocations to brokers affiliated with the Investment Advisers, the use of brokerage commissions to pay fund expenses, and the use of "soft" commission dollars to pay for research services.The Board noted that the growth of fund assets over time across the complex allows Fidelity to reinvest in the development of services designed to enhance the value or convenience of the Fidelity funds as investment vehicles. These services include 24-hour access to account information and market information through telephone representatives and over the Internet, investor education materials and asset allocation tools, and the expanded availability of Fidelity Investor Centers.In 2014, the Board formed an ad hoc Committee on Transfer Agency Fees to review the variety of transfer agency fee structures throughout the industry and Fidelity's competitive positioning with respect to industry participants.Investment in a Large Fund Family. The Board considered the benefits to shareholders of investing in a Fidelity fund, including the benefits of investing in a fund that is part of a large family of funds offering a variety of investment disciplines and providing a large variety of mutual fund investor services. The Board noted that Fidelity had taken, or had made recommendations that resulted in the Fidelity funds taking, a number of actions over the previous year that benefited particular funds, including: (i) continuing to dedicate additional resources to Fidelity's investment research process, and to the support of the senior management team that oversees asset management; (ii) continuing efforts to enhance Fidelity's global research capabilities; (iii) launching new funds and making other enhancements to meet client needs; (iv) launching new share classes of existing funds; (v) eliminating purchase minimums and broadening eligibility requirements for certain lower-priced share classes; (vi) reducing management fees and total expenses for certain growth equity funds and index funds; (vii) lowering expense caps for certain existing funds and classes to reduce expenses borne by shareholders; (viii) eliminating short-term redemption fees for certain funds; (ix) introducing a new pricing structure for certain funds of funds that is expected to reduce overall expenses paid by shareholders; (x) rationalizing product lines and gaining increased efficiencies through proposals for fund mergers and share class consolidations; (xi) continuing to develop, acquire and implement systems and technology to improve services to the funds and shareholders, strengthen information security, and increase efficiency; and (xii) implementing enhancements to further strengthen Fidelity's product line to increase investors' probability of success in achieving their investment goals, including retirement income goals.Investment Performance. The Board considered whether the fund has operated in accordance with its investment objective, as well as its record of compliance with its investment restrictions and its performance history. The Board noted that there was a portfolio management change for the fund in April 2017.The Board took into account discussions with representatives of the Investment Advisers about fund investment performance that occur at Board meetings throughout the year. In this regard the Board noted that as part of regularly scheduled fund reviews and other reports to the Board on fund performance, the Board considers annualized return information for the fund for different time periods, measured against a securities market index ("benchmark index") and a peer group of funds with similar objectives ("peer group"), if any. In its evaluation of fund investment performance, the Board gave particular attention to information indicating changes in performance of certain Fidelity funds for specific time periods and discussed with the Investment Advisers the reasons for any overperformance or underperformance.In addition to reviewing absolute and relative fund performance, the Independent Trustees periodically consider the appropriateness of fund performance metrics in evaluating the results achieved. In general, the Independent Trustees believe that fund performance should be evaluated based on net performance (after fees and expenses) of both the highest performing and lowest performing fund share classes, where applicable, compared to appropriate benchmark indices, over appropriate time periods that may include full market cycles, and compared to peer groups, as applicable, over the same periods, taking into account relevant factors including the following: general market conditions; issuer-specific information; and fund cash flows and other factors.The Independent Trustees recognize that shareholders evaluate performance on a net basis over their own holding periods, for which one-, three-, and five-year periods are often used as a proxy. For this reason, the performance information reviewed by the Board also included net cumulative calendar year total return information for the fund and an appropriate benchmark index and peer group for the most recent one-, three-, and five-year periods, as shown below. Returns are shown compared to the 25th percentile (top of box, 75% beaten) and 75th percentile (bottom of box, 25% beaten) of the peer universe.Fidelity Advisor Equity Income Fund
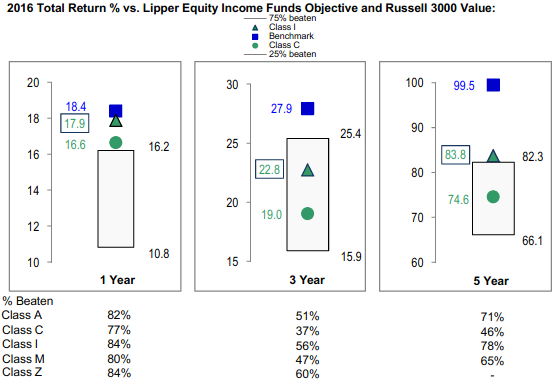
Fidelity Advisor Equity Income Fund
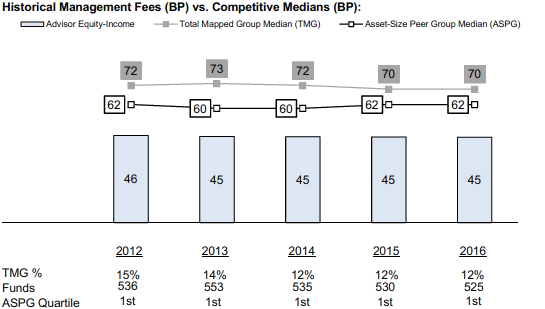
![]()
EPI-ANN-0118
1.539449.121
Fidelity Advisor® Equity Value Fund Class A, Class M (formerly Class T), Class C, Class I and Class Z Annual Report November 30, 2017 |
|
Contents
Board Approval of Investment Advisory Contracts and Management Fees |
To view a fund's proxy voting guidelines and proxy voting record for the 12-month period ended June 30, visit http://www.fidelity.com/proxyvotingresults or visit the Securities and Exchange Commission's (SEC) web site at http://www.sec.gov.
You may also call 1-877-208-0098 to request a free copy of the proxy voting guidelines.
Standard & Poor's, S&P and S&P 500 are registered service marks of The McGraw-Hill Companies, Inc. and have been licensed for use by Fidelity Distributors Corporation.
Other third-party marks appearing herein are the property of their respective owners.
All other marks appearing herein are registered or unregistered trademarks or service marks of FMR LLC or an affiliated company. © 2018 FMR LLC. All rights reserved.
This report and the financial statements contained herein are submitted for the general information of the shareholders of the Fund. This report is not authorized for distribution to prospective investors in the Fund unless preceded or accompanied by an effective prospectus.
A fund files its complete schedule of portfolio holdings with the SEC for the first and third quarters of each fiscal year on Form N-Q. Forms N-Q are available on the SEC’s web site at http://www.sec.gov. A fund's Forms N-Q may be reviewed and copied at the SEC’s Public Reference Room in Washington, DC. Information regarding the operation of the SEC's Public Reference Room may be obtained by calling 1-800-SEC-0330.
For a complete list of a fund's portfolio holdings, view the most recent holdings listing, semiannual report, or annual report on Fidelity's web site at http://www.fidelity.com, http://www.institutional.fidelity.com, or http://www.401k.com, as applicable.
NOT FDIC INSURED •MAY LOSE VALUE •NO BANK GUARANTEE
Neither the Fund nor Fidelity Distributors Corporation is a bank.
Performance: The Bottom Line
Average annual total return reflects the change in the value of an investment, assuming reinvestment of distributions from dividend income and capital gains (the profits earned upon the sale of securities that have grown in value, if any) and assuming a constant rate of performance each year. The hypothetical investment and the average annual total returns do not reflect the deduction of taxes that a shareholder would pay on fund distributions or the redemption of fund shares. During periods of reimbursement by Fidelity, a fund’s total return will be greater than it would be had the reimbursement not occurred. How a fund did yesterday is no guarantee of how it will do tomorrow.
Average Annual Total Returns
| For the periods ended November 30, 2017 | Past 1 year | Past 5 years | Past 10 years |
| Class A (incl. 5.75% sales charge) | 8.72% | 12.33% | 5.40% |
| Class M (incl. 3.50% sales charge) | 10.99% | 12.57% | 5.37% |
| Class C (incl. contingent deferred sales charge) | 13.44% | 12.81% | 5.23% |
| Class I | 15.73% | 14.04% | 6.32% |
| Class Z | 15.85% | 14.06% | 6.33% |
Class C shares' contingent deferred sales charges included in the past one year, past five years and past ten years total return figures are 1%, 0% and 0%, respectively.
The initial offering of Class Z shares took place on February 1, 2017. Returns prior to February 1, 2017, are those of Class I.
$10,000 Over 10 Years
Let's say hypothetically that $10,000 was invested in Fidelity Advisor® Equity Value Fund - Class A on November 30, 2007, and the current 5.75% sales charge was paid.
The chart shows how the value of your investment would have changed, and also shows how the Russell 3000® Value Index performed over the same period.
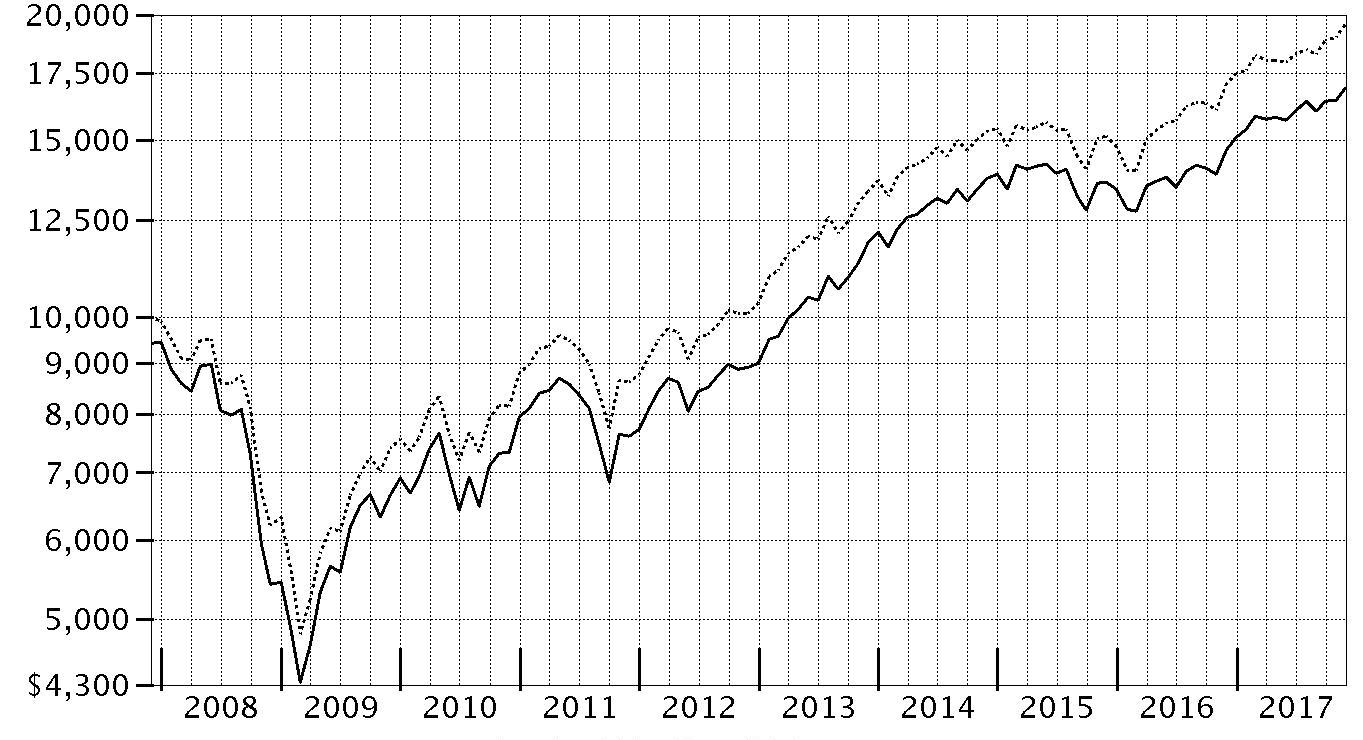
| Period Ending Values | ||
| $16,922 | Fidelity Advisor® Equity Value Fund - Class A | |
| $19,578 | Russell 3000® Value Index | |
Management's Discussion of Fund Performance
Market Recap: The U.S. equity bellwether S&P 500® index gained 22.87% for the year ending November 30, 2017, rising steadily and closing the period at an all-time high after a particularly strong three-month finish. Early on, equities rallied on optimism for President Trump’s pro-business agenda but leveled off in March amid fading optimism and stalled efforts by Congress to repeal and replace the Affordable Care Act. Upward momentum soon returned and continued through period end with consumer sentiment and other market indicators staying positive. The lone exception was a brief cooldown in August, when geopolitical tension escalated and uncertainty grew regarding the future of health care, tax reform and the debt ceiling. Sector-wise, info tech (+41%) led by a wide margin, surging amid strong earnings growth from several major index constituents. Utilities and financials each gained about 25%, the latter group riding an uptick in bond yields. Conversely, consumer discretionary (+20%) also rose solidly but lagged the broader market, as many brick-and-mortar retailers continued to suffer from increased online competition. Rising interest rates held back real estate (+16%), while consumer staples (+15%) and telecom (+1%) struggled due to investors’ general preference for risk assets. Lastly, sluggish oil prices pushed energy to a -4% return.Comments from Portfolio Manager Sean Gavin: For the fiscal year, the fund’s share classes (excluding sales charges, if applicable) gained about 14% to 16%, with all but one outperforming the 14.70% result of the benchmark Russell 3000® Value Index. Favorable positioning in energy and information technology lifted returns versus the benchmark. In contrast, poor stock picking in health care hurt relative results. A cash stake of about 5%, on average, also detracted. Health insurer Cigna – one of the fund's largest holdings as of November 30 – added value, aided by investors' easing concerns related to changes to medical reimbursement rates. Another big relative contributor was timely ownership of General Electric, a benchmark component that originally struck me as attractively valued but, over time, became less compelling to me. I ultimately sold GE in September – a good decision in hindsight, given the stock’s subsequent decline. On the negative side, our biggest individual detractor by far was an untimely non-benchmark position in Teva Pharmaceutical Industries, an Israeli drug maker that encountered a number of significant challenges. We sold our stake in October. A second big detractor was Teekay Offshore, whose stock price plunged in May after a maintenance problem with one of its vessels. Lastly, our foreign investments detracted overall, despite the tailwind of a weaker U.S. dollar.The views expressed above reflect those of the portfolio manager(s) only through the end of the period as stated on the cover of this report and do not necessarily represent the views of Fidelity or any other person in the Fidelity organization. Any such views are subject to change at any time based upon market or other conditions and Fidelity disclaims any responsibility to update such views. These views may not be relied on as investment advice and, because investment decisions for a Fidelity fund are based on numerous factors, may not be relied on as an indication of trading intent on behalf of any Fidelity fund.
Investment Summary (Unaudited)
Top Ten Stocks as of November 30, 2017
| % of fund's net assets | % of fund's net assets 6 months ago | |
| JPMorgan Chase & Co. | 4.2 | 2.6 |
| Berkshire Hathaway, Inc. Class B | 3.8 | 3.4 |
| Wells Fargo & Co. | 3.3 | 3.0 |
| Amgen, Inc. | 2.3 | 2.0 |
| CVS Health Corp. | 2.1 | 1.2 |
| U.S. Bancorp | 2.0 | 2.0 |
| Time Warner, Inc. | 1.9 | 1.1 |
| Verizon Communications, Inc. | 1.8 | 1.6 |
| Johnson & Johnson | 1.7 | 1.7 |
| Cigna Corp. | 1.7 | 1.6 |
| 24.8 |
Top Five Market Sectors as of November 30, 2017
| % of fund's net assets | % of fund's net assets 6 months ago | |
| Financials | 28.0 | 22.9 |
| Health Care | 14.4 | 14.1 |
| Consumer Discretionary | 11.2 | 9.8 |
| Consumer Staples | 9.7 | 7.0 |
| Information Technology | 9.5 | 12.7 |
Asset Allocation (% of fund's net assets)
| As of November 30, 2017* | ||
| Stocks | 97.2% | |
| Short-Term Investments and Net Other Assets (Liabilities) | 2.8% | |

* Foreign investments - 20.1%
| As of May 31, 2017* | ||
| Stocks | 89.9% | |
| Short-Term Investments and Net Other Assets (Liabilities) | 10.1% | |

* Foreign investments - 22.1%
Investments November 30, 2017
Showing Percentage of Net Assets
| Common Stocks - 97.2% | |||
| Shares | Value | ||
| CONSUMER DISCRETIONARY - 11.2% | |||
| Leisure Products - 0.5% | |||
| Vista Outdoor, Inc. (a) | 88,400 | $1,273,844 | |
| Media - 8.6% | |||
| CBS Corp. Class B | 58,000 | 3,251,480 | |
| Cinemark Holdings, Inc. | 50,700 | 1,830,777 | |
| Interpublic Group of Companies, Inc. | 150,400 | 2,974,912 | |
| John Wiley & Sons, Inc. Class A | 27,315 | 1,615,682 | |
| Lions Gate Entertainment Corp. Class B | 114,081 | 3,541,074 | |
| Time Warner, Inc. | 57,900 | 5,298,429 | |
| Twenty-First Century Fox, Inc. Class A | 114,500 | 3,657,130 | |
| WPP PLC | 124,400 | 2,195,473 | |
| 24,364,957 | |||
| Textiles, Apparel & Luxury Goods - 2.1% | |||
| Christian Dior SA | 6,600 | 2,360,623 | |
| PVH Corp. | 26,300 | 3,538,665 | |
| 5,899,288 | |||
| TOTAL CONSUMER DISCRETIONARY | 31,538,089 | ||
| CONSUMER STAPLES - 9.7% | |||
| Beverages - 1.5% | |||
| C&C Group PLC | 462,720 | 1,575,152 | |
| PepsiCo, Inc. | 22,100 | 2,575,092 | |
| 4,150,244 | |||
| Food & Staples Retailing - 3.0% | |||
| CVS Health Corp. | 77,900 | 5,967,140 | |
| Sysco Corp. | 42,200 | 2,436,206 | |
| 8,403,346 | |||
| Food Products - 3.6% | |||
| Campbell Soup Co. | 32,600 | 1,607,180 | |
| Kellogg Co. | 38,400 | 2,540,544 | |
| Seaboard Corp. | 328 | 1,418,613 | |
| The J.M. Smucker Co. | 39,679 | 4,629,349 | |
| 10,195,686 | |||
| Personal Products - 0.6% | |||
| Unilever NV (Certificaten Van Aandelen) (Bearer) | 30,700 | 1,770,436 | |
| Tobacco - 1.0% | |||
| British American Tobacco PLC: | |||
| (United Kingdom) | 23,900 | 1,519,857 | |
| sponsored ADR | 22,100 | 1,406,223 | |
| 2,926,080 | |||
| TOTAL CONSUMER STAPLES | 27,445,792 | ||
| ENERGY - 7.6% | |||
| Energy Equipment & Services - 0.7% | |||
| Baker Hughes, a GE Co. Class A | 48,000 | 1,427,040 | |
| Dril-Quip, Inc. (a) | 10,646 | 510,476 | |
| 1,937,516 | |||
| Oil, Gas & Consumable Fuels - 6.9% | |||
| Chevron Corp. | 38,097 | 4,533,162 | |
| FLEX LNG Ltd. (a) | 752,771 | 1,049,606 | |
| GasLog Ltd. | 34,000 | 612,000 | |
| GasLog Partners LP | 97,700 | 2,159,170 | |
| Golar LNG Partners LP | 85,800 | 1,715,142 | |
| Hoegh LNG Partners LP | 59,300 | 1,037,750 | |
| Phillips 66 Co. | 28,500 | 2,780,460 | |
| Suncor Energy, Inc. | 43,200 | 1,498,430 | |
| Teekay Corp. (b) | 135,500 | 1,128,715 | |
| Teekay LNG Partners LP | 121,300 | 2,189,465 | |
| Teekay Offshore Partners LP | 375,913 | 883,396 | |
| 19,587,296 | |||
| TOTAL ENERGY | 21,524,812 | ||
| FINANCIALS - 28.0% | |||
| Banks - 12.0% | |||
| JPMorgan Chase & Co. | 114,352 | 11,952,069 | |
| PNC Financial Services Group, Inc. | 25,400 | 3,570,224 | |
| SunTrust Banks, Inc. | 55,400 | 3,414,302 | |
| U.S. Bancorp | 100,966 | 5,568,275 | |
| Wells Fargo & Co. | 166,032 | 9,375,827 | |
| 33,880,697 | |||
| Capital Markets - 1.4% | |||
| Goldman Sachs Group, Inc. | 14,800 | 3,665,072 | |
| State Street Corp. | 1,500 | 143,025 | |
| 3,808,097 | |||
| Consumer Finance - 2.9% | |||
| Capital One Financial Corp. | 24,818 | 2,283,256 | |
| Discover Financial Services | 39,400 | 2,781,640 | |
| Synchrony Financial | 88,800 | 3,187,032 | |
| 8,251,928 | |||
| Diversified Financial Services - 4.6% | |||
| Berkshire Hathaway, Inc. Class B (a) | 56,469 | 10,899,082 | |
| Cannae Holdings, Inc. (a) | 39,592 | 720,970 | |
| Standard Life PLC | 249,514 | 1,451,679 | |
| 13,071,731 | |||
| Insurance - 4.4% | |||
| Allstate Corp. | 26,400 | 2,710,224 | |
| Chubb Ltd. | 18,400 | 2,798,824 | |
| FNF Group | 41,380 | 1,674,235 | |
| Prudential PLC | 91,053 | 2,288,873 | |
| The Travelers Companies, Inc. | 22,487 | 3,048,563 | |
| 12,520,719 | |||
| Mortgage Real Estate Investment Trusts - 2.7% | |||
| AGNC Investment Corp. | 136,401 | 2,714,380 | |
| Annaly Capital Management, Inc. | 247,305 | 2,886,049 | |
| MFA Financial, Inc. | 262,536 | 2,100,288 | |
| 7,700,717 | |||
| TOTAL FINANCIALS | 79,233,889 | ||
| HEALTH CARE - 14.4% | |||
| Biotechnology - 3.5% | |||
| Amgen, Inc. | 36,600 | 6,429,156 | |
| Dyax Corp. rights 12/31/19 (a)(c) | 58,900 | 198,493 | |
| Shire PLC sponsored ADR | 22,443 | 3,338,396 | |
| 9,966,045 | |||
| Health Care Providers & Services - 4.6% | |||
| Aetna, Inc. | 13,900 | 2,504,502 | |
| Anthem, Inc. | 12,300 | 2,890,008 | |
| Cigna Corp. | 22,400 | 4,742,752 | |
| McKesson Corp. | 20,400 | 3,013,896 | |
| 13,151,158 | |||
| Pharmaceuticals - 6.3% | |||
| Allergan PLC | 21,000 | 3,650,430 | |
| Bayer AG | 27,800 | 3,548,481 | |
| Johnson & Johnson | 35,292 | 4,917,234 | |
| Pfizer, Inc. | 87,800 | 3,183,628 | |
| Sanofi SA sponsored ADR | 53,500 | 2,441,740 | |
| 17,741,513 | |||
| TOTAL HEALTH CARE | 40,858,716 | ||
| INDUSTRIALS - 6.4% | |||
| Aerospace & Defense - 1.7% | |||
| United Technologies Corp. | 39,000 | 4,736,550 | |
| Machinery - 0.8% | |||
| Allison Transmission Holdings, Inc. | 3,500 | 143,640 | |
| Deere & Co. | 13,510 | 2,024,609 | |
| 2,168,249 | |||
| Professional Services - 2.4% | |||
| Dun & Bradstreet Corp. | 30,100 | 3,705,611 | |
| Nielsen Holdings PLC | 87,000 | 3,194,640 | |
| 6,900,251 | |||
| Road & Rail - 1.0% | |||
| Union Pacific Corp. | 23,200 | 2,934,800 | |
| Trading Companies & Distributors - 0.5% | |||
| AerCap Holdings NV (a) | 26,000 | 1,351,220 | |
| TOTAL INDUSTRIALS | 18,091,070 | ||
| INFORMATION TECHNOLOGY - 9.5% | |||
| Communications Equipment - 3.1% | |||
| Cisco Systems, Inc. | 125,482 | 4,680,479 | |
| F5 Networks, Inc. (a) | 13,100 | 1,758,020 | |
| Harris Corp. | 16,000 | 2,312,000 | |
| 8,750,499 | |||
| Electronic Equipment & Components - 0.9% | |||
| TE Connectivity Ltd. | 27,598 | 2,606,355 | |
| Internet Software & Services - 2.5% | |||
| Alphabet, Inc. Class A (a) | 3,400 | 3,522,978 | |
| comScore, Inc. (a)(b) | 63,000 | 1,826,370 | |
| eBay, Inc. (a) | 4,000 | 138,680 | |
| VeriSign, Inc. (a)(b) | 14,900 | 1,714,990 | |
| 7,203,018 | |||
| IT Services - 1.8% | |||
| Amdocs Ltd. | 25,400 | 1,658,366 | |
| Cognizant Technology Solutions Corp. Class A | 26,700 | 1,929,876 | |
| The Western Union Co. | 79,500 | 1,565,355 | |
| 5,153,597 | |||
| Software - 0.1% | |||
| Black Knight, Inc. (a) | 5,588 | 250,901 | |
| Technology Hardware, Storage & Peripherals - 1.1% | |||
| Apple, Inc. | 17,700 | 3,041,745 | |
| TOTAL INFORMATION TECHNOLOGY | 27,006,115 | ||
| MATERIALS - 3.3% | |||
| Chemicals - 1.8% | |||
| LyondellBasell Industries NV Class A | 30,500 | 3,193,350 | |
| Monsanto Co. | 16,600 | 1,964,444 | |
| 5,157,794 | |||
| Containers & Packaging - 1.5% | |||
| Ball Corp. | 49,900 | 1,991,509 | |
| Graphic Packaging Holding Co. | 139,500 | 2,135,745 | |
| 4,127,254 | |||
| TOTAL MATERIALS | 9,285,048 | ||
| REAL ESTATE - 1.1% | |||
| Real Estate Management & Development - 1.1% | |||
| CBRE Group, Inc. (a) | 72,500 | 3,143,600 | |
| TELECOMMUNICATION SERVICES - 1.8% | |||
| Diversified Telecommunication Services - 1.8% | |||
| Verizon Communications, Inc. | 97,700 | 4,971,953 | |
| UTILITIES - 4.2% | |||
| Electric Utilities - 3.9% | |||
| Exelon Corp. | 106,100 | 4,425,431 | |
| PPL Corp. | 67,900 | 2,489,893 | |
| Xcel Energy, Inc. | 78,500 | 4,051,385 | |
| 10,966,709 | |||
| Gas Utilities - 0.3% | |||
| WGL Holdings, Inc. | 11,300 | 955,302 | |
| TOTAL UTILITIES | 11,922,011 | ||
| TOTAL COMMON STOCKS | |||
| (Cost $229,801,590) | 275,021,095 | ||
| Money Market Funds - 4.0% | |||
| Fidelity Cash Central Fund, 1.13% (d) | 8,163,756 | 8,165,389 | |
| Fidelity Securities Lending Cash Central Fund 1.13% (d)(e) | 3,261,956 | 3,262,283 | |
| TOTAL MONEY MARKET FUNDS | |||
| (Cost $11,427,581) | 11,427,672 | ||
| TOTAL INVESTMENT IN SECURITIES - 101.2% | |||
| (Cost $241,229,171) | 286,448,767 | ||
| NET OTHER ASSETS (LIABILITIES) - (1.2)% | (3,486,313) | ||
| NET ASSETS - 100% | $282,962,454 |
Legend
(a) Non-income producing
(b) Security or a portion of the security is on loan at period end.
(c) Level 3 security
(d) Affiliated fund that is generally available only to investment companies and other accounts managed by Fidelity Investments. The rate quoted is the annualized seven-day yield of the fund at period end. A complete unaudited listing of the fund's holdings as of its most recent quarter end is available upon request. In addition, each Fidelity Central Fund's financial statements, which are not covered by the Fund's Report of Independent Registered Public Accounting Firm, are available on the SEC's website or upon request.
(e) Investment made with cash collateral received from securities on loan.
Affiliated Central Funds
Information regarding fiscal year to date income earned by the Fund from investments in Fidelity Central Funds is as follows:
| Fund | Income earned |
| Fidelity Cash Central Fund | $107,284 |
| Fidelity Securities Lending Cash Central Fund | 47,711 |
| Total | $154,995 |
Investment Valuation
The following is a summary of the inputs used, as of November 30, 2017, involving the Fund's assets and liabilities carried at fair value. The inputs or methodology used for valuing securities may not be an indication of the risk associated with investing in those securities. For more information on valuation inputs, and their aggregation into the levels used below, please refer to the Investment Valuation section in the accompanying Notes to Financial Statements.
| Valuation Inputs at Reporting Date: | ||||
| Description | Total | Level 1 | Level 2 | Level 3 |
| Investments in Securities: | ||||
| Equities: | ||||
| Consumer Discretionary | $31,538,089 | $29,342,616 | $2,195,473 | $-- |
| Consumer Staples | 27,445,792 | 24,155,499 | 3,290,293 | -- |
| Energy | 21,524,812 | 21,524,812 | -- | -- |
| Financials | 79,233,889 | 76,945,016 | 2,288,873 | -- |
| Health Care | 40,858,716 | 37,111,742 | 3,548,481 | 198,493 |
| Industrials | 18,091,070 | 18,091,070 | -- | -- |
| Information Technology | 27,006,115 | 27,006,115 | -- | -- |
| Materials | 9,285,048 | 9,285,048 | -- | -- |
| Real Estate | 3,143,600 | 3,143,600 | -- | -- |
| Telecommunication Services | 4,971,953 | 4,971,953 | -- | -- |
| Utilities | 11,922,011 | 11,922,011 | -- | -- |
| Money Market Funds | 11,427,672 | 11,427,672 | -- | -- |
| Total Investments in Securities: | $286,448,767 | $274,927,154 | $11,323,120 | $198,493 |
Other Information
Distribution of investments by country or territory of incorporation, as a percentage of Total Net Assets, is as follows (Unaudited):
| United States of America | 79.9% |
| Marshall Islands | 3.2% |
| United Kingdom | 2.9% |
| Netherlands | 2.2% |
| Bailiwick of Jersey | 2.0% |
| Switzerland | 1.9% |
| Ireland | 1.9% |
| Canada | 1.8% |
| France | 1.7% |
| Germany | 1.3% |
| Others (Individually Less Than 1%) | 1.2% |
| 100.0% |
See accompanying notes which are an integral part of the financial statements.
Financial Statements
Statement of Assets and Liabilities
| November 30, 2017 | ||
| Assets | ||
| Investment in securities, at value (including securities loaned of $3,165,991) — See accompanying schedule: Unaffiliated issuers (cost $229,801,590) | $275,021,095 | |
| Fidelity Central Funds (cost $11,427,581) | 11,427,672 | |
| Total Investment in Securities (cost $241,229,171) | $286,448,767 | |
| Receivable for investments sold | 215,991 | |
| Receivable for fund shares sold | 168,405 | |
| Dividends receivable | 645,663 | |
| Distributions receivable from Fidelity Central Funds | 15,701 | |
| Prepaid expenses | 562 | |
| Other receivables | 2,461 | |
| Total assets | 287,497,550 | |
| Liabilities | ||
| Payable for investments purchased | $639,008 | |
| Payable for fund shares redeemed | 364,110 | |
| Accrued management fee | 114,264 | |
| Distribution and service plan fees payable | 53,192 | |
| Other affiliated payables | 55,179 | |
| Other payables and accrued expenses | 47,868 | |
| Collateral on securities loaned | 3,261,475 | |
| Total liabilities | 4,535,096 | |
| Net Assets | $282,962,454 | |
| Net Assets consist of: | ||
| Paid in capital | $235,798,858 | |
| Undistributed net investment income | 1,877,265 | |
| Accumulated undistributed net realized gain (loss) on investments and foreign currency transactions | 65,194 | |
| Net unrealized appreciation (depreciation) on investments and assets and liabilities in foreign currencies | 45,221,137 | |
| Net Assets | $282,962,454 | |
| Calculation of Maximum Offering Price | ||
| Class A: | ||
| Net Asset Value and redemption price per share ($81,228,829 ÷ 4,310,643 shares) | $18.84 | |
| Maximum offering price per share (100/94.25 of $18.84) | $19.99 | |
| Class M: | ||
| Net Asset Value and redemption price per share ($38,976,208 ÷ 2,072,692 shares) | $18.80 | |
| Maximum offering price per share (100/96.50 of $18.80) | $19.48 | |
| Class C: | ||
| Net Asset Value and offering price per share ($25,426,608 ÷ 1,387,206 shares)(a) | $18.33 | |
| Class I: | ||
| Net Asset Value, offering price and redemption price per share ($136,749,737 ÷ 7,130,242 shares) | $19.18 | |
| Class Z: | ||
| Net Asset Value, offering price and redemption price per share ($581,072 ÷ 30,260 shares) | $19.20 |
(a) Redemption price per share is equal to net asset value less any applicable contingent deferred sales charge.
See accompanying notes which are an integral part of the financial statements.
Statement of Operations
| Year ended November 30, 2017 | ||
| Investment Income | ||
| Dividends | $4,993,313 | |
| Interest | 127 | |
| Income from Fidelity Central Funds | 154,995 | |
| Total income | 5,148,435 | |
| Expenses | ||
| Management fee | ||
| Basic fee | $1,235,376 | |
| Performance adjustment | (50,318) | |
| Transfer agent fees | 468,877 | |
| Distribution and service plan fees | 684,912 | |
| Accounting and security lending fees | 88,982 | |
| Custodian fees and expenses | 18,410 | |
| Independent trustees' fees and expenses | 834 | |
| Registration fees | 83,991 | |
| Audit | 69,974 | |
| Legal | 4,812 | |
| Miscellaneous | 1,991 | |
| Total expenses before reductions | 2,607,841 | |
| Expense reductions | (26,881) | 2,580,960 |
| Net investment income (loss) | 2,567,475 | |
| Realized and Unrealized Gain (Loss) | ||
| Net realized gain (loss) on: | ||
| Investment securities: | ||
| Unaffiliated issuers | 3,205,760 | |
| Fidelity Central Funds | 859 | |
| Foreign currency transactions | 266 | |
| Futures contracts | (35,028) | |
| Total net realized gain (loss) | 3,171,857 | |
| Change in net unrealized appreciation (depreciation) on: | ||
| Investment securities: | ||
| Unaffiliated issuers | 26,263,685 | |
| Fidelity Central Funds | (962) | |
| Assets and liabilities in foreign currencies | 2,478 | |
| Total change in net unrealized appreciation (depreciation) | 26,265,201 | |
| Net gain (loss) | 29,437,058 | |
| Net increase (decrease) in net assets resulting from operations | $32,004,533 |
See accompanying notes which are an integral part of the financial statements.
Statement of Changes in Net Assets
| Year ended November 30, 2017 | Year ended November 30, 2016 | |
| Increase (Decrease) in Net Assets | ||
| Operations | ||
| Net investment income (loss) | $2,567,475 | $1,502,803 |
| Net realized gain (loss) | 3,171,857 | (1,679,697) |
| Change in net unrealized appreciation (depreciation) | 26,265,201 | 13,411,815 |
| Net increase (decrease) in net assets resulting from operations | 32,004,533 | 13,234,921 |
| Distributions to shareholders from net investment income | (1,129,904) | (2,149,087) |
| Distributions to shareholders from net realized gain | – | (1,357,985) |
| Total distributions | (1,129,904) | (3,507,072) |
| Share transactions - net increase (decrease) | 78,757,819 | 5,898,818 |
| Total increase (decrease) in net assets | 109,632,448 | 15,626,667 |
| Net Assets | ||
| Beginning of period | 173,330,006 | 157,703,339 |
| End of period | $282,962,454 | $173,330,006 |
| Other Information | ||
| Undistributed net investment income end of period | $1,877,265 | $985,499 |
See accompanying notes which are an integral part of the financial statements.
Financial Highlights
Fidelity Advisor Equity Value Fund Class A
| Years ended November 30, | 2017 | 2016 | 2015 | 2014 | 2013 |
| Selected Per–Share Data | |||||
| Net asset value, beginning of period | $16.46 | $15.66 | $16.00 | $13.93 | $10.60 |
| Income from Investment Operations | |||||
| Net investment income (loss)A | .21 | .17 | .35B | .17 | .13 |
| Net realized and unrealized gain (loss) | 2.30 | 1.00 | (.50)C | 2.01 | 3.33 |
| Total from investment operations | 2.51 | 1.17 | (.15) | 2.18 | 3.46 |
| Distributions from net investment income | (.13) | (.24)D | (.19) | (.11) | (.13) |
| Distributions from net realized gain | – | (.13)D | – | – | – |
| Total distributions | (.13) | (.37) | (.19) | (.11) | (.13) |
| Net asset value, end of period | $18.84 | $16.46 | $15.66 | $16.00 | $13.93 |
| Total ReturnE,F | 15.35% | 7.75% | (.91)%C | 15.79% | 33.09% |
| Ratios to Average Net AssetsG,H | |||||
| Expenses before reductions | 1.10% | 1.19% | 1.24% | 1.23% | 1.22% |
| Expenses net of fee waivers, if any | 1.09% | 1.19% | 1.23% | 1.23% | 1.22% |
| Expenses net of all reductions | 1.08% | 1.19% | 1.23% | 1.23% | 1.20% |
| Net investment income (loss) | 1.18% | 1.08% | 2.23%B | 1.15% | 1.07% |
| Supplemental Data | |||||
| Net assets, end of period (000 omitted) | $81,229 | $77,787 | $67,005 | $50,957 | $39,538 |
| Portfolio turnover rateI | 42% | 46% | 49% | 68% | 68% |
A Calculated based on average shares outstanding during the period.
B Net Investment income per share reflects a large, non-recurring dividend which amounted to $.14 per share. Excluding this non-recurring dividend, the ratio of net investment income (loss) to average net assets would have been 1.31%.
C Net realized and unrealized gain (loss) per share reflects proceeds received from litigation which amounted to $.01 per share. Excluding these litigation proceeds, the total return would have been (.99)%.
D The amounts shown reflect certain reclassifications related to book to tax differences that were made in the year shown.
E Total returns would have been lower if certain expenses had not been reduced during the applicable periods shown.
F Total returns do not include the effect of the sales charges.
G Fees and expenses of any underlying Fidelity Central Funds are not included in the Fund's expense ratio. The Fund indirectly bears its proportionate share of the expenses of any underlying Fidelity Central Funds.
H Expense ratios reflect operating expenses of the class. Expenses before reductions do not reflect amounts reimbursed by the investment adviser or reductions from brokerage service arrangements or reductions from other expense offset arrangements and do not represent the amount paid by the class during periods when reimbursements or reductions occur. Expenses net of fee waivers reflect expenses after reimbursement by the investment adviser but prior to reductions from brokerage service arrangements or other expense offset arrangements. Expenses net of all reductions represent the net expenses paid by the class.
I Amount does not include the portfolio activity of any underlying Fidelity Central Funds.
See accompanying notes which are an integral part of the financial statements.
Fidelity Advisor Equity Value Fund Class M
| Years ended November 30, | 2017 | 2016 | 2015 | 2014 | 2013 |
| Selected Per–Share Data | |||||
| Net asset value, beginning of period | $16.43 | $15.62 | $15.96 | $13.90 | $10.57 |
| Income from Investment Operations | |||||
| Net investment income (loss)A | .16 | .12 | .31B | .13 | .10 |
| Net realized and unrealized gain (loss) | 2.30 | 1.01 | (.50)C | 2.01 | 3.34 |
| Total from investment operations | 2.46 | 1.13 | (.19) | 2.14 | 3.44 |
| Distributions from net investment income | (.09) | (.19)D | (.15) | (.08) | (.11) |
| Distributions from net realized gain | – | (.13)D | – | – | – |
| Total distributions | (.09) | (.32) | (.15) | (.08) | (.11) |
| Net asset value, end of period | $18.80 | $16.43 | $15.62 | $15.96 | $13.90 |
| Total ReturnE,F | 15.02% | 7.49% | (1.19)%C | 15.46% | 32.82% |
| Ratios to Average Net AssetsG,H | |||||
| Expenses before reductions | 1.36% | 1.46% | 1.50% | 1.49% | 1.48% |
| Expenses net of fee waivers, if any | 1.35% | 1.46% | 1.50% | 1.49% | 1.48% |
| Expenses net of all reductions | 1.35% | 1.45% | 1.50% | 1.49% | 1.46% |
| Net investment income (loss) | .91% | .81% | 1.96%B | .88% | .81% |
| Supplemental Data | |||||
| Net assets, end of period (000 omitted) | $38,976 | $38,565 | $34,643 | $31,087 | $27,241 |
| Portfolio turnover rateI | 42% | 46% | 49% | 68% | 68% |
A Calculated based on average shares outstanding during the period.
B Net Investment income per share reflects a large, non-recurring dividend which amounted to $.14 per share. Excluding this non-recurring dividend, the ratio of net investment income (loss) to average net assets would have been 1.05%.
C Net realized and unrealized gain (loss) per share reflects proceeds received from litigation which amounted to $.01 per share. Excluding these litigation proceeds, the total return would have been (1.27)%.
D The amounts shown reflect certain reclassifications related to book to tax differences that were made in the year shown.
E Total returns would have been lower if certain expenses had not been reduced during the applicable periods shown.
F Total returns do not include the effect of the sales charges.
G Fees and expenses of any underlying Fidelity Central Funds are not included in the Fund's expense ratio. The Fund indirectly bears its proportionate share of the expenses of any underlying Fidelity Central Funds.
H Expense ratios reflect operating expenses of the class. Expenses before reductions do not reflect amounts reimbursed by the investment adviser or reductions from brokerage service arrangements or reductions from other expense offset arrangements and do not represent the amount paid by the class during periods when reimbursements or reductions occur. Expenses net of fee waivers reflect expenses after reimbursement by the investment adviser but prior to reductions from brokerage service arrangements or other expense offset arrangements. Expenses net of all reductions represent the net expenses paid by the class.
I Amount does not include the portfolio activity of any underlying Fidelity Central Funds.
See accompanying notes which are an integral part of the financial statements.
Fidelity Advisor Equity Value Fund Class C
| Years ended November 30, | 2017 | 2016 | 2015 | 2014 | 2013 |
| Selected Per–Share Data | |||||
| Net asset value, beginning of period | $16.04 | $15.27 | $15.63 | $13.63 | $10.37 |
| Income from Investment Operations | |||||
| Net investment income (loss)A | .07 | .05 | .23B | .06 | .04 |
| Net realized and unrealized gain (loss) | 2.24 | .98 | (.49)C | 1.97 | 3.28 |
| Total from investment operations | 2.31 | 1.03 | (.26) | 2.03 | 3.32 |
| Distributions from net investment income | (.02) | (.13)D | (.10) | (.03) | (.06) |
| Distributions from net realized gain | – | (.13)D | – | – | – |
| Total distributions | (.02) | (.26) | (.10) | (.03) | (.06) |
| Net asset value, end of period | $18.33 | $16.04 | $15.27 | $15.63 | $13.63 |
| Total ReturnE,F | 14.44% | 6.95% | (1.68)%C | 14.90% | 32.16% |
| Ratios to Average Net AssetsG,H | |||||
| Expenses before reductions | 1.87% | 1.96% | 2.00% | 2.00% | 1.97% |
| Expenses net of fee waivers, if any | 1.86% | 1.96% | 2.00% | 2.00% | 1.97% |
| Expenses net of all reductions | 1.86% | 1.95% | 2.00% | 1.99% | 1.96% |
| Net investment income (loss) | .40% | .31% | 1.46%B | .38% | .32% |
| Supplemental Data | |||||
| Net assets, end of period (000 omitted) | $25,427 | $34,006 | $28,295 | $18,614 | $12,329 |
| Portfolio turnover rateI | 42% | 46% | 49% | 68% | 68% |
A Calculated based on average shares outstanding during the period.
B Net Investment income per share reflects a large, non-recurring dividend which amounted to $.14 per share. Excluding this non-recurring dividend, the ratio of net investment income (loss) to average net assets would have been .55%.
C Net realized and unrealized gain (loss) per share reflects proceeds received from litigation which amounted to $.01 per share. Excluding these litigation proceeds, the total return would have been (1.76)%.
D The amounts shown reflect certain reclassifications related to book to tax differences that were made in the year shown.
E Total returns would have been lower if certain expenses had not been reduced during the applicable periods shown.
F Total returns do not include the effect of the contingent deferred sales charge.
G Fees and expenses of any underlying Fidelity Central Funds are not included in the Fund's expense ratio. The Fund indirectly bears its proportionate share of the expenses of any underlying Fidelity Central Funds.
H Expense ratios reflect operating expenses of the class. Expenses before reductions do not reflect amounts reimbursed by the investment adviser or reductions from brokerage service arrangements or reductions from other expense offset arrangements and do not represent the amount paid by the class during periods when reimbursements or reductions occur. Expenses net of fee waivers reflect expenses after reimbursement by the investment adviser but prior to reductions from brokerage service arrangements or other expense offset arrangements. Expenses net of all reductions represent the net expenses paid by the class.
I Amount does not include the portfolio activity of any underlying Fidelity Central Funds.
See accompanying notes which are an integral part of the financial statements.
Fidelity Advisor Equity Value Fund Class I
| Years ended November 30, | 2017 | 2016 | 2015 | 2014 | 2013 |
| Selected Per–Share Data | |||||
| Net asset value, beginning of period | $16.74 | $15.93 | $16.27 | $14.16 | $10.75 |
| Income from Investment Operations | |||||
| Net investment income (loss)A | .26 | .21 | .40B | .22 | .17 |
| Net realized and unrealized gain (loss) | 2.35 | 1.02 | (.50)C | 2.04 | 3.39 |
| Total from investment operations | 2.61 | 1.23 | (.10) | 2.26 | 3.56 |
| Distributions from net investment income | (.17) | (.29)D | (.24) | (.15) | (.15) |
| Distributions from net realized gain | – | (.13)D | – | – | – |
| Total distributions | (.17) | (.42) | (.24) | (.15) | (.15) |
| Net asset value, end of period | $19.18 | $16.74 | $15.93 | $16.27 | $14.16 |
| Total ReturnE | 15.73% | 8.02% | (.60)%C | 16.16% | 33.61% |
| Ratios to Average Net AssetsF,G | |||||
| Expenses before reductions | .82% | .91% | .93% | .91% | .89% |
| Expenses net of fee waivers, if any | .82% | .91% | .93% | .91% | .89% |
| Expenses net of all reductions | .82% | .91% | .93% | .91% | .87% |
| Net investment income (loss) | 1.45% | 1.36% | 2.53%B | 1.46% | 1.40% |
| Supplemental Data | |||||
| Net assets, end of period (000 omitted) | $136,750 | $22,972 | $25,984 | $5,162 | $3,126 |
| Portfolio turnover rateH | 42% | 46% | 49% | 68% | 68% |
A Calculated based on average shares outstanding during the period.
B Net Investment income per share reflects a large, non-recurring dividend which amounted to $.15 per share. Excluding this non-recurring dividend, the ratio of net investment income (loss) to average net assets would have been 1.61%.
C Net realized and unrealized gain (loss) per share reflects proceeds received from litigation which amounted to $.01 per share. Excluding these litigation proceeds, the total return would have been (.68)%.
D The amounts shown reflect certain reclassifications related to book to tax differences that were made in the year shown.
E Total returns would have been lower if certain expenses had not been reduced during the applicable periods shown.
F Fees and expenses of any underlying Fidelity Central Funds are not included in the Fund's expense ratio. The Fund indirectly bears its proportionate share of the expenses of any underlying Fidelity Central Funds.
G Expense ratios reflect operating expenses of the class. Expenses before reductions do not reflect amounts reimbursed by the investment adviser or reductions from brokerage service arrangements or reductions from other expense offset arrangements and do not represent the amount paid by the class during periods when reimbursements or reductions occur. Expenses net of fee waivers reflect expenses after reimbursement by the investment adviser but prior to reductions from brokerage service arrangements or other expense offset arrangements. Expenses net of all reductions represent the net expenses paid by the class.
H Amount does not include the portfolio activity of any underlying Fidelity Central Funds.
See accompanying notes which are an integral part of the financial statements.
Fidelity Advisor Equity Value Fund Class Z
| Years ended November 30, | 2017 A |
| Selected Per–Share Data | |
| Net asset value, beginning of period | $17.46 |
| Income from Investment Operations | |
| Net investment income (loss)B | .24 |
| Net realized and unrealized gain (loss) | 1.50 |
| Total from investment operations | 1.74 |
| Distributions from net investment income | – |
| Total distributions | – |
| Net asset value, end of period | $19.20 |
| Total ReturnC,D | 9.97% |
| Ratios to Average Net AssetsE,F | |
| Expenses before reductions | .69%G |
| Expenses net of fee waivers, if any | .69%G |
| Expenses net of all reductions | .68%G |
| Net investment income (loss) | 1.59%G |
| Supplemental Data | |
| Net assets, end of period (000 omitted) | $581 |
| Portfolio turnover rateH | 42% |
A For the period February 1, 2017 (commencement of sale of shares) to November 30, 2017.
B Calculated based on average shares outstanding during the period.
C Total returns for periods of less than one year are not annualized.
D Total returns would have been lower if certain expenses had not been reduced during the applicable periods shown.
E Fees and expenses of any underlying Fidelity Central Funds are not included in the Fund's expense ratio. The Fund indirectly bears its proportionate share of the expenses of any underlying Fidelity Central Funds.
F Expense ratios reflect operating expenses of the class. Expenses before reductions do not reflect amounts reimbursed by the investment adviser or reductions from brokerage service arrangements or reductions from other expense offset arrangements and do not represent the amount paid by the class during periods when reimbursements or reductions occur. Expense ratios before reductions for start-up periods may not be representative of longer-term operating periods. Expenses net of fee waivers reflect expenses after reimbursement by the investment adviser but prior to reductions from brokerage service arrangements or other expense offset arrangements. Expenses net of all reductions represent the net expenses paid by the class.
G Annualized
H Amount does not include the portfolio activity of any underlying Fidelity Central Funds.
See accompanying notes which are an integral part of the financial statements.
Notes to Financial Statements
For the period ended November 30, 2017
1. Organization.
Fidelity Advisor Equity Value Fund (the Fund) is a fund of Fidelity Advisor Series I (the Trust) and is authorized to issue an unlimited number of shares. The Trust is registered under the Investment Company Act of 1940, as amended (the 1940 Act), as an open-end management investment company organized as a Massachusetts business trust. The Fund commenced sale of Class Z shares on February 1, 2017. The Fund offers Class A, Class M (formerly Class T), Class C, Class I and Class Z shares, each of which has equal rights as to assets and voting privileges. Each class has exclusive voting rights with respect to matters that affect that class.
After the close of business on June 24, 2016, all outstanding Class B shares were converted to Class A shares. All prior fiscal period dollar and share amounts for Class B presented in the Notes to Financial Statements are for the period December 1, 2015 through June 24, 2016.
2. Investments in Fidelity Central Funds.
The Fund invests in Fidelity Central Funds, which are open-end investment companies generally available only to other investment companies and accounts managed by the investment adviser and its affiliates. The Fund's Schedule of Investments lists each of the Fidelity Central Funds held as of period end, if any, as an investment of the Fund, but does not include the underlying holdings of each Fidelity Central Fund. As an Investing Fund, the Fund indirectly bears its proportionate share of the expenses of the underlying Fidelity Central Funds.
The Money Market Central Funds seek preservation of capital and current income and are managed by Fidelity Investments Money Management, Inc. (FIMM), an affiliate of the investment adviser. Annualized expenses of the Money Market Central Funds as of their most recent shareholder report date are less than .005%.
A complete unaudited list of holdings for each Fidelity Central Fund is available upon request or at the Securities and Exchange Commission (the SEC) website at www.sec.gov. In addition, the financial statements of the Fidelity Central Funds, which are not covered by the Fund's Report of Independent Registered Public Accounting Firm, are available on the SEC website or upon request.
3. Significant Accounting Policies.
The Fund is an investment company and applies the accounting and reporting guidance of the Financial Accounting Standards Board (FASB) Accounting Standards Codification Topic 946 Financial Services – Investments Companies. The financial statements have been prepared in conformity with accounting principles generally accepted in the United States of America (GAAP), which require management to make certain estimates and assumptions at the date of the financial statements. Actual results could differ from those estimates. Subsequent events, if any, through the date that the financial statements were issued have been evaluated in the preparation of the financial statements. The following summarizes the significant accounting policies of the Fund:
Investment Valuation. Investments are valued as of 4:00 p.m. Eastern time on the last calendar day of the period. The Board of Trustees (the Board) has delegated the day to day responsibility for the valuation of the Fund's investments to the Fair Value Committee (the Committee) established by the Fund's investment adviser. In accordance with valuation policies and procedures approved by the Board, the Fund attempts to obtain prices from one or more third party pricing vendors or brokers to value its investments. When current market prices, quotations or currency exchange rates are not readily available or reliable, investments will be fair valued in good faith by the Committee, in accordance with procedures adopted by the Board. Factors used in determining fair value vary by investment type and may include market or investment specific events. The frequency with which these procedures are used cannot be predicted and they may be utilized to a significant extent. The Committee oversees the Fund's valuation policies and procedures and reports to the Board on the Committee's activities and fair value determinations. The Board monitors the appropriateness of the procedures used in valuing the Fund's investments and ratifies the fair value determinations of the Committee.
The Fund categorizes the inputs to valuation techniques used to value its investments into a disclosure hierarchy consisting of three levels as shown below:
- Level 1 – quoted prices in active markets for identical investments
- Level 2 – other significant observable inputs (including quoted prices for similar investments, interest rates, prepayment speeds, etc.)
- Level 3 – unobservable inputs (including the Fund's own assumptions based on the best information available)
Valuation techniques used to value the Fund's investments by major category are as follows:
Equity securities, including restricted securities, for which market quotations are readily available, are valued at the last reported sale price or official closing price as reported by a third party pricing vendor on the primary market or exchange on which they are traded and are categorized as Level 1 in the hierarchy. In the event there were no sales during the day or closing prices are not available, securities are valued at the last quoted bid price or may be valued using the last available price and are generally categorized as Level 2 in the hierarchy. For foreign equity securities, when market or security specific events arise, comparisons to the valuation of American Depositary Receipts (ADRs), futures contracts, Exchange-Traded Funds (ETFs) and certain indexes as well as quoted prices for similar securities may be used and would be categorized as Level 2 in the hierarchy. Utilizing these techniques may result in transfers between Level 1 and Level 2. For equity securities, including restricted securities, where observable inputs are limited, assumptions about market activity and risk are used and these securities may be categorized as Level 3 in the hierarchy.
Investments in open-end mutual funds, including the Fidelity Central Funds, are valued at their closing net asset value (NAV) each business day and are categorized as Level 1 in the hierarchy.
Changes in valuation techniques may result in transfers in or out of an assigned level within the disclosure hierarchy. The aggregate value of investments by input level as of November 30, 2017 is included at the end of the Fund's Schedule of Investments.
Foreign Currency. The Fund may use foreign currency contracts to facilitate transactions in foreign-denominated securities. Gains and losses from these transactions may arise from changes in the value of the foreign currency or if the counterparties do not perform under the contracts' terms.
Foreign-denominated assets, including investment securities, and liabilities are translated into U.S. dollars at the exchange rates at period end. Purchases and sales of investment securities, income and dividends received and expenses denominated in foreign currencies are translated into U.S. dollars at the exchange rate in effect on the transaction date.
The effects of exchange rate fluctuations on investments are included with the net realized and unrealized gain (loss) on investment securities. Other foreign currency transactions resulting in realized and unrealized gain (loss) are disclosed separately.
Investment Transactions and Income. For financial reporting purposes, the Fund's investment holdings and NAV include trades executed through the end of the last business day of the period. The NAV per share for processing shareholder transactions is calculated as of the close of business of the New York Stock Exchange (NYSE), normally 4:00 p.m. Eastern time and includes trades executed through the end of the prior business day. Gains and losses on securities sold are determined on the basis of identified cost and includes proceeds received from litigation. Dividend income is recorded on the ex-dividend date, except for certain dividends from foreign securities where the ex-dividend date may have passed, which are recorded as soon as the Fund is informed of the ex-dividend date. Non-cash dividends included in dividend income, if any, are recorded at the fair market value of the securities received. Income and capital gain distributions from Fidelity Central Funds, if any, are recorded on the ex-dividend date. Certain distributions received by the Fund represent a return of capital or capital gain. The Fund determines the components of these distributions subsequent to the ex-dividend date, based upon receipt of tax filings or other correspondence relating to the underlying investment. These distributions are recorded as a reduction of cost of investments and/or as a realized gain. Interest income is accrued as earned and includes coupon interest and amortization of premium and accretion of discount on debt securities as applicable. Investment income is recorded net of foreign taxes withheld where recovery of such taxes is uncertain.
Class Allocations and Expenses. Investment income, realized and unrealized capital gains and losses, common expenses of the Fund, and certain fund-level expense reductions, if any, are allocated daily on a pro-rata basis to each class based on the relative net assets of each class to the total net assets of the Fund. Each class differs with respect to transfer agent and distribution and service plan fees incurred. Certain expense reductions may also differ by class. For the reporting period, the allocated portion of income and expenses to each class as a percent of its average net assets may vary due to the timing of recording these transactions in relation to fluctuating net assets of the classes. Expenses directly attributable to a fund are charged to that fund. Expenses attributable to more than one fund are allocated among the respective funds on the basis of relative net assets or other appropriate methods. Expense estimates are accrued in the period to which they relate and adjustments are made when actual amounts are known.
Income Tax Information and Distributions to Shareholders. Each year, the Fund intends to qualify as a regulated investment company under Subchapter M of the Internal Revenue Code, including distributing substantially all of its taxable income and realized gains. As a result, no provision for U.S. Federal income taxes is required. As of November 30, 2017, the Fund did not have any unrecognized tax benefits in the financial statements; nor is the Fund aware of any tax positions for which it is reasonably possible that the total amounts of unrecognized tax benefits will significantly change in the next twelve months. The Fund files a U.S. federal tax return, in addition to state and local tax returns as required. The Fund's federal income tax returns are subject to examination by the Internal Revenue Service (IRS) for a period of three fiscal years after they are filed. State and local tax returns may be subject to examination for an additional fiscal year depending on the jurisdiction. Foreign taxes are provided for based on the Fund's understanding of the tax rules and rates that exist in the foreign markets in which it invests.
Distributions are declared and recorded on the ex-dividend date. Income dividends and capital gain distributions are declared separately for each class. Income and capital gain distributions are determined in accordance with income tax regulations, which may differ from GAAP. These differences resulted in distribution reclassifications. In addition, the Fund claimed a portion of the payment made to redeeming shareholders as a distribution for income tax purposes.
Capital accounts within the financial statements are adjusted for permanent book-tax differences. These adjustments have no impact on net assets or the results of operations. Capital accounts are not adjusted for temporary book-tax differences which will reverse in a subsequent period.
Book-tax differences are primarily due to foreign currency transactions, passive foreign investment companies (PFIC), partnerships, capital loss carryforwards and losses deferred due to wash sales.
As of period end, the cost and unrealized appreciation (depreciation) in securities, and derivatives if applicable, for federal income tax purposes were as follows:
| Gross unrealized appreciation | $50,958,685 |
| Gross unrealized depreciation | (6,252,989) |
| Net unrealized appreciation (depreciation) | $44,705,696 |
| Tax Cost | $241,743,071 |
The tax-based components of distributable earnings as of period end were as follows:
| Undistributed ordinary income | $2,054,206 |
| Undistributed long-term capital gain | $402,154 |
| Net unrealized appreciation (depreciation) on securities and other investments | $44,707,237 |
The tax character of distributions paid was as follows:
| November 30, 2017 | November 30, 2016 | |
| Ordinary Income | $1,129,904 | $ 2,149,087 |
| Long-term Capital Gains | – | 1,357,985 |
| Total | $1,129,904 | $ 3,507,072 |
4. Derivative Instruments.
Risk Exposures and the Use of Derivative Instruments. The Fund's investment objective allows the Fund to enter into various types of derivative contracts, including futures contracts. Derivatives are investments whose value is primarily derived from underlying assets, indices or reference rates and may be transacted on an exchange or over-the-counter (OTC). Derivatives may involve a future commitment to buy or sell a specified asset based on specified terms, to exchange future cash flows at periodic intervals based on a notional principal amount, or for one party to make one or more payments upon the occurrence of specified events in exchange for periodic payments from the other party.
The Fund used derivatives to increase returns and to manage exposure to certain risks as defined below. The success of any strategy involving derivatives depends on analysis of numerous economic factors, and if the strategies for investment do not work as intended, the Fund may not achieve its objectives.
The Fund's use of derivatives increased or decreased its exposure to the following risk:
| Equity Risk | Equity risk relates to the fluctuations in the value of financial instruments as a result of changes in market prices (other than those arising from interest rate risk or foreign exchange risk), whether caused by factors specific to an individual investment, its issuer, or all factors affecting all instruments traded in a market or market segment. |
The Fund is also exposed to additional risks from investing in derivatives, such as liquidity risk and counterparty credit risk. Liquidity risk is the risk that the Fund will be unable to close out the derivative in the open market in a timely manner. Counterparty credit risk is the risk that the counterparty will not be able to fulfill its obligation to the Fund. Counterparty credit risk related to exchange-traded futures contracts may be mitigated by the protection provided by the exchange on which they trade.
Investing in derivatives may involve greater risks than investing in the underlying assets directly and, to varying degrees, may involve risk of loss in excess of any initial investment and collateral received and amounts recognized in the Statement of Assets and Liabilities. In addition, there may be the risk that the change in value of the derivative contract does not correspond to the change in value of the underlying instrument.
Futures Contracts. A futures contract is an agreement between two parties to buy or sell a specified underlying instrument for a fixed price at a specified future date. The Fund used futures contracts to manage its exposure to the stock market.
Upon entering into a futures contract, a fund is required to deposit either cash or securities (initial margin) with a clearing broker in an amount equal to a certain percentage of the face value of the contract. Futures contracts are marked-to-market daily and subsequent daily payments (variation margin) are made or received by a fund depending on the daily fluctuations in the value of the futures contracts and are recorded as unrealized appreciation or (depreciation). This receivable and/or payable, if any, is included in daily variation margin on futures contracts in the Statement of Assets and Liabilities. Realized gain or (loss) is recorded upon the expiration or closing of a futures contract. The net realized gain (loss) and change in net unrealized appreciation (depreciation) on futures contracts during the period is presented in the Statement of Operations.
Any open futures contracts at period end are presented in the Schedule of Investments under the caption "Futures Contracts". The notional amount at value reflects each contract's exposure to the underlying instrument or index at period end.
5. Purchases and Sales of Investments.
Purchases and sales of securities, other than short-term securities, aggregated $175,450,362 and $91,776,021, respectively.
6. Fees and Other Transactions with Affiliates.
Management Fee. Fidelity Management & Research Company (the investment adviser) and its affiliates provide the Fund with investment management related services for which the Fund pays a monthly management fee. The management fee is the sum of an individual fund fee rate that is based on an annual rate of .30% of the Fund's average net assets and an annualized group fee rate that averaged .25% during the period. The group fee rate is based upon the average net assets of all the mutual funds advised by the investment adviser, including any mutual funds previously advised by the investment adviser that are currently advised by Fidelity SelectCo, LLC, an affiliate of the investment adviser. The group fee rate decreases as assets under management increase and increases as assets under management decrease. In addition, the management fee is subject to a performance adjustment (up to a maximum of +/- .20% of the Fund's average net assets over a 36 month performance period). The upward or downward adjustment to the management fee is based on the relative investment performance of Class I of the Fund as compared to its benchmark index, the Russell 3000 Value Index, over the same 36 month performance period. For the reporting period, the total annual management fee rate, including the performance adjustment, was .52% of the Fund's average net assets. The performance adjustment included in the management fee rate may be higher or lower than the maximum performance adjustment rate due to the difference between the average net assets for the reporting and performance periods.
Distribution and Service Plan Fees. In accordance with Rule 12b-1 of the 1940 Act, the Fund has adopted separate Distribution and Service Plans for each class of shares. Certain classes pay Fidelity Distributors Corporation (FDC), an affiliate of the investment adviser, separate Distribution and Service Fees, each of which is based on an annual percentage of each class' average net assets. In addition, FDC may pay financial intermediaries for selling shares of the Fund and providing shareholder support services. For the period, the Distribution and Service Fee rates, total fees and amounts retained by FDC were as follows:
| Distribution Fee | Service Fee | Total Fees | Retained by FDC | |
| Class A | -% | .25% | $203,548 | $6,119 |
| Class M | .25% | .25% | 200,360 | 465 |
| Class C | .75% | .25% | 281,004 | 30,589 |
| $684,912 | $37,173 |
Sales Load. FDC may receive a front-end sales charge of up to 5.75% for selling Class A shares and 3.50% for selling Class M shares, some of which is paid to financial intermediaries for selling shares of the Fund. Depending on the holding period, FDC may receive contingent deferred sales charges levied on Class A, Class M and Class C redemptions. The deferred sales charges are 1.00% for Class C shares, 1.00% for certain purchases of Class A shares and .25% for certain purchases of Class M shares.
For the period, sales charge amounts retained by FDC were as follows:
| Retained by FDC | |
| Class A | $28,448 |
| Class M | 7,554 |
| Class C(a) | 2,130 |
| $38,132 |
(a) When Class C shares are initially sold, FDC pays commissions from its own resources to financial intermediaries through which the sales are made.
Transfer Agent Fees. Fidelity Investments Institutional Operations Company, Inc., (FIIOC), an affiliate of the investment adviser, is the transfer, dividend disbursing and shareholder servicing agent for each class of the Fund. FIIOC receives account fees and asset-based fees that vary according to the account size and type of account of the shareholders of the respective classes of the Fund, except for Class Z. FIIOC receives an asset-based fee of Class Z's average net assets. FIIOC pays for typesetting, printing and mailing of shareholder reports, except proxy statements.
For the period, transfer agent fees for each class were as follows:
| Amount | % of Class-Level Average Net Assets | |
| Class A | $170,539 | .21 |
| Class M | 89,368 | .22 |
| Class C | 65,568 | .23 |
| Class I | 143,288 | .18 |
| Class Z | 114 | .05(a) |
| $468,877 |
(a) Annualized
Accounting and Security Lending Fees. Fidelity Service Company, Inc. (FSC), an affiliate of the investment adviser, maintains the Fund's accounting records. The accounting fee is based on the level of average net assets for each month. Under a separate contract, FSC administers the security lending program. The security lending fee is based on the number and duration of lending transactions.
Brokerage Commissions. The Fund placed a portion of its portfolio transactions with brokerage firms which are affiliates of the investment adviser. Brokerage commissions are included in net realized gain (loss) and change in net unrealized appreciation (depreciation) in the Statement of Operations. The commissions paid to these affiliated firms were $4,781 for the period.
Interfund Trades. The Fund may purchase from or sell securities to other Fidelity Funds under procedures adopted by the Board. The procedures have been designed to ensure these interfund trades are executed in accordance with Rule 17a-7 of the 1940 Act. Interfund trades are included within the respective purchases and sales amounts shown in the Purchases and Sales of Investments note.
7. Committed Line of Credit.
The Fund participates with other funds managed by the investment adviser or an affiliate in a $4.25 billion credit facility (the "line of credit") to be utilized for temporary or emergency purposes to fund shareholder redemptions or for other short-term liquidity purposes. The Fund has agreed to pay commitment fees on its pro-rata portion of the line of credit, which amounted to $664 and is reflected in Miscellaneous expenses on the Statement of Operations. During the period, the Fund did not borrow on this line of credit.
8. Security Lending.
The Fund lends portfolio securities through a lending agent from time to time in order to earn additional income. For equity securities, a lending agent is used and may loan securities to certain qualified borrowers, including Fidelity Capital Markets (FCM), a broker-dealer affiliated with the Fund. On the settlement date of the loan, the Fund receives collateral (in the form of U.S. Treasury obligations, letters of credit and/or cash) against the loaned securities and maintains collateral in an amount not less than 100% of the market value of the loaned securities during the period of the loan. The market value of the loaned securities is determined at the close of business of the Fund and any additional required collateral is delivered to the Fund on the next business day. The Fund or borrower may terminate the loan at any time, and if the borrower defaults on its obligation to return the securities loaned because of insolvency or other reasons, the Fund may apply collateral received from the borrower against the obligation. The Fund may experience delays and costs in recovering the securities loaned. Any cash collateral received is invested in the Fidelity Securities Lending Cash Central Fund. The value of loaned securities and cash collateral at period end are disclosed on the Fund's Statement of Assets and Liabilities. At period end, there were no security loans outstanding with FCM. Security lending income represents the income earned on investing cash collateral, less rebates paid to borrowers and any lending agent fees associated with the loan, plus any premium payments received for lending certain types of securities. Security lending income is presented in the Statement of Operations as a component of income from Fidelity Central Funds. Total security lending income during the period amounted to $47,711, including $127 from securities loaned to FCM.
9. Expense Reductions.
The investment adviser voluntarily agreed to reimburse a portion of the Fund's Class A, Class M, Class C and Class I operating expenses. During the period, this reimbursement reduced expenses as follows:
| Reimbursement | |
| Class A | $7,881 |
| Class M | 3,932 |
| Class C | 2,670 |
| Class I | 2,491 |
| $ 16,974 |
Commissions paid to certain brokers with whom the investment adviser, or its affiliates, places trades on behalf of the Fund include an amount in addition to trade execution, which may be rebated back to the Fund to offset certain expenses. This amount totaled $8,297 for the period.
In addition, during the period the investment adviser reimbursed and/or waived a portion of fund-level operating expenses in the amount of $1,610.
10. Distributions to Shareholders.
Distributions to shareholders of each class were as follows:
| Year ended November 30, 2017 | Year ended November 30, 2016 | |
| From net investment income | ||
| Class A | $626,176 | $1,016,439 |
| Class M | 207,819 | 418,210 |
| Class B | – | 6,399 |
| Class C | 51,210 | 238,977 |
| Class I | 244,699 | 469,062 |
| Total | $1,129,904 | $2,149,087 |
| From net realized gain | ||
| Class A | $– | $575,983 |
| Class M | – | 299,128 |
| Class B | – | 15,117 |
| Class C | – | 251,699 |
| Class I | – | 216,058 |
| Total | $– | $1,357,985 |
11. Share Transactions.
Share transactions for each class were as follows and may contain automatic conversions between classes or exchanges between affiliated funds:
| Shares | Shares | Dollars | Dollars | |
| Year ended November 30, 2017 (a) | Year ended November 30, 2016 | Year ended November 30, 2017 (a) | Year ended November 30, 2016 | |
| Class A | ||||
| Shares sold | 865,189 | 1,835,762 | $15,229,834 | $27,477,630 |
| Reinvestment of distributions | 35,742 | 104,688 | 606,547 | 1,546,248 |
| Shares redeemed | (1,315,692) | (1,492,894) | (23,326,026) | (22,929,181) |
| Net increase (decrease) | (414,761) | 447,556 | $(7,489,645) | $6,094,697 |
| Class M | ||||
| Shares sold | 330,063 | 779,181 | $5,777,329 | $11,489,838 |
| Reinvestment of distributions | 12,052 | 47,581 | 204,639 | 703,253 |
| Shares redeemed | (616,921) | (696,531) | (10,915,731) | (10,727,723) |
| Net increase (decrease) | (274,806) | 130,231 | $(4,933,763) | $1,465,368 |
| Class B | ||||
| Shares sold | – | 10,811 | $– | $153,477 |
| Reinvestment of distributions | – | 1,401 | – | 20,707 |
| Shares redeemed | – | (126,900) | – | (1,883,482) |
| Net increase (decrease) | – | (114,688) | $– | $(1,709,298) |
| Class C | ||||
| Shares sold | 247,472 | 699,956 | $4,232,230 | $10,471,711 |
| Reinvestment of distributions | 2,866 | 31,568 | 47,668 | 457,733 |
| Shares redeemed | (983,824) | (463,673) | (16,852,316) | (6,944,408) |
| Net increase (decrease) | (733,486) | 267,851 | $(12,572,418) | $3,985,036 |
| Class I | ||||
| Shares sold | 7,069,018 | 849,680 | $126,873,595 | $13,106,075 |
| Reinvestment of distributions | 8,771 | 30,682 | 151,116 | 459,926 |
| Shares redeemed | (1,319,482) | (1,139,412) | (23,819,535) | (17,502,986) |
| Net increase (decrease) | 5,758,307 | (259,050) | $103,205,176 | $(3,936,985) |
| Class Z | ||||
| Shares sold | 49,947 | – | $913,661 | $– |
| Shares redeemed | (19,687) | – | (365,192) | – |
| Net increase (decrease) | 30,260 | – | $548,469 | $– |
(a) Share transactions for Class Z are for the period February 1, 2017 (commencement of sale of shares) to November 30, 2017.
12. Other.
The Fund's organizational documents provide former and current trustees and officers with a limited indemnification against liabilities arising in connection with the performance of their duties to the Fund. In the normal course of business, the Fund may also enter into contracts that provide general indemnifications. The Fund's maximum exposure under these arrangements is unknown as this would be dependent on future claims that may be made against the Fund. The risk of material loss from such claims is considered remote.
Report of Independent Registered Public Accounting Firm
To the Trustees of Fidelity Advisor Series I and Shareholders of Fidelity Advisor Equity Value Fund:
We have audited the accompanying statement of assets and liabilities of Fidelity Advisor Equity Value Fund (the Fund), a fund of Fidelity Advisor Series I, including the schedule of investments, as of November 30, 2017, and the related statement of operations for the year then ended, the statement of changes in net assets for each of the two years in the period then ended, and the financial highlights for each of the five years in the period then ended. These financial statements and financial highlights are the responsibility of the Fund's management. Our responsibility is to express an opinion on these financial statements and financial highlights based on our audits.
We conducted our audits in accordance with the standards of the Public Company Accounting Oversight Board (United States). Those standards require that we plan and perform the audit to obtain reasonable assurance about whether the financial statements and financial highlights are free of material misstatement. The Fund is not required to have, nor were we engaged to perform, an audit of its internal control over financial reporting. Our audits included consideration of internal control over financial reporting as a basis for designing audit procedures that are appropriate in the circumstances, but not for the purpose of expressing an opinion on the effectiveness of the Fund's internal control over financial reporting. Accordingly, we express no such opinion. An audit also includes examining, on a test basis, evidence supporting the amounts and disclosures in the financial statements, assessing the accounting principles used and significant estimates made by management, as well as evaluating the overall financial statement presentation. Our procedures included confirmation of securities owned as of November 30, 2017, by correspondence with the custodians and brokers; when replies were not received from brokers, we performed other auditing procedures. We believe that our audits provide a reasonable basis for our opinion.
In our opinion, such financial statements and financial highlights referred to above present fairly, in all material respects, the financial position of Fidelity Advisor Equity Value Fund as of November 30, 2017, the results of its operations for the year then ended, the changes in its net assets for each of the two years in the period then ended, and the financial highlights for each of the five years in the period then ended, in conformity with accounting principles generally accepted in the United States of America.
DELOITTE & TOUCHE LLP
Boston, Massachusetts
January 17, 2018
Trustees and Officers
The Trustees, Members of the Advisory Board (if any), and officers of the trust and fund, as applicable, are listed below. The Board of Trustees governs the fund and is responsible for protecting the interests of shareholders. The Trustees are experienced executives who meet periodically throughout the year to oversee the fund's activities, review contractual arrangements with companies that provide services to the fund, oversee management of the risks associated with such activities and contractual arrangements, and review the fund's performance. Each of the Trustees oversees 190 funds.
The Trustees hold office without limit in time except that (a) any Trustee may resign; (b) any Trustee may be removed by written instrument, signed by at least two-thirds of the number of Trustees prior to such removal; (c) any Trustee who requests to be retired or who has become incapacitated by illness or injury may be retired by written instrument signed by a majority of the other Trustees; and (d) any Trustee may be removed at any special meeting of shareholders by a two-thirds vote of the outstanding voting securities of the trust. Each Trustee who is not an interested person (as defined in the 1940 Act) of the trust and the fund is referred to herein as an Independent Trustee. Each Independent Trustee shall retire not later than the last day of the calendar year in which his or her 75th birthday occurs. The Independent Trustees may waive this mandatory retirement age policy with respect to individual Trustees. Officers and Advisory Board Members hold office without limit in time, except that any officer or Advisory Board Member may resign or may be removed by a vote of a majority of the Trustees at any regular meeting or any special meeting of the Trustees. Except as indicated, each individual has held the office shown or other offices in the same company for the past five years.
The fund’s Statement of Additional Information (SAI) includes more information about the Trustees. To request a free copy, call Fidelity at 1-877-208-0098.
Experience, Skills, Attributes, and Qualifications of the Trustees. The Governance and Nominating Committee has adopted a statement of policy that describes the experience, qualifications, attributes, and skills that are necessary and desirable for potential Independent Trustee candidates (Statement of Policy). The Board believes that each Trustee satisfied at the time he or she was initially elected or appointed a Trustee, and continues to satisfy, the standards contemplated by the Statement of Policy. The Governance and Nominating Committee also engages professional search firms to help identify potential Independent Trustee candidates who have the experience, qualifications, attributes, and skills consistent with the Statement of Policy. From time to time, additional criteria based on the composition and skills of the current Independent Trustees, as well as experience or skills that may be appropriate in light of future changes to board composition, business conditions, and regulatory or other developments, have also been considered by the professional search firms and the Governance and Nominating Committee. In addition, the Board takes into account the Trustees' commitment and participation in Board and committee meetings, as well as their leadership of standing and ad hoc committees throughout their tenure.
In determining that a particular Trustee was and continues to be qualified to serve as a Trustee, the Board has considered a variety of criteria, none of which, in isolation, was controlling. The Board believes that, collectively, the Trustees have balanced and diverse experience, qualifications, attributes, and skills, which allow the Board to operate effectively in governing the fund and protecting the interests of shareholders. Information about the specific experience, skills, attributes, and qualifications of each Trustee, which in each case led to the Board's conclusion that the Trustee should serve (or continue to serve) as a trustee of the fund, is provided below.
Board Structure and Oversight Function. James C. Curvey is an interested person and currently serves as Chairman. The Trustees have determined that an interested Chairman is appropriate and benefits shareholders because an interested Chairman has a personal and professional stake in the quality and continuity of services provided to the fund. Independent Trustees exercise their informed business judgment to appoint an individual of their choosing to serve as Chairman, regardless of whether the Trustee happens to be independent or a member of management. The Independent Trustees have determined that they can act independently and effectively without having an Independent Trustee serve as Chairman and that a key structural component for assuring that they are in a position to do so is for the Independent Trustees to constitute a substantial majority for the Board. The Independent Trustees also regularly meet in executive session. Ned C. Lautenbach serves as Chairman of the Independent Trustees and as such (i) acts as a liaison between the Independent Trustees and management with respect to matters important to the Independent Trustees and (ii) with management prepares agendas for Board meetings.
Fidelity® funds are overseen by different Boards of Trustees. The fund's Board oversees Fidelity's high income and certain equity funds, and other Boards oversee Fidelity's investment-grade bond, money market, asset allocation, and sector funds. The asset allocation funds may invest in Fidelity® funds overseen by the fund's Board. The use of separate Boards, each with its own committee structure, allows the Trustees of each group of Fidelity® funds to focus on the unique issues of the funds they oversee, including common research, investment, and operational issues. On occasion, the separate Boards establish joint committees to address issues of overlapping consequences for the Fidelity® funds overseen by each Board.
The Trustees operate using a system of committees to facilitate the timely and efficient consideration of all matters of importance to the Trustees, the fund, and fund shareholders and to facilitate compliance with legal and regulatory requirements and oversight of the fund's activities and associated risks. The Board, acting through its committees, has charged FMR and its affiliates with (i) identifying events or circumstances the occurrence of which could have demonstrably adverse effects on the fund's business and/or reputation; (ii) implementing processes and controls to lessen the possibility that such events or circumstances occur or to mitigate the effects of such events or circumstances if they do occur; and (iii) creating and maintaining a system designed to evaluate continuously business and market conditions in order to facilitate the identification and implementation processes described in (i) and (ii) above. Because the day-to-day operations and activities of the fund are carried out by or through FMR, its affiliates, and other service providers, the fund's exposure to risks is mitigated but not eliminated by the processes overseen by the Trustees. While each of the Board's committees has responsibility for overseeing different aspects of the fund's activities, oversight is exercised primarily through the Operations, Audit, and Compliance Committees. In addition, the Independent Trustees have worked with FMR to enhance the Board's oversight of investment and financial risks, legal and regulatory risks, technology risks, and operational risks, including the development of additional risk reporting to the Board. For example, a working group comprised of Independent Trustees and FMR has worked and continues to work to review the Fidelity® funds' valuation-related activities, reporting and risk management. Appropriate personnel, including but not limited to the fund's Chief Compliance Officer (CCO), FMR's internal auditor, the independent accountants, the fund's Treasurer and portfolio management personnel, make periodic reports to the Board's committees, as appropriate, including an annual review of Fidelity's risk management program for the Fidelity® funds. The responsibilities of each standing committee, including their oversight responsibilities, are described further under "Standing Committees of the Trustees."
Interested Trustees*:
Correspondence intended for a Trustee who is an interested person may be sent to Fidelity Investments, 245 Summer Street, Boston, Massachusetts 02210.
Name, Year of Birth; Principal Occupations and Other Relevant Experience+
James C. Curvey (1935)
Year of Election or Appointment: 2007
Trustee
Chairman of the Board of Trustees
Mr. Curvey also serves as Trustee of other Fidelity® funds. Mr. Curvey is a Director of Fidelity Research & Analysis Co. (investment adviser firm, 2009-present), and Vice Chairman (2007-present) and Director of FMR LLC (diversified financial services company). In addition, Mr. Curvey serves as an Overseer for the Boston Symphony Orchestra and a member of the board of Artis-Naples, Naples, Florida, and as a Trustee for Brewster Academy, Wolfeboro, New Hampshire. Previously, Mr. Curvey served as a Director of Fidelity Investments Money Management, Inc. (investment adviser firm, 2009-2014) and a Director of FMR and FMR Co., Inc. (investment adviser firms, 2007-2014).
Charles S. Morrison (1960)
Year of Election or Appointment: 2014
Trustee
Mr. Morrison also serves as Trustee of other funds. He serves as President of Fidelity Management & Research Company (FMR) (investment adviser firm, 2016-present), a Director of Fidelity Investments Money Management, Inc. (FIMM) (investment adviser firm, 2014-present), Director of Fidelity SelectCo, LLC (investment adviser firm, 2014-present), President, Asset Management (2014-present), and is an employee of Fidelity Investments. Previously, Mr. Morrison served as Vice President of Fidelity's Fixed Income and Asset Allocation Funds (2012-2014), President, Fixed Income (2011-2014), Vice President of Fidelity's Money Market Funds (2005-2009), President, Money Market Group Leader of FMR (investment adviser firm, 2009), and Senior Vice President, Money Market Group of FMR (2004-2009). Mr. Morrison also served as Vice President of Fidelity's Bond Funds (2002-2005), certain Balanced Funds (2002-2005), and certain Asset Allocation Funds (2002-2007), and as Senior Vice President (2002-2005) of Fidelity's Bond Division.
* Determined to be an “Interested Trustee” by virtue of, among other things, his or her affiliation with the trust or various entities under common control with FMR.
+ The information includes the Trustee's principal occupation during the last five years and other information relating to the experience, attributes, and skills relevant to the Trustee's qualifications to serve as a Trustee, which led to the conclusion that the Trustee should serve as a Trustee for the fund.
Independent Trustees:
Correspondence intended for an Independent Trustee may be sent to Fidelity Investments, P.O. Box 55235, Boston, Massachusetts 02205-5235.
Name, Year of Birth; Principal Occupations and Other Relevant Experience+
Dennis J. Dirks (1948)
Year of Election or Appointment: 2005
Trustee
Mr. Dirks also serves as Trustee of other Fidelity® funds. Prior to his retirement in May 2003, Mr. Dirks was Chief Operating Officer and a member of the Board of The Depository Trust & Clearing Corporation (DTCC). He also served as President, Chief Operating Officer, and Board member of The Depository Trust Company (DTC) and President and Board member of the National Securities Clearing Corporation (NSCC). In addition, Mr. Dirks served as Chief Executive Officer and Board member of the Government Securities Clearing Corporation, Chief Executive Officer and Board member of the Mortgage-Backed Securities Clearing Corporation, as a Trustee and a member of the Finance Committee of Manhattan College (2005-2008), as a Trustee and a member of the Finance Committee of AHRC of Nassau County (2006-2008), as a member of the Independent Directors Council (IDC) Governing Council (2010-2015), and as a member of the Board of Directors for The Brookville Center for Children’s Services, Inc. (2009-2017). Mr. Dirks is a member of the Finance Committee (2016-present) and Board of Directors (2017-present) of the Asolo Repertory Theatre.
Alan J. Lacy (1953)
Year of Election or Appointment: 2008
Trustee
Mr. Lacy also serves as Trustee of other Fidelity® funds. Mr. Lacy serves as a Director of Bristol-Myers Squibb Company (global pharmaceuticals, 2008-present). He is a Trustee of the California Chapter of The Nature Conservancy (2015-present) and a Director of the Center for Advanced Study in the Behavioral Sciences at Stanford University (2015-present). In addition, Mr. Lacy served as Senior Adviser (2007-2014) of Oak Hill Capital Partners, L.P. (private equity) and also served as Chief Executive Officer (2005) and Vice Chairman (2005-2006) of Sears Holdings Corporation (retail) and Chief Executive Officer and Chairman of the Board of Sears, Roebuck and Co. (retail, 2000-2005). Previously, Mr. Lacy served as Chairman (2014-2017) and a member (2010-2017) of the Board of Directors of Dave & Buster’s Entertainment, Inc. (restaurant and entertainment complexes), as Chairman (2008-2011) and a member (2006-2015) of the Board of Trustees of the National Parks Conservation Association, and as a member of the Board of Directors for The Hillman Companies, Inc. (hardware wholesalers, 2010-2014), Earth Fare, Inc. (retail grocery, 2010-2014), and The Western Union Company (global money transfer, 2006-2011).
Ned C. Lautenbach (1944)
Year of Election or Appointment: 2000
Trustee
Chairman of the Independent Trustees
Mr. Lautenbach also serves as Trustee of other Fidelity® funds. Mr. Lautenbach currently serves as Vice Chair of the Board of Governors, State University System of Florida (2013-present) and is a member of the Council on Foreign Relations (1994-present). He is also a member and has most recently served as Chairman of the Board of Directors of Artis-Naples (2012-present). Previously, Mr. Lautenbach served as a member and then Lead Director of the Board of Directors of Eaton Corporation (diversified industrial, 1997-2016). He was also a Partner and Advisory Partner at Clayton, Dubilier & Rice, LLC (private equity investment, 1998-2010), as well as a Director of Sony Corporation (2006-2007). In addition, Mr. Lautenbach also had a 30-year career with IBM (technology company) during which time he served as Senior Vice President and a member of the Corporate Executive Committee (1968-1998).
Joseph Mauriello (1944)
Year of Election or Appointment: 2008
Trustee
Mr. Mauriello also serves as Trustee of other Fidelity® funds. Prior to his retirement in January 2006, Mr. Mauriello served in numerous senior management positions including Deputy Chairman and Chief Operating Officer (2004-2005), and Vice Chairman of Financial Services (2002-2004) of KPMG LLP US (professional services, 1965-2005). Mr. Mauriello currently serves as a member of the Board of Directors of XL Group plc. (global insurance and re-insurance, 2006-present) and the Independent Directors Council (IDC) Governing Council (2015-present). Previously, Mr. Mauriello served as a Director of the Hamilton Funds of the Bank of New York (2006-2007) and of Arcadia Resources Inc. (health care services and products, 2007-2012).
Cornelia M. Small (1944)
Year of Election or Appointment: 2005
Trustee
Ms. Small also serves as Trustee of other Fidelity® funds. Ms. Small is a member of the Board of Directors (2009-present) and Chair of the Investment Committee (2010-present) of the Teagle Foundation. Ms. Small also serves on the Investment Committee of the Berkshire Taconic Community Foundation (2008-present). Previously, Ms. Small served as Chairperson (2002-2008) and a member of the Investment Committee and Chairperson (2008-2012) and a member of the Board of Trustees of Smith College. In addition, Ms. Small served as Chief Investment Officer, Director of Global Equity Investments, and a member of the Board of Directors of Scudder, Stevens & Clark and Scudder Kemper Investments.
William S. Stavropoulos (1939)
Year of Election or Appointment: 2002
Trustee
Vice Chairman of the Independent Trustees
Mr. Stavropoulos also serves as Trustee of other Fidelity® funds. Mr. Stavropoulos serves as President and Founder of the Michigan Baseball Foundation, the Great Lakes Loons (2007-present). Mr. Stavropoulos is Chairman Emeritus of the Board of Directors of The Dow Chemical Company, where he previously served in numerous senior management positions, including President, CEO (1995-2000; 2002-2004), Chairman of the Executive Committee (2000-2006), and as a member of the Board of Directors (1990-2006). Currently, Mr. Stavropoulos is Chairman of the Board of Directors of Univar Inc. (global distributor of commodity and specialty chemicals), a Director of Teradata Corporation (data warehousing and technology solutions), and a member of the Advisory Board for Metalmark Capital LLC (private equity investment, 2005-present). Mr. Stavropoulos is an operating advisor to Clayton, Dubilier & Rice, LLC (private equity investment). In addition, Mr. Stavropoulos is a member of the University of Notre Dame Advisory Council for the College of Science, a Trustee of the Rollin L. Gerstacker Foundation, and a Director of Artis-Naples in Naples, Florida. Previously, Mr. Stavropoulos served as a Director of Chemical Financial Corporation (bank holding company, 1993-2012) and Tyco International, Ltd. (multinational manufacturing and services, 2007-2012).
David M. Thomas (1949)
Year of Election or Appointment: 2008
Trustee
Mr. Thomas also serves as Trustee of other Fidelity® funds. Mr. Thomas serves as Non-Executive Chairman of the Board of Directors of Fortune Brands Home and Security (home and security products, 2011-present), as a member of the Board of Directors (2004-present) and Presiding Director (2013-present) of Interpublic Group of Companies, Inc. (marketing communication), and as a member of the Board of Trustees of the University of Florida (2013-present). Previously, Mr. Thomas served as Executive Chairman (2005-2006) and Chairman and Chief Executive Officer (2000-2005) of IMS Health, Inc. (pharmaceutical and healthcare information solutions), and a Director of Fortune Brands, Inc. (consumer products, 2000-2011).
+ The information includes the Trustee's principal occupation during the last five years and other information relating to the experience, attributes, and skills relevant to the Trustee's qualifications to serve as a Trustee, which led to the conclusion that the Trustee should serve as a Trustee for the fund.
Advisory Board Members and Officers:
Correspondence intended for an officer or Peter S. Lynch may be sent to Fidelity Investments, 245 Summer Street, Boston, Massachusetts 02210. Officers appear below in alphabetical order.
Name, Year of Birth; Principal Occupation
Peter S. Lynch (1944)
Year of Election or Appointment: 2003
Member of the Advisory Board
Mr. Lynch also serves as Member of the Advisory Board of other Fidelity® funds. Mr. Lynch is Vice Chairman and a Director of FMR (investment adviser firm) and FMR Co., Inc. (investment adviser firm). In addition, Mr. Lynch serves as a Trustee of Boston College and as the Chairman of the Inner-City Scholarship Fund. Previously, Mr. Lynch served on the Special Olympics International Board of Directors (1997-2006).
Elizabeth Paige Baumann (1968)
Year of Election or Appointment: 2017
Anti-Money Laundering (AML) Officer
Ms. Baumann also serves as AML Officer of other funds. She is Chief AML Officer (2012-present) and Senior Vice President (2014-present) of FMR LLC (diversified financial services company) and is an employee of Fidelity Investments. Previously, Ms. Baumann served as AML Officer of the funds (2012-2016), and Vice President (2007-2014) and Deputy Anti-Money Laundering Officer (2007-2012) of FMR LLC.
Marc R. Bryant (1966)
Year of Election or Appointment: 2015
Secretary and Chief Legal Officer (CLO)
Mr. Bryant also serves as Secretary and CLO of other funds. Mr. Bryant serves as CLO, Secretary, and Senior Vice President of Fidelity Management & Research Company (investment adviser firm, 2015-present) and FMR Co., Inc. (investment adviser firm, 2015-present); Secretary of Fidelity SelectCo, LLC (investment adviser firm, 2015-present) and Fidelity Investments Money Management, Inc. (investment adviser firm, 2015-present); and CLO of Fidelity Management & Research (Hong Kong) Limited and FMR Investment Management (UK) Limited (investment adviser firms, 2015-present) and Fidelity Management & Research (Japan) Limited (investment adviser firm, 2016-present). He is Senior Vice President and Deputy General Counsel of FMR LLC (diversified financial services company). Previously, Mr. Bryant served as Secretary and CLO of Fidelity Rutland Square Trust II (2010-2014) and Assistant Secretary of Fidelity's Fixed Income and Asset Allocation Funds (2013-2015). Prior to joining Fidelity Investments, Mr. Bryant served as a Senior Vice President and the Head of Global Retail Legal for AllianceBernstein L.P. (2006-2010), and as the General Counsel for ProFund Advisors LLC (2001-2006).
William C. Coffey (1969)
Year of Election or Appointment: 2009
Assistant Secretary
Mr. Coffey also serves as Assistant Secretary of other funds. He is Senior Vice President and Deputy General Counsel of FMR LLC (diversified financial services company, 2010-present), and is an employee of Fidelity Investments. Previously, Mr. Coffey served as Vice President and Associate General Counsel of FMR LLC (2005-2009).
Jonathan Davis (1968)
Year of Election or Appointment: 2010
Assistant Treasurer
Mr. Davis also serves as Assistant Treasurer of other funds. Mr. Davis serves as Assistant Treasurer of FMR Capital, Inc. (2017-present) and is an employee of Fidelity Investments. Previously, Mr. Davis served as Vice President and Associate General Counsel of FMR LLC (diversified financial services company, 2003-2010).
Adrien E. Deberghes (1967)
Year of Election or Appointment: 2016
Assistant Treasurer
Mr. Deberghes also serves as an officer of other funds. He serves as Assistant Treasurer of FMR Capital, Inc. (2017-present), Executive Vice President of Fidelity Investments Money Management, Inc. (FIMM) (investment adviser firm, 2016-present), and is an employee of Fidelity Investments (2008-present). Prior to joining Fidelity Investments, Mr. Deberghes was Senior Vice President of Mutual Fund Administration at State Street Corporation (2007-2008), Senior Director of Mutual Fund Administration at Investors Bank & Trust (2005-2007), and Director of Finance for Dunkin' Brands (2000-2005). Previously, Mr. Deberghes served in other fund officer roles.
Stephanie J. Dorsey (1969)
Year of Election or Appointment: 2010
Assistant Treasurer
Ms. Dorsey also serves as an officer of other funds. Ms. Dorsey serves as Assistant Treasurer of FMR Capital, Inc. (2017-present), is an employee of Fidelity Investments (2008-present), and has served in other fund officer roles. Prior to joining Fidelity Investments, Ms. Dorsey served as Treasurer (2004-2008) of the JPMorgan Mutual Funds and Vice President (2004-2008) of JPMorgan Chase Bank.
Howard J. Galligan III (1966)
Year of Election or Appointment: 2014
Chief Financial Officer
Mr. Galligan also serves as Chief Financial Officer of other funds. Mr. Galligan serves as President of Fidelity Pricing and Cash Management Services (FPCMS) (2014-present) and as a Director of Strategic Advisers, Inc. (investment adviser firm, 2008-present). Previously, Mr. Galligan served as Chief Administrative Officer of Asset Management (2011-2014) and Chief Operating Officer and Senior Vice President of Investment Support for Strategic Advisers, Inc. (2003-2011).
Thomas C. Hense (1964)
Year of Election or Appointment: 2008, 2010, or 2015
Vice President
Mr. Hense serves as Vice President of Fidelity Advisor® Multi-Asset Income Fund (2015) and other funds (High Income (2008), Small Cap (2008), and Value (2010) funds), and is an employee of Fidelity Investments (1993-present). Previously, Mr. Hense served as a portfolio manager for Fidelity's Institutional Money Management Group (Pyramis) (2003-2008).
Brian B. Hogan (1964)
Year of Election or Appointment: 2009
Vice President
Mr. Hogan also serves as Trustee or Vice President of other funds. Mr. Hogan serves as a Director of FMR Investment Management (UK) Limited (investment adviser firm, 2015-present) and Fidelity SelectCo, LLC (investment adviser firm, 2014-present) and President of the Equity Division of FMR (investment adviser firm, 2009-present). Previously, Mr. Hogan served as Senior Vice President, Equity Research of FMR (2006-2009) and as a portfolio manager. Mr. Brian B. Hogan is not related to Mr. Colm A. Hogan.
Colm A. Hogan (1973)
Year of Election or Appointment: 2016
Deputy Treasurer
Mr. Hogan also serves as an officer of other funds. Mr. Hogan serves as Assistant Treasurer of FMR Capital, Inc. (2017-present) and is an employee of Fidelity Investments (2005-present). Mr. Colm A. Hogan is not related to Mr. Brian B. Hogan.
Chris Maher (1972)
Year of Election or Appointment: 2013
Assistant Treasurer
Mr. Maher serves as Assistant Treasurer of other funds. Mr. Maher is Vice President of Valuation Oversight, serves as Assistant Treasurer of FMR Capital, Inc. (2017-present), and is an employee of Fidelity Investments. Previously, Mr. Maher served as Vice President of Asset Management Compliance (2013), Vice President of the Program Management Group of FMR (investment adviser firm, 2010-2013), and Vice President of Valuation Oversight (2008-2010).
Rieco E. Mello (1969)
Year of Election or Appointment: 2017
Assistant Treasurer
Mr. Mello also serves as Assistant Treasurer of other funds. Mr. Mello serves as Assistant Treasurer of FMR Capital, Inc. (2017-present) and is an employee of Fidelity Investments (1995-present).
Kenneth B. Robins (1969)
Year of Election or Appointment: 2016
Chief Compliance Officer
Mr. Robins also serves as an officer of other funds. Mr. Robins serves as Compliance Officer of Fidelity Management & Research Company and FMR Co., Inc. (investment adviser firms, 2016-present) and is an employee of Fidelity Investments (2004-present). Previously, Mr. Robins served as Executive Vice President of Fidelity Investments Money Management, Inc. (investment adviser firm, 2013-2016) and served in other fund officer roles.
Stacie M. Smith (1974)
Year of Election or Appointment: 2016
President and Treasurer
Ms. Smith also serves as an officer of other funds. Ms. Smith serves as Assistant Treasurer of FMR Capital, Inc. (2017-present), is an employee of Fidelity Investments (2009-present), and has served in other fund officer roles. Prior to joining Fidelity Investments, Ms. Smith served as Senior Audit Manager of Ernst & Young LLP (accounting firm, 1996-2009). Previously, Ms. Smith served as Deputy Treasurer of certain Fidelity® funds (2013-2016).
Marc L. Spector (1972)
Year of Election or Appointment: 2016
Assistant Treasurer
Mr. Spector also serves as an officer of other funds. Mr. Spector serves as Assistant Treasurer of FMR Capital, Inc. (2017-present) and is an employee of Fidelity Investments (2016-present). Prior to joining Fidelity Investments, Mr. Spector served as Director at the Siegfried Group (accounting firm, 2013-2016), and prior to Siegfried Group as audit senior manager at Deloitte & Touche (accounting firm, 2005-2013).
Renee Stagnone (1975)
Year of Election or Appointment: 2016
Assistant Treasurer
Ms. Stagnone also serves as an officer of other funds. Ms. Stagnone serves as Assistant Treasurer of FMR Capital, Inc. (2017-present) and is an employee of Fidelity Investments (1997-present). Previously, Ms. Stagnone served as Deputy Treasurer of certain Fidelity® funds (2013-2016).
Shareholder Expense Example
As a shareholder of the Fund, you incur two types of costs: (1) transaction costs, including sales charges (loads) on purchase payments or redemption proceeds, and (2) ongoing costs, including management fees, distribution and/or service (12b-1) fees and other Fund expenses. This Example is intended to help you understand your ongoing costs (in dollars) of investing in the Fund and to compare these costs with the ongoing costs of investing in other mutual funds.
The Example is based on an investment of $1,000 invested at the beginning of the period and held for the entire period (June 1, 2017 to November 30, 2017).
Actual Expenses
The first line of the accompanying table for each class of the Fund provides information about actual account values and actual expenses. You may use the information in this line, together with the amount you invested, to estimate the expenses that you paid over the period. Simply divide your account value by $1,000.00 (for example, an $8,600 account value divided by $1,000.00 = 8.6), then multiply the result by the number in the first line for a class of the Fund under the heading entitled "Expenses Paid During Period" to estimate the expenses you paid on your account during this period. In addition, the Fund, as a shareholder in the underlying Fidelity Central Funds, will indirectly bear its pro-rata share of the fees and expenses incurred by the underlying Fidelity Central Funds. These fees and expenses are not included in the Fund's annualized expense ratio used to calculate the expense estimate in the table below.
Hypothetical Example for Comparison Purposes
The second line of the accompanying table for each class of the Fund provides information about hypothetical account values and hypothetical expenses based on a Class' actual expense ratio and an assumed rate of return of 5% per year before expenses, which is not the Class' actual return. The hypothetical account values and expenses may not be used to estimate the actual ending account balance or expenses you paid for the period. You may use this information to compare the ongoing costs of investing in the Fund and other funds. To do so, compare this 5% hypothetical example with the 5% hypothetical examples that appear in the shareholder reports of the other funds. In addition, the Fund, as a shareholder in the underlying Fidelity Central Funds, will indirectly bear its pro-rata share of the fees and expenses incurred by the underlying Fidelity Central Funds. These fees and expenses are not included in the Fund's annualized expense ratio used to calculate the expense estimate in the table below.
Please note that the expenses shown in the table are meant to highlight your ongoing costs only and do not reflect any transaction costs. Therefore, the second line of the table is useful in comparing ongoing costs only, and will not help you determine the relative total costs of owning different funds. In addition, if these transactional costs were included, your costs would have been higher.
| Annualized Expense Ratio-A | Beginning Account Value June 1, 2017 | Ending Account Value November 30, 2017 | Expenses Paid During Period-B June 1, 2017 to November 30, 2017 | |
| Class A | 1.03% | |||
| Actual | $1,000.00 | $1,077.20 | $5.36 | |
| Hypothetical-C | $1,000.00 | $1,019.90 | $5.22 | |
| Class M | 1.29% | |||
| Actual | $1,000.00 | $1,075.50 | $6.71 | |
| Hypothetical-C | $1,000.00 | $1,018.60 | $6.53 | |
| Class C | 1.80% | |||
| Actual | $1,000.00 | $1,073.20 | $9.35 | |
| Hypothetical-C | $1,000.00 | $1,016.04 | $9.10 | |
| Class I | .82% | |||
| Actual | $1,000.00 | $1,078.70 | $4.27 | |
| Hypothetical-C | $1,000.00 | $1,020.96 | $4.15 | |
| Class Z | .68% | |||
| Actual | $1,000.00 | $1,079.30 | $3.54 | |
| Hypothetical-C | $1,000.00 | $1,021.66 | $3.45 |
A Annualized expense ratio reflects expenses net of applicable fee waivers.
B Expenses are equal to each Class' annualized expense ratio, multiplied by the average account value over the period, multiplied by 183/365 (to reflect the one-half year period).
C 5% return per year before expenses
Distributions (Unaudited)
The Board of Trustees of Fidelity Advisor Equity Value Fund voted to pay to shareholders of record at the opening of business on record date, the following distributions per share derived from capital gains realized from sales of portfolio securities, and dividends derived from net investment income:
| Pay Date | Record Date | Dividends | Capital Gains | |
| Fidelity Advisor Equity Value Fund | ||||
| Class A | 12/27/17 | 12/26/17 | $0.126 | $0.045 |
| Class M | 12/27/17 | 12/26/17 | $0.073 | $0.045 |
| Class C | 12/27/17 | 12/26/17 | $0.000 | $0.027 |
| Class I | 12/27/17 | 12/26/17 | $0.191 | $0.045 |
| Class Z | 12/27/17 | 12/26/17 | $0.211 | $0.045 |
The fund hereby designates as a capital gain dividend with respect to the taxable year ended November 30, 2017, $402,154, or, if subsequently determined to be different, the net capital gain of such year.
Class A, Class M, Class C, and Class I designate 100% of the dividends distributed during the fiscal year as qualifying for the dividends–received deduction for corporate shareholders.
Class A, Class M, Class C, and Class I designate 100% of the dividends distributed during the fiscal year as amounts which may be taken into account as a dividend for purposes of the maximum rate under section 1(h)(11) of the Internal Revenue Code.
The fund will notify shareholders in January 2018 of amounts for use in preparing 2017 income tax returns.
Board Approval of Investment Advisory Contracts and Management Fees
Fidelity Advisor Equity Value Fund
Each year, the Board of Trustees, including the Independent Trustees (together, the Board), votes on the renewal of the management contract with Fidelity Management & Research Company (FMR) and the sub-advisory agreements (together, the Advisory Contracts) for the fund. FMR and the sub-advisers are referred to herein as the Investment Advisers. The Board, assisted by the advice of fund counsel and Independent Trustees' counsel, requests and considers a broad range of information relevant to the renewal of the Advisory Contracts throughout the year.
The Board meets regularly and, at each of its meetings, covers an extensive agenda of topics and materials and considers factors that are relevant to its annual consideration of the renewal of the fund's Advisory Contracts, including the services and support provided to the fund and its shareholders. The Board has established various standing committees (Committees), each composed of and chaired by Independent Trustees with varying backgrounds, to which the Board has assigned specific subject matter responsibilities in order to enhance effective decision-making by the Board. The Board, acting directly and through its Committees, requests and receives information concerning the annual consideration of the renewal of the fund's Advisory Contracts. The Board also meets as needed to review matters specifically related to the Board's annual consideration of the renewal of the Advisory Contracts. Members of the Board may also meet with trustees of other Fidelity funds through ad hoc joint committees to discuss certain matters relevant to all of the Fidelity funds.
At its July 2017 meeting, the Board unanimously determined to renew the fund's Advisory Contracts. In reaching its determination, the Board considered all factors it believed relevant, including (i) the nature, extent, and quality of the services to be provided to the fund and its shareholders (including the investment performance of the fund); (ii) the competitiveness of the fund's management fee and total expense ratio relative to peer funds; (iii) the total costs of the services to be provided by and the profits to be realized by Fidelity from its relationships with the fund; and (iv) the extent to which, if any, economies of scale exist and would be realized as the fund grows, and whether any economies of scale are appropriately shared with fund shareholders.
In considering whether to renew the Advisory Contracts for the fund, the Board reached a determination, with the assistance of fund counsel and Independent Trustees' counsel and through the exercise of its business judgment, that the renewal of the Advisory Contracts was in the best interests of the fund and its shareholders and that the compensation payable under the Advisory Contracts was fair and reasonable. The Board's decision to renew the Advisory Contracts was not based on any single factor, but rather was based on a comprehensive consideration of all the information provided to the Board at its meetings throughout the year. The Board, in reaching its determination to renew the Advisory Contracts, was aware that shareholders of the fund have a broad range of investment choices available to them, including a wide choice among funds offered by Fidelity's competitors, and that the fund's shareholders, who have the opportunity to review and weigh the disclosure provided by the fund in its prospectus and other public disclosures, have chosen to invest in this fund, which is part of the Fidelity family of funds.
Amendment to Group Fee Rate. The Board also approved an amendment to the management contract for the fund to add an additional breakpoint to the group fee schedule, effective October 1, 2017. The Board noted that the additional breakpoint would result in lower management fee rates as Fidelity's assets under management increase.
Nature, Extent, and Quality of Services Provided. The Board considered Fidelity's staffing as it relates to the fund, including the backgrounds of investment personnel of Fidelity, and also considered the fund's investment objective, strategies, and related investment philosophy. The Independent Trustees also had discussions with senior management of Fidelity's investment operations and investment groups. The Board considered the structure of the investment personnel compensation program and whether this structure provides appropriate incentives to act in the best interests of the fund. Additionally, the Board considered the portfolio managers' investments, if any, in the funds that they manage.Resources Dedicated to Investment Management and Support Services. The Board and the Fund Oversight and Research Committees reviewed the general qualifications and capabilities of Fidelity's investment staff, including its size, education, experience, and resources, as well as Fidelity's approach to recruiting, training, managing, and compensating investment personnel. The Board noted that Fidelity has continued to increase the resources devoted to non-U.S. offices, including expansion of Fidelity's global investment organization. The Board also noted that Fidelity's analysts have extensive resources, tools and capabilities that allow them to conduct sophisticated quantitative and fundamental analysis, as well as credit analysis of issuers, counterparties and guarantors. Further, the Board considered that Fidelity's investment professionals have sufficient access to global information and data so as to provide competitive investment results over time, and that those professionals also have access to sophisticated tools that permit them to assess portfolio construction and risk and performance attribution characteristics continuously, as well as to transmit new information and research conclusions rapidly around the world. Additionally, in its deliberations, the Board considered Fidelity's trading, risk management, compliance, and technology and operations capabilities and resources, which are integral parts of the investment management process.Shareholder and Administrative Services. The Board considered (i) the nature, extent, quality, and cost of advisory, administrative, and shareholder services performed by the Investment Advisers and their affiliates under the Advisory Contracts and under separate agreements covering transfer agency, pricing and bookkeeping, and securities lending services for the fund; (ii) the nature and extent of the supervision of third party service providers, principally custodians, subcustodians, and pricing vendors; and (iii) the resources devoted to, and the record of compliance with, the fund's compliance policies and procedures. The Board also reviewed the allocation of fund brokerage, including allocations to brokers affiliated with the Investment Advisers, the use of brokerage commissions to pay fund expenses, and the use of "soft" commission dollars to pay for research services.The Board noted that the growth of fund assets over time across the complex allows Fidelity to reinvest in the development of services designed to enhance the value or convenience of the Fidelity funds as investment vehicles. These services include 24-hour access to account information and market information through telephone representatives and over the Internet, investor education materials and asset allocation tools, and the expanded availability of Fidelity Investor Centers.In 2014, the Board formed an ad hoc Committee on Transfer Agency Fees to review the variety of transfer agency fee structures throughout the industry and Fidelity's competitive positioning with respect to industry participants.Investment in a Large Fund Family. The Board considered the benefits to shareholders of investing in a Fidelity fund, including the benefits of investing in a fund that is part of a large family of funds offering a variety of investment disciplines and providing a large variety of mutual fund investor services. The Board noted that Fidelity had taken, or had made recommendations that resulted in the Fidelity funds taking, a number of actions over the previous year that benefited particular funds, including: (i) continuing to dedicate additional resources to Fidelity's investment research process, and to the support of the senior management team that oversees asset management; (ii) continuing efforts to enhance Fidelity's global research capabilities; (iii) launching new funds and making other enhancements to meet client needs; (iv) launching new share classes of existing funds; (v) eliminating purchase minimums and broadening eligibility requirements for certain lower-priced share classes; (vi) reducing management fees and total expenses for certain growth equity funds and index funds; (vii) lowering expense caps for certain existing funds and classes to reduce expenses borne by shareholders; (viii) eliminating short-term redemption fees for certain funds; (ix) introducing a new pricing structure for certain funds of funds that is expected to reduce overall expenses paid by shareholders; (x) rationalizing product lines and gaining increased efficiencies through proposals for fund mergers and share class consolidations; (xi) continuing to develop, acquire and implement systems and technology to improve services to the funds and shareholders, strengthen information security, and increase efficiency; and (xii) implementing enhancements to further strengthen Fidelity's product line to increase investors' probability of success in achieving their investment goals, including retirement income goals.Investment Performance. The Board considered whether the fund has operated in accordance with its investment objective, as well as its record of compliance with its investment restrictions and its performance history.The Board took into account discussions with representatives of the Investment Advisers about fund investment performance that occur at Board meetings throughout the year. In this regard the Board noted that as part of regularly scheduled fund reviews and other reports to the Board on fund performance, the Board considers annualized return information for the fund for different time periods, measured against a securities market index ("benchmark index") and a peer group of funds with similar objectives ("peer group"), if any. In its evaluation of fund investment performance, the Board gave particular attention to information indicating changes in performance of certain Fidelity funds for specific time periods and discussed with the Investment Advisers the reasons for any overperformance or underperformance.In addition to reviewing absolute and relative fund performance, the Independent Trustees periodically consider the appropriateness of fund performance metrics in evaluating the results achieved. In general, the Independent Trustees believe that fund performance should be evaluated based on net performance (after fees and expenses) of both the highest performing and lowest performing fund share classes, where applicable, compared to appropriate benchmark indices, over appropriate time periods that may include full market cycles, and compared to peer groups, as applicable, over the same periods, taking into account relevant factors including the following: general market conditions; issuer-specific information; and fund cash flows and other factors.The Independent Trustees recognize that shareholders evaluate performance on a net basis over their own holding periods, for which one-, three-, and five-year periods are often used as a proxy. For this reason, the performance information reviewed by the Board also included net cumulative calendar year total return information for the fund and an appropriate benchmark index and peer group for the most recent one-, three-, and five-year periods, as shown below. Returns are shown compared to the 25th percentile (top of box, 75% beaten) and 75th percentile (bottom of box, 25% beaten) of the peer universe.Fidelity Advisor Equity Value Fund
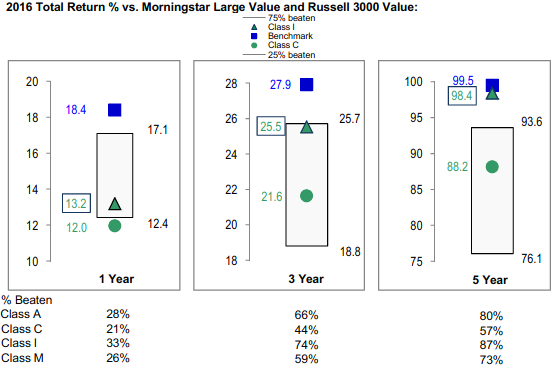
Fidelity Advisor Equity Value Fund
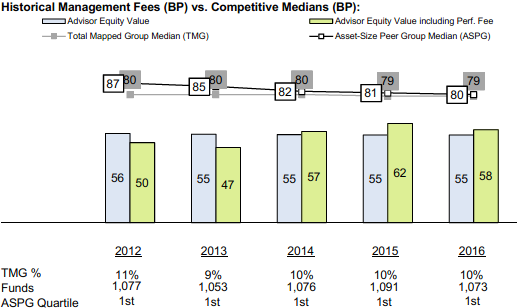
![]()
AEV-ANN-0118
1.767075.116
Fidelity Advisor® Growth & Income Fund Class A, Class M (formerly Class T), Class C, Class I and Class Z Annual Report November 30, 2017 |
|
Contents
Board Approval of Investment Advisory Contracts and Management Fees |
To view a fund's proxy voting guidelines and proxy voting record for the 12-month period ended June 30, visit http://www.fidelity.com/proxyvotingresults or visit the Securities and Exchange Commission's (SEC) web site at http://www.sec.gov.
You may also call 1-877-208-0098 to request a free copy of the proxy voting guidelines.
Standard & Poor's, S&P and S&P 500 are registered service marks of The McGraw-Hill Companies, Inc. and have been licensed for use by Fidelity Distributors Corporation.
Other third-party marks appearing herein are the property of their respective owners.
All other marks appearing herein are registered or unregistered trademarks or service marks of FMR LLC or an affiliated company. © 2018 FMR LLC. All rights reserved.
This report and the financial statements contained herein are submitted for the general information of the shareholders of the Fund. This report is not authorized for distribution to prospective investors in the Fund unless preceded or accompanied by an effective prospectus.
A fund files its complete schedule of portfolio holdings with the SEC for the first and third quarters of each fiscal year on Form N-Q. Forms N-Q are available on the SEC’s web site at http://www.sec.gov. A fund's Forms N-Q may be reviewed and copied at the SEC’s Public Reference Room in Washington, DC. Information regarding the operation of the SEC's Public Reference Room may be obtained by calling 1-800-SEC-0330.
For a complete list of a fund's portfolio holdings, view the most recent holdings listing, semiannual report, or annual report on Fidelity's web site at http://www.fidelity.com, http://www.institutional.fidelity.com, or http://www.401k.com, as applicable.
NOT FDIC INSURED •MAY LOSE VALUE •NO BANK GUARANTEE
Neither the Fund nor Fidelity Distributors Corporation is a bank.
Performance: The Bottom Line
Average annual total return reflects the change in the value of an investment, assuming reinvestment of distributions from dividend income and capital gains (the profits earned upon the sale of securities that have grown in value, if any) and assuming a constant rate of performance each year. The hypothetical investment and the average annual total returns do not reflect the deduction of taxes that a shareholder would pay on fund distributions or the redemption of fund shares. During periods of reimbursement by Fidelity, a fund’s total return will be greater than it would be had the reimbursement not occurred. How a fund did yesterday is no guarantee of how it will do tomorrow.
Average Annual Total Returns
| For the periods ended November 30, 2017 | Past 1 year | Past 5 years | Past 10 years |
| Class A (incl. 5.75% sales charge) | 9.47% | 12.35% | 5.98% |
| Class M (incl. 3.50% sales charge) | 11.79% | 12.61% | 5.98% |
| Class C (incl. contingent deferred sales charge) | 14.28% | 12.85% | 5.83% |
| Class I | 16.45% | 14.04% | 6.95% |
| Class Z | 16.57% | 14.06% | 6.96% |
Class C shares' contingent deferred sales charges included in the past one year, past five years and past ten years total return figures are 1%, 0% and 0%, respectively.
The initial offering of Class Z shares took place on February 1, 2017. Returns prior to February 1, 2017, are those of Class I.
$10,000 Over 10 Years
Let's say hypothetically that $10,000 was invested in Fidelity Advisor® Growth & Income Fund - Class A on November 30, 2007, and the current 5.75% sales charge was paid.
The chart shows how the value of your investment would have changed, and also shows how the S&P 500® Index performed over the same period.
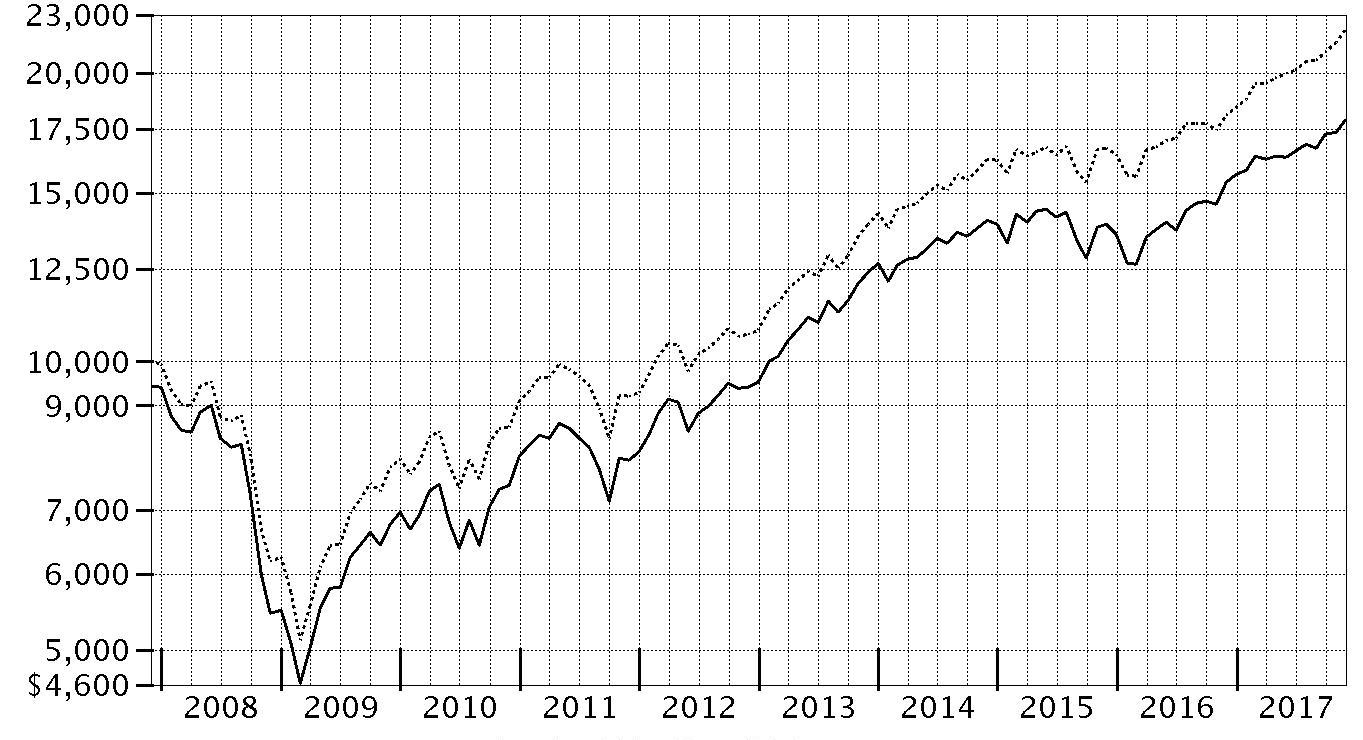
| Period Ending Values | ||
| $17,876 | Fidelity Advisor® Growth & Income Fund - Class A | |
| $22,199 | S&P 500® Index | |
Management's Discussion of Fund Performance
Market Recap: The U.S. equity bellwether S&P 500® index gained 22.87% for the year ending November 30, 2017, rising steadily and closing the period at an all-time high after a particularly strong three-month finish. Early on, equities rallied on optimism for President Trump’s pro-business agenda but leveled off in March amid fading optimism and stalled efforts by Congress to repeal and replace the Affordable Care Act. Upward momentum soon returned and continued through period end with consumer sentiment and other market indicators staying positive. The lone exception was a brief cooldown in August, when geopolitical tension escalated and uncertainty grew regarding the future of health care, tax reform and the debt ceiling. Sector-wise, info tech (+41%) led by a wide margin, surging amid strong earnings growth from several major index constituents. Utilities and financials each gained about 25%, the latter group riding an uptick in bond yields. Conversely, consumer discretionary (+20%) also rose solidly but lagged the broader market, as many brick-and-mortar retailers continued to suffer from increased online competition. Rising interest rates held back real estate (+16%), while consumer staples (+15%) and telecom (+1%) struggled due to investors’ general preference for risk assets. Lastly, sluggish oil prices pushed energy to a -4% return.Comments from Portfolio Manager Matthew Fruhan: For the fiscal year, the fund’s share classes (excluding sales charges, if applicable) gained about 15% to 17%, significantly lagging the benchmark S&P 500® index. The fund’s underperformance of the benchmark was shaped by a market environment that favored highly priced growth stocks, a headwind for my valuation-conscious, dividend-oriented strategy. A significant overweight in the weak energy sector materially detracted from relative results this period. Here, we were hurt by exploration and production company Apache, although our lack of exposure to energy giant and benchmark component Exxon Mobil helped relative results in light of the stock's poor performance. A combination of unfavorable picks and below-benchmark exposure to the market-leading information technology sector also detracted. Stock picking in health care, industrials and consumer discretionary further hurt. Within health care, a non-benchmark position in Israel-based drugmaker Teva Pharmaceutical Industries detracted. Another individual detractor was industrial conglomerate General Electric, one of our largest holdings. On the positive side, security selection in financials contributed, especially several large banks that were among our largest holdings and benefited from higher interest rates: Bank of America, Citigroup and JPMorgan Chase.The views expressed above reflect those of the portfolio manager(s) only through the end of the period as stated on the cover of this report and do not necessarily represent the views of Fidelity or any other person in the Fidelity organization. Any such views are subject to change at any time based upon market or other conditions and Fidelity disclaims any responsibility to update such views. These views may not be relied on as investment advice and, because investment decisions for a Fidelity fund are based on numerous factors, may not be relied on as an indication of trading intent on behalf of any Fidelity fund.
Investment Summary (Unaudited)
Top Ten Stocks as of November 30, 2017
| % of fund's net assets | % of fund's net assets 6 months ago | |
| Bank of America Corp.(a) | 3.8 | 3.2 |
| Microsoft Corp. | 3.6 | 3.5 |
| JPMorgan Chase & Co.(a) | 3.1 | 3.1 |
| Citigroup, Inc.(a) | 3.1 | 2.9 |
| Apple, Inc. | 2.6 | 3.0 |
| Comcast Corp. Class A | 2.0 | 2.1 |
| Wells Fargo & Co. | 2.0 | 1.6 |
| Qualcomm, Inc. | 1.9 | 1.7 |
| ConocoPhillips Co. | 1.9 | 1.7 |
| State Street Corp. | 1.9 | 1.9 |
| 25.9 |
(a) Security or a portion of the security is pledged as collateral for call options written.
Top Five Market Sectors as of November 30, 2017
| % of fund's net assets | % of fund's net assets 6 months ago | |
| Financials | 23.2 | 22.8 |
| Information Technology | 17.6 | 17.6 |
| Health Care | 13.2 | 14.4 |
| Energy | 12.6 | 12.2 |
| Industrials | 11.9 | 12.0 |
Asset Allocation (% of fund's net assets)
| As of November 30, 2017*,** | ||
| Stocks | 98.7% | |
| Convertible Securities | 0.4% | |
| Other Investments | 0.2% | |
| Short-Term Investments and Net Other Assets (Liabilities) | 0.7% | |

* Foreign investments - 10.8%
** Written options - (0.0)%
| As of May 31, 2017*,** | ||
| Stocks | 98.4% | |
| Convertible Securities | 1.2% | |
| Other Investments | 0.2% | |
| Short-Term Investments and Net Other Assets (Liabilities) | 0.2% | |

* Foreign investments - 10.3%
** Written options - (0.1)%
Percentages shown as 0.0% may reflect amounts less than 0.05%.
Investments November 30, 2017
Showing Percentage of Net Assets
| Common Stocks - 98.7% | |||
| Shares | Value (000s) | ||
| CONSUMER DISCRETIONARY - 6.2% | |||
| Auto Components - 0.1% | |||
| Gentex Corp. | 39,400 | $807 | |
| Hotels, Restaurants & Leisure - 0.2% | |||
| Cedar Fair LP (depositary unit) | 2,500 | 170 | |
| DineEquity, Inc. | 9,400 | 431 | |
| Dunkin' Brands Group, Inc. | 9,700 | 579 | |
| Marriott International, Inc. Class A | 1,700 | 216 | |
| 1,396 | |||
| Media - 3.2% | |||
| Comcast Corp. Class A | 314,958 | 11,824 | |
| Interpublic Group of Companies, Inc. | 122,500 | 2,423 | |
| Omnicom Group, Inc. | 15,200 | 1,086 | |
| The Walt Disney Co. | 20,000 | 2,096 | |
| Time Warner, Inc. | 11,100 | 1,016 | |
| Viacom, Inc. Class B (non-vtg.) | 15,200 | 430 | |
| 18,875 | |||
| Multiline Retail - 0.5% | |||
| Dollar General Corp. | 12,000 | 1,057 | |
| Macy's, Inc. | 2,400 | 57 | |
| Target Corp. | 30,899 | 1,851 | |
| 2,965 | |||
| Specialty Retail - 2.1% | |||
| L Brands, Inc. | 61,200 | 3,431 | |
| Lowe's Companies, Inc. (a) | 63,757 | 5,315 | |
| Ross Stores, Inc. | 15,400 | 1,171 | |
| TJX Companies, Inc. | 33,000 | 2,493 | |
| Williams-Sonoma, Inc. | 6,500 | 333 | |
| 12,743 | |||
| Textiles, Apparel & Luxury Goods - 0.1% | |||
| VF Corp. | 4,800 | 350 | |
| TOTAL CONSUMER DISCRETIONARY | 37,136 | ||
| CONSUMER STAPLES - 9.1% | |||
| Beverages - 2.1% | |||
| Coca-Cola European Partners PLC | 10,600 | 413 | |
| Dr. Pepper Snapple Group, Inc. | 16,300 | 1,470 | |
| Molson Coors Brewing Co. Class B | 37,500 | 2,929 | |
| The Coca-Cola Co. | 171,284 | 7,840 | |
| 12,652 | |||
| Food & Staples Retailing - 2.3% | |||
| Costco Wholesale Corp. | 1,600 | 295 | |
| CVS Health Corp. | 67,651 | 5,182 | |
| Kroger Co. | 107,400 | 2,777 | |
| Wal-Mart Stores, Inc. | 55,500 | 5,396 | |
| 13,650 | |||
| Food Products - 0.9% | |||
| B&G Foods, Inc. Class A (b) | 10,500 | 406 | |
| Campbell Soup Co. | 23,300 | 1,149 | |
| General Mills, Inc. | 3,300 | 187 | |
| Kellogg Co. | 20,600 | 1,363 | |
| Snyders-Lance, Inc. | 7,200 | 278 | |
| The J.M. Smucker Co. | 16,300 | 1,902 | |
| 5,285 | |||
| Household Products - 1.6% | |||
| Kimberly-Clark Corp. | 5,500 | 659 | |
| Procter & Gamble Co. | 91,735 | 8,255 | |
| Reckitt Benckiser Group PLC | 7,200 | 632 | |
| 9,546 | |||
| Personal Products - 0.5% | |||
| Coty, Inc. Class A | 36,200 | 624 | |
| Unilever NV (NY Reg.) | 38,600 | 2,229 | |
| 2,853 | |||
| Tobacco - 1.7% | |||
| Altria Group, Inc. | 103,320 | 7,008 | |
| British American Tobacco PLC sponsored ADR | 45,800 | 2,914 | |
| 9,922 | |||
| TOTAL CONSUMER STAPLES | 53,908 | ||
| ENERGY - 12.4% | |||
| Energy Equipment & Services - 0.7% | |||
| Baker Hughes, a GE Co. Class A | 36,300 | 1,079 | |
| Nabors Industries Ltd. | 63,800 | 385 | |
| National Oilwell Varco, Inc. | 46,000 | 1,543 | |
| Oceaneering International, Inc. | 60,900 | 1,190 | |
| 4,197 | |||
| Oil, Gas & Consumable Fuels - 11.7% | |||
| Anadarko Petroleum Corp. | 22,400 | 1,077 | |
| Apache Corp. | 101,041 | 4,227 | |
| Cabot Oil & Gas Corp. | 92,800 | 2,687 | |
| Cenovus Energy, Inc. | 428,500 | 4,085 | |
| Cenovus Energy, Inc. | 3,000 | 29 | |
| Chevron Corp. | 90,763 | 10,800 | |
| ConocoPhillips Co. | 224,495 | 11,422 | |
| Golar LNG Ltd. | 50,300 | 1,243 | |
| Imperial Oil Ltd. | 99,200 | 3,060 | |
| Kinder Morgan, Inc. | 244,700 | 4,216 | |
| Legacy Reserves LP (c) | 77,000 | 119 | |
| Phillips 66 Co. | 10,700 | 1,044 | |
| Suncor Energy, Inc. | 300,490 | 10,423 | |
| Teekay LNG Partners LP | 39,500 | 713 | |
| The Williams Companies, Inc. | 291,631 | 8,472 | |
| Valero Energy Corp. | 20,500 | 1,755 | |
| Williams Partners LP | 122,820 | 4,507 | |
| 69,879 | |||
| TOTAL ENERGY | 74,076 | ||
| FINANCIALS - 23.2% | |||
| Banks - 15.7% | |||
| Bank of America Corp. (a) | 800,942 | 22,562 | |
| Citigroup, Inc. (a) | 240,527 | 18,160 | |
| Cullen/Frost Bankers, Inc. | 1,300 | 128 | |
| JPMorgan Chase & Co. (a) | 178,243 | 18,630 | |
| M&T Bank Corp. | 1,600 | 270 | |
| PNC Financial Services Group, Inc. | 35,816 | 5,034 | |
| Regions Financial Corp. | 171,700 | 2,849 | |
| SunTrust Banks, Inc. | 125,935 | 7,761 | |
| U.S. Bancorp | 109,730 | 6,052 | |
| Wells Fargo & Co. | 209,350 | 11,822 | |
| 93,268 | |||
| Capital Markets - 6.6% | |||
| Apollo Global Management LLC Class A | 40,300 | 1,262 | |
| Charles Schwab Corp. (a) | 81,313 | 3,967 | |
| KKR & Co. LP | 191,713 | 3,819 | |
| Morgan Stanley (a) | 103,230 | 5,328 | |
| Northern Trust Corp. | 68,537 | 6,702 | |
| Oaktree Capital Group LLC Class A | 21,400 | 917 | |
| S&P Global, Inc. | 14,800 | 2,449 | |
| State Street Corp. | 116,170 | 11,077 | |
| TD Ameritrade Holding Corp. | 4,400 | 225 | |
| The Blackstone Group LP | 120,700 | 3,829 | |
| 39,575 | |||
| Insurance - 0.7% | |||
| Marsh & McLennan Companies, Inc. | 24,366 | 2,045 | |
| MetLife, Inc. | 36,500 | 1,959 | |
| 4,004 | |||
| Thrifts & Mortgage Finance - 0.2% | |||
| Radian Group, Inc. | 52,690 | 1,080 | |
| TOTAL FINANCIALS | 137,927 | ||
| HEALTH CARE - 13.0% | |||
| Biotechnology - 2.7% | |||
| Alexion Pharmaceuticals, Inc. (c) | 22,600 | 2,482 | |
| Amgen, Inc. | 52,192 | 9,168 | |
| Biogen, Inc. (c) | 4,600 | 1,482 | |
| Gilead Sciences, Inc. | 14,900 | 1,114 | |
| Intercept Pharmaceuticals, Inc. (c) | 10,058 | 618 | |
| Shire PLC sponsored ADR | 8,000 | 1,190 | |
| 16,054 | |||
| Health Care Equipment & Supplies - 2.0% | |||
| Becton, Dickinson & Co. | 1,500 | 342 | |
| Boston Scientific Corp. (c) | 43,100 | 1,133 | |
| ConvaTec Group PLC | 41,700 | 109 | |
| Danaher Corp. | 29,300 | 2,765 | |
| Fisher & Paykel Healthcare Corp. | 31,448 | 282 | |
| Medtronic PLC | 49,942 | 4,102 | |
| Meridian Bioscience, Inc. | 3,900 | 59 | |
| ResMed, Inc. | 8,900 | 760 | |
| Steris PLC | 4,800 | 432 | |
| Zimmer Biomet Holdings, Inc. | 17,290 | 2,025 | |
| 12,009 | |||
| Health Care Providers & Services - 3.8% | |||
| Aetna, Inc. | 4,200 | 757 | |
| AmerisourceBergen Corp. | 19,100 | 1,620 | |
| Anthem, Inc. | 15,200 | 3,571 | |
| Cardinal Health, Inc. | 60,400 | 3,575 | |
| Cigna Corp. | 16,700 | 3,536 | |
| Fresenius Medical Care AG & Co. KGaA sponsored ADR (b) | 14,300 | 713 | |
| Humana, Inc. | 7,400 | 1,930 | |
| McKesson Corp. | 24,233 | 3,580 | |
| Patterson Companies, Inc. (b) | 25,000 | 914 | |
| UnitedHealth Group, Inc. | 10,500 | 2,396 | |
| 22,592 | |||
| Pharmaceuticals - 4.5% | |||
| Allergan PLC | 7,800 | 1,356 | |
| AstraZeneca PLC sponsored ADR | 48,400 | 1,591 | |
| Bayer AG | 10,400 | 1,327 | |
| Bristol-Myers Squibb Co. | 17,000 | 1,074 | |
| Eisai Co. Ltd. | 1,100 | 62 | |
| GlaxoSmithKline PLC sponsored ADR | 234,309 | 8,215 | |
| Innoviva, Inc. (c) | 19,400 | 255 | |
| Johnson & Johnson | 64,401 | 8,973 | |
| Novartis AG sponsored ADR | 3,401 | 292 | |
| Sanofi SA | 18,423 | 1,681 | |
| Teva Pharmaceutical Industries Ltd. sponsored ADR (b) | 139,974 | 2,074 | |
| 26,900 | |||
| TOTAL HEALTH CARE | 77,555 | ||
| INDUSTRIALS - 11.8% | |||
| Aerospace & Defense - 2.1% | |||
| General Dynamics Corp. | 7,500 | 1,554 | |
| Meggitt PLC | 16,706 | 109 | |
| Rolls-Royce Holdings PLC | 100,600 | 1,166 | |
| The Boeing Co. | 5,294 | 1,465 | |
| United Technologies Corp. | 69,531 | 8,445 | |
| 12,739 | |||
| Air Freight & Logistics - 1.7% | |||
| C.H. Robinson Worldwide, Inc. | 34,500 | 2,989 | |
| Expeditors International of Washington, Inc. | 21,000 | 1,360 | |
| United Parcel Service, Inc. Class B | 49,179 | 5,973 | |
| 10,322 | |||
| Commercial Services & Supplies - 0.1% | |||
| KAR Auction Services, Inc. | 7,500 | 378 | |
| Ritchie Brothers Auctioneers, Inc. (b) | 16,300 | 432 | |
| 810 | |||
| Construction & Engineering - 0.1% | |||
| Fluor Corp. | 8,400 | 407 | |
| Electrical Equipment - 0.7% | |||
| Acuity Brands, Inc. | 6,600 | 1,131 | |
| AMETEK, Inc. | 15,000 | 1,090 | |
| Hubbell, Inc. Class B | 13,712 | 1,725 | |
| 3,946 | |||
| Industrial Conglomerates - 1.8% | |||
| General Electric Co. | 593,993 | 10,864 | |
| Machinery - 1.0% | |||
| Donaldson Co., Inc. | 11,300 | 564 | |
| Flowserve Corp. | 61,800 | 2,631 | |
| Snap-On, Inc. | 8,700 | 1,474 | |
| Wabtec Corp. | 17,300 | 1,330 | |
| Zardoya Otis SA | 9,300 | 104 | |
| 6,103 | |||
| Professional Services - 0.4% | |||
| Intertrust NV (d) | 29,400 | 546 | |
| Nielsen Holdings PLC | 43,200 | 1,586 | |
| 2,132 | |||
| Road & Rail - 3.0% | |||
| CSX Corp. | 102,333 | 5,705 | |
| J.B. Hunt Transport Services, Inc. | 44,120 | 4,903 | |
| Norfolk Southern Corp. | 20,908 | 2,898 | |
| Union Pacific Corp. | 33,800 | 4,276 | |
| 17,782 | |||
| Trading Companies & Distributors - 0.9% | |||
| Brenntag AG | 2,100 | 131 | |
| Bunzl PLC | 9,500 | 272 | |
| Fastenal Co. | 33,700 | 1,766 | |
| Howden Joinery Group PLC | 18,000 | 110 | |
| MSC Industrial Direct Co., Inc. Class A | 8,500 | 766 | |
| Watsco, Inc. | 12,864 | 2,155 | |
| 5,200 | |||
| TOTAL INDUSTRIALS | 70,305 | ||
| INFORMATION TECHNOLOGY - 17.6% | |||
| Communications Equipment - 1.5% | |||
| Cisco Systems, Inc. | 237,971 | 8,876 | |
| Electronic Equipment & Components - 0.1% | |||
| Avnet, Inc. | 10,400 | 431 | |
| Philips Lighting NV (d) | 10,118 | 383 | |
| 814 | |||
| Internet Software & Services - 3.0% | |||
| Alphabet, Inc.: | |||
| Class A (c) | 9,323 | 9,660 | |
| Class C (c) | 7,763 | 7,929 | |
| 17,589 | |||
| IT Services - 3.5% | |||
| Accenture PLC Class A | 11,000 | 1,628 | |
| Amdocs Ltd. | 11,600 | 757 | |
| Cognizant Technology Solutions Corp. Class A | 3,400 | 246 | |
| MasterCard, Inc. Class A (a) | 19,290 | 2,903 | |
| Paychex, Inc. (a) | 97,909 | 6,590 | |
| Unisys Corp. (b)(c) | 106,992 | 829 | |
| Visa, Inc. Class A | 70,340 | 7,920 | |
| 20,873 | |||
| Semiconductors & Semiconductor Equipment - 2.2% | |||
| Maxim Integrated Products, Inc. | 12,900 | 675 | |
| Qualcomm, Inc. | 173,598 | 11,516 | |
| United Microelectronics Corp. sponsored ADR | 114,300 | 291 | |
| Xilinx, Inc. | 5,700 | 396 | |
| 12,878 | |||
| Software - 4.7% | |||
| Micro Focus International PLC | 45,643 | 1,536 | |
| Microsoft Corp. | 255,173 | 21,478 | |
| Oracle Corp. | 67,984 | 3,335 | |
| SAP SE sponsored ADR (b) | 17,000 | 1,927 | |
| 28,276 | |||
| Technology Hardware, Storage & Peripherals - 2.6% | |||
| Apple, Inc. | 89,473 | 15,376 | |
| TOTAL INFORMATION TECHNOLOGY | 104,682 | ||
| MATERIALS - 2.3% | |||
| Chemicals - 1.9% | |||
| CF Industries Holdings, Inc. | 45,700 | 1,712 | |
| DowDuPont, Inc. | 16,983 | 1,222 | |
| LyondellBasell Industries NV Class A | 34,000 | 3,560 | |
| Monsanto Co. | 11,801 | 1,397 | |
| Potash Corp. of Saskatchewan, Inc. | 145,300 | 2,852 | |
| PPG Industries, Inc. | 1,900 | 222 | |
| The Scotts Miracle-Gro Co. Class A | 3,100 | 307 | |
| 11,272 | |||
| Containers & Packaging - 0.3% | |||
| Ball Corp. | 17,500 | 698 | |
| WestRock Co. | 14,200 | 886 | |
| 1,584 | |||
| Metals & Mining - 0.1% | |||
| BHP Billiton Ltd. sponsored ADR (b) | 2,800 | 116 | |
| Reliance Steel & Aluminum Co. | 6,100 | 480 | |
| 596 | |||
| TOTAL MATERIALS | 13,452 | ||
| REAL ESTATE - 0.7% | |||
| Equity Real Estate Investment Trusts (REITs) - 0.7% | |||
| American Tower Corp. | 6,800 | 979 | |
| CoreSite Realty Corp. | 5,100 | 579 | |
| Omega Healthcare Investors, Inc. | 12,000 | 322 | |
| Public Storage | 6,700 | 1,428 | |
| Sabra Health Care REIT, Inc. | 21,600 | 416 | |
| Spirit Realty Capital, Inc. | 59,100 | 505 | |
| 4,229 | |||
| TELECOMMUNICATION SERVICES - 1.2% | |||
| Diversified Telecommunication Services - 1.2% | |||
| Verizon Communications, Inc. | 146,009 | 7,430 | |
| UTILITIES - 1.2% | |||
| Electric Utilities - 1.1% | |||
| Exelon Corp. | 138,200 | 5,764 | |
| PPL Corp. | 18,100 | 664 | |
| Southern Co. | 3,500 | 179 | |
| 6,607 | |||
| Multi-Utilities - 0.1% | |||
| Public Service Enterprise Group, Inc. | 10,500 | 557 | |
| TOTAL UTILITIES | 7,164 | ||
| TOTAL COMMON STOCKS | |||
| (Cost $427,685) | 587,864 | ||
| Preferred Stocks - 0.3% | |||
| Convertible Preferred Stocks - 0.3% | |||
| HEALTH CARE - 0.1% | |||
| Health Care Equipment & Supplies - 0.1% | |||
| Becton, Dickinson & Co. Series A 6.125% | 16,700 | 1,010 | |
| INDUSTRIALS - 0.1% | |||
| Commercial Services & Supplies - 0.1% | |||
| Stericycle, Inc. 2.25% | 9,300 | 484 | |
| UTILITIES - 0.1% | |||
| Independent Power and Renewable Electricity Producers - 0.1% | |||
| Dynegy, Inc. 7.00% | 5,200 | 427 | |
| TOTAL CONVERTIBLE PREFERRED STOCKS | 1,921 | ||
| Nonconvertible Preferred Stocks - 0.0% | |||
| INDUSTRIALS - 0.0% | |||
| Aerospace & Defense - 0.0% | |||
| Rolls-Royce Holdings PLC: | |||
| (C Shares) (c) | 20,915,830 | 28 | |
| Series C (c) | 4,880,600 | 7 | |
| 35 | |||
| TOTAL PREFERRED STOCKS | |||
| (Cost $1,981) | 1,956 | ||
| Principal Amount (000s)(e) | Value (000s) | ||
| Convertible Bonds - 0.1% | |||
| HEALTH CARE - 0.1% | |||
| Pharmaceuticals - 0.1% | |||
| Bayer Capital Corp. BV 5.625% 11/22/19(d) | |||
| (Cost $534) | EUR 500 | 689 | |
| Shares | Value (000s) | ||
| Other - 0.2% | |||
| ENERGY - 0.2% | |||
| Oil, Gas & Consumable Fuels - 0.2% | |||
| Utica Shale Drilling Program (non-operating revenue interest) (f)(g)(h) | |||
| (Cost $1,470) | 1,469,796 | 1,132 | |
| Money Market Funds - 1.7% | |||
| Fidelity Cash Central Fund, 1.13% (i) | 4,236,012 | 4,237 | |
| Fidelity Securities Lending Cash Central Fund 1.13% (i)(j) | 5,532,024 | 5,533 | |
| TOTAL MONEY MARKET FUNDS | |||
| (Cost $9,770) | 9,770 | ||
| TOTAL INVESTMENT IN SECURITIES - 101.0% | |||
| (Cost $441,440) | 601,411 | ||
| NET OTHER ASSETS (LIABILITIES) - (1.0)% | (5,716) | ||
| NET ASSETS - 100% | $595,695 |
| Written Options | ||||||
| Counterparty | Number of Contracts | Notional Amount (000s) | Exercise Price | Expiration Date | Value (000s) | |
| Call Options | ||||||
| AMETEK, Inc. | Bank of America NA | 150 | $1,090 | $70.00 | 12/15/17 | $(41) |
| Bank of America Corp. | Chicago Board Options Exchange | 787 | 2,217 | 28.00 | 12/15/17 | (57) |
| Charles Schwab Corp. | Chicago Board Options Exchange | 122 | 595 | 46.00 | 12/15/17 | (38) |
| Citigroup, Inc. | Chicago Board Options Exchange | 237 | 1,789 | 77.50 | 12/15/17 | (15) |
| JPMorgan Chase & Co. | Chicago Board Options Exchange | 91 | 951 | 100.00 | 12/15/17 | (45) |
| Lowe's Companies, Inc. | Chicago Board Options Exchange | 87 | 725 | 85.00 | 1/19/18 | (14) |
| MasterCard, Inc. Class A | Chicago Board Options Exchange | 33 | 497 | 150.00 | 1/19/18 | (14) |
| Morgan Stanley | Chicago Board Options Exchange | 98 | 506 | 50.00 | 12/15/17 | (20) |
| Paychex, Inc. | Chicago Board Options Exchange | 146 | 983 | 65.00 | 12/15/17 | (37) |
| TOTAL WRITTEN OPTIONS | $(281) |
Currency Abbreviations
EUR – European Monetary Unit
Legend
(a) Security or a portion of the security is pledged as collateral for call options written. At period end, the value of securities pledged amounted to $8,263,000.
(b) Security or a portion of the security is on loan at period end.
(c) Non-income producing
(d) Security exempt from registration under Rule 144A of the Securities Act of 1933. These securities may be resold in transactions exempt from registration, normally to qualified institutional buyers. At the end of the period, the value of these securities amounted to $1,618,000 or 0.3% of net assets.
(e) Amount is stated in United States dollars unless otherwise noted.
(f) Investment is owned by a wholly-owned subsidiary (Subsidiary) that is treated as a corporation for U.S. tax purposes.
(g) Restricted securities - Investment in securities not registered under the Securities Act of 1933 (excluding 144A issues). At the end of the period, the value of restricted securities (excluding 144A issues) amounted to $1,132,000 or 0.2% of net assets.
(h) Level 3 security
(i) Affiliated fund that is generally available only to investment companies and other accounts managed by Fidelity Investments. The rate quoted is the annualized seven-day yield of the fund at period end. A complete unaudited listing of the fund's holdings as of its most recent quarter end is available upon request. In addition, each Fidelity Central Fund's financial statements, which are not covered by the Fund's Report of Independent Registered Public Accounting Firm, are available on the SEC's website or upon request.
(j) Investment made with cash collateral received from securities on loan.
Additional information on each restricted holding is as follows:
| Security | Acquisition Date | Acquisition Cost (000s) |
| Utica Shale Drilling Program (non-operating revenue interest) | 10/5/16 - 9/1/17 | $1,470 |
Affiliated Central Funds
Information regarding fiscal year to date income earned by the Fund from investments in Fidelity Central Funds is as follows:
| Fund | Income earned |
| (Amounts in thousands) | |
| Fidelity Cash Central Fund | $24 |
| Fidelity Securities Lending Cash Central Fund | 23 |
| Total | $47 |
Investment Valuation
The following is a summary of the inputs used, as of November 30, 2017, involving the Fund's assets and liabilities carried at fair value. The inputs or methodology used for valuing securities may not be an indication of the risk associated with investing in those securities. For more information on valuation inputs, and their aggregation into the levels used below, please refer to the Investment Valuation section in the accompanying Notes to Financial Statements.
| Valuation Inputs at Reporting Date: | ||||
| Description | Total | Level 1 | Level 2 | Level 3 |
| (Amounts in thousands) | ||||
| Investments in Securities: | ||||
| Equities: | ||||
| Consumer Discretionary | $37,136 | $37,136 | $-- | $-- |
| Consumer Staples | 53,908 | 53,276 | 632 | -- |
| Energy | 74,076 | 74,076 | -- | -- |
| Financials | 137,927 | 137,927 | -- | -- |
| Health Care | 78,565 | 74,485 | 4,080 | -- |
| Industrials | 70,824 | 70,340 | 484 | -- |
| Information Technology | 104,682 | 104,682 | -- | -- |
| Materials | 13,452 | 13,452 | -- | -- |
| Real Estate | 4,229 | 4,229 | -- | -- |
| Telecommunication Services | 7,430 | 7,430 | -- | -- |
| Utilities | 7,591 | 7,164 | 427 | -- |
| Corporate Bonds | 689 | -- | 689 | -- |
| Other | 1,132 | -- | -- | 1,132 |
| Money Market Funds | 9,770 | 9,770 | -- | -- |
| Total Investments in Securities: | $601,411 | $593,967 | $6,312 | $1,132 |
| Derivative Instruments: | ||||
| Liabilities | ||||
| Written Options | $(281) | $(240) | $(41) | $-- |
| Total Liabilities | $(281) | $(240) | $(41) | $-- |
| Total Derivative Instruments: | $(281) | $(240) | $(41) | $-- |
Value of Derivative Instruments
The following table is a summary of the Fund's value of derivative instruments by primary risk exposure as of November 30, 2017. For additional information on derivative instruments, please refer to the Derivative Instruments section in the accompanying Notes to Financial Statements.
| Primary Risk Exposure / Derivative Type | Value | |
| Asset | Liability | |
| (Amounts in thousands) | ||
| Equity Risk | ||
| Written Options(a) | $0 | $(281) |
| Total Value of Derivatives | $0 | $(281) |
(a) Gross value is presented in the Statement of Assets and Liabilities in the written options, at value line-item.
Other Information
Distribution of investments by country or territory of incorporation, as a percentage of Total Net Assets, is as follows (Unaudited):
| United States of America | 89.2% |
| Canada | 3.5% |
| United Kingdom | 2.8% |
| Netherlands | 1.2% |
| Ireland | 1.2% |
| Others (Individually Less Than 1%) | 2.1% |
| 100.0% |
See accompanying notes which are an integral part of the financial statements.
Financial Statements
Statement of Assets and Liabilities
| Amounts in thousands (except per-share amounts) | November 30, 2017 | |
| Assets | ||
| Investment in securities, at value (including securities loaned of $5,341) — See accompanying schedule: Unaffiliated issuers (cost $431,670) | $591,641 | |
| Fidelity Central Funds (cost $9,770) | 9,770 | |
| Total Investment in Securities (cost $441,440) | $601,411 | |
| Restricted cash | 8 | |
| Receivable for investments sold | 1,540 | |
| Receivable for fund shares sold | 109 | |
| Dividends receivable | 1,524 | |
| Interest receivable | 14 | |
| Distributions receivable from Fidelity Central Funds | 4 | |
| Prepaid expenses | 1 | |
| Other receivables | 1 | |
| Total assets | 604,612 | |
| Liabilities | ||
| Payable for investments purchased | $1,962 | |
| Payable for fund shares redeemed | 568 | |
| Accrued management fee | 214 | |
| Distribution and service plan fees payable | 197 | |
| Written options, at value (premium received $108) | 281 | |
| Other affiliated payables | 112 | |
| Other payables and accrued expenses | 50 | |
| Collateral on securities loaned | 5,533 | |
| Total liabilities | 8,917 | |
| Net Assets | $595,695 | |
| Net Assets consist of: | ||
| Paid in capital | $390,337 | |
| Undistributed net investment income | 4,231 | |
| Accumulated undistributed net realized gain (loss) on investments and foreign currency transactions | 41,332 | |
| Net unrealized appreciation (depreciation) on investments and assets and liabilities in foreign currencies | 159,795 | |
| Net Assets | $595,695 | |
| Calculation of Maximum Offering Price | ||
| Class A: | ||
| Net Asset Value and redemption price per share ($255,114.51 ÷ 8,421.1 shares) | $30.29 | |
| Maximum offering price per share (100/94.25 of $30.29) | $32.14 | |
| Class M: | ||
| Net Asset Value and redemption price per share ($185,768.57 ÷ 6,138.4 shares) | $30.26 | |
| Maximum offering price per share (100/96.50 of $30.26) | $31.36 | |
| Class C: | ||
| Net Asset Value and offering price per share ($86,077.94 ÷ 3,025.8 shares)(a) | $28.45 | |
| Class I: | ||
| Net Asset Value, offering price and redemption price per share ($52,753.82 ÷ 1,706.6 shares) | $30.91 | |
| Class Z: | ||
| Net Asset Value, offering price and redemption price per share ($15,979.99 ÷ 516.4 shares) | $30.94 |
(a) Redemption price per share is equal to net asset value less any applicable contingent deferred sales charge.
See accompanying notes which are an integral part of the financial statements.
Statement of Operations
| Amounts in thousands | Year ended November 30, 2017 | |
| Investment Income | ||
| Dividends | $13,702 | |
| Interest | 71 | |
| Income from Fidelity Central Funds | 47 | |
| Total income | 13,820 | |
| Expenses | ||
| Management fee | $2,516 | |
| Transfer agent fees | 1,145 | |
| Distribution and service plan fees | 2,373 | |
| Accounting and security lending fees | 213 | |
| Custodian fees and expenses | 44 | |
| Independent trustees' fees and expenses | 2 | |
| Registration fees | 87 | |
| Audit | 68 | |
| Legal | 10 | |
| Miscellaneous | 6 | |
| Total expenses before reductions | 6,464 | |
| Expense reductions | (32) | 6,432 |
| Net investment income (loss) | 7,388 | |
| Realized and Unrealized Gain (Loss) | ||
| Net realized gain (loss) on: | ||
| Investment securities: | ||
| Unaffiliated issuers | 46,282 | |
| Fidelity Central Funds | (1) | |
| Foreign currency transactions | 1 | |
| Written options | 938 | |
| Total net realized gain (loss) | 47,220 | |
| Change in net unrealized appreciation (depreciation) on: | ||
| Investment securities: | ||
| Unaffiliated issuers | 27,787 | |
| Fidelity Central Funds | (1) | |
| Assets and liabilities in foreign currencies | 3 | |
| Written options | 1,564 | |
| Total change in net unrealized appreciation (depreciation) | 29,353 | |
| Net gain (loss) | 76,573 | |
| Net increase (decrease) in net assets resulting from operations | $83,961 |
See accompanying notes which are an integral part of the financial statements.
Statement of Changes in Net Assets
| Amounts in thousands | Year ended November 30, 2017 | Year ended November 30, 2016 |
| Increase (Decrease) in Net Assets | ||
| Operations | ||
| Net investment income (loss) | $7,388 | $6,879 |
| Net realized gain (loss) | 47,220 | 7,484 |
| Change in net unrealized appreciation (depreciation) | 29,353 | 36,656 |
| Net increase (decrease) in net assets resulting from operations | 83,961 | 51,019 |
| Distributions to shareholders from net investment income | (7,084) | (7,087) |
| Distributions to shareholders from net realized gain | (9,088) | (32,560) |
| Total distributions | (16,172) | (39,647) |
| Share transactions - net increase (decrease) | (17,017) | (9,916) |
| Total increase (decrease) in net assets | 50,772 | 1,456 |
| Net Assets | ||
| Beginning of period | 544,923 | 543,467 |
| End of period | $595,695 | $544,923 |
| Other Information | ||
| Undistributed net investment income end of period | $4,231 | $5,976 |
See accompanying notes which are an integral part of the financial statements.
Financial Highlights
Fidelity Advisor Growth & Income Fund Class A
| Years ended November 30, | 2017 | 2016 | 2015 | 2014 | 2013 |
| Selected Per–Share Data | |||||
| Net asset value, beginning of period | $26.89 | $26.36 | $28.95 | $25.87 | $19.67 |
| Income from Investment Operations | |||||
| Net investment income (loss)A | .41 | .37 | .42 | .40 | .37 |
| Net realized and unrealized gain (loss) | 3.83 | 2.12 | (.76)B | 2.97 | 5.88 |
| Total from investment operations | 4.24 | 2.49 | (.34) | 3.37 | 6.25 |
| Distributions from net investment income | (.39)C | (.39) | (.36) | (.11) | (.05) |
| Distributions from net realized gain | (.45)C | (1.57) | (1.88) | (.18) | – |
| Total distributions | (.84) | (1.96) | (2.25)D | (.29) | (.05) |
| Net asset value, end of period | $30.29 | $26.89 | $26.36 | $28.95 | $25.87 |
| Total ReturnE,F | 16.15% | 10.59% | (.96)%B | 13.20% | 31.86% |
| Ratios to Average Net AssetsG,H | |||||
| Expenses before reductions | .97% | .99% | .99% | 1.01% | 1.02% |
| Expenses net of fee waivers, if any | .97% | .99% | .98% | 1.01% | 1.02% |
| Expenses net of all reductions | .97% | .99% | .98% | 1.01% | 1.00% |
| Net investment income (loss) | 1.47% | 1.51% | 1.57% | 1.48% | 1.61% |
| Supplemental Data | |||||
| Net assets, end of period (in millions) | $255 | $253 | $244 | $276 | $255 |
| Portfolio turnover rateI | 36% | 31% | 35% | 44% | 48% |
A Calculated based on average shares outstanding during the period.
B Net realized and unrealized gain (loss) per share reflects proceeds received from litigation which amounted to $0.04 per share. Excluding these litigation proceeds, the total return would have been (1.10)%.
C The amounts shown reflect certain reclassifications related to book to tax differences that were made in the year shown.
D Total distributions of $2.25 per share is comprised of distributions from net investment income of $.363 and distributions from net realized gain of $1.883 per share.
E Total returns would have been lower if certain expenses had not been reduced during the applicable periods shown.
F Total returns do not include the effect of the sales charges.
G Fees and expenses of any underlying Fidelity Central Funds are not included in the Fund's expense ratio. The Fund indirectly bears its proportionate share of the expenses of any underlying Fidelity Central Funds.
H Expense ratios reflect operating expenses of the class. Expenses before reductions do not reflect amounts reimbursed by the investment adviser or reductions from brokerage service arrangements or reductions from other expense offset arrangements and do not represent the amount paid by the class during periods when reimbursements or reductions occur. Expenses net of fee waivers reflect expenses after reimbursement by the investment adviser but prior to reductions from brokerage service arrangements or other expense offset arrangements. Expenses net of all reductions represent the net expenses paid by the class.
I Amount does not include the portfolio activity of any underlying Fidelity Central Funds.
See accompanying notes which are an integral part of the financial statements.
Fidelity Advisor Growth & Income Fund Class M
| Years ended November 30, | 2017 | 2016 | 2015 | 2014 | 2013 |
| Selected Per–Share Data | |||||
| Net asset value, beginning of period | $26.87 | $26.32 | $28.91 | $25.84 | $19.68 |
| Income from Investment Operations | |||||
| Net investment income (loss)A | .34 | .31 | .35 | .33 | .32 |
| Net realized and unrealized gain (loss) | 3.82 | 2.12 | (.76)B | 2.97 | 5.89 |
| Total from investment operations | 4.16 | 2.43 | (.41) | 3.30 | 6.21 |
| Distributions from net investment income | (.32)C | (.32) | (.29) | (.05) | (.05) |
| Distributions from net realized gain | (.45)C | (1.57) | (1.88) | (.18) | – |
| Total distributions | (.77) | (1.88)D | (2.18)E | (.23) | (.05) |
| Net asset value, end of period | $30.26 | $26.87 | $26.32 | $28.91 | $25.84 |
| Total ReturnF,G | 15.85% | 10.36% | (1.22)%B | 12.91% | 31.62% |
| Ratios to Average Net AssetsH,I | |||||
| Expenses before reductions | 1.23% | 1.24% | 1.23% | 1.25% | 1.25% |
| Expenses net of fee waivers, if any | 1.22% | 1.24% | 1.23% | 1.25% | 1.25% |
| Expenses net of all reductions | 1.22% | 1.24% | 1.23% | 1.24% | 1.23% |
| Net investment income (loss) | 1.22% | 1.26% | 1.32% | 1.24% | 1.38% |
| Supplemental Data | |||||
| Net assets, end of period (in millions) | $186 | $176 | $180 | $216 | $214 |
| Portfolio turnover rateJ | 36% | 31% | 35% | 44% | 48% |
A Calculated based on average shares outstanding during the period.
B Net realized and unrealized gain (loss) per share reflects proceeds received from litigation which amounted to $0.04 per share. Excluding these litigation proceeds, the total return would have been (1.36)%.
C The amounts shown reflect certain reclassifications related to book to tax differences that were made in the year shown.
D Total distributions of $1.88 per share is comprised of distributions from net investment income of $.319 and distributions from net realized gain of $1.565 per share.
E Total distributions of $2.18 per share is comprised of distributions from net investment income of $.293 and distributions from net realized gain of $1.883 per share.
F Total returns would have been lower if certain expenses had not been reduced during the applicable periods shown.
G Total returns do not include the effect of the sales charges.
H Fees and expenses of any underlying Fidelity Central Funds are not included in the Fund's expense ratio. The Fund indirectly bears its proportionate share of the expenses of any underlying Fidelity Central Funds.
I Expense ratios reflect operating expenses of the class. Expenses before reductions do not reflect amounts reimbursed by the investment adviser or reductions from brokerage service arrangements or reductions from other expense offset arrangements and do not represent the amount paid by the class during periods when reimbursements or reductions occur. Expenses net of fee waivers reflect expenses after reimbursement by the investment adviser but prior to reductions from brokerage service arrangements or other expense offset arrangements. Expenses net of all reductions represent the net expenses paid by the class.
J Amount does not include the portfolio activity of any underlying Fidelity Central Funds.
See accompanying notes which are an integral part of the financial statements.
Fidelity Advisor Growth & Income Fund Class C
| Years ended November 30, | 2017 | 2016 | 2015 | 2014 | 2013 |
| Selected Per–Share Data | |||||
| Net asset value, beginning of period | $25.33 | $24.92 | $27.51 | $24.66 | $18.87 |
| Income from Investment Operations | |||||
| Net investment income (loss)A | .19 | .17 | .21 | .19 | .19 |
| Net realized and unrealized gain (loss) | 3.60 | 2.01 | (.73)B | 2.84 | 5.64 |
| Total from investment operations | 3.79 | 2.18 | (.52) | 3.03 | 5.83 |
| Distributions from net investment income | (.22)C | (.21) | (.18) | – | (.04) |
| Distributions from net realized gain | (.45)C | (1.57) | (1.88) | (.18) | – |
| Total distributions | (.67) | (1.77)D | (2.07)E | (.18) | (.04) |
| Net asset value, end of period | $28.45 | $25.33 | $24.92 | $27.51 | $24.66 |
| Total ReturnF,G | 15.28% | 9.81% | (1.74)%B | 12.38% | 30.95% |
| Ratios to Average Net AssetsH,I | |||||
| Expenses before reductions | 1.73% | 1.74% | 1.73% | 1.74% | 1.74% |
| Expenses net of fee waivers, if any | 1.73% | 1.74% | 1.73% | 1.74% | 1.74% |
| Expenses net of all reductions | 1.72% | 1.74% | 1.73% | 1.74% | 1.73% |
| Net investment income (loss) | .72% | .76% | .82% | .74% | .89% |
| Supplemental Data | |||||
| Net assets, end of period (in millions) | $86 | $80 | $79 | $85 | $74 |
| Portfolio turnover rateJ | 36% | 31% | 35% | 44% | 48% |
A Calculated based on average shares outstanding during the period.
B Net realized and unrealized gain (loss) per share reflects proceeds received from litigation which amounted to $0.04 per share. Excluding these litigation proceeds, the total return would have been (1.88)%.
C The amounts shown reflect certain reclassifications related to book to tax differences that were made in the year shown.
D Total distributions of $1.77 per share is comprised of distributions from net investment income of $.206 and distributions from net realized gain of $1.565 per share.
E Total distributions of $2.07 per share is comprised of distributions from net investment income of $.183 and distributions from net realized gain of $1.883 per share.
F Total returns would have been lower if certain expenses had not been reduced during the applicable periods shown.
G Total returns do not include the effect of the contingent deferred sales charge.
H Fees and expenses of any underlying Fidelity Central Funds are not included in the Fund's expense ratio. The Fund indirectly bears its proportionate share of the expenses of any underlying Fidelity Central Funds.
I Expense ratios reflect operating expenses of the class. Expenses before reductions do not reflect amounts reimbursed by the investment adviser or reductions from brokerage service arrangements or reductions from other expense offset arrangements and do not represent the amount paid by the class during periods when reimbursements or reductions occur. Expenses net of fee waivers reflect expenses after reimbursement by the investment adviser but prior to reductions from brokerage service arrangements or other expense offset arrangements. Expenses net of all reductions represent the net expenses paid by the class.
J Amount does not include the portfolio activity of any underlying Fidelity Central Funds.
See accompanying notes which are an integral part of the financial statements.
Fidelity Advisor Growth & Income Fund Class I
| Years ended November 30, | 2017 | 2016 | 2015 | 2014 | 2013 |
| Selected Per–Share Data | |||||
| Net asset value, beginning of period | $27.41 | $26.85 | $29.47 | $26.13 | $19.79 |
| Income from Investment Operations | |||||
| Net investment income (loss)A | .50 | .44 | .50 | .49 | .43 |
| Net realized and unrealized gain (loss) | 3.90 | 2.16 | (.78)B | 3.03 | 5.97 |
| Total from investment operations | 4.40 | 2.60 | (.28) | 3.52 | 6.40 |
| Distributions from net investment income | (.45)C | (.48) | (.45) | – | (.06) |
| Distributions from net realized gain | (.45)C | (1.57) | (1.88) | (.18) | – |
| Total distributions | (.90) | (2.04)D | (2.34)E | (.18) | (.06) |
| Net asset value, end of period | $30.91 | $27.41 | $26.85 | $29.47 | $26.13 |
| Total ReturnF | 16.45% | 10.91% | (.70)%B | 13.56% | 32.41% |
| Ratios to Average Net AssetsG,H | |||||
| Expenses before reductions | .70% | .73% | .71% | .70% | .70% |
| Expenses net of fee waivers, if any | .70% | .73% | .70% | .70% | .70% |
| Expenses net of all reductions | .70% | .73% | .70% | .70% | .68% |
| Net investment income (loss) | 1.74% | 1.77% | 1.86% | 1.78% | 1.93% |
| Supplemental Data | |||||
| Net assets, end of period (in millions) | $53 | $35 | $36 | $28 | $24 |
| Portfolio turnover rateI | 36% | 31% | 35% | 44% | 48% |
A Calculated based on average shares outstanding during the period.
B Net realized and unrealized gain (loss) per share reflects proceeds received from litigation which amounted to $0.04 per share. Excluding these litigation proceeds, the total return would have been (.84)%.
C The amounts shown reflect certain reclassifications related to book to tax differences that were made in the year shown.
D Total distributions of $2.04 per share is comprised of distributions from net investment income of $.478 and distributions from net realized gain of $1.565 per share.
E Total distributions of $2.34 per share is comprised of distributions from net investment income of $.454 and distributions from net realized gain of $1.883 per share.
F Total returns would have been lower if certain expenses had not been reduced during the applicable periods shown.
G Fees and expenses of any underlying Fidelity Central Funds are not included in the Fund's expense ratio. The Fund indirectly bears its proportionate share of the expenses of any underlying Fidelity Central Funds.
H Expense ratios reflect operating expenses of the class. Expenses before reductions do not reflect amounts reimbursed by the investment adviser or reductions from brokerage service arrangements or reductions from other expense offset arrangements and do not represent the amount paid by the class during periods when reimbursements or reductions occur. Expenses net of fee waivers reflect expenses after reimbursement by the investment adviser but prior to reductions from brokerage service arrangements or other expense offset arrangements. Expenses net of all reductions represent the net expenses paid by the class.
I Amount does not include the portfolio activity of any underlying Fidelity Central Funds.
See accompanying notes which are an integral part of the financial statements.
Fidelity Advisor Growth & Income Fund Class Z
| Years ended November 30, | 2017 A |
| Selected Per–Share Data | |
| Net asset value, beginning of period | $27.35 |
| Income from Investment Operations | |
| Net investment income (loss)B | .51 |
| Net realized and unrealized gain (loss) | 3.08 |
| Total from investment operations | 3.59 |
| Distributions from net investment income | – |
| Distributions from net realized gain | – |
| Total distributions | – |
| Net asset value, end of period | $30.94 |
| Total ReturnC,D | 13.13% |
| Ratios to Average Net AssetsE,F | |
| Expenses before reductions | .57%G |
| Expenses net of fee waivers, if any | .57%G |
| Expenses net of all reductions | .57%G |
| Net investment income (loss) | 2.13%G |
| Supplemental Data | |
| Net assets, end of period (in millions) | $16 |
| Portfolio turnover rateH | 36% |
A For the period February 1, 2017 (commencement of sale of shares) to November 30, 2017.
B Calculated based on average shares outstanding during the period.
C Total returns for periods of less than one year are not annualized.
D Total returns would have been lower if certain expenses had not been reduced during the applicable periods shown.
E Fees and expenses of any underlying Fidelity Central Funds are not included in the Fund's expense ratio. The Fund indirectly bears its proportionate share of the expenses of any underlying Fidelity Central Funds.
F Expense ratios reflect operating expenses of the class. Expenses before reductions do not reflect amounts reimbursed by the investment adviser or reductions from brokerage service arrangements or reductions from other expense offset arrangements and do not represent the amount paid by the class during periods when reimbursements or reductions occur. Expense ratios before reductions for start-up periods may not be representative of longer-term operating periods. Expenses net of fee waivers reflect expenses after reimbursement by the investment adviser but prior to reductions from brokerage service arrangements or other expense offset arrangements. Expenses net of all reductions represent the net expenses paid by the class.
G Annualized
H Amount does not include the portfolio activity of any underlying Fidelity Central Funds.
See accompanying notes which are an integral part of the financial statements.
Notes to Financial Statements
For the period ended November 30, 2017
(Amounts in thousands except percentages)
1. Organization.
Fidelity Advisor Growth & Income Fund (the Fund) is a fund of Fidelity Advisor Series I (the Trust) and is authorized to issue an unlimited number of shares. The Trust is registered under the Investment Company Act of 1940, as amended (the 1940 Act), as an open-end management investment company organized as a Massachusetts business trust. The Fund commenced sale of Class Z shares on February 1, 2017. The Fund offers Class A, Class M (formerly Class T), Class C, Class I and Class Z shares, each of which has equal rights as to assets and voting privileges. Each class has exclusive voting rights with respect to matters that affect that class.
After the close of business on June 24, 2016, all outstanding Class B shares were converted to Class A shares. All prior fiscal period dollar and share amounts for Class B presented in the Notes to Financial Statements are for the period December 1, 2015 through June 24, 2016.
2. Investments in Fidelity Central Funds.
The Fund invests in Fidelity Central Funds, which are open-end investment companies generally available only to other investment companies and accounts managed by the investment adviser and its affiliates. The Fund's Schedule of Investments lists each of the Fidelity Central Funds held as of period end, if any, as an investment of the Fund, but does not include the underlying holdings of each Fidelity Central Fund. As an Investing Fund, the Fund indirectly bears its proportionate share of the expenses of the underlying Fidelity Central Funds.
The Money Market Central Funds seek preservation of capital and current income and are managed by Fidelity Investments Money Management, Inc. (FIMM), an affiliate of the investment adviser. Annualized expenses of the Money Market Central Funds as of their most recent shareholder report date are less than .005%.
A complete unaudited list of holdings for each Fidelity Central Fund is available upon request or at the Securities and Exchange Commission (the SEC) website at www.sec.gov. In addition, the financial statements of the Fidelity Central Funds, which are not covered by the Fund's Report of Independent Registered Public Accounting Firm, are available on the SEC website or upon request.
3. Significant Accounting Policies.
The Fund is an investment company and applies the accounting and reporting guidance of the Financial Accounting Standards Board (FASB) Accounting Standards Codification Topic 946 Financial Services – Investments Companies. The financial statements have been prepared in conformity with accounting principles generally accepted in the United States of America (GAAP), which require management to make certain estimates and assumptions at the date of the financial statements. Actual results could differ from those estimates. Subsequent events, if any, through the date that the financial statements were issued have been evaluated in the preparation of the financial statements. The following summarizes the significant accounting policies of the Fund:
Investment Valuation. Investments are valued as of 4:00 p.m. Eastern time on the last calendar day of the period. The Board of Trustees (the Board) has delegated the day to day responsibility for the valuation of the Fund's investments to the Fair Value Committee (the Committee) established by the Fund's investment adviser. In accordance with valuation policies and procedures approved by the Board, the Fund attempts to obtain prices from one or more third party pricing vendors or brokers to value its investments. When current market prices, quotations or currency exchange rates are not readily available or reliable, investments will be fair valued in good faith by the Committee, in accordance with procedures adopted by the Board. Factors used in determining fair value vary by investment type and may include market or investment specific events, changes in interest rates and credit quality. The frequency with which these procedures are used cannot be predicted and they may be utilized to a significant extent. The Committee oversees the Fund's valuation policies and procedures and reports to the Board on the Committee's activities and fair value determinations. The Board monitors the appropriateness of the procedures used in valuing the Fund's investments and ratifies the fair value determinations of the Committee.
The Fund categorizes the inputs to valuation techniques used to value its investments into a disclosure hierarchy consisting of three levels as shown below:
- Level 1 – quoted prices in active markets for identical investments
- Level 2 – other significant observable inputs (including quoted prices for similar investments, interest rates, prepayment speeds, etc.)
- Level 3 – unobservable inputs (including the Fund's own assumptions based on the best information available)
Valuation techniques used to value the Fund's investments by major category are as follows:
Equity securities, including restricted securities, for which market quotations are readily available, are valued at the last reported sale price or official closing price as reported by a third party pricing vendor on the primary market or exchange on which they are traded and are categorized as Level 1 in the hierarchy. In the event there were no sales during the day or closing prices are not available, securities are valued at the last quoted bid price or may be valued using the last available price and are generally categorized as Level 2 in the hierarchy. For foreign equity securities, when market or security specific events arise, comparisons to the valuation of American Depositary Receipts (ADRs), futures contracts, Exchange-Traded Funds (ETFs) and certain indexes as well as quoted prices for similar securities may be used and would be categorized as Level 2 in the hierarchy. Utilizing these techniques may result in transfers between Level 1 and Level 2. For equity securities, including restricted securities, where observable inputs are limited, assumptions about market activity and risk are used and these securities may be categorized as Level 3 in the hierarchy.
Debt securities, including restricted securities, are valued based on evaluated prices received from third party pricing vendors or from brokers who make markets in such securities. Corporate bonds are valued by pricing vendors who utilize matrix pricing which considers yield or price of bonds of comparable quality, coupon, maturity and type or by broker-supplied prices. When independent prices are unavailable or unreliable, debt securities may be valued utilizing pricing methodologies which consider similar factors that would be used by third party pricing vendors. Debt securities are generally categorized as Level 2 in the hierarchy but may be Level 3 depending on the circumstances.
Exchange-traded options are valued using the last sale price or, in the absence of a sale, the last offering price and are categorized as Level 1 in the hierarchy. Options traded over-the-counter are valued using broker-supplied valuations and are categorized as Level 2 in the hierarchy. Investments in open-end mutual funds, including the Fidelity Central Funds, are valued at their closing net asset value (NAV) each business day and are categorized as Level 1 in the hierarchy.
Changes in valuation techniques may result in transfers in or out of an assigned level within the disclosure hierarchy. The aggregate value of investments by input level as of November 30, 2017 is included at the end of the Fund's Schedule of Investments.
Foreign Currency. The Fund may use foreign currency contracts to facilitate transactions in foreign-denominated securities. Gains and losses from these transactions may arise from changes in the value of the foreign currency or if the counterparties do not perform under the contracts' terms.
Foreign-denominated assets, including investment securities, and liabilities are translated into U.S. dollars at the exchange rates at period end. Purchases and sales of investment securities, income and dividends received and expenses denominated in foreign currencies are translated into U.S. dollars at the exchange rate in effect on the transaction date.
The effects of exchange rate fluctuations on investments are included with the net realized and unrealized gain (loss) on investment securities. Other foreign currency transactions resulting in realized and unrealized gain (loss) are disclosed separately.
Investment Transactions and Income. For financial reporting purposes, the Fund's investment holdings and NAV include trades executed through the end of the last business day of the period. The NAV per share for processing shareholder transactions is calculated as of the close of business of the New York Stock Exchange (NYSE), normally 4:00 p.m. Eastern time and includes trades executed through the end of the prior business day. Gains and losses on securities sold are determined on the basis of identified cost and includes proceeds received from litigation. Dividend income is recorded on the ex-dividend date, except for certain dividends from foreign securities where the ex-dividend date may have passed, which are recorded as soon as the Fund is informed of the ex-dividend date. Non-cash dividends included in dividend income, if any, are recorded at the fair market value of the securities received. Income and capital gain distributions from Fidelity Central Funds, if any, are recorded on the ex-dividend date. Certain distributions received by the Fund represent a return of capital or capital gain. The Fund determines the components of these distributions subsequent to the ex-dividend date, based upon receipt of tax filings or other correspondence relating to the underlying investment. These distributions are recorded as a reduction of cost of investments and/or as a realized gain. Interest income is accrued as earned and includes coupon interest and amortization of premium and accretion of discount on debt securities as applicable. Investment income is recorded net of foreign taxes withheld where recovery of such taxes is uncertain.
Class Allocations and Expenses. Investment income, realized and unrealized capital gains and losses, common expenses of the Fund, and certain fund-level expense reductions, if any, are allocated daily on a pro-rata basis to each class based on the relative net assets of each class to the total net assets of the Fund. Each class differs with respect to transfer agent and distribution and service plan fees incurred. Certain expense reductions may also differ by class. For the reporting period, the allocated portion of income and expenses to each class as a percent of its average net assets may vary due to the timing of recording these transactions in relation to fluctuating net assets of the classes. Expenses directly attributable to a fund are charged to that fund. Expenses attributable to more than one fund are allocated among the respective funds on the basis of relative net assets or other appropriate methods. Expense estimates are accrued in the period to which they relate and adjustments are made when actual amounts are known.
Income Tax Information and Distributions to Shareholders. Each year, the Fund intends to qualify as a regulated investment company under Subchapter M of the Internal Revenue Code, including distributing substantially all of its taxable income and realized gains. As a result, no provision for U.S. Federal income taxes is required. As of November 30, 2017, the Fund did not have any unrecognized tax benefits in the financial statements; nor is the Fund aware of any tax positions for which it is reasonably possible that the total amounts of unrecognized tax benefits will significantly change in the next twelve months. The Fund files a U.S. federal tax return, in addition to state and local tax returns as required. The Fund's federal income tax returns are subject to examination by the Internal Revenue Service (IRS) for a period of three fiscal years after they are filed. State and local tax returns may be subject to examination for an additional fiscal year depending on the jurisdiction. Foreign taxes are provided for based on the Fund's understanding of the tax rules and rates that exist in the foreign markets in which it invests.
Distributions are declared and recorded on the ex-dividend date. Income dividends and capital gain distributions are declared separately for each class. Income and capital gain distributions are determined in accordance with income tax regulations, which may differ from GAAP. These differences resulted in distribution reclassifications. In addition, the Fund claimed a portion of the payment made to redeeming shareholders as a distribution for income tax purposes.
Capital accounts within the financial statements are adjusted for permanent book-tax differences. These adjustments have no impact on net assets or the results of operations. Capital accounts are not adjusted for temporary book-tax differences which will reverse in a subsequent period.
Book-tax differences are primarily due to foreign currency transactions, passive foreign investment companies (PFIC), partnerships, equity-debt classifications, certain conversion ratio adjustments and losses deferred due to wash sales.
As of period end, the cost and unrealized appreciation (depreciation) in securities, and derivatives if applicable, for federal income tax purposes were as follows:
| Gross unrealized appreciation | $184,184 |
| Gross unrealized depreciation | (27,319) |
| Net unrealized appreciation (depreciation) | $156,865 |
| Tax Cost | $444,264 |
The tax-based components of distributable earnings as of period end were as follows:
| Undistributed ordinary income | $7,771 |
| Undistributed long-term capital gain | $42,431 |
| Net unrealized appreciation (depreciation) on securities and other investments | $155,156 |
The tax character of distributions paid was as follows:
| November 30, 2017 | November 30, 2016 | |
| Ordinary Income | $7,671 | $ 7,087 |
| Long-term Capital Gains | 8,501 | 32,560 |
| Total | $16,172 | $ 39,647 |
Restricted Securities. The Fund may invest in securities that are subject to legal or contractual restrictions on resale. These securities generally may be resold in transactions exempt from registration or to the public if the securities are registered. Disposal of these securities may involve time-consuming negotiations and expense, and prompt sale at an acceptable price may be difficult. Information regarding restricted securities is included at the end of the Fund's Schedule of Investments.
Consolidated Subsidiary. The Fund invests in certain investments through a wholly-owned subsidiary ("Subsidiary"), which may be subject to federal and state taxes upon disposition.
As of period end, the Fund held an investment of $1,140 in this Subsidiary, representing .19% of the Fund's net assets. The financial statements have been consolidated and include accounts of the Fund and the Subsidiary. Accordingly, all inter-company transactions and balances have been eliminated.
Any cash held by the Subsidiary is restricted as to its use and is presented as Restricted cash in the Statement of Assets and Liabilities.
4. Derivative Instruments.
Risk Exposures and the Use of Derivative Instruments. The Fund's investment objective allows the Fund to enter into various types of derivative contracts, including options. Derivatives are investments whose value is primarily derived from underlying assets, indices or reference rates and may be transacted on an exchange or over-the-counter (OTC). Derivatives may involve a future commitment to buy or sell a specified asset based on specified terms, to exchange future cash flows at periodic intervals based on a notional principal amount, or for one party to make one or more payments upon the occurrence of specified events in exchange for periodic payments from the other party.
The Fund used derivatives to increase returns and to manage exposure to certain risks as defined below. The success of any strategy involving derivatives depends on analysis of numerous economic factors, and if the strategies for investment do not work as intended, the Fund may not achieve its objectives.
The Fund's use of derivatives increased or decreased its exposure to the following risk:
| Equity Risk | Equity risk relates to the fluctuations in the value of financial instruments as a result of changes in market prices (other than those arising from interest rate risk or foreign exchange risk), whether caused by factors specific to an individual investment, its issuer, or all factors affecting all instruments traded in a market or market segment. |
The Fund is also exposed to additional risks from investing in derivatives, such as liquidity risk and counterparty credit risk. Liquidity risk is the risk that the Fund will be unable to close out the derivative in the open market in a timely manner. Counterparty credit risk is the risk that the counterparty will not be able to fulfill its obligation to the Fund. Derivative counterparty credit risk is managed through formal evaluation of the creditworthiness of all potential counterparties. On certain OTC derivatives such as options, the Fund attempts to reduce its exposure to counterparty credit risk by entering into an International Swaps and Derivatives Association, Inc. (ISDA) Master Agreement with each of its counterparties. The ISDA Master Agreement gives the Fund the right to terminate all transactions traded under such agreement upon the deterioration in the credit quality of the counterparty beyond specified levels. The ISDA Master Agreement gives each party the right, upon an event of default by the other party or a termination of the agreement, to close out all transactions traded under such agreement and to net amounts owed under each transaction to one net payable by one party to the other. To mitigate counterparty credit risk on bi-lateral OTC derivatives, the Fund receives collateral in the form of cash or securities once the Fund's net unrealized appreciation on outstanding derivative contracts under an ISDA Master Agreement exceeds certain applicable thresholds, subject to certain minimum transfer provisions. The collateral received is held in segregated accounts with the Fund's custodian bank in accordance with the collateral agreements entered into between the Fund, the counterparty and the Fund's custodian bank. The Fund could experience delays and costs in gaining access to the collateral even though it is held by the Fund's custodian bank. The Fund's maximum risk of loss from counterparty credit risk related to bi-lateral OTC derivatives is generally the aggregate unrealized appreciation and unpaid counterparty payments in excess of any collateral pledged by the counterparty to the Fund. The Fund may be required to pledge collateral for the benefit of the counterparties on bi-lateral OTC derivatives in an amount not less than each counterparty's unrealized appreciation on outstanding derivative contracts, subject to certain minimum transfer provisions, and any such pledged collateral is identified in the Schedule of Investments. Counterparty credit risk related to exchange-traded options may be mitigated by the protection provided by the exchange on which they trade.
Investing in derivatives may involve greater risks than investing in the underlying assets directly and, to varying degrees, may involve risk of loss in excess of any initial investment and collateral received and amounts recognized in the Statement of Assets and Liabilities. In addition, there may be the risk that the change in value of the derivative contract does not correspond to the change in value of the underlying instrument.
Options. Options give the purchaser the right, but not the obligation, to buy (call) or sell (put) an underlying security or financial instrument at an agreed exercise or strike price between or on certain dates. Options obligate the seller (writer) to buy (put) or sell (call) an underlying instrument at the exercise or strike price or cash settle an underlying derivative instrument if the holder exercises the option on or before the expiration date.
The Fund used exchange-traded and OTC written covered call options to manage its exposure to the market. When the Fund writes a covered call option, the Fund holds the underlying instrument which must be delivered to the holder upon the exercise of the option.
Upon entering into a written options contract, the Fund will receive a premium. Premiums received are reflected as a liability on the Statement of Assets and Liabilities. Options are valued daily and any unrealized appreciation (depreciation) is reflected on the Statement of Assets and Liabilities. When a written option is exercised, the premium is added to the proceeds from the sale of the underlying instrument in determining the gain or loss realized on that investment. When an option is closed the Fund will realize a gain or loss depending on whether the proceeds or amount paid for the closing sale transaction are greater or less than the premium received. When an option expires, gains and losses are realized to the extent of premiums received. The net realized gain (loss) on closed and expired written options and the change in net unrealized appreciation (depreciation) on written options are presented in the Statement of Operations.
Writing call options tends to decrease exposure to the underlying instrument and risk of loss is the change in value in excess of the premium received.
Any open options at period end are presented in the Schedule of Investments under the caption "Written Options" and are representative of volume of activity during the period.
5. Purchases and Sales of Investments.
Purchases and sales of securities, other than short-term securities, aggregated $204,960 and $230,828, respectively.
6. Fees and Other Transactions with Affiliates.
Management Fee. Fidelity Management & Research Company (the investment adviser) and its affiliates provide the Fund with investment management related services for which the Fund pays a monthly management fee. The management fee is the sum of an individual fund fee rate that is based on an annual rate of .20% of the Fund's average net assets and an annualized group fee rate that averaged .25% during the period. The group fee rate is based upon the average net assets of all the mutual funds advised by the investment adviser, including any mutual funds previously advised by the investment adviser that are currently advised by Fidelity SelectCo, LLC, an affiliate of the investment adviser. The group fee rate decreases as assets under management increase and increases as assets under management decrease. For the reporting period, the total annual management fee rate was .44% of the Fund's average net assets.
Distribution and Service Plan Fees. In accordance with Rule 12b-1 of the 1940 Act, the Fund has adopted separate Distribution and Service Plans for each class of shares. Certain classes pay Fidelity Distributors Corporation (FDC), an affiliate of the investment adviser, separate Distribution and Service Fees, each of which is based on an annual percentage of each class' average net assets. In addition, FDC may pay financial intermediaries for selling shares of the Fund and providing shareholder support services. For the period, the Distribution and Service Fee rates, total fees and amounts retained by FDC were as follows:
| Distribution Fee | Service Fee | Total Fees | Retained by FDC | |
| Class A | -% | .25% | $624 | $5 |
| Class M | .25% | .25% | 908 | 2 |
| Class C | .75% | .25% | 841 | 58 |
| $2,373 | $65 |
Sales Load. FDC may receive a front-end sales charge of up to 5.75% for selling Class A shares and 3.50% for selling Class M shares, some of which is paid to financial intermediaries for selling shares of the Fund. Depending on the holding period, FDC may receive contingent deferred sales charges levied on Class A, Class M and Class C redemptions. The deferred sales charges are 1.00% for Class C shares, 1.00% for certain purchases of Class A shares and .25% for certain purchases of Class M shares.
For the period, sales charge amounts retained by FDC were as follows:
| Retained by FDC | |
| Class A | $64 |
| Class M | 16 |
| Class C(a) | 4 |
| $84 |
(a) When Class C shares are initially sold, FDC pays commissions from its own resources to financial intermediaries through which the sales are made.
Transfer Agent Fees. Fidelity Investments Institutional Operations Company, Inc., (FIIOC), an affiliate of the investment adviser, is the transfer, dividend disbursing and shareholder servicing agent for each class of the Fund. FIIOC receives account fees and asset-based fees that vary according to the account size and type of account of the shareholders of the respective classes of the Fund, except for Class Z. FIIOC receives an asset-based fee of Class Z's average net assets. FIIOC pays for typesetting, printing and mailing of shareholder reports, except proxy statements.
For the period, transfer agent fees for each class were as follows:
| Amount | % of Class-Level Average Net Assets | |
| Class A | $510 | .20 |
| Class M | 373 | .21 |
| Class C | 176 | .21 |
| Class I | 84 | .18 |
| Class Z | 2 | .05(a) |
| $1,145 |
(a) Annualized
Accounting and Security Lending Fees. Fidelity Service Company, Inc. (FSC), an affiliate of the investment adviser, maintains the Fund's accounting records. The accounting fee is based on the level of average net assets for each month. Under a separate contract, FSC administers the security lending program. The security lending fee is based on the number and duration of lending transactions.
Brokerage Commissions. The Fund placed a portion of its portfolio transactions with brokerage firms which are affiliates of the investment adviser. Brokerage commissions are included in net realized gain (loss) and change in net unrealized appreciation (depreciation) in the Statement of Operations. The commissions paid to these affiliated firms were $4 for the period.
Interfund Trades. The Fund may purchase from or sell securities to other Fidelity Funds under procedures adopted by the Board. The procedures have been designed to ensure these interfund trades are executed in accordance with Rule 17a-7 of the 1940 Act. Interfund trades are included within the respective purchases and sales amounts shown in the Purchases and Sales of Investments note.
7. Committed Line of Credit.
The Fund participates with other funds managed by the investment adviser or an affiliate in a $4.25 billion credit facility (the "line of credit") to be utilized for temporary or emergency purposes to fund shareholder redemptions or for other short-term liquidity purposes. The Fund has agreed to pay commitment fees on its pro-rata portion of the line of credit, which amounted to $2 and is reflected in Miscellaneous expenses on the Statement of Operations. During the period, the Fund did not borrow on this line of credit.
8. Security Lending.
The Fund lends portfolio securities through a lending agent from time to time in order to earn additional income. For equity securities, a lending agent is used and may loan securities to certain qualified borrowers, including Fidelity Capital Markets (FCM), a broker-dealer affiliated with the Fund. On the settlement date of the loan, the Fund receives collateral (in the form of U.S. Treasury obligations, letters of credit and/or cash) against the loaned securities and maintains collateral in an amount not less than 100% of the market value of the loaned securities during the period of the loan. The market value of the loaned securities is determined at the close of business of the Fund and any additional required collateral is delivered to the Fund on the next business day. The Fund or borrower may terminate the loan at any time, and if the borrower defaults on its obligation to return the securities loaned because of insolvency or other reasons, the Fund may apply collateral received from the borrower against the obligation. The Fund may experience delays and costs in recovering the securities loaned. Any cash collateral received is invested in the Fidelity Securities Lending Cash Central Fund. The value of loaned securities and cash collateral at period end are disclosed on the Fund's Statement of Assets and Liabilities. The value of securities loaned to FCM at period end was $217. Security lending income represents the income earned on investing cash collateral, less rebates paid to borrowers and any lending agent fees associated with the loan, plus any premium payments received for lending certain types of securities. Security lending income is presented in the Statement of Operations as a component of income from Fidelity Central Funds. Total security lending income during the period amounted to $23, including an amount less than five hundred dollars from securities loaned to FCM.
9. Expense Reductions.
The investment adviser voluntarily agreed to reimburse a portion of the Fund's Class A, Class M, Class C and Class I operating expenses. During the period, this reimbursement reduced expenses as follows:
| Reimbursement | |
| Class A | $7 |
| Class M | 5 |
| Class C | 3 |
| Class I | 1 |
| $16 |
Commissions paid to certain brokers with whom the investment adviser, or its affiliates, places trades on behalf of the Fund include an amount in addition to trade execution, which may be rebated back to the Fund to offset certain expenses. This amount totaled $11 for the period.
In addition, during the period the investment adviser reimbursed and/or waived a portion of fund-level operating expenses in the amount of $5.
10. Distributions to Shareholders.
Distributions to shareholders of each class were as follows:
| Year ended November 30, 2017 | Year ended November 30, 2016 | |
| From net investment income | ||
| Class A | $3,625 | $3,587 |
| Class M | 2,157 | 2,175 |
| Class B | – | 15 |
| Class C | 717 | 651 |
| Class I | 585 | 659 |
| Total | $7,084 | $7,087 |
| From net realized gain | ||
| Class A | $4,131 | $14,443 |
| Class M | 2,946 | 10,700 |
| Class B | – | 287 |
| Class C | 1,429 | 4,965 |
| Class I | 582 | 2,165 |
| Total | $9,088 | $32,560 |
11. Share Transactions.
Share transactions for each class were as follows and may contain automatic conversions between classes or exchanges between affiliated funds:
| Shares | Shares | Dollars | Dollars | |
| Year ended November 30, 2017(a) | Year ended November 30, 2016 | Year ended November 30, 2017(a) | Year ended November 30, 2016 | |
| Class A | ||||
| Shares sold | 831 | 1,081 | $23,130 | $26,026 |
| Reinvestment of distributions | 268 | 720 | 7,224 | 16,776 |
| Shares redeemed | (2,104) | (1,618) | (58,668) | (38,962) |
| Net increase (decrease) | (1,005) | 183 | $(28,314) | $3,840 |
| Class M | ||||
| Shares sold | 474 | 433 | $13,200 | $10,470 |
| Reinvestment of distributions | 183 | 536 | 4,948 | 12,512 |
| Shares redeemed | (1,071) | (1,248) | (30,045) | (30,152) |
| Net increase (decrease) | (414) | (279) | $(11,897) | $(7,170) |
| Class B | ||||
| Shares sold | – | 3 | $– | $51 |
| Reinvestment of distributions | – | 12 | – | 278 |
| Shares redeemed | – | (202) | – | (4,522) |
| Net increase (decrease) | – | (187) | $– | $(4,193) |
| Class C | ||||
| Shares sold | 381 | 388 | $10,013 | $8,771 |
| Reinvestment of distributions | 76 | 224 | 1,930 | 4,961 |
| Shares redeemed | (586) | (627) | (15,527) | (14,174) |
| Net increase (decrease) | (129) | (15) | $(3,584) | $(442) |
| Class I | ||||
| Shares sold | 1,079 | 600 | $30,698 | $15,066 |
| Reinvestment of distributions | 39 | 101 | 1,063 | 2,390 |
| Shares redeemed | (705) | (760) | (20,133) | (19,407) |
| Net increase (decrease) | 413 | (59) | $11,628 | $(1,951) |
| Class Z | ||||
| Shares sold | 538 | – | $15,811 | $– |
| Shares redeemed | (22) | – | (661) | – |
| Net increase (decrease) | 516 | – | $15,150 | $– |
(a) Share transactions for Class Z are for the period February 1, 2017 (commencement of sale of shares) to November 30, 2017
12. Other.
The Fund's organizational documents provide former and current trustees and officers with a limited indemnification against liabilities arising in connection with the performance of their duties to the Fund. In the normal course of business, the Fund may also enter into contracts that provide general indemnifications. The Fund's maximum exposure under these arrangements is unknown as this would be dependent on future claims that may be made against the Fund. The risk of material loss from such claims is considered remote.
Report of Independent Registered Public Accounting Firm
To the Trustees of Fidelity Advisor Series I and Shareholders of Fidelity Advisor Growth & Income Fund:
We have audited the accompanying statement of assets and liabilities of Fidelity Advisor Growth & Income Fund (the Fund), a fund of Fidelity Advisor Series I, including the schedule of investments, as of November 30, 2017, and the related statement of operations for the year then ended, the statement of changes in net assets for each of the two years in the period then ended, and the financial highlights for each of the five years in the period then ended. These financial statements and financial highlights are the responsibility of the Fund's management. Our responsibility is to express an opinion on these financial statements and financial highlights based on our audits.
We conducted our audits in accordance with the standards of the Public Company Accounting Oversight Board (United States). Those standards require that we plan and perform the audit to obtain reasonable assurance about whether the financial statements and financial highlights are free of material misstatement. The Fund is not required to have, nor were we engaged to perform, an audit of its internal control over financial reporting. Our audits included consideration of internal control over financial reporting as a basis for designing audit procedures that are appropriate in the circumstances, but not for the purpose of expressing an opinion on the effectiveness of the Fund's internal control over financial reporting. Accordingly, we express no such opinion. An audit also includes examining, on a test basis, evidence supporting the amounts and disclosures in the financial statements, assessing the accounting principles used and significant estimates made by management, as well as evaluating the overall financial statement presentation. Our procedures included confirmation of securities owned as of November 30, 2017, by correspondence with the custodians and brokers; when replies were not received from brokers, we performed other auditing procedures. We believe that our audits provide a reasonable basis for our opinion.
In our opinion, such financial statements and financial highlights referred to above present fairly, in all material respects, the financial position of Fidelity Advisor Growth & Income Fund as of November 30, 2017, the results of its operations for the year then ended, the changes in its net assets for each of the two years in the period then ended, and the financial highlights for the each of the five years in the period then ended, in conformity with accounting principles generally accepted in the United States of America.
DELOITTE & TOUCHE LLP
Boston, Massachusetts
January 16, 2018
Trustees and Officers
The Trustees, Members of the Advisory Board (if any), and officers of the trust and fund, as applicable, are listed below. The Board of Trustees governs the fund and is responsible for protecting the interests of shareholders. The Trustees are experienced executives who meet periodically throughout the year to oversee the fund's activities, review contractual arrangements with companies that provide services to the fund, oversee management of the risks associated with such activities and contractual arrangements, and review the fund's performance. Each of the Trustees oversees 190 funds.
The Trustees hold office without limit in time except that (a) any Trustee may resign; (b) any Trustee may be removed by written instrument, signed by at least two-thirds of the number of Trustees prior to such removal; (c) any Trustee who requests to be retired or who has become incapacitated by illness or injury may be retired by written instrument signed by a majority of the other Trustees; and (d) any Trustee may be removed at any special meeting of shareholders by a two-thirds vote of the outstanding voting securities of the trust. Each Trustee who is not an interested person (as defined in the 1940 Act) of the trust and the fund is referred to herein as an Independent Trustee. Each Independent Trustee shall retire not later than the last day of the calendar year in which his or her 75th birthday occurs. The Independent Trustees may waive this mandatory retirement age policy with respect to individual Trustees. Officers and Advisory Board Members hold office without limit in time, except that any officer or Advisory Board Member may resign or may be removed by a vote of a majority of the Trustees at any regular meeting or any special meeting of the Trustees. Except as indicated, each individual has held the office shown or other offices in the same company for the past five years.
The fund’s Statement of Additional Information (SAI) includes more information about the Trustees. To request a free copy, call Fidelity at 1-877-208-0098.
Experience, Skills, Attributes, and Qualifications of the Trustees. The Governance and Nominating Committee has adopted a statement of policy that describes the experience, qualifications, attributes, and skills that are necessary and desirable for potential Independent Trustee candidates (Statement of Policy). The Board believes that each Trustee satisfied at the time he or she was initially elected or appointed a Trustee, and continues to satisfy, the standards contemplated by the Statement of Policy. The Governance and Nominating Committee also engages professional search firms to help identify potential Independent Trustee candidates who have the experience, qualifications, attributes, and skills consistent with the Statement of Policy. From time to time, additional criteria based on the composition and skills of the current Independent Trustees, as well as experience or skills that may be appropriate in light of future changes to board composition, business conditions, and regulatory or other developments, have also been considered by the professional search firms and the Governance and Nominating Committee. In addition, the Board takes into account the Trustees' commitment and participation in Board and committee meetings, as well as their leadership of standing and ad hoc committees throughout their tenure.
In determining that a particular Trustee was and continues to be qualified to serve as a Trustee, the Board has considered a variety of criteria, none of which, in isolation, was controlling. The Board believes that, collectively, the Trustees have balanced and diverse experience, qualifications, attributes, and skills, which allow the Board to operate effectively in governing the fund and protecting the interests of shareholders. Information about the specific experience, skills, attributes, and qualifications of each Trustee, which in each case led to the Board's conclusion that the Trustee should serve (or continue to serve) as a trustee of the fund, is provided below.
Board Structure and Oversight Function. James C. Curvey is an interested person and currently serves as Chairman. The Trustees have determined that an interested Chairman is appropriate and benefits shareholders because an interested Chairman has a personal and professional stake in the quality and continuity of services provided to the fund. Independent Trustees exercise their informed business judgment to appoint an individual of their choosing to serve as Chairman, regardless of whether the Trustee happens to be independent or a member of management. The Independent Trustees have determined that they can act independently and effectively without having an Independent Trustee serve as Chairman and that a key structural component for assuring that they are in a position to do so is for the Independent Trustees to constitute a substantial majority for the Board. The Independent Trustees also regularly meet in executive session. Ned C. Lautenbach serves as Chairman of the Independent Trustees and as such (i) acts as a liaison between the Independent Trustees and management with respect to matters important to the Independent Trustees and (ii) with management prepares agendas for Board meetings.
Fidelity® funds are overseen by different Boards of Trustees. The fund's Board oversees Fidelity's high income and certain equity funds, and other Boards oversee Fidelity's investment-grade bond, money market, asset allocation, and sector funds. The asset allocation funds may invest in Fidelity® funds overseen by the fund's Board. The use of separate Boards, each with its own committee structure, allows the Trustees of each group of Fidelity® funds to focus on the unique issues of the funds they oversee, including common research, investment, and operational issues. On occasion, the separate Boards establish joint committees to address issues of overlapping consequences for the Fidelity® funds overseen by each Board.
The Trustees operate using a system of committees to facilitate the timely and efficient consideration of all matters of importance to the Trustees, the fund, and fund shareholders and to facilitate compliance with legal and regulatory requirements and oversight of the fund's activities and associated risks. The Board, acting through its committees, has charged FMR and its affiliates with (i) identifying events or circumstances the occurrence of which could have demonstrably adverse effects on the fund's business and/or reputation; (ii) implementing processes and controls to lessen the possibility that such events or circumstances occur or to mitigate the effects of such events or circumstances if they do occur; and (iii) creating and maintaining a system designed to evaluate continuously business and market conditions in order to facilitate the identification and implementation processes described in (i) and (ii) above. Because the day-to-day operations and activities of the fund are carried out by or through FMR, its affiliates, and other service providers, the fund's exposure to risks is mitigated but not eliminated by the processes overseen by the Trustees. While each of the Board's committees has responsibility for overseeing different aspects of the fund's activities, oversight is exercised primarily through the Operations, Audit, and Compliance Committees. In addition, the Independent Trustees have worked with FMR to enhance the Board's oversight of investment and financial risks, legal and regulatory risks, technology risks, and operational risks, including the development of additional risk reporting to the Board. For example, a working group comprised of Independent Trustees and FMR has worked and continues to work to review the Fidelity® funds' valuation-related activities, reporting and risk management. Appropriate personnel, including but not limited to the fund's Chief Compliance Officer (CCO), FMR's internal auditor, the independent accountants, the fund's Treasurer and portfolio management personnel, make periodic reports to the Board's committees, as appropriate, including an annual review of Fidelity's risk management program for the Fidelity® funds. The responsibilities of each standing committee, including their oversight responsibilities, are described further under "Standing Committees of the Trustees."
Interested Trustees*:
Correspondence intended for a Trustee who is an interested person may be sent to Fidelity Investments, 245 Summer Street, Boston, Massachusetts 02210.
Name, Year of Birth; Principal Occupations and Other Relevant Experience+
James C. Curvey (1935)
Year of Election or Appointment: 2007
Trustee
Chairman of the Board of Trustees
Mr. Curvey also serves as Trustee of other Fidelity® funds. Mr. Curvey is a Director of Fidelity Research & Analysis Co. (investment adviser firm, 2009-present), and Vice Chairman (2007-present) and Director of FMR LLC (diversified financial services company). In addition, Mr. Curvey serves as an Overseer for the Boston Symphony Orchestra and a member of the board of Artis-Naples, Naples, Florida, and as a Trustee for Brewster Academy, Wolfeboro, New Hampshire. Previously, Mr. Curvey served as a Director of Fidelity Investments Money Management, Inc. (investment adviser firm, 2009-2014) and a Director of FMR and FMR Co., Inc. (investment adviser firms, 2007-2014).
Charles S. Morrison (1960)
Year of Election or Appointment: 2014
Trustee
Mr. Morrison also serves as Trustee of other funds. He serves as President of Fidelity Management & Research Company (FMR) (investment adviser firm, 2016-present), a Director of Fidelity Investments Money Management, Inc. (FIMM) (investment adviser firm, 2014-present), Director of Fidelity SelectCo, LLC (investment adviser firm, 2014-present), President, Asset Management (2014-present), and is an employee of Fidelity Investments. Previously, Mr. Morrison served as Vice President of Fidelity's Fixed Income and Asset Allocation Funds (2012-2014), President, Fixed Income (2011-2014), Vice President of Fidelity's Money Market Funds (2005-2009), President, Money Market Group Leader of FMR (investment adviser firm, 2009), and Senior Vice President, Money Market Group of FMR (2004-2009). Mr. Morrison also served as Vice President of Fidelity's Bond Funds (2002-2005), certain Balanced Funds (2002-2005), and certain Asset Allocation Funds (2002-2007), and as Senior Vice President (2002-2005) of Fidelity's Bond Division.
* Determined to be an “Interested Trustee” by virtue of, among other things, his or her affiliation with the trust or various entities under common control with FMR.
+ The information includes the Trustee's principal occupation during the last five years and other information relating to the experience, attributes, and skills relevant to the Trustee's qualifications to serve as a Trustee, which led to the conclusion that the Trustee should serve as a Trustee for the fund.
Independent Trustees:
Correspondence intended for an Independent Trustee may be sent to Fidelity Investments, P.O. Box 55235, Boston, Massachusetts 02205-5235.
Name, Year of Birth; Principal Occupations and Other Relevant Experience+
Dennis J. Dirks (1948)
Year of Election or Appointment: 2005
Trustee
Mr. Dirks also serves as Trustee of other Fidelity® funds. Prior to his retirement in May 2003, Mr. Dirks was Chief Operating Officer and a member of the Board of The Depository Trust & Clearing Corporation (DTCC). He also served as President, Chief Operating Officer, and Board member of The Depository Trust Company (DTC) and President and Board member of the National Securities Clearing Corporation (NSCC). In addition, Mr. Dirks served as Chief Executive Officer and Board member of the Government Securities Clearing Corporation, Chief Executive Officer and Board member of the Mortgage-Backed Securities Clearing Corporation, as a Trustee and a member of the Finance Committee of Manhattan College (2005-2008), as a Trustee and a member of the Finance Committee of AHRC of Nassau County (2006-2008), as a member of the Independent Directors Council (IDC) Governing Council (2010-2015), and as a member of the Board of Directors for The Brookville Center for Children’s Services, Inc. (2009-2017). Mr. Dirks is a member of the Finance Committee (2016-present) and Board of Directors (2017-present) of the Asolo Repertory Theatre.
Alan J. Lacy (1953)
Year of Election or Appointment: 2008
Trustee
Mr. Lacy also serves as Trustee of other Fidelity® funds. Mr. Lacy serves as a Director of Bristol-Myers Squibb Company (global pharmaceuticals, 2008-present). He is a Trustee of the California Chapter of The Nature Conservancy (2015-present) and a Director of the Center for Advanced Study in the Behavioral Sciences at Stanford University (2015-present). In addition, Mr. Lacy served as Senior Adviser (2007-2014) of Oak Hill Capital Partners, L.P. (private equity) and also served as Chief Executive Officer (2005) and Vice Chairman (2005-2006) of Sears Holdings Corporation (retail) and Chief Executive Officer and Chairman of the Board of Sears, Roebuck and Co. (retail, 2000-2005). Previously, Mr. Lacy served as Chairman (2014-2017) and a member (2010-2017) of the Board of Directors of Dave & Buster’s Entertainment, Inc. (restaurant and entertainment complexes), as Chairman (2008-2011) and a member (2006-2015) of the Board of Trustees of the National Parks Conservation Association, and as a member of the Board of Directors for The Hillman Companies, Inc. (hardware wholesalers, 2010-2014), Earth Fare, Inc. (retail grocery, 2010-2014), and The Western Union Company (global money transfer, 2006-2011).
Ned C. Lautenbach (1944)
Year of Election or Appointment: 2000
Trustee
Chairman of the Independent Trustees
Mr. Lautenbach also serves as Trustee of other Fidelity® funds. Mr. Lautenbach currently serves as Vice Chair of the Board of Governors, State University System of Florida (2013-present) and is a member of the Council on Foreign Relations (1994-present). He is also a member and has most recently served as Chairman of the Board of Directors of Artis-Naples (2012-present). Previously, Mr. Lautenbach served as a member and then Lead Director of the Board of Directors of Eaton Corporation (diversified industrial, 1997-2016). He was also a Partner and Advisory Partner at Clayton, Dubilier & Rice, LLC (private equity investment, 1998-2010), as well as a Director of Sony Corporation (2006-2007). In addition, Mr. Lautenbach also had a 30-year career with IBM (technology company) during which time he served as Senior Vice President and a member of the Corporate Executive Committee (1968-1998).
Joseph Mauriello (1944)
Year of Election or Appointment: 2008
Trustee
Mr. Mauriello also serves as Trustee of other Fidelity® funds. Prior to his retirement in January 2006, Mr. Mauriello served in numerous senior management positions including Deputy Chairman and Chief Operating Officer (2004-2005), and Vice Chairman of Financial Services (2002-2004) of KPMG LLP US (professional services, 1965-2005). Mr. Mauriello currently serves as a member of the Board of Directors of XL Group plc. (global insurance and re-insurance, 2006-present) and the Independent Directors Council (IDC) Governing Council (2015-present). Previously, Mr. Mauriello served as a Director of the Hamilton Funds of the Bank of New York (2006-2007) and of Arcadia Resources Inc. (health care services and products, 2007-2012).
Cornelia M. Small (1944)
Year of Election or Appointment: 2005
Trustee
Ms. Small also serves as Trustee of other Fidelity® funds. Ms. Small is a member of the Board of Directors (2009-present) and Chair of the Investment Committee (2010-present) of the Teagle Foundation. Ms. Small also serves on the Investment Committee of the Berkshire Taconic Community Foundation (2008-present). Previously, Ms. Small served as Chairperson (2002-2008) and a member of the Investment Committee and Chairperson (2008-2012) and a member of the Board of Trustees of Smith College. In addition, Ms. Small served as Chief Investment Officer, Director of Global Equity Investments, and a member of the Board of Directors of Scudder, Stevens & Clark and Scudder Kemper Investments.
William S. Stavropoulos (1939)
Year of Election or Appointment: 2002
Trustee
Vice Chairman of the Independent Trustees
Mr. Stavropoulos also serves as Trustee of other Fidelity® funds. Mr. Stavropoulos serves as President and Founder of the Michigan Baseball Foundation, the Great Lakes Loons (2007-present). Mr. Stavropoulos is Chairman Emeritus of the Board of Directors of The Dow Chemical Company, where he previously served in numerous senior management positions, including President, CEO (1995-2000; 2002-2004), Chairman of the Executive Committee (2000-2006), and as a member of the Board of Directors (1990-2006). Currently, Mr. Stavropoulos is Chairman of the Board of Directors of Univar Inc. (global distributor of commodity and specialty chemicals), a Director of Teradata Corporation (data warehousing and technology solutions), and a member of the Advisory Board for Metalmark Capital LLC (private equity investment, 2005-present). Mr. Stavropoulos is an operating advisor to Clayton, Dubilier & Rice, LLC (private equity investment). In addition, Mr. Stavropoulos is a member of the University of Notre Dame Advisory Council for the College of Science, a Trustee of the Rollin L. Gerstacker Foundation, and a Director of Artis-Naples in Naples, Florida. Previously, Mr. Stavropoulos served as a Director of Chemical Financial Corporation (bank holding company, 1993-2012) and Tyco International, Ltd. (multinational manufacturing and services, 2007-2012).
David M. Thomas (1949)
Year of Election or Appointment: 2008
Trustee
Mr. Thomas also serves as Trustee of other Fidelity® funds. Mr. Thomas serves as Non-Executive Chairman of the Board of Directors of Fortune Brands Home and Security (home and security products, 2011-present), as a member of the Board of Directors (2004-present) and Presiding Director (2013-present) of Interpublic Group of Companies, Inc. (marketing communication), and as a member of the Board of Trustees of the University of Florida (2013-present). Previously, Mr. Thomas served as Executive Chairman (2005-2006) and Chairman and Chief Executive Officer (2000-2005) of IMS Health, Inc. (pharmaceutical and healthcare information solutions), and a Director of Fortune Brands, Inc. (consumer products, 2000-2011).
+ The information includes the Trustee's principal occupation during the last five years and other information relating to the experience, attributes, and skills relevant to the Trustee's qualifications to serve as a Trustee, which led to the conclusion that the Trustee should serve as a Trustee for the fund.
Advisory Board Members and Officers:
Correspondence intended for an officer or Peter S. Lynch may be sent to Fidelity Investments, 245 Summer Street, Boston, Massachusetts 02210. Officers appear below in alphabetical order.
Name, Year of Birth; Principal Occupation
Peter S. Lynch (1944)
Year of Election or Appointment: 2003
Member of the Advisory Board
Mr. Lynch also serves as Member of the Advisory Board of other Fidelity® funds. Mr. Lynch is Vice Chairman and a Director of FMR (investment adviser firm) and FMR Co., Inc. (investment adviser firm). In addition, Mr. Lynch serves as a Trustee of Boston College and as the Chairman of the Inner-City Scholarship Fund. Previously, Mr. Lynch served on the Special Olympics International Board of Directors (1997-2006).
Elizabeth Paige Baumann (1968)
Year of Election or Appointment: 2017
Anti-Money Laundering (AML) Officer
Ms. Baumann also serves as AML Officer of other funds. She is Chief AML Officer (2012-present) and Senior Vice President (2014-present) of FMR LLC (diversified financial services company) and is an employee of Fidelity Investments. Previously, Ms. Baumann served as AML Officer of the funds (2012-2016), and Vice President (2007-2014) and Deputy Anti-Money Laundering Officer (2007-2012) of FMR LLC.
Marc R. Bryant (1966)
Year of Election or Appointment: 2015
Secretary and Chief Legal Officer (CLO)
Mr. Bryant also serves as Secretary and CLO of other funds. Mr. Bryant serves as CLO, Secretary, and Senior Vice President of Fidelity Management & Research Company (investment adviser firm, 2015-present) and FMR Co., Inc. (investment adviser firm, 2015-present); Secretary of Fidelity SelectCo, LLC (investment adviser firm, 2015-present) and Fidelity Investments Money Management, Inc. (investment adviser firm, 2015-present); and CLO of Fidelity Management & Research (Hong Kong) Limited and FMR Investment Management (UK) Limited (investment adviser firms, 2015-present) and Fidelity Management & Research (Japan) Limited (investment adviser firm, 2016-present). He is Senior Vice President and Deputy General Counsel of FMR LLC (diversified financial services company). Previously, Mr. Bryant served as Secretary and CLO of Fidelity Rutland Square Trust II (2010-2014) and Assistant Secretary of Fidelity's Fixed Income and Asset Allocation Funds (2013-2015). Prior to joining Fidelity Investments, Mr. Bryant served as a Senior Vice President and the Head of Global Retail Legal for AllianceBernstein L.P. (2006-2010), and as the General Counsel for ProFund Advisors LLC (2001-2006).
William C. Coffey (1969)
Year of Election or Appointment: 2009
Assistant Secretary
Mr. Coffey also serves as Assistant Secretary of other funds. He is Senior Vice President and Deputy General Counsel of FMR LLC (diversified financial services company, 2010-present), and is an employee of Fidelity Investments. Previously, Mr. Coffey served as Vice President and Associate General Counsel of FMR LLC (2005-2009).
Jonathan Davis (1968)
Year of Election or Appointment: 2010
Assistant Treasurer
Mr. Davis also serves as Assistant Treasurer of other funds. Mr. Davis serves as Assistant Treasurer of FMR Capital, Inc. (2017-present) and is an employee of Fidelity Investments. Previously, Mr. Davis served as Vice President and Associate General Counsel of FMR LLC (diversified financial services company, 2003-2010).
Adrien E. Deberghes (1967)
Year of Election or Appointment: 2016
Assistant Treasurer
Mr. Deberghes also serves as an officer of other funds. He serves as Assistant Treasurer of FMR Capital, Inc. (2017-present), Executive Vice President of Fidelity Investments Money Management, Inc. (FIMM) (investment adviser firm, 2016-present), and is an employee of Fidelity Investments (2008-present). Prior to joining Fidelity Investments, Mr. Deberghes was Senior Vice President of Mutual Fund Administration at State Street Corporation (2007-2008), Senior Director of Mutual Fund Administration at Investors Bank & Trust (2005-2007), and Director of Finance for Dunkin' Brands (2000-2005). Previously, Mr. Deberghes served in other fund officer roles.
Stephanie J. Dorsey (1969)
Year of Election or Appointment: 2010
Assistant Treasurer
Ms. Dorsey also serves as an officer of other funds. Ms. Dorsey serves as Assistant Treasurer of FMR Capital, Inc. (2017-present), is an employee of Fidelity Investments (2008-present), and has served in other fund officer roles. Prior to joining Fidelity Investments, Ms. Dorsey served as Treasurer (2004-2008) of the JPMorgan Mutual Funds and Vice President (2004-2008) of JPMorgan Chase Bank.
Howard J. Galligan III (1966)
Year of Election or Appointment: 2014
Chief Financial Officer
Mr. Galligan also serves as Chief Financial Officer of other funds. Mr. Galligan serves as President of Fidelity Pricing and Cash Management Services (FPCMS) (2014-present) and as a Director of Strategic Advisers, Inc. (investment adviser firm, 2008-present). Previously, Mr. Galligan served as Chief Administrative Officer of Asset Management (2011-2014) and Chief Operating Officer and Senior Vice President of Investment Support for Strategic Advisers, Inc. (2003-2011).
Thomas C. Hense (1964)
Year of Election or Appointment: 2008, 2010, or 2015
Vice President
Mr. Hense serves as Vice President of Fidelity Advisor® Multi-Asset Income Fund (2015) and other funds (High Income (2008), Small Cap (2008), and Value (2010) funds), and is an employee of Fidelity Investments (1993-present). Previously, Mr. Hense served as a portfolio manager for Fidelity's Institutional Money Management Group (Pyramis) (2003-2008).
Brian B. Hogan (1964)
Year of Election or Appointment: 2009
Vice President
Mr. Hogan also serves as Trustee or Vice President of other funds. Mr. Hogan serves as a Director of FMR Investment Management (UK) Limited (investment adviser firm, 2015-present) and Fidelity SelectCo, LLC (investment adviser firm, 2014-present) and President of the Equity Division of FMR (investment adviser firm, 2009-present). Previously, Mr. Hogan served as Senior Vice President, Equity Research of FMR (2006-2009) and as a portfolio manager. Mr. Brian B. Hogan is not related to Mr. Colm A. Hogan.
Colm A. Hogan (1973)
Year of Election or Appointment: 2016
Deputy Treasurer
Mr. Hogan also serves as an officer of other funds. Mr. Hogan serves as Assistant Treasurer of FMR Capital, Inc. (2017-present) and is an employee of Fidelity Investments (2005-present). Mr. Colm A. Hogan is not related to Mr. Brian B. Hogan.
Chris Maher (1972)
Year of Election or Appointment: 2013
Assistant Treasurer
Mr. Maher serves as Assistant Treasurer of other funds. Mr. Maher is Vice President of Valuation Oversight, serves as Assistant Treasurer of FMR Capital, Inc. (2017-present), and is an employee of Fidelity Investments. Previously, Mr. Maher served as Vice President of Asset Management Compliance (2013), Vice President of the Program Management Group of FMR (investment adviser firm, 2010-2013), and Vice President of Valuation Oversight (2008-2010).
Rieco E. Mello (1969)
Year of Election or Appointment: 2017
Assistant Treasurer
Mr. Mello also serves as Assistant Treasurer of other funds. Mr. Mello serves as Assistant Treasurer of FMR Capital, Inc. (2017-present) and is an employee of Fidelity Investments (1995-present).
Kenneth B. Robins (1969)
Year of Election or Appointment: 2016
Chief Compliance Officer
Mr. Robins also serves as an officer of other funds. Mr. Robins serves as Compliance Officer of Fidelity Management & Research Company and FMR Co., Inc. (investment adviser firms, 2016-present) and is an employee of Fidelity Investments (2004-present). Previously, Mr. Robins served as Executive Vice President of Fidelity Investments Money Management, Inc. (investment adviser firm, 2013-2016) and served in other fund officer roles.
Stacie M. Smith (1974)
Year of Election or Appointment: 2016
President and Treasurer
Ms. Smith also serves as an officer of other funds. Ms. Smith serves as Assistant Treasurer of FMR Capital, Inc. (2017-present), is an employee of Fidelity Investments (2009-present), and has served in other fund officer roles. Prior to joining Fidelity Investments, Ms. Smith served as Senior Audit Manager of Ernst & Young LLP (accounting firm, 1996-2009). Previously, Ms. Smith served as Deputy Treasurer of certain Fidelity® funds (2013-2016).
Marc L. Spector (1972)
Year of Election or Appointment: 2016
Assistant Treasurer
Mr. Spector also serves as an officer of other funds. Mr. Spector serves as Assistant Treasurer of FMR Capital, Inc. (2017-present) and is an employee of Fidelity Investments (2016-present). Prior to joining Fidelity Investments, Mr. Spector served as Director at the Siegfried Group (accounting firm, 2013-2016), and prior to Siegfried Group as audit senior manager at Deloitte & Touche (accounting firm, 2005-2013).
Renee Stagnone (1975)
Year of Election or Appointment: 2016
Assistant Treasurer
Ms. Stagnone also serves as an officer of other funds. Ms. Stagnone serves as Assistant Treasurer of FMR Capital, Inc. (2017-present) and is an employee of Fidelity Investments (1997-present). Previously, Ms. Stagnone served as Deputy Treasurer of certain Fidelity® funds (2013-2016).
Shareholder Expense Example
As a shareholder of the Fund, you incur two types of costs: (1) transaction costs, including sales charges (loads) on purchase payments or redemption proceeds, and (2) ongoing costs, including management fees, distribution and/or service (12b-1) fees and other Fund expenses. This Example is intended to help you understand your ongoing costs (in dollars) of investing in the Fund and to compare these costs with the ongoing costs of investing in other mutual funds.
The Example is based on an investment of $1,000 invested at the beginning of the period and held for the entire period (June 1, 2017 to November 30, 2017).
Actual Expenses
The first line of the accompanying table for each class of the Fund provides information about actual account values and actual expenses. You may use the information in this line, together with the amount you invested, to estimate the expenses that you paid over the period. Simply divide your account value by $1,000.00 (for example, an $8,600 account value divided by $1,000.00 = 8.6), then multiply the result by the number in the first line for a class of the Fund under the heading entitled "Expenses Paid During Period" to estimate the expenses you paid on your account during this period. In addition, the Fund, as a shareholder in the underlying Fidelity Central Funds, will indirectly bear its pro-rata share of the fees and expenses incurred by the underlying Fidelity Central Funds. These fees and expenses are not included in the Fund's annualized expense ratio used to calculate the expense estimate in the table below.
Hypothetical Example for Comparison Purposes
The second line of the accompanying table for each class of the Fund provides information about hypothetical account values and hypothetical expenses based on a Class' actual expense ratio and an assumed rate of return of 5% per year before expenses, which is not the Class' actual return. The hypothetical account values and expenses may not be used to estimate the actual ending account balance or expenses you paid for the period. You may use this information to compare the ongoing costs of investing in the Fund and other funds. To do so, compare this 5% hypothetical example with the 5% hypothetical examples that appear in the shareholder reports of the other funds. In addition, the Fund, as a shareholder in the underlying Fidelity Central Funds, will indirectly bear its pro-rata share of the fees and expenses incurred by the underlying Fidelity Central Funds. These fees and expenses are not included in the Fund's annualized expense ratio used to calculate the expense estimate in the table below.
Please note that the expenses shown in the table are meant to highlight your ongoing costs only and do not reflect any transaction costs. Therefore, the second line of the table is useful in comparing ongoing costs only, and will not help you determine the relative total costs of owning different funds. In addition, if these transactional costs were included, your costs would have been higher.
| Annualized Expense Ratio-A | Beginning Account Value June 1, 2017 | Ending Account Value November 30, 2017 | Expenses Paid During Period-B June 1, 2017 to November 30, 2017 | |
| Class A | .96% | |||
| Actual | $1,000.00 | $1,094.70 | $5.04 | |
| Hypothetical-C | $1,000.00 | $1,020.26 | $4.86 | |
| Class M | 1.22% | |||
| Actual | $1,000.00 | $1,093.20 | $6.40 | |
| Hypothetical-C | $1,000.00 | $1,018.95 | $6.17 | |
| Class C | 1.72% | |||
| Actual | $1,000.00 | $1,090.90 | $9.02 | |
| Hypothetical-C | $1,000.00 | $1,016.44 | $8.69 | |
| Class I | .70% | |||
| Actual | $1,000.00 | $1,096.10 | $3.68 | |
| Hypothetical-C | $1,000.00 | $1,021.56 | $3.55 | |
| Class Z | .57% | |||
| Actual | $1,000.00 | $1,096.80 | $3.00 | |
| Hypothetical-C | $1,000.00 | $1,022.21 | $2.89 |
A Annualized expense ratio reflects expenses net of applicable fee waivers.
B Expenses are equal to each Class' annualized expense ratio, multiplied by the average account value over the period, multiplied by 183/365 (to reflect the one-half year period).
C 5% return per year before expenses
Distributions (Unaudited)
The Board of Trustees of Fidelity Advisor Growth & Income Fund voted to pay to shareholders of record at the opening of business on record date, the following distributions per share derived from capital gains realized from sales of portfolio securities, and dividends derived from net investment income:
| Pay Date | Record Date | Dividends | Capital Gains | |
| Fidelity Advisor Growth & Income Fund | ||||
| Class A | 12/27/17 | 12/26/17 | $0.355 | $2.257 |
| Class M | 12/27/17 | 12/26/17 | $0.280 | $2.257 |
| Class C | 12/27/17 | 12/26/17 | $0.150 | $2.257 |
| Class I | 12/27/17 | 12/26/17 | $0.438 | $2.257 |
| Class Z | 12/27/17 | 12/26/17 | $0.486 | $2.257 |
The fund hereby designates as a capital gain dividend with respect to the taxable year ended November 30, 2017, $42,910,386, or, if subsequently determined to be different, the net capital gain of such year.
Class A designates 100%; Class M designates 100%; Class C designates 100%; and Class I designates 94%; of the dividends distributed in December 2016, during the fiscal year as qualifying for the dividends–received deduction for corporate shareholders.
Class A, Class M, Class C, and Class I designate 100% of the dividends distributed during the fiscal year as amounts which may be taken into account as a dividend for purposes of the maximum rate under section 1(h)(11) of the Internal Revenue Code.
The fund will notify shareholders in January 2018 of amounts for use in preparing 2017 income tax returns.
Board Approval of Investment Advisory Contracts and Management Fees
Fidelity Advisor Growth & Income Fund
Each year, the Board of Trustees, including the Independent Trustees (together, the Board), votes on the renewal of the management contract with Fidelity Management & Research Company (FMR) and the sub-advisory agreements (together, the Advisory Contracts) for the fund. FMR and the sub-advisers are referred to herein as the Investment Advisers. The Board, assisted by the advice of fund counsel and Independent Trustees' counsel, requests and considers a broad range of information relevant to the renewal of the Advisory Contracts throughout the year.
The Board meets regularly and, at each of its meetings, covers an extensive agenda of topics and materials and considers factors that are relevant to its annual consideration of the renewal of the fund's Advisory Contracts, including the services and support provided to the fund and its shareholders. The Board has established various standing committees (Committees), each composed of and chaired by Independent Trustees with varying backgrounds, to which the Board has assigned specific subject matter responsibilities in order to enhance effective decision-making by the Board. The Board, acting directly and through its Committees, requests and receives information concerning the annual consideration of the renewal of the fund's Advisory Contracts. The Board also meets as needed to review matters specifically related to the Board's annual consideration of the renewal of the Advisory Contracts. Members of the Board may also meet with trustees of other Fidelity funds through ad hoc joint committees to discuss certain matters relevant to all of the Fidelity funds.
At its July 2017 meeting, the Board unanimously determined to renew the fund's Advisory Contracts. In reaching its determination, the Board considered all factors it believed relevant, including (i) the nature, extent, and quality of the services to be provided to the fund and its shareholders (including the investment performance of the fund); (ii) the competitiveness of the fund's management fee and total expense ratio relative to peer funds; (iii) the total costs of the services to be provided by and the profits to be realized by Fidelity from its relationships with the fund; and (iv) the extent to which, if any, economies of scale exist and would be realized as the fund grows, and whether any economies of scale are appropriately shared with fund shareholders.
In considering whether to renew the Advisory Contracts for the fund, the Board reached a determination, with the assistance of fund counsel and Independent Trustees' counsel and through the exercise of its business judgment, that the renewal of the Advisory Contracts was in the best interests of the fund and its shareholders and that the compensation payable under the Advisory Contracts was fair and reasonable. The Board's decision to renew the Advisory Contracts was not based on any single factor, but rather was based on a comprehensive consideration of all the information provided to the Board at its meetings throughout the year. The Board, in reaching its determination to renew the Advisory Contracts, was aware that shareholders of the fund have a broad range of investment choices available to them, including a wide choice among funds offered by Fidelity's competitors, and that the fund's shareholders, who have the opportunity to review and weigh the disclosure provided by the fund in its prospectus and other public disclosures, have chosen to invest in this fund, which is part of the Fidelity family of funds.
Amendment to Group Fee Rate. The Board also approved an amendment to the management contract for the fund to add an additional breakpoint to the group fee schedule, effective October 1, 2017. The Board noted that the additional breakpoint would result in lower management fee rates as Fidelity's assets under management increase.
Nature, Extent, and Quality of Services Provided. The Board considered Fidelity's staffing as it relates to the fund, including the backgrounds of investment personnel of Fidelity, and also considered the fund's investment objective, strategies, and related investment philosophy. The Independent Trustees also had discussions with senior management of Fidelity's investment operations and investment groups. The Board considered the structure of the investment personnel compensation program and whether this structure provides appropriate incentives to act in the best interests of the fund. Additionally, the Board considered the portfolio managers' investments, if any, in the funds that they manage.Resources Dedicated to Investment Management and Support Services. The Board and the Fund Oversight and Research Committees reviewed the general qualifications and capabilities of Fidelity's investment staff, including its size, education, experience, and resources, as well as Fidelity's approach to recruiting, training, managing, and compensating investment personnel. The Board noted that Fidelity has continued to increase the resources devoted to non-U.S. offices, including expansion of Fidelity's global investment organization. The Board also noted that Fidelity's analysts have extensive resources, tools and capabilities that allow them to conduct sophisticated quantitative and fundamental analysis, as well as credit analysis of issuers, counterparties and guarantors. Further, the Board considered that Fidelity's investment professionals have sufficient access to global information and data so as to provide competitive investment results over time, and that those professionals also have access to sophisticated tools that permit them to assess portfolio construction and risk and performance attribution characteristics continuously, as well as to transmit new information and research conclusions rapidly around the world. Additionally, in its deliberations, the Board considered Fidelity's trading, risk management, compliance, and technology and operations capabilities and resources, which are integral parts of the investment management process.Shareholder and Administrative Services. The Board considered (i) the nature, extent, quality, and cost of advisory, administrative, and shareholder services performed by the Investment Advisers and their affiliates under the Advisory Contracts and under separate agreements covering transfer agency, pricing and bookkeeping, and securities lending services for the fund; (ii) the nature and extent of the supervision of third party service providers, principally custodians, subcustodians, and pricing vendors; and (iii) the resources devoted to, and the record of compliance with, the fund's compliance policies and procedures. The Board also reviewed the allocation of fund brokerage, including allocations to brokers affiliated with the Investment Advisers, the use of brokerage commissions to pay fund expenses, and the use of "soft" commission dollars to pay for research services.The Board noted that the growth of fund assets over time across the complex allows Fidelity to reinvest in the development of services designed to enhance the value or convenience of the Fidelity funds as investment vehicles. These services include 24-hour access to account information and market information through telephone representatives and over the Internet, investor education materials and asset allocation tools, and the expanded availability of Fidelity Investor Centers.In 2014, the Board formed an ad hoc Committee on Transfer Agency Fees to review the variety of transfer agency fee structures throughout the industry and Fidelity's competitive positioning with respect to industry participants.Investment in a Large Fund Family. The Board considered the benefits to shareholders of investing in a Fidelity fund, including the benefits of investing in a fund that is part of a large family of funds offering a variety of investment disciplines and providing a large variety of mutual fund investor services. The Board noted that Fidelity had taken, or had made recommendations that resulted in the Fidelity funds taking, a number of actions over the previous year that benefited particular funds, including: (i) continuing to dedicate additional resources to Fidelity's investment research process, and to the support of the senior management team that oversees asset management; (ii) continuing efforts to enhance Fidelity's global research capabilities; (iii) launching new funds and making other enhancements to meet client needs; (iv) launching new share classes of existing funds; (v) eliminating purchase minimums and broadening eligibility requirements for certain lower-priced share classes; (vi) reducing management fees and total expenses for certain growth equity funds and index funds; (vii) lowering expense caps for certain existing funds and classes to reduce expenses borne by shareholders; (viii) eliminating short-term redemption fees for certain funds; (ix) introducing a new pricing structure for certain funds of funds that is expected to reduce overall expenses paid by shareholders; (x) rationalizing product lines and gaining increased efficiencies through proposals for fund mergers and share class consolidations; (xi) continuing to develop, acquire and implement systems and technology to improve services to the funds and shareholders, strengthen information security, and increase efficiency; and (xii) implementing enhancements to further strengthen Fidelity's product line to increase investors' probability of success in achieving their investment goals, including retirement income goals.Investment Performance. The Board considered whether the fund has operated in accordance with its investment objective, as well as its record of compliance with its investment restrictions and its performance history.The Board took into account discussions with representatives of the Investment Advisers about fund investment performance that occur at Board meetings throughout the year. In this regard the Board noted that as part of regularly scheduled fund reviews and other reports to the Board on fund performance, the Board considers annualized return information for the fund for different time periods, measured against a securities market index ("benchmark index") and a peer group of funds with similar objectives ("peer group"), if any. In its evaluation of fund investment performance, the Board gave particular attention to information indicating changes in performance of certain Fidelity funds for specific time periods and discussed with the Investment Advisers the reasons for any overperformance or underperformance.In addition to reviewing absolute and relative fund performance, the Independent Trustees periodically consider the appropriateness of fund performance metrics in evaluating the results achieved. In general, the Independent Trustees believe that fund performance should be evaluated based on net performance (after fees and expenses) of both the highest performing and lowest performing fund share classes, where applicable, compared to appropriate benchmark indices, over appropriate time periods that may include full market cycles, and compared to peer groups, as applicable, over the same periods, taking into account relevant factors including the following: general market conditions; issuer-specific information; and fund cash flows and other factors.The Independent Trustees recognize that shareholders evaluate performance on a net basis over their own holding periods, for which one-, three-, and five-year periods are often used as a proxy. For this reason, the performance information reviewed by the Board also included net cumulative calendar year total return information for the fund and an appropriate benchmark index and peer group for the most recent one-, three-, and five-year periods, as shown below. Returns are shown compared to the 25th percentile (top of box, 75% beaten) and 75th percentile (bottom of box, 25% beaten) of the peer universe.Fidelity Advisor Growth & Income Fund
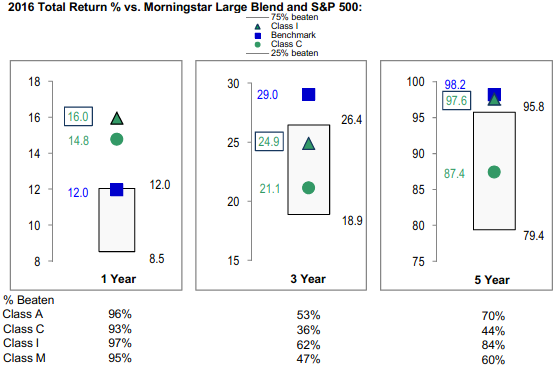
Fidelity Advisor Growth & Income Fund
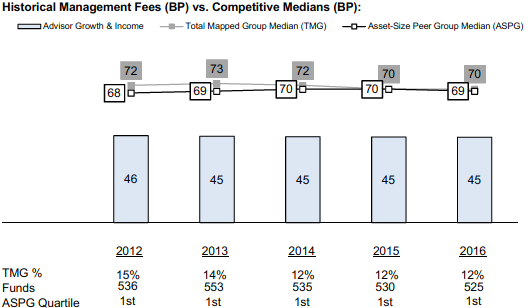
![]()
AGAI-ANN-0118
1.539472.120
Fidelity Advisor® Growth Opportunities Fund Class A, Class M (formerly Class T), Class C, Class I and Class Z Annual Report November 30, 2017 |
|
Contents
Board Approval of Investment Advisory Contracts and Management Fees |
To view a fund's proxy voting guidelines and proxy voting record for the 12-month period ended June 30, visit http://www.fidelity.com/proxyvotingresults or visit the Securities and Exchange Commission's (SEC) web site at http://www.sec.gov.
You may also call 1-877-208-0098 to request a free copy of the proxy voting guidelines.
Standard & Poor's, S&P and S&P 500 are registered service marks of The McGraw-Hill Companies, Inc. and have been licensed for use by Fidelity Distributors Corporation.
Other third-party marks appearing herein are the property of their respective owners.
All other marks appearing herein are registered or unregistered trademarks or service marks of FMR LLC or an affiliated company. © 2018 FMR LLC. All rights reserved.
This report and the financial statements contained herein are submitted for the general information of the shareholders of the Fund. This report is not authorized for distribution to prospective investors in the Fund unless preceded or accompanied by an effective prospectus.
A fund files its complete schedule of portfolio holdings with the SEC for the first and third quarters of each fiscal year on Form N-Q. Forms N-Q are available on the SEC’s web site at http://www.sec.gov. A fund's Forms N-Q may be reviewed and copied at the SEC’s Public Reference Room in Washington, DC. Information regarding the operation of the SEC's Public Reference Room may be obtained by calling 1-800-SEC-0330.
For a complete list of a fund's portfolio holdings, view the most recent holdings listing, semiannual report, or annual report on Fidelity's web site at http://www.fidelity.com, http://www.institutional.fidelity.com, or http://www.401k.com, as applicable.
NOT FDIC INSURED •MAY LOSE VALUE •NO BANK GUARANTEE
Neither the Fund nor Fidelity Distributors Corporation is a bank.
Performance: The Bottom Line
Average annual total return reflects the change in the value of an investment, assuming reinvestment of distributions from dividend income and capital gains (the profits earned upon the sale of securities that have grown in value, if any) and assuming a constant rate of performance each year. The hypothetical investment and the average annual total returns do not reflect the deduction of taxes that a shareholder would pay on fund distributions or the redemption of fund shares. During periods of reimbursement by Fidelity, a fund’s total return will be greater than it would be had the reimbursement not occurred. How a fund did yesterday is no guarantee of how it will do tomorrow.
Average Annual Total Returns
| For the periods ended November 30, 2017 | Past 1 year | Past 5 years | Past 10 years |
| Class A (incl. 5.75% sales charge) | 26.90% | 14.92% | 7.15% |
| Class M (incl. 3.50% sales charge) | 29.64% | 15.20% | 7.18% |
| Class C (incl. contingent deferred sales charge) | 32.64% | 15.42% | 6.99% |
| Class I | 35.01% | 16.61% | 8.13% |
| Class Z | 35.18% | 16.75% | 8.19% |
Class C shares' contingent deferred sales charges included in the past one year, past five years and past ten years total return figures are 1%, 0% and 0%, respectively.
The initial offering of Class Z shares took place on August 13, 2013. Returns prior to August 13, 2013, are those of Class I.
$10,000 Over 10 Years
Let's say hypothetically that $10,000 was invested in Fidelity Advisor® Growth Opportunities Fund - Class A on November 30, 2007, and the current 5.75% sales charge was paid.
The chart shows how the value of your investment would have changed, and also shows how the Russell 1000® Growth Index performed over the same period.
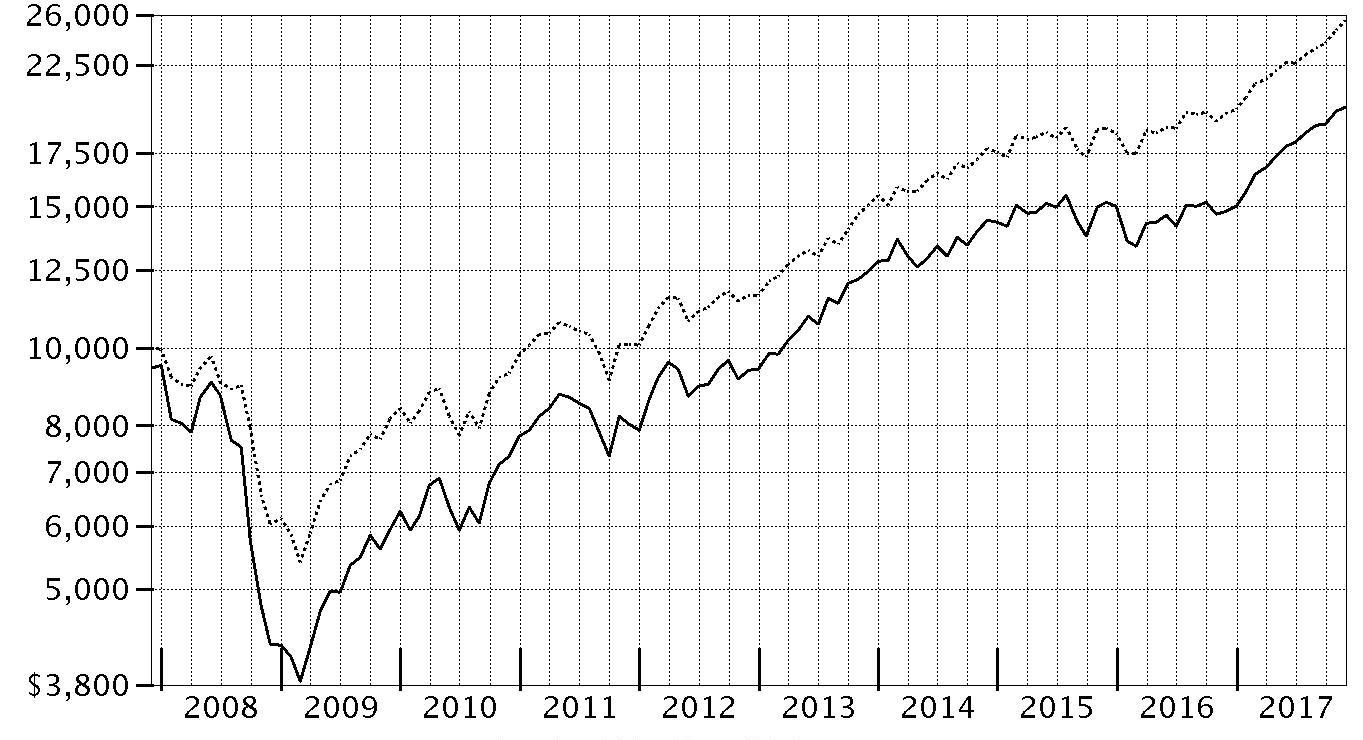
| Period Ending Values | ||
| $19,955 | Fidelity Advisor® Growth Opportunities Fund - Class A | |
| $25,636 | Russell 1000® Growth Index | |
Management's Discussion of Fund Performance
Market Recap: The U.S. equity bellwether S&P 500® index gained 22.87% for the year ending November 30, 2017, rising steadily and closing the period at an all-time high after a particularly strong three-month finish. Early on, equities rallied on optimism for President Trump’s pro-business agenda but leveled off in March amid fading optimism and stalled efforts by Congress to repeal and replace the Affordable Care Act. Upward momentum soon returned and continued through period end with consumer sentiment and other market indicators staying positive. The lone exception was a brief cooldown in August, when geopolitical tension escalated and uncertainty grew regarding the future of health care, tax reform and the debt ceiling. Sector-wise, info tech (+41%) led by a wide margin, surging amid strong earnings growth from several major index constituents. Utilities and financials each gained about 25%, the latter group riding an uptick in bond yields. Conversely, consumer discretionary (+20%) also rose solidly but lagged the broader market, as many brick-and-mortar retailers continued to suffer from increased online competition. Rising interest rates held back real estate (+16%), while consumer staples (+15%) and telecom (+1%) struggled due to investors’ general preference for risk assets. Lastly, sluggish oil prices pushed energy to a -4% return.Comments from Portfolio Manager Kyle Weaver: For the fiscal year, the fund’s share classes (excluding sales charges, if applicable) gained roughly 34% to 35%, handily topping the 30.81% advance of the benchmark Russell 1000® Growth Index. Versus the benchmark, stock picks in the consumer discretionary sector were the largest positive, followed by choices in consumer staples, real estate and financials. In information technology, my picks detracted, but this negative was more than offset by my decision to overweight this top-performing group. By a wide margin, the biggest individual relative contributor was electric automaker Tesla, whose stock was lifted by growing optimism about prospects for its Model 3 sedan, launched in July. A small private investment in JUUL Labs also paid off. We saw the value of our non-benchmark position in this leading e-cigarette maker rise along with the growing popularity of tobacco-free smoking. Options exchange CBOE Global Markets was another contributor. Conversely, stock selection in industrials and a modest overweighting in energy hampered relative results. At the stock level, Allergan – which was removed from the fund’s benchmark in June – was our biggest relative detractor. An overweighting in Alexion Pharmaceuticals further disappointed, along with a non-benchmark stake in China-based e-commerce firm Vipshop Holdings, which I bought this period.The views expressed above reflect those of the portfolio manager(s) only through the end of the period as stated on the cover of this report and do not necessarily represent the views of Fidelity or any other person in the Fidelity organization. Any such views are subject to change at any time based upon market or other conditions and Fidelity disclaims any responsibility to update such views. These views may not be relied on as investment advice and, because investment decisions for a Fidelity fund are based on numerous factors, may not be relied on as an indication of trading intent on behalf of any Fidelity fund.
Investment Summary (Unaudited)
Top Ten Stocks as of November 30, 2017
| % of fund's net assets | % of fund's net assets 6 months ago | |
| Apple, Inc. | 6.7 | 6.6 |
| Alphabet, Inc. Class C | 4.4 | 3.9 |
| Amazon.com, Inc. | 3.9 | 3.8 |
| Facebook, Inc. Class A | 3.9 | 2.6 |
| Microsoft Corp. | 3.3 | 2.6 |
| American Tower Corp. | 2.8 | 3.1 |
| Alphabet, Inc. Class A | 2.5 | 2.4 |
| Salesforce.com, Inc. | 2.2 | 1.7 |
| LyondellBasell Industries NV Class A | 2.0 | 2.4 |
| T-Mobile U.S., Inc. | 1.8 | 1.5 |
| 33.5 |
Top Five Market Sectors as of November 30, 2017
| % of fund's net assets | % of fund's net assets 6 months ago | |
| Information Technology | 47.0 | 40.8 |
| Health Care | 14.3 | 16.8 |
| Consumer Discretionary | 13.7 | 15.9 |
| Consumer Staples | 5.6 | 6.6 |
| Financials | 4.6 | 3.6 |
Asset Allocation (% of fund's net assets)
| As of November 30, 2017* | ||
| Stocks | 98.9% | |
| Convertible Securities | 1.1% | |

* Foreign investments - 13.3%
| As of May 31, 2017* | ||
| Stocks | 98.3% | |
| Convertible Securities | 1.3% | |
| Short-Term Investments and Net Other Assets (Liabilities) | 0.4% | |

* Foreign investments - 11.8%
Investments November 30, 2017
Showing Percentage of Net Assets
| Common Stocks - 98.9% | |||
| Shares | Value (000s) | ||
| CONSUMER DISCRETIONARY - 13.7% | |||
| Automobiles - 1.6% | |||
| Tesla, Inc. (a)(b) | 156,177 | $48,235 | |
| Hotels, Restaurants & Leisure - 1.1% | |||
| Compass Group PLC | 6,700 | 136 | |
| Marriott International, Inc. Class A | 800 | 102 | |
| Starbucks Corp. | 129,200 | 7,470 | |
| U.S. Foods Holding Corp. (a) | 879,803 | 25,620 | |
| 33,328 | |||
| Household Durables - 0.4% | |||
| Roku, Inc. Class A (b) | 286,640 | 12,583 | |
| Internet & Direct Marketing Retail - 6.5% | |||
| Amazon.com, Inc. (a) | 100,700 | 118,499 | |
| Blue Apron Holdings, Inc.: | |||
| Class A | 95,508 | 286 | |
| Class B | 382,036 | 1,085 | |
| Groupon, Inc. (a) | 1,595,938 | 9,001 | |
| Netflix, Inc. (a) | 157,600 | 29,563 | |
| Priceline Group, Inc. (a) | 5,700 | 9,916 | |
| Vipshop Holdings Ltd. ADR (a) | 1,805,900 | 14,863 | |
| Wayfair LLC Class A (a) | 195,165 | 13,660 | |
| 196,873 | |||
| Media - 2.6% | |||
| Charter Communications, Inc. Class A (a) | 119,260 | 38,904 | |
| China Literature Ltd. (a)(c) | 34,800 | 401 | |
| Comcast Corp. Class A | 707,000 | 26,541 | |
| Liberty Media Corp. Liberty Media Class A (a) | 114,600 | 3,987 | |
| Naspers Ltd. Class N | 2,600 | 699 | |
| The Walt Disney Co. | 24,200 | 2,537 | |
| Vivendi SA | 188,900 | 5,029 | |
| 78,098 | |||
| Multiline Retail - 0.4% | |||
| Dollar Tree, Inc. (a) | 129,300 | 13,287 | |
| Specialty Retail - 0.9% | |||
| Home Depot, Inc. | 98,700 | 17,748 | |
| TJX Companies, Inc. | 104,500 | 7,895 | |
| 25,643 | |||
| Textiles, Apparel & Luxury Goods - 0.2% | |||
| lululemon athletica, Inc. (a) | 100,316 | 6,717 | |
| TOTAL CONSUMER DISCRETIONARY | 414,764 | ||
| CONSUMER STAPLES - 4.9% | |||
| Beverages - 0.8% | |||
| Constellation Brands, Inc. Class A (sub. vtg.) | 48,600 | 10,575 | |
| Monster Beverage Corp. (a) | 133,700 | 8,379 | |
| The Coca-Cola Co. | 89,500 | 4,096 | |
| 23,050 | |||
| Food & Staples Retailing - 2.1% | |||
| Costco Wholesale Corp. | 63,300 | 11,674 | |
| CVS Health Corp. | 176,300 | 13,505 | |
| Performance Food Group Co. (a) | 1,289,150 | 38,223 | |
| 63,402 | |||
| Food Products - 0.0% | |||
| Kerry Group PLC Class A | 4,500 | 471 | |
| Personal Products - 0.3% | |||
| Unilever NV (Certificaten Van Aandelen) (Bearer) | 127,500 | 7,353 | |
| Tobacco - 1.7% | |||
| British American Tobacco PLC (United Kingdom) | 687,400 | 43,713 | |
| JUUL Labs, Inc.(d) | 2,772 | 9 | |
| Philip Morris International, Inc. | 87,500 | 8,991 | |
| 52,713 | |||
| TOTAL CONSUMER STAPLES | 146,989 | ||
| ENERGY - 1.7% | |||
| Oil, Gas & Consumable Fuels - 1.7% | |||
| Petronet LNG Ltd. (a) | 2,587,650 | 10,095 | |
| Reliance Industries Ltd. | 2,177,902 | 31,122 | |
| Teekay LNG Partners LP | 214,200 | 3,866 | |
| Williams Partners LP | 168,400 | 6,180 | |
| 51,263 | |||
| FINANCIALS - 4.5% | |||
| Banks - 0.3% | |||
| HDFC Bank Ltd. sponsored ADR | 102,311 | 9,934 | |
| Capital Markets - 3.7% | |||
| BlackRock, Inc. Class A | 64,800 | 32,477 | |
| CBOE Holdings, Inc. | 264,800 | 32,684 | |
| Charles Schwab Corp. | 345,900 | 16,876 | |
| MSCI, Inc. | 13,300 | 1,712 | |
| S&P Global, Inc. | 10,800 | 1,787 | |
| TD Ameritrade Holding Corp. | 507,500 | 25,969 | |
| 111,505 | |||
| Consumer Finance - 0.5% | |||
| Synchrony Financial | 398,600 | 14,306 | |
| TOTAL FINANCIALS | 135,745 | ||
| HEALTH CARE - 14.3% | |||
| Biotechnology - 8.3% | |||
| ACADIA Pharmaceuticals, Inc. (a) | 75,100 | 2,272 | |
| Acorda Therapeutics, Inc. (a) | 63,800 | 1,295 | |
| Agios Pharmaceuticals, Inc. (a) | 83,900 | 5,164 | |
| Alexion Pharmaceuticals, Inc. (a) | 382,000 | 41,947 | |
| Alkermes PLC (a) | 90,200 | 4,717 | |
| Alnylam Pharmaceuticals, Inc. (a) | 89,012 | 11,976 | |
| Amgen, Inc. | 285,600 | 50,168 | |
| Amicus Therapeutics, Inc. (a) | 249,800 | 3,477 | |
| AnaptysBio, Inc. | 56,700 | 4,766 | |
| aTyr Pharma, Inc. (a)(c) | 124,876 | 487 | |
| BioMarin Pharmaceutical, Inc. (a) | 116,600 | 10,004 | |
| bluebird bio, Inc. (a) | 85,200 | 14,723 | |
| Coherus BioSciences, Inc. (a) | 88,294 | 790 | |
| Epizyme, Inc. (a) | 30,300 | 364 | |
| Five Prime Therapeutics, Inc. (a) | 66,700 | 1,758 | |
| Insmed, Inc. (a) | 387,879 | 12,098 | |
| Intercept Pharmaceuticals, Inc. (a) | 10,235 | 629 | |
| Ionis Pharmaceuticals, Inc. (a) | 345,153 | 19,153 | |
| Neurocrine Biosciences, Inc. (a) | 183,875 | 13,219 | |
| Opko Health, Inc. (a) | 1 | 0 | |
| Prothena Corp. PLC (a) | 132,702 | 6,169 | |
| Regeneron Pharmaceuticals, Inc. (a) | 43,800 | 15,849 | |
| Rigel Pharmaceuticals, Inc. (a) | 498,548 | 2,074 | |
| Sage Therapeutics, Inc. (a) | 29,144 | 2,693 | |
| Sienna Biopharmaceuticals, Inc. (b) | 46,400 | 935 | |
| Spark Therapeutics, Inc. (a) | 25,300 | 1,853 | |
| TESARO, Inc. (a)(b) | 124,600 | 10,541 | |
| Vertex Pharmaceuticals, Inc. (a) | 69,090 | 9,969 | |
| Xencor, Inc. (a) | 65,100 | 1,413 | |
| 250,503 | |||
| Health Care Equipment & Supplies - 1.6% | |||
| Boston Scientific Corp. (a) | 1,169,500 | 30,734 | |
| Danaher Corp. | 78,200 | 7,379 | |
| Insulet Corp. (a) | 108,600 | 7,790 | |
| Intuitive Surgical, Inc. (a) | 11,500 | 4,597 | |
| 50,500 | |||
| Health Care Providers & Services - 2.5% | |||
| Anthem, Inc. | 119,800 | 28,148 | |
| Cigna Corp. | 47,200 | 9,994 | |
| Humana, Inc. | 40,400 | 10,539 | |
| OptiNose, Inc. | 32,600 | 622 | |
| UnitedHealth Group, Inc. | 113,700 | 25,943 | |
| 75,246 | |||
| Health Care Technology - 0.4% | |||
| athenahealth, Inc. (a) | 95,300 | 12,664 | |
| Pharmaceuticals - 1.5% | |||
| Akcea Therapeutics, Inc. (b) | 257,023 | 4,907 | |
| Allergan PLC | 154,590 | 26,872 | |
| Bristol-Myers Squibb Co. | 87,500 | 5,529 | |
| Innoviva, Inc. (a) | 239,400 | 3,141 | |
| Theravance Biopharma, Inc. (a)(b) | 152,125 | 4,328 | |
| 44,777 | |||
| TOTAL HEALTH CARE | 433,690 | ||
| INDUSTRIALS - 3.7% | |||
| Air Freight & Logistics - 0.2% | |||
| FedEx Corp. | 28,000 | 6,481 | |
| Airlines - 1.6% | |||
| JetBlue Airways Corp. (a) | 69,800 | 1,499 | |
| Spirit Airlines, Inc. (a) | 1,124,200 | 47,925 | |
| 49,424 | |||
| Commercial Services & Supplies - 0.1% | |||
| Copart, Inc. (a) | 40,800 | 1,761 | |
| Electrical Equipment - 0.3% | |||
| Fortive Corp. | 30,700 | 2,292 | |
| Sunrun, Inc. (a)(b) | 1,137,300 | 6,369 | |
| 8,661 | |||
| Machinery - 0.4% | |||
| Allison Transmission Holdings, Inc. | 81,700 | 3,353 | |
| Caterpillar, Inc. | 70,600 | 9,965 | |
| 13,318 | |||
| Professional Services - 0.2% | |||
| TransUnion Holding Co., Inc. (a) | 119,800 | 6,651 | |
| Trading Companies & Distributors - 0.9% | |||
| Bunzl PLC | 898,700 | 25,706 | |
| TOTAL INDUSTRIALS | 112,002 | ||
| INFORMATION TECHNOLOGY - 46.7% | |||
| Communications Equipment - 0.9% | |||
| Carvana Co. Class A (b) | 1,654,332 | 26,817 | |
| Internet Software & Services - 15.3% | |||
| 2U, Inc. (a) | 18,500 | 1,186 | |
| Alibaba Group Holding Ltd. sponsored ADR (a) | 49,600 | 8,783 | |
| Alphabet, Inc.: | |||
| Class A (a) | 71,365 | 73,946 | |
| Class C (a) | 131,075 | 133,881 | |
| CarGurus, Inc. Class A (b) | 4,900 | 144 | |
| Cloudera, Inc. (c) | 41,786 | 661 | |
| Criteo SA sponsored ADR (a) | 537,600 | 17,929 | |
| Facebook, Inc. Class A (a) | 667,441 | 118,257 | |
| GoDaddy, Inc. (a) | 497,749 | 24,215 | |
| IAC/InterActiveCorp (a) | 47,600 | 6,058 | |
| MongoDB, Inc. Class B | 257,562 | 6,613 | |
| NetEase, Inc. ADR | 5,400 | 1,775 | |
| Qudian, Inc. ADR | 80,000 | 1,088 | |
| The Trade Desk, Inc. (a)(b) | 635,700 | 31,238 | |
| Wix.com Ltd. (a) | 665,035 | 36,510 | |
| 462,284 | |||
| IT Services - 9.4% | |||
| Accenture PLC Class A | 12,700 | 1,880 | |
| Alliance Data Systems Corp. | 175,700 | 42,040 | |
| Cognizant Technology Solutions Corp. Class A | 485,792 | 35,113 | |
| EPAM Systems, Inc. (a) | 155,800 | 15,804 | |
| Euronet Worldwide, Inc. (a) | 186,800 | 17,064 | |
| FleetCor Technologies, Inc. (a) | 47,100 | 8,566 | |
| Global Payments, Inc. | 269,200 | 27,071 | |
| Luxoft Holding, Inc. (a) | 605,174 | 31,166 | |
| MasterCard, Inc. Class A | 229,800 | 34,578 | |
| PayPal Holdings, Inc. (a) | 307,800 | 23,310 | |
| Visa, Inc. Class A | 435,100 | 48,988 | |
| 285,580 | |||
| Semiconductors & Semiconductor Equipment - 3.9% | |||
| Analog Devices, Inc. | 94,800 | 8,163 | |
| Broadcom Ltd. | 117,000 | 32,519 | |
| Cavium, Inc. (a) | 23,500 | 2,009 | |
| Micron Technology, Inc. (a) | 505,900 | 21,445 | |
| NVIDIA Corp. | 116,230 | 23,329 | |
| ON Semiconductor Corp. (a) | 377,500 | 7,580 | |
| Qualcomm, Inc. | 281,800 | 18,695 | |
| SolarEdge Technologies, Inc. (a) | 125,257 | 4,559 | |
| 118,299 | |||
| Software - 10.5% | |||
| Activision Blizzard, Inc. | 441,900 | 27,575 | |
| Adobe Systems, Inc. (a) | 218,300 | 39,615 | |
| Altair Engineering, Inc. Class A (a) | 12,400 | 278 | |
| Autodesk, Inc. (a) | 265,300 | 29,103 | |
| Electronic Arts, Inc. (a) | 136,100 | 14,474 | |
| Microsoft Corp. | 1,186,500 | 99,868 | |
| Red Hat, Inc. (a) | 72,630 | 9,207 | |
| Salesforce.com, Inc. (a) | 636,600 | 66,410 | |
| ServiceNow, Inc. (a) | 165,000 | 20,295 | |
| Workday, Inc. Class A (a) | 117,600 | 12,113 | |
| 318,938 | |||
| Technology Hardware, Storage & Peripherals - 6.7% | |||
| Apple, Inc. | 1,176,506 | 202,183 | |
| TOTAL INFORMATION TECHNOLOGY | 1,414,101 | ||
| MATERIALS - 4.5% | |||
| Chemicals - 3.6% | |||
| DowDuPont, Inc. | 305,562 | 21,988 | |
| LG Chemical Ltd. | 33,201 | 12,743 | |
| LyondellBasell Industries NV Class A | 574,100 | 60,108 | |
| The Chemours Co. LLC | 297,100 | 15,271 | |
| 110,110 | |||
| Containers & Packaging - 0.9% | |||
| Ball Corp. | 694,000 | 27,698 | |
| TOTAL MATERIALS | 137,808 | ||
| REAL ESTATE - 3.1% | |||
| Equity Real Estate Investment Trusts (REITs) - 2.8% | |||
| American Tower Corp. | 591,400 | 85,120 | |
| Real Estate Management & Development - 0.3% | |||
| Redfin Corp. (b) | 5,100 | 116 | |
| Redfin Corp. | 360,578 | 7,803 | |
| 7,919 | |||
| TOTAL REAL ESTATE | 93,039 | ||
| TELECOMMUNICATION SERVICES - 1.8% | |||
| Wireless Telecommunication Services - 1.8% | |||
| T-Mobile U.S., Inc. (a) | 887,400 | 54,194 | |
| TOTAL COMMON STOCKS | |||
| (Cost $1,830,834) | 2,993,595 | ||
| Preferred Stocks - 1.1% | |||
| Convertible Preferred Stocks - 1.1% | |||
| CONSUMER STAPLES - 0.7% | |||
| Tobacco - 0.7% | |||
| JUUL Labs, Inc. Series C(a)(d)(e) | 1,069,313 | 21,519 | |
| FINANCIALS - 0.1% | |||
| Insurance - 0.1% | |||
| Clover Health Series D (d)(e) | 282,226 | 2,568 | |
| INFORMATION TECHNOLOGY - 0.3% | |||
| Internet Software & Services - 0.3% | |||
| Uber Technologies, Inc. Series D, 8.00% (a)(d)(e) | 221,104 | 7,721 | |
| TOTAL CONVERTIBLE PREFERRED STOCKS | 31,808 | ||
| Nonconvertible Preferred Stocks - 0.0% | |||
| CONSUMER STAPLES - 0.0% | |||
| Tobacco - 0.0% | |||
| PAX Labs, Inc. Series A (d)(e) | 1,069,313 | 1,465 | |
| TOTAL PREFERRED STOCKS | |||
| (Cost $10,194) | 33,273 | ||
| Money Market Funds - 2.8% | |||
| Fidelity Cash Central Fund, 1.13% (f) | 5,439,912 | 5,441 | |
| Fidelity Securities Lending Cash Central Fund 1.13% (f)(g)�� | 78,618,031 | 78,626 | |
| TOTAL MONEY MARKET FUNDS | |||
| (Cost $84,067) | 84,067 | ||
| TOTAL INVESTMENT IN SECURITIES - 102.8% | |||
| (Cost $1,925,095) | 3,110,935 | ||
| NET OTHER ASSETS (LIABILITIES) - (2.8)% | (83,808) | ||
| NET ASSETS - 100% | $3,027,127 |
Values shown as $0 may reflect amounts less than $500.
Legend
(a) Non-income producing
(b) Security or a portion of the security is on loan at period end.
(c) Security exempt from registration under Rule 144A of the Securities Act of 1933. These securities may be resold in transactions exempt from registration, normally to qualified institutional buyers. At the end of the period, the value of these securities amounted to $1,549,000 or 0.1% of net assets.
(d) Level 3 security
(e) Restricted securities - Investment in securities not registered under the Securities Act of 1933 (excluding 144A issues). At the end of the period, the value of restricted securities (excluding 144A issues) amounted to $33,273,000 or 1.1% of net assets.
(f) Affiliated fund that is generally available only to investment companies and other accounts managed by Fidelity Investments. The rate quoted is the annualized seven-day yield of the fund at period end. A complete unaudited listing of the fund's holdings as of its most recent quarter end is available upon request. In addition, each Fidelity Central Fund's financial statements, which are not covered by the Fund's Report of Independent Registered Public Accounting Firm, are available on the SEC's website or upon request.
(g) Investment made with cash collateral received from securities on loan.
Additional information on each restricted holding is as follows:
| Security | Acquisition Date | Acquisition Cost (000s) |
| Clover Health Series D | 6/7/17 | $2,647 |
| JUUL Labs, Inc. Series C | 5/22/15 - 11/21/17 | $3,335 |
| PAX Labs, Inc. Series A | 5/22/15 | $791 |
| Uber Technologies, Inc. Series D, 8.00% | 6/6/14 | $3,430 |
Affiliated Central Funds
Information regarding fiscal year to date income earned by the Fund from investments in Fidelity Central Funds is as follows:
| Fund | Income earned |
| (Amounts in thousands) | |
| Fidelity Cash Central Fund | $91 |
| Fidelity Securities Lending Cash Central Fund | 1,599 |
| Total | $1,690 |
Investment Valuation
The following is a summary of the inputs used, as of November 30, 2017, involving the Fund's assets and liabilities carried at fair value. The inputs or methodology used for valuing securities may not be an indication of the risk associated with investing in those securities. For more information on valuation inputs, and their aggregation into the levels used below, please refer to the Investment Valuation section in the accompanying Notes to Financial Statements.
| Valuation Inputs at Reporting Date: | ||||
| Description | Total | Level 1 | Level 2 | Level 3 |
| (Amounts in thousands) | ||||
| Investments in Securities: | ||||
| Equities: | ||||
| Consumer Discretionary | $414,764 | $413,679 | $1,085 | $-- |
| Consumer Staples | 169,973 | 95,914 | 51,066 | 22,993 |
| Energy | 51,263 | 51,263 | -- | -- |
| Financials | 138,313 | 135,745 | -- | 2,568 |
| Health Care | 433,690 | 433,690 | -- | -- |
| Industrials | 112,002 | 112,002 | -- | -- |
| Information Technology | 1,421,822 | 1,407,488 | 6,613 | 7,721 |
| Materials | 137,808 | 137,808 | -- | -- |
| Real Estate | 93,039 | 85,236 | 7,803 | -- |
| Telecommunication Services | 54,194 | 54,194 | -- | -- |
| Money Market Funds | 84,067 | 84,067 | -- | -- |
| Total Investments in Securities: | $3,110,935 | $3,011,086 | $66,567 | $33,282 |
The following is a reconciliation of Investments in Securities for which Level 3 inputs were used in determining value:
| (Amounts in thousands) | |
| Investments in Securities: | |
| Beginning Balance | $27,830 |
| Net Realized Gain (Loss) on Investment Securities | -- |
| Net Unrealized Gain (Loss) on Investment Securities | 18,486 |
| Cost of Purchases | 3,447 |
| Proceeds of Sales | (16,481) |
| Amortization/Accretion | -- |
| Transfers into Level 3 | -- |
| Transfers out of Level 3 | -- |
| Ending Balance | $33,282 |
| The change in unrealized gain (loss) for the period attributable to Level 3 securities held at November 30, 2017 | $16,666 |
The information used in the above reconciliation represents fiscal year to date activity for any Investments in Securities identified as using Level 3 inputs at either the beginning or the end of the current fiscal period. Transfers in or out of Level 3 represent the beginning value of any Security or Instrument where a change in the pricing level occurred from the beginning to the end of the period. The cost of purchases and the proceeds of sales may include securities received or delivered through corporate actions or exchanges.
Other Information
Distribution of investments by country or territory of incorporation, as a percentage of Total Net Assets, is as follows (Unaudited):
| United States of America | 86.7% |
| United Kingdom | 2.3% |
| Netherlands | 2.3% |
| India | 1.7% |
| Ireland | 1.4% |
| Israel | 1.2% |
| Singapore | 1.1% |
| Cayman Islands | 1.0% |
| British Virgin Islands | 1.0% |
| Others (Individually Less Than 1%) | 1.3% |
| 100.0% |
See accompanying notes which are an integral part of the financial statements.
Financial Statements
Statement of Assets and Liabilities
| Amounts in thousands (except per-share amounts) | November 30, 2017 | |
| Assets | ||
| Investment in securities, at value (including securities loaned of $77,391) — See accompanying schedule: Unaffiliated issuers (cost $1,841,028) | $3,026,868 | |
| Fidelity Central Funds (cost $84,067) | 84,067 | |
| Total Investment in Securities (cost $1,925,095) | $3,110,935 | |
| Receivable for fund shares sold | 976 | |
| Dividends receivable | 2,029 | |
| Distributions receivable from Fidelity Central Funds | 312 | |
| Prepaid expenses | 6 | |
| Other receivables | 135 | |
| Total assets | 3,114,393 | |
| Liabilities | ||
| Payable to custodian bank | $12 | |
| Payable for investments purchased | 2,762 | |
| Payable for fund shares redeemed | 3,240 | |
| Accrued management fee | 1,046 | |
| Distribution and service plan fees payable | 900 | |
| Other affiliated payables | 507 | |
| Other payables and accrued expenses | 184 | |
| Collateral on securities loaned | 78,615 | |
| Total liabilities | 87,266 | |
| Net Assets | $3,027,127 | |
| Net Assets consist of: | ||
| Paid in capital | $1,629,504 | |
| Accumulated net investment loss | (1,119) | |
| Accumulated undistributed net realized gain (loss) on investments and foreign currency transactions | 212,898 | |
| Net unrealized appreciation (depreciation) on investments and assets and liabilities in foreign currencies | 1,185,844 | |
| Net Assets | $3,027,127 | |
| Calculation of Maximum Offering Price | ||
| Class A: | ||
| Net Asset Value and redemption price per share ($540,449 ÷ 7,860 shares) | $68.76 | |
| Maximum offering price per share (100/94.25 of $68.76) | $72.95 | |
| Class M: | ||
| Net Asset Value and redemption price per share ($1,491,729 ÷ 21,851 shares) | $68.27 | |
| Maximum offering price per share (100/96.50 of $68.27) | $70.75 | |
| Class C: | ||
| Net Asset Value and offering price per share ($201,068 ÷ 3,318 shares)(a) | $60.60 | |
| Class I: | ||
| Net Asset Value, offering price and redemption price per share ($642,271 ÷ 8,753 shares) | $73.38 | |
| Class Z: | ||
| Net Asset Value, offering price and redemption price per share ($151,610 ÷ 2,052 shares) | $73.88 |
(a) Redemption price per share is equal to net asset value less any applicable contingent deferred sales charge.
See accompanying notes which are an integral part of the financial statements.
Statement of Operations
| Amounts in thousands | Year ended November 30, 2017 | |
| Investment Income | ||
| Dividends | $24,480 | |
| Income from Fidelity Central Funds (including $1,599 from security lending) | 1,690 | |
| Total income | 26,170 | |
| Expenses | ||
| Management fee | ||
| Basic fee | $14,711 | |
| Performance adjustment | (3,419) | |
| Transfer agent fees | 4,908 | |
| Distribution and service plan fees | 10,016 | |
| Accounting and security lending fees | 818 | |
| Custodian fees and expenses | 62 | |
| Independent trustees' fees and expenses | 11 | |
| Appreciation in deferred trustee compensation account | 1 | |
| Registration fees | 118 | |
| Audit | 77 | |
| Legal | 10 | |
| Interest | 5 | |
| Miscellaneous | 25 | |
| Total expenses before reductions | 27,343 | |
| Expense reductions | (115) | 27,228 |
| Net investment income (loss) | (1,058) | |
| Realized and Unrealized Gain (Loss) | ||
| Net realized gain (loss) on: | ||
| Investment securities: | ||
| Unaffiliated issuers | 247,823 | |
| Fidelity Central Funds | 11 | |
| Foreign currency transactions | 70 | |
| Total net realized gain (loss) | 247,904 | |
| Change in net unrealized appreciation (depreciation) on: | ||
| Investment securities: | ||
| Unaffiliated issuers | 540,787 | |
| Fidelity Central Funds | (8) | |
| Assets and liabilities in foreign currencies | 5 | |
| Total change in net unrealized appreciation (depreciation) | 540,784 | |
| Net gain (loss) | 788,688 | |
| Net increase (decrease) in net assets resulting from operations | $787,630 |
See accompanying notes which are an integral part of the financial statements.
Statement of Changes in Net Assets
| Amounts in thousands | Year ended November 30, 2017 | Year ended November 30, 2016 |
| Increase (Decrease) in Net Assets | ||
| Operations | ||
| Net investment income (loss) | $(1,058) | $1,051 |
| Net realized gain (loss) | 247,904 | 350,793 |
| Change in net unrealized appreciation (depreciation) | 540,784 | (466,911) |
| Net increase (decrease) in net assets resulting from operations | 787,630 | (115,067) |
| Distributions to shareholders from net realized gain | (308,776) | (371,621) |
| Share transactions - net increase (decrease) | 49,313 | (448,647) |
| Total increase (decrease) in net assets | 528,167 | (935,335) |
| Net Assets | ||
| Beginning of period | 2,498,960 | 3,434,295 |
| End of period | $3,027,127 | $2,498,960 |
| Other Information | ||
| Accumulated net investment loss end of period | $(1,119) | $(105) |
See accompanying notes which are an integral part of the financial statements.
Financial Highlights
Fidelity Advisor Growth Opportunities Fund Class A
| Years ended November 30, | 2017 | 2016 | 2015 | 2014 | 2013 |
| Selected Per–Share Data | |||||
| Net asset value, beginning of period | $58.24 | $66.87 | $63.52 | $54.89 | $41.34 |
| Income from Investment Operations | |||||
| Net investment income (loss)A | .04 | .07 | (.08) | (.11) | (.10) |
| Net realized and unrealized gain (loss) | 17.86 | (1.46) | 3.43 | 8.74 | 13.65 |
| Total from investment operations | 17.90 | (1.39) | 3.35 | 8.63 | 13.55 |
| Distributions from net realized gain | (7.38) | (7.24) | – | – | – |
| Total distributions | (7.38) | (7.24) | – | – | – |
| Net asset value, end of period | $68.76 | $58.24 | $66.87 | $63.52 | $54.89 |
| Total ReturnB,C | 34.64% | (2.37)% | 5.27% | 15.72% | 32.78% |
| Ratios to Average Net AssetsD,E | |||||
| Expenses before reductions | .91% | .86% | 1.05% | 1.08% | 1.23% |
| Expenses net of fee waivers, if any | .91% | .86% | 1.05% | 1.08% | 1.23% |
| Expenses net of all reductions | .91% | .86% | 1.05% | 1.08% | 1.23% |
| Net investment income (loss) | .06% | .13% | (.12)% | (.18)% | (.20)% |
| Supplemental Data | |||||
| Net assets, end of period (in millions) | $540 | $502 | $664 | $648 | $555 |
| Portfolio turnover rateF | 52% | 66% | 51% | 13% | 17% |
A Calculated based on average shares outstanding during the period.
B Total returns would have been lower if certain expenses had not been reduced during the applicable periods shown.
C Total returns do not include the effect of the sales charges.
D Fees and expenses of any underlying Fidelity Central Funds are not included in the Fund's expense ratio. The Fund indirectly bears its proportionate share of the expenses of any underlying Fidelity Central Funds.
E Expense ratios reflect operating expenses of the class. Expenses before reductions do not reflect amounts reimbursed by the investment adviser or reductions from brokerage service arrangements or reductions from other expense offset arrangements and do not represent the amount paid by the class during periods when reimbursements or reductions occur. Expenses net of fee waivers reflect expenses after reimbursement by the investment adviser but prior to reductions from brokerage service arrangements or other expense offset arrangements. Expenses net of all reductions represent the net expenses paid by the class.
F Amount does not include the portfolio activity of any underlying Fidelity Central Funds.
See accompanying notes which are an integral part of the financial statements.
Fidelity Advisor Growth Opportunities Fund Class M
| Years ended November 30, | 2017 | 2016 | 2015 | 2014 | 2013 |
| Selected Per–Share Data | |||||
| Net asset value, beginning of period | $57.99 | $66.75 | $63.55 | $55.04 | $41.54 |
| Income from Investment Operations | |||||
| Net investment income (loss)A | (.10) | (.06) | (.23) | (.24) | (.19) |
| Net realized and unrealized gain (loss) | 17.76 | (1.46) | 3.43 | 8.75 | 13.69 |
| Total from investment operations | 17.66 | (1.52) | 3.20 | 8.51 | 13.50 |
| Distributions from net realized gain | (7.38) | (7.24) | – | – | – |
| Total distributions | (7.38) | (7.24) | – | – | – |
| Net asset value, end of period | $68.27 | $57.99 | $66.75 | $63.55 | $55.04 |
| Total ReturnB,C | 34.34% | (2.59)% | 5.04% | 15.46% | 32.50% |
| Ratios to Average Net AssetsD,E | |||||
| Expenses before reductions | 1.14% | 1.09% | 1.28% | 1.31% | 1.43% |
| Expenses net of fee waivers, if any | 1.14% | 1.09% | 1.28% | 1.31% | 1.43% |
| Expenses net of all reductions | 1.13% | 1.09% | 1.28% | 1.31% | 1.43% |
| Net investment income (loss) | (.17)% | (.10)% | (.35)% | (.40)% | (.40)% |
| Supplemental Data | |||||
| Net assets, end of period (in millions) | $1,492 | $1,250 | $1,461 | $1,504 | $1,426 |
| Portfolio turnover rateF | 52% | 66% | 51% | 13% | 17% |
A Calculated based on average shares outstanding during the period.
B Total returns would have been lower if certain expenses had not been reduced during the applicable periods shown.
C Total returns do not include the effect of the sales charges.
D Fees and expenses of any underlying Fidelity Central Funds are not included in the Fund's expense ratio. The Fund indirectly bears its proportionate share of the expenses of any underlying Fidelity Central Funds.
E Expense ratios reflect operating expenses of the class. Expenses before reductions do not reflect amounts reimbursed by the investment adviser or reductions from brokerage service arrangements or reductions from other expense offset arrangements and do not represent the amount paid by the class during periods when reimbursements or reductions occur. Expenses net of fee waivers reflect expenses after reimbursement by the investment adviser but prior to reductions from brokerage service arrangements or other expense offset arrangements. Expenses net of all reductions represent the net expenses paid by the class.
F Amount does not include the portfolio activity of any underlying Fidelity Central Funds.
See accompanying notes which are an integral part of the financial statements.
Fidelity Advisor Growth Opportunities Fund Class C
| Years ended November 30, | 2017 | 2016 | 2015 | 2014 | 2013 |
| Selected Per–Share Data | |||||
| Net asset value, beginning of period | $52.52 | $61.42 | $58.78 | $51.17 | $38.83 |
| Income from Investment Operations | |||||
| Net investment income (loss)A | (.37) | (.32) | (.52) | (.50) | (.42) |
| Net realized and unrealized gain (loss) | 15.83 | (1.34) | 3.16 | 8.11 | 12.76 |
| Total from investment operations | 15.46 | (1.66) | 2.64 | 7.61 | 12.34 |
| Distributions from net realized gain | (7.38) | (7.24) | – | – | – |
| Total distributions | (7.38) | (7.24) | – | – | – |
| Net asset value, end of period | $60.60 | $52.52 | $61.42 | $58.78 | $51.17 |
| Total ReturnB,C | 33.64% | (3.10)% | 4.49% | 14.87% | 31.78% |
| Ratios to Average Net AssetsD,E | |||||
| Expenses before reductions | 1.66% | 1.61% | 1.80% | 1.83% | 1.96% |
| Expenses net of fee waivers, if any | 1.66% | 1.61% | 1.80% | 1.83% | 1.96% |
| Expenses net of all reductions | 1.66% | 1.61% | 1.80% | 1.83% | 1.96% |
| Net investment income (loss) | (.69)% | (.62)% | (.87)% | (.93)% | (.93)% |
| Supplemental Data | |||||
| Net assets, end of period (in millions) | $201 | $178 | $238 | $212 | $159 |
| Portfolio turnover rateF | 52% | 66% | 51% | 13% | 17% |
A Calculated based on average shares outstanding during the period.
B Total returns would have been lower if certain expenses had not been reduced during the applicable periods shown.
C Total returns do not include the effect of the contingent deferred sales charge.
D Fees and expenses of any underlying Fidelity Central Funds are not included in the Fund's expense ratio. The Fund indirectly bears its proportionate share of the expenses of any underlying Fidelity Central Funds.
E Expense ratios reflect operating expenses of the class. Expenses before reductions do not reflect amounts reimbursed by the investment adviser or reductions from brokerage service arrangements or reductions from other expense offset arrangements and do not represent the amount paid by the class during periods when reimbursements or reductions occur. Expenses net of fee waivers reflect expenses after reimbursement by the investment adviser but prior to reductions from brokerage service arrangements or other expense offset arrangements. Expenses net of all reductions represent the net expenses paid by the class.
F Amount does not include the portfolio activity of any underlying Fidelity Central Funds.
See accompanying notes which are an integral part of the financial statements.
Fidelity Advisor Growth Opportunities Fund Class I
| Years ended November 30, | 2017 | 2016 | 2015 | 2014 | 2013 |
| Selected Per–Share Data | |||||
| Net asset value, beginning of period | $61.52 | $70.05 | $66.35 | $57.18 | $42.94 |
| Income from Investment Operations | |||||
| Net investment income (loss)A | .22 | .25 | .11 | .05 | .05 |
| Net realized and unrealized gain (loss) | 19.02 | (1.54) | 3.59 | 9.12 | 14.19 |
| Total from investment operations | 19.24 | (1.29) | 3.70 | 9.17 | 14.24 |
| Distributions from net realized gain | (7.38) | (7.24) | – | – | – |
| Total distributions | (7.38) | (7.24) | – | – | – |
| Net asset value, end of period | $73.38 | $61.52 | $70.05 | $66.35 | $57.18 |
| Total ReturnB | 35.01% | (2.09)% | 5.58% | 16.04% | 33.16% |
| Ratios to Average Net AssetsC,D | |||||
| Expenses before reductions | .63% | .58% | .77% | .81% | .93% |
| Expenses net of fee waivers, if any | .63% | .58% | .77% | .81% | .93% |
| Expenses net of all reductions | .63% | .58% | .77% | .81% | .93% |
| Net investment income (loss) | .34% | .41% | .16% | .09% | .09% |
| Supplemental Data | |||||
| Net assets, end of period (in millions) | $642 | $562 | $1,061 | $1,357 | $1,112 |
| Portfolio turnover rateE | 52% | 66% | 51% | 13% | 17% |
A Calculated based on average shares outstanding during the period.
B Total returns would have been lower if certain expenses had not been reduced during the applicable periods shown.
C Fees and expenses of any underlying Fidelity Central Funds are not included in the Fund's expense ratio. The Fund indirectly bears its proportionate share of the expenses of any underlying Fidelity Central Funds.
D Expense ratios reflect operating expenses of the class. Expenses before reductions do not reflect amounts reimbursed by the investment adviser or reductions from brokerage service arrangements or reductions from other expense offset arrangements and do not represent the amount paid by the class during periods when reimbursements or reductions occur. Expenses net of fee waivers reflect expenses after reimbursement by the investment adviser but prior to reductions from brokerage service arrangements or other expense offset arrangements. Expenses net of all reductions represent the net expenses paid by the class.
E Amount does not include the portfolio activity of any underlying Fidelity Central Funds.
See accompanying notes which are an integral part of the financial statements.
Fidelity Advisor Growth Opportunities Fund Class Z
| Years ended November 30, | 2017 | 2016 | 2015 | 2014 | 2013 A |
| Selected Per–Share Data | |||||
| Net asset value, beginning of period | $61.82 | $70.27 | $66.48 | $57.20 | $53.30 |
| Income from Investment Operations | |||||
| Net investment income (loss)B | .32 | .33 | .20 | .14 | .02 |
| Net realized and unrealized gain (loss) | 19.12 | (1.54) | 3.59 | 9.14 | 3.88 |
| Total from investment operations | 19.44 | (1.21) | 3.79 | 9.28 | 3.90 |
| Distributions from net realized gain | (7.38) | (7.24) | – | – | – |
| Total distributions | (7.38) | (7.24) | – | – | – |
| Net asset value, end of period | $73.88 | $61.82 | $70.27 | $66.48 | $57.20 |
| Total ReturnC,D | 35.18% | (1.96)% | 5.70% | 16.22% | 7.32% |
| Ratios to Average Net AssetsE,F | |||||
| Expenses before reductions | .51% | .45% | .64% | .67% | .78%G |
| Expenses net of fee waivers, if any | .50% | .45% | .64% | .67% | .78%G |
| Expenses net of all reductions | .50% | .45% | .64% | .67% | .78%G |
| Net investment income (loss) | .47% | .54% | .29% | .24% | .14%G |
| Supplemental Data | |||||
| Net assets, end of period (000 omitted) | $151,610 | $7,403 | $4,597 | $2,955 | $107 |
| Portfolio turnover rateH | 52% | 66% | 51% | 13% | 17% |
A For the period August 13, 2013 (commencement of sale of shares) to November 30, 2013.
B Calculated based on average shares outstanding during the period.
C Total returns for periods of less than one year are not annualized.
D Total returns would have been lower if certain expenses had not been reduced during the applicable periods shown.
E Fees and expenses of any underlying Fidelity Central Funds are not included in the Fund's expense ratio. The Fund indirectly bears its proportionate share of the expenses of any underlying Fidelity Central Funds.
F Expense ratios reflect operating expenses of the class. Expenses before reductions do not reflect amounts reimbursed by the investment adviser or reductions from brokerage service arrangements or reductions from other expense offset arrangements and do not represent the amount paid by the class during periods when reimbursements or reductions occur. Expense ratios before reductions for start-up periods may not be representative of longer-term operating periods. Expenses net of fee waivers reflect expenses after reimbursement by the investment adviser but prior to reductions from brokerage service arrangements or other expense offset arrangements. Expenses net of all reductions represent the net expenses paid by the class.
G Annualized
H Amount does not include the portfolio activity of any underlying Fidelity Central Funds.
See accompanying notes which are an integral part of the financial statements.
Notes to Financial Statements
For the period ended November 30, 2017
(Amounts in thousands except percentages)
1. Organization.
Fidelity Advisor Growth Opportunities Fund (the Fund) is a fund of Fidelity Advisor Series I (the Trust) and is authorized to issue an unlimited number of shares. The Trust is registered under the Investment Company Act of 1940, as amended (the 1940 Act), as an open-end management investment company organized as a Massachusetts business trust. The Fund offers Class A, Class M (formerly Class T), Class C, Class I and Class Z shares, each of which has equal rights as to assets and voting privileges. Each class has exclusive voting rights with respect to matters that affect that class.
After the close of business on June 24, 2016, all outstanding Class B shares were converted to Class A shares. All prior fiscal period dollar and share amounts for Class B presented in the Notes to Financial Statements are for the period December 1, 2015 through June 24, 2016.
2. Investments in Fidelity Central Funds.
The Fund invests in Fidelity Central Funds, which are open-end investment companies generally available only to other investment companies and accounts managed by the investment adviser and its affiliates. The Fund's Schedule of Investments lists each of the Fidelity Central Funds held as of period end, if any, as an investment of the Fund, but does not include the underlying holdings of each Fidelity Central Fund. As an Investing Fund, the Fund indirectly bears its proportionate share of the expenses of the underlying Fidelity Central Funds.
The Money Market Central Funds seek preservation of capital and current income and are managed by Fidelity Investments Money Management, Inc. (FIMM), an affiliate of the investment adviser. Annualized expenses of the Money Market Central Funds as of their most recent shareholder report date are less than .005%.
A complete unaudited list of holdings for each Fidelity Central Fund is available upon request or at the Securities and Exchange Commission (the SEC) website at www.sec.gov. In addition, the financial statements of the Fidelity Central Funds, which are not covered by the Fund's Report of Independent Registered Public Accounting Firm, are available on the SEC website or upon request.
3. Significant Accounting Policies.
The Fund is an investment company and applies the accounting and reporting guidance of the Financial Accounting Standards Board (FASB) Accounting Standards Codification Topic 946 Financial Services – Investments Companies. The financial statements have been prepared in conformity with accounting principles generally accepted in the United States of America (GAAP), which require management to make certain estimates and assumptions at the date of the financial statements. Actual results could differ from those estimates. Subsequent events, if any, through the date that the financial statements were issued have been evaluated in the preparation of the financial statements. The following summarizes the significant accounting policies of the Fund:
Investment Valuation. Investments are valued as of 4:00 p.m. Eastern time on the last calendar day of the period. The Board of Trustees (the Board) has delegated the day to day responsibility for the valuation of the Fund's investments to the Fair Value Committee (the Committee) established by the Fund's investment adviser. In accordance with valuation policies and procedures approved by the Board, the Fund attempts to obtain prices from one or more third party pricing vendors or brokers to value its investments. When current market prices, quotations or currency exchange rates are not readily available or reliable, investments will be fair valued in good faith by the Committee, in accordance with procedures adopted by the Board. Factors used in determining fair value vary by investment type and may include market or investment specific events. The frequency with which these procedures are used cannot be predicted and they may be utilized to a significant extent. The Committee oversees the Fund's valuation policies and procedures and reports to the Board on the Committee's activities and fair value determinations. The Board monitors the appropriateness of the procedures used in valuing the Fund's investments and ratifies the fair value determinations of the Committee.
The Fund categorizes the inputs to valuation techniques used to value its investments into a disclosure hierarchy consisting of three levels as shown below:
- Level 1 – quoted prices in active markets for identical investments
- Level 2 – other significant observable inputs (including quoted prices for similar investments, interest rates, prepayment speeds, etc.)
- Level 3 – unobservable inputs (including the Fund's own assumptions based on the best information available)
Valuation techniques used to value the Fund's investments by major category are as follows:
Equity securities, including restricted securities, for which market quotations are readily available, are valued at the last reported sale price or official closing price as reported by a third party pricing vendor on the primary market or exchange on which they are traded and are categorized as Level 1 in the hierarchy. In the event there were no sales during the day or closing prices are not available, securities are valued at the last quoted bid price or may be valued using the last available price and are generally categorized as Level 2 in the hierarchy. For foreign equity securities, when market or security specific events arise, comparisons to the valuation of American Depositary Receipts (ADRs), futures contracts, Exchange-Traded Funds (ETFs) and certain indexes as well as quoted prices for similar securities may be used and would be categorized as Level 2 in the hierarchy. Utilizing these techniques may result in transfers between Level 1 and Level 2. For equity securities, including restricted securities, where observable inputs are limited, assumptions about market activity and risk are used and these securities may be categorized as Level 3 in the hierarchy. Equity securities, including restricted securities, for which observable inputs are not available are valued using alternate valuation approaches, including the market approach and the income approach and are categorized as Level 3 in the hierarchy. The market approach generally consists of using comparable market transactions while the income approach generally consists of using the net present value of estimated future cash flows, adjusted as appropriate for liquidity, credit, market and/or other risk factors.
Investments in open-end mutual funds, including the Fidelity Central Funds, are valued at their closing net asset value (NAV) each business day and are categorized as Level 1 in the hierarchy.
The following provides information on Level 3 securities held by the Fund that were valued at period end based on unobservable inputs. These amounts exclude valuations provided by a broker.
| Asset Type | Fair Value | Valuation Technique(s) | Unobservable Input | Amount or Range/Weighted Average | Impact to Valuation from an Increase in Input(a) |
| Equities | $33,282 | Market comparable | Enterprise value/Sales multiple (EV/S) | 1.0 – 5.4 / 4.7 | Increase |
| Discount rate | 10.0% | Decrease | |||
| Premium rate | 38.9% | Increase | |||
| Market approach | Transaction price | $32.97 - $48.77 / $40.87 | Increase |
(a) Represents the expected directional change in the fair value of the Level 3 investments that would result from an increase in the corresponding input. A decrease to the unobservable input would have the opposite effect. Significant changes in these inputs could result in significantly higher or lower fair value measurements.
Changes in valuation techniques may result in transfers in or out of an assigned level within the disclosure hierarchy. The aggregate value of investments by input level as of November 30, 2017, as well as a roll forward of Level 3 investments, is included at the end of the Fund's Schedule of Investments.
Foreign Currency. The Fund may use foreign currency contracts to facilitate transactions in foreign-denominated securities. Gains and losses from these transactions may arise from changes in the value of the foreign currency or if the counterparties do not perform under the contracts' terms.
Foreign-denominated assets, including investment securities, and liabilities are translated into U.S. dollars at the exchange rates at period end. Purchases and sales of investment securities, income and dividends received and expenses denominated in foreign currencies are translated into U.S. dollars at the exchange rate in effect on the transaction date.
The effects of exchange rate fluctuations on investments are included with the net realized and unrealized gain (loss) on investment securities. Other foreign currency transactions resulting in realized and unrealized gain (loss) are disclosed separately.
Investment Transactions and Income. For financial reporting purposes, the Fund's investment holdings and NAV include trades executed through the end of the last business day of the period. The NAV per share for processing shareholder transactions is calculated as of the close of business of the New York Stock Exchange (NYSE), normally 4:00 p.m. Eastern time and includes trades executed through the end of the prior business day. Gains and losses on securities sold are determined on the basis of identified cost and includes proceeds received from litigation. Dividend income is recorded on the ex-dividend date, except for certain dividends from foreign securities where the ex-dividend date may have passed, which are recorded as soon as the Fund is informed of the ex-dividend date. Non-cash dividends included in dividend income, if any, are recorded at the fair market value of the securities received. Income and capital gain distributions from Fidelity Central Funds, if any, are recorded on the ex-dividend date. Certain distributions received by the Fund represent a return of capital or capital gain. The Fund determines the components of these distributions subsequent to the ex-dividend date, based upon receipt of tax filings or other correspondence relating to the underlying investment. These distributions are recorded as a reduction of cost of investments and/or as a realized gain. Investment income is recorded net of foreign taxes withheld where recovery of such taxes is uncertain.
Class Allocations and Expenses. Investment income, realized and unrealized capital gains and losses, common expenses of the Fund, and certain fund-level expense reductions, if any, are allocated daily on a pro-rata basis to each class based on the relative net assets of each class to the total net assets of the Fund. Each class differs with respect to transfer agent and distribution and service plan fees incurred. Certain expense reductions may also differ by class. For the reporting period, the allocated portion of income and expenses to each class as a percent of its average net assets may vary due to the timing of recording these transactions in relation to fluctuating net assets of the classes. Expenses directly attributable to a fund are charged to that fund. Expenses attributable to more than one fund are allocated among the respective funds on the basis of relative net assets or other appropriate methods. Expense estimates are accrued in the period to which they relate and adjustments are made when actual amounts are known.
Deferred Trustee Compensation. Under a Deferred Compensation Plan (the Plan), independent Trustees may elect to defer receipt of a portion of their annual compensation. Deferred amounts are invested in a cross-section of Fidelity funds, are marked-to-market and remain in the Fund until distributed in accordance with the Plan. The investment of deferred amounts and the offsetting payable to the Trustees are included in the accompanying Statement of Assets and Liabilities.
Income Tax Information and Distributions to Shareholders. Each year, the Fund intends to qualify as a regulated investment company under Subchapter M of the Internal Revenue Code, including distributing substantially all of its taxable income and realized gains. As a result, no provision for U.S. Federal income taxes is required. As of November 30, 2017, the Fund did not have any unrecognized tax benefits in the financial statements; nor is the Fund aware of any tax positions for which it is reasonably possible that the total amounts of unrecognized tax benefits will significantly change in the next twelve months. The Fund files a U.S. federal tax return, in addition to state and local tax returns as required. The Fund's federal income tax returns are subject to examination by the Internal Revenue Service (IRS) for a period of three fiscal years after they are filed. State and local tax returns may be subject to examination for an additional fiscal year depending on the jurisdiction. Foreign taxes are provided for based on the Fund's understanding of the tax rules and rates that exist in the foreign markets in which it invests.
Distributions are declared and recorded on the ex-dividend date. Income dividends and capital gain distributions are declared separately for each class. Income and capital gain distributions are determined in accordance with income tax regulations, which may differ from GAAP. In addition, the Fund claimed a portion of the payment made to redeeming shareholders as a distribution for income tax purposes.
Capital accounts within the financial statements are adjusted for permanent book-tax differences. These adjustments have no impact on net assets or the results of operations. Capital accounts are not adjusted for temporary book-tax differences which will reverse in a subsequent period.
Book-tax differences are primarily due to foreign currency transactions, partnerships, passive foreign investment companies (PFIC), deferred trustees compensation, net operating losses and losses deferred due to wash sales.
As of period end, the cost and unrealized appreciation (depreciation) in securities, and derivatives if applicable, for federal income tax purposes were as follows:
| Gross unrealized appreciation | $1,240,206 |
| Gross unrealized depreciation | (55,779) |
| Net unrealized appreciation (depreciation) | $1,184,427 |
| Tax Cost | $1,926,508 |
The tax-based components of distributable earnings as of period end were as follows:
| Undistributed ordinary income | $32,314 |
| Undistributed long-term capital gain | $181,997 |
| Net unrealized appreciation (depreciation) on securities and other investments | $1,183,442 |
The tax character of distributions paid was as follows:
| November 30, 2017 | November 30, 2016 | |
| Long-term Capital Gains | $308,776 | $371,621 |
Restricted Securities. The Fund may invest in securities that are subject to legal or contractual restrictions on resale. These securities generally may be resold in transactions exempt from registration or to the public if the securities are registered. Disposal of these securities may involve time-consuming negotiations and expense, and prompt sale at an acceptable price may be difficult. Information regarding restricted securities is included at the end of the Fund's Schedule of Investments.
4. Purchases and Sales of Investments.
Purchases and sales of securities, other than short-term securities, aggregated $1,410,159 and $1,655,575, respectively.
5. Fees and Other Transactions with Affiliates.
Management Fee. Fidelity Management & Research Company (the investment adviser) and its affiliates provide the Fund with investment management related services for which the Fund pays a monthly management fee. The management fee is the sum of an individual fund fee rate that is based on an annual rate of .30% of the Fund's average net assets and an annualized group fee rate that averaged .25% during the period. The group fee rate is based upon the average net assets of all the mutual funds advised by the investment adviser, including any mutual funds previously advised by the investment adviser that are currently advised by Fidelity SelectCo, LLC, an affiliate of the investment adviser. The group fee rate decreases as assets under management increase and increases as assets under management decrease. In addition, the management fee is subject to a performance adjustment (up to a maximum of +/- .20% of the Fund's average net assets over a 36 month performance period). The upward or downward adjustment to the management fee is based on the investment performance of the asset-weighted return of all classes as compared to its benchmark index, the Russell 1000 Growth Index, over the same 36 month performance period. For the reporting period, the total annual management fee rate, including the performance adjustment, was .42% of the Fund's average net assets. The performance adjustment included in the management fee rate may be higher or lower than the maximum performance adjustment rate due to the difference between the average net assets for the reporting and performance periods.
Distribution and Service Plan Fees. In accordance with Rule 12b-1 of the 1940 Act, the Fund has adopted separate Distribution and Service Plans for each class of shares. Certain classes pay Fidelity Distributors Corporation (FDC), an affiliate of the investment adviser, separate Distribution and Service Fees, each of which is based on an annual percentage of each class' average net assets. In addition, FDC may pay financial intermediaries for selling shares of the Fund and providing shareholder support services. For the period, the Distribution and Service Fee rates, total fees and amounts retained by FDC were as follows:
| Distribution Fee | Service Fee | Total Fees | Retained by FDC | |
| Class A | -% | .25% | $1,263 | $11 |
| Class M | .25% | .25% | 6,907 | – |
| Class C | .75% | .25% | 1,846 | 80 |
| $10,016 | $91 |
Sales Load. FDC may receive a front-end sales charge of up to 5.75% for selling Class A shares and 3.50% for selling Class M shares, some of which is paid to financial intermediaries for selling shares of the Fund. Depending on the holding period, FDC may receive contingent deferred sales charges levied on Class A, Class M and Class C redemptions. The deferred sales charges are 1.00% for Class C shares, 1.00% for certain purchases of Class A shares and .25% for certain purchases of Class M shares.
For the period, sales charge amounts retained by FDC were as follows:
| Retained by FDC | |
| Class A | $97 |
| Class M | 25 |
| Class C(a) | 6 |
| $128 |
(a) When Class C shares are initially sold, FDC pays commissions from its own resources to financial intermediaries through which the sales are made.
Transfer Agent Fees. Fidelity Investments Institutional Operations Company, Inc., (FIIOC), an affiliate of the investment adviser, is the transfer, dividend disbursing and shareholder servicing agent for each class of the Fund. FIIOC receives account fees and asset-based fees that vary according to the account size and type of account of the shareholders of the respective classes of the Fund, except for Class Z. FIIOC pays for typesetting, printing and mailing of shareholder reports, except proxy statements.
For the period, transfer agent fees for each class were as follows:
| Amount | % of Class-Level Average Net Assets | |
| Class A | $1,017 | .20 |
| Class M | 2,479 | .18 |
| Class C | 378 | .20 |
| Class I | 1,009 | .17 |
| Class Z | 25 | .05 |
| $4,908 |
Accounting and Security Lending Fees. Fidelity Service Company, Inc. (FSC), an affiliate of the investment adviser, maintains the Fund's accounting records. The accounting fee is based on the level of average net assets for each month. Under a separate contract, FSC administers the security lending program. The security lending fee is based on the number and duration of lending transactions.
Brokerage Commissions. The Fund placed a portion of its portfolio transactions with brokerage firms which are affiliates of the investment adviser. Brokerage commissions are included in net realized gain (loss) and change in net unrealized appreciation (depreciation) in the Statement of Operations. The commissions paid to these affiliated firms were $40 for the period.
Interfund Lending Program. Pursuant to an Exemptive Order issued by the SEC, the Fund, along with other registered investment companies having management contracts with Fidelity Management & Research Company (FMR) or other affiliated entities of FMR, may participate in an interfund lending program. This program provides an alternative credit facility allowing the funds to borrow from, or lend money to, other participating affiliated funds. At period end, there were no interfund loans outstanding. The Fund's activity in this program during the period for which loans were outstanding was as follows:
| Borrower or Lender | Average Loan Balance | Weighted Average Interest Rate | Interest Expense |
| Borrower | $8,747 | .83% | $5 |
Interfund Trades. The Fund may purchase from or sell securities to other Fidelity Funds under procedures adopted by the Board. The procedures have been designed to ensure these interfund trades are executed in accordance with Rule 17a-7 of the 1940 Act. Interfund trades are included within the respective purchases and sales amounts shown in the Purchases and Sales of Investments note.
6. Committed Line of Credit.
The Fund participates with other funds managed by the investment adviser or an affiliate in a $4.25 billion credit facility (the "line of credit") to be utilized for temporary or emergency purposes to fund shareholder redemptions or for other short-term liquidity purposes. The Fund has agreed to pay commitment fees on its pro-rata portion of the line of credit, which amounted to $8 and is reflected in Miscellaneous expenses on the Statement of Operations. During the period, the Fund did not borrow on this line of credit.
7. Security Lending.
The Fund lends portfolio securities through a lending agent from time to time in order to earn additional income. For equity securities, a lending agent is used and may loan securities to certain qualified borrowers, including Fidelity Capital Markets (FCM), a broker-dealer affiliated with the Fund. On the settlement date of the loan, the Fund receives collateral (in the form of U.S. Treasury obligations, letters of credit and/or cash) against the loaned securities and maintains collateral in an amount not less than 100% of the market value of the loaned securities during the period of the loan. The market value of the loaned securities is determined at the close of business of the Fund and any additional required collateral is delivered to the Fund on the next business day. The Fund or borrower may terminate the loan at any time, and if the borrower defaults on its obligation to return the securities loaned because of insolvency or other reasons, the Fund may apply collateral received from the borrower against the obligation. The Fund may experience delays and costs in recovering the securities loaned. Any cash collateral received is invested in the Fidelity Securities Lending Cash Central Fund. The value of loaned securities and cash collateral at period end are disclosed on the Fund's Statement of Assets and Liabilities. The value of securities loaned to FCM at period end was $4,942. Security lending income represents the income earned on investing cash collateral, less rebates paid to borrowers and any lending agent fees associated with the loan, plus any premium payments received for lending certain types of securities. Security lending income is presented in the Statement of Operations as a component of income from Fidelity Central Funds, and includes $447 from securities loaned to FCM.
8. Expense Reductions.
Commissions paid to certain brokers with whom the investment adviser, or its affiliates, places trades on behalf of the Fund include an amount in addition to trade execution, which may be rebated back to the Fund to offset certain expenses. This amount totaled $93 for the period.
In addition, during the period the investment adviser reimbursed and/or waived a portion of fund-level operating expenses in the amount of $22.
9. Distributions to Shareholders.
Distributions to shareholders of each class were as follows:
| Year ended November 30, 2017 | Year ended November 30, 2016 | |
| From net realized gain | ||
| Class A | $61,177 | $72,321 |
| Class M | 157,755 | 159,663 |
| Class B | – | 693 |
| Class C | 23,721 | 28,157 |
| Class I | 65,238 | 110,148 |
| Class Z | 885 | 639 |
| Total | $308,776 | $371,621 |
10. Share Transactions.
Share transactions for each class were as follows and may contain automatic conversions between classes or exchanges between affiliated funds:
| Shares | Shares | Dollars | Dollars | |
| Year ended November 30, 2017 | Year ended November 30, 2016 | Year ended November 30, 2017 | Year ended November 30, 2016 | |
| Class A | ||||
| Shares sold | 965 | 1,311 | $59,048 | $74,507 |
| Reinvestment of distributions | 1,085 | 1,108 | 57,029 | 66,937 |
| Shares redeemed | (2,807) | (3,734) | (166,066) | (212,794) |
| Net increase (decrease) | (757) | (1,315) | $(49,989) | $(71,350) |
| Class M | ||||
| Shares sold | 1,699 | 1,836 | $101,570 | $103,265 |
| Reinvestment of distributions | 2,861 | 2,514 | 149,667 | 151,539 |
| Shares redeemed | (4,259) | (4,690) | (254,711) | (265,874) |
| Net increase (decrease) | 301 | (340) | $(3,474) | $(11,070) |
| Class B | ||||
| Shares sold | – | 1 | $– | $86 |
| Reinvestment of distributions | – | 12 | – | 660 |
| Shares redeemed | – | (109) | – | (5,429) |
| Net increase (decrease) | – | (96) | $– | $(4,683) |
| Class C | ||||
| Shares sold | 530 | 580 | $28,137 | $30,299 |
| Reinvestment of distributions | 437 | 428 | 20,384 | 23,475 |
| Shares redeemed | (1,042) | (1,488) | (54,837) | (77,315) |
| Net increase (decrease) | (75) | (480) | $(6,316) | $(23,541) |
| Class I | ||||
| Shares sold | 2,197 | 2,036 | $141,765 | $122,538 |
| Reinvestment of distributions | 782 | 1,258 | 43,776 | 79,978 |
| Shares redeemed | (3,359) | (9,303) | (209,655) | (544,163) |
| Net increase (decrease) | (380) | (6,009) | $(24,114) | $(341,647) |
| Class Z | ||||
| Shares sold | 2,133 | 79 | $146,967 | $5,053 |
| Reinvestment of distributions | 16 | 10 | 885 | 639 |
| Shares redeemed | (217) | (34) | (14,646) | (2,048) |
| Net increase (decrease) | 1,932 | 55 | $133,206 | $3,644 |
11. Other.
The Fund's organizational documents provide former and current trustees and officers with a limited indemnification against liabilities arising in connection with the performance of their duties to the Fund. In the normal course of business, the Fund may also enter into contracts that provide general indemnifications. The Fund's maximum exposure under these arrangements is unknown as this would be dependent on future claims that may be made against the Fund. The risk of material loss from such claims is considered remote.
Report of Independent Registered Public Accounting Firm
To the Trustees of Fidelity Advisor Series I and Shareholders of Fidelity Advisor Growth Opportunities Fund:
We have audited the accompanying statement of assets and liabilities of Fidelity Advisor Growth Opportunities Fund (the Fund), a fund of Fidelity Advisor Series I, including the schedule of investments, as of November 30, 2017, and the related statement of operations for the year then ended, the statement of changes in net assets for each of the two years in the period then ended, and the financial highlights for each of the five years in the period then ended. These financial statements and financial highlights are the responsibility of the Fund's management. Our responsibility is to express an opinion on these financial statements and financial highlights based on our audits.
We conducted our audits in accordance with the standards of the Public Company Accounting Oversight Board (United States). Those standards require that we plan and perform the audit to obtain reasonable assurance about whether the financial statements and financial highlights are free of material misstatement. The Fund is not required to have, nor were we engaged to perform, an audit of its internal control over financial reporting. Our audits included consideration of internal control over financial reporting as a basis for designing audit procedures that are appropriate in the circumstances, but not for the purpose of expressing an opinion on the effectiveness of the Fund's internal control over financial reporting. Accordingly, we express no such opinion. An audit also includes examining, on a test basis, evidence supporting the amounts and disclosures in the financial statements, assessing the accounting principles used and significant estimates made by management, as well as evaluating the overall financial statement presentation. Our procedures included confirmation of securities owned as of November 30, 2017, by correspondence with the custodians and brokers; when replies were not received from brokers, we performed other auditing procedures. We believe that our audits provide a reasonable basis for our opinion.
In our opinion, such financial statements and financial highlights referred to above present fairly, in all material respects, the financial position of Fidelity Advisor Growth Opportunities Fund as of November 30, 2017, the results of its operations for the year then ended, the changes in its net assets for each of the two years in the period then ended, and the financial highlights for each of the five years in the period then ended, in conformity with accounting principles generally accepted in the United States of America.
DELOITTE & TOUCHE LLP
Boston, Massachusetts
January 18, 2018
Trustees and Officers
The Trustees, Members of the Advisory Board (if any), and officers of the trust and fund, as applicable, are listed below. The Board of Trustees governs the fund and is responsible for protecting the interests of shareholders. The Trustees are experienced executives who meet periodically throughout the year to oversee the fund's activities, review contractual arrangements with companies that provide services to the fund, oversee management of the risks associated with such activities and contractual arrangements, and review the fund's performance. Each of the Trustees oversees 190 funds.
The Trustees hold office without limit in time except that (a) any Trustee may resign; (b) any Trustee may be removed by written instrument, signed by at least two-thirds of the number of Trustees prior to such removal; (c) any Trustee who requests to be retired or who has become incapacitated by illness or injury may be retired by written instrument signed by a majority of the other Trustees; and (d) any Trustee may be removed at any special meeting of shareholders by a two-thirds vote of the outstanding voting securities of the trust. Each Trustee who is not an interested person (as defined in the 1940 Act) of the trust and the fund is referred to herein as an Independent Trustee. Each Independent Trustee shall retire not later than the last day of the calendar year in which his or her 75th birthday occurs. The Independent Trustees may waive this mandatory retirement age policy with respect to individual Trustees. Officers and Advisory Board Members hold office without limit in time, except that any officer or Advisory Board Member may resign or may be removed by a vote of a majority of the Trustees at any regular meeting or any special meeting of the Trustees. Except as indicated, each individual has held the office shown or other offices in the same company for the past five years.
The fund’s Statement of Additional Information (SAI) includes more information about the Trustees. To request a free copy, call Fidelity at 1-877-208-0098.
Experience, Skills, Attributes, and Qualifications of the Trustees. The Governance and Nominating Committee has adopted a statement of policy that describes the experience, qualifications, attributes, and skills that are necessary and desirable for potential Independent Trustee candidates (Statement of Policy). The Board believes that each Trustee satisfied at the time he or she was initially elected or appointed a Trustee, and continues to satisfy, the standards contemplated by the Statement of Policy. The Governance and Nominating Committee also engages professional search firms to help identify potential Independent Trustee candidates who have the experience, qualifications, attributes, and skills consistent with the Statement of Policy. From time to time, additional criteria based on the composition and skills of the current Independent Trustees, as well as experience or skills that may be appropriate in light of future changes to board composition, business conditions, and regulatory or other developments, have also been considered by the professional search firms and the Governance and Nominating Committee. In addition, the Board takes into account the Trustees' commitment and participation in Board and committee meetings, as well as their leadership of standing and ad hoc committees throughout their tenure.
In determining that a particular Trustee was and continues to be qualified to serve as a Trustee, the Board has considered a variety of criteria, none of which, in isolation, was controlling. The Board believes that, collectively, the Trustees have balanced and diverse experience, qualifications, attributes, and skills, which allow the Board to operate effectively in governing the fund and protecting the interests of shareholders. Information about the specific experience, skills, attributes, and qualifications of each Trustee, which in each case led to the Board's conclusion that the Trustee should serve (or continue to serve) as a trustee of the fund, is provided below.
Board Structure and Oversight Function. James C. Curvey is an interested person and currently serves as Chairman. The Trustees have determined that an interested Chairman is appropriate and benefits shareholders because an interested Chairman has a personal and professional stake in the quality and continuity of services provided to the fund. Independent Trustees exercise their informed business judgment to appoint an individual of their choosing to serve as Chairman, regardless of whether the Trustee happens to be independent or a member of management. The Independent Trustees have determined that they can act independently and effectively without having an Independent Trustee serve as Chairman and that a key structural component for assuring that they are in a position to do so is for the Independent Trustees to constitute a substantial majority for the Board. The Independent Trustees also regularly meet in executive session. Ned C. Lautenbach serves as Chairman of the Independent Trustees and as such (i) acts as a liaison between the Independent Trustees and management with respect to matters important to the Independent Trustees and (ii) with management prepares agendas for Board meetings.
Fidelity® funds are overseen by different Boards of Trustees. The fund's Board oversees Fidelity's high income and certain equity funds, and other Boards oversee Fidelity's investment-grade bond, money market, asset allocation, and sector funds. The asset allocation funds may invest in Fidelity® funds overseen by the fund's Board. The use of separate Boards, each with its own committee structure, allows the Trustees of each group of Fidelity® funds to focus on the unique issues of the funds they oversee, including common research, investment, and operational issues. On occasion, the separate Boards establish joint committees to address issues of overlapping consequences for the Fidelity® funds overseen by each Board.
The Trustees operate using a system of committees to facilitate the timely and efficient consideration of all matters of importance to the Trustees, the fund, and fund shareholders and to facilitate compliance with legal and regulatory requirements and oversight of the fund's activities and associated risks. The Board, acting through its committees, has charged FMR and its affiliates with (i) identifying events or circumstances the occurrence of which could have demonstrably adverse effects on the fund's business and/or reputation; (ii) implementing processes and controls to lessen the possibility that such events or circumstances occur or to mitigate the effects of such events or circumstances if they do occur; and (iii) creating and maintaining a system designed to evaluate continuously business and market conditions in order to facilitate the identification and implementation processes described in (i) and (ii) above. Because the day-to-day operations and activities of the fund are carried out by or through FMR, its affiliates, and other service providers, the fund's exposure to risks is mitigated but not eliminated by the processes overseen by the Trustees. While each of the Board's committees has responsibility for overseeing different aspects of the fund's activities, oversight is exercised primarily through the Operations, Audit, and Compliance Committees. In addition, the Independent Trustees have worked with FMR to enhance the Board's oversight of investment and financial risks, legal and regulatory risks, technology risks, and operational risks, including the development of additional risk reporting to the Board. For example, a working group comprised of Independent Trustees and FMR has worked and continues to work to review the Fidelity® funds' valuation-related activities, reporting and risk management. Appropriate personnel, including but not limited to the fund's Chief Compliance Officer (CCO), FMR's internal auditor, the independent accountants, the fund's Treasurer and portfolio management personnel, make periodic reports to the Board's committees, as appropriate, including an annual review of Fidelity's risk management program for the Fidelity® funds. The responsibilities of each standing committee, including their oversight responsibilities, are described further under "Standing Committees of the Trustees."
Interested Trustees*:
Correspondence intended for a Trustee who is an interested person may be sent to Fidelity Investments, 245 Summer Street, Boston, Massachusetts 02210.
Name, Year of Birth; Principal Occupations and Other Relevant Experience+
James C. Curvey (1935)
Year of Election or Appointment: 2007
Trustee
Chairman of the Board of Trustees
Mr. Curvey also serves as Trustee of other Fidelity® funds. Mr. Curvey is a Director of Fidelity Research & Analysis Co. (investment adviser firm, 2009-present), and Vice Chairman (2007-present) and Director of FMR LLC (diversified financial services company). In addition, Mr. Curvey serves as an Overseer for the Boston Symphony Orchestra and a member of the board of Artis-Naples, Naples, Florida, and as a Trustee for Brewster Academy, Wolfeboro, New Hampshire. Previously, Mr. Curvey served as a Director of Fidelity Investments Money Management, Inc. (investment adviser firm, 2009-2014) and a Director of FMR and FMR Co., Inc. (investment adviser firms, 2007-2014).
Charles S. Morrison (1960)
Year of Election or Appointment: 2014
Trustee
Mr. Morrison also serves as Trustee of other funds. He serves as President of Fidelity Management & Research Company (FMR) (investment adviser firm, 2016-present), a Director of Fidelity Investments Money Management, Inc. (FIMM) (investment adviser firm, 2014-present), Director of Fidelity SelectCo, LLC (investment adviser firm, 2014-present), President, Asset Management (2014-present), and is an employee of Fidelity Investments. Previously, Mr. Morrison served as Vice President of Fidelity's Fixed Income and Asset Allocation Funds (2012-2014), President, Fixed Income (2011-2014), Vice President of Fidelity's Money Market Funds (2005-2009), President, Money Market Group Leader of FMR (investment adviser firm, 2009), and Senior Vice President, Money Market Group of FMR (2004-2009). Mr. Morrison also served as Vice President of Fidelity's Bond Funds (2002-2005), certain Balanced Funds (2002-2005), and certain Asset Allocation Funds (2002-2007), and as Senior Vice President (2002-2005) of Fidelity's Bond Division.
* Determined to be an “Interested Trustee” by virtue of, among other things, his or her affiliation with the trust or various entities under common control with FMR.
+ The information includes the Trustee's principal occupation during the last five years and other information relating to the experience, attributes, and skills relevant to the Trustee's qualifications to serve as a Trustee, which led to the conclusion that the Trustee should serve as a Trustee for the fund.
Independent Trustees:
Correspondence intended for an Independent Trustee may be sent to Fidelity Investments, P.O. Box 55235, Boston, Massachusetts 02205-5235.
Name, Year of Birth; Principal Occupations and Other Relevant Experience+
Dennis J. Dirks (1948)
Year of Election or Appointment: 2005
Trustee
Mr. Dirks also serves as Trustee of other Fidelity® funds. Prior to his retirement in May 2003, Mr. Dirks was Chief Operating Officer and a member of the Board of The Depository Trust & Clearing Corporation (DTCC). He also served as President, Chief Operating Officer, and Board member of The Depository Trust Company (DTC) and President and Board member of the National Securities Clearing Corporation (NSCC). In addition, Mr. Dirks served as Chief Executive Officer and Board member of the Government Securities Clearing Corporation, Chief Executive Officer and Board member of the Mortgage-Backed Securities Clearing Corporation, as a Trustee and a member of the Finance Committee of Manhattan College (2005-2008), as a Trustee and a member of the Finance Committee of AHRC of Nassau County (2006-2008), as a member of the Independent Directors Council (IDC) Governing Council (2010-2015), and as a member of the Board of Directors for The Brookville Center for Children’s Services, Inc. (2009-2017). Mr. Dirks is a member of the Finance Committee (2016-present) and Board of Directors (2017-present) of the Asolo Repertory Theatre.
Alan J. Lacy (1953)
Year of Election or Appointment: 2008
Trustee
Mr. Lacy also serves as Trustee of other Fidelity® funds. Mr. Lacy serves as a Director of Bristol-Myers Squibb Company (global pharmaceuticals, 2008-present). He is a Trustee of the California Chapter of The Nature Conservancy (2015-present) and a Director of the Center for Advanced Study in the Behavioral Sciences at Stanford University (2015-present). In addition, Mr. Lacy served as Senior Adviser (2007-2014) of Oak Hill Capital Partners, L.P. (private equity) and also served as Chief Executive Officer (2005) and Vice Chairman (2005-2006) of Sears Holdings Corporation (retail) and Chief Executive Officer and Chairman of the Board of Sears, Roebuck and Co. (retail, 2000-2005). Previously, Mr. Lacy served as Chairman (2014-2017) and a member (2010-2017) of the Board of Directors of Dave & Buster’s Entertainment, Inc. (restaurant and entertainment complexes), as Chairman (2008-2011) and a member (2006-2015) of the Board of Trustees of the National Parks Conservation Association, and as a member of the Board of Directors for The Hillman Companies, Inc. (hardware wholesalers, 2010-2014), Earth Fare, Inc. (retail grocery, 2010-2014), and The Western Union Company (global money transfer, 2006-2011).
Ned C. Lautenbach (1944)
Year of Election or Appointment: 2000
Trustee
Chairman of the Independent Trustees
Mr. Lautenbach also serves as Trustee of other Fidelity® funds. Mr. Lautenbach currently serves as Vice Chair of the Board of Governors, State University System of Florida (2013-present) and is a member of the Council on Foreign Relations (1994-present). He is also a member and has most recently served as Chairman of the Board of Directors of Artis-Naples (2012-present). Previously, Mr. Lautenbach served as a member and then Lead Director of the Board of Directors of Eaton Corporation (diversified industrial, 1997-2016). He was also a Partner and Advisory Partner at Clayton, Dubilier & Rice, LLC (private equity investment, 1998-2010), as well as a Director of Sony Corporation (2006-2007). In addition, Mr. Lautenbach also had a 30-year career with IBM (technology company) during which time he served as Senior Vice President and a member of the Corporate Executive Committee (1968-1998).
Joseph Mauriello (1944)
Year of Election or Appointment: 2008
Trustee
Mr. Mauriello also serves as Trustee of other Fidelity® funds. Prior to his retirement in January 2006, Mr. Mauriello served in numerous senior management positions including Deputy Chairman and Chief Operating Officer (2004-2005), and Vice Chairman of Financial Services (2002-2004) of KPMG LLP US (professional services, 1965-2005). Mr. Mauriello currently serves as a member of the Board of Directors of XL Group plc. (global insurance and re-insurance, 2006-present) and the Independent Directors Council (IDC) Governing Council (2015-present). Previously, Mr. Mauriello served as a Director of the Hamilton Funds of the Bank of New York (2006-2007) and of Arcadia Resources Inc. (health care services and products, 2007-2012).
Cornelia M. Small (1944)
Year of Election or Appointment: 2005
Trustee
Ms. Small also serves as Trustee of other Fidelity® funds. Ms. Small is a member of the Board of Directors (2009-present) and Chair of the Investment Committee (2010-present) of the Teagle Foundation. Ms. Small also serves on the Investment Committee of the Berkshire Taconic Community Foundation (2008-present). Previously, Ms. Small served as Chairperson (2002-2008) and a member of the Investment Committee and Chairperson (2008-2012) and a member of the Board of Trustees of Smith College. In addition, Ms. Small served as Chief Investment Officer, Director of Global Equity Investments, and a member of the Board of Directors of Scudder, Stevens & Clark and Scudder Kemper Investments.
William S. Stavropoulos (1939)
Year of Election or Appointment: 2002
Trustee
Vice Chairman of the Independent Trustees
Mr. Stavropoulos also serves as Trustee of other Fidelity® funds. Mr. Stavropoulos serves as President and Founder of the Michigan Baseball Foundation, the Great Lakes Loons (2007-present). Mr. Stavropoulos is Chairman Emeritus of the Board of Directors of The Dow Chemical Company, where he previously served in numerous senior management positions, including President, CEO (1995-2000; 2002-2004), Chairman of the Executive Committee (2000-2006), and as a member of the Board of Directors (1990-2006). Currently, Mr. Stavropoulos is Chairman of the Board of Directors of Univar Inc. (global distributor of commodity and specialty chemicals), a Director of Teradata Corporation (data warehousing and technology solutions), and a member of the Advisory Board for Metalmark Capital LLC (private equity investment, 2005-present). Mr. Stavropoulos is an operating advisor to Clayton, Dubilier & Rice, LLC (private equity investment). In addition, Mr. Stavropoulos is a member of the University of Notre Dame Advisory Council for the College of Science, a Trustee of the Rollin L. Gerstacker Foundation, and a Director of Artis-Naples in Naples, Florida. Previously, Mr. Stavropoulos served as a Director of Chemical Financial Corporation (bank holding company, 1993-2012) and Tyco International, Ltd. (multinational manufacturing and services, 2007-2012).
David M. Thomas (1949)
Year of Election or Appointment: 2008
Trustee
Mr. Thomas also serves as Trustee of other Fidelity® funds. Mr. Thomas serves as Non-Executive Chairman of the Board of Directors of Fortune Brands Home and Security (home and security products, 2011-present), as a member of the Board of Directors (2004-present) and Presiding Director (2013-present) of Interpublic Group of Companies, Inc. (marketing communication), and as a member of the Board of Trustees of the University of Florida (2013-present). Previously, Mr. Thomas served as Executive Chairman (2005-2006) and Chairman and Chief Executive Officer (2000-2005) of IMS Health, Inc. (pharmaceutical and healthcare information solutions), and a Director of Fortune Brands, Inc. (consumer products, 2000-2011).
+ The information includes the Trustee's principal occupation during the last five years and other information relating to the experience, attributes, and skills relevant to the Trustee's qualifications to serve as a Trustee, which led to the conclusion that the Trustee should serve as a Trustee for the fund.
Advisory Board Members and Officers:
Correspondence intended for an officer or Peter S. Lynch may be sent to Fidelity Investments, 245 Summer Street, Boston, Massachusetts 02210. Officers appear below in alphabetical order.
Name, Year of Birth; Principal Occupation
Peter S. Lynch (1944)
Year of Election or Appointment: 2003
Member of the Advisory Board
Mr. Lynch also serves as Member of the Advisory Board of other Fidelity® funds. Mr. Lynch is Vice Chairman and a Director of FMR (investment adviser firm) and FMR Co., Inc. (investment adviser firm). In addition, Mr. Lynch serves as a Trustee of Boston College and as the Chairman of the Inner-City Scholarship Fund. Previously, Mr. Lynch served on the Special Olympics International Board of Directors (1997-2006).
Elizabeth Paige Baumann (1968)
Year of Election or Appointment: 2017
Anti-Money Laundering (AML) Officer
Ms. Baumann also serves as AML Officer of other funds. She is Chief AML Officer (2012-present) and Senior Vice President (2014-present) of FMR LLC (diversified financial services company) and is an employee of Fidelity Investments. Previously, Ms. Baumann served as AML Officer of the funds (2012-2016), and Vice President (2007-2014) and Deputy Anti-Money Laundering Officer (2007-2012) of FMR LLC.
Marc R. Bryant (1966)
Year of Election or Appointment: 2015
Secretary and Chief Legal Officer (CLO)
Mr. Bryant also serves as Secretary and CLO of other funds. Mr. Bryant serves as CLO, Secretary, and Senior Vice President of Fidelity Management & Research Company (investment adviser firm, 2015-present) and FMR Co., Inc. (investment adviser firm, 2015-present); Secretary of Fidelity SelectCo, LLC (investment adviser firm, 2015-present) and Fidelity Investments Money Management, Inc. (investment adviser firm, 2015-present); and CLO of Fidelity Management & Research (Hong Kong) Limited and FMR Investment Management (UK) Limited (investment adviser firms, 2015-present) and Fidelity Management & Research (Japan) Limited (investment adviser firm, 2016-present). He is Senior Vice President and Deputy General Counsel of FMR LLC (diversified financial services company). Previously, Mr. Bryant served as Secretary and CLO of Fidelity Rutland Square Trust II (2010-2014) and Assistant Secretary of Fidelity's Fixed Income and Asset Allocation Funds (2013-2015). Prior to joining Fidelity Investments, Mr. Bryant served as a Senior Vice President and the Head of Global Retail Legal for AllianceBernstein L.P. (2006-2010), and as the General Counsel for ProFund Advisors LLC (2001-2006).
William C. Coffey (1969)
Year of Election or Appointment: 2009
Assistant Secretary
Mr. Coffey also serves as Assistant Secretary of other funds. He is Senior Vice President and Deputy General Counsel of FMR LLC (diversified financial services company, 2010-present), and is an employee of Fidelity Investments. Previously, Mr. Coffey served as Vice President and Associate General Counsel of FMR LLC (2005-2009).
Jonathan Davis (1968)
Year of Election or Appointment: 2010
Assistant Treasurer
Mr. Davis also serves as Assistant Treasurer of other funds. Mr. Davis serves as Assistant Treasurer of FMR Capital, Inc. (2017-present) and is an employee of Fidelity Investments. Previously, Mr. Davis served as Vice President and Associate General Counsel of FMR LLC (diversified financial services company, 2003-2010).
Adrien E. Deberghes (1967)
Year of Election or Appointment: 2016
Assistant Treasurer
Mr. Deberghes also serves as an officer of other funds. He serves as Assistant Treasurer of FMR Capital, Inc. (2017-present), Executive Vice President of Fidelity Investments Money Management, Inc. (FIMM) (investment adviser firm, 2016-present), and is an employee of Fidelity Investments (2008-present). Prior to joining Fidelity Investments, Mr. Deberghes was Senior Vice President of Mutual Fund Administration at State Street Corporation (2007-2008), Senior Director of Mutual Fund Administration at Investors Bank & Trust (2005-2007), and Director of Finance for Dunkin' Brands (2000-2005). Previously, Mr. Deberghes served in other fund officer roles.
Stephanie J. Dorsey (1969)
Year of Election or Appointment: 2010
Assistant Treasurer
Ms. Dorsey also serves as an officer of other funds. Ms. Dorsey serves as Assistant Treasurer of FMR Capital, Inc. (2017-present), is an employee of Fidelity Investments (2008-present), and has served in other fund officer roles. Prior to joining Fidelity Investments, Ms. Dorsey served as Treasurer (2004-2008) of the JPMorgan Mutual Funds and Vice President (2004-2008) of JPMorgan Chase Bank.
Howard J. Galligan III (1966)
Year of Election or Appointment: 2014
Chief Financial Officer
Mr. Galligan also serves as Chief Financial Officer of other funds. Mr. Galligan serves as President of Fidelity Pricing and Cash Management Services (FPCMS) (2014-present) and as a Director of Strategic Advisers, Inc. (investment adviser firm, 2008-present). Previously, Mr. Galligan served as Chief Administrative Officer of Asset Management (2011-2014) and Chief Operating Officer and Senior Vice President of Investment Support for Strategic Advisers, Inc. (2003-2011).
Brian B. Hogan (1964)
Year of Election or Appointment: 2009
Vice President
Mr. Hogan also serves as Trustee or Vice President of other funds. Mr. Hogan serves as a Director of FMR Investment Management (UK) Limited (investment adviser firm, 2015-present) and Fidelity SelectCo, LLC (investment adviser firm, 2014-present) and President of the Equity Division of FMR (investment adviser firm, 2009-present). Previously, Mr. Hogan served as Senior Vice President, Equity Research of FMR (2006-2009) and as a portfolio manager. Mr. Brian B. Hogan is not related to Mr. Colm A. Hogan.
Colm A. Hogan (1973)
Year of Election or Appointment: 2016
Deputy Treasurer
Mr. Hogan also serves as an officer of other funds. Mr. Hogan serves as Assistant Treasurer of FMR Capital, Inc. (2017-present) and is an employee of Fidelity Investments (2005-present). Mr. Colm A. Hogan is not related to Mr. Brian B. Hogan.
Chris Maher (1972)
Year of Election or Appointment: 2013
Assistant Treasurer
Mr. Maher serves as Assistant Treasurer of other funds. Mr. Maher is Vice President of Valuation Oversight, serves as Assistant Treasurer of FMR Capital, Inc. (2017-present), and is an employee of Fidelity Investments. Previously, Mr. Maher served as Vice President of Asset Management Compliance (2013), Vice President of the Program Management Group of FMR (investment adviser firm, 2010-2013), and Vice President of Valuation Oversight (2008-2010).
Rieco E. Mello (1969)
Year of Election or Appointment: 2017
Assistant Treasurer
Mr. Mello also serves as Assistant Treasurer of other funds. Mr. Mello serves as Assistant Treasurer of FMR Capital, Inc. (2017-present) and is an employee of Fidelity Investments (1995-present).
Melissa M. Reilly (1971)
Year of Election or Appointment: 2014
Vice President of certain Equity Funds
Ms. Reilly also serves as Vice President of other funds. Ms. Reilly is an employee of Fidelity Investments (2004-present).
Kenneth B. Robins (1969)
Year of Election or Appointment: 2016
Chief Compliance Officer
Mr. Robins also serves as an officer of other funds. Mr. Robins serves as Compliance Officer of Fidelity Management & Research Company and FMR Co., Inc. (investment adviser firms, 2016-present) and is an employee of Fidelity Investments (2004-present). Previously, Mr. Robins served as Executive Vice President of Fidelity Investments Money Management, Inc. (investment adviser firm, 2013-2016) and served in other fund officer roles.
Stacie M. Smith (1974)
Year of Election or Appointment: 2016
President and Treasurer
Ms. Smith also serves as an officer of other funds. Ms. Smith serves as Assistant Treasurer of FMR Capital, Inc. (2017-present), is an employee of Fidelity Investments (2009-present), and has served in other fund officer roles. Prior to joining Fidelity Investments, Ms. Smith served as Senior Audit Manager of Ernst & Young LLP (accounting firm, 1996-2009). Previously, Ms. Smith served as Deputy Treasurer of certain Fidelity® funds (2013-2016).
Marc L. Spector (1972)
Year of Election or Appointment: 2016
Assistant Treasurer
Mr. Spector also serves as an officer of other funds. Mr. Spector serves as Assistant Treasurer of FMR Capital, Inc. (2017-present) and is an employee of Fidelity Investments (2016-present). Prior to joining Fidelity Investments, Mr. Spector served as Director at the Siegfried Group (accounting firm, 2013-2016), and prior to Siegfried Group as audit senior manager at Deloitte & Touche (accounting firm, 2005-2013).
Renee Stagnone (1975)
Year of Election or Appointment: 2016
Assistant Treasurer
Ms. Stagnone also serves as an officer of other funds. Ms. Stagnone serves as Assistant Treasurer of FMR Capital, Inc. (2017-present) and is an employee of Fidelity Investments (1997-present). Previously, Ms. Stagnone served as Deputy Treasurer of certain Fidelity® funds (2013-2016).
Shareholder Expense Example
As a shareholder of the Fund, you incur two types of costs: (1) transaction costs, including sales charges (loads) on purchase payments or redemption proceeds, and (2) ongoing costs, including management fees, distribution and/or service (12b-1) fees and other Fund expenses. This Example is intended to help you understand your ongoing costs (in dollars) of investing in the Fund and to compare these costs with the ongoing costs of investing in other mutual funds.
The Example is based on an investment of $1,000 invested at the beginning of the period and held for the entire period (June 1, 2017 to November 30, 2017).
Actual Expenses
The first line of the accompanying table for each class of the Fund provides information about actual account values and actual expenses. You may use the information in this line, together with the amount you invested, to estimate the expenses that you paid over the period. Simply divide your account value by $1,000.00 (for example, an $8,600 account value divided by $1,000.00 = 8.6), then multiply the result by the number in the first line for a class of the Fund under the heading entitled "Expenses Paid During Period" to estimate the expenses you paid on your account during this period. In addition, the Fund, as a shareholder in the underlying Fidelity Central Funds, will indirectly bear its pro-rata share of the fees and expenses incurred by the underlying Fidelity Central Funds. These fees and expenses are not included in the Fund's annualized expense ratio used to calculate the expense estimate in the table below.
Hypothetical Example for Comparison Purposes
The second line of the accompanying table for each class of the Fund provides information about hypothetical account values and hypothetical expenses based on a Class' actual expense ratio and an assumed rate of return of 5% per year before expenses, which is not the Class' actual return. The hypothetical account values and expenses may not be used to estimate the actual ending account balance or expenses you paid for the period. You may use this information to compare the ongoing costs of investing in the Fund and other funds. To do so, compare this 5% hypothetical example with the 5% hypothetical examples that appear in the shareholder reports of the other funds. In addition, the Fund, as a shareholder in the underlying Fidelity Central Funds, will indirectly bear its pro-rata share of the fees and expenses incurred by the underlying Fidelity Central Funds. These fees and expenses are not included in the Fund's annualized expense ratio used to calculate the expense estimate in the table below.
Please note that the expenses shown in the table are meant to highlight your ongoing costs only and do not reflect any transaction costs. Therefore, the second line of the table is useful in comparing ongoing costs only, and will not help you determine the relative total costs of owning different funds. In addition, if these transactional costs were included, your costs would have been higher.
| Annualized Expense Ratio-A | Beginning Account Value June 1, 2017 | Ending Account Value November 30, 2017 | Expenses Paid During Period-B June 1, 2017 to November 30, 2017 | |
| Class A | .97% | |||
| Actual | $1,000.00 | $1,119.30 | $5.15 | |
| Hypothetical-C | $1,000.00 | $1,020.21 | $4.91 | |
| Class M | 1.20% | |||
| Actual | $1,000.00 | $1,118.10 | $6.37 | |
| Hypothetical-C | $1,000.00 | $1,019.05 | $6.07 | |
| Class C | 1.72% | |||
| Actual | $1,000.00 | $1,115.00 | $9.12 | |
| Hypothetical-C | $1,000.00 | $1,016.44 | $8.69 | |
| Class I | .69% | |||
| Actual | $1,000.00 | $1,120.80 | $3.67 | |
| Hypothetical-C | $1,000.00 | $1,021.61 | $3.50 | |
| Class Z | .52% | |||
| Actual | $1,000.00 | $1,121.60 | $2.77 | |
| Hypothetical-C | $1,000.00 | $1,022.46 | $2.64 |
A Annualized expense ratio reflects expenses net of applicable fee waivers.
B Expenses are equal to each Class' annualized expense ratio, multiplied by the average account value over the period, multiplied by 183/365 (to reflect the one-half year period).
C 5% return per year before expenses
Distributions (Unaudited)
The Board of Trustees of Fidelity Advisor Growth Opportunities Fund voted to pay to shareholders of record at the opening of business on record date, the following distributions per share derived from capital gains realized from sales of portfolio securities, and dividends derived from net investment income:
| Pay Date | Record Date | Dividends | Capital Gains | |
| Fidelity Advisor Growth Opportunities Fund | ||||
| Class A | 12/27/17 | 12/26/17 | $0.00 | $4.968 |
| Class M | 12/27/17 | 12/26/17 | $0.00 | $4.815 |
| Class C | 12/27/17 | 12/26/17 | $0.00 | $4.549 |
| Class I | 12/27/17 | 12/26/17 | $0.00 | $5.159 |
| Class Z | 12/27/17 | 12/26/17 | $0.05 | $5.221 |
The fund hereby designates as a capital gain dividend with respect to the taxable year ended November 2017, $184,486,786, or, if subsequently determined to be different, the net capital gain of such year.
The fund will notify shareholders in January 2018 of amounts for use in preparing 2017 income tax returns.
Board Approval of Investment Advisory Contracts and Management Fees
Fidelity Advisor Growth Opportunities Fund
Each year, the Board of Trustees, including the Independent Trustees (together, the Board), votes on the renewal of the management contract with Fidelity Management & Research Company (FMR) and the sub-advisory agreements (together, the Advisory Contracts) for the fund. FMR and the sub-advisers are referred to herein as the Investment Advisers. The Board, assisted by the advice of fund counsel and Independent Trustees' counsel, requests and considers a broad range of information relevant to the renewal of the Advisory Contracts throughout the year.
The Board meets regularly and, at each of its meetings, covers an extensive agenda of topics and materials and considers factors that are relevant to its annual consideration of the renewal of the fund's Advisory Contracts, including the services and support provided to the fund and its shareholders. The Board has established various standing committees (Committees), each composed of and chaired by Independent Trustees with varying backgrounds, to which the Board has assigned specific subject matter responsibilities in order to enhance effective decision-making by the Board. The Board, acting directly and through its Committees, requests and receives information concerning the annual consideration of the renewal of the fund's Advisory Contracts. The Board also meets as needed to review matters specifically related to the Board's annual consideration of the renewal of the Advisory Contracts. Members of the Board may also meet with trustees of other Fidelity funds through ad hoc joint committees to discuss certain matters relevant to all of the Fidelity funds.
At its July 2017 meeting, the Board unanimously determined to renew the fund's Advisory Contracts. In reaching its determination, the Board considered all factors it believed relevant, including (i) the nature, extent, and quality of the services to be provided to the fund and its shareholders (including the investment performance of the fund); (ii) the competitiveness of the fund's management fee and total expense ratio relative to peer funds; (iii) the total costs of the services to be provided by and the profits to be realized by Fidelity from its relationships with the fund; and (iv) the extent to which, if any, economies of scale exist and would be realized as the fund grows, and whether any economies of scale are appropriately shared with fund shareholders.
In considering whether to renew the Advisory Contracts for the fund, the Board reached a determination, with the assistance of fund counsel and Independent Trustees' counsel and through the exercise of its business judgment, that the renewal of the Advisory Contracts was in the best interests of the fund and its shareholders and that the compensation payable under the Advisory Contracts was fair and reasonable. The Board's decision to renew the Advisory Contracts was not based on any single factor, but rather was based on a comprehensive consideration of all the information provided to the Board at its meetings throughout the year. The Board, in reaching its determination to renew the Advisory Contracts, was aware that shareholders of the fund have a broad range of investment choices available to them, including a wide choice among funds offered by Fidelity's competitors, and that the fund's shareholders, who have the opportunity to review and weigh the disclosure provided by the fund in its prospectus and other public disclosures, have chosen to invest in this fund, which is part of the Fidelity family of funds.
Amendment to Group Fee Rate. The Board also approved an amendment to the management contract for the fund to add an additional breakpoint to the group fee schedule, effective October 1, 2017. The Board noted that the additional breakpoint would result in lower management fee rates as Fidelity's assets under management increase.
Nature, Extent, and Quality of Services Provided. The Board considered Fidelity's staffing as it relates to the fund, including the backgrounds of investment personnel of Fidelity, and also considered the fund's investment objective, strategies, and related investment philosophy. The Independent Trustees also had discussions with senior management of Fidelity's investment operations and investment groups. The Board considered the structure of the investment personnel compensation program and whether this structure provides appropriate incentives to act in the best interests of the fund. Additionally, the Board considered the portfolio managers' investments, if any, in the funds that they manage.Resources Dedicated to Investment Management and Support Services. The Board and the Fund Oversight and Research Committees reviewed the general qualifications and capabilities of Fidelity's investment staff, including its size, education, experience, and resources, as well as Fidelity's approach to recruiting, training, managing, and compensating investment personnel. The Board noted that Fidelity has continued to increase the resources devoted to non-U.S. offices, including expansion of Fidelity's global investment organization. The Board also noted that Fidelity's analysts have extensive resources, tools and capabilities that allow them to conduct sophisticated quantitative and fundamental analysis, as well as credit analysis of issuers, counterparties and guarantors. Further, the Board considered that Fidelity's investment professionals have sufficient access to global information and data so as to provide competitive investment results over time, and that those professionals also have access to sophisticated tools that permit them to assess portfolio construction and risk and performance attribution characteristics continuously, as well as to transmit new information and research conclusions rapidly around the world. Additionally, in its deliberations, the Board considered Fidelity's trading, risk management, compliance, and technology and operations capabilities and resources, which are integral parts of the investment management process.Shareholder and Administrative Services. The Board considered (i) the nature, extent, quality, and cost of advisory, administrative, and shareholder services performed by the Investment Advisers and their affiliates under the Advisory Contracts and under separate agreements covering transfer agency, pricing and bookkeeping, and securities lending services for the fund; (ii) the nature and extent of the supervision of third party service providers, principally custodians, subcustodians, and pricing vendors; and (iii) the resources devoted to, and the record of compliance with, the fund's compliance policies and procedures. The Board also reviewed the allocation of fund brokerage, including allocations to brokers affiliated with the Investment Advisers, the use of brokerage commissions to pay fund expenses, and the use of "soft" commission dollars to pay for research services.The Board noted that the growth of fund assets over time across the complex allows Fidelity to reinvest in the development of services designed to enhance the value or convenience of the Fidelity funds as investment vehicles. These services include 24-hour access to account information and market information through telephone representatives and over the Internet, investor education materials and asset allocation tools, and the expanded availability of Fidelity Investor Centers.In 2014, the Board formed an ad hoc Committee on Transfer Agency Fees to review the variety of transfer agency fee structures throughout the industry and Fidelity's competitive positioning with respect to industry participants.Investment in a Large Fund Family. The Board considered the benefits to shareholders of investing in a Fidelity fund, including the benefits of investing in a fund that is part of a large family of funds offering a variety of investment disciplines and providing a large variety of mutual fund investor services. The Board noted that Fidelity had taken, or had made recommendations that resulted in the Fidelity funds taking, a number of actions over the previous year that benefited particular funds, including: (i) continuing to dedicate additional resources to Fidelity's investment research process, and to the support of the senior management team that oversees asset management; (ii) continuing efforts to enhance Fidelity's global research capabilities; (iii) launching new funds and making other enhancements to meet client needs; (iv) launching new share classes of existing funds; (v) eliminating purchase minimums and broadening eligibility requirements for certain lower-priced share classes; (vi) reducing management fees and total expenses for certain growth equity funds and index funds; (vii) lowering expense caps for certain existing funds and classes to reduce expenses borne by shareholders; (viii) eliminating short-term redemption fees for certain funds; (ix) introducing a new pricing structure for certain funds of funds that is expected to reduce overall expenses paid by shareholders; (x) rationalizing product lines and gaining increased efficiencies through proposals for fund mergers and share class consolidations; (xi) continuing to develop, acquire and implement systems and technology to improve services to the funds and shareholders, strengthen information security, and increase efficiency; and (xii) implementing enhancements to further strengthen Fidelity's product line to increase investors' probability of success in achieving their investment goals, including retirement income goals.Investment Performance. The Board considered whether the fund has operated in accordance with its investment objective, as well as its record of compliance with its investment restrictions and its performance history.The Board took into account discussions with representatives of the Investment Advisers about fund investment performance that occur at Board meetings throughout the year. In this regard the Board noted that as part of regularly scheduled fund reviews and other reports to the Board on fund performance, the Board considers annualized return information for the fund for different time periods, measured against a securities market index ("benchmark index") and a peer group of funds with similar objectives ("peer group"), if any. In its evaluation of fund investment performance, the Board gave particular attention to information indicating changes in performance of certain Fidelity funds for specific time periods and discussed with the Investment Advisers the reasons for any overperformance or underperformance.In addition to reviewing absolute and relative fund performance, the Independent Trustees periodically consider the appropriateness of fund performance metrics in evaluating the results achieved. In general, the Independent Trustees believe that fund performance should be evaluated based on net performance (after fees and expenses) of both the highest performing and lowest performing fund share classes, where applicable, compared to appropriate benchmark indices, over appropriate time periods that may include full market cycles, and compared to peer groups, as applicable, over the same periods, taking into account relevant factors including the following: general market conditions; issuer-specific information; and fund cash flows and other factors.The Independent Trustees recognize that shareholders evaluate performance on a net basis over their own holding periods, for which one-, three-, and five-year periods are often used as a proxy. For this reason, the performance information reviewed by the Board also included net cumulative calendar year total return information for the fund and an appropriate benchmark index and peer group for the most recent one-, three-, and five-year periods, as shown below. Returns are shown compared to the 25th percentile (top of box, 75% beaten) and 75th percentile (bottom of box, 25% beaten) of the peer universe.Fidelity Advisor Growth Opportunities Fund
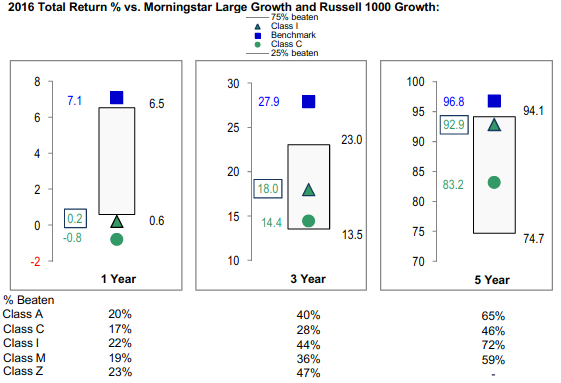
Fidelity Advisor Growth Opportunities Fund
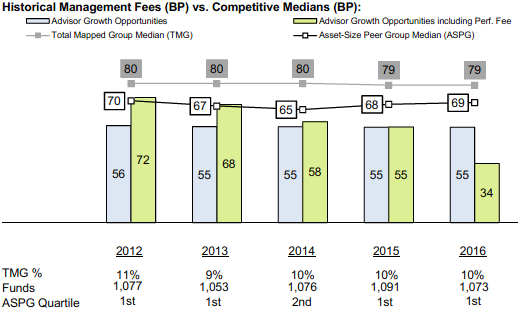
![]()
GO-ANN-0118
1.704314.120
Fidelity Advisor® Large Cap Fund Class A, Class M (formerly Class T), Class C, Class I and Class Z Annual Report November 30, 2017 |
|
Contents
Board Approval of Investment Advisory Contracts and Management Fees |
To view a fund's proxy voting guidelines and proxy voting record for the 12-month period ended June 30, visit http://www.fidelity.com/proxyvotingresults or visit the Securities and Exchange Commission's (SEC) web site at http://www.sec.gov.
You may also call 1-877-208-0098 to request a free copy of the proxy voting guidelines.
Standard & Poor's, S&P and S&P 500 are registered service marks of The McGraw-Hill Companies, Inc. and have been licensed for use by Fidelity Distributors Corporation.
Other third-party marks appearing herein are the property of their respective owners.
All other marks appearing herein are registered or unregistered trademarks or service marks of FMR LLC or an affiliated company. © 2018 FMR LLC. All rights reserved.
This report and the financial statements contained herein are submitted for the general information of the shareholders of the Fund. This report is not authorized for distribution to prospective investors in the Fund unless preceded or accompanied by an effective prospectus.
A fund files its complete schedule of portfolio holdings with the SEC for the first and third quarters of each fiscal year on Form N-Q. Forms N-Q are available on the SEC’s web site at http://www.sec.gov. A fund's Forms N-Q may be reviewed and copied at the SEC’s Public Reference Room in Washington, DC. Information regarding the operation of the SEC's Public Reference Room may be obtained by calling 1-800-SEC-0330.
For a complete list of a fund's portfolio holdings, view the most recent holdings listing, semiannual report, or annual report on Fidelity's web site at http://www.fidelity.com, http://www.institutional.fidelity.com, or http://www.401k.com, as applicable.
NOT FDIC INSURED •MAY LOSE VALUE •NO BANK GUARANTEE
Neither the Fund nor Fidelity Distributors Corporation is a bank.
Performance: The Bottom Line
Average annual total return reflects the change in the value of an investment, assuming reinvestment of distributions from dividend income and capital gains (the profits earned upon the sale of securities that have grown in value, if any) and assuming a constant rate of performance each year. The hypothetical investment and the average annual total returns do not reflect the deduction of taxes that a shareholder would pay on fund distributions or the redemption of fund shares. During periods of reimbursement by Fidelity, a fund’s total return will be greater than it would be had the reimbursement not occurred. How a fund did yesterday is no guarantee of how it will do tomorrow.
Average Annual Total Returns
| For the periods ended November 30, 2017 | Past 1 year | Past 5 years | Past 10 years |
| Class A (incl. 5.75% sales charge) | 11.07% | 13.88% | 7.53% |
| Class M (incl. 3.50% sales charge) | 13.42% | 14.12% | 7.51% |
| Class C (incl. contingent deferred sales charge) | 15.97% | 14.37% | 7.36% |
| Class I | 18.16% | 15.54% | 8.49% |
| Class Z | 18.29% | 15.57% | 8.50% |
Class C shares' contingent deferred sales charges included in the past one year, past five years and past ten years total return figures are 1%, 0% and 0%, respectively.
The initial offering of Class Z shares took place on February 1, 2017. Returns prior to February 1, 2017, are those of Class I.
$10,000 Over 10 Years
Let's say hypothetically that $10,000 was invested in Fidelity Advisor® Large Cap Fund - Class A on November 30, 2007, and the current 5.75% sales charge was paid.
The chart shows how the value of your investment would have changed, and also shows how the S&P 500® Index performed over the same period.
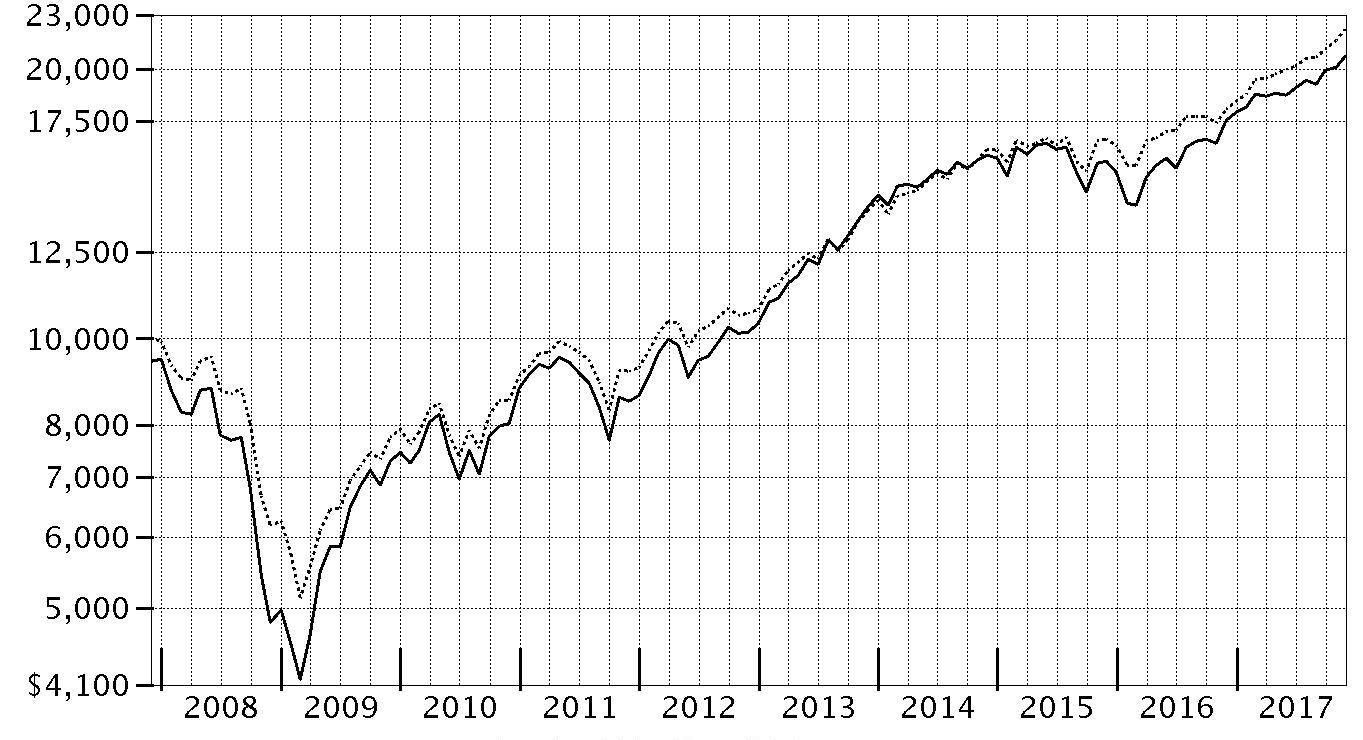
| Period Ending Values | ||
| $20,677 | Fidelity Advisor® Large Cap Fund - Class A | |
| $22,199 | S&P 500® Index | |
Management's Discussion of Fund Performance
Market Recap: The U.S. equity bellwether S&P 500® index gained 22.87% for the year ending November 30, 2017, rising steadily and closing the period at an all-time high after a particularly strong three-month finish. Early on, equities rallied on optimism for President Trump’s pro-business agenda but leveled off in March amid fading optimism and stalled efforts by Congress to repeal and replace the Affordable Care Act. Upward momentum soon returned and continued through period end with consumer sentiment and other market indicators staying positive. The lone exception was a brief cooldown in August, when geopolitical tension escalated and uncertainty grew regarding the future of health care, tax reform and the debt ceiling. Sector-wise, info tech (+41%) led by a wide margin, surging amid strong earnings growth from several major index constituents. Utilities and financials each gained about 25%, the latter group riding an uptick in bond yields. Conversely, consumer discretionary (+20%) also rose solidly but lagged the broader market, as many brick-and-mortar retailers continued to suffer from increased online competition. Rising interest rates held back real estate (+16%), while consumer staples (+15%) and telecom (+1%) struggled due to investors’ general preference for risk assets. Lastly, sluggish oil prices pushed energy to a -4% returnComments from Portfolio Manager Matthew Fruhan: For the fiscal year, the fund’s share classes (excluding sales charges, if applicable) gained about 17% to 18%, significantly lagging the benchmark S&P 500® index. The fund’s underperformance of the benchmark was shaped by a market environment that favored highly priced growth stocks, a headwind for my valuation-conscious strategy. A sizable overweight in the weak energy sector materially detracted from relative results this period. Here, we were hurt by exploration & production company Apache, although our lack of exposure to energy giant and benchmark component Exxon Mobil helped relative results in light of the stock's poor performance. Stock picking in health care also hampered results – especially a non-benchmark position in Israel-based drugmaker Teva Pharmaceutical Industries, whose stock disappointed – as did a combination of unfavorable security selection and below-benchmark exposure to the market-leading information technology sector. Another notable laggard was industrial conglomerate General Electric, one of our largest holdings, as the company encountered various business challenges. On the positive side, security selection in financials contributed, especially several large banks that were among our largest holdings: Bank of America, Citigroup and JPMorgan Chase. Elsewhere, railroad operator CSX added value.The views expressed above reflect those of the portfolio manager(s) only through the end of the period as stated on the cover of this report and do not necessarily represent the views of Fidelity or any other person in the Fidelity organization. Any such views are subject to change at any time based upon market or other conditions and Fidelity disclaims any responsibility to update such views. These views may not be relied on as investment advice and, because investment decisions for a Fidelity fund are based on numerous factors, may not be relied on as an indication of trading intent on behalf of any Fidelity fund.
Investment Summary (Unaudited)
Top Ten Stocks as of November 30, 2017
| % of fund's net assets | % of fund's net assets 6 months ago | |
| Microsoft Corp. | 3.7 | 3.2 |
| Bank of America Corp. | 3.6 | 3.3 |
| Citigroup, Inc. | 3.2 | 3.0 |
| JPMorgan Chase & Co. | 3.1 | 3.1 |
| Apple, Inc. | 2.7 | 3.3 |
| ConocoPhillips Co. | 2.1 | 1.8 |
| Comcast Corp. Class A | 2.1 | 2.2 |
| State Street Corp. | 2.0 | 1.9 |
| Qualcomm, Inc. | 1.9 | 1.8 |
| General Electric Co. | 1.8 | 2.3 |
| 26.2 |
Top Five Market Sectors as of November 30, 2017
| % of fund's net assets | % of fund's net assets 6 months ago | |
| Financials | 24.0 | 22.8 |
| Information Technology | 18.8 | 19.2 |
| Health Care | 14.5 | 15.0 |
| Energy | 12.8 | 12.3 |
| Industrials | 10.6 | 11.0 |
Asset Allocation (% of fund's net assets)
| As of November 30, 2017* | ||
| Stocks | 99.6% | |
| Other Investments | 0.2% | |
| Short-Term Investments and Net Other Assets (Liabilities) | 0.2% | |

* Foreign investments – 8.4%
| As of May 31, 2017* | ||
| Stocks | 99.1% | |
| Other Investments | 0.2% | |
| Short-Term Investments and Net Other Assets (Liabilities) | 0.7% | |

* Foreign investments – 8.4%
Investments November 30, 2017
Showing Percentage of Net Assets
| Common Stocks - 99.6% | |||
| Shares | Value | ||
| CONSUMER DISCRETIONARY - 6.0% | |||
| Distributors - 0.2% | |||
| LKQ Corp. (a) | 82,090 | $3,235,988 | |
| Household Durables - 0.2% | |||
| KB Home | 23,000 | 721,280 | |
| Taylor Morrison Home Corp. (a) | 84,400 | 2,039,104 | |
| 2,760,384 | |||
| Media - 3.2% | |||
| Comcast Corp. Class A | 754,174 | 28,311,692 | |
| Interpublic Group of Companies, Inc. | 187,700 | 3,712,706 | |
| Omnicom Group, Inc. | 15,900 | 1,135,896 | |
| Sinclair Broadcast Group, Inc. Class A | 33,500 | 1,140,675 | |
| The Walt Disney Co. | 58,100 | 6,090,042 | |
| Time Warner, Inc. | 18,400 | 1,683,784 | |
| Viacom, Inc. Class B (non-vtg.) | 62,600 | 1,772,832 | |
| 43,847,627 | |||
| Multiline Retail - 0.3% | |||
| Target Corp. | 67,840 | 4,063,616 | |
| Specialty Retail - 2.1% | |||
| AutoZone, Inc. (a) | 4,300 | 2,953,068 | |
| L Brands, Inc. | 118,500 | 6,644,295 | |
| Lowe's Companies, Inc. | 148,479 | 12,378,694 | |
| O'Reilly Automotive, Inc. (a) | 10,100 | 2,385,721 | |
| Ross Stores, Inc. | 2,000 | 152,060 | |
| TJX Companies, Inc. | 55,400 | 4,185,470 | |
| 28,699,308 | |||
| TOTAL CONSUMER DISCRETIONARY | 82,606,923 | ||
| CONSUMER STAPLES - 7.6% | |||
| Beverages - 1.7% | |||
| Dr. Pepper Snapple Group, Inc. | 25,500 | 2,299,845 | |
| Molson Coors Brewing Co. Class B | 74,400 | 5,810,640 | |
| The Coca-Cola Co. | 345,775 | 15,826,122 | |
| 23,936,607 | |||
| Food & Staples Retailing - 2.1% | |||
| Costco Wholesale Corp. | 3,500 | 645,505 | |
| CVS Health Corp. | 143,411 | 10,985,283 | |
| Kroger Co. | 159,200 | 4,116,912 | |
| Wal-Mart Stores, Inc. | 130,200 | 12,659,346 | |
| 28,407,046 | |||
| Food Products - 0.6% | |||
| Amplify Snack Brands, Inc. (a) | 104,400 | 605,520 | |
| Campbell Soup Co. | 56,800 | 2,800,240 | |
| Kellogg Co. | 39,600 | 2,619,936 | |
| The J.M. Smucker Co. | 17,300 | 2,018,391 | |
| The Simply Good Foods Co. | 44,800 | 593,152 | |
| 8,637,239 | |||
| Household Products - 1.5% | |||
| Kimberly-Clark Corp. | 2,300 | 275,448 | |
| Procter & Gamble Co. | 214,152 | 19,271,538 | |
| Reckitt Benckiser Group PLC | 9,300 | 816,331 | |
| 20,363,317 | |||
| Personal Products - 0.3% | |||
| Coty, Inc. Class A | 111,600 | 1,922,868 | |
| Unilever NV (NY Reg.) | 46,400 | 2,679,136 | |
| 4,602,004 | |||
| Tobacco - 1.4% | |||
| Altria Group, Inc. | 218,900 | 14,847,987 | |
| British American Tobacco PLC sponsored ADR | 79,000 | 5,026,770 | |
| 19,874,757 | |||
| TOTAL CONSUMER STAPLES | 105,820,970 | ||
| ENERGY - 12.6% | |||
| Energy Equipment & Services - 0.8% | |||
| Baker Hughes, a GE Co. Class A | 100,500 | 2,987,865 | |
| Ensco PLC Class A | 91,450 | 491,087 | |
| National Oilwell Varco, Inc. | 142,232 | 4,771,884 | |
| Oceaneering International, Inc. | 142,800 | 2,790,312 | |
| 11,041,148 | |||
| Oil, Gas & Consumable Fuels - 11.8% | |||
| Amyris, Inc. (a)(b) | 58,656 | 212,921 | |
| Anadarko Petroleum Corp. | 90,700 | 4,361,763 | |
| Apache Corp. | 264,910 | 11,081,185 | |
| Cabot Oil & Gas Corp. | 296,000 | 8,569,200 | |
| Cenovus Energy, Inc. | 1,102,500 | 10,510,987 | |
| Cheniere Energy, Inc. (a) | 31,100 | 1,502,752 | |
| Chevron Corp. | 166,607 | 19,824,567 | |
| ConocoPhillips Co. | 559,800 | 28,482,624 | |
| Golar LNG Ltd. | 67,000 | 1,655,570 | |
| Imperial Oil Ltd. | 191,100 | 5,895,268 | |
| Kinder Morgan, Inc. | 569,895 | 9,819,291 | |
| Noble Energy, Inc. | 15,400 | 405,020 | |
| PDC Energy, Inc. (a) | 31,800 | 1,461,210 | |
| Phillips 66 Co. | 15,500 | 1,512,180 | |
| Suncor Energy, Inc. | 681,300 | 23,631,496 | |
| Teekay Offshore Partners LP | 261,000 | 613,350 | |
| The Williams Companies, Inc. | 721,929 | 20,972,037 | |
| Valero Energy Corp. | 30,700 | 2,628,534 | |
| Williams Partners LP | 281,800 | 10,342,060 | |
| 163,482,015 | |||
| TOTAL ENERGY | 174,523,163 | ||
| FINANCIALS - 24.0% | |||
| Banks - 15.6% | |||
| Bank of America Corp. | 1,753,389 | 49,392,968 | |
| Citigroup, Inc. | 582,797 | 44,001,174 | |
| JPMorgan Chase & Co. | 410,468 | 42,902,115 | |
| PNC Financial Services Group, Inc. | 74,585 | 10,483,668 | |
| Regions Financial Corp. | 461,900 | 7,662,921 | |
| Signature Bank (a) | 25,200 | 3,459,456 | |
| Standard Chartered PLC (United Kingdom) (a) | 117,821 | 1,176,575 | |
| SunTrust Banks, Inc. | 308,508 | 19,013,348 | |
| U.S. Bancorp | 247,165 | 13,631,150 | |
| Wells Fargo & Co. | 420,894 | 23,767,884 | |
| 215,491,259 | |||
| Capital Markets - 6.4% | |||
| Charles Schwab Corp. | 202,853 | 9,897,198 | |
| Goldman Sachs Group, Inc. | 9,000 | 2,228,760 | |
| KKR & Co. LP | 353,236 | 7,036,461 | |
| Morgan Stanley | 326,043 | 16,827,079 | |
| Northern Trust Corp. | 153,686 | 15,027,417 | |
| State Street Corp. | 287,158 | 27,380,515 | |
| TD Ameritrade Holding Corp. | 22,200 | 1,135,974 | |
| The Blackstone Group LP | 268,400 | 8,513,648 | |
| 88,047,052 | |||
| Diversified Financial Services - 0.8% | |||
| KKR Renaissance Co-Invest LP unit (a)(c) | 29,500 | 11,591,438 | |
| Insurance - 0.3% | |||
| MetLife, Inc. | 75,700 | 4,063,576 | |
| Thrifts & Mortgage Finance - 0.9% | |||
| MGIC Investment Corp. (a) | 103,492 | 1,513,053 | |
| Radian Group, Inc. | 565,568 | 11,588,488 | |
| 13,101,541 | |||
| TOTAL FINANCIALS | 332,294,866 | ||
| HEALTH CARE - 14.5% | |||
| Biotechnology - 3.8% | |||
| Alexion Pharmaceuticals, Inc. (a) | 72,505 | 7,961,774 | |
| Alnylam Pharmaceuticals, Inc. (a) | 17,300 | 2,327,542 | |
| Amgen, Inc. | 114,457 | 20,105,517 | |
| Biogen, Inc. (a) | 15,500 | 4,993,635 | |
| BioMarin Pharmaceutical, Inc. (a) | 28,800 | 2,471,040 | |
| Bioverativ, Inc. | 2,700 | 135,054 | |
| Celldex Therapeutics, Inc. (a) | 4,800 | 14,400 | |
| Genocea Biosciences, Inc. (a)(b) | 64,200 | 78,324 | |
| Gilead Sciences, Inc. | 26,800 | 2,004,104 | |
| Insmed, Inc. (a) | 63,764 | 1,988,799 | |
| Intercept Pharmaceuticals, Inc. (a) | 57,931 | 3,557,543 | |
| Regeneron Pharmaceuticals, Inc. (a) | 3,700 | 1,338,882 | |
| Spark Therapeutics, Inc. (a) | 26,800 | 1,962,564 | |
| TESARO, Inc. (a) | 2,000 | 169,200 | |
| Trevena, Inc. (a) | 100,500 | 166,830 | |
| Vertex Pharmaceuticals, Inc. (a) | 19,400 | 2,799,226 | |
| 52,074,434 | |||
| Health Care Equipment & Supplies - 2.5% | |||
| Boston Scientific Corp. (a) | 716,586 | 18,831,880 | |
| Danaher Corp. | 66,800 | 6,303,248 | |
| DexCom, Inc. (a) | 10,800 | 631,044 | |
| Medtronic PLC | 64,500 | 5,297,385 | |
| ResMed, Inc. | 6,600 | 563,640 | |
| Zimmer Biomet Holdings, Inc. | 31,000 | 3,630,100 | |
| 35,257,297 | |||
| Health Care Providers & Services - 3.4% | |||
| Aetna, Inc. | 10,400 | 1,873,872 | |
| AmerisourceBergen Corp. | 37,100 | 3,146,822 | |
| Anthem, Inc. | 27,595 | 6,483,721 | |
| Cardinal Health, Inc. | 135,000 | 7,990,650 | |
| Cigna Corp. | 37,500 | 7,939,875 | |
| Express Scripts Holding Co. (a) | 23,710 | 1,545,418 | |
| Humana, Inc. | 16,900 | 4,408,534 | |
| McKesson Corp. | 61,296 | 9,055,871 | |
| UnitedHealth Group, Inc. | 23,500 | 5,361,995 | |
| 47,806,758 | |||
| Health Care Technology - 0.1% | |||
| Castlight Health, Inc. Class B (a) | 203,380 | 793,182 | |
| Life Sciences Tools & Services - 0.1% | |||
| Agilent Technologies, Inc. | 16,200 | 1,121,688 | |
| Pharmaceuticals - 4.6% | |||
| Allergan PLC | 21,429 | 3,725,003 | |
| AstraZeneca PLC sponsored ADR | 45,900 | 1,508,733 | |
| Bayer AG | 15,400 | 1,965,705 | |
| Bristol-Myers Squibb Co. | 65,300 | 4,126,307 | |
| CymaBay Therapeutics, Inc. (a) | 284,500 | 2,463,770 | |
| GlaxoSmithKline PLC sponsored ADR | 526,929 | 18,474,131 | |
| Jazz Pharmaceuticals PLC (a) | 52,107 | 7,281,432 | |
| Johnson & Johnson | 99,763 | 13,899,979 | |
| Novartis AG sponsored ADR | 2,500 | 214,500 | |
| Sanofi SA | 13,342 | 1,217,052 | |
| Teva Pharmaceutical Industries Ltd. sponsored ADR (b) | 343,491 | 5,090,537 | |
| TherapeuticsMD, Inc. (a)(b) | 700,500 | 4,413,150 | |
| 64,380,299 | |||
| TOTAL HEALTH CARE | 201,433,658 | ||
| INDUSTRIALS - 10.6% | |||
| Aerospace & Defense - 1.9% | |||
| General Dynamics Corp. | 7,400 | 1,532,984 | |
| The Boeing Co. | 19,863 | 5,498,078 | |
| United Technologies Corp. | 160,982 | 19,551,264 | |
| 26,582,326 | |||
| Air Freight & Logistics - 1.7% | |||
| C.H. Robinson Worldwide, Inc. | 66,859 | 5,793,332 | |
| FedEx Corp. | 16,400 | 3,795,944 | |
| United Parcel Service, Inc. Class B | 109,675 | 13,320,029 | |
| 22,909,305 | |||
| Commercial Services & Supplies - 0.1% | |||
| Stericycle, Inc. (a) | 22,200 | 1,472,082 | |
| Electrical Equipment - 1.0% | |||
| Acuity Brands, Inc. | 16,000 | 2,742,720 | |
| AMETEK, Inc. | 73,630 | 5,352,165 | |
| Hubbell, Inc. Class B | 20,282 | 2,551,273 | |
| Melrose Industries PLC | 1,001,490 | 2,707,476 | |
| 13,353,634 | |||
| Industrial Conglomerates - 1.8% | |||
| General Electric Co. | 1,354,044 | 24,765,465 | |
| ITT, Inc. | 2,600 | 140,920 | |
| 24,906,385 | |||
| Machinery - 0.8% | |||
| Flowserve Corp. | 156,900 | 6,680,802 | |
| Snap-On, Inc. | 2,200 | 372,746 | |
| Wabtec Corp. (b) | 45,900 | 3,529,710 | |
| 10,583,258 | |||
| Professional Services - 0.2% | |||
| Acacia Research Corp. (a) | 36,900 | 154,980 | |
| IHS Markit Ltd. (a) | 70,236 | 3,133,930 | |
| 3,288,910 | |||
| Road & Rail - 3.1% | |||
| CSX Corp. | 229,001 | 12,766,806 | |
| Genesee & Wyoming, Inc. Class A (a) | 48,600 | 3,830,652 | |
| J.B. Hunt Transport Services, Inc. | 88,400 | 9,824,776 | |
| Norfolk Southern Corp. | 44,958 | 6,232,528 | |
| Old Dominion Freight Lines, Inc. | 3,500 | 452,340 | |
| Union Pacific Corp. | 76,900 | 9,727,850 | |
| 42,834,952 | |||
| Trading Companies & Distributors - 0.0% | |||
| Fastenal Co. | 6,100 | 319,579 | |
| Univar, Inc. (a) | 8,300 | 244,518 | |
| 564,097 | |||
| TOTAL INDUSTRIALS | 146,494,949 | ||
| INFORMATION TECHNOLOGY - 18.8% | |||
| Communications Equipment - 1.7% | |||
| Cisco Systems, Inc. | 604,854 | 22,561,054 | |
| F5 Networks, Inc. (a) | 9,700 | 1,301,740 | |
| 23,862,794 | |||
| Internet Software & Services - 3.6% | |||
| Akamai Technologies, Inc. (a) | 45,300 | 2,526,834 | |
| Alphabet, Inc.: | |||
| Class A (a) | 23,136 | 23,972,829 | |
| Class C (a) | 19,817 | 20,241,282 | |
| Facebook, Inc. Class A (a) | 18,200 | 3,224,676 | |
| 49,965,621 | |||
| IT Services - 3.9% | |||
| Accenture PLC Class A | 2,000 | 296,020 | |
| Cognizant Technology Solutions Corp. Class A | 38,084 | 2,752,712 | |
| FleetCor Technologies, Inc. (a) | 13,600 | 2,473,432 | |
| MasterCard, Inc. Class A | 85,200 | 12,820,044 | |
| Paychex, Inc. | 150,122 | 10,104,712 | |
| PayPal Holdings, Inc. (a) | 39,200 | 2,968,616 | |
| Unisys Corp. (a)(b) | 307,187 | 2,380,699 | |
| Visa, Inc. Class A | 181,010 | 20,379,916 | |
| 54,176,151 | |||
| Semiconductors & Semiconductor Equipment - 1.9% | |||
| Qualcomm, Inc. | 399,950 | 26,532,683 | |
| Software - 5.0% | |||
| Adobe Systems, Inc. (a) | 32,610 | 5,917,737 | |
| Autodesk, Inc. (a) | 1,481 | 162,466 | |
| Microsoft Corp. | 607,954 | 51,171,486 | |
| Oracle Corp. | 104,500 | 5,126,770 | |
| SAP SE sponsored ADR | 37,400 | 4,239,290 | |
| Ultimate Software Group, Inc. (a) | 9,000 | 1,899,270 | |
| 68,517,019 | |||
| Technology Hardware, Storage & Peripherals - 2.7% | |||
| Apple, Inc. | 214,821 | 36,916,989 | |
| TOTAL INFORMATION TECHNOLOGY | 259,971,257 | ||
| MATERIALS - 3.1% | |||
| Chemicals - 2.6% | |||
| CF Industries Holdings, Inc. | 123,100 | 4,612,557 | |
| DowDuPont, Inc. | 34,914 | 2,512,411 | |
| Intrepid Potash, Inc. (a)(b) | 624,260 | 2,384,673 | |
| LyondellBasell Industries NV Class A | 70,300 | 7,360,410 | |
| Monsanto Co. | 74,817 | 8,853,844 | |
| Potash Corp. of Saskatchewan, Inc. | 336,800 | 6,609,910 | |
| W.R. Grace & Co. | 40,100 | 2,939,731 | |
| 35,273,536 | |||
| Containers & Packaging - 0.3% | |||
| WestRock Co. | 74,089 | 4,623,894 | |
| Metals & Mining - 0.2% | |||
| BHP Billiton Ltd. sponsored ADR (b) | 6,800 | 282,540 | |
| Freeport-McMoRan, Inc. (a) | 177,000 | 2,463,840 | |
| 2,746,380 | |||
| TOTAL MATERIALS | 42,643,810 | ||
| REAL ESTATE - 0.1% | |||
| Equity Real Estate Investment Trusts (REITs) - 0.1% | |||
| American Tower Corp. | 1,600 | 230,288 | |
| Public Storage | 8,900 | 1,896,768 | |
| 2,127,056 | |||
| TELECOMMUNICATION SERVICES - 1.1% | |||
| Diversified Telecommunication Services - 1.1% | |||
| Verizon Communications, Inc. | 281,594 | 14,330,319 | |
| Zayo Group Holdings, Inc. (a) | 11,200 | 395,808 | |
| 14,726,127 | |||
| UTILITIES - 1.2% | |||
| Electric Utilities - 0.9% | |||
| Exelon Corp. | 287,400 | 11,987,454 | |
| PPL Corp. | 10,100 | 370,367 | |
| 12,357,821 | |||
| Independent Power and Renewable Electricity Producers - 0.3% | |||
| Dynegy, Inc. (a) | 384,900 | 4,668,837 | |
| TOTAL UTILITIES | 17,026,658 | ||
| TOTAL COMMON STOCKS | |||
| (Cost $1,009,649,188) | 1,379,669,437 | ||
| Other - 0.2% | |||
| ENERGY - 0.2% | |||
| Oil, Gas & Consumable Fuels - 0.2% | |||
| Utica Shale Drilling Program (non-operating revenue interest) (c)(d)(e) | |||
| (Cost $3,301,608) | 3,301,608 | 2,542,238 | |
| Money Market Funds - 1.2% | |||
| Fidelity Cash Central Fund, 1.13% (f) | 493,609 | 493,707 | |
| Fidelity Securities Lending Cash Central Fund 1.13% (f)(g) | 15,552,314 | 15,553,870 | |
| TOTAL MONEY MARKET FUNDS | |||
| (Cost $16,047,771) | 16,047,577 | ||
| TOTAL INVESTMENT IN SECURITIES - 101.0% | |||
| (Cost $1,028,998,567) | 1,398,259,252 | ||
| NET OTHER ASSETS (LIABILITIES) - (1.0)% | (13,445,119) | ||
| NET ASSETS - 100% | $1,384,814,133 |
Legend
(a) Non-income producing
(b) Security or a portion of the security is on loan at period end.
(c) Restricted securities - Investment in securities not registered under the Securities Act of 1933 (excluding 144A issues). At the end of the period, the value of restricted securities (excluding 144A issues) amounted to $14,133,676 or 1.0% of net assets.
(d) Investment is owned by a wholly-owned subsidiary (Subsidiary) that is treated as a corporation for U.S. tax purposes.
(e) Level 3 security
(f) Affiliated fund that is generally available only to investment companies and other accounts managed by Fidelity Investments. The rate quoted is the annualized seven-day yield of the fund at period end. A complete unaudited listing of the fund's holdings as of its most recent quarter end is available upon request. In addition, each Fidelity Central Fund's financial statements, which are not covered by the Fund's Report of Independent Registered Public Accounting Firm, are available on the SEC's website or upon request.
(g) Investment made with cash collateral received from securities on loan.
Additional information on each restricted holding is as follows:
| Security | Acquisition Date | Acquisition Cost |
| KKR Renaissance Co-Invest LP unit | 7/25/13 | $3,112,250 |
| Utica Shale Drilling Program (non-operating revenue interest) | 10/5/16 - 9/1/17 | $3,301,608 |
Affiliated Central Funds
Information regarding fiscal year to date income earned by the Fund from investments in Fidelity Central Funds is as follows:
| Fund | Income earned |
| Fidelity Cash Central Fund | $61,093 |
| Fidelity Securities Lending Cash Central Fund | 71,136 |
| Total | $132,229 |
Investment Valuation
The following is a summary of the inputs used, as of November 30, 2017, involving the Fund's assets and liabilities carried at fair value. The inputs or methodology used for valuing securities may not be an indication of the risk associated with investing in those securities. For more information on valuation inputs, and their aggregation into the levels used below, please refer to the Investment Valuation section in the accompanying Notes to Financial Statements.
| Valuation Inputs at Reporting Date: | ||||
| Description | Total | Level 1 | Level 2 | Level 3 |
| Investments in Securities: | ||||
| Equities: | ||||
| Consumer Discretionary | $82,606,923 | $82,606,923 | $-- | $-- |
| Consumer Staples | 105,820,970 | 105,004,639 | 816,331 | -- |
| Energy | 174,523,163 | 174,523,163 | -- | -- |
| Financials | 332,294,866 | 320,703,428 | 11,591,438 | -- |
| Health Care | 201,433,658 | 198,250,901 | 3,182,757 | -- |
| Industrials | 146,494,949 | 146,494,949 | -- | -- |
| Information Technology | 259,971,257 | 259,971,257 | -- | -- |
| Materials | 42,643,810 | 42,643,810 | -- | -- |
| Real Estate | 2,127,056 | 2,127,056 | -- | -- |
| Telecommunication Services | 14,726,127 | 14,726,127 | -- | -- |
| Utilities | 17,026,658 | 17,026,658 | -- | -- |
| Other | 2,542,238 | -- | -- | 2,542,238 |
| Money Market Funds | 16,047,577 | 16,047,577 | -- | -- |
| Total Investments in Securities: | $1,398,259,252 | $1,380,126,488 | $15,590,526 | $2,542,238 |
See accompanying notes which are an integral part of the financial statements.
Financial Statements
Statement of Assets and Liabilities
| November 30, 2017 | ||
| Assets | ||
| Investment in securities, at value (including securities loaned of $15,159,738) — See accompanying schedule: Unaffiliated issuers (cost $1,012,950,796) | $1,382,211,675 | |
| Fidelity Central Funds (cost $16,047,771) | 16,047,577 | |
| Total Investment in Securities (cost $1,028,998,567) | $1,398,259,252 | |
| Cash | 12 | |
| Restricted cash | 16,227 | |
| Foreign currency held at value (cost $3) | 3 | |
| Receivable for investments sold | 7,212,470 | |
| Receivable for fund shares sold | 690,195 | |
| Dividends receivable | 3,053,422 | |
| Distributions receivable from Fidelity Central Funds | 5,811 | |
| Prepaid expenses | 2,706 | |
| Other receivables | 3,353 | |
| Total assets | 1,409,243,451 | |
| Liabilities | ||
| Payable for investments purchased | $4,933,916 | |
| Payable for fund shares redeemed | 2,836,376 | |
| Accrued management fee | 470,838 | |
| Distribution and service plan fees payable | 332,705 | |
| Other affiliated payables | 249,403 | |
| Other payables and accrued expenses | 48,436 | |
| Collateral on securities loaned | 15,557,644 | |
| Total liabilities | 24,429,318 | |
| Net Assets | $1,384,814,133 | |
| Net Assets consist of: | ||
| Paid in capital | $926,605,676 | |
| Undistributed net investment income | 11,455,652 | |
| Accumulated undistributed net realized gain (loss) on investments and foreign currency transactions | 77,495,144 | |
| Net unrealized appreciation (depreciation) on investments and assets and liabilities in foreign currencies | 369,257,661 | |
| Net Assets | $1,384,814,133 | |
| Calculation of Maximum Offering Price | ||
| Class A: | ||
| Net Asset Value and redemption price per share ($461,949,012 ÷ 13,207,621 shares) | $34.98 | |
| Maximum offering price per share (100/94.25 of $34.98) | $37.11 | |
| Class M: | ||
| Net Asset Value and redemption price per share ($193,881,811 ÷ 5,562,467 shares) | $34.86 | |
| Maximum offering price per share (100/96.50 of $34.86) | $36.12 | |
| Class C: | ||
| Net Asset Value and offering price per share ($194,552,668 ÷ 6,121,595 shares)(a) | $31.78 | |
| Class I: | ||
| Net Asset Value, offering price and redemption price per share ($520,464,659 ÷ 14,246,102 shares) | $36.53 | |
| Class Z: | ||
| Net Asset Value, offering price and redemption price per share ($13,965,983 ÷ 381,885 shares) | $36.57 |
(a) Redemption price per share is equal to net asset value less any applicable contingent deferred sales charge.
See accompanying notes which are an integral part of the financial statements.
Statement of Operations
| Year ended November 30, 2017 | ||
| Investment Income | ||
| Dividends | $28,380,327 | |
| Interest | 38,694 | |
| Income from Fidelity Central Funds | 132,229 | |
| Total income | 28,551,250 | |
| Expenses | ||
| Management fee | ||
| Basic fee | $7,317,836 | |
| Performance adjustment | (1,760,006) | |
| Transfer agent fees | 2,559,531 | |
| Distribution and service plan fees | 3,976,629 | |
| Accounting and security lending fees | 427,837 | |
| Custodian fees and expenses | 46,110 | |
| Independent trustees' fees and expenses | 5,152 | |
| Registration fees | 112,781 | |
| Audit | 64,683 | |
| Legal | 10,651 | |
| Interest | 223 | |
| Miscellaneous | 11,281 | |
| Total expenses before reductions | 12,772,708 | |
| Expense reductions | (51,821) | 12,720,887 |
| Net investment income (loss) | 15,830,363 | |
| Realized and Unrealized Gain (Loss) | ||
| Net realized gain (loss) on: | ||
| Investment securities: | ||
| Unaffiliated issuers | 85,080,952 | |
| Fidelity Central Funds | (3,865) | |
| Foreign currency transactions | 1,439 | |
| Total net realized gain (loss) | 85,078,526 | |
| Change in net unrealized appreciation (depreciation) on: | ||
| Investment securities: | ||
| Unaffiliated issuers | 117,519,492 | |
| Fidelity Central Funds | (528) | |
| Assets and liabilities in foreign currencies | 2,338 | |
| Total change in net unrealized appreciation (depreciation) | 117,521,302 | |
| Net gain (loss) | 202,599,828 | |
| Net increase (decrease) in net assets resulting from operations | $218,430,191 |
See accompanying notes which are an integral part of the financial statements.
Statement of Changes in Net Assets
| Year ended November 30, 2017 | Year ended November 30, 2016 | |
| Increase (Decrease) in Net Assets | ||
| Operations | ||
| Net investment income (loss) | $15,830,363 | $14,380,305 |
| Net realized gain (loss) | 85,078,526 | 7,404,292 |
| Change in net unrealized appreciation (depreciation) | 117,521,302 | 95,980,039 |
| Net increase (decrease) in net assets resulting from operations | 218,430,191 | 117,764,636 |
| Distributions to shareholders from net investment income | (13,125,307) | (10,152,553) |
| Distributions to shareholders from net realized gain | (11,235,798) | (28,234,872) |
| Total distributions | (24,361,105) | (38,387,425) |
| Share transactions - net increase (decrease) | (40,158,418) | (180,256,330) |
| Total increase (decrease) in net assets | 153,910,668 | (100,879,119) |
| Net Assets | ||
| Beginning of period | 1,230,903,465 | 1,331,782,584 |
| End of period | $1,384,814,133 | $1,230,903,465 |
| Other Information | ||
| Undistributed net investment income end of period | $11,455,652 | $12,332,373 |
See accompanying notes which are an integral part of the financial statements.
Financial Highlights
Fidelity Advisor Large Cap Fund Class A
| Years ended November 30, | 2017 | 2016 | 2015 | 2014 | 2013 |
| Selected Per–Share Data | |||||
| Net asset value, beginning of period | $30.27 | $28.12 | $29.60 | $28.11 | $20.43 |
| Income from Investment Operations | |||||
| Net investment income (loss)A | .39 | .34 | .25 | .20 | .16 |
| Net realized and unrealized gain (loss) | 4.93 | 2.64 | (.74) | 3.45 | 7.61 |
| Total from investment operations | 5.32 | 2.98 | (.49) | 3.65 | 7.77 |
| Distributions from net investment income | (.33) | (.23) | (.14) | (.22) | (.02) |
| Distributions from net realized gain | (.27) | (.60) | (.85) | (1.94) | (.07) |
| Total distributions | (.61)B | (.83) | (.99) | (2.16) | (.09) |
| Net asset value, end of period | $34.98 | $30.27 | $28.12 | $29.60 | $28.11 |
| Total ReturnC,D | 17.84% | 11.09% | (1.57)% | 14.13% | 38.16% |
| Ratios to Average Net AssetsE,F | |||||
| Expenses before reductions | .91% | .92% | 1.15% | 1.30% | 1.26% |
| Expenses net of fee waivers, if any | .91% | .92% | 1.15% | 1.25% | 1.26% |
| Expenses net of all reductions | .90% | .91% | 1.15% | 1.25% | 1.24% |
| Net investment income (loss) | 1.22% | 1.25% | .90% | .72% | .68% |
| Supplemental Data | |||||
| Net assets, end of period (000 omitted) | $461,949 | $455,182 | $469,026 | $414,421 | $214,686 |
| Portfolio turnover rateG | 31% | 28% | 31% | 28% | 54% |
A Calculated based on average shares outstanding during the period.
B Total distributions of $.61 per share is comprised of distributions from net investment income of $.334 and distributions from net realized gain of $.273 per share.
C Total returns would have been lower if certain expenses had not been reduced during the applicable periods shown.
D Total returns do not include the effect of the sales charges.
E Fees and expenses of any underlying Fidelity Central Funds are not included in the Fund's expense ratio. The Fund indirectly bears its proportionate share of the expenses of any underlying Fidelity Central Funds.
F Expense ratios reflect operating expenses of the class. Expenses before reductions do not reflect amounts reimbursed by the investment adviser or reductions from brokerage service arrangements or reductions from other expense offset arrangements and do not represent the amount paid by the class during periods when reimbursements or reductions occur. Expenses net of fee waivers reflect expenses after reimbursement by the investment adviser but prior to reductions from brokerage service arrangements or other expense offset arrangements. Expenses net of all reductions represent the net expenses paid by the class.
G Amount does not include the portfolio activity of any underlying Fidelity Central Funds.
See accompanying notes which are an integral part of the financial statements.
Fidelity Advisor Large Cap Fund Class M
| Years ended November 30, | 2017 | 2016 | 2015 | 2014 | 2013 |
| Selected Per–Share Data | |||||
| Net asset value, beginning of period | $30.17 | $28.02 | $29.50 | $28.02 | $20.41 |
| Income from Investment Operations | |||||
| Net investment income (loss)A | .31 | .27 | .18 | .13 | .10 |
| Net realized and unrealized gain (loss) | 4.91 | 2.64 | (.74) | 3.44 | 7.59 |
| Total from investment operations | 5.22 | 2.91 | (.56) | 3.57 | 7.69 |
| Distributions from net investment income | (.26) | (.16) | (.07) | (.15) | (.01) |
| Distributions from net realized gain | (.27) | (.60) | (.85) | (1.94) | (.07) |
| Total distributions | (.53) | (.76) | (.92) | (2.09) | (.08) |
| Net asset value, end of period | $34.86 | $30.17 | $28.02 | $29.50 | $28.02 |
| Total ReturnB,C | 17.54% | 10.81% | (1.84)% | 13.83% | 37.82% |
| Ratios to Average Net AssetsD,E | |||||
| Expenses before reductions | 1.17% | 1.18% | 1.41% | 1.56% | 1.51% |
| Expenses net of fee waivers, if any | 1.17% | 1.18% | 1.41% | 1.50% | 1.51% |
| Expenses net of all reductions | 1.17% | 1.18% | 1.41% | 1.50% | 1.49% |
| Net investment income (loss) | .96% | .99% | .63% | .47% | .42% |
| Supplemental Data | |||||
| Net assets, end of period (000 omitted) | $193,882 | $173,119 | $177,560 | $170,613 | $114,864 |
| Portfolio turnover rateF | 31% | 28% | 31% | 28% | 54% |
A Calculated based on average shares outstanding during the period.
B Total returns would have been lower if certain expenses had not been reduced during the applicable periods shown.
C Total returns do not include the effect of the sales charges.
D Fees and expenses of any underlying Fidelity Central Funds are not included in the Fund's expense ratio. The Fund indirectly bears its proportionate share of the expenses of any underlying Fidelity Central Funds.
E Expense ratios reflect operating expenses of the class. Expenses before reductions do not reflect amounts reimbursed by the investment adviser or reductions from brokerage service arrangements or reductions from other expense offset arrangements and do not represent the amount paid by the class during periods when reimbursements or reductions occur. Expenses net of fee waivers reflect expenses after reimbursement by the investment adviser but prior to reductions from brokerage service arrangements or other expense offset arrangements. Expenses net of all reductions represent the net expenses paid by the class.
F Amount does not include the portfolio activity of any underlying Fidelity Central Funds.
See accompanying notes which are an integral part of the financial statements.
Fidelity Advisor Large Cap Fund Class C
| Years ended November 30, | 2017 | 2016 | 2015 | 2014 | 2013 |
| Selected Per–Share Data | |||||
| Net asset value, beginning of period | $27.58 | $25.70 | $27.21 | $26.07 | $19.08 |
| Income from Investment Operations | |||||
| Net investment income (loss)A | .14 | .12 | .04 | (.01) | (.02) |
| Net realized and unrealized gain (loss) | 4.49 | 2.40 | (.69) | 3.19 | 7.08 |
| Total from investment operations | 4.63 | 2.52 | (.65) | 3.18 | 7.06 |
| Distributions from net investment income | (.15) | (.04) | (.01) | (.10) | –B |
| Distributions from net realized gain | (.27) | (.60) | (.85) | (1.94) | (.07) |
| Total distributions | (.43)C | (.64) | (.86) | (2.04) | (.07) |
| Net asset value, end of period | $31.78 | $27.58 | $25.70 | $27.21 | $26.07 |
| Total ReturnD,E | 16.97% | 10.21% | (2.33)% | 13.31% | 37.14% |
| Ratios to Average Net AssetsF,G | |||||
| Expenses before reductions | 1.67% | 1.67% | 1.90% | 2.05% | 2.00% |
| Expenses net of fee waivers, if any | 1.67% | 1.67% | 1.90% | 2.00% | 2.00% |
| Expenses net of all reductions | 1.66% | 1.67% | 1.90% | 2.00% | 1.99% |
| Net investment income (loss) | .46% | .49% | .14% | (.03)% | (.07)% |
| Supplemental Data | |||||
| Net assets, end of period (000 omitted) | $194,553 | $169,524 | $181,957 | $168,763 | $67,780 |
| Portfolio turnover rateH | 31% | 28% | 31% | 28% | 54% |
A Calculated based on average shares outstanding during the period.
B Amount represents less than .005%.
C Total distributions of $.43 per share is comprised of distributions from net investment income of $.152 and distributions from net realized gain of $.273 per share.
D Total returns would have been lower if certain expenses had not been reduced during the applicable periods shown.
E Total returns do not include the effect of the contingent deferred sales charge.
F Fees and expenses of any underlying Fidelity Central Funds are not included in the Fund's expense ratio. The Fund indirectly bears its proportionate share of the expenses of any underlying Fidelity Central Funds.
G Expense ratios reflect operating expenses of the class. Expenses before reductions do not reflect amounts reimbursed by the investment adviser or reductions from brokerage service arrangements or reductions from other expense offset arrangements and do not represent the amount paid by the class during periods when reimbursements or reductions occur. Expenses net of fee waivers reflect expenses after reimbursement by the investment adviser but prior to reductions from brokerage service arrangements or other expense offset arrangements. Expenses net of all reductions represent the net expenses paid by the class.
H Amount does not include the portfolio activity of any underlying Fidelity Central Funds.
See accompanying notes which are an integral part of the financial statements.
Fidelity Advisor Large Cap Fund Class I
| Years ended November 30, | 2017 | 2016 | 2015 | 2014 | 2013 |
| Selected Per–Share Data | |||||
| Net asset value, beginning of period | $31.57 | $29.30 | $30.78 | $29.03 | $21.03 |
| Income from Investment Operations | |||||
| Net investment income (loss)A | .50 | .43 | .34 | .28 | .24 |
| Net realized and unrealized gain (loss) | 5.14 | 2.74 | (.78) | 3.59 | 7.85 |
| Total from investment operations | 5.64 | 3.17 | (.44) | 3.87 | 8.09 |
| Distributions from net investment income | (.40) | (.30) | (.20) | (.18) | (.02) |
| Distributions from net realized gain | (.27) | (.60) | (.85) | (1.94) | (.07) |
| Total distributions | (.68)B | (.90) | (1.04)C | (2.12) | (.09) |
| Net asset value, end of period | $36.53 | $31.57 | $29.30 | $30.78 | $29.03 |
| Total ReturnD | 18.16% | 11.34% | (1.33)% | 14.43% | 38.62% |
| Ratios to Average Net AssetsE,F | |||||
| Expenses before reductions | .64% | .65% | .89% | 1.04% | .95% |
| Expenses net of fee waivers, if any | .64% | .65% | .89% | 1.00% | .95% |
| Expenses net of all reductions | .64% | .65% | .89% | 1.00% | .94% |
| Net investment income (loss) | 1.48% | 1.51% | 1.15% | .97% | .98% |
| Supplemental Data | |||||
| Net assets, end of period (000 omitted) | $520,465 | $433,079 | $498,404 | $515,771 | $242,897 |
| Portfolio turnover rateG | 31% | 28% | 31% | 28% | 54% |
A Calculated based on average shares outstanding during the period.
B Total distributions of $.68 per share is comprised of distributions from net investment income of $.404 and distributions from net realized gain of $.273 per share.
C Total distributions of $1.04 per share is comprised of distributions from net investment income of $.195 and distributions from net realized gain of $.849 per share.
D Total returns would have been lower if certain expenses had not been reduced during the applicable periods shown.
E Fees and expenses of any underlying Fidelity Central Funds are not included in the Fund's expense ratio. The Fund indirectly bears its proportionate share of the expenses of any underlying Fidelity Central Funds.
F Expense ratios reflect operating expenses of the class. Expenses before reductions do not reflect amounts reimbursed by the investment adviser or reductions from brokerage service arrangements or reductions from other expense offset arrangements and do not represent the amount paid by the class during periods when reimbursements or reductions occur. Expenses net of fee waivers reflect expenses after reimbursement by the investment adviser but prior to reductions from brokerage service arrangements or other expense offset arrangements. Expenses net of all reductions represent the net expenses paid by the class.
G Amount does not include the portfolio activity of any underlying Fidelity Central Funds.
See accompanying notes which are an integral part of the financial statements.
Fidelity Advisor Large Cap Fund Class Z
| Years ended November 30, | 2017 A |
| Selected Per–Share Data | |
| Net asset value, beginning of period | $32.04 |
| Income from Investment Operations | |
| Net investment income (loss)B | .51 |
| Net realized and unrealized gain (loss) | 4.02 |
| Total from investment operations | 4.53 |
| Distributions from net investment income | – |
| Distributions from net realized gain | – |
| Total distributions | – |
| Net asset value, end of period | $36.57 |
| Total ReturnC,D | 14.14% |
| Ratios to Average Net AssetsE,F | |
| Expenses before reductions | .51%G |
| Expenses net of fee waivers, if any | .51%G |
| Expenses net of all reductions | .51%G |
| Net investment income (loss) | 1.80%G |
| Supplemental Data | |
| Net assets, end of period (000 omitted) | $13,966 |
| Portfolio turnover rateH | 31% |
A For the period February 1, 2017 (commencement of sale of shares) to November 30, 2017.
B Calculated based on average shares outstanding during the period.
C Total returns for periods of less than one year are not annualized.
D Total returns would have been lower if certain expenses had not been reduced during the applicable periods shown.
E Fees and expenses of any underlying Fidelity Central Funds are not included in the Fund's expense ratio. The Fund indirectly bears its proportionate share of the expenses of any underlying Fidelity Central Funds.
F Expense ratios reflect operating expenses of the class. Expenses before reductions do not reflect amounts reimbursed by the investment adviser or reductions from brokerage service arrangements or reductions from other expense offset arrangements and do not represent the amount paid by the class during periods when reimbursements or reductions occur. Expense ratios before reductions for start-up periods may not be representative of longer-term operating periods. Expenses net of fee waivers reflect expenses after reimbursement by the investment adviser but prior to reductions from brokerage service arrangements or other expense offset arrangements. Expenses net of all reductions represent the net expenses paid by the class.
G Annualized
H Amount does not include the portfolio activity of any underlying Fidelity Central Funds.
See accompanying notes which are an integral part of the financial statements.
Notes to Financial Statements
For the period ended November 30, 2017
1. Organization.
Fidelity Advisor Large Cap Fund (the Fund) is a fund of Fidelity Advisor Series I (the Trust) and is authorized to issue an unlimited number of shares. The Trust is registered under the Investment Company Act of 1940, as amended (the 1940 Act), as an open-end management investment company organized as a Massachusetts business trust. The Fund commenced sale of Class Z shares on February 1, 2017. The Fund offers Class A, Class M (formerly Class T), Class C, Class I, and Class Z shares, each of which has equal rights as to assets and voting privileges. Each class has exclusive voting rights with respect to matters that affect that class.
After the close of business on June 24, 2016, all outstanding Class B shares were converted to Class A shares. All prior fiscal period dollar and share amounts for Class B presented in the Notes to Financial Statements are for the period December 1, 2015, through June 24, 2016.
2. Investments in Fidelity Central Funds.
The Fund invests in Fidelity Central Funds, which are open-end investment companies generally available only to other investment companies and accounts managed by the investment adviser and its affiliates. The Fund's Schedule of Investments lists each of the Fidelity Central Funds held as of period end, if any, as an investment of the Fund, but does not include the underlying holdings of each Fidelity Central Fund. As an Investing Fund, the Fund indirectly bears its proportionate share of the expenses of the underlying Fidelity Central Funds.
The Money Market Central Funds seek preservation of capital and current income and are managed by Fidelity Investments Money Management, Inc. (FIMM), an affiliate of the investment adviser. Annualized expenses of the Money Market Central Funds as of their most recent shareholder report date are less than .005%.
A complete unaudited list of holdings for each Fidelity Central Fund is available upon request or at the Securities and Exchange Commission (the SEC) website at www.sec.gov. In addition, the financial statements of the Fidelity Central Funds, which are not covered by the Fund's Report of Independent Registered Public Accounting Firm, are available on the SEC website or upon request.
3. Significant Accounting Policies.
The Fund is an investment company and applies the accounting and reporting guidance of the Financial Accounting Standards Board (FASB) Accounting Standards Codification Topic 946 Financial Services – Investments Companies. The financial statements have been prepared in conformity with accounting principles generally accepted in the United States of America (GAAP), which require management to make certain estimates and assumptions at the date of the financial statements. Actual results could differ from those estimates. Subsequent events, if any, through the date that the financial statements were issued have been evaluated in the preparation of the financial statements. The following summarizes the significant accounting policies of the Fund:
Investment Valuation. Investments are valued as of 4:00 p.m. Eastern time on the last calendar day of the period. The Board of Trustees (the Board) has delegated the day to day responsibility for the valuation of the Fund's investments to the Fair Value Committee (the Committee) established by the Fund's investment adviser. In accordance with valuation policies and procedures approved by the Board, the Fund attempts to obtain prices from one or more third party pricing vendors or brokers to value its investments. When current market prices, quotations or currency exchange rates are not readily available or reliable, investments will be fair valued in good faith by the Committee, in accordance with procedures adopted by the Board. Factors used in determining fair value vary by investment type and may include market or investment specific events. The frequency with which these procedures are used cannot be predicted and they may be utilized to a significant extent. The Committee oversees the Fund's valuation policies and procedures and reports to the Board on the Committee's activities and fair value determinations. The Board monitors the appropriateness of the procedures used in valuing the Fund's investments and ratifies the fair value determinations of the Committee.
The Fund categorizes the inputs to valuation techniques used to value its investments into a disclosure hierarchy consisting of three levels as shown below:
- Level 1 – quoted prices in active markets for identical investments
- Level 2 – other significant observable inputs (including quoted prices for similar investments, interest rates, prepayment speeds, etc.)
- Level 3 – unobservable inputs (including the Fund's own assumptions based on the best information available)
Valuation techniques used to value the Fund's investments by major category are as follows:
Equity securities, including restricted securities, for which market quotations are readily available, are valued at the last reported sale price or official closing price as reported by a third party pricing vendor on the primary market or exchange on which they are traded and are categorized as Level 1 in the hierarchy. In the event there were no sales during the day or closing prices are not available, securities are valued at the last quoted bid price or may be valued using the last available price and are generally categorized as Level 2 in the hierarchy. For foreign equity securities, when market or security specific events arise, comparisons to the valuation of American Depositary Receipts (ADRs), futures contracts, Exchange-Traded Funds (ETFs) and certain indexes as well as quoted prices for similar securities may be used and would be categorized as Level 2 in the hierarchy. Utilizing these techniques may result in transfers between Level 1 and Level 2. For equity securities, including restricted securities, where observable inputs are limited, assumptions about market activity and risk are used and these securities may be categorized as Level 3 in the hierarchy.
Investments in open-end mutual funds, including the Fidelity Central Funds, are valued at their closing net asset value (NAV) each business day and are categorized as Level 1 in the hierarchy.
Changes in valuation techniques may result in transfers in or out of an assigned level within the disclosure hierarchy. The aggregate value of investments by input level as of November 30, 2017 is included at the end of the Fund's Schedule of Investments.
Foreign Currency. The Fund may use foreign currency contracts to facilitate transactions in foreign-denominated securities. Gains and losses from these transactions may arise from changes in the value of the foreign currency or if the counterparties do not perform under the contracts' terms.
Foreign-denominated assets, including investment securities, and liabilities are translated into U.S. dollars at the exchange rates at period end. Purchases and sales of investment securities, income and dividends received and expenses denominated in foreign currencies are translated into U.S. dollars at the exchange rate in effect on the transaction date.
The effects of exchange rate fluctuations on investments are included with the net realized and unrealized gain (loss) on investment securities. Other foreign currency transactions resulting in realized and unrealized gain (loss) are disclosed separately.
Investment Transactions and Income. For financial reporting purposes, the Fund's investment holdings and NAV include trades executed through the end of the last business day of the period. The NAV per share for processing shareholder transactions is calculated as of the close of business of the New York Stock Exchange (NYSE), normally 4:00 p.m. Eastern time and includes trades executed through the end of the prior business day. Gains and losses on securities sold are determined on the basis of identified cost and includes proceeds received from litigation. Dividend income is recorded on the ex-dividend date, except for certain dividends from foreign securities where the ex-dividend date may have passed, which are recorded as soon as the Fund is informed of the ex-dividend date. Non-cash dividends included in dividend income, if any, are recorded at the fair market value of the securities received. Income and capital gain distributions from Fidelity Central Funds, if any, are recorded on the ex-dividend date. Certain distributions received by the Fund represent a return of capital or capital gain. The Fund determines the components of these distributions subsequent to the ex-dividend date, based upon receipt of tax filings or other correspondence relating to the underlying investment. These distributions are recorded as a reduction of cost of investments and/or as a realized gain. Interest income is accrued as earned and includes coupon interest and amortization of premium and accretion of discount on debt securities as applicable. Investment income is recorded net of foreign taxes withheld where recovery of such taxes is uncertain.
Class Allocations and Expenses. Investment income, realized and unrealized capital gains and losses, common expenses of the Fund, and certain fund-level expense reductions, if any, are allocated daily on a pro-rata basis to each class based on the relative net assets of each class to the total net assets of each Fund. Each class differs with respect to transfer agent and distribution and service plan fees incurred. Certain expense reductions may also differ by class. For the reporting period, the allocated portion of income and expenses to each class as a percent of its average net assets may vary due to the timing of recording these transactions in relation to fluctuating net assets of the classes. Expenses directly attributable to a fund are charged to that fund. Expenses attributable to more than one fund are allocated among the respective funds on the basis of relative net assets or other appropriate methods. Expense estimates are accrued in the period to which they relate and adjustments are made when actual amounts are known.
Income Tax Information and Distributions to Shareholders. Each year, the Fund intends to qualify as a regulated investment company under Subchapter M of the Internal Revenue Code, including distributing substantially all of its taxable income and realized gains. As a result, no provision for U.S. Federal income taxes is required. As of November 30, 2017, the Fund did not have any unrecognized tax benefits in the financial statements; nor is the Fund aware of any tax positions for which it is reasonably possible that the total amounts of unrecognized tax benefits will significantly change in the next twelve months. The Fund files a U.S. federal tax return, in addition to state and local tax returns as required. The Fund's federal income tax returns are subject to examination by the Internal Revenue Service (IRS) for a period of three fiscal years after they are filed. State and local tax returns may be subject to examination for an additional fiscal year depending on the jurisdiction. Foreign taxes are provided for based on the Fund's understanding of the tax rules and rates that exist in the foreign markets in which it invests.
Distributions are declared and recorded on the ex-dividend date. Income dividends and capital gain distributions are declared separately for each class. Income and capital gain distributions are determined in accordance with income tax regulations, which may differ from GAAP. In addition, the Fund claimed a portion of the payment made to redeeming shareholders as a distribution for income tax purposes.
Capital accounts within the financial statements are adjusted for permanent book-tax differences. These adjustments have no impact on net assets or the results of operations. Capital accounts are not adjusted for temporary book-tax differences which will reverse in a subsequent period.
Book-tax differences are primarily due to partnerships, foreign currency transactions, deferred trustees compensation and losses deferred due to wash sales.
As of period end, the cost and unrealized appreciation (depreciation) in securities, and derivatives if applicable, for federal income tax purposes were as follows:
| Gross unrealized appreciation | $436,618,601 |
| Gross unrealized depreciation | (72,793,709) |
| Net unrealized appreciation (depreciation) | $363,824,892 |
| Tax Cost | $1,034,434,360 |
The tax-based components of distributable earnings as of period end were as follows:
| Undistributed ordinary income | $22,670,221 |
| Undistributed long-term capital gain | $74,089,948 |
| Net unrealized appreciation (depreciation) on securities and other investments | $361,448,301 |
The tax character of distributions paid was as follows:
| November 30, 2017 | November 30, 2016 | |
| Ordinary Income | $13,536,874 | $ 10,152,553 |
| Long-term Capital Gains | 10,824,231 | 28,234,872 |
| Total | $24,361,105 | $ 38,387,425 |
Restricted Securities. The Fund may invest in securities that are subject to legal or contractual restrictions on resale. These securities generally may be resold in transactions exempt from registration or to the public if the securities are registered. Disposal of these securities may involve time-consuming negotiations and expense, and prompt sale at an acceptable price may be difficult. Information regarding restricted securities is included at the end of the Fund's Schedule of Investments.
Consolidated Subsidiary. The Fund invests in certain investments through a wholly-owned subsidiary ("Subsidiary"), which may be subject to federal and state taxes upon disposition.
As of period end, the Fund held an investment of $2,558,465 in this Subsidiary, representing .18% of the Fund's net assets. The financial statements have been consolidated and include accounts of the Fund and the Subsidiary. Accordingly, all inter-company transactions and balances have been eliminated.
Any cash held by the Subsidiary is restricted as to its use and is presented as Restricted cash in the Statement of Assets and Liabilities.
4. Purchases and Sales of Investments.
Purchases and sales of securities, other than short-term securities, aggregated $409,982,843 and $453,971,536, respectively.
5. Fees and Other Transactions with Affiliates.
Management Fee. Fidelity Management & Research Company (the investment adviser) and its affiliates provide the Fund with investment management related services for which the Fund pays a monthly management fee. The management fee is the sum of an individual fund fee rate that is based on an annual rate of .30% of the Fund's average net assets and an annualized group fee rate that averaged .25% during the period. The group fee rate is based upon the average net assets of all the mutual funds advised by the investment adviser, including any mutual funds previously advised by the investment adviser that are currently advised by Fidelity SelectCo, LLC, an affiliate of the investment adviser. The group fee rate decreases as assets under management increase and increases as assets under management decrease. In addition, the management fee is subject to a performance adjustment (up to a maximum of +/- .20% of the Fund's average net assets over a 36 month performance period). The upward or downward adjustment to the management fee is based on the relative investment performance of Class I of the Fund as compared to its benchmark index, the S&P 500 Index, over the same 36 month performance period. For the reporting period, the total annual management fee rate, including the performance adjustment, was .41% of the Fund's average net assets. The performance adjustment included in the management fee rate may be higher or lower than the maximum performance adjustment rate due to the difference between the average net assets for the reporting and performance periods.
Distribution and Service Plan Fees. In accordance with Rule 12b-1 of the 1940 Act, the Fund has adopted separate Distribution and Service Plans for each class of shares Certain classes pay Fidelity Distributors Corporation (FDC), an affiliate of the investment adviser, separate Distribution and Service Fees, each of which is based on an annual percentage of each class' average net assets. In addition, FDC may pay financial intermediaries for selling shares of the Fund and providing shareholder support services. For the period, the Distribution and Service Fee rates, total fees and amounts retained by FDC were as follows:
| Distribution Fee | Service Fee | Total Fees | Retained by FDC | |
| Class A | -% | .25% | $1,149,340 | $29,629 |
| Class M | .25% | .25% | 926,038 | – |
| Class C | .75% | .25% | 1,901,251 | 246,874 |
| $3,976,629 | $276,503 |
Sales Load. FDC may receive a front-end sales charge of up to 5.75% for selling Class A shares and 3.50% for selling Class M shares, some of which is paid to financial intermediaries for selling shares of the Fund. Depending on the holding period, FDC may receive contingent deferred sales charges levied on Class A, Class M and Class C redemptions. The deferred sales charges are 1.00% for Class C shares, 1.00% for certain purchases of Class A shares and .25% for certain purchases of Class M shares.
For the period, sales charge amounts retained by FDC were as follows:
| Retained by FDC | |
| Class A | $145,290 |
| Class M | 23,420 |
| Class C(a) | 16,160 |
| $184,870 |
(a) When Class C shares are initially sold, FDC pays commissions from its own resources to financial intermediaries through which the sales are made.
Transfer Agent Fees. Fidelity Investments Institutional Operations Company, Inc., (FIIOC), an affiliate of the investment adviser, is the transfer, dividend disbursing and shareholder servicing agent for each class of the Fund. FIIOC receives account fees and asset-based fees that vary according to the account size and type of account of the shareholders of the respective classes of the Fund, except for Class Z. FIIOC receives an asset-based fee of Class Z's average net assets. FIIOC pays for typesetting, printing and mailing of shareholder reports, except proxy statements.
For the period, transfer agent fees for each class were as follows:
| Amount | % of Class-Level Average Net Assets | |
| Class A | $889,714 | .19 |
| Class M | 380,729 | .21 |
| Class C | 386,865 | .20 |
| Class I | 897,386 | .18 |
| Class Z | 4,837 | .05(a) |
| $2,559,531 |
(a) Annualized
Accounting and Security Lending Fees. Fidelity Service Company, Inc. (FSC), an affiliate of the investment adviser, maintains the Fund's accounting records. The accounting fee is based on the level of average net assets for each month. Under a separate contract, FSC administers the security lending program. The security lending fee is based on the number and duration of lending transactions.
Brokerage Commissions. The Fund placed a portion of its portfolio transactions with brokerage firms which are affiliates of the investment adviser. Brokerage commissions are included in net realized gain (loss) and change in net unrealized appreciation (depreciation) in the Statement of Operations. The commissions paid to these affiliated firms were $9,725 for the period.
Interfund Lending Program. Pursuant to an Exemptive Order issued by the SEC, the Fund, along with other registered investment companies having management contracts with Fidelity Management & Research Company (FMR) or other affiliated entities of FMR, may participate in an interfund lending program. This program provides an alternative credit facility allowing the funds to borrow from, or lend money to, other participating affiliated funds. At period end, there were no interfund loans outstanding. The Fund's activity in this program during the period for which loans were outstanding was as follows:
| Borrower or Lender | Average Loan Balance | Weighted Average Interest Rate | Interest Expense |
| Borrower | $2,986,000 | 1.34% | $223 |
Interfund Trades. The Fund may purchase from or sell securities to other Fidelity Funds under procedures adopted by the Board. The procedures have been designed to ensure these interfund trades are executed in accordance with Rule 17a-7 of the 1940 Act. Interfund trades are included within the respective purchases and sales amounts shown in the Purchases and Sales of Investments note.
6. Committed Line of Credit.
The Fund participates with other funds managed by the investment adviser or an affiliate in a $4.25 billion credit facility (the "line of credit") to be utilized for temporary or emergency purposes to fund shareholder redemptions or for other short-term liquidity purposes. The Fund has agreed to pay commitment fees on its pro-rata portion of the line of credit, which amounted to $4,199 and is reflected in Miscellaneous expenses on the Statement of Operations. During the period, the Fund did not borrow on this line of credit.
7. Security Lending.
The Fund lends portfolio securities through a lending agent from time to time in order to earn additional income. For equity securities, a lending agent is used and may loan securities to certain qualified borrowers, including Fidelity Capital Markets (FCM), a broker-dealer affiliated with the Fund. On the settlement date of the loan, the Fund receives collateral (in the form of U.S. Treasury obligations, letters of credit and/or cash) against the loaned securities and maintains collateral in an amount not less than 100% of the market value of the loaned securities during the period of the loan. The market value of the loaned securities is determined at the close of business of the Fund and any additional required collateral is delivered to the Fund on the next business day. The Fund or borrower may terminate the loan at any time, and if the borrower defaults on its obligation to return the securities loaned because of insolvency or other reasons, the Fund may apply collateral received from the borrower against the obligation. The Fund may experience delays and costs in recovering the securities loaned. Any cash collateral received is invested in the Fidelity Securities Lending Cash Central Fund. The value of loaned securities and cash collateral at period end are disclosed on the Fund's Statement of Assets and Liabilities. The value of securities loaned to FCM at period end was $1,813,539. Security lending income represents the income earned on investing cash collateral, less rebates paid to borrowers and any lending agent fees associated with the loan, plus any premium payments received for lending certain types of securities. Security lending income is presented in the Statement of Operations as a component of income from Fidelity Central Funds. Total security lending income during the period amounted to $71,136, including $567 from securities loaned to FCM.
8. Expense Reductions.
The investment adviser voluntarily agreed to reimburse a portion of the Fund's Class A, Class M, Class C and Class I operating expenses. During the period, the reimbursement reduced expenses as follows:
| Reimbursement | |
| Class A | $5,718 |
| Class M | 2,338 |
| Class C | 2,458 |
| Class I | 6,462 |
| $16,976 |
Commissions paid to certain brokers with whom the investment adviser, or its affiliates, places trades on behalf of the Fund include an amount in addition to trade execution, which may be rebated back to the Fund to offset certain expenses. This amount totaled $23,436 for the period.
In addition, during the period the investment adviser reimbursed and/or waived a portion of fund-level operating expenses in the amount of $11,409.
9. Distributions to Shareholders.
Distributions to shareholders of each class were as follows:
| Year ended November 30, 2017 | Year ended November 30, 2016 | |
| From net investment income | ||
| Class A | $5,099,262 | $3,826,802 |
| Class M | 1,475,469 | 981,442 |
| Class C | 953,207 | 295,369 |
| Class I | 5,597,369 | 5,048,940 |
| Total | $13,125,307 | $10,152,553 |
| From net realized gain | ||
| Class A | $4,167,959 | $9,966,960 |
| Class M | 1,573,449 | 3,809,662 |
| Class B | – | 110,345 |
| Class C | 1,712,010 | 4,228,922 |
| Class I | 3,782,380 | 10,118,983 |
| Total | $11,235,798 | $28,234,872 |
10. Share Transactions.
Share transactions for each class were as follows and may contain automatic conversions between classes or exchanges between affiliated funds:
| Shares | Shares | Dollars | Dollars | |
| Year ended November 30, 2017 | Year ended November 30, 2016 | Year ended November 30, 2017 | Year ended November 30, 2016 | |
| Class A | ||||
| Shares sold | 3,335,635 | 3,471,102 | $105,955,818 | $92,742,592 |
| Reinvestment of distributions | 289,062 | 506,726 | 8,882,868 | 13,174,015 |
| Shares redeemed | (5,456,801) | (5,617,229) | (175,106,485) | (150,837,777) |
| Net increase (decrease) | (1,832,104) | (1,639,401) | $(60,267,799) | $(44,921,170) |
| Class M | ||||
| Shares sold | 966,917 | 838,207 | $30,770,230 | $22,424,576 |
| Reinvestment of distributions | 96,794 | 178,870 | 2,971,572 | 4,645,631 |
| Shares redeemed | (1,240,208) | (1,614,297) | (39,777,162) | (43,435,570) |
| Net increase (decrease) | (176,497) | (597,220) | $(6,035,360) | $(16,365,363) |
| Class B | ||||
| Shares sold | – | 1,731 | $– | $41,950 |
| Reinvestment of distributions | – | 4,310 | – | 104,666 |
| Shares redeemed | – | (191,235) | – | (4,624,336) |
| Net increase (decrease) | – | (185,194) | $– | $(4,477,720) |
| Class C | ||||
| Shares sold | 1,666,007 | 967,123 | $47,964,478 | $24,084,991 |
| Reinvestment of distributions | 83,161 | 161,472 | 2,338,494 | 3,852,174 |
| Shares redeemed | (1,773,151) | (2,063,532) | (51,988,707) | (50,478,565) |
| Net increase (decrease) | (23,983) | (934,937) | $(1,685,735) | $(22,541,400) |
| Class I | ||||
| Shares sold | 5,289,459 | 3,784,048 | $176,163,579 | $106,099,731 |
| Reinvestment of distributions | 273,175 | 510,015 | 8,747,051 | 13,796,737 |
| Shares redeemed | (5,033,155) | (7,590,256) | (169,303,967) | (211,847,145) |
| Net increase (decrease) | 529,479 | (3,296,193) | $15,606,663 | $(91,950,677) |
| Class Z(a) | ||||
| Shares sold | 789,170 | – | $26,644,229 | $– |
| Shares redeemed | (407,285) | – | (14,420,416) | – |
| Net increase (decrease) | 381,885 | – | $12,223,813 | $– |
(a) Share transactions for Class Z are for the period February 1, 2017 (commencement of sale of shares) to November 30, 2017.
11. Other.
The Fund's organizational documents provide former and current trustees and officers with a limited indemnification against liabilities arising in connection with the performance of their duties to the Fund. In the normal course of business, the Fund may also enter into contracts that provide general indemnifications. The Fund's maximum exposure under these arrangements is unknown as this would be dependent on future claims that may be made against the Fund. The risk of material loss from such claims is considered remote.
Report of Independent Registered Public Accounting Firm
To the Trustees of Fidelity Advisor Series I and Shareholders of Fidelity Advisor Large Cap Fund:
We have audited the accompanying statement of assets and liabilities of Fidelity Advisor Large Cap Fund (the Fund), a fund of Fidelity Advisor Series I, including the schedule of investments, as of November 30, 2017, and the related statement of operations for the year then ended, the statement of changes in net assets for each of the two years in the period then ended, and the financial highlights for each of the five years in the period then ended. These financial statements and financial highlights are the responsibility of the Fund's management. Our responsibility is to express an opinion on these financial statements and financial highlights based on our audits.
We conducted our audits in accordance with the standards of the Public Company Accounting Oversight Board (United States). Those standards require that we plan and perform the audit to obtain reasonable assurance about whether the financial statements and financial highlights are free of material misstatement. The Fund is not required to have, nor were we engaged to perform, an audit of its internal control over financial reporting. Our audits included consideration of internal control over financial reporting as a basis for designing audit procedures that are appropriate in the circumstances, but not for the purpose of expressing an opinion on the effectiveness of the Fund's internal control over financial reporting. Accordingly, we express no such opinion. An audit also includes examining, on a test basis, evidence supporting the amounts and disclosures in the financial statements, assessing the accounting principles used and significant estimates made by management, as well as evaluating the overall financial statement presentation. Our procedures included confirmation of securities owned as of November 30, 2017, by correspondence with the custodians and brokers; when replies were not received from brokers, we performed other auditing procedures. We believe that our audits provide a reasonable basis for our opinion.
In our opinion, such financial statements and financial highlights referred to above present fairly, in all material respects, the financial position of Fidelity Advisor Large Cap Fund as of November 30, 2017, the results of its operations for the year then ended, the changes in its net assets for each of the two years in the period then ended, and the financial highlights for each of the five years in the period then ended, in conformity with accounting principles generally accepted in the United States of America.
DELOITTE & TOUCHE LLP
Boston, Massachusetts
January 16, 2018
Trustees and Officers
The Trustees, Members of the Advisory Board (if any), and officers of the trust and fund, as applicable, are listed below. The Board of Trustees governs the fund and is responsible for protecting the interests of shareholders. The Trustees are experienced executives who meet periodically throughout the year to oversee the fund's activities, review contractual arrangements with companies that provide services to the fund, oversee management of the risks associated with such activities and contractual arrangements, and review the fund's performance. Each of the Trustees oversees 190 funds.
The Trustees hold office without limit in time except that (a) any Trustee may resign; (b) any Trustee may be removed by written instrument, signed by at least two-thirds of the number of Trustees prior to such removal; (c) any Trustee who requests to be retired or who has become incapacitated by illness or injury may be retired by written instrument signed by a majority of the other Trustees; and (d) any Trustee may be removed at any special meeting of shareholders by a two-thirds vote of the outstanding voting securities of the trust. Each Trustee who is not an interested person (as defined in the 1940 Act) of the trust and the fund is referred to herein as an Independent Trustee. Each Independent Trustee shall retire not later than the last day of the calendar year in which his or her 75th birthday occurs. The Independent Trustees may waive this mandatory retirement age policy with respect to individual Trustees. Officers and Advisory Board Members hold office without limit in time, except that any officer or Advisory Board Member may resign or may be removed by a vote of a majority of the Trustees at any regular meeting or any special meeting of the Trustees. Except as indicated, each individual has held the office shown or other offices in the same company for the past five years.
The fund’s Statement of Additional Information (SAI) includes more information about the Trustees. To request a free copy, call Fidelity at 1-877-208-0098.
Experience, Skills, Attributes, and Qualifications of the Trustees. The Governance and Nominating Committee has adopted a statement of policy that describes the experience, qualifications, attributes, and skills that are necessary and desirable for potential Independent Trustee candidates (Statement of Policy). The Board believes that each Trustee satisfied at the time he or she was initially elected or appointed a Trustee, and continues to satisfy, the standards contemplated by the Statement of Policy. The Governance and Nominating Committee also engages professional search firms to help identify potential Independent Trustee candidates who have the experience, qualifications, attributes, and skills consistent with the Statement of Policy. From time to time, additional criteria based on the composition and skills of the current Independent Trustees, as well as experience or skills that may be appropriate in light of future changes to board composition, business conditions, and regulatory or other developments, have also been considered by the professional search firms and the Governance and Nominating Committee. In addition, the Board takes into account the Trustees' commitment and participation in Board and committee meetings, as well as their leadership of standing and ad hoc committees throughout their tenure.
In determining that a particular Trustee was and continues to be qualified to serve as a Trustee, the Board has considered a variety of criteria, none of which, in isolation, was controlling. The Board believes that, collectively, the Trustees have balanced and diverse experience, qualifications, attributes, and skills, which allow the Board to operate effectively in governing the fund and protecting the interests of shareholders. Information about the specific experience, skills, attributes, and qualifications of each Trustee, which in each case led to the Board's conclusion that the Trustee should serve (or continue to serve) as a trustee of the fund, is provided below.
Board Structure and Oversight Function. James C. Curvey is an interested person and currently serves as Chairman. The Trustees have determined that an interested Chairman is appropriate and benefits shareholders because an interested Chairman has a personal and professional stake in the quality and continuity of services provided to the fund. Independent Trustees exercise their informed business judgment to appoint an individual of their choosing to serve as Chairman, regardless of whether the Trustee happens to be independent or a member of management. The Independent Trustees have determined that they can act independently and effectively without having an Independent Trustee serve as Chairman and that a key structural component for assuring that they are in a position to do so is for the Independent Trustees to constitute a substantial majority for the Board. The Independent Trustees also regularly meet in executive session. Ned C. Lautenbach serves as Chairman of the Independent Trustees and as such (i) acts as a liaison between the Independent Trustees and management with respect to matters important to the Independent Trustees and (ii) with management prepares agendas for Board meetings.
Fidelity® funds are overseen by different Boards of Trustees. The fund's Board oversees Fidelity's high income and certain equity funds, and other Boards oversee Fidelity's investment-grade bond, money market, asset allocation, and sector funds. The asset allocation funds may invest in Fidelity® funds overseen by the fund's Board. The use of separate Boards, each with its own committee structure, allows the Trustees of each group of Fidelity® funds to focus on the unique issues of the funds they oversee, including common research, investment, and operational issues. On occasion, the separate Boards establish joint committees to address issues of overlapping consequences for the Fidelity® funds overseen by each Board.
The Trustees operate using a system of committees to facilitate the timely and efficient consideration of all matters of importance to the Trustees, the fund, and fund shareholders and to facilitate compliance with legal and regulatory requirements and oversight of the fund's activities and associated risks. The Board, acting through its committees, has charged FMR and its affiliates with (i) identifying events or circumstances the occurrence of which could have demonstrably adverse effects on the fund's business and/or reputation; (ii) implementing processes and controls to lessen the possibility that such events or circumstances occur or to mitigate the effects of such events or circumstances if they do occur; and (iii) creating and maintaining a system designed to evaluate continuously business and market conditions in order to facilitate the identification and implementation processes described in (i) and (ii) above. Because the day-to-day operations and activities of the fund are carried out by or through FMR, its affiliates, and other service providers, the fund's exposure to risks is mitigated but not eliminated by the processes overseen by the Trustees. While each of the Board's committees has responsibility for overseeing different aspects of the fund's activities, oversight is exercised primarily through the Operations, Audit, and Compliance Committees. In addition, the Independent Trustees have worked with FMR to enhance the Board's oversight of investment and financial risks, legal and regulatory risks, technology risks, and operational risks, including the development of additional risk reporting to the Board. For example, a working group comprised of Independent Trustees and FMR has worked and continues to work to review the Fidelity® funds' valuation-related activities, reporting and risk management. Appropriate personnel, including but not limited to the fund's Chief Compliance Officer (CCO), FMR's internal auditor, the independent accountants, the fund's Treasurer and portfolio management personnel, make periodic reports to the Board's committees, as appropriate, including an annual review of Fidelity's risk management program for the Fidelity® funds. The responsibilities of each standing committee, including their oversight responsibilities, are described further under "Standing Committees of the Trustees."
Interested Trustees*:
Correspondence intended for a Trustee who is an interested person may be sent to Fidelity Investments, 245 Summer Street, Boston, Massachusetts 02210.
Name, Year of Birth; Principal Occupations and Other Relevant Experience+
James C. Curvey (1935)
Year of Election or Appointment: 2007
Trustee
Chairman of the Board of Trustees
Mr. Curvey also serves as Trustee of other Fidelity® funds. Mr. Curvey is a Director of Fidelity Research & Analysis Co. (investment adviser firm, 2009-present), and Vice Chairman (2007-present) and Director of FMR LLC (diversified financial services company). In addition, Mr. Curvey serves as an Overseer for the Boston Symphony Orchestra and a member of the board of Artis-Naples, Naples, Florida, and as a Trustee for Brewster Academy, Wolfeboro, New Hampshire. Previously, Mr. Curvey served as a Director of Fidelity Investments Money Management, Inc. (investment adviser firm, 2009-2014) and a Director of FMR and FMR Co., Inc. (investment adviser firms, 2007-2014).
Charles S. Morrison (1960)
Year of Election or Appointment: 2014
Trustee
Mr. Morrison also serves as Trustee of other funds. He serves as President of Fidelity Management & Research Company (FMR) (investment adviser firm, 2016-present), a Director of Fidelity Investments Money Management, Inc. (FIMM) (investment adviser firm, 2014-present), Director of Fidelity SelectCo, LLC (investment adviser firm, 2014-present), President, Asset Management (2014-present), and is an employee of Fidelity Investments. Previously, Mr. Morrison served as Vice President of Fidelity's Fixed Income and Asset Allocation Funds (2012-2014), President, Fixed Income (2011-2014), Vice President of Fidelity's Money Market Funds (2005-2009), President, Money Market Group Leader of FMR (investment adviser firm, 2009), and Senior Vice President, Money Market Group of FMR (2004-2009). Mr. Morrison also served as Vice President of Fidelity's Bond Funds (2002-2005), certain Balanced Funds (2002-2005), and certain Asset Allocation Funds (2002-2007), and as Senior Vice President (2002-2005) of Fidelity's Bond Division.
* Determined to be an “Interested Trustee” by virtue of, among other things, his or her affiliation with the trust or various entities under common control with FMR.
+ The information includes the Trustee's principal occupation during the last five years and other information relating to the experience, attributes, and skills relevant to the Trustee's qualifications to serve as a Trustee, which led to the conclusion that the Trustee should serve as a Trustee for the fund.
Independent Trustees:
Correspondence intended for an Independent Trustee may be sent to Fidelity Investments, P.O. Box 55235, Boston, Massachusetts 02205-5235.
Name, Year of Birth; Principal Occupations and Other Relevant Experience+
Dennis J. Dirks (1948)
Year of Election or Appointment: 2005
Trustee
Mr. Dirks also serves as Trustee of other Fidelity® funds. Prior to his retirement in May 2003, Mr. Dirks was Chief Operating Officer and a member of the Board of The Depository Trust & Clearing Corporation (DTCC). He also served as President, Chief Operating Officer, and Board member of The Depository Trust Company (DTC) and President and Board member of the National Securities Clearing Corporation (NSCC). In addition, Mr. Dirks served as Chief Executive Officer and Board member of the Government Securities Clearing Corporation, Chief Executive Officer and Board member of the Mortgage-Backed Securities Clearing Corporation, as a Trustee and a member of the Finance Committee of Manhattan College (2005-2008), as a Trustee and a member of the Finance Committee of AHRC of Nassau County (2006-2008), as a member of the Independent Directors Council (IDC) Governing Council (2010-2015), and as a member of the Board of Directors for The Brookville Center for Children’s Services, Inc. (2009-2017). Mr. Dirks is a member of the Finance Committee (2016-present) and Board of Directors (2017-present) of the Asolo Repertory Theatre.
Alan J. Lacy (1953)
Year of Election or Appointment: 2008
Trustee
Mr. Lacy also serves as Trustee of other Fidelity® funds. Mr. Lacy serves as a Director of Bristol-Myers Squibb Company (global pharmaceuticals, 2008-present). He is a Trustee of the California Chapter of The Nature Conservancy (2015-present) and a Director of the Center for Advanced Study in the Behavioral Sciences at Stanford University (2015-present). In addition, Mr. Lacy served as Senior Adviser (2007-2014) of Oak Hill Capital Partners, L.P. (private equity) and also served as Chief Executive Officer (2005) and Vice Chairman (2005-2006) of Sears Holdings Corporation (retail) and Chief Executive Officer and Chairman of the Board of Sears, Roebuck and Co. (retail, 2000-2005). Previously, Mr. Lacy served as Chairman (2014-2017) and a member (2010-2017) of the Board of Directors of Dave & Buster’s Entertainment, Inc. (restaurant and entertainment complexes), as Chairman (2008-2011) and a member (2006-2015) of the Board of Trustees of the National Parks Conservation Association, and as a member of the Board of Directors for The Hillman Companies, Inc. (hardware wholesalers, 2010-2014), Earth Fare, Inc. (retail grocery, 2010-2014), and The Western Union Company (global money transfer, 2006-2011).
Ned C. Lautenbach (1944)
Year of Election or Appointment: 2000
Trustee
Chairman of the Independent Trustees
Mr. Lautenbach also serves as Trustee of other Fidelity® funds. Mr. Lautenbach currently serves as Vice Chair of the Board of Governors, State University System of Florida (2013-present) and is a member of the Council on Foreign Relations (1994-present). He is also a member and has most recently served as Chairman of the Board of Directors of Artis-Naples (2012-present). Previously, Mr. Lautenbach served as a member and then Lead Director of the Board of Directors of Eaton Corporation (diversified industrial, 1997-2016). He was also a Partner and Advisory Partner at Clayton, Dubilier & Rice, LLC (private equity investment, 1998-2010), as well as a Director of Sony Corporation (2006-2007). In addition, Mr. Lautenbach also had a 30-year career with IBM (technology company) during which time he served as Senior Vice President and a member of the Corporate Executive Committee (1968-1998).
Joseph Mauriello (1944)
Year of Election or Appointment: 2008
Trustee
Mr. Mauriello also serves as Trustee of other Fidelity® funds. Prior to his retirement in January 2006, Mr. Mauriello served in numerous senior management positions including Deputy Chairman and Chief Operating Officer (2004-2005), and Vice Chairman of Financial Services (2002-2004) of KPMG LLP US (professional services, 1965-2005). Mr. Mauriello currently serves as a member of the Board of Directors of XL Group plc. (global insurance and re-insurance, 2006-present) and the Independent Directors Council (IDC) Governing Council (2015-present). Previously, Mr. Mauriello served as a Director of the Hamilton Funds of the Bank of New York (2006-2007) and of Arcadia Resources Inc. (health care services and products, 2007-2012).
Cornelia M. Small (1944)
Year of Election or Appointment: 2005
Trustee
Ms. Small also serves as Trustee of other Fidelity® funds. Ms. Small is a member of the Board of Directors (2009-present) and Chair of the Investment Committee (2010-present) of the Teagle Foundation. Ms. Small also serves on the Investment Committee of the Berkshire Taconic Community Foundation (2008-present). Previously, Ms. Small served as Chairperson (2002-2008) and a member of the Investment Committee and Chairperson (2008-2012) and a member of the Board of Trustees of Smith College. In addition, Ms. Small served as Chief Investment Officer, Director of Global Equity Investments, and a member of the Board of Directors of Scudder, Stevens & Clark and Scudder Kemper Investments.
William S. Stavropoulos (1939)
Year of Election or Appointment: 2002
Trustee
Vice Chairman of the Independent Trustees
Mr. Stavropoulos also serves as Trustee of other Fidelity® funds. Mr. Stavropoulos serves as President and Founder of the Michigan Baseball Foundation, the Great Lakes Loons (2007-present). Mr. Stavropoulos is Chairman Emeritus of the Board of Directors of The Dow Chemical Company, where he previously served in numerous senior management positions, including President, CEO (1995-2000; 2002-2004), Chairman of the Executive Committee (2000-2006), and as a member of the Board of Directors (1990-2006). Currently, Mr. Stavropoulos is Chairman of the Board of Directors of Univar Inc. (global distributor of commodity and specialty chemicals), a Director of Teradata Corporation (data warehousing and technology solutions), and a member of the Advisory Board for Metalmark Capital LLC (private equity investment, 2005-present). Mr. Stavropoulos is an operating advisor to Clayton, Dubilier & Rice, LLC (private equity investment). In addition, Mr. Stavropoulos is a member of the University of Notre Dame Advisory Council for the College of Science, a Trustee of the Rollin L. Gerstacker Foundation, and a Director of Artis-Naples in Naples, Florida. Previously, Mr. Stavropoulos served as a Director of Chemical Financial Corporation (bank holding company, 1993-2012) and Tyco International, Ltd. (multinational manufacturing and services, 2007-2012).
David M. Thomas (1949)
Year of Election or Appointment: 2008
Trustee
Mr. Thomas also serves as Trustee of other Fidelity® funds. Mr. Thomas serves as Non-Executive Chairman of the Board of Directors of Fortune Brands Home and Security (home and security products, 2011-present), as a member of the Board of Directors (2004-present) and Presiding Director (2013-present) of Interpublic Group of Companies, Inc. (marketing communication), and as a member of the Board of Trustees of the University of Florida (2013-present). Previously, Mr. Thomas served as Executive Chairman (2005-2006) and Chairman and Chief Executive Officer (2000-2005) of IMS Health, Inc. (pharmaceutical and healthcare information solutions), and a Director of Fortune Brands, Inc. (consumer products, 2000-2011).
+ The information includes the Trustee's principal occupation during the last five years and other information relating to the experience, attributes, and skills relevant to the Trustee's qualifications to serve as a Trustee, which led to the conclusion that the Trustee should serve as a Trustee for the fund.
Advisory Board Members and Officers:
Correspondence intended for an officer or Peter S. Lynch may be sent to Fidelity Investments, 245 Summer Street, Boston, Massachusetts 02210. Officers appear below in alphabetical order.
Name, Year of Birth; Principal Occupation
Peter S. Lynch (1944)
Year of Election or Appointment: 2003
Member of the Advisory Board
Mr. Lynch also serves as Member of the Advisory Board of other Fidelity® funds. Mr. Lynch is Vice Chairman and a Director of FMR (investment adviser firm) and FMR Co., Inc. (investment adviser firm). In addition, Mr. Lynch serves as a Trustee of Boston College and as the Chairman of the Inner-City Scholarship Fund. Previously, Mr. Lynch served on the Special Olympics International Board of Directors (1997-2006).
Elizabeth Paige Baumann (1968)
Year of Election or Appointment: 2017
Anti-Money Laundering (AML) Officer
Ms. Baumann also serves as AML Officer of other funds. She is Chief AML Officer (2012-present) and Senior Vice President (2014-present) of FMR LLC (diversified financial services company) and is an employee of Fidelity Investments. Previously, Ms. Baumann served as AML Officer of the funds (2012-2016), and Vice President (2007-2014) and Deputy Anti-Money Laundering Officer (2007-2012) of FMR LLC.
Marc R. Bryant (1966)
Year of Election or Appointment: 2015
Secretary and Chief Legal Officer (CLO)
Mr. Bryant also serves as Secretary and CLO of other funds. Mr. Bryant serves as CLO, Secretary, and Senior Vice President of Fidelity Management & Research Company (investment adviser firm, 2015-present) and FMR Co., Inc. (investment adviser firm, 2015-present); Secretary of Fidelity SelectCo, LLC (investment adviser firm, 2015-present) and Fidelity Investments Money Management, Inc. (investment adviser firm, 2015-present); and CLO of Fidelity Management & Research (Hong Kong) Limited and FMR Investment Management (UK) Limited (investment adviser firms, 2015-present) and Fidelity Management & Research (Japan) Limited (investment adviser firm, 2016-present). He is Senior Vice President and Deputy General Counsel of FMR LLC (diversified financial services company). Previously, Mr. Bryant served as Secretary and CLO of Fidelity Rutland Square Trust II (2010-2014) and Assistant Secretary of Fidelity's Fixed Income and Asset Allocation Funds (2013-2015). Prior to joining Fidelity Investments, Mr. Bryant served as a Senior Vice President and the Head of Global Retail Legal for AllianceBernstein L.P. (2006-2010), and as the General Counsel for ProFund Advisors LLC (2001-2006).
William C. Coffey (1969)
Year of Election or Appointment: 2009
Assistant Secretary
Mr. Coffey also serves as Assistant Secretary of other funds. He is Senior Vice President and Deputy General Counsel of FMR LLC (diversified financial services company, 2010-present), and is an employee of Fidelity Investments. Previously, Mr. Coffey served as Vice President and Associate General Counsel of FMR LLC (2005-2009).
Jonathan Davis (1968)
Year of Election or Appointment: 2010
Assistant Treasurer
Mr. Davis also serves as Assistant Treasurer of other funds. Mr. Davis serves as Assistant Treasurer of FMR Capital, Inc. (2017-present) and is an employee of Fidelity Investments. Previously, Mr. Davis served as Vice President and Associate General Counsel of FMR LLC (diversified financial services company, 2003-2010).
Adrien E. Deberghes (1967)
Year of Election or Appointment: 2016
Assistant Treasurer
Mr. Deberghes also serves as an officer of other funds. He serves as Assistant Treasurer of FMR Capital, Inc. (2017-present), Executive Vice President of Fidelity Investments Money Management, Inc. (FIMM) (investment adviser firm, 2016-present), and is an employee of Fidelity Investments (2008-present). Prior to joining Fidelity Investments, Mr. Deberghes was Senior Vice President of Mutual Fund Administration at State Street Corporation (2007-2008), Senior Director of Mutual Fund Administration at Investors Bank & Trust (2005-2007), and Director of Finance for Dunkin' Brands (2000-2005). Previously, Mr. Deberghes served in other fund officer roles.
Stephanie J. Dorsey (1969)
Year of Election or Appointment: 2010
Assistant Treasurer
Ms. Dorsey also serves as an officer of other funds. Ms. Dorsey serves as Assistant Treasurer of FMR Capital, Inc. (2017-present), is an employee of Fidelity Investments (2008-present), and has served in other fund officer roles. Prior to joining Fidelity Investments, Ms. Dorsey served as Treasurer (2004-2008) of the JPMorgan Mutual Funds and Vice President (2004-2008) of JPMorgan Chase Bank.
Howard J. Galligan III (1966)
Year of Election or Appointment: 2014
Chief Financial Officer
Mr. Galligan also serves as Chief Financial Officer of other funds. Mr. Galligan serves as President of Fidelity Pricing and Cash Management Services (FPCMS) (2014-present) and as a Director of Strategic Advisers, Inc. (investment adviser firm, 2008-present). Previously, Mr. Galligan served as Chief Administrative Officer of Asset Management (2011-2014) and Chief Operating Officer and Senior Vice President of Investment Support for Strategic Advisers, Inc. (2003-2011).
Thomas C. Hense (1964)
Year of Election or Appointment: 2008, 2010, or 2015
Vice President
Mr. Hense serves as Vice President of Fidelity Advisor® Multi-Asset Income Fund (2015) and other funds (High Income (2008), Small Cap (2008), and Value (2010) funds), and is an employee of Fidelity Investments (1993-present). Previously, Mr. Hense served as a portfolio manager for Fidelity's Institutional Money Management Group (Pyramis) (2003-2008).
Brian B. Hogan (1964)
Year of Election or Appointment: 2009
Vice President
Mr. Hogan also serves as Trustee or Vice President of other funds. Mr. Hogan serves as a Director of FMR Investment Management (UK) Limited (investment adviser firm, 2015-present) and Fidelity SelectCo, LLC (investment adviser firm, 2014-present) and President of the Equity Division of FMR (investment adviser firm, 2009-present). Previously, Mr. Hogan served as Senior Vice President, Equity Research of FMR (2006-2009) and as a portfolio manager. Mr. Brian B. Hogan is not related to Mr. Colm A. Hogan.
Colm A. Hogan (1973)
Year of Election or Appointment: 2016
Deputy Treasurer
Mr. Hogan also serves as an officer of other funds. Mr. Hogan serves as Assistant Treasurer of FMR Capital, Inc. (2017-present) and is an employee of Fidelity Investments (2005-present). Mr. Colm A. Hogan is not related to Mr. Brian B. Hogan.
Chris Maher (1972)
Year of Election or Appointment: 2013
Assistant Treasurer
Mr. Maher serves as Assistant Treasurer of other funds. Mr. Maher is Vice President of Valuation Oversight, serves as Assistant Treasurer of FMR Capital, Inc. (2017-present), and is an employee of Fidelity Investments. Previously, Mr. Maher served as Vice President of Asset Management Compliance (2013), Vice President of the Program Management Group of FMR (investment adviser firm, 2010-2013), and Vice President of Valuation Oversight (2008-2010).
Rieco E. Mello (1969)
Year of Election or Appointment: 2017
Assistant Treasurer
Mr. Mello also serves as Assistant Treasurer of other funds. Mr. Mello serves as Assistant Treasurer of FMR Capital, Inc. (2017-present) and is an employee of Fidelity Investments (1995-present).
Kenneth B. Robins (1969)
Year of Election or Appointment: 2016
Chief Compliance Officer
Mr. Robins also serves as an officer of other funds. Mr. Robins serves as Compliance Officer of Fidelity Management & Research Company and FMR Co., Inc. (investment adviser firms, 2016-present) and is an employee of Fidelity Investments (2004-present). Previously, Mr. Robins served as Executive Vice President of Fidelity Investments Money Management, Inc. (investment adviser firm, 2013-2016) and served in other fund officer roles.
Stacie M. Smith (1974)
Year of Election or Appointment: 2016
President and Treasurer
Ms. Smith also serves as an officer of other funds. Ms. Smith serves as Assistant Treasurer of FMR Capital, Inc. (2017-present), is an employee of Fidelity Investments (2009-present), and has served in other fund officer roles. Prior to joining Fidelity Investments, Ms. Smith served as Senior Audit Manager of Ernst & Young LLP (accounting firm, 1996-2009). Previously, Ms. Smith served as Deputy Treasurer of certain Fidelity® funds (2013-2016).
Marc L. Spector (1972)
Year of Election or Appointment: 2016
Assistant Treasurer
Mr. Spector also serves as an officer of other funds. Mr. Spector serves as Assistant Treasurer of FMR Capital, Inc. (2017-present) and is an employee of Fidelity Investments (2016-present). Prior to joining Fidelity Investments, Mr. Spector served as Director at the Siegfried Group (accounting firm, 2013-2016), and prior to Siegfried Group as audit senior manager at Deloitte & Touche (accounting firm, 2005-2013).
Renee Stagnone (1975)
Year of Election or Appointment: 2016
Assistant Treasurer
Ms. Stagnone also serves as an officer of other funds. Ms. Stagnone serves as Assistant Treasurer of FMR Capital, Inc. (2017-present) and is an employee of Fidelity Investments (1997-present). Previously, Ms. Stagnone served as Deputy Treasurer of certain Fidelity® funds (2013-2016).
Shareholder Expense Example
As a shareholder of the Fund, you incur two types of costs: (1) transaction costs, including sales charges (loads) on purchase payments or redemption proceeds, and (2) ongoing costs, including distribution and/or service (12b-1) fees and other Fund expenses. This Example is intended to help you understand your ongoing costs (in dollars) of investing in the Fund and to compare these costs with the ongoing costs of investing in other mutual funds.
The Example is based on an investment of $1,000 invested at the beginning of the period and held for the entire period (June 1, 2017 to November 30, 2017).
Actual Expenses
The first line of the accompanying table for each class of the Fund provides information about actual account values and actual expenses. You may use the information in this line, together with the amount you invested, to estimate the expenses that you paid over the period. Simply divide your account value by $1,000.00 (for example, an $8,600 account value divided by $1,000.00 = 8.6), then multiply the result by the number in the first line for a class of the Fund under the heading entitled "Expenses Paid During Period" to estimate the expenses you paid on your account during this period. In addition, the Fund, as a shareholder in the underlying Fidelity Central Funds, will indirectly bear its pro-rata share of the fees and expenses incurred by the underlying Fidelity Central Funds. These fees and expenses are not included in the Fund's annualized expense ratio used to calculate the expense estimate in the table below.
Hypothetical Example for Comparison Purposes
The second line of the accompanying table for each class of the Fund provides information about hypothetical account values and hypothetical expenses based on a Class' actual expense ratio and an assumed rate of return of 5% per year before expenses, which is not the Class' actual return. The hypothetical account values and expenses may not be used to estimate the actual ending account balance or expenses you paid for the period. You may use this information to compare the ongoing costs of investing in the Fund and other funds. To do so, compare this 5% hypothetical example with the 5% hypothetical examples that appear in the shareholder reports of the other funds. In addition, the Fund, as a shareholder in the underlying Fidelity Central Funds, will indirectly bear its pro-rata share of the fees and expenses incurred by the underlying Fidelity Central Funds. These fees and expenses are not included in the Fund's annualized expense ratio used to calculate the expense estimate in the table below.
Please note that the expenses shown in the table are meant to highlight your ongoing costs only and do not reflect any transaction costs. Therefore, the second line of the table is useful in comparing ongoing costs only, and will not help you determine the relative total costs of owning different funds. In addition, if these transactional costs were included, your costs would have been higher.
| Annualized Expense Ratio-A | Beginning Account Value June 1, 2017 | Ending Account Value November 30, 2017 | Expenses Paid During Period-B June 1, 2017 to November 30, 2017 | |
| Class A | .89% | |||
| Actual | $1,000.00 | $1,105.20 | $4.70 | |
| Hypothetical-C | $1,000.00 | $1,020.61 | $4.51 | |
| Class M | 1.15% | |||
| Actual | $1,000.00 | $1,103.90 | $6.07 | |
| Hypothetical-C | $1,000.00 | $1,019.30 | $5.82 | |
| Class C | 1.65% | |||
| Actual | $1,000.00 | $1,100.80 | $8.69 | |
| Hypothetical-C | $1,000.00 | $1,016.80 | $8.34 | |
| Class I | .63% | |||
| Actual | $1,000.00 | $1,106.60 | $3.33 | |
| Hypothetical-C | $1,000.00 | $1,021.91 | $3.19 | |
| Class Z | .51% | |||
| Actual | $1,000.00 | $1,007.20 | $2.69 | |
| Hypothetical-C | $1,000.00 | $1,022.51 | $2.59 |
A Annualized expense ratio reflects expenses net of applicable fee waivers.
B Expenses are equal to each Class' annualized expense ratio, multiplied by the average account value over the period, multiplied by 183/365 (to reflect the one-half year period).
C 5% return per year before expenses
Distributions (Unaudited)
The Board of Trustees of Fidelity Advisor Large Cap Fund voted to pay to shareholders of record at the opening of business on record date, the following distributions per share derived from capital gains realized from sales of portfolio securities, and dividends derived from net investment income:
| Pay Date | Record Date | Dividends | Capital Gains | |
| Fidelity Advisor Large Cap Fund | ||||
| Class A | 12/27/17 | 12/26/17 | $0.376 | $2.132 |
| Class M | 12/27/17 | 12/26/17 | $0.294 | $2.132 |
| Class C | 12/27/17 | 12/26/17 | $0.151 | $2.132 |
| Class I | 12/27/17 | 12/26/17 | $0.468 | $2.132 |
| Class Z | 12/27/17 | 12/26/17 | $0.518 | $2.132 |
The fund hereby designates as a capital gain dividend with respect to the taxable year ended November 30, 2017, $75,721,269, or, if subsequently determined to be different, the net capital gain of such year.
Class A, Class M, Class C, and Class I designate 100% of the dividends distributed during the fiscal year as qualifying for the dividends–received deduction for corporate shareholders.
Class A, Class M, Class C, and Class I designate 100% of the dividends distributed during the fiscal year as amounts which may be taken into account as a dividend for purposes of the maximum rate under section 1(h)(11) of the Internal Revenue Code.
The fund will notify shareholders in January 2018 of amounts for use in preparing 2017 income tax returns.
Board Approval of Investment Advisory Contracts and Management Fees
Fidelity Advisor Large Cap Fund
Each year, the Board of Trustees, including the Independent Trustees (together, the Board), votes on the renewal of the management contract with Fidelity Management & Research Company (FMR) and the sub-advisory agreements (together, the Advisory Contracts) for the fund. FMR and the sub-advisers are referred to herein as the Investment Advisers. The Board, assisted by the advice of fund counsel and Independent Trustees' counsel, requests and considers a broad range of information relevant to the renewal of the Advisory Contracts throughout the year.
The Board meets regularly and, at each of its meetings, covers an extensive agenda of topics and materials and considers factors that are relevant to its annual consideration of the renewal of the fund's Advisory Contracts, including the services and support provided to the fund and its shareholders. The Board has established various standing committees (Committees), each composed of and chaired by Independent Trustees with varying backgrounds, to which the Board has assigned specific subject matter responsibilities in order to enhance effective decision-making by the Board. The Board, acting directly and through its Committees, requests and receives information concerning the annual consideration of the renewal of the fund's Advisory Contracts. The Board also meets as needed to review matters specifically related to the Board's annual consideration of the renewal of the Advisory Contracts. Members of the Board may also meet with trustees of other Fidelity funds through ad hoc joint committees to discuss certain matters relevant to all of the Fidelity funds.
At its July 2017 meeting, the Board unanimously determined to renew the fund's Advisory Contracts. In reaching its determination, the Board considered all factors it believed relevant, including (i) the nature, extent, and quality of the services to be provided to the fund and its shareholders (including the investment performance of the fund); (ii) the competitiveness of the fund's management fee and total expense ratio relative to peer funds; (iii) the total costs of the services to be provided by and the profits to be realized by Fidelity from its relationships with the fund; and (iv) the extent to which, if any, economies of scale exist and would be realized as the fund grows, and whether any economies of scale are appropriately shared with fund shareholders.
In considering whether to renew the Advisory Contracts for the fund, the Board reached a determination, with the assistance of fund counsel and Independent Trustees' counsel and through the exercise of its business judgment, that the renewal of the Advisory Contracts was in the best interests of the fund and its shareholders and that the compensation payable under the Advisory Contracts was fair and reasonable. The Board's decision to renew the Advisory Contracts was not based on any single factor, but rather was based on a comprehensive consideration of all the information provided to the Board at its meetings throughout the year. The Board, in reaching its determination to renew the Advisory Contracts, was aware that shareholders of the fund have a broad range of investment choices available to them, including a wide choice among funds offered by Fidelity's competitors, and that the fund's shareholders, who have the opportunity to review and weigh the disclosure provided by the fund in its prospectus and other public disclosures, have chosen to invest in this fund, which is part of the Fidelity family of funds.
Amendment to Group Fee Rate. The Board also approved an amendment to the management contract for the fund to add an additional breakpoint to the group fee schedule, effective October 1, 2017. The Board noted that the additional breakpoint would result in lower management fee rates as Fidelity's assets under management increase.
Nature, Extent, and Quality of Services Provided. The Board considered Fidelity's staffing as it relates to the fund, including the backgrounds of investment personnel of Fidelity, and also considered the fund's investment objective, strategies, and related investment philosophy. The Independent Trustees also had discussions with senior management of Fidelity's investment operations and investment groups. The Board considered the structure of the investment personnel compensation program and whether this structure provides appropriate incentives to act in the best interests of the fund. Additionally, the Board considered the portfolio managers' investments, if any, in the funds that they manage.Resources Dedicated to Investment Management and Support Services. The Board and the Fund Oversight and Research Committees reviewed the general qualifications and capabilities of Fidelity's investment staff, including its size, education, experience, and resources, as well as Fidelity's approach to recruiting, training, managing, and compensating investment personnel. The Board noted that Fidelity has continued to increase the resources devoted to non-U.S. offices, including expansion of Fidelity's global investment organization. The Board also noted that Fidelity's analysts have extensive resources, tools and capabilities that allow them to conduct sophisticated quantitative and fundamental analysis, as well as credit analysis of issuers, counterparties and guarantors. Further, the Board considered that Fidelity's investment professionals have sufficient access to global information and data so as to provide competitive investment results over time, and that those professionals also have access to sophisticated tools that permit them to assess portfolio construction and risk and performance attribution characteristics continuously, as well as to transmit new information and research conclusions rapidly around the world. Additionally, in its deliberations, the Board considered Fidelity's trading, risk management, compliance, and technology and operations capabilities and resources, which are integral parts of the investment management process.Shareholder and Administrative Services. The Board considered (i) the nature, extent, quality, and cost of advisory, administrative, and shareholder services performed by the Investment Advisers and their affiliates under the Advisory Contracts and under separate agreements covering transfer agency, pricing and bookkeeping, and securities lending services for the fund; (ii) the nature and extent of the supervision of third party service providers, principally custodians, subcustodians, and pricing vendors; and (iii) the resources devoted to, and the record of compliance with, the fund's compliance policies and procedures. The Board also reviewed the allocation of fund brokerage, including allocations to brokers affiliated with the Investment Advisers, the use of brokerage commissions to pay fund expenses, and the use of "soft" commission dollars to pay for research services.The Board noted that the growth of fund assets over time across the complex allows Fidelity to reinvest in the development of services designed to enhance the value or convenience of the Fidelity funds as investment vehicles. These services include 24-hour access to account information and market information through telephone representatives and over the Internet, investor education materials and asset allocation tools, and the expanded availability of Fidelity Investor Centers.In 2014, the Board formed an ad hoc Committee on Transfer Agency Fees to review the variety of transfer agency fee structures throughout the industry and Fidelity's competitive positioning with respect to industry participants.Investment in a Large Fund Family. The Board considered the benefits to shareholders of investing in a Fidelity fund, including the benefits of investing in a fund that is part of a large family of funds offering a variety of investment disciplines and providing a large variety of mutual fund investor services. The Board noted that Fidelity had taken, or had made recommendations that resulted in the Fidelity funds taking, a number of actions over the previous year that benefited particular funds, including: (i) continuing to dedicate additional resources to Fidelity's investment research process, and to the support of the senior management team that oversees asset management; (ii) continuing efforts to enhance Fidelity's global research capabilities; (iii) launching new funds and making other enhancements to meet client needs; (iv) launching new share classes of existing funds; (v) eliminating purchase minimums and broadening eligibility requirements for certain lower-priced share classes; (vi) reducing management fees and total expenses for certain growth equity funds and index funds; (vii) lowering expense caps for certain existing funds and classes to reduce expenses borne by shareholders; (viii) eliminating short-term redemption fees for certain funds; (ix) introducing a new pricing structure for certain funds of funds that is expected to reduce overall expenses paid by shareholders; (x) rationalizing product lines and gaining increased efficiencies through proposals for fund mergers and share class consolidations; (xi) continuing to develop, acquire and implement systems and technology to improve services to the funds and shareholders, strengthen information security, and increase efficiency; and (xii) implementing enhancements to further strengthen Fidelity's product line to increase investors' probability of success in achieving their investment goals, including retirement income goals.Investment Performance. The Board considered whether the fund has operated in accordance with its investment objective, as well as its record of compliance with its investment restrictions and its performance history.The Board took into account discussions with representatives of the Investment Advisers about fund investment performance that occur at Board meetings throughout the year. In this regard the Board noted that as part of regularly scheduled fund reviews and other reports to the Board on fund performance, the Board considers annualized return information for the fund for different time periods, measured against a securities market index ("benchmark index") and a peer group of funds with similar objectives ("peer group"), if any. In its evaluation of fund investment performance, the Board gave particular attention to information indicating changes in performance of certain Fidelity funds for specific time periods and discussed with the Investment Advisers the reasons for any overperformance or underperformance.In addition to reviewing absolute and relative fund performance, the Independent Trustees periodically consider the appropriateness of fund performance metrics in evaluating the results achieved. In general, the Independent Trustees believe that fund performance should be evaluated based on net performance (after fees and expenses) of both the highest performing and lowest performing fund share classes, where applicable, compared to appropriate benchmark indices, over appropriate time periods that may include full market cycles, and compared to peer groups, as applicable, over the same periods, taking into account relevant factors including the following: general market conditions; issuer-specific information; and fund cash flows and other factors.The Independent Trustees recognize that shareholders evaluate performance on a net basis over their own holding periods, for which one-, three-, and five-year periods are often used as a proxy. For this reason, the performance information reviewed by the Board also included net cumulative calendar year total return information for the fund and an appropriate benchmark index and peer group for the most recent one-, three-, and five-year periods, as shown below. Returns are shown compared to the 25th percentile (top of box, 75% beaten) and 75th percentile (bottom of box, 25% beaten) of the peer universe.Fidelity Advisor Large Cap Fund
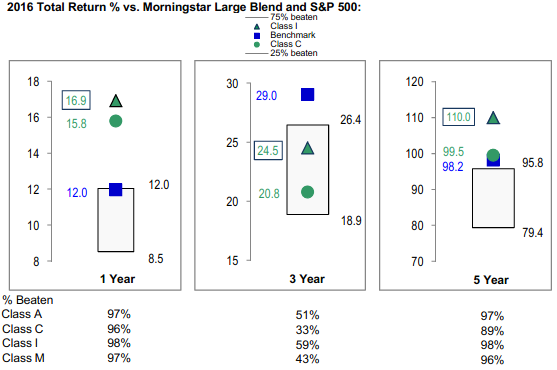
Fidelity Advisor Large Cap Fund
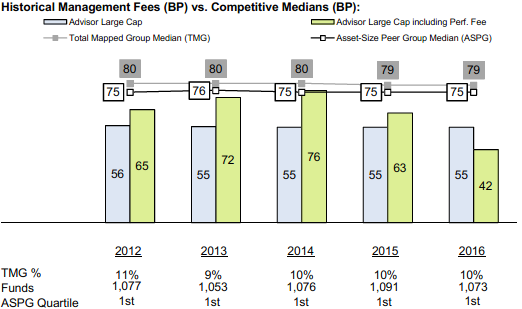
![]()
LC-ANN-0118
1.539156.120
Fidelity Advisor® Series Equity Growth Fund Annual Report November 30, 2017 |
|
Contents
Board Approval of Investment Advisory Contracts and Management Fees |
To view a fund's proxy voting guidelines and proxy voting record for the 12-month period ended June 30, visit http://www.fidelity.com/proxyvotingresults or visit the Securities and Exchange Commission's (SEC) web site at http://www.sec.gov.
You may also call 1-877-208-0098 to request a free copy of the proxy voting guidelines.
Standard & Poor's, S&P and S&P 500 are registered service marks of The McGraw-Hill Companies, Inc. and have been licensed for use by Fidelity Distributors Corporation.
Other third-party marks appearing herein are the property of their respective owners.
All other marks appearing herein are registered or unregistered trademarks or service marks of FMR LLC or an affiliated company. © 2018 FMR LLC. All rights reserved.
This report and the financial statements contained herein are submitted for the general information of the shareholders of the Fund. This report is not authorized for distribution to prospective investors in the Fund unless preceded or accompanied by an effective prospectus.
A fund files its complete schedule of portfolio holdings with the SEC for the first and third quarters of each fiscal year on Form N-Q. Forms N-Q are available on the SEC’s web site at http://www.sec.gov. A fund's Forms N-Q may be reviewed and copied at the SEC’s Public Reference Room in Washington, DC. Information regarding the operation of the SEC's Public Reference Room may be obtained by calling 1-800-SEC-0330.
For a complete list of a fund's portfolio holdings, view the most recent holdings listing, semiannual report, or annual report on Fidelity's web site at http://www.fidelity.com, http://www.institutional.fidelity.com, or http://www.401k.com, as applicable.
NOT FDIC INSURED •MAY LOSE VALUE •NO BANK GUARANTEE
Neither the Fund nor Fidelity Distributors Corporation is a bank.
Performance: The Bottom Line
Average annual total return reflects the change in the value of an investment, assuming reinvestment of distributions from dividend income and capital gains (the profits earned upon the sale of securities that have grown in value, if any) and assuming a constant rate of performance each year. The hypothetical investment and the average annual total returns do not reflect the deduction of taxes that a shareholder would pay on fund distributions or the redemption of fund shares. During periods of reimbursement by Fidelity, a fund’s total return will be greater than it would be had the reimbursement not occurred. How a fund did yesterday is no guarantee of how it will do tomorrow.
Average Annual Total Returns
| For the periods ended November 30, 2017 | Past 1 year | Life of fundA |
| Fidelity Advisor® Series Equity Growth Fund | 37.51% | 13.31% |
A From June 6, 2014
$10,000 Over Life of Fund
Let's say hypothetically that $10,000 was invested in Fidelity Advisor® Series Equity Growth Fund on June 6, 2014, when the fund started.
The chart shows how the value of your investment would have changed, and also shows how the Russell 3000® Growth Index performed over the same period.
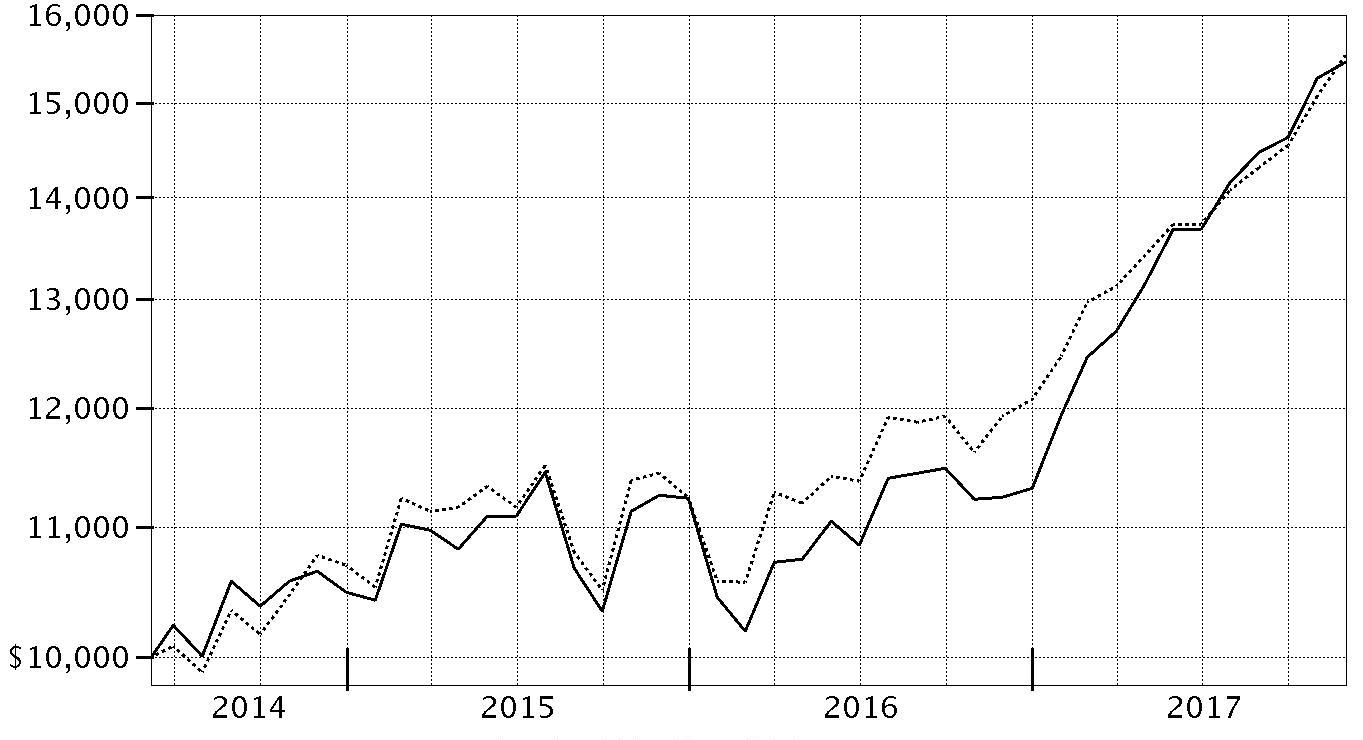
| Period Ending Values | ||
| $15,462 | Fidelity Advisor® Series Equity Growth Fund | |
| $15,535 | Russell 3000® Growth Index | |
Management's Discussion of Fund Performance
Market Recap: The U.S. equity bellwether S&P 500® index gained 22.87% for the year ending November 30, 2017, rising steadily and closing the period at an all-time high after a particularly strong three-month finish. Early on, equities rallied on optimism for President Trump’s pro-business agenda but leveled off in March amid fading optimism and stalled efforts by Congress to repeal and replace the Affordable Care Act. Upward momentum soon returned and continued through period end with consumer sentiment and other market indicators staying positive. The lone exception was a brief cooldown in August, when geopolitical tension escalated and uncertainty grew regarding the future of health care, tax reform and the debt ceiling. Sector-wise, info tech (+41%) led by a wide margin, surging amid strong earnings growth from several major index constituents. Utilities and financials each gained about 25%, the latter group riding an uptick in bond yields. Conversely, consumer discretionary (+20%) also rose solidly but lagged the broader market, as many brick-and-mortar retailers continued to suffer from increased online competition. Rising interest rates held back real estate (+16%), while consumer staples (+15%) and telecom (+1%) struggled due to investors’ general preference for risk assets. Lastly, sluggish oil prices pushed energy to a -4% return.Comments from Lead Portfolio Manager Jason Weiner: The fund rose 37.51% for the year, compared with 30.25% for the Russell 3000® Growth Index. Overall, active management added relative value in eight of 11 market sectors. Security selection in technology (software & services) significantly contributed, led by an overweighting in Facebook. Shares of the social-media giant were up nearly 50%, propelled by the broader market rally as well as the continued strength of the firm's revenue from mobile advertising. Stocks of several electronic payments processors also soared this period, including Square (+203%) and PayPal Holdings (+91%). These holdings benefited from expectations of a benign regulatory environment. In addition, Square rallied in November after the firm announced it would begin to test support for the digital currency Bitcoin on its payment application. Strong picks within the consumer sectors also notably contributed. Conversely, underweighting major index component Apple was by far the fund's largest detractor, as the stock rose roughly 58% amid better-than-expected sales for its iPhone® devices.The views expressed above reflect those of the portfolio manager(s) only through the end of the period as stated on the cover of this report and do not necessarily represent the views of Fidelity or any other person in the Fidelity organization. Any such views are subject to change at any time based upon market or other conditions and Fidelity disclaims any responsibility to update such views. These views may not be relied on as investment advice and, because investment decisions for a Fidelity fund are based on numerous factors, may not be relied on as an indication of trading intent on behalf of any Fidelity fund.
Note to shareholders: On July 1, 2017, Asher Anolic became Co-Portfolio Manager of the fund. Asher will serve as interim manager while Lead Portfolio Manager Jason Weiner is on a leave of absence from January 1, 2018, through mid-June 2018.Investment Summary (Unaudited)
Top Ten Stocks as of November 30, 2017
| % of fund's net assets | % of fund's net assets 6 months ago | |
| Alphabet, Inc. Class A | 6.5 | 6.3 |
| Amazon.com, Inc. | 4.7 | 4.4 |
| Apple, Inc. | 3.1 | 3.0 |
| Facebook, Inc. Class A | 3.0 | 6.9 |
| Home Depot, Inc. | 2.9 | 2.7 |
| Microsoft Corp. | 2.6 | 1.0 |
| Charles Schwab Corp. | 2.3 | 0.3 |
| Adobe Systems, Inc. | 2.3 | 2.0 |
| PayPal Holdings, Inc. | 1.8 | 1.4 |
| JPMorgan Chase & Co. | 1.8 | 1.3 |
| 31.0 |
Top Five Market Sectors as of November 30, 2017
| % of fund's net assets | % of fund's net assets 6 months ago | |
| Information Technology | 40.0 | 40.8 |
| Consumer Discretionary | 12.5 | 16.4 |
| Financials | 11.2 | 7.2 |
| Health Care | 10.7 | 11.2 |
| Industrials | 8.6 | 7.5 |
Asset Allocation (% of fund's net assets)
| As of November 30, 2017* | ||
| Stocks | 97.0% | |
| Convertible Securities | 0.1% | |
| Short-Term Investments and Net Other Assets (Liabilities) | 2.9% | |

* Foreign investments - 12.4%
| As of May 31, 2017* | ||
| Stocks | 97.8% | |
| Convertible Securities | 0.1% | |
| Short-Term Investments and Net Other Assets (Liabilities) | 2.1% | |

* Foreign investments - 10.9%
Investments November 30, 2017
Showing Percentage of Net Assets
| Common Stocks - 96.8% | |||
| Shares | Value | ||
| CONSUMER DISCRETIONARY - 12.5% | |||
| Diversified Consumer Services - 0.6% | |||
| Grand Canyon Education, Inc. (a) | 58,300 | $5,536,168 | |
| Hotels, Restaurants & Leisure - 1.1% | |||
| Dave & Buster's Entertainment, Inc. (a) | 119,300 | 6,326,479 | |
| Marriott International, Inc. Class A | 16,800 | 2,133,600 | |
| Wingstop, Inc. (b) | 46,700 | 1,830,173 | |
| 10,290,252 | |||
| Household Durables - 1.1% | |||
| Gree Electric Appliances, Inc. of Zhuhai Class A | 110,900 | 711,913 | |
| Panasonic Corp. | 617,700 | 9,244,355 | |
| 9,956,268 | |||
| Internet & Direct Marketing Retail - 4.9% | |||
| Amazon.com, Inc. (a) | 37,600 | 44,245,800 | |
| Priceline Group, Inc. (a) | 1,000 | 1,739,710 | |
| 45,985,510 | |||
| Media - 1.4% | |||
| Charter Communications, Inc. Class A (a) | 31,500 | 10,275,615 | |
| China Literature Ltd. (a)(c) | 177 | 2,040 | |
| Sirius XM Holdings, Inc. (b) | 497,600 | 2,736,800 | |
| 13,014,455 | |||
| Specialty Retail - 2.9% | |||
| Home Depot, Inc. | 151,200 | 27,188,784 | |
| Textiles, Apparel & Luxury Goods - 0.5% | |||
| Kering SA | 1,500 | 665,499 | |
| LVMH Moet Hennessy - Louis Vuitton SA (b) | 12,307 | 3,585,171 | |
| 4,250,670 | |||
| TOTAL CONSUMER DISCRETIONARY | 116,222,107 | ||
| CONSUMER STAPLES - 4.8% | |||
| Beverages - 1.1% | |||
| Constellation Brands, Inc. Class A (sub. vtg.) | 21,000 | 4,569,390 | |
| Fever-Tree Drinks PLC | 22,504 | 593,471 | |
| Kweichow Moutai Co. Ltd. (A Shares) | 27,780 | 2,650,815 | |
| Pernod Ricard SA ADR | 76,300 | 2,382,315 | |
| 10,195,991 | |||
| Food Products - 0.6% | |||
| Danone SA | 59,327 | 5,010,101 | |
| Hostess Brands, Inc. Class A (a) | 19,800 | 278,388 | |
| 5,288,489 | |||
| Household Products - 0.2% | |||
| Reckitt Benckiser Group PLC | 20,000 | 1,755,550 | |
| Personal Products - 2.3% | |||
| Coty, Inc. Class A (b) | 195,600 | 3,370,188 | |
| Estee Lauder Companies, Inc. Class A | 53,000 | 6,615,990 | |
| Herbalife Ltd. (a)(b) | 67,800 | 4,755,492 | |
| Unilever NV (NY Reg.) | 121,300 | 7,003,862 | |
| 21,745,532 | |||
| Tobacco - 0.6% | |||
| British American Tobacco PLC sponsored ADR | 95,700 | 6,089,391 | |
| TOTAL CONSUMER STAPLES | 45,074,953 | ||
| ENERGY - 2.1% | |||
| Oil, Gas & Consumable Fuels - 2.1% | |||
| Cheniere Energy, Inc. (a) | 295,200 | 14,264,064 | |
| Reliance Industries Ltd. | 367,483 | 5,251,263 | |
| 19,515,327 | |||
| FINANCIALS - 11.0% | |||
| Banks - 5.4% | |||
| Bank of America Corp. | 282,300 | 7,952,391 | |
| Citigroup, Inc. | 104,400 | 7,882,200 | |
| First Republic Bank | 88,400 | 8,445,736 | |
| HDFC Bank Ltd. sponsored ADR | 18,700 | 1,815,770 | |
| Home Bancshares, Inc. | 83,000 | 1,975,400 | |
| Huntington Bancshares, Inc. | 341,300 | 4,914,720 | |
| JPMorgan Chase & Co. | 161,400 | 16,869,528 | |
| Metro Bank PLC (a) | 16,900 | 789,431 | |
| 50,645,176 | |||
| Capital Markets - 5.6% | |||
| CBOE Holdings, Inc. | 7,752 | 956,829 | |
| Charles Schwab Corp. | 449,000 | 21,906,710 | |
| CME Group, Inc. | 96,638 | 14,451,247 | |
| Goldman Sachs Group, Inc. | 10,500 | 2,600,220 | |
| JMP Group, Inc. | 50,300 | 266,590 | |
| MSCI, Inc. | 43,200 | 5,559,840 | |
| The Blackstone Group LP | 208,400 | 6,610,448 | |
| 52,351,884 | |||
| TOTAL FINANCIALS | 102,997,060 | ||
| HEALTH CARE - 10.7% | |||
| Biotechnology - 4.2% | |||
| Alexion Pharmaceuticals, Inc. (a) | 32,818 | 3,603,745 | |
| Amgen, Inc. | 54,300 | 9,538,338 | |
| Biogen, Inc. (a) | 13,100 | 4,220,427 | |
| BioMarin Pharmaceutical, Inc. (a) | 26,700 | 2,290,860 | |
| Cytokinetics, Inc. (a) | 28,910 | 248,626 | |
| Insmed, Inc. (a) | 247,075 | 7,706,269 | |
| Samsung Biologics Co. Ltd. (a)(c) | 726 | 228,588 | |
| TESARO, Inc. (a) | 33,200 | 2,808,720 | |
| Vertex Pharmaceuticals, Inc. (a) | 55,667 | 8,032,191 | |
| 38,677,764 | |||
| Health Care Equipment & Supplies - 4.5% | |||
| Becton, Dickinson & Co. | 29,200 | 6,663,732 | |
| Boston Scientific Corp. (a) | 401,000 | 10,538,280 | |
| Danaher Corp. | 85,700 | 8,086,652 | |
| Intuitive Surgical, Inc. (a) | 33,200 | 13,272,696 | |
| ResMed, Inc. | 30,600 | 2,613,240 | |
| Sartorius Stedim Biotech | 14,800 | 1,058,704 | |
| 42,233,304 | |||
| Health Care Providers & Services - 0.3% | |||
| National Vision Holdings, Inc. | 3,300 | 107,547 | |
| OptiNose, Inc. | 4,300 | 82,087 | |
| UnitedHealth Group, Inc. | 11,300 | 2,578,321 | |
| 2,767,955 | |||
| Health Care Technology - 0.1% | |||
| Veeva Systems, Inc. Class A (a) | 15,700 | 945,297 | |
| Pharmaceuticals - 1.6% | |||
| Allergan PLC | 16,800 | 2,920,344 | |
| Astellas Pharma, Inc. | 177,700 | 2,258,989 | |
| Johnson & Johnson | 61,400 | 8,554,862 | |
| Mallinckrodt PLC (a) | 65,300 | 1,424,846 | |
| 15,159,041 | |||
| TOTAL HEALTH CARE | 99,783,361 | ||
| INDUSTRIALS - 8.6% | |||
| Aerospace & Defense - 0.4% | |||
| Axon Enterprise, Inc. (a)(b) | 43,777 | 1,089,172 | |
| TransDigm Group, Inc. | 10,500 | 2,979,795 | |
| 4,068,967 | |||
| Airlines - 0.3% | |||
| Ryanair Holdings PLC sponsored ADR (a) | 23,680 | 2,887,539 | |
| Commercial Services & Supplies - 0.6% | |||
| Copart, Inc. (a) | 79,000 | 3,409,640 | |
| KAR Auction Services, Inc. | 3,760 | 189,391 | |
| Prosegur Compania de Seguridad SA (Reg.) | 248,300 | 2,027,398 | |
| 5,626,429 | |||
| Electrical Equipment - 2.4% | |||
| AMETEK, Inc. | 127,200 | 9,246,168 | |
| Fortive Corp. | 138,150 | 10,312,898 | |
| Nidec Corp. | 22,200 | 3,032,772 | |
| 22,591,838 | |||
| Industrial Conglomerates - 2.1% | |||
| 3M Co. | 62,000 | 15,074,680 | |
| Roper Technologies, Inc. | 15,100 | 4,034,871 | |
| 19,109,551 | |||
| Machinery - 1.2% | |||
| Allison Transmission Holdings, Inc. | 244,800 | 10,046,592 | |
| Rational AG | 1,200 | 784,994 | |
| 10,831,586 | |||
| Professional Services - 1.6% | |||
| IHS Markit Ltd. (a) | 154,000 | 6,871,480 | |
| Robert Half International, Inc. | 48,400 | 2,760,736 | |
| TransUnion Holding Co., Inc. (a) | 97,639 | 5,420,917 | |
| 15,053,133 | |||
| TOTAL INDUSTRIALS | 80,169,043 | ||
| INFORMATION TECHNOLOGY - 39.9% | |||
| Electronic Equipment & Components - 0.2% | |||
| CDW Corp. | 31,600 | 2,212,316 | |
| Internet Software & Services - 15.5% | |||
| Alibaba Group Holding Ltd. sponsored ADR (a) | 72,300 | 12,802,884 | |
| Alphabet, Inc. Class A (a) | 58,400 | 60,512,327 | |
| CommerceHub, Inc.: | |||
| Series A (a) | 56,869 | 1,300,025 | |
| Series C (a) | 94,220 | 2,021,961 | |
| Facebook, Inc. Class A (a) | 158,300 | 28,047,594 | |
| GoDaddy, Inc. (a) | 101,900 | 4,957,435 | |
| NetEase, Inc. ADR | 8,600 | 2,826,906 | |
| Shopify, Inc. Class A (a) | 29,400 | 3,080,033 | |
| Stamps.com, Inc. (a) | 72,500 | 12,209,000 | |
| Tencent Holdings Ltd. | 211,400 | 10,823,922 | |
| VeriSign, Inc. (a) | 51,800 | 5,962,180 | |
| 144,544,267 | |||
| IT Services - 8.4% | |||
| Cognizant Technology Solutions Corp. Class A | 132,492 | 9,576,522 | |
| Fidelity National Information Services, Inc. | 50,700 | 4,782,531 | |
| Global Payments, Inc. | 79,900 | 8,034,744 | |
| MasterCard, Inc. Class A | 37,500 | 5,642,625 | |
| PayPal Holdings, Inc. (a) | 227,200 | 17,205,856 | |
| Square, Inc. (a) | 332,200 | 13,028,884 | |
| Vantiv, Inc. (a)(b) | 49,400 | 3,705,000 | |
| Visa, Inc. Class A | 147,100 | 16,561,989 | |
| 78,538,151 | |||
| Semiconductors & Semiconductor Equipment - 2.6% | |||
| ASML Holding NV | 22,800 | 4,001,856 | |
| Broadcom Ltd. | 17,800 | 4,947,332 | |
| Maxim Integrated Products, Inc. | 84,314 | 4,412,152 | |
| Monolithic Power Systems, Inc. | 21,348 | 2,526,536 | |
| Qualcomm, Inc. | 120,000 | 7,960,800 | |
| 23,848,676 | |||
| Software - 10.1% | |||
| Activision Blizzard, Inc. | 85,000 | 5,304,000 | |
| Adobe Systems, Inc. (a) | 116,700 | 21,177,549 | |
| Autodesk, Inc. (a) | 83,300 | 9,138,010 | |
| Blackbaud, Inc. | 12,800 | 1,260,160 | |
| Computer Modelling Group Ltd. | 166,300 | 1,270,951 | |
| Electronic Arts, Inc. (a) | 72,100 | 7,667,835 | |
| Intuit, Inc. | 32,100 | 5,046,762 | |
| Microsoft Corp. | 292,000 | 24,577,640 | |
| Red Hat, Inc. (a) | 46,000 | 5,830,960 | |
| Salesforce.com, Inc. (a) | 124,100 | 12,946,112 | |
| 94,219,979 | |||
| Technology Hardware, Storage & Peripherals - 3.1% | |||
| Apple, Inc. | 170,700 | 29,334,795 | |
| TOTAL INFORMATION TECHNOLOGY | 372,698,184 | ||
| MATERIALS - 3.5% | |||
| Chemicals - 2.3% | |||
| CF Industries Holdings, Inc. | 150,000 | 5,620,500 | |
| Sherwin-Williams Co. | 13,500 | 5,392,170 | |
| The Chemours Co. LLC | 102,400 | 5,263,360 | |
| Umicore SA | 105,941 | 4,944,235 | |
| 21,220,265 | |||
| Construction Materials - 1.2% | |||
| Eagle Materials, Inc. | 88,100 | 9,861,033 | |
| Summit Materials, Inc. | 51,400 | 1,581,064 | |
| 11,442,097 | |||
| TOTAL MATERIALS | 32,662,362 | ||
| REAL ESTATE - 3.4% | |||
| Equity Real Estate Investment Trusts (REITs) - 2.2% | |||
| American Tower Corp. | 108,400 | 15,602,012 | |
| Equinix, Inc. | 5,800 | 2,694,042 | |
| SBA Communications Corp. Class A (a) | 16,800 | 2,851,800 | |
| 21,147,854 | |||
| Real Estate Management & Development - 1.2% | |||
| Realogy Holdings Corp. | 394,900 | 11,021,659 | |
| TOTAL REAL ESTATE | 32,169,513 | ||
| UTILITIES - 0.3% | |||
| Electric Utilities - 0.3% | |||
| PG&E Corp. | 52,200 | 2,831,328 | |
| TOTAL COMMON STOCKS | |||
| (Cost $631,797,754) | 904,123,238 | ||
| Preferred Stocks - 0.3% | |||
| Convertible Preferred Stocks - 0.1% | |||
| INFORMATION TECHNOLOGY - 0.1% | |||
| IT Services - 0.1% | |||
| AppNexus, Inc. Series E (a)(d)(e) | 38,419 | 889,400 | |
| Nonconvertible Preferred Stocks - 0.2% | |||
| FINANCIALS - 0.2% | |||
| Banks - 0.2% | |||
| Itau Unibanco Holding SA sponsored ADR | 134,700 | 1,690,485 | |
| TOTAL PREFERRED STOCKS | |||
| (Cost $2,596,014) | 2,579,885 | ||
| Money Market Funds - 3.8% | |||
| Fidelity Cash Central Fund, 1.13% (f) | 20,268,450 | 20,272,504 | |
| Fidelity Securities Lending Cash Central Fund 1.13% (f)(g) | 14,815,410 | 14,816,892 | |
| TOTAL MONEY MARKET FUNDS | |||
| (Cost $35,089,396) | 35,089,396 | ||
| TOTAL INVESTMENT IN SECURITIES - 100.9% | |||
| (Cost $669,483,164) | 941,792,519 | ||
| NET OTHER ASSETS (LIABILITIES) - (0.9)% | (8,230,635) | ||
| NET ASSETS - 100% | $933,561,884 |
Legend
(a) Non-income producing
(b) Security or a portion of the security is on loan at period end.
(c) Security exempt from registration under Rule 144A of the Securities Act of 1933. These securities may be resold in transactions exempt from registration, normally to qualified institutional buyers. At the end of the period, the value of these securities amounted to $230,628 or 0.0% of net assets.
(d) Restricted securities - Investment in securities not registered under the Securities Act of 1933 (excluding 144A issues). At the end of the period, the value of restricted securities (excluding 144A issues) amounted to $889,400 or 0.1% of net assets.
(e) Level 3 security
(f) Affiliated fund that is generally available only to investment companies and other accounts managed by Fidelity Investments. The rate quoted is the annualized seven-day yield of the fund at period end. A complete unaudited listing of the fund's holdings as of its most recent quarter end is available upon request. In addition, each Fidelity Central Fund's financial statements, which are not covered by the Fund's Report of Independent Registered Public Accounting Firm, are available on the SEC's website or upon request.
(g) Investment made with cash collateral received from securities on loan.
Additional information on each restricted holding is as follows:
| Security | Acquisition Date | Acquisition Cost |
| AppNexus, Inc. Series E | 8/1/14 | $769,617 |
Affiliated Central Funds
Information regarding fiscal year to date income earned by the Fund from investments in Fidelity Central Funds is as follows:
| Fund | Income earned |
| Fidelity Cash Central Fund | $142,000 |
| Fidelity Securities Lending Cash Central Fund | 428,591 |
| Total | $570,591 |
Investment Valuation
The following is a summary of the inputs used, as of November 30, 2017, involving the Fund's assets and liabilities carried at fair value. The inputs or methodology used for valuing securities may not be an indication of the risk associated with investing in those securities. For more information on valuation inputs, and their aggregation into the levels used below, please refer to the Investment Valuation section in the accompanying Notes to Financial Statements.
| Valuation Inputs at Reporting Date: | ||||
| Description | Total | Level 1 | Level 2 | Level 3 |
| Investments in Securities: | ||||
| Equities: | ||||
| Consumer Discretionary | $116,222,107 | $103,392,581 | $12,829,526 | $-- |
| Consumer Staples | 45,074,953 | 38,309,302 | 6,765,651 | -- |
| Energy | 19,515,327 | 19,515,327 | -- | -- |
| Financials | 104,687,545 | 104,687,545 | -- | -- |
| Health Care | 99,783,361 | 97,524,372 | 2,258,989 | -- |
| Industrials | 80,169,043 | 77,136,271 | 3,032,772 | -- |
| Information Technology | 373,587,584 | 361,874,262 | 10,823,922 | 889,400 |
| Materials | 32,662,362 | 32,662,362 | -- | -- |
| Real Estate | 32,169,513 | 32,169,513 | -- | -- |
| Utilities | 2,831,328 | 2,831,328 | -- | -- |
| Money Market Funds | 35,089,396 | 35,089,396 | -- | -- |
| Total Investments in Securities: | $941,792,519 | $905,192,259 | $35,710,860 | $889,400 |
Other Information
Distribution of investments by country or territory of incorporation, as a percentage of Total Net Assets, is as follows (Unaudited):
| United States of America | 87.6% |
| Cayman Islands | 3.4% |
| Japan | 1.5% |
| France | 1.4% |
| Netherlands | 1.1% |
| Others (Individually Less Than 1%) | 5.0% |
| 100.0% |
See accompanying notes which are an integral part of the financial statements.
Financial Statements
Statement of Assets and Liabilities
| November 30, 2017 | ||
| Assets | ||
| Investment in securities, at value (including securities loaned of $14,475,486) — See accompanying schedule: Unaffiliated issuers (cost $634,393,768) | $906,703,123 | |
| Fidelity Central Funds (cost $35,089,396) | 35,089,396 | |
| Total Investment in Securities (cost $669,483,164) | $941,792,519 | |
| Foreign currency held at value (cost $182,458) | 182,613 | |
| Receivable for investments sold | 21,130,891 | |
| Receivable for fund shares sold | 13,880 | |
| Dividends receivable | 818,250 | |
| Distributions receivable from Fidelity Central Funds | 25,412 | |
| Prepaid expenses | 4,267 | |
| Other receivables | 4,287 | |
| Total assets | 963,972,119 | |
| Liabilities | ||
| Payable for investments purchased | $13,606,990 | |
| Payable for fund shares redeemed | 1,746,289 | |
| Other payables and accrued expenses | 243,092 | |
| Collateral on securities loaned | 14,813,864 | |
| Total liabilities | 30,410,235 | |
| Net Assets | $933,561,884 | |
| Net Assets consist of: | ||
| Paid in capital | $518,962,062 | |
| Undistributed net investment income | 4,414,460 | |
| Accumulated undistributed net realized gain (loss) on investments and foreign currency transactions | 138,096,702 | |
| Net unrealized appreciation (depreciation) on investments and assets and liabilities in foreign currencies | 272,088,660 | |
| Net Assets, for 60,572,462 shares outstanding | $933,561,884 | |
| Net Asset Value, offering price and redemption price per share ($933,561,884 ÷ 60,572,462 shares) | $15.41 |
See accompanying notes which are an integral part of the financial statements.
Statement of Operations
| Year ended November 30, 2017 | ||
| Investment Income | ||
| Dividends | $7,698,237 | |
| Interest | 2,581 | |
| Income from Fidelity Central Funds (including $428,591 from security lending) | 570,591 | |
| Total income | 8,271,409 | |
| Expenses | ||
| Management fee | ||
| Basic fee | $2,549,410 | |
| Performance adjustment | (574,399) | |
| Transfer agent fees | 788,537 | |
| Accounting and security lending fees | 157,625 | |
| Custodian fees and expenses | 41,692 | |
| Independent trustees' fees and expenses | 3,609 | |
| Audit | 23,154 | |
| Legal | 1,139 | |
| Interest | 9,042 | |
| Miscellaneous | 1,859 | |
| Total expenses before reductions | 3,001,668 | |
| Expense reductions | (32,882) | 2,968,786 |
| Net investment income (loss) | 5,302,623 | |
| Realized and Unrealized Gain (Loss) | ||
| Net realized gain (loss) on: | ||
| Investment securities: | ||
| Unaffiliated issuers (net of foreign taxes of $1,130) | 141,063,768 | |
| Fidelity Central Funds | 14,247 | |
| Foreign currency transactions | (43,379) | |
| Futures contracts | 2,248,588 | |
| Total net realized gain (loss) | 143,283,224 | |
| Change in net unrealized appreciation (depreciation) on: | ||
| Unaffiliated issuers (net of increase in deferred foreign taxes of $220,661) | 149,324,948 | |
| Fidelity Central Funds | (14,378) | |
| Assets and liabilities in foreign currencies | 2,771 | |
| Futures contracts | (555,053) | |
| Total change in net unrealized appreciation (depreciation) | 148,758,288 | |
| Net gain (loss) | 292,041,512 | |
| Net increase (decrease) in net assets resulting from operations | $297,344,135 |
See accompanying notes which are an integral part of the financial statements.
Statement of Changes in Net Assets
| Year ended November 30, 2017 | Year ended November 30, 2016 | |
| Increase (Decrease) in Net Assets | ||
| Operations | ||
| Net investment income (loss) | $5,302,623 | $1,310,366 |
| Net realized gain (loss) | 143,283,224 | 14,270,223 |
| Change in net unrealized appreciation (depreciation) | 148,758,288 | (17,525,762) |
| Net increase (decrease) in net assets resulting from operations | 297,344,135 | (1,945,173) |
| Distributions to shareholders from net investment income | (1,111,461) | (1,456,889) |
| Share transactions | ||
| Proceeds from sales of shares | 64,402,665 | 132,279,798 |
| Reinvestment of distributions | 1,111,461 | 1,456,889 |
| Cost of shares redeemed | (330,174,404) | (193,262,817) |
| Net increase (decrease) in net assets resulting from share transactions | (264,660,278) | (59,526,130) |
| Total increase (decrease) in net assets | 31,572,396 | (62,928,192) |
| Net Assets | ||
| Beginning of period | 901,989,488 | 964,917,680 |
| End of period | $933,561,884 | $901,989,488 |
| Other Information | ||
| Undistributed net investment income end of period | $4,414,460 | $475,461 |
| Shares | ||
| Sold | 4,902,858 | 12,128,698 |
| Issued in reinvestment of distributions | 97,497 | 133,293 |
| Redeemed | (24,836,652) | (17,651,190) |
| Net increase (decrease) | (19,836,297) | (5,389,199) |
See accompanying notes which are an integral part of the financial statements.
Financial Highlights
Fidelity Advisor Series Equity Growth Fund
| Years ended November 30, | 2017 | 2016 | 2015 | 2014 A |
| Selected Per–Share Data | ||||
| Net asset value, beginning of period | $11.22 | $11.25 | $10.65 | $10.00 |
| Income from Investment Operations | ||||
| Net investment income (loss)B | .08 | .02 | .02 | .01 |
| Net realized and unrealized gain (loss) | 4.12 | (.03) | .59 | .64 |
| Total from investment operations | 4.20 | (.01) | .61 | .65 |
| Distributions from net investment income | (.01) | (.02) | (.01) | – |
| Total distributions | (.01) | (.02) | (.01) | – |
| Net asset value, end of period | $15.41 | $11.22 | $11.25 | $10.65 |
| Total ReturnC,D | 37.51% | (.11)% | 5.70% | 6.50% |
| Ratios to Average Net AssetsE,F | ||||
| Expenses before reductions | .32% | .65% | .74% | .77%G |
| Expenses net of fee waivers, if any | .32% | .65% | .74% | .77%G |
| Expenses net of all reductions | .32% | .65% | .73% | .77%G |
| Net investment income (loss) | .57% | .15% | .19% | .23%G |
| Supplemental Data | ||||
| Net assets, end of period (000 omitted) | $933,562 | $901,989 | $964,918 | $986,534 |
| Portfolio turnover rateH | 48% | 60% | 65% | 26%I,J |
A For the period June 6, 2014 (commencement of operations) to November 30, 2014.
B Calculated based on average shares outstanding during the period.
C Total returns for periods of less than one year are not annualized.
D Total returns would have been lower if certain expenses had not been reduced during the applicable periods shown.
E Fees and expenses of any underlying Fidelity Central Funds are not included in the Fund's expense ratio. The Fund indirectly bears its proportionate share of the expenses of any underlying Fidelity Central Funds.
F Expense ratios reflect operating expenses of the Fund. Expenses before reductions do not reflect amounts reimbursed by the investment adviser or reductions from brokerage service arrangements or reductions from other expense offset arrangements and do not represent the amount paid by the Fund during periods when reimbursements or reductions occur. Expense ratios before reductions for start-up periods may not be representative of longer term operating periods. Expenses net of fee waivers reflect expenses after reimbursement by the investment adviser but prior to reductions from brokerage service arrangements or other expense offset arrangements. Expenses net of all reductions represent the net expenses paid by the Fund.
G Annualized
H Amount does not include the portfolio activity of any underlying Fidelity Central Funds.
I Portfolio turnover rate excludes securities received or delivered in-kind.
J Amount not annualized.
See accompanying notes which are an integral part of the financial statements.
Notes to Financial Statements
For the period ended November 30, 2017
1. Organization.
Fidelity Advisor Series Equity Growth Fund (the Fund) is a fund of Fidelity Advisor Series I (the Trust) and is authorized to issue an unlimited number of shares. Shares of the Fund are only available for purchase by mutual funds for which Fidelity Management & Research Company (FMR) or an affiliate serves as an investment manager. The Trust is registered under the Investment Company Act of 1940, as amended (the 1940 Act), as an open-end management investment company organized as a Massachusetts business trust.
2. Investments in Fidelity Central Funds.
The Fund invests in Fidelity Central Funds, which are open-end investment companies generally available only to other investment companies and accounts managed by the investment adviser and its affiliates. The Fund's Schedule of Investments lists each of the Fidelity Central Funds held as of period end, if any, as an investment of the Fund, but does not include the underlying holdings of each Fidelity Central Fund. As an Investing Fund, the Fund indirectly bears its proportionate share of the expenses of the underlying Fidelity Central Funds.
The Money Market Central Funds seek preservation of capital and current income and are managed by Fidelity Investments Money Management, Inc. (FIMM), an affiliate of the investment adviser. Annualized expenses of the Money Market Central Funds as of their most recent shareholder report date are less than .005%.
A complete unaudited list of holdings for each Fidelity Central Fund is available upon request or at the Securities and Exchange Commission (the SEC) website at www.sec.gov. In addition, the financial statements of the Fidelity Central Funds, which are not covered by the Fund's Report of Independent Registered Public Accounting Firm, are available on the SEC website or upon request.
3. Significant Accounting Policies.
The Fund is an investment company and applies the accounting and reporting guidance of the Financial Accounting Standards Board (FASB) Accounting Standards Codification Topic 946 Financial Services – Investments Companies. The financial statements have been prepared in conformity with accounting principles generally accepted in the United States of America (GAAP), which require management to make certain estimates and assumptions at the date of the financial statements. Actual results could differ from those estimates. Subsequent events, if any, through the date that the financial statements were issued have been evaluated in the preparation of the financial statements. The following summarizes the significant accounting policies of the Fund:
Investment Valuation. Investments are valued as of 4:00 p.m. Eastern time on the last calendar day of the period. The Board of Trustees (the Board) has delegated the day to day responsibility for the valuation of the Fund's investments to the Fair Value Committee (the Committee) established by the Fund's investment adviser. In accordance with valuation policies and procedures approved by the Board, the Fund attempts to obtain prices from one or more third party pricing vendors or brokers to value its investments. When current market prices, quotations or currency exchange rates are not readily available or reliable, investments will be fair valued in good faith by the Committee, in accordance with procedures adopted by the Board. Factors used in determining fair value vary by investment type and may include market or investment specific events. The frequency with which these procedures are used cannot be predicted and they may be utilized to a significant extent. The Committee oversees the Fund's valuation policies and procedures and reports to the Board on the Committee's activities and fair value determinations. The Board monitors the appropriateness of the procedures used in valuing the Fund's investments and ratifies the fair value determinations of the Committee.
The Fund categorizes the inputs to valuation techniques used to value its investments into a disclosure hierarchy consisting of three levels as shown below:
- Level 1 – quoted prices in active markets for identical investments
- Level 2 – other significant observable inputs (including quoted prices for similar investments, interest rates, prepayment speeds, etc.)
- Level 3 – unobservable inputs (including the Fund's own assumptions based on the best information available)
Valuation techniques used to value the Fund's investments by major category are as follows:
Equity securities, including restricted securities, for which market quotations are readily available, are valued at the last reported sale price or official closing price as reported by a third party pricing vendor on the primary market or exchange on which they are traded and are categorized as Level 1 in the hierarchy. In the event there were no sales during the day or closing prices are not available, securities are valued at the last quoted bid price or may be valued using the last available price and are generally categorized as Level 2 in the hierarchy. For foreign equity securities, when market or security specific events arise, comparisons to the valuation of American Depositary Receipts (ADRs), futures contracts, Exchange-Traded Funds (ETFs) and certain indexes as well as quoted prices for similar securities may be used and would be categorized as Level 2 in the hierarchy. Utilizing these techniques may result in transfers between Level 1 and Level 2. For equity securities, including restricted securities, where observable inputs are limited, assumptions about market activity and risk are used and these securities may be categorized as Level 3 in the hierarchy.
Investments in open-end mutual funds, including the Fidelity Central Funds, are valued at their closing net asset value (NAV) each business day and are categorized as Level 1 in the hierarchy.
Changes in valuation techniques may result in transfers in or out of an assigned level within the disclosure hierarchy. The aggregate value of investments by input level as of November 30, 2017 is included at the end of the Fund's Schedule of Investments.
Foreign Currency. The Fund may use foreign currency contracts to facilitate transactions in foreign-denominated securities. Gains and losses from these transactions may arise from changes in the value of the foreign currency or if the counterparties do not perform under the contracts' terms.
Foreign-denominated assets, including investment securities, and liabilities are translated into U.S. dollars at the exchange rates at period end. Purchases and sales of investment securities, income and dividends received and expenses denominated in foreign currencies are translated into U.S. dollars at the exchange rate in effect on the transaction date.
The effects of exchange rate fluctuations on investments are included with the net realized and unrealized gain (loss) on investment securities. Other foreign currency transactions resulting in realized and unrealized gain (loss) are disclosed separately.
Investment Transactions and Income. For financial reporting purposes, the Fund's investment holdings and NAV include trades executed through the end of the last business day of the period. The NAV per share for processing shareholder transactions is calculated as of the close of business of the New York Stock Exchange (NYSE), normally 4:00 p.m. Eastern time and includes trades executed through the end of the prior business day. Gains and losses on securities sold are determined on the basis of identified cost. Dividend income is recorded on the ex-dividend date, except for certain dividends from foreign securities where the ex-dividend date may have passed, which are recorded as soon as the Fund is informed of the ex-dividend date. Non-cash dividends included in dividend income, if any, are recorded at the fair market value of the securities received. Income and capital gain distributions from Fidelity Central Funds, if any, are recorded on the ex-dividend date. Certain distributions received by the Fund represent a return of capital or capital gain. The Fund determines the components of these distributions subsequent to the ex-dividend date, based upon receipt of tax filings or other correspondence relating to the underlying investment. These distributions are recorded as a reduction of cost of investments and/or as a realized gain. Interest income is accrued as earned and includes coupon interest and amortization of premium and accretion of discount on debt securities as applicable. Investment income is recorded net of foreign taxes withheld where recovery of such taxes is uncertain.
Expenses. Expenses directly attributable to a fund are charged to that fund. Expenses attributable to more than one fund are allocated among the respective funds on the basis of relative net assets or other appropriate methods. Expense estimates are accrued in the period to which they relate and adjustments are made when actual amounts are known.
Income Tax Information and Distributions to Shareholders. Each year, the Fund intends to qualify as a regulated investment company under Subchapter M of the Internal Revenue Code, including distributing substantially all of its taxable income and realized gains. As a result, no provision for U.S. Federal income taxes is required. As of November 30, 2017, the Fund did not have any unrecognized tax benefits in the financial statements; nor is the Fund aware of any tax positions for which it is reasonably possible that the total amounts of unrecognized tax benefits will significantly change in the next twelve months. The Fund files a U.S. federal tax return, in addition to state and local tax returns as required. The Fund's federal income tax returns are subject to examination by the Internal Revenue Service (IRS) for a period of three fiscal years after they are filed. State and local tax returns may be subject to examination for an additional fiscal year depending on the jurisdiction. Foreign taxes are provided for based on the Fund's understanding of the tax rules and rates that exist in the foreign markets in which it invests. The Fund is subject to a tax imposed on capital gains by certain countries in which it invests. An estimated deferred tax liability for net unrealized appreciation on the applicable securities is included in Other payables and accrued expenses on the Statement of Assets & Liabilities.
Distributions are declared and recorded on the ex-dividend date. Income and capital gain distributions are determined in accordance with income tax regulations, which may differ from GAAP.
Capital accounts within the financial statements are adjusted for permanent book-tax differences. These adjustments have no impact on net assets or the results of operations. Capital accounts are not adjusted for temporary book-tax differences which will reverse in a subsequent period.
Book-tax differences are primarily due to futures contracts, foreign currency transactions, certain foreign taxes, passive foreign investment companies (PFIC), market discount, partnerships, capital loss carryforwards and losses deferred due to wash sales.
As of period end, the cost and unrealized appreciation (depreciation) in securities, and derivatives if applicable, for federal income tax purposes were as follows:
| Gross unrealized appreciation | $279,867,820 |
| Gross unrealized depreciation | (7,733,181) |
| Net unrealized appreciation (depreciation) | $272,134,639 |
| Tax Cost | $669,657,880 |
The tax-based components of distributable earnings as of period end were as follows:
| Undistributed ordinary income | $17,932,746 |
| Undistributed long-term capital gain | $124,753,133 |
| Net unrealized appreciation (depreciation) on securities and other investments | $272,134,605 |
The tax character of distributions paid was as follows:
| November 30, 2017 | November 30, 2016 | |
| Ordinary Income | $1,111,461 | $ 1,456,889 |
| Total | $1,111,461 | $ 1,456,889 |
Restricted Securities. The Fund may invest in securities that are subject to legal or contractual restrictions on resale. These securities generally may be resold in transactions exempt from registration or to the public if the securities are registered. Disposal of these securities may involve time-consuming negotiations and expense, and prompt sale at an acceptable price may be difficult. Information regarding restricted securities is included at the end of the Fund's Schedule of Investments.
4. Derivative Instruments.
Risk Exposures and the Use of Derivative Instruments. The Fund's investment objective allows the Fund to enter into various types of derivative contracts, including futures contracts. Derivatives are investments whose value is primarily derived from underlying assets, indices or reference rates and may be transacted on an exchange or over-the-counter (OTC). Derivatives may involve a future commitment to buy or sell a specified asset based on specified terms, to exchange future cash flows at periodic intervals based on a notional principal amount, or for one party to make one or more payments upon the occurrence of specified events in exchange for periodic payments from the other party.
The Fund used derivatives to increase returns and to manage exposure to certain risks as defined below. The success of any strategy involving derivatives depends on analysis of numerous economic factors, and if the strategies for investment do not work as intended, the Fund may not achieve its objectives.
The Fund's use of derivatives increased or decreased its exposure to the following risk:
| Equity Risk | Equity risk relates to the fluctuations in the value of financial instruments as a result of changes in market prices (other than those arising from interest rate risk or foreign exchange risk), whether caused by factors specific to an individual investment, its issuer, or all factors affecting all instruments traded in a market or market segment. |
The Fund is also exposed to additional risks from investing in derivatives, such as liquidity risk and counterparty credit risk. Liquidity risk is the risk that the Fund will be unable to close out the derivative in the open market in a timely manner. Counterparty credit risk is the risk that the counterparty will not be able to fulfill its obligation to the Fund. Derivative counterparty credit risk is managed through formal evaluation of the creditworthiness of all potential counterparties.
Investing in derivatives may involve greater risks than investing in the underlying assets directly and, to varying degrees, may involve risk of loss in excess of any initial investment and collateral received and amounts recognized in the Statement of Assets and Liabilities. In addition, there may be the risk that the change in value of the derivative contract does not correspond to the change in value of the underlying instrument.
Futures Contracts. A futures contract is an agreement between two parties to buy or sell a specified underlying instrument for a fixed price at a specified future date. The Fund used futures contracts to manage its exposure to the stock market.
Upon entering into a futures contract, a fund is required to deposit either cash or securities (initial margin) with a clearing broker in an amount equal to a certain percentage of the face value of the contract. Futures contracts are marked-to-market daily and subsequent daily payments (variation margin) are made or received by a fund depending on the daily fluctuations in the value of the futures contracts and are recorded as unrealized appreciation or (depreciation). This receivable and/or payable, if any, is included in daily variation margin on futures contracts in the Statement of Assets and Liabilities. Realized gain or (loss) is recorded upon the expiration or closing of a futures contract. The net realized gain (loss) and change in net unrealized appreciation (depreciation) on futures contracts during the period is presented in the Statement of Operations.
Any open futures contracts at period end are presented in the Schedule of Investments under the caption "Futures Contracts". The notional amount at value reflects each contract's exposure to the underlying instrument or index at period end.
5. Purchases and Sales of Investments.
Purchases and sales of securities, other than short-term securities, aggregated $433,554,311 and $666,946,305, respectively.
6. Fees and Other Transactions with Affiliates.
Management Fee. Effective June 1, 2017, under the management contract approved by the Board and shareholders, Fidelity Management & Research Company (the investment adviser) and its affiliates provide the Fund with investment management related services for which the Fund does not pay a management fee. In addition, the investment adviser pays all ordinary operating expenses of the Fund, except custody fees, fees and expenses of the independent Trustees, and certain miscellaneous expenses such as proxy and shareholder meeting expenses.
Prior to June 1, 2017, the investment adviser and its affiliates provided the Fund with investment management related services for which the Fund paid a monthly management fee. The management fee was the sum of an individual fund fee rate that was based on an annual rate of .30% of the Fund's average net assets and an annualized group fee rate that averaged .25% during the period. The group fee rate was based upon the average net assets of all the mutual funds advised by the investment adviser, including any mutual funds previously advised by the investment adviser that are currently advised by Fidelity SelectCo, LLC, an affiliate of the investment adviser. The group fee rate decreased as assets under management increased and increased as assets under management decreased. In addition, the management fee was subject to a performance adjustment (up to a maximum of +/- .20% of the Fund's average net assets over a 36 month performance period). The upward or downward adjustment to the management fee was based on the Fund's relative investment performance as compared to its benchmark index, the Russell 3000 Growth Index, over the same 36 month performance period. The performance adjustment included in the management fee rate may be higher or lower than the maximum performance adjustment rate due to the difference between the average net assets for the reporting and performance periods.
Transfer Agent Fees. Fidelity Investments Institutional Operations Company, Inc. (FIIOC), an affiliate of the investment adviser, is the Fund's transfer, dividend disbursing and shareholder servicing agent. Effective June 1, 2017, fees for these services are no longer charged to the classes. Prior to June 1, 2017, FIIOC received account fees and asset-based fees that varied according to account size and type of account. FIIOC pays for typesetting, printing and mailing of shareholder reports, except proxy statements. For the period, the transfer agent fees were equivalent to a rate of .08% of average net assets.
Accounting and Security Lending Fees. Fidelity Service Company, Inc. (FSC), an affiliate of the investment adviser, maintains the Fund's accounting records. The accounting fee is based on the level of average net assets for each month. Under a separate contract, FSC administers the security lending program. The security lending fee is based on the number and duration of lending transactions. Effective June 1, 2017, these fees are paid by the investment adviser or an affiliate.
Brokerage Commissions. The Fund placed a portion of its portfolio transactions with brokerage firms which are affiliates of the investment adviser. Brokerage commissions are included in net realized gain (loss) and change in net unrealized appreciation (depreciation) in the Statement of Operations. The commissions paid to these affiliated firms were $15,158 for the period.
Interfund Lending Program. Pursuant to an Exemptive Order issued by the SEC, the Fund, along with other registered investment companies having management contracts with FMR or other affiliated entities of FMR, may participate in an interfund lending program. This program provides an alternative credit facility allowing the funds to borrow from, or lend money to, other participating affiliated funds. At period end, there were no interfund loans outstanding. The Fund's activity in this program during the period for which loans were outstanding was as follows:
| Borrower or Lender | Average Loan Balance | Weighted Average Interest Rate | Interest Expense |
| Borrower | $33,577,875 | 1.21% | $9,042 |
Interfund Trades. The Fund may purchase from or sell securities to other Fidelity Funds under procedures adopted by the Board. The procedures have been designed to ensure these interfund trades are executed in accordance with Rule 17a-7 of the 1940 Act. Interfund trades are included within the respective purchases and sales amounts shown in the Purchases and Sales of Investments note.
7. Committed Line of Credit.
The Fund participates with other funds managed by the investment adviser or an affiliate in a $4.25 billion credit facility (the "line of credit") to be utilized for temporary or emergency purposes to fund shareholder redemptions or for other short-term liquidity purposes. The Fund has agreed to pay commitment fees on its pro-rata portion of the line of credit, which amounted to $2,975 and is reflected in Miscellaneous expenses on the Statement of Operations. During the period, the Fund did not borrow on this line of credit.
8. Security Lending.
The Fund lends portfolio securities through a lending agent from time to time in order to earn additional income. For equity securities, a lending agent is used and may loan securities to certain qualified borrowers, including Fidelity Capital Markets (FCM), a broker-dealer affiliated with the Fund. On the settlement date of the loan, the Fund receives collateral (in the form of U.S. Treasury obligations, letters of credit and/or cash) against the loaned securities and maintains collateral in an amount not less than 100% of the market value of the loaned securities during the period of the loan. The market value of the loaned securities is determined at the close of business of the Fund and any additional required collateral is delivered to the Fund on the next business day. The Fund or borrower may terminate the loan at any time, and if the borrower defaults on its obligation to return the securities loaned because of insolvency or other reasons, the Fund may apply collateral received from the borrower against the obligation. The Fund may experience delays and costs in recovering the securities loaned. Any cash collateral received is invested in the Fidelity Securities Lending Cash Central Fund. The value of loaned securities and cash collateral at period end are disclosed on the Fund's Statement of Assets and Liabilities. At period end, there were no security loans outstanding with FCM. Security lending income represents the income earned on investing cash collateral, less rebates paid to borrowers and any lending agent fees associated with the loan, plus any premium payments received for lending certain types of securities. Security lending income is presented in the Statement of Operations as a component of income from Fidelity Central Funds, and includes $604 from securities loaned to FCM.
9. Expense Reductions.
Commissions paid to certain brokers with whom the investment adviser, or its affiliates, places trades on behalf of the Fund include an amount in addition to trade execution, which may be rebated back to the Fund to offset certain expenses. This amount totaled $24,754 for the period.
In addition, during the period the investment adviser reimbursed and/or waived a portion of operating expenses in the amount of $8,128.
Effective June 1, 2017, the investment adviser will contractually reimburse expenses of the Fund to the extent annual operating expenses exceed .014% of average net assets. Fees and expenses of the independent Trustees and certain miscellaneous expenses such as proxy and shareholder meeting expenses will be excluded from this reimbursement.
10. Other.
The Fund's organizational documents provide former and current trustees and officers with a limited indemnification against liabilities arising in connection with the performance of their duties to the Fund. In the normal course of business, the Fund may also enter into contracts that provide general indemnifications. The Fund's maximum exposure under these arrangements is unknown as this would be dependent on future claims that may be made against the Fund. The risk of material loss from such claims is considered remote.
At the end of the period, mutual funds managed by the investment adviser or its affiliates were the owners of record of all of the outstanding shares of the Fund.
Report of Independent Registered Public Accounting Firm
To the Trustees of Fidelity Advisor Series I and Shareholders of Fidelity Advisor Series Equity Growth Fund:
In our opinion, the accompanying statement of assets and liabilities, including the schedule of investments, and the related statements of operations and of changes in net assets and the financial highlights present fairly, in all material respects, the financial position of Fidelity Advisor Series Equity Growth Fund (a fund of Fidelity Advisor Series I) as of November 30, 2017, the results of its operations for the year then ended, the changes in its net assets for each of the two years in the period then ended and the financial highlights for each of the periods indicated, in conformity with accounting principles generally accepted in the United States of America. These financial statements and financial highlights (hereafter referred to as “financial statements”) are the responsibility of the Fidelity Advisor Series Equity Growth Fund’s management. Our responsibility is to express an opinion on these financial statements based on our audits. We conducted our audits of these financial statements in accordance with the standards of the Public Company Accounting Oversight Board (United States). Those standards require that we plan and perform the audit to obtain reasonable assurance about whether the financial statements are free of material misstatement. An audit includes examining, on a test basis, evidence supporting the amounts and disclosures in the financial statements, assessing the accounting principles used and significant estimates made by management, and evaluating the overall financial statement presentation. Our procedures included confirmation of securities owned as of November 30, 2017 by correspondence with the custodian and brokers; when replies were not received from brokers, we performed other auditing procedures. We believe that our audits provide a reasonable basis for our opinion.
PricewaterhouseCoopers LLP
Boston, Massachusetts
January 18, 2018
Trustees and Officers
The Trustees, Members of the Advisory Board (if any), and officers of the trust and fund, as applicable, are listed below. The Board of Trustees governs the fund and is responsible for protecting the interests of shareholders. The Trustees are experienced executives who meet periodically throughout the year to oversee the fund's activities, review contractual arrangements with companies that provide services to the fund, oversee management of the risks associated with such activities and contractual arrangements, and review the fund's performance. Each of the Trustees oversees 190 funds.
The Trustees hold office without limit in time except that (a) any Trustee may resign; (b) any Trustee may be removed by written instrument, signed by at least two-thirds of the number of Trustees prior to such removal; (c) any Trustee who requests to be retired or who has become incapacitated by illness or injury may be retired by written instrument signed by a majority of the other Trustees; and (d) any Trustee may be removed at any special meeting of shareholders by a two-thirds vote of the outstanding voting securities of the trust. Each Trustee who is not an interested person (as defined in the 1940 Act) of the trust and the fund is referred to herein as an Independent Trustee. Each Independent Trustee shall retire not later than the last day of the calendar year in which his or her 75th birthday occurs. The Independent Trustees may waive this mandatory retirement age policy with respect to individual Trustees. Officers and Advisory Board Members hold office without limit in time, except that any officer or Advisory Board Member may resign or may be removed by a vote of a majority of the Trustees at any regular meeting or any special meeting of the Trustees. Except as indicated, each individual has held the office shown or other offices in the same company for the past five years.
The fund’s Statement of Additional Information (SAI) includes more information about the Trustees. To request a free copy, call Fidelity at 1-877-208-0098.
Experience, Skills, Attributes, and Qualifications of the Trustees. The Governance and Nominating Committee has adopted a statement of policy that describes the experience, qualifications, attributes, and skills that are necessary and desirable for potential Independent Trustee candidates (Statement of Policy). The Board believes that each Trustee satisfied at the time he or she was initially elected or appointed a Trustee, and continues to satisfy, the standards contemplated by the Statement of Policy. The Governance and Nominating Committee also engages professional search firms to help identify potential Independent Trustee candidates who have the experience, qualifications, attributes, and skills consistent with the Statement of Policy. From time to time, additional criteria based on the composition and skills of the current Independent Trustees, as well as experience or skills that may be appropriate in light of future changes to board composition, business conditions, and regulatory or other developments, have also been considered by the professional search firms and the Governance and Nominating Committee. In addition, the Board takes into account the Trustees' commitment and participation in Board and committee meetings, as well as their leadership of standing and ad hoc committees throughout their tenure.
In determining that a particular Trustee was and continues to be qualified to serve as a Trustee, the Board has considered a variety of criteria, none of which, in isolation, was controlling. The Board believes that, collectively, the Trustees have balanced and diverse experience, qualifications, attributes, and skills, which allow the Board to operate effectively in governing the fund and protecting the interests of shareholders. Information about the specific experience, skills, attributes, and qualifications of each Trustee, which in each case led to the Board's conclusion that the Trustee should serve (or continue to serve) as a trustee of the fund, is provided below.
Board Structure and Oversight Function. James C. Curvey is an interested person and currently serves as Chairman. The Trustees have determined that an interested Chairman is appropriate and benefits shareholders because an interested Chairman has a personal and professional stake in the quality and continuity of services provided to the fund. Independent Trustees exercise their informed business judgment to appoint an individual of their choosing to serve as Chairman, regardless of whether the Trustee happens to be independent or a member of management. The Independent Trustees have determined that they can act independently and effectively without having an Independent Trustee serve as Chairman and that a key structural component for assuring that they are in a position to do so is for the Independent Trustees to constitute a substantial majority for the Board. The Independent Trustees also regularly meet in executive session. Ned C. Lautenbach serves as Chairman of the Independent Trustees and as such (i) acts as a liaison between the Independent Trustees and management with respect to matters important to the Independent Trustees and (ii) with management prepares agendas for Board meetings.
Fidelity® funds are overseen by different Boards of Trustees. The fund's Board oversees Fidelity's high income and certain equity funds, and other Boards oversee Fidelity's investment-grade bond, money market, asset allocation, and sector funds. The asset allocation funds may invest in Fidelity® funds overseen by the fund's Board. The use of separate Boards, each with its own committee structure, allows the Trustees of each group of Fidelity® funds to focus on the unique issues of the funds they oversee, including common research, investment, and operational issues. On occasion, the separate Boards establish joint committees to address issues of overlapping consequences for the Fidelity® funds overseen by each Board.
The Trustees operate using a system of committees to facilitate the timely and efficient consideration of all matters of importance to the Trustees, the fund, and fund shareholders and to facilitate compliance with legal and regulatory requirements and oversight of the fund's activities and associated risks. The Board, acting through its committees, has charged FMR and its affiliates with (i) identifying events or circumstances the occurrence of which could have demonstrably adverse effects on the fund's business and/or reputation; (ii) implementing processes and controls to lessen the possibility that such events or circumstances occur or to mitigate the effects of such events or circumstances if they do occur; and (iii) creating and maintaining a system designed to evaluate continuously business and market conditions in order to facilitate the identification and implementation processes described in (i) and (ii) above. Because the day-to-day operations and activities of the fund are carried out by or through FMR, its affiliates, and other service providers, the fund's exposure to risks is mitigated but not eliminated by the processes overseen by the Trustees. While each of the Board's committees has responsibility for overseeing different aspects of the fund's activities, oversight is exercised primarily through the Operations, Audit, and Compliance Committees. In addition, the Independent Trustees have worked with FMR to enhance the Board's oversight of investment and financial risks, legal and regulatory risks, technology risks, and operational risks, including the development of additional risk reporting to the Board. For example, a working group comprised of Independent Trustees and FMR has worked and continues to work to review the Fidelity® funds' valuation-related activities, reporting and risk management. Appropriate personnel, including but not limited to the fund's Chief Compliance Officer (CCO), FMR's internal auditor, the independent accountants, the fund's Treasurer and portfolio management personnel, make periodic reports to the Board's committees, as appropriate, including an annual review of Fidelity's risk management program for the Fidelity® funds. The responsibilities of each standing committee, including their oversight responsibilities, are described further under "Standing Committees of the Trustees."
Interested Trustees*:
Correspondence intended for a Trustee who is an interested person may be sent to Fidelity Investments, 245 Summer Street, Boston, Massachusetts 02210.
Name, Year of Birth; Principal Occupations and Other Relevant Experience+
James C. Curvey (1935)
Year of Election or Appointment: 2007
Trustee
Chairman of the Board of Trustees
Mr. Curvey also serves as Trustee of other Fidelity® funds. Mr. Curvey is a Director of Fidelity Research & Analysis Co. (investment adviser firm, 2009-present), and Vice Chairman (2007-present) and Director of FMR LLC (diversified financial services company). In addition, Mr. Curvey serves as an Overseer for the Boston Symphony Orchestra and a member of the board of Artis-Naples, Naples, Florida, and as a Trustee for Brewster Academy, Wolfeboro, New Hampshire. Previously, Mr. Curvey served as a Director of Fidelity Investments Money Management, Inc. (investment adviser firm, 2009-2014) and a Director of FMR and FMR Co., Inc. (investment adviser firms, 2007-2014).
Charles S. Morrison (1960)
Year of Election or Appointment: 2014
Trustee
Mr. Morrison also serves as Trustee of other funds. He serves as President of Fidelity Management & Research Company (FMR) (investment adviser firm, 2016-present), a Director of Fidelity Investments Money Management, Inc. (FIMM) (investment adviser firm, 2014-present), Director of Fidelity SelectCo, LLC (investment adviser firm, 2014-present), President, Asset Management (2014-present), and is an employee of Fidelity Investments. Previously, Mr. Morrison served as Vice President of Fidelity's Fixed Income and Asset Allocation Funds (2012-2014), President, Fixed Income (2011-2014), Vice President of Fidelity's Money Market Funds (2005-2009), President, Money Market Group Leader of FMR (investment adviser firm, 2009), and Senior Vice President, Money Market Group of FMR (2004-2009). Mr. Morrison also served as Vice President of Fidelity's Bond Funds (2002-2005), certain Balanced Funds (2002-2005), and certain Asset Allocation Funds (2002-2007), and as Senior Vice President (2002-2005) of Fidelity's Bond Division.
* Determined to be an “Interested Trustee” by virtue of, among other things, his or her affiliation with the trust or various entities under common control with FMR.
+ The information includes the Trustee's principal occupation during the last five years and other information relating to the experience, attributes, and skills relevant to the Trustee's qualifications to serve as a Trustee, which led to the conclusion that the Trustee should serve as a Trustee for the fund.
Independent Trustees:
Correspondence intended for an Independent Trustee may be sent to Fidelity Investments, P.O. Box 55235, Boston, Massachusetts 02205-5235.
Name, Year of Birth; Principal Occupations and Other Relevant Experience+
Dennis J. Dirks (1948)
Year of Election or Appointment: 2005
Trustee
Mr. Dirks also serves as Trustee of other Fidelity® funds. Prior to his retirement in May 2003, Mr. Dirks was Chief Operating Officer and a member of the Board of The Depository Trust & Clearing Corporation (DTCC). He also served as President, Chief Operating Officer, and Board member of The Depository Trust Company (DTC) and President and Board member of the National Securities Clearing Corporation (NSCC). In addition, Mr. Dirks served as Chief Executive Officer and Board member of the Government Securities Clearing Corporation, Chief Executive Officer and Board member of the Mortgage-Backed Securities Clearing Corporation, as a Trustee and a member of the Finance Committee of Manhattan College (2005-2008), as a Trustee and a member of the Finance Committee of AHRC of Nassau County (2006-2008), as a member of the Independent Directors Council (IDC) Governing Council (2010-2015), and as a member of the Board of Directors for The Brookville Center for Children’s Services, Inc. (2009-2017). Mr. Dirks is a member of the Finance Committee (2016-present) and Board of Directors (2017-present) of the Asolo Repertory Theatre.
Alan J. Lacy (1953)
Year of Election or Appointment: 2008
Trustee
Mr. Lacy also serves as Trustee of other Fidelity® funds. Mr. Lacy serves as a Director of Bristol-Myers Squibb Company (global pharmaceuticals, 2008-present). He is a Trustee of the California Chapter of The Nature Conservancy (2015-present) and a Director of the Center for Advanced Study in the Behavioral Sciences at Stanford University (2015-present). In addition, Mr. Lacy served as Senior Adviser (2007-2014) of Oak Hill Capital Partners, L.P. (private equity) and also served as Chief Executive Officer (2005) and Vice Chairman (2005-2006) of Sears Holdings Corporation (retail) and Chief Executive Officer and Chairman of the Board of Sears, Roebuck and Co. (retail, 2000-2005). Previously, Mr. Lacy served as Chairman (2014-2017) and a member (2010-2017) of the Board of Directors of Dave & Buster’s Entertainment, Inc. (restaurant and entertainment complexes), as Chairman (2008-2011) and a member (2006-2015) of the Board of Trustees of the National Parks Conservation Association, and as a member of the Board of Directors for The Hillman Companies, Inc. (hardware wholesalers, 2010-2014), Earth Fare, Inc. (retail grocery, 2010-2014), and The Western Union Company (global money transfer, 2006-2011).
Ned C. Lautenbach (1944)
Year of Election or Appointment: 2000
Trustee
Chairman of the Independent Trustees
Mr. Lautenbach also serves as Trustee of other Fidelity® funds. Mr. Lautenbach currently serves as Vice Chair of the Board of Governors, State University System of Florida (2013-present) and is a member of the Council on Foreign Relations (1994-present). He is also a member and has most recently served as Chairman of the Board of Directors of Artis-Naples (2012-present). Previously, Mr. Lautenbach served as a member and then Lead Director of the Board of Directors of Eaton Corporation (diversified industrial, 1997-2016). He was also a Partner and Advisory Partner at Clayton, Dubilier & Rice, LLC (private equity investment, 1998-2010), as well as a Director of Sony Corporation (2006-2007). In addition, Mr. Lautenbach also had a 30-year career with IBM (technology company) during which time he served as Senior Vice President and a member of the Corporate Executive Committee (1968-1998).
Joseph Mauriello (1944)
Year of Election or Appointment: 2008
Trustee
Mr. Mauriello also serves as Trustee of other Fidelity® funds. Prior to his retirement in January 2006, Mr. Mauriello served in numerous senior management positions including Deputy Chairman and Chief Operating Officer (2004-2005), and Vice Chairman of Financial Services (2002-2004) of KPMG LLP US (professional services, 1965-2005). Mr. Mauriello currently serves as a member of the Board of Directors of XL Group plc. (global insurance and re-insurance, 2006-present) and the Independent Directors Council (IDC) Governing Council (2015-present). Previously, Mr. Mauriello served as a Director of the Hamilton Funds of the Bank of New York (2006-2007) and of Arcadia Resources Inc. (health care services and products, 2007-2012).
Cornelia M. Small (1944)
Year of Election or Appointment: 2005
Trustee
Ms. Small also serves as Trustee of other Fidelity® funds. Ms. Small is a member of the Board of Directors (2009-present) and Chair of the Investment Committee (2010-present) of the Teagle Foundation. Ms. Small also serves on the Investment Committee of the Berkshire Taconic Community Foundation (2008-present). Previously, Ms. Small served as Chairperson (2002-2008) and a member of the Investment Committee and Chairperson (2008-2012) and a member of the Board of Trustees of Smith College. In addition, Ms. Small served as Chief Investment Officer, Director of Global Equity Investments, and a member of the Board of Directors of Scudder, Stevens & Clark and Scudder Kemper Investments.
William S. Stavropoulos (1939)
Year of Election or Appointment: 2002
Trustee
Vice Chairman of the Independent Trustees
Mr. Stavropoulos also serves as Trustee of other Fidelity® funds. Mr. Stavropoulos serves as President and Founder of the Michigan Baseball Foundation, the Great Lakes Loons (2007-present). Mr. Stavropoulos is Chairman Emeritus of the Board of Directors of The Dow Chemical Company, where he previously served in numerous senior management positions, including President, CEO (1995-2000; 2002-2004), Chairman of the Executive Committee (2000-2006), and as a member of the Board of Directors (1990-2006). Currently, Mr. Stavropoulos is Chairman of the Board of Directors of Univar Inc. (global distributor of commodity and specialty chemicals), a Director of Teradata Corporation (data warehousing and technology solutions), and a member of the Advisory Board for Metalmark Capital LLC (private equity investment, 2005-present). Mr. Stavropoulos is an operating advisor to Clayton, Dubilier & Rice, LLC (private equity investment). In addition, Mr. Stavropoulos is a member of the University of Notre Dame Advisory Council for the College of Science, a Trustee of the Rollin L. Gerstacker Foundation, and a Director of Artis-Naples in Naples, Florida. Previously, Mr. Stavropoulos served as a Director of Chemical Financial Corporation (bank holding company, 1993-2012) and Tyco International, Ltd. (multinational manufacturing and services, 2007-2012).
David M. Thomas (1949)
Year of Election or Appointment: 2008
Trustee
Mr. Thomas also serves as Trustee of other Fidelity® funds. Mr. Thomas serves as Non-Executive Chairman of the Board of Directors of Fortune Brands Home and Security (home and security products, 2011-present), as a member of the Board of Directors (2004-present) and Presiding Director (2013-present) of Interpublic Group of Companies, Inc. (marketing communication), and as a member of the Board of Trustees of the University of Florida (2013-present). Previously, Mr. Thomas served as Executive Chairman (2005-2006) and Chairman and Chief Executive Officer (2000-2005) of IMS Health, Inc. (pharmaceutical and healthcare information solutions), and a Director of Fortune Brands, Inc. (consumer products, 2000-2011).
+ The information includes the Trustee's principal occupation during the last five years and other information relating to the experience, attributes, and skills relevant to the Trustee's qualifications to serve as a Trustee, which led to the conclusion that the Trustee should serve as a Trustee for the fund.
Advisory Board Members and Officers:
Correspondence intended for an officer or Peter S. Lynch may be sent to Fidelity Investments, 245 Summer Street, Boston, Massachusetts 02210. Officers appear below in alphabetical order.
Name, Year of Birth; Principal Occupation
Peter S. Lynch (1944)
Year of Election or Appointment: 2003
Member of the Advisory Board
Mr. Lynch also serves as Member of the Advisory Board of other Fidelity® funds. Mr. Lynch is Vice Chairman and a Director of FMR (investment adviser firm) and FMR Co., Inc. (investment adviser firm). In addition, Mr. Lynch serves as a Trustee of Boston College and as the Chairman of the Inner-City Scholarship Fund. Previously, Mr. Lynch served on the Special Olympics International Board of Directors (1997-2006).
Elizabeth Paige Baumann (1968)
Year of Election or Appointment: 2017
Anti-Money Laundering (AML) Officer
Ms. Baumann also serves as AML Officer of other funds. She is Chief AML Officer (2012-present) and Senior Vice President (2014-present) of FMR LLC (diversified financial services company) and is an employee of Fidelity Investments. Previously, Ms. Baumann served as AML Officer of the funds (2012-2016), and Vice President (2007-2014) and Deputy Anti-Money Laundering Officer (2007-2012) of FMR LLC.
Marc R. Bryant (1966)
Year of Election or Appointment: 2015
Secretary and Chief Legal Officer (CLO)
Mr. Bryant also serves as Secretary and CLO of other funds. Mr. Bryant serves as CLO, Secretary, and Senior Vice President of Fidelity Management & Research Company (investment adviser firm, 2015-present) and FMR Co., Inc. (investment adviser firm, 2015-present); Secretary of Fidelity SelectCo, LLC (investment adviser firm, 2015-present) and Fidelity Investments Money Management, Inc. (investment adviser firm, 2015-present); and CLO of Fidelity Management & Research (Hong Kong) Limited and FMR Investment Management (UK) Limited (investment adviser firms, 2015-present) and Fidelity Management & Research (Japan) Limited (investment adviser firm, 2016-present). He is Senior Vice President and Deputy General Counsel of FMR LLC (diversified financial services company). Previously, Mr. Bryant served as Secretary and CLO of Fidelity Rutland Square Trust II (2010-2014) and Assistant Secretary of Fidelity's Fixed Income and Asset Allocation Funds (2013-2015). Prior to joining Fidelity Investments, Mr. Bryant served as a Senior Vice President and the Head of Global Retail Legal for AllianceBernstein L.P. (2006-2010), and as the General Counsel for ProFund Advisors LLC (2001-2006).
William C. Coffey (1969)
Year of Election or Appointment: 2009
Assistant Secretary
Mr. Coffey also serves as Assistant Secretary of other funds. He is Senior Vice President and Deputy General Counsel of FMR LLC (diversified financial services company, 2010-present), and is an employee of Fidelity Investments. Previously, Mr. Coffey served as Vice President and Associate General Counsel of FMR LLC (2005-2009).
Jonathan Davis (1968)
Year of Election or Appointment: 2010
Assistant Treasurer
Mr. Davis also serves as Assistant Treasurer of other funds. Mr. Davis serves as Assistant Treasurer of FMR Capital, Inc. (2017-present) and is an employee of Fidelity Investments. Previously, Mr. Davis served as Vice President and Associate General Counsel of FMR LLC (diversified financial services company, 2003-2010).
Adrien E. Deberghes (1967)
Year of Election or Appointment: 2016
Assistant Treasurer
Mr. Deberghes also serves as an officer of other funds. He serves as Assistant Treasurer of FMR Capital, Inc. (2017-present), Executive Vice President of Fidelity Investments Money Management, Inc. (FIMM) (investment adviser firm, 2016-present), and is an employee of Fidelity Investments (2008-present). Prior to joining Fidelity Investments, Mr. Deberghes was Senior Vice President of Mutual Fund Administration at State Street Corporation (2007-2008), Senior Director of Mutual Fund Administration at Investors Bank & Trust (2005-2007), and Director of Finance for Dunkin' Brands (2000-2005). Previously, Mr. Deberghes served in other fund officer roles.
Stephanie J. Dorsey (1969)
Year of Election or Appointment: 2010
Assistant Treasurer
Ms. Dorsey also serves as an officer of other funds. Ms. Dorsey serves as Assistant Treasurer of FMR Capital, Inc. (2017-present), is an employee of Fidelity Investments (2008-present), and has served in other fund officer roles. Prior to joining Fidelity Investments, Ms. Dorsey served as Treasurer (2004-2008) of the JPMorgan Mutual Funds and Vice President (2004-2008) of JPMorgan Chase Bank.
Howard J. Galligan III (1966)
Year of Election or Appointment: 2014
Chief Financial Officer
Mr. Galligan also serves as Chief Financial Officer of other funds. Mr. Galligan serves as President of Fidelity Pricing and Cash Management Services (FPCMS) (2014-present) and as a Director of Strategic Advisers, Inc. (investment adviser firm, 2008-present). Previously, Mr. Galligan served as Chief Administrative Officer of Asset Management (2011-2014) and Chief Operating Officer and Senior Vice President of Investment Support for Strategic Advisers, Inc. (2003-2011).
Brian B. Hogan (1964)
Year of Election or Appointment: 2009
Vice President
Mr. Hogan also serves as Trustee or Vice President of other funds. Mr. Hogan serves as a Director of FMR Investment Management (UK) Limited (investment adviser firm, 2015-present) and Fidelity SelectCo, LLC (investment adviser firm, 2014-present) and President of the Equity Division of FMR (investment adviser firm, 2009-present). Previously, Mr. Hogan served as Senior Vice President, Equity Research of FMR (2006-2009) and as a portfolio manager. Mr. Brian B. Hogan is not related to Mr. Colm A. Hogan.
Colm A. Hogan (1973)
Year of Election or Appointment: 2016
Deputy Treasurer
Mr. Hogan also serves as an officer of other funds. Mr. Hogan serves as Assistant Treasurer of FMR Capital, Inc. (2017-present) and is an employee of Fidelity Investments (2005-present). Mr. Colm A. Hogan is not related to Mr. Brian B. Hogan.
Chris Maher (1972)
Year of Election or Appointment: 2013
Assistant Treasurer
Mr. Maher serves as Assistant Treasurer of other funds. Mr. Maher is Vice President of Valuation Oversight, serves as Assistant Treasurer of FMR Capital, Inc. (2017-present), and is an employee of Fidelity Investments. Previously, Mr. Maher served as Vice President of Asset Management Compliance (2013), Vice President of the Program Management Group of FMR (investment adviser firm, 2010-2013), and Vice President of Valuation Oversight (2008-2010).
Rieco E. Mello (1969)
Year of Election or Appointment: 2017
Assistant Treasurer
Mr. Mello also serves as Assistant Treasurer of other funds. Mr. Mello serves as Assistant Treasurer of FMR Capital, Inc. (2017-present) and is an employee of Fidelity Investments (1995-present).
Melissa M. Reilly (1971)
Year of Election or Appointment: 2014
Vice President of certain Equity Funds
Ms. Reilly also serves as Vice President of other funds. Ms. Reilly is an employee of Fidelity Investments (2004-present).
Kenneth B. Robins (1969)
Year of Election or Appointment: 2016
Chief Compliance Officer
Mr. Robins also serves as an officer of other funds. Mr. Robins serves as Compliance Officer of Fidelity Management & Research Company and FMR Co., Inc. (investment adviser firms, 2016-present) and is an employee of Fidelity Investments (2004-present). Previously, Mr. Robins served as Executive Vice President of Fidelity Investments Money Management, Inc. (investment adviser firm, 2013-2016) and served in other fund officer roles.
Stacie M. Smith (1974)
Year of Election or Appointment: 2016
President and Treasurer
Ms. Smith also serves as an officer of other funds. Ms. Smith serves as Assistant Treasurer of FMR Capital, Inc. (2017-present), is an employee of Fidelity Investments (2009-present), and has served in other fund officer roles. Prior to joining Fidelity Investments, Ms. Smith served as Senior Audit Manager of Ernst & Young LLP (accounting firm, 1996-2009). Previously, Ms. Smith served as Deputy Treasurer of certain Fidelity® funds (2013-2016).
Marc L. Spector (1972)
Year of Election or Appointment: 2016
Assistant Treasurer
Mr. Spector also serves as an officer of other funds. Mr. Spector serves as Assistant Treasurer of FMR Capital, Inc. (2017-present) and is an employee of Fidelity Investments (2016-present). Prior to joining Fidelity Investments, Mr. Spector served as Director at the Siegfried Group (accounting firm, 2013-2016), and prior to Siegfried Group as audit senior manager at Deloitte & Touche (accounting firm, 2005-2013).
Renee Stagnone (1975)
Year of Election or Appointment: 2016
Assistant Treasurer
Ms. Stagnone also serves as an officer of other funds. Ms. Stagnone serves as Assistant Treasurer of FMR Capital, Inc. (2017-present) and is an employee of Fidelity Investments (1997-present). Previously, Ms. Stagnone served as Deputy Treasurer of certain Fidelity® funds (2013-2016).
Shareholder Expense Example
As a shareholder of the Fund, you incur two types of costs: (1) transaction costs and (2) ongoing costs, including other Fund expenses. This Example is intended to help you understand your ongoing costs (in dollars) of investing in the Fund and to compare these costs with the ongoing costs of investing in other mutual funds.
The Example is based on an investment of $1,000 invested at the beginning of the period and held for the entire period (June 1, 2017 to November 30, 2017).
Actual Expenses
The first line of the accompanying table provides information about actual account values and actual expenses. You may use the information in this line, together with the amount you invested, to estimate the expenses that you paid over the period. Simply divide your account value by $1,000.00 (for example, an $8,600 account value divided by $1,000.00 = 8.6), then multiply the result by the number in the first line under the heading entitled "Expenses Paid During Period" to estimate the expenses you paid on your account during this period. In addition, the Fund, as a shareholder in the underlying Fidelity Central Funds, will indirectly bear its pro-rata share of the fees and expenses incurred by the underlying Fidelity Central Funds. These fees and expenses are not included in the Fund's annualized expense ratio used to calculate the expense estimate in the table below.
Hypothetical Example for Comparison Purposes
The second line of the accompanying table provides information about hypothetical account values and hypothetical expenses based on the Fund's actual expense ratio and an assumed rate of return of 5% per year before expenses, which is not the Fund's actual return. The hypothetical account values and expenses may not be used to estimate the actual ending account balance or expenses you paid for the period. You may use this information to compare the ongoing costs of investing in the Fund and other funds. To do so, compare this 5% hypothetical example with the 5% hypothetical examples that appear in the shareholder reports of the other funds. In addition, the Fund, as a shareholder in the underlying Fidelity Central Funds, will indirectly bear its pro-rata share of the fees and expenses incurred by the underlying Fidelity Central Funds. These fees and expenses are not included in the Fund's annualized expense ratio used to calculate the expense estimate in the table below.
Please note that the expenses shown in the table are meant to highlight your ongoing costs only and do not reflect any transaction costs. Therefore, the second line of the table is useful in comparing ongoing costs only, and will not help you determine the relative total costs of owning different funds.
| Annualized Expense Ratio-A | Beginning Account Value June 1, 2017 | Ending Account Value November 30, 2017 | Expenses Paid During Period-B June 1, 2017 to November 30, 2017 | |
| Actual | .01% | $1,000.00 | $1,130.60 | $.05 |
| Hypothetical-C | $1,000.00 | $1,025.02 | $.05 |
A Annualized expense ratio reflects expenses net of applicable fee waivers.
B Expenses are equal to the Fund's annualized expense ratio, multiplied by the average account value over the period, multiplied by 183/365 (to reflect the one-half year period).
C 5% return per year before expenses
Distributions (Unaudited)
The Board of Trustees of Fidelity Advisor Series Equity Growth Fund voted to pay on December 18, 2017, to shareholders of record at the opening of business on December 15, 2017, a distribution of $2.299 per share derived from capital gains realized from sales of portfolio securities and a dividend of $0.086 per share from net investment income.
The fund hereby designates as a capital gain dividend with respect to the taxable year ended November 30, 2017, $124,753,133, or, if subsequently determined to be different, the net capital gain of such year.
The fund designates 100% of the dividends distributed during the fiscal year as qualifying for the dividends–received deduction for corporate shareholders.
The fund designates 100% of the dividends distributed in December 2017 during the fiscal year as amounts which may be taken into account as a dividend for the purposes of the maximum rate under section 1(h)(11) of the Internal Revenue Code.
The fund will notify shareholders in January 2018 of amounts for use in preparing 2017 income tax returns.
Board Approval of Investment Advisory Contracts and Management Fees
Fidelity Advisor Series Equity Growth Fund
Each year, the Board of Trustees, including the Independent Trustees (together, the Board), votes on the renewal of the management contract with Fidelity Management & Research Company (FMR) and the sub-advisory agreements (together, the Advisory Contracts) for the fund. FMR and the sub-advisers are referred to herein as the Investment Advisers. The Board, assisted by the advice of fund counsel and Independent Trustees' counsel, requests and considers a broad range of information relevant to the renewal of the Advisory Contracts throughout the year.
The Board meets regularly and, at each of its meetings, covers an extensive agenda of topics and materials and considers factors that are relevant to its annual consideration of the renewal of the fund's Advisory Contracts, including the services and support provided to the fund and its shareholders. The Board has established various standing committees (Committees), each composed of and chaired by Independent Trustees with varying backgrounds, to which the Board has assigned specific subject matter responsibilities in order to enhance effective decision-making by the Board. The Board, acting directly and through its Committees, requests and receives information concerning the annual consideration of the renewal of the fund's Advisory Contracts. The Board also meets as needed to review matters specifically related to the Board's annual consideration of the renewal of the Advisory Contracts. Members of the Board may also meet with trustees of other Fidelity funds through ad hoc joint committees to discuss certain matters relevant to all of the Fidelity funds.
At its July 2017 meeting, the Board unanimously determined to renew the fund's Advisory Contracts. In reaching its determination, the Board considered that the Advisory Contracts currently in place had become effective on June 1, 2017 in connection with shareholders of certain other Fidelity funds that invest in the fund (referred to herein as Freedom Funds) voting to approve new management contracts for the Freedom Funds. The Board noted the Advisory Contracts implemented a new fee structure pursuant to which the fund does not pay a management fee to FMR. The Board also approved certain amendments to the sub-advisory agreements for the fund to ensure consistency in the sub-advisory fees paid under the new fee structure compared to the sub-advisory fees paid under the prior fee structure. The Board noted that the amendments will not result in any changes to the nature, extent, and quality of services provided to the fund.
In considering whether to renew the Advisory Contracts for the fund, the Board considered all factors it believed relevant and reached a determination, with the assistance of fund counsel and Independent Trustees' counsel and through the exercise of its business judgment, that the renewal of the Advisory Contracts was in the best interests of the fund and its shareholders and the fact that no fee is payable under the management contract was fair and reasonable.
Nature, Extent, and Quality of Services Provided. The Board considered Fidelity's staffing as it relates to the fund, including the backgrounds of investment personnel of Fidelity, and also considered the fund's investment objective, strategies, and related investment philosophy. The Independent Trustees also had discussions with senior management of Fidelity's investment operations and investment groups. The Board considered the structure of the investment personnel compensation program and whether this structure provides appropriate incentives to act in the best interests of the fund.Resources Dedicated to Investment Management and Support Services. The Board and the Fund Oversight and Research Committees reviewed the general qualifications and capabilities of Fidelity's investment staff, including its size, education, experience, and resources, as well as Fidelity's approach to recruiting, training, managing, and compensating investment personnel. The Board noted that Fidelity has continued to increase the resources devoted to non-U.S. offices, including expansion of Fidelity's global investment organization. The Board also noted that Fidelity's analysts have extensive resources, tools and capabilities that allow them to conduct sophisticated quantitative and fundamental analysis, as well as credit analysis of issuers, counterparties and guarantors. Further, the Board considered that Fidelity's investment professionals have sufficient access to global information and data so as to provide competitive investment results over time, and that those professionals also have access to sophisticated tools that permit them to assess portfolio construction and risk and performance attribution characteristics continuously, as well as to transmit new information and research conclusions rapidly around the world. Additionally, in its deliberations, the Board considered Fidelity's trading, risk management, compliance, and technology and operations capabilities and resources, which are integral parts of the investment management process.Administrative Services. The Board considered (i) the nature, extent, quality, and cost of advisory and administrative services performed by the Investment Advisers and their affiliates under the Advisory Contracts and under separate agreements covering transfer agency, pricing and bookkeeping, and securities lending services for the fund; (ii) the nature and extent of the supervision of third party service providers, principally custodians, subcustodians, and pricing vendors; and (iii) the resources devoted to, and the record of compliance with, the fund's compliance policies and procedures. The Board also reviewed the allocation of fund brokerage, including allocations to brokers affiliated with the Investment Advisers, the use of brokerage commissions to pay fund expenses, and the use of "soft" commission dollars to pay for research services.Investment Performance. The Board considered whether the fund has operated in accordance with its investment objective, as well as its record of compliance with its investment restrictions. The Board reviewed the fund's absolute investment performance, as well as the fund's relative investment performance, but did not consider performance to be a material factor in its decision to renew the fund's Advisory Contracts, as the fund is not publicly offered as a stand-alone investment product. In this regard, the Board noted that the fund is designed to offer an investment option for other investment companies managed by Fidelity and ultimately to enhance the performance of those investment companies.Based on its review, the Board concluded that the nature, extent, and quality of services provided to the fund under the Advisory Contracts should continue to benefit the shareholders of the fund.Competitiveness of Management Fee and Total Expense Ratio. The Board considered that the fund does not pay FMR a management fee for investment advisory services. The Board also noted that FMR or an affiliate undertakes to pay all operating expenses of the fund, except transfer agent fees, 12b-1 fees, Independent Trustee fees and expenses, custodian fees and expenses, proxy and shareholder meeting expenses, interest, taxes, brokerage expenses, and extraordinary expenses (such as litigation expenses).The Board further considered that, effective June 1, 2017, FMR has contractually agreed to reimburse the fund to the extent that total operating expenses (excluding interest, certain taxes, certain securities lending costs, brokerage commissions, fees and expenses of the Independent Trustees, proxy and shareholder meeting expenses, extraordinary expenses, and acquired fund fees and expenses, if any), as a percentage of its average net assets, exceed 0.014% through January 31, 2021.Based on its review, the Board considered that the fund does not pay a management fee and concluded that the fund's total expense ratio was reasonable in light of the services that the fund and its shareholders receive and the other factors considered.Costs of the Services and Profitability. The Board considered the level of Fidelity's profits in respect of all the Fidelity funds.PricewaterhouseCoopers LLP (PwC), independent registered public accounting firm and auditor to Fidelity and certain Fidelity funds, has been engaged annually by the Board as part of the Board's assessment of Fidelity's profitability analysis. PwC's engagement includes the review and assessment of the methodologies used by Fidelity in determining the revenues and expenses attributable to Fidelity's mutual fund business, and completion of agreed-upon procedures in respect of the mathematical accuracy of the fund profitability information and its conformity to established allocation methodologies. After considering PwC's reports issued under the engagement and information provided by Fidelity, the Board concluded that while other allocation methods may also be reasonable, Fidelity's profitability methodologies are reasonable in all material respects.The Board also reviewed Fidelity's non-fund businesses and potential fall-out benefits related to the mutual fund business as well as cases where Fidelity's affiliates may benefit from or be related to the fund's business.The Board concluded that the costs of the services provided by and the profits realized by Fidelity in connection with the operation of the fund were not relevant to the renewal of the Advisory Contracts because the fund pays no advisory fees and FMR or an affiliate bears all expenses of the fund, with limited exceptions.Economies of Scale. The Board concluded that because the fund pays no advisory fees and FMR or an affiliate bears all expenses of the fund, with limited exceptions, economies of scale cannot be realized by the fund.Additional Information Requested by the Board. In order to develop fully the factual basis for consideration of the Fidelity funds' advisory contracts, the Board requested and received additional information on certain topics, including: (i) fund performance trends, in particular the underperformance of certain funds, and Fidelity's long-term strategies for certain funds; (ii) Fidelity's fund profitability methodology, profitability trends for certain funds, and the impact of certain factors on fund profitability results, including the impact of market trends on actively managed funds; (iii) the use of performance fees and the calculation of performance adjustments, including the impact of underperformance and fund outflows on performance adjustments; (iv) metrics for evaluating index fund performance; (v) Fidelity's group fee structure, including the group fee breakpoint schedules; (vi) the terms of Fidelity's contractual and voluntary expense cap arrangements with the funds; (vii) the methodology with respect to evaluating competitive fund data and peer group classifications and fee comparisons; (viii) the expense structures for different funds and classes; (ix) Fidelity's arrangements with affiliated sub-advisers on behalf of the funds; (x) information regarding other accounts managed by Fidelity, including institutional accounts and collective investment trusts; (xi) recent changes to the fee structure for certain funds of funds; and (xii) the impact of the Department of Labor's new fiduciary rule on the funds' comparative expense information.Based on its evaluation of all of the conclusions noted above, and after considering all factors it believed relevant, the Board concluded that the advisory fee structures are fair and reasonable, and that the fund's Advisory Contracts should be renewed.![]()
Corporate Headquarters
245 Summer St.
Boston, MA 02210
www.fidelity.com
AXM1-ANN-0118
1.9860268.103
Fidelity Advisor® Series Growth Opportunities Fund Annual Report November 30, 2017 |
|
Contents
Board Approval of Investment Advisory Contracts and Management Fees |
To view a fund's proxy voting guidelines and proxy voting record for the 12-month period ended June 30, visit http://www.fidelity.com/proxyvotingresults or visit the Securities and Exchange Commission's (SEC) web site at http://www.sec.gov.
You may also call 1-877-208-0098 to request a free copy of the proxy voting guidelines.
Standard & Poor's, S&P and S&P 500 are registered service marks of The McGraw-Hill Companies, Inc. and have been licensed for use by Fidelity Distributors Corporation.
Other third-party marks appearing herein are the property of their respective owners.
All other marks appearing herein are registered or unregistered trademarks or service marks of FMR LLC or an affiliated company. © 2018 FMR LLC. All rights reserved.
This report and the financial statements contained herein are submitted for the general information of the shareholders of the Fund. This report is not authorized for distribution to prospective investors in the Fund unless preceded or accompanied by an effective prospectus.
A fund files its complete schedule of portfolio holdings with the SEC for the first and third quarters of each fiscal year on Form N-Q. Forms N-Q are available on the SEC’s web site at http://www.sec.gov. A fund's Forms N-Q may be reviewed and copied at the SEC’s Public Reference Room in Washington, DC. Information regarding the operation of the SEC's Public Reference Room may be obtained by calling 1-800-SEC-0330.
For a complete list of a fund's portfolio holdings, view the most recent holdings listing, semiannual report, or annual report on Fidelity's web site at http://www.fidelity.com, http://www.institutional.fidelity.com, or http://www.401k.com, as applicable.
NOT FDIC INSURED •MAY LOSE VALUE •NO BANK GUARANTEE
Neither the Fund nor Fidelity Distributors Corporation is a bank.
Performance: The Bottom Line
Average annual total return reflects the change in the value of an investment, assuming reinvestment of distributions from dividend income and capital gains (the profits earned upon the sale of securities that have grown in value, if any) and assuming a constant rate of performance each year. The hypothetical investment and the average annual total returns do not reflect the deduction of taxes that a shareholder would pay on fund distributions or the redemption of fund shares. During periods of reimbursement by Fidelity, a fund’s total return will be greater than it would be had the reimbursement not occurred. How a fund did yesterday is no guarantee of how it will do tomorrow.
Average Annual Total Returns
| For the periods ended November 30, 2017 | Past 1 year | Life of fundA |
| Fidelity Advisor® Series Growth Opportunities Fund | 35.40% | 13.21% |
A From November 7, 2013
$10,000 Over Life of Fund
Let's say hypothetically that $10,000 was invested in Fidelity Advisor® Series Growth Opportunities Fund on November 7, 2013, when the fund started.
The chart shows how the value of your investment would have changed, and also shows how the Russell 3000® Growth Index performed over the same period.
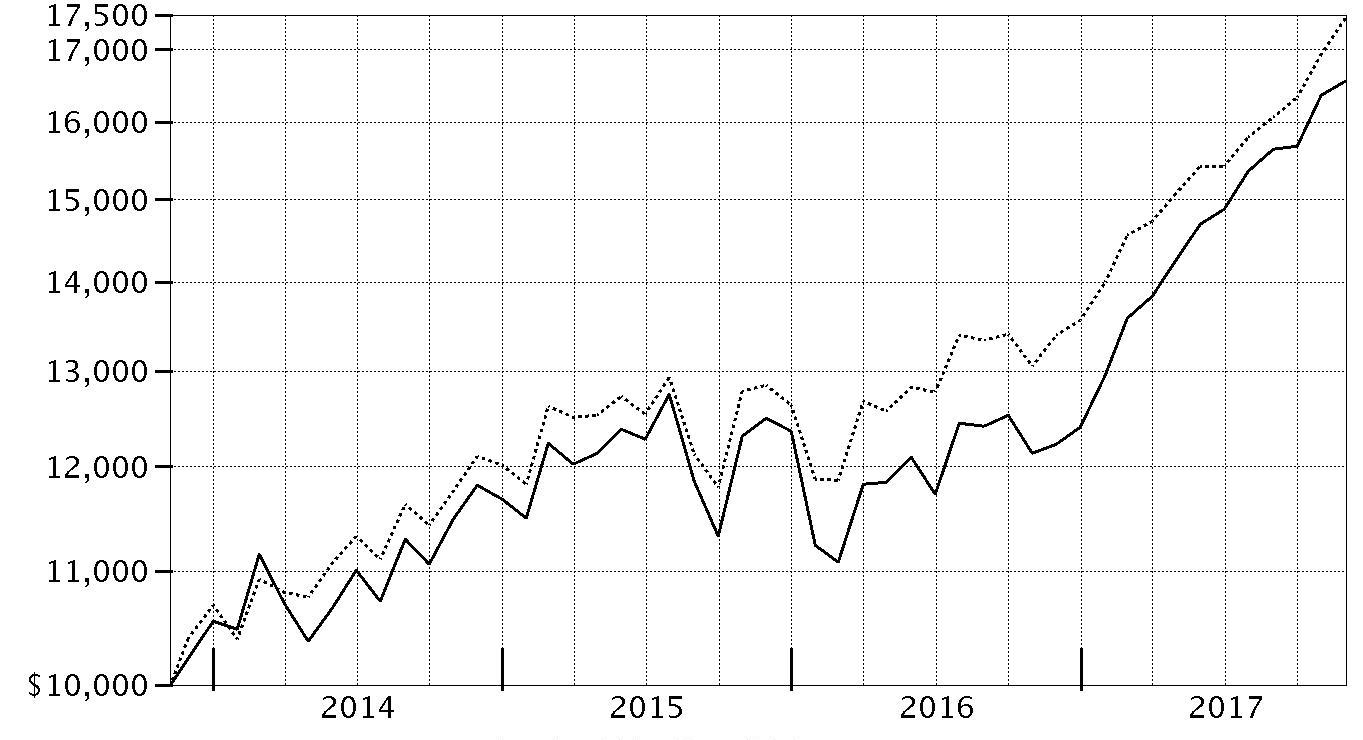
| Period Ending Values | ||
| $16,560 | Fidelity Advisor® Series Growth Opportunities Fund | |
| $17,448 | Russell 3000® Growth Index | |
Management's Discussion of Fund Performance
Market Recap: The U.S. equity bellwether S&P 500® index gained 22.87% for the year ending November 30, 2017, rising steadily and closing the period at an all-time high after a particularly strong three-month finish. Early on, equities rallied on optimism for President Trump’s pro-business agenda but leveled off in March amid fading optimism and stalled efforts by Congress to repeal and replace the Affordable Care Act. Upward momentum soon returned and continued through period end with consumer sentiment and other market indicators staying positive. The lone exception was a brief cooldown in August, when geopolitical tension escalated and uncertainty grew regarding the future of health care, tax reform and the debt ceiling. Sector-wise, info tech (+41%) led by a wide margin, surging amid strong earnings growth from several major index constituents. Utilities and financials each gained about 25%, the latter group riding an uptick in bond yields. Conversely, consumer discretionary (+20%) also rose solidly but lagged the broader market, as many brick-and-mortar retailers continued to suffer from increased online competition. Rising interest rates held back real estate (+16%), while consumer staples (+15%) and telecom (+1%) struggled due to investors’ general preference for risk assets. Lastly, sluggish oil prices pushed energy to a -4% return.Comments from Portfolio Manager Kyle Weaver: For the fiscal year, the fund gained 35.40%, handily topping the 30.25% advance of the benchmark Russell 3000® Growth Index. Versus the benchmark, stock picks in the consumer discretionary sector were the largest positive, followed by choices in consumer staples, real estate and financials. In information technology, my picks detracted, but this negative was more than offset by my decision to overweight this top-performing group. By a wide margin, the biggest individual relative contributor was electric automaker Tesla, whose stock was lifted by growing optimism about prospects for its Model 3 sedan, launched in July. A small private investment in JUUL Labs also paid off. We saw the value of our non-benchmark position in this leading e-cigarette maker rise along with the growing popularity of tobacco-free smoking. Options exchange CBOE Global Markets was another notable contributor. Conversely, stock selection in industrials meaningfully hampered our relative result. Among individual holdings, pharmaceutical stock Allergan – which was removed from the fund’s benchmark in June – was our biggest relative detractor. An overweighting in Alexion Pharmaceuticals further disappointed, along with a non-benchmark stake in China-based e-commerce firm Vipshop Holdings, which I bought this period.The views expressed above reflect those of the portfolio manager(s) only through the end of the period as stated on the cover of this report and do not necessarily represent the views of Fidelity or any other person in the Fidelity organization. Any such views are subject to change at any time based upon market or other conditions and Fidelity disclaims any responsibility to update such views. These views may not be relied on as investment advice and, because investment decisions for a Fidelity fund are based on numerous factors, may not be relied on as an indication of trading intent on behalf of any Fidelity fund.
Investment Summary (Unaudited)
Top Ten Stocks as of November 30, 2017
| % of fund's net assets | % of fund's net assets 6 months ago | |
| Apple, Inc. | 6.6 | 6.7 |
| Alphabet, Inc. Class C | 4.4 | 3.9 |
| Amazon.com, Inc. | 3.9 | 3.8 |
| Facebook, Inc. Class A | 3.9 | 2.6 |
| Microsoft Corp. | 3.3 | 2.6 |
| American Tower Corp. | 2.8 | 3.1 |
| Alphabet, Inc. Class A | 2.4 | 2.4 |
| Salesforce.com, Inc. | 2.2 | 1.7 |
| LyondellBasell Industries NV Class A | 2.0 | 2.4 |
| T-Mobile U.S., Inc. | 1.8 | 1.5 |
| 33.3 |
Top Five Market Sectors as of November 30, 2017
| % of fund's net assets | % of fund's net assets 6 months ago | |
| Information Technology | 46.6 | 40.7 |
| Health Care | 14.6 | 16.7 |
| Consumer Discretionary | 13.7 | 16.0 |
| Consumer Staples | 5.8 | 6.6 |
| Financials | 4.6 | 3.6 |
Asset Allocation (% of fund's net assets)
| As of November 30, 2017* | ||
| Stocks | 98.8% | |
| Convertible Securities | 1.3% | |
| Short-Term Investments and Net Other Assets (Liabilities)** | (0.1)% | |

* Foreign investments - 13.3%
** Short-Term Investments and Net Other Assets (Liabilities) are not included in the pie chart
| As of May 31, 2017* | ||
| Stocks | 98.5% | |
| Convertible Securities | 1.0% | |
| Short-Term Investments and Net Other Assets (Liabilities) | 0.5% | |

* Foreign investments - 11.8%
Investments November 30, 2017
Showing Percentage of Net Assets
| Common Stocks - 98.7% | |||
| Shares | Value | ||
| CONSUMER DISCRETIONARY - 13.7% | |||
| Automobiles - 1.6% | |||
| Tesla, Inc. (a)(b) | 31,621 | $9,766,146 | |
| Hotels, Restaurants & Leisure - 1.1% | |||
| Compass Group PLC | 1,400 | 28,381 | |
| Marriott International, Inc. Class A | 200 | 25,400 | |
| Starbucks Corp. | 26,400 | 1,526,448 | |
| U.S. Foods Holding Corp. (a) | 177,800 | 5,177,536 | |
| 6,757,765 | |||
| Household Durables - 0.4% | |||
| Roku, Inc. Class A (b) | 58,700 | 2,576,930 | |
| Internet & Direct Marketing Retail - 6.6% | |||
| Amazon.com, Inc. (a) | 20,500 | 24,123,375 | |
| Blue Apron Holdings, Inc.: | |||
| Class A | 23,632 | 70,660 | |
| Class B | 94,530 | 268,512 | |
| Groupon, Inc. (a) | 326,700 | 1,842,588 | |
| Netflix, Inc. (a) | 32,300 | 6,058,834 | |
| Priceline Group, Inc. (a) | 1,200 | 2,087,652 | |
| Vipshop Holdings Ltd. ADR (a) | 364,900 | 3,003,127 | |
| Wayfair LLC Class A (a) | 43,500 | 3,044,565 | |
| 40,499,313 | |||
| Media - 2.6% | |||
| Charter Communications, Inc. Class A (a) | 24,462 | 7,979,749 | |
| China Literature Ltd. (a)(c) | 7,200 | 82,969 | |
| Comcast Corp. Class A | 144,700 | 5,432,038 | |
| Liberty Global PLC LiLAC Class A (a) | 2 | 42 | |
| Liberty Media Corp. Liberty Media Class A (a) | 23,500 | 817,565 | |
| Naspers Ltd. Class N | 600 | 161,329 | |
| The Walt Disney Co. | 5,000 | 524,100 | |
| Vivendi SA | 38,700 | 1,030,192 | |
| 16,027,984 | |||
| Multiline Retail - 0.4% | |||
| Dollar Tree, Inc. (a) | 26,100 | 2,682,036 | |
| Specialty Retail - 0.8% | |||
| Home Depot, Inc. | 20,100 | 3,614,382 | |
| TJX Companies, Inc. | 21,300 | 1,609,215 | |
| 5,223,597 | |||
| Textiles, Apparel & Luxury Goods - 0.2% | |||
| lululemon athletica, Inc. (a) | 20,500 | 1,372,680 | |
| TOTAL CONSUMER DISCRETIONARY | 84,906,451 | ||
| CONSUMER STAPLES - 4.8% | |||
| Beverages - 0.8% | |||
| Constellation Brands, Inc. Class A (sub. vtg.) | 9,900 | 2,154,141 | |
| Monster Beverage Corp. (a) | 27,400 | 1,717,158 | |
| The Coca-Cola Co. | 18,100 | 828,437 | |
| 4,699,736 | |||
| Food & Staples Retailing - 2.1% | |||
| Costco Wholesale Corp. | 12,800 | 2,360,704 | |
| CVS Health Corp. | 35,900 | 2,749,940 | |
| Performance Food Group Co. (a) | 261,700 | 7,759,405 | |
| 12,870,049 | |||
| Food Products - 0.0% | |||
| Kerry Group PLC Class A | 1,000 | 104,742 | |
| Personal Products - 0.2% | |||
| Unilever NV (Certificaten Van Aandelen) (Bearer) | 25,800 | 1,487,858 | |
| Tobacco - 1.7% | |||
| British American Tobacco PLC (United Kingdom) | 139,500 | 8,871,130 | |
| JUUL Labs, Inc.(d) | 709 | 2,198 | |
| Philip Morris International, Inc. | 17,700 | 1,818,675 | |
| 10,692,003 | |||
| TOTAL CONSUMER STAPLES | 29,854,388 | ||
| ENERGY - 1.7% | |||
| Oil, Gas & Consumable Fuels - 1.7% | |||
| Petronet LNG Ltd. | 529,707 | 2,066,588 | |
| Reliance Industries Ltd. | 446,353 | 6,378,301 | |
| Teekay LNG Partners LP | 44,800 | 808,640 | |
| Williams Partners LP | 34,000 | 1,247,800 | |
| 10,501,329 | |||
| FINANCIALS - 4.5% | |||
| Banks - 0.3% | |||
| HDFC Bank Ltd. sponsored ADR | 21,000 | 2,039,100 | |
| Capital Markets - 3.7% | |||
| BlackRock, Inc. Class A | 13,300 | 6,665,827 | |
| CBOE Holdings, Inc. | 53,800 | 6,640,534 | |
| Charles Schwab Corp. | 70,800 | 3,454,332 | |
| MSCI, Inc. | 2,900 | 373,230 | |
| S&P Global, Inc. | 2,300 | 380,604 | |
| TD Ameritrade Holding Corp. | 102,600 | 5,250,042 | |
| 22,764,569 | |||
| Consumer Finance - 0.5% | |||
| Synchrony Financial | 80,500 | 2,889,145 | |
| TOTAL FINANCIALS | 27,692,814 | ||
| HEALTH CARE - 14.6% | |||
| Biotechnology - 8.5% | |||
| ACADIA Pharmaceuticals, Inc. (a) | 17,846 | 539,842 | |
| Acorda Therapeutics, Inc. (a) | 15,807 | 320,882 | |
| Agios Pharmaceuticals, Inc. (a) | 8,000 | 492,400 | |
| Alexion Pharmaceuticals, Inc. (a) | 77,500 | 8,510,275 | |
| Alkermes PLC (a) | 18,261 | 954,868 | |
| Alnylam Pharmaceuticals, Inc. (a) | 18,177 | 2,445,534 | |
| Amgen, Inc. | 58,000 | 10,188,280 | |
| Amicus Therapeutics, Inc. (a) | 51,200 | 712,704 | |
| AnaptysBio, Inc. | 11,700 | 983,385 | |
| BioMarin Pharmaceutical, Inc. (a) | 23,600 | 2,024,880 | |
| bluebird bio, Inc. (a) | 17,600 | 3,041,280 | |
| Coherus BioSciences, Inc. (a) | 19,000 | 170,050 | |
| Epizyme, Inc. (a) | 6,200 | 74,400 | |
| Five Prime Therapeutics, Inc. (a) | 14,200 | 374,170 | |
| Insmed, Inc. (a) | 80,800 | 2,520,152 | |
| Intercept Pharmaceuticals, Inc. (a) | 2,900 | 178,089 | |
| Ionis Pharmaceuticals, Inc. (a) | 81,756 | 4,536,640 | |
| Neurocrine Biosciences, Inc. (a) | 44,055 | 3,167,114 | |
| Prothena Corp. PLC (a) | 31,405 | 1,460,018 | |
| Regeneron Pharmaceuticals, Inc. (a) | 9,092 | 3,290,031 | |
| Rigel Pharmaceuticals, Inc. (a) | 181,900 | 756,704 | |
| Sage Therapeutics, Inc. (a) | 6,000 | 554,460 | |
| Sienna Biopharmaceuticals, Inc. | 10,300 | 207,648 | |
| Spark Therapeutics, Inc. (a) | 5,400 | 395,442 | |
| TESARO, Inc. (a) | 25,500 | 2,157,300 | |
| Vertex Pharmaceuticals, Inc. (a) | 14,100 | 2,034,489 | |
| Xencor, Inc. (a) | 15,400 | 334,334 | |
| 52,425,371 | |||
| Health Care Equipment & Supplies - 1.7% | |||
| Boston Scientific Corp. (a) | 237,400 | 6,238,872 | |
| Danaher Corp. | 16,100 | 1,519,196 | |
| Insulet Corp. (a) | 22,000 | 1,578,060 | |
| Intuitive Surgical, Inc. (a) | 2,400 | 959,472 | |
| 10,295,600 | |||
| Health Care Providers & Services - 2.5% | |||
| Anthem, Inc. | 24,300 | 5,709,528 | |
| Cigna Corp. | 9,600 | 2,032,608 | |
| Humana, Inc. | 8,200 | 2,139,052 | |
| OptiNose, Inc. | 11,500 | 219,535 | |
| UnitedHealth Group, Inc. | 23,000 | 5,247,910 | |
| 15,348,633 | |||
| Health Care Technology - 0.4% | |||
| athenahealth, Inc. (a) | 19,223 | 2,554,544 | |
| Pharmaceuticals - 1.5% | |||
| Akcea Therapeutics, Inc. | 52,800 | 1,007,952 | |
| Allergan PLC | 31,360 | 5,451,309 | |
| Bristol-Myers Squibb Co. | 17,700 | 1,118,463 | |
| Innoviva, Inc. (a) | 49,400 | 648,128 | |
| Theravance Biopharma, Inc. (a) | 37,400 | 1,064,030 | |
| 9,289,882 | |||
| TOTAL HEALTH CARE | 89,914,030 | ||
| INDUSTRIALS - 3.7% | |||
| Air Freight & Logistics - 0.2% | |||
| FedEx Corp. | 5,600 | 1,296,176 | |
| Airlines - 1.6% | |||
| JetBlue Airways Corp. (a) | 15,100 | 324,197 | |
| Spirit Airlines, Inc. (a) | 228,200 | 9,728,166 | |
| 10,052,363 | |||
| Commercial Services & Supplies - 0.1% | |||
| Copart, Inc. (a) | 8,500 | 366,860 | |
| Electrical Equipment - 0.3% | |||
| Fortive Corp. | 6,200 | 462,830 | |
| Sunrun, Inc. (a)(b) | 250,200 | 1,401,120 | |
| 1,863,950 | |||
| Machinery - 0.4% | |||
| Allison Transmission Holdings, Inc. | 16,899 | 693,535 | |
| Caterpillar, Inc. | 14,400 | 2,032,560 | |
| 2,726,095 | |||
| Professional Services - 0.2% | |||
| TransUnion Holding Co., Inc. (a) | 24,600 | 1,365,792 | |
| Trading Companies & Distributors - 0.9% | |||
| Bunzl PLC | 184,000 | 5,263,000 | |
| TOTAL INDUSTRIALS | 22,934,236 | ||
| INFORMATION TECHNOLOGY - 46.3% | |||
| Communications Equipment - 0.9% | |||
| Carvana Co. Class A (b) | 338,650 | 5,489,517 | |
| Internet Software & Services - 15.0% | |||
| 2U, Inc. (a) | 4,200 | 269,220 | |
| Alibaba Group Holding Ltd. sponsored ADR (a) | 10,100 | 1,788,508 | |
| Alphabet, Inc.: | |||
| Class A (a) | 14,500 | 15,024,465 | |
| Class C (a) | 26,600 | 27,169,506 | |
| CarGurus, Inc. Class A | 1,000 | 29,480 | |
| Cloudera, Inc. (c) | 10,396 | 164,569 | |
| Criteo SA sponsored ADR (a)(b) | 109,800 | 3,661,830 | |
| Facebook, Inc. Class A (a) | 135,500 | 24,007,890 | |
| GoDaddy, Inc. (a) | 100,600 | 4,894,190 | |
| IAC/InterActiveCorp (a) | 9,600 | 1,221,792 | |
| NetEase, Inc. ADR | 1,100 | 361,581 | |
| Qudian, Inc. ADR | 16,700 | 227,120 | |
| The Trade Desk, Inc. (a)(b) | 130,100 | 6,393,114 | |
| Wix.com Ltd. (a) | 136,469 | 7,492,148 | |
| 92,705,413 | |||
| IT Services - 9.4% | |||
| Accenture PLC Class A | 2,600 | 384,826 | |
| Alliance Data Systems Corp. | 35,700 | 8,541,939 | |
| Cognizant Technology Solutions Corp. Class A | 98,600 | 7,126,808 | |
| EPAM Systems, Inc. (a) | 31,500 | 3,195,360 | |
| Euronet Worldwide, Inc. (a) | 37,700 | 3,443,895 | |
| FleetCor Technologies, Inc. (a) | 9,700 | 1,764,139 | |
| Global Payments, Inc. | 54,600 | 5,490,576 | |
| Luxoft Holding, Inc. (a) | 123,699 | 6,370,499 | |
| MasterCard, Inc. Class A | 46,600 | 7,011,902 | |
| PayPal Holdings, Inc. (a) | 62,200 | 4,710,406 | |
| Visa, Inc. Class A | 88,300 | 9,941,697 | |
| 57,982,047 | |||
| Semiconductors & Semiconductor Equipment - 3.9% | |||
| Analog Devices, Inc. | 19,300 | 1,661,923 | |
| Broadcom Ltd. | 24,000 | 6,670,560 | |
| Cavium, Inc. (a) | 4,800 | 410,304 | |
| Micron Technology, Inc. (a) | 102,200 | 4,332,258 | |
| NVIDIA Corp. | 23,500 | 4,716,685 | |
| ON Semiconductor Corp. (a) | 76,300 | 1,532,104 | |
| Qualcomm, Inc. | 57,400 | 3,807,916 | |
| SolarEdge Technologies, Inc. (a) | 25,980 | 945,672 | |
| 24,077,422 | |||
| Software - 10.5% | |||
| Activision Blizzard, Inc. | 89,700 | 5,597,280 | |
| Adobe Systems, Inc. (a) | 44,300 | 8,039,121 | |
| Altair Engineering, Inc. Class A (a) | 2,600 | 58,214 | |
| Autodesk, Inc. (a) | 53,900 | 5,912,830 | |
| Electronic Arts, Inc. (a) | 27,500 | 2,924,625 | |
| Microsoft Corp. | 243,200 | 20,470,144 | |
| Red Hat, Inc. (a) | 14,800 | 1,876,048 | |
| Salesforce.com, Inc. (a) | 129,248 | 13,483,151 | |
| ServiceNow, Inc. (a) | 33,300 | 4,095,900 | |
| Workday, Inc. Class A (a) | 23,800 | 2,451,400 | |
| 64,908,713 | |||
| Technology Hardware, Storage & Peripherals - 6.6% | |||
| Apple, Inc. | 238,800 | 41,037,778 | |
| TOTAL INFORMATION TECHNOLOGY | 286,200,890 | ||
| MATERIALS - 4.5% | |||
| Chemicals - 3.6% | |||
| DowDuPont, Inc. | 61,774 | 4,445,257 | |
| LG Chemical Ltd. | 6,804 | 2,611,426 | |
| LyondellBasell Industries NV Class A | 116,500 | 12,197,550 | |
| The Chemours Co. LLC | 60,900 | 3,130,260 | |
| 22,384,493 | |||
| Containers & Packaging - 0.9% | |||
| Ball Corp. | 140,900 | 5,623,319 | |
| TOTAL MATERIALS | 28,007,812 | ||
| REAL ESTATE - 3.1% | |||
| Equity Real Estate Investment Trusts (REITs) - 2.8% | |||
| American Tower Corp. | 120,100 | 17,285,993 | |
| Real Estate Management & Development - 0.3% | |||
| Redfin Corp. | 1,100 | 25,058 | |
| Redfin Corp. | 94,108 | 2,036,591 | |
| 2,061,649 | |||
| TOTAL REAL ESTATE | 19,347,642 | ||
| TELECOMMUNICATION SERVICES - 1.8% | |||
| Wireless Telecommunication Services - 1.8% | |||
| T-Mobile U.S., Inc. (a) | 182,000 | 11,114,740 | |
| TOTAL COMMON STOCKS | |||
| (Cost $416,859,217) | 610,474,332 | ||
| Preferred Stocks - 1.4% | |||
| Convertible Preferred Stocks - 1.3% | |||
| CONSUMER STAPLES - 0.9% | |||
| Tobacco - 0.9% | |||
| JUUL Labs, Inc. Series C(a)(d)(e) | 273,248 | 5,498,859 | |
| FINANCIALS - 0.1% | |||
| Insurance - 0.1% | |||
| Clover Health Series D (d)(e) | 67,979 | 618,609 | |
| INFORMATION TECHNOLOGY - 0.3% | |||
| Internet Software & Services - 0.3% | |||
| Uber Technologies, Inc. Series D, 8.00% (a)(d)(e) | 55,696 | 1,944,904 | |
| TOTAL CONVERTIBLE PREFERRED STOCKS | 8,062,372 | ||
| Nonconvertible Preferred Stocks - 0.1% | |||
| CONSUMER STAPLES - 0.1% | |||
| Tobacco - 0.1% | |||
| PAX Labs, Inc. Series A(d)(e) | 273,248 | 374,350 | |
| TOTAL PREFERRED STOCKS | |||
| (Cost $2,553,513) | 8,436,722 | ||
| Money Market Funds - 3.1% | |||
| Fidelity Cash Central Fund, 1.13% (f) | 745,090 | 745,239 | |
| Fidelity Securities Lending Cash Central Fund 1.13% (f)(g) | 18,774,125 | 18,776,003 | |
| TOTAL MONEY MARKET FUNDS | |||
| (Cost $19,521,242) | 19,521,242 | ||
| TOTAL INVESTMENT IN SECURITIES - 103.2% | |||
| (Cost $438,933,972) | 638,432,296 | ||
| NET OTHER ASSETS (LIABILITIES) - (3.2)% | (19,945,150) | ||
| NET ASSETS - 100% | $618,487,146 |
Legend
(a) Non-income producing
(b) Security or a portion of the security is on loan at period end.
(c) Security exempt from registration under Rule 144A of the Securities Act of 1933. These securities may be resold in transactions exempt from registration, normally to qualified institutional buyers. At the end of the period, the value of these securities amounted to $247,538 or 0.0% of net assets.
(d) Level 3 security
(e) Restricted securities - Investment in securities not registered under the Securities Act of 1933 (excluding 144A issues). At the end of the period, the value of restricted securities (excluding 144A issues) amounted to $8,436,722 or 1.4% of net assets.
(f) Affiliated fund that is generally available only to investment companies and other accounts managed by Fidelity Investments. The rate quoted is the annualized seven-day yield of the fund at period end. A complete unaudited listing of the fund's holdings as of its most recent quarter end is available upon request. In addition, each Fidelity Central Fund's financial statements, which are not covered by the Fund's Report of Independent Registered Public Accounting Firm, are available on the SEC's website or upon request.
(g) Investment made with cash collateral received from securities on loan.
Additional information on each restricted holding is as follows:
| Security | Acquisition Date | Acquisition Cost |
| Clover Health Series D | 6/7/17 | $637,493 |
| PAX Labs, Inc. Series A | 5/22/15 | $202,204 |
| JUUL Labs, Inc. Series C | 5/22/15 | $849,801 |
| Uber Technologies, Inc. Series D, 8.00% | 6/6/14 | $864,015 |
Affiliated Central Funds
Information regarding fiscal year to date income earned by the Fund from investments in Fidelity Central Funds is as follows:
| Fund | Income earned |
| Fidelity Cash Central Fund | $41,521 |
| Fidelity Securities Lending Cash Central Fund | 589,119 |
| Total | $630,640 |
Investment Valuation
The following is a summary of the inputs used, as of November 30, 2017, involving the Fund's assets and liabilities carried at fair value. The inputs or methodology used for valuing securities may not be an indication of the risk associated with investing in those securities. For more information on valuation inputs, and their aggregation into the levels used below, please refer to the Investment Valuation section in the accompanying Notes to Financial Statements.
| Valuation Inputs at Reporting Date: | ||||
| Description | Total | Level 1 | Level 2 | Level 3 |
| Investments in Securities: | ||||
| Equities: | ||||
| Consumer Discretionary | $84,906,451 | $84,637,939 | $268,512 | $-- |
| Consumer Staples | 35,727,597 | 19,493,202 | 10,358,988 | 5,875,407 |
| Energy | 10,501,329 | 10,501,329 | -- | -- |
| Financials | 28,311,423 | 27,692,814 | -- | 618,609 |
| Health Care | 89,914,030 | 89,914,030 | -- | -- |
| Industrials | 22,934,236 | 22,934,236 | -- | -- |
| Information Technology | 288,145,794 | 286,200,890 | -- | 1,944,904 |
| Materials | 28,007,812 | 28,007,812 | -- | -- |
| Real Estate | 19,347,642 | 17,311,051 | 2,036,591 | -- |
| Telecommunication Services | 11,114,740 | 11,114,740 | -- | -- |
| Money Market Funds | 19,521,242 | 19,521,242 | -- | -- |
| Total Investments in Securities: | $638,432,296 | $617,329,285 | $12,664,091 | $8,438,920 |
The following is a reconciliation of Investments in Securities for which Level 3 inputs were used in determining value:
| Investments in Securities: | |
| Beginning Balance | $5,987,176 |
| Net Realized Gain (Loss) on Investment Securities | -- |
| Net Unrealized Gain (Loss) on Investment Securities | 3,644,437 |
| Cost of Purchases | 841,895 |
| Proceeds of Sales | (2,034,588) |
| Amortization/Accretion | -- |
| Transfers into Level 3 | -- |
| Transfers out of Level 3 | -- |
| Ending Balance | $8,438,920 |
| The change in unrealized gain (loss) for the period attributable to Level 3 securities held at November 30, 2017 | $4,271,264 |
The information used in the above reconciliation represents fiscal year to date activity for any Investments in Securities identified as using Level 3 inputs at either the beginning or the end of the current fiscal period. Transfers in or out of Level 3 represent the beginning value of any Security or Instrument where a change in the pricing level occurred from the beginning to the end of the period. The cost of purchases and the proceeds of sales may include securities received or delivered through corporate actions or exchanges. Realized and unrealized gains (losses) disclosed in the reconciliation are included in Net Gain (Loss) on the Fund's Statement of Operations.
Other Information
Distribution of investments by country or territory of incorporation, as a percentage of Total Net Assets, is as follows (Unaudited):
| United States of America | 86.7% |
| United Kingdom | 2.3% |
| Netherlands | 2.2% |
| India | 1.7% |
| Ireland | 1.4% |
| Israel | 1.2% |
| Singapore | 1.1% |
| Cayman Islands | 1.1% |
| British Virgin Islands | 1.0% |
| Others (Individually Less Than 1%) | 1.3% |
| 100.0% |
See accompanying notes which are an integral part of the financial statements.
Financial Statements
Statement of Assets and Liabilities
| November 30, 2017 | ||
| Assets | ||
| Investment in securities, at value (including securities loaned of $18,585,231) — See accompanying schedule: Unaffiliated issuers (cost $419,412,730) | $618,911,054 | |
| Fidelity Central Funds (cost $19,521,242) | 19,521,242 | |
| Total Investment in Securities (cost $438,933,972) | $638,432,296 | |
| Foreign currency held at value (cost $36,419) | 36,879 | |
| Receivable for fund shares sold | 9,106 | |
| Dividends receivable | 412,715 | |
| Distributions receivable from Fidelity Central Funds | 119,815 | |
| Other receivables | 3,044 | |
| Total assets | 639,013,855 | |
| Liabilities | ||
| Payable for investments purchased | $548,352 | |
| Payable for fund shares redeemed | 1,144,910 | |
| Other payables and accrued expenses | 55,887 | |
| Collateral on securities loaned | 18,777,560 | |
| Total liabilities | 20,526,709 | |
| Net Assets | $618,487,146 | |
| Net Assets consist of: | ||
| Paid in capital | $362,016,874 | |
| Undistributed net investment income | 4,069,411 | |
| Accumulated undistributed net realized gain (loss) on investments and foreign currency transactions | 52,933,946 | |
| Net unrealized appreciation (depreciation) on investments and assets and liabilities in foreign currencies | 199,466,915 | |
| Net Assets, for 44,635,196 shares outstanding | $618,487,146 | |
| Net Asset Value, offering price and redemption price per share ($618,487,146 ÷ 44,635,196 shares) | $13.86 |
See accompanying notes which are an integral part of the financial statements.
Statement of Operations
| Year ended November 30, 2017 | ||
| Investment Income | ||
| Dividends | $5,544,107 | |
| Income from Fidelity Central Funds (including $589,119 from security lending) | 630,640 | |
| Total income | 6,174,747 | |
| Expenses | ||
| Management fee | ||
| Basic fee | $1,672,070 | |
| Performance adjustment | (516,104) | |
| Transfer agent fees | 516,998 | |
| Accounting and security lending fees | 115,188 | |
| Custodian fees and expenses | 39,178 | |
| Independent trustees' fees and expenses | 2,364 | |
| Audit | 30,079 | |
| Legal | 2,220 | |
| Interest | 7,456 | |
| Miscellaneous | 4,089 | |
| Total expenses before reductions | 1,873,538 | |
| Expense reductions | (28,029) | 1,845,509 |
| Net investment income (loss) | 4,329,238 | |
| Realized and Unrealized Gain (Loss) | ||
| Net realized gain (loss) on: | ||
| Investment securities: | ||
| Unaffiliated issuers | 54,817,374 | |
| Fidelity Central Funds | (746) | |
| Foreign currency transactions | 13,301 | |
| Total net realized gain (loss) | 54,829,929 | |
| Change in net unrealized appreciation (depreciation) on: | ||
| Unaffiliated issuers (net of increase in deferred foreign taxes of $32,684) | 126,039,223 | |
| Fidelity Central Funds | (1,484) | |
| Assets and liabilities in foreign currencies | 1,436 | |
| Total change in net unrealized appreciation (depreciation) | 126,039,175 | |
| Net gain (loss) | 180,869,104 | |
| Net increase (decrease) in net assets resulting from operations | $185,198,342 |
See accompanying notes which are an integral part of the financial statements.
Statement of Changes in Net Assets
| Year ended November 30, 2017 | Year ended November 30, 2016 | |
| Increase (Decrease) in Net Assets | ||
| Operations | ||
| Net investment income (loss) | $4,329,238 | $2,654,868 |
| Net realized gain (loss) | 54,829,929 | 21,127,257 |
| Change in net unrealized appreciation (depreciation) | 126,039,175 | (36,293,383) |
| Net increase (decrease) in net assets resulting from operations | 185,198,342 | (12,511,258) |
| Distributions to shareholders from net investment income | (2,032,804) | (3,620,189) |
| Distributions to shareholders from net realized gain | (19,503,931) | (65,761,689) |
| Total distributions | (21,536,735) | (69,381,878) |
| Share transactions | ||
| Proceeds from sales of shares | 44,288,542 | 82,016,938 |
| Reinvestment of distributions | 21,536,735 | 69,381,877 |
| Cost of shares redeemed | (201,987,626) | (111,626,598) |
| Net increase (decrease) in net assets resulting from share transactions | (136,162,349) | 39,772,217 |
| Total increase (decrease) in net assets | 27,499,258 | (42,120,919) |
| Net Assets | ||
| Beginning of period | 590,987,888 | 633,108,807 |
| End of period | $618,487,146 | $590,987,888 |
| Other Information | ||
| Undistributed net investment income end of period | $4,069,411 | $1,780,441 |
| Shares | ||
| Sold | 3,681,047 | 7,910,300 |
| Issued in reinvestment of distributions | 2,060,932 | 6,584,295 |
| Redeemed | (16,754,045) | (10,624,052) |
| Net increase (decrease) | (11,012,066) | 3,870,543 |
See accompanying notes which are an integral part of the financial statements.
Financial Highlights
Fidelity Advisor Series Growth Opportunities Fund
| Years ended November 30, | 2017 | 2016 | 2015 | 2014 | 2013 A |
| Selected Per–Share Data | |||||
| Net asset value, beginning of period | $10.62 | $12.23 | $11.79 | $10.23 | $10.00 |
| Income from Investment Operations | |||||
| Net investment income (loss)B | .09 | .05 | .05C | .02 | –D |
| Net realized and unrealized gain (loss) | 3.54 | (.32) | .60 | 1.56 | .23 |
| Total from investment operations | 3.63 | (.27) | .65 | 1.58 | .23 |
| Distributions from net investment income | (.04) | (.07) | (.02) | –D | – |
| Distributions from net realized gain | (.36) | (1.27) | (.20) | (.02) | – |
| Total distributions | (.39)E | (1.34) | (.21)F | (.02) | – |
| Net asset value, end of period | $13.86 | $10.62 | $12.23 | $11.79 | $10.23 |
| Total ReturnG,H | 35.40% | (2.09)% | 5.71% | 15.51% | 2.30% |
| Ratios to Average Net AssetsI,J | |||||
| Expenses before reductions | .31% | .62% | .74% | .77% | .85%K |
| Expenses net of fee waivers, if any | .31% | .62% | .74% | .77% | .85%K |
| Expenses net of all reductions | .30% | .61% | .74% | .77% | .85%K |
| Net investment income (loss) | .71% | .45% | .44%C | .16% | .38%K |
| Supplemental Data | |||||
| Net assets, end of period (000 omitted) | $618,487 | $590,988 | $633,109 | $974,463 | $852,281 |
| Portfolio turnover rateL | 50% | 67% | 50% | 16% | 65%M |
A For the period November 7, 2013 (commencement of operations) to November 30, 2013.
B Calculated based on average shares outstanding during the period.
C Net Investment income per share reflects a large, non-recurring dividend which amounted to $.03 per share. Excluding this non-recurring dividend, the ratio of net investment income (loss) to average net assets would have been .22%.
D Amount represents less than $.005 per share.
E Total distributions of $.39 per share is comprised of distributions from net investment income of $.037 and distributions from net realized gain of $.355 per share.
F Total distributions of $.21 per share is comprised of distributions from net investment income of $.016 and distributions from net realized gain of $.197 per share.
G Total returns for periods of less than one year are not annualized.
H Total returns would have been lower if certain expenses had not been reduced during the applicable periods shown.
I Fees and expenses of any underlying Fidelity Central Funds are not included in the Fund's expense ratio. The Fund indirectly bears its proportionate share of the expenses of any underlying Fidelity Central Funds.
J Expense ratios reflect operating expenses of the Fund. Expenses before reductions do not reflect amounts reimbursed by the investment adviser or reductions from brokerage service arrangements or reductions from other expense offset arrangements and do not represent the amount paid by the Fund during periods when reimbursements or reductions occur. Expense ratios before reductions for start-up periods may not be representative of longer term operating periods. Expenses net of fee waivers reflect expenses after reimbursement by the investment adviser but prior to reductions from brokerage service arrangements or other expense offset arrangements. Expenses net of all reductions represent the net expenses paid by the Fund.
K Annualized
L Amount does not include the portfolio activity of any underlying Fidelity Central Funds.
M Amount not annualized.
See accompanying notes which are an integral part of the financial statements.
Notes to Financial Statements
For the period ended November 30, 2017
1. Organization.
Fidelity Advisor Series Growth Opportunities Fund (the Fund) is a fund of Fidelity Advisor Series I (the Trust) and is authorized to issue an unlimited number of shares. Shares of the Fund are only available for purchase by mutual funds for which Fidelity Management & Research Company (FMR) or an affiliate serves as an investment manager. The Trust is registered under the Investment Company Act of 1940, as amended (the 1940 Act), as an open-end management investment company organized as a Massachusetts business trust.
2. Investments in Fidelity Central Funds.
The Fund invests in Fidelity Central Funds, which are open-end investment companies generally available only to other investment companies and accounts managed by the investment adviser and its affiliates. The Fund's Schedule of Investments lists each of the Fidelity Central Funds held as of period end, if any, as an investment of the Fund, but does not include the underlying holdings of each Fidelity Central Fund. As an Investing Fund, the Fund indirectly bears its proportionate share of the expenses of the underlying Fidelity Central Funds.
The Money Market Central Funds seek preservation of capital and current income and are managed by Fidelity Investments Money Management, Inc. (FIMM), an affiliate of the investment adviser. Annualized expenses of the Money Market Central Funds as of their most recent shareholder report date are less than .005%.
A complete unaudited list of holdings for each Fidelity Central Fund is available upon request or at the Securities and Exchange Commission (the SEC) website at www.sec.gov. In addition, the financial statements of the Fidelity Central Funds, which are not covered by the Fund's Report of Independent Registered Public Accounting Firm, are available on the SEC website or upon request.
3. Significant Accounting Policies.
The Fund is an investment company and applies the accounting and reporting guidance of the Financial Accounting Standards Board (FASB) Accounting Standards Codification Topic 946 Financial Services – Investments Companies. The financial statements have been prepared in conformity with accounting principles generally accepted in the United States of America (GAAP), which require management to make certain estimates and assumptions at the date of the financial statements. Actual results could differ from those estimates. Subsequent events, if any, through the date that the financial statements were issued have been evaluated in the preparation of the financial statements. The following summarizes the significant accounting policies of the Fund:
Investment Valuation. Investments are valued as of 4:00 p.m. Eastern time on the last calendar day of the period. The Board of Trustees (the Board) has delegated the day to day responsibility for the valuation of the Fund's investments to the Fair Value Committee (the Committee) established by the Fund's investment adviser. In accordance with valuation policies and procedures approved by the Board, the Fund attempts to obtain prices from one or more third party pricing vendors or brokers to value its investments. When current market prices, quotations or currency exchange rates are not readily available or reliable, investments will be fair valued in good faith by the Committee, in accordance with procedures adopted by the Board. Factors used in determining fair value vary by investment type and may include market or investment specific events. The frequency with which these procedures are used cannot be predicted and they may be utilized to a significant extent. The Committee oversees the Fund's valuation policies and procedures and reports to the Board on the Committee's activities and fair value determinations. The Board monitors the appropriateness of the procedures used in valuing the Fund's investments and ratifies the fair value determinations of the Committee.
The Fund categorizes the inputs to valuation techniques used to value its investments into a disclosure hierarchy consisting of three levels as shown below:
- Level 1 – quoted prices in active markets for identical investments
- Level 2 – other significant observable inputs (including quoted prices for similar investments, interest rates, prepayment speeds, etc.)
- Level 3 – unobservable inputs (including the Fund's own assumptions based on the best information available)
Valuation techniques used to value the Fund's investments by major category are as follows:
Equity securities, including restricted securities, for which market quotations are readily available, are valued at the last reported sale price or official closing price as reported by a third party pricing vendor on the primary market or exchange on which they are traded and are categorized as Level 1 in the hierarchy. In the event there were no sales during the day or closing prices are not available, securities are valued at the last quoted bid price or may be valued using the last available price and are generally categorized as Level 2 in the hierarchy. For foreign equity securities, when market or security specific events arise, comparisons to the valuation of American Depositary Receipts (ADRs), futures contracts, Exchange-Traded Funds (ETFs)and certain indexes as well as quoted prices for similar securities may be used and would be categorized as Level 2 in the hierarchy. Utilizing these techniques may result in transfers between Level 1 and Level 2. For equity securities, including restricted securities, where observable inputs are limited, assumptions about market activity and risk are used and these securities may be categorized as Level 3 in the hierarchy. Equity securities, including restricted securities, for which observable inputs are not available are valued using alternate valuation approaches, including the market approach and the income approach and are categorized as Level 3 in the hierarchy. The market approach generally consists of using comparable market transactions while the income approach generally consists of using the net present value of estimated future cash flows, adjusted as appropriate for liquidity, credit, market and/or other risk factors.
Investments in open-end mutual funds, including the Fidelity Central Funds, are valued at their closing net asset value (NAV) each business day and are categorized as Level 1 in the hierarchy.
The following provides information on Level 3 securities held by the Fund that were valued at period end based on unobservable inputs. These amounts exclude valuations provided by a broker.
| Asset Type | Fair Value | Valuation Technique (s) | Unobservable Input | Amount or Range / Weighted Average | Impact to Valuation from an Increase in Input(a) |
| Equities | $8,438,920 | Market comparable | Enterprise value/Sales multiple (EV/S) | 1.0 - 5.4 / 4.7 | Increase |
| Discount rate | 10.0% | Decrease | |||
| Premium rate | 38.9% | Increase | |||
| Market approach | Transaction price | $32.97 - $48.77 / $40.87 | Increase |
(a) Represents the expected directional change in the fair value of the Level 3 investments that would result from an increase in the corresponding input. A decrease to the unobservable input would have the opposite effect. Significant changes in these inputs could result in significantly higher or lower fair value measurements.
Changes in valuation techniques may result in transfers in or out of an assigned level within the disclosure hierarchy. The aggregate value of investments by input level as of November 30, 2017, as well as a roll forward of Level 3 investments, is included at the end of the Fund's Schedule of Investments.
Foreign Currency. The Fund may use foreign currency contracts to facilitate transactions in foreign-denominated securities. Gains and losses from these transactions may arise from changes in the value of the foreign currency or if the counterparties do not perform under the contracts' terms.
Foreign-denominated assets, including investment securities, and liabilities are translated into U.S. dollars at the exchange rates at period end. Purchases and sales of investment securities, income and dividends received and expenses denominated in foreign currencies are translated into U.S. dollars at the exchange rate in effect on the transaction date.
The effects of exchange rate fluctuations on investments are included with the net realized and unrealized gain (loss) on investment securities. Other foreign currency transactions resulting in realized and unrealized gain (loss) are disclosed separately.
Investment Transactions and Income. For financial reporting purposes, the Fund's investment holdings and NAV include trades executed through the end of the last business day of the period. The NAV per share for processing shareholder transactions is calculated as of the close of business of the New York Stock Exchange (NYSE), normally 4:00 p.m. Eastern time and includes trades executed through the end of the prior business day. Gains and losses on securities sold are determined on the basis of identified cost and includes proceeds received from litigation. Dividend income is recorded on the ex-dividend date, except for certain dividends from foreign securities where the ex-dividend date may have passed, which are recorded as soon as the Fund is informed of the ex-dividend date. Non-cash dividends included in dividend income, if any, are recorded at the fair market value of the securities received. Income and capital gain distributions from Fidelity Central Funds, if any, are recorded on the ex-dividend date. Certain distributions received by the Fund represent a return of capital or capital gain. The Fund determines the components of these distributions subsequent to the ex-dividend date, based upon receipt of tax filings or other correspondence relating to the underlying investment. These distributions are recorded as a reduction of cost of investments and/or as a realized gain. Investment income is recorded net of foreign taxes withheld where recovery of such taxes is uncertain.
Expenses. Expenses directly attributable to a fund are charged to that fund. Expenses attributable to more than one fund are allocated among the respective funds on the basis of relative net assets or other appropriate methods. Expense estimates are accrued in the period to which they relate and adjustments are made when actual amounts are known.
Income Tax Information and Distributions to Shareholders. Each year, the Fund intends to qualify as a regulated investment company under Subchapter M of the Internal Revenue Code, including distributing substantially all of its taxable income and realized gains. As a result, no provision for U.S. Federal income taxes is required. As of November 30, 2017, the Fund did not have any unrecognized tax benefits in the financial statements; nor is the Fund aware of any tax positions for which it is reasonably possible that the total amounts of unrecognized tax benefits will significantly change in the next twelve months. The Fund files a U.S. federal tax return, in addition to state and local tax returns as required. The Fund's federal income tax returns are subject to examination by the Internal Revenue Service (IRS) for a period of three fiscal years after they are filed. State and local tax returns may be subject to examination for an additional fiscal year depending on the jurisdiction. Foreign taxes are provided for based on the Fund's understanding of the tax rules and rates that exist in the foreign markets in which it invests. The Fund is subject to a tax imposed on capital gains by certain countries in which it invests. An estimated deferred tax liability for net unrealized appreciation on the applicable securities is included in Other payables and accrued expenses on the Statement of Assets & Liabilities.
Distributions are declared and recorded on the ex-dividend date. Income and capital gain distributions are determined in accordance with income tax regulations, which may differ from GAAP.
Capital accounts within the financial statements are adjusted for permanent book-tax differences. These adjustments have no impact on net assets or the results of operations. Capital accounts are not adjusted for temporary book-tax differences which will reverse in a subsequent period.
Book-tax differences are primarily due to foreign currency transactions, partnerships and losses deferred due to wash sales.
As of period end, the cost and unrealized appreciation (depreciation) in securities, and derivatives if applicable, for federal income tax purposes were as follows:
| Gross unrealized appreciation | $210,021,515 |
| Gross unrealized depreciation | (10,767,854) |
| Net unrealized appreciation (depreciation) | $199,253,661 |
| Tax Cost | $439,178,635 |
The tax-based components of distributable earnings as of period end were as follows:
| Undistributed ordinary income | $17,814,323 |
| Undistributed long-term capital gain | $39,433,699 |
| Net unrealized appreciation (depreciation) on securities and other investments | $199,254,936 |
The tax character of distributions paid was as follows:
| November 30, 2017 | November 30, 2016 | |
| Ordinary Income | $2,032,804 | $ 4,137,359 |
| Long-term Capital Gains | 19,503,931 | 65,244,519 |
| Total | $21,536,735 | $ 69,381,878 |
Restricted Securities. The Fund may invest in securities that are subject to legal or contractual restrictions on resale. These securities generally may be resold in transactions exempt from registration or to the public if the securities are registered. Disposal of these securities may involve time-consuming negotiations and expense, and prompt sale at an acceptable price may be difficult. Information regarding restricted securities is included at the end of the Fund's Schedule of Investments.
4. Purchases and Sales of Investments.
Purchases and sales of securities, other than short-term securities, aggregated $299,759,933 and $445,754,761, respectively.
5. Fees and Other Transactions with Affiliates.
Management Fee. Effective June 1, 2017, under the management contract approved by the Board and shareholders, Fidelity Management & Research Company (the investment adviser) and its affiliates provide the Fund with investment management related services for which the Fund does not pay a management fee. In addition, the investment adviser pays all ordinary operating expenses of the Fund, except custody fees, fees and expenses of the independent Trustees, and certain miscellaneous expenses such as proxy and shareholder meeting expenses.
Prior to June 1, 2017 the investment adviser and its affiliates provided the Fund with investment management related services for which the Fund paid a monthly management fee. The management fee was the sum of an individual fund fee rate that was based on an annual rate of .30% of the Fund's average net assets and an annualized group fee rate that averaged .25% during the period. The group fee rate was based upon the average net assets of all the mutual funds advised by the investment adviser, including any mutual funds previously advised by the investment adviser that are currently advised by Fidelity SelectCo, LLC, an affiliate of the investment adviser. The group fee rate decreased as assets under management increased and increased as assets under management decreased. In addition, the management fee was subject to a performance adjustment (up to a maximum of +/- .20% of the Fund's average net assets over a 36 month performance period). The upward or downward adjustment to the management fee was based on the Fund's relative investment performance as compared to its benchmark index, the Russell 3000 Growth Index, over the same 36 month performance period. The performance adjustment included in the management fee rate may be higher or lower than the maximum performance adjustment rate due to the difference between the average net assets for the reporting and performance periods.
Transfer Agent Fees. Fidelity Investments Institutional Operations Company, Inc. (FIIOC), an affiliate of the investment adviser, is the Fund's transfer, dividend disbursing and shareholder servicing agent. Effective June 1, 2017, fees for these services are no longer charged to the classes. Prior to June 1, 2017, FIIOC received account fees and asset-based fees that varied according to account size and type of account. FIIOC pays for typesetting, printing and mailing of shareholder reports, except proxy statements. For the period, the transfer agent fees were equivalent to a rate of .08% of average net assets.
Accounting and Security Lending Fees. Fidelity Service Company, Inc. (FSC), an affiliate of the investment adviser, maintains the Fund's accounting records. The accounting fee is based on the level of average net assets for each month. Under a separate contract, FSC administers the security lending program. The security lending fee is based on the number and duration of lending transactions. Effective June 1, 2017, these fees are paid by the investment adviser or an affiliate.
Brokerage Commissions. The Fund placed a portion of its portfolio transactions with brokerage firms which are affiliates of the investment adviser. Brokerage commissions are included in net realized gain (loss) and change in net unrealized appreciation (depreciation) in the Statement of Operations. The commissions paid to these affiliated firms were $9,573 for the period.
Interfund Lending Program. Pursuant to an Exemptive Order issued by the SEC, the Fund, along with other registered investment companies having management contracts with FMR or other affiliated entities of FMR, may participate in an interfund lending program. This program provides an alternative credit facility allowing the funds to borrow from, or lend money to, other participating affiliated funds. At period end, there were no interfund loans outstanding. The Fund's activity in this program during the period for which loans were outstanding was as follows:
| Borrower or Lender | Average Loan Balance | Weighted Average Interest Rate | Interest Expense |
| Borrower | $11,532,421 | 1.23% | $7,456 |
Interfund Trades. The Fund may purchase from or sell securities to other Fidelity Funds under procedures adopted by the Board. The procedures have been designed to ensure these interfund trades are executed in accordance with Rule 17a-7 of the 1940 Act. Interfund trades are included within the respective purchases and sales amounts shown in the Purchases and Sales of Investments note.
6. Committed Line of Credit.
The Fund participates with other funds managed by the investment adviser or an affiliate in a $4.25 billion credit facility (the "line of credit") to be utilized for temporary or emergency purposes to fund shareholder redemptions or for other short-term liquidity purposes. The Fund has agreed to pay commitment fees on its pro-rata portion of the line of credit, which amounted to $1,952 and is reflected in Miscellaneous expenses on the Statement of Operations. During the period, the Fund did not borrow on this line of credit.
7. Security Lending.
The Fund lends portfolio securities through a lending agent from time to time in order to earn additional income. For equity securities, a lending agent is used and may loan securities to certain qualified borrowers, including Fidelity Capital Markets (FCM), a broker-dealer affiliated with the Fund. On the settlement date of the loan, the Fund receives collateral (in the form of U.S. Treasury obligations, letters of credit and/or cash) against the loaned securities and maintains collateral in an amount not less than 100% of the market value of the loaned securities during the period of the loan. The market value of the loaned securities is determined at the close of business of the Fund and any additional required collateral is delivered to the Fund on the next business day. The Fund or borrower may terminate the loan at any time, and if the borrower defaults on its obligation to return the securities loaned because of insolvency or other reasons, the Fund may apply collateral received from the borrower against the obligation. The Fund may experience delays and costs in recovering the securities loaned. Any cash collateral received is invested in the Fidelity Securities Lending Cash Central Fund. The value of loaned securities and cash collateral at period end are disclosed on the Fund's Statement of Assets and Liabilities. Security lending income represents the income earned on investing cash collateral, less rebates paid to borrowers and any lending agent fees associated with the loan, plus any premium payments received for lending certain types of securities. Security lending income is presented in the Statement of Operations as a component of income from Fidelity Central Funds. During the period, there were no securities loaned to FCM.
8. Expense Reductions.
Commissions paid to certain brokers with whom the investment adviser, or its affiliates, places trades on behalf of the Fund include an amount in addition to trade execution, which may be rebated back to the Fund to offset certain expenses. This amount totaled $22,698 for the period.
In addition, during the period the investment adviser reimbursed and/or waived a portion of operating expenses in the amount of $5,331.
9. Other.
The Fund's organizational documents provide former and current trustees and officers with a limited indemnification against liabilities arising in connection with the performance of their duties to the Fund. In the normal course of business, the Fund may also enter into contracts that provide general indemnifications. The Fund's maximum exposure under these arrangements is unknown as this would be dependent on future claims that may be made against the Fund. The risk of material loss from such claims is considered remote.
At the end of the period, mutual funds managed by the investment adviser or its affiliates were the owners of record of all of the outstanding shares of the Fund.
Report of Independent Registered Public Accounting Firm
To the Trustees of Fidelity Advisor Series I and Shareholders of Fidelity Advisor Series Growth Opportunities Fund:
We have audited the accompanying statement of assets and liabilities of Fidelity Advisor Series Growth Opportunities Fund (the Fund), a fund of Fidelity Advisor Series I, including the schedule of investments, as of November 30, 2017, and the related statement of operations for the year then ended, the statement of changes in net assets for each of the two years in the period then ended, and the financial highlights for each of the four years in the period then ended and for the period from November 7, 2013 (commencement of operations) to November 30, 2013. These financial statements and financial highlights are the responsibility of the Fund's management. Our responsibility is to express an opinion on these financial statements and financial highlights based on our audits.
We conducted our audits in accordance with the standards of the Public Company Accounting Oversight Board (United States). Those standards require that we plan and perform the audit to obtain reasonable assurance about whether the financial statements and financial highlights are free of material misstatement. The Fund is not required to have, nor were we engaged to perform, an audit of its internal control over financial reporting. Our audits included consideration of internal control over financial reporting as a basis for designing audit procedures that are appropriate in the circumstances, but not for the purpose of expressing an opinion on the effectiveness of the Fund's internal control over financial reporting. Accordingly, we express no such opinion. An audit also includes examining, on a test basis, evidence supporting the amounts and disclosures in the financial statements, assessing the accounting principles used and significant estimates made by management, as well as evaluating the overall financial statement presentation. Our procedures included confirmation of securities owned as of November 30, 2017, by correspondence with the custodians and brokers; when replies were not received from brokers, we performed other auditing procedures. We believe that our audits provide a reasonable basis for our opinion.
In our opinion, such financial statements and financial highlights referred to above present fairly, in all material respects, the financial position of Fidelity Advisor Series Growth Opportunities Fund as of November 30, 2017, the results of its operations for the year then ended, the changes in its net assets for each of the two years in the period then ended, and the financial highlights for each of the four years in the period then ended and for the period from November 7, 2013 (commencement of operations) to November 30, 2013, in conformity with accounting principles generally accepted in the United States of America.
DELOITTE & TOUCHE LLP
Boston, Massachusetts
January 18, 2018
Trustees and Officers
The Trustees, Members of the Advisory Board (if any), and officers of the trust and fund, as applicable, are listed below. The Board of Trustees governs the fund and is responsible for protecting the interests of shareholders. The Trustees are experienced executives who meet periodically throughout the year to oversee the fund's activities, review contractual arrangements with companies that provide services to the fund, oversee management of the risks associated with such activities and contractual arrangements, and review the fund's performance. Each of the Trustees oversees 190 funds.
The Trustees hold office without limit in time except that (a) any Trustee may resign; (b) any Trustee may be removed by written instrument, signed by at least two-thirds of the number of Trustees prior to such removal; (c) any Trustee who requests to be retired or who has become incapacitated by illness or injury may be retired by written instrument signed by a majority of the other Trustees; and (d) any Trustee may be removed at any special meeting of shareholders by a two-thirds vote of the outstanding voting securities of the trust. Each Trustee who is not an interested person (as defined in the 1940 Act) of the trust and the fund is referred to herein as an Independent Trustee. Each Independent Trustee shall retire not later than the last day of the calendar year in which his or her 75th birthday occurs. The Independent Trustees may waive this mandatory retirement age policy with respect to individual Trustees. Officers and Advisory Board Members hold office without limit in time, except that any officer or Advisory Board Member may resign or may be removed by a vote of a majority of the Trustees at any regular meeting or any special meeting of the Trustees. Except as indicated, each individual has held the office shown or other offices in the same company for the past five years.
The fund’s Statement of Additional Information (SAI) includes more information about the Trustees. To request a free copy, call Fidelity at 1-877-208-0098.
Experience, Skills, Attributes, and Qualifications of the Trustees. The Governance and Nominating Committee has adopted a statement of policy that describes the experience, qualifications, attributes, and skills that are necessary and desirable for potential Independent Trustee candidates (Statement of Policy). The Board believes that each Trustee satisfied at the time he or she was initially elected or appointed a Trustee, and continues to satisfy, the standards contemplated by the Statement of Policy. The Governance and Nominating Committee also engages professional search firms to help identify potential Independent Trustee candidates who have the experience, qualifications, attributes, and skills consistent with the Statement of Policy. From time to time, additional criteria based on the composition and skills of the current Independent Trustees, as well as experience or skills that may be appropriate in light of future changes to board composition, business conditions, and regulatory or other developments, have also been considered by the professional search firms and the Governance and Nominating Committee. In addition, the Board takes into account the Trustees' commitment and participation in Board and committee meetings, as well as their leadership of standing and ad hoc committees throughout their tenure.
In determining that a particular Trustee was and continues to be qualified to serve as a Trustee, the Board has considered a variety of criteria, none of which, in isolation, was controlling. The Board believes that, collectively, the Trustees have balanced and diverse experience, qualifications, attributes, and skills, which allow the Board to operate effectively in governing the fund and protecting the interests of shareholders. Information about the specific experience, skills, attributes, and qualifications of each Trustee, which in each case led to the Board's conclusion that the Trustee should serve (or continue to serve) as a trustee of the fund, is provided below.
Board Structure and Oversight Function. James C. Curvey is an interested person and currently serves as Chairman. The Trustees have determined that an interested Chairman is appropriate and benefits shareholders because an interested Chairman has a personal and professional stake in the quality and continuity of services provided to the fund. Independent Trustees exercise their informed business judgment to appoint an individual of their choosing to serve as Chairman, regardless of whether the Trustee happens to be independent or a member of management. The Independent Trustees have determined that they can act independently and effectively without having an Independent Trustee serve as Chairman and that a key structural component for assuring that they are in a position to do so is for the Independent Trustees to constitute a substantial majority for the Board. The Independent Trustees also regularly meet in executive session. Ned C. Lautenbach serves as Chairman of the Independent Trustees and as such (i) acts as a liaison between the Independent Trustees and management with respect to matters important to the Independent Trustees and (ii) with management prepares agendas for Board meetings.
Fidelity® funds are overseen by different Boards of Trustees. The fund's Board oversees Fidelity's high income and certain equity funds, and other Boards oversee Fidelity's investment-grade bond, money market, asset allocation, and sector funds. The asset allocation funds may invest in Fidelity® funds overseen by the fund's Board. The use of separate Boards, each with its own committee structure, allows the Trustees of each group of Fidelity® funds to focus on the unique issues of the funds they oversee, including common research, investment, and operational issues. On occasion, the separate Boards establish joint committees to address issues of overlapping consequences for the Fidelity® funds overseen by each Board.
The Trustees operate using a system of committees to facilitate the timely and efficient consideration of all matters of importance to the Trustees, the fund, and fund shareholders and to facilitate compliance with legal and regulatory requirements and oversight of the fund's activities and associated risks. The Board, acting through its committees, has charged FMR and its affiliates with (i) identifying events or circumstances the occurrence of which could have demonstrably adverse effects on the fund's business and/or reputation; (ii) implementing processes and controls to lessen the possibility that such events or circumstances occur or to mitigate the effects of such events or circumstances if they do occur; and (iii) creating and maintaining a system designed to evaluate continuously business and market conditions in order to facilitate the identification and implementation processes described in (i) and (ii) above. Because the day-to-day operations and activities of the fund are carried out by or through FMR, its affiliates, and other service providers, the fund's exposure to risks is mitigated but not eliminated by the processes overseen by the Trustees. While each of the Board's committees has responsibility for overseeing different aspects of the fund's activities, oversight is exercised primarily through the Operations, Audit, and Compliance Committees. In addition, the Independent Trustees have worked with FMR to enhance the Board's oversight of investment and financial risks, legal and regulatory risks, technology risks, and operational risks, including the development of additional risk reporting to the Board. For example, a working group comprised of Independent Trustees and FMR has worked and continues to work to review the Fidelity® funds' valuation-related activities, reporting and risk management. Appropriate personnel, including but not limited to the fund's Chief Compliance Officer (CCO), FMR's internal auditor, the independent accountants, the fund's Treasurer and portfolio management personnel, make periodic reports to the Board's committees, as appropriate, including an annual review of Fidelity's risk management program for the Fidelity® funds. The responsibilities of each standing committee, including their oversight responsibilities, are described further under "Standing Committees of the Trustees."
Interested Trustees*:
Correspondence intended for a Trustee who is an interested person may be sent to Fidelity Investments, 245 Summer Street, Boston, Massachusetts 02210.
Name, Year of Birth; Principal Occupations and Other Relevant Experience+
James C. Curvey (1935)
Year of Election or Appointment: 2007
Trustee
Chairman of the Board of Trustees
Mr. Curvey also serves as Trustee of other Fidelity® funds. Mr. Curvey is a Director of Fidelity Research & Analysis Co. (investment adviser firm, 2009-present), and Vice Chairman (2007-present) and Director of FMR LLC (diversified financial services company). In addition, Mr. Curvey serves as an Overseer for the Boston Symphony Orchestra and a member of the board of Artis-Naples, Naples, Florida, and as a Trustee for Brewster Academy, Wolfeboro, New Hampshire. Previously, Mr. Curvey served as a Director of Fidelity Investments Money Management, Inc. (investment adviser firm, 2009-2014) and a Director of FMR and FMR Co., Inc. (investment adviser firms, 2007-2014).
Charles S. Morrison (1960)
Year of Election or Appointment: 2014
Trustee
Mr. Morrison also serves as Trustee of other funds. He serves as President of Fidelity Management & Research Company (FMR) (investment adviser firm, 2016-present), a Director of Fidelity Investments Money Management, Inc. (FIMM) (investment adviser firm, 2014-present), Director of Fidelity SelectCo, LLC (investment adviser firm, 2014-present), President, Asset Management (2014-present), and is an employee of Fidelity Investments. Previously, Mr. Morrison served as Vice President of Fidelity's Fixed Income and Asset Allocation Funds (2012-2014), President, Fixed Income (2011-2014), Vice President of Fidelity's Money Market Funds (2005-2009), President, Money Market Group Leader of FMR (investment adviser firm, 2009), and Senior Vice President, Money Market Group of FMR (2004-2009). Mr. Morrison also served as Vice President of Fidelity's Bond Funds (2002-2005), certain Balanced Funds (2002-2005), and certain Asset Allocation Funds (2002-2007), and as Senior Vice President (2002-2005) of Fidelity's Bond Division.
* Determined to be an “Interested Trustee” by virtue of, among other things, his or her affiliation with the trust or various entities under common control with FMR.
+ The information includes the Trustee's principal occupation during the last five years and other information relating to the experience, attributes, and skills relevant to the Trustee's qualifications to serve as a Trustee, which led to the conclusion that the Trustee should serve as a Trustee for the fund.
Independent Trustees:
Correspondence intended for an Independent Trustee may be sent to Fidelity Investments, P.O. Box 55235, Boston, Massachusetts 02205-5235.
Name, Year of Birth; Principal Occupations and Other Relevant Experience+
Dennis J. Dirks (1948)
Year of Election or Appointment: 2005
Trustee
Mr. Dirks also serves as Trustee of other Fidelity® funds. Prior to his retirement in May 2003, Mr. Dirks was Chief Operating Officer and a member of the Board of The Depository Trust & Clearing Corporation (DTCC). He also served as President, Chief Operating Officer, and Board member of The Depository Trust Company (DTC) and President and Board member of the National Securities Clearing Corporation (NSCC). In addition, Mr. Dirks served as Chief Executive Officer and Board member of the Government Securities Clearing Corporation, Chief Executive Officer and Board member of the Mortgage-Backed Securities Clearing Corporation, as a Trustee and a member of the Finance Committee of Manhattan College (2005-2008), as a Trustee and a member of the Finance Committee of AHRC of Nassau County (2006-2008), as a member of the Independent Directors Council (IDC) Governing Council (2010-2015), and as a member of the Board of Directors for The Brookville Center for Children’s Services, Inc. (2009-2017). Mr. Dirks is a member of the Finance Committee (2016-present) and Board of Directors (2017-present) of the Asolo Repertory Theatre.
Alan J. Lacy (1953)
Year of Election or Appointment: 2008
Trustee
Mr. Lacy also serves as Trustee of other Fidelity® funds. Mr. Lacy serves as a Director of Bristol-Myers Squibb Company (global pharmaceuticals, 2008-present). He is a Trustee of the California Chapter of The Nature Conservancy (2015-present) and a Director of the Center for Advanced Study in the Behavioral Sciences at Stanford University (2015-present). In addition, Mr. Lacy served as Senior Adviser (2007-2014) of Oak Hill Capital Partners, L.P. (private equity) and also served as Chief Executive Officer (2005) and Vice Chairman (2005-2006) of Sears Holdings Corporation (retail) and Chief Executive Officer and Chairman of the Board of Sears, Roebuck and Co. (retail, 2000-2005). Previously, Mr. Lacy served as Chairman (2014-2017) and a member (2010-2017) of the Board of Directors of Dave & Buster’s Entertainment, Inc. (restaurant and entertainment complexes), as Chairman (2008-2011) and a member (2006-2015) of the Board of Trustees of the National Parks Conservation Association, and as a member of the Board of Directors for The Hillman Companies, Inc. (hardware wholesalers, 2010-2014), Earth Fare, Inc. (retail grocery, 2010-2014), and The Western Union Company (global money transfer, 2006-2011).
Ned C. Lautenbach (1944)
Year of Election or Appointment: 2000
Trustee
Chairman of the Independent Trustees
Mr. Lautenbach also serves as Trustee of other Fidelity® funds. Mr. Lautenbach currently serves as Vice Chair of the Board of Governors, State University System of Florida (2013-present) and is a member of the Council on Foreign Relations (1994-present). He is also a member and has most recently served as Chairman of the Board of Directors of Artis-Naples (2012-present). Previously, Mr. Lautenbach served as a member and then Lead Director of the Board of Directors of Eaton Corporation (diversified industrial, 1997-2016). He was also a Partner and Advisory Partner at Clayton, Dubilier & Rice, LLC (private equity investment, 1998-2010), as well as a Director of Sony Corporation (2006-2007). In addition, Mr. Lautenbach also had a 30-year career with IBM (technology company) during which time he served as Senior Vice President and a member of the Corporate Executive Committee (1968-1998).
Joseph Mauriello (1944)
Year of Election or Appointment: 2008
Trustee
Mr. Mauriello also serves as Trustee of other Fidelity® funds. Prior to his retirement in January 2006, Mr. Mauriello served in numerous senior management positions including Deputy Chairman and Chief Operating Officer (2004-2005), and Vice Chairman of Financial Services (2002-2004) of KPMG LLP US (professional services, 1965-2005). Mr. Mauriello currently serves as a member of the Board of Directors of XL Group plc. (global insurance and re-insurance, 2006-present) and the Independent Directors Council (IDC) Governing Council (2015-present). Previously, Mr. Mauriello served as a Director of the Hamilton Funds of the Bank of New York (2006-2007) and of Arcadia Resources Inc. (health care services and products, 2007-2012).
Cornelia M. Small (1944)
Year of Election or Appointment: 2005
Trustee
Ms. Small also serves as Trustee of other Fidelity® funds. Ms. Small is a member of the Board of Directors (2009-present) and Chair of the Investment Committee (2010-present) of the Teagle Foundation. Ms. Small also serves on the Investment Committee of the Berkshire Taconic Community Foundation (2008-present). Previously, Ms. Small served as Chairperson (2002-2008) and a member of the Investment Committee and Chairperson (2008-2012) and a member of the Board of Trustees of Smith College. In addition, Ms. Small served as Chief Investment Officer, Director of Global Equity Investments, and a member of the Board of Directors of Scudder, Stevens & Clark and Scudder Kemper Investments.
William S. Stavropoulos (1939)
Year of Election or Appointment: 2002
Trustee
Vice Chairman of the Independent Trustees
Mr. Stavropoulos also serves as Trustee of other Fidelity® funds. Mr. Stavropoulos serves as President and Founder of the Michigan Baseball Foundation, the Great Lakes Loons (2007-present). Mr. Stavropoulos is Chairman Emeritus of the Board of Directors of The Dow Chemical Company, where he previously served in numerous senior management positions, including President, CEO (1995-2000; 2002-2004), Chairman of the Executive Committee (2000-2006), and as a member of the Board of Directors (1990-2006). Currently, Mr. Stavropoulos is Chairman of the Board of Directors of Univar Inc. (global distributor of commodity and specialty chemicals), a Director of Teradata Corporation (data warehousing and technology solutions), and a member of the Advisory Board for Metalmark Capital LLC (private equity investment, 2005-present). Mr. Stavropoulos is an operating advisor to Clayton, Dubilier & Rice, LLC (private equity investment). In addition, Mr. Stavropoulos is a member of the University of Notre Dame Advisory Council for the College of Science, a Trustee of the Rollin L. Gerstacker Foundation, and a Director of Artis-Naples in Naples, Florida. Previously, Mr. Stavropoulos served as a Director of Chemical Financial Corporation (bank holding company, 1993-2012) and Tyco International, Ltd. (multinational manufacturing and services, 2007-2012).
David M. Thomas (1949)
Year of Election or Appointment: 2008
Trustee
Mr. Thomas also serves as Trustee of other Fidelity® funds. Mr. Thomas serves as Non-Executive Chairman of the Board of Directors of Fortune Brands Home and Security (home and security products, 2011-present), as a member of the Board of Directors (2004-present) and Presiding Director (2013-present) of Interpublic Group of Companies, Inc. (marketing communication), and as a member of the Board of Trustees of the University of Florida (2013-present). Previously, Mr. Thomas served as Executive Chairman (2005-2006) and Chairman and Chief Executive Officer (2000-2005) of IMS Health, Inc. (pharmaceutical and healthcare information solutions), and a Director of Fortune Brands, Inc. (consumer products, 2000-2011).
+ The information includes the Trustee's principal occupation during the last five years and other information relating to the experience, attributes, and skills relevant to the Trustee's qualifications to serve as a Trustee, which led to the conclusion that the Trustee should serve as a Trustee for the fund.
Advisory Board Members and Officers:
Correspondence intended for an officer or Peter S. Lynch may be sent to Fidelity Investments, 245 Summer Street, Boston, Massachusetts 02210. Officers appear below in alphabetical order.
Name, Year of Birth; Principal Occupation
Peter S. Lynch (1944)
Year of Election or Appointment: 2003
Member of the Advisory Board
Mr. Lynch also serves as Member of the Advisory Board of other Fidelity® funds. Mr. Lynch is Vice Chairman and a Director of FMR (investment adviser firm) and FMR Co., Inc. (investment adviser firm). In addition, Mr. Lynch serves as a Trustee of Boston College and as the Chairman of the Inner-City Scholarship Fund. Previously, Mr. Lynch served on the Special Olympics International Board of Directors (1997-2006).
Elizabeth Paige Baumann (1968)
Year of Election or Appointment: 2017
Anti-Money Laundering (AML) Officer
Ms. Baumann also serves as AML Officer of other funds. She is Chief AML Officer (2012-present) and Senior Vice President (2014-present) of FMR LLC (diversified financial services company) and is an employee of Fidelity Investments. Previously, Ms. Baumann served as AML Officer of the funds (2012-2016), and Vice President (2007-2014) and Deputy Anti-Money Laundering Officer (2007-2012) of FMR LLC.
Marc R. Bryant (1966)
Year of Election or Appointment: 2015
Secretary and Chief Legal Officer (CLO)
Mr. Bryant also serves as Secretary and CLO of other funds. Mr. Bryant serves as CLO, Secretary, and Senior Vice President of Fidelity Management & Research Company (investment adviser firm, 2015-present) and FMR Co., Inc. (investment adviser firm, 2015-present); Secretary of Fidelity SelectCo, LLC (investment adviser firm, 2015-present) and Fidelity Investments Money Management, Inc. (investment adviser firm, 2015-present); and CLO of Fidelity Management & Research (Hong Kong) Limited and FMR Investment Management (UK) Limited (investment adviser firms, 2015-present) and Fidelity Management & Research (Japan) Limited (investment adviser firm, 2016-present). He is Senior Vice President and Deputy General Counsel of FMR LLC (diversified financial services company). Previously, Mr. Bryant served as Secretary and CLO of Fidelity Rutland Square Trust II (2010-2014) and Assistant Secretary of Fidelity's Fixed Income and Asset Allocation Funds (2013-2015). Prior to joining Fidelity Investments, Mr. Bryant served as a Senior Vice President and the Head of Global Retail Legal for AllianceBernstein L.P. (2006-2010), and as the General Counsel for ProFund Advisors LLC (2001-2006).
William C. Coffey (1969)
Year of Election or Appointment: 2009
Assistant Secretary
Mr. Coffey also serves as Assistant Secretary of other funds. He is Senior Vice President and Deputy General Counsel of FMR LLC (diversified financial services company, 2010-present), and is an employee of Fidelity Investments. Previously, Mr. Coffey served as Vice President and Associate General Counsel of FMR LLC (2005-2009).
Jonathan Davis (1968)
Year of Election or Appointment: 2010
Assistant Treasurer
Mr. Davis also serves as Assistant Treasurer of other funds. Mr. Davis serves as Assistant Treasurer of FMR Capital, Inc. (2017-present) and is an employee of Fidelity Investments. Previously, Mr. Davis served as Vice President and Associate General Counsel of FMR LLC (diversified financial services company, 2003-2010).
Adrien E. Deberghes (1967)
Year of Election or Appointment: 2016
Assistant Treasurer
Mr. Deberghes also serves as an officer of other funds. He serves as Assistant Treasurer of FMR Capital, Inc. (2017-present), Executive Vice President of Fidelity Investments Money Management, Inc. (FIMM) (investment adviser firm, 2016-present), and is an employee of Fidelity Investments (2008-present). Prior to joining Fidelity Investments, Mr. Deberghes was Senior Vice President of Mutual Fund Administration at State Street Corporation (2007-2008), Senior Director of Mutual Fund Administration at Investors Bank & Trust (2005-2007), and Director of Finance for Dunkin' Brands (2000-2005). Previously, Mr. Deberghes served in other fund officer roles.
Stephanie J. Dorsey (1969)
Year of Election or Appointment: 2010
Assistant Treasurer
Ms. Dorsey also serves as an officer of other funds. Ms. Dorsey serves as Assistant Treasurer of FMR Capital, Inc. (2017-present), is an employee of Fidelity Investments (2008-present), and has served in other fund officer roles. Prior to joining Fidelity Investments, Ms. Dorsey served as Treasurer (2004-2008) of the JPMorgan Mutual Funds and Vice President (2004-2008) of JPMorgan Chase Bank.
Howard J. Galligan III (1966)
Year of Election or Appointment: 2014
Chief Financial Officer
Mr. Galligan also serves as Chief Financial Officer of other funds. Mr. Galligan serves as President of Fidelity Pricing and Cash Management Services (FPCMS) (2014-present) and as a Director of Strategic Advisers, Inc. (investment adviser firm, 2008-present). Previously, Mr. Galligan served as Chief Administrative Officer of Asset Management (2011-2014) and Chief Operating Officer and Senior Vice President of Investment Support for Strategic Advisers, Inc. (2003-2011).
Brian B. Hogan (1964)
Year of Election or Appointment: 2009
Vice President
Mr. Hogan also serves as Trustee or Vice President of other funds. Mr. Hogan serves as a Director of FMR Investment Management (UK) Limited (investment adviser firm, 2015-present) and Fidelity SelectCo, LLC (investment adviser firm, 2014-present) and President of the Equity Division of FMR (investment adviser firm, 2009-present). Previously, Mr. Hogan served as Senior Vice President, Equity Research of FMR (2006-2009) and as a portfolio manager. Mr. Brian B. Hogan is not related to Mr. Colm A. Hogan.
Colm A. Hogan (1973)
Year of Election or Appointment: 2016
Deputy Treasurer
Mr. Hogan also serves as an officer of other funds. Mr. Hogan serves as Assistant Treasurer of FMR Capital, Inc. (2017-present) and is an employee of Fidelity Investments (2005-present). Mr. Colm A. Hogan is not related to Mr. Brian B. Hogan.
Chris Maher (1972)
Year of Election or Appointment: 2013
Assistant Treasurer
Mr. Maher serves as Assistant Treasurer of other funds. Mr. Maher is Vice President of Valuation Oversight, serves as Assistant Treasurer of FMR Capital, Inc. (2017-present), and is an employee of Fidelity Investments. Previously, Mr. Maher served as Vice President of Asset Management Compliance (2013), Vice President of the Program Management Group of FMR (investment adviser firm, 2010-2013), and Vice President of Valuation Oversight (2008-2010).
Rieco E. Mello (1969)
Year of Election or Appointment: 2017
Assistant Treasurer
Mr. Mello also serves as Assistant Treasurer of other funds. Mr. Mello serves as Assistant Treasurer of FMR Capital, Inc. (2017-present) and is an employee of Fidelity Investments (1995-present).
Melissa M. Reilly (1971)
Year of Election or Appointment: 2014
Vice President of certain Equity Funds
Ms. Reilly also serves as Vice President of other funds. Ms. Reilly is an employee of Fidelity Investments (2004-present).
Kenneth B. Robins (1969)
Year of Election or Appointment: 2016
Chief Compliance Officer
Mr. Robins also serves as an officer of other funds. Mr. Robins serves as Compliance Officer of Fidelity Management & Research Company and FMR Co., Inc. (investment adviser firms, 2016-present) and is an employee of Fidelity Investments (2004-present). Previously, Mr. Robins served as Executive Vice President of Fidelity Investments Money Management, Inc. (investment adviser firm, 2013-2016) and served in other fund officer roles.
Stacie M. Smith (1974)
Year of Election or Appointment: 2016
President and Treasurer
Ms. Smith also serves as an officer of other funds. Ms. Smith serves as Assistant Treasurer of FMR Capital, Inc. (2017-present), is an employee of Fidelity Investments (2009-present), and has served in other fund officer roles. Prior to joining Fidelity Investments, Ms. Smith served as Senior Audit Manager of Ernst & Young LLP (accounting firm, 1996-2009). Previously, Ms. Smith served as Deputy Treasurer of certain Fidelity® funds (2013-2016).
Marc L. Spector (1972)
Year of Election or Appointment: 2016
Assistant Treasurer
Mr. Spector also serves as an officer of other funds. Mr. Spector serves as Assistant Treasurer of FMR Capital, Inc. (2017-present) and is an employee of Fidelity Investments (2016-present). Prior to joining Fidelity Investments, Mr. Spector served as Director at the Siegfried Group (accounting firm, 2013-2016), and prior to Siegfried Group as audit senior manager at Deloitte & Touche (accounting firm, 2005-2013).
Renee Stagnone (1975)
Year of Election or Appointment: 2016
Assistant Treasurer
Ms. Stagnone also serves as an officer of other funds. Ms. Stagnone serves as Assistant Treasurer of FMR Capital, Inc. (2017-present) and is an employee of Fidelity Investments (1997-present). Previously, Ms. Stagnone served as Deputy Treasurer of certain Fidelity® funds (2013-2016).
Shareholder Expense Example
As a shareholder of a Fund, you incur two types of costs: (1) transaction costs, and (2) ongoing costs, including other Fund expenses. This Example is intended to help you understand your ongoing costs (in dollars) of investing in the Funds and to compare these costs with the ongoing costs of investing in other mutual funds.
The Example is based on an investment of $1,000 invested at the beginning of the period and held for the entire period (June 1, 2017 to November 30, 2017).
Actual Expenses
The first line of the accompanying table provides information about actual account values and actual expenses. You may use the information in this line, together with the amount you invested, to estimate the expenses that you paid over the period. Simply divide your account value by $1,000.00 (for example, an $8,600 account value divided by $1,000.00 = 8.6), then multiply the result by the number in the first line under the heading entitled "Expenses Paid During Period" to estimate the expenses you paid on your account during this period. In addition, the Fund, as a shareholder in the underlying Fidelity Central Funds, will indirectly bear its pro-rata share of the fees and expenses incurred by the underlying Fidelity Central Funds. These fees and expenses are not included in the Fund's annualized expense ratio used to calculate the expense estimate in the table below.
Hypothetical Example for Comparison Purposes
The second line of the accompanying table provides information about hypothetical account values and hypothetical expenses based on the Fund's actual expense ratio and an assumed rate of return of 5% per year before expenses, which is not the Fund's actual return. The hypothetical account values and expenses may not be used to estimate the actual ending account balance or expenses you paid for the period. You may use this information to compare the ongoing costs of investing in the Fund and other funds. To do so, compare this 5% hypothetical example with the 5% hypothetical examples that appear in the shareholder reports of the other funds. In addition, the Fund, as a shareholder in the underlying Fidelity Central Funds, will indirectly bear its pro-rata share of the fees and expenses incurred by the underlying Fidelity Central Funds. These fees and expenses are not included in the Fund's annualized expense ratio used to calculate the expense estimate in the table below.
Please note that the expenses shown in the table are meant to highlight your ongoing costs only and do not reflect any transaction costs. Therefore, the second line of the table is useful in comparing ongoing costs only, and will not help you determine the relative total costs of owning different funds.
| Annualized Expense Ratio-A | Beginning Account Value June 1, 2017 | Ending Account Value November 30, 2017 | Expenses Paid During Period-B June 1, 2017 to November 30, 2017 | |
| Actual | .01% | $1,000.00 | $1,126.80 | $.05 |
| Hypothetical-C | $1,000.00 | $1,025.02 | $.05 |
A Annualized expense ratio reflects expenses net of applicable fee waivers.
B Expenses are equal to the Fund's annualized expense ratio, multiplied by the average account value over the period, multiplied by 183/365 (to reflect the one-half year period).
C 5% return per year before expenses
Distributions (Unaudited)
The Board of Trustees of Fidelity Advisor Series Growth Opportunities Fund voted to pay on December 18, 2017, to shareholders of record at the opening of business on December 15, 2017, a distribution of $1.22 per share derived from capital gains realized from sales of portfolio securities and a dividend of $0.105 per share from net investment income.
The fund hereby designates as a capital gain dividend with respect to the taxable year ended November 30, 2017 $39,558,386, or, if subsequently determined to be different, the net capital gain of such year.
The fund designates 100% of the dividends distributed during the fiscal year as qualifying for the dividends–received deduction for corporate shareholders.
The fund designates 100% of the dividends distributed during the fiscal year as amounts which may be taken into account as a dividend for the purposes of the maximum rate under section 1(h)(11) of the Internal Revenue Code.
The fund will notify shareholders in January 2018 of amounts for use in preparing 2017 income tax returns.
Board Approval of Investment Advisory Contracts and Management Fees
Fidelity Advisor Series Growth Opportunities Fund
Each year, the Board of Trustees, including the Independent Trustees (together, the Board), votes on the renewal of the management contract with Fidelity Management & Research Company (FMR) and the sub-advisory agreements (together, the Advisory Contracts) for the fund. FMR and the sub-advisers are referred to herein as the Investment Advisers. The Board, assisted by the advice of fund counsel and Independent Trustees' counsel, requests and considers a broad range of information relevant to the renewal of the Advisory Contracts throughout the year.
The Board meets regularly and, at each of its meetings, covers an extensive agenda of topics and materials and considers factors that are relevant to its annual consideration of the renewal of the fund's Advisory Contracts, including the services and support provided to the fund and its shareholders. The Board has established various standing committees (Committees), each composed of and chaired by Independent Trustees with varying backgrounds, to which the Board has assigned specific subject matter responsibilities in order to enhance effective decision-making by the Board. The Board, acting directly and through its Committees, requests and receives information concerning the annual consideration of the renewal of the fund's Advisory Contracts. The Board also meets as needed to review matters specifically related to the Board's annual consideration of the renewal of the Advisory Contracts. Members of the Board may also meet with trustees of other Fidelity funds through ad hoc joint committees to discuss certain matters relevant to all of the Fidelity funds.
At its July 2017 meeting, the Board unanimously determined to renew the fund's Advisory Contracts. In reaching its determination, the Board considered that the Advisory Contracts currently in place had become effective on June 1, 2017 in connection with shareholders of certain other Fidelity funds that invest in the fund (referred to herein as Freedom Funds) voting to approve new management contracts for the Freedom Funds. The Board noted the Advisory Contracts implemented a new fee structure pursuant to which the fund does not pay a management fee to FMR. The Board also approved certain amendments to the sub-advisory agreements for the fund to ensure consistency in the sub-advisory fees paid under the new fee structure compared to the sub-advisory fees paid under the prior fee structure. The Board noted that the amendments will not result in any changes to the nature, extent, and quality of services provided to the fund.
In considering whether to renew the Advisory Contracts for the fund, the Board considered all factors it believed relevant and reached a determination, with the assistance of fund counsel and Independent Trustees' counsel and through the exercise of its business judgment, that the renewal of the Advisory Contracts was in the best interests of the fund and its shareholders and the fact that no fee is payable under the management contract was fair and reasonable.
Nature, Extent, and Quality of Services Provided. The Board considered Fidelity's staffing as it relates to the fund, including the backgrounds of investment personnel of Fidelity, and also considered the fund's investment objective, strategies, and related investment philosophy. The Independent Trustees also had discussions with senior management of Fidelity's investment operations and investment groups. The Board considered the structure of the investment personnel compensation program and whether this structure provides appropriate incentives to act in the best interests of the fund.Resources Dedicated to Investment Management and Support Services. The Board and the Fund Oversight and Research Committees reviewed the general qualifications and capabilities of Fidelity's investment staff, including its size, education, experience, and resources, as well as Fidelity's approach to recruiting, training, managing, and compensating investment personnel. The Board noted that Fidelity has continued to increase the resources devoted to non-U.S. offices, including expansion of Fidelity's global investment organization. The Board also noted that Fidelity's analysts have extensive resources, tools and capabilities that allow them to conduct sophisticated quantitative and fundamental analysis, as well as credit analysis of issuers, counterparties and guarantors. Further, the Board considered that Fidelity's investment professionals have sufficient access to global information and data so as to provide competitive investment results over time, and that those professionals also have access to sophisticated tools that permit them to assess portfolio construction and risk and performance attribution characteristics continuously, as well as to transmit new information and research conclusions rapidly around the world. Additionally, in its deliberations, the Board considered Fidelity's trading, risk management, compliance, and technology and operations capabilities and resources, which are integral parts of the investment management process.Administrative Services. The Board considered (i) the nature, extent, quality, and cost of advisory and administrative services performed by the Investment Advisers and their affiliates under the Advisory Contracts and under separate agreements covering transfer agency, pricing and bookkeeping, and securities lending services for the fund; (ii) the nature and extent of the supervision of third party service providers, principally custodians, subcustodians, and pricing vendors; and (iii) the resources devoted to, and the record of compliance with, the fund's compliance policies and procedures. The Board also reviewed the allocation of fund brokerage, including allocations to brokers affiliated with the Investment Advisers, the use of brokerage commissions to pay fund expenses, and the use of "soft" commission dollars to pay for research services.Investment Performance. The Board considered whether the fund has operated in accordance with its investment objective, as well as its record of compliance with its investment restrictions. The Board reviewed the fund's absolute investment performance, as well as the fund's relative investment performance, but did not consider performance to be a material factor in its decision to renew the fund's Advisory Contracts, as the fund is not publicly offered as a stand-alone investment product. In this regard, the Board noted that the fund is designed to offer an investment option for other investment companies managed by Fidelity and ultimately to enhance the performance of those investment companies.Based on its review, the Board concluded that the nature, extent, and quality of services provided to the fund under the Advisory Contracts should continue to benefit the shareholders of the fund.Competitiveness of Management Fee and Total Expense Ratio. The Board considered that the fund does not pay FMR a management fee for investment advisory services. The Board also noted that FMR or an affiliate undertakes to pay all operating expenses of the fund, except transfer agent fees, 12b-1 fees, Independent Trustee fees and expenses, custodian fees and expenses, proxy and shareholder meeting expenses, interest, taxes, brokerage expenses, and extraordinary expenses (such as litigation expenses).The Board further considered that, effective June 1, 2017, FMR has contractually agreed to reimburse the fund to the extent that total operating expenses (excluding interest, certain taxes, certain securities lending costs, brokerage commissions, fees and expenses of the Independent Trustees, proxy and shareholder meeting expenses, extraordinary expenses, and acquired fund fees and expenses, if any), as a percentage of its average net assets, exceed 0.014% through January 31, 2021.Based on its review, the Board considered that the fund does not pay a management fee and concluded that the fund's total expense ratio was reasonable in light of the services that the fund and its shareholders receive and the other factors considered.Costs of the Services and Profitability. The Board considered the level of Fidelity's profits in respect of all the Fidelity funds.PricewaterhouseCoopers LLP (PwC), independent registered public accounting firm and auditor to Fidelity and certain Fidelity funds, has been engaged annually by the Board as part of the Board's assessment of Fidelity's profitability analysis. PwC's engagement includes the review and assessment of the methodologies used by Fidelity in determining the revenues and expenses attributable to Fidelity's mutual fund business, and completion of agreed-upon procedures in respect of the mathematical accuracy of the fund profitability information and its conformity to established allocation methodologies. After considering PwC's reports issued under the engagement and information provided by Fidelity, the Board concluded that while other allocation methods may also be reasonable, Fidelity's profitability methodologies are reasonable in all material respects.The Board also reviewed Fidelity's non-fund businesses and potential fall-out benefits related to the mutual fund business as well as cases where Fidelity's affiliates may benefit from or be related to the fund's business.The Board concluded that the costs of the services provided by and the profits realized by Fidelity in connection with the operation of the fund were not relevant to the renewal of the Advisory Contracts because the fund pays no advisory fees and FMR or an affiliate bears all expenses of the fund, with limited exceptions.Economies of Scale. The Board concluded that because the fund pays no advisory fees and FMR or an affiliate bears all expenses of the fund, with limited exceptions, economies of scale cannot be realized by the fund.Additional Information Requested by the Board. In order to develop fully the factual basis for consideration of the Fidelity funds' advisory contracts, the Board requested and received additional information on certain topics, including: (i) fund performance trends, in particular the underperformance of certain funds, and Fidelity's long-term strategies for certain funds; (ii) Fidelity's fund profitability methodology, profitability trends for certain funds, and the impact of certain factors on fund profitability results, including the impact of market trends on actively managed funds; (iii) the use of performance fees and the calculation of performance adjustments, including the impact of underperformance and fund outflows on performance adjustments; (iv) metrics for evaluating index fund performance; (v) Fidelity's group fee structure, including the group fee breakpoint schedules; (vi) the terms of Fidelity's contractual and voluntary expense cap arrangements with the funds; (vii) the methodology with respect to evaluating competitive fund data and peer group classifications and fee comparisons; (viii) the expense structures for different funds and classes; (ix) Fidelity's arrangements with affiliated sub-advisers on behalf of the funds; (x) information regarding other accounts managed by Fidelity, including institutional accounts and collective investment trusts; (xi) recent changes to the fee structure for certain funds of funds; and (xii) the impact of the Department of Labor's new fiduciary rule on the funds' comparative expense information.Based on its evaluation of all of the conclusions noted above, and after considering all factors it believed relevant, the Board concluded that the advisory fee structures are fair and reasonable, and that the fund's Advisory Contracts should be renewed.![]()
Corporate Headquarters
245 Summer St.
Boston, MA 02210
www.fidelity.com
AXS3-ANN-0118
1.967930.104
Fidelity Advisor® Series Small Cap Fund Annual Report November 30, 2017 |
|
Contents
Board Approval of Investment Advisory Contracts and Management Fees |
To view a fund's proxy voting guidelines and proxy voting record for the 12-month period ended June 30, visit http://www.fidelity.com/proxyvotingresults or visit the Securities and Exchange Commission's (SEC) web site at http://www.sec.gov.
You may also call 1-877-208-0098 to request a free copy of the proxy voting guidelines.
Standard & Poor's, S&P and S&P 500 are registered service marks of The McGraw-Hill Companies, Inc. and have been licensed for use by Fidelity Distributors Corporation.
Other third-party marks appearing herein are the property of their respective owners.
All other marks appearing herein are registered or unregistered trademarks or service marks of FMR LLC or an affiliated company. © 2018 FMR LLC. All rights reserved.
This report and the financial statements contained herein are submitted for the general information of the shareholders of the Fund. This report is not authorized for distribution to prospective investors in the Fund unless preceded or accompanied by an effective prospectus.
A fund files its complete schedule of portfolio holdings with the SEC for the first and third quarters of each fiscal year on Form N-Q. Forms N-Q are available on the SEC’s web site at http://www.sec.gov. A fund's Forms N-Q may be reviewed and copied at the SEC’s Public Reference Room in Washington, DC. Information regarding the operation of the SEC's Public Reference Room may be obtained by calling 1-800-SEC-0330.
For a complete list of a fund's portfolio holdings, view the most recent holdings listing, semiannual report, or annual report on Fidelity's web site at http://www.fidelity.com, http://www.institutional.fidelity.com, or http://www.401k.com, as applicable.
NOT FDIC INSURED •MAY LOSE VALUE •NO BANK GUARANTEE
Neither the Fund nor Fidelity Distributors Corporation is a bank.
Performance: The Bottom Line
Average annual total return reflects the change in the value of an investment, assuming reinvestment of distributions from dividend income and capital gains (the profits earned upon the sale of securities that have grown in value, if any) and assuming a constant rate of performance each year. The hypothetical investment and the average annual total returns do not reflect the deduction of taxes that a shareholder would pay on fund distributions or the redemption of fund shares. During periods of reimbursement by Fidelity, a fund’s total return will be greater than it would be had the reimbursement not occurred. How a fund did yesterday is no guarantee of how it will do tomorrow.
Average Annual Total Returns
| For the periods ended November 30, 2017 | Past 1 year | Life of fundA |
| Fidelity Advisor® Series Small Cap Fund | 17.37% | 8.54% |
A From November 7, 2013
$10,000 Over Life of Fund
Let's say hypothetically that $10,000 was invested in Fidelity Advisor® Series Small Cap Fund on November 7, 2013, when the fund started.
The chart shows how the value of your investment would have changed, and also shows how the Russell 2000® Index performed over the same period.
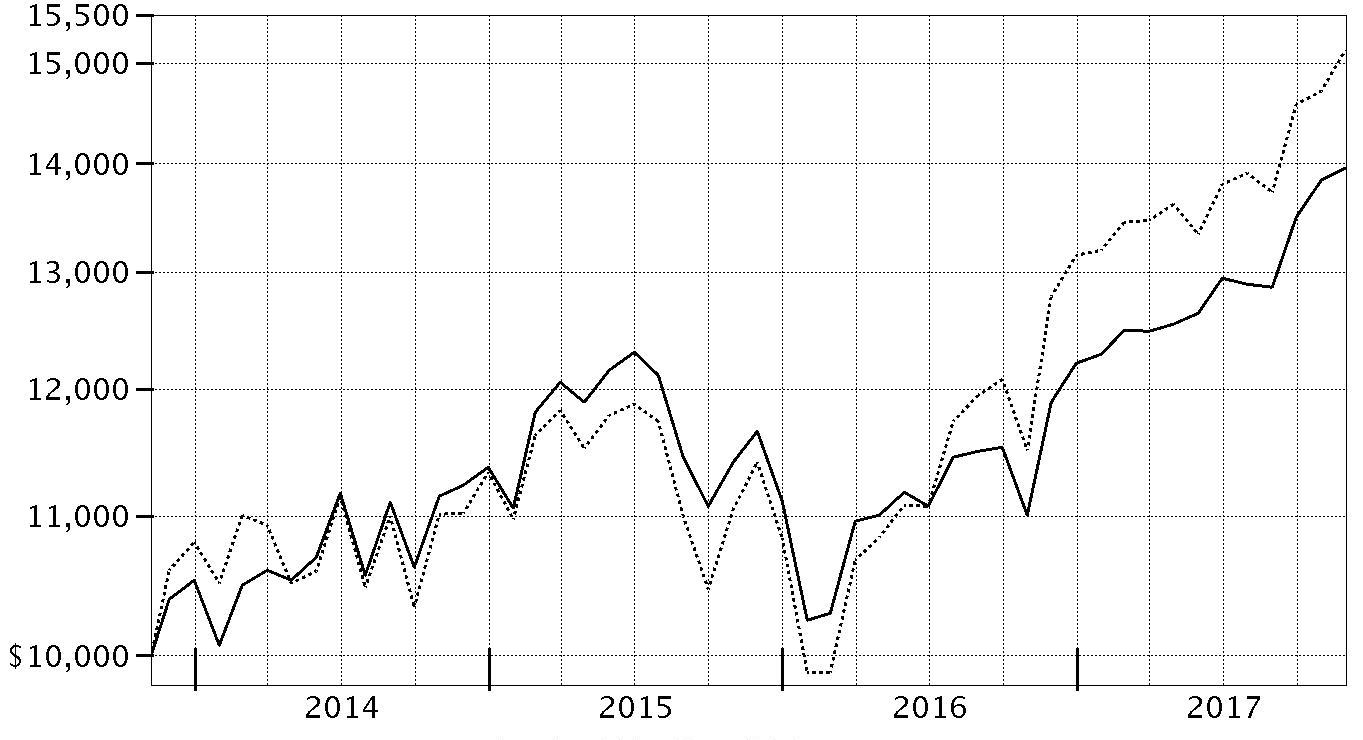
| Period Ending Values | ||
| $13,955 | Fidelity Advisor® Series Small Cap Fund | |
| $15,134 | Russell 2000® Index | |
Management's Discussion of Fund Performance
Market Recap: The U.S. equity bellwether S&P 500® index gained 22.87% for the year ending November 30, 2017, rising steadily and closing the period at an all-time high after a particularly strong three-month finish. Early on, equities rallied on optimism for President Trump’s pro-business agenda but leveled off in March amid fading optimism and stalled efforts by Congress to repeal and replace the Affordable Care Act. Upward momentum soon returned and continued through period end with consumer sentiment and other market indicators staying positive. The lone exception was a brief cooldown in August, when geopolitical tension escalated and uncertainty grew regarding the future of health care, tax reform and the debt ceiling. Sector-wise, info tech (+41%) led by a wide margin, surging amid strong earnings growth from several major index constituents. Utilities and financials each gained about 25%, the latter group riding an uptick in bond yields. Conversely, consumer discretionary (+20%) also rose solidly but lagged the broader market, as many brick-and-mortar retailers continued to suffer from increased online competition. Rising interest rates held back real estate (+16%), while consumer staples (+15%) and telecom (+1%) struggled due to investors’ general preference for risk assets. Lastly, sluggish oil prices pushed energy to a -4% return.Comments from Portfolio Manager James Harmon: For the year, the fund gained 17.37%, versus 18.34% for the benchmark Russell 2000® Index. Unhelpful security selection in health care proved a major drag on relative performance. Three of the five individual holdings that detracted most were indeed health care names: Premier, a provider of health care group purchasing services; pharmaceutical company Mallinckrodt; and Surgery Partners, an operator of surgical facilities. We sold both Mallinckrodt, an out-of-index position, and Surgery Partners, in the second half of the period. Outside of health care, detractors included Hess Midstream Partners, a master limited partnership (MLP) focused on energy transportation, and J2 Global, a provider of cloud-computing services that was among the fund's largest holdings. Conversely, the fund benefited most from stock picks in the consumer discretionary and real estate sectors. Within the former, Marriott Vacations World, another of the fund’s largest positions, helped substantially, as the company continued to generate strong financial results. Elsewhere, major holding Stamps.com, a provider of postage and delivery services notably contributed, as did homebuilder NVR. The fund's foreign holdings also provided a boost, aided in part by a weaker U.S. dollar.The views expressed above reflect those of the portfolio manager(s) only through the end of the period as stated on the cover of this report and do not necessarily represent the views of Fidelity or any other person in the Fidelity organization. Any such views are subject to change at any time based upon market or other conditions and Fidelity disclaims any responsibility to update such views. These views may not be relied on as investment advice and, because investment decisions for a Fidelity fund are based on numerous factors, may not be relied on as an indication of trading intent on behalf of any Fidelity fund.
Investment Summary (Unaudited)
Top Ten Stocks as of November 30, 2017
| % of fund's net assets | % of fund's net assets 6 months ago | |
| SYNNEX Corp. | 2.6 | 1.2 |
| MSC Industrial Direct Co., Inc. Class A | 2.4 | 0.0 |
| Stamps.com, Inc. | 2.3 | 2.3 |
| Marriott Vacations Worldwide Corp. | 2.2 | 3.0 |
| HealthSouth Corp. | 2.2 | 2.0 |
| Conduent, Inc. | 2.2 | 2.6 |
| B&G Foods, Inc. Class A | 2.1 | 0.0 |
| j2 Global, Inc. | 2.0 | 2.2 |
| Bank of the Ozarks, Inc. | 2.0 | 1.9 |
| Charles River Laboratories International, Inc. | 2.0 | 0.0 |
| 22.0 |
Top Five Market Sectors as of November 30, 2017
| % of fund's net assets | % of fund's net assets 6 months ago | |
| Information Technology | 18.3 | 21.5 |
| Financials | 17.4 | 14.5 |
| Industrials | 15.9 | 10.1 |
| Consumer Discretionary | 14.2 | 16.1 |
| Health Care | 13.2 | 9.2 |
Asset Allocation (% of fund's net assets)
| As of November 30, 2017 * | ||
| Stocks and Equity Futures | 98.9% | |
| Short-Term Investments and Net Other Assets (Liabilities) | 1.1% | |

* Foreign investments - 14.4%
| As of May 31, 2017 * | ||
| Stocks and Equity Futures | 99.1% | |
| Short-Term Investments and Net Other Assets (Liabilities) | 0.9% | |

* Foreign investments - 15.3%
Percentages shown as 0.0% may reflect amounts less than 0.05%.
Investments November 30, 2017
Showing Percentage of Net Assets
| Common Stocks - 96.3% | |||
| Shares | Value | ||
| CONSUMER DISCRETIONARY - 14.2% | |||
| Auto Components - 2.0% | |||
| Dorman Products, Inc. (a) | 79,900 | $5,457,969 | |
| Standard Motor Products, Inc. | 88,775 | 4,013,518 | |
| 9,471,487 | |||
| Diversified Consumer Services - 1.1% | |||
| Grand Canyon Education, Inc. (a) | 53,000 | 5,032,880 | |
| Hotels, Restaurants & Leisure - 3.8% | |||
| Hilton Grand Vacations, Inc. | 185,056 | 7,396,688 | |
| Marriott Vacations Worldwide Corp. | 76,200 | 10,229,850 | |
| 17,626,538 | |||
| Household Durables - 3.5% | |||
| NVR, Inc. (a) | 1,300 | 4,517,500 | |
| PulteGroup, Inc. | 143,600 | 4,901,068 | |
| TopBuild Corp. (a) | 97,400 | 6,622,226 | |
| 16,040,794 | |||
| Leisure Products - 1.9% | |||
| Polaris Industries, Inc. (b) | 70,900 | 9,005,009 | |
| Media - 1.0% | |||
| AMC Networks, Inc. Class A (a) | 53,200 | 2,741,928 | |
| Sinclair Broadcast Group, Inc. Class A (b) | 52,273 | 1,779,896 | |
| 4,521,824 | |||
| Specialty Retail - 0.4% | |||
| Signet Jewelers Ltd. (b) | 35,400 | 1,851,066 | |
| Textiles, Apparel & Luxury Goods - 0.5% | |||
| G-III Apparel Group Ltd. (a) | 72,100 | 2,220,680 | |
| TOTAL CONSUMER DISCRETIONARY | 65,770,278 | ||
| CONSUMER STAPLES - 5.1% | |||
| Food & Staples Retailing - 1.1% | |||
| Sundrug Co. Ltd. | 53,500 | 2,466,905 | |
| Tsuruha Holdings, Inc. | 18,400 | 2,543,074 | |
| 5,009,979 | |||
| Food Products - 4.0% | |||
| B&G Foods, Inc. Class A (b) | 248,800 | 9,628,560 | |
| The Hain Celestial Group, Inc. (a) | 213,500 | 8,774,850 | |
| 18,403,410 | |||
| TOTAL CONSUMER STAPLES | 23,413,389 | ||
| ENERGY - 2.9% | |||
| Energy Equipment & Services - 1.1% | |||
| Hess Midstream Partners LP | 252,399 | 5,335,715 | |
| Oil, Gas & Consumable Fuels - 1.8% | |||
| Noble Midstream Partners LP | 115,100 | 5,691,695 | |
| Noble Midstream Partners LP (c) | 49,623 | 2,453,857 | |
| 8,145,552 | |||
| TOTAL ENERGY | 13,481,267 | ||
| FINANCIALS - 17.4% | |||
| Banks - 11.5% | |||
| Allegiance Bancshares, Inc. (a) | 178,897 | 7,129,045 | |
| Bank of Hawaii Corp. | 44,400 | 3,768,672 | |
| Bank of the Ozarks, Inc. | 193,600 | 9,335,392 | |
| ConnectOne Bancorp, Inc. | 248,776 | 6,754,268 | |
| German American Bancorp, Inc. | 126,791 | 4,768,610 | |
| Great Western Bancorp, Inc. | 137,616 | 5,686,293 | |
| Home Bancshares, Inc. | 323,874 | 7,708,201 | |
| ServisFirst Bancshares, Inc. | 110,885 | 4,656,061 | |
| Signature Bank (a) | 27,300 | 3,747,744 | |
| 53,554,286 | |||
| Capital Markets - 1.6% | |||
| LPL Financial | 141,700 | 7,345,728 | |
| Insurance - 2.9% | |||
| Enstar Group Ltd. (a) | 23,100 | 5,120,115 | |
| Hastings Group Holdings PLC (d) | 1,128,561 | 4,790,949 | |
| James River Group Holdings Ltd. | 87,463 | 3,540,502 | |
| 13,451,566 | |||
| Thrifts & Mortgage Finance - 1.4% | |||
| Essent Group Ltd. (a) | 145,400 | 6,433,950 | |
| TOTAL FINANCIALS | 80,785,530 | ||
| HEALTH CARE - 13.2% | |||
| Biotechnology - 1.0% | |||
| Bioverativ, Inc. | 90,500 | 4,526,810 | |
| Health Care Equipment & Supplies - 1.7% | |||
| LivaNova PLC (a) | 92,400 | 8,055,432 | |
| Health Care Providers & Services - 7.0% | |||
| AMN Healthcare Services, Inc. (a) | 71,900 | 3,609,380 | |
| HealthSouth Corp. | 204,300 | 10,204,785 | |
| MEDNAX, Inc. (a) | 124,400 | 6,193,876 | |
| Owens & Minor, Inc. | 214,300 | 4,101,702 | |
| Premier, Inc. (a) | 274,682 | 7,971,272 | |
| Sigma Healthcare Ltd. | 655,468 | 391,679 | |
| 32,472,694 | |||
| Life Sciences Tools & Services - 3.5% | |||
| Charles River Laboratories International, Inc. (a) | 88,800 | 9,252,960 | |
| ICON PLC (a) | 58,100 | 6,786,661 | |
| 16,039,621 | |||
| TOTAL HEALTH CARE | 61,094,557 | ||
| INDUSTRIALS - 15.9% | |||
| Building Products - 1.9% | |||
| Apogee Enterprises, Inc. | 106,300 | 5,318,189 | |
| GMS, Inc. (a) | 98,900 | 3,689,959 | |
| 9,008,148 | |||
| Commercial Services & Supplies - 0.5% | |||
| Coor Service Management Holding AB | 263,300 | 2,091,692 | |
| Construction & Engineering - 2.7% | |||
| Argan, Inc. (a) | 88,900 | 5,245,100 | |
| EMCOR Group, Inc. | 88,800 | 7,172,376 | |
| 12,417,476 | |||
| Electrical Equipment - 2.1% | |||
| Generac Holdings, Inc. (a) | 187,900 | 9,239,043 | |
| Hamilton Beach Brands Holding Co. Class A | 15,600 | 445,848 | |
| 9,684,891 | |||
| Machinery - 1.4% | |||
| AGCO Corp. | 62,800 | 4,444,984 | |
| Hy-Lok Corp. | 79,784 | 1,800,629 | |
| 6,245,613 | |||
| Professional Services - 3.1% | |||
| ICF International, Inc. (a) | 102,576 | 5,544,233 | |
| On Assignment, Inc. (a) | 139,800 | 8,941,608 | |
| 14,485,841 | |||
| Trading Companies & Distributors - 4.2% | |||
| MSC Industrial Direct Co., Inc. Class A | 124,600 | 11,222,722 | |
| Univar, Inc. (a) | 284,200 | 8,372,532 | |
| 19,595,254 | |||
| TOTAL INDUSTRIALS | 73,528,915 | ||
| INFORMATION TECHNOLOGY - 18.3% | |||
| Electronic Equipment & Components - 5.7% | |||
| CDW Corp. | 129,800 | 9,087,298 | |
| ePlus, Inc. (a) | 65,613 | 5,327,776 | |
| SYNNEX Corp. | 87,213 | 11,878,410 | |
| 26,293,484 | |||
| Internet Software & Services - 4.3% | |||
| j2 Global, Inc. | 124,400 | 9,387,224 | |
| Stamps.com, Inc. (a) | 61,900 | 10,423,960 | |
| 19,811,184 | |||
| IT Services - 6.7% | |||
| Booz Allen Hamilton Holding Corp. Class A | 115,200 | 4,457,088 | |
| Conduent, Inc. | 665,900 | 10,161,634 | |
| ExlService Holdings, Inc. (a) | 25,781 | 1,582,438 | |
| Genpact Ltd. | 179,100 | 5,774,184 | |
| Global Payments, Inc. | 56,500 | 5,681,640 | |
| Syntel, Inc. (a) | 125,600 | 3,216,616 | |
| 30,873,600 | |||
| Semiconductors & Semiconductor Equipment - 1.0% | |||
| Versum Materials, Inc. | 124,700 | 4,788,480 | |
| Software - 0.4% | |||
| Zensar Technologies Ltd. | 145,057 | 1,922,472 | |
| Technology Hardware, Storage & Peripherals - 0.2% | |||
| NCR Corp. (a) | 27,100 | 847,959 | |
| TOTAL INFORMATION TECHNOLOGY | 84,537,179 | ||
| MATERIALS - 3.1% | |||
| Chemicals - 1.1% | |||
| Valvoline, Inc. | 203,500 | 5,018,310 | |
| Containers & Packaging - 1.2% | |||
| Berry Global Group, Inc. (a) | 96,300 | 5,755,851 | |
| Paper & Forest Products - 0.8% | |||
| Neenah Paper, Inc. | 42,300 | 3,781,620 | |
| TOTAL MATERIALS | 14,555,781 | ||
| REAL ESTATE - 4.0% | |||
| Real Estate Management & Development - 4.0% | |||
| CBRE Group, Inc. (a) | 198,300 | 8,598,288 | |
| Daito Trust Construction Co. Ltd. | 24,000 | 4,393,401 | |
| Relo Holdings Corp. | 210,800 | 5,620,963 | |
| 18,612,652 | |||
| UTILITIES - 2.2% | |||
| Gas Utilities - 1.6% | |||
| Amerigas Partners LP | 94,200 | 4,228,638 | |
| Star Gas Partners LP | 314,936 | 3,250,140 | |
| 7,478,778 | |||
| Multi-Utilities - 0.6% | |||
| Telecom Plus PLC | 167,100 | 2,689,234 | |
| TOTAL UTILITIES | 10,168,012 | ||
| TOTAL COMMON STOCKS | |||
| (Cost $358,439,837) | 445,947,560 | ||
| Principal Amount | Value | ||
| U.S. Treasury Obligations - 0.2% | |||
| U.S. Treasury Bills, yield at date of purchase 1.01% to 1.21% 12/14/17 to 2/15/18 (e) | |||
| (Cost $1,069,175) | 1,070,000 | 1,069,211 | |
| Shares | Value | ||
| Money Market Funds - 8.5% | |||
| Fidelity Cash Central Fund, 1.13% (f) | 18,289,774 | $18,293,432 | |
| Fidelity Securities Lending Cash Central Fund 1.13% (f)(g) | 21,126,364 | 21,128,476 | |
| TOTAL MONEY MARKET FUNDS | |||
| (Cost $39,421,908) | 39,421,908 | ||
| TOTAL INVESTMENT IN SECURITIES - 105.0% | |||
| (Cost $398,930,920) | 486,438,679 | ||
| NET OTHER ASSETS (LIABILITIES) - (5.0)% | (23,343,311) | ||
| NET ASSETS - 100% | $463,095,368 |
| Futures Contracts | |||||
| Number of contracts | Expiration Date | Notional Amount | Value | Unrealized Appreciation/(Depreciation) | |
| Purchased | |||||
| Equity Index Contracts | |||||
| CME E-mini Russell 2000 Index Contracts (United States) | 157 | Dec. 2017 | $12,131,390 | $557,842 | $557,842 |
The notional amount of futures purchased as a percentage of Net Assets is 2.6%
For the period, the average monthly underlying face amount at value for futures contracts in the aggregate was $25,401,317.
Legend
(a) Non-income producing
(b) Security or a portion of the security is on loan at period end.
(c) Restricted securities - Investment in securities not registered under the Securities Act of 1933 (excluding 144A issues). At the end of the period, the value of restricted securities (excluding 144A issues) amounted to $2,453,857 or 0.5% of net assets.
(d) Security exempt from registration under Rule 144A of the Securities Act of 1933. These securities may be resold in transactions exempt from registration, normally to qualified institutional buyers. At the end of the period, the value of these securities amounted to $4,790,949 or 1.0% of net assets.
(e) Security or a portion of the security was pledged to cover margin requirements for futures contracts. At period end, the value of securities pledged amounted to $658,347.
(f) Affiliated fund that is generally available only to investment companies and other accounts managed by Fidelity Investments. The rate quoted is the annualized seven-day yield of the fund at period end. A complete unaudited listing of the fund's holdings as of its most recent quarter end is available upon request. In addition, each Fidelity Central Fund's financial statements, which are not covered by the Fund's Report of Independent Registered Public Accounting Firm, are available on the SEC's website or upon request.
(g) Investment made with cash collateral received from securities on loan.
Additional information on each restricted holding is as follows:
| Security | Acquisition Date | Acquisition Cost |
| Noble Midstream Partners LP | 6/21/17 | $2,007,250 |
Affiliated Central Funds
Information regarding fiscal year to date income earned by the Fund from investments in Fidelity Central Funds is as follows:
| Fund | Income earned |
| Fidelity Cash Central Fund | $243,789 |
| Fidelity Securities Lending Cash Central Fund | 163,226 |
| Total | $407,015 |
Investment Valuation
The following is a summary of the inputs used, as of November 30, 2017, involving the Fund's assets and liabilities carried at fair value. The inputs or methodology used for valuing securities may not be an indication of the risk associated with investing in those securities. For more information on valuation inputs, and their aggregation into the levels used below, please refer to the Investment Valuation section in the accompanying Notes to Financial Statements.
| Valuation Inputs at Reporting Date: | ||||
| Description | Total | Level 1 | Level 2 | Level 3 |
| Investments in Securities: | ||||
| Equities: | ||||
| Consumer Discretionary | $65,770,278 | $65,770,278 | $-- | $-- |
| Consumer Staples | 23,413,389 | 18,403,410 | 5,009,979 | -- |
| Energy | 13,481,267 | 13,481,267 | -- | -- |
| Financials | 80,785,530 | 80,785,530 | -- | -- |
| Health Care | 61,094,557 | 61,094,557 | -- | -- |
| Industrials | 73,528,915 | 73,528,915 | -- | -- |
| Information Technology | 84,537,179 | 84,537,179 | -- | -- |
| Materials | 14,555,781 | 14,555,781 | -- | -- |
| Real Estate | 18,612,652 | 8,598,288 | 10,014,364 | -- |
| Utilities | 10,168,012 | 10,168,012 | -- | -- |
| U.S. Government and Government Agency Obligations | 1,069,211 | -- | 1,069,211 | -- |
| Money Market Funds | 39,421,908 | 39,421,908 | -- | -- |
| Total Investments in Securities: | $486,438,679 | $470,345,125 | $16,093,554 | $-- |
| Derivative Instruments: | ||||
| Assets | ||||
| Futures Contracts | $557,842 | $557,842 | $-- | $-- |
| Total Assets | $557,842 | $557,842 | $-- | $-- |
| Total Derivative Instruments: | $557,842 | $557,842 | $-- | $-- |
The following is a summary of transfers between Level 1 and Level 2 for the period ended November 30, 2017. Transfers are assumed to have occurred at the beginning of the period, and are primarily attributable to the valuation techniques used for foreign equity securities, as discussed in the accompanying Notes to Financial Statements:
| Transfers | Total |
| Level 1 to Level 2 | $0 |
| Level 2 to Level 1 | $5,626,057 |
Value of Derivative Instruments
The following table is a summary of the Fund's value of derivative instruments by primary risk exposure as of November 30, 2017. For additional information on derivative instruments, please refer to the Derivative Instruments section in the accompanying Notes to Financial Statements.
| Primary Risk Exposure / Derivative Type | Value | |
| Asset | Liability | |
| Equity Risk | ||
| Futures Contracts(a) | $557,842 | $0 |
| Total Value of Derivatives | $557,842 | $0 |
(a) Reflects gross cumulative appreciation (depreciation) on futures contracts as presented in the Schedule of Investments. In the Statement of Assets and Liabilities, the period end daily variation margin is included in receivable or payable for daily variation margin on futures contracts, and the net cumulative appreciation (depreciation) is included in net unrealized appreciation (depreciation).
Other Information
Distribution of investments by country or territory of incorporation, as a percentage of Total Net Assets, is as follows (Unaudited):
| United States of America | 85.6% |
| Bermuda | 5.0% |
| United Kingdom | 3.3% |
| Japan | 3.2% |
| Ireland | 1.5% |
| Others (Individually Less Than 1%) | 1.4% |
| 100.0% |
See accompanying notes which are an integral part of the financial statements.
Financial Statements
Statement of Assets and Liabilities
| November 30, 2017 | ||
| Assets | ||
| Investment in securities, at value (including securities loaned of $20,488,911) — See accompanying schedule: Unaffiliated issuers (cost $359,509,012) | $447,016,771 | |
| Fidelity Central Funds (cost $39,421,908) | 39,421,908 | |
| Total Investment in Securities (cost $398,930,920) | $486,438,679 | |
| Receivable for investments sold | 472,063 | |
| Receivable for fund shares sold | 6,944 | |
| Dividends receivable | 326,121 | |
| Distributions receivable from Fidelity Central Funds | 46,845 | |
| Receivable for daily variation margin on futures contracts | 38,086 | |
| Other receivables | 6,766 | |
| Total assets | 487,335,504 | |
| Liabilities | ||
| Payable for investments purchased | $2,211,132 | |
| Payable for fund shares redeemed | 872,658 | |
| Other payables and accrued expenses | 26,961 | |
| Collateral on securities loaned | 21,129,385 | |
| Total liabilities | 24,240,136 | |
| Net Assets | $463,095,368 | |
| Net Assets consist of: | ||
| Paid in capital | $345,374,392 | |
| Undistributed net investment income | 1,479,308 | |
| Accumulated undistributed net realized gain (loss) on investments and foreign currency transactions | 28,174,464 | |
| Net unrealized appreciation (depreciation) on investments and assets and liabilities in foreign currencies | 88,067,204 | |
| Net Assets, for 36,394,455 shares outstanding | $463,095,368 | |
| Net Asset Value, offering price and redemption price per share ($463,095,368 ÷ 36,394,455 shares) | $12.72 |
See accompanying notes which are an integral part of the financial statements.
Statement of Operations
| Year ended November 30, 2017 | ||
| Investment Income | ||
| Dividends | $4,690,319 | |
| Interest | 11,563 | |
| Income from Fidelity Central Funds | 407,015 | |
| Total income | 5,108,897 | |
| Expenses | ||
| Management fee | ||
| Basic fee | $1,588,689 | |
| Performance adjustment | (287,467) | |
| Transfer agent fees | 387,278 | |
| Accounting and security lending fees | 89,762 | |
| Custodian fees and expenses | 53,497 | |
| Independent trustees' fees and expenses | 1,773 | |
| Audit | 30,555 | |
| Legal | 565 | |
| Miscellaneous | 2,627 | |
| Total expenses before reductions | 1,867,279 | |
| Expense reductions | (45,674) | 1,821,605 |
| Net investment income (loss) | 3,287,292 | |
| Realized and Unrealized Gain (Loss) | ||
| Net realized gain (loss) on: | ||
| Investment securities: | ||
| Unaffiliated issuers | 39,395,186 | |
| Fidelity Central Funds | (246) | |
| Foreign currency transactions | 5,019 | |
| Futures contracts | 4,404,813 | |
| Total net realized gain (loss) | 43,804,772 | |
| Change in net unrealized appreciation (depreciation) on: | ||
| Investment securities: | ||
| Unaffiliated issuers | 27,081,547 | |
| Fidelity Central Funds | (2,118) | |
| Assets and liabilities in foreign currencies | 19,003 | |
| Futures contracts | (538,953) | |
| Total change in net unrealized appreciation (depreciation) | 26,559,479 | |
| Net gain (loss) | 70,364,251 | |
| Net increase (decrease) in net assets resulting from operations | $73,651,543 |
See accompanying notes which are an integral part of the financial statements.
Statement of Changes in Net Assets
| Year ended November 30, 2017 | Year ended November 30, 2016 | |
| Increase (Decrease) in Net Assets | ||
| Operations | ||
| Net investment income (loss) | $3,287,292 | $3,836,873 |
| Net realized gain (loss) | 43,804,772 | (16,140,191) |
| Change in net unrealized appreciation (depreciation) | 26,559,479 | 21,365,425 |
| Net increase (decrease) in net assets resulting from operations | 73,651,543 | 9,062,107 |
| Distributions to shareholders from net investment income | (3,874,433) | (1,156,042) |
| Distributions to shareholders from net realized gain | – | (21,339,829) |
| Total distributions | (3,874,433) | (22,495,871) |
| Share transactions | ||
| Proceeds from sales of shares | 39,758,702 | 74,361,903 |
| Reinvestment of distributions | 3,874,433 | 22,495,871 |
| Cost of shares redeemed | (101,683,132) | (115,621,992) |
| Net increase (decrease) in net assets resulting from share transactions | (58,049,997) | (18,764,218) |
| Total increase (decrease) in net assets | 11,727,113 | (32,197,982) |
| Net Assets | ||
| Beginning of period | 451,368,255 | 483,566,237 |
| End of period | $463,095,368 | $451,368,255 |
| Other Information | ||
| Undistributed net investment income end of period | $1,479,308 | $2,900,515 |
| Shares | ||
| Sold | 3,439,672 | 7,404,925 |
| Issued in reinvestment of distributions | 347,795 | 2,149,872 |
| Redeemed | (8,693,635) | (11,192,117) |
| Net increase (decrease) | (4,906,168) | (1,637,320) |
See accompanying notes which are an integral part of the financial statements.
Financial Highlights
Fidelity Advisor Series Small Cap Fund
| Years ended November 30, | 2017 | 2016 | 2015 | 2014 | 2013 A |
| Selected Per–Share Data | |||||
| Net asset value, beginning of period | $10.93 | $11.26 | $11.19 | $10.39 | $10.00 |
| Income from Investment Operations | |||||
| Net investment income (loss)B | .08 | .09C | .03D | .02 | –E,F |
| Net realized and unrealized gain (loss) | 1.81 | .10 | .38 | .82 | .39 |
| Total from investment operations | 1.89 | .19 | .41 | .84 | .39 |
| Distributions from net investment income | (.10) | (.03) | (.02) | (.01) | – |
| Distributions from net realized gain | – | (.50) | (.32) | (.03) | – |
| Total distributions | (.10) | (.52)G | (.34) | (.04) | – |
| Net asset value, end of period | $12.72 | $10.93 | $11.26 | $11.19 | $10.39 |
| Total ReturnH,I | 17.37% | 1.96% | 3.81% | 8.12% | 3.90% |
| Ratios to Average Net AssetsJ,K | |||||
| Expenses before reductions | .41% | .97% | 1.04% | .94% | 1.07%L |
| Expenses net of fee waivers, if any | .41% | .97% | 1.03% | .94% | .95%L |
| Expenses net of all reductions | .40% | .97% | 1.02% | .94% | .95%L |
| Net investment income (loss) | .72% | .85%C | .30%D | .16% | (.25)%E,L |
| Supplemental Data | |||||
| Net assets, end of period (000 omitted) | $463,095 | $451,368 | $483,566 | $517,827 | $485,539 |
| Portfolio turnover rateM | 88% | 90% | 35% | 58% | 4%N |
A For the period November 7, 2013 (commencement of operations) to November 30, 2013.
B Calculated based on average shares outstanding during the period.
C Net Investment income per share reflects a large, non-recurring dividend which amounted to $.05 per share. Excluding this non-recurring dividend, the ratio of net investment income (loss) to average net assets would have been .40%.
D Net Investment income per share reflects a large, non-recurring dividend which amounted to $.03 per share. Excluding this non-recurring dividend, the ratio of net investment income (loss) to average net assets would have been .06%.
E Net Investment income per share reflects a large, non-recurring dividend which amounted to $.01 per share. Excluding this non-recurring dividend, the ratio of net investment income (loss) to average net assets would have been (.36) %.
F Amount represents less than $.005 per share.
G Total distributions of $.52 per share is comprised of distributions from net investment income of $.027 and distributions from net realized gain of $.496 per share.
H Total returns for periods of less than one year are not annualized.
I Total returns would have been lower if certain expenses had not been reduced during the applicable periods shown.
J Fees and expenses of any underlying Fidelity Central Funds are not included in the Fund's expense ratio. The Fund indirectly bears its proportionate share of the expenses of any underlying Fidelity Central Funds.
K Expense ratios reflect operating expenses of the Fund. Expenses before reductions do not reflect amounts reimbursed by the investment adviser or reductions from brokerage service arrangements or reductions from other expense offset arrangements and do not represent the amount paid by the Fund during periods when reimbursements or reductions occur. Expense ratios before reductions for start-up periods may not be representative of longer term operating periods. Expenses net of fee waivers reflect expenses after reimbursement by the investment adviser but prior to reductions from brokerage service arrangements or other expense offset arrangements. Expenses net of all reductions represent the net expenses paid by the Fund.
L Annualized
M Amount does not include the portfolio activity of any underlying Fidelity Central Funds.
N Amount not annualized.
See accompanying notes which are an integral part of the financial statements.
Notes to Financial Statements
For the period ended November 30, 2017
1. Organization.
Fidelity Advisor Series Small Cap Fund (the Fund) is a fund of Fidelity Advisor Series I (the Trust) and is authorized to issue an unlimited number of shares. Shares of the Fund are only available for purchase by mutual funds for which Fidelity Management & Research Company (FMR) or an affiliate serves as an investment manager. The Trust is registered under the Investment Company Act of 1940, as amended (the 1940 Act), as an open-end management investment company organized as a Massachusetts business trust.
2. Investments in Fidelity Central Funds.
The Fund invests in Fidelity Central Funds, which are open-end investment companies generally available only to other investment companies and accounts managed by the investment adviser and its affiliates. The Fund's Schedule of Investments lists each of the Fidelity Central Funds held as of period end, if any, as an investment of the Fund, but does not include the underlying holdings of each Fidelity Central Fund. As an Investing Fund, the Fund indirectly bears its proportionate share of the expenses of the underlying Fidelity Central Funds.
The Money Market Central Funds seek preservation of capital and current income and are managed by Fidelity Investments Money Management, Inc. (FIMM), an affiliate of the investment adviser. Annualized expenses of the Money Market Central Funds as of their most recent shareholder report date are less than .005%.
A complete unaudited list of holdings for each Fidelity Central Fund is available upon request or at the Securities and Exchange Commission (the SEC) website at www.sec.gov. In addition, the financial statements of the Fidelity Central Funds, which are not covered by the Fund's Report of Independent Registered Public Accounting Firm, are available on the SEC website or upon request.
3. Significant Accounting Policies.
The Fund is an investment company and applies the accounting and reporting guidance of the Financial Accounting Standards Board (FASB) Accounting Standards Codification Topic 946 Financial Services – Investments Companies. The financial statements have been prepared in conformity with accounting principles generally accepted in the United States of America (GAAP), which require management to make certain estimates and assumptions at the date of the financial statements. Actual results could differ from those estimates. Subsequent events, if any, through the date that the financial statements were issued have been evaluated in the preparation of the financial statements. The following summarizes the significant accounting policies of the Fund:
Investment Valuation. Investments are valued as of 4:00 p.m. Eastern time on the last calendar day of the period. The Board of Trustees (the Board) has delegated the day to day responsibility for the valuation of the Fund's investments to the Fair Value Committee (the Committee) established by the Fund's investment adviser. In accordance with valuation policies and procedures approved by the Board, the Fund attempts to obtain prices from one or more third party pricing vendors or brokers to value its investments. When current market prices, quotations or currency exchange rates are not readily available or reliable, investments will be fair valued in good faith by the Committee, in accordance with procedures adopted by the Board. Factors used in determining fair value vary by investment type and may include market or investment specific events, changes in interest rates and credit quality. The frequency with which these procedures are used cannot be predicted and they may be utilized to a significant extent. The Committee oversees the Fund's valuation policies and procedures and reports to the Board on the Committee's activities and fair value determinations. The Board monitors the appropriateness of the procedures used in valuing the Fund's investments and ratifies the fair value determinations of the Committee.
The Fund categorizes the inputs to valuation techniques used to value its investments into a disclosure hierarchy consisting of three levels as shown below:
- Level 1 – quoted prices in active markets for identical investments
- Level 2 – other significant observable inputs (including quoted prices for similar investments, interest rates, prepayment speeds, etc.)
- Level 3 – unobservable inputs (including the Fund's own assumptions based on the best information available)
Valuation techniques used to value the Fund's investments by major category are as follows:
Equity securities, including restricted securities, for which market quotations are readily available, are valued at the last reported sale price or official closing price as reported by a third party pricing vendor on the primary market or exchange on which they are traded and are categorized as Level 1 in the hierarchy. In the event there were no sales during the day or closing prices are not available, securities are valued at the last quoted bid price or may be valued using the last available price and are generally categorized as Level 2 in the hierarchy. For foreign equity securities, when market or security specific events arise, comparisons to the valuation of American Depositary Receipts (ADRs), futures contracts, Exchange-Traded Funds (ETFs) and certain indexes as well as quoted prices for similar securities may be used and would be categorized as Level 2 in the hierarchy. Utilizing these techniques may result in transfers between Level 1 and Level 2. For equity securities, including restricted securities, where observable inputs are limited, assumptions about market activity and risk are used and these securities may be categorized as Level 3 in the hierarchy.
Debt securities, including restricted securities, are valued based on evaluated prices received from third party pricing vendors or from brokers who make markets in such securities. U.S. government and government agency obligations are valued by pricing vendors who utilize matrix pricing which considers yield or price of bonds of comparable quality, coupon, maturity and type or by broker-supplied prices. When independent prices are unavailable or unreliable, debt securities may be valued utilizing pricing methodologies which consider similar factors that would be used by third party pricing vendors. Debt securities are generally categorized as Level 2 in the hierarchy but may be Level 3 depending on the circumstances.
Futures contracts are valued at the settlement price established each day by the board of trade or exchange on which they are traded and are categorized as Level 1 in the hierarchy. Investments in open-end mutual funds, including the Fidelity Central Funds, are valued at their closing net asset value (NAV) each business day and are categorized as Level 1 in the hierarchy.
Changes in valuation techniques may result in transfers in or out of an assigned level within the disclosure hierarchy. The aggregate value of investments by input level as of November 30, 2017, including information on transfers between Levels 1 and 2 is included at the end of the Fund's Schedule of Investments.
Foreign Currency. The Fund may use foreign currency contracts to facilitate transactions in foreign-denominated securities. Gains and losses from these transactions may arise from changes in the value of the foreign currency or if the counterparties do not perform under the contracts' terms.
Foreign-denominated assets, including investment securities, and liabilities are translated into U.S. dollars at the exchange rates at period end. Purchases and sales of investment securities, income and dividends received and expenses denominated in foreign currencies are translated into U.S. dollars at the exchange rate in effect on the transaction date.
The effects of exchange rate fluctuations on investments are included with the net realized and unrealized gain (loss) on investment securities. Other foreign currency transactions resulting in realized and unrealized gain (loss) are disclosed separately.
Investment Transactions and Income. For financial reporting purposes, the Fund's investment holdings and NAV include trades executed through the end of the last business day of the period. The NAV per share for processing shareholder transactions is calculated as of the close of business of the New York Stock Exchange (NYSE), normally 4:00 p.m. Eastern time and includes trades executed through the end of the prior business day. Gains and losses on securities sold are determined on the basis of identified cost. Dividend income is recorded on the ex-dividend date, except for certain dividends from foreign securities where the ex-dividend date may have passed, which are recorded as soon as the Fund is informed of the ex-dividend date. Non-cash dividends included in dividend income, if any, are recorded at the fair market value of the securities received. Income and capital gain distributions from Fidelity Central Funds, if any, are recorded on the ex-dividend date. Certain distributions received by the Fund represent a return of capital or capital gain. The Fund determines the components of these distributions subsequent to the ex-dividend date, based upon receipt of tax filings or other correspondence relating to the underlying investment. These distributions are recorded as a reduction of cost of investments and/or as a realized gain. Interest income is accrued as earned and includes coupon interest and amortization of premium and accretion of discount on debt securities as applicable. Investment income is recorded net of foreign taxes withheld where recovery of such taxes is uncertain.
Expenses. Expenses directly attributable to a fund are charged to that fund. Expenses attributable to more than one fund are allocated among the respective funds on the basis of relative net assets or other appropriate methods. Expense estimates are accrued in the period to which they relate and adjustments are made when actual amounts are known.
Income Tax Information and Distributions to Shareholders. Each year, the Fund intends to qualify as a regulated investment company under Subchapter M of the Internal Revenue Code, including distributing substantially all of its taxable income and realized gains. As a result, no provision for U.S. Federal income taxes is required. As of November 30, 2017, the Fund did not have any unrecognized tax benefits in the financial statements; nor is the Fund aware of any tax positions for which it is reasonably possible that the total amounts of unrecognized tax benefits will significantly change in the next twelve months. The Fund files a U.S. federal tax return, in addition to state and local tax returns as required. The Fund's federal income tax returns are subject to examination by the Internal Revenue Service (IRS) for a period of three fiscal years after they are filed. State and local tax returns may be subject to examination for an additional fiscal year depending on the jurisdiction. Foreign taxes are provided for based on the Fund's understanding of the tax rules and rates that exist in the foreign markets in which it invests.
Distributions are declared and recorded on the ex-dividend date. Income and capital gain distributions are determined in accordance with income tax regulations, which may differ from GAAP.
Capital accounts within the financial statements are adjusted for permanent book-tax differences. These adjustments have no impact on net assets or the results of operations. Capital accounts are not adjusted for temporary book-tax differences which will reverse in a subsequent period.
Book-tax differences are primarily due to futures contracts, foreign currency transactions, market discount, partnerships, capital loss carryforwards and losses deferred due to wash sales.
As of period end, the cost and unrealized appreciation (depreciation) in securities, and derivatives if applicable, for federal income tax purposes were as follows:
| Gross unrealized appreciation | $95,332,892 |
| Gross unrealized depreciation | (6,842,041) |
| Net unrealized appreciation (depreciation) | $88,490,851 |
| Tax Cost | $397,947,828 |
The tax-based components of distributable earnings as of period end were as follows:
| Undistributed tax-exempt income | $– |
| Undistributed ordinary income | $2,004,162 |
| Undistributed long-term capital gain | $27,751,135 |
| Net unrealized appreciation (depreciation) on securities and other investments | $87,965,678 |
The tax character of distributions paid was as follows:
| November 30, 2017 | November 30, 2016 | |
| Ordinary Income | $3,874,433 | $ 1,156,042 |
| Long-term Capital Gains | – | 21,339,829 |
| Total | $3,874,433 | $ 22,495,871 |
Restricted Securities. The Fund may invest in securities that are subject to legal or contractual restrictions on resale. These securities generally may be resold in transactions exempt from registration or to the public if the securities are registered. Disposal of these securities may involve time-consuming negotiations and expense, and prompt sale at an acceptable price may be difficult. Information regarding restricted securities is included at the end of the Fund's Schedule of Investments.
4. Derivative Instruments.
Risk Exposures and the Use of Derivative Instruments. The Fund's investment objective allows the Fund to enter into various types of derivative contracts, including futures contracts. Derivatives are investments whose value is primarily derived from underlying assets, indices or reference rates and may be transacted on an exchange or over-the-counter (OTC). Derivatives may involve a future commitment to buy or sell a specified asset based on specified terms, to exchange future cash flows at periodic intervals based on a notional principal amount, or for one party to make one or more payments upon the occurrence of specified events in exchange for periodic payments from the other party.
The Fund used derivatives to increase returns and to manage exposure to certain risks as defined below. The success of any strategy involving derivatives depends on analysis of numerous economic factors, and if the strategies for investment do not work as intended, the Fund may not achieve its objectives.
The Fund's use of derivatives increased or decreased its exposure to the following risk:
| Equity Risk | Equity risk relates to the fluctuations in the value of financial instruments as a result of changes in market prices (other than those arising from interest rate risk or foreign exchange risk), whether caused by factors specific to an individual investment, its issuer, or all factors affecting all instruments traded in a market or market segment. |
The Fund is also exposed to additional risks from investing in derivatives, such as liquidity risk and counterparty credit risk. Liquidity risk is the risk that the Fund will be unable to close out the derivative in the open market in a timely manner. Counterparty credit risk is the risk that the counterparty will not be able to fulfill its obligation to the Fund. Counterparty credit risk related to exchange-traded futures contracts may be mitigated by the protection provided by the exchange on which they trade.
Investing in derivatives may involve greater risks than investing in the underlying assets directly and, to varying degrees, may involve risk of loss in excess of any initial investment and collateral received and amounts recognized in the Statement of Assets and Liabilities. In addition, there may be the risk that the change in value of the derivative contract does not correspond to the change in value of the underlying instrument.
Futures Contracts. A futures contract is an agreement between two parties to buy or sell a specified underlying instrument for a fixed price at a specified future date. The Fund used futures contracts to manage its exposure to the stock market.
Upon entering into a futures contract, a fund is required to deposit either cash or securities (initial margin) with a clearing broker in an amount equal to a certain percentage of the face value of the contract. Futures contracts are marked-to-market daily and subsequent daily payments (variation margin) are made or received by a fund depending on the daily fluctuations in the value of the futures contracts and are recorded as unrealized appreciation or (depreciation). This receivable and/or payable, if any, is included in daily variation margin on futures contracts in the Statement of Assets and Liabilities. Realized gain or (loss) is recorded upon the expiration or closing of a futures contract. The net realized gain (loss) and change in net unrealized appreciation (depreciation) on futures contracts during the period is presented in the Statement of Operations.
Any open futures contracts at period end are presented in the Schedule of Investments under the caption "Futures Contracts". The notional amount at value reflects each contract's exposure to the underlying instrument or index at period end. Securities deposited to meet initial margin requirements are identified in the Schedule of Investments.
5. Purchases and Sales of Investments.
Purchases and sales of securities, other than short-term securities, aggregated $379,616,075 and $436,060,647, respectively.
6. Fees and Other Transactions with Affiliates.
Management Fee. Effective June 1, 2017, under the management contract approved by the Board and shareholders, Fidelity Management & Research Company (the investment adviser) and its affiliates provide the Fund with investment management related services for which the Fund does not pay a management fee. In addition, the investment adviser pays all ordinary operating expenses of the Fund, except custody fees, fees and expenses of the independent Trustees, and certain miscellaneous expenses such as proxy and shareholder meeting expenses.
Prior to June 1, 2017, the investment adviser and its affiliates provided the Fund with investment management related services for which the Fund paid a monthly management fee. The management fee was the sum of an individual fund fee rate that was based on an annual rate of .45% of the Fund's average net assets and an annualized group fee rate that averaged .25% during the period. The group fee rate was based upon the average net assets of all the mutual funds advised by the investment adviser, including any mutual funds previously advised by the investment adviser that are currently advised by Fidelity SelectCo, LLC, an affiliate of the investment adviser. The group fee rate decreased as assets under management increased and increased as assets under management decreased. In addition, the management fee was subject to a performance adjustment (up to a maximum of +/- .20% of the Fund's average net assets over a 36 month performance period). The upward or downward adjustment to the management fee was based on the Fund's relative investment performance as compared to its benchmark index, the Russell 2000 Index, over the same 36 month performance period. The performance adjustment included in the management fee rate may be higher or lower than the maximum performance adjustment rate due to the difference between the average net assets for the reporting and performance periods.
Transfer Agent Fees. Fidelity Investments Institutional Operations Company, Inc. (FIIOC), an affiliate of the investment adviser, is the Fund's transfer, dividend disbursing and shareholder servicing agent. Effective June 1, 2017, fees for these services are no longer charged to the classes. Prior to June 1, 2017, FIIOC received account fees and asset-based fees that varied according to account size and type of account. FIIOC pays for typesetting, printing and mailing of shareholder reports, except proxy statements. For the period, the transfer agent fees were equivalent to a rate of .08% of average net assets.
Accounting and Security Lending Fees. Fidelity Service Company, Inc. (FSC), an affiliate of the investment adviser, maintains the Fund's accounting records. The accounting fee is based on the level of average net assets for each month. Under a separate contract, FSC administers the security lending program. The security lending fee is based on the number and duration of lending transactions. Effective June 1, 2017, these fees are paid by the investment adviser or an affiliate.
Brokerage Commissions. The Fund placed a portion of its portfolio transactions with brokerage firms which are affiliates of the investment. Brokerage commissions are included in net realized gain (loss) and change in net unrealized appreciation (depreciation) in the Statement of Operations. The commissions paid to these affiliated firms were $17,824 for the period.
Interfund Trades. The Fund may purchase from or sell securities to other Fidelity Funds under procedures adopted by the Board. The procedures have been designed to ensure these interfund trades are executed in accordance with Rule 17a-7 of the 1940 Act. Interfund trades are included within the respective purchases and sales amounts shown in the Purchases and Sales of Investments note.
7. Committed Line of Credit.
The Fund participates with other funds managed by the investment adviser or an affiliate in a $4.25 billion credit facility (the "line of credit") to be utilized for temporary or emergency purposes to fund shareholder redemptions or for other short-term liquidity purposes. The Fund has agreed to pay commitment fees on its pro-rata portion of the line of credit, which amounted to $1,463 and is reflected in Miscellaneous expenses on the Statement of Operations. During the period, the Fund did not borrow on this line of credit.
8. Security Lending.
The Fund lends portfolio securities through a lending agent from time to time in order to earn additional income. For equity securities, a lending agent is used and may loan securities to certain qualified borrowers, including Fidelity Capital Markets (FCM), a broker-dealer affiliated with the Fund. On the settlement date of the loan, the Fund receives collateral (in the form of U.S. Treasury obligations, letters of credit and/or cash) against the loaned securities and maintains collateral in an amount not less than 100% of the market value of the loaned securities during the period of the loan. The market value of the loaned securities is determined at the close of business of the Fund and any additional required collateral is delivered to the Fund on the next business day. The Fund or borrower may terminate the loan at any time, and if the borrower defaults on its obligation to return the securities loaned because of insolvency or other reasons, the Fund may apply collateral received from the borrower against the obligation. The Fund may experience delays and costs in recovering the securities loaned. Any cash collateral received is invested in the Fidelity Securities Lending Cash Central Fund. The value of loaned securities and cash collateral at period end are disclosed on the Fund's Statement of Assets and Liabilities. Security lending income represents the income earned on investing cash collateral, less rebates paid to borrowers and any lending agent fees associated with the loan, plus any premium payments received for lending certain types of securities. Security lending income is presented in the Statement of Operations as a component of income from Fidelity Central Funds. Total security lending income during the period amounted to $163,226. During the period, there were no securities loaned to FCM.
9. Expense Reductions.
Commissions paid to certain brokers with whom the investment adviser, or its affiliates, places trades on behalf of the Fund include an amount in addition to trade execution, which may be rebated back to the Fund to offset certain expenses. This amount totaled $41,545 for the period.
In addition, during the period the investment adviser reimbursed and/or waived a portion of operating expenses in the amount of $4,129.
10. Other.
The Fund's organizational documents provide former and current trustees and officers with a limited indemnification against liabilities arising in connection with the performance of their duties to the Fund. In the normal course of business, the Fund may also enter into contracts that provide general indemnifications. The Fund's maximum exposure under these arrangements is unknown as this would be dependent on future claims that may be made against the Fund. The risk of material loss from such claims is considered remote.
At the end of the period, mutual funds managed by the investment adviser or its affiliates were the owners of record of all of the outstanding shares of the Fund.
Report of Independent Registered Public Accounting Firm
To the Trustees of Fidelity Advisor Series I and Shareholders of Fidelity Advisor Series Small Cap Fund:
In our opinion, the accompanying statement of assets and liabilities, including the schedule of investments, and the related statements of operations and of changes in net assets and the financial highlights present fairly, in all material respects, the financial position of Fidelity Advisor Series Small Cap Fund (a fund of Fidelity Advisor Series I) as of November 30, 2017, the results of its operations for the year then ended, the changes in its net assets for each of the two years in the period then ended and the financial highlights for each of the periods indicated, in conformity with accounting principles generally accepted in the United States of America. These financial statements and financial highlights (hereafter referred to as “financial statements”) are the responsibility of the Fidelity Advisor Series Small Cap Fund’s management. Our responsibility is to express an opinion on these financial statements based on our audits. We conducted our audits of these financial statements in accordance with the standards of the Public Company Accounting Oversight Board (United States). Those standards require that we plan and perform the audit to obtain reasonable assurance about whether the financial statements are free of material misstatement. An audit includes examining, on a test basis, evidence supporting the amounts and disclosures in the financial statements, assessing the accounting principles used and significant estimates made by management, and evaluating the overall financial statement presentation. Our procedures included confirmation of securities owned as of November 30, 2017 by correspondence with the custodian and brokers; when replies were not received from brokers, we performed other auditing procedures. We believe that our audits provide a reasonable basis for our opinion.
PricewaterhouseCoopers LLP
Boston, Massachusetts
January 18, 2018
Trustees and Officers
The Trustees, Members of the Advisory Board (if any), and officers of the trust and fund, as applicable, are listed below. The Board of Trustees governs the fund and is responsible for protecting the interests of shareholders. The Trustees are experienced executives who meet periodically throughout the year to oversee the fund's activities, review contractual arrangements with companies that provide services to the fund, oversee management of the risks associated with such activities and contractual arrangements, and review the fund's performance. Each of the Trustees oversees 190 funds.
The Trustees hold office without limit in time except that (a) any Trustee may resign; (b) any Trustee may be removed by written instrument, signed by at least two-thirds of the number of Trustees prior to such removal; (c) any Trustee who requests to be retired or who has become incapacitated by illness or injury may be retired by written instrument signed by a majority of the other Trustees; and (d) any Trustee may be removed at any special meeting of shareholders by a two-thirds vote of the outstanding voting securities of the trust. Each Trustee who is not an interested person (as defined in the 1940 Act) of the trust and the fund is referred to herein as an Independent Trustee. Each Independent Trustee shall retire not later than the last day of the calendar year in which his or her 75th birthday occurs. The Independent Trustees may waive this mandatory retirement age policy with respect to individual Trustees. Officers and Advisory Board Members hold office without limit in time, except that any officer or Advisory Board Member may resign or may be removed by a vote of a majority of the Trustees at any regular meeting or any special meeting of the Trustees. Except as indicated, each individual has held the office shown or other offices in the same company for the past five years.
The fund’s Statement of Additional Information (SAI) includes more information about the Trustees. To request a free copy, call Fidelity at 1-877-208-0098.
Experience, Skills, Attributes, and Qualifications of the Trustees. The Governance and Nominating Committee has adopted a statement of policy that describes the experience, qualifications, attributes, and skills that are necessary and desirable for potential Independent Trustee candidates (Statement of Policy). The Board believes that each Trustee satisfied at the time he or she was initially elected or appointed a Trustee, and continues to satisfy, the standards contemplated by the Statement of Policy. The Governance and Nominating Committee also engages professional search firms to help identify potential Independent Trustee candidates who have the experience, qualifications, attributes, and skills consistent with the Statement of Policy. From time to time, additional criteria based on the composition and skills of the current Independent Trustees, as well as experience or skills that may be appropriate in light of future changes to board composition, business conditions, and regulatory or other developments, have also been considered by the professional search firms and the Governance and Nominating Committee. In addition, the Board takes into account the Trustees' commitment and participation in Board and committee meetings, as well as their leadership of standing and ad hoc committees throughout their tenure.
In determining that a particular Trustee was and continues to be qualified to serve as a Trustee, the Board has considered a variety of criteria, none of which, in isolation, was controlling. The Board believes that, collectively, the Trustees have balanced and diverse experience, qualifications, attributes, and skills, which allow the Board to operate effectively in governing the fund and protecting the interests of shareholders. Information about the specific experience, skills, attributes, and qualifications of each Trustee, which in each case led to the Board's conclusion that the Trustee should serve (or continue to serve) as a trustee of the fund, is provided below.
Board Structure and Oversight Function. James C. Curvey is an interested person and currently serves as Chairman. The Trustees have determined that an interested Chairman is appropriate and benefits shareholders because an interested Chairman has a personal and professional stake in the quality and continuity of services provided to the fund. Independent Trustees exercise their informed business judgment to appoint an individual of their choosing to serve as Chairman, regardless of whether the Trustee happens to be independent or a member of management. The Independent Trustees have determined that they can act independently and effectively without having an Independent Trustee serve as Chairman and that a key structural component for assuring that they are in a position to do so is for the Independent Trustees to constitute a substantial majority for the Board. The Independent Trustees also regularly meet in executive session. Ned C. Lautenbach serves as Chairman of the Independent Trustees and as such (i) acts as a liaison between the Independent Trustees and management with respect to matters important to the Independent Trustees and (ii) with management prepares agendas for Board meetings.
Fidelity® funds are overseen by different Boards of Trustees. The fund's Board oversees Fidelity's high income and certain equity funds, and other Boards oversee Fidelity's investment-grade bond, money market, asset allocation, and sector funds. The asset allocation funds may invest in Fidelity® funds overseen by the fund's Board. The use of separate Boards, each with its own committee structure, allows the Trustees of each group of Fidelity® funds to focus on the unique issues of the funds they oversee, including common research, investment, and operational issues. On occasion, the separate Boards establish joint committees to address issues of overlapping consequences for the Fidelity® funds overseen by each Board.
The Trustees operate using a system of committees to facilitate the timely and efficient consideration of all matters of importance to the Trustees, the fund, and fund shareholders and to facilitate compliance with legal and regulatory requirements and oversight of the fund's activities and associated risks. The Board, acting through its committees, has charged FMR and its affiliates with (i) identifying events or circumstances the occurrence of which could have demonstrably adverse effects on the fund's business and/or reputation; (ii) implementing processes and controls to lessen the possibility that such events or circumstances occur or to mitigate the effects of such events or circumstances if they do occur; and (iii) creating and maintaining a system designed to evaluate continuously business and market conditions in order to facilitate the identification and implementation processes described in (i) and (ii) above. Because the day-to-day operations and activities of the fund are carried out by or through FMR, its affiliates, and other service providers, the fund's exposure to risks is mitigated but not eliminated by the processes overseen by the Trustees. While each of the Board's committees has responsibility for overseeing different aspects of the fund's activities, oversight is exercised primarily through the Operations, Audit, and Compliance Committees. In addition, the Independent Trustees have worked with FMR to enhance the Board's oversight of investment and financial risks, legal and regulatory risks, technology risks, and operational risks, including the development of additional risk reporting to the Board. For example, a working group comprised of Independent Trustees and FMR has worked and continues to work to review the Fidelity® funds' valuation-related activities, reporting and risk management. Appropriate personnel, including but not limited to the fund's Chief Compliance Officer (CCO), FMR's internal auditor, the independent accountants, the fund's Treasurer and portfolio management personnel, make periodic reports to the Board's committees, as appropriate, including an annual review of Fidelity's risk management program for the Fidelity® funds. The responsibilities of each standing committee, including their oversight responsibilities, are described further under "Standing Committees of the Trustees."
Interested Trustees*:
Correspondence intended for a Trustee who is an interested person may be sent to Fidelity Investments, 245 Summer Street, Boston, Massachusetts 02210.
Name, Year of Birth; Principal Occupations and Other Relevant Experience+
James C. Curvey (1935)
Year of Election or Appointment: 2007
Trustee
Chairman of the Board of Trustees
Mr. Curvey also serves as Trustee of other Fidelity® funds. Mr. Curvey is a Director of Fidelity Research & Analysis Co. (investment adviser firm, 2009-present), and Vice Chairman (2007-present) and Director of FMR LLC (diversified financial services company). In addition, Mr. Curvey serves as an Overseer for the Boston Symphony Orchestra and a member of the board of Artis-Naples, Naples, Florida, and as a Trustee for Brewster Academy, Wolfeboro, New Hampshire. Previously, Mr. Curvey served as a Director of Fidelity Investments Money Management, Inc. (investment adviser firm, 2009-2014) and a Director of FMR and FMR Co., Inc. (investment adviser firms, 2007-2014).
Charles S. Morrison (1960)
Year of Election or Appointment: 2014
Trustee
Mr. Morrison also serves as Trustee of other funds. He serves as President of Fidelity Management & Research Company (FMR) (investment adviser firm, 2016-present), a Director of Fidelity Investments Money Management, Inc. (FIMM) (investment adviser firm, 2014-present), Director of Fidelity SelectCo, LLC (investment adviser firm, 2014-present), President, Asset Management (2014-present), and is an employee of Fidelity Investments. Previously, Mr. Morrison served as Vice President of Fidelity's Fixed Income and Asset Allocation Funds (2012-2014), President, Fixed Income (2011-2014), Vice President of Fidelity's Money Market Funds (2005-2009), President, Money Market Group Leader of FMR (investment adviser firm, 2009), and Senior Vice President, Money Market Group of FMR (2004-2009). Mr. Morrison also served as Vice President of Fidelity's Bond Funds (2002-2005), certain Balanced Funds (2002-2005), and certain Asset Allocation Funds (2002-2007), and as Senior Vice President (2002-2005) of Fidelity's Bond Division.
* Determined to be an “Interested Trustee” by virtue of, among other things, his or her affiliation with the trust or various entities under common control with FMR.
+ The information includes the Trustee's principal occupation during the last five years and other information relating to the experience, attributes, and skills relevant to the Trustee's qualifications to serve as a Trustee, which led to the conclusion that the Trustee should serve as a Trustee for the fund.
Independent Trustees:
Correspondence intended for an Independent Trustee may be sent to Fidelity Investments, P.O. Box 55235, Boston, Massachusetts 02205-5235.
Name, Year of Birth; Principal Occupations and Other Relevant Experience+
Dennis J. Dirks (1948)
Year of Election or Appointment: 2005
Trustee
Mr. Dirks also serves as Trustee of other Fidelity® funds. Prior to his retirement in May 2003, Mr. Dirks was Chief Operating Officer and a member of the Board of The Depository Trust & Clearing Corporation (DTCC). He also served as President, Chief Operating Officer, and Board member of The Depository Trust Company (DTC) and President and Board member of the National Securities Clearing Corporation (NSCC). In addition, Mr. Dirks served as Chief Executive Officer and Board member of the Government Securities Clearing Corporation, Chief Executive Officer and Board member of the Mortgage-Backed Securities Clearing Corporation, as a Trustee and a member of the Finance Committee of Manhattan College (2005-2008), as a Trustee and a member of the Finance Committee of AHRC of Nassau County (2006-2008), as a member of the Independent Directors Council (IDC) Governing Council (2010-2015), and as a member of the Board of Directors for The Brookville Center for Children’s Services, Inc. (2009-2017). Mr. Dirks is a member of the Finance Committee (2016-present) and Board of Directors (2017-present) of the Asolo Repertory Theatre.
Alan J. Lacy (1953)
Year of Election or Appointment: 2008
Trustee
Mr. Lacy also serves as Trustee of other Fidelity® funds. Mr. Lacy serves as a Director of Bristol-Myers Squibb Company (global pharmaceuticals, 2008-present). He is a Trustee of the California Chapter of The Nature Conservancy (2015-present) and a Director of the Center for Advanced Study in the Behavioral Sciences at Stanford University (2015-present). In addition, Mr. Lacy served as Senior Adviser (2007-2014) of Oak Hill Capital Partners, L.P. (private equity) and also served as Chief Executive Officer (2005) and Vice Chairman (2005-2006) of Sears Holdings Corporation (retail) and Chief Executive Officer and Chairman of the Board of Sears, Roebuck and Co. (retail, 2000-2005). Previously, Mr. Lacy served as Chairman (2014-2017) and a member (2010-2017) of the Board of Directors of Dave & Buster’s Entertainment, Inc. (restaurant and entertainment complexes), as Chairman (2008-2011) and a member (2006-2015) of the Board of Trustees of the National Parks Conservation Association, and as a member of the Board of Directors for The Hillman Companies, Inc. (hardware wholesalers, 2010-2014), Earth Fare, Inc. (retail grocery, 2010-2014), and The Western Union Company (global money transfer, 2006-2011).
Ned C. Lautenbach (1944)
Year of Election or Appointment: 2000
Trustee
Chairman of the Independent Trustees
Mr. Lautenbach also serves as Trustee of other Fidelity® funds. Mr. Lautenbach currently serves as Vice Chair of the Board of Governors, State University System of Florida (2013-present) and is a member of the Council on Foreign Relations (1994-present). He is also a member and has most recently served as Chairman of the Board of Directors of Artis-Naples (2012-present). Previously, Mr. Lautenbach served as a member and then Lead Director of the Board of Directors of Eaton Corporation (diversified industrial, 1997-2016). He was also a Partner and Advisory Partner at Clayton, Dubilier & Rice, LLC (private equity investment, 1998-2010), as well as a Director of Sony Corporation (2006-2007). In addition, Mr. Lautenbach also had a 30-year career with IBM (technology company) during which time he served as Senior Vice President and a member of the Corporate Executive Committee (1968-1998).
Joseph Mauriello (1944)
Year of Election or Appointment: 2008
Trustee
Mr. Mauriello also serves as Trustee of other Fidelity® funds. Prior to his retirement in January 2006, Mr. Mauriello served in numerous senior management positions including Deputy Chairman and Chief Operating Officer (2004-2005), and Vice Chairman of Financial Services (2002-2004) of KPMG LLP US (professional services, 1965-2005). Mr. Mauriello currently serves as a member of the Board of Directors of XL Group plc. (global insurance and re-insurance, 2006-present) and the Independent Directors Council (IDC) Governing Council (2015-present). Previously, Mr. Mauriello served as a Director of the Hamilton Funds of the Bank of New York (2006-2007) and of Arcadia Resources Inc. (health care services and products, 2007-2012).
Cornelia M. Small (1944)
Year of Election or Appointment: 2005
Trustee
Ms. Small also serves as Trustee of other Fidelity® funds. Ms. Small is a member of the Board of Directors (2009-present) and Chair of the Investment Committee (2010-present) of the Teagle Foundation. Ms. Small also serves on the Investment Committee of the Berkshire Taconic Community Foundation (2008-present). Previously, Ms. Small served as Chairperson (2002-2008) and a member of the Investment Committee and Chairperson (2008-2012) and a member of the Board of Trustees of Smith College. In addition, Ms. Small served as Chief Investment Officer, Director of Global Equity Investments, and a member of the Board of Directors of Scudder, Stevens & Clark and Scudder Kemper Investments.
William S. Stavropoulos (1939)
Year of Election or Appointment: 2002
Trustee
Vice Chairman of the Independent Trustees
Mr. Stavropoulos also serves as Trustee of other Fidelity® funds. Mr. Stavropoulos serves as President and Founder of the Michigan Baseball Foundation, the Great Lakes Loons (2007-present). Mr. Stavropoulos is Chairman Emeritus of the Board of Directors of The Dow Chemical Company, where he previously served in numerous senior management positions, including President, CEO (1995-2000; 2002-2004), Chairman of the Executive Committee (2000-2006), and as a member of the Board of Directors (1990-2006). Currently, Mr. Stavropoulos is Chairman of the Board of Directors of Univar Inc. (global distributor of commodity and specialty chemicals), a Director of Teradata Corporation (data warehousing and technology solutions), and a member of the Advisory Board for Metalmark Capital LLC (private equity investment, 2005-present). Mr. Stavropoulos is an operating advisor to Clayton, Dubilier & Rice, LLC (private equity investment). In addition, Mr. Stavropoulos is a member of the University of Notre Dame Advisory Council for the College of Science, a Trustee of the Rollin L. Gerstacker Foundation, and a Director of Artis-Naples in Naples, Florida. Previously, Mr. Stavropoulos served as a Director of Chemical Financial Corporation (bank holding company, 1993-2012) and Tyco International, Ltd. (multinational manufacturing and services, 2007-2012).
David M. Thomas (1949)
Year of Election or Appointment: 2008
Trustee
Mr. Thomas also serves as Trustee of other Fidelity® funds. Mr. Thomas serves as Non-Executive Chairman of the Board of Directors of Fortune Brands Home and Security (home and security products, 2011-present), as a member of the Board of Directors (2004-present) and Presiding Director (2013-present) of Interpublic Group of Companies, Inc. (marketing communication), and as a member of the Board of Trustees of the University of Florida (2013-present). Previously, Mr. Thomas served as Executive Chairman (2005-2006) and Chairman and Chief Executive Officer (2000-2005) of IMS Health, Inc. (pharmaceutical and healthcare information solutions), and a Director of Fortune Brands, Inc. (consumer products, 2000-2011).
+ The information includes the Trustee's principal occupation during the last five years and other information relating to the experience, attributes, and skills relevant to the Trustee's qualifications to serve as a Trustee, which led to the conclusion that the Trustee should serve as a Trustee for the fund.
Advisory Board Members and Officers:
Correspondence intended for an officer or Peter S. Lynch may be sent to Fidelity Investments, 245 Summer Street, Boston, Massachusetts 02210. Officers appear below in alphabetical order.
Name, Year of Birth; Principal Occupation
Peter S. Lynch (1944)
Year of Election or Appointment: 2003
Member of the Advisory Board
Mr. Lynch also serves as Member of the Advisory Board of other Fidelity® funds. Mr. Lynch is Vice Chairman and a Director of FMR (investment adviser firm) and FMR Co., Inc. (investment adviser firm). In addition, Mr. Lynch serves as a Trustee of Boston College and as the Chairman of the Inner-City Scholarship Fund. Previously, Mr. Lynch served on the Special Olympics International Board of Directors (1997-2006).
Elizabeth Paige Baumann (1968)
Year of Election or Appointment: 2017
Anti-Money Laundering (AML) Officer
Ms. Baumann also serves as AML Officer of other funds. She is Chief AML Officer (2012-present) and Senior Vice President (2014-present) of FMR LLC (diversified financial services company) and is an employee of Fidelity Investments. Previously, Ms. Baumann served as AML Officer of the funds (2012-2016), and Vice President (2007-2014) and Deputy Anti-Money Laundering Officer (2007-2012) of FMR LLC.
Marc R. Bryant (1966)
Year of Election or Appointment: 2015
Secretary and Chief Legal Officer (CLO)
Mr. Bryant also serves as Secretary and CLO of other funds. Mr. Bryant serves as CLO, Secretary, and Senior Vice President of Fidelity Management & Research Company (investment adviser firm, 2015-present) and FMR Co., Inc. (investment adviser firm, 2015-present); Secretary of Fidelity SelectCo, LLC (investment adviser firm, 2015-present) and Fidelity Investments Money Management, Inc. (investment adviser firm, 2015-present); and CLO of Fidelity Management & Research (Hong Kong) Limited and FMR Investment Management (UK) Limited (investment adviser firms, 2015-present) and Fidelity Management & Research (Japan) Limited (investment adviser firm, 2016-present). He is Senior Vice President and Deputy General Counsel of FMR LLC (diversified financial services company). Previously, Mr. Bryant served as Secretary and CLO of Fidelity Rutland Square Trust II (2010-2014) and Assistant Secretary of Fidelity's Fixed Income and Asset Allocation Funds (2013-2015). Prior to joining Fidelity Investments, Mr. Bryant served as a Senior Vice President and the Head of Global Retail Legal for AllianceBernstein L.P. (2006-2010), and as the General Counsel for ProFund Advisors LLC (2001-2006).
William C. Coffey (1969)
Year of Election or Appointment: 2009
Assistant Secretary
Mr. Coffey also serves as Assistant Secretary of other funds. He is Senior Vice President and Deputy General Counsel of FMR LLC (diversified financial services company, 2010-present), and is an employee of Fidelity Investments. Previously, Mr. Coffey served as Vice President and Associate General Counsel of FMR LLC (2005-2009).
Jonathan Davis (1968)
Year of Election or Appointment: 2010
Assistant Treasurer
Mr. Davis also serves as Assistant Treasurer of other funds. Mr. Davis serves as Assistant Treasurer of FMR Capital, Inc. (2017-present) and is an employee of Fidelity Investments. Previously, Mr. Davis served as Vice President and Associate General Counsel of FMR LLC (diversified financial services company, 2003-2010).
Adrien E. Deberghes (1967)
Year of Election or Appointment: 2016
Assistant Treasurer
Mr. Deberghes also serves as an officer of other funds. He serves as Assistant Treasurer of FMR Capital, Inc. (2017-present), Executive Vice President of Fidelity Investments Money Management, Inc. (FIMM) (investment adviser firm, 2016-present), and is an employee of Fidelity Investments (2008-present). Prior to joining Fidelity Investments, Mr. Deberghes was Senior Vice President of Mutual Fund Administration at State Street Corporation (2007-2008), Senior Director of Mutual Fund Administration at Investors Bank & Trust (2005-2007), and Director of Finance for Dunkin' Brands (2000-2005). Previously, Mr. Deberghes served in other fund officer roles.
Stephanie J. Dorsey (1969)
Year of Election or Appointment: 2010
Assistant Treasurer
Ms. Dorsey also serves as an officer of other funds. Ms. Dorsey serves as Assistant Treasurer of FMR Capital, Inc. (2017-present), is an employee of Fidelity Investments (2008-present), and has served in other fund officer roles. Prior to joining Fidelity Investments, Ms. Dorsey served as Treasurer (2004-2008) of the JPMorgan Mutual Funds and Vice President (2004-2008) of JPMorgan Chase Bank.
Howard J. Galligan III (1966)
Year of Election or Appointment: 2014
Chief Financial Officer
Mr. Galligan also serves as Chief Financial Officer of other funds. Mr. Galligan serves as President of Fidelity Pricing and Cash Management Services (FPCMS) (2014-present) and as a Director of Strategic Advisers, Inc. (investment adviser firm, 2008-present). Previously, Mr. Galligan served as Chief Administrative Officer of Asset Management (2011-2014) and Chief Operating Officer and Senior Vice President of Investment Support for Strategic Advisers, Inc. (2003-2011).
Thomas C. Hense (1964)
Year of Election or Appointment: 2008, 2010, or 2015
Vice President
Mr. Hense serves as Vice President of Fidelity Advisor® Multi-Asset Income Fund (2015) and other funds (High Income (2008), Small Cap (2008), and Value (2010) funds), and is an employee of Fidelity Investments (1993-present). Previously, Mr. Hense served as a portfolio manager for Fidelity's Institutional Money Management Group (Pyramis) (2003-2008).
Brian B. Hogan (1964)
Year of Election or Appointment: 2009
Vice President
Mr. Hogan also serves as Trustee or Vice President of other funds. Mr. Hogan serves as a Director of FMR Investment Management (UK) Limited (investment adviser firm, 2015-present) and Fidelity SelectCo, LLC (investment adviser firm, 2014-present) and President of the Equity Division of FMR (investment adviser firm, 2009-present). Previously, Mr. Hogan served as Senior Vice President, Equity Research of FMR (2006-2009) and as a portfolio manager. Mr. Brian B. Hogan is not related to Mr. Colm A. Hogan.
Colm A. Hogan (1973)
Year of Election or Appointment: 2016
Deputy Treasurer
Mr. Hogan also serves as an officer of other funds. Mr. Hogan serves as Assistant Treasurer of FMR Capital, Inc. (2017-present) and is an employee of Fidelity Investments (2005-present). Mr. Colm A. Hogan is not related to Mr. Brian B. Hogan.
Chris Maher (1972)
Year of Election or Appointment: 2013
Assistant Treasurer
Mr. Maher serves as Assistant Treasurer of other funds. Mr. Maher is Vice President of Valuation Oversight, serves as Assistant Treasurer of FMR Capital, Inc. (2017-present), and is an employee of Fidelity Investments. Previously, Mr. Maher served as Vice President of Asset Management Compliance (2013), Vice President of the Program Management Group of FMR (investment adviser firm, 2010-2013), and Vice President of Valuation Oversight (2008-2010).
Rieco E. Mello (1969)
Year of Election or Appointment: 2017
Assistant Treasurer
Mr. Mello also serves as Assistant Treasurer of other funds. Mr. Mello serves as Assistant Treasurer of FMR Capital, Inc. (2017-present) and is an employee of Fidelity Investments (1995-present).
Kenneth B. Robins (1969)
Year of Election or Appointment: 2016
Chief Compliance Officer
Mr. Robins also serves as an officer of other funds. Mr. Robins serves as Compliance Officer of Fidelity Management & Research Company and FMR Co., Inc. (investment adviser firms, 2016-present) and is an employee of Fidelity Investments (2004-present). Previously, Mr. Robins served as Executive Vice President of Fidelity Investments Money Management, Inc. (investment adviser firm, 2013-2016) and served in other fund officer roles.
Stacie M. Smith (1974)
Year of Election or Appointment: 2016
President and Treasurer
Ms. Smith also serves as an officer of other funds. Ms. Smith serves as Assistant Treasurer of FMR Capital, Inc. (2017-present), is an employee of Fidelity Investments (2009-present), and has served in other fund officer roles. Prior to joining Fidelity Investments, Ms. Smith served as Senior Audit Manager of Ernst & Young LLP (accounting firm, 1996-2009). Previously, Ms. Smith served as Deputy Treasurer of certain Fidelity® funds (2013-2016).
Marc L. Spector (1972)
Year of Election or Appointment: 2016
Assistant Treasurer
Mr. Spector also serves as an officer of other funds. Mr. Spector serves as Assistant Treasurer of FMR Capital, Inc. (2017-present) and is an employee of Fidelity Investments (2016-present). Prior to joining Fidelity Investments, Mr. Spector served as Director at the Siegfried Group (accounting firm, 2013-2016), and prior to Siegfried Group as audit senior manager at Deloitte & Touche (accounting firm, 2005-2013).
Renee Stagnone (1975)
Year of Election or Appointment: 2016
Assistant Treasurer
Ms. Stagnone also serves as an officer of other funds. Ms. Stagnone serves as Assistant Treasurer of FMR Capital, Inc. (2017-present) and is an employee of Fidelity Investments (1997-present). Previously, Ms. Stagnone served as Deputy Treasurer of certain Fidelity® funds (2013-2016).
Shareholder Expense Example
As a shareholder of the Fund, you incur two types of costs: (1) transaction costs, and (2) ongoing costs, including other Fund expenses. This Example is intended to help you understand your ongoing costs (in dollars) of investing in the Fund and to compare these costs with the ongoing costs of investing in other mutual funds.
The Example is based on an investment of $1,000 invested at the beginning of the period and held for the entire period (June 1, 2017 to November 30, 2017).
Actual Expenses
The first line of the accompanying table provides information about actual account values and actual expenses. You may use the information in this line, together with the amount you invested, to estimate the expenses that you paid over the period. Simply divide your account value by $1,000.00 (for example, an $8,600 account value divided by $1,000.00 = 8.6), then multiply the result by the number in the first line under the heading entitled "Expenses Paid During Period" to estimate the expenses you paid on your account during this period. In addition, the Fund, as a shareholder in the underlying Fidelity Central Funds, will indirectly bear its pro-rata share of the fees and expenses incurred by the underlying Fidelity Central Funds. These fees and expenses are not included in the Fund's annualized expense ratio used to calculate the expense estimate in the table below.
Hypothetical Example for Comparison Purposes
The second line of the accompanying table provides information about hypothetical account values and hypothetical expenses based on the Fund's actual expense ratio and an assumed rate of return of 5% per year before expenses, which is not the Fund's actual return. The hypothetical account values and expenses may not be used to estimate the actual ending account balance or expenses you paid for the period. You may use this information to compare the ongoing costs of investing in the Fund and other funds. To do so, compare this 5% hypothetical example with the 5% hypothetical examples that appear in the shareholder reports of the other funds. In addition, the Fund, as a shareholder in the underlying Fidelity Central Funds, will indirectly bear its pro-rata share of the fees and expenses incurred by the underlying Fidelity Central Funds. These fees and expenses are not included in the Fund's annualized expense ratio used to calculate the expense estimate in the table below.
Please note that the expenses shown in the table are meant to highlight your ongoing costs only and do not reflect any transaction costs. Therefore, the second line of the table is useful in comparing ongoing costs only, and will not help you determine the relative total costs of owning different funds.
| Annualized Expense Ratio-A | Beginning Account Value June 1, 2017 | Ending Account Value November 30, 2017 | Expenses Paid During Period-B June 1, 2017 to November 30, 2017 | |
| Actual | .01% | $1,000.00 | $1,104.20 | $.05 |
| Hypothetical-C | $1,000.00 | $1,025.02 | $.05 |
A Annualized expense ratio reflects expenses net of applicable fee waivers.
B Expenses are equal to the Fund's annualized expense ratio, multiplied by the average account value over the period, multiplied by 183/365 (to reflect the one-half year period).
C 5% return per year before expenses
Distributions (Unaudited)
The Board of Trustees of Fidelity Advisor Series Small Cap Fund voted to pay on December 18, 2017, to shareholders of record at the opening of business on December 15, 2017, a distribution of $0.763 per share derived from capital gains realized from sales of portfolio securities and a dividend of $0.066 per share from net investment income.
The fund hereby designates as a capital gain dividend with respect to the taxable year ended November 30, 2017, $27,751,135, or, if subsequently determined to be different, the net capital gain of such year.
The fund designates 80% of the dividend distributed during the fiscal year as qualifying for the dividends–received deduction for corporate shareholders.
The fund designates 90% of the dividend distributed during the fiscal year as amounts which may be taken into account as a dividend for the purposes of the maximum rate under section 1(h)(11) of the Internal Revenue Code.
The fund will notify shareholders in January 2018 of amounts for use in preparing 2017 income tax returns.
Board Approval of Investment Advisory Contracts and Management Fees
Fidelity Advisor Series Small Cap Fund
Each year, the Board of Trustees, including the Independent Trustees (together, the Board), votes on the renewal of the management contract with Fidelity Management & Research Company (FMR) and the sub-advisory agreements (together, the Advisory Contracts) for the fund. FMR and the sub-advisers are referred to herein as the Investment Advisers. The Board, assisted by the advice of fund counsel and Independent Trustees' counsel, requests and considers a broad range of information relevant to the renewal of the Advisory Contracts throughout the year.
The Board meets regularly and, at each of its meetings, covers an extensive agenda of topics and materials and considers factors that are relevant to its annual consideration of the renewal of the fund's Advisory Contracts, including the services and support provided to the fund and its shareholders. The Board has established various standing committees (Committees), each composed of and chaired by Independent Trustees with varying backgrounds, to which the Board has assigned specific subject matter responsibilities in order to enhance effective decision-making by the Board. The Board, acting directly and through its Committees, requests and receives information concerning the annual consideration of the renewal of the fund's Advisory Contracts. The Board also meets as needed to review matters specifically related to the Board's annual consideration of the renewal of the Advisory Contracts. Members of the Board may also meet with trustees of other Fidelity funds through ad hoc joint committees to discuss certain matters relevant to all of the Fidelity funds.
At its July 2017 meeting, the Board unanimously determined to renew the fund's Advisory Contracts. In reaching its determination, the Board considered that the Advisory Contracts currently in place had become effective on June 1, 2017 in connection with shareholders of certain other Fidelity funds that invest in the fund (referred to herein as Freedom Funds) voting to approve new management contracts for the Freedom Funds. The Board noted the Advisory Contracts implemented a new fee structure pursuant to which the fund does not pay a management fee to FMR. The Board also approved certain amendments to the sub-advisory agreements for the fund to ensure consistency in the sub-advisory fees paid under the new fee structure compared to the sub-advisory fees paid under the prior fee structure. The Board noted that the amendments will not result in any changes to the nature, extent, and quality of services provided to the fund.
In considering whether to renew the Advisory Contracts for the fund, the Board considered all factors it believed relevant and reached a determination, with the assistance of fund counsel and Independent Trustees' counsel and through the exercise of its business judgment, that the renewal of the Advisory Contracts was in the best interests of the fund and its shareholders and the fact that no fee is payable under the management contract was fair and reasonable.
Nature, Extent, and Quality of Services Provided. The Board considered Fidelity's staffing as it relates to the fund, including the backgrounds of investment personnel of Fidelity, and also considered the fund's investment objective, strategies, and related investment philosophy. The Independent Trustees also had discussions with senior management of Fidelity's investment operations and investment groups. The Board considered the structure of the investment personnel compensation program and whether this structure provides appropriate incentives to act in the best interests of the fund.Resources Dedicated to Investment Management and Support Services. The Board and the Fund Oversight and Research Committees reviewed the general qualifications and capabilities of Fidelity's investment staff, including its size, education, experience, and resources, as well as Fidelity's approach to recruiting, training, managing, and compensating investment personnel. The Board noted that Fidelity has continued to increase the resources devoted to non-U.S. offices, including expansion of Fidelity's global investment organization. The Board also noted that Fidelity's analysts have extensive resources, tools and capabilities that allow them to conduct sophisticated quantitative and fundamental analysis, as well as credit analysis of issuers, counterparties and guarantors. Further, the Board considered that Fidelity's investment professionals have sufficient access to global information and data so as to provide competitive investment results over time, and that those professionals also have access to sophisticated tools that permit them to assess portfolio construction and risk and performance attribution characteristics continuously, as well as to transmit new information and research conclusions rapidly around the world. Additionally, in its deliberations, the Board considered Fidelity's trading, risk management, compliance, and technology and operations capabilities and resources, which are integral parts of the investment management process.Administrative Services. The Board considered (i) the nature, extent, quality, and cost of advisory and administrative services performed by the Investment Advisers and their affiliates under the Advisory Contracts and under separate agreements covering transfer agency, pricing and bookkeeping, and securities lending services for the fund; (ii) the nature and extent of the supervision of third party service providers, principally custodians, subcustodians, and pricing vendors; and (iii) the resources devoted to, and the record of compliance with, the fund's compliance policies and procedures. The Board also reviewed the allocation of fund brokerage, including allocations to brokers affiliated with the Investment Advisers, the use of brokerage commissions to pay fund expenses, and the use of "soft" commission dollars to pay for research services.Investment Performance. The Board considered whether the fund has operated in accordance with its investment objective, as well as its record of compliance with its investment restrictions. The Board reviewed the fund's absolute investment performance, as well as the fund's relative investment performance, but did not consider performance to be a material factor in its decision to renew the fund's Advisory Contracts, as the fund is not publicly offered as a stand-alone investment product. In this regard, the Board noted that the fund is designed to offer an investment option for other investment companies managed by Fidelity and ultimately to enhance the performance of those investment companies.Based on its review, the Board concluded that the nature, extent, and quality of services provided to the fund under the Advisory Contracts should continue to benefit the shareholders of the fund.Competitiveness of Management Fee and Total Expense Ratio. The Board considered that the fund does not pay FMR a management fee for investment advisory services. The Board also noted that FMR or an affiliate undertakes to pay all operating expenses of the fund, except transfer agent fees, 12b-1 fees, Independent Trustee fees and expenses, custodian fees and expenses, proxy and shareholder meeting expenses, interest, taxes, brokerage expenses, and extraordinary expenses (such as litigation expenses).The Board further considered that, effective June 1, 2017, FMR has contractually agreed to reimburse the fund to the extent that total operating expenses (excluding interest, certain taxes, certain securities lending costs, brokerage commissions, fees and expenses of the Independent Trustees, proxy and shareholder meeting expenses, extraordinary expenses, and acquired fund fees and expenses, if any), as a percentage of its average net assets, exceed 0.014% through January 31, 2021.Based on its review, the Board considered that the fund does not pay a management fee and concluded that the fund's total expense ratio was reasonable in light of the services that the fund and its shareholders receive and the other factors considered.Costs of the Services and Profitability. The Board considered the level of Fidelity's profits in respect of all the Fidelity funds.PricewaterhouseCoopers LLP (PwC), independent registered public accounting firm and auditor to Fidelity and certain Fidelity funds, has been engaged annually by the Board as part of the Board's assessment of Fidelity's profitability analysis. PwC's engagement includes the review and assessment of the methodologies used by Fidelity in determining the revenues and expenses attributable to Fidelity's mutual fund business, and completion of agreed-upon procedures in respect of the mathematical accuracy of the fund profitability information and its conformity to established allocation methodologies. After considering PwC's reports issued under the engagement and information provided by Fidelity, the Board concluded that while other allocation methods may also be reasonable, Fidelity's profitability methodologies are reasonable in all material respects.The Board also reviewed Fidelity's non-fund businesses and potential fall-out benefits related to the mutual fund business as well as cases where Fidelity's affiliates may benefit from or be related to the fund's business.The Board concluded that the costs of the services provided by and the profits realized by Fidelity in connection with the operation of the fund were not relevant to the renewal of the Advisory Contracts because the fund pays no advisory fees and FMR or an affiliate bears all expenses of the fund, with limited exceptions.Economies of Scale. The Board concluded that because the fund pays no advisory fees and FMR or an affiliate bears all expenses of the fund, with limited exceptions, economies of scale cannot be realized by the fund.Additional Information Requested by the Board. In order to develop fully the factual basis for consideration of the Fidelity funds' advisory contracts, the Board requested and received additional information on certain topics, including: (i) fund performance trends, in particular the underperformance of certain funds, and Fidelity's long-term strategies for certain funds; (ii) Fidelity's fund profitability methodology, profitability trends for certain funds, and the impact of certain factors on fund profitability results, including the impact of market trends on actively managed funds; (iii) the use of performance fees and the calculation of performance adjustments, including the impact of underperformance and fund outflows on performance adjustments; (iv) metrics for evaluating index fund performance; (v) Fidelity's group fee structure, including the group fee breakpoint schedules; (vi) the terms of Fidelity's contractual and voluntary expense cap arrangements with the funds; (vii) the methodology with respect to evaluating competitive fund data and peer group classifications and fee comparisons; (viii) the expense structures for different funds and classes; (ix) Fidelity's arrangements with affiliated sub-advisers on behalf of the funds; (x) information regarding other accounts managed by Fidelity, including institutional accounts and collective investment trusts; (xi) recent changes to the fee structure for certain funds of funds; and (xii) the impact of the Department of Labor's new fiduciary rule on the funds' comparative expense information.Based on its evaluation of all of the conclusions noted above, and after considering all factors it believed relevant, the Board concluded that the advisory fee structures are fair and reasonable, and that the fund's Advisory Contracts should be renewed.![]()
Corporate Headquarters
245 Summer St.
Boston, MA 02210
www.fidelity.com
AXS5-ANN-0118
1.967941.104
Fidelity Advisor® Small Cap Fund Class A, Class M (formerly Class T), Class C, Class I and Class Z Annual Report November 30, 2017 |
|
Contents
Board Approval of Investment Advisory Contracts and Management Fees |
To view a fund's proxy voting guidelines and proxy voting record for the 12-month period ended June 30, visit http://www.fidelity.com/proxyvotingresults or visit the Securities and Exchange Commission's (SEC) web site at http://www.sec.gov.
You may also call 1-877-208-0098 to request a free copy of the proxy voting guidelines.
Standard & Poor's, S&P and S&P 500 are registered service marks of The McGraw-Hill Companies, Inc. and have been licensed for use by Fidelity Distributors Corporation.
Other third-party marks appearing herein are the property of their respective owners.
All other marks appearing herein are registered or unregistered trademarks or service marks of FMR LLC or an affiliated company. © 2018 FMR LLC. All rights reserved.
This report and the financial statements contained herein are submitted for the general information of the shareholders of the Fund. This report is not authorized for distribution to prospective investors in the Fund unless preceded or accompanied by an effective prospectus.
A fund files its complete schedule of portfolio holdings with the SEC for the first and third quarters of each fiscal year on Form N-Q. Forms N-Q are available on the SEC’s web site at http://www.sec.gov. A fund's Forms N-Q may be reviewed and copied at the SEC’s Public Reference Room in Washington, DC. Information regarding the operation of the SEC's Public Reference Room may be obtained by calling 1-800-SEC-0330.
For a complete list of a fund's portfolio holdings, view the most recent holdings listing, semiannual report, or annual report on Fidelity's web site at http://www.fidelity.com, http://www.institutional.fidelity.com, or http://www.401k.com, as applicable.
NOT FDIC INSURED •MAY LOSE VALUE •NO BANK GUARANTEE
Neither the Fund nor Fidelity Distributors Corporation is a bank.
Performance: The Bottom Line
Average annual total return reflects the change in the value of an investment, assuming reinvestment of distributions from dividend income and capital gains (the profits earned upon the sale of securities that have grown in value, if any) and assuming a constant rate of performance each year. The hypothetical investment and the average annual total returns do not reflect the deduction of taxes that a shareholder would pay on fund distributions or the redemption of fund shares. During periods of reimbursement by Fidelity, a fund’s total return will be greater than it would be had the reimbursement not occurred. How a fund did yesterday is no guarantee of how it will do tomorrow.
Average Annual Total Returns
| For the periods ended November 30, 2017 | Past 1 year | Past 5 years | Past 10 years |
| Class A (incl. 5.75% sales charge) | 9.97% | 11.85% | 6.94% |
| Class M (incl. 3.50% sales charge) | 12.33% | 12.14% | 6.96% |
| Class C (incl. contingent deferred sales charge) | 14.80% | 12.33% | 6.76% |
| Class I | 17.01% | 13.50% | 7.88% |
| Class Z | 17.17% | 13.65% | 7.95% |
Class C shares' contingent deferred sales charges included in the past one year, past five years and past ten years total return figures are 1%, 0% and 0%, respectively.
The initial offering of Class Z shares took place on August 13, 2013. Returns prior to August 13, 2013, are those of Class I.
$10,000 Over 10 Years
Let's say hypothetically that $10,000 was invested in Fidelity Advisor® Small Cap Fund - Class A on November 30, 2007, and the current 5.75% sales charge was paid.
The chart shows how the value of your investment would have changed, and also shows how the Russell 2000® Index performed over the same period.
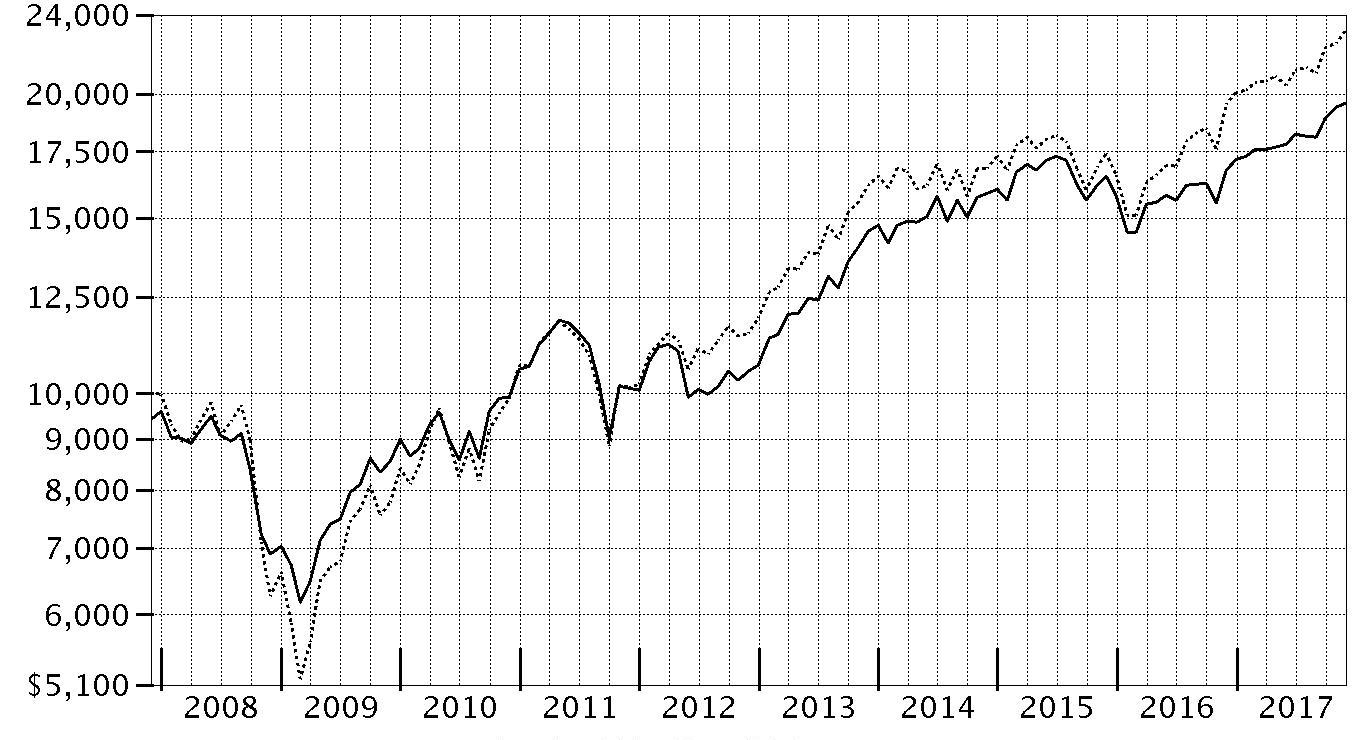
| Period Ending Values | ||
| $19,554 | Fidelity Advisor® Small Cap Fund - Class A | |
| $23,133 | Russell 2000® Index | |
Management's Discussion of Fund Performance
Market Recap: The U.S. equity bellwether S&P 500® index gained 22.87% for the year ending November 30, 2017, rising steadily and closing the period at an all-time high after a particularly strong three-month finish. Early on, equities rallied on optimism for President Trump’s pro-business agenda but leveled off in March amid fading optimism and stalled efforts by Congress to repeal and replace the Affordable Care Act. Upward momentum soon returned and continued through period end with consumer sentiment and other market indicators staying positive. The lone exception was a brief cooldown in August, when geopolitical tension escalated and uncertainty grew regarding the future of health care, tax reform and the debt ceiling. Sector-wise, info tech (+41%) led by a wide margin, surging amid strong earnings growth from several major index constituents. Utilities and financials each gained about 25%, the latter group riding an uptick in bond yields. Conversely, consumer discretionary (+20%) also rose solidly but lagged the broader market, as many brick-and-mortar retailers continued to suffer from increased online competition. Rising interest rates held back real estate (+16%), while consumer staples (+15%) and telecom (+1%) struggled due to investors’ general preference for risk assets. Lastly, sluggish oil prices pushed energy to a -4% return.Comments from Portfolio Manager James Harmon: For the fiscal year, the fund’s share classes (excluding sales charges, if applicable) gained about 16% to 17%, lagging the 18.34% result of the benchmark Russell 2000® Index. The biggest factor behind the fund's underperformance of the benchmark was security selection in health care. Here, our biggest individual detractors were Premier, a provider of health care group purchasing services, and pharmaceutical company Mallinckrodt. We sold Mallinckrodt, an out-of-benchmark name, in the second half of the period. Other detractors included a non-index stake in Hess Midstream Partners, an MLP focused on energy transportation, and J2 Global, a provider of cloud-computing services. On the positive side, the fund benefited most from stock picking in consumer discretionary and real estate. Within consumer discretionary, a position in Marriott Vacations World, one of the fund’s largest positions, contributed most, as the company continued to generate strong financial results. Other consumer discretionary contributors were out-of-benchmark positions in Polaris Industries, which makes power sports vehicles, and homebuilder NVR. Elsewhere, it helped to own Stamps.com, a provider of postage and delivery services and a large portfolio holding.Lastly, the fund's foreign investments contributed overall, aided in part by a generally weaker U.S. dollar.The views expressed above reflect those of the portfolio manager(s) only through the end of the period as stated on the cover of this report and do not necessarily represent the views of Fidelity or any other person in the Fidelity organization. Any such views are subject to change at any time based upon market or other conditions and Fidelity disclaims any responsibility to update such views. These views may not be relied on as investment advice and, because investment decisions for a Fidelity fund are based on numerous factors, may not be relied on as an indication of trading intent on behalf of any Fidelity fund.
Investment Summary (Unaudited)
Top Ten Stocks as of November 30, 2017
| % of fund's net assets | % of fund's net assets 6 months ago | |
| SYNNEX Corp. | 2.5 | 1.2 |
| MSC Industrial Direct Co., Inc. Class A | 2.4 | 0.0 |
| Stamps.com, Inc. | 2.3 | 2.3 |
| Marriott Vacations Worldwide Corp. | 2.2 | 3.1 |
| HealthSouth Corp. | 2.2 | 2.0 |
| Conduent, Inc. | 2.2 | 2.6 |
| B&G Foods, Inc. Class A | 2.0 | 0.0 |
| Bank of the Ozarks, Inc. | 2.0 | 1.9 |
| j2 Global, Inc. | 2.0 | 2.3 |
| CDW Corp. | 2.0 | 2.2 |
| 21.8 |
Top Five Market Sectors as of November 30, 2017
| % of fund's net assets | % of fund's net assets 6 months ago | |
| Information Technology | 18.2 | 21.9 |
| Financials | 17.4 | 14.8 |
| Industrials | 15.8 | 10.4 |
| Consumer Discretionary | 14.2 | 16.6 |
| Health Care | 13.3 | 9.5 |
Asset Allocation (% of fund's net assets)
| As of November 30, 2017 * | ||
| Stocks and Equity Futures | 99.3% | |
| Short-Term Investments and Net Other Assets (Liabilities) | 0.7% | |

* Foreign investments - 14.7%
| As of May 31, 2017 * | ||
| Stocks and Equity Futures | 99.3% | |
| Short-Term Investments and Net Other Assets (Liabilities) | 0.7% | |

* Foreign investments - 16.3%
Percentages shown as 0.0% may reflect amounts less than 0.05%.
Investments November 30, 2017
Showing Percentage of Net Assets
| Common Stocks - 96.4% | |||
| Shares | Value (000s) | ||
| CONSUMER DISCRETIONARY - 14.2% | |||
| Auto Components - 2.0% | |||
| Dorman Products, Inc. (a) | 450,000 | $30,740 | |
| Standard Motor Products, Inc. | 500,000 | 22,605 | |
| 53,345 | |||
| Diversified Consumer Services - 1.1% | |||
| Grand Canyon Education, Inc. (a) | 300,000 | 28,488 | |
| Hotels, Restaurants & Leisure - 3.8% | |||
| Hilton Grand Vacations, Inc. | 1,035,713 | 41,397 | |
| Marriott Vacations Worldwide Corp. | 430,000 | 57,728 | |
| 99,125 | |||
| Household Durables - 3.6% | |||
| NVR, Inc. (a) | 8,000 | 27,800 | |
| PulteGroup, Inc. | 850,000 | 29,011 | |
| TopBuild Corp. (a) | 550,000 | 37,395 | |
| 94,206 | |||
| Leisure Products - 1.9% | |||
| Polaris Industries, Inc. (b) | 400,000 | 50,804 | |
| Media - 0.9% | |||
| AMC Networks, Inc. Class A (a) | 300,000 | 15,462 | |
| Sinclair Broadcast Group, Inc. Class A (b) | 277,900 | 9,462 | |
| 24,924 | |||
| Specialty Retail - 0.4% | |||
| Signet Jewelers Ltd. (b) | 200,000 | 10,458 | |
| Textiles, Apparel & Luxury Goods - 0.5% | |||
| G-III Apparel Group Ltd. (a) | 400,000 | 12,320 | |
| TOTAL CONSUMER DISCRETIONARY | 373,670 | ||
| CONSUMER STAPLES - 5.1% | |||
| Food & Staples Retailing - 1.2% | |||
| Sundrug Co. Ltd. | 320,000 | 14,755 | |
| Tsuruha Holdings, Inc. | 110,000 | 15,203 | |
| 29,958 | |||
| Food Products - 3.9% | |||
| B&G Foods, Inc. Class A (b) | 1,400,000 | 54,180 | |
| The Hain Celestial Group, Inc. (a) | 1,200,000 | 49,320 | |
| 103,500 | |||
| TOTAL CONSUMER STAPLES | 133,458 | ||
| ENERGY - 2.8% | |||
| Energy Equipment & Services - 1.1% | |||
| Hess Midstream Partners LP (c) | 1,420,848 | 30,037 | |
| Oil, Gas & Consumable Fuels - 1.7% | |||
| Noble Midstream Partners LP | 647,933 | 32,040 | |
| Noble Midstream Partners LP (d) | 252,067 | 12,465 | |
| 44,505 | |||
| TOTAL ENERGY | 74,542 | ||
| FINANCIALS - 17.4% | |||
| Banks - 11.5% | |||
| Allegiance Bancshares, Inc. (a)(c) | 1,004,020 | 40,010 | |
| Bank of Hawaii Corp. | 250,000 | 21,220 | |
| Bank of the Ozarks, Inc. | 1,110,000 | 53,524 | |
| ConnectOne Bancorp, Inc. | 1,400,000 | 38,010 | |
| German American Bancorp, Inc. | 713,406 | 26,831 | |
| Great Western Bancorp, Inc. | 774,419 | 31,999 | |
| Home Bancshares, Inc. | 1,824,626 | 43,426 | |
| ServisFirst Bancshares, Inc. | 624,958 | 26,242 | |
| Signature Bank (a) | 150,000 | 20,592 | |
| 301,854 | |||
| Capital Markets - 1.6% | |||
| LPL Financial | 800,000 | 41,472 | |
| Insurance - 2.9% | |||
| Enstar Group Ltd. (a) | 130,000 | 28,815 | |
| Hastings Group Holdings PLC (e) | 6,753,539 | 28,670 | |
| James River Group Holdings Ltd. | 501,889 | 20,316 | |
| 77,801 | |||
| Thrifts & Mortgage Finance - 1.4% | |||
| Essent Group Ltd. (a) | 818,423 | 36,215 | |
| TOTAL FINANCIALS | 457,342 | ||
| HEALTH CARE - 13.3% | |||
| Biotechnology - 1.0% | |||
| Bioverativ, Inc. | 500,000 | 25,010 | |
| Health Care Equipment & Supplies - 1.8% | |||
| LivaNova PLC (a) | 529,900 | 46,197 | |
| Health Care Providers & Services - 7.0% | |||
| AMN Healthcare Services, Inc. (a) | 400,000 | 20,080 | |
| HealthSouth Corp. | 1,150,000 | 57,443 | |
| MEDNAX, Inc. (a) | 700,000 | 34,853 | |
| Owens & Minor, Inc. | 1,200,000 | 22,968 | |
| Premier, Inc. (a) | 1,600,300 | 46,441 | |
| Sigma Healthcare Ltd. | 3,922,453 | 2,344 | |
| 184,129 | |||
| Life Sciences Tools & Services - 3.5% | |||
| Charles River Laboratories International, Inc. (a) | 500,000 | 52,100 | |
| ICON PLC (a) | 350,000 | 40,884 | |
| 92,984 | |||
| TOTAL HEALTH CARE | 348,320 | ||
| INDUSTRIALS - 15.8% | |||
| Building Products - 1.9% | |||
| Apogee Enterprises, Inc. | 600,000 | 30,018 | |
| GMS, Inc. (a) | 550,000 | 20,521 | |
| 50,539 | |||
| Commercial Services & Supplies - 0.5% | |||
| Coor Service Management Holding AB | 1,535,502 | 12,198 | |
| Construction & Engineering - 2.7% | |||
| Argan, Inc. | 500,000 | 29,500 | |
| EMCOR Group, Inc. | 500,000 | 40,385 | |
| 69,885 | |||
| Electrical Equipment - 2.1% | |||
| Generac Holdings, Inc. (a) | 1,050,000 | 51,629 | |
| Hamilton Beach Brands Holding Co. Class A | 84,119 | 2,404 | |
| 54,033 | |||
| Machinery - 1.3% | |||
| AGCO Corp. | 350,000 | 24,773 | |
| Hy-Lok Corp. | 468,708 | 10,578 | |
| 35,351 | |||
| Professional Services - 3.1% | |||
| ICF International, Inc. (a) | 584,379 | 31,586 | |
| On Assignment, Inc. (a) | 780,000 | 49,889 | |
| 81,475 | |||
| Trading Companies & Distributors - 4.2% | |||
| MSC Industrial Direct Co., Inc. Class A | 700,000 | 63,049 | |
| Univar, Inc. (a) | 1,600,000 | 47,136 | |
| 110,185 | |||
| TOTAL INDUSTRIALS | 413,666 | ||
| INFORMATION TECHNOLOGY - 18.2% | |||
| Electronic Equipment & Components - 5.7% | |||
| CDW Corp. | 750,000 | 52,508 | |
| ePlus, Inc. (a) | 369,489 | 30,003 | |
| SYNNEX Corp. | 490,000 | 66,733 | |
| 149,244 | |||
| Internet Software & Services - 4.3% | |||
| j2 Global, Inc. | 700,000 | 52,822 | |
| Stamps.com, Inc. (a) | 350,309 | 58,992 | |
| 111,814 | |||
| IT Services - 6.6% | |||
| Booz Allen Hamilton Holding Corp. Class A | 650,000 | 25,149 | |
| Conduent, Inc. | 3,750,000 | 57,225 | |
| ExlService Holdings, Inc. (a) | 146,411 | 8,987 | |
| Genpact Ltd. | 1,000,000 | 32,240 | |
| Global Payments, Inc. | 330,000 | 33,185 | |
| Syntel, Inc. (a) | 700,000 | 17,927 | |
| 174,713 | |||
| Semiconductors & Semiconductor Equipment - 1.0% | |||
| Versum Materials, Inc. | 700,000 | 26,880 | |
| Software - 0.4% | |||
| Zensar Technologies Ltd. | 868,049 | 11,504 | |
| Technology Hardware, Storage & Peripherals - 0.2% | |||
| NCR Corp. (a) | 150,000 | 4,694 | |
| TOTAL INFORMATION TECHNOLOGY | 478,849 | ||
| MATERIALS - 3.2% | |||
| Chemicals - 1.1% | |||
| Valvoline, Inc. | 1,150,000 | 28,359 | |
| Containers & Packaging - 1.3% | |||
| Berry Global Group, Inc. (a) | 570,000 | 34,069 | |
| Paper & Forest Products - 0.8% | |||
| Neenah Paper, Inc. | 241,400 | 21,581 | |
| TOTAL MATERIALS | 84,009 | ||
| REAL ESTATE - 4.2% | |||
| Real Estate Management & Development - 4.2% | |||
| CBRE Group, Inc. (a) | 1,150,000 | 49,864 | |
| Daito Trust Construction Co. Ltd. | 145,000 | 26,543 | |
| Relo Holdings Corp. | 1,261,500 | 33,638 | |
| 110,045 | |||
| UTILITIES - 2.2% | |||
| Gas Utilities - 1.6% | |||
| Amerigas Partners LP | 530,000 | 23,792 | |
| Star Gas Partners LP | 1,777,068 | 18,339 | |
| 42,131 | |||
| Multi-Utilities - 0.6% | |||
| Telecom Plus PLC | 1,000,000 | 16,094 | |
| TOTAL UTILITIES | 58,225 | ||
| TOTAL COMMON STOCKS | |||
| (Cost $1,983,134) | 2,532,126 | ||
| Principal Amount (000s) | Value (000s) | ||
| U.S. Treasury Obligations - 0.2% | |||
| U.S. Treasury Bills, yield at date of purchase 1.01% to 1.23% 12/14/17 to 2/15/18 (f) | |||
| (Cost $6,018) | 6,030 | 6,018 | |
| Shares | Value (000s) | ||
| Money Market Funds - 6.9% | |||
| Fidelity Cash Central Fund, 1.13% (g) | 100,925,891 | $100,946 | |
| Fidelity Securities Lending Cash Central Fund 1.13% (g)(h) | 81,314,652 | 81,323 | |
| TOTAL MONEY MARKET FUNDS | |||
| (Cost $182,269) | 182,269 | ||
| TOTAL INVESTMENT IN SECURITIES - 103.5% | |||
| (Cost $2,171,421) | 2,720,413 | ||
| NET OTHER ASSETS (LIABILITIES) - (3.5)% | (92,977) | ||
| NET ASSETS - 100% | $2,627,436 |
| Futures Contracts | |||||
| Number of contracts | Expiration Date | Notional Amount (000s) | Value (000s) | Unrealized Appreciation/(Depreciation) (000s) | |
| Purchased | |||||
| Equity Index Contracts | |||||
| CME E-mini Russell 2000 Index Contracts (United States) | 984 | Dec. 2017 | $76,034 | $3,458 | $3,458 |
The notional amount of futures purchased as a percentage of Net Assets is 2.9%
Legend
(a) Non-income producing
(b) Security or a portion of the security is on loan at period end.
(c) Affiliated company
(d) Restricted securities - Investment in securities not registered under the Securities Act of 1933 (excluding 144A issues). At the end of the period, the value of restricted securities (excluding 144A issues) amounted to $12,465,000 or 0.5% of net assets.
(e) Security exempt from registration under Rule 144A of the Securities Act of 1933. These securities may be resold in transactions exempt from registration, normally to qualified institutional buyers. At the end of the period, the value of these securities amounted to $28,670,000 or 1.1% of net assets.
(f) Security or a portion of the security was pledged to cover margin requirements for futures contracts. At period end, the value of securities pledged amounted to $3,566,000.
(g) Affiliated fund that is generally available only to investment companies and other accounts managed by Fidelity Investments. The rate quoted is the annualized seven-day yield of the fund at period end. A complete unaudited listing of the fund's holdings as of its most recent quarter end is available upon request. In addition, each Fidelity Central Fund's financial statements, which are not covered by the Fund's Report of Independent Registered Public Accounting Firm, are available on the SEC's website or upon request.
(h) Investment made with cash collateral received from securities on loan.
Additional information on each restricted holding is as follows:
| Security | Acquisition Date | Acquisition Cost (000s) |
| Noble Midstream Partners LP | 6/21/17 | $10,196 |
Affiliated Central Funds
Information regarding fiscal year to date income earned by the Fund from investments in Fidelity Central Funds is as follows:
| Fund | Income earned |
| (Amounts in thousands) | |
| Fidelity Cash Central Fund | $1,162 |
| Fidelity Securities Lending Cash Central Fund | 1,125 |
| Total | $2,287 |
Other Affiliated Issuers
An affiliated company is a company in which the Fund has ownership of at least 5% of the voting securities. Fiscal year to date transactions with companies which are or were affiliates are as follows:
| Affiliate (Amounts in thousands) | Value, beginning of period | Purchases | Sales Proceeds | Dividend Income | Realized Gain (loss) | Change in Unrealized appreciation (depreciation) | Value, end of period |
| Allegiance Bancshares, Inc. | $11,016 | $24,885 | $-- | $-- | $-- | $4,109 | $40,010 |
| Hess Midstream Partners LP | -- | 47,425 | 8,317 | 826 | (3,085) | (5,986) | 30,037 |
| Tsukada Global Holdings, Inc. | 17,683 | -- | 14,880 | 151 | 1,777 | (4,580) | -- |
| Total | $28,699 | $72,310 | $23,197 | $977 | $(1,308) | $(6,457) | $70,047 |
Investment Valuation
The following is a summary of the inputs used, as of November 30, 2017, involving the Fund's assets and liabilities carried at fair value. The inputs or methodology used for valuing securities may not be an indication of the risk associated with investing in those securities. For more information on valuation inputs, and their aggregation into the levels used below, please refer to the Investment Valuation section in the accompanying Notes to Financial Statements.
| Valuation Inputs at Reporting Date: | ||||
| Description | Total | Level 1 | Level 2 | Level 3 |
| (Amounts in thousands) | ||||
| Investments in Securities: | ||||
| Equities: | ||||
| Consumer Discretionary | $373,670 | $373,670 | $-- | $-- |
| Consumer Staples | 133,458 | 103,500 | 29,958 | -- |
| Energy | 74,542 | 74,542 | -- | -- |
| Financials | 457,342 | 457,342 | -- | -- |
| Health Care | 348,320 | 348,320 | -- | -- |
| Industrials | 413,666 | 413,666 | -- | -- |
| Information Technology | 478,849 | 478,849 | -- | -- |
| Materials | 84,009 | 84,009 | -- | -- |
| Real Estate | 110,045 | 49,864 | 60,181 | -- |
| Utilities | 58,225 | 58,225 | -- | -- |
| U.S. Government and Government Agency Obligations | 6,018 | -- | 6,018 | -- |
| Money Market Funds | 182,269 | 182,269 | -- | -- |
| Total Investments in Securities: | $2,720,413 | $2,624,256 | $96,157 | $-- |
| Derivative Instruments: | ||||
| Assets | ||||
| Futures Contracts | $3,458 | $3,458 | $-- | $-- |
| Total Assets | $3,458 | $3,458 | $-- | $-- |
| Total Derivative Instruments: | $3,458 | $3,458 | $-- | $-- |
The following is a summary of transfers between Level 1 and Level 2 for the period ended November 30, 2017. Transfers are assumed to have occurred at the beginning of the period, and are primarily attributable to the valuation techniques used for foreign equity securities, as discussed in the accompanying Notes to Financial Statements:
| Transfers | Total (000s) |
| Level 1 to Level 2 | $0 |
| Level 2 to Level 1 | $31,533 |
Value of Derivative Instruments
The following table is a summary of the Fund's value of derivative instruments by primary risk exposure as of November 30, 2017. For additional information on derivative instruments, please refer to the Derivative Instruments section in the accompanying Notes to Financial Statements.
| Primary Risk Exposure / Derivative Type | Value | |
| Asset | Liability | |
| (Amounts in thousands) | ||
| Equity Risk | ||
| Futures Contracts(a) | $3,458 | $0 |
| Total Equity Risk | 3,458 | 0 |
| Total Value of Derivatives | $3,458 | $0 |
(a) Reflects gross cumulative appreciation (depreciation) on futures contracts as presented in the Schedule of Investments. In the Statement of Assets and Liabilities, the period end daily variation margin is included in receivable or payable for daily variation margin on futures contracts, and the net cumulative appreciation (depreciation) is included in net unrealized appreciation (depreciation).
Other Information
Distribution of investments by country or territory of incorporation, as a percentage of Total Net Assets, is as follows (Unaudited):
| United States of America | 85.3% |
| Bermuda | 4.8% |
| United Kingdom | 3.5% |
| Japan | 3.5% |
| Ireland | 1.5% |
| Others (Individually Less Than 1%) | 1.4% |
| 100.0% |
See accompanying notes which are an integral part of the financial statements.
Financial Statements
Statement of Assets and Liabilities
| Amounts in thousands (except per-share amounts) | November 30, 2017 | |
| Assets | ||
| Investment in securities, at value (including securities loaned of $78,807) — See accompanying schedule: Unaffiliated issuers (cost $1,919,824) | $2,468,097 | |
| Fidelity Central Funds (cost $182,269) | 182,269 | |
| Other affiliated issuers (cost $69,328) | 70,047 | |
| Total Investment in Securities (cost $2,171,421) | $2,720,413 | |
| Cash | 546 | |
| Receivable for investments sold | 2,694 | |
| Receivable for fund shares sold | 1,105 | |
| Dividends receivable | 1,873 | |
| Distributions receivable from Fidelity Central Funds | 240 | |
| Receivable for daily variation margin on futures contracts | 222 | |
| Prepaid expenses | 5 | |
| Other receivables | 41 | |
| Total assets | 2,727,139 | |
| Liabilities | ||
| Payable for investments purchased | $12,430 | |
| Payable for fund shares redeemed | 3,707 | |
| Accrued management fee | 1,025 | |
| Distribution and service plan fees payable | 690 | |
| Other affiliated payables | 490 | |
| Other payables and accrued expenses | 53 | |
| Collateral on securities loaned | 81,308 | |
| Total liabilities | 99,703 | |
| Net Assets | $2,627,436 | |
| Net Assets consist of: | ||
| Paid in capital | $1,753,203 | |
| Distributions in excess of net investment income | (5,726) | |
| Accumulated undistributed net realized gain (loss) on investments and foreign currency transactions | 327,499 | |
| Net unrealized appreciation (depreciation) on investments and assets and liabilities in foreign currencies | 552,460 | |
| Net Assets | $2,627,436 | |
| Calculation of Maximum Offering Price | ||
| Class A: | ||
| Net Asset Value and redemption price per share ($804,872 ÷ 27,422.1 shares) | $29.35 | |
| Maximum offering price per share (100/94.25 of $29.35) | $31.14 | |
| Class M: | ||
| Net Asset Value and redemption price per share ($733,794 ÷ 26,755.2 shares) | $27.43 | |
| Maximum offering price per share (100/96.50 of $27.43) | $28.42 | |
| Class C: | ||
| Net Asset Value and offering price per share ($273,444 ÷ 11,876.6 shares)(a) | $23.02 | |
| Class I: | ||
| Net Asset Value, offering price and redemption price per share ($758,399 ÷ 23,819.8 shares) | $31.84 | |
| Class Z: | ||
| Net Asset Value, offering price and redemption price per share ($56,927 ÷ 1,789.4 shares) | $31.81 |
(a) Redemption price per share is equal to net asset value less any applicable contingent deferred sales charge.
See accompanying notes which are an integral part of the financial statements.
Statement of Operations
| Amounts in thousands | Year ended November 30, 2017 | |
| Investment Income | ||
| Dividends (including $977 earned from other affiliated issuers) | $27,305 | |
| Interest | 51 | |
| Income from Fidelity Central Funds | 2,287 | |
| Total income | 29,643 | |
| Expenses | ||
| Management fee | ||
| Basic fee | $18,165 | |
| Performance adjustment | (4,027) | |
| Transfer agent fees | 5,223 | |
| Distribution and service plan fees | 8,543 | |
| Accounting and security lending fees | 790 | |
| Custodian fees and expenses | 94 | |
| Independent trustees' fees and expenses | 10 | |
| Registration fees | 115 | |
| Audit | 75 | |
| Legal | 7 | |
| Miscellaneous | 21 | |
| Total expenses before reductions | 29,016 | |
| Expense reductions | (259) | 28,757 |
| Net investment income (loss) | 886 | |
| Realized and Unrealized Gain (Loss) | ||
| Net realized gain (loss) on: | ||
| Investment securities: | ||
| Unaffiliated issuers | 363,239 | |
| Fidelity Central Funds | 13 | |
| Other affiliated issuers | (1,308) | |
| Foreign currency transactions | 68 | |
| Futures contracts | 19,273 | |
| Total net realized gain (loss) | 381,285 | |
| Change in net unrealized appreciation (depreciation) on: | ||
| Investment securities: | ||
| Unaffiliated issuers | 28,938 | |
| Fidelity Central Funds | (14) | |
| Other affiliated issuers | (6,457) | |
| Assets and liabilities in foreign currencies | 103 | |
| Futures contracts | (3,137) | |
| Total change in net unrealized appreciation (depreciation) | $19,433 | |
| Net gain (loss) | 400,718 | |
| Net increase (decrease) in net assets resulting from operations | $401,604 |
See accompanying notes which are an integral part of the financial statements.
Statement of Changes in Net Assets
| Amounts in thousands | Year ended November 30, 2017 | Year ended November 30, 2016 |
| Increase (Decrease) in Net Assets | ||
| Operations | ||
| Net investment income (loss) | $886 | $11,777 |
| Net realized gain (loss) | 381,285 | 29,088 |
| Change in net unrealized appreciation (depreciation) | 19,433 | (27,109) |
| Net increase (decrease) in net assets resulting from operations | 401,604 | 13,756 |
| Distributions to shareholders from net investment income | (7,493) | – |
| Distributions to shareholders from net realized gain | (31,569) | (249,036) |
| Total distributions | (39,062) | (249,036) |
| Share transactions - net increase (decrease) | (393,358) | (125,212) |
| Total increase (decrease) in net assets | (30,816) | (360,492) |
| Net Assets | ||
| Beginning of period | 2,658,252 | 3,018,744 |
| End of period | $2,627,436 | $2,658,252 |
| Other Information | ||
| Undistributed net investment income end of period | $– | $5,060 |
| Distributions in excess of net investment income end of period | $(5,726) | $– |
See accompanying notes which are an integral part of the financial statements.
Financial Highlights
Fidelity Advisor Small Cap Fund Class A
| Years ended November 30, | 2017 | 2016 | 2015 | 2014 | 2013 |
| Selected Per–Share Data | |||||
| Net asset value, beginning of period | $25.52 | $27.56 | $29.85 | $30.96 | $22.45 |
| Income from Investment Operations | |||||
| Net investment income (loss)A | .03 | .12B | .02C | .04 | .12D |
| Net realized and unrealized gain (loss) | 4.18 | .05 | 1.10 | 2.36 | 8.45 |
| Total from investment operations | 4.21 | .17 | 1.12 | 2.40 | 8.57 |
| Distributions from net investment income | (.08) | – | – | (.01) | (.05) |
| Distributions from net realized gain | (.30) | (2.21) | (3.41) | (3.50) | (.01) |
| Total distributions | (.38) | (2.21) | (3.41) | (3.51) | (.06) |
| Net asset value, end of period | $29.35 | $25.52 | $27.56 | $29.85 | $30.96 |
| Total ReturnE,F | 16.68% | 1.31% | 4.17% | 9.06% | 38.30% |
| Ratios to Average Net AssetsG,H | |||||
| Expenses before reductions | 1.05% | 1.32% | 1.26% | .98% | 1.01% |
| Expenses net of fee waivers, if any | 1.05% | 1.32% | 1.26% | .98% | 1.01% |
| Expenses net of all reductions | 1.04% | 1.31% | 1.25% | .97% | 1.00% |
| Net investment income (loss) | .10% | .52%B | .07%C | .14% | .46%D |
| Supplemental Data | |||||
| Net assets, end of period (in millions) | $805 | $932 | $1,047 | $1,097 | $1,263 |
| Portfolio turnover rateI | 84% | 81% | 33% | 39% | 34% |
A Calculated based on average shares outstanding during the period.
B Net Investment income per share reflects a large, non-recurring dividend which amounted to $.11 per share. Excluding this non-recurring dividend, the ratio of net investment income (loss) to average net assets would have been .07%.
C Net Investment income per share reflects a large, non-recurring dividend which amounted to $.06 per share. Excluding this non-recurring dividend, the ratio of net investment income (loss) to average net assets would have been (.16) %.
D Net Investment income per share reflects a large, non-recurring dividend which amounted to $.04 per share. Excluding this non-recurring dividend, the ratio of net investment income (loss) to average net assets would have been .29%.
E Total returns would have been lower if certain expenses had not been reduced during the applicable periods shown.
F Total returns do not include the effect of the sales charges.
G Fees and expenses of any underlying Fidelity Central Funds are not included in the Fund's expense ratio. The Fund indirectly bears its proportionate share of the expenses of any underlying Fidelity Central Funds.
H Expense ratios reflect operating expenses of the class. Expenses before reductions do not reflect amounts reimbursed by the investment adviser or reductions from brokerage service arrangements or reductions from other expense offset arrangements and do not represent the amount paid by the class during periods when reimbursements or reductions occur. Expenses net of fee waivers reflect expenses after reimbursement by the investment adviser but prior to reductions from brokerage service arrangements or other expense offset arrangements. Expenses net of all reductions represent the net expenses paid by the class.
I Amount does not include the portfolio activity of any underlying Fidelity Central Funds.
See accompanying notes which are an integral part of the financial statements.
Fidelity Advisor Small Cap Fund Class M
| Years ended November 30, | 2017 | 2016 | 2015 | 2014 | 2013 |
| Selected Per–Share Data | |||||
| Net asset value, beginning of period | $23.88 | $25.99 | $28.40 | $29.69 | $21.52 |
| Income from Investment Operations | |||||
| Net investment income (loss)A | (.03) | .07B | (.04)C | (.02) | .06D |
| Net realized and unrealized gain (loss) | 3.91 | .03 | 1.04 | 2.23 | 8.13 |
| Total from investment operations | 3.88 | .10 | 1.00 | 2.21 | 8.19 |
| Distributions from net investment income | (.03) | – | – | – | (.01) |
| Distributions from net realized gain | (.30) | (2.21) | (3.41) | (3.50) | (.01) |
| Total distributions | (.33) | (2.21) | (3.41) | (3.50) | (.02) |
| Net asset value, end of period | $27.43 | $23.88 | $25.99 | $28.40 | $29.69 |
| Total ReturnE,F | 16.41% | 1.10% | 3.93% | 8.79% | 38.11% |
| Ratios to Average Net AssetsG,H | |||||
| Expenses before reductions | 1.28% | 1.54% | 1.49% | 1.20% | 1.22% |
| Expenses net of fee waivers, if any | 1.28% | 1.54% | 1.49% | 1.20% | 1.22% |
| Expenses net of all reductions | 1.27% | 1.54% | 1.49% | 1.20% | 1.21% |
| Net investment income (loss) | (.13)% | .29%B | (.16)%C | (.08)% | .25%D |
| Supplemental Data | |||||
| Net assets, end of period (in millions) | $734 | $756 | $888 | $958 | $1,113 |
| Portfolio turnover rateI | 84% | 81% | 33% | 39% | 34% |
A Calculated based on average shares outstanding during the period.
B Net Investment income per share reflects a large, non-recurring dividend which amounted to $.10 per share. Excluding this non-recurring dividend, the ratio of net investment income (loss) to average net assets would have been (.16) %.
C Net Investment income per share reflects a large, non-recurring dividend which amounted to $.06 per share. Excluding this non-recurring dividend, the ratio of net investment income (loss) to average net assets would have been (.39) %.
D Net Investment income per share reflects a large, non-recurring dividend which amounted to $.04 per share. Excluding this non-recurring dividend, the ratio of net investment income (loss) to average net assets would have been .09%.
E Total returns would have been lower if certain expenses had not been reduced during the applicable periods shown.
F Total returns do not include the effect of the sales charges.
G Fees and expenses of any underlying Fidelity Central Funds are not included in the Fund's expense ratio. The Fund indirectly bears its proportionate share of the expenses of any underlying Fidelity Central Funds.
H Expense ratios reflect operating expenses of the class. Expenses before reductions do not reflect amounts reimbursed by the investment adviser or reductions from brokerage service arrangements or reductions from other expense offset arrangements and do not represent the amount paid by the class during periods when reimbursements or reductions occur. Expenses net of fee waivers reflect expenses after reimbursement by the investment adviser but prior to reductions from brokerage service arrangements or other expense offset arrangements. Expenses net of all reductions represent the net expenses paid by the class.
I Amount does not include the portfolio activity of any underlying Fidelity Central Funds.
See accompanying notes which are an integral part of the financial statements.
Fidelity Advisor Small Cap Fund Class C
| Years ended November 30, | 2017 | 2016 | 2015 | 2014 | 2013 |
| Selected Per–Share Data | |||||
| Net asset value, beginning of period | $20.17 | $22.44 | $25.10 | $26.77 | $19.50 |
| Income from Investment Operations | |||||
| Net investment income (loss)A | (.14) | (.05)B | (.16)C | (.15) | (.07)D |
| Net realized and unrealized gain (loss) | 3.29 | (.01)E | .91 | 1.98 | 7.34 |
| Total from investment operations | 3.15 | (.06) | .75 | 1.83 | 7.27 |
| Distributions from net realized gain | (.30) | (2.21) | (3.41) | (3.50) | – |
| Total distributions | (.30) | (2.21) | (3.41) | (3.50) | – |
| Net asset value, end of period | $23.02 | $20.17 | $22.44 | $25.10 | $26.77 |
| Total ReturnF,G | 15.80% | .50% | 3.38% | 8.26% | 37.28% |
| Ratios to Average Net AssetsH,I | |||||
| Expenses before reductions | 1.81% | 2.08% | 2.02% | 1.73% | 1.76% |
| Expenses net of fee waivers, if any | 1.81% | 2.08% | 2.02% | 1.73% | 1.76% |
| Expenses net of all reductions | 1.80% | 2.07% | 2.01% | 1.73% | 1.75% |
| Net investment income (loss) | (.66)% | (.24)%B | (.69)%C | (.62)% | (.29)%D |
| Supplemental Data | |||||
| Net assets, end of period (in millions) | $273 | $274 | $318 | $317 | $334 |
| Portfolio turnover rateJ | 84% | 81% | 33% | 39% | 34% |
A Calculated based on average shares outstanding during the period.
B Net Investment income per share reflects a large, non-recurring dividend which amounted to $.08 per share. Excluding this non-recurring dividend, the ratio of net investment income (loss) to average net assets would have been (.69) %.
C Net Investment income per share reflects a large, non-recurring dividend which amounted to $.05 per share. Excluding this non-recurring dividend, the ratio of net investment income (loss) to average net assets would have been (.91) %.
D Net Investment income per share reflects a large, non-recurring dividend which amounted to $.04 per share. Excluding this non-recurring dividend, the ratio of net investment income (loss) to average net assets would have been (.45) %.
E The amount shown for a share outstanding does not correspond with the aggregate net gain (loss) on investments for the period due to the timing of sales and repurchases of shares in relation to fluctuating market values of the investments of the Fund.
F Total returns would have been lower if certain expenses had not been reduced during the applicable periods shown.
G Total returns do not include the effect of the contingent deferred sales charge.
H Fees and expenses of any underlying Fidelity Central Funds are not included in the Fund's expense ratio. The Fund indirectly bears its proportionate share of the expenses of any underlying Fidelity Central Funds.
I Expense ratios reflect operating expenses of the class. Expenses before reductions do not reflect amounts reimbursed by the investment adviser or reductions from brokerage service arrangements or reductions from other expense offset arrangements and do not represent the amount paid by the class during periods when reimbursements or reductions occur. Expenses net of fee waivers reflect expenses after reimbursement by the investment adviser but prior to reductions from brokerage service arrangements or other expense offset arrangements. Expenses net of all reductions represent the net expenses paid by the class.
J Amount does not include the portfolio activity of any underlying Fidelity Central Funds.
See accompanying notes which are an integral part of the financial statements.
Fidelity Advisor Small Cap Fund Class I
| Years ended November 30, | 2017 | 2016 | 2015 | 2014 | 2013 |
| Selected Per–Share Data | |||||
| Net asset value, beginning of period | $27.65 | $29.59 | $31.80 | $32.73 | $23.73 |
| Income from Investment Operations | |||||
| Net investment income (loss)A | .11 | .20B | .10C | .13 | .21D |
| Net realized and unrealized gain (loss) | 4.54 | .07 | 1.18 | 2.50 | 8.94 |
| Total from investment operations | 4.65 | .27 | 1.28 | 2.63 | 9.15 |
| Distributions from net investment income | (.15) | – | (.08) | (.06) | (.13) |
| Distributions from net realized gain | (.30) | (2.21) | (3.41) | (3.50) | (.01) |
| Total distributions | (.46)E | (2.21) | (3.49) | (3.56) | (.15)F |
| Net asset value, end of period | $31.84 | $27.65 | $29.59 | $31.80 | $32.73 |
| Total ReturnG | 17.01% | 1.58% | 4.46% | 9.33% | 38.79% |
| Ratios to Average Net AssetsH,I | |||||
| Expenses before reductions | .78% | 1.05% | .99% | .70% | .71% |
| Expenses net of fee waivers, if any | .78% | 1.04% | .99% | .70% | .71% |
| Expenses net of all reductions | .77% | 1.04% | .99% | .70% | .70% |
| Net investment income (loss) | .37% | .79%B | .34%C | .41% | .76%D |
| Supplemental Data | |||||
| Net assets, end of period (in millions) | $758 | $652 | $704 | $627 | $718 |
| Portfolio turnover rateJ | 84% | 81% | 33% | 39% | 34% |
A Calculated based on average shares outstanding during the period.
B Net Investment income per share reflects a large, non-recurring dividend which amounted to $.12 per share. Excluding this non-recurring dividend, the ratio of net investment income (loss) to average net assets would have been .34%.
C Net Investment income per share reflects a large, non-recurring dividend which amounted to $.07 per share. Excluding this non-recurring dividend, the ratio of net investment income (loss) to average net assets would have been .11%.
D Net Investment income per share reflects a large, non-recurring dividend which amounted to $.05 per share. Excluding this non-recurring dividend, the ratio of net investment income (loss) to average net assets would have been .59%.
E Total distributions of $.46 per share is comprised of distributions from net investment income of $.152 and distributions from net realized gain of $.304 per share.
F Total distributions of $.15 per share is comprised of distributions from net investment income of $.133 and distributions from net realized gain of $.014 per share.
G Total returns would have been lower if certain expenses had not been reduced during the applicable periods shown.
H Fees and expenses of any underlying Fidelity Central Funds are not included in the Fund's expense ratio. The Fund indirectly bears its proportionate share of the expenses of any underlying Fidelity Central Funds.
I Expense ratios reflect operating expenses of the class. Expenses before reductions do not reflect amounts reimbursed by the investment adviser or reductions from brokerage service arrangements or reductions from other expense offset arrangements and do not represent the amount paid by the class during periods when reimbursements or reductions occur. Expenses net of fee waivers reflect expenses after reimbursement by the investment adviser but prior to reductions from brokerage service arrangements or other expense offset arrangements. Expenses net of all reductions represent the net expenses paid by the class.
J Amount does not include the portfolio activity of any underlying Fidelity Central Funds.
See accompanying notes which are an integral part of the financial statements.
Fidelity Advisor Small Cap Fund Class Z
| Years ended November 30, | 2017 | 2016 | 2015 | 2014 | 2013 A |
| Selected Per–Share Data | |||||
| Net asset value, beginning of period | $27.63 | $29.53 | $31.76 | $32.74 | $29.79 |
| Income from Investment Operations | |||||
| Net investment income (loss)B | .15 | .24C | .14D | .17 | .02E |
| Net realized and unrealized gain (loss) | 4.53 | .07 | 1.17 | 2.51 | 2.93 |
| Total from investment operations | 4.68 | .31 | 1.31 | 2.68 | 2.95 |
| Distributions from net investment income | (.20) | – | (.14) | (.16) | – |
| Distributions from net realized gain | (.30) | (2.21) | (3.41) | (3.50) | – |
| Total distributions | (.50) | (2.21) | (3.54)F | (3.66) | – |
| Net asset value, end of period | $31.81 | $27.63 | $29.53 | $31.76 | $32.74 |
| Total ReturnG,H | 17.17% | 1.73% | 4.59% | 9.52% | 9.90% |
| Ratios to Average Net AssetsI,J | |||||
| Expenses before reductions | .63% | .89% | .84% | .55% | .56%K |
| Expenses net of fee waivers, if any | .63% | .89% | .84% | .55% | .56%K |
| Expenses net of all reductions | .62% | .89% | .84% | .54% | .55%K |
| Net investment income (loss) | .51% | .94%C | .48%D | .57% | .26%E,K |
| Supplemental Data | |||||
| Net assets, end of period (in millions) | $57 | $44 | $41 | $20 | $5 |
| Portfolio turnover rateL | 84% | 81% | 33% | 39% | 34% |
A For the period August 13, 2013 (commencement of sale of shares) to November 30, 2013.
B Calculated based on average shares outstanding during the period.
C Net Investment income per share reflects a large, non-recurring dividend which amounted to $.12 per share. Excluding this non-recurring dividend, the ratio of net investment income (loss) to average net assets would have been .50%.
D Net Investment income per share reflects a large, non-recurring dividend which amounted to $.07 per share. Excluding this non-recurring dividend, the ratio of net investment income (loss) to average net assets would have been .26%.
E Net Investment income per share reflects a large, non-recurring dividend which amounted to $.01 per share. Excluding this non-recurring dividend, the ratio of net investment income (loss) to average net assets would have been .09%.
F Total distributions of $3.54 per share is comprised of distributions from net investment income of $.136 and distributions from net realized gain of $3.406 per share.
G Total returns for periods of less than one year are not annualized.
H Total returns would have been lower if certain expenses had not been reduced during the applicable periods shown.
I Fees and expenses of any underlying Fidelity Central Funds are not included in the Fund's expense ratio. The Fund indirectly bears its proportionate share of the expenses of any underlying Fidelity Central Funds.
J Expense ratios reflect operating expenses of the class. Expenses before reductions do not reflect amounts reimbursed by the investment adviser or reductions from brokerage service arrangements or reductions from other expense offset arrangements and do not represent the amount paid by the class during periods when reimbursements or reductions occur. Expense ratios before reductions for start-up periods may not be representative of longer-term operating periods. Expenses net of fee waivers reflect expenses after reimbursement by the investment adviser but prior to reductions from brokerage service arrangements or other expense offset arrangements. Expenses net of all reductions represent the net expenses paid by the class.
K Annualized
L Amount does not include the portfolio activity of any underlying Fidelity Central Funds.
See accompanying notes which are an integral part of the financial statements.
Notes to Financial Statements
For the period ended November 30, 2017
(Amounts in thousands except percentages)
1. Organization.
Fidelity Advisor Small Cap Fund (the Fund) is a fund of Fidelity Advisor Series I (the Trust) and is authorized to issue an unlimited number of shares. The Trust is registered under the Investment Company Act of 1940, as amended (the 1940 Act), as an open-end management investment company organized as a Massachusetts business trust. The Fund offers Class A, Class M (formerly Class T), Class C, Class I and Class Z shares, each of which has equal rights as to assets and voting privileges. Each class has exclusive voting rights with respect to matters that affect that class.
After the close of business on June 24, 2016, all outstanding Class B shares were converted to Class A shares. All prior fiscal period dollar and share amounts for Class B presented in the Notes to Financial Statements are for the period December 1, 2015 through June 24, 2016.
2. Investments in Fidelity Central Funds.
The Fund invests in Fidelity Central Funds, which are open-end investment companies generally available only to other investment companies and accounts managed by the investment adviser and its affiliates. The Fund's Schedule of Investments lists each of the Fidelity Central Funds held as of period end, if any, as an investment of the Fund, but does not include the underlying holdings of each Fidelity Central Fund. As an Investing Fund, the Fund indirectly bears its proportionate share of the expenses of the underlying Fidelity Central Funds.
The Money Market Central Funds seek preservation of capital and current income and are managed by Fidelity Investments Money Management, Inc. (FIMM), an affiliate of the investment adviser. Annualized expenses of the Money Market Central Funds as of their most recent shareholder report date are less than .005%.
A complete unaudited list of holdings for each Fidelity Central Fund is available upon request or at the Securities and Exchange Commission (the SEC) website at www.sec.gov. In addition, the financial statements of the Fidelity Central Funds, which are not covered by the Fund's Report of Independent Registered Public Accounting Firm, are available on the SEC website or upon request.
3. Significant Accounting Policies.
The Fund is an investment company and applies the accounting and reporting guidance of the Financial Accounting Standards Board (FASB) Accounting Standards Codification Topic 946 Financial Services – Investments Companies. The financial statements have been prepared in conformity with accounting principles generally accepted in the United States of America (GAAP), which require management to make certain estimates and assumptions at the date of the financial statements. Actual results could differ from those estimates. Subsequent events, if any, through the date that the financial statements were issued have been evaluated in the preparation of the financial statements. The following summarizes the significant accounting policies of the Fund:
Investment Valuation. Investments are valued as of 4:00 p.m. Eastern time on the last calendar day of the period. The Board of Trustees (the Board) has delegated the day to day responsibility for the valuation of the Fund's investments to the Fair Value Committee (the Committee) established by the Fund's investment adviser. In accordance with valuation policies and procedures approved by the Board, the Fund attempts to obtain prices from one or more third party pricing vendors or brokers to value its investments. When current market prices, quotations or currency exchange rates are not readily available or reliable, investments will be fair valued in good faith by the Committee, in accordance with procedures adopted by the Board. Factors used in determining fair value vary by investment type and may include market or investment specific events, changes in interest rates and credit quality. The frequency with which these procedures are used cannot be predicted and they may be utilized to a significant extent. The Committee oversees the Fund's valuation policies and procedures and reports to the Board on the Committee's activities and fair value determinations. The Board monitors the appropriateness of the procedures used in valuing the Fund's investments and ratifies the fair value determinations of the Committee.
The Fund categorizes the inputs to valuation techniques used to value its investments into a disclosure hierarchy consisting of three levels as shown below:
- Level 1 – quoted prices in active markets for identical investments
- Level 2 – other significant observable inputs (including quoted prices for similar investments, interest rates, prepayment speeds, etc.)
- Level 3 – unobservable inputs (including the Fund's own assumptions based on the best information available)
Valuation techniques used to value the Fund's investments by major category are as follows:
Equity securities, including restricted securities, for which market quotations are readily available, are valued at the last reported sale price or official closing price as reported by a third party pricing vendor on the primary market or exchange on which they are traded and are categorized as Level 1 in the hierarchy. In the event there were no sales during the day or closing prices are not available, securities are valued at the last quoted bid price or may be valued using the last available price and are generally categorized as Level 2 in the hierarchy. For foreign equity securities, when market or security specific events arise, comparisons to the valuation of American Depositary Receipts (ADRs), futures contracts, Exchange-Traded Funds (ETFs) and certain indexes as well as quoted prices for similar securities may be used and would be categorized as Level 2 in the hierarchy. Utilizing these techniques may result in transfers between Level 1 and Level 2. For equity securities, including restricted securities, where observable inputs are limited, assumptions about market activity and risk are used and these securities may be categorized as Level 3 in the hierarchy.
Debt securities, including restricted securities, are valued based on evaluated prices received from third party pricing vendors or from brokers who make markets in such securities. U.S. government and government agency obligations are valued by pricing vendors who utilize matrix pricing which considers yield or price of bonds of comparable quality, coupon, maturity and type or by broker-supplied prices. When independent prices are unavailable or unreliable, debt securities may be valued utilizing pricing methodologies which consider similar factors that would be used by third party pricing vendors. Debt securities are generally categorized as Level 2 in the hierarchy but may be Level 3 depending on the circumstances.
Futures contracts are valued at the settlement price established each day by the board of trade or exchange on which they are traded and are categorized as Level 1 in the hierarchy. Investments in open-end mutual funds, including the Fidelity Central Funds, are valued at their closing net asset value (NAV) each business day and are categorized as Level 1 in the hierarchy.
Changes in valuation techniques may result in transfers in or out of an assigned level within the disclosure hierarchy. The aggregate value of investments by input level as of November 30, 2017, including information on transfers between Levels 1 and 2, is included at the end of the Fund's Schedule of Investments.
Foreign Currency. The Fund may use foreign currency contracts to facilitate transactions in foreign-denominated securities. Gains and losses from these transactions may arise from changes in the value of the foreign currency or if the counterparties do not perform under the contracts' terms.
Foreign-denominated assets, including investment securities, and liabilities are translated into U.S. dollars at the exchange rates at period end. Purchases and sales of investment securities, income and dividends received and expenses denominated in foreign currencies are translated into U.S. dollars at the exchange rate in effect on the transaction date.
The effects of exchange rate fluctuations on investments are included with the net realized and unrealized gain (loss) on investment securities. Other foreign currency transactions resulting in realized and unrealized gain (loss) are disclosed separately.
Investment Transactions and Income. For financial reporting purposes, the Fund's investment holdings and NAV include trades executed through the end of the last business day of the period. The NAV per share for processing shareholder transactions is calculated as of the close of business of the New York Stock Exchange (NYSE), normally 4:00 p.m. Eastern time and includes trades executed through the end of the prior business day. Gains and losses on securities sold are determined on the basis of identified cost and includes proceeds received from litigation. Dividend income is recorded on the ex-dividend date, except for certain dividends from foreign securities where the ex-dividend date may have passed, which are recorded as soon as the Fund is informed of the ex-dividend date. Non-cash dividends included in dividend income, if any, are recorded at the fair market value of the securities received. Income and capital gain distributions from Fidelity Central Funds, if any, are recorded on the ex-dividend date. Certain distributions received by the Fund represent a return of capital or capital gain. The Fund determines the components of these distributions subsequent to the ex-dividend date, based upon receipt of tax filings or other correspondence relating to the underlying investment. These distributions are recorded as a reduction of cost of investments and/or as a realized gain. Interest income is accrued as earned and includes coupon interest and amortization of premium and accretion of discount on debt securities as applicable. Investment income is recorded net of foreign taxes withheld where recovery of such taxes is uncertain.
Class Allocations and Expenses. Investment income, realized and unrealized capital gains and losses, common expenses of the Fund, and certain fund-level expense reductions, if any, are allocated daily on a pro-rata basis to each class based on the relative net assets of each class to the total net assets of the Fund. Each class differs with respect to transfer agent and distribution and service plan fees incurred. Certain expense reductions may also differ by class. For the reporting period, the allocated portion of income and expenses to each class as a percent of its average net assets may vary due to the timing of recording these transactions in relation to fluctuating net assets of the classes. Expenses directly attributable to a fund are charged to that fund. Expenses attributable to more than one fund are allocated among the respective funds on the basis of relative net assets or other appropriate methods. Expense estimates are accrued in the period to which they relate and adjustments are made when actual amounts are known.
Income Tax Information and Distributions to Shareholders. Each year, the Fund intends to qualify as a regulated investment company under Subchapter M of the Internal Revenue Code, including distributing substantially all of its taxable income and realized gains. As a result, no provision for U.S. Federal income taxes is required. As of November 30, 2017, the Fund did not have any unrecognized tax benefits in the financial statements; nor is the Fund aware of any tax positions for which it is reasonably possible that the total amounts of unrecognized tax benefits will significantly change in the next twelve months. The Fund files a U.S. federal tax return, in addition to state and local tax returns as required. The Fund's federal income tax returns are subject to examination by the Internal Revenue Service (IRS) for a period of three fiscal years after they are filed. State and local tax returns may be subject to examination for an additional fiscal year depending on the jurisdiction. Foreign taxes are provided for based on the Fund's understanding of the tax rules and rates that exist in the foreign markets in which it invests.
Distributions are declared and recorded on the ex-dividend date. Income dividends and capital gain distributions are declared separately for each class. Income and capital gain distributions are determined in accordance with income tax regulations, which may differ from GAAP. In addition, the Fund claimed a portion of the payment made to redeeming shareholders as a distribution for income tax purposes.
Capital accounts within the financial statements are adjusted for permanent book-tax differences. These adjustments have no impact on net assets or the results of operations. Capital accounts are not adjusted for temporary book-tax differences which will reverse in a subsequent period.
Book-tax differences are primarily due to futures contracts, market discount, foreign currency transactions, partnerships and losses deferred due to wash sales and excise tax regulations.
As of period end, the cost and unrealized appreciation (depreciation) in securities, and derivatives if applicable, for federal income tax purposes were as follows:
| Gross unrealized appreciation | $591,215 |
| Gross unrealized depreciation | (36,567) |
| Net unrealized appreciation (depreciation) | $554,648 |
| Tax Cost | $2,165,765 |
The tax-based components of distributable earnings as of period end were as follows:
| Undistributed long-term capital gain | $325,306 |
| Net unrealized appreciation (depreciation) on securities and other investments | $551,623 |
The Fund intends to elect to defer to its next fiscal year $2,696 of ordinary losses recognized during the period January 1, 2017 to November 30, 2017.
The tax character of distributions paid was as follows:
| November 30, 2017 | November 30, 2016 | |
| Ordinary Income | $7,493 | $ - |
| Long-term Capital Gains | 31,569 | 249,036 |
| Total | $39,062 | $ 249,036 |
Restricted Securities. The Fund may invest in securities that are subject to legal or contractual restrictions on resale. These securities generally may be resold in transactions exempt from registration or to the public if the securities are registered. Disposal of these securities may involve time-consuming negotiations and expense, and prompt sale at an acceptable price may be difficult. Information regarding restricted securities is included at the end of the Fund's Schedule of Investments.
4. Derivative Instruments.
Risk Exposures and the Use of Derivative Instruments. The Fund's investment objective allows the Fund to enter into various types of derivative contracts, including futures contracts. Derivatives are investments whose value is primarily derived from underlying assets, indices or reference rates and may be transacted on an exchange or over-the-counter (OTC). Derivatives may involve a future commitment to buy or sell a specified asset based on specified terms, to exchange future cash flows at periodic intervals based on a notional principal amount, or for one party to make one or more payments upon the occurrence of specified events in exchange for periodic payments from the other party.
The Fund used derivatives to increase returns and to manage exposure to certain risks as defined below. The success of any strategy involving derivatives depends on analysis of numerous economic factors, and if the strategies for investment do not work as intended, the Fund may not achieve its objectives.
The Fund's use of derivatives increased or decreased its exposure to the following risk:
| Equity Risk | Equity risk relates to the fluctuations in the value of financial instruments as a result of changes in market prices (other than those arising from interest rate risk or foreign exchange risk), whether caused by factors specific to an individual investment, its issuer, or all factors affecting all instruments traded in a market or market segment. |
The Fund is also exposed to additional risks from investing in derivatives, such as liquidity risk and counterparty credit risk. Liquidity risk is the risk that the Fund will be unable to close out the derivative in the open market in a timely manner. Counterparty credit risk is the risk that the counterparty will not be able to fulfill its obligation to the Fund. Counterparty credit risk related to exchange-traded futures contracts may be mitigated by the protection provided by the exchange on which they trade.
Investing in derivatives may involve greater risks than investing in the underlying assets directly and, to varying degrees, may involve risk of loss in excess of any initial investment and collateral received and amounts recognized in the Statement of Assets and Liabilities. In addition, there may be the risk that the change in value of the derivative contract does not correspond to the change in value of the underlying instrument.
Futures Contracts. A futures contract is an agreement between two parties to buy or sell a specified underlying instrument for a fixed price at a specified future date. The Fund used futures contracts to manage its exposure to the stock market.
Upon entering into a futures contract, a fund is required to deposit either cash or securities (initial margin) with a clearing broker in an amount equal to a certain percentage of the face value of the contract. Futures contracts are marked-to-market daily and subsequent daily payments (variation margin) are made or received by a fund depending on the daily fluctuations in the value of the futures contracts and are recorded as unrealized appreciation or (depreciation). This receivable and/or payable, if any, is included in daily variation margin on futures contracts in the Statement of Assets and Liabilities. Realized gain or (loss) is recorded upon the expiration or closing of a futures contract. The net realized gain (loss) and change in net unrealized appreciation (depreciation) on futures contracts during the period is presented in the Statement of Operations.
Any open futures contracts at period end are presented in the Schedule of Investments under the caption "Futures Contracts". The notional amount at value reflects each contract's exposure to the underlying instrument or index at period end and is representative of volume of activity during the period. Securities deposited to meet initial margin requirements are identified in the Schedule of Investments.
5. Purchases and Sales of Investments.
Purchases and sales of securities, other than short-term securities, aggregated $2,083,285 and $2,500,292, respectively.
6. Fees and Other Transactions with Affiliates.
Management Fee. Fidelity Management & Research Company and its affiliates provide the Fund with investment management related services for which the Fund pays a monthly management fee. The management fee is the sum of an individual fund fee rate that is based on an annual rate of .45% of the Fund's average net assets and an annualized group fee rate that averaged .25% during the period. The group fee rate is based upon the average net assets of all the mutual funds advised by the investment adviser, including any mutual funds previously advised by the investment adviser that are currently advised by Fidelity SelectCo, LLC, an affiliate of the investment adviser. The group fee rate decreases as assets under management increase and increases as assets under management decrease. In addition, the management fee is subject to a performance adjustment (up to a maximum of +/- .20% of the Fund's average net assets over a 36 month performance period). The upward or downward adjustment to the management fee is based on the relative investment performance of Class I of the Fund as compared to its benchmark index, the Russell 2000 Index, over the same 36 month performance period. For the reporting period, the total annual management fee rate, including the performance adjustment, was .54% of the Fund's average net assets. The performance adjustment included in the management fee rate may be higher or lower than the maximum performance adjustment rate due to the difference between the average net assets for the reporting and performance periods.
Distribution and Service Plan Fees. In accordance with Rule 12b-1 of the 1940 Act, the Fund has adopted separate Distribution and Service Plans for each class of shares. Certain classes pay Fidelity Distributors Corporation (FDC), an affiliate of the investment adviser, separate Distribution and Service Fees, each of which is based on an annual percentage of each class' average net assets. In addition, FDC may pay financial intermediaries for selling shares of the Fund and providing shareholder support services. For the period, the Distribution and Service Fee rates, total fees and amounts retained by FDC were as follows:
| Distribution Fee | Service Fee | Total Fees | Retained by FDC | |
| Class A | -% | .25% | $2,108 | $7 |
| Class M | .25% | .25% | 3,703 | 3 |
| Class C | .75% | .25% | 2,732 | 128 |
| $8,543 | $138 |
Sales Load. FDC may receive a front-end sales charge of up to 5.75% for selling Class A shares and 3.50% for selling Class M shares, some of which is paid to financial intermediaries for selling shares of the Fund. Depending on the holding period, FDC may receive contingent deferred sales charges levied on Class A, Class M and Class C redemptions. The deferred sales charges are 1.00% for Class C shares, 1.00% for certain purchases of Class A shares and .25% for certain purchases of Class M shares.
For the period, sales charge amounts retained by FDC were as follows:
| Retained by FDC | |
| Class A | $105 |
| Class M | 17 |
| Class C(a) | 10 |
| $132 |
(a) When Class C shares are initially sold, FDC pays commissions from its own resources to financial intermediaries through which the sales are made.
Transfer Agent Fees. Fidelity Investments Institutional Operations Company, Inc., (FIIOC), an affiliate of the investment adviser, is the transfer, dividend disbursing and shareholder servicing agent for each class of the Fund. FIIOC receives account fees and asset-based fees that vary according to the account size and type of account of the shareholders of the respective classes of the Fund, except for Class Z. FIIOC receives an asset-based fee of Class Z's average net assets. FIIOC pays for typesetting, printing and mailing of shareholder reports, except proxy statements.
For the period, transfer agent fees for each class were as follows:
| Amount | % of Class-Level Average Net Assets | |
| Class A | $1,785 | .21 |
| Class M | 1,432 | .19 |
| Class C | 607 | .22 |
| Class I | 1,378 | .19 |
| Class Z | 21 | .05 |
| $5,223 |
Accounting and Security Lending Fees. Fidelity Service Company, Inc. (FSC), an affiliate of the investment adviser, maintains the Fund's accounting records. The accounting fee is based on the level of average net assets for each month. Under a separate contract, FSC administers the security lending program. The security lending fee is based on the number and duration of lending transactions.
Brokerage Commissions. The Fund placed a portion of its portfolio transactions with brokerage firms which are affiliates of the investment adviser. Brokerage commissions are included in net realized gain (loss) and change in net unrealized appreciation (depreciation) in the Statement of Operations. The commissions paid to these affiliated firms were $102 for the period.
Interfund Trades. The Fund may purchase from or sell securities to other Fidelity Funds under procedures adopted by the Board. The procedures have been designed to ensure these interfund trades are executed in accordance with Rule 17a-7 of the 1940 Act. Interfund trades are included within the respective purchases and sales amounts shown in the Purchases and Sales of Investments note.
7. Committed Line of Credit.
The Fund participates with other funds managed by the investment adviser or an affiliate in a $4.25 billion credit facility (the "line of credit") to be utilized for temporary or emergency purposes to fund shareholder redemptions or for other short-term liquidity purposes. The Fund has agreed to pay commitment fees on its pro-rata portion of the line of credit, which amounted to $8 and is reflected in Miscellaneous expenses on the Statement of Operations. During the period, the Fund did not borrow on this line of credit.
8. Security Lending.
The Fund lends portfolio securities through a lending agent from time to time in order to earn additional income. For equity securities, a lending agent is used and may loan securities to certain qualified borrowers, including Fidelity Capital Markets (FCM), a broker-dealer affiliated with the Fund. On the settlement date of the loan, the Fund receives collateral (in the form of U.S. Treasury obligations, letters of credit and/or cash) against the loaned securities and maintains collateral in an amount not less than 100% of the market value of the loaned securities during the period of the loan. The market value of the loaned securities is determined at the close of business of the Fund and any additional required collateral is delivered to the Fund on the next business day. The Fund or borrower may terminate the loan at any time, and if the borrower defaults on its obligation to return the securities loaned because of insolvency or other reasons, the Fund may apply collateral received from the borrower against the obligation. The Fund may experience delays and costs in recovering the securities loaned. Any cash collateral received is invested in the Fidelity Securities Lending Cash Central Fund. The value of loaned securities and cash collateral at period end are disclosed on the Fund's Statement of Assets and Liabilities. The value of securities loaned to FCM at period end was $23,179. Security lending income represents the income earned on investing cash collateral, less rebates paid to borrowers and any lending agent fees associated with the loan, plus any premium payments received for lending certain types of securities. Security lending income is presented in the Statement of Operations as a component of income from Fidelity Central Funds. Total security lending income during the period amounted to $1,125, including $90 from securities loaned to FCM.
9. Expense Reductions.
Commissions paid to certain brokers with whom the investment adviser, or its affiliates, places trades on behalf of the Fund include an amount in addition to trade execution, which may be rebated back to the Fund to offset certain expenses. This amount totaled $235 for the period.
In addition, during the period the investment adviser reimbursed and/or waived a portion of fund-level operating expenses in the amount of $24.
10. Distributions to Shareholders.
Distributions to shareholders of each class were as follows:
| Year ended November 30, 2017 | Year ended November 30, 2016 | |
| From net investment income | ||
| Class A | $2,808 | $– |
| Class M | 819 | – |
| Class I | 3,550 | – |
| Class Z | 316 | – |
| Total | $7,493 | $– |
| From net realized gain | ||
| Class A | $10,566 | $84,569 |
| Class M | 9,377 | 76,028 |
| Class B | – | 2,089 |
| Class C | 4,017 | 31,633 |
| Class I | 7,137 | 51,636 |
| Class Z | 472 | 3,081 |
| Total | $31,569 | $249,036 |
11. Share Transactions.
Share transactions for each class were as follows and may contain automatic conversions between classes or exchanges between affiliated funds:
| Shares | Shares | Dollars | Dollars | |
| Year ended November 30, 2017 | Year ended November 30, 2016 | Year ended November 30, 2017 | Year ended November 30, 2016 | |
| Class A | ||||
| Shares sold | 3,169 | 5,928 | $85,030 | $140,735 |
| Reinvestment of distributions | 494 | 3,443 | 12,957 | 81,777 |
| Shares redeemed | (12,763) | (10,822) | (342,606) | (258,061) |
| Net increase (decrease) | (9,100) | (1,451) | $(244,619) | $(35,549) |
| Class M | ||||
| Shares sold | 3,520 | 4,643 | $88,385 | $103,682 |
| Reinvestment of distributions | 405 | 3,332 | 9,963 | 74,245 |
| Shares redeemed | (8,820) | (10,503) | (222,262) | (234,117) |
| Net increase (decrease) | (4,895) | (2,528) | $(123,914) | $(56,190) |
| Class B | ||||
| Shares sold | – | 6 | $– | $95 |
| Reinvestment of distributions | – | 108 | – | 2,016 |
| Shares redeemed | – | (1,070) | – | (19,638) |
| Net increase (decrease) | – | (956) | $– | $(17,527) |
| Class C | ||||
| Shares sold | 1,392 | 1,506 | $29,232 | $28,368 |
| Reinvestment of distributions | 181 | 1,552 | 3,752 | 29,420 |
| Shares redeemed | (3,288) | (3,634) | (69,702) | (69,050) |
| Net increase (decrease) | (1,715) | (576) | $(36,718) | $(11,262) |
| Class I | ||||
| Shares sold | 9,426 | 7,918 | $274,662 | $201,293 |
| Reinvestment of distributions | 331 | 1,747 | 9,396 | 44,806 |
| Shares redeemed | (9,521) | (9,861) | (278,258) | (256,027) |
| Net increase (decrease) | 236 | (196) | $5,800 | $(9,928) |
| Class Z | ||||
| Shares sold | 1,353 | 590 | $40,314 | $15,126 |
| Reinvestment of distributions | 28 | 120 | 785 | 3,081 |
| Shares redeemed | (1,193) | (500) | (35,006) | (12,963) |
| Net increase (decrease) | 188 | 210 | $6,093 | $5,244 |
12. Other.
The Fund's organizational documents provide former and current trustees and officers with a limited indemnification against liabilities arising in connection with the performance of their duties to the Fund. In the normal course of business, the Fund may also enter into contracts that provide general indemnifications. The Fund's maximum exposure under these arrangements is unknown as this would be dependent on future claims that may be made against the Fund. The risk of material loss from such claims is considered remote.
Report of Independent Registered Public Accounting Firm
To the Trustees of Fidelity Advisor Series I and Shareholders of Fidelity Advisor Small Cap Fund:
In our opinion, the accompanying statement of assets and liabilities, including the schedule of investments, and the related statements of operations and of changes in net assets and the financial highlights present fairly, in all material respects, the financial position of Fidelity Advisor Small Cap Fund (a fund of Fidelity Advisor Series I) as of November 30, 2017, the results of its operations for the year then ended, the changes in its net assets for each of the two years in the period then ended and the financial highlights for each of the periods indicated, in conformity with accounting principles generally accepted in the United States of America. These financial statements and financial highlights (hereafter referred to as “financial statements”) are the responsibility of the Fidelity Advisor Small Cap Fund’s management. Our responsibility is to express an opinion on these financial statements based on our audits. We conducted our audits of these financial statements in accordance with the standards of the Public Company Accounting Oversight Board (United States). Those standards require that we plan and perform the audit to obtain reasonable assurance about whether the financial statements are free of material misstatement. An audit includes examining, on a test basis, evidence supporting the amounts and disclosures in the financial statements, assessing the accounting principles used and significant estimates made by management, and evaluating the overall financial statement presentation. Our procedures included confirmation of securities owned as of November 30, 2017 by correspondence with the custodian and brokers; when replies were not received from brokers, we performed other auditing procedures. We believe that our audits provide a reasonable basis for our opinion.
PricewaterhouseCoopers LLP
Boston, Massachusetts
January 19, 2018
Trustees and Officers
The Trustees, Members of the Advisory Board (if any), and officers of the and fund, as applicable, are listed below. The Board of Trustees governs the fund and is responsible for protecting the interests of shareholders. The Trustees are experienced executives who meet periodically throughout the year to oversee the fund's activities, review contractual arrangements with companies that provide services to the fund, oversee management of the risks associated with such activities and contractual arrangements, and review the fund's performance. Each of the Trustees oversees 190 funds.
The Trustees hold office without limit in time except that (a) any Trustee may resign; (b) any Trustee may be removed by written instrument, signed by at least two-thirds of the number of Trustees prior to such removal; (c) any Trustee who requests to be retired or who has become incapacitated by illness or injury may be retired by written instrument signed by a majority of the other Trustees; and (d) any Trustee may be removed at any special meeting of shareholders by a two-thirds vote of the outstanding voting securities of the trust. Each Trustee who is not an interested person (as defined in the 1940 Act) of the trust and the fund is referred to herein as an Independent Trustee. Each Independent Trustee shall retire not later than the last day of the calendar year in which his or her 75th birthday occurs. The Independent Trustees may waive this mandatory retirement age policy with respect to individual Trustees. Officers and Advisory Board Members hold office without limit in time, except that any officer or Advisory Board Member may resign or may be removed by a vote of a majority of the Trustees at any regular meeting or any special meeting of the Trustees. Except as indicated, each individual has held the office shown or other offices in the same company for the past five years.
The fund’s Statement of Additional Information (SAI) includes more information about the Trustees. To request a free copy, call Fidelity at 1-877-208-0098.
Experience, Skills, Attributes, and Qualifications of the Trustees. The Governance and Nominating Committee has adopted a statement of policy that describes the experience, qualifications, attributes, and skills that are necessary and desirable for potential Independent Trustee candidates (Statement of Policy). The Board believes that each Trustee satisfied at the time he or she was initially elected or appointed a Trustee, and continues to satisfy, the standards contemplated by the Statement of Policy. The Governance and Nominating Committee also engages professional search firms to help identify potential Independent Trustee candidates who have the experience, qualifications, attributes, and skills consistent with the Statement of Policy. From time to time, additional criteria based on the composition and skills of the current Independent Trustees, as well as experience or skills that may be appropriate in light of future changes to board composition, business conditions, and regulatory or other developments, have also been considered by the professional search firms and the Governance and Nominating Committee. In addition, the Board takes into account the Trustees' commitment and participation in Board and committee meetings, as well as their leadership of standing and ad hoc committees throughout their tenure.
In determining that a particular Trustee was and continues to be qualified to serve as a Trustee, the Board has considered a variety of criteria, none of which, in isolation, was controlling. The Board believes that, collectively, the Trustees have balanced and diverse experience, qualifications, attributes, and skills, which allow the Board to operate effectively in governing the fund and protecting the interests of shareholders. Information about the specific experience, skills, attributes, and qualifications of each Trustee, which in each case led to the Board's conclusion that the Trustee should serve (or continue to serve) as a trustee of the fund, is provided below.
Board Structure and Oversight Function. James C. Curvey is an interested person and currently serves as Chairman. The Trustees have determined that an interested Chairman is appropriate and benefits shareholders because an interested Chairman has a personal and professional stake in the quality and continuity of services provided to the fund. Independent Trustees exercise their informed business judgment to appoint an individual of their choosing to serve as Chairman, regardless of whether the Trustee happens to be independent or a member of management. The Independent Trustees have determined that they can act independently and effectively without having an Independent Trustee serve as Chairman and that a key structural component for assuring that they are in a position to do so is for the Independent Trustees to constitute a substantial majority for the Board. The Independent Trustees also regularly meet in executive session. Ned C. Lautenbach serves as Chairman of the Independent Trustees and as such (i) acts as a liaison between the Independent Trustees and management with respect to matters important to the Independent Trustees and (ii) with management prepares agendas for Board meetings.
Fidelity® funds are overseen by different Boards of Trustees. The fund's Board oversees Fidelity's high income and certain equity funds, and other Boards oversee Fidelity's investment-grade bond, money market, asset allocation, and sector funds. The asset allocation funds may invest in Fidelity® funds overseen by the fund's Board. The use of separate Boards, each with its own committee structure, allows the Trustees of each group of Fidelity® funds to focus on the unique issues of the funds they oversee, including common research, investment, and operational issues. On occasion, the separate Boards establish joint committees to address issues of overlapping consequences for the Fidelity® funds overseen by each Board.
The Trustees operate using a system of committees to facilitate the timely and efficient consideration of all matters of importance to the Trustees, the fund, and fund shareholders and to facilitate compliance with legal and regulatory requirements and oversight of the fund's activities and associated risks. The Board, acting through its committees, has charged FMR and its affiliates with (i) identifying events or circumstances the occurrence of which could have demonstrably adverse effects on the fund's business and/or reputation; (ii) implementing processes and controls to lessen the possibility that such events or circumstances occur or to mitigate the effects of such events or circumstances if they do occur; and (iii) creating and maintaining a system designed to evaluate continuously business and market conditions in order to facilitate the identification and implementation processes described in (i) and (ii) above. Because the day-to-day operations and activities of the fund are carried out by or through FMR, its affiliates, and other service providers, the fund's exposure to risks is mitigated but not eliminated by the processes overseen by the Trustees. While each of the Board's committees has responsibility for overseeing different aspects of the fund's activities, oversight is exercised primarily through the Operations, Audit, and Compliance Committees. In addition, the Independent Trustees have worked with FMR to enhance the Board's oversight of investment and financial risks, legal and regulatory risks, technology risks, and operational risks, including the development of additional risk reporting to the Board. For example, a working group comprised of Independent Trustees and FMR has worked and continues to work to review the Fidelity® funds' valuation-related activities, reporting and risk management. Appropriate personnel, including but not limited to the fund's Chief Compliance Officer (CCO), FMR's internal auditor, the independent accountants, the fund's Treasurer and portfolio management personnel, make periodic reports to the Board's committees, as appropriate, including an annual review of Fidelity's risk management program for the Fidelity® funds. The responsibilities of each standing committee, including their oversight responsibilities, are described further under "Standing Committees of the Trustees."
Interested Trustees*:
Correspondence intended for a Trustee who is an interested person may be sent to Fidelity Investments, 245 Summer Street, Boston, Massachusetts 02210.
Name, Year of Birth; Principal Occupations and Other Relevant Experience+
James C. Curvey (1935)
Year of Election or Appointment: 2007
Trustee
Chairman of the Board of Trustees
Mr. Curvey also serves as Trustee of other Fidelity® funds. Mr. Curvey is a Director of Fidelity Research & Analysis Co. (investment adviser firm, 2009-present), and Vice Chairman (2007-present) and Director of FMR LLC (diversified financial services company). In addition, Mr. Curvey serves as an Overseer for the Boston Symphony Orchestra and a member of the board of Artis-Naples, Naples, Florida, and as a Trustee for Brewster Academy, Wolfeboro, New Hampshire. Previously, Mr. Curvey served as a Director of Fidelity Investments Money Management, Inc. (investment adviser firm, 2009-2014) and a Director of FMR and FMR Co., Inc. (investment adviser firms, 2007-2014).
Charles S. Morrison (1960)
Year of Election or Appointment: 2014
Trustee
Mr. Morrison also serves as Trustee of other funds. He serves as President of Fidelity Management & Research Company (FMR) (investment adviser firm, 2016-present), a Director of Fidelity Investments Money Management, Inc. (FIMM) (investment adviser firm, 2014-present), Director of Fidelity SelectCo, LLC (investment adviser firm, 2014-present), President, Asset Management (2014-present), and is an employee of Fidelity Investments. Previously, Mr. Morrison served as Vice President of Fidelity's Fixed Income and Asset Allocation Funds (2012-2014), President, Fixed Income (2011-2014), Vice President of Fidelity's Money Market Funds (2005-2009), President, Money Market Group Leader of FMR (investment adviser firm, 2009), and Senior Vice President, Money Market Group of FMR (2004-2009). Mr. Morrison also served as Vice President of Fidelity's Bond Funds (2002-2005), certain Balanced Funds (2002-2005), and certain Asset Allocation Funds (2002-2007), and as Senior Vice President (2002-2005) of Fidelity's Bond Division.
* Determined to be an “Interested Trustee” by virtue of, among other things, his or her affiliation with the trust or various entities under common control with FMR.
+ The information includes the Trustee's principal occupation during the last five years and other information relating to the experience, attributes, and skills relevant to the Trustee's qualifications to serve as a Trustee, which led to the conclusion that the Trustee should serve as a Trustee for the fund.
Independent Trustees:
Correspondence intended for an Independent Trustee may be sent to Fidelity Investments, P.O. Box 55235, Boston, Massachusetts 02205-5235.
Name, Year of Birth; Principal Occupations and Other Relevant Experience+
Dennis J. Dirks (1948)
Year of Election or Appointment: 2005
Trustee
Mr. Dirks also serves as Trustee of other Fidelity® funds. Prior to his retirement in May 2003, Mr. Dirks was Chief Operating Officer and a member of the Board of The Depository Trust & Clearing Corporation (DTCC). He also served as President, Chief Operating Officer, and Board member of The Depository Trust Company (DTC) and President and Board member of the National Securities Clearing Corporation (NSCC). In addition, Mr. Dirks served as Chief Executive Officer and Board member of the Government Securities Clearing Corporation, Chief Executive Officer and Board member of the Mortgage-Backed Securities Clearing Corporation, as a Trustee and a member of the Finance Committee of Manhattan College (2005-2008), as a Trustee and a member of the Finance Committee of AHRC of Nassau County (2006-2008), as a member of the Independent Directors Council (IDC) Governing Council (2010-2015), and as a member of the Board of Directors for The Brookville Center for Children’s Services, Inc. (2009-2017). Mr. Dirks is a member of the Finance Committee (2016-present) and Board of Directors (2017-present) of the Asolo Repertory Theatre.
Alan J. Lacy (1953)
Year of Election or Appointment: 2008
Trustee
Mr. Lacy also serves as Trustee of other Fidelity® funds. Mr. Lacy serves as a Director of Bristol-Myers Squibb Company (global pharmaceuticals, 2008-present). He is a Trustee of the California Chapter of The Nature Conservancy (2015-present) and a Director of the Center for Advanced Study in the Behavioral Sciences at Stanford University (2015-present). In addition, Mr. Lacy served as Senior Adviser (2007-2014) of Oak Hill Capital Partners, L.P. (private equity) and also served as Chief Executive Officer (2005) and Vice Chairman (2005-2006) of Sears Holdings Corporation (retail) and Chief Executive Officer and Chairman of the Board of Sears, Roebuck and Co. (retail, 2000-2005). Previously, Mr. Lacy served as Chairman (2014-2017) and a member (2010-2017) of the Board of Directors of Dave & Buster’s Entertainment, Inc. (restaurant and entertainment complexes), as Chairman (2008-2011) and a member (2006-2015) of the Board of Trustees of the National Parks Conservation Association, and as a member of the Board of Directors for The Hillman Companies, Inc. (hardware wholesalers, 2010-2014), Earth Fare, Inc. (retail grocery, 2010-2014), and The Western Union Company (global money transfer, 2006-2011).
Ned C. Lautenbach (1944)
Year of Election or Appointment: 2000
Trustee
Chairman of the Independent Trustees
Mr. Lautenbach also serves as Trustee of other Fidelity® funds. Mr. Lautenbach currently serves as Vice Chair of the Board of Governors, State University System of Florida (2013-present) and is a member of the Council on Foreign Relations (1994-present). He is also a member and has most recently served as Chairman of the Board of Directors of Artis-Naples (2012-present). Previously, Mr. Lautenbach served as a member and then Lead Director of the Board of Directors of Eaton Corporation (diversified industrial, 1997-2016). He was also a Partner and Advisory Partner at Clayton, Dubilier & Rice, LLC (private equity investment, 1998-2010), as well as a Director of Sony Corporation (2006-2007). In addition, Mr. Lautenbach also had a 30-year career with IBM (technology company) during which time he served as Senior Vice President and a member of the Corporate Executive Committee (1968-1998).
Joseph Mauriello (1944)
Year of Election or Appointment: 2008
Trustee
Mr. Mauriello also serves as Trustee of other Fidelity® funds. Prior to his retirement in January 2006, Mr. Mauriello served in numerous senior management positions including Deputy Chairman and Chief Operating Officer (2004-2005), and Vice Chairman of Financial Services (2002-2004) of KPMG LLP US (professional services, 1965-2005). Mr. Mauriello currently serves as a member of the Board of Directors of XL Group plc. (global insurance and re-insurance, 2006-present) and the Independent Directors Council (IDC) Governing Council (2015-present). Previously, Mr. Mauriello served as a Director of the Hamilton Funds of the Bank of New York (2006-2007) and of Arcadia Resources Inc. (health care services and products, 2007-2012).
Cornelia M. Small (1944)
Year of Election or Appointment: 2005
Trustee
Ms. Small also serves as Trustee of other Fidelity® funds. Ms. Small is a member of the Board of Directors (2009-present) and Chair of the Investment Committee (2010-present) of the Teagle Foundation. Ms. Small also serves on the Investment Committee of the Berkshire Taconic Community Foundation (2008-present). Previously, Ms. Small served as Chairperson (2002-2008) and a member of the Investment Committee and Chairperson (2008-2012) and a member of the Board of Trustees of Smith College. In addition, Ms. Small served as Chief Investment Officer, Director of Global Equity Investments, and a member of the Board of Directors of Scudder, Stevens & Clark and Scudder Kemper Investments.
William S. Stavropoulos (1939)
Year of Election or Appointment: 2002
Trustee
Vice Chairman of the Independent Trustees
Mr. Stavropoulos also serves as Trustee of other Fidelity® funds. Mr. Stavropoulos serves as President and Founder of the Michigan Baseball Foundation, the Great Lakes Loons (2007-present). Mr. Stavropoulos is Chairman Emeritus of the Board of Directors of The Dow Chemical Company, where he previously served in numerous senior management positions, including President, CEO (1995-2000; 2002-2004), Chairman of the Executive Committee (2000-2006), and as a member of the Board of Directors (1990-2006). Currently, Mr. Stavropoulos is Chairman of the Board of Directors of Univar Inc. (global distributor of commodity and specialty chemicals), a Director of Teradata Corporation (data warehousing and technology solutions), and a member of the Advisory Board for Metalmark Capital LLC (private equity investment, 2005-present). Mr. Stavropoulos is an operating advisor to Clayton, Dubilier & Rice, LLC (private equity investment). In addition, Mr. Stavropoulos is a member of the University of Notre Dame Advisory Council for the College of Science, a Trustee of the Rollin L. Gerstacker Foundation, and a Director of Artis-Naples in Naples, Florida. Previously, Mr. Stavropoulos served as a Director of Chemical Financial Corporation (bank holding company, 1993-2012) and Tyco International, Ltd. (multinational manufacturing and services, 2007-2012).
David M. Thomas (1949)
Year of Election or Appointment: 2008
Trustee
Mr. Thomas also serves as Trustee of other Fidelity® funds. Mr. Thomas serves as Non-Executive Chairman of the Board of Directors of Fortune Brands Home and Security (home and security products, 2011-present), as a member of the Board of Directors (2004-present) and Presiding Director (2013-present) of Interpublic Group of Companies, Inc. (marketing communication), and as a member of the Board of Trustees of the University of Florida (2013-present). Previously, Mr. Thomas served as Executive Chairman (2005-2006) and Chairman and Chief Executive Officer (2000-2005) of IMS Health, Inc. (pharmaceutical and healthcare information solutions), and a Director of Fortune Brands, Inc. (consumer products, 2000-2011).
+ The information includes the Trustee's principal occupation during the last five years and other information relating to the experience, attributes, and skills relevant to the Trustee's qualifications to serve as a Trustee, which led to the conclusion that the Trustee should serve as a Trustee for the fund.
Advisory Board Members and Officers:
Correspondence intended for an officer or Peter S. Lynch may be sent to Fidelity Investments, 245 Summer Street, Boston, Massachusetts 02210. Officers appear below in alphabetical order.
Name, Year of Birth; Principal Occupation
Peter S. Lynch (1944)
Year of Election or Appointment: 2003
Member of the Advisory Board
Mr. Lynch also serves as Member of the Advisory Board of other Fidelity® funds. Mr. Lynch is Vice Chairman and a Director of FMR (investment adviser firm) and FMR Co., Inc. (investment adviser firm). In addition, Mr. Lynch serves as a Trustee of Boston College and as the Chairman of the Inner-City Scholarship Fund. Previously, Mr. Lynch served on the Special Olympics International Board of Directors (1997-2006).
Elizabeth Paige Baumann (1968)
Year of Election or Appointment: 2017
Anti-Money Laundering (AML) Officer
Ms. Baumann also serves as AML Officer of other funds. She is Chief AML Officer (2012-present) and Senior Vice President (2014-present) of FMR LLC (diversified financial services company) and is an employee of Fidelity Investments. Previously, Ms. Baumann served as AML Officer of the funds (2012-2016), and Vice President (2007-2014) and Deputy Anti-Money Laundering Officer (2007-2012) of FMR LLC.
Marc R. Bryant (1966)
Year of Election or Appointment: 2015
Secretary and Chief Legal Officer (CLO)
Mr. Bryant also serves as Secretary and CLO of other funds. Mr. Bryant serves as CLO, Secretary, and Senior Vice President of Fidelity Management & Research Company (investment adviser firm, 2015-present) and FMR Co., Inc. (investment adviser firm, 2015-present); Secretary of Fidelity SelectCo, LLC (investment adviser firm, 2015-present) and Fidelity Investments Money Management, Inc. (investment adviser firm, 2015-present); and CLO of Fidelity Management & Research (Hong Kong) Limited and FMR Investment Management (UK) Limited (investment adviser firms, 2015-present) and Fidelity Management & Research (Japan) Limited (investment adviser firm, 2016-present). He is Senior Vice President and Deputy General Counsel of FMR LLC (diversified financial services company). Previously, Mr. Bryant served as Secretary and CLO of Fidelity Rutland Square Trust II (2010-2014) and Assistant Secretary of Fidelity's Fixed Income and Asset Allocation Funds (2013-2015). Prior to joining Fidelity Investments, Mr. Bryant served as a Senior Vice President and the Head of Global Retail Legal for AllianceBernstein L.P. (2006-2010), and as the General Counsel for ProFund Advisors LLC (2001-2006).
William C. Coffey (1969)
Year of Election or Appointment: 2009
Assistant Secretary
Mr. Coffey also serves as Assistant Secretary of other funds. He is Senior Vice President and Deputy General Counsel of FMR LLC (diversified financial services company, 2010-present), and is an employee of Fidelity Investments. Previously, Mr. Coffey served as Vice President and Associate General Counsel of FMR LLC (2005-2009).
Jonathan Davis (1968)
Year of Election or Appointment: 2010
Assistant Treasurer
Mr. Davis also serves as Assistant Treasurer of other funds. Mr. Davis serves as Assistant Treasurer of FMR Capital, Inc. (2017-present) and is an employee of Fidelity Investments. Previously, Mr. Davis served as Vice President and Associate General Counsel of FMR LLC (diversified financial services company, 2003-2010).
Adrien E. Deberghes (1967)
Year of Election or Appointment: 2016
Assistant Treasurer
Mr. Deberghes also serves as an officer of other funds. He serves as Assistant Treasurer of FMR Capital, Inc. (2017-present), Executive Vice President of Fidelity Investments Money Management, Inc. (FIMM) (investment adviser firm, 2016-present), and is an employee of Fidelity Investments (2008-present). Prior to joining Fidelity Investments, Mr. Deberghes was Senior Vice President of Mutual Fund Administration at State Street Corporation (2007-2008), Senior Director of Mutual Fund Administration at Investors Bank & Trust (2005-2007), and Director of Finance for Dunkin' Brands (2000-2005). Previously, Mr. Deberghes served in other fund officer roles.
Stephanie J. Dorsey (1969)
Year of Election or Appointment: 2010
Assistant Treasurer
Ms. Dorsey also serves as an officer of other funds. Ms. Dorsey serves as Assistant Treasurer of FMR Capital, Inc. (2017-present), is an employee of Fidelity Investments (2008-present), and has served in other fund officer roles. Prior to joining Fidelity Investments, Ms. Dorsey served as Treasurer (2004-2008) of the JPMorgan Mutual Funds and Vice President (2004-2008) of JPMorgan Chase Bank.
Howard J. Galligan III (1966)
Year of Election or Appointment: 2014
Chief Financial Officer
Mr. Galligan also serves as Chief Financial Officer of other funds. Mr. Galligan serves as President of Fidelity Pricing and Cash Management Services (FPCMS) (2014-present) and as a Director of Strategic Advisers, Inc. (investment adviser firm, 2008-present). Previously, Mr. Galligan served as Chief Administrative Officer of Asset Management (2011-2014) and Chief Operating Officer and Senior Vice President of Investment Support for Strategic Advisers, Inc. (2003-2011).
Thomas C. Hense (1964)
Year of Election or Appointment: 2008, 2010, or 2015
Vice President
Mr. Hense serves as Vice President of Fidelity Advisor® Multi-Asset Income Fund (2015) and other funds (High Income (2008), Small Cap (2008), and Value (2010) funds), and is an employee of Fidelity Investments (1993-present). Previously, Mr. Hense served as a portfolio manager for Fidelity's Institutional Money Management Group (Pyramis) (2003-2008).
Brian B. Hogan (1964)
Year of Election or Appointment: 2009
Vice President
Mr. Hogan also serves as Trustee or Vice President of other funds. Mr. Hogan serves as a Director of FMR Investment Management (UK) Limited (investment adviser firm, 2015-present) and Fidelity SelectCo, LLC (investment adviser firm, 2014-present) and President of the Equity Division of FMR (investment adviser firm, 2009-present). Previously, Mr. Hogan served as Senior Vice President, Equity Research of FMR (2006-2009) and as a portfolio manager. Mr. Brian B. Hogan is not related to Mr. Colm A. Hogan.
Colm A. Hogan (1973)
Year of Election or Appointment: 2016
Deputy Treasurer
Mr. Hogan also serves as an officer of other funds. Mr. Hogan serves as Assistant Treasurer of FMR Capital, Inc. (2017-present) and is an employee of Fidelity Investments (2005-present). Mr. Colm A. Hogan is not related to Mr. Brian B. Hogan.
Chris Maher (1972)
Year of Election or Appointment: 2013
Assistant Treasurer
Mr. Maher serves as Assistant Treasurer of other funds. Mr. Maher is Vice President of Valuation Oversight, serves as Assistant Treasurer of FMR Capital, Inc. (2017-present), and is an employee of Fidelity Investments. Previously, Mr. Maher served as Vice President of Asset Management Compliance (2013), Vice President of the Program Management Group of FMR (investment adviser firm, 2010-2013), and Vice President of Valuation Oversight (2008-2010).
Rieco E. Mello (1969)
Year of Election or Appointment: 2017
Assistant Treasurer
Mr. Mello also serves as Assistant Treasurer of other funds. Mr. Mello serves as Assistant Treasurer of FMR Capital, Inc. (2017-present) and is an employee of Fidelity Investments (1995-present).
Kenneth B. Robins (1969)
Year of Election or Appointment: 2016
Chief Compliance Officer
Mr. Robins also serves as an officer of other funds. Mr. Robins serves as Compliance Officer of Fidelity Management & Research Company and FMR Co., Inc. (investment adviser firms, 2016-present) and is an employee of Fidelity Investments (2004-present). Previously, Mr. Robins served as Executive Vice President of Fidelity Investments Money Management, Inc. (investment adviser firm, 2013-2016) and served in other fund officer roles.
Stacie M. Smith (1974)
Year of Election or Appointment: 2016
President and Treasurer
Ms. Smith also serves as an officer of other funds. Ms. Smith serves as Assistant Treasurer of FMR Capital, Inc. (2017-present), is an employee of Fidelity Investments (2009-present), and has served in other fund officer roles. Prior to joining Fidelity Investments, Ms. Smith served as Senior Audit Manager of Ernst & Young LLP (accounting firm, 1996-2009). Previously, Ms. Smith served as Deputy Treasurer of certain Fidelity® funds (2013-2016).
Marc L. Spector (1972)
Year of Election or Appointment: 2016
Assistant Treasurer
Mr. Spector also serves as an officer of other funds. Mr. Spector serves as Assistant Treasurer of FMR Capital, Inc. (2017-present) and is an employee of Fidelity Investments (2016-present). Prior to joining Fidelity Investments, Mr. Spector served as Director at the Siegfried Group (accounting firm, 2013-2016), and prior to Siegfried Group as audit senior manager at Deloitte & Touche (accounting firm, 2005-2013).
Renee Stagnone (1975)
Year of Election or Appointment: 2016
Assistant Treasurer
Ms. Stagnone also serves as an officer of other funds. Ms. Stagnone serves as Assistant Treasurer of FMR Capital, Inc. (2017-present) and is an employee of Fidelity Investments (1997-present). Previously, Ms. Stagnone served as Deputy Treasurer of certain Fidelity® funds (2013-2016).
Shareholder Expense Example
As a shareholder of the Fund, you incur two types of costs: (1) transaction costs, including sales charges (loads) on purchase payments or redemption proceeds, and (2) ongoing costs, including distribution and/or service (12b-1) fees and other Fund expenses. This Example is intended to help you understand your ongoing costs (in dollars) of investing in the Fund and to compare these costs with the ongoing costs of investing in other mutual funds.
The Example is based on an investment of $1,000 invested at the beginning of the period and held for the entire period (June 1, 2017 to November 30, 2017).
Actual Expenses
The first line of the accompanying table for each class of the Fund provides information about actual account values and actual expenses. You may use the information in this line, together with the amount you invested, to estimate the expenses that you paid over the period. Simply divide your account value by $1,000.00 (for example, an $8,600 account value divided by $1,000.00 = 8.6), then multiply the result by the number in the first line for a class of the Fund under the heading entitled "Expenses Paid During Period" to estimate the expenses you paid on your account during this period. In addition, the Fund, as a shareholder in the underlying Fidelity Central Funds, will indirectly bear its pro-rata share of the fees and expenses incurred by the underlying Fidelity Central Funds. These fees and expenses are not included in the Fund's annualized expense ratio used to calculate the expense estimate in the table below.
Hypothetical Example for Comparison Purposes
The second line of the accompanying table for each class of the Fund provides information about hypothetical account values and hypothetical expenses based on a Class' actual expense ratio and an assumed rate of return of 5% per year before expenses, which is not the Class' actual return. The hypothetical account values and expenses may not be used to estimate the actual ending account balance or expenses you paid for the period. You may use this information to compare the ongoing costs of investing in the Fund and other funds. To do so, compare this 5% hypothetical example with the 5% hypothetical examples that appear in the shareholder reports of the other funds. In addition, the Fund, as a shareholder in the underlying Fidelity Central Funds, will indirectly bear its pro-rata share of the fees and expenses incurred by the underlying Fidelity Central Funds. These fees and expenses are not included in the Fund's annualized expense ratio used to calculate the expense estimate in the table below.
Please note that the expenses shown in the table are meant to highlight your ongoing costs only and do not reflect any transaction costs. Therefore, the second line of the table is useful in comparing ongoing costs only, and will not help you determine the relative total costs of owning different funds. In addition, if these transactional costs were included, your costs would have been higher.
| Annualized Expense Ratio-A | Beginning Account Value June 1, 2017 | Ending Account Value November 30, 2017 | Expenses Paid During Period-B June 1, 2017 to November 30, 2017 | |
| Class A | .99% | |||
| Actual | $1,000.00 | $1,098.40 | $5.21 | |
| Hypothetical-C | $1,000.00 | $1,020.10 | $5.01 | |
| Class M | 1.23% | |||
| Actual | $1,000.00 | $1,097.60 | $6.47 | |
| Hypothetical-C | $1,000.00 | $1,018.90 | $6.23 | |
| Class C | 1.75% | |||
| Actual | $1,000.00 | $1,094.10 | $9.19 | |
| Hypothetical-C | $1,000.00 | $1,016.29 | $8.85 | |
| Class I | .73% | |||
| Actual | $1,000.00 | $1,100.20 | $3.84 | |
| Hypothetical-C | $1,000.00 | $1,021.41 | $3.70 | |
| Class Z | .58% | |||
| Actual | $1,000.00 | $1,100.70 | $3.05 | |
| Hypothetical-C | $1,000.00 | $1,022.16 | $2.94 |
A Annualized expense ratio reflects expenses net of applicable fee waivers.
B Expenses are equal to each Class' annualized expense ratio, multiplied by the average account value over the period, multiplied by 183/365 (to reflect the one-half year period).
C 5% return per year before expenses
Distributions (Unaudited)
The Board of Trustees of Fidelity Advisor Small Cap Fund voted to pay to shareholders of record at the opening of business on record date, the following distributions per share derived from capital gains realized from sales of portfolio securities.
| Pay Date | Record Date | Capital Gains | |
| Fidelity Advisor Small Cap Fund | |||
| Class A | 12/27/17 | 12/26/17 | $3.570 |
| Class M | 12/27/17 | 12/26/17 | $3.570 |
| Class C | 12/27/17 | 12/26/17 | $3.570 |
| Class I | 12/27/17 | 12/26/17 | $3.570 |
| Class Z | 12/27/17 | 12/26/17 | $3.570 |
The fund hereby designates as a capital gain dividend with respect to the taxable year ended November 30, 2017, $346,654,877, or, if subsequently determined to be different, the net capital gain of such year.
Class A designates 100%, Class M designates 100%, Class I designates 72% and Class Z designates 55% of the dividends distributed during the fiscal year as qualifying for the dividends–received deduction for corporate shareholders.
Class A, Class M, Class I and Class Z designate 100% of the dividends distributed during the fiscal year as amounts which may be taken into account as a dividend for purposes of the maximum rate under section 1(h)(11) of the Internal Revenue Code.
The fund will notify shareholders in January 2018 of amounts for use in preparing 2017 income tax returns.
Board Approval of Investment Advisory Contracts and Management Fees
Fidelity Advisor Small Cap Fund
Each year, the Board of Trustees, including the Independent Trustees (together, the Board), votes on the renewal of the management contract with Fidelity Management & Research Company (FMR) and the sub-advisory agreements (together, the Advisory Contracts) for the fund. FMR and the sub-advisers are referred to herein as the Investment Advisers. The Board, assisted by the advice of fund counsel and Independent Trustees' counsel, requests and considers a broad range of information relevant to the renewal of the Advisory Contracts throughout the year.
The Board meets regularly and, at each of its meetings, covers an extensive agenda of topics and materials and considers factors that are relevant to its annual consideration of the renewal of the fund's Advisory Contracts, including the services and support provided to the fund and its shareholders. The Board has established various standing committees (Committees), each composed of and chaired by Independent Trustees with varying backgrounds, to which the Board has assigned specific subject matter responsibilities in order to enhance effective decision-making by the Board. The Board, acting directly and through its Committees, requests and receives information concerning the annual consideration of the renewal of the fund's Advisory Contracts. The Board also meets as needed to review matters specifically related to the Board's annual consideration of the renewal of the Advisory Contracts. Members of the Board may also meet with trustees of other Fidelity funds through ad hoc joint committees to discuss certain matters relevant to all of the Fidelity funds.
At its July 2017 meeting, the Board unanimously determined to renew the fund's Advisory Contracts. In reaching its determination, the Board considered all factors it believed relevant, including (i) the nature, extent, and quality of the services to be provided to the fund and its shareholders (including the investment performance of the fund); (ii) the competitiveness of the fund's management fee and total expense ratio relative to peer funds; (iii) the total costs of the services to be provided by and the profits to be realized by Fidelity from its relationships with the fund; and (iv) the extent to which, if any, economies of scale exist and would be realized as the fund grows, and whether any economies of scale are appropriately shared with fund shareholders.
In considering whether to renew the Advisory Contracts for the fund, the Board reached a determination, with the assistance of fund counsel and Independent Trustees' counsel and through the exercise of its business judgment, that the renewal of the Advisory Contracts was in the best interests of the fund and its shareholders and that the compensation payable under the Advisory Contracts was fair and reasonable. The Board's decision to renew the Advisory Contracts was not based on any single factor, but rather was based on a comprehensive consideration of all the information provided to the Board at its meetings throughout the year. The Board, in reaching its determination to renew the Advisory Contracts, was aware that shareholders of the fund have a broad range of investment choices available to them, including a wide choice among funds offered by Fidelity's competitors, and that the fund's shareholders, who have the opportunity to review and weigh the disclosure provided by the fund in its prospectus and other public disclosures, have chosen to invest in this fund, which is part of the Fidelity family of funds.
Amendment to Group Fee Rate. The Board also approved an amendment to the management contract for the fund to add an additional breakpoint to the group fee schedule, effective October 1, 2017. The Board noted that the additional breakpoint would result in lower management fee rates as Fidelity's assets under management increase.
Nature, Extent, and Quality of Services Provided. The Board considered Fidelity's staffing as it relates to the fund, including the backgrounds of investment personnel of Fidelity, and also considered the fund's investment objective, strategies, and related investment philosophy. The Independent Trustees also had discussions with senior management of Fidelity's investment operations and investment groups. The Board considered the structure of the investment personnel compensation program and whether this structure provides appropriate incentives to act in the best interests of the fund. Additionally, the Board considered the portfolio managers' investments, if any, in the funds that they manage.Resources Dedicated to Investment Management and Support Services. The Board and the Fund Oversight and Research Committees reviewed the general qualifications and capabilities of Fidelity's investment staff, including its size, education, experience, and resources, as well as Fidelity's approach to recruiting, training, managing, and compensating investment personnel. The Board noted that Fidelity has continued to increase the resources devoted to non-U.S. offices, including expansion of Fidelity's global investment organization. The Board also noted that Fidelity's analysts have extensive resources, tools and capabilities that allow them to conduct sophisticated quantitative and fundamental analysis, as well as credit analysis of issuers, counterparties and guarantors. Further, the Board considered that Fidelity's investment professionals have sufficient access to global information and data so as to provide competitive investment results over time, and that those professionals also have access to sophisticated tools that permit them to assess portfolio construction and risk and performance attribution characteristics continuously, as well as to transmit new information and research conclusions rapidly around the world. Additionally, in its deliberations, the Board considered Fidelity's trading, risk management, compliance, and technology and operations capabilities and resources, which are integral parts of the investment management process.Shareholder and Administrative Services. The Board considered (i) the nature, extent, quality, and cost of advisory, administrative, and shareholder services performed by the Investment Advisers and their affiliates under the Advisory Contracts and under separate agreements covering transfer agency, pricing and bookkeeping, and securities lending services for the fund; (ii) the nature and extent of the supervision of third party service providers, principally custodians, subcustodians, and pricing vendors; and (iii) the resources devoted to, and the record of compliance with, the fund's compliance policies and procedures. The Board also reviewed the allocation of fund brokerage, including allocations to brokers affiliated with the Investment Advisers, the use of brokerage commissions to pay fund expenses, and the use of "soft" commission dollars to pay for research services.The Board noted that the growth of fund assets over time across the complex allows Fidelity to reinvest in the development of services designed to enhance the value or convenience of the Fidelity funds as investment vehicles. These services include 24-hour access to account information and market information through telephone representatives and over the Internet, investor education materials and asset allocation tools, and the expanded availability of Fidelity Investor Centers.In 2014, the Board formed an ad hoc Committee on Transfer Agency Fees to review the variety of transfer agency fee structures throughout the industry and Fidelity's competitive positioning with respect to industry participants.Investment in a Large Fund Family. The Board considered the benefits to shareholders of investing in a Fidelity fund, including the benefits of investing in a fund that is part of a large family of funds offering a variety of investment disciplines and providing a large variety of mutual fund investor services. The Board noted that Fidelity had taken, or had made recommendations that resulted in the Fidelity funds taking, a number of actions over the previous year that benefited particular funds, including: (i) continuing to dedicate additional resources to Fidelity's investment research process, and to the support of the senior management team that oversees asset management; (ii) continuing efforts to enhance Fidelity's global research capabilities; (iii) launching new funds and making other enhancements to meet client needs; (iv) launching new share classes of existing funds; (v) eliminating purchase minimums and broadening eligibility requirements for certain lower-priced share classes; (vi) reducing management fees and total expenses for certain growth equity funds and index funds; (vii) lowering expense caps for certain existing funds and classes to reduce expenses borne by shareholders; (viii) eliminating short-term redemption fees for certain funds; (ix) introducing a new pricing structure for certain funds of funds that is expected to reduce overall expenses paid by shareholders; (x) rationalizing product lines and gaining increased efficiencies through proposals for fund mergers and share class consolidations; (xi) continuing to develop, acquire and implement systems and technology to improve services to the funds and shareholders, strengthen information security, and increase efficiency; and (xii) implementing enhancements to further strengthen Fidelity's product line to increase investors' probability of success in achieving their investment goals, including retirement income goals.Investment Performance. The Board considered whether the fund has operated in accordance with its investment objective, as well as its record of compliance with its investment restrictions and its performance history.The Board took into account discussions with representatives of the Investment Advisers about fund investment performance that occur at Board meetings throughout the year. In this regard the Board noted that as part of regularly scheduled fund reviews and other reports to the Board on fund performance, the Board considers annualized return information for the fund for different time periods, measured against a securities market index ("benchmark index") and a peer group of funds with similar objectives ("peer group"), if any. In its evaluation of fund investment performance, the Board gave particular attention to information indicating changes in performance of certain Fidelity funds for specific time periods and discussed with the Investment Advisers the reasons for any overperformance or underperformance.In addition to reviewing absolute and relative fund performance, the Independent Trustees periodically consider the appropriateness of fund performance metrics in evaluating the results achieved. In general, the Independent Trustees believe that fund performance should be evaluated based on net performance (after fees and expenses) of both the highest performing and lowest performing fund share classes, where applicable, compared to appropriate benchmark indices, over appropriate time periods that may include full market cycles, and compared to peer groups, as applicable, over the same periods, taking into account relevant factors including the following: general market conditions; issuer-specific information; and fund cash flows and other factors.The Independent Trustees recognize that shareholders evaluate performance on a net basis over their own holding periods, for which one-, three-, and five-year periods are often used as a proxy. For this reason, the performance information reviewed by the Board also included net cumulative calendar year total return information for the fund and an appropriate benchmark index and peer group for the most recent one-, three-, and five-year periods, as shown below. Returns are shown compared to the 25th percentile (top of box, 75% beaten) and 75th percentile (bottom of box, 25% beaten) of the peer universe.Fidelity Advisor Small Cap Fund
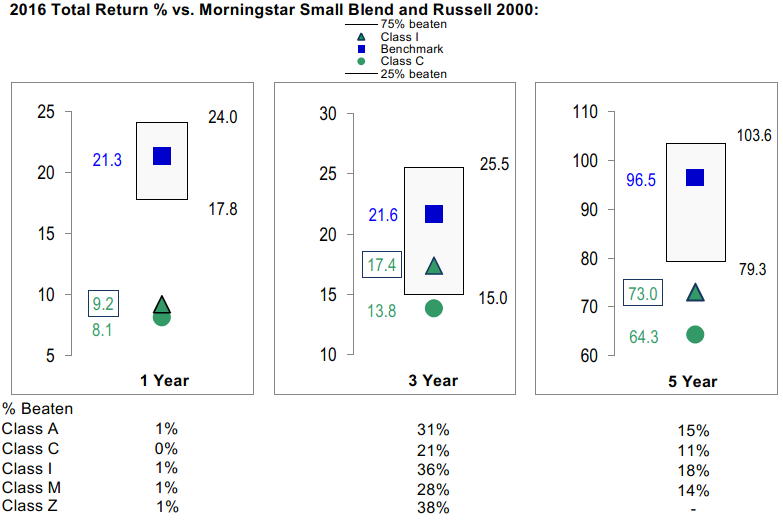
Fidelity Advisor Small Cap Fund
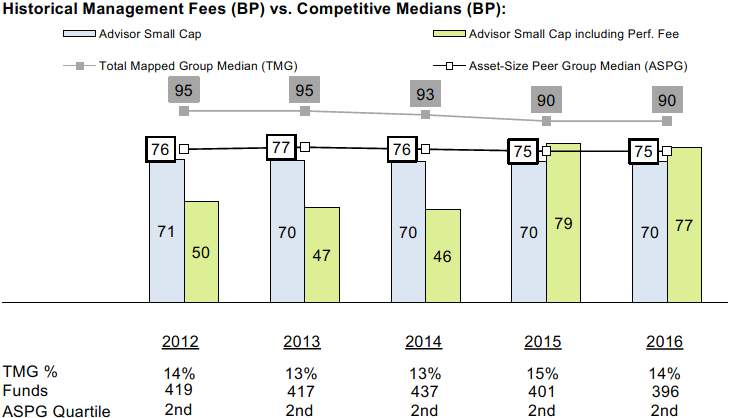
![]()
ASCF-ANN-0118
1.713164.120
Fidelity Advisor® Stock Selector Mid Cap Fund Class A, Class M (formerly Class T), Class C, Class I and Class Z Annual Report November 30, 2017 |
|
Contents
Board Approval of Investment Advisory Contracts and Management Fees |
To view a fund's proxy voting guidelines and proxy voting record for the 12-month period ended June 30, visit http://www.fidelity.com/proxyvotingresults or visit the Securities and Exchange Commission's (SEC) web site at http://www.sec.gov.
You may also call 1-877-208-0098 to request a free copy of the proxy voting guidelines.
Standard & Poor's, S&P and S&P 500 are registered service marks of The McGraw-Hill Companies, Inc. and have been licensed for use by Fidelity Distributors Corporation.
Other third-party marks appearing herein are the property of their respective owners.
All other marks appearing herein are registered or unregistered trademarks or service marks of FMR LLC or an affiliated company. © 2018 FMR LLC. All rights reserved.
This report and the financial statements contained herein are submitted for the general information of the shareholders of the Fund. This report is not authorized for distribution to prospective investors in the Fund unless preceded or accompanied by an effective prospectus.
A fund files its complete schedule of portfolio holdings with the SEC for the first and third quarters of each fiscal year on Form N-Q. Forms N-Q are available on the SEC’s web site at http://www.sec.gov. A fund's Forms N-Q may be reviewed and copied at the SEC’s Public Reference Room in Washington, DC. Information regarding the operation of the SEC's Public Reference Room may be obtained by calling 1-800-SEC-0330.
For a complete list of a fund's portfolio holdings, view the most recent holdings listing, semiannual report, or annual report on Fidelity's web site at http://www.fidelity.com, http://www.institutional.fidelity.com, or http://www.401k.com, as applicable.
NOT FDIC INSURED •MAY LOSE VALUE •NO BANK GUARANTEE
Neither the Fund nor Fidelity Distributors Corporation is a bank.
Performance: The Bottom Line
Average annual total return reflects the change in the value of an investment, assuming reinvestment of distributions from dividend income and capital gains (the profits earned upon the sale of securities that have grown in value, if any) and assuming a constant rate of performance each year. The hypothetical investment and the average annual total returns do not reflect the deduction of taxes that a shareholder would pay on fund distributions or the redemption of fund shares. During periods of reimbursement by Fidelity, a fund’s total return will be greater than it would be had the reimbursement not occurred. How a fund did yesterday is no guarantee of how it will do tomorrow.
Average Annual Total Returns
| For the periods ended November 30, 2017 | Past 1 year | Past 5 years | Past 10 years |
| Class A (incl. 5.75% sales charge) | 13.71% | 11.81% | 5.25% |
| Class M (incl. 3.50% sales charge) | 16.15% | 12.07% | 5.28% |
| Class C (incl. contingent deferred sales charge) | 18.72% | 12.28% | 5.09% |
| Class I | 20.92% | 13.40% | 6.16% |
| Class Z | 21.10% | 13.43% | 6.18% |
Class C shares' contingent deferred sales charges included in the past one year, past five years and past ten years total return figures are 1%, 0% and 0%, respectively.
The initial offering of Class Z shares took place on February 1, 2017. Returns prior to February 1, 2017, are those of Class I.
$10,000 Over 10 Years
Let's say hypothetically that $10,000 was invested in Fidelity Advisor® Stock Selector Mid Cap Fund - Class A on November 30, 2007, and the current 5.75% sales charge was paid.
The chart shows how the value of your investment would have changed, and also shows how the S&P MidCap 400® Index performed over the same period.
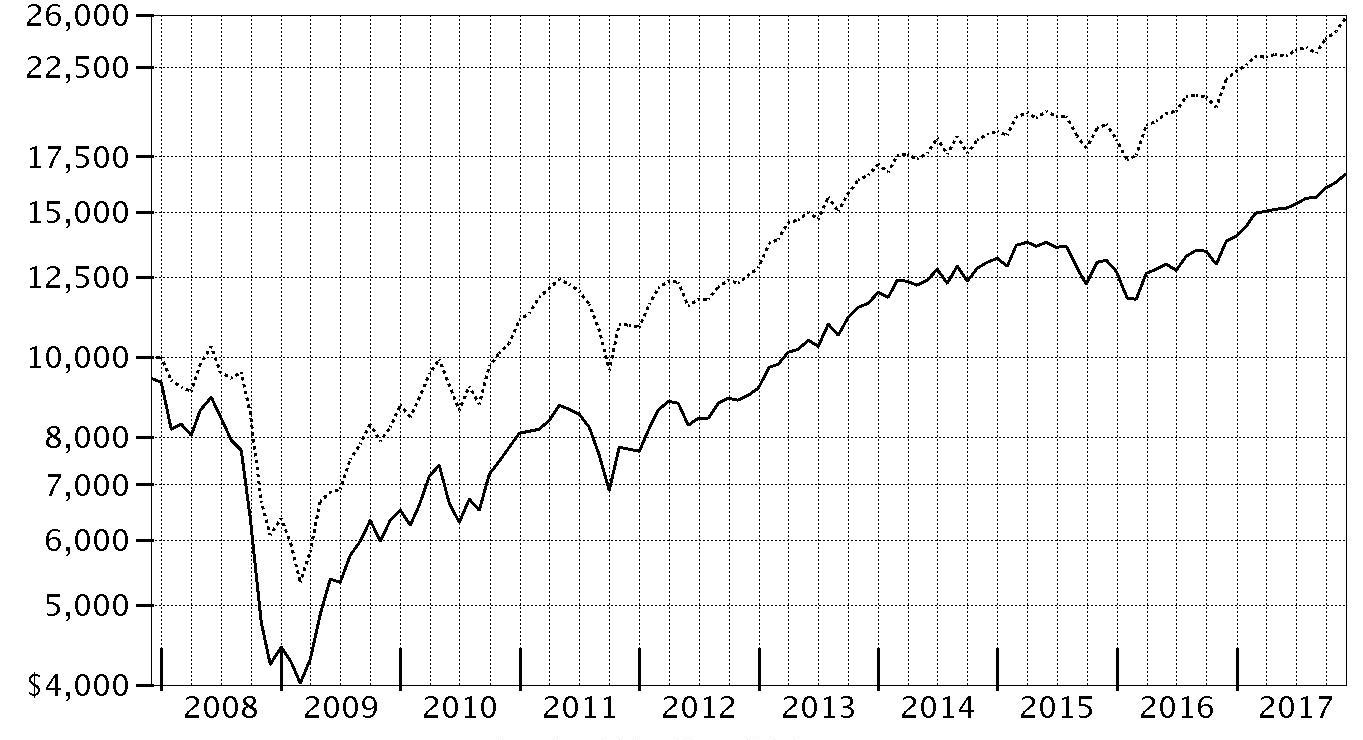
| Period Ending Values | ||
| $16,676 | Fidelity Advisor® Stock Selector Mid Cap Fund - Class A | |
| $25,751 | S&P MidCap 400® Index | |
Management's Discussion of Fund Performance
Market Recap: The U.S. equity bellwether S&P 500® index gained 22.87% for the year ending November 30, 2017, rising steadily and closing the period at an all-time high after a particularly strong three-month finish. Early on, equities rallied on optimism for President Trump’s pro-business agenda but leveled off in March amid fading optimism and stalled efforts by Congress to repeal and replace the Affordable Care Act. Upward momentum soon returned and continued through period end with consumer sentiment and other market indicators staying positive. The lone exception was a brief cooldown in August, when geopolitical tension escalated and uncertainty grew regarding the future of health care, tax reform and the debt ceiling. Sector-wise, info tech (+41%) led by a wide margin, surging amid strong earnings growth from several major index constituents. Utilities and financials each gained about 25%, the latter group riding an uptick in bond yields. Conversely, consumer discretionary (+20%) also rose solidly but lagged the broader market, as many brick-and-mortar retailers continued to suffer from increased online competition. Rising interest rates held back real estate (+16%), while consumer staples (+15%) and telecom (+1%) struggled due to investors’ general preference for risk assets. Lastly, sluggish oil prices pushed energy to a -4% return.Comments from Co-Portfolio Manager Robert Stansky: For the fiscal year, the fund’s share classes (excluding sales charges, if applicable) gained roughly 20% to 21%, outpacing the 18.53% rise of the benchmark S&P MidCap 400® Index. Versus the benchmark, stock selection in financials, materials and information technology contributed most. Overall, active management added value in 10 of eleven sectors. The top relative contributor was a non-benchmark stake in Aerojet Rocketdyne Holdings, a manufacturer of rocket propulsion systems. In August, the company announced that both net sales and net income were well ahead of year-earlier quarterly results. Overweighting homebuilder NVR and a non-benchmark position in Stamps.com further aided relative results. Conversely, positioning in consumer discretionary detracted modestly, as did a small cash position in a rising market. Not owning strong-performing index name Cognex hurt relative results. The company makes machine-vision products. Lastly, untimely ownership of Netherlands-based Chicago Bridge & Iron, a provider of engineering and construction services, detracted while held in the fund. We exited this position.The views expressed above reflect those of the portfolio manager(s) only through the end of the period as stated on the cover of this report and do not necessarily represent the views of Fidelity or any other person in the Fidelity organization. Any such views are subject to change at any time based upon market or other conditions and Fidelity disclaims any responsibility to update such views. These views may not be relied on as investment advice and, because investment decisions for a Fidelity fund are based on numerous factors, may not be relied on as an indication of trading intent on behalf of any Fidelity fund.
Note to shareholders: On April 13, 2017, Robert Stansky joined the portfolio management team as Group Leader and Co-Manager, responsible for overall risk management, sector rebalancing and maintaining a disciplined portfolio construction process.Investment Summary (Unaudited)
Top Ten Stocks as of November 30, 2017
| % of fund's net assets | % of fund's net assets 6 months ago | |
| Capital One Financial Corp. | 2.4 | 1.6 |
| Huntington Bancshares, Inc. | 2.2 | 1.7 |
| AECOM | 1.7 | 1.6 |
| Steel Dynamics, Inc. | 1.3 | 1.5 |
| American Airlines Group, Inc. | 1.2 | 1.2 |
| OneMain Holdings, Inc. | 1.1 | 0.7 |
| Bank of the Ozarks, Inc. | 1.1 | 0.0 |
| Signature Bank | 1.0 | 0.3 |
| E*TRADE Financial Corp. | 1.0 | 0.5 |
| Arthur J. Gallagher & Co. | 1.0 | 1.0 |
| 14.0 |
Top Five Market Sectors as of November 30, 2017
| % of fund's net assets | % of fund's net assets 6 months ago | |
| Information Technology | 17.0 | 17.4 |
| Financials | 16.4 | 15.6 |
| Industrials | 14.4 | 12.5 |
| Consumer Discretionary | 13.0 | 12.8 |
| Real Estate | 9.5 | 9.9 |
Asset Allocation (% of fund's net assets)
| As of November 30, 2017* | ||
| Stocks and Equity Futures | 98.5% | |
| Short-Term Investments and Net Other Assets (Liabilities) | 1.5% | |

* Foreign investments - 7.0%
| As of May 31, 2017* | ||
| Stocks and Equity Futures | 96.5% | |
| Short-Term Investments and Net Other Assets (Liabilities) | 3.5% | |

* Foreign investments - 7.4%
Percentages shown as 0.0% may reflect amounts less than 0.05%.
Investments November 30, 2017
Showing Percentage of Net Assets
| Common Stocks - 97.7% | |||
| Shares | Value (000s) | ||
| CONSUMER DISCRETIONARY - 13.0% | |||
| Auto Components - 0.8% | |||
| Gentex Corp. | 736,300 | $15,079 | |
| Hertz Global Holdings, Inc. (a)(b) | 84,983 | 1,610 | |
| The Goodyear Tire & Rubber Co. | 149,100 | 4,826 | |
| 21,515 | |||
| Distributors - 0.5% | |||
| LKQ Corp. (a) | 301,900 | 11,901 | |
| Diversified Consumer Services - 1.9% | |||
| Graham Holdings Co. | 23,900 | 13,936 | |
| Grand Canyon Education, Inc. (a) | 115,300 | 10,949 | |
| ServiceMaster Global Holdings, Inc. (a) | 474,856 | 23,211 | |
| 48,096 | |||
| Hotels, Restaurants & Leisure - 0.8% | |||
| ARAMARK Holdings Corp. | 196,000 | 8,350 | |
| Brinker International, Inc. (b) | 168,500 | 6,189 | |
| U.S. Foods Holding Corp. (a) | 187,500 | 5,460 | |
| 19,999 | |||
| Household Durables - 1.0% | |||
| NVR, Inc. (a) | 7,300 | 25,368 | |
| Internet & Direct Marketing Retail - 0.3% | |||
| Liberty Interactive Corp. QVC Group (Venture Group) Series A (a) | 123,040 | 6,867 | |
| Media - 2.7% | |||
| Cinemark Holdings, Inc. | 532,400 | 19,225 | |
| Discovery Communications, Inc. Class A (a)(b) | 151,000 | 2,872 | |
| Interpublic Group of Companies, Inc. | 388,600 | 7,687 | |
| Liberty Broadband Corp. Class A (a) | 124,800 | 10,697 | |
| Omnicom Group, Inc. | 133,300 | 9,523 | |
| Scripps Networks Interactive, Inc. Class A | 121,300 | 9,927 | |
| The Madison Square Garden Co. (a) | 47,800 | 10,356 | |
| 70,287 | |||
| Multiline Retail - 0.9% | |||
| Dollar General Corp. | 111,000 | 9,777 | |
| Dollar Tree, Inc. (a) | 135,300 | 13,903 | |
| 23,680 | |||
| Specialty Retail - 2.6% | |||
| AutoZone, Inc. (a) | 16,500 | 11,332 | |
| Foot Locker, Inc. | 118,200 | 5,064 | |
| L Brands, Inc. | 75,000 | 4,205 | |
| O'Reilly Automotive, Inc. (a) | 45,400 | 10,724 | |
| Ross Stores, Inc. | 275,200 | 20,923 | |
| Williams-Sonoma, Inc. (b) | 268,700 | 13,747 | |
| 65,995 | |||
| Textiles, Apparel & Luxury Goods - 1.5% | |||
| Carter's, Inc. | 150,900 | 16,345 | |
| PVH Corp. | 99,800 | 13,428 | |
| Tapestry, Inc. | 203,400 | 8,480 | |
| 38,253 | |||
| TOTAL CONSUMER DISCRETIONARY | 331,961 | ||
| CONSUMER STAPLES - 3.4% | |||
| Beverages - 0.4% | |||
| Coca-Cola European Partners PLC | 115,700 | 4,511 | |
| Dr. Pepper Snapple Group, Inc. | 58,600 | 5,285 | |
| 9,796 | |||
| Food Products - 2.2% | |||
| ConAgra Foods, Inc. | 74,900 | 2,796 | |
| Hostess Brands, Inc. Class A (a) | 427,610 | 6,012 | |
| Ingredion, Inc. | 111,900 | 15,496 | |
| Lamb Weston Holdings, Inc. | 218,300 | 11,869 | |
| Pinnacle Foods, Inc. | 92,200 | 5,369 | |
| The J.M. Smucker Co. | 37,800 | 4,410 | |
| The Simply Good Foods Co. | 728,300 | 9,643 | |
| 55,595 | |||
| Household Products - 0.6% | |||
| Church & Dwight Co., Inc. | 126,600 | 5,962 | |
| Energizer Holdings, Inc. (b) | 167,800 | 7,707 | |
| Spectrum Brands Holdings, Inc. (b) | 26,300 | 3,021 | |
| 16,690 | |||
| Personal Products - 0.2% | |||
| Coty, Inc. Class A | 236,200 | 4,070 | |
| TOTAL CONSUMER STAPLES | 86,151 | ||
| ENERGY - 3.9% | |||
| Energy Equipment & Services - 0.9% | |||
| Dril-Quip, Inc. (a) | 192,200 | 9,216 | |
| Ensco PLC Class A (b) | 1,456,700 | 7,822 | |
| Nabors Industries Ltd. | 1,143,100 | 6,904 | |
| 23,942 | |||
| Oil, Gas & Consumable Fuels - 3.0% | |||
| Cimarex Energy Co. | 77,700 | 9,022 | |
| Energen Corp. (a) | 321,000 | 18,124 | |
| HollyFrontier Corp. | 532,900 | 23,703 | |
| PDC Energy, Inc. (a) | 117,900 | 5,418 | |
| Whiting Petroleum Corp. (a) | 129,400 | 3,229 | |
| WPX Energy, Inc. (a) | 1,355,000 | 17,168 | |
| 76,664 | |||
| TOTAL ENERGY | 100,606 | ||
| FINANCIALS - 16.4% | |||
| Banks - 5.8% | |||
| Bank of the Ozarks, Inc. | 581,500 | 28,040 | |
| CIT Group, Inc. | 202,036 | 10,069 | |
| Huntington Bancshares, Inc. | 3,799,106 | 54,707 | |
| Signature Bank (a) | 192,100 | 26,371 | |
| Synovus Financial Corp. | 466,027 | 23,129 | |
| The Jammu & Kashmir Bank Ltd. (a) | 3,777,961 | 4,329 | |
| 146,645 | |||
| Capital Markets - 3.0% | |||
| CBOE Holdings, Inc. | 134,800 | 16,638 | |
| E*TRADE Financial Corp. (a) | 545,400 | 26,256 | |
| Legg Mason, Inc. | 237,800 | 9,502 | |
| MSCI, Inc. | 167,000 | 21,493 | |
| Virtu Financial, Inc. Class A (b) | 164,000 | 2,673 | |
| 76,562 | |||
| Consumer Finance - 4.5% | |||
| Capital One Financial Corp. | 671,000 | 61,729 | |
| Navient Corp. | 75,000 | 946 | |
| OneMain Holdings, Inc. (a) | 1,128,414 | 29,124 | |
| SLM Corp. (a) | 2,090,562 | 24,188 | |
| 115,987 | |||
| Diversified Financial Services - 0.2% | |||
| On Deck Capital, Inc. (a) | 514,658 | 2,723 | |
| Quantenna Communications, Inc. (a) | 185,300 | 2,266 | |
| 4,989 | |||
| Insurance - 2.0% | |||
| Arthur J. Gallagher & Co. | 395,800 | 26,056 | |
| Direct Line Insurance Group PLC | 2,511,558 | 12,425 | |
| Employers Holdings, Inc. | 117,906 | 5,777 | |
| FNF Group | 165,200 | 6,684 | |
| 50,942 | |||
| Mortgage Real Estate Investment Trusts - 0.4% | |||
| Redwood Trust, Inc. | 675,500 | 10,146 | |
| Thrifts & Mortgage Finance - 0.5% | |||
| Essent Group Ltd. (a) | 181,300 | 8,023 | |
| LIC Housing Finance Ltd. | 430,966 | 3,887 | |
| 11,910 | |||
| TOTAL FINANCIALS | 417,181 | ||
| HEALTH CARE - 7.3% | |||
| Biotechnology - 0.4% | |||
| Bioverativ, Inc. | 224,000 | 11,204 | |
| Health Care Equipment & Supplies - 2.8% | |||
| Boston Scientific Corp. (a) | 620,000 | 16,294 | |
| Dentsply Sirona, Inc. | 118,000 | 7,907 | |
| DexCom, Inc. (a)(b) | 164,000 | 9,583 | |
| Insulet Corp. (a) | 172,000 | 12,338 | |
| Integra LifeSciences Holdings Corp. (a) | 240,000 | 11,669 | |
| Wright Medical Group NV (a) | 500,000 | 12,155 | |
| 69,946 | |||
| Health Care Providers & Services - 1.2% | |||
| Molina Healthcare, Inc. (a) | 100,000 | 7,824 | |
| Premier, Inc. (a) | 300,000 | 8,706 | |
| Teladoc, Inc. (a) | 400,000 | 14,840 | |
| 31,370 | |||
| Health Care Technology - 0.8% | |||
| Cerner Corp. (a) | 224,000 | 15,835 | |
| Evolent Health, Inc. (a)(b) | 400,000 | 5,140 | |
| 20,975 | |||
| Life Sciences Tools & Services - 1.0% | |||
| Bio-Rad Laboratories, Inc. Class A (a) | 72,000 | 19,534 | |
| Bruker Corp. | 160,000 | 5,629 | |
| 25,163 | |||
| Pharmaceuticals - 1.1% | |||
| Catalent, Inc. (a) | 100,000 | 3,979 | |
| Indivior PLC (a) | 1,290,000 | 6,469 | |
| Jazz Pharmaceuticals PLC (a) | 55,000 | 7,686 | |
| Mallinckrodt PLC (a) | 440,000 | 9,601 | |
| 27,735 | |||
| TOTAL HEALTH CARE | 186,393 | ||
| INDUSTRIALS - 14.4% | |||
| Aerospace & Defense - 1.5% | |||
| Aerojet Rocketdyne Holdings, Inc. (a) | 321,336 | 10,119 | |
| Axon Enterprise, Inc. (a)(b) | 208,800 | 5,195 | |
| Hexcel Corp. | 66,300 | 4,111 | |
| Orbital ATK, Inc. | 138,400 | 18,260 | |
| 37,685 | |||
| Airlines - 2.7% | |||
| American Airlines Group, Inc. | 618,470 | 31,227 | |
| JetBlue Airways Corp. (a) | 1,191,000 | 25,571 | |
| United Continental Holdings, Inc. (a) | 192,300 | 12,176 | |
| 68,974 | |||
| Building Products - 0.7% | |||
| Allegion PLC | 226,210 | 19,033 | |
| Construction & Engineering - 2.7% | |||
| AECOM (a) | 1,191,437 | 44,679 | |
| KBR, Inc. | 1,315,739 | 24,670 | |
| 69,349 | |||
| Electrical Equipment - 1.9% | |||
| AMETEK, Inc. | 169,272 | 12,304 | |
| Fortive Corp. | 156,800 | 11,705 | |
| Sensata Technologies Holding BV (a) | 467,076 | 23,330 | |
| 47,339 | |||
| Machinery - 1.5% | |||
| Allison Transmission Holdings, Inc. | 380,163 | 15,602 | |
| IDEX Corp. | 80,658 | 10,935 | |
| WABCO Holdings, Inc. (a) | 76,600 | 11,448 | |
| 37,985 | |||
| Marine - 0.0% | |||
| A.P. Moller - Maersk A/S Series B | 199 | 357 | |
| Road & Rail - 2.4% | |||
| AMERCO | 9,700 | 3,595 | |
| Avis Budget Group, Inc. (a) | 643,500 | 24,517 | |
| CSX Corp. | 301,400 | 16,803 | |
| Norfolk Southern Corp. | 119,000 | 16,497 | |
| 61,412 | |||
| Trading Companies & Distributors - 1.0% | |||
| HD Supply Holdings, Inc. (a) | 528,100 | 19,529 | |
| MRC Global, Inc. (a) | 306,605 | 4,817 | |
| 24,346 | |||
| TOTAL INDUSTRIALS | 366,480 | ||
| INFORMATION TECHNOLOGY - 17.0% | |||
| Communications Equipment - 0.8% | |||
| CommScope Holding Co., Inc. (a) | 265,800 | 9,566 | |
| F5 Networks, Inc. (a) | 75,030 | 10,069 | |
| 19,635 | |||
| Electronic Equipment & Components - 2.5% | |||
| Arrow Electronics, Inc. (a) | 129,000 | 10,414 | |
| IPG Photonics Corp. (a) | 66,000 | 15,113 | |
| Jabil, Inc. | 873,100 | 25,189 | |
| Largan Precision Co. Ltd. | 80,000 | 13,695 | |
| 64,411 | |||
| Internet Software & Services - 1.8% | |||
| Akamai Technologies, Inc. (a) | 202,200 | 11,279 | |
| GoDaddy, Inc. (a) | 249,400 | 12,133 | |
| NetEase, Inc. ADR | 6,100 | 2,005 | |
| Stamps.com, Inc. (a) | 116,700 | 19,652 | |
| Velti PLC (a)(c) | 215,084 | 0 | |
| 45,069 | |||
| IT Services - 4.5% | |||
| Capgemini SA | 141,300 | 16,294 | |
| Cognizant Technology Solutions Corp. Class A | 210,900 | 15,244 | |
| EPAM Systems, Inc. (a) | 131,900 | 13,380 | |
| FleetCor Technologies, Inc. (a) | 66,800 | 12,149 | |
| Global Payments, Inc. | 116,900 | 11,755 | |
| Jack Henry & Associates, Inc. | 106,900 | 12,328 | |
| Leidos Holdings, Inc. | 355,800 | 22,618 | |
| Maximus, Inc. | 158,400 | 10,942 | |
| 114,710 | |||
| Semiconductors & Semiconductor Equipment - 3.1% | |||
| Cirrus Logic, Inc. (a) | 27,100 | 1,497 | |
| Dialog Semiconductor PLC (a) | 310,600 | 11,263 | |
| Entegris, Inc. | 342,400 | 10,375 | |
| Integrated Device Technology, Inc. (a) | 195,200 | 5,874 | |
| Maxim Integrated Products, Inc. | 99,200 | 5,191 | |
| ON Semiconductor Corp. (a) | 588,500 | 11,817 | |
| Qorvo, Inc. (a) | 190,600 | 14,596 | |
| Semtech Corp. (a) | 235,700 | 8,026 | |
| Skyworks Solutions, Inc. | 109,000 | 11,417 | |
| 80,056 | |||
| Software - 4.3% | |||
| ANSYS, Inc. (a) | 67,300 | 9,973 | |
| Black Knight, Inc. (a) | 2,533 | 114 | |
| CDK Global, Inc. | 310,400 | 21,446 | |
| Fair Isaac Corp. | 89,800 | 14,104 | |
| Parametric Technology Corp. (a) | 269,700 | 17,174 | |
| Tableau Software, Inc. (a) | 162,600 | 11,431 | |
| Take-Two Interactive Software, Inc. (a) | 40,600 | 4,529 | |
| Ubisoft Entertainment SA (a) | 130,628 | 10,018 | |
| Ultimate Software Group, Inc. (a) | 92,600 | 19,541 | |
| 108,330 | |||
| TOTAL INFORMATION TECHNOLOGY | 432,211 | ||
| MATERIALS - 7.2% | |||
| Chemicals - 4.2% | |||
| Ashland Global Holdings, Inc. | 191,100 | 14,138 | |
| Axalta Coating Systems LLC (a) | 302,300 | 9,571 | |
| Olin Corp. | 539,600 | 19,231 | |
| PPG Industries, Inc. | 67,800 | 7,922 | |
| RPM International, Inc. | 300,700 | 15,928 | |
| The Chemours Co. LLC | 417,800 | 21,475 | |
| Valvoline, Inc. | 377,829 | 9,317 | |
| W.R. Grace & Co. | 118,797 | 8,709 | |
| 106,291 | |||
| Containers & Packaging - 1.7% | |||
| Greif, Inc. Class A | 109,700 | 5,986 | |
| Packaging Corp. of America | 130,000 | 15,418 | |
| Sealed Air Corp. | 83,400 | 4,007 | |
| Sonoco Products Co. | 352,600 | 18,868 | |
| 44,279 | |||
| Metals & Mining - 1.3% | |||
| Steel Dynamics, Inc. | 876,700 | 33,753 | |
| TOTAL MATERIALS | 184,323 | ||
| REAL ESTATE - 9.5% | |||
| Equity Real Estate Investment Trusts (REITs) - 9.1% | |||
| Altisource Residential Corp. Class B | 748,021 | 8,191 | |
| CareTrust (REIT), Inc. | 781,900 | 14,246 | |
| CoreSite Realty Corp. | 113,800 | 12,914 | |
| Corporate Office Properties Trust (SBI) | 651,600 | 19,770 | |
| Corrections Corp. of America | 381,696 | 8,974 | |
| DCT Industrial Trust, Inc. | 380,190 | 22,865 | |
| Douglas Emmett, Inc. | 426,300 | 17,184 | |
| Education Realty Trust, Inc. | 333,500 | 12,196 | |
| Equity Lifestyle Properties, Inc. | 146,500 | 13,230 | |
| Extra Space Storage, Inc. | 64,700 | 5,523 | |
| Healthcare Realty Trust, Inc. | 632,200 | 20,717 | |
| Hudson Pacific Properties, Inc. | 195,700 | 6,973 | |
| InfraReit, Inc. | 192,323 | 4,062 | |
| LaSalle Hotel Properties (SBI) | 388,900 | 11,060 | |
| Outfront Media, Inc. | 371,500 | 8,715 | |
| Potlatch Corp. | 125,400 | 6,471 | |
| SBA Communications Corp. Class A (a) | 21,870 | 3,712 | |
| Taubman Centers, Inc. | 154,100 | 9,044 | |
| Uniti Group, Inc. | 427,515 | 6,883 | |
| Urban Edge Properties | 275,868 | 7,048 | |
| VEREIT, Inc. | 1,613,600 | 12,586 | |
| 232,364 | |||
| Real Estate Management & Development - 0.4% | |||
| CBRE Group, Inc. (a) | 220,550 | 9,563 | |
| TOTAL REAL ESTATE | 241,927 | ||
| TELECOMMUNICATION SERVICES - 0.1% | |||
| Wireless Telecommunication Services - 0.1% | |||
| T-Mobile U.S., Inc. (a) | 50,150 | 3,063 | |
| UTILITIES - 5.5% | |||
| Electric Utilities - 2.7% | |||
| Great Plains Energy, Inc. | 741,900 | 25,455 | |
| Hawaiian Electric Industries, Inc. | 154,500 | 5,925 | |
| OGE Energy Corp. | 554,526 | 19,830 | |
| PNM Resources, Inc. | 75,000 | 3,413 | |
| Westar Energy, Inc. | 255,400 | 14,611 | |
| 69,234 | |||
| Gas Utilities - 1.8% | |||
| Atmos Energy Corp. | 217,040 | 20,031 | |
| National Fuel Gas Co. | 194,111 | 11,414 | |
| South Jersey Industries, Inc. | 395,300 | 13,385 | |
| 44,830 | |||
| Independent Power and Renewable Electricity Producers - 0.1% | |||
| NRG Energy, Inc. | 111,600 | 3,086 | |
| Multi-Utilities - 0.9% | |||
| Avangrid, Inc. | 275,800 | 14,637 | |
| MDU Resources Group, Inc. | 301,905 | 8,438 | |
| 23,075 | |||
| TOTAL UTILITIES | 140,225 | ||
| TOTAL COMMON STOCKS | |||
| (Cost $2,102,117) | 2,490,521 | ||
| Principal Amount (000s) | Value (000s) | ||
| U.S. Treasury Obligations - 0.1% | |||
| U.S. Treasury Bills, yield at date of purchase 1.03% to 1.09% 12/14/17 to 1/25/18 (d) | |||
| (Cost $839) | 840 | 839 | |
| Shares | Value (000s) | ||
| Money Market Funds - 4.2% | |||
| Fidelity Cash Central Fund, 1.13% (e) | 60,227,208 | $60,239 | |
| Fidelity Securities Lending Cash Central Fund 1.13% (e)(f) | 47,339,692 | 47,344 | |
| TOTAL MONEY MARKET FUNDS | |||
| (Cost $107,580) | 107,583 | ||
| TOTAL INVESTMENT IN SECURITIES - 102.0% | |||
| (Cost $2,210,536) | 2,598,943 | ||
| NET OTHER ASSETS (LIABILITIES) - (2.0)% | (49,729) | ||
| NET ASSETS - 100% | $2,549,214 |
| Futures Contracts | |||||
| Number of contracts | Expiration Date | Notional Amount (000s) | Value (000s) | Unrealized Appreciation/(Depreciation) (000s) | |
| Purchased | |||||
| Equity Index Contracts | |||||
| CME E-mini S&P MidCap 400 Index Contracts (United States) | 110 | Dec. 2017 | $20,900 | $840 | $840 |
The notional amount of futures purchased as a percentage of Net Assets is 0.8%
Values shown as $0 may reflect amounts less than $500.
Legend
(a) Non-income producing
(b) Security or a portion of the security is on loan at period end.
(c) Restricted securities - Investment in securities not registered under the Securities Act of 1933 (excluding 144A issues). At the end of the period, the value of restricted securities (excluding 144A issues) amounted to $0 or 0.0% of net assets.
(d) Security or a portion of the security was pledged to cover margin requirements for futures contracts. At period end, the value of securities pledged amounted to $789,000.
(e) Affiliated fund that is generally available only to investment companies and other accounts managed by Fidelity Investments. The rate quoted is the annualized seven-day yield of the fund at period end. A complete unaudited listing of the fund's holdings as of its most recent quarter end is available upon request. In addition, each Fidelity Central Fund's financial statements, which are not covered by the Fund's Report of Independent Registered Public Accounting Firm, are available on the SEC's website or upon request.
(f) Investment made with cash collateral received from securities on loan.
Additional information on each restricted holding is as follows:
| Security | Acquisition Date | Acquisition Cost (000s) |
| Velti PLC | 4/19/13 | $323 |
Affiliated Central Funds
Information regarding fiscal year to date income earned by the Fund from investments in Fidelity Central Funds is as follows:
| Fund | Income earned |
| (Amounts in thousands) | |
| Fidelity Cash Central Fund | $684 |
| Fidelity Securities Lending Cash Central Fund | 194 |
| Total | $878 |
Investment Valuation
The following is a summary of the inputs used, as of November 30, 2017, involving the Fund's assets and liabilities carried at fair value. The inputs or methodology used for valuing securities may not be an indication of the risk associated with investing in those securities. For more information on valuation inputs, and their aggregation into the levels used below, please refer to the Investment Valuation section in the accompanying Notes to Financial Statements.
| Valuation Inputs at Reporting Date: | ||||
| Description | Total | Level 1 | Level 2 | Level 3 |
| (Amounts in thousands) | ||||
| Investments in Securities: | ||||
| Equities: | ||||
| Consumer Discretionary | $331,961 | $331,961 | $-- | $-- |
| Consumer Staples | 86,151 | 86,151 | -- | -- |
| Energy | 100,606 | 100,606 | -- | -- |
| Financials | 417,181 | 417,181 | -- | -- |
| Health Care | 186,393 | 186,393 | -- | -- |
| Industrials | 366,480 | 366,480 | -- | -- |
| Information Technology | 432,211 | 432,211 | -- | -- |
| Materials | 184,323 | 184,323 | -- | -- |
| Real Estate | 241,927 | 241,927 | -- | -- |
| Telecommunication Services | 3,063 | 3,063 | -- | -- |
| Utilities | 140,225 | 140,225 | -- | -- |
| U.S. Government and Government Agency Obligations | 839 | -- | 839 | -- |
| Money Market Funds | 107,583 | 107,583 | -- | -- |
| Total Investments in Securities: | $2,598,943 | $2,598,104 | $839 | $-- |
| Derivative Instruments: | ||||
| Assets | ||||
| Futures Contracts | $840 | $840 | $-- | $-- |
| Total Assets | $840 | $840 | $-- | $-- |
| Total Derivative Instruments: | $840 | $840 | $-- | $-- |
Value of Derivative Instruments
The following table is a summary of the Fund's value of derivative instruments by primary risk exposure as of November 30, 2017. For additional information on derivative instruments, please refer to the Derivative Instruments section in the accompanying Notes to Financial Statements.
| Primary Risk Exposure / Derivative Type | Value | |
| Asset | Liability | |
| (Amounts in thousands) | ||
| Equity Risk | ||
| Futures Contracts(a) | $840 | $0 |
| Total Equity Risk | 840 | 0 |
| Total Value of Derivatives | $840 | $0 |
(a) Reflects gross cumulative appreciation (depreciation) on futures contracts as presented in the Schedule of Investments. In the Statement of Assets and Liabilities, the period end daily variation margin is included in receivable or payable for daily variation margin on futures contracts, and the net cumulative appreciation (depreciation) is included in net unrealized appreciation (depreciation).
See accompanying notes which are an integral part of the financial statements.
Financial Statements
Statement of Assets and Liabilities
| Amounts in thousands (except per-share amounts) | November 30, 2017 | |
| Assets | ||
| Investment in securities, at value (including securities loaned of $46,282) — See accompanying schedule: Unaffiliated issuers (cost $2,102,956) | $2,491,360 | |
| Fidelity Central Funds (cost $107,580) | 107,583 | |
| Total Investment in Securities (cost $2,210,536) | $2,598,943 | |
| Cash | 40 | |
| Receivable for investments sold | 26,861 | |
| Receivable for fund shares sold | 843 | |
| Dividends receivable | 2,399 | |
| Distributions receivable from Fidelity Central Funds | 75 | |
| Receivable for daily variation margin on futures contracts | 125 | |
| Prepaid expenses | 5 | |
| Other receivables | 35 | |
| Total assets | 2,629,326 | |
| Liabilities | ||
| Payable for investments purchased | $28,558 | |
| Payable for fund shares redeemed | 2,387 | |
| Accrued management fee | 788 | |
| Distribution and service plan fees payable | 480 | |
| Other affiliated payables | 504 | |
| Other payables and accrued expenses | 50 | |
| Collateral on securities loaned | 47,345 | |
| Total liabilities | 80,112 | |
| Net Assets | $2,549,214 | |
| Net Assets consist of: | ||
| Paid in capital | $2,056,554 | |
| Undistributed net investment income | 5,629 | |
| Accumulated undistributed net realized gain (loss) on investments and foreign currency transactions | 97,792 | |
| Net unrealized appreciation (depreciation) on investments and assets and liabilities in foreign currencies | 389,239 | |
| Net Assets | $2,549,214 | |
| Calculation of Maximum Offering Price | ||
| Class A: | ||
| Net Asset Value and redemption price per share ($564,099 ÷ 14,195 shares) | $39.74 | |
| Maximum offering price per share (100/94.25 of $39.74) | $42.16 | |
| Class M: | ||
| Net Asset Value and redemption price per share ($606,079 ÷ 15,195 shares) | $39.89 | |
| Maximum offering price per share (100/96.50 of $39.89) | $41.34 | |
| Class C: | ||
| Net Asset Value and offering price per share ($142,230 ÷ 3,924 shares)(a) | $36.25 | |
| Fidelity Stock Selector Mid Cap Fund: | ||
| Net Asset Value, offering price and redemption price per share ($545,085 ÷ 13,157 shares) | $41.43 | |
| Class I: | ||
| Net Asset Value, offering price and redemption price per share ($682,908 ÷ 16,451 shares) | $41.51 | |
| Class Z: | ||
| Net Asset Value, offering price and redemption price per share ($8,813 ÷ 212 shares) | $41.57 |
(a) Redemption price per share is equal to net asset value less any applicable contingent deferred sales charge.
See accompanying notes which are an integral part of the financial statements.
Statement of Operations
| Amounts in thousands | Year ended November 30, 2017 | |
| Investment Income | ||
| Dividends | $26,710 | |
| Interest | 9 | |
| Income from Fidelity Central Funds | 878 | |
| Total income | 27,597 | |
| Expenses | ||
| Management fee | ||
| Basic fee | $12,366 | |
| Performance adjustment | (3,704) | |
| Transfer agent fees | 4,748 | |
| Distribution and service plan fees | 5,765 | |
| Accounting and security lending fees | 688 | |
| Custodian fees and expenses | 77 | |
| Independent trustees' fees and expenses | 9 | |
| Registration fees | 158 | |
| Audit | 68 | |
| Legal | 15 | |
| Miscellaneous | 17 | |
| Total expenses before reductions | 20,207 | |
| Expense reductions | (302) | 19,905 |
| Net investment income (loss) | 7,692 | |
| Realized and Unrealized Gain (Loss) | ||
| Net realized gain (loss) on: | ||
| Investment securities: | ||
| Unaffiliated issuers | 192,833 | |
| Foreign currency transactions | 3 | |
| Futures contracts | 1,905 | |
| Total net realized gain (loss) | 194,741 | |
| Change in net unrealized appreciation (depreciation) on: | ||
| Investment securities: | ||
| Unaffiliated issuers | 221,503 | |
| Fidelity Central Funds | (3) | |
| Assets and liabilities in foreign currencies | 5 | |
| Futures contracts | 760 | |
| Total change in net unrealized appreciation (depreciation) | 222,265 | |
| Net gain (loss) | 417,006 | |
| Net increase (decrease) in net assets resulting from operations | $424,698 |
See accompanying notes which are an integral part of the financial statements.
Statement of Changes in Net Assets
| Amounts in thousands | Year ended November 30, 2017 | Year ended November 30, 2016 |
| Increase (Decrease) in Net Assets | ||
| Operations | ||
| Net investment income (loss) | $7,692 | $12,537 |
| Net realized gain (loss) | 194,741 | (88,889) |
| Change in net unrealized appreciation (depreciation) | 222,265 | 160,670 |
| Net increase (decrease) in net assets resulting from operations | 424,698 | 84,318 |
| Distributions to shareholders from net investment income | (10,708) | (3,959) |
| Distributions to shareholders from net realized gain | (333) | (39,216) |
| Total distributions | (11,041) | (43,175) |
| Share transactions - net increase (decrease) | 112,615 | (421,318) |
| Total increase (decrease) in net assets | 526,272 | (380,175) |
| Net Assets | ||
| Beginning of period | 2,022,942 | 2,403,117 |
| End of period | $2,549,214 | $2,022,942 |
| Other Information | ||
| Undistributed net investment income end of period | $5,629 | $8,778 |
See accompanying notes which are an integral part of the financial statements.
Financial Highlights
Fidelity Advisor Stock Selector Mid Cap Fund Class A
| Years ended November 30, | 2017 | 2016 | 2015 | 2014 | 2013 |
| Selected Per–Share Data | |||||
| Net asset value, beginning of period | $33.13 | $32.01 | $31.80 | $28.37 | $22.16 |
| Income from Investment Operations | |||||
| Net investment income (loss)A | .13 | .20 | .08 | .08 | .10 |
| Net realized and unrealized gain (loss) | 6.68 | 1.49 | .13 | 3.36 | 6.29 |
| Total from investment operations | 6.81 | 1.69 | .21 | 3.44 | 6.39 |
| Distributions from net investment income | (.19) | (.04) | – | (.01) | (.14) |
| Distributions from net realized gain | (.01) | (.53) | – | – | (.04) |
| Total distributions | (.20) | (.57) | – | (.01) | (.18) |
| Net asset value, end of period | $39.74 | $33.13 | $32.01 | $31.80 | $28.37 |
| Total ReturnB,C | 20.64% | 5.49% | .66% | 12.11% | 29.07% |
| Ratios to Average Net AssetsD,E | |||||
| Expenses before reductions | .87% | .88% | .98% | 1.05% | .95% |
| Expenses net of fee waivers, if any | .87% | .88% | .98% | 1.05% | .95% |
| Expenses net of all reductions | .86% | .88% | .97% | 1.05% | .92% |
| Net investment income (loss) | .36% | .64% | .24% | .26% | .39% |
| Supplemental Data | |||||
| Net assets, end of period (in millions) | $564 | $546 | $593 | $652 | $692 |
| Portfolio turnover rateF | 84% | 98% | 109% | 89% | 79%G |
A Calculated based on average shares outstanding during the period.
B Total returns would have been lower if certain expenses had not been reduced during the applicable periods shown.
C Total returns do not include the effect of the sales charges.
D Fees and expenses of any underlying Fidelity Central Funds are not included in the Fund's expense ratio. The Fund indirectly bears its proportionate share of the expenses of any underlying Fidelity Central Funds.
E Expense ratios reflect operating expenses of the class. Expenses before reductions do not reflect amounts reimbursed by the investment adviser or reductions from brokerage service arrangements or reductions from other expense offset arrangements and do not represent the amount paid by the class during periods when reimbursements or reductions occur. Expenses net of fee waivers reflect expenses after reimbursement by the investment adviser but prior to reductions from brokerage service arrangements or other expense offset arrangements. Expenses net of all reductions represent the net expenses paid by the class.
F Amount does not include the portfolio activity of any underlying Fidelity Central Funds.
G The portfolio turnover rate does not include the assets acquired in the merger.
See accompanying notes which are an integral part of the financial statements.
Fidelity Advisor Stock Selector Mid Cap Fund Class M
| Years ended November 30, | 2017 | 2016 | 2015 | 2014 | 2013 |
| Selected Per–Share Data | |||||
| Net asset value, beginning of period | $33.25 | $32.16 | $32.02 | $28.63 | $22.36 |
| Income from Investment Operations | |||||
| Net investment income (loss)A | .04 | .13 | – | .01 | .04 |
| Net realized and unrealized gain (loss) | 6.71 | 1.49 | .14 | 3.38 | 6.36 |
| Total from investment operations | 6.75 | 1.62 | .14 | 3.39 | 6.40 |
| Distributions from net investment income | (.11) | – | – | – | (.09) |
| Distributions from net realized gain | (.01) | (.53) | – | – | (.04) |
| Total distributions | (.11)B | (.53) | – | – | (.13) |
| Net asset value, end of period | $39.89 | $33.25 | $32.16 | $32.02 | $28.63 |
| Total ReturnC,D | 20.37% | 5.22% | .44% | 11.84% | 28.80% |
| Ratios to Average Net AssetsE,F | |||||
| Expenses before reductions | 1.11% | 1.12% | 1.22% | 1.28% | 1.16% |
| Expenses net of fee waivers, if any | 1.11% | 1.12% | 1.21% | 1.28% | 1.16% |
| Expenses net of all reductions | 1.10% | 1.11% | 1.21% | 1.27% | 1.13% |
| Net investment income (loss) | . 11% | .41% | .01% | .03% | .17% |
| Supplemental Data | |||||
| Net assets, end of period (in millions) | $606 | $591 | $681 | $794 | $817 |
| Portfolio turnover rateG | 84% | 98% | 109% | 89% | 79%H |
A Calculated based on average shares outstanding during the period.
B Total distributions of $.11 per share is comprised of distributions from net investment income of $.106 and distributions from net realized gain of $.006 per share.
C Total returns would have been lower if certain expenses had not been reduced during the applicable periods shown.
D Total returns do not include the effect of the sales charges.
E Fees and expenses of any underlying Fidelity Central Funds are not included in the Fund's expense ratio. The Fund indirectly bears its proportionate share of the expenses of any underlying Fidelity Central Funds.
F Expense ratios reflect operating expenses of the class. Expenses before reductions do not reflect amounts reimbursed by the investment adviser or reductions from brokerage service arrangements or reductions from other expense offset arrangements and do not represent the amount paid by the class during periods when reimbursements or reductions occur. Expenses net of fee waivers reflect expenses after reimbursement by the investment adviser but prior to reductions from brokerage service arrangements or other expense offset arrangements. Expenses net of all reductions represent the net expenses paid by the class.
G Amount does not include the portfolio activity of any underlying Fidelity Central Funds.
H The portfolio turnover rate does not include the assets acquired in the merger.
See accompanying notes which are an integral part of the financial statements.
Fidelity Advisor Stock Selector Mid Cap Fund Class C
| Years ended November 30, | 2017 | 2016 | 2015 | 2014 | 2013 |
| Selected Per–Share Data | |||||
| Net asset value, beginning of period | $30.28 | $29.48 | $29.51 | $26.52 | $20.73 |
| Income from Investment Operations | |||||
| Net investment income (loss)A | (.13) | (.03) | (.15) | (.14) | (.09) |
| Net realized and unrealized gain (loss) | 6.10 | 1.36 | .12 | 3.13 | 5.91 |
| Total from investment operations | 5.97 | 1.33 | (.03) | 2.99 | 5.82 |
| Distributions from net investment income | – | – | – | – | (.02) |
| Distributions from net realized gain | – | (.53) | – | – | (.01) |
| Total distributions | – | (.53) | – | – | (.03) |
| Net asset value, end of period | $36.25 | $30.28 | $29.48 | $29.51 | $26.52 |
| Total ReturnB,C | 19.72% | 4.71% | (.10)% | 11.27% | 28.09% |
| Ratios to Average Net AssetsD,E | |||||
| Expenses before reductions | 1.63% | 1.63% | 1.74% | 1.80% | 1.69% |
| Expenses net of fee waivers, if any | 1.63% | 1.63% | 1.73% | 1.80% | 1.69% |
| Expenses net of all reductions | 1.62% | 1.63% | 1.73% | 1.80% | 1.67% |
| Net investment income (loss) | (.40)% | (.11)% | (.51)% | (.49)% | (.36)% |
| Supplemental Data | |||||
| Net assets, end of period (in millions) | $142 | $140 | $155 | $172 | $172 |
| Portfolio turnover rateF | 84% | 98% | 109% | 89% | 79%G |
A Calculated based on average shares outstanding during the period.
B Total returns would have been lower if certain expenses had not been reduced during the applicable periods shown.
C Total returns do not include the effect of the contingent deferred sales charge.
D Fees and expenses of any underlying Fidelity Central Funds are not included in the Fund's expense ratio. The Fund indirectly bears its proportionate share of the expenses of any underlying Fidelity Central Funds.
E Expense ratios reflect operating expenses of the class. Expenses before reductions do not reflect amounts reimbursed by the investment adviser or reductions from brokerage service arrangements or reductions from other expense offset arrangements and do not represent the amount paid by the class during periods when reimbursements or reductions occur. Expenses net of fee waivers reflect expenses after reimbursement by the investment adviser but prior to reductions from brokerage service arrangements or other expense offset arrangements. Expenses net of all reductions represent the net expenses paid by the class.
F Amount does not include the portfolio activity of any underlying Fidelity Central Funds.
G The portfolio turnover rate does not include the assets acquired in the merger.
See accompanying notes which are an integral part of the financial statements.
Fidelity Stock Selector Mid Cap Fund
| Years ended November 30, | 2017 | 2016 | 2015 | 2014 | 2013 |
| Selected Per–Share Data | |||||
| Net asset value, beginning of period | $34.53 | $33.34 | $33.14 | $29.56 | $23.14 |
| Income from Investment Operations | |||||
| Net investment income (loss)A | .20 | .28 | .16 | .16 | .17 |
| Net realized and unrealized gain (loss) | 6.96 | 1.55 | .14 | 3.49 | 6.54 |
| Total from investment operations | 7.16 | 1.83 | .30 | 3.65 | 6.71 |
| Distributions from net investment income | (.26) | (.12) | (.10) | (.07) | (.25) |
| Distributions from net realized gain | (.01) | (.53) | – | – | (.04) |
| Total distributions | (.26)B | (.64)C | (.10) | (.07) | (.29) |
| Net asset value, end of period | $41.43 | $34.53 | $33.34 | $33.14 | $29.56 |
| Total ReturnD,E | 20.87% | 5.73% | .90% | 12.38% | 29.36% |
| Ratios to Average Net AssetsF,G | |||||
| Expenses before reductions | .70% | .64% | .75% | .81% | .71% |
| Expenses net of fee waivers, if any | .70% | .64% | .74% | .81% | .71% |
| Expenses net of all reductions | .69% | .63% | .74% | .81% | .69% |
| Net investment income (loss) | .53% | .89% | .48% | .50% | .62% |
| Supplemental Data | |||||
| Net assets, end of period (in millions) | $545 | $222 | $486 | $553 | $225 |
| Portfolio turnover rateH | 84% | 98% | 109% | 89% | 79%I |
A Calculated based on average shares outstanding during the period.
B Total distributions of $.26 per share is comprised of distributions from net investment income of $.255 and distributions from net realized gain of $.006 per share.
C Total distributions of $.64 per share is comprised of distributions from net investment income of $.115 and distributions from net realized gain of $.529 per share.
D Total returns for periods of less than one year are not annualized.
E Total returns would have been lower if certain expenses had not been reduced during the applicable periods shown.
F Fees and expenses of any underlying Fidelity Central Funds are not included in the Fund's expense ratio. The Fund indirectly bears its proportionate share of the expenses of any underlying Fidelity Central Funds.
G Expense ratios reflect operating expenses of the class. Expenses before reductions do not reflect amounts reimbursed by the investment adviser or reductions from brokerage service arrangements or reductions from other expense offset arrangements and do not represent the amount paid by the class during periods when reimbursements or reductions occur. Expenses net of fee waivers reflect expenses after reimbursement by the investment adviser but prior to reductions from brokerage service arrangements or other expense offset arrangements. Expenses net of all reductions represent the net expenses paid by the class.
H Amount does not include the portfolio activity of any underlying Fidelity Central Funds.
I The portfolio turnover rate does not include the assets acquired in the merger.
See accompanying notes which are an integral part of the financial statements.
Fidelity Advisor Stock Selector Mid Cap Fund Class I
| Years ended November 30, | 2017 | 2016 | 2015 | 2014 | 2013 |
| Selected Per–Share Data | |||||
| Net asset value, beginning of period | $34.60 | $33.39 | $33.22 | $29.64 | $23.14 |
| Income from Investment Operations | |||||
| Net investment income (loss)A | .23 | .28 | .13 | .16 | .18 |
| Net realized and unrealized gain (loss) | 6.96 | 1.56 | .14 | 3.50 | 6.56 |
| Total from investment operations | 7.19 | 1.84 | .27 | 3.66 | 6.74 |
| Distributions from net investment income | (.27) | (.11) | (.10) | (.08) | (.20) |
| Distributions from net realized gain | (.01) | (.53) | – | – | (.04) |
| Total distributions | (.28) | (.63)B | (.10) | (.08) | (.24) |
| Net asset value, end of period | $41.51 | $34.60 | $33.39 | $33.22 | $29.64 |
| Total ReturnC | 20.92% | 5.75% | .80% | 12.39% | 29.44% |
| Ratios to Average Net AssetsD,E | |||||
| Expenses before reductions | .63% | .64% | .83% | .80% | .67% |
| Expenses net of fee waivers, if any | .63% | .64% | .83% | .80% | .67% |
| Expenses net of all reductions | .62% | .64% | .82% | .80% | .65% |
| Net investment income (loss) | .60% | .88% | .39% | .51% | .66% |
| Supplemental Data | |||||
| Net assets, end of period (in millions) | $683 | $523 | $479 | $371 | $214 |
| Portfolio turnover rateF | 84% | 98% | 109% | 89% | 79%G |
A Calculated based on average shares outstanding during the period.
B Total distributions of $.63 per share is comprised of distributions from net investment income of $.105 and distributions from net realized gain of $.529 per share.
C Total returns would have been lower if certain expenses had not been reduced during the applicable periods shown.
D Fees and expenses of any underlying Fidelity Central Funds are not included in the Fund's expense ratio. The Fund indirectly bears its proportionate share of the expenses of any underlying Fidelity Central Funds.
E Expense ratios reflect operating expenses of the class. Expenses before reductions do not reflect amounts reimbursed by the investment adviser or reductions from brokerage service arrangements or reductions from other expense offset arrangements and do not represent the amount paid by the class during periods when reimbursements or reductions occur. Expenses net of fee waivers reflect expenses after reimbursement by the investment adviser but prior to reductions from brokerage service arrangements or other expense offset arrangements. Expenses net of all reductions represent the net expenses paid by the class.
F Amount does not include the portfolio activity of any underlying Fidelity Central Funds.
G The portfolio turnover rate does not include the assets acquired in the merger.
See accompanying notes which are an integral part of the financial statements.
Fidelity Advisor Stock Selector Mid Cap Fund Class Z
| Years ended November 30, | 2017 A |
| Selected Per–Share Data | |
| Net asset value, beginning of period | $35.79 |
| Income from Investment Operations | |
| Net investment income (loss)B | .23 |
| Net realized and unrealized gain (loss) | 5.55 |
| Total from investment operations | 5.78 |
| Distributions from net investment income | – |
| Distributions from net realized gain | – |
| Total distributions | – |
| Net asset value, end of period | $41.57 |
| Total ReturnC,D | 16.15% |
| Ratios to Average Net AssetsE,F | |
| Expenses before reductions | .48%G |
| Expenses net of fee waivers, if any | .47%G |
| Expenses net of all reductions | .46%G |
| Net investment income (loss) | .69%G |
| Supplemental Data | |
| Net assets, end of period (in millions) | $9 |
| Portfolio turnover rateH | 84% |
A For the period February 1, 2017 (commencement of sale of shares) to November 30, 2017.
B Calculated based on average shares outstanding during the period.
C Total returns for periods of less than one year are not annualized.
D Total returns would have been lower if certain expenses had not been reduced during the applicable periods shown.
E Fees and expenses of any underlying Fidelity Central Funds are not included in the Fund's expense ratio. The Fund indirectly bears its proportionate share of the expenses of any underlying Fidelity Central Funds.
F Expense ratios reflect operating expenses of the class. Expenses before reductions do not reflect amounts reimbursed by the investment adviser or reductions from brokerage service arrangements or reductions from other expense offset arrangements and do not represent the amount paid by the class during periods when reimbursements or reductions occur. Expense ratios before reductions for start-up periods may not be representative of longer-term operating periods. Expenses net of fee waivers reflect expenses after reimbursement by the investment adviser but prior to reductions from brokerage service arrangements or other expense offset arrangements. Expenses net of all reductions represent the net expenses paid by the class.
G Annualized
H Amount does not include the portfolio activity of any underlying Fidelity Central Funds.
See accompanying notes which are an integral part of the financial statements.
Notes to Financial Statements
For the period ended November 30, 2017
(Amounts in thousands except percentages)
1. Organization.
Fidelity Advisor Stock Selector Mid Cap Fund (the Fund) is a fund of Fidelity Advisor Series I (the Trust) and is authorized to issue an unlimited number of shares. The Trust is registered under the Investment Company Act of 1940, as amended (the 1940 Act), as an open-end management investment company organized as a Massachusetts business trust. The Fund commenced sale of Class Z shares on February 1, 2017. The Fund offers Class A, Class M (formerly Class T), Class C, Fidelity Stock Selector Mid Cap Fund, Class I and Class Z shares, each of which has equal rights as to assets and voting privileges. Each class has exclusive voting rights with respect to matters that affect that class.
After the close of business on June 24, 2016, all outstanding Class B shares were converted to Class A shares. All prior fiscal period dollar and share amounts for Class B presented in the Notes to Financial Statements are for the period December 1, 2015 through June 24, 2016.
2. Investments in Fidelity Central Funds.
The Fund invests in Fidelity Central Funds, which are open-end investment companies generally available only to other investment companies and accounts managed by the investment adviser and its affiliates. The Fund's Schedule of Investments lists each of the Fidelity Central Funds held as of period end, if any, as an investment of the Fund, but does not include the underlying holdings of each Fidelity Central Fund. As an Investing Fund, the Fund indirectly bears its proportionate share of the expenses of the underlying Fidelity Central Funds.
The Money Market Central Funds seek preservation of capital and current income and are managed by Fidelity Investments Money Management, Inc. (FIMM), an affiliate of the investment adviser. Annualized expenses of the Money Market Central Funds as of their most recent shareholder report date are less than .005%.
A complete unaudited list of holdings for each Fidelity Central Fund is available upon request or at the Securities and Exchange Commission (the SEC) website at www.sec.gov. In addition, the financial statements of the Fidelity Central Funds, which are not covered by the Fund's Report of Independent Registered Public Accounting Firm, are available on the SEC website or upon request.
3. Significant Accounting Policies.
The Fund is an investment company and applies the accounting and reporting guidance of the Financial Accounting Standards Board (FASB) Accounting Standards Codification Topic 946 Financial Services – Investments Companies. The financial statements have been prepared in conformity with accounting principles generally accepted in the United States of America (GAAP), which require management to make certain estimates and assumptions at the date of the financial statements. Actual results could differ from those estimates. Subsequent events, if any, through the date that the financial statements were issued have been evaluated in the preparation of the financial statements. The following summarizes the significant accounting policies of the Fund:
Investment Valuation. Investments are valued as of 4:00 p.m. Eastern time on the last calendar day of the period. The Board of Trustees (the Board) has delegated the day to day responsibility for the valuation of the Fund's investments to the Fair Value Committee (the Committee) established by the Fund's investment adviser. In accordance with valuation policies and procedures approved by the Board, the Fund attempts to obtain prices from one or more third party pricing vendors or brokers to value its investments. When current market prices, quotations or currency exchange rates are not readily available or reliable, investments will be fair valued in good faith by the Committee, in accordance with procedures adopted by the Board. Factors used in determining fair value vary by investment type and may include market or investment specific events, changes in interest rates and credit quality. The frequency with which these procedures are used cannot be predicted and they may be utilized to a significant extent. The Committee oversees the Fund's valuation policies and procedures and reports to the Board on the Committee's activities and fair value determinations. The Board monitors the appropriateness of the procedures used in valuing the Fund's investments and ratifies the fair value determinations of the Committee.
The Fund categorizes the inputs to valuation techniques used to value its investments into a disclosure hierarchy consisting of three levels as shown below:
- Level 1 – quoted prices in active markets for identical investments
- Level 2 – other significant observable inputs (including quoted prices for similar investments, interest rates, prepayment speeds, etc.)
- Level 3 – unobservable inputs (including the Fund's own assumptions based on the best information available)
Valuation techniques used to value the Fund's investments by major category are as follows:
Equity securities, including restricted securities, for which market quotations are readily available, are valued at the last reported sale price or official closing price as reported by a third party pricing vendor on the primary market or exchange on which they are traded and are categorized as Level 1 in the hierarchy. In the event there were no sales during the day or closing prices are not available, securities are valued at the last quoted bid price or may be valued using the last available price and are generally categorized as Level 2 in the hierarchy. For foreign equity securities, when market or security specific events arise, comparisons to the valuation of American Depositary Receipts (ADRs), futures contracts, Exchange-Traded Funds (ETFs) and certain indexes as well as quoted prices for similar securities may be used and would be categorized as Level 2 in the hierarchy. Utilizing these techniques may result in transfers between Level 1 and Level 2. For equity securities, including restricted securities, where observable inputs are limited, assumptions about market activity and risk are used and these securities may be categorized as Level 3 in the hierarchy.
Debt securities, including restricted securities, are valued based on evaluated prices received from third party pricing vendors or from brokers who make markets in such securities. U.S. government and government agency obligations are valued by pricing vendors who utilize matrix pricing which considers yield or price of bonds of comparable quality, coupon, maturity and type or by broker-supplied prices. When independent prices are unavailable or unreliable, debt securities may be valued utilizing pricing methodologies which consider similar factors that would be used by third party pricing vendors. Debt securities are generally categorized as Level 2 in the hierarchy but may be Level 3 depending on the circumstances.
Futures contracts are valued at the settlement price established each day by the board of trade or exchange on which they are traded and are categorized as Level 1 in the hierarchy. Investments in open-end mutual funds, including the Fidelity Central Funds, are valued at their closing net asset value (NAV) each business day and are categorized as Level 1 in the hierarchy.
Changes in valuation techniques may result in transfers in or out of an assigned level within the disclosure hierarchy. The aggregate value of investments by input level as of November 30, 2017, is included at the end of the Fund's Schedule of Investments.
Foreign Currency. The Fund may use foreign currency contracts to facilitate transactions in foreign-denominated securities. Gains and losses from these transactions may arise from changes in the value of the foreign currency or if the counterparties do not perform under the contracts' terms.
Foreign-denominated assets, including investment securities, and liabilities are translated into U.S. dollars at the exchange rates at period end. Purchases and sales of investment securities, income and dividends received and expenses denominated in foreign currencies are translated into U.S. dollars at the exchange rate in effect on the transaction date.
The effects of exchange rate fluctuations on investments are included with the net realized and unrealized gain (loss) on investment securities. Other foreign currency transactions resulting in realized and unrealized gain (loss) are disclosed separately.
Investment Transactions and Income. For financial reporting purposes, the Fund's investment holdings and NAV include trades executed through the end of the last business day of the period. The NAV per share for processing shareholder transactions is calculated as of the close of business of the New York Stock Exchange (NYSE), normally 4:00 p.m. Eastern time and includes trades executed through the end of the prior business day. Gains and losses on securities sold are determined on the basis of identified cost and includes proceeds received from litigation. Dividend income is recorded on the ex-dividend date, except for certain dividends from foreign securities where the ex-dividend date may have passed, which are recorded as soon as the Fund is informed of the ex-dividend date. Non-cash dividends included in dividend income, if any, are recorded at the fair market value of the securities received. Income and capital gain distributions from Fidelity Central Funds, if any, are recorded on the ex-dividend date. Certain distributions received by the Fund represent a return of capital or capital gain. The Fund determines the components of these distributions subsequent to the ex-dividend date, based upon receipt of tax filings or other correspondence relating to the underlying investment. These distributions are recorded as a reduction of cost of investments and/or as a realized gain. Interest income is accrued as earned and includes coupon interest and amortization of premium and accretion of discount on debt securities as applicable. Investment income is recorded net of foreign taxes withheld where recovery of such taxes is uncertain.
Class Allocations and Expenses. Investment income, realized and unrealized capital gains and losses, common expenses of the Fund, and certain fund-level expense reductions, if any, are allocated daily on a pro-rata basis to each class based on the relative net assets of each class to the total net assets of the Fund. Each class differs with respect to transfer agent and distribution and service plan fees incurred. Certain expense reductions may also differ by class. For the reporting period, the allocated portion of income and expenses to each class as a percent of its average net assets may vary due to the timing of recording these transactions in relation to fluctuating net assets of the classes. Expenses directly attributable to a fund are charged to that fund. Expenses attributable to more than one fund are allocated among the respective funds on the basis of relative net assets or other appropriate methods. Expense estimates are accrued in the period to which they relate and adjustments are made when actual amounts are known.
Income Tax Information and Distributions to Shareholders. Each year, the Fund intends to qualify as a regulated investment company under Subchapter M of the Internal Revenue Code, including distributing substantially all of its taxable income and realized gains. As a result, no provision for U.S. Federal income taxes is required. As of November 30, 2017, the Fund did not have any unrecognized tax benefits in the financial statements; nor is the Fund aware of any tax positions for which it is reasonably possible that the total amounts of unrecognized tax benefits will significantly change in the next twelve months. The Fund files a U.S. federal tax return, in addition to state and local tax returns as required. The Fund's federal income tax returns are subject to examination by the Internal Revenue Service (IRS) for a period of three fiscal years after they are filed. State and local tax returns may be subject to examination for an additional fiscal year depending on the jurisdiction. Foreign taxes are provided for based on the Fund's understanding of the tax rules and rates that exist in the foreign markets in which it invests.
Distributions are declared and recorded on the ex-dividend date. Income dividends and capital gain distributions are declared separately for each class. Income and capital gain distributions are determined in accordance with income tax regulations, which may differ from GAAP. In addition, the Fund claimed a portion of the payment made to redeeming shareholders as a distribution for income tax purposes.
Capital accounts within the financial statements are adjusted for permanent book-tax differences. These adjustments have no impact on net assets or the results of operations. Capital accounts are not adjusted for temporary book-tax differences which will reverse in a subsequent period.
Book-tax differences are primarily due to futures contracts, foreign currency transactions, market discount, deferred trustees compensation, capital loss carryforwards and losses deferred due to wash sales.
As of period end, the cost and unrealized appreciation (depreciation) in securities, and derivatives if applicable, for federal income tax purposes were as follows:
| Gross unrealized appreciation | $472,131 |
| Gross unrealized depreciation | (86,649) |
| Net unrealized appreciation (depreciation) | $385,482 |
| Tax Cost | $2,213,461 |
The tax-based components of distributable earnings as of period end were as follows:
| Undistributed ordinary income | $50,136 |
| Undistributed long-term capital gain | $57,050 |
| Net unrealized appreciation (depreciation) on securities and other investments | $385,474 |
The tax character of distributions paid was as follows:
| November 30, 2017 | November 30, 2016 | |
| Ordinary Income | $11,041 | $ 3,959 |
| Long-term Capital Gains | – | 39,216 |
| Total | $11,041 | $ 43,175 |
Restricted Securities. The Fund may invest in securities that are subject to legal or contractual restrictions on resale. These securities generally may be resold in transactions exempt from registration or to the public if the securities are registered. Disposal of these securities may involve time-consuming negotiations and expense, and prompt sale at an acceptable price may be difficult. Information regarding restricted securities is included at the end of the Fund's Schedule of Investments.
4. Derivative Instruments.
Risk Exposures and the Use of Derivative Instruments. The Fund's investment objective allows the Fund to enter into various types of derivative contracts, including futures contracts. Derivatives are investments whose value is primarily derived from underlying assets, indices or reference rates and may be transacted on an exchange or over-the-counter (OTC). Derivatives may involve a future commitment to buy or sell a specified asset based on specified terms, to exchange future cash flows at periodic intervals based on a notional principal amount, or for one party to make one or more payments upon the occurrence of specified events in exchange for periodic payments from the other party.
The Fund used derivatives to increase returns and to manage exposure to certain risks as defined below. The success of any strategy involving derivatives depends on analysis of numerous economic factors, and if the strategies for investment do not work as intended, the Fund may not achieve its objectives.
The Fund's use of derivatives increased or decreased its exposure to the following risk:
| Equity Risk | Equity risk relates to the fluctuations in the value of financial instruments as a result of changes in market prices (other than those arising from interest rate risk or foreign exchange risk), whether caused by factors specific to an individual investment, its issuer, or all factors affecting all instruments traded in a market or market segment. |
The Fund is also exposed to additional risks from investing in derivatives, such as liquidity risk and counterparty credit risk. Liquidity risk is the risk that the Fund will be unable to close out the derivative in the open market in a timely manner. Counterparty credit risk is the risk that the counterparty will not be able to fulfill its obligation to the Fund. Counterparty credit risk related to exchange-traded futures contracts may be mitigated by the protection provided by the exchange on which they trade.
Investing in derivatives may involve greater risks than investing in the underlying assets directly and, to varying degrees, may involve risk of loss in excess of any initial investment and collateral received and amounts recognized in the Statement of Assets and Liabilities. In addition, there may be the risk that the change in value of the derivative contract does not correspond to the change in value of the underlying instrument.
Futures Contracts. A futures contract is an agreement between two parties to buy or sell a specified underlying instrument for a fixed price at a specified future date. The Fund used futures contracts to manage its exposure to the stock market.
Upon entering into a futures contract, a fund is required to deposit either cash or securities (initial margin) with a clearing broker in an amount equal to a certain percentage of the face value of the contract. Futures contracts are marked-to-market daily and subsequent daily payments (variation margin) are made or received by a fund depending on the daily fluctuations in the value of the futures contracts and are recorded as unrealized appreciation or (depreciation). This receivable and/or payable, if any, is included in daily variation margin on futures contracts in the Statement of Assets and Liabilities. Realized gain or (loss) is recorded upon the expiration or closing of a futures contract. The net realized gain (loss) and change in net unrealized appreciation (depreciation) on futures contracts during the period is presented in the Statement of Operations.
Any open futures contracts at period end are presented in the Schedule of Investments under the caption "Futures Contracts". The notional amount at value reflects each contract's exposure to the underlying instrument or index at period end and is representative of volume of activity during the period. Securities deposited to meet initial margin requirements are identified in the Schedule of Investments.
5. Purchases and Sales of Investments.
Purchases and sales of securities, other than short-term securities, aggregated $1,977,724 and $1,856,759, respectively.
6. Fees and Other Transactions with Affiliates.
Management Fee. Fidelity Management & Research Company (the investment adviser) and its affiliates provide the Fund with investment management related services for which the Fund pays a monthly management fee. The management fee is the sum of an individual fund fee rate that is based on an annual rate of .30% of the Fund's average net assets and an annualized group fee rate that averaged .25% during the period. The group fee rate is based upon the average net assets of all the mutual funds advised by the investment adviser, including any mutual funds previously advised by the investment adviser that are currently advised by Fidelity SelectCo, LLC, an affiliate of the investment adviser. The group fee rate decreases as assets under management increase and increases as assets under management decrease. In addition, the management fee is subject to a performance adjustment (up to a maximum of +/- .20% of the Fund's average net assets over a 36 month performance period). The upward or downward adjustment to the management fee is based on the relative investment performance of Class I of the Fund as compared to its benchmark index, the S&P MidCap 400 Index, over the same 36 month performance period. For the reporting period, the total annual management fee rate, including the performance adjustment, was .38% of the Fund's average net assets. The performance adjustment included in the management fee rate may be higher or lower than the maximum performance adjustment rate due to the difference between the average net assets for the reporting and performance periods.
Distribution and Service Plan Fees. In accordance with Rule 12b-1 of the 1940 Act, the Fund has adopted separate Distribution and Service Plans for each class of shares. Certain classes pay Fidelity Distributors Corporation (FDC), an affiliate of the investment adviser, separate Distribution and Service Fees, each of which is based on an annual percentage of each class' average net assets. In addition, FDC may pay financial intermediaries for selling shares of the Fund and providing shareholder support services. For the period, the Distribution and Service Fee rates, total fees and amounts retained by FDC were as follows:
| Distribution Fee | Service Fee | Total Fees | Retained by FDC | |
| Class A | -% | .25% | $1,389 | $3 |
| Class M | .25% | .25% | 2,958 | 10 |
| Class C | .75% | .25% | 1,418 | 5 |
| $5,765 | $18 |
Sales Load. FDC may receive a front-end sales charge of up to 5.75% for selling Class A shares and 3.50% for selling Class M shares, some of which is paid to financial intermediaries for selling shares of the Fund. Depending on the holding period, FDC may receive contingent deferred sales charges levied on Class A, Class M and Class C redemptions. The deferred sales charges are 1.00% for Class C shares, 1.00% for certain purchases of Class A shares and .25% for certain purchases of Class M shares.
For the period, sales charge amounts retained by FDC were as follows:
| Retained by FDC | |
| Class A | $36 |
| Class M | 12 |
| Class C(a) | 1 |
| $49 |
(a) When Class C shares are initially sold, FDC pays commissions from its own resources to financial intermediaries through which the sales are made.
Transfer Agent Fees. Fidelity Investments Institutional Operations Company, Inc., (FIIOC), an affiliate of the investment adviser, is the transfer, dividend disbursing and shareholder servicing agent for each class of the Fund. FIIOC receives account fees and asset-based fees that vary according to the account size and type of account of the shareholders of the respective classes of the Fund, except for Class Z. FIIOC receives an asset-based fee of Class Z's average net assets. FIIOC pays for typesetting, printing and mailing of shareholder reports, except proxy statements.
For the period, transfer agent fees for each applicable class were as follows:
| Amount | % of Class-Level Average Net Assets | |
| Class A | $1,086 | .20 |
| Class M | 1,109 | .19 |
| Class C | 290 | .20 |
| Fidelity Stock Selector Mid Cap Fund | 1,033 | .27 |
| Class I | 1,229 | .20 |
| Class Z | 1 | .05(a) |
| $4,748 |
(a) Annualized
Accounting and Security Lending Fees. Fidelity Service Company, Inc. (FSC), an affiliate of the investment adviser, maintains the Fund's accounting records. The accounting fee is based on the level of average net assets for each month. Under a separate contract, FSC administers the security lending program. The security lending fee is based on the number and duration of lending transactions.
Brokerage Commissions. The Fund placed a portion of its portfolio transactions with brokerage firms which are affiliates of the investment adviser. Brokerage commissions are included in net realized gain (loss) and change in net unrealized appreciation (depreciation) in the Statement of Operations. The commissions paid to these affiliated firms were $60 for the period.
Interfund Trades. The Fund may purchase from or sell securities to other Fidelity Funds under procedures adopted by the Board. The procedures have been designed to ensure these interfund trades are executed in accordance with Rule 17a-7 of the 1940 Act. Interfund trades are included within the respective purchases and sales amounts shown in the Purchases and Sales of Investments note.
7. Committed Line of Credit.
The Fund participates with other funds managed by the investment adviser or an affiliate in a $4.25 billion credit facility (the "line of credit") to be utilized for temporary or emergency purposes to fund shareholder redemptions or for other short-term liquidity purposes. The Fund has agreed to pay commitment fees on its pro-rata portion of the line of credit, which amounted to $7 and is reflected in Miscellaneous expenses on the Statement of Operations. During the period, the Fund did not borrow on this line of credit.
8. Security Lending.
The Fund lends portfolio securities through a lending agent from time to time in order to earn additional income. For equity securities, a lending agent is used and may loan securities to certain qualified borrowers, including Fidelity Capital Markets (FCM), a broker-dealer affiliated with the Fund. On the settlement date of the loan, the Fund receives collateral (in the form of U.S. Treasury obligations, letters of credit and/or cash) against the loaned securities and maintains collateral in an amount not less than 100% of the market value of the loaned securities during the period of the loan. The market value of the loaned securities is determined at the close of business of the Fund and any additional required collateral is delivered to the Fund on the next business day. The Fund or borrower may terminate the loan at any time, and if the borrower defaults on its obligation to return the securities loaned because of insolvency or other reasons, the Fund may apply collateral received from the borrower against the obligation. The Fund may experience delays and costs in recovering the securities loaned. Any cash collateral received is invested in the Fidelity Securities Lending Cash Central Fund. The value of loaned securities and cash collateral at period end are disclosed on the Fund's Statement of Assets and Liabilities. The value of securities loaned to FCM at period end was $215. Security lending income represents the income earned on investing cash collateral, less rebates paid to borrowers and any lending agent fees associated with the loan, plus any premium payments received for lending certain types of securities. Security lending income is presented in the Statement of Operations as a component of income from Fidelity Central Funds. Total security lending income during the period amounted to $194, including $13 from securities loaned to FCM.
9. Expense Reductions.
The investment adviser voluntarily agreed to reimburse a portion of the Fund's Class A, Class M, Class C, Fidelity Stock Selector Mid Cap Fund and Class I operating expenses. During the period, the reimbursement reduced expenses as follows:
| Reimbursement | |
| Class A | $4 |
| Class M | 4 |
| Class C | 1 |
| Fidelity Stock Selector Mid Cap Fund | 3 |
| Class I | 5 |
| $17 |
Commissions paid to certain brokers with whom the investment adviser, or its affiliates, places trades on behalf of the Fund include an amount in addition to trade execution, which may be rebated back to the Fund to offset certain expenses. This amount totaled $267 for the period.
In addition, during the period the investment adviser reimbursed and/or waived a portion of fund-level operating expenses in the amount of $18.
10. Distributions to Shareholders.
Distributions to shareholders of each class were as follows:
| Year ended November 30, 2017 | Year ended November 30, 2016 | |
| From net investment income | ||
| Class A | $3,079 | $755 |
| Class M | 1,865 | – |
| Fidelity Stock Selector Mid Cap Fund | 1,644 | 1,674 |
| Class I | 4,120 | 1,530 |
| Total | $10,708 | $3,959 |
| From net realized gain | ||
| Class A | $98 | $9,744 |
| Class M | 105 | 11,098 |
| Class B | – | 166 |
| Class C | – | 2,758 |
| Fidelity Stock Selector Mid Cap Fund | 39 | 7,708 |
| Class I | 91 | 7,742 |
| Total | $333 | $39,216 |
11. Share Transactions.
Share transactions for each class were as follows and may contain automatic conversions between classes or exchanges between affiliated funds:
| Shares | Shares | Dollars | Dollars | |
| Year ended November 30, 2017 | Year ended November 30, 2016 | Year ended November 30, 2017 | Year ended November 30, 2016 | |
| Class A | ||||
| Shares sold | 914 | 1,039 | $33,050 | $31,500 |
| Reinvestment of distributions | 88 | 331 | 2,963 | 9,838 |
| Shares redeemed | (3,286) | (3,402) | (118,879) | (104,169) |
| Net increase (decrease) | (2,284) | (2,032) | $(82,866) | $(62,831) |
| Class M | ||||
| Shares sold | 1,370 | 1,180 | $50,634 | $36,250 |
| Reinvestment of distributions | 55 | 356 | 1,885 | 10,639 |
| Shares redeemed | (4,007) | (4,950) | (145,515) | (152,516) |
| Net increase (decrease) | (2,582) | (3,414) | $(92,996) | $(105,627) |
| Class B | ||||
| Shares sold | – | 1 | $– | $31 |
| Reinvestment of distributions | – | 5 | – | 145 |
| Shares redeemed | – | (331) | – | (9,046) |
| Net increase (decrease) | – | (325) | $– | $(8,870) |
| Class C | ||||
| Shares sold | 131 | 114 | $4,256 | $3,221 |
| Reinvestment of distributions | – | 90 | – | 2,469 |
| Shares redeemed | (835) | (819) | (27,684) | (23,061) |
| Net increase (decrease) | (704) | (615) | $(23,428) | $(17,371) |
| Fidelity Stock Selector Mid Cap Fund | ||||
| Shares sold | 8,585 | 1,163 | $325,907 | $37,438 |
| Reinvestment of distributions | 47 | 300 | 1,639 | 9,281 |
| Shares redeemed | (1,916) | (9,609) | (73,800) | (298,117) |
| Net increase (decrease) | 6,716 | (8,146) | $253,746 | $(251,398) |
| Class I | ||||
| Shares sold | 4,203 | 5,294 | $158,956 | $166,666 |
| Reinvestment of distributions | 114 | 291 | 4,019 | 9,016 |
| Shares redeemed | (2,996) | (4,795) | (113,072) | (150,903) |
| Net increase (decrease) | 1,321 | 790 | $49,903 | $24,779 |
| Class Z(a) | ||||
| Shares sold | 234 | – | $9,125 | $– |
| Shares redeemed | (22) | – | (869) | – |
| Net increase (decrease) | 212 | – | $8,256 | $– |
(a) Share transactions for Class Z are for the period February 1, 2017 (commencement of sale of shares) to November 30, 2017.
12. Other.
The Fund's organizational documents provide former and current trustees and officers with a limited indemnification against liabilities arising in connection with the performance of their duties to the Fund. In the normal course of business, the Fund may also enter into contracts that provide general indemnifications. The Fund's maximum exposure under these arrangements is unknown as this would be dependent on future claims that may be made against the Fund. The risk of material loss from such claims is considered remote.
Report of Independent Registered Public Accounting Firm
To the Trustees of Fidelity Advisor Series I and Shareholders of Fidelity Advisor Stock Selector Mid Cap Fund:
We have audited the accompanying statement of assets and liabilities of Fidelity Advisor Stock Selector Mid Cap Fund (the Fund), a fund of Fidelity Advisor Series I, including the schedule of investments, as of November 30, 2017, and the related statement of operations for the year then ended, the statement of changes in net assets for each of the two years in the period then ended, and the financial highlights for each of the periods presented. These financial statements and financial highlights are the responsibility of the Fund's management. Our responsibility is to express an opinion on these financial statements and financial highlights based on our audits.
We conducted our audits in accordance with the standards of the Public Company Accounting Oversight Board (United States). Those standards require that we plan and perform the audit to obtain reasonable assurance about whether the financial statements and financial highlights are free of material misstatement. The Fund is not required to have, nor were we engaged to perform, an audit of its internal control over financial reporting. Our audits included consideration of internal control over financial reporting as a basis for designing audit procedures that are appropriate in the circumstances, but not for the purpose of expressing an opinion on the effectiveness of the Fund's internal control over financial reporting. Accordingly, we express no such opinion. An audit also includes examining, on a test basis, evidence supporting the amounts and disclosures in the financial statements, assessing the accounting principles used and significant estimates made by management, as well as evaluating the overall financial statement presentation. Our procedures included confirmation of securities owned as of November 30, 2017, by correspondence with the custodians and brokers; when replies were not received from brokers, we performed other auditing procedures. We believe that our audits provide a reasonable basis for our opinion.
In our opinion, such financial statements and financial highlights referred to above present fairly, in all material respects, the financial position of Fidelity Advisor Stock Selector Mid Cap Fund as of November 30, 2017, the results of its operations for the year then ended, the changes in its net assets for each of the two years in the period then ended, and the financial highlights for each of the periods presented, in conformity with accounting principles generally accepted in the United States of America.
DELOITTE & TOUCHE LLP
Boston, Massachusetts
January 16, 2018
Trustees and Officers
The Trustees, Members of the Advisory Board (if any), and officers of the trust and fund, as applicable, are listed below. The Board of Trustees governs the fund and is responsible for protecting the interests of shareholders. The Trustees are experienced executives who meet periodically throughout the year to oversee the fund's activities, review contractual arrangements with companies that provide services to the fund, oversee management of the risks associated with such activities and contractual arrangements, and review the fund's performance. Each of the Trustees oversees 190 funds.
The Trustees hold office without limit in time except that (a) any Trustee may resign; (b) any Trustee may be removed by written instrument, signed by at least two-thirds of the number of Trustees prior to such removal; (c) any Trustee who requests to be retired or who has become incapacitated by illness or injury may be retired by written instrument signed by a majority of the other Trustees; and (d) any Trustee may be removed at any special meeting of shareholders by a two-thirds vote of the outstanding voting securities of the trust. Each Trustee who is not an interested person (as defined in the 1940 Act) of the trust and the fund is referred to herein as an Independent Trustee. Each Independent Trustee shall retire not later than the last day of the calendar year in which his or her 75th birthday occurs. The Independent Trustees may waive this mandatory retirement age policy with respect to individual Trustees. Officers and Advisory Board Members hold office without limit in time, except that any officer or Advisory Board Member may resign or may be removed by a vote of a majority of the Trustees at any regular meeting or any special meeting of the Trustees. Except as indicated, each individual has held the office shown or other offices in the same company for the past five years.
The fund’s Statement of Additional Information (SAI) includes more information about the Trustees. To request a free copy, call Fidelity at 1-877-208-0098.
Experience, Skills, Attributes, and Qualifications of the Trustees. The Governance and Nominating Committee has adopted a statement of policy that describes the experience, qualifications, attributes, and skills that are necessary and desirable for potential Independent Trustee candidates (Statement of Policy). The Board believes that each Trustee satisfied at the time he or she was initially elected or appointed a Trustee, and continues to satisfy, the standards contemplated by the Statement of Policy. The Governance and Nominating Committee also engages professional search firms to help identify potential Independent Trustee candidates who have the experience, qualifications, attributes, and skills consistent with the Statement of Policy. From time to time, additional criteria based on the composition and skills of the current Independent Trustees, as well as experience or skills that may be appropriate in light of future changes to board composition, business conditions, and regulatory or other developments, have also been considered by the professional search firms and the Governance and Nominating Committee. In addition, the Board takes into account the Trustees' commitment and participation in Board and committee meetings, as well as their leadership of standing and ad hoc committees throughout their tenure.
In determining that a particular Trustee was and continues to be qualified to serve as a Trustee, the Board has considered a variety of criteria, none of which, in isolation, was controlling. The Board believes that, collectively, the Trustees have balanced and diverse experience, qualifications, attributes, and skills, which allow the Board to operate effectively in governing the fund and protecting the interests of shareholders. Information about the specific experience, skills, attributes, and qualifications of each Trustee, which in each case led to the Board's conclusion that the Trustee should serve (or continue to serve) as a trustee of the fund, is provided below.
Board Structure and Oversight Function. James C. Curvey is an interested person and currently serves as Chairman. The Trustees have determined that an interested Chairman is appropriate and benefits shareholders because an interested Chairman has a personal and professional stake in the quality and continuity of services provided to the fund. Independent Trustees exercise their informed business judgment to appoint an individual of their choosing to serve as Chairman, regardless of whether the Trustee happens to be independent or a member of management. The Independent Trustees have determined that they can act independently and effectively without having an Independent Trustee serve as Chairman and that a key structural component for assuring that they are in a position to do so is for the Independent Trustees to constitute a substantial majority for the Board. The Independent Trustees also regularly meet in executive session. Ned C. Lautenbach serves as Chairman of the Independent Trustees and as such (i) acts as a liaison between the Independent Trustees and management with respect to matters important to the Independent Trustees and (ii) with management prepares agendas for Board meetings.
Fidelity® funds are overseen by different Boards of Trustees. The fund's Board oversees Fidelity's high income and certain equity funds, and other Boards oversee Fidelity's investment-grade bond, money market, asset allocation, and sector funds. The asset allocation funds may invest in Fidelity® funds overseen by the fund's Board. The use of separate Boards, each with its own committee structure, allows the Trustees of each group of Fidelity® funds to focus on the unique issues of the funds they oversee, including common research, investment, and operational issues. On occasion, the separate Boards establish joint committees to address issues of overlapping consequences for the Fidelity® funds overseen by each Board.
The Trustees operate using a system of committees to facilitate the timely and efficient consideration of all matters of importance to the Trustees, the fund, and fund shareholders and to facilitate compliance with legal and regulatory requirements and oversight of the fund's activities and associated risks. The Board, acting through its committees, has charged FMR and its affiliates with (i) identifying events or circumstances the occurrence of which could have demonstrably adverse effects on the fund's business and/or reputation; (ii) implementing processes and controls to lessen the possibility that such events or circumstances occur or to mitigate the effects of such events or circumstances if they do occur; and (iii) creating and maintaining a system designed to evaluate continuously business and market conditions in order to facilitate the identification and implementation processes described in (i) and (ii) above. Because the day-to-day operations and activities of the fund are carried out by or through FMR, its affiliates, and other service providers, the fund's exposure to risks is mitigated but not eliminated by the processes overseen by the Trustees. While each of the Board's committees has responsibility for overseeing different aspects of the fund's activities, oversight is exercised primarily through the Operations, Audit, and Compliance Committees. In addition, the Independent Trustees have worked with FMR to enhance the Board's oversight of investment and financial risks, legal and regulatory risks, technology risks, and operational risks, including the development of additional risk reporting to the Board. For example, a working group comprised of Independent Trustees and FMR has worked and continues to work to review the Fidelity® funds' valuation-related activities, reporting and risk management. Appropriate personnel, including but not limited to the fund's Chief Compliance Officer (CCO), FMR's internal auditor, the independent accountants, the fund's Treasurer and portfolio management personnel, make periodic reports to the Board's committees, as appropriate, including an annual review of Fidelity's risk management program for the Fidelity® funds. The responsibilities of each standing committee, including their oversight responsibilities, are described further under "Standing Committees of the Trustees."
Interested Trustees*:
Correspondence intended for a Trustee who is an interested person may be sent to Fidelity Investments, 245 Summer Street, Boston, Massachusetts 02210.
Name, Year of Birth; Principal Occupations and Other Relevant Experience+
James C. Curvey (1935)
Year of Election or Appointment: 2007
Trustee
Chairman of the Board of Trustees
Mr. Curvey also serves as Trustee of other Fidelity® funds. Mr. Curvey is a Director of Fidelity Research & Analysis Co. (investment adviser firm, 2009-present), and Vice Chairman (2007-present) and Director of FMR LLC (diversified financial services company). In addition, Mr. Curvey serves as an Overseer for the Boston Symphony Orchestra and a member of the board of Artis-Naples, Naples, Florida, and as a Trustee for Brewster Academy, Wolfeboro, New Hampshire. Previously, Mr. Curvey served as a Director of Fidelity Investments Money Management, Inc. (investment adviser firm, 2009-2014) and a Director of FMR and FMR Co., Inc. (investment adviser firms, 2007-2014).
Charles S. Morrison (1960)
Year of Election or Appointment: 2014
Trustee
Mr. Morrison also serves as Trustee of other funds. He serves as President of Fidelity Management & Research Company (FMR) (investment adviser firm, 2016-present), a Director of Fidelity Investments Money Management, Inc. (FIMM) (investment adviser firm, 2014-present), Director of Fidelity SelectCo, LLC (investment adviser firm, 2014-present), President, Asset Management (2014-present), and is an employee of Fidelity Investments. Previously, Mr. Morrison served as Vice President of Fidelity's Fixed Income and Asset Allocation Funds (2012-2014), President, Fixed Income (2011-2014), Vice President of Fidelity's Money Market Funds (2005-2009), President, Money Market Group Leader of FMR (investment adviser firm, 2009), and Senior Vice President, Money Market Group of FMR (2004-2009). Mr. Morrison also served as Vice President of Fidelity's Bond Funds (2002-2005), certain Balanced Funds (2002-2005), and certain Asset Allocation Funds (2002-2007), and as Senior Vice President (2002-2005) of Fidelity's Bond Division.
* Determined to be an “Interested Trustee” by virtue of, among other things, his or her affiliation with the trust or various entities under common control with FMR.
+ The information includes the Trustee's principal occupation during the last five years and other information relating to the experience, attributes, and skills relevant to the Trustee's qualifications to serve as a Trustee, which led to the conclusion that the Trustee should serve as a Trustee for the fund.
Independent Trustees:
Correspondence intended for an Independent Trustee may be sent to Fidelity Investments, P.O. Box 55235, Boston, Massachusetts 02205-5235.
Name, Year of Birth; Principal Occupations and Other Relevant Experience+
Dennis J. Dirks (1948)
Year of Election or Appointment: 2005
Trustee
Mr. Dirks also serves as Trustee of other Fidelity® funds. Prior to his retirement in May 2003, Mr. Dirks was Chief Operating Officer and a member of the Board of The Depository Trust & Clearing Corporation (DTCC). He also served as President, Chief Operating Officer, and Board member of The Depository Trust Company (DTC) and President and Board member of the National Securities Clearing Corporation (NSCC). In addition, Mr. Dirks served as Chief Executive Officer and Board member of the Government Securities Clearing Corporation, Chief Executive Officer and Board member of the Mortgage-Backed Securities Clearing Corporation, as a Trustee and a member of the Finance Committee of Manhattan College (2005-2008), as a Trustee and a member of the Finance Committee of AHRC of Nassau County (2006-2008), as a member of the Independent Directors Council (IDC) Governing Council (2010-2015), and as a member of the Board of Directors for The Brookville Center for Children’s Services, Inc. (2009-2017). Mr. Dirks is a member of the Finance Committee (2016-present) and Board of Directors (2017-present) of the Asolo Repertory Theatre.
Alan J. Lacy (1953)
Year of Election or Appointment: 2008
Trustee
Mr. Lacy also serves as Trustee of other Fidelity® funds. Mr. Lacy serves as a Director of Bristol-Myers Squibb Company (global pharmaceuticals, 2008-present). He is a Trustee of the California Chapter of The Nature Conservancy (2015-present) and a Director of the Center for Advanced Study in the Behavioral Sciences at Stanford University (2015-present). In addition, Mr. Lacy served as Senior Adviser (2007-2014) of Oak Hill Capital Partners, L.P. (private equity) and also served as Chief Executive Officer (2005) and Vice Chairman (2005-2006) of Sears Holdings Corporation (retail) and Chief Executive Officer and Chairman of the Board of Sears, Roebuck and Co. (retail, 2000-2005). Previously, Mr. Lacy served as Chairman (2014-2017) and a member (2010-2017) of the Board of Directors of Dave & Buster’s Entertainment, Inc. (restaurant and entertainment complexes), as Chairman (2008-2011) and a member (2006-2015) of the Board of Trustees of the National Parks Conservation Association, and as a member of the Board of Directors for The Hillman Companies, Inc. (hardware wholesalers, 2010-2014), Earth Fare, Inc. (retail grocery, 2010-2014), and The Western Union Company (global money transfer, 2006-2011).
Ned C. Lautenbach (1944)
Year of Election or Appointment: 2000
Trustee
Chairman of the Independent Trustees
Mr. Lautenbach also serves as Trustee of other Fidelity® funds. Mr. Lautenbach currently serves as Vice Chair of the Board of Governors, State University System of Florida (2013-present) and is a member of the Council on Foreign Relations (1994-present). He is also a member and has most recently served as Chairman of the Board of Directors of Artis-Naples (2012-present). Previously, Mr. Lautenbach served as a member and then Lead Director of the Board of Directors of Eaton Corporation (diversified industrial, 1997-2016). He was also a Partner and Advisory Partner at Clayton, Dubilier & Rice, LLC (private equity investment, 1998-2010), as well as a Director of Sony Corporation (2006-2007). In addition, Mr. Lautenbach also had a 30-year career with IBM (technology company) during which time he served as Senior Vice President and a member of the Corporate Executive Committee (1968-1998).
Joseph Mauriello (1944)
Year of Election or Appointment: 2008
Trustee
Mr. Mauriello also serves as Trustee of other Fidelity® funds. Prior to his retirement in January 2006, Mr. Mauriello served in numerous senior management positions including Deputy Chairman and Chief Operating Officer (2004-2005), and Vice Chairman of Financial Services (2002-2004) of KPMG LLP US (professional services, 1965-2005). Mr. Mauriello currently serves as a member of the Board of Directors of XL Group plc. (global insurance and re-insurance, 2006-present) and the Independent Directors Council (IDC) Governing Council (2015-present). Previously, Mr. Mauriello served as a Director of the Hamilton Funds of the Bank of New York (2006-2007) and of Arcadia Resources Inc. (health care services and products, 2007-2012).
Cornelia M. Small (1944)
Year of Election or Appointment: 2005
Trustee
Ms. Small also serves as Trustee of other Fidelity® funds. Ms. Small is a member of the Board of Directors (2009-present) and Chair of the Investment Committee (2010-present) of the Teagle Foundation. Ms. Small also serves on the Investment Committee of the Berkshire Taconic Community Foundation (2008-present). Previously, Ms. Small served as Chairperson (2002-2008) and a member of the Investment Committee and Chairperson (2008-2012) and a member of the Board of Trustees of Smith College. In addition, Ms. Small served as Chief Investment Officer, Director of Global Equity Investments, and a member of the Board of Directors of Scudder, Stevens & Clark and Scudder Kemper Investments.
William S. Stavropoulos (1939)
Year of Election or Appointment: 2002
Trustee
Vice Chairman of the Independent Trustees
Mr. Stavropoulos also serves as Trustee of other Fidelity® funds. Mr. Stavropoulos serves as President and Founder of the Michigan Baseball Foundation, the Great Lakes Loons (2007-present). Mr. Stavropoulos is Chairman Emeritus of the Board of Directors of The Dow Chemical Company, where he previously served in numerous senior management positions, including President, CEO (1995-2000; 2002-2004), Chairman of the Executive Committee (2000-2006), and as a member of the Board of Directors (1990-2006). Currently, Mr. Stavropoulos is Chairman of the Board of Directors of Univar Inc. (global distributor of commodity and specialty chemicals), a Director of Teradata Corporation (data warehousing and technology solutions), and a member of the Advisory Board for Metalmark Capital LLC (private equity investment, 2005-present). Mr. Stavropoulos is an operating advisor to Clayton, Dubilier & Rice, LLC (private equity investment). In addition, Mr. Stavropoulos is a member of the University of Notre Dame Advisory Council for the College of Science, a Trustee of the Rollin L. Gerstacker Foundation, and a Director of Artis-Naples in Naples, Florida. Previously, Mr. Stavropoulos served as a Director of Chemical Financial Corporation (bank holding company, 1993-2012) and Tyco International, Ltd. (multinational manufacturing and services, 2007-2012).
David M. Thomas (1949)
Year of Election or Appointment: 2008
Trustee
Mr. Thomas also serves as Trustee of other Fidelity® funds. Mr. Thomas serves as Non-Executive Chairman of the Board of Directors of Fortune Brands Home and Security (home and security products, 2011-present), as a member of the Board of Directors (2004-present) and Presiding Director (2013-present) of Interpublic Group of Companies, Inc. (marketing communication), and as a member of the Board of Trustees of the University of Florida (2013-present). Previously, Mr. Thomas served as Executive Chairman (2005-2006) and Chairman and Chief Executive Officer (2000-2005) of IMS Health, Inc. (pharmaceutical and healthcare information solutions), and a Director of Fortune Brands, Inc. (consumer products, 2000-2011).
+ The information includes the Trustee's principal occupation during the last five years and other information relating to the experience, attributes, and skills relevant to the Trustee's qualifications to serve as a Trustee, which led to the conclusion that the Trustee should serve as a Trustee for the fund.
Advisory Board Members and Officers:
Correspondence intended for an officer or Peter S. Lynch may be sent to Fidelity Investments, 245 Summer Street, Boston, Massachusetts 02210. Officers appear below in alphabetical order.
Name, Year of Birth; Principal Occupation
Peter S. Lynch (1944)
Year of Election or Appointment: 2003
Member of the Advisory Board
Mr. Lynch also serves as Member of the Advisory Board of other Fidelity® funds. Mr. Lynch is Vice Chairman and a Director of FMR (investment adviser firm) and FMR Co., Inc. (investment adviser firm). In addition, Mr. Lynch serves as a Trustee of Boston College and as the Chairman of the Inner-City Scholarship Fund. Previously, Mr. Lynch served on the Special Olympics International Board of Directors (1997-2006).
Elizabeth Paige Baumann (1968)
Year of Election or Appointment: 2017
Anti-Money Laundering (AML) Officer
Ms. Baumann also serves as AML Officer of other funds. She is Chief AML Officer (2012-present) and Senior Vice President (2014-present) of FMR LLC (diversified financial services company) and is an employee of Fidelity Investments. Previously, Ms. Baumann served as AML Officer of the funds (2012-2016), and Vice President (2007-2014) and Deputy Anti-Money Laundering Officer (2007-2012) of FMR LLC.
Marc R. Bryant (1966)
Year of Election or Appointment: 2015
Secretary and Chief Legal Officer (CLO)
Mr. Bryant also serves as Secretary and CLO of other funds. Mr. Bryant serves as CLO, Secretary, and Senior Vice President of Fidelity Management & Research Company (investment adviser firm, 2015-present) and FMR Co., Inc. (investment adviser firm, 2015-present); Secretary of Fidelity SelectCo, LLC (investment adviser firm, 2015-present) and Fidelity Investments Money Management, Inc. (investment adviser firm, 2015-present); and CLO of Fidelity Management & Research (Hong Kong) Limited and FMR Investment Management (UK) Limited (investment adviser firms, 2015-present) and Fidelity Management & Research (Japan) Limited (investment adviser firm, 2016-present). He is Senior Vice President and Deputy General Counsel of FMR LLC (diversified financial services company). Previously, Mr. Bryant served as Secretary and CLO of Fidelity Rutland Square Trust II (2010-2014) and Assistant Secretary of Fidelity's Fixed Income and Asset Allocation Funds (2013-2015). Prior to joining Fidelity Investments, Mr. Bryant served as a Senior Vice President and the Head of Global Retail Legal for AllianceBernstein L.P. (2006-2010), and as the General Counsel for ProFund Advisors LLC (2001-2006).
William C. Coffey (1969)
Year of Election or Appointment: 2009
Assistant Secretary
Mr. Coffey also serves as Assistant Secretary of other funds. He is Senior Vice President and Deputy General Counsel of FMR LLC (diversified financial services company, 2010-present), and is an employee of Fidelity Investments. Previously, Mr. Coffey served as Vice President and Associate General Counsel of FMR LLC (2005-2009).
Jonathan Davis (1968)
Year of Election or Appointment: 2010
Assistant Treasurer
Mr. Davis also serves as Assistant Treasurer of other funds. Mr. Davis serves as Assistant Treasurer of FMR Capital, Inc. (2017-present) and is an employee of Fidelity Investments. Previously, Mr. Davis served as Vice President and Associate General Counsel of FMR LLC (diversified financial services company, 2003-2010).
Adrien E. Deberghes (1967)
Year of Election or Appointment: 2016
Assistant Treasurer
Mr. Deberghes also serves as an officer of other funds. He serves as Assistant Treasurer of FMR Capital, Inc. (2017-present), Executive Vice President of Fidelity Investments Money Management, Inc. (FIMM) (investment adviser firm, 2016-present), and is an employee of Fidelity Investments (2008-present). Prior to joining Fidelity Investments, Mr. Deberghes was Senior Vice President of Mutual Fund Administration at State Street Corporation (2007-2008), Senior Director of Mutual Fund Administration at Investors Bank & Trust (2005-2007), and Director of Finance for Dunkin' Brands (2000-2005). Previously, Mr. Deberghes served in other fund officer roles.
Stephanie J. Dorsey (1969)
Year of Election or Appointment: 2010
Assistant Treasurer
Ms. Dorsey also serves as an officer of other funds. Ms. Dorsey serves as Assistant Treasurer of FMR Capital, Inc. (2017-present), is an employee of Fidelity Investments (2008-present), and has served in other fund officer roles. Prior to joining Fidelity Investments, Ms. Dorsey served as Treasurer (2004-2008) of the JPMorgan Mutual Funds and Vice President (2004-2008) of JPMorgan Chase Bank.
Howard J. Galligan III (1966)
Year of Election or Appointment: 2014
Chief Financial Officer
Mr. Galligan also serves as Chief Financial Officer of other funds. Mr. Galligan serves as President of Fidelity Pricing and Cash Management Services (FPCMS) (2014-present) and as a Director of Strategic Advisers, Inc. (investment adviser firm, 2008-present). Previously, Mr. Galligan served as Chief Administrative Officer of Asset Management (2011-2014) and Chief Operating Officer and Senior Vice President of Investment Support for Strategic Advisers, Inc. (2003-2011).
Thomas C. Hense (1964)
Year of Election or Appointment: 2008, 2010, or 2015
Vice President
Mr. Hense serves as Vice President of Fidelity Advisor® Multi-Asset Income Fund (2015) and other funds (High Income (2008), Small Cap (2008), and Value (2010) funds), and is an employee of Fidelity Investments (1993-present). Previously, Mr. Hense served as a portfolio manager for Fidelity's Institutional Money Management Group (Pyramis) (2003-2008).
Brian B. Hogan (1964)
Year of Election or Appointment: 2009
Vice President
Mr. Hogan also serves as Trustee or Vice President of other funds. Mr. Hogan serves as a Director of FMR Investment Management (UK) Limited (investment adviser firm, 2015-present) and Fidelity SelectCo, LLC (investment adviser firm, 2014-present) and President of the Equity Division of FMR (investment adviser firm, 2009-present). Previously, Mr. Hogan served as Senior Vice President, Equity Research of FMR (2006-2009) and as a portfolio manager. Mr. Brian B. Hogan is not related to Mr. Colm A. Hogan.
Colm A. Hogan (1973)
Year of Election or Appointment: 2016
Deputy Treasurer
Mr. Hogan also serves as an officer of other funds. Mr. Hogan serves as Assistant Treasurer of FMR Capital, Inc. (2017-present) and is an employee of Fidelity Investments (2005-present). Mr. Colm A. Hogan is not related to Mr. Brian B. Hogan.
Chris Maher (1972)
Year of Election or Appointment: 2013
Assistant Treasurer
Mr. Maher serves as Assistant Treasurer of other funds. Mr. Maher is Vice President of Valuation Oversight, serves as Assistant Treasurer of FMR Capital, Inc. (2017-present), and is an employee of Fidelity Investments. Previously, Mr. Maher served as Vice President of Asset Management Compliance (2013), Vice President of the Program Management Group of FMR (investment adviser firm, 2010-2013), and Vice President of Valuation Oversight (2008-2010).
Rieco E. Mello (1969)
Year of Election or Appointment: 2017
Assistant Treasurer
Mr. Mello also serves as Assistant Treasurer of other funds. Mr. Mello serves as Assistant Treasurer of FMR Capital, Inc. (2017-present) and is an employee of Fidelity Investments (1995-present).
Kenneth B. Robins (1969)
Year of Election or Appointment: 2016
Chief Compliance Officer
Mr. Robins also serves as an officer of other funds. Mr. Robins serves as Compliance Officer of Fidelity Management & Research Company and FMR Co., Inc. (investment adviser firms, 2016-present) and is an employee of Fidelity Investments (2004-present). Previously, Mr. Robins served as Executive Vice President of Fidelity Investments Money Management, Inc. (investment adviser firm, 2013-2016) and served in other fund officer roles.
Stacie M. Smith (1974)
Year of Election or Appointment: 2016
President and Treasurer
Ms. Smith also serves as an officer of other funds. Ms. Smith serves as Assistant Treasurer of FMR Capital, Inc. (2017-present), is an employee of Fidelity Investments (2009-present), and has served in other fund officer roles. Prior to joining Fidelity Investments, Ms. Smith served as Senior Audit Manager of Ernst & Young LLP (accounting firm, 1996-2009). Previously, Ms. Smith served as Deputy Treasurer of certain Fidelity® funds (2013-2016).
Marc L. Spector (1972)
Year of Election or Appointment: 2016
Assistant Treasurer
Mr. Spector also serves as an officer of other funds. Mr. Spector serves as Assistant Treasurer of FMR Capital, Inc. (2017-present) and is an employee of Fidelity Investments (2016-present). Prior to joining Fidelity Investments, Mr. Spector served as Director at the Siegfried Group (accounting firm, 2013-2016), and prior to Siegfried Group as audit senior manager at Deloitte & Touche (accounting firm, 2005-2013).
Renee Stagnone (1975)
Year of Election or Appointment: 2016
Assistant Treasurer
Ms. Stagnone also serves as an officer of other funds. Ms. Stagnone serves as Assistant Treasurer of FMR Capital, Inc. (2017-present) and is an employee of Fidelity Investments (1997-present). Previously, Ms. Stagnone served as Deputy Treasurer of certain Fidelity® funds (2013-2016).
Shareholder Expense Example
As a shareholder of the Fund, you incur two types of costs: (1) transaction costs, including sales charges (loads) on purchase payments or redemption proceeds, and (2) ongoing costs, including management fees, distribution and/or service (12b-1) fees and other Fund expenses. This Example is intended to help you understand your ongoing costs (in dollars) of investing in the Fund and to compare these costs with the ongoing costs of investing in other mutual funds.
The Example is based on an investment of $1,000 invested at the beginning of the period and held for the entire period (June 1, 2017 to November 30, 2017).
Actual Expenses
The first line of the accompanying table for each class of the Fund provides information about actual account values and actual expenses. You may use the information in this line, together with the amount you invested, to estimate the expenses that you paid over the period. Simply divide your account value by $1,000.00 (for example, an $8,600 account value divided by $1,000.00 = 8.6), then multiply the result by the number in the first line for a class of the Fund under the heading entitled "Expenses Paid During Period" to estimate the expenses you paid on your account during this period. A small balance maintenance fee of $12.00 that is charged once a year may apply for certain accounts with a value of less than $2,000. This fee is not included in the table below. If it was, the estimate of expenses you paid during the period would be higher, and your ending account value lower, by this amount. In addition, the Fund, as a shareholder in the underlying Fidelity Central Funds, will indirectly bear its pro-rata share of the fees and expenses incurred by the underlying Fidelity Central Funds. These fees and expenses are not included in the Fund's annualized expense ratio used to calculate the expense estimate in the table below.
Hypothetical Example for Comparison Purposes
The second line of the accompanying table for each class of the Fund provides information about hypothetical account values and hypothetical expenses based on a Class' actual expense ratio and an assumed rate of return of 5% per year before expenses, which is not the Class' actual return. The hypothetical account values and expenses may not be used to estimate the actual ending account balance or expenses you paid for the period. You may use this information to compare the ongoing costs of investing in the Fund and other funds. To do so, compare this 5% hypothetical example with the 5% hypothetical examples that appear in the shareholder reports of the other funds. A small balance maintenance fee of $12.00 that is charged once a year may apply for certain accounts with a value of less than $2,000. This fee is not included in the table below. If it was, the estimate of expenses you paid during the period would be higher, and your ending account value lower, by this amount. In addition, the Fund, as a shareholder in the underlying Fidelity Central Funds, will indirectly bear its pro-rata share of the fees and expenses incurred by the underlying Fidelity Central Funds. These fees and expenses are not included in the Fund's annualized expense ratio used to calculate the expense estimate in the table below.
Please note that the expenses shown in the table are meant to highlight your ongoing costs only and do not reflect any transaction costs. Therefore, the second line of the table is useful in comparing ongoing costs only, and will not help you determine the relative total costs of owning different funds. In addition, if these transactional costs were included, your costs would have been higher.
| Annualized Expense Ratio-A | Beginning Account Value June 1, 2017 | Ending Account Value November 30, 2017 | Expenses Paid During Period-B June 1, 2017 to November 30, 2017 | |
| Class A | .90% | |||
| Actual | $1,000.00 | $1,100.50 | $4.74 | |
| Hypothetical-C | $1,000.00 | $1,020.56 | $4.56 | |
| Class M | 1.14% | |||
| Actual | $1,000.00 | $1,099.20 | $6.00 | |
| Hypothetical-C | $1,000.00 | $1,019.35 | $5.77 | |
| Class C | 1.66% | |||
| Actual | $1,000.00 | $1,096.20 | $8.72 | |
| Hypothetical-C | $1,000.00 | $1,016.75 | $8.39 | |
| Fidelity Stock Selector Mid Cap Fund | .75% | |||
| Actual | $1,000.00 | $1,101.30 | $3.95 | |
| Hypothetical-C | $1,000.00 | $1,021.31 | $3.80 | |
| Class I | .65% | |||
| Actual | $1,000.00 | $1,101.60 | $3.42 | |
| Hypothetical-C | $1,000.00 | $1,021.81 | $3.29 | |
| Class Z | .48% | |||
| Actual | $1,000.00 | $1,102.70 | $2.53 | |
| Hypothetical-C | $1,000.00 | $1,022.66 | $2.43 |
A Annualized expense ratio reflects expenses net of applicable fee waivers.
B Expenses are equal to each Class' annualized expense ratio, multiplied by the average account value over the period, multiplied by 183/365 (to reflect the one-half year period).
C 5% return per year before expenses
Distributions (Unaudited)
The Board of Trustees of Fidelity Advisor Stock Selector Mid Cap Fund voted to pay to shareholders of record at the opening of business on record date, the following distributions per share derived from capital gains realized from sales of portfolio securities, and dividends derived from net investment income:
| Pay Date | Record Date | Dividends | Capital Gains | |
| Fidelity Advisor Stock Selector Mid Cap Fund | ||||
| Class A | 12/27/2017 | 12/26/2017 | $0.107 | $1.648 |
| Class M | 12/27/2017 | 12/26/2017 | $0.012 | $1.648 |
| Class C | 12/27/2017 | 12/26/2017 | $0.000 | $1.493 |
| Fidelity Stock Selector Mid Cap Fund | 12/27/2017 | 12/26/2017 | $0.197 | $1.648 |
| Class I | 12/27/2017 | 12/26/2017 | $0.208 | $1.648 |
| Class Z | 12/27/2017 | 12/26/2017 | $0.278 | $1.648 |
The fund hereby designates as a capital gain dividend with respect to the taxable year ended November 30, 2017, $57,049,530, or, if subsequently determined to be different, the net capital gain of such year.
Class A designates 100%; Class M designates 100%; Fidelity Stock Selector Mid Cap Fund designates 100%; and Class I designates 98% of the dividends distributed in December 2016, during the fiscal year as qualifying for the dividends–received deduction for corporate shareholders.
Class A, Class M, Fidelity Stock Selector Mid Cap Fund and Class I designate 100% of the dividends distributed during the fiscal year as amounts which may be taken into account as a dividend for purposes of the maximum rate under section 1(h)(11) of the Internal Revenue Code.
The fund will notify shareholders in January 2018 of amounts for use in preparing 2017 income tax returns.
Board Approval of Investment Advisory Contracts and Management Fees
Fidelity Advisor Stock Selector Mid Cap Fund
Each year, the Board of Trustees, including the Independent Trustees (together, the Board), votes on the renewal of the management contract with Fidelity Management & Research Company (FMR) and the sub-advisory agreements (together, the Advisory Contracts) for the fund. FMR and the sub-advisers are referred to herein as the Investment Advisers. The Board, assisted by the advice of fund counsel and Independent Trustees' counsel, requests and considers a broad range of information relevant to the renewal of the Advisory Contracts throughout the year.
The Board meets regularly and, at each of its meetings, covers an extensive agenda of topics and materials and considers factors that are relevant to its annual consideration of the renewal of the fund's Advisory Contracts, including the services and support provided to the fund and its shareholders. The Board has established various standing committees (Committees), each composed of and chaired by Independent Trustees with varying backgrounds, to which the Board has assigned specific subject matter responsibilities in order to enhance effective decision-making by the Board. The Board, acting directly and through its Committees, requests and receives information concerning the annual consideration of the renewal of the fund's Advisory Contracts. The Board also meets as needed to review matters specifically related to the Board's annual consideration of the renewal of the Advisory Contracts. Members of the Board may also meet with trustees of other Fidelity funds through ad hoc joint committees to discuss certain matters relevant to all of the Fidelity funds.
At its July 2017 meeting, the Board unanimously determined to renew the fund's Advisory Contracts. In reaching its determination, the Board considered all factors it believed relevant, including (i) the nature, extent, and quality of the services to be provided to the fund and its shareholders (including the investment performance of the fund); (ii) the competitiveness of the fund's management fee and total expense ratio relative to peer funds; (iii) the total costs of the services to be provided by and the profits to be realized by Fidelity from its relationships with the fund; and (iv) the extent to which, if any, economies of scale exist and would be realized as the fund grows, and whether any economies of scale are appropriately shared with fund shareholders.
In considering whether to renew the Advisory Contracts for the fund, the Board reached a determination, with the assistance of fund counsel and Independent Trustees' counsel and through the exercise of its business judgment, that the renewal of the Advisory Contracts was in the best interests of the fund and its shareholders and that the compensation payable under the Advisory Contracts was fair and reasonable. The Board's decision to renew the Advisory Contracts was not based on any single factor, but rather was based on a comprehensive consideration of all the information provided to the Board at its meetings throughout the year. The Board, in reaching its determination to renew the Advisory Contracts, was aware that shareholders of the fund have a broad range of investment choices available to them, including a wide choice among funds offered by Fidelity's competitors, and that the fund's shareholders, who have the opportunity to review and weigh the disclosure provided by the fund in its prospectus and other public disclosures, have chosen to invest in this fund, which is part of the Fidelity family of funds.
Amendment to Group Fee Rate. The Board also approved an amendment to the management contract for the fund to add an additional breakpoint to the group fee schedule, effective October 1, 2017. The Board noted that the additional breakpoint would result in lower management fee rates as Fidelity's assets under management increase.
Nature, Extent, and Quality of Services Provided. The Board considered Fidelity's staffing as it relates to the fund, including the backgrounds of investment personnel of Fidelity, and also considered the fund's investment objective, strategies, and related investment philosophy. The Independent Trustees also had discussions with senior management of Fidelity's investment operations and investment groups. The Board considered the structure of the investment personnel compensation program and whether this structure provides appropriate incentives to act in the best interests of the fund. Additionally, the Board considered the portfolio managers' investments, if any, in the funds that they manage.Resources Dedicated to Investment Management and Support Services. The Board and the Fund Oversight and Research Committees reviewed the general qualifications and capabilities of Fidelity's investment staff, including its size, education, experience, and resources, as well as Fidelity's approach to recruiting, training, managing, and compensating investment personnel. The Board noted that Fidelity has continued to increase the resources devoted to non-U.S. offices, including expansion of Fidelity's global investment organization. The Board also noted that Fidelity's analysts have extensive resources, tools and capabilities that allow them to conduct sophisticated quantitative and fundamental analysis, as well as credit analysis of issuers, counterparties and guarantors. Further, the Board considered that Fidelity's investment professionals have sufficient access to global information and data so as to provide competitive investment results over time, and that those professionals also have access to sophisticated tools that permit them to assess portfolio construction and risk and performance attribution characteristics continuously, as well as to transmit new information and research conclusions rapidly around the world. Additionally, in its deliberations, the Board considered Fidelity's trading, risk management, compliance, and technology and operations capabilities and resources, which are integral parts of the investment management process.Shareholder and Administrative Services. The Board considered (i) the nature, extent, quality, and cost of advisory, administrative, and shareholder services performed by the Investment Advisers and their affiliates under the Advisory Contracts and under separate agreements covering transfer agency, pricing and bookkeeping, and securities lending services for the fund; (ii) the nature and extent of the supervision of third party service providers, principally custodians, subcustodians, and pricing vendors; and (iii) the resources devoted to, and the record of compliance with, the fund's compliance policies and procedures. The Board also reviewed the allocation of fund brokerage, including allocations to brokers affiliated with the Investment Advisers, the use of brokerage commissions to pay fund expenses, and the use of "soft" commission dollars to pay for research services.The Board noted that the growth of fund assets over time across the complex allows Fidelity to reinvest in the development of services designed to enhance the value or convenience of the Fidelity funds as investment vehicles. These services include 24-hour access to account information and market information through telephone representatives and over the Internet, investor education materials and asset allocation tools, and the expanded availability of Fidelity Investor Centers.In 2014, the Board formed an ad hoc Committee on Transfer Agency Fees to review the variety of transfer agency fee structures throughout the industry and Fidelity's competitive positioning with respect to industry participants.Investment in a Large Fund Family. The Board considered the benefits to shareholders of investing in a Fidelity fund, including the benefits of investing in a fund that is part of a large family of funds offering a variety of investment disciplines and providing a large variety of mutual fund investor services. The Board noted that Fidelity had taken, or had made recommendations that resulted in the Fidelity funds taking, a number of actions over the previous year that benefited particular funds, including: (i) continuing to dedicate additional resources to Fidelity's investment research process, and to the support of the senior management team that oversees asset management; (ii) continuing efforts to enhance Fidelity's global research capabilities; (iii) launching new funds and making other enhancements to meet client needs; (iv) launching new share classes of existing funds; (v) eliminating purchase minimums and broadening eligibility requirements for certain lower-priced share classes; (vi) reducing management fees and total expenses for certain growth equity funds and index funds; (vii) lowering expense caps for certain existing funds and classes to reduce expenses borne by shareholders; (viii) eliminating short-term redemption fees for certain funds; (ix) introducing a new pricing structure for certain funds of funds that is expected to reduce overall expenses paid by shareholders; (x) rationalizing product lines and gaining increased efficiencies through proposals for fund mergers and share class consolidations; (xi) continuing to develop, acquire and implement systems and technology to improve services to the funds and shareholders, strengthen information security, and increase efficiency; and (xii) implementing enhancements to further strengthen Fidelity's product line to increase investors' probability of success in achieving their investment goals, including retirement income goals.Investment Performance. The Board considered whether the fund has operated in accordance with its investment objective, as well as its record of compliance with its investment restrictions and its performance history.The Board took into account discussions with representatives of the Investment Advisers about fund investment performance that occur at Board meetings throughout the year. In this regard the Board noted that as part of regularly scheduled fund reviews and other reports to the Board on fund performance, the Board considers annualized return information for the fund for different time periods, measured against a securities market index ("benchmark index") and a peer group of funds with similar objectives ("peer group"), if any. In its evaluation of fund investment performance, the Board gave particular attention to information indicating changes in performance of certain Fidelity funds for specific time periods and discussed with the Investment Advisers the reasons for any overperformance or underperformance.In addition to reviewing absolute and relative fund performance, the Independent Trustees periodically consider the appropriateness of fund performance metrics in evaluating the results achieved. In general, the Independent Trustees believe that fund performance should be evaluated based on net performance (after fees and expenses) of both the highest performing and lowest performing fund share classes, where applicable, compared to appropriate benchmark indices, over appropriate time periods that may include full market cycles, and compared to peer groups, as applicable, over the same periods, taking into account relevant factors including the following: general market conditions; issuer-specific information; and fund cash flows and other factors.The Independent Trustees recognize that shareholders evaluate performance on a net basis over their own holding periods, for which one-, three-, and five-year periods are often used as a proxy. For this reason, the performance information reviewed by the Board also included net cumulative calendar year total return information for the fund and an appropriate benchmark index and peer group for the most recent one-, three-, and five-year periods, as shown below. Returns are shown compared to the 25th percentile (top of box, 75% beaten) and 75th percentile (bottom of box, 25% beaten) of the peer universe.Fidelity Advisor Stock Selector Mid Cap Fund
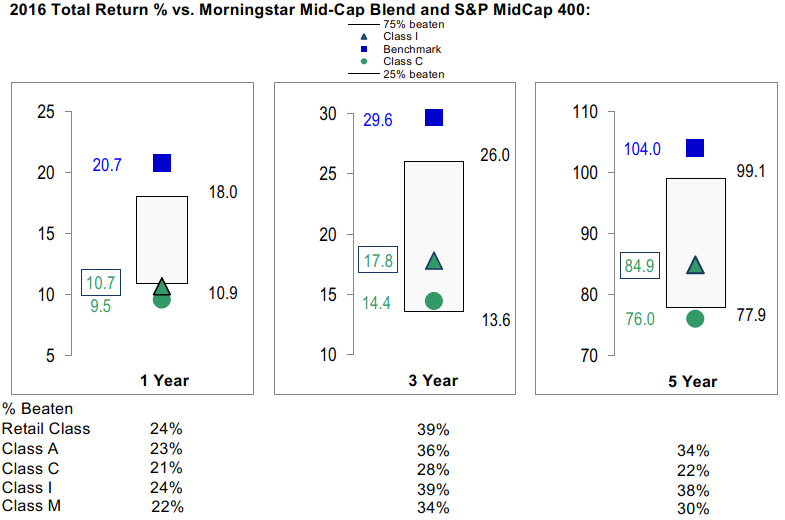
Fidelity Advisor Stock Selector Mid Cap Fund
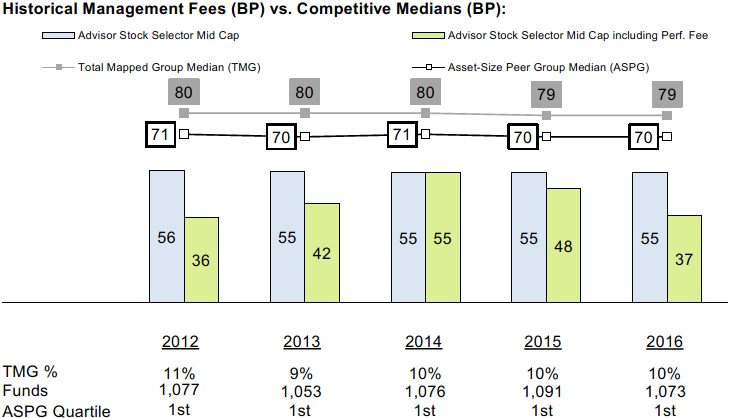
![]()
MC-ANN-0118
1.539186.120
Fidelity® Stock Selector Mid Cap Fund Annual Report November 30, 2017 Fidelity® Stock Selector Mid Cap Fund is a class of Fidelity Advisor® Stock Selector Mid Cap Fund |
|
Contents
Board Approval of Investment Advisory Contracts and Management Fees |
To view a fund's proxy voting guidelines and proxy voting record for the 12-month period ended June 30, visit http://www.fidelity.com/proxyvotingresults or visit the Securities and Exchange Commission's (SEC) web site at http://www.sec.gov.
You may also call 1-800-544-8544 to request a free copy of the proxy voting guidelines.
Standard & Poor's, S&P and S&P 500 are registered service marks of The McGraw-Hill Companies, Inc. and have been licensed for use by Fidelity Distributors Corporation.
Other third-party marks appearing herein are the property of their respective owners.
All other marks appearing herein are registered or unregistered trademarks or service marks of FMR LLC or an affiliated company. © 2018 FMR LLC. All rights reserved.
This report and the financial statements contained herein are submitted for the general information of the shareholders of the Fund. This report is not authorized for distribution to prospective investors in the Fund unless preceded or accompanied by an effective prospectus.
A fund files its complete schedule of portfolio holdings with the SEC for the first and third quarters of each fiscal year on Form N-Q. Forms N-Q are available on the SEC’s web site at http://www.sec.gov. A fund's Forms N-Q may be reviewed and copied at the SEC’s Public Reference Room in Washington, DC. Information regarding the operation of the SEC's Public Reference Room may be obtained by calling 1-800-SEC-0330.
For a complete list of a fund's portfolio holdings, view the most recent holdings listing, semiannual report, or annual report on Fidelity's web site at http://www.fidelity.com, http://www.institutional.fidelity.com, or http://www.401k.com, as applicable.
NOT FDIC INSURED •MAY LOSE VALUE •NO BANK GUARANTEE
Neither the Fund nor Fidelity Distributors Corporation is a bank.
Performance: The Bottom Line
Average annual total return reflects the change in the value of an investment, assuming reinvestment of distributions from dividend income and capital gains (the profits earned upon the sale of securities that have grown in value, if any) and assuming a constant rate of performance each year. The hypothetical investment and the average annual total returns do not reflect the deduction of taxes that a shareholder would pay on fund distributions or the redemption of fund shares. During periods of reimbursement by Fidelity, a fund’s total return will be greater than it would be had the reimbursement not occurred. How a fund did yesterday is no guarantee of how it will do tomorrow.
Average Annual Total Returns
| For the periods ended November 30, 2017 | Past 1 year | Past 5 years | Past 10 years |
| Fidelity® Stock Selector Mid Cap Fund | 20.87% | 13.39% | 6.16% |
The initial offering of Fidelity® Stock Selector Mid Cap Fund took place on June 6, 2012. Returns prior to June 6, 2012, are those of Class I.
$10,000 Over 10 Years
Let's say hypothetically that $10,000 was invested in Fidelity® Stock Selector Mid Cap Fund, a class of the fund, on November 30, 2007.
The chart shows how the value of your investment would have changed, and also shows how the S&P MidCap 400® Index performed over the same period.
See (previous page) for additional information regarding the performance of Fidelity® Stock Selector Mid Cap Fund.
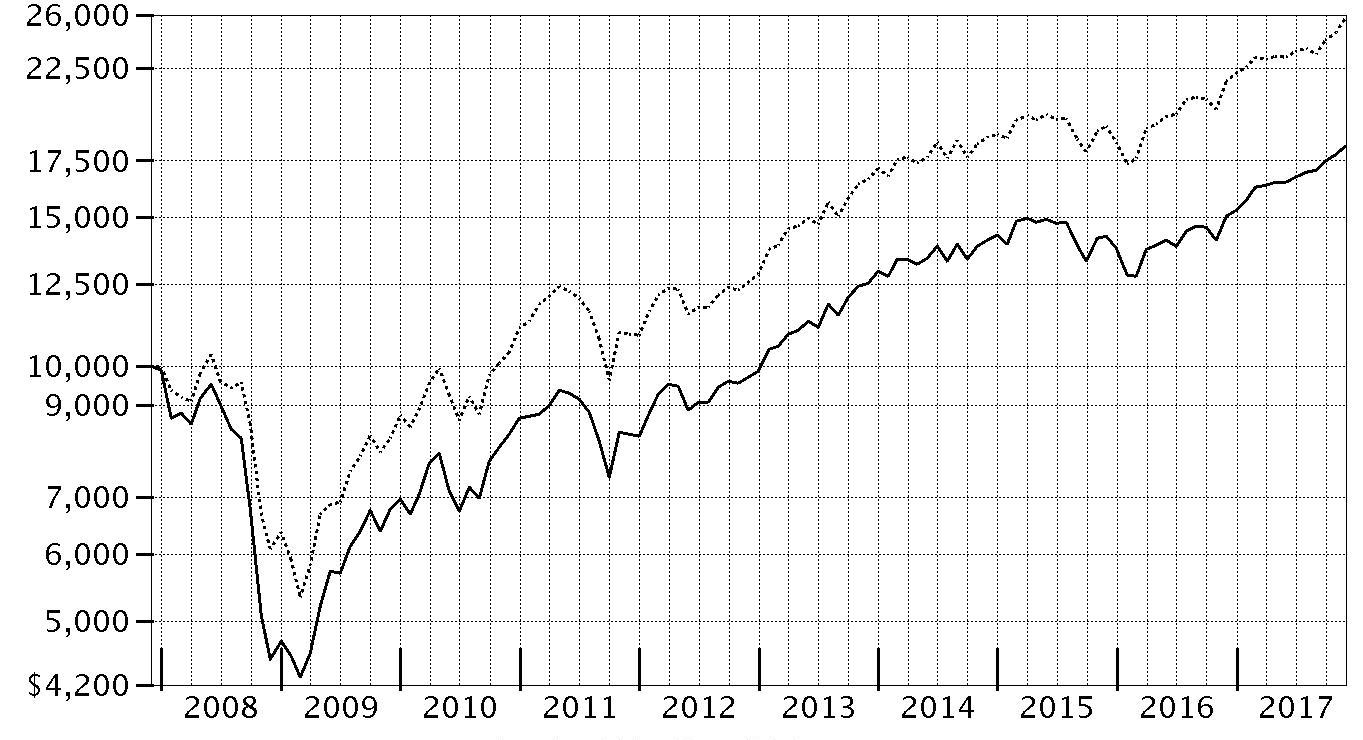
| Period Ending Values | ||
| $18,180 | Fidelity® Stock Selector Mid Cap Fund | |
| $25,751 | S&P MidCap 400® Index | |
Management's Discussion of Fund Performance
Market Recap: The U.S. equity bellwether S&P 500® index gained 22.87% for the year ending November 30, 2017, rising steadily and closing the period at an all-time high after a particularly strong three-month finish. Early on, equities rallied on optimism for President Trump’s pro-business agenda but leveled off in March amid fading optimism and stalled efforts by Congress to repeal and replace the Affordable Care Act. Upward momentum soon returned and continued through period end with consumer sentiment and other market indicators staying positive. The lone exception was a brief cooldown in August, when geopolitical tension escalated and uncertainty grew regarding the future of health care, tax reform and the debt ceiling. Sector-wise, info tech (+41%) led by a wide margin, surging amid strong earnings growth from several major index constituents. Utilities and financials each gained about 25%, the latter group riding an uptick in bond yields. Conversely, consumer discretionary (+20%) also rose solidly but lagged the broader market, as many brick-and-mortar retailers continued to suffer from increased online competition. Rising interest rates held back real estate (+16%), while consumer staples (+15%) and telecom (+1%) struggled due to investors’ general preference for risk assets. Lastly, sluggish oil prices pushed energy to a -4% return.Comments from Co-Portfolio Manager Robert Stansky: For the fiscal year, the fund’s share classes (excluding sales charges, if applicable) gained roughly 20% to 21%, outpacing the 18.53% rise of the benchmark S&P MidCap 400® Index. Versus the benchmark, stock selection in financials, materials and information technology contributed most. Overall, active management added value in 10 of eleven sectors. The top relative contributor was a non-benchmark stake in Aerojet Rocketdyne Holdings, a manufacturer of rocket propulsion systems. In August, the company announced that both net sales and net income were well ahead of year-earlier quarterly results. Overweighting homebuilder NVR and a non-benchmark position in Stamps.com further aided relative results. Conversely, positioning in consumer discretionary detracted modestly, as did a small cash position in a rising market. Not owning strong-performing index name Cognex hurt relative results. The company makes machine-vision products. Lastly, untimely ownership of Netherlands-based Chicago Bridge & Iron, a provider of engineering and construction services, detracted while held in the fund. We exited this position.The views expressed above reflect those of the portfolio manager(s) only through the end of the period as stated on the cover of this report and do not necessarily represent the views of Fidelity or any other person in the Fidelity organization. Any such views are subject to change at any time based upon market or other conditions and Fidelity disclaims any responsibility to update such views. These views may not be relied on as investment advice and, because investment decisions for a Fidelity fund are based on numerous factors, may not be relied on as an indication of trading intent on behalf of any Fidelity fund.
Note to shareholders: On April 13, 2017, Robert Stansky joined the portfolio management team as Group Leader and Co-Manager, responsible for overall risk management, sector rebalancing and maintaining a disciplined portfolio construction process.Investment Summary (Unaudited)
Top Ten Stocks as of November 30, 2017
| % of fund's net assets | % of fund's net assets 6 months ago | |
| Capital One Financial Corp. | 2.4 | 1.6 |
| Huntington Bancshares, Inc. | 2.2 | 1.7 |
| AECOM | 1.7 | 1.6 |
| Steel Dynamics, Inc. | 1.3 | 1.5 |
| American Airlines Group, Inc. | 1.2 | 1.2 |
| OneMain Holdings, Inc. | 1.1 | 0.7 |
| Bank of the Ozarks, Inc. | 1.1 | 0.0 |
| Signature Bank | 1.0 | 0.3 |
| E*TRADE Financial Corp. | 1.0 | 0.5 |
| Arthur J. Gallagher & Co. | 1.0 | 1.0 |
| 14.0 |
Top Five Market Sectors as of November 30, 2017
| % of fund's net assets | % of fund's net assets 6 months ago | |
| Information Technology | 17.0 | 17.4 |
| Financials | 16.4 | 15.6 |
| Industrials | 14.4 | 12.5 |
| Consumer Discretionary | 13.0 | 12.8 |
| Real Estate | 9.5 | 9.9 |
Asset Allocation (% of fund's net assets)
| As of November 30, 2017* | ||
| Stocks and Equity Futures | 98.5% | |
| Short-Term Investments and Net Other Assets (Liabilities) | 1.5% | |

* Foreign investments - 7.0%
| As of May 31, 2017* | ||
| Stocks and Equity Futures | 96.5% | |
| Short-Term Investments and Net Other Assets (Liabilities) | 3.5% | |

* Foreign investments - 7.4%
Percentages shown as 0.0% may reflect amounts less than 0.05%.
Investments November 30, 2017
Showing Percentage of Net Assets
| Common Stocks - 97.7% | |||
| Shares | Value (000s) | ||
| CONSUMER DISCRETIONARY - 13.0% | |||
| Auto Components - 0.8% | |||
| Gentex Corp. | 736,300 | $15,079 | |
| Hertz Global Holdings, Inc. (a)(b) | 84,983 | 1,610 | |
| The Goodyear Tire & Rubber Co. | 149,100 | 4,826 | |
| 21,515 | |||
| Distributors - 0.5% | |||
| LKQ Corp. (a) | 301,900 | 11,901 | |
| Diversified Consumer Services - 1.9% | |||
| Graham Holdings Co. | 23,900 | 13,936 | |
| Grand Canyon Education, Inc. (a) | 115,300 | 10,949 | |
| ServiceMaster Global Holdings, Inc. (a) | 474,856 | 23,211 | |
| 48,096 | |||
| Hotels, Restaurants & Leisure - 0.8% | |||
| ARAMARK Holdings Corp. | 196,000 | 8,350 | |
| Brinker International, Inc. (b) | 168,500 | 6,189 | |
| U.S. Foods Holding Corp. (a) | 187,500 | 5,460 | |
| 19,999 | |||
| Household Durables - 1.0% | |||
| NVR, Inc. (a) | 7,300 | 25,368 | |
| Internet & Direct Marketing Retail - 0.3% | |||
| Liberty Interactive Corp. QVC Group (Venture Group) Series A (a) | 123,040 | 6,867 | |
| Media - 2.7% | |||
| Cinemark Holdings, Inc. | 532,400 | 19,225 | |
| Discovery Communications, Inc. Class A (a)(b) | 151,000 | 2,872 | |
| Interpublic Group of Companies, Inc. | 388,600 | 7,687 | |
| Liberty Broadband Corp. Class A (a) | 124,800 | 10,697 | |
| Omnicom Group, Inc. | 133,300 | 9,523 | |
| Scripps Networks Interactive, Inc. Class A | 121,300 | 9,927 | |
| The Madison Square Garden Co. (a) | 47,800 | 10,356 | |
| 70,287 | |||
| Multiline Retail - 0.9% | |||
| Dollar General Corp. | 111,000 | 9,777 | |
| Dollar Tree, Inc. (a) | 135,300 | 13,903 | |
| 23,680 | |||
| Specialty Retail - 2.6% | |||
| AutoZone, Inc. (a) | 16,500 | 11,332 | |
| Foot Locker, Inc. | 118,200 | 5,064 | |
| L Brands, Inc. | 75,000 | 4,205 | |
| O'Reilly Automotive, Inc. (a) | 45,400 | 10,724 | |
| Ross Stores, Inc. | 275,200 | 20,923 | |
| Williams-Sonoma, Inc. (b) | 268,700 | 13,747 | |
| 65,995 | |||
| Textiles, Apparel & Luxury Goods - 1.5% | |||
| Carter's, Inc. | 150,900 | 16,345 | |
| PVH Corp. | 99,800 | 13,428 | |
| Tapestry, Inc. | 203,400 | 8,480 | |
| 38,253 | |||
| TOTAL CONSUMER DISCRETIONARY | 331,961 | ||
| CONSUMER STAPLES - 3.4% | |||
| Beverages - 0.4% | |||
| Coca-Cola European Partners PLC | 115,700 | 4,511 | |
| Dr. Pepper Snapple Group, Inc. | 58,600 | 5,285 | |
| 9,796 | |||
| Food Products - 2.2% | |||
| ConAgra Foods, Inc. | 74,900 | 2,796 | |
| Hostess Brands, Inc. Class A (a) | 427,610 | 6,012 | |
| Ingredion, Inc. | 111,900 | 15,496 | |
| Lamb Weston Holdings, Inc. | 218,300 | 11,869 | |
| Pinnacle Foods, Inc. | 92,200 | 5,369 | |
| The J.M. Smucker Co. | 37,800 | 4,410 | |
| The Simply Good Foods Co. | 728,300 | 9,643 | |
| 55,595 | |||
| Household Products - 0.6% | |||
| Church & Dwight Co., Inc. | 126,600 | 5,962 | |
| Energizer Holdings, Inc. (b) | 167,800 | 7,707 | |
| Spectrum Brands Holdings, Inc. (b) | 26,300 | 3,021 | |
| 16,690 | |||
| Personal Products - 0.2% | |||
| Coty, Inc. Class A | 236,200 | 4,070 | |
| TOTAL CONSUMER STAPLES | 86,151 | ||
| ENERGY - 3.9% | |||
| Energy Equipment & Services - 0.9% | |||
| Dril-Quip, Inc. (a) | 192,200 | 9,216 | |
| Ensco PLC Class A (b) | 1,456,700 | 7,822 | |
| Nabors Industries Ltd. | 1,143,100 | 6,904 | |
| 23,942 | |||
| Oil, Gas & Consumable Fuels - 3.0% | |||
| Cimarex Energy Co. | 77,700 | 9,022 | |
| Energen Corp. (a) | 321,000 | 18,124 | |
| HollyFrontier Corp. | 532,900 | 23,703 | |
| PDC Energy, Inc. (a) | 117,900 | 5,418 | |
| Whiting Petroleum Corp. (a) | 129,400 | 3,229 | |
| WPX Energy, Inc. (a) | 1,355,000 | 17,168 | |
| 76,664 | |||
| TOTAL ENERGY | 100,606 | ||
| FINANCIALS - 16.4% | |||
| Banks - 5.8% | |||
| Bank of the Ozarks, Inc. | 581,500 | 28,040 | |
| CIT Group, Inc. | 202,036 | 10,069 | |
| Huntington Bancshares, Inc. | 3,799,106 | 54,707 | |
| Signature Bank (a) | 192,100 | 26,371 | |
| Synovus Financial Corp. | 466,027 | 23,129 | |
| The Jammu & Kashmir Bank Ltd. (a) | 3,777,961 | 4,329 | |
| 146,645 | |||
| Capital Markets - 3.0% | |||
| CBOE Holdings, Inc. | 134,800 | 16,638 | |
| E*TRADE Financial Corp. (a) | 545,400 | 26,256 | |
| Legg Mason, Inc. | 237,800 | 9,502 | |
| MSCI, Inc. | 167,000 | 21,493 | |
| Virtu Financial, Inc. Class A (b) | 164,000 | 2,673 | |
| 76,562 | |||
| Consumer Finance - 4.5% | |||
| Capital One Financial Corp. | 671,000 | 61,729 | |
| Navient Corp. | 75,000 | 946 | |
| OneMain Holdings, Inc. (a) | 1,128,414 | 29,124 | |
| SLM Corp. (a) | 2,090,562 | 24,188 | |
| 115,987 | |||
| Diversified Financial Services - 0.2% | |||
| On Deck Capital, Inc. (a) | 514,658 | 2,723 | |
| Quantenna Communications, Inc. (a) | 185,300 | 2,266 | |
| 4,989 | |||
| Insurance - 2.0% | |||
| Arthur J. Gallagher & Co. | 395,800 | 26,056 | |
| Direct Line Insurance Group PLC | 2,511,558 | 12,425 | |
| Employers Holdings, Inc. | 117,906 | 5,777 | |
| FNF Group | 165,200 | 6,684 | |
| 50,942 | |||
| Mortgage Real Estate Investment Trusts - 0.4% | |||
| Redwood Trust, Inc. | 675,500 | 10,146 | |
| Thrifts & Mortgage Finance - 0.5% | |||
| Essent Group Ltd. (a) | 181,300 | 8,023 | |
| LIC Housing Finance Ltd. | 430,966 | 3,887 | |
| 11,910 | |||
| TOTAL FINANCIALS | 417,181 | ||
| HEALTH CARE - 7.3% | |||
| Biotechnology - 0.4% | |||
| Bioverativ, Inc. | 224,000 | 11,204 | |
| Health Care Equipment & Supplies - 2.8% | |||
| Boston Scientific Corp. (a) | 620,000 | 16,294 | |
| Dentsply Sirona, Inc. | 118,000 | 7,907 | |
| DexCom, Inc. (a)(b) | 164,000 | 9,583 | |
| Insulet Corp. (a) | 172,000 | 12,338 | |
| Integra LifeSciences Holdings Corp. (a) | 240,000 | 11,669 | |
| Wright Medical Group NV (a) | 500,000 | 12,155 | |
| 69,946 | |||
| Health Care Providers & Services - 1.2% | |||
| Molina Healthcare, Inc. (a) | 100,000 | 7,824 | |
| Premier, Inc. (a) | 300,000 | 8,706 | |
| Teladoc, Inc. (a) | 400,000 | 14,840 | |
| 31,370 | |||
| Health Care Technology - 0.8% | |||
| Cerner Corp. (a) | 224,000 | 15,835 | |
| Evolent Health, Inc. (a)(b) | 400,000 | 5,140 | |
| 20,975 | |||
| Life Sciences Tools & Services - 1.0% | |||
| Bio-Rad Laboratories, Inc. Class A (a) | 72,000 | 19,534 | |
| Bruker Corp. | 160,000 | 5,629 | |
| 25,163 | |||
| Pharmaceuticals - 1.1% | |||
| Catalent, Inc. (a) | 100,000 | 3,979 | |
| Indivior PLC (a) | 1,290,000 | 6,469 | |
| Jazz Pharmaceuticals PLC (a) | 55,000 | 7,686 | |
| Mallinckrodt PLC (a) | 440,000 | 9,601 | |
| 27,735 | |||
| TOTAL HEALTH CARE | 186,393 | ||
| INDUSTRIALS - 14.4% | |||
| Aerospace & Defense - 1.5% | |||
| Aerojet Rocketdyne Holdings, Inc. (a) | 321,336 | 10,119 | |
| Axon Enterprise, Inc. (a)(b) | 208,800 | 5,195 | |
| Hexcel Corp. | 66,300 | 4,111 | |
| Orbital ATK, Inc. | 138,400 | 18,260 | |
| 37,685 | |||
| Airlines - 2.7% | |||
| American Airlines Group, Inc. | 618,470 | 31,227 | |
| JetBlue Airways Corp. (a) | 1,191,000 | 25,571 | |
| United Continental Holdings, Inc. (a) | 192,300 | 12,176 | |
| 68,974 | |||
| Building Products - 0.7% | |||
| Allegion PLC | 226,210 | 19,033 | |
| Construction & Engineering - 2.7% | |||
| AECOM (a) | 1,191,437 | 44,679 | |
| KBR, Inc. | 1,315,739 | 24,670 | |
| 69,349 | |||
| Electrical Equipment - 1.9% | |||
| AMETEK, Inc. | 169,272 | 12,304 | |
| Fortive Corp. | 156,800 | 11,705 | |
| Sensata Technologies Holding BV (a) | 467,076 | 23,330 | |
| 47,339 | |||
| Machinery - 1.5% | |||
| Allison Transmission Holdings, Inc. | 380,163 | 15,602 | |
| IDEX Corp. | 80,658 | 10,935 | |
| WABCO Holdings, Inc. (a) | 76,600 | 11,448 | |
| 37,985 | |||
| Marine - 0.0% | |||
| A.P. Moller - Maersk A/S Series B | 199 | 357 | |
| Road & Rail - 2.4% | |||
| AMERCO | 9,700 | 3,595 | |
| Avis Budget Group, Inc. (a) | 643,500 | 24,517 | |
| CSX Corp. | 301,400 | 16,803 | |
| Norfolk Southern Corp. | 119,000 | 16,497 | |
| 61,412 | |||
| Trading Companies & Distributors - 1.0% | |||
| HD Supply Holdings, Inc. (a) | 528,100 | 19,529 | |
| MRC Global, Inc. (a) | 306,605 | 4,817 | |
| 24,346 | |||
| TOTAL INDUSTRIALS | 366,480 | ||
| INFORMATION TECHNOLOGY - 17.0% | |||
| Communications Equipment - 0.8% | |||
| CommScope Holding Co., Inc. (a) | 265,800 | 9,566 | |
| F5 Networks, Inc. (a) | 75,030 | 10,069 | |
| 19,635 | |||
| Electronic Equipment & Components - 2.5% | |||
| Arrow Electronics, Inc. (a) | 129,000 | 10,414 | |
| IPG Photonics Corp. (a) | 66,000 | 15,113 | |
| Jabil, Inc. | 873,100 | 25,189 | |
| Largan Precision Co. Ltd. | 80,000 | 13,695 | |
| 64,411 | |||
| Internet Software & Services - 1.8% | |||
| Akamai Technologies, Inc. (a) | 202,200 | 11,279 | |
| GoDaddy, Inc. (a) | 249,400 | 12,133 | |
| NetEase, Inc. ADR | 6,100 | 2,005 | |
| Stamps.com, Inc. (a) | 116,700 | 19,652 | |
| Velti PLC (a)(c) | 215,084 | 0 | |
| 45,069 | |||
| IT Services - 4.5% | |||
| Capgemini SA | 141,300 | 16,294 | |
| Cognizant Technology Solutions Corp. Class A | 210,900 | 15,244 | |
| EPAM Systems, Inc. (a) | 131,900 | 13,380 | |
| FleetCor Technologies, Inc. (a) | 66,800 | 12,149 | |
| Global Payments, Inc. | 116,900 | 11,755 | |
| Jack Henry & Associates, Inc. | 106,900 | 12,328 | |
| Leidos Holdings, Inc. | 355,800 | 22,618 | |
| Maximus, Inc. | 158,400 | 10,942 | |
| 114,710 | |||
| Semiconductors & Semiconductor Equipment - 3.1% | |||
| Cirrus Logic, Inc. (a) | 27,100 | 1,497 | |
| Dialog Semiconductor PLC (a) | 310,600 | 11,263 | |
| Entegris, Inc. | 342,400 | 10,375 | |
| Integrated Device Technology, Inc. (a) | 195,200 | 5,874 | |
| Maxim Integrated Products, Inc. | 99,200 | 5,191 | |
| ON Semiconductor Corp. (a) | 588,500 | 11,817 | |
| Qorvo, Inc. (a) | 190,600 | 14,596 | |
| Semtech Corp. (a) | 235,700 | 8,026 | |
| Skyworks Solutions, Inc. | 109,000 | 11,417 | |
| 80,056 | |||
| Software - 4.3% | |||
| ANSYS, Inc. (a) | 67,300 | 9,973 | |
| Black Knight, Inc. (a) | 2,533 | 114 | |
| CDK Global, Inc. | 310,400 | 21,446 | |
| Fair Isaac Corp. | 89,800 | 14,104 | |
| Parametric Technology Corp. (a) | 269,700 | 17,174 | |
| Tableau Software, Inc. (a) | 162,600 | 11,431 | |
| Take-Two Interactive Software, Inc. (a) | 40,600 | 4,529 | |
| Ubisoft Entertainment SA (a) | 130,628 | 10,018 | |
| Ultimate Software Group, Inc. (a) | 92,600 | 19,541 | |
| 108,330 | |||
| TOTAL INFORMATION TECHNOLOGY | 432,211 | ||
| MATERIALS - 7.2% | |||
| Chemicals - 4.2% | |||
| Ashland Global Holdings, Inc. | 191,100 | 14,138 | |
| Axalta Coating Systems LLC (a) | 302,300 | 9,571 | |
| Olin Corp. | 539,600 | 19,231 | |
| PPG Industries, Inc. | 67,800 | 7,922 | |
| RPM International, Inc. | 300,700 | 15,928 | |
| The Chemours Co. LLC | 417,800 | 21,475 | |
| Valvoline, Inc. | 377,829 | 9,317 | |
| W.R. Grace & Co. | 118,797 | 8,709 | |
| 106,291 | |||
| Containers & Packaging - 1.7% | |||
| Greif, Inc. Class A | 109,700 | 5,986 | |
| Packaging Corp. of America | 130,000 | 15,418 | |
| Sealed Air Corp. | 83,400 | 4,007 | |
| Sonoco Products Co. | 352,600 | 18,868 | |
| 44,279 | |||
| Metals & Mining - 1.3% | |||
| Steel Dynamics, Inc. | 876,700 | 33,753 | |
| TOTAL MATERIALS | 184,323 | ||
| REAL ESTATE - 9.5% | |||
| Equity Real Estate Investment Trusts (REITs) - 9.1% | |||
| Altisource Residential Corp. Class B | 748,021 | 8,191 | |
| CareTrust (REIT), Inc. | 781,900 | 14,246 | |
| CoreSite Realty Corp. | 113,800 | 12,914 | |
| Corporate Office Properties Trust (SBI) | 651,600 | 19,770 | |
| Corrections Corp. of America | 381,696 | 8,974 | |
| DCT Industrial Trust, Inc. | 380,190 | 22,865 | |
| Douglas Emmett, Inc. | 426,300 | 17,184 | |
| Education Realty Trust, Inc. | 333,500 | 12,196 | |
| Equity Lifestyle Properties, Inc. | 146,500 | 13,230 | |
| Extra Space Storage, Inc. | 64,700 | 5,523 | |
| Healthcare Realty Trust, Inc. | 632,200 | 20,717 | |
| Hudson Pacific Properties, Inc. | 195,700 | 6,973 | |
| InfraReit, Inc. | 192,323 | 4,062 | |
| LaSalle Hotel Properties (SBI) | 388,900 | 11,060 | |
| Outfront Media, Inc. | 371,500 | 8,715 | |
| Potlatch Corp. | 125,400 | 6,471 | |
| SBA Communications Corp. Class A (a) | 21,870 | 3,712 | |
| Taubman Centers, Inc. | 154,100 | 9,044 | |
| Uniti Group, Inc. | 427,515 | 6,883 | |
| Urban Edge Properties | 275,868 | 7,048 | |
| VEREIT, Inc. | 1,613,600 | 12,586 | |
| 232,364 | |||
| Real Estate Management & Development - 0.4% | |||
| CBRE Group, Inc. (a) | 220,550 | 9,563 | |
| TOTAL REAL ESTATE | 241,927 | ||
| TELECOMMUNICATION SERVICES - 0.1% | |||
| Wireless Telecommunication Services - 0.1% | |||
| T-Mobile U.S., Inc. (a) | 50,150 | 3,063 | |
| UTILITIES - 5.5% | |||
| Electric Utilities - 2.7% | |||
| Great Plains Energy, Inc. | 741,900 | 25,455 | |
| Hawaiian Electric Industries, Inc. | 154,500 | 5,925 | |
| OGE Energy Corp. | 554,526 | 19,830 | |
| PNM Resources, Inc. | 75,000 | 3,413 | |
| Westar Energy, Inc. | 255,400 | 14,611 | |
| 69,234 | |||
| Gas Utilities - 1.8% | |||
| Atmos Energy Corp. | 217,040 | 20,031 | |
| National Fuel Gas Co. | 194,111 | 11,414 | |
| South Jersey Industries, Inc. | 395,300 | 13,385 | |
| 44,830 | |||
| Independent Power and Renewable Electricity Producers - 0.1% | |||
| NRG Energy, Inc. | 111,600 | 3,086 | |
| Multi-Utilities - 0.9% | |||
| Avangrid, Inc. | 275,800 | 14,637 | |
| MDU Resources Group, Inc. | 301,905 | 8,438 | |
| 23,075 | |||
| TOTAL UTILITIES | 140,225 | ||
| TOTAL COMMON STOCKS | |||
| (Cost $2,102,117) | 2,490,521 | ||
| Principal Amount (000s) | Value (000s) | ||
| U.S. Treasury Obligations - 0.1% | |||
| U.S. Treasury Bills, yield at date of purchase 1.03% to 1.09% 12/14/17 to 1/25/18 (d) | |||
| (Cost $839) | 840 | 839 | |
| Shares | Value (000s) | ||
| Money Market Funds - 4.2% | |||
| Fidelity Cash Central Fund, 1.13% (e) | 60,227,208 | $60,239 | |
| Fidelity Securities Lending Cash Central Fund 1.13% (e)(f) | 47,339,692 | 47,344 | |
| TOTAL MONEY MARKET FUNDS | |||
| (Cost $107,580) | 107,583 | ||
| TOTAL INVESTMENT IN SECURITIES - 102.0% | |||
| (Cost $2,210,536) | 2,598,943 | ||
| NET OTHER ASSETS (LIABILITIES) - (2.0)% | (49,729) | ||
| NET ASSETS - 100% | $2,549,214 |
| Futures Contracts | |||||
| Number of contracts | Expiration Date | Notional Amount (000s) | Value (000s) | Unrealized Appreciation/(Depreciation) (000s) | |
| Purchased | |||||
| Equity Index Contracts | |||||
| CME E-mini S&P MidCap 400 Index Contracts (United States) | 110 | Dec. 2017 | $20,900 | $840 | $840 |
The notional amount of futures purchased as a percentage of Net Assets is 0.8%
Values shown as $0 may reflect amounts less than $500.
Legend
(a) Non-income producing
(b) Security or a portion of the security is on loan at period end.
(c) Restricted securities - Investment in securities not registered under the Securities Act of 1933 (excluding 144A issues). At the end of the period, the value of restricted securities (excluding 144A issues) amounted to $0 or 0.0% of net assets.
(d) Security or a portion of the security was pledged to cover margin requirements for futures contracts. At period end, the value of securities pledged amounted to $789,000.
(e) Affiliated fund that is generally available only to investment companies and other accounts managed by Fidelity Investments. The rate quoted is the annualized seven-day yield of the fund at period end. A complete unaudited listing of the fund's holdings as of its most recent quarter end is available upon request. In addition, each Fidelity Central Fund's financial statements, which are not covered by the Fund's Report of Independent Registered Public Accounting Firm, are available on the SEC's website or upon request.
(f) Investment made with cash collateral received from securities on loan.
Additional information on each restricted holding is as follows:
| Security | Acquisition Date | Acquisition Cost (000s) |
| Velti PLC | 4/19/13 | $323 |
Affiliated Central Funds
Information regarding fiscal year to date income earned by the Fund from investments in Fidelity Central Funds is as follows:
| Fund | Income earned |
| (Amounts in thousands) | |
| Fidelity Cash Central Fund | $684 |
| Fidelity Securities Lending Cash Central Fund | 194 |
| Total | $878 |
Investment Valuation
The following is a summary of the inputs used, as of November 30, 2017, involving the Fund's assets and liabilities carried at fair value. The inputs or methodology used for valuing securities may not be an indication of the risk associated with investing in those securities. For more information on valuation inputs, and their aggregation into the levels used below, please refer to the Investment Valuation section in the accompanying Notes to Financial Statements.
| Valuation Inputs at Reporting Date: | ||||
| Description | Total | Level 1 | Level 2 | Level 3 |
| (Amounts in thousands) | ||||
| Investments in Securities: | ||||
| Equities: | ||||
| Consumer Discretionary | $331,961 | $331,961 | $-- | $-- |
| Consumer Staples | 86,151 | 86,151 | -- | -- |
| Energy | 100,606 | 100,606 | -- | -- |
| Financials | 417,181 | 417,181 | -- | -- |
| Health Care | 186,393 | 186,393 | -- | -- |
| Industrials | 366,480 | 366,480 | -- | -- |
| Information Technology | 432,211 | 432,211 | -- | -- |
| Materials | 184,323 | 184,323 | -- | -- |
| Real Estate | 241,927 | 241,927 | -- | -- |
| Telecommunication Services | 3,063 | 3,063 | -- | -- |
| Utilities | 140,225 | 140,225 | -- | -- |
| U.S. Government and Government Agency Obligations | 839 | -- | 839 | -- |
| Money Market Funds | 107,583 | 107,583 | -- | -- |
| Total Investments in Securities: | $2,598,943 | $2,598,104 | $839 | $-- |
| Derivative Instruments: | ||||
| Assets | ||||
| Futures Contracts | $840 | $840 | $-- | $-- |
| Total Assets | $840 | $840 | $-- | $-- |
| Total Derivative Instruments: | $840 | $840 | $-- | $-- |
Value of Derivative Instruments
The following table is a summary of the Fund's value of derivative instruments by primary risk exposure as of November 30, 2017. For additional information on derivative instruments, please refer to the Derivative Instruments section in the accompanying Notes to Financial Statements.
| Primary Risk Exposure / Derivative Type | Value | |
| Asset | Liability | |
| (Amounts in thousands) | ||
| Equity Risk | ||
| Futures Contracts(a) | $840 | $0 |
| Total Equity Risk | 840 | 0 |
| Total Value of Derivatives | $840 | $0 |
(a) Reflects gross cumulative appreciation (depreciation) on futures contracts as presented in the Schedule of Investments. In the Statement of Assets and Liabilities, the period end daily variation margin is included in receivable or payable for daily variation margin on futures contracts, and the net cumulative appreciation (depreciation) is included in net unrealized appreciation (depreciation).
See accompanying notes which are an integral part of the financial statements.
Financial Statements
Statement of Assets and Liabilities
| Amounts in thousands (except per-share amounts) | November 30, 2017 | |
| Assets | ||
| Investment in securities, at value (including securities loaned of $46,282) — See accompanying schedule: Unaffiliated issuers (cost $2,102,956) | $2,491,360 | |
| Fidelity Central Funds (cost $107,580) | 107,583 | |
| Total Investment in Securities (cost $2,210,536) | $2,598,943 | |
| Cash | 40 | |
| Receivable for investments sold | 26,861 | |
| Receivable for fund shares sold | 843 | |
| Dividends receivable | 2,399 | |
| Distributions receivable from Fidelity Central Funds | 75 | |
| Receivable for daily variation margin on futures contracts | 125 | |
| Prepaid expenses | 5 | |
| Other receivables | 35 | |
| Total assets | 2,629,326 | |
| Liabilities | ||
| Payable for investments purchased | $28,558 | |
| Payable for fund shares redeemed | 2,387 | |
| Accrued management fee | 788 | |
| Distribution and service plan fees payable | 480 | |
| Other affiliated payables | 504 | |
| Other payables and accrued expenses | 50 | |
| Collateral on securities loaned | 47,345 | |
| Total liabilities | 80,112 | |
| Net Assets | $2,549,214 | |
| Net Assets consist of: | ||
| Paid in capital | $2,056,554 | |
| Undistributed net investment income | 5,629 | |
| Accumulated undistributed net realized gain (loss) on investments and foreign currency transactions | 97,792 | |
| Net unrealized appreciation (depreciation) on investments and assets and liabilities in foreign currencies | 389,239 | |
| Net Assets | $2,549,214 | |
| Calculation of Maximum Offering Price | ||
| Class A: | ||
| Net Asset Value and redemption price per share ($564,099 ÷ 14,195 shares) | $39.74 | |
| Maximum offering price per share (100/94.25 of $39.74) | $42.16 | |
| Class M: | ||
| Net Asset Value and redemption price per share ($606,079 ÷ 15,195 shares) | $39.89 | |
| Maximum offering price per share (100/96.50 of $39.89) | $41.34 | |
| Class C: | ||
| Net Asset Value and offering price per share ($142,230 ÷ 3,924 shares)(a) | $36.25 | |
| Fidelity Stock Selector Mid Cap Fund: | ||
| Net Asset Value, offering price and redemption price per share ($545,085 ÷ 13,157 shares) | $41.43 | |
| Class I: | ||
| Net Asset Value, offering price and redemption price per share ($682,908 ÷ 16,451 shares) | $41.51 | |
| Class Z: | ||
| Net Asset Value, offering price and redemption price per share ($8,813 ÷ 212 shares) | $41.57 |
(a) Redemption price per share is equal to net asset value less any applicable contingent deferred sales charge.
See accompanying notes which are an integral part of the financial statements.
Statement of Operations
| Amounts in thousands | Year ended November 30, 2017 | |
| Investment Income | ||
| Dividends | $26,710 | |
| Interest | 9 | |
| Income from Fidelity Central Funds | 878 | |
| Total income | 27,597 | |
| Expenses | ||
| Management fee | ||
| Basic fee | $12,366 | |
| Performance adjustment | (3,704) | |
| Transfer agent fees | 4,748 | |
| Distribution and service plan fees | 5,765 | |
| Accounting and security lending fees | 688 | |
| Custodian fees and expenses | 77 | |
| Independent trustees' fees and expenses | 9 | |
| Registration fees | 158 | |
| Audit | 68 | |
| Legal | 15 | |
| Miscellaneous | 17 | |
| Total expenses before reductions | 20,207 | |
| Expense reductions | (302) | 19,905 |
| Net investment income (loss) | 7,692 | |
| Realized and Unrealized Gain (Loss) | ||
| Net realized gain (loss) on: | ||
| Investment securities: | ||
| Unaffiliated issuers | 192,833 | |
| Foreign currency transactions | 3 | |
| Futures contracts | 1,905 | |
| Total net realized gain (loss) | 194,741 | |
| Change in net unrealized appreciation (depreciation) on: | ||
| Investment securities: | ||
| Unaffiliated issuers | 221,503 | |
| Fidelity Central Funds | (3) | |
| Assets and liabilities in foreign currencies | 5 | |
| Futures contracts | 760 | |
| Total change in net unrealized appreciation (depreciation) | 222,265 | |
| Net gain (loss) | 417,006 | |
| Net increase (decrease) in net assets resulting from operations | $424,698 |
See accompanying notes which are an integral part of the financial statements.
Statement of Changes in Net Assets
| Amounts in thousands | Year ended November 30, 2017 | Year ended November 30, 2016 |
| Increase (Decrease) in Net Assets | ||
| Operations | ||
| Net investment income (loss) | $7,692 | $12,537 |
| Net realized gain (loss) | 194,741 | (88,889) |
| Change in net unrealized appreciation (depreciation) | 222,265 | 160,670 |
| Net increase (decrease) in net assets resulting from operations | 424,698 | 84,318 |
| Distributions to shareholders from net investment income | (10,708) | (3,959) |
| Distributions to shareholders from net realized gain | (333) | (39,216) |
| Total distributions | (11,041) | (43,175) |
| Share transactions - net increase (decrease) | 112,615 | (421,318) |
| Total increase (decrease) in net assets | 526,272 | (380,175) |
| Net Assets | ||
| Beginning of period | 2,022,942 | 2,403,117 |
| End of period | $2,549,214 | $2,022,942 |
| Other Information | ||
| Undistributed net investment income end of period | $5,629 | $8,778 |
See accompanying notes which are an integral part of the financial statements.
Financial Highlights
Fidelity Advisor Stock Selector Mid Cap Fund Class A
| Years ended November 30, | 2017 | 2016 | 2015 | 2014 | 2013 |
| Selected Per–Share Data | |||||
| Net asset value, beginning of period | $33.13 | $32.01 | $31.80 | $28.37 | $22.16 |
| Income from Investment Operations | |||||
| Net investment income (loss)A | .13 | .20 | .08 | .08 | .10 |
| Net realized and unrealized gain (loss) | 6.68 | 1.49 | .13 | 3.36 | 6.29 |
| Total from investment operations | 6.81 | 1.69 | .21 | 3.44 | 6.39 |
| Distributions from net investment income | (.19) | (.04) | – | (.01) | (.14) |
| Distributions from net realized gain | (.01) | (.53) | – | – | (.04) |
| Total distributions | (.20) | (.57) | – | (.01) | (.18) |
| Net asset value, end of period | $39.74 | $33.13 | $32.01 | $31.80 | $28.37 |
| Total ReturnB,C | 20.64% | 5.49% | .66% | 12.11% | 29.07% |
| Ratios to Average Net AssetsD,E | |||||
| Expenses before reductions | .87% | .88% | .98% | 1.05% | .95% |
| Expenses net of fee waivers, if any | .87% | .88% | .98% | 1.05% | .95% |
| Expenses net of all reductions | .86% | .88% | .97% | 1.05% | .92% |
| Net investment income (loss) | .36% | .64% | .24% | .26% | .39% |
| Supplemental Data | |||||
| Net assets, end of period (in millions) | $564 | $546 | $593 | $652 | $692 |
| Portfolio turnover rateF | 84% | 98% | 109% | 89% | 79%G |
A Calculated based on average shares outstanding during the period.
B Total returns would have been lower if certain expenses had not been reduced during the applicable periods shown.
C Total returns do not include the effect of the sales charges.
D Fees and expenses of any underlying Fidelity Central Funds are not included in the Fund's expense ratio. The Fund indirectly bears its proportionate share of the expenses of any underlying Fidelity Central Funds.
E Expense ratios reflect operating expenses of the class. Expenses before reductions do not reflect amounts reimbursed by the investment adviser or reductions from brokerage service arrangements or reductions from other expense offset arrangements and do not represent the amount paid by the class during periods when reimbursements or reductions occur. Expenses net of fee waivers reflect expenses after reimbursement by the investment adviser but prior to reductions from brokerage service arrangements or other expense offset arrangements. Expenses net of all reductions represent the net expenses paid by the class.
F Amount does not include the portfolio activity of any underlying Fidelity Central Funds.
G The portfolio turnover rate does not include the assets acquired in the merger.
See accompanying notes which are an integral part of the financial statements.
Fidelity Advisor Stock Selector Mid Cap Fund Class M
| Years ended November 30, | 2017 | 2016 | 2015 | 2014 | 2013 |
| Selected Per–Share Data | |||||
| Net asset value, beginning of period | $33.25 | $32.16 | $32.02 | $28.63 | $22.36 |
| Income from Investment Operations | |||||
| Net investment income (loss)A | .04 | .13 | – | .01 | .04 |
| Net realized and unrealized gain (loss) | 6.71 | 1.49 | .14 | 3.38 | 6.36 |
| Total from investment operations | 6.75 | 1.62 | .14 | 3.39 | 6.40 |
| Distributions from net investment income | (.11) | – | – | – | (.09) |
| Distributions from net realized gain | (.01) | (.53) | – | – | (.04) |
| Total distributions | (.11)B | (.53) | – | – | (.13) |
| Net asset value, end of period | $39.89 | $33.25 | $32.16 | $32.02 | $28.63 |
| Total ReturnC,D | 20.37% | 5.22% | .44% | 11.84% | 28.80% |
| Ratios to Average Net AssetsE,F | |||||
| Expenses before reductions | 1.11% | 1.12% | 1.22% | 1.28% | 1.16% |
| Expenses net of fee waivers, if any | 1.11% | 1.12% | 1.21% | 1.28% | 1.16% |
| Expenses net of all reductions | 1.10% | 1.11% | 1.21% | 1.27% | 1.13% |
| Net investment income (loss) | . 11% | .41% | .01% | .03% | .17% |
| Supplemental Data | |||||
| Net assets, end of period (in millions) | $606 | $591 | $681 | $794 | $817 |
| Portfolio turnover rateG | 84% | 98% | 109% | 89% | 79%H |
A Calculated based on average shares outstanding during the period.
B Total distributions of $.11 per share is comprised of distributions from net investment income of $.106 and distributions from net realized gain of $.006 per share.
C Total returns would have been lower if certain expenses had not been reduced during the applicable periods shown.
D Total returns do not include the effect of the sales charges.
E Fees and expenses of any underlying Fidelity Central Funds are not included in the Fund's expense ratio. The Fund indirectly bears its proportionate share of the expenses of any underlying Fidelity Central Funds.
F Expense ratios reflect operating expenses of the class. Expenses before reductions do not reflect amounts reimbursed by the investment adviser or reductions from brokerage service arrangements or reductions from other expense offset arrangements and do not represent the amount paid by the class during periods when reimbursements or reductions occur. Expenses net of fee waivers reflect expenses after reimbursement by the investment adviser but prior to reductions from brokerage service arrangements or other expense offset arrangements. Expenses net of all reductions represent the net expenses paid by the class.
G Amount does not include the portfolio activity of any underlying Fidelity Central Funds.
H The portfolio turnover rate does not include the assets acquired in the merger.
See accompanying notes which are an integral part of the financial statements.
Fidelity Advisor Stock Selector Mid Cap Fund Class C
| Years ended November 30, | 2017 | 2016 | 2015 | 2014 | 2013 |
| Selected Per–Share Data | |||||
| Net asset value, beginning of period | $30.28 | $29.48 | $29.51 | $26.52 | $20.73 |
| Income from Investment Operations | |||||
| Net investment income (loss)A | (.13) | (.03) | (.15) | (.14) | (.09) |
| Net realized and unrealized gain (loss) | 6.10 | 1.36 | .12 | 3.13 | 5.91 |
| Total from investment operations | 5.97 | 1.33 | (.03) | 2.99 | 5.82 |
| Distributions from net investment income | – | – | – | – | (.02) |
| Distributions from net realized gain | – | (.53) | – | – | (.01) |
| Total distributions | – | (.53) | – | – | (.03) |
| Net asset value, end of period | $36.25 | $30.28 | $29.48 | $29.51 | $26.52 |
| Total ReturnB,C | 19.72% | 4.71% | (.10)% | 11.27% | 28.09% |
| Ratios to Average Net AssetsD,E | |||||
| Expenses before reductions | 1.63% | 1.63% | 1.74% | 1.80% | 1.69% |
| Expenses net of fee waivers, if any | 1.63% | 1.63% | 1.73% | 1.80% | 1.69% |
| Expenses net of all reductions | 1.62% | 1.63% | 1.73% | 1.80% | 1.67% |
| Net investment income (loss) | (.40)% | (.11)% | (.51)% | (.49)% | (.36)% |
| Supplemental Data | |||||
| Net assets, end of period (in millions) | $142 | $140 | $155 | $172 | $172 |
| Portfolio turnover rateF | 84% | 98% | 109% | 89% | 79%G |
A Calculated based on average shares outstanding during the period.
B Total returns would have been lower if certain expenses had not been reduced during the applicable periods shown.
C Total returns do not include the effect of the contingent deferred sales charge.
D Fees and expenses of any underlying Fidelity Central Funds are not included in the Fund's expense ratio. The Fund indirectly bears its proportionate share of the expenses of any underlying Fidelity Central Funds.
E Expense ratios reflect operating expenses of the class. Expenses before reductions do not reflect amounts reimbursed by the investment adviser or reductions from brokerage service arrangements or reductions from other expense offset arrangements and do not represent the amount paid by the class during periods when reimbursements or reductions occur. Expenses net of fee waivers reflect expenses after reimbursement by the investment adviser but prior to reductions from brokerage service arrangements or other expense offset arrangements. Expenses net of all reductions represent the net expenses paid by the class.
F Amount does not include the portfolio activity of any underlying Fidelity Central Funds.
G The portfolio turnover rate does not include the assets acquired in the merger.
See accompanying notes which are an integral part of the financial statements.
Fidelity Stock Selector Mid Cap Fund
| Years ended November 30, | 2017 | 2016 | 2015 | 2014 | 2013 |
| Selected Per–Share Data | |||||
| Net asset value, beginning of period | $34.53 | $33.34 | $33.14 | $29.56 | $23.14 |
| Income from Investment Operations | |||||
| Net investment income (loss)A | .20 | .28 | .16 | .16 | .17 |
| Net realized and unrealized gain (loss) | 6.96 | 1.55 | .14 | 3.49 | 6.54 |
| Total from investment operations | 7.16 | 1.83 | .30 | 3.65 | 6.71 |
| Distributions from net investment income | (.26) | (.12) | (.10) | (.07) | (.25) |
| Distributions from net realized gain | (.01) | (.53) | – | – | (.04) |
| Total distributions | (.26)B | (.64)C | (.10) | (.07) | (.29) |
| Net asset value, end of period | $41.43 | $34.53 | $33.34 | $33.14 | $29.56 |
| Total ReturnD,E | 20.87% | 5.73% | .90% | 12.38% | 29.36% |
| Ratios to Average Net AssetsF,G | |||||
| Expenses before reductions | .70% | .64% | .75% | .81% | .71% |
| Expenses net of fee waivers, if any | .70% | .64% | .74% | .81% | .71% |
| Expenses net of all reductions | .69% | .63% | .74% | .81% | .69% |
| Net investment income (loss) | .53% | .89% | .48% | .50% | .62% |
| Supplemental Data | |||||
| Net assets, end of period (in millions) | $545 | $222 | $486 | $553 | $225 |
| Portfolio turnover rateH | 84% | 98% | 109% | 89% | 79%I |
A Calculated based on average shares outstanding during the period.
B Total distributions of $.26 per share is comprised of distributions from net investment income of $.255 and distributions from net realized gain of $.006 per share.
C Total distributions of $.64 per share is comprised of distributions from net investment income of $.115 and distributions from net realized gain of $.529 per share.
D Total returns for periods of less than one year are not annualized.
E Total returns would have been lower if certain expenses had not been reduced during the applicable periods shown.
F Fees and expenses of any underlying Fidelity Central Funds are not included in the Fund's expense ratio. The Fund indirectly bears its proportionate share of the expenses of any underlying Fidelity Central Funds.
G Expense ratios reflect operating expenses of the class. Expenses before reductions do not reflect amounts reimbursed by the investment adviser or reductions from brokerage service arrangements or reductions from other expense offset arrangements and do not represent the amount paid by the class during periods when reimbursements or reductions occur. Expenses net of fee waivers reflect expenses after reimbursement by the investment adviser but prior to reductions from brokerage service arrangements or other expense offset arrangements. Expenses net of all reductions represent the net expenses paid by the class.
H Amount does not include the portfolio activity of any underlying Fidelity Central Funds.
I The portfolio turnover rate does not include the assets acquired in the merger.
See accompanying notes which are an integral part of the financial statements.
Fidelity Advisor Stock Selector Mid Cap Fund Class I
| Years ended November 30, | 2017 | 2016 | 2015 | 2014 | 2013 |
| Selected Per–Share Data | |||||
| Net asset value, beginning of period | $34.60 | $33.39 | $33.22 | $29.64 | $23.14 |
| Income from Investment Operations | |||||
| Net investment income (loss)A | .23 | .28 | .13 | .16 | .18 |
| Net realized and unrealized gain (loss) | 6.96 | 1.56 | .14 | 3.50 | 6.56 |
| Total from investment operations | 7.19 | 1.84 | .27 | 3.66 | 6.74 |
| Distributions from net investment income | (.27) | (.11) | (.10) | (.08) | (.20) |
| Distributions from net realized gain | (.01) | (.53) | – | – | (.04) |
| Total distributions | (.28) | (.63)B | (.10) | (.08) | (.24) |
| Net asset value, end of period | $41.51 | $34.60 | $33.39 | $33.22 | $29.64 |
| Total ReturnC | 20.92% | 5.75% | .80% | 12.39% | 29.44% |
| Ratios to Average Net AssetsD,E | |||||
| Expenses before reductions | .63% | .64% | .83% | .80% | .67% |
| Expenses net of fee waivers, if any | .63% | .64% | .83% | .80% | .67% |
| Expenses net of all reductions | .62% | .64% | .82% | .80% | .65% |
| Net investment income (loss) | .60% | .88% | .39% | .51% | .66% |
| Supplemental Data | |||||
| Net assets, end of period (in millions) | $683 | $523 | $479 | $371 | $214 |
| Portfolio turnover rateF | 84% | 98% | 109% | 89% | 79%G |
A Calculated based on average shares outstanding during the period.
B Total distributions of $.63 per share is comprised of distributions from net investment income of $.105 and distributions from net realized gain of $.529 per share.
C Total returns would have been lower if certain expenses had not been reduced during the applicable periods shown.
D Fees and expenses of any underlying Fidelity Central Funds are not included in the Fund's expense ratio. The Fund indirectly bears its proportionate share of the expenses of any underlying Fidelity Central Funds.
E Expense ratios reflect operating expenses of the class. Expenses before reductions do not reflect amounts reimbursed by the investment adviser or reductions from brokerage service arrangements or reductions from other expense offset arrangements and do not represent the amount paid by the class during periods when reimbursements or reductions occur. Expenses net of fee waivers reflect expenses after reimbursement by the investment adviser but prior to reductions from brokerage service arrangements or other expense offset arrangements. Expenses net of all reductions represent the net expenses paid by the class.
F Amount does not include the portfolio activity of any underlying Fidelity Central Funds.
G The portfolio turnover rate does not include the assets acquired in the merger.
See accompanying notes which are an integral part of the financial statements.
Fidelity Advisor Stock Selector Mid Cap Fund Class Z
| Years ended November 30, | 2017 A |
| Selected Per–Share Data | |
| Net asset value, beginning of period | $35.79 |
| Income from Investment Operations | |
| Net investment income (loss)B | .23 |
| Net realized and unrealized gain (loss) | 5.55 |
| Total from investment operations | 5.78 |
| Distributions from net investment income | – |
| Distributions from net realized gain | – |
| Total distributions | – |
| Net asset value, end of period | $41.57 |
| Total ReturnC,D | 16.15% |
| Ratios to Average Net AssetsE,F | |
| Expenses before reductions | .48%G |
| Expenses net of fee waivers, if any | .47%G |
| Expenses net of all reductions | .46%G |
| Net investment income (loss) | .69%G |
| Supplemental Data | |
| Net assets, end of period (in millions) | $9 |
| Portfolio turnover rateH | 84% |
A For the period February 1, 2017 (commencement of sale of shares) to November 30, 2017.
B Calculated based on average shares outstanding during the period.
C Total returns for periods of less than one year are not annualized.
D Total returns would have been lower if certain expenses had not been reduced during the applicable periods shown.
E Fees and expenses of any underlying Fidelity Central Funds are not included in the Fund's expense ratio. The Fund indirectly bears its proportionate share of the expenses of any underlying Fidelity Central Funds.
F Expense ratios reflect operating expenses of the class. Expenses before reductions do not reflect amounts reimbursed by the investment adviser or reductions from brokerage service arrangements or reductions from other expense offset arrangements and do not represent the amount paid by the class during periods when reimbursements or reductions occur. Expense ratios before reductions for start-up periods may not be representative of longer-term operating periods. Expenses net of fee waivers reflect expenses after reimbursement by the investment adviser but prior to reductions from brokerage service arrangements or other expense offset arrangements. Expenses net of all reductions represent the net expenses paid by the class.
G Annualized
H Amount does not include the portfolio activity of any underlying Fidelity Central Funds.
See accompanying notes which are an integral part of the financial statements.
Notes to Financial Statements
For the period ended November 30, 2017
(Amounts in thousands except percentages)
1. Organization.
Fidelity Advisor Stock Selector Mid Cap Fund (the Fund) is a fund of Fidelity Advisor Series I (the Trust) and is authorized to issue an unlimited number of shares. The Trust is registered under the Investment Company Act of 1940, as amended (the 1940 Act), as an open-end management investment company organized as a Massachusetts business trust. The Fund commenced sale of Class Z shares on February 1, 2017. The Fund offers Class A, Class M (formerly Class T), Class C, Fidelity Stock Selector Mid Cap Fund, Class I and Class Z shares, each of which has equal rights as to assets and voting privileges. Each class has exclusive voting rights with respect to matters that affect that class.
After the close of business on June 24, 2016, all outstanding Class B shares were converted to Class A shares. All prior fiscal period dollar and share amounts for Class B presented in the Notes to Financial Statements are for the period December 1, 2015 through June 24, 2016.
2. Investments in Fidelity Central Funds.
The Fund invests in Fidelity Central Funds, which are open-end investment companies generally available only to other investment companies and accounts managed by the investment adviser and its affiliates. The Fund's Schedule of Investments lists each of the Fidelity Central Funds held as of period end, if any, as an investment of the Fund, but does not include the underlying holdings of each Fidelity Central Fund. As an Investing Fund, the Fund indirectly bears its proportionate share of the expenses of the underlying Fidelity Central Funds.
The Money Market Central Funds seek preservation of capital and current income and are managed by Fidelity Investments Money Management, Inc. (FIMM), an affiliate of the investment adviser. Annualized expenses of the Money Market Central Funds as of their most recent shareholder report date are less than .005%.
A complete unaudited list of holdings for each Fidelity Central Fund is available upon request or at the Securities and Exchange Commission (the SEC) website at www.sec.gov. In addition, the financial statements of the Fidelity Central Funds, which are not covered by the Fund's Report of Independent Registered Public Accounting Firm, are available on the SEC website or upon request.
3. Significant Accounting Policies.
The Fund is an investment company and applies the accounting and reporting guidance of the Financial Accounting Standards Board (FASB) Accounting Standards Codification Topic 946 Financial Services – Investments Companies. The financial statements have been prepared in conformity with accounting principles generally accepted in the United States of America (GAAP), which require management to make certain estimates and assumptions at the date of the financial statements. Actual results could differ from those estimates. Subsequent events, if any, through the date that the financial statements were issued have been evaluated in the preparation of the financial statements. The following summarizes the significant accounting policies of the Fund:
Investment Valuation. Investments are valued as of 4:00 p.m. Eastern time on the last calendar day of the period. The Board of Trustees (the Board) has delegated the day to day responsibility for the valuation of the Fund's investments to the Fair Value Committee (the Committee) established by the Fund's investment adviser. In accordance with valuation policies and procedures approved by the Board, the Fund attempts to obtain prices from one or more third party pricing vendors or brokers to value its investments. When current market prices, quotations or currency exchange rates are not readily available or reliable, investments will be fair valued in good faith by the Committee, in accordance with procedures adopted by the Board. Factors used in determining fair value vary by investment type and may include market or investment specific events, changes in interest rates and credit quality. The frequency with which these procedures are used cannot be predicted and they may be utilized to a significant extent. The Committee oversees the Fund's valuation policies and procedures and reports to the Board on the Committee's activities and fair value determinations. The Board monitors the appropriateness of the procedures used in valuing the Fund's investments and ratifies the fair value determinations of the Committee.
The Fund categorizes the inputs to valuation techniques used to value its investments into a disclosure hierarchy consisting of three levels as shown below:
- Level 1 – quoted prices in active markets for identical investments
- Level 2 – other significant observable inputs (including quoted prices for similar investments, interest rates, prepayment speeds, etc.)
- Level 3 – unobservable inputs (including the Fund's own assumptions based on the best information available)
Valuation techniques used to value the Fund's investments by major category are as follows:
Equity securities, including restricted securities, for which market quotations are readily available, are valued at the last reported sale price or official closing price as reported by a third party pricing vendor on the primary market or exchange on which they are traded and are categorized as Level 1 in the hierarchy. In the event there were no sales during the day or closing prices are not available, securities are valued at the last quoted bid price or may be valued using the last available price and are generally categorized as Level 2 in the hierarchy. For foreign equity securities, when market or security specific events arise, comparisons to the valuation of American Depositary Receipts (ADRs), futures contracts, Exchange-Traded Funds (ETFs) and certain indexes as well as quoted prices for similar securities may be used and would be categorized as Level 2 in the hierarchy. Utilizing these techniques may result in transfers between Level 1 and Level 2. For equity securities, including restricted securities, where observable inputs are limited, assumptions about market activity and risk are used and these securities may be categorized as Level 3 in the hierarchy.
Debt securities, including restricted securities, are valued based on evaluated prices received from third party pricing vendors or from brokers who make markets in such securities. U.S. government and government agency obligations are valued by pricing vendors who utilize matrix pricing which considers yield or price of bonds of comparable quality, coupon, maturity and type or by broker-supplied prices. When independent prices are unavailable or unreliable, debt securities may be valued utilizing pricing methodologies which consider similar factors that would be used by third party pricing vendors. Debt securities are generally categorized as Level 2 in the hierarchy but may be Level 3 depending on the circumstances.
Futures contracts are valued at the settlement price established each day by the board of trade or exchange on which they are traded and are categorized as Level 1 in the hierarchy. Investments in open-end mutual funds, including the Fidelity Central Funds, are valued at their closing net asset value (NAV) each business day and are categorized as Level 1 in the hierarchy.
Changes in valuation techniques may result in transfers in or out of an assigned level within the disclosure hierarchy. The aggregate value of investments by input level as of November 30, 2017, is included at the end of the Fund's Schedule of Investments.
Foreign Currency. The Fund may use foreign currency contracts to facilitate transactions in foreign-denominated securities. Gains and losses from these transactions may arise from changes in the value of the foreign currency or if the counterparties do not perform under the contracts' terms.
Foreign-denominated assets, including investment securities, and liabilities are translated into U.S. dollars at the exchange rates at period end. Purchases and sales of investment securities, income and dividends received and expenses denominated in foreign currencies are translated into U.S. dollars at the exchange rate in effect on the transaction date.
The effects of exchange rate fluctuations on investments are included with the net realized and unrealized gain (loss) on investment securities. Other foreign currency transactions resulting in realized and unrealized gain (loss) are disclosed separately.
Investment Transactions and Income. For financial reporting purposes, the Fund's investment holdings and NAV include trades executed through the end of the last business day of the period. The NAV per share for processing shareholder transactions is calculated as of the close of business of the New York Stock Exchange (NYSE), normally 4:00 p.m. Eastern time and includes trades executed through the end of the prior business day. Gains and losses on securities sold are determined on the basis of identified cost and includes proceeds received from litigation. Dividend income is recorded on the ex-dividend date, except for certain dividends from foreign securities where the ex-dividend date may have passed, which are recorded as soon as the Fund is informed of the ex-dividend date. Non-cash dividends included in dividend income, if any, are recorded at the fair market value of the securities received. Income and capital gain distributions from Fidelity Central Funds, if any, are recorded on the ex-dividend date. Certain distributions received by the Fund represent a return of capital or capital gain. The Fund determines the components of these distributions subsequent to the ex-dividend date, based upon receipt of tax filings or other correspondence relating to the underlying investment. These distributions are recorded as a reduction of cost of investments and/or as a realized gain. Interest income is accrued as earned and includes coupon interest and amortization of premium and accretion of discount on debt securities as applicable. Investment income is recorded net of foreign taxes withheld where recovery of such taxes is uncertain.
Class Allocations and Expenses. Investment income, realized and unrealized capital gains and losses, common expenses of the Fund, and certain fund-level expense reductions, if any, are allocated daily on a pro-rata basis to each class based on the relative net assets of each class to the total net assets of the Fund. Each class differs with respect to transfer agent and distribution and service plan fees incurred. Certain expense reductions may also differ by class. For the reporting period, the allocated portion of income and expenses to each class as a percent of its average net assets may vary due to the timing of recording these transactions in relation to fluctuating net assets of the classes. Expenses directly attributable to a fund are charged to that fund. Expenses attributable to more than one fund are allocated among the respective funds on the basis of relative net assets or other appropriate methods. Expense estimates are accrued in the period to which they relate and adjustments are made when actual amounts are known.
Income Tax Information and Distributions to Shareholders. Each year, the Fund intends to qualify as a regulated investment company under Subchapter M of the Internal Revenue Code, including distributing substantially all of its taxable income and realized gains. As a result, no provision for U.S. Federal income taxes is required. As of November 30, 2017, the Fund did not have any unrecognized tax benefits in the financial statements; nor is the Fund aware of any tax positions for which it is reasonably possible that the total amounts of unrecognized tax benefits will significantly change in the next twelve months. The Fund files a U.S. federal tax return, in addition to state and local tax returns as required. The Fund's federal income tax returns are subject to examination by the Internal Revenue Service (IRS) for a period of three fiscal years after they are filed. State and local tax returns may be subject to examination for an additional fiscal year depending on the jurisdiction. Foreign taxes are provided for based on the Fund's understanding of the tax rules and rates that exist in the foreign markets in which it invests.
Distributions are declared and recorded on the ex-dividend date. Income dividends and capital gain distributions are declared separately for each class. Income and capital gain distributions are determined in accordance with income tax regulations, which may differ from GAAP. In addition, the Fund claimed a portion of the payment made to redeeming shareholders as a distribution for income tax purposes.
Capital accounts within the financial statements are adjusted for permanent book-tax differences. These adjustments have no impact on net assets or the results of operations. Capital accounts are not adjusted for temporary book-tax differences which will reverse in a subsequent period.
Book-tax differences are primarily due to futures contracts, foreign currency transactions, market discount, deferred trustees compensation, capital loss carryforwards and losses deferred due to wash sales.
As of period end, the cost and unrealized appreciation (depreciation) in securities, and derivatives if applicable, for federal income tax purposes were as follows:
| Gross unrealized appreciation | $472,131 |
| Gross unrealized depreciation | (86,649) |
| Net unrealized appreciation (depreciation) | $385,482 |
| Tax Cost | $2,213,461 |
The tax-based components of distributable earnings as of period end were as follows:
| Undistributed ordinary income | $50,136 |
| Undistributed long-term capital gain | $57,050 |
| Net unrealized appreciation (depreciation) on securities and other investments | $385,474 |
The tax character of distributions paid was as follows:
| November 30, 2017 | November 30, 2016 | |
| Ordinary Income | $11,041 | $ 3,959 |
| Long-term Capital Gains | – | 39,216 |
| Total | $11,041 | $ 43,175 |
Restricted Securities. The Fund may invest in securities that are subject to legal or contractual restrictions on resale. These securities generally may be resold in transactions exempt from registration or to the public if the securities are registered. Disposal of these securities may involve time-consuming negotiations and expense, and prompt sale at an acceptable price may be difficult. Information regarding restricted securities is included at the end of the Fund's Schedule of Investments.
4. Derivative Instruments.
Risk Exposures and the Use of Derivative Instruments. The Fund's investment objective allows the Fund to enter into various types of derivative contracts, including futures contracts. Derivatives are investments whose value is primarily derived from underlying assets, indices or reference rates and may be transacted on an exchange or over-the-counter (OTC). Derivatives may involve a future commitment to buy or sell a specified asset based on specified terms, to exchange future cash flows at periodic intervals based on a notional principal amount, or for one party to make one or more payments upon the occurrence of specified events in exchange for periodic payments from the other party.
The Fund used derivatives to increase returns and to manage exposure to certain risks as defined below. The success of any strategy involving derivatives depends on analysis of numerous economic factors, and if the strategies for investment do not work as intended, the Fund may not achieve its objectives.
The Fund's use of derivatives increased or decreased its exposure to the following risk:
| Equity Risk | Equity risk relates to the fluctuations in the value of financial instruments as a result of changes in market prices (other than those arising from interest rate risk or foreign exchange risk), whether caused by factors specific to an individual investment, its issuer, or all factors affecting all instruments traded in a market or market segment. |
The Fund is also exposed to additional risks from investing in derivatives, such as liquidity risk and counterparty credit risk. Liquidity risk is the risk that the Fund will be unable to close out the derivative in the open market in a timely manner. Counterparty credit risk is the risk that the counterparty will not be able to fulfill its obligation to the Fund. Counterparty credit risk related to exchange-traded futures contracts may be mitigated by the protection provided by the exchange on which they trade.
Investing in derivatives may involve greater risks than investing in the underlying assets directly and, to varying degrees, may involve risk of loss in excess of any initial investment and collateral received and amounts recognized in the Statement of Assets and Liabilities. In addition, there may be the risk that the change in value of the derivative contract does not correspond to the change in value of the underlying instrument.
Futures Contracts. A futures contract is an agreement between two parties to buy or sell a specified underlying instrument for a fixed price at a specified future date. The Fund used futures contracts to manage its exposure to the stock market.
Upon entering into a futures contract, a fund is required to deposit either cash or securities (initial margin) with a clearing broker in an amount equal to a certain percentage of the face value of the contract. Futures contracts are marked-to-market daily and subsequent daily payments (variation margin) are made or received by a fund depending on the daily fluctuations in the value of the futures contracts and are recorded as unrealized appreciation or (depreciation). This receivable and/or payable, if any, is included in daily variation margin on futures contracts in the Statement of Assets and Liabilities. Realized gain or (loss) is recorded upon the expiration or closing of a futures contract. The net realized gain (loss) and change in net unrealized appreciation (depreciation) on futures contracts during the period is presented in the Statement of Operations.
Any open futures contracts at period end are presented in the Schedule of Investments under the caption "Futures Contracts". The notional amount at value reflects each contract's exposure to the underlying instrument or index at period end and is representative of volume of activity during the period. Securities deposited to meet initial margin requirements are identified in the Schedule of Investments.
5. Purchases and Sales of Investments.
Purchases and sales of securities, other than short-term securities, aggregated $1,977,724 and $1,856,759, respectively.
6. Fees and Other Transactions with Affiliates.
Management Fee. Fidelity Management & Research Company (the investment adviser) and its affiliates provide the Fund with investment management related services for which the Fund pays a monthly management fee. The management fee is the sum of an individual fund fee rate that is based on an annual rate of .30% of the Fund's average net assets and an annualized group fee rate that averaged .25% during the period. The group fee rate is based upon the average net assets of all the mutual funds advised by the investment adviser, including any mutual funds previously advised by the investment adviser that are currently advised by Fidelity SelectCo, LLC, an affiliate of the investment adviser. The group fee rate decreases as assets under management increase and increases as assets under management decrease. In addition, the management fee is subject to a performance adjustment (up to a maximum of +/- .20% of the Fund's average net assets over a 36 month performance period). The upward or downward adjustment to the management fee is based on the relative investment performance of Class I of the Fund as compared to its benchmark index, the S&P MidCap 400 Index, over the same 36 month performance period. For the reporting period, the total annual management fee rate, including the performance adjustment, was .38% of the Fund's average net assets. The performance adjustment included in the management fee rate may be higher or lower than the maximum performance adjustment rate due to the difference between the average net assets for the reporting and performance periods.
Distribution and Service Plan Fees. In accordance with Rule 12b-1 of the 1940 Act, the Fund has adopted separate Distribution and Service Plans for each class of shares. Certain classes pay Fidelity Distributors Corporation (FDC), an affiliate of the investment adviser, separate Distribution and Service Fees, each of which is based on an annual percentage of each class' average net assets. In addition, FDC may pay financial intermediaries for selling shares of the Fund and providing shareholder support services. For the period, the Distribution and Service Fee rates, total fees and amounts retained by FDC were as follows:
| Distribution Fee | Service Fee | Total Fees | Retained by FDC | |
| Class A | -% | .25% | $1,389 | $3 |
| Class M | .25% | .25% | 2,958 | 10 |
| Class C | .75% | .25% | 1,418 | 5 |
| $5,765 | $18 |
Sales Load. FDC may receive a front-end sales charge of up to 5.75% for selling Class A shares and 3.50% for selling Class M shares, some of which is paid to financial intermediaries for selling shares of the Fund. Depending on the holding period, FDC may receive contingent deferred sales charges levied on Class A, Class M and Class C redemptions. The deferred sales charges are 1.00% for Class C shares, 1.00% for certain purchases of Class A shares and .25% for certain purchases of Class M shares.
For the period, sales charge amounts retained by FDC were as follows:
| Retained by FDC | |
| Class A | $36 |
| Class M | 12 |
| Class C(a) | 1 |
| $49 |
(a) When Class C shares are initially sold, FDC pays commissions from its own resources to financial intermediaries through which the sales are made.
Transfer Agent Fees. Fidelity Investments Institutional Operations Company, Inc., (FIIOC), an affiliate of the investment adviser, is the transfer, dividend disbursing and shareholder servicing agent for each class of the Fund. FIIOC receives account fees and asset-based fees that vary according to the account size and type of account of the shareholders of the respective classes of the Fund, except for Class Z. FIIOC receives an asset-based fee of Class Z's average net assets. FIIOC pays for typesetting, printing and mailing of shareholder reports, except proxy statements.
For the period, transfer agent fees for each applicable class were as follows:
| Amount | % of Class-Level Average Net Assets | |
| Class A | $1,086 | .20 |
| Class M | 1,109 | .19 |
| Class C | 290 | .20 |
| Fidelity Stock Selector Mid Cap Fund | 1,033 | .27 |
| Class I | 1,229 | .20 |
| Class Z | 1 | .05(a) |
| $4,748 |
(a) Annualized
Accounting and Security Lending Fees. Fidelity Service Company, Inc. (FSC), an affiliate of the investment adviser, maintains the Fund's accounting records. The accounting fee is based on the level of average net assets for each month. Under a separate contract, FSC administers the security lending program. The security lending fee is based on the number and duration of lending transactions.
Brokerage Commissions. The Fund placed a portion of its portfolio transactions with brokerage firms which are affiliates of the investment adviser. Brokerage commissions are included in net realized gain (loss) and change in net unrealized appreciation (depreciation) in the Statement of Operations. The commissions paid to these affiliated firms were $60 for the period.
Interfund Trades. The Fund may purchase from or sell securities to other Fidelity Funds under procedures adopted by the Board. The procedures have been designed to ensure these interfund trades are executed in accordance with Rule 17a-7 of the 1940 Act. Interfund trades are included within the respective purchases and sales amounts shown in the Purchases and Sales of Investments note.
7. Committed Line of Credit.
The Fund participates with other funds managed by the investment adviser or an affiliate in a $4.25 billion credit facility (the "line of credit") to be utilized for temporary or emergency purposes to fund shareholder redemptions or for other short-term liquidity purposes. The Fund has agreed to pay commitment fees on its pro-rata portion of the line of credit, which amounted to $7 and is reflected in Miscellaneous expenses on the Statement of Operations. During the period, the Fund did not borrow on this line of credit.
8. Security Lending.
The Fund lends portfolio securities through a lending agent from time to time in order to earn additional income. For equity securities, a lending agent is used and may loan securities to certain qualified borrowers, including Fidelity Capital Markets (FCM), a broker-dealer affiliated with the Fund. On the settlement date of the loan, the Fund receives collateral (in the form of U.S. Treasury obligations, letters of credit and/or cash) against the loaned securities and maintains collateral in an amount not less than 100% of the market value of the loaned securities during the period of the loan. The market value of the loaned securities is determined at the close of business of the Fund and any additional required collateral is delivered to the Fund on the next business day. The Fund or borrower may terminate the loan at any time, and if the borrower defaults on its obligation to return the securities loaned because of insolvency or other reasons, the Fund may apply collateral received from the borrower against the obligation. The Fund may experience delays and costs in recovering the securities loaned. Any cash collateral received is invested in the Fidelity Securities Lending Cash Central Fund. The value of loaned securities and cash collateral at period end are disclosed on the Fund's Statement of Assets and Liabilities. The value of securities loaned to FCM at period end was $215. Security lending income represents the income earned on investing cash collateral, less rebates paid to borrowers and any lending agent fees associated with the loan, plus any premium payments received for lending certain types of securities. Security lending income is presented in the Statement of Operations as a component of income from Fidelity Central Funds. Total security lending income during the period amounted to $194, including $13 from securities loaned to FCM.
9. Expense Reductions.
The investment adviser voluntarily agreed to reimburse a portion of the Fund's Class A, Class M, Class C, Fidelity Stock Selector Mid Cap Fund and Class I operating expenses. During the period, the reimbursement reduced expenses as follows:
| Reimbursement | |
| Class A | $4 |
| Class M | 4 |
| Class C | 1 |
| Fidelity Stock Selector Mid Cap Fund | 3 |
| Class I | 5 |
| $17 |
Commissions paid to certain brokers with whom the investment adviser, or its affiliates, places trades on behalf of the Fund include an amount in addition to trade execution, which may be rebated back to the Fund to offset certain expenses. This amount totaled $267 for the period.
In addition, during the period the investment adviser reimbursed and/or waived a portion of fund-level operating expenses in the amount of $18.
10. Distributions to Shareholders.
Distributions to shareholders of each class were as follows:
| Year ended November 30, 2017 | Year ended November 30, 2016 | |
| From net investment income | ||
| Class A | $3,079 | $755 |
| Class M | 1,865 | – |
| Fidelity Stock Selector Mid Cap Fund | 1,644 | 1,674 |
| Class I | 4,120 | 1,530 |
| Total | $10,708 | $3,959 |
| From net realized gain | ||
| Class A | $98 | $9,744 |
| Class M | 105 | 11,098 |
| Class B | – | 166 |
| Class C | – | 2,758 |
| Fidelity Stock Selector Mid Cap Fund | 39 | 7,708 |
| Class I | 91 | 7,742 |
| Total | $333 | $39,216 |
11. Share Transactions.
Share transactions for each class were as follows and may contain automatic conversions between classes or exchanges between affiliated funds:
| Shares | Shares | Dollars | Dollars | |
| Year ended November 30, 2017 | Year ended November 30, 2016 | Year ended November 30, 2017 | Year ended November 30, 2016 | |
| Class A | ||||
| Shares sold | 914 | 1,039 | $33,050 | $31,500 |
| Reinvestment of distributions | 88 | 331 | 2,963 | 9,838 |
| Shares redeemed | (3,286) | (3,402) | (118,879) | (104,169) |
| Net increase (decrease) | (2,284) | (2,032) | $(82,866) | $(62,831) |
| Class M | ||||
| Shares sold | 1,370 | 1,180 | $50,634 | $36,250 |
| Reinvestment of distributions | 55 | 356 | 1,885 | 10,639 |
| Shares redeemed | (4,007) | (4,950) | (145,515) | (152,516) |
| Net increase (decrease) | (2,582) | (3,414) | $(92,996) | $(105,627) |
| Class B | ||||
| Shares sold | – | 1 | $– | $31 |
| Reinvestment of distributions | – | 5 | – | 145 |
| Shares redeemed | – | (331) | – | (9,046) |
| Net increase (decrease) | – | (325) | $– | $(8,870) |
| Class C | ||||
| Shares sold | 131 | 114 | $4,256 | $3,221 |
| Reinvestment of distributions | – | 90 | – | 2,469 |
| Shares redeemed | (835) | (819) | (27,684) | (23,061) |
| Net increase (decrease) | (704) | (615) | $(23,428) | $(17,371) |
| Fidelity Stock Selector Mid Cap Fund | ||||
| Shares sold | 8,585 | 1,163 | $325,907 | $37,438 |
| Reinvestment of distributions | 47 | 300 | 1,639 | 9,281 |
| Shares redeemed | (1,916) | (9,609) | (73,800) | (298,117) |
| Net increase (decrease) | 6,716 | (8,146) | $253,746 | $(251,398) |
| Class I | ||||
| Shares sold | 4,203 | 5,294 | $158,956 | $166,666 |
| Reinvestment of distributions | 114 | 291 | 4,019 | 9,016 |
| Shares redeemed | (2,996) | (4,795) | (113,072) | (150,903) |
| Net increase (decrease) | 1,321 | 790 | $49,903 | $24,779 |
| Class Z(a) | ||||
| Shares sold | 234 | – | $9,125 | $– |
| Shares redeemed | (22) | – | (869) | – |
| Net increase (decrease) | 212 | – | $8,256 | $– |
(a) Share transactions for Class Z are for the period February 1, 2017 (commencement of sale of shares) to November 30, 2017.
12. Other.
The Fund's organizational documents provide former and current trustees and officers with a limited indemnification against liabilities arising in connection with the performance of their duties to the Fund. In the normal course of business, the Fund may also enter into contracts that provide general indemnifications. The Fund's maximum exposure under these arrangements is unknown as this would be dependent on future claims that may be made against the Fund. The risk of material loss from such claims is considered remote.
Report of Independent Registered Public Accounting Firm
To the Trustees of Fidelity Advisor Series I and Shareholders of Fidelity Advisor Stock Selector Mid Cap Fund:
We have audited the accompanying statement of assets and liabilities of Fidelity Advisor Stock Selector Mid Cap Fund (the Fund), a fund of Fidelity Advisor Series I, including the schedule of investments, as of November 30, 2017, and the related statement of operations for the year then ended, the statement of changes in net assets for each of the two years in the period then ended, and the financial highlights for each of the periods presented. These financial statements and financial highlights are the responsibility of the Fund's management. Our responsibility is to express an opinion on these financial statements and financial highlights based on our audits.
We conducted our audits in accordance with the standards of the Public Company Accounting Oversight Board (United States). Those standards require that we plan and perform the audit to obtain reasonable assurance about whether the financial statements and financial highlights are free of material misstatement. The Fund is not required to have, nor were we engaged to perform, an audit of its internal control over financial reporting. Our audits included consideration of internal control over financial reporting as a basis for designing audit procedures that are appropriate in the circumstances, but not for the purpose of expressing an opinion on the effectiveness of the Fund's internal control over financial reporting. Accordingly, we express no such opinion. An audit also includes examining, on a test basis, evidence supporting the amounts and disclosures in the financial statements, assessing the accounting principles used and significant estimates made by management, as well as evaluating the overall financial statement presentation. Our procedures included confirmation of securities owned as of November 30, 2017, by correspondence with the custodians and brokers; when replies were not received from brokers, we performed other auditing procedures. We believe that our audits provide a reasonable basis for our opinion.
In our opinion, such financial statements and financial highlights referred to above present fairly, in all material respects, the financial position of Fidelity Advisor Stock Selector Mid Cap Fund as of November 30, 2017, the results of its operations for the year then ended, the changes in its net assets for each of the two years in the period then ended, and the financial highlights for each of the periods presented, in conformity with accounting principles generally accepted in the United States of America.
DELOITTE & TOUCHE LLP
Boston, Massachusetts
January 16, 2018
Trustees and Officers
The Trustees, Members of the Advisory Board (if any), and officers of the trust and fund, as applicable, are listed below. The Board of Trustees governs the fund and is responsible for protecting the interests of shareholders. The Trustees are experienced executives who meet periodically throughout the year to oversee the fund's activities, review contractual arrangements with companies that provide services to the fund, oversee management of the risks associated with such activities and contractual arrangements, and review the fund's performance. Each of the Trustees oversees 190 funds.
The Trustees hold office without limit in time except that (a) any Trustee may resign; (b) any Trustee may be removed by written instrument, signed by at least two-thirds of the number of Trustees prior to such removal; (c) any Trustee who requests to be retired or who has become incapacitated by illness or injury may be retired by written instrument signed by a majority of the other Trustees; and (d) any Trustee may be removed at any special meeting of shareholders by a two-thirds vote of the outstanding voting securities of the trust. Each Trustee who is not an interested person (as defined in the 1940 Act) of the trust and the fund is referred to herein as an Independent Trustee. Each Independent Trustee shall retire not later than the last day of the calendar year in which his or her 75th birthday occurs. The Independent Trustees may waive this mandatory retirement age policy with respect to individual Trustees. Officers and Advisory Board Members hold office without limit in time, except that any officer or Advisory Board Member may resign or may be removed by a vote of a majority of the Trustees at any regular meeting or any special meeting of the Trustees. Except as indicated, each individual has held the office shown or other offices in the same company for the past five years.
The fund’s Statement of Additional Information (SAI) includes more information about the Trustees. To request a free copy, call Fidelity at 1-800-544-8544.
Experience, Skills, Attributes, and Qualifications of the Trustees. The Governance and Nominating Committee has adopted a statement of policy that describes the experience, qualifications, attributes, and skills that are necessary and desirable for potential Independent Trustee candidates (Statement of Policy). The Board believes that each Trustee satisfied at the time he or she was initially elected or appointed a Trustee, and continues to satisfy, the standards contemplated by the Statement of Policy. The Governance and Nominating Committee also engages professional search firms to help identify potential Independent Trustee candidates who have the experience, qualifications, attributes, and skills consistent with the Statement of Policy. From time to time, additional criteria based on the composition and skills of the current Independent Trustees, as well as experience or skills that may be appropriate in light of future changes to board composition, business conditions, and regulatory or other developments, have also been considered by the professional search firms and the Governance and Nominating Committee. In addition, the Board takes into account the Trustees' commitment and participation in Board and committee meetings, as well as their leadership of standing and ad hoc committees throughout their tenure.
In determining that a particular Trustee was and continues to be qualified to serve as a Trustee, the Board has considered a variety of criteria, none of which, in isolation, was controlling. The Board believes that, collectively, the Trustees have balanced and diverse experience, qualifications, attributes, and skills, which allow the Board to operate effectively in governing the fund and protecting the interests of shareholders. Information about the specific experience, skills, attributes, and qualifications of each Trustee, which in each case led to the Board's conclusion that the Trustee should serve (or continue to serve) as a trustee of the fund, is provided below.
Board Structure and Oversight Function. James C. Curvey is an interested person and currently serves as Chairman. The Trustees have determined that an interested Chairman is appropriate and benefits shareholders because an interested Chairman has a personal and professional stake in the quality and continuity of services provided to the fund. Independent Trustees exercise their informed business judgment to appoint an individual of their choosing to serve as Chairman, regardless of whether the Trustee happens to be independent or a member of management. The Independent Trustees have determined that they can act independently and effectively without having an Independent Trustee serve as Chairman and that a key structural component for assuring that they are in a position to do so is for the Independent Trustees to constitute a substantial majority for the Board. The Independent Trustees also regularly meet in executive session. Ned C. Lautenbach serves as Chairman of the Independent Trustees and as such (i) acts as a liaison between the Independent Trustees and management with respect to matters important to the Independent Trustees and (ii) with management prepares agendas for Board meetings.
Fidelity® funds are overseen by different Boards of Trustees. The fund's Board oversees Fidelity's high income and certain equity funds, and other Boards oversee Fidelity's investment-grade bond, money market, asset allocation, and sector funds. The asset allocation funds may invest in Fidelity® funds overseen by the fund's Board. The use of separate Boards, each with its own committee structure, allows the Trustees of each group of Fidelity® funds to focus on the unique issues of the funds they oversee, including common research, investment, and operational issues. On occasion, the separate Boards establish joint committees to address issues of overlapping consequences for the Fidelity® funds overseen by each Board.
The Trustees operate using a system of committees to facilitate the timely and efficient consideration of all matters of importance to the Trustees, the fund, and fund shareholders and to facilitate compliance with legal and regulatory requirements and oversight of the fund's activities and associated risks. The Board, acting through its committees, has charged FMR and its affiliates with (i) identifying events or circumstances the occurrence of which could have demonstrably adverse effects on the fund's business and/or reputation; (ii) implementing processes and controls to lessen the possibility that such events or circumstances occur or to mitigate the effects of such events or circumstances if they do occur; and (iii) creating and maintaining a system designed to evaluate continuously business and market conditions in order to facilitate the identification and implementation processes described in (i) and (ii) above. Because the day-to-day operations and activities of the fund are carried out by or through FMR, its affiliates, and other service providers, the fund's exposure to risks is mitigated but not eliminated by the processes overseen by the Trustees. While each of the Board's committees has responsibility for overseeing different aspects of the fund's activities, oversight is exercised primarily through the Operations, Audit, and Compliance Committees. In addition, the Independent Trustees have worked with FMR to enhance the Board's oversight of investment and financial risks, legal and regulatory risks, technology risks, and operational risks, including the development of additional risk reporting to the Board. For example, a working group comprised of Independent Trustees and FMR has worked and continues to work to review the Fidelity® funds' valuation-related activities, reporting and risk management. Appropriate personnel, including but not limited to the fund's Chief Compliance Officer (CCO), FMR's internal auditor, the independent accountants, the fund's Treasurer and portfolio management personnel, make periodic reports to the Board's committees, as appropriate, including an annual review of Fidelity's risk management program for the Fidelity® funds. The responsibilities of each standing committee, including their oversight responsibilities, are described further under "Standing Committees of the Trustees."
Interested Trustees*:
Correspondence intended for a Trustee who is an interested person may be sent to Fidelity Investments, 245 Summer Street, Boston, Massachusetts 02210.
Name, Year of Birth; Principal Occupations and Other Relevant Experience+
James C. Curvey (1935)
Year of Election or Appointment: 2007
Trustee
Chairman of the Board of Trustees
Mr. Curvey also serves as Trustee of other Fidelity® funds. Mr. Curvey is a Director of Fidelity Research & Analysis Co. (investment adviser firm, 2009-present), and Vice Chairman (2007-present) and Director of FMR LLC (diversified financial services company). In addition, Mr. Curvey serves as an Overseer for the Boston Symphony Orchestra and a member of the board of Artis-Naples, Naples, Florida, and as a Trustee for Brewster Academy, Wolfeboro, New Hampshire. Previously, Mr. Curvey served as a Director of Fidelity Investments Money Management, Inc. (investment adviser firm, 2009-2014) and a Director of FMR and FMR Co., Inc. (investment adviser firms, 2007-2014).
Charles S. Morrison (1960)
Year of Election or Appointment: 2014
Trustee
Mr. Morrison also serves as Trustee of other funds. He serves as President of Fidelity Management & Research Company (FMR) (investment adviser firm, 2016-present), a Director of Fidelity Investments Money Management, Inc. (FIMM) (investment adviser firm, 2014-present), Director of Fidelity SelectCo, LLC (investment adviser firm, 2014-present), President, Asset Management (2014-present), and is an employee of Fidelity Investments. Previously, Mr. Morrison served as Vice President of Fidelity's Fixed Income and Asset Allocation Funds (2012-2014), President, Fixed Income (2011-2014), Vice President of Fidelity's Money Market Funds (2005-2009), President, Money Market Group Leader of FMR (investment adviser firm, 2009), and Senior Vice President, Money Market Group of FMR (2004-2009). Mr. Morrison also served as Vice President of Fidelity's Bond Funds (2002-2005), certain Balanced Funds (2002-2005), and certain Asset Allocation Funds (2002-2007), and as Senior Vice President (2002-2005) of Fidelity's Bond Division.
* Determined to be an “Interested Trustee” by virtue of, among other things, his or her affiliation with the trust or various entities under common control with FMR.
+ The information includes the Trustee's principal occupation during the last five years and other information relating to the experience, attributes, and skills relevant to the Trustee's qualifications to serve as a Trustee, which led to the conclusion that the Trustee should serve as a Trustee for the fund.
Independent Trustees:
Correspondence intended for an Independent Trustee may be sent to Fidelity Investments, P.O. Box 55235, Boston, Massachusetts 02205-5235.
Name, Year of Birth; Principal Occupations and Other Relevant Experience+
Dennis J. Dirks (1948)
Year of Election or Appointment: 2005
Trustee
Mr. Dirks also serves as Trustee of other Fidelity® funds. Prior to his retirement in May 2003, Mr. Dirks was Chief Operating Officer and a member of the Board of The Depository Trust & Clearing Corporation (DTCC). He also served as President, Chief Operating Officer, and Board member of The Depository Trust Company (DTC) and President and Board member of the National Securities Clearing Corporation (NSCC). In addition, Mr. Dirks served as Chief Executive Officer and Board member of the Government Securities Clearing Corporation, Chief Executive Officer and Board member of the Mortgage-Backed Securities Clearing Corporation, as a Trustee and a member of the Finance Committee of Manhattan College (2005-2008), as a Trustee and a member of the Finance Committee of AHRC of Nassau County (2006-2008), as a member of the Independent Directors Council (IDC) Governing Council (2010-2015), and as a member of the Board of Directors for The Brookville Center for Children’s Services, Inc. (2009-2017). Mr. Dirks is a member of the Finance Committee (2016-present) and Board of Directors (2017-present) of the Asolo Repertory Theatre.
Alan J. Lacy (1953)
Year of Election or Appointment: 2008
Trustee
Mr. Lacy also serves as Trustee of other Fidelity® funds. Mr. Lacy serves as a Director of Bristol-Myers Squibb Company (global pharmaceuticals, 2008-present). He is a Trustee of the California Chapter of The Nature Conservancy (2015-present) and a Director of the Center for Advanced Study in the Behavioral Sciences at Stanford University (2015-present). In addition, Mr. Lacy served as Senior Adviser (2007-2014) of Oak Hill Capital Partners, L.P. (private equity) and also served as Chief Executive Officer (2005) and Vice Chairman (2005-2006) of Sears Holdings Corporation (retail) and Chief Executive Officer and Chairman of the Board of Sears, Roebuck and Co. (retail, 2000-2005). Previously, Mr. Lacy served as Chairman (2014-2017) and a member (2010-2017) of the Board of Directors of Dave & Buster’s Entertainment, Inc. (restaurant and entertainment complexes), as Chairman (2008-2011) and a member (2006-2015) of the Board of Trustees of the National Parks Conservation Association, and as a member of the Board of Directors for The Hillman Companies, Inc. (hardware wholesalers, 2010-2014), Earth Fare, Inc. (retail grocery, 2010-2014), and The Western Union Company (global money transfer, 2006-2011).
Ned C. Lautenbach (1944)
Year of Election or Appointment: 2000
Trustee
Chairman of the Independent Trustees
Mr. Lautenbach also serves as Trustee of other Fidelity® funds. Mr. Lautenbach currently serves as Vice Chair of the Board of Governors, State University System of Florida (2013-present) and is a member of the Council on Foreign Relations (1994-present). He is also a member and has most recently served as Chairman of the Board of Directors of Artis-Naples (2012-present). Previously, Mr. Lautenbach served as a member and then Lead Director of the Board of Directors of Eaton Corporation (diversified industrial, 1997-2016). He was also a Partner and Advisory Partner at Clayton, Dubilier & Rice, LLC (private equity investment, 1998-2010), as well as a Director of Sony Corporation (2006-2007). In addition, Mr. Lautenbach also had a 30-year career with IBM (technology company) during which time he served as Senior Vice President and a member of the Corporate Executive Committee (1968-1998).
Joseph Mauriello (1944)
Year of Election or Appointment: 2008
Trustee
Mr. Mauriello also serves as Trustee of other Fidelity® funds. Prior to his retirement in January 2006, Mr. Mauriello served in numerous senior management positions including Deputy Chairman and Chief Operating Officer (2004-2005), and Vice Chairman of Financial Services (2002-2004) of KPMG LLP US (professional services, 1965-2005). Mr. Mauriello currently serves as a member of the Board of Directors of XL Group plc. (global insurance and re-insurance, 2006-present) and the Independent Directors Council (IDC) Governing Council (2015-present). Previously, Mr. Mauriello served as a Director of the Hamilton Funds of the Bank of New York (2006-2007) and of Arcadia Resources Inc. (health care services and products, 2007-2012).
Cornelia M. Small (1944)
Year of Election or Appointment: 2005
Trustee
Ms. Small also serves as Trustee of other Fidelity® funds. Ms. Small is a member of the Board of Directors (2009-present) and Chair of the Investment Committee (2010-present) of the Teagle Foundation. Ms. Small also serves on the Investment Committee of the Berkshire Taconic Community Foundation (2008-present). Previously, Ms. Small served as Chairperson (2002-2008) and a member of the Investment Committee and Chairperson (2008-2012) and a member of the Board of Trustees of Smith College. In addition, Ms. Small served as Chief Investment Officer, Director of Global Equity Investments, and a member of the Board of Directors of Scudder, Stevens & Clark and Scudder Kemper Investments.
William S. Stavropoulos (1939)
Year of Election or Appointment: 2002
Trustee
Vice Chairman of the Independent Trustees
Mr. Stavropoulos also serves as Trustee of other Fidelity® funds. Mr. Stavropoulos serves as President and Founder of the Michigan Baseball Foundation, the Great Lakes Loons (2007-present). Mr. Stavropoulos is Chairman Emeritus of the Board of Directors of The Dow Chemical Company, where he previously served in numerous senior management positions, including President, CEO (1995-2000; 2002-2004), Chairman of the Executive Committee (2000-2006), and as a member of the Board of Directors (1990-2006). Currently, Mr. Stavropoulos is Chairman of the Board of Directors of Univar Inc. (global distributor of commodity and specialty chemicals), a Director of Teradata Corporation (data warehousing and technology solutions), and a member of the Advisory Board for Metalmark Capital LLC (private equity investment, 2005-present). Mr. Stavropoulos is an operating advisor to Clayton, Dubilier & Rice, LLC (private equity investment). In addition, Mr. Stavropoulos is a member of the University of Notre Dame Advisory Council for the College of Science, a Trustee of the Rollin L. Gerstacker Foundation, and a Director of Artis-Naples in Naples, Florida. Previously, Mr. Stavropoulos served as a Director of Chemical Financial Corporation (bank holding company, 1993-2012) and Tyco International, Ltd. (multinational manufacturing and services, 2007-2012).
David M. Thomas (1949)
Year of Election or Appointment: 2008
Trustee
Mr. Thomas also serves as Trustee of other Fidelity® funds. Mr. Thomas serves as Non-Executive Chairman of the Board of Directors of Fortune Brands Home and Security (home and security products, 2011-present), as a member of the Board of Directors (2004-present) and Presiding Director (2013-present) of Interpublic Group of Companies, Inc. (marketing communication), and as a member of the Board of Trustees of the University of Florida (2013-present). Previously, Mr. Thomas served as Executive Chairman (2005-2006) and Chairman and Chief Executive Officer (2000-2005) of IMS Health, Inc. (pharmaceutical and healthcare information solutions), and a Director of Fortune Brands, Inc. (consumer products, 2000-2011).
+ The information includes the Trustee's principal occupation during the last five years and other information relating to the experience, attributes, and skills relevant to the Trustee's qualifications to serve as a Trustee, which led to the conclusion that the Trustee should serve as a Trustee for the fund.
Advisory Board Members and Officers:
Correspondence intended for an officer or Peter S. Lynch may be sent to Fidelity Investments, 245 Summer Street, Boston, Massachusetts 02210. Officers appear below in alphabetical order.
Name, Year of Birth; Principal Occupation
Peter S. Lynch (1944)
Year of Election or Appointment: 2003
Member of the Advisory Board
Mr. Lynch also serves as Member of the Advisory Board of other Fidelity® funds. Mr. Lynch is Vice Chairman and a Director of FMR (investment adviser firm) and FMR Co., Inc. (investment adviser firm). In addition, Mr. Lynch serves as a Trustee of Boston College and as the Chairman of the Inner-City Scholarship Fund. Previously, Mr. Lynch served on the Special Olympics International Board of Directors (1997-2006).
Elizabeth Paige Baumann (1968)
Year of Election or Appointment: 2017
Anti-Money Laundering (AML) Officer
Ms. Baumann also serves as AML Officer of other funds. She is Chief AML Officer (2012-present) and Senior Vice President (2014-present) of FMR LLC (diversified financial services company) and is an employee of Fidelity Investments. Previously, Ms. Baumann served as AML Officer of the funds (2012-2016), and Vice President (2007-2014) and Deputy Anti-Money Laundering Officer (2007-2012) of FMR LLC.
Marc R. Bryant (1966)
Year of Election or Appointment: 2015
Secretary and Chief Legal Officer (CLO)
Mr. Bryant also serves as Secretary and CLO of other funds. Mr. Bryant serves as CLO, Secretary, and Senior Vice President of Fidelity Management & Research Company (investment adviser firm, 2015-present) and FMR Co., Inc. (investment adviser firm, 2015-present); Secretary of Fidelity SelectCo, LLC (investment adviser firm, 2015-present) and Fidelity Investments Money Management, Inc. (investment adviser firm, 2015-present); and CLO of Fidelity Management & Research (Hong Kong) Limited and FMR Investment Management (UK) Limited (investment adviser firms, 2015-present) and Fidelity Management & Research (Japan) Limited (investment adviser firm, 2016-present). He is Senior Vice President and Deputy General Counsel of FMR LLC (diversified financial services company). Previously, Mr. Bryant served as Secretary and CLO of Fidelity Rutland Square Trust II (2010-2014) and Assistant Secretary of Fidelity's Fixed Income and Asset Allocation Funds (2013-2015). Prior to joining Fidelity Investments, Mr. Bryant served as a Senior Vice President and the Head of Global Retail Legal for AllianceBernstein L.P. (2006-2010), and as the General Counsel for ProFund Advisors LLC (2001-2006).
William C. Coffey (1969)
Year of Election or Appointment: 2009
Assistant Secretary
Mr. Coffey also serves as Assistant Secretary of other funds. He is Senior Vice President and Deputy General Counsel of FMR LLC (diversified financial services company, 2010-present), and is an employee of Fidelity Investments. Previously, Mr. Coffey served as Vice President and Associate General Counsel of FMR LLC (2005-2009).
Jonathan Davis (1968)
Year of Election or Appointment: 2010
Assistant Treasurer
Mr. Davis also serves as Assistant Treasurer of other funds. Mr. Davis serves as Assistant Treasurer of FMR Capital, Inc. (2017-present) and is an employee of Fidelity Investments. Previously, Mr. Davis served as Vice President and Associate General Counsel of FMR LLC (diversified financial services company, 2003-2010).
Adrien E. Deberghes (1967)
Year of Election or Appointment: 2016
Assistant Treasurer
Mr. Deberghes also serves as an officer of other funds. He serves as Assistant Treasurer of FMR Capital, Inc. (2017-present), Executive Vice President of Fidelity Investments Money Management, Inc. (FIMM) (investment adviser firm, 2016-present), and is an employee of Fidelity Investments (2008-present). Prior to joining Fidelity Investments, Mr. Deberghes was Senior Vice President of Mutual Fund Administration at State Street Corporation (2007-2008), Senior Director of Mutual Fund Administration at Investors Bank & Trust (2005-2007), and Director of Finance for Dunkin' Brands (2000-2005). Previously, Mr. Deberghes served in other fund officer roles.
Stephanie J. Dorsey (1969)
Year of Election or Appointment: 2010
Assistant Treasurer
Ms. Dorsey also serves as an officer of other funds. Ms. Dorsey serves as Assistant Treasurer of FMR Capital, Inc. (2017-present), is an employee of Fidelity Investments (2008-present), and has served in other fund officer roles. Prior to joining Fidelity Investments, Ms. Dorsey served as Treasurer (2004-2008) of the JPMorgan Mutual Funds and Vice President (2004-2008) of JPMorgan Chase Bank.
Howard J. Galligan III (1966)
Year of Election or Appointment: 2014
Chief Financial Officer
Mr. Galligan also serves as Chief Financial Officer of other funds. Mr. Galligan serves as President of Fidelity Pricing and Cash Management Services (FPCMS) (2014-present) and as a Director of Strategic Advisers, Inc. (investment adviser firm, 2008-present). Previously, Mr. Galligan served as Chief Administrative Officer of Asset Management (2011-2014) and Chief Operating Officer and Senior Vice President of Investment Support for Strategic Advisers, Inc. (2003-2011).
Thomas C. Hense (1964)
Year of Election or Appointment: 2008, 2010, or 2015
Vice President
Mr. Hense serves as Vice President of Fidelity Advisor® Multi-Asset Income Fund (2015) and other funds (High Income (2008), Small Cap (2008), and Value (2010) funds), and is an employee of Fidelity Investments (1993-present). Previously, Mr. Hense served as a portfolio manager for Fidelity's Institutional Money Management Group (Pyramis) (2003-2008).
Brian B. Hogan (1964)
Year of Election or Appointment: 2009
Vice President
Mr. Hogan also serves as Trustee or Vice President of other funds. Mr. Hogan serves as a Director of FMR Investment Management (UK) Limited (investment adviser firm, 2015-present) and Fidelity SelectCo, LLC (investment adviser firm, 2014-present) and President of the Equity Division of FMR (investment adviser firm, 2009-present). Previously, Mr. Hogan served as Senior Vice President, Equity Research of FMR (2006-2009) and as a portfolio manager. Mr. Brian B. Hogan is not related to Mr. Colm A. Hogan.
Colm A. Hogan (1973)
Year of Election or Appointment: 2016
Deputy Treasurer
Mr. Hogan also serves as an officer of other funds. Mr. Hogan serves as Assistant Treasurer of FMR Capital, Inc. (2017-present) and is an employee of Fidelity Investments (2005-present). Mr. Colm A. Hogan is not related to Mr. Brian B. Hogan.
Chris Maher (1972)
Year of Election or Appointment: 2013
Assistant Treasurer
Mr. Maher serves as Assistant Treasurer of other funds. Mr. Maher is Vice President of Valuation Oversight, serves as Assistant Treasurer of FMR Capital, Inc. (2017-present), and is an employee of Fidelity Investments. Previously, Mr. Maher served as Vice President of Asset Management Compliance (2013), Vice President of the Program Management Group of FMR (investment adviser firm, 2010-2013), and Vice President of Valuation Oversight (2008-2010).
Rieco E. Mello (1969)
Year of Election or Appointment: 2017
Assistant Treasurer
Mr. Mello also serves as Assistant Treasurer of other funds. Mr. Mello serves as Assistant Treasurer of FMR Capital, Inc. (2017-present) and is an employee of Fidelity Investments (1995-present).
Kenneth B. Robins (1969)
Year of Election or Appointment: 2016
Chief Compliance Officer
Mr. Robins also serves as an officer of other funds. Mr. Robins serves as Compliance Officer of Fidelity Management & Research Company and FMR Co., Inc. (investment adviser firms, 2016-present) and is an employee of Fidelity Investments (2004-present). Previously, Mr. Robins served as Executive Vice President of Fidelity Investments Money Management, Inc. (investment adviser firm, 2013-2016) and served in other fund officer roles.
Stacie M. Smith (1974)
Year of Election or Appointment: 2016
President and Treasurer
Ms. Smith also serves as an officer of other funds. Ms. Smith serves as Assistant Treasurer of FMR Capital, Inc. (2017-present), is an employee of Fidelity Investments (2009-present), and has served in other fund officer roles. Prior to joining Fidelity Investments, Ms. Smith served as Senior Audit Manager of Ernst & Young LLP (accounting firm, 1996-2009). Previously, Ms. Smith served as Deputy Treasurer of certain Fidelity® funds (2013-2016).
Marc L. Spector (1972)
Year of Election or Appointment: 2016
Assistant Treasurer
Mr. Spector also serves as an officer of other funds. Mr. Spector serves as Assistant Treasurer of FMR Capital, Inc. (2017-present) and is an employee of Fidelity Investments (2016-present). Prior to joining Fidelity Investments, Mr. Spector served as Director at the Siegfried Group (accounting firm, 2013-2016), and prior to Siegfried Group as audit senior manager at Deloitte & Touche (accounting firm, 2005-2013).
Renee Stagnone (1975)
Year of Election or Appointment: 2016
Assistant Treasurer
Ms. Stagnone also serves as an officer of other funds. Ms. Stagnone serves as Assistant Treasurer of FMR Capital, Inc. (2017-present) and is an employee of Fidelity Investments (1997-present). Previously, Ms. Stagnone served as Deputy Treasurer of certain Fidelity® funds (2013-2016).
Shareholder Expense Example
As a shareholder of the Fund, you incur two types of costs: (1) transaction costs, including sales charges (loads) on purchase payments or redemption proceeds, and (2) ongoing costs, including management fees, distribution and/or service (12b-1) fees and other Fund expenses. This Example is intended to help you understand your ongoing costs (in dollars) of investing in the Fund and to compare these costs with the ongoing costs of investing in other mutual funds.
The Example is based on an investment of $1,000 invested at the beginning of the period and held for the entire period (June 1, 2017 to November 30, 2017).
Actual Expenses
The first line of the accompanying table for each class of the Fund provides information about actual account values and actual expenses. You may use the information in this line, together with the amount you invested, to estimate the expenses that you paid over the period. Simply divide your account value by $1,000.00 (for example, an $8,600 account value divided by $1,000.00 = 8.6), then multiply the result by the number in the first line for a class of the Fund under the heading entitled "Expenses Paid During Period" to estimate the expenses you paid on your account during this period. A small balance maintenance fee of $12.00 that is charged once a year may apply for certain accounts with a value of less than $2,000. This fee is not included in the table below. If it was, the estimate of expenses you paid during the period would be higher, and your ending account value lower, by this amount. In addition, the Fund, as a shareholder in the underlying Fidelity Central Funds, will indirectly bear its pro-rata share of the fees and expenses incurred by the underlying Fidelity Central Funds. These fees and expenses are not included in the Fund's annualized expense ratio used to calculate the expense estimate in the table below.
Hypothetical Example for Comparison Purposes
The second line of the accompanying table for each class of the Fund provides information about hypothetical account values and hypothetical expenses based on a Class' actual expense ratio and an assumed rate of return of 5% per year before expenses, which is not the Class' actual return. The hypothetical account values and expenses may not be used to estimate the actual ending account balance or expenses you paid for the period. You may use this information to compare the ongoing costs of investing in the Fund and other funds. To do so, compare this 5% hypothetical example with the 5% hypothetical examples that appear in the shareholder reports of the other funds. A small balance maintenance fee of $12.00 that is charged once a year may apply for certain accounts with a value of less than $2,000. This fee is not included in the table below. If it was, the estimate of expenses you paid during the period would be higher, and your ending account value lower, by this amount. In addition, the Fund, as a shareholder in the underlying Fidelity Central Funds, will indirectly bear its pro-rata share of the fees and expenses incurred by the underlying Fidelity Central Funds. These fees and expenses are not included in the Fund's annualized expense ratio used to calculate the expense estimate in the table below.
Please note that the expenses shown in the table are meant to highlight your ongoing costs only and do not reflect any transaction costs. Therefore, the second line of the table is useful in comparing ongoing costs only, and will not help you determine the relative total costs of owning different funds. In addition, if these transactional costs were included, your costs would have been higher.
| Annualized Expense Ratio-A | Beginning Account Value June 1, 2017 | Ending Account Value November 30, 2017 | Expenses Paid During Period-B June 1, 2017 to November 30, 2017 | |
| Class A | .90% | |||
| Actual | $1,000.00 | $1,100.50 | $4.74 | |
| Hypothetical-C | $1,000.00 | $1,020.56 | $4.56 | |
| Class M | 1.14% | |||
| Actual | $1,000.00 | $1,099.20 | $6.00 | |
| Hypothetical-C | $1,000.00 | $1,019.35 | $5.77 | |
| Class C | 1.66% | |||
| Actual | $1,000.00 | $1,096.20 | $8.72 | |
| Hypothetical-C | $1,000.00 | $1,016.75 | $8.39 | |
| Fidelity Stock Selector Mid Cap Fund | .75% | |||
| Actual | $1,000.00 | $1,101.30 | $3.95 | |
| Hypothetical-C | $1,000.00 | $1,021.31 | $3.80 | |
| Class I | .65% | |||
| Actual | $1,000.00 | $1,101.60 | $3.42 | |
| Hypothetical-C | $1,000.00 | $1,021.81 | $3.29 | |
| Class Z | .48% | |||
| Actual | $1,000.00 | $1,102.70 | $2.53 | |
| Hypothetical-C | $1,000.00 | $1,022.66 | $2.43 |
A Annualized expense ratio reflects expenses net of applicable fee waivers.
B Expenses are equal to each Class' annualized expense ratio, multiplied by the average account value over the period, multiplied by 183/365 (to reflect the one-half year period).
C 5% return per year before expenses
Distributions (Unaudited)
The Board of Trustees of Fidelity Advisor Stock Selector Mid Cap Fund voted to pay to shareholders of record at the opening of business on record date, the following distributions per share derived from capital gains realized from sales of portfolio securities, and dividends derived from net investment income:
| Pay Date | Record Date | Dividends | Capital Gains | |
| Fidelity Advisor Stock Selector Mid Cap Fund | ||||
| Class A | 12/27/2017 | 12/26/2017 | $0.107 | $1.648 |
| Class M | 12/27/2017 | 12/26/2017 | $0.012 | $1.648 |
| Class C | 12/27/2017 | 12/26/2017 | $0.000 | $1.493 |
| Fidelity Stock Selector Mid Cap Fund | 12/27/2017 | 12/26/2017 | $0.197 | $1.648 |
| Class I | 12/27/2017 | 12/26/2017 | $0.208 | $1.648 |
| Class Z | 12/27/2017 | 12/26/2017 | $0.278 | $1.648 |
The fund hereby designates as a capital gain dividend with respect to the taxable year ended November 30, 2017, $57,049,530, or, if subsequently determined to be different, the net capital gain of such year.
Class A designates 100%; Class M designates 100%; Fidelity Stock Selector Mid Cap Fund designates 100%; and Class I designates 98% of the dividends distributed in December 2016, during the fiscal year as qualifying for the dividends–received deduction for corporate shareholders.
Class A, Class M, Fidelity Stock Selector Mid Cap Fund and Class I designate 100% of the dividends distributed during the fiscal year as amounts which may be taken into account as a dividend for purposes of the maximum rate under section 1(h)(11) of the Internal Revenue Code.
The fund will notify shareholders in January 2018 of amounts for use in preparing 2017 income tax returns.
Board Approval of Investment Advisory Contracts and Management Fees
Fidelity Advisor Stock Selector Mid Cap Fund
Each year, the Board of Trustees, including the Independent Trustees (together, the Board), votes on the renewal of the management contract with Fidelity Management & Research Company (FMR) and the sub-advisory agreements (together, the Advisory Contracts) for the fund. FMR and the sub-advisers are referred to herein as the Investment Advisers. The Board, assisted by the advice of fund counsel and Independent Trustees' counsel, requests and considers a broad range of information relevant to the renewal of the Advisory Contracts throughout the year.
The Board meets regularly and, at each of its meetings, covers an extensive agenda of topics and materials and considers factors that are relevant to its annual consideration of the renewal of the fund's Advisory Contracts, including the services and support provided to the fund and its shareholders. The Board has established various standing committees (Committees), each composed of and chaired by Independent Trustees with varying backgrounds, to which the Board has assigned specific subject matter responsibilities in order to enhance effective decision-making by the Board. The Board, acting directly and through its Committees, requests and receives information concerning the annual consideration of the renewal of the fund's Advisory Contracts. The Board also meets as needed to review matters specifically related to the Board's annual consideration of the renewal of the Advisory Contracts. Members of the Board may also meet with trustees of other Fidelity funds through ad hoc joint committees to discuss certain matters relevant to all of the Fidelity funds.
At its July 2017 meeting, the Board unanimously determined to renew the fund's Advisory Contracts. In reaching its determination, the Board considered all factors it believed relevant, including (i) the nature, extent, and quality of the services to be provided to the fund and its shareholders (including the investment performance of the fund); (ii) the competitiveness of the fund's management fee and total expense ratio relative to peer funds; (iii) the total costs of the services to be provided by and the profits to be realized by Fidelity from its relationships with the fund; and (iv) the extent to which, if any, economies of scale exist and would be realized as the fund grows, and whether any economies of scale are appropriately shared with fund shareholders.
In considering whether to renew the Advisory Contracts for the fund, the Board reached a determination, with the assistance of fund counsel and Independent Trustees' counsel and through the exercise of its business judgment, that the renewal of the Advisory Contracts was in the best interests of the fund and its shareholders and that the compensation payable under the Advisory Contracts was fair and reasonable. The Board's decision to renew the Advisory Contracts was not based on any single factor, but rather was based on a comprehensive consideration of all the information provided to the Board at its meetings throughout the year. The Board, in reaching its determination to renew the Advisory Contracts, was aware that shareholders of the fund have a broad range of investment choices available to them, including a wide choice among funds offered by Fidelity's competitors, and that the fund's shareholders, who have the opportunity to review and weigh the disclosure provided by the fund in its prospectus and other public disclosures, have chosen to invest in this fund, which is part of the Fidelity family of funds.
Amendment to Group Fee Rate. The Board also approved an amendment to the management contract for the fund to add an additional breakpoint to the group fee schedule, effective October 1, 2017. The Board noted that the additional breakpoint would result in lower management fee rates as Fidelity's assets under management increase.
Nature, Extent, and Quality of Services Provided. The Board considered Fidelity's staffing as it relates to the fund, including the backgrounds of investment personnel of Fidelity, and also considered the fund's investment objective, strategies, and related investment philosophy. The Independent Trustees also had discussions with senior management of Fidelity's investment operations and investment groups. The Board considered the structure of the investment personnel compensation program and whether this structure provides appropriate incentives to act in the best interests of the fund. Additionally, the Board considered the portfolio managers' investments, if any, in the funds that they manage.Resources Dedicated to Investment Management and Support Services. The Board and the Fund Oversight and Research Committees reviewed the general qualifications and capabilities of Fidelity's investment staff, including its size, education, experience, and resources, as well as Fidelity's approach to recruiting, training, managing, and compensating investment personnel. The Board noted that Fidelity has continued to increase the resources devoted to non-U.S. offices, including expansion of Fidelity's global investment organization. The Board also noted that Fidelity's analysts have extensive resources, tools and capabilities that allow them to conduct sophisticated quantitative and fundamental analysis, as well as credit analysis of issuers, counterparties and guarantors. Further, the Board considered that Fidelity's investment professionals have sufficient access to global information and data so as to provide competitive investment results over time, and that those professionals also have access to sophisticated tools that permit them to assess portfolio construction and risk and performance attribution characteristics continuously, as well as to transmit new information and research conclusions rapidly around the world. Additionally, in its deliberations, the Board considered Fidelity's trading, risk management, compliance, and technology and operations capabilities and resources, which are integral parts of the investment management process.Shareholder and Administrative Services. The Board considered (i) the nature, extent, quality, and cost of advisory, administrative, and shareholder services performed by the Investment Advisers and their affiliates under the Advisory Contracts and under separate agreements covering transfer agency, pricing and bookkeeping, and securities lending services for the fund; (ii) the nature and extent of the supervision of third party service providers, principally custodians, subcustodians, and pricing vendors; and (iii) the resources devoted to, and the record of compliance with, the fund's compliance policies and procedures. The Board also reviewed the allocation of fund brokerage, including allocations to brokers affiliated with the Investment Advisers, the use of brokerage commissions to pay fund expenses, and the use of "soft" commission dollars to pay for research services.The Board noted that the growth of fund assets over time across the complex allows Fidelity to reinvest in the development of services designed to enhance the value or convenience of the Fidelity funds as investment vehicles. These services include 24-hour access to account information and market information through telephone representatives and over the Internet, investor education materials and asset allocation tools, and the expanded availability of Fidelity Investor Centers.In 2014, the Board formed an ad hoc Committee on Transfer Agency Fees to review the variety of transfer agency fee structures throughout the industry and Fidelity's competitive positioning with respect to industry participants.Investment in a Large Fund Family. The Board considered the benefits to shareholders of investing in a Fidelity fund, including the benefits of investing in a fund that is part of a large family of funds offering a variety of investment disciplines and providing a large variety of mutual fund investor services. The Board noted that Fidelity had taken, or had made recommendations that resulted in the Fidelity funds taking, a number of actions over the previous year that benefited particular funds, including: (i) continuing to dedicate additional resources to Fidelity's investment research process, and to the support of the senior management team that oversees asset management; (ii) continuing efforts to enhance Fidelity's global research capabilities; (iii) launching new funds and making other enhancements to meet client needs; (iv) launching new share classes of existing funds; (v) eliminating purchase minimums and broadening eligibility requirements for certain lower-priced share classes; (vi) reducing management fees and total expenses for certain growth equity funds and index funds; (vii) lowering expense caps for certain existing funds and classes to reduce expenses borne by shareholders; (viii) eliminating short-term redemption fees for certain funds; (ix) introducing a new pricing structure for certain funds of funds that is expected to reduce overall expenses paid by shareholders; (x) rationalizing product lines and gaining increased efficiencies through proposals for fund mergers and share class consolidations; (xi) continuing to develop, acquire and implement systems and technology to improve services to the funds and shareholders, strengthen information security, and increase efficiency; and (xii) implementing enhancements to further strengthen Fidelity's product line to increase investors' probability of success in achieving their investment goals, including retirement income goals.Investment Performance. The Board considered whether the fund has operated in accordance with its investment objective, as well as its record of compliance with its investment restrictions and its performance history.The Board took into account discussions with representatives of the Investment Advisers about fund investment performance that occur at Board meetings throughout the year. In this regard the Board noted that as part of regularly scheduled fund reviews and other reports to the Board on fund performance, the Board considers annualized return information for the fund for different time periods, measured against a securities market index ("benchmark index") and a peer group of funds with similar objectives ("peer group"), if any. In its evaluation of fund investment performance, the Board gave particular attention to information indicating changes in performance of certain Fidelity funds for specific time periods and discussed with the Investment Advisers the reasons for any overperformance or underperformance.In addition to reviewing absolute and relative fund performance, the Independent Trustees periodically consider the appropriateness of fund performance metrics in evaluating the results achieved. In general, the Independent Trustees believe that fund performance should be evaluated based on net performance (after fees and expenses) of both the highest performing and lowest performing fund share classes, where applicable, compared to appropriate benchmark indices, over appropriate time periods that may include full market cycles, and compared to peer groups, as applicable, over the same periods, taking into account relevant factors including the following: general market conditions; issuer-specific information; and fund cash flows and other factors.The Independent Trustees recognize that shareholders evaluate performance on a net basis over their own holding periods, for which one-, three-, and five-year periods are often used as a proxy. For this reason, the performance information reviewed by the Board also included net cumulative calendar year total return information for the fund and an appropriate benchmark index and peer group for the most recent one-, three-, and five-year periods, as shown below. Returns are shown compared to the 25th percentile (top of box, 75% beaten) and 75th percentile (bottom of box, 25% beaten) of the peer universe.Fidelity Advisor Stock Selector Mid Cap Fund
Fidelity Advisor Stock Selector Mid Cap Fund
![]()
Corporate Headquarters
245 Summer St.
Boston, MA 02210
www.fidelity.com
SKD-ANN-0118
1.940899.105
Fidelity Advisor® Value Strategies Fund Class A, Class M (formerly Class T), Class C and Class I Annual Report November 30, 2017 |
|
Contents
Board Approval of Investment Advisory Contracts and Management Fees |
To view a fund's proxy voting guidelines and proxy voting record for the 12-month period ended June 30, visit http://www.fidelity.com/proxyvotingresults or visit the Securities and Exchange Commission's (SEC) web site at http://www.sec.gov.
You may also call 1-877-208-0098 to request a free copy of the proxy voting guidelines.
Standard & Poor's, S&P and S&P 500 are registered service marks of The McGraw-Hill Companies, Inc. and have been licensed for use by Fidelity Distributors Corporation.
Other third-party marks appearing herein are the property of their respective owners.
All other marks appearing herein are registered or unregistered trademarks or service marks of FMR LLC or an affiliated company. © 2018 FMR LLC. All rights reserved.
This report and the financial statements contained herein are submitted for the general information of the shareholders of the Fund. This report is not authorized for distribution to prospective investors in the Fund unless preceded or accompanied by an effective prospectus.
A fund files its complete schedule of portfolio holdings with the SEC for the first and third quarters of each fiscal year on Form N-Q. Forms N-Q are available on the SEC’s web site at http://www.sec.gov. A fund's Forms N-Q may be reviewed and copied at the SEC’s Public Reference Room in Washington, DC. Information regarding the operation of the SEC's Public Reference Room may be obtained by calling 1-800-SEC-0330.
For a complete list of a fund's portfolio holdings, view the most recent holdings listing, semiannual report, or annual report on Fidelity's web site at http://www.fidelity.com, http://www.institutional.fidelity.com, or http://www.401k.com, as applicable.
NOT FDIC INSURED •MAY LOSE VALUE •NO BANK GUARANTEE
Neither the Fund nor Fidelity Distributors Corporation is a bank.
Performance: The Bottom Line
Average annual total return reflects the change in the value of an investment, assuming reinvestment of distributions from dividend income and capital gains (the profits earned upon the sale of securities that have grown in value, if any) and assuming a constant rate of performance each year. The hypothetical investment and the average annual total returns do not reflect the deduction of taxes that a shareholder would pay on fund distributions or the redemption of fund shares. During periods of reimbursement by Fidelity, a fund’s total return will be greater than it would be had the reimbursement not occurred. How a fund did yesterday is no guarantee of how it will do tomorrow.
Average Annual Total Returns
| For the periods ended November 30, 2017 | Past 1 year | Past 5 years | Past 10 years |
| Class A (incl. 5.75% sales charge) | 12.95% | 11.11% | 6.21% |
| Class M (incl. 3.50% sales charge) | 15.38% | 11.40% | 6.25% |
| Class C (incl. contingent deferred sales charge) | 18.02% | 11.58% | 6.03% |
| Class I | 20.13% | 12.72% | 7.14% |
Class C shares' contingent deferred sales charges included in the past one year, past five years and past ten years total return figures are 1%, 0% and 0%, respectively.
$10,000 Over 10 Years
Let's say hypothetically that $10,000 was invested in Fidelity Advisor® Value Strategies Fund - Class A on November 30, 2007, and the current 5.75% sales charge was paid.
The chart shows how the value of your investment would have changed, and also shows how the Russell Midcap® Value Index performed over the same period.
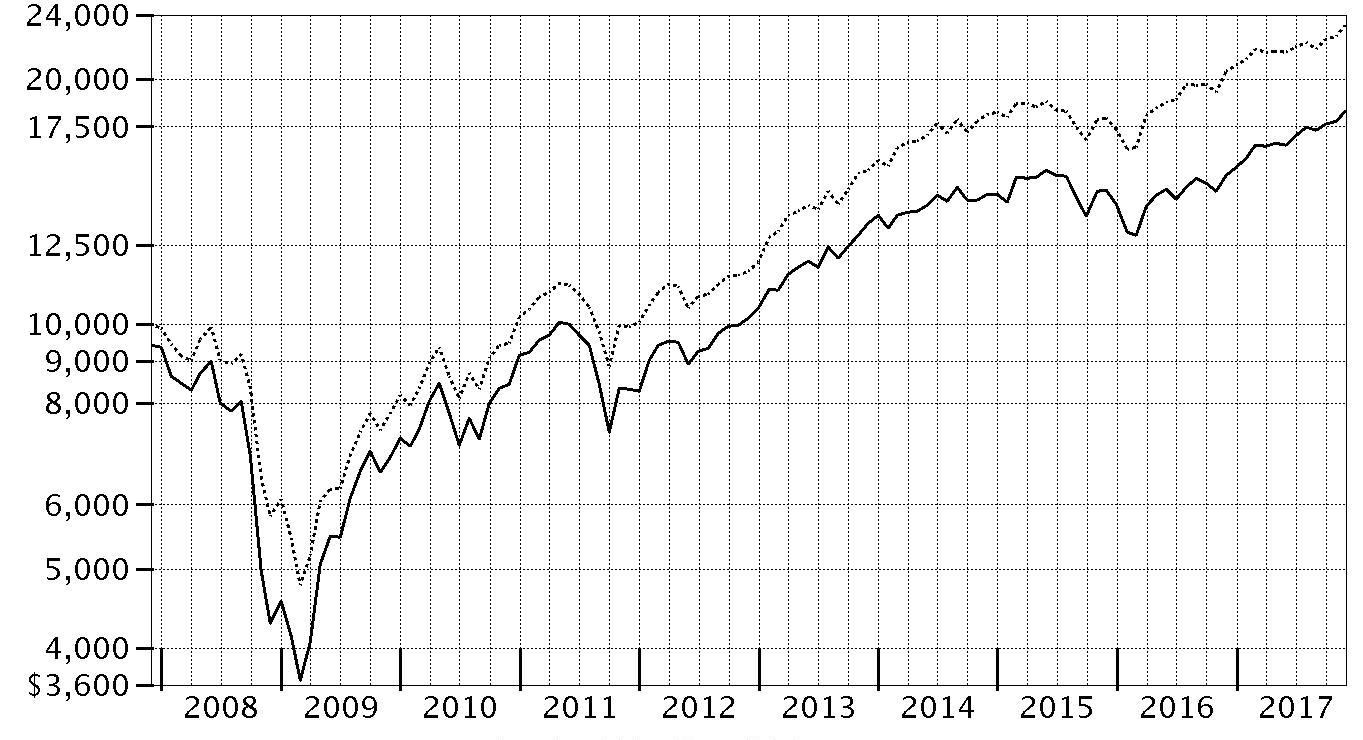
| Period Ending Values | ||
| $18,262 | Fidelity Advisor® Value Strategies Fund - Class A | |
| $23,335 | Russell Midcap® Value Index | |
Management's Discussion of Fund Performance
Market Recap: The U.S. equity bellwether S&P 500® index gained 22.87% for the year ending November 30, 2017, rising steadily and closing the period at an all-time high after a particularly strong three-month finish. Early on, equities rallied on optimism for President Trump’s pro-business agenda but leveled off in March amid fading optimism and stalled efforts by Congress to repeal and replace the Affordable Care Act. Upward momentum soon returned and continued through period end with consumer sentiment and other market indicators staying positive. The lone exception was a brief cooldown in August, when geopolitical tension escalated and uncertainty grew regarding the future of health care, tax reform and the debt ceiling. Sector-wise, info tech (+41%) led by a wide margin, surging amid strong earnings growth from several major index constituents. Utilities and financials each gained about 25%, the latter group riding an uptick in bond yields. Conversely, consumer discretionary (+20%) also rose solidly but lagged the broader market, as many brick-and-mortar retailers continued to suffer from increased online competition. Rising interest rates held back real estate (+16%), while consumer staples (+15%) and telecom (+1%) struggled due to investors’ general preference for risk assets. Lastly, sluggish oil prices pushed energy to a -4% return.Comments from Portfolio Manager Matthew Friedman: For the fiscal year, the fund’s share classes (excluding sales charges, if applicable) gained about 19% to 20%, handily outpacing the 13.95% return of the benchmark Russell Midcap® Value Index. Versus the benchmark, both security selection and sector positioning boosted performance. The biggest contribution came from security selection in real estate. Here, American Tower, an owner and operator of wireless and broadcast communications towers, was the fund’s largest individual contributor. The stock, which was not in the benchmark, benefited from increased investment by wireless carriers in their 5G networks, as well as rising demand for tower leasing, due to growing use of smartphones and tablets. The firm continued its expansion and benefited from strong organic revenue growth in its international segments. FNF Group, a provider of title insurance and transaction services to the real estate and mortgage industries, was another notable contributor. Conversely, choices in health care detracted most, especially a non-benchmark position in Israel's Teva Pharmaceutical Industries, a maker of generic drugs and the fund’s biggest individual detractor. The stock was hurt by a combination of excess debt from the company’s 2016 acquisition of Actavis’ generics business and drug-pricing pressure. We sold our stake in Teva by period end.The views expressed above reflect those of the portfolio manager(s) only through the end of the period as stated on the cover of this report and do not necessarily represent the views of Fidelity or any other person in the Fidelity organization. Any such views are subject to change at any time based upon market or other conditions and Fidelity disclaims any responsibility to update such views. These views may not be relied on as investment advice and, because investment decisions for a Fidelity fund are based on numerous factors, may not be relied on as an indication of trading intent on behalf of any Fidelity fund.
Investment Summary (Unaudited)
Top Ten Stocks as of November 30, 2017
| % of fund's net assets | % of fund's net assets 6 months ago | |
| Edison International | 2.8 | 3.3 |
| Sempra Energy | 2.7 | 3.1 |
| American Tower Corp. | 2.6 | 3.4 |
| Synchrony Financial | 2.6 | 2.2 |
| U.S. Bancorp | 2.3 | 2.4 |
| Wells Fargo & Co. | 2.2 | 1.7 |
| Extra Space Storage, Inc. | 2.1 | 2.2 |
| Discover Financial Services | 2.0 | 1.3 |
| Xcel Energy, Inc. | 1.9 | 0.0 |
| Equity Lifestyle Properties, Inc. | 1.9 | 2.0 |
| 23.1 |
Top Five Market Sectors as of November 30, 2017
| % of fund's net assets | % of fund's net assets 6 months ago | |
| Financials | 18.3 | 16.3 |
| Real Estate | 14.7 | 13.8 |
| Consumer Discretionary | 11.2 | 9.7 |
| Industrials | 10.9 | 11.3 |
| Information Technology | 10.0 | 11.5 |
Asset Allocation (% of fund's net assets)
| As of November 30, 2017* | ||
| Stocks | 98.5% | |
| Convertible Securities | 0.2% | |
| Short-Term Investments and Net Other Assets (Liabilities) | 1.3% | |

* Foreign investments - 16.7%
| As of May 31, 2017* | ||
| Stocks | 99.2% | |
| Convertible Securities | 0.6% | |
| Short-Term Investments and Net Other Assets (Liabilities) | 0.2% | |

* Foreign investments - 16.7%
Percentages shown as 0.0% may reflect amounts less than 0.05%.
Investments November 30, 2017
Showing Percentage of Net Assets
| Common Stocks - 98.5% | |||
| Shares | Value (000s) | ||
| CONSUMER DISCRETIONARY - 11.2% | |||
| Auto Components - 1.1% | |||
| Delphi Automotive PLC | 115,477 | $12,087 | |
| Diversified Consumer Services - 2.1% | |||
| Houghton Mifflin Harcourt Co. (a) | 946,656 | 9,230 | |
| Service Corp. International | 386,550 | 14,283 | |
| 23,513 | |||
| Hotels, Restaurants & Leisure - 2.2% | |||
| U.S. Foods Holding Corp. (a) | 450,700 | 13,124 | |
| Wyndham Worldwide Corp. | 97,467 | 10,954 | |
| 24,078 | |||
| Internet & Direct Marketing Retail - 0.9% | |||
| Liberty Interactive Corp. QVC Group (Venture Group) Series A (a) | 188,400 | 10,515 | |
| Leisure Products - 0.9% | |||
| Mattel, Inc. (b) | 552,900 | 10,090 | |
| Media - 2.7% | |||
| Liberty Global PLC Class C (a) | 387,900 | 11,959 | |
| Omnicom Group, Inc. | 117,100 | 8,366 | |
| Sinclair Broadcast Group, Inc. Class A (b) | 289,799 | 9,868 | |
| 30,193 | |||
| Specialty Retail - 1.3% | |||
| AutoZone, Inc. (a) | 9,400 | 6,456 | |
| Signet Jewelers Ltd. (b) | 143,100 | 7,483 | |
| 13,939 | |||
| TOTAL CONSUMER DISCRETIONARY | 124,415 | ||
| CONSUMER STAPLES - 3.3% | |||
| Beverages - 1.1% | |||
| Cott Corp. | 756,264 | 12,984 | |
| Food Products - 2.2% | |||
| Darling International, Inc. (a) | 850,222 | 15,261 | |
| The J.M. Smucker Co. | 77,300 | 9,019 | |
| 24,280 | |||
| TOTAL CONSUMER STAPLES | 37,264 | ||
| ENERGY - 7.5% | |||
| Oil, Gas & Consumable Fuels - 7.5% | |||
| Boardwalk Pipeline Partners, LP | 827,936 | 11,127 | |
| Cabot Oil & Gas Corp. | 281,600 | 8,152 | |
| Cheniere Energy, Inc. (a) | 249,600 | 12,061 | |
| EQT Corp. | 140,800 | 8,392 | |
| GasLog Ltd. (b) | 550,461 | 9,908 | |
| Lundin Petroleum AB | 435,400 | 10,018 | |
| Teekay Corp. (b) | 1,472,713 | 12,268 | |
| Valero Energy Corp. | 130,800 | 11,199 | |
| 83,125 | |||
| FINANCIALS - 18.3% | |||
| Banks - 5.3% | |||
| CIT Group, Inc. | 182,000 | 9,071 | |
| U.S. Bancorp | 455,384 | 25,114 | |
| Wells Fargo & Co. | 444,670 | 25,111 | |
| 59,296 | |||
| Capital Markets - 4.6% | |||
| Apollo Global Management LLC Class A | 393,150 | 12,310 | |
| Legg Mason, Inc. | 338,117 | 13,511 | |
| State Street Corp. | 100,200 | 9,554 | |
| The Blackstone Group LP | 489,600 | 15,530 | |
| 50,905 | |||
| Consumer Finance - 5.3% | |||
| Discover Financial Services | 311,900 | 22,020 | |
| OneMain Holdings, Inc. (a) | 317,300 | 8,190 | |
| Synchrony Financial | 813,213 | 29,186 | |
| 59,396 | |||
| Insurance - 3.1% | |||
| Chubb Ltd. | 113,982 | 17,338 | |
| FNF Group | 441,359 | 17,857 | |
| 35,195 | |||
| TOTAL FINANCIALS | 204,792 | ||
| HEALTH CARE - 5.7% | |||
| Biotechnology - 2.3% | |||
| Amgen, Inc. | 80,200 | 14,088 | |
| United Therapeutics Corp. (a) | 95,000 | 12,349 | |
| 26,437 | |||
| Health Care Providers & Services - 1.3% | |||
| Aetna, Inc. | 51,500 | 9,279 | |
| Envision Healthcare Corp. (a) | 160,151 | 5,114 | |
| 14,393 | |||
| Pharmaceuticals - 2.1% | |||
| Jazz Pharmaceuticals PLC (a) | 141,900 | 19,829 | |
| Mallinckrodt PLC (a) | 152,400 | 3,325 | |
| 23,154 | |||
| TOTAL HEALTH CARE | 63,984 | ||
| INDUSTRIALS - 10.9% | |||
| Aerospace & Defense - 1.5% | |||
| Huntington Ingalls Industries, Inc. | 27,300 | 6,598 | |
| KLX, Inc. (a) | 180,110 | 10,106 | |
| 16,704 | |||
| Airlines - 1.3% | |||
| American Airlines Group, Inc. | 288,700 | 14,576 | |
| Commercial Services & Supplies - 1.4% | |||
| IWG PLC | 1,635,100 | 4,356 | |
| KAR Auction Services, Inc. | 234,300 | 11,802 | |
| 16,158 | |||
| Construction & Engineering - 1.5% | |||
| AECOM (a) | 449,400 | 16,853 | |
| Machinery - 1.4% | |||
| Allison Transmission Holdings, Inc. | 389,475 | 15,984 | |
| Road & Rail - 0.9% | |||
| Swift Transporation Co. (b) | 226,200 | 9,654 | |
| Trading Companies & Distributors - 2.9% | |||
| AerCap Holdings NV (a) | 375,037 | 19,491 | |
| WESCO International, Inc. (a) | 191,300 | 12,540 | |
| 32,031 | |||
| TOTAL INDUSTRIALS | 121,960 | ||
| INFORMATION TECHNOLOGY - 10.0% | |||
| Communications Equipment - 1.1% | |||
| CommScope Holding Co., Inc. (a) | 351,168 | 12,639 | |
| Electronic Equipment & Components - 1.9% | |||
| Jabil, Inc. | 191,900 | 5,536 | |
| TE Connectivity Ltd. | 158,681 | 14,986 | |
| 20,522 | |||
| IT Services - 5.4% | |||
| Amdocs Ltd. | 171,200 | 11,178 | |
| Cognizant Technology Solutions Corp. Class A | 237,800 | 17,188 | |
| Conduent, Inc. | 448,000 | 6,836 | |
| DXC Technology Co. | 167,800 | 16,132 | |
| First Data Corp. Class A (a) | 556,240 | 9,150 | |
| 60,484 | |||
| Semiconductors & Semiconductor Equipment - 1.6% | |||
| Qualcomm, Inc. | 268,900 | 17,839 | |
| TOTAL INFORMATION TECHNOLOGY | 111,484 | ||
| MATERIALS - 9.5% | |||
| Chemicals - 7.0% | |||
| DowDuPont, Inc. | 285,612 | 20,553 | |
| Eastman Chemical Co. | 209,434 | 19,345 | |
| LyondellBasell Industries NV Class A | 165,692 | 17,348 | |
| Westlake Chemical Corp. | 211,203 | 20,683 | |
| 77,929 | |||
| Construction Materials - 0.8% | |||
| Eagle Materials, Inc. | 83,900 | 9,391 | |
| Containers & Packaging - 1.7% | |||
| Ball Corp. | 258,066 | 10,299 | |
| Sealed Air Corp. | 178,100 | 8,558 | |
| 18,857 | |||
| TOTAL MATERIALS | 106,177 | ||
| REAL ESTATE - 14.7% | |||
| Equity Real Estate Investment Trusts (REITs) - 13.1% | |||
| American Tower Corp. | 205,208 | 29,536 | |
| Douglas Emmett, Inc. | 495,600 | 19,978 | |
| Equinix, Inc. | 39,200 | 18,208 | |
| Equity Lifestyle Properties, Inc. | 231,700 | 20,925 | |
| Extra Space Storage, Inc. | 272,128 | 23,229 | |
| National Retail Properties, Inc. | 437,300 | 17,960 | |
| Outfront Media, Inc. | 710,804 | 16,675 | |
| 146,511 | |||
| Real Estate Management & Development - 1.6% | |||
| CBRE Group, Inc. (a) | 404,500 | 17,539 | |
| TOTAL REAL ESTATE | 164,050 | ||
| UTILITIES - 7.4% | |||
| Electric Utilities - 4.7% | |||
| Edison International | 376,771 | 30,619 | |
| Xcel Energy, Inc. | 413,300 | 21,330 | |
| 51,949 | |||
| Multi-Utilities - 2.7% | |||
| Sempra Energy | 250,788 | 30,343 | |
| TOTAL UTILITIES | 82,292 | ||
| TOTAL COMMON STOCKS | |||
| (Cost $901,502) | 1,099,543 | ||
| Principal Amount (000s) | Value (000s) | ||
| Convertible Bonds - 0.2% | |||
| ENERGY - 0.2% | |||
| Oil, Gas & Consumable Fuels - 0.2% | |||
| Cobalt International Energy, Inc. 2.625% 12/1/19 (Cost $11,132) | 18,190 | 1,910 | |
| Shares | Value (000s) | ||
| Money Market Funds - 5.3% | |||
| Fidelity Cash Central Fund, 1.13% (c) | 19,283,550 | 19,287 | |
| Fidelity Securities Lending Cash Central Fund 1.13% (c)(d) | 40,450,985 | 40,455 | |
| TOTAL MONEY MARKET FUNDS | |||
| (Cost $59,742) | 59,742 | ||
| TOTAL INVESTMENT IN SECURITIES - 104.0% | |||
| (Cost $972,376) | 1,161,195 | ||
| NET OTHER ASSETS (LIABILITIES) - (4.0)% | (44,487) | ||
| NET ASSETS - 100% | $1,116,708 |
Legend
(a) Non-income producing
(b) Security or a portion of the security is on loan at period end.
(c) Affiliated fund that is generally available only to investment companies and other accounts managed by Fidelity Investments. The rate quoted is the annualized seven-day yield of the fund at period end. A complete unaudited listing of the fund's holdings as of its most recent quarter end is available upon request. In addition, each Fidelity Central Fund's financial statements, which are not covered by the Fund's Report of Independent Registered Public Accounting Firm, are available on the SEC's website or upon request.
(d) Investment made with cash collateral received from securities on loan.
Affiliated Central Funds
Information regarding fiscal year to date income earned by the Fund from investments in Fidelity Central Funds is as follows:
| Fund | Income earned |
| (Amounts in thousands) | |
| Fidelity Cash Central Fund | $66 |
| Fidelity Securities Lending Cash Central Fund | 406 |
| Total | $472 |
Investment Valuation
The following is a summary of the inputs used, as of November 30, 2017, involving the Fund's assets and liabilities carried at fair value. The inputs or methodology used for valuing securities may not be an indication of the risk associated with investing in those securities. For more information on valuation inputs, and their aggregation into the levels used below, please refer to the Investment Valuation section in the accompanying Notes to Financial Statements.
| Valuation Inputs at Reporting Date: | ||||
| Description | Total | Level 1 | Level 2 | Level 3 |
| (Amounts in thousands) | ||||
| Investments in Securities: | ||||
| Equities: | ||||
| Consumer Discretionary | $124,415 | $124,415 | $-- | $-- |
| Consumer Staples | 37,264 | 37,264 | -- | -- |
| Energy | 83,125 | 83,125 | -- | -- |
| Financials | 204,792 | 204,792 | -- | -- |
| Health Care | 63,984 | 63,984 | -- | -- |
| Industrials | 121,960 | 121,960 | -- | -- |
| Information Technology | 111,484 | 111,484 | -- | -- |
| Materials | 106,177 | 106,177 | -- | -- |
| Real Estate | 164,050 | 164,050 | -- | -- |
| Utilities | 82,292 | 82,292 | -- | -- |
| Corporate Bonds | 1,910 | -- | 1,910 | -- |
| Money Market Funds | 59,742 | 59,742 | -- | -- |
| Total Investments in Securities: | $1,161,195 | $1,159,285 | $1,910 | $-- |
Other Information
Distribution of investments by country or territory of incorporation, as a percentage of Total Net Assets, is as follows (Unaudited):
| United States of America | 83.3% |
| Netherlands | 3.4% |
| Switzerland | 2.9% |
| Ireland | 2.1% |
| Bermuda | 1.6% |
| Bailiwick of Jersey | 1.5% |
| Canada | 1.1% |
| Marshall Islands | 1.1% |
| United Kingdom | 1.1% |
| Bailiwick of Guernsey | 1.0% |
| Others (Individually Less Than 1%) | 0.9% |
| 100.0% |
See accompanying notes which are an integral part of the financial statements.
Financial Statements
Statement of Assets and Liabilities
| Amounts in thousands (except per-share amounts) | November 30, 2017 | |
| Assets | ||
| Investment in securities, at value (including securities loaned of $39,238) — See accompanying schedule: Unaffiliated issuers (cost $912,634) | $1,101,453 | |
| Fidelity Central Funds (cost $59,742) | 59,742 | |
| Total Investment in Securities (cost $972,376) | $1,161,195 | |
| Receivable for fund shares sold | 319 | |
| Dividends receivable | 1,238 | |
| Interest receivable | 239 | |
| Distributions receivable from Fidelity Central Funds | 52 | |
| Prepaid expenses | 2 | |
| Other receivables | 6 | |
| Total assets | 1,163,051 | |
| Liabilities | ||
| Payable for investments purchased | $3,086 | |
| Payable for fund shares redeemed | 1,904 | |
| Accrued management fee | 463 | |
| Distribution and service plan fees payable | 193 | |
| Other affiliated payables | 193 | |
| Other payables and accrued expenses | 45 | |
| Collateral on securities loaned | 40,459 | |
| Total liabilities | 46,343 | |
| Net Assets | $1,116,708 | |
| Net Assets consist of: | ||
| Paid in capital | $838,764 | |
| Undistributed net investment income | 14,922 | |
| Accumulated undistributed net realized gain (loss) on investments and foreign currency transactions | 74,203 | |
| Net unrealized appreciation (depreciation) on investments | 188,819 | |
| Net Assets | $1,116,708 | |
| Calculation of Maximum Offering Price | ||
| Class A: | ||
| Net Asset Value and redemption price per share ($211,781 ÷ 5,442.7 shares) | $38.91 | |
| Maximum offering price per share (100/94.25 of $38.91) | $41.28 | |
| Class M: | ||
| Net Asset Value and redemption price per share ($271,177 ÷ 6,664.1 shares) | $40.69 | |
| Maximum offering price per share (100/96.50 of $40.69) | $42.17 | |
| Class C: | ||
| Net Asset Value and offering price per share ($46,074 ÷ 1,351.7 shares)(a) | $34.09 | |
| Fidelity Value Strategies Fund: | ||
| Net Asset Value, offering price and redemption price per share ($435,845 ÷ 9,725.7 shares) | $44.81 | |
| Class K: | ||
| Net Asset Value, offering price and redemption price per share ($79,387 ÷ 1,771.4 shares) | $44.82 | |
| Class I: | ||
| Net Asset Value, offering price and redemption price per share ($72,444 ÷ 1,713.7 shares) | $42.27 |
(a) Redemption price per share is equal to net asset value less any applicable contingent deferred sales charge.
See accompanying notes which are an integral part of the financial statements.
Statement of Operations
| Amounts in thousands | Year ended November 30, 2017 | |
| Investment Income | ||
| Dividends | $21,225 | |
| Special dividends | 3,977 | |
| Interest | 2,821 | |
| Income from Fidelity Central Funds | 472 | |
| Total income | 28,495 | |
| Expenses | ||
| Management fee | ||
| Basic fee | $6,110 | |
| Performance adjustment | (1,679) | |
| Transfer agent fees | 2,010 | |
| Distribution and service plan fees | 2,287 | |
| Accounting and security lending fees | 370 | |
| Custodian fees and expenses | 30 | |
| Independent trustees' fees and expenses | 5 | |
| Registration fees | 104 | |
| Audit | 70 | |
| Legal | 6 | |
| Interest | 5 | |
| Miscellaneous | 10 | |
| Total expenses before reductions | 9,328 | |
| Expense reductions | (70) | 9,258 |
| Net investment income (loss) | 19,237 | |
| Realized and Unrealized Gain (Loss) | ||
| Net realized gain (loss) on: | ||
| Investment securities: | ||
| Unaffiliated issuers | 81,500 | |
| Fidelity Central Funds | (5) | |
| Total net realized gain (loss) | 81,495 | |
| Change in net unrealized appreciation (depreciation) on: | ||
| Investment securities: | ||
| Unaffiliated issuers | 107,648 | |
| Fidelity Central Funds | (1) | |
| Total change in net unrealized appreciation (depreciation) | 107,647 | |
| Net gain (loss) | 189,142 | |
| Net increase (decrease) in net assets resulting from operations | $208,379 |
See accompanying notes which are an integral part of the financial statements.
Statement of Changes in Net Assets
| Amounts in thousands | Year ended November 30, 2017 | Year ended November 30, 2016 |
| Increase (Decrease) in Net Assets | ||
| Operations | ||
| Net investment income (loss) | $19,237 | $22,186 |
| Net realized gain (loss) | 81,495 | 392,411 |
| Change in net unrealized appreciation (depreciation) | 107,647 | (369,931) |
| Net increase (decrease) in net assets resulting from operations | 208,379 | 44,666 |
| Distributions to shareholders from net investment income | (18,090) | (15,368) |
| Distributions to shareholders from net realized gain | (229,818) | (316) |
| Total distributions | (247,908) | (15,684) |
| Share transactions - net increase (decrease) | (206,873) | (80,508) |
| Total increase (decrease) in net assets | (246,402) | (51,526) |
| Net Assets | ||
| Beginning of period | 1,363,110 | 1,414,636 |
| End of period | $1,116,708 | $1,363,110 |
| Other Information | ||
| Undistributed net investment income end of period | $14,922 | $15,960 |
See accompanying notes which are an integral part of the financial statements.
Financial Highlights
Fidelity Advisor Value Strategies Fund Class A
| Years ended November 30, | 2017 | 2016 | 2015 | 2014 | 2013 |
| Selected Per–Share Data | |||||
| Net asset value, beginning of period | $40.25 | $39.01 | $38.91 | $36.02 | $27.62 |
| Income from Investment Operations | |||||
| Net investment income (loss)A | .60B | .56 | .35 | .25 | .23 |
| Net realized and unrealized gain (loss) | 6.13 | 1.09 | .06 | 2.87 | 8.25 |
| Total from investment operations | 6.73 | 1.65 | .41 | 3.12 | 8.48 |
| Distributions from net investment income | (.56) | (.40) | (.28)C | (.23) | (.08) |
| Distributions from net realized gain | (7.52) | (.01) | (.03)C | – | – |
| Total distributions | (8.07)D | (.41) | (.31) | (.23) | (.08) |
| Net asset value, end of period | $38.91 | $40.25 | $39.01 | $38.91 | $36.02 |
| Total ReturnE,F | 19.84% | 4.33% | 1.07% | 8.74% | 30.77% |
| Ratios to Average Net AssetsG,H | |||||
| Expenses before reductions | .91% | .86% | .93% | .96% | 1.04% |
| Expenses net of fee waivers, if any | .91% | .86% | .93% | .96% | 1.04% |
| Expenses net of all reductions | .90% | .86% | .93% | .96% | 1.03% |
| Net investment income (loss) | 1.64%B | 1.48% | .89% | .68% | .73% |
| Supplemental Data | |||||
| Net assets, end of period (in millions) | $212 | $203 | $215 | $233 | $243 |
| Portfolio turnover rateI | 46% | 121% | 9% | 6% | 22% |
A Calculated based on average shares outstanding during the period.
B Net Investment income per share reflects a large, non-recurring dividend which amounted to $.13 per share. Excluding this non-recurring dividend, the ratio of net investment income (loss) to average net assets would have been 1.29%.
C The amounts shown reflect certain reclassifications related to book to tax differences that were made in the year shown.
D Total distributions of $8.07 per share is comprised of distributions from net investment income of $.555 and distributions from net realized gain of $7.517 per share.
E Total returns would have been lower if certain expenses had not been reduced during the applicable periods shown.
F Total returns do not include the effect of the sales charges.
G Fees and expenses of any underlying Fidelity Central Funds are not included in the Fund's expense ratio. The Fund indirectly bears its proportionate share of the expenses of any underlying Fidelity Central Funds.
H Expense ratios reflect operating expenses of the class. Expenses before reductions do not reflect amounts reimbursed by the investment adviser or reductions from brokerage service arrangements or reductions from other expense offset arrangements and do not represent the amount paid by the class during periods when reimbursements or reductions occur. Expenses net of fee waivers reflect expenses after reimbursement by the investment adviser but prior to reductions from brokerage service arrangements or other expense offset arrangements. Expenses net of all reductions represent the net expenses paid by the class.
I Amount does not include the portfolio activity of any underlying Fidelity Central Funds.
See accompanying notes which are an integral part of the financial statements.
Fidelity Advisor Value Strategies Fund Class M
| Years ended November 30, | 2017 | 2016 | 2015 | 2014 | 2013 |
| Selected Per–Share Data | |||||
| Net asset value, beginning of period | $41.72 | $40.40 | $40.28 | $37.28 | $28.58 |
| Income from Investment Operations | |||||
| Net investment income (loss)A | .54B | .49 | .28 | .18 | .18 |
| Net realized and unrealized gain (loss) | 6.40 | 1.14 | .06 | 2.98 | 8.54 |
| Total from investment operations | 6.94 | 1.63 | .34 | 3.16 | 8.72 |
| Distributions from net investment income | (.46) | (.30) | (.19)C | (.16) | (.02) |
| Distributions from net realized gain | (7.52) | (.01) | (.03)C | – | – |
| Total distributions | (7.97)D | (.31) | (.22) | (.16) | (.02) |
| Net asset value, end of period | $40.69 | $41.72 | $40.40 | $40.28 | $37.28 |
| Total ReturnE,F | 19.57% | 4.11% | .86% | 8.51% | 30.52% |
| Ratios to Average Net AssetsG,H | |||||
| Expenses before reductions | 1.13% | 1.08% | 1.15% | 1.17% | 1.23% |
| Expenses net of fee waivers, if any | 1.13% | 1.08% | 1.14% | 1.17% | 1.23% |
| Expenses net of all reductions | 1.13% | 1.07% | 1.14% | 1.17% | 1.22% |
| Net investment income (loss) | 1.42%B | 1.27% | .68% | .47% | .54% |
| Supplemental Data | |||||
| Net assets, end of period (in millions) | $271 | $263 | $294 | $324 | $335 |
| Portfolio turnover rateI | 46% | 121% | 9% | 6% | 22% |
A Calculated based on average shares outstanding during the period.
B Net Investment income per share reflects a large, non-recurring dividend which amounted to $.13 per share. Excluding this non-recurring dividend, the ratio of net investment income (loss) to average net assets would have been 1.06%.
C The amounts shown reflect certain reclassifications related to book to tax differences that were made in the year shown.
D Total distributions of $7.97 per share is comprised of distributions from net investment income of $.456 and distributions from net realized gain of $7.517 per share.
E Total returns would have been lower if certain expenses had not been reduced during the applicable periods shown.
F Total returns do not include the effect of the sales charges.
G Fees and expenses of any underlying Fidelity Central Funds are not included in the Fund's expense ratio. The Fund indirectly bears its proportionate share of the expenses of any underlying Fidelity Central Funds.
H Expense ratios reflect operating expenses of the class. Expenses before reductions do not reflect amounts reimbursed by the investment adviser or reductions from brokerage service arrangements or reductions from other expense offset arrangements and do not represent the amount paid by the class during periods when reimbursements or reductions occur. Expenses net of fee waivers reflect expenses after reimbursement by the investment adviser but prior to reductions from brokerage service arrangements or other expense offset arrangements. Expenses net of all reductions represent the net expenses paid by the class.
I Amount does not include the portfolio activity of any underlying Fidelity Central Funds.
See accompanying notes which are an integral part of the financial statements.
Fidelity Advisor Value Strategies Fund Class C
| Years ended November 30, | 2017 | 2016 | 2015 | 2014 | 2013 |
| Selected Per–Share Data | |||||
| Net asset value, beginning of period | $36.19 | $35.12 | $35.07 | $32.52 | $25.06 |
| Income from Investment Operations | |||||
| Net investment income (loss)A | .28B | .24 | .05 | (.03) | (.01) |
| Net realized and unrealized gain (loss) | 5.43 | .97 | .07 | 2.60 | 7.47 |
| Total from investment operations | 5.71 | 1.21 | .12 | 2.57 | 7.46 |
| Distributions from net investment income | (.30) | (.13) | (.04)C | (.02) | – |
| Distributions from net realized gain | (7.52) | (.01) | (.03)C | – | – |
| Total distributions | (7.81)D | (.14) | (.07) | (.02) | – |
| Net asset value, end of period | $34.09 | $36.19 | $35.12 | $35.07 | $32.52 |
| Total ReturnE,F | 18.97% | 3.49% | .33% | 7.91% | 29.77% |
| Ratios to Average Net AssetsG,H | |||||
| Expenses before reductions | 1.68% | 1.63% | 1.70% | 1.72% | 1.78% |
| Expenses net of fee waivers, if any | 1.68% | 1.63% | 1.69% | 1.72% | 1.78% |
| Expenses net of all reductions | 1.67% | 1.63% | 1.69% | 1.72% | 1.77% |
| Net investment income (loss) | .87%B | .72% | .13% | (.08)% | (.02)% |
| Supplemental Data | |||||
| Net assets, end of period (in millions) | $46 | $44 | $49 | $53 | $54 |
| Portfolio turnover rateI | 46% | 121% | 9% | 6% | 22% |
A Calculated based on average shares outstanding during the period.
B Net Investment income per share reflects a large, non-recurring dividend which amounted to $.11 per share. Excluding this non-recurring dividend, the ratio of net investment income (loss) to average net assets would have been .52%.
C The amounts shown reflect certain reclassifications related to book to tax differences that were made in the year shown.
D Total distributions of $7.81 per share is comprised of distributions from net investment income of $.295 and distributions from net realized gain of $7.517 per share.
E Total returns would have been lower if certain expenses had not been reduced during the applicable periods shown.
F Total returns do not include the effect of the contingent deferred sales charge.
G Fees and expenses of any underlying Fidelity Central Funds are not included in the Fund's expense ratio. The Fund indirectly bears its proportionate share of the expenses of any underlying Fidelity Central Funds.
H Expense ratios reflect operating expenses of the class. Expenses before reductions do not reflect amounts reimbursed by the investment adviser or reductions from brokerage service arrangements or reductions from other expense offset arrangements and do not represent the amount paid by the class during periods when reimbursements or reductions occur. Expenses net of fee waivers reflect expenses after reimbursement by the investment adviser but prior to reductions from brokerage service arrangements or other expense offset arrangements. Expenses net of all reductions represent the net expenses paid by the class.
I Amount does not include the portfolio activity of any underlying Fidelity Central Funds.
See accompanying notes which are an integral part of the financial statements.
Fidelity Advisor Value Strategies Fund
| Years ended November 30, | 2017 | 2016 | 2015 | 2014 | 2013 |
| Selected Per–Share Data | |||||
| Net asset value, beginning of period | $45.17 | $43.72 | $43.56 | $40.28 | $30.89 |
| Income from Investment Operations | |||||
| Net investment income (loss)A | .81B | .76 | .51 | .40 | .37 |
| Net realized and unrealized gain (loss) | 7.01 | 1.21 | .07 | 3.21 | 9.20 |
| Total from investment operations | 7.82 | 1.97 | .58 | 3.61 | 9.57 |
| Distributions from net investment income | (.66) | (.51) | (.39)C | (.33) | (.18) |
| Distributions from net realized gain | (7.52) | (.01) | (.03)C | – | – |
| Total distributions | (8.18) | (.52) | (.42) | (.33) | (.18) |
| Net asset value, end of period | $44.81 | $45.17 | $43.72 | $43.56 | $40.28 |
| Total ReturnD | 20.18% | 4.64% | 1.35% | 9.05% | 31.14% |
| Ratios to Average Net AssetsE,F | |||||
| Expenses before reductions | .62% | .56% | .67% | .69% | .73% |
| Expenses net of fee waivers, if any | .62% | .56% | .67% | .69% | .73% |
| Expenses net of all reductions | .62% | .55% | .66% | .69% | .72% |
| Net investment income (loss) | 1.93%B | 1.79% | 1.16% | .95% | 1.03% |
| Supplemental Data | |||||
| Net assets, end of period (in millions) | $436 | $713 | $716 | $786 | $681 |
| Portfolio turnover rateG | 46% | 121% | 9% | 6% | 22% |
A Calculated based on average shares outstanding during the period.
B Net Investment income per share reflects a large, non-recurring dividend which amounted to $.15 per share. Excluding this non-recurring dividend, the ratio of net investment income (loss) to average net assets would have been 1.57%.
C The amounts shown reflect certain reclassifications related to book to tax differences that were made in the year shown.
D Total returns would have been lower if certain expenses had not been reduced during the applicable periods shown.
E Fees and expenses of any underlying Fidelity Central Funds are not included in the Fund's expense ratio. The Fund indirectly bears its proportionate share of the expenses of any underlying Fidelity Central Funds.
F Expense ratios reflect operating expenses of the class. Expenses before reductions do not reflect amounts reimbursed by the investment adviser or reductions from brokerage service arrangements or reductions from other expense offset arrangements and do not represent the amount paid by the class during periods when reimbursements or reductions occur. Expenses net of fee waivers reflect expenses after reimbursement by the investment adviser but prior to reductions from brokerage service arrangements or other expense offset arrangements. Expenses net of all reductions represent the net expenses paid by the class.
G Amount does not include the portfolio activity of any underlying Fidelity Central Funds.
See accompanying notes which are an integral part of the financial statements.
Fidelity Advisor Value Strategies Fund Class K
| Years ended November 30, | 2017 | 2016 | 2015 | 2014 | 2013 |
| Selected Per–Share Data | |||||
| Net asset value, beginning of period | $45.18 | $43.74 | $43.57 | $40.28 | $30.89 |
| Income from Investment Operations | |||||
| Net investment income (loss)A | .86B | .80 | .58 | .47 | .43 |
| Net realized and unrealized gain (loss) | 7.02 | 1.22 | .07 | 3.20 | 9.18 |
| Total from investment operations | 7.88 | 2.02 | .65 | 3.67 | 9.61 |
| Distributions from net investment income | (.72) | (.57) | (.45)C | (.38) | (.22) |
| Distributions from net realized gain | (7.52) | (.01) | (.03)C | – | – |
| Total distributions | (8.24) | (.58) | (.48) | (.38) | (.22) |
| Net asset value, end of period | $44.82 | $45.18 | $43.74 | $43.57 | $40.28 |
| Total ReturnD | 20.36% | 4.76% | 1.51% | 9.21% | 31.34% |
| Ratios to Average Net AssetsE,F | |||||
| Expenses before reductions | .50% | .44% | .51% | .53% | .58% |
| Expenses net of fee waivers, if any | .50% | .44% | .51% | .53% | .58% |
| Expenses net of all reductions | .49% | .43% | .51% | .53% | .57% |
| Net investment income (loss) | 2.05%B | 1.91% | 1.31% | 1.11% | 1.18% |
| Supplemental Data | |||||
| Net assets, end of period (in millions) | $79 | $68 | $72 | $97 | $119 |
| Portfolio turnover rateG | 46% | 121% | 9% | 6% | 22% |
A Calculated based on average shares outstanding during the period.
B Net Investment income per share reflects a large, non-recurring dividend which amounted to $.15 per share. Excluding this non-recurring dividend, the ratio of net investment income (loss) to average net assets would have been 1.70%.
C The amounts shown reflect certain reclassifications related to book to tax differences that were made in the year shown.
D Total returns would have been lower if certain expenses had not been reduced during the applicable periods shown.
E Fees and expenses of any underlying Fidelity Central Funds are not included in the Fund's expense ratio. The Fund indirectly bears its proportionate share of the expenses of any underlying Fidelity Central Funds.
F Expense ratios reflect operating expenses of the class. Expenses before reductions do not reflect amounts reimbursed by the investment adviser or reductions from brokerage service arrangements or reductions from other expense offset arrangements and do not represent the amount paid by the class during periods when reimbursements or reductions occur. Expenses net of fee waivers reflect expenses after reimbursement by the investment adviser but prior to reductions from brokerage service arrangements or other expense offset arrangements. Expenses net of all reductions represent the net expenses paid by the class.
G Amount does not include the portfolio activity of any underlying Fidelity Central Funds.
See accompanying notes which are an integral part of the financial statements.
Fidelity Advisor Value Strategies Fund Class I
| Years ended November 30, | 2017 | 2016 | 2015 | 2014 | 2013 |
| Selected Per–Share Data | |||||
| Net asset value, beginning of period | $43.07 | $41.71 | $41.57 | $38.46 | $29.51 |
| Income from Investment Operations | |||||
| Net investment income (loss)A | .74B | .70 | .48 | .37 | .34 |
| Net realized and unrealized gain (loss) | 6.64 | 1.15 | .08 | 3.06 | 8.79 |
| Total from investment operations | 7.38 | 1.85 | .56 | 3.43 | 9.13 |
| Distributions from net investment income | (.66) | (.48) | (.39)C | (.32) | (.18) |
| Distributions from net realized gain | (7.52) | (.01) | (.03)C | – | – |
| Total distributions | (8.18) | (.49) | (.42) | (.32) | (.18) |
| Net asset value, end of period | $42.27 | $43.07 | $41.71 | $41.57 | $38.46 |
| Total ReturnD | 20.13% | 4.57% | 1.36% | 9.01% | 31.11% |
| Ratios to Average Net AssetsE,F | |||||
| Expenses before reductions | .67% | .61% | .68% | .71% | .76% |
| Expenses net of fee waivers, if any | .67% | .61% | .68% | .71% | .76% |
| Expenses net of all reductions | .66% | .61% | .68% | .71% | .75% |
| Net investment income (loss) | 1.88%B | 1.74% | 1.14% | .93% | 1.00% |
| Supplemental Data | |||||
| Net assets, end of period (in millions) | $72 | $73 | $65 | $86 | $74 |
| Portfolio turnover rateG | 46% | 121% | 9% | 6% | 22% |
A Calculated based on average shares outstanding during the period.
B Net Investment income per share reflects a large, non-recurring dividend which amounted to $.14 per share. Excluding this non-recurring dividend, the ratio of net investment income (loss) to average net assets would have been 1.53%.
C The amounts shown reflect certain reclassifications related to book to tax differences that were made in the year shown.
D Total returns would have been lower if certain expenses had not been reduced during the applicable periods shown.
E Fees and expenses of any underlying Fidelity Central Funds are not included in the Fund's expense ratio. The Fund indirectly bears its proportionate share of the expenses of any underlying Fidelity Central Funds.
F Expense ratios reflect operating expenses of the class. Expenses before reductions do not reflect amounts reimbursed by the investment adviser or reductions from brokerage service arrangements or reductions from other expense offset arrangements and do not represent the amount paid by the class during periods when reimbursements or reductions occur. Expenses net of fee waivers reflect expenses after reimbursement by the investment adviser but prior to reductions from brokerage service arrangements or other expense offset arrangements. Expenses net of all reductions represent the net expenses paid by the class.
G Amount does not include the portfolio activity of any underlying Fidelity Central Funds.
See accompanying notes which are an integral part of the financial statements.
Notes to Financial Statements
For the period ended November 30, 2017
(Amounts in thousands except percentages)
1. Organization.
Fidelity Advisor Value Strategies Fund (the Fund) is a fund of Fidelity Advisor Series I (the Trust) and is authorized to issue an unlimited number of shares. The Trust is registered under the Investment Company Act of 1940, as amended (the 1940 Act), as an open-end management investment company organized as a Massachusetts business trust. The Fund offers Class A, Class M (formerly Class T), Class C, Fidelity Value Strategies Fund, Class K and Class I shares, each of which has equal rights as to assets and voting privileges. Each class has exclusive voting rights with respect to matters that affect that class.
After the close of business on June 24, 2016, all outstanding Class B shares were converted to Class A shares. All prior fiscal period dollar and share amounts for Class B presented in the Notes to Financial Statements are for the period December 1, 2015 through June 24, 2016.
2. Investments in Fidelity Central Funds.
The Fund invests in Fidelity Central Funds, which are open-end investment companies generally available only to other investment companies and accounts managed by the investment adviser and its affiliates. The Fund's Schedule of Investments lists each of the Fidelity Central Funds held as of period end, if any, as an investment of the Fund, but does not include the underlying holdings of each Fidelity Central Fund. As an Investing Fund, the Fund indirectly bears its proportionate share of the expenses of the underlying Fidelity Central Funds.
The Money Market Central Funds seek preservation of capital and current income and are managed by Fidelity Investments Money Management, Inc. (FIMM), an affiliate of the investment adviser. Annualized expenses of the Money Market Central Funds as of their most recent shareholder report date are less than .005%.
A complete unaudited list of holdings for each Fidelity Central Fund is available upon request or at the Securities and Exchange Commission (the SEC) website at www.sec.gov. In addition, the financial statements of the Fidelity Central Funds, which are not covered by the Fund's Report of Independent Registered Public Accounting Firm, are available on the SEC website or upon request.
3. Significant Accounting Policies.
The Fund is an investment company and applies the accounting and reporting guidance of the Financial Accounting Standards Board (FASB) Accounting Standards Codification Topic 946 Financial Services – Investments Companies. The financial statements have been prepared in conformity with accounting principles generally accepted in the United States of America (GAAP), which require management to make certain estimates and assumptions at the date of the financial statements. Actual results could differ from those estimates. Subsequent events, if any, through the date that the financial statements were issued have been evaluated in the preparation of the financial statements. The following summarizes the significant accounting policies of the Fund:
Investment Valuation. Investments are valued as of 4:00 p.m. Eastern time on the last calendar day of the period. The Board of Trustees (the Board) has delegated the day to day responsibility for the valuation of the Fund's investments to the Fair Value Committee (the Committee) established by the Fund's investment adviser. In accordance with valuation policies and procedures approved by the Board, the Fund attempts to obtain prices from one or more third party pricing vendors or brokers to value its investments. When current market prices, quotations or currency exchange rates are not readily available or reliable, investments will be fair valued in good faith by the Committee, in accordance with procedures adopted by the Board. Factors used in determining fair value vary by investment type and may include market or investment specific events, changes in interest rates and credit quality. The frequency with which these procedures are used cannot be predicted and they may be utilized to a significant extent. The Committee oversees the Fund's valuation policies and procedures and reports to the Board on the Committee's activities and fair value determinations. The Board monitors the appropriateness of the procedures used in valuing the Fund's investments and ratifies the fair value determinations of the Committee.
The Fund categorizes the inputs to valuation techniques used to value its investments into a disclosure hierarchy consisting of three levels as shown below:
- Level 1 – quoted prices in active markets for identical investments
- Level 2 – other significant observable inputs (including quoted prices for similar investments, interest rates, prepayment speeds, etc.)
- Level 3 – unobservable inputs (including the Fund's own assumptions based on the best information available)
Valuation techniques used to value the Fund's investments by major category are as follows:
Equity securities, including restricted securities, for which market quotations are readily available, are valued at the last reported sale price or official closing price as reported by a third party pricing vendor on the primary market or exchange on which they are traded and are categorized as Level 1 in the hierarchy. In the event there were no sales during the day or closing prices are not available, securities are valued at the last quoted bid price or may be valued using the last available price and are generally categorized as Level 2 in the hierarchy. For foreign equity securities, when market or security specific events arise, comparisons to the valuation of American Depositary Receipts (ADRs), futures contracts, Exchange-Traded Funds (ETFs) and certain indexes as well as quoted prices for similar securities may be used and would be categorized as Level 2 in the hierarchy. Utilizing these techniques may result in transfers between Level 1 and Level 2. For equity securities, including restricted securities, where observable inputs are limited, assumptions about market activity and risk are used and these securities may be categorized as Level 3 in the hierarchy.
Debt securities, including restricted securities, are valued based on evaluated prices received from third party pricing vendors or from brokers who make markets in such securities. Corporate bonds are valued by pricing vendors who utilize matrix pricing which considers yield or price of bonds of comparable quality, coupon, maturity and type or by broker-supplied prices. When independent prices are unavailable or unreliable, debt securities may be valued utilizing pricing methodologies which consider similar factors that would be used by third party pricing vendors. Debt securities are generally categorized as Level 2 in the hierarchy but may be Level 3 depending on the circumstances.
Investments in open-end mutual funds, including the Fidelity Central Funds, are valued at their closing net asset value (NAV) each business day and are categorized as Level 1 in the hierarchy.
Changes in valuation techniques may result in transfers in or out of an assigned level within the disclosure hierarchy. The aggregate value of investments by input level as of November 30, 2017 is included at the end of the Fund's Schedule of Investments.
Foreign Currency. The Fund may use foreign currency contracts to facilitate transactions in foreign-denominated securities. Gains and losses from these transactions may arise from changes in the value of the foreign currency or if the counterparties do not perform under the contracts' terms.
Foreign-denominated assets, including investment securities, and liabilities are translated into U.S. dollars at the exchange rates at period end. Purchases and sales of investment securities, income and dividends received and expenses denominated in foreign currencies are translated into U.S. dollars at the exchange rate in effect on the transaction date.
The effects of exchange rate fluctuations on investments are included with the net realized and unrealized gain (loss) on investment securities. Other foreign currency transactions resulting in realized and unrealized gain (loss) are disclosed separately.
Investment Transactions and Income. For financial reporting purposes, the Fund's investment holdings and NAV include trades executed through the end of the last business day of the period. The NAV per share for processing shareholder transactions is calculated as of the close of business of the New York Stock Exchange (NYSE), normally 4:00 p.m. Eastern time and includes trades executed through the end of the prior business day. Gains and losses on securities sold are determined on the basis of identified cost and includes proceeds received from litigation. Dividend income is recorded on the ex-dividend date, except for certain dividends from foreign securities where the ex-dividend date may have passed, which are recorded as soon as the Fund is informed of the ex-dividend date. Non-cash dividends included in dividend income, if any, are recorded at the fair market value of the securities received. Income and capital gain distributions from Fidelity Central Funds, if any, are recorded on the ex-dividend date. Certain distributions received by the Fund represent a return of capital or capital gain. The Fund determines the components of these distributions subsequent to the ex-dividend date, based upon receipt of tax filings or other correspondence relating to the underlying investment. These distributions are recorded as a reduction of cost of investments and/or as a realized gain. Large, non-recurring dividends recognized by the Fund are presented separately on the Statement of Operations as "Special Dividends" and the impact of these dividends is presented in the Financial Highlights. Interest income is accrued as earned and includes coupon interest and amortization of premium and accretion of discount on debt securities as applicable. Investment income is recorded net of foreign taxes withheld where recovery of such taxes is uncertain.
Class Allocations and Expenses. Investment income, realized and unrealized capital gains and losses, common expenses of the Fund, and certain fund-level expense reductions, if any, are allocated daily on a pro-rata basis to each class based on the relative net assets of each class to the total net assets of the Fund. Each class differs with respect to transfer agent and distribution and service plan fees incurred. Certain expense reductions may also differ by class. For the reporting period, the allocated portion of income and expenses to each class as a percent of its average net assets may vary due to the timing of recording these transactions in relation to fluctuating net assets of the classes. Expenses directly attributable to a fund are charged to that fund. Expenses attributable to more than one fund are allocated among the respective funds on the basis of relative net assets or other appropriate methods. Expense estimates are accrued in the period to which they relate and adjustments are made when actual amounts are known.
Income Tax Information and Distributions to Shareholders. Each year, the Fund intends to qualify as a regulated investment company under Subchapter M of the Internal Revenue Code, including distributing substantially all of its taxable income and realized gains. As a result, no provision for U.S. Federal income taxes is required. As of November 30, 2017, the Fund did not have any unrecognized tax benefits in the financial statements; nor is the Fund aware of any tax positions for which it is reasonably possible that the total amounts of unrecognized tax benefits will significantly change in the next twelve months. The Fund files a U.S. federal tax return, in addition to state and local tax returns as required. The Fund's federal income tax returns are subject to examination by the Internal Revenue Service (IRS) for a period of three fiscal years after they are filed. State and local tax returns may be subject to examination for an additional fiscal year depending on the jurisdiction. Foreign taxes are provided for based on the Fund's understanding of the tax rules and rates that exist in the foreign markets in which it invests.
Distributions are declared and recorded on the ex-dividend date. Income dividends and capital gain distributions are declared separately for each class. Income and capital gain distributions are determined in accordance with income tax regulations, which may differ from GAAP. In addition, the Fund claimed a portion of the payment made to redeeming shareholders as a distribution for income tax purposes.
Capital accounts within the financial statements are adjusted for permanent book-tax differences. These adjustments have no impact on net assets or the results of operations. Capital accounts are not adjusted for temporary book-tax differences which will reverse in a subsequent period.
Book-tax differences are primarily due to foreign currency transactions, market discount, deferred trustees compensation, partnerships, and losses deferred due to wash sales.
As of period end, the cost and unrealized appreciation (depreciation) in securities, and derivatives if applicable, for federal income tax purposes were as follows:
| Gross unrealized appreciation | $220,500 |
| Gross unrealized depreciation | (27,398) |
| Net unrealized appreciation (depreciation) | $193,102 |
| Tax Cost | $968,093 |
The tax-based components of distributable earnings as of period end were as follows:
| Undistributed ordinary income | $65,013 |
| Undistributed long-term capital gain | $20,108 |
| Net unrealized appreciation (depreciation) on securities and other investments | $192,824 |
The tax character of distributions paid was as follows:
| November 30, 2017 | November 30, 2016 | |
| Ordinary Income | $18,090 | $ 15,684 |
| Long-term Capital Gains | 229,818 | – |
| Total | $247,908 | $ 15,684 |
4. Purchases and Sales of Investments.
Purchases and sales of securities, other than short-term securities, aggregated $517,038 and $963,540, respectively.
5. Fees and Other Transactions with Affiliates.
Management Fee. Fidelity Management & Research Company (the investment adviser) and its affiliates provide the Fund with investment management related services for which the Fund pays a monthly management fee. The management fee is the sum of an individual fund fee rate that is based on an annual rate of .30% of the Fund's average net assets and an annualized group fee rate that averaged .25% during the period. The group fee rate is based upon the average net assets of all the mutual funds advised by the investment adviser, including any mutual funds previously advised by the investment adviser that are currently advised by Fidelity SelectCo, LLC, an affiliate of the investment adviser. The group fee rate decreases as assets under management increase and increases as assets under management decrease. In addition, the management fee is subject to a performance adjustment (up to a maximum of +/- .20% of the Fund's average net assets over a 36 month performance period). The upward or downward adjustment to the management fee is based on the relative investment performance of Fidelity Value Strategies Fund as compared to its benchmark index, the Russell Midcap Value Index, over the same 36 month performance period. For the reporting period, the total annual management fee rate, including the performance adjustment, was .40% of the Fund's average net assets. The performance adjustment included in the management fee rate may be higher or lower than the maximum performance adjustment rate due to the difference between the average net assets for the reporting and performance periods.
Distribution and Service Plan Fees. In accordance with Rule 12b-1 of the 1940 Act, the Fund has adopted separate Distribution and Service Plans for each class of shares. Certain classes pay Fidelity Distributors Corporation (FDC), an affiliate of the investment adviser, separate Distribution and Service Fees, each of which is based on an annual percentage of each class' average net assets. In addition, FDC may pay financial intermediaries for selling shares of the Fund and providing shareholder support services. For the period, the Distribution and Service Fee rates, total fees and amounts retained by FDC were as follows:
| Distribution Fee | Service Fee | Total Fees | Retained by FDC | |
| Class A | -% | .25% | $512 | $3 |
| Class M | .25% | .25% | 1,325 | 10 |
| Class C | .75% | .25% | 450 | 9 |
| $2,287 | $22 |
Sales Load. FDC may receive a front-end sales charge of up to 5.75% for selling Class A shares and 3.50% for selling Class M shares, some of which is paid to financial intermediaries for selling shares of the Fund. Depending on the holding period, FDC may receive contingent deferred sales charges levied on Class A, Class M and Class C redemptions. The deferred sales charges are 1.00% for Class C shares, 1.00% for certain purchases of Class A shares and .25% for certain purchases of Class M shares.
For the period, sales charge amounts retained by FDC were as follows:
| Retained by FDC | |
| Class A | $17 |
| Class M | 6 |
| Class C(a) | 1 |
| $24 |
(a) When Class C shares are initially sold, FDC pays commissions from its own resources to financial intermediaries through which the sales are made.
Transfer Agent Fees. Fidelity Investments Institutional Operations Company, Inc., (FIIOC), an affiliate of the investment adviser, is the transfer, dividend disbursing and shareholder servicing agent for each class of the Fund. FIIOC receives account fees and asset-based fees that vary according to the account size and type of account of the shareholders of the respective classes of the Fund, except for Class K. FIIOC receives an asset-based fee of Class K's average net assets. FIIOC pays for typesetting, printing and mailing of shareholder reports, except proxy statements.
For the period, transfer agent fees for each class were as follows:
| Amount | % of Class-Level Average Net Assets | |
| Class A | $424 | .21 |
| Class M | 485 | .18 |
| Class C | 103 | .23 |
| Fidelity Value Strategies Fund | 806 | .17 |
| Class K | 31 | .05 |
| Class I | 161 | .22 |
| $2,010 |
Accounting and Security Lending Fees. Fidelity Service Company, Inc. (FSC), an affiliate of the investment adviser, maintains the Fund's accounting records. The accounting fee is based on the level of average net assets for each month. Under a separate contract, FSC administers the security lending program. The security lending fee is based on the number and duration of lending transactions.
Brokerage Commissions. The Fund placed a portion of its portfolio transactions with brokerage firms which are affiliates of the investment adviser. Brokerage commissions are included in net realized gain (loss) and change in net unrealized appreciation (depreciation) in the Statement of Operations. The commissions paid to these affiliated firms were $26 for the period.
Interfund Lending Program. Pursuant to an Exemptive Order issued by the SEC, the Fund, along with other registered investment companies having management contracts with Fidelity Management & Research Company (FMR) or other affiliated entities of FMR, may participate in an interfund lending program. This program provides an alternative credit facility allowing the funds to borrow from, or lend money to, other participating affiliated funds. At period end, there were no interfund loans outstanding. The Fund's activity in this program during the period for which loans were outstanding was as follows:
| Borrower or Lender | Average Loan Balance | Weighted Average Interest Rate | Interest Expense |
| Borrower | $12,437 | .89% | $4 |
Interfund Trades. The Fund may purchase from or sell securities to other Fidelity Funds under procedures adopted by the Board. The procedures have been designed to ensure these interfund trades are executed in accordance with Rule 17a-7 of the 1940 Act. Interfund trades are included within the respective purchases and sales amounts shown in the Purchases and Sales of Investments note.
6. Committed Line of Credit.
The Fund participates with other funds managed by the investment adviser or an affiliate in a $4.25 billion credit facility (the "line of credit") to be utilized for temporary or emergency purposes to fund shareholder redemptions or for other short-term liquidity purposes. The Fund has agreed to pay commitment fees on its pro-rata portion of the line of credit, which amounted to $4 and is reflected in Miscellaneous expenses on the Statement of Operations. During the period, the Fund did not borrow on this line of credit.
7. Security Lending.
The Fund lends portfolio securities through a lending agent from time to time in order to earn additional income. For equity securities, a lending agent is used and may loan securities to certain qualified borrowers, including Fidelity Capital Markets (FCM), a broker-dealer affiliated with the Fund. On the settlement date of the loan, the Fund receives collateral (in the form of U.S. Treasury obligations, letters of credit and/or cash) against the loaned securities and maintains collateral in an amount not less than 100% of the market value of the loaned securities during the period of the loan. The market value of the loaned securities is determined at the close of business of the Fund and any additional required collateral is delivered to the Fund on the next business day. The Fund or borrower may terminate the loan at any time, and if the borrower defaults on its obligation to return the securities loaned because of insolvency or other reasons, the Fund may apply collateral received from the borrower against the obligation. The Fund may experience delays and costs in recovering the securities loaned. Any cash collateral received is invested in the Fidelity Securities Lending Cash Central Fund. The value of loaned securities and cash collateral at period end are disclosed on the Fund's Statement of Assets and Liabilities. At period end, there were no security loans outstanding with FCM. Security lending income represents the income earned on investing cash collateral, less rebates paid to borrowers and any lending agent fees associated with the loan, plus any premium payments received for lending certain types of securities. Security lending income is presented in the Statement of Operations as a component of income from Fidelity Central Funds. Total security lending income during the period amounted to $406, including $6 from securities loaned to FCM.
8. Bank Borrowings.
The Fund is permitted to have bank borrowings for temporary or emergency purposes to fund shareholder redemptions or for other short-term liquidity requirements. The Fund has established borrowing arrangements with certain banks. The interest rate on the borrowings is the bank's base rate, as revised from time to time. The average loan balance during the period for which loans were outstanding amounted to $5,859. The weighted average interest rate was 1.16%. The interest expense amounted to $1 under the bank borrowing program. At period end, there were no bank borrowings outstanding.
9. Expense Reductions.
Commissions paid to certain brokers with whom the investment adviser, or its affiliates, places trades on behalf of the Fund include an amount in addition to trade execution, which may be rebated back to the Fund to offset certain expenses. This amount totaled $58 for the period.
In addition, during the period the investment adviser reimbursed and/or waived a portion of fund-level operating expenses in the amount of $12.
10. Distributions to Shareholders.
Distributions to shareholders of each class were as follows:
| Year ended November 30, 2017 | Year ended November 30, 2016 | |
| From net investment income | ||
| Class A | $2,766 | $2,186 |
| Class M | 2,831 | 2,155 |
| Class C | 357 | 187 |
| Fidelity Value Strategies Fund | 9,926 | 9,139 |
| Class K | 1,087 | 955 |
| Class I | 1,123 | 746 |
| Total | $18,090 | $15,368 |
| From net realized gain | ||
| Class A | $37,462 | $49 |
| Class M | 46,673 | 65 |
| Class C | 9,088 | 13 |
| Fidelity Value Strategies Fund | 112,547 | 160 |
| Class K | 11,298 | 15 |
| Class I | 12,750 | 14 |
| Total | $229,818 | $316 |
11. Share Transactions.
Share transactions for each class were as follows and may contain automatic conversions between classes or exchanges between affiliated funds:
| Shares | Shares | Dollars | Dollars | |
| Year ended November 30, 2017 | Year ended November 30, 2016 | Year ended November 30, 2017 | Year ended November 30, 2016 | |
| Class A | ||||
| Shares sold | 296 | 471 | $10,638 | $17,474 |
| Reinvestment of distributions | 1,127 | 58 | 37,943 | 2,110 |
| Shares redeemed | (1,026) | (998) | (36,865) | (37,279) |
| Net increase (decrease) | 397 | (469) | $11,716 | $(17,695) |
| Class M | ||||
| Shares sold | 349 | 349 | $13,029 | $13,447 |
| Reinvestment of distributions | 1,294 | 54 | 45,666 | 2,045 |
| Shares redeemed | (1,277) | (1,385) | (48,234) | (53,890) |
| Net increase (decrease) | 366 | (982) | $10,461 | $(38,398) |
| Class B | ||||
| Shares sold | – | – | $– | $9 |
| Shares redeemed | – | (110) | – | (3,723) |
| Net increase (decrease) | – | (110) | $– | $(3,714) |
| Class C | ||||
| Shares sold | 89 | 78 | $2,827 | $2,605 |
| Reinvestment of distributions | 307 | 6 | 9,116 | 191 |
| Shares redeemed | (264) | (263) | (8,379) | (8,759) |
| Net increase (decrease) | 132 | (179) | $3,564 | $(5,963) |
| Fidelity Value Strategies Fund | ||||
| Shares sold | 1,169 | 9,301 | $50,402 | $395,357 |
| Reinvestment of distributions | 2,966 | 182 | 114,742 | 7,409 |
| Shares redeemed | (10,188) | (10,077) | (409,648) | (417,147) |
| Net increase (decrease) | (6,053) | (594) | $(244,504) | $(14,381) |
| Class K | ||||
| Shares sold | 617 | 480 | $26,514 | $20,396 |
| Reinvestment of distributions | 321 | 24 | 12,384 | 970 |
| Shares redeemed | (665) | (644) | (27,215) | (27,300) |
| Net increase (decrease) | 273 | (140) | $11,683 | $(5,934) |
| Class I | ||||
| Shares sold | 459 | 445 | $17,823 | $18,090 |
| Reinvestment of distributions | 339 | 19 | 12,386 | 723 |
| Shares redeemed | (774) | (330) | (30,001) | (13,236) |
| Net increase (decrease) | 24 | 134 | $208 | $5,577 |
12. Other.
The Fund's organizational documents provide former and current trustees and officers with a limited indemnification against liabilities arising in connection with the performance of their duties to the Fund. In the normal course of business, the Fund may also enter into contracts that provide general indemnifications. The Fund's maximum exposure under these arrangements is unknown as this would be dependent on future claims that may be made against the Fund. The risk of material loss from such claims is considered remote.
Report of Independent Registered Public Accounting Firm
To the Trustees of Fidelity Advisor Series I and Shareholders of Fidelity Advisor Value Strategies Fund:
We have audited the accompanying statement of assets and liabilities of Fidelity Advisor Value Strategies Fund (the Fund), a fund of Fidelity Advisor Series I, including the schedule of investments, as of November 30, 2017, and the related statement of operations for the year then ended, the statement of changes in net assets for each of the two years in the period then ended, and the financial highlights for each of the five years in the period then ended. These financial statements and financial highlights are the responsibility of the Fund's management. Our responsibility is to express an opinion on these financial statements and financial highlights based on our audits.
We conducted our audits in accordance with the standards of the Public Company Accounting Oversight Board (United States). Those standards require that we plan and perform the audit to obtain reasonable assurance about whether the financial statements and financial highlights are free of material misstatement. The Fund is not required to have, nor were we engaged to perform, an audit of its internal control over financial reporting. Our audits included consideration of internal control over financial reporting as a basis for designing audit procedures that are appropriate in the circumstances, but not for the purpose of expressing an opinion on the effectiveness of the Fund's internal control over financial reporting. Accordingly, we express no such opinion. An audit also includes examining, on a test basis, evidence supporting the amounts and disclosures in the financial statements, assessing the accounting principles used and significant estimates made by management, as well as evaluating the overall financial statement presentation. Our procedures included confirmation of securities owned as of November 30, 2017, by correspondence with the custodians and brokers; when replies were not received from brokers, we performed other auditing procedures. We believe that our audits provide a reasonable basis for our opinion.
In our opinion, such financial statements and financial highlights referred to above present fairly, in all material respects, the financial position of Fidelity Advisor Value Strategies Fund as of November 30, 2017, the results of its operations for the year then ended, the changes in its net assets for each of the two years in the period then ended, and the financial highlights for each of the five years in the period then ended, in conformity with accounting principles generally accepted in the United States of America.
DELOITTE & TOUCHE LLP
Boston, Massachusetts
January 16, 2018
Trustees and Officers
The Trustees, Members of the Advisory Board (if any), and officers of the trust and fund, as applicable, are listed below. The Board of Trustees governs the fund and is responsible for protecting the interests of shareholders. The Trustees are experienced executives who meet periodically throughout the year to oversee the fund's activities, review contractual arrangements with companies that provide services to the fund, oversee management of the risks associated with such activities and contractual arrangements, and review the fund's performance. Each of the Trustees oversees 190 funds.
The Trustees hold office without limit in time except that (a) any Trustee may resign; (b) any Trustee may be removed by written instrument, signed by at least two-thirds of the number of Trustees prior to such removal; (c) any Trustee who requests to be retired or who has become incapacitated by illness or injury may be retired by written instrument signed by a majority of the other Trustees; and (d) any Trustee may be removed at any special meeting of shareholders by a two-thirds vote of the outstanding voting securities of the trust. Each Trustee who is not an interested person (as defined in the 1940 Act) of the trust and the fund is referred to herein as an Independent Trustee. Each Independent Trustee shall retire not later than the last day of the calendar year in which his or her 75th birthday occurs. The Independent Trustees may waive this mandatory retirement age policy with respect to individual Trustees. Officers and Advisory Board Members hold office without limit in time, except that any officer or Advisory Board Member may resign or may be removed by a vote of a majority of the Trustees at any regular meeting or any special meeting of the Trustees. Except as indicated, each individual has held the office shown or other offices in the same company for the past five years.
The fund’s Statement of Additional Information (SAI) includes more information about the Trustees. To request a free copy, call Fidelity at 1-877-208-0098.
Experience, Skills, Attributes, and Qualifications of the Trustees. The Governance and Nominating Committee has adopted a statement of policy that describes the experience, qualifications, attributes, and skills that are necessary and desirable for potential Independent Trustee candidates (Statement of Policy). The Board believes that each Trustee satisfied at the time he or she was initially elected or appointed a Trustee, and continues to satisfy, the standards contemplated by the Statement of Policy. The Governance and Nominating Committee also engages professional search firms to help identify potential Independent Trustee candidates who have the experience, qualifications, attributes, and skills consistent with the Statement of Policy. From time to time, additional criteria based on the composition and skills of the current Independent Trustees, as well as experience or skills that may be appropriate in light of future changes to board composition, business conditions, and regulatory or other developments, have also been considered by the professional search firms and the Governance and Nominating Committee. In addition, the Board takes into account the Trustees' commitment and participation in Board and committee meetings, as well as their leadership of standing and ad hoc committees throughout their tenure.
In determining that a particular Trustee was and continues to be qualified to serve as a Trustee, the Board has considered a variety of criteria, none of which, in isolation, was controlling. The Board believes that, collectively, the Trustees have balanced and diverse experience, qualifications, attributes, and skills, which allow the Board to operate effectively in governing the fund and protecting the interests of shareholders. Information about the specific experience, skills, attributes, and qualifications of each Trustee, which in each case led to the Board's conclusion that the Trustee should serve (or continue to serve) as a trustee of the fund, is provided below.
Board Structure and Oversight Function. James C. Curvey is an interested person and currently serves as Chairman. The Trustees have determined that an interested Chairman is appropriate and benefits shareholders because an interested Chairman has a personal and professional stake in the quality and continuity of services provided to the fund. Independent Trustees exercise their informed business judgment to appoint an individual of their choosing to serve as Chairman, regardless of whether the Trustee happens to be independent or a member of management. The Independent Trustees have determined that they can act independently and effectively without having an Independent Trustee serve as Chairman and that a key structural component for assuring that they are in a position to do so is for the Independent Trustees to constitute a substantial majority for the Board. The Independent Trustees also regularly meet in executive session. Ned C. Lautenbach serves as Chairman of the Independent Trustees and as such (i) acts as a liaison between the Independent Trustees and management with respect to matters important to the Independent Trustees and (ii) with management prepares agendas for Board meetings.
Fidelity® funds are overseen by different Boards of Trustees. The fund's Board oversees Fidelity's high income and certain equity funds, and other Boards oversee Fidelity's investment-grade bond, money market, asset allocation, and sector funds. The asset allocation funds may invest in Fidelity® funds overseen by the fund's Board. The use of separate Boards, each with its own committee structure, allows the Trustees of each group of Fidelity® funds to focus on the unique issues of the funds they oversee, including common research, investment, and operational issues. On occasion, the separate Boards establish joint committees to address issues of overlapping consequences for the Fidelity® funds overseen by each Board.
The Trustees operate using a system of committees to facilitate the timely and efficient consideration of all matters of importance to the Trustees, the fund, and fund shareholders and to facilitate compliance with legal and regulatory requirements and oversight of the fund's activities and associated risks. The Board, acting through its committees, has charged FMR and its affiliates with (i) identifying events or circumstances the occurrence of which could have demonstrably adverse effects on the fund's business and/or reputation; (ii) implementing processes and controls to lessen the possibility that such events or circumstances occur or to mitigate the effects of such events or circumstances if they do occur; and (iii) creating and maintaining a system designed to evaluate continuously business and market conditions in order to facilitate the identification and implementation processes described in (i) and (ii) above. Because the day-to-day operations and activities of the fund are carried out by or through FMR, its affiliates, and other service providers, the fund's exposure to risks is mitigated but not eliminated by the processes overseen by the Trustees. While each of the Board's committees has responsibility for overseeing different aspects of the fund's activities, oversight is exercised primarily through the Operations, Audit, and Compliance Committees. In addition, the Independent Trustees have worked with FMR to enhance the Board's oversight of investment and financial risks, legal and regulatory risks, technology risks, and operational risks, including the development of additional risk reporting to the Board. For example, a working group comprised of Independent Trustees and FMR has worked and continues to work to review the Fidelity® funds' valuation-related activities, reporting and risk management. Appropriate personnel, including but not limited to the fund's Chief Compliance Officer (CCO), FMR's internal auditor, the independent accountants, the fund's Treasurer and portfolio management personnel, make periodic reports to the Board's committees, as appropriate, including an annual review of Fidelity's risk management program for the Fidelity® funds. The responsibilities of each standing committee, including their oversight responsibilities, are described further under "Standing Committees of the Trustees."
Interested Trustees*:
Correspondence intended for a Trustee who is an interested person may be sent to Fidelity Investments, 245 Summer Street, Boston, Massachusetts 02210.
Name, Year of Birth; Principal Occupations and Other Relevant Experience+
James C. Curvey (1935)
Year of Election or Appointment: 2007
Trustee
Chairman of the Board of Trustees
Mr. Curvey also serves as Trustee of other Fidelity® funds. Mr. Curvey is a Director of Fidelity Research & Analysis Co. (investment adviser firm, 2009-present), and Vice Chairman (2007-present) and Director of FMR LLC (diversified financial services company). In addition, Mr. Curvey serves as an Overseer for the Boston Symphony Orchestra and a member of the board of Artis-Naples, Naples, Florida, and as a Trustee for Brewster Academy, Wolfeboro, New Hampshire. Previously, Mr. Curvey served as a Director of Fidelity Investments Money Management, Inc. (investment adviser firm, 2009-2014) and a Director of FMR and FMR Co., Inc. (investment adviser firms, 2007-2014).
Charles S. Morrison (1960)
Year of Election or Appointment: 2014
Trustee
Mr. Morrison also serves as Trustee of other funds. He serves as President of Fidelity Management & Research Company (FMR) (investment adviser firm, 2016-present), a Director of Fidelity Investments Money Management, Inc. (FIMM) (investment adviser firm, 2014-present), Director of Fidelity SelectCo, LLC (investment adviser firm, 2014-present), President, Asset Management (2014-present), and is an employee of Fidelity Investments. Previously, Mr. Morrison served as Vice President of Fidelity's Fixed Income and Asset Allocation Funds (2012-2014), President, Fixed Income (2011-2014), Vice President of Fidelity's Money Market Funds (2005-2009), President, Money Market Group Leader of FMR (investment adviser firm, 2009), and Senior Vice President, Money Market Group of FMR (2004-2009). Mr. Morrison also served as Vice President of Fidelity's Bond Funds (2002-2005), certain Balanced Funds (2002-2005), and certain Asset Allocation Funds (2002-2007), and as Senior Vice President (2002-2005) of Fidelity's Bond Division.
* Determined to be an “Interested Trustee” by virtue of, among other things, his or her affiliation with the trust or various entities under common control with FMR.
+ The information includes the Trustee's principal occupation during the last five years and other information relating to the experience, attributes, and skills relevant to the Trustee's qualifications to serve as a Trustee, which led to the conclusion that the Trustee should serve as a Trustee for the fund.
Independent Trustees:
Correspondence intended for an Independent Trustee may be sent to Fidelity Investments, P.O. Box 55235, Boston, Massachusetts 02205-5235.
Name, Year of Birth; Principal Occupations and Other Relevant Experience+
Dennis J. Dirks (1948)
Year of Election or Appointment: 2005
Trustee
Mr. Dirks also serves as Trustee of other Fidelity® funds. Prior to his retirement in May 2003, Mr. Dirks was Chief Operating Officer and a member of the Board of The Depository Trust & Clearing Corporation (DTCC). He also served as President, Chief Operating Officer, and Board member of The Depository Trust Company (DTC) and President and Board member of the National Securities Clearing Corporation (NSCC). In addition, Mr. Dirks served as Chief Executive Officer and Board member of the Government Securities Clearing Corporation, Chief Executive Officer and Board member of the Mortgage-Backed Securities Clearing Corporation, as a Trustee and a member of the Finance Committee of Manhattan College (2005-2008), as a Trustee and a member of the Finance Committee of AHRC of Nassau County (2006-2008), as a member of the Independent Directors Council (IDC) Governing Council (2010-2015), and as a member of the Board of Directors for The Brookville Center for Children’s Services, Inc. (2009-2017). Mr. Dirks is a member of the Finance Committee (2016-present) and Board of Directors (2017-present) of the Asolo Repertory Theatre.
Alan J. Lacy (1953)
Year of Election or Appointment: 2008
Trustee
Mr. Lacy also serves as Trustee of other Fidelity® funds. Mr. Lacy serves as a Director of Bristol-Myers Squibb Company (global pharmaceuticals, 2008-present). He is a Trustee of the California Chapter of The Nature Conservancy (2015-present) and a Director of the Center for Advanced Study in the Behavioral Sciences at Stanford University (2015-present). In addition, Mr. Lacy served as Senior Adviser (2007-2014) of Oak Hill Capital Partners, L.P. (private equity) and also served as Chief Executive Officer (2005) and Vice Chairman (2005-2006) of Sears Holdings Corporation (retail) and Chief Executive Officer and Chairman of the Board of Sears, Roebuck and Co. (retail, 2000-2005). Previously, Mr. Lacy served as Chairman (2014-2017) and a member (2010-2017) of the Board of Directors of Dave & Buster’s Entertainment, Inc. (restaurant and entertainment complexes), as Chairman (2008-2011) and a member (2006-2015) of the Board of Trustees of the National Parks Conservation Association, and as a member of the Board of Directors for The Hillman Companies, Inc. (hardware wholesalers, 2010-2014), Earth Fare, Inc. (retail grocery, 2010-2014), and The Western Union Company (global money transfer, 2006-2011).
Ned C. Lautenbach (1944)
Year of Election or Appointment: 2000
Trustee
Chairman of the Independent Trustees
Mr. Lautenbach also serves as Trustee of other Fidelity® funds. Mr. Lautenbach currently serves as Vice Chair of the Board of Governors, State University System of Florida (2013-present) and is a member of the Council on Foreign Relations (1994-present). He is also a member and has most recently served as Chairman of the Board of Directors of Artis-Naples (2012-present). Previously, Mr. Lautenbach served as a member and then Lead Director of the Board of Directors of Eaton Corporation (diversified industrial, 1997-2016). He was also a Partner and Advisory Partner at Clayton, Dubilier & Rice, LLC (private equity investment, 1998-2010), as well as a Director of Sony Corporation (2006-2007). In addition, Mr. Lautenbach also had a 30-year career with IBM (technology company) during which time he served as Senior Vice President and a member of the Corporate Executive Committee (1968-1998).
Joseph Mauriello (1944)
Year of Election or Appointment: 2008
Trustee
Mr. Mauriello also serves as Trustee of other Fidelity® funds. Prior to his retirement in January 2006, Mr. Mauriello served in numerous senior management positions including Deputy Chairman and Chief Operating Officer (2004-2005), and Vice Chairman of Financial Services (2002-2004) of KPMG LLP US (professional services, 1965-2005). Mr. Mauriello currently serves as a member of the Board of Directors of XL Group plc. (global insurance and re-insurance, 2006-present) and the Independent Directors Council (IDC) Governing Council (2015-present). Previously, Mr. Mauriello served as a Director of the Hamilton Funds of the Bank of New York (2006-2007) and of Arcadia Resources Inc. (health care services and products, 2007-2012).
Cornelia M. Small (1944)
Year of Election or Appointment: 2005
Trustee
Ms. Small also serves as Trustee of other Fidelity® funds. Ms. Small is a member of the Board of Directors (2009-present) and Chair of the Investment Committee (2010-present) of the Teagle Foundation. Ms. Small also serves on the Investment Committee of the Berkshire Taconic Community Foundation (2008-present). Previously, Ms. Small served as Chairperson (2002-2008) and a member of the Investment Committee and Chairperson (2008-2012) and a member of the Board of Trustees of Smith College. In addition, Ms. Small served as Chief Investment Officer, Director of Global Equity Investments, and a member of the Board of Directors of Scudder, Stevens & Clark and Scudder Kemper Investments.
William S. Stavropoulos (1939)
Year of Election or Appointment: 2002
Trustee
Vice Chairman of the Independent Trustees
Mr. Stavropoulos also serves as Trustee of other Fidelity® funds. Mr. Stavropoulos serves as President and Founder of the Michigan Baseball Foundation, the Great Lakes Loons (2007-present). Mr. Stavropoulos is Chairman Emeritus of the Board of Directors of The Dow Chemical Company, where he previously served in numerous senior management positions, including President, CEO (1995-2000; 2002-2004), Chairman of the Executive Committee (2000-2006), and as a member of the Board of Directors (1990-2006). Currently, Mr. Stavropoulos is Chairman of the Board of Directors of Univar Inc. (global distributor of commodity and specialty chemicals), a Director of Teradata Corporation (data warehousing and technology solutions), and a member of the Advisory Board for Metalmark Capital LLC (private equity investment, 2005-present). Mr. Stavropoulos is an operating advisor to Clayton, Dubilier & Rice, LLC (private equity investment). In addition, Mr. Stavropoulos is a member of the University of Notre Dame Advisory Council for the College of Science, a Trustee of the Rollin L. Gerstacker Foundation, and a Director of Artis-Naples in Naples, Florida. Previously, Mr. Stavropoulos served as a Director of Chemical Financial Corporation (bank holding company, 1993-2012) and Tyco International, Ltd. (multinational manufacturing and services, 2007-2012).
David M. Thomas (1949)
Year of Election or Appointment: 2008
Trustee
Mr. Thomas also serves as Trustee of other Fidelity® funds. Mr. Thomas serves as Non-Executive Chairman of the Board of Directors of Fortune Brands Home and Security (home and security products, 2011-present), as a member of the Board of Directors (2004-present) and Presiding Director (2013-present) of Interpublic Group of Companies, Inc. (marketing communication), and as a member of the Board of Trustees of the University of Florida (2013-present). Previously, Mr. Thomas served as Executive Chairman (2005-2006) and Chairman and Chief Executive Officer (2000-2005) of IMS Health, Inc. (pharmaceutical and healthcare information solutions), and a Director of Fortune Brands, Inc. (consumer products, 2000-2011).
+ The information includes the Trustee's principal occupation during the last five years and other information relating to the experience, attributes, and skills relevant to the Trustee's qualifications to serve as a Trustee, which led to the conclusion that the Trustee should serve as a Trustee for the fund.
Advisory Board Members and Officers:
Correspondence intended for an officer or Peter S. Lynch may be sent to Fidelity Investments, 245 Summer Street, Boston, Massachusetts 02210. Officers appear below in alphabetical order.
Name, Year of Birth; Principal Occupation
Peter S. Lynch (1944)
Year of Election or Appointment: 2003
Member of the Advisory Board
Mr. Lynch also serves as Member of the Advisory Board of other Fidelity® funds. Mr. Lynch is Vice Chairman and a Director of FMR (investment adviser firm) and FMR Co., Inc. (investment adviser firm). In addition, Mr. Lynch serves as a Trustee of Boston College and as the Chairman of the Inner-City Scholarship Fund. Previously, Mr. Lynch served on the Special Olympics International Board of Directors (1997-2006).
Elizabeth Paige Baumann (1968)
Year of Election or Appointment: 2017
Anti-Money Laundering (AML) Officer
Ms. Baumann also serves as AML Officer of other funds. She is Chief AML Officer (2012-present) and Senior Vice President (2014-present) of FMR LLC (diversified financial services company) and is an employee of Fidelity Investments. Previously, Ms. Baumann served as AML Officer of the funds (2012-2016), and Vice President (2007-2014) and Deputy Anti-Money Laundering Officer (2007-2012) of FMR LLC.
Marc R. Bryant (1966)
Year of Election or Appointment: 2015
Secretary and Chief Legal Officer (CLO)
Mr. Bryant also serves as Secretary and CLO of other funds. Mr. Bryant serves as CLO, Secretary, and Senior Vice President of Fidelity Management & Research Company (investment adviser firm, 2015-present) and FMR Co., Inc. (investment adviser firm, 2015-present); Secretary of Fidelity SelectCo, LLC (investment adviser firm, 2015-present) and Fidelity Investments Money Management, Inc. (investment adviser firm, 2015-present); and CLO of Fidelity Management & Research (Hong Kong) Limited and FMR Investment Management (UK) Limited (investment adviser firms, 2015-present) and Fidelity Management & Research (Japan) Limited (investment adviser firm, 2016-present). He is Senior Vice President and Deputy General Counsel of FMR LLC (diversified financial services company). Previously, Mr. Bryant served as Secretary and CLO of Fidelity Rutland Square Trust II (2010-2014) and Assistant Secretary of Fidelity's Fixed Income and Asset Allocation Funds (2013-2015). Prior to joining Fidelity Investments, Mr. Bryant served as a Senior Vice President and the Head of Global Retail Legal for AllianceBernstein L.P. (2006-2010), and as the General Counsel for ProFund Advisors LLC (2001-2006).
William C. Coffey (1969)
Year of Election or Appointment: 2009
Assistant Secretary
Mr. Coffey also serves as Assistant Secretary of other funds. He is Senior Vice President and Deputy General Counsel of FMR LLC (diversified financial services company, 2010-present), and is an employee of Fidelity Investments. Previously, Mr. Coffey served as Vice President and Associate General Counsel of FMR LLC (2005-2009).
Jonathan Davis (1968)
Year of Election or Appointment: 2010
Assistant Treasurer
Mr. Davis also serves as Assistant Treasurer of other funds. Mr. Davis serves as Assistant Treasurer of FMR Capital, Inc. (2017-present) and is an employee of Fidelity Investments. Previously, Mr. Davis served as Vice President and Associate General Counsel of FMR LLC (diversified financial services company, 2003-2010).
Adrien E. Deberghes (1967)
Year of Election or Appointment: 2016
Assistant Treasurer
Mr. Deberghes also serves as an officer of other funds. He serves as Assistant Treasurer of FMR Capital, Inc. (2017-present), Executive Vice President of Fidelity Investments Money Management, Inc. (FIMM) (investment adviser firm, 2016-present), and is an employee of Fidelity Investments (2008-present). Prior to joining Fidelity Investments, Mr. Deberghes was Senior Vice President of Mutual Fund Administration at State Street Corporation (2007-2008), Senior Director of Mutual Fund Administration at Investors Bank & Trust (2005-2007), and Director of Finance for Dunkin' Brands (2000-2005). Previously, Mr. Deberghes served in other fund officer roles.
Stephanie J. Dorsey (1969)
Year of Election or Appointment: 2010
Assistant Treasurer
Ms. Dorsey also serves as an officer of other funds. Ms. Dorsey serves as Assistant Treasurer of FMR Capital, Inc. (2017-present), is an employee of Fidelity Investments (2008-present), and has served in other fund officer roles. Prior to joining Fidelity Investments, Ms. Dorsey served as Treasurer (2004-2008) of the JPMorgan Mutual Funds and Vice President (2004-2008) of JPMorgan Chase Bank.
Howard J. Galligan III (1966)
Year of Election or Appointment: 2014
Chief Financial Officer
Mr. Galligan also serves as Chief Financial Officer of other funds. Mr. Galligan serves as President of Fidelity Pricing and Cash Management Services (FPCMS) (2014-present) and as a Director of Strategic Advisers, Inc. (investment adviser firm, 2008-present). Previously, Mr. Galligan served as Chief Administrative Officer of Asset Management (2011-2014) and Chief Operating Officer and Senior Vice President of Investment Support for Strategic Advisers, Inc. (2003-2011).
Thomas C. Hense (1964)
Year of Election or Appointment: 2008, 2010, or 2015
Vice President
Mr. Hense serves as Vice President of Fidelity Advisor® Multi-Asset Income Fund (2015) and other funds (High Income (2008), Small Cap (2008), and Value (2010) funds), and is an employee of Fidelity Investments (1993-present). Previously, Mr. Hense served as a portfolio manager for Fidelity's Institutional Money Management Group (Pyramis) (2003-2008).
Brian B. Hogan (1964)
Year of Election or Appointment: 2009
Vice President
Mr. Hogan also serves as Trustee or Vice President of other funds. Mr. Hogan serves as a Director of FMR Investment Management (UK) Limited (investment adviser firm, 2015-present) and Fidelity SelectCo, LLC (investment adviser firm, 2014-present) and President of the Equity Division of FMR (investment adviser firm, 2009-present). Previously, Mr. Hogan served as Senior Vice President, Equity Research of FMR (2006-2009) and as a portfolio manager. Mr. Brian B. Hogan is not related to Mr. Colm A. Hogan.
Colm A. Hogan (1973)
Year of Election or Appointment: 2016
Deputy Treasurer
Mr. Hogan also serves as an officer of other funds. Mr. Hogan serves as Assistant Treasurer of FMR Capital, Inc. (2017-present) and is an employee of Fidelity Investments (2005-present). Mr. Colm A. Hogan is not related to Mr. Brian B. Hogan.
Chris Maher (1972)
Year of Election or Appointment: 2013
Assistant Treasurer
Mr. Maher serves as Assistant Treasurer of other funds. Mr. Maher is Vice President of Valuation Oversight, serves as Assistant Treasurer of FMR Capital, Inc. (2017-present), and is an employee of Fidelity Investments. Previously, Mr. Maher served as Vice President of Asset Management Compliance (2013), Vice President of the Program Management Group of FMR (investment adviser firm, 2010-2013), and Vice President of Valuation Oversight (2008-2010).
Rieco E. Mello (1969)
Year of Election or Appointment: 2017
Assistant Treasurer
Mr. Mello also serves as Assistant Treasurer of other funds. Mr. Mello serves as Assistant Treasurer of FMR Capital, Inc. (2017-present) and is an employee of Fidelity Investments (1995-present).
Kenneth B. Robins (1969)
Year of Election or Appointment: 2016
Chief Compliance Officer
Mr. Robins also serves as an officer of other funds. Mr. Robins serves as Compliance Officer of Fidelity Management & Research Company and FMR Co., Inc. (investment adviser firms, 2016-present) and is an employee of Fidelity Investments (2004-present). Previously, Mr. Robins served as Executive Vice President of Fidelity Investments Money Management, Inc. (investment adviser firm, 2013-2016) and served in other fund officer roles.
Stacie M. Smith (1974)
Year of Election or Appointment: 2016
President and Treasurer
Ms. Smith also serves as an officer of other funds. Ms. Smith serves as Assistant Treasurer of FMR Capital, Inc. (2017-present), is an employee of Fidelity Investments (2009-present), and has served in other fund officer roles. Prior to joining Fidelity Investments, Ms. Smith served as Senior Audit Manager of Ernst & Young LLP (accounting firm, 1996-2009). Previously, Ms. Smith served as Deputy Treasurer of certain Fidelity® funds (2013-2016).
Marc L. Spector (1972)
Year of Election or Appointment: 2016
Assistant Treasurer
Mr. Spector also serves as an officer of other funds. Mr. Spector serves as Assistant Treasurer of FMR Capital, Inc. (2017-present) and is an employee of Fidelity Investments (2016-present). Prior to joining Fidelity Investments, Mr. Spector served as Director at the Siegfried Group (accounting firm, 2013-2016), and prior to Siegfried Group as audit senior manager at Deloitte & Touche (accounting firm, 2005-2013).
Renee Stagnone (1975)
Year of Election or Appointment: 2016
Assistant Treasurer
Ms. Stagnone also serves as an officer of other funds. Ms. Stagnone serves as Assistant Treasurer of FMR Capital, Inc. (2017-present) and is an employee of Fidelity Investments (1997-present). Previously, Ms. Stagnone served as Deputy Treasurer of certain Fidelity® funds (2013-2016).
Shareholder Expense Example
As a shareholder of the Fund, you incur two types of costs: (1) transaction costs, including sales charges (loads) on purchase payments or redemption proceeds, and (2) ongoing costs, including distribution and/or service (12b-1) fees and other Fund expenses. This Example is intended to help you understand your ongoing costs (in dollars) of investing in the Fund and to compare these costs with the ongoing costs of investing in other mutual funds.
The Example is based on an investment of $1,000 invested at the beginning of the period and held for the entire period (June 1, 2017 to November 30, 2017).
Actual Expenses
The first line of the accompanying table for each class of the Fund provides information about actual account values and actual expenses. You may use the information in this line, together with the amount you invested, to estimate the expenses that you paid over the period. Simply divide your account value by $1,000.00 (for example, an $8,600 account value divided by $1,000.00 = 8.6), then multiply the result by the number in the first line for a class of the Fund under the heading entitled "Expenses Paid During Period" to estimate the expenses you paid on your account during this period. A small balance maintenance fee of $12.00 that is charged once a year may apply for certain accounts with a value of less than $2,000. This fee is not included in the table below. If it was, the estimate of expenses you paid during the period would be higher, and your ending account value lower, by this amount. In addition, the Fund, as a shareholder in the underlying Fidelity Central Funds, will indirectly bear its pro-rata share of the fees and expenses incurred by the underlying Fidelity Central Funds. These fees and expenses are not included in the Fund's annualized expense ratio used to calculate the expense estimate in the table below.
Hypothetical Example for Comparison Purposes
The second line of the accompanying table for each class of the Fund provides information about hypothetical account values and hypothetical expenses based on a Class' actual expense ratio and an assumed rate of return of 5% per year before expenses, which is not the Class' actual return. The hypothetical account values and expenses may not be used to estimate the actual ending account balance or expenses you paid for the period. You may use this information to compare the ongoing costs of investing in the Fund and other funds. To do so, compare this 5% hypothetical example with the 5% hypothetical examples that appear in the shareholder reports of the other funds. A small balance maintenance fee of $12.00 that is charged once a year may apply for certain accounts with a value of less than $2,000. This fee is not included in the table below. If it was, the estimate of expenses you paid during the period would be higher, and your ending account value lower, by this amount. In addition, the Fund, as a shareholder in the underlying Fidelity Central Funds, will indirectly bear its pro-rata share of the fees and expenses incurred by the underlying Fidelity Central Funds. These fees and expenses are not included in the Fund's annualized expense ratio used to calculate the expense estimate in the table below.
Please note that the expenses shown in the table are meant to highlight your ongoing costs only and do not reflect any transaction costs. Therefore, the second line of the table is useful in comparing ongoing costs only, and will not help you determine the relative total costs of owning different funds. In addition, if these transactional costs were included, your costs would have been higher.
| Annualized Expense Ratio-A | Beginning Account Value June 1, 2017 | Ending Account Value November 30, 2017 | Expenses Paid During Period-B June 1, 2017 to November 30, 2017 | |
| Class A | .96% | |||
| Actual | $1,000.00 | $1,098.80 | $5.05 | |
| Hypothetical-C | $1,000.00 | $1,020.26 | $4.86 | |
| Class M | 1.18% | |||
| Actual | $1,000.00 | $1,097.70 | $6.21 | |
| Hypothetical-C | $1,000.00 | $1,019.15 | $5.97 | |
| Class C | 1.73% | |||
| Actual | $1,000.00 | $1,094.70 | $9.08 | |
| Hypothetical-C | $1,000.00 | $1,016.39 | $8.74 | |
| Fidelity Value Strategies Fund | .69% | |||
| Actual | $1,000.00 | $1,100.40 | $3.63 | |
| Hypothetical-C | $1,000.00 | $1,021.61 | $3.50 | |
| Class K | .55% | |||
| Actual | $1,000.00 | $1,101.20 | $2.90 | |
| Hypothetical-C | $1,000.00 | $1,022.31 | $2.79 | |
| Class I | .72% | |||
| Actual | $1,000.00 | $1,100.20 | $3.79 | |
| Hypothetical-C | $1,000.00 | $1,021.46 | $3.65 |
A Annualized expense ratio reflects expenses net of applicable fee waivers.
B Expenses are equal to each Class' annualized expense ratio, multiplied by the average account value over the period, multiplied by 183/365 (to reflect the one-half year period).
C 5% return per year before expenses
Distributions (Unaudited)
The Board of Trustees of Fidelity Advisor Value Strategies Fund voted to pay to shareholders of record at the opening of business on record date, the following distributions per share derived from capital gains realized from sales of portfolio securities, and dividends derived from net investment income:
| Pay Date | Record Date | Dividends | Capital Gains | |
| Fidelity Advisor Value Strategies Fund | ||||
| Class A | 12/27/17 | 12/26/17 | $0.513 | $2.765 |
| Class M | 12/27/17 | 12/26/17 | $0.412 | $2.765 |
| Class C | 12/27/17 | 12/26/17 | $0.273 | $2.765 |
| Fidelity Value Strategies Fund | 12/27/17 | 12/26/17 | $0.608 | $2.765 |
| Class K | 12/27/17 | 12/26/17 | $0.670 | $2.765 |
| Class I | 12/27/17 | 12/26/17 | $0.594 | $2.765 |
The fund hereby designates as a capital gain dividend with respect to the taxable year ended November 30, 2017, $21,296,902, or, if subsequently determined to be different, the net capital gain of such year.
Class A, Class M, Class C, Fidelity Value Strategies Fund, Class K, and Class I designate 100%, 100%, 100%, 87%, 80%, and 87% of the dividends distributed in December 2016, respectively during the fiscal year as qualifying for the dividends–received deduction for corporate shareholders.
Class A, Class M, Class C, Fidelity Value Strategies Fund, Class K, and Class I designate 100%, 100%, 100%, 96%, 88%, and 96% of the dividends distributed during the fiscal year as amounts which may be taken into account as a dividend for purposes of the maximum rate under section 1(h)(11) of the Internal Revenue Code.
The fund will notify shareholders in January 2018 of amounts for use in preparing 2017 income tax returns.
Board Approval of Investment Advisory Contracts and Management Fees
Fidelity Advisor Value Strategies Fund
Each year, the Board of Trustees, including the Independent Trustees (together, the Board), votes on the renewal of the management contract with Fidelity Management & Research Company (FMR) and the sub-advisory agreements (together, the Advisory Contracts) for the fund. FMR and the sub-advisers are referred to herein as the Investment Advisers. The Board, assisted by the advice of fund counsel and Independent Trustees' counsel, requests and considers a broad range of information relevant to the renewal of the Advisory Contracts throughout the year.
The Board meets regularly and, at each of its meetings, covers an extensive agenda of topics and materials and considers factors that are relevant to its annual consideration of the renewal of the fund's Advisory Contracts, including the services and support provided to the fund and its shareholders. The Board has established various standing committees (Committees), each composed of and chaired by Independent Trustees with varying backgrounds, to which the Board has assigned specific subject matter responsibilities in order to enhance effective decision-making by the Board. The Board, acting directly and through its Committees, requests and receives information concerning the annual consideration of the renewal of the fund's Advisory Contracts. The Board also meets as needed to review matters specifically related to the Board's annual consideration of the renewal of the Advisory Contracts. Members of the Board may also meet with trustees of other Fidelity funds through ad hoc joint committees to discuss certain matters relevant to all of the Fidelity funds.
At its July 2017 meeting, the Board unanimously determined to renew the fund's Advisory Contracts. In reaching its determination, the Board considered all factors it believed relevant, including (i) the nature, extent, and quality of the services to be provided to the fund and its shareholders (including the investment performance of the fund); (ii) the competitiveness of the fund's management fee and total expense ratio relative to peer funds; (iii) the total costs of the services to be provided by and the profits to be realized by Fidelity from its relationships with the fund; and (iv) the extent to which, if any, economies of scale exist and would be realized as the fund grows, and whether any economies of scale are appropriately shared with fund shareholders.
In considering whether to renew the Advisory Contracts for the fund, the Board reached a determination, with the assistance of fund counsel and Independent Trustees' counsel and through the exercise of its business judgment, that the renewal of the Advisory Contracts was in the best interests of the fund and its shareholders and that the compensation payable under the Advisory Contracts was fair and reasonable. The Board's decision to renew the Advisory Contracts was not based on any single factor, but rather was based on a comprehensive consideration of all the information provided to the Board at its meetings throughout the year. The Board, in reaching its determination to renew the Advisory Contracts, was aware that shareholders of the fund have a broad range of investment choices available to them, including a wide choice among funds offered by Fidelity's competitors, and that the fund's shareholders, who have the opportunity to review and weigh the disclosure provided by the fund in its prospectus and other public disclosures, have chosen to invest in this fund, which is part of the Fidelity family of funds.
Amendment to Group Fee Rate. The Board also approved an amendment to the management contract for the fund to add an additional breakpoint to the group fee schedule, effective October 1, 2017. The Board noted that the additional breakpoint would result in lower management fee rates as Fidelity's assets under management increase.
Nature, Extent, and Quality of Services Provided. The Board considered Fidelity's staffing as it relates to the fund, including the backgrounds of investment personnel of Fidelity, and also considered the fund's investment objective, strategies, and related investment philosophy. The Independent Trustees also had discussions with senior management of Fidelity's investment operations and investment groups. The Board considered the structure of the investment personnel compensation program and whether this structure provides appropriate incentives to act in the best interests of the fund. Additionally, the Board considered the portfolio managers' investments, if any, in the funds that they manage.Resources Dedicated to Investment Management and Support Services. The Board and the Fund Oversight and Research Committees reviewed the general qualifications and capabilities of Fidelity's investment staff, including its size, education, experience, and resources, as well as Fidelity's approach to recruiting, training, managing, and compensating investment personnel. The Board noted that Fidelity has continued to increase the resources devoted to non-U.S. offices, including expansion of Fidelity's global investment organization. The Board also noted that Fidelity's analysts have extensive resources, tools and capabilities that allow them to conduct sophisticated quantitative and fundamental analysis, as well as credit analysis of issuers, counterparties and guarantors. Further, the Board considered that Fidelity's investment professionals have sufficient access to global information and data so as to provide competitive investment results over time, and that those professionals also have access to sophisticated tools that permit them to assess portfolio construction and risk and performance attribution characteristics continuously, as well as to transmit new information and research conclusions rapidly around the world. Additionally, in its deliberations, the Board considered Fidelity's trading, risk management, compliance, and technology and operations capabilities and resources, which are integral parts of the investment management process.Shareholder and Administrative Services. The Board considered (i) the nature, extent, quality, and cost of advisory, administrative, and shareholder services performed by the Investment Advisers and their affiliates under the Advisory Contracts and under separate agreements covering transfer agency, pricing and bookkeeping, and securities lending services for the fund; (ii) the nature and extent of the supervision of third party service providers, principally custodians, subcustodians, and pricing vendors; and (iii) the resources devoted to, and the record of compliance with, the fund's compliance policies and procedures. The Board also reviewed the allocation of fund brokerage, including allocations to brokers affiliated with the Investment Advisers, the use of brokerage commissions to pay fund expenses, and the use of "soft" commission dollars to pay for research services.The Board noted that the growth of fund assets over time across the complex allows Fidelity to reinvest in the development of services designed to enhance the value or convenience of the Fidelity funds as investment vehicles. These services include 24-hour access to account information and market information through telephone representatives and over the Internet, investor education materials and asset allocation tools, and the expanded availability of Fidelity Investor Centers.In 2014, the Board formed an ad hoc Committee on Transfer Agency Fees to review the variety of transfer agency fee structures throughout the industry and Fidelity's competitive positioning with respect to industry participants.Investment in a Large Fund Family. The Board considered the benefits to shareholders of investing in a Fidelity fund, including the benefits of investing in a fund that is part of a large family of funds offering a variety of investment disciplines and providing a large variety of mutual fund investor services. The Board noted that Fidelity had taken, or had made recommendations that resulted in the Fidelity funds taking, a number of actions over the previous year that benefited particular funds, including: (i) continuing to dedicate additional resources to Fidelity's investment research process, and to the support of the senior management team that oversees asset management; (ii) continuing efforts to enhance Fidelity's global research capabilities; (iii) launching new funds and making other enhancements to meet client needs; (iv) launching new share classes of existing funds; (v) eliminating purchase minimums and broadening eligibility requirements for certain lower-priced share classes; (vi) reducing management fees and total expenses for certain growth equity funds and index funds; (vii) lowering expense caps for certain existing funds and classes to reduce expenses borne by shareholders; (viii) eliminating short-term redemption fees for certain funds; (ix) introducing a new pricing structure for certain funds of funds that is expected to reduce overall expenses paid by shareholders; (x) rationalizing product lines and gaining increased efficiencies through proposals for fund mergers and share class consolidations; (xi) continuing to develop, acquire and implement systems and technology to improve services to the funds and shareholders, strengthen information security, and increase efficiency; and (xii) implementing enhancements to further strengthen Fidelity's product line to increase investors' probability of success in achieving their investment goals, including retirement income goals.Investment Performance. The Board considered whether the fund has operated in accordance with its investment objective, as well as its record of compliance with its investment restrictions and its performance history.The Board took into account discussions with representatives of the Investment Advisers about fund investment performance that occur at Board meetings throughout the year. In this regard the Board noted that as part of regularly scheduled fund reviews and other reports to the Board on fund performance, the Board considers annualized return information for the fund for different time periods, measured against a securities market index ("benchmark index") and a peer group of funds with similar objectives ("peer group"), if any. In its evaluation of fund investment performance, the Board gave particular attention to information indicating changes in performance of certain Fidelity funds for specific time periods and discussed with the Investment Advisers the reasons for any overperformance or underperformance.In addition to reviewing absolute and relative fund performance, the Independent Trustees periodically consider the appropriateness of fund performance metrics in evaluating the results achieved. In general, the Independent Trustees believe that fund performance should be evaluated based on net performance (after fees and expenses) of both the highest performing and lowest performing fund share classes, where applicable, compared to appropriate benchmark indices, over appropriate time periods that may include full market cycles, and compared to peer groups, as applicable, over the same periods, taking into account relevant factors including the following: general market conditions; issuer-specific information; and fund cash flows and other factors.The Independent Trustees recognize that shareholders evaluate performance on a net basis over their own holding periods, for which one-, three-, and five-year periods are often used as a proxy. For this reason, the performance information reviewed by the Board also included net cumulative calendar year total return information for the fund and an appropriate benchmark index and peer group for the most recent one-, three-, and five-year periods, as shown below. Returns are shown compared to the 25th percentile (top of box, 75% beaten) and 75th percentile (bottom of box, 25% beaten) of the peer universe.Fidelity Advisor Value Strategies Fund
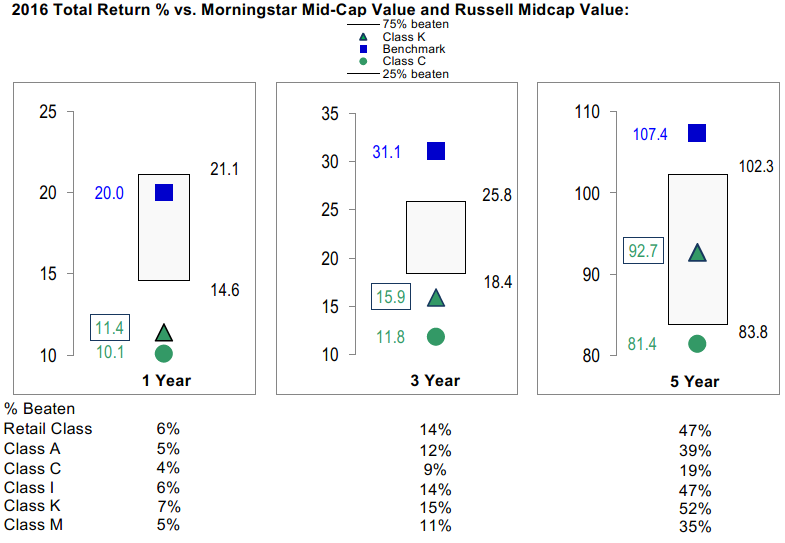
Fidelity Advisor Value Strategies Fund
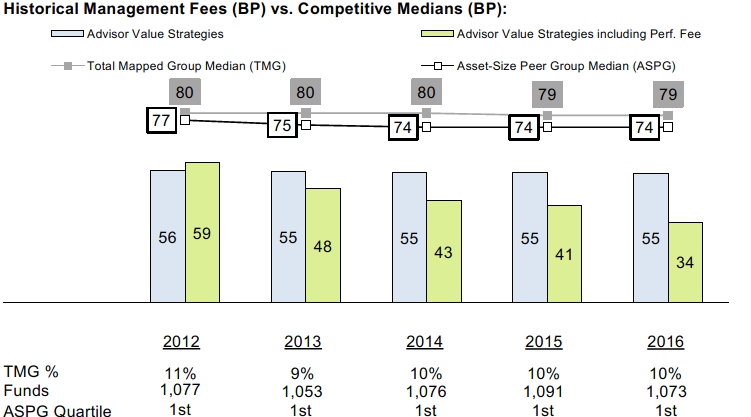
![]()
SO-ANN-0118
1.539180.120
Fidelity® Value Strategies Fund Class K Annual Report November 30, 2017 (A class of Fidelity Advisor® Value Strategies Fund) |
|
Contents
Board Approval of Investment Advisory Contracts and Management Fees |
To view a fund's proxy voting guidelines and proxy voting record for the 12-month period ended June 30, visit http://www.fidelity.com/proxyvotingresults or visit the Securities and Exchange Commission's (SEC) web site at http://www.sec.gov.
You may also call 1-800-835-5092 to request a free copy of the proxy voting guidelines.
Standard & Poor's, S&P and S&P 500 are registered service marks of The McGraw-Hill Companies, Inc. and have been licensed for use by Fidelity Distributors Corporation.
Other third-party marks appearing herein are the property of their respective owners.
All other marks appearing herein are registered or unregistered trademarks or service marks of FMR LLC or an affiliated company. © 2018 FMR LLC. All rights reserved.
This report and the financial statements contained herein are submitted for the general information of the shareholders of the Fund. This report is not authorized for distribution to prospective investors in the Fund unless preceded or accompanied by an effective prospectus.
A fund files its complete schedule of portfolio holdings with the SEC for the first and third quarters of each fiscal year on Form N-Q. Forms N-Q are available on the SEC’s web site at http://www.sec.gov. A fund's Forms N-Q may be reviewed and copied at the SEC’s Public Reference Room in Washington, DC. Information regarding the operation of the SEC's Public Reference Room may be obtained by calling 1-800-SEC-0330.
For a complete list of a fund's portfolio holdings, view the most recent holdings listing, semiannual report, or annual report on Fidelity's web site at http://www.fidelity.com, http://www.institutional.fidelity.com, or http://www.401k.com, as applicable.
NOT FDIC INSURED •MAY LOSE VALUE •NO BANK GUARANTEE
Neither the Fund nor Fidelity Distributors Corporation is a bank.
Performance: The Bottom Line
Average annual total return reflects the change in the value of an investment, assuming reinvestment of distributions from dividend income and capital gains (the profits earned upon the sale of securities that have grown in value, if any) and assuming a constant rate of performance each year. The hypothetical investment and the average annual total returns do not reflect the deduction of taxes that a shareholder would pay on fund distributions or the redemption of fund shares. During periods of reimbursement by Fidelity, a fund’s total return will be greater than it would be had the reimbursement not occurred. How a fund did yesterday is no guarantee of how it will do tomorrow.
Average Annual Total Returns
| For the periods ended November 30, 2017 | Past 1 year | Past 5 years | Past 10 years |
| Class K | 20.36% | 12.92% | 7.33% |
The initial offering of Class K shares took place on May 9, 2008. Returns prior to May 9, 2008 are those of Fidelity Advisor® Value Strategies Fund, the original class of the fund.
$10,000 Over 10 Years
Let's say hypothetically that $10,000 was invested in Fidelity® Value Strategies Fund - Class K on November 30, 2007.
The chart shows how the value of your investment would have changed, and also shows how the Russell Midcap® Value Index performed over the same period.
See above for additional information regarding the performance of Class K.
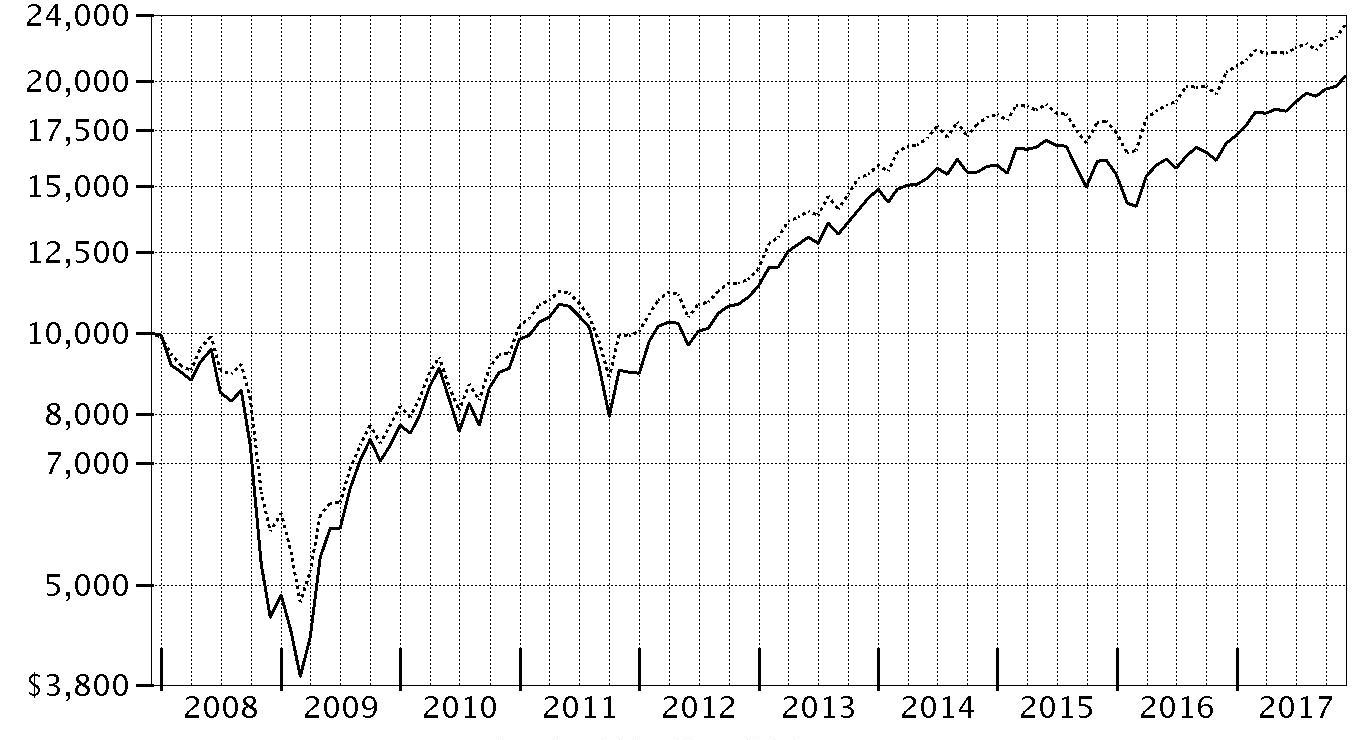
| Period Ending Values | ||
| $20,281 | Fidelity® Value Strategies Fund - Class K | |
| $23,335 | Russell Midcap® Value Index | |
Management's Discussion of Fund Performance
Market Recap: The U.S. equity bellwether S&P 500® index gained 22.87% for the year ending November 30, 2017, rising steadily and closing the period at an all-time high after a particularly strong three-month finish. Early on, equities rallied on optimism for President Trump’s pro-business agenda but leveled off in March amid fading optimism and stalled efforts by Congress to repeal and replace the Affordable Care Act. Upward momentum soon returned and continued through period end with consumer sentiment and other market indicators staying positive. The lone exception was a brief cooldown in August, when geopolitical tension escalated and uncertainty grew regarding the future of health care, tax reform and the debt ceiling. Sector-wise, info tech (+41%) led by a wide margin, surging amid strong earnings growth from several major index constituents. Utilities and financials each gained about 25%, the latter group riding an uptick in bond yields. Conversely, consumer discretionary (+20%) also rose solidly but lagged the broader market, as many brick-and-mortar retailers continued to suffer from increased online competition. Rising interest rates held back real estate (+16%), while consumer staples (+15%) and telecom (+1%) struggled due to investors’ general preference for risk assets. Lastly, sluggish oil prices pushed energy to a -4% return.Comments from Portfolio Manager Matthew Friedman: For the fiscal year, the fund’s share classes (excluding sales charges, if applicable) gained about 19% to 20%, handily outpacing the 13.95% return of the benchmark Russell Midcap® Value Index. Versus the benchmark, both security selection and sector positioning boosted performance. The biggest contribution came from security selection in real estate. Here, American Tower, an owner and operator of wireless and broadcast communications towers, was the fund’s largest individual contributor. The stock, which was not in the benchmark, benefited from increased investment by wireless carriers in their 5G networks, as well as rising demand for tower leasing, due to growing use of smartphones and tablets. The firm continued its expansion and benefited from strong organic revenue growth in its international segments. FNF Group, a provider of title insurance and transaction services to the real estate and mortgage industries, was another notable contributor. Conversely, choices in health care detracted most, especially a non-benchmark position in Israel's Teva Pharmaceutical Industries, a maker of generic drugs and the fund’s biggest individual detractor. The stock was hurt by a combination of excess debt from the company’s 2016 acquisition of Actavis’ generics business and drug-pricing pressure. We sold our stake in Teva by period end.The views expressed above reflect those of the portfolio manager(s) only through the end of the period as stated on the cover of this report and do not necessarily represent the views of Fidelity or any other person in the Fidelity organization. Any such views are subject to change at any time based upon market or other conditions and Fidelity disclaims any responsibility to update such views. These views may not be relied on as investment advice and, because investment decisions for a Fidelity fund are based on numerous factors, may not be relied on as an indication of trading intent on behalf of any Fidelity fund.
Investment Summary (Unaudited)
Top Ten Stocks as of November 30, 2017
| % of fund's net assets | % of fund's net assets 6 months ago | |
| Edison International | 2.8 | 3.3 |
| Sempra Energy | 2.7 | 3.1 |
| American Tower Corp. | 2.6 | 3.4 |
| Synchrony Financial | 2.6 | 2.2 |
| U.S. Bancorp | 2.3 | 2.4 |
| Wells Fargo & Co. | 2.2 | 1.7 |
| Extra Space Storage, Inc. | 2.1 | 2.2 |
| Discover Financial Services | 2.0 | 1.3 |
| Xcel Energy, Inc. | 1.9 | 0.0 |
| Equity Lifestyle Properties, Inc. | 1.9 | 2.0 |
| 23.1 |
Top Five Market Sectors as of November 30, 2017
| % of fund's net assets | % of fund's net assets 6 months ago | |
| Financials | 18.3 | 16.3 |
| Real Estate | 14.7 | 13.8 |
| Consumer Discretionary | 11.2 | 9.7 |
| Industrials | 10.9 | 11.3 |
| Information Technology | 10.0 | 11.5 |
Asset Allocation (% of fund's net assets)
| As of November 30, 2017* | ||
| Stocks | 98.5% | |
| Convertible Securities | 0.2% | |
| Short-Term Investments and Net Other Assets (Liabilities) | 1.3% | |

* Foreign investments - 16.7%
| As of May 31, 2017* | ||
| Stocks | 99.2% | |
| Convertible Securities | 0.6% | |
| Short-Term Investments and Net Other Assets (Liabilities) | 0.2% | |

* Foreign investments - 16.7%
Percentages shown as 0.0% may reflect amounts less than 0.05%.
Investments November 30, 2017
Showing Percentage of Net Assets
| Common Stocks - 98.5% | |||
| Shares | Value (000s) | ||
| CONSUMER DISCRETIONARY - 11.2% | |||
| Auto Components - 1.1% | |||
| Delphi Automotive PLC | 115,477 | $12,087 | |
| Diversified Consumer Services - 2.1% | |||
| Houghton Mifflin Harcourt Co. (a) | 946,656 | 9,230 | |
| Service Corp. International | 386,550 | 14,283 | |
| 23,513 | |||
| Hotels, Restaurants & Leisure - 2.2% | |||
| U.S. Foods Holding Corp. (a) | 450,700 | 13,124 | |
| Wyndham Worldwide Corp. | 97,467 | 10,954 | |
| 24,078 | |||
| Internet & Direct Marketing Retail - 0.9% | |||
| Liberty Interactive Corp. QVC Group (Venture Group) Series A (a) | 188,400 | 10,515 | |
| Leisure Products - 0.9% | |||
| Mattel, Inc. (b) | 552,900 | 10,090 | |
| Media - 2.7% | |||
| Liberty Global PLC Class C (a) | 387,900 | 11,959 | |
| Omnicom Group, Inc. | 117,100 | 8,366 | |
| Sinclair Broadcast Group, Inc. Class A (b) | 289,799 | 9,868 | |
| 30,193 | |||
| Specialty Retail - 1.3% | |||
| AutoZone, Inc. (a) | 9,400 | 6,456 | |
| Signet Jewelers Ltd. (b) | 143,100 | 7,483 | |
| 13,939 | |||
| TOTAL CONSUMER DISCRETIONARY | 124,415 | ||
| CONSUMER STAPLES - 3.3% | |||
| Beverages - 1.1% | |||
| Cott Corp. | 756,264 | 12,984 | |
| Food Products - 2.2% | |||
| Darling International, Inc. (a) | 850,222 | 15,261 | |
| The J.M. Smucker Co. | 77,300 | 9,019 | |
| 24,280 | |||
| TOTAL CONSUMER STAPLES | 37,264 | ||
| ENERGY - 7.5% | |||
| Oil, Gas & Consumable Fuels - 7.5% | |||
| Boardwalk Pipeline Partners, LP | 827,936 | 11,127 | |
| Cabot Oil & Gas Corp. | 281,600 | 8,152 | |
| Cheniere Energy, Inc. (a) | 249,600 | 12,061 | |
| EQT Corp. | 140,800 | 8,392 | |
| GasLog Ltd. (b) | 550,461 | 9,908 | |
| Lundin Petroleum AB | 435,400 | 10,018 | |
| Teekay Corp. (b) | 1,472,713 | 12,268 | |
| Valero Energy Corp. | 130,800 | 11,199 | |
| 83,125 | |||
| FINANCIALS - 18.3% | |||
| Banks - 5.3% | |||
| CIT Group, Inc. | 182,000 | 9,071 | |
| U.S. Bancorp | 455,384 | 25,114 | |
| Wells Fargo & Co. | 444,670 | 25,111 | |
| 59,296 | |||
| Capital Markets - 4.6% | |||
| Apollo Global Management LLC Class A | 393,150 | 12,310 | |
| Legg Mason, Inc. | 338,117 | 13,511 | |
| State Street Corp. | 100,200 | 9,554 | |
| The Blackstone Group LP | 489,600 | 15,530 | |
| 50,905 | |||
| Consumer Finance - 5.3% | |||
| Discover Financial Services | 311,900 | 22,020 | |
| OneMain Holdings, Inc. (a) | 317,300 | 8,190 | |
| Synchrony Financial | 813,213 | 29,186 | |
| 59,396 | |||
| Insurance - 3.1% | |||
| Chubb Ltd. | 113,982 | 17,338 | |
| FNF Group | 441,359 | 17,857 | |
| 35,195 | |||
| TOTAL FINANCIALS | 204,792 | ||
| HEALTH CARE - 5.7% | |||
| Biotechnology - 2.3% | |||
| Amgen, Inc. | 80,200 | 14,088 | |
| United Therapeutics Corp. (a) | 95,000 | 12,349 | |
| 26,437 | |||
| Health Care Providers & Services - 1.3% | |||
| Aetna, Inc. | 51,500 | 9,279 | |
| Envision Healthcare Corp. (a) | 160,151 | 5,114 | |
| 14,393 | |||
| Pharmaceuticals - 2.1% | |||
| Jazz Pharmaceuticals PLC (a) | 141,900 | 19,829 | |
| Mallinckrodt PLC (a) | 152,400 | 3,325 | |
| 23,154 | |||
| TOTAL HEALTH CARE | 63,984 | ||
| INDUSTRIALS - 10.9% | |||
| Aerospace & Defense - 1.5% | |||
| Huntington Ingalls Industries, Inc. | 27,300 | 6,598 | |
| KLX, Inc. (a) | 180,110 | 10,106 | |
| 16,704 | |||
| Airlines - 1.3% | |||
| American Airlines Group, Inc. | 288,700 | 14,576 | |
| Commercial Services & Supplies - 1.4% | |||
| IWG PLC | 1,635,100 | 4,356 | |
| KAR Auction Services, Inc. | 234,300 | 11,802 | |
| 16,158 | |||
| Construction & Engineering - 1.5% | |||
| AECOM (a) | 449,400 | 16,853 | |
| Machinery - 1.4% | |||
| Allison Transmission Holdings, Inc. | 389,475 | 15,984 | |
| Road & Rail - 0.9% | |||
| Swift Transporation Co. (b) | 226,200 | 9,654 | |
| Trading Companies & Distributors - 2.9% | |||
| AerCap Holdings NV (a) | 375,037 | 19,491 | |
| WESCO International, Inc. (a) | 191,300 | 12,540 | |
| 32,031 | |||
| TOTAL INDUSTRIALS | 121,960 | ||
| INFORMATION TECHNOLOGY - 10.0% | |||
| Communications Equipment - 1.1% | |||
| CommScope Holding Co., Inc. (a) | 351,168 | 12,639 | |
| Electronic Equipment & Components - 1.9% | |||
| Jabil, Inc. | 191,900 | 5,536 | |
| TE Connectivity Ltd. | 158,681 | 14,986 | |
| 20,522 | |||
| IT Services - 5.4% | |||
| Amdocs Ltd. | 171,200 | 11,178 | |
| Cognizant Technology Solutions Corp. Class A | 237,800 | 17,188 | |
| Conduent, Inc. | 448,000 | 6,836 | |
| DXC Technology Co. | 167,800 | 16,132 | |
| First Data Corp. Class A (a) | 556,240 | 9,150 | |
| 60,484 | |||
| Semiconductors & Semiconductor Equipment - 1.6% | |||
| Qualcomm, Inc. | 268,900 | 17,839 | |
| TOTAL INFORMATION TECHNOLOGY | 111,484 | ||
| MATERIALS - 9.5% | |||
| Chemicals - 7.0% | |||
| DowDuPont, Inc. | 285,612 | 20,553 | |
| Eastman Chemical Co. | 209,434 | 19,345 | |
| LyondellBasell Industries NV Class A | 165,692 | 17,348 | |
| Westlake Chemical Corp. | 211,203 | 20,683 | |
| 77,929 | |||
| Construction Materials - 0.8% | |||
| Eagle Materials, Inc. | 83,900 | 9,391 | |
| Containers & Packaging - 1.7% | |||
| Ball Corp. | 258,066 | 10,299 | |
| Sealed Air Corp. | 178,100 | 8,558 | |
| 18,857 | |||
| TOTAL MATERIALS | 106,177 | ||
| REAL ESTATE - 14.7% | |||
| Equity Real Estate Investment Trusts (REITs) - 13.1% | |||
| American Tower Corp. | 205,208 | 29,536 | |
| Douglas Emmett, Inc. | 495,600 | 19,978 | |
| Equinix, Inc. | 39,200 | 18,208 | |
| Equity Lifestyle Properties, Inc. | 231,700 | 20,925 | |
| Extra Space Storage, Inc. | 272,128 | 23,229 | |
| National Retail Properties, Inc. | 437,300 | 17,960 | |
| Outfront Media, Inc. | 710,804 | 16,675 | |
| 146,511 | |||
| Real Estate Management & Development - 1.6% | |||
| CBRE Group, Inc. (a) | 404,500 | 17,539 | |
| TOTAL REAL ESTATE | 164,050 | ||
| UTILITIES - 7.4% | |||
| Electric Utilities - 4.7% | |||
| Edison International | 376,771 | 30,619 | |
| Xcel Energy, Inc. | 413,300 | 21,330 | |
| 51,949 | |||
| Multi-Utilities - 2.7% | |||
| Sempra Energy | 250,788 | 30,343 | |
| TOTAL UTILITIES | 82,292 | ||
| TOTAL COMMON STOCKS | |||
| (Cost $901,502) | 1,099,543 | ||
| Principal Amount (000s) | Value (000s) | ||
| Convertible Bonds - 0.2% | |||
| ENERGY - 0.2% | |||
| Oil, Gas & Consumable Fuels - 0.2% | |||
| Cobalt International Energy, Inc. 2.625% 12/1/19 (Cost $11,132) | 18,190 | 1,910 | |
| Shares | Value (000s) | ||
| Money Market Funds - 5.3% | |||
| Fidelity Cash Central Fund, 1.13% (c) | 19,283,550 | 19,287 | |
| Fidelity Securities Lending Cash Central Fund 1.13% (c)(d) | 40,450,985 | 40,455 | |
| TOTAL MONEY MARKET FUNDS | |||
| (Cost $59,742) | 59,742 | ||
| TOTAL INVESTMENT IN SECURITIES - 104.0% | |||
| (Cost $972,376) | 1,161,195 | ||
| NET OTHER ASSETS (LIABILITIES) - (4.0)% | (44,487) | ||
| NET ASSETS - 100% | $1,116,708 |
Legend
(a) Non-income producing
(b) Security or a portion of the security is on loan at period end.
(c) Affiliated fund that is generally available only to investment companies and other accounts managed by Fidelity Investments. The rate quoted is the annualized seven-day yield of the fund at period end. A complete unaudited listing of the fund's holdings as of its most recent quarter end is available upon request. In addition, each Fidelity Central Fund's financial statements, which are not covered by the Fund's Report of Independent Registered Public Accounting Firm, are available on the SEC's website or upon request.
(d) Investment made with cash collateral received from securities on loan.
Affiliated Central Funds
Information regarding fiscal year to date income earned by the Fund from investments in Fidelity Central Funds is as follows:
| Fund | Income earned |
| (Amounts in thousands) | |
| Fidelity Cash Central Fund | $66 |
| Fidelity Securities Lending Cash Central Fund | 406 |
| Total | $472 |
Investment Valuation
The following is a summary of the inputs used, as of November 30, 2017, involving the Fund's assets and liabilities carried at fair value. The inputs or methodology used for valuing securities may not be an indication of the risk associated with investing in those securities. For more information on valuation inputs, and their aggregation into the levels used below, please refer to the Investment Valuation section in the accompanying Notes to Financial Statements.
| Valuation Inputs at Reporting Date: | ||||
| Description | Total | Level 1 | Level 2 | Level 3 |
| (Amounts in thousands) | ||||
| Investments in Securities: | ||||
| Equities: | ||||
| Consumer Discretionary | $124,415 | $124,415 | $-- | $-- |
| Consumer Staples | 37,264 | 37,264 | -- | -- |
| Energy | 83,125 | 83,125 | -- | -- |
| Financials | 204,792 | 204,792 | -- | -- |
| Health Care | 63,984 | 63,984 | -- | -- |
| Industrials | 121,960 | 121,960 | -- | -- |
| Information Technology | 111,484 | 111,484 | -- | -- |
| Materials | 106,177 | 106,177 | -- | -- |
| Real Estate | 164,050 | 164,050 | -- | -- |
| Utilities | 82,292 | 82,292 | -- | -- |
| Corporate Bonds | 1,910 | -- | 1,910 | -- |
| Money Market Funds | 59,742 | 59,742 | -- | -- |
| Total Investments in Securities: | $1,161,195 | $1,159,285 | $1,910 | $-- |
Other Information
Distribution of investments by country or territory of incorporation, as a percentage of Total Net Assets, is as follows (Unaudited):
| United States of America | 83.3% |
| Netherlands | 3.4% |
| Switzerland | 2.9% |
| Ireland | 2.1% |
| Bermuda | 1.6% |
| Bailiwick of Jersey | 1.5% |
| Canada | 1.1% |
| Marshall Islands | 1.1% |
| United Kingdom | 1.1% |
| Bailiwick of Guernsey | 1.0% |
| Others (Individually Less Than 1%) | 0.9% |
| 100.0% |
See accompanying notes which are an integral part of the financial statements.
Financial Statements
Statement of Assets and Liabilities
| Amounts in thousands (except per-share amounts) | November 30, 2017 | |
| Assets | ||
| Investment in securities, at value (including securities loaned of $39,238) — See accompanying schedule: Unaffiliated issuers (cost $912,634) | $1,101,453 | |
| Fidelity Central Funds (cost $59,742) | 59,742 | |
| Total Investment in Securities (cost $972,376) | $1,161,195 | |
| Receivable for fund shares sold | 319 | |
| Dividends receivable | 1,238 | |
| Interest receivable | 239 | |
| Distributions receivable from Fidelity Central Funds | 52 | |
| Prepaid expenses | 2 | |
| Other receivables | 6 | |
| Total assets | 1,163,051 | |
| Liabilities | ||
| Payable for investments purchased | $3,086 | |
| Payable for fund shares redeemed | 1,904 | |
| Accrued management fee | 463 | |
| Distribution and service plan fees payable | 193 | |
| Other affiliated payables | 193 | |
| Other payables and accrued expenses | 45 | |
| Collateral on securities loaned | 40,459 | |
| Total liabilities | 46,343 | |
| Net Assets | $1,116,708 | |
| Net Assets consist of: | ||
| Paid in capital | $838,764 | |
| Undistributed net investment income | 14,922 | |
| Accumulated undistributed net realized gain (loss) on investments and foreign currency transactions | 74,203 | |
| Net unrealized appreciation (depreciation) on investments | 188,819 | |
| Net Assets | $1,116,708 | |
| Calculation of Maximum Offering Price | ||
| Class A: | ||
| Net Asset Value and redemption price per share ($211,781 ÷ 5,442.7 shares) | $38.91 | |
| Maximum offering price per share (100/94.25 of $38.91) | $41.28 | |
| Class M: | ||
| Net Asset Value and redemption price per share ($271,177 ÷ 6,664.1 shares) | $40.69 | |
| Maximum offering price per share (100/96.50 of $40.69) | $42.17 | |
| Class C: | ||
| Net Asset Value and offering price per share ($46,074 ÷ 1,351.7 shares)(a) | $34.09 | |
| Fidelity Value Strategies Fund: | ||
| Net Asset Value, offering price and redemption price per share ($435,845 ÷ 9,725.7 shares) | $44.81 | |
| Class K: | ||
| Net Asset Value, offering price and redemption price per share ($79,387 ÷ 1,771.4 shares) | $44.82 | |
| Class I: | ||
| Net Asset Value, offering price and redemption price per share ($72,444 ÷ 1,713.7 shares) | $42.27 |
(a) Redemption price per share is equal to net asset value less any applicable contingent deferred sales charge.
See accompanying notes which are an integral part of the financial statements.
Statement of Operations
| Amounts in thousands | Year ended November 30, 2017 | |
| Investment Income | ||
| Dividends | $21,225 | |
| Special dividends | 3,977 | |
| Interest | 2,821 | |
| Income from Fidelity Central Funds | 472 | |
| Total income | 28,495 | |
| Expenses | ||
| Management fee | ||
| Basic fee | $6,110 | |
| Performance adjustment | (1,679) | |
| Transfer agent fees | 2,010 | |
| Distribution and service plan fees | 2,287 | |
| Accounting and security lending fees | 370 | |
| Custodian fees and expenses | 30 | |
| Independent trustees' fees and expenses | 5 | |
| Registration fees | 104 | |
| Audit | 70 | |
| Legal | 6 | |
| Interest | 5 | |
| Miscellaneous | 10 | |
| Total expenses before reductions | 9,328 | |
| Expense reductions | (70) | 9,258 |
| Net investment income (loss) | 19,237 | |
| Realized and Unrealized Gain (Loss) | ||
| Net realized gain (loss) on: | ||
| Investment securities: | ||
| Unaffiliated issuers | 81,500 | |
| Fidelity Central Funds | (5) | |
| Total net realized gain (loss) | 81,495 | |
| Change in net unrealized appreciation (depreciation) on: | ||
| Investment securities: | ||
| Unaffiliated issuers | 107,648 | |
| Fidelity Central Funds | (1) | |
| Total change in net unrealized appreciation (depreciation) | 107,647 | |
| Net gain (loss) | 189,142 | |
| Net increase (decrease) in net assets resulting from operations | $208,379 |
See accompanying notes which are an integral part of the financial statements.
Statement of Changes in Net Assets
| Amounts in thousands | Year ended November 30, 2017 | Year ended November 30, 2016 |
| Increase (Decrease) in Net Assets | ||
| Operations | ||
| Net investment income (loss) | $19,237 | $22,186 |
| Net realized gain (loss) | 81,495 | 392,411 |
| Change in net unrealized appreciation (depreciation) | 107,647 | (369,931) |
| Net increase (decrease) in net assets resulting from operations | 208,379 | 44,666 |
| Distributions to shareholders from net investment income | (18,090)�� | (15,368) |
| Distributions to shareholders from net realized gain | (229,818) | (316) |
| Total distributions | (247,908) | (15,684) |
| Share transactions - net increase (decrease) | (206,873) | (80,508) |
| Total increase (decrease) in net assets | (246,402) | (51,526) |
| Net Assets | ||
| Beginning of period | 1,363,110 | 1,414,636 |
| End of period | $1,116,708 | $1,363,110 |
| Other Information | ||
| Undistributed net investment income end of period | $14,922 | $15,960 |
See accompanying notes which are an integral part of the financial statements.
Financial Highlights
Fidelity Advisor Value Strategies Fund Class A
| Years ended November 30, | 2017 | 2016 | 2015 | 2014 | 2013 |
| Selected Per–Share Data | |||||
| Net asset value, beginning of period | $40.25 | $39.01 | $38.91 | $36.02 | $27.62 |
| Income from Investment Operations | |||||
| Net investment income (loss)A | .60B | .56 | .35 | .25 | .23 |
| Net realized and unrealized gain (loss) | 6.13 | 1.09 | .06 | 2.87 | 8.25 |
| Total from investment operations | 6.73 | 1.65 | .41 | 3.12 | 8.48 |
| Distributions from net investment income | (.56) | (.40) | (.28)C | (.23) | (.08) |
| Distributions from net realized gain | (7.52) | (.01) | (.03)C | – | – |
| Total distributions | (8.07)D | (.41) | (.31) | (.23) | (.08) |
| Net asset value, end of period | $38.91 | $40.25 | $39.01 | $38.91 | $36.02 |
| Total ReturnE,F | 19.84% | 4.33% | 1.07% | 8.74% | 30.77% |
| Ratios to Average Net AssetsG,H | |||||
| Expenses before reductions | .91% | .86% | .93% | .96% | 1.04% |
| Expenses net of fee waivers, if any | .91% | .86% | .93% | .96% | 1.04% |
| Expenses net of all reductions | .90% | .86% | .93% | .96% | 1.03% |
| Net investment income (loss) | 1.64%B | 1.48% | .89% | .68% | .73% |
| Supplemental Data | |||||
| Net assets, end of period (in millions) | $212 | $203 | $215 | $233 | $243 |
| Portfolio turnover rateI | 46% | 121% | 9% | 6% | 22% |
A Calculated based on average shares outstanding during the period.
B Net Investment income per share reflects a large, non-recurring dividend which amounted to $.13 per share. Excluding this non-recurring dividend, the ratio of net investment income (loss) to average net assets would have been 1.29%.
C The amounts shown reflect certain reclassifications related to book to tax differences that were made in the year shown.
D Total distributions of $8.07 per share is comprised of distributions from net investment income of $.555 and distributions from net realized gain of $7.517 per share.
E Total returns would have been lower if certain expenses had not been reduced during the applicable periods shown.
F Total returns do not include the effect of the sales charges.
G Fees and expenses of any underlying Fidelity Central Funds are not included in the Fund's expense ratio. The Fund indirectly bears its proportionate share of the expenses of any underlying Fidelity Central Funds.
H Expense ratios reflect operating expenses of the class. Expenses before reductions do not reflect amounts reimbursed by the investment adviser or reductions from brokerage service arrangements or reductions from other expense offset arrangements and do not represent the amount paid by the class during periods when reimbursements or reductions occur. Expenses net of fee waivers reflect expenses after reimbursement by the investment adviser but prior to reductions from brokerage service arrangements or other expense offset arrangements. Expenses net of all reductions represent the net expenses paid by the class.
I Amount does not include the portfolio activity of any underlying Fidelity Central Funds.
See accompanying notes which are an integral part of the financial statements.
Fidelity Advisor Value Strategies Fund Class M
| Years ended November 30, | 2017 | 2016 | 2015 | 2014 | 2013 |
| Selected Per–Share Data | |||||
| Net asset value, beginning of period | $41.72 | $40.40 | $40.28 | $37.28 | $28.58 |
| Income from Investment Operations | |||||
| Net investment income (loss)A | .54B | .49 | .28 | .18 | .18 |
| Net realized and unrealized gain (loss) | 6.40 | 1.14 | .06 | 2.98 | 8.54 |
| Total from investment operations | 6.94 | 1.63 | .34 | 3.16 | 8.72 |
| Distributions from net investment income | (.46) | (.30) | (.19)C | (.16) | (.02) |
| Distributions from net realized gain | (7.52) | (.01) | (.03)C | – | – |
| Total distributions | (7.97)D | (.31) | (.22) | (.16) | (.02) |
| Net asset value, end of period | $40.69 | $41.72 | $40.40 | $40.28 | $37.28 |
| Total ReturnE,F | 19.57% | 4.11% | .86% | 8.51% | 30.52% |
| Ratios to Average Net AssetsG,H | |||||
| Expenses before reductions | 1.13% | 1.08% | 1.15% | 1.17% | 1.23% |
| Expenses net of fee waivers, if any | 1.13% | 1.08% | 1.14% | 1.17% | 1.23% |
| Expenses net of all reductions | 1.13% | 1.07% | 1.14% | 1.17% | 1.22% |
| Net investment income (loss) | 1.42%B | 1.27% | .68% | .47% | .54% |
| Supplemental Data | |||||
| Net assets, end of period (in millions) | $271 | $263 | $294 | $324 | $335 |
| Portfolio turnover rateI | 46% | 121% | 9% | 6% | 22% |
A Calculated based on average shares outstanding during the period.
B Net Investment income per share reflects a large, non-recurring dividend which amounted to $.13 per share. Excluding this non-recurring dividend, the ratio of net investment income (loss) to average net assets would have been 1.06%.
C The amounts shown reflect certain reclassifications related to book to tax differences that were made in the year shown.
D Total distributions of $7.97 per share is comprised of distributions from net investment income of $.456 and distributions from net realized gain of $7.517 per share.
E Total returns would have been lower if certain expenses had not been reduced during the applicable periods shown.
F Total returns do not include the effect of the sales charges.
G Fees and expenses of any underlying Fidelity Central Funds are not included in the Fund's expense ratio. The Fund indirectly bears its proportionate share of the expenses of any underlying Fidelity Central Funds.
H Expense ratios reflect operating expenses of the class. Expenses before reductions do not reflect amounts reimbursed by the investment adviser or reductions from brokerage service arrangements or reductions from other expense offset arrangements and do not represent the amount paid by the class during periods when reimbursements or reductions occur. Expenses net of fee waivers reflect expenses after reimbursement by the investment adviser but prior to reductions from brokerage service arrangements or other expense offset arrangements. Expenses net of all reductions represent the net expenses paid by the class.
I Amount does not include the portfolio activity of any underlying Fidelity Central Funds.
See accompanying notes which are an integral part of the financial statements.
Fidelity Advisor Value Strategies Fund Class C
| Years ended November 30, | 2017 | 2016 | 2015 | 2014 | 2013 |
| Selected Per–Share Data | |||||
| Net asset value, beginning of period | $36.19 | $35.12 | $35.07 | $32.52 | $25.06 |
| Income from Investment Operations | |||||
| Net investment income (loss)A | .28B | .24 | .05 | (.03) | (.01) |
| Net realized and unrealized gain (loss) | 5.43 | .97 | .07 | 2.60 | 7.47 |
| Total from investment operations | 5.71 | 1.21 | .12 | 2.57 | 7.46 |
| Distributions from net investment income | (.30) | (.13) | (.04)C | (.02) | – |
| Distributions from net realized gain | (7.52) | (.01) | (.03)C | – | – |
| Total distributions | (7.81)D | (.14) | (.07) | (.02) | – |
| Net asset value, end of period | $34.09 | $36.19 | $35.12 | $35.07 | $32.52 |
| Total ReturnE,F | 18.97% | 3.49% | .33% | 7.91% | 29.77% |
| Ratios to Average Net AssetsG,H | |||||
| Expenses before reductions | 1.68% | 1.63% | 1.70% | 1.72% | 1.78% |
| Expenses net of fee waivers, if any | 1.68% | 1.63% | 1.69% | 1.72% | 1.78% |
| Expenses net of all reductions | 1.67% | 1.63% | 1.69% | 1.72% | 1.77% |
| Net investment income (loss) | .87%B | .72% | .13% | (.08)% | (.02)% |
| Supplemental Data | |||||
| Net assets, end of period (in millions) | $46 | $44 | $49 | $53 | $54 |
| Portfolio turnover rateI | 46% | 121% | 9% | 6% | 22% |
A Calculated based on average shares outstanding during the period.
B Net Investment income per share reflects a large, non-recurring dividend which amounted to $.11 per share. Excluding this non-recurring dividend, the ratio of net investment income (loss) to average net assets would have been .52%.
C The amounts shown reflect certain reclassifications related to book to tax differences that were made in the year shown.
D Total distributions of $7.81 per share is comprised of distributions from net investment income of $.295 and distributions from net realized gain of $7.517 per share.
E Total returns would have been lower if certain expenses had not been reduced during the applicable periods shown.
F Total returns do not include the effect of the contingent deferred sales charge.
G Fees and expenses of any underlying Fidelity Central Funds are not included in the Fund's expense ratio. The Fund indirectly bears its proportionate share of the expenses of any underlying Fidelity Central Funds.
H Expense ratios reflect operating expenses of the class. Expenses before reductions do not reflect amounts reimbursed by the investment adviser or reductions from brokerage service arrangements or reductions from other expense offset arrangements and do not represent the amount paid by the class during periods when reimbursements or reductions occur. Expenses net of fee waivers reflect expenses after reimbursement by the investment adviser but prior to reductions from brokerage service arrangements or other expense offset arrangements. Expenses net of all reductions represent the net expenses paid by the class.
I Amount does not include the portfolio activity of any underlying Fidelity Central Funds.
See accompanying notes which are an integral part of the financial statements.
Fidelity Advisor Value Strategies Fund
| Years ended November 30, | 2017 | 2016 | 2015 | 2014 | 2013 |
| Selected Per–Share Data | |||||
| Net asset value, beginning of period | $45.17 | $43.72 | $43.56 | $40.28 | $30.89 |
| Income from Investment Operations | |||||
| Net investment income (loss)A | .81B | .76 | .51 | .40 | .37 |
| Net realized and unrealized gain (loss) | 7.01 | 1.21 | .07 | 3.21 | 9.20 |
| Total from investment operations | 7.82 | 1.97 | .58 | 3.61 | 9.57 |
| Distributions from net investment income | (.66) | (.51) | (.39)C | (.33) | (.18) |
| Distributions from net realized gain | (7.52) | (.01) | (.03)C | – | – |
| Total distributions | (8.18) | (.52) | (.42) | (.33) | (.18) |
| Net asset value, end of period | $44.81 | $45.17 | $43.72 | $43.56 | $40.28 |
| Total ReturnD | 20.18% | 4.64% | 1.35% | 9.05% | 31.14% |
| Ratios to Average Net AssetsE,F | |||||
| Expenses before reductions | .62% | .56% | .67% | .69% | .73% |
| Expenses net of fee waivers, if any | .62% | .56% | .67% | .69% | .73% |
| Expenses net of all reductions | .62% | .55% | .66% | .69% | .72% |
| Net investment income (loss) | 1.93%B | 1.79% | 1.16% | .95% | 1.03% |
| Supplemental Data | |||||
| Net assets, end of period (in millions) | $436 | $713 | $716 | $786 | $681 |
| Portfolio turnover rateG | 46% | 121% | 9% | 6% | 22% |
A Calculated based on average shares outstanding during the period.
B Net Investment income per share reflects a large, non-recurring dividend which amounted to $.15 per share. Excluding this non-recurring dividend, the ratio of net investment income (loss) to average net assets would have been 1.57%.
C The amounts shown reflect certain reclassifications related to book to tax differences that were made in the year shown.
D Total returns would have been lower if certain expenses had not been reduced during the applicable periods shown.
E Fees and expenses of any underlying Fidelity Central Funds are not included in the Fund's expense ratio. The Fund indirectly bears its proportionate share of the expenses of any underlying Fidelity Central Funds.
F Expense ratios reflect operating expenses of the class. Expenses before reductions do not reflect amounts reimbursed by the investment adviser or reductions from brokerage service arrangements or reductions from other expense offset arrangements and do not represent the amount paid by the class during periods when reimbursements or reductions occur. Expenses net of fee waivers reflect expenses after reimbursement by the investment adviser but prior to reductions from brokerage service arrangements or other expense offset arrangements. Expenses net of all reductions represent the net expenses paid by the class.
G Amount does not include the portfolio activity of any underlying Fidelity Central Funds.
See accompanying notes which are an integral part of the financial statements.
Fidelity Advisor Value Strategies Fund Class K
| Years ended November 30, | 2017 | 2016 | 2015 | 2014 | 2013 |
| Selected Per–Share Data | |||||
| Net asset value, beginning of period | $45.18 | $43.74 | $43.57 | $40.28 | $30.89 |
| Income from Investment Operations | |||||
| Net investment income (loss)A | .86B | .80 | .58 | .47 | .43 |
| Net realized and unrealized gain (loss) | 7.02 | 1.22 | .07 | 3.20 | 9.18 |
| Total from investment operations | 7.88 | 2.02 | .65 | 3.67 | 9.61 |
| Distributions from net investment income | (.72) | (.57) | (.45)C | (.38) | (.22) |
| Distributions from net realized gain | (7.52) | (.01) | (.03)C | – | – |
| Total distributions | (8.24) | (.58) | (.48) | (.38) | (.22) |
| Net asset value, end of period | $44.82 | $45.18 | $43.74 | $43.57 | $40.28 |
| Total ReturnD | 20.36% | 4.76% | 1.51% | 9.21% | 31.34% |
| Ratios to Average Net AssetsE,F | |||||
| Expenses before reductions | .50% | .44% | .51% | .53% | .58% |
| Expenses net of fee waivers, if any | .50% | .44% | .51% | .53% | .58% |
| Expenses net of all reductions | .49% | .43% | .51% | .53% | .57% |
| Net investment income (loss) | 2.05%B | 1.91% | 1.31% | 1.11% | 1.18% |
| Supplemental Data | |||||
| Net assets, end of period (in millions) | $79 | $68 | $72 | $97 | $119 |
| Portfolio turnover rateG | 46% | 121% | 9% | 6% | 22% |
A Calculated based on average shares outstanding during the period.
B Net Investment income per share reflects a large, non-recurring dividend which amounted to $.15 per share. Excluding this non-recurring dividend, the ratio of net investment income (loss) to average net assets would have been 1.70%.
C The amounts shown reflect certain reclassifications related to book to tax differences that were made in the year shown.
D Total returns would have been lower if certain expenses had not been reduced during the applicable periods shown.
E Fees and expenses of any underlying Fidelity Central Funds are not included in the Fund's expense ratio. The Fund indirectly bears its proportionate share of the expenses of any underlying Fidelity Central Funds.
F Expense ratios reflect operating expenses of the class. Expenses before reductions do not reflect amounts reimbursed by the investment adviser or reductions from brokerage service arrangements or reductions from other expense offset arrangements and do not represent the amount paid by the class during periods when reimbursements or reductions occur. Expenses net of fee waivers reflect expenses after reimbursement by the investment adviser but prior to reductions from brokerage service arrangements or other expense offset arrangements. Expenses net of all reductions represent the net expenses paid by the class.
G Amount does not include the portfolio activity of any underlying Fidelity Central Funds.
See accompanying notes which are an integral part of the financial statements.
Fidelity Advisor Value Strategies Fund Class I
| Years ended November 30, | 2017 | 2016 | 2015 | 2014 | 2013 |
| Selected Per–Share Data | |||||
| Net asset value, beginning of period | $43.07 | $41.71 | $41.57 | $38.46 | $29.51 |
| Income from Investment Operations | |||||
| Net investment income (loss)A | .74B | .70 | .48 | .37 | .34 |
| Net realized and unrealized gain (loss) | 6.64 | 1.15 | .08 | 3.06 | 8.79 |
| Total from investment operations | 7.38 | 1.85 | .56 | 3.43 | 9.13 |
| Distributions from net investment income | (.66) | (.48) | (.39)C | (.32) | (.18) |
| Distributions from net realized gain | (7.52) | (.01) | (.03)C | – | – |
| Total distributions | (8.18) | (.49) | (.42) | (.32) | (.18) |
| Net asset value, end of period | $42.27 | $43.07 | $41.71 | $41.57 | $38.46 |
| Total ReturnD | 20.13% | 4.57% | 1.36% | 9.01% | 31.11% |
| Ratios to Average Net AssetsE,F | |||||
| Expenses before reductions | .67% | .61% | .68% | .71% | .76% |
| Expenses net of fee waivers, if any | .67% | .61% | .68% | .71% | .76% |
| Expenses net of all reductions | .66% | .61% | .68% | .71% | .75% |
| Net investment income (loss) | 1.88%B | 1.74% | 1.14% | .93% | 1.00% |
| Supplemental Data | |||||
| Net assets, end of period (in millions) | $72 | $73 | $65 | $86 | $74 |
| Portfolio turnover rateG | 46% | 121% | 9% | 6% | 22% |
A Calculated based on average shares outstanding during the period.
B Net Investment income per share reflects a large, non-recurring dividend which amounted to $.14 per share. Excluding this non-recurring dividend, the ratio of net investment income (loss) to average net assets would have been 1.53%.
C The amounts shown reflect certain reclassifications related to book to tax differences that were made in the year shown.
D Total returns would have been lower if certain expenses had not been reduced during the applicable periods shown.
E Fees and expenses of any underlying Fidelity Central Funds are not included in the Fund's expense ratio. The Fund indirectly bears its proportionate share of the expenses of any underlying Fidelity Central Funds.
F Expense ratios reflect operating expenses of the class. Expenses before reductions do not reflect amounts reimbursed by the investment adviser or reductions from brokerage service arrangements or reductions from other expense offset arrangements and do not represent the amount paid by the class during periods when reimbursements or reductions occur. Expenses net of fee waivers reflect expenses after reimbursement by the investment adviser but prior to reductions from brokerage service arrangements or other expense offset arrangements. Expenses net of all reductions represent the net expenses paid by the class.
G Amount does not include the portfolio activity of any underlying Fidelity Central Funds.
See accompanying notes which are an integral part of the financial statements.
Notes to Financial Statements
For the period ended November 30, 2017
(Amounts in thousands except percentages)
1. Organization.
Fidelity Advisor Value Strategies Fund (the Fund) is a fund of Fidelity Advisor Series I (the Trust) and is authorized to issue an unlimited number of shares. The Trust is registered under the Investment Company Act of 1940, as amended (the 1940 Act), as an open-end management investment company organized as a Massachusetts business trust. The Fund offers Class A, Class M (formerly Class T), Class C, Fidelity Value Strategies Fund, Class K and Class I shares, each of which has equal rights as to assets and voting privileges. Each class has exclusive voting rights with respect to matters that affect that class.
After the close of business on June 24, 2016, all outstanding Class B shares were converted to Class A shares. All prior fiscal period dollar and share amounts for Class B presented in the Notes to Financial Statements are for the period December 1, 2015 through June 24, 2016.
2. Investments in Fidelity Central Funds.
The Fund invests in Fidelity Central Funds, which are open-end investment companies generally available only to other investment companies and accounts managed by the investment adviser and its affiliates. The Fund's Schedule of Investments lists each of the Fidelity Central Funds held as of period end, if any, as an investment of the Fund, but does not include the underlying holdings of each Fidelity Central Fund. As an Investing Fund, the Fund indirectly bears its proportionate share of the expenses of the underlying Fidelity Central Funds.
The Money Market Central Funds seek preservation of capital and current income and are managed by Fidelity Investments Money Management, Inc. (FIMM), an affiliate of the investment adviser. Annualized expenses of the Money Market Central Funds as of their most recent shareholder report date are less than .005%.
A complete unaudited list of holdings for each Fidelity Central Fund is available upon request or at the Securities and Exchange Commission (the SEC) website at www.sec.gov. In addition, the financial statements of the Fidelity Central Funds, which are not covered by the Fund's Report of Independent Registered Public Accounting Firm, are available on the SEC website or upon request.
3. Significant Accounting Policies.
The Fund is an investment company and applies the accounting and reporting guidance of the Financial Accounting Standards Board (FASB) Accounting Standards Codification Topic 946 Financial Services – Investments Companies. The financial statements have been prepared in conformity with accounting principles generally accepted in the United States of America (GAAP), which require management to make certain estimates and assumptions at the date of the financial statements. Actual results could differ from those estimates. Subsequent events, if any, through the date that the financial statements were issued have been evaluated in the preparation of the financial statements. The following summarizes the significant accounting policies of the Fund:
Investment Valuation. Investments are valued as of 4:00 p.m. Eastern time on the last calendar day of the period. The Board of Trustees (the Board) has delegated the day to day responsibility for the valuation of the Fund's investments to the Fair Value Committee (the Committee) established by the Fund's investment adviser. In accordance with valuation policies and procedures approved by the Board, the Fund attempts to obtain prices from one or more third party pricing vendors or brokers to value its investments. When current market prices, quotations or currency exchange rates are not readily available or reliable, investments will be fair valued in good faith by the Committee, in accordance with procedures adopted by the Board. Factors used in determining fair value vary by investment type and may include market or investment specific events, changes in interest rates and credit quality. The frequency with which these procedures are used cannot be predicted and they may be utilized to a significant extent. The Committee oversees the Fund's valuation policies and procedures and reports to the Board on the Committee's activities and fair value determinations. The Board monitors the appropriateness of the procedures used in valuing the Fund's investments and ratifies the fair value determinations of the Committee.
The Fund categorizes the inputs to valuation techniques used to value its investments into a disclosure hierarchy consisting of three levels as shown below:
- Level 1 – quoted prices in active markets for identical investments
- Level 2 – other significant observable inputs (including quoted prices for similar investments, interest rates, prepayment speeds, etc.)
- Level 3 – unobservable inputs (including the Fund's own assumptions based on the best information available)
Valuation techniques used to value the Fund's investments by major category are as follows:
Equity securities, including restricted securities, for which market quotations are readily available, are valued at the last reported sale price or official closing price as reported by a third party pricing vendor on the primary market or exchange on which they are traded and are categorized as Level 1 in the hierarchy. In the event there were no sales during the day or closing prices are not available, securities are valued at the last quoted bid price or may be valued using the last available price and are generally categorized as Level 2 in the hierarchy. For foreign equity securities, when market or security specific events arise, comparisons to the valuation of American Depositary Receipts (ADRs), futures contracts, Exchange-Traded Funds (ETFs) and certain indexes as well as quoted prices for similar securities may be used and would be categorized as Level 2 in the hierarchy. Utilizing these techniques may result in transfers between Level 1 and Level 2. For equity securities, including restricted securities, where observable inputs are limited, assumptions about market activity and risk are used and these securities may be categorized as Level 3 in the hierarchy.
Debt securities, including restricted securities, are valued based on evaluated prices received from third party pricing vendors or from brokers who make markets in such securities. Corporate bonds are valued by pricing vendors who utilize matrix pricing which considers yield or price of bonds of comparable quality, coupon, maturity and type or by broker-supplied prices. When independent prices are unavailable or unreliable, debt securities may be valued utilizing pricing methodologies which consider similar factors that would be used by third party pricing vendors. Debt securities are generally categorized as Level 2 in the hierarchy but may be Level 3 depending on the circumstances.
Investments in open-end mutual funds, including the Fidelity Central Funds, are valued at their closing net asset value (NAV) each business day and are categorized as Level 1 in the hierarchy.
Changes in valuation techniques may result in transfers in or out of an assigned level within the disclosure hierarchy. The aggregate value of investments by input level as of November 30, 2017 is included at the end of the Fund's Schedule of Investments.
Foreign Currency. The Fund may use foreign currency contracts to facilitate transactions in foreign-denominated securities. Gains and losses from these transactions may arise from changes in the value of the foreign currency or if the counterparties do not perform under the contracts' terms.
Foreign-denominated assets, including investment securities, and liabilities are translated into U.S. dollars at the exchange rates at period end. Purchases and sales of investment securities, income and dividends received and expenses denominated in foreign currencies are translated into U.S. dollars at the exchange rate in effect on the transaction date.
The effects of exchange rate fluctuations on investments are included with the net realized and unrealized gain (loss) on investment securities. Other foreign currency transactions resulting in realized and unrealized gain (loss) are disclosed separately.
Investment Transactions and Income. For financial reporting purposes, the Fund's investment holdings and NAV include trades executed through the end of the last business day of the period. The NAV per share for processing shareholder transactions is calculated as of the close of business of the New York Stock Exchange (NYSE), normally 4:00 p.m. Eastern time and includes trades executed through the end of the prior business day. Gains and losses on securities sold are determined on the basis of identified cost and includes proceeds received from litigation. Dividend income is recorded on the ex-dividend date, except for certain dividends from foreign securities where the ex-dividend date may have passed, which are recorded as soon as the Fund is informed of the ex-dividend date. Non-cash dividends included in dividend income, if any, are recorded at the fair market value of the securities received. Income and capital gain distributions from Fidelity Central Funds, if any, are recorded on the ex-dividend date. Certain distributions received by the Fund represent a return of capital or capital gain. The Fund determines the components of these distributions subsequent to the ex-dividend date, based upon receipt of tax filings or other correspondence relating to the underlying investment. These distributions are recorded as a reduction of cost of investments and/or as a realized gain. Large, non-recurring dividends recognized by the Fund are presented separately on the Statement of Operations as "Special Dividends" and the impact of these dividends is presented in the Financial Highlights. Interest income is accrued as earned and includes coupon interest and amortization of premium and accretion of discount on debt securities as applicable. Investment income is recorded net of foreign taxes withheld where recovery of such taxes is uncertain.
Class Allocations and Expenses. Investment income, realized and unrealized capital gains and losses, common expenses of the Fund, and certain fund-level expense reductions, if any, are allocated daily on a pro-rata basis to each class based on the relative net assets of each class to the total net assets of the Fund. Each class differs with respect to transfer agent and distribution and service plan fees incurred. Certain expense reductions may also differ by class. For the reporting period, the allocated portion of income and expenses to each class as a percent of its average net assets may vary due to the timing of recording these transactions in relation to fluctuating net assets of the classes. Expenses directly attributable to a fund are charged to that fund. Expenses attributable to more than one fund are allocated among the respective funds on the basis of relative net assets or other appropriate methods. Expense estimates are accrued in the period to which they relate and adjustments are made when actual amounts are known.
Income Tax Information and Distributions to Shareholders. Each year, the Fund intends to qualify as a regulated investment company under Subchapter M of the Internal Revenue Code, including distributing substantially all of its taxable income and realized gains. As a result, no provision for U.S. Federal income taxes is required. As of November 30, 2017, the Fund did not have any unrecognized tax benefits in the financial statements; nor is the Fund aware of any tax positions for which it is reasonably possible that the total amounts of unrecognized tax benefits will significantly change in the next twelve months. The Fund files a U.S. federal tax return, in addition to state and local tax returns as required. The Fund's federal income tax returns are subject to examination by the Internal Revenue Service (IRS) for a period of three fiscal years after they are filed. State and local tax returns may be subject to examination for an additional fiscal year depending on the jurisdiction. Foreign taxes are provided for based on the Fund's understanding of the tax rules and rates that exist in the foreign markets in which it invests.
Distributions are declared and recorded on the ex-dividend date. Income dividends and capital gain distributions are declared separately for each class. Income and capital gain distributions are determined in accordance with income tax regulations, which may differ from GAAP. In addition, the Fund claimed a portion of the payment made to redeeming shareholders as a distribution for income tax purposes.
Capital accounts within the financial statements are adjusted for permanent book-tax differences. These adjustments have no impact on net assets or the results of operations. Capital accounts are not adjusted for temporary book-tax differences which will reverse in a subsequent period.
Book-tax differences are primarily due to foreign currency transactions, market discount, deferred trustees compensation, partnerships, and losses deferred due to wash sales.
As of period end, the cost and unrealized appreciation (depreciation) in securities, and derivatives if applicable, for federal income tax purposes were as follows:
| Gross unrealized appreciation | $220,500 |
| Gross unrealized depreciation | (27,398) |
| Net unrealized appreciation (depreciation) | $193,102 |
| Tax Cost | $968,093 |
The tax-based components of distributable earnings as of period end were as follows:
| Undistributed ordinary income | $65,013 |
| Undistributed long-term capital gain | $20,108 |
| Net unrealized appreciation (depreciation) on securities and other investments | $192,824 |
The tax character of distributions paid was as follows:
| November 30, 2017 | November 30, 2016 | |
| Ordinary Income | $18,090 | $ 15,684 |
| Long-term Capital Gains | 229,818 | – |
| Total | $247,908 | $ 15,684 |
4. Purchases and Sales of Investments.
Purchases and sales of securities, other than short-term securities, aggregated $517,038 and $963,540, respectively.
5. Fees and Other Transactions with Affiliates.
Management Fee. Fidelity Management & Research Company (the investment adviser) and its affiliates provide the Fund with investment management related services for which the Fund pays a monthly management fee. The management fee is the sum of an individual fund fee rate that is based on an annual rate of .30% of the Fund's average net assets and an annualized group fee rate that averaged .25% during the period. The group fee rate is based upon the average net assets of all the mutual funds advised by the investment adviser, including any mutual funds previously advised by the investment adviser that are currently advised by Fidelity SelectCo, LLC, an affiliate of the investment adviser. The group fee rate decreases as assets under management increase and increases as assets under management decrease. In addition, the management fee is subject to a performance adjustment (up to a maximum of +/- .20% of the Fund's average net assets over a 36 month performance period). The upward or downward adjustment to the management fee is based on the relative investment performance of Fidelity Value Strategies Fund as compared to its benchmark index, the Russell Midcap Value Index, over the same 36 month performance period. For the reporting period, the total annual management fee rate, including the performance adjustment, was .40% of the Fund's average net assets. The performance adjustment included in the management fee rate may be higher or lower than the maximum performance adjustment rate due to the difference between the average net assets for the reporting and performance periods.
Distribution and Service Plan Fees. In accordance with Rule 12b-1 of the 1940 Act, the Fund has adopted separate Distribution and Service Plans for each class of shares. Certain classes pay Fidelity Distributors Corporation (FDC), an affiliate of the investment adviser, separate Distribution and Service Fees, each of which is based on an annual percentage of each class' average net assets. In addition, FDC may pay financial intermediaries for selling shares of the Fund and providing shareholder support services. For the period, the Distribution and Service Fee rates, total fees and amounts retained by FDC were as follows:
| Distribution Fee | Service Fee | Total Fees | Retained by FDC | |
| Class A | -% | .25% | $512 | $3 |
| Class M | .25% | .25% | 1,325 | 10 |
| Class C | .75% | .25% | 450 | 9 |
| $2,287 | $22 |
Sales Load. FDC may receive a front-end sales charge of up to 5.75% for selling Class A shares and 3.50% for selling Class M shares, some of which is paid to financial intermediaries for selling shares of the Fund. Depending on the holding period, FDC may receive contingent deferred sales charges levied on Class A, Class M and Class C redemptions. The deferred sales charges are 1.00% for Class C shares, 1.00% for certain purchases of Class A shares and .25% for certain purchases of Class M shares.
For the period, sales charge amounts retained by FDC were as follows:
| Retained by FDC | |
| Class A | $17 |
| Class M | 6 |
| Class C(a) | 1 |
| $24 |
(a) When Class C shares are initially sold, FDC pays commissions from its own resources to financial intermediaries through which the sales are made.
Transfer Agent Fees. Fidelity Investments Institutional Operations Company, Inc., (FIIOC), an affiliate of the investment adviser, is the transfer, dividend disbursing and shareholder servicing agent for each class of the Fund. FIIOC receives account fees and asset-based fees that vary according to the account size and type of account of the shareholders of the respective classes of the Fund, except for Class K. FIIOC receives an asset-based fee of Class K's average net assets. FIIOC pays for typesetting, printing and mailing of shareholder reports, except proxy statements.
For the period, transfer agent fees for each class were as follows:
| Amount | % of Class-Level Average Net Assets | |
| Class A | $424 | .21 |
| Class M | 485 | .18 |
| Class C | 103 | .23 |
| Fidelity Value Strategies Fund | 806 | .17 |
| Class K | 31 | .05 |
| Class I | 161 | .22 |
| $2,010 |
Accounting and Security Lending Fees. Fidelity Service Company, Inc. (FSC), an affiliate of the investment adviser, maintains the Fund's accounting records. The accounting fee is based on the level of average net assets for each month. Under a separate contract, FSC administers the security lending program. The security lending fee is based on the number and duration of lending transactions.
Brokerage Commissions. The Fund placed a portion of its portfolio transactions with brokerage firms which are affiliates of the investment adviser. Brokerage commissions are included in net realized gain (loss) and change in net unrealized appreciation (depreciation) in the Statement of Operations. The commissions paid to these affiliated firms were $26 for the period.
Interfund Lending Program. Pursuant to an Exemptive Order issued by the SEC, the Fund, along with other registered investment companies having management contracts with Fidelity Management & Research Company (FMR) or other affiliated entities of FMR, may participate in an interfund lending program. This program provides an alternative credit facility allowing the funds to borrow from, or lend money to, other participating affiliated funds. At period end, there were no interfund loans outstanding. The Fund's activity in this program during the period for which loans were outstanding was as follows:
| Borrower or Lender | Average Loan Balance | Weighted Average Interest Rate | Interest Expense |
| Borrower | $12,437 | .89% | $4 |
Interfund Trades. The Fund may purchase from or sell securities to other Fidelity Funds under procedures adopted by the Board. The procedures have been designed to ensure these interfund trades are executed in accordance with Rule 17a-7 of the 1940 Act. Interfund trades are included within the respective purchases and sales amounts shown in the Purchases and Sales of Investments note.
6. Committed Line of Credit.
The Fund participates with other funds managed by the investment adviser or an affiliate in a $4.25 billion credit facility (the "line of credit") to be utilized for temporary or emergency purposes to fund shareholder redemptions or for other short-term liquidity purposes. The Fund has agreed to pay commitment fees on its pro-rata portion of the line of credit, which amounted to $4 and is reflected in Miscellaneous expenses on the Statement of Operations. During the period, the Fund did not borrow on this line of credit.
7. Security Lending.
The Fund lends portfolio securities through a lending agent from time to time in order to earn additional income. For equity securities, a lending agent is used and may loan securities to certain qualified borrowers, including Fidelity Capital Markets (FCM), a broker-dealer affiliated with the Fund. On the settlement date of the loan, the Fund receives collateral (in the form of U.S. Treasury obligations, letters of credit and/or cash) against the loaned securities and maintains collateral in an amount not less than 100% of the market value of the loaned securities during the period of the loan. The market value of the loaned securities is determined at the close of business of the Fund and any additional required collateral is delivered to the Fund on the next business day. The Fund or borrower may terminate the loan at any time, and if the borrower defaults on its obligation to return the securities loaned because of insolvency or other reasons, the Fund may apply collateral received from the borrower against the obligation. The Fund may experience delays and costs in recovering the securities loaned. Any cash collateral received is invested in the Fidelity Securities Lending Cash Central Fund. The value of loaned securities and cash collateral at period end are disclosed on the Fund's Statement of Assets and Liabilities. At period end, there were no security loans outstanding with FCM. Security lending income represents the income earned on investing cash collateral, less rebates paid to borrowers and any lending agent fees associated with the loan, plus any premium payments received for lending certain types of securities. Security lending income is presented in the Statement of Operations as a component of income from Fidelity Central Funds. Total security lending income during the period amounted to $406, including $6 from securities loaned to FCM.
8. Bank Borrowings.
The Fund is permitted to have bank borrowings for temporary or emergency purposes to fund shareholder redemptions or for other short-term liquidity requirements. The Fund has established borrowing arrangements with certain banks. The interest rate on the borrowings is the bank's base rate, as revised from time to time. The average loan balance during the period for which loans were outstanding amounted to $5,859. The weighted average interest rate was 1.16%. The interest expense amounted to $1 under the bank borrowing program. At period end, there were no bank borrowings outstanding.
9. Expense Reductions.
Commissions paid to certain brokers with whom the investment adviser, or its affiliates, places trades on behalf of the Fund include an amount in addition to trade execution, which may be rebated back to the Fund to offset certain expenses. This amount totaled $58 for the period.
In addition, during the period the investment adviser reimbursed and/or waived a portion of fund-level operating expenses in the amount of $12.
10. Distributions to Shareholders.
Distributions to shareholders of each class were as follows:
| Year ended November 30, 2017 | Year ended November 30, 2016 | |
| From net investment income | ||
| Class A | $2,766 | $2,186 |
| Class M | 2,831 | 2,155 |
| Class C | 357 | 187 |
| Fidelity Value Strategies Fund | 9,926 | 9,139 |
| Class K | 1,087 | 955 |
| Class I | 1,123 | 746 |
| Total | $18,090 | $15,368 |
| From net realized gain | ||
| Class A | $37,462 | $49 |
| Class M | 46,673 | 65 |
| Class C | 9,088 | 13 |
| Fidelity Value Strategies Fund | 112,547 | 160 |
| Class K | 11,298 | 15 |
| Class I | 12,750 | 14 |
| Total | $229,818 | $316 |
11. Share Transactions.
Share transactions for each class were as follows and may contain automatic conversions between classes or exchanges between affiliated funds:
| Shares | Shares | Dollars | Dollars | |
| Year ended November 30, 2017 | Year ended November 30, 2016 | Year ended November 30, 2017 | Year ended November 30, 2016 | |
| Class A | ||||
| Shares sold | 296 | 471 | $10,638 | $17,474 |
| Reinvestment of distributions | 1,127 | 58 | 37,943 | 2,110 |
| Shares redeemed | (1,026) | (998) | (36,865) | (37,279) |
| Net increase (decrease) | 397 | (469) | $11,716 | $(17,695) |
| Class M | ||||
| Shares sold | 349 | 349 | $13,029 | $13,447 |
| Reinvestment of distributions | 1,294 | 54 | 45,666 | 2,045 |
| Shares redeemed | (1,277) | (1,385) | (48,234) | (53,890) |
| Net increase (decrease) | 366 | (982) | $10,461 | $(38,398) |
| Class B | ||||
| Shares sold | – | – | $– | $9 |
| Shares redeemed | – | (110) | – | (3,723) |
| Net increase (decrease) | – | (110) | $– | $(3,714) |
| Class C | ||||
| Shares sold | 89 | 78 | $2,827 | $2,605 |
| Reinvestment of distributions | 307 | 6 | 9,116 | 191 |
| Shares redeemed | (264) | (263) | (8,379) | (8,759) |
| Net increase (decrease) | 132 | (179) | $3,564 | $(5,963) |
| Fidelity Value Strategies Fund | ||||
| Shares sold | 1,169 | 9,301 | $50,402 | $395,357 |
| Reinvestment of distributions | 2,966 | 182 | 114,742 | 7,409 |
| Shares redeemed | (10,188) | (10,077) | (409,648) | (417,147) |
| Net increase (decrease) | (6,053) | (594) | $(244,504) | $(14,381) |
| Class K | ||||
| Shares sold | 617 | 480 | $26,514 | $20,396 |
| Reinvestment of distributions | 321 | 24 | 12,384 | 970 |
| Shares redeemed | (665) | (644) | (27,215) | (27,300) |
| Net increase (decrease) | 273 | (140) | $11,683 | $(5,934) |
| Class I | ||||
| Shares sold | 459 | 445 | $17,823 | $18,090 |
| Reinvestment of distributions | 339 | 19 | 12,386 | 723 |
| Shares redeemed | (774) | (330) | (30,001) | (13,236) |
| Net increase (decrease) | 24 | 134 | $208 | $5,577 |
12. Other.
The Fund's organizational documents provide former and current trustees and officers with a limited indemnification against liabilities arising in connection with the performance of their duties to the Fund. In the normal course of business, the Fund may also enter into contracts that provide general indemnifications. The Fund's maximum exposure under these arrangements is unknown as this would be dependent on future claims that may be made against the Fund. The risk of material loss from such claims is considered remote.
Report of Independent Registered Public Accounting Firm
To the Trustees of Fidelity Advisor Series I and Shareholders of Fidelity Advisor Value Strategies Fund:
We have audited the accompanying statement of assets and liabilities of Fidelity Advisor Value Strategies Fund (the Fund), a fund of Fidelity Advisor Series I, including the schedule of investments, as of November 30, 2017, and the related statement of operations for the year then ended, the statement of changes in net assets for each of the two years in the period then ended, and the financial highlights for each of the five years in the period then ended. These financial statements and financial highlights are the responsibility of the Fund's management. Our responsibility is to express an opinion on these financial statements and financial highlights based on our audits.
We conducted our audits in accordance with the standards of the Public Company Accounting Oversight Board (United States). Those standards require that we plan and perform the audit to obtain reasonable assurance about whether the financial statements and financial highlights are free of material misstatement. The Fund is not required to have, nor were we engaged to perform, an audit of its internal control over financial reporting. Our audits included consideration of internal control over financial reporting as a basis for designing audit procedures that are appropriate in the circumstances, but not for the purpose of expressing an opinion on the effectiveness of the Fund's internal control over financial reporting. Accordingly, we express no such opinion. An audit also includes examining, on a test basis, evidence supporting the amounts and disclosures in the financial statements, assessing the accounting principles used and significant estimates made by management, as well as evaluating the overall financial statement presentation. Our procedures included confirmation of securities owned as of November 30, 2017, by correspondence with the custodians and brokers; when replies were not received from brokers, we performed other auditing procedures. We believe that our audits provide a reasonable basis for our opinion.
In our opinion, such financial statements and financial highlights referred to above present fairly, in all material respects, the financial position of Fidelity Advisor Value Strategies Fund as of November 30, 2017, the results of its operations for the year then ended, the changes in its net assets for each of the two years in the period then ended, and the financial highlights for each of the five years in the period then ended, in conformity with accounting principles generally accepted in the United States of America.
DELOITTE & TOUCHE LLP
Boston, Massachusetts
January 16, 2018
Trustees and Officers
The Trustees, Members of the Advisory Board (if any), and officers of the trust and fund, as applicable, are listed below. The Board of Trustees governs the fund and is responsible for protecting the interests of shareholders. The Trustees are experienced executives who meet periodically throughout the year to oversee the fund's activities, review contractual arrangements with companies that provide services to the fund, oversee management of the risks associated with such activities and contractual arrangements, and review the fund's performance. Each of the Trustees oversees 190 funds.
The Trustees hold office without limit in time except that (a) any Trustee may resign; (b) any Trustee may be removed by written instrument, signed by at least two-thirds of the number of Trustees prior to such removal; (c) any Trustee who requests to be retired or who has become incapacitated by illness or injury may be retired by written instrument signed by a majority of the other Trustees; and (d) any Trustee may be removed at any special meeting of shareholders by a two-thirds vote of the outstanding voting securities of the trust. Each Trustee who is not an interested person (as defined in the 1940 Act) of the trust and the fund is referred to herein as an Independent Trustee. Each Independent Trustee shall retire not later than the last day of the calendar year in which his or her 75th birthday occurs. The Independent Trustees may waive this mandatory retirement age policy with respect to individual Trustees. Officers and Advisory Board Members hold office without limit in time, except that any officer or Advisory Board Member may resign or may be removed by a vote of a majority of the Trustees at any regular meeting or any special meeting of the Trustees. Except as indicated, each individual has held the office shown or other offices in the same company for the past five years.
The fund’s Statement of Additional Information (SAI) includes more information about the Trustees. To request a free copy, call Fidelity at 1-800-835-5092.
Experience, Skills, Attributes, and Qualifications of the Trustees. The Governance and Nominating Committee has adopted a statement of policy that describes the experience, qualifications, attributes, and skills that are necessary and desirable for potential Independent Trustee candidates (Statement of Policy). The Board believes that each Trustee satisfied at the time he or she was initially elected or appointed a Trustee, and continues to satisfy, the standards contemplated by the Statement of Policy. The Governance and Nominating Committee also engages professional search firms to help identify potential Independent Trustee candidates who have the experience, qualifications, attributes, and skills consistent with the Statement of Policy. From time to time, additional criteria based on the composition and skills of the current Independent Trustees, as well as experience or skills that may be appropriate in light of future changes to board composition, business conditions, and regulatory or other developments, have also been considered by the professional search firms and the Governance and Nominating Committee. In addition, the Board takes into account the Trustees' commitment and participation in Board and committee meetings, as well as their leadership of standing and ad hoc committees throughout their tenure.
In determining that a particular Trustee was and continues to be qualified to serve as a Trustee, the Board has considered a variety of criteria, none of which, in isolation, was controlling. The Board believes that, collectively, the Trustees have balanced and diverse experience, qualifications, attributes, and skills, which allow the Board to operate effectively in governing the fund and protecting the interests of shareholders. Information about the specific experience, skills, attributes, and qualifications of each Trustee, which in each case led to the Board's conclusion that the Trustee should serve (or continue to serve) as a trustee of the fund, is provided below.
Board Structure and Oversight Function. James C. Curvey is an interested person and currently serves as Chairman. The Trustees have determined that an interested Chairman is appropriate and benefits shareholders because an interested Chairman has a personal and professional stake in the quality and continuity of services provided to the fund. Independent Trustees exercise their informed business judgment to appoint an individual of their choosing to serve as Chairman, regardless of whether the Trustee happens to be independent or a member of management. The Independent Trustees have determined that they can act independently and effectively without having an Independent Trustee serve as Chairman and that a key structural component for assuring that they are in a position to do so is for the Independent Trustees to constitute a substantial majority for the Board. The Independent Trustees also regularly meet in executive session. Ned C. Lautenbach serves as Chairman of the Independent Trustees and as such (i) acts as a liaison between the Independent Trustees and management with respect to matters important to the Independent Trustees and (ii) with management prepares agendas for Board meetings.
Fidelity® funds are overseen by different Boards of Trustees. The fund's Board oversees Fidelity's high income and certain equity funds, and other Boards oversee Fidelity's investment-grade bond, money market, asset allocation, and sector funds. The asset allocation funds may invest in Fidelity® funds overseen by the fund's Board. The use of separate Boards, each with its own committee structure, allows the Trustees of each group of Fidelity® funds to focus on the unique issues of the funds they oversee, including common research, investment, and operational issues. On occasion, the separate Boards establish joint committees to address issues of overlapping consequences for the Fidelity® funds overseen by each Board.
The Trustees operate using a system of committees to facilitate the timely and efficient consideration of all matters of importance to the Trustees, the fund, and fund shareholders and to facilitate compliance with legal and regulatory requirements and oversight of the fund's activities and associated risks. The Board, acting through its committees, has charged FMR and its affiliates with (i) identifying events or circumstances the occurrence of which could have demonstrably adverse effects on the fund's business and/or reputation; (ii) implementing processes and controls to lessen the possibility that such events or circumstances occur or to mitigate the effects of such events or circumstances if they do occur; and (iii) creating and maintaining a system designed to evaluate continuously business and market conditions in order to facilitate the identification and implementation processes described in (i) and (ii) above. Because the day-to-day operations and activities of the fund are carried out by or through FMR, its affiliates, and other service providers, the fund's exposure to risks is mitigated but not eliminated by the processes overseen by the Trustees. While each of the Board's committees has responsibility for overseeing different aspects of the fund's activities, oversight is exercised primarily through the Operations, Audit, and Compliance Committees. In addition, the Independent Trustees have worked with FMR to enhance the Board's oversight of investment and financial risks, legal and regulatory risks, technology risks, and operational risks, including the development of additional risk reporting to the Board. For example, a working group comprised of Independent Trustees and FMR has worked and continues to work to review the Fidelity® funds' valuation-related activities, reporting and risk management. Appropriate personnel, including but not limited to the fund's Chief Compliance Officer (CCO), FMR's internal auditor, the independent accountants, the fund's Treasurer and portfolio management personnel, make periodic reports to the Board's committees, as appropriate, including an annual review of Fidelity's risk management program for the Fidelity® funds. The responsibilities of each standing committee, including their oversight responsibilities, are described further under "Standing Committees of the Trustees."
Interested Trustees*:
Correspondence intended for a Trustee who is an interested person may be sent to Fidelity Investments, 245 Summer Street, Boston, Massachusetts 02210.
Name, Year of Birth; Principal Occupations and Other Relevant Experience+
James C. Curvey (1935)
Year of Election or Appointment: 2007
Trustee
Chairman of the Board of Trustees
Mr. Curvey also serves as Trustee of other Fidelity® funds. Mr. Curvey is a Director of Fidelity Research & Analysis Co. (investment adviser firm, 2009-present), and Vice Chairman (2007-present) and Director of FMR LLC (diversified financial services company). In addition, Mr. Curvey serves as an Overseer for the Boston Symphony Orchestra and a member of the board of Artis-Naples, Naples, Florida, and as a Trustee for Brewster Academy, Wolfeboro, New Hampshire. Previously, Mr. Curvey served as a Director of Fidelity Investments Money Management, Inc. (investment adviser firm, 2009-2014) and a Director of FMR and FMR Co., Inc. (investment adviser firms, 2007-2014).
Charles S. Morrison (1960)
Year of Election or Appointment: 2014
Trustee
Mr. Morrison also serves as Trustee of other funds. He serves as President of Fidelity Management & Research Company (FMR) (investment adviser firm, 2016-present), a Director of Fidelity Investments Money Management, Inc. (FIMM) (investment adviser firm, 2014-present), Director of Fidelity SelectCo, LLC (investment adviser firm, 2014-present), President, Asset Management (2014-present), and is an employee of Fidelity Investments. Previously, Mr. Morrison served as Vice President of Fidelity's Fixed Income and Asset Allocation Funds (2012-2014), President, Fixed Income (2011-2014), Vice President of Fidelity's Money Market Funds (2005-2009), President, Money Market Group Leader of FMR (investment adviser firm, 2009), and Senior Vice President, Money Market Group of FMR (2004-2009). Mr. Morrison also served as Vice President of Fidelity's Bond Funds (2002-2005), certain Balanced Funds (2002-2005), and certain Asset Allocation Funds (2002-2007), and as Senior Vice President (2002-2005) of Fidelity's Bond Division.
* Determined to be an “Interested Trustee” by virtue of, among other things, his or her affiliation with the trust or various entities under common control with FMR.
+ The information includes the Trustee's principal occupation during the last five years and other information relating to the experience, attributes, and skills relevant to the Trustee's qualifications to serve as a Trustee, which led to the conclusion that the Trustee should serve as a Trustee for the fund.
Independent Trustees:
Correspondence intended for an Independent Trustee may be sent to Fidelity Investments, P.O. Box 55235, Boston, Massachusetts 02205-5235.
Name, Year of Birth; Principal Occupations and Other Relevant Experience+
Dennis J. Dirks (1948)
Year of Election or Appointment: 2005
Trustee
Mr. Dirks also serves as Trustee of other Fidelity® funds. Prior to his retirement in May 2003, Mr. Dirks was Chief Operating Officer and a member of the Board of The Depository Trust & Clearing Corporation (DTCC). He also served as President, Chief Operating Officer, and Board member of The Depository Trust Company (DTC) and President and Board member of the National Securities Clearing Corporation (NSCC). In addition, Mr. Dirks served as Chief Executive Officer and Board member of the Government Securities Clearing Corporation, Chief Executive Officer and Board member of the Mortgage-Backed Securities Clearing Corporation, as a Trustee and a member of the Finance Committee of Manhattan College (2005-2008), as a Trustee and a member of the Finance Committee of AHRC of Nassau County (2006-2008), as a member of the Independent Directors Council (IDC) Governing Council (2010-2015), and as a member of the Board of Directors for The Brookville Center for Children’s Services, Inc. (2009-2017). Mr. Dirks is a member of the Finance Committee (2016-present) and Board of Directors (2017-present) of the Asolo Repertory Theatre.
Alan J. Lacy (1953)
Year of Election or Appointment: 2008
Trustee
Mr. Lacy also serves as Trustee of other Fidelity® funds. Mr. Lacy serves as a Director of Bristol-Myers Squibb Company (global pharmaceuticals, 2008-present). He is a Trustee of the California Chapter of The Nature Conservancy (2015-present) and a Director of the Center for Advanced Study in the Behavioral Sciences at Stanford University (2015-present). In addition, Mr. Lacy served as Senior Adviser (2007-2014) of Oak Hill Capital Partners, L.P. (private equity) and also served as Chief Executive Officer (2005) and Vice Chairman (2005-2006) of Sears Holdings Corporation (retail) and Chief Executive Officer and Chairman of the Board of Sears, Roebuck and Co. (retail, 2000-2005). Previously, Mr. Lacy served as Chairman (2014-2017) and a member (2010-2017) of the Board of Directors of Dave & Buster’s Entertainment, Inc. (restaurant and entertainment complexes), as Chairman (2008-2011) and a member (2006-2015) of the Board of Trustees of the National Parks Conservation Association, and as a member of the Board of Directors for The Hillman Companies, Inc. (hardware wholesalers, 2010-2014), Earth Fare, Inc. (retail grocery, 2010-2014), and The Western Union Company (global money transfer, 2006-2011).
Ned C. Lautenbach (1944)
Year of Election or Appointment: 2000
Trustee
Chairman of the Independent Trustees
Mr. Lautenbach also serves as Trustee of other Fidelity® funds. Mr. Lautenbach currently serves as Vice Chair of the Board of Governors, State University System of Florida (2013-present) and is a member of the Council on Foreign Relations (1994-present). He is also a member and has most recently served as Chairman of the Board of Directors of Artis-Naples (2012-present). Previously, Mr. Lautenbach served as a member and then Lead Director of the Board of Directors of Eaton Corporation (diversified industrial, 1997-2016). He was also a Partner and Advisory Partner at Clayton, Dubilier & Rice, LLC (private equity investment, 1998-2010), as well as a Director of Sony Corporation (2006-2007). In addition, Mr. Lautenbach also had a 30-year career with IBM (technology company) during which time he served as Senior Vice President and a member of the Corporate Executive Committee (1968-1998).
Joseph Mauriello (1944)
Year of Election or Appointment: 2008
Trustee
Mr. Mauriello also serves as Trustee of other Fidelity® funds. Prior to his retirement in January 2006, Mr. Mauriello served in numerous senior management positions including Deputy Chairman and Chief Operating Officer (2004-2005), and Vice Chairman of Financial Services (2002-2004) of KPMG LLP US (professional services, 1965-2005). Mr. Mauriello currently serves as a member of the Board of Directors of XL Group plc. (global insurance and re-insurance, 2006-present) and the Independent Directors Council (IDC) Governing Council (2015-present). Previously, Mr. Mauriello served as a Director of the Hamilton Funds of the Bank of New York (2006-2007) and of Arcadia Resources Inc. (health care services and products, 2007-2012).
Cornelia M. Small (1944)
Year of Election or Appointment: 2005
Trustee
Ms. Small also serves as Trustee of other Fidelity® funds. Ms. Small is a member of the Board of Directors (2009-present) and Chair of the Investment Committee (2010-present) of the Teagle Foundation. Ms. Small also serves on the Investment Committee of the Berkshire Taconic Community Foundation (2008-present). Previously, Ms. Small served as Chairperson (2002-2008) and a member of the Investment Committee and Chairperson (2008-2012) and a member of the Board of Trustees of Smith College. In addition, Ms. Small served as Chief Investment Officer, Director of Global Equity Investments, and a member of the Board of Directors of Scudder, Stevens & Clark and Scudder Kemper Investments.
William S. Stavropoulos (1939)
Year of Election or Appointment: 2002
Trustee
Vice Chairman of the Independent Trustees
Mr. Stavropoulos also serves as Trustee of other Fidelity® funds. Mr. Stavropoulos serves as President and Founder of the Michigan Baseball Foundation, the Great Lakes Loons (2007-present). Mr. Stavropoulos is Chairman Emeritus of the Board of Directors of The Dow Chemical Company, where he previously served in numerous senior management positions, including President, CEO (1995-2000; 2002-2004), Chairman of the Executive Committee (2000-2006), and as a member of the Board of Directors (1990-2006). Currently, Mr. Stavropoulos is Chairman of the Board of Directors of Univar Inc. (global distributor of commodity and specialty chemicals), a Director of Teradata Corporation (data warehousing and technology solutions), and a member of the Advisory Board for Metalmark Capital LLC (private equity investment, 2005-present). Mr. Stavropoulos is an operating advisor to Clayton, Dubilier & Rice, LLC (private equity investment). In addition, Mr. Stavropoulos is a member of the University of Notre Dame Advisory Council for the College of Science, a Trustee of the Rollin L. Gerstacker Foundation, and a Director of Artis-Naples in Naples, Florida. Previously, Mr. Stavropoulos served as a Director of Chemical Financial Corporation (bank holding company, 1993-2012) and Tyco International, Ltd. (multinational manufacturing and services, 2007-2012).
David M. Thomas (1949)
Year of Election or Appointment: 2008
Trustee
Mr. Thomas also serves as Trustee of other Fidelity® funds. Mr. Thomas serves as Non-Executive Chairman of the Board of Directors of Fortune Brands Home and Security (home and security products, 2011-present), as a member of the Board of Directors (2004-present) and Presiding Director (2013-present) of Interpublic Group of Companies, Inc. (marketing communication), and as a member of the Board of Trustees of the University of Florida (2013-present). Previously, Mr. Thomas served as Executive Chairman (2005-2006) and Chairman and Chief Executive Officer (2000-2005) of IMS Health, Inc. (pharmaceutical and healthcare information solutions), and a Director of Fortune Brands, Inc. (consumer products, 2000-2011).
+ The information includes the Trustee's principal occupation during the last five years and other information relating to the experience, attributes, and skills relevant to the Trustee's qualifications to serve as a Trustee, which led to the conclusion that the Trustee should serve as a Trustee for the fund.
Advisory Board Members and Officers:
Correspondence intended for an officer or Peter S. Lynch may be sent to Fidelity Investments, 245 Summer Street, Boston, Massachusetts 02210. Officers appear below in alphabetical order.
Name, Year of Birth; Principal Occupation
Peter S. Lynch (1944)
Year of Election or Appointment: 2003
Member of the Advisory Board
Mr. Lynch also serves as Member of the Advisory Board of other Fidelity® funds. Mr. Lynch is Vice Chairman and a Director of FMR (investment adviser firm) and FMR Co., Inc. (investment adviser firm). In addition, Mr. Lynch serves as a Trustee of Boston College and as the Chairman of the Inner-City Scholarship Fund. Previously, Mr. Lynch served on the Special Olympics International Board of Directors (1997-2006).
Elizabeth Paige Baumann (1968)
Year of Election or Appointment: 2017
Anti-Money Laundering (AML) Officer
Ms. Baumann also serves as AML Officer of other funds. She is Chief AML Officer (2012-present) and Senior Vice President (2014-present) of FMR LLC (diversified financial services company) and is an employee of Fidelity Investments. Previously, Ms. Baumann served as AML Officer of the funds (2012-2016), and Vice President (2007-2014) and Deputy Anti-Money Laundering Officer (2007-2012) of FMR LLC.
Marc R. Bryant (1966)
Year of Election or Appointment: 2015
Secretary and Chief Legal Officer (CLO)
Mr. Bryant also serves as Secretary and CLO of other funds. Mr. Bryant serves as CLO, Secretary, and Senior Vice President of Fidelity Management & Research Company (investment adviser firm, 2015-present) and FMR Co., Inc. (investment adviser firm, 2015-present); Secretary of Fidelity SelectCo, LLC (investment adviser firm, 2015-present) and Fidelity Investments Money Management, Inc. (investment adviser firm, 2015-present); and CLO of Fidelity Management & Research (Hong Kong) Limited and FMR Investment Management (UK) Limited (investment adviser firms, 2015-present) and Fidelity Management & Research (Japan) Limited (investment adviser firm, 2016-present). He is Senior Vice President and Deputy General Counsel of FMR LLC (diversified financial services company). Previously, Mr. Bryant served as Secretary and CLO of Fidelity Rutland Square Trust II (2010-2014) and Assistant Secretary of Fidelity's Fixed Income and Asset Allocation Funds (2013-2015). Prior to joining Fidelity Investments, Mr. Bryant served as a Senior Vice President and the Head of Global Retail Legal for AllianceBernstein L.P. (2006-2010), and as the General Counsel for ProFund Advisors LLC (2001-2006).
William C. Coffey (1969)
Year of Election or Appointment: 2009
Assistant Secretary
Mr. Coffey also serves as Assistant Secretary of other funds. He is Senior Vice President and Deputy General Counsel of FMR LLC (diversified financial services company, 2010-present), and is an employee of Fidelity Investments. Previously, Mr. Coffey served as Vice President and Associate General Counsel of FMR LLC (2005-2009).
Jonathan Davis (1968)
Year of Election or Appointment: 2010
Assistant Treasurer
Mr. Davis also serves as Assistant Treasurer of other funds. Mr. Davis serves as Assistant Treasurer of FMR Capital, Inc. (2017-present) and is an employee of Fidelity Investments. Previously, Mr. Davis served as Vice President and Associate General Counsel of FMR LLC (diversified financial services company, 2003-2010).
Adrien E. Deberghes (1967)
Year of Election or Appointment: 2016
Assistant Treasurer
Mr. Deberghes also serves as an officer of other funds. He serves as Assistant Treasurer of FMR Capital, Inc. (2017-present), Executive Vice President of Fidelity Investments Money Management, Inc. (FIMM) (investment adviser firm, 2016-present), and is an employee of Fidelity Investments (2008-present). Prior to joining Fidelity Investments, Mr. Deberghes was Senior Vice President of Mutual Fund Administration at State Street Corporation (2007-2008), Senior Director of Mutual Fund Administration at Investors Bank & Trust (2005-2007), and Director of Finance for Dunkin' Brands (2000-2005). Previously, Mr. Deberghes served in other fund officer roles.
Stephanie J. Dorsey (1969)
Year of Election or Appointment: 2010
Assistant Treasurer
Ms. Dorsey also serves as an officer of other funds. Ms. Dorsey serves as Assistant Treasurer of FMR Capital, Inc. (2017-present), is an employee of Fidelity Investments (2008-present), and has served in other fund officer roles. Prior to joining Fidelity Investments, Ms. Dorsey served as Treasurer (2004-2008) of the JPMorgan Mutual Funds and Vice President (2004-2008) of JPMorgan Chase Bank.
Howard J. Galligan III (1966)
Year of Election or Appointment: 2014
Chief Financial Officer
Mr. Galligan also serves as Chief Financial Officer of other funds. Mr. Galligan serves as President of Fidelity Pricing and Cash Management Services (FPCMS) (2014-present) and as a Director of Strategic Advisers, Inc. (investment adviser firm, 2008-present). Previously, Mr. Galligan served as Chief Administrative Officer of Asset Management (2011-2014) and Chief Operating Officer and Senior Vice President of Investment Support for Strategic Advisers, Inc. (2003-2011).
Thomas C. Hense (1964)
Year of Election or Appointment: 2008, 2010, or 2015
Vice President
Mr. Hense serves as Vice President of Fidelity Advisor® Multi-Asset Income Fund (2015) and other funds (High Income (2008), Small Cap (2008), and Value (2010) funds), and is an employee of Fidelity Investments (1993-present). Previously, Mr. Hense served as a portfolio manager for Fidelity's Institutional Money Management Group (Pyramis) (2003-2008).
Brian B. Hogan (1964)
Year of Election or Appointment: 2009
Vice President
Mr. Hogan also serves as Trustee or Vice President of other funds. Mr. Hogan serves as a Director of FMR Investment Management (UK) Limited (investment adviser firm, 2015-present) and Fidelity SelectCo, LLC (investment adviser firm, 2014-present) and President of the Equity Division of FMR (investment adviser firm, 2009-present). Previously, Mr. Hogan served as Senior Vice President, Equity Research of FMR (2006-2009) and as a portfolio manager. Mr. Brian B. Hogan is not related to Mr. Colm A. Hogan.
Colm A. Hogan (1973)
Year of Election or Appointment: 2016
Deputy Treasurer
Mr. Hogan also serves as an officer of other funds. Mr. Hogan serves as Assistant Treasurer of FMR Capital, Inc. (2017-present) and is an employee of Fidelity Investments (2005-present). Mr. Colm A. Hogan is not related to Mr. Brian B. Hogan.
Chris Maher (1972)
Year of Election or Appointment: 2013
Assistant Treasurer
Mr. Maher serves as Assistant Treasurer of other funds. Mr. Maher is Vice President of Valuation Oversight, serves as Assistant Treasurer of FMR Capital, Inc. (2017-present), and is an employee of Fidelity Investments. Previously, Mr. Maher served as Vice President of Asset Management Compliance (2013), Vice President of the Program Management Group of FMR (investment adviser firm, 2010-2013), and Vice President of Valuation Oversight (2008-2010).
Rieco E. Mello (1969)
Year of Election or Appointment: 2017
Assistant Treasurer
Mr. Mello also serves as Assistant Treasurer of other funds. Mr. Mello serves as Assistant Treasurer of FMR Capital, Inc. (2017-present) and is an employee of Fidelity Investments (1995-present).
Kenneth B. Robins (1969)
Year of Election or Appointment: 2016
Chief Compliance Officer
Mr. Robins also serves as an officer of other funds. Mr. Robins serves as Compliance Officer of Fidelity Management & Research Company and FMR Co., Inc. (investment adviser firms, 2016-present) and is an employee of Fidelity Investments (2004-present). Previously, Mr. Robins served as Executive Vice President of Fidelity Investments Money Management, Inc. (investment adviser firm, 2013-2016) and served in other fund officer roles.
Stacie M. Smith (1974)
Year of Election or Appointment: 2016
President and Treasurer
Ms. Smith also serves as an officer of other funds. Ms. Smith serves as Assistant Treasurer of FMR Capital, Inc. (2017-present), is an employee of Fidelity Investments (2009-present), and has served in other fund officer roles. Prior to joining Fidelity Investments, Ms. Smith served as Senior Audit Manager of Ernst & Young LLP (accounting firm, 1996-2009). Previously, Ms. Smith served as Deputy Treasurer of certain Fidelity® funds (2013-2016).
Marc L. Spector (1972)
Year of Election or Appointment: 2016
Assistant Treasurer
Mr. Spector also serves as an officer of other funds. Mr. Spector serves as Assistant Treasurer of FMR Capital, Inc. (2017-present) and is an employee of Fidelity Investments (2016-present). Prior to joining Fidelity Investments, Mr. Spector served as Director at the Siegfried Group (accounting firm, 2013-2016), and prior to Siegfried Group as audit senior manager at Deloitte & Touche (accounting firm, 2005-2013).
Renee Stagnone (1975)
Year of Election or Appointment: 2016
Assistant Treasurer
Ms. Stagnone also serves as an officer of other funds. Ms. Stagnone serves as Assistant Treasurer of FMR Capital, Inc. (2017-present) and is an employee of Fidelity Investments (1997-present). Previously, Ms. Stagnone served as Deputy Treasurer of certain Fidelity® funds (2013-2016).
Shareholder Expense Example
As a shareholder of the Fund, you incur two types of costs: (1) transaction costs, including sales charges (loads) on purchase payments or redemption proceeds, and (2) ongoing costs, including distribution and/or service (12b-1) fees and other Fund expenses. This Example is intended to help you understand your ongoing costs (in dollars) of investing in the Fund and to compare these costs with the ongoing costs of investing in other mutual funds.
The Example is based on an investment of $1,000 invested at the beginning of the period and held for the entire period (June 1, 2017 to November 30, 2017).
Actual Expenses
The first line of the accompanying table for each class of the Fund provides information about actual account values and actual expenses. You may use the information in this line, together with the amount you invested, to estimate the expenses that you paid over the period. Simply divide your account value by $1,000.00 (for example, an $8,600 account value divided by $1,000.00 = 8.6), then multiply the result by the number in the first line for a class of the Fund under the heading entitled "Expenses Paid During Period" to estimate the expenses you paid on your account during this period. A small balance maintenance fee of $12.00 that is charged once a year may apply for certain accounts with a value of less than $2,000. This fee is not included in the table below. If it was, the estimate of expenses you paid during the period would be higher, and your ending account value lower, by this amount. In addition, the Fund, as a shareholder in the underlying Fidelity Central Funds, will indirectly bear its pro-rata share of the fees and expenses incurred by the underlying Fidelity Central Funds. These fees and expenses are not included in the Fund's annualized expense ratio used to calculate the expense estimate in the table below.
Hypothetical Example for Comparison Purposes
The second line of the accompanying table for each class of the Fund provides information about hypothetical account values and hypothetical expenses based on a Class' actual expense ratio and an assumed rate of return of 5% per year before expenses, which is not the Class' actual return. The hypothetical account values and expenses may not be used to estimate the actual ending account balance or expenses you paid for the period. You may use this information to compare the ongoing costs of investing in the Fund and other funds. To do so, compare this 5% hypothetical example with the 5% hypothetical examples that appear in the shareholder reports of the other funds. A small balance maintenance fee of $12.00 that is charged once a year may apply for certain accounts with a value of less than $2,000. This fee is not included in the table below. If it was, the estimate of expenses you paid during the period would be higher, and your ending account value lower, by this amount. In addition, the Fund, as a shareholder in the underlying Fidelity Central Funds, will indirectly bear its pro-rata share of the fees and expenses incurred by the underlying Fidelity Central Funds. These fees and expenses are not included in the Fund's annualized expense ratio used to calculate the expense estimate in the table below.
Please note that the expenses shown in the table are meant to highlight your ongoing costs only and do not reflect any transaction costs. Therefore, the second line of the table is useful in comparing ongoing costs only, and will not help you determine the relative total costs of owning different funds. In addition, if these transactional costs were included, your costs would have been higher.
| Annualized Expense Ratio-A | Beginning Account Value June 1, 2017 | Ending Account Value November 30, 2017 | Expenses Paid During Period-B June 1, 2017 to November 30, 2017 | |
| Class A | .96% | |||
| Actual | $1,000.00 | $1,098.80 | $5.05 | |
| Hypothetical-C | $1,000.00 | $1,020.26 | $4.86 | |
| Class M | 1.18% | |||
| Actual | $1,000.00 | $1,097.70 | $6.21 | |
| Hypothetical-C | $1,000.00 | $1,019.15 | $5.97 | |
| Class C | 1.73% | |||
| Actual | $1,000.00 | $1,094.70 | $9.08 | |
| Hypothetical-C | $1,000.00 | $1,016.39 | $8.74 | |
| Fidelity Value Strategies Fund | .69% | |||
| Actual | $1,000.00 | $1,100.40 | $3.63 | |
| Hypothetical-C | $1,000.00 | $1,021.61 | $3.50 | |
| Class K | .55% | |||
| Actual | $1,000.00 | $1,101.20 | $2.90 | |
| Hypothetical-C | $1,000.00 | $1,022.31 | $2.79 | |
| Class I | .72% | |||
| Actual | $1,000.00 | $1,100.20 | $3.79 | |
| Hypothetical-C | $1,000.00 | $1,021.46 | $3.65 |
A Annualized expense ratio reflects expenses net of applicable fee waivers.
B Expenses are equal to each Class' annualized expense ratio, multiplied by the average account value over the period, multiplied by 183/365 (to reflect the one-half year period).
C 5% return per year before expenses
Distributions (Unaudited)
The Board of Trustees of Fidelity Advisor Value Strategies Fund voted to pay to shareholders of record at the opening of business on record date, the following distributions per share derived from capital gains realized from sales of portfolio securities, and dividends derived from net investment income:
| Pay Date | Record Date | Dividends | Capital Gains | |
| Fidelity Advisor Value Strategies Fund | ||||
| Class A | 12/27/17 | 12/26/17 | $0.513 | $2.765 |
| Class M | 12/27/17 | 12/26/17 | $0.412 | $2.765 |
| Class C | 12/27/17 | 12/26/17 | $0.273 | $2.765 |
| Fidelity Value Strategies Fund | 12/27/17 | 12/26/17 | $0.608 | $2.765 |
| Class K | 12/27/17 | 12/26/17 | $0.670 | $2.765 |
| Class I | 12/27/17 | 12/26/17 | $0.594 | $2.765 |
The fund hereby designates as a capital gain dividend with respect to the taxable year ended November 30, 2017, $21,296,902, or, if subsequently determined to be different, the net capital gain of such year.
Class A, Class M, Class C, Fidelity Value Strategies Fund, Class K, and Class I designate 100%, 100%, 100%, 87%, 80%, and 87% of the dividends distributed in December 2016, respectively during the fiscal year as qualifying for the dividends–received deduction for corporate shareholders.
Class A, Class M, Class C, Fidelity Value Strategies Fund, Class K, and Class I designate 100%, 100%, 100%, 96%, 88%, and 96% of the dividends distributed during the fiscal year as amounts which may be taken into account as a dividend for purposes of the maximum rate under section 1(h)(11) of the Internal Revenue Code.
The fund will notify shareholders in January 2018 of amounts for use in preparing 2017 income tax returns.
Board Approval of Investment Advisory Contracts and Management Fees
Fidelity Advisor Value Strategies Fund
Each year, the Board of Trustees, including the Independent Trustees (together, the Board), votes on the renewal of the management contract with Fidelity Management & Research Company (FMR) and the sub-advisory agreements (together, the Advisory Contracts) for the fund. FMR and the sub-advisers are referred to herein as the Investment Advisers. The Board, assisted by the advice of fund counsel and Independent Trustees' counsel, requests and considers a broad range of information relevant to the renewal of the Advisory Contracts throughout the year.
The Board meets regularly and, at each of its meetings, covers an extensive agenda of topics and materials and considers factors that are relevant to its annual consideration of the renewal of the fund's Advisory Contracts, including the services and support provided to the fund and its shareholders. The Board has established various standing committees (Committees), each composed of and chaired by Independent Trustees with varying backgrounds, to which the Board has assigned specific subject matter responsibilities in order to enhance effective decision-making by the Board. The Board, acting directly and through its Committees, requests and receives information concerning the annual consideration of the renewal of the fund's Advisory Contracts. The Board also meets as needed to review matters specifically related to the Board's annual consideration of the renewal of the Advisory Contracts. Members of the Board may also meet with trustees of other Fidelity funds through ad hoc joint committees to discuss certain matters relevant to all of the Fidelity funds.
At its July 2017 meeting, the Board unanimously determined to renew the fund's Advisory Contracts. In reaching its determination, the Board considered all factors it believed relevant, including (i) the nature, extent, and quality of the services to be provided to the fund and its shareholders (including the investment performance of the fund); (ii) the competitiveness of the fund's management fee and total expense ratio relative to peer funds; (iii) the total costs of the services to be provided by and the profits to be realized by Fidelity from its relationships with the fund; and (iv) the extent to which, if any, economies of scale exist and would be realized as the fund grows, and whether any economies of scale are appropriately shared with fund shareholders.
In considering whether to renew the Advisory Contracts for the fund, the Board reached a determination, with the assistance of fund counsel and Independent Trustees' counsel and through the exercise of its business judgment, that the renewal of the Advisory Contracts was in the best interests of the fund and its shareholders and that the compensation payable under the Advisory Contracts was fair and reasonable. The Board's decision to renew the Advisory Contracts was not based on any single factor, but rather was based on a comprehensive consideration of all the information provided to the Board at its meetings throughout the year. The Board, in reaching its determination to renew the Advisory Contracts, was aware that shareholders of the fund have a broad range of investment choices available to them, including a wide choice among funds offered by Fidelity's competitors, and that the fund's shareholders, who have the opportunity to review and weigh the disclosure provided by the fund in its prospectus and other public disclosures, have chosen to invest in this fund, which is part of the Fidelity family of funds.
Amendment to Group Fee Rate. The Board also approved an amendment to the management contract for the fund to add an additional breakpoint to the group fee schedule, effective October 1, 2017. The Board noted that the additional breakpoint would result in lower management fee rates as Fidelity's assets under management increase.
Nature, Extent, and Quality of Services Provided. The Board considered Fidelity's staffing as it relates to the fund, including the backgrounds of investment personnel of Fidelity, and also considered the fund's investment objective, strategies, and related investment philosophy. The Independent Trustees also had discussions with senior management of Fidelity's investment operations and investment groups. The Board considered the structure of the investment personnel compensation program and whether this structure provides appropriate incentives to act in the best interests of the fund. Additionally, the Board considered the portfolio managers' investments, if any, in the funds that they manage.Resources Dedicated to Investment Management and Support Services. The Board and the Fund Oversight and Research Committees reviewed the general qualifications and capabilities of Fidelity's investment staff, including its size, education, experience, and resources, as well as Fidelity's approach to recruiting, training, managing, and compensating investment personnel. The Board noted that Fidelity has continued to increase the resources devoted to non-U.S. offices, including expansion of Fidelity's global investment organization. The Board also noted that Fidelity's analysts have extensive resources, tools and capabilities that allow them to conduct sophisticated quantitative and fundamental analysis, as well as credit analysis of issuers, counterparties and guarantors. Further, the Board considered that Fidelity's investment professionals have sufficient access to global information and data so as to provide competitive investment results over time, and that those professionals also have access to sophisticated tools that permit them to assess portfolio construction and risk and performance attribution characteristics continuously, as well as to transmit new information and research conclusions rapidly around the world. Additionally, in its deliberations, the Board considered Fidelity's trading, risk management, compliance, and technology and operations capabilities and resources, which are integral parts of the investment management process.Shareholder and Administrative Services. The Board considered (i) the nature, extent, quality, and cost of advisory, administrative, and shareholder services performed by the Investment Advisers and their affiliates under the Advisory Contracts and under separate agreements covering transfer agency, pricing and bookkeeping, and securities lending services for the fund; (ii) the nature and extent of the supervision of third party service providers, principally custodians, subcustodians, and pricing vendors; and (iii) the resources devoted to, and the record of compliance with, the fund's compliance policies and procedures. The Board also reviewed the allocation of fund brokerage, including allocations to brokers affiliated with the Investment Advisers, the use of brokerage commissions to pay fund expenses, and the use of "soft" commission dollars to pay for research services.The Board noted that the growth of fund assets over time across the complex allows Fidelity to reinvest in the development of services designed to enhance the value or convenience of the Fidelity funds as investment vehicles. These services include 24-hour access to account information and market information through telephone representatives and over the Internet, investor education materials and asset allocation tools, and the expanded availability of Fidelity Investor Centers.In 2014, the Board formed an ad hoc Committee on Transfer Agency Fees to review the variety of transfer agency fee structures throughout the industry and Fidelity's competitive positioning with respect to industry participants.Investment in a Large Fund Family. The Board considered the benefits to shareholders of investing in a Fidelity fund, including the benefits of investing in a fund that is part of a large family of funds offering a variety of investment disciplines and providing a large variety of mutual fund investor services. The Board noted that Fidelity had taken, or had made recommendations that resulted in the Fidelity funds taking, a number of actions over the previous year that benefited particular funds, including: (i) continuing to dedicate additional resources to Fidelity's investment research process, and to the support of the senior management team that oversees asset management; (ii) continuing efforts to enhance Fidelity's global research capabilities; (iii) launching new funds and making other enhancements to meet client needs; (iv) launching new share classes of existing funds; (v) eliminating purchase minimums and broadening eligibility requirements for certain lower-priced share classes; (vi) reducing management fees and total expenses for certain growth equity funds and index funds; (vii) lowering expense caps for certain existing funds and classes to reduce expenses borne by shareholders; (viii) eliminating short-term redemption fees for certain funds; (ix) introducing a new pricing structure for certain funds of funds that is expected to reduce overall expenses paid by shareholders; (x) rationalizing product lines and gaining increased efficiencies through proposals for fund mergers and share class consolidations; (xi) continuing to develop, acquire and implement systems and technology to improve services to the funds and shareholders, strengthen information security, and increase efficiency; and (xii) implementing enhancements to further strengthen Fidelity's product line to increase investors' probability of success in achieving their investment goals, including retirement income goals.Investment Performance. The Board considered whether the fund has operated in accordance with its investment objective, as well as its record of compliance with its investment restrictions and its performance history.The Board took into account discussions with representatives of the Investment Advisers about fund investment performance that occur at Board meetings throughout the year. In this regard the Board noted that as part of regularly scheduled fund reviews and other reports to the Board on fund performance, the Board considers annualized return information for the fund for different time periods, measured against a securities market index ("benchmark index") and a peer group of funds with similar objectives ("peer group"), if any. In its evaluation of fund investment performance, the Board gave particular attention to information indicating changes in performance of certain Fidelity funds for specific time periods and discussed with the Investment Advisers the reasons for any overperformance or underperformance.In addition to reviewing absolute and relative fund performance, the Independent Trustees periodically consider the appropriateness of fund performance metrics in evaluating the results achieved. In general, the Independent Trustees believe that fund performance should be evaluated based on net performance (after fees and expenses) of both the highest performing and lowest performing fund share classes, where applicable, compared to appropriate benchmark indices, over appropriate time periods that may include full market cycles, and compared to peer groups, as applicable, over the same periods, taking into account relevant factors including the following: general market conditions; issuer-specific information; and fund cash flows and other factors.The Independent Trustees recognize that shareholders evaluate performance on a net basis over their own holding periods, for which one-, three-, and five-year periods are often used as a proxy. For this reason, the performance information reviewed by the Board also included net cumulative calendar year total return information for the fund and an appropriate benchmark index and peer group for the most recent one-, three-, and five-year periods, as shown below. Returns are shown compared to the 25th percentile (top of box, 75% beaten) and 75th percentile (bottom of box, 25% beaten) of the peer universe.Fidelity Advisor Value Strategies Fund
Fidelity Advisor Value Strategies Fund
![]()
Corporate Headquarters
245 Summer St.
Boston, MA 02210
www.fidelity.com
SOI-K-ANN-0118
1.863336.109
Fidelity® Value Strategies Fund Annual Report November 30, 2017 Fidelity® Value Strategies Fund is a class of Fidelity Advisor® Value Strategies Fund |
|
Contents
Board Approval of Investment Advisory Contracts and Management Fees |
To view a fund's proxy voting guidelines and proxy voting record for the 12-month period ended June 30, visit http://www.fidelity.com/proxyvotingresults or visit the Securities and Exchange Commission's (SEC) web site at http://www.sec.gov.
You may also call 1-800-544-8544 to request a free copy of the proxy voting guidelines.
Standard & Poor's, S&P and S&P 500 are registered service marks of The McGraw-Hill Companies, Inc. and have been licensed for use by Fidelity Distributors Corporation.
Other third-party marks appearing herein are the property of their respective owners.
All other marks appearing herein are registered or unregistered trademarks or service marks of FMR LLC or an affiliated company. © 2018 FMR LLC. All rights reserved.
This report and the financial statements contained herein are submitted for the general information of the shareholders of the Fund. This report is not authorized for distribution to prospective investors in the Fund unless preceded or accompanied by an effective prospectus.
A fund files its complete schedule of portfolio holdings with the SEC for the first and third quarters of each fiscal year on Form N-Q. Forms N-Q are available on the SEC’s web site at http://www.sec.gov. A fund's Forms N-Q may be reviewed and copied at the SEC’s Public Reference Room in Washington, DC. Information regarding the operation of the SEC's Public Reference Room may be obtained by calling 1-800-SEC-0330.
For a complete list of a fund's portfolio holdings, view the most recent holdings listing, semiannual report, or annual report on Fidelity's web site at http://www.fidelity.com, http://www.institutional.fidelity.com, or http://www.401k.com, as applicable.
NOT FDIC INSURED •MAY LOSE VALUE •NO BANK GUARANTEE
Neither the Fund nor Fidelity Distributors Corporation is a bank.
Performance: The Bottom Line
Average annual total return reflects the change in the value of an investment, assuming reinvestment of distributions from dividend income and capital gains (the profits earned upon the sale of securities that have grown in value, if any) and assuming a constant rate of performance each year. The hypothetical investment and the average annual total returns do not reflect the deduction of taxes that a shareholder would pay on fund distributions or the redemption of fund shares. During periods of reimbursement by Fidelity, a fund’s total return will be greater than it would be had the reimbursement not occurred. How a fund did yesterday is no guarantee of how it will do tomorrow.
Average Annual Total Returns
| For the periods ended November 30, 2017 | Past 1 year | Past 5 years | Past 10 years |
| Fidelity® Value Strategies Fund | 20.18% | 12.76% | 7.14% |
$10,000 Over 10 Years
Let's say hypothetically that $10,000 was invested in Fidelity® Value Strategies Fund, a class of the fund, on November 30, 2007.
The chart shows how the value of your investment would have changed, and also shows how the Russell Midcap® Value Index performed over the same period.
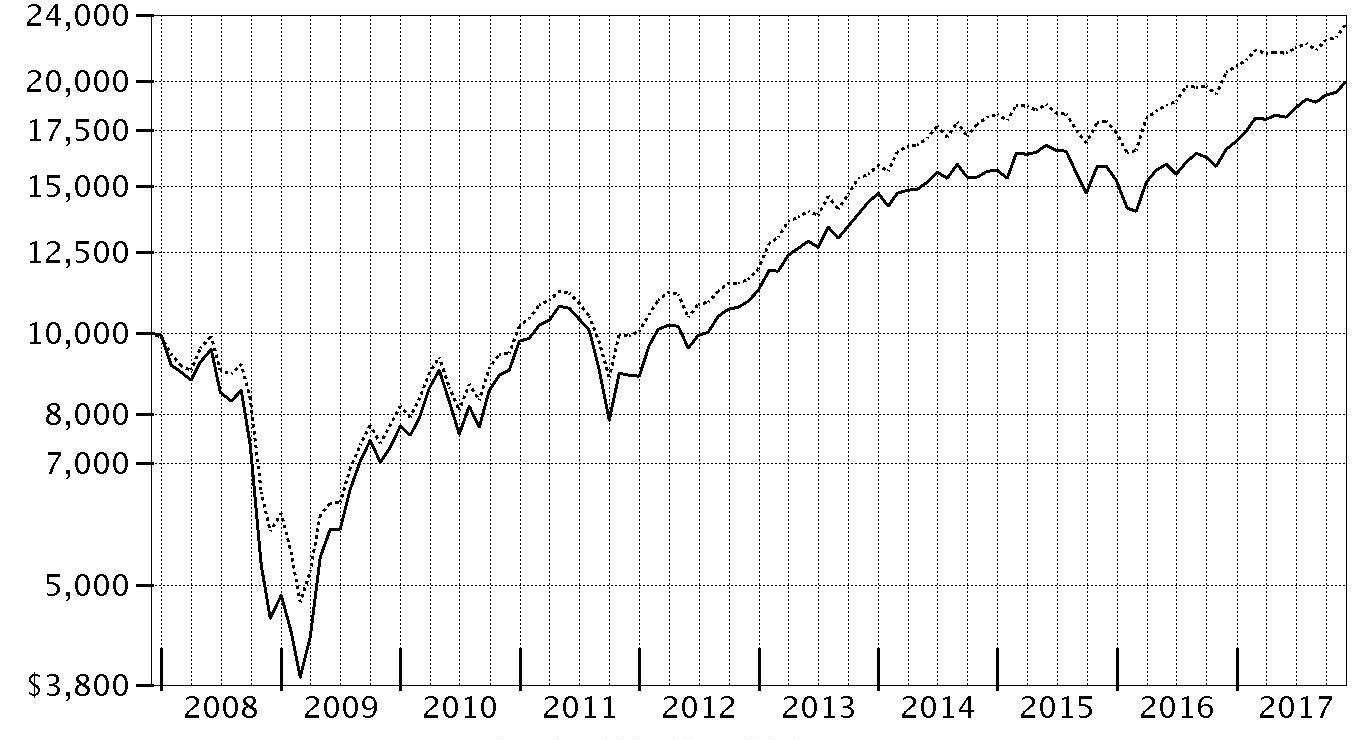
| Period Ending Values | ||
| $19,925 | Fidelity® Value Strategies Fund | |
| $23,335 | Russell Midcap® Value Index | |
Management's Discussion of Fund Performance
Market Recap: The U.S. equity bellwether S&P 500® index gained 22.87% for the year ending November 30, 2017, rising steadily and closing the period at an all-time high after a particularly strong three-month finish. Early on, equities rallied on optimism for President Trump’s pro-business agenda but leveled off in March amid fading optimism and stalled efforts by Congress to repeal and replace the Affordable Care Act. Upward momentum soon returned and continued through period end with consumer sentiment and other market indicators staying positive. The lone exception was a brief cooldown in August, when geopolitical tension escalated and uncertainty grew regarding the future of health care, tax reform and the debt ceiling. Sector-wise, info tech (+41%) led by a wide margin, surging amid strong earnings growth from several major index constituents. Utilities and financials each gained about 25%, the latter group riding an uptick in bond yields. Conversely, consumer discretionary (+20%) also rose solidly but lagged the broader market, as many brick-and-mortar retailers continued to suffer from increased online competition. Rising interest rates held back real estate (+16%), while consumer staples (+15%) and telecom (+1%) struggled due to investors’ general preference for risk assets. Lastly, sluggish oil prices pushed energy to a -4% return.Comments from Portfolio Manager Matthew Friedman: For the fiscal year, the fund’s share classes (excluding sales charges, if applicable) gained about 19% to 20%, handily outpacing the 13.95% return of the benchmark Russell Midcap® Value Index. Versus the benchmark, both security selection and sector positioning boosted performance. The biggest contribution came from security selection in real estate. Here, American Tower, an owner and operator of wireless and broadcast communications towers, was the fund’s largest individual contributor. The stock, which was not in the benchmark, benefited from increased investment by wireless carriers in their 5G networks, as well as rising demand for tower leasing, due to growing use of smartphones and tablets. The firm continued its expansion and benefited from strong organic revenue growth in its international segments. FNF Group, a provider of title insurance and transaction services to the real estate and mortgage industries, was another notable contributor. Conversely, choices in health care detracted most, especially a non-benchmark position in Israel's Teva Pharmaceutical Industries, a maker of generic drugs and the fund’s biggest individual detractor. The stock was hurt by a combination of excess debt from the company’s 2016 acquisition of Actavis’ generics business and drug-pricing pressure. We sold our stake in Teva by period end.The views expressed above reflect those of the portfolio manager(s) only through the end of the period as stated on the cover of this report and do not necessarily represent the views of Fidelity or any other person in the Fidelity organization. Any such views are subject to change at any time based upon market or other conditions and Fidelity disclaims any responsibility to update such views. These views may not be relied on as investment advice and, because investment decisions for a Fidelity fund are based on numerous factors, may not be relied on as an indication of trading intent on behalf of any Fidelity fund.
Investment Summary (Unaudited)
Top Ten Stocks as of November 30, 2017
| % of fund's net assets | % of fund's net assets 6 months ago | |
| Edison International | 2.8 | 3.3 |
| Sempra Energy | 2.7 | 3.1 |
| American Tower Corp. | 2.6 | 3.4 |
| Synchrony Financial | 2.6 | 2.2 |
| U.S. Bancorp | 2.3 | 2.4 |
| Wells Fargo & Co. | 2.2 | 1.7 |
| Extra Space Storage, Inc. | 2.1 | 2.2 |
| Discover Financial Services | 2.0 | 1.3 |
| Xcel Energy, Inc. | 1.9 | 0.0 |
| Equity Lifestyle Properties, Inc. | 1.9 | 2.0 |
| 23.1 |
Top Five Market Sectors as of November 30, 2017
| % of fund's net assets | % of fund's net assets 6 months ago | |
| Financials | 18.3 | 16.3 |
| Real Estate | 14.7 | 13.8 |
| Consumer Discretionary | 11.2 | 9.7 |
| Industrials | 10.9 | 11.3 |
| Information Technology | 10.0 | 11.5 |
Asset Allocation (% of fund's net assets)
| As of November 30, 2017* | ||
| Stocks | 98.5% | |
| Convertible Securities | 0.2% | |
| Short-Term Investments and Net Other Assets (Liabilities) | 1.3% | |

* Foreign investments - 16.7%
| As of May 31, 2017* | ||
| Stocks | 99.2% | |
| Convertible Securities | 0.6% | |
| Short-Term Investments and Net Other Assets (Liabilities) | 0.2% | |

* Foreign investments - 16.7%
Percentages shown as 0.0% may reflect amounts less than 0.05%.
Investments November 30, 2017
Showing Percentage of Net Assets
| Common Stocks - 98.5% | |||
| Shares | Value (000s) | ||
| CONSUMER DISCRETIONARY - 11.2% | |||
| Auto Components - 1.1% | |||
| Delphi Automotive PLC | 115,477 | $12,087 | |
| Diversified Consumer Services - 2.1% | |||
| Houghton Mifflin Harcourt Co. (a) | 946,656 | 9,230 | |
| Service Corp. International | 386,550 | 14,283 | |
| 23,513 | |||
| Hotels, Restaurants & Leisure - 2.2% | |||
| U.S. Foods Holding Corp. (a) | 450,700 | 13,124 | |
| Wyndham Worldwide Corp. | 97,467 | 10,954 | |
| 24,078 | |||
| Internet & Direct Marketing Retail - 0.9% | |||
| Liberty Interactive Corp. QVC Group (Venture Group) Series A (a) | 188,400 | 10,515 | |
| Leisure Products - 0.9% | |||
| Mattel, Inc. (b) | 552,900 | 10,090 | |
| Media - 2.7% | |||
| Liberty Global PLC Class C (a) | 387,900 | 11,959 | |
| Omnicom Group, Inc. | 117,100 | 8,366 | |
| Sinclair Broadcast Group, Inc. Class A (b) | 289,799 | 9,868 | |
| 30,193 | |||
| Specialty Retail - 1.3% | |||
| AutoZone, Inc. (a) | 9,400 | 6,456 | |
| Signet Jewelers Ltd. (b) | 143,100 | 7,483 | |
| 13,939 | |||
| TOTAL CONSUMER DISCRETIONARY | 124,415 | ||
| CONSUMER STAPLES - 3.3% | |||
| Beverages - 1.1% | |||
| Cott Corp. | 756,264 | 12,984 | |
| Food Products - 2.2% | |||
| Darling International, Inc. (a) | 850,222 | 15,261 | |
| The J.M. Smucker Co. | 77,300 | 9,019 | |
| 24,280 | |||
| TOTAL CONSUMER STAPLES | 37,264 | ||
| ENERGY - 7.5% | |||
| Oil, Gas & Consumable Fuels - 7.5% | |||
| Boardwalk Pipeline Partners, LP | 827,936 | 11,127 | |
| Cabot Oil & Gas Corp. | 281,600 | 8,152 | |
| Cheniere Energy, Inc. (a) | 249,600 | 12,061 | |
| EQT Corp. | 140,800 | 8,392 | |
| GasLog Ltd. (b) | 550,461 | 9,908 | |
| Lundin Petroleum AB | 435,400 | 10,018 | |
| Teekay Corp. (b) | 1,472,713 | 12,268 | |
| Valero Energy Corp. | 130,800 | 11,199 | |
| 83,125 | |||
| FINANCIALS - 18.3% | |||
| Banks - 5.3% | |||
| CIT Group, Inc. | 182,000 | 9,071 | |
| U.S. Bancorp | 455,384 | 25,114 | |
| Wells Fargo & Co. | 444,670 | 25,111 | |
| 59,296 | |||
| Capital Markets - 4.6% | |||
| Apollo Global Management LLC Class A | 393,150 | 12,310 | |
| Legg Mason, Inc. | 338,117 | 13,511 | |
| State Street Corp. | 100,200 | 9,554 | |
| The Blackstone Group LP | 489,600 | 15,530 | |
| 50,905 | |||
| Consumer Finance - 5.3% | |||
| Discover Financial Services | 311,900 | 22,020 | |
| OneMain Holdings, Inc. (a) | 317,300 | 8,190 | |
| Synchrony Financial | 813,213 | 29,186 | |
| 59,396 | |||
| Insurance - 3.1% | |||
| Chubb Ltd. | 113,982 | 17,338 | |
| FNF Group | 441,359 | 17,857 | |
| 35,195 | |||
| TOTAL FINANCIALS | 204,792 | ||
| HEALTH CARE - 5.7% | |||
| Biotechnology - 2.3% | |||
| Amgen, Inc. | 80,200 | 14,088 | |
| United Therapeutics Corp. (a) | 95,000 | 12,349 | |
| 26,437 | |||
| Health Care Providers & Services - 1.3% | |||
| Aetna, Inc. | 51,500 | 9,279 | |
| Envision Healthcare Corp. (a) | 160,151 | 5,114 | |
| 14,393 | |||
| Pharmaceuticals - 2.1% | |||
| Jazz Pharmaceuticals PLC (a) | 141,900 | 19,829 | |
| Mallinckrodt PLC (a) | 152,400 | 3,325 | |
| 23,154 | |||
| TOTAL HEALTH CARE | 63,984 | ||
| INDUSTRIALS - 10.9% | |||
| Aerospace & Defense - 1.5% | |||
| Huntington Ingalls Industries, Inc. | 27,300 | 6,598 | |
| KLX, Inc. (a) | 180,110 | 10,106 | |
| 16,704 | |||
| Airlines - 1.3% | |||
| American Airlines Group, Inc. | 288,700 | 14,576 | |
| Commercial Services & Supplies - 1.4% | |||
| IWG PLC | 1,635,100 | 4,356 | |
| KAR Auction Services, Inc. | 234,300 | 11,802 | |
| 16,158 | |||
| Construction & Engineering - 1.5% | |||
| AECOM (a) | 449,400 | 16,853 | |
| Machinery - 1.4% | |||
| Allison Transmission Holdings, Inc. | 389,475 | 15,984 | |
| Road & Rail - 0.9% | |||
| Swift Transporation Co. (b) | 226,200 | 9,654 | |
| Trading Companies & Distributors - 2.9% | |||
| AerCap Holdings NV (a) | 375,037 | 19,491 | |
| WESCO International, Inc. (a) | 191,300 | 12,540 | |
| 32,031 | |||
| TOTAL INDUSTRIALS | 121,960 | ||
| INFORMATION TECHNOLOGY - 10.0% | |||
| Communications Equipment - 1.1% | |||
| CommScope Holding Co., Inc. (a) | 351,168 | 12,639 | |
| Electronic Equipment & Components - 1.9% | |||
| Jabil, Inc. | 191,900 | 5,536 | |
| TE Connectivity Ltd. | 158,681 | 14,986 | |
| 20,522 | |||
| IT Services - 5.4% | |||
| Amdocs Ltd. | 171,200 | 11,178 | |
| Cognizant Technology Solutions Corp. Class A | 237,800 | 17,188 | |
| Conduent, Inc. | 448,000 | 6,836 | |
| DXC Technology Co. | 167,800 | 16,132 | |
| First Data Corp. Class A (a) | 556,240 | 9,150 | |
| 60,484 | |||
| Semiconductors & Semiconductor Equipment - 1.6% | |||
| Qualcomm, Inc. | 268,900 | 17,839 | |
| TOTAL INFORMATION TECHNOLOGY | 111,484 | ||
| MATERIALS - 9.5% | |||
| Chemicals - 7.0% | |||
| DowDuPont, Inc. | 285,612 | 20,553 | |
| Eastman Chemical Co. | 209,434 | 19,345 | |
| LyondellBasell Industries NV Class A | 165,692 | 17,348 | |
| Westlake Chemical Corp. | 211,203 | 20,683 | |
| 77,929 | |||
| Construction Materials - 0.8% | |||
| Eagle Materials, Inc. | 83,900 | 9,391 | |
| Containers & Packaging - 1.7% | |||
| Ball Corp. | 258,066 | 10,299 | |
| Sealed Air Corp. | 178,100 | 8,558 | |
| 18,857 | |||
| TOTAL MATERIALS | 106,177 | ||
| REAL ESTATE - 14.7% | |||
| Equity Real Estate Investment Trusts (REITs) - 13.1% | |||
| American Tower Corp. | 205,208 | 29,536 | |
| Douglas Emmett, Inc. | 495,600 | 19,978 | |
| Equinix, Inc. | 39,200 | 18,208 | |
| Equity Lifestyle Properties, Inc. | 231,700 | 20,925 | |
| Extra Space Storage, Inc. | 272,128 | 23,229 | |
| National Retail Properties, Inc. | 437,300 | 17,960 | |
| Outfront Media, Inc. | 710,804 | 16,675 | |
| 146,511 | |||
| Real Estate Management & Development - 1.6% | |||
| CBRE Group, Inc. (a) | 404,500 | 17,539 | |
| TOTAL REAL ESTATE | 164,050 | ||
| UTILITIES - 7.4% | |||
| Electric Utilities - 4.7% | |||
| Edison International | 376,771 | 30,619 | |
| Xcel Energy, Inc. | 413,300 | 21,330 | |
| 51,949 | |||
| Multi-Utilities - 2.7% | |||
| Sempra Energy | 250,788 | 30,343 | |
| TOTAL UTILITIES | 82,292 | ||
| TOTAL COMMON STOCKS | |||
| (Cost $901,502) | 1,099,543 | ||
| Principal Amount (000s) | Value (000s) | ||
| Convertible Bonds - 0.2% | |||
| ENERGY - 0.2% | |||
| Oil, Gas & Consumable Fuels - 0.2% | |||
| Cobalt International Energy, Inc. 2.625% 12/1/19 (Cost $11,132) | 18,190 | 1,910 | |
| Shares | Value (000s) | ||
| Money Market Funds - 5.3% | |||
| Fidelity Cash Central Fund, 1.13% (c) | 19,283,550 | 19,287 | |
| Fidelity Securities Lending Cash Central Fund 1.13% (c)(d) | 40,450,985 | 40,455 | |
| TOTAL MONEY MARKET FUNDS | |||
| (Cost $59,742) | 59,742 | ||
| TOTAL INVESTMENT IN SECURITIES - 104.0% | |||
| (Cost $972,376) | 1,161,195 | ||
| NET OTHER ASSETS (LIABILITIES) - (4.0)% | (44,487) | ||
| NET ASSETS - 100% | $1,116,708 |
Legend
(a) Non-income producing
(b) Security or a portion of the security is on loan at period end.
(c) Affiliated fund that is generally available only to investment companies and other accounts managed by Fidelity Investments. The rate quoted is the annualized seven-day yield of the fund at period end. A complete unaudited listing of the fund's holdings as of its most recent quarter end is available upon request. In addition, each Fidelity Central Fund's financial statements, which are not covered by the Fund's Report of Independent Registered Public Accounting Firm, are available on the SEC's website or upon request.
(d) Investment made with cash collateral received from securities on loan.
Affiliated Central Funds
Information regarding fiscal year to date income earned by the Fund from investments in Fidelity Central Funds is as follows:
| Fund | Income earned |
| (Amounts in thousands) | |
| Fidelity Cash Central Fund | $66 |
| Fidelity Securities Lending Cash Central Fund | 406 |
| Total | $472 |
Investment Valuation
The following is a summary of the inputs used, as of November 30, 2017, involving the Fund's assets and liabilities carried at fair value. The inputs or methodology used for valuing securities may not be an indication of the risk associated with investing in those securities. For more information on valuation inputs, and their aggregation into the levels used below, please refer to the Investment Valuation section in the accompanying Notes to Financial Statements.
| Valuation Inputs at Reporting Date: | ||||
| Description | Total | Level 1 | Level 2 | Level 3 |
| (Amounts in thousands) | ||||
| Investments in Securities: | ||||
| Equities: | ||||
| Consumer Discretionary | $124,415 | $124,415 | $-- | $-- |
| Consumer Staples | 37,264 | 37,264 | -- | -- |
| Energy | 83,125 | 83,125 | -- | -- |
| Financials | 204,792 | 204,792 | -- | -- |
| Health Care | 63,984 | 63,984 | -- | -- |
| Industrials | 121,960 | 121,960 | -- | -- |
| Information Technology | 111,484 | 111,484 | -- | -- |
| Materials | 106,177 | 106,177 | -- | -- |
| Real Estate | 164,050 | 164,050 | -- | -- |
| Utilities | 82,292 | 82,292 | -- | -- |
| Corporate Bonds | 1,910 | -- | 1,910 | -- |
| Money Market Funds | 59,742 | 59,742 | -- | -- |
| Total Investments in Securities: | $1,161,195 | $1,159,285 | $1,910 | $-- |
Other Information
Distribution of investments by country or territory of incorporation, as a percentage of Total Net Assets, is as follows (Unaudited):
| United States of America | 83.3% |
| Netherlands | 3.4% |
| Switzerland | 2.9% |
| Ireland | 2.1% |
| Bermuda | 1.6% |
| Bailiwick of Jersey | 1.5% |
| Canada | 1.1% |
| Marshall Islands | 1.1% |
| United Kingdom | 1.1% |
| Bailiwick of Guernsey | 1.0% |
| Others (Individually Less Than 1%) | 0.9% |
| 100.0% |
See accompanying notes which are an integral part of the financial statements.
Financial Statements
Statement of Assets and Liabilities
| Amounts in thousands (except per-share amounts) | November 30, 2017 | |
| Assets | ||
| Investment in securities, at value (including securities loaned of $39,238) — See accompanying schedule: Unaffiliated issuers (cost $912,634) | $1,101,453 | |
| Fidelity Central Funds (cost $59,742) | 59,742 | |
| Total Investment in Securities (cost $972,376) | $1,161,195 | |
| Receivable for fund shares sold | 319 | |
| Dividends receivable | 1,238 | |
| Interest receivable | 239 | |
| Distributions receivable from Fidelity Central Funds | 52 | |
| Prepaid expenses | 2 | |
| Other receivables | 6 | |
| Total assets | 1,163,051 | |
| Liabilities | ||
| Payable for investments purchased | $3,086 | |
| Payable for fund shares redeemed | 1,904 | |
| Accrued management fee | 463 | |
| Distribution and service plan fees payable | 193 | |
| Other affiliated payables | 193 | |
| Other payables and accrued expenses | 45 | |
| Collateral on securities loaned | 40,459 | |
| Total liabilities | 46,343 | |
| Net Assets | $1,116,708 | |
| Net Assets consist of: | ||
| Paid in capital | $838,764 | |
| Undistributed net investment income | 14,922 | |
| Accumulated undistributed net realized gain (loss) on investments and foreign currency transactions | 74,203 | |
| Net unrealized appreciation (depreciation) on investments | 188,819 | |
| Net Assets | $1,116,708 | |
| Calculation of Maximum Offering Price | ||
| Class A: | ||
| Net Asset Value and redemption price per share ($211,781 ÷ 5,442.7 shares) | $38.91 | |
| Maximum offering price per share (100/94.25 of $38.91) | $41.28 | |
| Class M: | ||
| Net Asset Value and redemption price per share ($271,177 ÷ 6,664.1 shares) | $40.69 | |
| Maximum offering price per share (100/96.50 of $40.69) | $42.17 | |
| Class C: | ||
| Net Asset Value and offering price per share ($46,074 ÷ 1,351.7 shares)(a) | $34.09 | |
| Fidelity Value Strategies Fund: | ||
| Net Asset Value, offering price and redemption price per share ($435,845 ÷ 9,725.7 shares) | $44.81 | |
| Class K: | ||
| Net Asset Value, offering price and redemption price per share ($79,387 ÷ 1,771.4 shares) | $44.82 | |
| Class I: | ||
| Net Asset Value, offering price and redemption price per share ($72,444 ÷ 1,713.7 shares) | $42.27 |
(a) Redemption price per share is equal to net asset value less any applicable contingent deferred sales charge.
See accompanying notes which are an integral part of the financial statements.
Statement of Operations
| Amounts in thousands | Year ended November 30, 2017 | |
| Investment Income | ||
| Dividends | $21,225 | |
| Special dividends | 3,977 | |
| Interest | 2,821 | |
| Income from Fidelity Central Funds | 472 | |
| Total income | 28,495 | |
| Expenses | ||
| Management fee | ||
| Basic fee | $6,110 | |
| Performance adjustment | (1,679) | |
| Transfer agent fees | 2,010 | |
| Distribution and service plan fees | 2,287 | |
| Accounting and security lending fees | 370 | |
| Custodian fees and expenses | 30 | |
| Independent trustees' fees and expenses | 5 | |
| Registration fees | 104 | |
| Audit | 70 | |
| Legal | 6 | |
| Interest | 5 | |
| Miscellaneous | 10 | |
| Total expenses before reductions | 9,328 | |
| Expense reductions | (70) | 9,258 |
| Net investment income (loss) | 19,237 | |
| Realized and Unrealized Gain (Loss) | ||
| Net realized gain (loss) on: | ||
| Investment securities: | ||
| Unaffiliated issuers | 81,500 | |
| Fidelity Central Funds | (5) | |
| Total net realized gain (loss) | 81,495 | |
| Change in net unrealized appreciation (depreciation) on: | ||
| Investment securities: | ||
| Unaffiliated issuers | 107,648 | |
| Fidelity Central Funds | (1) | |
| Total change in net unrealized appreciation (depreciation) | 107,647 | |
| Net gain (loss) | 189,142 | |
| Net increase (decrease) in net assets resulting from operations | $208,379 |
See accompanying notes which are an integral part of the financial statements.
Statement of Changes in Net Assets
| Amounts in thousands | Year ended November 30, 2017 | Year ended November 30, 2016 |
| Increase (Decrease) in Net Assets | ||
| Operations | ||
| Net investment income (loss) | $19,237 | $22,186 |
| Net realized gain (loss) | 81,495 | 392,411 |
| Change in net unrealized appreciation (depreciation) | 107,647 | (369,931) |
| Net increase (decrease) in net assets resulting from operations | 208,379 | 44,666 |
| Distributions to shareholders from net investment income | (18,090) | (15,368) |
| Distributions to shareholders from net realized gain | (229,818) | (316) |
| Total distributions | (247,908) | (15,684) |
| Share transactions - net increase (decrease) | (206,873) | (80,508) |
| Total increase (decrease) in net assets | (246,402) | (51,526) |
| Net Assets | ||
| Beginning of period | 1,363,110 | 1,414,636 |
| End of period | $1,116,708 | $1,363,110 |
| Other Information | ||
| Undistributed net investment income end of period | $14,922 | $15,960 |
See accompanying notes which are an integral part of the financial statements.
Financial Highlights
Fidelity Advisor Value Strategies Fund Class A
| Years ended November 30, | 2017 | 2016 | 2015 | 2014 | 2013 |
| Selected Per–Share Data | |||||
| Net asset value, beginning of period | $40.25 | $39.01 | $38.91 | $36.02 | $27.62 |
| Income from Investment Operations | |||||
| Net investment income (loss)A | .60B | .56 | .35 | .25 | .23 |
| Net realized and unrealized gain (loss) | 6.13 | 1.09 | .06 | 2.87 | 8.25 |
| Total from investment operations | 6.73 | 1.65 | .41 | 3.12 | 8.48 |
| Distributions from net investment income | (.56) | (.40) | (.28)C | (.23) | (.08) |
| Distributions from net realized gain | (7.52) | (.01) | (.03)C | – | – |
| Total distributions | (8.07)D | (.41) | (.31) | (.23) | (.08) |
| Net asset value, end of period | $38.91 | $40.25 | $39.01 | $38.91 | $36.02 |
| Total ReturnE,F | 19.84% | 4.33% | 1.07% | 8.74% | 30.77% |
| Ratios to Average Net AssetsG,H | |||||
| Expenses before reductions | .91% | .86% | .93% | .96% | 1.04% |
| Expenses net of fee waivers, if any | .91% | .86% | .93% | .96% | 1.04% |
| Expenses net of all reductions | .90% | .86% | .93% | .96% | 1.03% |
| Net investment income (loss) | 1.64%B | 1.48% | .89% | .68% | .73% |
| Supplemental Data | |||||
| Net assets, end of period (in millions) | $212 | $203 | $215 | $233 | $243 |
| Portfolio turnover rateI | 46% | 121% | 9% | 6% | 22% |
A Calculated based on average shares outstanding during the period.
B Net Investment income per share reflects a large, non-recurring dividend which amounted to $.13 per share. Excluding this non-recurring dividend, the ratio of net investment income (loss) to average net assets would have been 1.29%.
C The amounts shown reflect certain reclassifications related to book to tax differences that were made in the year shown.
D Total distributions of $8.07 per share is comprised of distributions from net investment income of $.555 and distributions from net realized gain of $7.517 per share.
E Total returns would have been lower if certain expenses had not been reduced during the applicable periods shown.
F Total returns do not include the effect of the sales charges.
G Fees and expenses of any underlying Fidelity Central Funds are not included in the Fund's expense ratio. The Fund indirectly bears its proportionate share of the expenses of any underlying Fidelity Central Funds.
H Expense ratios reflect operating expenses of the class. Expenses before reductions do not reflect amounts reimbursed by the investment adviser or reductions from brokerage service arrangements or reductions from other expense offset arrangements and do not represent the amount paid by the class during periods when reimbursements or reductions occur. Expenses net of fee waivers reflect expenses after reimbursement by the investment adviser but prior to reductions from brokerage service arrangements or other expense offset arrangements. Expenses net of all reductions represent the net expenses paid by the class.
I Amount does not include the portfolio activity of any underlying Fidelity Central Funds.
See accompanying notes which are an integral part of the financial statements.
Fidelity Advisor Value Strategies Fund Class M
| Years ended November 30, | 2017 | 2016 | 2015 | 2014 | 2013 |
| Selected Per–Share Data | |||||
| Net asset value, beginning of period | $41.72 | $40.40 | $40.28 | $37.28 | $28.58 |
| Income from Investment Operations | |||||
| Net investment income (loss)A | .54B | .49 | .28 | .18 | .18 |
| Net realized and unrealized gain (loss) | 6.40 | 1.14 | .06 | 2.98 | 8.54 |
| Total from investment operations | 6.94 | 1.63 | .34 | 3.16 | 8.72 |
| Distributions from net investment income | (.46) | (.30) | (.19)C | (.16) | (.02) |
| Distributions from net realized gain | (7.52) | (.01) | (.03)C | – | – |
| Total distributions | (7.97)D | (.31) | (.22) | (.16) | (.02) |
| Net asset value, end of period | $40.69 | $41.72 | $40.40 | $40.28 | $37.28 |
| Total ReturnE,F | 19.57% | 4.11% | .86% | 8.51% | 30.52% |
| Ratios to Average Net AssetsG,H | |||||
| Expenses before reductions | 1.13% | 1.08% | 1.15% | 1.17% | 1.23% |
| Expenses net of fee waivers, if any | 1.13% | 1.08% | 1.14% | 1.17% | 1.23% |
| Expenses net of all reductions | 1.13% | 1.07% | 1.14% | 1.17% | 1.22% |
| Net investment income (loss) | 1.42%B | 1.27% | .68% | .47% | .54% |
| Supplemental Data | |||||
| Net assets, end of period (in millions) | $271 | $263 | $294 | $324 | $335 |
| Portfolio turnover rateI | 46% | 121% | 9% | 6% | 22% |
A Calculated based on average shares outstanding during the period.
B Net Investment income per share reflects a large, non-recurring dividend which amounted to $.13 per share. Excluding this non-recurring dividend, the ratio of net investment income (loss) to average net assets would have been 1.06%.
C The amounts shown reflect certain reclassifications related to book to tax differences that were made in the year shown.
D Total distributions of $7.97 per share is comprised of distributions from net investment income of $.456 and distributions from net realized gain of $7.517 per share.
E Total returns would have been lower if certain expenses had not been reduced during the applicable periods shown.
F Total returns do not include the effect of the sales charges.
G Fees and expenses of any underlying Fidelity Central Funds are not included in the Fund's expense ratio. The Fund indirectly bears its proportionate share of the expenses of any underlying Fidelity Central Funds.
H Expense ratios reflect operating expenses of the class. Expenses before reductions do not reflect amounts reimbursed by the investment adviser or reductions from brokerage service arrangements or reductions from other expense offset arrangements and do not represent the amount paid by the class during periods when reimbursements or reductions occur. Expenses net of fee waivers reflect expenses after reimbursement by the investment adviser but prior to reductions from brokerage service arrangements or other expense offset arrangements. Expenses net of all reductions represent the net expenses paid by the class.
I Amount does not include the portfolio activity of any underlying Fidelity Central Funds.
See accompanying notes which are an integral part of the financial statements.
Fidelity Advisor Value Strategies Fund Class C
| Years ended November 30, | 2017 | 2016 | 2015 | 2014 | 2013 |
| Selected Per–Share Data | |||||
| Net asset value, beginning of period | $36.19 | $35.12 | $35.07 | $32.52 | $25.06 |
| Income from Investment Operations | |||||
| Net investment income (loss)A | .28B | .24 | .05 | (.03) | (.01) |
| Net realized and unrealized gain (loss) | 5.43 | .97 | .07 | 2.60 | 7.47 |
| Total from investment operations | 5.71 | 1.21 | .12 | 2.57 | 7.46 |
| Distributions from net investment income | (.30) | (.13) | (.04)C | (.02) | – |
| Distributions from net realized gain | (7.52) | (.01) | (.03)C | – | – |
| Total distributions | (7.81)D | (.14) | (.07) | (.02) | – |
| Net asset value, end of period | $34.09 | $36.19 | $35.12 | $35.07 | $32.52 |
| Total ReturnE,F | 18.97% | 3.49% | .33% | 7.91% | 29.77% |
| Ratios to Average Net AssetsG,H | |||||
| Expenses before reductions | 1.68% | 1.63% | 1.70% | 1.72% | 1.78% |
| Expenses net of fee waivers, if any | 1.68% | 1.63% | 1.69% | 1.72% | 1.78% |
| Expenses net of all reductions | 1.67% | 1.63% | 1.69% | 1.72% | 1.77% |
| Net investment income (loss) | .87%B | .72% | .13% | (.08)% | (.02)% |
| Supplemental Data | |||||
| Net assets, end of period (in millions) | $46 | $44 | $49 | $53 | $54 |
| Portfolio turnover rateI | 46% | 121% | 9% | 6% | 22% |
A Calculated based on average shares outstanding during the period.
B Net Investment income per share reflects a large, non-recurring dividend which amounted to $.11 per share. Excluding this non-recurring dividend, the ratio of net investment income (loss) to average net assets would have been .52%.
C The amounts shown reflect certain reclassifications related to book to tax differences that were made in the year shown.
D Total distributions of $7.81 per share is comprised of distributions from net investment income of $.295 and distributions from net realized gain of $7.517 per share.
E Total returns would have been lower if certain expenses had not been reduced during the applicable periods shown.
F Total returns do not include the effect of the contingent deferred sales charge.
G Fees and expenses of any underlying Fidelity Central Funds are not included in the Fund's expense ratio. The Fund indirectly bears its proportionate share of the expenses of any underlying Fidelity Central Funds.
H Expense ratios reflect operating expenses of the class. Expenses before reductions do not reflect amounts reimbursed by the investment adviser or reductions from brokerage service arrangements or reductions from other expense offset arrangements and do not represent the amount paid by the class during periods when reimbursements or reductions occur. Expenses net of fee waivers reflect expenses after reimbursement by the investment adviser but prior to reductions from brokerage service arrangements or other expense offset arrangements. Expenses net of all reductions represent the net expenses paid by the class.
I Amount does not include the portfolio activity of any underlying Fidelity Central Funds.
See accompanying notes which are an integral part of the financial statements.
Fidelity Advisor Value Strategies Fund
| Years ended November 30, | 2017 | 2016 | 2015 | 2014 | 2013 |
| Selected Per–Share Data | |||||
| Net asset value, beginning of period | $45.17 | $43.72 | $43.56 | $40.28 | $30.89 |
| Income from Investment Operations | |||||
| Net investment income (loss)A | .81B | .76 | .51 | .40 | .37 |
| Net realized and unrealized gain (loss) | 7.01 | 1.21 | .07 | 3.21 | 9.20 |
| Total from investment operations | 7.82 | 1.97 | .58 | 3.61 | 9.57 |
| Distributions from net investment income | (.66) | (.51) | (.39)C | (.33) | (.18) |
| Distributions from net realized gain | (7.52) | (.01) | (.03)C | – | – |
| Total distributions | (8.18) | (.52) | (.42) | (.33) | (.18) |
| Net asset value, end of period | $44.81 | $45.17 | $43.72 | $43.56 | $40.28 |
| Total ReturnD | 20.18% | 4.64% | 1.35% | 9.05% | 31.14% |
| Ratios to Average Net AssetsE,F | |||||
| Expenses before reductions | .62% | .56% | .67% | .69% | .73% |
| Expenses net of fee waivers, if any | .62% | .56% | .67% | .69% | .73% |
| Expenses net of all reductions | .62% | .55% | .66% | .69% | .72% |
| Net investment income (loss) | 1.93%B | 1.79% | 1.16% | .95% | 1.03% |
| Supplemental Data | |||||
| Net assets, end of period (in millions) | $436 | $713 | $716 | $786 | $681 |
| Portfolio turnover rateG | 46% | 121% | 9% | 6% | 22% |
A Calculated based on average shares outstanding during the period.
B Net Investment income per share reflects a large, non-recurring dividend which amounted to $.15 per share. Excluding this non-recurring dividend, the ratio of net investment income (loss) to average net assets would have been 1.57%.
C The amounts shown reflect certain reclassifications related to book to tax differences that were made in the year shown.
D Total returns would have been lower if certain expenses had not been reduced during the applicable periods shown.
E Fees and expenses of any underlying Fidelity Central Funds are not included in the Fund's expense ratio. The Fund indirectly bears its proportionate share of the expenses of any underlying Fidelity Central Funds.
F Expense ratios reflect operating expenses of the class. Expenses before reductions do not reflect amounts reimbursed by the investment adviser or reductions from brokerage service arrangements or reductions from other expense offset arrangements and do not represent the amount paid by the class during periods when reimbursements or reductions occur. Expenses net of fee waivers reflect expenses after reimbursement by the investment adviser but prior to reductions from brokerage service arrangements or other expense offset arrangements. Expenses net of all reductions represent the net expenses paid by the class.
G Amount does not include the portfolio activity of any underlying Fidelity Central Funds.
See accompanying notes which are an integral part of the financial statements.
Fidelity Advisor Value Strategies Fund Class K
| Years ended November 30, | 2017 | 2016 | 2015 | 2014 | 2013 |
| Selected Per–Share Data | |||||
| Net asset value, beginning of period | $45.18 | $43.74 | $43.57 | $40.28 | $30.89 |
| Income from Investment Operations | |||||
| Net investment income (loss)A | .86B | .80 | .58 | .47 | .43 |
| Net realized and unrealized gain (loss) | 7.02 | 1.22 | .07 | 3.20 | 9.18 |
| Total from investment operations | 7.88 | 2.02 | .65 | 3.67 | 9.61 |
| Distributions from net investment income | (.72) | (.57) | (.45)C | (.38) | (.22) |
| Distributions from net realized gain | (7.52) | (.01) | (.03)C | – | – |
| Total distributions | (8.24) | (.58) | (.48) | (.38) | (.22) |
| Net asset value, end of period | $44.82 | $45.18 | $43.74 | $43.57 | $40.28 |
| Total ReturnD | 20.36% | 4.76% | 1.51% | 9.21% | 31.34% |
| Ratios to Average Net AssetsE,F | |||||
| Expenses before reductions | .50% | .44% | .51% | .53% | .58% |
| Expenses net of fee waivers, if any | .50% | .44% | .51% | .53% | .58% |
| Expenses net of all reductions | .49% | .43% | .51% | .53% | .57% |
| Net investment income (loss) | 2.05%B | 1.91% | 1.31% | 1.11% | 1.18% |
| Supplemental Data | |||||
| Net assets, end of period (in millions) | $79 | $68 | $72 | $97 | $119 |
| Portfolio turnover rateG | 46% | 121% | 9% | 6% | 22% |
A Calculated based on average shares outstanding during the period.
B Net Investment income per share reflects a large, non-recurring dividend which amounted to $.15 per share. Excluding this non-recurring dividend, the ratio of net investment income (loss) to average net assets would have been 1.70%.
C The amounts shown reflect certain reclassifications related to book to tax differences that were made in the year shown.
D Total returns would have been lower if certain expenses had not been reduced during the applicable periods shown.
E Fees and expenses of any underlying Fidelity Central Funds are not included in the Fund's expense ratio. The Fund indirectly bears its proportionate share of the expenses of any underlying Fidelity Central Funds.
F Expense ratios reflect operating expenses of the class. Expenses before reductions do not reflect amounts reimbursed by the investment adviser or reductions from brokerage service arrangements or reductions from other expense offset arrangements and do not represent the amount paid by the class during periods when reimbursements or reductions occur. Expenses net of fee waivers reflect expenses after reimbursement by the investment adviser but prior to reductions from brokerage service arrangements or other expense offset arrangements. Expenses net of all reductions represent the net expenses paid by the class.
G Amount does not include the portfolio activity of any underlying Fidelity Central Funds.
See accompanying notes which are an integral part of the financial statements.
Fidelity Advisor Value Strategies Fund Class I
| Years ended November 30, | 2017 | 2016 | 2015 | 2014 | 2013 |
| Selected Per–Share Data | |||||
| Net asset value, beginning of period | $43.07 | $41.71 | $41.57 | $38.46 | $29.51 |
| Income from Investment Operations | |||||
| Net investment income (loss)A | .74B | .70 | .48 | .37 | .34 |
| Net realized and unrealized gain (loss) | 6.64 | 1.15 | .08 | 3.06 | 8.79 |
| Total from investment operations | 7.38 | 1.85 | .56 | 3.43 | 9.13 |
| Distributions from net investment income | (.66) | (.48) | (.39)C | (.32) | (.18) |
| Distributions from net realized gain | (7.52) | (.01) | (.03)C | – | – |
| Total distributions | (8.18) | (.49) | (.42) | (.32) | (.18) |
| Net asset value, end of period | $42.27 | $43.07 | $41.71 | $41.57 | $38.46 |
| Total ReturnD | 20.13% | 4.57% | 1.36% | 9.01% | 31.11% |
| Ratios to Average Net AssetsE,F | |||||
| Expenses before reductions | .67% | .61% | .68% | .71% | .76% |
| Expenses net of fee waivers, if any | .67% | .61% | .68% | .71% | .76% |
| Expenses net of all reductions | .66% | .61% | .68% | .71% | .75% |
| Net investment income (loss) | 1.88%B | 1.74% | 1.14% | .93% | 1.00% |
| Supplemental Data | |||||
| Net assets, end of period (in millions) | $72 | $73 | $65 | $86 | $74 |
| Portfolio turnover rateG | 46% | 121% | 9% | 6% | 22% |
A Calculated based on average shares outstanding during the period.
B Net Investment income per share reflects a large, non-recurring dividend which amounted to $.14 per share. Excluding this non-recurring dividend, the ratio of net investment income (loss) to average net assets would have been 1.53%.
C The amounts shown reflect certain reclassifications related to book to tax differences that were made in the year shown.
D Total returns would have been lower if certain expenses had not been reduced during the applicable periods shown.
E Fees and expenses of any underlying Fidelity Central Funds are not included in the Fund's expense ratio. The Fund indirectly bears its proportionate share of the expenses of any underlying Fidelity Central Funds.
F Expense ratios reflect operating expenses of the class. Expenses before reductions do not reflect amounts reimbursed by the investment adviser or reductions from brokerage service arrangements or reductions from other expense offset arrangements and do not represent the amount paid by the class during periods when reimbursements or reductions occur. Expenses net of fee waivers reflect expenses after reimbursement by the investment adviser but prior to reductions from brokerage service arrangements or other expense offset arrangements. Expenses net of all reductions represent the net expenses paid by the class.
G Amount does not include the portfolio activity of any underlying Fidelity Central Funds.
See accompanying notes which are an integral part of the financial statements.
Notes to Financial Statements
For the period ended November 30, 2017
(Amounts in thousands except percentages)
1. Organization.
Fidelity Advisor Value Strategies Fund (the Fund) is a fund of Fidelity Advisor Series I (the Trust) and is authorized to issue an unlimited number of shares. The Trust is registered under the Investment Company Act of 1940, as amended (the 1940 Act), as an open-end management investment company organized as a Massachusetts business trust. The Fund offers Class A, Class M (formerly Class T), Class C, Fidelity Value Strategies Fund, Class K and Class I shares, each of which has equal rights as to assets and voting privileges. Each class has exclusive voting rights with respect to matters that affect that class.
After the close of business on June 24, 2016, all outstanding Class B shares were converted to Class A shares. All prior fiscal period dollar and share amounts for Class B presented in the Notes to Financial Statements are for the period December 1, 2015 through June 24, 2016.
2. Investments in Fidelity Central Funds.
The Fund invests in Fidelity Central Funds, which are open-end investment companies generally available only to other investment companies and accounts managed by the investment adviser and its affiliates. The Fund's Schedule of Investments lists each of the Fidelity Central Funds held as of period end, if any, as an investment of the Fund, but does not include the underlying holdings of each Fidelity Central Fund. As an Investing Fund, the Fund indirectly bears its proportionate share of the expenses of the underlying Fidelity Central Funds.
The Money Market Central Funds seek preservation of capital and current income and are managed by Fidelity Investments Money Management, Inc. (FIMM), an affiliate of the investment adviser. Annualized expenses of the Money Market Central Funds as of their most recent shareholder report date are less than .005%.
A complete unaudited list of holdings for each Fidelity Central Fund is available upon request or at the Securities and Exchange Commission (the SEC) website at www.sec.gov. In addition, the financial statements of the Fidelity Central Funds, which are not covered by the Fund's Report of Independent Registered Public Accounting Firm, are available on the SEC website or upon request.
3. Significant Accounting Policies.
The Fund is an investment company and applies the accounting and reporting guidance of the Financial Accounting Standards Board (FASB) Accounting Standards Codification Topic 946 Financial Services – Investments Companies. The financial statements have been prepared in conformity with accounting principles generally accepted in the United States of America (GAAP), which require management to make certain estimates and assumptions at the date of the financial statements. Actual results could differ from those estimates. Subsequent events, if any, through the date that the financial statements were issued have been evaluated in the preparation of the financial statements. The following summarizes the significant accounting policies of the Fund:
Investment Valuation. Investments are valued as of 4:00 p.m. Eastern time on the last calendar day of the period. The Board of Trustees (the Board) has delegated the day to day responsibility for the valuation of the Fund's investments to the Fair Value Committee (the Committee) established by the Fund's investment adviser. In accordance with valuation policies and procedures approved by the Board, the Fund attempts to obtain prices from one or more third party pricing vendors or brokers to value its investments. When current market prices, quotations or currency exchange rates are not readily available or reliable, investments will be fair valued in good faith by the Committee, in accordance with procedures adopted by the Board. Factors used in determining fair value vary by investment type and may include market or investment specific events, changes in interest rates and credit quality. The frequency with which these procedures are used cannot be predicted and they may be utilized to a significant extent. The Committee oversees the Fund's valuation policies and procedures and reports to the Board on the Committee's activities and fair value determinations. The Board monitors the appropriateness of the procedures used in valuing the Fund's investments and ratifies the fair value determinations of the Committee.
The Fund categorizes the inputs to valuation techniques used to value its investments into a disclosure hierarchy consisting of three levels as shown below:
- Level 1 – quoted prices in active markets for identical investments
- Level 2 – other significant observable inputs (including quoted prices for similar investments, interest rates, prepayment speeds, etc.)
- Level 3 – unobservable inputs (including the Fund's own assumptions based on the best information available)
Valuation techniques used to value the Fund's investments by major category are as follows:
Equity securities, including restricted securities, for which market quotations are readily available, are valued at the last reported sale price or official closing price as reported by a third party pricing vendor on the primary market or exchange on which they are traded and are categorized as Level 1 in the hierarchy. In the event there were no sales during the day or closing prices are not available, securities are valued at the last quoted bid price or may be valued using the last available price and are generally categorized as Level 2 in the hierarchy. For foreign equity securities, when market or security specific events arise, comparisons to the valuation of American Depositary Receipts (ADRs), futures contracts, Exchange-Traded Funds (ETFs) and certain indexes as well as quoted prices for similar securities may be used and would be categorized as Level 2 in the hierarchy. Utilizing these techniques may result in transfers between Level 1 and Level 2. For equity securities, including restricted securities, where observable inputs are limited, assumptions about market activity and risk are used and these securities may be categorized as Level 3 in the hierarchy.
Debt securities, including restricted securities, are valued based on evaluated prices received from third party pricing vendors or from brokers who make markets in such securities. Corporate bonds are valued by pricing vendors who utilize matrix pricing which considers yield or price of bonds of comparable quality, coupon, maturity and type or by broker-supplied prices. When independent prices are unavailable or unreliable, debt securities may be valued utilizing pricing methodologies which consider similar factors that would be used by third party pricing vendors. Debt securities are generally categorized as Level 2 in the hierarchy but may be Level 3 depending on the circumstances.
Investments in open-end mutual funds, including the Fidelity Central Funds, are valued at their closing net asset value (NAV) each business day and are categorized as Level 1 in the hierarchy.
Changes in valuation techniques may result in transfers in or out of an assigned level within the disclosure hierarchy. The aggregate value of investments by input level as of November 30, 2017 is included at the end of the Fund's Schedule of Investments.
Foreign Currency. The Fund may use foreign currency contracts to facilitate transactions in foreign-denominated securities. Gains and losses from these transactions may arise from changes in the value of the foreign currency or if the counterparties do not perform under the contracts' terms.
Foreign-denominated assets, including investment securities, and liabilities are translated into U.S. dollars at the exchange rates at period end. Purchases and sales of investment securities, income and dividends received and expenses denominated in foreign currencies are translated into U.S. dollars at the exchange rate in effect on the transaction date.
The effects of exchange rate fluctuations on investments are included with the net realized and unrealized gain (loss) on investment securities. Other foreign currency transactions resulting in realized and unrealized gain (loss) are disclosed separately.
Investment Transactions and Income. For financial reporting purposes, the Fund's investment holdings and NAV include trades executed through the end of the last business day of the period. The NAV per share for processing shareholder transactions is calculated as of the close of business of the New York Stock Exchange (NYSE), normally 4:00 p.m. Eastern time and includes trades executed through the end of the prior business day. Gains and losses on securities sold are determined on the basis of identified cost and includes proceeds received from litigation. Dividend income is recorded on the ex-dividend date, except for certain dividends from foreign securities where the ex-dividend date may have passed, which are recorded as soon as the Fund is informed of the ex-dividend date. Non-cash dividends included in dividend income, if any, are recorded at the fair market value of the securities received. Income and capital gain distributions from Fidelity Central Funds, if any, are recorded on the ex-dividend date. Certain distributions received by the Fund represent a return of capital or capital gain. The Fund determines the components of these distributions subsequent to the ex-dividend date, based upon receipt of tax filings or other correspondence relating to the underlying investment. These distributions are recorded as a reduction of cost of investments and/or as a realized gain. Large, non-recurring dividends recognized by the Fund are presented separately on the Statement of Operations as "Special Dividends" and the impact of these dividends is presented in the Financial Highlights. Interest income is accrued as earned and includes coupon interest and amortization of premium and accretion of discount on debt securities as applicable. Investment income is recorded net of foreign taxes withheld where recovery of such taxes is uncertain.
Class Allocations and Expenses. Investment income, realized and unrealized capital gains and losses, common expenses of the Fund, and certain fund-level expense reductions, if any, are allocated daily on a pro-rata basis to each class based on the relative net assets of each class to the total net assets of the Fund. Each class differs with respect to transfer agent and distribution and service plan fees incurred. Certain expense reductions may also differ by class. For the reporting period, the allocated portion of income and expenses to each class as a percent of its average net assets may vary due to the timing of recording these transactions in relation to fluctuating net assets of the classes. Expenses directly attributable to a fund are charged to that fund. Expenses attributable to more than one fund are allocated among the respective funds on the basis of relative net assets or other appropriate methods. Expense estimates are accrued in the period to which they relate and adjustments are made when actual amounts are known.
Income Tax Information and Distributions to Shareholders. Each year, the Fund intends to qualify as a regulated investment company under Subchapter M of the Internal Revenue Code, including distributing substantially all of its taxable income and realized gains. As a result, no provision for U.S. Federal income taxes is required. As of November 30, 2017, the Fund did not have any unrecognized tax benefits in the financial statements; nor is the Fund aware of any tax positions for which it is reasonably possible that the total amounts of unrecognized tax benefits will significantly change in the next twelve months. The Fund files a U.S. federal tax return, in addition to state and local tax returns as required. The Fund's federal income tax returns are subject to examination by the Internal Revenue Service (IRS) for a period of three fiscal years after they are filed. State and local tax returns may be subject to examination for an additional fiscal year depending on the jurisdiction. Foreign taxes are provided for based on the Fund's understanding of the tax rules and rates that exist in the foreign markets in which it invests.
Distributions are declared and recorded on the ex-dividend date. Income dividends and capital gain distributions are declared separately for each class. Income and capital gain distributions are determined in accordance with income tax regulations, which may differ from GAAP. In addition, the Fund claimed a portion of the payment made to redeeming shareholders as a distribution for income tax purposes.
Capital accounts within the financial statements are adjusted for permanent book-tax differences. These adjustments have no impact on net assets or the results of operations. Capital accounts are not adjusted for temporary book-tax differences which will reverse in a subsequent period.
Book-tax differences are primarily due to foreign currency transactions, market discount, deferred trustees compensation, partnerships, and losses deferred due to wash sales.
As of period end, the cost and unrealized appreciation (depreciation) in securities, and derivatives if applicable, for federal income tax purposes were as follows:
| Gross unrealized appreciation | $220,500 |
| Gross unrealized depreciation | (27,398) |
| Net unrealized appreciation (depreciation) | $193,102 |
| Tax Cost | $968,093 |
The tax-based components of distributable earnings as of period end were as follows:
| Undistributed ordinary income | $65,013 |
| Undistributed long-term capital gain | $20,108 |
| Net unrealized appreciation (depreciation) on securities and other investments | $192,824 |
The tax character of distributions paid was as follows:
| November 30, 2017 | November 30, 2016 | |
| Ordinary Income | $18,090 | $ 15,684 |
| Long-term Capital Gains | 229,818 | – |
| Total | $247,908 | $ 15,684 |
4. Purchases and Sales of Investments.
Purchases and sales of securities, other than short-term securities, aggregated $517,038 and $963,540, respectively.
5. Fees and Other Transactions with Affiliates.
Management Fee. Fidelity Management & Research Company (the investment adviser) and its affiliates provide the Fund with investment management related services for which the Fund pays a monthly management fee. The management fee is the sum of an individual fund fee rate that is based on an annual rate of .30% of the Fund's average net assets and an annualized group fee rate that averaged .25% during the period. The group fee rate is based upon the average net assets of all the mutual funds advised by the investment adviser, including any mutual funds previously advised by the investment adviser that are currently advised by Fidelity SelectCo, LLC, an affiliate of the investment adviser. The group fee rate decreases as assets under management increase and increases as assets under management decrease. In addition, the management fee is subject to a performance adjustment (up to a maximum of +/- .20% of the Fund's average net assets over a 36 month performance period). The upward or downward adjustment to the management fee is based on the relative investment performance of Fidelity Value Strategies Fund as compared to its benchmark index, the Russell Midcap Value Index, over the same 36 month performance period. For the reporting period, the total annual management fee rate, including the performance adjustment, was .40% of the Fund's average net assets. The performance adjustment included in the management fee rate may be higher or lower than the maximum performance adjustment rate due to the difference between the average net assets for the reporting and performance periods.
Distribution and Service Plan Fees. In accordance with Rule 12b-1 of the 1940 Act, the Fund has adopted separate Distribution and Service Plans for each class of shares. Certain classes pay Fidelity Distributors Corporation (FDC), an affiliate of the investment adviser, separate Distribution and Service Fees, each of which is based on an annual percentage of each class' average net assets. In addition, FDC may pay financial intermediaries for selling shares of the Fund and providing shareholder support services. For the period, the Distribution and Service Fee rates, total fees and amounts retained by FDC were as follows:
| Distribution Fee | Service Fee | Total Fees | Retained by FDC | |
| Class A | -% | .25% | $512 | $3 |
| Class M | .25% | .25% | 1,325 | 10 |
| Class C | .75% | .25% | 450 | 9 |
| $2,287 | $22 |
Sales Load. FDC may receive a front-end sales charge of up to 5.75% for selling Class A shares and 3.50% for selling Class M shares, some of which is paid to financial intermediaries for selling shares of the Fund. Depending on the holding period, FDC may receive contingent deferred sales charges levied on Class A, Class M and Class C redemptions. The deferred sales charges are 1.00% for Class C shares, 1.00% for certain purchases of Class A shares and .25% for certain purchases of Class M shares.
For the period, sales charge amounts retained by FDC were as follows:
| Retained by FDC | |
| Class A | $17 |
| Class M | 6 |
| Class C(a) | 1 |
| $24 |
(a) When Class C shares are initially sold, FDC pays commissions from its own resources to financial intermediaries through which the sales are made.
Transfer Agent Fees. Fidelity Investments Institutional Operations Company, Inc., (FIIOC), an affiliate of the investment adviser, is the transfer, dividend disbursing and shareholder servicing agent for each class of the Fund. FIIOC receives account fees and asset-based fees that vary according to the account size and type of account of the shareholders of the respective classes of the Fund, except for Class K. FIIOC receives an asset-based fee of Class K's average net assets. FIIOC pays for typesetting, printing and mailing of shareholder reports, except proxy statements.
For the period, transfer agent fees for each class were as follows:
| Amount | % of Class-Level Average Net Assets | |
| Class A | $424 | .21 |
| Class M | 485 | .18 |
| Class C | 103 | .23 |
| Fidelity Value Strategies Fund | 806 | .17 |
| Class K | 31 | .05 |
| Class I | 161 | .22 |
| $2,010 |
Accounting and Security Lending Fees. Fidelity Service Company, Inc. (FSC), an affiliate of the investment adviser, maintains the Fund's accounting records. The accounting fee is based on the level of average net assets for each month. Under a separate contract, FSC administers the security lending program. The security lending fee is based on the number and duration of lending transactions.
Brokerage Commissions. The Fund placed a portion of its portfolio transactions with brokerage firms which are affiliates of the investment adviser. Brokerage commissions are included in net realized gain (loss) and change in net unrealized appreciation (depreciation) in the Statement of Operations. The commissions paid to these affiliated firms were $26 for the period.
Interfund Lending Program. Pursuant to an Exemptive Order issued by the SEC, the Fund, along with other registered investment companies having management contracts with Fidelity Management & Research Company (FMR) or other affiliated entities of FMR, may participate in an interfund lending program. This program provides an alternative credit facility allowing the funds to borrow from, or lend money to, other participating affiliated funds. At period end, there were no interfund loans outstanding. The Fund's activity in this program during the period for which loans were outstanding was as follows:
| Borrower or Lender | Average Loan Balance | Weighted Average Interest Rate | Interest Expense |
| Borrower | $12,437 | .89% | $4 |
Interfund Trades. The Fund may purchase from or sell securities to other Fidelity Funds under procedures adopted by the Board. The procedures have been designed to ensure these interfund trades are executed in accordance with Rule 17a-7 of the 1940 Act. Interfund trades are included within the respective purchases and sales amounts shown in the Purchases and Sales of Investments note.
6. Committed Line of Credit.
The Fund participates with other funds managed by the investment adviser or an affiliate in a $4.25 billion credit facility (the "line of credit") to be utilized for temporary or emergency purposes to fund shareholder redemptions or for other short-term liquidity purposes. The Fund has agreed to pay commitment fees on its pro-rata portion of the line of credit, which amounted to $4 and is reflected in Miscellaneous expenses on the Statement of Operations. During the period, the Fund did not borrow on this line of credit.
7. Security Lending.
The Fund lends portfolio securities through a lending agent from time to time in order to earn additional income. For equity securities, a lending agent is used and may loan securities to certain qualified borrowers, including Fidelity Capital Markets (FCM), a broker-dealer affiliated with the Fund. On the settlement date of the loan, the Fund receives collateral (in the form of U.S. Treasury obligations, letters of credit and/or cash) against the loaned securities and maintains collateral in an amount not less than 100% of the market value of the loaned securities during the period of the loan. The market value of the loaned securities is determined at the close of business of the Fund and any additional required collateral is delivered to the Fund on the next business day. The Fund or borrower may terminate the loan at any time, and if the borrower defaults on its obligation to return the securities loaned because of insolvency or other reasons, the Fund may apply collateral received from the borrower against the obligation. The Fund may experience delays and costs in recovering the securities loaned. Any cash collateral received is invested in the Fidelity Securities Lending Cash Central Fund. The value of loaned securities and cash collateral at period end are disclosed on the Fund's Statement of Assets and Liabilities. At period end, there were no security loans outstanding with FCM. Security lending income represents the income earned on investing cash collateral, less rebates paid to borrowers and any lending agent fees associated with the loan, plus any premium payments received for lending certain types of securities. Security lending income is presented in the Statement of Operations as a component of income from Fidelity Central Funds. Total security lending income during the period amounted to $406, including $6 from securities loaned to FCM.
8. Bank Borrowings.
The Fund is permitted to have bank borrowings for temporary or emergency purposes to fund shareholder redemptions or for other short-term liquidity requirements. The Fund has established borrowing arrangements with certain banks. The interest rate on the borrowings is the bank's base rate, as revised from time to time. The average loan balance during the period for which loans were outstanding amounted to $5,859. The weighted average interest rate was 1.16%. The interest expense amounted to $1 under the bank borrowing program. At period end, there were no bank borrowings outstanding.
9. Expense Reductions.
Commissions paid to certain brokers with whom the investment adviser, or its affiliates, places trades on behalf of the Fund include an amount in addition to trade execution, which may be rebated back to the Fund to offset certain expenses. This amount totaled $58 for the period.
In addition, during the period the investment adviser reimbursed and/or waived a portion of fund-level operating expenses in the amount of $12.
10. Distributions to Shareholders.
Distributions to shareholders of each class were as follows:
| Year ended November 30, 2017 | Year ended November 30, 2016 | |
| From net investment income | ||
| Class A | $2,766 | $2,186 |
| Class M | 2,831 | 2,155 |
| Class C | 357 | 187 |
| Fidelity Value Strategies Fund | 9,926 | 9,139 |
| Class K | 1,087 | 955 |
| Class I | 1,123 | 746 |
| Total | $18,090 | $15,368 |
| From net realized gain | ||
| Class A | $37,462 | $49 |
| Class M | 46,673 | 65 |
| Class C | 9,088 | 13 |
| Fidelity Value Strategies Fund | 112,547 | 160 |
| Class K | 11,298 | 15 |
| Class I | 12,750 | 14 |
| Total | $229,818 | $316 |
11. Share Transactions.
Share transactions for each class were as follows and may contain automatic conversions between classes or exchanges between affiliated funds:
| Shares | Shares | Dollars | Dollars | |
| Year ended November 30, 2017 | Year ended November 30, 2016 | Year ended November 30, 2017 | Year ended November 30, 2016 | |
| Class A | ||||
| Shares sold | 296 | 471 | $10,638 | $17,474 |
| Reinvestment of distributions | 1,127 | 58 | 37,943 | 2,110 |
| Shares redeemed | (1,026) | (998) | (36,865) | (37,279) |
| Net increase (decrease) | 397 | (469) | $11,716 | $(17,695) |
| Class M | ||||
| Shares sold | 349 | 349 | $13,029 | $13,447 |
| Reinvestment of distributions | 1,294 | 54 | 45,666 | 2,045 |
| Shares redeemed | (1,277) | (1,385) | (48,234) | (53,890) |
| Net increase (decrease) | 366 | (982) | $10,461 | $(38,398) |
| Class B | ||||
| Shares sold | – | – | $– | $9 |
| Shares redeemed | – | (110) | – | (3,723) |
| Net increase (decrease) | – | (110) | $– | $(3,714) |
| Class C | ||||
| Shares sold | 89 | 78 | $2,827 | $2,605 |
| Reinvestment of distributions | 307 | 6 | 9,116 | 191 |
| Shares redeemed | (264) | (263) | (8,379) | (8,759) |
| Net increase (decrease) | 132 | (179) | $3,564 | $(5,963) |
| Fidelity Value Strategies Fund | ||||
| Shares sold | 1,169 | 9,301 | $50,402 | $395,357 |
| Reinvestment of distributions | 2,966 | 182 | 114,742 | 7,409 |
| Shares redeemed | (10,188) | (10,077) | (409,648) | (417,147) |
| Net increase (decrease) | (6,053) | (594) | $(244,504) | $(14,381) |
| Class K | ||||
| Shares sold | 617 | 480 | $26,514 | $20,396 |
| Reinvestment of distributions | 321 | 24 | 12,384 | 970 |
| Shares redeemed | (665) | (644) | (27,215) | (27,300) |
| Net increase (decrease) | 273 | (140) | $11,683 | $(5,934) |
| Class I | ||||
| Shares sold | 459 | 445 | $17,823 | $18,090 |
| Reinvestment of distributions | 339 | 19 | 12,386 | 723 |
| Shares redeemed | (774) | (330) | (30,001) | (13,236) |
| Net increase (decrease) | 24 | 134 | $208 | $5,577 |
12. Other.
The Fund's organizational documents provide former and current trustees and officers with a limited indemnification against liabilities arising in connection with the performance of their duties to the Fund. In the normal course of business, the Fund may also enter into contracts that provide general indemnifications. The Fund's maximum exposure under these arrangements is unknown as this would be dependent on future claims that may be made against the Fund. The risk of material loss from such claims is considered remote.
Report of Independent Registered Public Accounting Firm
To the Trustees of Fidelity Advisor Series I and Shareholders of Fidelity Advisor Value Strategies Fund:
We have audited the accompanying statement of assets and liabilities of Fidelity Advisor Value Strategies Fund (the Fund), a fund of Fidelity Advisor Series I, including the schedule of investments, as of November 30, 2017, and the related statement of operations for the year then ended, the statement of changes in net assets for each of the two years in the period then ended, and the financial highlights for each of the five years in the period then ended. These financial statements and financial highlights are the responsibility of the Fund's management. Our responsibility is to express an opinion on these financial statements and financial highlights based on our audits.
We conducted our audits in accordance with the standards of the Public Company Accounting Oversight Board (United States). Those standards require that we plan and perform the audit to obtain reasonable assurance about whether the financial statements and financial highlights are free of material misstatement. The Fund is not required to have, nor were we engaged to perform, an audit of its internal control over financial reporting. Our audits included consideration of internal control over financial reporting as a basis for designing audit procedures that are appropriate in the circumstances, but not for the purpose of expressing an opinion on the effectiveness of the Fund's internal control over financial reporting. Accordingly, we express no such opinion. An audit also includes examining, on a test basis, evidence supporting the amounts and disclosures in the financial statements, assessing the accounting principles used and significant estimates made by management, as well as evaluating the overall financial statement presentation. Our procedures included confirmation of securities owned as of November 30, 2017, by correspondence with the custodians and brokers; when replies were not received from brokers, we performed other auditing procedures. We believe that our audits provide a reasonable basis for our opinion.
In our opinion, such financial statements and financial highlights referred to above present fairly, in all material respects, the financial position of Fidelity Advisor Value Strategies Fund as of November 30, 2017, the results of its operations for the year then ended, the changes in its net assets for each of the two years in the period then ended, and the financial highlights for each of the five years in the period then ended, in conformity with accounting principles generally accepted in the United States of America.
DELOITTE & TOUCHE LLP
Boston, Massachusetts
January 16, 2018
Trustees and Officers
The Trustees, Members of the Advisory Board (if any), and officers of the trust and fund, as applicable, are listed below. The Board of Trustees governs the fund and is responsible for protecting the interests of shareholders. The Trustees are experienced executives who meet periodically throughout the year to oversee the fund's activities, review contractual arrangements with companies that provide services to the fund, oversee management of the risks associated with such activities and contractual arrangements, and review the fund's performance. Each of the Trustees oversees 190 funds.
The Trustees hold office without limit in time except that (a) any Trustee may resign; (b) any Trustee may be removed by written instrument, signed by at least two-thirds of the number of Trustees prior to such removal; (c) any Trustee who requests to be retired or who has become incapacitated by illness or injury may be retired by written instrument signed by a majority of the other Trustees; and (d) any Trustee may be removed at any special meeting of shareholders by a two-thirds vote of the outstanding voting securities of the trust. Each Trustee who is not an interested person (as defined in the 1940 Act) of the trust and the fund is referred to herein as an Independent Trustee. Each Independent Trustee shall retire not later than the last day of the calendar year in which his or her 75th birthday occurs. The Independent Trustees may waive this mandatory retirement age policy with respect to individual Trustees. Officers and Advisory Board Members hold office without limit in time, except that any officer or Advisory Board Member may resign or may be removed by a vote of a majority of the Trustees at any regular meeting or any special meeting of the Trustees. Except as indicated, each individual has held the office shown or other offices in the same company for the past five years.
The fund’s Statement of Additional Information (SAI) includes more information about the Trustees. To request a free copy, call Fidelity at 1-800-544-8544.
Experience, Skills, Attributes, and Qualifications of the Trustees. The Governance and Nominating Committee has adopted a statement of policy that describes the experience, qualifications, attributes, and skills that are necessary and desirable for potential Independent Trustee candidates (Statement of Policy). The Board believes that each Trustee satisfied at the time he or she was initially elected or appointed a Trustee, and continues to satisfy, the standards contemplated by the Statement of Policy. The Governance and Nominating Committee also engages professional search firms to help identify potential Independent Trustee candidates who have the experience, qualifications, attributes, and skills consistent with the Statement of Policy. From time to time, additional criteria based on the composition and skills of the current Independent Trustees, as well as experience or skills that may be appropriate in light of future changes to board composition, business conditions, and regulatory or other developments, have also been considered by the professional search firms and the Governance and Nominating Committee. In addition, the Board takes into account the Trustees' commitment and participation in Board and committee meetings, as well as their leadership of standing and ad hoc committees throughout their tenure.
In determining that a particular Trustee was and continues to be qualified to serve as a Trustee, the Board has considered a variety of criteria, none of which, in isolation, was controlling. The Board believes that, collectively, the Trustees have balanced and diverse experience, qualifications, attributes, and skills, which allow the Board to operate effectively in governing the fund and protecting the interests of shareholders. Information about the specific experience, skills, attributes, and qualifications of each Trustee, which in each case led to the Board's conclusion that the Trustee should serve (or continue to serve) as a trustee of the fund, is provided below.
Board Structure and Oversight Function. James C. Curvey is an interested person and currently serves as Chairman. The Trustees have determined that an interested Chairman is appropriate and benefits shareholders because an interested Chairman has a personal and professional stake in the quality and continuity of services provided to the fund. Independent Trustees exercise their informed business judgment to appoint an individual of their choosing to serve as Chairman, regardless of whether the Trustee happens to be independent or a member of management. The Independent Trustees have determined that they can act independently and effectively without having an Independent Trustee serve as Chairman and that a key structural component for assuring that they are in a position to do so is for the Independent Trustees to constitute a substantial majority for the Board. The Independent Trustees also regularly meet in executive session. Ned C. Lautenbach serves as Chairman of the Independent Trustees and as such (i) acts as a liaison between the Independent Trustees and management with respect to matters important to the Independent Trustees and (ii) with management prepares agendas for Board meetings.
Fidelity® funds are overseen by different Boards of Trustees. The fund's Board oversees Fidelity's high income and certain equity funds, and other Boards oversee Fidelity's investment-grade bond, money market, asset allocation, and sector funds. The asset allocation funds may invest in Fidelity® funds overseen by the fund's Board. The use of separate Boards, each with its own committee structure, allows the Trustees of each group of Fidelity® funds to focus on the unique issues of the funds they oversee, including common research, investment, and operational issues. On occasion, the separate Boards establish joint committees to address issues of overlapping consequences for the Fidelity® funds overseen by each Board.
The Trustees operate using a system of committees to facilitate the timely and efficient consideration of all matters of importance to the Trustees, the fund, and fund shareholders and to facilitate compliance with legal and regulatory requirements and oversight of the fund's activities and associated risks. The Board, acting through its committees, has charged FMR and its affiliates with (i) identifying events or circumstances the occurrence of which could have demonstrably adverse effects on the fund's business and/or reputation; (ii) implementing processes and controls to lessen the possibility that such events or circumstances occur or to mitigate the effects of such events or circumstances if they do occur; and (iii) creating and maintaining a system designed to evaluate continuously business and market conditions in order to facilitate the identification and implementation processes described in (i) and (ii) above. Because the day-to-day operations and activities of the fund are carried out by or through FMR, its affiliates, and other service providers, the fund's exposure to risks is mitigated but not eliminated by the processes overseen by the Trustees. While each of the Board's committees has responsibility for overseeing different aspects of the fund's activities, oversight is exercised primarily through the Operations, Audit, and Compliance Committees. In addition, the Independent Trustees have worked with FMR to enhance the Board's oversight of investment and financial risks, legal and regulatory risks, technology risks, and operational risks, including the development of additional risk reporting to the Board. For example, a working group comprised of Independent Trustees and FMR has worked and continues to work to review the Fidelity® funds' valuation-related activities, reporting and risk management. Appropriate personnel, including but not limited to the fund's Chief Compliance Officer (CCO), FMR's internal auditor, the independent accountants, the fund's Treasurer and portfolio management personnel, make periodic reports to the Board's committees, as appropriate, including an annual review of Fidelity's risk management program for the Fidelity® funds. The responsibilities of each standing committee, including their oversight responsibilities, are described further under "Standing Committees of the Trustees."
Interested Trustees*:
Correspondence intended for a Trustee who is an interested person may be sent to Fidelity Investments, 245 Summer Street, Boston, Massachusetts 02210.
Name, Year of Birth; Principal Occupations and Other Relevant Experience+
James C. Curvey (1935)
Year of Election or Appointment: 2007
Trustee
Chairman of the Board of Trustees
Mr. Curvey also serves as Trustee of other Fidelity® funds. Mr. Curvey is a Director of Fidelity Research & Analysis Co. (investment adviser firm, 2009-present), and Vice Chairman (2007-present) and Director of FMR LLC (diversified financial services company). In addition, Mr. Curvey serves as an Overseer for the Boston Symphony Orchestra and a member of the board of Artis-Naples, Naples, Florida, and as a Trustee for Brewster Academy, Wolfeboro, New Hampshire. Previously, Mr. Curvey served as a Director of Fidelity Investments Money Management, Inc. (investment adviser firm, 2009-2014) and a Director of FMR and FMR Co., Inc. (investment adviser firms, 2007-2014).
Charles S. Morrison (1960)
Year of Election or Appointment: 2014
Trustee
Mr. Morrison also serves as Trustee of other funds. He serves as President of Fidelity Management & Research Company (FMR) (investment adviser firm, 2016-present), a Director of Fidelity Investments Money Management, Inc. (FIMM) (investment adviser firm, 2014-present), Director of Fidelity SelectCo, LLC (investment adviser firm, 2014-present), President, Asset Management (2014-present), and is an employee of Fidelity Investments. Previously, Mr. Morrison served as Vice President of Fidelity's Fixed Income and Asset Allocation Funds (2012-2014), President, Fixed Income (2011-2014), Vice President of Fidelity's Money Market Funds (2005-2009), President, Money Market Group Leader of FMR (investment adviser firm, 2009), and Senior Vice President, Money Market Group of FMR (2004-2009). Mr. Morrison also served as Vice President of Fidelity's Bond Funds (2002-2005), certain Balanced Funds (2002-2005), and certain Asset Allocation Funds (2002-2007), and as Senior Vice President (2002-2005) of Fidelity's Bond Division.
* Determined to be an “Interested Trustee” by virtue of, among other things, his or her affiliation with the trust or various entities under common control with FMR.
+ The information includes the Trustee's principal occupation during the last five years and other information relating to the experience, attributes, and skills relevant to the Trustee's qualifications to serve as a Trustee, which led to the conclusion that the Trustee should serve as a Trustee for the fund.
Independent Trustees:
Correspondence intended for an Independent Trustee may be sent to Fidelity Investments, P.O. Box 55235, Boston, Massachusetts 02205-5235.
Name, Year of Birth; Principal Occupations and Other Relevant Experience+
Dennis J. Dirks (1948)
Year of Election or Appointment: 2005
Trustee
Mr. Dirks also serves as Trustee of other Fidelity® funds. Prior to his retirement in May 2003, Mr. Dirks was Chief Operating Officer and a member of the Board of The Depository Trust & Clearing Corporation (DTCC). He also served as President, Chief Operating Officer, and Board member of The Depository Trust Company (DTC) and President and Board member of the National Securities Clearing Corporation (NSCC). In addition, Mr. Dirks served as Chief Executive Officer and Board member of the Government Securities Clearing Corporation, Chief Executive Officer and Board member of the Mortgage-Backed Securities Clearing Corporation, as a Trustee and a member of the Finance Committee of Manhattan College (2005-2008), as a Trustee and a member of the Finance Committee of AHRC of Nassau County (2006-2008), as a member of the Independent Directors Council (IDC) Governing Council (2010-2015), and as a member of the Board of Directors for The Brookville Center for Children’s Services, Inc. (2009-2017). Mr. Dirks is a member of the Finance Committee (2016-present) and Board of Directors (2017-present) of the Asolo Repertory Theatre.
Alan J. Lacy (1953)
Year of Election or Appointment: 2008
Trustee
Mr. Lacy also serves as Trustee of other Fidelity® funds. Mr. Lacy serves as a Director of Bristol-Myers Squibb Company (global pharmaceuticals, 2008-present). He is a Trustee of the California Chapter of The Nature Conservancy (2015-present) and a Director of the Center for Advanced Study in the Behavioral Sciences at Stanford University (2015-present). In addition, Mr. Lacy served as Senior Adviser (2007-2014) of Oak Hill Capital Partners, L.P. (private equity) and also served as Chief Executive Officer (2005) and Vice Chairman (2005-2006) of Sears Holdings Corporation (retail) and Chief Executive Officer and Chairman of the Board of Sears, Roebuck and Co. (retail, 2000-2005). Previously, Mr. Lacy served as Chairman (2014-2017) and a member (2010-2017) of the Board of Directors of Dave & Buster’s Entertainment, Inc. (restaurant and entertainment complexes), as Chairman (2008-2011) and a member (2006-2015) of the Board of Trustees of the National Parks Conservation Association, and as a member of the Board of Directors for The Hillman Companies, Inc. (hardware wholesalers, 2010-2014), Earth Fare, Inc. (retail grocery, 2010-2014), and The Western Union Company (global money transfer, 2006-2011).
Ned C. Lautenbach (1944)
Year of Election or Appointment: 2000
Trustee
Chairman of the Independent Trustees
Mr. Lautenbach also serves as Trustee of other Fidelity® funds. Mr. Lautenbach currently serves as Vice Chair of the Board of Governors, State University System of Florida (2013-present) and is a member of the Council on Foreign Relations (1994-present). He is also a member and has most recently served as Chairman of the Board of Directors of Artis-Naples (2012-present). Previously, Mr. Lautenbach served as a member and then Lead Director of the Board of Directors of Eaton Corporation (diversified industrial, 1997-2016). He was also a Partner and Advisory Partner at Clayton, Dubilier & Rice, LLC (private equity investment, 1998-2010), as well as a Director of Sony Corporation (2006-2007). In addition, Mr. Lautenbach also had a 30-year career with IBM (technology company) during which time he served as Senior Vice President and a member of the Corporate Executive Committee (1968-1998).
Joseph Mauriello (1944)
Year of Election or Appointment: 2008
Trustee
Mr. Mauriello also serves as Trustee of other Fidelity® funds. Prior to his retirement in January 2006, Mr. Mauriello served in numerous senior management positions including Deputy Chairman and Chief Operating Officer (2004-2005), and Vice Chairman of Financial Services (2002-2004) of KPMG LLP US (professional services, 1965-2005). Mr. Mauriello currently serves as a member of the Board of Directors of XL Group plc. (global insurance and re-insurance, 2006-present) and the Independent Directors Council (IDC) Governing Council (2015-present). Previously, Mr. Mauriello served as a Director of the Hamilton Funds of the Bank of New York (2006-2007) and of Arcadia Resources Inc. (health care services and products, 2007-2012).
Cornelia M. Small (1944)
Year of Election or Appointment: 2005
Trustee
Ms. Small also serves as Trustee of other Fidelity® funds. Ms. Small is a member of the Board of Directors (2009-present) and Chair of the Investment Committee (2010-present) of the Teagle Foundation. Ms. Small also serves on the Investment Committee of the Berkshire Taconic Community Foundation (2008-present). Previously, Ms. Small served as Chairperson (2002-2008) and a member of the Investment Committee and Chairperson (2008-2012) and a member of the Board of Trustees of Smith College. In addition, Ms. Small served as Chief Investment Officer, Director of Global Equity Investments, and a member of the Board of Directors of Scudder, Stevens & Clark and Scudder Kemper Investments.
William S. Stavropoulos (1939)
Year of Election or Appointment: 2002
Trustee
Vice Chairman of the Independent Trustees
Mr. Stavropoulos also serves as Trustee of other Fidelity® funds. Mr. Stavropoulos serves as President and Founder of the Michigan Baseball Foundation, the Great Lakes Loons (2007-present). Mr. Stavropoulos is Chairman Emeritus of the Board of Directors of The Dow Chemical Company, where he previously served in numerous senior management positions, including President, CEO (1995-2000; 2002-2004), Chairman of the Executive Committee (2000-2006), and as a member of the Board of Directors (1990-2006). Currently, Mr. Stavropoulos is Chairman of the Board of Directors of Univar Inc. (global distributor of commodity and specialty chemicals), a Director of Teradata Corporation (data warehousing and technology solutions), and a member of the Advisory Board for Metalmark Capital LLC (private equity investment, 2005-present). Mr. Stavropoulos is an operating advisor to Clayton, Dubilier & Rice, LLC (private equity investment). In addition, Mr. Stavropoulos is a member of the University of Notre Dame Advisory Council for the College of Science, a Trustee of the Rollin L. Gerstacker Foundation, and a Director of Artis-Naples in Naples, Florida. Previously, Mr. Stavropoulos served as a Director of Chemical Financial Corporation (bank holding company, 1993-2012) and Tyco International, Ltd. (multinational manufacturing and services, 2007-2012).
David M. Thomas (1949)
Year of Election or Appointment: 2008
Trustee
Mr. Thomas also serves as Trustee of other Fidelity® funds. Mr. Thomas serves as Non-Executive Chairman of the Board of Directors of Fortune Brands Home and Security (home and security products, 2011-present), as a member of the Board of Directors (2004-present) and Presiding Director (2013-present) of Interpublic Group of Companies, Inc. (marketing communication), and as a member of the Board of Trustees of the University of Florida (2013-present). Previously, Mr. Thomas served as Executive Chairman (2005-2006) and Chairman and Chief Executive Officer (2000-2005) of IMS Health, Inc. (pharmaceutical and healthcare information solutions), and a Director of Fortune Brands, Inc. (consumer products, 2000-2011).
+ The information includes the Trustee's principal occupation during the last five years and other information relating to the experience, attributes, and skills relevant to the Trustee's qualifications to serve as a Trustee, which led to the conclusion that the Trustee should serve as a Trustee for the fund.
Advisory Board Members and Officers:
Correspondence intended for an officer or Peter S. Lynch may be sent to Fidelity Investments, 245 Summer Street, Boston, Massachusetts 02210. Officers appear below in alphabetical order.
Name, Year of Birth; Principal Occupation
Peter S. Lynch (1944)
Year of Election or Appointment: 2003
Member of the Advisory Board
Mr. Lynch also serves as Member of the Advisory Board of other Fidelity® funds. Mr. Lynch is Vice Chairman and a Director of FMR (investment adviser firm) and FMR Co., Inc. (investment adviser firm). In addition, Mr. Lynch serves as a Trustee of Boston College and as the Chairman of the Inner-City Scholarship Fund. Previously, Mr. Lynch served on the Special Olympics International Board of Directors (1997-2006).
Elizabeth Paige Baumann (1968)
Year of Election or Appointment: 2017
Anti-Money Laundering (AML) Officer
Ms. Baumann also serves as AML Officer of other funds. She is Chief AML Officer (2012-present) and Senior Vice President (2014-present) of FMR LLC (diversified financial services company) and is an employee of Fidelity Investments. Previously, Ms. Baumann served as AML Officer of the funds (2012-2016), and Vice President (2007-2014) and Deputy Anti-Money Laundering Officer (2007-2012) of FMR LLC.
Marc R. Bryant (1966)
Year of Election or Appointment: 2015
Secretary and Chief Legal Officer (CLO)
Mr. Bryant also serves as Secretary and CLO of other funds. Mr. Bryant serves as CLO, Secretary, and Senior Vice President of Fidelity Management & Research Company (investment adviser firm, 2015-present) and FMR Co., Inc. (investment adviser firm, 2015-present); Secretary of Fidelity SelectCo, LLC (investment adviser firm, 2015-present) and Fidelity Investments Money Management, Inc. (investment adviser firm, 2015-present); and CLO of Fidelity Management & Research (Hong Kong) Limited and FMR Investment Management (UK) Limited (investment adviser firms, 2015-present) and Fidelity Management & Research (Japan) Limited (investment adviser firm, 2016-present). He is Senior Vice President and Deputy General Counsel of FMR LLC (diversified financial services company). Previously, Mr. Bryant served as Secretary and CLO of Fidelity Rutland Square Trust II (2010-2014) and Assistant Secretary of Fidelity's Fixed Income and Asset Allocation Funds (2013-2015). Prior to joining Fidelity Investments, Mr. Bryant served as a Senior Vice President and the Head of Global Retail Legal for AllianceBernstein L.P. (2006-2010), and as the General Counsel for ProFund Advisors LLC (2001-2006).
William C. Coffey (1969)
Year of Election or Appointment: 2009
Assistant Secretary
Mr. Coffey also serves as Assistant Secretary of other funds. He is Senior Vice President and Deputy General Counsel of FMR LLC (diversified financial services company, 2010-present), and is an employee of Fidelity Investments. Previously, Mr. Coffey served as Vice President and Associate General Counsel of FMR LLC (2005-2009).
Jonathan Davis (1968)
Year of Election or Appointment: 2010
Assistant Treasurer
Mr. Davis also serves as Assistant Treasurer of other funds. Mr. Davis serves as Assistant Treasurer of FMR Capital, Inc. (2017-present) and is an employee of Fidelity Investments. Previously, Mr. Davis served as Vice President and Associate General Counsel of FMR LLC (diversified financial services company, 2003-2010).
Adrien E. Deberghes (1967)
Year of Election or Appointment: 2016
Assistant Treasurer
Mr. Deberghes also serves as an officer of other funds. He serves as Assistant Treasurer of FMR Capital, Inc. (2017-present), Executive Vice President of Fidelity Investments Money Management, Inc. (FIMM) (investment adviser firm, 2016-present), and is an employee of Fidelity Investments (2008-present). Prior to joining Fidelity Investments, Mr. Deberghes was Senior Vice President of Mutual Fund Administration at State Street Corporation (2007-2008), Senior Director of Mutual Fund Administration at Investors Bank & Trust (2005-2007), and Director of Finance for Dunkin' Brands (2000-2005). Previously, Mr. Deberghes served in other fund officer roles.
Stephanie J. Dorsey (1969)
Year of Election or Appointment: 2010
Assistant Treasurer
Ms. Dorsey also serves as an officer of other funds. Ms. Dorsey serves as Assistant Treasurer of FMR Capital, Inc. (2017-present), is an employee of Fidelity Investments (2008-present), and has served in other fund officer roles. Prior to joining Fidelity Investments, Ms. Dorsey served as Treasurer (2004-2008) of the JPMorgan Mutual Funds and Vice President (2004-2008) of JPMorgan Chase Bank.
Howard J. Galligan III (1966)
Year of Election or Appointment: 2014
Chief Financial Officer
Mr. Galligan also serves as Chief Financial Officer of other funds. Mr. Galligan serves as President of Fidelity Pricing and Cash Management Services (FPCMS) (2014-present) and as a Director of Strategic Advisers, Inc. (investment adviser firm, 2008-present). Previously, Mr. Galligan served as Chief Administrative Officer of Asset Management (2011-2014) and Chief Operating Officer and Senior Vice President of Investment Support for Strategic Advisers, Inc. (2003-2011).
Thomas C. Hense (1964)
Year of Election or Appointment: 2008, 2010, or 2015
Vice President
Mr. Hense serves as Vice President of Fidelity Advisor® Multi-Asset Income Fund (2015) and other funds (High Income (2008), Small Cap (2008), and Value (2010) funds), and is an employee of Fidelity Investments (1993-present). Previously, Mr. Hense served as a portfolio manager for Fidelity's Institutional Money Management Group (Pyramis) (2003-2008).
Brian B. Hogan (1964)
Year of Election or Appointment: 2009
Vice President
Mr. Hogan also serves as Trustee or Vice President of other funds. Mr. Hogan serves as a Director of FMR Investment Management (UK) Limited (investment adviser firm, 2015-present) and Fidelity SelectCo, LLC (investment adviser firm, 2014-present) and President of the Equity Division of FMR (investment adviser firm, 2009-present). Previously, Mr. Hogan served as Senior Vice President, Equity Research of FMR (2006-2009) and as a portfolio manager. Mr. Brian B. Hogan is not related to Mr. Colm A. Hogan.
Colm A. Hogan (1973)
Year of Election or Appointment: 2016
Deputy Treasurer
Mr. Hogan also serves as an officer of other funds. Mr. Hogan serves as Assistant Treasurer of FMR Capital, Inc. (2017-present) and is an employee of Fidelity Investments (2005-present). Mr. Colm A. Hogan is not related to Mr. Brian B. Hogan.
Chris Maher (1972)
Year of Election or Appointment: 2013
Assistant Treasurer
Mr. Maher serves as Assistant Treasurer of other funds. Mr. Maher is Vice President of Valuation Oversight, serves as Assistant Treasurer of FMR Capital, Inc. (2017-present), and is an employee of Fidelity Investments. Previously, Mr. Maher served as Vice President of Asset Management Compliance (2013), Vice President of the Program Management Group of FMR (investment adviser firm, 2010-2013), and Vice President of Valuation Oversight (2008-2010).
Rieco E. Mello (1969)
Year of Election or Appointment: 2017
Assistant Treasurer
Mr. Mello also serves as Assistant Treasurer of other funds. Mr. Mello serves as Assistant Treasurer of FMR Capital, Inc. (2017-present) and is an employee of Fidelity Investments (1995-present).
Kenneth B. Robins (1969)
Year of Election or Appointment: 2016
Chief Compliance Officer
Mr. Robins also serves as an officer of other funds. Mr. Robins serves as Compliance Officer of Fidelity Management & Research Company and FMR Co., Inc. (investment adviser firms, 2016-present) and is an employee of Fidelity Investments (2004-present). Previously, Mr. Robins served as Executive Vice President of Fidelity Investments Money Management, Inc. (investment adviser firm, 2013-2016) and served in other fund officer roles.
Stacie M. Smith (1974)
Year of Election or Appointment: 2016
President and Treasurer
Ms. Smith also serves as an officer of other funds. Ms. Smith serves as Assistant Treasurer of FMR Capital, Inc. (2017-present), is an employee of Fidelity Investments (2009-present), and has served in other fund officer roles. Prior to joining Fidelity Investments, Ms. Smith served as Senior Audit Manager of Ernst & Young LLP (accounting firm, 1996-2009). Previously, Ms. Smith served as Deputy Treasurer of certain Fidelity® funds (2013-2016).
Marc L. Spector (1972)
Year of Election or Appointment: 2016
Assistant Treasurer
Mr. Spector also serves as an officer of other funds. Mr. Spector serves as Assistant Treasurer of FMR Capital, Inc. (2017-present) and is an employee of Fidelity Investments (2016-present). Prior to joining Fidelity Investments, Mr. Spector served as Director at the Siegfried Group (accounting firm, 2013-2016), and prior to Siegfried Group as audit senior manager at Deloitte & Touche (accounting firm, 2005-2013).
Renee Stagnone (1975)
Year of Election or Appointment: 2016
Assistant Treasurer
Ms. Stagnone also serves as an officer of other funds. Ms. Stagnone serves as Assistant Treasurer of FMR Capital, Inc. (2017-present) and is an employee of Fidelity Investments (1997-present). Previously, Ms. Stagnone served as Deputy Treasurer of certain Fidelity® funds (2013-2016).
Shareholder Expense Example
As a shareholder of the Fund, you incur two types of costs: (1) transaction costs, including sales charges (loads) on purchase payments or redemption proceeds, and (2) ongoing costs, including distribution and/or service (12b-1) fees and other Fund expenses. This Example is intended to help you understand your ongoing costs (in dollars) of investing in the Fund and to compare these costs with the ongoing costs of investing in other mutual funds.
The Example is based on an investment of $1,000 invested at the beginning of the period and held for the entire period (June 1, 2017 to November 30, 2017).
Actual Expenses
The first line of the accompanying table for each class of the Fund provides information about actual account values and actual expenses. You may use the information in this line, together with the amount you invested, to estimate the expenses that you paid over the period. Simply divide your account value by $1,000.00 (for example, an $8,600 account value divided by $1,000.00 = 8.6), then multiply the result by the number in the first line for a class of the Fund under the heading entitled "Expenses Paid During Period" to estimate the expenses you paid on your account during this period. A small balance maintenance fee of $12.00 that is charged once a year may apply for certain accounts with a value of less than $2,000. This fee is not included in the table below. If it was, the estimate of expenses you paid during the period would be higher, and your ending account value lower, by this amount. In addition, the Fund, as a shareholder in the underlying Fidelity Central Funds, will indirectly bear its pro-rata share of the fees and expenses incurred by the underlying Fidelity Central Funds. These fees and expenses are not included in the Fund's annualized expense ratio used to calculate the expense estimate in the table below.
Hypothetical Example for Comparison Purposes
The second line of the accompanying table for each class of the Fund provides information about hypothetical account values and hypothetical expenses based on a Class' actual expense ratio and an assumed rate of return of 5% per year before expenses, which is not the Class' actual return. The hypothetical account values and expenses may not be used to estimate the actual ending account balance or expenses you paid for the period. You may use this information to compare the ongoing costs of investing in the Fund and other funds. To do so, compare this 5% hypothetical example with the 5% hypothetical examples that appear in the shareholder reports of the other funds. A small balance maintenance fee of $12.00 that is charged once a year may apply for certain accounts with a value of less than $2,000. This fee is not included in the table below. If it was, the estimate of expenses you paid during the period would be higher, and your ending account value lower, by this amount. In addition, the Fund, as a shareholder in the underlying Fidelity Central Funds, will indirectly bear its pro-rata share of the fees and expenses incurred by the underlying Fidelity Central Funds. These fees and expenses are not included in the Fund's annualized expense ratio used to calculate the expense estimate in the table below.
Please note that the expenses shown in the table are meant to highlight your ongoing costs only and do not reflect any transaction costs. Therefore, the second line of the table is useful in comparing ongoing costs only, and will not help you determine the relative total costs of owning different funds. In addition, if these transactional costs were included, your costs would have been higher.
| Annualized Expense Ratio-A | Beginning Account Value June 1, 2017 | Ending Account Value November 30, 2017 | Expenses Paid During Period-B June 1, 2017 to November 30, 2017 | |
| Class A | .96% | |||
| Actual | $1,000.00 | $1,098.80 | $5.05 | |
| Hypothetical-C | $1,000.00 | $1,020.26 | $4.86 | |
| Class M | 1.18% | |||
| Actual | $1,000.00 | $1,097.70 | $6.21 | |
| Hypothetical-C | $1,000.00 | $1,019.15 | $5.97 | |
| Class C | 1.73% | |||
| Actual | $1,000.00 | $1,094.70 | $9.08 | |
| Hypothetical-C | $1,000.00 | $1,016.39 | $8.74 | |
| Fidelity Value Strategies Fund | .69% | |||
| Actual | $1,000.00 | $1,100.40 | $3.63 | |
| Hypothetical-C | $1,000.00 | $1,021.61 | $3.50 | |
| Class K | .55% | |||
| Actual | $1,000.00 | $1,101.20 | $2.90 | |
| Hypothetical-C | $1,000.00 | $1,022.31 | $2.79 | |
| Class I | .72% | |||
| Actual | $1,000.00 | $1,100.20 | $3.79 | |
| Hypothetical-C | $1,000.00 | $1,021.46 | $3.65 |
A Annualized expense ratio reflects expenses net of applicable fee waivers.
B Expenses are equal to each Class' annualized expense ratio, multiplied by the average account value over the period, multiplied by 183/365 (to reflect the one-half year period).
C 5% return per year before expenses
Distributions (Unaudited)
The Board of Trustees of Fidelity Advisor Value Strategies Fund voted to pay to shareholders of record at the opening of business on record date, the following distributions per share derived from capital gains realized from sales of portfolio securities, and dividends derived from net investment income:
| Pay Date | Record Date | Dividends | Capital Gains | |
| Fidelity Advisor Value Strategies Fund | ||||
| Class A | 12/27/17 | 12/26/17 | $0.513 | $2.765 |
| Class M | 12/27/17 | 12/26/17 | $0.412 | $2.765 |
| Class C | 12/27/17 | 12/26/17 | $0.273 | $2.765 |
| Fidelity Value Strategies Fund | 12/27/17 | 12/26/17 | $0.608 | $2.765 |
| Class K | 12/27/17 | 12/26/17 | $0.670 | $2.765 |
| Class I | 12/27/17 | 12/26/17 | $0.594 | $2.765 |
The fund hereby designates as a capital gain dividend with respect to the taxable year ended November 30, 2017, $21,296,902, or, if subsequently determined to be different, the net capital gain of such year.
Class A, Class M, Class C, Fidelity Value Strategies Fund, Class K, and Class I designate 100%, 100%, 100%, 87%, 80%, and 87% of the dividends distributed in December 2016, respectively during the fiscal year as qualifying for the dividends–received deduction for corporate shareholders.
Class A, Class M, Class C, Fidelity Value Strategies Fund, Class K, and Class I designate 100%, 100%, 100%, 96%, 88%, and 96% of the dividends distributed during the fiscal year as amounts which may be taken into account as a dividend for purposes of the maximum rate under section 1(h)(11) of the Internal Revenue Code.
The fund will notify shareholders in January 2018 of amounts for use in preparing 2017 income tax returns.
Board Approval of Investment Advisory Contracts and Management Fees
Fidelity Advisor Value Strategies Fund
Each year, the Board of Trustees, including the Independent Trustees (together, the Board), votes on the renewal of the management contract with Fidelity Management & Research Company (FMR) and the sub-advisory agreements (together, the Advisory Contracts) for the fund. FMR and the sub-advisers are referred to herein as the Investment Advisers. The Board, assisted by the advice of fund counsel and Independent Trustees' counsel, requests and considers a broad range of information relevant to the renewal of the Advisory Contracts throughout the year.
The Board meets regularly and, at each of its meetings, covers an extensive agenda of topics and materials and considers factors that are relevant to its annual consideration of the renewal of the fund's Advisory Contracts, including the services and support provided to the fund and its shareholders. The Board has established various standing committees (Committees), each composed of and chaired by Independent Trustees with varying backgrounds, to which the Board has assigned specific subject matter responsibilities in order to enhance effective decision-making by the Board. The Board, acting directly and through its Committees, requests and receives information concerning the annual consideration of the renewal of the fund's Advisory Contracts. The Board also meets as needed to review matters specifically related to the Board's annual consideration of the renewal of the Advisory Contracts. Members of the Board may also meet with trustees of other Fidelity funds through ad hoc joint committees to discuss certain matters relevant to all of the Fidelity funds.
At its July 2017 meeting, the Board unanimously determined to renew the fund's Advisory Contracts. In reaching its determination, the Board considered all factors it believed relevant, including (i) the nature, extent, and quality of the services to be provided to the fund and its shareholders (including the investment performance of the fund); (ii) the competitiveness of the fund's management fee and total expense ratio relative to peer funds; (iii) the total costs of the services to be provided by and the profits to be realized by Fidelity from its relationships with the fund; and (iv) the extent to which, if any, economies of scale exist and would be realized as the fund grows, and whether any economies of scale are appropriately shared with fund shareholders.
In considering whether to renew the Advisory Contracts for the fund, the Board reached a determination, with the assistance of fund counsel and Independent Trustees' counsel and through the exercise of its business judgment, that the renewal of the Advisory Contracts was in the best interests of the fund and its shareholders and that the compensation payable under the Advisory Contracts was fair and reasonable. The Board's decision to renew the Advisory Contracts was not based on any single factor, but rather was based on a comprehensive consideration of all the information provided to the Board at its meetings throughout the year. The Board, in reaching its determination to renew the Advisory Contracts, was aware that shareholders of the fund have a broad range of investment choices available to them, including a wide choice among funds offered by Fidelity's competitors, and that the fund's shareholders, who have the opportunity to review and weigh the disclosure provided by the fund in its prospectus and other public disclosures, have chosen to invest in this fund, which is part of the Fidelity family of funds.
Amendment to Group Fee Rate. The Board also approved an amendment to the management contract for the fund to add an additional breakpoint to the group fee schedule, effective October 1, 2017. The Board noted that the additional breakpoint would result in lower management fee rates as Fidelity's assets under management increase.
Nature, Extent, and Quality of Services Provided. The Board considered Fidelity's staffing as it relates to the fund, including the backgrounds of investment personnel of Fidelity, and also considered the fund's investment objective, strategies, and related investment philosophy. The Independent Trustees also had discussions with senior management of Fidelity's investment operations and investment groups. The Board considered the structure of the investment personnel compensation program and whether this structure provides appropriate incentives to act in the best interests of the fund. Additionally, the Board considered the portfolio managers' investments, if any, in the funds that they manage.Resources Dedicated to Investment Management and Support Services. The Board and the Fund Oversight and Research Committees reviewed the general qualifications and capabilities of Fidelity's investment staff, including its size, education, experience, and resources, as well as Fidelity's approach to recruiting, training, managing, and compensating investment personnel. The Board noted that Fidelity has continued to increase the resources devoted to non-U.S. offices, including expansion of Fidelity's global investment organization. The Board also noted that Fidelity's analysts have extensive resources, tools and capabilities that allow them to conduct sophisticated quantitative and fundamental analysis, as well as credit analysis of issuers, counterparties and guarantors. Further, the Board considered that Fidelity's investment professionals have sufficient access to global information and data so as to provide competitive investment results over time, and that those professionals also have access to sophisticated tools that permit them to assess portfolio construction and risk and performance attribution characteristics continuously, as well as to transmit new information and research conclusions rapidly around the world. Additionally, in its deliberations, the Board considered Fidelity's trading, risk management, compliance, and technology and operations capabilities and resources, which are integral parts of the investment management process.Shareholder and Administrative Services. The Board considered (i) the nature, extent, quality, and cost of advisory, administrative, and shareholder services performed by the Investment Advisers and their affiliates under the Advisory Contracts and under separate agreements covering transfer agency, pricing and bookkeeping, and securities lending services for the fund; (ii) the nature and extent of the supervision of third party service providers, principally custodians, subcustodians, and pricing vendors; and (iii) the resources devoted to, and the record of compliance with, the fund's compliance policies and procedures. The Board also reviewed the allocation of fund brokerage, including allocations to brokers affiliated with the Investment Advisers, the use of brokerage commissions to pay fund expenses, and the use of "soft" commission dollars to pay for research services.The Board noted that the growth of fund assets over time across the complex allows Fidelity to reinvest in the development of services designed to enhance the value or convenience of the Fidelity funds as investment vehicles. These services include 24-hour access to account information and market information through telephone representatives and over the Internet, investor education materials and asset allocation tools, and the expanded availability of Fidelity Investor Centers.In 2014, the Board formed an ad hoc Committee on Transfer Agency Fees to review the variety of transfer agency fee structures throughout the industry and Fidelity's competitive positioning with respect to industry participants.Investment in a Large Fund Family. The Board considered the benefits to shareholders of investing in a Fidelity fund, including the benefits of investing in a fund that is part of a large family of funds offering a variety of investment disciplines and providing a large variety of mutual fund investor services. The Board noted that Fidelity had taken, or had made recommendations that resulted in the Fidelity funds taking, a number of actions over the previous year that benefited particular funds, including: (i) continuing to dedicate additional resources to Fidelity's investment research process, and to the support of the senior management team that oversees asset management; (ii) continuing efforts to enhance Fidelity's global research capabilities; (iii) launching new funds and making other enhancements to meet client needs; (iv) launching new share classes of existing funds; (v) eliminating purchase minimums and broadening eligibility requirements for certain lower-priced share classes; (vi) reducing management fees and total expenses for certain growth equity funds and index funds; (vii) lowering expense caps for certain existing funds and classes to reduce expenses borne by shareholders; (viii) eliminating short-term redemption fees for certain funds; (ix) introducing a new pricing structure for certain funds of funds that is expected to reduce overall expenses paid by shareholders; (x) rationalizing product lines and gaining increased efficiencies through proposals for fund mergers and share class consolidations; (xi) continuing to develop, acquire and implement systems and technology to improve services to the funds and shareholders, strengthen information security, and increase efficiency; and (xii) implementing enhancements to further strengthen Fidelity's product line to increase investors' probability of success in achieving their investment goals, including retirement income goals.Investment Performance. The Board considered whether the fund has operated in accordance with its investment objective, as well as its record of compliance with its investment restrictions and its performance history.The Board took into account discussions with representatives of the Investment Advisers about fund investment performance that occur at Board meetings throughout the year. In this regard the Board noted that as part of regularly scheduled fund reviews and other reports to the Board on fund performance, the Board considers annualized return information for the fund for different time periods, measured against a securities market index ("benchmark index") and a peer group of funds with similar objectives ("peer group"), if any. In its evaluation of fund investment performance, the Board gave particular attention to information indicating changes in performance of certain Fidelity funds for specific time periods and discussed with the Investment Advisers the reasons for any overperformance or underperformance.In addition to reviewing absolute and relative fund performance, the Independent Trustees periodically consider the appropriateness of fund performance metrics in evaluating the results achieved. In general, the Independent Trustees believe that fund performance should be evaluated based on net performance (after fees and expenses) of both the highest performing and lowest performing fund share classes, where applicable, compared to appropriate benchmark indices, over appropriate time periods that may include full market cycles, and compared to peer groups, as applicable, over the same periods, taking into account relevant factors including the following: general market conditions; issuer-specific information; and fund cash flows and other factors.The Independent Trustees recognize that shareholders evaluate performance on a net basis over their own holding periods, for which one-, three-, and five-year periods are often used as a proxy. For this reason, the performance information reviewed by the Board also included net cumulative calendar year total return information for the fund and an appropriate benchmark index and peer group for the most recent one-, three-, and five-year periods, as shown below. Returns are shown compared to the 25th percentile (top of box, 75% beaten) and 75th percentile (bottom of box, 25% beaten) of the peer universe.Fidelity Advisor Value Strategies Fund
Fidelity Advisor Value Strategies Fund
![]()
Corporate Headquarters
245 Summer St.
Boston, MA 02210
www.fidelity.com
SOI-ANN-0118
1.539183.120
Item 2.
Code of Ethics
As of the end of the period, November 30, 2017, Fidelity Advisor Series I (the trust) has adopted a code of ethics, as defined in Item 2 of Form N-CSR, that applies to its President and Treasurer and its Chief Financial Officer. A copy of the code of ethics is filed as an exhibit to this Form N-CSR.
Item 3.
Audit Committee Financial Expert
The Board of Trustees of the trust has determined that Joseph Mauriello is an audit committee financial expert, as defined in Item 3 of Form N-CSR. Mr. Mauriello is independent for purposes of Item 3 of Form N-CSR.
Item 4.
Principal Accountant Fees and Services
Fees and Services
The following table presents fees billed by Deloitte & Touche LLP, the member firms of Deloitte Touche Tohmatsu, and their respective affiliates (collectively, “Deloitte Entities”) in each of the last two fiscal years for services rendered to Fidelity Advisor Equity Growth Fund, Fidelity Advisor Equity Income Fund, Fidelity Advisor Equity Value Fund, Fidelity Advisor Growth & Income Fund, Fidelity Advisor Growth Opportunities Fund, Fidelity Advisor Large Cap Fund, Fidelity Advisor Series Growth Opportunities Fund, Fidelity Advisor Stock Selector Mid Cap Fund, and Fidelity Advisor Value Strategies Fund (the “Funds”):
Services Billed by Deloitte Entities
November 30, 2017 FeesA
| Audit Fees | Audit-Related Fees | Tax Fees | All Other Fees |
Fidelity Advisor Equity Growth Fund | $52,000 | $100 | $6,400 | $1,400 |
Fidelity Advisor Equity Income Fund | $47,000 | $100 | $7,200 | $1,300 |
Fidelity Advisor Equity Value Fund | $54,000 | $100 | $6,700 | $1,400 |
Fidelity Advisor Growth & Income Fund | $48,000 | $100 | $5,400 | $1,300 |
Fidelity Advisor Growth Opportunities Fund | $54,000 | $100 | $6,200 | $1,500 |
Fidelity Advisor Large Cap Fund | $51,000 | $100 | $5,400 | $1,300 |
Fidelity Advisor Series Growth Opportunities Fund | $51,000 | $100 | $6,400 | $1,400 |
Fidelity Advisor Stock Selector Mid Cap Fund | $46,000 | $100 | $5,200 | $1,300 |
Fidelity Advisor Value Strategies Fund | $46,000 | $100 | $7,200 | $1,300 |
November 30, 2016 FeesA,B
| Audit Fees | Audit-Related Fees | Tax Fees | All Other Fees |
Fidelity Advisor Equity Growth Fund | $49,000 | $100 | $6,200 | $1,400 |
Fidelity Advisor Equity Income Fund | $47,000 | $100 | $7,400 | $1,300 |
Fidelity Advisor Equity Value Fund | $50,000 | $100 | $7,200 | $1,400 |
Fidelity Advisor Growth & Income Fund | $45,000 | $100 | $5,500 | $1,300 |
Fidelity Advisor Growth Opportunities Fund | $53,000 | $100 | $6,200 | $1,500 |
Fidelity Advisor Large Cap Fund | $46,000 | $100 | $5,500 | $1,300 |
Fidelity Advisor Series Growth Opportunities Fund | $50,000 | $100 | $6,500 | $1,400 |
Fidelity Advisor Stock Selector Mid Cap Fund | $45,000 | $100 | $5,500 | $1,300 |
Fidelity Advisor Value Strategies Fund | $46,000 | $100 | $7,200 | $1,300 |
A Amounts may reflect rounding.
B Certain amounts have been reclassified to align with current period presentation.
The following table presents fees billed by PricewaterhouseCoopers LLP (“PwC”) in each of the last two fiscal years for services rendered to Fidelity Advisor Dividend Growth Fund, Fidelity Advisor Series Equity Growth Fund, Fidelity Advisor Series Small Cap Fund, and Fidelity Advisor Small Cap Fund (the “Funds”):
Services Billed by PwC
November 30, 2017 FeesA
| Audit Fees | Audit-Related Fees | Tax Fees | All Other Fees |
Fidelity Advisor Dividend Growth Fund | $54,000 | $4,900 | $3,700 | $2,400 |
Fidelity Advisor Series Equity Growth Fund | $31,000 | $2,900 | $3,000 | $1,400 |
Fidelity Advisor Series Small Cap Fund | $43,000 | $3,900 | $3,700 | $1,900 |
Fidelity Advisor Small Cap Fund | $45,000 | $4,100 | $3,700 | $2,000 |
November 30, 2016 FeesA,B
| Audit Fees | Audit-Related Fees | Tax Fees | All Other Fees |
Fidelity Advisor Dividend Growth Fund | $53,000 | $5,400 | $3,700 | $2,500 |
Fidelity Advisor Series Equity Growth Fund | $31,000 | $3,300 | $3,000 | $1,500 |
Fidelity Advisor Series Small Cap Fund | $42,000 | $4,300 | $3,700 | $2,000 |
Fidelity Advisor Small Cap Fund | $44,000 | $4,700 | $3,700 | $2,200 |
|
|
|
|
|
A Amounts may reflect rounding.
B Certain amounts have been reclassified to align with current period presentation.
The following table presents fees billed by PwC and Deloitte Entities that were required to be approved by the Audit Committee for services that relate directly to the operations and financial reporting of the Funds and that are rendered on behalf of Fidelity Management & Research Company (“FMR”) and entities controlling, controlled by, or under common control with FMR (not including any sub-adviser whose role is primarily portfolio management and is subcontracted with or overseen by another investment adviser) that provide ongoing services to the Funds (“Fund Service Providers”):
Services Billed by Deloitte Entities
| November 30, 2017A | November 30, 2016A |
Audit-Related Fees | $- | $35,000 |
Tax Fees | $25,000 | $- |
All Other Fees | $- | $- |
A Amounts may reflect rounding.
Services Billed by PwC
| November 30, 2017A | November 30, 2016A |
Audit-Related Fees | $9,220,000 | $5,315,000 |
Tax Fees | $150,000 | $10,000 |
All Other Fees | $- | $- |
A Amounts may reflect rounding.
“Audit-Related Fees” represent fees billed for assurance and related services that are reasonably related to the performance of the fund audit or the review of the fund's financial statements and that are not reported under Audit Fees.
“Tax Fees” represent fees billed for tax compliance, tax advice or tax planning that relate directly to the operations and financial reporting of the fund.
“All Other Fees” represent fees billed for services provided to the fund or Fund Service Provider, a significant portion of which are assurance related, that relate directly to the operations and financial reporting of the fund, excluding those services that are reported under Audit Fees, Audit-Related Fees or Tax Fees.
Assurance services must be performed by an independent public accountant.
* * *
The aggregate non-audit fees billed by PwC and Deloitte Entities for services rendered to the Funds, FMR (not including any sub-adviser whose role is primarily portfolio management and is subcontracted with or overseen by another investment adviser), and any Fund Service Provider for each of the last two fiscal years of the Funds are as follows:
Billed By | November 30, 2017A | November 30, 2016A,B |
Deloitte Entities | $365,000 | $335,000 |
PwC | $12,670,000 | $6,640,000 |
A Amounts may reflect rounding.
B Certain amounts have been reclassified to align with current period presentation.
The trust's Audit Committee has considered non-audit services that were not pre-approved that were provided by PwC and Deloitte Entities to Fund Service Providers to be compatible with maintaining the independence of PwC and Deloitte Entities in their audits of the Funds, taking into account representations from PwC and Deloitte Entities, in accordance with Public Company Accounting Oversight Board rules, regarding their independence from the Funds and their related entities and FMR’s review of the appropriateness and permissibility under applicable law of such non-audit services prior to their provision to the Fund Service Providers.
Audit Committee Pre-Approval Policies and Procedures
The trust’s Audit Committee must pre-approve all audit and non-audit services provided by a fund’s independent registered public accounting firm relating to the operations or financial reporting of the fund. Prior to the commencement of any audit or non-audit services to a fund, the Audit Committee reviews the services to determine whether they are appropriate and permissible under applicable law.
The Audit Committee has adopted policies and procedures to, among other purposes, provide a framework for the Committee’s consideration of non-audit services by the audit firms that audit the Fidelity funds. The policies and procedures require that any non-audit service provided by a fund audit firm to a Fidelity fund and any non-audit service provided by a fund auditor to a Fund Service Provider that relates directly to the operations and financial reporting of a Fidelity fund (“Covered Service”) are subject to approval by the Audit Committee before such service is provided.
All Covered Services must be approved in advance of provision of the service either: (i) by formal resolution of the Audit Committee, or (ii) by oral or written approval of the service by the Chair of the Audit Committee (or if the Chair is unavailable, such other member of the Audit Committee as may be designated by the Chair to act in the Chair’s absence). The approval contemplated by (ii) above is permitted where the Treasurer determines that action on such an engagement is necessary before the next meeting of the Audit Committee.
Non-audit services provided by a fund audit firm to a Fund Service Provider that do not relate directly to the operations and financial reporting of a Fidelity fund are reported to the Audit Committee on a periodic basis.
Non-Audit Services Approved Pursuant to Rule 2-01(c)(7)(i)(C) and (ii) of Regulation S-X (“De Minimis Exception”)
There were no non-audit services approved or required to be approved by the Audit Committee pursuant to the De Minimis Exception during the Funds’ last two fiscal years relating to services provided to (i) the Funds or (ii) any Fund Service Provider that relate directly to the operations and financial reporting of the Funds.
Item 5.
Audit Committee of Listed Registrants
Not applicable.
Item 6.
Investments
(a)
Not applicable.
(b)
Not applicable
Item 7.
Disclosure of Proxy Voting Policies and Procedures for Closed-End Management Investment Companies
Not applicable.
Item 8.
Portfolio Managers of Closed-End Management Investment Companies
Not applicable.
Item 9.
Purchase of Equity Securities by Closed-End Management Investment Company and Affiliated Purchasers
Not applicable.
Item 10.
Submission of Matters to a Vote of Security Holders
There were no material changes to the procedures by which shareholders may recommend nominees to the trust’s Board of Trustees.
Item 11.
Controls and Procedures
(a)(i) The President and Treasurer and the Chief Financial Officer have concluded that the disclosure controls and procedures (as defined in Rule 30a-3(c) under the Investment Company Act) for each Fund provide reasonable assurances that material information relating to such Fund is made known to them by the appropriate persons, based on their evaluation of these controls and procedures as of a date within 90 days of the filing date of this report.
(a)(ii) There was no change in a Fund’s internal control over financial reporting (as defined in Rule 30a-3(d) under the Investment Company Act) that occurred during the second fiscal quarter of the period covered by this report that has materially affected, or is reasonably likely to materially affect, a Fund’s internal control over financial reporting.
Item 12.
Exhibits
(a) | (1) | Code of Ethics pursuant to Item 2 of Form N-CSR is filed and attached hereto as EX-99.CODE ETH. |
(a) | (2) | Certification pursuant to Rule 30a-2(a) under the Investment Company Act of 1940 (17 CFR 270.30a-2(a)) is filed and attached hereto as Exhibit 99.CERT. |
(a) | (3) | Not applicable. |
(b) |
| Certification pursuant to Rule 30a-2(b) under the Investment Company Act of 1940 (17 CFR 270.30a-2(b)) is furnished and attached hereto as Exhibit 99.906CERT. |
SIGNATURES
Pursuant to the requirements of the Securities Exchange Act of 1934 and the Investment Company Act of 1940, the registrant has duly caused this report to be signed on its behalf by the undersigned, thereunto duly authorized.
Fidelity Advisor Series I
By: | /s/Stacie M. Smith |
| Stacie M. Smith |
| President and Treasurer |
|
|
Date: | January 24, 2018 |
Pursuant to the requirements of the Securities Exchange Act of 1934 and the Investment Company Act of 1940, this report has been signed below by the following persons on behalf of the registrant and in the capacities and on the dates indicated.
By: | /s/ Stacie M. Smith |
| Stacie M. Smith |
| President and Treasurer |
|
|
Date: | January 24, 2018 |
By: | /s/Howard J. Galligan III |
| Howard J. Galligan III |
| Chief Financial Officer |
|
|
Date: | January 24, 2018 |