UNITED STATES
SECURITIES AND EXCHANGE COMMISSION
Washington, D.C. 20549
FORM 10-K
| x | ANNUAL REPORT PURSUANT TO SECTION 13 OR 15(d) OF THE SECURITIES EXCHANGE ACT OF 1934 |
For the fiscal year ended December 31, 2006
OR
| ¨ | TRANSITION REPORT PURSUANT TO SECTION 13 OR 15(d) OF THE SECURITIES EXCHANGE ACT OF 1934 |
For the transition period from to
Commission file number 0-18561
AMERICANWEST BANCORPORATION
(Exact name of registrant as specified in its charter)
| | |
| Washington | | 91-1259511 |
(State or other jurisdiction
of incorporation) | | (IRS Employer
Identification No.) |
41 West Riverside Avenue, Suite 400
Spokane, Washington 99201
(Address of principal executive offices, including zip code)
Registrant’s telephone number, including area code (509) 467-6993
Securities registered pursuant to Section 12(b) of the Act:
| | |
Title of each class: | | Name of each exchange on which registered: |
| None | | |
Securities registered pursuant to section 12(g) of the Act:
Common Stock, no par value
Indicate by a check mark if the registrant is a well-known seasoned issuer, as defined in Rule 405 of the Securities Act. YES ¨ NO x
Indicate by a check mark if the registrant is not required to file reports pursuant to Section 13 or 15(d) of the Exchange Act. YES ¨ NO x
Indicate by check mark whether the registrant (1) has filed all reports required to be filed by Section 13 or 15 (d) of the Securities Exchange Act of 1934 during the preceding 12 months (or for such shorter period that the registrant was required to file such reports), and (2) has been subject to such filing requirements for the past 90 days. YES x NO ¨
Indicate by check mark if disclosure of delinquent filers pursuant to Item 405 of Regulation S-K is not contained herein, and will not be contained, to the best of registrant’s knowledge, in definitive proxy or information statements incorporated by reference in Part III of this Form 10-K or any amendments to this Form 10-K. ¨
Indicate by check mark whether the registrant is a large accelerated filer, an accelerated filer, or a non-accelerated filer (as defined in Exchange Act Rule 12b-2). Large accelerated filer ¨ Accelerated filer x Non-accelerated filer ¨
Indicate by check mark whether the registrant is a shell company (as defined by Rule 12b-2 of the Exchange Act. YES ¨ NO x
The aggregate market value of the common stock held by non-affiliates of the registrant is approximately $254,153,000 based on the June 30, 2006 closing price of the registrant’s common stock as quoted on the Nasdaq National Market of $22.55.
The number of shares of the registrant’s common stock outstanding at March 1, 2007 was 11,419,628.
DOCUMENTS INCORPORATED BY REFERENCE
| | |
Documents of the Registrant | | Form 10-K Reference Locations |
Portions of the Proxy Statement for the 2007
Annual Meeting of Shareholders | | PART III |
AMERICANWEST BANCORPORATION
ANNUAL REPORT ON FORM 10-K FOR THE FISCAL YEAR
ENDED DECEMBER 31, 2006
TABLE OF CONTENTS
2
PART I
Forward Looking Statements.
Certain matters discussed or incorporated by reference in this Annual Report on Form 10-K including, but not limited to, matters described in Item 7, “Management’s Discussion and Analysis of Financial Condition and Results of Operation,” are forward-looking statements within the meaning of the Private Securities Litigation Reform Act of 1995 (PSLRA). Such forward looking statements include statements about the business strategy, financial condition, results of operations, future financial targets and earnings outlook of the Company. The forward-looking statements are subject to risks and uncertainties that could cause actual results to differ materially from those projected. Those factors include, but are not limited to, impact of the current national and regional economy on small business loan demand in the Company’s market, loan delinquency rates, changes in portfolio composition, the Company’s ability to increase market share, the Company’s ability to attract quality commercial business, the Company’s ability to expand its markets through new branches and acquisitions, interest rate movements and the impact on net interest margins such movement may cause, changes in the demographic make-up of the Company’s market, the Company’s products and services, the Company’s ability to attract and retain qualified people, regulatory changes, competition with other banks and financial institutions, and other factors. Words such as “targets,” “expects,” “anticipates,” “believes,” other similar expressions or future or conditional verbs such as “will,” “may,” “should,” “would,” and “could” are intended to identify such forward-looking statements. Readers should not place undue reliance on the forward-looking statements, which reflect management’s view only as of the date hereto. The Company undertakes no obligation to publicly revise these forward-looking statements to reflect subsequent events or circumstances. This statement is included for the express purpose of protecting the Company under PSLRA’s safe harbor provisions.
Item 1. Business.
AmericanWest Bancorporation
AmericanWest Bancorporation (Company) is a Washington corporation registered as a bank holding company under the Bank Holding Company Act of 1956. The Company is headquartered in Spokane, Washington. The Company’s wholly-owned subsidiary is AmericanWest Bank (Bank), a Washington state chartered bank that operates in Eastern and Central Washington and Northern Idaho. Additionally, the Bank has a loan production office in the Salt Lake City, Utah, metropolitan area doing business as Precision Bank. Unless otherwise indicated, reference to the Company shall include its wholly-owned subsidiary. The Company’s unconsolidated information will be referred to as the Parent Company. At December 31, 2006, the Company had total assets of $1.4 billion, net loans of $1.2 billion, deposits of $1.1 billion and stockholders’ equity of $152.0 million. The Company also has three statutory trust subsidiaries.
The holding company was formed in 1983 as United Security Bancorporation, with its initial subsidiary, United Security Bank, founded in 1974. The Initial Public Offering of the holding company’s common stock occurred in 1994. In 2001, the Company’s five subsidiary bank charters (United Security Bank, Home Security Bank, Bank of Pullman, Grant National Bank and AmericanWest Bank) were consolidated into the AmericanWest Bank charter and the holding company name changed to AmericanWest Bancorporation. The Company’s stock trades on the NASDAQ Global Select market under the symbol AWBC. The discussion in this Annual Report of the Company and its financial statements reflects the Company’s acquisition of Columbia Trust Bancorp (CTB) and its subsidiaries on March 15, 2006. Latah Bancorporation, Inc. merged into the Company on July 31, 2002, and its subsidiary, Bank of Latah (BOL), was operated as a subsidiary of the Company until it was merged with and into AmericanWest Bank on March 19, 2003.
Available Information
The Company’s internet address is www.awbank.net. Copies of the following documents, free of charge, are available from the Company’s website by using the “Investor Relations” hyperlink on that website:
| | • | | Annual Reports on Form 10-K; |
3
| | • | | Quarterly Reports on Form 10-Q; and |
| | • | | Current Reports on Form 8-K. |
The Company makes these reports and certain other information that it files with the Securities and Exchange Commission (SEC) available on the Company’s website as soon as reasonably practicable after filing or furnishing them electronically with the SEC. These and other SEC filings of the Company are also available, free of charge, from the SEC on its website at www.sec.gov. The information contained on the Company’s website is not incorporated by reference into this document and should not be considered a part of this Annual Report. The Company’s website address is included in this document as an inactive textual reference only.
Business Strategy
AmericanWest Bank pursues a profit-based growth strategy, the key components of which include:
| | • | | Increasing market share in communities within the Bank’s current markets by being a trustworthy community partner with an entrepreneurial spirit and a relationship-based model for providing financial services. |
| | • | | Enhancing customer relationships with high quality products and services to meet the needs of existing and new customers. |
| | • | | Providing service through a team that works together to assist customers in identifying and implementing financial solutions. |
| | • | | Improving the efficiency of operations through higher revenues based on enhanced production levels as compared to the increase in costs to support this growth. |
| | • | | Profitably expanding the markets served through new locations and acquisitions. |
Increasing market share in communities within the Bank’s current markets by being a trustworthy community partner with an entrepreneurial spirit and a relationship-based model for providing financial services. Bank management strives to be active in each community and have a positive impact on that community’s quality of life. The Bank’s position as a local, community bank sends a powerful message that distinguishes it immediately in the minds of customers, prospects and community leaders. The Bank is more adaptable than national or large-scale regional banks and extends this financial flexibility and commitment to its customers. This commitment is evident not only through the services offered, but also through active participation in causes that contribute to quality of life, especially in the areas of housing, youth and education.
Enhancing customer relationships with high quality products and services to meet the needs of existing and new customers.Since its formation, the Bank has focused on commercial banking for small and medium-sized businesses. The Bank has ongoing initiatives to enhance its commercial products, including its commercial and industrial lending, business deposits and cash management services. Since 2005, the Bank has also offered a more complete line of retail financial products and services that help consumers use, save and manage their money in both their personal and business lives. Management believes that the Bank can gain market share by expanding its retail and commercial product offerings for consumers and businesses.
Providing service through a team that works together to assist customers in identifying and implementing financial solutions. The Bank’s focus is on offering customers greater value than the larger regional and national banks through responsive and reliable service from experts throughout the Bank. The Bank’s customers and communities know the Bank as a local provider and trust it to provide banking products and services that are helping them achieve their financial goals. The Bank places a strong emphasis on maintaining a relationship banking culture where service includes recommending additional products and services that can benefit a customer. In addition, support activities have been centralized to enable the Bank’s production groups to focus on service and to improve compliance and enhance efficiencies.
4
Improving the efficiency of operations through higher revenues based on enhanced production levels as compared to the increase in costs to support this growth.Management anticipates achieving greater market share in the Bank’s current markets based on a knowledgeable and experienced team throughout the Bank that works together to provide high quality products and service to customers. Management and support staff have the capability to support additional production teams, expanded activities and growth in our market areas. Ongoing improvements related to the design of new locations, technology and ongoing centralization also support improved efficiency.
Profitably expanding the markets served through new locations and acquisitions. The Bank intends to expand its presence in its existing and contiguous markets by opening new locations and acquiring other financial institutions that will be accretive to earnings within a reasonable timeframe. Management considers a variety of criteria in evaluating potential expansion opportunities, including the demographics and growth prospects for the market area, the degree to which the geographic diversity of the Bank would be enhanced, the management and other resources needed to integrate the expansion into existing operations, the estimated costs of operating the new locations, and whether risks related to the transactions are reasonable.
Recent Events
During 2006, the Bank opened new financial centers in Coeur d’Alene and Sandpoint, Idaho and in West Plains and Yakima, Washington. The Bank also opened a loan production office in the Salt Lake City, Utah area during 2006. Additionally, on March 15, 2006, the Company acquired Columbia Trust Bancorp and its principal operating subsidiary, Columbia Trust Bank (CTB) in Pasco, Washington. CTB had branches located in Pasco, Kennewick, Sunnyside and Yakima, Washington through which it provided commercial banking services.
In October, 2006 the Company and Utah-based Far West Bancorporation (Far West) announced the signing of a definitive agreement for Far West to merge with and into the Company, followed by the merger of Far West’s principal operating subsidiary, Far West Bank (FWB) with and into the Bank, in a transaction valued at approximately $150 million. The transaction is subject to approval by shareholders’ of both companies and other customary conditions for closing, and is expected to be completed on or about April 1, 2007. As of December 31, 2006, Far West had total assets of $429 million, total gross loans of $344 million and total deposits of $361 million. Upon closing this transaction, the Bank will operate with 64 locations in three states, Washington, Idaho and Utah.
The Company’s ability to make future acquisitions depends on several factors such as the availability of suitable acquisition candidates, necessary regulatory and shareholder approval, compliance with applicable capital requirements and, in the case of cash acquisitions, on its cash assets or ability to acquire cash. The Company may need to obtain additional debt or equity capital to pursue an acquisition strategy. Its access to capital markets or the costs of this capital could be affected by economic, financial, competitive and other conditions beyond its control. Further, acquisition candidates may not be available in the future on favorable terms. Therefore, no assurance can be made that additional acquisitions will occur.
Products and Services
The Bank’s business consists mainly of gathering deposits and providing loans to enable its customers to meet their financial objectives.
The Bank offers a variety of deposit accounts designed to attract both short term and long term deposits from its retail and business customers. These accounts include checking accounts, negotiable order of withdrawal (NOW) accounts, money market demand accounts (MMDA), savings accounts and time deposits. Interest bearing accounts earn interest at rates established by the Bank’s management based on competitive market factors and management’s desire to increase or decrease certain deposit types or maturities of deposits based on anticipated future funding needs. The bank places significant emphasis on attracting low cost-of-funds deposits through targeted marketing for checking and money market balances.
5
In addition, the Bank offers numerous services that provide customers convenient access, provide the Bank with cost effective delivery channels and have a positive impact on the Bank’s noninterest income through fee generation. Commercial services include ACH origination, merchant bankcard services, sweep accounts and currency services. Additional services offered to both consumers and business customers include ATM and debit cards, wire transfers, official checks and money orders, online banking and bill payment, safe deposit boxes, night deposit boxes and traveler’s checks. In addition, the Bank generates noninterest income by offering both consumers and business credit card products through a third-party provider, who holds the Bank-branded credit card portfolio.
The Bank’s loan portfolio consists of commercial real estate loans, commercial and industrial loans, agricultural loans, residential mortgage loans, residential construction loans and installment and other loans. The majority of the loans held by the Bank were to borrowers within the Bank’s principal market areas.
Commercial Real Estate Loans.Commercial real estate loans primarily consist of loans to purchase, refinance or construct commercial and multifamily properties. Loans are also provided for land acquisition and development. These loans are secured by real estate, generally mature in one to ten years and can be fixed or adjustable rate. Commercial construction loans may involve additional risks because loan funds are collateralized by the project under construction, which is of uncertain value prior to completion. Delays may arise from labor problems, material shortages, and other unpredictable contingencies that may occur. It is important to evaluate accurately the total loan funds required to complete a project and related loan-to-value ratios. Because of these factors, the analysis of prospective construction loan projects requires an expertise that is different in significant respects from the expertise required for other commercial real estate lending. The Bank’s underwriting criteria are designed to evaluate and minimize the risks of each commercial construction loan. Among other things, the Bank’s management considers evidence of the availability of permanent financing for the borrower, the reputation of the borrower, the amount of the borrower’s equity in the project, the independent appraisal and review of cost estimates, the pre-construction sale and leasing information, and the cash flow projections of the borrower.
Commercial and Industrial Loans. Commercial and industrial loans primarily consist of loans to businesses for various purposes, including term loans, revolving lines of credit, equipment financing loans and letters of credit. These loans generally mature within one to five years, have adjustable rates and are secured by inventory, accounts receivable or equipment, although certain loans are unsecured. Commercial lending risk results from dependence on income production for future repayment and, in certain circumstances, the lack of tangible collateral. Commercial and industrial loans are underwritten based on the financial strength and repayment ability of the borrower, as well as the value of any collateral securing the loans. Commercial lending operations rely on a strong credit culture that combines prudent credit policies and individual lender accountability.
Agricultural Loans.Agricultural loans primarily consist of farm loans to finance operating expenses. These loans generally mature within one year, have adjustable rates and are secured by farm real estate, equipment, crops or livestock. Since agricultural loans present risks not associated with other types of lending, such as weather, the policy of the Bank is to make such loans only to agricultural producers that carry crop insurance, thereby mitigating the risk of loss attributable to a crop failure caused by weather factors.
Residential Mortgage Loans. Residential mortgage loans include various types of loans for which residential real property is held as collateral. These loans include adjustable and fixed rate first mortgage loans secured by one to four family residential properties, second mortgage loans secured by one to four family residential properties and home equity lines of credit. Mortgage loans that are held in portfolio typically mature or reprice in one to five years and require payments on amortization schedules ranging from one year to 30 years. The Bank sells most of its fixed rate real estate mortgage loans with maturities of more than ten years.
Residential Construction Loans.Construction loans are primarily made to individuals and contractors to construct single family residences. These loans typically have maturities of one year and variable interest rates.
6
The Bank’s policies generally require that a permanent financing commitment be in place before a construction loan is made to an individual borrower. Construction loans have unique risks because loan funds are collateralized by the project under construction, which is of uncertain value prior to completion. Delays may arise from labor problems, material shortages and other unpredictable contingencies that may occur. It is important to evaluate accurately the total loan funds required to complete a project and related loan-to-value ratios. Because of these factors, the analysis of prospective construction loan projects requires an expertise that is different in significant respects from the expertise required for real estate mortgage lending. Construction lending is generally considered to involve a higher degree of collateral risk than long term financing of residential properties. The Bank’s underwriting criteria are designed to evaluate and minimize the risks of each real estate construction loan. Among other things, the Bank’s management considers evidence of the availability of permanent financing for the borrower, the reputation of the borrower, the amount of the borrower’s equity in the project, the independent appraisal and review of cost estimates, pre-construction sale and leasing information, and the cash flow projections of the borrower.
Installment and Other Loans.Installment and other loans are primarily automobile and personal loans, otherwise known as consumer loans. These loans generally have maturities of five years or less, and are offered at adjustable and fixed interest rates. Consumer lending may involve special risks, including decreases in the value of collateral and transaction costs associated with foreclosure and repossession.
Principal Market Area and Competition
The Bank’s financial centers are located in the four largest metropolitan areas in Eastern and Central Washington: Spokane, Yakima, Walla Walla and the Tri-Cities area (comprised of Pasco, Kennewick and Richland), and in suburban and rural communities in Eastern and Central Washington and Northern Idaho. Additionally, a loan production office (doing business as Precision Bank) was opened during 2006 in the Salt Lake City, Utah, metropolitan area.
The Bank competes primarily with large national and regional banks, as well as community banks, credit unions, savings and loans, mortgage companies and other financial service providers. Management also believes that its competitive position has been strengthened by the continued consolidation in the banking industry, which has resulted in many independent community banks becoming part of large national or regional banks. The Bank’s strategy, by contrast, is to remain closely tied to a community banking model with strong local connections.
The following table presents the Bank’s market share percentage and rank for total deposits in each county where it has financial center operations. The table also indicates the ranking by deposit size in each market. All information in the table was obtained from SNL Financial of Charlottesville, Virginia, which compiles deposit data published by the FDIC as of June 30, 2006 and updates the information for any bank mergers completed subsequent to the reporting date. The number of financial centers is as of December 31, 2006.
| | | | | | | |
| | | Idaho | | Number of
Financial
Centers |
County | | Market
Share | | | Market
Rank | |
Benewah | | 36.1 | % | | 2 | | 2 |
Bonner | | 0.2 | % | | 6 | | 1 |
Clearwater | | 45.5 | % | | 1 | | 1 |
Kootenai | | 1.1 | % | | 12 | | 2 |
Latah | | 7.2 | % | | 4 | | 1 |
Nez Perce | | 2.4 | % | | 7 | | 1 |
Shoshone | | 21.2 | % | | 3 | | 2 |
| | | | | | | |
Total | | | | | | | 10 |
| | | | | | | |
| | | | | | | |
| | | Washington | | Number of
Financial
Centers |
County | | Market
Share | | | Market
Rank | |
Benton | | 5.6 | % | | 7 | | 3 |
Columbia | | 26.1 | % | | 2 | | 1 |
Franklin | | 17.2 | % | | 2 | | 1 |
Grant | | 8.2 | % | | 6 | | 2 |
Lincoln | | 10.6 | % | | 5 | | 1 |
Spokane | | 4.2 | % | | 8 | | 9 |
Stevens | | 30.2 | % | | 1 | | 3 |
Walla Walla | | 6.4 | % | | 4 | | 3 |
Whitman | | 12.4 | % | | 3 | | 7 |
Yakima | | 7.1 | % | | 6 | | 6 |
| | | | | | | |
Total | | | | | | | 36 |
| | | | | | | |
7
Employees
As of December 31, 2006, the Company had 508 full-time equivalent employees, none of which are covered by a collective bargaining agreement. Management believes employee relations are currently good.
Supervision and Regulation
The laws and regulations applicable to the Company and the Bank are primarily intended to protect depositors of the Bank and not shareholders. Proposals to change the laws and regulations governing the banking industry are frequently introduced in Congress, in state legislatures and by various bank regulatory agencies. Changes in applicable laws and regulations or in the policies of banking and other government regulators may have a material effect on the business and prospects of the Company or the Bank. The likelihood and timing of any such proposals or legislation and the impact they might have on the Company or the Bank cannot be determined.
Bank Holding Company Regulation. As a bank holding company, AmericanWest Bancorporation is subject to the Bank Holding Company Act of 1956 (BHCA), as amended, which places it under the supervision of the Board of Governors of the Federal Reserve System (FRB). The Company must file periodic reports with the FRB and must provide it with such additional information as it may require. In addition, the FRB periodically examines the Company.
The BHCA limits bank holding company business to owning or controlling banks and engaging in other banking-related activities. Bank holding companies must obtain the FRB’s approval before they: (1) acquire direct or indirect ownership or control of any voting shares of any bank that results in total ownership or control, directly or indirectly, of more than 5% of the voting shares of such bank, (2) merge or consolidate with another bank holding company; or (3) acquire substantially all of the assets of any additional bank. Subject to certain state laws, a bank holding company that is adequately capitalized and adequately managed may acquire the assets of both in-state and out-of-state banks.
Under the Financial Modernization Act of 1999, a bank holding company may apply to the FRB to become a financial holding company, and thereby engage (directly or through a subsidiary) in certain activities deemed financial in nature, such as securities brokerage and insurance underwriting. The Company has not made this application and is not currently engaged in such activities.
State Law Restrictions. As a Washington business corporation, the Company is subject to certain limitations and restrictions as provided under applicable Washington corporate law. In addition, Washington banking law may restrict certain activities of the Company.
Transactions with Affiliates.The Parent Company and the Bank are deemed affiliates within the meaning of the Federal Reserve Act, and transactions between affiliates are subject to restrictions including compliance with Sections 23A and 23B of the Federal Reserve Act. Generally, Sections 23A and 23B: (1) limit the extent to which a financial institution or its subsidiaries may engage in covered transactions with an affiliate, as defined, to an amount equal to 10% of such institution’s capital and surplus and an aggregate limit on all such transactions with all affiliates to an amount equal to 20% of such capital and surplus, and (2) require all transactions with an affiliate, whether or not covered transactions, to be on terms substantially the same, or at least as favorable to the institution or subsidiary, as those provided to a nonaffiliate. The term covered transaction includes the making of loans, purchase of assets, issuance of a guarantee and other similar types of transactions.
Bank Regulation.AmericanWest Bank is a Washington state-chartered commercial bank operating in Washington, Idaho and Utah subject to regulation by the Washington Department of Financial Institutions (DFI) and the Federal Deposit Insurance Corporation (FDIC). The federal and state laws that apply to the Bank regulate, among other things, the scope of its business, its investments, its reserves against deposits, the timing of the availability of deposited funds and the nature and amount of and collateral for loans.
8
Premiums for Deposit Insurance.The deposits of the Bank are currently insured to a maximum amount allowable per depositor through the Deposit Insurance Fund (DIF) administered by the FDIC. The FDIC has implemented a new risk-based insurance premium system effective January 1, 2007 under which banks are assessed insurance premiums based on how much risk they present to the DIF. Banks with higher levels of capital and a lower degree of supervisory risk are assessed lower premium rates than banks with lower levels of capital and/or a higher degree of supervisory risk. These premium rates are applied to the average balance of deposits in the prior quarter. The FDIC has provided a one time assessment credit to eligible institutions based on the assessment base of the institution as of December 31, 1996, as compared to the combined aggregate assessment base of all eligible institutions as of that date. This one time assessment credit is expected to offset most of the deposit insurance premiums of the Bank during 2007. The FDIC may increase or decrease the assessment rate schedule in order to manage the DIF to prescribed statutory target levels. An increase in the assessment rate could have an adverse effect on the Bank’s earnings, depending upon the amount of the increase. The FDIC may terminate deposit insurance if it determines the institution involved has engaged in or is engaging in unsafe or unsound banking practices, is in unsafe or unsound condition, or has violated applicable laws, regulations or orders.
Community Reinvestment Act. The Community Reinvestment Act (CRA) requires that, in connection with examinations of financial institutions within their jurisdiction, regulators must evaluate the records of the financial institutions in meeting the credit needs of their local communities, including low and moderate income neighborhoods, consistent with the safe and sound operation of those banks. These factors are also considered in evaluating mergers, acquisitions and applications to open a branch or facility. As of the Bank’s most recent CRA examination in 2005, the Bank’s rating was “satisfactory.”
Insider Credit Transactions.Banks are also subject to certain restrictions imposed by the Federal Reserve Act on extensions of credit to executive officers, directors, principal shareholders and any related interests of such persons. Extensions of credit: (1) must be made on substantially the same terms, including interest rates and collateral, and follow credit underwriting procedures that are not less stringent than those prevailing at the time for comparable transactions with persons not covered above and who are not employees; and (2) must not involve more than the normal risk of repayment or present other unfavorable features. Banks are also subject to certain lending limits and restrictions on overdrafts to such persons. A violation of these restrictions may result in the assessment of substantial civil monetary penalties on the affected bank or any officer, director, employee, agent or other person participating in the conduct of the affairs of that bank, the imposition of a cease and desist order and other regulatory sanctions.
Federal Deposit Insurance Corporation Improvement Act of 1991 (FDICIA). Under FDICIA, each federal banking agency has prescribed, by regulation, non-capital safety and soundness standards for institutions under its authority. These standards cover internal controls, information and internal audit systems, loan documentation, credit underwriting, interest rate exposure, asset growth, compensation, fees and benefits, such other operational and managerial standards as the agency determines to be appropriate, and standards for asset quality, earnings and stock valuation. An institution which fails to meet these standards must develop a plan acceptable to the agency, specifying the steps that the institution will take to meet the standards. Failure to submit or implement such a plan may subject the institution to regulatory sanctions. Management believes that the Bank meets all such standards and, therefore, does not believe that these regulatory standards materially affect its business operations.
Privacy. The FDIC and other bank regulatory agencies, pursuant to the Financial Modernization Act of 1999, have published guidelines and adopted final regulations (Privacy Rules) which, among other things, require each financial institution to: (1) develop, implement and maintain, under the supervision and ongoing oversight of its Board of Directors or committee thereof, a comprehensive written information security program designed to ensure the security and confidentiality of customer information, protect against anticipated threats to the security or integrity of such information, and protect against unauthorized access to or use of such information; and (2) provide notice to customers (and other consumers under certain circumstances) about its privacy policies,
9
describe the conditions under which the institution may disclose nonpublic information to nonaffiliated third parties and provide a method for consumers to prevent the institution from disclosing that information to most nonaffiliated third parties by opting out of its disclosure policy, subject to certain exceptions. In addition, sections 501 and 505(b) of the Gramm-Leach-Bliley Act (GLBA) require financial institutions to establish appropriate policies, procedures and processes relating to administrative, technical and physical safeguards for customer records and information. Management believes the Bank is currently in substantive compliance with the Privacy Rules and the GLBA.
Dividends.The Bank is subject to restrictions on the payment of cash dividends to the Parent Company. The principal sources of the Parent Company’s cash are dividends received from its subsidiary bank, the issuance of junior subordinated debentures and cash received from the exercise of stock options. Regulatory authorities may prohibit banks and bank holding companies from paying dividends which would constitute an unsafe or unsound banking practice. In addition, a bank may not pay cash dividends if that payment could reduce the amount of its capital below that necessary to meet the adequately capitalized level in accordance with regulatory capital requirements. Also, the payment of cash dividends by the Bank must satisfy a net profits test and an undivided profits test or the Bank must obtain prior approval of its regulators before such dividend is paid. The net profits test limits the dividend declared in any calendar year to the net profits of the current year plus retained net income of the preceding two years. The undivided profits test limits the dividends declared to the undivided profits on hand after deducting bad debts in excess of the allowance for loan and lease losses. Based on the regulatory restrictions noted above, the Bank could pay up to $52.8 million in dividends as of December 31, 2006, and remain adequately capitalized, but regulatory approval would be required to pay more than $24.3 million. The Company is not currently subject to any regulatory restrictions on dividends other than those noted above.
Capital Adequacy.Federal bank regulatory agencies use capital adequacy guidelines in the examination and regulation of banks and bank holding companies. If capital falls below minimum guideline levels, a bank or bank holding company may be denied approval, among other things, to acquire or establish additional banks or non-bank businesses or to open new facilities.
The FDIC and FRB use risk-based capital guidelines for banks and bank holding companies. These are designed to make such capital requirements more sensitive to differences in risk profiles among banks and bank holding companies, to account for off-balance sheet exposure and to minimize disincentives for holding liquid assets. Assets and off-balance sheet items are assigned to broad risk categories, using a formula that assigns specific risk weights to different groups of assets and off-balance sheet items. The resulting capital ratios represent capital as a percentage of total risk-weighted assets.
Federal regulations establish minimum requirements for the capital adequacy of depository institutions, such as banks and bank holding companies. The FRB may require that a banking organization maintain ratios in excess of the minimums, particularly organizations contemplating significant expansion programs. Current guidelines require all bank holding companies and federally regulated banks to maintain a minimum risk-based total capital ratio equal to 8%, of which at least 4% must be Tier I capital. Tier I capital for bank holding companies includes common shareholders’ equity, certain qualifying perpetual preferred stock and minority interests in equity accounts of consolidated subsidiaries, less specified intangible assets and accumulated other comprehensive income or loss. The Company’s and Bank’s regulatory capital ratios are reported in Note 22 to the Consolidated Financial Statements in Item 8.
The FRB also employs a leverage ratio, which is Tier I capital as a percentage of total average assets less intangibles, as a supplement to risk-based guidelines. The principal objective of the leverage ratio is to constrain the maximum degree to which a bank holding company may leverage its equity capital base. The FRB requires a minimum leverage ratio of 3%. However, for all but the most highly rated bank holding companies and for bank holding companies seeking to expand, the FRB generally expects an additional amount of capital of at least 1% to 2%.
10
FDICIA created a statutory framework of supervisory actions indexed to the capital level of the individual institution. Under regulations adopted by the FDIC, an institution is assigned to one of five capital categories depending on its total risk-based capital ratio, Tier I risk-based capital ratio and leverage ratio, together with certain subjective factors. The Bank is considered well capitalized as of December 31, 2006, which is the highest of the five categories. Institutions which are deemed to be undercapitalized may be subject to certain mandatory supervisory corrective actions.
Effects of Government Monetary Policy.The earnings and growth of the Company are affected not only by general economic conditions, but also by the fiscal and monetary policies of the federal government, particularly the FRB. The FRB can and does implement national monetary policy for such purposes as curbing inflation and combating recession, but its open market operations in U.S. government securities, control of the discount rate applicable to borrowings from the FRB, and establishment of reserve requirements against certain deposits, also influence the growth of bank loans, investments and deposits and affect interest rates charged on loans or paid on deposits. The nature and impact of future changes in monetary policies and their impact on the Company and the Bank cannot be predicted with certainty.
Sarbanes-Oxley Controls and Procedures. The Sarbanes-Oxley Act of 2002 and related rulemaking by the Securities and Exchange Commission (SEC), which effected sweeping corporate disclosure and financial reporting reform, generally require public companies to maintain and carefully monitor a system of disclosure and internal controls and procedures. As a result, public companies such as AmericanWest Bancorporation must make disclosures about the adequacy of controls and procedures in periodic SEC reports (i.e., Forms 10-K and 10-Q) and their chief executive and chief financial officers must certify in these filings, among other things, that they are responsible for establishing and maintaining disclosure controls and procedures and disclose their conclusions about the effectiveness of such controls and procedures based on their evaluation as of the end of the period covered by the relevant report. Additionally, as a result, most public companies have enhanced controls and procedures. The Company is monitoring the status of other related ongoing rulemaking by the SEC and other regulatory entities. Management believes that the Company is in compliance with the Sarbanes-Oxley Act of 2002.
Anti-Terrorism Legislation. The Uniting and Strengthening America by Providing Appropriate Tools Required to Intercept and Obstruct Terrorism Act of 2001 (USA PATRIOT Act), designed to deny terrorists and others the ability to obtain anonymous access to the U.S. financial system, had a significant impact on depository institutions. The USA PATRIOT Act, together with the implementing regulations of various federal regulatory agencies, required financial institutions to implement additional or amend existing policies and procedures with respect to, among other things, anti-money laundering compliance, suspicious activity and currency transaction reporting and due diligence on customers. They also permit information sharing for counter-terrorist purposes between federal law enforcement agencies and financial institutions, as well as among financial institutions, subject to certain conditions, and require the FRB and other federal banking agencies to evaluate the effectiveness of an applicant in combating money laundering activities when considering applications filed under Section 3 of the BHCA or the Bank Merger Act. Management believes that the Bank is currently in compliance with all effective requirements prescribed by the USA PATRIOT Act.
Item 1A. Risk Factors.
The following risk factors are not listed in any particular order and should not be considered to include all risks to the Company.
The Company’s business is subject to interest rate risk, and variations in interest rates may harm financial performance.Unfavorable changes in the interest rate environment may reduce profits. It is expected that the Company will continue to realize income from the differential, or spread, between the interest earned on loans, securities and other interest earning assets and the interest paid on deposits, borrowings and other interest bearing liabilities. Net interest spreads are affected by the difference between the maturities and repricing
11
characteristics of interest earning assets and interest bearing liabilities. In addition, loan volume and yields are affected by market interest rates on loans, and rising interest rates generally are associated with a lower volume of loan originations. An increase in the general level of interest rates may increase the net interest margin and loan yield, but it may adversely affect the ability of borrowers with variable rate loans to pay the interest on and principal of their obligations. The Company does not have control of these factors. Accordingly, changes in levels of market interest rates could materially harm the net interest spread, asset quality, loan origination volume and overall profitability.
The Company faces strong competition from financial services companies and other companies that offer banking services, which could harm business.The Company currently conducts its banking operations primarily in Central and Eastern Washington and Northern Idaho. In 2006, the Company opened a loan production office in the Salt Lake City, Utah area and expects to continue its expansion into Utah during 2007. Increased competition in our markets may result in reduced loans and deposits. Ultimately, the Company may not be able to compete successfully against current and future competitors. Many competitors offer the same banking services within the market area of the Bank. These competitors include national banks, regional banks and other community banks. The Company also faces competition from many other types of financial institutions including, without limitation, savings and loan institutions, finance companies, brokerage firms, insurance companies, credit unions, mortgage banks and other financial intermediaries. In particular, the competitors include several major financial companies whose greater resources may afford them a marketplace advantage by enabling them to maintain numerous banking locations and ATMs and conduct extensive promotional and advertising campaigns.
Additionally, banks and other financial institutions with larger capitalization and financial intermediaries not subject to bank regulatory restrictions have larger lending limits and are thereby able to serve the credit needs of larger customers. Areas of competition include interest rates for loans and deposits, efforts to obtain deposits, and range and quality of products and services provided, including new technology-driven products and services. Technological innovation continues to contribute to greater competition in domestic and international financial services markets as technological advances enable more companies to provide financial services. The Company also faces competition from out-of-state financial intermediaries that have opened low-end production offices or that solicit deposits in the Bank’s market areas. If the Bank is unable to attract and retain banking customers, the Company may be unable to continue to grow the loan and deposit portfolios, and results of operations and financial condition may otherwise be harmed.
Changes in economic conditions, in particular an economic slowdown in the Company’s market area, could harm business. The Company’s business is directly impacted by factors such as economic, political and market conditions, broad trends in industry and finance, legislative and regulatory changes, changes in government monetary and fiscal policies and inflation, all of which are beyond the Company’s control. A deterioration in economic conditions, whether caused by national or local concerns, in particular an economic slowdown in Central and Eastern Washington and Northern Idaho, could result in the following consequences, any of which could materially hurt the business of the Company: loan delinquencies may increase; problem assets and foreclosures may increase; demand for products and services may decrease; low cost or noninterest bearing deposits may decrease; and collateral for loans made by the Bank, especially real estate, may decline in value, in turn reducing customers’ borrowing power and reducing the value of assets and collateral associated with existing loans. The States of Washington and Idaho and certain local governments in the market area presently face fiscal challenges the long term impact of which on either State’s or the local economy cannot be predicted.
A downturn in the real estate market could harm business. A significant downturn in the real estate market, especially in those markets served by the Bank, could harm business because a significant portion of the Bank’s loans are secured by real estate. The ability to recover on defaulted loans by selling the real estate collateral would then be diminished, and the Bank would be more likely to suffer losses on defaulted loans.
12
A substantial amount of the Bank’s real property collateral is located in Central and Eastern Washington. The bank has significant concentrations of credit in commercial real estate loans. Real estate values could be affected by, among other things, an economic slowdown, an increase in interest rates, drought and other natural disasters, specific to Washington.
The Company is dependent on key personnel and the loss of one or more of those key personnel may harm prospects. The Company currently depends heavily on the services of its president and chief executive officer, Robert M. Daugherty, and a number of other key management personnel. The loss of Mr. Daugherty’s services or that of other key personnel could harm the results of operations and financial condition. Success also depends in part on the ability to attract and retain additional qualified management personnel. Competition for such personnel is strong in the banking industry, and the Company may not be successful in attracting or retaining the personnel required.
The Company is subject to extensive regulation which could harm business. The operations are subject to extensive regulation by federal, state and local governmental authorities and to various laws and judicial and administrative decisions imposing requirements and restrictions on part or all of its operations. Because the banking business is highly regulated, the laws, rules and regulations applicable to the Company are subject to frequent change. There are typically proposed laws, rules and regulations that, if adopted, would adversely impact operations. These proposed laws, rules and regulations, or any other laws, rules or regulations, could (1) make compliance more difficult or expensive, (2) restrict the ability to originate, broker or sell loans or accept certain deposits, (3) further limit or restrict the amount of commissions, interest or other charges earned on loans originated or sold, or (4) otherwise harm business or prospects for business.
The Company is exposed to risk of environmental liabilities with respect to properties to which it takes title.In the ordinary course of business, the Bank may own or foreclose and take title to real estate and could be or become subject to environmental liabilities with respect to these properties. The Bank may be held liable to a governmental entity or to third parties for property damage, personal injury, investigation and clean-up costs incurred by these parties in connection with environmental contamination, or may be required to investigate or clean up hazardous or toxic substances, or chemical releases at a property. The costs associated with investigation or remediation activities could be substantial. In addition, as the owner or former owner of a contaminated site, the Company may be subject to common law claims by third parties based on damages and costs resulting from environmental contamination emanating from the property. If the Company ever became subject to significant environmental liabilities, the business, financial condition, liquidity and results of operations could be harmed.
The allowance for credit losses may not be adequate to cover actual losses.In accordance with generally accepted accounting principles in the United States of America (GAAP), the Company maintains an allowance for credit losses. The allowance for credit losses may not be adequate to cover actual loan losses, and future provisions for credit losses could harm operating results. The allowance for credit losses is based on prior experience, as well as an evaluation of the risks in the current portfolio. The amount of future losses is susceptible to changes in economic, operating and other conditions, including changes in interest rates that may be beyond the Company’s control, and these losses may exceed current estimates. Federal regulatory agencies, as an integral part of their examination process, review the loans and allowance for credit losses. While management believes that the allowance for credit losses is adequate to cover current losses, management may decide to increase the allowance for credit losses or regulators may require the Company to increase this allowance. Either of these occurrences could reduce future earnings.
If the Company is unable to consummate the pending merger transaction with Far West Bancorporation (FWB) or successfully integrate FWB’s operations, its business and earnings may be negatively affected. The merger with FWB is expected to be completed on or about April 1, 2007, but is subject to shareholder approval, which may not be received, and customary closing conditions, which may not be satisfied. If the Company cannot complete the merger, it will have incurred expenses and will never see the
13
benefits anticipated from the merger. If the merger is complete, the Company will integrate two companies that have previously operated independently. Successful integration of FWB operations will depend primarily on the Company’s ability to consolidate operations, systems and procedures and to eliminate redundancies and costs. It is possible that the Company might not be able to integrate its post-merger operations without encountering difficulties including, without limitation, the loss of key employees and customers, the disruption of its respective ongoing businesses or possible inconsistencies in standards, controls, procedures and policies. If the Company has difficulties with the integration, it might not fully achieve the economic benefits it expects from the merger. In addition, the Company may experience greater than expected costs or difficulties related to the integration of the business of FWB, and/or may not realize expected cost savings from the merger within the expected time frame.
Item 1B. Unresolved Staff Comments.
None.
Item 2. Properties.
At December 31, 2006, the Bank had 47 banking locations including 36 in Eastern and Central Washington, ten in Northern Idaho and a loan production office (doing business as Precision Bank) in the Salt Lake City, Utah area. The Company’s main office is located in downtown Spokane, Washington, which is leased. The Bank owns 23 banking facilities, leases 15 banking facilities and has 9 owned buildings on leased land at which banking services are provided. About 8,200 square feet is used for the Administrative Offices. In addition, the Bank leases approximately 9,000 square feet for its Data Processing Center.
Item 3. Legal Proceedings.
Periodically and in the ordinary course of business, various claims and lawsuits are brought against the Company or the Bank, such as claims to enforce liens, condemnation proceedings on properties in which the Bank held a security interest, claims involving the making and servicing of real property loans, actions relating to employee claims and other issues incident to the business of the Company and the Bank. In the opinion of management, the ultimate liability, if any, resulting from current claims or lawsuits will not have a material adverse effect on the financial position or results of operations of the Company.
Item 4. Submission of Matters to a Vote of Security Holders.
No matters were submitted to a vote of the Company’s shareholders during the fourth quarter of 2006.
14
PART II
Item 5. Market for Registrant’s Common Equity and Related Stockholder Matters.
The common stock of AmericanWest Bancorporation is quoted on the Nasdaq Global Select Market (NASDAQ) under the symbol “AWBC”. The following table sets out the high and low prices per share for the common stock for each quarter of 2006 and 2005 as reported by NASDAQ. The following quotes reflect inter-dealer prices, without retail mark-up, mark-down or commission and may not necessarily represent actual transactions:
| | | | | | | | | |
Quarter Ended | | High | | Low | | Cash Dividends
Declared Per
Share |
December 31, 2006 | | $ | 25.09 | | $ | 19.98 | | $ | 0.03 |
September 30, 2006 | | $ | 23.33 | | $ | 20.18 | | $ | 0.03 |
June 30, 2006 | | $ | 26.65 | | $ | 21.54 | | $ | 0.03 |
March 31, 2006 | | $ | 26.86 | | $ | 23.30 | | | — |
December 31, 2005 | | $ | 24.43 | | $ | 22.36 | | | — |
September 30, 2005 | | $ | 24.55 | | $ | 19.83 | | | — |
June 30, 2005 | | $ | 20.88 | | $ | 17.54 | | | — |
March 31, 2005 | | $ | 20.50 | | $ | 17.85 | | | — |
As of March 1, 2007, the Company’s common stock was held by approximately 1,577 shareholders, a number that does not include beneficial owners who hold shares in a street name. As of December 31, 2006, a total of 444,049 stock options and 79,333 unvested restricted stock shares were outstanding. Additional information about stock options and restricted shares is included in Note 15 of the Notes to Consolidated Financial Statements in Item 8.
The payment of future cash dividends is at the discretion of the Board of Directors and is subject to a number of factors, including results of operations, general business conditions, growth, financial condition and other factors deemed relevant. Further, the Company’s ability to pay future cash dividends is subject to certain regulatory requirements and restrictions discussed in theSupervision and Regulation section in Item 1 above. The dividend rate will be reassessed on a quarterly basis by the Board of Directors in accordance with the capital and dividend policy.
During the year ended December 31, 2006, the Board of Directors authorized the repurchase of up to 250,000 shares. No shares were repurchased under this authorization during 2006.
The following table provides information as of December 31, 2006 with respect to the Company’s compensation plans under which shares of the Company’s common stock are authorized for issuance:
| | | | | | | |
Plan Category | | Number of securities
to be issued upon
exercise of
outstanding options,
warrants and rights | | Weighted average
exercise price of
outstanding
options, warrants
and rights | | Number of securities
remaining available for
future issuance under
equity compensation plans
(excluding securities
reflected in column (a) |
| | | (a) | | (b) | | (c) |
Equity compensation plans approved by security holders | | 444,049 | | $ | 16.51 | | 285,073 |
Equity compensation plans not approved by security holders | | — | | | — | | — |
Total | | 444,049 | | $ | 16.51 | | 285,073 |
15
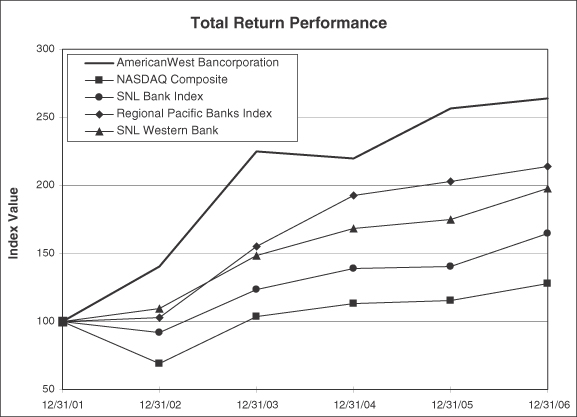
The following graph, which is “furnished” not “filed,” compares the cumulative total shareholder return on the Company’s common stock during the period beginning December 31, 2001, and ending December 31, 2006, with cumulative total returns on the NASDAQ Composite, Regional Pacific Banks Index and the SNL Bank Index for the same period. The graph and table assume that $100 was invested on December 31, 2001, and that all dividends were reinvested during each year presented. The information shown on the graph is not necessarily indicative of future performance. The source for the information is SNL Financial LC, Charlottesville, VA.
| | | | | | | | | | | | | | | | | | |
| | | Period Ending |
Index | | 12/31/01 | | 12/31/02 | | 12/31/03 | | 12/31/04 | | 12/31/05 | | 12/31/06 |
AmericanWest Bancorporation | | $ | 100.00 | | $ | 140.35 | | $ | 225.21 | | $ | 220.02 | | $ | 256.75 | | $ | 264.25 |
NASDAQ Composite | | $ | 100.00 | | $ | 68.76 | | $ | 103.67 | | $ | 113.16 | | $ | 115.57 | | $ | 127.58 |
SNL Bank Index | | $ | 100.00 | | $ | 91.69 | | $ | 123.69 | | $ | 138.61 | | $ | 140.50 | | $ | 164.35 |
SNL Western Bank | | $ | 100.00 | | $ | 109.41 | | $ | 148.21 | | $ | 168.43 | | $ | 175.36 | | $ | 197.86 |
Regional Pacific Banks Index | | $ | 100.00 | | $ | 103.19 | | $ | 155.44 | | $ | 192.46 | | $ | 203.22 | | $ | 213.74 |
16
Item 6. Selected Financial Data.
The following table sets forth certain selected consolidated financial data of the Company at and for the years ended December 31:
| | | | | | | | | | | | | | | | | | | | |
($ in thousands, except per share amounts) | | 2006 | | | 2005 | | | 2004 | | | 2003 | | | 2002 | |
Statements of Income | | | | | | | | | | | | | | | | | | | | |
Net interest income | | $ | 60,286 | | | $ | 53,987 | | | $ | 59,720 | | | $ | 55,618 | | | $ | 43,280 | |
Provision for credit losses | | | 5,791 | | | | 2,365 | | | | 13,046 | | | | 6,324 | | | | 5,663 | |
Noninterest income | | | 9,275 | | | | 8,383 | | | | 9,247 | | | | 7,320 | | | | 6,196 | |
Noninterest expense | | | 51,783 | | | | 41,135 | | | | 42,746 | | | | 35,120 | | | | 27,560 | |
| | | | | | | | | | | | | | | | | | | | |
Income before provision for income tax | | | 11,987 | | | | 18,870 | | | | 13,175 | | | | 21,494 | | | | 16,253 | |
| | | | | | | | | | | | | | | | | | | | |
Provision for income tax | | | 4,357 | | | | 4,998 | | | | 3,670 | | | | 7,508 | | | | 5,354 | |
| | | | | | | | | | | | | | | | | | | | |
Net income | | $ | 7,630 | | | $ | 13,872 | | | $ | 9,505 | | | $ | 13,986 | | | $ | 10,899 | |
| | | | | | | | | | | | | | | | | | | | |
Basic earnings per common share | | $ | 0.68 | | | $ | 1.33 | | | $ | 0.93 | | | $ | 1.39 | | | $ | 1.13 | |
Diluted earnings per common share | | $ | 0.67 | | | $ | 1.31 | | | $ | 0.91 | | | $ | 1.34 | | | $ | 1.10 | |
Basic weighted average shares outstanding | | | 11,182,526 | | | | 10,407,180 | | | | 10,185,246 | | | | 10,045,836 | | | | 9,625,038 | |
Diluted weighted average shares outstanding | | | 11,354,654 | | | | 10,593,903 | | | | 10,478,969 | | | | 10,473,852 | | | | 9,915,354 | |
| | | | | |
Statements of Condition | | | | | | | | | | | | | | | | | | | | |
Securities | | $ | 39,518 | | | $ | 31,364 | | | $ | 28,511 | | | $ | 38,163 | | | $ | 43,609 | |
Total assets | | | 1,416,528 | | | | 1,109,600 | | | | 1,048,994 | | | | 1,023,907 | | | | 917,141 | |
Gross loans: | | | | | | | | | | | | | | | | | | | | |
Commercial and industrial, including commercial real estate | | | 935,275 | | | | 728,292 | | | | 695,165 | | | | 645,156 | | | | 540,467 | |
Agricultural | | | 141,646 | | | | 119,355 | | | | 122,735 | | | | 124,395 | | | | 121,279 | |
Residential mortgage | | | 74,222 | | | | 58,803 | | | | 31,406 | | | | 37,508 | | | | 46,399 | |
Residential construction | | | 47,235 | | | | 33,906 | | | | 45,908 | | | | 32,236 | | | | 29,303 | |
Installment and other | | | 22,508 | | | | 22,527 | | | | 31,363 | | | | 36,528 | | | | 36,917 | |
| | | | | | | | | | | | | | | | | | | | |
Total gross loans | | | 1,220,886 | | | | 962,883 | | | | 926,577 | | | | 875,823 | | | | 774,365 | |
| | | | | | | | | | | | | | | | | | | | |
Deposits | | | 1,123,939 | | | | 897,430 | | | | 894,798 | | | | 871,125 | | | | 766,335 | |
Borrowings | | | 126,686 | | | | 81,847 | | | | 40,933 | | | | 47,781 | | | | 64,006 | |
Stockholders’ equity | | $ | 152,037 | | | $ | 121,477 | | | $ | 105,075 | | | $ | 96,198 | | | $ | 81,130 | |
| | | | | |
Financial Ratios | | | | | | | | | | | | | | | | | | | | |
Return on average assets | | | 0.58 | % | | | 1.29 | % | | | 0.88 | % | | | 1.47 | % | | | 1.41 | % |
Return on average equity | | | 5.33 | % | | | 12.34 | % | | | 9.37 | % | | | 15.87 | % | | | 15.08 | % |
Net interest margin (1) | | | 5.06 | % | | | 5.47 | % | | | 6.04 | % | | | 6.36 | % | | | 6.08 | % |
Noninterest income to average assets | | | 0.71 | % | | | 0.78 | % | | | 0.85 | % | | | 0.77 | % | | | 0.80 | % |
Noninterest expense to average assets | | | 3.96 | % | | | 3.84 | % | | | 3.94 | % | | | 3.70 | % | | | 3.55 | % |
Efficiency ratio | | | 73.0 | % | | | 66.0 | % | | | 62.0 | % | | | 55.8 | % | | | 55.7 | % |
| | | | | |
Cash dividends declared per share | | $ | 0.09 | | | $ | — | | | $ | — | | | $ | — | | | $ | — | |
Cash dividend payout ratio | | | 13.2 | % | | | — | | | | — | | | | — | | | | — | |
Book value per share | | $ | 13.35 | | | $ | 11.58 | | | $ | 10.23 | | | $ | 10.45 | | | $ | 10.03 | |
Tangible book value per share | | $ | 9.79 | | | $ | 10.20 | | | $ | 8.80 | | | $ | 8.83 | | | $ | 8.15 | |
| | | | | |
Average equity to average assets ratio | | | 10.95 | % | | | 10.50 | % | | | 9.36 | % | | | 9.28 | % | | | 9.32 | % |
Ending tangible equity to tangible assets | | | 8.10 | % | | | 9.77 | % | | | 8.74 | % | | | 8.05 | % | | | 7.31 | % |
Nonperforming loans to gross loans (2) | | | 0.94 | % | | | 1.50 | % | | | 2.62 | % | | | 1.43 | % | | | 1.75 | % |
Allowance for credit losses to gross loans | | | 1.31 | % | | | 1.49 | % | | | 1.99 | % | | | 1.42 | % | | | 1.33 | % |
| (1) | Tax-exempt securities included using a tax equivalent basis and an assumed tax rate of 34%. |
| (2) | Ratio shown net of government guarantees. |
17
Item 7. Management’s Discussion and Analysis of Financial Condition and Results of Operations.
The reader should read the following discussion together with the Company’s consolidated financial statements, related notes and supplementary data of the Company and its subsidiaries, which are included under Item 8. The following discussion contains forward-looking statements that reflect plans, estimates and beliefs. The actual results of the Company could differ materially from those discussed in the forward-looking statements.
AmericanWest Bancorporation (Company) is a bank holding company with a single banking subsidiary, AmericanWest Bank (Bank) which operates full service financial centers located in Eastern and Central Washington and Northern Idaho. The Bank also has loan production offices in Ellensburg, Washington and in the Salt Lake City, Utah area (doing business as Precision Bank). Unless otherwise indicated, reference to the Company shall include its wholly-owned subsidiary the Bank.
Critical Accounting Policies
The Company must manage and control certain inherent risks in the normal course of business. These include credit risk, fraud risk, operations and settlement risk, and interest rate risk. The Company has established an allowance for loan losses which represents an estimate of the probable amount of loans that the Bank will be unable to collect as of the date of the financial statements. Refer to Note 1 of the Consolidated Financial Statements included in Item 8 and the Analysis of Allowance for Loan Losses section within this Item for further information.
Executive Overview
Results of Operations
| | | | | | | | | | | | | | | |
| | | | | | | | | % Change | |
($ in thousands, except per share) | | 2006 | | 2005 | | 2004 | | 2006 | | | 2005 | |
Interest income | | $ | 93,853 | | $ | 72,320 | | $ | 73,679 | | 30 | % | | -2 | % |
Interest expense | | | 33,567 | | | 18,333 | | | 13,959 | | 83 | % | | 31 | % |
| | | | | | | | | | | | | | | |
Net interest income | | | 60,286 | | | 53,987 | | | 59,720 | | 12 | % | | -10 | % |
Provision for credit losses | | | 5,791 | | | 2,365 | | | 13,046 | | 145 | % | | -82 | % |
| | | | | | | | | | | | | | | |
Net interest income after provision for credit losses | | | 54,495 | | | 51,622 | | | 46,674 | | 6 | % | | 11 | % |
Noninterest income | | | 9,275 | | | 8,383 | | | 9,247 | | 11 | % | | -9 | % |
Noninterest expense | | | 51,783 | | | 41,135 | | | 42,746 | | 26 | % | | -4 | % |
| | | | | | | | | | | | | | | |
Income before provision for income tax | | | 11,987 | | | 18,870 | | | 13,175 | | -36 | % | | 43 | % |
Provision for income tax | | | 4,357 | | | 4,998 | | | 3,670 | | -13 | % | | 36 | % |
| | | | | | | | | | | | | | | |
Net income | | $ | 7,630 | | $ | 13,872 | | $ | 9,505 | | -45 | % | | 46 | % |
| | | | | | | | | | | | | | | |
Basic earnings per common share | | $ | 0.68 | | $ | 1.33 | | $ | 0.93 | | -49 | % | | 43 | % |
Diluted earnings per common share | | $ | 0.67 | | $ | 1.31 | | $ | 0.91 | | -49 | % | | 44 | % |
The Company’s net income was $7.6 million in 2006 which was $6.2 million less than 2005 and $1.9 million lower than 2004. Basic earnings per share in 2006 of $0.68 was $0.65 lower than 2005 and $0.25 lower than 2004. Diluted earnings per share in 2006 of $0.67 was $0.64 lower than 2005 and $0.24 lower than 2004.
The return on average assets of 0.58% in 2006 was 71 basis points lower than in 2005 and 30 basis points lower than in 2004. The return on average equity for 2006 was 5.33%, as compared to 12.34% and 9.37% for 2005 and 2004, respectively.
2006 financial results were shaped by the following:
| | • | | Merger with Columbia Trust Bancorp (CTB) in the first quarter which added $145.5 million of gross loans and $175.9 million of deposits. |
18
| | • | | 12% organic loan growth and 6% organic deposit growth. |
| | • | | Noninterest expense increased $10.6 million, or 26%, mainly due to the following items: |
| | • | | Salary and employee benefits expense increased $6.8 million, or 29%, related to an increase in full time equivalent employees. |
| | • | | Other increases related mainly to occupancy, equipment and other are due to growth initiatives. |
| | • | | Opening of five financial centers and a loan production office. |
| | • | | Provision for credit losses of $5.8 million included the impact of charge-offs related to one borrower of $4.8 million during the year. |
| | • | | The net interest margin compressed 41 basis points due primarily to higher cost of funds. |
| | • | | Noninterest income increased $0.9 million, or 11%, mainly due to increases in fees and service charges on deposits of $0.6 million and fees on mortgage loan sales of $0.4 million. |
| | • | | The Company paid cash dividends of $0.09 per share. |
2005 financial results were shaped by the following:
| | • | | Asset quality improvement including a decrease of nonperforming assets of $11.8 million, or 41%, and a decrease in the provision for credit losses of $10.7 million. |
| | • | | Decreased net interest income due to margin compression of 57 basis points. |
| | • | | Loan growth of $36.3 million or 3.9% and deposit growth of $2.6 million. |
| | • | | Noninterest expense decline of $1.6 million, or 3.8%, mainly due to foreclosed real estate and other foreclosed assets write-downs in 2004 of $4.8 million. |
| | • | | Noninterest income decline of $0.9 million, or 9.3%, due to a reduction in gains on the sale of assets compared to 2004. |
Net Interest Income.Net interest income increased 11.7% to $60.3 million in 2006 compared to $54.0 million in 2005. The 2005 results were a 9.6% decrease over 2004 results. The increase in 2006 is due mainly to the growth in average earning assets, including the impact of the CTB merger, partially offset by the reduction in the net interest margin.
The Company’s net interest margin was 5.06% in 2006. This is a decline from 5.47% and 6.04% in 2005 and 2004, respectively. During 2006, the net interest margin compressed as the cost of funds increased more than the earning assets yield. The cost of funds increased to 3.59% for 2006 as compared to 2.38% and 1.71% for 2005 and 2004, respectively. The primary drivers of the compression were higher market interest rates during the recent years and heightened competition for deposits. The earning assets yield increased to 7.86% as compared to 7.33% and 7.45% for 2005 and 2004, respectively. The slower rise in the earning assets yield is attributable in part to deliberate changes made by management to improve the credit quality of the loan portfolio with the result that although loan yields may be lower they are expected to be offset by a reduction in future loan losses. Another factor is that fixed rate term loans repriced at similar or lower rates during the year due to the flat-to-inverted yield curve. Additionally, the loan spreads compressed due to increased competition. The net interest income decrease in 2005 was also principally attributable to an increase in market interest rates which caused the deposit and borrowing costs to increase over the year without a corresponding increase in interest income.
19
The following table sets forth information with regard to average balances of assets and liabilities, and interest income from interest earning assets and interest expense on interest bearing liabilities, resultant yields or costs, net interest income, net interest spread (the difference between the average yield on interest earning assets and the average cost of interest bearing liabilities) and the net interest margin:
| | | | | | | | | | | | | | | | | | | | | | | | | | | |
| | | Year Ended December 31, | |
| | | 2006 | | | 2005 | | | 2004 | |
($ in thousands) | | Average
Balance | | Interest | | % | | | Average
Balance | | Interest | | % | | | Average
Balance | | Interest | | % | |
| Assets | | | | | | | | | | | | | | | | | | | | | | | | | | | |
Loans (1) | | $ | 1,145,558 | | $ | 91,743 | | 8.01 | % | | $ | 952,151 | | $ | 70,898 | | 7.45 | % | | $ | 913,844 | | $ | 70,565 | | 7.72 | % |
Taxable securities | | | 31,069 | | | 1,504 | | 4.84 | % | | | 17,805 | | | 820 | | 4.61 | % | | | 57,297 | | | 2,535 | | 4.42 | % |
Nontaxable securities (2) | | | 9,919 | | | 601 | | 6.06 | % | | | 8,536 | | | 538 | | 6.30 | % | | | 9,070 | | | 523 | | 5.77 | % |
Federal Home Loan Bank stock | | | 6,122 | | | 6 | | 0.10 | % | | | 5,392 | | | 22 | | 0.41 | % | | | 4,018 | | | 104 | | 2.59 | % |
Overnight deposits with other banks | | | 3,945 | | | 203 | | 5.15 | % | | | 5,533 | | | 224 | | 4.05 | % | | | 6,118 | | | 84 | | 1.37 | % |
| | | | | | | | | | | | | | | | | | | | | | | | | | | |
Total interest earning assets | | | 1,196,613 | | | 94,057 | | 7.86 | % | | | 989,417 | | | 72,502 | | 7.33 | % | | | 990,347 | | | 73,811 | | 7.45 | % |
| | | | | | | | | | | | | | | | | | | | | | | | | | | |
Noninterest earning assets | | | 110,739 | | | | | | | | | 81,872 | | | | | | | | | 93,777 | | | | | | |
| | | | | | | | | | | | | | | | | | | | | | | | | | | |
Total assets | | $ | 1,307,352 | | | | | | | | $ | 1,071,289 | | | | | | | | $ | 1,084,124 | | | | | | |
| | | | | | | | | | | | | | | | | | | | | | | | | | | |
| Liabilities | | | | | | | | | | | | | | | | | | | | | | | | | | | |
Interest bearing demand deposits | | $ | 88,936 | | $ | 650 | | 0.73 | % | | $ | 67,700 | | $ | 278 | | 0.41 | % | | $ | 62,046 | | $ | 159 | | 0.26 | % |
Savings deposits | | | 351,697 | | | 10,246 | | 2.91 | % | | | 343,574 | | | 6,858 | | 2.00 | % | | | 384,064 | | | 5,544 | | 1.44 | % |
Time deposits | | | 376,340 | | | 15,947 | | 4.24 | % | | | 283,639 | | | 8,087 | | 2.85 | % | | | 282,182 | | | 6,110 | | 2.17 | % |
| | | | | | | | | | | | | | | | | | | | | | | | | | | |
Total interest bearing deposits | | | 816,973 | | | 26,843 | | 3.29 | % | | | 694,913 | | | 15,223 | | 2.19 | % | | | 728,292 | | | 11,813 | | 1.62 | % |
| | | | | | | | | | | | | | | | | | | | | | | | | | | |
Overnight borrowings | | | 39,056 | | | 2,019 | | 5.17 | % | | | 30,727 | | | 970 | | 3.16 | % | | | 34,187 | | | 501 | | 1.47 | % |
Other borrowings (3) | | | 79,934 | | | 4,705 | | 5.89 | % | | | 44,737 | | | 2,140 | | 4.78 | % | | | 52,786 | | | 1,645 | | 3.12 | % |
| | | | | | | | | | | | | | | | | | | | | | | | | | | |
Total interest bearing liabilities | | | 935,963 | | | 33,567 | | 3.59 | % | | | 770,377 | | | 18,333 | | 2.38 | % | | | 815,265 | | | 13,959 | | 1.71 | % |
| | | | | | | | | | | | | | | | | | | | | | | | | | | |
Noninterest bearing demand deposits | | | 218,230 | | | | | | | | | 179,115 | | | | | | | | | 159,704 | | | | | | |
Other noninterest bearing liabilities | | | 9,955 | | | | | | | | | 9,341 | | | | | | | | | 7,665 | | | | | | |
| | | | | | | | | | | | | | | | | | | | | | | | | | | |
Total liabilities | | | 1,164,148 | | | | | | | | | 958,833 | | | | | | | | | 982,634 | | | | | | |
| | | | | | | | | |
| Stockholders’ Equity | | | 143,204 | | | | | | | | | 112,456 | | | | | | | | | 101,490 | | | | | | |
| | | | | | | | | | | | | | | | | | | | | | | | | | | |
Total liabilities and stockholders’ equity | | $ | 1,307,352 | | | | | | | | $ | 1,071,289 | | | | | | | | $ | 1,084,124 | | | | | | |
| | | | | | | | | | | | | | | | | | | | | | | | | | | |
Net interest income and spread | | | | | $ | 60,490 | | 4.27 | % | | | | | $ | 54,169 | | 4.95 | % | | | | | $ | 59,852 | | 5.74 | % |
| | | | | | | | | | | | | | | | | | | | | | | | | | | |
Net interest margin to average earning assets | | | | | | | | 5.06 | % | | | | | | | | 5.47 | % | | | | | | | | 6.04 | % |
| | | | | | | | | | | | | | | | | | | | | | | | | | | |
20
The following table sets forth a summary of changes in the components of net interest income due to changes in average interest earning assets and interest earning liabilities and the resultant changes in interest income and interest expense:
| | | | | | | | | | | | | | | | | | | | | | | | |
| | | 2006 vs 2005 | | | 2005 vs 2004 | |
| | | Increase (decrease) in net interest income due to changes in | |
($ in thousands) | | Volume | | | Rate | | | Total | | | Volume | | | Rate | | | Total | |
| Interest earning assets | | | | | | | | | | | | | | | | | | | | | | | | |
Loans (1) | | $ | 14,409 | | | $ | 6,436 | | | $ | 20,845 | | | $ | 2,958 | | | $ | (2,625 | ) | | $ | 333 | |
Securities (2) | | | 756 | | | | (9 | ) | | | 747 | | | | (1,844 | ) | | | 144 | | | | (1,700 | ) |
Overnight deposits with other banks and FHLB stock | | | (19 | ) | | | (18 | ) | | | (37 | ) | | | 14 | | | | 44 | | | | 58 | |
| | | | | | | | | | | | | | | | | | | | | | | | |
Total interest earning assets | | $ | 15,146 | | | $ | 6,409 | | | $ | 21,555 | | | $ | 1,128 | | | $ | (2,437 | ) | | $ | (1,309 | ) |
| | | | | | | | | | | | | | | | | | | | | | | | |
| Interest bearing liabilities | | | | | | | | | | | | | | | | | | | | | | | | |
Interest bearing demand deposits | | $ | 87 | | | $ | 285 | | | $ | 372 | | | $ | 14 | | | $ | 105 | | | $ | 119 | |
Savings deposits | | | 162 | | | | 3,226 | | | | 3,388 | | | | (584 | ) | | | 1,898 | | | | 1,314 | |
Time deposits | | | 2,642 | | | | 5,218 | | | | 7,860 | | | | 32 | | | | 1,945 | | | | 1,977 | |
| | | | | | | | | | | | | | | | | | | | | | | | |
Total interest bearing deposits | | | 2,891 | | | | 8,729 | | | | 11,620 | | | | (538 | ) | | | 3,948 | | | | 3,410 | |
Overnight borrowings | | | 263 | | | | 786 | | | | 1,049 | | | | (51 | ) | | | 520 | | | | 469 | |
Other borrowings (3) | | | 1,682 | | | | 883 | | | | 2,565 | | | | (251 | ) | | | 746 | | | | 495 | |
| | | | | | | | | | | | | | | | | | | | | | | | |
Total interest bearing liabilities | | | 4,836 | | | | 10,398 | | | | 15,234 | | | | (840 | ) | | | 5,214 | | | | 4,374 | |
| | | | | | | | | | | | | | | | | | | | | | | | |
Total increase (decrease) in net interest income | | $ | 10,310 | | | $ | (3,989 | ) | | $ | 6,321 | | | $ | 1,968 | | | $ | (7,651 | ) | | $ | (5,683 | ) |
| | | | | | | | | | | | | | | | | | | | | | | | |
| (1) | Nonperforming loans and held for sale loans are included with loan balances. |
| (2) | Tax-exempt securities income has been presented using a tax equivalent basis and an assumed tax rate of 34%. |
| (3) | Includes junior subordinated debt. |
The interest rates on loans vary with the degree of risk and amount of the loan, and are further subject to competitive pressures, market rates, the availability of funds and government regulations. As of December 31, 2006 and 2005, approximately 71% and 64%, respectively, of the total loans had interest rates that adjust based on a spread to market reference rates. The market reference rates are based on various indices such as the Prime rates of interest charged by money center banks, the Federal Home Loan Bank of Seattle (FHLB) borrowing rates or London Interbank Offering Rates (LIBOR). Some of these rate adjustments are immediate while some will reprice in up to five years.
Provision for Credit Losses.Provision for credit losses was $5.8 million in 2006 as compared to $2.4 million in 2005, and $13.0 million in 2004. The increase in the provision during 2006 was principally due to charge-offs totaling $4.8 million related to one borrower. These charge-offs resulted in larger than originally anticipated provisions despite the continued improvements in the nonperforming loan ratios. In 2005, the provision for credit losses was in line with management’s expectations given the significant efforts undertaken since late 2004 to improve the credit quality of the portfolio. During 2004, the company took two large provisions, one in the second quarter and one in the fourth quarter. The second quarter 2004 provision and subsequent related charge-off of $4.0 million was related to a single borrowing relationship with a company that provided telecommunications and electricity transmission infrastructure. The fourth quarter 2004 provision of $4.5 million was related to an extensive portfolio review conducted by new management combined with the identified deterioration of several large loans.
The Bank regularly evaluates the adequacy of the allowance for credit losses by considering such factors as current loan grades, historical loss rates, change in the nature of the loan portfolio, overall portfolio quality, industry concentrations, delinquency trends, current economic factors and estimated impact of current economic conditions that may affect a borrower’s ability to pay.
21
The provision for credit losses is an estimate and the use of different estimates or assumptions could produce a different provision for credit losses. If negative trends and expectations of management do not materialize, the allowance may be high relative to the actual performance of the loan portfolio. This may lead to decreased future provisions. Likewise, if positive trends and expectations of management fail to come to fruition, the provision for credit losses in the current period may be inadequate and increased future provisions may be necessary.
Noninterest Income.Noninterest income increased $0.9 million to $9.3 million for 2006 as compared to $8.4 million for 2005. Noninterest income for 2004 was $9.2 million. The following table summarizes certain noninterest income categories for the years ended December 31, 2006, 2005 and 2004.
| | | | | | | | | | | | | | | | | | | | | | | | | | |
| | | 2006 compared to 2005 | | | 2005 compared to 2004 | |
($ in thousands) | | 2006 | | 2005 | | Dollar Change | | | Percent Change | | | 2005 | | 2004 | | Dollar Change | | | Percent Change | |
Fees and service charges on deposits | | $ | 5,526 | | $ | 4,942 | | $ | 584 | | | 12 | % | | $ | 4,942 | | $ | 4,925 | | $ | 17 | | | 0 | % |
Fees on mortgage loan sales | | | 1,713 | | | 1,293 | | | 420 | | | 32 | % | | | 1,293 | | | 1,257 | | | 36 | | | 3 | % |
Bank owned life insurance | | | 533 | | | 813 | | | (280 | ) | | -34 | % | | | 813 | | | 835 | | | (22 | ) | | -3 | % |
Asset sale income | | | 433 | | | 585 | | | (152 | ) | | -26 | % | | | 585 | | | 1,379 | | | (794 | ) | | -58 | % |
Other | | | 1,070 | | | 750 | | | 320 | | | 43 | % | | | 750 | | | 851 | | | (101 | ) | | -12 | % |
| | | | | | | | | | | | | | | | | | | | | | | | | | |
Total | | $ | 9,275 | | $ | 8,383 | | $ | 892 | | | 11 | % | | $ | 8,383 | | $ | 9,247 | | $ | (864 | ) | | -9 | % |
| | | | | | | | | | | | | | | | | | | | | | | | | | |
The fees and service charges on deposits increase in 2006 was related mainly to the growth in deposit accounts over the prior year, including the impact of the CTB acquisition, and new products offered to customers. The fees on mortgage loan sales increased due to an increase in the loan origination volume.
In 2006, asset sale income included $0.5 million related to the sales of government guaranteed loans and $0.2 million gain related to the sale of mortgage loan servicing. Offsetting the asset sale income in 2006 were impairment charges of $0.3 million related to buildings reclassified to held for sale and $0.2 million for a facility taken out of service and replaced with a new building. The asset sale income in 2005 included a $0.7 million gain on the sale of the credit card portfolio. For 2004, the asset sale income included $0.6 million gain on sale of the Ione, Washington financial center and net aggregate gains on sales of foreclosed real estate and other foreclosed assets of $0.5 million. In 2006, the other noninterest income is related mainly to revenue sharing related to the sold credit card portfolio and an increase in merchant bankcard fees.
Noninterest Expense. Noninterest expense increased by 26% to $51.8 million in 2006 compared to $41.1 million in 2005. Noninterest expense for 2004 was $42.7 million. The following table summarizes the major noninterest expense categories for the years ended December 31, 2006, 2005 and 2004.
| | | | | | | | | | | | | | | | | | | | | | | | | | |
| | | 2006 compared to 2005 | | | 2005 compared to 2004 | |
($ in thousands) | | 2006 | | 2005 | | Dollar Change | | | Percent Change | | | 2005 | | 2004 | | Dollar Change | | | Percent Change | |
Salaries and employee benefits | | $ | 30,284 | | $ | 23,439 | | $ | 6,845 | | | 29 | % | | $ | 23,439 | | $ | 22,936 | | $ | 503 | | | 2 | % |
Occupancy and equipment | | | 8,110 | | | 6,191 | | | 1,919 | | | 31 | % | | | 6,191 | | | 5,310 | | | 881 | | | 17 | % |
State business and occupancy tax | | | 1,238 | | | 960 | | | 278 | | | 29 | % | | | 960 | | | 936 | | | 24 | | | 3 | % |
Supplies | | | 1,118 | | | 883 | | | 235 | | | 27 | % | | | 883 | | | 683 | | | 200 | | | 29 | % |
Marketing | | | 1,081 | | | 669 | | | 412 | | | 62 | % | | | 669 | | | 1,210 | | | (541 | ) | | -45 | % |
Amortization of intangible assets | | | 982 | | | 251 | | | 731 | | | 291 | % | | | 251 | | | 251 | | | — | | | 0 | % |
Loan expenses | | | 762 | | | 513 | | | 249 | | | 49 | % | | | 513 | | | 171 | | | 342 | | | 200 | % |
Foreclosed asset expense | | | 750 | | | 669 | | | 81 | | | 12 | % | | | 669 | | | 5,281 | | | (4,612 | ) | | -87 | % |
FRB and correspondent bank fees | | | 621 | | | 557 | | | 64 | | | 11 | % | | | 557 | | | 448 | | | 109 | | | 24 | % |
Other | | | 6,837 | | | 7,003 | | | (166 | ) | | -2 | % | | | 7,003 | | | 5,520 | | | 1,483 | | | 27 | % |
| | | | | | | | | | | | | | | | | | | | | | | | | | |
Total | | $ | 51,783 | | $ | 41,135 | | $ | 10,648 | | | 26 | % | | $ | 41,135 | | $ | 42,746 | | $ | (1,611 | ) | | -4 | % |
| | | | | | | | | | | | | | | | | | | | | | | | | | |
22
The increase in salaries and employee benefits is related to the higher number of full-time equivalent employees including former CTB employees, increasing benefit costs, new financial centers and a new loan production center in Utah. Additionally, during 2005, there was a reversal of a deferred compensation liability which offset the salary continuation expenses by $0.7 million.
The increases in the occupancy and equipment expenses relate mainly to new locations and costs related to remodeling and the updating of older facilities. Marketing expenses increased in 2006 mainly due to increased loan and deposit gathering campaigns. The increase in the intangible assets amortization expense relates to the CTB merger which occurred in March of 2006. The increase in the loan expenses is attributable mainly to the Bank beginning to pay appraisal and closing costs on home equity loans on its customers’ behalf during 2006. Other increases relate to continued investments in technology infrastructure and overall increases in activity levels.
Provision for Income Tax. Provision for income tax as a percentage of income before income tax for the year ended December 31, 2006 increased to 36.3% as compared to 26.5% for the year ended December 31, 2005. For the year ended December 31, 2004 it was 27.9%. During the years ended December 31, 2005 and 2004 the Company recorded $0.3 million and $1.0 million, respectively, in historical rehabilitation tax credits. Additionally, in 2005, the Company reversed a $0.9 million tax reserve recorded in 2004, related to the anticipated cash surrender of certain bank owned life insurance policies. These items decreased the effective tax rate in those years by 6.1% and 1.3%, respectively. The year ended December 31, 2004 had other items reducing taxable income which resulted in the significantly lower rate. During the year ended December 31, 2006, the Company recorded recaptures totaling $0.5 million related to certain historical rehabilitation tax credits which increased the effective tax rate by 3.8%. Additional amounts are anticipated to be recaptured in 2007, which are not expected to be material.
Balance Sheet Management
Lending and Credit Risk Management. The Company follows loan policies that establish levels of loan commitment by loan type, credit review and grading criteria, and other matters such as loan administration, loans to affiliates, loan costs, problem loans and loan loss reserves, and related items. Loans are analyzed at origination and on a periodic basis as conditions warrant as outlined in the Company’s loan policies.
All loan applications are processed centrally through loan processing and administration. Designated lending officers follow approved guidelines and underwriting policies prior to approving a loan application. Credit limits generally vary according to the type of loan and the lender’s experience. Maximum loan approval limits per aggregate relationship that are available to any one employee are established up to $10.0 million. Aggregate lending relationships in excess of $10.0 million require the approval of the credit committee, comprised of members of executive management and members of the board of directors.
Under applicable state laws, loans by the Bank to a single borrower or related entity are limited. The Bank may purchase or sell whole or portions of loans without recourse to third parties. At December 31, 2006 and 2005, the outstanding balance of loan participations sold was $17.7 million and $38.9 million, respectively. At December 31, 2006 and 2005, the Bank had outstanding purchased loans of $104.9 million and $97.7 million, respectively.
During the year ended December 31, 2005, the Bank purchased $76.2 million loans at a premium. At December 31, 2006 and 2005, the remaining unamortized premium on these purchased loans was approximately $0.4 million and $0.5 million, respectively, and is included in the commercial real estate loan category with the remaining principal on these loans.
23
Loan Concentrations. The aggregate maturities of certain loans in the Bank’s loan portfolio at December 31, 2006 are shown in the following table. Additionally, the table identifies the balance of loans with variable and adjustable interest rates which mature in greater than one year. Actual maturities may differ from the contractual maturities shown below as a result of renewals and prepayments:
| | | | | | | | | | | | | | | | | | |
| | | Maturity | | Loans Over One Year By Rate Sensitivity |
($ in thousands) | | Less than 1 year | | 1-5 years | | Thereafter | | Total | | Fixed Rate | | Variable Rate |
Commercial, Financial and | | | | | | | | | | | | | | | | | | |
Agricultural | | $ | 176,579 | | $ | 80,242 | | $ | 36,762 | | $ | 293,583 | | $ | 54,643 | | $ | 62,361 |
Construction—Real Estate | | | 136,012 | | | 91,675 | | | 2,626 | | | 230,313 | | | 8,883 | | | 85,418 |
| | | | | | | | | | | | | | | | | | |
Total | | $ | 312,591 | | $ | 171,917 | | $ | 39,388 | | $ | 523,896 | | $ | 63,526 | | $ | 147,779 |
| | | | | | | | | | | | | | | | | | |
The following table provides a summary of the major categories of loans and the percentage of the total composition for each as of December 31, 2006 and 2005.
| | | | | | | | | | | | |
($ in thousands) | | 2006 | | % of Total | | | 2005 | | % of Total | |
Commercial real estate | | $ | 651,386 | | 53 | % | | $ | 501,328 | | 52 | % |
Commercial and industrial | | | 283,889 | | 23 | % | | | 226,964 | | 24 | % |
Agricultural | | | 141,646 | | 12 | % | | | 119,355 | | 12 | % |
Residential mortgage | | | 74,222 | | 6 | % | | | 58,803 | | 6 | % |
Residential construction | | | 47,235 | | 4 | % | | | 33,906 | | 4 | % |
Installment and other | | | 22,508 | | 2 | % | | | 22,527 | | 2 | % |
| | | | | | | | | | | | |
Total loans | | $ | 1,220,886 | | 100 | % | | $ | 962,883 | | 100 | % |
| | | | | | | | | | | | |
Management has assessed, and will continue to assess on an on-going basis, the effect of the economy within the Bank’s principal market area on the credit risk in the loan portfolio and of overall economic conditions on the entire balance sheet. Currently, management is not aware of any unusually large loan concentrations in industries negatively affected by recent events and changes in the economy. Commercial real estate concentrations are managed to assure wide geographic and business diversity. Management continues to closely monitor the Bank’s credit quality and focus on identifying potential problem credits and any loss exposure in a timely manner. Industry concentration and related limits will continue to be subject to on-going assessments.
As of December 31, 2006, the Bank’s largest 20 credit relationships consisted of loans and loan commitments ranging from $9.5 million to $25.0 million, with an aggregate total credit exposure of $249.5 million and outstanding balances of $157.6 million. Bank management believes that these credits have been underwritten in an appropriate manner and structured to minimize the Bank’s potential exposure to loss.
24
Asset Quality and Nonperforming Assets.The following table provides information for the Company’s nonperforming assets:
| | | | | | | | | | | | | | | | | | | | |
| | | As December 31, | |
($ in thousands) | | 2006 | | | 2005 | | | 2004 | | | 2003 | | | 2002 | |
Nonperforming loans: | | | | | | | | | | | | | | | | | | | | |
Nonaccrual loans | | $ | 11,500 | | | $ | 14,452 | | | $ | 24,222 | | | $ | 12,485 | | | $ | 13,315 | |
Accruing loans 90 days or more past due | | | — | | | | 31 | | | | 53 | | | | 43 | | | | 244 | |
| | | | | | | | | | | | | | | | | | | | |
Total nonperforming loans | | | 11,500 | | | | 14,483 | | | | 24,275 | | | | 12,528 | | | | 13,559 | |
Other real estate owned and other repossessed assets | | | 644 | | | | 2,221 | | | | 4,201 | | | | 7,408 | | | | 7,874 | |
| | | | | | | | | | | | | | | | | | | | |
Total nonperforming assets | | $ | 12,144 | | | $ | 16,704 | | | $ | 28,476 | | | $ | 19,936 | | | $ | 21,433 | |
| | | | | | | | | | | | | | | | | | | | |
Allowance for loan losses | | $ | 15,136 | | | $ | 13,895 | | | $ | 18,282 | | | $ | 12,252 | | | $ | 10,170 | |
Reserve for unfunded commitments | | | 881 | | | | 466 | | | | 193 | | | | 201 | | | | 102 | |
| | | | | | | | | | | | | | | | | | | | |
Allowance for credit losses | | $ | 16,017 | | | $ | 14,361 | | | $ | 18,475 | | | $ | 12,453 | | | $ | 10,272 | |
| | | | | | | | | | | | | | | | | | | | |
Government guarantee portion of loans excluded from nonperforming loans | | $ | 3,978 | | | $ | 1,225 | | | $ | 1,276 | | | $ | 334 | | | $ | 110 | |
Ratio of total nonperforming assets to total assets | | | 0.86 | % | | | 1.51 | % | | | 2.71 | % | | | 1.95 | % | | | 2.34 | % |
Ratio of total nonperforming loans to total loans | | | 0.94 | % | | | 1.50 | % | | | 2.62 | % | | | 1.43 | % | | | 1.75 | % |
Ratio of allowance for credit losses to total nonperforming loans | | | 139.28 | % | | | 99.16 | % | | | 76.11 | % | | | 99.40 | % | | | 75.76 | % |
Nonperforming assets include loans that are 90 or more days past due or in nonaccrual status, and real estate and other loan collateral acquired through foreclosure and repossession. Accruing loans 90 days or more past due may remain on an accrual basis because they are adequately collateralized and in the process of collection. For nonaccrual loans no interest income is recognized unless the borrower demonstrates an ability to resume payments of principal and interest, and the loan is returned to accrual status. Interest previously accrued, but not collected, is reversed and charged against income at the time a loan is placed on nonaccrual status.
Total nonperforming assets, net of government guarantees, were $12.1 million or 0.86% of total assets, at December 31, 2006. This compares to $16.7 million, or 1.51% of assets, at December 31, 2005.
Significant events in nonperforming assets during the year ended December 31, 2006 are discussed below.
| | • | | The Company was carrying as nonaccrual two related loans with a carrying value at December 31, 2005 of $6.3 million. The loans are related to private investments of the guarantor and a casino operation located in Western Washington that is owned in part by the guarantor. During the first quarter of 2006, the Company collected $1.5 million from liquidation of a portion of the collateral, and also charged off $2.4 million due to the principal guarantor seeking relief under a Chapter 11 Bankruptcy filing. During the third quarter of 2006, the Company charged off the remaining nonaccrual balance of $2.4 million, due to the extended time frame anticipated for the resolution of the bankruptcy. Based upon schedules provided to the Creditors’ Committee in the Bankruptcy proceeding, the Company anticipates ultimately receiving payment on a portion of the loans that have been charged off. |
| | • | | During the fourth quarter of 2006, the Company placed loans totaling $6.2 million, relating to a forest products company located in north Idaho, on nonaccrual due to continued operating losses and the inability to demonstrate debt service capacity. Of these loans, $2.8 million are guaranteed by the United States Department of Agriculture. Subsequent to year end, the borrower negotiated a sale of its assets, which is scheduled to close during the first quarter of 2007. Based upon this purchase and sale agreement, the Company does not anticipate any additional provisions for loan losses related to this relationship. |
| | • | | During the year, the Company sold $6.3 million of nonperforming assets to third parties with an aggregate loss of $0.3 million and received payment in full on a $1.0 million nonaccrual loan. |
25
The Bank has evaluated adequacy for all collateral dependent impaired loans that are included in nonperforming and has provided for specific reserves related to these assets of $1.1 million, which is included in the Company’s allowance for loan losses. If the nonperforming loans would have been performing during the year, the Company would have recognized an additional $1.1 million in interest income.
Analysis of Allowance for Loan Losses
The allowance for loan losses is established to absorb known and inherent losses primarily resulting from loans outstanding. Accordingly, all loan losses are charged to the allowance and all recoveries are credited to it. The provision for credit losses charged to operating expense is based on past credit loss experience and other factors which in management’s judgment deserve current recognition in estimating probable credit losses. Such other factors include growth and composition of the loan portfolio, credit concentrations, trends in portfolio volume, maturities, delinquencies and nonaccruals, the relationship of the allowance for loan losses to outstanding loans, historical loss trends and general economic conditions. While management uses the best information available to base its estimates, future adjustments to the allowance may be necessary if economic conditions, particularly in the Company’s market areas, differ substantially from the assumptions initially used. In addition, various regulatory agencies, as an integral part of their examination process, periodically review the Company’s allowance for loan losses. Such agencies may require the Company to recognize additions to the allowance based on their judgments about information available to them at the time of their examination.
The Company utilizes a loan loss reserve methodology and documentation process which it believes is consistent with Securities and Exchange Commission (SEC) Accounting Bulletin No. 102,Selected Loan Loss Allowance Methodology and Documentation Issues. Additionally, the Company adopted Statement of Financial Accounting Standards No. 114 and No. 118,Accounting by Creditors for Impairment of a Loan. These accounting pronouncements require specific identification of an allowance for loan loss for an impaired loan. To this end, the Company developed a systematic methodology using a nine-grade risk rating system to determine its allowance for loan losses. On a quarterly basis, the allowance is recalculated using the methodology to determine if the amount allocated is adequate.
This methodology includes a detailed analysis of the loan portfolio that is performed by competent and well-trained personnel who have the skills and experience to perform analyses, estimates, reviews and other loan loss methodology functions. All loans are considered in the analysis, either on an individual or group basis, using current and reliable data. Loans are evaluated for impairment on an individual basis, if applicable, and the remainder of the portfolio is segmented into groups of loans with similar risk characteristics. Management considers all relevant internal and external factors that may affect loan collections, including interest, if applicable. Additionally, the methodology includes consideration of particular risks inherent in different kinds of lending. Current collateral values, less costs to sell, are considered in cases where this type of analysis is applicable. The analysis ensures the credit loss allowance balance and methodology is in accordance with accounting principles generally accepted in the United States of America and, further, that it also complies with the provisions of theInteragency Policy Statement issued in 2006 by the federal bank regulatory agencies. Management believes that the allowance for loan losses is adequate as of December 31, 2006.
At December 31, 2006 and 2005, the Company had approximately $19.3 million and $19.9 million, respectively, of loans that were not classified as nonperforming but for which known information about the borrower’s financial condition caused management to have concern about the ability of the borrowers to comply with the repayment terms of the loans. These loans were identified through the loan review process described above that provides for assignment of a risk rating based on a nine-grade scale. Based on the evaluation of current market conditions, loan collateral, other secondary sources of repayment and cash flow generation, management does not anticipate any significant losses related to these loans. These loans are subject to continuing management attention and are considered in the determination of the allowance for credit losses. A decline in the economic conditions in the Company’s market areas or other factors could adversely impact individual borrowers or the loan portfolio in general. Accordingly, there can be no assurance that other
26
loans will not become 90 days or more past due, be placed on nonaccrual or transferred to foreclosed real estate and other foreclosed assets in the future.
The following table sets forth information by loan type regarding charge-offs and recoveries in the Company’s allowance for loan losses as follows:
| | | | | | | | | | | | | | | | | | | | |
($ in thousands) | | 2006 | | | 2005 | | | 2004 | | | 2003 | | | 2002 | |
Balance of allowance for loan losses at beginning of period | | $ | 13,895 | | | $ | 18,282 | | | $ | 12,252 | | | $ | 10,170 | | | $ | 6,624 | |
Charge-offs | | | | | | | | | | | | | | | | | | | | |
Commercial | | | 6,089 | | | | 3,835 | | | | 7,359 | | | | 1,452 | | | | 1,292 | |
Agricultural | | | 546 | | | | 1,374 | | | | 279 | | | | 177 | | | | 1,541 | |
Real estate | | | 240 | | | | 1,355 | | | | 90 | | | | 2,154 | | | | 26 | |
Installment and other | | | 146 | | | | 361 | | | | 394 | | | | 741 | | | | 421 | |
| | | | | | | | | | | | | | | | | | | | |
Total charge-offs | | | 7,021 | | | | 6,925 | | | | 8,122 | | | | 4,524 | | | | 3,280 | |
Recoveries | | | | | | | | | | | | | | | | | | | | |
Commercial | | | 172 | | | | 246 | | | | 1,013 | | | | 71 | | | | 140 | |
Agricultural | | | 456 | | | | 113 | | | | 26 | | | | 90 | | | | 173 | |
Real estate | | | 85 | | | | 18 | | | | 10 | | | | 15 | | | | 3 | |
Installment and other | | | 105 | | | | 69 | | | | 49 | | | | 205 | | | | 71 | |
| | | | | | | | | | | | | | | | | | | | |
Total recoveries | | | 818 | | | | 446 | | | | 1,098 | | | | 381 | | | | 387 | |
Net charge-offs | | | 6,203 | | | | 6,479 | | | | 7,024 | | | | 4,143 | | | | 2,893 | |
Provision for loan losses | | | 5,376 | | | | 2,092 | | | | 13,054 | | | | 6,225 | | | | 5,561 | |
Allowance acquired through acquisition | | | 2,068 | | | | — | | | | — | | | | — | | | | 878 | |
| | | | | | | | | | | | | | | | | | | | |
Balance of allowance for loan losses at end of period | | $ | 15,136 | | | $ | 13,895 | | | $ | 18,282 | | | $ | 12,252 | | | $ | 10,170 | |
| | | | | | | | | | | | | | | | | | | | |
Ratio of net charge-offs to average loans | | | 0.54 | % | | | 0.68 | % | | | 0.77 | % | | | 0.50 | % | | | 0.43 | % |
Ratio of provision for loan losses to average loans | | | 0.47 | % | | | 0.22 | % | | | 1.43 | % | | | 0.76 | % | | | 0.82 | % |
Recoveries as a percentage of charge-offs | | | 11.65 | % | | | 6.44 | % | | | 13.52 | % | | | 8.42 | % | | | 11.80 | % |
Average loans outstanding during the period | | $ | 1,145,558 | | | $ | 952,151 | | | $ | 913,844 | | | $ | 821,407 | | | $ | 675,344 | |
The following table sets forth the allowance for loan losses by loan category, based on management’s assessment of the risk associated with such categories as of the dates indicated. The allowance for loan losses is available for all losses, regardless of the allocation below.
| | | | | | | | | | | | | | | | | | | | | | | | | | | | | | |
| | | December 31, | |
| | | 2006 | | | 2005 | | | 2004 | | | 2003 | | | 2002 | |
($ in thousands) | | Amount of
Allowance | | Loans to
Gross
Loans | | | Amount of
Allowance | | Loans to
Gross
Loans | | | Amount of
Allowance | | Loans to
Gross
Loans | | | Amount of
Allowance | | Loans to
Gross
Loans | | | Amount of
Allowance | | Loans to
Gross
Loans | |
Commercial and commercial real estate | | $ | 8,996 | | 76.6 | % | | $ | 9,056 | | 75.7 | % | | $ | 11,730 | | 75.0 | % | | $ | 8,619 | | 73.6 | % | | $ | 6,628 | | 69.7 | % |
Agricultural | | | 3,430 | | 11.6 | % | | | 2,808 | | 12.4 | % | | | 2,489 | | 13.2 | % | | | 1,823 | | 14.2 | % | | | 2,031 | | 15.7 | % |
Residential construction | | | 1,763 | | 3.9 | % | | | 1,221 | | 3.5 | % | | | 2,614 | | 5.0 | % | | | 194 | | 3.7 | % | | | 177 | | 3.8 | % |
Residential mortgage | | | 316 | | 6.1 | % | | | 275 | | 6.1 | % | | | 1,014 | | 3.4 | % | | | 1,245 | | 4.3 | % | | | 719 | | 6.0 | % |
Installment and other | | | 631 | | 1.8 | % | | | 535 | | 2.3 | % | | | 435 | | 3.4 | % | | | 371 | | 4.2 | % | | | 615 | | 4.8 | % |
| | | | | | | | | | | | | | | | | | | | | | | | | | | | | | |
Total | | $ | 15,136 | | 100.0 | % | | $ | 13,895 | | 100.0 | % | | $ | 18,282 | | 100.0 | % | | $ | 12,252 | | 100.0 | % | | $ | 10,170 | | 100.0 | % |
| | | | | | | | | | | | | | | | | | | | | | | | | | | | | | |
27
Investments
Investment activities are undertaken in accordance with the Asset/Liability Management Policy that has been approved by the Board of Directors of the Company. Activities are reviewed by the Asset/Liability Management Committee and the Board of Directors of the Company. The following table sets forth the carrying value, by type, of the securities in the Company’s portfolio at December 31, 2006, 2005 and 2004:
| | | | | | | | | | | | | | | | | | |
($ in thousands) | | 2006 | | % of
Total | | | 2005 | | % of
Total | | | 2004 | | % of
Total | |
U.S. Treasury and other U.S. Government agencies | | $ | 11,857 | | 30 | % | | $ | 12,769 | | 41 | % | | $ | 7,681 | | 27 | % |
States of the U.S. and political subdivisions | | | 9,062 | | 23 | % | | | 7,625 | | 24 | % | | | 8,886 | | 31 | % |
Mortgage backed securities | | | 14,739 | | 37 | % | | | 6,815 | | 22 | % | | | 4,642 | | 16 | % |
Corporate Securities | | | 1,481 | | 4 | % | | | 2,866 | | 9 | % | | | 6,140 | | 22 | % |
Other securities | | | 2,379 | | 6 | % | | | 1,289 | | 4 | % | | | 1,162 | | 4 | % |
| | | | | | | | | | | | | | | | | | |
Total securities | | $ | 39,518 | | 100 | % | | $ | 31,364 | | 100 | % | | $ | 28,511 | | 100 | % |
| | | | | | | | | | | | | | | | | | |
At December 31, 2006, the amortized cost of the Company’s securities exceeded fair value by approximately $100,000. At December 31, 2005 and 2004, the fair value of the Company’s securities exceeded amortized cost by $95,000 and $316,000, respectively. No portion of the Company’s investment portfolio is invested in derivative securities (meaning securities whose value derives from the value of an underlying security or securities, or market index of underlying securities’ values).
The following table sets forth the carrying values, maturities and approximate average aggregate yields of securities in the Company’s investment portfolio by type at December 31, 2006:
| | | | | | |
($ in thousands) | | Yield | | | Amount |
U.S. Treasury and other U.S. government agencies: | | | | | | |
Over 1 through 5 years | | 4.30 | % | | $ | 9,599 |
Over 5 through 10 years | | 5.83 | % | | | 1,591 |
Over 10 years | | 6.56 | % | | | 667 |
| | | | | | |
Total | | 4.64 | % | | $ | 11,857 |
| | | | | | |
States and political subdivisions: | | | | | | |
1 year or less | | 4.15 | % | | $ | 1,810 |
Over 1 through 5 years | | 4.52 | % | | | 4,349 |
Over 5 through 10 years | | 5.00 | % | | | 1,349 |
Over 10 Years | | 3.14 | % | | | 1,554 |
| | | | | | |
Total | | 4.28 | % | | $ | 9,062 |
| | | | | | |
Other securities, including mortgage backed and corporate: | | | | | | |
Over 1 through 5 years | | 5.36 | % | | $ | 5,629 |
Over 5 through 10 years | | 4.08 | % | | | 890 |
Over 10 years | | 4.26 | % | | | 12,080 |
| | | | | | |
Total | | 4.59 | % | | $ | 18,599 |
| | | | | | |
Total investment securities: | | | | | | |
1 year or less | | 4.15 | % | | $ | 1,810 |
Over 1 through 5 years | | 4.65 | % | | | 19,577 |
Over 5 through 10 years | | 5.13 | % | | | 3,830 |
Over 10 years | | 4.25 | % | | | 14,301 |
| | | | | | |
Total | | 4.53 | % | | $ | 39,518 |
| | | | | | |
28
The weighted average yield related to states and political subdivisions reflects the actual yield and is not presented on a tax equivalent basis.
Goodwill and Intangible Assets
At December 31, 2006 AWBC had goodwill and intangible assets of $33.1 million and $7.5 million, respectively, as compared to $12.1 million and $2.4 million, respectively at December 31, 2005. The goodwill recorded in connection with the CTB merger represented the excess of the purchase price over the estimated fair value of the net assets acquired. A portion of the purchase price was allocated to the value of CTB’s core deposits, which included all deposits except time deposits. Additionally, the intangible assets include covenants not to compete. The core deposit intangible asset is being amortized on a straight-line basis with an anticipated life of 8 years. The goodwill is evaluated for impairment on an annual basis, or if events or circumstances indicate a potential impairment.
Deposits
The Bank’s primary source of funds is customer deposits. The Bank strives to maintain a high percentage of noninterest bearing deposits, which lowers the Bank’s cost of funds and results in higher net interest margins. At December 31, 2006, 2005 and 2004, the Company’s ratios of noninterest bearing deposits to total deposits were 21.0%, 21.3% and 19.0%, respectively.
The following table sets forth the average balances for each major category of deposits and the weighted average interest rate paid for deposits for the years ended 2006, 2005, and 2004:
| | | | | | | | | | | | | | | | | | |
| | | 2006 | | | 2005 | | | 2004 | |
($ in thousands) | | Average Balance | | Interest Rate | | | Average Balance | | Interest Rate | | | Average Balance | | Interest Rate | |
| | | | | | |
Interest bearing demand deposits | | $ | 88,936 | | 0.73 | % | | $ | 67,700 | | 0.41 | % | | $ | 62,046 | | 0.26 | % |
Savings and MMDA deposits | | | 351,697 | | 2.91 | % | | | 343,574 | | 2.00 | % | | | 384,064 | | 1.44 | % |
Time deposits | | | 376,340 | | 4.24 | % | | | 283,639 | | 2.85 | % | | | 282,182 | | 2.17 | % |
Noninterest bearing demand deposits | | | 218,230 | | — | | | | 179,115 | | — | | | | 159,704 | | — | |
| | | | | | | | | | | | | | | | | | |
Total | | $ | 1,035,203 | | 2.59 | % | | $ | 874,028 | | 1.74 | % | | $ | 887,996 | | 1.33 | % |
| | | | | | | | | | | | | | | | | | |
The following table shows the amounts and maturities of time deposits that had balances of $100,000 or more at December 31, 2006, 2005 and 2004:
| | | | | | | | | |
($ in thousands) | | 2006 | | 2005 | | 2004 |
Less than three months | | $ | 79,066 | | $ | 39,168 | | $ | 46,071 |
Three months to one year | | | 113,764 | | | 84,023 | | | 48,297 |
Over one year | | | 24,678 | | | 25,910 | | | 28,638 |
| | | | | | | | | |
Total | | $ | 217,508 | | $ | 149,101 | | $ | 123,006 |
| | | | | | | | | |
Time deposits in the table above include brokered certificates of deposits of $56.4 million, $27.3 million and $6.6 million as of December 31, 2006, 2005 and 2004, respectively. Brokered certificates of deposit provide a source of liquidity for the Bank.
Borrowings
At December 31, 2006 and 2005, FHLB advances were $105.8 million and $70.6 million, respectively. The increase in borrowings is related mainly to the increase in loan demand and a slower than expected growth in deposit balances. At December 31, 2006 and 2005 there were no federal funds (Fed Funds) purchased balances, however, the Bank does utilize these borrowings during the year as needed.
29
Junior subordinated debt was $20.6 million and $10.3 million at December 31, 2006 and 2005, respectively. The increase in the junior subordinated debt during the year is related to the acquired balance from CTB of $3.1 million and a new issuance related to the CTB merger of $7.2 million.
Liquidity and Capital Resources
Management believes that the Company’s cash flow will be sufficient to support its existing operations for the foreseeable future. Cash flows from operations contribute significantly to liquidity, as do proceeds from maturities of securities and increasing customer deposits. In 2006, the Company generated $20.5 million in net cash flows from its operating activities, compared to $18.8 million in 2005. Additionally, the Company generated $83.3 million and $45.8 million in net cash from financing activities in 2006 and 2005, respectively.
The Bank’s primary source of funds is its deposits. In addition, the Bank has the ability to borrow from various sources, including the FHLB and correspondent banks that provide Fed Funds lines. At December 31, 2006, the Bank had approximately $244 million of available credit (after deducting outstanding borrowings) from these sources compared to $170 million at December 31, 2005. During 2005, the FHLB increased the Bank’s line of credit to 20% of assets, subject to collateral requirements, from 18% of assets that was applicable at the end of 2004.
The Parent Company had cash balances of $3 million as of December 31, 2006. The Parent Company received a cash dividend of $10 million from the Bank during the year to partially fund the merger with CTB. Additionally, the Parent Company issued junior subordinated debentures of $7 million related to the merger. The Parent Company paid $0.09 per share of dividends on its common stock during 2006. There were no common stock repurchases during the year ended December 31, 2006.
The Parent Company’s ability to service borrowings is generally dependent upon the availability of dividends from the Bank. The payments of dividends by the Bank are subject to limitations imposed by law and governmental regulations. In determining whether the Bank or the Company will declare a dividend, the respective boards of directors consider factors including financial condition, anticipated growth, acquisition opportunities, and applicable laws, regulations and regulatory capital requirements. Another potential source of cash is a line of credit of $5 million that the Parent Company has with a correspondent bank. The line was not used during 2006.
The Company’s total stockholders’ equity increased to $152 million at December 31, 2006 as compared to $121 million at December 31, 2005. This increase is related to retained net income of $6.6 million and stock issued and the value of options acquired related to the CTB merger of $20.6 million. At December 31, 2006, stockholders’ equity was 10.7% of total assets, compared to 10.9% at December 31, 2005. At December 31, 2006 and 2005, the Company also held cash and cash equivalent assets of $56 million and $52 million, respectively.
The capital levels of the Company and the Bank exceeded applicable regulatory well-capitalized guidelines at December 31, 2006 and 2005. Regulatory capital ratios can be reviewed in Note 22 Regulatory Matters in Item 8 of this report.
Effects of Inflation and Changing Prices. The primary impact of inflation on the Company’s operations is increased asset yields, deposit costs and operating overhead. Unlike most industrial companies, virtually all of the assets and liabilities of a financial institution are monetary in nature. As a result, interest rates generally have a more significant impact on a financial institution’s performance than the effects of general levels of inflation. Although interest rates do not necessarily move in the same direction or to the same extent as the prices of goods and services, increases in inflation generally have resulted in increased interest rates. The effects of inflation can magnify the growth of assets, and if significant, would require that equity capital increase at a faster rate than would otherwise be necessary.
30
Contractual Obligations
The following summarizes the Company’s contractual obligations at December 31, 2006:
| | | | | | | | | | | | | | | |
($ in thousands) | | Less than 1 year | | 1-3 years | | 3-5 years | | Thereafter | | Total |
FHLB advances | | $ | 76,207 | | $ | 28,952 | | $ | — | | $ | 600 | | $ | 105,759 |
Capital lease obligations | | | 95 | | | 190 | | | 95 | | | — | | | 380 |
Junior subordinated debentures | | | — | | | — | | | — | | | 20,620 | | | 20,620 |
| | | | | | | | | | | | | | | |
Obligations reflected on Consolidated Statements of Condition | | $ | 76,302 | | $ | 29,142 | | $ | 95 | | $ | 21,220 | | $ | 126,759 |
| | | | | | | | | | | | | | | |
Operating lease obligations | | $ | 2,406 | | $ | 4,298 | | $ | 3,873 | | $ | 24,788 | | $ | 35,365 |
Salary continuation agreements | | | 289 | | | 541 | | | 565 | | | 5,616 | | | 7,011 |
Purchase obligations | | | 1,073 | | | 1,256 | | | 577 | | | — | | | 2,906 |
| | | | | | | | | | | | | | | |
Obligations not reflected on Consolidated Statements of Condition | | $ | 3,768 | | $ | 6,095 | | $ | 5,015 | | $ | 30,404 | | $ | 45,282 |
| | | | | | | | | | | | | | | |
Total | | $ | 80,070 | | $ | 35,237 | | $ | 5,110 | | $ | 51,624 | | $ | 172,041 |
| | | | | | | | | | | | | | | |
The table above does not include time deposit liabilities or accrued interest liabilities.
Off-balance Sheet Arrangements
In the ordinary course of business, the Company has entered into off-balance sheet financial instruments consisting of commitments to extend credit, commercial letters of credit and standby letters of credit. Such financial instruments are held for purposes other than trading and are recorded in the financial statements when they are funded or related fees are incurred or received. Since many of the commitments will expire without being drawn upon, the total commitment amounts do not necessarily reflect future cash requirements. The following summarizes the amount of commitments per expiration period:
| | | | | | | | | | | | | | | |
($ in thousands) | | Less than 1 year | | 1-3 years | | 3-5 years | | Thereafter | | Total |
Commitments to extend credit | | $ | 238,172 | | $ | 69,152 | | $ | 4,436 | | $ | 32,044 | | $ | 343,804 |
Standby letters of credit and financial guarantees written | | | 2,058 | | | 14,663 | | | 4,786 | | | — | | | 21,507 |
| | | | | | | | | | | | | | | |
Total | | $ | 240,230 | | $ | 83,815 | | $ | 9,222 | | $ | 32,044 | | $ | 365,311 |
| | | | | | | | | | | | | | | |
Recent Accounting Pronouncements
Refer to Note 2 in Item 8 of this Report.
Item 7A. Quantitative and Qualitative Disclosures about Market Risk.
Market Risk
The primary form of market risk to which financial institutions are exposed is interest rate risk. This is the effect of changes in market interest rates on a financial institution’s income, fair values of assets and liabilities and capital. Any changes in market interest rates may impact the financial institution’s net interest income, the spread between the interest earned on loans, securities and other interest earning assets, and interest paid on deposits, borrowings and other interest bearing liabilities.
The Company has an Asset/Liability Management Committee (ALCO), consisting of senior managers and a board of directors representative, to monitor interest rate risk. The ALCO meets quarterly to review current
31
interest rate sensitivity and plan balance sheet and pricing strategies. The ALCO looks at many components of interest rate risk. Repricing risk results from differences between the timing of market rate changes and the timing of cash flows of the Bank’s assets and liabilities. Basis risk comes from changes in the relationship between different market rates on assets and liabilities and their impact on the Bank’s earnings. Yield curve risk arises from changes in the shape of the yield curve. All of these aspects of interest rate risk are considered by management in monitoring the Bank’s market risk profile.
As is true for any banking services provider, unfavorable changes in the interest rate environment may reduce profits. Net interest spreads are affected by the difference between the maturities and repricing characteristics of interest earning assets and interest bearing liabilities. In addition, loan volumes and yields are affected by market interest rates on loans: for example rising interest rates are generally associated with a lower volume of loan originations. While an increase in the general level of interest rates may increase the net interest margin and loan yields, it may adversely affect the ability of borrowers with variable rate loans to make principal and interest payments. Accordingly, changes in levels of market interest rates could materially and adversely affect the net interest spread, asset quality, loan origination volume and overall profitability.
Net Interest Income Sensitivity
To monitor the impact of changing interest rates on net interest income, the Company employs an interest rate simulation model. The model integrates existing balance sheet maturity and repricing detail with various assumptions including prepayment projections and interest rate spreads over key index rates. This simulation measures changes in net interest income over one year that would occur if market interest rates move in even increments up or down by 100 and 200 basis points; that is, if rates change by 8.3 and 16.7 basis points each month over 12 months. All yield curve shifts are parallel in this simulation and any loans or deposits that prepay or mature are replaced by like instruments to keep the balance sheet composition constant.
Based on the simulation results, shown below as of December 31, 2006 and 2005, the Company’s net interest income may increase under rising interest rates and decline under falling interest rates, indicating that the Company is slightly asset sensitive.
| | | | | | |
| | | Percentage Change in Net Interest Income over 12 Months | |
Rate Scenario | | 2006 | | | 2005 | |
Rates increase 200 basis points | | 4.91 | % | | 3.39 | % |
Rates increase 100 basis points | | 2.40 | % | | 1.60 | % |
Rates decrease 100 basis points | | -3.12 | % | | -3.86 | % |
Rates decrease 200 basis points | | -6.18 | % | | -6.32 | % |
The Company’s asset sensitivity increased during 2006 primarily due to a change in management expectations for the magnitude of the likely increase in transaction account rates as compared to the rise in market rates. The magnitude of the increase is expected to be lower in 2007 as compared to expectations for 2006 based on market experience.
It should be noted that the preceding interest rate sensitivity analysis does not represent a forecast by the Company and should not be relied upon as being indicative of future operating results. These hypothetical estimates are based on numerous assumptions including, but not limited to: the nature and timing of interest rate levels; yield curve shape; repayments on loans and securities; and pricing decisions on loans and deposits. As market conditions vary from those assumed in the sensitivity analysis, actual results may also differ due to prepayment and refinancing levels deviating from those assumed, the varying impact on adjustable rate assets of interest rate change caps and floors, the potential effect of changing debt service levels on customers with adjustable rate loans, and depositor early withdrawals and product preference changes. Also, the sensitivity analysis does not reflect future actions that the ALCO might take in responding to or anticipating changes in
32
interest rates. While assumptions are developed based upon current economic and local market conditions, the Company cannot give any assurance as to the predictive nature of these assumptions, including how customer preferences or competitor influences might change.
The Company’s policy sets limits on allowable change in one year net interest income if rates rise or fall by 200 basis points. Percentage changes noted in the table above are within these limits.
Economic Value of Equity
As a further means of quantifying interest rate risk, the Company’s management looks at the economic perspective by capturing the impact of interest rate changes on the net value of future cash flows, or Economic Value of Equity (EVE).
To determine the economic value of equity, cash flows projected from the Company’s current assets and liabilities are discounted based on current market rates. Investment securities are valued using current market prices. Loans are discounted at current Bank pricing spreads to market reference rates. Deposits and borrowings are discounted based on the FHLB yield curve as of the simulation date. Deposit cash flows include Federal Reserve Bank estimates of operating costs for each deposit type.
The table below shows the effect on equity of market value changes of the Company’s financial assets and liabilities if interest rates change immediately up or down by 100 or 200 basis points as of December 31, 2006:
| | | |
Rate Scenario | | Percentage Change in EVE | |
Rates increase 200 basis points | | 4.65 | % |
Rates increase 100 basis points | | 2.28 | % |
Rates decrease 100 basis points | | -2.75 | % |
Rates decrease 200 basis points | | -4.70 | % |
The Company’s policy sets limits on allowable change in the economic value of equity if rates rise or fall by 200 basis points. Percentage changes noted in the table above are within these limits. Since the market value of the Company’s equity would increase with rising interest rates, this table again indicates the Company is slightly asset sensitive.
33
Interest Rate Sensitivity Gap
The table below presents the Company’s balance sheet with estimated repricing information as of December 31, 2006. It indicates that the Company has more liabilities than assets repricing during the first year. It should be noted that transaction deposits (interest bearing demand deposits, savings and MMDA) comprise the major portion of these liabilities, and changes in rates on these deposits often occur after changes to key index rates on loans.
| | | | | | | | | | | | | | | | | | | | | | | |
| | | Repricing Interval |
($ in thousands) | | 1 - 3 Months | | | 4 - 12 Months | | | 2 - 5 Years | | | Over 5 Years | | | Non Rate Sensitive | | | Total |
Assets | | | | | | | | | | | | | | | | | | | | | | | |
Overnight interest bearing deposits with other banks | | $ | 9,863 | | | $ | — | | | $ | — | | | $ | — | | | $ | — | | | $ | 9,863 |
Securities | | | 1,065 | | | | 1,743 | | | | 18,605 | | | | 16,690 | | | | 1,415 | | | | 39,518 |
Loans and loans held for sale, gross | | | 546,882 | | | | 164,831 | | | | 446,011 | | | | 49,367 | | | | 16,708 | | | | 1,223,799 |
Noninterest earning assets | | | — | | | | — | | | | — | | | | — | | | | 143,348 | | | | 143,348 |
| | | | | | | | | | | | | | | | | | | | | | | |
Total Assets | | $ | 557,810 | | | $ | 166,574 | | | $ | 464,616 | | | $ | 66,057 | | | $ | 161,471 | | | $ | 1,416,528 |
| | | | | | | | | | | | | | | | | | | | | | | |
Liabilities and Shareholders’ Equity | | | | | | | | | | | | | | | | | | | | | | | |
Interest bearing demand deposits | | $ | 93,787 | | | $ | — | | | $ | — | | | $ | — | | | $ | — | | | $ | 93,787 |
Savings and MMDA | | | 383,065 | | | | — | | | | — | | | | — | | | | — | | | | 383,065 |
Time deposits | | | 123,446 | | | | 229,147 | | | | 57,646 | | | | 473 | | | | — | | | | 410,712 |
FHLB advances | | | 74,350 | | | | 2,009 | | | | 29,100 | | | | 300 | | | | — | | | | 105,759 |
Other borrowings and capital lease obligations | | | — | | | | — | | | | — | | | | 307 | | | | — | | | | 307 |
Junior subordinated debt | | | 13,310 | | | | — | | | | 7,310 | | | | — | | | | — | | | | 20,620 |
Noninterest bearing liabilities and shareholders’ equity | | | — | | | | — | | | | — | | | | — | | | | 402,278 | | | | 402,278 |
| | | | | | | | | | | | | | | | | | | | | | | |
Total Liabilities and Shareholders’ Equity | | $ | 687,958 | | | $ | 231,156 | | | $ | 94,056 | | | $ | 1,080 | | | $ | 402,278 | | | $ | 1,416,528 |
| | | | | | | | | | | | | | | | | | | | | | | |
Interest Rate Repricing Gap | | | (130,148 | ) | | | (64,582 | ) | | | 370,560 | | | | 64,977 | | | | (240,807 | ) | | | |
Cumulative Repricing Gap | | | (130,148 | ) | | | (194,730 | ) | | | 175,830 | | | | 240,807 | | | | — | | | | |
Cumulative Gap as a % of Total Earning Assets | | | -10.2 | % | | | -15.3 | % | | | 13.8 | % | | | 18.9 | % | | | | | | | |
34
Item 8. Financial Statements and Supplementary Data.
Report of Independent Registered Public Accounting Firm
To the Board of Directors and Stockholders
AmericanWest Bancorporation
We have audited the accompanying consolidated statements of financial condition of AmericanWest Bancorporation and subsidiaries (Company) as of December 31, 2006 and 2005, and the related consolidated statements of income, stockholders’ equity and comprehensive income, and cash flows for the three years in the period ended December 31, 2006. We also have audited management’s assessment included in the accompanying Management’s Report on Internal Control over Financial Reporting that the Company maintained effective internal control over financial reporting as of December 31, 2006, based on criteria established in Internal Control—Integrated Framework issued by the Committee of Sponsoring Organizations of the Treadway Commission (COSO). The Company’s management is responsible for these financial statements, for maintaining effective internal control over financial reporting, and for its assessment of the effectiveness of internal control over financial reporting. Our responsibility is to express an opinion on these financial statements, an opinion on management’s assessment, and an opinion on the effectiveness of the Company’s internal control over financial reporting based on our audits.
We conducted our audits in accordance with auditing standards of the Public Company Accounting Oversight Board (United States). Those standards require that we plan and perform the audit to obtain reasonable assurance about whether the financial statements are free of material misstatement and whether effective internal control over financial reporting was maintained in all material respects. An audit includes examining, on a test basis, evidence supporting the amounts and disclosures in the financial statements. An audit also includes assessing the accounting principles used and significant estimates made by management, as well as evaluating the overall financial statement presentation. Our audit of internal control over financial reporting included obtaining an understanding of internal control over financial reporting, evaluating management’s assessment, testing and evaluating the design and operating effectiveness of internal control, and performing such other procedures as we considered necessary in the circumstances. We believe that our audits provide a reasonable basis for our opinion.
The Company’s internal control over financial reporting is a process designed to provide reasonable assurance regarding the reliability of financial reporting and the preparation of financial statements for external purposes in accordance with generally accepted accounting principles. A Company’s internal control over financial reporting includes those policies and procedures that (1) pertain to the maintenance of records that, in reasonable detail, accurately and fairly reflect the transactions and dispositions of the assets of the Company; (2) provide reasonable assurance that transactions are recorded as necessary to permit preparation of financial statements in accordance with generally accepted accounting principles, and that receipts and expenditures of the Company are being made only in accordance with authorizations of management and Directors of the Company; and (3) provide reasonable assurance regarding prevention or timely detection of unauthorized acquisition, use, or disposition of the Company’s assets that could have a material effect on the financial statements.
Because of its inherent limitations, internal control over financial reporting may not prevent or detect misstatements. Also, projections of any evaluation of effectiveness to future periods are subject to the risk that controls may become inadequate because of changes in conditions, or that the degree of compliance with the policies or procedures may deteriorate.
In our opinion, the consolidated financial statements referred to above present fairly, in all material respects, the consolidated financial position of AmericanWest Bancorporation and subsidiaries as of December 31, 2006 and 2005, and the results of their operations and cash flows for each of the three years in the period ended December 31, 2006, in conformity with accounting principles generally accepted in the United States of America. Also in our opinion, management’s assessment that AmericanWest Bancorporation and subsidiaries maintained effective internal control over financial reporting as of December 31, 2006, is fairly stated, in all material respects, based on criteria established in Internal Control—Integrated Framework issued by the Committee of Sponsoring Organizations of the Treadway Commission. Furthermore, in our opinion, AmericanWest Bancorporation and subsidiaries maintained, in all material respects, effective internal control over financial reporting as of December 31, 2006, based on criteria established in Internal Control—Integrated Framework issued by the Committee of Sponsoring Organizations of the Treadway Commission.
/s/ Moss Adams LLP
Spokane, Washington
March 13, 2007
35
AMERICANWEST BANCORPORATION
CONSOLIDATED STATEMENTS OF FINANCIAL CONDITION
DECEMBER 31, 2006 and 2005
($ in thousands)
| | | | | | | |
| | | 2006 | | 2005 | |
| ASSETS | | | | | | | |
Cash and due from banks | | $ | 45,866 | | $ | 40,825 | |
Overnight interest bearing deposits with other banks | | | 9,863 | | | 11,119 | |
| | | | | | | |
Cash and cash equivalents | | | 55,729 | | | 51,944 | |
| | |
Securities, available-for-sale at fair value | | | 39,518 | | | 31,364 | |
| | |
Loans, net of allowance for loan losses of $15,136 and $13,895, respectively | | | 1,204,519 | | | 948,359 | |
Loans, held for sale | | | 2,913 | | | 3,395 | |
Accrued interest receivable | | | 8,311 | | | 6,969 | |
FHLB stock | | | 6,319 | | | 5,397 | |
Premises and equipment, net | | | 30,484 | | | 21,762 | |
Foreclosed real estate and other foreclosed assets | | | 644 | | | 2,221 | |
Bank owned life insurance | | | 19,716 | | | 16,987 | |
Goodwill | | | 33,073 | | | 12,050 | |
Intangible assets | | | 7,506 | | | 2,391 | |
Other assets | | | 7,796 | | | 6,761 | |
| | | | | | | |
TOTAL ASSETS | | $ | 1,416,528 | | $ | 1,109,600 | |
| | | | | | | |
| LIABILITIES | | | | | | | |
Noninterest bearing demand deposits | | $ | 236,375 | | $ | 191,192 | |
Interest bearing deposits: | | | | | | | |
NOW, savings account and money market accounts | | | 476,852 | | | 391,876 | |
Time, $100,000 and over | | | 217,508 | | | 149,101 | |
Other time | | | 193,204 | | | 165,261 | |
| | | | | | | |
TOTAL DEPOSITS | | | 1,123,939 | | | 897,430 | |
| | |
Federal Home Loan Bank advances | | | 105,759 | | | 70,638 | |
Other borrowings and capital lease obligations | | | 307 | | | 899 | |
Junior subordinated debt | | | 20,620 | | | 10,310 | |
Accrued interest payable | | | 4,270 | | | 1,754 | |
Other liabilities | | | 9,596 | | | 7,092 | |
| | | | | | | |
TOTAL LIABILITIES | | | 1,264,491 | | | 988,123 | |
| | |
| STOCKHOLDERS’ EQUITY | | | | | | | |
Common stock, no par, shares authorized 15 million; 11,467,648 issued and 11,388,315 outstanding at December 31, 2006; 10,547,407 issued and 10,490,907 outstanding at December 31, 2005 | | | 127,396 | | | 104,667 | |
Retained earnings | | | 24,576 | | | 17,967 | |
Unearned compensation | | | — | | | (1,095 | ) |
Accumulated other comprehensive income (loss), net of tax | | | 65 | | | (62 | ) |
| | | | | | | |
TOTAL STOCKHOLDERS’ EQUITY | | | 152,037 | | | 121,477 | |
| | | | | | | |
TOTAL LIABILITIES AND STOCKHOLDERS’ EQUITY | | $ | 1,416,528 | | $ | 1,109,600 | |
| | | | | | | |
The accompanying notes are an integral part of the financial statements.
36
AMERICANWEST BANCORPORATION
CONSOLIDATED STATEMENTS OF INCOME
YEARS ENDED DECEMBER 31, 2006, 2005 and 2004
($ in thousands, except per share amounts)
| | | | | | | | | |
| | | 2006 | | 2005 | | 2004 |
Interest Income | | | | | | | | | |
Interest and fees on loans | | $ | 91,743 | | $ | 70,898 | | $ | 70,565 |
Interest on securities | | | 1,901 | | | 1,176 | | | 2,926 |
Other interest income | | | 209 | | | 246 | | | 188 |
| | | | | | | | | |
Total Interest Income | | | 93,853 | | | 72,320 | | | 73,679 |
| | | | | | | | | |
Interest Expense | | | | | | | | | |
Interest on deposits | | | 26,843 | | | 15,223 | | | 11,813 |
Interest on borrowings | | | 6,724 | | | 3,110 | | | 2,146 |
| | | | | | | | | |
Total Interest Expense | | | 33,567 | | | 18,333 | | | 13,959 |
| | | | | | | | | |
Net Interest Income | | | 60,286 | | | 53,987 | | | 59,720 |
Provision for credit losses | | | 5,791 | | | 2,365 | | | 13,046 |
| | | | | | | | | |
Net Interest Income After Provision for Credit Losses | | | 54,495 | | | 51,622 | | | 46,674 |
| | | | | | | | | |
Noninterest Income | | | | | | | | | |
Fees and service charges on deposits | | | 5,526 | | | 4,942 | | | 4,925 |
Fees on mortgage loan sales | | | 1,713 | | | 1,293 | | | 1,257 |
Other | | | 2,036 | | | 2,148 | | | 3,065 |
| | | | | | | | | |
Total Noninterest Income | | | 9,275 | | | 8,383 | | | 9,247 |
| | | | | | | | | |
Noninterest Expense | | | | | | | | | |
Salaries and employee benefits | | | 30,284 | | | 23,439 | | | 22,936 |
Occupancy expense, net | | | 4,167 | | | 3,534 | | | 3,078 |
Equipment expense | | | 3,943 | | | 2,657 | | | 2,232 |
State business and occupation tax | | | 1,238 | | | 960 | | | 936 |
Amortization of intangible assets | | | 982 | | | 251 | | | 251 |
Foreclosed real estate and other foreclosed assets expense | | | 750 | | | 669 | | | 5,281 |
Other | | | 10,419 | | | 9,625 | | | 8,032 |
| | | | | | | | | |
Total Noninterest Expense | | | 51,783 | | | 41,135 | | | 42,746 |
| | | | | | | | | |
Income Before Provision for Income Tax | | | 11,987 | | | 18,870 | | | 13,175 |
| | | |
Provision for Income Tax | | | 4,357 | | | 4,998 | | | 3,670 |
| | | | | | | | | |
Net Income | | $ | 7,630 | | $ | 13,872 | | $ | 9,505 |
| | | | | | | | | |
Basic earnings per common share | | $ | 0.68 | | $ | 1.33 | | $ | 0.93 |
Diluted earnings per common share | | $ | 0.67 | | $ | 1.31 | | $ | 0.91 |
Basic weighted average shares outstanding | | | 11,182,526 | | | 10,407,180 | | | 10,185,246 |
Diluted weighted average shares outstanding | | | 11,354,654 | | | 10,593,903 | | | 10,478,969 |
The accompanying notes are an integral part of the financial statements.
37
AMERICANWEST BANCORPORATION
CONSOLIDATED STATEMENTS OF STOCKHOLDERS’ EQUITY AND COMPREHENSIVE INCOME
YEARS ENDED DECEMBER 31, 2006, 2005 and 2004
($ in thousands)
| | | | | | | | | | | | | | | | | | | | | | | | | | | |
| | | | | | | | | Retained
Earnings | | | Unearned
Employee
Compensation | | | Accumulated
Other
Comprehensive
Income (Loss) | | | Total | | | Comprehensive
Income | |
| | | Common Stock | | | | | | |
| | | Shares | | | Amount | | | | | | |
Balances, December 31, 2003 | | 9,207,250 | | | $ | 78,908 | | | $ | 16,817 | | | $ | — | | | $ | 473 | | | $ | 96,198 | | | $ | 14,024 | |
| | | | | | | |
Issuances of common stock under equity incentive plans, net of tax benefits | | 295,399 | | | | 2,441 | | | | | | | | | | | | | | | | 2,441 | | | | | |
Net income | | | | | | | | | | 9,505 | | | | | | | | | | | | 9,505 | | | | 9,505 | |
10% stock dividend declared in January 2004 | | 923,034 | | | | 20,990 | | | | (20,990 | ) | | | | | | | | | | | | | | | | |
Stock repurchase program | | (156,229 | ) | | | (1,527 | ) | | | (1,325 | ) | | | | | | | | | | | (2,852 | ) | | | | |
Compensatory stock options issued | | | | | | | | | | 50 | | | | | | | | | | | | 50 | | | | | |
Net change in unrealized loss on available-for-sale securities, net of $144 tax benefit | | | | | | | | | | | | | | | | | | (267 | ) | | | (267 | ) | | | (267 | ) |
| | | | | | | | | | | | | | | | | | | | | | | | | | | |
Balances, December 31, 2004 | | 10,269,454 | | | $ | 100,812 | | | $ | 4,057 | | | $ | — | | | $ | 206 | | | $ | 105,075 | | | $ | 9,238 | |
| | | | | | | | | | | | | | | | | | | | | | | | | | | |
Issuances of common stock under equity incentive plans, net of tax benefits | | 221,453 | | | | 2,660 | | | | | | | | | | | | | | | | 2,660 | | | | | |
Net income | | | | | | | | | | 13,872 | | | | | | | | | | | | 13,872 | | | | 13,872 | |
Unearned employee restricted stock awards granted | | 56,500 | | | | 1,195 | | | | | | | | (1,195 | ) | | | | | | | | | | | | |
Compensatory restricted stock awards | | | | | | | | | | | | | | 100 | | | | | | | | 100 | | | | | |
Compensatory stock options issued | | | | | | | | | | 38 | | | | | | | | | | | | 38 | | | | | |
Net change in unrealized loss on available-for-sale securities, net of $143 tax benefit | | | | | | | | | | | | | | | | | | (268 | ) | | | (268 | ) | | | (268 | ) |
| | | | | | | | | | | | | | | | | | | | | | | | | | | |
Balances, December 31, 2005 | | 10,547,407 | | | $ | 104,667 | | | $ | 17,967 | | | $ | (1,095 | ) | | $ | (62 | ) | | $ | 121,477 | | | $ | 13,604 | |
| | | | | | | | | | | | | | | | | | | | | | | | | | | |
Issuances of common stock under equity incentive plans, net of tax benefits | | 176,662 | | | | 2,557 | | | | | | | | | | | | | | | | 2,557 | | | | | |
Net Income | | | | | | | | | | 7,630 | | | | | | | | | | | | 7,630 | | | | 7,630 | |
Compensatory restricted stock awards | | | | | | 82 | | | | | | | | | | | | | | | | 82 | | | | | |
Restricted stock awards activity (Note 15) | | 22,833 | | | | (1,095 | ) | | | | | | | 1,095 | | | | | | | | — | | | | | |
Stock issued in connection with acquisition | | 720,746 | | | | 20,592 | | | | | | | | | | | | | | | | 20,592 | | | | | |
Cash Dividends ($0.09 per share) | | | | | | | | | | (1,021 | ) | | | | | | | | | | | (1,021 | ) | | | | |
Compensatory stock options issued | | | | | | 593 | | | | | | | | | | | | | | | | 593 | | | | | |
Net change in unrealized gain on available-for-sale securities, net of $68 tax liability | | | | | | | | | | | | | | | | | | 127 | | | | 127 | | | | 127 | |
| | | | | | | | | | | | | | | | | | | | | | | | | | | |
Balances, December 31, 2006 | | 11,467,648 | | | $ | 127,396 | | | $ | 24,576 | | | $ | — | | | $ | 65 | | | $ | 152,037 | | | $ | 7,757 | |
| | | | | | | | | | | | | | | | | | | | | | | | | | | |
The accompanying notes are an integral part of the financial statements.
38
AMERICANWEST BANCORPORATION
CONSOLIDATED STATEMENTS OF CASH FLOWS
YEARS ENDED DECEMBER 31, 2006, 2005 and 2004
($ in thousands)
| | | | | | | | | | | | |
| | | 2006 | | | 2005 | | | 2004 | |
CASH FLOWS FROM OPERATING ACTIVITIES | | | | | | | | | | | | |
Net Income | | $ | 7,630 | | | $ | 13,872 | | | $ | 9,505 | |
Adjustments to reconcile net income to net cash provided by operating activities: | | | | | | | | | | | | |
Provision for loan losses and foreclosed real estate and other foreclosed assets | | | 6,230 | | | | 2,401 | | | | 17,834 | |
Depreciation and amortization | | | 3,392 | | | | 2,498 | | | | 2,518 | |
Deferred income taxes | | | 1,146 | | | | 1,364 | | | | (1,512 | ) |
Compensatory stock options and restricted stock expense | | | 675 | | | | 138 | | | | 50 | |
Loss on writedown or impairment of facilities | | | 507 | | | | — | | | | — | |
Gain on disposal of branch | | | — | | | | — | | | | (618 | ) |
(Gain)/loss on sale of other premises and equipment, investments and foreclosed real estate and other foreclosed assets | | | (66 | ) | | | 108 | | | | (531 | ) |
Federal Home Loan Bank stock dividends | | | — | | | | (22 | ) | | | (104 | ) |
Originations of loans held for sale | | | (82,938 | ) | | | (52,993 | ) | | | (45,300 | ) |
Proceeds from loans sold | | | 83,420 | | | | 50,895 | | | | 44,569 | |
Changes in assets and liabilities: | | | | | | | | | | | | |
Accrued interest receivable | | | (419 | ) | | | (449 | ) | | | 230 | |
Bank owned life insurance | | | (533 | ) | | | 580 | | | | (1,269 | ) |
Other assets | | | (2,737 | ) | | | 757 | | | | (2,598 | ) |
Accrued interest payable | | | 2,106 | | | | 754 | | | | 102 | |
Other liabilities | | | 2,069 | | | | (1,084 | ) | | | (735 | ) |
| | | | | | | | | | | | |
NET CASH FROM OPERATING ACTIVITIES | | | 20,482 | | | | 18,819 | | | | 22,141 | |
| | | | | | | | | | | | |
CASH FLOWS FROM INVESTING ACTIVITIES | | | | | | | | | | | | |
Securities available-for-sale: | | | | | | | | | | | | |
Maturities, calls, sales and principal payments | | | 10,827 | | | | 8,808 | | | | 86,904 | |
Purchases | | | (2,878 | ) | | | (12,156 | ) | | | (80,566 | ) |
Purchase of CTB, net of cash acquired | | | 17,858 | | | | — | | | | — | |
Proceeds from sale of bankcard portfolio | | | — | | | | 5,075 | | | | — | |
Net increase in loans | | | (119,208 | ) | | | (48,276 | ) | | | (64,091 | ) |
Purchase of life insurance contracts | | | — | | | | — | | | | (2,000 | ) |
Death benefit proceeds on life insurance contracts | | | — | | | | 1,345 | | | | — | |
Purchases of premises and equipment | | | (9,493 | ) | | | (2,052 | ) | | | (3,970 | ) |
Proceeds from sale of premises and equipment | | | 860 | | | | 1,116 | | | | 592 | |
Proceeds from foreclosed real estate and other foreclosed assets | | | 2,026 | | | | 4,450 | | | | 5,084 | |
Other expenses related to foreclosed real estate and other foreclosed assets | | | — | | | | (225 | ) | | | (187 | ) |
Cash payments for sale of branch | | | — | | | | — | | | | (14,458 | ) |
| | | | | | | | | | | | |
NET CASH FROM INVESTING ACTIVITIES | | | (100,008 | ) | | | (41,915 | ) | | | (72,692 | ) |
| | | | | | | | | | | | |
CASH FLOWS FROM FINANCING ACTIVITIES | | | | | | | | | | | | |
Net increase in deposits | | | 50,595 | | | | 2,632 | | | | 38,785 | |
Proceeds from Federal Home Loan Bank advances | | | 130,000 | | | | 167,050 | | | | 102,519 | |
Repayments of Federal Home Loan Bank advances and other borrowing activity | | | (106,037 | ) | | | (126,088 | ) | | | (109,241 | ) |
Principal payments on capital lease obligations | | | — | | | | (48 | ) | | | (47 | ) |
Proceeds from issuances of common stock under equity incentive plans | | | 2,557 | | | | 2,277 | | | | 2,309 | |
Proceeds from issuance of junior subordinated debt | | | 7,217 | | | | — | | | | — | |
Payment of cash dividend | | | (1,021 | ) | | | — | | | | — | |
Stock repurchased and retired | | | — | | | | — | | | | (2,852 | ) |
| | | | | | | | | | | | |
NET CASH FROM FINANCING ACTIVITIES | | | 83,311 | | | | 45,823 | | | | 31,473 | |
| | | | | | | | | | | | |
NET CHANGE IN CASH AND CASH EQUIVALENTS | | | 3,785 | | | | 22,727 | | | | (19,078 | ) |
Cash and cash equivalents, beginning of year | | $ | 51,944 | | | $ | 29,217 | | | $ | 48,295 | |
| | | | | | | | | | | | |
Cash and cash equivalents, end of year | | $ | 55,729 | | | $ | 51,944 | | | $ | 29,217 | |
| | | | | | | | | | | | |
Supplemental Disclosures: | | | | | | | | | | | | |
Cash paid during the period for: | | | | | | | | | | | | |
Interest | | $ | 24,737 | | | $ | 17,579 | | | $ | 13,899 | |
Income taxes | | $ | 5,026 | | | $ | 1,885 | | | $ | 6,665 | |
Noncash Investing and Financing Activities: | | | | | | | | | | | | |
Foreclosed real estate acquired in settlement of loans | | $ | 701 | | | $ | 2,256 | | | $ | 6,197 | |
Common stock dividend | | $ | — | | | $ | — | | | $ | 20,990 | |
Fair value of assets acquired | | $ | 229,972 | | | $ | — | | | $ | — | |
Cash consideration paid for acquisition | | $ | (18,961 | ) | | $ | — | | | $ | — | |
Stock-based consideration issued for acquisition | | $ | (20,593 | ) | | $ | — | | | $ | — | |
Liabilities assumed in acquisition | | $ | 190,418 | | | $ | — | | | $ | — | |
The accompanying notes are an integral part of the financial statements.
39
AMERICANWEST BANCORPORATION
NOTES TO CONSOLIDATED FINANCIAL STATEMENTS
Note 1. Business and Summary of Significant Accounting Policies
Nature of business:
AmericanWest Bancorporation (Company) is a Washington corporation and a bank holding company headquartered in Spokane, Washington. The Company’s wholly-owned banking subsidiary is AmericanWest Bank (Bank), a Washington state chartered bank that operates in Eastern and Central Washington, Northern Idaho and the Salt Lake City, Utah metropolitan area. Unless otherwise indicated, reference to the Company shall include the Bank. Bank’s operations in Utah are currently doing business as Precision Bank. The Company’s unconsolidated information will be referred to as the Parent Company.
Basis of Financial Statement Presentation:
The consolidated financial statements have been prepared in accordance with generally accepted accounting principles in the United States of America and with prevailing practices within the banking industry. In preparing such financial statements, management is required to make certain estimates and judgments that affect the reported amounts of assets and liabilities and disclosure of contingent assets and liabilities as of the date of the balance sheet and the reported amounts of revenues and expenses for the reporting period. Actual results could differ significantly from those estimates. Material estimates that are particularly susceptible to significant change relate to the determination of the allowance for loan losses and the valuation of goodwill and other intangibles.
Basis of consolidation:
The consolidated financial statements include the accounts of the Company and its wholly owned subsidiaries, excluding the Trusts, after eliminating all intercompany balances and transactions.
Cash and cash equivalents:
Cash equivalents are any highly liquid investment with a remaining maturity of three months or less at the date of purchase. The Company has cash and cash equivalents on deposit with other banks and financial institutions in amounts that periodically exceed the federal insurance limit. The Company evaluates the credit quality of these banks and financial institutions to mitigate its credit risk.
Securities:
All securities are classified as available-for-sale and are carried at fair value. Fair value is determined using published quotes when available or other indicators of value when such are not available. As of December 31, 2006, published quotes were available for approximately 96% of all available-for-sale investment securities. Unrealized holding gains and losses, net of tax, on available-for-sale securities are excluded from earnings and reported as a net amount in a separate component of stockholders’ equity until realized. Gains and losses on the sale of available-for-sale securities are determined using the specific identification method and are recorded on the trade date. Purchase premiums and discounts are recognized in interest income using the interest method over the terms of the securities.
Declines in the fair value of available-for-sale securities below their cost that are deemed to be other than temporary are reflected in earnings as realized losses. In estimating other than temporary impairment losses, management considers (1) the length of time and the extent to which the fair value has been less than cost, (2) the financial condition and near term prospects of the issuer, and (3) the intent and ability of the Company to retain its investment in the issuer for a period of time sufficient to allow for any anticipated recovery in fair value.
40
AMERICANWEST BANCORPORATION
NOTES TO CONSOLIDATED FINANCIAL STATEMENTS—(Continued)
Federal Home Loan Bank stock:
As a member of the Federal Home Loan Bank of Seattle (FHLB), the Bank is required to maintain a minimum level of investment in FHLB stock based on specified percentages of its outstanding FHLB advances. The Bank’s investment in FHLB stock is carried at par value, $100 per share, which reasonably approximates its fair value. The Bank may request redemption at par value of any stock in excess of the amount the Bank is required to hold. However, stock redemptions are at the discretion of the FHLB. Cash and stock dividends received related to the FHLB stock was approximately $6,000, $22,000 and $104,000 for the years ended December 31, 2006, 2005 and 2004, respectively.
Loans held for sale:
Loans originated and intended for sale in the secondary market are carried at the lower of aggregate cost or fair value, as determined by the aggregate outstanding commitments from investors or current investor yield requirements. Net unrealized losses are recognized through a valuation allowance by charges to income. Gains or losses on sales of mortgage loans are recognized based on the differences between the selling price and the carrying value of the mortgage loans sold.
Loans:
Loans that management has the intent and ability to hold for the foreseeable future or until maturity or pay-off are reported at their outstanding principal adjusted for any charge-offs, the allowance for loan losses, any deferred fees or costs on originated loans and unamortized premiums or discounts on purchased loans.
Interest income is accrued on the unpaid principal balance. For loans held for investment, the Bank’s policy is to defer loan origination and commitment fees as well as certain loan origination costs and to amortize the net amount as an adjustment of the yield of the related loan over its contractual life using the interest method.
Loans are classified as impaired when, based on current information and events, it is probable the Bank will be unable to collect all amounts as scheduled under the loan agreement. Impaired loans are measured based on the present value of expected future cash flows discounted at the loan’s effective interest rate or the fair value of the collateral, if the loan is collateral dependent. Changes in these values are reflected in income through charges to the provision for credit losses or as adjustments to the allocation of the allowance for loan losses.
Income recognition on nonaccrual loans:
The accrual of interest on impaired loans is discontinued when the loan is 90 days past due or when, in management’s opinion, the borrower may be unable to meet payments as they become due. When the interest accrual is discontinued, all unpaid accrued interest is reversed. Payments received at the time a loan is on nonaccrual status are applied to principal. Interest income is not recognized until the loan is returned to accrual status. Loans are returned to accrual status when all the principal and interest amounts contractually due are brought current and future payments are reasonably assured.
Allowance for loan losses and reserve for unfunded commitments:
The allowance for loan losses is maintained at a level management believes is adequate to provide for probable loan losses as of the balance sheet dates. The allowance for loan losses is based on an ongoing review of the loan portfolio, which includes consideration of actual loss experience, changes in the size and character of the portfolio, identification of individual problem situations which may affect a borrower’s ability to repay, and
41
AMERICANWEST BANCORPORATION
NOTES TO CONSOLIDATED FINANCIAL STATEMENTS—(Continued)
evaluation of the prevailing and anticipated economic conditions. The evaluation is inherently subjective, as it requires estimates that are susceptible to significant revision as more information becomes available.
The allowance for loan losses is increased by charges to income and decreased by charge-offs, net of recoveries. While management uses available information to recognize losses on loans, changes in economic conditions may necessitate revision of the estimate in future periods.
A reserve for unfunded commitments is maintained at a level that, in the opinion of management, is adequate to absorb probable losses associated with the Bank’s commitment to lend funds under existing agreements such as letters or lines of credit. Management determines the adequacy of the reserve for unfunded commitments based upon reviews of individual credit facilities, current economic conditions, the risk characteristics of the various categories of commitments and other relevant factors. The reserve is based on estimates, and ultimate losses may vary from the current estimates. These estimates are evaluated on a regular basis and, as adjustments become necessary, they are recognized in earnings in the periods in which they become known through charges to other noninterest expense. Draws on unfunded commitments that are considered uncollectible at the time funds are advanced are charged to the reserve for unfunded commitments. Provisions for unfunded commitment losses, and recoveries on commitment advances previously charged-off, are added to the reserve for unfunded commitments, which is included in the Other Liabilities section of the consolidated statements of financial condition.
During the fourth quarter of 2006, the Company reclassified the portion of the allowance for loan losses attributable to unfunded commitments to other liabilities. This reclassification was applied to all periods presented in order to provide a comparable presentation and had no impact on the reported provision for credit losses.
The factors supporting the allowance for loan losses and the reserve for unfunded commitments do not diminish the fact that the entire allowance for loan losses and reserve for unfunded commitments are each available to absorb losses in the loan portfolio and related commitment portfolio, respectively. The Company’s principal focus, therefore, is on the adequacy of the total allowance for loan losses and reserve for unfunded commitments.
The allowance for loan losses and reserve for unfunded commitments are both subject to review by banking regulators. The Bank’s primary regulators regularly conduct reviews of the allowance for loan losses and reserve for unfunded commitments as an integral part of their examination process. Should the regulators determine that the allowance for loan losses or reserve for unfunded commitments are not, in their opinion, adequate, the Bank may be required to recognize additional provision expense or charge-offs.
Foreclosed real estate and other foreclosed assets:
Real estate properties acquired through, or in lieu of, loan foreclosure are to be sold and are initially recorded at the lower of the recorded investment or its fair value at the date of foreclosure establishing a new cost basis. After foreclosure, management periodically performs valuations and the real estate is carried at the lower of carrying amount or fair value less cost to sell. Any subsequent write-downs are recorded as a decrease in the asset and charged against operating expenses. Operating expenses of such properties, net of related income, are included in foreclosed real estate and other foreclosed assets expense, and gains and losses on their disposition are included in noninterest income.
42
AMERICANWEST BANCORPORATION
NOTES TO CONSOLIDATED FINANCIAL STATEMENTS—(Continued)
Premises and equipment:
Premises and equipment are stated at cost less accumulated depreciation over estimated useful lives ranging from 3 to 39 years. Land is carried at cost. Depreciation expense is calculated using the straight-line method for financial statement purposes. Expenditures for new premises and equipment and major betterments are capitalized. Normal costs of maintenance and repairs are charged to expense as incurred.
In accordance with Statement of Financial Accounting Standards (SFAS) No. 144,Accounting for the Impairment or Disposal of Long-Lived Assets, management reviews long-lived assets and intangibles any time that a change in circumstance indicates that the carrying amount of these assets may not be recoverable. Recoverability of these assets is determined by comparing the carrying value of the assets to the forecasted undiscounted cash flows of the operation associated with the asset. If the evaluation of the forecasted cash flows indicates that the carrying value of the asset is not recoverable, the asset is written down to fair value.
Goodwill and intangible assets:
Net assets of companies acquired in purchase transactions are recorded at fair value at the date of acquisition. Identified intangibles are amortized on a straight-line basis over the period benefited. Goodwill is not amortized but is reviewed for potential impairment on an annual basis, or more frequently if events or circumstances indicate a potential impairment. An impairment loss is recorded to the extent that the carrying amount of goodwill exceeds its implied fair value. The Company tested its goodwill and found no impairment for the years ended December 31, 2006, 2005 or 2004.
Income taxes:
The Company accounts for income taxes using the liability method, which requires that deferred tax assets and liabilities be determined based on the temporary differences between the financial statement carrying amounts and tax bases of assets and liabilities and tax attributes using enacted tax rates in effect in the years in which the temporary differences are expected to reverse.
Earnings per share:
Basic earnings per share (EPS) is computed by dividing net income by the weighted average number of shares outstanding during the year giving retroactive effect to stock dividends. Diluted EPS reflects the potential dilutive effect of stock options and unvested restricted stock and is computed by taking the denominator above plus the dilutive effect of stock options and restricted stock using the treasury stock method.
Stock-based compensation:
Effective January 1, 2006, the Company adopted SFAS No. 123(R),Share-Based Payment, which is a revision of SFAS No. 123,Accounting for Stock-Based Compensation. Statement 123(R) supersedes Accounting Principles Board Opinion (APB) No. 25,Accounting for Stock Issued to Employees,and amends SFAS No. 95,Statement of Cash Flows.Generally, the approach in SFAS 123(R) is similar to the approach described in SFAS 123. However, SFAS 123(R) requires all share-based payments to employees, including grants of employee stock options, to be recognized in the income statement based on their fair values. The fair values were calculated using the Black-Scholes-Merton model. Compensation cost is recorded as if each vesting portion of the award is a separate award.
43
AMERICANWEST BANCORPORATION
NOTES TO CONSOLIDATED FINANCIAL STATEMENTS—(Continued)
Comprehensive income:
GAAP requires that recognized revenue, expenses, gains and losses be included in net income. Although certain changes in assets and liabilities, such as unrealized gains and losses on available-for-sale securities, are reported as a separate component of the equity section of the balance sheet, such items, along with net income, are components of comprehensive income.
The following table summarizes the available-for-sale securities component of comprehensive income for the periods presented:
| | | | | | | | | | | | |
($ in thousands) | | Year Ended December 31, | |
| | 2006 | | | 2005 | | | 2004 | |
Unrealized holding gains (losses) on available-for-sale securities | | $ | 182 | | | $ | (436 | ) | | $ | (455 | ) |
Reclassification adjustments for losses included in income | | | 13 | | | | 25 | | | | 44 | |
| | | | | | | | | | | | |
Net unrealized gains | | $ | 195 | | | $ | (411 | ) | | $ | (411 | ) |
| | | | | | | | | | | | |
Tax benefit (liability) | | | (68 | ) | | | 143 | | | | 144 | |
| | | | | | | | | | | | |
Net change in unrealized loss on available-for-sale securities | | $ | 127 | | | $ | (268 | ) | | $ | (267 | ) |
| | | | | | | | | | | | |
Other off-balance sheet instruments:
In the ordinary course of business the Bank has entered into off-balance sheet financial instruments consisting of commitments to extend credit, commercial letters of credit and standby letters of credit and financial guarantees. Such financial instruments are held for purposes other than trading and are recorded in the financial statements when they are funded or related fees are incurred or received.
Bank owned life insurance:
The Bank has purchased, or acquired through mergers, life insurance policies that provide protection against the adverse financial effects that could result from the death of a key employee and provide tax deferred income. Although the lives of individual current or former management-level employees are insured, the Bank is the owner and beneficiary. The Bank is exposed to the credit to the extent an insurance company is unable to fulfill its financial obligations under a policy. In order to mitigate this risk, the policies are placed with multiple insurance companies and the Bank regularly monitors their financial condition.
Transfer of financial assets:
Transfers of financial assets are accounted for as sales when control over the assets has been surrendered. Control over transferred assets is deemed to be surrendered when (1) the assets have been isolated from the Bank, (2) the transferee obtains the right (free of conditions that constrain it from taking advantage of that right) to pledge or exchange the transferred assets, and (3) the Bank does not maintain effective control over the transferred assets through an agreement to repurchase them before their maturity.
Significant group concentrations of credit risk:
Most of the Bank’s business activity is concentrated with customers located within its footprint. The Bank originates commercial and industrial, commercial real estate, agricultural, real estate construction, real estate mortgage, installment and other loans. Generally, loans are secured by accounts receivable, inventory, deposit accounts, personal property or real estate. Rights to collateral vary and are legally documented to the extent
44
AMERICANWEST BANCORPORATION
NOTES TO CONSOLIDATED FINANCIAL STATEMENTS—(Continued)
practicable. Although the Bank has a diversified loan portfolio, local economic conditions may affect borrowers’ ability to meet the stated repayment terms. The ability of the Bank’s borrowers to honor their contracts is dependent upon the real estate and general economic conditions in the area.
Advertising:
The Company expenses all costs associated with advertising and promotional efforts as incurred. Advertising costs for the years ended December 31, 2006, 2005 and 2004 were approximately $1,081,000, $669,000 and $1,210,000, respectively.
Estimates:
In preparing the financial statements, management is required to make estimates and assumptions that affect the reported amounts of certain assets and liabilities and the disclosure of contingent assets and liabilities as of the date of the statement of financial condition and certain revenues and expenses for the period and the accompanying notes. Actual results could differ materially from those estimates. Material estimates that are particularly susceptible to significant changes in the near term relate to the determination of the allowance for loan losses, reserve for unfunded commitments and the valuation of foreclosed real estate and other foreclosed assets. In connection with the determination of estimated losses on loans and foreclosed real estate and other foreclosed assets, management obtains independent appraisals for significant properties.
Reclassifications:
Certain prior year balances have been reclassified to conform to the current year presentation. These reclassifications had no effect on retained earnings or net income as previously presented.
Note 2. Recently Issued Accounting Pronouncements
Effective January 1, 2007, the Company will adopt SFAS No. 155,Accounting for Certain Hybrid Instruments, which permits, but does not require, fair value accounting for any hybrid financial instrument that contains an embedded derivative that would otherwise require bifurcation in accordance with SFAS No. 133,Accounting for Derivative Instruments and Hedging Activities. This statement also subjects beneficial interests issued by securitization vehicles to the requirements of SFAS No. 133. The implementation of this guidance, applying the exception outlined in Derivatives Implementation Group Issue B40, is not expected to have a material impact.
Effective January 1, 2007, the Company will adopt SFAS No. 156,Accounting for Servicing of Financial Assets—an amendment of FASB Statement No. 140. This standard amends the guidance in SFAS No. 140,Accounting for Transfers and Servicing of Financial Assets and Extinguishments of Liabilities, to simplify the accounting for servicing assets and liabilities. Specifically, the SFAS No. 156 addresses the recognition and measurement of separately recognized servicing assets and liabilities and provides an approach to simplify efforts to obtain hedge-like (offset) accounting. SFAS No. 156 clarifies when an obligation to service financial assets should be separately recognized as a servicing asset or a servicing liability. It also requires all separately recognized servicing assets and servicing liabilities to be initially measured at fair value, if practicable, and permits an entity to choose either the amortization method or the fair value measurement method for subsequent measurement of each class of separately recognized servicing assets and servicing liabilities. The implementation of this guidance is not expected to have a material impact.
In September 2006, the FASB issued SFAS No. 157,Fair Value Measurements. SFAS No. 157 defines fair value, establishes a framework for measuring fair value and expands disclosures about fair value measurements.
45
AMERICANWEST BANCORPORATION
NOTES TO CONSOLIDATED FINANCIAL STATEMENTS—(Continued)
This statement applies under other accounting pronouncements that require or permit fair value measurements. Accordingly, this statement does not require any new fair value measurements. SFAS No. 157 is effective for financial statements issued for fiscal years beginning after November 15, 2007, and interim periods within those fiscal years. The implementation of this guidance is not expected to have a material impact.
In September 2006, the FASB issued SFAS No. 158,Employers’ Accounting for Defined Benefit Pension and other Postretirement Plans—an amendment of FASB Statements No. 87, 88, 106, and 123(R). This Statement requires employers with defined post-retirement benefit plans to recognize the overfunded or underfunded status of such plans as an asset or liability in its statement of financial position and to recognize changes in that funded status in the year in which the changes occur through comprehensive income. Since the Company does not currently have any defined post-employment benefit plans, the implementation of this guidance is not expected to have a material impact.
On September 7, 2006, the Emerging Issues Task Force (EITF) reached a final consensus on Issue 06-4,Accounting for Deferred Compensation and Postretirement Benefit Aspects of Endorsement Split-Dollar Life Insurance Arrangements. Under the new guidance contained in the final consensus, an employer (policy holder) will be required to determine whether they have promised the participant (i) a death benefit, or (ii) to maintain the split-dollar arrangement and share some portion of the death benefits of the underlying life insurance policy with the participant. If the employer has promised to provide a death benefit, then a liability for the present value of the death benefit must be accrued over the employee’s required service period. If the employer has promised to maintain the split dollar arrangement and underlying life insurance policy, then the postretirement cost of insurance must be accrued over the employee’s required service period. The Company is assessing the impact of the implementation of this guidance.
On July 13, 2006, Financial Accounting Standards Board Interpretation Number (FIN) 48,Accounting for Uncertainty in Income Taxes—An Interpretation of FASB Statement No. 109, was issued. FIN 48 clarifies the accounting and reporting for income taxes where interpretation of the tax law may be uncertain. FIN 48 prescribes a comprehensive model for the financial statement recognition, measurement, presentation and disclosure of income tax uncertainties with respect to positions taken or expected to be taken in income tax returns. The Company will adopt FIN 48 on January 1, 2007. The cumulative effect, if any, of applying FIN 48 will be recorded as an adjustment to the beginning balance of retained earnings. FIN 48 is not expected to have a material impact.
On September 13, 2006, the SEC issued Staff Accounting Bulletin No. 108 (SAB 108). SAB 108 expresses the SEC Staff’s views regarding the process of quantifying financial statement misstatements. SAB 108 states that in evaluating the materiality of financial statement misstatements the company must quantify the impact of correcting misstatements, including both the carryover and reversing effects of prior year misstatements, on the current year financial statements. SAB 108 is effective for the year ended December 31, 2006. The implementation of this guidance did not have a material impact.
Effective January 1, 2006, the Company adopted SFAS No. 123(R),Share-Based Payment, which is a revision of SFAS No. 123,Accounting for Stock-Based Compensation. Previously, the Company accounted for stock-based compensation under Accounting Principles Board Opinion (APB) No. 25, Accounting for Stock Issued to Employees. For additional information on stock-based employee compensation, refer to Note 15 of the Consolidated Financial Statements.
46
AMERICANWEST BANCORPORATION
NOTES TO CONSOLIDATED FINANCIAL STATEMENTS—(Continued)
Note 3. Business Combination
On March 15, 2006 the Company acquired Columbia Trust Bancorp (CTB) and its wholly-owned subsidiaries, Columbia Trust Bank and Columbia Trust Statutory Trust I, in an acquisition accounted for under the purchase method of accounting. The results of CTB have been included in the consolidated financial statements since that date.
The aggregate purchase price was approximately $39,554,000 and included cash of $17,487,000, common stock of $17,980,000, conversion of stock options valued at $2,613,000, and direct merger costs of $1,474,000. The value of the 720,746 shares issued was determined based on the $24.96 average closing market price of the Company’s common stock for the two trading days before and after the measurement date of March 8, 2006 when the number of shares to be issued was determined. Outstanding CTB stock options were converted (using the same 1.8035 exchange ratio applied to the share conversion) into approximately 161,000 stock options at a weighted average fair value of $16.25 per option. Total transaction expenses of $2,834,000 included $1,474,000 of direct expenses noted above, $771,000 of merger expenses that were paid by CTB prior to the close of the transaction, $300,000 of loss related to the reclassification of premises into held for sale and $289,000 of other miscellaneous expenses.
The following table summarizes the estimated fair value of the assets acquired and liabilities assumed at the date of acquisition.
| | | |
($ in thousands) | | |
Assets acquired: | | | |
Cash and cash equivalents | | $ | 36,820 |
Securities | | | 15,937 |
Loans, net of allowance for loan losses | | | 143,444 |
Goodwill | | | 21,023 |
Other intangibles | | | 6,097 |
Premises and equipment, net | | | 3,022 |
Other assets | | | 3,629 |
| | | |
Total assets | | $ | 229,972 |
| | | |
| |
Liabilities assumed: | | | |
Deposits | | | 175,914 |
FHLB advances and other borrowings | | | 10,566 |
Junior subordinated debt | | | 3,093 |
Other liabilities | | | 845 |
| | | |
Total liabilities | | $ | 190,418 |
| | | |
Net assets acquired | | $ | 39,554 |
| | | |
The core deposit intangible of $5,794,000 is being amortized on a straight-line basis over 8 years. Noncompete agreements of $303,000 are being amortized on a straight-line basis over 1-2 years. Goodwill of $21,023,000 is not amortized but will be reviewed for potential impairment on an annual basis, or if events or circumstances indicate a potential impairment. Goodwill of approximately $1,820,000 is expected to be deductible for tax purposes.
The following table presents unaudited pro forma results of operations related to the acquisition consummated on March 15, 2006, for the year ended December 31, 2006 and for the year ended December 31,
47
AMERICANWEST BANCORPORATION
NOTES TO CONSOLIDATED FINANCIAL STATEMENTS—(Continued)
2005. The cost savings already realized by the Company as a result of the CTB merger are included in the AWBC column for the year ended December 31, 2006. Additional cost savings anticipated are not reflected in the pro forma consolidated condensed statements of income. No assurance can be given with respect to the ultimate level of such cost savings. The AWBC column reflects the Company’s actual results reported for the periods shown. The CTB column reflects the actual results for the periods shown, prior to the acquisition date. The pro forma column represents purchase adjustments which would have occurred during the periods shown if the acquisition would have occurred on January 1, 2005. The pro forma results do not necessarily indicate the results that would have been obtained had the acquisition actually occurred on January 1, 2005.
For the year ended December 31, 2006
| | | | | | | | | | | | | | |
(unaudited, $ in thousands, except per share amounts) | | AWBC | | CTB | | | Pro forma
Adjustments | | | Pro forma
Combined |
Net interest income | | $ | 60,286 | | $ | 1,411 | | | $ | (307 | ) (a) | | $ | 61,390 |
Provision for credit losses | | | 5,791 | | | 1,126 | | | | | | | | 6,917 |
Noninterest income | | | 9,275 | | | (196 | ) | | | | | | | 9,079 |
Noninterest expense | | | 51,783 | | | 2,192 | | | | 97 | (b) | | | 54,072 |
| | | | | | | | | | | | | | |
Income before provision for income tax | | | 11,987 | | | (2,103 | ) | | | (404 | ) | | | 9,480 |
Provision for income taxes | | | 4,357 | | | (779 | ) | | | (143 | ) (c) | | | 3,435 |
| | | | | | | | | | | | | | |
Net Income | | $ | 7,630 | | $ | (1,324 | ) | | $ | (261 | ) | | $ | 6,045 |
| | | | | | | | | | | | | | |
Basic earnings per share | | $ | 0.68 | | | | | | | | | | $ | 0.53 |
Diluted earnings per share | | $ | 0.67 | | | | | | | | | | $ | 0.53 |
Basic weighted average shares outstanding | | | 11,182,526 | | | | | | | | | | | 11,328,650 |
Diluted weighted average shares outstanding | | | 11,354,654 | | | | | | | | | | | 11,512,467 |
| (a) | Amount represents amortization of purchase adjustments and interest expense on junior subordinated debt issuance. |
| (b) | Amount represents amortization of intangibles. |
| (c) | Income tax effect of proforma adjustments. |
For the year ended December 31, 2005
| | | | | | | | | | | | | |
(unaudited, $ in thousands, except per share amounts) | | AWBC | | CTB | | Pro forma
Adjustments | | | Pro forma
Combined |
Net interest income | | $ | 53,987 | | $ | 8,227 | | $ | (658 | ) (a) | | $ | 61,556 |
Provision for credit losses | | | 2,365 | | | 415 | | | | | | | 2,780 |
Noninterest income | | | 8,383 | | | 772 | | | | | | | 9,155 |
Noninterest expense | | | 41,135 | | | 7,010 | | | 924 | (b) | | | 49,069 |
| | | | | | | | | | | | | |
Income before provision for income tax | | | 18,870 | | | 1,574 | | | (1,582 | ) | | | 18,862 |
Provision for income taxes | | | 4,998 | | | 488 | | | (562 | ) (c) | | | 4,924 |
| | | | | | | | | | | | | |
Net Income | | $ | 13,872 | | $ | 1,086 | | $ | (1,020 | ) | | $ | 13,938 |
| | | | | | | | | | | | | |
Basic earnings per share | | $ | 1.33 | | | | | | | | | $ | 1.25 |
Diluted earnings per share | | $ | 1.31 | | | | | | | | | $ | 1.22 |
Basic weighted average shares outstanding | | | 10,407,180 | | | | | | | | | | 11,129,536 |
Diluted weighted average shares outstanding | | | 10,593,903 | | | | | | | | | | 11,384,561 |
| (a) | Amount represents amortization of purchase adjustments and interest expense on junior subordinated debt issuance. |
| (b) | Amount represents amortization of intangibles. |
| (c) | Income tax effect of proforma adjustments. |
48
AMERICANWEST BANCORPORATION
NOTES TO CONSOLIDATED FINANCIAL STATEMENTS—(Continued)
Note 4. Cash and Cash Equivalents
The Bank is required to maintain prescribed reserves with the Federal Reserve Bank or in the form of cash. Cash reserve requirements are computed by applying prescribed percentages to various types of deposits. When the Bank’s cash reserves are in excess of that required, it may lend the excess to other banks. Conversely, when cash reserves are less than required, the Bank borrows funds on a daily basis. Such reserve requirements at December 31, 2006 and 2005 were approximately $1,512,000 and $2,898,000, respectively.
The average amounts of federal funds sold and overnight interest bearing deposits with other banks for the years ended December 31, 2006 and 2005 were approximately $3,185,000 and $3,949,000, respectively.
Note 5. Securities
Debt and equity securities have been classified according to management’s intent to have them available-for-sale. The amortized cost of securities, their gross unrealized gains and losses and their fair values at the respective dates are shown in the following table.
| | | | | | | | | | | | |
December 31, 2006
($ in thousands) | | Amortized
Cost | | Gross
Unrealized
Gains | | Gross
Unrealized
Losses | | Fair
Value |
Obligations of federal government agencies | | | 11,927 | | | 17 | | | 87 | | $ | 11,857 |
Obligations of states, municipalities and political subdivisions | | | 9,016 | | | 90 | | | 44 | | | 9,062 |
Mortgage backed securities | | | 14,680 | | | 94 | | | 35 | | | 14,739 |
Corporate securities | | | 1,498 | | | — | | | 17 | | | 1,481 |
Other securities | | | 2,297 | | | 82 | | | — | | | 2,379 |
| | | | | | | | | | | | |
Total | | $ | 39,418 | | $ | 283 | | $ | 183 | | $ | 39,518 |
| | | | | | | | | | | | |
| | | | |
December 31, 2005
($ in thousands) | | Amortized
Cost | | Gross
Unrealized
Gains | | Gross
Unrealized
Losses | | Fair
Value |
Obligations of federal government agencies | | $ | 12,915 | | $ | — | | $ | 146 | | $ | 12,769 |
Obligations of states, municipalities and political subdivisions | | | 7,539 | | | 119 | | | 33 | | | 7,625 |
Mortgage backed securities | | | 6,792 | | | 33 | | | 10 | | | 6,815 |
Corporate securities | | | 3,001 | | | 1 | | | 136 | | | 2,866 |
Other securities | | | 1,212 | | | 77 | | | — | | | 1,289 |
| | | | | | | | | | | | |
Total | | $ | 31,459 | | $ | 230 | | $ | 325 | | $ | 31,364 |
| | | | | | | | | | | | |
The following table includes information on investment securities with unrealized losses at the respective dates.
| | | | | | | | | | | | | | | | | | |
| | | Less than 12 months | | 12 Months or Longer | | Total |
December 31, 2006
($ in thousands) | | Fair
Value | | Unrealized
Losses | | Fair
Value | | Unrealized
Losses | | Fair
Value | | Unrealized
Losses |
Obligations of federal government agencies | | $ | 1,332 | | $ | 14 | | $ | 4,279 | | $ | 73 | | $ | 5,611 | | $ | 87 |
Obligations of states, municipalities and political subdivisions | | | 3,173 | | | 13 | | | 1,880 | | | 31 | | | 5,053 | | | 44 |
Mortgage backed securities | | | 1,672 | | | 6 | | | 1,975 | | | 29 | | | 3,647 | | | 35 |
Corporate securities | | | — | | | — | | | 1,498 | | | 17 | | | 1,498 | | | 17 |
| | | | | | | | | | | | | | | | | | |
Total | | $ | 6,177 | | $ | 33 | | $ | 9,632 | | $ | 150 | | $ | 15,809 | | $ | 183 |
| | | | | | | | | | | | | | | | | | |
49
AMERICANWEST BANCORPORATION
NOTES TO CONSOLIDATED FINANCIAL STATEMENTS—(Continued)
| | | | | | | | | | | | | | | | | | |
| | | |
| | | Less than 12 months | | 12 Months or Longer | | Total |
December 31, 2005 ($ in thousands) | | Fair
Value | | Unrealized
Losses | | Fair
Value | | Unrealized
Losses | | Fair
Value | | Unrealized
Losses |
Obligations of federal government agencies | | $ | 7,743 | | $ | 42 | | $ | 4,998 | | $ | 104 | | $ | 12,741 | | $ | 146 |
Obligations of states, municipalities and political subdivisions | | | 1,885 | | | 4 | | | 778 | | | 29 | | | 2,663 | | | 33 |
Mortgage backed securities | | | 2,394 | | | 10 | | | 105 | | | — | | | 2,499 | | | 10 |
Corporate securities | | | 2,002 | | | 136 | | | — | | | — | | | 2,002 | | | 136 |
| | | | | | | | | | | | | | | | | | |
Total | | $ | 14,024 | | $ | 192 | | $ | 5,881 | | $ | 133 | | $ | 19,905 | | $ | 325 |
| | | | | | | | | | | | | | | | | | |
Certain investment securities shown above have fair values less than amortized cost and therefore contain unrealized losses. The Company has evaluated these securities and has determined that the decline in value is temporary and primarily related to the change in market interest rates since purchase. There were 46 and 38 investment securities with unrealized losses at December 31, 2006 and 2005, respectively. Management has determined that no investment security is other than temporarily impaired. The Company anticipates full recovery of amortized cost with respect to these securities at maturity or sooner in the event of a more favorable market interest rate environment.
Taxable interest income on securities was approximately $1,504,000, $820,000 and $2,535,000 for 2006, 2005, and 2004, respectively. Nontaxable interest income on securities was approximately $397,000, $356,000 and $391,000 for 2006, 2005 and 2004, respectively. There were no sales of securities during the years ended December 31, 2006 or 2005. Total proceeds from sales of securities for the year ended December 31, 2004 were approximately $81,206,000 and included gains and losses of approximately $271,000 and $315,000, respectively.
Securities with an amortized cost of $15,991,000 and $12,578,000 at December 31, 2006 and 2005, respectively, were pledged for purposes required or permitted by law. The market value of these securities was approximately $15,884,000 and $12,442,000 at December 31, 2006 and 2005, respectively.
The contractual scheduled maturity of securities at December 31, 2006 was as follows:
| | | | | | |
($ in thousands) | | Amortized
Cost | | Fair
Value |
Due in one year or less | | $ | 1,814 | | $ | 1,810 |
Due from one to five years | | | 19,587 | | | 19,577 |
Due from five to ten years | | | 3,792 | | | 3,830 |
Due after ten years | | | 14,225 | | | 14,301 |
| | | | | | |
Total | | $ | 39,418 | | $ | 39,518 |
| | | | | | |
Expected maturities will differ from contractual maturities as the issuers of certain debt securities have the right to call or prepay their obligations without penalties.
50
AMERICANWEST BANCORPORATION
NOTES TO CONSOLIDATED FINANCIAL STATEMENTS—(Continued)
Note 6. Loans, Allowance for Loan Losses and Reserve for Unfunded Commitments
Loan categories as of December 31, 2006 and 2005 were as follows:
| | | | | | | | |
($ in thousands) | | 2006 | | | 2005 | |
Commercial real estate | | $ | 651,386 | | | $ | 501,328 | |
Commercial and industrial | | | 283,889 | | | | 226,964 | |
Agricultural | | | 141,646 | | | | 119,355 | |
Residential mortgage | | | 74,222 | | | | 58,803 | |
Residential construction | | | 47,235 | | | | 33,906 | |
Installment and other | | | 22,508 | | | | 22,527 | |
| | | | | | | | |
Total loans | | | 1,220,886 | | | | 962,883 | |
| | | | | | | | |
Allowance for loan losses | | | (15,136 | ) | | | (13,895 | ) |
Deferred loan fees, net of deferred costs | | | (1,231 | ) | | | (629 | ) |
| | | | | | | | |
Net loans | | $ | 1,204,519 | | | $ | 948,359 | |
| | | | | | | | |
Installment and other loans include approximately $181,000 and $399,000 in overdraft deposits reclassified as loans as of December 31, 2006 and 2005, respectively. Approximately $230,257,000 and $170,925,000 of loans were pledged as security for borrowings as of December 31, 2006 and 2005, respectively.
In 2006, the Company reclassified the reserve for unfunded commitments from the allowance for loan losses to other liabilities. The reclassifications had no effect on the provision for credit losses as reported. The activity related to the allowance for loan losses, as adjusted for the reclassification, for each of the years ended December 31, 2006, 2005 and 2004, is presented below:
| | | | | | | | | | | | |
($ in thousands) | | 2006 | | | 2005 | | | 2004 | |
Balance, beginning of year | | $ | 13,895 | | | $ | 18,282 | | | $ | 12,252 | |
Provision for loan losses | | | 5,376 | | | | 2,092 | | | | 13,054 | |
Allowance related to acquired loans | | | 2,068 | | | | — | | | | — | |
Loans charged-off | | | (7,021 | ) | | | (6,925 | ) | | | (8,122 | ) |
Recoveries | | | 818 | | | | 446 | | | | 1,098 | |
| | | | | | | | | | | | |
Balance, end of year | | $ | 15,136 | | | $ | 13,895 | | | $ | 18,282 | |
| | | | | | | | | | | | |
The activity related to the reserve for unfunded commitments, for each of the years ended December 31, 2006, 2005 and 2004, is presented below:
| | | | | | | | | | |
($ in thousands) | | 2006 | | 2005 | | 2004 | |
Balance, beginning of period | | $ | 466 | | $ | 193 | | $ | 201 | |
Provision for credit losses | | | 415 | | | 273 | | | (8 | ) |
| | | | | | | | | | |
Balance, end of period | | $ | 881 | | $ | 466 | | $ | 193 | |
| | | | | | | | | | |
Impaired loan information as of December 31, 2006 and 2005 was as follows:
| | | | | | |
($ in thousands) | | 2006 | | 2005 |
Impaired loans: | | | | | | |
Impaired loans with specific allowance for loan losses | | $ | 6,264 | | $ | 4,468 |
Impaired loans without a specific allowance for loan losses | | | 2,255 | | | 3,695 |
| | | | | | |
Total impaired loans | | $ | 8,519 | | $ | 8,163 |
| | | | | | |
Impaired loans allowance for loan losses | | $ | 1,145 | | $ | 1,256 |
Average impaired loans | | $ | 8,031 | | $ | 12,752 |
51
AMERICANWEST BANCORPORATION
NOTES TO CONSOLIDATED FINANCIAL STATEMENTS—(Continued)
Nonperforming relationships greater than $500,000 are included in management’s analysis above as impaired loans. Other nonperforming relationships are collectively evaluated for impairment. Additionally, the government guaranteed portion of nonperforming loans included in the above analysis was approximately $3,978,000 and $1,225,000 as of December 31, 2006 and 2005, respectively.
Note 7. Premises and Equipment
Major classifications of premises and equipment are summarized as of December 31, 2006 and 2005 as follows:
| | | | | | | | | | |
($ in thousands) | | 2006 | | | 2005 | | | Estimated Useful Life |
| | | |
Premises | | $ | 21,878 | | | $ | 18,214 | | | 5-39 Years |
Furniture, fixtures, and equipment | | | 13,123 | | | | 9,911 | | | 3-7 Years |
Leasehold improvements | | | 4,976 | | | | 2,627 | | | 5-15 Years |
| | | | | | | | | | |
| | | 39,977 | | | | 30,752 | | | |
Less accumulated depreciation | | | (13,467 | ) | | | (12,805 | ) | | |
| | | | | | | | | | |
| | | 26,510 | | | | 17,947 | | | |
Land | | | 3,974 | | | | 3,815 | | | |
| | | | | | | | | | |
Premises and equipment, net | | $ | 30,484 | | | $ | 21,762 | | | |
| | | | | | | | | | |
Depreciation expense for the years ended December 31, 2006, 2005 and 2004 was approximately $2,394,000, $2,188,000 and $2,117,000, respectively.
During the year ended December 31, 2006, the Bank reclassified three buildings as held for sale related to consolidations which occurred in conjunction with the CTB merger. Buildings held for sale are recorded at the lower of cost or market value. During the year ended December 31, 2006, the Bank recorded write-downs to the market values of these properties of approximately $335,000. Sales of two of these buildings resulted in a net gain of approximately $27,000, which is included in noninterest income. As of December 31, 2006, one building with a carrying value of $697,000 remains held for sale and is included in the above table in premises. Additionally, during the year ended December 31, 2006, the Bank recorded impairment of approximately $172,000 on another building which was taken out of service and replaced with a new facility.
Note 8. Goodwill and Intangible Assets
The following table summarizes the changes in the Company’s goodwill and intangible assets for the years ended December 31, 2006 and 2005. The additions are related to the CTB merger on March 15, 2006.
| | | | | | | |
($ in thousands) | | Goodwill | | Intangible
Assets | |
Balance, December 31, 2004 | | $ | 12,050 | | $ | 2,642 | |
Amortization | | | — | | | (251 | ) |
| | | | | | | |
Balance, December 31, 2005 | | | 12,050 | | | 2,391 | |
| | | | | | | |
Additions | | | 21,023 | | | 6,097 | |
Amortization | | | — | | | (982 | ) |
| | | | | | | |
Balance, December 31, 2006 | | $ | 33,073 | | $ | 7,506 | |
| | | | | | | |
52
AMERICANWEST BANCORPORATION
NOTES TO CONSOLIDATED FINANCIAL STATEMENTS—(Continued)
The table below presents the forecasted amortization expense for 2007 through 2011 for other intangible assets acquired in all mergers. The weighted average remaining amortization period for intangible assets is 6.5 years.
| | | |
($ in thousands) | | Expected
Amortization |
| |
2007 | | $ | 1,100 |
2008 | | | 997 |
2009 | | | 975 |
2010 | | | 975 |
2011 | | | 975 |
Note 9. Bank Owned Life Insurance
The cash surrender values related to life insurance policies net of estimated surrender charges were approximately $19,716,000 and $16,987,000 at December 31, 2006 and 2005, respectively. For the years ended December 31, 2006, 2005 and 2004, income related to bank owned life insurance was approximately $533,000, $813,000 and $835,000, respectively, and is reflected in other noninterest income on the Consolidated Statements of Income.
During the year ended December 31, 2005, the Company received the death benefit related to the death of a former bank executive. The recorded value of the policy was approximately $2,048,000 resulting in a gain of approximately $64,000.
Note 10. Income Taxes
The components of income tax expense for the years presented were as follows:
| | | | | | | | | | | |
($ in thousands) | | 2006 | | | 2005 | | 2004 | |
Current expense | | $ | 5,503 | | | $ | 3,634 | | $ | 5,182 | |
Deferred tax expense (benefit) | | | (1,146 | ) | | | 1,364 | | | (1,512 | ) |
| | | | | | | | | | | |
Income tax expense | | $ | 4,357 | | | $ | 4,998 | | $ | 3,670 | |
| | | | | | | | | | | |
The effective tax rate differs from the statutory tax rate as follows:
| | | | | | | | | | | | |
($ in thousands) | | 2006 | | | 2005 | | | 2004 | |
Income tax at statutory rate | | $ | 4,196 | | | $ | 6,604 | | | $ | 4,611 | |
Effect of tax-exempt interest income | | | (222 | ) | | | (203 | ) | | | (225 | ) |
Effect of bank owned life insurance | | | (187 | ) | | | (797 | ) | | | 578 | |
Effect of tax credits | | | 457 | | | | (280 | ) | | | (1,035 | ) |
Effect of nondeductible expenses and other | | | 113 | | | | (326 | ) | | | (259 | ) |
| | | | | | | | | | | | |
Income tax expense | | $ | 4,357 | | | $ | 4,998 | | | $ | 3,670 | |
| | | | | | | | | | | | |
53
AMERICANWEST BANCORPORATION
NOTES TO CONSOLIDATED FINANCIAL STATEMENTS—(Continued)
The following were the significant components of deferred tax assets and liabilities:
| | | | | | |
($ in thousands) | | 2006 | | 2005 |
Deferred tax assets: | | | | | | |
Allowance for loan losses and reserve for unfunded commitments | | $ | 5,531 | | $ | 5,098 |
Deferred compensation expense | | | 1,158 | | | 1,176 |
Unrealized losses on available-for-sale securities | | | — | | | 33 |
Other | | | 1,852 | | | 1,740 |
| | | | | | |
Total deferred tax assets | | | 8,541 | | | 8,047 |
| | | | | | |
Deferred tax liabilities: | | | | | | |
Deferred loan fees | | | 269 | | | 800 |
Depreciation | | | 1,614 | | | 1,558 |
Unrealized gains on available-for-sale securities | | | 35 | | | — |
FHLB stock dividend income | | | 608 | | | 574 |
Intangible assets | | | 1,905 | | | — |
Other | | | 1,013 | | | 872 |
| | | | | | |
Total deferred tax liabilities | | | 5,444 | | | 3,804 |
| | | | | | |
Net deferred tax assets | | $ | 3,097 | | $ | 4,243 |
| | | | | | |
During the years ended December 31, 2005 and 2004, the Company recognized historical rehabilitation tax credits as noted in the table above of approximately $280,000 and $1,035,000, respectively. These credits relate to historical buildings located in Spokane, Washington. During the year ended December 31, 2006, credits of $457,000 was subject to recapture related to a modification in the usage of one building and uncertain completion of construction of another building. Additional amounts may be subject to recapture in future years depending on the ultimate usage of these buildings.
Note 11. Federal Home Loan Bank advances and other borrowings:
Federal Home Loan Bank (FHLB) advances maturities and weighted average interest rates as of December 31, 2006 and 2005 are summarized as follows:
| | | | | | | | | | | | |
| | | December 31, | |
| | | 2006 | | | 2005 | |
($ in thousands) Maturity Date | | Amount | | Weighted Average Interest Rate | | | Amount | | Weighted Average Interest Rate | |
2006 | | $ | — | | 0.00 | % | | $ | 67,400 | | 4.26 | % |
2007 | | | 76,207 | | 5.44 | % | | | 1,538 | | 2.79 | % |
2008 | | | 25,884 | | 5.03 | % | | | 1,000 | | 5.90 | % |
2009 | | | 3,068 | | 3.60 | % | | | 100 | | 6.96 | % |
2010 | | | — | | 0.00 | % | | | — | | 0.00 | % |
Thereafter | | | 600 | | 3.83 | % | | | 600 | | 3.83 | % |
| | | | | | | | | | | | |
Total | | $ | 105,759 | | 5.28 | % | | $ | 70,638 | | 4.25 | % |
| | | | | | | | | | | | |
54
AMERICANWEST BANCORPORATION
NOTES TO CONSOLIDATED FINANCIAL STATEMENTS—(Continued)
The maximum amount of FHLB advances outstanding at any month-end and the average amounts outstanding for each of the respective periods presented are summarized below:
| | | | | | |
| | | December 31, |
($ in thousands) | | 2006 | | 2005 |
Maximum amount of outstanding FHLB advances at any month-end | | $ | 144,429 | | $ | 106,455 |
Average amount of outstanding FHLB advances during the year | | $ | 95,580 | | $ | 58,998 |
The Bank’s FHLB advances were all fixed-rate as of December 31, 2006. The Bank had two advances totaling $8,000,000 at December 31, 2006, where the FHLB has the option to convert the advance to a variable rate after a specified period of time. The Bank’s credit line is the lesser of 20% of total assets or up to the eligible collateral balance. At December 31, 2006, the Bank had available on its line of credit from the FHLB approximately $124,197,000, subject to the availability of collateral. FHLB advances are collateralized by otherwise unencumbered permanent residential mortgages, investment grade securities and other eligible real estate mortgages. Federal statute requires all members of the FHLB to maintain collateral on FHLB advances equivalent to the amount borrowed on a daily basis.
Capital lease obligations are also included in other borrowings on the consolidated statements of condition. The balances at December 31, 2006 and 2005 were approximately $307,000 and $368,000, respectively.
In addition to the FHLB available line of credit, the Bank had available $120,000,000 of Fed Funds lines through correspondent banks at December 31, 2006. The Parent Company had available $5,000,000 through a line of credit with a correspondent bank at December 31, 2006.
Note 12. Time Deposit Maturities
At December 31, 2006, the scheduled maturities of time deposits were as follows:
| | | |
($ in thousands) | | |
2007 | | $ | 352,825 |
2008 | | | 35,577 |
2009 | | | 15,545 |
2010 | | | 4,486 |
2011 | | | 1,806 |
Thereafter | | | 473 |
| | | |
Total | | $ | 410,712 |
| | | |
Note 13. Junior Subordinated Debentures
As of December 31, 2006, the Company had three wholly-owned trusts (Trusts) that were formed to issue trust preferred securities and related common securities of the Trusts. The Trusts are summarized as follows:
| | | | | | | | | | | | | | | |
($ in thousands) Trust Name | | Issue Date | | Outstanding
Amount | | Rate | | | Effective
Rate | | | Maturity Date | | Call Date |
AmericanWest Statutory Trust I | | September 2002 | | $ | 10,310 | | Floating | (1) | | 8.76 | % | | September 2032 | | September 2007 |
Columbia Trust Statutory Trust I | | June 2003 | | $ | 3,093 | | Floating | (2) | | 8.46 | % | | June 2033 | | June 2008 |
AmericanWest Capital Trust II | | March 2006 | | $ | 7,217 | | 6.76% | (3) | | 6.76 | % | | March 2036 | | March 2011 |
| (1) | Rate based on LIBOR plus 3.40%, adjusted quarterly. |
| (2) | Rate based on LIBOR plus 3.10%, adjusted quarterly. |
| (3) | Rate fixed for 5 years from issuance, then adjusted quarterly thereafter based on LIBOR plus 1.50%. |
55
AMERICANWEST BANCORPORATION
NOTES TO CONSOLIDATED FINANCIAL STATEMENTS—(Continued)
All of the common securities of the Trusts are owned by the Company. The Company has fully and unconditionally guaranteed the capital securities along with all obligations of the Trusts under the trust agreements. Interest income from the junior subordinated debentures is the source of revenues for these Trusts. In accordance with Financial Accounting Standards Board Interpretation No. 46R,Consolidation of Variable Interest Entities, the Trusts are not consolidated in the Company’s financial statements.
All of the subordinated debentures issued to the Trusts, less the common stock of the Trusts, qualified as Tier I capital as of December 31, 2006, under the guidance issued by the Board of Governors of the Federal Reserve System (FRB). Effective April 11, 2005, the FRB adopted a rule that permits the inclusion of trust preferred securities in Tier I capital, but with stricter quantitative limits. Under the FRB rule, after a five-year transition period ending March 31, 2009, the aggregate amount of trust preferred securities and certain other restricted core capital elements is limited to 25% of Tier I capital elements, net of goodwill. The amount of trust preferred securities and certain other elements in excess of the limit could be included in Tier II capital, subject to restrictions. The Company currently includes all issued trust preferred securities in Tier I capital and all of the currently issued trust preferred securities are expected to qualify under the new limitations as of March 31, 2009. There can be no assurance that the FRB will not further limit the amount of trust preferred securities permitted to be included in Tier I capital for regulatory capital purposes.
Note 14. Common Stock
In 2006, the Board of Directors authorized the repurchase of up to 250,000 shares at a stock price within certain parameters. In 2004, 156,229 shares were repurchased under a previously authorized repurchase plan for approximately $2,852,000. There were no stock repurchases in 2006 or 2005.
In January of 2004 the Board of Directors declared a 10% common stock dividend. The Company recorded a transfer from retained earnings to common stock for the market value of the additional shares on the date issued. Per share amounts and weighted average shares outstanding have been retroactively adjusted to reflect the stock dividends. No stock dividends were declared in 2006 or 2005. During the year ended December 31, 2006, the Company declared cash dividends of $0.09 per share. No cash dividends were declared in 2005 or 2004.
Note 15. Stock-Based Compensation
Stock Options
In April 2006, the Company’s shareholders approved the AmericanWest Bancorporation 2006 Equity Incentive Plan (Plan), which superseded the Company’s 2001 Incentive Stock Option Plan (2001 Plan) with respect to any issuance of incentive stock options, nonqualified stock options, restricted stock awards and unrestricted stock awards to key employees, officers and directors made on and after the Plan’s effective date (March 17, 2006, which was the date of adoption by the board of directors subject to approval of the shareholders within twelve (12) months of such adoption). The maximum aggregate number of authorized shares issued under the Plan is 314,666, which was the number of unissued shares remaining under the 2001 Plan on the date of such effective date, plus any shares under the 2001 Plan as to which options or other benefits granted thereunder and outstanding as of March 17, 2006 may lapse, expire, terminate or be cancelled. As of December 31, 2006, the remaining authorized shares available for issuance under the Plan is 286,073. The Compensation Committee of the board of directors administers the Plan. The maximum term of an incentive stock option granted under the Plan is ten years and the Plan will terminate on March 17, 2016. All awards made under the 2001 Plan remain(ed) in effect in accordance with their terms.
56
AMERICANWEST BANCORPORATION
NOTES TO CONSOLIDATED FINANCIAL STATEMENTS—(Continued)
The status of the Plan as of December 31, 2006 and of the 2001 Plan as of December 31, 2005 and 2004 was as follows:
| | | | | | | | | | | | | | | | | | |
| | | 2006 | | 2005 | | 2004 |
| | | Number | | | Weighted
Average
Exercise
Price | | Number | | | Weighted
Average
Exercise
Price | | Number | | | Weighted
Average
Exercise
Price |
Outstanding at beginning of year | | 454,136 | | | $ | 15.96 | | 697,231 | | | $ | 13.87 | | 624,562 | | | $ | 9.44 |
Granted | | 177,343 | | | | 19.44 | | 45,293 | | | | 20.58 | | 393,816 | | | | 17.87 |
Assumed through acquisition | | 160,818 | | | | 12.00 | | — | | | | — | | — | | | | — |
Exercised | | (179,932 | ) | | | 12.40 | | (222,863 | ) | | | 10.01 | | (282,612 | ) | | | 7.27 |
Forfeited and expired | | (168,316 | ) | | | 18.18 | | (65,525 | ) | | | 16.90 | | (38,535 | ) | | | 16.04 |
| | | | | | | | | | | | | | | | | | |
Outstanding at year end | | 444,049 | | | $ | 16.51 | | 454,136 | | | $ | 15.96 | | 697,231 | | | $ | 13.87 |
| | | | | | | | | | | | | | | | | | |
Exercisable at year end | | 293,069 | | | $ | 15.03 | | 228,946 | | | $ | 13.30 | | 354,513 | | | $ | 10.30 |
During the year ended December 31, 2006, certain nonqualified stock options were modified. The amendment provided for the exercise price of the 158,836 unexercised stock options related to one employee issued in 2004 to be increased. The original vesting schedule and expiration term related to the options remains unchanged. These options are included in the granted and forfeited categories above at the respective prices of $18.71 and $18.07 per share.
Additional information related to the stock options outstanding and exercisable as of December 31, 2006 and 2005 is below.
| | | | | | | | | | |
($ in thousand except per share amounts) | | Options | | Weighted
Average
Exercise
Price | | Weighted
Average
Remaining
Contractual
Life | | Aggregate
Intrinsic
Value |
Outstanding at December 31, 2006 | | 444,049 | | $ | 16.51 | | 6.2 years | | $ | 3,422 |
Exercisable at December 31, 2006 | | 293,069 | | $ | 15.03 | | 5.5 years | | $ | 2,693 |
Outstanding at December 31, 2005 | | 454,136 | | $ | 15.96 | | 6.7 years | | $ | 3,485 |
Exercisable at December 31, 2005 | | 228,946 | | $ | 13.30 | | 5.2 years | | $ | 2,364 |
The fair value assumptions for grants in each of the years, excluding the modification discussed above, ending December 31, 2006, 2005 and 2004 are as follows:
| | | | | | | | | |
| | | 2006 | | | 2005 | | | 2004 | |
Risk free interest rate | | 4.9 | % | | 4.3 | % | | 4.1 | % |
Expected volatility | | 27.5 | % | | 24.7 | % | | 25.3 | % |
Expected cash dividends | | 0.4 | % | | 0.0 | % | | 0.0 | % |
Expected life | | 5.5 years | | | 7.5 years | | | 7.5 years | |
57
AMERICANWEST BANCORPORATION
NOTES TO CONSOLIDATED FINANCIAL STATEMENTS—(Continued)
The following table summarizes information about stock options outstanding at December 31, 2006:
| | | | | | | | | | | | |
Options Outstanding | | Options Exercisable |
Range of Exercise Prices | | Number
Outstanding | | Weighted
Average
Remaining
Contractual
Life | | Weighted
Average
Exercise Price | | Number
Exercisable | | Weighted
Average
Exercise Price |
$1.84 - $4.62 | | 30,401 | | 1.9 years | | $ | 3.43 | | 30,401 | | $ | 3.43 |
$5.49 - $8.32 | | 41,287 | | 2.1 years | | $ | 7.19 | | 41,287 | | $ | 7.19 |
$9.14 - $13.86 | | 34,276 | | 3.2 years | | $ | 11.26 | | 34,276 | | $ | 11.26 |
$15.42 - $18.91 | | 246,285 | | 7.4 years | | $ | 18.24 | | 129,905 | | $ | 17.91 |
$20.71 - $23.05 | | 74,293 | | 6.9 years | | $ | 21.55 | | 41,293 | | $ | 21.29 |
$24.22 - $25.92 | | 17,507 | | 9.3 years | | $ | 25.89 | | 15,907 | | $ | 25.91 |
| | | | | | | | | | | | |
Total | | 444,049 | | | | | | | 293,069 | | | |
| | | | | | | | | | | | |
SFAS 123(R) requires all share-based payments to employees, including grants of employee stock options, to be recognized in the income statement based on their fair values. The fair values were calculated using the Black-Scholes-Merton model and the weighted average fair values of options granted during the years ended December 31, 2006, 2005 and 2004 were $8.75, $8.04 and $9.10, respectively. Compensation cost is recorded as if each vesting portion of the award is a separate award. The adoption of this standard, as of January 1, 2006, using the modified prospective method, resulted in approximately $593,000 of compensation expense for the year ended December 31, 2006. Net of taxes for the year ended December 31, 2006 this reduced net income by approximately $434,000 or $0.04 on both a basic and diluted earnings per share basis. Total unrecognized compensation cost at December 31, 2006 is approximately $406,000 which will be recognized through 2010.
SFAS 123(R) requires the recognition of stock-based compensation for the number of awards that are expected to vest. As a result, for most awards, recognized stock compensation expense was reduced by estimated forfeitures primarily based on historical forfeiture rates. Estimated forfeitures will be continually evaluated in subsequent periods and may change based on new facts and circumstances.
Prior to January 1, 2006, employee stock options were accounted for under the intrinsic value method as allowed under APB No. 25. Stock options are generally granted at exercise prices not less than the fair market value of the Company’s common stock on the date of grant. Under APB No. 25, no compensation expense was recognized pursuant to the Company’s stock option plans for stock options that were granted at exercise prices not less than the fair market value of common stock on the date of grant.
58
AMERICANWEST BANCORPORATION
NOTES TO CONSOLIDATED FINANCIAL STATEMENTS—(Continued)
The following table sets out the pro forma amounts of net income and earnings per share that would have been reported had the Company elected to follow the fair value recognition provisions of SFAS No. 123(R) in the years ended December 31, 2005 and December 31, 2004.
| | | | | | | | |
($ in thousands, except per share) | | 2005 | | | 2004 | |
Reported net income | | $ | 13,872 | | | $ | 9,505 | |
Add: stock-based compensation expense reported in net income, net of tax | | | 25 | | | | 33 | |
Deduct: total stock-based compensation expense determined under fair value based method for all awards, net of tax effects | | | (676 | ) | | | (729 | ) |
| | | | | | | | |
Pro forma net income | | $ | 13,221 | | | $ | 8,809 | |
| | | | | | | | |
Basic earnings per share | | | | | | | | |
Reported earnings per share | | $ | 1.33 | | | $ | 0.93 | |
Stock-based employee compensation, fair value | | | (0.06 | ) | | | (0.07 | ) |
| | | | | | | | |
Pro forma earnings per share | | $ | 1.27 | | | $ | 0.86 | |
| | | | | | | | |
Diluted earnings per share | | | | | | | | |
Reported diluted earnings per share | | $ | 1.31 | | | $ | 0.91 | |
Stock-based employee compensation, fair value | | | (0.06 | ) | | | (0.07 | ) |
| | | | | | | | |
Pro forma diluted earnings per share | | $ | 1.25 | | | $ | 0.84 | |
| | | | | | | | |
Restricted Common Stock Awards
The Company has granted performance restricted common stock awards to certain executives and employees. The performance restricted common stock awards vest between January 2010 and September 2011 and are expensed as compensation over the period earned. The agreements require that the Company will achieve a return on average assets of 1.0% per year and, for every year that this goal is not achieved the award recipients will forfeit 20% of their performance restricted common stock. Additionally, during the year ended December 31, 2006, the Company granted 10,433 restricted common stock awards. These awards do not have performance criteria and will vest between January 2007 and June 2011. Awards are forfeited if an employee is terminated prior to vesting other than pursuant to a change in control.
The purpose of these awards was to promote the long term interests of the Company and its shareholders by providing a financial incentive as a means for retaining certain key executives and employees. For the years ended December 31, 2006 and 2005 compensation expense, pre-tax, related to these grants was approximately $82,000 and $100,000, respectively. During the year ended December 31, 2006, 17,100 performance restricted stock awards were forfeited as the Company did not meet the performance criteria of 1.0% per year return on average assets. At December 31, 2006 there were 68,900 performance restricted common stock awards outstanding and 10,433 restricted common stock awards outstanding. At December 31, 2005, there were 56,500 performance restricted common stock awards outstanding.
Due to the adoption of SFAS No. 123(R) these unvested amounts are no longer shown as common stock and as a negative component of stockholders’ equity as unearned compensation, but are added to common stock as they are expensed. Total stockholders’ equity remained unchanged by the adoption of this standard.
59
AMERICANWEST BANCORPORATION
NOTES TO CONSOLIDATED FINANCIAL STATEMENTS—(Continued)
The following table summarizes both unvested performance restricted and unvested restricted common stock activity for the year.
| | | | | | |
| | | Restricted
Stock | | | Weighted
average
grant date
fair value |
Unvested as of December 31, 2005 | | 56,500 | | | $ | 21.15 |
Granted | | 48,433 | | | | 22.05 |
Forfeited | | (25,600 | ) | | | 21.50 |
| | | | | | |
Unvested as of December 31, 2006 | | 79,333 | | | $ | 21.59 |
| | | | | | |
Note 16. Commitments and Contingent Liabilities
In the ordinary course of business, the Company has various outstanding commitments and contingent liabilities that are not reflected in the accompanying consolidated financial statements. In addition, the Company is a defendant in certain claims and legal actions arising in the ordinary course of business. In the opinion of management, after consultation with legal counsel, the ultimate disposition of these matters is not expected to have a material effect on the consolidated financial condition or results of operations of the Company.
The minimum annual rental commitments on capital and operating leases at December 31, 2006, exclusive of taxes and other charges, are summarized as follows:
| | | | | | | |
($ in thousands) | | Capital Leases | | | Operating Leases |
2007 | | $ | 95 | | | $ | 2,406 |
2008 | | | 95 | | | | 2,221 |
2009 | | | 95 | | | | 2,077 |
2010 | | | 95 | | | | 2,011 |
2011 | | | — | | | | 1,862 |
Thereafter | | | — | | | | 24,788 |
| | | | | | | |
Total minimum amounts due | | $ | 380 | | | $ | 35,365 |
| | | | | | | |
Less: Amount representing interest | | | (73 | ) | | | |
| | | | | | | |
Present value of net minimum lease payments | | $ | 307 | | | | |
| | | | | | | |
The Company’s rental expense for 2006, 2005 and 2004 was approximately $1,735,000, $1,262,000 and $868,000, respectively. In addition to the above required lease payments, the Company has purchase obligations related mainly to information technology contracts and other maintenance contracts of approximately $1,916,000 in total over the next five years.
The Bank is a party to financial instruments with off-balance sheet risk in the normal course of business to meet the financing needs of its customers. These financial instruments include commitments to extend credit, standby letters of credit and financial guarantees. Those instruments involve, to varying degrees, elements of credit and interest rate risk in excess of the amount recognized in the statement of condition. The contract or notional amounts of those instruments reflect the extent of involvement the Bank has in particular classes of financial instruments.
60
AMERICANWEST BANCORPORATION
NOTES TO CONSOLIDATED FINANCIAL STATEMENTS—(Continued)
The Company’s exposure to credit loss in the event of nonperformance by the other party to the financial instrument for commitments to extend credit and standby letters of credit and financial guarantees written is represented by the contractual or notional amount of those instruments. The Company uses the same credit policies in making commitments and conditional obligations as it does for statement of condition instruments. During the year ended December 31, 2005, the Company sold its bankcard portfolio and no longer has unused commitments related to bankcards.
The following table summarizes the contract or notional amount at December 31, 2006 and 2005:
| | | | | | |
($ in thousands) | | 2006 | | 2005 |
Financial instruments whose contract amounts represent credit risk: | | | | | | |
Commitments to extend credit | | $ | 343,804 | | $ | 194,136 |
Standby letters of credit and financial guarantees written | | | 21,507 | | | 8,817 |
| | | | | | |
Total | | $ | 365,311 | | $ | 202,953 |
| | | | | | |
The Bank does not anticipate any material losses as a result of the commitments, standby letters of credit or guarantees.
Commitments to extend credit are agreements to lend to a customer as long as there is no violation of any condition established in the contract. Commitments generally have fixed expiration dates or other termination clauses and may require payment of a fee. Since many of the commitments are expected to expire without being drawn upon, the total commitment amount does not necessarily represent future cash requirements. The Bank evaluates each customer’s creditworthiness on a case-by-case basis. The amount of collateral obtained, if deemed necessary by the Bank upon extension of credit, is based on management’s credit evaluation of the counterparty. Collateral required varies but may include accounts receivable, inventory, property, plant and equipment and income producing commercial properties.
Standby letters of credit and financial guarantees written are conditional commitments issued by the Bank to guarantee to a third party the performance of a customer. Those guarantees are primarily issued to support public and private borrowing arrangements, including commercial paper, bond financing and similar transactions. The credit risk involved in issuing letters of credit is essentially the same as that involved in extending loan facilities to customers. The related liability for the Bank’s obligation under standby letters of credit and guarantees is immaterial.
A majority of the Bank’s loans, commitments, and commercial and standby letters of credit have been granted to customers in the Company’s market area. As such, significant changes in economic conditions in the states of Washington and Idaho or within its primary industries could adversely affect the Company’s ability to collect loans. Substantially all such customers are depositors of the Company. The concentrations of credit by type of loan are set forth in Note 6. The Bank’s related party loans and deposits are disclosed in Note 20.
As of December 31, 2006 and 2005, the Bank had lines of credit available of approximately $244,197,000 and $170,287,000, respectively. The Parent Company had available $5,000,000 through a line of credit with a correspondent bank at December 31, 2006. The lines were available for short term and long term borrowings with maturities up to 30 years at market interest rates.
Note 17. Restrictions on Dividends and Loans
The Bank is subject to banking regulations relating to the payment of dividends and the amount of loans that it may extend. The Bank is allowed to pay dividends out of retained earnings. In determining whether a dividend will be declared, the Bank’s Board of Directors considers factors including applicable laws and regulatory
61
AMERICANWEST BANCORPORATION
NOTES TO CONSOLIDATED FINANCIAL STATEMENTS—(Continued)
requirements, the Bank’s financial condition, anticipated growth and regulatory capital requirements. As of December 31, 2006, 2005 and 2004, the amount of retained earnings of the Bank was approximately $76,794,000, $77,363,000 and $62,453,000, respectively. During the year ended December 31, 2006, the Bank paid a dividend to the Parent Company of $10,000,000 related to the merger with CTB.
Note 18. Employee Benefit Plans
The Company has a 401(k) Retirement Savings Plan (Plan). Employees are eligible to contribute to the Plan after completing six months of employment and attaining age 18. The Company matches employee deferrals up to 3% of participant compensation and 50% from 3% to 5% of participant compensation. Employees are fully vested on all contributions made to the Plan. Contributions to the Plan in 2006, 2005 and 2004 were approximately $566,000, $449,000 and $523,000, respectively.
During the year ended December 31, 2006, the Company merged the prior Employee Stock Ownership Plan (ESOP) into the 401(k) Retirement Savings Plan. Contributions to the ESOP plan were discretionary and totaled approximately $90,000 for 2004. There were no contributions in 2006 or 2005.
The Company maintains salary continuation plans for the benefit of certain directors and other key employees. The plans provide for monthly payments to such persons, or their designated beneficiaries, for a period of time following retirement, or in some cases death prior to retirement. At December 31, 2006 and 2005, the reported liabilities for future benefit obligations related to these plans were approximately $3,263,000 and $3,313,000, respectively, and are included in other liabilities on the Consolidated Statements of Financial Condition.
During the year ended December 31, 2005, a reduction of approximately $683,000 of liabilities related to a former bank executive was offset against salaries and employee benefits expense. This adjustment was related to the unfortunate passing of the executive which resulted in his salary continuation and deferred compensation agreements no longer being payable.
Note 19. Parent Company Only Statements
The following are the condensed statements of condition, income and cash flows for the Parent Company only:
Condensed Statements of Condition
December 31, 2006 and 2005
($ in thousands)
| | | | | | |
| | | 2006 | | 2005 |
Cash | | $ | 3,197 | | $ | 3,159 |
Investment in Bank subsidiary | | | 168,682 | | | 128,490 |
Other assets | | | 1,016 | | | 619 |
| | | | | | |
TOTAL ASSETS | | $ | 172,895 | | $ | 132,268 |
| | | | | | |
Junior Subordinated Debt and other liabilities | | $ | 20,858 | | $ | 10,791 |
Stockholders’ equity | | | 152,037 | | | 121,477 |
| | | | | | |
TOTAL LIABILITIES AND STOCKHOLDERS’ EQUITY | | $ | 172,895 | | $ | 132,268 |
| | | | | | |
62
AMERICANWEST BANCORPORATION
NOTES TO CONSOLIDATED FINANCIAL STATEMENTS—(Continued)
Condensed Statements of Income
Years Ended December 31, 2006, 2005 and 2004
($ in thousands)
| | | | | | | | | | | | |
| | | 2006 | | | 2005 | | | 2004 | |
INCOME | | | | | | | | | | | | |
Bank subsidiary dividends | | $ | 10,000 | | | $ | — | | | $ | — | |
Other income | | | 46 | | | | 18 | | | | 23 | |
| | | | | | | | | | | | |
| | | 10,046 | | | | 18 | | | | 23 | |
| | | | | | | | | | | | |
EXPENSES | | | | | | | | | | | | |
Interest expense | | | 1,554 | | | | 758 | | | | 579 | |
Other operating expenses | | | 1,317 | | | | 828 | | | | 122 | |
| | | | | | | | | | | | |
| | | 2,871 | | | | 1,586 | | | | 701 | |
| | | | | | | | | | | | |
INCOME (LOSS) BEFORE PROVISION FOR INCOME TAX AND NET INCOME OF SUBSIDIARY, NET OF DIVIDENDS PAID TO PARENT | | | 7,175 | | | | (1,568 | ) | | | (678 | ) |
Benefit for income tax | | | 1,024 | | | | 530 | | | | 212 | |
INCOME (LOSS) BEFORE NET INCOME OF SUBSIDIARY, NET OF DIVIDENDS PAID TO PARENT | | | 8,199 | | | | (1,038 | ) | | | (466 | ) |
| | | | | | | | | | | | |
Net income of subsidiary, net of dividends paid to Parent | | | (569 | ) | | | 14,910 | | | | 9,971 | |
| | | | | | | | | | | | |
NET INCOME | | $ | 7,630 | | | $ | 13,872 | | | $ | 9,505 | |
| | | | | | | | | | | | |
Condensed Statements of Cash Flows
Years Ended December 31, 2006, 2005 and 2004
($ in thousands)
| | | | | | | | | | | | |
| | | 2006 | | | 2005 | | | 2004 | |
CASH FLOWS FROM OPERATING ACTIVITIES | | | | | | | | | | | | |
Net Income | | $ | 7,630 | | | $ | 13,872 | | | $ | 9,505 | |
Adjustments to reconcile net income to cash provided by operating activities: | | | | | | | | | | | | |
Net income of subsidiary, net of dividends paid to Parent | | | 569 | | | | (14,910 | ) | | | (9,971 | ) |
Compensation expense for stock based awards | | | 675 | | | | 138 | | | | 50 | |
Net change in other assets | | | (64 | ) | | | 446 | | | | 195 | |
Net change in other liabilities | | | (175 | ) | | | 449 | | | | 312 | |
| | | | | | | | | | | | |
NET CASH FROM (USED BY) OPERATING ACTIVITIES | | | 8,635 | | | | (5 | ) | | | 91 | |
| | | | | | | | | | | | |
CASH FLOWS FROM INVESTING ACTIVITIES | | | | | | | | | | | | |
Investment purchased | | | — | | | | (50 | ) | | | (50 | ) |
Purchase of Columbia Trust Bancorp, net of cash acquired | | | (17,350 | ) | | | — | | | | — | |
| | | | | | | | | | | | |
NET CASH (USED BY) INVESTING ACTIVITIES | | | (17,350 | ) | | | (50 | ) | | | (50 | ) |
| | | | | | | | | | | | |
CASH FLOWS FROM FINANCING ACTIVITIES | | | | | | | | | | | | |
Proceeds from issuances of common stock under equity incentive plans | | | 2,557 | | | | 2,277 | | | | 2,309 | |
Stock repurchased and retired | | | — | | | | — | | | | (2,852 | ) |
Cash dividends paid | | | (1,021 | ) | | | — | | | | — | |
Proceeds from issuance of junior subordinated debentures | | | 7,217 | | | | — | | | | — | |
| | | | | | | | | | | | |
NET CASH FROM (USED BY) FINANCING ACTIVITIES | | | 8,753 | | | | 2,277 | | | | (543 | ) |
| | | | | | | | | | | | |
NET CHANGE IN CASH | | | 38 | | | | 2,222 | | | | (502 | ) |
CASH, beginning of year | | | 3,159 | | | | 937 | | | | 1,439 | |
| | | | | | | | | | | | |
CASH, end of year | | $ | 3,197 | | | $ | 3,159 | | | $ | 937 | |
| | | | | | | | | | | | |
63
AMERICANWEST BANCORPORATION
NOTES TO CONSOLIDATED FINANCIAL STATEMENTS—(Continued)
Note 20. Related Party Transactions
Loans to related parties:
Loans to the Company’s officers and directors are on substantially the same terms, including interest rates and collateral, as those prevailing at the time for comparable transactions with unrelated persons and do not involve more than normal risk of collectability. Such loans had the following balances and activity during the years ended December 31, 2006, 2005 and 2004:
| | | | | | | | | | | | |
($ in thousands) | | 2006 | | | 2005 | | | 2004 | |
Balance at beginning of year | | $ | 1,034 | | | $ | 1,024 | | | $ | 3,186 | |
New loans or advances | | | 2,072 | | | | 1,218 | | | | 3,325 | |
Repayments and reclasses due to resignation | | | (2,599 | ) | | | (1,208 | ) | | | (5,487 | ) |
| | | | | | | | | | | | |
Balance at end of year | | $ | 507 | | | $ | 1,034 | | | $ | 1,024 | |
| | | | | | | | | | | | |
Deposits from related parties:
Deposits from related parties were approximately $1,032,000 and $1,554,000 at December 31, 2006 and 2005, respectively.
Payments to related parties:
The Bank paid approximately $97,000, $120,000 and $104,000 in the years ended December 31, 2006, 2005 and 2004 to related parties for various services provided. Approximately $97,000, $119,000 and $84,000 for the years ended December 31, 2006, 2005 and 2004, respectively, relates to operating lease payments for the Ephrata facility to a partnership of which one of the partners is a related party.
Note 21. Fair Value of Financial Instruments
SFAS No. 107,Disclosures about Fair Value of Financial Instruments, requires disclosure of fair value information about financial instruments for which it is practicable to estimate fair value. As defined by SFAS No. 107, financial instruments include the categories listed below. It does not include the value of premises and equipment and intangible assets such as customer relationships and core deposit intangibles. The following table summarizes carrying amounts, estimated fair values, and assumptions used by the Company to estimate fair value as of December 31, 2006 and 2005:
| | | | | | | | |
As of December 31, 2006: ($ in thousands) | | Assumptions Used in Estimating Fair Value | | Carrying
Amount | | Estimated
Fair Value |
Financial Assets: | | | | | | | | |
Cash and due from banks | | Equal to carrying value | | $ | 45,866 | | $ | 45,866 |
Overnight interest bearing deposits with other banks | | Equal to carrying value | | | 9,863 | | | 9,863 |
Securities | | Quoted market prices | | | 39,518 | | | 39,518 |
Federal Home Loan Bank Stock | | Par value | | | 6,319 | | | 6,319 |
Loans, held for sale | | Equal to carrying value | | | 2,913 | | | 2,913 |
Loans | | Fixed-rate loans: Discounted expected future cash flows, variable-rate loans: equal to carrying value, net of allowance for loan losses | | | 1,204,519 | | | 1,192,676 |
Financial Liabilities: | | | | | | | | |
Deposits | | Fixed-rate certificates of deposit: Discounted expected future cash flows All other deposits: Equal to carrying value | | | 1,123,939 | | | 1,122,768 |
Federal Home Loan Bank advances and other borrowings | | Discounted expected future cash flows | | | 106,066 | | | 105,775 |
Junior subordinated debentures | | Equal to carrying value | | | 20,620 | | | 20,620 |
64
AMERICANWEST BANCORPORATION
NOTES TO CONSOLIDATED FINANCIAL STATEMENTS—(Continued)
| | | | | | | | |
As of December 31, 2005: ($ in thousands) | | Assumptions Used in Estimating Fair Value | | Carrying
Amount | | Estimated
Fair Value |
Financial Assets: | | | | | | | | |
Cash and due from banks | | Equal to carrying value | | $ | 40,825 | | $ | 40,825 |
Overnight interest bearing deposits with other banks | | Equal to carrying value | | | 11,119 | | | 11,119 |
Securities | | Quoted market prices | | | 31,364 | | | 31,364 |
Federal Home Loan Bank Stock | | Par value | | | 5,397 | | | 5,397 |
Loans, held for sale | | Equal to carrying value | | | 3,395 | | | 3,395 |
Loans | | Fixed-rate loans: Discounted expected future cash flows, variable-rate loans: equal to carrying value, net of allowance for loan losses | | | 948,359 | | | 939,113 |
Financial Liabilities: | | | | | | | | |
Deposits | | Fixed-rate certificates of deposit: Discounted expected future cash flows All other deposits: Equal to carrying value | | | 897,430 | | | 895,247 |
Federal Home Loan Bank advances and other borrowings | | Discounted expected future cash flows | | | 71,537 | | | 71,487 |
Junior subordinated debentures | | Equal to carrying value | | | 10,310 | | | 10,310 |
In addition to these financial instruments on the Consolidated Statements of Financial Condition, the Bank has off balance sheet financial instruments consisting of commitments to extend credit and standby letters of credit. As there is generally no secondary market for these instruments, they are not included in the table above.
Note 22. Regulatory Matters
The Company and the Bank are subject to various regulatory capital requirements administered by the federal banking agencies. Failure to meet minimum capital requirements can initiate certain mandatory and possibly additional discretionary actions by regulators that, if undertaken, could have a direct material effect on the Company’s financial statements. Under capital adequacy guidelines and the regulatory framework for prompt corrective action, the Company and the Bank must meet specific capital guidelines that involve quantitative measures of their assets, liabilities and certain off-balance sheet items as calculated under regulatory accounting practices. The capital amounts and classification are also subject to qualitative judgments by the regulators about components, risk weightings and other factors.
Quantitative measures established by regulation to ensure capital adequacy require the Company and the Bank to maintain minimum amounts and ratios of total and Tier I capital to risk-weighted assets and of Tier I capital to average assets, as defined in the regulations. Management believes, as of December 31, 2006 and 2005, that the Company and the Bank meet all capital adequacy requirements to which they are subject.
65
AMERICANWEST BANCORPORATION
NOTES TO CONSOLIDATED FINANCIAL STATEMENTS—(Continued)
As of December 31, 2006, the most recent notification from the Federal Deposit Insurance Company categorized the Bank as well capitalized under the regulatory framework for prompt corrective action. To be categorized as well capitalized, an institution must maintain minimum total risk-based, Tier 1 risk-based and Tier 1 leverage ratios as set forth in the following tables. There are no conditions or events since the notification that management believes have changed the Bank’s category. The Company’s and the Bank’s actual capital amounts and ratios as of December 31, 2006 and 2005 are also presented in the tables:
| | | | | | | | | | | | | | | | | | | | | | | | |
| | | Actual | | | | | Adequately
Capitalized | | | | | Well Capitalized | |
($ in thousands) | | Amount | | Ratio | | | | | Amount | | Ratio | | | | | Amount | | Ratio | |
As of December 31, 2006: | | | | | | | | | | | | | | | | | | | | | | | | |
Total capital to risk weighted assets: | | | | | | | | | | | | | | | | | | | | | | | | |
AWBC | | $ | 147,410 | | 11.16 | % | | ³ | | | $ | 105,633 | | 8.00 | % | | ³ | | | | N/A | | N/A | |
AWB | | | 144,121 | | 10.92 | % | | ³ | | | | 105,573 | | 8.00 | % | | ³ | | | $ | 131,966 | | 10.00 | % |
Tier I capital to risk weighted assets: | | | | | | | | | | | | | | | | | | | | | | | | |
AWBC | | | 131,393 | | 9.95 | % | | ³ | | | | 52,816 | | 4.00 | % | | ³ | | | | N/A | | N/A | |
AWB | | | 128,104 | | 9.71 | % | | ³ | | | | 52,786 | | 4.00 | % | | ³ | | | | 79,180 | | 6.00 | % |
| | | | | | | | |
Leverage capital, Tier I capital to average assets: | | | | | | | | | | | | | | | | | | | | | | | | |
AWBC | | | 131,393 | | 9.83 | % | | ³ | | | | 53,474 | | 4.00 | % | | ³ | | | | N/A | | N/A | |
AWB | | | 128,104 | | 9.58 | % | | ³ | | | | 53,505 | | 4.00 | % | | ³ | | | | 66,882 | | 5.00 | % |
| | | | | |
| | | Actual | | | | | Adequately
Capitalized | | | | | Well Capitalized | |
($ in thousands) | | Amount | | Ratio | | | | | Amount | | Ratio | | | | | Amount | | Ratio | |
As of December 31, 2005: | | | | | | | | | | | | | | | | | | | | | | | | |
Total capital to risk weighted assets: | | | | | | | | | | | | | | | | | | | | | | | | |
AWBC | | $ | 129,587 | | 12.99 | % | | ³ | | | $ | 79,779 | | 8.00 | % | | ³ | | | | N/A | | N/A | |
AWB | | | 126,536 | | 12.69 | % | | ³ | | | | 79,762 | | 8.00 | % | | ³ | | | $ | 99,703 | | 10.00 | % |
Tier I capital to risk weighted assets: | | | | | | | | | | | | | | | | | | | | | | | | |
AWBC | | | 117,098 | | 11.74 | % | | ³ | | | | 39,890 | | 4.00 | % | | ³ | | | | N/A | | N/A | |
AWB | | | 114,050 | | 11.44 | % | | ³ | | | | 39,881 | | 4.00 | % | | ³ | | | | 59,822 | | 6.00 | % |
Leverage capital, Tier I capital to average assets: | | | | | | | | | | | | | | | | | | | | | | | | |
AWBC | | | 117,098 | | 10.65 | % | | ³ | | | | 43,986 | | 4.00 | % | | ³ | | | | N/A | | N/A | |
AWB | | | 114,050 | | 10.37 | % | | ³ | | | | 43,986 | | 4.00 | % | | ³ | | | | 54,982 | | 5.00 | % |
Note 23. Earnings Per Share
The following is a reconciliation of the numerators and denominators for basic and diluted earnings per share computations for the years ended December 31, 2006, 2005 and 2004:
| | | | | | | | | |
($ in thousands, except per share) | | 2006 | | 2005 | | 2004 |
Numerator: | | | | | | | | | |
Net income | | $ | 7,630 | | $ | 13,872 | | $ | 9,505 |
Denominator: | | | | | | | | | |
Weighted-average number of common shares outstanding | | | 11,182,526 | | | 10,407,180 | | | 10,185,246 |
Incremental shares assumed for stock options | | | 172,128 | | | 186,723 | | | 293,723 |
| | | | | | | | | |
Total | | | 11,354,654 | | | 10,593,903 | | | 10,478,969 |
| | | | | | | | | |
Basic earnings per common share | | $ | 0.68 | | $ | 1.33 | | $ | 0.93 |
Diluted earnings per common share | | $ | 0.67 | | $ | 1.31 | | $ | 0.91 |
| | | |
Antidilutive options not included in diluted earnings per share | | | 56,227 | | | 6,074 | | | 11,202 |
66
AMERICANWEST BANCORPORATION
NOTES TO CONSOLIDATED FINANCIAL STATEMENTS—(Continued)
Note 24. Other Noninterest Expenses
Components of other noninterest expense which exceed 1% of the aggregate total net interest income and total noninterest income for any of the years presented on the Consolidated Statements of Income is in the following table.
| | | | | | | | | |
($ in thousands) | | 2006 | | 2005 | | 2004 |
Supplies | | $ | 1,118 | | $ | 883 | | $ | 683 |
Marketing | | | 1,081 | | | 669 | | | 1,210 |
Other | | | 8,220 | | | 8,073 | | | 6,139 |
| | | | | | | | | |
Total | | $ | 10,419 | | $ | 9,625 | | $ | 8,032 |
| | | | | | | | | |
Note 25. Other events
The Company and Utah-based Far West Bancorporation (FWB) announced the signing of a definitive agreement for FWB to merge with and into the Company, immediately followed by the merger of FWB’s principal operating subsidiary, Far West Bank with and into the Bank. The transaction is valued at approximately $150 million and is expected to be completed at the beginning of the second quarter 2007, and is subject to approval by the shareholders of both companies and other customary conditions for closing.
67
AMERICANWEST BANCORPORATION
QUARTERLY UNAUDITED FINANCIAL DATA
CONDENSED CONSOLIDATED STATEMENT OF QUARTERLY INCOME
($ in thousands, except per share)
| | | | | | | | | | | | |
| | | Quarter Ended |
| | | December 31,
2006 | | September 30,
2006 | | June 30, 2006 | | March 31,
2006 |
Statement of Income: | | | | | | | | | | | | |
Interest income | | $ | 25,481 | | $ | 24,985 | | $ | 24,021 | | $ | 19,366 |
Interest expense | | | 9,642 | | | 9,274 | | | 8,508 | | | 6,143 |
| | | | | | | | | | | | |
Net Interest Income | | | 15,839 | | | 15,711 | | | 15,513 | | | 13,223 |
Provision for credit losses | | | 624 | | | 3,681 | | | 704 | | | 782 |
| | | | | | | | | | | | |
Net interest income after provision for credit losses | | | 15,215 | | | 12,030 | | | 14,809 | | | 12,441 |
Noninterest income | | | 2,565 | | | 2,764 | | | 2,190 | | | 1,756 |
Noninterest expense | | | 14,186 | | | 13,245 | | | 12,684 | | | 11,668 |
| | | | | | | | | | | | |
Income before provision for income tax | | | 3,594 | | | 1,549 | | | 4,315 | | | 2,529 |
Provision for income tax | | | 1,343 | | | 587 | | | 1,547 | | | 880 |
| | | | | | | | | | | | |
Net income | | $ | 2,251 | | $ | 962 | | $ | 2,768 | | $ | 1,649 |
| | | | | | | | | | | | |
Basic earnings per common share | | $ | 0.20 | | $ | 0.08 | | $ | 0.24 | | $ | 0.15 |
Diluted earnings per common share | | $ | 0.20 | | $ | 0.08 | | $ | 0.24 | | $ | 0.15 |
Basic weighted average shares outstanding | | | 11,383,248 | | | 11,373,559 | | | 11,317,386 | | | 10,641,585 |
Diluted weighted average shares outstanding | | | 11,531,166 | | | 11,530,546 | | | 11,511,564 | | | 10,880,915 |
| |
| | | Quarter Ended |
| | | December 31,
2005 | | September 30,
2005 | | June 30, 2005 | | March 31,
2005 |
Statement of Income: | | | | | | | | | | | | |
Interest income | | $ | 19,182 | | $ | 18,675 | | $ | 17,595 | | $ | 16,868 |
Interest expense | | | 5,424 | | | 5,242 | | | 4,072 | | | 3,595 |
| | | | | | | | | | | | |
Net Interest Income | | | 13,758 | | | 13,433 | | | 13,523 | | | 13,273 |
Provision for loan losses | | | — | | | 1,100 | | | 190 | | | 1,075 |
| | | | | | | | | | | | |
Net interest income after provision for credit losses | | | 13,758 | | | 12,333 | | | 13,333 | | | 12,198 |
Noninterest income | | | 2,552 | | | 1,966 | | | 1,832 | | | 2,033 |
Noninterest expense | | | 11,220 | | | 10,523 | | | 9,866 | | | 9,526 |
| | | | | | | | | | | | |
Income before provision for income tax | | | 5,090 | | | 3,776 | | | 5,299 | | | 4,705 |
Provision for income tax | | | 1,123 | | | 552 | | | 1,757 | | | 1,566 |
| | | | | | | | | | | | |
Net income | | $ | 3,967 | | $ | 3,224 | | $ | 3,542 | | $ | 3,139 |
| | | | | | | | | | | | |
Basic earnings per common share | | $ | 0.38 | | $ | 0.31 | | $ | 0.34 | | $ | 0.30 |
Diluted earnings per common share | | $ | 0.37 | | $ | 0.30 | | $ | 0.34 | | $ | 0.30 |
Basic weighted average shares outstanding | | | 10,451,783 | | | 10,425,258 | | | 10,387,957 | | | 10,338,025 |
Diluted weighted average shares outstanding | | | 10,614,101 | | | 10,633,733 | | | 10,530,674 | | | 10,490,197 |
68
Item 9. Changes in and Disagreements with Accountants on Accounting and Financial Disclosure.
There were no changes in or disagreements with accountants on accounting and financial disclosure.
Item 9A. Controls and Procedures.
An evaluation of the Company’s disclosure controls and procedures (as defined in Section 13a-15(e) of the Securities Exchange Act of 1934 (Act)) was carried out under the supervision and with the participation of the Company’s Chief Executive Officer, Chief Financial Officer and other members of the Company’s management team as of the end of the period covered by this annual report. The Company’s Chief Executive Officer and Chief Financial Officer concluded that the Company’s disclosure controls and procedures as currently in effect are effective, in all material respects, in ensuring that the information required to be disclosed by the Company in the reports it files or submits under the Act is (1) accumulated and communicated to the Company’s management (including the Chief Executive Officer and Chief Financial Officer) in a timely manner, and (2) recorded, processed, summarized and reported within the time periods specified in the SEC’s rules and forms.
In the year ended December 31, 2006, the Company has not made significant changes in its internal controls or other factors that could significantly affect the Company’s disclosure controls and procedures.
Management’s Report on Internal Control Over Financial Reporting
Management of the Company, including its consolidated subsidiaries, is responsible for establishing and maintaining adequate internal control over financial reporting (as defined in Rule 13a-15(f) under the Securities Exchange Act of 1934). The Company’s internal control over financial reporting is a process designed under the supervision of the Company’s management, including its Chief Executive Officer and its Chief Financial Officer, to provide reasonable assurance regarding the reliability of financial reporting and the preparation of the Company’s financial statements for external reporting purposes in accordance with generally accepted accounting principles in the United States of America.
The Company’s internal control over financial reporting includes policies and procedures that: pertain to the maintenance of records which, in reasonable detail, accurately and fairly reflect transactions and dispositions of assets; provide reasonable assurance that transactions are recorded as necessary to permit preparation of financial statements in accordance with generally accepted accounting principles in the United States of America, and that receipts and expenditures are being made only in accordance with authorizations of management and the directors of the Company; and provide reasonable assurance regarding prevention or timely detection of unauthorized acquisition, use or disposition of the Company’s assets that could have a material effect on the Company’s financial statements.
Management recognizes that there are inherent limitations in the effectiveness of any system of internal control and, accordingly, even effective internal control can provide only reasonable assurance with respect to financial statement preparation and fair presentation. Further, because of changes in conditions, the effectiveness of internal control may vary over time.
Under the supervision and with the participation of the Company’s management, including the Company’s Chief Executive Officer and Chief Financial Officer, the Company conducted an assessment of the effectiveness of the Company’s internal control over financial reporting based on the framework established in Internal Control-Integrated Framework issued by the Committee of Sponsoring Organizations of the Treadway Commission. Based on this assessment, management has determined that the Company’s internal control over financial reporting as of December 31, 2006 is effective.
Management’s assessment of the effectiveness of the Company’s internal control over financial reporting as of December 31, 2006 has been audited by Moss Adams LLP, the independent registered public accounting firm that audits the Company’s consolidated financial statements, as stated in their report included in Item 8, which expresses unqualified opinions on management’s assessment and on the effectiveness of the Company’s internal control over financial reporting as of December 31, 2006.
Item 9B. Other Information.
There is no other information to report.
69
PART III
Item 10. Directors, Executive Officers and Corporate Governance.
Information included under the following captions in the Company’s proxy statement relating to its 2007 annual meeting of stockholders (the “2007 Proxy Statement”) which will be filed within 120 days of the Company’s year-end is incorporated herein by reference:
| | • | | “Election of Directors”; |
| | • | | “Board Committees and Meetings”; |
| | • | | “Corporate Governance”; |
| | • | | “Compliance with Section 16(a) of the Exchange Act”; |
| | • | | “Executive Officers Who are Not Directors”; and |
With the exception of the information expressly incorporated herein by reference, the 2007 Proxy Statement is not deemed filed as part of this Annual Report on Form 10-K.
Item 11. Executive Compensation.
Information included under the following captions in the 2007 Proxy Statement which will be filed with the SEC within 120 days of the Company’s year-end is incorporated herein by reference:
| | • | | “Directors’ Compensation”; |
| | • | | “Compensation Committee Interlocks and Insider Participation”; |
| | • | | “Executive Compensation;” and |
| | • | | “Related Party Transactions and Business Relationships.” |
With the exception of the information expressly incorporated herein by reference, the 2007 Proxy Statement is not deemed filed as part of this Annual Report on Form 10-K.
Item 12. Security Ownership of Certain Beneficial Owners and Management and Related Stockholder Matters.
Information included under the following caption in the 2007 Proxy Statement which will be filed with the SEC within 120 days of the Company’s year-end is incorporated herein by reference:
| | • | | “Security Ownership of Certain Beneficial Owners and Management.” |
See also Note 15 of the Notes to the Consolidated Financial Statements, including the table presenting equity compensation plan information, included in this report.
With the exception of the information expressly incorporated herein by reference, the 2007 Proxy Statement is not deemed filed as part of this Annual Report on Form 10-K.
Item 13. Certain Relationships and Related Transactions, and Director Independence.
Information included under the following captions in the 2007 Proxy Statement which will be filed with the SEC within 120 days of the Company’s year-end is incorporated herein by reference:
| | • | | “Compensation Committee Interlocks and Insider Participation”; and |
| | • | | “Related Party Transactions and Business Relationships.” |
70
With the exception of the information expressly incorporated herein by reference, the 2007 Proxy Statement is not deemed filed as part of this Annual Report on Form 10-K.
Item 14. Principal Accountant Fees and Services.
The information included under the following captions in the 2007 Proxy Statement which will be filed with the SEC within 120 days of the Company’s year-end is incorporated herein by reference:
| | • | | “Independent Registered Public Accounting Firm.” |
71
PART IV
Item 15. Exhibits and Financial Statement Schedules.
| | |
(a) (1) | | All financial statements are included in Item 8 of this report. |
| |
(a) (2) | | All schedules are omitted as the required information is not applicable or the information is presented in the Consolidated Financial Statements or related notes. |
| |
(a) (3) | | Exhibits. A list of the Company’s exhibits are as follows: |
EXHIBIT INDEX
| | |
| 2.1 | | Agreement and Plan of Merger, dated as of October 18, 2006, by and between AmericanWest and Far West (included as Appendix A to the joint proxy statement/prospectus in Part I of the Registration Statement on Form S-4 (File No.333-139311 / Film No. 07611403)). |
| |
| 3.1 | | Amended and Restated Articles of Incorporation of AmericanWest (filed as Exhibit 3.1 to the Registrant’s Quarterly Report Form 10-Q for the quarter ended June 30, 2004, filed on August 9, 2004, and incorporated herein by this reference). |
| |
| 3.2 | | Amended and Restated Bylaws of AmericanWest (filed as Exhibit 3.2 to the Registrant’s Quarterly Report Form 10-Q for the quarter ended June 30, 2004, filed on August 9, 2004, and incorporated herein by this reference). |
| |
| 4.1 | | Specimen certificate for shares of Common Stock (filed as Exhibit 4.1 to the Registrant’s Registration Statement on Form S-4/A, filed on January 23, 2006 and incorporated herein by reference). |
| |
| 10.1 | | Form of Voting Agreement, dated as of October 18, 2006, by and among AmericanWest Bancorporation and certain stockholders of Far West Bancorporation (filed as Exhibit 10.1 to the Registrant’s Current Report on Form 8-K filed on October 19, 2006, and incorporated herein by this reference). |
| |
| 10.2 | | Employment Agreement, dated as of October 18, 2006, by and between AmericanWest Bank and H. Don Norton (filed as Exhibit 10.2 to the Registrant’s Current Report on Form 8-K filed on October 19, 2006, and incorporated herein by this reference).* |
| |
| 10.3 | | Placement Agreement dated as of September 18, 2002, between AmericanWest Bancorporation and AmericanWest Statutory Trust I, as Offerors, and FTN Financial Capital Markets and Keefe, Bruyette & Woods, Inc., as Placement Agents, for the issuance of Floating Rate Capital Securities to Preferred Term Securities VII, Ltd. is incorporated by reference to Exhibit 10.4 to the registrant’s annual report on Form 10-K (File No. 000-18561) filed March 26, 2003. |
| |
| 10.4 | | Indenture dated as of September 26, 2002, between AmericanWest Bancorporation, as Issuer, and State Street Bank and Trust Company of Connecticut, National Association, as Trustee, for the issuance of Floating Rate Junior Subordinated Deferrable Interest Debentures due 2032 is incorporated by reference to Exhibit 10.5 to the registrant’s annual report on Form 10-K (File No. 000-18561) filed March 26, 2003. |
| |
| 10.5 | | Form of AmericanWest Bancorporation Floating Rate Junior Subordinated Deferrable Interest Debentures is incorporated by reference to Exhibit 10.6 to the registrant’s annual report on Form 10-K (File No. 000-18561) filed March 26, 2003. |
| |
| 10.6 | | Form of AmericanWest Statutory Trust I Floating Rate Capital Securities is incorporated by reference to Exhibit 10.7 to the registrant’s annual report on Form 10-K (File No. 000-18561) filed March 26, 2003. |
72
| | |
| 10.7 | | Form of AmericanWest Statutory Trust I Floating Rate Common Securities is incorporated by reference to Exhibit 10.8 to the registrant’s annual report on Form 10-K (File No. 000-18561) filed March 26, 2003. |
| |
| 10.8 | | Amended and Restated Declaration of Trust dated as of September 26, 2002, between AmericanWest Bancorporation, as Sponsor; Wesley E. Colley, Wade Griffith and John L. Gilbert, as Administrators; and State Street Bank and Trust Company of Connecticut National Association, as Institutional Trustee is incorporated by reference to Exhibit 10.9 to the registrant’s annual report on Form 10-K (File No. 000-18561) filed March 26, 2003. |
| |
| 10.9 | | Guarantee Agreement dated as of September 26, 2002, between AmericanWest Bancorporation, as Guarantor, and State Street Bank and Trust Company of Connecticut National Association, as Guarantee Trustee is incorporated by reference to Exhibit 10.10 to the registrant’s annual report on Form 10-K (File No. 000-18561) filed March 26, 2003. |
| |
| 10.10 | | Subscription Agreement dated as of September 26, 2002, between AmericanWest Bancorporation and AmericanWest Statutory Trust I, as Offerors, and Preferred Term Securities VII, Ltd., as Purchaser is incorporated by reference to Exhibit 10.11 to the registrant’s annual report on Form 10-K (File No. 000-18561) filed March 26, 2003. |
| |
| 10.11 | | AmericanWest Bancorporation 2001 Employee Stock Purchase Plan is incorporated by reference to Exhibit 99.1 to the registrant’s registration statement on Form S-8 (File No. 333-65630) filed July 23, 2001.* |
| |
| 10.12 | | Employment Agreement dated as of September 20, 2004 with Robert M. Daugherty is incorporated by reference to Exhibit 10.14 to the registrant’s quarterly report on Form 10-Q (File No. 000-18561) filed November 2, 2004.* |
| |
| 10.13 | | Form of Fee Continuation Agreement dated as of January 1, 2003 with Donald Swartz, II is incorporated by reference to Exhibit 10.16 to the registrant’s annual report on Form 10-K (File No. 000-18561) filed March 15, 2005. Director P. Mike Taylor is party to an agreement under the same Form with substantially similar terms and benefits.* |
| |
| 10.14 | | Employment Agreement dated as of June 6, 2005 with Diane Kelleher is incorporated by reference to Exhibit 10.17 to the registrant’s quarterly report on Form 10-Q (File No. 000-18561) filed August 9, 2005.* |
| |
| 10.15 | | Employment Agreement dated as of January 25, 2005 with R. Blair Reynolds is incorporated by reference to Exhibit 10.18 to the registrant’s quarterly report on Form 10-Q (File No. 000-18561) filed August 9, 2005.* |
| |
| 10.16 | | Employment Agreement dated as of January 28, 2005 with Rick Shamberger is incorporated by reference to Exhibit 10.19 to the registrant’s quarterly report on Form 10-Q (File No. 000-18561) filed August 9, 2005.* |
| |
| 10.17 | | Employment Agreement dated as of January 28, 2005 with Nicole Sherman is incorporated by reference to Exhibit 10.20 to the registrant’s quarterly report on Form 10-Q (File No. 000-18561) filed August 9, 2005.* |
| |
| 10.18 | | Employment Agreement dated as of May 23, 2005 with Greg Hansen is incorporated by reference to Exhibit 10.21 to the registrant’s quarterly report on Form 10-Q (File No. 000-18561) filed August 9, 2005.* |
| |
| 10.19 | | Grant of Performance Shares dated as of June 6, 2005 to Diane Kelleher is incorporated by reference to Exhibit 10.22 to the registrant’s quarterly report on Form 10-Q (File No. 000-18561) filed August 9, 2005.* |
| |
| 10.20 | | Grant of Performance Shares dated as of June 6, 2005 to R. Blair Reynolds is incorporated by reference to Exhibit 10.23 to the registrant’s quarterly report on Form 10-Q (File No. 000-18561) filed August 9, 2005.* |
73
| | |
| 10.21 | | Grant of Performance Shares dated as of June 6, 2005 to Rick Shamberger is incorporated by reference to Exhibit 10.24 to the registrant’s quarterly report on Form 10-Q (File No. 000-18561) filed August 9, 2005.* |
| |
| 10.22 | | Grant of Performance Shares dated as of June 6, 2005 to Nicole Sherman is incorporated by reference to Exhibit 10.25 to the registrant’s quarterly report on Form 10-Q (File No. 000-18561) filed August 9, 2005.* |
| |
| 10.23 | | Grant of Performance Shares dated as of May 23, 2005 to Greg Hansen is incorporated by reference to Exhibit 10.26 to the registrant’s quarterly report on Form 10-Q (File No. 000-18561) filed August 9, 2005.* |
| |
| 10.24 | | Employment Agreement dated as of September 18, 2006 with Patrick J. Rusnak is incorporated by reference to Exhibit 99.1 to the Form 8-K filed on September 19, 2006.* |
| |
| 10.25 | | Restricted Stock Unit Agreement dated effective September 26, 2006 between the Company and Patrick J. Rusnak.*+ |
| |
| 10.26 | | Amendment to Nonqualified Stock Option Agreement dated effective September 20, 2004 between AmericanWest Bancorporation and Robert M. Daugherty is incorporated by reference to Exhibit 99.1 to the Form 8-K filed on December 1, 2006.* |
| |
| 10.27 | | Restricted Stock Grant Agreement dated November 28, 2006 between AmericanWest Bancorporation and Robert M. Daugherty is incorporated by reference to Exhibit 99.2 to the Form 8-K filed on December 1, 2006.* |
| |
| 10.28 | | Amendment No. 1 to Employment Agreement with Robert M. Daugherty incorporated by reference to Exhibit 99.1 to the registrant’s current report on Form 8-K/A filed January 5, 2007 (File No. 000-18561).* |
| |
| 10.29 | | Amendment No. 1 to Employment Agreement with Rick Shamberger incorporated by reference to Exhibit 99.2 to the registrant’s current report on Form 8-K/A filed January 5, 2007 (File No. 000-18561).* |
| |
| 10.30 | | Amendment No. 1 to Employment Agreement with Diane Kelleher incorporated by reference to Exhibit 99.3 to the registrant’s current report on Form 8-K/A filed January 5, 2007 (File No. 000-18561).* |
| |
| 10.31 | | Amendment No. 1 to Employment Agreement with Greg Hansen incorporated by reference to Exhibit 99.4 to the registrant’s current report on Form 8-K/A filed January 5, 2007 (File No. 000-18561).* |
| |
| 10.32 | | Amendment No. 1 to Employment Agreement with Nicole Sherman incorporated by reference to Exhibit 99.5 to the registrant’s current report on Form 8-K/A filed January 5, 2007 (File No. 000-18561).* |
| |
| 10.33 | | Amendment No. 2 to Employment Agreement with R. Blair Reynolds incorporated by reference to Exhibit 99.6 to the registrant’s current report on Form 8-K/A filed January 5, 2007 (File No. 000-18561).* |
| |
| 10.34 | | Change in Control Agreement for Wade Griffith incorporated by reference to Exhibit 99.7 to the registrant’s current report on Form 8-K/A filed January 5, 2007 (File No. 000-18561).* |
| |
| 10.35 | | 2006 Equity Incentive Plan incorporated herein by reference to Exhibit A to the registrant’s Definitive Proxy Statement filed March 27, 2006.* |
| |
| 10.36 | | Amendment No. 1 to Employment Agreement with R. Blair Reynolds dated effective December 15, 2005.*+ |
| |
| 14.1 | | Code of Ethics is incorporated by reference to Exhibit 99.1 of the registrant’s current report on Form 8-K (File No. 000-18561) filed June 1, 2006. |
| |
| 14.2 | | Code of Ethics for Directors and Senior Financial Officers is incorporated by reference to Exhibit 99.2 of the registrant’s current report on Form 8-K (File No. 000-18561) filed June 1, 2006. |
74
| | |
| 21.1 | | Subsidiaries of Registrant.+ |
| |
| 23.1 | | Consent of Moss Adams LLP, Independent Registered Public Accounting Firm.+ |
| |
| 31(a) | | Certification of the Chief Executive Officer pursuant to Section 302 of the Sarbanes-Oxley Act of 2002.+ |
| |
| 31(b) | | Certification of the Chief Financial Officer pursuant to Section 302 of the Sarbanes-Oxley Act of 2002.+ |
| |
| 32(a) | | Certification of the Chief Executive Officer pursuant to 18 U.S.C. Section 1350, as adopted pursuant to Section 906 of the Sarbanes-Oxley Act of 2002.+ |
| |
| 32(b) | | Certification of the Chief Financial Officer pursuant to 18 U.S.C. Section 1350, as adopted pursuant to Section 906 of the Sarbanes-Oxley Act of 2002.+ |
| * | Denotes executive compensation plan or arrangement. |
| + | Denotes items filed herewith. |
75
SIGNATURES
Pursuant to the requirements of Section 13 or 15(d) of the Securities Exchange Act of 1934, the registrant has duly caused this report to be signed on its behalf by the undersigned, thereunto duly authorized on the 15th day of March, 2007.
| | |
AMERICANWEST BANCORPORATION |
| |
By: | | /s/ ROBERT M. DAUGHERTY |
| | Robert M. Daugherty President, Chief Executive Officer and Director |
Pursuant to the requirements of the Securities Exchange Act of 1934, this report has been signed below by the following persons on behalf of the registrant and in the capacities indicated on the 15th day of March, 2007.
Principal Executive Officer
| | | | | | |
By: | | /s/ ROBERT M. DAUGHERTY | | | | |
| | Robert M. Daugherty, President, Chief Executive Officer and Director | | | | |
| |
Principal Financial and Accounting Officer | | |
By: | | /s/ DIANE L. KELLEHER | | | | |
| | Diane L. Kelleher, Executive Vice President and Chief Financial Officer | | | | |
| | | | | | |
| |
Remaining Directors | | |
By: | | /s/ J. FRANK ARMIJO | | By: | | /s/ DONALD H. SWARTZ, II |
| | J. Frank Armijo, Director | | | | Donald H. Swartz, II, Director |
| | | |
By: | | /s/ CRAIG D. EERKES | | By: | | /s/ P. MIKE TAYLOR |
| | Craig D. Eerkes, Director | | | | P. Mike Taylor, Director |
| | | |
By: | | /s/ KAY C. CARNES | | | | |
| | Kay C. Carnes, Director | | | | |
| | | |
By: | | /s/ DONALD H. LIVINGSTONE | | | | |
| | Donald H. Livingstone, Director | | | | |
76