UNITED STATES
SECURITIES AND EXCHANGE COMMISSION
Washington, D.C. 20549
FormN-CSR
CERTIFIED SHAREHOLDER REPORT OF REGISTERED
MANAGEMENT INVESTMENT COMPANIES
Investment Company Act File Number:811-04015
Eaton Vance Mutual Funds Trust
(Exact Name of Registrant as Specified in Charter)
Two International Place, Boston, Massachusetts 02110
(Address of Principal Executive Offices)
Maureen A. Gemma
Two International Place, Boston, Massachusetts 02110
(Name and Address of Agent for Services)
(617)482-8260
(Registrant’s Telephone Number)
December 31
Date of Fiscal Year End
December 31, 2019
Date of Reporting Period
Item 1. Reports to Stockholders

Eaton Vance
Stock Fund
Annual Report
December 31, 2019
Important Note. Beginning on January 1, 2021, as permitted by regulations adopted by the Securities and Exchange Commission, paper copies of the Fund’s annual and semi-annual shareholder reports will no longer be sent by mail unless you specifically request paper copies of the reports. Instead, the reports will be made available on the Fund’s website (eatonvance.com/funddocuments), and you will be notified by mail each time a report is posted and provided with a website address to access the report.
If you already elected to receive shareholder reports electronically, you will not be affected by this change and you need not take any action. If you are a direct investor, you may elect to receive shareholder reports and other communications from the Fund electronically by signing up for e-Delivery at eatonvance.com/edelivery. If you own your shares through a financial intermediary (such as broker-dealer or bank), you must contact your financial intermediary to sign up.
You may elect to receive all future Fund shareholder reports in paper free of charge. If you are a direct investor, you can inform the Fund that you wish to continue receiving paper copies of your shareholder reports by calling 1-800-262-1122. If you own these shares through a financial intermediary, you must contact your financial intermediary or follow instructions included with this disclosure, if applicable, to elect to continue to receive paper copies of your shareholder reports. Your election to receive reports in paper will apply to all Eaton Vance funds held directly or to all funds held through your financial intermediary, as applicable.

Commodity Futures Trading Commission Registration. Effective December 31, 2012, the Commodity Futures Trading Commission (“CFTC”) adopted certain regulatory changes that subject registered investment companies and advisers to regulation by the CFTC if a fund invests more than a prescribed level of its assets in certain CFTC-regulated instruments (including futures, certain options and swap agreements) or markets itself as providing investment exposure to such instruments. The Fund has claimed an exclusion from the definition of the term “commodity pool operator” under the Commodity Exchange Act. Accordingly, neither the Fund nor the adviser with respect to the operation of the Fund is subject to CFTC regulation. Because of its management of other strategies, the Fund’s adviser is registered with the CFTC as a commodity pool operator and a commodity trading advisor.
Fund shares are not insured by the FDIC and are not deposits or other obligations of, or guaranteed by, any depository institution. Shares are subject to investment risks, including possible loss of principal invested.
This report must be preceded or accompanied by a current summary prospectus or prospectus. Before investing, investors should consider carefully the investment objective, risks, and charges and expenses of a mutual fund. This and other important information is contained in the summary prospectus and prospectus, which can be obtained from a financial intermediary. Prospective investors should read the prospectus carefully before investing. For further information, please call1-800-262-1122.
Annual ReportDecember 31, 2019
Eaton Vance
Stock Fund
Table of Contents
| | | | |
Management’s Discussion of Fund Performance | | | 2 | |
| |
Performance | | | 3 | |
| |
Fund Profile | | | 4 | |
| |
Endnotes and Additional Disclosures | | | 5 | |
| |
Fund Expenses | | | 6 | |
| |
Financial Statements | | | 7 | |
| |
Report of Independent Registered Public Accounting Firm | | | 16 and 28 | |
| |
Federal Tax Information | | | 17 | |
| |
Management and Organization | | | 29 | |
| |
Important Notices | | | 32 | |
Eaton Vance
Stock Fund
December 31, 2019
Management’s Discussion of Fund Performance1
Economic and Market Conditions
With virtually every U.S. equity index posting strong double- digit returns for the 12-month period ended December 31, 2019 — and bond markets solidly in the black as well — 2019 was a good year for investments.
As the new year dawned in January 2019, investors appeared to be taking a “glass is half full” approach. Although U.S. manufacturing output and business investment remained weak — held back by slowing global growth and an on- again/off-again U.S.-China trade war — strong spending by U.S. consumers and dovish remarks by the U.S. Federal Reserve (the Fed) combined to lift investor sentiment. After four federal funds rate hikes the previous year, markets began to project the Fed might actually lower rates in 2019 to stimulate the economy. U.S. unemployment, meanwhile, remained low and hiring remained strong.
As a result, U.S. stocks across multiple markets climbed from January through April 2019. Overseas, central banks around the world began to cut interest rates and employ other tools to stimulate their respective economies. Even a global stock pullback in May — sparked by heightened concerns about the U.S.-China trade spat — proved to be temporary, and the U.S. and global stock rallies resumed in June and July.
After holding interest rates steady through the first half of the year, the Fed cut the federal funds rate on July 31, 2019 — its first reduction in over a decade — followed by two additional rate cuts in September and October to end the period at 1.50%-1.75%. By end of the third quarter, 60 central banks around the world had lowered their interest rates as well.
After falling in August, U.S. equities rallied again during the final months of the period, spurred by optimism about a U.S.-China trade détente and better-than-expected U.S. employment reports. The year ended with two events in December that did much to allay investor concerns about international trade and tariffs: passage of the United States-Mexico-Canada Agreement by the U.S. House of Representatives and the Trump administration’s agreement to a so-called “phase–one” trade deal with China.
During the 12-month period ended December 31, 2019, the blue-chip Dow Jones Industrial Average®2 returned 25.34%, while the broader U.S. equity market, as measured by the S&P 500® Index, returned 31.49%. The technology-laden Nasdaq Composite Index returned 36.69% during the period. Large-cap U.S. stocks, as measured by the S&P 500® Index, generally outperformed their small-cap counterparts, as measured by the Russell 2000® Index. As a group, growth stocks outpaced value stocks in both large- and small-cap categories, as measured by the Russell growth and value indexes.
Fund Performance
For the 12-month period ended December 31, 2019, Eaton Vance Stock Fund (the Fund) returned 35.01% for Class A shares at net asset value (NAV), outperforming its benchmark, the S&P 500® Index (the Index), which returned 31.49%.
Stock selections in the health care, financials, and industrials sectors contributed to Fund performance versus the Index. In health care, not owning global pharmaceutical firm Pfizer, Inc. (Pfizer), an Index component, helped performance versus the Index. Underperformance of Upjohn Co., Pfizer’s generic drug division, along with difficulties surrounding the merger of Upjohn and generics firm Mylan NV, caused Pfizer’s stock to decline during the period.
The Fund initiated a position in Bristol-Myers Squibb Co. (Bristol-Myers), another global pharmaceutical firm, in May 2019 after its stock price declined on the announcement of Bristol-Myers’ intent to acquire rival Celgene Corp. (Celgene). Bristol-Myers’ stock subsequently rose — and contributed to relative performance versus the Index — due to positive data from a Celgene cancer drug trial, as well as the market’s recognition that Celgene’s new products were more effective than initially perceived.
Not owning Warren Buffet’s multinational holding company Berkshire Hathaway, Inc. (Berkshire Hathaway), an Index component in the financials sector, aided performance relative to the Index as well. The stock underperformed the market as investors reacted negatively to Berkshire Hathaway’s inability to find a large acquisition during the period to put its growing cash reserves to work. In the industrials sector, performance versus the Index benefited from the Fund’s out-of-Index position in Gardner Denver Holdings, Inc. (Gardner Denver), a conglomerate that manufactures compressors, pumps, and blowers. The stock outperformed the Index after Gardner Denver announced a pending merger with Ingersoll Rand PLC’s pumps business, making Gardner Denver the second-largest player in its industry.
In contrast, stock selections in the information technology (IT), communication services, and consumer discretionary sectors detracted from Fund performance versus the Index. In IT, underweighting semiconductor and telecommunications equipment firm QUALCOMM, Inc. (QUALCOMM), and then selling the stock during the period, detracted from relative performance versus the Index. After the Fund sold QUALCOMM, the company’s stock price rose sharply following the firm’s settlement with Apple, Inc. over a long-running dispute over licensing fees for QUALCOMM technology.
In communication services, the Fund’s overweight position in broadband and cellular service provider Verizon Communications, Inc. hurt relative results versus the Index. While the stock delivered double-digit gains, it underperformed the market during a period when investors favored companies viewed as having higher growth potential than cell-service providers. Canadian apparel maker Gildan Activewear, Inc. (Gildan), an out-of-Index holding in the consumer discretionary sector, also detracted from Fund performance versus the Index. Gildan’s stock price declined after it surprised the market in October 2019 with an announcement that annual sales and earnings would be lower than projected. By period-end, Gildan was sold from the Fund.
See Endnotes and Additional Disclosures in this report.
Past performance is no guarantee of future results. Returns are historical and are calculated by determining the percentage change in net asset value (NAV) or offering price (as applicable) with all distributions reinvested. Investment return and principal value will fluctuate so that shares, when redeemed, may be worth more or less than their original cost. Performance for periods less than or equal to one year is cumulative. Performance is for the stated time period only; due to market volatility, current Fund performance may be lower or higher than the quoted return. For performance as of the most recentmonth-end, please refer to eatonvance.com.
Eaton Vance
Stock Fund
December 31, 2019
Performance2,3
Portfolio ManagerCharles B. Gaffney
| | | | | | | | | | | | | | | | | | | | |
% Average Annual Total Returns | | Class
Inception Date | | | Performance
Inception Date | | | One Year | | | Five Years | | | Ten Years | |
Class A at NAV | | | 11/01/2001 | | | | 11/01/2001 | | | | 35.01 | % | | | 11.19 | % | | | 12.16 | % |
Class A with 5.75% Maximum Sales Charge | | | — | | | | — | | | | 27.23 | | | | 9.88 | | | | 11.50 | |
Class C at NAV | | | 10/01/2009 | | | | 11/01/2001 | | | | 34.04 | | | | 10.37 | | | | 11.34 | |
Class C with 1% Maximum Sales Charge | | | — | | | | — | | | | 33.04 | | | | 10.37 | | | | 11.34 | |
Class I at NAV | | | 09/03/2008 | | | | 11/01/2001 | | | | 35.32 | | | | 11.47 | | | | 12.44 | |
S&P 500® Index | | | — | | | | — | | | | 31.49 | % | | | 11.69 | % | | | 13.55 | % |
| | | | | |
| | | | | | | | | | | | | | | | | | | | |
| % Total Annual Operating Expense Ratios4 | | | | | | | | Class A | | | Class C | | | Class I | |
Gross | | | | | | | | | | | 1.10 | % | | | 1.85 | % | | | 0.85 | % |
Net | | | | | | | | | | | 0.98 | | | | 1.73 | | | | 0.73 | |
Growth of $10,000
This graph shows the change in value of a hypothetical investment of $10,000 in Class A of the Fund for the period indicated. For comparison, the same investment is shown in the indicated index.

| | | | | | | | | | | | | | | | |
| Growth of Investment | | Amount Invested | | | Period Beginning | | | At NAV | | | With Maximum Sales Charge | |
Class C | | $ | 10,000 | | | | 12/31/2009 | | | $ | 29,287 | | | | N.A. | |
Class I | | $ | 250,000 | | | | 12/31/2009 | | | $ | 807,675 | | | | N.A. | |
See Endnotes and Additional Disclosures in this report.
Past performance is no guarantee of future results. Returns are historical and are calculated by determining the percentage change in net asset value (NAV) or offering price (as applicable) with all distributions reinvested. Investment return and principal value will fluctuate so that shares, when redeemed, may be worth more or less than their original cost. Performance for periods less than or equal to one year is cumulative. Performance is for the stated time period only; due to market volatility, current Fund performance may be lower or higher than the quoted return. For performance as of the most recentmonth-end, please refer to eatonvance.com.
Eaton Vance
Stock Fund
December 31, 2019
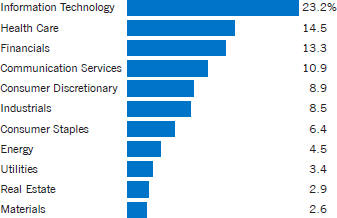
Fund Profile5
Sector Allocation (% of net assets)6
Top 10 Holdings (% of net assets)6
| | | | |
Microsoft Corp. | | | 5.0 | % |
| |
Alphabet, Inc., Class C | | | 4.6 | |
| |
Apple, Inc. | | | 3.9 | |
| |
Amazon.com, Inc. | | | 3.5 | |
| |
Visa, Inc., Class A | | | 2.7 | |
| |
PepsiCo, Inc. | | | 2.6 | |
| |
Anthem, Inc. | | | 2.5 | |
| |
Lowe’s Cos., Inc. | | | 2.4 | |
| |
Facebook, Inc., Class A | | | 2.3 | |
| |
Bank of America Corp. | | | 2.3 | |
| |
Total | | | 31.8 | % |
See Endnotes and Additional Disclosures in this report.
Eaton Vance
Stock Fund
December 31, 2019
Endnotes and Additional Disclosures
| 1 | The views expressed in this report are those of the portfolio manager(s) and are current only through the date stated at the top of this page. These views are subject to change at any time based upon market or other conditions, and Eaton Vance and the Fund(s) disclaim any responsibility to update such views. These views may not be relied upon as investment advice and, because investment decisions are based on many factors, may not be relied upon as an indication of trading intent on behalf of any Eaton Vance fund. This commentary may contain statements that are not historical facts, referred to as “forward looking statements.” The Fund’s actual future results may differ significantly from those stated in any forward looking statement, depending on factors such as changes in securities or financial markets or general economic conditions, the volume of sales and purchases of Fund shares, the continuation of investment advisory, administrative and service contracts, and other risks discussed from time to time in the Fund’s filings with the Securities and Exchange Commission. |
| 2 | Dow Jones Industrial Average® is a price-weighted average of 30 blue-chip stocks that are generally the leaders in their industry. S&P 500® Index is an unmanaged index of large- cap stocks commonly used as a measure of U.S. stock market performance. S&P Dow Jones Indices are a product of S&P Dow Jones Indices LLC (“S&P DJI”) and have been licensed for use. S&P®and S&P 500® are registered trademarks of S&P DJI; Dow Jones® is a registered trademark of Dow Jones Trademark Holdings LLC (“Dow Jones”); S&P DJI, Dow Jones and their respective affiliates do not sponsor, endorse, sell or promote the Fund, will not have any liability with respect thereto and do not have any liability for any errors, omissions, or interruptions of the S&P Dow Jones Indices. Nasdaq Composite Index is a market capitalization- weighted index of all domestic and international securities listed on Nasdaq. Source: Nasdaq, Inc. The information is provided by Nasdaq (with its affiliates, are referred to as the “Corporations”) and Nasdaq’s third party licensors on an “as is” basis and the Corporations make no guarantees and bear no liability of any kind with respect to the information or the Fund. Russell 2000®Index is an unmanaged index of 2,000 U.S.small-cap stocks. Unless otherwise stated, index returns do not reflect the effect of any applicable sales charges, commissions, expenses, taxes or leverage, as applicable. It is not possible to invest directly in an index. |
| 3 | Total Returns at NAV do not include applicable sales charges. If sales charges were deducted, the returns would be lower. Total Returns shown with maximum sales charge reflect the stated maximum sales charge. Unless otherwise stated, performance does not reflect the deduction of taxes on Fund distributions or redemptions of Fund shares. |
| 4 | Source: Fund prospectus. Net expense ratios reflect a contractual expense reimbursement that continues through 4/30/20. Without the reimbursement, performance would have been lower. The expense ratios for the current reporting period can be found in the Financial Highlights section of this report. |
| 5 | Fund invests in an affiliated investment company (Portfolio) with the same objective(s) and policies as the Fund. References to investments are to the Portfolio’s holdings. |
| 6 | Excludes cash and cash equivalents. |
| | Fund profile subject to change due to active management. |
Eaton Vance
Stock Fund
December 31, 2019
Fund Expenses
Example: As a Fund shareholder, you incur two types of costs: (1) transaction costs, including sales charges (loads) on purchases and redemption fees (if applicable); and (2) ongoing costs, including management fees; distribution and/or service fees; and other Fund expenses. This Example is intended to help you understand your ongoing costs (in dollars) of Fund investing and to compare these costs with the ongoing costs of investing in other mutual funds. The Example is based on an investment of $1,000 invested at the beginning of the period and held for the entire period (July 1, 2019 – December 31, 2019).
Actual Expenses: The first section of the table below provides information about actual account values and actual expenses. You may use the information in this section, together with the amount you invested, to estimate the expenses that you paid over the period. Simply divide your account value by $1,000 (for example, an $8,600 account value divided by $1,000 = 8.6), then multiply the result by the number in the first section under the heading entitled “Expenses Paid During Period” to estimate the expenses you paid on your account during this period.
Hypothetical Example for Comparison Purposes: The second section of the table below provides information about hypothetical account values and hypothetical expenses based on the actual Fund expense ratio and an assumed rate of return of 5% per year (before expenses), which is not the actual Fund return. The hypothetical account values and expenses may not be used to estimate the actual ending account balance or expenses you paid for the period. You may use this information to compare the ongoing costs of investing in your Fund and other funds. To do so, compare this 5% hypothetical example with the 5% hypothetical examples that appear in the shareholder reports of the other funds.
Please note that the expenses shown in the table are meant to highlight your ongoing costs only and do not reflect any transactional costs, such as sales charges (loads) or redemption fees (if applicable). Therefore, the second section of the table is useful in comparing ongoing costs only, and will not help you determine the relative total costs of owning different funds. In addition, if these transactional costs were included, your costs would be higher.
| | | | | | | | | | | | | | | | |
| | | Beginning Account Value
(7/1/19) | | | Ending Account Value
(12/31/19) | | | Expenses Paid During Period*
(7/1/19 – 12/31/19) | | | Annualized Expense
Ratio | |
| | | |
Actual | | | | | | | | | | | | | |
Class A | | $ | 1,000.00 | | | $ | 1,103.40 | | | $ | 5.20 | ** | | | 0.98 | % |
Class C | | $ | 1,000.00 | | | $ | 1,099.60 | | | $ | 9.16 | ** | | | 1.73 | % |
Class I | | $ | 1,000.00 | | | $ | 1,104.70 | | | $ | 3.87 | ** | | | 0.73 | % |
| | | | | |
Hypothetical | | | | | | | | | | | | | | | | |
(5% return per year before expenses) | | | | | | | | | | | | | | | | |
Class A | | $ | 1,000.00 | | | $ | 1,020.30 | | | $ | 4.99 | ** | | | 0.98 | % |
Class C | | $ | 1,000.00 | | | $ | 1,016.50 | | | $ | 8.79 | ** | | | 1.73 | % |
Class I | | $ | 1,000.00 | | | $ | 1,021.50 | | | $ | 3.72 | ** | | | 0.73 | % |
| * | Expenses are equal to the Fund’s annualized expense ratio for the indicated Class, multiplied by the average account value over the period, multiplied by 184/365 (to reflect theone-half year period). The Example assumes that the $1,000 was invested at the net asset value per share determined at the close of business on June 30, 2019. The Example reflects the expenses of both the Fund and the Portfolio. |
| ** | Absent an allocation of certain expenses to an affiliate, expenses would be higher. |
Eaton Vance
Stock Fund
December 31, 2019
Statement of Assets and Liabilities
| | | | |
| Assets | | December 31, 2019 | |
| |
Investment in Stock Portfolio, at value (identified cost, $70,559,807) | | $ | 101,960,261 | |
| |
Receivable for Fund shares sold | | | 118,426 | |
| |
Total assets | | $ | 102,078,687 | |
|
| Liabilities | |
| |
Payable for Fund shares redeemed | | $ | 45,868 | |
| |
Payable to affiliates: | | | | |
| |
Distribution and service fees | | | 20,674 | |
| |
Trustees’ fees | | | 125 | |
| |
Other | | | 11,740 | |
| |
Accrued expenses | | | 54,555 | |
| |
Total liabilities | | $ | 132,962 | |
| |
Net Assets | | $ | 101,945,725 | |
|
| Sources of Net Assets | |
| |
Paid-in capital | | $ | 73,125,823 | |
| |
Distributable earnings | | | 28,819,902 | |
| |
Total | | $ | 101,945,725 | |
|
| Class A Shares | |
| |
Net Assets | | $ | 53,152,727 | |
| |
Shares Outstanding | | | 2,781,522 | |
| |
Net Asset Value and Redemption Price Per Share | | | | |
| |
(net assets ÷ shares of beneficial interest outstanding) | | $ | 19.11 | |
| |
Maximum Offering Price Per Share | | | | |
| |
(100 ÷ 94.25 of net asset value per share) | | $ | 20.28 | |
|
| Class C Shares | |
| |
Net Assets | | $ | 11,417,783 | |
| |
Shares Outstanding | | | 613,478 | |
| |
Net Asset Value and Offering Price Per Share* | | | | |
| |
(net assets ÷ shares of beneficial interest outstanding) | | $ | 18.61 | |
|
| Class I Shares | |
| |
Net Assets | | $ | 37,375,215 | |
| |
Shares Outstanding | | | 1,955,300 | |
| |
Net Asset Value, Offering Price and Redemption Price Per Share | | | | |
| |
(net assets ÷ shares of beneficial interest outstanding) | | $ | 19.11 | |
On sales of $50,000 or more, the offering price of Class A shares is reduced.
| * | Redemption price per share is equal to the net asset value less any applicable contingent deferred sales charge. |
| | | | |
| | 7 | | See Notes to Financial Statements. |
Eaton Vance
Stock Fund
December 31, 2019
Statement of Operations
| | | | |
| Investment Income | | Year Ended December 31, 2019 | |
| |
Dividends allocated from Portfolio (net of foreign taxes, $14,874) | | $ | 1,520,162 | |
| |
Expenses allocated from Portfolio | | | (593,107 | ) |
| |
Total investment income from Portfolio | | $ | 927,055 | |
|
| Expenses | |
| |
Distribution and service fees | | | | |
| |
Class A | | $ | 121,941 | |
| |
Class C | | | 109,152 | |
| |
Trustees’ fees and expenses | | | 500 | |
| |
Custodian fee | | | 19,528 | |
| |
Transfer and dividend disbursing agent fees | | | 63,953 | |
| |
Legal and accounting services | | | 24,839 | |
| |
Printing and postage | | | 22,169 | |
| |
Registration fees | | | 59,688 | |
| |
Miscellaneous | | | 10,203 | |
| |
Total expenses | | $ | 431,973 | |
| |
Deduct — | | | | |
| |
Allocation of expenses to affiliate | | $ | 110,868 | |
| |
Total expense reductions | | $ | 110,868 | |
| |
Net expenses | | $ | 321,105 | |
| |
Net investment income | | $ | 605,950 | |
|
| Realized and Unrealized Gain (Loss) from Portfolio | |
| |
Net realized gain (loss) — | | | | |
| |
Investment transactions | | $ | 5,540,110 | |
| |
Foreign currency transactions | | | 39 | |
| |
Net realized gain | | $ | 5,540,149 | |
| |
Change in unrealized appreciation (depreciation) — | | | | |
| |
Investments | | $ | 21,450,715 | |
| |
Foreign currency | | | 318 | |
| |
Net change in unrealized appreciation (depreciation) | | $ | 21,451,033 | |
| |
Net realized and unrealized gain | | $ | 26,991,182 | |
| |
Net increase in net assets from operations | | $ | 27,597,132 | |
| | | | |
| | 8 | | See Notes to Financial Statements. |
Eaton Vance
Stock Fund
December 31, 2019
Statements of Changes in Net Assets
| | | | | | | | |
| | | Year Ended December 31, | |
| Increase (Decrease) in Net Assets | | 2019 | | | 2018 | |
|
From operations — | |
| | |
Net investment income | | $ | 605,950 | | | $ | 769,842 | |
| | |
Net realized gain | | | 5,540,149 | | | | 7,936,404 | (1) |
| | |
Net change in unrealized appreciation (depreciation) | | | 21,451,033 | | | | (13,917,629 | ) |
| | |
Net increase (decrease) in net assets from operations | | $ | 27,597,132 | | | $ | (5,211,383 | ) |
| | |
Distributions to shareholders — | | | | | | | | |
| | |
Class A | | $ | (2,001,151 | ) | | $ | (4,801,685 | ) |
| | |
Class C | | | (392,938 | ) | | | (1,206,463 | ) |
| | |
Class I | | | (1,485,075 | ) | | | (3,453,645 | ) |
| | |
Total distributions to shareholders | | $ | (3,879,164 | ) | | $ | (9,461,793 | ) |
| | |
Transactions in shares of beneficial interest — | | | | | | | | |
| | |
Proceeds from sale of shares | | | | | | | | |
| | |
Class A | | $ | 4,661,998 | | | $ | 5,948,746 | |
| | |
Class C | | | 1,277,411 | | | | 1,350,480 | |
| | |
Class I | | | 7,532,472 | | | | 6,250,370 | |
| | |
Net asset value of shares issued to shareholders in payment of distributions declared | | | | | | | | |
| | |
Class A | | | 1,931,979 | | | | 4,592,175 | |
| | |
Class C | | | 389,163 | | | | 1,195,293 | |
| | |
Class I | | | 1,483,659 | | | | 3,453,390 | |
| | |
Cost of shares redeemed | | | | | | | | |
| | |
Class A | | | (10,007,314 | ) | | | (12,984,370 | ) |
| | |
Class C | | | (2,603,422 | ) | | | (5,197,497 | ) |
| | |
Class I | | | (9,618,672 | ) | | | (10,038,207 | ) |
| | |
Net asset value of shares converted | | | | | | | | |
| | |
Class A | | | 2,126,996 | | | | — | |
| | |
Class C | | | (2,126,996 | ) | | | — | |
| | |
Net decrease in net assets from Fund share transactions | | $ | (4,952,726 | ) | | $ | (5,429,620 | ) |
|
Other capital — | |
| | |
Portfolio transaction fee contributed to Portfolio | | $ | (34,918 | ) | | $ | (31,433 | ) |
| | |
Portfolio transaction fee allocated from Portfolio | | | 47,687 | | | | 38,833 | |
| | |
Net increase in net assets from other capital | | $ | 12,769 | | | $ | 7,400 | |
| | |
Net increase (decrease) in net assets | | $ | 18,778,011 | | | $ | (20,095,396 | ) |
|
| Net Assets | |
| | |
At beginning of year | | $ | 83,167,714 | | | $ | 103,263,110 | |
| | |
At end of year | | $ | 101,945,725 | | | $ | 83,167,714 | |
| (1) | Includes $332,783 of net realized gains from redemptionsin-kind. |
| | | | |
| | 9 | | See Notes to Financial Statements. |
Eaton Vance
Stock Fund
December 31, 2019
Financial Highlights
| | | | | | | | | | | | | | | | | | | | |
| | | Class A | |
| |
| | | Year Ended December 31, | |
| | | 2019 | | | 2018 | | | 2017 | | | 2016 | | | 2015 | |
| | | | | |
Net asset value — Beginning of year | | $ | 14.720 | | | $ | 17.490 | | | $ | 15.740 | | | $ | 15.160 | | | $ | 15.680 | |
| | | | | |
| Income (Loss) From Operations | | | | | | | | | | | | | | | | | | | | |
| | | | | |
Net investment income(1) | | $ | 0.114 | | | $ | 0.144 | | | $ | 0.178 | | | $ | 0.193 | | | $ | 0.129 | |
| | | | | |
Net realized and unrealized gain (loss) | | | 5.023 | | | | (1.133 | ) | | | 2.933 | | | | 0.834 | | | | 0.584 | |
| | | | | |
Total income (loss) from operations | | $ | 5.137 | | | $ | (0.989 | ) | | $ | 3.111 | | | $ | 1.027 | | | $ | 0.713 | |
| | | |
| Less Distributions | | | | | | | | | | | | | |
| | | | | |
From net investment income | | $ | (0.096 | ) | | $ | (0.145 | ) | | $ | (0.168 | ) | | $ | (0.140 | ) | | $ | (0.107 | ) |
| | | | | |
From net realized gain | | | (0.653 | ) | | | (1.637 | ) | | | (1.191 | ) | | | (0.311 | ) | | | (1.126 | ) |
| | | | | |
Total distributions | | $ | (0.749 | ) | | $ | (1.782 | ) | | $ | (1.359 | ) | | $ | (0.451 | ) | | $ | (1.233 | ) |
| | | | | |
Portfolio transaction fee, net(1) | | $ | 0.002 | | | $ | 0.001 | | | $ | (0.002 | ) | | $ | 0.004 | | | $ | — | |
| | | | | |
Net asset value — End of year | | $ | 19.110 | | | $ | 14.720 | | | $ | 17.490 | | | $ | 15.740 | | | $ | 15.160 | |
| | | | | |
Total Return(2)(3) | | | 35.01 | % | | | (5.89 | )% | | | 19.91 | % | | | 6.80 | % | | | 4.51 | % |
| | | |
| Ratios/Supplemental Data | | | | | | | | | | | | | |
| | | | | |
Net assets, end of year (000’s omitted) | | $ | 53,153 | | | $ | 42,087 | | | $ | 51,999 | | | $ | 58,620 | | | $ | 55,496 | |
| | | | | |
Ratios (as a percentage of average daily net assets):(4) | | | | | | | | | | | | | | | | | | | | |
| | | | | |
Expenses(3) | | | 0.98 | % | | | 0.98 | % | | | 0.98 | % | | | 0.98 | % | | | 1.05 | % |
| | | | | |
Net investment income | | | 0.65 | % | | | 0.80 | % | | | 1.05 | % | | | 1.26 | % | | | 0.81 | % |
| | | | | |
Portfolio Turnover of the Portfolio | | | 55 | % | | | 90 | % | | | 101 | % | | | 118 | % | | | 96 | % |
| (1) | Computed using average shares outstanding. |
| (2) | Returns are historical and are calculated by determining the percentage change in net asset value with all distributions reinvested and do not reflect the effect of sales charges. |
| (3) | The administrator waived its fees and/or reimbursed certain operating expenses (equal to 0.12%, 0.12%, 0.13%, 0.12% and 0.14% of average daily net assets for the years ended December 31, 2019, 2018, 2017, 2016 and 2015, respectively). Absent the waivers and reimbursement, total return would be lower. |
| (4) | Includes the Fund’s share of the Portfolio’s allocated expenses. |
| | | | |
| | 10 | | See Notes to Financial Statements. |
Eaton Vance
Stock Fund
December 31, 2019
Financial Highlights — continued
| | | | | | | | | | | | | | | | | | | | |
| | | Class C | |
| |
| | | Year Ended December 31, | |
| | | 2019 | | | 2018 | | | 2017 | | | 2016 | | | 2015 | |
| | | | | |
Net asset value — Beginning of year | | $ | 14.380 | | | $ | 17.100 | | | $ | 15.420 | | | $ | 14.870 | | | $ | 15.420 | |
| | | | | |
| Income (Loss) From Operations | | | | | | | | | | | | | | | | | | | | |
| | | | | |
Net investment income (loss)(1) | | $ | (0.018 | ) | | $ | 0.008 | | | $ | 0.050 | | | $ | 0.076 | | | $ | 0.009 | |
| | | | | |
Net realized and unrealized gain (loss) | | | 4.899 | | | | (1.096 | ) | | | 2.851 | | | | 0.813 | | | | 0.580 | |
| | | | | |
Total income (loss) from operations | | $ | 4.881 | | | $ | (1.088 | ) | | $ | 2.901 | | | $ | 0.889 | | | $ | 0.589 | |
| | | |
| Less Distributions | | | | | | | | | | | | | |
| | | | | |
From net investment income | | $ | — | | | $ | (0.010 | ) | | $ | (0.028 | ) | | $ | (0.034 | ) | | $ | (0.013 | ) |
| | | | | |
From net realized gain | | | (0.653 | ) | | | (1.623 | ) | | | (1.191 | ) | | | (0.309 | ) | | | (1.126 | ) |
| | | | | |
Total distributions | | $ | (0.653 | ) | | $ | (1.633 | ) | | $ | (1.219 | ) | | $ | (0.343 | ) | | $ | (1.139 | ) |
| | | | | |
Portfolio transaction fee, net(1) | | $ | 0.002 | | | $ | 0.001 | | | $ | (0.002 | ) | | $ | 0.004 | | | $ | — | |
| | | | | |
Net asset value — End of year | | $ | 18.610 | | | $ | 14.380 | | | $ | 17.100 | | | $ | 15.420 | | | $ | 14.870 | |
| | | | | |
Total Return(2)(3) | | | 34.04 | % | | | (6.60 | )% | | | 18.94 | % | | | 6.00 | % | | | 3.77 | % |
| | | |
| Ratios/Supplemental Data | | | | | | | | | | | | | |
| | | | | |
Net assets, end of year (000’s omitted) | | $ | 11,418 | | | $ | 11,627 | | | $ | 16,196 | | | $ | 15,370 | | | $ | 14,986 | |
| | | | | |
Ratios (as a percentage of average daily net assets):(4) | | | | | | | | | | | | | | | | | | | | |
| | | | | |
Expenses(3) | | | 1.73 | % | | | 1.73 | % | | | 1.73 | % | | | 1.73 | % | | | 1.80 | % |
| | | | | |
Net investment income (loss) | | | (0.11 | )% | | | 0.05 | % | | | 0.30 | % | | | 0.51 | % | | | 0.06 | % |
| | | | | |
Portfolio Turnover of the Portfolio | | | 55 | % | | | 90 | % | | | 101 | % | | | 118 | % | | | 96 | % |
| (1) | Computed using average shares outstanding. |
| (2) | Returns are historical and are calculated by determining the percentage change in net asset value with all distributions reinvested and do not reflect the effect of sales charges. |
| (3) | The administrator waived its fees and/or reimbursed certain operating expenses (equal to 0.12%, 0.12%, 0.13%, 0.12% and 0.14% of average daily net assets for the years ended December 31, 2019, 2018, 2017, 2016 and 2015, respectively). Absent the waivers and reimbursement, total return would be lower. |
| (4) | Includes the Fund’s share of the Portfolio’s allocated expenses. |
| | | | |
| | 11 | | See Notes to Financial Statements. |
Eaton Vance
Stock Fund
December 31, 2019
Financial Highlights — continued
| | | | | | | | | | | | | | | | | | | | |
| | | Class I | |
| |
| | | Year Ended December 31, | |
| | | 2019 | | | 2018 | | | 2017 | | | 2016 | | | 2015 | |
| | | | | |
Net asset value — Beginning of year | | $ | 14.720 | | | $ | 17.490 | | | $ | 15.750 | | | $ | 15.170 | | | $ | 15.680 | |
| | | | | |
| Income (Loss) From Operations | | | | | | | | | | | | | | | | | | | | |
| | | | | |
Net investment income(1) | | $ | 0.158 | | | $ | 0.190 | | | $ | 0.219 | | | $ | 0.233 | | | $ | 0.172 | |
| | | | | |
Net realized and unrealized gain (loss) | | | 5.023 | | | | (1.132 | ) | | | 2.931 | | | | 0.834 | | | | 0.590 | |
| | | | | |
Total income (loss) from operations | | $ | 5.181 | | | $ | (0.942 | ) | | $ | 3.150 | | | $ | 1.067 | | | $ | 0.762 | |
| | | |
| Less Distributions | | | | | | | | | | | | | |
| | | | | |
From net investment income | | $ | (0.140 | ) | | $ | (0.192 | ) | | $ | (0.217 | ) | | $ | (0.180 | ) | | $ | (0.146 | ) |
| | | | | |
From net realized gain | | | (0.653 | ) | | | (1.637 | ) | | | (1.191 | ) | | | (0.311 | ) | | | (1.126 | ) |
| | | | | |
Total distributions | | $ | (0.793 | ) | | $ | (1.829 | ) | | $ | (1.408 | ) | | $ | (0.491 | ) | | $ | (1.272 | ) |
| | | | | |
Portfolio transaction fee, net(1) | | $ | 0.002 | | | $ | 0.001 | | | $ | (0.002 | ) | | $ | 0.004 | | | $ | — | |
| | | | | |
Net asset value — End of year | | $ | 19.110 | | | $ | 14.720 | | | $ | 17.490 | | | $ | 15.750 | | | $ | 15.170 | |
| | | | | |
Total Return(2)(3) | | | 35.32 | % | | | (5.63 | )% | | | 20.14 | % | | | 7.05 | % | | | 4.83 | % |
| | | |
| Ratios/Supplemental Data | | | | | | | | | | | | | |
| | | | | |
Net assets, end of year (000’s omitted) | | $ | 37,375 | | | $ | 29,455 | | | $ | 35,068 | | | $ | 28,121 | | | $ | 20,457 | |
| | | | | |
Ratios (as a percentage of average daily net assets):(4) | | | | | | | | | | | | | | | | | | | | |
| | | | | |
Expenses(3) | | | 0.73 | % | | | 0.73 | % | | | 0.73 | % | | | 0.73 | % | | | 0.80 | % |
| | | | | |
Net investment income | | | 0.89 | % | | | 1.06 | % | | | 1.28 | % | | | 1.51 | % | | | 1.07 | % |
| | | | | |
Portfolio Turnover of the Portfolio | | | 55 | % | | | 90 | % | | | 101 | % | | | 118 | % | | | 96 | % |
| (1) | Computed using average shares outstanding. |
| (2) | Returns are historical and are calculated by determining the percentage change in net asset value with all distributions reinvested. |
| (3) | The administrator waived its fees and/or reimbursed certain operating expenses (equal to 0.12%, 0.12%, 0.13%, 0.12% and 0.14% of average daily net assets for the years ended December 31, 2019, 2018, 2017, 2016 and 2015, respectively). Absent the waivers and reimbursement, total return would be lower. |
| (4) | Includes the Fund’s share of the Portfolio’s allocated expenses. |
| | | | |
| | 12 | | See Notes to Financial Statements. |
Eaton Vance
Stock Fund
December 31, 2019
Notes to Financial Statements
1 Significant Accounting Policies
Eaton Vance Stock Fund (the Fund) is a diversified series of Eaton Vance Mutual Funds Trust (the Trust). The Trust is a Massachusetts business trust registered under the Investment Company Act of 1940, as amended (the 1940 Act), as anopen-end management investment company. The Fund offers three classes of shares. Class A shares are generally sold subject to a sales charge imposed at time of purchase. Class C shares are sold at net asset value and are generally subject to a contingent deferred sales charge (see Note 5). Effective January 25, 2019, Class C shares generally automatically convert to Class A shares ten years after their purchase as described in the Fund’s prospectus. Class I shares are sold at net asset value and are not subject to a sales charge. Each class represents apro-rata interest in the Fund, but votes separately on class-specific matters and (as noted below) is subject to different expenses. Realized and unrealized gains and losses and net investment income and losses, other than class-specific expenses, are allocated daily to each class of shares based on the relative net assets of each class to the total net assets of the Fund. Each class of shares differs in its distribution plan and certain other class-specific expenses. The Fund invests all of its investable assets in interests in Stock Portfolio (the Portfolio), a Massachusetts business trust, having the same investment objective and policies as the Fund. The value of the Fund’s investment in the Portfolio reflects the Fund’s proportionate interest in the net assets of the Portfolio (14.9% at December 31, 2019). The performance of the Fund is directly affected by the performance of the Portfolio. The financial statements of the Portfolio, including the portfolio of investments, are included elsewhere in this report and should be read in conjunction with the Fund’s financial statements.
The following is a summary of significant accounting policies of the Fund. The policies are in conformity with accounting principles generally accepted in the United States of America (U.S. GAAP). The Fund is an investment company and follows accounting and reporting guidance in the Financial Accounting Standards Board (FASB) Accounting Standards Codification Topic 946.
A Investment Valuation — Valuation of securities by the Portfolio is discussed in Note 1A of the Portfolio’s Notes to Financial Statements, which are included elsewhere in this report.
B Income — The Fund’s net investment income or loss consists of the Fund’spro-rata share of the net investment income or loss of the Portfolio, less all actual and accrued expenses of the Fund.
C Federal Taxes — The Fund’s policy is to comply with the provisions of the Internal Revenue Code applicable to regulated investment companies and to distribute to shareholders each year substantially all of its net investment income, and all or substantially all of its net realized capital gains. Accordingly, no provision for federal income or excise tax is necessary.
As of December 31, 2019, the Fund had no uncertain tax positions that would require financial statement recognition,de-recognition, or disclosure. The Fund files a U.S. federal income tax return annually after its fiscalyear-end, which is subject to examination by the Internal Revenue Service for a period of three years from the date of filing.
D Expenses — The majority of expenses of the Trust are directly identifiable to an individual fund. Expenses which are not readily identifiable to a specific fund are allocated taking into consideration, among other things, the nature and type of expense and the relative size of the funds.
E Use of Estimates — The preparation of the financial statements in conformity with U.S. GAAP requires management to make estimates and assumptions that affect the reported amounts of assets and liabilities at the date of the financial statements and the reported amounts of income and expense during the reporting period. Actual results could differ from those estimates.
F Indemnifications — Under the Trust’s organizational documents, its officers and Trustees may be indemnified against certain liabilities and expenses arising out of the performance of their duties to the Fund. Under Massachusetts law, if certain conditions prevail, shareholders of a Massachusetts business trust (such as the Trust) could be deemed to have personal liability for the obligations of the Trust. However, the Trust’s Declaration of Trust contains an express disclaimer of liability on the part of Fund shareholders and theBy-laws provide that the Trust shall assume, upon request by the shareholder, the defense on behalf of any Fund shareholders. Moreover, theBy-laws also provide for indemnification out of Fund property of any shareholder held personally liable solely by reason of being or having been a shareholder for all loss or expense arising from such liability. Additionally, in the normal course of business, the Fund enters into agreements with service providers that may contain indemnification clauses. The Fund’s maximum exposure under these arrangements is unknown as this would involve future claims that may be made against the Fund that have not yet occurred.
G Other — Investment transactions are accounted for on a trade date basis.
2 Distributions to Shareholders and Income Tax Information
It is the present policy of the Fund to make at least one distribution annually (normally in December) of all or substantially all of its net investment income and to distribute annually all or substantially all of its net realized capital gains. Distributions to shareholders are recorded on theex-dividend date. Distributions are declared separately for each class of shares. Shareholders may reinvest income and capital gain distributions in additional shares of the same class of the Fund at the net asset value as of theex-dividend date or, at the election of the shareholder, receive distributions in cash. Distributions to shareholders are determined in accordance with income tax regulations, which may differ from U.S. GAAP. As required by U.S. GAAP, only distributions in excess of tax basis earnings and profits are reported in the financial statements as a return of capital. Permanent differences between book and tax
Eaton Vance
Stock Fund
December 31, 2019
Notes to Financial Statements — continued
accounting relating to distributions are reclassified topaid-in capital. For tax purposes, distributions from short-term capital gains are considered to be from ordinary income.
The tax character of distributions declared for the years ended December 31, 2019 and December 31, 2018 was as follows:
| | | | | | | | |
| | | Year Ended December 31, | |
| | | 2019 | | | 2018 | |
| | |
Ordinary income | | $ | 517,874 | | | $ | 2,610,754 | |
| | |
Long-term capital gains | | $ | 3,361,290 | | | $ | 6,851,039 | |
During the year ended December 31, 2019, distributable earnings was decreased by $414,862 andpaid-in capital was increased by $414,862 due to the Fund’s use of equalization accounting and differences between book and tax accounting. Tax equalization accounting allows the Fund to treat as a distribution that portion of redemption proceeds representing a redeeming shareholder’s portion of undistributed taxable income and net capital gains. These reclassifications had no effect on the net assets or net asset value per share of the Fund.
As of December 31, 2019, the components of distributable earnings (accumulated loss) on a tax basis were as follows:
| | | | |
| | |
Undistributed ordinary income | | $ | 72,229 | |
| |
Undistributed long-term capital gains | | $ | 1,899,905 | |
| |
Net unrealized appreciation | | $ | 26,847,768 | |
3 Transactions with Affiliates
Eaton Vance Management (EVM) serves as the administrator of the Fund, but receives no compensation. EVM has agreed to reimburse the Fund’s expenses to the extent that total annual operating expenses (relating to ordinary operating expenses only) exceed 0.98%, 1.73% and 0.73% of the Fund’s average daily net assets for Class A, Class C and Class I, respectively. This agreement may be changed or terminated after April 30, 2020. Pursuant to this agreement, EVM was allocated $110,868 of the Fund’s operating expenses for the year ended December 31, 2019. The Portfolio has engaged Boston Management and Research (BMR), a subsidiary of EVM, to render investment advisory services. See Note 2 of the Portfolio’s Notes to Financial Statements which are included elsewhere in this report.
EVM providessub-transfer agency and related services to the Fund pursuant to aSub-Transfer Agency Support Services Agreement. For the year ended December 31, 2019, EVM earned $10,112 from the Fund pursuant to such agreement, which is included in transfer and dividend disbursing agent fees on the Statement of Operations. The Fund was informed that Eaton Vance Distributors, Inc. (EVD), an affiliate of EVM and the Fund’s principal underwriter, received $6,444 as its portion of the sales charge on sales of Class A shares for the year ended December 31, 2019. EVD also received distribution and service fees from Class A and Class C shares (see Note 4) and contingent deferred sales charges (see Note 5).
Trustees and officers of the Fund who are members of EVM’s or BMR’s organizations receive remuneration for their services to the Fund out of the investment adviser fee. Certain officers and Trustees of the Fund and the Portfolio are officers of the above organizations.
4 Distribution Plans
The Fund has in effect a distribution plan for Class A shares (Class A Plan) pursuant to Rule12b-1 under the 1940 Act. Pursuant to the Class A Plan, the Fund pays EVD a distribution and service fee of 0.25% per annum of its average daily net assets attributable to Class A shares for distribution services and facilities provided to the Fund by EVD, as well as for personal services and/or the maintenance of shareholder accounts. Distribution and service fees paid or accrued to EVD for the year ended December 31, 2019 amounted to $121,941 for Class A shares.
The Fund also has in effect a distribution plan for Class C shares (Class C Plan) pursuant to Rule12b-1 under the 1940 Act. Pursuant to the Class C Plan, the Fund pays EVD amounts equal to 0.75% per annum of its average daily net assets attributable to Class C shares for providing ongoing distribution services and facilities to the Fund. For the year ended December 31, 2019, the Fund paid or accrued to EVD $81,864 for Class C shares.
Pursuant to the Class C Plan, the Fund also makes payments of service fees to EVD, financial intermediaries and other persons in amounts equal to 0.25% per annum of its average daily net assets attributable to that class. Service fees paid or accrued are for personal services and/or the maintenance of shareholder accounts. They are separate and distinct from the sales commissions and distribution fees payable to EVD. Service fees paid or accrued for the year ended December 31, 2019 amounted to $27,288 for Class C shares.
Distribution and service fees are subject to the limitations contained in the Financial Industry Regulatory Authority Rule 2341(d).
Eaton Vance
Stock Fund
December 31, 2019
Notes to Financial Statements — continued
5 Contingent Deferred Sales Charges
A contingent deferred sales charge (CDSC) of 1% generally is imposed on redemptions of Class C shares made within one year of purchase. Class A shares may be subject to a 1% CDSC if redeemed within 18 months of purchase (depending on the circumstances of purchase). Generally, the CDSC is based upon the lower of the net asset value at date of redemption or date of purchase. No charge is levied on shares acquired by reinvestment of dividends or capital gain distributions. For the year ended December 31, 2019, the Fund was informed that EVD received approximately $200 and $300 of CDSCs paid by Class A and Class C shareholders, respectively.
6 Investment Transactions
For the year ended December 31, 2019, increases and decreases in the Fund’s investment in the Portfolio aggregated $5,238,178 and $15,412,987, respectively. In addition, a Portfolio transaction fee is imposed by the Portfolio on the combined daily inflows or outflows of the Fund and the Portfolio’s other investors as more fully described at Note 1H of the Portfolio’s financial statements included herein. Such fee is allocated to the Fund based on itspro-rata interest in the Portfolio. The amount of the Portfolio transaction fee imposed on the Fund, if any, and the allocation of such fee are presented as Other capital on the Statements of Changes in Net Assets.
7 Shares of Beneficial Interest
The Fund’s Declaration of Trust permits the Trustees to issue an unlimited number of full and fractional shares of beneficial interest (without par value). Such shares may be issued in a number of different series (such as the Fund) and classes. Transactions in Fund shares were as follows:
| | | | | | | | |
| | | Year Ended December 31, | |
| Class A | | 2019 | | | 2018 | |
| | |
Sales | | | 259,131 | | | | 330,540 | |
| | |
Issued to shareholders electing to receive payments of distributions in Fund shares | | | 103,094 | | | | 302,767 | |
| | |
Redemptions | | | (572,212 | ) | | | (746,974 | ) |
| | |
Converted from Class C shares | | | 131,539 | | | | — | |
| | |
Net decrease | | | (78,448 | ) | | | (113,667 | ) |
| |
| | | Year Ended December 31, | |
| Class C | | 2019 | | | 2018 | |
| | |
Sales | | | 71,557 | | | | 81,008 | |
| | |
Issued to shareholders electing to receive payments of distributions in Fund shares | | | 21,312 | | | | 80,567 | |
| | |
Redemptions | | | (152,996 | ) | | | (300,116 | ) |
| | |
Converted to Class A shares | | | (134,746 | ) | | | — | |
| | |
Net decrease | | | (194,873 | ) | | | (138,541 | ) |
| |
| | | Year Ended December 31, | |
| Class I | | 2019 | | | 2018 | |
| | |
Sales | | | 420,905 | | | | 347,160 | |
| | |
Issued to shareholders electing to receive payments of distributions in Fund shares | | | 79,171 | | | | 227,842 | |
| | |
Redemptions | | | (546,176 | ) | | | (578,267 | ) |
| | |
Net decrease | | | (46,100 | ) | | | (3,265 | ) |
Eaton Vance
Stock Fund
December 31, 2019
Report of Independent Registered Public Accounting Firm
To the Trustees of Eaton Vance Mutual Funds Trust and Shareholders of Eaton Vance Stock Fund:
Opinion on the Financial Statements and Financial Highlights
We have audited the accompanying statement of assets and liabilities of Eaton Vance Stock Fund (the “Fund”) (one of the funds constituting Eaton Vance Mutual Funds Trust), as of December 31, 2019, the related statement of operations for the year then ended, the statements of changes in net assets for each of the two years in the period then ended, the financial highlights for each of the five years in the period then ended, and the related notes. In our opinion, the financial statements and financial highlights present fairly, in all material respects, the financial position of the Fund as of December 31, 2019, and the results of its operations for the year then ended, the changes in its net assets for each of the two years in the period then ended, and the financial highlights for each of the five years in the period then ended, in conformity with accounting principles generally accepted in the United States of America.
Basis for Opinion
These financial statements and financial highlights are the responsibility of the Fund’s management. Our responsibility is to express an opinion on the Fund’s financial statements and financial highlights based on our audits. We are a public accounting firm registered with the Public Company Accounting Oversight Board (United States) (PCAOB) and are required to be independent with respect to the Fund in accordance with the U.S. federal securities laws and the applicable rules and regulations of the Securities and Exchange Commission and the PCAOB.
We conducted our audits in accordance with the standards of the PCAOB. Those standards require that we plan and perform the audit to obtain reasonable assurance about whether the financial statements and financial highlights are free of material misstatement, whether due to error or fraud. The Fund is not required to have, nor were we engaged to perform, an audit of its internal control over financial reporting. As part of our audits we are required to obtain an understanding of internal control over financial reporting but not for the purpose of expressing an opinion on the effectiveness of the Fund’s internal control over financial reporting. Accordingly, we express no such opinion.
Our audits included performing procedures to assess the risks of material misstatement of the financial statements and financial highlights, whether due to error or fraud, and performing procedures that respond to those risks. Such procedures included examining, on a test basis, evidence regarding the amounts and disclosures in the financial statements and financial highlights. Our audits also included evaluating the accounting principles used and significant estimates made by management, as well as evaluating the overall presentation of the financial statements and financial highlights. We believe that our audits provide a reasonable basis for our opinion.
/s/ Deloitte & Touche LLP
Boston, Massachusetts
February 21, 2020
We have served as the auditor of one or more Eaton Vance investment companies since 1959.
Eaton Vance
Stock Fund
December 31, 2019
Federal Tax Information (Unaudited)
The Form1099-DIV you received in February 2020 showed the tax status of all distributions paid to your account in calendar year 2019. Shareholders are advised to consult their own tax adviser with respect to the tax consequences of their investment in the Fund. As required by the Internal Revenue Code and/or regulations, shareholders must be notified regarding the status of qualified dividend income for individuals, the dividends received deduction for corporations and capital gains dividends.
Qualified Dividend Income. For the fiscal year ended December 31, 2019, the Fund designates approximately $1,436,016, or up to the maximum amount of such dividends allowable pursuant to the Internal Revenue Code, as qualified dividend income eligible for the reduced tax rate of 15%.
Dividends Received Deduction. Corporate shareholders are generally entitled to take the dividends received deduction on the portion of the Fund’s dividend distribution that qualifies under tax law. For the Fund’s fiscal 2019 ordinary income dividends, 100% qualifies for the corporate dividends received deduction.
Capital Gains Dividends. The Fund hereby designates as a capital gain dividend with respect to the taxable year ended December 31, 2019, $5,660,112 or, if subsequently determined to be different, the net capital gain of such year.
Stock Portfolio
December 31, 2019
Portfolio of Investments
| | | | | | | | |
| Common Stocks— 99.0% | |
| Security | | Shares | | | Value | |
|
| Aerospace & Defense — 1.1% | |
| | |
Hexcel Corp. | | | 103,500 | | | $ | 7,587,585 | |
| |
| | | | $ | 7,587,585 | |
|
| Banks — 6.3% | |
| | |
Bank of America Corp. | | | 451,440 | | | $ | 15,899,717 | |
| | |
JPMorgan Chase & Co. | | | 111,420 | | | | 15,531,948 | |
| | |
PNC Financial Services Group, Inc. (The) | | | 72,340 | | | | 11,547,634 | |
| |
| | | | $ | 42,979,299 | |
|
| Beverages — 2.6% | |
| | |
PepsiCo, Inc. | | | 132,800 | | | $ | 18,149,776 | |
| |
| | | | $ | 18,149,776 | |
|
| Capital Markets — 1.0% | |
| | |
Tradeweb Markets, Inc., Class A | | | 148,739 | | | $ | 6,894,053 | |
| |
| | | | $ | 6,894,053 | |
|
| Chemicals — 0.6% | |
| | |
Ecolab, Inc. | | | 21,100 | | | $ | 4,072,089 | |
| |
| | | | $ | 4,072,089 | |
|
| Commercial Services & Supplies — 1.3% | |
| | |
Waste Management, Inc. | | | 77,882 | | | $ | 8,875,433 | |
| |
| | | | $ | 8,875,433 | |
|
| Communications Equipment — 1.3% | |
| | |
Cisco Systems, Inc. | | | 189,800 | | | $ | 9,102,808 | |
| |
| | | | $ | 9,102,808 | |
|
| Consumer Finance — 1.4% | |
| | |
American Express Co. | | | 75,960 | | | $ | 9,456,260 | |
| |
| | | | $ | 9,456,260 | |
|
| Diversified Telecommunication Services — 2.0% | |
| | |
Verizon Communications, Inc. | | | 220,190 | | | $ | 13,519,666 | |
| |
| | | | $ | 13,519,666 | |
|
| Electric Utilities — 1.3% | |
| | |
NextEra Energy, Inc. | | | 35,596 | | | $ | 8,619,927 | |
| |
| | | | $ | 8,619,927 | |
| | | | | | | | |
| Security | | Shares | | | Value | |
|
| Electrical Equipment — 3.0% | |
| | |
AMETEK, Inc. | | | 123,600 | | | $ | 12,327,864 | |
| | |
Emerson Electric Co. | | | 111,842 | | | | 8,529,071 | |
| |
| | | | $ | 20,856,935 | |
|
| Electronic Equipment, Instruments & Components — 0.5% | |
| | |
Zebra Technologies Corp., Class A(1) | | | 14,700 | | | $ | 3,754,968 | |
| |
| | | | $ | 3,754,968 | |
|
| Entertainment — 2.0% | |
| | |
Walt Disney Co. (The) | | | 92,826 | | | $ | 13,425,424 | |
| |
| | | | $ | 13,425,424 | |
|
| Equity Real Estate Investment Trusts (REITs) — 2.9% | |
| | |
American Tower Corp. | | | 55,300 | | | $ | 12,709,046 | |
| | |
AvalonBay Communities, Inc. | | | 33,780 | | | | 7,083,666 | |
| |
| | | | $ | 19,792,712 | |
|
| Food Products — 2.3% | |
| | |
Mondelez International, Inc., Class A | | | 286,920 | | | $ | 15,803,554 | |
| |
| | | | $ | 15,803,554 | |
|
| Health Care Equipment & Supplies — 4.4% | |
| | |
Abbott Laboratories | | | 83,200 | | | $ | 7,226,752 | |
| | |
Boston Scientific Corp.(1) | | | 186,620 | | | | 8,438,956 | |
| | |
Danaher Corp. | | | 95,566 | | | | 14,667,470 | |
| |
| | | | $ | 30,333,178 | |
|
| Health Care Providers & Services — 2.5% | |
| | |
Anthem, Inc. | | | 55,960 | | | $ | 16,901,599 | |
| |
| | | | $ | 16,901,599 | |
|
| Household Products — 1.5% | |
| | |
Kimberly-Clark Corp. | | | 73,900 | | | $ | 10,164,945 | |
| |
| | | | $ | 10,164,945 | |
|
| Insurance — 4.6% | |
| | |
American International Group, Inc. | | | 199,740 | | | $ | 10,252,654 | |
| | |
Assurant, Inc. | | | 42,100 | | | | 5,518,468 | |
| | |
First American Financial Corp. | | | 107,372 | | | | 6,261,935 | |
| | |
Progressive Corp. (The) | | | 132,000 | | | | 9,555,480 | |
| |
| | | | $ | 31,588,537 | |
| | | | |
| | 18 | | See Notes to Financial Statements. |
Stock Portfolio
December 31, 2019
Portfolio of Investments — continued
| | | | | | | | |
| Security | | Shares | | | Value | |
|
| Interactive Media & Services — 6.9% | |
| | |
Alphabet, Inc., Class C(1) | | | 23,329 | | | $ | 31,191,340 | |
| | |
Facebook, Inc., Class A(1) | | | 78,544 | | | | 16,121,156 | |
| |
| | | | $ | 47,312,496 | |
|
| Internet & Direct Marketing Retail — 3.5% | |
| | |
Amazon.com, Inc.(1) | | | 12,822 | | | $ | 23,693,005 | |
| |
| | | | $ | 23,693,005 | |
|
| IT Services — 7.5% | |
| | |
Cognizant Technology Solutions Corp., Class A | | | 160,512 | | | $ | 9,954,954 | |
| | |
Fidelity National Information Services, Inc. | | | 102,300 | | | | 14,228,907 | |
| | |
PayPal Holdings, Inc.(1) | | | 78,100 | | | | 8,448,077 | |
| | |
Visa, Inc., Class A | | | 98,100 | | | | 18,432,990 | |
| |
| | | | $ | 51,064,928 | |
|
| Life Sciences Tools & Services — 2.1% | |
| | |
Thermo Fisher Scientific, Inc. | | | 43,300 | | | $ | 14,066,871 | |
| |
| | | | $ | 14,066,871 | |
|
| Machinery — 2.2% | |
| | |
Gardner Denver Holdings, Inc.(1) | | | 220,920 | | | $ | 8,103,346 | |
| | |
Stanley Black & Decker, Inc. | | | 41,200 | | | | 6,828,488 | |
| |
| | | | $ | 14,931,834 | |
|
| Metals & Mining — 2.0% | |
| | |
Steel Dynamics, Inc. | | | 402,700 | | | $ | 13,707,908 | |
| |
| | | | $ | 13,707,908 | |
|
| Multi-Utilities — 2.1% | |
| | |
CMS Energy Corp. | | | 106,300 | | | $ | 6,679,892 | |
| | |
Sempra Energy | | | 52,942 | | | | 8,019,654 | |
| |
| | | | $ | 14,699,546 | |
|
| Oil, Gas & Consumable Fuels — 4.5% | |
| | |
ConocoPhillips | | | 102,086 | | | $ | 6,638,653 | |
| | |
EOG Resources, Inc. | | | 61,500 | | | | 5,151,240 | |
| | |
Exxon Mobil Corp. | | | 157,044 | | | | 10,958,530 | |
| | |
Phillips 66 | | | 69,425 | | | | 7,734,639 | |
| |
| | | | $ | 30,483,062 | |
|
| Pharmaceuticals — 5.4% | |
| | |
Bristol-Myers Squibb Co. | | | 233,100 | | | $ | 14,962,689 | |
| | |
Catalent, Inc.(1) | | | 97,700 | | | | 5,500,510 | |
| | | | | | | | |
| Security | | Shares | | | Value | |
|
| Pharmaceuticals(continued) | |
| | |
GlaxoSmithKline PLC ADR | | | 73,300 | | | $ | 3,444,367 | |
| | |
Merck & Co., Inc. | | | 140,400 | | | | 12,769,380 | |
| |
| | | | $ | 36,676,946 | |
|
| Road & Rail — 0.9% | |
| | |
CSX Corp. | | | 85,700 | | | $ | 6,201,252 | |
| |
| | | | $ | 6,201,252 | |
|
| Semiconductors & Semiconductor Equipment— 3.2% | |
| | |
ASML Holding NV - NY Shares | | | 11,800 | | | $ | 3,492,092 | |
| | |
Taiwan Semiconductor Manufacturing Co., Ltd. ADR | | | 141,123 | | | | 8,199,246 | |
| | |
Texas Instruments, Inc. | | | 78,579 | | | | 10,080,900 | |
| |
| | | | $ | 21,772,238 | |
|
| Software— 6.8% | |
| | |
Adobe, Inc.(1) | | | 22,978 | | | $ | 7,578,374 | |
| | |
Intuit, Inc. | | | 17,536 | | | | 4,593,205 | |
| | |
Microsoft Corp. | | | 215,720 | | | | 34,019,044 | |
| |
| | | | $ | 46,190,623 | |
|
| Specialty Retail— 5.4% | |
| | |
Home Depot, Inc. (The) | | | 55,188 | | | $ | 12,051,955 | |
| | |
Lowe’s Cos., Inc. | | | 136,306 | | | | 16,324,007 | |
| | |
TJX Cos., Inc. (The) | | | 139,940 | | | | 8,544,736 | |
| |
| | | | $ | 36,920,698 | |
|
| Technology Hardware, Storage & Peripherals— 3.9% | |
| | |
Apple, Inc. | | | 91,797 | | | $ | 26,956,189 | |
| |
| | | | $ | 26,956,189 | |
| |
Total Common Stocks
(identified cost $500,493,335) | | | $ | 676,556,344 | |
|
| Rights— 0.1% | |
| Security | | Shares | | | Value | |
|
| Pharmaceuticals— 0.1% | |
| | |
Bristol-Myers Squibb Co. CVR, Exp. 3/31/21(1) | | | 320,300 | | | $ | 964,103 | |
| |
Total Rights
(identified cost $679,120) | | | $ | 964,103 | |
| | | | |
| | 19 | | See Notes to Financial Statements. |
Stock Portfolio
December 31, 2019
Portfolio of Investments — continued
| | | | | | |
| Short-Term Investments— 0.8% | |
| Description | | Units | | Value | |
| | |
Eaton Vance Cash Reserves Fund, LLC, 1.78%(2) | | 5,512,026 | | $ | 5,512,026 | |
| |
Total Short-Term Investments
(identified cost $5,511,762) | | $ | 5,512,026 | |
| |
Total Investments — 99.9%
(identified cost $506,684,217) | | $ | 683,032,473 | |
| |
Other Assets, Less Liabilities — 0.1% | | $ | 515,045 | |
| |
Net Assets — 100.0% | | $ | 683,547,518 | |
The percentage shown for each investment category in the Portfolio of Investments is based on net assets.
| (1) | Non-income producing security. |
| (2) | Affiliated investment company, available to Eaton Vance portfolios and funds, which invests in high quality, U.S. dollar denominated money market instruments. The rate shown is the annualizedseven-day yield as of December 31, 2019. |
| | | | |
|
| Abbreviations: |
| | |
| ADR | | — | | American Depositary Receipt |
| | |
| CVR | | — | | Contingent Value Rights |
| | | | |
| | 20 | | See Notes to Financial Statements. |
Stock Portfolio
December 31, 2019
Statement of Assets and Liabilities
| | | | |
| Assets | | December 31, 2019 | |
| |
Unaffiliated investments, at value (identified cost, $501,172,455) | | $ | 677,520,447 | |
| |
Affiliated investment, at value (identified cost, $5,511,762) | | | 5,512,026 | |
| |
Foreign currency, at value (identified cost, $16,206) | | | 16,204 | |
| |
Dividends receivable | | | 823,919 | |
| |
Dividends receivable from affiliated investment | | | 9,135 | |
| |
Tax reclaims receivable | | | 157,340 | |
| |
Total assets | | $ | 684,039,071 | |
|
| Liabilities | |
| |
Payable to affiliates: | | | | |
| |
Investment adviser fee | | $ | 338,988 | |
| |
Trustees’ fees | | | 7,953 | |
| |
Accrued expenses | | | 144,612 | |
| |
Total liabilities | | $ | 491,553 | |
| |
Net Assets applicable to investors’ interest in Portfolio | | $ | 683,547,518 | |
| | | | |
| | 21 | | See Notes to Financial Statements. |
Stock Portfolio
December 31, 2019
Statement of Operations
| | | | |
| Investment Income | | Year Ended December 31, 2019 | |
| |
Dividends (net of foreign taxes, $99,328) | | $ | 10,052,771 | |
| |
Dividends from affiliated investment | | | 63,749 | |
| |
Total investment income | | $ | 10,116,520 | |
|
| Expenses | |
| |
Investment adviser fee | | $ | 3,702,875 | |
| |
Trustees’ fees and expenses | | | 23,862 | |
| |
Custodian fee | | | 142,399 | |
| |
Legal and accounting services | | | 50,091 | |
| |
Miscellaneous | | | 24,691 | |
| |
Total expenses | | $ | 3,943,918 | |
| |
Net investment income | | $ | 6,172,602 | |
|
| Realized and Unrealized Gain (Loss) | |
| |
Net realized gain (loss) — | | | | |
| |
Investment transactions | | $ | 37,237,059 | |
| |
Investment transactions — affiliated investment | | | (377 | ) |
| |
Foreign currency transactions | | | 253 | |
| |
Net realized gain | | $ | 37,236,935 | |
| |
Change in unrealized appreciation (depreciation) — | | | | |
| |
Investments | | $ | 139,851,452 | |
| |
Investments — affiliated investment | | | 262 | |
| |
Foreign currency | | | 2,081 | |
| |
Net change in unrealized appreciation (depreciation) | | $ | 139,853,795 | |
| |
Net realized and unrealized gain | | $ | 177,090,730 | |
| |
Net increase in net assets from operations | | $ | 183,263,332 | |
| | | | |
| | 22 | | See Notes to Financial Statements. |
Stock Portfolio
December 31, 2019
Statements of Changes in Net Assets
| | | | | | | | |
| | | Year Ended December 31, | |
| Increase (Decrease) in Net Assets | | 2019 | | | 2018 | |
| | |
From operations — | | | | | | | | |
| | |
Net investment income | | $ | 6,172,602 | | | $ | 7,128,802 | |
| | |
Net realized gain | | | 37,236,935 | | | | 50,384,018 | (1) |
| | |
Net change in unrealized appreciation (depreciation) | | | 139,853,795 | | | | (84,773,096 | ) |
| | |
Net increase (decrease) in net assets from operations | | $ | 183,263,332 | | | $ | (27,260,276 | ) |
| | |
Capital transactions — | | | | | | | | |
| | |
Contributions | | $ | 63,196,014 | | | $ | 19,957,986 | |
| | |
Withdrawals | | | (79,842,250 | ) | | | (123,729,807 | ) |
| | |
Portfolio transaction fee | | | 315,199 | | | | 242,333 | |
| | |
Net decrease in net assets from capital transactions | | $ | (16,331,037 | ) | | $ | (103,529,488 | ) |
| | |
Net increase (decrease) in net assets | | $ | 166,932,295 | | | $ | (130,789,764 | ) |
|
| Net Assets | |
| | |
At beginning of year | | $ | 516,615,223 | | | $ | 647,404,987 | |
| | |
At end of year | | $ | 683,547,518 | | | $ | 516,615,223 | |
| (1) | Includes $2,091,763 of net realized gains from redemptionsin-kind. |
| | | | |
| | 23 | | See Notes to Financial Statements. |
Stock Portfolio
December 31, 2019
Financial Highlights
| | | | | | | | | | | | | | | | | | | | |
| | | Year Ended December 31, | |
| Ratios/Supplemental Data | | 2019 | | | 2018 | | | 2017 | | | 2016 | | | 2015 | |
| | | | | |
Ratios (as a percentage of average daily net assets): | | | | | | | | | | | | | | | | | | | | |
| | | | | |
Expenses(1) | | | 0.63 | % | | | 0.64 | % | | | 0.64 | % | | | 0.65 | % | | | 0.70 | % |
| | | | | |
Net investment income | | | 0.99 | % | | | 1.14 | % | | | 1.38 | % | | | 1.60 | % | | | 1.16 | % |
| | | | | |
Portfolio Turnover | | | 55 | % | | | 90 | % | | | 101 | % | | | 118 | % | | | 96 | % |
| | | | | |
Total Return | | | 35.47 | % | | | (5.57 | )% | | | 20.31 | % | | | 7.14 | % | | | 4.88 | % |
| | | | | |
Net assets, end of year (000’s omitted) | | $ | 683,548 | | | $ | 516,615 | | | $ | 647,405 | | | $ | 640,973 | | | $ | 395,492 | |
| (1) | Excludes the effect of custody fee credits, if any, of less than 0.005%. Effective September 1, 2015, custody fee credits, which were earned on cash deposit balances, were discontinued by the custodian. |
| | | | |
| | 24 | | See Notes to Financial Statements. |
Stock Portfolio
December 31, 2019
Notes to Financial Statements
1 Significant Accounting Policies
Stock Portfolio (the Portfolio) is a Massachusetts business trust registered under the Investment Company Act of 1940, as amended (the 1940 Act), as a diversified,open-end management investment company. The Portfolio’s investment objective is to achieve long-term capital appreciation by investing in a diversified portfolio of equity securities. The Declaration of Trust permits the Trustees to issue interests in the Portfolio. At December 31, 2019, Eaton Vance Stock Fund, Eaton Vance Stock NextShares and Eaton Vance Balanced Fund held an interest of 14.9%, 1.0% and 84.0%, respectively, in the Portfolio.
The following is a summary of significant accounting policies of the Portfolio. The policies are in conformity with accounting principles generally accepted in the United States of America (U.S. GAAP). The Portfolio is an investment company and follows accounting and reporting guidance in the Financial Accounting Standards Board (FASB) Accounting Standards Codification Topic 946.
A Investment Valuation — The following methodologies are used to determine the market value or fair value of investments.
Equity Securities. Equity securities listed on a U.S. securities exchange generally are valued at the last sale or closing price on the day of valuation or, if no sales took place on such date, at the mean between the closing bid and ask prices on the exchange where such securities are principally traded. Equity securities listed on the NASDAQ Global or Global Select Market generally are valued at the NASDAQ official closing price. Unlisted or listed securities for which closing sales prices or closing quotations are not available are valued at the mean between the latest available bid and ask prices.
Foreign Securities and Currencies. Foreign securities and currencies are valued in U.S. dollars, based on foreign currency exchange rate quotations supplied by a third party pricing service. The pricing service uses a proprietary model to determine the exchange rate. Inputs to the model include reported trades and implied bid/ask spreads. The daily valuation of exchange-traded foreign securities generally is determined as of the close of trading on the principal exchange on which such securities trade. Events occurring after the close of trading on foreign exchanges may result in adjustments to the valuation of foreign securities to more accurately reflect their fair value as of the close of regular trading on the New York Stock Exchange. When valuing foreign equity securities that meet certain criteria, the Portfolio’s Trustees have approved the use of a fair value service that values such securities to reflect market trading that occurs after the close of the applicable foreign markets of comparable securities or other instruments that have a strong correlation to the fair-valued securities.
Affiliated Fund. The Portfolio may invest in Eaton Vance Cash Reserves Fund, LLC (Cash Reserves Fund), an affiliated investment company managed by
Eaton Vance Management (EVM). While Cash Reserves Fund is not a registered money market mutual fund, it conducts all of its investment activities in accordance with the requirements of Rule2a-7 under the 1940 Act. Investments in Cash Reserves Fund are valued at the closing net asset value per unit on the valuation day. Cash Reserves Fund generally values its investment securities based on available market quotations provided by a third party pricing service.
Fair Valuation. Investments for which valuations or market quotations are not readily available or are deemed unreliable are valued at fair value using methods determined in good faith by or at the direction of the Trustees of the Portfolio in a manner that most fairly reflects the security’s “fair value”, which is the amount that the Portfolio might reasonably expect to receive for the security upon its current sale in the ordinary course. Each such determination is based on a consideration of relevant factors, which are likely to vary from one pricing context to another. These factors may include, but are not limited to, the type of security, the existence of any contractual restrictions on the security’s disposition, the price and extent of public trading in similar securities of the issuer or of comparable companies or entities, quotations or relevant information obtained from broker/dealers or other market participants, information obtained from the issuer, analysts, and/or the appropriate stock exchange (for exchange-traded securities), an analysis of the company’s or entity’s financial statements, and an evaluation of the forces that influence the issuer and the market(s) in which the security is purchased and sold.
B Investment Transactions — Investment transactions for financial statement purposes are accounted for on a trade date basis. Realized gains and losses on investments sold are determined on the basis of identified cost.
C Income — Dividend income is recorded on theex-dividend date for dividends received in cash and/or securities. However, if theex-dividend date has passed, certain dividends from foreign securities are recorded as the Portfolio is informed of theex-dividend date. Withholding taxes on foreign dividends and capital gains have been provided for in accordance with the Portfolio’s understanding of the applicable countries’ tax rules and rates.
D Federal Taxes — The Portfolio has elected to be treated as a partnership for federal tax purposes. No provision is made by the Portfolio for federal or state taxes on any taxable income of the Portfolio because each investor in the Portfolio is ultimately responsible for the payment of any taxes on its share of taxable income. Since at least one of the Portfolio’s investors is a regulated investment company that invests all or substantially all of its assets in the Portfolio, the Portfolio normally must satisfy the applicable source of income and diversification requirements (under the Internal Revenue Code) in order for its investors to satisfy them. The Portfolio will allocate, at least annually among its investors, each investor’s distributive share of the Portfolio’s net investment income, net realized capital gains and losses and any other items of income, gain, loss, deduction or credit.
As of December 31, 2019, the Portfolio had no uncertain tax positions that would require financial statement recognition,de-recognition, or disclosure. The Portfolio files a U.S. federal income tax return annually after its fiscalyear-end, which is subject to examination by the Internal Revenue Service for a period of three years from the date of filing.
E Foreign Currency Translation — Investment valuations, other assets, and liabilities initially expressed in foreign currencies are translated each business day into U.S. dollars based upon current exchange rates. Purchases and sales of foreign investment securities and income and expenses denominated in
Stock Portfolio
December 31, 2019
Notes to Financial Statements — continued
foreign currencies are translated into U.S. dollars based upon currency exchange rates in effect on the respective dates of such transactions. Recognized gains or losses on investment transactions attributable to changes in foreign currency exchange rates are recorded for financial statement purposes as net realized gains and losses on investments. That portion of unrealized gains and losses on investments that results from fluctuations in foreign currency exchange rates is not separately disclosed.
F Use of Estimates — The preparation of the financial statements in conformity with U.S. GAAP requires management to make estimates and assumptions that affect the reported amounts of assets and liabilities at the date of the financial statements and the reported amounts of income and expense during the reporting period. Actual results could differ from those estimates.
G Indemnifications — Under the Portfolio’s organizational documents, its officers and Trustees may be indemnified against certain liabilities and expenses arising out of the performance of their duties to the Portfolio. Under Massachusetts law, if certain conditions prevail, interestholders in the Portfolio could be deemed to have personal liability for the obligations of the Portfolio. However, the Portfolio’s Declaration of Trust contains an express disclaimer of liability on the part of Portfolio interestholders. Additionally, in the normal course of business, the Portfolio enters into agreements with service providers that may contain indemnification clauses. The Portfolio’s maximum exposure under these arrangements is unknown as this would involve future claims that may be made against the Portfolio that have not yet occurred.
H Capital Transactions — To seek to protect the Portfolio (and, indirectly, other investors in the Portfolio) against the costs of accommodating investor inflows and outflows, the Portfolio imposes a fee (“Portfolio transaction fee”) on inflows and outflows by Portfolio investors. The Portfolio transaction fee is sized to cover the estimated cost to the Portfolio of, in connection with issuing interests, converting the cash and/or other instruments it receives to the desired composition and, in connection with redeeming its interests, converting Portfolio holdings to cash and/or other instruments to be distributed. Such fee, which may vary over time, is limited to amounts that have been authorized by the Board of Trustees and determined by EVM to be appropriate. The maximum Portfolio transaction fee is 2% of the amount of net contributions or withdrawals. The Portfolio transaction fee is recorded as a component of capital transactions on the Statements of Changes in Net Assets.
2 Investment Adviser Fee and Other Transactions with Affiliates
The investment adviser fee is earned by Boston Management and Research (BMR), a subsidiary of EVM, as compensation for investment advisory services rendered to the Portfolio. Pursuant to the investment advisory agreement and subsequent fee reduction agreement between the Portfolio and BMR, the fee is computed at an annual rate of 0.60% of the Portfolio’s average daily net assets up to $500 million and 0.575% from $500 million but less than $1 billion, and is payable monthly. On net assets of $1 billion or over, the annual fee is reduced. The fee reduction cannot be terminated or reduced without the approval of a majority vote of the Trustees of the Portfolio who are not interested persons of BMR or the Portfolio and by the vote of a majority of the holders of interest in the Portfolio. For the year ended December 31, 2019, the Portfolio’s investment adviser fee amounted to $3,702,875 or 0.59% of the Portfolio’s average daily net assets. The Portfolio invests its cash in Cash Reserves Fund. EVM does not currently receive a fee for advisory services provided to Cash Reserves Fund.
Trustees and officers of the Portfolio who are members of EVM’s or BMR’s organizations receive remuneration for their services to the Portfolio out of the investment adviser fee. Trustees of the Portfolio who are not affiliated with the investment adviser may elect to defer receipt of all or a percentage of their annual fees in accordance with the terms of the Trustees Deferred Compensation Plan. For the year ended December 31, 2019, no significant amounts have been deferred. Certain officers and Trustees of the Portfolio are officers of the above organizations.
3 Purchases and Sales of Investments
Purchases and sales of investments, other than short-term obligations, aggregated $339,548,841 and $353,500,921, respectively, for the year ended December 31, 2019.
4 Federal Income Tax Basis of Investments
The cost and unrealized appreciation (depreciation) of investments of the Portfolio at December 31, 2019, as determined on a federal income tax basis, were as follows:
| | | | |
| |
Aggregate cost | | $ | 507,636,901 | |
| |
Gross unrealized appreciation | | $ | 177,139,783 | |
| |
Gross unrealized depreciation | | | (1,744,211 | ) |
| |
Net unrealized appreciation | | $ | 175,395,572 | |
Stock Portfolio
December 31, 2019
Notes to Financial Statements — continued
5 Line of Credit
The Portfolio participates with other portfolios and funds managed by EVM and its affiliates in an $800 million unsecured line of credit agreement with a group of banks, which is in effect through October 27, 2020. In connection with the renewal of the agreement on October 29, 2019, funds managed by Calvert Research and Management, an affiliate of EVM, were added as participating funds to the agreement and the borrowing limit was increased from $625 million. Borrowings are made by the Portfolio solely to facilitate the handling of unusual and/or unanticipated short-term cash requirements. Interest is charged to the Portfolio based on its borrowings at an amount above either the Eurodollar rate or Federal Funds rate. In addition, a fee computed at an annual rate of 0.15% on the daily unused portion of the line of credit is allocated among the participating portfolios and funds at the end of each quarter. Because the line of credit is not available exclusively to the Portfolio, it may be unable to borrow some or all of its requested amounts at any particular time. The Portfolio did not have any significant borrowings or allocated fees during the year ended December 31, 2019.
6 Investments in Affiliated Funds
At December 31, 2019, the value of the Portfolio’s investment in affiliated funds was $5,512,026, which represents 0.8% of the Portfolio’s net assets. Transactions in affiliated funds by the Portfolio for the year ended December 31, 2019 were as follows:
| | | | | | | | | | | | | | | | | | | | | | | | | | | | | | | | |
| Name of affiliated fund | | Value,
beginning of
period | | | Purchases | | | Sales proceeds | | | Net
realized
gain (loss) | | | Change in
unrealized
appreciation
(depreciation) | | | Value, end
of period | | | Dividend
income | | | Units, end
of period | |
Short-Term Investments | |
| | | | | | | | |
Eaton Vance Cash Reserves Fund, LLC, 1.78% | | $ | 46,118 | | | $ | 106,004,358 | | | $ | (100,538,335 | ) | | $ | (377 | ) | | $ | 262 | | | $ | 5,512,026 | | | $ | 63,749 | | | | 5,512,026 | |
7 Fair Value Measurements
Under generally accepted accounting principles for fair value measurements, a three-tier hierarchy to prioritize the assumptions, referred to as inputs, is used in valuation techniques to measure fair value. The three-tier hierarchy of inputs is summarized in the three broad levels listed below.
| • | | Level 1 – quoted prices in active markets for identical investments |
| • | | Level 2 – other significant observable inputs (including quoted prices for similar investments, interest rates, prepayment speeds, credit risk, etc.) |
| • | | Level 3 – significant unobservable inputs (including a fund’s own assumptions in determining the fair value of investments) |
In cases where the inputs used to measure fair value fall in different levels of the fair value hierarchy, the level disclosed is determined based on the lowest level input that is significant to the fair value measurement in its entirety. The inputs or methodology used for valuing securities are not necessarily an indication of the risk associated with investing in those securities.
At December 31, 2019, the hierarchy of inputs used in valuing the Portfolio’s investments, which are carried at value, were as follows:
| | | | | | | | | | | | | | | | |
| Asset Description | | Level 1 | | | Level 2 | | | Level 3 | | | Total | |
| | | | |
Common Stocks | | $ | 676,556,344 | * | | $ | — | | | $ | — | | | $ | 676,556,344 | |
| | | | |
Rights | | | 964,103 | | | | — | | | | — | | | | 964,103 | |
| | | | |
Short-Term Investments | | | — | | | | 5,512,026 | | | | — | | | | 5,512,026 | |
| | | | |
Total Investments | | $ | 677,520,447 | | | $ | 5,512,026 | | | $ | — | | | $ | 683,032,473 | |
| * | The level classification by major category of investments is the same as the category presentation in the Portfolio of Investments. |
Stock Portfolio
December 31, 2019
Report of Independent Registered Public Accounting Firm
To the Trustees and Investors of Stock Portfolio:
Opinion on the Financial Statements and Financial Highlights
We have audited the accompanying statement of assets and liabilities of Stock Portfolio (the “Portfolio”), including the portfolio of investments, as of December 31, 2019, the related statement of operations for the year then ended, the statements of changes in net assets for each of the two years in the period then ended, the financial highlights for each of the five years in the period then ended, and the related notes. In our opinion, the financial statements and financial highlights present fairly, in all material respects, the financial position of the Portfolio as of December 31, 2019, and the results of its operations for the year then ended, the changes in its net assets for each of the two years in the period then ended, and the financial highlights for each of the five years in the period then ended, in conformity with accounting principles generally accepted in the United States of America.
Basis for Opinion
These financial statements and financial highlights are the responsibility of the Portfolio’s management. Our responsibility is to express an opinion on the Portfolio’s financial statements and financial highlights based on our audits. We are a public accounting firm registered with the Public Company Accounting Oversight Board (United States) (PCAOB) and are required to be independent with respect to the Portfolio in accordance with the U.S. federal securities laws and the applicable rules and regulations of the Securities and Exchange Commission and the PCAOB.
We conducted our audits in accordance with the standards of the PCAOB. Those standards require that we plan and perform the audit to obtain reasonable assurance about whether the financial statements and financial highlights are free of material misstatement, whether due to error or fraud. The Portfolio is not required to have, nor were we engaged to perform, an audit of its internal control over financial reporting. As part of our audits we are required to obtain an understanding of internal control over financial reporting but not for the purpose of expressing an opinion on the effectiveness of the Portfolio’s internal control over financial reporting. Accordingly, we express no such opinion.
Our audits included performing procedures to assess the risks of material misstatement of the financial statements and financial highlights, whether due to error or fraud, and performing procedures that respond to those risks. Such procedures included examining, on a test basis, evidence regarding the amounts and disclosures in the financial statements and financial highlights. Our audits also included evaluating the accounting principles used and significant estimates made by management, as well as evaluating the overall presentation of the financial statements and financial highlights. Our procedures included confirmation of securities owned as of December 31, 2019, by correspondence with the custodian and brokers; when replies were not received from brokers, we performed other auditing procedures. We believe that our audits provide a reasonable basis for our opinion.
/s/ Deloitte & Touche LLP
Boston, Massachusetts
February 21, 2020
We have served as the auditor of one or more Eaton Vance investment companies since 1959.
Eaton Vance
Stock Fund
December 31, 2019
Management and Organization
Fund Management. The Trustees of Eaton Vance Mutual Funds Trust (the Trust) and Stock Portfolio (the Portfolio) are responsible for the overall management and supervision of the Trust’s and Portfolio’s affairs. The Trustees and officers of the Trust and the Portfolio are listed below. Except as indicated, each individual has held the office shown or other offices in the same company for the last five years. Trustees and officers of the Trust and the Portfolio hold indefinite terms of office. The “noninterested Trustees” consist of those Trustees who are not “interested persons” of the Trust and the Portfolio, as that term is defined under the 1940 Act. The business address of each Trustee and officer is Two International Place, Boston, Massachusetts 02110. As used below, “EVC” refers to Eaton Vance Corp., “EV” refers to Eaton Vance, Inc., “EVM” refers to Eaton Vance Management, “BMR” refers to Boston Management and Research and “EVD” refers to
Eaton Vance Distributors, Inc. EVC and EV are the corporate parent and trustee, respectively, of EVM and BMR. EVD is the Fund’s principal underwriter, the Portfolio’s placement agent and a wholly-owned subsidiary of EVC. Each officer affiliated with Eaton Vance may hold a position with other Eaton Vance affiliates that is comparable to his or her position with EVM listed below. Each Trustee oversees 159 portfolios in the Eaton Vance Complex (including all master and feeder funds in a master feeder structure). Each officer serves as an officer of certain other Eaton Vance funds. Each Trustee and officer serves until his or her successor is elected.
| | | | | | |
| Name and Year of Birth | | Position(s) with the
Trust and the Portfolio | | Trustee Since(1) | | Principal Occupation(s) and Directorships During Past Five Years and Other Relevant Experience |
| | | |
| Interested Trustee | | | | | | |
| | | |
Thomas E. Faust Jr. 1958 | | Trustee | | 2007 | | Chairman, Chief Executive Officer and President of EVC, Director and President of EV, Chief Executive Officer and President of EVM and BMR, and Director of EVD. Trustee and/or officer of 159 registered investment companies. Mr. Faust is an interested person because of his positions with EVM, BMR, EVD, EVC and EV, which are affiliates of the Trust and the Portfolio. Directorships in the Last Five Years. Director of EVC and Hexavest Inc. (investment management firm). |
| | | |
| Noninterested Trustees | | | | | | |
| | | |
Mark R. Fetting 1954 | | Trustee | | 2016 | | Private investor. Formerly held various positions at Legg Mason, Inc. (investment management firm) (2000-2012), including President, Chief Executive Officer, Director and Chairman (2008-2012), Senior Executive Vice President (2004-2008) and Executive Vice President (2001-2004). Formerly, President of Legg Mason family of funds
(2001-2008). Formerly, Division President and Senior Officer of Prudential Financial Group, Inc. and related companies (investment management firm)(1991-2000). Other Directorships in the Last Five Years. None. |
| | | |
Cynthia E. Frost 1961 | | Trustee | | 2014 | | Private investor. Formerly, Chief Investment Officer of Brown University (university endowment) (2000-2012). Formerly, Portfolio Strategist for Duke Management Company (university endowment manager) (1995-2000). Formerly, Managing Director, Cambridge Associates (investment consulting company) (1989-1995). Formerly, Consultant, Bain and Company (management consulting firm) (1987-1989). Formerly, Senior Equity Analyst, BA Investment Management Company (1983-1985). Other Directorships in the Last Five Years.None. |
| | | |
George J. Gorman 1952 | | Trustee | | 2014 | | Principal at George J. Gorman LLC (consulting firm). Formerly, Senior Partner at Ernst & Young LLP (a registered public accounting firm) (1974-2009). Other Directorships in the Last Five Years.Formerly, Trustee of the BofA Funds Series Trust (11 funds) (2011-2014) and of the Ashmore Funds (9 funds) (2010-2014). |
| | | |
Valerie A. Mosley 1960 | | Trustee | | 2014 | | Chairwoman and Chief Executive Officer of Valmo Ventures (a consulting and investment firm). Former Partner and Senior Vice President, Portfolio Manager and Investment Strategist at Wellington Management Company, LLP (investment management firm)
(1992-2012). Former Chief Investment Officer, PG Corbin Asset Management (1990-1992). Formerly worked in institutional corporate bond sales at Kidder Peabody (1986-1990). Other Directorships in the Last Five Years. Director of Envestnet, Inc. (provider of intelligent systems for wealth management and financial wellness) (since 2018). Director of Dynex Capital, Inc. (mortgage REIT) (since 2013). |
Eaton Vance
Stock Fund
December 31, 2019
Management and Organization — continued
| | | | | | |
| Name and Year of Birth | | Position(s) with the
Trust and the Portfolio | | Trustee Since(1) | | Principal Occupation(s) and Directorships During Past Five Years and Other Relevant Experience |
| |
| Noninterested Trustees (continued) | | |
| | | |
William H. Park 1947 | | Chairperson of the Board and Trustee | | 2016 (Chairperson) 2003 (Trustee) | | Private investor. Formerly, Consultant (management and transactional) (2012-2014). Formerly, Chief Financial Officer, Aveon Group L.P. (investment management firm) (2010-2011). Formerly, Vice Chairman, Commercial Industrial Finance Corp. (specialty finance company) (2006-2010). Formerly, President and Chief Executive Officer, Prizm Capital Management, LLC (investment management firm) (2002-2005). Formerly, Executive Vice President and Chief Financial Officer, United Asset Management Corporation (investment management firm) (1982-2001). Formerly, Senior Manager, Price Waterhouse (now PricewaterhouseCoopers) (a registered public accounting firm) (1972-1981). Other Directorships in the Last Five Years.None. |
| | | |
Helen Frame Peters 1948 | | Trustee | | 2008 | | Professor of Finance, Carroll School of Management, Boston College. Formerly, Dean, Carroll School of Management, Boston College (2000-2002). Formerly, Chief Investment Officer, Fixed Income, Scudder Kemper Investments (investment management firm) (1998-1999). Formerly, Chief Investment Officer, Equity and Fixed Income, Colonial Management Associates (investment management firm) (1991-1998). Other Directorships in the Last Five Years. None. |
| | | |
Keith Quinton 1958 | | Trustee | | 2018 | | Independent Investment Committee Member at New Hampshire Retirement System (since 2017). Advisory Committee member at Northfield Information Services, Inc. (risk management analytics provider) (since 2016). Formerly, Portfolio Manager and Senior Quantitative Analyst at Fidelity Investments (investment management firm)(2001-2014). Other Directorships in the Last Five Years.Director of New Hampshire Municipal Bond Bank (since 2016). |
| | | |
Marcus L. Smith 1966 | | Trustee | | 2018 | | Member of Posse Boston Advisory Board (foundation) (since 2015). Trustee at University of Mount Union (since 2008). Formerly, Portfolio Manager at MFS Investment Management (investment management firm) (1994-2017). Other Directorships in the Last Five Years. Director of MSCI Inc. (global provider of investment decision support tools) (since 2017). Formerly, Director of DCT Industrial Trust Inc. (logistics real estate company) (2017-2018). |
| | | |
Susan J. Sutherland 1957 | | Trustee | | 2015 | | Private investor. Formerly, Associate, Counsel and Partner at Skadden, Arps, Slate, Meagher & Flom LLP (law firm) (1982-2013). Other Directorships in the Last Five Years.Formerly, Director of Montpelier Re Holdings Ltd. (global provider of customized insurance and reinsurance products) (2013-2015). |
| | | |
Scott E. Wennerholm 1959 | | Trustee | | 2016 | | Formerly, Trustee at Wheelock College (postsecondary institution) (2012-2018). Formerly, Consultant at GF Parish Group (executive recruiting firm) (2016-2017). Formerly, Chief Operating Officer and Executive Vice President at BNY Mellon Asset Management (investment management firm) (2005-2011). Formerly, Chief Operating Officer and Chief Financial Officer at Natixis Global Asset Management (investment management firm) (1997-2004). Formerly, Vice President at Fidelity Investments Institutional Services (investment management firm) (1994-1997). Other Directorships in the Last Five Years.None. |
| | | |
| Name and Year of Birth | | Position(s) with the Trust and the Portfolio | | Officer
Since(2) | | Principal Occupation(s) During Past Five Years |
| |
| Principal Officers who are not Trustees | | |
| | | |
Payson F. Swaffield 1956 | | President of the Trust | | 2003 | | Vice President and Chief Income Investment Officer of EVM and BMR. Also Vice President of Calvert Research and Management (“CRM”). |
| | | |
Edward J. Perkin 1972 | | President of the Portfolio | | 2014 | | Chief Equity Investment Officer and Vice President of EVM and BMR since 2014. Also Vice President of Calvert Research and Management (“CRM”) since 2016. |
Eaton Vance
Stock Fund
December 31, 2019
Management and Organization — continued
| | | | | | |
| Name and Year of Birth | | Position(s) with the Trust and the Portfolio | | Officer
Since(2) | | Principal Occupation(s) During Past Five Years |
| |
| Principal Officers who are not Trustees (continued) | | |
| | | |
Maureen A. Gemma 1960 | | Vice President, Secretary and Chief Legal Officer | | 2005 | | Vice President of EVM and BMR. Also Vice President of CRM. |
| | | |
James F. Kirchner 1967 | | Treasurer | | 2007 | | Vice President of EVM and BMR. Also Vice President of CRM. |
| | | |
Richard F. Froio 1968 | | Chief Compliance Officer | | 2017 | | Vice President of EVM and BMR since 2017. Formerly Deputy Chief Compliance Officer (Adviser/Funds) and Chief Compliance Officer (Distribution) at PIMCO (2012-2017) and Managing Director at BlackRock/Barclays Global Investors (2009-2012). |
| (1) | Year first appointed to serve as Trustee for a fund in the Eaton Vance family of funds. Each Trustee has served continuously since appointment unless indicated otherwise. |
| (2) | Year first elected to serve as officer of a fund in the Eaton Vance family of funds when the officer has served continuously. Otherwise, year of most recent election as an officer of a fund in the Eaton Vance family of funds. Titles may have changed since initial election. |
The SAI for the Fund includes additional information about the Trustees and officers of the Fund and the Portfolio and can be obtained without charge on
Eaton Vance’s website at www.eatonvance.com or by calling1-800-262-1122.
Eaton Vance Funds
IMPORTANT NOTICES
Privacy. The Eaton Vance organization is committed to ensuring your financial privacy. Each entity listed below has adopted a privacy policy and procedures (“Privacy Program”) Eaton Vance believes is reasonably designed to protect your personal information and to govern when and with whom Eaton Vance may share your personal information.
| • | | At the time of opening an account, Eaton Vance generally requires you to provide us with certain information such as name, address, social security number, tax status, account numbers, and account balances. This information is necessary for us to both open an account for you and to allow us to satisfy legal requirements such as applicable anti-money laundering reviews and know-your-customer requirements. |
| • | | On an ongoing basis, in the normal course of servicing your account, Eaton Vance may share your information with unaffiliated third parties that perform various services for Eaton Vance and/or your account. These third parties include transfer agents, custodians, broker/dealers and our professional advisers, including auditors, accountants, and legal counsel. Eaton Vance may additionally share your personal information with our affiliates. |
| • | | We believe our Privacy Program is reasonably designed to protect the confidentiality of your personal information and to prevent unauthorized access to that information. |
| • | | We reserve the right to change our Privacy Program at any time upon proper notification to you. You may want to review our Privacy Program periodically for changes by accessing the link on our homepage: www.eatonvance.com. |
Our pledge of protecting your personal information applies to the following entities within the Eaton Vance organization: the Eaton Vance Family of Funds,
Eaton Vance Management, Eaton Vance Investment Counsel, Eaton Vance Distributors, Inc., Eaton Vance Trust Company, Eaton Vance Management (International) Limited, Eaton Vance Advisers International Limited, Eaton Vance Global Advisors Limited, Eaton Vance Management’s Real Estate Investment Group, Boston Management and Research, Calvert Research and Management, and Calvert Funds. This Privacy Notice supersedes all previously issued privacy disclosures. For more information about our Privacy Program or about how your personal information may be used, please call1-800-262-1122.
Delivery of Shareholder Documents. The Securities and Exchange Commission (SEC) permits funds to deliver only one copy of shareholder documents, including prospectuses, proxy statements and shareholder reports, to fund investors with multiple accounts at the same residential or post office box address. This practice is often called “householding” and it helps eliminate duplicate mailings to shareholders.Eaton Vance, or your financial intermediary, may household the mailing of your documents indefinitely unless you instruct Eaton Vance, or your financial intermediary, otherwise.If you would prefer that your Eaton Vance documents not be householded, please contact Eaton Vance at1-800-262-1122, or contact your financial intermediary. Your instructions that householding not apply to delivery of your Eaton Vance documents will typically be effective within 30 days of receipt by Eaton Vance or your financial intermediary.
Portfolio Holdings. Each Eaton Vance Fund and its underlying Portfolio(s) (if applicable) files a schedule of portfolio holdings on Part F to FormN-PORT with the SEC for the first and third quarters of each fiscal year. The FormN-PORT will be available on the Eaton Vance website at www.eatonvance.com, by calling
Eaton Vance at1-800-262-1122 or in the EDGAR database on the SEC’s website at www.sec.gov.
Proxy Voting. From time to time, funds are required to vote proxies related to the securities held by the funds. The Eaton Vance Funds or their underlying Portfolios (if applicable) vote proxies according to a set of policies and procedures approved by the Funds’ and Portfolios’ Boards. You may obtain a description of these policies and procedures and information on how the Funds or Portfolios voted proxies relating to portfolio securities during the most recent12-month period ended June 30, without charge, upon request, by calling1-800-262-1122 and by accessing the SEC’s website at www.sec.gov.
Investment Adviser of Stock Portfolio
Boston Management and Research
Two International Place
Boston, MA 02110
Administrator of Eaton Vance Stock Fund
Eaton Vance Management
Two International Place
Boston, MA 02110
Principal Underwriter*
Eaton Vance Distributors, Inc.
Two International Place
Boston, MA 02110
(617)482-8260
Custodian
State Street Bank and Trust Company
State Street Financial Center, One Lincoln Street
Boston, MA 02111
Transfer Agent
BNY Mellon Investment Servicing (US) Inc.
Attn: Eaton Vance Funds
P.O. Box 9653
Providence, RI 02940-9653
(800)262-1122
Independent Registered Public Accounting Firm
Deloitte & Touche LLP
200 Berkeley Street
Boston, MA 02116-5022
Fund Offices
Two International Place
Boston, MA 02110
| * | FINRA BrokerCheck. Investors may check the background of their Investment Professional by contacting the Financial Industry Regulatory Authority (FINRA). FINRA BrokerCheck is a free tool to help investors check the professional background of current and former FINRA-registered securities firms and brokers. FINRA BrokerCheck is available by calling1-800-289-9999 and at www.FINRA.org. The FINRA BrokerCheck brochure describing this program is available to investors at www.FINRA.org. |

1325 12.31.19

Eaton Vance
Tax-Managed Growth Funds 1.1 and 1.2
Annual Report
December 31, 2019
Important Note. Beginning on January 1, 2021, as permitted by regulations adopted by the Securities and Exchange Commission, paper copies of the Fund’s annual and semi-annual shareholder reports will no longer be sent by mail unless you specifically request paper copies of the reports. Instead, the reports will be made available on the Fund’s website (eatonvance.com/funddocuments), and you will be notified by mail each time a report is posted and provided with a website address to access the report.
If you already elected to receive shareholder reports electronically, you will not be affected by this change and you need not take any action. If you are a direct investor, you may elect to receive shareholder reports and other communications from the Fund electronically by signing up for e-Delivery at eatonvance.com/edelivery. If you own your shares through a financial intermediary (such as a broker-dealer or bank), you must contact your financial intermediary to sign up.
You may elect to receive all future Fund shareholder reports in paper free of charge. If you are a direct investor, you can inform the Fund that you wish to continue receiving paper copies of your shareholder reports by calling 1-800-262-1122. If you own these shares through a financial intermediary, you must contact your financial intermediary or follow instructions included with this disclosure, if applicable, to elect to continue to receive paper copies of your shareholder reports. Your election to receive reports in paper will apply to all Eaton Vance funds held directly or to all funds held through your financial intermediary, as applicable.

Commodity Futures Trading Commission Registration. Effective December 31, 2012, the Commodity Futures Trading Commission (“CFTC”) adopted certain regulatory changes that subject registered investment companies and advisers to regulation by the CFTC if a fund invests more than a prescribed level of its assets in certain CFTC-regulated instruments (including futures, certain options and swap agreements) or markets itself as providing investment exposure to such instruments. Each Fund has claimed an exclusion from the definition of the term “commodity pool operator” under the Commodity Exchange Act. Accordingly, neither the Funds nor the adviser with respect to the operation of the Funds is subject to CFTC regulation. Because of its management of other strategies, each Fund’s adviser is registered with the CFTC as a commodity pool operator and a commodity trading advisor.
Fund shares are not insured by the FDIC and are not deposits or other obligations of, or guaranteed by, any depository institution. Shares are subject to investment risks, including possible loss of principal invested.
This report must be preceded or accompanied by a current summary prospectus or prospectus. Before investing, investors should consider carefully the investment objective, risks, and charges and expenses of a mutual fund. This and other important information is contained in the summary prospectus and prospectus, which can be obtained from a financial intermediary. Prospective investors should read the prospectus carefully before investing. For further information, please call 1-800-262-1122.
Annual ReportDecember 31, 2019
Eaton Vance
Tax-Managed Growth Funds 1.1 and 1.2
Table of Contents
| | | | |
Management’s Discussion of Fund Performance | | | 2 | |
| |
Performance | | | | |
| |
| | | | |
Tax-Managed Growth Fund 1.1 | | | 3 | |
Tax-Managed Growth Fund 1.2 | | | 4 | |
| |
| | | | |
| |
Fund Profile | | | 5 | |
| |
Endnotes and Additional Disclosures | | | 6 | |
| |
Fund Expenses | | | 7 | |
| |
Financial Statements | | | 9 | |
| |
Report of Independent Registered Public Accounting Firm | | | 25 and 46 | |
| |
Federal Tax Information | | | 26 | |
| |
Management and Organization | | | 47 | |
| |
Important Notices | | | 53 | |
Eaton Vance
Tax-Managed Growth Funds 1.1 and 1.2
December 31, 2019
Management’s Discussion of Fund Performance1
Economic and Market Conditions
With virtually every U.S. equity index posting strong double-digit returns for the12-month period ended December 31, 2019 — and bond markets solidly in the black as well — 2019 was a good year for investments.
As the new year dawned in January 2019, investors appeared to be taking a “glass is half full” approach. Although U.S. manufacturing output and business investment remained weak — held back by slowing global growth and anon-again/off-again U.S.-China trade war — strong spending by U.S. consumers and dovish remarks by the U.S. Federal Reserve (the Fed) combined to lift investor sentiment. After four federal funds rate hikes the previous year, markets began to project the Fed might actually lower rates in 2019 to stimulate the economy. U.S. unemployment, meanwhile, remained low and hiring remained strong.
As a result, U.S. stocks across multiple markets climbed from January through April 2019. Overseas, central banks around the world began to cut interest rates and employ other tools to stimulate their respective economies. Even a global stock pullback in May — sparked by heightened concerns about the U.S.-China trade spat — proved to be temporary, and the U.S. and global stock rallies resumed in June and July.
After holding interest rates steady through the first half of the year, the Fed cut the federal funds rate on July 31, 2019 — its first reduction in over a decade — followed by two additional rate cuts in September and October to end the period at1.50%-1.75%. By end of the third quarter, 60 central banks around the world had lowered their interest rates as well.
After falling in August, U.S. equities rallied again during the final months of the period, spurred by optimism about a U.S.-China trade détente and better-than-expected U.S. employment reports. The year ended with two events in December that did much to allay investor concerns about international trade and tariffs: passage of the United States-Mexico-Canada Agreement by the U.S. House of Representatives and the Trump administration’s agreement to aso-called “phase–one” trade deal with China.
During the12-month period ended December 31, 2019, the blue-chip Dow Jones Industrial Average®2 returned 25.34%, while the broader U.S. equity market, as measured by the S&P 500® Index, returned 31.49%. The technology-laden Nasdaq Composite Index returned 36.69% during the period.Large-cap U.S. stocks, as measured by the S&P 500® Index, generally outperformed theirsmall-cap counterparts, as measured by the Russell 2000® Index. As a group, growth stocks outpaced value stocks in both large- andsmall-cap categories, as measured by the Russell growth and value indexes.
Fund Performance
For the12-month period ended December 31, 2019, Eaton VanceTax-Managed Growth Fund 1.1 and Eaton VanceTax-Managed Growth Fund 1.2 (collectively, the Funds) returned 29.45% and 29.28%, respectively, for Class A shares at net asset value (NAV), underperforming their benchmark, the S&P 500® Index (the Index), which returned 31.49%.
The Funds underperformed relative to the Index largely due to stock selection. Sector and industry allocations were marginally positive. The Funds had positive returns in all 11 market sectors in the Index. The Index had positive returns in 10 sectors.
The industrials sector detracted most from relative Funds’ performance versus the Index during the period largely due to stock selection. In the aerospace & defense industry, aircraft manufacturer Boeing Co. (Boeing) was among the Funds’ worst performing individual stocks. The grounding of the 737 MAX aircraft after two crashes detracted from the Boeing’s operational results. The Funds’ overweight position in the lagging air freight & logistics industry also hampered returns relative to the Index during the period.
The information technology (IT) sector also detracted from Funds’ performance versus the Index due to subpar stock selection as well as the Funds’ underweight position in the outperforming sector. Within the IT sector, the communications equipment industry was a notable laggard during the period. Among the Funds’ weakest stocks was Arista Networks, Inc., a developer of cloud networking equipment. The stock price declined during the period due to disappointing financial results amid slowing infrastructure spending and increased competition. An underweight position in two outperforming stocks — consumer electronics company Apple, Inc. and software giant Microsoft Corp. — also detracted from relative Funds’ results.
Stock selection in the health care sector constrained relative returns versus the Index during the period. In particular, the Funds’ overweight position in the underperforming biotechnology industry hurt relative results. Within the industry, biopharmaceutical company AbbVie, Inc. was among the Funds’ weakest stocks as sales results disappointed amid slower growth and limited new product advances.
On the positive side, the consumer discretionary sector contributed to relative performance versus the Index aided by strong stock selection. In the outperforming hotels, restaurants & leisure industry, casual restaurant operator Chipotle Mexican Grill, Inc. was one of the Funds’ leading stocks after reporting positive sales and earnings results during the period.
The Funds’ underweight position in the lagging utilities sector also boosted relative Funds’ performance versus the Index during the period.
The communication services sector also contributed to returns relative to the Index mostly due to stock selection and a favorable overweight position. In particular, the interactive media & services industry delivered notable results. Leading social networking company Facebook, Inc. was among the Funds’ leading stocks after reporting double-digit revenue growth.
Overall, the Funds’ leading individual stock was Paycom Software, Inc., a cloud-based human capital management software provider. The company generated better-than-expected financial results driven by continued demand for its talent management software.
See Endnotes and Additional Disclosures in this report.
Past performance is no guarantee of future results. Returns are historical and are calculated by determining the percentage change in net asset value (NAV) or offering price (as applicable) with all distributions reinvested. Investment return and principal value will fluctuate so that shares, when redeemed, may be worth more or less than their original cost. Performance for periods less than or equal to one year is cumulative. Performance is for the stated time period only; due to market volatility, current Fund performance may be lower or higher than the quoted return. For performance as of the most recentmonth-end, please refer to eatonvance.com.
Eaton Vance
Tax-Managed Growth Fund 1.1
December 31, 2019
Performance2,3
Portfolio ManagersLewis R. Piantedosi, Michael A. Allison, CFA and Yana S. Barton, CFA
| | | | | | | | | | | | | | | | | | | | |
| % Average Annual Total Returns | | Class Inception Date | | | Performance Inception Date | | | One Year | | | Five Years | | | Ten Years | |
Class A at NAV | | | 03/28/1996 | | | | 03/29/1966 | | | | 29.45 | % | | | 10.71 | % | | | 12.34 | % |
Class A with 5.75% Maximum Sales Charge | | | — | | | | — | | | | 22.01 | | | | 9.41 | | | | 11.67 | |
Class C at NAV | | | 08/02/1996 | | | | 03/29/1966 | | | | 28.34 | | | | 9.88 | | | | 11.50 | |
Class C with 1% Maximum Sales Charge | | | — | | | | — | | | | 27.34 | | | | 9.88 | | | | 11.50 | |
Class I at NAV | | | 07/02/1999 | | | | 03/29/1966 | | | | 29.74 | | | | 10.99 | | | | 12.60 | |
S&P 500® Index | | | — | | | | — | | | | 31.49 | % | | | 11.69 | % | | | 13.55 | % |
| | | | | |
| | | | | | | | | | | | | | | | | | | | |
| % After-Tax Returns | | Class Inception Date | | | Performance
Inception Date | | | One Year | | | Five Years | | | Ten Years | |
Class A After Taxes on Distributions | | | 03/28/1996 | | | | 03/29/1966 | | | | 21.81 | % | | | 9.18 | % | | | 11.44 | % |
Class A After Taxes on Distributions and Sale of Fund Shares | | | — | | | | — | | | | 13.24 | | | | 7.71 | | | | 9.99 | |
Class C After Taxes on Distributions | | | 08/02/1996 | | | | 03/29/1966 | | | | 27.34 | | | | 9.82 | | | | 11.41 | |
Class C After Taxes on Distributions and Sale of Fund Shares | | | — | | | | — | | | | 16.18 | | | | 8.16 | | | | 9.89 | |
Class I After Taxes on Distributions | | | 07/02/1999 | | | | 03/29/1966 | | | | 29.45 | | | | 10.67 | | | | 12.29 | |
Class I After Taxes on Distributions and Sale of Fund Shares | | | — | | | | — | | | | 17.91 | | | | 9.03 | | | | 10.81 | |
| | | | | |
| | | | | | | | | | | | | | | | | | | | |
| % Total Annual Operating Expense Ratios4 | | | | | | | | Class A | | | Class C | | | Class I | |
| | | | | | | | | | | 0.79 | % | | | 1.54 | % | | | 0.54 | % |
Growth of $10,000
This graph shows the change in value of a hypothetical investment of $10,000 in Class A of the Fund for the period indicated. For comparison, the same investment is shown in the indicated index.
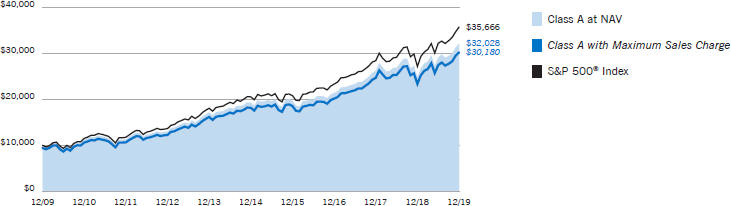
| | | | | | | | | | | | | | | | |
| Growth of Investment | | Amount Invested | | | Period Beginning | | | At NAV | | | With Maximum Sales Charge | |
Class C | | $ | 10,000 | | | | 12/31/2009 | | | $ | 29,714 | | | | N.A. | |
Class I | | $ | 250,000 | | | | 12/31/2009 | | | $ | 819,351 | | | | N.A. | |
See Endnotes and Additional Disclosures in this report.
Past performance is no guarantee of future results. Returns are historical and are calculated by determining the percentage change in net asset value (NAV) or offering price (as applicable) with all distributions reinvested. Investment return and principal value will fluctuate so that shares, when redeemed, may be worth more or less than their original cost. Performance for periods less than or equal to one year is cumulative. Performance is for the stated time period only; due to market volatility, current Fund performance may be lower or higher than the quoted return. For performance as of the most recentmonth-end, please refer to eatonvance.com.
Eaton Vance
Tax-Managed Growth Fund 1.2
December 31, 2019
Performance2,3
Portfolio ManagersLewis R. Piantedosi, Michael A. Allison, CFA and Yana S. Barton, CFA
| | | | | | | | | | | | | | | | | | | | |
| % Average Annual Total Returns | | Class Inception Date | | | Performance Inception Date | | | One Year | | | Five Years | | | Ten Years | |
Class A at NAV | | | 02/28/2001 | | | | 03/29/1966 | | | | 29.28 | % | | | 10.55 | % | | | 12.15 | % |
Class A with 5.75% Maximum Sales Charge | | | — | | | | — | | | | 21.85 | | | | 9.25 | | | | 11.49 | |
Class C at NAV | | | 02/28/2001 | | | | 03/29/1966 | | | | 28.22 | | | | 9.72 | | | | 11.31 | |
Class C with 1% Maximum Sales Charge | | | — | | | | — | | | | 27.22 | | | | 9.72 | | | | 11.31 | |
Class I at NAV | | | 02/28/2001 | | | | 03/29/1966 | | | | 29.61 | | | | 10.83 | | | | 12.42 | |
S&P 500® Index | | | — | | | | — | | | | 31.49 | % | | | 11.69 | % | | | 13.55 | % |
| | | | | |
| | | | | | | | | | | | | | | | | | | | |
| % After-Tax Returns | | Class
Inception Date | | | Performance
Inception Date | | | One Year | | | Five Years | | | Ten Years | |
Class A After Taxes on Distributions | | | 02/28/2001 | | | | 03/29/1966 | | | | 21.68 | % | | | 9.05 | % | | | 11.29 | % |
Class A After Taxes on Distributions and Sale of Fund Shares | | | — | | | | — | | | | 13.11 | | | | 7.58 | | | | 9.84 | |
Class C After Taxes on Distributions | | | 02/28/2001 | | | | 03/29/1966 | | | | 27.22 | | | | 9.70 | | | | 11.27 | |
Class C After Taxes on Distributions and Sale of Fund Shares | | | — | | | | — | | | | 16.12 | | | | 8.04 | | | | 9.74 | |
Class I After Taxes on Distributions | | | 02/28/2001 | | | | 03/29/1966 | | | | 29.38 | | | | 10.57 | | | | 12.17 | |
Class I After Taxes on Distributions and Sale of Fund Shares | | | — | | | | — | | | | 17.78 | | | | 8.91 | | | | 10.67 | |
| | | | | |
| | | | | | | | | | | | | | | | | | | | |
| % Total Annual Operating Expense Ratios4 | | | | | | | | Class A | | | Class C | | | Class I | |
| | | | | | | | | | | 0.94 | % | | | 1.69 | % | | | 0.69 | % |
Growth of $10,000
This graph shows the change in value of a hypothetical investment of $10,000 in Class A of the Fund for the period indicated. For comparison, the same investment is shown in the indicated index.
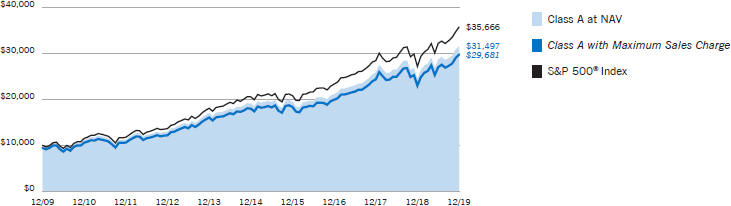
| | | | | | | | | | | | | | | | |
| Growth of Investment | | Amount Invested | | | Period Beginning | | | At NAV | | | With Maximum Sales Charge | |
Class C | | $ | 10,000 | | | | 12/31/2009 | | | $ | 29,224 | | | | N.A. | |
Class I | | $ | 250,000 | | | | 12/31/2009 | | | $ | 806,903 | | | | N.A. | |
See Endnotes and Additional Disclosures in this report.
Past performance is no guarantee of future results. Returns are historical and are calculated by determining the percentage change in net asset value (NAV) or offering price (as applicable) with all distributions reinvested. Investment return and principal value will fluctuate so that shares, when redeemed, may be worth more or less than their original cost. Performance for periods less than or equal to one year is cumulative. Performance is for the stated time period only; due to market volatility, current Fund performance may be lower or higher than the quoted return. For performance as of the most recentmonth-end, please refer to eatonvance.com.
Eaton Vance
Tax-Managed Growth Funds 1.1 and 1.2
December 31, 2019
Fund Profile5
Sector Allocation (% of net assets)6
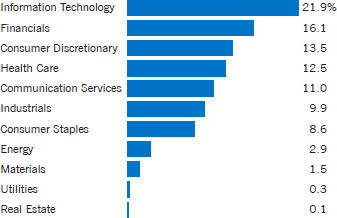
Top 10 Holdings (% of net assets)6
| | | | |
| |
Apple, Inc. | | | 3.7 | % |
| |
Amazon.com, Inc. | | | 3.3 | |
| |
Facebook, Inc., Class A | | | 3.2 | |
| |
Microsoft Corp. | | | 2.9 | |
| |
JPMorgan Chase & Co. | | | 2.5 | |
| |
Alphabet, Inc., Class C | | | 2.3 | |
| |
Intel Corp. | | | 2.0 | |
| |
Walt Disney Co. (The) | | | 2.0 | |
| |
Alphabet, Inc., Class A | | | 1.8 | |
| |
Berkshire Hathaway, Inc., Class B | | | 1.7 | |
| |
Total | | | 25.4 | % |
See Endnotes and Additional Disclosures in this report.
Eaton Vance
Tax-Managed Growth Funds 1.1 and 1.2
December 31, 2019
Endnotes and Additional Disclosures
| 1 | The views expressed in this report are those of the portfolio manager(s) and are current only through the date stated at the top of this page. These views are subject to change at any time based upon market or other conditions, and Eaton Vance and the Fund(s) disclaim any responsibility to update such views. These views may not be relied upon as investment advice and, because investment decisions are based on many factors, may not be relied upon as an indication of trading intent on behalf of any Eaton Vance fund. This commentary may contain statements that are not historical facts, referred to as “forward looking statements.” The Fund’s actual future results may differ significantly from those stated in any forward looking statement, depending on factors such as changes in securities or financial markets or general economic conditions, the volume of sales and purchases of Fund shares, the continuation of investment advisory, administrative and service contracts, and other risks discussed from time to time in the Fund’s filings with the Securities and Exchange Commission. |
| 2 | Dow Jones Industrial Average® is a price-weighted average of 30 blue-chip stocks that are generally the leaders in their industry. S&P 500® Index is an unmanaged index oflarge-cap stocks commonly used as a measure of U.S. stock market performance. S&P Dow Jones Indices are a product of S&P Dow Jones Indices LLC (“S&P DJI”) and have been licensed for use. S&P® and S&P 500® are registered trademarks of S&P DJI; Dow Jones® is a registered trademark of Dow Jones Trademark Holdings LLC (“Dow Jones”); S&P DJI, Dow Jones and their respective affiliates do not sponsor, endorse, sell or promote the Fund, will not have any liability with respect thereto and do not have any liability for any errors, omissions, or interruptions of the S&P Dow Jones Indices. Nasdaq Composite Index is a market capitalization-weighted index of all domestic and international securities listed on Nasdaq. Source: Nasdaq, Inc. The information is provided by Nasdaq (with its affiliates, are referred to as the “Corporations”) and Nasdaq’s third party licensors on an “as is” basis and the Corporations make no guarantees and bear no liability of any kind with respect to the information or the Fund. Russell 2000® Index is an unmanaged index of 2,000 U.S.small-cap stocks. Unless otherwise stated, index returns do not reflect the effect of any applicable sales charges, commissions, expenses, taxes or leverage, as applicable. It is not possible to invest directly in an index. |
| 3 | Total Returns at NAV do not include applicable sales charges. If sales charges were deducted, the returns would be lower. Total Returns shown with maximum sales charge reflect the stated maximum sales charge. Unless otherwise stated, performance does not reflect the deduction of taxes on Fund distributions or redemptions of Fund shares. Performance since inception for an index, if presented, is the performance since the Fund’s or oldest share class’ inception, as applicable.After-tax returns are calculated using certain assumptions, including using the highest historical individual federal income tax rates, and do not reflect the impact of state/local taxes. Actualafter-tax returns depend on a shareholder’s tax situation and the actual characterization of distributions and may differ from those shown.After-tax returns are not relevant to shareholders who hold shares intax-deferred accounts or shares held by nontaxable entities. Return After Taxes on Distributions may be the same as Return Before Taxes for the same period because no taxable distributions were made during that period. Return After Taxes on Distributions and Sale of Fund Shares may be greater than or equal to Return After Taxes on Distributions for the same period because of losses realized on the sale of Fund shares. The Fund’safter-tax returns also may reflect foreign tax credits passed by the Fund to its shareholders. |
| 4 | Source: Fund prospectus. The expense ratios for the current reporting period can be found in the Financial Highlights section of this report. |
| 5 | Fund invests in an affiliated investment company (Portfolio) with the same objective(s) and policies as the Fund. References to investments are to the Portfolio’s holdings. |
| 6 | Excludes cash and cash equivalents. |
| | Fund profile subject to change due to active management. |
Eaton Vance
Tax-Managed Growth Funds 1.1 and 1.2
December 31, 2019
Fund Expenses
Example: As a Fund shareholder, you incur two types of costs: (1) transaction costs, including sales charges (loads) on purchases and redemption fees (if applicable); and (2) ongoing costs, including management fees; distribution or service fees; and other Fund expenses. This Example is intended to help you understand your ongoing costs (in dollars) of Fund investing and to compare these costs with the ongoing costs of investing in other mutual funds. The Example is based on an investment of $1,000 invested at the beginning of the period and held for the entire period (July 1, 2019 – December 31, 2019).
Actual Expenses: The first section of the table below provides information about actual account values and actual expenses. You may use the information in this section, together with the amount you invested, to estimate the expenses that you paid over the period. Simply divide your account value by $1,000 (for example, an $8,600 account value divided by $1,000 = 8.6), then multiply the result by the number in the first section under the heading entitled “Expenses Paid During Period” to estimate the expenses you paid on your account during this period.
Hypothetical Example for Comparison Purposes: The second section of the table below provides information about hypothetical account values and hypothetical expenses based on the actual Fund expense ratio and an assumed rate of return of 5% per year (before expenses), which is not the actual Fund return. The hypothetical account values and expenses may not be used to estimate the actual ending account balance or expenses you paid for the period. You may use this information to compare the ongoing costs of investing in your Fund and other funds. To do so, compare this 5% hypothetical example with the 5% hypothetical examples that appear in the shareholder reports of the other funds.
Please note that the expenses shown in the table are meant to highlight your ongoing costs only and do not reflect any transactional costs, such as sales charges (loads) or redemption fees (if applicable). Therefore, the second section of the table is useful in comparing ongoing costs only, and will not help you determine the relative total costs of owning different funds. In addition, if these transactional costs were included, your costs would be higher.
Eaton Vance Tax-Managed Growth Fund 1.1
| | | | | | | | | | | | | | | | |
| | | Beginning
Account Value
(7/1/19) | | | Ending
Account Value
(12/31/19) | | | Expenses Paid
During Period*
(7/1/19 – 12/31/19) | | | Annualized
Expense
Ratio | |
| | | | |
Actual | | | | | | | | | | | | | | | | |
Class A | | $ | 1,000.00 | | | $ | 1,101.60 | | | $ | 4.08 | | | | 0.77 | % |
Class C | | $ | 1,000.00 | | | $ | 1,097.70 | | | $ | 8.04 | | | | 1.52 | % |
Class I | | $ | 1,000.00 | | | $ | 1,103.00 | | | $ | 2.76 | | | | 0.52 | % |
| | | | | |
Hypothetical | | | | | | | | | | | | | | | | |
(5% return per year before expenses) | | | | | | | | | | | | | | | | |
Class A | | $ | 1,000.00 | | | $ | 1,021.30 | | | $ | 3.92 | | | | 0.77 | % |
Class C | | $ | 1,000.00 | | | $ | 1,017.50 | | | $ | 7.73 | | | | 1.52 | % |
Class I | | $ | 1,000.00 | | | $ | 1,022.60 | | | $ | 2.65 | | | | 0.52 | % |
| * | Expenses are equal to the Fund’s annualized expense ratio for the indicated Class, multiplied by the average account value over the period, multiplied by 184/365 (to reflect the one-half year period). The Example assumes that the $1,000 was invested at the net asset value per share determined at the close of business on June 30, 2019. |
Eaton Vance
Tax-Managed Growth Funds 1.1 and 1.2
December 31, 2019
Fund Expenses — continued
Eaton Vance Tax-Managed Growth Fund 1.2
| | | | | | | | | | | | | | | | |
| | | Beginning
Account Value
(7/1/19) | | | Ending
Account Value
(12/31/19) | | | Expenses Paid
During Period*
(7/1/19 – 12/31/19) | | | Annualized
Expense
Ratio | |
| | | | |
Actual | | | | | | | | | | | | | | | | |
Class A | | $ | 1,000.00 | | | $ | 1,100.90 | | | $ | 4.87 | | | | 0.92 | % |
Class C | | $ | 1,000.00 | | | $ | 1,097.00 | | | $ | 8.83 | | | | 1.67 | % |
Class I | | $ | 1,000.00 | | | $ | 1,102.30 | | | $ | 3.55 | | | | 0.67 | % |
| | | | | |
Hypothetical | | | | | | | | | | | | | | | | |
(5% return per year before expenses) | | | | | | | | | | | | | | | | |
Class A | | $ | 1,000.00 | | | $ | 1,020.60 | | | $ | 4.69 | | | | 0.92 | % |
Class C | | $ | 1,000.00 | | | $ | 1,016.80 | | | $ | 8.49 | | | | 1.67 | % |
Class I | | $ | 1,000.00 | | | $ | 1,021.80 | | | $ | 3.41 | | | | 0.67 | % |
| * | Expenses are equal to the Fund’s annualized expense ratio for the indicated Class, multiplied by the average account value over the period, multiplied by 184/365 (to reflect the one-half year period). The Example assumes that the $1,000 was invested at the net asset value per share determined at the close of business on June 30, 2019. |
Eaton Vance
Tax-Managed Growth Funds 1.1 and 1.2
December 31, 2019
Statements of Assets and Liabilities
| | | | | | | | |
| | | December 31, 2019 | |
| Assets | | Tax-Managed
Growth Fund 1.1 | | | Tax-Managed
Growth Fund 1.2 | |
| | |
Investment in Tax-Managed Growth Portfolio, at value (identified cost, $398,416,620 and $337,618,828, respectively) | | $ | 1,770,599,551 | | | $ | 917,127,321 | |
| | |
Receivable for Fund shares sold | | | 88,645 | | | | 343,127 | |
| | |
Total assets | | $ | 1,770,688,196 | | | $ | 917,470,448 | |
|
| Liabilities | |
| | |
Payable for Fund shares redeemed | | $ | 6,831,922 | | | $ | 2,308,525 | |
|
Payable to affiliates: | |
| | |
Administration fee | | | — | | | | 114,753 | |
| | |
Distribution and service fees | | | 340,108 | | | | 183,920 | |
| | |
Trustees’ fees | | | 125 | | | | 125 | |
| | |
Accrued expenses | | | 288,850 | | | | 164,630 | |
| | |
Total liabilities | | $ | 7,461,005 | | | $ | 2,771,953 | |
| | |
Net Assets | | $ | 1,763,227,191 | | | $ | 914,698,495 | |
|
| Sources of Net Assets | |
| | |
Paid-in capital | | $ | 1,187,867,028 | | | $ | 793,528,474 | |
| | |
Distributable earnings | | | 575,360,163 | | | | 121,170,021 | |
| | |
Total | | $ | 1,763,227,191 | | | $ | 914,698,495 | |
|
| Class A Shares | |
| | |
Net Assets | | $ | 1,565,795,378 | | | $ | 629,529,935 | |
| | |
Shares Outstanding | | | 25,355,856 | | | | 22,670,216 | |
|
Net Asset Value and Redemption Price Per Share | |
| | |
(net assets ÷ shares of beneficial interest outstanding) | | $ | 61.75 | | | $ | 27.77 | |
|
Maximum Offering Price Per Share | |
| | |
(100 ÷ 94.25 of net asset value per share) | | $ | 65.52 | | | $ | 29.46 | |
|
| Class C Shares | |
| | |
Net Assets | | $ | 13,729,520 | | | $ | 61,397,403 | |
| | |
Shares Outstanding | | | 247,257 | | | | 2,271,487 | |
|
Net Asset Value and Offering Price Per Share* | |
| | |
(net assets ÷ shares of beneficial interest outstanding) | | $ | 55.53 | | | $ | 27.03 | |
|
| Class I Shares | |
| | |
Net Assets | | $ | 183,702,293 | | | $ | 223,771,157 | |
| | |
Shares Outstanding | | | 3,190,823 | | | | 8,041,983 | |
|
Net Asset Value, Offering Price and Redemption Price Per Share | |
| | |
(net assets ÷ shares of beneficial interest outstanding) | | $ | 57.57 | | | $ | 27.83 | |
On sales of $50,000 or more, the offering price of Class A shares is reduced.
| * | Redemption price per share is equal to the net asset value less any applicable contingent deferred sales charge. |
| | | | |
| | 9 | | See Notes to Financial Statements. |
Eaton Vance
Tax-Managed Growth Funds 1.1 and 1.2
December 31, 2019
Statements of Operations
| | | | | | | | |
| | | Year Ended December 31, 2019 | |
| Investment Income | | Tax-Managed
Growth Fund 1.1 | | | Tax-Managed
Growth Fund 1.2 | |
| | |
Dividends allocated from Portfolio (net of foreign taxes, $550,657 and $274,980, respectively) | | $ | 28,528,922 | | | $ | 14,431,117 | |
| | |
Expenses allocated from Portfolio | | | (7,380,478 | ) | | | (3,735,969 | ) |
| | |
Total investment income from Portfolio | | $ | 21,148,444 | | | $ | 10,695,148 | |
|
| Expenses | |
| | |
Administration fee | | $ | — | | | $ | 1,245,797 | |
|
Distribution and service fees | |
| | |
Class A | | | 3,620,892 | | | | 1,441,684 | |
| | |
Class B | | | 4,207 | | | | 3,991 | |
| | |
Class C | | | 279,211 | | | | 658,707 | |
| | |
Trustees’ fees and expenses | | | 500 | | | | 500 | |
| | |
Custodian fee | | | 69,976 | | | | 57,927 | |
| | |
Transfer and dividend disbursing agent fees | | | 819,248 | | | | 373,651 | |
| | |
Professional fees | | | 47,607 | | | | 36,570 | |
| | |
Printing and postage | | | 83,145 | | | | 45,081 | |
| | |
Registration fees | | | 85,447 | | | | 83,427 | |
| | |
Miscellaneous | | | 253,577 | | | | 86,560 | |
| | |
Total expenses | | $ | 5,263,810 | | | $ | 4,033,895 | |
| | |
Net investment income | | $ | 15,884,634 | | | $ | 6,661,253 | |
| | |
| Realized and Unrealized Gain (Loss) from Portfolio | | | | | | | | |
| | |
Net realized gain (loss) — | | | | | | | | |
| | |
Investment transactions(1) | | $ | 42,578,347 | | | $ | 21,562,037 | |
| | |
Foreign currency transactions | | | (6,926 | ) | | | (3,499 | ) |
| | |
Net realized gain | | $ | 42,571,421 | | | $ | 21,558,538 | |
| | |
Change in unrealized appreciation (depreciation) — | | | | | | | | |
| | |
Investments | | $ | 355,773,612 | | | $ | 180,245,262 | |
| | |
Foreign currency | | | 8,565 | | | | 4,393 | |
| | |
Net change in unrealized appreciation (depreciation) | | $ | 355,782,177 | | | $ | 180,249,655 | |
| | |
Net realized and unrealized gain | | $ | 398,353,598 | | | $ | 201,808,193 | |
| | |
Net increase in net assets from operations | | $ | 414,238,232 | | | $ | 208,469,446 | |
| (1) | Includes $43,482,436 and $22,020,008, respectively, of net realized gains from redemptions in-kind. |
| | | | |
| | 10 | | See Notes to Financial Statements. |
Eaton Vance
Tax-Managed Growth Funds 1.1 and 1.2
December 31, 2019
Statements of Changes in Net Assets
| | | | | | | | |
| | | Year Ended December 31, 2019 | |
| Increase (Decrease) in Net Assets | | Tax-Managed
Growth Fund 1.1 | | | Tax-Managed
Growth Fund 1.2 | |
| | |
From operations — | | | | | | | | |
| | |
Net investment income | | $ | 15,884,634 | | | $ | 6,661,253 | |
| | |
Net realized gain | | | 42,571,421 | | | | 21,558,538 | |
| | |
Net change in unrealized appreciation (depreciation) | | | 355,782,177 | | | | 180,249,655 | |
| | |
Net increase in net assets from operations | | $ | 414,238,232 | | | $ | 208,469,446 | |
| | |
Distributions to shareholders — | | | | | | | | |
| | |
Class A | | $ | (12,891,964 | ) | | $ | (4,346,325 | ) |
| | |
Class I | | | (2,075,519 | ) | | | (2,037,988 | ) |
| | |
Total distributions to shareholders | | $ | (14,967,483 | ) | | $ | (6,384,313 | ) |
| | |
Transactions in shares of beneficial interest — | | | | | | | | |
| | |
Proceeds from sale of shares | | | | | | | | |
| | |
Class A | | $ | 7,444,769 | | | $ | 18,357,473 | |
| | |
Class B | | | 5 | | | | 28 | |
| | |
Class C | | | 473,288 | | | | 6,587,230 | |
| | |
Class I | | | 166,808,130 | | | | 74,629,417 | |
| | |
Net asset value of shares issued to shareholders in payment of distributions declared | | | | | | | | |
| | |
Class A | | | 11,063,702 | | | | 3,897,004 | |
| | |
Class I | | | 1,680,754 | | | | 1,852,484 | |
| | |
Cost of shares redeemed | | | | | | | | |
| | |
Class A | | | (116,662,699 | ) | | | (53,203,916 | ) |
| | |
Class B | | | (40,812 | ) | | | (53,050 | ) |
| | |
Class C | | | (3,508,546 | ) | | | (11,669,202 | ) |
| | |
Class I | | | (160,424,924 | ) | | | (52,588,935 | ) |
| | |
Net asset value of shares converted(1) | | | | | | | | |
| | |
Class A | | | 201,454,316 | | | | 95,861,467 | |
| | |
Class B | | | (908,387 | ) | | | (736,564 | ) |
| | |
Class C | | | (200,545,930 | ) | | | (95,124,903 | ) |
| | |
Net decrease in net assets from Fund share transactions | | $ | (93,166,334 | ) | | $ | (12,191,467 | ) |
| | |
Net increase in net assets | | $ | 306,104,415 | | | $ | 189,893,666 | |
|
| Net Assets | |
| | |
At beginning of year | | $ | 1,457,122,776 | | | $ | 724,804,829 | |
| | |
At end of year | | $ | 1,763,227,191 | | | $ | 914,698,495 | |
| (1) | Includes the conversion of Class B to Class A shares at the close of business on October 15, 2019 upon the termination of Class B. |
| | | | |
| | 11 | | See Notes to Financial Statements. |
Eaton Vance
Tax-Managed Growth Funds 1.1 and 1.2
December 31, 2019
Statements of Changes in Net Assets — continued
| | | | | | | | |
| | | Year Ended December 31, 2018 | |
| Increase (Decrease) in Net Assets | | Tax-Managed
Growth Fund 1.1 | | | Tax-Managed
Growth Fund 1.2 | |
| | |
From operations — | | | | | | | | |
| | |
Net investment income | | $ | 13,606,957 | | | $ | 5,268,839 | |
| | |
Net realized gain | | | 44,417,999 | | | | 21,703,216 | |
| | |
Net change in unrealized appreciation (depreciation) | | | (137,410,583 | ) | | | (68,819,851 | ) |
| | |
Net decrease in net assets from operations | | $ | (79,385,627 | ) | | $ | (41,847,796 | ) |
| | |
Distributions to shareholders — | | | | | | | | |
| | |
Class A | | $ | (10,346,691 | ) | | $ | (3,179,321 | ) |
| | |
Class C | | | (329,696 | ) | | | — | |
| | |
Class I | | | (1,672,079 | ) | | | (1,560,470 | ) |
| | |
Total distributions to shareholders | | $ | (12,348,466 | ) | | $ | (4,739,791 | ) |
| | |
Transactions in shares of beneficial interest — | | | | | | | | |
| | |
Proceeds from sale of shares | | | | | | | | |
| | |
Class A | | $ | 13,916,145 | | | $ | 31,038,781 | |
| | |
Class B | | | 8,411 | | | | 25 | |
| | |
Class C | | | 703,554 | | | | 8,640,508 | |
| | |
Class I | | | 124,685,726 | | | | 77,458,490 | |
| | |
Net asset value of shares issued to shareholders in payment of distributions declared | | | | | | | | |
| | |
Class A | | | 8,651,898 | | | | 2,798,049 | |
| | |
Class C | | | 321,366 | | | | — | |
| | |
Class I | | | 1,282,979 | | | | 1,394,629 | |
| | |
Cost of shares redeemed | | | | | | | | |
| | |
Class A | | | (95,117,186 | ) | | | (52,676,828 | ) |
| | |
Class B | | | (239,204 | ) | | | (133,509 | ) |
| | |
Class C | | | (33,985,038 | ) | | | (31,508,302 | ) |
| | |
Class I | | | (93,741,234 | ) | | | (47,782,161 | ) |
| | |
Net asset value of shares converted | | | | | | | | |
| | |
Class A | | | 1,007,775 | | | | 952,863 | |
| | |
Class B | | | (1,007,775 | ) | | | (952,863 | ) |
| | |
Net decrease in net assets from Fund share transactions | | $ | (73,512,583 | ) | | $ | (10,770,318 | ) |
| | |
Net decrease in net assets | | $ | (165,246,676 | ) | | $ | (57,357,905 | ) |
|
| Net Assets | |
| | |
At beginning of year | | $ | 1,622,369,452 | | | $ | 782,162,734 | |
| | |
At end of year | | $ | 1,457,122,776 | | | $ | 724,804,829 | |
| | | | |
| | 12 | | See Notes to Financial Statements. |
Eaton Vance
Tax-Managed Growth Funds 1.1 and 1.2
December 31, 2019
Financial Highlights
| | | | | | | | | | | | | | | | | | | | |
| | | Tax-Managed Growth Fund 1.1 — Class A | |
| |
| | | Year Ended December 31, | |
| | | 2019 | | | 2018 | | | 2017 | | | 2016 | | | 2015 | |
| | | | | |
Net asset value — Beginning of year | | $ | 48.150 | | | $ | 51.300 | | | $ | 42.300 | | | $ | 39.330 | | | $ | 38.910 | |
| | | | | |
| Income (Loss) From Operations | | | | | | | | | | | | | | | | | | | | |
| | | | | |
Net investment income(1) | | $ | 0.539 | | | $ | 0.491 | | | $ | 0.467 | | | $ | 0.455 | | | $ | 0.435 | |
| | | | | |
Net realized and unrealized gain (loss) | | | 13.572 | | | | (3.192 | ) | | | 8.982 | | | | 2.964 | | | | 0.402 | |
| | | | | |
Total income (loss) from operations | | $ | 14.111 | | | $ | (2.701 | ) | | $ | 9.449 | | | $ | 3.419 | | | $ | 0.837 | |
| | | | | |
| Less Distributions | | | | | | | | | | | | | | | | | | | | |
| | | | | |
From net investment income | | $ | (0.511 | ) | | $ | (0.449 | ) | | $ | (0.449 | ) | | $ | (0.449 | ) | | $ | (0.417 | ) |
| | | | | |
Total distributions | | $ | (0.511 | ) | | $ | (0.449 | ) | | $ | (0.449 | ) | | $ | (0.449 | ) | | $ | (0.417 | ) |
| | | | | |
Net asset value — End of year | | $ | 61.750 | | | $ | 48.150 | | | $ | 51.300 | | | $ | 42.300 | | | $ | 39.330 | |
| | | | | |
Total Return(2) | | | 29.45 | % | | | (5.36 | )% | | | 22.35 | % | | | 8.68 | % | | | 2.15 | % |
| | | | | |
| Ratios/Supplemental Data | | | | | | | | | | | | | | | | | | | | |
| | | | | |
Net assets, end of year (000’s omitted) | | $ | 1,565,795 | | | $ | 1,116,349 | | | $ | 1,257,823 | | | $ | 1,068,182 | | | $ | 1,055,259 | |
| | | | | |
Ratios (as a percentage of average daily net assets):(3) | | | | | | | | | | | | | | | | | | | | |
| | | | | |
Expenses(4) | | | 0.78 | % | | | 0.79 | % | | | 0.79 | % | | | 0.81 | % | | | 0.82 | % |
| | | | | |
Net investment income | | | 0.96 | % | | | 0.92 | % | | | 1.00 | % | | | 1.14 | % | | | 1.10 | % |
| | | | | |
Portfolio Turnover of the Portfolio | | | 1 | %(5) | | | 1 | %(5) | | | 0 | %(5)(6) | | | 1 | %(5) | | | 9 | % |
| (1) | Computed using average shares outstanding. |
| (2) | Returns are historical and are calculated by determining the percentage change in net asset value with all distributions reinvested and do not reflect the effect of sales charges. |
| (3) | Includes the Fund’s share of the Portfolio’s allocated expenses. |
| (4) | Excludes the effect of custody fee credits, if any, of less than 0.005%. Effective September 1, 2015, custody fee credits, which were earned on cash deposit balances, were discontinued by the custodian. |
| (5) | Excludes the value of portfolio securities contributed or distributed as a result of in-kind shareholder transactions. The portfolio turnover of the Portfolio including in-kind contributions and distributions of securities was 6%, 6%, 5% and 6% for the years ended December 31, 2019, 2018, 2017 and 2016, respectively. |
| (6) | Amount is less than 0.5%. |
| | | | |
| | 13 | | See Notes to Financial Statements. |
Eaton Vance
Tax-Managed Growth Funds 1.1 and 1.2
December 31, 2019
Financial Highlights — continued
| | | | | | | | | | | | | | | | | | | | |
| | | Tax-Managed Growth Fund 1.1 — Class C | |
| |
| | | Year Ended December 31, | |
| | | 2019 | | | 2018 | | | 2017 | | | 2016 | | | 2015 | |
| | | | | |
Net asset value — Beginning of year | | $ | 43.280 | | | $ | 46.100 | | | $ | 38.040 | | | $ | 35.440 | | | $ | 35.100 | |
| | | | | |
| Income (Loss) From Operations | | | | | | | | | | | | | | | | | | | | |
| | | | | |
Net investment income (loss)(1) | | $ | (0.018 | ) | | $ | 0.082 | | | $ | 0.114 | | | $ | 0.140 | | | $ | 0.125 | |
| | | | | |
Net realized and unrealized gain (loss) | | | 12.268 | | | | (2.832 | ) | | | 8.047 | | | | 2.645 | | | | 0.365 | |
| | | | | |
Total income (loss) from operations | | $ | 12.250 | | | $ | (2.750 | ) | | $ | 8.161 | | | $ | 2.785 | | | $ | 0.490 | |
| | | | | |
| Less Distributions | | | | | | | | | | | | | | | | | | | | |
| | | | | |
From net investment income | | $ | — | | | $ | (0.070 | ) | | $ | (0.101 | ) | | $ | (0.185 | ) | | $ | (0.150 | ) |
| | | | | |
Total distributions | | $ | — | | | $ | (0.070 | ) | | $ | (0.101 | ) | | $ | (0.185 | ) | | $ | (0.150 | ) |
| | | | | |
Net asset value — End of year | | $ | 55.530 | | | $ | 43.280 | | | $ | 46.100 | | | $ | 38.040 | | | $ | 35.440 | |
| | | | | |
Total Return(2) | | | 28.34 | % | | | (5.99 | )% | | | 21.46 | % | | | 7.85 | % | | | 1.40 | % |
| | | | | |
| Ratios/Supplemental Data | | | | | | | | | | | | | | | | | | | | |
| | | | | |
Net assets, end of year (000’s omitted) | | $ | 13,730 | | | $ | 202,974 | | | $ | 248,201 | | | $ | 265,708 | | | $ | 263,896 | |
| | | | | |
Ratios (as a percentage of average daily net assets):(3) | | | | | | | | | | | | | | | | | | | | |
| | | | | |
Expenses(4) | | | 1.55 | % | | | 1.54 | % | | | 1.54 | % | | | 1.56 | % | | | 1.57 | % |
| | | | | |
Net investment income (loss) | | | (0.04 | )% | | | 0.17 | % | | | 0.27 | % | | | 0.39 | % | | | 0.35 | % |
| | | | | |
Portfolio Turnover of the Portfolio | | | 1 | %(5) | | | 1 | %(5) | | | 0 | %(5)(6) | | | 1 | %(5) | | | 9 | % |
| (1) | Computed using average shares outstanding. |
| (2) | Returns are historical and are calculated by determining the percentage change in net asset value with all distributions reinvested and do not reflect the effect of sales charges. |
| (3) | Includes the Fund’s share of the Portfolio’s allocated expenses. |
| (4) | Excludes the effect of custody fee credits, if any, of less than 0.005%. Effective September 1, 2015, custody fee credits, which were earned on cash deposit balances, were discontinued by the custodian. |
| (5) | Excludes the value of portfolio securities contributed or distributed as a result of in-kind shareholder transactions. The portfolio turnover of the Portfolio including in-kind contributions and distributions of securities was 6%, 6%, 5% and 6% for the years ended December 31, 2019, 2018, 2017 and 2016, respectively. |
| (6) | Amount is less than 0.5%. |
| | | | |
| | 14 | | See Notes to Financial Statements. |
Eaton Vance
Tax-Managed Growth Funds 1.1 and 1.2
December 31, 2019
Financial Highlights — continued
| | | | | | | | | | | | | | | | | | | | |
| | | Tax-Managed Growth Fund 1.1 — Class I | |
| |
| | | Year Ended December 31, | |
| | | 2019 | | | 2018 | | | 2017 | | | 2016 | | | 2015 | |
| | | | | |
Net asset value — Beginning of year | | $ | 44.920 | | | $ | 47.920 | | | $ | 39.530 | | | $ | 36.790 | | | $ | 36.430 | |
| | | | | |
| Income (Loss) From Operations | | | | | | | | | | | | | | | | | | | | |
| | | | | |
Net investment income(1) | | $ | 0.628 | | | $ | 0.584 | | | $ | 0.542 | | | $ | 0.516 | | | $ | 0.497 | |
| | | | | |
Net realized and unrealized gain (loss) | | | 12.675 | | | | (2.996 | ) | | | 8.414 | | | | 2.776 | | | | 0.381 | |
| | | | | |
Total income (loss) from operations | | $ | 13.303 | | | $ | (2.412 | ) | | $ | 8.956 | | | $ | 3.292 | | | $ | 0.878 | |
| | | | | |
| Less Distributions | | | | | | | | | | | | | | | | | | | | |
| | | | | |
From net investment income | | $ | (0.653 | ) | | $ | (0.588 | ) | | $ | (0.566 | ) | | $ | (0.552 | ) | | $ | (0.518 | ) |
| | | | | |
Total distributions | | $ | (0.653 | ) | | $ | (0.588 | ) | | $ | (0.566 | ) | | $ | (0.552 | ) | | $ | (0.518 | ) |
| | | | | |
Net asset value — End of year | | $ | 57.570 | | | $ | 44.920 | | | $ | 47.920 | | | $ | 39.530 | | | $ | 36.790 | |
| | | | | |
Total Return(2) | | | 29.74 | % | | | (5.11 | )% | | | 22.67 | % | | | 8.93 | % | | | 2.41 | % |
| | | | | |
| Ratios/Supplemental Data | | | | | | | | | | | | | | | | | | | | |
| | | | | |
Net assets, end of year (000’s omitted) | | $ | 183,702 | | | $ | 136,976 | | | $ | 114,276 | | | $ | 69,864 | | | $ | 50,278 | |
| | | | | |
Ratios (as a percentage of average daily net assets):(3) | | | | | | | | | | | | | | | | | | | | |
| | | | | |
Expenses(4) | | | 0.53 | % | | | 0.54 | % | | | 0.54 | % | | | 0.56 | % | | | 0.56 | % |
| | | | | |
Net investment income | | | 1.20 | % | | | 1.17 | % | | | 1.24 | % | | | 1.38 | % | | | 1.34 | % |
| | | | | |
Portfolio Turnover of the Portfolio | | | 1 | %(5) | | | 1 | %(5) | | | — | (5)(6) | | | 1 | %(5) | | | 9 | % |
| (1) | Computed using average shares outstanding. |
| (2) | Returns are historical and are calculated by determining the percentage change in net asset value with all distributions reinvested. |
| (3) | Includes the Fund’s share of the Portfolio’s allocated expenses. |
| (4) | Excludes the effect of custody fee credits, if any, of less than 0.005%. Effective September 1, 2015, custody fee credits, which were earned on cash deposit balances, were discontinued by the custodian. |
| (5) | Excludes the value of portfolio securities contributed or distributed as a result of in-kind shareholder transactions. The portfolio turnover of the Portfolio including in-kind contributions and distributions of securities was 6%, 6%, 5% and 6% for the years ended December 31, 2019, 2018, 2017 and 2016, respectively. |
| (6) | Amount is less than 0.5%. |
| | | | |
| | 15 | | See Notes to Financial Statements. |
Eaton Vance
Tax-Managed Growth Funds 1.1 and 1.2
December 31, 2019
Financial Highlights — continued
| | | | | | | | | | | | | | | | | | | | |
| | | Tax-Managed Growth Fund 1.2 — Class A | |
| |
| | | Year Ended December 31, | |
| | | 2019 | | | 2018 | | | 2017 | | | 2016 | | | 2015 | |
| | | | | |
Net asset value — Beginning of year | | $ | 21.650 | | | $ | 23.060 | | | $ | 19.020 | | | $ | 17.690 | | | $ | 17.500 | |
| | | | | |
| Income (Loss) From Operations | | | | | | | | | | | | | | | | | | | | |
| | | | | |
Net investment income(1) | | $ | 0.205 | | | $ | 0.184 | | | $ | 0.177 | | | $ | 0.176 | | | $ | 0.168 | |
| | | | | |
Net realized and unrealized gain (loss) | | | 6.108 | | | | (1.432 | ) | | | 4.035 | | | | 1.326 | | | | 0.187 | |
| | | | | |
Total income (loss) from operations | | $ | 6.313 | | | $ | (1.248 | ) | | $ | 4.212 | | | $ | 1.502 | | | $ | 0.355 | |
| | | | | |
| Less Distributions | | | | | | | | | | | | | | | | | | | | |
| | | | | |
From net investment income | | $ | (0.193 | ) | | $ | (0.162 | ) | | $ | (0.172 | ) | | $ | (0.172 | ) | | $ | (0.165 | ) |
| | | | | |
Total distributions | | $ | (0.193 | ) | | $ | (0.162 | ) | | $ | (0.172 | ) | | $ | (0.172 | ) | | $ | (0.165 | ) |
| | | | | |
Net asset value — End of year | | $ | 27.770 | | | $ | 21.650 | | | $ | 23.060 | | | $ | 19.020 | | | $ | 17.690 | |
| | | | | |
Total Return(2) | | | 29.28 | % | | | (5.50 | )% | | | 22.15 | % | | | 8.48 | % | | | 2.03 | % |
| | | | | |
| Ratios/Supplemental Data | | | | | | | | | | | | | | | | | | | | |
| | | | | |
Net assets, end of year (000’s omitted) | | $ | 629,530 | | | $ | 427,333 | | | $ | 472,741 | | | $ | 403,485 | | | $ | 379,685 | |
| | | | | |
Ratios (as a percentage of average daily net assets):(3) | | | | | | | | | | | | | | | | | | | | |
| | | | | |
Expenses(4) | | | 0.93 | % | | | 0.94 | % | | | 0.95 | % | | | 0.97 | % | | | 0.97 | % |
| | | | | |
Net investment income | | | 0.81 | % | | | 0.77 | % | | | 0.84 | % | | | 0.98 | % | | | 0.95 | % |
| | | | | |
Portfolio Turnover of the Fund(5) | | | — | | | | — | | | | 1 | % | | | — | | | | — | |
| | | | | |
Portfolio Turnover of the Portfolio | | | 1 | %(6) | | | 1 | %(6) | | | 0 | %(6)(7) | | | 1 | %(6) | | | 9 | % |
| (1) | Computed using average shares outstanding. |
| (2) | Returns are historical and are calculated by determining the percentage change in net asset value with all distributions reinvested and do not reflect the effect of sales charges. |
| (3) | Includes the Fund’s share of the Portfolio’s allocated expenses. |
| (4) | Excludes the effect of custody fee credits, if any, of less than 0.005%. Effective September 1, 2015, custody fee credits, which were earned on cash deposit balances, were discontinued by the custodian. |
| (5) | Excludes the value of Fund securities contributed or distributed as a result of in-kind transactions. The portfolio turnover of the Fund including in-kind contributions and distributions of securities was 3% for the year ended December 31, 2017. |
| (6) | Excludes the value of portfolio securities contributed or distributed as a result of in-kind shareholder transactions. The portfolio turnover of the Portfolio including in-kind contributions and distributions of securities was 6%, 6%, 5% and 6% for the years ended December 31, 2019, 2018, 2017 and 2016, respectively. |
| (7) | Amount is less than 0.5%. |
| | | | |
| | 16 | | See Notes to Financial Statements. |
Eaton Vance
Tax-Managed Growth Funds 1.1 and 1.2
December 31, 2019
Financial Highlights — continued
| | | | | | | | | | | | | | | | | | | | |
| | | Tax-Managed Growth Fund 1.2 — Class C | |
| |
| | | Year Ended December 31, | |
| | | 2019 | | | 2018 | | | 2017 | | | 2016 | | | 2015 | |
| | | | | |
Net asset value — Beginning of year | | $ | 21.080 | | | $ | 22.460 | | | $ | 18.530 | | | $ | 17.240 | | | $ | 17.070 | |
| | | | | |
| Income (Loss) From Operations | | | | | | | | | | | | | | | | | | | | |
| | | | | |
Net investment income(1) | | $ | 0.003 | | | $ | 0.004 | | | $ | 0.022 | | | $ | 0.041 | | | $ | 0.034 | |
| | | | | |
Net realized and unrealized gain (loss) | | | 5.947 | | | | (1.384 | ) | | | 3.912 | | | | 1.289 | | | | 0.176 | |
| | | | | |
Total income (loss) from operations | | $ | 5.950 | | | $ | (1.380 | ) | | $ | 3.934 | | | $ | 1.330 | | | $ | 0.210 | |
| | | | | |
| Less Distributions | | | | | | | | | | | | | | | | | | | | |
| | | | | |
From net investment income | | $ | — | | | $ | — | | | $ | (0.004 | ) | | $ | (0.040 | ) | | $ | (0.040 | ) |
| | | | | |
Total distributions | | $ | — | | | $ | — | | | $ | (0.004 | ) | | $ | (0.040 | ) | | $ | (0.040 | ) |
| | | | | |
Net asset value — End of year | | $ | 27.030 | | | $ | 21.080 | | | $ | 22.460 | | | $ | 18.530 | | | $ | 17.240 | |
| | | | | |
Total Return(2) | | | 28.22 | % | | | (6.14 | )% | | | 21.23 | % | | | 7.71 | % | | | 1.23 | % |
| | | | | |
| Ratios/Supplemental Data | | | | | | | | | | | | | | | | | | | | |
| | | | | |
Net assets, end of year (000’s omitted) | | $ | 61,397 | | | $ | 142,020 | | | $ | 173,289 | | | $ | 175,072 | | | $ | 173,494 | |
| | | | | |
Ratios (as a percentage of average daily net assets):(3) | | | | | | | | | | | | | | | | | | | | |
| | | | | |
Expenses(4) | | | 1.68 | % | | | 1.69 | % | | | 1.70 | % | | | 1.72 | % | | | 1.72 | % |
| | | | | |
Net investment income | | | 0.01 | % | | | 0.02 | % | | | 0.11 | % | | | 0.23 | % | | | 0.20 | % |
| | | | | |
Portfolio Turnover of the Fund(5) | | | — | | | | — | | | | 1 | % | | | — | | | | — | |
| | | | | |
Portfolio Turnover of the Portfolio | | | 1 | %(6) | | | 1 | %(6) | | | 0 | %(6)(7) | | | 1 | %(6) | | | 9 | % |
| (1) | Computed using average shares outstanding. |
| (2) | Returns are historical and are calculated by determining the percentage change in net asset value with all distributions reinvested and do not reflect the effect of sales charges. |
| (3) | Includes the Fund’s share of the Portfolio’s allocated expenses. |
| (4) | Excludes the effect of custody fee credits, if any, of less than 0.005%. Effective September 1, 2015, custody fee credits, which were earned on cash deposit balances, were discontinued by the custodian. |
| (5) | Excludes the value of Fund securities contributed or distributed as a result of in-kind transactions. The portfolio turnover of the Fund including in-kind contributions and distributions of securities was 3% for the year ended December 31, 2017. |
| (6) | Excludes the value of portfolio securities contributed or distributed as a result of in-kind shareholder transactions. The portfolio turnover of the Portfolio including in-kind contributions and distributions of securities was 6%, 6%, 5% and 6% for the years ended December 31, 2019, 2018, 2017 and 2016, respectively. |
| (7) | Amount is less than 0.5%. |
| | | | |
| | 17 | | See Notes to Financial Statements. |
Eaton Vance
Tax-Managed Growth Funds 1.1 and 1.2
December 31, 2019
Financial Highlights — continued
| | | | | | | | | | | | | | | | | | | | |
| | | Tax-Managed Growth Fund 1.2 — Class I | |
| |
| | | Year Ended December 31, | |
| | | 2019 | | | 2018 | | | 2017 | | | 2016 | | | 2015 | |
| | | | | |
Net asset value — Beginning of year | | $ | 21.690 | | | $ | 23.110 | | | $ | 19.060 | | | $ | 17.720 | | | $ | 17.530 | |
| | | | | |
| Income (Loss) From Operations | | | | | | | | | | | | | | | | | | | | |
| | | | | |
Net investment income(1) | | $ | 0.266 | | | $ | 0.244 | | | $ | 0.229 | | | $ | 0.221 | | | $ | 0.213 | |
| | | | | |
Net realized and unrealized gain (loss) | | | 6.130 | | | | (1.439 | ) | | | 4.046 | | | | 1.336 | | | | 0.187 | |
| | | | | |
Total income (loss) from operations | | $ | 6.396 | | | $ | (1.195 | ) | | $ | 4.275 | | | $ | 1.557 | | | $ | 0.400 | |
| | | | | |
| Less Distributions | | | | | | | | | | | | | | | | | | | | |
| | | | | |
From net investment income | | $ | (0.256 | ) | | $ | (0.225 | ) | | $ | (0.225 | ) | | $ | (0.217 | ) | | $ | (0.210 | ) |
| | | | | |
Total distributions | | $ | (0.256 | ) | | $ | (0.225 | ) | | $ | (0.225 | ) | | $ | (0.217 | ) | | $ | (0.210 | ) |
| | | | | |
Net asset value — End of year | | $ | 27.830 | | | $ | 21.690 | | | $ | 23.110 | | | $ | 19.060 | | | $ | 17.720 | |
| | | | | |
Total Return(2) | | | 29.61 | % | | | (5.25 | )% | | | 22.44 | % | | | 8.77 | % | | | 2.28 | % |
| | | | | |
| Ratios/Supplemental Data | | | | | | | | | | | | | | | | | | | | |
| | | | | |
Net assets, end of year (000’s omitted) | | $ | 223,771 | | | $ | 154,772 | | | $ | 134,355 | | | $ | 78,948 | | | $ | 61,538 | |
| | | | | |
Ratios (as a percentage of average daily net assets):(3) | | | | | | | | | | | | | | | | | | | | |
| | | | | |
Expenses(4) | | | 0.68 | % | | | 0.69 | % | | | 0.70 | % | | | 0.72 | % | | | 0.72 | % |
| | | | | |
Net investment income | | | 1.05 | % | | | 1.02 | % | | | 1.09 | % | | | 1.23 | % | | | 1.20 | % |
| | | | | |
Portfolio Turnover of the Fund(5) | | | — | | | | — | | | | 1 | % | | | — | | | | — | |
| | | | | |
Portfolio Turnover of the Portfolio | | | 1 | %(6) | | | 1 | %(6) | | | 0 | %(6)(7) | | | 1 | %(6) | | | 9 | % |
| (1) | Computed using average shares outstanding. |
| (2) | Returns are historical and are calculated by determining the percentage change in net asset value with all distributions reinvested. |
| (3) | Includes the Fund’s share of the Portfolio’s allocated expenses. |
| (4) | Excludes the effect of custody fee credits, if any, of less than 0.005%. Effective September 1, 2015, custody fee credits, which were earned on cash deposit balances, were discontinued by the custodian. |
| (5) | Excludes the value of Fund securities contributed or distributed as a result of in-kind transactions. The portfolio turnover of the Fund including in-kind contributions and distributions of securities was 3% for the year ended December 31, 2017. |
| (6) | Excludes the value of portfolio securities contributed or distributed as a result of in-kind shareholder transactions. The portfolio turnover of the Portfolio including in-kind contributions and distributions of securities was 6%, 6%, 5% and 6% for the years ended December 31, 2019, 2018, 2017 and 2016, respectively. |
| (7) | Amount is less than 0.5%. |
| | | | |
| | 18 | | See Notes to Financial Statements. |
Eaton Vance
Tax-Managed Growth Funds 1.1 and 1.2
December 31, 2019
Notes to Financial Statements
1 Significant Accounting Policies
Eaton Vance Tax-Managed Growth Fund 1.1 (Tax-Managed Growth Fund 1.1) and Eaton Vance Tax-Managed Growth Fund 1.2 (Tax-Managed Growth Fund 1.2) (each a Fund, and collectively the Funds) are diversified series of the Eaton Vance Mutual Funds Trust (the Trust). The Trust is a Massachusetts business trust registered under the Investment Company Act of 1940, as amended (the 1940 Act), as an open-end management investment company. Each Fund currently offers Class A, Class C and Class I shares. Class A shares are generally sold subject to a sales charge imposed at time of purchase. Class C shares are sold at net asset value and are generally subject to a contingent deferred sales charge (see Note 5). Effective January 25, 2019, Class C shares generally automatically convert to Class A shares ten years after their purchase as described in the Fund’s prospectus. Class I shares are sold at net asset value and are not subject to a sales charge. Each Fund previously offered Class B shares, which beginning January 1, 2012, were only available for purchase upon exchange from another Eaton Vance fund or through reinvestment of distributions. Class B shares automatically converted to Class A shares eight years after their purchase as described in the Fund’s prospectus. At the close of business on October 15, 2019, Class B shares were converted into Class A shares and Class B was terminated. Tax-Managed Growth Fund 1.1 is closed to new investors. Each class represents a pro-rata interest in each Fund, but votes separately on class-specific matters and (as noted below) is subject to different expenses. Realized and unrealized gains and losses and net investment income and losses, other than class-specific expenses, are allocated daily to each class of shares based on the relative net assets of each class to the total net assets of the Fund. Each class of shares differs in its distribution plan and certain other class-specific expenses. Each Fund typically invests all of its investable assets in interests in Tax-Managed Growth Portfolio (the Portfolio), a Massachusetts business trust, having the same investment objective and policies as the Funds. The value of each Fund’s investment in the Portfolio reflects the Fund’s proportionate interest in the net assets of the Portfolio (8.0% and 4.2% for Tax-Managed Growth Fund 1.1 and Tax-Managed Growth Fund 1.2, respectively, at December 31, 2019). The performance of each Fund is directly affected by the performance of the Portfolio. The financial statements of the Portfolio, including the portfolio of investments, are included elsewhere in this report and should be read in conjunction with the Funds’ financial statements.
The following is a summary of significant accounting policies of the Funds. The policies are in conformity with accounting principles generally accepted in the United States of America (U.S. GAAP). Each Fund is an investment company and follows accounting and reporting guidance in the Financial Accounting Standards Board (FASB) Accounting Standards Codification Topic 946 “Financial Services – Investment Companies.”
A Investment Valuation — Valuation of securities by the Portfolio is discussed in Note 1A of the Portfolio’s Notes to Financial Statements, which are included elsewhere in this report.
B Income — Each Fund’s net investment income or loss consists of the Fund’s pro-rata share of the net investment income or loss of the Portfolio, less all actual and accrued expenses of the Fund.
C Federal Taxes — Each Fund’s policy is to comply with the provisions of the Internal Revenue Code applicable to regulated investment companies and to distribute to shareholders each year substantially all of its net investment income, and all or substantially all of its net realized capital gains. Accordingly, no provision for federal income or excise tax is necessary.
As of December 31, 2019, the Funds had no uncertain tax positions that would require financial statement recognition, de-recognition, or disclosure. Each Fund files a U.S. federal income tax return annually after its fiscal year-end, which is subject to examination by the Internal Revenue Service for a period of three years from the date of filing.
D Expenses — The majority of expenses of the Trust are directly identifiable to an individual fund. Expenses which are not readily identifiable to a specific fund are allocated taking into consideration, among other things, the nature and type of expense and the relative size of the funds.
E Use of Estimates — The preparation of the financial statements in conformity with U.S. GAAP requires management to make estimates and assumptions that affect the reported amounts of assets and liabilities at the date of the financial statements and the reported amounts of income and expense during the reporting period. Actual results could differ from those estimates.
F Indemnifications — Under the Trust’s organizational documents, its officers and Trustees may be indemnified against certain liabilities and expenses arising out of the performance of their duties to each Fund. Under Massachusetts law, if certain conditions prevail, shareholders of a Massachusetts business trust (such as the Trust) could be deemed to have personal liability for the obligations of the Trust. However, the Trust’s Declaration of Trust contains an express disclaimer of liability on the part of Fund shareholders and the By-laws provide that the Trust shall assume, upon request by the shareholder, the defense on behalf of any Fund shareholders. Moreover, the By-laws also provide for indemnification out of Fund property of any shareholder held personally liable solely by reason of being or having been a shareholder for all loss or expense arising from such liability. Additionally, in the normal course of business, each Fund enters into agreements with service providers that may contain indemnification clauses. Each Fund’s maximum exposure under these arrangements is unknown as this would involve future claims that may be made against each Fund that have not yet occurred.
G Other — Investment transactions are accounted for on a trade date basis. Realized gains and losses on investments sold are determined on the basis of identified cost.
Eaton Vance
Tax-Managed Growth Funds 1.1 and 1.2
December 31, 2019
Notes to Financial Statements — continued
2 Distributions to Shareholders and Income Tax Information
It is the present policy of each Fund to make at least one distribution annually (normally in December) of all or substantially all of its net investment income and to distribute annually all or substantially all of its net realized capital gains (reduced by available capital loss carryforwards from prior years). Distributions to shareholders are recorded on the ex-dividend date. Distributions are declared separately for each class of shares. Shareholders may reinvest income and capital gain distributions in additional shares of the same class of a Fund at the net asset value as of the ex-dividend date or, at the election of the shareholder, receive distributions in cash. Distributions to shareholders are determined in accordance with income tax regulations, which may differ from U.S. GAAP. As required by U.S. GAAP, only distributions in excess of tax basis earnings and profits are reported in the financial statements as a return of capital. Permanent differences between book and tax accounting relating to distributions are reclassified to paid-in capital. For tax purposes, distributions from short-term capital gains are considered to be from ordinary income.
The tax character of distributions declared for the years ended December 31, 2019 and December 31, 2018 was as follows:
| | | | | | | | |
| | | Year Ended December 31, 2019 | |
| | | Tax-Managed
Growth Fund 1.1 | | | Tax-Managed
Growth Fund 1.2 | |
| | |
Distributions declared from: | | | | | | | | |
| | |
Ordinary income | | $ | 14,967,483 | | | $ | 6,384,313 | |
| |
| | | Year Ended December 31, 2018 | |
| | | Tax-Managed
Growth Fund 1.1 | | | Tax-Managed
Growth Fund 1.2 | |
| | |
Distributions declared from: | | | | | | | | |
| | |
Ordinary income | | $ | 12,348,466 | | | $ | 4,739,791 | |
During the year ended December 31, 2019, the following amounts were reclassified due to the Funds’ use of equalization accounting and differences between book and tax accounting for the Fund’s investment in the Portfolio. Tax equalization accounting allows the Funds to treat as a distribution that portion of redemption proceeds representing a redeeming shareholder’s portion of undistributed taxable income and net capital gains.
| | | | | | | | |
| | | |
Change in: | | | | | | | | |
| | |
Paid-in capital | | $ | 92,314,600 | | | $ | 22,430,430 | |
| | |
Distributable earnings | | $ | (92,314,600 | ) | | $ | (22,430,430 | ) |
These reclassifications had no effect on the net assets or net asset value per share of the Funds.
As of December 31, 2019, the components of distributable earnings (accumulated loss) and unrealized appreciation (depreciation) on a tax basis were as follows:
| | | | | | | | |
| | | Tax-Managed
Growth Fund 1.1 | | | Tax-Managed
Growth Fund 1.2 | |
| | |
Deferred capital losses | | $ | (5,010,421 | ) | | $ | (1,606,688 | ) |
| | |
Net unrealized appreciation | | $ | 580,370,584 | | | $ | 122,776,709 | |
At December 31, 2019, the Funds, for federal income tax purposes, had deferred capital losses which would reduce the respective Fund’s taxable income arising from future net realized gains on investment transactions, if any, to the extent permitted by the Internal Revenue Code, and thus would reduce the amount of distributions to shareholders, which would otherwise be necessary to relieve the Funds of any liability for federal income or excise tax. The
Eaton Vance
Tax-Managed Growth Funds 1.1 and 1.2
December 31, 2019
Notes to Financial Statements — continued
deferred capital losses are treated as arising on the first day of the respective Fund’s next taxable year and retain the same short-term or long-term character as when originally deferred. The amounts of the deferred capital losses are as follows:
| | | | | | | | |
| | | Tax-Managed
Growth Fund 1.1 | | | Tax-Managed
Growth Fund 1.2 | |
| | |
Deferred capital losses | | | | | | | | |
| | |
Short-term | | $ | 5,010,421 | | | $ | 1,597,050 | |
| | |
Long-term | | | — | | | | 9,638 | |
3 Transactions with Affiliates
Eaton Vance Management (EVM) serves as the administrator to the Funds. EVM receives no compensation from Tax-Managed Growth Fund 1.1 for such services and a fee computed at an annual rate of 0.15% of average daily net assets from Tax-Managed Growth Fund 1.2 for such services. For the year ended December 31, 2019, the administration fee for Tax-Managed Growth Fund 1.2 amounted to $1,245,797. The Portfolio has engaged Boston Management and Research (BMR), a subsidiary of EVM, to render investment advisory services. See Note 2 of the Portfolio’s Notes to Financial Statements which are included elsewhere in this report.
EVM provides sub-transfer agency and related services to the Funds pursuant to a Sub-Transfer Agency Support Services Agreement. Eaton Vance Distributors, Inc. (EVD), an affiliate of EVM and the Funds’ principal underwriter, received a portion of the sales charge on sales of Class A shares of the Funds. EVD also received distribution and service fees from Class A, Class B and Class C shares (see Note 4) and contingent deferred sales charges (see Note 5). Sub-transfer agent fees earned by EVM, which are included in transfer and dividend disbursing agent fees on the Statements of Operations, and Class A sales charges that the Funds were informed were received by EVD for the year ended December 31, 2019 were as follows:
| | | | | | | | |
| | | Tax-Managed
Growth Fund 1.1 | | | Tax-Managed
Growth Fund 1.2 | |
| | |
EVM’s Sub-Transfer Agent Fees | | $ | 226,402 | | | $ | 80,749 | |
| | |
EVD’s Class A Sales Charges | | $ | 17,350 | | | $ | 52,680 | |
Trustees and officers of the Funds who are members of EVM’s or BMR’s organizations receive remuneration for their services to the Funds out of the investment adviser fee. Certain officers and Trustees of the Funds and the Portfolio are officers of the above organizations.
4 Distribution Plans
Each Fund has in effect a distribution plan for Class A shares (Class A Plan) pursuant to Rule 12b-1 under the 1940 Act. Pursuant to the Class A Plan, each Fund pays EVD a distribution and service fee of 0.25% per annum of its average daily net assets attributable to Class A shares for distribution services and facilities provided to each Fund by EVD, as well as for personal services and/or the maintenance of shareholder accounts. Distribution and service fees paid or accrued to EVD for the year ended December 31, 2019 for Class A shares amounted to the following:
| | | | | | | | |
| | | Tax-Managed
Growth Fund 1.1 | | | Tax-Managed
Growth Fund 1.2 | |
| | |
Class A Distribution and Service Fees | | $ | 3,620,892 | | | $ | 1,441,684 | |
Each Fund also has in effect distribution plans for Class C shares (Class C Plan) and, prior to the close of business on October 15, 2019, Class B shares (Class B Plan) pursuant to Rule 12b-1 under the 1940 Act. Pursuant to the Class B and Class C Plans, each Fund paid/pays EVD amounts equal to 0.75% per annum of its average daily net assets attributable to Class B and Class C shares for providing ongoing distribution services and facilities to the respective Fund. For the year ended December 31, 2019, the Funds paid or accrued to EVD the following distribution fees:
| | | | | | | | |
| | | Tax-Managed
Growth Fund 1.1 | | | Tax-Managed
Growth Fund 1.2 | |
| | |
Class B Distribution Fees | | $ | 3,155 | | | $ | 2,993 | |
| | |
Class C Distribution Fees | | $ | 209,408 | | | $ | 494,030 | |
Eaton Vance
Tax-Managed Growth Funds 1.1 and 1.2
December 31, 2019
Notes to Financial Statements — continued
Pursuant to the Class B (prior to the close of business on October 15, 2019), and Class C Plans, each Fund also made/makes payments of service fees to EVD, financial intermediaries and other persons in amounts equal to 0.25% per annum of its average daily net assets attributable to that class. Service fees paid or accrued are for personal services and/or the maintenance of shareholder accounts. They are separate and distinct from the sales commissions and distribution fees payable to EVD. Service fees paid or accrued for the year ended December 31, 2019 amounted to the following:
| | | | | | | | |
| | | Tax-Managed
Growth Fund 1.1 | | | Tax-Managed
Growth Fund 1.2 | |
| | |
Class B Service Fees | | $ | 1,052 | | | $ | 998 | |
| | |
Class C Service Fees | | $ | 69,803 | | | $ | 164,677 | |
Distribution and service fees are subject to the limitations contained in the Financial Industry Regulatory Authority Rule 2341(d).
5 Contingent Deferred Sales Charges
A contingent deferred sales charge (CDSC) generally is imposed on redemptions of Class C shares made within one year of purchase and, prior to the close of business on October 15, 2019, on redemptions of Class B shares made within six years of purchase. Class A shares may be subject to a 1% CDSC if redeemed within 18 months of purchase (depending on the circumstances of purchase). Generally, the CDSC is based upon the lower of the net asset value at date of redemption or date of purchase. No charge is levied on shares acquired by reinvestment of dividends or capital gain distributions. The CDSC for Class B shares was imposed at declining rates that began at 5% in the case of redemptions in the first and second year after purchase, declining one percentage point each subsequent year. Class C shares are subject to a 1% CDSC if redeemed within one year of purchase. For the year ended December 31, 2019, the Funds were informed that EVD received approximately the following amounts of CDSCs paid by Class A, Class B, and Class C shareholders:
| | | | | | | | |
| | | Tax-Managed
Growth Fund 1.1 | | | Tax-Managed
Growth Fund 1.2 | |
| | |
Class A | | $ | — | | | $ | 5,000 | |
| | |
Class B | | $ | — | | | $ | — | |
| | |
Class C | | $ | 200 | | | $ | 3,000 | |
6 Investment Transactions
For the year ended December 31, 2019, increases and decreases in each Fund’s investment in the Portfolio aggregated, as follows:
| | | | | | | | |
| Fund | | Increases | | | Decreases | |
| | |
Tax-Managed Growth Fund 1.1 | | $ | 20,077,636 | | | $ | 127,098,225 | |
| | |
Tax-Managed Growth Fund 1.2 | | $ | 16,998,321 | | | $ | 38,249,603 | |
Decreases in each Fund’s investment in the Portfolio include distributions of securities as the result of redemptions in-kind, as follows:
| | | | |
| Fund | | Redemptions
in-kind | |
| |
Tax-Managed Growth Fund 1.1 | | $ | 113,877,312 | |
| |
Tax-Managed Growth Fund 1.2 | | | 27,006,610 | |
7 Shares of Beneficial Interest
Each Fund’s Declaration of Trust permits the Trustees to issue an unlimited number of full and fractional shares of beneficial interest (without par value). Such shares may be issued in a number of different series (such as the Funds) and classes. Sales and redemptions of Class I shares include shares
Eaton Vance
Tax-Managed Growth Funds 1.1 and 1.2
December 31, 2019
Notes to Financial Statements — continued
purchased and redeemed in connection with the ReFlow liquidity program, a program designed to provide an alternative liquidity source for mutual funds experiencing net redemptions of their shares. Transactions in Fund shares were as follows:
| | | | | | | | | | | | | | | | |
Tax-Managed Growth Fund 1.1 | | | | | | | | | | | | |
| | | Year Ended December 31, 2019 | |
| | | Class A | | | Class B(1) | | | Class C | | | Class I | |
| | | | |
Sales | | | 131,208 | | | | — | | | | 9,884 | | | | 3,202,823 | |
| | | | |
Issued to shareholders electing to receive payments of distributions in Fund shares | | | 180,191 | | | | — | | | | — | | | | 29,363 | |
| | | | |
Redemptions | | | (2,089,668 | ) | | | (439 | ) | | | (71,725 | ) | | | (3,090,733 | ) |
| | | | |
Converted from Class B shares | | | 16,311 | | | | — | | | | — | | | | — | |
| | | | |
Converted from Class C shares | | | 3,934,421 | | | | — | | | | — | | | | — | |
| | | | |
Converted to Class A shares | | | — | | | | (16,908 | ) | | | (4,381,065 | ) | | | — | |
| | | | |
Net increase (decrease) | | | 2,172,463 | | | | (17,347 | ) | | | (4,442,906 | ) | | | 141,453 | |
| |
| | | Year Ended December 31, 2018 | |
| | | Class A | | | Class B | | | Class C | | | Class I | |
| | | | |
Sales | | | 263,086 | | | | 161 | | | | 14,755 | | | | 2,521,491 | |
| | | | |
Issued to shareholders electing to receive payments of distributions in Fund shares | | | 180,624 | | | | — | | | | 7,463 | | | | 28,715 | |
| | | | |
Redemptions | | | (1,796,496 | ) | | | (4,576 | ) | | | (716,133 | ) | | | (1,885,774 | ) |
| | | | |
Converted from Class B shares | | | 18,867 | | | | — | | | | — | | | | — | |
| | | | |
Converted to Class A shares | | | — | | | | (19,228 | ) | | | — | | | | — | |
| | | | |
Net increase (decrease) | | | (1,333,919 | ) | | | (23,643 | ) | | | (693,915 | ) | | | 664,432 | |
| (1) | At the close of business on October 15, 2019, Class B shares were converted into Class A and Class B was terminated. |
Eaton Vance
Tax-Managed Growth Funds 1.1 and 1.2
December 31, 2019
Notes to Financial Statements — continued
| | | | | | | | | | | | | | | | |
Tax-Managed Growth Fund 1.2 | | | | | | | | | | | | |
| | | Year Ended December 31, 2019 | |
| | | Class A | | | Class B(1) | | | Class C | | | Class I | |
| | | | |
Sales | | | 732,485 | | | | 1 | | | | 269,131 | | | | 2,932,826 | |
| | | | |
Issued to shareholders electing to receive payments of distributions in Fund shares | | | 141,145 | | | | — | | | | — | | | | 66,973 | |
| | | | |
Redemptions | | | (2,110,088 | ) | | | (2,261 | ) | | | (478,274 | ) | | | (2,093,275 | ) |
| | | | |
Converted from Class B shares | | | 30,189 | | | | — | | | | — | | | | — | |
| | | | |
Converted from Class C shares | | | 4,139,683 | | | | — | | | | — | | | | — | |
| | | | |
Converted to Class A shares | | | — | | | | (29,380 | ) | | | (4,255,437 | ) | | | — | |
| | | | |
Net increase (decrease) | | | 2,933,414 | | | | (31,640 | ) | | | (4,464,580 | ) | | | 906,524 | |
| |
| | | Year Ended December 31, 2018 | |
| | | Class A | | | Class B | | | Class C | | | Class I | |
| | | | |
Sales | | | 1,299,425 | | | | 1 | | | | 375,180 | | | | 3,272,616 | |
| | | | |
Issued to shareholders electing to receive payments of distributions in Fund shares | | | 129,900 | | | | — | | | | — | | | | 64,656 | |
| | | | |
Redemptions | | | (2,231,307 | ) | | | (5,713 | ) | | | (1,355,642 | ) | | | (2,015,026 | ) |
| | | | |
Converted from Class B shares | | | 39,861 | | | | — | | | | — | | | | — | |
| | | | |
Converted to Class A shares | | | — | | | | (40,275 | ) | | | — | | | | — | |
| | | | |
Net increase (decrease) | | | (762,121 | ) | | | (45,987 | ) | | | (980,462 | ) | | | 1,322,246 | |
| (1) | At the close of business on October 15, 2019, Class B shares were converted into Class A and Class B was terminated. |
Eaton Vance
Tax-Managed Growth Funds 1.1 and 1.2
December 31, 2019
Report of Independent Registered Public Accounting Firm
To the Trustees of Eaton Vance Mutual Funds Trust and Shareholders of Eaton Vance Tax-Managed Growth Fund 1.1 and Eaton Vance Tax-Managed Growth Fund 1.2:
Opinion on the Financial Statements and Financial Highlights
We have audited the accompanying statements of assets and liabilities of Eaton Vance Tax-Managed Growth Fund 1.1 and Eaton Vance Tax-Managed Growth Fund 1.2 (collectively the “Funds”) (each a fund constituting Eaton Vance Mutual Funds Trust), as of December 31, 2019, the related statements of operations for the year then ended, the statements of changes in net assets for each of the two years in the period then ended, the financial highlights for each of the five years in the period then ended, and the related notes. In our opinion, the financial statements and financial highlights present fairly, in all material respects, the financial position of the Funds as of December 31, 2019, and the results of their operations for the year then ended, the changes in their net assets for each of the two years in the period then ended, and the financial highlights for each of the five years in the period then ended, in conformity with accounting principles generally accepted in the United States of America.
Basis for Opinion
These financial statements and financial highlights are the responsibility of the Funds’ management. Our responsibility is to express an opinion on the Funds’ financial statements and financial highlights based on our audits. We are a public accounting firm registered with the Public Company Accounting Oversight Board (United States) (PCAOB) and are required to be independent with respect to the Funds in accordance with the U.S. federal securities laws and the applicable rules and regulations of the Securities and Exchange Commission and the PCAOB.
We conducted our audits in accordance with the standards of the PCAOB. Those standards require that we plan and perform the audits to obtain reasonable assurance about whether the financial statements and financial highlights are free of material misstatement, whether due to error or fraud. The Funds are not required to have, nor were we engaged to perform, an audit of their internal control over financial reporting. As part of our audits we are required to obtain an understanding of internal control over financial reporting but not for the purpose of expressing an opinion on the effectiveness of the Funds’ internal control over financial reporting. Accordingly, we express no such opinion.
Our audits included performing procedures to assess the risks of material misstatement of the financial statements and financial highlights, whether due to error or fraud, and performing procedures that respond to those risks. Such procedures included examining, on a test basis, evidence regarding the amounts and disclosures in the financial statements and financial highlights. Our audits also included evaluating the accounting principles used and significant estimates made by management, as well as evaluating the overall presentation of the financial statements and financial highlights. We believe that our audits provide a reasonable basis for our opinion.
/s/ Deloitte & Touche LLP
Boston, Massachusetts
February 21, 2020
We have served as the auditor of one or more Eaton Vance investment companies since 1959.
Eaton Vance
Tax-Managed Growth Funds 1.1 and 1.2
December 31, 2019
Federal Tax Information (Unaudited)
The Form 1099-DIV you received in February 2020 showed the tax status of all distributions paid to your account in calendar year 2019. Shareholders are advised to consult their own tax adviser with respect to the tax consequences of their investment in the Fund. As required by the Internal Revenue Code and/or regulations, shareholders must be notified regarding the status of qualified dividend income for individuals and the dividends received deduction for corporations.
Qualified Dividend Income. For the fiscal year ended December 31, 2019, the Funds designate approximately the following amounts, or up to the maximum amount of such dividends allowable pursuant to the Internal Revenue Code, as qualified dividend income eligible for the reduced tax rate of 15%.
| | | | |
| |
Tax-Managed Growth Fund 1.1 | | $ | 28,048,573 | |
| |
Tax-Managed Growth Fund 1.2 | | $ | 14,184,697 | |
Dividends Received Deduction. Corporate shareholders are generally entitled to take the dividends received deduction on the portion of the Funds’ dividend distribution that qualifies under tax law. For the Funds’ fiscal 2019 ordinary income dividends, the following amounts qualify for the corporate dividends received deduction.
| | | | |
| |
Tax-Managed Growth Fund 1.1 | | | 100 | % |
| |
Tax-Managed Growth Fund 1.2 | | | 100 | % |
Tax-Managed Growth Portfolio
December 31, 2019
Portfolio of Investments
| | | | | | | | |
| Common Stocks— 98.3% | |
| Security | | Shares | | | Value | |
|
| Aerospace & Defense — 2.5% | |
| | |
Arconic, Inc. | | | 4 | | | $ | 123 | |
| | |
Boeing Co. (The) | | | 881,665 | | | | 287,211,190 | |
| | |
General Dynamics Corp. | | | 139,307 | | | | 24,566,789 | |
| | |
Huntington Ingalls Industries, Inc. | | | 1,096 | | | | 274,964 | |
| | |
L3Harris Technologies, Inc. | | | 2,240 | | | | 443,229 | |
| | |
Lockheed Martin Corp. | | | 80,559 | | | | 31,368,063 | |
| | |
Northrop Grumman Corp. | | | 48,050 | | | | 16,527,759 | |
| | |
Raytheon Co. | | | 246,559 | | | | 54,178,875 | |
| | |
Textron, Inc. | | | 1,025 | | | | 45,715 | |
| | |
TransDigm Group, Inc. | | | 847 | | | | 474,320 | |
| | |
United Technologies Corp. | | | 842,360 | | | | 126,151,834 | |
| | |
| | | | | | | $ | 541,242,861 | |
|
| Air Freight & Logistics — 1.4% | |
| | |
C.H. Robinson Worldwide, Inc. | | | 1,056,440 | | | $ | 82,613,608 | |
| | |
Expeditors International of Washington, Inc. | | | 1,300 | | | | 101,426 | |
| | |
FedEx Corp. | | | 344,010 | | | | 52,017,752 | |
| | |
United Parcel Service, Inc., Class B | | | 1,558,497 | | | | 182,437,659 | |
| | |
XPO Logistics, Inc.(1) | | | 30,000 | | | | 2,391,000 | |
| | |
| | | | | | | $ | 319,561,445 | |
|
| Airlines — 0.0%(2) | |
| | |
American Airlines Group, Inc. | | | 66,989 | | | $ | 1,921,244 | |
| | |
Delta Air Lines, Inc. | | | 56,768 | | | | 3,319,793 | |
| | |
Southwest Airlines Co. | | | 27,758 | | | | 1,498,377 | |
| | |
| | | | | | | $ | 6,739,414 | |
|
| Auto Components — 0.6% | |
| | |
Adient PLC(1) | | | 15,055 | | | $ | 319,919 | |
| | |
Aptiv PLC | | | 887,200 | | | | 84,257,384 | |
| | |
BorgWarner, Inc. | | | 800 | | | | 34,704 | |
| | |
Dorman Products, Inc.(1) | | | 20,445 | | | | 1,548,095 | |
| | |
Garrett Motion, Inc.(1) | | | 36,184 | | | | 361,478 | |
| | |
Gentex Corp. | | | 1,443,192 | | | | 41,823,704 | |
| | |
| | | | | | | $ | 128,345,284 | |
|
| Automobiles — 0.1% | |
| | |
Daimler AG | | | 38,000 | | | $ | 2,070,240 | |
| | |
Ford Motor Co. | | | 1,212,584 | | | | 11,277,031 | |
| | |
General Motors Co. | | | 79,498 | | | | 2,909,627 | |
| | |
Harley-Davidson, Inc. | | | 20,162 | | | | 749,825 | |
| | |
Tesla, Inc.(1) | | | 7,397 | | | | 3,094,387 | |
| | |
Toyota Motor Corp. ADR | | | 5,000 | | | | 702,700 | |
| | |
| | | | | | | $ | 20,803,810 | |
| | | | | | | | |
| Security | | Shares | | | Value | |
|
| Banks — 6.2% | |
| | |
Bank of America Corp. | | | 3,427,178 | | | $ | 120,705,209 | |
| | |
Bank of Montreal | | | 4 | | | | 310 | |
| | |
CIT Group, Inc. | | | 1,490 | | | | 67,989 | |
| | |
Citigroup, Inc. | | | 860,598 | | | | 68,753,174 | |
| | |
Commerce Bancshares, Inc. | | | 66,314 | | | | 4,505,373 | |
| | |
CVB Financial Corp. | | | 608,432 | | | | 13,129,963 | |
| | |
Fifth Third Bancorp | | | 1,545,175 | | | | 47,498,680 | |
| | |
First Republic Bank | | | 1,200 | | | | 140,940 | |
| | |
HSBC Holdings PLC | | | 220,592 | | | | 1,725,927 | |
| | |
HSBC Holdings PLC ADR | | | 424 | | | | 16,574 | |
| | |
Huntington Bancshares, Inc. | | | 144,510 | | | | 2,179,211 | |
| | |
ING Groep NV ADR | | | 131,510 | | | | 1,584,696 | |
| | |
JPMorgan Chase & Co. | | | 3,943,238 | | | | 549,687,377 | |
| | |
KeyCorp | | | 111,489 | | | | 2,256,537 | |
| | |
M&T Bank Corp. | | | 230,611 | | | | 39,146,217 | |
| | |
Pinnacle Financial Partners, Inc. | | | 34,686 | | | | 2,219,904 | |
| | |
PNC Financial Services Group, Inc. (The) | | | 103,180 | | | | 16,470,624 | |
| | |
Regions Financial Corp. | | | 731,394 | | | | 12,550,721 | |
| | |
Societe Generale SA | | | 460,793 | | | | 16,080,737 | |
| | |
Sterling Bancorp | | | 103,627 | | | | 2,184,457 | |
| | |
SVB Financial Group(1) | | | 28,107 | | | | 7,055,981 | |
| | |
Synovus Financial Corp. | | | 1,565 | | | | 61,348 | |
| | |
Toronto-Dominion Bank (The) | | | 569 | | | | 31,938 | |
| | |
Truist Financial Corp. | | | 1,890,538 | | | | 106,475,100 | |
| | |
U.S. Bancorp | | | 1,223,475 | | | | 72,539,833 | |
| | |
Wells Fargo & Co. | | | 5,046,234 | | | | 271,487,389 | |
| | |
Western Alliance Bancorp | | | 23,987 | | | | 1,367,259 | |
| | |
| | | | | | | $ | 1,359,923,468 | |
|
| Beverages — 2.4% | |
| | |
Anheuser-Busch InBev SA/NV ADR | | | 25,379 | | | $ | 2,082,093 | |
| | |
Boston Beer Co., Inc. (The), Class A(1) | | | 4,730 | | | | 1,787,231 | |
| | |
Brown-Forman Corp., Class A | | | 10,699 | | | | 671,576 | |
| | |
Brown-Forman Corp., Class B | | | 347,685 | | | | 23,503,506 | |
| | |
Coca-Cola Co. (The) | | | 3,498,673 | | | | 193,651,551 | |
| | |
Constellation Brands, Inc., Class A | | | 39,872 | | | | 7,565,712 | |
| | |
Diageo PLC ADR | | | 8,226 | | | | 1,385,423 | |
| | |
Keurig Dr Pepper, Inc. | | | 2,700 | | | | 78,165 | |
| | |
Molson Coors Brewing Co., Class B | | | 186,000 | | | | 10,025,400 | |
| | |
Monster Beverage Corp.(1) | | | 171,250 | | | | 10,882,937 | |
| | |
PepsiCo, Inc. | | | 2,047,051 | | | | 279,770,460 | |
| | |
| | | | | | | $ | 531,404,054 | |
| | | | |
| | 27 | | See Notes to Financial Statements. |
Tax-Managed Growth Portfolio
December 31, 2019
Portfolio of Investments — continued
| | | | | | | | |
| Security | | Shares | | | Value | |
|
| Biotechnology — 2.8% | |
| | |
AbbVie, Inc. | | | 1,403,016 | | | $ | 124,223,037 | |
| | |
Agios Pharmaceuticals, Inc.(1) | | | 74,972 | | | | 3,579,913 | |
| | |
Alexion Pharmaceuticals, Inc.(1) | | | 470,965 | | | | 50,934,865 | |
| | |
Alkermes PLC(1) | | | 5,000 | | | | 102,000 | |
| | |
Alnylam Pharmaceuticals, Inc.(1) | | | 188,700 | | | | 21,732,579 | |
| | |
Amgen, Inc. | | | 603,952 | | | | 145,594,709 | |
| | |
Argenx SE ADR(1) | | | 308,910 | | | | 49,586,233 | |
| | |
Biogen, Inc.(1) | | | 108,957 | | | | 32,330,810 | |
| | |
Bluebird Bio, Inc.(1) | | | 77,845 | | | | 6,830,899 | |
| | |
Exact Sciences Corp.(1) | | | 130,554 | | | | 12,073,634 | |
| | |
Gilead Sciences, Inc. | | | 981,135 | | | | 63,754,152 | |
| | |
Incyte Corp.(1) | | | 82,222 | | | | 7,179,625 | |
| | |
Neurocrine Biosciences, Inc.(1) | | | 64,045 | | | | 6,884,197 | |
| | |
Regeneron Pharmaceuticals, Inc.(1) | | | 20,995 | | | | 7,883,202 | |
| | |
Vertex Pharmaceuticals, Inc.(1) | | | 343,283 | | | | 75,161,813 | |
| | |
| | | | | | | $ | 607,851,668 | |
|
| Building Products — 0.4% | |
| | |
A.O. Smith Corp. | | | 27,845 | | | $ | 1,326,536 | |
| | |
Fortune Brands Home & Security, Inc. | | | 2,923 | | | | 190,989 | |
| | |
Johnson Controls International PLC | | | 345,321 | | | | 14,058,018 | |
| | |
Lennox International, Inc. | | | 236,627 | | | | 57,729,889 | |
| | |
Lennox International, Inc.(3) | | | 25,181 | | | | 6,143,409 | |
| | |
Masco Corp. | | | 25,000 | | | | 1,199,750 | |
| | |
Resideo Technologies, Inc.(1) | | | 60,308 | | | | 719,474 | |
| | |
| | | | | | | $ | 81,368,065 | |
|
| Capital Markets — 4.4% | |
| | |
Affiliated Managers Group, Inc. | | | 58,716 | | | $ | 4,975,594 | |
| | |
Ameriprise Financial, Inc. | | | 216,131 | | | | 36,003,102 | |
| | |
Bank of New York Mellon Corp. (The) | | | 476,763 | | | | 23,995,482 | |
| | |
BlackRock, Inc. | | | 11,190 | | | | 5,625,213 | |
| | |
Brookfield Asset Management, Inc., Class A | | | 88,282 | | | | 5,102,700 | |
| | |
Cboe Global Markets, Inc. | | | 175,414 | | | | 21,049,680 | |
| | |
Charles Schwab Corp. (The) | | | 3,896,040 | | | | 185,295,662 | |
| | |
CME Group, Inc. | | | 220,294 | | | | 44,217,412 | |
| | |
E*TRADE Financial Corp. | | | 4,593 | | | | 208,385 | |
| | |
FactSet Research Systems, Inc. | | | 11,308 | | | | 3,033,936 | |
| | |
FactSet Research Systems, Inc.(3) | | | 75,000 | | | | 20,117,469 | |
| | |
Federated Investors, Inc., Class B | | | 549 | | | | 17,892 | |
| | |
Franklin Resources, Inc. | | | 211,191 | | | | 5,486,742 | |
| | |
Goldman Sachs Group, Inc. (The) | | | 759,181 | | | | 174,558,487 | |
| | |
Intercontinental Exchange, Inc. | | | 152,641 | | | | 14,126,925 | |
| | |
Invesco Ltd. | | | 1,367 | | | | 24,579 | |
| | |
Legg Mason, Inc. | | | 122,902 | | | | 4,413,411 | |
| | | | | | | | |
| Security | | Shares | | | Value | |
|
| Capital Markets(continued) | |
| | |
LPL Financial Holdings, Inc. | | | 215,573 | | | $ | 19,886,609 | |
| | |
Moody’s Corp. | | | 246,080 | | | | 58,421,853 | |
| | |
Morgan Stanley | | | 2,565,982 | | | | 131,173,000 | |
| | |
Nasdaq, Inc. | | | 71,203 | | | | 7,625,841 | |
| | |
Northern Trust Corp. | | | 2,500 | | | | 265,600 | |
| | |
Raymond James Financial, Inc. | | | 39,363 | | | | 3,521,414 | |
| | |
S&P Global, Inc. | | | 247,057 | | | | 67,458,914 | |
| | |
SEI Investments Co. | | | 150,000 | | | | 9,822,000 | |
| | |
State Street Corp. | | | 457,614 | | | | 36,197,267 | |
| | |
Stifel Financial Corp. | | | 112,796 | | | | 6,841,077 | |
| | |
T. Rowe Price Group, Inc. | | | 587,312 | | | | 71,558,094 | |
| | |
UBS Group AG(1) | | | 9 | | | | 113 | |
| | |
Waddell & Reed Financial, Inc., Class A | | | 9,248 | | | | 154,627 | |
| | |
| | | | | | | $ | 961,179,080 | |
|
| Chemicals — 1.3% | |
| | |
AdvanSix, Inc.(1) | | | 1,768 | | | $ | 35,289 | |
| | |
Air Products and Chemicals, Inc. | | | 10,421 | | | | 2,448,831 | |
| | |
Albemarle Corp. | | | 90,157 | | | | 6,585,067 | |
| | |
Balchem Corp. | | | 17,292 | | | | 1,757,386 | |
| | |
Celanese Corp. | | | 16,713 | | | | 2,057,705 | |
| | |
Chemours Co. (The) | | | 151 | | | | 2,732 | |
| | |
Corteva, Inc.(1) | | | 488,916 | | | | 14,452,357 | |
| | |
Dow, Inc.(1) | | | 299,401 | | | | 16,386,217 | |
| | |
DuPont de Nemours, Inc. | | | 494,104 | | | | 31,721,477 | |
| | |
Eastman Chemical Co. | | | 650 | | | | 51,519 | |
| | |
Ecolab, Inc. | | | 584,286 | | | | 112,761,355 | |
| | |
International Flavors & Fragrances, Inc. | | | 5,000 | | | | 645,100 | |
| | |
Linde PLC | | | 6,143 | | | | 1,307,845 | |
| | |
LyondellBasell Industries NV, Class A | | | 4,274 | | | | 403,807 | |
| | |
NewMarket Corp. | | | 12,318 | | | | 5,992,953 | |
| | |
PPG Industries, Inc. | | | 410,020 | | | | 54,733,570 | |
| | |
Sherwin-Williams Co. (The) | | | 52,582 | | | | 30,683,700 | |
| | |
Westlake Chemical Corp. | | | 1,000 | | | | 70,150 | |
| | |
| | | | | | | $ | 282,097,060 | |
|
| Commercial Services & Supplies — 0.2% | |
| | |
Copart, Inc.(1) | | | 3,800 | | | $ | 345,572 | |
| | |
Pitney Bowes, Inc. | | | 14,270 | | | | 57,508 | |
| | |
Republic Services, Inc. | | | 1,750 | | | | 156,853 | |
| | |
Rollins, Inc. | | | 28,750 | | | | 953,350 | |
| | |
Stericycle, Inc.(1) | | | 8,000 | | | | 510,480 | |
| | |
Waste Connections, Inc. | | | 115,655 | | | | 10,500,317 | |
| | |
Waste Management, Inc. | | | 203,580 | | | | 23,199,977 | |
| | |
| | | | | | | $ | 35,724,057 | |
| | | | |
| | 28 | | See Notes to Financial Statements. |
Tax-Managed Growth Portfolio
December 31, 2019
Portfolio of Investments — continued
| | | | | | | | |
| Security | | Shares | | | Value | |
|
| Communications Equipment — 1.4% | |
| | |
Arista Networks, Inc.(1) | | | 777,596 | | | $ | 158,163,026 | |
| | |
Cisco Systems, Inc. | | | 2,668,130 | | | | 127,963,515 | |
| | |
Juniper Networks, Inc. | | | 285,300 | | | | 7,026,939 | |
| | |
Motorola Solutions, Inc. | | | 38,385 | | | | 6,185,359 | |
| | |
Nokia Oyj ADR | | | 192 | | | | 712 | |
| | |
| | | | | | | $ | 299,339,551 | |
|
| Construction & Engineering — 0.0%(2) | |
| | |
Fluor Corp. | | | 3,250 | | | $ | 61,360 | |
| | |
Jacobs Engineering Group, Inc. | | | 83,115 | | | | 7,466,220 | |
| | |
Quanta Services, Inc. | | | 2,000 | | | | 81,420 | |
| | |
| | | | | | | $ | 7,609,000 | |
|
| Construction Materials — 0.0%(2) | |
| | |
Vulcan Materials Co. | | | 38,764 | | | $ | 5,581,628 | |
| | |
| | | | | | | $ | 5,581,628 | |
|
| Consumer Finance — 1.4% | |
| | |
American Express Co. | | | 1,054,634 | | | $ | 131,291,387 | |
| | |
Capital One Financial Corp. | | | 132,363 | | | | 13,621,476 | |
| | |
Discover Financial Services | | | 1,248,041 | | | | 105,858,838 | |
| | |
LendingClub Corp.(1) | | | 15,938 | | | | 201,138 | |
| | |
Navient Corp. | | | 10,200 | | | | 139,536 | |
| | |
SLM Corp. | | | 10,200 | | | | 90,882 | |
| | |
Synchrony Financial | | | 1,642,244 | | | | 59,137,206 | |
| | |
| | | | | | | $ | 310,340,463 | |
|
| Containers & Packaging — 0.1% | |
| | |
Amcor PLC(1) | | | 723,751 | | | $ | 7,845,461 | |
| | |
AptarGroup, Inc. | | | 65,000 | | | | 7,515,300 | |
| | |
Avery Dennison Corp. | | | 2,250 | | | | 294,345 | |
| | |
Ball Corp. | | | 53,090 | | | | 3,433,330 | |
| | |
Crown Holdings, Inc.(1) | | | 13,787 | | | | 1,000,109 | |
| | |
International Paper Co. | | | 284 | | | | 13,078 | |
| | |
Packaging Corp. of America | | | 7,890 | | | | 883,601 | |
| | |
Sealed Air Corp. | | | 6,200 | | | | 246,946 | |
| | |
Sonoco Products Co. | | | 390 | | | | 24,071 | |
| | |
WestRock Co. | | | 39,303 | | | | 1,686,492 | |
| | |
| | | | | | | $ | 22,942,733 | |
|
| Distributors — 0.1% | |
| | |
Genuine Parts Co. | | | 211,037 | | | $ | 22,418,460 | |
| | |
LKQ Corp.(1) | | | 49,518 | | | | 1,767,793 | |
| | |
| | | | | | | $ | 24,186,253 | |
| | | | | | | | |
| Security | | Shares | | | Value | |
|
| Diversified Consumer Services — 0.0%(2) | |
| | |
H&R Block, Inc. | | | 25,610 | | | $ | 601,323 | |
| | |
Service Corporation International | | | 15,900 | | | | 731,877 | |
| | |
| | | | | | | $ | 1,333,200 | |
|
| Diversified Financial Services — 2.4% | |
| | |
Berkshire Hathaway, Inc., Class A(1) | | | 453 | | | $ | 153,834,270 | |
| | |
Berkshire Hathaway, Inc., Class B(1) | | | 1,676,927 | | | | 379,823,965 | |
| | |
| | | | | | | $ | 533,658,235 | |
|
| Diversified Telecommunication Services — 0.5% | |
| | |
AT&T, Inc. | | | 772,910 | | | $ | 30,205,323 | |
| | |
CenturyLink, Inc. | | | 5,086 | | | | 67,186 | |
| | |
Frontier Communications Corp.(1) | | | 894 | | | | 795 | |
| | |
Verizon Communications, Inc. | | | 1,185,329 | | | | 72,779,201 | |
| | |
Windstream Holdings, Inc.(1) | | | 821 | | | | 74 | |
| | |
| | | | | | | $ | 103,052,579 | |
|
| Electric Utilities — 0.2% | |
| | |
Duke Energy Corp. | | | 31,500 | | | $ | 2,873,115 | |
| | |
Edison International | | | 1,134 | | | | 85,515 | |
| | |
Entergy Corp. | | | 1,300 | | | | 155,740 | |
| | |
Exelon Corp. | | | 28,310 | | | | 1,290,653 | |
| | |
NextEra Energy, Inc. | | | 130,151 | | | | 31,517,366 | |
| | |
Southern Co. (The) | | | 102,565 | | | | 6,533,390 | |
| | |
| | | | | | | $ | 42,455,779 | |
|
| Electrical Equipment — 0.9% | |
| | |
Acuity Brands, Inc. | | | 11,121 | | | $ | 1,534,698 | |
| | |
AMETEK, Inc. | | | 64,232 | | | | 6,406,500 | |
| | |
Eaton Corp. PLC | | | 86,839 | | | | 8,225,390 | |
| | |
Emerson Electric Co. | | | 2,192,191 | | | | 167,176,486 | |
| | |
Hubbell, Inc. | | | 1,978 | | | | 292,388 | |
| | |
nVent Electric PLC | | | 4 | | | | 102 | |
| | |
Rockwell Automation, Inc. | | | 112,165 | | | | 22,732,480 | |
| | |
| | | | | | | $ | 206,368,044 | |
|
| Electronic Equipment, Instruments & Components — 0.4% | |
| | |
Amphenol Corp., Class A | | | 15,644 | | | $ | 1,693,150 | |
| | |
CDW Corp. | | | 142,695 | | | | 20,382,554 | |
| | |
Corning, Inc. | | | 1,555,623 | | | | 45,284,186 | |
| | |
FLIR Systems, Inc. | | | 1,750 | | | | 91,122 | |
| | |
Keysight Technologies, Inc.(1) | | | 14,701 | | | | 1,508,764 | |
| | |
Knowles Corp.(1) | | | 8,001 | | | | 169,221 | |
| | |
Littelfuse, Inc.(3) | | | 52,675 | | | | 10,071,185 | |
| | | | |
| | 29 | | See Notes to Financial Statements. |
Tax-Managed Growth Portfolio
December 31, 2019
Portfolio of Investments — continued
| | | | | | | | |
| Security | | Shares | | | Value | |
|
| Electronic Equipment, Instruments & Components(continued) | |
| | |
TE Connectivity, Ltd. | | | 47,770 | | | $ | 4,578,277 | |
| | |
Trimble, Inc.(1) | | | 3,200 | | | | 133,408 | |
| | |
| | | | | | | $ | 83,911,867 | |
|
| Energy Equipment & Services — 0.4% | |
| | |
Apergy Corp.(1) | | | 18,853 | | | $ | 636,854 | |
| | |
Core Laboratories NV | | | 16,652 | | | | 627,281 | |
| | |
Frank’s International NV(1) | | | 1,500,000 | | | | 7,755,000 | |
| | |
Halliburton Co. | | | 948,842 | | | | 23,218,164 | |
| | |
National Oilwell Varco, Inc. | | | 5,400 | | | | 135,270 | |
| | |
Schlumberger, Ltd. | | | 1,165,771 | | | | 46,863,994 | |
| | |
Transocean, Ltd.(1) | | | 3,626 | | | | 24,947 | |
| | |
| | | | | | | $ | 79,261,510 | |
|
| Entertainment — 2.3% | |
| | |
Activision Blizzard, Inc. | | | 218,092 | | | $ | 12,959,027 | |
| | |
Electronic Arts, Inc.(1) | | | 56,410 | | | | 6,064,639 | |
| | |
Liberty Braves Group, Series A(1) | | | 1,236 | | | | 36,647 | |
| | |
Liberty Braves Group, Series C(1) | | | 2,473 | | | | 73,052 | |
| | |
Liberty Formula One, Series A(1) | | | 3,091 | | | | 135,324 | |
| | |
Liberty Formula One, Series C(1) | | | 6,183 | | | | 284,202 | |
| | |
Live Nation Entertainment, Inc.(1) | | | 43,744 | | | | 3,126,384 | |
| | |
Madison Square Garden Co. (The), Class A(1) | | | 1,000 | | | | 294,190 | |
| | |
Netflix, Inc.(1) | | | 154,950 | | | | 50,137,172 | |
| | |
Spotify Technology SA(1) | | | 32,417 | | | | 4,847,962 | |
| | |
Walt Disney Co. (The) | | | 2,969,876 | | | | 429,533,166 | |
| | |
| | | | | | | $ | 507,491,765 | |
|
| Equity Real Estate Investment Trusts (REITs) — 0.1% | |
| | |
American Tower Corp. | | | 56,291 | | | $ | 12,936,798 | |
| | |
AvalonBay Communities, Inc. | | | 7,000 | | | | 1,467,900 | |
| | |
Host Hotels & Resorts, Inc. | | | 222,765 | | | | 4,132,291 | |
| | |
Host Hotels & Resorts, Inc.(3) | | | 306,221 | | | | 5,677,276 | |
| | |
ProLogis, Inc. | | | 28,120 | | | | 2,506,617 | |
| | |
Public Storage | | | 1,949 | | | | 415,059 | |
| | |
Simon Property Group, Inc. | | | 25,563 | | | | 3,807,864 | |
| | |
| | | | | | | $ | 30,943,805 | |
|
| Food & Staples Retailing — 1.8% | |
| | |
Costco Wholesale Corp. | | | 892,315 | | | $ | 262,269,225 | |
| | |
Kroger Co. (The) | | | 226,899 | | | | 6,577,802 | |
| | |
Sprouts Farmers Market, Inc.(1) | | | 1,529,238 | | | | 29,590,755 | |
| | |
Sysco Corp. | | | 442,381 | | | | 37,841,271 | |
| | |
Walgreens Boots Alliance, Inc. | | | 650,624 | | | | 38,360,791 | |
| | |
Walmart, Inc. | | | 188,073 | | | | 22,350,595 | |
| | |
| | | | | | | $ | 396,990,439 | |
| | | | | | | | |
| Security | | Shares | | | Value | |
|
| Food Products — 1.7% | |
| | |
Archer-Daniels-Midland Co. | | | 307,441 | | | $ | 14,249,890 | |
| | |
Campbell Soup Co. | | | 749,720 | | | | 37,051,162 | |
| | |
Conagra Brands, Inc. | | | 499,875 | | | | 17,115,720 | |
| | |
Flowers Foods, Inc. | | | 261,924 | | | | 5,694,228 | |
| | |
General Mills, Inc. | | | 89,945 | | | | 4,817,454 | |
| | |
Hain Celestial Group, Inc. (The)(1) | | | 17,240 | | | | 447,464 | |
| | |
Hershey Co. (The) | | | 557,464 | | | | 81,936,059 | |
| | |
Hormel Foods Corp. | | | 289,691 | | | | 13,067,961 | |
| | |
JM Smucker Co. (The) | | | 19,434 | | | | 2,023,663 | |
| | |
Kellogg Co. | | | 67,139 | | | | 4,643,333 | |
| | |
Kraft Heinz Co. (The) | | | 108,171 | | | | 3,475,534 | |
| | |
Lamb Weston Holdings, Inc. | | | 115,108 | | | | 9,902,741 | |
| | |
McCormick & Co., Inc. | | | 62,860 | | | | 10,669,228 | |
| | |
Mondelez International, Inc., Class A | | | 853,758 | | | | 47,024,991 | |
| | |
Nestle SA | | | 1,118,348 | | | | 121,078,165 | |
| | |
Tyson Foods, Inc., Class A | | | 27,528 | | | | 2,506,149 | |
| | |
| | | | | | | $ | 375,703,742 | |
|
| Health Care Equipment & Supplies — 2.6% | |
| | |
Abbott Laboratories | | | 1,871,486 | | | $ | 162,557,274 | |
| | |
ABIOMED, Inc.(1) | | | 80,924 | | | | 13,804,825 | |
| | |
Alcon, Inc.(1) | | | 22,924 | | | | 1,296,811 | |
| | |
Align Technology, Inc.(1)(3) | | | 18,700 | | | | 5,218,048 | |
| | |
Avanos Medical, Inc.(1) | | | 542 | | | | 18,265 | |
| | |
Baxter International, Inc. | | | 34,115 | | | | 2,852,696 | |
| | |
Becton, Dickinson and Co. | | | 60,652 | | | | 16,495,524 | |
| | |
Boston Scientific Corp.(1) | | | 90,143 | | | | 4,076,266 | |
| | |
Danaher Corp. | | | 145,360 | | | | 22,309,853 | |
| | |
DexCom, Inc.(1) | | | 94,962 | | | | 20,771,988 | |
| | |
Edwards Lifesciences Corp.(1) | | | 10,027 | | | | 2,339,199 | |
| | |
Hologic, Inc.(1) | | | 154,947 | | | | 8,089,783 | |
| | |
IDEXX Laboratories, Inc.(1) | | | 8,000 | | | | 2,089,040 | |
| | |
Integra LifeSciences Holdings Corp.(3) | | | 520,000 | | | | 30,298,024 | |
| | |
Integra LifeSciences Holdings Corp.(3) | | | 491,205 | | | | 28,610,250 | |
| | |
Intuitive Surgical, Inc.(1) | | | 140,412 | | | | 83,004,554 | |
| | |
Medtronic PLC | | | 537,489 | | | | 60,978,127 | |
| | |
Penumbra, Inc.(1) | | | 75,462 | | | | 12,396,143 | |
| | |
ResMed, Inc. | | | 21,305 | | | | 3,301,636 | |
| | |
Smith & Nephew PLC ADR | | | 5,500 | | | | 264,385 | |
| | |
Stryker Corp. | | | 272,171 | | | | 57,139,580 | |
| | |
Teleflex, Inc. | | | 14,325 | | | | 5,392,503 | |
| | |
Varian Medical Systems, Inc.(1) | | | 45,609 | | | | 6,476,934 | |
| | |
Zimmer Biomet Holdings, Inc. | | | 151,526 | | | | 22,680,412 | |
| | |
| | | | | | | $ | 572,462,120 | |
| | | | |
| | 30 | | See Notes to Financial Statements. |
Tax-Managed Growth Portfolio
December 31, 2019
Portfolio of Investments — continued
| | | | | | | | |
| Security | | Shares | | | Value | |
|
| Health Care Providers & Services — 1.2% | |
| | |
Acadia Healthcare Co., Inc.(1) | | | 32,000 | | | $ | 1,063,040 | |
| | |
Anthem, Inc. | | | 144,301 | | | | 43,583,231 | |
| | |
Cardinal Health, Inc. | | | 29,103 | | | | 1,472,030 | |
| | |
Centene Corp.(1) | | | 61,728 | | | | 3,880,839 | |
| | |
Cigna Corp.(1) | | | 30,693 | | | | 6,276,411 | |
| | |
Covetrus, Inc.(1) | | | 10,538 | | | | 139,102 | |
| | |
CVS Health Corp. | | | 1,226,354 | | | | 91,105,839 | |
| | |
DaVita, Inc.(1) | | | 157,055 | | | | 11,783,837 | |
| | |
HCA Healthcare, Inc. | | | 187,964 | | | | 27,782,959 | |
| | |
Henry Schein, Inc.(1) | | | 26,346 | | | | 1,757,805 | |
| | |
Humana, Inc. | | | 1,323 | | | | 484,906 | |
| | |
Laboratory Corp. of America Holdings(1) | | | 550 | | | | 93,043 | |
| | |
McKesson Corp. | | | 152,093 | | | | 21,037,504 | |
| | |
Molina Healthcare, Inc.(1) | | | 151,406 | | | | 20,544,280 | |
| | |
UnitedHealth Group, Inc. | | | 146,843 | | | | 43,168,905 | |
| | |
| | | | | | | $ | 274,173,731 | |
|
| Health Care Technology — 0.0%(2) | |
| | |
Cerner Corp. | | | 17,440 | | | $ | 1,279,922 | |
| | |
| | | | | | | $ | 1,279,922 | |
|
| Hotels, Restaurants & Leisure — 4.4% | |
| | |
Aramark | | | 137,669 | | | $ | 5,974,835 | |
| | |
Carnival Corp. | | | 22,069 | | | | 1,121,767 | |
| | |
Chipotle Mexican Grill, Inc.(1) | | | 121,117 | | | | 101,388,252 | |
| | |
Choice Hotels International, Inc. | | | 30,002 | | | | 3,103,107 | |
| | |
Darden Restaurants, Inc. | | | 66,089 | | | | 7,204,362 | |
| | |
Domino’s Pizza, Inc. | | | 148 | | | | 43,479 | |
| | |
Dunkin’ Brands Group, Inc. | | | 6,300 | | | | 475,902 | |
| | |
Hilton Worldwide Holdings, Inc. | | | 106,201 | | | | 11,778,753 | |
| | |
Hyatt Hotels Corp., Class A | | | 653,442 | | | | 58,620,281 | |
| | |
Hyatt Hotels Corp., Class A(3) | | | 700,000 | | | | 62,765,602 | |
| | |
Marriott International, Inc., Class A | | | 1,575,495 | | | | 238,577,208 | |
| | |
McDonald’s Corp. | | | 82,073 | | | | 16,218,445 | |
| | |
MGM Resorts International | | | 892,202 | | | | 29,683,561 | |
| | |
Royal Caribbean Cruises, Ltd. | | | 1,900 | | | | 253,669 | |
| | |
Starbucks Corp. | | | 4,050,857 | | | | 356,151,347 | |
| | |
Texas Roadhouse, Inc. | | | 398,116 | | | | 22,421,893 | |
| | |
Texas Roadhouse, Inc.(3) | | | 18,691 | | | | 1,052,414 | |
| | |
Yum China Holdings, Inc. | | | 367,698 | | | | 17,653,181 | |
| | |
Yum! Brands, Inc. | | | 334,327 | | | | 33,676,759 | |
| | |
| | | | | | | $ | 968,164,817 | |
| | | | | | | | |
| Security | | Shares | | | Value | |
|
| Household Durables — 0.2% | |
| | |
D.R. Horton, Inc. | | | 5,956 | | | $ | 314,179 | |
| | |
Leggett & Platt, Inc. | | | 92,079 | | | | 4,680,376 | |
| | |
Lennar Corp., Class A | | | 8,589 | | | | 479,180 | |
| | |
Lennar Corp., Class B | | | 21 | | | | 939 | |
| | |
Mohawk Industries, Inc.(1) | | | 4,820 | | | | 657,352 | |
| | |
Newell Brands, Inc. | | | 479,252 | | | | 9,211,223 | |
| | |
NVR, Inc.(1) | | | 1,822 | | | | 6,938,923 | |
| | |
PulteGroup, Inc. | | | 221,275 | | | | 8,585,470 | |
| | |
Tempur Sealy International, Inc.(1) | | | 135,025 | | | | 11,755,276 | |
| | |
Toll Brothers, Inc. | | | 2,223 | | | | 87,831 | |
| | |
Whirlpool Corp. | | | 1,391 | | | | 205,214 | |
| | |
| | | | | | | $ | 42,915,963 | |
|
| Household Products — 2.0% | |
| | |
Church & Dwight Co., Inc. | | | 153,589 | | | $ | 10,803,450 | |
| | |
Clorox Co. (The) | | | 15,801 | | | | 2,426,086 | |
| | |
Colgate-Palmolive Co. | | | 2,344,954 | | | | 161,426,633 | |
| | |
Energizer Holdings, Inc. | | | 9,500 | | | | 477,090 | |
| | |
Kimberly-Clark Corp. | | | 84,758 | | | | 11,658,463 | |
| | |
Procter & Gamble Co. (The) | | | 2,101,487 | | | | 262,475,726 | |
| | |
| | | | | | | $ | 449,267,448 | |
|
| Independent Power and Renewable Electricity Producers — 0.0%(2) | |
| | |
AES Corp. (The) | | | 1,730 | | | $ | 34,427 | |
| | |
NRG Energy, Inc. | | | 461 | | | | 18,325 | |
| | |
| | | | | | | $ | 52,752 | |
|
| Industrial Conglomerates — 1.3% | |
| | |
3M Co. | | | 740,724 | | | $ | 130,678,528 | |
| | |
Carlisle Cos., Inc. | | | 55,809 | | | | 9,032,128 | |
| | |
General Electric Co. | | | 5,452,756 | | | | 60,852,757 | |
| | |
Honeywell International, Inc. | | | 392,987 | | | | 69,558,699 | |
| | |
Roper Technologies, Inc. | | | 20,247 | | | | 7,172,095 | |
| | |
| | | | | | | $ | 277,294,207 | |
|
| Insurance — 1.7% | |
| | |
Aegon NV ADR | | | 5 | | | $ | 23 | |
| | |
Aflac, Inc. | | | 706,153 | | | | 37,355,494 | |
| | |
Alleghany Corp.(1) | | | 3,985 | | | | 3,186,286 | |
| | |
Allstate Corp. (The) | | | 38,758 | | | | 4,358,337 | |
| | |
American International Group, Inc. | | | 160,299 | | | | 8,228,148 | |
| | |
Aon PLC | | | 146,257 | | | | 30,463,871 | |
| | |
Arch Capital Group, Ltd.(1) | | | 239,759 | | | | 10,283,264 | |
| | | | |
| | 31 | | See Notes to Financial Statements. |
Tax-Managed Growth Portfolio
December 31, 2019
Portfolio of Investments — continued
| | | | | | | | |
| Security | | Shares | | | Value | |
|
| Insurance(continued) | |
| | |
Arthur J. Gallagher & Co. | | | 444,814 | | | $ | 42,359,637 | |
| | |
Assurant, Inc. | | | 11,200 | | | | 1,468,096 | |
| | |
Brighthouse Financial, Inc.(1) | | | 936 | | | | 36,719 | |
| | |
Chubb, Ltd. | | | 36,643 | | | | 5,703,849 | |
| | |
Cincinnati Financial Corp. | | | 175,349 | | | | 18,437,947 | |
| | |
Fidelity National Financial, Inc. | | | 57,521 | | | | 2,608,577 | |
| | |
Globe Life, Inc. | | | 430,474 | | | | 45,307,388 | |
| | |
Hartford Financial Services Group, Inc. | | | 83,487 | | | | 5,073,505 | |
| | |
Lincoln National Corp. | | | 2,950 | | | | 174,080 | |
| | |
Markel Corp.(1) | | | 6,362 | | | | 7,272,848 | |
| | |
Marsh & McLennan Cos., Inc. | | | 225,062 | | | | 25,074,157 | |
| | |
MetLife, Inc. | | | 16,911 | | | | 861,954 | |
| | |
Progressive Corp. (The) | | | 1,313,661 | | | | 95,095,920 | |
| | |
Prudential Financial, Inc. | | | 20,261 | | | | 1,899,266 | |
| | |
Reinsurance Group of America, Inc. | | | 6,425 | | | | 1,047,660 | |
| | |
Travelers Cos., Inc. (The) | | | 140,472 | | | | 19,237,640 | |
| | |
Trisura Group, Ltd.(1) | | | 124 | | | | 3,833 | |
| | |
Willis Towers Watson PLC | | | 101 | | | | 20,396 | |
| | |
WR Berkley Corp. | | | 2,250 | | | | 155,475 | |
| | |
| | | | | | | $ | 365,714,370 | |
|
| Interactive Media & Services — 7.5% | |
| | |
Alphabet, Inc., Class A(1) | | | 302,144 | | | $ | 404,688,652 | |
| | |
Alphabet, Inc., Class C(1) | | | 383,896 | | | | 513,276,630 | |
| | |
Baidu, Inc. ADR(1) | | | 72,500 | | | | 9,164,000 | |
| | |
CarGurus, Inc.(1) | | | 37,803 | | | | 1,329,909 | |
| | |
Cars.com, Inc.(1) | | | 400 | | | | 4,888 | |
| | |
Facebook, Inc., Class A(1) | | | 3,401,272 | | | | 698,111,078 | |
| | |
IAC/InterActiveCorp.(1) | | | 6,680 | | | | 1,664,055 | |
| | |
Pinterest, Inc., Class A(1) | | | 385,406 | | | | 7,183,968 | |
| | |
Twitter, Inc.(1) | | | 578,870 | | | | 18,552,783 | |
| | |
Yelp, Inc.(1) | | | 149,508 | | | | 5,207,364 | |
| | |
| | | | | | | $ | 1,659,183,327 | |
|
| Internet & Direct Marketing Retail — 4.3% | |
| | |
Alibaba Group Holding, Ltd. ADR(1) | | | 223,541 | | | $ | 47,413,046 | |
| | |
Altaba, Inc.(4) | | | 114,070 | | | | 1,791,355 | |
| | |
Amazon.com, Inc.(1) | | | 393,877 | | | | 727,821,676 | |
| | |
Booking Holdings, Inc.(1) | | | 52,136 | | | | 107,073,267 | |
| | |
eBay, Inc. | | | 1,344,516 | | | | 48,550,472 | |
| | |
eBay, Inc.(3) | | | 171,429 | | | | 6,186,897 | |
| | |
Expedia Group, Inc. | | | 2,670 | | | | 288,734 | |
| | |
Qurate Retail, Inc., Series A(1) | | | 99,802 | | | | 841,331 | |
| | |
Trip.com Group, Ltd. ADR(1) | | | 5,200 | | | | 174,408 | |
| | |
Wayfair, Inc., Class A(1) | | | 60,453 | | | | 5,463,138 | |
| | |
| | | | | | | $ | 945,604,324 | |
| | | | | | | | |
| Security | | Shares | | | Value | |
|
| IT Services — 3.3% | |
| | |
Accenture PLC, Class A | | | 855,587 | | | $ | 180,160,955 | |
| | |
Akamai Technologies, Inc.(1) | | | 226,957 | | | | 19,604,546 | |
| | |
Alliance Data Systems Corp. | | | 686 | | | | 76,969 | |
| | |
Automatic Data Processing, Inc. | | | 233,798 | | | | 39,862,559 | |
| | |
Broadridge Financial Solutions, Inc. | | | 74,456 | | | | 9,198,294 | |
| | |
CACI International, Inc., Class A(1) | | | 13,584 | | | | 3,395,864 | |
| | |
Cognizant Technology Solutions Corp., Class A | | | 11,990 | | | | 743,620 | |
| | |
Fidelity National Information Services, Inc. | | | 18,757 | | | | 2,608,911 | |
| | |
Fiserv, Inc.(1) | | | 670,623 | | | | 77,544,138 | |
| | |
Global Payments, Inc. | | | 9,504 | | | | 1,735,050 | |
| | |
International Business Machines Corp. | | | 534,177 | | | | 71,601,085 | |
| | |
Mastercard, Inc., Class A | | | 82,613 | | | | 24,667,416 | |
| | |
Okta, Inc.(1) | | | 183,039 | | | | 21,117,209 | |
| | |
Paychex, Inc. | | | 46,165 | | | | 3,926,795 | |
| | |
PayPal Holdings, Inc.(1) | | | 288,272 | | | | 31,182,382 | |
| | |
Sabre Corp. | | | 157,290 | | | | 3,529,588 | |
| | |
Shopify, Inc., Class A(1) | | | 12,524 | | | | 4,979,292 | |
| | |
Square, Inc., Class A(1) | | | 234,588 | | | | 14,675,825 | |
| | |
Twilio, Inc., Class A(1) | | | 516,605 | | | | 50,771,939 | |
| | |
VeriSign, Inc.(1) | | | 19,370 | | | | 3,732,212 | |
| | |
Visa, Inc., Class A | | | 863,250 | | | | 162,204,675 | |
| | |
Western Union Co. (The) | | | 83,244 | | | | 2,229,274 | |
| | |
| | | | | | | $ | 729,548,598 | |
|
| Leisure Products — 0.0%(2) | |
| | |
Hasbro, Inc. | | | 786 | | | $ | 83,009 | |
| | |
Mattel, Inc.(1) | | | 3,941 | | | | 53,401 | |
| | |
Polaris Industries, Inc. | | | 52,104 | | | | 5,298,977 | |
| | |
| | | | | | | $ | 5,435,387 | |
|
| Life Sciences Tools & Services — 0.5% | |
| | |
Agilent Technologies, Inc. | | | 660,825 | | | $ | 56,374,981 | |
| | |
Illumina, Inc.(1) | | | 115,595 | | | | 38,347,485 | |
| | |
IQVIA Holdings, Inc.(1) | | | 34,269 | | | | 5,294,903 | |
| | |
Thermo Fisher Scientific, Inc. | | | 52,843 | | | | 17,167,106 | |
| | |
| | | | | | | $ | 117,184,475 | |
|
| Machinery — 1.6% | |
| | |
Caterpillar, Inc. | | | 317,457 | | | $ | 46,882,050 | |
| | |
Cummins, Inc. | | | 1,178 | | | | 210,815 | |
| | |
Deere & Co. | | | 183,142 | | | | 31,731,183 | |
| | |
Donaldson Co., Inc. | | | 142,204 | | | | 8,193,794 | |
| | |
Dover Corp. | | | 340,788 | | | | 39,279,225 | |
| | |
Fortive Corp. | | | 29,955 | | | | 2,288,262 | |
| | |
Illinois Tool Works, Inc. | | | 1,059,776 | | | | 190,367,563 | |
| | | | |
| | 32 | | See Notes to Financial Statements. |
Tax-Managed Growth Portfolio
December 31, 2019
Portfolio of Investments — continued
| | | | | | | | |
| Security | | Shares | | | Value | |
|
| Machinery(continued) | |
| | |
Ingersoll-Rand PLC | | | 26,539 | | | $ | 3,527,564 | |
| | |
Lincoln Electric Holdings, Inc. | | | 53,660 | | | | 5,190,532 | |
| | |
Manitowoc Co., Inc. (The)(1) | | | 11,435 | | | | 200,113 | |
| | |
Middleby Corp.(1) | | | 2,000 | | | | 219,040 | |
| | |
PACCAR, Inc. | | | 186,094 | | | | 14,720,035 | |
| | |
Parker-Hannifin Corp. | | | 18,857 | | | | 3,881,148 | |
| | |
Pentair PLC | | | 4 | | | | 183 | |
| | |
Snap-on, Inc. | | | 29,674 | | | | 5,026,776 | |
| | |
Stanley Black & Decker, Inc. | | | 288 | | | | 47,733 | |
| | |
Trinity Industries, Inc. | | | 11,100 | | | | 245,865 | |
| | |
WABCO Holdings, Inc.(1) | | | 3,080 | | | | 417,340 | |
| | |
Welbilt, Inc.(1) | | | 45,741 | | | | 714,017 | |
| | |
Westinghouse Air Brake Technologies Corp. | | | 14,082 | | | | 1,095,580 | |
| | |
Xylem, Inc. | | | 100,950 | | | | 7,953,850 | |
| | |
| | | | | | | $ | 362,192,668 | |
|
| Media — 0.7% | |
| | |
Comcast Corp., Class A | | | 2,367,617 | | | $ | 106,471,736 | |
| | |
Discovery, Inc., Class A(1) | | | 24,623 | | | | 806,157 | |
| | |
Discovery, Inc., Class C(1) | | | 207 | | | | 6,311 | |
| | |
Fox Corp., Class A | | | 5,412 | | | | 200,623 | |
| | |
Interpublic Group of Cos., Inc. (The) | | | 726 | | | | 16,771 | |
| | |
Liberty Broadband Corp., Series A(1) | | | 3,091 | | | | 385,015 | |
| | |
Liberty Broadband Corp., Series C(1) | | | 6,183 | | | | 777,512 | |
| | |
Liberty Global PLC, Class A(1) | | | 8,854 | | | | 201,340 | |
| | |
Liberty Global PLC, Class C(1) | | | 27,614 | | | | 601,847 | |
| | |
Liberty Latin America Ltd., Class A(1) | | | 1,546 | | | | 29,838 | |
| | |
Liberty Latin America Ltd., Class C(1) | | | 4,825 | | | | 93,895 | |
| | |
Liberty SiriusXM Group, Series A(1) | | | 12,367 | | | | 597,821 | |
| | |
Liberty SiriusXM Group, Series C(1) | | | 24,734 | | | | 1,190,695 | |
| | |
News Corp., Class A | | | 24 | | | | 339 | |
| | |
Omnicom Group, Inc. | | | 59,711 | | | | 4,837,785 | |
| | |
Sinclair Broadcast Group, Inc., Class A | | | 2,500 | | | | 83,350 | |
| | |
Sirius XM Holdings, Inc. | | | 53,280 | | | | 380,952 | |
| | |
TEGNA, Inc. | | | 1,201 | | | | 20,045 | |
| | |
ViacomCBS, Inc., Class B | | | 749,695 | | | | 31,464,699 | |
| | |
| | | | | | | $ | 148,166,731 | |
|
| Metals & Mining — 0.1% | |
| | |
Alcoa Corp.(1) | | | 5,862 | | | $ | 126,092 | |
| | |
Cleveland-Cliffs, Inc. | | | 527,743 | | | | 4,433,041 | |
| | |
Freeport-McMoRan, Inc. | | | 58,282 | | | | 764,660 | |
| | |
Glencore PLC | | | 598,405 | | | | 1,863,264 | |
| | |
Nucor Corp. | | | 234,384 | | | | 13,191,131 | |
| | |
Sibanye Gold, Ltd.(1) | | | 64 | | | | 164 | |
| | | | | | | | |
| Security | | Shares | | | Value | |
|
| Metals & Mining(continued) | |
| | |
Southern Copper Corp. | | | 12,126 | | | $ | 515,112 | |
| | |
Steel Dynamics, Inc. | | | 232,124 | | | | 7,901,501 | |
| | |
| | | | | | | $ | 28,794,965 | |
|
| Multi-Utilities — 0.1% | |
| | |
Consolidated Edison, Inc. | | | 52,125 | | | $ | 4,715,749 | |
| | |
Dominion Energy, Inc. | | | 13,510 | | | | 1,118,898 | |
| | |
DTE Energy Co. | | | 77,124 | | | | 10,016,094 | |
| | |
Sempra Energy | | | 66,344 | | | | 10,049,789 | |
| | |
WEC Energy Group, Inc. | | | 10,221 | | | | 942,683 | |
| | |
| | | | | | | $ | 26,843,213 | |
|
| Multiline Retail — 0.1% | |
| | |
Dollar Tree, Inc.(1) | | | 139,458 | | | $ | 13,116,025 | |
| | |
Nordstrom, Inc. | | | 7,429 | | | | 304,069 | |
| | |
Target Corp. | | | 36,405 | | | | 4,667,485 | |
| | |
| | | | | | | $ | 18,087,579 | |
|
| Oil, Gas & Consumable Fuels — 2.5% | |
| | |
Antero Resources Corp.(1) | | | 1,876,986 | | | $ | 5,349,410 | |
| | |
California Resources Corp.(1) | | | 275 | | | | 2,483 | |
| | |
Cheniere Energy, Inc.(1) | | | 723,539 | | | | 44,186,527 | |
| | |
Chesapeake Energy Corp.(1) | | | 284 | | | | 235 | |
| | |
Chevron Corp. | | | 1,009,769 | | | | 121,687,262 | |
| | |
Concho Resources, Inc. | | | 40,000 | | | | 3,502,800 | |
| | |
ConocoPhillips | | | 287,973 | | | | 18,726,884 | |
| | |
Devon Energy Corp. | | | 1,378,677 | | | | 35,804,242 | |
| | |
EOG Resources, Inc. | | | 887,557 | | | | 74,341,774 | |
| | |
EQT Corp. | | | 180,474 | | | | 1,967,167 | |
| | |
Equitrans Midstream Corp. | | | 144,379 | | | | 1,928,904 | |
| | |
Exxon Mobil Corp. | | | 2,633,340 | | | | 183,754,465 | |
| | |
Hess Corp. | | | 164,190 | | | | 10,969,534 | |
| | |
HollyFrontier Corp. | | | 8,000 | | | | 405,680 | |
| | |
Kinder Morgan, Inc. | | | 112,332 | | | | 2,378,069 | |
| | |
Marathon Oil Corp. | | | 123,481 | | | | 1,676,872 | |
| | |
Marathon Petroleum Corp. | | | 171,145 | | | | 10,311,486 | |
| | |
Murphy Oil Corp. | | | 145,312 | | | | 3,894,362 | |
| | |
Occidental Petroleum Corp. | | | 27,827 | | | | 1,146,751 | |
| | |
Phillips 66 | | | 182,769 | | | | 20,362,294 | |
| | |
Pioneer Natural Resources Co. | | | 21,266 | | | | 3,219,034 | |
| | |
Range Resources Corp. | | | 664,831 | | | | 3,224,430 | |
| | |
Royal Dutch Shell PLC, Class A, ADR | | | 39,498 | | | | 2,329,592 | |
| | |
Southwestern Energy Co.(1) | | | 720 | | | | 1,742 | |
| | |
Valero Energy Corp. | | | 28,568 | | | | 2,675,393 | |
| | | | |
| | 33 | | See Notes to Financial Statements. |
Tax-Managed Growth Portfolio
December 31, 2019
Portfolio of Investments — continued
| | | | | | | | |
| Security | | Shares | | | Value | |
|
| Oil, Gas & Consumable Fuels(continued) | |
| | |
Williams Cos., Inc. (The) | | | 20,025 | | | $ | 474,993 | |
| | |
WPX Energy, Inc.(1) | | | 666 | | | | 9,151 | |
| | |
| | | | | | | $ | 554,331,536 | |
|
| Personal Products — 0.1% | |
| | |
Estee Lauder Cos., Inc. (The), Class A | | | 46,739 | | | $ | 9,653,473 | |
| | |
Unilever NV — NY Shares | | | 19,032 | | | | 1,093,579 | |
| | |
Unilever PLC ADR | | | 18,708 | | | | 1,069,536 | |
| | |
| | | | | | | $ | 11,816,588 | |
|
| Pharmaceuticals — 5.4% | |
| | |
Allergan PLC | | | 14,939 | | | $ | 2,855,889 | |
| | |
AstraZeneca PLC ADR | | | 216,121 | | | | 10,775,793 | |
| | |
Bristol-Myers Squibb Co. | | | 2,335,509 | | | | 149,916,323 | |
| | |
Catalent, Inc.(1) | | | 45,943 | | | | 2,586,591 | |
| | |
Eli Lilly & Co. | | | 2,034,871 | | | | 267,443,095 | |
| | |
GlaxoSmithKline PLC ADR | | | 1,468 | | | | 68,981 | |
| | |
Johnson & Johnson | | | 2,494,625 | | | | 363,890,949 | |
| | |
Mallinckrodt PLC(1) | | | 6 | | | | 21 | |
| | |
Merck & Co., Inc. | | | 2,264,830 | | | | 205,986,288 | |
| | |
Novartis AG ADR | | | 125,516 | | | | 11,885,110 | |
| | |
Novo Nordisk A/S ADR | | | 1,305,451 | | | | 75,559,504 | |
| | |
Pfizer, Inc. | | | 2,113,994 | | | | 82,826,285 | |
| | |
Reata Pharmaceuticals, Inc., Class A(1) | | | 4,694 | | | | 959,594 | |
| | |
Roche Holding AG ADR | | | 35,808 | | | | 1,455,953 | |
| | |
Sanofi ADR | | | 5,100 | | | | 256,020 | |
| | |
Takeda Pharmaceutical Co., Ltd. ADR(1) | | | 31,905 | | | | 629,486 | |
| | |
Teva Pharmaceutical Industries, Ltd. ADR(1) | | | 576,992 | | | | 5,654,522 | |
| | |
Zoetis, Inc. | | | 23,920 | | | | 3,165,812 | |
| | |
| | | | | | | $ | 1,185,916,216 | |
|
| Professional Services — 0.2% | |
| | |
Equifax, Inc. | | | 12,654 | | | $ | 1,773,078 | |
| | |
Nielsen Holdings PLC | | | 72,356 | | | | 1,468,827 | |
| | |
On Assignment, Inc.(1) | | | 228,139 | | | | 16,191,025 | |
| | |
Verisk Analytics, Inc. | | | 102,837 | | | | 15,357,678 | |
| | |
| | | | | | | $ | 34,790,608 | |
|
| Road & Rail — 1.2% | |
| | |
Canadian National Railway Co. | | | 525,943 | | | $ | 47,571,544 | |
| | |
Canadian Pacific Railway, Ltd. | | | 942 | | | | 240,163 | |
| | |
CSX Corp. | | | 657,876 | | | | 47,603,907 | |
| | |
Kansas City Southern | | | 12,000 | | | | 1,837,920 | |
| | |
Lyft, Inc., Class A(1) | | | 34,899 | | | | 1,501,355 | |
| | | | | | | | |
| Security | | Shares | | | Value | |
|
| Road & Rail(continued) | |
| | |
Norfolk Southern Corp. | | | 240,830 | | | $ | 46,752,328 | |
| | |
Uber Technologies, Inc.(1) | | | 1,331,274 | | | | 39,592,089 | |
| | |
Union Pacific Corp. | | | 435,536 | | | | 78,740,554 | |
| | |
| | | | | | | $ | 263,839,860 | |
|
| Semiconductors & Semiconductor Equipment — 5.8% | |
| | |
Analog Devices, Inc. | | | 635,826 | | | $ | 75,561,562 | |
| | |
Applied Materials, Inc. | | | 195,223 | | | | 11,916,412 | |
| | |
ASML Holding NV — NY Shares | | | 12,063 | | | | 3,569,924 | |
| | |
Broadcom, Inc. | | | 89,633 | | | | 28,325,821 | |
| | |
Cypress Semiconductor Corp. | | | 107,346 | | | | 2,504,382 | |
| | |
Intel Corp. | | | 7,255,880 | | | | 434,264,418 | |
| | |
Lam Research Corp. | | | 56,304 | | | | 16,463,290 | |
| | |
Lam Research Corp.(3) | | | 21,452 | | | | 6,267,860 | |
| | |
Marvell Technology Group, Ltd. | | | 95,391 | | | | 2,533,585 | |
| | |
Microchip Technology, Inc. | | | 577,298 | | | | 60,454,646 | |
| | |
Micron Technology, Inc.(1) | | | 231,291 | | | | 12,438,830 | |
| | |
NVIDIA Corp. | | | 472,704 | | | | 111,227,251 | |
| | |
NVIDIA Corp.(3) | | | 19,186 | | | | 4,513,337 | |
| | |
Qorvo, Inc.(1) | | | 13,586 | | | | 1,579,101 | |
| | |
QUALCOMM, Inc. | | | 4,033,637 | | | | 355,887,792 | |
| | |
Texas Instruments, Inc. | | | 1,048,840 | | | | 134,555,684 | |
| | |
Xilinx, Inc. | | | 105,444 | | | | 10,309,260 | |
| | |
| | | | | | | $ | 1,272,373,155 | |
|
| Software — 7.1% | |
| | |
Adobe, Inc.(1) | | | 397,445 | | | $ | 131,081,335 | |
| | |
ANSYS, Inc.(1) | | | 4,596 | | | | 1,183,056 | |
| | |
Autodesk, Inc.(1) | | | 20,256 | | | | 3,716,166 | |
| | |
Box, Inc., Class A(1) | | | 176,143 | | | | 2,955,680 | |
| | |
Cadence Design Systems, Inc.(1) | | | 559,754 | | | | 38,824,537 | |
| | |
CDK Global, Inc. | | | 3 | | | | 164 | |
| | |
Check Point Software Technologies, Ltd.(1) | | | 151,500 | | | | 16,810,440 | |
| | |
Citrix Systems, Inc. | | | 8,036 | | | | 891,192 | |
| | |
Coupa Software, Inc.(1) | | | 28,188 | | | | 4,122,495 | |
| | |
Crowdstrike Holdings, Inc., Class A(1) | | | 91,713 | | | | 4,573,727 | |
| | |
DocuSign, Inc.(1) | | | 1,300,015 | | | | 96,344,112 | |
| | |
Dropbox, Inc., Class A(1) | | | 1,713,027 | | | | 30,680,314 | |
| | |
Envestnet, Inc.(1) | | | 41,786 | | | | 2,909,559 | |
| | |
FireEye, Inc.(1) | | | 84,766 | | | | 1,401,182 | |
| | |
Fortinet, Inc.(1) | | | 20,179 | | | | 2,154,310 | |
| | |
Guidewire Software, Inc.(1) | | | 67,562 | | | | 7,416,281 | |
| | |
Intuit, Inc. | | | 90,298 | | | | 23,651,755 | |
| | |
LogMeIn, Inc. | | | 1,149 | | | | 98,515 | |
| | |
Manhattan Associates, Inc.(1) | | | 56,873 | | | | 4,535,622 | |
| | | | |
| | 34 | | See Notes to Financial Statements. |
Tax-Managed Growth Portfolio
December 31, 2019
Portfolio of Investments — continued
| | | | | | | | |
| Security | | Shares | | | Value | |
|
| Software(continued) | |
| | |
Microsoft Corp. | | | 3,990,114 | | | $ | 629,240,978 | |
| | |
Nortonlifelock, Inc. | | | 194,276 | | | | 4,957,923 | |
| | |
Nutanix, Inc., Class A(1) | | | 18,402 | | | | 575,247 | |
| | |
Oracle Corp. | | | 1,083,218 | | | | 57,388,890 | |
| | |
Palo Alto Networks, Inc.(1) | | | 178,467 | | | | 41,270,494 | |
| | |
Paycom Software, Inc.(1) | | | 550,825 | | | | 145,836,427 | |
| | |
Proofpoint, Inc.(1) | | | 60,744 | | | | 6,972,196 | |
| | |
RingCentral, Inc., Class A(1) | | | 5,988 | | | | 1,009,996 | |
| | |
salesforce.com, Inc.(1) | | | 264,736 | | | | 43,056,663 | |
| | |
ServiceNow, Inc.(1) | | | 172,409 | | | | 48,674,509 | |
| | |
Slack Technologies, Inc., Class A(1) | | | 1,249,111 | | | | 28,080,015 | |
| | |
Smartsheet, Inc., Class A(1) | | | 207,811 | | | | 9,334,870 | |
| | |
Splunk, Inc.(1) | | | 411,122 | | | | 61,573,742 | |
| | |
Synopsys, Inc.(1) | | | 18,742 | | | | 2,608,886 | |
| | |
Teradata Corp.(1) | | | 200 | | | | 5,354 | |
| | |
Tyler Technologies, Inc.(1) | | | 232,333 | | | | 69,704,547 | |
| | |
Workday, Inc., Class A(1) | | | 178,366 | | | | 29,332,289 | |
| | |
Workday, Inc., Class A(1)(3) | | | 23,896 | | | | 3,927,732 | |
| | |
| | | | | | | $ | 1,556,901,200 | |
|
| Specialty Retail — 2.2% | |
| | |
Advance Auto Parts, Inc. | | | 78,893 | | | $ | 12,635,503 | |
| | |
AutoNation, Inc.(1) | | | 13,540 | | | | 658,450 | |
| | |
AutoZone, Inc.(1) | | | 2,475 | | | | 2,948,492 | |
| | |
Bed Bath & Beyond, Inc. | | | 22,000 | | | | 380,600 | |
| | |
Best Buy Co., Inc. | | | 311,979 | | | | 27,391,756 | |
| | |
Burlington Stores, Inc.(1) | | | 17,552 | | | | 4,002,383 | |
| | |
CarMax, Inc.(1) | | | 6,276 | | | | 550,217 | |
| | |
Dick’s Sporting Goods, Inc. | | | 35,000 | | | | 1,732,150 | |
| | |
Gap, Inc. (The) | | | 154,138 | | | | 2,725,160 | |
| | |
GNC Holdings, Inc., Class A(1) | | | 900 | | | | 2,430 | |
| | |
Home Depot, Inc. (The) | | | 46,138 | | | | 10,075,617 | |
| | |
Home Depot, Inc. (The)(3) | | | 11,095 | | | | 2,422,926 | |
| | |
L Brands, Inc. | | | 307,212 | | | | 5,566,682 | |
| | |
Lowe’s Cos., Inc. | | | 996,668 | | | | 119,360,960 | |
| | |
O’Reilly Automotive, Inc.(1) | | | 158,453 | | | | 69,443,612 | |
| | |
Ross Stores, Inc. | | | 429,074 | | | | 49,952,795 | |
| | |
Ross Stores, Inc.(3) | | | 60,000 | | | | 6,985,200 | |
| | |
Ross Stores, Inc.(3) | | | 50,000 | | | | 5,821,000 | |
| | |
Ross Stores, Inc.(3) | | | 15,000 | | | | 1,745,863 | |
| | |
Signet Jewelers, Ltd. | | | 65,986 | | | | 1,434,536 | |
| | |
Tiffany & Co. | | | 14,845 | | | | 1,984,034 | |
| | |
TJX Cos., Inc. (The) | | | 1,863,356 | | | | 113,776,517 | |
| | |
Tractor Supply Co. | | | 244,964 | | | | 22,889,436 | |
| | |
Ulta Beauty, Inc.(1) | | | 101,010 | | | | 25,569,671 | |
| | |
| | | | | | | $ | 490,055,990 | |
| | | | | | | | |
| Security | | Shares | | | Value | |
|
| Technology Hardware, Storage & Peripherals — 3.9% | |
| | |
Apple, Inc. | | | 2,750,413 | | | $ | 807,658,777 | |
| | |
Dell Technologies, Class C(1) | | | 2,415 | | | | 124,107 | |
| | |
Hewlett Packard Enterprise Co. | | | 381,616 | | | | 6,052,430 | |
| | |
NetApp, Inc. | | | 480,220 | | | | 29,893,695 | |
| | |
Pure Storage, Inc., Class A(1) | | | 1,300,000 | | | | 22,243,000 | |
| | |
| | | | | | | $ | 865,972,009 | |
|
| Textiles, Apparel & Luxury Goods — 1.5% | |
| | |
Hanesbrands, Inc. | | | 221,909 | | | $ | 3,295,349 | |
| | |
Kontoor Brands, Inc.(1) | | | 37,542 | | | | 1,576,389 | |
| | |
Lululemon Athletica, Inc.(1) | | | 1,000 | | | | 231,670 | |
| | |
NIKE, Inc., Class B | | | 2,884,108 | | | | 292,188,981 | |
| | |
Skechers U.S.A., Inc., Class A(3) | | | 100,000 | | | | 4,317,920 | |
| | |
Under Armour, Inc., Class A(1) | | | 2,400 | | | | 51,840 | |
| | |
VF Corp. | | | 273,527 | | | | 27,259,701 | |
| | |
| | | | | | | $ | 328,921,850 | |
|
| Thrifts & Mortgage Finance — 0.0%(2) | |
| | |
Essent Group, Ltd. | | | 96,312 | | | $ | 5,007,261 | |
| | |
| | | | | | | $ | 5,007,261 | |
|
| Tobacco — 0.6% | |
| | |
Altria Group, Inc. | | | 723,883 | | | $ | 36,129,000 | |
| | |
British American Tobacco PLC ADR | | | 3,399 | | | | 144,322 | |
| | |
Philip Morris International, Inc. | | | 1,015,074 | | | | 86,372,647 | |
| | |
| | | | | | | $ | 122,645,969 | |
|
| Trading Companies & Distributors — 0.2% | |
| | |
Fastenal Co. | | | 1,011,228 | | | $ | 37,364,875 | |
| | |
NOW, Inc.(1) | | | 944 | | | | 10,610 | |
| | |
United Rentals, Inc.(1) | | | 15,200 | | | | 2,534,904 | |
| | |
W.W. Grainger, Inc. | | | 8,210 | | | | 2,779,249 | |
| | |
| | | | | | | $ | 42,689,638 | |
|
| Water Utilities — 0.0%(2) | |
| | |
American Water Works Co., Inc. | | | 1,900 | | | $ | 233,415 | |
| | |
| | | | | | | $ | 233,415 | |
|
| Wireless Telecommunication Services — 0.0%(2) | |
| | |
America Movil SAB de CV, Series L, ADR | | | 270,852 | | | $ | 4,333,632 | |
| | |
Sprint Corp.(1) | | | 1 | | | | 5 | |
| | | | |
| | 35 | | See Notes to Financial Statements. |
Tax-Managed Growth Portfolio
December 31, 2019
Portfolio of Investments — continued
| | | | | | | | |
| Security | | Shares | | | Value | |
|
| Wireless Telecommunication Services(continued) | |
| | |
Vodafone Group PLC ADR | | | 5 | | | $ | 97 | |
| | |
| | | | | �� | | $ | 4,333,734 | |
| |
Total Common Stocks
(identified cost $11,357,609,539) | | | $ | 21,639,606,485 | |
|
| Rights— 0.0%(2) | |
| Security | | Shares | | | Value | |
|
| Pharmaceuticals — 0.0%(2) | |
| | |
Bristol-Myers Squibb Co. CVR, Exp. 3/31/21(1) | | | 237,107 | | | $ | 713,692 | |
| | |
Sanofi CVR, Exp. 12/31/20(1) | | | 6,984 | | | | 6,008 | |
| |
Total Rights
(identified cost $521,478) | | | $ | 719,700 | |
|
| Short-Term Investments — 1.6% | |
| Description | | Units | | | Value | |
| | |
Eaton Vance Cash Reserves Fund, LLC, 1.78%(5) | | | 346,625,190 | | | $ | 346,625,190 | |
| |
Total Short-Term Investments
(identified cost $346,614,645) | | | $ | 346,625,190 | |
| |
Total Investments — 99.9%
(identified cost $11,704,745,662) | | | $ | 21,986,951,375 | |
| |
Other Assets, Less Liabilities — 0.1% | | | $ | 26,401,207 | |
| |
Net Assets — 100.0% | | | $ | 22,013,352,582 | |
The percentage shown for each investment category in the Portfolio of Investments is based on net assets.
| (1) | Non-income producing security. |
| (2) | Amount is less than 0.05%. |
| (3) | Restricted security (see Note 5). |
| (4) | For fair value measurement disclosure purposes, security is categorized as Level 3 (see Note 8). |
| (5) | Affiliated investment company, available to Eaton Vance portfolios and funds, which invests in high quality, U.S. dollar denominated money market instruments. The rate shown is the annualizedseven-day yield as of December 31, 2019. |
Abbreviations:
| | | | |
| | |
| ADR | | – | | American Depositary Receipt |
| | |
| CVR | | – | | Contingent Value Rights |
| | | | |
| | 36 | | See Notes to Financial Statements. |
Tax-Managed Growth Portfolio
December 31, 2019
Statement of Assets and Liabilities
| | | | |
| Assets | | December 31, 2019 | |
| |
Unaffiliated investments, at value (identified cost, $11,358,131,017) | | $ | 21,640,326,185 | |
| |
Affiliated investment fund, at value (identified cost, $346,614,645) | | | 346,625,190 | |
| |
Cash | | | 11,253 | |
| |
Dividends and interest receivable | | | 16,221,716 | |
| |
Dividends receivable from affiliated investment | | | 453,557 | |
| |
Receivable for investments sold | | | 17,079,700 | |
| |
Tax reclaims receivable | | | 2,568,954 | |
| |
Total assets | | $ | 22,023,286,555 | |
| |
| Liabilities | | | | |
| |
Payable to affiliates: | | | | |
| |
Investment adviser fee | | $ | 7,712,184 | |
| |
Trustees’ fees | | | 27,125 | |
| |
Accrued expenses | | | 2,194,664 | |
| |
Total liabilities | | $ | 9,933,973 | |
| |
Commitments and contingencies (Note 9) | | | | |
| |
Net Assets applicable to investors’ interest in Portfolio | | $ | 22,013,352,582 | |
| | | | |
| | 37 | | See Notes to Financial Statements. |
Tax-Managed Growth Portfolio
December 31, 2019
Statement of Operations
| | | | |
| Investment Income | | Year Ended December 31, 2019 | |
| |
Dividends (net of foreign taxes, $6,179,445) | | $ | 322,111,567 | |
| |
Dividends from affiliated investment | | | 5,406,740 | |
| |
Total investment income | | $ | 327,518,307 | |
| |
| Expenses | | | | |
| |
Investment adviser fee | | $ | 81,541,698 | |
| |
Trustees’ fees and expenses | | | 110,250 | |
| |
Custodian fee | | | 2,369,374 | |
| |
Professional fees | | | 403,955 | |
| |
Miscellaneous | | | 545,959 | |
| |
Total expenses | | $ | 84,971,236 | |
| |
Net investment income | | $ | 242,547,071 | |
| |
| Realized and Unrealized Gain (Loss) | | | | |
|
Net realized gain (loss) — | |
| |
Investment transactions(1) | | $ | 489,531,799 | |
| |
Investment transactions — affiliated investment | | | (4,227 | ) |
| |
Foreign currency transactions | | | (79,171 | ) |
| |
Net realized gain | | $ | 489,448,401 | |
|
Change in unrealized appreciation (depreciation) — | |
| |
Investments | | $ | 4,080,943,063 | |
| |
Investments — affiliated investment | | | 23,296 | |
| |
Foreign currency | | | 99,904 | |
| |
Net change in unrealized appreciation (depreciation) | | $ | 4,081,066,263 | |
| |
Net realized and unrealized gain | | $ | 4,570,514,664 | |
| |
Net increase in net assets from operations | | $ | 4,813,061,735 | |
| (1) | Includes $499,998,800 of net realized gains from redeptionsin-kind. |
| | | | |
| | 38 | | See Notes to Financial Statements. |
Tax-Managed Growth Portfolio
December 31, 2019
Statements of Changes in Net Assets
| | | | | | | | |
| | | Year Ended December 31, | |
| Increase (Decrease) in Net Assets | | 2019 | | | 2018 | |
|
From operations — | |
| | |
Net investment income | | $ | 242,547,071 | | | $ | 214,584,213 | |
| | |
Net realized gain | | | 489,448,401 | | | | 462,326,236 | |
| | |
Net change in unrealized appreciation (depreciation) | | | 4,081,066,263 | | | | (1,556,354,108 | ) |
| | |
Net increase (decrease) in net assets from operations | | $ | 4,813,061,735 | | | $ | (879,443,659 | ) |
|
Capital transactions — | |
| | |
Contributions | | $ | 2,251,431,385 | | | $ | 1,599,259,969 | |
| | |
Withdrawals | | | (1,067,186,292 | ) | | | (928,460,409 | ) |
| | |
Net increase in net assets from capital transactions | | $ | 1,184,245,093 | | | $ | 670,799,560 | |
| | |
Net increase (decrease) in net assets | | $ | 5,997,306,828 | | | $ | (208,644,099 | ) |
| | |
| Net Assets | | | | | | | | |
| | |
At beginning of year | | $ | 16,016,045,754 | | | $ | 16,224,689,853 | |
| | |
At end of year | | $ | 22,013,352,582 | | | $ | 16,016,045,754 | |
| | | | |
| | 39 | | See Notes to Financial Statements. |
Tax-Managed Growth Portfolio
December 31, 2019
Financial Highlights
| | | | | | | | | | | | | | | | | | | | |
| | | Year Ended December 31, | |
| Ratios/Supplemental Data | | 2019 | | | 2018 | | | 2017 | | | 2016 | | | 2015 | |
| | | | | |
Ratios (as a percentage of average daily net assets): | | | | | | | | | | | | | | | | | | | | |
| | | | | |
Expenses(1) | | | 0.45 | % | | | 0.46 | % | | | 0.46 | % | | | 0.47 | % | | | 0.47 | % |
| | | | | |
Net investment income | | | 1.28 | % | | | 1.25 | % | | | 1.33 | % | | | 1.48 | % | | | 1.44 | % |
| | | | | |
Portfolio Turnover | | | 1 | %(2) | | | 1 | %(2) | | | 0 | %(2)(3) | | | 1 | %(2) | | | 9 | % |
| | | | | |
Total Return | | | 29.87 | % | | | (5.02 | )% | | | 22.76 | % | | | 9.06 | % | | | 2.53 | % |
| | | | | |
Net assets, end of year (000’s omitted) | | $ | 22,013,353 | | | $ | 16,016,046 | | | $ | 16,224,690 | | | $ | 12,577,024 | | | $ | 11,055,385 | |
| (1) | Excludes the effect of custody fee credits, if any, of less than 0.005%. Effective September 1, 2015, custody fee credits, which were earned on cash deposit balances, were discontinued by the custodian. |
| (2) | Excludes the value of portfolio securities contributed or distributed as a result ofin-kind shareholder transactions. The portfolio turnover of the Portfolio includingin-kind contributions and distributions of securities was 6%, 6%, 5% and 6% for the years ended December 31, 2019, 2018, 2017 and 2016, respectively. |
| (3) | Amount is less than 0.5%. |
| | | | |
| | 40 | | See Notes to Financial Statements. |
Tax-Managed Growth Portfolio
December 31, 2019
Notes to Financial Statements
1 Significant Accounting Policies
Tax-Managed Growth Portfolio (the Portfolio) is a Massachusetts business trust registered under the Investment Company Act of 1940, as amended (the 1940 Act), as a diversified,open-end management investment company. The Portfolio’s investment objective is to achieve long-term,after-tax returns for interestholders through investing in a diversified portfolio of equity securities. The Declaration of Trust permits the Trustees to issue interests in the Portfolio. At December 31, 2019, Eaton VanceTax-Managed Growth Fund 1.0, Eaton VanceTax-Managed Growth Fund 1.1, Eaton VanceTax-Managed Growth Fund 1.2 and Eaton VanceTax-Managed Equity Asset Allocation Fund held an interest of 4.7%, 8.0%, 4.2%, and 0.8% respectively, in the Portfolio. In addition, an unregistered fund managed by the adviser to the Portfolio held an aggregate interest of 82.3% in the Portfolio.
The following is a summary of significant accounting policies of the Portfolio. The policies are in conformity with accounting principles generally accepted in the United States of America (U.S. GAAP). The Portfolio is an investment company and follows accounting and reporting guidance in the Financial Accounting Standards Board (FASB) Accounting Standards Codification Topic 946 “Financial Services — Investment Companies.”
A Investment Valuation — The following methodologies are used to determine the market value or fair value of investments.
Equity Securities. Equity securities listed on a U.S. securities exchange generally are valued at the last sale or closing price on the day of valuation or, if no sales took place on such date, at the mean between the closing bid and asked prices on the exchange where such securities are principally traded. Equity securities listed on the NASDAQ Global or Global Select Market generally are valued at the NASDAQ official closing price. Unlisted or listed securities for which closing sales prices or closing quotations are not available are valued at the mean between the latest available bid and asked prices.
Foreign Securities and Currencies. Foreign securities and currencies are valued in U.S. dollars, based on foreign currency exchange rate quotations supplied by a third party pricing service. The pricing service uses a proprietary model to determine the exchange rate. Inputs to the model include reported trades and implied bid/ask spreads. The daily valuation of exchange-traded foreign securities generally is determined as of the close of trading on the principal exchange on which such securities trade. Events occurring after the close of trading on foreign exchanges may result in adjustments to the valuation of foreign securities to more accurately reflect their fair value as of the close of regular trading on the New York Stock Exchange. When valuing foreign equity securities that meet certain criteria, the Portfolio’s Trustees have approved the use of a fair value service that values such securities to reflect market trading that occurs after the close of the applicable foreign markets of comparable securities or other instruments that have a strong correlation to the fair-valued securities.
Affiliated Fund. The Portfolio may invest in Eaton Vance Cash Reserves Fund, LLC (Cash Reserves Fund), an affiliated investment company managed by Eaton Vance Management (EVM). While Cash Reserves Fund is not a registered money market mutual fund, it conducts all of its investment activities in accordance with the requirements of Rule2a-7 under the 1940 Act. Investments in Cash Reserves Fund are valued at the closing net asset value per unit on the valuation day. Cash Reserves Fund generally values its investment securities based on available market quotations provided by a third party pricing service.
Fair Valuation. Investments for which valuations or market quotations are not readily available or are deemed unreliable are valued at fair value using methods determined in good faith by or at the direction of the Trustees of the Portfolio in a manner that most fairly reflects the security’s “fair value”, which is the amount that the Portfolio might reasonably expect to receive for the security upon its current sale in the ordinary course. Each such determination is based on a consideration of relevant factors, which are likely to vary from one pricing context to another. These factors may include, but are not limited to, the type of security, the existence of any contractual restrictions on the security’s disposition, the price and extent of public trading in similar securities of the issuer or of comparable companies or entities, quotations or relevant information obtained from broker/dealers or other market participants, information obtained from the issuer, analysts, and/or the appropriate stock exchange (for exchange-traded securities), an analysis of the company’s or entity’s financial statements, and an evaluation of the forces that influence the issuer and the market(s) in which the security is purchased and sold.
B Investment Transactions — Investment transactions for financial statement purposes are accounted for on a trade date basis. Realized gains and losses on investments sold are determined on the basis of identified cost.
C Income — Dividend income is recorded on theex-dividend date for dividends received in cash and/or securities. However, if theex-dividend date has passed, certain dividends from foreign securities are recorded as the Portfolio is informed of theex-dividend date. Withholding taxes on foreign dividends and capital gains have been provided for in accordance with the Portfolio’s understanding of the applicable countries’ tax rules and rates. In consideration of recent decisions rendered by European courts, the Portfolio has filed additional tax reclaims for previously withheld taxes on dividends earned in certain European Union countries. These filings are subject to various administrative and judicial proceedings within these countries. Due to the uncertainty as to the ultimate resolution of these proceedings, the likelihood of receipt of these reclaims, and the potential timing of payment, no amounts are reflected in the financial statements for such reclaims. Interest income is recorded on the basis of interest accrued, adjusted for amortization of premium or accretion of discount.
D Federal Taxes — The Portfolio has elected to be treated as a partnership for federal tax purposes. No provision is made by the Portfolio for federal or state taxes on any taxable income of the Portfolio because each investor in the Portfolio is ultimately responsible for the payment of any taxes on its share of taxable income. Since at least one of the Portfolio’s investors is a regulated investment company that invests all or substantially all of its assets in the Portfolio, the Portfolio normally must satisfy the applicable source of income and diversification requirements (under the Internal Revenue Code) in order for its investors to satisfy them. The Portfolio will allocate, at least annually among its investors, each investor’s distributive share of the Portfolio’s net investment income, net realized capital gains and losses and any other items of income, gain, loss, deduction or credit.
Tax-Managed Growth Portfolio
December 31, 2019
Notes to Financial Statements — continued
As of December 31, 2019, the Portfolio had no uncertain tax positions that would require financial statement recognition,de-recognition, or disclosure. The Portfolio files a U.S. federal income tax return annually after its fiscalyear-end, which is subject to examination by the Internal Revenue Service for a period of three years from the date of filing.
E Foreign Currency Translation— Investment valuations, other assets, and liabilities initially expressed in foreign currencies are translated each business day into U.S. dollars based upon current exchange rates. Purchases and sales of foreign investment securities and income and expenses denominated in foreign currencies are translated into U.S. dollars based upon currency exchange rates in effect on the respective dates of such transactions. Recognized gains or losses on investment transactions attributable to changes in foreign currency exchange rates are recorded for financial statement purposes as net realized gains and losses on investments. That portion of unrealized gains and losses on investments that results from fluctuations in foreign currency exchange rates is not separately disclosed.
F Use of Estimates— The preparation of the financial statements in conformity with U.S. GAAP requires management to make estimates and assumptions that affect the reported amounts of assets and liabilities at the date of the financial statements and the reported amounts of income and expense during the reporting period. Actual results could differ from those estimates.
G Indemnifications— Under the Portfolio’s organizational documents, its officers and Trustees may be indemnified against certain liabilities and expenses arising out of the performance of their duties to the Portfolio. Under Massachusetts law, if certain conditions prevail, interestholders in the Portfolio could be deemed to have personal liability for the obligations of the Portfolio. However, the Portfolio’s Declaration of Trust contains an express disclaimer of liability on the part of Portfolio interestholders. Additionally, in the normal course of business, the Portfolio enters into agreements with service providers that may contain indemnification clauses. The Portfolio’s maximum exposure under these arrangements is unknown as this would involve future claims that may be made against the Portfolio that have not yet occurred.
2 Investment Adviser Fee and Other Transactions with Affiliates
The investment adviser fee is earned by Boston Management and Research (BMR), a subsidiary of EVM, as compensation for investment advisory services rendered to the Portfolio. Under the investment advisory agreement, BMR receives a monthly advisory fee at a rate of 0.625% annually of the Portfolio’s average daily net assets up to $500 million. The advisory fee on net assets of $500 million or more is reduced as follows:
| | | | |
| Average Daily Net Assets | | Annual Fee Rate
(for each level) | |
| |
$500 million but less than $1 billion | | | 0.5625 | % |
| |
$1 billion but less than $1.5 billion | | | 0.5000 | % |
| |
$1.5 billion but less than $7 billion | | | 0.4375 | % |
| |
$7 billion but less than $10 billion | | | 0.4250 | % |
| |
$10 billion but less than $15 billion | | | 0.4125 | % |
| |
$15 billion but less than $20 billion | | | 0.4000 | % |
| |
$20 billion but less than $25 billion | | | 0.3900 | % |
| |
$25 billion and over | | | 0.3800 | % |
The Portfolio invests its cash in Cash Reserves Fund. EVM does not currently receive a fee for advisory services provided to Cash Reserves Fund. For the year ended December 31, 2019, the Portfolio’s investment adviser fee amounted to $81,541,698 or 0.43% of the Portfolio’s average daily net assets.
Officers and Trustees of the Portfolio who are members of EVM’s or BMR’s organizations receive remuneration for their services to the Portfolio out of the investment adviser fee. Trustees of the Portfolio who are not affiliated with the investment adviser may elect to defer receipt of all or a percentage of their annual fees in accordance with the terms of the Trustees Deferred Compensation Plan. For the year ended December 31, 2019, no significant amounts have been deferred. Certain officers and Trustees of the Portfolio are officers of the above organizations.
3 Purchases and Sales of Investments
Purchases and sales of investments, other than short-term obligations, aggregated $206,905,515 and $121,317,923, respectively, for the year ended December 31, 2019. In addition, investors contributed securities with an aggregate market value of $2,162,578,875 and investments having an aggregate market value of $943,319,699 were distributed in payment for capital withdrawals during the year ended December 31, 2019.
Tax-Managed Growth Portfolio
December 31, 2019
Notes to Financial Statements — continued
4 Federal Income Tax Basis of Investments
The cost and unrealized appreciation (depreciation) of investments of the Portfolio at December 31, 2019, as determined on a federal income tax basis, were as follows:
| | | | |
| |
Aggregate cost | | $ | 3,366,069,163 | |
| |
Gross unrealized appreciation | | $ | 18,633,953,788 | |
| |
Gross unrealized depreciation | | | (13,071,576 | ) |
| |
Net unrealized appreciation | | $ | 18,620,882,212 | |
5 Restricted Securities
At December 31, 2019, the Portfolio owned the following securities (representing 1.0%of net assets) which were restricted as to public resale and not registered under the Securities Act of 1933. The Portfolio has various registration rights (exercisable under a variety of circumstances) with respect to these securities. The value of these securities is determined based on valuations provided by brokers when available, or if not available, they are valued at fair value using methods determined in good faith by or at the direction of the Trustees.
| | | | | | | | | | | | | | | | | | | | |
| Common Stocks | | Date of
Acquisition | | | Eligible for
Resale | | | Shares | | | Cost | | | Value | |
| | | | | |
Align Technology, Inc. | | | 6/20/19 | | | | 6/20/20 | | | | 18,700 | | | $ | 5,547,577 | | | $ | 5,218,048 | |
| | | | | |
eBay, Inc. | | | 12/19/19 | | | | 12/19/20 | | | | 171,429 | | | | 6,105,513 | | | | 6,186,897 | |
| | | | | |
FactSet Research Systems, Inc. | | | 9/19/19 | | | | 9/19/20 | | | | 75,000 | | | | 21,214,388 | | | | 20,117,469 | |
| | | | | |
Home Depot, Inc. (The) | | | 6/20/19 | | | | 6/20/20 | | | | 11,095 | | | | 2,305,710 | | | | 2,422,926 | |
| | | | | |
Host Hotels & Resorts, Inc. | | | 12/19/19 | | | | 12/19/20 | | | | 306,221 | | | | 5,665,033 | | | | 5,677,276 | |
| | | | | |
Hyatt Hotels Corp., Class A | | | 12/19/19 | | | | 12/19/20 | | | | 700,000 | | | | 59,987,991 | | | | 62,765,602 | |
| | | | | |
Integra LifeSciences Holdings Corp. | | | 9/19/19 | | | | 9/19/20 | | | | 520,000 | | | | 31,704,140 | | | | 30,298,024 | |
| | | | | |
Integra LifeSciences Holdings Corp. | | | 12/19/19 | | | | 12/19/20 | | | | 491,205 | | | | 29,169,890 | | | | 28,610,250 | |
| | | | | |
Lam Research Corp. | | | 12/19/19 | | | | 12/19/20 | | | | 21,452 | | | | 6,173,971 | | | | 6,267,860 | |
| | | | | |
Lennox International, Inc. | | | 6/20/19 | | | | 6/20/20 | | | | 25,181 | | | | 6,827,920 | | | | 6,143,409 | |
| | | | | |
Littelfuse, Inc. | | | 12/19/19 | | | | 12/19/20 | | | | 52,675 | | | | 10,000,112 | | | | 10,071,185 | |
| | | | | |
NVIDIA Corp. | | | 9/19/19 | | | | 9/19/20 | | | | 19,186 | | | | 3,451,370 | | | | 4,513,337 | |
| | | | | |
Ross Stores, Inc. | | | 3/21/19 | | | | 3/21/20 | | | | 50,000 | | | | 4,572,983 | | | | 5,821,000 | |
| | | | | |
Ross Stores, Inc. | | | 6/20/19 | | | | 6/20/20 | | | | 60,000 | | | | 6,199,078 | | | | 6,985,200 | |
| | | | | |
Ross Stores, Inc. | | | 9/19/19 | | | | 9/19/20 | | | | 15,000 | | | | 1,629,835 | | | | 1,745,863 | |
| | | | | |
Skechers U.S.A., Inc., Class A | | | 9/19/19 | | | | 9/19/20 | | | | 100,000 | | | | 3,453,272 | | | | 4,317,920 | |
| | | | | |
Texas Roadhouse, Inc. | | | 9/19/19 | | | | 9/19/20 | | | | 18,691 | | | | 1,000,029 | | | | 1,052,414 | |
| | | | | |
Workday, Inc., Class A | | | 12/19/19 | | | | 12/19/20 | | | | 23,986 | | | | 3,856,797 | | | | 3,927,732 | |
| | | | | |
Total Restricted Securities | | | | | | | | | | | | | | $ | 208,865,609 | | | $ | 212,142,412 | |
6 Line of Credit
The Portfolio participates with other portfolios and funds managed by EVM and its affiliates in an $800 million unsecured line of credit agreement with a group of banks, which is in effect through October 27, 2020. In connection with the renewal of the agreement on October 29, 2019, funds managed by Calvert Research and Management, an affiliate of EVM, were added as participating funds to the agreement and the borrowing limit was increased from $625 million. Borrowings are made by the Portfolio solely to facilitate the handling of unusual and/or unanticipated short-term cash requirements. Interest is charged to the Portfolio based on its borrowings at an amount above either the Eurodollar rate or Federal Funds rate. In addition, a fee computed at an annual rate of 0.15% on the daily unused portion of the line of credit is allocated among the participating portfolios and funds at the end of each quarter. Because the line of credit is not available exclusively to the Portfolio, it may be unable to borrow some or all of its requested amounts at any particular time. The Portfolio did not have any significant borrowings or allocated fees during the year ended December 31, 2019.
Tax-Managed Growth Portfolio
December 31, 2019
Notes to Financial Statements — continued
7 Investments in Affiliated Funds
At December 31, 2019, the value of the Portfolio’s investment in affiliated funds was $346,625,190, which represents 1.6% of the Portfolio’s net assets. Transactions in affiliated funds by the Portfolio for the year ended December 31, 2019 were as follows:
| | | | | | | | | | | | | | | | | | | | | | | | | | | | | | | | |
| Name of affiliated fund | | Value,
beginning
of period | | | Purchases | | | Sales proceeds | | | Net
realized
gain (loss) | | | Change in
unrealized
appreciation
(depreciation) | | | Value, end of period | | | Dividend
income | | | Units, end of period | |
|
Short-Term Investments | |
| | | | | | | | |
Eaton Vance Cash Reserves Fund, LLC, 1.78% | | $ | 234,953,084 | | | $ | 421,039,355 | | | $ | (309,386,318 | ) | | $ | (4,227 | ) | | $ | 23,296 | | | $ | 346,625,190 | | | $ | 5,406,740 | | | | 346,625,190 | |
8 Fair Value Measurements
Under generally accepted accounting principles for fair value measurements, a three-tier hierarchy to prioritize the assumptions, referred to as inputs, is used in valuation techniques to measure fair value. The three-tier hierarchy of inputs is summarized in the three broad levels listed below.
| • | | Level 1 – quoted prices in active markets for identical investments |
| • | | Level 2 – other significant observable inputs (including quoted prices for similar investments, interest rates, prepayment speeds, credit risk, etc.) |
| • | | Level 3 – significant unobservable inputs (including a fund’s own assumptions in determining the fair value of investments) |
In cases where the inputs used to measure fair value fall in different levels of the fair value hierarchy, the level disclosed is determined based on the lowest level input that is significant to the fair value measurement in its entirety. The inputs or methodology used for valuing securities are not necessarily an indication of the risk associated with investing in those securities.
At December 31, 2019, the hierarchy of inputs used in valuing the Portfolio’s investments, which are carried at value, were as follows:
| | | | | | | | | | | | | | | | | | | | |
| Asset Description | | Level 1 | | | Level 2 | | | Level 3* | | | Total | |
|
Common Stocks | |
| | | | | |
Communication Services | | $ | 2,422,228,136 | | | | | | | $ | — | | | $ | — | | | $ | 2,422,228,136 | |
| | | | | |
Consumer Discretionary | | | 2,895,994,406 | | | | | | | | 76,068,696 | | | | 1,791,355 | | | | 2,973,854,457 | |
| | | | | |
Consumer Staples | | | 1,766,750,075 | | | | | | | | 121,078,165 | | | | — | | | | 1,887,828,240 | |
| | | | | |
Energy | | | 633,593,046 | | | | | | | | — | | | | — | | | | 633,593,046 | |
| | | | | |
Financials | | | 3,497,898,744 | | | | | | | | 37,924,133 | | | | — | | | | 3,535,822,877 | |
| | | | | |
Health Care | | | 2,699,959,858 | | | | | | | | 58,908,274 | | | | — | | | | 2,758,868,132 | |
| | | | | |
Industrials | | | 2,179,419,867 | | | | | | | | — | | | | — | | | | 2,179,419,867 | |
| | | | | |
Information Technology | | | 4,783,266,266 | | | | | | | | 24,780,114 | | | | — | | | | 4,808,046,380 | |
| | | | | |
Materials | | | 337,552,958 | | | | | | | | 1,863,428 | | | | — | | | | 339,416,386 | |
| | | | | |
Real Estate | | | 25,266,529 | | | | | | | | 5,677,276 | | | | — | | | | 30,943,805 | |
| | | | | |
Utilities | | | 69,585,159 | | | | | | | | — | | | | — | | | | 69,585,159 | |
| | | | | |
Total Common Stocks | | $ | 21,311,515,044 | | | $ | | | | | 326,300,086 | ** | | $ | 1,791,355 | | | $ | 21,639,606,485 | |
| | | | | |
Rights | | $ | 719,700 | | | | | | | $ | — | | | $ | — | | | $ | 719,700 | |
| | | | | |
Short-Term Investments | | | — | | | | | | | | 346,625,190 | | | | — | | | | 346,625,190 | |
| | | | | |
Total Investments | | $ | 21,312,234,744 | | | | | | | $ | 672,925,276 | | | $ | 1,791,355 | | | $ | 21,986,951,375 | |
| * | None of the unobservable inputs for Level 3 assets, individually or collectively, had a material impact on the Fund. |
| ** | Includes foreign equity securities whose values were adjusted to reflect market trading of comparable securities or other correlated instruments that occurred after the close of trading in their applicable foreign markets. |
Tax-Managed Growth Portfolio
December 31, 2019
Notes to Financial Statements — continued
Level 3 investments at the beginning and/or end of the period in relation to net assets were not significant and accordingly, a reconciliation of Level 3 assets for the year ended December 31, 2019, is not presented.
9 Legal Proceedings
In November 2010, the Portfolio was named as defendant and a putative member of the proposed defendant class of shareholders in the case entitled Official Committee of Unsecured Creditors (UCC) of the Tribune Company v. FitzSimons, et al. as a result of its ownership of shares in the Tribune Company (Tribune) in 2007 when Tribune effected a leveraged buyout transaction (LBO) and was converted to a privately held company. The UCC, which has been replaced by a Litigation Trustee pursuant to Tribune’s plan of reorganization, seeks to recover payments of the proceeds of the LBO. In June 2011, a group of Tribune creditors filed multiple actions against former Tribune shareholders involving state law constructive fraudulent conveyance claims arising out of the LBO (the “SLFC actions”). The Portfolio has been named as a defendant in one of the SLFC actions filed in United States District Court — District of Massachusetts by Deutsche Bank Trust Co. Americas seeking to recover the proceeds received in connection with the LBO from former shareholders. The FitzSimons action and the SLFC actions are now part of a multi-district litigation proceeding in the Southern District of New York. The value of the proceeds received by the Portfolio is approximately $48,237,000 (equal to 0.2% of net assets at December 31, 2019).
The Portfolio cannot predict the outcome of these proceedings or the effect, if any, on the Portfolio’s net asset value. The attorneys’ fees and costs related to these actions are expensed by the Portfolio as incurred.
Tax-Managed Growth Portfolio
December 31, 2019
Report of Independent Registered Public Accounting Firm
To the Trustees and Investors ofTax-Managed Growth Portfolio:
Opinion on the Financial Statements and Financial Highlights
We have audited the accompanying statement of assets and liabilities ofTax-Managed Growth Portfolio (the “Portfolio”), including the portfolio of investments, as of December 31, 2019, the related statement of operations for the year then ended, the statements of changes in net assets for each of the two years in the period then ended, the financial highlights for each of the five years in the period then ended, and the related notes. In our opinion, the financial statements and financial highlights present fairly, in all material respects, the financial position of the Portfolio as of December 31, 2019, and the results of its operations for the year then ended, the changes in its net assets for each of the two years in the period then ended, and the financial highlights for each of the five years in the period then ended in conformity with accounting principles generally accepted in the United States of America.
Basis for Opinion
These financial statements and financial highlights are the responsibility of the Portfolio’s management. Our responsibility is to express an opinion on the Portfolio’s financial statements and financial highlights based on our audits. We are a public accounting firm registered with the Public Company Accounting Oversight Board (United States) (PCAOB) and are required to be independent with respect to the Portfolio in accordance with the U.S. federal securities laws and the applicable rules and regulations of the Securities and Exchange Commission and the PCAOB.
We conducted our audits in accordance with the standards of the PCAOB. Those standards require that we plan and perform the audit to obtain reasonable assurance about whether the financial statements and financial highlights are free of material misstatement, whether due to error or fraud. The Portfolio is not required to have, nor were we engaged to perform, an audit of its internal control over financial reporting. As part of our audits we are required to obtain an understanding of internal control over financial reporting but not for the purpose of expressing an opinion on the effectiveness of the Portfolio’s internal control over financial reporting. Accordingly, we express no such opinion.
Our audits included performing procedures to assess the risks of material misstatement of the financial statements and financial highlights, whether due to error or fraud, and performing procedures that respond to those risks. Such procedures included examining, on a test basis, evidence regarding the amounts and disclosures in the financial statements and financial highlights. Our audits also included evaluating the accounting principles used and significant estimates made by management, as well as evaluating the overall presentation of the financial statements and financial highlights. Our procedures included confirmation of securities owned as of December 31, 2019, by correspondence with the custodian and brokers; when replies were not received from brokers, we performed other auditing procedures. We believe that our audits provide a reasonable basis for our opinion.
/s/ Deloitte & Touche LLP
Boston, Massachusetts
February 21, 2020
We have served as the auditor of one or more Eaton Vance investment companies since 1959.
Eaton Vance
Tax-Managed Growth Fund 1.1
December 31, 2019
Management and Organization
Fund Management. The Trustees of Eaton Vance Mutual Funds Trust (the Trust) and Tax-Managed Growth Portfolio (the Portfolio) are responsible for the overall management and supervision of the Trust’s and Portfolio’s affairs. The Trustees and officers of the Trust and the Portfolio are listed below. Except as indicated, each individual has held the office shown or other offices in the same company for the last five years. Trustees and officers of the Trust and the Portfolio hold indefinite terms of office. The “noninterested Trustees” consist of those Trustees who are not “interested persons” of the Trust and the Portfolio, as that term is defined under the 1940 Act. The business address of each Trustee and officer is Two International Place, Boston, Massachusetts 02110. As used below, “EVC” refers to Eaton Vance Corp., “EV” refers to Eaton Vance, Inc., “EVM” refers to Eaton Vance Management, “BMR” refers to Boston Management and Research and “EVD” refers to Eaton Vance Distributors, Inc. EVC and EV are the corporate parent and trustee, respectively, of EVM and BMR. EVD is the Fund’s principal underwriter, the Portfolio’s placement agent and a wholly-owned subsidiary of EVC. Each officer affiliated with Eaton Vance may hold a position with other Eaton Vance affiliates that is comparable to his or her position with EVM listed below. Each Trustee oversees 159 portfolios in the Eaton Vance Complex (including all master and feeder funds in a master feeder structure). Each officer serves as an officer of certain other Eaton Vance funds. Each Trustee and officer serves until his or her successor is elected.
| | | | | | |
| Name and Year of Birth | | Position(s)
with the Trust
and the
Portfolio | | Trustee
Since(1) | | Principal Occupation(s) and Directorships During Past Five Years and Other Relevant Experience |
|
| Interested Trustee |
| | | |
Thomas E. Faust Jr. 1958 | | Trustee | | 2007 | | Chairman, Chief Executive Officer and President of EVC, Director and President of EV, Chief Executive Officer and President of EVM and BMR, and Director of EVD. Trustee and/or officer of 159 registered investment companies. Mr. Faust is an interested person because of his positions with EVM, BMR, EVD, EVC and EV, which are affiliates of the Trust and the Portfolio. Directorships in the Last Five Years. Director of EVC and Hexavest Inc. (investment management firm). |
|
| Noninterested Trustees |
| | | |
Mark R. Fetting 1954 | | Trustee | | 2016 | | Private investor. Formerly held various positions at Legg Mason, Inc. (investment management firm) (2000-2012), including President, Chief Executive Officer, Director and Chairman (2008-2012), Senior Executive Vice President (2004-2008) and Executive Vice President (2001-2004). Formerly, President of Legg Mason family of funds (2001-2008). Formerly, Division President and Senior Officer of Prudential Financial Group, Inc. and related companies (investment management firm) (1991-2000). Other Directorships in the Last Five Years. None. |
| | | |
Cynthia E. Frost 1961 | | Trustee | | 2014 | | Private investor. Formerly, Chief Investment Officer of Brown University (university endowment) (2000-2012). Formerly, Portfolio Strategist for Duke Management Company (university endowment manager) (1995-2000). Formerly, Managing Director, Cambridge Associates (investment consulting company) (1989-1995). Formerly, Consultant, Bain and Company (management consulting firm) (1987-1989). Formerly, Senior Equity Analyst, BA Investment Management Company (1983-1985). Other Directorships in the Last Five Years. None. |
| | | |
George J. Gorman 1952 | | Trustee | | 2014 | | Principal at George J. Gorman LLC (consulting firm). Formerly, Senior Partner at Ernst & Young LLP (a registered public accounting firm) (1974-2009). Other Directorships in the Last Five Years. Formerly, Trustee of the BofA Funds Series Trust (11 funds) (2011-2014) and of the Ashmore Funds (9 funds) (2010-2014). |
| | | |
Valerie A. Mosley 1960 | | Trustee | | 2014 | | Chairwoman and Chief Executive Officer of Valmo Ventures (a consulting and investment firm). Former Partner and Senior Vice President, Portfolio Manager and Investment Strategist at Wellington Management Company, LLP (investment management firm) (1992-2012). Former Chief Investment Officer, PG Corbin Asset Management (1990-1992). Formerly worked in institutional corporate bond sales at Kidder Peabody (1986-1990). Other Directorships in the Last Five Years. Director of Envestnet, Inc. (provider of intelligent systems for wealth management and financial wellness) (since 2018). Director of Dynex Capital, Inc. (mortgage REIT) (since 2013). |
Eaton Vance
Tax-Managed Growth Fund 1.1
December 31, 2019
Management and Organization — continued
| | | | | | |
| Name and Year of Birth | | Position(s)
with the Trust
and the
Portfolio | | Trustee
Since(1) | | Principal Occupation(s) and Directorships During Past Five Years and Other Relevant Experience |
|
| Noninterested Trustees (continued) |
| | | |
William H. Park 1947 | | Chairperson of the Board and Trustee | | 2016 (Chairperson) 2003 (Trustee) | | Private investor. Formerly, Consultant (management and transactional) (2012-2014). Formerly, Chief Financial Officer, Aveon Group L.P. (investment management firm) (2010-2011). Formerly, Vice Chairman, Commercial Industrial Finance Corp. (specialty finance company) (2006-2010). Formerly, President and Chief Executive Officer, Prizm Capital Management, LLC (investment management firm) (2002-2005). Formerly, Executive Vice President and Chief Financial Officer, United Asset Management Corporation (investment management firm) (1982-2001). Formerly, Senior Manager, Price Waterhouse (now PricewaterhouseCoopers) (a registered public accounting firm) (1972-1981). Other Directorships in the Last Five Years. None. |
| | | |
Helen Frame Peters 1948 | | Trustee | | 2008 | | Professor of Finance, Carroll School of Management, Boston College. Formerly, Dean, Carroll School of Management, Boston College (2000-2002). Formerly, Chief Investment Officer, Fixed Income, Scudder Kemper Investments (investment management firm) (1998-1999). Formerly, Chief Investment Officer, Equity and Fixed Income, Colonial Management Associates (investment management firm) (1991-1998). Other Directorships in the Last Five Years. None. |
| | | |
Keith Quinton 1958 | | Trustee | | 2018 | | Independent Investment Committee Member at New Hampshire Retirement System (since 2017). Advisory Committee member at Northfield Information Services, Inc. (risk management analytics provider) (since 2016). Formerly, Portfolio Manager and Senior Quantitative Analyst at Fidelity Investments (investment management firm)(2001-2014). Other Directorships in the Last Five Years. Director of New Hampshire Municipal Bond Bank (since 2016). |
| | | |
Marcus L. Smith 1966 | | Trustee | | 2018 | | Member of Posse Boston Advisory Board (foundation) (since 2015). Trustee at University of Mount Union (since 2008). Formerly, Portfolio Manager at MFS Investment Management (investment management firm) (1994-2017). Other Directorships in the Last Five Years. Director of MSCI Inc. (global provider of investment decision support tools) (since 2017). Formerly, Director of DCT Industrial Trust Inc. (logistics real estate company) (2017-2018). |
| | | |
Susan J. Sutherland 1957 | | Trustee | | 2015 | | Private investor. Formerly, Associate, Counsel and Partner at Skadden, Arps, Slate, Meagher & Flom LLP (law firm) (1982-2013). Other Directorships in the Last Five Years. Formerly, Director of Montpelier Re Holdings Ltd. (global provider of customized insurance and reinsurance products) (2013-2015). |
| | | |
Scott E. Wennerholm 1959 | | Trustee | | 2016 | | Formerly, Trustee at Wheelock College (postsecondary institution) (2012-2018). Formerly, Consultant at GF Parish Group (executive recruiting firm) (2016-2017). Formerly, Chief Operating Officer and Executive Vice President at BNY Mellon Asset Management (investment management firm) (2005-2011). Formerly, Chief Operating Officer and Chief Financial Officer at Natixis Global Asset Management (investment management firm) (1997-2004). Formerly, Vice President at Fidelity Investments Institutional Services (investment management firm) (1994-1997). Other Directorships in the Last Five Years. None. |
| | | | | | |
| Name and Year of Birth | | Position(s) with the Trust and the Portfolio | | Officer
Since(2) | | Principal Occupation(s) During Past Five Years |
|
| Principal Officers who are not Trustees |
| | | |
Payson F. Swaffield 1956 | | President of the Trust | | 2003 | | Vice President and Chief Income Investment Officer of EVM and BMR. Also Vice President of Calvert Research and Management (“CRM”). |
| | | |
Edward J. Perkin 1972 | | President of the Portfolio | | 2014 | | Chief Equity Investment Officer and Vice President of EVM and BMR since 2014. Also Vice President of Calvert Research and Management (“CRM”) since 2016. |
Eaton Vance
Tax-Managed Growth Fund 1.1
December 31, 2019
Management and Organization — continued
| | | | | | |
| Name and Year of Birth | | Position(s) with the Trust and the Portfolio | | Officer
Since(2) | | Principal Occupation(s) During Past Five Years |
|
| Principal Officers who are not Trustees (continued) |
| | | |
Maureen A. Gemma 1960 | | Vice President, Secretary and Chief Legal Officer | | 2005 | | Vice President of EVM and BMR. Also Vice President of CRM. |
| | | |
James F. Kirchner 1967 | | Treasurer | | 2007 | | Vice President of EVM and BMR. Also Vice President of CRM. |
| | | |
Richard F. Froio 1968 | | Chief Compliance Officer | | 2017 | | Vice President of EVM and BMR since 2017. Formerly Deputy Chief Compliance Officer (Adviser/Funds) and Chief Compliance Officer (Distribution) at PIMCO (2012-2017) and Managing Director at BlackRock/Barclays Global Investors (2009-2012). |
| (1) | Year first appointed to serve as Trustee for a fund in the Eaton Vance family of funds. Each Trustee has served continuously since appointment unless indicated otherwise. |
| (2) | Year first elected to serve as officer of a fund in the Eaton Vance family of funds when the officer has served continuously. Otherwise, year of most recent election as an officer of a fund in the Eaton Vance family of funds. Titles may have changed since initial election. |
The SAI for the Fund includes additional information about the Trustees and officers of the Fund and the Portfolio and can be obtained without charge on Eaton Vance’s website at www.eatonvance.com or by calling 1-800-262-1122.
Eaton Vance
Tax-Managed Growth Fund 1.2
December 31, 2019
Management and Organization
Fund Management. The Trustees of Eaton Vance Mutual Funds Trust (the Trust) and Tax-Managed Growth Portfolio (the Portfolio) are responsible for the overall management and supervision of the Trust’s and Portfolio’s affairs. The Trustees and officers of the Trust and the Portfolio are listed below. Except as indicated, each individual has held the office shown or other offices in the same company for the last five years. Trustees and officers of the Trust and the Portfolio hold indefinite terms of office. The “noninterested Trustees” consist of those Trustees who are not “interested persons” of the Trust and the Portfolio, as that term is defined under the 1940 Act. The business address of each Trustee and officer is Two International Place, Boston, Massachusetts 02110. As used below, “EVC” refers to Eaton Vance Corp., “EV” refers to Eaton Vance, Inc., “EVM” refers to Eaton Vance Management, “BMR” refers to Boston Management and Research and “EVD” refers to Eaton Vance Distributors, Inc. EVC and EV are the corporate parent and trustee, respectively, of EVM and BMR. EVD is the Fund’s principal underwriter, the Portfolio’s placement agent and a wholly-owned subsidiary of EVC. Each officer affiliated with Eaton Vance may hold a position with other Eaton Vance affiliates that is comparable to his or her position with EVM listed below. Each Trustee oversees 159 portfolios in the Eaton Vance Complex (including all master and feeder funds in a master feeder structure). Each officer serves as an officer of certain other Eaton Vance funds. Each Trustee and officer serves until his or her successor is elected.
| | | | | | |
| Name and Year of Birth | | Position(s)
with the Trust
and the Portfolio | | Trustee
Since(1) | | Principal Occupation(s) and Directorships
During Past Five Years and Other Relevant Experience |
|
| Interested Trustee |
| | | |
Thomas E. Faust Jr. 1958 | | Trustee | | 2007 | | Chairman, Chief Executive Officer and President of EVC, Director and President of EV, Chief Executive Officer and President of EVM and BMR, and Director of EVD. Trustee and/or officer of 159 registered investment companies. Mr. Faust is an interested person because of his positions with EVM, BMR, EVD, EVC and EV, which are affiliates of the Trust and the Portfolio. Directorships in the Last Five Years. Director of EVC and Hexavest Inc. (investment management firm). |
|
| Noninterested Trustees |
| | | |
Mark R. Fetting 1954 | | Trustee | | 2016 | | Private investor. Formerly held various positions at Legg Mason, Inc. (investment management firm) (2000-2012), including President, Chief Executive Officer, Director and Chairman (2008-2012), Senior Executive Vice President (2004-2008) and Executive Vice President (2001-2004). Formerly, President of Legg Mason family of funds (2001-2008). Formerly, Division President and Senior Officer of Prudential Financial Group, Inc. and related companies (investment management firm)(1991-2000). Other Directorships in the Last Five Years. None. |
| | | |
Cynthia E. Frost 1961 | | Trustee | | 2014 | | Private investor. Formerly, Chief Investment Officer of Brown University (university endowment) (2000-2012). Formerly, Portfolio Strategist for Duke Management Company (university endowment manager) (1995-2000). Formerly, Managing Director, Cambridge Associates (investment consulting company) (1989-1995). Formerly, Consultant, Bain and Company (management consulting firm) (1987-1989). Formerly, Senior Equity Analyst, BA Investment Management Company (1983-1985). Other Directorships in the Last Five Years. None. |
| | | |
George J. Gorman 1952 | | Trustee | | 2014 | | Principal at George J. Gorman LLC (consulting firm). Formerly, Senior Partner at Ernst & Young LLP (a registered public accounting firm) (1974-2009). Other Directorships in the Last Five Years. Formerly, Trustee of the BofA Funds Series Trust (11 funds) (2011-2014) and of the Ashmore Funds (9 funds) (2010-2014). |
| | | |
Valerie A. Mosley 1960 | | Trustee | | 2014 | | Chairwoman and Chief Executive Officer of Valmo Ventures (a consulting and investment firm). Former Partner and Senior Vice President, Portfolio Manager and Investment Strategist at Wellington Management Company, LLP (investment management firm) (1992-2012). Former Chief Investment Officer, PG Corbin Asset Management (1990-1992). Formerly worked in institutional corporate bond sales at Kidder Peabody (1986-1990). Other Directorships in the Last Five Years. Director of Envestnet, Inc. (provider of intelligent systems for wealth management and financial wellness) (since 2018). Director of Dynex Capital, Inc. (mortgage REIT) (since 2013). |
Eaton Vance
Tax-Managed Growth Fund 1.2
December 31, 2019
Management and Organization — continued
| | | | | | |
| Name and Year of Birth | | Position(s)
with the Trust
and the Portfolio | | Trustee
Since(1) | | Principal Occupation(s) and Directorships
During Past Five Years and Other Relevant Experience |
|
| Noninterested Trustees (continued) |
| | | |
William H. Park 1947 | | Chairperson of the Board and Trustee | | 2016 (Chairperson) 2003 (Trustee) | | Private investor. Formerly, Consultant (management and transactional) (2012-2014). Formerly, Chief Financial Officer, Aveon Group L.P. (investment management firm) (2010-2011). Formerly, Vice Chairman, Commercial Industrial Finance Corp. (specialty finance company) (2006-2010). Formerly, President and Chief Executive Officer, Prizm Capital Management, LLC (investment management firm) (2002-2005). Formerly, Executive Vice President and Chief Financial Officer, United Asset Management Corporation (investment management firm) (1982-2001). Formerly, Senior Manager, Price Waterhouse (now PricewaterhouseCoopers) (a registered public accounting firm) (1972-1981). Other Directorships in the Last Five Years. None. |
| | | |
Helen Frame Peters 1948 | | Trustee | | 2008 | | Professor of Finance, Carroll School of Management, Boston College. Formerly, Dean, Carroll School of Management, Boston College (2000-2002). Formerly, Chief Investment Officer, Fixed Income, Scudder Kemper Investments (investment management firm) (1998-1999). Formerly, Chief Investment Officer, Equity and Fixed Income, Colonial Management Associates (investment management firm) (1991-1998). Other Directorships in the Last Five Years. None. |
| | | |
Keith Quinton 1958 | | Trustee | | 2018 | | Independent Investment Committee Member at New Hampshire Retirement System (since 2017). Advisory Committee member at Northfield Information Services, Inc. (risk management analytics provider) (since 2016). Formerly, Portfolio Manager and Senior Quantitative Analyst at Fidelity Investments (investment management firm)(2001-2014). Other Directorships in the Last Five Years. Director of New Hampshire Municipal Bond Bank (since 2016). |
| | | |
Marcus L. Smith 1966 | | Trustee | | 2018 | | Member of Posse Boston Advisory Board (foundation) (since 2015). Trustee at University of Mount Union (since 2008). Formerly, Portfolio Manager at MFS Investment Management (investment management firm) (1994-2017). Other Directorships in the Last Five Years. Director of MSCI Inc. (global provider of investment decision support tools) (since 2017). Formerly, Director of DCT Industrial Trust Inc. (logistics real estate company) (2017-2018). |
| | | |
Susan J. Sutherland 1957 | | Trustee | | 2015 | | Private investor. Formerly, Associate, Counsel and Partner at Skadden, Arps, Slate, Meagher & Flom LLP (law firm) (1982-2013). Other Directorships in the Last Five Years. Formerly, Director of Montpelier Re Holdings Ltd. (global provider of customized insurance and reinsurance products) (2013-2015). |
| | | |
Scott E. Wennerholm 1959 | | Trustee | | 2016 | | Formerly, Trustee at Wheelock College (postsecondary institution) (2012-2018). Formerly, Consultant at GF Parish Group (executive recruiting firm) (2016-2017). Formerly, Chief Operating Officer and Executive Vice President at BNY Mellon Asset Management (investment management firm) (2005-2011). Formerly, Chief Operating Officer and Chief Financial Officer at Natixis Global Asset Management (investment management firm) (1997-2004). Formerly, Vice President at Fidelity Investments Institutional Services (investment management firm) (1994-1997). Other Directorships in the Last Five Years. None. |
| | | | | | |
| Name and Year of Birth | | Position(s)
with the Trust
and the
Portfolio | | Officer
Since(2) | | Principal Occupation(s)
During Past Five Years |
|
| Principal Officers who are not Trustees |
| | | |
Payson F. Swaffield 1956 | | President of the Trust | | 2003 | | Vice President and Chief Income Investment Officer of EVM and BMR. Also Vice President of Calvert Research and Management (“CRM”). |
Eaton Vance
Tax-Managed Growth Fund 1.2
December 31, 2019
Management and Organization — continued
| | | | | | |
| Name and Year of Birth | | Position(s)
with the Trust
and the
Portfolio | | Officer
Since(2) | | Principal Occupation(s)
During Past Five Years |
|
| Principal Officers who are not Trustees (continued) |
| | | |
Edward J. Perkin 1972 | | President of the Portfolio | | 2014 | | Chief Equity Investment Officer and Vice President of EVM and BMR since 2014. Also Vice President of Calvert Research and Management (“CRM”) since 2016. |
| | | |
Maureen A. Gemma 1960 | | Vice President, Secretary and Chief Legal Officer | | 2005 | | Vice President of EVM and BMR. Also Vice President of CRM. |
| | | |
James F. Kirchner 1967 | | Treasurer | | 2007 | | Vice President of EVM and BMR. Also Vice President of CRM. |
| | | |
Richard F. Froio 1968 | | Chief Compliance Officer | | 2017 | | Vice President of EVM and BMR since 2017. Formerly Deputy Chief Compliance Officer (Adviser/Funds) and Chief Compliance Officer (Distribution) at PIMCO (2012-2017) and Managing Director at BlackRock/Barclays Global Investors (2009-2012). |
| (1) | Year first appointed to serve as Trustee for a fund in the Eaton Vance family of funds. Each Trustee has served continuously since appointment unless indicated otherwise. |
| (2) | Year first elected to serve as officer of a fund in the Eaton Vance family of funds when the officer has served continuously. Otherwise, year of most recent election as an officer of a fund in the Eaton Vance family of funds. Titles may have changed since initial election. |
The SAI for the Fund includes additional information about the Trustees and officers of the Fund and the Portfolio and can be obtained without charge on Eaton Vance’s website at www.eatonvance.com or by calling 1-800-262-1122.
Eaton Vance Funds
IMPORTANT NOTICES
Privacy. The Eaton Vance organization is committed to ensuring your financial privacy. Each entity listed below has adopted a privacy policy and procedures (“Privacy Program”) Eaton Vance believes is reasonably designed to protect your personal information and to govern when and with whom Eaton Vance may share your personal information.
| • | | At the time of opening an account, Eaton Vance generally requires you to provide us with certain information such as name, address, social security number, tax status, account numbers, and account balances. This information is necessary for us to both open an account for you and to allow us to satisfy legal requirements such as applicable anti-money laundering reviews and know-your-customer requirements. |
| • | | On an ongoing basis, in the normal course of servicing your account, Eaton Vance may share your information with unaffiliated third parties that perform various services for Eaton Vance and/or your account. These third parties include transfer agents, custodians, broker/dealers and our professional advisers, including auditors, accountants, and legal counsel. Eaton Vance may additionally share your personal information with our affiliates. |
| • | | We believe our Privacy Program is reasonably designed to protect the confidentiality of your personal information and to prevent unauthorized access to that information. |
| • | | We reserve the right to change our Privacy Program at any time upon proper notification to you. You may want to review our Privacy Program periodically for changes by accessing the link on our homepage: www.eatonvance.com. |
Our pledge of protecting your personal information applies to the following entities within the Eaton Vance organization: the Eaton Vance Family of Funds, Eaton Vance Management, Eaton Vance Investment Counsel, Eaton Vance Distributors, Inc., Eaton Vance Trust Company, Eaton Vance Management (International) Limited, Eaton Vance Advisers International Limited, Eaton Vance Global Advisors Limited, Eaton Vance Management’s Real Estate Investment Group, Boston Management and Research, Calvert Research and Management, and Calvert Funds. This Privacy Notice supersedes all previously issued privacy disclosures. For more information about our Privacy Program or about how your personal information may be used, please call 1-800-262-1122.
Delivery of Shareholder Documents. The Securities and Exchange Commission (SEC) permits funds to deliver only one copy of shareholder documents, including prospectuses, proxy statements and shareholder reports, to fund investors with multiple accounts at the same residential or post office box address. This practice is often called “householding” and it helps eliminate duplicate mailings to shareholders.Eaton Vance, or your financial intermediary, may household the mailing of your documents indefinitely unless you instruct Eaton Vance, or your financial intermediary, otherwise.If you would prefer that your Eaton Vance documents not be householded, please contact Eaton Vance at1-800-262-1122, or contact your financial intermediary. Your instructions that householding not apply to delivery of your Eaton Vance documents will typically be effective within 30 days of receipt by Eaton Vance or your financial intermediary.
Portfolio Holdings. Each Eaton Vance Fund and its underlying Portfolio(s) (if applicable) files a schedule of portfolio holdings on Part F toForm N-PORT with the SEC for the first and third quarters of each fiscal year. The Form N-PORT will be available on the Eaton Vance website at www.eatonvance.com, by calling Eaton Vance at 1-800-262-1122 or in the EDGAR database on the SEC’s website at www.sec.gov.
Proxy Voting. From time to time, funds are required to vote proxies related to the securities held by the funds. The Eaton Vance Funds or their underlying Portfolios (if applicable) vote proxies according to a set of policies and procedures approved by the Funds’ and Portfolios’ Boards. You may obtain a description of these policies and procedures and information on how the Funds or Portfolios voted proxies relating to portfolio securities during the most recent 12-month period ended June 30, without charge, upon request, by calling 1-800-262-1122 and by accessing the SEC’s website at www.sec.gov.
This Page Intentionally Left Blank
This Page Intentionally Left Blank
This Page Intentionally Left Blank
Investment Adviser of Tax-Managed Growth Portfolio
Boston Management and Research
Two International Place
Boston, MA 02110
Administrator of Eaton Vance Tax-Managed Growth Funds 1.1 and 1.2
Eaton Vance Management
Two International Place
Boston, MA 02110
Principal Underwriter*
Eaton Vance Distributors, Inc.
Two International Place
Boston, MA 02110
(617) 482-8260
Custodian
State Street Bank and Trust Company
State Street Financial Center, One Lincoln Street
Boston, MA 02111
Transfer Agent
BNY Mellon Investment Servicing (US) Inc.
Attn: Eaton Vance Funds
P.O. Box 9653
Providence, RI 02940-9653
(800) 262-1122
Independent Registered Public Accounting Firm
Deloitte & Touche LLP
200 Berkeley Street
Boston, MA 02116-5022
Fund Offices
Two International Place
Boston, MA 02110
| * | FINRA BrokerCheck. Investors may check the background of their Investment Professional by contacting the Financial Industry Regulatory Authority (FINRA). FINRA BrokerCheck is a free tool to help investors check the professional background of current and former FINRA-registered securities firms and brokers. FINRA BrokerCheck is available by calling 1-800-289-9999 and at www.FINRA.org. The FINRA BrokerCheck brochure describing this program is available to investors at www.FINRA.org. |

4966 12.31.19

Parametric
Commodity Strategy Fund
Annual Report
December 31, 2019
Important Note. Beginning on January 1, 2021, as permitted by regulations adopted by the Securities and Exchange Commission, paper copies of the Fund’s annual and semi-annual shareholder reports will no longer be sent by mail unless you specifically request paper copies of the reports. Instead, the reports will be made available on the Fund’s website (eatonvance.com/ppafunddocuments), and you will be notified by mail each time a report is posted and provided with a website address to access the report.
If you already elected to receive shareholder reports electronically, you will not be affected by this change and you need not take any action. If you are a direct investor, you may elect to receive shareholder reports and other communications from the Fund electronically by enrolling at eatonvance.com/edelivery. If you own your shares through a financial intermediary (such as a broker-dealer or bank), you must contact your financial intermediary to sign up.
You may elect to receive all future Fund shareholder reports in paper free of charge. If you are a direct investor, you can inform the Fund that you wish to continue receiving paper copies of your shareholder reports by calling 1-800-260-0761. If you own these shares through a financial intermediary, you must contact your financial intermediary or follow instructions included with this disclosure, if applicable, to elect to continue to receive paper copies of your shareholder reports. Your election to receive reports in paper will apply to all Eaton Vance funds held directly or to all funds held through your financial intermediary, as applicable.

Commodity Futures Trading Commission Registration. Effective December 31, 2012, the Commodity Futures Trading Commission (“CFTC”) adopted certain regulatory changes that subject registered investment companies and advisers to regulation by the CFTC if a fund invests more than a prescribed level of its assets in certain CFTC-regulated instruments (including futures, certain options and swap agreements) or markets itself as providing investment exposure to such instruments. The Fund is considered to be a commodity pool operator under CFTC regulations. The Fund’s adviser and sub-adviser are registered with the CFTC as commodity pool operators and commodity trading advisors. The CFTC has neither reviewed nor approved the Fund’s investment strategies.
Fund shares are not insured by the FDIC and are not deposits or other obligations of, or guaranteed by, any depository institution. Shares are subject to investment risks, including possible loss of principal invested.
This report must be preceded or accompanied by a current summary prospectus or prospectus. Before investing, investors should consider carefully the investment objective, risks, and charges and expenses of a mutual fund. This and other important information is contained in the summary prospectus and prospectus, which can be obtained from a financial intermediary. Prospective investors should read the prospectus carefully before investing. For further information, please call 1-800-260-0761.
Annual ReportDecember 31, 2019
Parametric
Commodity Strategy Fund
Table of Contents
| | | | |
Management’s Discussion of Fund Performance | | | 2 | |
| |
Performance | | | 3 | |
| |
Fund Profile | | | 4 | |
| |
Endnotes and Additional Disclosures | | | 5 | |
| |
Fund Expenses | | | 6 | |
| |
Financial Statements | | | 7 | |
| |
Report of Independent Registered Public Accounting Firm | | | 21 | |
| |
Federal Tax Information | | | 22 | |
| |
Management and Organization | | | 23 | |
| |
Important Notices | | | 26 | |
Parametric
Commodity Strategy Fund
December 31, 2019
Management’s Discussion of Fund Performance1
Economic and Market Conditions
The commodity asset class, as measured by the Bloomberg Commodity Index Total Return (the Index),2 found strength in 2019, finishing the 12-month period ended December 31, 2019, up 7.69%. Commodity prices whipsawed for much of 2019, but benefited overall from the strong months that started and ended the year.
Despite headline strengths, results by Index commodity were more dispersed, as idiosyncratic risks for some commodities dominated the major macroeconomic themes of global trade and monetary policy.
Precious metals was the best performing sector during the period, as the previously hawkish U.S. Federal Reserve reverted to a more dovish stance and delivered three interest-rate cuts during the period. A pickup in global volatility following a recession warning in the U.S. further lifted the sector.
The energy sector experienced similar strengths, led by increasing crude oil prices. This was partially due to an agreement by members of Organization of the Petroleum Exporting Countries (OPEC+) to further cut production, in addition to falling rig counts in North American oilfields. Gasoline and gas oil prices broadly mirrored the increase in the price of crude oil, one of the main inputs in producing both commodities. Natural gas was the sole detractor, tumbling due to a combination of record supply and limited demand caused by abnormally warm weather across much of the U.S.
Industrial metals and agriculture also increased during 2019, although results within each sector varied. Nickel benefited for much of the year as consumers drew down stocks ahead of a planned 2020 Indonesian export ban. Meanwhile, aluminum and zinc struggled against uncertainties over global trade and a slowdown in manufacturing. Within agriculture, coffee prices rebounded as supply concerns were eased, while the price of grains broadly fell as the effects of restricted trade between the U.S. and China were realized.
Fund Performance
For the 12-month period ended December 31, 2019, Parametric Commodity Strategy Fund (the Fund) returned 9.18% for Investor Class shares at net asset value (NAV), outperforming its benchmark, the Index, which returned 7.69%.
An overweight exposure to gasoline contributed to the Fund’s relative performance versus the Index. Gasoline prices climbed in response to multiple supply shocks, as well as robust demand throughout the year. An out-of-Index exposure to palladium also aided relative results, as prices soared amid a growing supply deficit during the period. Finally, the Fund’s underweight exposure to natural gas contributed to relative performance, as did the ownership of longer-dated contracts.
A main detractor from the Fund’s relative performance versus the Index was its underweight position in crude oil, as production cuts levied by OPEC+ boosted prices. An underweight exposure to gold also weighed on relative results, as easing monetary policies and a rise in global volatility supported prices. Additionally, an overweight exposure to aluminum hurt relative performance, as prices were pressured by weakness in global manufacturing during the period.
See Endnotes and Additional Disclosures in this report.
Past performance is no guarantee of future results. Returns are historical and are calculated by determining the percentage change in net asset value (NAV) or offering price (as applicable) with all distributions reinvested. Investment return and prin-cipal value will fluctuate so that shares, when redeemed, may be worth more or less than their original cost. Performance for periods less than or equal to one year is cumulative. Performance is for the stated time period only; due to market volatility, current Fund performance may be lower or higher than the quoted return. For performance as of the most recent month-end, please refer to eatonvance.com.
Parametric
Commodity Strategy Fund
December 31, 2019
Performance2,3
Portfolio Managers Thomas C. Seto and Gregory J. Liebl, CFA, each of Parametric Portfolio Associates LLC
| | | | | | | | | | | | | | | | | | | | |
% Average Annual Total Returns | | Class Inception Date | | | Performance Inception Date | | | One Year | | | Five
Years | | | Since Inception | |
Investor Class at NAV | | | 01/03/2012 | | | | 05/25/2011 | | | | 9.18 | % | | | –1.43 | % | | | –5.35 | % |
Institutional Class at NAV | | | 05/25/2011 | | | | 05/25/2011 | | | | 9.58 | | | | –1.18 | | | | –5.12 | |
Bloomberg Commodity Index Total Return | | | — | | | | — | | | | 7.69 | % | | | –3.92 | % | | | –7.27 | % |
| | | | | |
| % Total Annual Operating Expense Ratios4 | | | | | | | | | | | Investor Class | | | Institutional Class | |
Gross | | | | | | | | | | | | | | | 0.98 | % | | | 0.73 | % |
Net | | | | | | | | | | | | | | | 0.90 | | | | 0.65 | |
Growth of $10,0003
This graph shows the change in value of a hypothetical investment of $10,000 in Investor Class of the Fund for the period indicated. For comparison, the same investment is shown in the indicated index.
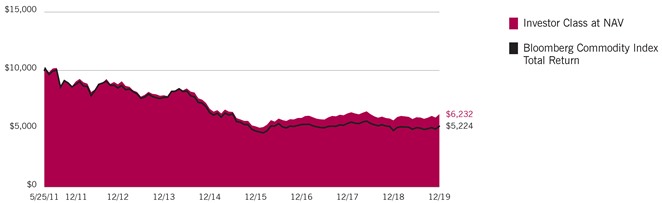
| | | | | | | | | | | | | | | | |
| Growth of Investment | | Amount Invested | | | Period Beginning | | | At NAV | | | With Maximum Sales Charge | |
Institutional Class | | $ | 50,000 | | | | 05/25/2011 | | | $ | 31,796 | | | | N.A. | |
See Endnotes and Additional Disclosures in this report.
Past performance is no guarantee of future results. Returns are historical and are calculated by determining the percentage change in net asset value (NAV) or offering price (as applicable) with all distributions reinvested. Investment return and prin-cipal value will fluctuate so that shares, when redeemed, may be worth more or less than their original cost. Performance for periods less than or equal to one year is cumulative. Performance is for the stated time period only; due to market volatility, current Fund performance may be lower or higher than the quoted return. For performance as of the most recent month-end, please refer to eatonvance.com.
Parametric
Commodity Strategy Fund
December 31, 2019
Fund Profile
Commodity Exposure (% of net assets)5
| | | | |
| |
Agriculture | | | 26.09 | % |
| |
Soybean | | | 3.62 | |
| |
Corn | | | 3.59 | |
| |
Soybean Oil | | | 3.59 | |
| |
Coffee | | | 3.56 | |
| |
Cocoa | | | 1.84 | |
| |
Wheat | | | 1.84 | |
| |
Cotton | | | 1.82 | |
| |
Soybean Meal | | | 1.79 | |
| |
Sugar | | | 1.73 | |
| |
Kansas Wheat | | | 0.92 | |
| |
Robusta Coffee | | | 0.91 | |
| |
White Sugar | | | 0.88 | |
| |
Energy | | | 25.10 | % |
| |
Natural Gas | | | 7.33 | |
| |
RBOB Gasoline | | | 7.07 | |
| |
Heating Oil | | | 3.57 | |
| |
Gasoil | | | 3.56 | |
| |
Brent Crude Oil | | | 1.79 | |
| |
WTI Crude Oil | | | 1.78 | |
| | | | |
| |
Industrial Metals | | | 24.26 | % |
| |
Aluminum | | | 7.20 | |
| |
Copper | | | 3.61 | |
| |
Zinc | | | 3.61 | |
| |
New York Copper | | | 3.57 | |
| |
Nickel | | | 3.57 | |
| |
Lead | | | 1.80 | |
| |
Tin | | | 0.90 | |
| |
Precious Metals | | | 18.21 | % |
| |
Silver | | | 7.26 | |
| |
Gold | | | 7.25 | |
| |
Platinum | | | 1.86 | |
| |
Palladium | | | 1.84 | |
| |
Livestock | | | 6.30 | % |
| |
Live Cattle | | | 3.60 | |
| |
Lean Hogs | | | 1.79 | |
| |
Feeder Cattle | | | 0.91 | |
Asset Allocation (% of net assets)6
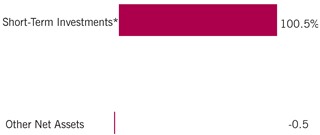
| * | Short-Term Investments are held as collateral for the Fund’s futures contracts positions. |
See Endnotes and Additional Disclosures in this report.
Parametric
Commodity Strategy Fund
December 31, 2019
Endnotes and Additional Disclosures
| 1 | The views expressed in this report are those of the portfolio manager(s) and are current only through the date stated at the top of this page. These views are subject to change at any time based upon market or other conditions, and Eaton Vance and the Fund(s) disclaim any responsibility to update such views. These views may not be relied upon as investment advice and, because investment decisions are based on many factors, may not be relied upon as an indication of trading intent on behalf of any Eaton Vance fund. This commentary may contain statements that are not historical facts, referred to as “forward looking statements.” The Fund’s actual future results may differ significantly from those stated in any forward looking statement, depending on factors such as changes in securities or financial markets or general economic conditions, the volume of sales and purchases of Fund shares, the continuation of investment advisory, administrative and service contracts, and other risks discussed from time to time in the Fund’s filings with the Securities and Exchange Commission. |
| 2 | Bloomberg Commodity Index Total Return is designed to provide diversified commodity exposure, with weightings based on each underlying commodity’s liquidity and economic significance. Unless otherwise stated, index returns do not reflect the effect of any applicable sales charges, commissions, expenses, taxes or leverage, as applicable. It is not possible to invest directly in an index. |
| 3 | Returns are historical and are calculated by determining the percentage change in net asset value (NAV) with all distributions reinvested. Unless otherwise stated, performance does not reflect the deduction of taxes on Fund distributions or redemptions of Fund shares. |
| | Performance prior to the inception date of a class may be linked to the performance of an older class of the Fund. This linked performance is adjusted for any applicable sales charge, but is not adjusted for class expense differences. If adjusted for such differences, the performance would be different. The performance of Investor Class is linked to Institutional Class. Performance since inception for an index, if presented, is the performance since the Fund’s or oldest share class’ inception, as applicable. Performance presented in the Financial Highlights included in the financial statements is not linked. |
| 4 | Source: Fund prospectus. Net expense ratios reflect a contractual expense reimbursement that continues through 4/30/20. Without the reimbursement, performance would have been lower. The expense ratios for the current reporting period can be found in the Financial Highlights section of this report. |
| 5 | Commodity Exposure reflects the Fund’s net exposure to commodities through its investment in commodity-linked derivative instruments. |
| 6 | Other Net Assets represents other assets less liabilities and includes any investment type that represents less than 1% of net assets. |
| | Fund profile subject to change due to active management. |
Parametric
Commodity Strategy Fund
December 31, 2019
Fund Expenses
Example: As a Fund shareholder, you incur two types of costs: (1) transaction costs, including sales charges (loads) on purchases and redemption fees (if applicable); and (2) ongoing costs, including management fees; distribution and/or service fees; and other Fund expenses. This Example is intended to help you understand your ongoing costs (in dollars) of Fund investing and to compare these costs with the ongoing costs of investing in other mutual funds. The Example is based on an investment of $1,000 invested at the beginning of the period and held for the entire period (July 1, 2019 – December 31, 2019).
Actual Expenses: The first section of the table below provides information about actual account values and actual expenses. You may use the information in this section, together with the amount you invested, to estimate the expenses that you paid over the period. Simply divide your account value by $1,000 (for example, an $8,600 account value divided by $1,000 = 8.6), then multiply the result by the number in the first section under the heading entitled “Expenses Paid During Period” to estimate the expenses you paid on your account during this period.
Hypothetical Example for Comparison Purposes: The second section of the table below provides information about hypothetical account values and hypothetical expenses based on the actual Fund expense ratio and an assumed rate of return of 5% per year (before expenses), which is not the actual Fund return. The hypothetical account values and expenses may not be used to estimate the actual ending account balance or expenses you paid for the period. You may use this information to compare the ongoing costs of investing in your Fund and other funds. To do so, compare this 5% hypothetical example with the 5% hypothetical examples that appear in the shareholder reports of the other funds.
Please note that the expenses shown in the table are meant to highlight your ongoing costs only and do not reflect any transactional costs, such as sales charges (loads) or redemption fees (if applicable). Therefore, the second section of the table is useful in comparing ongoing costs only, and will not help you determine the relative total costs of owning different funds. In addition, if these transactional costs were included, your costs would be higher.
| | | | | | | | | | | | | | | | |
| | | Beginning
Account Value
(7/1/19) | | | Ending
Account Value
(12/31/19) | | | Expenses Paid
During Period*
(7/1/19 - 12/31/19) | | | Annualized
Expense
Ratio | |
| | | | |
Actual | | | | | | | | | | | | | | | | |
Investor Class | | $ | 1,000.00 | | | $ | 1,042.70 | | | $ | 4.63 | ** | | | 0.90 | % |
Institutional Class | | $ | 1,000.00 | | | $ | 1,044.80 | | | $ | 3.35 | ** | | | 0.65 | % |
| | | | | |
Hypothetical | | | | | | | | | | | | | | | | |
(5% return per year before expenses) | | | | | | | | | | | | | | | | |
Investor Class | | $ | 1,000.00 | | | $ | 1,020.70 | | | $ | 4.58 | ** | | | 0.90 | % |
Institutional Class | | $ | 1,000.00 | | | $ | 1,021.90 | | | $ | 3.31 | ** | | | 0.65 | % |
| * | Expenses are equal to the Fund’s annualized expense ratio for the indicated Class, multiplied by the average account value over the period, multiplied by 184/365 (to reflect the one-half year period). The Example assumes that the $1,000 was invested at the net asset value per share determined at the close of business on June 30, 2019. |
| ** | Absent an allocation of certain expenses to affiliates, expenses would be higher. |
Parametric
Commodity Strategy Fund
December 31, 2019
Consolidated Portfolio of Investments
| | | | | | | | |
| Short-Term Investments — 100.5% | |
|
| U.S. Treasury Obligations — 95.2% | |
| Security | | Principal
Amount
(000’s omitted) | | | Value | |
| | |
U.S. Treasury Bill, 0.00%, 1/2/20(1) | | $ | 58,400 | | | $ | 58,400,000 | |
| | |
U.S. Treasury Bill, 0.00%, 1/30/20 | | | 26,000 | | | | 25,970,674 | |
| | |
U.S. Treasury Bill, 0.00%, 5/21/20(1) | | | 6,000 | | | | 5,964,504 | |
| | |
U.S. Treasury Bill, 0.00%, 6/18/20 | | | 22,100 | | | | 21,941,673 | |
| | |
U.S. Treasury Bill, 0.00%, 7/16/20(1) | | | 52,800 | | | | 52,359,816 | |
| | |
U.S. Treasury Bill, 0.00%, 8/13/20(1) | | | 42,400 | | | | 41,998,331 | |
| | |
U.S. Treasury Bill, 0.00%, 9/10/20(1) | | | 20,800 | | | | 20,579,416 | |
| | |
U.S. Treasury Bill, 0.00%, 10/8/20 | | | 29,500 | | | | 29,154,113 | |
| | |
U.S. Treasury Bill, 0.00%, 11/5/20 | | | 70,100 | | | | 69,199,584 | |
| |
Total U.S. Treasury Obligations
(identified cost $325,295,711) | | | $ | 325,568,111 | |
| | | | | | | | |
| Other — 5.3% | |
| Description | | Units | | | Value | |
| | |
Eaton Vance Cash Reserves Fund, LLC, 1.78%(2) | | | 18,055,234 | | | $ | 18,055,234 | |
| |
Total Other
(identified cost $18,054,905) | | | $ | 18,055,234 | |
| |
Total Short-Term Investments
(identified cost $343,350,616) | | | $ | 343,623,345 | |
| |
Total Investments — 100.5%
(identified cost $343,350,616) | | | $ | 343,623,345 | |
| |
Other Assets, Less Liabilities — (0.5)% | | | $ | (1,683,815 | ) |
| |
Net Assets — 100.0% | | | $ | 341,939,530 | |
The percentage shown for each investment category in the Consolidated Portfolio of Investments is based on net assets.
| (1) | Security (or a portion thereof) has been pledged as collateral for open futures contracts. |
| (2) | Affiliated investment company, available to Eaton Vance portfolios and funds, which invests in high quality, U.S. dollar denominated money market instruments. The rate shown is the annualized seven-day yield as of December 31, 2019. |
| | | | | | | | | | | | | | | | | | | | |
| Futures Contracts | |
| | | | | |
| Description | | Number of
Contracts | | | Position | | | Expiration
Date | | | Notional
Amount | | | Value/Unrealized
Appreciation
(Depreciation) | |
| | | | | |
Commodity Futures | | | | | | | | | | | | | | | | | | | | |
| | | | | |
| Brent Crude Oil | | | 94 | | | | Long | | | | 2/28/20 | | | $ | 6,137,260 | | | $ | 340,533 | |
| | | | | |
| Cocoa | | | 248 | | | | Long | | | | 3/16/20 | | | | 6,299,200 | | | | 43,634 | |
| | | | | |
| Coffee | | | 250 | | | | Long | | | | 3/19/20 | | | | 12,159,375 | | | | 2,219,888 | |
| | | | | |
| Copper | | | 175 | | | | Long | | | | 3/27/20 | | | | 12,236,875 | | | | 999,118 | |
| | | | | |
| Corn | | | 634 | | | | Long | | | | 3/13/20 | | | | 12,291,675 | | | | (367,837 | ) |
| | | | | |
| Cotton No. 2 | | | 180 | | | | Long | | | | 3/9/20 | | | | 6,214,500 | | | | 584,453 | |
| | | | | |
| Feeder Cattle | | | 43 | | | | Long | | | | 3/26/20 | | | | 3,100,838 | | | | 4,212 | |
| | | | | |
| Gold | | | 162 | | | | Long | | | | 4/28/20 | | | | 24,774,660 | | | | 709,553 | |
| | | | | |
| Hard Red Winter Wheat | | | 129 | | | | Long | | | | 3/13/20 | | | | 3,134,700 | | | | 422,475 | |
| | | | | |
| Lean Hogs | | | 196 | | | | Long | | | | 4/15/20 | | | | 6,109,320 | | | | 243,429 | |
| | | | | |
| Live Cattle | | | 242 | | | | Long | | | | 4/30/20 | | | | 12,310,540 | | | | 195,630 | |
| | | | | |
| LME Copper | | | 83 | | | | Long | | | | 1/13/20 | | | | 12,778,888 | | | | 1,023,463 | |
| | | | | |
| LME Copper | | | 80 | | | | Long | | | | 2/17/20 | | | | 12,337,000 | | | | 516,500 | |
| | | | | |
| LME Copper | | | 82 | | | | Long | | | | 3/16/20 | | | | 12,658,750 | | | | 578,675 | |
| | | | | |
| LME Lead | | | 115 | | | | Long | | | | 1/13/20 | | | | 5,511,375 | | | | (617,462 | ) |
| | | | | |
| LME Lead | | | 122 | | | | Long | | | | 2/17/20 | | | | 5,873,538 | | | | (551,319 | ) |
| | | | | |
| LME Lead | | | 129 | | | | Long | | | | 3/16/20 | | | | 6,219,413 | | | | 20,937 | |
| | | | | |
| LME Nickel | | | 119 | | | | Long | | | | 1/13/20 | | | | 9,973,152 | | | | (2,538,522 | ) |
| | | | |
| | 7 | | See Notes to Consolidated Financial Statements. |
Parametric
Commodity Strategy Fund
December 31, 2019
Consolidated Portfolio of Investments — continued
| | | | | | | | | | | | | | | | | | | | |
| Futures Contracts (continued) | |
| | | | | |
| Description | | Number of
Contracts | | | Position | | | Expiration
Date | | | Notional
Amount | | | Value/Unrealized
Appreciation
(Depreciation) | |
| | | | | |
Commodity Futures (continued) | | | | | | | | | | | | | | | | | | | | |
| | | | | |
| LME Nickel | | | 136 | | | | Long | | | | 2/17/20 | | | $ | 11,424,000 | | | $ | (1,702,644 | ) |
| | | | | |
| LME Nickel | | | 153 | | | | Long | | | | 3/16/20 | | | | 12,874,950 | | | | 780,018 | |
| | | | | |
| LME Primary Aluminum | | | 561 | | | | Long | | | | 1/13/20 | | | | 25,094,231 | | | | 1,035,375 | |
| | | | | |
| LME Primary Aluminum | | | 530 | | | | Long | | | | 2/17/20 | | | | 23,863,250 | | | | (159,744 | ) |
| | | | | |
| LME Primary Aluminum | | | 555 | | | | Long | | | | 3/16/20 | | | | 25,113,750 | | | | 650,560 | |
| | | | | |
| LME Tin | | | 36 | | | | Long | | | | 1/13/20 | | | | 3,095,640 | | | | 131,310 | |
| | | | | |
| LME Tin | | | 36 | | | | Long | | | | 2/17/20 | | | | 3,093,840 | | | | 112,320 | |
| | | | | |
| LME Tin | | | 38 | | | | Long | | | | 3/16/20 | | | | 3,264,200 | | | | 74,045 | |
| | | | | |
| LME Zinc | | | 198 | | | | Long | | | | 1/13/20 | | | | 11,290,950 | | | | (61,875 | ) |
| | | | | |
| LME Zinc | | | 207 | | | | Long | | | | 2/17/20 | | | | 11,787,356 | | | | (939,744 | ) |
| | | | | |
| LME Zinc | | | 221 | | | | Long | | | | 3/16/20 | | | | 12,567,994 | | | | 160,741 | |
| | | | | |
| Low Sulphur Gasoil | | | 199 | | | | Long | | | | 3/12/20 | | | | 12,163,875 | | | | 657,846 | |
| | | | | |
| Natural Gas | | | 922 | | | | Long | | | | 12/29/20 | | | | 25,078,400 | | | | 46,767 | |
| | | | | |
| NY Harbor ULSD | | | 144 | | | | Long | | | | 2/28/20 | | | | 12,195,792 | | | | 609,348 | |
| | | | | |
| Palladium | | | 33 | | | | Long | | | | 3/27/20 | | | | 6,300,690 | | | | 487,808 | |
| | | | | |
| Platinum | | | 130 | | | | Long | | | | 4/28/20 | | | | 6,355,700 | | | | 447,540 | |
| | | | | |
| RBOB Gasoline | | | 338 | | | | Long | | | | 2/28/20 | | | | 24,175,788 | | | | 1,066,538 | |
| | | | | |
| Robusta Coffee | | | 225 | | | | Long | | | | 3/25/20 | | | | 3,109,500 | | | | 22,710 | |
| | | | | |
| Silver | | | 277 | | | | Long | | | | 3/27/20 | | | | 24,820,585 | | | | 230,456 | |
| | | | | |
| Soybean | | | 259 | | | | Long | | | | 3/13/20 | | | | 12,373,725 | | | | 135,813 | |
| | | | | |
| Soybean Meal | | | 201 | | | | Long | | | | 3/13/20 | | | | 6,124,470 | | | | (78,421 | ) |
| | | | | |
| Soybean Oil | | | 589 | | | | Long | | | | 3/13/20 | | | | 12,287,718 | | | | 975,703 | |
| | | | | |
| Sugar No. 11 | | | 394 | | | | Long | | | | 2/28/20 | | | | 5,921,978 | | | | 295,886 | |
| | | | | |
| Wheat | | | 225 | | | | Long | | | | 3/13/20 | | | | 6,285,938 | | | | 691,276 | |
| | | | | |
| White Sugar | | | 167 | | | | Long | | | | 2/14/20 | | | | 2,999,320 | | | | 175,038 | |
| | | | | |
| WTI Crude Oil | | | 100 | | | | Long | | | | 2/20/20 | | | | 6,077,000 | | | | 264,917 | |
| | | | | |
| LME Copper | | | 83 | | | | Short | | | | 1/13/20 | | | | (12,778,888 | ) | | | (524,394 | ) |
| | | | | |
| LME Copper | | | 80 | | | | Short | | | | 2/17/20 | | | | (12,337,000 | ) | | | (573,500 | ) |
| | | | | |
| LME Copper | | | 2 | | | | Short | | | | 3/16/20 | | | | (308,750 | ) | | | (9,175 | ) |
| | | | | |
| LME Lead | | | 115 | | | | Short | | | | 1/13/20 | | | | (5,511,375 | ) | | | 588,669 | |
| | | | | |
| LME Lead | | | 122 | | | | Short | | | | 2/17/20 | | | | (5,873,538 | ) | | | (19,825 | ) |
| | | | | |
| LME Lead | | | 1 | | | | Short | | | | 3/16/20 | | | | (48,213 | ) | | | (931 | ) |
| | | | | |
| LME Nickel | | | 119 | | | | Short | | | | 1/13/20 | | | | (9,973,152 | ) | | | 1,646,484 | |
| | | | | |
| LME Nickel | | | 136 | | | | Short | | | | 2/17/20 | | | | (11,424,000 | ) | | | (717,264 | ) |
| | | | | |
| LME Nickel | | | 8 | | | | Short | | | | 3/16/20 | | | | (673,200 | ) | | | 5,076 | |
| | | | | |
| LME Primary Aluminum | | | 561 | | | | Short | | | | 1/13/20 | | | | (25,094,231 | ) | | | 236,800 | |
| | | | | |
| LME Primary Aluminum | | | 530 | | | | Short | | | | 2/17/20 | | | | (23,863,250 | ) | | | (606,188 | ) |
| | | | | |
| LME Primary Aluminum | | | 11 | | | | Short | | | | 3/16/20 | | | | (497,750 | ) | | | (1,237 | ) |
| | | | | |
| LME Tin | | | 36 | | | | Short | | | | 1/13/20 | | | | (3,095,640 | ) | | | (113,400 | ) |
| | | | | |
| LME Tin | | | 36 | | | | Short | | | | 2/17/20 | | | | (3,093,840 | ) | | | (77,400 | ) |
| | | | | |
| LME Tin | | | 2 | | | | Short | | | | 3/16/20 | | | | (171,800 | ) | | | 50 | |
| | | | | |
| LME Zinc | | | 198 | | | | Short | | | | 1/13/20 | | | | (11,290,950 | ) | | | 1,029,500 | |
| | | | | |
| LME Zinc | | | 207 | | | | Short | | | | 2/17/20 | | | | (11,787,356 | ) | | | (155,250 | ) |
| | | | | |
| LME Zinc | | | 4 | | | | Short | | | | 3/16/20 | | | | (227,475 | ) | | | (3,950 | ) |
| |
| | | | $ | 10,641,012 | |
| | | | |
| | 8 | | See Notes to Consolidated Financial Statements. |
Parametric
Commodity Strategy Fund
December 31, 2019
Consolidated Portfolio of Investments — continued
Abbreviations:
| | | | |
| | |
| LME | | – | | London Metal Exchange |
| | |
| RBOB | | – | | Reformulated Blendstock for Oxygenate Blending |
| | |
| ULSD | | – | | Ultra-Low Sulfur Diesel |
| | |
| WTI | | – | | West Texas Intermediate |
| | | | |
| | 9 | | See Notes to Consolidated Financial Statements. |
Parametric
Commodity Strategy Fund
December 31, 2019
Consolidated Statement of Assets and Liabilities
| | | | |
| Assets | | December 31, 2019 | |
| |
Unaffiliated investments, at value (identified cost, $325,295,711) | | $ | 325,568,111 | |
| |
Affiliated investment, at value (identified cost, $18,054,905) | | | 18,055,234 | |
| |
Dividends receivable from affiliated investment | | | 27,518 | |
| |
Receivable for Fund shares sold | | | 958,775 | |
| |
Total assets | | $ | 344,609,638 | |
| |
| Liabilities | | | | |
| |
Payable for Fund shares redeemed | | $ | 361,378 | |
| |
Payable for variation margin on open futures contracts | | | 1,929,241 | |
| |
Payable to affiliates: | | | | |
| |
Investment adviser and administration fee | | | 155,159 | |
| |
Distribution and service fees | | | 2,043 | |
| |
Trustees’ fees | | | 4,005 | |
| |
Other | | | 10,820 | |
| |
Accrued expenses | | | 207,462 | |
| |
Total liabilities | | $ | 2,670,108 | |
| |
Net Assets | | $ | 341,939,530 | |
| |
| Sources of Net Assets | | | | |
| |
Paid-in capital | | $ | 357,775,810 | |
| |
Accumulated loss | | | (15,836,280 | ) |
| |
Total | | $ | 341,939,530 | |
| |
| Investor Class Shares | | | | |
| |
Net Assets | | $ | 9,699,704 | |
| |
Shares Outstanding | | | 1,838,881 | |
| |
Net Asset Value, Offering Price and Redemption Price Per Share | | | | |
| |
(net assets ÷ shares of beneficial interest outstanding) | | $ | 5.27 | |
| |
| Institutional Class Shares | | | | |
| |
Net Assets | | $ | 332,239,826 | |
| |
Shares Outstanding | | | 62,603,208 | |
| |
Net Asset Value, Offering Price and Redemption Price Per Share | | | | |
| |
(net assets ÷ shares of beneficial interest outstanding) | | $ | 5.31 | |
| | | | |
| | 10 | | See Notes to Consolidated Financial Statements. |
Parametric
Commodity Strategy Fund
December 31, 2019
Consolidated Statement of Operations
| | | | |
| Investment Income | | Year Ended
December 31, 2019 | |
| |
Interest | | $ | 7,044,347 | |
| |
Dividends from affiliated investment | | | 404,800 | |
| |
Total investment income | | $ | 7,449,147 | |
|
| Expenses | |
| |
Investment adviser and administration fee | | $ | 1,739,934 | |
| |
Distribution and service fees | | | | |
| |
Investor Class | | | 41,151 | |
| |
Trustees’ fees and expenses | | | 17,211 | |
| |
Custodian fee | | | 133,969 | |
| |
Transfer and dividend disbursing agent fees | | | 128,756 | |
| |
Legal and accounting services | | | 96,117 | |
| |
Printing and postage | | | 24,595 | |
| |
Registration fees | | | 66,674 | |
| |
Miscellaneous | | | 24,126 | |
| |
Total expenses | | $ | 2,272,533 | |
| |
Deduct — | | | | |
| |
Allocation of expenses to affiliates | | $ | 174,503 | |
| |
Total expense reductions | | $ | 174,503 | |
| |
Net expenses | | $ | 2,098,030 | |
| |
Net investment income | | $ | 5,351,117 | |
|
| Realized and Unrealized Gain (Loss) | |
| |
Net realized gain (loss) — | | | | |
| |
Investment transactions | | $ | 13,301 | |
| |
Investment transactions — affiliated investment | | | 4,853 | |
| |
Futures contracts | | | (2,260,187 | ) |
| |
Net realized loss | | $ | (2,242,033 | ) |
| |
Change in unrealized appreciation (depreciation) — | | | | |
| |
Investments | | $ | 407,595 | |
| |
Investments — affiliated investment | | | (168 | ) |
| |
Futures contracts | | | 24,870,690 | |
| |
Net change in unrealized appreciation (depreciation) | | $ | 25,278,117 | |
| |
Net realized and unrealized gain | | $ | 23,036,084 | |
| |
Net increase in net assets from operations | | $ | 28,387,201 | |
| | | | |
| | 11 | | See Notes to Consolidated Financial Statements. |
Parametric
Commodity Strategy Fund
December 31, 2019
Consolidated Statements of Changes in Net Assets
| | | | | | | | |
| | | Year Ended December 31, | |
| Increase (Decrease) in Net Assets | | 2019 | | | 2018 | |
| | |
From operations — | | | | | | | | |
| | |
Net investment income | | $ | 5,351,117 | | | $ | 3,611,220 | |
| | |
Net realized loss | | | (2,242,033 | ) | | | (14,923,214 | ) |
| | |
Net change in unrealized appreciation (depreciation) | | | 25,278,117 | | | | (19,884,522 | ) |
| | |
Net increase (decrease) in net assets from operations | | $ | 28,387,201 | | | $ | (31,196,516 | ) |
| | |
Distributions to shareholders — | | | | | | | | |
| | |
Investor Class | | $ | (107,065 | ) | | $ | (78,690 | ) |
| | |
Institutional Class | | | (5,051,252 | ) | | | (2,602,206 | ) |
| | |
Total distributions to shareholders | | $ | (5,158,317 | ) | | $ | (2,680,896 | ) |
| | |
Transactions in shares of beneficial interest — | | | | | | | | |
| | |
Proceeds from sale of shares | | | | | | | | |
| | |
Investor Class | | $ | 8,789,352 | | | $ | 28,263,399 | |
| | |
Institutional Class | | | 142,780,714 | | | | 271,101,557 | |
| | |
Net asset value of shares issued to shareholders in payment of distributions declared | | | | | | | | |
| | |
Investor Class | | | 107,065 | | | | 78,690 | |
| | |
Institutional Class | | | 4,983,406 | | | | 2,527,310 | |
| | |
Cost of shares redeemed | | | | | | | | |
| | |
Investor Class | | | (19,877,810 | ) | | | (53,883,097 | ) |
| | |
Institutional Class | | | (106,981,195 | ) | | | (178,895,214 | ) |
| | |
Net increase in net assets from Fund share transactions | | $ | 29,801,532 | | | $ | 69,192,645 | |
| | |
Net increase in net assets | | $ | 53,030,416 | | | $ | 35,315,233 | |
|
| Net Assets | |
| | |
At beginning of year | | $ | 288,909,114 | | | $ | 253,593,881 | |
| | |
At end of year | | $ | 341,939,530 | | | $ | 288,909,114 | |
| | | | |
| | 12 | | See Notes to Consolidated Financial Statements. |
Parametric
Commodity Strategy Fund
December 31, 2019
Consolidated Financial Highlights
| | | | | | | | | | | | | | | | | | | | |
| | | Investor Class | |
| |
| | | Year Ended December 31, | |
| | | 2019 | | | 2018 | | | 2017 | | | 2016 | | | 2015 | |
| | | | | | |
Net asset value — Beginning of year | | $ | 4.880 | | | $ | 5.420 | | | $ | 5.340 | | | $ | 5.000 | | | $ | 6.440 | |
| | | | | |
| Income (Loss) From Operations | | | | | | | | | | | | | | | | | | | | |
| | | | | |
Net investment income (loss)(1) | | $ | 0.077 | | | $ | 0.043 | | | $ | (0.000 | )(2) | | $ | (0.023 | ) | | $ | (0.042 | ) |
| | | | | |
Net realized and unrealized gain (loss) | | | 0.372 | | | | (0.563 | ) | | | 0.350 | | | | 0.710 | | | | (1.398 | ) |
| | | | | |
Total income (loss) from operations | | $ | 0.449 | | | $ | (0.520 | ) | | $ | 0.350 | | | $ | 0.687 | | | $ | (1.440 | ) |
| | | | | |
| Less Distributions | | | | | | | | | | | | | | | | | | | | |
| | | | | |
From net investment income | | $ | (0.059 | ) | | $ | (0.020 | ) | | $ | (0.270 | ) | | $ | (0.347 | ) | | $ | — | |
| | | | | |
Total distributions | | $ | (0.059 | ) | | $ | (0.020 | ) | | $ | (0.270 | ) | | $ | (0.347 | ) | | $ | — | |
| | | | | |
Net asset value — End of year | | $ | 5.270 | | | $ | 4.880 | | | $ | 5.420 | | | $ | 5.340 | | | $ | 5.000 | |
| | | | | |
Total Return(3)(4) | | | 9.18 | % | | | (9.60 | )% | | | 6.70 | % | | | 13.78 | % | | | (22.36 | )% |
| | | | | |
| Ratios/Supplemental Data | | | | | | | | | | | | | | | | | | | | |
| | | | | |
Net assets, end of year (000’s omitted) | | $ | 9,700 | | | $ | 19,709 | | | $ | 47,621 | | | $ | 31,373 | | | $ | 9,579 | |
| | | | | |
Ratios (as a percentage of average daily net assets): | | | | | | | | | | | | | | | | | | | | |
| | | | | |
Expenses(4)(5) | | | 0.90 | % | | | 0.90 | % | | | 0.90 | % | | | 0.94 | % | | | 0.95 | % |
| | | | | |
Net investment income (loss) | | | 1.51 | % | | | 0.81 | % | | | (0.01 | )% | | | (0.43 | )% | | | (0.74 | )% |
| | | | | |
Portfolio Turnover | | | 0 | % | | | 0 | % | | | 0 | % | | | 0 | % | | | 573 | %(6) |
| (1) | Computed using average shares outstanding. |
| (2) | Amount represents less than $(0.0005) per share. |
| (3) | Returns are historical and are calculated by determining the percentage change in net asset value with all distributions reinvested and do not reflect the effect of sales charges, if any. |
| (4) | The investment adviser and administrator and sub-adviser reimbursed certain operating expenses (equal to 0.06%, 0.08%, 0.09%, 0.19% and 0.29% of average daily net assets for the years ended December 31, 2019, 2018, 2017, 2016 and 2015, respectively). Absent this reimbursement, total return would be lower. |
| (5) | Excludes the effect of custody fee credits, if any, of less than 0.005%. Effective September 1, 2015, custody fee credits, which were earned on cash deposit balances, were discontinued by the custodian. |
| (6) | Excluding the Fund’s investment in exchange-traded notes, which were used as temporary cash investments but offer commodity exposure, the portfolio turnover would be 0%. |
| | | | |
| | 13 | | See Notes to Consolidated Financial Statements. |
Parametric
Commodity Strategy Fund
December 31, 2019
Consolidated Financial Highlights — continued
| | | | | | | | | | | | | | | | | | | | |
| | | Institutional Class | |
| |
| | | Year Ended December 31, | |
| | | 2019 | | | 2018 | | | 2017 | | | 2016 | | | 2015 | |
| | | | | | |
Net asset value — Beginning of year | | $ | 4.930 | | | $ | 5.480 | | | $ | 5.390 | | | $ | 5.040 | | | $ | 6.480 | |
| | | | | |
| Income (Loss) From Operations | | | | | | | | | | | | | | | | | | | | |
| | | | | |
Net investment income (loss)(1) | | $ | 0.088 | | | $ | 0.064 | | | $ | 0.013 | | | $ | (0.011 | ) | | $ | (0.030 | ) |
| | | | | |
Net realized and unrealized gain (loss) | | | 0.374 | | | | (0.571 | ) | | | 0.359 | | | | 0.716 | | | | (1.410 | ) |
| | | | | |
Total income (loss) from operations | | $ | 0.462 | | | $ | (0.507 | ) | | $ | 0.372 | | | $ | 0.705 | | | $ | (1.440 | ) |
| | | | | |
| Less Distributions | | | | | | | | | | | | | | | | | | | | |
| | | | | |
From net investment income | | $ | (0.082 | ) | | $ | (0.043 | ) | | $ | (0.282 | ) | | $ | (0.355 | ) | | $ | — | |
| | | | | |
Total distributions | | $ | (0.082 | ) | | $ | (0.043 | ) | | $ | (0.282 | ) | | $ | (0.355 | ) | | $ | — | |
| | | | | |
Net asset value — End of year | | $ | 5.310 | | | $ | 4.930 | | | $ | 5.480 | | | $ | 5.390 | | | $ | 5.040 | |
| | | | | |
Total Return(2)(3) | | | 9.58 | % | | | (9.44 | )% | | | 7.06 | % | | | 14.04 | % | | | (22.22 | )% |
| | | | | |
| Ratios/Supplemental Data | | | | | | | | | | | | | | | | | | | | |
| | | | | |
Net assets, end of year (000’s omitted) | | $ | 332,240 | | | $ | 269,200 | | | $ | 205,973 | | | $ | 123,822 | | | $ | 97,359 | |
| | | | | |
Ratios (as a percentage of average daily net assets): | | | | | | | | | | | | | | | | | | | | |
| | | | | |
Expenses(3)(4) | | | 0.65 | % | | | 0.65 | % | | | 0.65 | % | | | 0.69 | % | | | 0.70 | % |
| | | | | |
Net investment income (loss) | | | 1.70 | % | | | 1.20 | % | | | 0.24 | % | | | (0.20 | )% | | | (0.51 | )% |
| | | | | |
Portfolio Turnover | | | 0 | % | | | 0 | % | | | 0 | % | | | 0 | % | | | 573 | %(5) |
| (1) | Computed using average shares outstanding. |
| (2) | Returns are historical and are calculated by determining the percentage change in net asset value with all distributions reinvested. |
| (3) | The investment adviser and administrator and sub-adviser reimbursed certain operating expenses (equal to 0.06%, 0.08%, 0.09%, 0.19% and 0.29% of average daily net assets for the years ended December 31, 2019, 2018, 2017, 2016 and 2015, respectively). Absent this reimbursement, total return would be lower. |
| (4) | Excludes the effect of custody fee credits, if any, of less than 0.005%. Effective September 1, 2015, custody fee credits, which were earned on cash deposit balances, were discontinued by the custodian. |
| (5) | Excluding the Fund’s investment in exchange-traded notes, which were used as temporary cash investments but offer commodity exposure, the portfolio turnover would be 0%. |
| | | | |
| | 14 | | See Notes to Consolidated Financial Statements. |
Parametric
Commodity Strategy Fund
December 31, 2019
Notes to Consolidated Financial Statements
1 Significant Accounting Policies
Parametric Commodity Strategy Fund (the Fund) is a diversified series of Eaton Vance Mutual Funds Trust (the Trust). The Trust is a Massachusetts business trust registered under the Investment Company Act of 1940, as amended (the 1940 Act), as an open-end management investment company. The Fund’s investment objective is to seek total return. The Fund offers Investor Class and Institutional Class shares, which are offered at net asset value and are not subject to a sales charge. Each class represents a pro-rata interest in the Fund, but votes separately on class-specific matters and (as noted below) is subject to different expenses. Realized and unrealized gains and losses and net investment income and losses, other than class-specific expenses, are allocated daily to each class of shares based on the relative net assets of each class to the total net assets of the Fund. Each class of shares differs in its distribution plan and certain other class-specific expenses.
The Fund seeks to gain exposure to the commodity markets, in whole or in part, through investments in PSC Commodity Subsidiary, Ltd. (the Subsidiary), a wholly-owned subsidiary of the Fund organized under the laws of the Cayman Islands with the same objective and investment policies and restrictions as the Fund. The Fund may invest up to 25% of its total assets in the Subsidiary. The net assets of the Subsidiary at December 31, 2019 were $73,421,111 or 21.5% of the Fund’s consolidated net assets. The accompanying consolidated financial statements include the accounts of the Subsidiary. Intercompany balances and transactions have been eliminated in consolidation.
The following is a summary of significant accounting policies of the Fund. The policies are in conformity with accounting principles generally accepted in the United States of America (U.S. GAAP). The Fund is an investment company and follows accounting and reporting guidance in the Financial Accounting Standards Board (FASB) Accounting Standards Codification Topic 946.
A Investment Valuation — The following methodologies are used to determine the market value or fair value of investments.
Debt Obligations.Debt obligations are generally valued on the basis of valuations provided by third party pricing services, as derived from such services’ pricing models. Inputs to the models may include, but are not limited to, reported trades, executable bid and ask prices, broker/dealer quotations, prices or yields of securities with similar characteristics, interest rates, anticipated prepayments, benchmark curves or information pertaining to the issuer, as well as industry and economic events. The pricing services may use a matrix approach, which considers information regarding securities with similar characteristics to determine the valuation for a security. Short-term debt obligations purchased with a remaining maturity of sixty days or less for which a valuation from a third party pricing service is not readily available may be valued at amortized cost, which approximates fair value.
Derivatives. Financial and commodities futures contracts are valued at the closing settlement price established by the board of trade or exchange on which they are traded.
Affiliated Fund.The Fund may invest in Eaton Vance Cash Reserves Fund, LLC (Cash Reserves Fund), an affiliated investment company managed by Eaton Vance Management (EVM). While Cash Reserves Fund is not a registered money market mutual fund, it conducts all of its investment activities in accordance with the requirements of Rule 2a-7 under the 1940 Act. Investments in Cash Reserves Fund are valued at the closing net asset value per unit on the valuation day. Cash Reserves Fund generally values its investment securities based on available market quotations provided by a third party pricing service.
Fair Valuation.Investments for which valuations or market quotations are not readily available or are deemed unreliable are valued at fair value using methods determined in good faith by or at the direction of the Trustees of the Fund in a manner that most fairly reflects the security’s “fair value”, which is the amount that the Fund might reasonably expect to receive for the security upon its current sale in the ordinary course. Each such determination is based on a consideration of relevant factors, which are likely to vary from one pricing context to another. These factors may include, but are not limited to, the type of security, the existence of any contractual restrictions on the security’s disposition, the price and extent of public trading in similar securities of the issuer or of comparable companies or entities, quotations or relevant information obtained from broker/dealers or other market participants, information obtained from the issuer, analysts, and/or the appropriate stock exchange (for exchange-traded securities), an analysis of the company’s or entity’s financial statements, and an evaluation of the forces that influence the issuer and the market(s) in which the security is purchased and sold.
B Investment Transactions — Investment transactions for financial statement purposes are accounted for on a trade date basis. Realized gains and losses on investments sold are determined on the basis of identified cost.
C Income — Interest income is recorded on the basis of interest accrued, adjusted for amortization of premium or accretion of discount.
D Federal Taxes — The Fund’s policy is to comply with the provisions of the Internal Revenue Code applicable to regulated investment companies and to distribute to shareholders each year substantially all of its net investment income, and all or substantially all of its net realized capital gains. Accordingly, no provision for federal income or excise tax is necessary.
The Subsidiary is treated as a controlled foreign corporation under the Internal Revenue Code and is not expected to be subject to U.S. federal income tax. The Fund is treated as a U.S. shareholder of the Subsidiary. As a result, the Fund is required to include in gross income for U.S. federal tax purposes all of the Subsidiary’s income, whether or not such income is distributed by the Subsidiary. If a net loss is realized by the Subsidiary, such loss is not generally available to offset the income earned by the Fund.
As of December 31, 2019, the Fund had no uncertain tax positions that would require financial statement recognition, de-recognition, or disclosure. The Fund files a U.S. federal income tax return annually after its fiscal year-end, which is subject to examination by the Internal Revenue Service for a period of three years from the date of filing.
Parametric
Commodity Strategy Fund
December 31, 2019
Notes to Consolidated Financial Statements — continued
E Expenses — The majority of expenses of the Trust are directly identifiable to an individual fund. Expenses which are not readily identifiable to a specific fund are allocated taking into consideration, among other things, the nature and type of expense and the relative size of the funds.
F Use of Estimates — The preparation of the consolidated financial statements in conformity with U.S. GAAP requires management to make estimates and assumptions that affect the reported amounts of assets and liabilities at the date of the consolidated financial statements and the reported amounts of income and expense during the reporting period. Actual results could differ from those estimates.
G Indemnifications — Under the Trust’s organizational documents, its officers and Trustees may be indemnified against certain liabilities and expenses arising out of the performance of their duties to the Fund. Under Massachusetts law, if certain conditions prevail, shareholders of a Massachusetts business trust (such as the Trust) could be deemed to have personal liability for the obligations of the Trust. However, the Trust’s Declaration of Trust contains an express disclaimer of liability on the part of Fund shareholders and the By-laws provide that the Trust shall assume, upon request by the shareholder, the defense on behalf of any Fund shareholders. Moreover, the By-laws also provide for indemnification out of Fund property of any shareholder held personally liable solely by reason of being or having been a shareholder for all loss or expense arising from such liability. Additionally, in the normal course of business, the Fund enters into agreements with service providers that may contain indemnification clauses. The Fund’s maximum exposure under these arrangements is unknown as this would involve future claims that may be made against the Fund that have not yet occurred.
H Financial and Commodities Futures Contracts — Upon entering into a financial or commodities futures contract, the Fund is required to deposit with the broker, either in cash or securities, an amount equal to a certain percentage of the contract amount (initial margin). Subsequent payments, known as variation margin, are made or received by the Fund each business day (except for futures contracts traded on the London Metal Exchange, which make payments at contract expiration), depending on the daily fluctuations in the value of the underlying security, commodity or currency, and are recorded as unrealized gains or losses by the Fund. Gains (losses) are realized upon the expiration or closing of the financial or commodities futures contracts. Should market conditions change unexpectedly, the Fund may not achieve the anticipated benefits of the financial or commodities futures contracts and may realize a loss. Futures contracts have minimal counterparty risk as they are exchange traded and the clearinghouse for the exchange is substituted as the counterparty, guaranteeing counterparty performance.
2 Distributions to Shareholders and Income Tax Information
It is the present policy of the Fund to make at least one distribution annually (normally in December) of all or substantially all of its net investment income and to distribute annually all or substantially all of its net realized capital gains. Distributions to shareholders are recorded on the ex-dividend date. Distributions are declared separately for each class of shares. Shareholders may reinvest income and capital gain distributions in additional shares of the same class of the Fund at the net asset value as of the ex-dividend date or, at the election of the shareholder, receive distributions in cash. Distributions to shareholders are determined in accordance with income tax regulations, which may differ from U.S. GAAP. As required by U.S. GAAP, only distributions in excess of tax basis earnings and profits are reported in the financial statements as a return of capital. Permanent differences between book and tax accounting relating to distributions are reclassified to paid-in capital. For tax purposes, distributions from short-term capital gains are considered to be from ordinary income.
The tax character of distributions declared for the years ended December 31, 2019 and December 31, 2018 was as follows:
| | | | | | | | |
| | | Year Ended December 31, | |
| | | 2019 | | | 2018 | |
| | |
Ordinary income | | $ | 5,158,317 | | | $ | 2,680,896 | |
During the year ended December 31, 2019, accumulated loss was decreased by $700,810 and paid-in capital was decreased by $700,810 due to the Fund’s use of equalization accounting and differences between book and tax accounting for the Funds’s investment in the Subsidiary. Tax equalization accounting allows the Fund to treat as a distribution that portion of redemption proceeds representing a redeeming shareholder’s portion of undistributed taxable income and net capital gains. These reclassifications had no effect on the net assets or net asset value per share of the Fund
As of December 31, 2019, the components of distributable earnings (accumulated loss) on a tax basis were as follows:
| | | | |
| | |
Deferred capital losses | | $ | (69,049 | ) |
| |
Net unrealized depreciation | | $ | (15,767,231 | ) |
At December 31, 2019, the Fund, for federal income tax purposes, had deferred capital losses of $69,049 which would reduce its taxable income arising from future net realized gains on investment transactions, if any, to the extent permitted by the Internal Revenue Code, and thus would reduce the amount of distributions to shareholders, which would otherwise be necessary to relieve the Fund of any liability for federal income or excise tax. The deferred capital losses are treated as arising on the first day of the Fund’s next taxable year and retain the same short-term or long-term character as when originally deferred. Of the deferred capital losses at December 31, 2019, $35,267 are short-term and $33,782 are long-term.
Parametric
Commodity Strategy Fund
December 31, 2019
Notes to Consolidated Financial Statements — continued
The cost and unrealized appreciation (depreciation) of investments of the Fund, including open derivative contracts and the Fund’s investment in the Subsidiary, at December 31, 2019, as determined on a federal income tax basis, were as follows:
| | | | |
| |
Aggregate cost | | $ | 395,614,178 | |
| |
Gross unrealized appreciation | | $ | 236,388 | |
| |
Gross unrealized depreciation | | | (54,218,338 | ) |
| |
Net unrealized depreciation | | $ | (53,981,950 | ) |
3 Investment Adviser and Administration Fee and Other Transactions with Affiliates
The investment adviser and administration fee is earned by EVM as compensation for investment advisory and administrative services rendered to the Fund and the Subsidiary. Pursuant to the investment advisory and administrative agreement and subsequent fee reduction agreement between the Trust and EVM and the investment advisory agreement and subsequent fee reduction agreement between the Subsidiary and EVM, the Fund and Subsidiary pay EVM an aggregate fee at an annual rate of 0.55% of the Fund’s consolidated average daily net assets up to $1 billion and at reduced rates on consolidated net assets of $1 billion and over, and is payable monthly. The fee reductions cannot be terminated or reduced without the approval of a majority vote of the Trustees of the Fund who are not interested persons of EVM or the Fund and by the vote of a majority of shareholders. For the year ended December 31, 2019, the investment adviser and administration fee amounted to $1,739,934 or 0.55% of the Fund’s consolidated average daily net assets. Pursuant to a sub-advisory agreement, EVM has delegated the investment management of the Fund to Parametric Portfolio Associates LLC (Parametric), a wholly-owned indirect subsidiary of Eaton Vance Corp. EVM pays Parametric a portion of its investment adviser and administration fee for sub-advisory services provided to the Fund. EVM and Parametric have agreed to reimburse the Fund’s expenses, including expenses of the Subsidiary, to the extent that total annual operating expenses (relating to ordinary operating expenses only) exceed 0.90% and 0.65% of the Fund’s consolidated average daily net assets of Investor Class and Institutional Class, respectively. This agreement may be changed or terminated at any time after April 30, 2020. Pursuant to this agreement, EVM and Parametric were allocated $174,503 in total of the Fund’s operating expenses for the year ended December 31, 2019.
EVM provides sub-transfer agency and related services to the Fund pursuant to a Sub-Transfer Agency Support Services Agreement. For the year ended December 31, 2019, EVM earned $2,881 from the Fund pursuant to such agreement, which is included in transfer and dividend disbursing agent fees on the Consolidated Statement of Operations. Eaton Vance Distributors, Inc. (EVD), an affiliate of EVM and the Fund’s principal underwriter, received distribution and service fees from Investor Class (see Note 4).
Trustees and officers of the Fund who are members of EVM’s organization receive remuneration for their services to the Fund out of the investment adviser and administration fee. Trustees of the Fund who are not affiliated with EVM may elect to defer receipt of all or a percentage of their annual fees in accordance with the terms of the Trustees Deferred Compensation Plan. For the year ended December 31, 2019, no significant amounts have been deferred. Certain officers and Trustees of the Fund are officers of the above organizations.
4 Distribution Plan
The Fund has in effect a distribution plan for Investor Class shares (Investor Class Plan) pursuant to Rule 12b-1 under the 1940 Act. Pursuant to the Investor Class Plan, the Fund pays EVD a distribution and service fee of 0.25% per annum of its average daily net assets attributable to Investor Class shares for distribution services and facilities provided to the Fund by EVD, as well as for personal services and/or the maintenance of shareholder accounts. Distribution and service fees paid or accrued to EVD for the year ended December 31, 2019 amounted to $41,151 for Investor Class shares.
Distribution and service fees are subject to the limitations contained in the Financial Industry Regulatory Authority Rule 2341(d).
5 Purchases and Sales of Investments
There were no purchases and sales of investments, other than short-term obligations, for the year ended December 31, 2019.
Parametric
Commodity Strategy Fund
December 31, 2019
Notes to Consolidated Financial Statements — continued
6 Shares of Beneficial Interest
The Fund’s Declaration of Trust permits the Trustees to issue an unlimited number of full and fractional shares of beneficial interest (without par value). Such shares may be issued in a number of different series (such as the Fund) and classes. Transactions in Fund shares were as follows:
| | | | | | | | |
| | | Year Ended December 31, | |
| Investor Class | | 2019 | | | 2018 | |
| | |
Sales | | | 1,710,967 | | | | 5,276,163 | |
| | |
Issued to shareholders electing to receive payments of distributions in Fund shares | | | 20,201 | | | | 15,994 | |
| | |
Redemptions | | | (3,927,543 | ) | | | (10,045,466 | ) |
| | |
Net decrease | | | (2,196,375 | ) | | | (4,753,309 | ) |
| |
| | | Year Ended December 31, | |
| Institutional Class | | 2019 | | | 2018 | |
| | |
Sales | | | 27,642,349 | | | | 50,799,836 | |
| | |
Issued to shareholders electing to receive payments of distributions in Fund shares | | | 934,973 | | | | 509,538 | |
| | |
Redemptions | | | (20,632,315 | ) | | | (34,262,286 | ) |
| | |
Net increase | | | 7,945,007 | | | | 17,047,088 | |
7 Financial Instruments
The Fund may trade in financial instruments with off-balance sheet risk in the normal course of its investing activities. These financial instruments may include futures contracts and may involve, to a varying degree, elements of risk in excess of the amounts recognized for financial statement purposes. The notional or contractual amounts of these instruments represent the investment the Fund has in particular classes of financial instruments and do not necessarily represent the amounts potentially subject to risk. The measurement of the risks associated with these instruments is meaningful only when all related and offsetting transactions are considered. A summary of obligations under these financial instruments at December 31, 2019 is included in the Consolidated Portfolio of Investments. At December 31, 2019, the Fund had sufficient cash and/or securities to cover commitments under these contracts.
The Fund is subject to commodity risk in the normal course of pursuing its investment objective. Commodity risk is the risk that the value of a commodity or commodity index will fluctuate based on increases or decreases in the commodities market and factors specific to a particular industry or commodity. The Fund invests primarily in commodities-linked derivative investments, including commodity futures contracts that provide exposure to the investment returns of the commodities markets, without investing directly in physical commodities.
The fair value of open derivative instruments (not considered to be hedging instruments for accounting disclosure purposes) and whose primary underlying risk exposure is commodity risk at December 31, 2019 was as follows:
| | | | | | | | |
| | | Fair Value | |
| Derivative | | Asset Derivative | | | Liability Derivative | |
| | |
Futures contracts | | $ | 20,461,094 | (1) | | $ | (9,820,082 | )(1) |
| | |
Total | | $ | 20,461,094 | | | $ | (9,820,082 | ) |
| (1) | Amount represents cumulative unrealized appreciation or (depreciation) on futures contracts. Only the current day’s variation margin on open futures contracts is reported within the Consolidated Statement of Assets and Liabilities as Receivable or Payable for variation margin on open futures contracts, as applicable. |
Parametric
Commodity Strategy Fund
December 31, 2019
Notes to Consolidated Financial Statements — continued
The effect of derivative instruments (not considered to be hedging instruments for accounting disclosure purposes) on the Consolidated Statement of Operations and whose primary underlying risk exposure is commodity risk for the year ended December 31, 2019 was as follows:
| | | | | | | | |
| Derivative | | Realized Gain (Loss)
on Derivatives Recognized
in Income | | | Change in Unrealized
Appreciation (Depreciation) on
Derivatives Recognized in Income | |
| | |
Futures contracts | | $ | (2,260,187 | )(1) | | $ | 24,870,690 | (2) |
| (1) | Consolidated Statement of Operations location: Net realized gain (loss) – Futures contracts. |
| (2) | Consolidated Statement of Operations location: Change in unrealized appreciation (depreciation) – Futures contracts. |
The average notional cost of futures contracts outstanding during the year ended December 31, 2019, which are indicative of the volume of these derivative types, were approximately as follows:
| | | | | | |
Futures
Contracts — Long | | | Futures
Contracts — Short | |
| |
| | $452,739,000 | | | $ | 135,133,000 | |
8 Line of Credit
The Fund participates with other portfolios and funds managed by EVM and its affiliates in an $800 million unsecured line of credit agreement with a group of banks, which is in effect through October 27, 2020. In connection with the renewal of the agreement on October 29, 2019, funds managed by Calvert Research and Management, an affiliate of EVM, were added as participating funds to the agreement and the borrowing limit was increased from $625 million. Borrowings are made by the Fund solely to facilitate the handling of unusual and/or unanticipated short-term cash requirements. Interest is charged to the Fund based on its borrowings at an amount above either the Eurodollar rate or Federal Funds rate. In addition, a fee computed at an annual rate of 0.15% on the daily unused portion of the line of credit is allocated among the participating portfolios and funds at the end of each quarter. Because the line of credit is not available exclusively to the Fund, it may be unable to borrow some or all of its requested amounts at any particular time. The Fund did not have any significant borrowings or allocated fees during the year ended December 31, 2019.
9 Risks Associated with Commodities
The commodities which underlie commodity-linked derivatives in which the Fund invests may be subject to additional economic and non-economic variables, such as drought, floods, weather, livestock disease, embargoes, tariffs, and international economic, political and regulatory developments. These factors may have a larger impact on commodity prices and commodity-linked instruments than on traditional securities. Certain commodities are also subject to limited pricing flexibility because of supply and demand factors. Others are subject to broad price fluctuations as a result of the volatility of the prices for certain raw materials and the instability of supplies of other materials. These additional variables may create additional investment risks which subject the Fund’s investments to greater volatility than investments in traditional securities.
10 Investments in Affiliated Funds
At December 31, 2019, the value of the Fund’s investment in affiliated funds was $18,055,234, which represents 5.3% of the Fund’s net assets. Transactions in affiliated funds by the Fund for the year ended December 31, 2019 were as follows:
| | | | | | | | | | | | | | | | | | | | | | | | | | | | | | | | |
| Name of affiliated fund | | Value,
beginning
of period | | | Purchases | | | Sales
proceeds | | | Net
realized
gain (loss) | | | Change in
unrealized
appreciation
(depreciation) | | | Value, end
of period | | | Dividend
income | | | Units, end
of period | |
| | | | | | | | |
Short-Term Investments | | | | | | | | | | | | | | | | | | | | | | | | | | | | | | | | |
| | | | | | | | |
Eaton Vance Cash Reserves Fund, LLC, 1.78% | | $ | 19,731,789 | | | $ | 451,852,489 | | | $ | (453,533,729 | ) | | $ | 4,853 | | | $ | (168 | ) | | $ | 18,055,234 | | | $ | 404,800 | | | | 18,055,234 | |
Parametric
Commodity Strategy Fund
December 31, 2019
Notes to Consolidated Financial Statements — continued
11 Fair Value Measurements
Under generally accepted accounting principles for fair value measurements, a three-tier hierarchy to prioritize the assumptions, referred to as inputs, is used in valuation techniques to measure fair value. The three-tier hierarchy of inputs is summarized in the three broad levels listed below.
| • | | Level 1 – quoted prices in active markets for identical investments |
| • | | Level 2 – other significant observable inputs (including quoted prices for similar investments, interest rates, prepayment speeds, credit risk, etc.) |
| • | | Level 3 – significant unobservable inputs (including a fund’s own assumptions in determining the fair value of investments) |
In cases where the inputs used to measure fair value fall in different levels of the fair value hierarchy, the level disclosed is determined based on the lowest level input that is significant to the fair value measurement in its entirety. The inputs or methodology used for valuing securities are not necessarily an indication of the risk associated with investing in those securities.
At December 31, 2019, the hierarchy of inputs used in valuing the Fund’s investments and open derivative instruments, which are carried at value, were as follows:
| | | | | | | | | | | | | | | | |
| Asset Description | | Level 1 | | | Level 2 | | | Level 3 | | | Total | |
| | | | |
Short-Term Investments — | | | | | | | | | | | | | | | | |
| | | | |
U.S. Treasury Obligations | | $ | — | | | $ | 325,568,111 | | | $ | — | | | $ | 325,568,111 | |
| | | | |
Other | | | — | | | | 18,055,234 | | | | — | | | | 18,055,234 | |
| | | | |
Total Investments | | $ | — | | | $ | 343,623,345 | | | $ | — | | | $ | 343,623,345 | |
| | | | |
Futures Contracts | | $ | 20,461,094 | | | $ | — | | | $ | — | | | $ | 20,461,094 | |
| | | | |
Total | | $ | 20,461,094 | | | $ | 343,623,345 | | | $ | — | | | $ | 364,084,439 | |
| | | | |
Liability Description | | | | | | | | | | | | | | | | |
| | | | |
Futures Contracts | | $ | (9,820,082 | ) | | $ | — | | | $ | — | | | $ | (9,820,082 | ) |
| | | | |
Total | | $ | (9,820,082 | ) | | $ | — | | | $ | — | | | $ | (9,820,082 | ) |
Parametric
Commodity Strategy Fund
December 31, 2019
Report of Independent Registered Public Accounting Firm
To the Trustees of Eaton Vance Mutual Funds Trust and Shareholders of Parametric Commodity Strategy Fund:
Opinion on the Financial Statements and Financial Highlights
We have audited the accompanying consolidated statement of assets and liabilities of Parametric Commodity Strategy Fund and subsidiary (the “Fund”) (one of the funds constituting Eaton Vance Mutual Funds Trust), including the consolidated portfolio of investments, as of December 31, 2019, the related consolidated statement of operations for the year then ended, the consolidated statements of changes in net assets for each of the two years in the period then ended, the consolidated financial highlights for each of the five years in the period then ended, and the related notes (collectively referred to as the “financial statements and financial highlights”). In our opinion, the financial statements and financial highlights present fairly, in all material respects, the financial position of the Fund as of December 31, 2019, and the results of its operations for the year then ended, the changes in its net assets for each of the two years in the period then ended, and the financial highlights for each of the five years in the period then ended, in conformity with accounting principles generally accepted in the United States of America.
Basis for Opinion
These financial statements and financial highlights are the responsibility of the Fund’s management. Our responsibility is to express an opinion on the Fund’s financial statements and financial highlights based on our audits. We are a public accounting firm registered with the Public Company Accounting Oversight Board (United States) (PCAOB) and are required to be independent with respect to the Fund in accordance with the U.S. federal securities laws and the applicable rules and regulations of the Securities and Exchange Commission and the PCAOB.
We conducted our audits in accordance with the standards of the PCAOB. Those standards require that we plan and perform the audit to obtain reasonable assurance about whether the financial statements and financial highlights are free of material misstatement, whether due to error or fraud. The Fund is not required to have, nor were we engaged to perform, an audit of its internal control over financial reporting. As part of our audits we are required to obtain an understanding of internal control over financial reporting but not for the purpose of expressing an opinion on the effectiveness of the Fund’s internal control over financial reporting. Accordingly, we express no such opinion.
Our audits included performing procedures to assess the risks of material misstatement of the financial statements and financial highlights, whether due to error or fraud, and performing procedures that respond to those risks. Such procedures included examining, on a test basis, evidence regarding the amounts and disclosures in the financial statements and financial highlights. Our audits also included evaluating the accounting principles used and significant estimates made by management, as well as evaluating the overall presentation of the financial statements and financial highlights. Our procedures included confirmation of securities owned as of December 31, 2019, by correspondence with the custodian and brokers; when replies were not received from brokers, we performed other auditing procedures. We believe that our audits provide a reasonable basis for our opinion.
/s/ Deloitte & Touche LLP
Boston, Massachusetts
February 24, 2020
We have served as the auditor of one or more Eaton Vance investment companies since 1959.
Parametric
Commodity Strategy Fund
December 31, 2019
Federal Tax Information (Unaudited)
The Form 1099-DIV you received in February 2020 showed the tax status of all distributions paid to your account in calendar year 2019. Shareholders are advised to consult their own tax adviser with respect to the tax consequences of their investment in the Fund.
Parametric
Commodity Strategy Fund
December 31, 2019
Management and Organization
Fund Management. The Trustees of Eaton Vance Mutual Funds Trust (the Trust) are responsible for the overall management and supervision of the Trust’s affairs. The Trustees and officers of the Trust are listed below. Except as indicated, each individual has held the office shown or other offices in the same company for the last five years. Trustees and officers of the Trust hold indefinite terms of office. The “noninterested Trustees” consist of those Trustees who are not “interested persons” of the Trust, as that term is defined under the 1940 Act. The business address of each Trustee and officer is Two International Place, Boston, Massachusetts 02110. As used below, “EVC” refers to Eaton Vance Corp., “EV” refers to Eaton Vance, Inc., “EVM” refers to Eaton Vance Management, “BMR” refers to Boston Management and Research and “EVD” refers to Eaton Vance Distributors, Inc. EVC and EV are the corporate parent and trustee, respectively, of EVM and BMR. EVD is the Fund’s principal underwriter and a wholly-owned subsidiary of EVC. Each officer affiliated with Eaton Vance may hold a position with other Eaton Vance affiliates that is comparable to his or her position with EVM listed below. Each Trustee oversees 159 portfolios in the Eaton Vance Complex (including all master and feeder funds in a master feeder structure). Each officer serves as an officer of certain other Eaton Vance funds. Each Trustee and officer serves until his or her successor is elected.
| | | | | | |
| Name and Year of Birth | | Position(s)
with the
Trust | | Trustee
Since(1) | | Principal Occupation(s) and Directorships
During Past Five Years and Other Relevant Experience |
|
| Interested Trustee |
| | | |
Thomas E. Faust Jr. 1958 | | Trustee | | 2007 | | Chairman, Chief Executive Officer and President of EVC, Director and President of EV, Chief Executive Officer and President of EVM and BMR, and Director of EVD. Trustee and/or officer of 159 registered investment companies. Mr. Faust is an interested person because of his positions with EVM, BMR, EVD, EVC and EV, which are affiliates of the Trust. Directorships in the Last Five Years. Director of EVC and Hexavest Inc. (investment management firm). |
|
| Noninterested Trustees |
| | | |
Mark R. Fetting 1954 | | Trustee | | 2016 | | Private investor. Formerly held various positions at Legg Mason, Inc. (investment management firm) (2000-2012), including President, Chief Executive Officer, Director and Chairman (2008-2012), Senior Executive Vice President(2004-2008) and Executive Vice President (2001-2004). Formerly, President of Legg Mason family of funds (2001-2008). Formerly, Division President and Senior Officer of Prudential Financial Group, Inc. and related companies (investment management firm) (1991-2000). Other Directorships in the Last Five Years. None. |
| | | |
Cynthia E. Frost 1961 | | Trustee | | 2014 | | Private investor. Formerly, Chief Investment Officer of Brown University (university endowment) (2000-2012). Formerly, Portfolio Strategist for Duke Management Company (university endowment manager) (1995-2000). Formerly, Managing Director, Cambridge Associates (investment consulting company) (1989-1995). Formerly, Consultant, Bain and Company (management consulting firm) (1987-1989). Formerly, Senior Equity Analyst, BA Investment Management Company (1983-1985). Other Directorships in the Last Five Years. None. |
| | | |
George J. Gorman 1952 | | Trustee | | 2014 | | Principal at George J. Gorman LLC (consulting firm). Formerly, Senior Partner at Ernst & Young LLP (a registered public accounting firm) (1974-2009). Other Directorships in the Last Five Years. Formerly, Trustee of the BofA Funds Series Trust (11 funds) (2011-2014) and of the Ashmore Funds (9 funds) (2010-2014). |
| | | |
Valerie A. Mosley 1960 | | Trustee | | 2014 | | Chairwoman and Chief Executive Officer of Valmo Ventures (a consulting and investment firm). Former Partner and Senior Vice President, Portfolio Manager and Investment Strategist at Wellington Management Company, LLP (investment management firm) (1992-2012). Former Chief Investment Officer, PG Corbin Asset Management (1990-1992). Formerly worked in institutional corporate bond sales at Kidder Peabody (1986-1990). Other Directorships in the Last Five Years. Director of Envestnet, Inc. (provider of intelligent systems for wealth management and financial wellness) (since 2018). Director of Dynex Capital, Inc. (mortgage REIT) (since 2013). |
Parametric
Commodity Strategy Fund
December 31, 2019
Management and Organization — continued
| | | | | | |
| Name and Year of Birth | | Position(s)
with the
Trust | | Trustee
Since(1) | | Principal Occupation(s) and Directorships
During Past Five Years and Other Relevant Experience |
|
| Noninterested Trustees (continued) |
| | | |
William H. Park 1947 | | Chairperson of the Board and Trustee | | 2016 (Chairperson) 2003 (Trustee) | | Private investor. Formerly, Consultant (management and transactional)(2012-2014). Formerly, Chief Financial Officer, Aveon Group L.P. (investment management firm) (2010-2011). Formerly, Vice Chairman, Commercial Industrial Finance Corp. (specialty finance company) (2006-2010). Formerly, President and Chief Executive Officer, Prizm Capital Management, LLC (investment management firm) (2002-2005). Formerly, Executive Vice President and Chief Financial Officer, United Asset Management Corporation (investment management firm) (1982-2001). Formerly, Senior Manager, Price Waterhouse (now PricewaterhouseCoopers) (a registered public accounting firm)(1972-1981). Other Directorships in the Last Five Years. None. |
| | | |
Helen Frame Peters 1948 | | Trustee | | 2008 | | Professor of Finance, Carroll School of Management, Boston College. Formerly, Dean, Carroll School of Management, Boston College (2000-2002). Formerly, Chief Investment Officer, Fixed Income, Scudder Kemper Investments (investment management firm) (1998-1999). Formerly, Chief Investment Officer, Equity and Fixed Income, Colonial Management Associates (investment management firm) (1991-1998). Other Directorships in the Last Five Years. None. |
| | | |
Keith Quinton 1958 | | Trustee | | 2018 | | Independent Investment Committee Member at New Hampshire Retirement System (since 2017). Advisory Committee member at Northfield Information Services, Inc. (risk management analytics provider) (since 2016). Formerly, Portfolio Manager and Senior Quantitative Analyst at Fidelity Investments (investment management firm) (2001-2014). Other Directorships in the Last Five Years. Director of New Hampshire Municipal Bond Bank (since 2016). |
| | | |
Marcus L. Smith 1966 | | Trustee | | 2018 | | Member of Posse Boston Advisory Board (foundation) (since 2015). Trustee at University of Mount Union (since 2008). Formerly, Portfolio Manager at MFS Investment Management (investment management firm) (1994-2017). Other Directorships in the Last Five Years. Director of MSCI Inc. (global provider of investment decision support tools) (since 2017). Formerly, Director of DCT Industrial Trust Inc. (logistics real estate company) (2017-2018). |
| | | |
Susan J. Sutherland 1957 | | Trustee | | 2015 | | Private investor. Formerly, Associate, Counsel and Partner at Skadden, Arps, Slate, Meagher & Flom LLP (law firm) (1982-2013). Other Directorships in the Last Five Years. Formerly, Director of Montpelier Re Holdings Ltd. (global provider of customized insurance and reinsurance products) (2013-2015). |
| | | |
Scott E. Wennerholm 1959 | | Trustee | | 2016 | | Formerly, Trustee at Wheelock College (postsecondary institution) (2012-2018). Formerly, Consultant at GF Parish Group (executive recruiting firm) (2016-2017). Formerly, Chief Operating Officer and Executive Vice President at BNY Mellon Asset Management (investment management firm) (2005-2011). Formerly, Chief Operating Officer and Chief Financial Officer at Natixis Global Asset Management (investment management firm) (1997-2004). Formerly, Vice President at Fidelity Investments Institutional Services (investment management firm) (1994-1997). Other Directorships in the Last Five Years. None. |
| | | | | | |
| Name and Year of Birth | | Position(s)
with the
Trust | | Officer
Since(2) | | Principal Occupation(s)
During Past Five Years |
|
| Principal Officers who are not Trustees |
| | | |
Payson F. Swaffield 1956 | | President | | 2003 | | Vice President and Chief Income Investment Officer of EVM and BMR. Also Vice President of Calvert Research and Management (“CRM”). |
| | | |
Maureen A. Gemma 1960 | | Vice President, Secretary and Chief Legal Officer | | 2005 | | Vice President of EVM and BMR. Also Vice President of CRM. |
Parametric
Commodity Strategy Fund
December 31, 2019
Management and Organization — continued
| | | | | | |
| Name and Year of Birth | | Position(s)
with the
Trust | | Officer
Since(2) | | Principal Occupation(s)
During Past Five Years |
|
| Principal Officers who are not Trustees (continued) |
| | | |
James F. Kirchner 1967 | | Treasurer | | 2007 | | Vice President of EVM and BMR. Also Vice President of CRM. |
| | | |
Richard F. Froio 1968 | | Chief Compliance Officer | | 2017 | | Vice President of EVM and BMR since 2017. Formerly Deputy Chief Compliance Officer (Adviser/Funds) and Chief Compliance Officer (Distribution) at PIMCO (2012-2017) and Managing Director at BlackRock/Barclays Global Investors(2009-2012). |
| (1) | Year first appointed to serve as Trustee for a fund in the Eaton Vance family of funds. Each Trustee has served continuously since appointment unless indicated otherwise. |
| (2) | Year first elected to serve as officer of a fund in the Eaton Vance family of funds when the officer has served continuously. Otherwise, year of most recent election as an officer of a fund in the Eaton Vance family of funds. Titles may have changed since initial election. |
The SAI for the Fund includes additional information about the Trustees and officers of the Fund and can be obtained without charge on Eaton Vance’s website at www.eatonvance.com or by calling 1-800-260-0761.
Eaton Vance Funds
IMPORTANT NOTICES
Privacy. The Eaton Vance organization is committed to ensuring your financial privacy. Each entity listed below has adopted a privacy policy and procedures (“Privacy Program”) Eaton Vance believes is reasonably designed to protect your personal information and to govern when and with whom Eaton Vance may share your personal information.
| • | | At the time of opening an account, Eaton Vance generally requires you to provide us with certain information such as name, address, social security number, tax status, account numbers, and account balances. This information is necessary for us to both open an account for you and to allow us to satisfy legal requirements such as applicable anti-money laundering reviews and know-your-customer requirements. |
| • | | On an ongoing basis, in the normal course of servicing your account, Eaton Vance may share your information with unaffiliated third parties that perform various services for Eaton Vance and/or your account. These third parties include transfer agents, custodians, broker/dealers and our professional advisers, including auditors, accountants, and legal counsel. Eaton Vance may additionally share your personal information with our affiliates. |
| • | | We believe our Privacy Program is reasonably designed to protect the confidentiality of your personal information and to prevent unauthorized access to that information. |
| • | | We reserve the right to change our Privacy Program at any time upon proper notification to you. You may want to review our Privacy Program periodically for changes by accessing the link on our homepage: www.eatonvance.com. |
Our pledge of protecting your personal information applies to the following entities within the Eaton Vance organization: the Eaton Vance Family of Funds, Eaton Vance Management, Eaton Vance Investment Counsel, Eaton Vance Distributors, Inc., Eaton Vance Trust Company, Eaton Vance Management (International) Limited, Eaton Vance Advisers International Limited, Eaton Vance Global Advisors Limited, Eaton Vance Management’s Real Estate Investment Group, Boston Management and Research, Calvert Research and Management, and Calvert Funds. This Privacy Notice supersedes all previously issued privacy disclosures. For more information about our Privacy Program or about how your personal information may be used, please call 1-800-262-1122.
Delivery of Shareholder Documents. The Securities and Exchange Commission (SEC) permits funds to deliver only one copy of shareholder documents, including prospectuses, proxy statements and shareholder reports, to fund investors with multiple accounts at the same residential or post office box address. This practice is often called “householding” and it helps eliminate duplicate mailings to shareholders.Eaton Vance, or your financial intermediary, may household the mailing of your documents indefinitely unless you instruct Eaton Vance, or your financial intermediary, otherwise.If you would prefer that your Eaton Vance documents not be householded, please contact Eaton Vanceat 1-800-260-0761, or contact your financial intermediary. Your instructions that householding not apply to delivery of your Eaton Vance documents will typically be effective within 30 days of receipt by Eaton Vance or your financial intermediary.
Portfolio Holdings. Each Eaton Vance Fund and its underlying Portfolio(s) (if applicable) files a schedule of portfolio holdings on Part F toForm N-PORT with the SEC for the first and third quarters of each fiscal year. The Form N-PORT will be available on the Eaton Vance website at www.eatonvance.com, by calling Eaton Vance at 1-800-260-0761 or in the EDGAR database on the SEC’s website at www.sec.gov.
Proxy Voting. From time to time, funds are required to vote proxies related to the securities held by the funds. The Eaton Vance Funds or their underlying Portfolios (if applicable) vote proxies according to a set of policies and procedures approved by the Funds’ and Portfolios’ Boards. You may obtain a description of these policies and procedures and information on how the Funds or Portfolios voted proxies relating to portfolio securities during the most recent 12-month period ended June 30, without charge, upon request, by calling 1-800-260-0761 and by accessing the SEC’s website at www.sec.gov.
This Page Intentionally Left Blank
This Page Intentionally Left Blank
Investment Adviser and Administrator
Eaton Vance Management
Two International Place
Boston, MA 02110
Sub-Adviser
Parametric Portfolio Associates LLC
800 Fifth Avenue, Suite 2800
Seattle, WA 98104
Principal Underwriter*
Eaton Vance Distributors, Inc.
Two International Place
Boston, MA 02110
(617) 482-8260
Custodian
State Street Bank and Trust Company
State Street Financial Center, One Lincoln Street
Boston, MA 02111
Transfer Agent
BNY Mellon Investment Servicing (US) Inc.
Attn: Eaton Vance Funds
P.O. Box 9653
Providence, RI 02940-9653
(800) 260-0761
Independent Registered Public Accounting Firm
Deloitte & Touche LLP
200 Berkeley Street
Boston, MA 02116-5022
Fund Offices
Two International Place
Boston, MA 02110
| * | FINRA BrokerCheck. Investors may check the background of their Investment Professional by contacting the Financial Industry Regulatory Authority (FINRA). FINRA BrokerCheck is a free tool to help investors check the professional background of current and former FINRA-registered securities firms and brokers. FINRA BrokerCheck is available by calling 1-800-289-9999 and at www.FINRA.org. The FINRA BrokerCheck brochure describing this program is available to investors at www.FINRA.org. |

5255 12.31.19
Item 2. Code of Ethics
The registrant has adopted a code of ethics applicable to its Principal Executive Officer, Principal Financial Officer and Principal Accounting Officer. The registrant undertakes to provide a copy of such code of ethics to any person upon request, without charge, by calling1-800-262-1122. The registrant has not amended the code of ethics as described in FormN-CSR during the period covered by this report. The registrant has not granted any waiver, including an implicit waiver, from a provision of the code of ethics as described in FormN-CSR during the period covered by this report.
Item 3. Audit Committee Financial Expert
The registrant’s Board has designated George J. Gorman and William H. Park, each an independent trustee, as audit committee financial experts. Mr. Gorman is a certified public accountant who is the Principal at George J. Gorman LLC (a consulting firm). Previously, Mr. Gorman served in various capacities at Ernst & Young LLP (a registered public accounting firm), including as Senior Partner. Mr. Gorman also has experience serving as an independent trustee and audit committee financial expert of other mutual fund complexes. Mr. Park is a certified public accountant who is a private investor. Previously, he served as a consultant, as the Chief Financial Officer of Aveon Group, L.P. (an investment management firm), as the Vice Chairman of Commercial Industrial Finance Corp. (specialty finance company), as President and Chief Executive Officer of Prizm Capital Management, LLC (investment management firm), as Executive Vice President and Chief Financial Officer of United Asset Management Corporation (an institutional investment management firm) and as a Senior Manager at Price Waterhouse (now PricewaterhouseCoopers) (a registered public accounting firm).
Item 4. Principal Accountant Fees and Services
Parametric Commodity Strategy Fund, Eaton Vance Stock Fund, Eaton VanceTax-Managed Growth Fund 1.1 and Eaton VanceTax-Managed Growth Fund 1.2 (the “Fund(s)”) are series of Eaton Vance Mutual Funds Trust (the “Trust”), a Massachusetts business trust, which, including the Funds, contains a total of 33 series (the “Series”). The Trust is registered under the Investment Company Act of 1940 as anopen-end management investment company. This FormN-CSR relates to the Funds’ annual reports.
(a)-(d)
The following tables present the aggregate fees billed to each Fund for the Fund’s fiscal years ended December 31, 2018 and December 31, 2019 by the registrant’s principal accountant, Deloitte & Touche LLP (“D&T”), for professional services rendered for the audit of the Fund’s annual financial statements and fees billed for other services rendered by D&T during such periods.
Parametric Commodity Strategy Fund
| | | | | | | | |
Fiscal Years Ended | | 12/31/18 | | | 12/31/19 | |
Audit Fees | | $ | 52,360 | | | $ | 52,950 | |
Audit-Related Fees(1) | | $ | 0 | | | $ | 0 | |
Tax Fees(2) | | $ | 38,072 | | | $ | 37,914 | |
All Other Fees(3) | | $ | 0 | | | $ | 0 | |
| | | | | | | | |
Total | | $ | 90,432 | | | $ | 90,864 | |
| | | | | | | | |
Eaton Vance Stock Fund
| | | | | | | | |
Fiscal Years Ended | | 12/31/18 | | | 12/31/19 | |
Audit Fees | | $ | 15,840 | | | $ | 16,050 | |
Audit-Related Fees(1) | | $ | 0 | | | $ | 0 | |
Tax Fees(2) | | $ | 9,615 | | | $ | 9,140 | |
All Other Fees(3) | | $ | 0 | | | $ | 0 | |
| | | | | | | | |
Total | | $ | 25,455 | | | $ | 25,190 | |
| | | | | | | | |
Eaton VanceTax-Managed Growth Fund 1.1
| | | | | | | | |
Fiscal Years Ended | | 12/31/18 | | | 12/31/19 | |
Audit Fees | | $ | 18,560 | | | $ | 18,850 | |
Audit-Related Fees(1) | | $ | 0 | | | $ | 0 | |
Tax Fees(2) | | $ | 8,701 | | | $ | 8,212 | |
All Other Fees(3) | | $ | 0 | | | $ | 0 | |
| | | | | | | | |
Total | | $ | 27,261 | | | $ | 27,062 | |
| | | | | | | | |
Eaton VanceTax-Managed Growth Fund 1.2
| | | | | | | | |
Fiscal Years Ended | | 12/31/18 | | | 12/31/19 | |
Audit Fees | | $ | 18,560 | | | $ | 18,850 | |
Audit-Related Fees(1) | | $ | 0 | | | $ | 0 | |
Tax Fees(2) | | $ | 8,701 | | | $ | 8,212 | |
All Other Fees(3) | | $ | 0 | | | $ | 0 | |
| | | | | | | | |
Total | | $ | 27,261 | | | $ | 27,062 | |
| | | | | | | | |
| (1) | Audit-related fees consist of the aggregate fees billed for assurance and related services that are reasonably related to the performance of the audit of financial statements and are not reported under the category of audit fees. |
| (2) | Tax fees consist of the aggregate fees billed for professional services rendered by the principal accountant relating to tax compliance, tax advice, and tax planning and specifically include fees for tax return preparation and other related tax compliance/planning matters. |
| (3) | All other fees consist of the aggregate fees billed for products and services provided by the principal accountant other than audit, audit-related, and tax services. |
The various Series comprising the Trust have differing fiscal year ends (January 31, February 28/29, July 31, September 30, October 31 or December 31). The following table presents the aggregate audit, audit-related, tax, and other fees billed to all of the Series in the Trust by D&T for the last two fiscal years of each Series.
| | | | | | | | | | | | | | | | | | | | | | | | | | | | | | | | | | | | | | | | | | | | |
Fiscal
Years
Ended* | | 1/31/18 | | | 2/28/18 | | | 9/30/18 | | | 10/31/18 | | | 12/31/18 | | | 1/31/19 | | | 2/28/19 | | | 7/31/19 | | | 9/30/19 | | | 10/31/19 | | | 12/31/19 | |
Audit Fees | | $ | 154,630 | | | $ | 25,850 | | | $ | 99,625 | | | $ | 621,075 | | | $ | 105,320 | | | $ | 191,680 | | | $ | 25,850 | | | $ | 37,050 | | | $ | 98,300 | | | $ | 661,708 | | | $ | 106,700 | |
Audit-Related Fees(1) | | $ | 0 | | | $ | 0 | | | $ | 0 | | | $ | 0 | | | $ | 0 | | | $ | 0 | | | $ | 0 | | | $ | 0 | | | $ | 0 | | | $ | 0 | | | $ | 0 | |
Tax Fees(2) | | $ | 52,884 | | | $ | 9,890 | | | $ | 28,606 | | | $ | 430,938 | | | $ | 65,089 | | | $ | 85,957 | | | $ | 11,190 | | | $ | 16,000 | | | $ | 24,768 | | | $ | 345,480 | | | $ | 63,478 | |
All Other Fees(3) | | $ | 0 | | | $ | 0 | | | $ | 0 | | | $ | 0 | | | $ | 0 | | | $ | 0 | | | $ | 0 | | | $ | 0 | | | $ | 0 | | | $ | 0 | | | $ | 0 | |
| | | | | | | | | | | | | | | | | | | | | | | | | | | | | | | | | | | | | | | | | | | | |
Total | | $ | 207,514 | | | $ | 35,740 | | | $ | 128,231 | | | $ | 1,052,013 | | | $ | 170,409 | | | $ | 277,637 | | | $ | 37,040 | | | $ | 53,050 | | | $ | 123,068 | | | $ | 1,007,188 | | | $ | 170,178 | |
| | | | | | | | | | | | | | | | | | | | | | | | | | | | | | | | | | | | | | | | | | | | |
| * | Information is not presented for the fiscal year ended 7/31/18, as no Series in the Trust with such fiscal year end was in operation during such period. |
| (1) | Audit-related fees consist of the aggregate fees billed for assurance and related services that are reasonably related to the performance of the audit of financial statements and are not reported under the category of audit fees. |
| (2) | Tax fees consist of the aggregate fees billed for professional services rendered by the principal accountant relating to tax compliance, tax advice, and tax planning and specifically include fees for tax return preparation and other related tax compliance/planning matters. |
| (3) | All other fees consist of the aggregate fees billed for products and services provided by the principal accountant other than audit, audit-related, and tax services. |
(e)(1) The registrant’s audit committee has adopted policies and procedures relating to thepre-approval of services provided by the registrant’s principal accountant (the“Pre-Approval Policies”). ThePre-Approval Policies establish a framework intended to assist the audit committee in the proper discharge of itspre-approval responsibilities. As a general matter, thePre-Approval Policies (i) specify certain types of audit, audit-related, tax, and other services determined to bepre-approved by the audit committee; and (ii) delineate specific procedures governing the mechanics of thepre-approval process, including the approval and monitoring of audit andnon-audit service fees. Unless a service is specificallypre-approved under thePre-Approval Policies, it must be separatelypre-approved by the audit committee.
ThePre-Approval Policies and the types of audit andnon-audit servicespre-approved therein must be reviewed and ratified by the registrant’s audit committee at least annually. The registrant’s audit committee maintains full responsibility for the appointment, compensation, and oversight of the work of the registrant’s principal accountant.
(e)(2) No services described in paragraphs (b)-(d) above were approved by the registrant’s audit committee pursuant to the “de minimis exception” set forth in Rule2-01(c)(7)(i)(C) of RegulationS-X.
(f) Not applicable.
(g)The following table presents (i) the aggregatenon-audit fees (i.e., fees for audit-related, tax, and other services) billed for services rendered to all of the Series in the Trust by D&T for the last two fiscal years of each Series; and (ii) the aggregatenon-audit fees (i.e., fees for audit-related, tax, and other services) billed to the Eaton Vance organization by D&T for the last two fiscal years of each Series.
| | | | | | | | | | | | | | | | | | | | | | | | | | | | | | | | | | | | | | | | | | | | |
Fiscal Years
Ended* | | 1/31/18 | | �� | 2/28/18 | | | 9/30/18 | | | 10/31/18 | | | 12/31/18 | | | 1/31/19 | | | 2/28/19 | | | 7/31/19 | | | 9/30/19 | | | 10/31/19 | | | 12/31/19 | |
Registrant(1) | | $ | 52,884 | | | $ | 9,890 | | | $ | 28,606 | | | $ | 430,938 | | | $ | 65,089 | | | $ | 85,957 | | | $ | 11,190 | | | $ | 16,000 | | | $ | 24,768 | | | $ | 345,480 | | | $ | 63,478 | |
Eaton Vance(2) | | $ | 148,018 | | | $ | 148,018 | | | $ | 126,485 | | | $ | 126,485 | | | $ | 126,485 | | | $ | 126,485 | | | $ | 126,485 | | | $ | 60,130 | | | $ | 59,903 | | | $ | 59,903 | | | $ | 59,903 | |
| * | Information is not presented for the fiscal year ended 7/31/18, as no Series in the Trust with such fiscal year end was in operation during such period. |
| (1) | Includes all of the Series of the Trust. During the fiscal years reported above, certain of the Funds were “feeder” funds in a “master-feeder” fund structure or funds of funds.\ |
| (2) | Various subsidiaries of Eaton Vance Corp. act in either an investment advisory and/or service provider capacity with respect to the Series and/or their respective “master” funds (if applicable). |
(h) The registrant’s audit committee has considered whether the provision by the registrant’s principal accountant ofnon-audit services to the registrant’s investment adviser and any entity controlling, controlled by, or under common control with the adviser that provides ongoing services to the registrant that were notpre-approved pursuant to Rule2-01(c)(7)(ii) of RegulationS-X is compatible with maintaining the principal accountant’s independence.
Item 5. Audit Committee of Listed Registrants
Not applicable.
Item 6. Schedule of Investments
Please see schedule of investments contained in the Report to Stockholders included under Item 1 of this FormN-CSR.
Item 7. Disclosure of Proxy Voting Policies and Procedures forClosed-End Management Investment Companies
Not applicable.
Item 8. Portfolio Managers ofClosed-End Management Investment Companies
Not applicable.
Item 9. Purchases of Equity Securities byClosed-End Management Investment Company and Affiliated Purchasers
Not applicable.
Item 10. Submission of Matters to a Vote of Security Holders
No material changes.
Item 11. Controls and Procedures
(a) It is the conclusion of the registrant’s principal executive officer and principal financial officer that the effectiveness of the registrant’s current disclosure controls and procedures (such disclosure controls and procedures having been evaluated within 90 days of the date of this filing) provide reasonable assurance that the information required to be disclosed by the registrant has been recorded, processed, summarized and reported within the time period specified in the Commission’s rules and forms and that the information required to be disclosed by the registrant has been accumulated and communicated to the registrant’s principal executive officer and principal financial officer in order to allow timely decisions regarding required disclosure.
(b) There have been no changes in the registrant’s internal controls over financial reporting during the period covered by this report that has materially affected, or is reasonably likely to materially affect, the registrant’s internal control over financial reporting.
Item 12. Disclosure of Securities Lending Activities forClosed-End Management Investment Companies
Not applicable.
Item 13. Exhibits
| | |
(a)(1) | | Registrant’s Code of Ethics – Not applicable (please see Item 2). |
| |
(a)(2)(i) | | Treasurer’s Section 302 certification. |
| |
(a)(2)(ii) | | President’s Section 302 certification. |
| |
(b) | | Combined Section 906 certification. |
Signatures
Pursuant to the requirements of the Securities Exchange Act of 1934 and the Investment Company Act of 1940, the registrant has duly caused this report to be signed on its behalf by the undersigned, thereunto duly authorized.
Eaton Vance Mutual Funds Trust
| | |
| By: | | /s/ Payson F. Swaffield |
| | Payson F. Swaffield |
| | President |
| |
| Date: | | February 24, 2020 |
Pursuant to the requirements of the Securities Exchange Act of 1934 and the Investment Company Act of 1940, this report has been signed below by the following persons on behalf of the registrant and in the capacities and on the dates indicated.
| | |
| By: | | /s/ James F. Kirchner |
| | James F. Kirchner |
| | Treasurer |
| |
| Date: | | February 24, 2020 |
| | |
| By: | | /s/ Payson F. Swaffield |
| | Payson F. Swaffield |
| | President |
| |
| Date: | | February 24, 2020 |