0000751199fmr:C000038102Memberfmr:TH2Member2024-08-31
UNITED STATES
SECURITIES AND EXCHANGE COMMISSION
Washington, D.C. 20549
FORM N-CSR
CERTIFIED SHAREHOLDER REPORT OF REGISTERED
MANAGEMENT INVESTMENT COMPANIES
Investment Company Act file number 811-04085
Fidelity Income Fund
(Exact name of registrant as specified in charter)
245 Summer St., Boston, Massachusetts 02210
(Address of principal executive offices) (Zip code)
Nicole Macarchuk, Secretary
245 Summer St.
Boston, Massachusetts 02210
(Name and address of agent for service)
Registrant's telephone number, including area code:
617-563-7000
| |
Date of fiscal year end: | August 31 |
|
|
Date of reporting period: | August 31, 2024 |
Item 1.
Reports to Stockholders
| |
| | ANNUAL SHAREHOLDER REPORT | AS OF AUGUST 31, 2024 | This report describes changes to the Fund that occurred during the reporting period. |
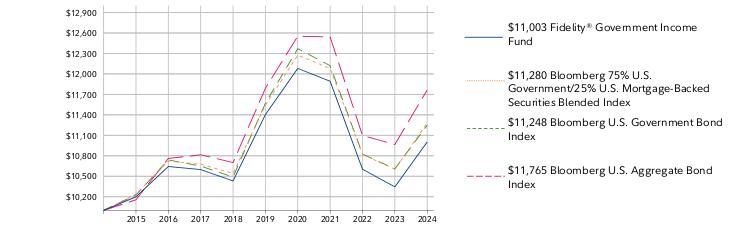
| | Fidelity® Government Income Fund Fidelity Advisor® Government Income Fund Class C : FVICX |
| | | |
This annual shareholder report contains information about Fidelity® Government Income Fund for the period September 1, 2023 to August 31, 2024. You can find additional information about the Fund at fundresearch.fidelity.com/prospectus/sec. You can also request this information by contacting us at 1-877-208-0098 or by sending an e-mail to fidfunddocuments@fidelity.com.
What were your Fund costs for the last year?(based on hypothetical $10,000 investment)
FUND COST (PREVIOUS YEAR)
| | Costs of a $10,000 investment | Costs paid as a percentage of a $10,000 investment | |
| Class C | $ 158 | 1.54% | |
What affected the Fund's performance this period?
•U.S. taxable investment-grade bonds posted a strong advance for the 12 months ending August 31, 2024, helped by a late-period gain, as the bond market reflected anticipated interest-rate reductions by the U.S. Federal Reserve, which are expected to start in September. The full 12-month period was marked by high volatility.
•Against this backdrop, the fund's positioning in mortgage-backed securities contributed to the fund's performance versus the Bloomberg 75% US Government/25% US Mortgage-Backed Securities Blended Index for the fiscal year.
•Specifically, an overweight in GNMAs with coupons 2% and lower, and in those with coupons 5.5% and higher, helped relative performance the past 12 months.
•Larger-than-index exposure to lower-coupon 15- and 20-year Fannie Mae/Freddie Mac mortgage securities also contributed.
•An overweight in short-duration government agency commercial mortgage-backed securities also lifted
•In contrast, exposure to cash flows based on the Secured Overnight Financing Rate detracted versus the index the past 12 months. An underweight in agency debentures also hurt.
How did the Fund perform over the past 10 years?
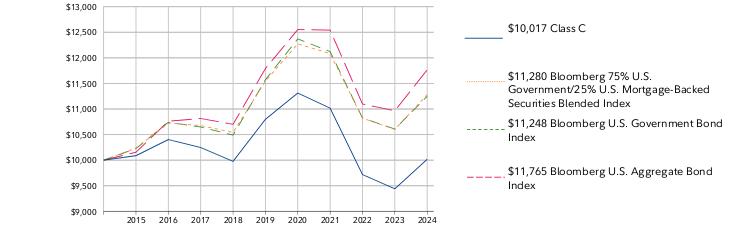
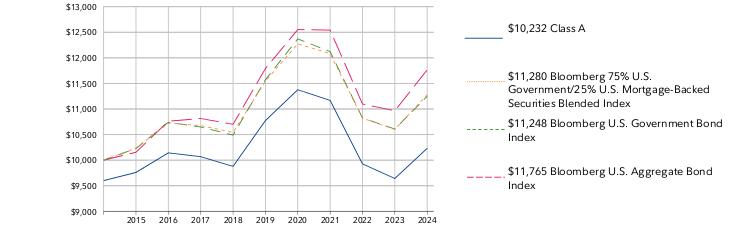
CUMULATIVE PERFORMANCE
August 31, 2014 through August 31, 2024.
Initial investment of $10,000.
Class C | $10,000 | $10,088 | $10,403 | $10,247 | $9,977 | $10,798 | $11,312 | $11,016 | $9,719 | $9,440 | $10,017 |
Bloomberg 75% U.S. Government/25% U.S. Mortgage-Backed Securities Blended Index | $10,000 | $10,237 | $10,723 | $10,676 | $10,542 | $11,543 | $12,274 | $12,083 | $10,820 | $10,602 | $11,280 |
Bloomberg U.S. Government Bond Index | $10,000 | $10,227 | $10,739 | $10,649 | $10,489 | $11,570 | $12,371 | $12,121 | $10,825 | $10,608 | $11,248 |
Bloomberg U.S. Aggregate Bond Index | $10,000 | $10,156 | $10,761 | $10,814 | $10,701 | $11,789 | $12,553 | $12,542 | $11,098 | $10,965 | $11,765 |
| | 2014 | 2015 | 2016 | 2017 | 2018 | 2019 | 2020 | 2021 | 2022 | 2023 | 2024 |
AVERAGE ANNUAL TOTAL RETURNS: | | 1 Year | 5 Year | 10 Year |
| Class C (incl. contingent deferred sales charge) | 4.23% | -1.79% | 0.02% |
| Class C | 5.23% | -1.79% | 0.02% |
| Bloomberg 75% U.S. Government/25% U.S. Mortgage-Backed Securities Blended Index | 6.40% | -0.46% | 1.21% |
| Bloomberg U.S. Government Bond Index | 6.03% | -0.56% | 1.18% |
| Bloomberg U.S. Aggregate Bond Index | 7.30% | -0.04% | 1.64% |
Visit institutional.fidelity.com for more recent performance information. |
The Fund's past performance is not a good predictor of the Fund's future performance. The graph and table do not reflect the deduction of taxes that a shareholder would pay on fund distributions or redemption of fund shares. |
Key Fund Statistics (as of August 31, 2024)
KEY FACTS | | |
| Fund Size | $2,324,957,949 | |
| Number of Holdings | 2,073 | |
| Total Advisory Fee | $8,233,532 | |
| Portfolio Turnover | 393% | |
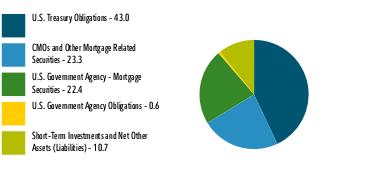
What did the Fund invest in?
(as of August 31, 2024)
COUPON DISTRIBUTION (% of Fund's net assets) |
| Zero coupon bonds | 0.0 | |
| 0.01 - 0.99% | 0.0 | |
| 1 - 1.99% | 7.0 | |
| 2 - 2.99% | 32.8 | |
| 3 - 3.99% | 22.8 | |
| 4 - 4.99% | 18.6 | |
| 5 - 5.99% | 4.9 | |
| 6 - 6.99% | 3.2 | |
| 7 - 7.99% | 0.0 | |
| 8 - 8.99% | 0.0 | |
| U.S. Treasury Obligations | 43.0 |
| CMOs and Other Mortgage Related Securities | 23.3 |
| U.S. Government Agency - Mortgage Securities | 22.4 |
| U.S. Government Agency Obligations | 0.6 |
| Short-Term Investments and Net Other Assets (Liabilities) | 10.7 |
ASSET ALLOCATION (% of Fund's net assets) |
|
|
TOP HOLDINGS (% of Fund's net assets) | | |
| US Treasury Notes | 26.9 | |
| US Treasury Bonds | 16.1 | |
| Fannie Mae Mortgage pass-thru certificates | 14.9 | |
| Freddie Mac Multiclass Mortgage participation certificates | 14.6 | |
| Freddie Mac Gold Pool | 9.3 | |
| Fannie Mae Guaranteed REMICS | 5.4 | |
| Ginnie Mae II Pool | 3.5 | |
| Ginnie Mae I Pool | 1.4 | |
| Ginnie Mae REMIC pass-thru certificates | 1.1 | |
| Freddie Mac Non Gold Pool | 0.8 | |
| | 94.0 | |
How has the Fund changed?
This is a summary of certain changes to the Fund since September 1, 2023. For more complete information, you may review the Fund's next prospectus, which we expect to be available by October 30, 2024 at fundresearch.fidelity.com/prospectus/sec or upon request at 1-877-208-0098 or by sending an e-mail to fidfunddocuments@fidelity.com.
The fund's contractural management fee was reduced during the reporting period. | |
| Fidelity, the Fidelity Investments Logo and all other Fidelity trademarks or service marks used herein are trademarks or service marks of FMR LLC. Any third-party marks that are used herein are trademarks or service marks of their respective owners. © 2024 FMR LLC. All rights reserved. |
| | For additional information about the Fund; including its prospectus, financial information, holdings and proxy information, scan the QR code or visit fundresearch.fidelity.com/prospectus/sec 1.9913599.100 1757-TSRA-1024 |
| |
| | ANNUAL SHAREHOLDER REPORT | AS OF AUGUST 31, 2024 | This report describes changes to the Fund that occurred during the reporting period. |
| | Fidelity® Intermediate Government Income Fund Fidelity® Intermediate Government Income Fund : FSTGX |
| | | |
This annual shareholder report contains information about Fidelity® Intermediate Government Income Fund for the period September 1, 2023 to August 31, 2024. You can find additional information about the Fund at fundresearch.fidelity.com/prospectus/sec. You can also request this information by contacting us at 1-800-544-8544 or by sending an e-mail to fidfunddocuments@fidelity.com.
What were your Fund costs for the last year?(based on hypothetical $10,000 investment)
FUND COST (PREVIOUS YEAR)
| | Costs of a $10,000 investment | Costs paid as a percentage of a $10,000 investment | |
| Fidelity® Intermediate Government Income Fund | $ 46 | 0.45% | |
What affected the Fund's performance this period?
•U.S. taxable investment-grade bonds posted a strong advance for the 12 months ending August 31, 2024, helped by a late-period gain, as the bond market reflected anticipated interest-rate reductions by the U.S. Federal Reserve, which are expected to start in September. The full 12-month period was marked by high volatility.
•Against this backdrop, the fund's positioning in mortgage-backed securities contributed to the fund's performance versus the benchmark, the Bloomberg US Intermediate Government Bond Index, for the fiscal year.
•Specifically, an overweight in GNMAs with coupons 2% and lower, and in those with coupons 5.5% and higher, lifted relative performance the past 12 months.
•Larger-than-benchmark exposure to lower-coupon 15- and 20-year Fannie Mae/Freddie Mac mortgage securities also contributed.
•An overweight in short-duration government agency commercial mortgage-backed securities also lifted the fund's relative result this period.
•In contrast, exposure to cash flows based on the Secured Overnight Financing Rate detracted versus the index the past 12 months.
•An underweight in agency debentures also hurt.
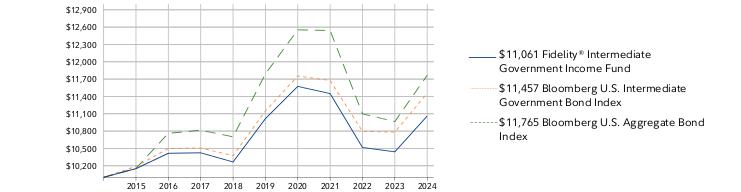
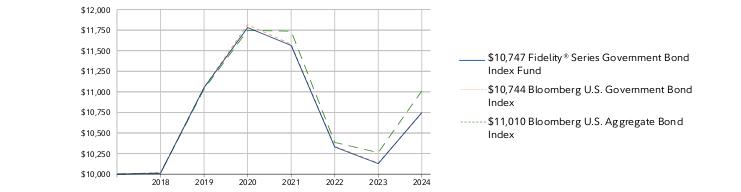
How did the Fund perform over the past 10 years?
CUMULATIVE PERFORMANCE
August 31, 2014 through August 31, 2024.
Initial investment of $10,000.
Fidelity® Intermediate Government Income Fund | $10,000 | $10,150 | $10,416 | $10,424 | $10,265 | $11,015 | $11,574 | $11,449 | $10,516 | $10,441 | $11,061 |
Bloomberg U.S. Intermediate Government Bond Index | $10,000 | $10,189 | $10,497 | $10,506 | $10,375 | $11,148 | $11,753 | $11,676 | $10,796 | $10,782 | $11,457 |
Bloomberg U.S. Aggregate Bond Index | $10,000 | $10,156 | $10,761 | $10,814 | $10,701 | $11,789 | $12,553 | $12,542 | $11,098 | $10,965 | $11,765 |
| | 2014 | 2015 | 2016 | 2017 | 2018 | 2019 | 2020 | 2021 | 2022 | 2023 | 2024 |
AVERAGE ANNUAL TOTAL RETURNS: | | 1 Year | 5 Year | 10 Year |
| Fidelity® Intermediate Government Income Fund | 5.94% | 0.08% | 1.01% |
| Bloomberg U.S. Intermediate Government Bond Index | 6.26% | 0.55% | 1.37% |
| Bloomberg U.S. Aggregate Bond Index | 7.30% | -0.04% | 1.64% |
Visit www.fidelity.com for more recent performance information. |
The Fund's past performance is not a good predictor of the Fund's future performance. The graph and table do not reflect the deduction of taxes that a shareholder would pay on fund distributions or redemption of fund shares. |
Key Fund Statistics (as of August 31, 2024)
KEY FACTS | | |
| Fund Size | $467,016,210 | |
| Number of Holdings | 243 | |
| Total Advisory Fee | $1,256,127 | |
| Portfolio Turnover | 199% | |
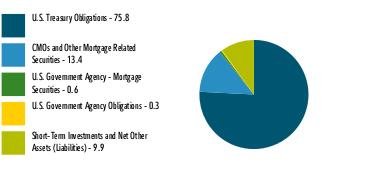
What did the Fund invest in?
(as of August 31, 2024)
COUPON DISTRIBUTION (% of Fund's net assets) |
| 0.01 - 0.99% | 4.8 | |
| 1 - 1.99% | 13.9 | |
| 2 - 2.99% | 21.0 | |
| 3 - 3.99% | 16.4 | |
| 4 - 4.99% | 33.6 | |
| 5 - 5.99% | -0.2 | |
| 6 - 6.99% | 0.6 | |
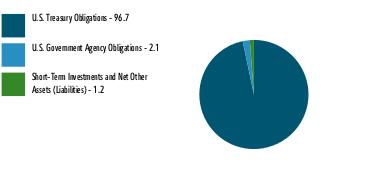
| U.S. Treasury Obligations | 75.8 |
| CMOs and Other Mortgage Related Securities | 13.4 |
| U.S. Government Agency - Mortgage Securities | 0.6 |
| U.S. Government Agency Obligations | 0.3 |
| Short-Term Investments and Net Other Assets (Liabilities) | 9.9 |
ASSET ALLOCATION (% of Fund's net assets) |
|
|
TOP HOLDINGS (% of Fund's net assets) | | |
| US Treasury Notes | 74.3 | |
| Freddie Mac Multiclass Mortgage participation certificates | 9.7 | |
| Fannie Mae Mortgage pass-thru certificates | 2.8 | |
| Freddie Mac Gold Pool | 2.2 | |
| Fannie Mae Guaranteed REMICS | 2.0 | |
| US Treasury Bonds | 1.5 | |
| Fremf 2015-Kplb Mortgage Trust | 0.9 | |
| Freddie Mac Multifamily Structured Pass Through Certificates | 0.7 | |
| Private Export Funding Corp | 0.3 | |
| Ginnie Mae I Pool | 0.2 | |
| | 94.6 | |
How has the Fund changed?
This is a summary of certain changes to the Fund since September 1, 2023. For more complete information, you may review the Fund's next prospectus, which we expect to be available by October 30, 2024 at fundresearch.fidelity.com/prospectus/sec or upon request at 1-800-544-8544 or by sending an e-mail to fidfunddocuments@fidelity.com.
The fund's contractual management fee was reduced during the reporting period. | |
| Fidelity, the Fidelity Investments Logo and all other Fidelity trademarks or service marks used herein are trademarks or service marks of FMR LLC. Any third-party marks that are used herein are trademarks or service marks of their respective owners. © 2024 FMR LLC. All rights reserved. |
| | For additional information about the Fund; including its prospectus, financial information, holdings and proxy information, scan the QR code or visit fundresearch.fidelity.com/prospectus/sec 1.9913625.100 452-TSRA-1024 |
| |
| | ANNUAL SHAREHOLDER REPORT | AS OF AUGUST 31, 2024 | This report describes changes to the Fund that occurred during the reporting period. |
| | Fidelity® Total Bond Fund Fidelity Advisor® Total Bond Fund Class M : FEPTX |
| | | |
This annual shareholder report contains information about Fidelity® Total Bond Fund for the period September 1, 2023 to August 31, 2024. You can find additional information about the Fund at fundresearch.fidelity.com/prospectus/sec. You can also request this information by contacting us at 1-877-208-0098 or by sending an e-mail to fidfunddocuments@fidelity.com.
What were your Fund costs for the last year?(based on hypothetical $10,000 investment)
FUND COST (PREVIOUS YEAR)
| | Costs of a $10,000 investment | Costs paid as a percentage of a $10,000 investment | |
| Class M | $ 78 | 0.75% | |
What affected the Fund's performance this period?
•U.S. taxable investment-grade bonds posted a strong advance for the 12 months ending August 31, 2024, helped by a late-period gain as the bond market reflected anticipated interest-rate reductions by the U.S. Federal Reserve, which are expected to start in September. The full 12-month period was marked by high levels of volatility.
•Against this backdrop, allocations to "plus sectors" - including high-yield bonds, leveraged loans and emerging markets debt - notably contributed to the fund's outperformance of the Bloomberg U.S. Aggregate Index for the fiscal year.
•Among investment-grade securities, security selection and sector allocation also meaningfully contributed.
•In terms of sector allocation, investment choices and overweight positions in the asset-backed securities, mortgage-backed securities and commercial mortgage-backed securities segments each helped relative performance the past 12 months.
•As for security selection, fund holdings in the corporate segment made a notable contribution, led by picks among financials, particularly REITs and banks.
•In contrast, the fund's underweight in industrial bonds within the corporate sector detracted versus the Aggregate index the past 12 months.
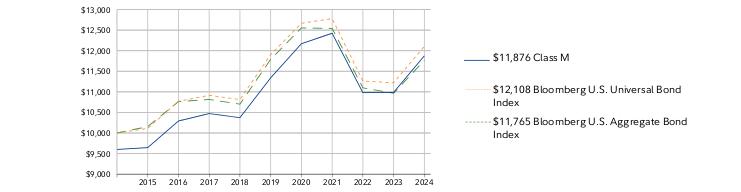
How did the Fund perform over the past 10 years?
CUMULATIVE PERFORMANCE
August 31, 2014 through August 31, 2024.
Initial investment of $10,000 and the current sales charge was paid.
Class M | $9,600 | $9,645 | $10,291 | $10,472 | $10,372 | $11,340 | $12,169 | $12,423 | $10,980 | $10,986 | $11,876 |
Bloomberg U.S. Universal Bond Index | $10,000 | $10,113 | $10,770 | $10,915 | $10,814 | $11,903 | $12,666 | $12,778 | $11,264 | $11,219 | $12,108 |
Bloomberg U.S. Aggregate Bond Index | $10,000 | $10,156 | $10,761 | $10,814 | $10,701 | $11,789 | $12,553 | $12,542 | $11,098 | $10,965 | $11,765 |
| | 2014 | 2015 | 2016 | 2017 | 2018 | 2019 | 2020 | 2021 | 2022 | 2023 | 2024 |
AVERAGE ANNUAL TOTAL RETURNS: | | 1 Year | 5 Year | 10 Year |
| Class M (incl. 4.00% sales charge) | 3.77% | 0.11% | 1.73% |
| Class M (without 4.00% sales charge) | 8.10% | 0.93% | 2.15% |
| Bloomberg U.S. Universal Bond Index | 7.92% | 0.34% | 1.93% |
| Bloomberg U.S. Aggregate Bond Index | 7.30% | -0.04% | 1.64% |
Visit institutional.fidelity.com for more recent performance information. |
The Fund's past performance is not a good predictor of the Fund's future performance. The graph and table do not reflect the deduction of taxes that a shareholder would pay on fund distributions or redemption of fund shares. |
Key Fund Statistics (as of August 31, 2024)
KEY FACTS | | |
| Fund Size | $39,553,262,535 | |
| Number of Holdings | 6,935 | |
| Total Advisory Fee | $100,486,629 | |
| Portfolio Turnover | 206% | |
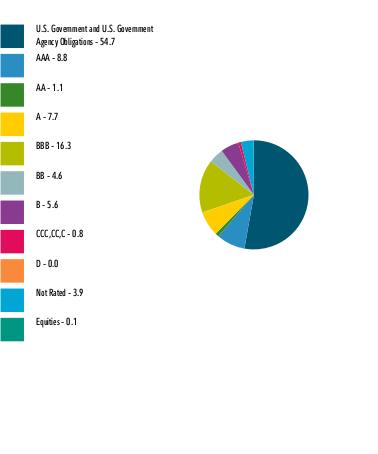
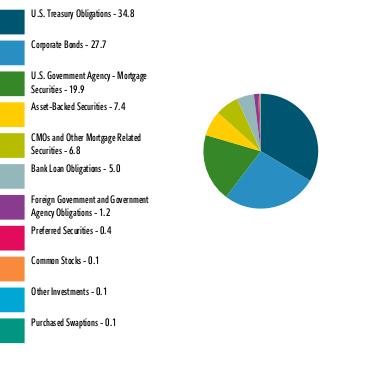
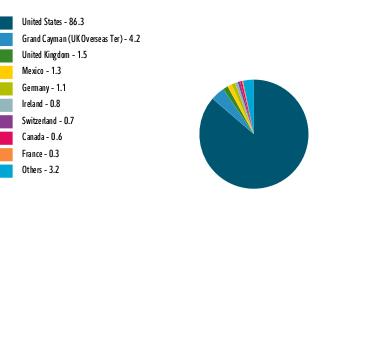
What did the Fund invest in?
(as of August 31, 2024)
| U.S. Government and U.S. Government Agency Obligations | 54.7 |
| AAA | 8.8 |
| AA | 1.1 |
| A | 7.7 |
| BBB | 16.3 |
| BB | 4.6 |
| B | 5.6 |
| CCC,CC,C | 0.8 |
| D | 0.0 |
| Not Rated | 3.9 |
| Equities | 0.1 |
QUALITY DIVERSIFICATION (% of Fund's net assets) |
|
| Short-Term Investments and Net Other Assets (Liabilities) - (3.6)% |
| |
| We have used ratings from Moody's Investors Service, Inc. Where Moody's® ratings are not available, we have used S&P® ratings. All ratings are as of the date indicated and do not reflect subsequent changes. |
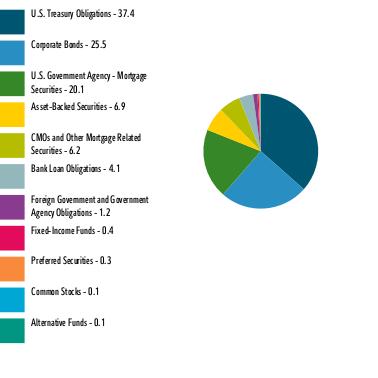
| U.S. Treasury Obligations | 34.8 |
| Corporate Bonds | 27.7 |
| U.S. Government Agency - Mortgage Securities | 19.9 |
| Asset-Backed Securities | 7.4 |
| CMOs and Other Mortgage Related Securities | 6.8 |
| Bank Loan Obligations | 5.0 |
| Foreign Government and Government Agency Obligations | 1.2 |
| Preferred Securities | 0.4 |
| Common Stocks | 0.1 |
| Other Investments | 0.1 |
| Purchased Swaptions | 0.1 |
| Supranational Obligations | 0.1 |
| Preferred Stocks | 0.0 |
ASSET ALLOCATION (% of Fund's net assets) |
|
| Short-Term Investments and Net Other Assets (Liabilities) - (3.6)% |
|
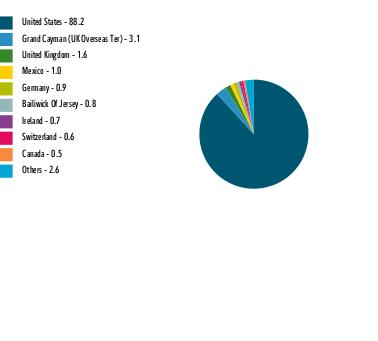
| United States | 86.3 |
| Grand Cayman (UK Overseas Ter) | 4.2 |
| United Kingdom | 1.5 |
| Mexico | 1.3 |
| Germany | 1.1 |
| Ireland | 0.8 |
| Switzerland | 0.7 |
| Canada | 0.6 |
| France | 0.3 |
| Others | 3.2 |
GEOGRAPHIC DIVERSIFICATION (% of Fund's net assets) |
|
| |
|
TOP HOLDINGS (% of Fund's net assets) | | |
| US Treasury Notes | 25.4 | |
| US Treasury Bonds | 9.4 | |
| Fannie Mae Mortgage pass-thru certificates | 6.6 | |
| Ginnie Mae II Pool | 5.2 | |
| Uniform Mortgage Backed Securities | 3.9 | |
| Freddie Mac Gold Pool | 3.6 | |
| JPMorgan Chase & Co | 1.2 | |
| Petroleos Mexicanos | 1.1 | |
| Freddie Mac Multiclass Mortgage participation certificates | 1.0 | |
| Bank of America Corp | 0.9 | |
| | 58.3 | |
How has the Fund changed?
This is a summary of certain changes to the Fund since September 1, 2023. For more complete information, you may review the Fund's next prospectus, which we expect to be available by October 30, 2024 at fundresearch.fidelity.com/prospectus/sec or upon request at 1-877-208-0098 or by sending an e-mail to fidfunddocuments@fidelity.com.
The fund's contractual management fee was reduced during the reporting period. | |
| Fidelity, the Fidelity Investments Logo and all other Fidelity trademarks or service marks used herein are trademarks or service marks of FMR LLC. Any third-party marks that are used herein are trademarks or service marks of their respective owners. © 2024 FMR LLC. All rights reserved. |
| | For additional information about the Fund; including its prospectus, financial information, holdings and proxy information, scan the QR code or visit fundresearch.fidelity.com/prospectus/sec 1.9913629.100 1344-TSRA-1024 |
| |
| | ANNUAL SHAREHOLDER REPORT | AS OF AUGUST 31, 2024 | This report describes changes to the Fund that occurred during the reporting period. |
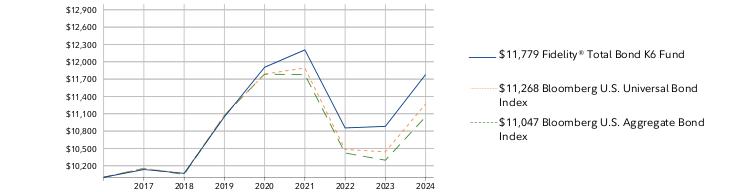
| | Fidelity® Total Bond Fund Fidelity® Total Bond Fund : FTBFX |
| | | |
This annual shareholder report contains information about Fidelity® Total Bond Fund for the period September 1, 2023 to August 31, 2024. You can find additional information about the Fund at fundresearch.fidelity.com/prospectus/sec. You can also request this information by contacting us at 1-800-544-8544 or by sending an e-mail to fidfunddocuments@fidelity.com.
What were your Fund costs for the last year?(based on hypothetical $10,000 investment)
FUND COST (PREVIOUS YEAR)
| | Costs of a $10,000 investment | Costs paid as a percentage of a $10,000 investment | |
| Fidelity® Total Bond Fund | $ 47 | 0.45% | |
What affected the Fund's performance this period?
•U.S. taxable investment-grade bonds posted a strong advance for the 12 months ending August 31, 2024, helped by a late-period gain as the bond market reflected anticipated interest-rate reductions by the U.S. Federal Reserve, which are expected to start in September. The full 12-month period was marked by high levels of volatility.
•Against this backdrop, allocations to "plus sectors" - including high-yield bonds, leveraged loans and emerging markets debt - notably contributed to the fund's outperformance of the Bloomberg U.S. Aggregate Index for the fiscal year.
•Among investment-grade securities, security selection and sector allocation also meaningfully contributed.
•In terms of sector allocation, investment choices and overweight positions in the asset-backed securities, mortgage-backed securities and commercial mortgage-backed securities segments each helped relative performance the past 12 months.
•As for security selection, fund holdings in the corporate segment made a notable contribution, led by picks among financials, particularly REITs and banks.
•In contrast, the fund's underweight in industrial bonds within the corporate sector detracted versus the Aggregate index the past 12 months.
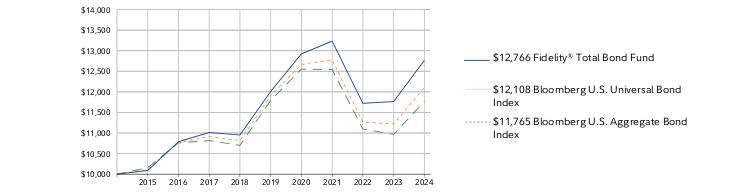
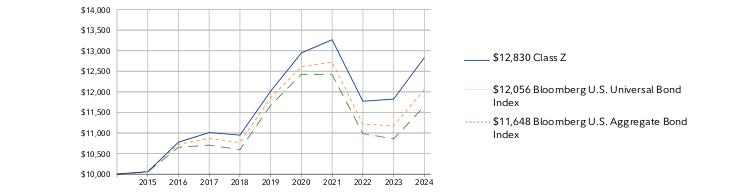
How did the Fund perform over the past 10 years?
CUMULATIVE PERFORMANCE
August 31, 2014 through August 31, 2024.
Initial investment of $10,000.
Fidelity® Total Bond Fund | $10,000 | $10,088 | $10,788 | $11,012 | $10,951 | $12,008 | $12,923 | $13,232 | $11,721 | $11,764 | $12,766 |
Bloomberg U.S. Universal Bond Index | $10,000 | $10,113 | $10,770 | $10,915 | $10,814 | $11,903 | $12,666 | $12,778 | $11,264 | $11,219 | $12,108 |
Bloomberg U.S. Aggregate Bond Index | $10,000 | $10,156 | $10,761 | $10,814 | $10,701 | $11,789 | $12,553 | $12,542 | $11,098 | $10,965 | $11,765 |
| | 2014 | 2015 | 2016 | 2017 | 2018 | 2019 | 2020 | 2021 | 2022 | 2023 | 2024 |
AVERAGE ANNUAL TOTAL RETURNS: | | 1 Year | 5 Year | 10 Year |
| Fidelity® Total Bond Fund | 8.52% | 1.23% | 2.47% |
| Bloomberg U.S. Universal Bond Index | 7.92% | 0.34% | 1.93% |
| Bloomberg U.S. Aggregate Bond Index | 7.30% | -0.04% | 1.64% |
Visit www.fidelity.com for more recent performance information. |
The Fund's past performance is not a good predictor of the Fund's future performance. The graph and table do not reflect the deduction of taxes that a shareholder would pay on fund distributions or redemption of fund shares. |
Key Fund Statistics (as of August 31, 2024)
KEY FACTS | | |
| Fund Size | $39,553,262,535 | |
| Number of Holdings | 6,935 | |
| Total Advisory Fee | $100,486,629 | |
| Portfolio Turnover | 206% | |
What did the Fund invest in?
(as of August 31, 2024)
| U.S. Government and U.S. Government Agency Obligations | 54.7 |
| AAA | 8.8 |
| AA | 1.1 |
| A | 7.7 |
| BBB | 16.3 |
| BB | 4.6 |
| B | 5.6 |
| CCC,CC,C | 0.8 |
| D | 0.0 |
| Not Rated | 3.9 |
| Equities | 0.1 |
QUALITY DIVERSIFICATION (% of Fund's net assets) |
|
| Short-Term Investments and Net Other Assets (Liabilities) - (3.6)% |
| |
| We have used ratings from Moody's Investors Service, Inc. Where Moody's® ratings are not available, we have used S&P® ratings. All ratings are as of the date indicated and do not reflect subsequent changes. |
| U.S. Treasury Obligations | 34.8 |
| Corporate Bonds | 27.7 |
| U.S. Government Agency - Mortgage Securities | 19.9 |
| Asset-Backed Securities | 7.4 |
| CMOs and Other Mortgage Related Securities | 6.8 |
| Bank Loan Obligations | 5.0 |
| Foreign Government and Government Agency Obligations | 1.2 |
| Preferred Securities | 0.4 |
| Common Stocks | 0.1 |
| Other Investments | 0.1 |
| Purchased Swaptions | 0.1 |
| Supranational Obligations | 0.1 |
| Preferred Stocks | 0.0 |
ASSET ALLOCATION (% of Fund's net assets) |
|
| Short-Term Investments and Net Other Assets (Liabilities) - (3.6)% |
|
| United States | 86.3 |
| Grand Cayman (UK Overseas Ter) | 4.2 |
| United Kingdom | 1.5 |
| Mexico | 1.3 |
| Germany | 1.1 |
| Ireland | 0.8 |
| Switzerland | 0.7 |
| Canada | 0.6 |
| France | 0.3 |
| Others | 3.2 |
GEOGRAPHIC DIVERSIFICATION (% of Fund's net assets) |
|
| |
|
TOP HOLDINGS (% of Fund's net assets) | | |
| US Treasury Notes | 25.4 | |
| US Treasury Bonds | 9.4 | |
| Fannie Mae Mortgage pass-thru certificates | 6.6 | |
| Ginnie Mae II Pool | 5.2 | |
| Uniform Mortgage Backed Securities | 3.9 | |
| Freddie Mac Gold Pool | 3.6 | |
| JPMorgan Chase & Co | 1.2 | |
| Petroleos Mexicanos | 1.1 | |
| Freddie Mac Multiclass Mortgage participation certificates | 1.0 | |
| Bank of America Corp | 0.9 | |
| | 58.3 | |
How has the Fund changed?
This is a summary of certain changes to the Fund since September 1, 2023. For more complete information, you may review the Fund's next prospectus, which we expect to be available by October 30, 2024 at fundresearch.fidelity.com/prospectus/sec or upon request at 1-800-544-8544 or by sending an e-mail to fidfunddocuments@fidelity.com.
The fund's contractual management fee was reduced during the reporting period. | |
| Fidelity, the Fidelity Investments Logo and all other Fidelity trademarks or service marks used herein are trademarks or service marks of FMR LLC. Any third-party marks that are used herein are trademarks or service marks of their respective owners. © 2024 FMR LLC. All rights reserved. |
| | For additional information about the Fund; including its prospectus, financial information, holdings and proxy information, scan the QR code or visit fundresearch.fidelity.com/prospectus/sec 1.9913632.100 820-TSRA-1024 |
| |
| | ANNUAL SHAREHOLDER REPORT | AS OF AUGUST 31, 2024 | This report describes changes to the Fund that occurred during the reporting period. |
| | Fidelity® Total Bond Fund Fidelity Advisor® Total Bond Fund Class C : FCEPX |
| | | |
This annual shareholder report contains information about Fidelity® Total Bond Fund for the period September 1, 2023 to August 31, 2024. You can find additional information about the Fund at fundresearch.fidelity.com/prospectus/sec. You can also request this information by contacting us at 1-877-208-0098 or by sending an e-mail to fidfunddocuments@fidelity.com.
What were your Fund costs for the last year?(based on hypothetical $10,000 investment)
FUND COST (PREVIOUS YEAR)
| | Costs of a $10,000 investment | Costs paid as a percentage of a $10,000 investment | |
| Class C | $ 157 | 1.51% | |
What affected the Fund's performance this period?
•U.S. taxable investment-grade bonds posted a strong advance for the 12 months ending August 31, 2024, helped by a late-period gain as the bond market reflected anticipated interest-rate reductions by the U.S. Federal Reserve, which are expected to start in September. The full 12-month period was marked by high levels of volatility.
•Against this backdrop, allocations to "plus sectors" - including high-yield bonds, leveraged loans and emerging markets debt - notably contributed to the fund's outperformance of the Bloomberg U.S. Aggregate Index for the fiscal year.
•Among investment-grade securities, security selection and sector allocation also meaningfully contributed.
•In terms of sector allocation, investment choices and overweight positions in the asset-backed securities, mortgage-backed securities and commercial mortgage-backed securities segments each helped relative performance the past 12 months.
•As for security selection, fund holdings in the corporate segment made a notable contribution, led by picks among financials, particularly REITs and banks.
•In contrast, the fund's underweight in industrial bonds within the corporate sector detracted versus the Aggregate index the past 12 months.
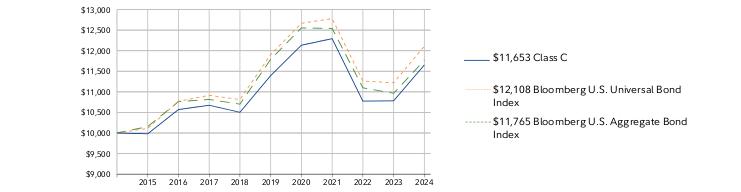
How did the Fund perform over the past 10 years?
CUMULATIVE PERFORMANCE
August 31, 2014 through August 31, 2024.
Initial investment of $10,000.
Class C | $10,000 | $9,980 | $10,569 | $10,674 | $10,503 | $11,394 | $12,133 | $12,292 | $10,774 | $10,782 | $11,653 |
Bloomberg U.S. Universal Bond Index | $10,000 | $10,113 | $10,770 | $10,915 | $10,814 | $11,903 | $12,666 | $12,778 | $11,264 | $11,219 | $12,108 |
Bloomberg U.S. Aggregate Bond Index | $10,000 | $10,156 | $10,761 | $10,814 | $10,701 | $11,789 | $12,553 | $12,542 | $11,098 | $10,965 | $11,765 |
| | 2014 | 2015 | 2016 | 2017 | 2018 | 2019 | 2020 | 2021 | 2022 | 2023 | 2024 |
AVERAGE ANNUAL TOTAL RETURNS: | | 1 Year | 5 Year | 10 Year |
| Class C (incl. contingent deferred sales charge) | 6.27% | 0.14% | 1.54% |
| Class C | 7.27% | 0.14% | 1.54% |
| Bloomberg U.S. Universal Bond Index | 7.92% | 0.34% | 1.93% |
| Bloomberg U.S. Aggregate Bond Index | 7.30% | -0.04% | 1.64% |
Visit institutional.fidelity.com for more recent performance information. |
The Fund's past performance is not a good predictor of the Fund's future performance. The graph and table do not reflect the deduction of taxes that a shareholder would pay on fund distributions or redemption of fund shares. |
Key Fund Statistics (as of August 31, 2024)
KEY FACTS | | |
| Fund Size | $39,553,262,535 | |
| Number of Holdings | 6,935 | |
| Total Advisory Fee | $100,486,629 | |
| Portfolio Turnover | 206% | |
What did the Fund invest in?
(as of August 31, 2024)
| U.S. Government and U.S. Government Agency Obligations | 54.7 |
| AAA | 8.8 |
| AA | 1.1 |
| A | 7.7 |
| BBB | 16.3 |
| BB | 4.6 |
| B | 5.6 |
| CCC,CC,C | 0.8 |
| D | 0.0 |
| Not Rated | 3.9 |
| Equities | 0.1 |
QUALITY DIVERSIFICATION (% of Fund's net assets) |
|
| Short-Term Investments and Net Other Assets (Liabilities) - (3.6)% |
| |
| We have used ratings from Moody's Investors Service, Inc. Where Moody's® ratings are not available, we have used S&P® ratings. All ratings are as of the date indicated and do not reflect subsequent changes. |
| U.S. Treasury Obligations | 34.8 |
| Corporate Bonds | 27.7 |
| U.S. Government Agency - Mortgage Securities | 19.9 |
| Asset-Backed Securities | 7.4 |
| CMOs and Other Mortgage Related Securities | 6.8 |
| Bank Loan Obligations | 5.0 |
| Foreign Government and Government Agency Obligations | 1.2 |
| Preferred Securities | 0.4 |
| Common Stocks | 0.1 |
| Other Investments | 0.1 |
| Purchased Swaptions | 0.1 |
| Supranational Obligations | 0.1 |
| Preferred Stocks | 0.0 |
ASSET ALLOCATION (% of Fund's net assets) |
|
| Short-Term Investments and Net Other Assets (Liabilities) - (3.6)% |
|
| United States | 86.3 |
| Grand Cayman (UK Overseas Ter) | 4.2 |
| United Kingdom | 1.5 |
| Mexico | 1.3 |
| Germany | 1.1 |
| Ireland | 0.8 |
| Switzerland | 0.7 |
| Canada | 0.6 |
| France | 0.3 |
| Others | 3.2 |
GEOGRAPHIC DIVERSIFICATION (% of Fund's net assets) |
|
| |
|
TOP HOLDINGS (% of Fund's net assets) | | |
| US Treasury Notes | 25.4 | |
| US Treasury Bonds | 9.4 | |
| Fannie Mae Mortgage pass-thru certificates | 6.6 | |
| Ginnie Mae II Pool | 5.2 | |
| Uniform Mortgage Backed Securities | 3.9 | |
| Freddie Mac Gold Pool | 3.6 | |
| JPMorgan Chase & Co | 1.2 | |
| Petroleos Mexicanos | 1.1 | |
| Freddie Mac Multiclass Mortgage participation certificates | 1.0 | |
| Bank of America Corp | 0.9 | |
| | 58.3 | |
How has the Fund changed?
This is a summary of certain changes to the Fund since September 1, 2023. For more complete information, you may review the Fund's next prospectus, which we expect to be available by October 30, 2024 at fundresearch.fidelity.com/prospectus/sec or upon request at 1-877-208-0098 or by sending an e-mail to fidfunddocuments@fidelity.com.
The fund's contractual management fee was reduced during the reporting period. | |
| Fidelity, the Fidelity Investments Logo and all other Fidelity trademarks or service marks used herein are trademarks or service marks of FMR LLC. Any third-party marks that are used herein are trademarks or service marks of their respective owners. © 2024 FMR LLC. All rights reserved. |
| | For additional information about the Fund; including its prospectus, financial information, holdings and proxy information, scan the QR code or visit fundresearch.fidelity.com/prospectus/sec 1.9913628.100 1343-TSRA-1024 |
| |
| | ANNUAL SHAREHOLDER REPORT | AS OF AUGUST 31, 2024 | This report describes changes to the Fund that occurred during the reporting period. |
| | Fidelity® Government Income Fund Fidelity Advisor® Government Income Fund Class M : FVITX |
| | | |
This annual shareholder report contains information about Fidelity® Government Income Fund for the period September 1, 2023 to August 31, 2024. You can find additional information about the Fund at fundresearch.fidelity.com/prospectus/sec. You can also request this information by contacting us at 1-877-208-0098 or by sending an e-mail to fidfunddocuments@fidelity.com.
What were your Fund costs for the last year?(based on hypothetical $10,000 investment)
FUND COST (PREVIOUS YEAR)
| | Costs of a $10,000 investment | Costs paid as a percentage of a $10,000 investment | |
| Class M | $ 78 | 0.76% | |
What affected the Fund's performance this period?
•U.S. taxable investment-grade bonds posted a strong advance for the 12 months ending August 31, 2024, helped by a late-period gain, as the bond market reflected anticipated interest-rate reductions by the U.S. Federal Reserve, which are expected to start in September. The full 12-month period was marked by high volatility.
•Against this backdrop, the fund's positioning in mortgage-backed securities contributed to the fund's performance versus the Bloomberg 75% US Government/25% US Mortgage-Backed Securities Blended Index for the fiscal year.
•Specifically, an overweight in GNMAs with coupons 2% and lower, and in those with coupons 5.5% and higher, helped relative performance the past 12 months.
•Larger-than-index exposure to lower-coupon 15- and 20-year Fannie Mae/Freddie Mac mortgage securities also contributed.
•An overweight in short-duration government agency commercial mortgage-backed securities also lifted
•In contrast, exposure to cash flows based on the Secured Overnight Financing Rate detracted versus the index the past 12 months. An underweight in agency debentures also hurt.
How did the Fund perform over the past 10 years?
CUMULATIVE PERFORMANCE
August 31, 2014 through August 31, 2024.
Initial investment of $10,000 and the current sales charge was paid.
Class M | $9,600 | $9,761 | $10,144 | $10,070 | $9,881 | $10,778 | $11,383 | $11,164 | $9,934 | $9,652 | $10,245 |
Bloomberg 75% U.S. Government/25% U.S. Mortgage-Backed Securities Blended Index | $10,000 | $10,237 | $10,723 | $10,676 | $10,542 | $11,543 | $12,274 | $12,083 | $10,820 | $10,602 | $11,280 |
Bloomberg U.S. Government Bond Index | $10,000 | $10,227 | $10,739 | $10,649 | $10,489 | $11,570 | $12,371 | $12,121 | $10,825 | $10,608 | $11,248 |
Bloomberg U.S. Aggregate Bond Index | $10,000 | $10,156 | $10,761 | $10,814 | $10,701 | $11,789 | $12,553 | $12,542 | $11,098 | $10,965 | $11,765 |
| | 2014 | 2015 | 2016 | 2017 | 2018 | 2019 | 2020 | 2021 | 2022 | 2023 | 2024 |
AVERAGE ANNUAL TOTAL RETURNS: | | 1 Year | 5 Year | 10 Year |
| Class M (incl. 4.00% sales charge) | 1.90% | -1.82% | 0.24% |
| Class M (without 4.00% sales charge) | 6.14% | -1.01% | 0.65% |
| Bloomberg 75% U.S. Government/25% U.S. Mortgage-Backed Securities Blended Index | 6.40% | -0.46% | 1.21% |
| Bloomberg U.S. Government Bond Index | 6.03% | -0.56% | 1.18% |
| Bloomberg U.S. Aggregate Bond Index | 7.30% | -0.04% | 1.64% |
Visit institutional.fidelity.com for more recent performance information. |
The Fund's past performance is not a good predictor of the Fund's future performance. The graph and table do not reflect the deduction of taxes that a shareholder would pay on fund distributions or redemption of fund shares. |
Key Fund Statistics (as of August 31, 2024)
KEY FACTS | | |
| Fund Size | $2,324,957,949 | |
| Number of Holdings | 2,073 | |
| Total Advisory Fee | $8,233,532 | |
| Portfolio Turnover | 393% | |
What did the Fund invest in?
(as of August 31, 2024)
COUPON DISTRIBUTION (% of Fund's net assets) |
| Zero coupon bonds | 0.0 | |
| 0.01 - 0.99% | 0.0 | |
| 1 - 1.99% | 7.0 | |
| 2 - 2.99% | 32.8 | |
| 3 - 3.99% | 22.8 | |
| 4 - 4.99% | 18.6 | |
| 5 - 5.99% | 4.9 | |
| 6 - 6.99% | 3.2 | |
| 7 - 7.99% | 0.0 | |
| 8 - 8.99% | 0.0 | |
| U.S. Treasury Obligations | 43.0 |
| CMOs and Other Mortgage Related Securities | 23.3 |
| U.S. Government Agency - Mortgage Securities | 22.4 |
| U.S. Government Agency Obligations | 0.6 |
| Short-Term Investments and Net Other Assets (Liabilities) | 10.7 |
ASSET ALLOCATION (% of Fund's net assets) |
|
|
TOP HOLDINGS (% of Fund's net assets) | | |
| US Treasury Notes | 26.9 | |
| US Treasury Bonds | 16.1 | |
| Fannie Mae Mortgage pass-thru certificates | 14.9 | |
| Freddie Mac Multiclass Mortgage participation certificates | 14.6 | |
| Freddie Mac Gold Pool | 9.3 | |
| Fannie Mae Guaranteed REMICS | 5.4 | |
| Ginnie Mae II Pool | 3.5 | |
| Ginnie Mae I Pool | 1.4 | |
| Ginnie Mae REMIC pass-thru certificates | 1.1 | |
| Freddie Mac Non Gold Pool | 0.8 | |
| | 94.0 | |
How has the Fund changed?
This is a summary of certain changes to the Fund since September 1, 2023. For more complete information, you may review the Fund's next prospectus, which we expect to be available by October 30, 2024 at fundresearch.fidelity.com/prospectus/sec or upon request at 1-877-208-0098 or by sending an e-mail to fidfunddocuments@fidelity.com.
The fund's contractural management fee was reduced during the reporting period. | |
| Fidelity, the Fidelity Investments Logo and all other Fidelity trademarks or service marks used herein are trademarks or service marks of FMR LLC. Any third-party marks that are used herein are trademarks or service marks of their respective owners. © 2024 FMR LLC. All rights reserved. |
| | For additional information about the Fund; including its prospectus, financial information, holdings and proxy information, scan the QR code or visit fundresearch.fidelity.com/prospectus/sec 1.9913600.100 1758-TSRA-1024 |
| |
| | ANNUAL SHAREHOLDER REPORT | AS OF AUGUST 31, 2024 | |
| | Fidelity® Environmental Bond Fund Fidelity Advisor® Environmental Bond Fund Class C : FEBDX |
| | | |
This annual shareholder report contains information about Fidelity® Environmental Bond Fund for the period September 1, 2023 to August 31, 2024. You can find additional information about the Fund at fundresearch.fidelity.com/prospectus/sec. You can also request this information by contacting us at 1-877-208-0098 or by sending an e-mail to fidfunddocuments@fidelity.com.
What were your Fund costs for the last year?(based on hypothetical $10,000 investment)
FUND COST (PREVIOUS YEAR)
| | Costs of a $10,000 investment | Costs paid as a percentage of a $10,000 investment | |
| Class C | $ 149 | 1.44% | |
What affected the Fund's performance this period?
•U.S. taxable investment-grade bonds posted a strong advance for the 12 months ending August 31, 2024, helped by a late-period gain as the bond market reflected anticipated interest-rate reductions by the U.S. Federal Reserve, which are expected to start in September. The full 12-month period was marked by high levels of volatility.
•Against this backdrop, sector allocation and security selection notably contributed to the fund's outperformance of the Bloomberg U.S. Aggregate Index for the fiscal year.
•In terms of sector allocation, investment choices and an overweight position in asset-backed securities, and underweights in U.S. Treasurys and mortgage securities, each helped relative performance the past 12 months.
•As for security selection, fund holdings in the corporate segment made a notable contribution, led by picks among financials, particularly REITs and banks.
•In contrast, the fund's underweight in energy bonds and consumer non-cyclicals within the corporate sector detracted versus the Aggregate index the past 12 months.
Application of FMR's environmental, social, and governance (ESG) ratings process and/or its sustainable investing exclusion criteria may affect the Fund's exposure to certain issuers, sectors, regions, and countries and may affect the Fund's performance.
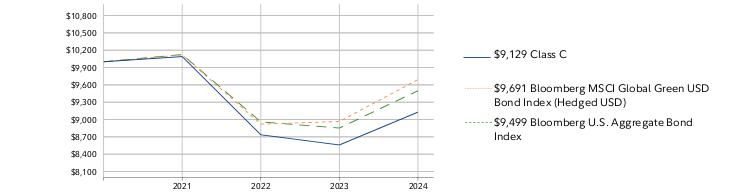
How did the Fund perform over the life of Fund?
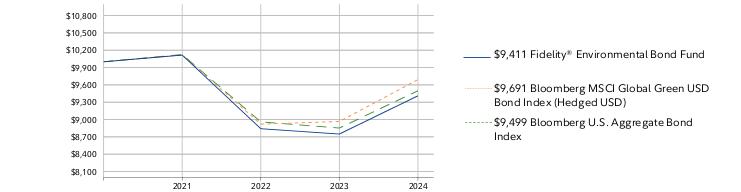
CUMULATIVE PERFORMANCE
June 15, 2021 through August 31, 2024.
Initial investment of $10,000.
Class C | $10,000 | $10,090 | $8,736 | $8,560 |
Bloomberg MSCI Global Green USD Bond Index (Hedged USD) | $10,000 | $10,120 | $8,921 | $8,966 |
Bloomberg U.S. Aggregate Bond Index | $10,000 | $10,126 | $8,960 | $8,853 |
| | 2021 | 2022 | 2023 | 2024 |
AVERAGE ANNUAL TOTAL RETURNS: | | 1 Year | Life of Fund A |
| Class C (incl. contingent deferred sales charge) | 5.65% | -2.80% |
| Class C | 6.65% | -2.80% |
| Bloomberg MSCI Global Green USD Bond Index (Hedged USD) | 8.09% | -0.97% |
| Bloomberg U.S. Aggregate Bond Index | 7.30% | -1.59% |
A From June 15, 2021
Visit institutional.fidelity.com for more recent performance information. |
The Fund's past performance is not a good predictor of the Fund's future performance. The graph and table do not reflect the deduction of taxes that a shareholder would pay on fund distributions or redemption of fund shares. |
Key Fund Statistics (as of August 31, 2024)
KEY FACTS | | |
| Fund Size | $37,501,935 | |
| Number of Holdings | 199 | |
| Total Advisory Fee | $120,006 | |
| Portfolio Turnover | 97% | |
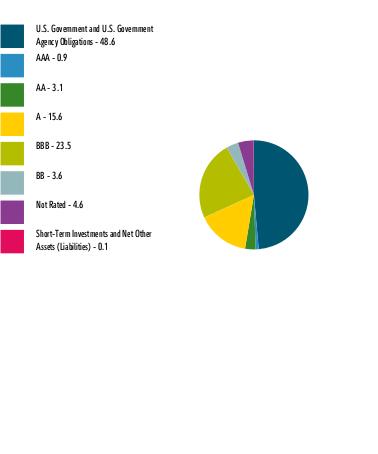
What did the Fund invest in?
(as of August 31, 2024)
| U.S. Government and U.S. Government Agency Obligations | 48.6 |
| AAA | 0.9 |
| AA | 3.1 |
| A | 15.6 |
| BBB | 23.5 |
| BB | 3.6 |
| Not Rated | 4.6 |
| Short-Term Investments and Net Other Assets (Liabilities) | 0.1 |
QUALITY DIVERSIFICATION (% of Fund's net assets) |
|
| |
| We have used ratings from Moody's Investors Service, Inc. Where Moody's® ratings are not available, we have used S&P® ratings. All ratings are as of the date indicated and do not reflect subsequent changes. |
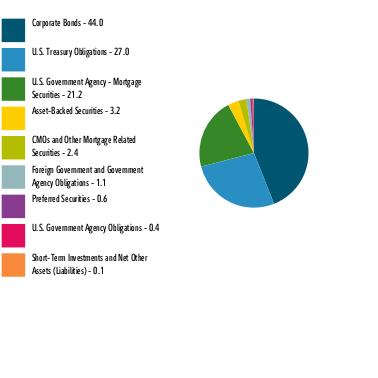
| Corporate Bonds | 44.0 |
| U.S. Treasury Obligations | 27.0 |
| U.S. Government Agency - Mortgage Securities | 21.2 |
| Asset-Backed Securities | 3.2 |
| CMOs and Other Mortgage Related Securities | 2.4 |
| Foreign Government and Government Agency Obligations | 1.1 |
| Preferred Securities | 0.6 |
| U.S. Government Agency Obligations | 0.4 |
| Short-Term Investments and Net Other Assets (Liabilities) | 0.1 |
ASSET ALLOCATION (% of Fund's net assets) |
|
|
| United States | 82.6 |
| Germany | 2.9 |
| United Kingdom | 2.2 |
| Netherlands | 1.9 |
| Italy | 1.4 |
| Japan | 1.4 |
| France | 1.3 |
| Ireland | 1.2 |
| Luxembourg | 1.1 |
| Others | 4.0 |
GEOGRAPHIC DIVERSIFICATION (% of Fund's net assets) |
|
| |
|
TOP HOLDINGS (% of Fund's net assets) | | |
| US Treasury Notes | 17.0 | |
| US Treasury Bonds | 10.0 | |
| Fannie Mae Mortgage pass-thru certificates | 9.8 | |
| Freddie Mac Gold Pool | 8.9 | |
| Freddie Mac Multiclass Mortgage participation certificates | 2.1 | |
| Uniform Mortgage Backed Securities | 2.1 | |
| Bank of America Corp | 1.7 | |
| Verizon Communications Inc | 1.6 | |
| BNP Paribas SA | 1.3 | |
| PNC Financial Services Group Inc/The | 1.2 | |
| | 55.7 | |
| Fidelity, the Fidelity Investments Logo and all other Fidelity trademarks or service marks used herein are trademarks or service marks of FMR LLC. Any third-party marks that are used herein are trademarks or service marks of their respective owners. © 2024 FMR LLC. All rights reserved. |
| | For additional information about the Fund; including its prospectus, financial information, holdings and proxy information, scan the QR code or visit fundresearch.fidelity.com/prospectus/sec 1.9913672.100 6381-TSRA-1024 |
| |
| | ANNUAL SHAREHOLDER REPORT | AS OF AUGUST 31, 2024 | |
| | Fidelity® Environmental Bond Fund Fidelity Advisor® Environmental Bond Fund Class M : FEBEX |
| | | |
This annual shareholder report contains information about Fidelity® Environmental Bond Fund for the period September 1, 2023 to August 31, 2024. You can find additional information about the Fund at fundresearch.fidelity.com/prospectus/sec. You can also request this information by contacting us at 1-877-208-0098 or by sending an e-mail to fidfunddocuments@fidelity.com.
What were your Fund costs for the last year?(based on hypothetical $10,000 investment)
FUND COST (PREVIOUS YEAR)
| | Costs of a $10,000 investment | Costs paid as a percentage of a $10,000 investment | |
| Class M | $ 70 | 0.68% | |
What affected the Fund's performance this period?
•U.S. taxable investment-grade bonds posted a strong advance for the 12 months ending August 31, 2024, helped by a late-period gain as the bond market reflected anticipated interest-rate reductions by the U.S. Federal Reserve, which are expected to start in September. The full 12-month period was marked by high levels of volatility.
•Against this backdrop, sector allocation and security selection notably contributed to the fund's outperformance of the Bloomberg U.S. Aggregate Index for the fiscal year.
•In terms of sector allocation, investment choices and an overweight position in asset-backed securities, and underweights in U.S. Treasurys and mortgage securities, each helped relative performance the past 12 months.
•As for security selection, fund holdings in the corporate segment made a notable contribution, led by picks among financials, particularly REITs and banks.
•In contrast, the fund's underweight in energy bonds and consumer non-cyclicals within the corporate sector detracted versus the Aggregate index the past 12 months.
Application of FMR's environmental, social, and governance (ESG) ratings process and/or its sustainable investing exclusion criteria may affect the Fund's exposure to certain issuers, sectors, regions, and countries and may affect the Fund's performance.
How did the Fund perform over the life of Fund?
CUMULATIVE PERFORMANCE
June 15, 2021 through August 31, 2024.
Initial investment of $10,000 and the current sales charge was paid.
Class M | $9,600 | $9,706 | $8,466 | $8,357 |
Bloomberg MSCI Global Green USD Bond Index (Hedged USD) | $10,000 | $10,120 | $8,921 | $8,966 |
Bloomberg U.S. Aggregate Bond Index | $10,000 | $10,126 | $8,960 | $8,853 |
| | 2021 | 2022 | 2023 | 2024 |
AVERAGE ANNUAL TOTAL RETURNS: | | 1 Year | Life of Fund A |
| Class M (incl. 4.00% sales charge) | 3.04% | -3.33% |
| Class M (without 4.00% sales charge) | 7.33% | -2.09% |
| Bloomberg MSCI Global Green USD Bond Index (Hedged USD) | 8.09% | -0.97% |
| Bloomberg U.S. Aggregate Bond Index | 7.30% | -1.59% |
A From June 15, 2021
Visit institutional.fidelity.com for more recent performance information. |
The Fund's past performance is not a good predictor of the Fund's future performance. The graph and table do not reflect the deduction of taxes that a shareholder would pay on fund distributions or redemption of fund shares. |
Key Fund Statistics (as of August 31, 2024)
KEY FACTS | | |
| Fund Size | $37,501,935 | |
| Number of Holdings | 199 | |
| Total Advisory Fee | $120,006 | |
| Portfolio Turnover | 97% | |
What did the Fund invest in?
(as of August 31, 2024)
| U.S. Government and U.S. Government Agency Obligations | 48.6 |
| AAA | 0.9 |
| AA | 3.1 |
| A | 15.6 |
| BBB | 23.5 |
| BB | 3.6 |
| Not Rated | 4.6 |
| Short-Term Investments and Net Other Assets (Liabilities) | 0.1 |
QUALITY DIVERSIFICATION (% of Fund's net assets) |
|
| |
| We have used ratings from Moody's Investors Service, Inc. Where Moody's® ratings are not available, we have used S&P® ratings. All ratings are as of the date indicated and do not reflect subsequent changes. |
| Corporate Bonds | 44.0 |
| U.S. Treasury Obligations | 27.0 |
| U.S. Government Agency - Mortgage Securities | 21.2 |
| Asset-Backed Securities | 3.2 |
| CMOs and Other Mortgage Related Securities | 2.4 |
| Foreign Government and Government Agency Obligations | 1.1 |
| Preferred Securities | 0.6 |
| U.S. Government Agency Obligations | 0.4 |
| Short-Term Investments and Net Other Assets (Liabilities) | 0.1 |
ASSET ALLOCATION (% of Fund's net assets) |
|
|
| United States | 82.6 |
| Germany | 2.9 |
| United Kingdom | 2.2 |
| Netherlands | 1.9 |
| Italy | 1.4 |
| Japan | 1.4 |
| France | 1.3 |
| Ireland | 1.2 |
| Luxembourg | 1.1 |
| Others | 4.0 |
GEOGRAPHIC DIVERSIFICATION (% of Fund's net assets) |
|
| |
|
TOP HOLDINGS (% of Fund's net assets) | | |
| US Treasury Notes | 17.0 | |
| US Treasury Bonds | 10.0 | |
| Fannie Mae Mortgage pass-thru certificates | 9.8 | |
| Freddie Mac Gold Pool | 8.9 | |
| Freddie Mac Multiclass Mortgage participation certificates | 2.1 | |
| Uniform Mortgage Backed Securities | 2.1 | |
| Bank of America Corp | 1.7 | |
| Verizon Communications Inc | 1.6 | |
| BNP Paribas SA | 1.3 | |
| PNC Financial Services Group Inc/The | 1.2 | |
| | 55.7 | |
| Fidelity, the Fidelity Investments Logo and all other Fidelity trademarks or service marks used herein are trademarks or service marks of FMR LLC. Any third-party marks that are used herein are trademarks or service marks of their respective owners. © 2024 FMR LLC. All rights reserved. |
| | For additional information about the Fund; including its prospectus, financial information, holdings and proxy information, scan the QR code or visit fundresearch.fidelity.com/prospectus/sec 1.9913673.100 6382-TSRA-1024 |
| |
| | ANNUAL SHAREHOLDER REPORT | AS OF AUGUST 31, 2024 | This report describes changes to the Fund that occurred during the reporting period. |
| | Fidelity® Total Bond Fund Fidelity Advisor® Total Bond Fund Class A : FEPAX |
| | | |
This annual shareholder report contains information about Fidelity® Total Bond Fund for the period September 1, 2023 to August 31, 2024. You can find additional information about the Fund at fundresearch.fidelity.com/prospectus/sec. You can also request this information by contacting us at 1-877-208-0098 or by sending an e-mail to fidfunddocuments@fidelity.com.
What were your Fund costs for the last year?(based on hypothetical $10,000 investment)
FUND COST (PREVIOUS YEAR)
| | Costs of a $10,000 investment | Costs paid as a percentage of a $10,000 investment | |
| Class A | $ 78 | 0.75% | |
What affected the Fund's performance this period?
•U.S. taxable investment-grade bonds posted a strong advance for the 12 months ending August 31, 2024, helped by a late-period gain as the bond market reflected anticipated interest-rate reductions by the U.S. Federal Reserve, which are expected to start in September. The full 12-month period was marked by high levels of volatility.
•Against this backdrop, allocations to "plus sectors" - including high-yield bonds, leveraged loans and emerging markets debt - notably contributed to the fund's outperformance of the Bloomberg U.S. Aggregate Index for the fiscal year.
•Among investment-grade securities, security selection and sector allocation also meaningfully contributed.
•In terms of sector allocation, investment choices and overweight positions in the asset-backed securities, mortgage-backed securities and commercial mortgage-backed securities segments each helped relative performance the past 12 months.
•As for security selection, fund holdings in the corporate segment made a notable contribution, led by picks among financials, particularly REITs and banks.
•In contrast, the fund's underweight in industrial bonds within the corporate sector detracted versus the Aggregate index the past 12 months.
How did the Fund perform over the past 10 years?
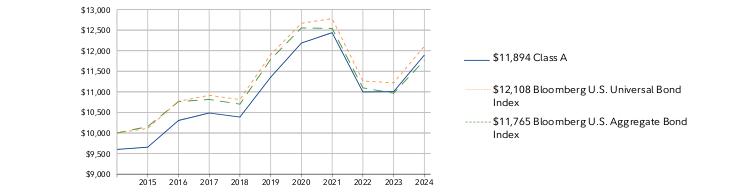
CUMULATIVE PERFORMANCE
August 31, 2014 through August 31, 2024.
Initial investment of $10,000 and the current sales charge was paid.
Class A | $9,600 | $9,655 | $10,304 | $10,486 | $10,387 | $11,355 | $12,185 | $12,439 | $10,997 | $11,004 | $11,894 |
Bloomberg U.S. Universal Bond Index | $10,000 | $10,113 | $10,770 | $10,915 | $10,814 | $11,903 | $12,666 | $12,778 | $11,264 | $11,219 | $12,108 |
Bloomberg U.S. Aggregate Bond Index | $10,000 | $10,156 | $10,761 | $10,814 | $10,701 | $11,789 | $12,553 | $12,542 | $11,098 | $10,965 | $11,765 |
| | 2014 | 2015 | 2016 | 2017 | 2018 | 2019 | 2020 | 2021 | 2022 | 2023 | 2024 |
AVERAGE ANNUAL TOTAL RETURNS: | | 1 Year | 5 Year | 10 Year |
| Class A (incl. 4.00% sales charge) | 3.76% | 0.11% | 1.75% |
| Class A (without 4.00% sales charge) | 8.09% | 0.93% | 2.17% |
| Bloomberg U.S. Universal Bond Index | 7.92% | 0.34% | 1.93% |
| Bloomberg U.S. Aggregate Bond Index | 7.30% | -0.04% | 1.64% |
Visit institutional.fidelity.com for more recent performance information. |
The Fund's past performance is not a good predictor of the Fund's future performance. The graph and table do not reflect the deduction of taxes that a shareholder would pay on fund distributions or redemption of fund shares. |
Key Fund Statistics (as of August 31, 2024)
KEY FACTS | | |
| Fund Size | $39,553,262,535 | |
| Number of Holdings | 6,935 | |
| Total Advisory Fee | $100,486,629 | |
| Portfolio Turnover | 206% | |
What did the Fund invest in?
(as of August 31, 2024)
| U.S. Government and U.S. Government Agency Obligations | 54.7 |
| AAA | 8.8 |
| AA | 1.1 |
| A | 7.7 |
| BBB | 16.3 |
| BB | 4.6 |
| B | 5.6 |
| CCC,CC,C | 0.8 |
| D | 0.0 |
| Not Rated | 3.9 |
| Equities | 0.1 |
QUALITY DIVERSIFICATION (% of Fund's net assets) |
|
| Short-Term Investments and Net Other Assets (Liabilities) - (3.6)% |
| |
| We have used ratings from Moody's Investors Service, Inc. Where Moody's® ratings are not available, we have used S&P® ratings. All ratings are as of the date indicated and do not reflect subsequent changes. |
| U.S. Treasury Obligations | 34.8 |
| Corporate Bonds | 27.7 |
| U.S. Government Agency - Mortgage Securities | 19.9 |
| Asset-Backed Securities | 7.4 |
| CMOs and Other Mortgage Related Securities | 6.8 |
| Bank Loan Obligations | 5.0 |
| Foreign Government and Government Agency Obligations | 1.2 |
| Preferred Securities | 0.4 |
| Common Stocks | 0.1 |
| Other Investments | 0.1 |
| Purchased Swaptions | 0.1 |
| Supranational Obligations | 0.1 |
| Preferred Stocks | 0.0 |
ASSET ALLOCATION (% of Fund's net assets) |
|
| Short-Term Investments and Net Other Assets (Liabilities) - (3.6)% |
|
| United States | 86.3 |
| Grand Cayman (UK Overseas Ter) | 4.2 |
| United Kingdom | 1.5 |
| Mexico | 1.3 |
| Germany | 1.1 |
| Ireland | 0.8 |
| Switzerland | 0.7 |
| Canada | 0.6 |
| France | 0.3 |
| Others | 3.2 |
GEOGRAPHIC DIVERSIFICATION (% of Fund's net assets) |
|
| |
|
TOP HOLDINGS (% of Fund's net assets) | | |
| US Treasury Notes | 25.4 | |
| US Treasury Bonds | 9.4 | |
| Fannie Mae Mortgage pass-thru certificates | 6.6 | |
| Ginnie Mae II Pool | 5.2 | |
| Uniform Mortgage Backed Securities | 3.9 | |
| Freddie Mac Gold Pool | 3.6 | |
| JPMorgan Chase & Co | 1.2 | |
| Petroleos Mexicanos | 1.1 | |
| Freddie Mac Multiclass Mortgage participation certificates | 1.0 | |
| Bank of America Corp | 0.9 | |
| | 58.3 | |
How has the Fund changed?
This is a summary of certain changes to the Fund since September 1, 2023. For more complete information, you may review the Fund's next prospectus, which we expect to be available by October 30, 2024 at fundresearch.fidelity.com/prospectus/sec or upon request at 1-877-208-0098 or by sending an e-mail to fidfunddocuments@fidelity.com.
The fund's contractual management fee was reduced during the reporting period. | |
| Fidelity, the Fidelity Investments Logo and all other Fidelity trademarks or service marks used herein are trademarks or service marks of FMR LLC. Any third-party marks that are used herein are trademarks or service marks of their respective owners. © 2024 FMR LLC. All rights reserved. |
| | For additional information about the Fund; including its prospectus, financial information, holdings and proxy information, scan the QR code or visit fundresearch.fidelity.com/prospectus/sec 1.9913627.100 1341-TSRA-1024 |
| |
| | ANNUAL SHAREHOLDER REPORT | AS OF AUGUST 31, 2024 | |
| | Fidelity® Environmental Bond Fund Fidelity Advisor® Environmental Bond Fund Class A : FEBBX |
| | | |
This annual shareholder report contains information about Fidelity® Environmental Bond Fund for the period September 1, 2023 to August 31, 2024. You can find additional information about the Fund at fundresearch.fidelity.com/prospectus/sec. You can also request this information by contacting us at 1-877-208-0098 or by sending an e-mail to fidfunddocuments@fidelity.com.
What were your Fund costs for the last year?(based on hypothetical $10,000 investment)
FUND COST (PREVIOUS YEAR)
| | Costs of a $10,000 investment | Costs paid as a percentage of a $10,000 investment | |
| Class A | $ 72 | 0.69% | |
What affected the Fund's performance this period?
•U.S. taxable investment-grade bonds posted a strong advance for the 12 months ending August 31, 2024, helped by a late-period gain as the bond market reflected anticipated interest-rate reductions by the U.S. Federal Reserve, which are expected to start in September. The full 12-month period was marked by high levels of volatility.
•Against this backdrop, sector allocation and security selection notably contributed to the fund's outperformance of the Bloomberg U.S. Aggregate Index for the fiscal year.
•In terms of sector allocation, investment choices and an overweight position in asset-backed securities, and underweights in U.S. Treasurys and mortgage securities, each helped relative performance the past 12 months.
•As for security selection, fund holdings in the corporate segment made a notable contribution, led by picks among financials, particularly REITs and banks.
•In contrast, the fund's underweight in energy bonds and consumer non-cyclicals within the corporate sector detracted versus the Aggregate index the past 12 months.
Application of FMR's environmental, social, and governance (ESG) ratings process and/or its sustainable investing exclusion criteria may affect the Fund's exposure to certain issuers, sectors, regions, and countries and may affect the Fund's performance.
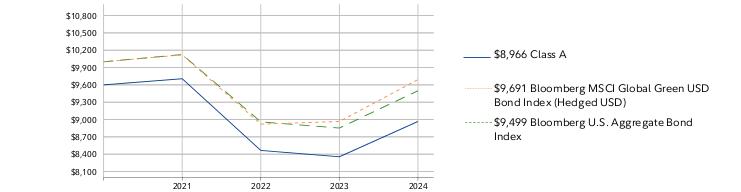
How did the Fund perform over the life of Fund?
CUMULATIVE PERFORMANCE
June 15, 2021 through August 31, 2024.
Initial investment of $10,000 and the current sales charge was paid.
Class A | $9,600 | $9,706 | $8,465 | $8,355 |
Bloomberg MSCI Global Green USD Bond Index (Hedged USD) | $10,000 | $10,120 | $8,921 | $8,966 |
Bloomberg U.S. Aggregate Bond Index | $10,000 | $10,126 | $8,960 | $8,853 |
| | 2021 | 2022 | 2023 | 2024 |
AVERAGE ANNUAL TOTAL RETURNS: | | 1 Year | Life of Fund A |
| Class A (incl. 4.00% sales charge) | 3.02% | -3.34% |
| Class A (without 4.00% sales charge) | 7.31% | -2.10% |
| Bloomberg MSCI Global Green USD Bond Index (Hedged USD) | 8.09% | -0.97% |
| Bloomberg U.S. Aggregate Bond Index | 7.30% | -1.59% |
A From June 15, 2021
Visit institutional.fidelity.com for more recent performance information. |
The Fund's past performance is not a good predictor of the Fund's future performance. The graph and table do not reflect the deduction of taxes that a shareholder would pay on fund distributions or redemption of fund shares. |
Key Fund Statistics (as of August 31, 2024)
KEY FACTS | | |
| Fund Size | $37,501,935 | |
| Number of Holdings | 199 | |
| Total Advisory Fee | $120,006 | |
| Portfolio Turnover | 97% | |
What did the Fund invest in?
(as of August 31, 2024)
| U.S. Government and U.S. Government Agency Obligations | 48.6 |
| AAA | 0.9 |
| AA | 3.1 |
| A | 15.6 |
| BBB | 23.5 |
| BB | 3.6 |
| Not Rated | 4.6 |
| Short-Term Investments and Net Other Assets (Liabilities) | 0.1 |
QUALITY DIVERSIFICATION (% of Fund's net assets) |
|
| |
| We have used ratings from Moody's Investors Service, Inc. Where Moody's® ratings are not available, we have used S&P® ratings. All ratings are as of the date indicated and do not reflect subsequent changes. |
| Corporate Bonds | 44.0 |
| U.S. Treasury Obligations | 27.0 |
| U.S. Government Agency - Mortgage Securities | 21.2 |
| Asset-Backed Securities | 3.2 |
| CMOs and Other Mortgage Related Securities | 2.4 |
| Foreign Government and Government Agency Obligations | 1.1 |
| Preferred Securities | 0.6 |
| U.S. Government Agency Obligations | 0.4 |
| Short-Term Investments and Net Other Assets (Liabilities) | 0.1 |
ASSET ALLOCATION (% of Fund's net assets) |
|
|
| United States | 82.6 |
| Germany | 2.9 |
| United Kingdom | 2.2 |
| Netherlands | 1.9 |
| Italy | 1.4 |
| Japan | 1.4 |
| France | 1.3 |
| Ireland | 1.2 |
| Luxembourg | 1.1 |
| Others | 4.0 |
GEOGRAPHIC DIVERSIFICATION (% of Fund's net assets) |
|
| |
|
TOP HOLDINGS (% of Fund's net assets) | | |
| US Treasury Notes | 17.0 | |
| US Treasury Bonds | 10.0 | |
| Fannie Mae Mortgage pass-thru certificates | 9.8 | |
| Freddie Mac Gold Pool | 8.9 | |
| Freddie Mac Multiclass Mortgage participation certificates | 2.1 | |
| Uniform Mortgage Backed Securities | 2.1 | |
| Bank of America Corp | 1.7 | |
| Verizon Communications Inc | 1.6 | |
| BNP Paribas SA | 1.3 | |
| PNC Financial Services Group Inc/The | 1.2 | |
| | 55.7 | |
| Fidelity, the Fidelity Investments Logo and all other Fidelity trademarks or service marks used herein are trademarks or service marks of FMR LLC. Any third-party marks that are used herein are trademarks or service marks of their respective owners. © 2024 FMR LLC. All rights reserved. |
| | For additional information about the Fund; including its prospectus, financial information, holdings and proxy information, scan the QR code or visit fundresearch.fidelity.com/prospectus/sec 1.9913671.100 6380-TSRA-1024 |
| |
| | ANNUAL SHAREHOLDER REPORT | AS OF AUGUST 31, 2024 | This report describes changes to the Fund that occurred during the reporting period. |
| | Fidelity® Environmental Bond Fund Fidelity Advisor® Environmental Bond Fund Class I : FEBFX |
| | | |
This annual shareholder report contains information about Fidelity® Environmental Bond Fund for the period September 1, 2023 to August 31, 2024. You can find additional information about the Fund at fundresearch.fidelity.com/prospectus/sec. You can also request this information by contacting us at 1-877-208-0098 or by sending an e-mail to fidfunddocuments@fidelity.com.
What were your Fund costs for the last year?(based on hypothetical $10,000 investment)
FUND COST (PREVIOUS YEAR)
| | Costs of a $10,000 investment | Costs paid as a percentage of a $10,000 investment | |
| Class I | $ 54 | 0.52% | |
What affected the Fund's performance this period?
•U.S. taxable investment-grade bonds posted a strong advance for the 12 months ending August 31, 2024, helped by a late-period gain as the bond market reflected anticipated interest-rate reductions by the U.S. Federal Reserve, which are expected to start in September. The full 12-month period was marked by high levels of volatility.
•Against this backdrop, sector allocation and security selection notably contributed to the fund's outperformance of the Bloomberg U.S. Aggregate Index for the fiscal year.
•In terms of sector allocation, investment choices and an overweight position in asset-backed securities, and underweights in U.S. Treasurys and mortgage securities, each helped relative performance the past 12 months.
•As for security selection, fund holdings in the corporate segment made a notable contribution, led by picks among financials, particularly REITs and banks.
•In contrast, the fund's underweight in energy bonds and consumer non-cyclicals within the corporate sector detracted versus the Aggregate index the past 12 months.
Application of FMR's environmental, social, and governance (ESG) ratings process and/or its sustainable investing exclusion criteria may affect the Fund's exposure to certain issuers, sectors, regions, and countries and may affect the Fund's performance.
How did the Fund perform over the life of Fund?
CUMULATIVE PERFORMANCE
June 15, 2021 through August 31, 2024.
Initial investment of $10,000.
Class I | $10,000 | $10,116 | $8,844 | $8,740 |
Bloomberg MSCI Global Green USD Bond Index (Hedged USD) | $10,000 | $10,120 | $8,921 | $8,966 |
Bloomberg U.S. Aggregate Bond Index | $10,000 | $10,126 | $8,960 | $8,853 |
| | 2021 | 2022 | 2023 | 2024 |
AVERAGE ANNUAL TOTAL RETURNS: | | 1 Year | Life of Fund A |
| Class I | 7.63% | -1.88% |
| Bloomberg MSCI Global Green USD Bond Index (Hedged USD) | 8.09% | -0.97% |
| Bloomberg U.S. Aggregate Bond Index | 7.30% | -1.59% |
A From June 15, 2021
Visit institutional.fidelity.com for more recent performance information. |
The Fund's past performance is not a good predictor of the Fund's future performance. The graph and table do not reflect the deduction of taxes that a shareholder would pay on fund distributions or redemption of fund shares. |
Key Fund Statistics (as of August 31, 2024)
KEY FACTS | | |
| Fund Size | $37,501,935 | |
| Number of Holdings | 199 | |
| Total Advisory Fee | $120,006 | |
| Portfolio Turnover | 97% | |
What did the Fund invest in?
(as of August 31, 2024)
| U.S. Government and U.S. Government Agency Obligations | 48.6 |
| AAA | 0.9 |
| AA | 3.1 |
| A | 15.6 |
| BBB | 23.5 |
| BB | 3.6 |
| Not Rated | 4.6 |
| Short-Term Investments and Net Other Assets (Liabilities) | 0.1 |
QUALITY DIVERSIFICATION (% of Fund's net assets) |
|
| |
| We have used ratings from Moody's Investors Service, Inc. Where Moody's® ratings are not available, we have used S&P® ratings. All ratings are as of the date indicated and do not reflect subsequent changes. |
| Corporate Bonds | 44.0 |
| U.S. Treasury Obligations | 27.0 |
| U.S. Government Agency - Mortgage Securities | 21.2 |
| Asset-Backed Securities | 3.2 |
| CMOs and Other Mortgage Related Securities | 2.4 |
| Foreign Government and Government Agency Obligations | 1.1 |
| Preferred Securities | 0.6 |
| U.S. Government Agency Obligations | 0.4 |
| Short-Term Investments and Net Other Assets (Liabilities) | 0.1 |
ASSET ALLOCATION (% of Fund's net assets) |
|
|
| United States | 82.6 |
| Germany | 2.9 |
| United Kingdom | 2.2 |
| Netherlands | 1.9 |
| Italy | 1.4 |
| Japan | 1.4 |
| France | 1.3 |
| Ireland | 1.2 |
| Luxembourg | 1.1 |
| Others | 4.0 |
GEOGRAPHIC DIVERSIFICATION (% of Fund's net assets) |
|
| |
|
TOP HOLDINGS (% of Fund's net assets) | | |
| US Treasury Notes | 17.0 | |
| US Treasury Bonds | 10.0 | |
| Fannie Mae Mortgage pass-thru certificates | 9.8 | |
| Freddie Mac Gold Pool | 8.9 | |
| Freddie Mac Multiclass Mortgage participation certificates | 2.1 | |
| Uniform Mortgage Backed Securities | 2.1 | |
| Bank of America Corp | 1.7 | |
| Verizon Communications Inc | 1.6 | |
| BNP Paribas SA | 1.3 | |
| PNC Financial Services Group Inc/The | 1.2 | |
| | 55.7 | |
How has the Fund changed?
This is a summary of certain changes to the Fund since September 1, 2023. For more complete information, you may review the Fund's next prospectus, which we expect to be available by October 30, 2024 at fundresearch.fidelity.com/prospectus/sec or upon request at 1-877-208-0098 or by sending an e-mail to fidfunddocuments@fidelity.com.
The fees associated with this class changed during the reporting year. The variations in class fees are primarily the result of the following changes: - •Operating expenses
- •Expense reductions
The class added a contractual expense cap during the reporting period. | |
| Fidelity, the Fidelity Investments Logo and all other Fidelity trademarks or service marks used herein are trademarks or service marks of FMR LLC. Any third-party marks that are used herein are trademarks or service marks of their respective owners. © 2024 FMR LLC. All rights reserved. |
| | For additional information about the Fund; including its prospectus, financial information, holdings and proxy information, scan the QR code or visit fundresearch.fidelity.com/prospectus/sec 1.9913674.100 6383-TSRA-1024 |
| |
| | ANNUAL SHAREHOLDER REPORT | AS OF AUGUST 31, 2024 | |
| | Fidelity® Environmental Bond Fund Fidelity Advisor® Environmental Bond Fund Class Z : FEBGX |
| | | |
This annual shareholder report contains information about Fidelity® Environmental Bond Fund for the period September 1, 2023 to August 31, 2024. You can find additional information about the Fund at fundresearch.fidelity.com/prospectus/sec. You can also request this information by contacting us at 1-877-208-0098 or by sending an e-mail to fidfunddocuments@fidelity.com.
What were your Fund costs for the last year?(based on hypothetical $10,000 investment)
FUND COST (PREVIOUS YEAR)
| | Costs of a $10,000 investment | Costs paid as a percentage of a $10,000 investment | |
| Class Z | $ 37 | 0.36% | |
What affected the Fund's performance this period?
•U.S. taxable investment-grade bonds posted a strong advance for the 12 months ending August 31, 2024, helped by a late-period gain as the bond market reflected anticipated interest-rate reductions by the U.S. Federal Reserve, which are expected to start in September. The full 12-month period was marked by high levels of volatility.
•Against this backdrop, sector allocation and security selection notably contributed to the fund's outperformance of the Bloomberg U.S. Aggregate Index for the fiscal year.
•In terms of sector allocation, investment choices and an overweight position in asset-backed securities, and underweights in U.S. Treasurys and mortgage securities, each helped relative performance the past 12 months.
•As for security selection, fund holdings in the corporate segment made a notable contribution, led by picks among financials, particularly REITs and banks.
•In contrast, the fund's underweight in energy bonds and consumer non-cyclicals within the corporate sector detracted versus the Aggregate index the past 12 months.
Application of FMR's environmental, social, and governance (ESG) ratings process and/or its sustainable investing exclusion criteria may affect the Fund's exposure to certain issuers, sectors, regions, and countries and may affect the Fund's performance.
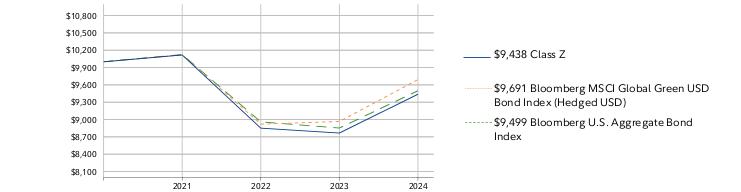
How did the Fund perform over the life of Fund?
CUMULATIVE PERFORMANCE
June 15, 2021 through August 31, 2024.
Initial investment of $10,000.
Class Z | $10,000 | $10,118 | $8,851 | $8,766 |
Bloomberg MSCI Global Green USD Bond Index (Hedged USD) | $10,000 | $10,120 | $8,921 | $8,966 |
Bloomberg U.S. Aggregate Bond Index | $10,000 | $10,126 | $8,960 | $8,853 |
| | 2021 | 2022 | 2023 | 2024 |
AVERAGE ANNUAL TOTAL RETURNS: | | 1 Year | Life of Fund A |
| Class Z | 7.67% | -1.78% |
| Bloomberg MSCI Global Green USD Bond Index (Hedged USD) | 8.09% | -0.97% |
| Bloomberg U.S. Aggregate Bond Index | 7.30% | -1.59% |
A From June 15, 2021
Visit institutional.fidelity.com for more recent performance information. |
The Fund's past performance is not a good predictor of the Fund's future performance. The graph and table do not reflect the deduction of taxes that a shareholder would pay on fund distributions or redemption of fund shares. |
Key Fund Statistics (as of August 31, 2024)
KEY FACTS | | |
| Fund Size | $37,501,935 | |
| Number of Holdings | 199 | |
| Total Advisory Fee | $120,006 | |
| Portfolio Turnover | 97% | |
What did the Fund invest in?
(as of August 31, 2024)
| U.S. Government and U.S. Government Agency Obligations | 48.6 |
| AAA | 0.9 |
| AA | 3.1 |
| A | 15.6 |
| BBB | 23.5 |
| BB | 3.6 |
| Not Rated | 4.6 |
| Short-Term Investments and Net Other Assets (Liabilities) | 0.1 |
QUALITY DIVERSIFICATION (% of Fund's net assets) |
|
| |
| We have used ratings from Moody's Investors Service, Inc. Where Moody's® ratings are not available, we have used S&P® ratings. All ratings are as of the date indicated and do not reflect subsequent changes. |
| Corporate Bonds | 44.0 |
| U.S. Treasury Obligations | 27.0 |
| U.S. Government Agency - Mortgage Securities | 21.2 |
| Asset-Backed Securities | 3.2 |
| CMOs and Other Mortgage Related Securities | 2.4 |
| Foreign Government and Government Agency Obligations | 1.1 |
| Preferred Securities | 0.6 |
| U.S. Government Agency Obligations | 0.4 |
| Short-Term Investments and Net Other Assets (Liabilities) | 0.1 |
ASSET ALLOCATION (% of Fund's net assets) |
|
|
| United States | 82.6 |
| Germany | 2.9 |
| United Kingdom | 2.2 |
| Netherlands | 1.9 |
| Italy | 1.4 |
| Japan | 1.4 |
| France | 1.3 |
| Ireland | 1.2 |
| Luxembourg | 1.1 |
| Others | 4.0 |
GEOGRAPHIC DIVERSIFICATION (% of Fund's net assets) |
|
| |
|
TOP HOLDINGS (% of Fund's net assets) | | |
| US Treasury Notes | 17.0 | |
| US Treasury Bonds | 10.0 | |
| Fannie Mae Mortgage pass-thru certificates | 9.8 | |
| Freddie Mac Gold Pool | 8.9 | |
| Freddie Mac Multiclass Mortgage participation certificates | 2.1 | |
| Uniform Mortgage Backed Securities | 2.1 | |
| Bank of America Corp | 1.7 | |
| Verizon Communications Inc | 1.6 | |
| BNP Paribas SA | 1.3 | |
| PNC Financial Services Group Inc/The | 1.2 | |
| | 55.7 | |
| Fidelity, the Fidelity Investments Logo and all other Fidelity trademarks or service marks used herein are trademarks or service marks of FMR LLC. Any third-party marks that are used herein are trademarks or service marks of their respective owners. © 2024 FMR LLC. All rights reserved. |
| | For additional information about the Fund; including its prospectus, financial information, holdings and proxy information, scan the QR code or visit fundresearch.fidelity.com/prospectus/sec 1.9913675.100 6384-TSRA-1024 |
| |
| | ANNUAL SHAREHOLDER REPORT | AS OF AUGUST 31, 2024 | This report describes changes to the Fund that occurred during the reporting period. |
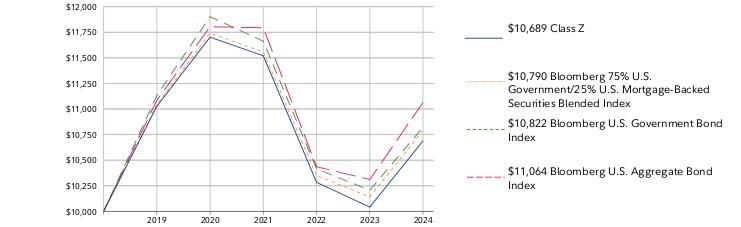
| | Fidelity® Government Income Fund Fidelity Advisor® Government Income Fund Class Z : FIKPX |
| | | |
This annual shareholder report contains information about Fidelity® Government Income Fund for the period September 1, 2023 to August 31, 2024. You can find additional information about the Fund at fundresearch.fidelity.com/prospectus/sec. You can also request this information by contacting us at 1-877-208-0098 or by sending an e-mail to fidfunddocuments@fidelity.com.
What were your Fund costs for the last year?(based on hypothetical $10,000 investment)
FUND COST (PREVIOUS YEAR)
| | Costs of a $10,000 investment | Costs paid as a percentage of a $10,000 investment | |
| Class Z | $ 37 | 0.36% | |
What affected the Fund's performance this period?
•U.S. taxable investment-grade bonds posted a strong advance for the 12 months ending August 31, 2024, helped by a late-period gain, as the bond market reflected anticipated interest-rate reductions by the U.S. Federal Reserve, which are expected to start in September. The full 12-month period was marked by high volatility.
•Against this backdrop, the fund's positioning in mortgage-backed securities contributed to the fund's performance versus the Bloomberg 75% US Government/25% US Mortgage-Backed Securities Blended Index for the fiscal year.
•Specifically, an overweight in GNMAs with coupons 2% and lower, and in those with coupons 5.5% and higher, helped relative performance the past 12 months.
•Larger-than-index exposure to lower-coupon 15- and 20-year Fannie Mae/Freddie Mac mortgage securities also contributed.
•An overweight in short-duration government agency commercial mortgage-backed securities also lifted
•In contrast, exposure to cash flows based on the Secured Overnight Financing Rate detracted versus the index the past 12 months. An underweight in agency debentures also hurt.
How did the Fund perform over the life of Fund?
CUMULATIVE PERFORMANCE
October 2, 2018 through August 31, 2024.
Initial investment of $10,000.
Class Z | $10,000 | $11,027 | $11,702 | $11,520 | $10,283 | $10,041 | $10,689 |
Bloomberg 75% U.S. Government/25% U.S. Mortgage-Backed Securities Blended Index | $10,000 | $11,042 | $11,740 | $11,558 | $10,350 | $10,141 | $10,790 |
Bloomberg U.S. Government Bond Index | $10,000 | $11,132 | $11,902 | $11,662 | $10,415 | $10,206 | $10,822 |
Bloomberg U.S. Aggregate Bond Index | $10,000 | $11,086 | $11,804 | $11,794 | $10,436 | $10,311 | $11,064 |
| | 2018 | 2019 | 2020 | 2021 | 2022 | 2023 | 2024 |
AVERAGE ANNUAL TOTAL RETURNS: | | 1 Year | 5 Year | Life of Fund A |
| Class Z | 6.45% | -0.62% | 1.13% |
| Bloomberg 75% U.S. Government/25% U.S. Mortgage-Backed Securities Blended Index | 6.40% | -0.46% | 1.29% |
| Bloomberg U.S. Government Bond Index | 6.03% | -0.56% | 1.34% |
| Bloomberg U.S. Aggregate Bond Index | 7.30% | -0.04% | 1.72% |
A From October 2, 2018
Visit institutional.fidelity.com for more recent performance information. |
The Fund's past performance is not a good predictor of the Fund's future performance. The graph and table do not reflect the deduction of taxes that a shareholder would pay on fund distributions or redemption of fund shares. |
Key Fund Statistics (as of August 31, 2024)
KEY FACTS | | |
| Fund Size | $2,324,957,949 | |
| Number of Holdings | 2,073 | |
| Total Advisory Fee | $8,233,532 | |
| Portfolio Turnover | 393% | |
What did the Fund invest in?
(as of August 31, 2024)
COUPON DISTRIBUTION (% of Fund's net assets) |
| Zero coupon bonds | 0.0 | |
| 0.01 - 0.99% | 0.0 | |
| 1 - 1.99% | 7.0 | |
| 2 - 2.99% | 32.8 | |
| 3 - 3.99% | 22.8 | |
| 4 - 4.99% | 18.6 | |
| 5 - 5.99% | 4.9 | |
| 6 - 6.99% | 3.2 | |
| 7 - 7.99% | 0.0 | |
| 8 - 8.99% | 0.0 | |
| U.S. Treasury Obligations | 43.0 |
| CMOs and Other Mortgage Related Securities | 23.3 |
| U.S. Government Agency - Mortgage Securities | 22.4 |
| U.S. Government Agency Obligations | 0.6 |
| Short-Term Investments and Net Other Assets (Liabilities) | 10.7 |
ASSET ALLOCATION (% of Fund's net assets) |
|
|
TOP HOLDINGS (% of Fund's net assets) | | |
| US Treasury Notes | 26.9 | |
| US Treasury Bonds | 16.1 | |
| Fannie Mae Mortgage pass-thru certificates | 14.9 | |
| Freddie Mac Multiclass Mortgage participation certificates | 14.6 | |
| Freddie Mac Gold Pool | 9.3 | |
| Fannie Mae Guaranteed REMICS | 5.4 | |
| Ginnie Mae II Pool | 3.5 | |
| Ginnie Mae I Pool | 1.4 | |
| Ginnie Mae REMIC pass-thru certificates | 1.1 | |
| Freddie Mac Non Gold Pool | 0.8 | |
| | 94.0 | |
How has the Fund changed?
This is a summary of certain changes to the Fund since September 1, 2023. For more complete information, you may review the Fund's next prospectus, which we expect to be available by October 30, 2024 at fundresearch.fidelity.com/prospectus/sec or upon request at 1-877-208-0098 or by sending an e-mail to fidfunddocuments@fidelity.com.
The fund's contractural management fee was reduced during the reporting period. | |
| Fidelity, the Fidelity Investments Logo and all other Fidelity trademarks or service marks used herein are trademarks or service marks of FMR LLC. Any third-party marks that are used herein are trademarks or service marks of their respective owners. © 2024 FMR LLC. All rights reserved. |
| | For additional information about the Fund; including its prospectus, financial information, holdings and proxy information, scan the QR code or visit fundresearch.fidelity.com/prospectus/sec 1.9913602.100 3305-TSRA-1024 |
| |
| | ANNUAL SHAREHOLDER REPORT | AS OF AUGUST 31, 2024 | This report describes changes to the Fund that occurred during the reporting period. |
| | Fidelity® Government Income Fund Fidelity® Government Income Fund : FGOVX |
| | | |
This annual shareholder report contains information about Fidelity® Government Income Fund for the period September 1, 2023 to August 31, 2024. You can find additional information about the Fund at fundresearch.fidelity.com/prospectus/sec. You can also request this information by contacting us at 1-800-544-8544 or by sending an e-mail to fidfunddocuments@fidelity.com.
What were your Fund costs for the last year?(based on hypothetical $10,000 investment)
FUND COST (PREVIOUS YEAR)
| | Costs of a $10,000 investment | Costs paid as a percentage of a $10,000 investment | |
| Fidelity® Government Income Fund | $ 46 | 0.45% | |
What affected the Fund's performance this period?
•U.S. taxable investment-grade bonds posted a strong advance for the 12 months ending August 31, 2024, helped by a late-period gain, as the bond market reflected anticipated interest-rate reductions by the U.S. Federal Reserve, which are expected to start in September. The full 12-month period was marked by high volatility.
•Against this backdrop, the fund's positioning in mortgage-backed securities contributed to the fund's performance versus the Bloomberg 75% US Government/25% US Mortgage-Backed Securities Blended Index for the fiscal year.
•Specifically, an overweight in GNMAs with coupons 2% and lower, and in those with coupons 5.5% and higher, helped relative performance the past 12 months.
•Larger-than-index exposure to lower-coupon 15- and 20-year Fannie Mae/Freddie Mac mortgage securities also contributed.
•An overweight in short-duration government agency commercial mortgage-backed securities also lifted
•In contrast, exposure to cash flows based on the Secured Overnight Financing Rate detracted versus the index the past 12 months. An underweight in agency debentures also hurt.
How did the Fund perform over the past 10 years?
CUMULATIVE PERFORMANCE
August 31, 2014 through August 31, 2024.
Initial investment of $10,000.
Fidelity® Government Income Fund | $10,000 | $10,199 | $10,643 | $10,598 | $10,431 | $11,404 | $12,081 | $11,893 | $10,603 | $10,344 | $11,003 |
Bloomberg 75% U.S. Government/25% U.S. Mortgage-Backed Securities Blended Index | $10,000 | $10,237 | $10,723 | $10,676 | $10,542 | $11,543 | $12,274 | $12,083 | $10,820 | $10,602 | $11,280 |
Bloomberg U.S. Government Bond Index | $10,000 | $10,227 | $10,739 | $10,649 | $10,489 | $11,570 | $12,371 | $12,121 | $10,825 | $10,608 | $11,248 |
Bloomberg U.S. Aggregate Bond Index | $10,000 | $10,156 | $10,761 | $10,814 | $10,701 | $11,789 | $12,553 | $12,542 | $11,098 | $10,965 | $11,765 |
| | 2014 | 2015 | 2016 | 2017 | 2018 | 2019 | 2020 | 2021 | 2022 | 2023 | 2024 |
AVERAGE ANNUAL TOTAL RETURNS: | | 1 Year | 5 Year | 10 Year |
| Fidelity® Government Income Fund | 6.36% | -0.71% | 0.96% |
| Bloomberg 75% U.S. Government/25% U.S. Mortgage-Backed Securities Blended Index | 6.40% | -0.46% | 1.21% |
| Bloomberg U.S. Government Bond Index | 6.03% | -0.56% | 1.18% |
| Bloomberg U.S. Aggregate Bond Index | 7.30% | -0.04% | 1.64% |
Visit www.fidelity.com for more recent performance information. |
The Fund's past performance is not a good predictor of the Fund's future performance. The graph and table do not reflect the deduction of taxes that a shareholder would pay on fund distributions or redemption of fund shares. |
Key Fund Statistics (as of August 31, 2024)
KEY FACTS | | |
| Fund Size | $2,324,957,949 | |
| Number of Holdings | 2,073 | |
| Total Advisory Fee | $8,233,532 | |
| Portfolio Turnover | 393% | |
What did the Fund invest in?
(as of August 31, 2024)
COUPON DISTRIBUTION (% of Fund's net assets) |
| Zero coupon bonds | 0.0 | |
| 0.01 - 0.99% | 0.0 | |
| 1 - 1.99% | 7.0 | |
| 2 - 2.99% | 32.8 | |
| 3 - 3.99% | 22.8 | |
| 4 - 4.99% | 18.6 | |
| 5 - 5.99% | 4.9 | |
| 6 - 6.99% | 3.2 | |
| 7 - 7.99% | 0.0 | |
| 8 - 8.99% | 0.0 | |
| U.S. Treasury Obligations | 43.0 |
| CMOs and Other Mortgage Related Securities | 23.3 |
| U.S. Government Agency - Mortgage Securities | 22.4 |
| U.S. Government Agency Obligations | 0.6 |
| Short-Term Investments and Net Other Assets (Liabilities) | 10.7 |
ASSET ALLOCATION (% of Fund's net assets) |
|
|
TOP HOLDINGS (% of Fund's net assets) | | |
| US Treasury Notes | 26.9 | |
| US Treasury Bonds | 16.1 | |
| Fannie Mae Mortgage pass-thru certificates | 14.9 | |
| Freddie Mac Multiclass Mortgage participation certificates | 14.6 | |
| Freddie Mac Gold Pool | 9.3 | |
| Fannie Mae Guaranteed REMICS | 5.4 | |
| Ginnie Mae II Pool | 3.5 | |
| Ginnie Mae I Pool | 1.4 | |
| Ginnie Mae REMIC pass-thru certificates | 1.1 | |
| Freddie Mac Non Gold Pool | 0.8 | |
| | 94.0 | |
How has the Fund changed?
This is a summary of certain changes to the Fund since September 1, 2023. For more complete information, you may review the Fund's next prospectus, which we expect to be available by October 30, 2024 at fundresearch.fidelity.com/prospectus/sec or upon request at 1-800-544-8544 or by sending an e-mail to fidfunddocuments@fidelity.com.
The fund's contractural management fee was reduced during the reporting period. | |
| Fidelity, the Fidelity Investments Logo and all other Fidelity trademarks or service marks used herein are trademarks or service marks of FMR LLC. Any third-party marks that are used herein are trademarks or service marks of their respective owners. © 2024 FMR LLC. All rights reserved. |
| | For additional information about the Fund; including its prospectus, financial information, holdings and proxy information, scan the QR code or visit fundresearch.fidelity.com/prospectus/sec 1.9913603.100 54-TSRA-1024 |
| |
| | ANNUAL SHAREHOLDER REPORT | AS OF AUGUST 31, 2024 | This report describes changes to the Fund that occurred during the reporting period. |
| | Fidelity® Government Income Fund Fidelity Advisor® Government Income Fund Class I : FVIIX |
| | | |
This annual shareholder report contains information about Fidelity® Government Income Fund for the period September 1, 2023 to August 31, 2024. You can find additional information about the Fund at fundresearch.fidelity.com/prospectus/sec. You can also request this information by contacting us at 1-877-208-0098 or by sending an e-mail to fidfunddocuments@fidelity.com.
What were your Fund costs for the last year?(based on hypothetical $10,000 investment)
FUND COST (PREVIOUS YEAR)
| | Costs of a $10,000 investment | Costs paid as a percentage of a $10,000 investment | |
| Class I | $ 52 | 0.50% | |
What affected the Fund's performance this period?
•U.S. taxable investment-grade bonds posted a strong advance for the 12 months ending August 31, 2024, helped by a late-period gain, as the bond market reflected anticipated interest-rate reductions by the U.S. Federal Reserve, which are expected to start in September. The full 12-month period was marked by high volatility.
•Against this backdrop, the fund's positioning in mortgage-backed securities contributed to the fund's performance versus the Bloomberg 75% US Government/25% US Mortgage-Backed Securities Blended Index for the fiscal year.
•Specifically, an overweight in GNMAs with coupons 2% and lower, and in those with coupons 5.5% and higher, helped relative performance the past 12 months.
•Larger-than-index exposure to lower-coupon 15- and 20-year Fannie Mae/Freddie Mac mortgage securities also contributed.
•An overweight in short-duration government agency commercial mortgage-backed securities also lifted
•In contrast, exposure to cash flows based on the Secured Overnight Financing Rate detracted versus the index the past 12 months. An underweight in agency debentures also hurt.
How did the Fund perform over the past 10 years?
CUMULATIVE PERFORMANCE
August 31, 2014 through August 31, 2024.
Initial investment of $10,000.
Class I | $10,000 | $10,194 | $10,621 | $10,572 | $10,402 | $11,377 | $12,048 | $11,856 | $10,570 | $10,296 | $10,957 |
Bloomberg 75% U.S. Government/25% U.S. Mortgage-Backed Securities Blended Index | $10,000 | $10,237 | $10,723 | $10,676 | $10,542 | $11,543 | $12,274 | $12,083 | $10,820 | $10,602 | $11,280 |
Bloomberg U.S. Government Bond Index | $10,000 | $10,227 | $10,739 | $10,649 | $10,489 | $11,570 | $12,371 | $12,121 | $10,825 | $10,608 | $11,248 |
Bloomberg U.S. Aggregate Bond Index | $10,000 | $10,156 | $10,761 | $10,814 | $10,701 | $11,789 | $12,553 | $12,542 | $11,098 | $10,965 | $11,765 |
| | 2014 | 2015 | 2016 | 2017 | 2018 | 2019 | 2020 | 2021 | 2022 | 2023 | 2024 |
AVERAGE ANNUAL TOTAL RETURNS: | | 1 Year | 5 Year | 10 Year |
| Class I | 6.42% | -0.75% | 0.92% |
| Bloomberg 75% U.S. Government/25% U.S. Mortgage-Backed Securities Blended Index | 6.40% | -0.46% | 1.21% |
| Bloomberg U.S. Government Bond Index | 6.03% | -0.56% | 1.18% |
| Bloomberg U.S. Aggregate Bond Index | 7.30% | -0.04% | 1.64% |
Visit institutional.fidelity.com for more recent performance information. |
The Fund's past performance is not a good predictor of the Fund's future performance. The graph and table do not reflect the deduction of taxes that a shareholder would pay on fund distributions or redemption of fund shares. |
Key Fund Statistics (as of August 31, 2024)
KEY FACTS | | |
| Fund Size | $2,324,957,949 | |
| Number of Holdings | 2,073 | |
| Total Advisory Fee | $8,233,532 | |
| Portfolio Turnover | 393% | |
What did the Fund invest in?
(as of August 31, 2024)
COUPON DISTRIBUTION (% of Fund's net assets) |
| Zero coupon bonds | 0.0 | |
| 0.01 - 0.99% | 0.0 | |
| 1 - 1.99% | 7.0 | |
| 2 - 2.99% | 32.8 | |
| 3 - 3.99% | 22.8 | |
| 4 - 4.99% | 18.6 | |
| 5 - 5.99% | 4.9 | |
| 6 - 6.99% | 3.2 | |
| 7 - 7.99% | 0.0 | |
| 8 - 8.99% | 0.0 | |
| U.S. Treasury Obligations | 43.0 |
| CMOs and Other Mortgage Related Securities | 23.3 |
| U.S. Government Agency - Mortgage Securities | 22.4 |
| U.S. Government Agency Obligations | 0.6 |
| Short-Term Investments and Net Other Assets (Liabilities) | 10.7 |
ASSET ALLOCATION (% of Fund's net assets) |
|
|
TOP HOLDINGS (% of Fund's net assets) | | |
| US Treasury Notes | 26.9 | |
| US Treasury Bonds | 16.1 | |
| Fannie Mae Mortgage pass-thru certificates | 14.9 | |
| Freddie Mac Multiclass Mortgage participation certificates | 14.6 | |
| Freddie Mac Gold Pool | 9.3 | |
| Fannie Mae Guaranteed REMICS | 5.4 | |
| Ginnie Mae II Pool | 3.5 | |
| Ginnie Mae I Pool | 1.4 | |
| Ginnie Mae REMIC pass-thru certificates | 1.1 | |
| Freddie Mac Non Gold Pool | 0.8 | |
| | 94.0 | |
How has the Fund changed?
This is a summary of certain changes to the Fund since September 1, 2023. For more complete information, you may review the Fund's next prospectus, which we expect to be available by October 30, 2024 at fundresearch.fidelity.com/prospectus/sec or upon request at 1-877-208-0098 or by sending an e-mail to fidfunddocuments@fidelity.com.
The fund's contractural management fee was reduced during the reporting period. | |
| Fidelity, the Fidelity Investments Logo and all other Fidelity trademarks or service marks used herein are trademarks or service marks of FMR LLC. Any third-party marks that are used herein are trademarks or service marks of their respective owners. © 2024 FMR LLC. All rights reserved. |
| | For additional information about the Fund; including its prospectus, financial information, holdings and proxy information, scan the QR code or visit fundresearch.fidelity.com/prospectus/sec 1.9913601.100 1759-TSRA-1024 |
| |
| | ANNUAL SHAREHOLDER REPORT | AS OF AUGUST 31, 2024 | |
| | Fidelity® Total Bond K6 Fund Fidelity® Total Bond K6 Fund : FTKFX |
| | | |
This annual shareholder report contains information about Fidelity® Total Bond K6 Fund for the period September 1, 2023 to August 31, 2024. You can find additional information about the Fund at fundresearch.fidelity.com/prospectus/sec. You can also request this information by contacting us at 1-800-835-5092 or by sending an e-mail to fidfunddocuments@fidelity.com.
What were your Fund costs for the last year?(based on hypothetical $10,000 investment)
FUND COST (PREVIOUS YEAR)
| | Costs of a $10,000 investment | Costs paid as a percentage of a $10,000 investment | |
| Fidelity® Total Bond K6 Fund | $ 31 | 0.30% | |
What affected the Fund's performance this period?
•U.S. taxable investment-grade bonds posted a strong advance for the 12 months ending August 31, 2024, helped by a late-period gain, as the bond market reflected anticipated interest-rate reductions by the U.S. Federal Reserve, which are expected to start in September. The full 12-month period was marked by high volatility.
•Against this backdrop, allocations to "plus sectors" - including high-yield bonds, leveraged loans and emerging markets debt - notably contributed to the fund's outperformance of the Bloomberg U.S. Aggregate Index for the fiscal year.
•Among investment-grade securities, security selection and sector allocation also meaningfully contributed.
•In terms of sector allocation, investment choices and overweight positions in the asset-backed securities, mortgage-backed securities and commercial mortgage-backed securities segments each helped relative performance the past 12 months.
•As for security selection, fund holdings in the corporate segment made a notable contribution, led by picks among financials, particularly REITs and banks.
•In contrast, the fund's underweight in industrial bonds within the corporate sector detracted versus the Aggregate index the past 12 months.
How did the Fund perform over the life of Fund?
CUMULATIVE PERFORMANCE
May 25, 2017 through August 31, 2024.
Initial investment of $10,000.
Fidelity® Total Bond K6 Fund | $10,000 | $10,135 | $10,068 | $11,046 | $11,905 | $12,206 | $10,854 | $10,882 |
Bloomberg U.S. Universal Bond Index | $10,000 | $10,157 | $10,063 | $11,077 | $11,787 | $11,891 | $10,482 | $10,441 |
Bloomberg U.S. Aggregate Bond Index | $10,000 | $10,154 | $10,047 | $11,070 | $11,786 | $11,776 | $10,420 | $10,296 |
| | 2017 | 2018 | 2019 | 2020 | 2021 | 2022 | 2023 | 2024 |
AVERAGE ANNUAL TOTAL RETURNS: | | 1 Year | 5 Year | Life of Fund A |
| Fidelity® Total Bond K6 Fund | 8.25% | 1.29% | 2.28% |
| Bloomberg U.S. Universal Bond Index | 7.92% | 0.34% | 1.65% |
| Bloomberg U.S. Aggregate Bond Index | 7.30% | -0.04% | 1.38% |
A From May 25, 2017
Visit www.401k.com for more recent performance information. |
The Fund's past performance is not a good predictor of the Fund's future performance. The graph and table do not reflect the deduction of taxes that a shareholder would pay on fund distributions or redemption of fund shares. |
Key Fund Statistics (as of August 31, 2024)
KEY FACTS | | |
| Fund Size | $5,566,487,263 | |
| Number of Holdings | 4,171 | |
| Total Advisory Fee | $11,115,971 | |
| Portfolio Turnover | 306% | |
What did the Fund invest in?
(as of August 31, 2024)
| U.S. Government and U.S. Government Agency Obligations | 57.5 |
| AAA | 7.5 |
| AA | 0.5 |
| A | 7.1 |
| BBB | 15.1 |
| BB | 4.2 |
| B | 5.1 |
| CCC,CC,C | 0.9 |
| D | 0.0 |
| Not Rated | 3.9 |
| Equities | 0.6 |
QUALITY DIVERSIFICATION (% of Fund's net assets) |
|
| Short-Term Investments and Net Other Assets (Liabilities) - (2.4)% |
| |
| We have used ratings from Moody's Investors Service, Inc. Where Moody's® ratings are not available, we have used S&P® ratings. All ratings are as of the date indicated and do not reflect subsequent changes. |
| U.S. Treasury Obligations | 37.4 |
| Corporate Bonds | 25.5 |
| U.S. Government Agency - Mortgage Securities | 20.1 |
| Asset-Backed Securities | 6.9 |
| CMOs and Other Mortgage Related Securities | 6.2 |
| Bank Loan Obligations | 4.1 |
| Foreign Government and Government Agency Obligations | 1.2 |
| Fixed-Income Funds | 0.4 |
| Preferred Securities | 0.3 |
| Common Stocks | 0.1 |
| Alternative Funds | 0.1 |
| Purchased Swaptions | 0.1 |
| Other Investments | 0.0 |
ASSET ALLOCATION (% of Fund's net assets) |
|
| Short-Term Investments and Net Other Assets (Liabilities) - (2.4)% |
|
| United States | 88.2 |
| Grand Cayman (UK Overseas Ter) | 3.1 |
| United Kingdom | 1.6 |
| Mexico | 1.0 |
| Germany | 0.9 |
| Bailiwick Of Jersey | 0.8 |
| Ireland | 0.7 |
| Switzerland | 0.6 |
| Canada | 0.5 |
| Others | 2.6 |
GEOGRAPHIC DIVERSIFICATION (% of Fund's net assets) |
|
| |
|
TOP HOLDINGS (% of Fund's net assets) | | |
| US Treasury Notes | 28.4 | |
| US Treasury Bonds | 9.0 | |
| Uniform Mortgage Backed Securities | 6.1 | |
| Ginnie Mae II Pool | 5.7 | |
| Fannie Mae Mortgage pass-thru certificates | 5.4 | |
| Freddie Mac Gold Pool | 2.6 | |
| JPMorgan Chase & Co | 1.1 | |
| Bank of America Corp | 0.9 | |
| Petroleos Mexicanos | 0.9 | |
| Charter Communications Operating LLC / Charter Communications Operating Capital | 0.8 | |
| | 60.9 | |
| Fidelity, the Fidelity Investments Logo and all other Fidelity trademarks or service marks used herein are trademarks or service marks of FMR LLC. Any third-party marks that are used herein are trademarks or service marks of their respective owners. © 2024 FMR LLC. All rights reserved. |
| | For additional information about the Fund; including its prospectus, financial information, holdings and proxy information, scan the QR code or visit fundresearch.fidelity.com/prospectus/sec 1.9913652.100 2944-TSRA-1024 |
| |
| | ANNUAL SHAREHOLDER REPORT | AS OF AUGUST 31, 2024 | |
| | Fidelity® Series Government Bond Index Fund Fidelity® Series Government Bond Index Fund : FHNFX |
| | | |
This annual shareholder report contains information about Fidelity® Series Government Bond Index Fund for the period September 1, 2023 to August 31, 2024. You can find additional information about the Fund at fundresearch.fidelity.com/prospectus/sec. You can also request this information by contacting us at 1-800-544-8544.
What were your Fund costs for the last year?(based on hypothetical $10,000 investment)
FUND COST (PREVIOUS YEAR)
| | Costs of a $10,000 investment | Costs paid as a percentage of a $10,000 investment | |
| Fidelity® Series Government Bond Index Fund | $ 0 A | 0.00%B | |
A Amount represents less than $.50
B Amount represents less than 0.005%
What affected the Fund's performance this period?
•U.S. taxable investment-grade bonds posted a strong advance for the 12 months ending August 31, 2024, helped by late-period gains as the bond market priced in anticipated interest-rate reductions by the U.S. Federal Reserve, which are expected to start in September. The full 12-month period was marked by high levels of volatility.
•Given the large number of securities in the index (roughly 690) and the significant costs associated with full replication of the index, we construct the portfolio using optimization. This approach minimizes the differences between risk exposures of the fund relative to the index.
•Exposures include duration, key rate durations, credit quality, sector and issuer allocation, and other factors.
How did the Fund perform over the life of Fund?
CUMULATIVE PERFORMANCE
August 17, 2018 through August 31, 2024.
Initial investment of $10,000.
Fidelity® Series Government Bond Index Fund | $10,000 | $10,010 | $11,052 | $11,781 | $11,563 | $10,330 | $10,128 |
Bloomberg U.S. Government Bond Index | $10,000 | $10,019 | $11,052 | $11,816 | $11,578 | $10,340 | $10,133 |
Bloomberg U.S. Aggregate Bond Index | $10,000 | $10,014 | $11,033 | $11,747 | $11,737 | $10,386 | $10,262 |
| | 2018 | 2019 | 2020 | 2021 | 2022 | 2023 | 2024 |
AVERAGE ANNUAL TOTAL RETURNS: | | 1 Year | 5 Year | Life of Fund A |
| Fidelity® Series Government Bond Index Fund | 6.11% | -0.56% | 1.20% |
| Bloomberg U.S. Government Bond Index | 6.03% | -0.56% | 1.19% |
| Bloomberg U.S. Aggregate Bond Index | 7.30% | -0.04% | 1.61% |
A From August 17, 2018
Visit www.fidelity.com for more recent performance information. |
The Fund's past performance is not a good predictor of the Fund's future performance. The graph and table do not reflect the deduction of taxes that a shareholder would pay on fund distributions or redemption of fund shares. |
Key Fund Statistics (as of August 31, 2024)
KEY FACTS | | |
| Fund Size | $939,274,989 | |
| Number of Holdings | 243 | |
| Total Advisory Fee | $0 | |
| Portfolio Turnover | 23% | |
What did the Fund invest in?
(as of August 31, 2024)
COUPON DISTRIBUTION (% of Fund's net assets) |
| 0.01 - 0.99% | 24.0 | |
| 1 - 1.99% | 22.5 | |
| 2 - 2.99% | 18.6 | |
| 3 - 3.99% | 14.4 | |
| 4 - 4.99% | 15.6 | |
| 5 - 5.99% | 2.5 | |
| 6 - 6.99% | 1.1 | |
| 7 - 7.99% | 0.1 | |
| U.S. Treasury Obligations | 96.7 |
| U.S. Government Agency Obligations | 2.1 |
| Short-Term Investments and Net Other Assets (Liabilities) | 1.2 |
ASSET ALLOCATION (% of Fund's net assets) |
|
|
TOP HOLDINGS (% of Fund's net assets) | | |
| US Treasury Notes | 74.0 | |
| US Treasury Bonds | 22.7 | |
| Fannie Mae | 0.6 | |
| Federal Home Loan Bank | 0.4 | |
| Freddie Mac Non Gold Pool | 0.4 | |
| Federal Farm Credit Banks Funding Corp | 0.4 | |
| Tennessee Valley Authority Generic Strip | 0.3 | |
| | 98.8 | |
| Fidelity, the Fidelity Investments Logo and all other Fidelity trademarks or service marks used herein are trademarks or service marks of FMR LLC. Any third-party marks that are used herein are trademarks or service marks of their respective owners. © 2024 FMR LLC. All rights reserved. |
| | For additional information about the Fund; including its prospectus, financial information, holdings and proxy information, scan the QR code or visit fundresearch.fidelity.com/prospectus/sec 1.9913659.100 3221-TSRA-1024 |
| |
| | ANNUAL SHAREHOLDER REPORT | AS OF AUGUST 31, 2024 | This report describes changes to the Fund that occurred during the reporting period. |
| | Fidelity® Government Income Fund Fidelity Advisor® Government Income Fund Class A : FVIAX |
| | | |
This annual shareholder report contains information about Fidelity® Government Income Fund for the period September 1, 2023 to August 31, 2024. You can find additional information about the Fund at fundresearch.fidelity.com/prospectus/sec. You can also request this information by contacting us at 1-877-208-0098 or by sending an e-mail to fidfunddocuments@fidelity.com.
What were your Fund costs for the last year?(based on hypothetical $10,000 investment)
FUND COST (PREVIOUS YEAR)
| | Costs of a $10,000 investment | Costs paid as a percentage of a $10,000 investment | |
| Class A | $ 81 | 0.79% | |
What affected the Fund's performance this period?
•U.S. taxable investment-grade bonds posted a strong advance for the 12 months ending August 31, 2024, helped by a late-period gain, as the bond market reflected anticipated interest-rate reductions by the U.S. Federal Reserve, which are expected to start in September. The full 12-month period was marked by high volatility.
•Against this backdrop, the fund's positioning in mortgage-backed securities contributed to the fund's performance versus the Bloomberg 75% US Government/25% US Mortgage-Backed Securities Blended Index for the fiscal year.
•Specifically, an overweight in GNMAs with coupons 2% and lower, and in those with coupons 5.5% and higher, helped relative performance the past 12 months.
•Larger-than-index exposure to lower-coupon 15- and 20-year Fannie Mae/Freddie Mac mortgage securities also contributed.
•An overweight in short-duration government agency commercial mortgage-backed securities also lifted
•In contrast, exposure to cash flows based on the Secured Overnight Financing Rate detracted versus the index the past 12 months. An underweight in agency debentures also hurt.
How did the Fund perform over the past 10 years?
CUMULATIVE PERFORMANCE
August 31, 2014 through August 31, 2024.
Initial investment of $10,000 and the current sales charge was paid.
Class A | $9,600 | $9,760 | $10,143 | $10,069 | $9,878 | $10,774 | $11,376 | $11,168 | $9,927 | $9,642 | $10,232 |
Bloomberg 75% U.S. Government/25% U.S. Mortgage-Backed Securities Blended Index | $10,000 | $10,237 | $10,723 | $10,676 | $10,542 | $11,543 | $12,274 | $12,083 | $10,820 | $10,602 | $11,280 |
Bloomberg U.S. Government Bond Index | $10,000 | $10,227 | $10,739 | $10,649 | $10,489 | $11,570 | $12,371 | $12,121 | $10,825 | $10,608 | $11,248 |
Bloomberg U.S. Aggregate Bond Index | $10,000 | $10,156 | $10,761 | $10,814 | $10,701 | $11,789 | $12,553 | $12,542 | $11,098 | $10,965 | $11,765 |
| | 2014 | 2015 | 2016 | 2017 | 2018 | 2019 | 2020 | 2021 | 2022 | 2023 | 2024 |
AVERAGE ANNUAL TOTAL RETURNS: | | 1 Year | 5 Year | 10 Year |
| Class A (incl. 4.00% sales charge) | 1.87% | -1.83% | 0.23% |
| Class A (without 4.00% sales charge) | 6.11% | -1.03% | 0.64% |
| Bloomberg 75% U.S. Government/25% U.S. Mortgage-Backed Securities Blended Index | 6.40% | -0.46% | 1.21% |
| Bloomberg U.S. Government Bond Index | 6.03% | -0.56% | 1.18% |
| Bloomberg U.S. Aggregate Bond Index | 7.30% | -0.04% | 1.64% |
Visit institutional.fidelity.com for more recent performance information. |
The Fund's past performance is not a good predictor of the Fund's future performance. The graph and table do not reflect the deduction of taxes that a shareholder would pay on fund distributions or redemption of fund shares. |
Key Fund Statistics (as of August 31, 2024)
KEY FACTS | | |
| Fund Size | $2,324,957,949 | |
| Number of Holdings | 2,073 | |
| Total Advisory Fee | $8,233,532 | |
| Portfolio Turnover | 393% | |
What did the Fund invest in?
(as of August 31, 2024)
COUPON DISTRIBUTION (% of Fund's net assets) |
| Zero coupon bonds | 0.0 | |
| 0.01 - 0.99% | 0.0 | |
| 1 - 1.99% | 7.0 | |
| 2 - 2.99% | 32.8 | |
| 3 - 3.99% | 22.8 | |
| 4 - 4.99% | 18.6 | |
| 5 - 5.99% | 4.9 | |
| 6 - 6.99% | 3.2 | |
| 7 - 7.99% | 0.0 | |
| 8 - 8.99% | 0.0 | |
| U.S. Treasury Obligations | 43.0 |
| CMOs and Other Mortgage Related Securities | 23.3 |
| U.S. Government Agency - Mortgage Securities | 22.4 |
| U.S. Government Agency Obligations | 0.6 |
| Short-Term Investments and Net Other Assets (Liabilities) | 10.7 |
ASSET ALLOCATION (% of Fund's net assets) |
|
|
TOP HOLDINGS (% of Fund's net assets) | | |
| US Treasury Notes | 26.9 | |
| US Treasury Bonds | 16.1 | |
| Fannie Mae Mortgage pass-thru certificates | 14.9 | |
| Freddie Mac Multiclass Mortgage participation certificates | 14.6 | |
| Freddie Mac Gold Pool | 9.3 | |
| Fannie Mae Guaranteed REMICS | 5.4 | |
| Ginnie Mae II Pool | 3.5 | |
| Ginnie Mae I Pool | 1.4 | |
| Ginnie Mae REMIC pass-thru certificates | 1.1 | |
| Freddie Mac Non Gold Pool | 0.8 | |
| | 94.0 | |
How has the Fund changed?
This is a summary of certain changes to the Fund since September 1, 2023. For more complete information, you may review the Fund's next prospectus, which we expect to be available by October 30, 2024 at fundresearch.fidelity.com/prospectus/sec or upon request at 1-877-208-0098 or by sending an e-mail to fidfunddocuments@fidelity.com.
The fund's contractural management fee was reduced during the reporting period. | |
| Fidelity, the Fidelity Investments Logo and all other Fidelity trademarks or service marks used herein are trademarks or service marks of FMR LLC. Any third-party marks that are used herein are trademarks or service marks of their respective owners. © 2024 FMR LLC. All rights reserved. |
| | For additional information about the Fund; including its prospectus, financial information, holdings and proxy information, scan the QR code or visit fundresearch.fidelity.com/prospectus/sec 1.9913598.100 1755-TSRA-1024 |
| |
| | ANNUAL SHAREHOLDER REPORT | AS OF AUGUST 31, 2024 | |
| | Fidelity® Environmental Bond Fund Fidelity® Environmental Bond Fund : FFEBX |
| | | |
This annual shareholder report contains information about Fidelity® Environmental Bond Fund for the period September 1, 2023 to August 31, 2024. You can find additional information about the Fund at fundresearch.fidelity.com/prospectus/sec. You can also request this information by contacting us at 1-800-544-8544 or by sending an e-mail to fidfunddocuments@fidelity.com.
What were your Fund costs for the last year?(based on hypothetical $10,000 investment)
FUND COST (PREVIOUS YEAR)
| | Costs of a $10,000 investment | Costs paid as a percentage of a $10,000 investment | |
| Fidelity® Environmental Bond Fund | $ 47 | 0.45% | |
What affected the Fund's performance this period?
•U.S. taxable investment-grade bonds posted a strong advance for the 12 months ending August 31, 2024, helped by a late-period gain as the bond market reflected anticipated interest-rate reductions by the U.S. Federal Reserve, which are expected to start in September. The full 12-month period was marked by high levels of volatility.
•Against this backdrop, sector allocation and security selection notably contributed to the fund's outperformance of the Bloomberg U.S. Aggregate Index for the fiscal year.
•In terms of sector allocation, investment choices and an overweight position in asset-backed securities, and underweights in U.S. Treasurys and mortgage securities, each helped relative performance the past 12 months.
•As for security selection, fund holdings in the corporate segment made a notable contribution, led by picks among financials, particularly REITs and banks.
•In contrast, the fund's underweight in energy bonds and consumer non-cyclicals within the corporate sector detracted versus the Aggregate index the past 12 months.
Application of FMR's environmental, social, and governance (ESG) ratings process and/or its sustainable investing exclusion criteria may affect the Fund's exposure to certain issuers, sectors, regions, and countries and may affect the Fund's performance.
How did the Fund perform over the life of Fund?
CUMULATIVE PERFORMANCE
June 15, 2021 through August 31, 2024.
Initial investment of $10,000.
Fidelity® Environmental Bond Fund | $10,000 | $10,116 | $8,841 | $8,748 |
Bloomberg MSCI Global Green USD Bond Index (Hedged USD) | $10,000 | $10,120 | $8,921 | $8,966 |
Bloomberg U.S. Aggregate Bond Index | $10,000 | $10,126 | $8,960 | $8,853 |
| | 2021 | 2022 | 2023 | 2024 |
AVERAGE ANNUAL TOTAL RETURNS: | | 1 Year | Life of Fund A |
| Fidelity® Environmental Bond Fund | 7.57% | -1.87% |
| Bloomberg MSCI Global Green USD Bond Index (Hedged USD) | 8.09% | -0.97% |
| Bloomberg U.S. Aggregate Bond Index | 7.30% | -1.59% |
A From June 15, 2021
Visit www.fidelity.com for more recent performance information. |
The Fund's past performance is not a good predictor of the Fund's future performance. The graph and table do not reflect the deduction of taxes that a shareholder would pay on fund distributions or redemption of fund shares. |
Key Fund Statistics (as of August 31, 2024)
KEY FACTS | | |
| Fund Size | $37,501,935 | |
| Number of Holdings | 199 | |
| Total Advisory Fee | $120,006 | |
| Portfolio Turnover | 97% | |
What did the Fund invest in?
(as of August 31, 2024)
| U.S. Government and U.S. Government Agency Obligations | 48.6 |
| AAA | 0.9 |
| AA | 3.1 |
| A | 15.6 |
| BBB | 23.5 |
| BB | 3.6 |
| Not Rated | 4.6 |
| Short-Term Investments and Net Other Assets (Liabilities) | 0.1 |
QUALITY DIVERSIFICATION (% of Fund's net assets) |
|
| |
| We have used ratings from Moody's Investors Service, Inc. Where Moody's® ratings are not available, we have used S&P® ratings. All ratings are as of the date indicated and do not reflect subsequent changes. |
| Corporate Bonds | 44.0 |
| U.S. Treasury Obligations | 27.0 |
| U.S. Government Agency - Mortgage Securities | 21.2 |
| Asset-Backed Securities | 3.2 |
| CMOs and Other Mortgage Related Securities | 2.4 |
| Foreign Government and Government Agency Obligations | 1.1 |
| Preferred Securities | 0.6 |
| U.S. Government Agency Obligations | 0.4 |
| Short-Term Investments and Net Other Assets (Liabilities) | 0.1 |
ASSET ALLOCATION (% of Fund's net assets) |
|
|
| United States | 82.6 |
| Germany | 2.9 |
| United Kingdom | 2.2 |
| Netherlands | 1.9 |
| Italy | 1.4 |
| Japan | 1.4 |
| France | 1.3 |
| Ireland | 1.2 |
| Luxembourg | 1.1 |
| Others | 4.0 |
GEOGRAPHIC DIVERSIFICATION (% of Fund's net assets) |
|
| |
|
TOP HOLDINGS (% of Fund's net assets) | | |
| US Treasury Notes | 17.0 | |
| US Treasury Bonds | 10.0 | |
| Fannie Mae Mortgage pass-thru certificates | 9.8 | |
| Freddie Mac Gold Pool | 8.9 | |
| Freddie Mac Multiclass Mortgage participation certificates | 2.1 | |
| Uniform Mortgage Backed Securities | 2.1 | |
| Bank of America Corp | 1.7 | |
| Verizon Communications Inc | 1.6 | |
| BNP Paribas SA | 1.3 | |
| PNC Financial Services Group Inc/The | 1.2 | |
| | 55.7 | |
| Fidelity, the Fidelity Investments Logo and all other Fidelity trademarks or service marks used herein are trademarks or service marks of FMR LLC. Any third-party marks that are used herein are trademarks or service marks of their respective owners. © 2024 FMR LLC. All rights reserved. |
| | For additional information about the Fund; including its prospectus, financial information, holdings and proxy information, scan the QR code or visit fundresearch.fidelity.com/prospectus/sec 1.9913670.100 6379-TSRA-1024 |
| |
| | ANNUAL SHAREHOLDER REPORT | AS OF AUGUST 31, 2024 | This report describes changes to the Fund that occurred during the reporting period. |
| | Fidelity® Total Bond Fund Fidelity Advisor® Total Bond Fund Class Z : FBKWX |
| | | |
This annual shareholder report contains information about Fidelity® Total Bond Fund for the period September 1, 2023 to August 31, 2024. You can find additional information about the Fund at fundresearch.fidelity.com/prospectus/sec. You can also request this information by contacting us at 1-877-208-0098 or by sending an e-mail to fidfunddocuments@fidelity.com.
What were your Fund costs for the last year?(based on hypothetical $10,000 investment)
FUND COST (PREVIOUS YEAR)
| | Costs of a $10,000 investment | Costs paid as a percentage of a $10,000 investment | |
| Class Z | $ 38 | 0.36% | |
What affected the Fund's performance this period?
•U.S. taxable investment-grade bonds posted a strong advance for the 12 months ending August 31, 2024, helped by a late-period gain as the bond market reflected anticipated interest-rate reductions by the U.S. Federal Reserve, which are expected to start in September. The full 12-month period was marked by high levels of volatility.
•Against this backdrop, allocations to "plus sectors" - including high-yield bonds, leveraged loans and emerging markets debt - notably contributed to the fund's outperformance of the Bloomberg U.S. Aggregate Index for the fiscal year.
•Among investment-grade securities, security selection and sector allocation also meaningfully contributed.
•In terms of sector allocation, investment choices and overweight positions in the asset-backed securities, mortgage-backed securities and commercial mortgage-backed securities segments each helped relative performance the past 12 months.
•As for security selection, fund holdings in the corporate segment made a notable contribution, led by picks among financials, particularly REITs and banks.
•In contrast, the fund's underweight in industrial bonds within the corporate sector detracted versus the Aggregate index the past 12 months.
How did the Fund perform over the life of Fund?
CUMULATIVE PERFORMANCE
December 22, 2014 through August 31, 2024.
Initial investment of $10,000.
Class Z | $10,000 | $10,059 | $10,777 | $11,010 | $10,948 | $12,017 | $12,945 | $13,267 | $11,771 | $11,824 | $12,830 |
Bloomberg U.S. Universal Bond Index | $10,000 | $10,069 | $10,724 | $10,868 | $10,767 | $11,852 | $12,612 | $12,724 | $11,215 | $11,171 | $12,056 |
Bloomberg U.S. Aggregate Bond Index | $10,000 | $10,054 | $10,654 | $10,706 | $10,594 | $11,672 | $12,427 | $12,417 | $10,987 | $10,856 | $11,648 |
| | 2014 | 2015 | 2016 | 2017 | 2018 | 2019 | 2020 | 2021 | 2022 | 2023 | 2024 |
AVERAGE ANNUAL TOTAL RETURNS: | | 1 Year | 5 Year | Life of Fund A |
| Class Z | 8.51% | 1.32% | 2.60% |
| Bloomberg U.S. Universal Bond Index | 7.92% | 0.34% | 1.95% |
| Bloomberg U.S. Aggregate Bond Index | 7.30% | -0.04% | 1.59% |
A From December 22, 2014
Visit institutional.fidelity.com for more recent performance information. |
The Fund's past performance is not a good predictor of the Fund's future performance. The graph and table do not reflect the deduction of taxes that a shareholder would pay on fund distributions or redemption of fund shares. |
Key Fund Statistics (as of August 31, 2024)
KEY FACTS | | |
| Fund Size | $39,553,262,535 | |
| Number of Holdings | 6,935 | |
| Total Advisory Fee | $100,486,629 | |
| Portfolio Turnover | 206% | |
What did the Fund invest in?
(as of August 31, 2024)
| U.S. Government and U.S. Government Agency Obligations | 54.7 |
| AAA | 8.8 |
| AA | 1.1 |
| A | 7.7 |
| BBB | 16.3 |
| BB | 4.6 |
| B | 5.6 |
| CCC,CC,C | 0.8 |
| D | 0.0 |
| Not Rated | 3.9 |
| Equities | 0.1 |
QUALITY DIVERSIFICATION (% of Fund's net assets) |
|
| Short-Term Investments and Net Other Assets (Liabilities) - (3.6)% |
| |
| We have used ratings from Moody's Investors Service, Inc. Where Moody's® ratings are not available, we have used S&P® ratings. All ratings are as of the date indicated and do not reflect subsequent changes. |
| U.S. Treasury Obligations | 34.8 |
| Corporate Bonds | 27.7 |
| U.S. Government Agency - Mortgage Securities | 19.9 |
| Asset-Backed Securities | 7.4 |
| CMOs and Other Mortgage Related Securities | 6.8 |
| Bank Loan Obligations | 5.0 |
| Foreign Government and Government Agency Obligations | 1.2 |
| Preferred Securities | 0.4 |
| Common Stocks | 0.1 |
| Other Investments | 0.1 |
| Purchased Swaptions | 0.1 |
| Supranational Obligations | 0.1 |
| Preferred Stocks | 0.0 |
ASSET ALLOCATION (% of Fund's net assets) |
|
| Short-Term Investments and Net Other Assets (Liabilities) - (3.6)% |
|
| United States | 86.3 |
| Grand Cayman (UK Overseas Ter) | 4.2 |
| United Kingdom | 1.5 |
| Mexico | 1.3 |
| Germany | 1.1 |
| Ireland | 0.8 |
| Switzerland | 0.7 |
| Canada | 0.6 |
| France | 0.3 |
| Others | 3.2 |
GEOGRAPHIC DIVERSIFICATION (% of Fund's net assets) |
|
| |
|
TOP HOLDINGS (% of Fund's net assets) | | |
| US Treasury Notes | 25.4 | |
| US Treasury Bonds | 9.4 | |
| Fannie Mae Mortgage pass-thru certificates | 6.6 | |
| Ginnie Mae II Pool | 5.2 | |
| Uniform Mortgage Backed Securities | 3.9 | |
| Freddie Mac Gold Pool | 3.6 | |
| JPMorgan Chase & Co | 1.2 | |
| Petroleos Mexicanos | 1.1 | |
| Freddie Mac Multiclass Mortgage participation certificates | 1.0 | |
| Bank of America Corp | 0.9 | |
| | 58.3 | |
How has the Fund changed?
This is a summary of certain changes to the Fund since September 1, 2023. For more complete information, you may review the Fund's next prospectus, which we expect to be available by October 30, 2024 at fundresearch.fidelity.com/prospectus/sec or upon request at 1-877-208-0098 or by sending an e-mail to fidfunddocuments@fidelity.com.
The fund's contractual management fee was reduced during the reporting period. | |
| Fidelity, the Fidelity Investments Logo and all other Fidelity trademarks or service marks used herein are trademarks or service marks of FMR LLC. Any third-party marks that are used herein are trademarks or service marks of their respective owners. © 2024 FMR LLC. All rights reserved. |
| | For additional information about the Fund; including its prospectus, financial information, holdings and proxy information, scan the QR code or visit fundresearch.fidelity.com/prospectus/sec 1.9913631.100 2733-TSRA-1024 |
| |
| | ANNUAL SHAREHOLDER REPORT | AS OF AUGUST 31, 2024 | This report describes changes to the Fund that occurred during the reporting period. |
| | Fidelity® Total Bond Fund Fidelity Advisor® Total Bond Fund Class I : FEPIX |
| | | |
This annual shareholder report contains information about Fidelity® Total Bond Fund for the period September 1, 2023 to August 31, 2024. You can find additional information about the Fund at fundresearch.fidelity.com/prospectus/sec. You can also request this information by contacting us at 1-877-208-0098 or by sending an e-mail to fidfunddocuments@fidelity.com.
What were your Fund costs for the last year?(based on hypothetical $10,000 investment)
FUND COST (PREVIOUS YEAR)
| | Costs of a $10,000 investment | Costs paid as a percentage of a $10,000 investment | |
| Class I | $ 52 | 0.50% | |
What affected the Fund's performance this period?
•U.S. taxable investment-grade bonds posted a strong advance for the 12 months ending August 31, 2024, helped by a late-period gain as the bond market reflected anticipated interest-rate reductions by the U.S. Federal Reserve, which are expected to start in September. The full 12-month period was marked by high levels of volatility.
•Against this backdrop, allocations to "plus sectors" - including high-yield bonds, leveraged loans and emerging markets debt - notably contributed to the fund's outperformance of the Bloomberg U.S. Aggregate Index for the fiscal year.
•Among investment-grade securities, security selection and sector allocation also meaningfully contributed.
•In terms of sector allocation, investment choices and overweight positions in the asset-backed securities, mortgage-backed securities and commercial mortgage-backed securities segments each helped relative performance the past 12 months.
•As for security selection, fund holdings in the corporate segment made a notable contribution, led by picks among financials, particularly REITs and banks.
•In contrast, the fund's underweight in industrial bonds within the corporate sector detracted versus the Aggregate index the past 12 months.
How did the Fund perform over the past 10 years?
CUMULATIVE PERFORMANCE
August 31, 2014 through August 31, 2024.
Initial investment of $10,000.
Class I | $10,000 | $10,073 | $10,778 | $10,996 | $10,919 | $11,968 | $12,875 | $13,176 | $11,675 | $11,711 | $12,690 |
Bloomberg U.S. Universal Bond Index | $10,000 | $10,113 | $10,770 | $10,915 | $10,814 | $11,903 | $12,666 | $12,778 | $11,264 | $11,219 | $12,108 |
Bloomberg U.S. Aggregate Bond Index | $10,000 | $10,156 | $10,761 | $10,814 | $10,701 | $11,789 | $12,553 | $12,542 | $11,098 | $10,965 | $11,765 |
| | 2014 | 2015 | 2016 | 2017 | 2018 | 2019 | 2020 | 2021 | 2022 | 2023 | 2024 |
AVERAGE ANNUAL TOTAL RETURNS: | | 1 Year | 5 Year | 10 Year |
| Class I | 8.36% | 1.18% | 2.41% |
| Bloomberg U.S. Universal Bond Index | 7.92% | 0.34% | 1.93% |
| Bloomberg U.S. Aggregate Bond Index | 7.30% | -0.04% | 1.64% |
Visit institutional.fidelity.com for more recent performance information. |
The Fund's past performance is not a good predictor of the Fund's future performance. The graph and table do not reflect the deduction of taxes that a shareholder would pay on fund distributions or redemption of fund shares. |
Key Fund Statistics (as of August 31, 2024)
KEY FACTS | | |
| Fund Size | $39,553,262,535 | |
| Number of Holdings | 6,935 | |
| Total Advisory Fee | $100,486,629 | |
| Portfolio Turnover | 206% | |
What did the Fund invest in?
(as of August 31, 2024)
| U.S. Government and U.S. Government Agency Obligations | 54.7 |
| AAA | 8.8 |
| AA | 1.1 |
| A | 7.7 |
| BBB | 16.3 |
| BB | 4.6 |
| B | 5.6 |
| CCC,CC,C | 0.8 |
| D | 0.0 |
| Not Rated | 3.9 |
| Equities | 0.1 |
QUALITY DIVERSIFICATION (% of Fund's net assets) |
|
| Short-Term Investments and Net Other Assets (Liabilities) - (3.6)% |
| |
| We have used ratings from Moody's Investors Service, Inc. Where Moody's® ratings are not available, we have used S&P® ratings. All ratings are as of the date indicated and do not reflect subsequent changes. |
| U.S. Treasury Obligations | 34.8 |
| Corporate Bonds | 27.7 |
| U.S. Government Agency - Mortgage Securities | 19.9 |
| Asset-Backed Securities | 7.4 |
| CMOs and Other Mortgage Related Securities | 6.8 |
| Bank Loan Obligations | 5.0 |
| Foreign Government and Government Agency Obligations | 1.2 |
| Preferred Securities | 0.4 |
| Common Stocks | 0.1 |
| Other Investments | 0.1 |
| Purchased Swaptions | 0.1 |
| Supranational Obligations | 0.1 |
| Preferred Stocks | 0.0 |
ASSET ALLOCATION (% of Fund's net assets) |
|
| Short-Term Investments and Net Other Assets (Liabilities) - (3.6)% |
|
| United States | 86.3 |
| Grand Cayman (UK Overseas Ter) | 4.2 |
| United Kingdom | 1.5 |
| Mexico | 1.3 |
| Germany | 1.1 |
| Ireland | 0.8 |
| Switzerland | 0.7 |
| Canada | 0.6 |
| France | 0.3 |
| Others | 3.2 |
GEOGRAPHIC DIVERSIFICATION (% of Fund's net assets) |
|
| |
|
TOP HOLDINGS (% of Fund's net assets) | | |
| US Treasury Notes | 25.4 | |
| US Treasury Bonds | 9.4 | |
| Fannie Mae Mortgage pass-thru certificates | 6.6 | |
| Ginnie Mae II Pool | 5.2 | |
| Uniform Mortgage Backed Securities | 3.9 | |
| Freddie Mac Gold Pool | 3.6 | |
| JPMorgan Chase & Co | 1.2 | |
| Petroleos Mexicanos | 1.1 | |
| Freddie Mac Multiclass Mortgage participation certificates | 1.0 | |
| Bank of America Corp | 0.9 | |
| | 58.3 | |
How has the Fund changed?
This is a summary of certain changes to the Fund since September 1, 2023. For more complete information, you may review the Fund's next prospectus, which we expect to be available by October 30, 2024 at fundresearch.fidelity.com/prospectus/sec or upon request at 1-877-208-0098 or by sending an e-mail to fidfunddocuments@fidelity.com.
The fund's contractual management fee was reduced during the reporting period. | |
| Fidelity, the Fidelity Investments Logo and all other Fidelity trademarks or service marks used herein are trademarks or service marks of FMR LLC. Any third-party marks that are used herein are trademarks or service marks of their respective owners. © 2024 FMR LLC. All rights reserved. |
| | For additional information about the Fund; including its prospectus, financial information, holdings and proxy information, scan the QR code or visit fundresearch.fidelity.com/prospectus/sec 1.9913630.100 1345-TSRA-1024 |
Item 2.
Code of Ethics
As of the end of the period, August 31, 2024, Fidelity Income Fund (the trust) has adopted a code of ethics, as defined in Item 2 of Form N-CSR, that applies to its President and Treasurer and its Chief Financial Officer. A copy of the code of ethics is filed as an exhibit to this Form N-CSR.
Item 3.
Audit Committee Financial Expert
The Board of Trustees of the trust has determined that Elizabeth S. Acton is an audit committee financial expert, as defined in Item 3 of Form N-CSR. Ms. Acton is independent for purposes of Item 3 of Form N-CSR.
Item 4.
Principal Accountant Fees and Services
Fees and Services
The following table presents fees billed by Deloitte & Touche LLP, the member firms of Deloitte Touche Tohmatsu, and their respective affiliates (collectively, “Deloitte Entities”) in each of the last two fiscal years for services rendered to Fidelity Total Bond K6 Fund (the “Fund”):
Services Billed by Deloitte Entities
August 31, 2024 FeesA
|
| Audit Fees | Audit-Related Fees | Tax Fees | All Other Fees |
Fidelity Total Bond K6 Fund | $72,100 | $- | $11,300 | $1,700 |
|
| Audit Fees | Audit-Related Fees | Tax Fees | All Other Fees |
Fidelity Total Bond K6 Fund | $72,300 | $- | $11,300 | $1,800 |
A Amounts may reflect rounding
The following table presents fees billed by PricewaterhouseCoopers LLP (“PwC”) in each of the last two fiscal years for services rendered to Fidelity Environmental Bond Fund, Fidelity Government Income Fund, Fidelity Intermediate Government Income Fund, Fidelity Series Government Bond Index Fund, and Fidelity Total Bond Fund (the “Funds”):
Services Billed by PwC
August 31, 2024 FeesA
|
| Audit Fees | Audit-Related Fees | Tax Fees | All Other Fees |
Fidelity Environmental Bond Fund | $76,300 | $6,200 | $7,900 | $2,600 |
Fidelity Government Income Fund | $71,300 | $5,900 | $9,800 | $2,500 |
Fidelity Intermediate Government Income Fund | $67,400 | $5,600 | $9,800 | $2,400 |
Fidelity Series Government Bond Index Fund | $61,900 | $5,300 | $10,300 | $2,300 |
Fidelity Total Bond Fund | $122,800 | $9,700 | $11,900 | $4,200 |
|
| Audit Fees | Audit-Related Fees | Tax Fees | All Other Fees |
Fidelity Environmental Bond Fund | $76,500 | $6,100 | $10,100 | $2,600 |
Fidelity Government Income Fund | $74,000 | $5,900 | $9,800 | $2,500 |
Fidelity Intermediate Government Income Fund | $67,600 | $5,600 | $9,800 | $2,400 |
Fidelity Series Government Bond Index Fund | $62,100 | $5,200 | $10,300 | $2,200 |
Fidelity Total Bond Fund | $122,700 | $9,700 | $11,900 | $4,100 |
A Amounts may reflect rounding.
The following table(s) present(s) fees billed by Deloitte Entities and PwC that were required to be approved by the Audit Committee for services that relate directly to the operations and financial reporting of the Fund(s) and that are rendered on behalf of Fidelity Management & Research Company LLC ("FMR") and entities controlling, controlled by, or under common control with FMR (not including any sub-adviser whose role is primarily portfolio management and is subcontracted with or overseen by another investment adviser) that provide ongoing services to the Fund(s) (“Fund Service Providers”):
Services Billed by Deloitte Entities
|
| August 31, 2024A | August 31, 2023A |
|
Audit-Related Fees | $200,000 | $- |
|
Tax Fees | $- | $- |
|
All Other Fees | $1,929,500 | $- |
|
A Amounts may reflect rounding.
Services Billed by PwC
|
| August 31, 2024A | August 31, 2023A |
|
Audit-Related Fees | $9,437,800 | $8,379,200 |
|
Tax Fees | $61,000 | $1,000 |
|
All Other Fees | $35,000 | $- |
|
A Amounts may reflect rounding.
“Audit-Related Fees” represent fees billed for assurance and related services that are reasonably related to the performance of the fund audit or the review of the fund's financial statements and that are not reported under Audit Fees.
“Tax Fees” represent fees billed for tax compliance, tax advice or tax planning that relate directly to the operations and financial reporting of the fund.
“All Other Fees” represent fees billed for services provided to the fund or Fund Service Provider, a significant portion of which are assurance related, that relate directly to the operations and financial reporting of the fund, excluding those services that are reported under Audit Fees, Audit-Related Fees or Tax Fees.
Assurance services must be performed by an independent public accountant.
* * *
The aggregate non-audit fees billed by Deloitte Entities and PwC for services rendered to the Fund(s), FMR (not including any sub-adviser whose role is primarily portfolio management and is subcontracted with or overseen by another investment adviser), and any Fund Service Provider for each of the last two fiscal years of the Fund(s) are as follows:
|
Billed By | August 31, 2024A | August 31, 2023A |
Deloitte Entities | $4,961,500 | $3,231,100 |
PwC | $15,104,800 | $13,931,200 |
A Amounts may reflect rounding.
The trust's Audit Committee has considered non-audit services that were not pre-approved that were provided by Deloitte Entities and PwC to Fund Service Providers to be compatible with maintaining the independence of Deloitte Entities and PwC in its(their) audit of the Fund(s), taking into account representations from Deloitte Entities and PwC, in accordance with Public Company Accounting Oversight Board rules, regarding its independence from the Fund(s) and its(their) related entities and FMR’s review of the appropriateness and permissibility under applicable law of such non-audit services prior to their provision to the Fund(s) Service Providers.
Audit Committee Pre-Approval Policies and Procedures
The trust’s Audit Committee must pre-approve all audit and non-audit services provided by a fund’s independent registered public accounting firm relating to the operations or financial reporting of the fund. Prior to the commencement of any audit or non-audit services to a fund, the Audit Committee reviews the services to determine whether they are appropriate and permissible under applicable law.
The Audit Committee has adopted policies and procedures to, among other purposes, provide a framework for the Committee’s consideration of non-audit services by the audit firms that audit the Fidelity funds. The policies and procedures require that any non-audit service provided by a fund audit firm to a Fidelity fund and any non-audit service provided by a fund auditor to a Fund Service Provider that relates directly to the operations and financial reporting of a Fidelity fund (“Covered Service”) are subject to approval by the Audit Committee before such service is provided.
All Covered Services must be approved in advance of provision of the service either: (i) by formal resolution of the Audit Committee, or (ii) by oral or written approval of the service by the Chair of the Audit Committee (or if the Chair is unavailable, such other member of the Audit Committee as may be designated by the Chair to act in the Chair’s absence). The approval contemplated by (ii) above is permitted where the Treasurer determines that action on such an engagement is necessary before the next meeting of the Audit Committee.
Non-audit services provided by a fund audit firm to a Fund Service Provider that do not relate directly to the operations and financial reporting of a Fidelity fund are reported to the Audit Committee periodically.
Non-Audit Services Approved Pursuant to Rule 2-01(c)(7)(i)(C) and (ii) of Regulation S-X (“De Minimis Exception”)
There were no non-audit services approved or required to be approved by the Audit Committee pursuant to the De Minimis Exception during the Fund’s(s’) last two fiscal years relating to services provided to (i) the Fund(s) or (ii) any Fund Service Provider that relate directly to the operations and financial reporting of the Fund(s).
The Registrant has not retained, for the preparation of the audit report on the financial statements included in the Form N-CSR, a registered public accounting firm that has a branch or office that is located in a foreign jurisdiction and that the Public Company Accounting Oversight Board (the “PCAOB”) has determined that the PCAOB is unable to inspect or investigate completely because of a position taken by an authority in the foreign jurisdiction.
The Registrant is not a “foreign issuer,” as defined in 17 CFR 240.3b-4.
Item 5.
Audit Committee of Listed Registrants
Not applicable.
Item 6.
Investments
(a)
Not applicable.
(b)
Not applicable.
Item 7.
Financial Statements and Financial Highlights for Open-End Management Investment Companies
Fidelity® Total Bond Fund
Annual Report
August 31, 2024
Includes Fidelity and Fidelity Advisor share classes
Contents
To view a fund's proxy voting guidelines and proxy voting record for the 12-month period ended June 30, visit http://www.fidelity.com/proxyvotingresults or visit the Securities and Exchange Commission's (SEC) web site at http://www.sec.gov.
You may also call 1-800-544-8544 if you're an individual investing directly with Fidelity, call 1-800-835-5092 if you're a plan sponsor or participant with Fidelity as your recordkeeper or call 1-877-208-0098 on institutional accounts or if you're an advisor or invest through one to request a free copy of the proxy voting guidelines.
Standard & Poor's, S&P and S&P 500 are registered service marks of The McGraw-Hill Companies, Inc. and have been licensed for use by Fidelity Distributors Corporation.
Other third-party marks appearing herein are the property of their respective owners.
All other marks appearing herein are registered or unregistered trademarks or service marks of FMR LLC or an affiliated company. © 2024 FMR LLC. All rights reserved.
This report and the financial statements contained herein are submitted for the general information of the shareholders of the Fund. This report is not authorized for distribution to prospective investors in the Fund unless preceded or accompanied by an effective prospectus.
A fund files its complete schedule of portfolio holdings with the SEC for the first and third quarters of each fiscal year on Form N-PORT. Forms N-PORT are available on the SEC's web site at http://www.sec.gov. A fund's Forms N-PORT may be reviewed and copied at the SEC's Public Reference Room in Washington, DC. Information regarding the operation of the SEC's Public Reference Room may be obtained by calling 1-800-SEC-0330.
For a complete list of a fund's portfolio holdings, view the most recent holdings listing, semiannual report, or annual report on Fidelity's web site at http://www.fidelity.com, http://www.institutional.fidelity.com, or http://www.401k.com, as applicable.
NOT FDIC INSURED •MAY LOSE VALUE •NO BANK GUARANTEE
Neither the Fund nor Fidelity Distributors Corporation is a bank.
Item 7: Financial Statements and Financial Highlights for Open-End Management Investment Companies (Annual Report)
Fidelity® Total Bond Fund
Schedule of Investments August 31, 2024
Showing Percentage of Net Assets
| Corporate Bonds - 27.7% |
| | | Principal Amount (a) | Value ($) |
| Convertible Bonds - 0.1% | | | |
| COMMUNICATION SERVICES - 0.1% | | | |
| Media - 0.1% | | | |
| DISH Network Corp. 3.375% 8/15/26 | | 17,378,000 | 10,819,344 |
| INFORMATION TECHNOLOGY - 0.0% | | | |
| Electronic Equipment, Instruments & Components - 0.0% | | | |
| Itron, Inc. 1.375% 7/15/30 (b) | | 730,000 | 746,790 |
| Semiconductors & Semiconductor Equipment - 0.0% | | | |
| MKS Instruments, Inc. 1.25% 6/1/30 (b) | | 2,110,000 | 2,172,245 |
| Wolfspeed, Inc. 1.875% 12/1/29 | | 9,366,000 | 3,570,351 |
| | | | 5,742,596 |
TOTAL INFORMATION TECHNOLOGY | | | 6,489,386 |
| | | | |
| REAL ESTATE - 0.0% | | | |
| Real Estate Management & Development - 0.0% | | | |
| Realogy Group LLC/Realogy Co-Issuer Corp. 0.25% 6/15/26 | | 1,760,000 | 1,496,000 |
| Redfin Corp. 0.5% 4/1/27 | | 6,297,000 | 4,313,445 |
| | | | 5,809,445 |
| UTILITIES - 0.0% | | | |
| Electric Utilities - 0.0% | | | |
| PG&E Corp. 4.25% 12/1/27 (b) | | 1,897,000 | 2,024,099 |
| Independent Power and Renewable Electricity Producers - 0.0% | | | |
| NextEra Energy Partners LP 2.5% 6/15/26 (b) | | 1,705,000 | 1,572,971 |
| Sunnova Energy International, Inc.: | | | |
| 0.25% 12/1/26 | | 3,664,000 | 2,775,167 |
| 2.625% 2/15/28 | | 287,000 | 185,259 |
| | | | 4,533,397 |
TOTAL UTILITIES | | | 6,557,496 |
| | | | |
| TOTAL CONVERTIBLE BONDS | | | 29,675,671 |
| Nonconvertible Bonds - 27.6% | | | |
| COMMUNICATION SERVICES - 2.5% | | | |
| Diversified Telecommunication Services - 0.5% | | | |
| Altice France SA: | | | |
| 5.125% 1/15/29(b) | | 6,900,000 | 4,790,389 |
| 5.125% 7/15/29(b) | | 12,028,000 | 8,391,784 |
| 5.5% 1/15/28(b) | | 3,621,000 | 2,576,698 |
| 5.5% 10/15/29(b) | | 35,000 | 24,284 |
| AT&T, Inc.: | | | |
| 2.55% 12/1/33 | | 46,000,000 | 38,100,048 |
| 4.3% 2/15/30 | | 10,373,000 | 10,267,846 |
| Cablevision Lightpath LLC: | | | |
| 3.875% 9/15/27(b) | | 1,135,000 | 1,065,185 |
| 5.625% 9/15/28(b) | | 895,000 | 811,435 |
| Colombia Telecomunicaciones SA 4.95% 7/17/30 (b) | | 760,000 | 649,177 |
| Connect Finco SARL / Connect U.S. Finco LLC 6.75% 10/1/26 (b) | | 2,285,000 | 2,267,695 |
| Consolidated Communications, Inc. 5% 10/1/28 (b) | | 1,385,000 | 1,209,064 |
| Frontier Communications Holdings LLC: | | | |
| 5% 5/1/28(b) | | 5,717,000 | 5,551,520 |
| 5.875% 10/15/27(b) | | 1,141,000 | 1,136,522 |
| 5.875% 11/1/29 | | 2,650,000 | 2,437,694 |
| 8.75% 5/15/30(b) | | 2,236,000 | 2,354,957 |
| IHS Holding Ltd.: | | | |
| 5.625% 11/29/26(b) | | 3,485,000 | 3,384,806 |
| 6.25% 11/29/28(b) | | 490,000 | 450,496 |
| Iliad Holding SAS: | | | |
| 7% 10/15/28(b) | | 235,000 | 238,512 |
| 8.5% 4/15/31(b) | | 3,605,000 | 3,820,100 |
| Koninklijke KPN NV 3.875% 2/16/36 (Reg. S) | EUR | 900,000 | 999,331 |
| Level 3 Financing, Inc.: | | | |
| 3.625% 1/15/29(b) | | 375,000 | 233,438 |
| 3.875% 10/15/30(b) | | 1,130,000 | 768,929 |
| 4% 4/15/31(b) | | 235,000 | 157,448 |
| 4.5% 4/1/30(b) | | 2,690,000 | 1,971,855 |
| 10.5% 5/15/30(b) | | 7,534,000 | 8,072,455 |
| 11% 11/15/29(b) | | 2,119,796 | 2,323,947 |
| Liquid Telecommunications Financing PLC 5.5% 9/4/26 (b) | | 7,260,000 | 4,514,123 |
| Optics Bidco SpA: | | | |
| 7.2% 7/18/36(b) | | 1,640,000 | 1,722,489 |
| 7.721% 6/4/38(b) | | 407,000 | 440,886 |
| Qtel International Finance Ltd. 2.625% 4/8/31 (b) | | 1,280,000 | 1,142,000 |
| Sable International Finance Ltd. 5.75% 9/7/27 (b) | | 2,355,000 | 2,320,405 |
| Sitios Latinoamerica S.A.B. de CV 5.375% 4/4/32 (b) | | 4,370,000 | 4,147,130 |
| Telefonica Celular del Paraguay SA 5.875% 4/15/27 (b) | | 1,565,000 | 1,552,284 |
| Telenet Finance Luxembourg Notes SARL 5.5% 3/1/28 (b) | | 1,800,000 | 1,739,250 |
| Telstra Group Ltd. 3.5% 9/3/36 (Reg. S) | EUR | 4,825,000 | 5,319,634 |
| Verizon Communications, Inc.: | | | |
| 2.55% 3/21/31 | | 21,181,000 | 18,631,498 |
| 3.75% 2/28/36 | EUR | 1,925,000 | 2,132,443 |
| 4.78% 2/15/35(b) | | 26,362,000 | 25,994,207 |
| 4.862% 8/21/46 | | 26,720,000 | 25,251,008 |
| 5.012% 4/15/49 | | 569,000 | 564,405 |
| Windstream Escrow LLC 7.75% 8/15/28 (b) | | 3,730,000 | 3,640,876 |
| Zayo Group Holdings, Inc. 4% 3/1/27 (b)(c) | | 3,914,000 | 3,416,271 |
| | | | 206,584,524 |
| Entertainment - 0.0% | | | |
| Roblox Corp. 3.875% 5/1/30 (b) | | 5,810,000 | 5,352,449 |
| Universal Music Group NV 4% 6/13/31 (Reg. S) | EUR | 1,800,000 | 2,060,908 |
| | | | 7,413,357 |
| Interactive Media & Services - 0.0% | | | |
| Baidu, Inc.: | | | |
| 1.72% 4/9/26 | | 1,135,000 | 1,083,074 |
| 2.375% 10/9/30 | | 635,000 | 560,216 |
| Tencent Holdings Ltd.: | | | |
| 1.81% 1/26/26(b) | | 845,000 | 813,203 |
| 2.39% 6/3/30(b) | | 1,765,000 | 1,573,608 |
| 3.975% 4/11/29(b) | | 480,000 | 468,989 |
| | | | 4,499,090 |
| Media - 1.6% | | | |
| Advantage Sales & Marketing, Inc. 6.5% 11/15/28 (b) | | 5,155,000 | 4,833,127 |
| Altice Financing SA 5.75% 8/15/29 (b) | | 12,689,000 | 9,774,397 |
| Altice France Holding SA 6% 2/15/28 (b) | | 2,705,000 | 871,216 |
| CCO Holdings LLC/CCO Holdings Capital Corp.: | | | |
| 4.25% 2/1/31(b) | | 7,195,000 | 6,243,142 |
| 4.25% 1/15/34(b) | | 4,575,000 | 3,689,330 |
| 4.5% 8/15/30(b) | | 1,185,000 | 1,056,791 |
| 4.5% 5/1/32 | | 7,900,000 | 6,745,451 |
| 4.5% 6/1/33(b) | | 8,375,000 | 7,001,504 |
| 4.75% 2/1/32(b) | | 300,000 | 261,400 |
| 5.375% 6/1/29(b) | | 3,061,000 | 2,903,551 |
| Charter Communications Operating LLC/Charter Communications Operating Capital Corp.: | | | |
| 3.85% 4/1/61 | | 3,000,000 | 1,821,018 |
| 3.9% 6/1/52 | | 4,000,000 | 2,619,541 |
| 4.4% 4/1/33 | | 24,687,000 | 22,438,363 |
| 4.8% 3/1/50 | | 10,200,000 | 7,759,727 |
| 5.25% 4/1/53 | | 33,312,000 | 27,278,417 |
| 5.375% 5/1/47 | | 43,892,000 | 36,603,319 |
| 5.5% 4/1/63 | | 36,711,000 | 29,432,457 |
| 6.1% 6/1/29 | | 20,698,000 | 21,384,711 |
| 6.484% 10/23/45 | | 9,078,000 | 8,677,052 |
| 6.55% 6/1/34 | | 11,285,000 | 11,689,987 |
| 6.65% 2/1/34 | | 37,000,000 | 38,535,643 |
| 6.834% 10/23/55 | | 3,000,000 | 2,977,196 |
| Clear Channel Outdoor Holdings, Inc.: | | | |
| 5.125% 8/15/27(b) | | 2,313,000 | 2,259,598 |
| 7.5% 6/1/29(b) | | 2,367,000 | 1,995,909 |
| 7.875% 4/1/30(b)(c) | | 3,520,000 | 3,677,897 |
| 9% 9/15/28(b)(c) | | 3,180,000 | 3,380,238 |
| Comcast Corp.: | | | |
| 3.9% 3/1/38 | | 3,341,000 | 2,960,756 |
| 4.65% 7/15/42 | | 7,870,000 | 7,331,327 |
| 6.45% 3/15/37 | | 1,399,000 | 1,589,623 |
| CSC Holdings LLC: | | | |
| 3.375% 2/15/31(b) | | 2,636,000 | 1,695,060 |
| 4.125% 12/1/30(b) | | 3,005,000 | 1,981,669 |
| 4.5% 11/15/31(b) | | 950,000 | 631,805 |
| 4.625% 12/1/30(b) | | 7,663,000 | 2,996,189 |
| 5.375% 2/1/28(b) | | 5,145,000 | 3,955,940 |
| Diamond Sports Group LLC/Diamond Sports Finance Co. 5.375% (b)(d) | | 3,135,000 | 39,188 |
| Discovery Communications LLC 3.625% 5/15/30 | | 13,528,000 | 12,007,582 |
| DISH DBS Corp.: | | | |
| 5.75% 12/1/28(b) | | 4,415,000 | 3,396,935 |
| 5.875% 11/15/24 | | 855,000 | 829,929 |
| DISH Network Corp. 11.75% 11/15/27 (b) | | 9,654,000 | 9,815,849 |
| Fox Corp.: | | | |
| 4.709% 1/25/29 | | 5,868,000 | 5,909,120 |
| 5.476% 1/25/39 | | 5,787,000 | 5,765,169 |
| 5.576% 1/25/49 | | 3,840,000 | 3,715,378 |
| LCPR Senior Secured Financing DAC: | | | |
| 5.125% 7/15/29(b) | | 5,432,000 | 4,386,848 |
| 6.75% 10/15/27(b) | | 4,561,000 | 4,170,084 |
| Outfront Media Capital LLC / Corp. 7.375% 2/15/31 (b) | | 3,030,000 | 3,220,566 |
| Sirius XM Radio, Inc.: | | | |
| 4.125% 7/1/30(b) | | 3,450,000 | 3,096,661 |
| 5.5% 7/1/29(b) | | 553,000 | 538,209 |
| Telecomunicaciones Digitales SA 4.5% 1/30/30 (b) | | 3,155,000 | 2,869,094 |
| Time Warner Cable LLC: | | | |
| 4.5% 9/15/42 | | 18,291,000 | 13,862,403 |
| 5.5% 9/1/41 | | 8,265,000 | 7,152,068 |
| 5.875% 11/15/40 | | 10,540,000 | 9,514,351 |
| 6.55% 5/1/37 | | 29,622,000 | 29,225,260 |
| 7.3% 7/1/38 | | 24,672,000 | 25,802,611 |
| TV Azteca SA de CV 8.25% (Reg. S) (d) | | 4,321,000 | 1,641,980 |
| Univision Communications, Inc.: | | | |
| 4.5% 5/1/29(b) | | 2,915,000 | 2,558,115 |
| 6.625% 6/1/27(b) | | 4,568,000 | 4,521,510 |
| 7.375% 6/30/30(b) | | 2,515,000 | 2,413,998 |
| 8% 8/15/28(b) | | 2,718,000 | 2,749,896 |
| 8.5% 7/31/31(b) | | 2,895,000 | 2,889,250 |
| Virgin Media Secured Finance PLC 4.5% 8/15/30 (b) | | 4,925,000 | 4,349,279 |
| VTR Finance BV 6.375% 7/15/28 (b) | | 2,080,000 | 1,903,200 |
| Warnermedia Holdings, Inc.: | | | |
| 3.755% 3/15/27 | | 15,793,000 | 15,130,387 |
| 4.054% 3/15/29 | | 5,474,000 | 5,114,193 |
| 4.279% 3/15/32 | | 67,020,000 | 58,585,593 |
| 4.693% 5/17/33 (Reg. S) | EUR | 3,425,000 | 3,739,469 |
| 5.05% 3/15/42 | | 11,773,000 | 9,434,113 |
| 5.141% 3/15/52 | | 75,442,000 | 57,381,077 |
| Ziggo Bond Co. BV 6% 1/15/27 (b) | | 243,000 | 242,301 |
| Ziggo BV 4.875% 1/15/30 (b) | | 2,545,000 | 2,372,748 |
| | | | 609,397,765 |
| Wireless Telecommunication Services - 0.4% | | | |
| AXIAN Telecom 7.375% 2/16/27 (b) | | 2,995,000 | 2,988,448 |
| C&W Senior Finance Ltd. 6.875% 9/15/27 (b) | | 11,737,000 | 11,554,593 |
| CT Trust 5.125% 2/3/32 (b) | | 2,520,000 | 2,258,550 |
| Intelsat Jackson Holdings SA 6.5% 3/15/30 (b) | | 7,795,000 | 7,484,745 |
| Millicom International Cellular SA: | | | |
| 4.5% 4/27/31(b) | | 3,335,000 | 2,966,082 |
| 5.125% 1/15/28(b) | | 549,000 | 530,954 |
| 7.375% 4/2/32(b) | | 2,850,000 | 2,876,790 |
| MTN (Mauritius) Investments Ltd. 6.5% 10/13/26 (b) | | 1,019,000 | 1,028,553 |
| T-Mobile U.S.A., Inc.: | | | |
| 2.25% 11/15/31 | | 35,000,000 | 29,702,506 |
| 3.75% 4/15/27 | | 23,850,000 | 23,417,130 |
| 3.875% 4/15/30 | | 42,000,000 | 40,408,039 |
| 4.375% 4/15/40 | | 5,147,000 | 4,638,798 |
| 5.05% 7/15/33 | | 29,000,000 | 29,354,727 |
| VMED O2 UK Financing I PLC: | | | |
| 4.25% 1/31/31(b) | | 4,510,000 | 3,920,736 |
| 7.75% 4/15/32(b) | | 240,000 | 243,996 |
| Vodafone Group PLC: | | | |
| 4.875% 10/3/78 (Reg. S)(e) | GBP | 5,150,000 | 6,687,608 |
| 6.25% 10/3/78 (Reg. S)(e) | | 739,000 | 738,933 |
| VTR Comunicaciones SpA: | | | |
| 4.375% 4/15/29(b) | | 565,000 | 486,606 |
| 5.125% 1/15/28(b) | | 1,768,000 | 1,621,592 |
| | | | 172,909,386 |
TOTAL COMMUNICATION SERVICES | | | 1,000,804,122 |
| | | | |
| CONSUMER DISCRETIONARY - 1.3% | | | |
| Automobile Components - 0.1% | | | |
| Adient Global Holdings Ltd. 7% 4/15/28 (b) | | 575,000 | 590,970 |
| Dana, Inc.: | | | |
| 4.25% 9/1/30 | | 775,000 | 697,957 |
| 5.375% 11/15/27 | | 515,000 | 509,816 |
| Hertz Corp. 12.625% 7/15/29 (b)(c) | | 230,000 | 244,989 |
| Macquarie AirFinance Holdings: | | | |
| 6.4% 3/26/29(b) | | 3,205,000 | 3,335,480 |
| 6.5% 3/26/31(b) | | 2,915,000 | 3,073,442 |
| 8.125% 3/30/29(b) | | 3,120,000 | 3,315,693 |
| 8.375% 5/1/28(b) | | 2,070,000 | 2,193,235 |
| Metalsa SA de CV 3.75% 5/4/31 (b) | | 1,525,000 | 1,277,188 |
| Robert Bosch GmbH 4.375% 6/2/43 (Reg. S) | EUR | 1,500,000 | 1,720,187 |
| Schaeffler AG 4.75% 8/14/29 (Reg. S) | EUR | 3,000,000 | 3,389,751 |
| ZF Europe Finance BV 2% 2/23/26 (Reg. S) | EUR | 1,600,000 | 1,711,159 |
| ZF Finance GmbH 2% 5/6/27 (Reg. S) | EUR | 2,600,000 | 2,711,213 |
| ZF North America Capital, Inc.: | | | |
| 4.75% 4/29/25(b) | | 3,149,000 | 3,121,345 |
| 6.75% 4/23/30(b) | | 2,900,000 | 2,981,101 |
| 6.875% 4/14/28(b) | | 1,040,000 | 1,074,466 |
| 6.875% 4/23/32(b) | | 1,760,000 | 1,828,682 |
| 7.125% 4/14/30(b) | | 1,040,000 | 1,089,821 |
| | | | 34,866,495 |
| Automobiles - 0.2% | | | |
| Aston Martin Capital Holdings Ltd. 10% 3/31/29 (b) | | 2,095,000 | 2,133,504 |
| Ford Motor Co. 3.25% 2/12/32 | | 54,000,000 | 45,993,175 |
| McLaren Finance PLC 7.5% 8/1/26 (b) | | 2,380,000 | 2,090,820 |
| RCI Banque SA 5.5% 10/9/34 (Reg. S) (e) | EUR | 1,900,000 | 2,139,883 |
| Rivian Holdco & Rivian LLC & Rivian Automotive LLC CME Term SOFR 6 Month Index + 6.050% 11.3595% 10/15/26 (b)(e)(f) | | 14,947,000 | 14,948,212 |
| | | | 67,305,594 |
| Broadline Retail - 0.1% | | | |
| Alibaba Group Holding Ltd. 2.125% 2/9/31 | | 1,005,000 | 862,481 |
| JD.com, Inc. 3.375% 1/14/30 | | 2,505,000 | 2,359,184 |
| John Lewis PLC 6.125% 1/21/25 | GBP | 14,058,000 | 18,487,028 |
| Kohl's Corp. 4.25% 7/17/25 | | 260,000 | 257,526 |
| Match Group Holdings II LLC: | | | |
| 4.125% 8/1/30(b) | | 1,210,000 | 1,114,576 |
| 5% 12/15/27(b) | | 2,650,000 | 2,598,013 |
| Nordstrom, Inc.: | | | |
| 4.25% 8/1/31 | | 2,260,000 | 2,011,003 |
| 4.375% 4/1/30(c) | | 1,185,000 | 1,088,235 |
| Prosus NV: | | | |
| 3.061% 7/13/31(b) | | 1,585,000 | 1,359,633 |
| 3.68% 1/21/30(b) | | 1,370,000 | 1,262,113 |
| 4.027% 8/3/50(b) | | 2,355,000 | 1,652,916 |
| 4.193% 1/19/32(b) | | 720,000 | 653,400 |
| | | | 33,706,108 |
| Distributors - 0.0% | | | |
| The Gates Corp. 6.875% 7/1/29 (b) | | 2,450,000 | 2,513,074 |
| Windsor Holdings III, LLC 8.5% 6/15/30 (b) | | 1,990,000 | 2,131,622 |
| | | | 4,644,696 |
| Diversified Consumer Services - 0.1% | | | |
| Service Corp. International: | | | |
| 4% 5/15/31 | | 1,650,000 | 1,514,139 |
| 5.125% 6/1/29(c) | | 1,040,000 | 1,027,731 |
| Sotheby's 7.375% 10/15/27 (b) | | 2,783,000 | 2,657,617 |
| StoneMor, Inc. 8.5% 5/15/29 (b) | | 995,000 | 885,360 |
| TKC Holdings, Inc.: | | | |
| 6.875% 5/15/28(b) | | 3,464,000 | 3,441,566 |
| 10.5% 5/15/29(b) | | 4,516,000 | 4,504,630 |
| WASH Multifamily Acquisition, Inc. 5.75% 4/15/26 (b) | | 6,510,000 | 6,480,098 |
| | | | 20,511,141 |
| Hotels, Restaurants & Leisure - 0.4% | | | |
| 1011778 BC Unlimited Liability Co./New Red Finance, Inc.: | | | |
| 3.875% 1/15/28(b) | | 1,475,000 | 1,408,533 |
| 4% 10/15/30(b) | | 2,910,000 | 2,665,506 |
| 4.375% 1/15/28(b) | | 4,380,000 | 4,234,297 |
| 5.75% 4/15/25(b) | | 837,000 | 835,585 |
| 6.125% 6/15/29(b) | | 2,495,000 | 2,548,081 |
| Affinity Interactive 6.875% 12/15/27 (b) | | 1,170,000 | 1,002,930 |
| Aramark Services, Inc. 5% 2/1/28 (b) | | 2,324,000 | 2,279,466 |
| Bimbo Bakeries U.S.A., Inc.: | | | |
| 5.375% 1/9/36(b) | | 1,025,000 | 1,040,375 |
| 6.4% 1/15/34(b) | | 1,155,000 | 1,262,559 |
| Caesars Entertainment, Inc.: | | | |
| 6.5% 2/15/32(b) | | 4,105,000 | 4,218,425 |
| 7% 2/15/30(b) | | 3,161,000 | 3,273,430 |
| 8.125% 7/1/27(b) | | 4,035,000 | 4,120,703 |
| Carnival Corp.: | | | |
| 6% 5/1/29(b) | | 2,885,000 | 2,897,899 |
| 6.65% 1/15/28 | | 450,000 | 459,544 |
| 7.625% 3/1/26(b) | | 6,600,000 | 6,666,858 |
| 10.5% 6/1/30(b) | | 5,990,000 | 6,501,247 |
| ClubCorp Holdings, Inc. 8.5% 9/15/25 (b) | | 880,000 | 818,400 |
| Fertitta Entertainment LLC / Fertitta Entertainment Finance Co., Inc. 6.75% 1/15/30 (b) | | 7,227,000 | 6,496,770 |
| Garden SpinCo Corp. 8.625% 7/20/30 (b)(c) | | 935,000 | 1,020,284 |
| GENM Capital Labuan Ltd. 3.882% 4/19/31 (b) | | 1,985,000 | 1,774,714 |
| Hilton Domestic Operating Co., Inc.: | | | |
| 3.625% 2/15/32(b) | | 6,640,000 | 5,951,652 |
| 4% 5/1/31(b) | | 2,915,000 | 2,693,649 |
| 5.875% 4/1/29(b) | | 1,755,000 | 1,788,470 |
| 6.125% 4/1/32(b) | | 1,755,000 | 1,799,344 |
| Hilton Grand Vacations Borrower Escrow LLC: | | | |
| 4.875% 7/1/31(b) | | 1,425,000 | 1,277,616 |
| 6.625% 1/15/32(b) | | 4,085,000 | 4,134,232 |
| InterContinental Hotel Group PLC 3.375% 10/8/28 (Reg. S) | GBP | 2,700,000 | 3,339,643 |
| Jacobs Entertainment, Inc. 6.75% 2/15/29 (b) | | 2,013,000 | 1,920,409 |
| Life Time, Inc.: | | | |
| 5.75% 1/15/26(b) | | 3,639,000 | 3,639,597 |
| 8% 4/15/26(b)(c) | | 5,129,000 | 5,206,289 |
| Lindblad Expeditions LLC 6.75% 2/15/27 (b) | | 490,000 | 486,885 |
| MajorDrive Holdings IV LLC 6.375% 6/1/29 (b) | | 3,954,000 | 3,727,678 |
| McDonald's Corp. 3.5% 7/1/27 | | 6,642,000 | 6,499,587 |
| Meituan: | | | |
| 2.125% 10/28/25(b) | | 1,375,000 | 1,327,026 |
| 3.05% 10/28/30(b) | | 1,885,000 | 1,688,281 |
| Merlin Entertainments Group 7.375% 2/15/31 (b) | | 975,000 | 971,393 |
| MGM Resorts International 6.5% 4/15/32 | | 2,100,000 | 2,115,013 |
| NCL Corp. Ltd.: | | | |
| 3.625% 12/15/24(b) | | 4,265,000 | 4,235,442 |
| 5.875% 3/15/26(b) | | 1,345,000 | 1,344,266 |
| Ontario Gaming GTA LP / OTG Co. issuer, Inc. 8% 8/1/30 (b) | | 97,000 | 99,978 |
| Royal Caribbean Cruises Ltd.: | | | |
| 4.25% 7/1/26(b) | | 2,445,000 | 2,401,886 |
| 5.375% 7/15/27(b) | | 1,930,000 | 1,933,298 |
| 5.5% 8/31/26(b) | | 5,135,000 | 5,142,276 |
| 6% 2/1/33(b) | | 4,335,000 | 4,440,722 |
| 6.25% 3/15/32(b) | | 1,060,000 | 1,094,681 |
| 7.25% 1/15/30(b) | | 850,000 | 898,585 |
| Station Casinos LLC: | | | |
| 4.5% 2/15/28(b) | | 2,371,000 | 2,275,614 |
| 6.625% 3/15/32(b) | | 2,085,000 | 2,126,854 |
| Sugarhouse HSP Gaming Prop Mezz LP/Sugarhouse HSP Gaming Finance Corp. 5.875% 5/15/25 (b) | | 546,000 | 545,665 |
| Times Square Hotel Trust 8.528% 8/1/26 (b) | | 421,125 | 421,325 |
| Viking Cruises Ltd. 9.125% 7/15/31 (b) | | 665,000 | 729,543 |
| Viking Ocean Cruises Ship VII Ltd. 5.625% 2/15/29 (b) | | 950,000 | 942,098 |
| Voc Escrow Ltd. 5% 2/15/28 (b) | | 1,305,000 | 1,280,273 |
| Whitbread PLC 2.375% 5/31/27 (Reg. S) | GBP | 1,850,000 | 2,246,220 |
| Wynn Resorts Finance LLC / Wynn Resorts Capital Corp. 7.125% 2/15/31 (b) | | 950,000 | 1,008,267 |
| Yum! Brands, Inc.: | | | |
| 3.625% 3/15/31 | | 490,000 | 449,748 |
| 4.625% 1/31/32 | | 5,170,000 | 4,899,961 |
| 5.375% 4/1/32 | | 760,000 | 753,444 |
| | | | 143,362,516 |
| Household Durables - 0.0% | | | |
| Ashton Woods U.S.A. LLC/Ashton Woods Finance Co. 4.625% 8/1/29 (b) | | 1,345,000 | 1,273,602 |
| Beazer Homes U.S.A., Inc. 7.5% 3/15/31 (b) | | 1,655,000 | 1,684,812 |
| Landsea Homes Corp. 8.875% 4/1/29 (b) | | 1,313,000 | 1,359,011 |
| LGI Homes, Inc.: | | | |
| 4% 7/15/29(b) | | 1,268,000 | 1,151,258 |
| 8.75% 12/15/28(b) | | 862,000 | 918,418 |
| Newell Brands, Inc.: | | | |
| 5.7% 4/1/26 | | 640,000 | 637,739 |
| 6.375% 9/15/27 | | 740,000 | 743,510 |
| 6.625% 9/15/29 | | 1,055,000 | 1,053,379 |
| 6.875% 4/1/36(c)(g) | | 556,000 | 528,712 |
| 7% 4/1/46(g) | | 760,000 | 658,970 |
| The Berkeley Group PLC 2.5% 8/11/31 (Reg. S) | GBP | 3,350,000 | 3,503,000 |
| TopBuild Corp. 4.125% 2/15/32 (b) | | 1,870,000 | 1,702,047 |
| Vestel Elektonik Sanayi ve Ticaret A/S 9.75% 5/15/29 (b) | | 1,165,000 | 1,172,118 |
| | | | 16,386,576 |
| Leisure Products - 0.0% | | | |
| Amer Sports Co. 6.75% 2/16/31 (b)(c) | | 4,735,000 | 4,811,876 |
| Specialty Retail - 0.2% | | | |
| Arko Corp. 5.125% 11/15/29 (b) | | 2,162,000 | 1,920,245 |
| AutoNation, Inc. 4.75% 6/1/30 | | 2,958,000 | 2,922,451 |
| AutoZone, Inc. 4% 4/15/30 | | 20,750,000 | 20,157,119 |
| Bath & Body Works, Inc. 6.694% 1/15/27 | | 955,000 | 983,437 |
| Carvana Co.: | | | |
| 4.875% 9/1/29(b) | | 1,397,000 | 1,174,949 |
| 5.5% 4/15/27(b) | | 1,512,000 | 1,404,048 |
| 5.625% 10/1/25(b) | | 4,515,000 | 4,413,459 |
| 5.875% 10/1/28(b) | | 800,000 | 719,046 |
| 10.25% 5/1/30(b) | | 220,000 | 226,150 |
| 12% 12/1/28 pay-in-kind(b)(e) | | 2,165,462 | 2,247,671 |
| 13% 6/1/30 pay-in-kind(b)(e) | | 1,174,080 | 1,253,394 |
| 14% 6/1/31 pay-in-kind(b)(e) | | 4,746,735 | 5,405,883 |
| Champions Financing, Inc. 8.75% 2/15/29 (b) | | 3,798,000 | 3,895,444 |
| Group 1 Automotive, Inc. 6.375% 1/15/30 (b) | | 470,000 | 478,137 |
| Hudson Automotive Group 8% 5/15/32 (b) | | 1,290,000 | 1,360,625 |
| LBM Acquisition LLC 6.25% 1/15/29 (b) | | 2,705,000 | 2,445,220 |
| LCM Investments Holdings 8.25% 8/1/31 (b) | | 980,000 | 1,041,987 |
| Lowe's Companies, Inc.: | | | |
| 3.35% 4/1/27 | | 2,389,000 | 2,329,980 |
| 4.45% 4/1/62 | | 33,905,000 | 27,677,157 |
| Michaels Companies, Inc.: | | | |
| 5.25% 5/1/28(b) | | 1,363,000 | 1,070,150 |
| 7.875% 5/1/29(b) | | 430,000 | 251,731 |
| O'Reilly Automotive, Inc. 4.2% 4/1/30 | | 4,640,000 | 4,556,656 |
| Sally Holdings LLC 6.75% 3/1/32 (c) | | 2,070,000 | 2,111,549 |
| Staples, Inc.: | | | |
| 10.75% 9/1/29(b) | | 3,925,000 | 3,696,977 |
| 12.75% 1/15/30(b) | | 3,167,485 | 2,448,069 |
| Wand NewCo 3, Inc. 7.625% 1/30/32 (b) | | 2,605,000 | 2,729,076 |
| | | | 98,920,610 |
| Textiles, Apparel & Luxury Goods - 0.2% | | | |
| Crocs, Inc. 4.125% 8/15/31 (b) | | 1,255,000 | 1,128,021 |
| Kontoor Brands, Inc. 4.125% 11/15/29 (b) | | 800,000 | 753,327 |
| Levi Strauss & Co. 3.5% 3/1/31 (b) | | 450,000 | 405,940 |
| Tapestry, Inc.: | | | |
| 7% 11/27/26 | | 10,275,000 | 10,598,582 |
| 7.05% 11/27/25 | | 3,809,000 | 3,879,605 |
| 7.35% 11/27/28 | | 16,432,000 | 17,235,974 |
| 7.7% 11/27/30 | | 19,003,000 | 20,234,478 |
| 7.85% 11/27/33 | | 19,003,000 | 20,333,732 |
| Wolverine World Wide, Inc. 4% 8/15/29 (b) | | 2,580,000 | 2,197,021 |
| | | | 76,766,680 |
TOTAL CONSUMER DISCRETIONARY | | | 501,282,292 |
| | | | |
| CONSUMER STAPLES - 1.0% | | | |
| Beverages - 0.3% | | | |
| Anheuser-Busch Companies LLC / Anheuser-Busch InBev Worldwide, Inc. 4.9% 2/1/46 | | 10,000,000 | 9,600,820 |
| Anheuser-Busch InBev Worldwide, Inc.: | | | |
| 4.35% 6/1/40 | | 13,754,000 | 12,686,112 |
| 5.45% 1/23/39 | | 18,170,000 | 19,119,913 |
| 5.55% 1/23/49 | | 34,229,000 | 35,870,030 |
| 5.8% 1/23/59 (Reg. S) | | 36,395,000 | 39,954,264 |
| Central American Bottling Corp. 5.25% 4/27/29 (b) | | 2,520,000 | 2,429,438 |
| Triton Water Holdings, Inc. 6.25% 4/1/29 (b) | | 4,595,000 | 4,544,089 |
| | | | 124,204,666 |
| Consumer Staples Distribution & Retail - 0.3% | | | |
| Albertsons Companies LLC/Safeway, Inc./New Albertson's, Inc./Albertson's LLC: | | | |
| 3.5% 3/15/29(b) | | 4,205,000 | 3,894,456 |
| 4.875% 2/15/30(b) | | 3,815,000 | 3,728,639 |
| C&S Group Enterprises LLC 5% 12/15/28 (b) | | 4,516,000 | 3,411,403 |
| KeHE Distributor / Nextwave 9% 2/15/29 (b) | | 4,105,000 | 4,282,648 |
| Kroger Co.: | | | |
| 4.65% 9/15/29 | | 19,550,000 | 19,549,008 |
| 4.9% 9/15/31 | | 19,550,000 | 19,535,371 |
| 5% 9/15/34 | | 19,550,000 | 19,489,237 |
| Minerva Luxembourg SA 8.875% 9/13/33 (b) | | 1,210,000 | 1,306,113 |
| NBM U.S. Holdings, Inc. 6.625% 8/6/29 (b) | | 2,015,000 | 2,020,662 |
| Performance Food Group, Inc. 5.5% 10/15/27 (b) | | 2,247,000 | 2,234,195 |
| REWE International Finance 4.875% 9/13/30 (Reg. S) | EUR | 1,100,000 | 1,291,123 |
| Sigma Holdco BV 7.875% 5/15/26 (b) | | 4,445,000 | 4,384,638 |
| Sysco Corp. 5.95% 4/1/30 | | 8,801,000 | 9,393,261 |
| Tesco Corporate Treasury Services PLC 2.75% 4/27/30 (Reg. S) | GBP | 3,545,000 | 4,177,066 |
| U.S. Foods, Inc.: | | | |
| 4.625% 6/1/30(b)(c) | | 1,130,000 | 1,081,622 |
| 4.75% 2/15/29(b) | | 3,290,000 | 3,207,902 |
| 6.875% 9/15/28(b) | | 1,230,000 | 1,279,479 |
| United Natural Foods, Inc. 6.75% 10/15/28 (b) | | 630,000 | 591,689 |
| Walgreens Boots Alliance, Inc. 8.125% 8/15/29 | | 1,455,000 | 1,456,637 |
| | | | 106,315,149 |
| Food Products - 0.0% | | | |
| Adecoagro SA 6% 9/21/27 (b) | | 870,000 | 859,943 |
| Camposol SA 6% 2/3/27 (b) | | 1,395,000 | 1,258,388 |
| Darling Ingredients, Inc. 6% 6/15/30 (b)(c) | | 1,365,000 | 1,381,707 |
| Fiesta Purchaser, Inc. 7.875% 3/1/31 (b)(c) | | 1,895,000 | 1,993,542 |
| JDE Peet's BV 2.25% 9/24/31 (b) | | 3,931,000 | 3,257,767 |
| Lamb Weston Holdings, Inc.: | | | |
| 4.125% 1/31/30(b) | | 5,800,000 | 5,398,841 |
| 4.375% 1/31/32(b) | | 850,000 | 782,957 |
| MARB BondCo PLC 3.95% 1/29/31 (b) | | 1,235,000 | 1,044,810 |
| Post Holdings, Inc.: | | | |
| 4.625% 4/15/30(b) | | 2,555,000 | 2,428,296 |
| 5.5% 12/15/29(b) | | 3,595,000 | 3,533,236 |
| 6.25% 2/15/32(b) | | 2,480,000 | 2,543,267 |
| 6.375% 3/1/33(b) | | 2,140,000 | 2,155,622 |
| | | | 26,638,376 |
| Household Products - 0.0% | | | |
| Kronos Acquisition Holdings, Inc.: | | | |
| 8.25% 6/30/31(b) | | 1,065,000 | 1,095,854 |
| 10.75% 6/30/32(b) | | 1,065,000 | 1,061,702 |
| Reckitt Benckiser Treasury Services PLC 3.875% 9/14/33 (Reg. S) | EUR | 830,000 | 931,565 |
| Resideo Funding, Inc. 6.5% 7/15/32 (b) | | 1,510,000 | 1,537,275 |
| | | | 4,626,396 |
| Personal Care Products - 0.0% | | | |
| BellRing Brands, Inc. 7% 3/15/30 (b) | | 760,000 | 789,322 |
| Tobacco - 0.4% | | | |
| Altria Group, Inc.: | | | |
| 3.875% 9/16/46 | | 28,850,000 | 22,068,742 |
| 4.25% 8/9/42 | | 17,795,000 | 14,953,239 |
| 4.5% 5/2/43 | | 11,887,000 | 10,247,349 |
| 4.8% 2/14/29 | | 3,305,000 | 3,323,969 |
| 5.95% 2/14/49 | | 14,275,000 | 14,710,363 |
| BAT Capital Corp.: | | | |
| 5.834% 2/20/31 | | 4,500,000 | 4,723,305 |
| 6.421% 8/2/33 | | 21,453,000 | 23,261,957 |
| BAT International Finance PLC 4.125% 4/12/32 (Reg. S) | EUR | 4,650,000 | 5,155,673 |
| Imperial Brands Finance PLC: | | | |
| 4.25% 7/21/25(b) | | 1,212,000 | 1,201,278 |
| 6.125% 7/27/27(b) | | 12,116,000 | 12,538,352 |
| Reynolds American, Inc.: | | | |
| 4.45% 6/12/25 | | 5,827,000 | 5,796,787 |
| 5.7% 8/15/35 | | 2,699,000 | 2,763,490 |
| 5.85% 8/15/45 | | 22,737,000 | 22,270,381 |
| 6.15% 9/15/43 | | 2,874,000 | 2,918,081 |
| 7.25% 6/15/37 | | 3,221,000 | 3,654,618 |
| | | | 149,587,584 |
TOTAL CONSUMER STAPLES | | | 412,161,493 |
| | | | |
| ENERGY - 3.7% | | | |
| Energy Equipment & Services - 0.1% | | | |
| Archrock Partners LP / Archrock Partners Finance Corp. 6.625% 9/1/32 (b) | | 2,175,000 | 2,202,128 |
| Guara Norte SARL 5.198% 6/15/34 (b) | | 1,387,151 | 1,313,161 |
| Halliburton Co.: | | | |
| 3.8% 11/15/25 | | 152,000 | 150,326 |
| 4.85% 11/15/35 | | 5,447,000 | 5,377,227 |
| Nabors Industries, Inc.: | | | |
| 8.875% 8/15/31(b) | | 1,310,000 | 1,312,637 |
| 9.125% 1/31/30(b) | | 505,000 | 541,153 |
| Oleoducto Central SA 4% 7/14/27 (b) | | 1,503,000 | 1,434,895 |
| Seadrill Finance Ltd. 8.375% 8/1/30 (b) | | 925,000 | 976,411 |
| Southern Gas Corridor CJSC 6.875% 3/24/26 (b) | | 4,031,000 | 4,099,023 |
| Star Holding LLC 8.75% 8/1/31 (b) | | 835,000 | 818,008 |
| State Oil Co. of Azerbaijan Republic 6.95% 3/18/30 (Reg. S) | | 950,000 | 1,002,155 |
| The Oil and Gas Holding Co.: | | | |
| 7.5% 10/25/27(b) | | 2,177,000 | 2,264,760 |
| 8.375% 11/7/28(b) | | 485,000 | 525,318 |
| Transocean Aquila Ltd. 8% 9/30/28 (b) | | 690,000 | 709,566 |
| Transocean Poseidon Ltd. 6.875% 2/1/27 (b) | | 1,267,800 | 1,268,720 |
| Transocean, Inc.: | | | |
| 8% 2/1/27(b) | | 3,949,000 | 3,948,594 |
| 8.25% 5/15/29(b) | | 1,755,000 | 1,776,727 |
| 8.5% 5/15/31(b) | | 2,255,000 | 2,288,167 |
| 8.75% 2/15/30(b) | | 1,534,250 | 1,620,684 |
| U.S.A. Compression Partners LP/U.S.A. Compression Finance Corp. 7.125% 3/15/29 (b) | | 2,100,000 | 2,157,042 |
| Valaris Ltd. 8.375% 4/30/30 (b) | | 3,900,000 | 4,068,613 |
| Vallourec SA 7.5% 4/15/32 (b) | | 4,205,000 | 4,427,966 |
| Viridien 8.75% 4/1/27 (b) | | 4,965,000 | 4,756,616 |
| Yinson Boronia Production BV 8.947% 7/31/42 (b) | | 3,362,000 | 3,523,544 |
| | | | 52,563,441 |
| Oil, Gas & Consumable Fuels - 3.6% | | | |
| Antero Midstream Partners LP/Antero Midstream Finance Corp. 5.75% 3/1/27 (b) | | 950,000 | 946,309 |
| Baytex Energy Corp. 7.375% 3/15/32 (b) | | 2,095,000 | 2,169,760 |
| Blue Racer Midstream LLC/Blue Racer Finance Corp.: | | | |
| 7% 7/15/29(b) | | 730,000 | 759,318 |
| 7.25% 7/15/32(b) | | 730,000 | 765,393 |
| California Resources Corp.: | | | |
| 7.125% 2/1/26(b) | | 529,000 | 531,058 |
| 8.25% 6/15/29(b) | | 5,745,000 | 5,925,549 |
| Calumet Specialty Products Partners LP/Calumet Finance Corp. 9.75% 7/15/28 (b) | | 1,460,000 | 1,435,481 |
| Canacol Energy Ltd. 5.75% 11/24/28 (b) | | 5,400,000 | 3,111,750 |
| Canadian Natural Resources Ltd.: | | | |
| 2.95% 7/15/30 | | 23,000,000 | 20,827,009 |
| 3.9% 2/1/25 | | 15,925,000 | 15,829,495 |
| 5.85% 2/1/35 | | 6,942,000 | 7,203,953 |
| Cenovus Energy, Inc.: | | | |
| 3.75% 2/15/52 | | 3,670,000 | 2,669,786 |
| 5.25% 6/15/37 | | 9,640,000 | 9,476,878 |
| 5.4% 6/15/47 | | 2,422,000 | 2,323,660 |
| 6.75% 11/15/39 | | 969,000 | 1,083,499 |
| Cheniere Energy Partners LP 5.75% 8/15/34 (b) | | 2,455,000 | 2,541,772 |
| Citgo Petroleum Corp.: | | | |
| 6.375% 6/15/26(b) | | 4,172,000 | 4,195,476 |
| 7% 6/15/25(b) | | 4,319,000 | 4,321,609 |
| 8.375% 1/15/29(b) | | 3,196,000 | 3,319,720 |
| CNX Midstream Partners LP 4.75% 4/15/30 (b) | | 2,780,000 | 2,592,866 |
| CNX Resources Corp.: | | | |
| 7.25% 3/1/32(b) | | 2,845,000 | 2,978,931 |
| 7.375% 1/15/31(b)(c) | | 2,150,000 | 2,246,765 |
| Columbia Pipelines Operating Co. LLC: | | | |
| 5.927% 8/15/30(b) | | 3,692,000 | 3,878,262 |
| 6.036% 11/15/33(b) | | 9,954,000 | 10,509,686 |
| 6.497% 8/15/43(b) | | 2,975,000 | 3,233,759 |
| 6.544% 11/15/53(b) | | 5,356,000 | 5,939,988 |
| 6.714% 8/15/63(b) | | 3,206,000 | 3,564,285 |
| Comstock Resources, Inc.: | | | |
| 5.875% 1/15/30(b) | | 4,274,000 | 4,040,734 |
| 6.75% 3/1/29(b)(c) | | 3,305,000 | 3,250,930 |
| CQP Holdco LP / BIP-V Chinook Holdco LLC 7.5% 12/15/33 (b) | | 4,195,000 | 4,532,471 |
| Crescent Energy Finance LLC 7.625% 4/1/32 (b) | | 1,070,000 | 1,103,345 |
| CrownRock LP/CrownRock Finance, Inc. 5% 5/1/29 (b) | | 2,795,000 | 2,833,546 |
| CVR Energy, Inc.: | | | |
| 5.75% 2/15/28(b) | | 6,446,000 | 6,078,853 |
| 8.5% 1/15/29(b) | | 3,830,000 | 3,902,003 |
| DCP Midstream Operating LP 6.45% 11/3/36 (b) | | 8,754,000 | 9,501,828 |
| Delek Logistics Partners LP/Delek Logistics Finance Corp.: | | | |
| 7.125% 6/1/28(b) | | 6,325,000 | 6,374,044 |
| 8.625% 3/15/29(b) | | 3,060,000 | 3,217,520 |
| DT Midstream, Inc.: | | | |
| 4.125% 6/15/29(b) | | 2,270,000 | 2,156,477 |
| 4.375% 6/15/31(b) | | 950,000 | 892,654 |
| Ecopetrol SA: | | | |
| 4.625% 11/2/31 | | 950,000 | 803,415 |
| 8.375% 1/19/36 | | 870,000 | 881,153 |
| 8.875% 1/13/33 | | 4,105,000 | 4,355,405 |
| EG Global Finance PLC 12% 11/30/28 (b) | | 13,445,000 | 14,666,115 |
| EIG Pearl Holdings SARL 3.545% 8/31/36 (b) | | 5,070,000 | 4,441,003 |
| Empresa Nacional de Petroleo: | | | |
| 5.95% 7/30/34(b) | | 730,000 | 757,375 |
| 6.15% 5/10/33(b) | | 1,065,000 | 1,112,925 |
| Energean Israel Finance Ltd.: | | | |
| 4.875% 3/30/26 (Reg. S)(b) | | 2,365,000 | 2,248,819 |
| 5.375% 3/30/28 (Reg. S)(b) | | 995,000 | 898,784 |
| 8.5% 9/30/33 (Reg. S)(b) | | 800,000 | 770,096 |
| Energean PLC 6.5% 4/30/27 (b) | | 4,315,000 | 4,259,509 |
| Energy Transfer LP: | | | |
| 3.75% 5/15/30 | | 18,703,000 | 17,691,529 |
| 4.95% 6/15/28 | | 12,566,000 | 12,696,219 |
| 5% 5/15/50 | | 36,762,000 | 32,604,489 |
| 5.25% 4/15/29 | | 6,576,000 | 6,722,839 |
| 5.4% 10/1/47 | | 33,221,000 | 31,061,390 |
| 5.8% 6/15/38 | | 7,006,000 | 7,179,050 |
| 6% 6/15/48 | | 6,263,000 | 6,324,354 |
| 6.125% 12/15/45 | | 1,400,000 | 1,437,532 |
| 6.25% 4/15/49 | | 4,516,000 | 4,698,828 |
| 7.375% 2/1/31(b) | | 1,695,000 | 1,804,617 |
| EnLink Midstream LLC: | | | |
| 5.625% 1/15/28(b) | | 2,235,000 | 2,276,164 |
| 6.5% 9/1/30(b) | | 3,465,000 | 3,704,452 |
| EnLink Midstream Partners LP: | | | |
| 4.15% 6/1/25 | | 1,015,000 | 1,003,112 |
| 4.85% 7/15/26 | | 1,780,000 | 1,774,601 |
| EQM Midstream Partners LP: | | | |
| 4.75% 1/15/31(b)(c) | | 780,000 | 749,421 |
| 6% 7/1/25(b) | | 239,000 | 239,251 |
| 6.5% 7/1/27(b) | | 650,000 | 666,245 |
| FEL Energy VI SARL 5.75% 12/1/40 (b) | | 1,301,867 | 1,229,451 |
| Galaxy Pipeline Assets BidCo Ltd.: | | | |
| 2.16% 3/31/34(b) | | 810,400 | 713,405 |
| 2.625% 3/31/36(b) | | 5,030,000 | 4,256,638 |
| GeoPark Ltd. 5.5% 1/17/27 (b) | | 1,720,000 | 1,622,184 |
| Global Partners LP/GLP Finance Corp.: | | | |
| 6.875% 1/15/29 | | 2,440,000 | 2,457,450 |
| 7% 8/1/27 | | 5,189,000 | 5,233,516 |
| 8.25% 1/15/32(b) | | 1,010,000 | 1,049,967 |
| Golar LNG Ltd. 7% 10/20/25 (b) | | 4,431,000 | 4,427,765 |
| Gran Tierra Energy, Inc. 9.5% 10/15/29 (b) | | 4,215,000 | 4,096,453 |
| Harbour Energy PLC 5.5% 10/15/26 (b) | | 720,000 | 714,703 |
| Harvest Midstream I LP: | | | |
| 7.5% 9/1/28(b) | | 3,815,000 | 3,904,286 |
| 7.5% 5/15/32(b) | | 1,235,000 | 1,298,300 |
| Hess Corp.: | | | |
| 5.6% 2/15/41 | | 19,538,000 | 19,979,073 |
| 5.8% 4/1/47 | | 15,757,000 | 16,344,891 |
| 7.125% 3/15/33 | | 3,656,000 | 4,164,650 |
| 7.3% 8/15/31 | | 8,054,000 | 9,189,785 |
| 7.875% 10/1/29 | | 13,500,000 | 15,418,926 |
| Hess Midstream Operations LP: | | | |
| 4.25% 2/15/30(b) | | 1,370,000 | 1,294,815 |
| 5.125% 6/15/28(b) | | 3,922,000 | 3,877,182 |
| 5.5% 10/15/30(b) | | 850,000 | 842,100 |
| 5.625% 2/15/26(b) | | 4,255,000 | 4,243,343 |
| 6.5% 6/1/29(b) | | 910,000 | 938,933 |
| HF Sinclair Corp. 5% 2/1/28 (b) | | 3,570,000 | 3,518,797 |
| Howard Midstream Energy Partners LLC: | | | |
| 7.375% 7/15/32(b) | | 1,490,000 | 1,542,540 |
| 8.875% 7/15/28(b) | | 3,500,000 | 3,731,165 |
| KazMunaiGaz National Co.: | | | |
| 3.5% 4/14/33(b) | | 1,415,000 | 1,205,849 |
| 5.375% 4/24/30(b) | | 520,000 | 514,150 |
| 5.75% 4/19/47(b) | | 460,000 | 418,457 |
| Kinder Morgan Energy Partners LP: | | | |
| 5.5% 3/1/44 | | 27,364,000 | 26,388,088 |
| 6.55% 9/15/40 | | 1,203,000 | 1,287,924 |
| Kinder Morgan, Inc.: | | | |
| 5.05% 2/15/46 | | 3,092,000 | 2,807,363 |
| 5.55% 6/1/45 | | 7,786,000 | 7,552,868 |
| Kinetik Holdings LP: | | | |
| 5.875% 6/15/30(b) | | 2,300,000 | 2,307,388 |
| 6.625% 12/15/28(b) | | 3,065,000 | 3,158,121 |
| Kosmos Energy Ltd.: | | | |
| 7.125% 4/4/26(b) | | 4,915,000 | 4,876,614 |
| 7.5% 3/1/28(b)(c) | | 1,784,000 | 1,728,250 |
| 7.75% 5/1/27(b) | | 500,000 | 494,531 |
| Leviathan Bond Ltd. 6.125% 6/30/25 (Reg. S) (b) | | 1,885,000 | 1,853,758 |
| Matador Resources Co. 6.5% 4/15/32 (b) | | 2,520,000 | 2,557,510 |
| MC Brazil Downstream Trading SARL 7.25% 6/30/31 (b) | | 3,518,588 | 3,174,426 |
| Medco Laurel Tree PTE Ltd. 6.95% 11/12/28 (b) | | 2,195,000 | 2,195,768 |
| Medco Maple Tree Pte. Ltd. 8.96% 4/27/29 (b) | | 1,995,000 | 2,110,959 |
| Medco Oak Tree Pte Ltd. 7.375% 5/14/26 (b) | | 288,000 | 291,330 |
| Mesquite Energy, Inc. 7.25% (b)(d)(h) | | 7,883,000 | 1 |
| Moss Creek Resources Holdings, Inc. 8.25% 9/1/31 (b) | | 2,185,000 | 2,203,802 |
| MPLX LP: | | | |
| 4.8% 2/15/29 | | 3,672,000 | 3,706,701 |
| 4.875% 12/1/24 | | 8,532,000 | 8,518,258 |
| 4.95% 9/1/32 | | 22,661,000 | 22,431,077 |
| 5.5% 2/15/49 | | 11,018,000 | 10,565,007 |
| Murphy Oil U.S.A., Inc. 3.75% 2/15/31 (b) | | 1,205,000 | 1,090,239 |
| NAK Naftogaz Ukraine: | | | |
| 7.625% 11/8/28(b) | | 1,165,000 | 920,350 |
| 7.65% (Reg. S) | | 792,803 | 685,775 |
| New Fortress Energy, Inc.: | | | |
| 6.5% 9/30/26(b)(c) | | 13,106,000 | 11,344,900 |
| 6.75% 9/15/25(b) | | 8,050,000 | 7,849,861 |
| Northern Oil & Gas, Inc.: | | | |
| 8.125% 3/1/28(b) | | 3,040,000 | 3,108,260 |
| 8.75% 6/15/31(b) | | 950,000 | 1,014,717 |
| Occidental Petroleum Corp.: | | | |
| 5.55% 3/15/26 | | 14,762,000 | 14,883,491 |
| 6.45% 9/15/36(c) | | 18,151,000 | 19,671,464 |
| 6.6% 3/15/46 | | 18,160,000 | 19,609,076 |
| 6.625% 9/1/30 | | 33,925,000 | 36,547,233 |
| 7.5% 5/1/31 | | 26,639,000 | 30,220,161 |
| 7.875% 9/15/31 | | 735,000 | 848,560 |
| 8.875% 7/15/30 | | 4,355,000 | 5,136,979 |
| Parkland Corp.: | | | |
| 4.5% 10/1/29(b) | | 1,115,000 | 1,052,532 |
| 4.625% 5/1/30(b) | | 5,315,000 | 4,971,031 |
| 6.625% 8/15/32(b) | | 1,735,000 | 1,753,173 |
| PBF Holding Co. LLC/PBF Finance Corp. 7.875% 9/15/30 (b) | | 5,980,000 | 6,218,381 |
| Permian Resources Operating LLC: | | | |
| 5.875% 7/1/29(b) | | 2,750,000 | 2,750,000 |
| 6.25% 2/1/33(b) | | 1,000,000 | 1,025,404 |
| 7% 1/15/32(b) | | 660,000 | 692,347 |
| Petroleos de Venezuela SA: | | | |
| 5.375%(d) | | 621,100 | 63,383 |
| 6%(b)(d) | | 3,540,167 | 359,327 |
| 6%(b)(d) | | 4,107,669 | 408,713 |
| 12.75%(b)(d) | | 172,000 | 21,199 |
| Petroleos Mexicanos: | | | |
| 4.5% 1/23/26 | | 22,915,000 | 22,034,205 |
| 5.35% 2/12/28 | | 650,000 | 592,599 |
| 5.95% 1/28/31 | | 123,292,000 | 101,985,909 |
| 6.35% 2/12/48 | | 43,373,000 | 28,631,385 |
| 6.49% 1/23/27 | | 36,590,000 | 35,497,154 |
| 6.5% 3/13/27 | | 61,276,000 | 58,932,193 |
| 6.5% 6/2/41 | | 380,000 | 267,425 |
| 6.625% 6/15/35 | | 6,753,000 | 5,247,081 |
| 6.7% 2/16/32 | | 64,277,000 | 55,181,805 |
| 6.75% 9/21/47 | | 33,853,000 | 23,033,243 |
| 6.84% 1/23/30 | | 17,201,000 | 15,487,780 |
| 6.875% 10/16/25 | | 1,060,000 | 1,059,006 |
| 6.875% 8/4/26 | | 1,895,000 | 1,867,769 |
| 6.95% 1/28/60 | | 24,897,000 | 16,958,094 |
| 7.69% 1/23/50 | | 57,080,000 | 42,364,776 |
| Petronas Capital Ltd.: | | | |
| 3.404% 4/28/61(b) | | 2,425,000 | 1,716,148 |
| 3.5% 4/21/30(b) | | 625,000 | 592,344 |
| Petrorio Luxembourg Holding SA 6.125% 6/9/26 (b) | | 1,115,000 | 1,107,334 |
| Phillips 66 Co. 3.85% 4/9/25 | | 2,401,000 | 2,380,501 |
| Plains All American Pipeline LP/PAA Finance Corp.: | | | |
| 3.55% 12/15/29 | | 4,919,000 | 4,630,284 |
| 3.6% 11/1/24 | | 4,912,000 | 4,894,972 |
| Prairie Acquiror LP 9% 8/1/29 (b) | | 645,000 | 674,631 |
| PT Adaro Indonesia 4.25% 10/31/24 (b) | | 2,375,000 | 2,362,745 |
| PT Pertamina Persero 4.175% 1/21/50 (b) | | 845,000 | 690,999 |
| QatarEnergy: | | | |
| 1.375% 9/12/26(b) | | 2,965,000 | 2,797,300 |
| 2.25% 7/12/31(b) | | 4,935,000 | 4,305,788 |
| 3.125% 7/12/41(b) | | 3,545,000 | 2,800,550 |
| 3.3% 7/12/51(b) | | 5,580,000 | 4,141,755 |
| Rockies Express Pipeline LLC: | | | |
| 4.8% 5/15/30(b) | | 220,000 | 204,221 |
| 4.95% 7/15/29(b) | | 2,610,000 | 2,494,512 |
| 6.875% 4/15/40(b) | | 990,000 | 959,600 |
| SA Global Sukuk Ltd. 1.602% 6/17/26 (b) | | 2,520,000 | 2,386,913 |
| Sabine Pass Liquefaction LLC 4.5% 5/15/30 | | 31,000,000 | 30,676,043 |
| Saudi Arabian Oil Co.: | | | |
| 2.25% 11/24/30(b) | | 5,210,000 | 4,542,469 |
| 3.25% 11/24/50(b) | | 2,170,000 | 1,521,713 |
| 3.5% 4/16/29(b) | | 3,740,000 | 3,575,206 |
| 3.5% 11/24/70(b) | | 1,580,000 | 1,066,500 |
| 4.25% 4/16/39(b) | | 4,395,000 | 3,989,122 |
| 4.375% 4/16/49(b) | | 640,000 | 550,000 |
| 5.875% 7/17/64(b) | | 615,000 | 622,903 |
| Seplat Energy PLC 7.75% 4/1/26 (b) | | 415,000 | 413,055 |
| Sitio Royalties OP / Sitio Finance Corp. 7.875% 11/1/28 (b) | | 1,230,000 | 1,295,464 |
| SM Energy Co.: | | | |
| 6.75% 8/1/29(b) | | 495,000 | 502,725 |
| 7% 8/1/32(b) | | 495,000 | 507,113 |
| Southwestern Energy Co. 4.75% 2/1/32 | | 2,275,000 | 2,156,204 |
| Sunoco Logistics Partners, LP: | | | |
| 7% 5/1/29(b) | | 950,000 | 989,603 |
| 7.25% 5/1/32(b)(c) | | 1,445,000 | 1,528,310 |
| Sunoco LP/Sunoco Finance Corp.: | | | |
| 4.5% 5/15/29 | | 2,900,000 | 2,784,307 |
| 5.875% 3/15/28 | | 2,625,000 | 2,627,559 |
| Tallgrass Energy Partners LP / Tallgrass Energy Finance Corp.: | | | |
| 5.5% 1/15/28(b) | | 3,710,000 | 3,579,686 |
| 6% 3/1/27(b) | | 2,595,000 | 2,587,671 |
| 6% 12/31/30(b) | | 7,715,000 | 7,357,437 |
| 6% 9/1/31(b) | | 5,080,000 | 4,814,353 |
| Talos Production, Inc.: | | | |
| 9% 2/1/29(b) | | 885,000 | 940,163 |
| 9.375% 2/1/31(b) | | 1,240,000 | 1,324,252 |
| Teine Energy Ltd. 6.875% 4/15/29 (b) | | 515,000 | 512,715 |
| Tengizchevroil Finance Co. International Ltd. 3.25% 8/15/30 (b) | | 2,227,000 | 1,902,704 |
| The Williams Companies, Inc.: | | | |
| 3.5% 11/15/30 | | 32,834,000 | 30,764,499 |
| 3.9% 1/15/25 | | 16,989,000 | 16,896,768 |
| 4% 9/15/25 | | 1,911,000 | 1,893,286 |
| 4.65% 8/15/32 | | 23,596,000 | 23,211,723 |
| 5.3% 8/15/52 | | 5,344,000 | 5,116,713 |
| Transcontinental Gas Pipe Line Co. LLC 3.25% 5/15/30 | | 3,952,000 | 3,669,167 |
| Tullow Oil PLC: | | | |
| 7% 3/1/25(b) | | 2,405,000 | 2,343,384 |
| 10.25% 5/15/26(b) | | 4,694,000 | 4,542,384 |
| Venture Global Calcasieu Pass LLC: | | | |
| 3.875% 8/15/29(b) | | 5,960,000 | 5,634,489 |
| 4.125% 8/15/31(b) | | 2,605,000 | 2,414,798 |
| 6.25% 1/15/30(b) | | 1,600,000 | 1,663,542 |
| Venture Global LNG, Inc. 7% 1/15/30 (b) | | 245,000 | 250,475 |
| Viper Energy, Inc. 7.375% 11/1/31 (b) | | 750,000 | 796,394 |
| Western Midstream Operating LP: | | | |
| 4.05% 2/1/30 | | 19,000,000 | 18,186,810 |
| 4.65% 7/1/26 | | 5,039,000 | 5,013,108 |
| 4.75% 8/15/28 | | 3,701,000 | 3,683,344 |
| | | | 1,397,509,370 |
TOTAL ENERGY | | | 1,450,072,811 |
| | | | |
| FINANCIALS - 11.2% | | | |
| Banks - 4.8% | | | |
| ABN AMRO Bank NV 3.875% 1/15/32 (Reg. S) | EUR | 3,400,000 | 3,815,752 |
| Access Bank PLC 6.125% 9/21/26 (b) | | 940,000 | 892,709 |
| AIB Group PLC: | | | |
| 2.25% 4/4/28 (Reg. S)(e) | EUR | 8,450,000 | 9,066,900 |
| 5.25% 10/23/31 (Reg. S)(e) | EUR | 1,880,000 | 2,255,435 |
| 6.608% 9/13/29(b)(e) | | 1,700,000 | 1,802,318 |
| Banco Bilbao Vizcaya Argentaria SA 6.033% 3/13/35 (e) | | 4,800,000 | 4,994,298 |
| Banco Do Brasil SA 6% 3/18/31 (b) | | 1,555,000 | 1,576,304 |
| Banco Espirito Santo SA 4% (Reg. S) (d)(h) | EUR | 1,300,000 | 402,366 |
| Bancolombia SA 8.625% 12/24/34 (e) | | 1,080,000 | 1,131,635 |
| Bank of America Corp.: | | | |
| 2.299% 7/21/32(e) | | 34,460,000 | 29,333,067 |
| 2.496% 2/13/31(e) | | 10,000,000 | 8,959,255 |
| 3.419% 12/20/28(e) | | 14,844,000 | 14,312,620 |
| 3.705% 4/24/28(e) | | 20,736,000 | 20,268,985 |
| 4.25% 10/22/26 | | 9,380,000 | 9,331,577 |
| 4.571% 4/27/33(e) | | 10,000,000 | 9,783,131 |
| 5.015% 7/22/33(e) | | 202,394,000 | 204,751,775 |
| 5.468% 1/23/35(e) | | 31,000,000 | 32,085,942 |
| Bank of Ireland Group PLC 5.601% 3/20/30 (b)(e) | | 4,600,000 | 4,708,261 |
| BankMuscat SAOG 4.75% 3/17/26 (Reg. S) | | 825,000 | 816,492 |
| Barclays PLC: | | | |
| 2.852% 5/7/26(e) | | 16,500,000 | 16,219,372 |
| 5.088% 6/20/30(e) | | 26,155,000 | 26,056,892 |
| 5.2% 5/12/26 | | 12,530,000 | 12,562,785 |
| 5.262% 1/29/34 (Reg. S)(e) | EUR | 5,490,000 | 6,607,044 |
| 5.69% 3/12/30(e) | | 28,747,000 | 29,636,518 |
| 5.829% 5/9/27(e) | | 27,350,000 | 27,735,127 |
| 6.224% 5/9/34(e) | | 20,610,000 | 21,895,624 |
| 6.49% 9/13/29(e) | | 36,156,000 | 38,300,631 |
| 8.407% 11/14/32 (Reg. S)(e) | GBP | 2,300,000 | 3,211,762 |
| BNP Paribas SA: | | | |
| 2.159% 9/15/29(b)(e) | | 10,072,000 | 9,082,748 |
| 2.219% 6/9/26(b)(e) | | 27,762,000 | 27,120,455 |
| 2.5% 3/31/32 (Reg. S)(e) | EUR | 5,000,000 | 5,317,388 |
| BPCE SA: | | | |
| 5.716% 1/18/30(b)(e) | | 2,250,000 | 2,305,023 |
| 7.003% 10/19/34(b)(e) | | 1,959,000 | 2,167,826 |
| Citigroup, Inc.: | | | |
| 2.666% 1/29/31(e) | | 10,000,000 | 9,007,713 |
| 4.3% 11/20/26 | | 5,384,000 | 5,350,226 |
| 4.4% 6/10/25 | | 13,145,000 | 13,072,679 |
| 4.412% 3/31/31(e) | | 42,031,000 | 41,342,843 |
| 4.45% 9/29/27 | | 19,254,000 | 19,163,311 |
| 4.6% 3/9/26 | | 8,567,000 | 8,546,043 |
| 4.91% 5/24/33(e) | | 98,011,000 | 97,487,257 |
| Citizens Financial Group, Inc. 2.638% 9/30/32 | | 10,185,000 | 8,273,917 |
| Commerzbank AG: | | | |
| 4.875% 10/16/34 (Reg. S)(e) | EUR | 2,600,000 | 2,926,620 |
| 8.625% 2/28/33 (Reg. S)(e) | GBP | 700,000 | 992,708 |
| Commonwealth Bank of Australia 3.61% 9/12/34 (b)(e) | | 9,644,000 | 8,997,939 |
| Cooperatieve Rabobank UA: | | | |
| 3.822% 7/26/34 (Reg. S) | EUR | 1,300,000 | 1,468,832 |
| 4% 1/10/30 (Reg. S) | EUR | 2,600,000 | 2,970,878 |
| 4.375% 8/4/25 | | 16,524,000 | 16,405,003 |
| Danske Bank A/S: | | | |
| 2.25% 1/14/28 (Reg. S)(e) | GBP | 3,450,000 | 4,240,206 |
| 3.875% 1/9/32 (Reg. S)(e) | EUR | 9,350,000 | 10,464,621 |
| DNB Bank ASA 0.25% 2/23/29 (Reg. S) (e) | EUR | 1,600,000 | 1,589,636 |
| HAT Holdings I LLC/HAT Holdings II LLC: | | | |
| 3.375% 6/15/26(b) | | 2,274,000 | 2,178,389 |
| 8% 6/15/27(b) | | 905,000 | 948,245 |
| HSBC Holdings PLC: | | | |
| 2.804% 5/24/32(e) | | 5,616,000 | 4,877,542 |
| 4.787% 3/10/32 (Reg. S)(e) | EUR | 3,930,000 | 4,616,031 |
| 4.856% 5/23/33 (Reg. S)(e) | EUR | 5,100,000 | 6,046,396 |
| 6.8% 9/14/31(e) | GBP | 1,160,000 | 1,647,884 |
| 7.39% 11/3/28(e) | | 2,850,000 | 3,067,622 |
| 8.201% 11/16/34 (Reg. S)(e) | GBP | 3,200,000 | 4,619,874 |
| ING Groep NV: | | | |
| 4.5% 5/23/29 (Reg. S)(e) | EUR | 2,300,000 | 2,633,485 |
| 4.75% 5/23/34 (Reg. S)(e) | EUR | 8,000,000 | 9,488,435 |
| Intesa Sanpaolo SpA: | | | |
| 3.875% 7/14/27(b) | | 5,666,000 | 5,499,474 |
| 4.198% 6/1/32(b)(e) | | 4,469,000 | 3,909,858 |
| 5.71% 1/15/26(b) | | 65,914,000 | 66,134,967 |
| 6.625% 6/20/33(b) | | 2,500,000 | 2,681,003 |
| JPMorgan Chase & Co.: | | | |
| 2.739% 10/15/30(e) | | 10,000,000 | 9,156,268 |
| 2.956% 5/13/31(e) | | 16,800,000 | 15,280,680 |
| 3.761% 3/21/34 (Reg. S)(e) | EUR | 2,350,000 | 2,624,355 |
| 4.452% 12/5/29(e) | | 40,200,000 | 40,041,951 |
| 4.493% 3/24/31(e) | | 60,900,000 | 60,704,126 |
| 4.586% 4/26/33(e) | | 89,633,000 | 88,477,651 |
| 4.912% 7/25/33(e) | | 89,141,000 | 89,631,758 |
| 5.299% 7/24/29(e) | | 35,000,000 | 35,913,769 |
| 5.336% 1/23/35(e) | | 45,000,000 | 46,342,402 |
| 5.717% 9/14/33(e) | | 41,000,000 | 42,886,701 |
| Jyske Bank A/S: | | | |
| 5% 10/26/28(e) | EUR | 1,825,000 | 2,099,723 |
| 5.125% 5/1/35 (Reg. S)(e) | EUR | 1,183,000 | 1,365,336 |
| KBC Group NV 6.324% 9/21/34 (b)(e) | | 4,450,000 | 4,775,471 |
| Lloyds Banking Group PLC: | | | |
| 1.985% 12/15/31(e) | GBP | 3,200,000 | 3,906,187 |
| 4.5% 1/11/29 (Reg. S)(e) | EUR | 1,960,000 | 2,249,690 |
| 4.75% 9/21/31 (Reg. S)(e) | EUR | 4,800,000 | 5,626,419 |
| Magyar Export-Import Bank 6.125% 12/4/27 (b) | | 540,000 | 549,956 |
| NatWest Group PLC: | | | |
| 2.105% 11/28/31 (Reg. S)(e) | GBP | 5,300,000 | 6,486,933 |
| 3.073% 5/22/28(e) | | 17,464,000 | 16,743,437 |
| 3.622% 8/14/30 (Reg. S)(e) | GBP | 2,250,000 | 2,909,868 |
| 4.771% 2/16/29 (Reg. S)(e) | EUR | 4,800,000 | 5,530,233 |
| 4.8% 4/5/26 | | 15,141,000 | 15,139,674 |
| 7.416% 6/6/33 (Reg. S)(e) | GBP | 2,600,000 | 3,585,309 |
| Nordea Bank Abp 4.125% 5/5/28 (Reg. S) | EUR | 5,300,000 | 6,039,101 |
| OTP Bank PLC 8.75% 5/15/33 (Reg. S) (e) | | 650,000 | 684,938 |
| PNC Financial Services Group, Inc. 4.626% 6/6/33 (e) | | 25,000,000 | 24,128,940 |
| Societe Generale: | | | |
| 1.488% 12/14/26(b)(e) | | 37,622,000 | 35,839,623 |
| 4.25% 4/14/25(b) | | 2,700,000 | 2,673,428 |
| 4.75% 11/24/25(b) | | 1,750,000 | 1,732,019 |
| 6.691% 1/10/34(b)(e) | | 1,700,000 | 1,822,061 |
| Synchrony Bank: | | | |
| 5.4% 8/22/25 | | 21,633,000 | 21,647,787 |
| 5.625% 8/23/27 | | 19,587,000 | 19,864,851 |
| UniCredit SpA: | | | |
| 5.459% 6/30/35(b)(e) | | 3,269,000 | 3,190,575 |
| 5.861% 6/19/32(b)(e) | | 1,155,000 | 1,152,392 |
| Virgin Money UK PLC 7.625% 8/23/29 (Reg. S) (e) | GBP | 5,000,000 | 7,135,260 |
| Wells Fargo & Co.: | | | |
| 2.572% 2/11/31(e) | | 10,000,000 | 8,972,662 |
| 3.526% 3/24/28(e) | | 33,177,000 | 32,305,236 |
| 4.478% 4/4/31(e) | | 58,414,000 | 57,814,751 |
| 4.897% 7/25/33(e) | | 54,000,000 | 53,737,014 |
| 5.013% 4/4/51(e) | | 32,932,000 | 31,555,359 |
| 5.389% 4/24/34(e) | | 29,117,000 | 29,839,901 |
| 5.499% 1/23/35(e) | | 10,279,000 | 10,607,467 |
| 5.574% 7/25/29(e) | | 33,000,000 | 34,076,948 |
| 6.303% 10/23/29(e) | | 20,000,000 | 21,215,126 |
| Western Alliance Bancorp. 3% 6/15/31 (e) | | 4,737,000 | 4,283,669 |
| Westpac Banking Corp. 4.11% 7/24/34 (e) | | 13,519,000 | 12,963,604 |
| | | | 1,884,468,263 |
| Capital Markets - 3.2% | | | |
| Ares Capital Corp. 3.875% 1/15/26 | | 47,916,000 | 46,999,850 |
| AssuredPartners, Inc.: | | | |
| 5.625% 1/15/29(b) | | 2,035,000 | 1,944,778 |
| 7.5% 2/15/32(b) | | 2,470,000 | 2,519,632 |
| Athene Global Funding: | | | |
| 5.339% 1/15/27(b) | | 46,561,000 | 47,120,639 |
| 5.583% 1/9/29(b) | | 20,758,000 | 21,316,540 |
| Blackstone Private Credit Fund: | | | |
| 4.7% 3/24/25 | | 63,655,000 | 63,307,267 |
| 4.875% 4/14/26 | GBP | 3,591,000 | 4,622,023 |
| 7.05% 9/29/25 | | 28,315,000 | 28,761,795 |
| Coinbase Global, Inc. 3.625% 10/1/31 (b) | | 2,775,000 | 2,286,757 |
| Deutsche Bank AG: | | | |
| 3.25% 5/24/28 (Reg. S)(e) | EUR | 1,600,000 | 1,757,458 |
| 4.1% 1/13/26 | | 5,495,000 | 5,442,996 |
| 4.5% 4/1/25 | | 82,560,000 | 82,038,057 |
| 4.5% 7/12/35 (Reg. S)(e) | EUR | 1,500,000 | 1,691,623 |
| 6.125% 12/12/30 (Reg. S)(e) | GBP | 6,100,000 | 8,227,324 |
| Deutsche Bank AG New York Branch: | | | |
| 3.729% 1/14/32(e) | | 60,841,000 | 53,800,751 |
| 5.882% 7/8/31(e) | | 10,000,000 | 10,130,263 |
| 6.72% 1/18/29(e) | | 1,700,000 | 1,789,732 |
| Goldman Sachs Group, Inc.: | | | |
| 2.383% 7/21/32(e) | | 34,782,000 | 29,615,663 |
| 2.6% 2/7/30 | | 10,000,000 | 9,075,710 |
| 3.102% 2/24/33(e) | | 64,036,000 | 56,643,376 |
| 3.691% 6/5/28(e) | | 128,004,000 | 124,976,040 |
| 3.8% 3/15/30 | | 70,690,000 | 68,156,653 |
| 6.75% 10/1/37 | | 6,976,000 | 7,862,739 |
| Hightower Holding LLC: | | | |
| 6.75% 4/15/29(b) | | 1,140,000 | 1,088,380 |
| 9.125% 1/31/30(b) | | 4,325,000 | 4,478,550 |
| Jane Street Group LLC/JSG Finance, Inc.: | | | |
| 4.5% 11/15/29(b) | | 1,320,000 | 1,259,865 |
| 7.125% 4/30/31(b) | | 3,020,000 | 3,171,725 |
| Jefferies Finance LLC/JFIN Co-Issuer Corp. 5% 8/15/28 (b) | | 680,000 | 646,182 |
| Moody's Corp.: | | | |
| 3.25% 1/15/28 | | 7,339,000 | 7,109,105 |
| 3.75% 3/24/25 | | 20,324,000 | 20,185,519 |
| Morgan Stanley: | | | |
| 2.699% 1/22/31(e) | | 10,000,000 | 9,053,515 |
| 3.622% 4/1/31(e) | | 39,278,000 | 37,267,965 |
| 3.955% 3/21/35 (Reg. S)(e) | EUR | 2,550,000 | 2,853,869 |
| 4.431% 1/23/30(e) | | 14,132,000 | 14,043,042 |
| 4.656% 3/2/29(e) | EUR | 2,100,000 | 2,422,439 |
| 4.889% 7/20/33(e) | | 69,805,000 | 69,636,360 |
| 5.25% 4/21/34(e) | | 45,000,000 | 45,758,896 |
| 5.449% 7/20/29(e) | | 16,205,000 | 16,702,446 |
| 5.831% 4/19/35(e) | | 32,000,000 | 33,848,915 |
| 6.407% 11/1/29(e) | | 70,000,000 | 74,600,185 |
| StoneX Group, Inc. 7.875% 3/1/31 (b) | | 1,405,000 | 1,477,369 |
| UBS Group AG: | | | |
| 1.494% 8/10/27(b)(e) | | 21,621,000 | 20,270,518 |
| 2.125% 11/15/29 (Reg. S)(e) | GBP | 3,900,000 | 4,558,566 |
| 2.593% 9/11/25(b)(e) | | 38,976,000 | 38,950,496 |
| 3.75% 3/26/25 | | 12,391,000 | 12,293,231 |
| 3.869% 1/12/29(b)(e) | | 11,793,000 | 11,428,320 |
| 4.125% 9/24/25(b) | | 12,029,000 | 11,920,264 |
| 4.125% 6/9/33 (Reg. S)(e) | EUR | 5,480,000 | 6,199,527 |
| 4.194% 4/1/31(b)(e) | | 36,361,000 | 35,135,710 |
| 4.75% 3/17/32 (Reg. S)(e) | EUR | 9,810,000 | 11,524,520 |
| 5.428% 2/8/30(b)(e) | | 65,000,000 | 66,596,048 |
| VFH Parent LLC / Valor Co-Issuer, Inc. 7.5% 6/15/31 (b) | | 2,505,000 | 2,598,707 |
| | | | 1,247,167,900 |
| Consumer Finance - 1.8% | | | |
| AerCap Ireland Capital Ltd./AerCap Global Aviation Trust: | | | |
| 1.65% 10/29/24 | | 10,823,000 | 10,753,323 |
| 2.45% 10/29/26 | | 15,103,000 | 14,394,421 |
| 3% 10/29/28 | | 15,819,000 | 14,794,700 |
| 3.3% 1/30/32 | | 26,922,000 | 23,930,342 |
| 4.45% 4/3/26 | | 10,546,000 | 10,467,827 |
| 6.45% 4/15/27 | | 49,188,000 | 51,181,477 |
| 6.5% 7/15/25 | | 13,367,000 | 13,495,761 |
| Ally Financial, Inc.: | | | |
| 5.125% 9/30/24 | | 8,417,000 | 8,411,113 |
| 5.75% 11/20/25 | | 22,874,000 | 22,934,797 |
| 5.8% 5/1/25 | | 20,531,000 | 20,572,073 |
| 6.7% 2/14/33(c) | | 5,050,000 | 5,198,519 |
| 7.1% 11/15/27 | | 32,320,000 | 34,323,052 |
| 8% 11/1/31 | | 42,441,000 | 48,438,059 |
| Capital One Financial Corp.: | | | |
| 2.636% 3/3/26(e) | | 17,584,000 | 17,336,132 |
| 3.273% 3/1/30(e) | | 22,490,000 | 20,954,793 |
| 3.65% 5/11/27 | | 52,443,000 | 51,162,260 |
| 3.8% 1/31/28 | | 24,176,000 | 23,456,113 |
| 4.985% 7/24/26(e) | | 22,984,000 | 22,933,939 |
| 5.247% 7/26/30(e) | | 35,910,000 | 36,278,082 |
| 5.817% 2/1/34(e) | | 6,428,000 | 6,568,515 |
| 6.377% 6/8/34(e) | | 3,572,000 | 3,794,950 |
| 7.624% 10/30/31(e) | | 47,805,000 | 53,964,525 |
| Capstone Borrower, Inc. 8% 6/15/30 (b) | | 1,155,000 | 1,216,544 |
| Discover Financial Services: | | | |
| 3.95% 11/6/24 | | 9,389,000 | 9,358,690 |
| 4.1% 2/9/27 | | 11,988,000 | 11,781,409 |
| 4.5% 1/30/26 | | 15,184,000 | 15,091,872 |
| 6.7% 11/29/32 | | 5,478,000 | 5,970,178 |
| Encore Capital Group, Inc.: | | | |
| 8.5% 5/15/30(b) | | 4,615,000 | 4,829,244 |
| 9.25% 4/1/29(b) | | 1,790,000 | 1,905,456 |
| Ford Motor Credit Co. LLC: | | | |
| U.S. Secured Overnight Fin. Rate (SOFR) Index + 2.950% 8.3165% 3/6/26(e)(f) | | 2,490,000 | 2,556,608 |
| 4.063% 11/1/24 | | 77,591,000 | 77,358,221 |
| 4.445% 2/14/30 | EUR | 2,175,000 | 2,430,856 |
| 6.86% 6/5/26 | GBP | 3,580,000 | 4,804,787 |
| Navient Corp.: | | | |
| 4.875% 3/15/28 | | 505,000 | 480,606 |
| 5% 3/15/27(c) | | 505,000 | 495,209 |
| 5.625% 8/1/33 | | 735,000 | 633,973 |
| OneMain Finance Corp.: | | | |
| 3.5% 1/15/27 | | 2,178,000 | 2,064,685 |
| 3.875% 9/15/28 | | 5,655,000 | 5,207,611 |
| 7.125% 3/15/26 | | 6,235,000 | 6,353,047 |
| 7.125% 11/15/31 | | 870,000 | 879,073 |
| 9% 1/15/29 | | 5,000 | 5,312 |
| PRA Group, Inc. 8.875% 1/31/30 (b) | | 975,000 | 1,007,755 |
| Shriram Finance Ltd.: | | | |
| 4.15% 7/18/25(b) | | 1,640,000 | 1,610,283 |
| 6.625% 4/22/27(b) | | 1,235,000 | 1,246,584 |
| SLM Corp. 4.2% 10/29/25 | | 1,255,000 | 1,240,432 |
| Synchrony Financial: | | | |
| 3.95% 12/1/27 | | 24,512,000 | 23,618,450 |
| 5.15% 3/19/29 | | 27,718,000 | 27,606,890 |
| | | | 725,098,548 |
| Financial Services - 0.8% | | | |
| Abu Dhabi Developmental Holding Co. PJSC 5.5% 5/8/34 (b) | | 835,000 | 880,407 |
| Block, Inc.: | | | |
| 2.75% 6/1/26 | | 950,000 | 912,368 |
| 3.5% 6/1/31 | | 6,054,000 | 5,464,786 |
| 6.5% 5/15/32(b) | | 6,385,000 | 6,621,328 |
| Boost Newco Borrower LLC 7.5% 1/15/31 (b) | | 4,925,000 | 5,251,281 |
| CBRE Global Investors Pan European Core Fund 4.75% 3/27/34 (Reg. S) | EUR | 1,450,000 | 1,681,475 |
| Corebridge Financial, Inc.: | | | |
| 3.5% 4/4/25 | | 7,079,000 | 7,005,267 |
| 3.65% 4/5/27 | | 24,155,000 | 23,650,275 |
| 3.85% 4/5/29 | | 9,902,000 | 9,559,768 |
| 3.9% 4/5/32 | | 11,788,000 | 10,913,891 |
| 4.35% 4/5/42 | | 2,681,000 | 2,306,648 |
| 4.4% 4/5/52 | | 7,930,000 | 6,589,269 |
| Cosan Luxembourg SA 7.25% 6/27/31 (b) | | 1,655,000 | 1,714,994 |
| Cruise Yacht Upper Holdco Ltd. 11.875% 7/5/28 | | 1,000,000 | 1,020,000 |
| Equitable Holdings, Inc. 4.572% 2/15/29 (b) | | 4,941,000 | 4,895,679 |
| GACI First Investment 5.25% 10/13/32 (Reg. S) | | 785,000 | 807,814 |
| GGAM Finance Ltd.: | | | |
| 6.875% 4/15/29(b) | | 500,000 | 515,973 |
| 7.75% 5/15/26(b) | | 1,905,000 | 1,954,700 |
| 8% 2/15/27(b) | | 4,725,000 | 4,925,694 |
| 8% 6/15/28(b) | | 5,914,000 | 6,321,711 |
| Global Aircraft Leasing Co. Ltd. 8.75% 9/1/27 (b) | | 2,475,000 | 2,499,772 |
| Gn Bondco LLC 9.5% 10/15/31 (b)(c) | | 2,397,000 | 2,439,840 |
| Icahn Enterprises LP/Icahn Enterprises Finance Corp.: | | | |
| 4.375% 2/1/29 | | 3,830,000 | 3,360,094 |
| 5.25% 5/15/27 | | 8,160,000 | 7,864,200 |
| 6.25% 5/15/26 | | 7,606,000 | 7,562,365 |
| 9% 6/15/30(b) | | 660,000 | 667,789 |
| 9.75% 1/15/29(b) | | 395,000 | 414,834 |
| Jackson Financial, Inc.: | | | |
| 3.125% 11/23/31 | | 2,681,000 | 2,320,067 |
| 5.17% 6/8/27 | | 10,301,000 | 10,441,076 |
| 5.67% 6/8/32 | | 11,039,000 | 11,395,532 |
| Jbs U.S.A. Holding Lux/ Jbs U.S.A. F: | | | |
| 2.5% 1/15/27 | | 32,955,000 | 31,289,042 |
| 3% 5/15/32 | | 33,235,000 | 28,403,811 |
| 3.625% 1/15/32 | | 9,085,000 | 8,163,650 |
| 5.125% 2/1/28 | | 11,235,000 | 11,291,658 |
| 5.5% 1/15/30 | | 6,505,000 | 6,552,155 |
| 5.75% 4/1/33 | | 30,595,000 | 31,318,847 |
| KfW: | | | |
| 0% 9/17/30 (Reg. S) | EUR | 3,400,000 | 3,226,552 |
| 0.75% 1/15/29 (Reg. S) | EUR | 9,000,000 | 9,225,206 |
| 2.875% 6/7/33 (Reg. S) | EUR | 9,300,000 | 10,472,398 |
| Leighton Finance U.S.A. Pty Ltd. 1.5% 5/28/29 (Reg. S) | EUR | 4,950,000 | 4,834,558 |
| Liberty Costa Rica SR SF 10.875% 1/15/31 (b) | | 1,395,000 | 1,500,497 |
| MDGH GMTN RSC Ltd.: | | | |
| 2.875% 11/7/29(b) | | 1,925,000 | 1,790,423 |
| 4.375% 11/22/33(b) | | 870,000 | 847,163 |
| 5.084% 5/22/53(b) | | 2,140,000 | 2,115,925 |
| 5.5% 4/28/33(b) | | 810,000 | 855,309 |
| NCR Atleos Corp. 9.5% 4/1/29 (b) | | 1,970,000 | 2,170,002 |
| Pine Street Trust II 5.568% 2/15/49 (b) | | 19,200,000 | 18,536,534 |
| PTT Treasury Center Co. Ltd. 3.7% 7/16/70 (b) | | 1,375,000 | 973,060 |
| Raizen Fuels Finance SA 6.95% 3/5/54 (b) | | 1,635,000 | 1,740,703 |
| Shift4 Payments LLC / Shift4 Payments Finance Sub, Inc. 6.75% 8/15/32 (b) | | 2,460,000 | 2,537,895 |
| | | | 329,804,285 |
| Insurance - 0.6% | | | |
| Acrisure LLC / Acrisure Finance, Inc.: | | | |
| 4.25% 2/15/29(b) | | 760,000 | 710,860 |
| 7.5% 11/6/30(b) | | 1,060,000 | 1,087,986 |
| 8.25% 2/1/29(b) | | 1,030,000 | 1,060,120 |
| 8.5% 6/15/29(b) | | 1,060,000 | 1,100,784 |
| Admiral Group PLC 8.5% 1/6/34 (Reg. S) | GBP | 2,600,000 | 3,845,696 |
| AIA Group Ltd. 0.88% 9/9/33 (Reg. S) (e) | EUR | 2,000,000 | 1,959,951 |
| Alliant Holdings Intermediate LLC/Alliant Holdings Co.-Issuer: | | | |
| 4.25% 10/15/27(b) | | 6,006,000 | 5,788,511 |
| 6.75% 10/15/27(b) | | 855,000 | 850,832 |
| 6.75% 4/15/28(b) | | 3,269,000 | 3,329,503 |
| 7% 1/15/31(b) | | 675,000 | 697,647 |
| AmWINS Group, Inc.: | | | |
| 4.875% 6/30/29(b) | | 6,145,000 | 5,857,823 |
| 6.375% 2/15/29(b) | | 2,070,000 | 2,122,417 |
| Argentum Netherlands BV: | | | |
| 5.625% 8/15/52 (Reg. S)(e) | | 6,561,000 | 6,555,728 |
| 5.75% 8/15/50 (Reg. S)(e) | | 14,850,000 | 14,816,356 |
| Cloverie PLC 4.5% 9/11/44 (Reg. S) (e) | | 4,198,000 | 4,192,753 |
| Fidelidade-Companhia de Seguros SA 4.25% 9/4/31 (Reg. S) (e) | EUR | 2,400,000 | 2,589,873 |
| Five Corners Funding Trust II 2.85% 5/15/30 (b) | | 42,017,000 | 38,348,466 |
| HUB International Ltd. 7.25% 6/15/30 (b) | | 2,035,000 | 2,125,043 |
| Jones DesLauriers Insurance Management, Inc. 10.5% 12/15/30 (b) | | 500,000 | 543,436 |
| Liberty Mutual Group, Inc. 4.569% 2/1/29 (b) | | 8,055,000 | 8,016,998 |
| Marsh & McLennan Companies, Inc.: | | | |
| 4.375% 3/15/29 | | 12,747,000 | 12,794,295 |
| 4.75% 3/15/39 | | 5,849,000 | 5,681,856 |
| Massachusetts Mutual Life Insurance Co. 3.729% 10/15/70 (b) | | 21,378,000 | 15,070,284 |
| Panther Escrow Issuer LLC 7.125% 6/1/31 (b) | | 3,450,000 | 3,593,561 |
| Pricoa Global Funding I 5.375% 5/15/45 (e) | | 11,144,000 | 11,066,969 |
| Prudential Funding Asia PLC 2.95% 11/3/33 (Reg. S) (e) | | 11,200,000 | 10,258,058 |
| QBE Insurance Group Ltd.: | | | |
| 2.5% 9/13/38 (Reg. S)(e) | GBP | 4,350,000 | 5,028,237 |
| 6.75% 12/2/44 (Reg. S)(e) | | 6,610,000 | 6,610,000 |
| Sagicor Financial Co. Ltd. 5.3% 5/13/28 (b) | | 1,590,000 | 1,538,643 |
| Swiss Re Finance Luxembourg SA 5% 4/2/49 (b)(e) | | 2,600,000 | 2,595,580 |
| TIAA Asset Management Finance LLC 4.125% 11/1/24 (b) | | 3,853,000 | 3,843,508 |
| Unum Group: | | | |
| 3.875% 11/5/25 | | 13,752,000 | 13,582,791 |
| 4% 6/15/29 | | 15,636,000 | 15,195,569 |
| 5.75% 8/15/42 | | 16,274,000 | 16,223,463 |
| USI, Inc. 7.5% 1/15/32 (b) | | 1,235,000 | 1,293,671 |
| Zurich Finance (Ireland) DAC 3.5% 5/2/52 (Reg. S) (e) | | 4,950,000 | 4,299,120 |
| | | | 234,276,388 |
| Mortgage Real Estate Investment Trusts - 0.0% | | | |
| Rithm Capital Corp.: | | | |
| 6.25% 10/15/25(b) | | 455,000 | 454,060 |
| 8% 4/1/29(b) | | 1,000,000 | 995,246 |
| Starwood Property Trust, Inc.: | | | |
| 3.625% 7/15/26(b) | | 490,000 | 471,604 |
| 3.75% 12/31/24(b) | | 1,510,000 | 1,496,441 |
| 4.75% 3/15/25 | | 500,000 | 496,719 |
| 7.25% 4/1/29(b) | | 1,245,000 | 1,295,949 |
| | | | 5,210,019 |
TOTAL FINANCIALS | | | 4,426,025,403 |
| | | | |
| HEALTH CARE - 1.5% | | | |
| Biotechnology - 0.2% | | | |
| Amgen, Inc.: | | | |
| 5.25% 3/2/30 | | 12,184,000 | 12,621,372 |
| 5.25% 3/2/33 | | 13,756,000 | 14,136,727 |
| 5.6% 3/2/43 | | 13,068,000 | 13,355,903 |
| 5.65% 3/2/53 | | 6,496,000 | 6,681,219 |
| 5.75% 3/2/63 | | 11,839,000 | 12,142,407 |
| Emergent BioSolutions, Inc. 3.875% 8/15/28 (b) | | 7,790,000 | 5,783,868 |
| Grifols SA % (b) | | 1,378,000 | 1,309,013 |
| | | | 66,030,509 |
| Health Care Equipment & Supplies - 0.1% | | | |
| AdaptHealth LLC 5.125% 3/1/30 (b)(c) | | 4,921,000 | 4,499,386 |
| Avantor Funding, Inc.: | | | |
| 3.875% 11/1/29(b) | | 2,350,000 | 2,195,985 |
| 4.625% 7/15/28(b) | | 1,545,000 | 1,503,546 |
| Embecta Corp. 5% 2/15/30 (b) | | 750,000 | 676,207 |
| Medline Borrower LP 3.875% 4/1/29 (b) | | 950,000 | 897,340 |
| Medline Borrower LP / Medline Co. 6.25% 4/1/29 (b) | | 10,620,000 | 10,947,362 |
| Sotera Health Holdings LLC 7.375% 6/1/31 (b) | | 2,055,000 | 2,149,195 |
| Teleflex, Inc. 4.25% 6/1/28 (b) | | 1,370,000 | 1,316,594 |
| Werfenlife SA 4.625% 6/6/28 (Reg. S) | EUR | 2,300,000 | 2,629,963 |
| | | | 26,815,578 |
| Health Care Providers & Services - 0.9% | | | |
| 180 Medical, Inc. 3.875% 10/15/29 (b) | | 1,845,000 | 1,730,142 |
| Akumin, Inc. 8% 8/1/28 (b) | | 1,255,000 | 1,041,650 |
| AMN Healthcare 4% 4/15/29 (b) | | 1,215,000 | 1,133,365 |
| Auna SA 10% 12/15/29 (b) | | 1,037,200 | 1,085,160 |
| Centene Corp.: | | | |
| 2.45% 7/15/28 | | 29,620,000 | 27,100,810 |
| 2.625% 8/1/31 | | 13,830,000 | 11,731,389 |
| 3.375% 2/15/30 | | 24,530,000 | 22,461,027 |
| 4.25% 12/15/27 | | 15,485,000 | 15,139,685 |
| 4.625% 12/15/29 | | 24,065,000 | 23,412,651 |
| CHS/Community Health Systems, Inc.: | | | |
| 4.75% 2/15/31(b) | | 7,305,000 | 6,230,620 |
| 5.25% 5/15/30(b) | | 11,255,000 | 10,091,621 |
| 5.625% 3/15/27(b) | | 7,615,000 | 7,369,393 |
| 6% 1/15/29(b) | | 3,545,000 | 3,363,198 |
| 6.125% 4/1/30(b) | | 3,864,000 | 3,059,921 |
| 6.875% 4/15/29(b) | | 7,502,000 | 6,455,701 |
| 10.875% 1/15/32(b) | | 2,160,000 | 2,338,245 |
| Cigna Group 3.05% 10/15/27 | | 10,400,000 | 9,999,838 |
| CVS Health Corp.: | | | |
| 3% 8/15/26 | | 2,303,000 | 2,230,757 |
| 3.625% 4/1/27 | | 7,027,000 | 6,878,907 |
| 4.78% 3/25/38 | | 18,481,000 | 16,977,260 |
| 5% 1/30/29 | | 10,678,000 | 10,829,428 |
| 5.25% 1/30/31 | | 4,378,000 | 4,451,576 |
| DaVita, Inc.: | | | |
| 3.75% 2/15/31(b) | | 1,425,000 | 1,268,394 |
| 4.625% 6/1/30(b) | | 7,070,000 | 6,666,298 |
| 6.875% 9/1/32(b) | | 3,605,000 | 3,688,125 |
| HCA Holdings, Inc.: | | | |
| 3.5% 9/1/30 | | 20,891,000 | 19,478,315 |
| 3.625% 3/15/32 | | 3,086,000 | 2,805,633 |
| 5.5% 6/1/33 | | 18,000,000 | 18,417,931 |
| 5.625% 9/1/28 | | 16,701,000 | 17,223,311 |
| 5.875% 2/1/29 | | 15,195,000 | 15,786,063 |
| Humana, Inc. 3.7% 3/23/29 | | 9,378,000 | 9,052,036 |
| LifePoint Health, Inc.: | | | |
| 5.375% 1/15/29(b) | | 1,715,000 | 1,600,796 |
| 9.875% 8/15/30(b) | | 1,940,000 | 2,127,561 |
| 10% 6/1/32(b) | | 1,220,000 | 1,324,094 |
| ModivCare Escrow Issuer, Inc. 5% 10/1/29 (b) | | 750,000 | 536,602 |
| Molina Healthcare, Inc.: | | | |
| 3.875% 11/15/30(b) | | 2,205,000 | 2,027,381 |
| 3.875% 5/15/32(b) | | 1,015,000 | 910,688 |
| Pediatrix Medical Group, Inc. 5.375% 2/15/30 (b) | | 3,235,000 | 3,093,558 |
| Prime Healthcare Services 9.375% 9/1/29 (b) | | 1,110,000 | 1,118,976 |
| Radiology Partners, Inc. 7.775% 1/31/29 pay-in-kind (b)(e) | | 5,197,373 | 4,995,975 |
| Sabra Health Care LP 3.2% 12/1/31 | | 36,074,000 | 31,288,878 |
| Surgery Center Holdings, Inc. 7.25% 4/15/32 (b) | | 3,930,000 | 4,127,754 |
| Tenet Healthcare Corp.: | | | |
| 4.25% 6/1/29 | | 4,460,000 | 4,279,758 |
| 4.375% 1/15/30 | | 5,010,000 | 4,789,834 |
| 4.625% 6/15/28 | | 4,010,000 | 3,918,420 |
| 6.125% 10/1/28 | | 5,185,000 | 5,194,540 |
| 6.125% 6/15/30 | | 3,770,000 | 3,828,902 |
| 6.25% 2/1/27 | | 1,120,000 | 1,122,110 |
| 6.75% 5/15/31 | | 665,000 | 689,419 |
| Toledo Hospital 5.325% 11/15/28 | | 6,970,000 | 6,848,025 |
| U.S. Acute Care Solutions 9.75% 5/15/29 (b) | | 1,356,000 | 1,387,199 |
| | | | 374,708,920 |
| Health Care Technology - 0.0% | | | |
| IQVIA, Inc.: | | | |
| 5% 10/15/26(b) | | 385,000 | 382,338 |
| 6.5% 5/15/30(b)(c) | | 1,895,000 | 1,966,017 |
| | | | 2,348,355 |
| Life Sciences Tools & Services - 0.0% | | | |
| Charles River Laboratories International, Inc.: | | | |
| 3.75% 3/15/29(b) | | 1,715,000 | 1,607,049 |
| 4% 3/15/31(b) | | 1,715,000 | 1,578,264 |
| | | | 3,185,313 |
| Pharmaceuticals - 0.3% | | | |
| 1375209 BC Ltd. 9% 1/30/28 (b) | | 3,633,000 | 3,530,727 |
| Bausch Health Companies, Inc.: | | | |
| 4.875% 6/1/28(b) | | 3,200,000 | 2,390,400 |
| 5.25% 1/30/30(b) | | 2,095,000 | 1,047,500 |
| 5.5% 11/1/25(b) | | 8,709,000 | 8,383,414 |
| 11% 9/30/28(b) | | 2,005,000 | 1,834,575 |
| Bayer AG 4.625% 5/26/33 (Reg. S) | EUR | 2,550,000 | 2,952,992 |
| Bayer U.S. Finance II LLC 4.25% 12/15/25 (b) | | 13,965,000 | 13,804,228 |
| Bayer U.S. Finance LLC: | | | |
| 6.375% 11/21/30(b) | | 4,640,000 | 4,933,067 |
| 6.5% 11/21/33(b) | | 4,350,000 | 4,636,948 |
| Catalent Pharma Solutions 3.5% 4/1/30 (b) | | 2,355,000 | 2,299,726 |
| Elanco Animal Health, Inc. 6.65% 8/28/28 (e) | | 4,279,000 | 4,431,007 |
| Jazz Securities DAC 4.375% 1/15/29 (b) | | 3,665,000 | 3,487,872 |
| Mylan NV 4.55% 4/15/28 | | 13,507,000 | 13,374,623 |
| Organon & Co. / Organon Foreign Debt Co-Issuer BV: | | | |
| 4.125% 4/30/28(b) | | 4,365,000 | 4,173,020 |
| 5.125% 4/30/31(b)(c) | | 3,320,000 | 3,109,325 |
| 6.75% 5/15/34(b)(c) | | 510,000 | 528,530 |
| 7.875% 5/15/34(b) | | 1,015,000 | 1,069,484 |
| Teva Pharmaceutical Finance Netherlands III BV: | | | |
| 3.15% 10/1/26 | | 2,295,000 | 2,197,222 |
| 4.75% 5/9/27 | | 1,320,000 | 1,297,234 |
| 7.875% 9/15/29 | | 2,120,000 | 2,334,578 |
| Utah Acquisition Sub, Inc. 3.95% 6/15/26 | | 7,088,000 | 6,987,262 |
| Viatris, Inc.: | | | |
| 2.7% 6/22/30 | | 26,404,000 | 23,243,838 |
| 4% 6/22/50 | | 7,372,000 | 5,225,260 |
| | | | 117,272,832 |
TOTAL HEALTH CARE | | | 590,361,507 |
| | | | |
| INDUSTRIALS - 1.4% | | | |
| Aerospace & Defense - 0.4% | | | |
| BAE Systems Holdings, Inc. 3.8% 10/7/24 (b) | | 5,811,000 | 5,800,968 |
| Bombardier, Inc.: | | | |
| 7% 6/1/32(b) | | 595,000 | 619,390 |
| 7.25% 7/1/31(b) | | 2,985,000 | 3,133,325 |
| 7.875% 4/15/27(b) | | 2,792,000 | 2,801,496 |
| 8.75% 11/15/30(b) | | 2,955,000 | 3,222,442 |
| BWX Technologies, Inc.: | | | |
| 4.125% 6/30/28(b) | | 5,115,000 | 4,935,968 |
| 4.125% 4/15/29(b) | | 2,315,000 | 2,214,063 |
| Embraer Netherlands Finance BV: | | | |
| 5.4% 2/1/27 | | 1,290,000 | 1,298,875 |
| 6.95% 1/17/28(b) | | 820,000 | 859,463 |
| 7% 7/28/30(b) | | 1,605,000 | 1,719,356 |
| Moog, Inc. 4.25% 12/15/27 (b) | | 285,000 | 274,508 |
| Spirit Aerosystems, Inc. 9.75% 11/15/30 (b) | | 1,515,000 | 1,695,502 |
| The Boeing Co.: | | | |
| 3.55% 3/1/38 | | 2,570,000 | 1,959,936 |
| 5.15% 5/1/30 | | 18,842,000 | 18,793,614 |
| 5.705% 5/1/40 | | 13,710,000 | 13,326,182 |
| 5.805% 5/1/50 | | 3,812,000 | 3,597,937 |
| 5.93% 5/1/60 | | 13,710,000 | 12,949,893 |
| 6.259% 5/1/27(b) | | 3,585,000 | 3,688,196 |
| 6.298% 5/1/29(b) | | 8,683,000 | 9,068,131 |
| 6.388% 5/1/31(b) | | 6,576,000 | 6,926,934 |
| 6.528% 5/1/34(b) | | 7,038,000 | 7,454,029 |
| 6.858% 5/1/54(b) | | 10,596,000 | 11,409,099 |
| 7.008% 5/1/64(b) | | 10,000,000 | 10,770,205 |
| TransDigm, Inc.: | | | |
| 4.625% 1/15/29 | | 7,395,000 | 7,114,434 |
| 5.5% 11/15/27 | | 14,265,000 | 14,140,181 |
| 6.375% 3/1/29(b) | | 6,355,000 | 6,549,215 |
| 6.625% 3/1/32(b) | | 1,660,000 | 1,726,350 |
| 6.75% 8/15/28(b) | | 2,555,000 | 2,622,069 |
| 7.125% 12/1/31(b) | | 415,000 | 438,248 |
| VistaJet Malta Finance PLC / XO Management Holding, Inc.: | | | |
| 6.375% 2/1/30(b) | | 6,175,000 | 5,063,572 |
| 7.875% 5/1/27(b) | | 2,933,000 | 2,752,732 |
| 9.5% 6/1/28(b) | | 1,745,000 | 1,631,890 |
| | | | 170,558,203 |
| Air Freight & Logistics - 0.0% | | | |
| Aercap Global Aviation Trust 6.5% 6/15/45 (b)(e) | | 1,856,000 | 1,850,191 |
| Aeropuerto Internacional de Tocumen SA 5.125% 8/11/61 (b) | | 545,000 | 428,168 |
| Cargo Aircraft Management, Inc. 4.75% 2/1/28 (b)(c) | | 4,206,000 | 4,016,730 |
| Rand Parent LLC 8.5% 2/15/30 (b)(c) | | 10,635,000 | 10,635,170 |
| | | | 16,930,259 |
| Building Products - 0.1% | | | |
| Advanced Drain Systems, Inc.: | | | |
| 5% 9/30/27(b) | | 3,005,000 | 2,958,545 |
| 6.375% 6/15/30(b) | | 205,000 | 208,381 |
| AmeriTex Holdco Intermediate LLC 10.25% 10/15/28 (b) | | 490,000 | 521,304 |
| Builders FirstSource, Inc.: | | | |
| 4.25% 2/1/32(b) | | 3,090,000 | 2,823,169 |
| 6.375% 3/1/34(b) | | 1,250,000 | 1,283,321 |
| Carrier Global Corp.: | | | |
| 4.5% 11/29/32 | EUR | 1,650,000 | 1,939,738 |
| 5.9% 3/15/34 | | 2,545,000 | 2,745,283 |
| 6.2% 3/15/54 | | 1,576,000 | 1,786,935 |
| EMRLD Borrower LP / Emerald Co.: | | | |
| 6.625% 12/15/30(b) | | 6,650,000 | 6,809,826 |
| 6.75% 7/15/31(b) | | 1,900,000 | 1,957,937 |
| MasterBrand, Inc. 7% 7/15/32 (b) | | 1,700,000 | 1,751,010 |
| MITER Brands Acquisition Holdco, Inc. / MIWD Borrower LLC 6.75% 4/1/32 (b) | | 1,650,000 | 1,695,624 |
| Oscar Acquisition Co. LLC / Oscar Finance, Inc. 9.5% 4/15/30 (b) | | 2,726,000 | 2,559,709 |
| Sisecam UK PLC 8.625% 5/2/32 (b) | | 2,145,000 | 2,220,075 |
| | | | 31,260,857 |
| Commercial Services & Supplies - 0.2% | | | |
| ADT Corp. 4.125% 8/1/29 (b)(c) | | 2,555,000 | 2,426,340 |
| Allied Universal Holdco LLC 7.875% 2/15/31 (b)(i) | | 4,855,000 | 4,929,202 |
| Allied Universal Holdco LLC / Allied Universal Finance Corp.: | | | |
| 6% 6/1/29(b) | | 2,420,000 | 2,153,996 |
| 9.75% 7/15/27(b) | | 6,595,000 | 6,610,498 |
| APX Group, Inc.: | | | |
| 5.75% 7/15/29(b) | | 2,420,000 | 2,397,736 |
| 6.75% 2/15/27(b) | | 2,321,000 | 2,325,329 |
| Artera Services LLC 8.5% 2/15/31 (b) | | 12,975,000 | 12,989,753 |
| Brand Industrial Services, Inc. 10.375% 8/1/30 (b) | | 7,987,000 | 8,702,412 |
| Cimpress PLC 7% 6/15/26 | | 1,370,000 | 1,365,643 |
| Clean Harbors, Inc. 6.375% 2/1/31 (b) | | 945,000 | 965,709 |
| CoreCivic, Inc.: | | | |
| 4.75% 10/15/27 | | 5,725,000 | 5,460,531 |
| 8.25% 4/15/29 | | 5,085,000 | 5,364,253 |
| Garda World Security Corp. 8.25% 8/1/32 (b) | | 1,740,000 | 1,768,452 |
| GFL Environmental, Inc.: | | | |
| 3.75% 8/1/25(b) | | 2,000,000 | 1,977,967 |
| 5.125% 12/15/26(b) | | 2,000,000 | 1,992,247 |
| 6.75% 1/15/31(b) | | 405,000 | 423,054 |
| Madison IAQ LLC: | | | |
| 4.125% 6/30/28(b) | | 601,000 | 571,851 |
| 5.875% 6/30/29(b) | | 4,105,000 | 3,911,692 |
| Neptune BidCo U.S., Inc. 9.29% 4/15/29 (b) | | 1,225,000 | 1,223,469 |
| Reworld Holding Corp. 4.875% 12/1/29 (b) | | 3,383,000 | 3,139,139 |
| The GEO Group, Inc.: | | | |
| 8.625% 4/15/29 | | 3,271,000 | 3,393,246 |
| 10.25% 4/15/31 | | 3,285,000 | 3,470,544 |
| Williams Scotsman, Inc. 6.625% 6/15/29 (b) | | 3,460,000 | 3,572,229 |
| Wrangler Holdco Corp. 6.625% 4/1/32 (b) | | 3,855,000 | 3,980,106 |
| | | | 85,115,398 |
| Construction & Engineering - 0.1% | | | |
| ATP Tower Holdings LLC/Andean Tower Partners 4.05% 4/27/26 (b) | | 3,586,000 | 3,430,785 |
| Greensaif Pipelines Bidco SARL: | | | |
| 5.8528% 2/23/36(b) | | 755,000 | 777,084 |
| 6.1027% 8/23/42(b) | | 1,390,000 | 1,419,538 |
| 6.129% 2/23/38(b) | | 4,065,000 | 4,270,791 |
| 6.51% 2/23/42(b) | | 850,000 | 908,172 |
| Pike Corp.: | | | |
| 5.5% 9/1/28(b) | | 4,668,000 | 4,547,186 |
| 8.625% 1/31/31(b) | | 3,795,000 | 4,096,847 |
| Railworks Holdings LP 8.25% 11/15/28 (b) | | 4,889,000 | 4,994,881 |
| | | | 24,445,284 |
| Electrical Equipment - 0.0% | | | |
| GrafTech Global Enterprises, Inc. 9.875% 12/15/28 (b) | | 1,210,000 | 970,889 |
| Regal Rexnord Corp.: | | | |
| 6.05% 2/15/26 | | 2,040,000 | 2,065,309 |
| 6.05% 4/15/28 | | 1,995,000 | 2,061,518 |
| 6.3% 2/15/30 | | 1,995,000 | 2,106,830 |
| Sensata Technologies BV 4% 4/15/29 (b) | | 1,985,000 | 1,868,952 |
| | | | 9,073,498 |
| Ground Transportation - 0.1% | | | |
| Alpha Trains Finance SA 2.064% 6/30/30 | EUR | 4,151,000 | 4,473,669 |
| Avis Budget Car Rental LLC/Avis Budget Finance, Inc. 5.75% 7/15/27 (b) | | 243,000 | 237,430 |
| Genesee & Wyoming, Inc. 6.25% 4/15/32 (b) | | 5,030,000 | 5,141,008 |
| JSC Georgian Railway 4% 6/17/28 (b) | | 520,000 | 467,028 |
| Mobico Group PLC 4.875% 9/26/31 (Reg. S) | EUR | 4,150,000 | 4,542,315 |
| Uber Technologies, Inc.: | | | |
| 4.5% 8/15/29(b)(c) | | 1,975,000 | 1,936,951 |
| 8% 11/1/26(b) | | 6,545,000 | 6,567,214 |
| XPO, Inc.: | | | |
| 6.25% 6/1/28(b) | | 570,000 | 581,527 |
| 7.125% 6/1/31(b) | | 940,000 | 982,010 |
| 7.125% 2/1/32(b) | | 3,680,000 | 3,849,917 |
| | | | 28,779,069 |
| Industrial Conglomerates - 0.0% | | | |
| GRUP KUO, S.A.B. de CV 5.75% 7/7/27 (b) | | 1,295,000 | 1,249,131 |
| Ladder Capital Finance Holdings LLLP/Ladder Capital Finance Corp.: | | | |
| 4.75% 6/15/29(b) | | 1,900,000 | 1,831,342 |
| 5.25% 10/1/25(b) | | 230,000 | 229,177 |
| 7% 7/15/31(b) | | 2,130,000 | 2,214,615 |
| | | | 5,524,265 |
| Machinery - 0.0% | | | |
| Chart Industries, Inc. 7.5% 1/1/30 (b) | | 256,000 | 268,989 |
| Mueller Water Products, Inc. 4% 6/15/29 (b) | | 2,825,000 | 2,670,536 |
| TK Elevator Holdco GmbH 7.625% 7/15/28 (b) | | 2,445,000 | 2,448,589 |
| TK Elevator U.S. Newco, Inc. 5.25% 7/15/27 (b) | | 6,660,000 | 6,556,504 |
| | | | 11,944,618 |
| Marine Transportation - 0.0% | | | |
| MISC Capital Two (Labuan) Ltd.: | | | |
| 3.625% 4/6/25(b) | | 915,000 | 907,280 |
| 3.75% 4/6/27(b) | | 2,601,000 | 2,536,885 |
| Seaspan Corp. 5.5% 8/1/29 (b) | | 4,217,000 | 4,016,657 |
| | | | 7,460,822 |
| Passenger Airlines - 0.1% | | | |
| Air Canada 3.875% 8/15/26 (b) | | 1,405,000 | 1,355,732 |
| American Airlines, Inc.: | | | |
| 7.25% 2/15/28(b)(c) | | 950,000 | 955,908 |
| 8.5% 5/15/29(b) | | 1,870,000 | 1,944,166 |
| American Airlines, Inc. / AAdvantage Loyalty IP Ltd. 5.5% 4/20/26 (b) | | 3,924,667 | 3,904,341 |
| Azul Secured Finance LLP: | | | |
| 11.5% 5/28/29(b) | | 1,919,911 | 1,170,647 |
| 11.93% 8/28/28(b) | | 1,210,000 | 1,116,225 |
| Delta Air Lines, Inc. / SkyMiles IP Ltd. 4.5% 10/20/25 (b) | | 248,124 | 247,149 |
| Hawaiian Brand Intellectual Property Ltd. / HawaiianMiles Loyalty Ltd. 11% 4/15/29 (b) | | 3,462,500 | 3,524,133 |
| JetBlue Airways Corp./JetBlue Loyalty LP 9.875% 9/20/31 (b) | | 2,475,000 | 2,446,217 |
| Mileage Plus Holdings LLC 6.5% 6/20/27 (b) | | 600,000 | 605,568 |
| Spirit Loyalty Cayman Ltd. / Spirit IP Cayman Ltd. 8% 9/20/25 (b) | | 2,285,000 | 1,427,022 |
| | | | 18,697,108 |
| Professional Services - 0.0% | | | |
| CoreLogic, Inc. 4.5% 5/1/28 (b) | | 1,925,000 | 1,801,436 |
| Thomson Reuters Corp. 3.85% 9/29/24 | | 2,221,000 | 2,217,397 |
| TriNet Group, Inc.: | | | |
| 3.5% 3/1/29(b) | | 5,700,000 | 5,272,942 |
| 7.125% 8/15/31(b) | | 1,085,000 | 1,125,251 |
| | | | 10,417,026 |
| Trading Companies & Distributors - 0.1% | | | |
| Air Lease Corp. 3.375% 7/1/25 | | 24,376,000 | 24,026,287 |
| Beacon Roofing Supply, Inc. 6.5% 8/1/30 (b) | | 1,960,000 | 2,012,755 |
| FLY Leasing Ltd. 7% 10/15/24 (b) | | 675,000 | 670,815 |
| Fortress Transportation & Infrastructure Investors LLC: | | | |
| 7% 6/15/32(b) | | 1,005,000 | 1,051,422 |
| 7.875% 12/1/30(b) | | 2,535,000 | 2,720,534 |
| Foundation Building Materials, Inc. 6% 3/1/29 (b) | | 1,250,000 | 1,121,417 |
| Travis Perkins PLC 3.75% 2/17/26 (Reg. S) | GBP | 3,353,000 | 4,232,121 |
| United Rentals North America, Inc. 6.125% 3/15/34 (b) | | 4,170,000 | 4,259,567 |
| | | | 40,094,918 |
| Transportation Infrastructure - 0.3% | | | |
| Aeropuertos Dominicanos Siglo XXI SA 7% 6/30/34 (b) | | 1,095,000 | 1,131,956 |
| Avolon Holdings Funding Ltd.: | | | |
| 2.875% 2/15/25(b) | | 37,550,000 | 37,060,543 |
| 4.25% 4/15/26(b) | | 5,430,000 | 5,345,789 |
| 4.375% 5/1/26(b) | | 16,881,000 | 16,628,093 |
| 5.5% 1/15/26(b) | | 14,454,000 | 14,472,006 |
| 5.75% 11/15/29(b) | | 1,225,000 | 1,254,106 |
| 6.375% 5/4/28(b) | | 23,134,000 | 24,047,309 |
| DP World Crescent Ltd. 3.7495% 1/30/30 (b) | | 2,070,000 | 1,976,203 |
| DP World Ltd. 5.625% 9/25/48 (b) | | 1,480,000 | 1,473,525 |
| Heathrow Funding Ltd. 6% 3/5/32 (Reg. S) | GBP | 3,850,000 | 5,096,395 |
| Holding d'Infrastructures et des Metiers de l'Environnement 0.625% 9/16/28 (Reg. S) | EUR | 1,900,000 | 1,810,478 |
| | | | 110,296,403 |
TOTAL INDUSTRIALS | | | 570,597,728 |
| | | | |
| INFORMATION TECHNOLOGY - 1.0% | | | |
| Communications Equipment - 0.0% | | | |
| CommScope, Inc.: | | | |
| 4.75% 9/1/29(b) | | 2,255,000 | 1,815,275 |
| 6% 3/1/26(b) | | 3,660,000 | 3,522,750 |
| HTA Group Ltd. 7.5% 6/4/29 (b) | | 9,875,000 | 9,938,694 |
| IHS Netherlands Holdco BV 8% 9/18/27 (b) | | 3,795,000 | 3,783,141 |
| ViaSat, Inc. 5.625% 9/15/25 (b) | | 4,530,000 | 4,484,869 |
| | | | 23,544,729 |
| Electronic Equipment, Instruments & Components - 0.1% | | | |
| Coherent Corp. 5% 12/15/29 (b)(c) | | 4,545,000 | 4,394,943 |
| CPI CG, Inc. 10% 7/15/29 (b) | | 1,140,000 | 1,198,978 |
| Dell International LLC/EMC Corp. 6.2% 7/15/30 | | 8,040,000 | 8,664,590 |
| Insight Enterprises, Inc. 6.625% 5/15/32 (b) | | 1,735,000 | 1,795,914 |
| Lightning Power LLC 7.25% 8/15/32 (b) | | 2,020,000 | 2,087,260 |
| Sensata Technologies, Inc.: | | | |
| 3.75% 2/15/31(b) | | 950,000 | 857,808 |
| 6.625% 7/15/32(b) | | 2,355,000 | 2,436,760 |
| TTM Technologies, Inc. 4% 3/1/29 (b) | | 5,805,000 | 5,478,522 |
| | | | 26,914,775 |
| IT Services - 0.1% | | | |
| Acuris Finance U.S.: | | | |
| 5% 5/1/28(b) | | 5,745,000 | 5,142,773 |
| 9% 8/1/29(b) | | 2,500,000 | 2,500,000 |
| Ahead DB Holdings LLC 6.625% 5/1/28 (b) | | 1,760,000 | 1,688,596 |
| Amentum Escrow Corp. 7.25% 8/1/32 (b) | | 2,565,000 | 2,681,960 |
| ASGN, Inc. 4.625% 5/15/28 (b) | | 1,795,000 | 1,734,275 |
| CA Magnum Holdings 5.375% 10/31/26 (b) | | 1,985,000 | 1,934,134 |
| Cogent Communications Group, Inc. 7% 6/15/27 (b) | | 3,730,000 | 3,773,244 |
| Gartner, Inc. 4.5% 7/1/28 (b) | | 3,095,000 | 3,039,590 |
| Go Daddy Operating Co. LLC / GD Finance Co., Inc.: | | | |
| 3.5% 3/1/29(b) | | 3,475,000 | 3,231,085 |
| 5.25% 12/1/27(b) | | 3,305,000 | 3,290,364 |
| Unisys Corp. 6.875% 11/1/27 (b) | | 490,000 | 458,653 |
| Virtusa Corp. 7.125% 12/15/28 (b) | | 937,000 | 881,906 |
| | | | 30,356,580 |
| Semiconductors & Semiconductor Equipment - 0.5% | | | |
| Broadcom, Inc.: | | | |
| 1.95% 2/15/28(b) | | 6,532,000 | 6,004,805 |
| 2.45% 2/15/31(b) | | 63,710,000 | 55,589,205 |
| 2.6% 2/15/33(b) | | 92,472,000 | 77,518,707 |
| 3.5% 2/15/41(b) | | 44,880,000 | 35,858,797 |
| Entegris, Inc.: | | | |
| 3.625% 5/1/29(b) | | 1,775,000 | 1,634,273 |
| 4.75% 4/15/29(b) | | 6,310,000 | 6,192,079 |
| 5.95% 6/15/30(b) | | 6,600,000 | 6,689,496 |
| ON Semiconductor Corp. 3.875% 9/1/28 (b) | | 2,785,000 | 2,646,754 |
| | | | 192,134,116 |
| Software - 0.3% | | | |
| Cloud Software Group, Inc.: | | | |
| 6.5% 3/31/29(b) | | 1,269,000 | 1,250,909 |
| 8.25% 6/30/32(b) | | 4,710,000 | 4,931,525 |
| 9% 9/30/29(b) | | 10,923,000 | 10,993,584 |
| CNT PRNT/CDK GLO II/FIN 8% 6/15/29 (b) | | 2,140,000 | 2,209,531 |
| Elastic NV 4.125% 7/15/29 (b) | | 2,840,000 | 2,646,010 |
| Gen Digital, Inc. 5% 4/15/25 (b) | | 1,910,000 | 1,902,654 |
| Helios Software Holdings, Inc. / ION Corporate Solutions Finance Sarl 8.75% 5/1/29 (b) | | 2,435,000 | 2,535,380 |
| ION Trading Technologies Ltd.: | | | |
| 5.75% 5/15/28(b) | | 5,438,000 | 5,118,547 |
| 9.5% 5/30/29(b) | | 840,000 | 891,936 |
| McAfee Corp. 7.375% 2/15/30 (b) | | 1,722,000 | 1,651,824 |
| MicroStrategy, Inc. 6.125% 6/15/28 (b) | | 4,175,000 | 4,069,537 |
| Open Text Corp.: | | | |
| 3.875% 2/15/28(b) | | 2,295,000 | 2,175,938 |
| 3.875% 12/1/29(b) | | 2,900,000 | 2,673,544 |
| Open Text Holdings, Inc.: | | | |
| 4.125% 2/15/30(b) | | 2,625,000 | 2,437,315 |
| 4.125% 12/1/31(b)(c) | | 3,045,000 | 2,772,713 |
| Oracle Corp.: | | | |
| 1.65% 3/25/26 | | 24,761,000 | 23,641,083 |
| 2.3% 3/25/28 | | 39,119,000 | 36,304,340 |
| Rackspace Finance LLC 3.5% 5/15/28 (b) | | 3,657,300 | 1,652,972 |
| UKG, Inc. 6.875% 2/1/31 (b) | | 2,545,000 | 2,632,604 |
| Veritas U.S., Inc./Veritas Bermuda Ltd. 7.5% 9/1/25 (b) | | 1,475,000 | 1,348,331 |
| | | | 113,840,277 |
| Technology Hardware, Storage & Peripherals - 0.0% | | | |
| Lenovo Group Ltd.: | | | |
| 3.421% 11/2/30(b) | | 1,705,000 | 1,557,411 |
| 5.875% 4/24/25 (Reg. S) | | 305,000 | 306,144 |
| Seagate HDD Cayman: | | | |
| 5.75% 12/1/34 | | 2,400,000 | 2,401,368 |
| 8.25% 12/15/29 | | 850,000 | 921,332 |
| 8.5% 7/15/31 | | 1,045,000 | 1,136,342 |
| Western Digital Corp.: | | | |
| 2.85% 2/1/29 | | 3,915,000 | 3,512,448 |
| 3.1% 2/1/32 | | 1,630,000 | 1,371,569 |
| 4.75% 2/15/26 | | 245,000 | 242,787 |
| | | | 11,449,401 |
TOTAL INFORMATION TECHNOLOGY | | | 398,239,878 |
| | | | |
| MATERIALS - 0.8% | | | |
| Chemicals - 0.4% | | | |
| Axalta Coating Systems Dutch Holding B BV 7.25% 2/15/31 (b) | | 970,000 | 1,027,250 |
| Braskem Idesa SAPI: | | | |
| 6.99% 2/20/32(b) | | 1,525,000 | 1,189,027 |
| 7.45% 11/15/29(b) | | 1,800,000 | 1,510,884 |
| Braskem Netherlands BV: | | | |
| 5.875% 1/31/50(b) | | 895,000 | 686,913 |
| 7.25% 2/13/33(b) | | 2,545,000 | 2,504,789 |
| 8.5% 1/12/31(b) | | 1,285,000 | 1,341,155 |
| Celanese U.S. Holdings LLC: | | | |
| 6.35% 11/15/28 | | 13,022,000 | 13,700,624 |
| 6.379% 7/15/32 | | 15,000,000 | 15,855,640 |
| 6.55% 11/15/30 | | 13,200,000 | 14,155,693 |
| 6.7% 11/15/33 | | 7,713,000 | 8,337,756 |
| Consolidated Energy Finance SA 12% 2/15/31 (b) | | 3,570,000 | 3,513,687 |
| CVR Partners LP/CVR Nitrogen Finance Corp. 6.125% 6/15/28 (b) | | 2,505,000 | 2,431,659 |
| ENN Clean Energy International Investment Ltd. 3.375% 5/12/26 (b) | | 1,795,000 | 1,736,102 |
| Herens HoldCo Sarl 4.75% 5/15/28 (b) | | 1,200,000 | 1,046,584 |
| INEOS Quattro Finance 2 PLC 9.625% 3/15/29 (b) | | 935,000 | 1,008,486 |
| Kobe U.S. Midco 2, Inc. 9.25% 11/1/26 pay-in-kind (b)(e) | | 4,711,287 | 3,863,255 |
| LSB Industries, Inc. 6.25% 10/15/28 (b) | | 1,500,000 | 1,469,979 |
| MEGlobal BV: | | | |
| 2.625% 4/28/28(b) | | 1,085,000 | 1,001,930 |
| 4.25% 11/3/26(b) | | 605,000 | 595,547 |
| MEGlobal Canada, Inc. 5% 5/18/25 (b) | | 1,460,000 | 1,452,919 |
| Methanex Corp.: | | | |
| 5.125% 10/15/27 | | 6,667,000 | 6,562,466 |
| 5.25% 12/15/29 | | 710,000 | 697,826 |
| 5.65% 12/1/44 | | 4,732,000 | 4,226,647 |
| NOVA Chemicals Corp.: | | | |
| 4.25% 5/15/29(b) | | 3,875,000 | 3,534,400 |
| 5% 5/1/25(b) | | 1,650,000 | 1,640,027 |
| 5.25% 6/1/27(b) | | 4,350,000 | 4,294,017 |
| 8.5% 11/15/28(b) | | 1,290,000 | 1,375,315 |
| 9% 2/15/30(b) | | 1,235,000 | 1,326,554 |
| Nufarm Australia Ltd. 5% 1/27/30 (b) | | 3,605,000 | 3,341,223 |
| OCP SA: | | | |
| 3.75% 6/23/31(b) | | 1,405,000 | 1,258,353 |
| 5.125% 6/23/51(b) | | 880,000 | 704,000 |
| 6.75% 5/2/34(b) | | 935,000 | 996,944 |
| 6.875% 4/25/44(b) | | 1,515,000 | 1,527,120 |
| 7.5% 5/2/54(b) | | 710,000 | 760,730 |
| Olin Corp. 5% 2/1/30 | | 6,975,000 | 6,742,345 |
| Olympus Water U.S. Holding Corp.: | | | |
| 4.25% 10/1/28(b) | | 2,325,000 | 2,183,633 |
| 6.25% 10/1/29(b) | | 4,229,000 | 3,972,202 |
| 7.25% 6/15/31(b) | | 2,115,000 | 2,186,043 |
| 9.75% 11/15/28(b) | | 5,805,000 | 6,183,416 |
| Orbia Advance Corp. S.A.B. de CV: | | | |
| 1.875% 5/11/26(b) | | 1,640,000 | 1,549,800 |
| 2.875% 5/11/31(b) | | 1,525,000 | 1,288,823 |
| Sasol Financing U.S.A. LLC: | | | |
| 4.375% 9/18/26 | | 2,840,000 | 2,733,500 |
| 5.5% 3/18/31 | | 690,000 | 606,737 |
| 6.5% 9/27/28 | | 535,000 | 523,798 |
| 8.75% 5/3/29(b) | | 295,000 | 307,814 |
| SCIH Salt Holdings, Inc.: | | | |
| 4.875% 5/1/28(b) | | 870,000 | 828,997 |
| 6.625% 5/1/29(b) | | 2,660,000 | 2,545,554 |
| SCIL IV LLC / SCIL U.S.A. Holdings LLC 5.375% 11/1/26 (b) | | 2,140,000 | 2,108,628 |
| The Chemours Co. LLC: | | | |
| 4.625% 11/15/29(b)(c) | | 2,165,000 | 1,904,573 |
| 5.375% 5/15/27 | | 6,573,000 | 6,386,795 |
| 5.75% 11/15/28(b) | | 4,150,000 | 3,888,928 |
| Tronox, Inc. 4.625% 3/15/29 (b)(c) | | 6,910,000 | 6,297,280 |
| W.R. Grace Holding LLC: | | | |
| 5.625% 8/15/29(b) | | 6,245,000 | 5,790,627 |
| 7.375% 3/1/31(b) | | 770,000 | 799,794 |
| | | | 169,504,788 |
| Construction Materials - 0.0% | | | |
| Eco Material Technologies, Inc. 7.875% 1/31/27 (b) | | 5,395,000 | 5,464,347 |
| Smyrna Ready Mix Concrete LLC 8.875% 11/15/31 (b) | | 2,540,000 | 2,726,433 |
| Summit Materials LLC/Summit Materials Finance Corp. 7.25% 1/15/31 (b) | | 1,620,000 | 1,703,025 |
| | | | 9,893,805 |
| Containers & Packaging - 0.1% | | | |
| ARD Finance SA 6.5% 6/30/27 pay-in-kind (b)(e) | | 1,389,000 | 319,994 |
| Ardagh Metal Packaging Finance U.S.A. LLC/Ardagh Metal Packaging Finance PLC: | | | |
| 3.25% 9/1/28(b) | | 751,000 | 681,381 |
| 4% 9/1/29(b) | | 4,020,000 | 3,464,237 |
| 6% 6/15/27(b) | | 2,965,000 | 2,956,319 |
| Ardagh Packaging Finance PLC/Ardagh MP Holdings U.S.A., Inc.: | | | |
| 4.125% 8/15/26(b) | | 967,000 | 833,980 |
| 5.25% 8/15/27(b) | | 368,000 | 221,369 |
| Ball Corp.: | | | |
| 2.875% 8/15/30 | | 950,000 | 839,666 |
| 6% 6/15/29 | | 1,210,000 | 1,245,039 |
| Clydesdale Acquisition Holdings, Inc.: | | | |
| 6.625% 4/15/29(b) | | 1,175,000 | 1,173,387 |
| 6.875% 1/15/30(b) | | 2,470,000 | 2,479,105 |
| 8.75% 4/15/30(b) | | 3,125,000 | 3,118,004 |
| Crown Americas LLC/Crown Americas Capital Corp. IV 4.75% 2/1/26 | | 245,000 | 242,676 |
| Graham Packaging Co., Inc. 7.125% 8/15/28 (b) | | 1,200,000 | 1,185,992 |
| Graphic Packaging International, Inc.: | | | |
| 3.75% 2/1/30(b) | | 1,190,000 | 1,100,616 |
| 6.375% 7/15/32(b) | | 2,070,000 | 2,116,428 |
| Mauser Packaging Solutions Holding Co. 7.875% 4/15/27 (b) | | 2,855,000 | 2,951,870 |
| Owens-Brockway Glass Container, Inc.: | | | |
| 7.25% 5/15/31(b)(c) | | 290,000 | 293,443 |
| 7.375% 6/1/32(b)(c) | | 765,000 | 768,457 |
| Sealed Air Corp.: | | | |
| 5% 4/15/29(b) | | 1,835,000 | 1,799,795 |
| 6.5% 7/15/32(b) | | 1,220,000 | 1,247,960 |
| Sealed Air Corp./Sealed Air Corp. U.S. 7.25% 2/15/31 (b) | | 2,020,000 | 2,122,802 |
| Trivium Packaging Finance BV: | | | |
| 5.5% 8/15/26(b) | | 3,219,000 | 3,178,156 |
| 8.5% 8/15/27(b) | | 2,499,000 | 2,495,774 |
| | | | 36,836,450 |
| Metals & Mining - 0.3% | | | |
| Alcoa Nederland Holding BV 7.125% 3/15/31 (b) | | 8,535,000 | 8,975,679 |
| Antofagasta PLC: | | | |
| 2.375% 10/14/30(b) | | 2,510,000 | 2,157,596 |
| 5.625% 5/13/32(b) | | 665,000 | 681,658 |
| Aris Mining Corp. 6.875% 8/9/26 (b) | | 2,340,000 | 2,274,199 |
| Arsenal AIC Parent LLC 8% 10/1/30 (b) | | 110,000 | 118,266 |
| ATI, Inc.: | | | |
| 5.875% 12/1/27 | | 2,275,000 | 2,279,473 |
| 7.25% 8/15/30(c) | | 1,020,000 | 1,083,152 |
| Celtic Resources Holdings DAC 4.125% (b)(d)(h) | | 1,205,000 | 172,749 |
| Cleveland-Cliffs, Inc. 7% 3/15/32 (b) | | 2,450,000 | 2,460,426 |
| Commercial Metals Co.: | | | |
| 3.875% 2/15/31 | | 1,150,000 | 1,043,198 |
| 4.125% 1/15/30 | | 2,295,000 | 2,156,074 |
| Compania de Minas Buenaventura SAA 5.5% 7/23/26 (b) | | 1,420,000 | 1,388,050 |
| Constellium NV 6.375% 8/15/32 (b) | | 425,000 | 431,376 |
| Corporacion Nacional del Cobre de Chile (Codelco): | | | |
| 3% 9/30/29(b) | | 290,000 | 263,266 |
| 3.15% 1/14/30(b) | | 1,100,000 | 998,938 |
| 3.7% 1/30/50(b) | | 3,820,000 | 2,775,469 |
| 5.125% 2/2/33(b) | | 790,000 | 776,916 |
| 5.95% 1/8/34(b) | | 900,000 | 933,750 |
| 6.3% 9/8/53(b) | | 865,000 | 899,330 |
| 6.44% 1/26/36(b) | | 930,000 | 997,134 |
| CSN Inova Ventures 6.75% 1/28/28 (b) | | 1,630,000 | 1,559,706 |
| CSN Resources SA: | | | |
| 5.875% 4/8/32(b) | | 1,050,000 | 871,500 |
| 8.875% 12/5/30(b) | | 1,185,000 | 1,178,483 |
| Eldorado Gold Corp. 6.25% 9/1/29 (b) | | 1,705,000 | 1,684,080 |
| Endeavour Mining PLC 5% 10/14/26 (b) | | 2,080,000 | 1,997,382 |
| ERO Copper Corp. 6.5% 2/15/30 (b) | | 7,091,000 | 6,910,109 |
| First Quantum Minerals Ltd.: | | | |
| 6.875% 10/15/27(b) | | 4,430,000 | 4,381,536 |
| 8.625% 6/1/31(b) | | 725,000 | 725,227 |
| 9.375% 3/1/29(b) | | 6,175,000 | 6,570,225 |
| FMG Resources August 2006 Pty Ltd. 4.375% 4/1/31 (b) | | 950,000 | 871,602 |
| Fresnillo PLC 4.25% 10/2/50 (b) | | 1,545,000 | 1,180,195 |
| HudBay Minerals, Inc. 4.5% 4/1/26 (b) | | 1,780,000 | 1,755,400 |
| Kaiser Aluminum Corp.: | | | |
| 4.5% 6/1/31(b) | | 205,000 | 184,226 |
| 4.625% 3/1/28(b) | | 1,032,000 | 980,033 |
| Metinvest BV 8.5% 4/23/26 (Reg. S) | | 435,000 | 345,825 |
| Mineral Resources Ltd.: | | | |
| 8% 11/1/27(b) | | 2,245,000 | 2,280,305 |
| 8.5% 5/1/30(b) | | 2,430,000 | 2,526,981 |
| 9.25% 10/1/28(b) | | 1,880,000 | 1,986,118 |
| Nexa Resources SA: | | | |
| 6.5% 1/18/28(b) | | 952,000 | 979,073 |
| 6.75% 4/9/34(b) | | 885,000 | 928,144 |
| Novelis Corp. 3.875% 8/15/31 (b) | | 955,000 | 856,263 |
| POSCO: | | | |
| 5.75% 1/17/28(b) | | 1,535,000 | 1,584,019 |
| 5.875% 1/17/33(b) | | 490,000 | 516,768 |
| PT Freeport Indonesia: | | | |
| 4.763% 4/14/27(b) | | 580,000 | 579,553 |
| 5.315% 4/14/32(b) | | 2,305,000 | 2,310,763 |
| 6.2% 4/14/52(b) | | 670,000 | 697,222 |
| PT Indonesia Asahan Aluminium 5.45% 5/15/30 (b) | | 3,310,000 | 3,340,816 |
| Samarco Mineracao SA 9% 6/30/31 pay-in-kind (b)(e) | | 6,768,590 | 6,309,612 |
| Stillwater Mining Co. 4% 11/16/26 (b) | | 1,305,000 | 1,220,175 |
| TMK Capital SA 4.3% (Reg. S) (d)(h) | | 990,000 | 148,500 |
| Vale Overseas Ltd. 6.4% 6/28/54 | | 1,870,000 | 1,907,400 |
| Vibrantz Technologies, Inc. 9% 2/15/30 (b) | | 3,870,000 | 3,530,477 |
| Volcan Compania Minera SAA 4.375% 2/11/26 (b) | | 1,890,000 | 1,617,727 |
| | | | 97,382,144 |
| Paper & Forest Products - 0.0% | | | |
| Ahlstrom Holding 3 OY 4.875% 2/4/28 (b) | | 3,940,000 | 3,703,127 |
| Inversiones CMPC SA: | | | |
| 3% 4/6/31(b) | | 1,080,000 | 949,730 |
| 6.125% 2/26/34(b) | | 700,000 | 737,800 |
| LABL, Inc.: | | | |
| 5.875% 11/1/28(b) | | 575,000 | 530,396 |
| 6.75% 7/15/26(b) | | 880,000 | 875,606 |
| 9.5% 11/1/28(b) | | 385,000 | 393,475 |
| Mercer International, Inc. 5.125% 2/1/29 | | 1,235,000 | 1,009,549 |
| Suzano Austria GmbH 3.75% 1/15/31 | | 930,000 | 846,021 |
| | | | 9,045,704 |
TOTAL MATERIALS | | | 322,662,891 |
| | | | |
| REAL ESTATE - 2.1% | | | |
| Equity Real Estate Investment Trusts (REITs) - 1.7% | | | |
| Alexandria Real Estate Equities, Inc. 4.9% 12/15/30 | | 16,606,000 | 16,791,209 |
| American Homes 4 Rent LP: | | | |
| 2.375% 7/15/31 | | 2,770,000 | 2,339,198 |
| 3.625% 4/15/32 | | 10,838,000 | 9,855,799 |
| 5.5% 2/1/34 | | 5,384,000 | 5,482,892 |
| American Tower Corp.: | | | |
| 4.05% 3/15/32 | | 1,254,000 | 1,187,570 |
| 5.45% 2/15/34 | | 1,200,000 | 1,239,244 |
| 5.55% 7/15/33 | | 1,450,000 | 1,503,152 |
| Boston Properties, Inc.: | | | |
| 3.25% 1/30/31 | | 15,144,000 | 13,332,646 |
| 4.5% 12/1/28 | | 12,665,000 | 12,338,428 |
| 6.75% 12/1/27 | | 16,978,000 | 17,745,694 |
| Brixmor Operating Partnership LP: | | | |
| 3.85% 2/1/25 | | 9,126,000 | 9,058,826 |
| 4.05% 7/1/30 | | 19,581,000 | 18,757,478 |
| 4.125% 6/15/26 | | 15,162,000 | 14,979,770 |
| 4.125% 5/15/29 | | 18,497,000 | 17,941,744 |
| Corporate Office Properties LP: | | | |
| 2% 1/15/29 | | 2,119,000 | 1,863,657 |
| 2.25% 3/15/26 | | 6,484,000 | 6,216,743 |
| 2.75% 4/15/31 | | 6,131,000 | 5,258,787 |
| CTR Partnership LP/CareTrust Capital Corp. 3.875% 6/30/28 (b) | | 2,860,000 | 2,690,410 |
| Diversified Healthcare Trust 9.75% 6/15/25 | | 301,000 | 301,536 |
| Global Net Lease, Inc. / Global Net Lease Operating Partnership LP 3.75% 12/15/27 (b) | | 1,115,000 | 1,016,202 |
| GLP Capital LP/GLP Financing II, Inc. 5.25% 6/1/25 | | 1,040,000 | 1,037,336 |
| Healthcare Realty Holdings LP: | | | |
| 3.1% 2/15/30 | | 4,838,000 | 4,401,435 |
| 3.5% 8/1/26 | | 5,039,000 | 4,923,162 |
| Healthpeak OP, LLC: | | | |
| 3.25% 7/15/26 | | 2,056,000 | 2,006,053 |
| 3.5% 7/15/29 | | 2,351,000 | 2,234,214 |
| Hudson Pacific Properties LP 4.65% 4/1/29 | | 27,154,000 | 22,447,745 |
| Invitation Homes Operating Partnership LP: | | | |
| 4.15% 4/15/32 | | 16,951,000 | 15,971,723 |
| 5.5% 8/15/33 | | 2,192,000 | 2,233,675 |
| Kite Realty Group Trust 4.75% 9/15/30 | | 1,467,000 | 1,452,960 |
| LXP Industrial Trust (REIT) 2.7% 9/15/30 | | 7,113,000 | 6,236,715 |
| MPT Operating Partnership LP/MPT Finance Corp.: | | | |
| 3.5% 3/15/31 | | 6,585,000 | 4,497,906 |
| 4.625% 8/1/29 | | 5,455,000 | 4,194,731 |
| 5% 10/15/27(c) | | 12,707,000 | 10,784,723 |
| 5.25% 8/1/26(c) | | 4,350,000 | 4,091,821 |
| Necessity Retail REIT, Inc./American Finance Operating Partnership LP 4.5% 9/30/28 (b) | | 1,420,000 | 1,304,377 |
| NNN (REIT), Inc. 5.6% 10/15/33 | | 2,219,000 | 2,281,553 |
| Omega Healthcare Investors, Inc.: | | | |
| 3.25% 4/15/33 | | 28,922,000 | 24,471,733 |
| 3.375% 2/1/31 | | 13,097,000 | 11,675,044 |
| 3.625% 10/1/29 | | 39,642,000 | 36,890,495 |
| 4.5% 1/15/25 | | 6,808,000 | 6,778,945 |
| 4.5% 4/1/27 | | 32,478,000 | 32,090,282 |
| 4.75% 1/15/28 | | 18,782,000 | 18,619,844 |
| 5.25% 1/15/26 | | 18,623,000 | 18,623,115 |
| Park Intermediate Holdings LLC / PK Domestic Property LLC / PK Finance Co.-Issuer 7% 2/1/30 (b) | | 1,445,000 | 1,481,163 |
| Piedmont Operating Partnership LP 2.75% 4/1/32 | | 5,512,000 | 4,331,126 |
| Prologis International Funding II SA 4.375% 7/1/36 (Reg. S) | EUR | 1,300,000 | 1,480,916 |
| Realty Income Corp.: | | | |
| 2.2% 6/15/28 | | 3,122,000 | 2,872,904 |
| 3.4% 1/15/28 | | 6,031,000 | 5,822,866 |
| Retail Opportunity Investments Partnership LP 4% 12/15/24 | | 2,151,000 | 2,140,184 |
| Safehold Operating Partnership LP: | | | |
| 2.8% 6/15/31 | | 4,450,000 | 3,862,942 |
| 2.85% 1/15/32 | | 2,770,000 | 2,374,281 |
| 6.1% 4/1/34 | | 4,551,000 | 4,733,848 |
| Simon Property Group LP 2.45% 9/13/29 | | 6,352,000 | 5,778,032 |
| Store Capital LLC: | | | |
| 2.7% 12/1/31 | | 7,899,000 | 6,628,538 |
| 2.75% 11/18/30 | | 7,730,000 | 6,684,006 |
| 4.625% 3/15/29 | | 5,948,000 | 5,786,406 |
| Sun Communities Operating LP: | | | |
| 2.3% 11/1/28 | | 6,226,000 | 5,631,033 |
| 2.7% 7/15/31 | | 15,891,000 | 13,608,486 |
| 4.2% 4/15/32 | | 473,000 | 438,678 |
| 5.7% 1/15/33 | | 3,638,000 | 3,703,328 |
| Uniti Group LP/Uniti Fiber Holdings, Inc./CSL Capital LLC 6% 1/15/30 (b) | | 6,430,000 | 4,710,489 |
| Uniti Group LP/Uniti Group Finance, Inc./CSL Capital LLC: | | | |
| 4.75% 4/15/28(b) | | 8,960,000 | 7,878,147 |
| 6.5% 2/15/29(b) | | 8,855,000 | 6,779,225 |
| 10.5% 2/15/28(b) | | 810,000 | 831,105 |
| 10.5% 2/15/28(b) | | 8,084,000 | 8,294,637 |
| Ventas Realty LP: | | | |
| 3% 1/15/30 | | 28,128,000 | 25,742,177 |
| 3.5% 2/1/25 | | 3,798,000 | 3,763,119 |
| 4% 3/1/28 | | 6,996,000 | 6,843,770 |
| 4.125% 1/15/26 | | 3,540,000 | 3,502,774 |
| 4.75% 11/15/30 | | 39,136,000 | 39,118,077 |
| VICI Properties LP: | | | |
| 4.375% 5/15/25 | | 2,699,000 | 2,673,539 |
| 4.75% 2/15/28 | | 21,253,000 | 21,169,367 |
| 4.95% 2/15/30 | | 33,145,000 | 33,026,062 |
| 5.125% 5/15/32 | | 18,569,000 | 18,355,495 |
| 5.75% 4/1/34(c) | | 4,128,000 | 4,252,071 |
| 6.125% 4/1/54 | | 2,053,000 | 2,093,947 |
| VICI Properties LP / VICI Note Co.: | | | |
| 3.5% 2/15/25(b) | | 137,000 | 135,463 |
| 4.125% 8/15/30(b) | | 1,675,000 | 1,577,808 |
| 4.25% 12/1/26(b) | | 199,000 | 196,445 |
| 4.625% 12/1/29(b) | | 470,000 | 457,210 |
| Vornado Realty LP 2.15% 6/1/26 | | 6,904,000 | 6,531,331 |
| WP Carey, Inc.: | | | |
| 3.85% 7/15/29 | | 4,522,000 | 4,352,073 |
| 4.25% 7/23/32 | EUR | 800,000 | 901,273 |
| | | | 679,694,913 |
| Real Estate Management & Development - 0.4% | | | |
| ACCENTRO Real Estate AG 5.625% 2/13/26 (Reg. S) | EUR | 4,086,000 | 1,831,507 |
| AGPS BondCo PLC: | | | |
| 4.625% 1/14/26 (Reg. S)(e) | EUR | 16,200,000 | 5,555,795 |
| 5% 4/27/27 (Reg. S)(e) | EUR | 1,800,000 | 618,803 |
| Alpha Star Holding VIII Ltd. 8.375% 4/12/27 (Reg. S) | | 900,000 | 930,094 |
| Anywhere Real Estate Group LLC 7% 4/15/30 (b)(c) | | 1,529,600 | 1,356,195 |
| Blackstone Property Partners Europe LP: | | | |
| 1% 5/4/28 (Reg. S) | EUR | 8,500,000 | 8,447,864 |
| 1.75% 3/12/29 (Reg. S) | EUR | 4,975,000 | 4,966,084 |
| 2.625% 10/20/28 (Reg. S) | GBP | 1,900,000 | 2,215,752 |
| Brandywine Operating Partnership LP: | | | |
| 3.95% 11/15/27 | | 14,429,000 | 13,517,475 |
| 4.55% 10/1/29 | | 15,790,000 | 14,467,957 |
| 8.05% 3/15/28 | | 22,792,000 | 24,252,466 |
| CBRE Group, Inc. 2.5% 4/1/31 | | 21,262,000 | 18,323,864 |
| CPI Property Group SA 7% 5/7/29 (Reg. S) | EUR | 1,150,000 | 1,281,545 |
| Essex Portfolio LP 5.5% 4/1/34 | | 2,768,000 | 2,841,111 |
| Extra Space Storage LP 5.4% 2/1/34 | | 1,665,000 | 1,694,919 |
| Greystar Real Estate Partners 7.75% 9/1/30 (b) | | 935,000 | 994,913 |
| GTC Aurora Luxembourg SA 2.25% 6/23/26 (Reg. S) | EUR | 4,150,000 | 4,062,656 |
| Heimstaden AB 4.375% 3/6/27 (Reg. S) | EUR | 4,100,000 | 3,641,574 |
| Howard Hughes Corp.: | | | |
| 4.125% 2/1/29(b) | | 1,425,000 | 1,312,760 |
| 4.375% 2/1/31(b) | | 895,000 | 802,229 |
| Kennedy-Wilson, Inc.: | | | |
| 4.75% 3/1/29 | | 1,030,000 | 929,739 |
| 4.75% 2/1/30 | | 3,860,000 | 3,406,204 |
| Logicor Financing SARL 4.25% 7/18/29 (Reg. S) | EUR | 3,700,000 | 4,127,082 |
| Realogy Group LLC/Realogy Co-Issuer Corp. 5.75% 1/15/29 (b) | | 1,350,000 | 968,947 |
| Realogy Group LLC/Realogy Co.-Issuer Corp. 5.25% 4/15/30 (b) | | 568,000 | 396,034 |
| Samhallsbyggnadsbolaget I Norden AB 2.25% 8/12/27 (Reg. S) | EUR | 2,000,000 | 1,702,316 |
| Sirius Real Estate Ltd. 1.125% 6/22/26 (Reg. S) | EUR | 2,300,000 | 2,421,287 |
| Tanger Properties LP: | | | |
| 2.75% 9/1/31 | | 16,274,000 | 13,867,272 |
| 3.125% 9/1/26 | | 8,723,000 | 8,389,531 |
| Taylor Morrison Communities, Inc./Monarch Communities, Inc. 5.125% 8/1/30 (b) | | 695,000 | 686,823 |
| Tritax EuroBox PLC 0.95% 6/2/26 (Reg. S) | EUR | 1,580,000 | 1,665,772 |
| | | | 151,676,570 |
TOTAL REAL ESTATE | | | 831,371,483 |
| | | | |
| UTILITIES - 1.1% | | | |
| Electric Utilities - 0.5% | | | |
| Amprion GmbH: | | | |
| 3.125% 8/27/30 (Reg. S) | EUR | 1,400,000 | 1,528,646 |
| 3.625% 5/21/31 (Reg. S) | EUR | 1,000,000 | 1,119,438 |
| Chile Electricity LUX MPC SARL 6.01% 1/20/33 (b) | | 699,625 | 722,804 |
| Clearway Energy Operating LLC: | | | |
| 3.75% 2/15/31(b) | | 4,015,000 | 3,643,119 |
| 3.75% 1/15/32(b) | | 475,000 | 421,909 |
| 4.75% 3/15/28(b) | | 660,000 | 641,193 |
| Cleco Corporate Holdings LLC 3.375% 9/15/29 | | 12,555,000 | 11,447,691 |
| DPL, Inc.: | | | |
| 4.125% 7/1/25 | | 2,660,000 | 2,611,240 |
| 4.35% 4/15/29 | | 315,000 | 294,508 |
| Duke Energy Corp.: | | | |
| 2.45% 6/1/30 | | 10,750,000 | 9,609,061 |
| 3.85% 6/15/34 | EUR | 4,500,000 | 4,920,605 |
| 4.5% 8/15/32 | | 8,000,000 | 7,793,329 |
| Duquesne Light Holdings, Inc.: | | | |
| 2.532% 10/1/30(b) | | 5,172,000 | 4,474,393 |
| 2.775% 1/7/32(b) | | 16,845,000 | 14,242,031 |
| Electricite de France SA: | | | |
| 4.75% 10/12/34 (Reg. S) | EUR | 5,600,000 | 6,626,648 |
| 5.5% 1/25/35 (Reg. S) | GBP | 1,700,000 | 2,182,463 |
| EnBW Energie Baden-Wuerttemberg AG 1.375% 8/31/81 (Reg. S) (e) | EUR | 3,700,000 | 3,646,319 |
| EnBW International Finance BV 3.5% 7/22/31 (Reg. S) | EUR | 2,200,000 | 2,444,771 |
| ENEL Finance International NV: | | | |
| 5.5% 6/26/34(b) | | 2,800,000 | 2,842,473 |
| 7.5% 10/14/32(b) | | 992,000 | 1,139,451 |
| Enel SpA 3.375% (Reg. S) (e)(j) | EUR | 2,091,000 | 2,266,289 |
| Entergy Corp. 2.8% 6/15/30 | | 11,033,000 | 9,978,475 |
| Eskom Holdings SOC Ltd.: | | | |
| 6.35% 8/10/28(b) | | 2,630,000 | 2,630,815 |
| 7.125% 2/11/25(b) | | 2,370,000 | 2,370,741 |
| 8.45% 8/10/28(b) | | 645,000 | 668,820 |
| Exelon Corp.: | | | |
| 3.35% 3/15/32 | | 16,412,000 | 14,951,970 |
| 4.05% 4/15/30 | | 6,798,000 | 6,626,647 |
| 4.7% 4/15/50 | | 3,027,000 | 2,680,712 |
| 5.3% 3/15/33 | | 10,000,000 | 10,293,420 |
| IPALCO Enterprises, Inc. 4.25% 5/1/30 | | 8,975,000 | 8,597,897 |
| Israel Electric Corp. Ltd. 3.75% 2/22/32 (Reg. S) (b) | | 925,000 | 794,316 |
| Lamar Funding Ltd. 3.958% 5/7/25 (b) | | 1,895,000 | 1,877,339 |
| Mong Duong Finance Holdings BV 5.125% 5/7/29 (b) | | 2,116,635 | 2,037,917 |
| NextEra Energy Partners LP: | | | |
| 4.5% 9/15/27(b)(c) | | 1,200,000 | 1,158,993 |
| 7.25% 1/15/29(b)(c) | | 640,000 | 670,060 |
| NGG Finance PLC 2.125% 9/5/82 (Reg. S) (e) | EUR | 6,100,000 | 6,315,033 |
| Northern Powergrid PLC 2.5% 4/1/25 (Reg. S) | GBP | 147,000 | 189,748 |
| NRG Energy, Inc.: | | | |
| 3.375% 2/15/29(b) | | 3,215,000 | 2,950,310 |
| 3.625% 2/15/31(b) | | 1,230,000 | 1,100,475 |
| 5.25% 6/15/29(b) | | 2,945,000 | 2,911,156 |
| PG&E Corp.: | | | |
| 5% 7/1/28 | | 3,305,000 | 3,237,026 |
| 5.25% 7/1/30(c) | | 12,225,000 | 11,969,296 |
| Scottish Hydro Electric Transmission PLC 3.375% 9/4/32 (Reg. S) | EUR | 3,275,000 | 3,594,264 |
| Southern Co. 1.875% 9/15/81 (e) | EUR | 7,100,000 | 7,201,637 |
| Vistra Operations Co. LLC: | | | |
| 5% 7/31/27(b) | | 3,400,000 | 3,365,305 |
| 5.5% 9/1/26(b) | | 1,775,000 | 1,771,257 |
| 5.625% 2/15/27(b) | | 3,020,000 | 3,015,457 |
| 6.875% 4/15/32(b) | | 2,520,000 | 2,617,506 |
| 7.75% 10/15/31(b) | | 2,550,000 | 2,713,251 |
| | | | 202,908,224 |
| Gas Utilities - 0.0% | | | |
| ENN Energy Holdings Ltd. 4.625% 5/17/27 (b) | | 2,045,000 | 2,033,497 |
| Nakilat, Inc. 6.067% 12/31/33 (b) | | 1,008,640 | 1,063,278 |
| | | | 3,096,775 |
| Independent Power and Renewable Electricity Producers - 0.3% | | | |
| Aydem Yenilenebilir Enerji A/S 7.75% 2/2/27 (b) | | 1,290,000 | 1,274,278 |
| Buffalo Energy Mexico Holdings 7.875% 2/15/39 (b) | | 1,215,000 | 1,302,747 |
| Calpine Corp.: | | | |
| 4.625% 2/1/29(b) | | 1,000,000 | 953,817 |
| 5.125% 3/15/28(b) | | 500,000 | 487,898 |
| Emera U.S. Finance LP 3.55% 6/15/26 | | 5,152,000 | 5,016,811 |
| Energo-Pro A/S 8.5% 2/4/27 (b) | | 1,815,000 | 1,825,777 |
| EnfraGen Energia Sur SA 5.375% 12/30/30 (b) | | 3,865,000 | 3,304,575 |
| Investment Energy Resources Ltd. 6.25% 4/26/29 (b) | | 1,600,000 | 1,580,496 |
| PT Pertamina Geothermal Energy 5.15% 4/27/28 (b) | | 775,000 | 782,023 |
| RWE Finance U.S. LLC 5.875% 4/16/34 (b) | | 6,901,000 | 7,124,269 |
| Sunnova Energy Corp.: | | | |
| 5.875% 9/1/26(b) | | 4,630,000 | 4,349,660 |
| 11.75% 10/1/28(b) | | 615,000 | 571,015 |
| Termocandelaria Power Ltd. 7.875% 1/30/29 (b) | | 1,267,000 | 1,279,277 |
| The AES Corp.: | | | |
| 2.45% 1/15/31 | | 23,060,000 | 19,665,180 |
| 3.3% 7/15/25(b) | | 33,229,000 | 32,576,276 |
| 3.95% 7/15/30(b) | | 28,974,000 | 27,354,388 |
| | | | 109,448,487 |
| Multi-Utilities - 0.3% | | | |
| Abu Dhabi National Energy Co. PJSC: | | | |
| 4% 10/3/49(b) | | 1,960,000 | 1,657,435 |
| 4.696% 4/24/33(b) | | 985,000 | 993,313 |
| 4.875% 4/23/30(b) | | 520,000 | 534,414 |
| E.ON SE 3.375% 1/15/31 (Reg. S) | EUR | 2,200,000 | 2,446,832 |
| Engie SA: | | | |
| 3.875% 3/6/36 (Reg. S) | EUR | 2,600,000 | 2,899,181 |
| 4.25% 9/6/34 (Reg. S) | EUR | 2,000,000 | 2,300,595 |
| NiSource, Inc.: | | | |
| 2.95% 9/1/29 | | 31,524,000 | 29,204,027 |
| 5.25% 2/15/43 | | 8,116,000 | 7,860,432 |
| 5.8% 2/1/42 | | 4,036,000 | 4,112,263 |
| 5.95% 6/15/41 | | 5,760,000 | 6,003,353 |
| Puget Energy, Inc.: | | | |
| 4.1% 6/15/30 | | 21,032,000 | 20,042,812 |
| 4.224% 3/15/32 | | 21,626,000 | 19,941,919 |
| Sempra 6% 10/15/39 | | 9,562,000 | 10,030,931 |
| WEC Energy Group, Inc. CME Term SOFR 3 Month Index + 2.110% 7.4922% 5/15/67 (e)(f) | | 2,459,000 | 2,392,156 |
| | | | 110,419,663 |
| Water Utilities - 0.0% | | | |
| Aegea Finance SARL 9% 1/20/31 (b) | | 530,000 | 568,425 |
| Anglian Water (Osprey) Financing PLC 2% 7/31/28 (Reg. S) | GBP | 1,450,000 | 1,482,886 |
| Anglian Water Services Financing PLC: | | | |
| 5.875% 6/20/31 (Reg. S) | GBP | 1,153,000 | 1,535,577 |
| 6.293% 7/30/30 (Reg. S) | GBP | 2,044,000 | 2,802,606 |
| Severn Trent Utilities Finance PLC 4.625% 11/30/34 (Reg. S) | GBP | 1,170,000 | 1,438,304 |
| Southern Water Services Finance Ltd.: | | | |
| 1.625% 3/30/27 (Reg. S) | GBP | 1,765,000 | 1,924,846 |
| 2.375% 5/28/28 (Reg. S) | GBP | 930,000 | 976,699 |
| SW Finance I PLC 7.375% 12/12/41 (Reg. S) | GBP | 1,334,000 | 1,532,816 |
| | | | 12,262,159 |
TOTAL UTILITIES | | | 438,135,308 |
| | | | |
| TOTAL NONCONVERTIBLE BONDS | | | 10,941,714,916 |
| TOTAL CORPORATE BONDS (Cost $11,280,099,625) | | | 10,971,390,587 |
| | | | |
| U.S. Treasury Obligations - 34.8% |
| | | Principal Amount (a) | Value ($) |
| U.S. Treasury Bonds: | | | |
| 1.125% 5/15/40 | | 207,334,000 | 134,200,170 |
| 1.125% 8/15/40 | | 5,000,000 | 3,207,813 |
| 1.75% 8/15/41 | | 208,680,000 | 145,057,055 |
| 1.875% 11/15/51 | | 400,075,000 | 245,483,520 |
| 2% 11/15/41 | | 199,600,000 | 144,062,859 |
| 2% 8/15/51 | | 668,247,000 | 423,658,160 |
| 2.25% 8/15/46 | | 750,000 | 527,227 |
| 2.875% 5/15/52 | | 179,725,000 | 138,893,727 |
| 3% 2/15/47 | | 396,205,000 | 319,270,036 |
| 3.25% 5/15/42 (k)(l) | | 183,189,000 | 159,617,727 |
| 3.625% 2/15/53 | | 467,854,000 | 419,661,384 |
| 3.625% 5/15/53 | | 179,000,000 | 160,673,477 |
| 3.875% 5/15/43 | | 3,000,000 | 2,831,717 |
| 4% 11/15/42 | | 5,140,000 | 4,959,297 |
| 4.125% 8/15/53 | | 504,327,000 | 495,245,175 |
| 4.25% 8/15/44 (i) | | 1,300,000 | 1,268,516 |
| 4.25% 2/15/54 | | 646,563,000 | 649,088,637 |
| 4.375% 8/15/43 | | 41,000,000 | 41,403,594 |
| 4.5% 2/15/44 | | 5,690,000 | 5,832,250 |
| 4.625% 5/15/44 | | 48,715,000 | 50,732,105 |
| 4.625% 5/15/54 | | 130,450,000 | 139,418,438 |
| 6.25% 5/15/30 (l) | | 26,000,000 | 29,273,359 |
| U.S. Treasury Notes: | | | |
| 1.25% 9/30/28 | | 84,070,000 | 76,158,882 |
| 2.625% 7/31/29 (k) | | 11,000,000 | 10,447,422 |
| 2.75% 5/31/29 | | 246,000,000 | 235,333,593 |
| 2.75% 8/15/32 | | 770,411,000 | 712,479,706 |
| 2.875% 5/15/32 | | 263,111,000 | 246,152,675 |
| 3.125% 8/31/29 | | 239,780,000 | 232,942,525 |
| 3.375% 5/15/33 (k) | | 1,126,000,000 | 1,083,511,030 |
| 3.5% 1/31/30 | | 176,400,000 | 174,036,515 |
| 3.5% 2/15/33 | | 9,000,000 | 8,755,313 |
| 3.625% 3/31/30 | | 2,688,000 | 2,667,315 |
| 3.75% 8/15/27 | | 47,650,000 | 47,597,883 |
| 3.75% 12/31/28 | | 242,180,000 | 242,151,619 |
| 3.75% 5/31/30 | | 13,869,000 | 13,846,246 |
| 3.75% 12/31/30 | | 3,600,000 | 3,589,734 |
| 3.875% 9/30/29 | | 300,000,000 | 301,593,750 |
| 3.875% 12/31/29 | | 225,000,000 | 226,116,212 |
| 3.875% 8/15/33 | | 273,333,000 | 272,724,408 |
| 3.875% 8/15/34 | | 183,920,000 | 183,229,914 |
| 4% 6/30/28 (k) | | 247,480,000 | 249,597,115 |
| 4% 10/31/29 | | 330,700,000 | 334,317,031 |
| 4% 2/28/30 | | 2,307,000 | 2,332,774 |
| 4% 1/31/31 | | 600,000,000 | 606,585,936 |
| 4% 2/15/34 | | 383,246,000 | 385,641,288 |
| 4.125% 3/31/31 | | 302,457,000 | 308,033,551 |
| 4.125% 7/31/31 | | 368,000,000 | 374,810,539 |
| 4.125% 11/15/32 | | 221,500,000 | 225,644,473 |
| 4.25% 3/15/27 | | 53,570,000 | 54,114,070 |
| 4.25% 2/28/29 | | 16,242,000 | 16,585,874 |
| 4.25% 6/30/31 | | 365,220,000 | 374,807,025 |
| 4.375% 10/31/24 | | 23,200,000 | 23,166,922 |
| 4.375% 11/30/28 | | 12,000,000 | 12,289,219 |
| 4.375% 11/30/30 | | 205,750,000 | 212,260,058 |
| 4.375% 5/15/34 | | 502,220,000 | 520,425,475 |
| 4.5% 5/31/29 | | 3,890,000 | 4,018,400 |
| 4.5% 11/15/33 | | 511,765,000 | 535,014,325 |
| 4.625% 2/28/25 | | 24,300,000 | 24,281,395 |
| 4.625% 3/15/26 | | 46,680,000 | 47,044,688 |
| 4.625% 11/15/26 | | 57,610,000 | 58,485,402 |
| 4.625% 6/15/27 | | 22,070,000 | 22,545,884 |
| 4.625% 9/30/28 | | 882,000 | 910,527 |
| 4.625% 4/30/29 | | 14,100,000 | 14,626,547 |
| 4.625% 9/30/30 | | 1,176,000 | 1,228,598 |
| 4.875% 10/31/28 | | 787,066,000 | 820,547,048 |
| 4.875% 10/31/30 | | 705,000,000 | 746,639,063 |
| TOTAL U.S. TREASURY OBLIGATIONS (Cost $14,539,564,999) | | | 13,763,654,212 |
| | | | |
| U.S. Government Agency - Mortgage Securities - 24.1% |
| | | Principal Amount (a) | Value ($) |
| Fannie Mae - 6.6% | | | |
| FTSE USD IBOR Consumer Cash Fallbacks Term 1Y + 1.440% 5.945% 4/1/37 (e)(f) | | 10,337 | 10,583 |
| FTSE USD IBOR Consumer Cash Fallbacks Term 1Y + 1.460% 6.085% 1/1/35 (e)(f) | | 3,067 | 3,140 |
| FTSE USD IBOR Consumer Cash Fallbacks Term 1Y + 1.470% 6.058% 10/1/33 (e)(f) | | 285 | 289 |
| FTSE USD IBOR Consumer Cash Fallbacks Term 1Y + 1.480% 7.48% 7/1/34 (e)(f) | | 1,427 | 1,463 |
| FTSE USD IBOR Consumer Cash Fallbacks Term 1Y + 1.500% 6.755% 1/1/35 (e)(f) | | 16,164 | 16,393 |
| FTSE USD IBOR Consumer Cash Fallbacks Term 1Y + 1.510% 7.26% 2/1/33 (e)(f) | | 218 | 221 |
| FTSE USD IBOR Consumer Cash Fallbacks Term 1Y + 1.530% 6.461% 12/1/34 (e)(f) | | 3,061 | 3,106 |
| FTSE USD IBOR Consumer Cash Fallbacks Term 1Y + 1.530% 6.785% 3/1/35 (e)(f) | | 2,489 | 2,527 |
| FTSE USD IBOR Consumer Cash Fallbacks Term 1Y + 1.550% 7.174% 10/1/33 (e)(f) | | 1,391 | 1,410 |
| FTSE USD IBOR Consumer Cash Fallbacks Term 1Y + 1.550% 7.428% 6/1/36 (e)(f) | | 7,985 | 8,214 |
| FTSE USD IBOR Consumer Cash Fallbacks Term 1Y + 1.560% 6.065% 3/1/37 (e)(f) | | 11,773 | 12,077 |
| FTSE USD IBOR Consumer Cash Fallbacks Term 1Y + 1.560% 7.315% 7/1/35 (e)(f) | | 1,981 | 2,015 |
| FTSE USD IBOR Consumer Cash Fallbacks Term 1Y + 1.630% 5.815% 9/1/36 (e)(f) | | 2,447 | 2,517 |
| FTSE USD IBOR Consumer Cash Fallbacks Term 1Y + 1.640% 6.413% 5/1/35 (e)(f) | | 18,895 | 19,430 |
| FTSE USD IBOR Consumer Cash Fallbacks Term 1Y + 1.640% 6.414% 3/1/33 (e)(f) | | 7,966 | 8,147 |
| FTSE USD IBOR Consumer Cash Fallbacks Term 1Y + 1.640% 6.837% 11/1/36 (e)(f) | | 4,847 | 4,978 |
| FTSE USD IBOR Consumer Cash Fallbacks Term 1Y + 1.680% 7.061% 5/1/36 (e)(f) | | 7,676 | 7,890 |
| FTSE USD IBOR Consumer Cash Fallbacks Term 1Y + 1.700% 7.167% 6/1/42 (e)(f) | | 15,154 | 15,590 |
| FTSE USD IBOR Consumer Cash Fallbacks Term 1Y + 1.730% 6.028% 3/1/40 (e)(f) | | 20,326 | 20,911 |
| FTSE USD IBOR Consumer Cash Fallbacks Term 1Y + 1.750% 6.434% 8/1/41 (e)(f) | | 33,446 | 34,408 |
| FTSE USD IBOR Consumer Cash Fallbacks Term 1Y + 1.750% 6.439% 7/1/35 (e)(f) | | 5,597 | 5,751 |
| FTSE USD IBOR Consumer Cash Fallbacks Term 1Y + 1.780% 6.163% 2/1/36 (e)(f) | | 9,327 | 9,594 |
| FTSE USD IBOR Consumer Cash Fallbacks Term 1Y + 1.800% 6.055% 1/1/42 (e)(f) | | 70,732 | 72,766 |
| FTSE USD IBOR Consumer Cash Fallbacks Term 1Y + 1.800% 6.444% 12/1/40 (e)(f) | | 686,958 | 706,708 |
| FTSE USD IBOR Consumer Cash Fallbacks Term 1Y + 1.800% 7.635% 7/1/41 (e)(f) | | 4,645 | 4,779 |
| FTSE USD IBOR Consumer Cash Fallbacks Term 1Y + 1.810% 6.06% 12/1/39 (e)(f) | | 6,889 | 7,087 |
| FTSE USD IBOR Consumer Cash Fallbacks Term 1Y + 1.810% 6.068% 9/1/41 (e)(f) | | 6,871 | 7,069 |
| FTSE USD IBOR Consumer Cash Fallbacks Term 1Y + 1.810% 6.297% 2/1/42 (e)(f) | | 23,728 | 24,410 |
| FTSE USD IBOR Consumer Cash Fallbacks Term 1Y + 1.810% 7.64% 7/1/41 (e)(f) | | 9,159 | 9,422 |
| FTSE USD IBOR Consumer Cash Fallbacks Term 1Y + 1.820% 6.195% 12/1/35 (e)(f) | | 13,810 | 14,208 |
| FTSE USD IBOR Consumer Cash Fallbacks Term 1Y + 1.830% 6.08% 10/1/41 (e)(f) | | 5,903 | 5,989 |
| FTSE USD IBOR Consumer Cash Fallbacks Term 1Y + 1.950% 7.703% 7/1/37 (e)(f) | | 15,233 | 15,671 |
| FTSE USD IBOR Consumer Cash Fallbacks Term 1Y + 1.960% 6.418% 9/1/35 (e)(f) | | 2,837 | 2,910 |
| U.S. TREASURY 1 YEAR INDEX + 1.940% 6.32% 10/1/33 (e)(f) | | 29,907 | 30,311 |
| U.S. TREASURY 1 YEAR INDEX + 2.200% 6.583% 3/1/35 (e)(f) | | 5,902 | 5,991 |
| U.S. TREASURY 1 YEAR INDEX + 2.270% 6.395% 6/1/36 (e)(f) | | 15,042 | 15,289 |
| U.S. TREASURY 1 YEAR INDEX + 2.280% 6.402% 10/1/33 (e)(f) | | 9,717 | 9,870 |
| U.S. TREASURY 1 YEAR INDEX + 2.460% 7.177% 7/1/34 (e)(f) | | 15,158 | 15,452 |
| 1.5% 11/1/35 to 4/1/52 | | 185,988,487 | 153,141,339 |
| 2% 2/1/28 to 3/1/52 (k)(m) | | 652,024,892 | 558,431,924 |
| 2.5% 5/1/31 to 5/1/53 | | 516,819,241 | 452,900,267 |
| 3% 5/1/30 to 3/1/52 (m) | | 327,175,227 | 296,955,252 |
| 3.5% 8/1/34 to 10/1/52 | | 254,159,940 | 238,159,233 |
| 4% 3/1/36 to 8/1/52 | | 150,185,746 | 145,037,969 |
| 4.5% to 4.5% 6/1/33 to 6/1/53 (k) | | 114,123,931 | 112,303,748 |
| 5% 9/1/25 to 4/1/53 | | 89,648,772 | 90,451,449 |
| 5.288% 8/1/41 (e) | | 468,243 | 473,085 |
| 5.5% 5/1/48 to 6/1/54 | | 149,647,094 | 151,882,428 |
| 6% to 6% 9/1/29 to 8/1/54 | | 273,403,955 | 279,840,516 |
| 6.5% 7/1/32 to 7/1/54 | | 104,037,348 | 107,935,058 |
| 6.723% 2/1/39 (e) | | 181,832 | 187,887 |
| 7% to 7% 8/1/25 to 7/1/37 | | 119,856 | 124,716 |
| 7.5% to 7.5% 7/1/25 to 11/1/31 | | 49,339 | 50,552 |
| 8% 3/1/37 | | 5,975 | 6,395 |
TOTAL FANNIE MAE | | | 2,589,020,404 |
| Freddie Mac - 3.8% | | | |
| FTSE USD IBOR Consumer Cash Fallbacks Term 1Y + 1.120% 6.029% 8/1/37 (e)(f) | | 15,833 | 15,883 |
| FTSE USD IBOR Consumer Cash Fallbacks Term 1Y + 1.320% 5.575% 1/1/36 (e)(f) | | 7,689 | 7,804 |
| FTSE USD IBOR Consumer Cash Fallbacks Term 1Y + 1.370% 5.625% 3/1/36 (e)(f) | | 31,341 | 31,941 |
| FTSE USD IBOR Consumer Cash Fallbacks Term 1Y + 1.500% 5.824% 3/1/36 (e)(f) | | 23,916 | 24,413 |
| FTSE USD IBOR Consumer Cash Fallbacks Term 1Y + 1.750% 6% 12/1/40 (e)(f) | | 261,658 | 269,167 |
| FTSE USD IBOR Consumer Cash Fallbacks Term 1Y + 1.750% 6% 9/1/41 (e)(f) | | 91,811 | 94,451 |
| FTSE USD IBOR Consumer Cash Fallbacks Term 1Y + 1.750% 7.567% 7/1/41 (e)(f) | | 55,106 | 56,691 |
| FTSE USD IBOR Consumer Cash Fallbacks Term 1Y + 1.860% 6.422% 10/1/36 (e)(f) | | 28,503 | 29,072 |
| FTSE USD IBOR Consumer Cash Fallbacks Term 1Y + 1.860% 7.239% 4/1/36 (e)(f) | | 16,421 | 16,893 |
| FTSE USD IBOR Consumer Cash Fallbacks Term 1Y + 1.880% 6.13% 9/1/41 (e)(f) | | 9,475 | 9,747 |
| FTSE USD IBOR Consumer Cash Fallbacks Term 1Y + 1.880% 7.255% 4/1/41 (e)(f) | | 2,208 | 2,271 |
| FTSE USD IBOR Consumer Cash Fallbacks Term 1Y + 1.910% 7.155% 5/1/41 (e)(f) | | 17,696 | 18,205 |
| FTSE USD IBOR Consumer Cash Fallbacks Term 1Y + 1.910% 7.54% 5/1/41 (e)(f) | | 17,480 | 17,982 |
| FTSE USD IBOR Consumer Cash Fallbacks Term 1Y + 1.910% 7.628% 6/1/41 (e)(f) | | 17,100 | 17,592 |
| FTSE USD IBOR Consumer Cash Fallbacks Term 1Y + 1.910% 7.785% 6/1/41 (e)(f) | | 6,955 | 7,155 |
| FTSE USD IBOR Consumer Cash Fallbacks Term 1Y + 1.920% 6.601% 10/1/42 (e)(f) | | 62,319 | 64,110 |
| FTSE USD IBOR Consumer Cash Fallbacks Term 1Y + 1.990% 7% 10/1/35 (e)(f) | | 19,114 | 19,481 |
| FTSE USD IBOR Consumer Cash Fallbacks Term 1Y + 2.020% 6.936% 4/1/38 (e)(f) | | 13,695 | 14,089 |
| FTSE USD IBOR Consumer Cash Fallbacks Term 1Y + 2.020% 7.635% 6/1/37 (e)(f) | | 9,245 | 9,470 |
| FTSE USD IBOR Consumer Cash Fallbacks Term 1Y + 2.030% 6.158% 3/1/33 (e)(f) | | 268 | 275 |
| FTSE USD IBOR Consumer Cash Fallbacks Term 1Y + 2.040% 7.91% 7/1/36 (e)(f) | | 16,391 | 16,862 |
| FTSE USD IBOR Consumer Cash Fallbacks Term 1Y + 2.200% 6.45% 12/1/36 (e)(f) | | 19,608 | 20,172 |
| FTSE USD IBOR Consumer Cash Fallbacks Term 1Y + 3.010% 8.637% 10/1/35 (e)(f) | | 2,599 | 2,673 |
| U.S. TREASURY 1 YEAR INDEX + 2.030% 6.782% 6/1/33 (e)(f) | | 25,923 | 26,151 |
| U.S. TREASURY 1 YEAR INDEX + 2.260% 7.127% 6/1/33 (e)(f) | | 49,332 | 49,942 |
| U.S. TREASURY 1 YEAR INDEX + 2.460% 6.899% 3/1/35 (e)(f) | | 85,874 | 87,285 |
| 1.5% 7/1/35 to 8/1/51 | | 150,156,908 | 122,577,192 |
| 2% 5/1/35 to 4/1/52 | | 452,891,453 | 384,457,696 |
| 2.5% 6/1/31 to 6/1/52 | | 298,985,028 | 263,260,056 |
| 3% 12/1/30 to 6/1/52 | | 177,984,825 | 160,907,119 |
| 3.5% 1/1/32 to 10/1/53 | | 174,889,414 | 164,406,307 |
| 4% 5/1/37 to 10/1/52 | | 93,273,490 | 90,559,974 |
| 4% 4/1/48 | | 37,018 | 35,667 |
| 4.5% 6/1/25 to 6/1/53 | | 53,436,327 | 52,439,871 |
| 5% 8/1/33 to 8/1/53 | | 70,193,391 | 70,511,802 |
| 5.5% 9/1/52 to 4/1/54 (l) | | 81,525,425 | 83,063,039 |
| 6% 7/1/28 to 4/1/54 | | 53,600,163 | 55,062,856 |
| 6.5% 1/1/32 to 1/1/54 (l) | | 53,543,701 | 55,784,010 |
| 7% 3/1/26 to 9/1/36 | | 137,255 | 142,989 |
| 7.5% 1/1/27 to 11/1/31 | | 953 | 997 |
| 8% 7/1/25 to 4/1/32 | | 3,579 | 3,725 |
| 8.5% 4/1/25 to 1/1/28 | | 1,755 | 1,797 |
TOTAL FREDDIE MAC | | | 1,504,144,874 |
| Freddie Mac Multi-family Structured pass-thru certificates - 0.0% | | | |
| 3% 10/1/31 | | 249,166 | 241,204 |
| Ginnie Mae - 6.8% | | | |
| 3.5% 6/20/34 to 12/20/49 | | 36,258,722 | 34,372,330 |
| 4% 5/20/33 to 5/20/49 | | 49,579,413 | 48,089,460 |
| 4.5% 6/20/33 to 6/20/54 | | 34,612,238 | 34,031,097 |
| 5% 12/15/32 to 4/20/48 | | 8,260,651 | 8,409,926 |
| 5.5% 7/15/33 to 9/15/39 | | 288,223 | 296,880 |
| 6% to 6% 10/15/30 to 11/15/39 | | 92,290 | 95,207 |
| 7% to 7% 8/15/25 to 11/15/32 | | 188,611 | 194,148 |
| 7.5% to 7.5% 8/15/25 to 9/15/31 | | 29,258 | 29,885 |
| 8% 10/15/24 to 11/15/29 | | 4,079 | 4,185 |
| 8.5% 11/15/27 to 1/15/31 | | 2,880 | 3,050 |
| 2% 10/20/50 to 2/20/52 | | 449,082,410 | 378,019,599 |
| 2% 9/1/54 (i) | | 18,400,000 | 15,491,830 |
| 2% 9/1/54 (i) | | 46,000,000 | 38,729,576 |
| 2% 9/1/54 (i) | | 13,850,000 | 11,660,970 |
| 2% 9/1/54 (i) | | 53,000,000 | 44,623,207 |
| 2% 9/1/54 (i) | | 24,300,000 | 20,459,319 |
| 2% 9/1/54 (i) | | 26,500,000 | 22,311,603 |
| 2% 10/1/54 (i) | | 27,100,000 | 22,842,178 |
| 2.5% 6/20/51 to 7/20/54 | | 381,453,382 | 331,929,694 |
| 3% 2/20/31 to 4/15/45 | | 18,588,183 | 17,740,189 |
| 3% 9/1/54 (i) | | 38,775,000 | 35,064,806 |
| 3% 9/1/54 (i) | | 116,300,000 | 105,171,811 |
| 3% 9/1/54 (i) | | 13,200,000 | 11,936,955 |
| 3% 9/1/54 (i) | | 13,200,000 | 11,936,955 |
| 3% 9/1/54 (i) | | 13,200,000 | 11,936,955 |
| 3% 9/1/54 (i) | | 33,050,000 | 29,887,604 |
| 3% 9/1/54 (i) | | 72,300,000 | 65,381,960 |
| 3% 9/1/54 (i) | | 12,225,000 | 11,055,248 |
| 3% 10/1/54 (i) | | 33,650,000 | 30,453,852 |
| 3% 10/1/54 (i) | | 65,000,000 | 58,826,164 |
| 3.5% 9/1/54 (i) | | 74,700,000 | 69,517,844 |
| 3.5% 9/1/54 (i) | | 5,700,000 | 5,304,574 |
| 3.5% 9/1/54 (i) | | 50,500,000 | 46,996,669 |
| 3.5% 9/1/54 (i) | | 37,350,000 | 34,758,922 |
| 3.5% 9/1/54 (i) | | 37,300,000 | 34,712,391 |
| 4% 9/1/54 (i) | | 76,825,000 | 73,410,982 |
| 4.5% 9/1/54 (i) | | 18,200,000 | 17,814,697 |
| 4.5% 9/1/54 (i) | | 13,500,000 | 13,214,198 |
| 4.5% 9/1/54 (i) | | 1,450,000 | 1,419,303 |
| 5% 9/1/54 (i) | | 35,450,000 | 35,375,080 |
| 5% 9/1/54 (i) | | 4,600,000 | 4,590,278 |
| 5% 9/1/54 (i) | | 43,200,000 | 43,108,701 |
| 5% 9/1/54 (i) | | 22,900,000 | 22,851,603 |
| 5% 9/1/54 (i) | | 15,400,000 | 15,367,454 |
| 5% 10/1/54 (i) | | 54,550,000 | 54,358,006 |
| 5% 10/1/54 (i) | | 67,000,000 | 66,764,187 |
| 5.5% 9/1/54 (i) | | 36,600,000 | 36,834,116 |
| 5.5% 9/1/54 (i) | | 23,200,000 | 23,348,401 |
| 5.5% 9/1/54 (i) | | 36,100,000 | 36,330,917 |
| 5.5% 9/1/54 (i) | | 36,900,000 | 37,136,035 |
| 5.5% 10/1/54 (i) | | 70,150,000 | 70,582,278 |
| 6% 9/1/54 (i) | | 37,300,000 | 37,840,921 |
| 6% 9/1/54 (i) | | 3,200,000 | 3,246,406 |
| 6% 9/1/54 (i) | | 1,600,000 | 1,623,203 |
| 6% 9/1/54 (i) | | 47,950,000 | 48,645,366 |
| 6% 9/1/54 (i) | | 28,750,000 | 29,166,930 |
| 6% 9/1/54 (i) | | 21,300,000 | 21,608,890 |
| 6% 9/1/54 (i) | | 65,000,000 | 65,942,624 |
| 6% 9/1/54 (i) | | 61,750,000 | 62,645,492 |
| 6% 9/1/54 (i) | | 19,850,000 | 20,137,863 |
| 6% 9/1/54 (i) | | 34,400,000 | 34,898,865 |
| 6% 10/1/54 (i) | | 133,950,000 | 135,834,985 |
| 6.5% 3/20/31 to 6/15/37 | | 76,185 | 79,223 |
| 6.5% 9/1/54 (i) | | 19,000,000 | 19,398,763 |
| 6.5% 9/1/54 (i) | | 27,750,000 | 28,332,403 |
| 6.5% 9/1/54 (i) | | 24,450,000 | 24,963,144 |
TOTAL GINNIE MAE | | | 2,679,148,357 |
| Uniform Mortgage Backed Securities - 6.9% | | | |
| 2% 9/1/39 (i) | | 8,100,000 | 7,324,805 |
| 2% 9/1/39 (i) | | 38,500,000 | 34,815,431 |
| 2% 10/1/39 (i) | | 25,700,000 | 23,272,555 |
| 2% 9/1/54 (i) | | 597,600,000 | 488,771,423 |
| 2% 9/1/54 (i) | | 52,250,000 | 42,734,784 |
| 2% 9/1/54 (i) | | 52,200,000 | 42,693,889 |
| 2% 9/1/54 (i) | | 54,550,000 | 44,615,932 |
| 2% 9/1/54 (i) | | 13,150,000 | 10,755,261 |
| 2% 9/1/54 (i) | | 17,975,000 | 14,701,584 |
| 2% 9/1/54 (i) | | 104,450,000 | 85,428,673 |
| 2% 9/1/54 (i) | | 105,350,000 | 86,164,775 |
| 2% 9/1/54 (i) | | 4,000,000 | 3,271,562 |
| 2% 10/1/54 (i) | | 264,350,000 | 216,498,500 |
| 2% 10/1/54 (i) | | 278,400,000 | 228,005,229 |
| 2.5% 9/1/54 (i) | | 145,550,000 | 124,075,684 |
| 2.5% 9/1/54 (i) | | 54,450,000 | 46,416,496 |
| 2.5% 9/1/54 (i) | | 53,100,000 | 45,265,674 |
| 2.5% 9/1/54 (i) | | 23,900,000 | 20,373,816 |
| 2.5% 9/1/54 (i) | | 18,425,000 | 15,706,592 |
| 2.5% 9/1/54 (i) | | 7,950,000 | 6,777,064 |
| 2.5% 10/1/54 (i) | | 187,200,000 | 159,770,820 |
| 3% 9/1/54 (i) | | 121,700,000 | 107,899,415 |
| 3% 9/1/54 (i) | | 18,700,000 | 16,579,450 |
| 3% 10/1/54 (i) | | 50,700,000 | 44,994,268 |
| 3.5% 9/1/54 (i) | | 50,375,000 | 46,366,646 |
| 3.5% 9/1/54 (i) | | 5,400,000 | 4,970,320 |
| 4% 9/1/54 (i) | | 78,150,000 | 74,111,231 |
| 4% 9/1/54 (i) | | 7,850,000 | 7,444,314 |
| 4.5% 9/1/54 (i) | | 19,375,000 | 18,855,054 |
| 5% 9/1/39 (i) | | 28,200,000 | 28,397,180 |
| 5% 9/1/39 (i) | | 32,175,000 | 32,399,974 |
| 5% 9/1/39 (i) | | 24,825,000 | 24,998,581 |
| 5.5% 9/1/54 (i) | | 46,975,000 | 47,296,116 |
| 5.5% 9/1/54 (i) | | 37,825,000 | 38,083,568 |
| 5.5% 9/1/54 (i) | | 12,500,000 | 12,585,449 |
| 5.5% 9/1/54 (i) | | 24,700,000 | 24,868,847 |
| 5.5% 9/1/54 (i) | | 51,900,000 | 52,254,783 |
| 6% 9/1/54 (i) | | 50,400,000 | 51,327,279 |
| 6% 9/1/54 (i) | | 31,550,000 | 32,130,470 |
| 6% 9/1/54 (i) | | 37,500,000 | 38,189,940 |
| 6% 9/1/54 (i) | | 37,500,000 | 38,189,940 |
| 6% 9/1/54 (i) | | 35,025,000 | 35,669,404 |
| 6% 9/1/54 (i) | | 69,000,000 | 70,269,490 |
| 6% 9/1/54 (i) | | 11,800,000 | 12,017,101 |
| 6% 9/1/54 (i) | | 25,700,000 | 26,172,839 |
| 6% 9/1/54 (i) | | 51,100,000 | 52,040,158 |
| 6.5% 9/1/54 (i) | | 75,000 | 77,224 |
| 6.5% 9/1/54 (i) | | 58,200,000 | 59,925,537 |
TOTAL UNIFORM MORTGAGE BACKED SECURITIES | | | 2,745,555,127 |
| TOTAL U.S. GOVERNMENT AGENCY - MORTGAGE SECURITIES (Cost $9,618,855,642) | | | 9,518,109,966 |
| | | | |
| Asset-Backed Securities - 7.4% |
| | | Principal Amount (a) | Value ($) |
| Aaset 2024-1 U.S. Ltd. / Aaset 20 Series 2024-1A: | | | |
| Class A1, 6.261% 5/16/49 (b) | | 17,515,539 | 18,093,098 |
| Class A2, 6.261% 5/16/49 (b) | | 16,038,134 | 16,566,976 |
| AASET Trust: | | | |
| Series 2018-1A Class A, 3.844% 1/16/38 (b) | | 7,004,961 | 5,022,518 |
| Series 2019-1 Class A, 3.844% 5/15/39 (b) | | 939,233 | 906,386 |
| Series 2019-2: | | | |
Class A, 3.376% 10/16/39 (b) | | 12,609,724 | 12,027,271 |
Class B, 4.458% 10/16/39 (b) | | 3,803,418 | 2,282,086 |
| Series 2021-1A Class A, 2.95% 11/16/41 (b) | | 16,123,179 | 14,990,475 |
| Series 2021-2A Class A, 2.798% 1/15/47 (b) | | 31,461,460 | 28,518,086 |
| Affirm Asset Securitization Trust: | | | |
| Series 2024-A Class 1A, 5.61% 2/15/29 (b) | | 5,500,000 | 5,550,736 |
| Series 2024-X1 Class A, 6.27% 5/15/29 (b) | | 6,621,259 | 6,639,145 |
| Aimco: | | | |
| Series 2024-10A Class ARR, CME Term SOFR 3 Month Index + 1.410% 6.692% 7/22/37 (b)(e)(f) | | 13,287,000 | 13,336,388 |
| Series 2024-BA Class ARR, CME Term SOFR 3 Month Index + 1.500% 6.7861% 4/16/37 (b)(e)(f) | | 26,700,000 | 26,779,646 |
| Aimco Clo 17 Ltd. / Aimco Clo 1 Series 2024-17A Class A1R, CME Term SOFR 3 Month Index + 1.350% 6.632% 7/20/37 (b)(e)(f) | | 26,319,958 | 26,328,880 |
| Aimco Clo 21 Ltd. / Aimco Clo 2 Series 2024-21A Class A1, CME Term SOFR 3 Month Index + 1.500% 6.8251% 4/18/37 (b)(e)(f) | | 18,984,000 | 19,068,555 |
| Aimco Clo 22 Ltd. / Aimco Clo 2 Series 2024-22A Class A, CME Term SOFR 3 Month Index + 1.500% 6.8266% 4/19/37 (b)(e)(f) | | 41,979,000 | 42,140,829 |
| AIMCO CLO Ltd. Series 2024-11A Class A1R2, CME Term SOFR 3 Month Index + 1.340% 6.5839% 7/17/37 (b)(e)(f) | | 23,628,000 | 23,627,646 |
| AIMCO CLO Ltd. / AIMCO CLO LLC Series 2021-14A Class A, CME Term SOFR 3 Month Index + 1.250% 6.5336% 4/20/34 (b)(e)(f) | | 39,309,000 | 39,329,873 |
| Aligned Data Centers Issuer LLC Series 2023-2A Class A2, 6.5% 11/16/48 (b) | | 1,383,000 | 1,426,503 |
| Allegro Clo Xii Ltd. Series 2024-1A Class A1R, CME Term SOFR 3 Month Index + 1.440% 6.7236% 7/21/37 (b)(e)(f) | | 35,274,000 | 35,326,911 |
| Allegro CLO XV, Ltd. / Allegro CLO VX LLC Series 2022-1A Class A, CME Term SOFR 3 Month Index + 1.500% 6.782% 7/20/35 (b)(e)(f) | | 18,066,000 | 18,077,508 |
| Allegro CLO, Ltd. Series 2021-1A Class A, CME Term SOFR 3 Month Index + 1.400% 6.6836% 7/20/34 (b)(e)(f) | | 18,308,000 | 18,285,042 |
| Ally Auto Receivables Trust Series 2024-1 Class A3, 5.08% 12/15/28 | | 14,218,000 | 14,338,361 |
| American Express Credit Account Master Trust Series 2023-1 Class A, 4.87% 5/15/28 | | 3,490,000 | 3,513,026 |
| American Homes 4 Rent Series 2015-SFR2 Class XS, 0% 10/17/52 (b)(e)(h)(n) | | 733,077 | 7 |
| Apollo Aviation Securitization Equity Trust Series 2020-1A: | | | |
| Class A, 3.351% 1/16/40 (b) | | 4,332,428 | 4,137,509 |
| Class B, 4.335% 1/16/40 (b) | | 1,019,255 | 843,340 |
| Ares CLO Series 2024-54A Class AR, CME Term SOFR 3 Month Index + 1.270% 6.5714% 10/15/32 (b)(e)(f) | | 28,190,000 | 28,195,469 |
| Ares LIX CLO Ltd. Series 2021-59A Class A, CME Term SOFR 3 Month Index + 1.290% 6.5762% 4/25/34 (b)(e)(f) | | 13,014,000 | 13,014,950 |
| Ares Ln Funding V Ltd. / Ares Ln Fund Series 2024-ALF5A Class A1, CME Term SOFR 3 Month Index + 1.500% 6.8235% 7/27/37 (b)(e)(f) | | 25,309,000 | 25,374,171 |
| Ares Loan Funding Vii Ltd. Series 2024-ALF7 Class E, CME Term SOFR 3 Month Index + 6.250% 6.25% 10/22/37 (b)(e)(f)(i) | | 150,000 | 150,000 |
| Ares LV CLO Ltd. Series 2021-55A Class A1R, CME Term SOFR 3 Month Index + 1.390% 6.693% 7/15/34 (b)(e)(f) | | 16,637,000 | 16,655,367 |
| Ares LVIII CLO LLC Series 2022-58A Class AR, CME Term SOFR 3 Month Index + 1.330% 6.6314% 1/15/35 (b)(e)(f) | | 30,273,000 | 30,293,707 |
| Ares XLI CLO Ltd. / Ares XLI CLO LLC Series 2021-41A Class AR2, CME Term SOFR 3 Month Index + 1.330% 6.633% 4/15/34 (b)(e)(f) | | 27,448,000 | 27,452,419 |
| Ari Fleet Lease Trust 2024-B Series 2024-B Class A2, 5.54% 4/15/33 (b) | | 6,624,000 | 6,685,486 |
| Babson CLO Ltd. Series 2021-1A Class AR, CME Term SOFR 3 Month Index + 1.410% 6.713% 10/15/36 (b)(e)(f) | | 15,712,000 | 15,726,769 |
| Barings CLO Ltd.: | | | |
| Series 2021-1A Class A, CME Term SOFR 3 Month Index + 1.280% 6.5662% 4/25/34 (b)(e)(f) | | 28,623,000 | 28,634,306 |
| Series 2021-4A Class A, CME Term SOFR 3 Month Index + 1.480% 6.7636% 1/20/32 (b)(e)(f) | | 18,225,713 | 18,225,713 |
| Series 2024-4A Class AR, 0% 10/20/37 (b)(e) | | 28,887,000 | 28,887,000 |
| Barings CLO Ltd. 2023-IV Series 2024-4A Class A, CME Term SOFR 3 Month Index + 1.750% 7.032% 1/20/37 (b)(e)(f) | | 30,407,000 | 30,761,029 |
| Bbam U.S. Clo Iv Ltd. Series 2024-4A Class D, CME Term SOFR 3 Month Index + 6.250% 11.5729% 7/15/39 (b)(e)(f) | | 250,000 | 247,802 |
| Beechwood Park CLO Ltd. Series 2022-1A Class A1R, CME Term SOFR 3 Month Index + 1.300% 6.5858% 1/17/35 (b)(e)(f) | | 31,025,000 | 31,029,964 |
| BETHP Series 2021-1A Class A, CME Term SOFR 3 Month Index + 1.390% 6.693% 1/15/35 (b)(e)(f) | | 23,740,000 | 23,764,428 |
| Birch Grove Clo 4 Ltd. Series 2024-4A Class ER, CME Term SOFR 3 Month Index + 6.500% 11.8014% 7/15/37 (b)(e)(f) | | 462,000 | 452,815 |
| Blackbird Capital Aircraft: | | | |
| Series 2016-1A Class A, 4.213% 12/16/41 (b) | | 11,278,056 | 11,185,463 |
| Series 2021-1A Class A, 2.443% 7/15/46 (b) | | 24,356,629 | 22,178,367 |
| Blueberry Park Clo Ltd. Series 2024-1A Class A, CME Term SOFR 3 Month Index + 1.350% 1.35% 10/20/37 (b)(e)(f)(i) | | 30,827,000 | 30,837,481 |
| Bofa Auto Trust 2024-1 Series 2024-1A Class A3, 5.35% 11/15/28 (b) | | 5,525,000 | 5,614,786 |
| Bristol Park CLO, Ltd. Series 2020-1A Class AR, CME Term SOFR 3 Month Index + 1.250% 6.553% 4/15/29 (b)(e)(f) | | 3,276,552 | 3,278,623 |
| Capital One Multi-Asset Execution Trust Series 2023-A1 Class A, 4.42% 5/15/28 | | 2,400,000 | 2,398,921 |
| Capital Trust RE CDO Ltd. Series 2005-1A Class E, CME Term SOFR 1 Month Index + 2.210% 7.5596% 3/20/50 (b)(e)(f)(h) | | 330,000 | 0 |
| Carlyle U.S. Clo 2024-2 Ltd. Series 2024-2A Class E, CME Term SOFR 3 Month Index + 6.850% 12.175% 4/25/37 (b)(e)(f) | | 250,000 | 250,686 |
| Carlyle U.S. CLO Ltd. Series 2024-11A Class A1R, CME Term SOFR 3 Month Index + 1.410% 6.7329% 7/25/37 (b)(e)(f) | | 30,219,000 | 30,220,451 |
| Carmax Auto Owner Trust Series 2024-2 Class A3, 5.5% 1/16/29 | | 10,297,000 | 10,508,134 |
| Carmax Auto Owner Trust 2023-4 Series 2023-4 Class A3, 6% 7/17/28 | | 12,110,000 | 12,375,328 |
| Castlelake Aircraft Securitization Trust Series 2019-1A: | | | |
| Class A, 3.967% 4/15/39 (b) | | 11,798,809 | 10,796,296 |
| Class B, 5.095% 4/15/39 (b) | | 7,616,545 | 5,200,038 |
| Castlelake Aircraft Structured Trust: | | | |
| Series 2018-1 Class A, 4.125% 6/15/43 (b) | | 3,428,425 | 3,197,244 |
| Series 2021-1A Class A, 3.474% 1/15/46 (b) | | 3,137,900 | 3,014,664 |
| Cedar Funding Ltd.: | | | |
| Series 2021-10A Class AR, CME Term SOFR 3 Month Index + 1.360% 6.6436% 10/20/32 (b)(e)(f) | | 18,972,000 | 18,975,472 |
| Series 2021-12A Class A1R, CME Term SOFR 3 Month Index + 1.390% 6.6762% 10/25/34 (b)(e)(f) | | 14,593,000 | 14,603,522 |
| Series 2022-15A Class A, CME Term SOFR 3 Month Index + 1.320% 6.602% 4/20/35 (b)(e)(f) | | 28,708,000 | 28,706,048 |
| Cedar Funding Xvii Clo Ltd. Series 2023-17A Class A, CME Term SOFR 3 Month Index + 1.850% 7.132% 7/20/36 (b)(e)(f) | | 17,958,000 | 18,032,400 |
| CEDF Series 2021-6A Class ARR, CME Term SOFR 3 Month Index + 1.310% 6.5936% 4/20/34 (b)(e)(f) | | 23,812,000 | 23,806,857 |
| CFMT LLC Series 2023 HB12 Class A, 4.25% 4/25/33 (b) | | 5,194,644 | 5,097,010 |
| Chase Auto Owner Trust Series 2024-1A Class A3, 5.13% 5/25/29 (b) | | 5,800,000 | 5,881,214 |
| Chesapeake Funding II LLC: | | | |
| Series 2023-2A Class A1, 6.16% 10/15/35 (b) | | 6,932,752 | 7,033,185 |
| Series 2024-1A Class A1, 5.52% 5/15/36 (b) | | 11,161,648 | 11,271,463 |
| Citizens Auto Receivables Trust Series 2024-2 Class A3, 5.33% 8/15/28 (b) | | 7,900,000 | 7,996,465 |
| Columbia Cent CLO 29 Ltd./Columbia Cent CLO 29 Corp. Series 2021-29A Class AR, CME Term SOFR 3 Month Index + 1.430% 6.7136% 10/20/34 (b)(e)(f) | | 23,751,000 | 23,774,727 |
| Columbia Cent CLO 31 Ltd. Series 2021-31A Class A1, CME Term SOFR 3 Month Index + 1.460% 6.7436% 4/20/34 (b)(e)(f) | | 31,300,000 | 31,323,851 |
| Crest Ltd. Series 2004-1A Class H1, 3 month U.S. LIBOR + 3.690% 8.9627% (b)(d)(e)(f)(h) | | 407,341 | 0 |
| Croton Pk Clo Ltd. CME Term SOFR 3 Month Index + 0.550% 0% 10/15/36 (b)(e)(f)(i) | | 285,000 | 285,000 |
| Cyrusone Data Centers Issuer I Series 2024-3A Class A2, 4.65% 5/20/49 (b) | | 2,600,000 | 2,416,915 |
| Daimler Trucks Retail Trust 20 Series 2023-1 Class A2, 6.03% 9/15/25 | | 13,011,538 | 13,027,429 |
| DB Master Finance LLC: | | | |
| Series 2017-1A Class A2II, 4.03% 11/20/47 (b) | | 17,526,575 | 17,013,173 |
| Series 2019-1A Class A23, 4.352% 5/20/49 (b) | | 6,392,550 | 6,198,293 |
| DigitalBridge Issuer, LLC / DigitalBridge Co.-Issuer, LLC Series 2021-1A Class A2, 3.933% 9/25/51 (b) | | 994,000 | 947,481 |
| Discover Card Execution Note Trust: | | | |
| Series 2022-A4, Class A, 5.03% 10/15/27 | | 4,500,000 | 4,513,594 |
| Series 2023 A1 Class A, 4.31% 3/15/28 | | 14,700,000 | 14,649,411 |
| Dllaa 2023-1A Series 2023-1A: | | | |
| Class A2, 5.93% 7/20/26 (b) | | 4,425,006 | 4,440,193 |
| Class A3, 5.64% 2/22/28 (b) | | 5,174,000 | 5,270,690 |
| DLLAD: | | | |
| Series 2023-1A Class A3, 4.79% 1/20/28 (b) | | 6,600,000 | 6,615,119 |
| Series 2024-1A Class A3, 5.3% 7/20/29 (b) | | 4,579,000 | 4,673,784 |
| Dllmt 2024-1 LLC Series 2024-1A Class A3, 4.84% 8/21/28 (b) | | 12,300,000 | 12,330,583 |
| Dryden 108 Clo Ltd. / Dryden 10 Series 2024-108A Class A1R, CME Term SOFR 3 Month Index + 1.360% 6.6386% 7/18/37 (b)(e)(f) | | 41,704,000 | 41,716,470 |
| Dryden 98 CLO Ltd. Series 2022-98A Class A, CME Term SOFR 3 Month Index + 1.300% 6.582% 4/20/35 (b)(e)(f) | | 16,182,000 | 16,212,794 |
| Dryden CLO, Ltd. Series 2024-83A Class AR, CME Term SOFR 3 Month Index + 1.530% 6.8642% 4/18/37 (b)(e)(f) | | 24,322,000 | 24,347,733 |
| Dryden CLO, Ltd. / Dryden CLO, LLC Series 2021-86A Class A1R, CME Term SOFR 3 Month Index + 1.360% 6.6474% 7/17/34 (b)(e)(f) | | 23,939,000 | 23,973,712 |
| Dryden Senior Loan Fund: | | | |
| Series 2018-58A Class A1, CME Term SOFR 3 Month Index + 1.260% 6.5474% 7/17/31 (b)(e)(f) | | 5,889,622 | 5,890,082 |
| Series 2021-90A Class A1A, CME Term SOFR 3 Month Index + 1.390% 6.52% 2/20/35 (b)(e)(f) | | 12,306,000 | 12,324,410 |
| Series 2024-78A Class A1R, CME Term SOFR 3 Month Index + 1.530% 6.8158% 4/17/37 (b)(e)(f) | | 30,702,000 | 30,804,760 |
| Series 2024-85A Class A1R2, CME Term SOFR 3 Month Index + 1.380% 6.6814% 7/15/37 (b)(e)(f) | | 24,007,000 | 24,044,187 |
| Eaton Vance CLO, Ltd.: | | | |
| Series 2021-2A Class AR, CME Term SOFR 3 Month Index + 1.410% 6.713% 1/15/35 (b)(e)(f) | | 36,609,000 | 36,621,740 |
| Series 2024-1A: | | | |
Class AR2, CME Term SOFR 3 Month Index + 1.510% 6.8399% 7/15/37 (b)(e)(f) | | 24,041,000 | 24,159,498 |
Class ARR, CME Term SOFR 3 Month Index + 1.390% 6.6914% 10/15/37 (b)(e)(f) | | 27,944,000 | 28,050,243 |
Class D2, CME Term SOFR 3 Month Index + 4.500% 9.8014% 10/15/37 (b)(e)(f) | | 200,000 | 200,029 |
| Eaton Vance CLO, Ltd. / Eaton Vance CLO LLC Series 2021-1A Class A13R, CME Term SOFR 3 Month Index + 1.510% 6.813% 1/15/34 (b)(e)(f) | | 6,600,000 | 6,600,792 |
| Elmwood CLO Ltd. Series 2021-5A Class E, CME Term SOFR 3 Month Index + 6.610% 11.8936% 1/20/35 (b)(e)(f) | | 685,000 | 688,350 |
| Enterprise Fleet Financing Series 2024-2: | | | |
| Class A2, 5.74% 12/20/26 (b) | | 9,600,000 | 9,689,351 |
| Class A3, 5.61% 4/20/28 (b) | | 9,502,000 | 9,731,088 |
| Enterprise Fleet Financing 2023-3 L Series 2023-3 Class A2, 6.4% 3/20/30 (b) | | 18,378,264 | 18,720,551 |
| FirstKey Homes Trust: | | | |
| Series 2020-SFR1 Class F2, 4.284% 8/17/37 (b) | | 756,000 | 738,328 |
| Series 2021-SFR1 Class F1, 3.238% 8/17/38 (b) | | 473,000 | 442,261 |
| Flatiron CLO Ltd.: | | | |
| Series 2021-1A: | | | |
Class A1, CME Term SOFR 3 Month Index + 1.370% 6.6511% 7/19/34 (b)(e)(f) | | 16,641,000 | 16,667,409 |
Class AR, CME Term SOFR 3 Month Index + 1.340% 6.4371% 11/16/34 (b)(e)(f) | | 15,169,000 | 15,131,548 |
| Series 2024-1A Class A1R, 0% 10/19/37 (b)(e) | | 27,878,000 | 27,878,000 |
| Flatiron CLO Ltd. / Flatiron CLO LLC Series 2024-1A Class AR, CME Term SOFR 3 Month Index + 1.380% 6.5084% 5/20/36 (b)(e)(f) | | 41,926,000 | 41,959,331 |
| Ford Credit Auto Owner Trust: | | | |
| Series 2018-1 Class A, 3.19% 7/15/31 (b) | | 5,100,000 | 5,060,186 |
| Series 2020-2 Class A, 1.06% 4/15/33 (b) | | 7,100,000 | 6,805,218 |
| Ford Credit Floorplan Master Owner Trust: | | | |
| Series 2023-1 Class A1, 4.92% 5/15/28 (b) | | 6,100,000 | 6,132,990 |
| Series 2024-1 Class A1, 5.29% 4/15/29 (b) | | 14,200,000 | 14,474,560 |
| GM Financial Automobile Leasing Trust Series 2023-2 Class A2A, 5.44% 10/20/25 | | 1,648,813 | 1,648,979 |
| Gm Financial Consumer Automobile Re Series 2023-3 Class A3, 5.45% 6/16/28 | | 10,757,000 | 10,881,545 |
| Gm Financial Leasing Trust 202 Series 2023-3 Class A3, 5.38% 11/20/26 | | 5,328,000 | 5,356,529 |
| Gm Financial Revolving Receiva Series 2024-1 Class A, 4.98% 12/11/36 (b) | | 5,799,000 | 5,902,749 |
| Goldentree Loan Management U.S. CLO 18, Ltd. Series 2024-21A Class DJ, CME Term SOFR 3 Month Index + 4.250% 9.5751% 7/20/37 (b)(e)(f) | | 390,000 | 391,424 |
| Goldentree Loan Management U.S. CLO 21, Ltd. Series 2024-21A Class E, CME Term SOFR 3 Month Index + 5.700% 11.0251% 7/20/37 (b)(e)(f) | | 588,000 | 586,606 |
| Golub Capital Partners Clo 76 B Lt Series 2024-76A Class E, CME Term SOFR 3 Month Index + 5.750% 0% 10/25/37 (b)(e)(f)(i) | | 175,000 | 175,000 |
| Home Partners of America Trust: | | | |
| Series 2019-2 Class F, 3.866% 10/19/39 (b) | | 884,712 | 816,180 |
| Series 2021-2 Class G, 4.505% 12/17/26 (b) | | 3,991,081 | 3,659,792 |
| Series 2021-3 Class F, 4.242% 1/17/41 (b) | | 579,679 | 512,824 |
| Honda Auto Receivables Series 2023-2 Class A3, 4.93% 11/15/27 | | 11,200,000 | 11,232,916 |
| Honda Auto Receivables 2023-3 Series 2023-3 Class A3, 5.41% 2/18/28 | | 6,100,000 | 6,156,702 |
| Horizon Aircraft Finance I Ltd. Series 2018-1 Class A, 4.458% 12/15/38 (b) | | 6,307,608 | 5,834,524 |
| Horizon Aircraft Finance Ltd. Series 2019-1 Class A, 3.721% 7/15/39 (b) | | 6,159,900 | 5,697,895 |
| Hyundai Auto Lease Securitizat Series 2024-B Class A3, 5.41% 5/17/27 (b) | | 21,100,000 | 21,389,739 |
| Invesco CLO Ltd. Series 2021-3A Class A, CME Term SOFR 3 Month Index + 1.390% 6.6736% 10/22/34 (b)(e)(f) | | 16,712,000 | 16,730,149 |
| Invesco U.S. Clo 2023-2 Ltd. Series 2023-2A Class F, CME Term SOFR 3 Month Index + 7.580% 12.862% 4/21/36 (b)(e)(f) | | 327,000 | 320,329 |
| Invesco U.S. Clo 2024-1 Ltd. Series 2024-1RA Class AR, CME Term SOFR 3 Month Index + 1.550% 6.8514% 4/15/37 (b)(e)(f) | | 21,493,000 | 21,576,307 |
| Invesco U.S. CLO Ltd. Series 2024-3A Class A, CME Term SOFR 3 Month Index + 1.510% 6.8292% 7/20/37 (b)(e)(f) | | 19,593,000 | 19,749,646 |
| KKR CLO Ltd. Series 2022-41A Class A1, CME Term SOFR 3 Month Index + 1.330% 6.6314% 4/15/35 (b)(e)(f) | | 37,587,000 | 37,605,606 |
| Madison Park Funding Series 2024-19A Class AR3, CME Term SOFR 3 Month Index + 1.600% 6.882% 1/22/37 (b)(e)(f) | | 12,766,000 | 12,839,149 |
| Madison Park Funding L Ltd. / Madison Park Funding L LLC Series 2021-50A Class A, CME Term SOFR 3 Month Index + 1.400% 6.6811% 4/19/34 (b)(e)(f) | | 33,250,000 | 33,259,510 |
| Madison Park Funding LII Ltd. / Madison Park Funding LII LLC Series 2021-52A Class A, CME Term SOFR 3 Month Index + 1.360% 6.6436% 1/22/35 (b)(e)(f) | | 26,843,000 | 26,854,059 |
| Madison Park Funding XLV Ltd./Madison Park Funding XLV LLC Series 2021-45A Class AR, CME Term SOFR 3 Month Index + 1.380% 6.683% 7/15/34 (b)(e)(f) | | 16,653,000 | 16,652,850 |
| Madison Pk Funding Lxvii Ltd. / Mad Series 2024-67A Class A1, CME Term SOFR 3 Month Index + 1.510% 6.8002% 4/25/37 (b)(e)(f) | | 27,525,000 | 27,551,617 |
| Magnetite CLO LTD Series 2023-36A Class A, CME Term SOFR 3 Month Index + 1.800% 7.082% 4/22/36 (b)(e)(f) | | 11,974,000 | 12,035,498 |
| Magnetite CLO Ltd. Series 2021-27A Class AR, CME Term SOFR 3 Month Index + 1.400% 6.6836% 10/20/34 (b)(e)(f) | | 5,653,000 | 5,661,689 |
| Magnetite IX, Ltd. / Magnetite IX LLC Series 2021-30A Class A, CME Term SOFR 3 Month Index + 1.390% 6.6762% 10/25/34 (b)(e)(f) | | 28,658,000 | 28,704,397 |
| Magnetite XXI Ltd. Series 2021-21A Class AR, CME Term SOFR 3 Month Index + 1.280% 6.5636% 4/20/34 (b)(e)(f) | | 23,008,000 | 23,037,427 |
| Magnetite XXIII, Ltd. Series 2021-23A Class AR, CME Term SOFR 3 Month Index + 1.390% 6.6762% 1/25/35 (b)(e)(f) | | 19,791,000 | 19,821,775 |
| Magnetite Xxix Ltd. Series 2024-29A Class ER, CME Term SOFR 3 Month Index + 6.000% 11.2417% 7/15/37 (b)(e)(f) | | 150,000 | 150,023 |
| Magnetite XXIX, Ltd. / Magnetite XXIX LLC Series 2024-29A Class AR, CME Term SOFR 3 Month Index + 1.350% 6.5917% 7/15/37 (b)(e)(f) | | 29,129,000 | 29,131,359 |
| Marlette Funding Trust 2023-3 Series 2023-3A Class A, 6.49% 9/15/33 (b) | | 2,512,657 | 2,514,823 |
| Mercedes-Benz Auto Lease Trust Series 2024-A Class A3, 5.32% 1/18/28 | | 16,350,000 | 16,643,862 |
| Merchants Fleet Funding LLC: | | | |
| Series 2023-1A Class A, 7.21% 5/20/36 (b) | | 10,276,418 | 10,396,995 |
| Series 2024-1A Class A, 5.82% 4/20/37 (b) | | 14,000,000 | 14,179,495 |
| Midocean Credit Clo Xii Ltd. Series 2024-12A Class ER, CME Term SOFR 3 Month Index + 6.650% 11.9292% 4/18/36 (b)(e)(f) | | 326,000 | 328,271 |
| Midocean Credit Clo Xv Ltd. Series 2024-15A Class E, CME Term SOFR 3 Month Index + 6.250% 11.5923% 7/21/37 (b)(e)(f) | | 250,000 | 249,400 |
| Milos CLO, Ltd. Series 2020-1A Class AR, CME Term SOFR 3 Month Index + 1.330% 6.6136% 10/20/30 (b)(e)(f) | | 15,249,079 | 15,272,151 |
| Neuberger Berman Loan Advisers: | | | |
| Series 2024-25A Class AR2, CME Term SOFR 3 Month Index + 1.400% 6.723% 7/18/38 (b)(e)(f) | | 22,806,000 | 22,829,331 |
| Series 2024-2A Class E, CME Term SOFR 3 Month Index + 7.500% 12.8235% 4/20/38 (b)(e)(f) | | 613,000 | 617,153 |
| Nissan Master Owner Trust Receiva Series 2024-B Class A, 5.05% 2/15/29 (b) | | 5,826,000 | 5,898,637 |
| Oak Hill Credit Partners: | | | |
| Series 2024-13A Class AR, CME Term SOFR 3 Month Index + 1.350% 6.632% 7/20/37 (b)(e)(f) | | 38,437,000 | 38,450,030 |
| Series 2024-18A: | | | |
Class A1, 6.7917% 4/20/37 (b)(e) | | 31,144,000 | 31,233,539 |
Class A2, CME Term SOFR 3 Month Index + 1.650% 6.9417% 4/20/37 (b)(e)(f) | | 1,651,000 | 1,658,005 |
| Ocp Clo 2017-14 Ltd. Series 2024-14A Class ER, CME Term SOFR 3 Month Index + 6.550% 11.2908% 7/20/37 (b)(e)(f) | | 200,000 | 199,180 |
| OCP CLO Ltd.: | | | |
| Series 2021-21A Class E, CME Term SOFR 3 Month Index + 6.540% 11.8236% 7/20/34 (b)(e)(f) | | 325,000 | 324,793 |
| Series 2024-11A Class ER2, CME Term SOFR 3 Month Index + 6.820% 12.0992% 4/26/36 (b)(e)(f) | | 428,000 | 429,128 |
| Oha Credit Funding 2 Ltd. Series 2021-2A Class ER, CME Term SOFR 3 Month Index + 6.620% 11.9036% 4/21/34 (b)(e)(f) | | 445,000 | 447,211 |
| Orchard Park Clo Ltd. Series 2024-1A Class E, CME Term SOFR 3 Month Index + 5.600% 0% 10/20/37 (b)(e)(f)(i) | | 285,000 | 285,000 |
| Palmer Square Clo 2024-2 Ltd. Series 2024-2A Class E, CME Term SOFR 3 Month Index + 5.700% 10.9939% 7/20/37 (b)(e)(f) | | 500,000 | 499,990 |
| Palmer Square Ln Funding 2024-3 Series 2024-3A Class D, CME Term SOFR 3 Month Index + 5.400% 10.7366% 8/8/32 (b)(e)(f) | | 800,000 | 780,182 |
| Park Place Securities, Inc. Series 2005-WCH1 Class M4, CME Term SOFR 1 Month Index + 1.350% 6.6374% 1/25/36 (e)(f) | | 102,876 | 101,789 |
| Peace Park CLO, Ltd. Series 2021-1A Class A, CME Term SOFR 3 Month Index + 1.390% 6.6736% 10/20/34 (b)(e)(f) | | 21,089,000 | 21,100,135 |
| PK ALIFT Loan Funding 3 LP Series 2024-1 Class A1, 5.842% 9/15/39 (b) | | 5,378,000 | 5,480,976 |
| Planet Fitness Master Issuer LLC: | | | |
| Series 2019-1A Class A2, 3.858% 12/5/49 (b) | | 17,033,380 | 15,870,528 |
| Series 2022-1A: | | | |
Class A2I, 3.251% 12/5/51 (b) | | 22,587,093 | 21,603,499 |
Class A2II, 4.008% 12/5/51 (b) | | 16,378,990 | 15,083,658 |
| Progress Residential: | | | |
| Series 2022-SFR3 Class F, 6.6% 4/17/39 (b) | | 1,450,000 | 1,423,854 |
| Series 2022-SFR4 Class E1, 6.121% 5/17/41 (b) | | 1,423,000 | 1,435,317 |
| Series 2022-SFR5: | | | |
Class E1, 6.618% 6/17/39 (b) | | 922,000 | 930,880 |
Class E2, 6.863% 6/17/39 (b) | | 1,544,000 | 1,554,721 |
| Progress Residential Trust: | | | |
| Series 2021-SFR2 Class H, 4.998% 4/19/38 (b) | | 735,000 | 697,855 |
| Series 2021-SFR6: | | | |
Class F, 3.422% 7/17/38 (b) | | 546,000 | 512,348 |
Class G, 4.003% 7/17/38 (b) | | 273,000 | 253,075 |
| Series 2021-SFR8: | | | |
Class F, 3.181% 10/17/38 (b) | | 361,000 | 335,901 |
Class G, 4.005% 10/17/38 (b) | | 2,380,000 | 2,194,725 |
| Series 2022-SFR2 Class E2, 4.8% 4/17/27 (b) | | 1,225,000 | 1,169,261 |
| Project Silver Series 2019-1 Class A, 3.967% 7/15/44 (b) | | 12,558,551 | 11,554,118 |
| Prpm 2023-Rcf2 LLC Series 2023-RCF2 Class A1, 4% 11/25/53 (b) | | 6,422,505 | 6,274,115 |
| Retained Vantage Data Ctrs Iss Series 2023-2A Class A2, 5.05% 9/15/48 (b) | | 1,670,000 | 1,612,214 |
| Rockland Park CLO Ltd. Series 2021-1A Class A, CME Term SOFR 3 Month Index + 1.380% 6.6636% 4/20/34 (b)(e)(f) | | 31,749,000 | 31,777,003 |
| Rr 31 Ltd. Series 2024-31A Class D, CME Term SOFR 3 Month Index + 6.000% 6% 10/15/39 (b)(e)(f)(i) | | 150,000 | 150,000 |
| RR Ltd. Series 2022-7A Class A1AB, CME Term SOFR 3 Month Index + 1.340% 6.6414% 1/15/37 (b)(e)(f) | | 31,230,000 | 31,243,085 |
| Sapphire Aviation Finance Series 2020-1A: | | | |
| Class A, 3.228% 3/15/40 (b) | | 14,182,694 | 13,017,019 |
| Class B, 4.335% 3/15/40 (b) | | 1,557,155 | 1,230,539 |
| SBA Tower Trust: | | | |
| Series 2019, 2.836% 1/15/50 (b) | | 22,598,000 | 22,367,744 |
| 1.884% 7/15/50 (b) | | 9,101,000 | 8,709,697 |
| 2.328% 7/15/52 (b) | | 6,959,000 | 6,376,326 |
| Sbna Auto Lease Trust Series 2024-B Class A3, 5.56% 11/22/27 (b) | | 14,000,000 | 14,202,083 |
| Sfs Auto Receivables Securitiz Series 2023-1A Class A2A, 5.89% 3/22/27 (b) | | 4,023,052 | 4,030,506 |
| Sfs Auto Receivables Securitization Trust Series 2024-2A Class A3, 5.33% 11/20/29 (b) | | 8,257,000 | 8,413,859 |
| Starwood Mortgage Residential Trust Series 2022-SFR3 Class F, CME Term SOFR 1 Month Index + 4.500% 9.8369% 5/17/39 (b)(e)(f) | | 2,884,000 | 2,838,375 |
| Subway Funding LLC Issuer Series 2024-1A: | | | |
| Class A23, 6.505% 7/30/54 (b) | | 20,726,000 | 21,656,639 |
| Class A2I, 6.028% 7/30/54 (b) | | 39,753,000 | 40,786,713 |
| Class A2II, 6.268% 7/30/54 (b) | | 23,633,000 | 24,499,424 |
| Switch Abs Issuer LLC Series 2024-2A Class C, 10.033% 6/25/54 (b) | | 2,160,000 | 2,206,318 |
| SYMP Series 2022-32A Class A1, CME Term SOFR 3 Month Index + 1.320% 6.603% 4/23/35 (b)(e)(f) | | 32,177,000 | 32,117,440 |
| Symphony Clo 43 Ltd. Series 2024-43A Class A1, CME Term SOFR 3 Month Index + 1.520% 6.8465% 4/15/37 (b)(e)(f) | | 19,181,000 | 19,265,895 |
| Symphony CLO XXI, Ltd. Series 2021-21A Class AR, CME Term SOFR 3 Month Index + 1.320% 6.623% 7/15/32 (b)(e)(f) | | 3,095,000 | 3,097,894 |
| Symphony CLO XXVI Ltd. / Symphony CLO XXVI LLC Series 2021-26A Class AR, CME Term SOFR 3 Month Index + 1.340% 6.6236% 4/20/33 (b)(e)(f) | | 28,188,399 | 28,216,588 |
| Taberna Preferred Funding VI Ltd. Series 2006-6A Class F1, CME Term SOFR 3 Month Index + 4.760% 10.0037% (b)(d)(e)(f)(h) | | 919,143 | 0 |
| Terwin Mortgage Trust Series 2003-4HE Class A1, CME Term SOFR 1 Month Index + 0.970% 6.2524% 9/25/34 (e)(f) | | 12,132 | 12,324 |
| Tesla Series 2024-A Class A2A, 5.37% 6/22/26 (b) | | 5,916,174 | 5,918,910 |
| Tesla Auto Lease Trust 2023-B Series 2023-B: | | | |
| Class A2, 6.02% 9/22/25 (b) | | 14,416,931 | 14,439,018 |
| Class A3, 6.13% 9/21/26 (b) | | 14,800,000 | 14,930,690 |
| Tesla Auto Lease Trust 23-A Series 2023-A Class A3, 5.89% 6/22/26 (b) | | 12,465,000 | 12,507,961 |
| Thunderbolt Aircraft Lease Ltd. Series 2018-A Class A, 4.147% 9/15/38 (b)(e) | | 12,842,005 | 11,815,053 |
| Thunderbolt III Aircraft Lease Ltd. Series 2019-1 Class A, 3.671% 11/15/39 (b) | | 19,356,278 | 17,420,650 |
| Towd Point Mortgage Trust Series 2018-1 Class A1, 3% 1/25/58 (b) | | 599,097 | 586,197 |
| Toyota Lease Owner Trust: | | | |
| Series 2023 A Class A3, 4.93% 4/20/26 (b) | | 12,231,000 | 12,214,773 |
| Series 2024-A Class A3, 5.25% 4/20/27 (b) | | 10,400,000 | 10,498,106 |
| Trapeza CDO XII Ltd./Trapeza CDO XII, Inc. Series 2007-12A Class B, CME Term SOFR 3 Month Index + 0.820% 6.1359% 4/6/42 (b)(e)(f) | | 1,639,000 | 1,156,809 |
| Tricon American Homes: | | | |
| Series 2019-SFR1 Class F, 3.745% 3/17/38 (b) | | 924,000 | 894,714 |
| Series 2020-SFR1 Class F, 4.882% 7/17/38 (b) | | 269,000 | 263,035 |
| Tricon Residential Series 2022-SFR1: | | | |
| Class E1, 5.344% 4/17/39 (b) | | 1,931,000 | 1,906,290 |
| Class E2, 5.739% 4/17/39 (b) | | 2,399,000 | 2,376,756 |
| Tricon Residential 2023-Sfr1 T Series 2023-SFR1 Class E, 7.977% 7/17/40 (b) | | 476,000 | 489,196 |
| Tricon Residential Trust Series 2021-SFR1 Class G, 4.133% 7/17/38 (b) | | 315,000 | 292,479 |
| Usaa Auto Owner Trust 2024-A Series 2024-A Class A3, 5.03% 3/15/29 (b) | | 10,600,000 | 10,722,256 |
| VB-S1 Issuer LLC Series 2024-1A: | | | |
| Class D, 6.644% 5/15/54 (b) | | 1,980,000 | 2,040,176 |
| Class F, 8.871% 5/15/54 (b) | | 2,537,000 | 2,629,168 |
| Volkswagen Auto Lease Trust 2024- Series 2024-A Class A3, 5.21% 6/21/27 | | 9,800,000 | 9,928,529 |
| Voya Clo 2023-1 Ltd. Series 2023-1A Class A1, CME Term SOFR 3 Month Index + 1.800% 7.082% 1/20/37 (b)(e)(f) | | 23,148,000 | 23,376,818 |
| Voya Clo Ltd. Series 2024-1A Class A1, CME Term SOFR 3 Month Index + 1.520% 6.8461% 4/15/37 (b)(e)(f) | | 18,502,000 | 18,508,938 |
| Voya CLO Ltd./Voya CLO LLC: | | | |
| Series 2021-2A Class A1R, CME Term SOFR 3 Month Index + 1.420% 6.7011% 7/19/34 (b)(e)(f) | | 7,846,000 | 7,847,624 |
| Series 2021-3A Class AR, CME Term SOFR 3 Month Index + 1.410% 6.6936% 10/20/34 (b)(e)(f) | | 31,775,000 | 31,776,748 |
| Wheels Fleet Lease Funding 1 L: | | | |
| Series 2023-2A Class A, 6.46% 8/18/38 (b) | | 22,716,271 | 22,871,985 |
| Series 2024-1A Class A1, 5.49% 2/18/39 (b) | | 12,600,000 | 12,725,722 |
| Series 2024-2A Class A1, 4.87% 6/21/39 (b) | | 15,500,000 | 15,565,911 |
| Willis Engine Structured Trust Vi Series 2023-A Class A, 8% 10/15/48 (b) | | 10,912,577 | 11,593,451 |
| World Omni Auto Receivables Trust: | | | |
| Series 2023 B Class A3, 4.66% 5/15/28 | | 12,950,000 | 12,938,610 |
| Series 2023-C Class A3, 5.15% 11/15/28 | | 6,547,000 | 6,591,522 |
| TOTAL ASSET-BACKED SECURITIES (Cost $2,919,435,710) | | | 2,909,108,683 |
| | | | |
| Collateralized Mortgage Obligations - 1.7% |
| | | Principal Amount (a) | Value ($) |
| Private Sponsor - 0.3% | | | |
| Ajax Mortgage Loan Trust sequential payer Series 2021-E Class A1, 1.74% 12/25/60 (b) | | 10,364,102 | 9,050,642 |
| Brass PLC Series 2021-10A Class A1, 0.669% 4/16/69 (b)(e) | | 1,807,649 | 1,789,340 |
| Bravo Residential Funding Trust sequential payer Series 2023-RPL1 Class A1, 5% 5/25/63 (b) | | 12,988,834 | 13,003,659 |
| CFMT Series 2022-HB10 Class A, 3.25% 11/25/35 (b) | | 8,410,123 | 8,292,183 |
| Cfmt 2024-Hb15 LLC sequential payer Series 2024-HB15 Class A, 4% 8/25/34 (b)(e) | | 6,543,000 | 6,418,029 |
| Cfmt LLC floater sequential payer Series 2024-HB13 Class A, 3% 5/25/34 (b)(e) | | 11,121,432 | 10,635,693 |
| CSMC: | | | |
| floater Series 2015-1R Class 6A1, CME Term SOFR 1 Month Index + 0.390% 4.181% 5/27/37 (b)(e)(f) | | 442,496 | 436,357 |
| Series 2014-3R Class 2A1, CME Term SOFR 1 Month Index + 0.810% 0% 5/27/37 (b)(e)(f)(h) | | 153,098 | 15 |
| Gs Mtg-Backed Securities Trust 2024-Rpl Series 2024-RPL2 Class A1, 3.75% 7/25/61 (b) | | 4,103,646 | 3,974,657 |
| MFA Trust sequential payer Series 2022-RPL1 Class A1, 3.3% 8/25/61 (b) | | 6,990,208 | 6,561,645 |
| Mfra Trst sequential payer Series 2024-RPL1 Class A1, 4.25% 2/25/66 (b)(e) | | 4,466,379 | 4,230,385 |
| NYMT Loan Trust sequential payer Series 2021-CP1 Class A1, 2.0424% 7/25/61 (b) | | 2,756,506 | 2,538,906 |
| Nymt Loan Trust 2024-Cp1 sequential payer Series 2024-CP1 Class A1, 3.75% 2/25/68 (b) | | 5,011,093 | 4,705,886 |
| Ocwen Ln Investment Trust 2023-Hb1 Series 2023-HB1 Class A, 3% 6/25/36 (b) | | 1,836,528 | 1,788,954 |
| Ocwen Loan Invest Trust Series 2024-HB1 Class A, 3% 2/25/37 (b) | | 1,735,333 | 1,683,950 |
| Pret 2024-Rpl1 Trust sequential payer Series 2024-RPL1 Class A1, 3.9% 10/25/63 (b) | | 8,735,875 | 8,321,165 |
| Prmi Securitization Trust 2024-Cm floater Series 2024-CMG1 Class A1, U.S. 30-Day Avg. Secured Overnight Fin. Rate (SOFR) Index + 1.300% 6.8012% 7/25/54 (b)(e)(f) | | 9,190,674 | 9,162,268 |
| Prpm 2024-Rcf3 LLC Series 2024-RCF3 Class A1, 4% 5/25/54 (b) | | 10,615,834 | 10,377,538 |
| Prpm 2024-Rpl2 LLC Series 2024-RPL2 Class A1, 3.5% 5/25/54 (b)(e) | | 11,008,283 | 10,609,069 |
| RMF Buyout Issuance Trust: | | | |
| sequential payer Series 2021-HB1 Class A, 1.2586% 11/25/31 (b) | | 1,740,560 | 1,720,768 |
| Series 2020-HB1 Class A1, 1.7188% 10/25/50 (b) | | 2,482,098 | 2,358,829 |
| Sequoia Mortgage Trust floater Series 2004-6 Class A3B, CME Term SOFR 6 Month Index + 1.300% 6.5772% 7/20/34 (e)(f) | | 2,300 | 2,125 |
| Thornburg Mortgage Securities Trust floater Series 2003-4 Class A1, CME Term SOFR 1 Month Index + 0.750% 6.0324% 9/25/43 (e)(f) | | 1,038,340 | 988,143 |
| Towd Point Mortgage Trust sequential payer Series 2022-K147 Class A2, 3.75% 7/25/62 (b) | | 6,918,797 | 6,554,377 |
TOTAL PRIVATE SPONSOR | | | 125,204,583 |
| U.S. Government Agency - 1.4% | | | |
| Fannie Mae: | | | |
| floater: | | | |
Series 2002-18 Class FD, U.S. 30-Day Avg. Secured Overnight Fin. Rate (SOFR) Index + 0.910% 6.2633% 2/25/32 (e)(f) | | 3,507 | 3,518 |
Series 2002-39 Class FD, U.S. 30-Day Avg. Secured Overnight Fin. Rate (SOFR) Index + 1.110% 6.4677% 3/18/32 (e)(f) | | 6,407 | 6,460 |
Series 2002-60 Class FV, U.S. 30-Day Avg. Secured Overnight Fin. Rate (SOFR) Index + 1.110% 6.4633% 4/25/32 (e)(f) | | 6,873 | 6,929 |
Series 2002-63 Class FN, U.S. 30-Day Avg. Secured Overnight Fin. Rate (SOFR) Index + 1.110% 6.4633% 10/25/32 (e)(f) | | 8,518 | 8,589 |
Series 2002-7 Class FC, U.S. 30-Day Avg. Secured Overnight Fin. Rate (SOFR) Index + 0.860% 6.2133% 1/25/32 (e)(f) | | 3,229 | 3,230 |
Series 2003-118 Class S, 7.980% - U.S. 30-Day Avg. Secured Overnight Fin. Rate (SOFR) Index 2.6367% 12/25/33 (e)(n)(o) | | 129,685 | 19,443 |
Series 2006-104 Class GI, 6.560% - U.S. 30-Day Avg. Secured Overnight Fin. Rate (SOFR) Index 1.2167% 11/25/36 (e)(n)(o) | | 95,578 | 10,153 |
| planned amortization class: | | | |
Series 1999-17 Class PG, 6% 4/25/29 | | 26,962 | 27,427 |
Series 1999-32 Class PL, 6% 7/25/29 | | 37,959 | 38,618 |
Series 1999-33 Class PK, 6% 7/25/29 | | 27,594 | 28,050 |
Series 2001-52 Class YZ, 6.5% 10/25/31 | | 5,011 | 5,174 |
Series 2005-102 Class CO 11/25/35 (p) | | 19,095 | 16,443 |
Series 2005-73 Class SA, 17.500% x U.S. 30-Day Avg. Secured Overnight Fin. Rate (SOFR) Index 3.3454% 8/25/35 (e)(f)(o) | | 3,809 | 3,975 |
Series 2005-81 Class PC, 5.5% 9/25/35 | | 64,521 | 66,330 |
Series 2006-12 Class BO 10/25/35 (p) | | 85,594 | 75,580 |
Series 2006-15 Class OP 3/25/36 (p) | | 128,178 | 108,905 |
Series 2006-37 Class OW 5/25/36 (p) | | 13,011 | 10,596 |
Series 2006-45 Class OP 6/25/36 (p) | | 39,667 | 32,920 |
Series 2006-62 Class KP 4/25/36 (p) | | 62,263 | 51,988 |
Series 2012-134 Class MX, 3.5% 5/25/42 | | 502,475 | 489,888 |
Series 2012-149: | | | |
Class DA, 1.75% 1/25/43 | | 1,103,427 | 1,023,457 |
Class GA, 1.75% 6/25/42 | | 1,328,564 | 1,229,695 |
Series 2017-22 Class ED, 3.5% 6/25/44 | | 421,253 | 414,992 |
Series 2021-45 Class DA, 3% 7/25/51 | | 4,707,178 | 4,245,940 |
Series 2021-69 Class JK, 1.5% 10/25/51 | | 2,688,763 | 2,271,120 |
Series 2022-2 Class TH, 2.5% 2/25/52 | | 1,585,228 | 1,458,299 |
| sequential payer: | | | |
Series 1997-41 Class J, 7.5% 6/18/27 | | 4,421 | 4,534 |
Series 1999-25 Class Z, 6% 6/25/29 | | 30,194 | 30,364 |
Series 2001-20 Class Z, 6% 5/25/31 | | 36,037 | 36,802 |
Series 2001-31 Class ZC, 6.5% 7/25/31 | | 16,012 | 16,251 |
Series 2002-16 Class ZD, 6.5% 4/25/32 | | 16,610 | 17,185 |
Series 2002-74 Class SV, 7.430% - U.S. 30-Day Avg. Secured Overnight Fin. Rate (SOFR) Index 2.0867% 11/25/32 (e)(n)(o) | | 15,680 | 393 |
Series 2012-67 Class AI, 4.5% 7/25/27 (n) | | 17,562 | 229 |
Series 2016-104 Class B, 4% 12/25/44 | | 939,010 | 921,397 |
Series 2016-99 Class KA, 4% 11/25/42 | | 1,141,192 | 1,123,587 |
Series 2020-43 Class MA, 2% 1/25/45 | | 4,915,129 | 4,538,091 |
Series 2020-49 Class JA, 2% 8/25/44 | | 2,233,948 | 2,074,171 |
Series 2020-51 Class BA, 2% 6/25/46 | | 7,763,514 | 6,865,316 |
Series 2020-80 Class BA, 1.5% 3/25/45 | | 5,591,277 | 4,923,462 |
Series 2021-85 Class L, 2.5% 8/25/48 | | 2,564,869 | 2,285,360 |
Series 2021-95: | | | |
Class 0, 2.5% 9/25/48 | | 7,847,540 | 7,009,494 |
Class BA, 2.5% 6/25/49 | | 11,932,425 | 10,603,594 |
Series 2021-96: | | | |
Class AH, 2.5% 3/25/49 | | 28,344,082 | 25,547,819 |
Class HA, 2.5% 2/25/50 | | 4,130,666 | 3,675,923 |
Series 2022-1 Class KA, 3% 5/25/48 | | 2,526,437 | 2,349,134 |
Series 2022-11 Class B, 3% 6/25/49 | | 3,337,202 | 3,119,884 |
Series 2022-13: | | | |
Class HA, 3% 8/25/46 | | 2,736,587 | 2,583,385 |
Class JA, 3% 5/25/48 | | 4,894,963 | 4,590,338 |
Series 2022-15 Class GC, 3% 1/25/47 | | 4,128,183 | 3,880,733 |
Series 2022-17 Class BH, 3% 5/25/47 | | 4,509,054 | 4,279,925 |
Series 2022-25 Class AB, 4% 9/25/47 | | 4,496,327 | 4,411,099 |
Series 2022-3: | | | |
Class D, 2% 2/25/48 | | 11,499,973 | 10,344,429 |
Class N, 2% 10/25/47 | | 29,587,938 | 26,492,768 |
Series 2022-30 Class E, 4.5% 7/25/48 | | 6,512,679 | 6,431,568 |
Series 2022-35 Class CK, 4% 3/25/47 | | 9,253,248 | 8,939,620 |
Series 2022-4 Class B, 2.5% 5/25/49 | | 3,002,881 | 2,683,551 |
Series 2022-49 Class TC, 4% 12/25/48 | | 2,073,469 | 2,009,960 |
Series 2022-5: | | | |
Class 0, 2.5% 6/25/48 | | 3,433,038 | 3,117,029 |
Class BA, 2.5% 12/25/49 | | 3,756,401 | 3,286,368 |
Class DA, 2.25% 11/25/47 | | 9,824,662 | 8,869,252 |
Series 2022-69 Class AB, 4.5% 1/25/44 | | 8,525,163 | 8,388,000 |
Series 2022-7: | | | |
Class A, 3% 5/25/48 | | 3,598,470 | 3,346,102 |
Class E, 2.5% 11/25/47 | | 11,456,399 | 10,465,339 |
Series 2022-9 Class BA, 3% 5/25/48 | | 3,715,825 | 3,455,447 |
| Series 06-116 Class SG, 6.520% - U.S. 30-Day Avg. Secured Overnight Fin. Rate (SOFR) Index 1.1767% 12/25/36 (e)(n)(o) | | 64,538 | 6,915 |
| Series 07-40 Class SE, 6.320% - U.S. 30-Day Avg. Secured Overnight Fin. Rate (SOFR) Index 0.9767% 5/25/37 (e)(n)(o) | | 31,659 | 3,766 |
| Series 2003-21 Class SK, 7.980% - U.S. 30-Day Avg. Secured Overnight Fin. Rate (SOFR) Index 2.6367% 3/25/33 (e)(n)(o) | | 6,828 | 745 |
| Series 2005-72 Class ZC, 5.5% 8/25/35 | | 520,598 | 528,911 |
| Series 2005-79 Class ZC, 5.9% 9/25/35 | | 417,196 | 425,419 |
| Series 2007-57 Class SA, 40.600% x U.S. 30-Day Avg. Secured Overnight Fin. Rate (SOFR) Index 7.8401% 6/25/37 (e)(f)(o) | | 26,491 | 33,448 |
| Series 2007-66: | | | |
Class SA, 38.910% x U.S. 30-Day Avg. Secured Overnight Fin. Rate (SOFR) Index 6.8201% 7/25/37 (e)(f)(o) | | 40,126 | 51,140 |
Class SB, 38.910% x U.S. 30-Day Avg. Secured Overnight Fin. Rate (SOFR) Index 6.8201% 7/25/37 (e)(f)(o) | | 9,152 | 10,310 |
| Series 2010-135 Class ZA, 4.5% 12/25/40 | | 937,773 | 951,037 |
| Series 2010-150 Class ZC, 4.75% 1/25/41 | | 1,545,647 | 1,550,719 |
| Series 2010-95 Class ZC, 5% 9/25/40 | | 3,215,960 | 3,257,496 |
| Series 2011-39 Class ZA, 6% 11/25/32 | | 149,670 | 155,592 |
| Series 2011-4 Class PZ, 5% 2/25/41 | | 556,376 | 547,011 |
| Series 2011-67 Class AI, 4% 7/25/26 (n) | | 4,479 | 65 |
| Series 2012-100 Class WI, 3% 9/25/27 (n) | | 397,716 | 11,587 |
| Series 2012-9 Class SH, 6.430% - U.S. 30-Day Avg. Secured Overnight Fin. Rate (SOFR) Index 1.0867% 6/25/41 (e)(n)(o) | | 14,263 | 62 |
| Series 2013-133 Class IB, 3% 4/25/32 (n) | | 85,668 | 989 |
| Series 2013-134 Class SA, 5.930% - U.S. 30-Day Avg. Secured Overnight Fin. Rate (SOFR) Index 0.5867% 1/25/44 (e)(n)(o) | | 217,342 | 24,408 |
| Series 2013-51 Class GI, 3% 10/25/32 (n) | | 680,889 | 31,783 |
| Series 2013-N1 Class A, 6.600% - U.S. 30-Day Avg. Secured Overnight Fin. Rate (SOFR) Index 1.2567% 6/25/35 (e)(n)(o) | | 166,565 | 13,417 |
| Series 2015-42 Class IL, 6% 6/25/45 (n) | | 1,167,482 | 186,536 |
| Series 2015-70 Class JC, 3% 10/25/45 | | 1,061,287 | 1,012,150 |
| Series 2017-30 Class AI, 5.5% 5/25/47 (n) | | 702,094 | 113,093 |
| Series 2020-39 Class MG, 1.5% 6/25/40 | | 13,995,100 | 11,825,950 |
| Series 2020-45: | | | |
Class JC, 1.5% 7/25/40 | | 14,274,979 | 12,062,366 |
Class JL, 3% 7/25/40 | | 237,660 | 218,530 |
| Series 2020-59 Class MC, 1.5% 8/25/40 | | 15,694,799 | 13,255,486 |
| Series 2021-21 Class HG, 2% 11/25/47 | | 3,622,704 | 3,230,146 |
| Series 2021-59 Class H, 2% 6/25/48 | | 2,695,270 | 2,240,506 |
| Series 2021-66: | | | |
Class DA, 2% 1/25/48 | | 2,889,188 | 2,412,845 |
Class DM, 2% 1/25/48 | | 3,070,379 | 2,564,163 |
| Series 2022-28 Class A, 2.5% 2/25/52 | | 8,473,190 | 7,999,416 |
| Series 2023-13 Class CK, 1.5% 11/25/50 | | 8,433,553 | 6,826,331 |
| Fannie Mae Stripped Mortgage-Backed Securities: | | | |
| Series 339 Class 5, 5.5% 7/25/33 (n) | | 32,555 | 4,907 |
| Series 343 Class 16, 5.5% 5/25/34 (n) | | 30,367 | 4,616 |
| Series 348 Class 14, 6.5% 8/25/34 (e)(n) | | 19,741 | 3,628 |
| Series 351: | | | |
Class 12, 5.5% 4/25/34 (e)(n) | | 12,182 | 1,930 |
Class 13, 6% 3/25/34 (n) | | 18,877 | 3,277 |
| Series 359 Class 19, 6% 7/25/35 (e)(n) | | 10,930 | 1,987 |
| Series 384 Class 6, 5% 7/25/37 (n) | | 126,491 | 20,809 |
| Freddie Mac: | | | |
| floater: | | | |
Series 2412 Class FK, U.S. 30-Day Avg. Secured Overnight Fin. Rate (SOFR) Index + 0.910% 6.268% 1/15/32 (e)(f) | | 2,545 | 2,552 |
Series 2423 Class FA, U.S. 30-Day Avg. Secured Overnight Fin. Rate (SOFR) Index + 1.010% 6.368% 3/15/32 (e)(f) | | 3,690 | 3,709 |
Series 2424 Class FM, U.S. 30-Day Avg. Secured Overnight Fin. Rate (SOFR) Index + 1.110% 6.468% 3/15/32 (e)(f) | | 3,451 | 3,473 |
Series 2432: | | | |
Class FE, U.S. 30-Day Avg. Secured Overnight Fin. Rate (SOFR) Index + 1.010% 6.368% 6/15/31 (e)(f) | | 5,913 | 5,933 |
Class FG, U.S. 30-Day Avg. Secured Overnight Fin. Rate (SOFR) Index + 1.010% 6.368% 3/15/32 (e)(f) | | 2,133 | 2,141 |
| planned amortization class: | | | |
Series 2012-4026 Class MQ, 4% 4/15/42 | | 118,788 | 116,658 |
Series 2017-4676 Class VD, 4% 8/15/37 | | 199,810 | 198,487 |
Series 2017-4744 Class JA, 3% 9/15/47 | | 992,599 | 918,230 |
Series 2017-4746 Class PA, 4% 2/15/47 | | 1,070,101 | 1,056,855 |
Series 2020-5050 Class KP, 1% 12/25/50 | | 1,779,773 | 1,482,011 |
Series 2021-5141 Class JM, 1.5% 4/25/51 | | 1,985,990 | 1,683,839 |
Series 2021-5148: | | | |
Class AD, 1.5% 10/25/51 | | 2,670,291 | 2,260,878 |
Class PC, 1.5% 10/25/51 | | 2,639,173 | 2,212,835 |
Series 2022-5214 Class CG, 3.5% 4/25/52 | | 3,776,996 | 3,607,817 |
Series 2022-5220 Class PK, 3.5% 1/25/51 | | 5,324,212 | 5,055,834 |
Series 2095 Class PE, 6% 11/15/28 | | 35,895 | 36,523 |
Series 2101 Class PD, 6% 11/15/28 | | 3,377 | 3,442 |
Series 2121 Class MG, 6% 2/15/29 | | 15,494 | 15,778 |
Series 2131 Class BG, 6% 3/15/29 | | 109,227 | 111,311 |
Series 2137 Class PG, 6% 3/15/29 | | 18,209 | 18,544 |
Series 2154 Class PT, 6% 5/15/29 | | 28,264 | 28,795 |
Series 2162 Class PH, 6% 6/15/29 | | 5,414 | 5,510 |
Series 2520 Class BE, 6% 11/15/32 | | 63,335 | 65,462 |
Series 2693 Class MD, 5.5% 10/15/33 | | 599,794 | 608,374 |
Series 2802 Class OB, 6% 5/15/34 | | 38,342 | 39,308 |
Series 3002 Class NE, 5% 7/15/35 | | 149,002 | 151,714 |
Series 3110 Class OP 9/15/35 (p) | | 19,521 | 18,734 |
Series 3119 Class PO 2/15/36 (p) | | 149,911 | 122,588 |
Series 3121 Class KO 3/15/36 (p) | | 23,008 | 19,829 |
Series 3123 Class LO 3/15/36 (p) | | 82,507 | 68,088 |
Series 3145 Class GO 4/15/36 (p) | | 89,770 | 74,689 |
Series 3189 Class PD, 6% 7/15/36 | | 136,120 | 142,659 |
Series 3225 Class EO 10/15/36 (p) | | 45,411 | 37,254 |
Series 3258 Class PM, 5.5% 12/15/36 | | 46,996 | 48,300 |
Series 3415 Class PC, 5% 12/15/37 | | 62,684 | 63,297 |
Series 3832 Class PE, 5% 3/15/41 | | 608,881 | 620,176 |
Series 4135 Class AB, 1.75% 6/15/42 | | 1,023,203 | 952,579 |
| sequential payer: | | | |
Series 2014-4422 Class LA, 4.5% 3/15/43 | | 69,784 | 69,533 |
Series 2015-4492 Class LB, 4% 3/15/44 | | 134,892 | 134,045 |
Series 2015-4506 Class LB, 4% 4/15/44 | | 259,098 | 257,411 |
Series 2015-4516 Class A, 4% 8/15/41 | | 396,456 | 392,935 |
Series 2015-4522 Class LB, 4% 6/15/44 | | 194,400 | 193,058 |
Series 2015-4535 Class LB, 4% 8/15/44 | | 193,271 | 191,945 |
Series 2016-4636 Class AE, 4% 7/15/42 | | 290,436 | 288,633 |
Series 2017-4646 Class LA, 4% 9/15/45 | | 719,231 | 711,818 |
Series 2017-4661 Class AC, 4% 4/15/43 | | 299,942 | 297,350 |
Series 2020-4993 Class LA, 2% 8/25/44 | | 4,665,875 | 4,334,521 |
Series 2020-5018: | | | |
Class LC, 3% 10/25/40 | | 1,603,450 | 1,477,528 |
Class LY, 3% 10/25/40 | | 1,218,005 | 1,122,056 |
Series 2020-5058 Class BE, 3% 11/25/50 | | 5,804,565 | 5,145,970 |
Series 2020-5066 Class A, 1.5% 11/25/44 | | 1,895,949 | 1,671,170 |
Series 2021-5115 Class A, 2% 3/25/40 | | 6,782,212 | 6,062,611 |
Series 2021-5139 Class JC, 2% 8/25/40 | | 6,485,412 | 5,732,478 |
Series 2021-5147 Class WN, 2% 1/25/40 | | 6,972,673 | 6,176,246 |
Series 2021-5169: | | | |
Class BA, 2.5% 5/25/49 | | 6,726,295 | 5,975,854 |
Class TP, 2.5% 6/25/49 | | 2,525,687 | 2,241,934 |
Series 2021-5175 Class CB, 2.5% 4/25/50 | | 14,931,661 | 13,260,254 |
Series 2021-5178: | | | |
Class CT, 2% 11/25/40 | | 7,078,662 | 6,232,116 |
Class TP, 2.5% 4/25/49 | | 5,879,401 | 5,234,533 |
Series 2021-5180 Class KA, 2.5% 10/25/47 | | 2,980,234 | 2,712,300 |
Series 2022-5189: | | | |
Class DA, 2.5% 5/25/49 | | 1,954,233 | 1,742,460 |
Class TP, 2.5% 5/25/49 | | 4,068,448 | 3,631,992 |
Series 2022-5190: | | | |
Class BA, 2.5% 11/25/47 | | 1,869,950 | 1,700,167 |
Class CA, 2.5% 5/25/49 | | 3,401,299 | 3,036,086 |
Series 2022-5191 Class CA, 2.5% 4/25/50 | | 3,498,460 | 3,087,129 |
Series 2022-5197: | | | |
Class A, 2.5% 6/25/49 | | 3,401,308 | 3,036,087 |
Class DA, 2.5% 11/25/47 | | 1,419,473 | 1,292,070 |
Series 2022-5198 Class BA, 2.5% 11/25/47 | | 6,253,972 | 5,718,797 |
Series 2022-5200: | | | |
Class C, 3% 5/25/48 | | 8,280,245 | 7,794,586 |
Class LA, 3% 10/25/48 | | 7,298,949 | 6,778,392 |
Series 2022-5202: | | | |
Class AG, 3% 1/25/49 | | 1,919,498 | 1,778,481 |
Class BC, 3% 5/25/48 | | 7,877,444 | 7,325,502 |
Class LB, 2.5% 10/25/47 | | 1,521,445 | 1,385,946 |
Class UA, 3% 4/25/50 | | 2,852,404 | 2,629,220 |
Series 2022-5210 Class TA, 3.5% 11/25/46 | | 2,690,880 | 2,556,935 |
Series 2022-5248 Class A, 4% 4/15/48 | | 7,824,999 | 7,712,141 |
Series 2135 Class JE, 6% 3/15/29 | | 5,903 | 6,040 |
Series 2274 Class ZM, 6.5% 1/15/31 | | 10,711 | 10,851 |
Series 2281 Class ZB, 6% 3/15/30 | | 19,205 | 19,629 |
Series 2303 Class ZV, 6% 4/15/31 | | 10,086 | 10,356 |
Series 2357 Class ZB, 6.5% 9/15/31 | | 96,594 | 99,301 |
Series 2502 Class ZC, 6% 9/15/32 | | 24,573 | 25,393 |
Series 2519 Class ZD, 5.5% 11/15/32 | | 34,205 | 35,038 |
Series 2998 Class LY, 5.5% 7/15/25 | | 1,772 | 1,769 |
| Series 06-3115 Class SM, 6.480% - U.S. 30-Day Avg. Secured Overnight Fin. Rate (SOFR) Index 1.132% 2/15/36 (e)(n)(o) | | 44,400 | 4,364 |
| Series 2013-4281 Class AI, 4% 12/15/28 (n) | | 3,819 | 26 |
| Series 2017-4683 Class LM, 3% 5/15/47 | | 1,599,416 | 1,535,326 |
| Series 2020-5041: | | | |
Class LA, 1.5% 11/25/40 | | 15,967,630 | 13,456,418 |
Class LB, 3% 11/25/40 | | 2,728,789 | 2,516,308 |
| Series 2020-5046 Class PT, 1.5% 11/25/40 | | 12,129,955 | 10,220,988 |
| Series 2021-5083 Class VA, 1% 8/15/38 | | 6,166,102 | 5,826,100 |
| Series 2021-5182 Class A, 2.5% 10/25/48 | | 19,601,514 | 17,487,559 |
| Series 2022-5210 Class AB, 3% 1/25/42 | | 4,389,078 | 4,111,211 |
| Series 2022-5213 Class AH, 2.25% 4/25/37 | | 6,669,021 | 6,228,434 |
| Series 2022-5236 Class P, 5% 4/25/48 | | 2,973,408 | 2,990,162 |
| Series 2022-5266 Class CD, 4.5% 10/25/44 | | 6,972,283 | 6,935,630 |
| Series 2933 Class ZM, 5.75% 2/15/35 | | 832,744 | 863,239 |
| Series 2947 Class XZ, 6% 3/15/35 | | 274,730 | 286,168 |
| Series 2996 Class ZD, 5.5% 6/15/35 | | 562,607 | 578,409 |
| Series 3237 Class C, 5.5% 11/15/36 | | 699,042 | 716,885 |
| Series 3244 Class SG, 6.540% - U.S. 30-Day Avg. Secured Overnight Fin. Rate (SOFR) Index 1.192% 11/15/36 (e)(n)(o) | | 195,506 | 18,262 |
| Series 3336 Class LI, 6.460% - U.S. 30-Day Avg. Secured Overnight Fin. Rate (SOFR) Index 1.112% 6/15/37 (e)(n)(o) | | 125,509 | 15,150 |
| Series 3949 Class MK, 4.5% 10/15/34 | | 101,690 | 101,421 |
| Series 4055 Class BI, 3.5% 5/15/31 (n) | | 25,403 | 57 |
| Series 4149 Class IO, 3% 1/15/33 (n) | | 382,877 | 27,356 |
| Series 4314 Class AI, 5% 3/15/34 (n) | | 7,820 | 102 |
| Series 4427 Class LI, 3.5% 2/15/34 (n) | | 509,289 | 22,621 |
| Series 4471 Class PA 4% 12/15/40 | | 351,442 | 347,190 |
| target amortization class: | | | |
Series 2007-3366 Class FD, U.S. 30-Day Avg. Secured Overnight Fin. Rate (SOFR) Index + 0.360% 5.718% 5/15/37 (e)(f) | | 158,416 | 154,375 |
Series 2017-4692 Class KB, 4% 10/15/46 | | 2,221,192 | 2,164,220 |
Series 2156 Class TC, 6.25% 5/15/29 | | 5,005 | 5,003 |
| Freddie Mac Manufactured Housing participation certificates guaranteed sequential payer: | | | |
| Series 2043 Class ZH, 6% 4/15/28 | | 9,990 | 10,149 |
| Series 2056 Class Z, 6% 5/15/28 | | 28,839 | 29,361 |
| Freddie Mac Multi-family Structured pass-thru certificates: | | | |
| planned amortization class Series 2021-5165 Class PC, 1.5% 11/25/51 | | 3,377,163 | 2,864,740 |
| sequential payer: | | | |
Series 2021-5159: | | | |
Class EA, 2.5% 8/25/48 | | 2,491,341 | 2,220,821 |
Class GC, 2% 11/25/47 | | 2,385,928 | 2,126,443 |
Series 2021-5164 Class M, 2.5% 7/25/48 | | 2,539,278 | 2,264,552 |
| Series 4386 Class AZ, 4.5% 11/15/40 | | 1,557,524 | 1,531,512 |
| Ginnie Mae guaranteed REMIC pass-thru certificates: | | | |
| floater: | | | |
Series 2007-37 Class TS, 6.570% - CME Term SOFR 1 Month Index 1.2369% 6/16/37 (e)(n)(o) | | 81,863 | 8,866 |
Series 2010-H03 Class FA, CME Term SOFR 1 Month Index + 0.660% 6.0116% 3/20/60 (e)(f)(q) | | 424,085 | 423,484 |
Series 2010-H17 Class FA, CME Term SOFR 1 Month Index + 0.440% 5.7916% 7/20/60 (e)(f)(q) | | 119,346 | 118,919 |
Series 2010-H18 Class AF, CME Term SOFR 1 Month Index + 0.410% 5.7464% 9/20/60 (e)(f)(q) | | 102,978 | 102,403 |
Series 2010-H19 Class FG, CME Term SOFR 1 Month Index + 0.410% 5.7464% 8/20/60 (e)(f)(q) | | 96,734 | 96,291 |
Series 2010-H27 Class FA, CME Term SOFR 1 Month Index + 0.380% 5.8264% 12/20/60 (e)(f)(q) | | 256,418 | 255,472 |
Series 2011-H05 Class FA, CME Term SOFR 1 Month Index + 0.610% 5.9464% 12/20/60 (e)(f)(q) | | 178,649 | 178,289 |
Series 2011-H07 Class FA, CME Term SOFR 1 Month Index + 0.610% 5.9464% 2/20/61 (e)(f)(q) | | 181,016 | 180,582 |
Series 2011-H12 Class FA, CME Term SOFR 1 Month Index + 0.600% 5.9364% 2/20/61 (e)(f)(q) | | 226,405 | 225,763 |
Series 2011-H13 Class FA, CME Term SOFR 1 Month Index + 0.610% 5.9464% 4/20/61 (e)(f)(q) | | 214,232 | 213,846 |
Series 2011-H14: | | | |
Class FB, CME Term SOFR 1 Month Index + 0.610% 5.9464% 5/20/61 (e)(f)(q) | | 200,832 | 200,329 |
Class FC, CME Term SOFR 1 Month Index + 0.610% 5.9464% 5/20/61 (e)(f)(q) | | 219,141 | 218,755 |
Series 2011-H17 Class FA, CME Term SOFR 1 Month Index + 0.640% 5.9764% 6/20/61 (e)(f)(q) | | 236,594 | 236,262 |
Series 2011-H21 Class FA, CME Term SOFR 1 Month Index + 0.710% 6.0464% 10/20/61 (e)(f)(q) | | 406,056 | 405,743 |
Series 2012-H01 Class FA, CME Term SOFR 1 Month Index + 0.810% 6.1464% 11/20/61 (e)(f)(q) | | 284,375 | 284,566 |
Series 2012-H03 Class FA, CME Term SOFR 1 Month Index + 0.810% 6.1464% 1/20/62 (e)(f)(q) | | 132,340 | 132,423 |
Series 2012-H06 Class FA, CME Term SOFR 1 Month Index + 0.740% 6.0764% 1/20/62 (e)(f)(q) | | 264,714 | 264,589 |
Series 2012-H07 Class FA, CME Term SOFR 1 Month Index + 0.740% 6.0764% 3/20/62 (e)(f)(q) | | 132,838 | 132,604 |
Series 2012-H21 Class DF, CME Term SOFR 1 Month Index + 0.760% 6.0964% 5/20/61 (e)(f)(q) | | 11,221 | 11,188 |
Series 2012-H23 Class WA, CME Term SOFR 1 Month Index + 0.630% 5.9664% 10/20/62 (e)(f)(q) | | 136,548 | 136,308 |
Series 2013-H07 Class BA, CME Term SOFR 1 Month Index + 0.360% 5.8064% 3/20/63 (e)(f)(q) | | 222,810 | 221,914 |
Series 2014-H03 Class FA, CME Term SOFR 1 Month Index + 0.710% 6.0464% 1/20/64 (e)(f)(q) | | 133,559 | 133,452 |
Series 2014-H05 Class FB, CME Term SOFR 1 Month Index + 0.710% 6.0464% 12/20/63 (e)(f)(q) | | 205,173 | 204,933 |
Series 2014-H11 Class BA, CME Term SOFR 1 Month Index + 0.610% 5.9464% 6/20/64 (e)(f)(q) | | 830,640 | 828,972 |
Series 2014-H20 Class BF, CME Term SOFR 1 Month Index + 0.610% 5.9464% 9/20/64 (e)(f)(q) | | 2,988,657 | 2,981,900 |
Series 2016-H20 Class FM, CME Term SOFR 1 Month Index + 0.510% 5.8464% 12/20/62 (e)(f)(q) | | 26,558 | 26,274 |
Series 2019-11 Class F, CME Term SOFR 1 Month Index + 0.510% 5.8502% 1/20/49 (e)(f) | | 3,402,942 | 3,369,335 |
Series 2019-128 Class FH, CME Term SOFR 1 Month Index + 0.610% 5.9502% 10/20/49 (e)(f) | | 1,065,721 | 1,044,597 |
Series 2019-23 Class NF, CME Term SOFR 1 Month Index + 0.560% 5.9002% 2/20/49 (e)(f) | | 2,127,703 | 2,095,096 |
| planned amortization class: | | | |
Series 2011-136 Class WI, 4.5% 5/20/40 (n) | | 22,872 | 1,223 |
Series 2016-69 Class WA, 3% 2/20/46 | | 994,817 | 932,627 |
Series 2017-134 Class BA, 2.5% 11/20/46 | | 1,490,871 | 1,373,413 |
| sequential payer: | | | |
Series 2004-24 Class ZM, 5% 4/20/34 | | 221,929 | 220,835 |
Series 2010-160 Class DY, 4% 12/20/40 | | 2,449,661 | 2,406,031 |
Series 2010-170 Class B, 4% 12/20/40 | | 541,676 | 531,480 |
Series 2017-139 Class BA, 3% 9/20/47 | | 4,737,481 | 4,324,700 |
| Series 2004-32 Class GS, 6.380% - CME Term SOFR 1 Month Index 1.0469% 5/16/34 (e)(n)(o) | | 45,941 | 3,320 |
| Series 2004-73 Class AL, 7.080% - CME Term SOFR 1 Month Index 1.7469% 8/17/34 (e)(n)(o) | | 44,451 | 4,115 |
| Series 2007-35 Class SC, 39.510% x CME Term SOFR 1 Month Index 7.4813% 6/16/37 (e)(f)(o) | | 2,833 | 3,293 |
| Series 2010-116 Class QB, 4% 9/16/40 | | 5,358,879 | 5,174,294 |
| Series 2010-H10 Class FA, CME Term SOFR 1 Month Index + 0.440% 5.7916% 5/20/60 (e)(f)(q) | | 286,683 | 285,720 |
| Series 2011-94 Class SA, 5.980% - CME Term SOFR 1 Month Index 0.6498% 7/20/41 (e)(n)(o) | | 209,348 | 21,342 |
| Series 2013-149 Class MA, 2.5% 5/20/40 | | 1,323,435 | 1,289,585 |
| Series 2014-2 Class BA, 3% 1/20/44 | | 3,024,654 | 2,810,936 |
| Series 2014-21 Class HA, 3% 2/20/44 | | 1,124,024 | 1,052,362 |
| Series 2014-25 Class HC, 3% 2/20/44 | | 1,920,255 | 1,779,726 |
| Series 2014-5 Class A, 3% 1/20/44 | | 1,557,011 | 1,446,643 |
| Series 2015-H13 Class HA, 2.5% 8/20/64 (q) | | 10,683 | 10,293 |
| Series 2017-186 Class HK, 3% 11/16/45 | | 2,762,584 | 2,574,622 |
| Series 2017-H06 Class FA, U.S. TREASURY 1 YEAR INDEX + 0.350% 5.45% 8/20/66 (e)(f)(q) | | 1,157,480 | 1,152,001 |
| Prpm 2024-Rcf4 LLC Series 2024-RCF4 Class A1, 4% 7/25/54 (b) | | 3,273,836 | 3,181,007 |
TOTAL U.S. GOVERNMENT AGENCY | | | 562,137,272 |
| TOTAL COLLATERALIZED MORTGAGE OBLIGATIONS (Cost $672,563,628) | | | 687,341,855 |
| | | | |
| Commercial Mortgage Securities - 5.1% |
| | | Principal Amount (a) | Value ($) |
| Arbor Multifamily Mortgage Securities Trust sequential payer Series 2021-MF2 Class ASB, 2.2446% 6/15/54 (b) | | 7,500,000 | 6,872,451 |
| BAMLL Commercial Mortgage Securities Trust: | | | |
| floater: | | | |
Series 2021-JACX Class E, CME Term SOFR 1 Month Index + 3.860% 9.2015% 9/15/38 (b)(e)(f) | | 1,120,000 | 860,550 |
Series 2022-DKLX: | | | |
| Class A, CME Term SOFR 1 Month Index + 1.150% 6.487% 1/15/39 (b)(e)(f) | | 16,838,000 | 16,598,766 |
| Class B, CME Term SOFR 1 Month Index + 1.550% 6.887% 1/15/39 (b)(e)(f) | | 3,181,000 | 3,122,047 |
| Class C, CME Term SOFR 1 Month Index + 2.150% 7.487% 1/15/39 (b)(e)(f) | | 2,271,000 | 2,223,994 |
| sequential payer Series 2019-BPR: | | | |
Class AMP, 3.287% 11/5/32 (b) | | 11,600,000 | 11,223,000 |
Class ANM, 3.112% 11/5/32 (b) | | 14,236,000 | 13,239,480 |
| Series 2015-200P Class F, 3.7157% 4/14/33 (b)(e) | | 831,000 | 791,853 |
| Series 2019-BPR: | | | |
Class BNM, 3.465% 11/5/32 (b) | | 3,196,000 | 2,756,550 |
Class CNM, 3.8425% 11/5/32 (b)(e) | | 1,322,000 | 961,755 |
| BANK sequential payer: | | | |
| Series 2017-BNK9 Class A4, 3.538% 11/15/54 | | 14,412,000 | 13,870,409 |
| Series 2018-BN10 Class ASB, 3.641% 2/15/61 | | 3,049,975 | 2,996,264 |
| Series 2018-BN14 Class A4, 4.231% 9/15/60 | | 19,100,000 | 18,735,073 |
| Series 2019-BN20 Class ASB, 2.933% 9/15/62 | | 700,000 | 668,496 |
| Series 2019-BN21 Class A5, 2.851% 10/17/52 | | 2,606,000 | 2,351,920 |
| Series 2019-BN23 Class ASB, 2.846% 12/15/52 | | 1,800,000 | 1,719,091 |
| Series 2020-BN28 Class A4, 1.844% 3/15/63 | | 1,473,000 | 1,254,822 |
| Series 2021-BN32 Class A5, 2.643% 4/15/54 | | 630,000 | 555,217 |
| Series 2021-BN33 Class A5, 2.556% 5/15/64 | | 1,238,000 | 1,079,628 |
| Series 2021-BN35 Class A5, 2.285% 6/15/64 | | 1,860,000 | 1,587,343 |
| Series 2022-BNK39 Class A4, 2.928% 2/15/55 | | 1,626,000 | 1,430,479 |
| Series 2022-BNK40, Class A4, 3.5063% 3/15/64 (e) | | 522,000 | 477,287 |
| Series 2022-BNK42: | | | |
Class D, 2.5% 6/15/55 (b) | | 943,000 | 659,484 |
Class E, 2.5% 6/15/55 (b) | | 738,000 | 483,277 |
| Series 2022-BNK42, Class A5, 4.493% 6/15/55 (e) | | 1,746,000 | 1,708,023 |
| Series 2023-5YR1 Class A3, 6.26% 4/15/56 | | 5,100,000 | 5,309,886 |
| Bank sequential payer Series 2023-BNK46 Class A4, 5.745% 8/15/56 | | 2,191,000 | 2,315,802 |
| BANK: | | | |
| Series 2017-BNK4 Class D, 3.357% 5/15/50 (b) | | 1,426,000 | 950,654 |
| Series 2017-BNK8: | | | |
Class D, 2.6% 11/15/50 (b) | | 1,738,000 | 856,512 |
Class E, 2.8% 11/15/50 (b) | | 1,092,000 | 446,472 |
| Series 2018-BN10 Class C, 4.163% 2/15/61 (e) | | 2,308,000 | 2,064,777 |
| Series 2018-BN15: | | | |
Class D, 3% 11/15/61 (b) | | 735,000 | 567,773 |
Class E, 3% 11/15/61 (b) | | 735,000 | 516,574 |
| Series 2020-BN25 Class C, 3.4666% 1/15/63 (e) | | 1,375,000 | 1,080,375 |
| Series 2020-BN27 Class D, 2.5% 4/15/63 (b) | | 430,000 | 304,635 |
| Series 2020-BN28: | | | |
Class A/S, 2.14% 3/15/63 | | 639,000 | 538,622 |
Class E, 2.5% 3/15/63 (b) | | 441,000 | 299,574 |
| Series 2020-BN30 Class MCDG, 3.0155% 12/15/53 (e) | | 3,731,000 | 1,796,151 |
| Series 2021-BN33: | | | |
Class B, 2.893% 5/15/64 | | 1,016,000 | 856,321 |
Class XA, 1.163% 5/15/64 (e)(n) | | 10,214,284 | 491,008 |
| Series 2021-BN38 Class C, 3.3249% 12/15/64 (e) | | 260,000 | 204,637 |
| Series 2022-BNK43 Class D, 3% 8/15/55 (b) | | 1,759,000 | 1,257,208 |
| Series 2022-BNK44: | | | |
Class A/S, 5.9361% 11/15/55 (e) | | 1,097,000 | 1,124,367 |
Class C, 5.9361% 11/15/55 (e) | | 3,642,000 | 3,549,357 |
| Series 2023-BNK45 Class B, 6.148% 2/15/56 (e) | | 1,465,000 | 1,502,474 |
| Bank Series 2023-BNK46 Class B, 6.9995% 8/15/56 (e) | | 1,491,000 | 1,595,158 |
| Bank 2018-Bnk13 sequential payer Series 2018-BN13 Class A4, 3.953% 8/15/61 | | 3,700,000 | 3,589,276 |
| Bank of America Commercial Mortgage Securities Trust Series 2017-BNK3 Class C, 4.352% 2/15/50 (e) | | 610,000 | 568,818 |
| Bank of America Commercial Mortgage Trust Series 2016-UB10: | | | |
| Class D, 3% 7/15/49 (b) | | 2,108,000 | 1,789,370 |
| Class XA, 1.8842% 7/15/49 (e)(n) | | 14,955,143 | 268,378 |
| Bank5 2023-5Yr3 sequential payer Series 2023-5YR3 Class A3, 6.724% 9/15/56 | | 6,700,000 | 7,135,471 |
| Bank5 2023-5Yr4 Series 2023-5YR4 Class C, 7.8581% 12/15/56 (e) | | 1,068,000 | 1,133,109 |
| Barclays Commercial Mortgage Securities sequential payer Series 2021-C12 Class A5, 2.689% 11/15/54 | | 501,000 | 438,249 |
| BBCMS Mortgage Trust: | | | |
| sequential payer: | | | |
Series 2020-C8 Class E, 2.25% 10/15/53 (b) | | 1,476,000 | 881,127 |
Series 2022-C14 Class A5, 2.946% 2/15/55 | | 2,455,000 | 2,163,502 |
Series 2022-C17: | | | |
| Class A5, 4.441% 9/15/55 | | 2,520,000 | 2,464,573 |
| Class D, 2.5% 9/15/55 (b) | | 3,429,000 | 2,235,778 |
Series 2022-C18 Class A5, 5.71% 12/15/55 | | 2,816,000 | 2,992,371 |
Series 2023-C19 Class A5, 5.451% 4/15/56 | | 1,796,000 | 1,874,157 |
Series 2023-C20 Class A5, 5.576% 7/15/56 | | 1,566,000 | 1,651,453 |
Series 2023-C21: | | | |
| Class A/S, 6.5064% 9/15/56 (e) | | 1,105,000 | 1,180,370 |
| Class A3, 6.5064% 9/15/56 (e) | | 5,900,000 | 6,359,536 |
Series 2023-C22 Class C, 7.3633% 11/15/56 (e) | | 2,818,000 | 2,969,954 |
Series 2024-C26 Class C, 6% 5/15/57 | | 520,000 | 518,574 |
| Series 2016-ETC: | | | |
Class D, 3.7292% 8/14/36 (b)(e) | | 868,000 | 751,286 |
Class E, 3.7292% 8/14/36 (b)(e) | | 637,000 | 533,901 |
| Series 2019-C3 Class C, 4.178% 5/15/52 | | 477,000 | 406,359 |
| Series 2019-C5 Class D, 2.5% 11/15/52 (b) | | 333,000 | 255,226 |
| Series 2020-C7: | | | |
Class A/S, 2.444% 4/15/53 | | 226,000 | 191,212 |
Class B, 3.152% 4/15/53 | | 851,000 | 704,216 |
| Series 2022-C15, Class A5, 3.662% 4/15/55 | | 2,126,000 | 1,954,266 |
| Series 2022-C16: | | | |
Class A5, 4.6% 6/15/55 | | 3,210,000 | 3,174,574 |
Class B, 4.6% 6/15/55 | | 791,000 | 723,291 |
| Series 2022-C17 Class B, 4.889% 9/15/55 | | 1,050,000 | 994,036 |
| Series 2022-C18, Class B, 6.3483% 12/15/55 (e) | | 1,323,000 | 1,359,883 |
| Series 2023 C19 Class B, 6.5448% 4/15/56 (e) | | 846,000 | 873,416 |
| Series 2023-C21 Class C, 6.5064% 9/15/56 (e) | | 2,214,000 | 2,212,090 |
| Bbcms Mtg Trust 2024-C24 sequential payer Series 2024-C24: | | | |
| Class B, 5.718% 2/15/57 | | 790,000 | 790,858 |
| Class C, 6% 2/15/57 | | 338,000 | 335,697 |
| Benchmark 2024-V5 Mortgage Trust sequential payer Series 2024-V5 Class C, 7.205% 1/10/57 (e) | | 977,000 | 999,251 |
| Benchmark 2024-V9 Mortgage Tru sequential payer Series 2024-V9 Class A3, 5.6019% 8/15/57 | | 8,900,000 | 9,171,996 |
| Benchmark Mortgage Trust: | | | |
| sequential payer: | | | |
Series 2018-B4 Class A5, 4.121% 7/15/51 | | 2,953,000 | 2,871,060 |
Series 2018-B7 Class A4, 4.51% 5/15/53 | | 2,200,000 | 2,164,293 |
Series 2019-B14: | | | |
| Class 225D, 3.4041% 12/15/62 (b)(e) | | 719,000 | 14,991 |
| Class 225E, 3.4041% 12/15/62 (b)(e) | | 485,000 | 4,867 |
Series 2019-B15 Class AAB, 2.859% 12/15/72 | | 2,500,000 | 2,389,716 |
Series 2020-B20 Class E, 2% 10/15/53 (b) | | 1,029,000 | 569,262 |
Series 2020-B21 Class A5, 1.9775% 12/17/53 | | 1,502,000 | 1,270,434 |
Series 2020-B22, Class A5, 1.973% 1/15/54 | | 1,043,000 | 873,724 |
Series 2021-B29, Class A5, 2.3879% 9/15/54 | | 3,032,000 | 2,591,024 |
Series 2022-B34 Class A5, 3.786% 4/15/55 | | 942,000 | 852,658 |
Series 2022-B36 Class A5, 4.4699% 7/15/55 | | 1,094,000 | 1,069,112 |
Series 2022-B37 Class A5, 5.7506% 11/15/55 (e) | | 1,270,000 | 1,355,714 |
Series 2023-B38 Class A4, 5.5246% 4/15/56 | | 1,084,000 | 1,134,939 |
Series 2023-B39 Class A5, 5.7536% 7/15/56 | | 2,406,000 | 2,562,321 |
Series 2023-C5 Class A5, 5.7653% 6/15/56 | | 1,355,000 | 1,442,609 |
Series 2023-V3 Class A3, 6.3629% 7/15/56 | | 2,200,000 | 2,310,980 |
| Series 2018-B6 Class D, 3.2427% 10/10/51 (b)(e) | | 1,089,000 | 796,438 |
| Series 2018-B7 Class D, 3% 5/15/53 (b)(e) | | 614,000 | 447,740 |
| Series 2019-B12 Class B, 3.5702% 8/15/52 | | 840,000 | 732,098 |
| Series 2019-B13 Class D, 2.5% 8/15/57 (b) | | 1,197,000 | 855,073 |
| Series 2019-B14 Class XA, 0.8924% 12/15/62 (e)(n) | | 32,956,583 | 753,407 |
| Series 2020-B18: | | | |
Class AGNG, 4.5348% 7/15/53 (b)(e) | | 1,995,000 | 1,846,101 |
Class D, 2.25% 7/15/53 (b) | | 1,365,000 | 745,365 |
| Series 2020-B21: | | | |
Class A/S, 2.2543% 12/17/53 | | 592,000 | 487,289 |
Class D, 2% 12/17/53 (b)(h) | | 798,000 | 521,462 |
| Series 2020-IG2: | | | |
Class C, 3.4028% 9/15/48 (b)(e)(h) | | 546,000 | 316,770 |
Class D, 3.4028% 9/15/48 (b)(e) | | 2,679,000 | 1,016,543 |
| Series 2020-IG3 Class 825E, 3.0763% 9/15/48 (b)(e) | | 1,400,000 | 1,021,890 |
| Series 2021-B25: | | | |
Class 300D, 3.094% 4/15/54 (b)(e)(h) | | 1,520,000 | 712,607 |
Class 300E, 2.9942% 4/15/54 (b)(e)(h) | | 504,000 | 178,392 |
| Series 2022 B37 Class B, 5.9423% 11/15/55 (e) | | 767,000 | 773,594 |
| Series 2022-B35 Class D, 2.5% 5/15/55 (b) | | 1,701,000 | 1,115,520 |
| Series 2022-B36: | | | |
Class A/S, 4.9505% 7/15/55 | | 1,092,000 | 1,050,983 |
Class D, 2.5% 7/15/55 (b) | | 1,259,000 | 776,660 |
| Series 2022-B37 Class C, 5.7506% 11/15/55 (e) | | 1,456,000 | 1,291,397 |
| Series 2023 B38: | | | |
Class B, 6.4527% 4/15/56 (e) | | 1,058,000 | 1,082,586 |
Class C, 6.4527% 4/15/56 (e) | | 1,415,000 | 1,274,703 |
| Series 2023-B39 Class C, 6.7933% 7/15/56 (e) | | 1,638,000 | 1,692,527 |
| Series 2023-V4 Class C, 7.709% 11/15/56 (e) | | 1,070,000 | 1,112,428 |
| Bfld 2024-Wrhs floater Series 2024-WRHS Class E, CME Term SOFR 1 Month Index + 3.680% 9.0258% 8/15/26 (b)(e)(f) | | 2,026,000 | 2,010,304 |
| BLP Commercial Mortgage Trust: | | | |
| floater Series 2024-IND2 Class D, CME Term SOFR 1 Month Index + 2.590% 7.9273% 3/15/41 (b)(e)(f) | | 1,116,000 | 1,104,840 |
| sequential payer Series 2024-IND2 Class A, CME Term SOFR 1 Month Index + 1.340% 6.679% 3/15/41 (b)(e)(f) | | 12,651,000 | 12,587,745 |
| BMO 2024-5C3 Mortgage Trust Series 2024-5C3 Class C, 6.8592% 2/15/57 (e) | | 280,000 | 287,556 |
| Bmo 2024-5C5 Mtg Trust sequential payer Series 2024-5C5 Class A3, 5.8574% 2/15/57 | | 3,600,000 | 3,749,062 |
| BMO Mortgage Trust: | | | |
| sequential payer: | | | |
Series 2022-C1 Class A5, 3.374% 2/15/55 | | 2,917,000 | 2,643,137 |
Series 2023-5C1 Class A3, 6.534% 8/15/56 | | 2,600,000 | 2,741,138 |
Series 2023-C6 Class A5, 5.9562% 9/15/56 | | 1,107,000 | 1,193,869 |
| Series 2022-C1: | | | |
Class 360D, 4.0699% 2/17/55 (b)(e) | | 798,000 | 561,627 |
Class 360E, 4.0699% 2/17/55 (b)(e) | | 966,000 | 636,699 |
| Series 2022-C3 Class D, 2.5% 9/15/54 (b) | | 639,000 | 378,961 |
| Series 2023-C4: | | | |
Class B, 5.5913% 2/15/56 (e) | | 835,000 | 844,070 |
Class C, 6.0584% 2/15/56 (e) | | 2,333,000 | 2,359,899 |
Class D, 6.0584% 2/15/56 (b)(e) | | 520,000 | 454,532 |
| Series 2023-C6 Class A/S, 6.5504% 9/15/56 (e) | | 1,096,000 | 1,192,912 |
| Series 2023-C7 Class B, 6.6738% 12/15/56 (e) | | 2,200,000 | 2,356,803 |
| BMP floater Series 2024-MF23: | | | |
| Class A, CME Term SOFR 1 Month Index + 1.370% 6.7088% 6/15/41 (b)(e)(f) | | 17,666,000 | 17,594,232 |
| Class B, CME Term SOFR 1 Month Index + 1.640% 6.9785% 6/15/41 (b)(e)(f) | | 8,722,000 | 8,656,634 |
| Class C, CME Term SOFR 1 Month Index + 1.840% 7.1782% 6/15/41 (b)(e)(f) | | 6,167,000 | 6,113,039 |
| BPR Trust floater Series 2022-OANA: | | | |
| Class A, CME Term SOFR 1 Month Index + 1.890% 7.2349% 4/15/37 (b)(e)(f) | | 55,733,000 | 55,802,666 |
| Class B, CME Term SOFR 1 Month Index + 2.440% 7.7839% 4/15/37 (b)(e)(f) | | 17,226,000 | 17,247,533 |
| Class D, CME Term SOFR 1 Month Index + 3.690% 9.0319% 4/15/37 (b)(e)(f) | | 2,373,000 | 2,370,036 |
| Braemar Hotels & Resorts Trust floater Series 2018-PRME Class E, CME Term SOFR 1 Month Index + 2.570% 7.909% 6/15/35 (b)(e)(f) | | 294,000 | 287,742 |
| BX Commercial Mortgage Trust: | | | |
| floater: | | | |
Series 2019-CALM Class E, CME Term SOFR 1 Month Index + 2.110% 7.4515% 11/15/32 (b)(e)(f) | | 265,300 | 264,305 |
Series 2019-IMC: | | | |
| Class B, CME Term SOFR 1 Month Index + 1.340% 6.6833% 4/15/34 (b)(e)(f) | | 11,328,000 | 11,158,327 |
| Class C, CME Term SOFR 1 Month Index + 1.640% 6.9833% 4/15/34 (b)(e)(f) | | 7,490,000 | 7,349,765 |
| Class D, CME Term SOFR 1 Month Index + 1.940% 7.2833% 4/15/34 (b)(e)(f) | | 7,862,000 | 7,685,360 |
| Class G, CME Term SOFR 1 Month Index + 3.640% 8.9833% 4/15/34 (b)(e)(f) | | 1,533,000 | 1,448,893 |
Series 2020-VKNG: | | | |
| Class E, CME Term SOFR 1 Month Index + 2.210% 7.5515% 10/15/37 (b)(e)(f) | | 463,400 | 456,758 |
| Class F, CME Term SOFR 1 Month Index + 2.860% 8.2015% 10/15/37 (b)(e)(f) | | 1,228,500 | 1,207,357 |
| Class G, CME Term SOFR 1 Month Index + 3.360% 8.7015% 10/15/37 (b)(e)(f) | | 1,087,800 | 1,062,008 |
Series 2021 LBA, Class GV, CME Term SOFR 1 Month Index + 3.110% 8.4515% 2/15/36 (b)(e)(f) | | 1,144,302 | 1,072,082 |
Series 2021-BXMF Class G, CME Term SOFR 1 Month Index + 3.460% 8.801% 10/15/26 (b)(e)(f) | | 3,094,443 | 2,969,334 |
Series 2021-LBA: | | | |
| Class AJV, CME Term SOFR 1 Month Index + 0.910% 6.2515% 2/15/36 (b)(e)(f) | | 5,800,000 | 5,743,813 |
| Class FJV, CME Term SOFR 1 Month Index + 2.510% 7.8515% 2/15/36 (b)(e)(f) | | 947,000 | 908,959 |
| Class FV, CME Term SOFR 1 Month Index + 2.510% 7.8515% 2/15/36 (b)(e)(f) | | 270,457 | 259,592 |
| Class GJV, CME Term SOFR 1 Month Index + 3.110% 8.4515% 2/15/36 (b)(e)(f) | | 2,779,000 | 2,603,611 |
Series 2021-MC Class G, CME Term SOFR 1 Month Index + 3.200% 8.5383% 4/15/34 (b)(e)(f) | | 709,000 | 593,930 |
Series 2021-PAC: | | | |
| Class A, CME Term SOFR 1 Month Index + 0.800% 6.1406% 10/15/36 (b)(e)(f) | | 37,565,000 | 37,201,089 |
| Class B, CME Term SOFR 1 Month Index + 1.010% 6.3503% 10/15/36 (b)(e)(f) | | 4,838,000 | 4,744,264 |
| Class C, CME Term SOFR 1 Month Index + 1.210% 6.5501% 10/15/36 (b)(e)(f) | | 6,475,000 | 6,329,313 |
| Class D, CME Term SOFR 1 Month Index + 1.410% 6.7498% 10/15/36 (b)(e)(f) | | 6,286,000 | 6,117,064 |
| Class E, CME Term SOFR 1 Month Index + 2.060% 7.399% 10/15/36 (b)(e)(f) | | 21,856,000 | 21,418,880 |
| Class G, CME Term SOFR 1 Month Index + 3.060% 8.3976% 10/15/36 (b)(e)(f) | | 1,428,000 | 1,382,315 |
Series 2021-SOAR: | | | |
| Class F, CME Term SOFR 1 Month Index + 2.460% 7.8015% 6/15/38 (b)(e)(f) | | 2,054,197 | 2,035,255 |
| Class G, CME Term SOFR 1 Month Index + 2.910% 8.2515% 6/15/38 (b)(e)(f) | | 3,466,621 | 3,391,709 |
| Class J, CME Term SOFR 1 Month Index + 3.860% 9.2015% 6/15/38 (b)(e)(f) | | 2,618,816 | 2,574,696 |
Series 2021-VINO: | | | |
| Class F, CME Term SOFR 1 Month Index + 2.910% 8.2538% 5/15/38 (b)(e)(f) | | 1,441,901 | 1,413,324 |
| Class G, CME Term SOFR 1 Month Index + 4.060% 9.4038% 5/15/38 (b)(e)(f) | | 2,545,677 | 2,492,934 |
Series 2021-VOLT: | | | |
| Class F, CME Term SOFR 1 Month Index + 2.510% 7.8514% 9/15/36 (b)(e)(f) | | 4,693,000 | 4,616,836 |
| Class G, CME Term SOFR 1 Month Index + 2.960% 8.3014% 9/15/36 (b)(e)(f) | | 6,499,000 | 6,352,338 |
Series 2022-IND Class A, CME Term SOFR 1 Month Index + 1.490% 6.8279% 4/15/37 (b)(e)(f) | | 21,382,099 | 21,302,592 |
Series 2022-LBA6: | | | |
| Class F, CME Term SOFR 1 Month Index + 3.350% 8.6869% 1/15/39 (b)(e)(f) | | 2,072,000 | 2,032,321 |
| Class G, CME Term SOFR 1 Month Index + 4.200% 9.5369% 1/15/39 (b)(e)(f) | | 651,000 | 638,641 |
Series 2022-LP2: | | | |
| Class A, CME Term SOFR 1 Month Index + 1.010% 6.3498% 2/15/39 (b)(e)(f) | | 32,366,972 | 32,063,532 |
| Class B, CME Term SOFR 1 Month Index + 1.310% 6.6492% 2/15/39 (b)(e)(f) | | 11,422,699 | 11,244,220 |
| Class C, CME Term SOFR 1 Month Index + 1.560% 6.8986% 2/15/39 (b)(e)(f) | | 9,752,381 | 9,587,810 |
| Class D, CME Term SOFR 1 Month Index + 1.960% 7.2977% 2/15/39 (b)(e)(f) | | 9,752,381 | 9,578,667 |
| Class G, CME Term SOFR 1 Month Index + 4.100% 9.4427% 2/15/39 (b)(e)(f) | | 2,630,751 | 2,586,351 |
Series 2023-XL3: | | | |
| Class A, CME Term SOFR 1 Month Index + 1.760% 7.0983% 12/9/40 (b)(e)(f) | | 15,167,037 | 15,204,955 |
| Class B, CME Term SOFR 1 Month Index + 2.190% 7.5277% 12/9/40 (b)(e)(f) | | 3,353,391 | 3,352,338 |
| Class C, CME Term SOFR 1 Month Index + 2.640% 7.9771% 12/9/40 (b)(e)(f) | | 1,816,214 | 1,813,944 |
| Class D, CME Term SOFR 1 Month Index + 3.580% 8.9257% 12/9/40 (b)(e)(f) | | 2,268,616 | 2,267,903 |
Series 2024-MF Class E, CME Term SOFR 1 Month Index + 3.730% 9.0752% 2/15/39 (b)(e)(f) | | 2,111,000 | 2,085,276 |
Series 2024-WPT Class E, CME Term SOFR 1 Month Index + 3.580% 8.9253% 3/15/34 (b)(e)(f) | | 1,930,000 | 1,912,268 |
Series 2024-XL5 Class E, CME Term SOFR 1 Month Index + 3.680% 9.0252% 3/15/41 (b)(e)(f) | | 5,894,866 | 5,868,120 |
| floater sequential payer: | | | |
Series 2019-CALM Class A, CME Term SOFR 1 Month Index + 0.990% 6.3275% 11/15/32 (b)(e)(f) | | 2,009,763 | 2,007,879 |
Series 2019-IMC Class A, CME Term SOFR 1 Month Index + 1.040% 6.3833% 4/15/34 (b)(e)(f) | | 10,114,868 | 10,020,179 |
Series 2021-SOAR Class A, CME Term SOFR 1 Month Index + 0.780% 6.1215% 6/15/38 (b)(e)(f) | | 14,324,142 | 14,167,472 |
Series 2024-XL5 Class A, CME Term SOFR 1 Month Index + 1.390% 6.7285% 3/15/41 (b)(e)(f) | | 67,802,944 | 67,591,059 |
| sequential payer Series 2019-OC11 Class A, 3.202% 12/9/41 (b) | | 3,131,000 | 2,876,979 |
| Series 2019-OC11: | | | |
Class D, 4.0755% 12/9/41 (b)(e) | | 168,000 | 153,024 |
Class E, 4.0755% 12/9/41 (b)(e) | | 10,841,000 | 9,562,618 |
| Series 2020-VIVA: | | | |
Class D, 3.667% 3/11/44 (b)(e) | | 5,861,000 | 5,141,965 |
Class E, 3.667% 3/11/44 (b)(e) | | 5,065,000 | 4,275,818 |
| BX Commercial Mortgage Trust 2024-Xl4: | | | |
| floater: | | | |
Series 2024-XL4: | | | |
| Class B, CME Term SOFR 1 Month Index + 1.790% 7.1284% 2/15/39 (b)(e)(f) | | 3,588,198 | 3,565,772 |
| Class E, CME Term SOFR 1 Month Index + 4.180% 9.525% 2/15/39 (b)(e)(f) | | 3,438,485 | 3,423,660 |
Series 2024-XL5: | | | |
| Class B, CME Term SOFR 1 Month Index + 1.690% 7.0281% 3/15/41 (b)(e)(f) | | 11,583,550 | 11,482,272 |
| Class C, CME Term SOFR 1 Month Index + 1.940% 7.2778% 3/15/41 (b)(e)(f) | | 15,378,244 | 15,205,371 |
| floater sequential payer Series 2024-XL4 Class A, CME Term SOFR 1 Month Index + 1.440% 6.7789% 2/15/39 (b)(e)(f) | | 28,507,610 | 28,471,976 |
| BX Commercial Mtg Trust floater Series 2024-MDHS: | | | |
| Class A, 6.9782% 5/15/41 (b)(e) | | 38,421,891 | 38,349,900 |
| Class E, CME Term SOFR 1 Month Index + 3.680% 9.0252% 5/15/41 (b)(e)(f) | | 3,249,359 | 3,186,888 |
| Bx Commercial Mtg Trust 2024-King floater Series 2024-KING Class E, CME Term SOFR 1 Month Index + 3.680% 9.0248% 5/15/34 (b)(e)(f) | | 5,972,000 | 5,876,145 |
| BX Trust floater: | | | |
| Series 2021-ACNT Class G, CME Term SOFR 1 Month Index + 3.400% 8.7465% 11/15/38 (b)(e)(f) | | 1,520,684 | 1,489,324 |
| Series 2021-MFM1: | | | |
Class F, CME Term SOFR 1 Month Index + 3.110% 8.4515% 1/15/34 (b)(e)(f) | | 2,640,400 | 2,573,671 |
Class G, CME Term SOFR 1 Month Index + 4.010% 9.3515% 1/15/34 (b)(e)(f) | | 142,800 | 138,205 |
| Series 2022-GPA: | | | |
Class A, CME Term SOFR 1 Month Index + 2.160% 7.5019% 8/15/39 (b)(e)(f) | | 17,159,008 | 17,180,438 |
Class D, CME Term SOFR 1 Month Index + 4.060% 9.3979% 8/15/43 (b)(e)(f) | | 2,501,762 | 2,493,942 |
| Series 2022-IND: | | | |
Class B, CME Term SOFR 1 Month Index + 1.940% 7.2769% 4/15/37 (b)(e)(f) | | 12,381,021 | 12,350,282 |
Class C, CME Term SOFR 1 Month Index + 2.290% 7.6269% 4/15/37 (b)(e)(f) | | 2,459,756 | 2,455,169 |
Class D, CME Term SOFR 1 Month Index + 2.830% 8.1759% 4/15/37 (b)(e)(f) | | 2,058,935 | 2,055,091 |
Class F, CME Term SOFR 1 Month Index + 4.780% 10.1229% 4/15/37 (b)(e)(f) | | 3,086,550 | 3,074,406 |
| Series 2022-VAMF Class F, CME Term SOFR 1 Month Index + 3.290% 8.6359% 1/15/39 (b)(e)(f) | | 783,000 | 770,454 |
| Series 2024-CNYN: | | | |
Class A, CME Term SOFR 1 Month Index + 1.440% 6.7788% 4/15/41 (b)(e)(f) | | 44,865,399 | 44,668,614 |
Class B, CME Term SOFR 1 Month Index + 1.690% 7.0284% 4/15/41 (b)(e)(f) | | 7,151,007 | 7,063,854 |
Class C, CME Term SOFR 1 Month Index + 1.940% 7.2781% 4/15/41 (b)(e)(f) | | 5,936,424 | 5,817,695 |
Class E, CME Term SOFR 1 Month Index + 3.680% 9.0255% 4/15/41 (b)(e)(f) | | 5,100,656 | 5,017,997 |
| Series 2024-VLT4: | | | |
Class E, CME Term SOFR 1 Month Index + 2.880% 8.2263% 7/15/29 (b)(e)(f) | | 2,450,000 | 2,429,328 |
Class F, CME Term SOFR 1 Month Index + 3.930% 9.2748% 7/15/29 (b)(e)(f) | | 6,050,000 | 5,959,315 |
| BXP Trust Series 2021-601L Class E, 2.868% 1/15/44 (b)(e) | | 336,000 | 230,732 |
| BXSC Commercial Mortgage Trust floater Series 2022-WSS Class F, 10.666% 3/15/35 (b)(e) | | 2,721,000 | 2,697,960 |
| CALI Mortgage Trust Series 2019-101C Class F, 4.4686% 3/10/39 (b)(e) | | 1,743,000 | 1,015,495 |
| CAMB Commercial Mortgage Trust floater Series 2019-LIFE: | | | |
| Class A, CME Term SOFR 1 Month Index + 1.360% 6.704% 12/15/37 (b)(e)(f) | | 1,538,000 | 1,537,039 |
| Class E, CME Term SOFR 1 Month Index + 2.440% 7.784% 12/15/37 (b)(e)(f) | | 4,468,000 | 4,459,623 |
| Class F, CME Term SOFR 1 Month Index + 2.840% 8.184% 12/15/37 (b)(e)(f) | | 151,000 | 150,240 |
| Class G, CME Term SOFR 1 Month Index + 3.540% 8.884% 12/15/37 (b)(e)(f) | | 6,423,000 | 6,327,273 |
| CD Mortgage Trust: | | | |
| Series 2016-CD2: | | | |
Class C, 4.1087% 11/10/49 (e) | | 619,000 | 454,196 |
Class D, 2.8587% 11/10/49 (e)(h) | | 546,000 | 268,218 |
| Series 2017-CD3: | | | |
Class C, 4.6882% 2/10/50 (e) | | 1,482,000 | 602,441 |
Class D, 3.25% 2/10/50 (b)(h) | | 1,340,000 | 451,815 |
| Series 2017-CD4: | | | |
Class C, 4.3497% 5/10/50 (e) | | 1,316,000 | 1,178,880 |
Class D, 3.3% 5/10/50 (b) | | 312,000 | 255,682 |
| CEDR Commercial Mortgage Trust floater Series 2022-SNAI Class F, CME Term SOFR 1 Month Index + 3.610% 8.9504% 2/15/39 (b)(e)(f) | | 3,948,000 | 3,351,912 |
| CF Hippolyta Issuer LLC sequential payer Series 2021-1A Class A1, 1.53% 3/15/61 (b) | | 36,435,022 | 33,929,335 |
| CFCRE Commercial Mortgage Trust sequential payer Series 2016-C7 Class A2, 3.5853% 12/10/54 | | 4,691,805 | 4,535,507 |
| Cgms Commercial Mortgage Trust sequential payer Series 2017-B1: | | | |
| Class A3, 3.197% 8/15/50 | | 3,193,235 | 3,069,123 |
| Class A4, 3.458% 8/15/50 | | 1,400,000 | 1,333,407 |
| Citigroup Commercial Mortgage Trust: | | | |
| sequential payer: | | | |
Series 2016-C1 Class A4, 3.209% 5/10/49 | | 3,539,305 | 3,435,205 |
Series 2018-B2 Class A4, 4.009% 3/10/51 | | 4,200,000 | 4,082,599 |
Series 2019-C7 Class A4, 3.102% 12/15/72 | | 1,596,000 | 1,475,634 |
Series 2019-GC41 Class AAB, 2.7198% 8/10/56 | | 9,694,680 | 9,216,723 |
Series 2020-GC46 Class AAB, 2.614% 2/15/53 | | 5,700,000 | 5,383,545 |
| Series 2015-GC27 Class A5, 3.137% 2/10/48 | | 12,200,000 | 12,143,189 |
| Series 2015-GC29 Class XA, 1.1463% 4/10/48 (e)(n) | | 30,946,952 | 81,115 |
| Series 2015-GC33 Class XA, 1.0182% 9/10/58 (e)(n) | | 49,483,047 | 288,437 |
| Series 2016-P4 Class D, 4.0944% 7/10/49 (b)(e) | | 1,707,000 | 1,367,078 |
| Series 2016-P6 Class XA, 0.692% 12/10/49 (e)(n) | | 36,430,076 | 354,895 |
| Series 2019-GC41 Class D, 3% 8/10/56 (b) | | 378,000 | 285,352 |
| Series 2020-420K: | | | |
Class D, 3.4222% 11/10/42 (b)(e) | | 496,000 | 429,210 |
Class E, 3.4222% 11/10/42 (b)(e) | | 2,374,000 | 1,921,463 |
| Series 2022-GC48 Class D, 2.5% 6/15/55 (b) | | 1,806,000 | 1,147,340 |
| Series 2023-PRM3: | | | |
Class C, 6.5717% 7/10/28 (b)(e) | | 525,000 | 530,745 |
Class D, 6.5717% 7/10/28 (b)(e) | | 1,195,000 | 1,168,599 |
| Series 2023-SMRT Class D, 6.0475% 10/12/40 (b)(e) | | 2,143,000 | 2,094,247 |
| COMM Mortgage Trust: | | | |
| floater Series 2018-HCLV: | | | |
Class F, CME Term SOFR 1 Month Index + 3.340% 8.683% 9/15/33 (b)(e)(f) | | 468,000 | 164,437 |
Class G, CME Term SOFR 1 Month Index + 5.350% 10.6893% 9/15/33 (b)(e)(f) | | 544,000 | 136,531 |
| sequential payer Series 2013-LC6 Class E, 3.5% 1/10/46 (b) | | 959,000 | 834,330 |
| Series 2012-CR1: | | | |
Class D, 5.3084% 5/15/45 (b)(e) | | 1,491,617 | 1,178,377 |
Class G, 2.462% 5/15/45 (b)(h) | | 264,578 | 3,548 |
| Series 2012-LC4 Class C, 5.4799% 12/10/44 (e) | | 166,000 | 147,624 |
| Series 2013-LC6 Class D, 4.068% 1/10/46 (b)(e) | | 493,136 | 459,750 |
| Series 2014-CR15 Class D, 4.0793% 2/10/47 (b)(e) | | 298,000 | 268,171 |
| Series 2014-CR17 Class E, 4.8841% 5/10/47 (b)(e)(h) | | 255,000 | 138,338 |
| Series 2014-CR20: | | | |
Class AM, 3.938% 11/10/47 | | 276,000 | 270,985 |
Class C, 4.5346% 11/10/47 (e) | | 1,020,000 | 972,288 |
Class XA, 0.8921% 11/10/47 (e)(n) | | 31,411,086 | 732 |
| Series 2014-LC17 Class XA, 0.6896% 10/10/47 (e)(n) | | 18,866,174 | 336 |
| Series 2014-UBS2 Class D, 4.9869% 3/10/47 (b)(e) | | 994,000 | 775,330 |
| Series 2014-UBS6 Class XA, 0.8612% 12/10/47 (e)(n) | | 48,611,141 | 1,035 |
| Series 2015-3BP Class F, 3.3463% 2/10/35 (b)(e) | | 1,538,000 | 1,276,867 |
| Series 2015-DC1: | | | |
Class B, 4.035% 2/10/48 (e) | | 2,059,000 | 1,947,083 |
Class C, 4.4163% 2/10/48 (e) | | 1,690,000 | 1,485,153 |
| Series 2015-LC19: | | | |
Class B, 3.829% 2/10/48 | | 177,000 | 169,264 |
Class C, 4.3787% 2/10/48 (e) | | 2,097,600 | 1,960,040 |
Class D, 2.867% 2/10/48 (b) | | 2,184,000 | 1,945,367 |
| COMM Trust Series 2017-COR2 Class D, 3% 9/10/50 (b) | | 368,000 | 296,914 |
| Computershare Corporate Trust: | | | |
| sequential payer Series 2020-C58 Class A4, 2.092% 7/15/53 | | 2,055,000 | 1,758,632 |
| Series 2018-C48 Class A5, 4.302% 1/15/52 | | 6,748,000 | 6,632,343 |
| Cone Trust 2024-Dfw1 floater Series 2024-DFW1 Class E, CME Term SOFR 1 Month Index + 3.880% 9.2254% 8/15/41 (b)(e)(f) | | 2,124,000 | 2,117,826 |
| CPT Mortgage Trust sequential payer Series 2019-CPT: | | | |
| Class E, 3.0967% 11/13/39 (b)(e) | | 1,687,000 | 1,228,971 |
| Class F, 3.0967% 11/13/39 (b)(e) | | 1,196,000 | 848,044 |
| Credit Suisse Commercial Mortgage Trust floater Series 2021-SOP2 Class F, CME Term SOFR 1 Month Index + 4.430% 9.7682% 6/15/34 (b)(f)(h) | | 1,135,200 | 380,884 |
| Credit Suisse Mortgage Trust: | | | |
| sequential payer Series 2020-NET Class A, 2.2569% 8/15/37 (b) | | 4,113,777 | 3,920,724 |
| Series 2021-BRIT Class A, CME Term SOFR 1 Month Index + 3.570% 8.9107% 5/9/25 (b)(e)(f) | | 1,394,720 | 1,341,444 |
| CSAIL 2018-CX12 Commercial Mortgage Trust sequential payer Series 2018-CX12 Class A3, 3.9585% 8/15/51 | | 3,580,000 | 3,474,414 |
| CSAIL Commercial Mortgage Trust: | | | |
| Series 2017-C8 Class C, 4.4093% 6/15/50 (e) | | 2,305,000 | 1,939,284 |
| Series 2018-CX11 Class C, 4.9806% 4/15/51 (e) | | 495,000 | 451,593 |
| Series 2019-C16 Class C, 4.2371% 6/15/52 (e) | | 1,113,000 | 970,402 |
| Series 2019-C18 Class A/S, 3.3214% 12/15/52 | | 849,706 | 753,993 |
| CSMC Series 2019-UVIL Class E, 3.3928% 12/15/41 (b)(e) | | 3,429,000 | 2,768,015 |
| DBGS Mortgage Trust: | | | |
| Series 2018-C1 Class C, 4.7957% 10/15/51 (e) | | 355,000 | 309,505 |
| Series 2019-1735 Class F, 4.3344% 4/10/37 (b)(e) | | 1,188,000 | 685,171 |
| DBJPM Mortgage Trust: | | | |
| Series 2016-C3 Class C, 3.619% 8/10/49 (e) | | 382,000 | 305,069 |
| Series 2020-C9: | | | |
Class AM, 2.34% 8/15/53 | | 639,000 | 535,661 |
Class D, 2.25% 9/15/53 (b) | | 377,000 | 254,001 |
| DBUBS Mortgage Trust Series 2011-LC3A Class D, 5.5328% 8/10/44 (b)(e) | | 679,637 | 612,094 |
| DC Office Trust Series 2019-MTC Class E, 3.1744% 9/15/45 (b)(e) | | 449,000 | 262,360 |
| Dk Trust 2024-Spbx floater Series 2024-SPBX Class E, CME Term SOFR 1 Month Index + 4.000% 9.3369% 3/15/34 (b)(e)(f) | | 2,848,000 | 2,831,419 |
| DTP Commercial Mortgage Trust 2023-Ste2 sequential payer Series 2023-STE2: | | | |
| Class A, 6.038% 1/15/41 (b)(e) | | 5,523,000 | 5,649,843 |
| Class C, 6.6891% 1/15/41 (b)(e) | | 621,000 | 630,291 |
| Class D, 6.9552% 1/15/41 (b)(e) | | 5,078,000 | 5,127,932 |
| Class E, 5.9685% 1/15/41 (b)(e) | | 810,000 | 761,829 |
| ELP Commercial Mortgage Trust floater Series 2021-ELP: | | | |
| Class A, CME Term SOFR 1 Month Index + 0.810% 6.1525% 11/15/38 (b)(e)(f) | | 57,379,212 | 56,626,109 |
| Class F, CME Term SOFR 1 Month Index + 2.780% 8.1185% 11/15/38 (b)(e)(f) | | 5,045,128 | 4,945,489 |
| Class G, CME Term SOFR 1 Month Index + 3.230% 8.5675% 11/15/38 (b)(e)(f) | | 1,967,710 | 1,901,451 |
| Class J, CME Term SOFR 1 Month Index + 3.720% 9.0664% 11/15/38 (b)(e)(f) | | 4,948,240 | 4,772,359 |
| Eqt Trust 2024-Extr: | | | |
| sequential payer Series 2024-EXTR Class A, 5.3308% 7/5/41 (b)(e) | | 18,258,000 | 18,593,253 |
| Series 2024-EXTR: | | | |
Class B, 1 month U.S. LIBOR + 0.000% 5.6546% 7/5/41 (b)(e)(f) | | 1,911,000 | 1,946,617 |
Class C, 6.0464% 7/5/41 (b)(e) | | 1,614,000 | 1,640,348 |
Class D, 6.6819% 7/5/41 (b)(e) | | 341,000 | 346,476 |
| Extended Stay America Trust floater Series 2021-ESH: | | | |
| Class A, CME Term SOFR 1 Month Index + 1.190% 6.5315% 7/15/38 (b)(e)(f) | | 15,423,849 | 15,356,369 |
| Class B, CME Term SOFR 1 Month Index + 1.490% 6.8315% 7/15/38 (b)(e)(f) | | 18,311,603 | 18,151,534 |
| Class C, CME Term SOFR 1 Month Index + 1.810% 7.1515% 7/15/38 (b)(e)(f) | | 5,494,830 | 5,446,839 |
| Class D, CME Term SOFR 1 Month Index + 2.360% 7.7015% 7/15/38 (b)(e)(f) | | 11,101,213 | 11,045,760 |
| Class F, CME Term SOFR 1 Month Index + 3.810% 9.1515% 7/15/38 (b)(e)(f) | | 6,352,161 | 6,348,195 |
| Freddie Mac sequential payer: | | | |
| Series 2015-K043 Class A2, 3.062% 12/25/24 | | 14,028,623 | 13,918,286 |
| Series 2015-K049 Class A2, 3.01% 7/25/25 | | 2,129,166 | 2,094,908 |
| Series 2016-K055 Class A2, 2.673% 3/25/26 | | 27,600,000 | 26,843,743 |
| Series 2019-K735 Class A2, 2.862% 5/25/26 | | 2,908,165 | 2,835,007 |
| Series 2019-K736 Class A2, 2.282% 7/25/26 | | 15,000,000 | 14,477,184 |
| Series 2023-K751 Class A2, 4.412% 3/25/30 | | 4,614,000 | 4,663,652 |
| Series K058 Class A2, 2.653% 8/25/26 | | 4,839,000 | 4,687,652 |
| FS Commercial Mortgage Trust Series 2023-4SZN: | | | |
| Class C, 8.3916% 11/10/39 (b)(e) | | 2,396,000 | 2,500,589 |
| Class D, 9.3827% 11/10/39 (b)(e) | | 555,000 | 581,075 |
| GS Mortgage Securities Trust: | | | |
| floater: | | | |
Series 2018-3PCK Class A, CME Term SOFR 1 Month Index + 2.060% 7.4015% 9/15/31 (b)(e)(f) | | 13,429,816 | 13,356,405 |
Series 2021-IP: | | | |
| Class A, CME Term SOFR 1 Month Index + 1.060% 6.4015% 10/15/36 (b)(e)(f) | | 18,953,000 | 18,669,061 |
| Class B, CME Term SOFR 1 Month Index + 1.260% 6.6015% 10/15/36 (b)(e)(f) | | 2,930,000 | 2,857,842 |
| Class C, CME Term SOFR 1 Month Index + 1.660% 7.0015% 10/15/36 (b)(e)(f) | | 2,414,000 | 2,353,725 |
| sequential payer: | | | |
Series 2015-GC34 Class A3, 3.244% 10/10/48 | | 1,157,715 | 1,135,559 |
Series 2017-GS6 Class A2, 3.164% 5/10/50 | | 1,809,917 | 1,725,834 |
Series 2018-GS9 Class A4, 3.992% 3/10/51 | | 2,900,000 | 2,798,172 |
Series 2019-GSA1 Class A4, 3.0479% 11/10/52 | | 2,087,000 | 1,933,747 |
Series 2020-GC45 Class A5, 2.9106% 2/13/53 | | 2,023,000 | 1,845,042 |
Series 2023-SHIP: | | | |
| Class D, 6.273% 9/10/38 (b)(e) | | 1,752,000 | 1,730,294 |
| Class E, 7.6814% 9/10/38 (b)(e) | | 4,514,000 | 4,520,458 |
| Series 2010-C1: | | | |
Class B, 5.148% 8/10/43 (b) | | 30,064 | 29,915 |
Class X, 0.5486% 8/10/43 (b)(e)(n) | | 384,708 | 6 |
| Series 2011-GC5: | | | |
Class C, 5.2958% 8/10/44 (b)(e) | | 908,923 | 700,677 |
Class D, 5.2958% 8/10/44 (b)(e) | | 623,936 | 322,251 |
Class E, 5.2958% 8/10/44 (b)(e)(h) | | 773,957 | 86,529 |
Class F, 4.5% 8/10/44 (b)(h) | | 1,339,218 | 4,018 |
| Series 2012-GCJ9: | | | |
Class D, 4.7543% 11/10/45 (b)(e) | | 1,572,836 | 1,431,280 |
Class E, 4.7543% 11/10/45 (b)(e) | | 896,000 | 734,720 |
| Series 2013-GC10 Class D, 4.6881% 2/10/46 (b)(e) | | 586,000 | 530,217 |
| Series 2015-GC34 Class XA, 1.3458% 10/10/48 (e)(n) | | 15,029,237 | 128,021 |
| Series 2016-GS2 Class D, 2.753% 5/10/49 (b) | | 703,000 | 611,132 |
| Series 2016-GS4 Class C, 4.0753% 11/10/49 (e) | | 464,000 | 389,864 |
| Series 2018-GS9 Class D, 3% 3/10/51 (b) | | 835,000 | 631,475 |
| Series 2019-GC38 Class D, 3% 2/10/52 (b) | | 1,000,000 | 760,826 |
| Series 2019-GC39 Class D, 3% 5/10/52 (b) | | 1,176,000 | 828,942 |
| Series 2019-GC42: | | | |
Class C, 3.8256% 9/10/52 (e) | | 1,750,000 | 1,439,773 |
Class D, 2.8% 9/10/52 (b) | | 408,000 | 289,635 |
| Series 2019-GS5 Class C, 4.299% 3/10/50 (e)(h) | | 1,155,000 | 793,014 |
| Series 2020-GC45: | | | |
Class D, 2.85% 2/13/53 (b)(h) | | 952,000 | 691,458 |
Class SWD, 3.3258% 12/13/39 (b)(e) | | 735,000 | 581,758 |
| Series 2020-GC47 Class D, 3.5681% 5/12/53 (b)(e) | | 336,000 | 239,003 |
| Gs Mtg Securities Corp. Trust 2024-Rvr sequential payer Series 2024-RVR Class B, 5.7226% 8/10/29 (b)(e) | | 989,000 | 988,236 |
| Hilton U.S.A. Trust Series 2016-HHV: | | | |
| Class E, 4.3333% 11/5/38 (b)(e) | | 5,051,000 | 4,802,462 |
| Class F, 4.3333% 11/5/38 (b)(e) | | 5,070,000 | 4,786,055 |
| Home Partners of America Trust Series 2019-1: | | | |
| Class E, 3.604% 9/17/39 (b) | | 543,435 | 507,589 |
| Class F, 4.101% 9/17/39 (b) | | 88,413 | 81,602 |
| Hudson Yards Mortgage Trust Series 2019-30HY Class E, 3.5579% 7/10/39 (b)(e) | | 861,000 | 701,734 |
| Independence Plaza Trust Series 2018-INDP Class E, 4.996% 7/10/35 (b) | | 1,064,000 | 978,005 |
| Intown Mortgage Trust: | | | |
| floater Series 2022-STAY Class E, CME Term SOFR 1 Month Index + 5.030% 10.3684% 8/15/39 (b)(e)(f) | | 1,087,000 | 1,086,998 |
| floater sequential payer Series 2022-STAY Class A, CME Term SOFR 1 Month Index + 2.480% 7.8256% 8/15/39 (b)(e)(f) | | 27,660,000 | 27,685,931 |
| J.P. Morgan Chase Commercial Mortgage Securities Trust floater Series 2022-NXSS Class D, CME Term SOFR 1 Month Index + 4.120% 9.4659% 9/15/39 (b)(e)(f) | | 1,653,000 | 1,653,051 |
| JPMBB Commercial Mortgage Securities Trust: | | | |
| sequential payer Series 2014-C23 Class A5, 3.9342% 9/15/47 | | 1,433,973 | 1,430,367 |
| Series 2014-C23 Class UH5, 4.7094% 9/15/47 (b) | | 194,000 | 183,543 |
| Series 2014-C26 Class D, 3.9904% 1/15/48 (b)(e) | | 3,811,000 | 2,996,671 |
| Series 2015-C30 Class XA, 0.5551% 7/15/48 (e)(n) | | 36,176,484 | 79,404 |
| Series 2015-C32 Class C, 4.8037% 11/15/48 (e) | | 1,942,000 | 782,282 |
| JPMCC Commercial Mortgage Securities Trust Series 2016-JP4 Class D, 3.5123% 12/15/49 (b)(e) | | 1,251,000 | 911,600 |
| JPMDB Commercial Mortgage Securities Trust: | | | |
| sequential payer Series 2016-C4 Class A2, 2.8822% 12/15/49 | | 3,040,167 | 2,925,105 |
| Series 2016-C4: | | | |
Class C, 3.1667% 12/15/49 (e) | | 603,000 | 467,704 |
Class D, 3.1667% 12/15/49 (b)(e) | | 1,242,000 | 905,853 |
| Series 2018-C8 Class D, 3.4157% 6/15/51 (b)(e) | | 406,000 | 294,365 |
| Series 2019-COR6 Class D, 2.5% 11/13/52 (b)(h) | | 567,000 | 245,826 |
| Series 2020-COR7 Class D, 1.75% 5/13/53 (b) | | 714,000 | 337,378 |
| JPMorgan Chase Commercial Mortgage Securities Trust: | | | |
| sequential payer Series 2019-OSB: | | | |
Class A, 3.3973% 6/5/39 (b) | | 1,569,000 | 1,429,777 |
Class D, 3.9089% 6/5/39 (b)(e) | | 876,000 | 759,754 |
| Series 2011-C3: | | | |
Class E, 5.7093% 2/15/46 (b)(e) | | 1,156,000 | 439,280 |
Class G, 4.409% 2/15/46 (b)(e) | | 368,000 | 34,934 |
Class H, 4.409% 2/15/46 (b)(e)(h) | | 828,000 | 57,244 |
Class J, 4.409% 2/15/46 (b)(e)(h) | | 106,000 | 322 |
| Series 2012-CBX: | | | |
Class E, 4.8459% 6/15/45 (b)(e) | | 1,393,676 | 1,276,603 |
Class F, 4% 6/15/45 (b) | | 1,124,000 | 931,490 |
Class G 4% 6/15/45 (b) | | 1,233,000 | 695,345 |
| Series 2013-LC11: | | | |
Class C, 3.9582% 4/15/46 (e) | | 1,025,000 | 688,042 |
Class D, 4.5176% 4/15/46 (e) | | 1,638,000 | 718,689 |
Class F, 3.25% 4/15/46 (b)(e)(h) | | 1,851,000 | 79,778 |
| Series 2014-DSTY: | | | |
Class D, 3.9314% 6/10/27 (b)(e)(h) | | 945,000 | 2,359 |
Class E, 3.9314% 6/10/27 (b)(e)(h) | | 1,519,000 | 3,697 |
| Series 2018-AON Class F, 4.767% 7/5/31 (b)(e) | | 743,000 | 149,520 |
| Series 2018-WPT: | | | |
Class AFX, 4.2475% 7/5/33 (b) | | 8,593,000 | 7,851,308 |
Class CFX, 4.9498% 7/5/33 (b) | | 2,322,000 | 1,793,946 |
Class DFX, 5.3503% 7/5/33 (b) | | 4,241,000 | 3,073,395 |
Class XAFX, 1.2948% 7/5/33 (b)(e)(n) | | 35,039,000 | 693,478 |
| Series 2019-OSB Class E, 3.9089% 6/5/39 (b)(e) | | 1,690,000 | 1,438,502 |
| Series 2020-NNN: | | | |
Class EFX, 3.972% 1/16/37 (b) | | 723,000 | 269,411 |
Class FFX, 4.6254% 1/16/37 (b) | | 1,145,000 | 355,007 |
Class GFX, 4.6882% 1/16/37 (b)(e)(h) | | 441,000 | 112,446 |
| KNDR Trust floater Series 2021-KIND: | | | |
| Class D, CME Term SOFR 1 Month Index + 2.410% 7.7545% 8/15/38 (b)(e)(f) | | 850,020 | 813,890 |
| Class F, CME Term SOFR 1 Month Index + 4.060% 9.4045% 8/15/38 (b)(e)(f) | | 1,968,832 | 1,874,082 |
| Ksl Commercial Mtg Trust 2023-Ht floater Series 2023-HT Class C, CME Term SOFR 1 Month Index + 3.430% 8.7754% 12/15/36 (b)(e)(f) | | 1,597,000 | 1,599,992 |
| LBA Trust floater Series 2024-BOLT: | | | |
| Class E, CME Term SOFR 1 Month Index + 3.680% 9.025% 6/15/26 (b)(e)(f) | | 860,000 | 845,126 |
| Class F, CME Term SOFR 1 Month Index + 4.430% 9.7739% 6/15/26 (b)(e)(f) | | 1,570,000 | 1,542,299 |
| LCCM Mortgage Loan Trust sequential payer Series 2017-LC26 Class A3, 3.289% 7/12/50 (b) | | 2,924,026 | 2,797,028 |
| Life Financial Services Trust floater Series 2022-BMR2: | | | |
| Class A1, CME Term SOFR 1 Month Index + 1.290% 6.6321% 5/15/39 (b)(e)(f) | | 41,422,000 | 40,524,493 |
| Class B, CME Term SOFR 1 Month Index + 1.790% 7.1308% 5/15/39 (b)(e)(f) | | 24,765,000 | 23,714,516 |
| Class C, CME Term SOFR 1 Month Index + 2.090% 7.43% 5/15/39 (b)(e)(f) | | 13,877,000 | 13,058,948 |
| Class D, CME Term SOFR 1 Month Index + 2.540% 7.8788% 5/15/39 (b)(e)(f) | | 12,332,000 | 11,494,922 |
| LIFE Mortgage Trust floater Series 2021-BMR: | | | |
| Class A, CME Term SOFR 1 Month Index + 0.810% 6.1515% 3/15/38 (b)(e)(f) | | 18,868,663 | 18,521,940 |
| Class B, CME Term SOFR 1 Month Index + 0.990% 6.3315% 3/15/38 (b)(e)(f) | | 5,325,103 | 5,195,738 |
| Class C, CME Term SOFR 1 Month Index + 1.210% 6.5515% 3/15/38 (b)(e)(f) | | 3,350,199 | 3,257,332 |
| Class D, CME Term SOFR 1 Month Index + 1.510% 6.8515% 3/15/38 (b)(e)(f) | | 4,659,664 | 4,533,629 |
| Class E, CME Term SOFR 1 Month Index + 1.860% 7.2015% 3/15/38 (b)(e)(f) | | 4,071,158 | 3,908,848 |
| Market Mortgage Trust Series 2020-525M Class F, 3.0386% 2/12/40 (b)(e) | | 819,000 | 444,691 |
| Merit floater Series 2021-STOR: | | | |
| Class A, CME Term SOFR 1 Month Index + 0.810% 6.1515% 7/15/38 (b)(e)(f) | | 3,100,000 | 3,066,094 |
| Class F, CME Term SOFR 1 Month Index + 2.310% 7.6515% 7/15/38 (b)(e)(f) | | 6,070,000 | 5,987,857 |
| Class G, CME Term SOFR 1 Month Index + 2.860% 8.2015% 7/15/38 (b)(e)(f) | | 1,752,000 | 1,728,286 |
| Class J, CME Term SOFR 1 Month Index + 4.060% 9.4015% 7/15/38 (b)(e)(f) | | 1,281,000 | 1,259,325 |
| MFT Trust Series 2020-B6 Class C, 3.3922% 8/10/40 (b)(e)(h) | | 707,000 | 418,999 |
| MHC Commercial Mortgage Trust floater Series 2021-MHC: | | | |
| Class F, CME Term SOFR 1 Month Index + 2.710% 8.0524% 4/15/38 (b)(e)(f) | | 2,031,759 | 1,986,116 |
| Class G, CME Term SOFR 1 Month Index + 3.310% 8.6524% 4/15/38 (b)(e)(f) | | 4,040,869 | 3,940,004 |
| MHP Commercial Mortgage Trust floater Series 2022-MHIL: | | | |
| Class F, CME Term SOFR 1 Month Index + 3.250% 8.5961% 1/15/27 (b)(e)(f) | | 346,413 | 341,488 |
| Class G, CME Term SOFR 1 Month Index + 3.950% 9.2944% 1/15/27 (b)(e)(f) | | 1,033,770 | 1,020,423 |
| Mira Trust 2023-Mile sequential payer Series 2023-MILE Class B, 7.2026% 6/10/38 (b) | | 867,000 | 888,849 |
| MOFT Trust Series 2020-ABC: | | | |
| Class D, 3.5926% 2/10/42 (b)(e) | | 475,000 | 250,239 |
| Class E, 3.5926% 2/10/42 (b)(e) | | 349,000 | 130,980 |
| Morgan Stanley BAML Trust: | | | |
| Series 2012-C6 Class D, 4.5046% 11/15/45 (b)(e)(h) | | 1,469,000 | 1,175,229 |
| Series 2012-C6, Class F, 4.5046% 11/15/45 (b)(e)(h) | | 693,000 | 93,565 |
| Series 2013-C12 Class D, 4.9641% 10/15/46 (b)(e) | | 1,299,000 | 1,138,249 |
| Series 2013-C7 Class C, 4.1771% 2/15/46 (e) | | 50,350 | 48,084 |
| Series 2013-C9: | | | |
Class C, 3.8493% 5/15/46 (e) | | 920,000 | 814,200 |
Class D, 3.9373% 5/15/46 (b)(e) | | 1,700,000 | 1,445,000 |
Class E, 3.9373% 5/15/46 (b)(e) | | 722,000 | 577,600 |
| Series 2015-C25 Class XA, 1.1751% 10/15/48 (e)(n) | | 23,959,400 | 133,955 |
| Series 2016-C30 Class C, 4.1721% 9/15/49 (e) | | 266,000 | 221,443 |
| Series 2016-C31 Class C, 4.399% 11/15/49 (e) | | 603,000 | 511,311 |
| Series 2016-C32 Class C, 4.4104% 12/15/49 (e) | | 415,000 | 366,080 |
| Series 2017-C33 Class D, 3.356% 5/15/50 (b) | | 947,000 | 784,019 |
| Morgan Stanley Capital I Trust: | | | |
| sequential payer: | | | |
Series 2017-HR2 Class A4, 3.587% 12/15/50 | | 3,580,000 | 3,436,515 |
Series 2018-L1 Class A3, 4.139% 10/15/51 | | 5,038,740 | 4,957,554 |
Series 2019-MEAD Class A, 3.17% 11/10/36 (b) | | 32,166,000 | 30,803,538 |
Series 2021-L5 Class A4, 2.728% 5/15/54 | | 3,345,000 | 2,951,780 |
Series 2024-BPR2 Class A, 7.291% 5/5/29 (b) | | 1,474,816 | 1,528,389 |
| Series 2011-C2: | | | |
Class D, 5.385% 6/15/44 (b)(e) | | 810,152 | 773,696 |
Class F, 5.385% 6/15/44 (b)(e) | | 748,000 | 432,494 |
Class XB, 0.5154% 6/15/44 (b)(e)(n) | | 2,469,388 | 8,540 |
| Series 2011-C3: | | | |
Class E, 5.1076% 7/15/49 (b)(e) | | 377,946 | 367,495 |
Class F, 5.1076% 7/15/49 (b)(e) | | 332,000 | 304,214 |
Class G, 5.1076% 7/15/49 (b)(e) | | 1,123,200 | 960,128 |
| Series 2012-C4 Class D, 5.3359% 3/15/45 (b)(e) | | 166,237 | 154,600 |
| Series 2014-150E: | | | |
Class C, 4.4382% 9/9/32 (b)(e) | | 418,000 | 244,530 |
Class F, 4.4382% 9/9/32 (b)(e) | | 734,000 | 254,573 |
| Series 2015-MS1: | | | |
Class B, 4.1571% 5/15/48 (e) | | 467,000 | 437,898 |
Class C, 4.1571% 5/15/48 (e) | | 779,000 | 683,733 |
Class D, 4.1571% 5/15/48 (b)(e) | | 1,371,000 | 1,011,992 |
| Series 2016-BNK2: | | | |
Class C, 3% 11/15/49 (b) | | 1,456,000 | 739,285 |
Class D, 4.009% 11/15/49 (e) | | 603,000 | 450,482 |
| Series 2017-H1: | | | |
Class A/S, 3.773% 6/15/50 | | 1,125,000 | 1,066,068 |
Class C, 4.281% 6/15/50 | | 1,985,000 | 1,807,939 |
Class D, 2.546% 6/15/50 (b) | | 3,406,000 | 2,769,374 |
| Series 2017-HR2 Class D, 2.73% 12/15/50 | | 2,054,000 | 1,729,216 |
| Series 2018-H4 Class A4, 4.31% 12/15/51 | | 7,706,000 | 7,511,880 |
| Series 2018-MP Class E, 4.4185% 7/11/40 (b)(e) | | 1,711,000 | 1,089,125 |
| Series 2019-MEAD: | | | |
Class B, 3.283% 11/10/36 (b)(e) | | 4,445,000 | 4,212,272 |
Class C, 3.283% 11/10/36 (b)(e) | | 4,265,000 | 3,977,722 |
| Series 2020-CNP Class D, 2.5085% 4/5/42 (b)(e) | | 462,000 | 311,031 |
| Series 2020-HR8 Class D, 2.5% 7/15/53 (b) | | 756,000 | 525,173 |
| Series 2020-L4, Class C, 3.536% 2/15/53 | | 205,000 | 166,052 |
| Series 2021-L6 Class XA, 1.3148% 6/15/54 (e)(n) | | 25,921,279 | 1,308,605 |
| Series 2024-BPR2 Class X, 1.0727% 5/5/29 (b)(e)(n) | | 65,918,101 | 2,394,963 |
| MSJP Commercial Securities Mortgage Trust Series 2015-HAUL Class E, 5.0127% 9/5/47 (b)(e) | | 311,000 | 261,601 |
| MSWF Commercial Mortgage Trust sequential payer: | | | |
| Series 2023-1: | | | |
Class A5, 5.752% 5/15/56 | | 1,625,000 | 1,727,265 |
Class C, 6.9056% 5/15/56 (e) | | 1,083,000 | 1,138,474 |
| Series 2023-2: | | | |
Class B, 7.1101% 12/15/56 (e) | | 1,126,000 | 1,221,075 |
Class C, 7.2521% 12/15/56 (e) | | 878,000 | 930,694 |
Class D, 4% 12/15/56 (b) | | 369,000 | 284,267 |
| Natixis Commercial Mortgage Securities Trust: | | | |
| Series 2018-285M Class F, 3.9167% 11/15/32 (b)(e) | | 307,000 | 201,085 |
| Series 2019-10K: | | | |
Class E, 4.2724% 5/15/39 (b)(e) | | 1,321,000 | 1,131,563 |
Class F, 4.2724% 5/15/39 (b)(e) | | 1,374,000 | 1,143,884 |
| Series 2020-2PAC: | | | |
Class AMZ2, 3.6167% 1/15/37 (b)(e) | | 735,000 | 453,911 |
Class AMZ3, 3.6167% 1/15/37 (b)(e) | | 336,000 | 173,927 |
| NYT Mortgage Trust floater Series 2019-NYT Class F, CME Term SOFR 1 Month Index + 3.290% 8.634% 12/15/35 (b)(e)(f) | | 1,385,000 | 933,540 |
| Open Trust 2023-Air sequential payer Series 2023-AIR: | | | |
| Class A, CME Term SOFR 1 Month Index + 3.080% 8.426% 10/15/28 (b)(e)(f) | | 14,550,896 | 14,678,216 |
| Class B, CME Term SOFR 1 Month Index + 3.830% 9.1749% 10/15/28 (b)(e)(f) | | 8,767,559 | 8,800,348 |
| Class C, CME Term SOFR 1 Month Index + 5.230% 10.5728% 10/15/28 (b)(e)(f) | | 1,179,851 | 1,184,263 |
| Class D, CME Term SOFR 1 Month Index + 6.680% 12.0206% 10/15/28 (b)(e)(f) | | 3,704,894 | 3,723,368 |
| Class E, CME Term SOFR 1 Month Index + 9.420% 14.7664% 10/15/28 (b)(e)(f) | | 1,573,434 | 1,581,280 |
| OPG Trust floater Series 2021-PORT: | | | |
| Class G, CME Term SOFR 1 Month Index + 2.510% 7.8495% 10/15/36 (b)(e)(f) | | 602,550 | 588,946 |
| Class J, CME Term SOFR 1 Month Index + 3.460% 8.7975% 10/15/36 (b)(e)(f) | | 638,300 | 617,854 |
| PKHL Commercial Mortgage Trust floater Series 2021-MF: | | | |
| Class F, CME Term SOFR 1 Month Index + 3.460% 8.8015% 7/15/38 (b)(e)(f) | | 986,000 | 645,846 |
| Class NR, CME Term SOFR 1 Month Index + 6.110% 11.4515% 7/15/38 (b)(e)(f)(h) | | 280,000 | 119,237 |
| Prima Capital CRE Securitization Ltd. Series 2020-8A Class C, 3% 12/26/70 (b) | | 3,045,000 | 2,458,229 |
| Prima Capital Ltd. floater Series 2021-9A Class C, CME Term SOFR 1 Month Index + 2.460% 7.8061% 12/15/37 (b)(e)(f) | | 1,419,983 | 1,420,606 |
| Providence Place Group Ltd. Partnership Series 2000-C1 Class A2, 7.75% 7/20/28 (b) | | 662,686 | 679,484 |
| SG Commercial Mortgage Securities Trust: | | | |
| Series 2019-PREZ Class F, 3.593% 9/15/39 (b)(e) | | 1,360,000 | 1,078,499 |
| Series 2020-COVE Class F, 3.8518% 3/15/37 (b)(e) | | 2,364,000 | 1,967,907 |
| SMRT Commercial Mortgage Trust floater Series 2022-MINI: | | | |
| Class E, CME Term SOFR 1 Month Index + 2.700% 8.037% 1/15/39 (b)(e)(f) | | 2,039,000 | 1,942,992 |
| Class F, CME Term SOFR 1 Month Index + 3.350% 8.687% 1/15/39 (b)(e)(f) | | 800,000 | 752,160 |
| SOHO Trust Series 2021-SOHO Class D, 2.6966% 8/10/38 (b)(e)(h) | | 1,113,000 | 447,359 |
| SPGN Mortgage Trust floater Series 2022-TFLM: | | | |
| Class B, CME Term SOFR 1 Month Index + 2.000% 7.3369% 2/15/39 (b)(e)(f) | | 7,618,000 | 7,456,754 |
| Class C, CME Term SOFR 1 Month Index + 2.650% 7.9869% 2/15/39 (b)(e)(f) | | 3,962,000 | 3,851,002 |
| SREIT Trust floater: | | | |
| Series 2021-FLWR Class A, CME Term SOFR 1 Month Index + 0.690% 6.028% 7/15/36 (b)(e)(f) | | 4,344,000 | 4,294,795 |
| Series 2021-IND Class G, CME Term SOFR 1 Month Index + 3.380% 8.7173% 10/15/38 (b)(e)(f) | | 1,487,000 | 1,439,546 |
| Series 2021-MFP: | | | |
Class A, CME Term SOFR 1 Month Index + 0.840% 6.1822% 11/15/38 (b)(e)(f) | | 32,154,421 | 31,762,539 |
Class B, CME Term SOFR 1 Month Index + 1.190% 6.5312% 11/15/38 (b)(e)(f) | | 16,326,951 | 16,123,111 |
Class C, CME Term SOFR 1 Month Index + 1.440% 6.7804% 11/15/38 (b)(e)(f) | | 10,139,877 | 9,987,962 |
Class D, CME Term SOFR 1 Month Index + 1.690% 7.0296% 11/15/38 (b)(e)(f) | | 6,663,594 | 6,530,322 |
Class G, CME Term SOFR 1 Month Index + 3.080% 8.4252% 11/15/38 (b)(e)(f) | | 5,465,601 | 5,363,242 |
| Series 2021-MFP2: | | | |
Class G, CME Term SOFR 1 Month Index + 3.080% 8.419% 11/15/36 (b)(e)(f) | | 1,090,000 | 1,057,400 |
Class J, CME Term SOFR 1 Month Index + 4.020% 9.367% 11/15/36 (b)(e)(f) | | 3,205,000 | 3,129,138 |
| Series 2021-PALM Class G, CME Term SOFR 1 Month Index + 3.730% 9.0676% 10/15/34 (b)(e)(f) | | 798,000 | 777,577 |
| STWD Trust floater sequential payer Series 2021-LIH: | | | |
| Class E, CME Term SOFR 1 Month Index + 3.010% 8.354% 11/15/36 (b)(e)(f) | | 2,268,000 | 2,220,015 |
| Class F, CME Term SOFR 1 Month Index + 3.660% 9.002% 11/15/36 (b)(e)(f) | | 2,492,000 | 2,444,565 |
| Class G, CME Term SOFR 1 Month Index + 4.310% 9.651% 11/15/36 (b)(e)(f) | | 525,000 | 510,367 |
| SUMIT Mortgage Trust Series 2022-BVUE Class F, 2.9889% 2/12/41 (b)(e) | | 185,000 | 117,448 |
| TPGI Trust floater Series 2021-DGWD: | | | |
| Class F, CME Term SOFR 1 Month Index + 3.110% 8.4545% 6/15/26 (b)(e)(f) | | 984,800 | 973,977 |
| Class G, CME Term SOFR 1 Month Index + 3.960% 9.3045% 6/15/26 (b)(e)(f) | | 367,200 | 363,503 |
| Tricon Residential Trust Series 2022-SFR2 Class E, 7.507% 7/17/40 (b) | | 2,499,000 | 2,574,639 |
| UBS Commercial Mortgage Trust: | | | |
| sequential payer Series 2018-C9 Class A4, 4.117% 3/15/51 | | 2,000,000 | 1,921,054 |
| Series 2012-C1: | | | |
Class E, 5% 5/10/45 (b)(e) | | 446,067 | 412,681 |
Class F, 5% 5/10/45 (b)(e)(h) | | 762,700 | 186,871 |
| Series 2017-C7 Class XA, 1.1325% 12/15/50 (e)(n) | | 41,420,146 | 1,083,667 |
| Series 2018-C8 Class C, 4.8396% 2/15/51 (e) | | 336,000 | 292,946 |
| UBS-BAMLL Trust: | | | |
| Series 12-WRM Class D, 4.3793% 6/10/30 (b)(e) | | 746,000 | 608,657 |
| Series 2012-WRM: | | | |
Class C, 4.3793% 6/10/30 (b)(e) | | 110,000 | 98,064 |
Class E, 4.3793% 6/10/30 (b)(e)(h) | | 849,000 | 614,413 |
| VASA Trust: | | | |
| floater Series 2021-VASA Class G, CME Term SOFR 1 Month Index + 5.110% 10.4515% 7/15/39 (b)(e)(f)(h) | | 315,000 | 143,500 |
| floater sequential payer Series 2021-VASA: | | | |
Class B, CME Term SOFR 1 Month Index + 1.360% 6.7015% 7/15/39 (b)(e)(f) | | 1,019,000 | 852,194 |
Class F, CME Term SOFR 1 Month Index + 4.010% 9.3515% 7/15/39 (b)(e)(f) | | 1,383,000 | 713,012 |
| VLS Commercial Mortgage Trust: | | | |
| sequential payer Series 2020-LAB Class A, 2.13% 10/10/42 (b) | | 25,554,000 | 20,889,322 |
| Series 2020-LAB: | | | |
Class B, 2.453% 10/10/42 (b) | | 1,600,000 | 1,306,300 |
Class X, 0.5162% 10/10/42 (b)(e)(n) | | 35,000,000 | 763,147 |
| Wells Fargo Commercial Mortage Trust 20 floater Series 2024-MGP: | | | |
| Class A11, CME Term SOFR 1 Month Index + 1.990% 7.3407% 8/15/41 (b)(e)(f) | | 3,200,000 | 3,191,654 |
| Class A12, CME Term SOFR 1 Month Index + 1.690% 7.0412% 8/15/41 (b)(e)(f) | | 12,400,000 | 12,367,665 |
| Wells Fargo Commercial Mortgag Series 2024-1CHI Class E, 7.5743% 7/15/35 (b)(e) | | 1,215,000 | 1,215,500 |
| Wells Fargo Commercial Mortgage Trust: | | | |
| floater: | | | |
Series 2021-FCMT Class A, CME Term SOFR 1 Month Index + 1.310% 6.6515% 5/15/31 (b)(e)(f) | | 17,572,000 | 17,124,343 |
Series 2021-SAVE: | | | |
| Class D, CME Term SOFR 1 Month Index + 2.610% 7.9515% 2/15/40 (b)(e)(f) | | 310,400 | 305,750 |
| Class E, CME Term SOFR 1 Month Index + 3.760% 9.1015% 2/15/40 (b)(e)(f) | | 220,800 | 217,805 |
| sequential payer: | | | |
Series 2020-C57 Class D, 2.5% 8/15/53 (b) | | 1,034,000 | 785,527 |
Series 2021-C60 Class A4, 2.342% 8/15/54 | | 2,113,000 | 1,812,876 |
Series 2021-C61 Class A4, 2.658% 11/15/54 | | 1,095,000 | 952,227 |
| Series 2015-C31 Class XA, 1.0985% 11/15/48 (e)(n) | | 19,557,690 | 133,268 |
| Series 2015-NXS4 Class D, 3.8264% 12/15/48 (e) | | 861,000 | 786,530 |
| Series 2016-BNK1: | | | |
Class C, 3.071% 8/15/49 | | 446,000 | 288,029 |
Class D, 3% 8/15/49 (b) | | 487,000 | 215,589 |
| Series 2016-C34 Class XA, 2.2161% 6/15/49 (e)(n) | | 15,789,427 | 300,760 |
| Series 2016-LC25 Class C, 4.4752% 12/15/59 (e) | | 575,000 | 515,801 |
| Series 2016-NXS6: | | | |
Class C, 4.5379% 11/15/49 (e) | | 1,323,000 | 1,213,659 |
Class D, 3.059% 11/15/49 (b) | | 1,337,000 | 1,117,156 |
| Series 2018-C43 Class C, 4.514% 3/15/51 | | 401,000 | 367,735 |
| Series 2018-C44 Class D, 3% 5/15/51 (b) | | 2,676,000 | 1,967,505 |
| Series 2018-C46 Class XA, 1.0782% 8/15/51 (e)(n) | | 41,692,000 | 954,142 |
| Series 2019-AA Class D, 3.514% 10/15/52 | | 1,142,000 | 1,006,506 |
| Series 2019-C49 Class C, 4.866% 3/15/52 (e) | | 2,887,000 | 2,713,334 |
| Series 2021-C60 Class D, 2.5% 8/15/54 (b) | | 880,000 | 621,664 |
| Wells Fargo Commercial Mtg Trust 2019-C sequential payer Series 2019-C51 Class ASB, 3.16% 6/15/52 | | 2,370,528 | 2,292,904 |
| Wells Fargo Commercial Mtg Trust 2020-C sequential payer Series 2020-C55 Class ASB, 2.651% 2/15/53 | | 4,000,000 | 3,791,170 |
| Wells Fargo Commercial Mtg Trust 2024-5 sequential payer Series 2024-5C1 Class A3, 5.928% 7/15/57 | | 7,300,000 | 7,629,630 |
| WF-RBS Commercial Mortgage Trust: | | | |
| sequential payer Series 2011-C4I Class G, 5% 6/15/44 (e)(h) | | 372,000 | 27,916 |
| Series 2011-C3 Class D, 6.0497% 3/15/44 (b)(e) | | 439,833 | 158,252 |
| Series 2011-C4: | | | |
Class D, 4.5552% 6/15/44 (b)(e) | | 351,792 | 313,095 |
Class E, 4.5552% 6/15/44 (b)(e) | | 335,432 | 271,700 |
| Series 2013-C11: | | | |
Class D, 4.1974% 3/15/45 (b)(e) | | 801,251 | 640,335 |
Class E, 4.1974% 3/15/45 (b)(e) | | 1,774,872 | 1,116,695 |
| Series 2013-C13 Class D, 4.1422% 5/15/45 (b)(e) | | 532,364 | 473,277 |
| Series 2013-C16 Class D, 4.7662% 9/15/46 (b)(e) | | 127,353 | 117,801 |
| Series 2014-C21 Class XA, 0.7162% 8/15/47 (e)(n) | | 4,310,698 | 76 |
| Series 2014-C24 Class XA, 0.9584% 11/15/47 (e)(n) | | 9,997,102 | 249 |
| WFCM: | | | |
| Series 2022-C62: | | | |
Class C, 4.3513% 4/15/55 (e) | | 1,923,000 | 1,583,158 |
Class D, 2.5% 4/15/55 (b) | | 1,365,000 | 866,350 |
| Series 2022-C62, Class A4, 4% 4/15/55 | | 1,461,000 | 1,384,170 |
| Worldwide Plaza Trust Series 2017-WWP: | | | |
| Class E, 3.7154% 11/10/36 (b)(e) | | 348,000 | 24,360 |
| Class F, 3.7154% 11/10/36 (b)(e) | | 1,960,000 | 98,000 |
| WP Glimcher Mall Trust Series 2015-WPG: | | | |
| Class PR1, 3.6332% 6/5/35 (b)(e) | | 528,000 | 436,738 |
| Class PR2, 3.6332% 6/5/35 (b)(e) | | 1,378,000 | 1,110,811 |
| TOTAL COMMERCIAL MORTGAGE SECURITIES (Cost $2,083,804,519) | | | 2,027,332,525 |
| | | | |
| Foreign Government and Government Agency Obligations - 1.2% |
| | | Principal Amount (a) | Value ($) |
| Abu Dhabi National Energy Co. PJSC 4.375% 1/24/29 (b) | | 880,000 | 881,373 |
| Angola Republic: | | | |
| 8.25% 5/9/28 (b) | | 2,170,000 | 2,074,384 |
| 8.75% 4/14/32 (b) | | 795,000 | 721,963 |
| 9.375% 5/8/48 (b) | | 1,610,000 | 1,384,600 |
| 9.5% 11/12/25 (b) | | 2,245,000 | 2,286,392 |
| Arab Republic of Egypt: | | | |
| 7.0529% 1/15/32 (b) | | 45,000 | 37,589 |
| 7.5% 1/31/27 (b) | | 2,427,000 | 2,373,909 |
| 7.5% 2/16/61 (b) | | 3,225,000 | 2,226,258 |
| 7.6003% 3/1/29 (b) | | 1,765,000 | 1,660,203 |
| 7.625% 5/29/32 (b) | | 1,110,000 | 950,438 |
| 7.903% 2/21/48 (b) | | 1,891,000 | 1,392,249 |
| 8.5% 1/31/47 (b) | | 1,586,000 | 1,226,672 |
| 8.7002% 3/1/49 (b) | | 1,420,000 | 1,110,255 |
| Argentine Republic: | | | |
| 0.75% 7/9/30 (g) | | 21,034,259 | 11,957,976 |
| 1% 7/9/29 | | 1,948,999 | 1,172,323 |
| 3.5% 7/9/41 (g) | | 3,950,000 | 1,645,175 |
| 4.125% 7/9/35 (g) | | 13,968,323 | 6,194,951 |
| 5% 1/9/38 (g) | | 5,332,281 | 2,594,155 |
| Bahamian Republic 6% 11/21/28 (b) | | 1,035,000 | 956,081 |
| Bahrain Kingdom: | | | |
| 5.625% 5/18/34 (b) | | 790,000 | 740,625 |
| 7.5% 2/12/36 (b) | | 580,000 | 613,169 |
| Bank Gospodarstwa Krajowego: | | | |
| 5.375% 5/22/33 (b) | | 780,000 | 798,470 |
| 6.25% 10/31/28 (b) | | 500,000 | 533,245 |
| 6.25% 7/9/54 (b) | | 1,805,000 | 1,949,274 |
| Barbados Government 6.5% 10/1/29 (b) | | 1,880,000 | 1,800,100 |
| Bermuda Government: | | | |
| 2.375% 8/20/30 (b) | | 385,000 | 336,875 |
| 3.375% 8/20/50 (b) | | 630,000 | 458,128 |
| 3.717% 1/25/27 (b) | | 2,220,000 | 2,163,806 |
| 4.75% 2/15/29 (b) | | 965,000 | 959,094 |
| 5% 7/15/32 (b) | | 490,000 | 491,072 |
| Bonos para la Reconstruccion de una Argentina Libre 0% 6/30/25 | | 2,369,670 | 1,925,736 |
| Brazilian Federative Republic: | | | |
| 3.875% 6/12/30 | | 2,310,000 | 2,119,425 |
| 6% 10/20/33 | | 1,900,000 | 1,902,470 |
| 7.125% 1/20/37 | | 2,250,000 | 2,443,793 |
| 7.125% 5/13/54 | | 1,435,000 | 1,469,469 |
| 8.25% 1/20/34 | | 2,809,000 | 3,255,350 |
| Canadian Government: | | | |
| 2.75% 6/1/33 | CAD | 2,150,000 | 1,551,082 |
| 3% 6/1/34 | CAD | 700,000 | 512,420 |
| Chilean Republic: | | | |
| 2.45% 1/31/31 | | 4,855,000 | 4,296,675 |
| 2.75% 1/31/27 | | 790,000 | 757,168 |
| 3.1% 1/22/61 | | 3,325,000 | 2,182,863 |
| 3.5% 1/31/34 | | 520,000 | 471,575 |
| 4% 1/31/52 | | 455,000 | 370,684 |
| 4.34% 3/7/42 | | 915,000 | 823,958 |
| 5.33% 1/5/54 | | 1,440,000 | 1,428,307 |
| Colombian Republic: | | | |
| 3% 1/30/30 | | 2,720,000 | 2,302,480 |
| 3.125% 4/15/31 | | 1,455,000 | 1,189,463 |
| 3.25% 4/22/32 | | 1,245,000 | 992,265 |
| 4.125% 5/15/51 | | 600,000 | 375,570 |
| 5% 6/15/45 | | 5,260,000 | 3,813,237 |
| 5.2% 5/15/49 | | 1,660,000 | 1,218,357 |
| 6.125% 1/18/41 | | 105,000 | 91,508 |
| 7.375% 9/18/37 | | 630,000 | 634,095 |
| 7.5% 2/2/34 | | 630,000 | 649,530 |
| 8% 4/20/33 | | 1,040,000 | 1,108,120 |
| 8% 11/14/35 | | 8,500,000 | 9,018,500 |
| 8.75% 11/14/53 | | 11,670,000 | 12,696,377 |
| Costa Rican Republic: | | | |
| 5.625% 4/30/43 (b) | | 980,000 | 906,500 |
| 7.3% 11/13/54 (b) | | 1,245,000 | 1,348,098 |
| Democratic Socialist Republic of Sri Lanka: | | | |
| 6.2% (b)(d) | | 635,000 | 331,591 |
| 6.825% (b)(d) | | 2,215,000 | 1,169,808 |
| 6.85% (b)(d) | | 900,000 | 482,625 |
| 7.55% (b)(d) | | 615,000 | 324,413 |
| 7.85% (b)(d) | | 1,545,000 | 821,264 |
| Dominican Republic: | | | |
| 4.5% 1/30/30 (b) | | 1,355,000 | 1,283,470 |
| 4.875% 9/23/32 (b) | | 5,535,000 | 5,209,819 |
| 5.875% 1/30/60 (b) | | 1,685,000 | 1,546,830 |
| 5.95% 1/25/27 (b) | | 1,881,000 | 1,897,459 |
| 6% 7/19/28 (b) | | 1,011,000 | 1,030,593 |
| 6.5% 2/15/48 (b) | | 635,000 | 642,544 |
| 6.6% 6/1/36 (b) | | 816,000 | 857,616 |
| 6.85% 1/27/45 (b) | | 1,143,000 | 1,202,299 |
| 6.875% 1/29/26 (b) | | 2,522,000 | 2,564,559 |
| 7.05% 2/3/31 (b) | | 1,295,000 | 1,386,298 |
| 7.45% 4/30/44 (b) | | 794,000 | 887,049 |
| Ecuador Republic: | | | |
| 5.5% 7/31/35 (b)(g) | | 3,250,000 | 1,795,625 |
| 6.9% 7/31/30 (b) | | 3,100,000 | 2,205,650 |
| El Salvador Republic: | | | |
| 0.25% 4/17/30 (b) | | 1,055,000 | 26,903 |
| 6.375% 1/18/27 (b) | | 195,000 | 182,691 |
| 7.1246% 1/20/50 (b) | | 1,000,000 | 692,810 |
| 7.625% 2/1/41 (b) | | 230,000 | 169,625 |
| 7.65% 6/15/35 (b) | | 855,000 | 669,893 |
| 9.25% 4/17/30 (b) | | 1,055,000 | 997,191 |
| Emirate of Abu Dhabi: | | | |
| 3% 9/15/51 (b) | | 3,520,000 | 2,510,218 |
| 3.125% 9/30/49 (b) | | 5,230,000 | 3,844,050 |
| 3.875% 4/16/50 (b) | | 2,400,000 | 2,020,512 |
| 5.5% 4/30/54 (b) | | 1,425,000 | 1,529,203 |
| Emirate of Dubai: | | | |
| 3.9% 9/9/50 (Reg. S) | | 3,300,000 | 2,539,350 |
| 5.25% 1/30/43 (Reg. S) | | 890,000 | 883,325 |
| Export Credit Bank of Turkey 9% 1/28/27 (b) | | 1,080,000 | 1,142,100 |
| Gabonese Republic: | | | |
| 6.625% 2/6/31 (b) | | 1,880,000 | 1,436,438 |
| 7% 11/24/31 (b) | | 1,245,000 | 949,313 |
| Georgia Republic 2.75% 4/22/26 (b) | | 1,580,000 | 1,484,706 |
| German Federal Republic: | | | |
| 1% 5/15/38(Reg. S) | EUR | 4,545,000 | 4,158,622 |
| 2.1% 11/15/29(Reg. S) | EUR | 2,100,000 | 2,312,273 |
| 2.5% 7/4/44 | EUR | 7,280,000 | 7,975,185 |
| 3.25% 7/4/42 (l) | EUR | 23,900,000 | 28,980,577 |
| Ghana Republic: | | | |
| 7.75% (b)(d) | | 1,150,000 | 602,313 |
| 8.627% (b)(d) | | 875,000 | 453,359 |
| 10.75% 10/14/30 (b) | | 1,600,000 | 1,093,008 |
| Guatemalan Republic: | | | |
| 4.875% 2/13/28 (b) | | 305,000 | 299,948 |
| 4.9% 6/1/30 (b) | | 890,000 | 866,638 |
| 6.125% 6/1/50 (b) | | 915,000 | 869,822 |
| 6.6% 6/13/36 (b) | | 835,000 | 870,913 |
| Hungarian Republic: | | | |
| 2.125% 9/22/31 (b) | | 880,000 | 724,680 |
| 3.125% 9/21/51 (b) | | 1,660,000 | 1,097,675 |
| 5.25% 6/16/29 (b) | | 1,305,000 | 1,317,724 |
| 5.5% 6/16/34 (b) | | 1,745,000 | 1,766,267 |
| 6.125% 5/22/28 (b) | | 610,000 | 632,684 |
| 6.25% 9/22/32 (b) | | 615,000 | 658,265 |
| 6.75% 9/25/52 (b) | | 430,000 | 484,288 |
| Indonesian Republic: | | | |
| 3.2% 9/23/61 | | 1,380,000 | 944,869 |
| 3.5% 2/14/50 | | 1,165,000 | 909,428 |
| 3.85% 10/15/30 | | 855,000 | 822,938 |
| 4.1% 4/24/28 | | 1,955,000 | 1,938,505 |
| 4.2% 10/15/50 | | 44,910,000 | 39,366,422 |
| 4.35% 1/11/48 | | 1,225,000 | 1,108,242 |
| 5.125% 1/15/45 (b) | | 4,090,000 | 4,142,475 |
| 5.25% 1/17/42 (b) | | 660,000 | 676,913 |
| 5.95% 1/8/46 (b) | | 985,000 | 1,085,963 |
| 6.75% 1/15/44 (b) | | 690,000 | 831,450 |
| 7.75% 1/17/38 (b) | | 2,648,000 | 3,352,203 |
| 8.5% 10/12/35 (b) | | 4,030,000 | 5,240,008 |
| Islamic Republic of Pakistan: | | | |
| 6% 4/8/26 (b) | | 2,270,000 | 2,082,725 |
| 6.875% 12/5/27 (b) | | 740,000 | 641,950 |
| 7.375% 4/8/31 (b) | | 2,260,000 | 1,799,525 |
| Israeli State: | | | |
| 3.375% 1/15/50 | | 2,760,000 | 1,863,707 |
| 5.75% 3/12/54 | | 955,000 | 916,800 |
| Ivory Coast: | | | |
| 6.125% 6/15/33 (b) | | 2,490,000 | 2,276,016 |
| 6.375% 3/3/28 (b) | | 3,770,000 | 3,743,685 |
| 8.25% 1/30/37 (b) | | 1,505,000 | 1,499,356 |
| Jamaican Government: | | | |
| 6.75% 4/28/28 | | 745,000 | 783,300 |
| 7.875% 7/28/45 | | 430,000 | 519,896 |
| Japan Government 0.005% 2/1/25 | JPY | 683,100,000 | 4,669,509 |
| Jordanian Kingdom: | | | |
| 4.95% 7/7/25 (b) | | 1,535,000 | 1,507,658 |
| 7.375% 10/10/47 (b) | | 640,000 | 580,800 |
| 7.5% 1/13/29 (b) | | 755,000 | 766,325 |
| 7.75% 1/15/28 (b) | | 825,000 | 844,487 |
| Kingdom of Saudi Arabia: | | | |
| 2.25% 2/2/33 (b) | | 2,285,000 | 1,892,266 |
| 3.25% 10/22/30 (b) | | 10,790,000 | 10,058,870 |
| 3.45% 2/2/61 (b) | | 4,585,000 | 3,180,844 |
| 3.625% 3/4/28 (b) | | 785,000 | 765,620 |
| 3.75% 1/21/55 (b) | | 1,250,000 | 932,422 |
| 4.5% 10/26/46 (b) | | 2,465,000 | 2,171,511 |
| 4.5% 4/22/60 (b) | | 7,675,000 | 6,535,742 |
| 4.625% 10/4/47 (b) | | 1,355,000 | 1,213,995 |
| 5% 1/18/53 (b) | | 1,010,000 | 936,775 |
| 5.75% 1/16/54 (b) | | 950,000 | 969,000 |
| Lebanese Republic: | | | |
| 5.8% (d) | | 1,814,000 | 117,348 |
| 6.375% (d) | | 1,956,000 | 125,918 |
| Mongolia Government 7.875% 6/5/29 (b) | | 245,000 | 255,719 |
| Moroccan Kingdom 6.5% 9/8/33 (b) | | 1,735,000 | 1,852,269 |
| Panamanian Republic: | | | |
| 2.252% 9/29/32 | | 1,515,000 | 1,133,978 |
| 3.298% 1/19/33 | | 1,135,000 | 920,655 |
| 3.87% 7/23/60 | | 2,230,000 | 1,360,991 |
| 4.5% 5/15/47 | | 645,000 | 470,805 |
| 4.5% 4/16/50 | | 2,915,000 | 2,071,399 |
| 6.4% 2/14/35 | | 1,935,000 | 1,930,453 |
| 6.853% 3/28/54 | | 525,000 | 514,663 |
| 7.875% 3/1/57 | | 865,000 | 947,720 |
| 8% 3/1/38 | | 915,000 | 1,008,504 |
| Peruvian Republic: | | | |
| 2.783% 1/23/31 | | 2,035,000 | 1,799,194 |
| 3% 1/15/34 | | 1,130,000 | 959,088 |
| 3.3% 3/11/41 | | 1,735,000 | 1,355,469 |
| Philippine Republic: | | | |
| 2.65% 12/10/45 | | 1,655,000 | 1,134,709 |
| 2.95% 5/5/45 | | 430,000 | 311,347 |
| 5% 7/17/33 | | 920,000 | 937,538 |
| 5.5% 1/17/48 | | 805,000 | 841,225 |
| 5.6% 5/14/49 | | 1,075,000 | 1,136,141 |
| 5.609% 4/13/33 | | 825,000 | 873,984 |
| 5.95% 10/13/47 | | 1,320,000 | 1,457,775 |
| Polish Government: | | | |
| 5.5% 4/4/53 | | 585,000 | 597,554 |
| 5.5% 3/18/54 | | 1,110,000 | 1,135,885 |
| 5.75% 11/16/32 | | 1,500,000 | 1,610,025 |
| Provincia de Cordoba: | | | |
| 6.875% 12/10/25 (b) | | 790,753 | 752,085 |
| 6.99% 6/1/27 (b) | | 1,310,721 | 1,137,496 |
| Republic of Armenia 3.6% 2/2/31 (b) | | 1,030,000 | 865,844 |
| Republic of Benin 7.96% 2/13/38 (b) | | 2,355,000 | 2,254,177 |
| Republic of Kenya: | | | |
| 6.3% 1/23/34 (b) | | 605,000 | 464,338 |
| 7.25% 2/28/28 (b) | | 640,000 | 587,200 |
| 9.75% 2/16/31 (b) | | 1,050,000 | 1,017,188 |
| Republic of Montenegro 7.25% 3/12/31 (b) | | 1,650,000 | 1,704,141 |
| Republic of Nigeria: | | | |
| 6.125% 9/28/28 (b) | | 4,410,000 | 3,969,000 |
| 6.5% 11/28/27 (b) | | 600,000 | 558,750 |
| 7.143% 2/23/30 (b) | | 1,650,000 | 1,492,734 |
| 7.625% 11/21/25 (b) | | 1,505,000 | 1,507,822 |
| 7.696% 2/23/38 (b) | | 1,110,000 | 889,388 |
| 7.875% 2/16/32 (b) | | 1,840,000 | 1,637,600 |
| Republic of Paraguay: | | | |
| 2.739% 1/29/33 (b) | | 1,045,000 | 880,413 |
| 4.95% 4/28/31 (b) | | 1,525,000 | 1,506,891 |
| 5.4% 3/30/50 (b) | | 930,000 | 851,843 |
| 6% 2/9/36 (b) | | 560,000 | 584,153 |
| Republic of Senegal 6.25% 5/23/33 (b) | | 1,085,000 | 941,577 |
| Republic of Serbia: | | | |
| 2.125% 12/1/30 (b) | | 2,910,000 | 2,397,113 |
| 6% 6/12/34 (b) | | 1,215,000 | 1,230,643 |
| 6.5% 9/26/33 (b) | | 1,650,000 | 1,721,363 |
| Republic of Uzbekistan: | | | |
| 3.7% 11/25/30 (b) | | 725,000 | 616,703 |
| 3.9% 10/19/31 (b) | | 495,000 | 418,584 |
| Republic of Zambia: | | | |
| 0.5% 12/31/53 (b) | | 172,927 | 85,707 |
| 5.75% 6/30/33 (b) | | 184,200 | 161,002 |
| Romanian Republic: | | | |
| 3% 2/27/27 (b) | | 1,076,000 | 1,020,048 |
| 3% 2/14/31 (b) | | 2,911,000 | 2,502,790 |
| 3.625% 3/27/32 (b) | | 1,206,000 | 1,059,773 |
| 4% 2/14/51 (b) | | 1,665,000 | 1,189,043 |
| 6.625% 2/17/28 (b) | | 610,000 | 634,095 |
| 7.125% 1/17/33 (b) | | 350,000 | 378,766 |
| Rwanda Republic 5.5% 8/9/31 (b) | | 1,800,000 | 1,446,188 |
| South African Republic: | | | |
| 4.85% 9/27/27 | | 1,010,000 | 996,648 |
| 4.85% 9/30/29 | | 620,000 | 591,654 |
| 5% 10/12/46 | | 1,415,000 | 1,063,769 |
| 5.65% 9/27/47 | | 760,000 | 613,153 |
| 5.75% 9/30/49 | | 2,045,000 | 1,646,225 |
| 5.875% 4/20/32 | | 1,415,000 | 1,376,130 |
| State of Qatar: | | | |
| 4.4% 4/16/50 (b) | | 3,580,000 | 3,293,600 |
| 4.625% 6/2/46 (b) | | 3,535,000 | 3,395,809 |
| 4.817% 3/14/49 (b) | | 3,480,000 | 3,420,188 |
| 5.103% 4/23/48 (b) | | 3,255,000 | 3,316,031 |
| 9.75% 6/15/30 (b) | | 722,000 | 930,252 |
| Sultanate of Oman: | | | |
| 5.625% 1/17/28 (b) | | 4,775,000 | 4,874,977 |
| 6% 8/1/29 (b) | | 1,185,000 | 1,233,585 |
| 6.25% 1/25/31 (b) | | 895,000 | 951,197 |
| 6.5% 3/8/47 (b) | | 325,000 | 343,281 |
| 6.75% 1/17/48 (b) | | 4,039,000 | 4,381,053 |
| 7% 1/25/51 (b) | | 185,000 | 206,680 |
| Turkish Republic: | | | |
| 4.25% 4/14/26 | | 2,845,000 | 2,797,880 |
| 4.75% 1/26/26 | | 2,780,000 | 2,755,675 |
| 4.875% 10/9/26 | | 3,940,000 | 3,891,981 |
| 4.875% 4/16/43 | | 2,105,000 | 1,544,544 |
| 5.125% 2/17/28 | | 2,945,000 | 2,874,136 |
| 5.25% 3/13/30 | | 1,055,000 | 999,138 |
| 5.75% 5/11/47 | | 3,093,000 | 2,443,470 |
| 6% 3/25/27 | | 440,000 | 443,163 |
| 6% 1/14/41 | | 3,615,000 | 3,110,030 |
| 6.625% 2/17/45 | | 1,020,000 | 904,613 |
| 7.125% 7/17/32 | | 880,000 | 886,600 |
| 7.625% 5/15/34 | | 990,000 | 1,029,600 |
| 9.125% 7/13/30 | | 1,120,000 | 1,250,200 |
| 9.375% 3/14/29 | | 2,305,000 | 2,572,956 |
| 9.375% 1/19/33 | | 3,315,000 | 3,799,819 |
| 9.875% 1/15/28 | | 3,115,000 | 3,469,331 |
| Ukraine Government: | | | |
| 0% 2/1/30 (b)(r) | | 424,979 | 179,554 |
| 0% 2/1/34 (b)(r) | | 1,588,089 | 488,337 |
| 0% 2/1/35 (b)(r) | | 1,342,050 | 536,820 |
| 0% 2/1/36 (b)(r) | | 1,118,373 | 442,876 |
| 0% 8/1/41 (b)(e) | | 975,000 | 672,750 |
| 1.75% 2/1/29 (b)(g) | | 2,910,680 | 1,731,855 |
| 1.75% 2/1/34 (b)(g) | | 2,514,930 | 1,100,282 |
| 1.75% 2/1/35 (b)(g) | | 1,408,520 | 605,664 |
| 1.75% 2/1/36 (b)(g) | | 945,870 | 401,995 |
| United Mexican States: | | | |
| 2.659% 5/24/31 | | 1,235,000 | 1,048,978 |
| 3.25% 4/16/30 | | 2,460,000 | 2,232,450 |
| 3.5% 2/12/34 | | 2,315,000 | 1,950,388 |
| 3.75% 1/11/28 | | 2,265,000 | 2,192,095 |
| 3.75% 4/19/71 | | 3,325,000 | 2,091,633 |
| 3.771% 5/24/61 | | 800,000 | 514,750 |
| 4.5% 4/22/29 | | 905,000 | 886,339 |
| 4.875% 5/19/33 | | 895,000 | 849,131 |
| 5.75% 10/12/2110 | | 2,265,000 | 1,939,406 |
| 6% 5/7/36 | | 2,400,000 | 2,422,500 |
| 6.05% 1/11/40 | | 1,810,000 | 1,812,263 |
| 6.338% 5/4/53 | | 1,260,000 | 1,237,556 |
| 6.35% 2/9/35 | | 1,240,000 | 1,288,825 |
| Uruguay Republic: | | | |
| 5.1% 6/18/50 | | 2,260,000 | 2,243,050 |
| 5.75% 10/28/34 | | 1,080,000 | 1,169,775 |
| Venezuelan Republic: | | | |
| 9.25% (d) | | 10,096,000 | 1,607,788 |
| 11.95% (Reg. S) (d) | | 1,641,700 | 256,105 |
| 12.75% (d) | | 450,400 | 72,064 |
| TOTAL FOREIGN GOVERNMENT AND GOVERNMENT AGENCY OBLIGATIONS (Cost $518,067,182) | | | 495,707,571 |
| | | | |
| Supranational Obligations - 0.1% |
| | | Principal Amount (a) | Value ($) |
| European Investment Bank: | | | |
| 0% 6/17/27 | EUR | 5,300,000 | 5,471,248 |
| 3% 11/15/28 (Reg. S) | EUR | 20,700,000 | 23,324,308 |
| TOTAL SUPRANATIONAL OBLIGATIONS (Cost $27,708,937) | | | 28,795,556 |
| | | | |
| Common Stocks - 0.1% |
| | | Shares | Value ($) |
| COMMUNICATION SERVICES - 0.0% | | | |
| Entertainment - 0.0% | | | |
| New Cineworld Ltd. (h)(s) | | 137,267 | 2,264,906 |
| Wireless Telecommunication Services - 0.0% | | | |
| Digicel Group Ltd. (h) | | 16,305 | 52,013 |
TOTAL COMMUNICATION SERVICES | | | 2,316,919 |
| CONSUMER DISCRETIONARY - 0.0% | | | |
| Automobile Components - 0.0% | | | |
| Aptiv PLC (s) | | 22,300 | 1,595,119 |
| Hotels, Restaurants & Leisure - 0.0% | | | |
| Old Claimco LLC (h)(s) | | 65,301 | 857,402 |
| Specialty Retail - 0.0% | | | |
| JOANN, Inc. (h) | | 945,558 | 2,184,239 |
TOTAL CONSUMER DISCRETIONARY | | | 4,636,760 |
| ENERGY - 0.1% | | | |
| Oil, Gas & Consumable Fuels - 0.1% | | | |
| California Resources Corp. | | 111,144 | 5,831,726 |
| California Resources Corp. warrants 10/27/24 (s) | | 6,440 | 109,802 |
| Chesapeake Energy Corp. | | 91,908 | 6,846,227 |
| Chesapeake Energy Corp. (t) | | 619 | 46,109 |
| EP Energy Corp. (h)(s) | | 6,556 | 9,113 |
| Exxon Mobil Corp. | | 22,714 | 2,678,889 |
| Mesquite Energy, Inc. (h)(s) | | 113,725 | 9,551,773 |
| | | | 25,073,639 |
| FINANCIALS - 0.0% | | | |
| Financial Services - 0.0% | | | |
| ACNR Holdings, Inc. (h) | | 39,857 | 3,466,762 |
| Carnelian Point Holdings LP warrants (h)(s) | | 1,766 | 5,157 |
| Lime Tree Bay Ltd. (h)(s) | | 809 | 57,196 |
| | | | 3,529,115 |
| HEALTH CARE - 0.0% | | | |
| Health Care Providers & Services - 0.0% | | | |
| Cano Health, Inc. (h) | | 196,812 | 2,182,645 |
| Cano Health, Inc. warrants (h)(s) | | 10,520 | 38,293 |
| Centene Corp. (s) | | 22,300 | 1,757,909 |
| | | | 3,978,847 |
| INDUSTRIALS - 0.0% | | | |
| Machinery - 0.0% | | | |
| TNT Crane & Rigging LLC (h)(s) | | 83,132 | 130,517 |
| TNT Crane & Rigging LLC warrants 10/31/25 (h)(s) | | 3,648 | 0 |
| | | | 130,517 |
| INFORMATION TECHNOLOGY - 0.0% | | | |
| Electronic Equipment, Instruments & Components - 0.0% | | | |
| Coherent Corp. (s) | | 28,000 | 2,182,600 |
| IT Services - 0.0% | | | |
| GTT Communications, Inc. (h)(s) | | 80,353 | 3,030,112 |
TOTAL INFORMATION TECHNOLOGY | | | 5,212,712 |
| TOTAL COMMON STOCKS (Cost $26,161,258) | | | 44,878,509 |
| | | | |
| Preferred Stocks - 0.0% |
| | | Shares | Value ($) |
| Convertible Preferred Stocks - 0.0% | | | |
| REAL ESTATE - 0.0% | | | |
| Equity Real Estate Investment Trusts (REITs) - 0.0% | | | |
| RLJ Lodging Trust Series A, 1.95% | | 20,725 | 536,674 |
| Nonconvertible Preferred Stocks - 0.0% | | | |
| FINANCIALS - 0.0% | | | |
| Mortgage Real Estate Investment Trusts - 0.0% | | | |
| AGNC Investment Corp. Series E, 6.50% | | 66,700 | 1,664,165 |
| Arbor Realty Trust, Inc. Series F, 6.25% (e) | | 40,700 | 761,497 |
| Dynex Capital, Inc. Series C 6.90% | | 20,200 | 502,374 |
| Franklin BSP Realty Trust, Inc. 7.50% | | 34,000 | 748,000 |
| MFA Financial, Inc. Series B, 7.50% | | 24,975 | 555,444 |
| | | | 4,231,480 |
| REAL ESTATE - 0.0% | | | |
| Equity Real Estate Investment Trusts (REITs) - 0.0% | | | |
| Cedar Realty Trust, Inc.: | | | |
| 7.25% | | 1,166 | 16,954 |
| Series C, 6.50% | | 26,075 | 359,835 |
| DiamondRock Hospitality Co. 8.25% | | 12,600 | 319,410 |
| National Storage Affiliates Trust Series A, 6.00% | | 12,600 | 288,288 |
| Realty Income Corp. 6.00% | | 18,100 | 457,387 |
| Rexford Industrial Realty, Inc. Series B, 5.875% | | 30,100 | 690,193 |
| | | | 2,132,067 |
| Real Estate Management & Development - 0.0% | | | |
| Digitalbridge Group, Inc.: | | | |
| Series H, 7.125% | | 22,855 | 546,235 |
| Series I, 7.15% | | 30,500 | 733,116 |
| | | | 1,279,351 |
TOTAL REAL ESTATE | | | 3,411,418 |
| | | | |
| TOTAL NONCONVERTIBLE PREFERRED STOCKS | | | 7,642,898 |
| TOTAL PREFERRED STOCKS (Cost $8,622,502) | | | 8,179,572 |
| | | | |
| Bank Loan Obligations - 5.0% |
| | | Principal Amount (a) | Value ($) |
| COMMUNICATION SERVICES - 0.4% | | | |
| Diversified Telecommunication Services - 0.1% | | | |
| Altice France SA Tranche B14 1LN, term loan CME Term SOFR 3 Month Index + 5.500% 10.8014% 8/15/28 (e)(f)(u) | | 18,490,880 | 14,014,608 |
| Aventiv Technologies LLC: | | | |
| 1LN, term loan: | | | |
| CME Term SOFR 3 Month Index + 5.090% 10.6862% 7/31/25 (e)(f)(u) | | 6,336,236 | 4,777,522 |
| CME Term SOFR 3 Month Index + 7.500% 13.0962% 7/31/25 (e)(f)(u) | | 165,848 | 166,262 |
| Tranche 2LN, term loan CME Term SOFR 3 Month Index + 8.650% 14.6462% 11/1/25 (e)(f)(u) | | 3,805,620 | 520,114 |
| Tranche FLSO 1LN, term loan CME Term SOFR 1 Month Index + 7.500% 13.0962% 7/31/25 (e)(f)(h)(u) | | 378,725 | 378,725 |
| Connect U.S. Finco LLC Tranche B 1LN, term loan: | | | |
| CME Term SOFR 1 Month Index + 3.500% 8.7467% 12/12/26 (e)(f)(u) | | 249,352 | 249,457 |
| CME Term SOFR 1 Month Index + 4.500% 9.7467% 9/13/29 (e)(f)(u) | | 2,240,890 | 2,176,465 |
| Frontier Communications Holdings LLC Tranche B 1LN, term loan CME Term SOFR 6 Month Index + 3.500% 8.763% 7/1/31 (e)(f)(u) | | 6,200,000 | 6,200,000 |
| Lorca Co.-Borrower LLC Tranche B 1LN, term loan CME Term SOFR 1 Month Index + 3.500% 8.8346% 4/17/31 (e)(f)(u) | | 1,261,838 | 1,264,992 |
| Patagonia Holdco LLC Tranche B 1LN, term loan CME Term SOFR 3 Month Index + 5.750% 10.8542% 8/1/29 (e)(f)(u) | | 2,137,780 | 1,985,014 |
| Windstream Services LLC Tranche B 1LN, term loan CME Term SOFR 1 Month Index + 6.250% 11.5967% 9/21/27 (e)(f)(u) | | 4,310,247 | 4,334,513 |
| Zayo Group Holdings, Inc. 1LN, term loan: | | | |
| CME Term SOFR 1 Month Index + 3.000% 8.3612% 3/9/27 (e)(f)(u) | | 13,769,224 | 12,687,789 |
| CME Term SOFR 1 Month Index + 4.320% 9.4967% 3/9/27 (e)(f)(u) | | 1,050,813 | 974,187 |
| | | | 49,729,648 |
| Entertainment - 0.1% | | | |
| Allen Media LLC Tranche B 1LN, term loan CME Term SOFR 3 Month Index + 5.500% 10.9846% 2/10/27 (e)(f)(u) | | 8,072,137 | 5,317,520 |
| AP Core Holdings II LLC: | | | |
| Tranche B1 1LN, term loan CME Term SOFR 1 Month Index + 5.500% 10.8612% 9/1/27 (e)(f)(u) | | 2,187,000 | 1,918,305 |
| Tranche B2 1LN, term loan CME Term SOFR 1 Month Index + 5.500% 10.8612% 9/1/27 (e)(f)(u) | | 4,085,000 | 3,542,471 |
| Crown Finance U.S., Inc. 1LN, term loan CME Term SOFR 1 Month Index + 8.500% 13.8612% 7/31/28 (e)(f)(u) | | 658,196 | 668,069 |
| ECL Entertainment LLC Tranche B 1LN, term loan CME Term SOFR 1 Month Index + 4.000% 9.2467% 8/30/30 (e)(f)(u) | | 1,388,025 | 1,391,495 |
| Sweetwater Borrower LLC Tranche B 1LN, term loan CME Term SOFR 1 Month Index + 4.250% 9.6112% 8/5/28 (e)(f)(u) | | 2,970,687 | 2,970,687 |
| | | | 15,808,547 |
| Interactive Media & Services - 0.0% | | | |
| TripAdvisor, Inc. Tranche B 1LN, term loan CME Term SOFR 1 Month Index + 2.750% 7.9967% 7/8/31 (e)(f)(u) | | 1,275,000 | 1,272,348 |
| Media - 0.2% | | | |
| Advantage Sales & Marketing, Inc. Tranche B 1LN, term loan CME Term SOFR 3 Month Index + 4.250% 9.8325% 10/28/27 (e)(f)(u) | | 3,405,446 | 3,323,613 |
| Altice Financing SA Tranche B 1LN, term loan CME Term SOFR 3 Month Index + 5.000% 10.3014% 10/31/27 (e)(f)(u) | | 1,691,733 | 1,505,642 |
| Century DE Buyer LLC 1LN, term loan CME Term SOFR 3 Month Index + 4.000% 9.2554% 10/30/30 (e)(f)(u) | | 2,719,185 | 2,724,297 |
| Charter Communication Operating LLC Tranche B2 1LN, term loan CME Term SOFR 3 Month Index + 1.750% 7.0816% 2/1/27 (e)(f)(u) | | 15,363,340 | 15,348,438 |
| Coral-U.S. Co.-Borrower LLC: | | | |
| Tranche B, term loan CME Term SOFR 1 Month Index + 2.250% 7.7014% 1/31/28 (e)(f)(u) | | 6,532,000 | 6,447,084 |
| Tranche B6 1LN, term loan CME Term SOFR 1 Month Index + 3.000% 8.4514% 10/15/29 (e)(f)(u) | | 1,415,000 | 1,404,826 |
| CSC Holdings LLC: | | | |
| Tranche B 5LN, term loan CME Term SOFR 1 Month Index + 2.500% 7.9514% 4/15/27 (e)(f)(u) | | 1,169,040 | 982,578 |
| Tranche B6 LN, term loan CME Term SOFR 1 Month Index + 4.500% 9.8369% 1/18/28 (e)(f)(u) | | 7,783,507 | 7,413,791 |
| Diamond Sports Group LLC: | | | |
| 1LN, term loan CME Term SOFR 1 Month Index + 8.000% 15.4423% 5/25/26 (e)(f)(u) | | 2,018,970 | 1,838,696 |
| 2LN, term loan CME Term SOFR 1 Month Index + 3.250% 0% (d)(f)(u) | | 11,143,754 | 139,297 |
| term loan 10% 8/2/27 (u) | | 2,247,241 | 2,865,233 |
| Dotdash Meredith, Inc. Tranche B 1LN, term loan CME Term SOFR 1 Month Index + 4.000% 9.3006% 12/1/28 (e)(f)(u) | | 7,584,171 | 7,574,691 |
| LCPR Loan Financing LLC 1LN, term loan CME Term SOFR 1 Month Index + 3.750% 9.2014% 9/25/28 (e)(f)(u) | | 960,000 | 881,280 |
| Nexstar Media, Inc. Tranche B, term loan CME Term SOFR 1 Month Index + 2.500% 7.8612% 9/19/26 (e)(f)(u) | | 3,717,523 | 3,720,609 |
| Planet U.S. Buyer LLC Tranche B 1LN, term loan CME Term SOFR 3 Month Index + 3.500% 8.6042% 2/10/31 (e)(f)(u) | | 2,750,000 | 2,765,125 |
| Univision Communications, Inc.: | | | |
| 1LN, term loan CME Term SOFR 3 Month Index + 4.250% 9.5846% 6/24/29 (e)(f)(u) | | 2,845,500 | 2,808,167 |
| Tranche B 1LN, term loan: | | | |
| CME Term SOFR 1 Month Index + 3.250% 8.6112% 3/24/26 (e)(f)(u) | | 1,674,087 | 1,672,212 |
| CME Term SOFR 1 Month Index + 3.250% 8.6112% 1/31/29 (e)(f)(u) | | 4,727,407 | 4,579,675 |
| CME Term SOFR 1 Month Index + 3.500% 8.8612% 1/31/29 (e)(f)(u) | | 1,660,000 | 1,608,640 |
| Virgin Media Bristol LLC: | | | |
| Tranche N, term loan CME Term SOFR 1 Month Index + 2.500% 7.9514% 1/31/28 (e)(f)(u) | | 3,841,000 | 3,704,952 |
| Tranche Y 1LN, term loan CME Term SOFR 6 Month Index + 3.250% 8.6562% 3/6/31 (e)(f)(u) | | 4,580,000 | 4,384,068 |
| | | | 77,692,914 |
| Wireless Telecommunication Services - 0.0% | | | |
| Crown Subsea Communications Holding, Inc. Tranche B 1LN, term loan CME Term SOFR 1 Month Index + 4.000% 9.2521% 1/30/31 (e)(f)(u) | | 6,270,000 | 6,306,554 |
| SBA Senior Finance II, LLC Tranche B 1LN, term loan CME Term SOFR 1 Month Index + 2.000% 7.25% 1/27/31 (e)(f)(u) | | 904,979 | 905,865 |
| | | | 7,212,419 |
TOTAL COMMUNICATION SERVICES | | | 151,715,876 |
| CONSUMER DISCRETIONARY - 1.1% | | | |
| Automobile Components - 0.1% | | | |
| American Trailer World Corp. Tranche B 1LN, term loan CME Term SOFR 1 Month Index + 3.750% 9.0967% 3/5/28 (e)(f)(u) | | 3,710,623 | 3,415,629 |
| Clarios Global LP Tranche B 1LN, term loan CME Term SOFR 1 Month Index + 2.500% 7.7467% 5/6/30 (e)(f)(u) | | 4,673,288 | 4,677,166 |
| Hertz Corp. Tranche B 1LN, term loan CME Term SOFR 3 Month Index + 3.750% 9.0975% 6/30/28 (e)(f)(u) | | 2,094,475 | 1,887,269 |
| Novae LLC 1LN, term loan CME Term SOFR 3 Month Index + 5.000% 10.4975% 12/22/28 (e)(f)(u) | | 1,751,561 | 1,743,906 |
| Power Stop LLC 1LN, term loan CME Term SOFR 3 Month Index + 4.750% 9.9072% 1/26/29 (e)(f)(u) | | 3,764,566 | 3,613,983 |
| | | | 15,337,953 |
| Automobiles - 0.0% | | | |
| Bombardier Recreational Products, Inc.: | | | |
| Tranche B3 1LN, term loan CME Term SOFR 1 Month Index + 2.750% 7.9967% 12/13/29 (e)(f)(u) | | 2,957,551 | 2,958,083 |
| Tranche B4 1LN, term loan CME Term SOFR 1 Month Index + 2.750% 7.9967% 1/22/31 (e)(f)(u) | | 1,268,884 | 1,269,201 |
| CWGS Group LLC Tranche B 1LN, term loan CME Term SOFR 1 Month Index + 2.500% 7.8905% 6/3/28 (e)(f)(u) | | 6,536,759 | 6,220,838 |
| HarbourVest Partners LLC Tranche B 1LN, term loan CME Term SOFR 3 Month Index + 2.250% 7.4911% 4/22/30 (e)(f)(u) | | 3,684,906 | 3,680,299 |
| | | | 14,128,421 |
| Broadline Retail - 0.2% | | | |
| CMG Media Corp. Tranche B 1LN, term loan CME Term SOFR 3 Month Index + 3.500% 8.9346% 12/17/26 (e)(f)(u) | | 9,033,899 | 7,779,000 |
| CNT Holdings I Corp. Tranche B 1LN, term loan CME Term SOFR 1 Month Index + 3.500% 8.7521% 11/8/27 (e)(f)(u) | | 4,370,806 | 4,379,591 |
| Great Outdoors Group LLC Tranche B 1LN, term loan CME Term SOFR 1 Month Index + 3.750% 9.1112% 3/5/28 (e)(f)(u) | | 60,543,543 | 60,518,114 |
| | | | 72,676,705 |
| Distributors - 0.1% | | | |
| Aip Rd Buyer Corp. Tranche B 1LN, term loan CME Term SOFR 1 Month Index + 5.000% 9.7467% 12/26/28 (e)(f)(u) | | 3,999,825 | 4,016,505 |
| BCPE Empire Holdings, Inc. 1LN, term loan CME Term SOFR 1 Month Index + 4.000% 9.2467% 12/25/28 (e)(f)(u) | | 7,162,070 | 7,166,583 |
| Gloves Buyer, Inc. Tranche B 1LN, term loan CME Term SOFR 1 Month Index + 4.000% 9.3612% 1/6/28 (e)(f)(u) | | 1,219,044 | 1,216,764 |
| Windsor Holdings III, LLC Tranche B 1LN, term loan CME Term SOFR 1 Month Index + 4.000% 9.3115% 8/1/30 (e)(f)(u) | | 3,860,874 | 3,871,723 |
| | | | 16,271,575 |
| Diversified Consumer Services - 0.1% | | | |
| AI Aqua Merger Sub, Inc. Tranche B 1LN, term loan CME Term SOFR 1 Month Index + 4.000% 8.8426% 7/30/28 (e)(f)(u) | | 9,306,541 | 9,315,290 |
| Fugue Finance LLC Tranche B 1LN, term loan: | | | |
| CME Term SOFR 3 Month Index + 3.750% 8.8072% 2/26/31 (e)(f)(u) | | 389,025 | 391,359 |
| CME Term SOFR 3 Month Index + 4.000% 9.0572% 1/26/28 (e)(f)(u) | | 2,157,674 | 2,167,556 |
| KUEHG Corp. Tranche B 1LN, term loan CME Term SOFR 3 Month Index + 4.500% 9.8346% 6/12/30 (e)(f)(u) | | 12,019,326 | 12,066,082 |
| Learning Care Group (U.S.) No 2, Inc. Tranche B 1LN, term loan CME Term SOFR 3 Month Index + 4.000% 9.2479% 8/11/28 (e)(f)(u) | | 2,233,153 | 2,240,411 |
| Sotheby's Tranche B 1LN, term loan CME Term SOFR 3 Month Index + 4.500% 10.063% 1/15/27 (e)(f)(u) | | 2,619,529 | 2,557,682 |
| Spin Holdco, Inc. Tranche B 1LN, term loan CME Term SOFR 3 Month Index + 4.000% 9.6001% 3/4/28 (e)(f)(u) | | 25,876,625 | 21,904,563 |
| TKC Holdings, Inc. 1LN, term loan 13.5% 2/14/27 (e)(u) | | 1,361,997 | 1,127,052 |
| | | | 51,769,995 |
| Hotels, Restaurants & Leisure - 0.5% | | | |
| 1011778 BC ULC Tranche B5 1LN, term loan CME Term SOFR 1 Month Index + 1.750% 6.9967% 9/23/30 (e)(f)(u) | | 4,468,450 | 4,430,066 |
| 19Th Holdings Golf LLC Tranche B 1LN, term loan CME Term SOFR 1 Month Index + 3.250% 8.7003% 2/7/29 (e)(f)(u) | | 4,139,588 | 4,049,883 |
| Alterra Mountain Co. Tranche B 1LN, term loan CME Term SOFR 1 Month Index + 3.250% 8.4967% 8/17/28 (e)(f)(u) | | 4,265,412 | 4,268,611 |
| Aramark Services, Inc.: | | | |
| Tranche B-4 1LN, term loan CME Term SOFR 1 Month Index + 1.750% 7.1112% 1/15/27 (e)(f)(u) | | 2,289,288 | 2,289,288 |
| Tranche B8 1LN, term loan CME Term SOFR 1 Month Index + 2.000% 7.2467% 6/24/30 (e)(f)(u) | | 2,228,546 | 2,235,232 |
| Arcis Golf LLC Tranche B 1LN, term loan CME Term SOFR 1 Month Index + 3.750% 9.1112% 11/24/28 (e)(f)(u) | | 2,398,580 | 2,403,569 |
| BRE/Everbright M6 Borrower LLC Tranche B 1LN, term loan CME Term SOFR 1 Month Index + 5.000% 10.4115% 9/9/26 (e)(f)(u) | | 1,092,516 | 1,092,516 |
| Bulldog Purchaser, Inc.: | | | |
| Tranche B 1LN, term loan CME Term SOFR 3 Month Index + 4.250% 9.5846% 6/30/31 (e)(f)(u) | | 1,465,000 | 1,467,930 |
| Tranche B 2LN, term loan CME Term SOFR 3 Month Index + 6.750% 12.0846% 6/14/32 (e)(f)(u) | | 430,000 | 426,418 |
| Caesars Entertainment, Inc.: | | | |
| Tranche B 1LN, term loan CME Term SOFR 1 Month Index + 2.750% 7.9967% 1/26/30 (e)(f)(u) | | 16,581,250 | 16,573,457 |
| Tranche B1 1LN, term loan CME Term SOFR 3 Month Index + 2.750% 7.9967% 2/6/31 (e)(f)(u) | | 4,847,850 | 4,839,754 |
| Carnival Corp. Tranche B 1LN, term loan: | | | |
| CME Term SOFR 1 Month Index + 2.750% 7.9967% 8/9/27 (e)(f)(u) | | 1,974,388 | 1,980,568 |
| CME Term SOFR 1 Month Index + 2.750% 7.9967% 10/18/28 (e)(f)(u) | | 4,453,823 | 4,456,985 |
| City Football Group Ltd. Tranche B 1LN, term loan CME Term SOFR 1 Month Index + 3.500% 8.3924% 7/21/30 (e)(f)(u) | | 18,540,365 | 18,447,664 |
| ClubCorp Holdings, Inc. Tranche B 1LN, term loan CME Term SOFR 3 Month Index + 5.000% 10.5962% 9/18/26 (e)(f)(u) | | 8,557,619 | 8,566,176 |
| Dave & Buster's, Inc. Tranche B 1LN, term loan CME Term SOFR 1 Month Index + 3.250% 8.5% 6/29/29 (e)(f)(u) | | 2,973,059 | 2,967,499 |
| Delta 2 SARL Tranche B 1LN, term loan CME Term SOFR 1 Month Index + 3.000% 7.5846% 1/15/30 (e)(f)(u) | | 6,040,000 | 6,062,650 |
| Entain Holdings Gibraltar Ltd. Tranche B4 1LN, term loan CME Term SOFR 6 Month Index + 2.250% 7.864% 3/16/27 (e)(f)(u) | | 1,843,000 | 1,847,220 |
| Entain PLC Tranche B 1LN, term loan CME Term SOFR 6 Month Index + 2.750% 8.014% 10/31/29 (e)(f)(u) | | 3,097,972 | 3,101,845 |
| Fertitta Entertainment LLC NV Tranche B 1LN, term loan CME Term SOFR 1 Month Index + 4.000% 9.0869% 1/27/29 (e)(f)(u) | | 28,407,882 | 28,341,408 |
| Fitness International LLC Tranche B 1LN, term loan CME Term SOFR 3 Month Index + 5.250% 10.5053% 2/12/29 (e)(f)(u) | | 1,745,625 | 1,739,079 |
| Flutter Financing B.V. Tranche B 1LN, term loan CME Term SOFR 3 Month Index + 2.250% 7.5846% 11/25/30 (e)(f)(u) | | 6,776,945 | 6,775,725 |
| Flynn Restaurant Group LP Tranche B 1LN, term loan CME Term SOFR 1 Month Index + 4.250% 9.6112% 12/1/28 (e)(f)(u) | | 1,484,072 | 1,485,556 |
| Four Seasons Hotels Ltd. Tranche B 1LN, term loan CME Term SOFR 1 Month Index + 2.000% 7.2467% 11/30/29 (e)(f)(u) | | 5,153,645 | 5,166,529 |
| Golden Entertainment, Inc. Tranche B 1LN, term loan CME Term SOFR 1 Month Index + 2.250% 7.5016% 5/26/30 (e)(f)(u) | | 4,410,450 | 4,404,937 |
| Herschend Entertainment Co. LLC Tranche B 1LN, term loan CME Term SOFR 1 Month Index + 3.750% 8.2467% 8/27/28 (e)(f)(u) | | 1,337,188 | 1,338,297 |
| Hilton Grand Vacations Borrower LLC Tranche B 1LN, term loan: | | | |
| CME Term SOFR 1 Month Index + 2.750% 7.4967% 1/17/31 (e)(f)(u) | | 2,608,463 | 2,596,829 |
| CME Term SOFR 1 Month Index + 3.000% 7.7467% 8/2/28 (e)(f)(u) | | 13,676,320 | 13,657,036 |
| Hilton Worldwide Finance LLC Tranche B 1LN, term loan CME Term SOFR 1 Month Index + 1.750% 7.028% 11/8/30 (e)(f)(u) | | 2,008,852 | 2,011,142 |
| J&J Ventures Gaming LLC Tranche B 1LN, term loan CME Term SOFR 1 Month Index + 4.250% 9.6112% 4/26/28 (e)(f)(u) | | 1,692,473 | 1,686,837 |
| Life Time, Inc. Tranche B 1LN, term loan CME Term SOFR 3 Month Index + 4.000% 9.5137% 1/15/26 (e)(f)(u) | | 1,029,032 | 1,031,389 |
| Light & Wonder International, Inc. Tranche B 1LN, term loan CME Term SOFR 1 Month Index + 2.250% 7.5916% 4/16/29 (e)(f)(u) | | 3,351,663 | 3,349,987 |
| Marriott Ownership Resorts, Inc. Tranche B 1LN, term loan CME Term SOFR 1 Month Index + 2.250% 7.4967% 4/1/31 (e)(f)(u) | | 3,220,000 | 3,209,954 |
| Ontario Gaming GTA LP Tranche B 1LN, term loan CME Term SOFR 3 Month Index + 4.250% 9.5846% 8/1/30 (e)(f)(u) | | 3,014,850 | 3,013,765 |
| Pacific Bells LLC Tranche B 1LN, term loan CME Term SOFR 3 Month Index + 4.500% 10.0962% 11/10/28 (e)(f)(u) | | 1,477,164 | 1,474,860 |
| PCI Gaming Authority 1LN, term loan CME Term SOFR 1 Month Index + 2.000% 7.3416% 7/18/31 (e)(f)(u) | | 2,255,817 | 2,240,906 |
| PFC Acquisition Corp. Tranche B 1LN, term loan CME Term SOFR 3 Month Index + 6.250% 11.652% 3/1/26 (e)(f)(u) | | 892,775 | 879,383 |
| Restaurant Technologies, Inc. Tranche B 1LN, term loan CME Term SOFR 3 Month Index + 4.250% 9.5846% 4/1/29 (e)(f)(u) | | 3,964,588 | 3,747,170 |
| SeaWorld Parks & Entertainment, Inc. Tranche B 1LN, term loan CME Term SOFR 1 Month Index + 2.500% 7.7467% 8/25/28 (e)(f)(u) | | 412,925 | 412,281 |
| Station Casinos LLC Tranche B 1LN, term loan CME Term SOFR 1 Month Index + 2.250% 7.4967% 3/14/31 (e)(f)(u) | | 6,528,638 | 6,523,610 |
| Tait LLC 1LN, term loan CME Term SOFR 1 Month Index + 4.500% 8/14/31 (f)(u)(v) | | 1,315,000 | 1,308,425 |
| Travelport Finance Luxembourg SARL 1LN, term loan CME Term SOFR 3 Month Index + 7.000% 13.5932% 9/29/28 (e)(f)(u) | | 3,341,264 | 2,874,990 |
| United PF Holdings LLC: | | | |
| 1LN, term loan CME Term SOFR 3 Month Index + 4.000% 9.5137% 12/30/26 (e)(f)(u) | | 11,604,314 | 10,548,321 |
| 2LN, term loan 3 month U.S. LIBOR + 8.500% 14.0137% 12/30/27 (e)(f)(u) | | 500,000 | 365,000 |
| Tranche B 1LN, term loan CME Term SOFR 3 Month Index + 8.500% 14.0137% 12/30/26 (e)(f)(u) | | 745,938 | 716,100 |
| Whatabrands LLC Tranche B 1LN, term loan CME Term SOFR 1 Month Index + 2.750% 7.9967% 8/3/28 (e)(f)(u) | | 6,796,142 | 6,798,725 |
| | | | 209,205,572 |
| Household Durables - 0.0% | | | |
| Mattress Firm, Inc. Tranche B 1LN, term loan CME Term SOFR 3 Month Index + 4.250% 9.8462% 9/24/28 (e)(f)(u) | | 5,230,078 | 5,227,253 |
| Runner Buyer, Inc. Tranche B 1LN, term loan CME Term SOFR 3 Month Index + 5.500% 10.6717% 10/21/28 (e)(f)(u) | | 1,779,050 | 890,646 |
| Weber-Stephen Products LLC Tranche B 1LN, term loan CME Term SOFR 1 Month Index + 3.250% 8.6112% 10/30/27 (e)(f)(u) | | 2,134,029 | 1,977,092 |
| | | | 8,094,991 |
| Leisure Products - 0.0% | | | |
| Topgolf Callaway Brands Corp. Tranche B 1LN, term loan CME Term SOFR 1 Month Index + 3.000% 8.2467% 3/18/30 (e)(f)(u) | | 4,884,363 | 4,833,467 |
| Specialty Retail - 0.1% | | | |
| Academy Ltd. Tranche B 1LN, term loan CME Term SOFR 1 Month Index + 3.750% 9.065% 11/6/27 (e)(f)(u) | | 1,458,237 | 1,453,381 |
| At Home Group, Inc. Tranche B 1LN, term loan CME Term SOFR 1 Month Index + 4.250% 9.565% 7/24/28 (e)(f)(u) | | 1,750,500 | 617,051 |
| Belron Finance U.S. LLC Tranche B 1LN, term loan: | | | |
| CME Term SOFR 3 Month Index + 2.000% 7.319% 4/28/28 (e)(f)(u) | | 815,784 | 817,571 |
| CME Term SOFR 3 Month Index + 2.250% 7.6292% 4/13/29 (e)(f)(u) | | 895,950 | 899,310 |
| Empire Today LLC Tranche B 1LN, term loan CME Term SOFR 3 Month Index + 5.000% 10.5137% 4/1/28 (e)(f)(u) | | 1,455,000 | 1,050,714 |
| Harbor Freight Tools U.S.A., Inc. Tranche B 1LN, term loan CME Term SOFR 1 Month Index + 2.500% 7.6872% 6/5/31 (e)(f)(u) | | 1,405,000 | 1,384,880 |
| Johnstone Supply LLC Tranche B 1LN, term loan CME Term SOFR 1 Month Index + 3.000% 8.352% 5/16/31 (e)(f)(u) | | 2,530,000 | 2,527,470 |
| Kodiak BP LLC Tranche B2 1LN, term loan CME Term SOFR 3 Month Index + 3.750% 9.0846% 3/13/28 (e)(f)(u) | | 957,600 | 962,388 |
| LBM Acquisition LLC Tranche B 1LN, term loan CME Term SOFR 1 Month Index + 3.750% 9.1395% 6/6/31 (e)(f)(u) | | 11,670,599 | 11,313,829 |
| RVR Dealership Holdings LLC Tranche B 1LN, term loan 1 month U.S. LIBOR + 4.000% 9.0967% 2/8/28 (e)(f)(u) | | 3,265,607 | 2,913,379 |
| Staples, Inc. Tranche B 1LN, term loan CME Term SOFR 3 Month Index + 5.750% 11.0844% 9/10/29 (e)(f)(u) | | 9,533,000 | 8,675,030 |
| Tory Burch LLC Tranche B 1LN, term loan CME Term SOFR 1 Month Index + 3.500% 8.6112% 4/16/28 (e)(f)(u) | | 3,938,488 | 3,943,411 |
| Wand NewCo 3, Inc. Tranche B 1LN, term loan CME Term SOFR 1 Month Index + 3.250% 8.5967% 1/30/31 (e)(f)(u) | | 3,515,000 | 3,517,917 |
| Woof Holdings LLC Tranche B 1LN, term loan CME Term SOFR 3 Month Index + 3.750% 9.3462% 12/21/27 (e)(f)(u) | | 2,700,693 | 1,814,542 |
| | | | 41,890,873 |
| Textiles, Apparel & Luxury Goods - 0.0% | | | |
| Crocs, Inc. Tranche B 1LN, term loan CME Term SOFR 1 Month Index + 2.250% 7.5846% 2/20/29 (e)(f)(u) | | 3,310,154 | 3,319,688 |
| Fanatics Commerce Intermediate Holdco LLC Tranche B 1LN, term loan CME Term SOFR 1 Month Index + 3.250% 8.6112% 11/23/28 (e)(f)(u) | | 594,402 | 590,937 |
| Varsity Brands LLC Tranche B 1LN, term loan CME Term SOFR 1 Month Index + 4.000% 7/26/31 (f)(u)(v) | | 5,285,000 | 5,260,213 |
| | | | 9,170,838 |
TOTAL CONSUMER DISCRETIONARY | | | 443,380,390 |
| CONSUMER STAPLES - 0.2% | | | |
| Beverages - 0.1% | | | |
| Naked Juice LLC: | | | |
| 1LN, term loan CME Term SOFR 3 Month Index + 3.250% 8.6846% 1/24/29 (e)(f)(u) | | 4,521,289 | 3,903,636 |
| 2LN, term loan CME Term SOFR 3 Month Index + 6.000% 11.4346% 1/24/30 (e)(f)(u) | | 1,930,000 | 1,419,766 |
| Triton Water Holdings, Inc. Tranche B 1LN, term loan CME Term SOFR 3 Month Index + 3.250% 8.8462% 3/31/28 (e)(f)(u) | | 12,370,643 | 12,362,231 |
| | | | 17,685,633 |
| Consumer Staples Distribution & Retail - 0.0% | | | |
| 8th Avenue Food & Provisions, Inc. 2LN, term loan CME Term SOFR 1 Month Index + 7.750% 13.1112% 10/1/26 (e)(f)(u) | | 57,000 | 50,217 |
| BJ's Wholesale Club, Inc. Tranche B 1LN, term loan CME Term SOFR 1 Month Index + 2.000% 7.3416% 2/3/29 (e)(f)(u) | | 1,895,078 | 1,901,009 |
| Cardenas Merger Sub, LLC 1LN, term loan CME Term SOFR 3 Month Index + 6.750% 12.1846% 8/1/29 (e)(f)(u) | | 4,368,115 | 4,383,404 |
| JP Intermediate B LLC term loan CME Term SOFR 3 Month Index + 5.500% 11.0137% 11/20/27 (e)(f)(u) | | 3,757,762 | 263,043 |
| Northeast Grocery, Inc. Tranche B 1LN, term loan CME Term SOFR 3 Month Index + 7.500% 12.5955% 12/13/28 (e)(f)(u) | | 1,727,000 | 1,737,794 |
| Primary Products Finance LLC Tranche B 1LN, term loan CME Term SOFR 3 Month Index + 3.500% 8.9709% 4/2/29 (e)(f)(u) | | 4,421,840 | 4,423,211 |
| Upfield U.S.A. Corp. Tranche B7 1LN, term loan CME Term SOFR 1 Month Index + 4.250% 9.76% 1/3/28 (e)(f)(u) | | 3,946,410 | 3,935,833 |
| | | | 16,694,511 |
| Food Products - 0.1% | | | |
| Aspire Bakeries Holdings LLC Tranche B 1LN, term loan CME Term SOFR 1 Month Index + 4.250% 9.528% 12/23/30 (e)(f)(u) | | 967,575 | 969,394 |
| Chobani LLC Tranche B 1LN, term loan CME Term SOFR 1 Month Index + 3.500% 8.6112% 10/23/27 (e)(f)(u) | | 4,067,387 | 4,080,606 |
| Del Monte Foods Corp. Ii, Inc.: | | | |
| 1LN, term loan CME Term SOFR 1 Month Index + 8.000% 13.4426% 8/2/28 (e)(f)(u) | | 3,180,195 | 3,021,185 |
| 2LN, term loan CME Term SOFR 1 Month Index + 4.250% 9.6919% 8/2/28 (e)(f)(u) | | 6,778,280 | 4,066,968 |
| Dm Escrow Corp. 1LN, term loan CME Term SOFR 1 Month Index + 8.000% 15.5% 9/3/24 (e)(f)(u) | | 379,667 | 360,683 |
| Fiesta Purchaser, Inc. Tranche B 1LN, term loan CME Term SOFR 1 Month Index + 4.000% 9.2467% 2/12/31 (e)(f)(u) | | 3,350,000 | 3,366,750 |
| Saratoga Food Specialties LLC Tranche B 1LN, term loan CME Term SOFR 3 Month Index + 3.750% 9.0932% 3/1/29 (e)(f)(u) | | 1,180,000 | 1,182,218 |
| | | | 17,047,804 |
| Household Products - 0.0% | | | |
| Kronos Acquisition Holdings, Inc. Tranche B 1LN, term loan CME Term SOFR 3 Month Index + 4.000% 9.3143% 6/27/31 (e)(f)(u) | | 1,225,000 | 1,209,173 |
| Resideo Funding, Inc.: | | | |
| 1LN, term loan CME Term SOFR 1 Month Index + 2.000% 7.2516% 2/14/28 (e)(f)(u) | | 192,380 | 192,861 |
| Tranche B 1LN, term loan CME Term SOFR 3 Month Index + 2.000% 7.3014% 5/14/31 (e)(f)(u) | | 1,375,000 | 1,375,000 |
| | | | 2,777,034 |
| Personal Care Products - 0.0% | | | |
| Conair Holdings LLC Tranche B 1LN, term loan CME Term SOFR 1 Month Index + 3.750% 9.1112% 5/17/28 (e)(f)(u) | | 3,734,400 | 3,454,320 |
TOTAL CONSUMER STAPLES | | | 57,659,302 |
| ENERGY - 0.1% | | | |
| Energy Equipment & Services - 0.0% | | | |
| Waterbridge Midstream Operatin Tranche B 1LN, term loan CME Term SOFR 3 Month Index + 4.750% 10.0894% 6/22/29 (e)(f)(u) | | 1,960,000 | 1,947,260 |
| Oil, Gas & Consumable Fuels - 0.1% | | | |
| Apro LLC Tranche B 1LN, term loan CME Term SOFR 1 Month Index + 3.750% 9.075% 7/9/31 (e)(f)(u) | | 3,140,000 | 3,140,000 |
| BCP Renaissance Parent LLC Tranche B 1LN, term loan CME Term SOFR 3 Month Index + 3.250% 8.5975% 10/31/28 (e)(f)(u) | | 1,848,554 | 1,854,710 |
| Delek U.S. Holdings, Inc. Tranche B 1LN, term loan CME Term SOFR 1 Month Index + 3.500% 8.8467% 11/19/29 (e)(f)(u) | | 5,087,083 | 5,082,861 |
| EG America LLC Tranche BC 1LN, term loan CME Term SOFR 1 Month Index + 5.500% 11.0716% 2/7/28 (e)(f)(u) | | 12,213,340 | 12,172,669 |
| Epic Y-Grade Services,LP Tranche B 1LN, term loan CME Term SOFR 3 Month Index + 5.500% 11.0682% 6/29/29 (e)(f)(u) | | 4,075,000 | 4,072,188 |
| GIP II Blue Holding LP Tranche B 1LN, term loan CME Term SOFR 1 Month Index + 3.750% 8.9967% 9/29/28 (e)(f)(u) | | 6,384,314 | 6,431,048 |
| GIP III Stetson I LP Tranche B 1LN, term loan CME Term SOFR 1 Month Index + 4.250% 8.8437% 10/31/28 (e)(f)(u) | | 3,550,908 | 3,557,584 |
| Hamilton Projs. Acquiror LLC Tranche B 1LN, term loan CME Term SOFR 1 Month Index + 3.750% 8.9967% 5/22/31 (e)(f)(u) | | 1,270,000 | 1,279,068 |
| Mesquite Energy, Inc.: | | | |
| 1LN, term loan 3 month U.S. LIBOR + 8.000% 0% (d)(f)(h)(u) | | 2,102,309 | 0 |
| term loan 0% (d)(e)(h)(u) | | 907,000 | 0 |
| New Fortress Energy, Inc. Tranche B 1LN, term loan CME Term SOFR 3 Month Index + 5.000% 10.2521% 10/30/28 (e)(f)(u) | | 7,910,250 | 7,398,299 |
| Par Petroleum LLC Tranche B 1LN, term loan CME Term SOFR 3 Month Index + 3.750% 9.0643% 2/28/30 (e)(f)(u) | | 1,872,426 | 1,880,852 |
| Prairie ECI Acquiror LP Tranche 1LN, term loan CME Term SOFR 1 Month Index + 4.750% 9.9967% 8/1/29 (e)(f)(u) | | 1,426,425 | 1,425,241 |
| TPF II Power LLC Tranche B, term loan CME Term SOFR 1 Month Index + 5.250% 10.5937% 4/3/28 (e)(f)(u) | | 939,888 | 939,719 |
| | | | 49,234,239 |
TOTAL ENERGY | | | 51,181,499 |
| FINANCIALS - 0.7% | | | |
| Capital Markets - 0.2% | | | |
| Aretec Group, Inc. 1LN, term loan CME Term SOFR 1 Month Index + 4.000% 9.2467% 8/9/30 (e)(f)(u) | | 5,431,568 | 5,311,313 |
| AssuredPartners, Inc. Tranche B5 1LN, term loan CME Term SOFR 1 Month Index + 3.500% 8.7467% 2/14/31 (e)(f)(u) | | 7,660,800 | 7,673,287 |
| Broadstreet Partners, Inc. Tranche B4 1LN, term loan CME Term SOFR 1 Month Index + 3.250% 8.4967% 6/14/31 (e)(f)(u) | | 4,699,188 | 4,695,805 |
| Citadel Securities LP Tranche B 1LN, term loan CME Term SOFR 1 Month Index + 2.250% 7.4967% 7/29/30 (e)(f)(u) | | 8,525,347 | 8,540,266 |
| Cpi Holdco B LLC Tranche B 1LN, term loan CME Term SOFR 1 Month Index + 2.000% 7.2467% 5/19/31 (e)(f)(u) | | 3,120,000 | 3,114,415 |
| CQP Holdco LP Tranche B 1LN, term loan CME Term SOFR 1 Month Index + 2.250% 7.5846% 12/31/30 (e)(f)(u) | | 11,755,945 | 11,787,216 |
| Fleet U.S. Bidco, Inc. Tranche B 1LN, term loan CME Term SOFR 1 Month Index + 2.750% 7.5777% 2/10/31 (e)(f)(u) | | 1,887,754 | 1,887,754 |
| Focus Financial Partners LLC Tranche B7 1LN, term loan CME Term SOFR 1 Month Index + 2.750% 7.9967% 6/30/28 (e)(f)(u) | | 4,763,914 | 4,758,864 |
| GTCR Everest Borrower, LLC 1LN, term loan CME Term SOFR 1 Month Index + 3.000% 6/3/31 (f)(u)(v) | | 4,245,000 | 4,216,686 |
| Hightower Holding LLC Tranche B 1LN, term loan CME Term SOFR 1 Month Index + 3.500% 8.7477% 4/21/28 (e)(f)(u) | | 4,526,815 | 4,532,474 |
| Jane Street Group LLC Tranche B 1LN, term loan CME Term SOFR 1 Month Index + 2.500% 7.9582% 1/26/28 (e)(f)(u) | | 2,372,706 | 2,373,750 |
| Ngp Xi Midstream Holdings LLC Tranche B 1LN, term loan CME Term SOFR 1 Month Index + 4.000% 9.2846% 7/25/31 (e)(f)(u) | | 1,450,000 | 1,448,188 |
| Superannuation & Investments U.S. LLC 1LN, term loan CME Term SOFR 1 Month Index + 3.750% 9.1112% 12/1/28 (e)(f)(u) | | 1,282,125 | 1,280,522 |
| | | | 61,620,540 |
| Financial Services - 0.2% | | | |
| Agellan Portfolio 9% 8/7/25 (h)(u) | | 424,000 | 424,000 |
| Boost Newco Borrower LLC Tranche B 1LN, term loan CME Term SOFR 1 Month Index + 2.500% 7.7477% 8/1/31 (e)(f)(u) | | 15,065,000 | 15,075,696 |
| Clue Opco LLC Tranche B 1LN, term loan CME Term SOFR 3 Month Index + 4.500% 9.7521% 12/19/30 (e)(f)(u) | | 4,500,467 | 4,418,108 |
| FinCo I LLC Tranche B 1LN, term loan CME Term SOFR 3 Month Index + 3.000% 8.2554% 6/27/29 (e)(f)(u) | | 1,397,466 | 1,404,453 |
| Heubach Holding U.S.A. LLC Tranche CME, term loan CME Term SOFR 1 Month Index + 10.000% 0% 12/31/49 (d)(f)(h)(u) | | 357,500 | 143,000 |
| IVI America LLC Tranche B 1LN, term loan CME Term SOFR 3 Month Index + 4.500% 9.8346% 3/10/31 (e)(f)(u) | | 1,105,000 | 1,113,055 |
| MHP Commercial Mortgage Trust U.S. Secured Overnight Fin. Rate (SOFR) Index + 5.000% 10.3369% 1/9/25 (e)(f)(h)(u) | | 6,198,931 | 5,981,968 |
| NCR Atleos Corp. Tranche B 1LN, term loan CME Term SOFR 3 Month Index + 4.750% 10.1021% 3/27/29 (e)(f)(u) | | 4,036,545 | 4,075,215 |
| Needle Holdings LLC Tranche EXIT 1LN, term loan CME Term SOFR 3 Month Index + 9.500% 14.8437% 4/28/28 (e)(f)(h)(u) | | 1,425,306 | 1,318,408 |
| Neon Maple U.S. Debt Mergersub I Tranche B 1LN, term loan CME Term SOFR 1 Month Index + 3.000% 7/21/31 (f)(u)(v) | | 6,275,000 | 6,251,469 |
| Nexus Buyer LLC: | | | |
| 2LN, term loan CME Term SOFR 1 Month Index + 6.250% 11.5967% 11/1/29 (e)(f)(u) | | 1,555,000 | 1,546,121 |
| Tranche B 1LN, term loan CME Term SOFR 1 Month Index + 4.000% 9.3437% 7/18/31 (e)(f)(u) | | 9,408,874 | 9,316,762 |
| Priority Holdings LLC Tranche B 1LN, term loan CME Term SOFR 1 Month Index + 4.750% 9.8077% 5/16/31 (e)(f)(u) | | 960,000 | 956,400 |
| Recess Holdings, Inc. Tranche B 1LN, term loan CME Term SOFR 3 Month Index + 4.500% 9.7521% 2/14/30 (e)(f)(u) | | 2,344,125 | 2,349,610 |
| Sk Neptune Husky Finance Sarl Tranche B 1LN, term loan CME Term SOFR 3 Month Index + 5.000% 10.4338% 1/3/29 (d)(e)(f)(u) | | 1,442,974 | 18,037 |
| TransUnion LLC: | | | |
| Tranche B 1LN, term loan CME Term SOFR 1 Month Index + 2.000% 7.2467% 12/1/28 (e)(f)(u) | | 1,848,595 | 1,849,427 |
| Tranche B8 1LN, term loan CME Term SOFR 1 Month Index + 1.750% 6.9967% 6/6/31 (e)(f)(u) | | 2,839,091 | 2,839,091 |
| Walker & Dunlop, Inc. Tranche B 1LN, term loan CME Term SOFR 1 Month Index + 2.250% 7.5967% 12/16/28 (e)(f)(u) | | 814,661 | 816,698 |
| WH Borrower LLC Tranche B 1LN, term loan: | | | |
| CME Term SOFR 3 Month Index + 5.500% 10.7858% 2/9/27 (e)(f)(u) | | 6,083,827 | 6,089,546 |
| CME Term SOFR 3 Month Index + 5.500% 10.7858% 2/15/27 (e)(f)(u) | | 4,138,568 | 4,159,261 |
| | | | 70,146,325 |
| Insurance - 0.3% | | | |
| Acrisure LLC Tranche B6 1LN, term loan CME Term SOFR 3 Month Index + 3.250% 8.5936% 11/6/30 (e)(f)(u) | | 27,715,914 | 27,493,078 |
| Alliant Holdings Intermediate LLC Tranche B6 1LN, term loan CME Term SOFR 1 Month Index + 3.500% 8.8115% 11/6/30 (e)(f)(u) | | 6,656,344 | 6,674,116 |
| AmWINS Group, Inc. Tranche B 1LN, term loan CME Term SOFR 1 Month Index + 2.250% 7.6112% 2/19/28 (e)(f)(u) | | 6,272,072 | 6,279,912 |
| Amynta Agency Borrower, Inc. Tranche B 1LN, term loan CME Term SOFR 1 Month Index + 3.750% 9.0021% 2/28/28 (e)(f)(u) | | 2,615,270 | 2,616,212 |
| Asurion LLC: | | | |
| 1LN, term loan CME Term SOFR 1 Month Index + 4.000% 9.3467% 8/19/28 (e)(f)(u) | | 4,353,476 | 4,309,158 |
| Tranche B11 1LN, term loan CME Term SOFR 1 Month Index + 4.250% 9.5967% 8/19/28 (e)(f)(u) | | 6,112,378 | 6,071,975 |
| Tranche B3 2LN, term loan CME Term SOFR 1 Month Index + 5.250% 10.6112% 1/31/28 (e)(f)(u) | | 9,525,000 | 8,882,539 |
| Tranche B4 2LN, term loan CME Term SOFR 1 Month Index + 5.250% 10.6112% 1/20/29 (e)(f)(u) | | 5,814,000 | 5,361,613 |
| Tranche B8 1LN, term loan CME Term SOFR 1 Month Index + 3.250% 8.6112% 12/23/26 (e)(f)(u) | | 16,622,792 | 16,540,676 |
| Tranche B9 1LN, term loan CME Term SOFR 1 Month Index + 3.250% 8.6112% 7/31/27 (e)(f)(u) | | 3,665,311 | 3,622,170 |
| HUB International Ltd. Tranche B 1LN, term loan CME Term SOFR 3 Month Index + 3.000% 8.2554% 6/20/30 (e)(f)(u) | | 15,213,356 | 15,219,745 |
| Jones DesLauriers Insurance Management, Inc. Tranche B 1LN, term loan CME Term SOFR 1 Month Index + 3.250% 8.3969% 3/15/30 (e)(f)(u) | | 1,955,150 | 1,954,544 |
| Ryan Specialty Group LLC Tranche B 1LN, term loan CME Term SOFR 1 Month Index + 2.750% 7.9967% 9/1/27 (e)(f)(u) | | 3,616,735 | 3,628,779 |
| Truist Insurance Holdings LLC: | | | |
| 2L, term loan CME Term SOFR 3 Month Index + 4.750% 10.0846% 3/8/32 (e)(f)(u) | | 6,410,000 | 6,504,996 |
| Tranche B 1LN, term loan CME Term SOFR 3 Month Index + 3.250% 8.5846% 5/6/31 (e)(f)(u) | | 7,530,000 | 7,531,581 |
| USI, Inc. Tranche B 1LN, term loan: | | | |
| CME Term SOFR 3 Month Index + 2.750% 8.0846% 11/23/29 (e)(f)(u) | | 6,874,569 | 6,872,026 |
| CME Term SOFR 3 Month Index + 2.750% 8.0846% 9/27/30 (e)(f)(u) | | 1,389,518 | 1,388,531 |
| | | | 130,951,651 |
TOTAL FINANCIALS | | | 262,718,516 |
| HEALTH CARE - 0.4% | | | |
| Health Care Equipment & Supplies - 0.1% | | | |
| Avantor Funding, Inc. Tranche B6 1LN, term loan CME Term SOFR 1 Month Index + 2.000% 7.3467% 11/8/27 (e)(f)(u) | | 1,420,421 | 1,427,920 |
| Embecta Corp. Tranche B 1LN, term loan CME Term SOFR 1 Month Index + 3.000% 8.2467% 3/31/29 (e)(f)(u) | | 3,794,690 | 3,720,087 |
| ICU Medical, Inc. Tranche B 1LN, term loan CME Term SOFR 3 Month Index + 2.500% 7.9846% 1/6/29 (e)(f)(u) | | 2,475,382 | 2,472,511 |
| Insulet Corp. Tranche B 1LN, term loan CME Term SOFR 1 Month Index + 2.500% 7.7467% 8/1/31 (e)(f)(u) | | 7,960,000 | 7,979,900 |
| Medline Borrower LP: | | | |
| 1LN, term loan CME Term SOFR 1 Month Index + 2.250% 7.4967% 10/21/28 (e)(f)(u) | | 4,720,000 | 4,723,540 |
| Tranche B 1LN, term loan CME Term SOFR 1 Month Index + 2.750% 7.9967% 10/23/28 (e)(f)(u) | | 14,229,670 | 14,257,560 |
| Packaging Coordinators Midco, Inc. 1LN, term loan CME Term SOFR 3 Month Index + 3.250% 8.5846% 11/30/27 (e)(f)(u) | | 5,012,980 | 5,021,352 |
| Sotera Health Holdings LLC Tranche B 1LN, term loan CME Term SOFR 1 Month Index + 3.250% 8.4967% 5/30/31 (e)(f)(u) | | 2,170,000 | 2,167,288 |
| | | | 41,770,158 |
| Health Care Providers & Services - 0.1% | | | |
| Accelerated Health Systems LLC Tranche B1 LN, term loan CME Term SOFR 3 Month Index + 4.250% 9.7346% 2/15/29 (e)(f)(u) | | 2,508,601 | 1,990,424 |
| Cano Health, Inc. 1LN, term loan CME Term SOFR 1 Month Index + 8.000% 13.3346% 6/28/29 (e)(f)(h)(u) | | 1,154,312 | 1,151,426 |
| Charlotte Buyer, Inc. Tranche B 1LN, term loan CME Term SOFR 1 Month Index + 4.750% 10.0767% 2/11/28 (e)(f)(u) | | 2,971,239 | 2,986,927 |
| DaVita, Inc. Tranche B1 1LN, term loan CME Term SOFR 1 Month Index + 2.000% 7.2467% 5/9/31 (e)(f)(u) | | 3,570,000 | 3,569,250 |
| Gainwell Acquisition Corp. Tranche B 1LN, term loan CME Term SOFR 3 Month Index + 4.000% 9.4346% 10/1/27 (e)(f)(u) | | 15,574,800 | 14,088,653 |
| HAH Group Holding Co. LLC: | | | |
| 1LN, term loan: | | | |
| CME Term SOFR 1 Month Index + 5.000% 10.35% 10/29/27 (e)(f)(u) | | 1,319,585 | 1,317,381 |
| CME Term SOFR 1 Month Index + 5.000% 10.45% 10/29/27 (e)(f)(u) | | 2,179,590 | 2,175,950 |
| Tranche DD 1LN, term loan CME Term SOFR 1 Month Index + 5.000% 10.35% 10/29/27 (e)(f)(u) | | 166,980 | 166,701 |
| Icon Luxembourg Sarl Tranche B 1LN, term loan: | | | |
| CME Term SOFR 3 Month Index + 2.000% 7.3346% 7/3/28 (e)(f)(u) | | 1,830,191 | 1,838,921 |
| CME Term SOFR 3 Month Index + 2.000% 7.3346% 7/3/28 (e)(f)(u) | | 455,993 | 458,168 |
| IVC Acquisition Ltd. Tranche B 1LN, term loan CME Term SOFR 3 Month Index + 4.750% 10.0846% 12/6/28 (e)(f)(u) | | 4,193,951 | 4,185,228 |
| MED ParentCo LP Tranche B 1LN, term loan CME Term SOFR 1 Month Index + 4.000% 9.2467% 4/7/31 (e)(f)(u) | | 3,267,924 | 3,272,009 |
| Modivcare, Inc. Tranche B 1LN, term loan CME Term SOFR 3 Month Index + 4.750% 10.0816% 7/1/31 (e)(f)(u) | | 1,990,000 | 1,937,763 |
| Pacific Dental Services, Inc. Tranche B 1LN, term loan CME Term SOFR 1 Month Index + 3.250% 8.5916% 3/17/31 (e)(f)(u) | | 1,551,113 | 1,555,549 |
| Phoenix Guarantor, Inc. term loan CME Term SOFR 1 Month Index + 3.250% 8.4967% 2/21/31 (e)(f)(u) | | 2,648,363 | 2,650,720 |
| Phoenix Newco, Inc. Tranche B 1LN, term loan CME Term SOFR 1 Month Index + 3.000% 8.2467% 11/15/28 (e)(f)(u) | | 8,919,212 | 8,948,913 |
| R1 RCM, Inc. Tranche B 1LN, term loan CME Term SOFR 1 Month Index + 3.000% 8.2467% 6/21/29 (e)(f)(u) | | 1,775,962 | 1,777,738 |
| Soliant Lower Intermediate LLC 1LN, term loan CME Term SOFR 1 Month Index + 3.750% 8.9967% 7/18/31 (e)(f)(u) | | 2,040,000 | 2,040,000 |
| Surgery Center Holdings, Inc. 1LN, term loan CME Term SOFR 1 Month Index + 3.000% 8.0615% 12/19/30 (e)(f)(u) | | 3,025,232 | 3,028,136 |
| U.S. Anesthesia Partners, Inc. 2LN, term loan CME Term SOFR 1 Month Index + 7.500% 12.815% 10/1/29 (e)(f)(h)(u) | | 565,000 | 468,950 |
| U.S. Radiology Specialists, Inc. 1LN, term loan CME Term SOFR 1 Month Index + 4.750% 10.0361% 12/15/27 (e)(f)(u) | | 1,155,000 | 1,156,155 |
| WCG Intermediate Corp. Tranche B 1LN, term loan CME Term SOFR 1 Month Index + 3.500% 8.7467% 1/8/27 (e)(f)(u) | | 2,187,261 | 2,189,535 |
| | | | 62,954,497 |
| Health Care Technology - 0.1% | | | |
| Athenahealth Group, Inc. Tranche B 1LN, term loan CME Term SOFR 1 Month Index + 3.250% 8.4967% 2/15/29 (e)(f)(u) | | 15,159,013 | 15,029,101 |
| Cotiviti, Inc.: | | | |
| Tranche 1LN, term loan 7.625% 5/1/31 (u) | | 1,300,000 | 1,296,750 |
| Tranche B 1LN, term loan CME Term SOFR 1 Month Index + 3.250% 8.4506% 5/1/31 (e)(f)(u) | | 7,760,550 | 7,757,291 |
| Zelis Payments Buyer, Inc. Tranche B 1LN, term loan CME Term SOFR 1 Month Index + 2.750% 7.9967% 9/28/29 (e)(f)(u) | | 4,054,838 | 4,057,798 |
| | | | 28,140,940 |
| Pharmaceuticals - 0.1% | | | |
| Catalent Pharma Solutions Tranche B4 1LN, term loan CME Term SOFR 1 Month Index + 3.000% 8.3115% 2/22/28 (e)(f)(u) | | 1,660,838 | 1,662,914 |
| Elanco Animal Health, Inc. Tranche B 1LN, term loan CME Term SOFR 1 Month Index + 1.750% 7.0506% 8/1/27 (e)(f)(u) | | 6,066,940 | 6,058,629 |
| Endo Finance Holdings, Inc. Tranche B-EXIT 1LN, term loan CME Term SOFR 3 Month Index + 4.500% 9.783% 4/23/31 (e)(f)(u) | | 3,170,000 | 3,162,075 |
| Jazz Financing Lux SARL Tranche B 1LN, term loan CME Term SOFR 1 Month Index + 2.250% 7.4967% 5/5/28 (e)(f)(u) | | 8,307,302 | 8,310,791 |
| Organon & Co. Tranche B 1LN, term loan CME Term SOFR 1 Month Index + 2.500% 7.8416% 5/17/31 (e)(f)(u) | | 4,085,137 | 4,103,030 |
| Perrigo Investments LLC Tranche B 1LN, term loan CME Term SOFR 1 Month Index + 2.500% 7.5967% 4/20/29 (e)(f)(u) | | 2,376,220 | 2,364,339 |
| | | | 25,661,778 |
TOTAL HEALTH CARE | | | 158,527,373 |
| INDUSTRIALS - 0.8% | | | |
| Aerospace & Defense - 0.1% | | | |
| Bleriot U.S. Bidco, Inc. Tranche B 1LN, term loan CME Term SOFR 3 Month Index + 4.250% 10/31/30 (f)(u)(v) | | 1,555,000 | 1,561,811 |
| Gemini HDPE LLC Tranche B 1LN, term loan CME Term SOFR 3 Month Index + 3.000% 8.5137% 12/31/27 (e)(f)(u) | | 1,766,994 | 1,768,761 |
| Ovation Parent, Inc. Tranche B 1LN, term loan CME Term SOFR 3 Month Index + 3.500% 8.8346% 4/21/31 (e)(f)(u) | | 1,920,000 | 1,926,394 |
| TransDigm, Inc.: | | | |
| Tranche I 1LN, term loan CME Term SOFR 3 Month Index + 2.750% 8.0846% 8/24/28 (e)(f)(u) | | 13,823,909 | 13,877,545 |
| Tranche K 1LN, term loan CME Term SOFR 3 Month Index + 2.750% 8.0846% 3/22/30 (e)(f)(u) | | 2,385,997 | 2,394,872 |
| | | | 21,529,383 |
| Air Freight & Logistics - 0.0% | | | |
| Echo Global Logistics, Inc. 2LN, term loan CME Term SOFR 3 Month Index + 7.000% 12.3467% 11/23/29 (e)(f)(h)(u) | | 1,525,000 | 1,525,000 |
| Rand Parent LLC Tranche B 1LN, term loan CME Term SOFR 3 Month Index + 4.250% 9.0709% 3/18/30 (e)(f)(u) | | 2,481,601 | 2,477,581 |
| STG Logistics, Inc. 1LN, term loan CME Term SOFR 3 Month Index + 6.000% 11.4846% 3/24/28 (e)(f)(h)(u) | | 1,823,038 | 891,465 |
| | | | 4,894,046 |
| Building Products - 0.1% | | | |
| Acproducts Holdings, Inc. Tranche B 1LN, term loan CME Term SOFR 3 Month Index + 4.250% 9.8462% 5/17/28 (e)(f)(u) | | 11,713,072 | 8,792,184 |
| APi Group DE, Inc. Tranche B 1LN, term loan CME Term SOFR 1 Month Index + 2.000% 7.2467% 1/3/29 (e)(f)(u) | | 3,936,141 | 3,942,124 |
| AZZ, Inc. Tranche B 1LN, term loan CME Term SOFR 1 Month Index + 3.250% 8.4967% 5/11/29 (e)(f)(u) | | 505,285 | 508,443 |
| Chariot Buyer LLC Tranche B 1LN, term loan: | | | |
| CME Term SOFR 1 Month Index + 3.500% 8.5967% 10/22/28 (e)(f)(u) | | 442,730 | 441,968 |
| CME Term SOFR 1 Month Index + 3.750% 8.7467% 11/3/28 (e)(f)(u) | | 1,586,025 | 1,584,042 |
| Copeland LP Tranche B 1LN, term loan CME Term SOFR 1 Month Index + 2.500% 7.5572% 6/18/31 (e)(f)(u) | | 1,625,000 | 1,623,846 |
| Griffon Corp. Tranche B 1LN, term loan CME Term SOFR 3 Month Index + 2.000% 7.3406% 1/24/29 (e)(f)(u) | | 3,097,825 | 3,092,032 |
| Hunter Douglas, Inc. Tranche B 1LN, term loan CME Term SOFR 3 Month Index + 3.500% 8.5713% 2/25/29 (e)(f)(u) | | 16,342,302 | 16,219,735 |
| MIWD Holdco II LLC Tranche B2, term loan CME Term SOFR 1 Month Index + 3.500% 8.7467% 3/28/31 (e)(f)(u) | | 1,205,000 | 1,210,025 |
| Oscar AcquisitionCo LLC 1LN, term loan CME Term SOFR 3 Month Index + 4.500% 9.5846% 4/29/29 (e)(f)(u) | | 6,578,419 | 6,520,858 |
| Standard Industries, Inc./New Jersey Tranche B 1LN, term loan CME Term SOFR 1 Month Index + 2.250% 7.3115% 9/22/28 (e)(f)(u) | | 1,264,436 | 1,268,710 |
| | | | 45,203,967 |
| Commercial Services & Supplies - 0.3% | | | |
| ABG Intermediate Holdings 2 LLC Tranche B1 1LN, term loan CME Term SOFR 1 Month Index + 2.750% 7.9967% 12/21/28 (e)(f)(u) | | 18,230,515 | 18,272,263 |
| AEA International Holdings Luxembourg SARL Tranche B 1LN, term loan CME Term SOFR 1 Month Index + 2.750% 8.0334% 9/7/28 (e)(f)(u) | | 1,482,152 | 1,481,233 |
| Allied Universal Holdco LLC Tranche B 1LN, term loan 1 month U.S. LIBOR + 3.750% 9.0967% 5/14/28 (e)(f)(u) | | 10,088,372 | 10,024,513 |
| Amentum Government Services Holdings LLC: | | | |
| Tranche B 1LN, term loan: | | | |
| CME Term SOFR 1 Month Index + 4.000% 9.278% 2/15/29 (e)(f)(u) | | 4,813,113 | 4,810,129 |
| CME Term SOFR 1 Month Index + 4.000% 9.3612% 1/23/27 (e)(f)(u) | | 3,511,754 | 3,511,754 |
| Tranche B 2LN, term loan CME Term SOFR 1 Month Index + 8.750% 14.1112% 1/31/28 (e)(f)(u) | | 1,590,448 | 1,587,474 |
| Anticimex Global AB: | | | |
| Tranche B 1LN, term loan CME Term SOFR 1 Month Index + 3.500% 8.75% 11/16/28 (e)(f)(u) | | 1,470,759 | 1,477,201 |
| Tranche B1 1LN, term loan CME Term SOFR 3 Month Index + 3.500% 8.48% 11/16/28 (e)(f)(u) | | 4,143,651 | 4,147,794 |
| APX Group, Inc. Tranche B 1LN, term loan CME Term SOFR 1 Month Index + 2.750% 8.0411% 7/9/28 (e)(f)(u) | | 4,158,336 | 4,163,534 |
| Archkey Holdings, Inc. Tranche B 1LN, term loan CME Term SOFR 1 Month Index + 5.250% 10.6112% 6/30/28 (e)(f)(u) | | 2,522,830 | 2,524,092 |
| Artera Services LLC Tranche B 1LN, term loan CME Term SOFR 3 Month Index + 4.500% 9.8346% 2/10/31 (e)(f)(u) | | 3,361,575 | 3,326,917 |
| Bifm California Buyer, Inc. Tranche 1LN, term loan CME Term SOFR 1 Month Index + 4.250% 9.4967% 5/31/28 (e)(f)(u) | | 2,264,325 | 2,271,412 |
| Brand Industrial Services, Inc. Tranche B 1LN, term loan CME Term SOFR 3 Month Index + 4.500% 9.7477% 8/1/30 (e)(f)(u) | | 11,506,400 | 11,405,719 |
| Brock Holdings Iii LLC Tranche B 1LN, term loan CME Term SOFR 3 Month Index + 6.000% 11.3346% 5/2/30 (e)(f)(u) | | 1,250,000 | 1,254,688 |
| Congruex Group LLC Tranche B 1LN, term loan CME Term SOFR 3 Month Index + 5.750% 11.1521% 5/3/29 (e)(f)(u) | | 2,695,000 | 2,065,879 |
| Core & Main LP Tranche B 1LN, term loan CME Term SOFR 3 Month Index + 2.250% 7.5894% 2/10/31 (e)(f)(u) | | 1,198,975 | 1,198,232 |
| Ensemble RCM LLC Tranche B 1LN, term loan CME Term SOFR 3 Month Index + 3.000% 8.2521% 8/1/29 (e)(f)(u) | | 5,038,071 | 5,048,903 |
| Filtration Group Corp. Tranche B 1LN, term loan CME Term SOFR 1 Month Index + 3.500% 8.8612% 10/21/28 (e)(f)(u) | | 3,621,879 | 3,630,427 |
| HomeServe U.S.A. Corp. Tranche B 1LN, term loan CME Term SOFR 1 Month Index + 2.500% 7.8357% 10/21/30 (e)(f)(u) | | 3,700,725 | 3,704,907 |
| KNS Acquisitions, Inc. Tranche B 1LN, term loan CME Term SOFR 1 Month Index + 6.250% 11.6112% 4/21/27 (e)(f)(u) | | 2,754,394 | 1,662,966 |
| Madison IAQ LLC Tranche B 1LN, term loan CME Term SOFR 1 Month Index + 3.250% 7.8892% 6/21/28 (e)(f)(u) | | 6,324,496 | 6,329,871 |
| Neptune BidCo U.S., Inc.: | | | |
| term loan CME Term SOFR 3 Month Index + 4.750% 10.154% 10/11/28 (e)(f)(u) | | 992,425 | 942,556 |
| Tranche B 1LN, term loan CME Term SOFR 3 Month Index + 5.000% 10.404% 4/11/29 (e)(f)(u) | | 11,499,425 | 10,989,196 |
| Omnia Partners LLC Tranche B 1LN, term loan CME Term SOFR 1 Month Index + 3.750% 8.5292% 7/25/30 (e)(f)(u) | | 4,795,548 | 4,810,558 |
| Optiv Security, Inc. Tranche B 1LN, term loan CME Term SOFR 3 Month Index + 5.250% 10.5292% 7/31/26 (e)(f)(u) | | 3,520,083 | 3,087,606 |
| PG Investment Co. 59 Sarl Tranche B 1LN, term loan CME Term SOFR 3 Month Index + 3.500% 8.8346% 3/24/31 (e)(f)(u) | | 4,255,000 | 4,265,638 |
| Pitney Bowes, Inc. Tranche B 1LN, term loan CME Term SOFR 1 Month Index + 4.000% 9.3612% 3/19/28 (e)(f)(u) | | 1,698,107 | 1,701,826 |
| Reworld Holding Corp.: | | | |
| Tranche B 1LN, term loan: | | | |
| CME Term SOFR 1 Month Index + 2.500% 7.7437% 11/30/28 (e)(f)(u) | | 1,863,883 | 1,864,461 |
| CME Term SOFR 1 Month Index + 2.750% 8.0869% 11/30/28 (e)(f)(u) | | 3,271,426 | 3,274,927 |
| Tranche C 1LN, term loan: | | | |
| CME Term SOFR 1 Month Index + 2.500% 7.5877% 11/30/28 (e)(f)(u) | | 142,830 | 142,875 |
| CME Term SOFR 1 Month Index + 2.750% 8.0869% 11/30/28 (e)(f)(u) | | 178,858 | 179,049 |
| RLG Holdings LLC Tranche B 1LN, term loan CME Term SOFR 1 Month Index + 4.250% 9.6112% 7/8/28 (e)(f)(u) | | 1,959,750 | 1,895,235 |
| Sabert Corp. Tranche B 1LN, term loan CME Term SOFR 1 Month Index + 3.000% 8.4259% 12/10/26 (e)(f)(u) | | 2,118,968 | 2,129,562 |
| The GEO Group, Inc. Tranche B 1LN, term loan CME Term SOFR 1 Month Index + 5.250% 10.4967% 4/14/29 (e)(f)(u) | | 2,166,653 | 2,190,573 |
| Vestis Corp. Tranche B 1LN, term loan CME Term SOFR 3 Month Index + 2.250% 7.3711% 2/24/31 (e)(f)(u) | | 2,010,794 | 2,000,740 |
| WMB Holdings, Inc. Tranche B 1LN, term loan CME Term SOFR 1 Month Index + 3.250% 7.7467% 11/3/29 (e)(f)(u) | | 1,435,876 | 1,437,671 |
| | | | 134,812,381 |
| Construction & Engineering - 0.0% | | | |
| Chromalloy Corp. Tranche B 1LN, term loan CME Term SOFR 3 Month Index + 3.750% 9.0816% 3/21/31 (e)(f)(u) | | 1,755,000 | 1,697,963 |
| OPE USIC Holdings, Inc. Tranche B 1LN, term loan CME Term SOFR 3 Month Index + 3.500% 9.0917% 5/14/28 (e)(f)(u) | | 1,561,969 | 1,421,392 |
| Traverse Midstream Partners Ll Tranche B, term loan CME Term SOFR 3 Month Index + 3.500% 8.7521% 2/16/28 (e)(f)(u) | | 1,345,896 | 1,347,295 |
| | | | 4,466,650 |
| Electrical Equipment - 0.0% | | | |
| Array Technologies, Inc. Tranche B 1LN, term loan CME Term SOFR 3 Month Index + 3.250% 8.6759% 10/14/27 (e)(f)(u) | | 1,822,135 | 1,817,124 |
| Vertiv Group Corp. Tranche B 1LN, term loan CME Term SOFR 1 Month Index + 2.000% 7.2006% 3/2/27 (e)(f)(u) | | 5,379,623 | 5,392,211 |
| | | | 7,209,335 |
| Ground Transportation - 0.0% | | | |
| Avis Budget Car Rental LLC Tranche C 1LN, term loan CME Term SOFR 1 Month Index + 3.000% 8.3467% 3/16/29 (e)(f)(u) | | 1,140,013 | 1,138,941 |
| Genesee & Wyoming, Inc. Tranche B 1LN, term loan CME Term SOFR 3 Month Index + 2.000% 7.3346% 4/10/31 (e)(f)(u) | | 3,505,000 | 3,503,913 |
| Uber Technologies, Inc. Tranche B 1LN, term loan CME Term SOFR 3 Month Index + 3.000% 8.0892% 3/3/30 (e)(f)(u) | | 7,113,339 | 7,139,232 |
| | | | 11,782,086 |
| Machinery - 0.1% | | | |
| Ali Group North America Corp. Tranche B 1LN, term loan CME Term SOFR 1 Month Index + 2.000% 7.3612% 7/22/29 (e)(f)(u) | | 2,242,156 | 2,249,286 |
| Chart Industries, Inc. Tranche B 1LN, term loan CME Term SOFR 3 Month Index + 2.500% 7.8246% 3/18/30 (e)(f)(u) | | 4,323,014 | 4,331,141 |
| CPM Holdings, Inc. 1LN, term loan CME Term SOFR 1 Month Index + 4.500% 9.7006% 9/28/28 (e)(f)(u) | | 2,359,069 | 2,265,438 |
| LSF11 Trinity Bidco, Inc. Tranche B 1LN, term loan CME Term SOFR 1 Month Index + 3.500% 8.8115% 6/17/30 (e)(f)(u) | | 756,276 | 752,495 |
| STS Operating, Inc. 1LN, term loan CME Term SOFR 3 Month Index + 4.000% 9.3467% 3/25/31 (e)(f)(u) | | 4,872,788 | 4,840,286 |
| TK Elevator U.S. Newco, Inc. Tranche B 1LN, term loan CME Term SOFR 1 Month Index + 3.500% 8.5877% 4/11/30 (e)(f)(u) | | 2,447,157 | 2,455,061 |
| TNT Crane & Rigging LLC 2LN, term loan 3 month U.S. LIBOR + 8.750% 14.3432% 4/16/25 (e)(f)(h)(u) | | 936,343 | 866,960 |
| | | | 17,760,667 |
| Passenger Airlines - 0.1% | | | |
| AAdvantage Loyalty IP Ltd. Tranche B 1LN, term loan CME Term SOFR 3 Month Index + 4.750% 10.2936% 4/20/28 (e)(f)(u) | | 6,595,500 | 6,818,956 |
| Air Canada Tranche B 1LN, term loan CME Term SOFR 3 Month Index + 2.500% 7.8474% 3/21/31 (e)(f)(u) | | 1,640,888 | 1,639,526 |
| American Airlines, Inc. Tranche B 1LN, term loan CME Term SOFR 1 Month Index + 3.500% 7.7749% 6/4/29 (e)(f)(u) | | 2,195,000 | 2,181,281 |
| SkyMiles IP Ltd. Tranche B 1LN, term loan CME Term SOFR 3 Month Index + 3.750% 9.032% 10/20/27 (e)(f)(u) | | 1,919,321 | 1,959,377 |
| United Airlines, Inc. Tranche 1LN, term loan CME Term SOFR 3 Month Index + 2.750% 8.0334% 2/24/31 (e)(f)(u) | | 4,234,388 | 4,240,993 |
| | | | 16,840,133 |
| Professional Services - 0.1% | | | |
| AlixPartners LLP Tranche B 1LN, term loan CME Term SOFR 1 Month Index + 2.750% 7.8612% 2/4/28 (e)(f)(u) | | 4,490,175 | 4,506,205 |
| Cast & Crew Payroll LLC Tranche B 1LN, term loan CME Term SOFR 1 Month Index + 3.750% 8.9967% 12/30/28 (e)(f)(u) | | 648,643 | 649,895 |
| CHG Healthcare Services, Inc.: | | | |
| 1LN, term loan CME Term SOFR 1 Month Index + 3.250% 8.6112% 9/30/28 (e)(f)(u) | | 1,412,446 | 1,415,977 |
| Tranche B 2LN, term loan CME Term SOFR 1 Month Index + 3.500% 8.8612% 9/29/28 (e)(f)(u) | | 1,712,500 | 1,717,090 |
| CoreLogic, Inc. Tranche B 1LN, term loan CME Term SOFR 1 Month Index + 3.500% 8.8612% 6/2/28 (e)(f)(u) | | 14,671,629 | 14,469,895 |
| Dayforce, Inc. Tranche B 1LN, term loan CME Term SOFR 1 Month Index + 2.500% 7.7467% 3/3/31 (e)(f)(u) | | 1,775,000 | 1,773,900 |
| EAB Global, Inc. Tranche B 1LN, term loan CME Term SOFR 1 Month Index + 3.500% 8.5937% 8/16/28 (e)(f)(u) | | 2,872,921 | 2,862,147 |
| Galaxy U.S. Opco, Inc. 1LN, term loan CME Term SOFR 3 Month Index + 4.750% 10.0021% 4/29/29 (e)(f)(u) | | 3,054,831 | 2,506,489 |
| Maximus, Inc. Tranche B 1LN, term loan CME Term SOFR 1 Month Index + 2.000% 7.2467% 5/30/31 (e)(f)(u) | | 1,120,000 | 1,122,453 |
| Sedgwick Claims Management Services, Inc. Tranche B 1LN, term loan CME Term SOFR 1 Month Index + 3.000% 8.2521% 7/31/31 (e)(f)(u) | | 3,293,706 | 3,296,440 |
| | | | 34,320,491 |
| Trading Companies & Distributors - 0.0% | | | |
| Foundation Building Materials, Inc. Tranche B2 1LN, term loan CME Term SOFR 3 Month Index + 4.000% 9.286% 1/29/31 (e)(f)(u) | | 6,313,125 | 6,106,496 |
| United Rentals North America, Inc. Tranche B 1LN, term loan CME Term SOFR 1 Month Index + 1.750% 6.9967% 2/14/31 (e)(f)(u) | | 2,084,775 | 2,095,199 |
| | | | 8,201,695 |
| Transportation Infrastructure - 0.0% | | | |
| AIT Worldwide Logistics Holdings, Inc. 1LN, term loan CME Term SOFR 1 Month Index + 4.750% 9.9681% 4/6/28 (e)(f)(u) | | 3,055,989 | 3,055,347 |
| ASP LS Acquisition Corp.: | | | |
| 2LN, term loan CME Term SOFR 3 Month Index + 7.500% 13.0962% 5/7/29 (e)(f)(u) | | 575,000 | 235,750 |
| Tranche B 1LN, term loan CME Term SOFR 3 Month Index + 4.500% 10.0962% 5/7/28 (e)(f)(u) | | 2,134,513 | 1,469,078 |
| Wwex Unified Topco Holdings LLC 1LN, term loan CME Term SOFR 3 Month Index + 4.250% 9.8462% 7/26/28 (e)(f)(u) | | 2,912,148 | 2,920,447 |
| | | | 7,680,622 |
TOTAL INDUSTRIALS | | | 314,701,456 |
| INFORMATION TECHNOLOGY - 0.8% | | | |
| Communications Equipment - 0.0% | | | |
| Anastasia Parent LLC Tranche B, term loan CME Term SOFR 3 Month Index + 3.750% 9.3462% 8/10/25 (e)(f)(u) | | 5,509,568 | 3,935,430 |
| Ciena Corp. Tranche B 1LN, term loan CME Term SOFR 1 Month Index + 2.000% 7.3357% 10/24/30 (e)(f)(u) | | 1,106,042 | 1,108,807 |
| | | | 5,044,237 |
| Electronic Equipment, Instruments & Components - 0.1% | | | |
| Coherent Corp. Tranche B 1LN, term loan CME Term SOFR 1 Month Index + 2.500% 7.7467% 7/2/29 (e)(f)(u) | | 5,689,518 | 5,700,897 |
| DG Investment Intermediate Holdings, Inc.: | | | |
| 2LN, term loan CME Term SOFR 1 Month Index + 6.750% 12.1112% 3/31/29 (e)(f)(u) | | 600,000 | 570,936 |
| Tranche B 1LN, term loan CME Term SOFR 1 Month Index + 3.750% 9.1112% 3/31/28 (e)(f)(u) | | 2,551,185 | 2,547,638 |
| Go Daddy Operating Co. LLC: | | | |
| Tranche B5 1LN, term loan CME Term SOFR 1 Month Index + 2.000% 7.2467% 11/12/29 (e)(f)(u) | | 2,433,567 | 2,433,908 |
| Tranche B7 1LN, term loan CME Term SOFR 1 Month Index + 1.750% 6.9967% 6/2/31 (e)(f)(u) | | 5,468,125 | 5,461,837 |
| Lightning Power LLC Tranche B 1LN, term loan CME Term SOFR 1 Month Index + 3.250% 8.3455% 8/18/31 (e)(f)(u) | | 4,675,000 | 4,689,633 |
| TTM Technologies, Inc. Tranche B 1LN, term loan CME Term SOFR 1 Month Index + 2.250% 7.4506% 5/30/30 (e)(f)(u) | | 1,822,213 | 1,819,935 |
| | | | 23,224,784 |
| IT Services - 0.1% | | | |
| Acuris Finance U.S., Inc. 1LN, term loan CME Term SOFR 3 Month Index + 4.000% 9.4846% 2/16/28 (e)(f)(u) | | 1,581,624 | 1,577,892 |
| Ahead DB Holdings LLC Tranche B3 1LN, term loan CME Term SOFR 1 Month Index + 3.500% 8.7984% 2/3/31 (e)(f)(u) | | 1,958,863 | 1,960,821 |
| Amazon Holdco, Inc. 1LN, term loan CME Term SOFR 1 Month Index + 2.250% 7/30/31 (f)(u)(v) | | 9,260,000 | 9,236,850 |
| Constant Contact, Inc. Tranche B 1LN, term loan CME Term SOFR 3 Month Index + 4.000% 9.5657% 2/10/28 (e)(f)(u) | | 4,169,286 | 4,016,065 |
| GTT Communications, Inc. 1LN, term loan CME Term SOFR 3 Month Index + 9.000% 14.4346% 6/30/28 (e)(f)(u) | | 1,016,331 | 741,921 |
| Ion Trading Finance Ltd. 1LN, term loan CME Term SOFR 3 Month Index + 4.000% 9.3461% 4/3/28 (e)(f)(u) | | 3,141,984 | 3,146,477 |
| Mitchell International, Inc. Tranche B 1LN, term loan CME Term SOFR 1 Month Index + 3.250% 8.4967% 6/17/31 (e)(f)(u) | | 4,935,000 | 4,887,081 |
| Peraton Corp. Tranche B 1LN, term loan CME Term SOFR 1 Month Index + 3.750% 9.0967% 2/1/28 (e)(f)(u) | | 16,470,576 | 16,099,988 |
| Plano Holdco, Inc. Tranche B 1LN, term loan CME Term SOFR 1 Month Index + 3.500% 8/4/31 (f)(u)(v) | | 1,605,000 | 1,609,013 |
| Tempo Acquisition LLC Tranche B1 1LN, term loan CME Term SOFR 1 Month Index + 2.250% 7.4967% 8/31/28 (e)(f)(u) | | 1,545,938 | 1,549,586 |
| VFH Parent LLC Tranche B 1LN, term loan CME Term SOFR 1 Month Index + 2.750% 7.9967% 6/23/31 (e)(f)(u) | | 4,000,000 | 4,000,000 |
| | | | 48,825,694 |
| Semiconductors & Semiconductor Equipment - 0.0% | | | |
| MKS Instruments, Inc. Tranche B 1LN, term loan CME Term SOFR 1 Month Index + 2.250% 7.5586% 8/17/29 (e)(f)(u) | | 3,743,773 | 3,750,324 |
| Software - 0.6% | | | |
| Applied Systems, Inc. Tranche B 1LN, term loan CME Term SOFR 3 Month Index + 3.500% 8.2856% 2/24/31 (e)(f)(u) | | 5,835,525 | 5,857,408 |
| AppLovin Corp. Tranche B 1LN, term loan CME Term SOFR 1 Month Index + 2.500% 7.7467% 8/19/30 (e)(f)(u) | | 6,553,178 | 6,559,338 |
| Ascend Learning LLC: | | | |
| 2LN, term loan CME Term SOFR 1 Month Index + 5.750% 11.0967% 12/10/29 (e)(f)(u) | | 3,100,000 | 2,968,250 |
| Tranche B 1LN, term loan CME Term SOFR 1 Month Index + 3.500% 8.8467% 12/10/28 (e)(f)(u) | | 10,186,238 | 10,162,402 |
| BYJU's Alpha, Inc.: | | | |
| term loan: | | | |
| CME Term SOFR 3 Month Index + 8.000% 13.3185% 4/9/26 (e)(f)(h)(u) | | 56,821 | 56,821 |
| CME Term SOFR 3 Month Index + 8.000% 13.3185% 4/9/26 (e)(f)(h)(u) | | 16,646 | 16,646 |
| Tranche B 1LN, term loan 3 month U.S. LIBOR + 8.000% 15.5% 11/24/26 (d)(e)(f)(u) | | 3,386,224 | 757,668 |
| Tranche DD 1 term loan CME Term SOFR 3 Month Index + 8.000% 4/3/26 (f)(h)(u)(w) | | 28,968 | 28,968 |
| Tranche DD 2 term loan CME Term SOFR 1 Month Index + 8.000% 13.3416% 4/9/26 (e)(f)(h)(u) | | 29,023 | 29,023 |
| Camelot U.S. Acquisition LLC Tranche B 1LN, term loan CME Term SOFR 1 Month Index + 2.750% 7.9967% 1/31/31 (e)(f)(u) | | 8,651,350 | 8,651,350 |
| Central Parent, Inc. Tranche B 1LN, term loan CME Term SOFR 3 Month Index + 3.250% 8.5846% 7/6/29 (e)(f)(u) | | 1,428,161 | 1,414,237 |
| Cloud Software Group, Inc. Tranche B 1LN, term loan: | | | |
| CME Term SOFR 3 Month Index + 4.000% 9.3346% 3/29/29 (e)(f)(u) | | 11,055,291 | 11,044,678 |
| CME Term SOFR 3 Month Index + 4.500% 9.8346% 3/24/31 (e)(f)(u) | | 1,980,000 | 1,987,425 |
| ConnectWise LLC Tranche B 1LN, term loan CME Term SOFR 3 Month Index + 3.500% 9.0962% 9/30/28 (e)(f)(u) | | 5,290,188 | 5,293,521 |
| DCert Buyer, Inc.: | | | |
| 1LN, term loan CME Term SOFR 1 Month Index + 4.000% 9.2467% 10/16/26 (e)(f)(u) | | 11,176,140 | 10,935,182 |
| Tranche B 2LN, term loan CME Term SOFR 1 Month Index + 7.000% 12.2467% 2/19/29 (e)(f)(u) | | 2,493,409 | 2,131,092 |
| DH Corp./Societe term loan CME Term SOFR 3 Month Index + 7.250% 12.4592% 9/13/29 (e)(f)(h)(u) | | 83,791 | 83,791 |
| Ellucian, Inc. Tranche B 1LN, term loan CME Term SOFR 1 Month Index + 3.500% 8.8467% 10/7/29 (e)(f)(u) | | 6,739,015 | 6,751,684 |
| Epicor Software Corp. 1LN, term loan CME Term SOFR 1 Month Index + 3.250% 8.4967% 5/23/31 (e)(f)(u) | | 4,377,591 | 4,392,344 |
| Finastra U.S.A., Inc. term loan CME Term SOFR 1 Month Index + 7.250% 12.4592% 9/13/29 (e)(f)(h)(u) | | 3,587,759 | 3,587,759 |
| Flexera Software LLC Tranche B 1LN, term loan CME Term SOFR 1 Month Index + 3.500% 8.8357% 3/3/28 (e)(f)(u) | | 4,029,739 | 4,042,352 |
| Gen Digital, Inc. Tranche B 1LN, term loan CME Term SOFR 1 Month Index + 1.750% 6.9967% 9/12/29 (e)(f)(u) | | 7,079,418 | 7,069,578 |
| Greeneden U.S. Holdings II LLC Tranche B 1LN, term loan CME Term SOFR 1 Month Index + 3.500% 8.7467% 12/1/27 (e)(f)(u) | | 4,101,250 | 4,115,481 |
| Helios Software Holdings, Inc. Tranche B 1LN, term loan CME Term SOFR 3 Month Index + 3.750% 9.0846% 7/15/30 (e)(f)(u) | | 1,356,098 | 1,356,098 |
| Leia Finco U.S. LLC: | | | |
| 1LN, term loan CME Term SOFR 1 Month Index + 3.250% 7/2/31 (f)(u)(v) | | 6,440,000 | 6,376,952 |
| 2LN, term loan CME Term SOFR 1 Month Index + 5.250% 7/2/32 (f)(u)(v) | | 2,465,000 | 2,411,583 |
| McAfee Corp. Tranche B 1LN, term loan CME Term SOFR 1 Month Index + 3.250% 8.4506% 3/1/29 (e)(f)(u) | | 9,574,065 | 9,536,631 |
| MH Sub I LLC: | | | |
| Tranche B 1LN, term loan CME Term SOFR 1 Month Index + 4.250% 9.4967% 5/3/28 (e)(f)(u) | | 17,103,328 | 17,048,940 |
| Tranche B 2LN, term loan CME Term SOFR 3 Month Index + 6.250% 11.5021% 2/23/29 (e)(f)(u) | | 2,065,000 | 2,024,567 |
| Modena Buyer LLC 1LN, term loan CME Term SOFR 3 Month Index + 4.500% 9.8316% 7/1/31 (e)(f)(u) | | 9,625,000 | 9,211,895 |
| Open Text Corp. Tranche B 1LN, term loan CME Term SOFR 1 Month Index + 2.750% 7.4967% 1/31/30 (e)(f)(u) | | 5,272,042 | 5,295,713 |
| Polaris Newco LLC: | | | |
| 2LN, term loan CME Term SOFR 1 Month Index + 2.000% 7.4321% 6/4/29 (e)(f)(u) | | 1,495,000 | 1,470,243 |
| Tranche B 1LN, term loan CME Term SOFR 3 Month Index + 4.000% 9.5137% 6/2/28 (e)(f)(u) | | 20,399,229 | 20,228,487 |
| Project Alpha Intermediate Holding, Inc. Tranche B 1LN, term loan CME Term SOFR 3 Month Index + 3.750% 9.0021% 10/28/30 (e)(f)(u) | | 5,187,000 | 5,210,030 |
| Project Boost Purchaser LLC: | | | |
| Tranche B 1LN, term loan CME Term SOFR 3 Month Index + 3.500% 8.7861% 7/2/31 (e)(f)(u) | | 1,820,000 | 1,824,095 |
| Tranche B 2LN, term loan CME Term SOFR 3 Month Index + 5.250% 10.5361% 7/17/32 (e)(f)(u) | | 875,000 | 879,926 |
| Proofpoint, Inc. Tranche B 1LN, term loan CME Term SOFR 1 Month Index + 3.000% 8.2467% 8/31/28 (e)(f)(u) | | 8,235,680 | 8,237,986 |
| Rackspace Finance LLC Tranche B 1LN, term loan: | | | |
| CME Term SOFR 1 Month Index + 2.750% 8.154% 5/15/28 (e)(f)(u) | | 6,072,278 | 2,990,597 |
| CME Term SOFR 1 Month Index + 6.250% 11.654% 5/15/28 (e)(f)(u) | | 2,006,797 | 2,019,841 |
| RealPage, Inc. Tranche B 1LN, term loan CME Term SOFR 1 Month Index + 3.000% 8.3612% 4/22/28 (e)(f)(u) | | 6,178,748 | 5,916,151 |
| Red Planet Borrower LLC Tranche B 1LN, term loan CME Term SOFR 1 Month Index + 3.750% 8.8467% 9/30/28 (e)(f)(u) | | 2,028,912 | 1,947,756 |
| Renaissance Holdings Corp. Tranche 1LN, term loan CME Term SOFR 3 Month Index + 4.250% 9.4967% 4/8/30 (e)(f)(u) | | 6,825,153 | 6,819,693 |
| Roper Industrial Products Investment Co. 1LN, term loan CME Term SOFR 3 Month Index + 3.250% 8.5846% 11/23/29 (e)(f)(u) | | 2,161,270 | 2,165,506 |
| Sovos Compliance LLC Tranche B 1LN, term loan CME Term SOFR 1 Month Index + 4.500% 9.8612% 8/11/28 (e)(f)(u) | | 1,346,550 | 1,347,156 |
| SS&C Technologies, Inc. Tranche B8 1LN, term loan CME Term SOFR 1 Month Index + 2.000% 7.2467% 5/9/31 (e)(f)(u) | | 6,017,789 | 6,032,834 |
| UKG, Inc. Tranche B 1LN, term loan CME Term SOFR 3 Month Index + 3.500% 8.5546% 2/10/31 (e)(f)(u) | | 18,823,784 | 18,863,879 |
| VS Buyer LLC Tranche B 1LN, term loan CME Term SOFR 1 Month Index + 3.250% 8.5869% 4/14/31 (e)(f)(u) | | 4,326,032 | 4,326,032 |
| Webpros Investments Sarl Tranche B 1LN, term loan CME Term SOFR 1 Month Index + 4.000% 9.2467% 3/19/31 (e)(f)(u) | | 947,625 | 948,222 |
| | | | 242,427,811 |
TOTAL INFORMATION TECHNOLOGY | | | 323,272,850 |
| MATERIALS - 0.4% | | | |
| Chemicals - 0.3% | | | |
| A-Gas Finco, Inc. Tranche B 1LN, term loan CME Term SOFR 3 Month Index + 5.250% 10.5846% 12/14/29 (e)(f)(u) | | 2,618,438 | 2,511,239 |
| American Rock Salt Co. LLC 1LN, term loan CME Term SOFR 3 Month Index + 4.000% 9.3188% 6/4/28 (e)(f)(u) | | 751,128 | 591,889 |
| ARC Falcon I, Inc.: | | | |
| Tranche B 1LN, term loan CME Term SOFR 1 Month Index + 3.750% 8.8467% 9/30/28 (e)(f)(u) | | 7,304,936 | 7,290,764 |
| Tranche B 2LN, term loan CME Term SOFR 1 Month Index + 7.000% 12.3467% 10/1/29 (e)(f)(u) | | 675,000 | 626,063 |
| Aruba Investment Holdings LLC: | | | |
| 1LN, term loan CME Term SOFR 1 Month Index + 4.750% 9.9967% 11/24/27 (e)(f)(u) | | 1,773,000 | 1,758,231 |
| 2LN, term loan CME Term SOFR 1 Month Index + 7.750% 13.0967% 11/24/28 (e)(f)(u) | | 935,000 | 890,195 |
| Tranche B 1LN, term loan CME Term SOFR 1 Month Index + 4.000% 9.4437% 11/24/27 (e)(f)(u) | | 3,100,321 | 3,067,396 |
| Avient Corp. Tranche B8 1LN, term loan CME Term SOFR 3 Month Index + 2.000% 7.3069% 8/29/29 (e)(f)(u) | | 951,086 | 953,463 |
| Axalta Coating Systems U.S. Holdings, Inc. Tranche B6 1LN, term loan CME Term SOFR 3 Month Index + 2.000% 7.3346% 12/20/29 (e)(f)(u) | | 1,011,063 | 1,013,490 |
| Bakelite U.S. Holding Ltd. 1LN, term loan CME Term SOFR 3 Month Index + 3.500% 8.8346% 5/29/29 (e)(f)(u) | | 2,308,027 | 2,315,251 |
| Consolidated Energy Finance SA Tranche B 1LN, term loan CME Term SOFR 1 Month Index + 4.500% 9.5572% 11/15/30 (e)(f)(u) | | 4,418,925 | 4,094,885 |
| Derby Buyer LLC 1LN, term loan CME Term SOFR 1 Month Index + 3.500% 8.8423% 11/1/30 (e)(f)(u) | | 2,912,700 | 2,916,341 |
| Discovery Purchaser Corp. 1LN, term loan CME Term SOFR 3 Month Index + 4.370% 9.6932% 10/4/29 (e)(f)(u) | | 10,276,584 | 10,265,588 |
| Groupe Solmax, Inc. Tranche B 1LN, term loan CME Term SOFR 3 Month Index + 4.750% 10.2375% 5/27/28 (e)(f)(u) | | 2,211,166 | 2,087,186 |
| Herens U.S. Holdco Corp. Tranche B 1LN, term loan CME Term SOFR 3 Month Index + 3.920% 9.3596% 7/3/28 (e)(f)(u) | | 2,606,916 | 2,498,573 |
| Hexion Holdings Corp. 1LN, term loan CME Term SOFR 3 Month Index + 4.500% 9.7711% 3/15/29 (e)(f)(u) | | 11,994,625 | 11,923,976 |
| Hexion, Inc. 2LN, term loan CME Term SOFR 1 Month Index + 7.430% 12.7842% 3/15/30 (e)(f)(u) | | 1,815,000 | 1,625,931 |
| INEOS U.S. Petrochem LLC: | | | |
| 1LN, term loan CME Term SOFR 1 Month Index + 3.750% 9.0967% 3/1/30 (e)(f)(u) | | 1,287,000 | 1,286,459 |
| Tranche B 1LN, term loan CME Term SOFR 1 Month Index + 4.250% 9.5967% 4/2/29 (e)(f)(u) | | 4,934,513 | 4,940,681 |
| Koppers, Inc. Tranche B 1LN, term loan CME Term SOFR 1 Month Index + 3.000% 8.34% 4/10/30 (e)(f)(u) | | 3,049,296 | 3,056,919 |
| M2S Group Intermediate Holding Tranche B 1LN, term loan CME Term SOFR 1 Month Index + 4.750% 9.8518% 8/25/31 (e)(f)(u) | | 5,790,000 | 5,428,125 |
| Manchester Acquisition Sub LLC Tranche B 1LN, term loan CME Term SOFR 3 Month Index + 5.750% 10.9157% 12/1/26 (e)(f)(u) | | 2,068,129 | 1,923,360 |
| Nouryon U.S.A. LLC Tranche B 1LN, term loan: | | | |
| CME Term SOFR 1 Month Index + 3.500% 8.8209% 4/3/28 (e)(f)(u) | | 1,637,625 | 1,643,766 |
| CME Term SOFR 3 Month Index + 3.500% 8.6284% 4/3/28 (e)(f)(u) | | 4,398,468 | 4,411,311 |
| Olympus Water U.S. Holding Corp. Tranche B 1LN, term loan CME Term SOFR 3 Month Index + 3.500% 8.8474% 6/23/31 (e)(f)(u) | | 9,645,536 | 9,668,299 |
| SCIH Salt Holdings, Inc. Tranche B 1LN, term loan CME Term SOFR 3 Month Index + 3.500% 8.7554% 3/16/27 (e)(f)(u) | | 1,609,934 | 1,610,384 |
| The Chemours Co. LLC Tranche B2 1LN, term loan CME Term SOFR 1 Month Index + 3.500% 8.7467% 8/18/28 (e)(f)(u) | | 7,408,446 | 7,389,925 |
| Touchdown Acquirer, Inc. Tranche B 1LN, term loan CME Term SOFR 1 Month Index + 3.250% 8.5602% 2/21/31 (e)(f)(u) | | 3,420,000 | 3,415,725 |
| W.R. Grace Holding LLC Tranche B 1LN, term loan CME Term SOFR 3 Month Index + 3.750% 8.4967% 9/22/28 (e)(f)(u) | | 1,783,835 | 1,787,402 |
| | | | 102,992,817 |
| Construction Materials - 0.0% | | | |
| Janus International Group LLC Tranche B 1LN, term loan CME Term SOFR 1 Month Index + 2.500% 7.7467% 8/5/30 (e)(f)(u) | | 907,200 | 905,504 |
| Smyrna Ready Mix Concrete LLC Tranche B 1LN, term loan CME Term SOFR 1 Month Index + 3.500% 8.778% 4/2/29 (e)(f)(u) | | 1,639,520 | 1,649,767 |
| VM Consolidated, Inc. Tranche B2 1LN, term loan CME Term SOFR 1 Month Index + 2.750% 7.9967% 3/27/28 (e)(f)(u) | | 3,309,411 | 3,325,958 |
| White Capital Buyer LLC Tranche B 1LN, term loan CME Term SOFR 1 Month Index + 3.250% 8.4967% 10/19/29 (e)(f)(u) | | 2,049,345 | 2,035,574 |
| | | | 7,916,803 |
| Containers & Packaging - 0.1% | | | |
| AOT Packaging Products AcquisitionCo LLC 1LN, term loan CME Term SOFR 1 Month Index + 3.250% 8.6112% 3/3/28 (e)(f)(u) | | 4,703,660 | 4,686,680 |
| Berlin Packaging, LLC Tranche B7 1LN, term loan CME Term SOFR 1 Month Index + 3.750% 8.9641% 6/7/31 (e)(f)(u) | | 8,613,332 | 8,604,375 |
| Berry Global, Inc. Tranche AA 1LN, term loan CME Term SOFR 3 Month Index + 1.750% 7.3162% 7/1/29 (e)(f)(u) | | 3,376,560 | 3,386,825 |
| Charter Next Generation, Inc. Tranche B 1LN, term loan CME Term SOFR 1 Month Index + 3.500% 8.4967% 12/1/27 (e)(f)(u) | | 4,495,787 | 4,504,913 |
| Clydesdale Acquisition Holdings, Inc. 1LN, term loan CME Term SOFR 1 Month Index + 3.670% 8.4217% 4/13/29 (e)(f)(u) | | 15,927,355 | 15,895,819 |
| Graham Packaging Co., Inc. Tranche B 1LN, term loan CME Term SOFR 1 Month Index + 2.500% 7.7467% 8/4/27 (e)(f)(u) | | 4,253,838 | 4,251,924 |
| Kloeckner Pentaplast of America, Inc. Tranche B 1LN, term loan CME Term SOFR 6 Month Index + 4.750% 9.7229% 2/9/26 (e)(f)(u) | | 3,207,460 | 3,019,599 |
| LC Ahab U.S. Bidco LLC Tranche B 1LN, term loan CME Term SOFR 1 Month Index + 3.500% 8.7467% 5/1/31 (e)(f)(u) | | 1,275,000 | 1,278,188 |
| Pactiv Evergreen Group Holdings, Inc. Tranche B4 1LN, term loan CME Term SOFR 1 Month Index + 2.500% 7.7467% 9/25/28 (e)(f)(u) | | 1,859,793 | 1,860,258 |
| Pregis TopCo Corp. 1LN, term loan CME Term SOFR 1 Month Index + 3.750% 9.2467% 8/3/26 (e)(f)(u) | | 1,089,297 | 1,089,983 |
| Reynolds Consumer Products LLC Tranche B 1LN, term loan CME Term SOFR 1 Month Index + 1.750% 7.0967% 1/30/27 (e)(f)(u) | | 3,118,452 | 3,128,587 |
| SupplyOne, Inc. Tranche B 1LN, term loan CME Term SOFR 1 Month Index + 4.250% 9.4967% 4/21/31 (e)(f)(u) | | 952,613 | 960,472 |
| | | | 52,667,623 |
| Metals & Mining - 0.0% | | | |
| Arsenal AIC Parent LLC Tranche B 1LN, term loan CME Term SOFR 1 Month Index + 3.250% 8.5602% 8/19/30 (e)(f)(u) | | 2,908,062 | 2,911,697 |
| Paper & Forest Products - 0.0% | | | |
| Ahlstrom-Munksjo OYJ 1LN, term loan CME Term SOFR 3 Month Index + 4.000% 9.3462% 2/4/28 (e)(f)(u) | | 2,255,401 | 2,246,943 |
| Asplundh Tree Expert LLC Tranche B 1LN, term loan CME Term SOFR 1 Month Index + 1.750% 6.9967% 5/23/31 (e)(f)(u) | | 2,582,415 | 2,586,986 |
| | | | 4,833,929 |
TOTAL MATERIALS | | | 171,322,869 |
| REAL ESTATE - 0.0% | | | |
| Real Estate Management & Development - 0.0% | | | |
| Cushman & Wakefield U.S. Borrower LLC Tranche B 1LN, term loan: | | | |
| CME Term SOFR 1 Month Index + 2.750% 8.1112% 8/21/25 (e)(f)(u) | | 18,334 | 18,311 |
| CME Term SOFR 1 Month Index + 3.000% 8.2467% 1/31/30 (e)(f)(u) | | 749,083 | 747,210 |
| Greystar Real Estate Partners 1LN, term loan CME Term SOFR 1 Month Index + 2.750% 8.0586% 8/21/30 (e)(f)(u) | | 2,408,584 | 2,411,595 |
| | | | 3,177,116 |
| UTILITIES - 0.1% | | | |
| Electric Utilities - 0.1% | | | |
| Brookfield WEC Holdings, Inc. Tranche B 1LN, term loan CME Term SOFR 1 Month Index + 2.750% 7.9967% 1/20/31 (e)(f)(u) | | 6,790,000 | 6,793,938 |
| Generation Bridge Northeast LLC Tranche B 1LN, term loan CME Term SOFR 1 Month Index + 3.500% 8.7467% 8/22/29 (e)(f)(u) | | 2,009,671 | 2,023,075 |
| PG&E Corp. Tranche B 1LN, term loan CME Term SOFR 1 Month Index + 3.000% 7.7467% 6/23/27 (e)(f)(u) | | 2,290,000 | 2,296,687 |
| Vistra Operations Co. LLC Tranche B 3LN, term loan CME Term SOFR 1 Month Index + 2.000% 7.2467% 12/20/30 (e)(f)(u) | | 5,002,167 | 5,013,772 |
| | | | 16,127,472 |
| Independent Power and Renewable Electricity Producers - 0.0% | | | |
| Calpine Construction Finance Co. LP Tranche B 1LN, term loan CME Term SOFR 1 Month Index + 2.000% 7.2467% 7/31/30 (e)(f)(u) | | 1,605,000 | 1,602,384 |
| Enstall Group BV Tranche B 1LN, term loan CME Term SOFR 3 Month Index + 4.750% 10.5962% 8/27/28 (e)(f)(h)(u) | | 5,655,471 | 5,344,420 |
| Win Waste Innovations Holdings Tranche B 1LN, term loan CME Term SOFR 1 Month Index + 2.750% 8.1112% 3/25/28 (e)(f)(u) | | 1,494,000 | 1,395,232 |
| | | | 8,342,036 |
| Multi-Utilities - 0.0% | | | |
| Osmose Utilities Services, Inc. Tranche B 1LN, term loan CME Term SOFR 1 Month Index + 3.250% 8.6112% 6/23/28 (e)(f)(u) | | 176,373 | 175,233 |
TOTAL UTILITIES | | | 24,644,741 |
| TOTAL BANK LOAN OBLIGATIONS (Cost $2,000,357,270) | | | 1,962,301,988 |
| | | | |
| Bank Notes - 0.1% |
| | | Principal Amount (a) | Value ($) |
| Discover Bank ICE IBA - USD SOFR SPREAD-ADJ + 1.730% 5.974% 8/9/28 (e)(f) | | 8,844,000 | 9,086,078 |
| KeyBank NA 6.95% 2/1/28 | | 1,259,000 | 1,325,819 |
| Regions Bank 6.45% 6/26/37 | | 15,683,000 | 16,699,203 |
| TOTAL BANK NOTES (Cost $25,774,261) | | | 27,111,100 |
| | | | |
| Preferred Securities - 0.4% |
| | | Principal Amount (a) | Value ($) |
| COMMUNICATION SERVICES - 0.0% | | | |
| Diversified Telecommunication Services - 0.0% | | | |
| CAS Capital No 1 Ltd. 4% (Reg. S) (e)(j) | | 2,030,000 | 1,951,062 |
| CONSUMER DISCRETIONARY - 0.0% | | | |
| Automobiles - 0.0% | | | |
| Volkswagen International Finance NV 3.875% (Reg. S) (e)(j) | EUR | 9,000,000 | 9,431,735 |
| CONSUMER STAPLES - 0.0% | | | |
| Food Products - 0.0% | | | |
| Cosan Overseas Ltd. 8.25% (j) | | 2,363,000 | 2,429,006 |
| Tobacco - 0.0% | | | |
| British American Tobacco PLC 3% (Reg. S) (e)(j) | EUR | 9,250,000 | 10,041,573 |
TOTAL CONSUMER STAPLES | | | 12,470,579 |
| ENERGY - 0.0% | | | |
| Oil, Gas & Consumable Fuels - 0.0% | | | |
| Energy Transfer LP 6.625% (e)(j) | | 1,235,000 | 1,204,889 |
| EnLink Midstream Partners LP CME Term SOFR 3 Month Index + 4.370% 9.7156% (e)(f)(j) | | 2,995,000 | 3,050,229 |
| Plains All American Pipeline LP CME Term SOFR 3 Month Index + 4.110% 9.4897% (e)(f)(j) | | 6,233,000 | 6,229,753 |
| | | | 10,484,871 |
| FINANCIALS - 0.2% | | | |
| Banks - 0.1% | | | |
| AIB Group PLC 6.25% (Reg. S) (e)(j) | EUR | 3,600,000 | 4,059,358 |
| Banco de Credito e Inversiones 8.75% (b)(e)(j) | | 1,075,000 | 1,157,728 |
| Banco del Estado de Chile 7.95% (b)(e)(j) | | 935,000 | 1,008,730 |
| Banco Do Brasil SA 10-Year Treasury Constant Maturity Rate + 4.390% 8.748% (b)(e)(f)(j) | | 1,895,000 | 1,979,864 |
| Banco Mercantil del Norte SA: | | | |
| 6.75% (b)(e)(j) | | 1,465,000 | 1,478,615 |
| 7.625% (b)(e)(j) | | 2,633,000 | 2,685,214 |
| Bank of America Corp.: | | | |
| 5.875% (e)(j) | | 3,830,000 | 3,907,404 |
| 6.25% (e)(j) | | 2,441,000 | 2,512,365 |
| Barclays PLC: | | | |
| 5.875% (Reg. S) (e)(j) | GBP | 2,950,000 | 3,922,742 |
| 7.125% (e)(j) | GBP | 645,000 | 859,721 |
| 8.875% (e)(j) | GBP | 1,600,000 | 2,214,848 |
| BBVA Bancomer SA Texas Branch: | | | |
| 5.125% 1/18/33 (b)(e) | | 1,500,000 | 1,431,119 |
| 5.35% 11/12/29 (b)(e) | | 485,000 | 486,938 |
| 8.45% 6/29/38 (b)(e) | | 885,000 | 964,142 |
| Citigroup, Inc. 7.125% (e)(j) | | 2,120,000 | 2,208,335 |
| Citigroup, Inc. 4.7% (e)(j) | | 1,915,000 | 1,909,367 |
| JPMorgan Chase & Co.: | | | |
| 4.6% (e)(j) | | 2,510,000 | 2,506,432 |
| 6.1% (e)(j) | | 3,287,000 | 3,370,261 |
| Lloyds Banking Group PLC 5.125% (e)(j) | GBP | 435,000 | 572,909 |
| M&T Bank Corp.: | | | |
| 3.5% (e)(j) | | 490,000 | 433,463 |
| 5.125% (e)(j) | | 965,000 | 955,141 |
| NBK Tier 1 Ltd. 3.625% (b)(e)(j) | | 835,000 | 791,197 |
| Tinkoff Bank JSC 6% (b)(d)(e)(h)(j) | | 715,000 | 35,750 |
| Wells Fargo & Co. 6.85% (e)(j) | | 2,160,000 | 2,235,726 |
| | | | 43,687,369 |
| Capital Markets - 0.0% | | | |
| Credit Suisse Group AG Claim (d)(e)(j) | | 15,540,000 | 1,709,400 |
| UBS Group AG 7% (Reg. S) (e)(j) | | 940,000 | 975,807 |
| | | | 2,685,207 |
| Consumer Finance - 0.1% | | | |
| Ally Financial, Inc.: | | | |
| 4.7% (e)(j) | | 3,166,000 | 2,884,167 |
| 4.7% (e)(j) | | 3,804,000 | 3,175,259 |
| | | | 6,059,426 |
TOTAL FINANCIALS | | | 52,432,002 |
| INDUSTRIALS - 0.1% | | | |
| Ground Transportation - 0.0% | | | |
| Mobico Group PLC 4.25% (Reg. S) (e)(j) | GBP | 1,540,000 | 1,909,892 |
| Marine Transportation - 0.0% | | | |
| DP World Salaam 6% (Reg. S) (e)(j) | | 2,800,000 | 2,815,704 |
| Trading Companies & Distributors - 0.1% | | | |
| AerCap Holdings NV 5.875% 10/10/79 (e) | | 8,890,000 | 9,083,638 |
| Air Lease Corp. 4.125% (e)(j) | | 4,242,000 | 3,905,359 |
| Aircastle Ltd. 5.25% (b)(e)(j) | | 4,937,000 | 4,970,369 |
| | | | 17,959,366 |
TOTAL INDUSTRIALS | | | 22,684,962 |
| INFORMATION TECHNOLOGY - 0.0% | | | |
| IT Services - 0.0% | | | |
| Network i2i Ltd.: | | | |
| 3.975% (b)(e)(j) | | 645,000 | 627,520 |
| 5.65% (b)(e)(j) | | 2,145,000 | 2,184,324 |
| | | | 2,811,844 |
| MATERIALS - 0.0% | | | |
| Construction Materials - 0.0% | | | |
| CEMEX S.A.B. de CV: | | | |
| 5.125% (b)(e)(j) | | 3,310,000 | 3,322,919 |
| 9.125% (b)(e)(j) | | 1,800,000 | 1,992,953 |
| | | | 5,315,872 |
| REAL ESTATE - 0.1% | | | |
| Real Estate Management & Development - 0.1% | | | |
| Aroundtown Finance Sarl 7.875% (e)(j) | | 13,000,000 | 10,335,486 |
| Aroundtown SA 3.375% (Reg. S) (e)(j) | EUR | 6,200,000 | 4,924,183 |
| Citycon Oyj 7.875% (Reg. S) (e)(j) | EUR | 2,550,000 | 2,369,482 |
| CPI Property Group SA 3.75% (Reg. S) (e)(j) | EUR | 6,840,000 | 4,980,302 |
| Grand City Properties SA 1.5% (Reg. S) (e)(j) | EUR | 10,500,000 | 9,452,990 |
| Heimstaden Bostad AB: | | | |
| 3.248% (Reg. S) (e)(j) | EUR | 11,640,000 | 11,545,637 |
| 3.625% (Reg. S) (e)(j) | EUR | 600,000 | 547,558 |
| Samhallsbyggnadsbolaget I Norden AB 2.624% (Reg. S) (d)(e)(j) | EUR | 5,240,000 | 2,041,784 |
| | | | 46,197,422 |
| UTILITIES - 0.0% | | | |
| Electric Utilities - 0.0% | | | |
| SSE PLC 3.74% (Reg. S) (e)(j) | GBP | 3,300,000 | 4,283,989 |
| TOTAL PREFERRED SECURITIES (Cost $201,601,217) | | | 168,064,338 |
| | | | |
| Money Market Funds - 3.4% |
| | | Shares | Value ($) |
| Fidelity Cash Central Fund 5.39% (x) | | 1,266,504,374 | 1,266,757,675 |
| Fidelity Securities Lending Cash Central Fund 5.39% (x)(y) | | 65,286,034 | 65,292,563 |
| TOTAL MONEY MARKET FUNDS (Cost $1,331,994,283) | | | 1,332,050,238 |
| | | | |
| Purchased Swaptions - 0.1% |
| | Expiration Date | Notional Amount (a) | Value ($) |
| Put Options - 0.0% | | | | |
| Option on an interest rate swap with Bank of America N.A. to pay annually a fixed rate of 3.7375% and receive annually a floating rate based on the U.S. Secured Overnight Fin. Rate (SOFR) Index, expiring February 2035. | 2/26/25 | | 22,700,000 | 304,320 |
| Option on an interest rate swap with Bank of America N.A. to pay annually a fixed rate of 4.05% and receive annually a floating rate based on the U.S. Secured Overnight Fin. Rate (SOFR) Index, expiring April 2034. | 4/23/29 | | 55,300,000 | 1,664,339 |
| Option on an interest rate swap with Citibank N.A. to pay annually a fixed rate of 3.755% and receive annually a floating rate based on the U.S. Secured Overnight Fin. Rate (SOFR) Index, expiring March 2034. | 3/19/29 | | 40,800,000 | 1,380,092 |
| Option on an interest rate swap with Citibank N.A. to pay annually a fixed rate of 3.778% and receive annually a floating rate based on the U.S. Secured Overnight Fin. Rate (SOFR) Index, expiring February 2035. | 2/24/25 | | 23,000,000 | 284,347 |
| Option on an interest rate swap with Goldman Sachs Bank U.S.A. to pay annually a fixed rate of 3.455% and receive annually a floating rate based on the U.S. Secured Overnight Fin. Rate (SOFR) Index, expiring August 2034. | 8/29/29 | | 57,200,000 | 2,299,230 |
| Option on an interest rate swap with Goldman Sachs Bank U.S.A. to pay annually a fixed rate of 3.53% and receive annually a floating rate based on the U.S. Secured Overnight Fin. Rate (SOFR) Index, expiring August 2034. | 8/01/29 | | 17,100,000 | 660,481 |
| Option on an interest rate swap with Goldman Sachs Bank U.S.A. to pay annually a fixed rate of 3.865% and receive annually a floating rate based on the U.S. Secured Overnight Fin. Rate (SOFR) Index, expiring May 2035. | 5/15/25 | | 59,600,000 | 853,096 |
| Option on an interest rate swap with JPMorgan Chase Bank N.A. to pay annually a fixed rate of 3.8225% and receive annually a floating rate based on the U.S. Secured Overnight Fin. Rate (SOFR) Index, expiring February 2035. | 2/24/25 | | 35,900,000 | 409,142 |
| | | | | |
| TOTAL PUT OPTIONS | | | | 7,855,047 |
| Call Options - 0.1% | | | | |
| Option on an interest rate swap with Bank of America N.A. to receive annually a fixed rate of 3.7375% and pay annually a floating rate based on the U.S. Secured Overnight Fin. Rate (SOFR) Index, expiring February 2035. | 2/26/25 | | 22,700,000 | 963,622 |
| Option on an interest rate swap with Bank of America N.A. to receive annually a fixed rate of 4.05% and pay annually a floating rate based on the U.S. Secured Overnight Fin. Rate (SOFR) Index, expiring April 2034. | 4/23/29 | | 55,300,000 | 2,907,462 |
| Option on an interest rate swap with Citibank N.A. to receive annually a fixed rate of 3.755% and pay annually a floating rate based on the U.S. Secured Overnight Fin. Rate (SOFR) Index, expiring March 2034. | 3/19/29 | | 40,800,000 | 1,837,264 |
| Option on an interest rate swap with Citibank N.A. to receive annually a fixed rate of 3.778% and pay annually a floating rate based on the U.S. Secured Overnight Fin. Rate (SOFR) Index, expiring February 2035. | 2/24/25 | | 23,000,000 | 1,029,102 |
| Option on an interest rate swap with Goldman Sachs Bank U.S.A. to receive annually a fixed rate of 3.455% and pay annually a floating rate based on the U.S. Secured Overnight Fin. Rate (SOFR) Index, expiring August 2034. | 8/29/29 | | 57,200,000 | 2,198,484 |
| Option on an interest rate swap with Goldman Sachs Bank U.S.A. to receive annually a fixed rate of 3.53% and pay annually a floating rate based on the U.S. Secured Overnight Fin. Rate (SOFR) Index, expiring August 2034. | 8/01/29 | | 17,100,000 | 683,488 |
| Option on an interest rate swap with Goldman Sachs Bank U.S.A. to receive annually a fixed rate of 3.865% and pay annually a floating rate based on the U.S. Secured Overnight Fin. Rate (SOFR) Index, expiring May 2035. | 5/15/25 | | 59,600,000 | 3,238,190 |
| Option on an interest rate swap with JPMorgan Chase Bank N.A. to receive annually a fixed rate of 3.8225% and pay annually a floating rate based on the U.S. Secured Overnight Fin. Rate (SOFR) Index, expiring February 2035. | 2/24/25 | | 35,900,000 | 1,704,103 |
| | | | | |
| TOTAL CALL OPTIONS | | | | 14,561,715 |
TOTAL PURCHASED SWAPTIONS (Cost $23,581,098) | | | | 22,416,762 |
| TOTAL INVESTMENT IN SECURITIES - 111.2% (Cost $45,278,192,131) | 43,966,443,462 |
NET OTHER ASSETS (LIABILITIES) - (11.2)% | (4,413,180,927) |
| NET ASSETS - 100.0% | 39,553,262,535 |
| | |
| TBA Sale Commitments |
| | Principal Amount (a) | Value ($) |
| Ginnie Mae | | |
| 2% 9/1/54 | (27,100,000) | (22,816,776) |
| 3% 9/1/54 | (33,650,000) | (30,430,193) |
| 3% 9/1/54 | (65,000,000) | (58,780,462) |
| 3.5% 9/1/54 | (6,900,000) | (6,421,327) |
| 5% 9/1/54 | (54,550,000) | (54,434,714) |
| 5% 9/1/54 | (67,000,000) | (66,858,402) |
| 5.5% 9/1/54 | (70,150,000) | (70,598,721) |
| 6% 9/1/54 | (133,950,000) | (135,892,530) |
| | | |
| TOTAL GINNIE MAE | | (446,233,125) |
| | | |
| Uniform Mortgage Backed Securities | | |
| 2% 9/1/39 | (25,700,000) | (23,240,430) |
| 2% 9/1/54 | (264,350,000) | (216,209,380) |
| 2% 9/1/54 | (17,975,000) | (14,701,584) |
| 2% 9/1/54 | (17,975,000) | (14,701,584) |
| 2% 9/1/54 | (104,450,000) | (85,428,673) |
| 2% 9/1/54 | (105,350,000) | (86,164,775) |
| 2% 9/1/54 | (278,400,000) | (227,700,743) |
| 2% 9/1/54 | (800,000) | (654,312) |
| 2.5% 9/1/54 | (187,200,000) | (159,580,680) |
| 2.5% 9/1/54 | (12,600,000) | (10,741,007) |
| 2.5% 9/1/54 | (12,700,000) | (10,826,253) |
| 3% 9/1/54 | (25,450,000) | (22,564,011) |
| 3% 9/1/54 | (4,400,000) | (3,901,047) |
| 3% 9/1/54 | (50,700,000) | (44,950,701) |
| 3% 9/1/54 | (6,300,000) | (5,585,590) |
| 3% 9/1/54 | (12,500,000) | (11,082,520) |
| 3% 9/1/54 | (22,350,000) | (19,815,546) |
| 3% 9/1/54 | (18,700,000) | (16,579,450) |
| 3% 10/1/54 | (18,700,000) | (16,595,519) |
| 3.5% 9/1/54 | (25,700,000) | (23,655,043) |
| 3.5% 9/1/54 | (12,800,000) | (11,781,500) |
| 4% 9/1/54 | (7,000,000) | (6,638,242) |
| 4% 9/1/54 | (26,300,000) | (24,940,824) |
| 4.5% 9/1/54 | (16,100,000) | (15,667,942) |
| 5% 9/1/54 | (6,225,000) | (6,179,528) |
| 6% 9/1/54 | (3,700,000) | (3,768,074) |
| 6% 9/1/54 | (26,700,000) | (27,191,237) |
| 6% 9/1/54 | (39,550,000) | (40,277,657) |
| 6% 9/1/54 | (12,750,000) | (12,984,580) |
| 6% 9/1/54 | (22,000,000) | (22,404,765) |
| | | |
| TOTAL UNIFORM MORTGAGE BACKED SECURITIES | | (1,186,513,197) |
| | | |
TOTAL TBA SALE COMMITMENTS (Proceeds $1,620,630,637) | | (1,632,746,322) |
| Futures Contracts |
| | Number of contracts | Expiration Date | Notional Amount ($) | Value ($) | Unrealized Appreciation/ (Depreciation) ($) |
| Purchased | | | | | |
| | | | | | |
| Bond Index Contracts | | | | | |
| TME 10 Year Canadian Note Contracts (Canada) | 315 | Dec 2024 | 28,764,071 | (292,662) | (292,662) |
| | | | | | |
| Treasury Contracts | | | | | |
| ASX 10 Year Treasury Bond Index Contracts (Australia) | 100 | Sep 2024 | 7,890,434 | 202,584 | 202,584 |
| CBOT 10-Year U.S. Treasury Note Contracts (United States) | 11 | Dec 2024 | 1,249,188 | (10,161) | (10,161) |
| CBOT 2-Year U.S. Treasury Note Contracts (United States) | 95 | Dec 2024 | 19,716,953 | (26,140) | (26,140) |
| CBOT 5-Year U.S. Treasury Note Contracts (United States) | 24,192 | Dec 2024 | 2,646,567,000 | (11,381,671) | (11,381,671) |
| CBOT Long Term U.S. Treasury Bond Contracts (United States) | 167 | Dec 2024 | 20,561,875 | (408,691) | (408,691) |
| | | | | | |
| TOTAL TREASURY CONTRACTS | | | | | (11,624,079) |
| | | | | | |
| TOTAL PURCHASED | | | | | (11,916,741) |
| | | | | | |
| Sold | | | | | |
| | | | | | |
| Bond Index Contracts | | | | | |
| ICE Long Gilt Contracts (United Kingdom) | 19 | Dec 2024 | 2,462,831 | 15,889 | 15,889 |
| | | | | | |
| Treasury Contracts | | | | | |
| CBOT 10-Year U.S. Treasury Note Contracts (United States) | 2,612 | Dec 2024 | 296,625,250 | 2,382,640 | 2,382,640 |
| CBOT Long Term U.S. Treasury Bond Contracts (United States) | 200 | Dec 2024 | 24,625,000 | 487,112 | 487,112 |
| | | | | | |
| TOTAL TREASURY CONTRACTS | | | | | 2,869,752 |
| | | | | | |
| TOTAL SOLD | | | | | 2,885,641 |
| | | | | | |
| TOTAL FUTURES CONTRACTS | | | | | (9,031,100) |
| The notional amount of futures purchased as a percentage of Net Assets is 6.9% |
| The notional amount of futures sold as a percentage of Net Assets is 0.8% |
| Forward Foreign Currency Contracts |
Currency Purchased
| Currency Sold | Counterparty | Settlement Date | Unrealized Appreciation/ (Depreciation) ($) |
| | | | | | | |
| EUR | 1,824,000 | USD | 2,019,589 | BNP Paribas S.A. | 9/04/24 | (3,340) |
| USD | 172,898 | AUD | 258,000 | UBS AG | 10/03/24 | (1,855) |
| USD | 2,404,616 | CAD | 3,284,000 | Bank of America, N.A. | 10/03/24 | (34,468) |
| USD | 3,940,318 | EUR | 3,554,000 | BNP Paribas S.A. | 10/03/24 | 6,508 |
| USD | 431,873,241 | EUR | 390,675,000 | Bank of America, N.A. | 10/03/24 | (552,558) |
| USD | 247,137 | EUR | 222,000 | Brown Brothers Harriman & Co | 10/03/24 | 1,412 |
| USD | 446,468 | EUR | 400,000 | JPMorgan Chase Bank, N.A. | 10/03/24 | 3,720 |
| USD | 150,226,922 | GBP | 115,945,000 | State Street Bank and Trust Co | 10/03/24 | (2,084,891) |
| USD | 4,663,765 | JPY | 677,750,000 | Brown Brothers Harriman & Co | 10/03/24 | 8,093 |
| | | | | | | |
| TOTAL FORWARD FOREIGN CURRENCY CONTRACTS | | (2,657,379) |
| Unrealized Appreciation | | | 19,733 |
| Unrealized Depreciation | | | (2,677,112) |
| Credit Default Swaps |
| Underlying Reference | Rating(1) | Maturity Date | Clearinghouse / Counterparty(2) | Fixed Payment Received/ (Paid) | Payment Frequency | Notional Amount(3)(4) | Value ($)(1) | Upfront Premium Received/ (Paid) ($)(5) | Unrealized Appreciation/ (Depreciation) ($) |
| Buy Protection | | | | | | | | | | |
| AXA SA | | Jun 2029 | Goldman Sachs Bank USA | (1%) | Quarterly | EUR | 2,050,000 | (25,950) | 24,405 | (1,545) |
| AXA SA | | Jun 2029 | Goldman Sachs Bank USA | (1%) | Quarterly | EUR | 2,050,000 | (25,950) | 24,405 | (1,545) |
| AXA SA | | Jun 2029 | Goldman Sachs Bank USA | (1%) | Quarterly | EUR | 4,350,000 | (55,064) | 51,798 | (3,266) |
| Assicurazioni Generali SpA | | Jun 2029 | BNP Paribas S.A. | (1%) | Quarterly | EUR | 5,050,000 | 8,861 | (46,606) | (37,745) |
| BMW Finance NV | | Jun 2029 | BNP Paribas S.A. | (1%) | Quarterly | EUR | 4,100,000 | (116,980) | 100,265 | (16,715) |
| BMW Finance NV | | Jun 2029 | BNP Paribas S.A. | (1%) | Quarterly | EUR | 2,100,000 | (59,916) | 51,561 | (8,355) |
| BMW Finance NV | | Jun 2029 | BNP Paribas S.A. | (1%) | Quarterly | EUR | 3,150,000 | (89,875) | 77,377 | (12,498) |
| BMW Finance NV | | Jun 2029 | BNP Paribas S.A. | (1%) | Quarterly | EUR | 3,050,000 | (87,021) | 74,902 | (12,119) |
| CMBX N.A. AAA Index Series 13 | | Dec 2072 | Citigroup Global Markets Ltd. | (0.5%) | Monthly | | 6,120,000 | 20,204 | (65,380) | (45,176) |
| CMBX N.A. AAA Index Series 13 | | Dec 2072 | Merrill Lynch Capital Services, Inc. | (0.5%) | Monthly | | 6,260,000 | 20,666 | (103,710) | (83,044) |
| CMBX N.A. AAA Index Series 15 | | Nov 2064 | JPMorgan Securities LLC | (0.5%) | Monthly | | 7,500,000 | 79,649 | (85,958) | (6,309) |
| CMBX N.A. BBB- Index Series 16 | | Apr 2065 | Citigroup Global Markets Ltd. | (3%) | Monthly | | 1,010,000 | 149,089 | (276,058) | (126,969) |
| CMBX N.A. BBB- Index Series 16 | | Apr 2065 | Citigroup Global Markets Ltd. | (3%) | Monthly | | 1,820,000 | 268,655 | (517,075) | (248,420) |
| CMBX N.A. BBB- Index Series 16 | | Apr 2065 | Citigroup Global Markets Ltd. | (3%) | Monthly | | 1,400,000 | 206,657 | (340,261) | (133,604) |
| CMBX N.A. BBB- Index Series 16 | | Apr 2065 | Citigroup Global Markets Ltd. | (3%) | Monthly | | 2,650,000 | 391,173 | (641,663) | (250,490) |
| CMBX N.A. BBB- Index Series 16 | | Apr 2065 | Citigroup Global Markets Ltd. | (3%) | Monthly | | 500,000 | 73,806 | (114,754) | (40,948) |
| CMBX N.A. BBB- Index Series 16 | | Apr 2065 | Citigroup Global Markets Ltd. | (3%) | Monthly | | 1,410,000 | 208,133 | (312,891) | (104,758) |
| CMBX N.A. BBB- Index Series 16 | | Apr 2065 | Citigroup Global Markets Ltd. | (3%) | Monthly | | 2,200,000 | 324,747 | (575,424) | (250,677) |
| CMBX N.A. BBB- Index Series 16 | | Apr 2065 | Citigroup Global Markets Ltd. | (3%) | Monthly | | 3,610,000 | 532,881 | (806,970) | (274,089) |
| CMBX N.A. BBB- Index Series 16 | | Apr 2065 | Goldman Sachs & Co. LLC | (3%) | Monthly | | 1,750,000 | 258,322 | (417,605) | (159,283) |
| CMBX N.A. BBB- Index Series 16 | | Apr 2065 | Goldman Sachs & Co. LLC | (3%) | Monthly | | 900,000 | 132,851 | (173,641) | (40,790) |
| CMBX N.A. BBB- Index Series 16 | | Apr 2065 | Goldman Sachs & Co. LLC | (3%) | Monthly | | 510,000 | 75,282 | (133,324) | (58,042) |
| CMBX N.A. BBB- Index Series 16 | | Apr 2065 | Goldman Sachs & Co. LLC | (3%) | Monthly | | 2,970,000 | 438,409 | (852,792) | (414,383) |
| CMBX N.A. BBB- Index Series 16 | | Apr 2065 | Goldman Sachs & Co. LLC | (3%) | Monthly | | 2,230,000 | 329,176 | (567,672) | (238,496) |
| CMBX N.A. BBB- Index Series 16 | | Apr 2065 | Goldman Sachs & Co. LLC | (3%) | Monthly | | 4,910,000 | 724,777 | (1,430,672) | (705,895) |
| CMBX N.A. BBB- Index Series 16 | | Apr 2065 | JPMorgan Securities LLC | (3%) | Monthly | | 1,800,000 | 265,702 | (505,509) | (239,807) |
| CMBX N.A. BBB- Index Series 16 | | Apr 2065 | JPMorgan Securities LLC | (3%) | Monthly | | 1,340,000 | 197,801 | (373,114) | (175,313) |
| CMBX N.A. BBB- Index Series 16 | | Apr 2065 | JPMorgan Securities LLC | (3%) | Monthly | | 1,200,000 | 177,135 | (315,247) | (138,112) |
| CMBX N.A. BBB- Index Series 16 | | Apr 2065 | JPMorgan Securities LLC | (3%) | Monthly | | 1,280,000 | 188,944 | (385,221) | (196,277) |
| CMBX N.A. BBB- Index Series 16 | | Apr 2065 | Morgan Stanley Capital Services LLC | (3%) | Monthly | | 1,990,000 | 293,749 | (467,923) | (174,174) |
| CMBX N.A. BBB- Index Series 16 | | Apr 2065 | Morgan Stanley Capital Services LLC | (3%) | Monthly | | 1,460,000 | 215,514 | (334,084) | (118,570) |
| CMBX N.A. BBB- Index Series 16 | | Apr 2065 | Morgan Stanley Capital Services LLC | (3%) | Monthly | | 1,670,000 | 246,513 | (397,935) | (151,422) |
| CMBX N.A. BBB- Index Series 16 | | Apr 2065 | Morgan Stanley Capital Services LLC | (3%) | Monthly | | 1,670,000 | 246,513 | (410,490) | (163,977) |
| CMBX N.A. BBB- Index Series 16 | | Apr 2065 | Morgan Stanley Capital Services LLC | (3%) | Monthly | | 1,680,000 | 247,989 | (414,987) | (166,998) |
| CMBX N.A. BBB- Index Series 16 | | Apr 2065 | Morgan Stanley Capital Services LLC | (3%) | Monthly | | 2,380,000 | 351,318 | (598,502) | (247,184) |
| CMBX N.A. BBB- Index Series 16 | | Apr 2065 | Morgan Stanley Capital Services LLC | (3%) | Monthly | | 900,000 | 132,851 | (149,636) | (16,785) |
| CMBX N.A. BBB- Index Series 16 | | Apr 2065 | Morgan Stanley Capital Services LLC | (3%) | Monthly | | 1,800,000 | 265,702 | (301,529) | (35,827) |
| CMBX N.A. BBB- Index Series 17 | | Dec 2056 | Citigroup Global Markets Ltd. | (3%) | Monthly | | 1,600,000 | 176,088 | (258,765) | (82,677) |
| CMBX N.A. BBB- Index Series 17 | | Dec 2056 | Goldman Sachs & Co. LLC | (3%) | Monthly | | 1,400,000 | 154,077 | (199,831) | (45,754) |
| CMBX N.A. BBB- Index Series 17 | | Dec 2056 | Goldman Sachs & Co. LLC | (3%) | Monthly | | 1,800,000 | 198,099 | (232,580) | (34,481) |
| CMBX N.A. BBB- Index Series 17 | | Dec 2056 | JPMorgan Securities LLC | (3%) | Monthly | | 800,000 | 88,044 | (105,330) | (17,286) |
| CMBX N.A. BBB- Index Series 17 | | Dec 2056 | Morgan Stanley Capital Services LLC | (3%) | Monthly | | 800,000 | 88,044 | (114,189) | (26,145) |
| CMBX N.A. BBB- Index Series 17 | | Dec 2056 | Morgan Stanley Capital Services LLC | (3%) | Monthly | | 1,500,000 | 165,082 | (208,894) | (43,812) |
| Heidelberg Materials AG | | Jun 2029 | BNP Paribas S.A. | (5%) | Quarterly | EUR | 4,100,000 | (899,074) | 832,171 | (66,903) |
| Heidelberg Materials AG | | Jun 2029 | BNP Paribas S.A. | (5%) | Quarterly | EUR | 1,650,000 | (361,823) | 333,455 | (28,368) |
| Intesa Sanpaolo SpA | | Jun 2029 | JPMorgan Chase Bank, N.A. | (1%) | Quarterly | EUR | 5,150,000 | 72,261 | (110,340) | (38,079) |
| Societe Generale | | Jun 2029 | Goldman Sachs Bank USA | (1%) | Quarterly | EUR | 5,650,000 | 68,827 | (37,211) | 31,616 |
| UniCredit SpA | | Jun 2029 | Goldman Sachs Bank USA | (1%) | Quarterly | EUR | 4,600,000 | 64,011 | (96,443) | (32,432) |
| | | | | | | | | | | |
| TOTAL BUY PROTECTION | | | | | | | | 6,425,949 | (11,909,877) | (5,483,928) |
| Sell Protection | | | | | | | | | | |
| 5-Year CDX N.A. EM Series 41 | NR | Jun 2029 | ICE | 1% | Quarterly | | 18,500,000 | 74,851 | 0 | 74,851 |
| CMBX N.A. AAA Index Series 13 | NR | Dec 2072 | Morgan Stanley Capital Services LLC | 0.5% | Monthly | | 12,380,000 | (40,870) | 287,027 | 246,157 |
| CMBX N.A. AAA Index Series 16 | NR | Apr 2065 | Citigroup Global Markets Ltd. | 0.5% | Monthly | | 5,700,000 | (84,465) | 90,143 | 5,678 |
| CMBX N.A. AAA Index Series 16 | NR | Apr 2065 | Citigroup Global Markets Ltd. | 0.5% | Monthly | | 29,340,000 | (434,775) | 590,741 | 155,966 |
| CMBX N.A. AAA Index Series 17 | NR | Dec 2056 | Citigroup Global Markets Ltd. | 0.5% | Monthly | | 5,500,000 | (109,734) | 115,024 | 5,290 |
| CMBX N.A. AAA Index Series 17 | NR | Dec 2056 | Citigroup Global Markets Ltd. | 0.5% | Monthly | | 13,000,000 | (259,372) | 324,510 | 65,138 |
| CMBX N.A. AAA Index Series 17 | NR | Dec 2056 | Citigroup Global Markets Ltd. | 0.5% | Monthly | | 37,600,000 | (750,184) | 944,588 | 194,404 |
| CMBX N.A. AAA Index Series 17 | NR | Dec 2056 | Goldman Sachs & Co. LLC | 0.5% | Monthly | | 5,100,000 | (101,754) | 115,134 | 13,380 |
| | | | | | | | | | | |
| TOTAL SELL PROTECTION | | | | | | | | (1,706,303) | 2,467,167 | 760,864 |
| TOTAL CREDIT DEFAULT SWAPS | | | | | | | | 4,719,646 | (9,442,710) | (4,723,064) |
(1)Ratings are presented for credit default swaps in which the Fund has sold protection on the underlying referenced debt. Ratings for an underlying index represent a weighted average of the ratings of all securities included in the index. The credit rating or value can be measures of the current payment/performance risk. Ratings are from Moody's Investors Service, Inc. Where Moody's® ratings are not available, S&P® ratings are disclosed and are indicated as such. All ratings are as of the report date and do not reflect subsequent changes.
(2)Swaps with Intercontinental Exchange (ICE) are centrally cleared swaps.
(3)The notional amount of each credit default swap where the Fund has sold protection approximates the maximum potential amount of future payments that the Fund could be required to make if a credit event were to occur.
(4)Notional amount is stated in U.S. Dollars unless otherwise noted.
(5)Any premiums for centrally cleared swaps are recorded periodically throughout the term of the swap to variation margin and included in unrealized appreciation (depreciation).
| Interest Rate Swaps |
| Payment Received | Payment Frequency | Payment Paid | Payment Frequency | Clearinghouse / Counterparty(1) | Maturity Date | Notional Amount(2) | Value ($) | Upfront Premium Received/ (Paid) ($)(3) | Unrealized Appreciation/ (Depreciation) ($) |
U.S. Secured Overnight Fin. Rate (SOFR) Index(4) | Annual | 3.75% | Annual | LCH | Sep 2026 | | 181,306,000 | (2,127,106) | 0 | (2,127,106) |
U.S. Secured Overnight Fin. Rate (SOFR) Index(4) | Annual | 3.5% | Annual | LCH | Sep 2027 | | 321,500,000 | (4,498,572) | 0 | (4,498,572) |
U.S. Secured Overnight Fin. Rate (SOFR) Index(4) | Annual | 3.5% | Annual | LCH | Sep 2029 | | 75,127,000 | (1,517,439) | 0 | (1,517,439) |
U.S. Secured Overnight Fin. Rate (SOFR) Index(4) | Annual | 3.5% | Annual | LCH | Sep 2031 | | 151,636,000 | (3,517,967) | 0 | (3,517,967) |
U.S. Secured Overnight Fin. Rate (SOFR) Index(4) | Annual | 3.75% | Annual | LCH | Sep 2044 | | 68,931,000 | (1,271,930) | 0 | (1,271,930) |
| 3.5% | Annual | U.S. Secured Overnight Fin. Rate (SOFR) Index(4) | Annual | LCH | Sep 2054 | | 4,235,000 | 121,625 | 0 | 121,625 |
| TOTAL INTEREST RATE SWAPS | | | | | | | | (12,811,389) | 0 | (12,811,389) |
| | | | | | | | | | | |
(1)Swaps with LCH Clearnet Group (LCH) are centrally cleared swaps.
(2)Notional amount is stated in U.S. Dollars unless otherwise noted.
(3)Any premiums for centrally cleared swaps are recorded periodically throughout the term of the swap to variation margin and included in unrealized appreciation (depreciation).
(4)Represents floating rate.
Currency Abbreviations
| AUD | - | Australian dollar |
| CAD | - | Canadian dollar |
| EUR | - | European Monetary Unit |
| GBP | - | British pound sterling |
| JPY | - | Japanese yen |
| USD | - | U.S. dollar |
Legend
| (a) | Amount is stated in United States dollars unless otherwise noted. |
| (b) | Security exempt from registration under Rule 144A of the Securities Act of 1933. These securities may be resold in transactions exempt from registration, normally to qualified institutional buyers. At the end of the period, the value of these securities amounted to $7,746,536,838 or 19.6% of net assets. |
| (c) | Security or a portion of the security is on loan at period end. |
| (d) | Non-income producing - Security is in default. |
| (e) | Coupon rates for floating and adjustable rate securities reflect the rates in effect at period end. |
| (f) | Coupon is indexed to a floating interest rate which may be multiplied by a specified factor and/or subject to caps or floors. |
| (g) | Security initially issued at one coupon which converts to a higher coupon at a specified date. The rate shown is the rate at period end. |
| (i) | Security or a portion of the security purchased on a delayed delivery or when-issued basis. |
| (j) | Security is perpetual in nature with no stated maturity date. |
| (k) | Security or a portion of the security was pledged to cover margin requirements for futures contracts. At period end, the value of securities pledged amounted to $40,606,676. |
| (l) | Security or a portion of the security has been segregated as collateral for open forward foreign currency contracts, options and bi-lateral over the counter (OTC) swaps. At period end, the value of securities pledged amounted to $7,650,451. |
| (m) | Security or a portion of the security was pledged to cover margin requirements for centrally cleared swaps. At period end, the value of securities pledged amounted to $24,482,065. |
| (n) | Interest Only (IO) security represents the right to receive only monthly interest payments on an underlying pool of mortgages or assets. Principal shown is the outstanding par amount of the pool as of the end of the period. |
| (o) | Coupon is inversely indexed to a floating interest rate multiplied by a specified factor. The price may be considerably more volatile than the price of a comparable fixed rate security. |
| (p) | Principal Only Strips represent the right to receive the monthly principal payments on an underlying pool of mortgage loans. |
| (q) | Represents an investment in an underlying pool of reverse mortgages which typically do not require regular principal and interest payments as repayment is deferred until a maturity event. |
| (r) | Security initially issued in zero coupon form which converts to coupon form at a specified rate and date. The rate shown is the rate at period end. |
| (t) | Restricted securities (including private placements) - Investment in securities not registered under the Securities Act of 1933 (excluding 144A issues). At the end of the period, the value of restricted securities (excluding 144A issues) amounted to $46,109 or 0.0% of net assets. |
| (u) | Remaining maturities of bank loan obligations may be less than the stated maturities shown as a result of contractual or optional prepayments by the borrower. Such prepayments cannot be predicted with certainty. |
| (v) | The coupon rate will be determined upon settlement of the loan after period end. |
| (w) | Position or a portion of the position represents an unfunded loan commitment. At period end, the total principal amount and market value of unfunded commitments totaled $28,968 and $28,968, respectively. |
| (x) | Affiliated fund that is generally available only to investment companies and other accounts managed by Fidelity Investments. The rate quoted is the annualized seven-day yield of the fund at period end. A complete unaudited listing of the fund's holdings as of its most recent quarter end is available upon request. In addition, each Fidelity Central Fund's financial statements, which are not covered by the Fund's Report of Independent Registered Public Accounting Firm, are available on the SEC's website or upon request. |
| (y) | Investment made with cash collateral received from securities on loan. |
| Additional information on each restricted holding is as follows: |
| Security | Acquisition Date | Acquisition Cost ($) |
| Chesapeake Energy Corp. | 2/10/21 | 5,862 |
| | | |
Affiliated Central Funds
Fiscal year to date information regarding the Fund's investments in Fidelity Central Funds, including the ownership percentage, is presented below.
| Affiliate | Value, beginning of period ($) | Purchases ($) | Sales Proceeds ($) | Dividend Income ($) | Realized Gain (loss) ($) | Change in Unrealized appreciation (depreciation) ($) | Value, end of period ($) | % ownership, end of period |
| Fidelity Cash Central Fund 5.39% | 552,247,527 | 13,578,939,860 | 12,864,430,135 | 57,073,760 | 423 | - | 1,266,757,675 | 2.8% |
| Fidelity Securities Lending Cash Central Fund 5.39% | 264,834,750 | 5,112,263,962 | 5,311,806,149 | 376,609 | - | - | 65,292,563 | 0.3% |
| Total | 817,082,277 | 18,691,203,822 | 18,176,236,284 | 57,450,369 | 423 | - | 1,332,050,238 | |
| | | | | | | | | |
Amounts in the dividend income column in the above table include any capital gain distributions from underlying funds, which are presented in the corresponding line item in the Statement of Operations, if applicable.
Amounts in the dividend income column for Fidelity Securities Lending Cash Central Fund represents the income earned on investing cash collateral, less rebates paid to borrowers and any lending agent fees associated with the loan, plus any premium payments received for lending certain types of securities.
Amounts included in the purchases and sales proceeds columns may include in-kind transactions, if applicable.
Investment Valuation
The following is a summary of the inputs used, as of August 31, 2024, involving the Fund's assets and liabilities carried at fair value. The inputs or methodology used for valuing securities may not be an indication of the risk associated with investing in those securities. For more information on valuation inputs, and their aggregation into the levels used below, please refer to the Investment Valuation section in the accompanying Notes to Financial Statements.
| Valuation Inputs at Reporting Date: |
| Description | Total ($) | Level 1 ($) | Level 2 ($) | Level 3 ($) |
Investments in Securities: | | | | |
|
| Equities: | | | | |
Communication Services | 2,316,919 | - | - | 2,316,919 |
Consumer Discretionary | 4,636,760 | 1,595,119 | - | 3,041,641 |
Energy | 25,073,639 | 15,512,753 | - | 9,560,886 |
Financials | 7,760,595 | 4,231,480 | - | 3,529,115 |
Health Care | 3,978,847 | 1,757,909 | - | 2,220,938 |
Industrials | 130,517 | - | - | 130,517 |
Information Technology | 5,212,712 | 2,182,600 | - | 3,030,112 |
Real Estate | 3,948,092 | 3,411,418 | 536,674 | - |
|
| Corporate Bonds | 10,971,390,587 | - | 10,970,666,971 | 723,616 |
|
| U.S. Government and Government Agency Obligations | 13,763,654,212 | - | 13,763,654,212 | - |
|
| U.S. Government Agency - Mortgage Securities | 9,518,109,966 | - | 9,518,109,966 | - |
|
| Asset-Backed Securities | 2,909,108,683 | - | 2,909,108,676 | 7 |
|
| Collateralized Mortgage Obligations | 687,341,855 | - | 687,341,840 | 15 |
|
| Commercial Mortgage Securities | 2,027,332,525 | - | 2,019,056,711 | 8,275,814 |
|
| Foreign Government and Government Agency Obligations | 495,707,571 | - | 495,707,571 | - |
|
| Supranational Obligations | 28,795,556 | - | 28,795,556 | - |
|
| Bank Loan Obligations | 1,962,301,988 | - | 1,940,004,658 | 22,297,330 |
|
| Bank Notes | 27,111,100 | - | 27,111,100 | - |
|
| Preferred Securities | 168,064,338 | - | 168,028,588 | 35,750 |
|
| Money Market Funds | 1,332,050,238 | 1,332,050,238 | - | - |
|
| Purchased Swaptions | 22,416,762 | - | 22,416,762 | - |
| Total Investments in Securities: | 43,966,443,462 | 1,360,741,517 | 42,550,539,285 | 55,162,660 |
Derivative Instruments: Assets | | | | |
Futures Contracts | 3,088,225 | 3,088,225 | - | - |
Forward Foreign Currency Contracts | 19,733 | - | 19,733 | - |
Swaps | 8,344,078 | - | 8,344,078 | - |
| Total Assets | 11,452,036 | 3,088,225 | 8,363,811 | - |
| Liabilities | | | | |
Futures Contracts | (12,119,325) | (12,119,325) | - | - |
Forward Foreign Currency Contracts | (2,677,112) | - | (2,677,112) | - |
Swaps | (16,435,821) | - | (16,435,821) | - |
| Total Liabilities | (31,232,258) | (12,119,325) | (19,112,933) | - |
| Total Derivative Instruments: | (19,780,222) | (9,031,100) | (10,749,122) | - |
Other Financial Instruments: | | | | |
TBA Sale Commitments | (1,632,746,322) | - | (1,632,746,322) | - |
| Total Other Financial Instruments: | (1,632,746,322) | - | (1,632,746,322) | - |
Value of Derivative Instruments
The following table is a summary of the Fund's value of derivative instruments by primary risk exposure as of August 31, 2024. For additional information on derivative instruments, please refer to the Derivative Instruments section in the accompanying Notes to Financial Statements.
Primary Risk Exposure / Derivative Type | Value |
| Asset ($) | Liability ($) |
| Credit Risk | | |
Swaps (a)(b) | 8,222,453 | (3,502,807) |
| Total Credit Risk | 8,222,453 | (3,502,807) |
| Foreign Exchange Risk | | |
Forward Foreign Currency Contracts (c) | 19,733 | (2,677,112) |
| Total Foreign Exchange Risk | 19,733 | (2,677,112) |
| Interest Rate Risk | | |
Futures Contracts (d) | 3,088,225 | (12,119,325) |
Purchased Swaptions (e) | 22,416,762 | 0 |
Swaps (a) | 121,625 | (12,933,014) |
| Total Interest Rate Risk | 25,626,612 | (25,052,339) |
| Total Value of Derivatives | 33,868,798 | (31,232,258) |
(a)For centrally cleared swaps, reflects gross cumulative appreciation (depreciation) as presented in the Schedule of Investments. In the Statement of Assets and Liabilities, the period end daily variation margin for centrally cleared swaps is included in receivable or payable for daily variation margin on centrally cleared swaps, and the net cumulative appreciation (depreciation) for centrally cleared swaps is included in Total accumulated earnings (loss).
(b)For bi-lateral over-the-counter (OTC) swaps, reflects gross value which is presented in the Statement of Assets and Liabilities in the bi-lateral OTC swaps, at value line-items.
(c)Gross value is presented in the Statement of Assets and Liabilities in the unrealized appreciation/depreciation on forward foreign currency contracts line-items.
(d)Reflects gross cumulative appreciation (depreciation) on futures contracts as presented in the Schedule of Investments. In the Statement of Assets and Liabilities, the period end daily variation margin is included in receivable or payable for daily variation margin on futures contracts, and the net cumulative appreciation (depreciation) is included in Total accumulated earnings (loss).
(e)Gross value is presented in the Statement of Assets and Liabilities in the Investments in Securities at value line-item.
Financial Statements
| Statement of Assets and Liabilities |
As of August 31, 2024 |
| Assets | | | | |
| Investment in securities, at value (including securities loaned of $62,783,030) - See accompanying schedule: | | | | |
Unaffiliated issuers (cost $43,946,197,848) | $ | 42,634,393,224 | | |
Fidelity Central Funds (cost $1,331,994,283) | | 1,332,050,238 | | |
| | | | | |
| | | | | |
| Total Investment in Securities (cost $45,278,192,131) | | | $ | 43,966,443,462 |
| Segregated cash with brokers for derivative instruments | | | | 2,079,363 |
| Cash | | | | 2,433,364 |
| Foreign currency held at value (cost $8,481,834) | | | | 8,474,337 |
| Receivable for investments sold | | | | |
Regular delivery | | | | 32,159,186 |
Delayed delivery | | | | 85,684 |
| Receivable for TBA sale commitments | | | | 1,620,630,637 |
| Unrealized appreciation on forward foreign currency contracts | | | | 19,733 |
| Receivable for fund shares sold | | | | 61,584,332 |
| Dividends receivable | | | | 127,045 |
| Interest receivable | | | | 340,484,649 |
| Distributions receivable from Fidelity Central Funds | | | | 4,580,786 |
| Receivable for daily variation margin on centrally cleared swaps | | | | 1,369,116 |
| Bi-lateral OTC swaps, at value | | | | 8,147,602 |
| Receivable from investment adviser for expense reductions | | | | 280,767 |
| Other receivables | | | | 456,698 |
Total assets | | | | 46,049,356,761 |
| Liabilities | | | | |
| Payable for investments purchased | | | | |
Regular delivery | $ | 178,526,716 | | |
Delayed delivery | | 4,544,728,735 | | |
| TBA sale commitments, at value | | 1,632,746,322 | | |
| Unrealized depreciation on forward foreign currency contracts | | 2,677,112 | | |
| Payable for fund shares redeemed | | 33,874,915 | | |
| Distributions payable | | 14,827,334 | | |
| Bi-lateral OTC swaps, at value | | 3,502,807 | | |
| Accrued management fee | | 9,176,206 | | |
| Distribution and service plan fees payable | | 376,667 | | |
| Payable for daily variation margin on futures contracts | | 4,199,443 | | |
| Other affiliated payables | | 5,573,400 | | |
| Other payables and accrued expenses | | 592,006 | | |
| Collateral on securities loaned | | 65,292,563 | | |
| Total liabilities | | | | 6,496,094,226 |
| Net Assets | | | $ | 39,553,262,535 |
| Net Assets consist of: | | | | |
| Paid in capital | | | $ | 42,699,290,753 |
| Total accumulated earnings (loss) | | | | (3,146,028,218) |
| Net Assets | | | $ | 39,553,262,535 |
| | | | | |
| Net Asset Value and Maximum Offering Price | | | | |
| Class A : | | | | |
Net Asset Value and redemption price per share ($990,346,966 ÷ 102,197,581 shares)(a) | | | $ | 9.69 |
| Maximum offering price per share (100/96.00 of $9.69) | | | $ | 10.09 |
| Class M : | | | | |
Net Asset Value and redemption price per share ($306,533,872 ÷ 31,690,204 shares)(a) | | | $ | 9.67 |
| Maximum offering price per share (100/96.00 of $9.67) | | | $ | 10.07 |
| Class C : | | | | |
Net Asset Value and offering price per share ($133,012,466 ÷ 13,722,013 shares)(a) | | | $ | 9.69 |
| Total Bond : | | | | |
Net Asset Value, offering price and redemption price per share ($15,368,724,757 ÷ 1,586,674,262 shares) | | | $ | 9.69 |
| Class I : | | | | |
Net Asset Value, offering price and redemption price per share ($12,786,951,992 ÷ 1,322,225,722 shares) | | | $ | 9.67 |
| Class Z : | | | | |
Net Asset Value, offering price and redemption price per share ($9,967,692,482 ÷ 1,030,639,256 shares) | | | $ | 9.67 |
(a)Redemption price per share is equal to net asset value less any applicable contingent deferred sales charge. |
| Statement of Operations |
| Year ended August 31, 2024 |
| Investment Income | | | | |
| Dividends | | | $ | 11,216,793 |
| Interest | | | | 1,695,146,934 |
| Income from Fidelity Central Funds (including $376,609 from security lending) | | | | 57,450,369 |
| Total income | | | | 1,763,814,096 |
| Expenses | | | | |
| Management fee | $ | 100,486,629 | | |
| Transfer agent fees | | 36,557,159 | | |
| Distribution and service plan fees | | 4,166,211 | | |
| Fund wide operations fee | | 21,400,972 | | |
| Independent trustees' fees and expenses | | 102,724 | | |
| Legal | | 225,773 | | |
| Total expenses before reductions | | 162,939,468 | | |
| Expense reductions | | (3,504,676) | | |
| Total expenses after reductions | | | | 159,434,792 |
| Net Investment income (loss) | | | | 1,604,379,304 |
| Realized and Unrealized Gain (Loss) | | | | |
| Net realized gain (loss) on: | | | | |
| Investment Securities: | | | | |
| Unaffiliated issuers | | (343,059,728) | | |
| Fidelity Central Funds | | 423 | | |
| Forward foreign currency contracts | | 4,499,730 | | |
| Foreign currency transactions | | 381,940 | | |
| Futures contracts | | 19,583,305 | | |
| Swaps | | (7,369,641) | | |
| Written options | | 211,675 | | |
| Total net realized gain (loss) | | | | (325,752,296) |
| Change in net unrealized appreciation (depreciation) on: | | | | |
| Investment Securities: | | | | |
| Unaffiliated issuers | | 1,664,354,768 | | |
| Forward foreign currency contracts | | (10,227,734) | | |
| Assets and liabilities in foreign currencies | | 207,310 | | |
| Futures contracts | | (5,428,371) | | |
| Swaps | | (16,019,046) | | |
| TBA Sale commitments | | (5,433,049) | | |
| Total change in net unrealized appreciation (depreciation) | | | | 1,627,453,878 |
| Net gain (loss) | | | | 1,301,701,582 |
| Net increase (decrease) in net assets resulting from operations | | | $ | 2,906,080,886 |
| Statement of Changes in Net Assets |
| |
| | Year ended August 31, 2024 | | Year ended August 31, 2023 |
| Increase (Decrease) in Net Assets | | | | |
| Operations | | | | |
| Net investment income (loss) | $ | 1,604,379,304 | $ | 1,238,601,056 |
| Net realized gain (loss) | | (325,752,296) | | (1,202,593,379) |
| Change in net unrealized appreciation (depreciation) | | 1,627,453,878 | | 16,691,444 |
| Net increase (decrease) in net assets resulting from operations | | 2,906,080,886 | | 52,699,121 |
| Distributions to shareholders | | (1,532,149,641) | | (1,223,895,143) |
| | | | | |
| Share transactions - net increase (decrease) | | 6,332,684,003 | | 3,426,795,976 |
| Total increase (decrease) in net assets | | 7,706,615,248 | | 2,255,599,954 |
| | | | | |
| Net Assets | | | | |
| Beginning of period | | 31,846,647,287 | | 29,591,047,333 |
| End of period | $ | 39,553,262,535 | $ | 31,846,647,287 |
| | | | | |
| | | | | |
Financial Highlights
Fidelity Advisor® Total Bond Fund Class A |
| |
| Years ended August 31, | | 2024 | | 2023 | | 2022 | | 2021 | | 2020 |
Selected Per-Share Data | | | | | | | | | | |
| Net asset value, beginning of period | $ | 9.34 | $ | 9.70 | $ | 11.23 | $ | 11.52 | $ | 11.00 |
| Income from Investment Operations | | | | | | | | | | |
Net investment income (loss) A,B | | .404 | | .367 | | .237 | | .224 | | .269 |
| Net realized and unrealized gain (loss) | | .331 | | (.364) | | (1.524) | | .006 | | .521 |
| Total from investment operations | | .735 | | .003 | | (1.287) | | .230 | | .790 |
| Distributions from net investment income | | (.385) | | (.363) | | (.238) | | (.214) | | (.260) |
| Distributions from net realized gain | | - | | - | | (.005) | | (.306) | | (.010) |
| Total distributions | | (.385) | | (.363) | | (.243) | | (.520) | | (.270) |
| Net asset value, end of period | $ | 9.69 | $ | 9.34 | $ | 9.70 | $ | 11.23 | $ | 11.52 |
Total Return C,D | | | | .07% | | (11.59)% | | 2.09% | | 7.30% |
Ratios to Average Net Assets B,E,F | | | | | | | | | | |
| Expenses before reductions | | .75% | | .75% | | .75% | | .75% | | .75% |
| Expenses net of fee waivers, if any | | | | .75% | | .75% | | .75% | | .75% |
| Expenses net of all reductions | | .75% | | .75% | | .75% | | .75% | | .75% |
| Net investment income (loss) | | 4.31% | | 3.90% | | 2.25% | | 2.01% | | 2.42% |
| Supplemental Data | | | | | | | | | | |
| Net assets, end of period (000 omitted) | $ | 990,347 | $ | 835,581 | $ | 729,405 | $ | 900,239 | $ | 803,222 |
Portfolio turnover rate G | | | | 177% | | 129% | | 195% | | 222% |
ACalculated based on average shares outstanding during the period.
BNet investment income (loss) is affected by the timing of the declaration of dividends by any underlying mutual funds or exchange-traded funds (ETFs). Net investment income (loss) of any mutual funds or ETFs is not included in the Fund's net investment income (loss) ratio.
CTotal returns would have been lower if certain expenses had not been reduced during the applicable periods shown.
DTotal returns do not include the effect of the sales charges.
EFees and expenses of any underlying mutual funds or exchange-traded funds (ETFs) are not included in the Fund's expense ratio. The Fund indirectly bears its proportionate share of these expenses. For additional expense information related to investments in Fidelity Central Funds, please refer to the "Investments in Fidelity Central Funds" note found in the Notes to Financial Statements section of the most recent Annual or Semi-Annual report.
FExpense ratios reflect operating expenses of the class. Expenses before reductions do not reflect amounts reimbursed, waived, or reduced through arrangements with the investment adviser, brokerage services, or other offset arrangements, if applicable, and do not represent the amount paid by the class during periods when reimbursements, waivers or reductions occur.
GAmount does not include the portfolio activity of any underlying mutual funds or exchange-traded funds (ETFs).
Fidelity Advisor® Total Bond Fund Class M |
| |
| Years ended August 31, | | 2024 | | 2023 | | 2022 | | 2021 | | 2020 |
Selected Per-Share Data | | | | | | | | | | |
| Net asset value, beginning of period | $ | 9.32 | $ | 9.68 | $ | 11.21 | $ | 11.50 | $ | 10.98 |
| Income from Investment Operations | | | | | | | | | | |
Net investment income (loss) A,B | | .403 | | .367 | | .237 | | .224 | | .268 |
| Net realized and unrealized gain (loss) | | .331 | | (.365) | | (1.525) | | .006 | | .522 |
| Total from investment operations | | .734 | | .002 | | (1.288) | | .230 | | .790 |
| Distributions from net investment income | | (.384) | | (.362) | | (.237) | | (.214) | | (.260) |
| Distributions from net realized gain | | - | | - | | (.005) | | (.306) | | (.010) |
| Total distributions | | (.384) | | (.362) | | (.242) | | (.520) | | (.270) |
| Net asset value, end of period | $ | 9.67 | $ | 9.32 | $ | 9.68 | $ | 11.21 | $ | 11.50 |
Total Return C,D | | | | .06% | | (11.62)% | | 2.09% | | 7.31% |
Ratios to Average Net Assets B,E,F | | | | | | | | | | |
| Expenses before reductions | | .75% | | .75% | | .75% | | .75% | | .75% |
| Expenses net of fee waivers, if any | | | | .75% | | .75% | | .75% | | .75% |
| Expenses net of all reductions | | .75% | | .75% | | .75% | | .75% | | .75% |
| Net investment income (loss) | | 4.31% | | 3.90% | | 2.25% | | 2.01% | | 2.42% |
| Supplemental Data | | | | | | | | | | |
| Net assets, end of period (000 omitted) | $ | 306,534 | $ | 291,127 | $ | 301,768 | $ | 373,315 | $ | 369,850 |
Portfolio turnover rate G | | | | 177% | | 129% | | 195% | | 222% |
ACalculated based on average shares outstanding during the period.
BNet investment income (loss) is affected by the timing of the declaration of dividends by any underlying mutual funds or exchange-traded funds (ETFs). Net investment income (loss) of any mutual funds or ETFs is not included in the Fund's net investment income (loss) ratio.
CTotal returns do not include the effect of the sales charges.
DTotal returns would have been lower if certain expenses had not been reduced during the applicable periods shown.
EFees and expenses of any underlying mutual funds or exchange-traded funds (ETFs) are not included in the Fund's expense ratio. The Fund indirectly bears its proportionate share of these expenses. For additional expense information related to investments in Fidelity Central Funds, please refer to the "Investments in Fidelity Central Funds" note found in the Notes to Financial Statements section of the most recent Annual or Semi-Annual report.
FExpense ratios reflect operating expenses of the class. Expenses before reductions do not reflect amounts reimbursed, waived, or reduced through arrangements with the investment adviser, brokerage services, or other offset arrangements, if applicable, and do not represent the amount paid by the class during periods when reimbursements, waivers or reductions occur.
GAmount does not include the portfolio activity of any underlying mutual funds or exchange-traded funds (ETFs).
Fidelity Advisor® Total Bond Fund Class C |
| |
| Years ended August 31, | | 2024 | | 2023 | | 2022 | | 2021 | | 2020 |
Selected Per-Share Data | | | | | | | | | | |
| Net asset value, beginning of period | $ | 9.34 | $ | 9.70 | $ | 11.24 | $ | 11.53 | $ | 11.01 |
| Income from Investment Operations | | | | | | | | | | |
Net investment income (loss) A,B | | .332 | | .295 | | .157 | | .139 | | .184 |
| Net realized and unrealized gain (loss) | | .331 | | (.364) | | (1.535) | | .006 | | .521 |
| Total from investment operations | | .663 | | (.069) | | (1.378) | | .145 | | .705 |
| Distributions from net investment income | | (.313) | | (.291) | | (.157) | | (.129) | | (.175) |
| Distributions from net realized gain | | - | | - | | (.005) | | (.306) | | (.010) |
| Total distributions | | (.313) | | (.291) | | (.162) | | (.435) | | (.185) |
| Net asset value, end of period | $ | 9.69 | $ | 9.34 | $ | 9.70 | $ | 11.24 | $ | 11.53 |
Total Return C,D | | | | (.70)% | | (12.35)% | | 1.31% | | 6.49% |
Ratios to Average Net Assets B,E,F | | | | | | | | | | |
| Expenses before reductions | | 1.51% | | 1.52% | | 1.52% | | 1.51% | | 1.51% |
| Expenses net of fee waivers, if any | | | | 1.52% | | 1.52% | | 1.51% | | 1.51% |
| Expenses net of all reductions | | 1.51% | | 1.52% | | 1.52% | | 1.51% | | 1.51% |
| Net investment income (loss) | | 3.55% | | 3.13% | | 1.49% | | 1.24% | | 1.66% |
| Supplemental Data | | | | | | | | | | |
| Net assets, end of period (000 omitted) | $ | 133,012 | $ | 109,821 | $ | 112,311 | $ | 171,689 | $ | 205,949 |
Portfolio turnover rate G | | | | 177% | | 129% | | 195% | | 222% |
ACalculated based on average shares outstanding during the period.
BNet investment income (loss) is affected by the timing of the declaration of dividends by any underlying mutual funds or exchange-traded funds (ETFs). Net investment income (loss) of any mutual funds or ETFs is not included in the Fund's net investment income (loss) ratio.
CTotal returns would have been lower if certain expenses had not been reduced during the applicable periods shown.
DTotal returns do not include the effect of the contingent deferred sales charge.
EFees and expenses of any underlying mutual funds or exchange-traded funds (ETFs) are not included in the Fund's expense ratio. The Fund indirectly bears its proportionate share of these expenses. For additional expense information related to investments in Fidelity Central Funds, please refer to the "Investments in Fidelity Central Funds" note found in the Notes to Financial Statements section of the most recent Annual or Semi-Annual report.
FExpense ratios reflect operating expenses of the class. Expenses before reductions do not reflect amounts reimbursed, waived, or reduced through arrangements with the investment adviser, brokerage services, or other offset arrangements, if applicable, and do not represent the amount paid by the class during periods when reimbursements, waivers or reductions occur.
GAmount does not include the portfolio activity of any underlying mutual funds or exchange-traded funds (ETFs).
Fidelity® Total Bond Fund |
| |
| Years ended August 31, | | 2024 | | 2023 | | 2022 | | 2021 | | 2020 |
Selected Per-Share Data | | | | | | | | | | |
| Net asset value, beginning of period | $ | 9.33 | $ | 9.69 | $ | 11.23 | $ | 11.52 | $ | 11.00 |
| Income from Investment Operations | | | | | | | | | | |
Net investment income (loss) A,B | | .432 | | .396 | | .267 | | .258 | | .301 |
| Net realized and unrealized gain (loss) | | .341 | | (.365) | | (1.533) | | .005 | | .522 |
| Total from investment operations | | .773 | | .031 | | (1.266) | | .263 | | .823 |
| Distributions from net investment income | | (.413) | | (.391) | | (.269) | | (.247) | | (.293) |
| Distributions from net realized gain | | - | | - | | (.005) | | (.306) | | (.010) |
| Total distributions | | (.413) | | (.391) | | (.274) | | (.553) | | (.303) |
| Net asset value, end of period | $ | 9.69 | $ | 9.33 | $ | 9.69 | $ | 11.23 | $ | 11.52 |
Total Return C | | | | .36% | | (11.42)% | | 2.39% | | 7.62% |
Ratios to Average Net Assets B,D,E | | | | | | | | | | |
| Expenses before reductions | | .45% | | .45% | | .45% | | .45% | | .45% |
| Expenses net of fee waivers, if any | | | | .45% | | .45% | | .45% | | .45% |
| Expenses net of all reductions | | .45% | | .45% | | .45% | | .45% | | .45% |
| Net investment income (loss) | | 4.61% | | 4.20% | | 2.55% | | 2.30% | | 2.72% |
| Supplemental Data | | | | | | | | | | |
| Net assets, end of period (000 omitted) | $ | 15,368,725 | $ | 14,131,225 | $ | 14,816,563 | $ | 16,260,424 | $ | 16,158,697 |
Portfolio turnover rate F | | | | 177% | | 129% | | 195% | | 222% |
ACalculated based on average shares outstanding during the period.
BNet investment income (loss) is affected by the timing of the declaration of dividends by any underlying mutual funds or exchange-traded funds (ETFs). Net investment income (loss) of any mutual funds or ETFs is not included in the Fund's net investment income (loss) ratio.
CTotal returns would have been lower if certain expenses had not been reduced during the applicable periods shown.
DFees and expenses of any underlying mutual funds or exchange-traded funds (ETFs) are not included in the Fund's expense ratio. The Fund indirectly bears its proportionate share of these expenses. For additional expense information related to investments in Fidelity Central Funds, please refer to the "Investments in Fidelity Central Funds" note found in the Notes to Financial Statements section of the most recent Annual or Semi-Annual report.
EExpense ratios reflect operating expenses of the class. Expenses before reductions do not reflect amounts reimbursed, waived, or reduced through arrangements with the investment adviser, brokerage services, or other offset arrangements, if applicable, and do not represent the amount paid by the class during periods when reimbursements, waivers or reductions occur.
FAmount does not include the portfolio activity of any underlying mutual funds or exchange-traded funds (ETFs).
Fidelity Advisor® Total Bond Fund Class I |
| |
| Years ended August 31, | | 2024 | | 2023 | | 2022 | | 2021 | | 2020 |
Selected Per-Share Data | | | | | | | | | | |
| Net asset value, beginning of period | $ | 9.32 | $ | 9.68 | $ | 11.21 | $ | 11.50 | $ | 10.98 |
| Income from Investment Operations | | | | | | | | | | |
Net investment income (loss) A,B | | .426 | | .390 | | .262 | | .252 | | .296 |
| Net realized and unrealized gain (loss) | | .331 | | (.364) | | (1.524) | | .006 | | .521 |
| Total from investment operations | | .757 | | .026 | | (1.262) | | .258 | | .817 |
| Distributions from net investment income | | (.407) | | (.386) | | (.263) | | (.242) | | (.287) |
| Distributions from net realized gain | | - | | - | | (.005) | | (.306) | | (.010) |
| Total distributions | | (.407) | | (.386) | | (.268) | | (.548) | | (.297) |
| Net asset value, end of period | $ | 9.67 | $ | 9.32 | $ | 9.68 | $ | 11.21 | $ | 11.50 |
Total Return C | | | | .31% | | (11.40)% | | 2.34% | | 7.58% |
Ratios to Average Net Assets B,D,E | | | | | | | | | | |
| Expenses before reductions | | .50% | | .50% | | .50% | | .50% | | .50% |
| Expenses net of fee waivers, if any | | | | .50% | | .50% | | .50% | | .50% |
| Expenses net of all reductions | | .50% | | .50% | | .50% | | .50% | | .50% |
| Net investment income (loss) | | 4.56% | | 4.15% | | 2.50% | | 2.25% | | 2.67% |
| Supplemental Data | | | | | | | | | | |
| Net assets, end of period (000 omitted) | $ | 12,786,952 | $ | 9,287,826 | $ | 7,251,751 | $ | 8,422,197 | $ | 7,629,091 |
Portfolio turnover rate F | | | | 177% | | 129% | | 195% | | 222% |
ACalculated based on average shares outstanding during the period.
BNet investment income (loss) is affected by the timing of the declaration of dividends by any underlying mutual funds or exchange-traded funds (ETFs). Net investment income (loss) of any mutual funds or ETFs is not included in the Fund's net investment income (loss) ratio.
CTotal returns would have been lower if certain expenses had not been reduced during the applicable periods shown.
DFees and expenses of any underlying mutual funds or exchange-traded funds (ETFs) are not included in the Fund's expense ratio. The Fund indirectly bears its proportionate share of these expenses. For additional expense information related to investments in Fidelity Central Funds, please refer to the "Investments in Fidelity Central Funds" note found in the Notes to Financial Statements section of the most recent Annual or Semi-Annual report.
EExpense ratios reflect operating expenses of the class. Expenses before reductions do not reflect amounts reimbursed, waived, or reduced through arrangements with the investment adviser, brokerage services, or other offset arrangements, if applicable, and do not represent the amount paid by the class during periods when reimbursements, waivers or reductions occur.
FAmount does not include the portfolio activity of any underlying mutual funds or exchange-traded funds (ETFs).
Fidelity Advisor® Total Bond Fund Class Z |
| |
| Years ended August 31, | | 2024 | | 2023 | | 2022 | | 2021 | | 2020 |
Selected Per-Share Data | | | | | | | | | | |
| Net asset value, beginning of period | $ | 9.32 | $ | 9.68 | $ | 11.21 | $ | 11.50 | $ | 10.98 |
| Income from Investment Operations | | | | | | | | | | |
Net investment income (loss) A,B | | .439 | | .403 | | .278 | | .267 | | .311 |
| Net realized and unrealized gain (loss) | | .331 | | (.364) | | (1.525) | | .006 | | .522 |
| Total from investment operations | | .770 | | .039 | | (1.247) | | .273 | | .833 |
| Distributions from net investment income | | (.420) | | (.399) | | (.278) | | (.257) | | (.303) |
| Distributions from net realized gain | | - | | - | | (.005) | | (.306) | | (.010) |
| Total distributions | | (.420) | | (.399) | | (.283) | | (.563) | | (.313) |
| Net asset value, end of period | $ | 9.67 | $ | 9.32 | $ | 9.68 | $ | 11.21 | $ | 11.50 |
Total Return C | | | | .45% | | (11.27)% | | 2.48% | | 7.73% |
Ratios to Average Net Assets B,D,E | | | | | | | | | | |
| Expenses before reductions | | .40% | | .40% | | .40% | | .40% | | .40% |
| Expenses net of fee waivers, if any | | | | .36% | | .36% | | .36% | | .36% |
| Expenses net of all reductions | | .36% | | .36% | | .36% | | .36% | | .36% |
| Net investment income (loss) | | 4.70% | | 4.29% | | 2.64% | | 2.39% | | 2.81% |
| Supplemental Data | | | | | | | | | | |
| Net assets, end of period (000 omitted) | $ | 9,967,692 | $ | 7,191,067 | $ | 6,379,250 | $ | 8,023,946 | $ | 5,723,315 |
Portfolio turnover rate F | | | | 177% | | 129% | | 195% | | 222% |
ACalculated based on average shares outstanding during the period.
BNet investment income (loss) is affected by the timing of the declaration of dividends by any underlying mutual funds or exchange-traded funds (ETFs). Net investment income (loss) of any mutual funds or ETFs is not included in the Fund's net investment income (loss) ratio.
CTotal returns would have been lower if certain expenses had not been reduced during the applicable periods shown.
DFees and expenses of any underlying mutual funds or exchange-traded funds (ETFs) are not included in the Fund's expense ratio. The Fund indirectly bears its proportionate share of these expenses. For additional expense information related to investments in Fidelity Central Funds, please refer to the "Investments in Fidelity Central Funds" note found in the Notes to Financial Statements section of the most recent Annual or Semi-Annual report.
EExpense ratios reflect operating expenses of the class. Expenses before reductions do not reflect amounts reimbursed, waived, or reduced through arrangements with the investment adviser, brokerage services, or other offset arrangements, if applicable, and do not represent the amount paid by the class during periods when reimbursements, waivers or reductions occur.
FAmount does not include the portfolio activity of any underlying mutual funds or exchange-traded funds (ETFs).
Notes to Financial Statements
For the period ended August 31, 2024
1. Organization.
Fidelity Total Bond Fund (the Fund) is a fund of Fidelity Income Fund (the Trust) and is authorized to issue an unlimited number of shares. The Trust is registered under the Investment Company Act of 1940, as amended (the 1940 Act), as an open-end management investment company organized as a Massachusetts business trust. The Fund offers Class A, Class M, Class C, Total Bond, Class I and Class Z shares, each of which has equal rights as to assets and voting privileges. Class A, Class M, Class C, Class I and Class Z are Fidelity Advisor classes. Each class has exclusive voting rights with respect to matters that affect that class. Class C shares will automatically convert to Class A shares after a holding period of eight years from the initial date of purchase, with certain exceptions.
2. Investments in Fidelity Central Funds.
Funds may invest in Fidelity Central Funds, which are open-end investment companies generally available only to other investment companies and accounts managed by the investment adviser and its affiliates. The Schedule of Investments lists any Fidelity Central Funds held as an investment as of period end, but does not include the underlying holdings of each Fidelity Central Fund. An investing fund indirectly bears its proportionate share of the expenses of the underlying Fidelity Central Funds.
Based on its investment objective, each Fidelity Central Fund may invest or participate in various investment vehicles or strategies that are similar to those of the investing fund. These strategies are consistent with the investment objectives of the investing fund and may involve certain economic risks which may cause a decline in value of each of the Fidelity Central Funds and thus a decline in the value of the investing fund.
| Fidelity Central Fund | Investment Manager | Investment Objective | Investment Practices | Expense RatioA |
| Fidelity Money Market Central Funds | Fidelity Management & Research Company LLC (FMR) | Each fund seeks to obtain a high level of current income consistent with the preservation of capital and liquidity. | Short-term Investments | Less than .005% |
A Expenses expressed as a percentage of average net assets and are as of each underlying Central Fund's most recent annual or semi-annual shareholder report.
A complete unaudited list of holdings for each Fidelity Central Fund is available upon request or at the Securities and Exchange Commission website at www.sec.gov. In addition, the financial statements of the Fidelity Central Funds which contain the significant accounting policies (including investment valuation policies) of those funds, and are not covered by the Report of Independent Registered Public Accounting Firm, are available on the Securities and Exchange Commission website or upon request.
3. Significant Accounting Policies.
The Fund is an investment company and applies the accounting and reporting guidance of the Financial Accounting Standards Board (FASB) Accounting Standards Codification Topic 946 Financial Services - Investment Companies. The financial statements have been prepared in conformity with accounting principles generally accepted in the United States of America (GAAP), which require management to make certain estimates and assumptions at the date of the financial statements. Actual results could differ from those estimates. Subsequent events, if any, through the date that the financial statements were issued have been evaluated in the preparation of the financial statements. The Fund's Schedule of Investments lists any underlying mutual funds or exchange-traded funds (ETFs) but does not include the underlying holdings of these funds. The following summarizes the significant accounting policies of the Fund:
Investment Valuation. Investments are valued as of 4:00 p.m. Eastern time on the last calendar day of the period. The Board of Trustees (the Board) has designated the Fund's investment adviser as the valuation designee responsible for the fair valuation function and performing fair value determinations as needed. The investment adviser has established a Fair Value Committee (the Committee) to carry out the day-to-day fair valuation responsibilities and has adopted policies and procedures to govern the fair valuation process and the activities of the Committee. In accordance with these fair valuation policies and procedures, which have been approved by the Board, the Fund attempts to obtain prices from one or more third party pricing services or brokers to value its investments. When current market prices, quotations or currency exchange rates are not readily available or reliable, investments will be fair valued in good faith by the Committee, in accordance with the policies and procedures. Factors used in determining fair value vary by investment type and may include market or investment specific events, transaction data, estimated cash flows, and market observations of comparable investments. The frequency that the fair valuation procedures are used cannot be predicted and they may be utilized to a significant extent. The Committee manages the Fund's fair valuation practices and maintains the fair valuation policies and procedures. The Fund's investment adviser reports to the Board information regarding the fair valuation process and related material matters.
The Fund categorizes the inputs to valuation techniques used to value its investments into a disclosure hierarchy consisting of three levels as shown below:
Level 1 - unadjusted quoted prices in active markets for identical investments
Level 2 - other significant observable inputs (including quoted prices for similar investments, interest rates, prepayment speeds, etc.)
Level 3 - unobservable inputs (including the Fund's own assumptions based on the best information available)
Valuation techniques used to value the Fund's investments by major category are as follows:
Debt securities, including restricted securities, are valued based on evaluated prices received from third party pricing services or from brokers who make markets in such securities. Corporate bonds, bank notes, bank loan obligations, foreign government and government agency obligations, preferred securities, supranational obligations and U.S. government and government agency obligations are valued by pricing services who utilize matrix pricing which considers yield or price of bonds of comparable quality, coupon, maturity and type or by broker-supplied prices. Asset backed securities, collateralized mortgage obligations, commercial mortgage securities, and U.S. government agency mortgage securities are valued by pricing services who utilize matrix pricing which considers prepayment speed assumptions, attributes of the collateral, yield or price of bonds of comparable quality, coupon, maturity and type or by broker-supplied prices. Swaps are marked-to-market daily based on valuations from third party pricing services, registered derivatives clearing organizations (clearinghouses) or broker-supplied valuations. These pricing sources may utilize inputs such as interest rate curves, credit spread curves, default possibilities and recovery rates. When independent prices are unavailable or unreliable, debt securities and swaps may be valued utilizing pricing methodologies which consider similar factors that would be used by third party pricing services. For foreign debt securities, when significant market or security specific events arise, valuations may be determined in good faith in accordance with procedures adopted by the Board. Debt securities and swaps are generally categorized as Level 2 in the hierarchy but may be Level 3 depending on the circumstances.
Equity securities, including restricted securities, for which market quotations are readily available, are valued at the last reported sale price or official closing price as reported by a third party pricing service on the primary market or exchange on which they are traded and are categorized as Level 1 in the hierarchy. In the event there were no sales during the day or closing prices are not available, securities are valued at the last quoted bid price or may be valued using the last available price and are generally categorized as Level 2 in the hierarchy. For foreign equity securities, when market or security specific events arise, comparisons to the valuation of American Depositary Receipts (ADRs), futures contracts, Exchange-Traded Funds (ETFs) and certain indexes as well as quoted prices for similar securities may be used and would be categorized as Level 2 in the hierarchy. For equity securities, including restricted securities, where observable inputs are limited, assumptions about market activity and risk are used and these securities may be categorized as Level 3 in the hierarchy.
The U.S. dollar value of forward foreign currency contracts is determined using currency exchange rates supplied by a pricing service and are categorized as Level 2 in the hierarchy. Futures contracts are valued at the settlement price established each day by the board of trade or exchange on which they are traded and are categorized as Level 1 in the hierarchy. Options traded over-the-counter are valued using service or broker-supplied valuations and are categorized as Level 2 in the hierarchy. Investments in open-end mutual funds, including the Fidelity Central Funds, are valued at their closing net asset value (NAV) each business day and are categorized as Level 1 in the hierarchy.
Changes in valuation techniques may result in transfers in or out of an assigned level within the disclosure hierarchy. The aggregate value of investments by input level as of August 31, 2024 is included at the end of the Fund's Schedule of Investments.
Foreign Currency. Foreign-denominated assets, including investment securities, and liabilities are translated into U.S. dollars at the exchange rates at period end. Purchases and sales of investment securities, income and dividends received, and expenses denominated in foreign currencies are translated into U.S. dollars at the exchange rate in effect on the transaction date.
The effects of exchange rate fluctuations on investments are included with the net realized and unrealized gain (loss) on investment securities. Other foreign currency transactions resulting in realized and unrealized gain (loss) are disclosed separately.
Realized gains and losses on foreign currency transactions arise from the disposition of foreign currency, realized changes in the value of foreign currency between the trade and settlement dates on security transactions, and the difference between the amounts of dividends, interest and foreign withholding taxes recorded on transaction date and the U.S. dollar equivalent of the amounts actually received or paid. Unrealized gains and losses on assets and liabilities in foreign currencies arise from changes in the value of foreign currency, and from assets and liabilities denominated in foreign currencies, other than investments, which are held at period end.
Investment Transactions and Income. For financial reporting purposes, the Fund's investment holdings and NAV include trades executed through the end of the last business day of the period. The NAV per share for processing shareholder transactions is calculated as of the close of business of the New York Stock Exchange (NYSE), normally 4:00 p.m. Eastern time and includes trades executed through the end of the prior business day. Gains and losses on securities sold are determined on the basis of identified cost and include proceeds received from litigation. Commissions paid to certain brokers with whom the investment adviser, or its affiliates, places trades on behalf of a fund include an amount in addition to trade execution, which may be rebated back to a fund. Any such rebates are included in net realized gain (loss) on investments in the Statement of Operations. Dividend income is recorded on the ex-dividend date, except for certain dividends from foreign securities where the ex-dividend date may have passed, which are recorded as soon as the Fund is informed of the ex-dividend date. Non-cash dividends included in dividend income, if any, are recorded at the fair market value of the securities received. Income and capital gain distributions from Fidelity Central Funds, if any, are recorded on the ex-dividend date. Certain distributions received by the Fund represent a return of capital or capital gain. The Fund determines the components of these distributions subsequent to the ex-dividend date, based upon receipt of tax filings or other correspondence relating to the underlying investment. These distributions are recorded as a reduction of cost of investments and/or as a realized gain. Interest income is accrued as earned and includes coupon interest and amortization of premium and accretion of discount on debt securities as applicable. Paid in Kind (PIK) income is recorded at the fair market value of the securities received. Investment income is recorded net of foreign taxes withheld where recovery of such taxes is uncertain. Debt obligations may be placed on non-accrual status and related interest income may be reduced by ceasing current accruals and writing off interest receivables when the collection of all or a portion of interest has become doubtful based on consistently applied procedures. A debt obligation is removed from non-accrual status when the issuer resumes interest payments or when collectability of interest is reasonably assured. Funds may file withholding tax reclaims in certain jurisdictions to recover a portion of amounts previously withheld. Any withholding tax reclaims income is included in the Statement of Operations in interest. Any receivables for withholding tax reclaims are included in the Statement of Assets and Liabilities in interest receivable.
Class Allocations and Expenses. Investment income, realized and unrealized capital gains and losses, common expenses of a fund, and certain fund-level expense reductions, if any, are allocated daily on a pro-rata basis to each class based on the relative net assets of each class to the total net assets of a fund. Each class differs with respect to transfer agent and distribution and service plan fees incurred, as applicable. Certain expense reductions may also differ by class, if applicable. For the reporting period, the allocated portion of income and expenses to each class as a percent of its average net assets may vary due to the timing of recording these transactions in relation to fluctuating net assets of the classes. Expenses directly attributable to a fund are charged to that fund. Expenses attributable to more than one fund are allocated among the respective funds on the basis of relative net assets or other appropriate methods. Expenses included in the accompanying financial statements reflect the expenses of that fund and do not include any expenses associated with any underlying mutual funds or exchange-traded funds (ETFs). Although not included in a fund's expenses, a fund indirectly bears its proportionate share of these expenses through the net asset value of each underlying mutual fund or exchange-traded fund (ETF). Expense estimates are accrued in the period to which they relate and adjustments are made when actual amounts are known.
Deferred Trustee Compensation. Under a Deferred Compensation Plan (the Plan) for certain Funds, certain independent Trustees have elected to defer receipt of a portion of their annual compensation. Deferred amounts are invested in affiliated mutual funds, are marked-to-market and remain in a fund until distributed in accordance with the Plan. The investment of deferred amounts and the offsetting payable to the Trustees presented below are included in the accompanying Statement of Assets and Liabilities in other receivables and other payables and accrued expenses, as applicable.
| Fidelity Total Bond Fund | $456,694 |
Income Tax Information and Distributions to Shareholders. Each year, the Fund intends to qualify as a regulated investment company under Subchapter M of the Internal Revenue Code, including distributing substantially all of its taxable income and realized gains. As a result, no provision for U.S. Federal income taxes is required. As of August 31, 2024, the Fund did not have any unrecognized tax benefits in the financial statements; nor is the Fund aware of any tax positions for which it is reasonably possible that the total amounts of unrecognized tax benefits will significantly change in the next twelve months. The Fund files a U.S. federal tax return, in addition to state and local tax returns as required. The Fund's federal income tax returns are subject to examination by the Internal Revenue Service (IRS) for a period of three fiscal years after they are filed. State and local tax returns may be subject to examination for an additional fiscal year depending on the jurisdiction. Foreign taxes are provided for based on the Fund's understanding of the tax rules and rates that exist in the foreign markets in which it invests.
Distributions are declared and recorded daily and paid monthly from net investment income. Distributions from realized gains, if any, are declared and recorded on the ex-dividend date. Income and capital gain distributions are declared separately for each class. Income and capital gain distributions are determined in accordance with income tax regulations, which may differ from GAAP.
Capital accounts within the financial statements are adjusted for permanent book-tax differences. These adjustments have no impact on net assets or the results of operations. Capital accounts are not adjusted for temporary book-tax differences which will reverse in a subsequent period.
Book-tax differences are primarily due to certain conversion ratio adjustments, swaps, futures transactions, foreign currency transactions, passive foreign investment companies (PFIC), partnerships, market discount, contingent interest, capital loss carryforwards and losses deferred due to wash sales and futures contracts.
As of period end, the cost and unrealized appreciation (depreciation) in securities, and derivatives if applicable, for federal income tax purposes were as follows:
| Gross unrealized appreciation | $712,150,296 |
| Gross unrealized depreciation | (1,949,586,565) |
| Net unrealized appreciation (depreciation) | $(1,237,436,269) |
| Tax Cost | $45,179,384,288 |
The tax-based components of distributable earnings as of period end were as follows:
| Undistributed ordinary income | $35,606,422 |
| Capital loss carryforward | $(1,898,258,960) |
| Net unrealized appreciation (depreciation) on securities and other investments | $(1,283,375,679) |
Capital loss carryforwards are only available to offset future capital gains of the Fund to the extent provided by regulations and may be limited. The capital loss carryforward information presented below, including any applicable limitation, is estimated as of fiscal period end and is subject to adjustment.
Short-term | $(847,723,985) |
Long-term | (1,050,534,975) |
| Total capital loss carryforward | $(1,898,258,960) |
The tax character of distributions paid was as follows:
| | August 31, 2024 | August 31, 2023 |
| Ordinary Income | $1,532,149,641 | $1,223,895,143 |
| Total | $1,532,149,641 | $1,223,895,143 |
Delayed Delivery Transactions and When-Issued Securities. During the period, certain Funds transacted in securities on a delayed delivery or when-issued basis. Payment and delivery may take place after the customary settlement period for that security. The price of the underlying securities and the date when the securities will be delivered and paid for are fixed at the time the transaction is negotiated. Securities purchased on a delayed delivery or when-issued basis are identified as such in the Schedule of Investments. Compensation for interest forgone in the purchase of a delayed delivery or when-issued debt security may be received. With respect to purchase commitments, each applicable Fund identifies securities as segregated in its records with a value at least equal to the amount of the commitment. Payables and receivables associated with the purchases and sales of delayed delivery securities having the same coupon, settlement date and broker are offset. Delayed delivery or when-issued securities that have been purchased from and sold to different brokers are reflected as both payables and receivables in the Statement of Assets and Liabilities under the caption "Delayed delivery", as applicable. Losses may arise due to changes in the value of the underlying securities or if the counterparty does not perform under the contract's terms, or if the issuer does not issue the securities due to political, economic, or other factors.
To-Be-Announced (TBA) Securities and Mortgage Dollar Rolls. TBA securities involve buying or selling mortgage-backed securities (MBS) on a forward commitment basis. A TBA transaction typically does not designate the actual security to be delivered and only includes an approximate principal amount; however delivered securities must meet specified terms defined by industry guidelines, including issuer, rate and current principal amount outstanding on underlying mortgage pools. Funds may enter into a TBA transaction with the intent to take possession of or deliver the underlying MBS, or a fund may elect to extend the settlement by entering into either a mortgage or reverse mortgage dollar roll. Mortgage dollar rolls are transactions where a fund sells TBA securities and simultaneously agrees to repurchase MBS on a later date at a lower price and with the same counterparty. Reverse mortgage dollar rolls involve the purchase and simultaneous agreement to sell TBA securities on a later date at a lower price. Transactions in mortgage dollar rolls and reverse mortgage dollar rolls are accounted for as purchases and sales and may result in an increase to a fund's portfolio turnover rate.
Purchases and sales of TBA securities involve risks similar to those discussed above for delayed delivery and when-issued securities. Also, if the counterparty in a mortgage dollar roll or a reverse mortgage dollar roll transaction files for bankruptcy or becomes insolvent, a fund's right to repurchase or sell securities may be limited. Additionally, when a fund sells TBA securities without already owning or having the right to obtain the deliverable securities (an uncovered forward commitment to sell), it incurs a risk of loss because it could have to purchase the securities at a price that is higher than the price at which it sold them. A fund may be unable to purchase the deliverable securities if the corresponding market is illiquid.
TBA securities subject to a forward commitment to sell at period end are included at the end of the Schedule of Investments under the caption "TBA Sale Commitments." The value of these commitments and proceeds to be received at contractual settlement date are reflected in the Statement of Assets and Liabilities as "TBA sale commitments, at value" and "Receivable for TBA sale commitments," respectively. If the TBA sale commitment is closed through the acquisition of an offsetting TBA purchase commitment, a fund realizes a gain or loss. If a fund delivers securities under the commitment, a fund realizes a gain or loss from the sale of the securities based upon the price established at the date the commitment was entered into.
Restricted Securities (including Private Placements). Funds may invest in securities that are subject to legal or contractual restrictions on resale. These securities generally may be resold in transactions exempt from registration or to the public if the securities are registered. Disposal of these securities may involve time-consuming negotiations and expense, and prompt sale at an acceptable price may be difficult. Information regarding restricted securities held at period end is included at the end of the Schedule of Investments, if applicable.
Loans and Other Direct Debt Instruments. Direct debt instruments are interests in amounts owed to lenders by corporate or other borrowers. These instruments may be in the form of loans, trade claims or other receivables and may include standby financing commitments such as revolving credit facilities that obligate a fund to supply additional cash to the borrower on demand. Loans may be acquired through assignment, participation, or may be made directly to a borrower. Such instruments are presented in the Bank Loan Obligations section in the Schedule of Investments. Certain funds may also invest in unfunded loan commitments, which are contractual obligations for future funding. Information regarding unfunded commitments is included at the end of the Schedule of Investments, if applicable.
4. Derivative Instruments.
Risk Exposures and the Use of Derivative Instruments. The Fund's investment objectives allow for various types of derivative instruments, including futures contracts, forward foreign currency contracts, options and swaps. Derivatives are investments whose value is primarily derived from underlying assets, indices or reference rates and may be transacted on an exchange or over-the-counter (OTC). Derivatives may involve a future commitment to buy or sell a specified asset based on specified terms, to exchange future cash flows at periodic intervals based on a notional principal amount, or for one party to make one or more payments upon the occurrence of specified events in exchange for periodic payments from the other party.
Derivatives were used to increase returns, to gain exposure to certain types of assets, to facilitate transactions in foreign-denominated securities and to manage exposure to certain risks as defined below. The success of any strategy involving derivatives depends on analysis of numerous economic factors, and if the strategies for investment do not work as intended, the objectives may not be achieved.
Derivatives were used to increase or decrease exposure to the following risk(s):
| | |
| Credit Risk | Credit risk relates to the ability of the issuer of a financial instrument to make further principal or interest payments on an obligation or commitment that it has to a fund. |
| Foreign Exchange Risk | Foreign exchange rate risk relates to fluctuations in the value of an asset or liability due to changes in currency exchange rates. |
| Interest Rate Risk | Interest rate risk relates to the fluctuations in the value of interest-bearing securities due to changes in the prevailing levels of market interest rates. |
Funds are also exposed to additional risks from investing in derivatives, such as liquidity risk and counterparty credit risk. Liquidity risk is the risk that a fund will be unable to close out the derivative in the open market in a timely manner. Counterparty credit risk is the risk that the counterparty will not be able to fulfill its obligation to a fund. Derivative counterparty credit risk is managed through formal evaluation of the creditworthiness of all potential counterparties. On certain OTC derivatives such as forward foreign currency contracts, options and bi-lateral swaps, a fund attempts to reduce its exposure to counterparty credit risk by entering into an International Swaps and Derivatives Association, Inc. (ISDA) Master Agreement with each of its counterparties. The ISDA Master Agreement gives a fund the right to terminate all transactions traded under such agreement upon the deterioration in the credit quality of the counterparty beyond specified levels. The ISDA Master Agreement gives each party the right, upon an event of default by the other party or a termination of the agreement, to close out all transactions traded under such agreement and to net amounts owed under each transaction to one net payable by one party to the other. To mitigate counterparty credit risk on bi-lateral OTC derivatives, a fund receives collateral in the form of cash or securities once net unrealized appreciation on outstanding derivative contracts under an ISDA Master Agreement exceeds certain applicable thresholds, subject to certain minimum transfer provisions. The collateral received is held in segregated accounts with the custodian bank in accordance with the collateral agreements entered into between a fund, the counterparty and the custodian bank. A fund could experience delays and costs in gaining access to the collateral even though it is held by the custodian bank. The maximum risk of loss to a fund from counterparty credit risk related to bi-lateral OTC derivatives is generally the aggregate unrealized appreciation and unpaid counterparty payments in excess of any collateral pledged by the counterparty to a fund. For OTC written options with upfront premiums received, a fund is obligated to perform and therefore does not have counterparty risk. For OTC written options with premiums to be received at a future date, the maximum risk of loss from counterparty credit risk is the amount of the premium in excess of any collateral pledged by the counterparty. A fund may be required to pledge collateral for the benefit of the counterparties on bi-lateral OTC derivatives in an amount not less than each counterparty's unrealized appreciation on outstanding derivative contracts, subject to certain minimum transfer provisions, and any such pledged collateral is identified in the Schedule of Investments. Exchange-traded contracts are not covered by the ISDA Master Agreement; however counterparty credit risk related to these contracts may be mitigated by the protection provided by the exchange on which they trade. Counterparty credit risk related to centrally cleared swaps may be mitigated by the protection provided by the clearinghouse.
Investing in derivatives may involve greater risks than investing in the underlying assets directly and, to varying degrees, may involve risk of loss in excess of any initial investment and collateral received and amounts recognized in the Statement of Assets and Liabilities. In addition, there may be the risk that the change in value of the derivative contract does not correspond to the change in value of the underlying instrument.
Net Realized Gain (Loss) and Change in Net Unrealized Appreciation (Depreciation) on Derivatives. The table below, which reflects the impacts of derivatives on the financial performance, summarizes the net realized gain (loss) and change in net unrealized appreciation (depreciation) for derivatives during the period as presented in the Statement of Operations.
| Primary Risk Exposure / Derivative Type | Net Realized Gain (Loss)($) | Change in Net Unrealized Appreciation (Depreciation)($) |
| Fidelity Total Bond Fund | | |
| Credit Risk | | |
| Swaps | (1,705,797) | (3,804,074) |
| Total Credit Risk | (1,705,797) | (3,804,074) |
| Foreign Exchange Risk | | |
| Forward Foreign Currency Contracts | 4,499,730 | (10,227,734) |
| Total Foreign Exchange Risk | 4,499,730 | (10,227,734) |
| Interest Rate Risk | | |
| Futures Contracts | 19,583,305 | (5,428,371) |
| Purchased Options | 40,762 | (1,177,800) |
| Written Options | 211,675 | - |
| Swaps | (5,663,844) | (12,214,972) |
| Total Interest Rate Risk | 14,171,898 | (18,821,143) |
| Totals | 16,965,831 | (32,852,951) |
If there are any open positions at period end, a summary of the value of derivatives by primary risk exposure is included at the end of the Schedule of Investments.
Forward Foreign Currency Contracts. Forward foreign currency contracts represent obligations to purchase or sell foreign currency on a specified future date at a price fixed at the time the contracts are entered into. Forward foreign currency contracts were used to facilitate transactions in foreign-denominated securities and to manage exposure to certain foreign currencies.
Forward foreign currency contracts are valued daily and fluctuations in exchange rates on open contracts are recorded as unrealized appreciation or (depreciation) and reflected in total accumulated earnings (loss) in the Statement of Assets and Liabilities. When the contract is closed, a gain or loss is realized equal to the difference between the closing value and the value at the time it was opened. Non-deliverable forward foreign currency exchange contracts are settled with the counterparty in cash without the delivery of foreign currency. The net realized gain (loss) and change in net unrealized appreciation (depreciation) on forward foreign currency contracts during the period is presented in the Statement of Operations.
Any open forward foreign currency contracts at period end are presented in the Schedule of Investments under the caption "Forward Foreign Currency Contracts." The contract amount and unrealized appreciation (depreciation) reflects each contract's exposure to the underlying currency at period end, and is representative of volume of activity during the period unless an average contract value is presented.
Futures Contracts. A futures contract is an agreement between two parties to buy or sell a specified underlying instrument for a fixed price at a specified future date. Futures contracts were used to manage exposure to the bond market and fluctuations in interest rates.
Upon entering into a futures contract, a fund is required to deposit either cash or securities (initial margin) with a clearing broker in an amount equal to a certain percentage of the face value of the contract. Futures contracts are marked-to-market daily and subsequent daily payments are made or received by a fund depending on the daily fluctuations in the value of the futures contracts and are recorded as unrealized appreciation or (depreciation). This receivable and/or payable, if any, is included in daily variation margin on futures contracts in the Statement of Assets and Liabilities. Realized gain or (loss) is recorded upon the expiration or closing of a futures contract. The net realized gain (loss) and change in net unrealized appreciation (depreciation) on futures contracts during the period is presented in the Statement of Operations.
Any open futures contracts at period end are presented in the Schedule of Investments under the caption "Futures Contracts". The notional amount at value reflects each contract's exposure to the underlying instrument or index at period end, and is representative of volume of activity during the period unless an average notional amount is presented. Any securities deposited to meet initial margin requirements are identified in the Schedule of Investments. Any cash deposited to meet initial margin requirements is presented as segregated cash with brokers for derivative instruments in the Statement of Assets and Liabilities.
Options. Options give the purchaser the right, but not the obligation, to buy (call) or sell (put) an underlying security or financial instrument at an agreed exercise or strike price between or on certain dates. Options obligate the seller (writer) to buy (put) or sell (call) an underlying instrument at the exercise or strike price or cash settle an underlying derivative instrument if the holder exercises the option on or before the expiration date. OTC options, such as swaptions, which are options where the underlying instrument is a swap, were used to manage exposure to fluctuations in interest rates.
Upon entering into an options contract, a fund will pay or receive a premium. Premiums paid on purchased options are reflected as cost of investments and premiums received on written options are reflected as a liability on the Statement of Assets and Liabilities. Certain options may be purchased or written with premiums to be paid or received on a future date. Options are valued daily and any unrealized appreciation (depreciation) is reflected in total accumulated earnings (loss) in the Statement of Assets and Liabilities. When an option is exercised, the cost or proceeds of the underlying instrument purchased or sold is adjusted by the amount of the premium. When an option is closed, a gain or loss is realized depending on whether the proceeds or amount paid for the closing sale transaction is greater or less than the premium received or paid. When an option expires, gains and losses are realized to the extent of premiums received and paid, respectively. The net realized and unrealized gains (losses) on purchased options are included in the Statement of Operations in net realized gain (loss) and change in net unrealized appreciation (depreciation) on investment securities. The net realized gain (loss) and change in net unrealized appreciation (depreciation) on written options are presented in the Statement of Operations.
Any open options at period end are presented in the Schedule of Investments under the captions "Purchased Options," "Purchased Swaptions," "Written Options" and "Written Swaptions," as applicable, and are representative of volume of activity during the period unless an average notional amount is presented.
Writing puts and buying calls tend to increase exposure to the underlying instrument while buying puts and writing calls tend to decrease exposure to the underlying instrument. For purchased options, risk of loss is limited to the premium paid, and for written options, risk of loss is the change in value in excess of the premium received.
Swaps. A swap is a contract between two parties to exchange future cash flows at periodic intervals based on a notional principal amount. A bi-lateral OTC swap is a transaction between a fund and a dealer counterparty where cash flows are exchanged between the two parties for the life of the swap. A centrally cleared swap is a transaction executed between a fund and a dealer counterparty, then cleared by a futures commission merchant (FCM) through a clearinghouse. Once cleared, the clearinghouse serves as a central counterparty, with whom a fund exchanges cash flows for the life of the transaction, similar to transactions in futures contracts.
Bi-lateral OTC swaps are marked-to-market daily and changes in value are reflected in the Statement of Assets and Liabilities in the bi-lateral OTC swaps at value line items. Any upfront premiums paid or received upon entering a bi-lateral OTC swap to compensate for differences between stated terms of the swap and prevailing market conditions (e.g. credit spreads, interest rates or other factors) are recorded in total accumulated earnings (loss) in the Statement of Assets and Liabilities and amortized to realized gain or (loss) ratably over the term of the swap. Any unamortized upfront premiums are presented in the Schedule of Investments.
Centrally cleared swaps require a fund to deposit either cash or securities (initial margin) with the FCM, at the instruction of and for the benefit of the clearinghouse. Any securities deposited to meet initial margin requirements are identified in the Schedule of Investments. Any cash deposited to meet initial margin requirements is presented in segregated cash with brokers for derivative instruments in the Statement of Assets and Liabilities. Centrally cleared swaps are marked-to-market daily and subsequent payments (variation margin) are made or received depending on the daily fluctuations in the value of the swaps and are recorded as unrealized appreciation or (depreciation). These daily payments, if any, are included in receivable or payable for daily variation margin on centrally cleared swaps in the Statement of Assets and Liabilities. Any premiums for centrally cleared swaps are recorded periodically throughout the term of the swap to variation margin and included in total accumulated earnings (loss) in the Statement of Assets and Liabilities. Any premiums are recognized as realized gain (loss) upon termination or maturity of the swap.
For both bi-lateral and centrally cleared swaps, payments are exchanged at specified intervals, accrued daily commencing with the effective date of the contract and recorded as realized gain or (loss). Some swaps may be terminated prior to the effective date and realize a gain or loss upon termination. The net realized gain (loss) and change in net unrealized appreciation (depreciation) on swaps during the period is presented in the Statement of Operations.
Any open swaps at period end are included in the Schedule of Investments under the caption "Swaps", and are representative of volume of activity during the period unless an average notional amount is presented.
Credit Default Swaps. Credit default swaps enable a fund to buy or sell protection against specified credit events on a single-name issuer or a traded credit index. Under the terms of a credit default swap the buyer of protection (buyer) receives credit protection in exchange for making periodic payments to the seller of protection (seller) based on a fixed percentage applied to a notional principal amount. In return for these payments, the seller will be required to make a payment upon the occurrence of one or more specified credit events. A fund enters into credit default swaps as a seller to gain credit exposure to an issuer and/or as a buyer to obtain a measure of protection against defaults of an issuer. Periodic payments are made over the life of the contract by the buyer provided that no credit event occurs.
For credit default swaps on most corporate and sovereign issuers, credit events include bankruptcy, failure to pay or repudiation/moratorium. For credit default swaps on corporate or sovereign issuers, the obligation that may be put to the seller is not limited to the specific reference obligation described in the Schedule of Investments. For credit default swaps on asset-backed securities, a credit event may be triggered by events such as failure to pay principal, maturity extension, rating downgrade or write-down. For credit default swaps on asset-backed securities, the reference obligation described represents the security that may be put to the seller. For credit default swaps on a traded credit index, a specified credit event may affect all or individual underlying securities included in the index.
As a seller, if an underlying credit event occurs, a fund will pay a net settlement amount of cash equal to the notional amount of the swap less the recovery value of the reference obligation or underlying securities comprising an index. Only in the event of the industry's inability to value the underlying asset will a fund be required to take delivery of the reference obligation or underlying securities comprising an index and pay an amount equal to the notional amount of the swap.
As a buyer, if an underlying credit event occurs, a fund will receive a net settlement amount of cash equal to the notional amount of the swap less the recovery value of the reference obligation or underlying securities comprising an index. Only in the event of the industry's inability to value the underlying asset will a fund be required to deliver the reference obligation or underlying securities comprising an index in exchange for payment of an amount equal to the notional amount of the swap.
Typically, the value of each credit default swap and credit rating disclosed for each reference obligation in the Schedule of Investments, where a fund is the seller, can be used as measures of the current payment/performance risk of the swap. As the value of the swap changes as a positive or negative percentage of the total notional amount, the payment/performance risk may decrease or increase, respectively. In addition to these measures, the investment adviser monitors a variety of factors including cash flow assumptions, market activity and market sentiment as part of its ongoing process of assessing payment/performance risk.
Interest Rate Swaps. Interest rate swaps are agreements between counterparties to exchange cash flows, one based on a fixed rate, and the other on a floating rate. A fund enters into interest rate swaps to manage its exposure to interest rate changes. Changes in interest rates can have an effect on both the value of bond holdings as well as the amount of interest income earned. In general, the value of bonds can fall when interest rates rise and can rise when interest rates fall.
5. Purchases and Sales of Investments.
Purchases and sales of securities, other than short-term securities, U.S. government securities and in-kind transactions, as applicable, are noted in the table below.
| | Purchases ($) | Sales ($) |
| Fidelity Total Bond Fund | 45,058,617,619 | 42,890,277,293 |
6. Fees and Other Transactions with Affiliates.
Management Fee. Fidelity Management & Research Company LLC (the investment adviser) and its affiliates provide the Fund with investment management related services for which the Fund pays a monthly management fee. Effective March 1, 2024, the Fund pays a monthly management fee that is based on an annual rate of .282% of the Fund's average net assets.
Prior to March 1, 2024 the management fee was the sum of an individual fund fee rate that was based on an annual rate of .20% of the Fund's average net assets and an annualized group fee rate that averaged .10% during the period. The group fee rate was based upon the monthly average net assets of a group of registered investment companies with which the investment adviser has management contracts. The group fee rate decreased as assets under management increased and increased as assets under management decreased.
For the reporting period, the total annual management fee rate was .29% of the Fund's average net assets.
Distribution and Service Plan Fees. In accordance with Rule 12b-1 of the 1940 Act, the Fund has adopted separate Distribution and Service Plans for each class of shares. Certain classes pay Fidelity Distributors Company LLC (FDC), an affiliate of the investment adviser, separate Distribution and Service Fees, each of which is based on an annual percentage of each class' average net assets. In addition, FDC may pay financial intermediaries for selling shares of the Fund and providing shareholder support services. For the period, the Distribution and Service Fee rates, total fees and amounts retained by FDC were as follows:
| | Distribution Fee | Service Fee | Total Fees ($) | Retained by FDC ($) |
| Class A | - % | .25% | 2,235,117 | 145,626 |
| Class M | - % | .25% | 737,326 | - |
| Class C | .75% | .25% | 1,193,768 | 366,116 |
| | | | 4,166,211 | 511,742 |
Sales Load. FDC may receive a front-end sales charge of up to 4.00% for selling Class A shares and Class M shares, some of which is paid to financial intermediaries for selling shares of the Fund. Depending on the holding period, FDC may receive contingent deferred sales charges levied on Class A, Class M and Class C redemptions. The deferred sales charges are 1.00% for Class C shares, .75% for certain purchases of Class A shares and .25% for certain purchases of Class M shares.
For the period, sales charge amounts retained by FDC were as follows:
| | Retained by FDC ($) |
| Class A | 180,269 |
| Class M | 11,293 |
Class C A | 2,071 |
| | 193,633 |
A When Class C shares are initially sold, FDC pays commissions from its own resources to financial intermediaries through which the sales are made.
Transfer Agent Fees. Fidelity Investments Institutional Operations Company LLC (FIIOC), an affiliate of the investment adviser, is the transfer, dividend disbursing and shareholder servicing agent for each class of the Fund. FIIOC receives account fees and asset-based fees that vary according to the account size and type of account of the shareholders of each respective class of the Fund, with the exception of Total Bond and Class Z. FIIOC receives an asset-based fee of Total Bond's and Class Z's average net assets. FIIOC pays for typesetting, printing and mailing of shareholder reports, except proxy statements. For the period, transfer agent fees for each class were as follows:
| | Amount ($) | % of Class-Level Average Net Assets |
| Class A | 1,325,695 | .15 |
| Class M | 434,222 | .15 |
| Class C | 194,961 | .16 |
| Total Bond | 14,265,538 | .10 |
| Class I | 16,098,701 | .15 |
| Class Z | 4,238,042 | .05 |
| | 36,557,159 | |
Fund Wide Operations Fee. Pursuant to the Fund Wide Operations and Expense Agreement (FWOE), the investment adviser has agreed to provide for fund-level expenses (which may not include transfer agent, the compensation of the independent Trustees, interest, taxes or extraordinary expenses, as applicable) in return for a FWOE fee equal to .35% of fund-level average net assets less the total amount of the management fee. The FWOE paid by a fund is reduced by an amount equal to the fees and expenses paid to the independent Trustees. For the period, the FWOE fees were equivalent to the following annual rate expressed as a percentage of average net assets:
| Fidelity Total Bond Fund | .06% |
Brokerage Commissions. A portion of portfolio transactions were placed with brokerage firms which are affiliates of the investment adviser. Brokerage commissions are included in net realized gain (loss) and change in net unrealized appreciation (depreciation) in the Statement of Operations. The commissions paid to these affiliated firms were as follows:
| | Amount ($) |
| Fidelity Total Bond Fund | 174 |
Interfund Trades. Funds may purchase from or sell securities to other Fidelity Funds under procedures adopted by the Board. The procedures have been designed to ensure these interfund trades are executed in accordance with Rule 17a-7 of the 1940 Act. Any interfund trades are included within the respective purchases and sales amounts shown in the Purchases and Sales of Investments note. Interfund trades during the period are noted in the table below.
| | Purchases ($) | Sales ($) | Realized Gain (Loss)($) |
| Fidelity Total Bond Fund | - | 258,178 | 87,520 |
Sub-Advisory Arrangements. Effective March 1, 2024, the Fund's sub-advisory agreements with FMR Investment Management (UK) Limited, Fidelity Management & Research (Hong Kong) Limited, and Fidelity Management & Research (Japan) Limited were amended to provide that the investment adviser pays each sub-adviser monthly fees equal to 110% of the sub-adviser's costs for providing sub-advisory services. Effective March 1, 2024, the Fund's sub-advisory agreement with FIL Investment Advisors (FIA) was amended to provide that the investment adviser pays FIA monthly fees at an annual rate of 0.30% with respect to the average daily net assets of the Fund managed by FIA. FIA in turn pays FIA(UK).
7. Committed Line of Credit.
Certain Funds participate with other funds managed by the investment adviser or an affiliate in a $4.25 billion credit facility (the "line of credit") to be utilized for temporary or emergency purposes to fund shareholder redemptions or for other short-term liquidity purposes. The commitment fees on the pro-rata portion of the line of credit are borne by the investment adviser. During the period, there were no borrowings on this line of credit.
8. Security Lending.
Funds lend portfolio securities from time to time in order to earn additional income. Lending agents are used, including National Financial Services (NFS), an affiliate of the investment adviser. Pursuant to a securities lending agreement, NFS will receive a fee, which is capped at 9.9% of a fund's daily lending revenue, for its services as lending agent. A fund may lend securities to certain qualified borrowers, including NFS. On the settlement date of the loan, a fund receives collateral (in the form of U.S. Treasury obligations, letters of credit and/or cash) against the loaned securities and maintains collateral in an amount not less than 100% of the market value of the loaned securities during the period of the loan. The market value of the loaned securities is determined at the close of business of a fund and any additional required collateral is delivered to a fund on the next business day. A fund or borrower may terminate the loan at any time, and if the borrower defaults on its obligation to return the securities loaned because of insolvency or other reasons, a fund may apply collateral received from the borrower against the obligation. A fund may experience delays and costs in recovering the securities loaned. Any cash collateral received is invested in the Fidelity Securities Lending Cash Central Fund. Any loaned securities are identified as such in the Schedule of Investments, and the value of loaned securities and cash collateral at period end, as applicable, are presented in the Statement of Assets and Liabilities. Security lending income represents the income earned on investing cash collateral, less rebates paid to borrowers and any lending agent fees associated with the loan, plus any premium payments received for lending certain types of securities. Security lending income is presented in the Statement of Operations as a component of income from Fidelity Central Funds. Affiliated security lending activity, if any, was as follows:
| | Total Security Lending Fees Paid to NFS ($) | Security Lending Income From Securities Loaned to NFS ($) | Value of Securities Loaned to NFS at Period End ($) |
| Fidelity Total Bond Fund | 39,101 | - | - |
9. Expense Reductions.
The investment adviser contractually agreed to reimburse expenses of each class to the extent annual operating expenses exceeded certain levels of class-level average net assets as noted in the table below. This reimbursement will remain in place through December 31, 2025. Some expenses, for example the compensation of the independent Trustees, and certain other expenses such as interest expense, are excluded from this reimbursement.
The following classes were in reimbursement during the period:
| | Expense Limitations | Reimbursement ($) |
| Class Z | .36% | 3,378,440 |
Through arrangements with the Fund's custodian, credits realized as a result of certain uninvested cash balances were used to reduce the Fund's expenses. During the period, custodian credits reduced the Fund's expenses by $126,236.
10. Distributions to Shareholders.
Distributions to shareholders of each class were as follows:
| | Year ended August 31, 2024 | Year ended August 31, 2023 |
| Fidelity Total Bond Fund | | |
| Distributions to shareholders | | |
| Class A | $36,709,476 | $29,313,852 |
| Class M | 12,114,707 | 11,280,779 |
| Class C | 3,984,300 | 3,292,973 |
| Total Bond | 628,273,268 | 580,079,347 |
| Class I | 470,331,447 | 331,812,591 |
| Class Z | 380,736,443 | 268,115,601 |
Total | $1,532,149,641 | $1,223,895,143 |
11. Share Transactions.
Share transactions for each class were as follows and may contain in-kind transactions, automatic conversions between classes or exchanges between affiliated funds:
| | Shares | Shares | Dollars | Dollars |
| | Year ended August 31, 2024 | Year ended August 31, 2023 | Year ended August 31, 2024 | Year ended August 31, 2023 |
| Fidelity Total Bond Fund | | | | |
| Class A | | | | |
| Shares sold | 32,860,021 | 31,496,069 | $308,442,427 | $297,683,264 |
| Reinvestment of distributions | 3,846,939 | 3,041,689 | 36,094,984 | 28,656,228 |
| Shares redeemed | (24,002,077) | (20,276,514) | (224,770,645) | (191,091,866) |
| Net increase (decrease) | 12,704,883 | 14,261,244 | $119,766,766 | $135,247,626 |
| Class M | | | | |
| Shares sold | 8,815,065 | 7,723,677 | $82,692,715 | $72,808,141 |
| Reinvestment of distributions | 1,288,003 | 1,193,780 | 12,055,549 | 11,223,357 |
| Shares redeemed | (9,650,276) | (8,862,373) | (90,465,251) | (83,493,790) |
| Net increase (decrease) | 452,792 | 55,084 | $4,283,013 | $537,708 |
| Class C | | | | |
| Shares sold | 5,606,352 | 4,274,731 | $52,877,814 | $40,409,231 |
| Reinvestment of distributions | 417,246 | 340,360 | 3,916,370 | 3,207,040 |
| Shares redeemed | (4,060,232) | (4,437,146) | (38,019,970) | (41,762,472) |
| Net increase (decrease) | 1,963,366 | 177,945 | $18,774,214 | $1,853,799 |
| Total Bond | | | | |
| Shares sold | 441,968,746 | 408,163,826 | $4,152,083,958 | $3,836,234,230 |
| Reinvestment of distributions | 59,241,274 | 54,228,842 | 555,422,831 | 510,422,634 |
| Shares redeemed | (428,711,040) | (477,138,941) | (3,991,860,778) | (4,459,488,339) |
| Net increase (decrease) | 72,498,980 | (14,746,273) | $715,646,011 | $(112,831,475) |
| Class I | | | | |
| Shares sold | 610,250,086 | 486,572,554 | $5,711,743,511 | $4,574,529,789 |
| Reinvestment of distributions | 49,027,768 | 33,954,063 | 459,378,367 | 319,340,003 |
| Shares redeemed | (333,832,619) | (273,236,836) | (3,121,420,022) | (2,565,015,312) |
| Net increase (decrease) | 325,445,235 | 247,289,781 | $3,049,701,856 | $2,328,854,480 |
| Class Z | | | | |
| Shares sold | 458,461,019 | 339,028,298 | $4,288,499,369 | $3,195,114,991 |
| Reinvestment of distributions | 31,853,441 | 22,583,760 | 298,470,213 | 212,295,381 |
| Shares redeemed | (231,379,685) | (249,165,559) | (2,162,457,439) | (2,334,276,534) |
| Net increase (decrease) | 258,934,775 | 112,446,499 | $2,424,512,143 | $1,073,133,838 |
12. Other.
A fund's organizational documents provide former and current trustees and officers with a limited indemnification against liabilities arising in connection with the performance of their duties to the fund. In the normal course of business, a fund may also enter into contracts that provide general indemnifications. A fund's maximum exposure under these arrangements is unknown as this would be dependent on future claims that may be made against a fund. The risk of material loss from such claims is considered remote.
13. Credit Risk.
The Fund invests a significant portion of its assets in structured securities of issuers backed by commercial and residential mortgage loans, credit card receivables and automotive loans. The value and related income of these securities is sensitive to changes in economic conditions, including delinquencies and/or defaults.
14. Risk and Uncertainties.
Many factors affect a fund's performance. Developments that disrupt global economies and financial markets, such as pandemics, epidemics, outbreaks of infectious diseases, war, terrorism, and environmental disasters, may significantly affect a fund's investment performance. The effects of these developments to a fund will be impacted by the types of securities in which a fund invests, the financial condition, industry, economic sector, and geographic location of an issuer, and a fund's level of investment in the securities of that issuer. Significant concentrations in security types, issuers, industries, sectors, and geographic locations may magnify the factors that affect a fund's performance.
Report of Independent Registered Public Accounting Firm
To the Board of Trustees of Fidelity Income Fund and Shareholders of Fidelity Total Bond Fund
Opinion on the Financial Statements
We have audited the accompanying statement of assets and liabilities, including the schedule of investments, of Fidelity Total Bond Fund (one of the funds constituting Fidelity Income Fund, referred to hereafter as the "Fund") as of August 31, 2024, the related statement of operations for the year ended August 31, 2024, the statement of changes in net assets for each of the two years in the period ended August 31, 2024, including the related notes, and the financial highlights for each of the five years in the period ended August 31, 2024 (collectively referred to as the "financial statements"). In our opinion, the financial statements present fairly, in all material respects, the financial position of the Fund as of August 31, 2024, the results of its operations for the year then ended, the changes in its net assets for each of the two years in the period ended August 31, 2024 and the financial highlights for each of the five years in the period ended August 31, 2024 in conformity with accounting principles generally accepted in the United States of America.
Basis for Opinion
These financial statements are the responsibility of the Fund's management. Our responsibility is to express an opinion on the Fund's financial statements based on our audits. We are a public accounting firm registered with the Public Company Accounting Oversight Board (United States) (PCAOB) and are required to be independent with respect to the Fund in accordance with the U.S. federal securities laws and the applicable rules and regulations of the Securities and Exchange Commission and the PCAOB.
We conducted our audits of these financial statements in accordance with the standards of the PCAOB. Those standards require that we plan and perform the audit to obtain reasonable assurance about whether the financial statements are free of material misstatement, whether due to error or fraud.
Our audits included performing procedures to assess the risks of material misstatement of the financial statements, whether due to error or fraud, and performing procedures that respond to those risks. Such procedures included examining, on a test basis, evidence regarding the amounts and disclosures in the financial statements. Our audits also included evaluating the accounting principles used and significant estimates made by management, as well as evaluating the overall presentation of the financial statements. Our procedures included confirmation of securities owned as of August 31, 2024 by correspondence with the custodian, issuers of privately offered securities, agent banks and brokers; when replies were not received from brokers, we performed other auditing procedures. We believe that our audits provide a reasonable basis for our opinion.
/s/ PricewaterhouseCoopers LLP
Boston, Massachusetts
October 14, 2024
We have served as the auditor of one or more investment companies in the Fidelity group of funds since 1932.
Distributions
(Unaudited)The dividend and capital gains distributions for the fund(s) are available on Fidelity.com or Institutional.Fidelity.com.
A total of 25.69% of the dividends distributed during the fiscal year was derived from interest on U.S. Government securities which is generally exempt from state income tax.
The fund designates $1,069,242,092 of distributions paid in the calendar year 2023 as qualifying to be taxed as interest-related dividends for nonresident alien shareholders.
The fund designates $1,532,152,916 of distributions paid during the fiscal year ended 2024 as qualifying to be taxed as section 163(j) interest dividends.
The fund will notify shareholders in January 2025 of amounts for use in preparing 2024 income tax returns.
Item 8: Changes in and Disagreements with Accountants for Open-End Management Investment Companies
(Unaudited)
Note: This is not applicable for any fund included in this document.
Item 9: Proxy Disclosures for Open-End Management Investment Companies
(Unaudited)
| A special meeting of shareholders was held on October 18, 2023. The results of votes taken among shareholders on the proposal before them are reported below. Each vote reported represents one dollar of net asset value held on the record date for the meeting. |
| Proposal 1 |
| To elect a Board of Trustees. |
| | # of Votes | % of Votes |
| Abigail P. Johnson |
| Affirmative | 29,408,520,731.18 | 96.84 |
| Withheld | 958,659,352.64 | 3.16 |
| TOTAL | 30,367,180,083.82 | 100.00 |
| Jennifer Toolin McAuliffe |
| Affirmative | 29,484,249,185.02 | 97.09 |
| Withheld | 882,930,898.80 | 2.91 |
| TOTAL | 30,367,180,083.82 | 100.00 |
| Christine J. Thompson |
| Affirmative | 29,483,889,948.58 | 97.09 |
| Withheld | 883,290,135.24 | 2.91 |
| TOTAL | 30,367,180,083.82 | 100.00 |
| Elizabeth S. Acton |
| Affirmative | 29,471,265,000.64 | 97.05 |
| Withheld | 895,915,083.18 | 2.95 |
| TOTAL | 30,367,180,083.82 | 100.00 |
| Laura M. Bishop |
| Affirmative | 29,508,015,754.27 | 97.17 |
| Withheld | 859,164,329.55 | 2.83 |
| TOTAL | 30,367,180,083.82 | 100.00 |
| Ann E. Dunwoody |
| Affirmative | 29,470,432,034.14 | 97.05 |
| Withheld | 896,748,049.68 | 2.95 |
| TOTAL | 30,367,180,083.82 | 100.00 |
| John Engler |
| Affirmative | 29,326,181,411.39 | 96.57 |
| Withheld | 1,040,998,672.43 | 3.43 |
| TOTAL | 30,367,180,083.82 | 100.00 |
| Robert F. Gartland |
| Affirmative | 29,422,803,481.93 | 96.89 |
| Withheld | 944,376,601.89 | 3.11 |
| TOTAL | 30,367,180,083.82 | 100.00 |
| Robert W. Helm |
| Affirmative | 29,445,540,968.38 | 96.97 |
| Withheld | 921,639,115.44 | 3.03 |
| TOTAL | 30,367,180,083.82 | 100.00 |
| Arthur E. Johnson |
| Affirmative | 29,395,582,286.37 | 96.80 |
| Withheld | 971,597,797.45 | 3.20 |
| TOTAL | 30,367,180,083.82 | 100.00 |
| Michael E. Kenneally |
| Affirmative | 29,420,582,069.08 | 96.88 |
| Withheld | 946,598,014.74 | 3.12 |
| TOTAL | 30,367,180,083.82 | 100.00 |
| Mark A. Murray |
| Affirmative | 29,446,384,581.44 | 96.97 |
| Withheld | 920,795,502.38 | 3.03 |
| TOTAL | 30,367,180,083.82 | 100.00 |
| Carol J. Zierhoffer |
| Affirmative | 29,510,392,522.55 | 97.18 |
| Withheld | 856,787,561.27 | 2.82 |
| TOTAL | 30,367,180,083.82 | 100.00 |
| | | |
| Proposal 1 reflects trust-wide proposal and voting results. |
Item 10: Remuneration Paid to Directors, Officers, and others of Open-End Management Investment Companies
(Unaudited)
Note: This information is disclosed as part of the financial statements for each Fund as part of Item 7: Financial Statements and Financial Highlights for Open-End Management Investment companies.
Item 11: Statement Regarding Basis for Approval of Investment Advisory Contract
(Unaudited)
Note: This is not applicable for any fund included in this document.
1.789692.122
TBD-ANN-1024
Fidelity® Environmental Bond Fund
Annual Report
August 31, 2024
Includes Fidelity and Fidelity Advisor share classes
Contents
To view a fund's proxy voting guidelines and proxy voting record for the 12-month period ended June 30, visit http://www.fidelity.com/proxyvotingresults or visit the Securities and Exchange Commission's (SEC) web site at http://www.sec.gov.
You may also call 1-800-544-8544 if you're an individual investing directly with Fidelity, call 1-800-835-5092 if you're a plan sponsor or participant with Fidelity as your recordkeeper or call 1-877-208-0098 on institutional accounts or if you're an advisor or invest through one to request a free copy of the proxy voting guidelines.
Standard & Poor's, S&P and S&P 500 are registered service marks of The McGraw-Hill Companies, Inc. and have been licensed for use by Fidelity Distributors Corporation.
Other third-party marks appearing herein are the property of their respective owners.
All other marks appearing herein are registered or unregistered trademarks or service marks of FMR LLC or an affiliated company. © 2024 FMR LLC. All rights reserved.
This report and the financial statements contained herein are submitted for the general information of the shareholders of the Fund. This report is not authorized for distribution to prospective investors in the Fund unless preceded or accompanied by an effective prospectus.
A fund files its complete schedule of portfolio holdings with the SEC for the first and third quarters of each fiscal year on Form N-PORT. Forms N-PORT are available on the SEC's web site at http://www.sec.gov. A fund's Forms N-PORT may be reviewed and copied at the SEC's Public Reference Room in Washington, DC. Information regarding the operation of the SEC's Public Reference Room may be obtained by calling 1-800-SEC-0330.
For a complete list of a fund's portfolio holdings, view the most recent holdings listing, semiannual report, or annual report on Fidelity's web site at http://www.fidelity.com, http://www.institutional.fidelity.com, or http://www.401k.com, as applicable.
NOT FDIC INSURED •MAY LOSE VALUE •NO BANK GUARANTEE
Neither the Fund nor Fidelity Distributors Corporation is a bank.
Item 7: Financial Statements and Financial Highlights for Open-End Management Investment Companies (Annual Report)
Fidelity® Environmental Bond Fund
Schedule of Investments August 31, 2024
Showing Percentage of Net Assets
| Nonconvertible Bonds - 44.0% |
| | | Principal Amount (a) | Value ($) |
| COMMUNICATION SERVICES - 5.0% | | | |
| Diversified Telecommunication Services - 3.8% | | | |
| AT&T, Inc. 5.4% 2/15/34 | | 150,000 | 154,897 |
| Elisa Corp. 4% 1/27/29 (Reg. S) | EUR | 100,000 | 113,778 |
| NTT Finance Corp.: | | | |
| 4.372% 7/27/27 (b) | | 100,000 | 99,724 |
| 5.104% 7/2/27 (b) | | 200,000 | 203,562 |
| TELUS Corp. 3.4% 5/13/32 | | 300,000 | 269,807 |
| Verizon Communications, Inc.: | | | |
| 2.55% 3/21/31 | | 50,000 | 43,982 |
| 3.875% 2/8/29 | | 450,000 | 439,792 |
| 5.05% 5/9/33 | | 100,000 | 101,786 |
| | | | 1,427,328 |
| Entertainment - 0.3% | | | |
| Netflix, Inc. 4.9% 8/15/34 | | 100,000 | 102,430 |
| Media - 0.7% | | | |
| Comcast Corp. 4.65% 2/15/33 | | 250,000 | 249,925 |
| Wireless Telecommunication Services - 0.2% | | | |
| VMED O2 UK Financing I PLC 4.75% 7/15/31 (b) | | 100,000 | 87,730 |
TOTAL COMMUNICATION SERVICES | | | 1,867,413 |
| CONSUMER DISCRETIONARY - 2.0% | | | |
| Automobile Components - 0.8% | | | |
| ZF Finance GmbH 2% 5/6/27 (Reg. S) | EUR | 100,000 | 104,277 |
| ZF North America Capital, Inc.: | | | |
| 6.75% 4/23/30 (b) | | 100,000 | 102,797 |
| 6.875% 4/23/32 (b) | | 100,000 | 103,902 |
| | | | 310,976 |
| Automobiles - 1.2% | | | |
| Ford Motor Co. 3.25% 2/12/32 | | 175,000 | 149,052 |
| General Motors Co.: | | | |
| 5.4% 10/15/29 | | 200,000 | 204,721 |
| 5.6% 10/15/32 | | 75,000 | 77,558 |
| | | | 431,331 |
TOTAL CONSUMER DISCRETIONARY | | | 742,307 |
| CONSUMER STAPLES - 2.5% | | | |
| Beverages - 0.2% | | | |
| PepsiCo, Inc. 3.9% 7/18/32 | | 100,000 | 97,029 |
| Consumer Staples Distribution & Retail - 1.0% | | | |
| REWE International Finance 4.875% 9/13/30 (Reg. S) | EUR | 100,000 | 117,375 |
| Walmart, Inc. 1.8% 9/22/31 | | 300,000 | 257,442 |
| | | | 374,817 |
| Food Products - 1.3% | | | |
| General Mills, Inc. 2.25% 10/14/31 | | 450,000 | 385,683 |
| Mondelez International, Inc. 4.75% 8/28/34 | | 100,000 | 99,443 |
| | | | 485,126 |
TOTAL CONSUMER STAPLES | | | 956,972 |
| FINANCIALS - 13.9% | | | |
| Banks - 9.8% | | | |
| ABN AMRO Bank NV 2.47% 12/13/29 (b)(c) | | 200,000 | 182,038 |
| AIB Group PLC 2.875% 5/30/31 (Reg. S) (c) | EUR | 125,000 | 135,444 |
| Bank of America Corp.: | | | |
| 2.456% 10/22/25 (c) | | 200,000 | 199,143 |
| 5.425% 8/15/35 (c) | | 100,000 | 100,217 |
| 6.204% 11/10/28 (c) | | 290,000 | 303,952 |
| Bank of Ireland Group PLC 5% 7/4/31 (Reg. S) (c) | EUR | 100,000 | 118,429 |
| BNP Paribas SA: | | | |
| 0.5% 5/30/28 (Reg. S) (c) | EUR | 100,000 | 102,525 |
| 1.675% 6/30/27 (b)(c) | | 200,000 | 189,073 |
| 5.497% 5/20/30 (b)(c) | | 200,000 | 205,240 |
| Danske Bank A/S 4.75% 6/21/30 (Reg. S) (c) | EUR | 100,000 | 116,667 |
| DNB Bank ASA 4% 3/14/29 (Reg. S) (c) | EUR | 100,000 | 113,560 |
| Fifth Third Bancorp 1.707% 11/1/27 (c) | | 300,000 | 281,148 |
| HAT Holdings I LLC/HAT Holdings II LLC 3.75% 9/15/30 (b) | | 100,000 | 88,931 |
| ING Groep NV 0.875% 6/9/32 (Reg. S) (c) | EUR | 100,000 | 102,278 |
| JPMorgan Chase & Co. 6.07% 10/22/27 (c) | | 200,000 | 206,514 |
| Lloyds Banking Group PLC 3.875% 5/14/32 (Reg. S) (c) | EUR | 100,000 | 112,382 |
| Mizuho Financial Group, Inc. 5.778% 7/6/29 (c) | | 200,000 | 207,816 |
| NatWest Group PLC: | | | |
| 3.673% 8/5/31 (Reg. S) (c) | EUR | 100,000 | 111,114 |
| 4.964% 8/15/30 (c) | | 200,000 | 200,883 |
| PNC Financial Services Group, Inc.: | | | |
| 4.758% 1/26/27 (c) | | 200,000 | 199,710 |
| 5.401% 7/23/35 (c) | | 100,000 | 102,417 |
| 5.676% 1/22/35 (c) | | 150,000 | 156,544 |
| Santander Holdings U.S.A., Inc. 5.807% 9/9/26 (c) | | 43,000 | 43,169 |
| Wells Fargo & Co. 4.54% 8/15/26 (c) | | 100,000 | 99,554 |
| | | | 3,678,748 |
| Capital Markets - 1.3% | | | |
| Moody's Corp. 5% 8/5/34 | | 100,000 | 101,104 |
| Nuveen LLC 5.55% 1/15/30 (b) | | 18,000 | 18,662 |
| S&P Global, Inc. 2.7% 3/1/29 | | 400,000 | 373,735 |
| | | | 493,501 |
| Financial Services - 1.7% | | | |
| ACEF Holding SCA 1.25% 4/26/30 (Reg. S) | EUR | 100,000 | 96,206 |
| CBRE Global Investors Pan European Core Fund 4.75% 3/27/34 (Reg. S) | EUR | 100,000 | 115,964 |
| KfW 2.75% 2/14/33 (Reg. S) | EUR | 50,000 | 55,859 |
| Rexford Industrial Realty LP 2.15% 9/1/31 | | 414,000 | 344,443 |
| | | | 612,472 |
| Insurance - 1.1% | | | |
| ASR Nederland NV 3.625% 12/12/28 (Reg. S) | EUR | 100,000 | 111,813 |
| Muenchener Rueckversicherungs-Gesellschaft AG in Muenchen 5.875% 5/23/42 (b)(c) | | 200,000 | 205,306 |
| Pine Street Trust III 6.223% 5/15/54 (b) | | 100,000 | 105,842 |
| | | | 422,961 |
TOTAL FINANCIALS | | | 5,207,682 |
| HEALTH CARE - 2.1% | | | |
| Health Care Providers & Services - 1.4% | | | |
| CVS Health Corp.: | | | |
| 5.25% 1/30/31 | | 100,000 | 101,681 |
| 5.875% 6/1/53 | | 50,000 | 49,322 |
| Humana, Inc. 5.375% 4/15/31 | | 122,000 | 124,938 |
| ICON Investments Six Designated Activity 6% 5/8/34 | | 200,000 | 210,607 |
| Kaiser Foundation Hospitals 3.15% 5/1/27 | | 50,000 | 48,760 |
| | | | 535,308 |
| Pharmaceuticals - 0.7% | | | |
| Merck & Co., Inc. 1.9% 12/10/28 | | 300,000 | 273,502 |
TOTAL HEALTH CARE | | | 808,810 |
| INDUSTRIALS - 0.4% | | | |
| Ground Transportation - 0.1% | | | |
| CSX Corp. 3.8% 4/15/50 | | 50,000 | 40,510 |
| Marine Transportation - 0.3% | | | |
| A.P. Moller - Maersk A/S 5.875% 9/14/33 (b) | | 100,000 | 105,802 |
TOTAL INDUSTRIALS | | | 146,312 |
| INFORMATION TECHNOLOGY - 2.6% | | | |
| Semiconductors & Semiconductor Equipment - 1.9% | | | |
| Analog Devices, Inc. 1.7% 10/1/28 | | 300,000 | 272,336 |
| Micron Technology, Inc. 2.703% 4/15/32 | | 200,000 | 171,344 |
| NXP BV/NXP Funding LLC/NXP U.S.A., Inc.: | | | |
| 2.5% 5/11/31 | | 100,000 | 86,142 |
| 5% 1/15/33 | | 200,000 | 199,777 |
| | | | 729,599 |
| Software - 0.7% | | | |
| Autodesk, Inc. 2.4% 12/15/31 | | 300,000 | 258,374 |
TOTAL INFORMATION TECHNOLOGY | | | 987,973 |
| MATERIALS - 1.9% | | | |
| Chemicals - 1.4% | | | |
| Air Products & Chemicals, Inc. 4.8% 3/3/33 | | 100,000 | 102,065 |
| Evonik Industries AG 1.375% 9/2/81 (Reg. S) (c) | EUR | 100,000 | 103,640 |
| LYB International Finance III LLC 5.625% 5/15/33 | | 100,000 | 104,978 |
| The Dow Chemical Co. 5.15% 2/15/34 | | 200,000 | 202,149 |
| | | | 512,832 |
| Construction Materials - 0.0% | | | |
| HeidelbergCement AG 3.95% 7/19/34 (Reg. S) | EUR | 10,000 | 11,179 |
| Containers & Packaging - 0.5% | | | |
| Smurfit Kappa Treasury ULC 5.2% 1/15/30 (b) | | 200,000 | 204,642 |
TOTAL MATERIALS | | | 728,653 |
| REAL ESTATE - 2.9% | | | |
| Equity Real Estate Investment Trusts (REITs) - 2.1% | | | |
| American Homes 4 Rent LP 5.5% 2/1/34 | | 50,000 | 50,918 |
| Boston Properties, Inc. 6.75% 12/1/27 | | 22,000 | 22,995 |
| Healthpeak OP, LLC 2.125% 12/1/28 | | 150,000 | 135,788 |
| Hudson Pacific Properties LP 5.95% 2/15/28 | | 151,000 | 134,872 |
| UDR, Inc. 1.9% 3/15/33 | | 375,000 | 295,491 |
| WP Carey, Inc. 2.45% 2/1/32 | | 150,000 | 125,975 |
| | | | 766,039 |
| Real Estate Management & Development - 0.8% | | | |
| Blackstone Property Partners Europe LP 1.625% 4/20/30 (Reg. S) | EUR | 100,000 | 96,550 |
| CTP BV 1.5% 9/27/31 (Reg. S) | EUR | 100,000 | 93,312 |
| Lend Lease Finance Ltd. 3.4% 10/27/27 (Reg. S) | AUD | 20,000 | 12,636 |
| P3 Group SARL 0.875% 1/26/26 (Reg. S) | EUR | 100,000 | 106,342 |
| | | | 308,840 |
TOTAL REAL ESTATE | | | 1,074,879 |
| UTILITIES - 10.7% | | | |
| Electric Utilities - 8.2% | | | |
| Amprion GmbH 3.875% 9/7/28 (Reg. S) | EUR | 100,000 | 113,016 |
| CenterPoint Energy Houston Electric LLC 5.3% 4/1/53 | | 50,000 | 49,756 |
| Clearway Energy Operating LLC 3.75% 1/15/32 (b) | | 100,000 | 88,823 |
| Consolidated Edison Co. of New York, Inc. 3.35% 4/1/30 | | 325,000 | 309,312 |
| EnBW Energie Baden-Wuerttemberg AG 1.875% 6/29/80 (Reg. S) (c) | EUR | 100,000 | 106,176 |
| ENEL Finance International NV 5.125% 6/26/29 (b) | | 400,000 | 406,035 |
| Energias de Portugal SA 1.7% 7/20/80 (Reg. S) (c) | EUR | 100,000 | 108,121 |
| MidAmerican Energy Co.: | | | |
| 5.3% 2/1/55 | | 50,000 | 49,806 |
| 5.35% 1/15/34 | | 150,000 | 157,095 |
| Northern States Power Co. 2.25% 4/1/31 | | 500,000 | 435,639 |
| NSTAR Electric Co. 4.95% 9/15/52 | | 200,000 | 190,285 |
| Oglethorpe Power Corp. 5.8% 6/1/54 (b) | | 100,000 | 101,970 |
| Oncor Electric Delivery Co. LLC 4.15% 6/1/32 | | 100,000 | 96,549 |
| Pacific Gas & Electric Co. 6.7% 4/1/53 | | 100,000 | 109,405 |
| Public Service Electric & Gas Co. 4.65% 3/15/33 | | 100,000 | 99,912 |
| Puget Sound Energy, Inc. 5.448% 6/1/53 | | 100,000 | 100,983 |
| Scottish Hydro Electric Transmission PLC 3.375% 9/4/32 (Reg. S) | EUR | 100,000 | 109,749 |
| Wisconsin Electric Power Co. 4.75% 9/30/32 | | 400,000 | 406,319 |
| Wisconsin Power & Light Co. 4.95% 4/1/33 | | 50,000 | 50,203 |
| | | | 3,089,154 |
| Independent Power and Renewable Electricity Producers - 1.9% | | | |
| Atlantica Sustainable Infrastructure PLC 4.125% 6/15/28 (b) | | 100,000 | 99,087 |
| RWE Finance U.S. LLC 6.25% 4/16/54 (b) | | 150,000 | 154,488 |
| The AES Corp.: | | | |
| 2.45% 1/15/31 | | 400,000 | 341,113 |
| 5.45% 6/1/28 | | 100,000 | 101,850 |
| | | | 696,538 |
| Multi-Utilities - 0.3% | | | |
| New York State Electric & Gas Corp. 5.3% 8/15/34 (b) | | 100,000 | 100,965 |
| Water Utilities - 0.3% | | | |
| Severn Trent Utilities Finance PLC 4% 3/5/34 (Reg. S) | EUR | 100,000 | 111,198 |
TOTAL UTILITIES | | | 3,997,855 |
| TOTAL NONCONVERTIBLE BONDS (Cost $16,714,969) | | | 16,518,856 |
| | | | |
| U.S. Government and Government Agency Obligations - 27.4% |
| | | Principal Amount (a) | Value ($) |
| U.S. Government Agency Obligations - 0.4% | | | |
| Tennessee Valley Authority 1.5% 9/15/31 | | 200,000 | 168,380 |
| U.S. Treasury Obligations - 27.0% | | | |
| U.S. Treasury Bonds: | | | |
| 2% 11/15/41 (d) | | 1,770,000 | 1,277,511 |
| 2.875% 5/15/52 | | 625,000 | 483,008 |
| 3% 8/15/52 | | 235,000 | 186,412 |
| 3.625% 2/15/53 | | 100,000 | 89,699 |
| 3.625% 5/15/53 | | 405,000 | 363,535 |
| 4.125% 8/15/53 | | 270,000 | 265,138 |
| 4.25% 2/15/54 | | 420,000 | 421,641 |
| 4.25% 8/15/54 | | 70,000 | 70,438 |
| 4.625% 5/15/54 | | 350,000 | 374,063 |
| 4.75% 11/15/53 | | 190,000 | 206,981 |
| U.S. Treasury Notes: | | | |
| 2.875% 5/15/32 | | 63,000 | 58,939 |
| 3.5% 1/31/28 | | 53,000 | 52,524 |
| 3.75% 8/31/31 | | 330,000 | 328,711 |
| 4% 7/31/30 | | 1,520,000 | 1,536,917 |
| 4% 1/31/31 | | 800,000 | 808,781 |
| 4% 2/15/34 | | 170,000 | 171,063 |
| 4.125% 7/31/28 | | 750,000 | 759,785 |
| 4.125% 7/31/31 | | 700,000 | 712,955 |
| 4.25% 2/28/29 | | 905,000 | 924,161 |
| 4.25% 2/28/31 | | 150,000 | 153,820 |
| 4.375% 11/30/30 | | 300,000 | 309,492 |
| 4.5% 11/15/33 | | 350,000 | 365,900 |
| 4.625% 9/30/28 (d) | | 190,000 | 196,145 |
TOTAL U.S. TREASURY OBLIGATIONS | | | 10,117,619 |
| TOTAL U.S. GOVERNMENT AND GOVERNMENT AGENCY OBLIGATIONS (Cost $10,720,812) | | | 10,285,999 |
| | | | |
| U.S. Government Agency - Mortgage Securities - 21.2% |
| | | Principal Amount (a) | Value ($) |
| Fannie Mae - 9.7% | | | |
| 2% 8/1/35 to 8/1/51 | | 692,659 | 603,246 |
| 2.5% 12/1/51 to 4/1/52 | | 274,437 | 234,606 |
| 3% 1/1/52 | | 906,948 | 806,841 |
| 4.5% 12/1/52 | | 568,773 | 553,677 |
| 5% 5/1/53 to 1/1/54 | | 1,066,427 | 1,058,710 |
| 5.5% 5/1/53 to 11/1/53 | | 324,401 | 326,748 |
| 6.5% 5/1/53 | | 63,242 | 65,186 |
TOTAL FANNIE MAE | | | 3,649,014 |
| Freddie Mac - 9.0% | | | |
| 2% 4/1/51 to 3/1/52 | | 1,028,038 | 841,743 |
| 2.5% 2/1/52 to 3/1/52 | | 1,619,949 | 1,383,393 |
| 3.5% 6/1/52 | | 93,412 | 85,987 |
| 4% 12/1/52 | | 370,625 | 351,333 |
| 5% 6/1/53 | | 188,132 | 186,760 |
| 5.5% 10/1/53 | | 190,865 | 192,246 |
| 6.5% 1/1/53 to 6/1/53 | | 113,913 | 117,523 |
| 1.5% 12/1/31 | | 211,480 | 195,840 |
TOTAL FREDDIE MAC | | | 3,354,825 |
| Ginnie Mae - 0.4% | | | |
| 2% 2/20/51 | | 185,390 | 156,144 |
| Uniform Mortgage Backed Securities - 2.1% | | | |
| 3.5% 9/1/54 (e) | | 200,000 | 184,086 |
| 4% 9/1/54 (e) | | 200,000 | 189,664 |
| 6.5% 9/1/54 (e) | | 400,000 | 411,859 |
TOTAL UNIFORM MORTGAGE BACKED SECURITIES | | | 785,609 |
| TOTAL U.S. GOVERNMENT AGENCY - MORTGAGE SECURITIES (Cost $8,136,668) | | | 7,945,592 |
| | | | |
| Asset-Backed Securities - 3.2% |
| | | Principal Amount (a) | Value ($) |
| Goodleap Sustainable Home Solutions: | | | |
| Series 2023-4C Class A, 6.48% 3/20/57 (b) | | 93,838 | 97,102 |
| Series 2024-1GS Class A, 6.25% 6/20/57 (b) | | 97,756 | 99,914 |
| GoodLeap Sustainable Home Solutions Trust Series 2021-5CS Class A, 2.31% 10/20/48 (b) | | 294,212 | 241,277 |
| Hertz Vehicle Financing III LLC Series 2023-1A Class A, 5.49% 6/25/27 (b) | | 100,000 | 100,819 |
| Mosaic Solar Loans LLC Series 2024-1 Class A, 5.5% 9/20/49 (b) | | 88,974 | 88,741 |
| Sunnova Helios Viii Issuer LLC Series 2022-A Class A, 2.79% 2/22/49 (b) | | 213,572 | 188,436 |
| Sunrun Callisto Issuer, LLC Series 2021-2A Class A, 2.27% 1/30/57 (b) | | 171,334 | 146,439 |
| Sunrun Julius Issuer 2023-2 Ll Series 2023-2A Class A1, 6.6% 1/30/59 (b) | | 147,059 | 148,813 |
| Tesla Auto Lease Trust 23-A Series 2023-A Class A3, 5.89% 6/22/26 (b) | | 51,000 | 51,176 |
| Tesla Electric Vehicle Trust 2023-1 Series 2023-1 Class A3, 5.38% 6/20/28 (b) | | 38,000 | 38,653 |
| TOTAL ASSET-BACKED SECURITIES (Cost $1,291,081) | | | 1,201,370 |
| | | | |
| Commercial Mortgage Securities - 2.4% |
| | | Principal Amount (a) | Value ($) |
| DC Commercial Morgage Trust sequential payer Series 2023-DC Class A, 6.3143% 9/12/40 (b) | | 100,000 | 103,899 |
| Freddie Mac: | | | |
| sequential payer: | | | |
Series 2020-KG03 Class A2, 1.297% 6/25/30 | | 160,000 | 136,875 |
Series 2022-KG07 Class A2, 3.123% 8/25/32 | | 200,000 | 184,713 |
Series 2022-KSG4 Class A2, 3.4% 8/25/32 (c) | | 200,000 | 188,192 |
| Series 2023-KG08 Class A2, 4.134% 5/25/33 | | 300,000 | 296,065 |
| TOTAL COMMERCIAL MORTGAGE SECURITIES (Cost $933,374) | | | 909,744 |
| | | | |
| Foreign Government and Government Agency Obligations - 1.1% |
| | | Principal Amount (a) | Value ($) |
| Dominican Republic 6.6% 6/1/36 (b) | | 150,000 | 157,650 |
| German Federal Republic: | | | |
| 0% 8/15/30 (Reg. S) | EUR | 22,000 | 21,464 |
| 2.3% 2/15/33(Reg. S) | EUR | 20,000 | 22,275 |
| United Kingdom, Great Britain and Northern Ireland: | | | |
| 0.375% 10/22/30 (Reg. S) | GBP | 55,000 | 58,964 |
| 4.25% 6/7/32 | GBP | 20,000 | 26,978 |
| Uruguay Republic 5.75% 10/28/34 | | 100,000 | 108,313 |
| TOTAL FOREIGN GOVERNMENT AND GOVERNMENT AGENCY OBLIGATIONS (Cost $372,981) | | | 395,644 |
| | | | |
| Preferred Securities - 0.6% |
| | | Principal Amount (a) | Value ($) |
| UTILITIES - 0.6% | | | |
| Electric Utilities - 0.6% | | | |
| TenneT Holding BV 4.625% (Reg. S) (c)(f) | EUR | 100,000 | 111,960 |
| Terna - Rete Elettrica Nazionale 2.375% (Reg. S) (c)(f) | EUR | 100,000 | 105,654 |
| TOTAL PREFERRED SECURITIES (Cost $221,136) | | | 217,614 |
| | | | |
| Money Market Funds - 1.8% |
| | | Shares | Value ($) |
Fidelity Cash Central Fund 5.39% (g) (Cost $674,248) | | 674,113 | 674,248 |
| | | | |
| TOTAL INVESTMENT IN SECURITIES - 101.7% (Cost $39,065,269) | 38,149,067 |
NET OTHER ASSETS (LIABILITIES) - (1.7)% | (647,132) |
| NET ASSETS - 100.0% | 37,501,935 |
| | |
| Futures Contracts |
| | Number of contracts | Expiration Date | Notional Amount ($) | Value ($) | Unrealized Appreciation/ (Depreciation) ($) |
| Purchased | | | | | |
| | | | | | |
| Treasury Contracts | | | | | |
| CBOT 5-Year U.S. Treasury Note Contracts (United States) | 5 | Dec 2024 | 546,992 | (2,352) | (2,352) |
| | | | | | |
| Sold | | | | | |
| | | | | | |
| Bond Index Contracts | | | | | |
| Eurex Euro-Bobl Contracts (Germany) | 8 | Dec 2024 | 1,051,987 | 1,676 | 1,676 |
| Eurex Euro-Bund Contracts (Germany) | 4 | Dec 2024 | 589,841 | 1,456 | 1,456 |
| Eurex Euro-Schatz Contracts (Germany) | 11 | Dec 2024 | 1,296,800 | 963 | 963 |
| | | | | | |
| TOTAL SOLD | | | | | 4,095 |
| | | | | | |
| TOTAL FUTURES CONTRACTS | | | | | 1,743 |
| The notional amount of futures purchased as a percentage of Net Assets is 1.5% |
| The notional amount of futures sold as a percentage of Net Assets is 7.8% |
| Forward Foreign Currency Contracts |
Currency Purchased
| Currency Sold | Counterparty | Settlement Date | Unrealized Appreciation/ (Depreciation) ($) |
| | | | | | | |
| USD | 220,339 | EUR | 199,000 | BNP Paribas S.A. | 9/04/24 | 364 |
| EUR | 199,000 | USD | 220,631 | BNP Paribas S.A. | 10/03/24 | (364) |
| EUR | 3,000 | USD | 3,339 | Citibank, N. A. | 10/03/24 | (19) |
| USD | 12,733 | AUD | 19,000 | UBS AG | 10/03/24 | (137) |
| USD | 3,120,697 | EUR | 2,823,000 | Bank of America, N.A. | 10/03/24 | (3,993) |
| USD | 2,227 | EUR | 2,000 | Bank of America, N.A. | 10/03/24 | 13 |
| USD | 4,465 | EUR | 4,000 | JPMorgan Chase Bank, N.A. | 10/03/24 | 37 |
| USD | 98,471 | GBP | 76,000 | State Street Bank and Trust Co | 10/03/24 | (1,367) |
| | | | | | | |
| TOTAL FORWARD FOREIGN CURRENCY CONTRACTS | | (5,466) |
| Unrealized Appreciation | | | 414 |
| Unrealized Depreciation | | | (5,880) |
Currency Abbreviations
| AUD | - | Australian dollar |
| EUR | - | European Monetary Unit |
| GBP | - | British pound sterling |
| USD | - | U.S. dollar |
Legend
| (a) | Amount is stated in United States dollars unless otherwise noted. |
| (b) | Security exempt from registration under Rule 144A of the Securities Act of 1933. These securities may be resold in transactions exempt from registration, normally to qualified institutional buyers. At the end of the period, the value of these securities amounted to $4,317,538 or 11.5% of net assets. |
| (c) | Coupon rates for floating and adjustable rate securities reflect the rates in effect at period end. |
| (d) | Security or a portion of the security was pledged to cover margin requirements for futures contracts. At period end, the value of securities pledged amounted to $54,170. |
| (e) | Security or a portion of the security purchased on a delayed delivery or when-issued basis. |
| (f) | Security is perpetual in nature with no stated maturity date. |
| (g) | Affiliated fund that is generally available only to investment companies and other accounts managed by Fidelity Investments. The rate quoted is the annualized seven-day yield of the fund at period end. A complete unaudited listing of the fund's holdings as of its most recent quarter end is available upon request. In addition, each Fidelity Central Fund's financial statements, which are not covered by the Fund's Report of Independent Registered Public Accounting Firm, are available on the SEC's website or upon request. |
Affiliated Central Funds
Fiscal year to date information regarding the Fund's investments in Fidelity Central Funds, including the ownership percentage, is presented below.
| Affiliate | Value, beginning of period ($) | Purchases ($) | Sales Proceeds ($) | Dividend Income ($) | Realized Gain (loss) ($) | Change in Unrealized appreciation (depreciation) ($) | Value, end of period ($) | % ownership, end of period |
| Fidelity Cash Central Fund 5.39% | 847,713 | 13,072,096 | 13,245,564 | 41,812 | 3 | - | 674,248 | 0.0% |
| Total | 847,713 | 13,072,096 | 13,245,564 | 41,812 | 3 | - | 674,248 | |
| | | | | | | | | |
Amounts in the dividend income column in the above table include any capital gain distributions from underlying funds, which are presented in the corresponding line item in the Statement of Operations, if applicable.
Amounts included in the purchases and sales proceeds columns may include in-kind transactions, if applicable.
Investment Valuation
The following is a summary of the inputs used, as of August 31, 2024, involving the Fund's assets and liabilities carried at fair value. The inputs or methodology used for valuing securities may not be an indication of the risk associated with investing in those securities. For more information on valuation inputs, and their aggregation into the levels used below, please refer to the Investment Valuation section in the accompanying Notes to Financial Statements.
| Valuation Inputs at Reporting Date: |
| Description | Total ($) | Level 1 ($) | Level 2 ($) | Level 3 ($) |
Investments in Securities: | | | | |
|
| Corporate Bonds | 16,518,856 | - | 16,518,856 | - |
|
| U.S. Government and Government Agency Obligations | 10,285,999 | - | 10,285,999 | - |
|
| U.S. Government Agency - Mortgage Securities | 7,945,592 | - | 7,945,592 | - |
|
| Asset-Backed Securities | 1,201,370 | - | 1,201,370 | - |
|
| Commercial Mortgage Securities | 909,744 | - | 909,744 | - |
|
| Foreign Government and Government Agency Obligations | 395,644 | - | 395,644 | - |
|
| Preferred Securities | 217,614 | - | 217,614 | - |
|
| Money Market Funds | 674,248 | 674,248 | - | - |
| Total Investments in Securities: | 38,149,067 | 674,248 | 37,474,819 | - |
Derivative Instruments: Assets | | | | |
Futures Contracts | 4,095 | 4,095 | - | - |
Forward Foreign Currency Contracts | 414 | - | 414 | - |
| Total Assets | 4,509 | 4,095 | 414 | - |
| Liabilities | | | | |
Futures Contracts | (2,352) | (2,352) | - | - |
Forward Foreign Currency Contracts | (5,880) | - | (5,880) | - |
| Total Liabilities | (8,232) | (2,352) | (5,880) | - |
| Total Derivative Instruments: | (3,723) | 1,743 | (5,466) | - |
Value of Derivative Instruments
The following table is a summary of the Fund's value of derivative instruments by primary risk exposure as of August 31, 2024. For additional information on derivative instruments, please refer to the Derivative Instruments section in the accompanying Notes to Financial Statements.
Primary Risk Exposure / Derivative Type | Value |
| Asset ($) | Liability ($) |
| Foreign Exchange Risk | | |
Forward Foreign Currency Contracts (a) | 414 | (5,880) |
| Total Foreign Exchange Risk | 414 | (5,880) |
| Interest Rate Risk | | |
Futures Contracts (b) | 4,095 | (2,352) |
| Total Interest Rate Risk | 4,095 | (2,352) |
| Total Value of Derivatives | 4,509 | (8,232) |
(a)Gross value is presented in the Statement of Assets and Liabilities in the unrealized appreciation/depreciation on forward foreign currency contracts line-items.
(b)Reflects gross cumulative appreciation (depreciation) on futures contracts as presented in the Schedule of Investments. In the Statement of Assets and Liabilities, the period end daily variation margin is included in receivable or payable for daily variation margin on futures contracts, and the net cumulative appreciation (depreciation) is included in Total accumulated earnings (loss).
Financial Statements
| Statement of Assets and Liabilities |
As of August 31, 2024 |
| Assets | | | | |
| Investment in securities, at value - See accompanying schedule: | | | | |
Unaffiliated issuers (cost $38,391,021) | $ | 37,474,819 | | |
Fidelity Central Funds (cost $674,248) | | 674,248 | | |
| | | | | |
| | | | | |
| Total Investment in Securities (cost $39,065,269) | | | $ | 38,149,067 |
| Cash | | | | 237 |
| Foreign currency held at value (cost $146,136) | | | | 146,106 |
| Receivable for investments sold | | | | 216,579 |
| Unrealized appreciation on forward foreign currency contracts | | | | 414 |
| Receivable for fund shares sold | | | | 20,011 |
| Interest receivable | | | | 291,683 |
| Distributions receivable from Fidelity Central Funds | | | | 2,969 |
| Receivable from investment adviser for expense reductions | | | | 694 |
Total assets | | | | 38,827,760 |
| Liabilities | | | | |
| Payable for investments purchased | | | | |
Regular delivery | $ | 450,001 | | |
Delayed delivery | | 783,555 | | |
| Unrealized depreciation on forward foreign currency contracts | | 5,880 | | |
| Payable for fund shares redeemed | | 3,430 | | |
| Distributions payable | | 68,767 | | |
| Accrued management fee | | 10,914 | | |
| Distribution and service plan fees payable | | 1,019 | | |
| Payable for daily variation margin on futures contracts | | 17 | | |
| Other affiliated payables | | 2,167 | | |
| Other payables and accrued expenses | | 75 | | |
| Total liabilities | | | | 1,325,825 |
| Net Assets | | | $ | 37,501,935 |
| Net Assets consist of: | | | | |
| Paid in capital | | | $ | 48,971,574 |
| Total accumulated earnings (loss) | | | | (11,469,639) |
| Net Assets | | | $ | 37,501,935 |
| | | | | |
| Net Asset Value and Maximum Offering Price | | | | |
| Class A : | | | | |
Net Asset Value and redemption price per share ($1,011,043 ÷ 117,242 shares)(a) | | | $ | 8.62 |
| Maximum offering price per share (100/96.00 of $8.62) | | | $ | 8.98 |
| Class M : | | | | |
Net Asset Value and redemption price per share ($780,024 ÷ 90,453 shares)(a) | | | $ | 8.62 |
| Maximum offering price per share (100/96.00 of $8.62) | | | $ | 8.98 |
| Class C : | | | | |
Net Asset Value and offering price per share ($777,473 ÷ 90,245 shares)(a) | | | $ | 8.62 |
| Fidelity Environmental Bond Fund : | | | | |
Net Asset Value, offering price and redemption price per share ($11,610,260 ÷ 1,346,333 shares) | | | $ | 8.62 |
| Class I : | | | | |
Net Asset Value, offering price and redemption price per share ($392,970 ÷ 45,608 shares) | | | $ | 8.62 |
| Class Z : | | | | |
Net Asset Value, offering price and redemption price per share ($22,930,165 ÷ 2,659,059 shares) | | | $ | 8.62 |
(a)Redemption price per share is equal to net asset value less any applicable contingent deferred sales charge. |
| Statement of Operations |
| Year ended August 31, 2024 |
| Investment Income | | | | |
| Dividends | | | $ | 7,306 |
| Interest | | | | 1,376,370 |
| Income from Fidelity Central Funds | | | | 41,812 |
| Total income | | | | 1,425,488 |
| Expenses | | | | |
| Management fee | $ | 120,006 | | |
| Transfer agent fees | | 24,011 | | |
| Distribution and service plan fees | | 11,693 | | |
| Independent trustees' fees and expenses | | 102 | | |
| Total expenses before reductions | | 155,812 | | |
| Expense reductions | | (10,190) | | |
| Total expenses after reductions | | | | 145,622 |
| Net Investment income (loss) | | | | 1,279,866 |
| Realized and Unrealized Gain (Loss) | | | | |
| Net realized gain (loss) on: | | | | |
| Investment Securities: | | | | |
| Unaffiliated issuers | | (635,639) | | |
| Fidelity Central Funds | | 3 | | |
| Forward foreign currency contracts | | 25,844 | | |
| Foreign currency transactions | | 1,345 | | |
| Futures contracts | | (5,669) | | |
| Total net realized gain (loss) | | | | (614,116) |
| Change in net unrealized appreciation (depreciation) on: | | | | |
| Investment Securities: | | | | |
| Unaffiliated issuers | | 1,951,972 | | |
| Forward foreign currency contracts | | (46,004) | | |
| Assets and liabilities in foreign currencies | | 1,450 | | |
| Futures contracts | | 11,002 | | |
| Total change in net unrealized appreciation (depreciation) | | | | 1,918,420 |
| Net gain (loss) | | | | 1,304,304 |
| Net increase (decrease) in net assets resulting from operations | | | $ | 2,584,170 |
| Statement of Changes in Net Assets |
| |
| | Year ended August 31, 2024 | | Year ended August 31, 2023 |
| Increase (Decrease) in Net Assets | | | | |
| Operations | | | | |
| Net investment income (loss) | $ | 1,279,866 | $ | 899,397 |
| Net realized gain (loss) | | (614,116) | | (1,736,621) |
| Change in net unrealized appreciation (depreciation) | | 1,918,420 | | 453,905 |
| Net increase (decrease) in net assets resulting from operations | | 2,584,170 | | (383,319) |
| Distributions to shareholders | | (1,175,819) | | (1,186,567) |
| | | | | |
| Share transactions - net increase (decrease) | | 3,329,779 | | 3,956,209 |
| Total increase (decrease) in net assets | | 4,738,130 | | 2,386,323 |
| | | | | |
| Net Assets | | | | |
| Beginning of period | | 32,763,805 | | 30,377,482 |
| End of period | $ | 37,501,935 | $ | 32,763,805 |
| | | | | |
| | | | | |
Financial Highlights
Fidelity Advisor® Environmental Bond Fund Class A |
| |
| Years ended August 31, | | 2024 | | 2023 | | 2022 | | 2021 A |
Selected Per-Share Data | | | | | | | | |
| Net asset value, beginning of period | $ | 8.29 | $ | 8.71 | $ | 10.10 | $ | 10.00 |
| Income from Investment Operations | | | | | | | | |
Net investment income (loss) B,C | | .289 | | .223 | | .101 | | .010 |
| Net realized and unrealized gain (loss) | | .304 | | (.337) | | (1.386) | | .101 |
| Total from investment operations | | .593 | | (.114) | | (1.285) | | .111 |
| Distributions from net investment income | | (.263) | | (.306) | | (.100) D | | (.011) |
| Distributions from net realized gain | | - | | - | | (.005) D | | - |
| Total distributions | | (.263) | | (.306) | | (.105) | | (.011) |
| Net asset value, end of period | $ | 8.62 | $ | 8.29 | $ | 8.71 | $ | 10.10 |
Total Return E,F,G | | | | (1.30)% | | (12.79)% | | 1.11% |
Ratios to Average Net Assets C,H,I | | | | | | | | |
| Expenses before reductions | | .69% | | .71% | | .67% | | .65% J |
| Expenses net of fee waivers, if any | | | | .71% | | .67% | | .65% J |
| Expenses net of all reductions | | .69% | | .70% | | .67% | | .65% J |
| Net investment income (loss) | | 3.47% | | 2.66% | | 1.07% | | .50% J |
| Supplemental Data | | | | | | | | |
| Net assets, end of period (000 omitted) | $ | 1,011 | $ | 1,000 | $ | 778 | $ | 809 |
Portfolio turnover rate K | | | | 84% | | 198% | | 12% L |
AFor the period June 15, 2021 (commencement of operations) through August 31, 2021.
BCalculated based on average shares outstanding during the period.
CNet investment income (loss) is affected by the timing of the declaration of dividends by any underlying mutual funds or exchange-traded funds (ETFs). Net investment income (loss) of any mutual funds or ETFs is not included in the Fund's net investment income (loss) ratio.
DThe amount shown reflects reclassifications related to book to tax differences that were made in the year shown.
ETotal returns for periods of less than one year are not annualized.
FTotal returns would have been lower if certain expenses had not been reduced during the applicable periods shown.
GTotal returns do not include the effect of the sales charges.
HFees and expenses of any underlying mutual funds or exchange-traded funds (ETFs) are not included in the Fund's expense ratio. The Fund indirectly bears its proportionate share of these expenses.
IExpense ratios reflect operating expenses of the class. Expenses before reductions do not reflect amounts reimbursed, waived, or reduced through arrangements with the investment adviser, brokerage services, or other offset arrangements, if applicable, and do not represent the amount paid by the class during periods when reimbursements, waivers or reductions occur.
JAnnualized.
KAmount does not include the portfolio activity of any underlying mutual funds or exchange-traded funds (ETFs).
LAmount not annualized.
Fidelity Advisor® Environmental Bond Fund Class M |
| |
| Years ended August 31, | | 2024 | | 2023 | | 2022 | | 2021 A |
Selected Per-Share Data | | | | | | | | |
| Net asset value, beginning of period | $ | 8.29 | $ | 8.71 | $ | 10.10 | $ | 10.00 |
| Income from Investment Operations | | | | | | | | |
Net investment income (loss) B,C | | .290 | | .225 | | .101 | | .010 |
| Net realized and unrealized gain (loss) | | .305 | | (.337) | | (1.386) | | .101 |
| Total from investment operations | | .595 | | (.112) | | (1.285) | | .111 |
| Distributions from net investment income | | (.265) | | (.308) | | (.100) D | | (.011) |
| Distributions from net realized gain | | - | | - | | (.005) D | | - |
| Total distributions | | (.265) | | (.308) | | (.105) | | (.011) |
| Net asset value, end of period | $ | 8.62 | $ | 8.29 | $ | 8.71 | $ | 10.10 |
Total Return E,F,G | | | | (1.28)% | | (12.78)% | | 1.11% |
Ratios to Average Net Assets C,H,I | | | | | | | | |
| Expenses before reductions | | .68% | | .69% | | .67% | | .65% J |
| Expenses net of fee waivers, if any | | | | .69% | | .67% | | .65% J |
| Expenses net of all reductions | | .67% | | .69% | | .66% | | .65% J |
| Net investment income (loss) | | 3.48% | | 2.68% | | 1.07% | | .50% J |
| Supplemental Data | | | | | | | | |
| Net assets, end of period (000 omitted) | $ | 780 | $ | 729 | $ | 736 | $ | 809 |
Portfolio turnover rate K | | | | 84% | | 198% | | 12% L |
AFor the period June 15, 2021 (commencement of operations) through August 31, 2021.
BCalculated based on average shares outstanding during the period.
CNet investment income (loss) is affected by the timing of the declaration of dividends by any underlying mutual funds or exchange-traded funds (ETFs). Net investment income (loss) of any mutual funds or ETFs is not included in the Fund's net investment income (loss) ratio.
DThe amount shown reflects reclassifications related to book to tax differences that were made in the year shown.
ETotal returns for periods of less than one year are not annualized.
FTotal returns would have been lower if certain expenses had not been reduced during the applicable periods shown.
GTotal returns do not include the effect of the sales charges.
HFees and expenses of any underlying mutual funds or exchange-traded funds (ETFs) are not included in the Fund's expense ratio. The Fund indirectly bears its proportionate share of these expenses.
IExpense ratios reflect operating expenses of the class. Expenses before reductions do not reflect amounts reimbursed, waived, or reduced through arrangements with the investment adviser, brokerage services, or other offset arrangements, if applicable, and do not represent the amount paid by the class during periods when reimbursements, waivers or reductions occur.
JAnnualized.
KAmount does not include the portfolio activity of any underlying mutual funds or exchange-traded funds (ETFs).
LAmount not annualized.
Fidelity Advisor® Environmental Bond Fund Class C |
| |
| Years ended August 31, | | 2024 | | 2023 | | 2022 | | 2021 A |
Selected Per-Share Data | | | | | | | | |
| Net asset value, beginning of period | $ | 8.28 | $ | 8.70 | $ | 10.09 | $ | 10.00 |
| Income from Investment Operations | | | | | | | | |
Net investment income (loss) B,C | | .226 | | .162 | | .030 | | (.005) |
| Net realized and unrealized gain (loss) | | .315 | | (.337) | | (1.382) | | .095 |
| Total from investment operations | | .541 | | (.175) | | (1.352) | | .090 |
| Distributions from net investment income | | (.201) | | (.245) | | (.033) D | | - E |
| Distributions from net realized gain | | - | | - | | (.005) D | | - |
| Total distributions | | (.201) | | (.245) | | (.038) | | - E |
| Net asset value, end of period | $ | 8.62 | $ | 8.28 | $ | 8.70 | $ | 10.09 |
Total Return F,G,H | | | | (2.02)% | | (13.42)% | | .90% |
Ratios to Average Net Assets C,I,J | | | | | | | | |
| Expenses before reductions | | 1.44% | | 1.43% | | 1.42% | | 1.39% K |
| Expenses net of fee waivers, if any | | | | 1.43% | | 1.42% | | 1.39% K |
| Expenses net of all reductions | | 1.43% | | 1.43% | | 1.42% | | 1.39% K |
| Net investment income (loss) | | 2.72% | | 1.93% | | .32% | | (.25)% K |
| Supplemental Data | | | | | | | | |
| Net assets, end of period (000 omitted) | $ | 777 | $ | 732 | $ | 741 | $ | 808 |
Portfolio turnover rate L | | | | 84% | | 198% | | 12% M |
AFor the period June 15, 2021 (commencement of operations) through August 31, 2021.
BCalculated based on average shares outstanding during the period.
CNet investment income (loss) is affected by the timing of the declaration of dividends by any underlying mutual funds or exchange-traded funds (ETFs). Net investment income (loss) of any mutual funds or ETFs is not included in the Fund's net investment income (loss) ratio.
DThe amount shown reflects reclassifications related to book to tax differences that were made in the year shown.
EAmount represents less than $.0005 per share.
FTotal returns for periods of less than one year are not annualized.
GTotal returns would have been lower if certain expenses had not been reduced during the applicable periods shown.
HTotal returns do not include the effect of the contingent deferred sales charge.
IFees and expenses of any underlying mutual funds or exchange-traded funds (ETFs) are not included in the Fund's expense ratio. The Fund indirectly bears its proportionate share of these expenses.
JExpense ratios reflect operating expenses of the class. Expenses before reductions do not reflect amounts reimbursed, waived, or reduced through arrangements with the investment adviser, brokerage services, or other offset arrangements, if applicable, and do not represent the amount paid by the class during periods when reimbursements, waivers or reductions occur.
KAnnualized.
LAmount does not include the portfolio activity of any underlying mutual funds or exchange-traded funds (ETFs).
MAmount not annualized.
Fidelity® Environmental Bond Fund |
| |
| Years ended August 31, | | 2024 | | 2023 | | 2022 | | 2021 A |
Selected Per-Share Data | | | | | | | | |
| Net asset value, beginning of period | $ | 8.29 | $ | 8.71 | $ | 10.10 | $ | 10.00 |
| Income from Investment Operations | | | | | | | | |
Net investment income (loss) B,C | | .309 | | .245 | | .120 | | .015 |
| Net realized and unrealized gain (loss) | | .304 | | (.337) | | (1.385) | | .101 |
| Total from investment operations | | .613 | | (.092) | | (1.265) | | .116 |
| Distributions from net investment income | | (.283) | | (.328) | | (.120) D | | (.016) |
| Distributions from net realized gain | | - | | - | | (.005) D | | - |
| Total distributions | | (.283) | | (.328) | | (.125) | | (.016) |
| Net asset value, end of period | $ | 8.62 | $ | 8.29 | $ | 8.71 | $ | 10.10 |
Total Return E,F | | | | (1.05)% | | (12.60)% | | 1.16% |
Ratios to Average Net Assets B,G,H | | | | | | | | |
| Expenses before reductions | | .45% | | .45% | | .45% | | .45% I |
| Expenses net of fee waivers, if any | | | | .45% | | .45% | | .45% I |
| Expenses net of all reductions | | .45% | | .45% | | .45% | | .45% I |
| Net investment income (loss) | | 3.71% | | 2.91% | | 1.29% | | .70% I |
| Supplemental Data | | | | | | | | |
| Net assets, end of period (000 omitted) | $ | 11,610 | $ | 10,241 | $ | 10,796 | $ | 7,663 |
Portfolio turnover rate J | | | | 84% | | 198% | | 12% K |
AFor the period June 15, 2021 (commencement of operations) through August 31, 2021.
BNet investment income (loss) is affected by the timing of the declaration of dividends by any underlying mutual funds or exchange-traded funds (ETFs). Net investment income (loss) of any mutual funds or ETFs is not included in the Fund's net investment income (loss) ratio.
CCalculated based on average shares outstanding during the period.
DThe amount shown reflects reclassifications related to book to tax differences that were made in the year shown.
ETotal returns for periods of less than one year are not annualized.
FTotal returns would have been lower if certain expenses had not been reduced during the applicable periods shown.
GExpense ratios reflect operating expenses of the class. Expenses before reductions do not reflect amounts reimbursed, waived, or reduced through arrangements with the investment adviser, brokerage services, or other offset arrangements, if applicable, and do not represent the amount paid by the class during periods when reimbursements, waivers or reductions occur.
HFees and expenses of any underlying mutual funds or exchange-traded funds (ETFs) are not included in the Fund's expense ratio. The Fund indirectly bears its proportionate share of these expenses.
IAnnualized.
JAmount does not include the portfolio activity of any underlying mutual funds or exchange-traded funds (ETFs).
KAmount not annualized.
Fidelity Advisor® Environmental Bond Fund Class I |
| |
| Years ended August 31, | | 2024 | | 2023 | | 2022 | | 2021 A |
Selected Per-Share Data | | | | | | | | |
| Net asset value, beginning of period | $ | 8.28 | $ | 8.70 | $ | 10.10 | $ | 10.00 |
| Income from Investment Operations | | | | | | | | |
Net investment income (loss) B,C | | .303 | | .236 | | .109 | | .016 |
| Net realized and unrealized gain (loss) | | .315 | | (.339) | | (1.372) | | .100 |
| Total from investment operations | | .618 | | (.103) | | (1.263) | | .116 |
| Distributions from net investment income | | (.278) | | (.317) | | (.132) D | | (.016) |
| Distributions from net realized gain | | - | | - | | (.005) D | | - |
| Total distributions | | (.278) | | (.317) | | (.137) | | (.016) |
| Net asset value, end of period | $ | 8.62 | $ | 8.28 | $ | 8.70 | $ | 10.10 |
Total Return E,F | | | | (1.18)% | | (12.58)% | | 1.16% |
Ratios to Average Net Assets C,G,H | | | | | | | | |
| Expenses before reductions | | .57% | | .58% | | .60% | | .40% I |
| Expenses net of fee waivers, if any | | | | .58% | | .60% | | .40% I |
| Expenses net of all reductions | | .52% | | .57% | | .59% | | .40% I |
| Net investment income (loss) | | 3.64% | | 2.79% | | 1.14% | | .74% I |
| Supplemental Data | | | | | | | | |
| Net assets, end of period (000 omitted) | $ | 393 | $ | 482 | $ | 996 | $ | 809 |
Portfolio turnover rate J | | | | 84% | | 198% | | 12% K |
AFor the period June 15, 2021 (commencement of operations) through August 31, 2021.
BCalculated based on average shares outstanding during the period.
CNet investment income (loss) is affected by the timing of the declaration of dividends by any underlying mutual funds or exchange-traded funds (ETFs). Net investment income (loss) of any mutual funds or ETFs is not included in the Fund's net investment income (loss) ratio.
DThe amount shown reflects reclassifications related to book to tax differences that were made in the year shown.
ETotal returns for periods of less than one year are not annualized.
FTotal returns would have been lower if certain expenses had not been reduced during the applicable periods shown.
GFees and expenses of any underlying mutual funds or exchange-traded funds (ETFs) are not included in the Fund's expense ratio. The Fund indirectly bears its proportionate share of these expenses.
HExpense ratios reflect operating expenses of the class. Expenses before reductions do not reflect amounts reimbursed, waived, or reduced through arrangements with the investment adviser, brokerage services, or other offset arrangements, if applicable, and do not represent the amount paid by the class during periods when reimbursements, waivers or reductions occur.
IAnnualized.
JAmount does not include the portfolio activity of any underlying mutual funds or exchange-traded funds (ETFs).
KAmount not annualized.
Fidelity Advisor® Environmental Bond Fund Class Z |
| |
| Years ended August 31, | | 2024 | | 2023 | | 2022 | | 2021 A |
Selected Per-Share Data | | | | | | | | |
| Net asset value, beginning of period | $ | 8.29 | $ | 8.71 | $ | 10.10 | $ | 10.00 |
| Income from Investment Operations | | | | | | | | |
Net investment income (loss) B,C | | .316 | | .252 | | .130 | | .017 |
| Net realized and unrealized gain (loss) | | .305 | | (.337) | | (1.386) | | .101 |
| Total from investment operations | | .621 | | (.085) | | (1.256) | | .118 |
| Distributions from net investment income | | (.291) | | (.335) | | (.129) D | | (.018) |
| Distributions from net realized gain | | - | | - | | (.005) D | | - |
| Total distributions | | (.291) | | (.335) | | (.134) | | (.018) |
| Net asset value, end of period | $ | 8.62 | $ | 8.29 | $ | 8.71 | $ | 10.10 |
Total Return E,F | | | | (.96)% | | (12.52)% | | 1.18% |
Ratios to Average Net Assets C,G,H | | | | | | | | |
| Expenses before reductions | | .40% | | .40% | | .40% | | .40% I |
| Expenses net of fee waivers, if any | | | | .36% | | .36% | | .36% I |
| Expenses net of all reductions | | .36% | | .36% | | .36% | | .36% I |
| Net investment income (loss) | | 3.80% | | 3.00% | | 1.38% | | .78% I |
| Supplemental Data | | | | | | | | |
| Net assets, end of period (000 omitted) | $ | 22,930 | $ | 19,580 | $ | 16,331 | $ | 809 |
Portfolio turnover rate J | | | | 84% | | 198% | | 12% K |
AFor the period June 15, 2021 (commencement of operations) through August 31, 2021.
BCalculated based on average shares outstanding during the period.
CNet investment income (loss) is affected by the timing of the declaration of dividends by any underlying mutual funds or exchange-traded funds (ETFs). Net investment income (loss) of any mutual funds or ETFs is not included in the Fund's net investment income (loss) ratio.
DThe amount shown reflects reclassifications related to book to tax differences that were made in the year shown.
ETotal returns for periods of less than one year are not annualized.
FTotal returns would have been lower if certain expenses had not been reduced during the applicable periods shown.
GFees and expenses of any underlying mutual funds or exchange-traded funds (ETFs) are not included in the Fund's expense ratio. The Fund indirectly bears its proportionate share of these expenses.
HExpense ratios reflect operating expenses of the class. Expenses before reductions do not reflect amounts reimbursed, waived, or reduced through arrangements with the investment adviser, brokerage services, or other offset arrangements, if applicable, and do not represent the amount paid by the class during periods when reimbursements, waivers or reductions occur.
IAnnualized.
JAmount does not include the portfolio activity of any underlying mutual funds or exchange-traded funds (ETFs).
KAmount not annualized.
Notes to Financial Statements
For the period ended August 31, 2024
1. Organization.
Fidelity Environmental Bond Fund (the Fund) is a fund of Fidelity Income Fund (the Trust) and is authorized to issue an unlimited number of shares. The Trust is registered under the Investment Company Act of 1940, as amended (the 1940 Act), as an open-end management investment company organized as a Massachusetts business trust. The Fund offers Class A, Class M, Class C, Fidelity Environmental Bond Fund, Class I and Class Z shares, each of which has equal rights as to assets and voting privileges. Class A, Class M, Class C, Class I and Class Z are Fidelity Advisor classes. Each class has exclusive voting rights with respect to matters that affect that class. Class C shares will automatically convert to Class A shares after a holding period of eight years from the initial date of purchase, with certain exceptions. The Fund normally invests in issuers whose products or services are intended or likely to have a positive environmental impact. Some industries and sectors might be more likely to issue environmental bonds, and events or factors impacting these sectors may have a greater effect on, and may more adversely affect, the Fund than they would a fund that does not invest in issuers with a common purpose. The Fund also will be affected by a decrease in governmental or other support for environmental initiatives.
2. Investments in Fidelity Central Funds.
Funds may invest in Fidelity Central Funds, which are open-end investment companies generally available only to other investment companies and accounts managed by the investment adviser and its affiliates. The Schedule of Investments lists any Fidelity Central Funds held as an investment as of period end, but does not include the underlying holdings of each Fidelity Central Fund. An investing fund indirectly bears its proportionate share of the expenses of the underlying Fidelity Central Funds.
Based on its investment objective, each Fidelity Central Fund may invest or participate in various investment vehicles or strategies that are similar to those of the investing fund. These strategies are consistent with the investment objectives of the investing fund and may involve certain economic risks which may cause a decline in value of each of the Fidelity Central Funds and thus a decline in the value of the investing fund.
| Fidelity Central Fund | Investment Manager | Investment Objective | Investment Practices | Expense RatioA |
| Fidelity Money Market Central Funds | Fidelity Management & Research Company LLC (FMR) | Each fund seeks to obtain a high level of current income consistent with the preservation of capital and liquidity. | Short-term Investments | Less than .005% |
A Expenses expressed as a percentage of average net assets and are as of each underlying Central Fund's most recent annual or semi-annual shareholder report.
A complete unaudited list of holdings for each Fidelity Central Fund is available upon request or at the Securities and Exchange Commission website at www.sec.gov. In addition, the financial statements of the Fidelity Central Funds which contain the significant accounting policies (including investment valuation policies) of those funds, and are not covered by the Report of Independent Registered Public Accounting Firm, are available on the Securities and Exchange Commission website or upon request.
3. Significant Accounting Policies.
The Fund is an investment company and applies the accounting and reporting guidance of the Financial Accounting Standards Board (FASB) Accounting Standards Codification Topic 946 Financial Services - Investment Companies. The financial statements have been prepared in conformity with accounting principles generally accepted in the United States of America (GAAP), which require management to make certain estimates and assumptions at the date of the financial statements. Actual results could differ from those estimates. Subsequent events, if any, through the date that the financial statements were issued have been evaluated in the preparation of the financial statements. The Fund's Schedule of Investments lists any underlying mutual funds or exchange-traded funds (ETFs) but does not include the underlying holdings of these funds. The following summarizes the significant accounting policies of the Fund:
Investment Valuation. Investments are valued as of 4:00 p.m. Eastern time on the last calendar day of the period. The Board of Trustees (the Board) has designated the Fund's investment adviser as the valuation designee responsible for the fair valuation function and performing fair value determinations as needed. The investment adviser has established a Fair Value Committee (the Committee) to carry out the day-to-day fair valuation responsibilities and has adopted policies and procedures to govern the fair valuation process and the activities of the Committee. In accordance with these fair valuation policies and procedures, which have been approved by the Board, the Fund attempts to obtain prices from one or more third party pricing services or brokers to value its investments. When current market prices, quotations or currency exchange rates are not readily available or reliable, investments will be fair valued in good faith by the Committee, in accordance with the policies and procedures. Factors used in determining fair value vary by investment type and may include market or investment specific events, transaction data, estimated cash flows, and market observations of comparable investments. The frequency that the fair valuation procedures are used cannot be predicted and they may be utilized to a significant extent. The Committee manages the Fund's fair valuation practices and maintains the fair valuation policies and procedures. The Fund's investment adviser reports to the Board information regarding the fair valuation process and related material matters.
The Fund categorizes the inputs to valuation techniques used to value its investments into a disclosure hierarchy consisting of three levels as shown below:
Level 1 - unadjusted quoted prices in active markets for identical investments
Level 2 - other significant observable inputs (including quoted prices for similar investments, interest rates, prepayment speeds, etc.)
Level 3 - unobservable inputs (including the Fund's own assumptions based on the best information available)
Valuation techniques used to value the Fund's investments by major category are as follows:
Debt securities, including restricted securities, are valued based on evaluated prices received from third party pricing services or from brokers who make markets in such securities. Corporate bonds, foreign government and government agency obligations, preferred securities and U.S. government and government agency obligations are valued by pricing services who utilize matrix pricing which considers yield or price of bonds of comparable quality, coupon, maturity and type or by broker-supplied prices. Asset backed securities, commercial mortgage securities and U.S. government agency mortgage securities are valued by pricing services who utilize matrix pricing which considers prepayment speed assumptions, attributes of the collateral, yield or price of bonds of comparable quality, coupon, maturity and type or by broker-supplied prices. When independent prices are unavailable or unreliable, debt securities may be valued utilizing pricing methodologies which consider similar factors that would be used by third party pricing services. For foreign debt securities, when significant market or security specific events arise, valuations may be determined in good faith in accordance with procedures adopted by the Board. Debt securities are generally categorized as Level 2 in the hierarchy but may be Level 3 depending on the circumstances.
The U.S. dollar value of forward foreign currency contracts is determined using currency exchange rates supplied by a pricing service and are categorized as Level 2 in the hierarchy. Futures contracts are valued at the settlement price established each day by the board of trade or exchange on which they are traded and are categorized as Level 1 in the hierarchy. Investments in open-end mutual funds, including the Fidelity Central Funds, are valued at their closing net asset value (NAV) each business day and are categorized as Level 1 in the hierarchy.
Changes in valuation techniques may result in transfers in or out of an assigned level within the disclosure hierarchy. The aggregate value of investments by input level as of August 31, 2024 is included at the end of the Fund's Schedule of Investments.
Foreign Currency. Foreign-denominated assets, including investment securities, and liabilities are translated into U.S. dollars at the exchange rates at period end. Purchases and sales of investment securities, income and dividends received, and expenses denominated in foreign currencies are translated into U.S. dollars at the exchange rate in effect on the transaction date.
The effects of exchange rate fluctuations on investments are included with the net realized and unrealized gain (loss) on investment securities. Other foreign currency transactions resulting in realized and unrealized gain (loss) are disclosed separately.
Realized gains and losses on foreign currency transactions arise from the disposition of foreign currency, realized changes in the value of foreign currency between the trade and settlement dates on security transactions, and the difference between the amounts of dividends, interest and foreign withholding taxes recorded on transaction date and the U.S. dollar equivalent of the amounts actually received or paid. Unrealized gains and losses on assets and liabilities in foreign currencies arise from changes in the value of foreign currency, and from assets and liabilities denominated in foreign currencies, other than investments, which are held at period end.
Investment Transactions and Income. For financial reporting purposes, the Fund's investment holdings and NAV include trades executed through the end of the last business day of the period. The NAV per share for processing shareholder transactions is calculated as of the close of business of the New York Stock Exchange (NYSE), normally 4:00 p.m. Eastern time and includes trades executed through the end of the prior business day. Gains and losses on securities sold are determined on the basis of identified cost. Dividend income is recorded on the ex-dividend date. Non-cash dividends included in dividend income, if any, are recorded at the fair market value of the securities received. Income and capital gain distributions from Fidelity Central Funds, if any, are recorded on the ex-dividend date. Interest income is accrued as earned and includes coupon interest and amortization of premium and accretion of discount on debt securities as applicable. Investment income is recorded net of foreign taxes withheld where recovery of such taxes is uncertain. Debt obligations may be placed on non-accrual status and related interest income may be reduced by ceasing current accruals and writing off interest receivables when the collection of all or a portion of interest has become doubtful based on consistently applied procedures. A debt obligation is removed from non-accrual status when the issuer resumes interest payments or when collectability of interest is reasonably assured.
Class Allocations and Expenses. Investment income, realized and unrealized capital gains and losses, common expenses of a fund, and certain fund-level expense reductions, if any, are allocated daily on a pro-rata basis to each class based on the relative net assets of each class to the total net assets of a fund. Each class differs with respect to transfer agent and distribution and service plan fees incurred, as applicable. Certain expense reductions may also differ by class, if applicable. For the reporting period, the allocated portion of income and expenses to each class as a percent of its average net assets may vary due to the timing of recording these transactions in relation to fluctuating net assets of the classes. Expenses directly attributable to a fund are charged to that fund. Expenses attributable to more than one fund are allocated among the respective funds on the basis of relative net assets or other appropriate methods. Expenses included in the accompanying financial statements reflect the expenses of that fund and do not include any expenses associated with any underlying mutual funds or exchange-traded funds (ETFs). Although not included in a fund's expenses, a fund indirectly bears its proportionate share of these expenses through the net asset value of each underlying mutual fund or exchange-traded fund (ETF). Expense estimates are accrued in the period to which they relate and adjustments are made when actual amounts are known.
Income Tax Information and Distributions to Shareholders. Each year, the Fund intends to qualify as a regulated investment company under Subchapter M of the Internal Revenue Code, including distributing substantially all of its taxable income and realized gains. As a result, no provision for U.S. Federal income taxes is required. As of August 31, 2024, the Fund did not have any unrecognized tax benefits in the financial statements; nor is the Fund aware of any tax positions for which it is reasonably possible that the total amounts of unrecognized tax benefits will significantly change in the next twelve months. The Fund files a U.S. federal tax return, in addition to state and local tax returns as required. The Fund's federal income tax returns are subject to examination by the Internal Revenue Service (IRS) for a period of three fiscal years after they are filed. State and local tax returns may be subject to examination for an additional fiscal year depending on the jurisdiction. Foreign taxes are provided for based on the Fund's understanding of the tax rules and rates that exist in the foreign markets in which it invests.
Distributions are declared and recorded daily and paid monthly from net investment income. Distributions from realized gains, if any, are declared and recorded on the ex-dividend date. Income and capital gain distributions are declared separately for each class. Income and capital gain distributions are determined in accordance with income tax regulations, which may differ from GAAP.
Capital accounts within the financial statements are adjusted for permanent book-tax differences. These adjustments have no impact on net assets or the results of operations. Capital accounts are not adjusted for temporary book-tax differences which will reverse in a subsequent period.
Book-tax differences are primarily due to futures contracts, foreign currency transactions, market discount, capital loss carry forwards and losses deferred due to wash sales.
As of period end, the cost and unrealized appreciation (depreciation) in securities, and derivatives if applicable, for federal income tax purposes were as follows:
| Gross unrealized appreciation | $731,729 |
| Gross unrealized depreciation | (1,657,292) |
| Net unrealized appreciation (depreciation) | $(925,563) |
| Tax Cost | $39,083,852 |
The tax-based components of distributable earnings as of period end were as follows:
| Undistributed ordinary income | $25,684 |
| Capital loss carryforward | $(10,571,219) |
| Net unrealized appreciation (depreciation) on securities and other investments | $(924,467) |
Capital loss carryforwards are only available to offset future capital gains of the Fund to the extent provided by regulations and may be limited. The capital loss carryforward information presented below, including any applicable limitation, is estimated as of fiscal period end and is subject to adjustment.
Short-term | $(8,880,600) |
Long-term | (1,690,619) |
| Total capital loss carryforward | $(10,571,219) |
The tax character of distributions paid was as follows:
| | August 31, 2024 | August 31, 2023 |
| Ordinary Income | $1,175,819 | $ 1,186,567 |
| | | |
Delayed Delivery Transactions and When-Issued Securities. During the period, certain Funds transacted in securities on a delayed delivery or when-issued basis. Payment and delivery may take place after the customary settlement period for that security. The price of the underlying securities and the date when the securities will be delivered and paid for are fixed at the time the transaction is negotiated. Securities purchased on a delayed delivery or when-issued basis are identified as such in the Schedule of Investments. Compensation for interest forgone in the purchase of a delayed delivery or when-issued debt security may be received. With respect to purchase commitments, each applicable Fund identifies securities as segregated in its records with a value at least equal to the amount of the commitment. Payables and receivables associated with the purchases and sales of delayed delivery securities having the same coupon, settlement date and broker are offset. Delayed delivery or when-issued securities that have been purchased from and sold to different brokers are reflected as both payables and receivables in the Statement of Assets and Liabilities under the caption "Delayed delivery", as applicable. Losses may arise due to changes in the value of the underlying securities or if the counterparty does not perform under the contract's terms, or if the issuer does not issue the securities due to political, economic, or other factors.
Restricted Securities (including Private Placements). Funds may invest in securities that are subject to legal or contractual restrictions on resale. These securities generally may be resold in transactions exempt from registration or to the public if the securities are registered. Disposal of these securities may involve time-consuming negotiations and expense, and prompt sale at an acceptable price may be difficult. Information regarding restricted securities held at period end is included at the end of the Schedule of Investments, if applicable.
4. Derivative Instruments.
Risk Exposures and the Use of Derivative Instruments. The Fund's investment objectives allow for various types of derivative instruments, including futures contracts and forward foreign currency contracts. Derivatives are investments whose value is primarily derived from underlying assets, indices or reference rates and may be transacted on an exchange or over-the-counter (OTC). Derivatives may involve a future commitment to buy or sell a specified asset based on specified terms, to exchange future cash flows at periodic intervals based on a notional principal amount, or for one party to make one or more payments upon the occurrence of specified events in exchange for periodic payments from the other party.
Derivatives were used to increase returns, to facilitate transactions in foreign-denominated securities and to manage exposure to certain risks as defined below. The success of any strategy involving derivatives depends on analysis of numerous economic factors, and if the strategies for investment do not work as intended, the objectives may not be achieved.
Derivatives were used to increase or decrease exposure to the following risk(s):
| | |
| Foreign Exchange Risk | Foreign exchange rate risk relates to fluctuations in the value of an asset or liability due to changes in currency exchange rates. |
| Interest Rate Risk | Interest rate risk relates to the fluctuations in the value of interest-bearing securities due to changes in the prevailing levels of market interest rates. |
Funds are also exposed to additional risks from investing in derivatives, such as liquidity risk and counterparty credit risk. Liquidity risk is the risk that a fund will be unable to close out the derivative in the open market in a timely manner. Counterparty credit risk is the risk that the counterparty will not be able to fulfill its obligation to a fund. Derivative counterparty credit risk is managed through formal evaluation of the creditworthiness of all potential counterparties. On certain OTC derivatives such as forward foreign currency contracts, a fund attempts to reduce its exposure to counterparty credit risk by entering into an International Swaps and Derivatives Association, Inc. (ISDA) Master Agreement with each of its counterparties. The ISDA Master Agreement gives a fund the right to terminate all transactions traded under such agreement upon the deterioration in the credit quality of the counterparty beyond specified levels. The ISDA Master Agreement gives each party the right, upon an event of default by the other party or a termination of the agreement, to close out all transactions traded under such agreement and to net amounts owed under each transaction to one net payable by one party to the other. To mitigate counterparty credit risk on bi-lateral OTC derivatives, a fund receives collateral in the form of cash or securities once net unrealized appreciation on outstanding derivative contracts under an ISDA Master Agreement exceeds certain applicable thresholds, subject to certain minimum transfer provisions. The collateral received is held in segregated accounts with the custodian bank in accordance with the collateral agreements entered into between a fund, the counterparty and the custodian bank. A fund could experience delays and costs in gaining access to the collateral even though it is held by the custodian bank. The maximum risk of loss to a fund from counterparty credit risk related to bi-lateral OTC derivatives is generally the aggregate unrealized appreciation and unpaid counterparty payments in excess of any collateral pledged by the counterparty to a fund. A fund may be required to pledge collateral for the benefit of the counterparties on bi-lateral OTC derivatives in an amount not less than each counterparty's unrealized appreciation on outstanding derivative contracts, subject to certain minimum transfer provisions, and any such pledged collateral is identified in the Schedule of Investments. Exchange-traded contracts are not covered by the ISDA Master Agreement; however counterparty credit risk related to these contracts may be mitigated by the protection provided by the exchange on which they trade.
Investing in derivatives may involve greater risks than investing in the underlying assets directly and, to varying degrees, may involve risk of loss in excess of any initial investment and collateral received and amounts recognized in the Statement of Assets and Liabilities. In addition, there may be the risk that the change in value of the derivative contract does not correspond to the change in value of the underlying instrument.
Net Realized Gain (Loss) and Change in Net Unrealized Appreciation (Depreciation) on Derivatives. The table below, which reflects the impacts of derivatives on the financial performance, summarizes the net realized gain (loss) and change in net unrealized appreciation (depreciation) for derivatives during the period as presented in the Statement of Operations.
| Primary Risk Exposure / Derivative Type | Net Realized Gain (Loss)($) | Change in Net Unrealized Appreciation (Depreciation)($) |
| Fidelity Environmental Bond Fund | | |
| Foreign Exchange Risk | | |
| Forward Foreign Currency Contracts | 25,844 | (46,004) |
| Total Foreign Exchange Risk | 25,844 | (46,004) |
| Interest Rate Risk | | |
| Futures Contracts | (5,669) | 11,002 |
| Total Interest Rate Risk | (5,669) | 11,002 |
| Totals | 20,175 | (35,002) |
If there are any open positions at period end, a summary of the value of derivatives by primary risk exposure is included at the end of the Schedule of Investments.
Forward Foreign Currency Contracts. Forward foreign currency contracts represent obligations to purchase or sell foreign currency on a specified future date at a price fixed at the time the contracts are entered into. Forward foreign currency contracts were used to facilitate transactions in foreign-denominated securities and to manage exposure to certain foreign currencies.
Forward foreign currency contracts are valued daily and fluctuations in exchange rates on open contracts are recorded as unrealized appreciation or (depreciation) and reflected in total accumulated earnings (loss) in the Statement of Assets and Liabilities. When the contract is closed, a gain or loss is realized equal to the difference between the closing value and the value at the time it was opened. Non-deliverable forward foreign currency exchange contracts are settled with the counterparty in cash without the delivery of foreign currency. The net realized gain (loss) and change in net unrealized appreciation (depreciation) on forward foreign currency contracts during the period is presented in the Statement of Operations.
Any open forward foreign currency contracts at period end are presented in the Schedule of Investments under the caption "Forward Foreign Currency Contracts." The contract amount and unrealized appreciation (depreciation) reflects each contract's exposure to the underlying currency at period end, and is representative of volume of activity during the period unless an average contract value is presented.
Futures Contracts. A futures contract is an agreement between two parties to buy or sell a specified underlying instrument for a fixed price at a specified future date. Futures contracts were used to manage exposure to the bond market and fluctuations in interest rates.
Upon entering into a futures contract, a fund is required to deposit either cash or securities (initial margin) with a clearing broker in an amount equal to a certain percentage of the face value of the contract. Futures contracts are marked-to-market daily and subsequent daily payments are made or received by a fund depending on the daily fluctuations in the value of the futures contracts and are recorded as unrealized appreciation or (depreciation). This receivable and/or payable, if any, is included in daily variation margin on futures contracts in the Statement of Assets and Liabilities. Realized gain or (loss) is recorded upon the expiration or closing of a futures contract. The net realized gain (loss) and change in net unrealized appreciation (depreciation) on futures contracts during the period is presented in the Statement of Operations.
Any open futures contracts at period end are presented in the Schedule of Investments under the caption "Futures Contracts". The notional amount at value reflects each contract's exposure to the underlying instrument or index at period end, and is representative of volume of activity during the period unless an average notional amount is presented. Any securities deposited to meet initial margin requirements are identified in the Schedule of Investments. Any cash deposited to meet initial margin requirements is presented as segregated cash with brokers for derivative instruments in the Statement of Assets and Liabilities.
5. Purchases and Sales of Investments.
Purchases and sales of securities, other than short-term securities, U.S. government securities and in-kind transactions, as applicable, are noted in the table below.
| | Purchases ($) | Sales ($) |
| Fidelity Environmental Bond Fund | 27,837,233 | 25,506,682 |
6. Fees and Other Transactions with Affiliates.
Management Fee. Fidelity Management & Research Company LLC (the investment adviser) and its affiliates provide the Fund with investment management related services for which the Fund pays a monthly management fee that is based on an annual rate of .35% of the Fund's average net assets. Under the management contract, the investment adviser pays all other expenses, except the compensation of the independent Trustees and certain other expenses such as transfer agent and distribution and service plan fees and other expenses such as interest expense.
Distribution and Service Plan Fees. In accordance with Rule 12b-1 of the 1940 Act, the Fund has adopted separate Distribution and Service Plans for each class of shares. Certain classes pay Fidelity Distributors Company LLC (FDC), an affiliate of the investment adviser, separate Distribution and Service Fees, each of which is based on an annual percentage of each class' average net assets. In addition, FDC may pay financial intermediaries for selling shares of the Fund and providing shareholder support services. For the period, the Distribution and Service Fee rates, total fees and amounts retained by FDC were as follows:
| | Distribution Fee | Service Fee | Total Fees ($) | Retained by FDC ($) |
| Class A | - % | .25% | 2,503 | 1,938 |
| Class M | - % | .25% | 1,854 | 1,773 |
| Class C | .75% | .25% | 7,336 | 7,093 |
| | | | 11,693 | 10,804 |
Sales Load. FDC may receive a front-end sales charge of up to 4.00% for selling Class A shares and Class M shares, some of which is paid to financial intermediaries for selling shares of the Fund. Depending on the holding period, FDC may receive contingent deferred sales charges levied on Class A, Class M and Class C redemptions. The deferred sales charges are 1.00% for Class C shares, .75% for certain purchases of Class A shares and .25% for certain purchases of Class M shares.
For the period, sales charge amounts retained by FDC were as follows:
| | Retained by FDC ($) |
| Class A | 13 |
| Class M | 8 |
| | 21 |
Transfer Agent Fees. Fidelity Investments Institutional Operations Company LLC (FIIOC), an affiliate of the investment adviser, is the transfer, dividend disbursing and shareholder servicing agent for each class of the Fund. FIIOC receives account fees and asset-based fees that vary according to the account size and type of account of the shareholders of the respective classes of the Fund, except for Class Z. FIIOC receives an asset-based fee of Class Z's average net assets. FIIOC pays for typesetting, printing and mailing of shareholder reports, except proxy statements.
For the period, transfer agent fees for each class were as follows:
| | Amount ($) | % of Class-Level Average Net Assets |
| Class A | 928 | .09 |
| Class M | 573 | .08 |
| Class C | 652 | .09 |
| Fidelity Environmental Bond Fund | 10,437 | .10 |
| Class I | 945 | .22 |
| Class Z | 10,476 | .05 |
| | 24,011 | |
Interfund Trades. Funds may purchase from or sell securities to other Fidelity Funds under procedures adopted by the Board. The procedures have been designed to ensure these interfund trades are executed in accordance with Rule 17a-7 of the 1940 Act. Any interfund trades are included within the respective purchases and sales amounts shown in the Purchases and Sales of Investments note. During the period, there were no interfund trades.
Sub-Advisory Arrangements. Effective March 1, 2024, each Fund's sub-advisory agreements with FMR Investment Management (UK) Limited, Fidelity Management & Research (Hong Kong) Limited, and Fidelity Management & Research (Japan) Limited were amended to provide that the investment adviser pays each sub-adviser monthly fees equal to 110% of the sub-adviser's costs for providing sub-advisory services.
7. Committed Line of Credit.
Certain Funds participate with other funds managed by the investment adviser or an affiliate in a $4.25 billion credit facility (the "line of credit") to be utilized for temporary or emergency purposes to fund shareholder redemptions or for other short-term liquidity purposes. The commitment fees on the pro-rata portion of the line of credit are borne by the investment adviser. During the period, there were no borrowings on this line of credit.
8. Expense Reductions.
The investment adviser contractually agreed to reimburse expenses of each class to the extent annual operating expenses exceeded certain levels of class-level average net assets as noted in the table below. This reimbursement will remain in place through December 31, 2025. Some expenses, for example the compensation of the independent Trustees, and certain miscellaneous expenses such as proxy and shareholder meeting expenses, are excluded from this reimbursement.
The following classes were in reimbursement during the period:
| | Expense Limitations | Reimbursement ($) |
| Class I | .45%A | 228 |
| Class Z | .36% | 8,365 |
| | | 8,593 |
A Expense limitation effective March 1, 2024.
Through arrangements with the Fund's custodian, credits realized as a result of certain uninvested cash balances were used to reduce the Fund's expenses. During the period, custodian credits reduced the Fund's expenses by $1,597.
9. Distributions to Shareholders.
Distributions to shareholders of each class were as follows:
| | Year ended August 31, 2024 | Year ended August 31, 2023 |
| Fidelity Environmental Bond Fund | | |
| Distributions to shareholders | | |
| Class A | $31,659 | $31,286 |
| Class M | 23,579 | 26,484 |
| Class C | 17,738 | 21,134 |
| Fidelity Environmental Bond Fund | 355,569 | 430,440 |
| Class I | 14,010 | 25,677 |
| Class Z | 733,264 | 651,546 |
Total | $1,175,819 | $1,186,567 |
10. Share Transactions.
Share transactions for each class were as follows and may contain in-kind transactions, automatic conversions between classes or exchanges between affiliated funds:
| | Shares | Shares | Dollars | Dollars |
| | Year ended August 31, 2024 | Year ended August 31, 2023 | Year ended August 31, 2024 | Year ended August 31, 2023 |
| Fidelity Environmental Bond Fund | | | | |
| Class A | | | | |
| Shares sold | 805 | 28,410 | $6,715 | $238,142 |
| Reinvestment of distributions | 3,798 | 3,721 | 31,655 | 31,286 |
| Shares redeemed | (7,975) | (805) | (66,981) | (6,774) |
| Net increase (decrease) | (3,372) | 31,326 | $(28,611) | $262,654 |
| Class M | | | | |
| Shares sold | 368 | 1,293 | $3,060 | $10,953 |
| Reinvestment of distributions | 2,827 | 3,149 | 23,568 | 26,467 |
| Shares redeemed | (705) | (993) | (5,892) | (8,362) |
| Net increase (decrease) | 2,490 | 3,449 | $20,736 | $29,058 |
| Class C | | | | |
| Shares sold | 2,248 | 943 | $18,938 | $8,011 |
| Reinvestment of distributions | 2,127 | 2,516 | 17,717 | 21,134 |
| Shares redeemed | (2,504) | (192) | (20,421) | (1,599) |
| Net increase (decrease) | 1,871 | 3,267 | $16,234 | $27,546 |
| Fidelity Environmental Bond Fund | | | | |
| Shares sold | 253,726 | 368,998 | $2,138,894 | $3,117,905 |
| Reinvestment of distributions | 38,933 | 44,374 | 324,640 | 372,993 |
| Shares redeemed | (181,609) | (417,550) | (1,519,593) | (3,486,711) |
| Net increase (decrease) | 111,050 | (4,178) | $943,941 | $4,187 |
| Class I | | | | |
| Shares sold | 2,162 | 21,555 | $17,936 | $181,063 |
| Reinvestment of distributions | 1,564 | 2,898 | 13,011 | 24,339 |
| Shares redeemed | (16,262) | (80,804) | (134,626) | (675,129) |
| Net increase (decrease) | (12,536) | (56,351) | $(103,679) | $(469,727) |
| Class Z | | | | |
| Shares sold | 514,452 | 700,912 | $4,288,702 | $5,884,450 |
| Reinvestment of distributions | 5,118 | 4,754 | 42,627 | 39,895 |
| Shares redeemed | (222,445) | (218,707) | (1,850,171) | (1,821,854) |
| Net increase (decrease) | 297,125 | 486,959 | $2,481,158 | $4,102,491 |
11. Other.
A fund's organizational documents provide former and current trustees and officers with a limited indemnification against liabilities arising in connection with the performance of their duties to the fund. In the normal course of business, a fund may also enter into contracts that provide general indemnifications. A fund's maximum exposure under these arrangements is unknown as this would be dependent on future claims that may be made against a fund. The risk of material loss from such claims is considered remote.
At the end of the period, the investment adviser or its affiliates were owners of record of more than 10% of the outstanding shares as follows:
| Fund | Affiliated % |
| Fidelity Environmental Bond Fund | 18% |
12. Risk and Uncertainties.
Many factors affect a fund's performance. Developments that disrupt global economies and financial markets, such as pandemics, epidemics, outbreaks of infectious diseases, war, terrorism, and environmental disasters, may significantly affect a fund's investment performance. The effects of these developments to a fund will be impacted by the types of securities in which a fund invests, the financial condition, industry, economic sector, and geographic location of an issuer, and a fund's level of investment in the securities of that issuer. Significant concentrations in security types, issuers, industries, sectors, and geographic locations may magnify the factors that affect a fund's performance.
Report of Independent Registered Public Accounting Firm
To the Board of Trustees of Fidelity Income Fund and Shareholders of Fidelity Environmental Bond Fund
Opinion on the Financial Statements
We have audited the accompanying statement of assets and liabilities, including the schedule of investments, of Fidelity Environmental Bond Fund (one of the funds constituting Fidelity Income Fund, referred to hereafter as the "Fund") as of August 31, 2024, the related statement of operations for the year ended August 31, 2024, the statement of changes in net assets for each of the two years in the period ended August 31, 2024, including the related notes, and the financial highlights for each of the three years in the period ended August 31, 2024 and for the period June 15, 2021 (commencement of operations) through August 31, 2021 (collectively referred to as the "financial statements"). In our opinion, the financial statements present fairly, in all material respects, the financial position of the Fund as of August 31, 2024, the results of its operations for the year then ended, the changes in its net assets for each of the two years in the period ended August 31, 2024 and the financial highlights for each of the three years in the period ended August 31, 2024 and for the period June 15, 2021 (commencement of operations) through August 31, 2021 in conformity with accounting principles generally accepted in the United States of America.
Basis for Opinion
These financial statements are the responsibility of the Fund's management. Our responsibility is to express an opinion on the Fund's financial statements based on our audits. We are a public accounting firm registered with the Public Company Accounting Oversight Board (United States) (PCAOB) and are required to be independent with respect to the Fund in accordance with the U.S. federal securities laws and the applicable rules and regulations of the Securities and Exchange Commission and the PCAOB.
We conducted our audits of these financial statements in accordance with the standards of the PCAOB. Those standards require that we plan and perform the audit to obtain reasonable assurance about whether the financial statements are free of material misstatement, whether due to error or fraud.
Our audits included performing procedures to assess the risks of material misstatement of the financial statements, whether due to error or fraud, and performing procedures that respond to those risks. Such procedures included examining, on a test basis, evidence regarding the amounts and disclosures in the financial statements. Our audits also included evaluating the accounting principles used and significant estimates made by management, as well as evaluating the overall presentation of the financial statements. Our procedures included confirmation of securities owned as of August 31, 2024 by correspondence with the custodian and brokers; when replies were not received from brokers, we performed other auditing procedures. We believe that our audits provide a reasonable basis for our opinion.
/s/ PricewaterhouseCoopers LLP
Boston, Massachusetts
October 16, 2024
We have served as the auditor of one or more investment companies in the Fidelity group of funds since 1932.
Distributions
(Unaudited)The dividend and capital gains distributions for the fund(s) are available on Fidelity.com or Institutional.Fidelity.com.
A total of 29.64% of the dividends distributed during the fiscal year was derived from interest on U.S. Government securities which is generally exempt from state income tax.
The fund designates $789,963 of distributions paid in the calendar year 2023 as indicated in the QII memo as qualifying to be taxed as interest-related dividends for nonresident alien shareholders.
The fund designates $ $1,175,819 of distributions paid during the fiscal year ended 2024 as qualifying to be taxed as section 163(j) interest dividends.
The fund will notify shareholders in January 2025 of amounts for use in preparing 2024 income tax returns.
Item 8: Changes in and Disagreements with Accountants for Open-End Management Investment Companies
(Unaudited)
Note: This is not applicable for any fund included in this document.
Item 9: Proxy Disclosures for Open-End Management Investment Companies
(Unaudited)
| A special meeting of shareholders was held on October 18, 2023. The results of votes taken among shareholders on the proposal before them are reported below. Each vote reported represents one dollar of net asset value held on the record date for the meeting. |
| Proposal 1 |
| To elect a Board of Trustees. |
| | # of Votes | % of Votes |
| Abigail P. Johnson |
| Affirmative | 29,408,520,731.18 | 96.84 |
| Withheld | 958,659,352.64 | 3.16 |
| TOTAL | 30,367,180,083.82 | 100.00 |
| Jennifer Toolin McAuliffe |
| Affirmative | 29,484,249,185.02 | 97.09 |
| Withheld | 882,930,898.80 | 2.91 |
| TOTAL | 30,367,180,083.82 | 100.00 |
| Christine J. Thompson |
| Affirmative | 29,483,889,948.58 | 97.09 |
| Withheld | 883,290,135.24 | 2.91 |
| TOTAL | 30,367,180,083.82 | 100.00 |
| Elizabeth S. Acton |
| Affirmative | 29,471,265,000.64 | 97.05 |
| Withheld | 895,915,083.18 | 2.95 |
| TOTAL | 30,367,180,083.82 | 100.00 |
| Laura M. Bishop |
| Affirmative | 29,508,015,754.27 | 97.17 |
| Withheld | 859,164,329.55 | 2.83 |
| TOTAL | 30,367,180,083.82 | 100.00 |
| Ann E. Dunwoody |
| Affirmative | 29,470,432,034.14 | 97.05 |
| Withheld | 896,748,049.68 | 2.95 |
| TOTAL | 30,367,180,083.82 | 100.00 |
| John Engler |
| Affirmative | 29,326,181,411.39 | 96.57 |
| Withheld | 1,040,998,672.43 | 3.43 |
| TOTAL | 30,367,180,083.82 | 100.00 |
| Robert F. Gartland |
| Affirmative | 29,422,803,481.93 | 96.89 |
| Withheld | 944,376,601.89 | 3.11 |
| TOTAL | 30,367,180,083.82 | 100.00 |
| Robert W. Helm |
| Affirmative | 29,445,540,968.38 | 96.97 |
| Withheld | 921,639,115.44 | 3.03 |
| TOTAL | 30,367,180,083.82 | 100.00 |
| Arthur E. Johnson |
| Affirmative | 29,395,582,286.37 | 96.80 |
| Withheld | 971,597,797.45 | 3.20 |
| TOTAL | 30,367,180,083.82 | 100.00 |
| Michael E. Kenneally |
| Affirmative | 29,420,582,069.08 | 96.88 |
| Withheld | 946,598,014.74 | 3.12 |
| TOTAL | 30,367,180,083.82 | 100.00 |
| Mark A. Murray |
| Affirmative | 29,446,384,581.44 | 96.97 |
| Withheld | 920,795,502.38 | 3.03 |
| TOTAL | 30,367,180,083.82 | 100.00 |
| Carol J. Zierhoffer |
| Affirmative | 29,510,392,522.55 | 97.18 |
| Withheld | 856,787,561.27 | 2.82 |
| TOTAL | 30,367,180,083.82 | 100.00 |
| | | |
| Proposal 1 reflects trust-wide proposal and voting results. |
Item 10: Remuneration Paid to Directors, Officers, and others of Open-End Management Investment Companies
(Unaudited)
Note: This information is disclosed as part of the financial statements for each Fund as part of Item 7: Financial Statements and Financial Highlights for Open-End Management Investment companies.
Item 11: Statement Regarding Basis for Approval of Investment Advisory Contract
(Unaudited)
Note: This is not applicable for any fund included in this document.
1.9901918.103
ENB-ANN-1024
Fidelity® Total Bond K6 Fund
Annual Report
August 31, 2024
Contents
To view a fund's proxy voting guidelines and proxy voting record for the 12-month period ended June 30, visit http://www.fidelity.com/proxyvotingresults or visit the Securities and Exchange Commission's (SEC) web site at http://www.sec.gov.
You may also call 1-800-835-5092 to request a free copy of the proxy voting guidelines.
Standard & Poor's, S&P and S&P 500 are registered service marks of The McGraw-Hill Companies, Inc. and have been licensed for use by Fidelity Distributors Corporation.
Other third-party marks appearing herein are the property of their respective owners.
All other marks appearing herein are registered or unregistered trademarks or service marks of FMR LLC or an affiliated company. © 2024 FMR LLC. All rights reserved.
This report and the financial statements contained herein are submitted for the general information of the shareholders of the Fund. This report is not authorized for distribution to prospective investors in the Fund unless preceded or accompanied by an effective prospectus.
A fund files its complete schedule of portfolio holdings with the SEC for the first and third quarters of each fiscal year on Form N-PORT. Forms N-PORT are available on the SEC's web site at http://www.sec.gov. A fund's Forms N-PORT may be reviewed and copied at the SEC's Public Reference Room in Washington, DC. Information regarding the operation of the SEC's Public Reference Room may be obtained by calling 1-800-SEC-0330.
For a complete list of a fund's portfolio holdings, view the most recent holdings listing, semiannual report, or annual report on Fidelity's web site at http://www.fidelity.com, http://www.institutional.fidelity.com, or http://www.401k.com, as applicable.
NOT FDIC INSURED •MAY LOSE VALUE •NO BANK GUARANTEE
Neither the Fund nor Fidelity Distributors Corporation is a bank.
Item 7: Financial Statements and Financial Highlights for Open-End Management Investment Companies (Annual Report)
Fidelity® Total Bond K6 Fund
Schedule of Investments August 31, 2024
Showing Percentage of Net Assets
| Corporate Bonds - 25.2% |
| | | Principal Amount (a) | Value ($) |
| Convertible Bonds - 0.0% | | | |
| COMMUNICATION SERVICES - 0.0% | | | |
| Media - 0.0% | | | |
| DISH Network Corp. 3.375% 8/15/26 | | 1,530,000 | 952,560 |
| INFORMATION TECHNOLOGY - 0.0% | | | |
| Electronic Equipment, Instruments & Components - 0.0% | | | |
| Itron, Inc. 1.375% 7/15/30 (b) | | 90,000 | 92,070 |
| Semiconductors & Semiconductor Equipment - 0.0% | | | |
| MKS Instruments, Inc. 1.25% 6/1/30 (b) | | 232,000 | 238,844 |
| Wolfspeed, Inc. 1.875% 12/1/29 | | 1,381,000 | 526,442 |
| | | | 765,286 |
TOTAL INFORMATION TECHNOLOGY | | | 857,356 |
| | | | |
| REAL ESTATE - 0.0% | | | |
| Real Estate Management & Development - 0.0% | | | |
| Realogy Group LLC/Realogy Co-Issuer Corp. 0.25% 6/15/26 | | 250,000 | 212,500 |
| Redfin Corp. 0.5% 4/1/27 | | 932,000 | 638,420 |
| | | | 850,920 |
| UTILITIES - 0.0% | | | |
| Electric Utilities - 0.0% | | | |
| PG&E Corp. 4.25% 12/1/27 (b) | | 230,000 | 245,410 |
| Independent Power and Renewable Electricity Producers - 0.0% | | | |
| Sunnova Energy International, Inc.: | | | |
| 0.25% 12/1/26 | | 455,000 | 344,624 |
| 2.625% 2/15/28 | | 232,000 | 149,756 |
| | | | 494,380 |
TOTAL UTILITIES | | | 739,790 |
| | | | |
| TOTAL CONVERTIBLE BONDS | | | 3,400,626 |
| Nonconvertible Bonds - 25.2% | | | |
| COMMUNICATION SERVICES - 2.5% | | | |
| Diversified Telecommunication Services - 0.5% | | | |
| Altice France SA: | | | |
| 5.125% 1/15/29(b) | | 750,000 | 520,694 |
| 5.125% 7/15/29(b) | | 1,730,000 | 1,206,999 |
| 5.5% 1/15/28(b) | | 69,000 | 49,100 |
| 5.5% 10/15/29(b) | | 491,000 | 340,676 |
| AT&T, Inc.: | | | |
| 2.55% 12/1/33 | | 8,339,000 | 6,906,876 |
| 3.8% 12/1/57 | | 4,105,000 | 3,008,790 |
| 4.3% 2/15/30 | | 559,000 | 553,333 |
| 5.15% 11/15/46 | | 1,000,000 | 958,270 |
| Colombia Telecomunicaciones SA 4.95% 7/17/30 (b) | | 95,000 | 81,147 |
| Connect Finco SARL / Connect U.S. Finco LLC 6.75% 10/1/26 (b) | | 252,000 | 250,092 |
| Consolidated Communications, Inc. 5% 10/1/28 (b) | | 148,000 | 129,200 |
| Frontier Communications Holdings LLC: | | | |
| 6% 1/15/30(b) | | 500,000 | 461,188 |
| 8.625% 3/15/31(b) | | 475,000 | 502,621 |
| IHS Holding Ltd.: | | | |
| 5.625% 11/29/26(b) | | 575,000 | 558,469 |
| 6.25% 11/29/28(b) | | 55,000 | 50,566 |
| Iliad Holding SAS: | | | |
| 7% 10/15/28(b) | | 26,000 | 26,389 |
| 8.5% 4/15/31(b) | | 400,000 | 423,867 |
| Koninklijke KPN NV 3.875% 2/16/36 (Reg. S) | EUR | 200,000 | 222,074 |
| Level 3 Financing, Inc.: | | | |
| 3.625% 1/15/29(b) | | 44,000 | 27,390 |
| 3.875% 10/15/30(b) | | 85,000 | 57,840 |
| 4% 4/15/31(b) | | 25,000 | 16,750 |
| 4.5% 4/1/30(b) | | 1,080,000 | 791,674 |
| 10.5% 5/15/30(b) | | 550,000 | 589,309 |
| 11% 11/15/29(b) | | 130,000 | 142,520 |
| Liquid Telecommunications Financing PLC 5.5% 9/4/26 (b) | | 955,000 | 593,800 |
| Qtel International Finance Ltd. 2.625% 4/8/31 (b) | | 170,000 | 151,672 |
| Sable International Finance Ltd. 5.75% 9/7/27 (b) | | 220,000 | 216,768 |
| Sitios Latinoamerica S.A.B. de CV 5.375% 4/4/32 (b) | | 535,000 | 507,715 |
| Telefonica Celular del Paraguay SA 5.875% 4/15/27 (b) | | 255,000 | 252,928 |
| Telenet Finance Luxembourg Notes SARL 5.5% 3/1/28 (b) | | 400,000 | 386,500 |
| Telstra Group Ltd. 3.5% 9/3/36 (Reg. S) | EUR | 550,000 | 606,383 |
| Verizon Communications, Inc.: | | | |
| 2.55% 3/21/31 | | 1,065,000 | 936,809 |
| 3.75% 2/28/36 | EUR | 193,000 | 213,798 |
| 4.78% 2/15/35(b) | | 1,330,000 | 1,311,444 |
| 4.862% 8/21/46 | | 1,250,000 | 1,181,278 |
| 5.012% 4/15/49 | | 16,000 | 15,871 |
| Windstream Escrow LLC 7.75% 8/15/28 (b) | | 370,000 | 361,159 |
| Zayo Group Holdings, Inc. 4% 3/1/27 (b)(c) | | 500,000 | 436,417 |
| | | | 25,048,376 |
| Entertainment - 0.0% | | | |
| Roblox Corp. 3.875% 5/1/30 (b) | | 445,000 | 409,955 |
| Universal Music Group NV 4% 6/13/31 (Reg. S) | EUR | 289,000 | 330,890 |
| | | | 740,845 |
| Interactive Media & Services - 0.0% | | | |
| Baidu, Inc. 2.375% 10/9/30 | | 225,000 | 198,502 |
| Tencent Holdings Ltd.: | | | |
| 1.81% 1/26/26(b) | | 110,000 | 105,861 |
| 2.39% 6/3/30(b) | | 225,000 | 200,602 |
| 3.975% 4/11/29(b) | | 80,000 | 78,165 |
| | | | 583,130 |
| Media - 1.7% | | | |
| Advantage Sales & Marketing, Inc. 6.5% 11/15/28 (b) | | 605,000 | 567,224 |
| Altice Financing SA: | | | |
| 5% 1/15/28(b) | | 285,000 | 228,892 |
| 5.75% 8/15/29(b) | | 1,195,000 | 920,514 |
| Altice France Holding SA 6% 2/15/28 (b) | | 375,000 | 120,779 |
| CCO Holdings LLC/CCO Holdings Capital Corp.: | | | |
| 4.5% 5/1/32 | | 1,440,000 | 1,229,550 |
| 5% 2/1/28(b) | | 3,015,000 | 2,905,258 |
| 5.125% 5/1/27(b) | | 700,000 | 686,056 |
| Charter Communications Operating LLC/Charter Communications Operating Capital Corp.: | | | |
| 2.3% 2/1/32 | | 5,000,000 | 3,994,040 |
| 4.4% 4/1/33 | | 6,526,000 | 5,931,574 |
| 5.25% 4/1/53 | | 4,181,000 | 3,423,723 |
| 5.375% 5/1/47 | | 3,320,000 | 2,768,683 |
| 5.5% 4/1/63 | | 2,499,000 | 2,003,533 |
| 5.75% 4/1/48 | | 861,000 | 747,490 |
| 6.1% 6/1/29 | | 2,402,000 | 2,481,693 |
| 6.55% 6/1/34 | | 6,310,000 | 6,536,448 |
| 6.65% 2/1/34 | | 11,000,000 | 11,456,543 |
| Clear Channel Outdoor Holdings, Inc.: | | | |
| 5.125% 8/15/27(b) | | 250,000 | 244,228 |
| 7.5% 6/1/29(b) | | 445,000 | 375,234 |
| 7.875% 4/1/30(b)(c) | | 400,000 | 417,943 |
| 9% 9/15/28(b)(c) | | 250,000 | 265,742 |
| Comcast Corp. 6.45% 3/15/37 | | 365,000 | 414,734 |
| CSC Holdings LLC: | | | |
| 3.375% 2/15/31(b) | | 2,025,000 | 1,302,161 |
| 4.125% 12/1/30(b) | | 5,000 | 3,297 |
| 4.5% 11/15/31(b) | | 365,000 | 242,746 |
| 4.625% 12/1/30(b) | | 500,000 | 195,497 |
| 5.375% 2/1/28(b) | | 100,000 | 76,889 |
| Discovery Communications LLC 3.625% 5/15/30 | | 708,000 | 628,428 |
| DISH DBS Corp.: | | | |
| 5.75% 12/1/28(b) | | 485,000 | 373,163 |
| 5.875% 11/15/24 | | 120,000 | 116,481 |
| DISH Network Corp. 11.75% 11/15/27 (b) | | 890,000 | 904,921 |
| Fox Corp.: | | | |
| 4.709% 1/25/29 | | 312,000 | 314,186 |
| 5.476% 1/25/39 | | 308,000 | 306,838 |
| Lamar Media Corp. 3.625% 1/15/31 | | 1,155,000 | 1,045,864 |
| LCPR Senior Secured Financing DAC: | | | |
| 5.125% 7/15/29(b) | | 655,000 | 528,974 |
| 6.75% 10/15/27(b) | | 421,000 | 384,917 |
| Sirius XM Radio, Inc. 5.5% 7/1/29 (b)(c) | | 1,225,000 | 1,192,236 |
| Telecomunicaciones Digitales SA 4.5% 1/30/30 (b) | | 400,000 | 363,752 |
| Time Warner Cable LLC: | | | |
| 6.75% 6/15/39 | | 545,000 | 541,894 |
| 7.3% 7/1/38 | | 2,420,000 | 2,530,898 |
| Univision Communications, Inc.: | | | |
| 7.375% 6/30/30(b) | | 1,160,000 | 1,113,414 |
| 8.5% 7/31/31(b) | | 605,000 | 603,798 |
| Virgin Media Secured Finance PLC 4.5% 8/15/30 (b) | | 1,855,000 | 1,638,155 |
| VTR Finance BV 6.375% 7/15/28 (b) | | 290,000 | 265,350 |
| Warnermedia Holdings, Inc.: | | | |
| 3.755% 3/15/27 | | 973,000 | 932,177 |
| 4.054% 3/15/29 | | 337,000 | 314,849 |
| 4.279% 3/15/32 | | 27,816,000 | 24,315,381 |
| 4.693% 5/17/33 (Reg. S) | EUR | 350,000 | 382,136 |
| 5.05% 3/15/42 | | 738,000 | 591,385 |
| 5.141% 3/15/52 | | 3,903,000 | 2,968,616 |
| Ziggo BV 4.875% 1/15/30 (b) | | 450,000 | 419,543 |
| | | | 92,317,827 |
| Wireless Telecommunication Services - 0.3% | | | |
| AXIAN Telecom 7.375% 2/16/27 (b) | | 465,000 | 463,983 |
| C&W Senior Finance Ltd. 6.875% 9/15/27 (b) | | 1,860,000 | 1,831,093 |
| CT Trust 5.125% 2/3/32 (b) | | 305,000 | 273,356 |
| Intelsat Jackson Holdings SA 6.5% 3/15/30 (b) | | 525,000 | 504,104 |
| Millicom International Cellular SA: | | | |
| 4.5% 4/27/31(b) | | 165,000 | 146,748 |
| 5.125% 1/15/28(b) | | 693,000 | 670,221 |
| 6.25% 3/25/29(b) | | 1,440,000 | 1,419,120 |
| 7.375% 4/2/32(b) | | 205,000 | 206,927 |
| MTN (Mauritius) Investments Ltd. 6.5% 10/13/26 (b) | | 145,000 | 146,359 |
| T-Mobile U.S.A., Inc.: | | | |
| 3.75% 4/15/27 | | 1,250,000 | 1,227,313 |
| 3.875% 4/15/30 | | 2,100,000 | 2,020,402 |
| 4.375% 4/15/40 | | 269,000 | 242,440 |
| 4.5% 4/15/50 | | 528,000 | 458,128 |
| 5.05% 7/15/33 | | 8,000,000 | 8,097,856 |
| Vodafone Group PLC: | | | |
| 4.875% 10/3/78 (Reg. S)(d) | GBP | 106,000 | 137,648 |
| 6.25% 10/3/78 (Reg. S)(d) | | 427,000 | 426,962 |
| VTR Comunicaciones SpA: | | | |
| 4.375% 4/15/29(b) | | 70,000 | 60,288 |
| 5.125% 1/15/28(b) | | 315,000 | 288,915 |
| | | | 18,621,863 |
TOTAL COMMUNICATION SERVICES | | | 137,312,041 |
| | | | |
| CONSUMER DISCRETIONARY - 1.1% | | | |
| Automobile Components - 0.1% | | | |
| Dana, Inc. 4.5% 2/15/32 | | 185,000 | 164,067 |
| Hertz Corp. 12.625% 7/15/29 (b)(c) | | 25,000 | 26,629 |
| Macquarie AirFinance Holdings: | | | |
| 6.4% 3/26/29(b) | | 75,000 | 78,053 |
| 8.125% 3/30/29(b) | | 365,000 | 387,894 |
| 8.375% 5/1/28(b) | | 860,000 | 911,199 |
| Metalsa SA de CV 3.75% 5/4/31 (b) | | 205,000 | 171,688 |
| Robert Bosch GmbH 4.375% 6/2/43 (Reg. S) | EUR | 300,000 | 344,037 |
| Schaeffler AG 4.75% 8/14/29 (Reg. S) | EUR | 300,000 | 338,975 |
| ZF Europe Finance BV 2% 2/23/26 (Reg. S) | EUR | 200,000 | 213,895 |
| ZF Finance GmbH 2% 5/6/27 (Reg. S) | EUR | 400,000 | 417,110 |
| ZF North America Capital, Inc.: | | | |
| 4.75% 4/29/25(b) | | 35,000 | 34,693 |
| 6.875% 4/14/28(b) | | 650,000 | 671,541 |
| | | | 3,759,781 |
| Automobiles - 0.1% | | | |
| Aston Martin Capital Holdings Ltd. 10% 3/31/29 (b) | | 245,000 | 249,503 |
| Ford Motor Co. 3.25% 2/12/32 | | 4,000,000 | 3,406,902 |
| McLaren Finance PLC 7.5% 8/1/26 (b) | | 300,000 | 263,549 |
| RCI Banque SA 5.5% 10/9/34 (Reg. S) (d) | EUR | 200,000 | 225,251 |
| Rivian Holdco & Rivian LLC & Rivian Automotive LLC CME Term SOFR 6 Month Index + 6.050% 11.3595% 10/15/26 (b)(d)(e) | | 365,000 | 365,030 |
| Thor Industries, Inc. 4% 10/15/29 (b) | | 240,000 | 219,109 |
| | | | 4,729,344 |
| Broadline Retail - 0.1% | | | |
| Alibaba Group Holding Ltd. 2.125% 2/9/31 | | 135,000 | 115,856 |
| JD.com, Inc. 3.375% 1/14/30 | | 380,000 | 357,880 |
| John Lewis PLC 6.125% 1/21/25 | GBP | 1,656,000 | 2,177,729 |
| Kohl's Corp. 4.25% 7/17/25 | | 25,000 | 24,762 |
| Marks & Spencer PLC 4.5% 7/10/27 (Reg. S) | GBP | 339,000 | 434,830 |
| Match Group Holdings II LLC 4.125% 8/1/30 (b) | | 855,000 | 787,572 |
| Nordstrom, Inc. 4.375% 4/1/30 (c) | | 315,000 | 289,278 |
| Prosus NV: | | | |
| 2.031% 8/3/32 (Reg. S) | EUR | 100,000 | 92,127 |
| 3.061% 7/13/31(b) | | 200,000 | 171,563 |
| 3.68% 1/21/30(b) | | 170,000 | 156,613 |
| 4.027% 8/3/50(b) | | 270,000 | 189,506 |
| 4.193% 1/19/32(b) | | 85,000 | 77,138 |
| | | | 4,874,854 |
| Distributors - 0.0% | | | |
| The Gates Corp. 6.875% 7/1/29 (b) | | 280,000 | 287,208 |
| Diversified Consumer Services - 0.1% | | | |
| Service Corp. International 5.125% 6/1/29 | | 850,000 | 839,973 |
| Sotheby's 7.375% 10/15/27 (b) | | 380,000 | 362,880 |
| StoneMor, Inc. 8.5% 5/15/29 (b) | | 118,000 | 104,997 |
| TKC Holdings, Inc.: | | | |
| 6.875% 5/15/28(b) | | 320,000 | 317,928 |
| 10.5% 5/15/29(b) | | 810,000 | 807,961 |
| WASH Multifamily Acquisition, Inc. 5.75% 4/15/26 (b) | | 865,000 | 861,027 |
| | | | 3,294,766 |
| Hotels, Restaurants & Leisure - 0.3% | | | |
| 1011778 BC Unlimited Liability Co./New Red Finance, Inc.: | | | |
| 3.875% 1/15/28(b) | | 655,000 | 625,484 |
| 6.125% 6/15/29(b) | | 565,000 | 577,020 |
| Aramark Services, Inc. 5% 2/1/28 (b)(c) | | 830,000 | 814,095 |
| Bimbo Bakeries U.S.A., Inc.: | | | |
| 5.375% 1/9/36(b) | | 75,000 | 76,125 |
| 6.4% 1/15/34(b) | | 155,000 | 169,434 |
| Boyd Gaming Corp. 4.75% 12/1/27 | | 650,000 | 637,824 |
| Caesars Entertainment, Inc.: | | | |
| 4.625% 10/15/29(b)(c) | | 700,000 | 662,136 |
| 6.5% 2/15/32(b) | | 620,000 | 637,131 |
| Carnival Corp.: | | | |
| 6% 5/1/29(b) | | 400,000 | 401,788 |
| 7.625% 3/1/26(b) | | 735,000 | 742,446 |
| Fertitta Entertainment LLC / Fertitta Entertainment Finance Co., Inc. 6.75% 1/15/30 (b) | | 1,000,000 | 898,958 |
| Garden SpinCo Corp. 8.625% 7/20/30 (b)(c) | | 75,000 | 81,841 |
| GENM Capital Labuan Ltd. 3.882% 4/19/31 (b) | | 265,000 | 236,927 |
| Hilton Domestic Operating Co., Inc.: | | | |
| 3.625% 2/15/32(b) | | 915,000 | 820,145 |
| 5.875% 4/1/29(b)(c) | | 1,095,000 | 1,115,883 |
| Hilton Grand Vacations Borrower Escrow LLC: | | | |
| 5% 6/1/29(b)(c) | | 500,000 | 472,737 |
| 6.625% 1/15/32(b) | | 50,000 | 50,603 |
| InterContinental Hotel Group PLC 3.375% 10/8/28 (Reg. S) | GBP | 254,000 | 314,174 |
| Jacobs Entertainment, Inc. 6.75% 2/15/29 (b) | | 223,000 | 212,743 |
| Life Time, Inc. 5.75% 1/15/26 (b) | | 250,000 | 250,041 |
| MajorDrive Holdings IV LLC 6.375% 6/1/29 (b) | | 250,000 | 235,690 |
| McDonald's Corp. 3.5% 7/1/27 | | 353,000 | 345,431 |
| Meituan: | | | |
| 2.125% 10/28/25(b) | | 125,000 | 120,639 |
| 3.05% 10/28/30(b) | | 290,000 | 259,736 |
| Melco Resorts Finance Ltd.: | | | |
| 5.375% 12/4/29(b) | | 270,000 | 246,134 |
| 5.75% 7/21/28(b) | | 405,000 | 385,593 |
| Merlin Entertainments Group 7.375% 2/15/31 (b) | | 150,000 | 149,445 |
| MGM Resorts International 5.75% 6/15/25 | | 310,000 | 309,959 |
| Royal Caribbean Cruises Ltd.: | | | |
| 5.375% 7/15/27(b) | | 165,000 | 165,282 |
| 5.5% 8/31/26(b) | | 1,755,000 | 1,757,487 |
| 6% 2/1/33(b) | | 800,000 | 819,510 |
| Whitbread PLC: | | | |
| 2.375% 5/31/27 (Reg. S) | GBP | 249,000 | 302,329 |
| 3.375% 10/16/25 (Reg. S) | GBP | 1,045,000 | 1,342,429 |
| Wynn Las Vegas LLC/Wynn Las Vegas Capital Corp. 5.25% 5/15/27 (b)(c) | | 2,105,000 | 2,091,000 |
| Yum! Brands, Inc.: | | | |
| 3.625% 3/15/31 | | 805,000 | 738,872 |
| 4.625% 1/31/32 | | 750,000 | 710,826 |
| | | | 19,777,897 |
| Household Durables - 0.1% | | | |
| Century Communities, Inc. 3.875% 8/15/29 (b) | | 215,000 | 199,196 |
| Landsea Homes Corp. 8.875% 4/1/29 (b) | | 280,000 | 289,812 |
| LGI Homes, Inc. 8.75% 12/15/28 (b) | | 201,000 | 214,155 |
| Newell Brands, Inc. 6.875% 4/1/36 (c)(f) | | 285,000 | 271,013 |
| Tempur Sealy International, Inc. 3.875% 10/15/31 (b) | | 1,190,000 | 1,046,585 |
| The Berkeley Group PLC 2.5% 8/11/31 (Reg. S) | GBP | 648,000 | 677,595 |
| TopBuild Corp. 4.125% 2/15/32 (b) | | 385,000 | 350,421 |
| Vestel Elektonik Sanayi ve Ticaret A/S 9.75% 5/15/29 (b) | | 200,000 | 201,222 |
| | | | 3,249,999 |
| Leisure Products - 0.0% | | | |
| Amer Sports Co. 6.75% 2/16/31 (b)(c) | | 740,000 | 752,014 |
| Specialty Retail - 0.2% | | | |
| Arko Corp. 5.125% 11/15/29 (b) | | 250,000 | 222,045 |
| Asbury Automotive Group, Inc.: | | | |
| 4.625% 11/15/29(b)(c) | | 1,070,000 | 1,018,708 |
| 5% 2/15/32(b) | | 575,000 | 541,565 |
| AutoNation, Inc. 4.75% 6/1/30 | | 156,000 | 154,125 |
| AutoZone, Inc. 4% 4/15/30 | | 1,110,000 | 1,078,284 |
| Bath & Body Works, Inc. 6.625% 10/1/30 (b) | | 510,000 | 516,371 |
| Carvana Co.: | | | |
| 5.625% 10/1/25(b) | | 510,000 | 498,530 |
| 12% 12/1/28 pay-in-kind(b)(d) | | 238,500 | 247,554 |
| 13% 6/1/30 pay-in-kind(b)(d) | | 266,250 | 284,236 |
| Champions Financing, Inc. 8.75% 2/15/29 (b) | | 430,000 | 441,032 |
| Group 1 Automotive, Inc. 6.375% 1/15/30 (b) | | 55,000 | 55,952 |
| Hudson Automotive Group 8% 5/15/32 (b) | | 140,000 | 147,665 |
| LBM Acquisition LLC 6.25% 1/15/29 (b) | | 525,000 | 474,581 |
| LCM Investments Holdings 4.875% 5/1/29 (b) | | 80,000 | 76,208 |
| Lowe's Companies, Inc.: | | | |
| 3.35% 4/1/27 | | 149,000 | 145,319 |
| 3.75% 4/1/32 | | 459,000 | 431,295 |
| 4.25% 4/1/52 | | 1,870,000 | 1,533,834 |
| 4.45% 4/1/62 | | 2,116,000 | 1,727,322 |
| O'Reilly Automotive, Inc. 4.2% 4/1/30 | | 246,000 | 241,581 |
| Sally Holdings LLC 6.75% 3/1/32 (c) | | 235,000 | 239,717 |
| Staples, Inc.: | | | |
| 10.75% 9/1/29(b) | | 450,000 | 423,857 |
| 12.75% 1/15/30(b) | | 338,275 | 261,444 |
| Wand NewCo 3, Inc. 7.625% 1/30/32 (b) | | 300,000 | 314,289 |
| | | | 11,075,514 |
| Textiles, Apparel & Luxury Goods - 0.1% | | | |
| Kontoor Brands, Inc. 4.125% 11/15/29 (b) | | 65,000 | 61,208 |
| Levi Strauss & Co. 3.5% 3/1/31 (b) | | 765,000 | 690,098 |
| Tapestry, Inc.: | | | |
| 7% 11/27/26 | | 896,000 | 924,217 |
| 7.05% 11/27/25 | | 332,000 | 338,154 |
| 7.35% 11/27/28 | | 1,433,000 | 1,503,113 |
| 7.7% 11/27/30 | | 1,598,000 | 1,701,557 |
| 7.85% 11/27/33 | | 1,598,000 | 1,709,904 |
| Wolverine World Wide, Inc. 4% 8/15/29 (b) | | 250,000 | 212,890 |
| | | | 7,141,141 |
TOTAL CONSUMER DISCRETIONARY | | | 58,942,518 |
| | | | |
| CONSUMER STAPLES - 0.9% | | | |
| Beverages - 0.2% | | | |
| Anheuser-Busch InBev Worldwide, Inc.: | | | |
| 4.35% 6/1/40 | | 720,000 | 664,098 |
| 4.5% 6/1/50 | | 1,000,000 | 932,694 |
| 4.75% 4/15/58 | | 613,000 | 573,215 |
| 5.45% 1/23/39 | | 800,000 | 841,823 |
| 5.55% 1/23/49 | | 1,824,000 | 1,911,447 |
| 5.8% 1/23/59 (Reg. S) | | 1,933,000 | 2,122,039 |
| Central American Bottling Corp. 5.25% 4/27/29 (b) | | 235,000 | 226,555 |
| Molson Coors Beverage Co. 5% 5/1/42 | | 2,945,000 | 2,797,589 |
| The Coca-Cola Co.: | | | |
| 3.375% 3/25/27 | | 1,279,000 | 1,258,823 |
| 3.45% 3/25/30 | | 713,000 | 686,676 |
| Triton Water Holdings, Inc. 6.25% 4/1/29 (b) | | 455,000 | 449,959 |
| | | | 12,464,918 |
| Consumer Staples Distribution & Retail - 0.3% | | | |
| Albertsons Companies LLC/Safeway, Inc./New Albertson's, Inc./Albertson's LLC: | | | |
| 4.875% 2/15/30(b) | | 650,000 | 635,286 |
| 6.5% 2/15/28(b) | | 350,000 | 354,508 |
| C&S Group Enterprises LLC 5% 12/15/28 (b) | | 595,000 | 449,465 |
| KeHE Distributor / Nextwave 9% 2/15/29 (b) | | 475,000 | 495,556 |
| Kroger Co.: | | | |
| 4.65% 9/15/29 | | 2,680,000 | 2,679,864 |
| 4.9% 9/15/31 | | 2,680,000 | 2,677,995 |
| 5% 9/15/34 | | 2,680,000 | 2,671,670 |
| Minerva Luxembourg SA 8.875% 9/13/33 (b) | | 125,000 | 134,929 |
| NBM U.S. Holdings, Inc. 6.625% 8/6/29 (b) | | 270,000 | 270,759 |
| REWE International Finance 4.875% 9/13/30 (Reg. S) | EUR | 400,000 | 469,499 |
| Sigma Holdco BV 7.875% 5/15/26 (b) | | 611,000 | 602,703 |
| Sysco Corp.: | | | |
| 5.95% 4/1/30 | | 471,000 | 502,696 |
| 6.6% 4/1/50 | | 710,000 | 816,039 |
| Tesco Corporate Treasury Services PLC 2.75% 4/27/30 (Reg. S) | GBP | 380,000 | 447,753 |
| U.S. Foods, Inc.: | | | |
| 4.625% 6/1/30(b)(c) | | 790,000 | 756,178 |
| 7.25% 1/15/32(b) | | 180,000 | 190,001 |
| United Natural Foods, Inc. 6.75% 10/15/28 (b) | | 87,000 | 81,709 |
| Walgreens Boots Alliance, Inc. 8.125% 8/15/29 | | 200,000 | 200,225 |
| | | | 14,436,835 |
| Food Products - 0.0% | | | |
| Adecoagro SA 6% 9/21/27 (b) | | 75,000 | 74,133 |
| Camposol SA 6% 2/3/27 (b) | | 200,000 | 180,414 |
| Darling Ingredients, Inc.: | | | |
| 5.25% 4/15/27(b) | | 640,000 | 636,674 |
| 6% 6/15/30(b)(c) | | 110,000 | 111,346 |
| Lamb Weston Holdings, Inc. 4.375% 1/31/32 (b) | | 925,000 | 852,042 |
| MARB BondCo PLC 3.95% 1/29/31 (b) | | 160,000 | 135,360 |
| Post Holdings, Inc.: | | | |
| 5.625% 1/15/28(b) | | 376,000 | 375,028 |
| 6.375% 3/1/33(b) | | 600,000 | 604,380 |
| | | | 2,969,377 |
| Household Products - 0.0% | | | |
| Central Garden & Pet Co. 4.125% 4/30/31 (b)(c) | | 500,000 | 453,073 |
| Kronos Acquisition Holdings, Inc.: | | | |
| 8.25% 6/30/31(b) | | 120,000 | 123,477 |
| 10.75% 6/30/32(b) | | 120,000 | 119,628 |
| Reckitt Benckiser Treasury Services PLC 3.875% 9/14/33 (Reg. S) | EUR | 378,000 | 424,255 |
| Resideo Funding, Inc. 6.5% 7/15/32 (b) | | 210,000 | 213,793 |
| | | | 1,334,226 |
| Tobacco - 0.4% | | | |
| Altria Group, Inc.: | | | |
| 3.875% 9/16/46 | | 1,521,000 | 1,163,486 |
| 4.25% 8/9/42 | | 932,000 | 783,165 |
| 4.5% 5/2/43 | | 632,000 | 544,824 |
| 4.8% 2/14/29 | | 173,000 | 173,993 |
| 5.95% 2/14/49 | | 600,000 | 618,299 |
| BAT Capital Corp.: | | | |
| 4.7% 4/2/27 | | 1,252,000 | 1,255,850 |
| 4.906% 4/2/30 | | 1,500,000 | 1,508,364 |
| 5.282% 4/2/50 | | 1,500,000 | 1,367,806 |
| 5.834% 2/20/31 | | 79,000 | 82,920 |
| 6% 2/20/34 | | 10,000,000 | 10,543,837 |
| 6.421% 8/2/33 | | 1,137,000 | 1,232,874 |
| BAT International Finance PLC 4.125% 4/12/32 (Reg. S) | EUR | 582,000 | 645,291 |
| Imperial Brands Finance Netherlands BV 5.25% 2/15/31 (Reg. S) | EUR | 602,000 | 708,120 |
| Imperial Brands Finance PLC 6.125% 7/27/27 (b) | | 764,000 | 790,632 |
| Reynolds American, Inc. 7.25% 6/15/37 | | 75,000 | 85,097 |
| | | | 21,504,558 |
TOTAL CONSUMER STAPLES | | | 52,709,914 |
| | | | |
| ENERGY - 3.5% | | | |
| Energy Equipment & Services - 0.1% | | | |
| Archrock Partners LP / Archrock Partners Finance Corp. 6.625% 9/1/32 (b) | | 300,000 | 303,742 |
| Guara Norte SARL 5.198% 6/15/34 (b) | | 186,334 | 176,395 |
| Kodiak Gas Services LLC 7.25% 2/15/29 (b) | | 325,000 | 336,580 |
| Nabors Industries, Inc. 8.875% 8/15/31 (b) | | 150,000 | 150,302 |
| Oleoducto Central SA 4% 7/14/27 (b) | | 195,000 | 186,164 |
| Seadrill Finance Ltd. 8.375% 8/1/30 (b) | | 540,000 | 570,013 |
| Southern Gas Corridor CJSC 6.875% 3/24/26 (b) | | 410,000 | 416,919 |
| Star Holding LLC 8.75% 8/1/31 (b) | | 95,000 | 93,067 |
| State Oil Co. of Azerbaijan Republic 6.95% 3/18/30 (Reg. S) | | 200,000 | 210,980 |
| The Oil and Gas Holding Co.: | | | |
| 7.5% 10/25/27(b) | | 240,000 | 249,675 |
| 8.375% 11/7/28(b) | | 80,000 | 86,650 |
| Transocean, Inc.: | | | |
| 8% 2/1/27(b) | | 300,000 | 299,969 |
| 8.25% 5/15/29(b) | | 560,000 | 566,933 |
| 8.5% 5/15/31(b) | | 575,000 | 583,457 |
| U.S.A. Compression Partners LP/U.S.A. Compression Finance Corp. 7.125% 3/15/29 (b) | | 230,000 | 236,247 |
| Valaris Ltd. 8.375% 4/30/30 (b) | | 280,000 | 292,106 |
| Vallourec SA 7.5% 4/15/32 (b) | | 595,000 | 626,549 |
| Viridien 8.75% 4/1/27 (b) | | 500,000 | 479,015 |
| Yinson Boronia Production BV 8.947% 7/31/42 (b) | | 455,000 | 476,863 |
| | | | 6,341,626 |
| Oil, Gas & Consumable Fuels - 3.4% | | | |
| Antero Midstream Partners LP/Antero Midstream Finance Corp. 5.75% 3/1/27 (b) | | 1,855,000 | 1,847,793 |
| Baytex Energy Corp. 7.375% 3/15/32 (b) | | 285,000 | 295,170 |
| Blue Racer Midstream LLC/Blue Racer Finance Corp.: | | | |
| 7% 7/15/29(b) | | 80,000 | 83,213 |
| 7.25% 7/15/32(b) | | 80,000 | 83,879 |
| California Resources Corp. 8.25% 6/15/29 (b) | | 730,000 | 752,942 |
| Calumet Specialty Products Partners LP/Calumet Finance Corp. 9.75% 7/15/28 (b) | | 200,000 | 196,641 |
| Canacol Energy Ltd. 5.75% 11/24/28 (b) | | 740,000 | 426,425 |
| Canadian Natural Resources Ltd.: | | | |
| 2.05% 7/15/25 | | 5,400,000 | 5,262,406 |
| 3.85% 6/1/27 | | 2,700,000 | 2,647,961 |
| 3.9% 2/1/25 | | 525,000 | 521,851 |
| 5.85% 2/1/35 | | 525,000 | 544,811 |
| Cenovus Energy, Inc.: | | | |
| 3.75% 2/15/52 | | 210,000 | 152,767 |
| 5.25% 6/15/37 | | 717,000 | 704,867 |
| 5.4% 6/15/47 | | 146,000 | 140,072 |
| 6.75% 11/15/39 | | 58,000 | 64,853 |
| Cheniere Energy Partners LP: | | | |
| 3.25% 1/31/32 | | 705,000 | 625,517 |
| 5.75% 8/15/34(b) | | 270,000 | 279,543 |
| CNX Midstream Partners LP 4.75% 4/15/30 (b) | | 745,000 | 694,851 |
| Columbia Pipeline Group, Inc. 5.8% 6/1/45 | | 10,000 | 10,121 |
| Columbia Pipelines Operating Co. LLC: | | | |
| 5.927% 8/15/30(b) | | 290,000 | 304,631 |
| 6.036% 11/15/33(b) | | 781,000 | 824,600 |
| 6.497% 8/15/43(b) | | 233,000 | 253,266 |
| 6.544% 11/15/53(b) | | 420,000 | 465,794 |
| 6.714% 8/15/63(b) | | 252,000 | 280,162 |
| Comstock Resources, Inc.: | | | |
| 5.875% 1/15/30(b) | | 380,000 | 359,260 |
| 6.75% 3/1/29(b)(c) | | 525,000 | 516,411 |
| CrownRock LP/CrownRock Finance, Inc. 5% 5/1/29 (b) | | 350,000 | 354,827 |
| CVR Energy, Inc.: | | | |
| 5.75% 2/15/28(b) | | 430,000 | 405,508 |
| 8.5% 1/15/29(b) | | 925,000 | 942,390 |
| DCP Midstream Operating LP 5.125% 5/15/29 | | 659,000 | 669,804 |
| Delek Logistics Partners LP/Delek Logistics Finance Corp.: | | | |
| 7.125% 6/1/28(b) | | 70,000 | 70,543 |
| 8.625% 3/15/29(b) | | 297,000 | 312,289 |
| Ecopetrol SA: | | | |
| 4.625% 11/2/31 | | 160,000 | 135,312 |
| 8.375% 1/19/36 | | 115,000 | 116,474 |
| 8.875% 1/13/33 | | 515,000 | 546,415 |
| EG Global Finance PLC 12% 11/30/28 (b) | | 1,805,000 | 1,968,936 |
| EIG Pearl Holdings SARL 3.545% 8/31/36 (b) | | 565,000 | 494,905 |
| Empresa Nacional de Petroleo: | | | |
| 5.95% 7/30/34(b) | | 200,000 | 207,500 |
| 6.15% 5/10/33(b) | | 50,000 | 52,250 |
| Endeavor Energy Resources LP/EER Finance, Inc. 5.75% 1/30/28 (b) | | 455,000 | 463,007 |
| Energean Israel Finance Ltd.: | | | |
| 4.875% 3/30/26 (Reg. S)(b) | | 395,000 | 375,596 |
| 5.375% 3/30/28 (Reg. S)(b) | | 115,000 | 103,880 |
| Energean PLC 6.5% 4/30/27 (b) | | 559,000 | 551,811 |
| Energy Transfer LP: | | | |
| 3.75% 5/15/30 | | 481,000 | 454,987 |
| 4.95% 6/15/28 | | 494,000 | 499,119 |
| 5% 5/15/50 | | 4,089,000 | 3,626,564 |
| 5.25% 4/15/29 | | 350,000 | 357,815 |
| 5.4% 10/1/47 | | 1,023,000 | 956,497 |
| 5.75% 2/15/33 | | 4,000,000 | 4,159,632 |
| 5.8% 6/15/38 | | 275,000 | 281,793 |
| 6% 6/15/48 | | 1,279,000 | 1,291,529 |
| 6.125% 12/15/45 | | 100,000 | 102,681 |
| 6.25% 4/15/49 | | 241,000 | 250,757 |
| 6.55% 12/1/33 | | 9,000,000 | 9,842,762 |
| 7.375% 2/1/31(b) | | 185,000 | 196,964 |
| EnLink Midstream LLC 5.625% 1/15/28 (b) | | 460,000 | 468,472 |
| EQM Midstream Partners LP: | | | |
| 4.75% 1/15/31(b)(c) | | 70,000 | 67,256 |
| 5.5% 7/15/28 | | 455,000 | 458,037 |
| 7.5% 6/1/27(b) | | 355,000 | 365,850 |
| Exxon Mobil Corp. 3.482% 3/19/30 | | 3,150,000 | 3,033,485 |
| FEL Energy VI SARL 5.75% 12/1/40 (b) | | 113,968 | 107,629 |
| Galaxy Pipeline Assets BidCo Ltd.: | | | |
| 2.16% 3/31/34(b) | | 137,768 | 121,279 |
| 2.625% 3/31/36(b) | | 670,000 | 566,988 |
| GeoPark Ltd. 5.5% 1/17/27 (b) | | 205,000 | 193,342 |
| Global Partners LP/GLP Finance Corp.: | | | |
| 6.875% 1/15/29 | | 250,000 | 251,788 |
| 7% 8/1/27 | | 850,000 | 857,292 |
| Gran Tierra Energy, Inc. 9.5% 10/15/29 (b) | | 550,000 | 534,531 |
| Harbour Energy PLC 5.5% 10/15/26 (b) | | 55,000 | 54,595 |
| Harvest Midstream I LP 7.5% 5/15/32 (b) | | 435,000 | 457,296 |
| Hess Corp.: | | | |
| 5.6% 2/15/41 | | 549,000 | 561,394 |
| 5.8% 4/1/47 | | 874,000 | 906,609 |
| 7.125% 3/15/33 | | 201,000 | 228,965 |
| 7.3% 8/15/31 | | 2,102,000 | 2,398,427 |
| Hess Midstream Operations LP: | | | |
| 5.125% 6/15/28(b) | | 565,000 | 558,544 |
| 5.625% 2/15/26(b) | | 295,000 | 294,192 |
| 6.5% 6/1/29(b) | | 550,000 | 567,487 |
| Hilcorp Energy I LP/Hilcorp Finance Co.: | | | |
| 6.25% 11/1/28(b) | | 190,000 | 191,001 |
| 6.25% 4/15/32(b) | | 1,000,000 | 996,591 |
| Howard Midstream Energy Partners LLC 7.375% 7/15/32 (b) | | 520,000 | 538,336 |
| KazMunaiGaz National Co.: | | | |
| 3.5% 4/14/33(b) | | 155,000 | 132,089 |
| 5.375% 4/24/30(b) | | 30,000 | 29,663 |
| 5.75% 4/19/47(b) | | 80,000 | 72,775 |
| Kinder Morgan Energy Partners LP 6.55% 9/15/40 | | 1,365,000 | 1,461,360 |
| Kinder Morgan, Inc. 5.55% 6/1/45 | | 415,000 | 402,574 |
| Kinetik Holdings LP: | | | |
| 5.875% 6/15/30(b) | | 520,000 | 521,670 |
| 6.625% 12/15/28(b) | | 395,000 | 407,001 |
| Kosmos Energy Ltd.: | | | |
| 7.125% 4/4/26(b) | | 585,000 | 580,431 |
| 7.5% 3/1/28(b) | | 280,000 | 271,250 |
| 7.75% 5/1/27(b) | | 120,000 | 118,688 |
| Leviathan Bond Ltd. 6.125% 6/30/25 (Reg. S) (b) | | 215,000 | 211,437 |
| Matador Resources Co. 6.5% 4/15/32 (b) | | 390,000 | 395,805 |
| MC Brazil Downstream Trading SARL 7.25% 6/30/31 (b) | | 505,329 | 455,902 |
| Medco Laurel Tree PTE Ltd. 6.95% 11/12/28 (b) | | 275,000 | 275,096 |
| Medco Maple Tree Pte. Ltd. 8.96% 4/27/29 (b) | | 315,000 | 333,309 |
| Medco Oak Tree Pte Ltd. 7.375% 5/14/26 (b) | | 50,000 | 50,578 |
| Moss Creek Resources Holdings, Inc. 8.25% 9/1/31 (b) | | 300,000 | 302,581 |
| MPLX LP: | | | |
| 4.8% 2/15/29 | | 175,000 | 176,654 |
| 4.875% 12/1/24 | | 272,000 | 271,562 |
| 4.95% 9/1/32 | | 5,463,000 | 5,407,571 |
| 5% 3/1/33 | | 2,000,000 | 1,979,151 |
| 5.5% 2/15/49 | | 525,000 | 503,415 |
| Murphy Oil U.S.A., Inc. 3.75% 2/15/31 (b) | | 435,000 | 393,572 |
| NAK Naftogaz Ukraine: | | | |
| 7.625% 11/8/28(b) | | 100,000 | 79,000 |
| 7.65% (Reg. S) | | 133,369 | 115,364 |
| New Fortress Energy, Inc.: | | | |
| 6.5% 9/30/26(b)(c) | | 1,790,000 | 1,549,471 |
| 6.75% 9/15/25(b) | | 785,000 | 765,483 |
| Northern Oil & Gas, Inc. 8.125% 3/1/28 (b) | | 250,000 | 255,614 |
| Occidental Petroleum Corp.: | | | |
| 5.55% 3/15/26 | | 831,000 | 837,839 |
| 6.2% 3/15/40 | | 700,000 | 731,566 |
| 6.45% 9/15/36 | | 600,000 | 650,261 |
| 6.6% 3/15/46 | | 807,000 | 871,395 |
| 6.625% 9/1/30 | | 8,000,000 | 8,618,360 |
| 7.5% 5/1/31 | | 927,000 | 1,051,619 |
| 7.875% 9/15/31 | | 4,000,000 | 4,618,012 |
| Ovintiv, Inc.: | | | |
| 5.15% 11/15/41 | | 1,916,000 | 1,670,423 |
| 6.625% 8/15/37 | | 350,000 | 373,738 |
| 7.375% 11/1/31 | | 435,000 | 486,037 |
| 8.125% 9/15/30 | | 1,083,000 | 1,251,303 |
| Parkland Corp.: | | | |
| 4.625% 5/1/30(b) | | 250,000 | 233,821 |
| 6.625% 8/15/32(b) | | 750,000 | 757,856 |
| PBF Holding Co. LLC/PBF Finance Corp.: | | | |
| 6% 2/15/28(c) | | 400,000 | 396,072 |
| 7.875% 9/15/30(b) | | 250,000 | 259,966 |
| Permian Resources Operating LLC: | | | |
| 5.875% 7/1/29(b) | | 245,000 | 245,000 |
| 6.25% 2/1/33(b) | | 115,000 | 117,921 |
| 7% 1/15/32(b) | | 635,000 | 666,122 |
| Petroleos de Venezuela SA: | | | |
| 5.375%(g) | | 200,000 | 20,410 |
| 5.5%(g) | | 15,000 | 1,529 |
| 6%(b)(g) | | 480,000 | 48,720 |
| 6%(b)(g) | | 385,000 | 38,308 |
| 9.75%(b)(g) | | 50,000 | 5,775 |
| 12.75%(b)(g) | | 51,667 | 6,368 |
| Petroleos Mexicanos: | | | |
| 5.95% 1/28/31 | | 29,470,000 | 24,377,289 |
| 6.35% 2/12/48 | | 3,548,000 | 2,342,106 |
| 6.49% 1/23/27 | | 570,000 | 552,976 |
| 6.5% 3/13/27 | | 375,000 | 360,656 |
| 6.5% 6/2/41 | | 85,000 | 59,819 |
| 6.625% 6/15/35 | | 870,000 | 675,990 |
| 6.7% 2/16/32 | | 4,920,000 | 4,223,820 |
| 6.75% 9/21/47 | | 13,340,000 | 9,076,403 |
| 6.84% 1/23/30 | | 1,532,000 | 1,379,413 |
| 6.875% 8/4/26 | | 200,000 | 197,126 |
| 6.95% 1/28/60 | | 1,224,000 | 833,703 |
| 7.69% 1/23/50 | | 3,735,000 | 2,772,117 |
| Petronas Capital Ltd.: | | | |
| 3.404% 4/28/61(b) | | 205,000 | 145,076 |
| 3.5% 4/21/30(b) | | 105,000 | 99,514 |
| Petrorio Luxembourg Holding SA 6.125% 6/9/26 (b) | | 190,000 | 188,694 |
| Phillips 66 Co. 3.85% 4/9/25 | | 125,000 | 123,933 |
| Plains All American Pipeline LP/PAA Finance Corp.: | | | |
| 3.55% 12/15/29 | | 4,767,000 | 4,487,206 |
| 3.6% 11/1/24 | | 266,000 | 265,078 |
| Prairie Acquiror LP 9% 8/1/29 (b) | | 310,000 | 324,241 |
| PT Adaro Indonesia 4.25% 10/31/24 (b) | | 280,000 | 278,555 |
| PT Pertamina Persero 4.175% 1/21/50 (b) | | 100,000 | 81,775 |
| QatarEnergy: | | | |
| 1.375% 9/12/26(b) | | 350,000 | 330,204 |
| 2.25% 7/12/31(b) | | 740,000 | 645,650 |
| 3.125% 7/12/41(b) | | 535,000 | 422,650 |
| 3.3% 7/12/51(b) | | 650,000 | 482,463 |
| Rockies Express Pipeline LLC: | | | |
| 4.8% 5/15/30(b) | | 550,000 | 510,552 |
| 4.95% 7/15/29(b) | | 285,000 | 272,389 |
| 6.875% 4/15/40(b) | | 110,000 | 106,622 |
| SA Global Sukuk Ltd. 1.602% 6/17/26 (b) | | 340,000 | 322,044 |
| Sabine Pass Liquefaction LLC 4.5% 5/15/30 | | 1,622,000 | 1,605,050 |
| Saudi Arabian Oil Co.: | | | |
| 2.25% 11/24/30(b) | | 445,000 | 387,984 |
| 3.25% 11/24/50(b) | | 345,000 | 241,931 |
| 3.5% 4/16/29(b) | | 560,000 | 535,325 |
| 3.5% 11/24/70(b) | | 135,000 | 91,125 |
| 4.25% 4/16/39(b) | | 620,000 | 562,743 |
| 4.375% 4/16/49(b) | | 95,000 | 81,641 |
| 5.875% 7/17/64(b) | | 200,000 | 202,570 |
| Seplat Energy PLC 7.75% 4/1/26 (b) | | 45,000 | 44,789 |
| SM Energy Co.: | | | |
| 6.75% 8/1/29(b) | | 55,000 | 55,858 |
| 7% 8/1/32(b) | | 55,000 | 56,346 |
| Southwestern Energy Co. 5.375% 2/1/29 | | 975,000 | 962,549 |
| Sunoco LP/Sunoco Finance Corp.: | | | |
| 4.5% 5/15/29 | | 150,000 | 144,016 |
| 5.875% 3/15/28 | | 110,000 | 110,107 |
| 6% 4/15/27 | | 705,000 | 706,022 |
| Tallgrass Energy Partners LP / Tallgrass Energy Finance Corp.: | | | |
| 5.5% 1/15/28(b) | | 325,000 | 313,584 |
| 6% 3/1/27(b) | | 555,000 | 553,432 |
| 6% 12/31/30(b) | | 1,365,000 | 1,301,737 |
| Talos Production, Inc. 9% 2/1/29 (b) | | 95,000 | 100,921 |
| Teine Energy Ltd. 6.875% 4/15/29 (b) | | 100,000 | 99,556 |
| Tengizchevroil Finance Co. International Ltd. 3.25% 8/15/30 (b) | | 285,000 | 243,498 |
| The Williams Companies, Inc.: | | | |
| 3.5% 11/15/30 | | 1,727,000 | 1,618,149 |
| 4.65% 8/15/32 | | 3,526,000 | 3,468,577 |
| 5.3% 8/15/52 | | 346,000 | 331,284 |
| 5.4% 3/2/26 | | 823,000 | 830,945 |
| 5.65% 3/15/33 | | 4,000,000 | 4,154,460 |
| 5.75% 6/24/44 | | 35,000 | 35,297 |
| Transcontinental Gas Pipe Line Co. LLC 3.25% 5/15/30 | | 207,000 | 192,186 |
| Tullow Oil PLC: | | | |
| 7% 3/1/25(b) | | 360,000 | 350,777 |
| 10.25% 5/15/26(b) | | 639,000 | 618,360 |
| Venture Global Calcasieu Pass LLC: | | | |
| 3.875% 8/15/29(b) | | 225,000 | 212,711 |
| 3.875% 11/1/33(b) | | 185,000 | 164,568 |
| Venture Global LNG, Inc.: | | | |
| 7% 1/15/30(b) | | 30,000 | 30,670 |
| 8.125% 6/1/28(b) | | 550,000 | 575,989 |
| Western Midstream Operating LP: | | | |
| 4.05% 2/1/30 | | 6,000,000 | 5,743,203 |
| 4.5% 3/1/28 | | 200,000 | 197,243 |
| 4.65% 7/1/26 | | 138,000 | 137,291 |
| 4.75% 8/15/28 | | 168,000 | 167,199 |
| | | | 187,556,984 |
TOTAL ENERGY | | | 193,898,610 |
| | | | |
| FINANCIALS - 9.3% | | | |
| Banks - 4.3% | | | |
| ABN AMRO Bank NV 3.875% 1/15/32 (Reg. S) | EUR | 500,000 | 561,140 |
| Access Bank PLC 6.125% 9/21/26 (b) | | 95,000 | 90,221 |
| AIB Group PLC: | | | |
| 2.25% 4/4/28 (Reg. S)(d) | EUR | 1,000,000 | 1,073,006 |
| 5.25% 10/23/31 (Reg. S)(d) | EUR | 125,000 | 149,962 |
| 6.608% 9/13/29(b)(d) | | 434,000 | 460,121 |
| Banco Bilbao Vizcaya Argentaria SA 6.033% 3/13/35 (d) | | 400,000 | 416,192 |
| Banco Do Brasil SA 6% 3/18/31 (b) | | 165,000 | 167,261 |
| Bancolombia SA 8.625% 12/24/34 (d) | | 200,000 | 209,562 |
| Bank of America Corp.: | | | |
| 2.299% 7/21/32(d) | | 1,880,000 | 1,600,295 |
| 3.705% 4/24/28(d) | | 528,000 | 516,108 |
| 4.376% 4/27/28(d) | | 10,000,000 | 9,946,988 |
| 5.015% 7/22/33(d) | | 13,317,000 | 13,472,135 |
| 5.288% 4/25/34(d) | | 11,000,000 | 11,281,950 |
| 5.872% 9/15/34(d) | | 9,000,000 | 9,565,356 |
| Bank of Ireland Group PLC 5.601% 3/20/30 (b)(d) | | 400,000 | 409,414 |
| Barclays PLC: | | | |
| 5.088% 6/20/30(d) | | 1,421,000 | 1,415,670 |
| 5.2% 5/12/26 | | 1,318,000 | 1,321,449 |
| 5.262% 1/29/34 (Reg. S)(d) | EUR | 821,000 | 988,048 |
| 5.69% 3/12/30(d) | | 3,094,000 | 3,189,738 |
| 5.829% 5/9/27(d) | | 2,370,000 | 2,403,373 |
| 6.224% 5/9/34(d) | | 8,576,000 | 9,110,959 |
| 6.49% 9/13/29(d) | | 2,400,000 | 2,542,359 |
| 6.692% 9/13/34(d) | | 2,000,000 | 2,192,070 |
| 8.407% 11/14/32 (Reg. S)(d) | GBP | 317,000 | 442,665 |
| BNP Paribas SA: | | | |
| 2.159% 9/15/29(b)(d) | | 532,000 | 479,748 |
| 2.219% 6/9/26(b)(d) | | 1,520,000 | 1,484,875 |
| 2.5% 3/31/32 (Reg. S)(d) | EUR | 300,000 | 319,043 |
| 4.125% 5/24/33 (Reg. S) | EUR | 500,000 | 581,498 |
| BPCE SA 5.716% 1/18/30 (b)(d) | | 250,000 | 256,114 |
| Citigroup, Inc.: | | | |
| 3.07% 2/24/28(d) | | 2,000,000 | 1,929,894 |
| 4.3% 11/20/26 | | 6,314,000 | 6,274,392 |
| 4.4% 6/10/25 | | 933,000 | 927,867 |
| 4.412% 3/31/31(d) | | 2,221,000 | 2,184,636 |
| 4.45% 9/29/27 | | 4,372,000 | 4,351,407 |
| 4.91% 5/24/33(d) | | 16,224,000 | 16,137,303 |
| 6.27% 11/17/33(d) | | 2,000,000 | 2,166,722 |
| Commerzbank AG: | | | |
| 4.875% 10/16/34 (Reg. S)(d) | EUR | 200,000 | 225,125 |
| 8.625% 2/28/33 (Reg. S)(d) | GBP | 200,000 | 283,631 |
| Commonwealth Bank of Australia 3.61% 9/12/34 (b)(d) | | 517,000 | 482,366 |
| Cooperatieve Rabobank UA: | | | |
| 3.822% 7/26/34 (Reg. S) | EUR | 100,000 | 112,987 |
| 4% 1/10/30 (Reg. S) | EUR | 600,000 | 685,587 |
| 4.375% 8/4/25 | | 500,000 | 496,399 |
| Danske Bank A/S: | | | |
| 2.25% 1/14/28 (Reg. S)(d) | GBP | 615,000 | 755,863 |
| 3.875% 1/9/32 (Reg. S)(d) | EUR | 900,000 | 1,007,290 |
| DNB Bank ASA 0.25% 2/23/29 (Reg. S) (d) | EUR | 279,000 | 277,193 |
| First Citizens Bank & Trust Co. 6.125% 3/9/28 | | 210,000 | 217,568 |
| HAT Holdings I LLC/HAT Holdings II LLC: | | | |
| 3.375% 6/15/26(b) | | 765,000 | 732,835 |
| 8% 6/15/27(b) | | 240,000 | 251,468 |
| HSBC Holdings PLC: | | | |
| 2.804% 5/24/32(d) | | 298,000 | 258,815 |
| 4.787% 3/10/32 (Reg. S)(d) | EUR | 547,000 | 642,486 |
| 4.856% 5/23/33 (Reg. S)(d) | EUR | 640,000 | 758,763 |
| 6.8% 9/14/31(d) | GBP | 139,000 | 197,462 |
| 8.201% 11/16/34 (Reg. S)(d) | GBP | 225,000 | 324,835 |
| ING Groep NV: | | | |
| 4.5% 5/23/29 (Reg. S)(d) | EUR | 400,000 | 457,997 |
| 4.75% 5/23/34 (Reg. S)(d) | EUR | 1,200,000 | 1,423,265 |
| Intesa Sanpaolo SpA: | | | |
| 4.198% 6/1/32(b)(d) | | 242,000 | 211,722 |
| 5.71% 1/15/26(b) | | 3,773,000 | 3,785,648 |
| 6.625% 6/20/33(b) | | 599,000 | 642,368 |
| JPMorgan Chase & Co.: | | | |
| 2.956% 5/13/31(d) | | 880,000 | 800,417 |
| 3.761% 3/21/34 (Reg. S)(d) | EUR | 251,000 | 280,303 |
| 3.882% 7/24/38(d) | | 1,000,000 | 892,141 |
| 4.323% 4/26/28(d) | | 5,000,000 | 4,977,096 |
| 4.452% 12/5/29(d) | | 5,500,000 | 5,478,376 |
| 4.493% 3/24/31(d) | | 3,000,000 | 2,990,351 |
| 4.586% 4/26/33(d) | | 2,682,000 | 2,647,430 |
| 4.912% 7/25/33(d) | | 9,234,000 | 9,284,837 |
| 5.299% 7/24/29(d) | | 6,500,000 | 6,669,700 |
| 5.336% 1/23/35(d) | | 5,000,000 | 5,149,156 |
| 5.35% 6/1/34(d) | | 14,000,000 | 14,443,743 |
| 5.717% 9/14/33(d) | | 2,700,000 | 2,824,246 |
| Jyske Bank A/S 5.125% 5/1/35 (Reg. S) (d) | EUR | 223,000 | 257,371 |
| KBC Group NV 6.324% 9/21/34 (b)(d) | | 913,000 | 979,776 |
| Lloyds Banking Group PLC: | | | |
| 1.985% 12/15/31(d) | GBP | 459,000 | 560,294 |
| 4.5% 1/11/29 (Reg. S)(d) | EUR | 260,000 | 298,428 |
| 4.75% 9/21/31 (Reg. S)(d) | EUR | 925,000 | 1,084,258 |
| Magyar Export-Import Bank 6.125% 12/4/27 (b) | | 75,000 | 76,383 |
| NatWest Group PLC: | | | |
| 2.105% 11/28/31 (Reg. S)(d) | GBP | 638,000 | 780,880 |
| 3.073% 5/22/28(d) | | 951,000 | 911,762 |
| 3.622% 8/14/30 (Reg. S)(d) | GBP | 237,000 | 306,506 |
| 4.771% 2/16/29 (Reg. S)(d) | EUR | 592,000 | 682,062 |
| 5.847% 3/2/27(d) | | 3,394,000 | 3,443,134 |
| 7.416% 6/6/33 (Reg. S)(d) | GBP | 341,000 | 470,227 |
| Nordea Bank Abp 4.125% 5/5/28 (Reg. S) | EUR | 626,000 | 713,298 |
| Societe Generale: | | | |
| 1.488% 12/14/26(b)(d) | | 1,953,000 | 1,860,475 |
| 4.75% 11/24/25(b) | | 470,000 | 465,171 |
| 6.691% 1/10/34(b)(d) | | 798,000 | 855,297 |
| Synchrony Bank: | | | |
| 5.4% 8/22/25 | | 1,384,000 | 1,384,946 |
| 5.625% 8/23/27 | | 1,253,000 | 1,270,774 |
| UniCredit SpA: | | | |
| 5.861% 6/19/32(b)(d) | | 80,000 | 79,819 |
| 7.296% 4/2/34(b)(d) | | 205,000 | 215,476 |
| Virgin Money UK PLC 7.625% 8/23/29 (Reg. S) (d) | GBP | 586,000 | 836,252 |
| Wells Fargo & Co.: | | | |
| 2.879% 10/30/30(d) | | 5,000,000 | 4,583,330 |
| 3.526% 3/24/28(d) | | 2,047,000 | 1,993,213 |
| 4.478% 4/4/31(d) | | 3,026,000 | 2,994,957 |
| 4.897% 7/25/33(d) | | 7,711,000 | 7,673,447 |
| 5.013% 4/4/51(d) | | 2,194,000 | 2,102,285 |
| 5.389% 4/24/34(d) | | 7,133,000 | 7,310,094 |
| 5.499% 1/23/35(d) | | 686,000 | 707,921 |
| 5.557% 7/25/34(d) | | 2,000,000 | 2,064,003 |
| 5.574% 7/25/29(d) | | 6,500,000 | 6,712,126 |
| 6.303% 10/23/29(d) | | 2,000,000 | 2,121,513 |
| Western Alliance Bancorp. 3% 6/15/31 (d) | | 105,000 | 94,952 |
| Westpac Banking Corp. 4.11% 7/24/34 (d) | | 744,000 | 713,435 |
| | | | 237,892,875 |
| Capital Markets - 2.4% | | | |
| Ares Capital Corp. 3.875% 1/15/26 | | 2,603,000 | 2,553,231 |
| AssuredPartners, Inc. 5.625% 1/15/29 (b) | | 500,000 | 477,832 |
| Athene Global Funding: | | | |
| 5.339% 1/15/27(b) | | 4,562,000 | 4,616,833 |
| 5.583% 1/9/29(b) | | 5,040,000 | 5,175,612 |
| Blackstone Private Credit Fund: | | | |
| 4.7% 3/24/25 | | 3,937,000 | 3,915,493 |
| 7.05% 9/29/25 | | 1,775,000 | 1,803,009 |
| Coinbase Global, Inc. 3.625% 10/1/31 (b) | | 250,000 | 206,014 |
| Deutsche Bank AG: | | | |
| 4.5% 4/1/25 | | 3,804,000 | 3,779,951 |
| 4.5% 7/12/35 (Reg. S)(d) | EUR | 100,000 | 112,775 |
| 6.125% 12/12/30 (Reg. S)(d) | GBP | 900,000 | 1,213,867 |
| Deutsche Bank AG New York Branch: | | | |
| 4.1% 1/13/26 | | 1,100,000 | 1,085,648 |
| 5.882% 7/8/31(d) | | 5,000,000 | 5,065,132 |
| 6.72% 1/18/29(d) | | 980,000 | 1,031,728 |
| 6.819% 11/20/29(d) | | 2,377,000 | 2,529,319 |
| Goldman Sachs Group, Inc.: | | | |
| 2.383% 7/21/32(d) | | 9,922,000 | 8,448,238 |
| 3.102% 2/24/33(d) | | 8,272,000 | 7,317,041 |
| 3.691% 6/5/28(d) | | 4,660,000 | 4,549,767 |
| 3.75% 5/22/25 | | 525,000 | 519,959 |
| 3.8% 3/15/30 | | 3,630,000 | 3,499,910 |
| 3.814% 4/23/29(d) | | 6,025,000 | 5,855,253 |
| 4.017% 10/31/38(d) | | 1,000,000 | 885,800 |
| 4.223% 5/1/29(d) | | 2,500,000 | 2,465,485 |
| 6.75% 10/1/37 | | 278,000 | 313,337 |
| Hightower Holding LLC 9.125% 1/31/30 (b) | | 495,000 | 512,574 |
| Jane Street Group LLC/JSG Finance, Inc. 4.5% 11/15/29 (b) | | 555,000 | 529,716 |
| Jefferies Finance LLC/JFIN Co-Issuer Corp. 5% 8/15/28 (b) | | 65,000 | 61,767 |
| Moody's Corp.: | | | |
| 3.25% 1/15/28 | | 10,000 | 9,687 |
| 3.75% 3/24/25 | | 1,044,000 | 1,036,887 |
| Morgan Stanley: | | | |
| 3.622% 4/1/31(d) | | 2,099,000 | 1,991,585 |
| 3.955% 3/21/35 (Reg. S)(d) | EUR | 270,000 | 302,174 |
| 4.431% 1/23/30(d) | | 2,242,000 | 2,227,887 |
| 4.656% 3/2/29(d) | EUR | 279,000 | 321,838 |
| 4.889% 7/20/33(d) | | 10,947,000 | 10,920,553 |
| 5.164% 4/20/29(d) | | 6,000,000 | 6,112,993 |
| 5.424% 7/21/34(d) | | 7,000,000 | 7,191,034 |
| 5.449% 7/20/29(d) | | 1,318,000 | 1,358,459 |
| 5.831% 4/19/35(d) | | 6,000,000 | 6,346,672 |
| StoneX Group, Inc. 7.875% 3/1/31 (b) | | 200,000 | 210,302 |
| UBS Group AG: | | | |
| 1.494% 8/10/27(b)(d) | | 1,190,000 | 1,115,671 |
| 2.125% 11/15/29 (Reg. S)(d) | GBP | 385,000 | 450,012 |
| 2.593% 9/11/25(b)(d) | | 2,086,000 | 2,084,635 |
| 3.75% 3/26/25 | | 1,200,000 | 1,190,532 |
| 3.869% 1/12/29(b)(d) | | 1,570,000 | 1,521,450 |
| 4.125% 9/24/25(b) | | 500,000 | 495,480 |
| 4.125% 6/9/33 (Reg. S)(d) | EUR | 378,000 | 427,632 |
| 4.194% 4/1/31(b)(d) | | 2,010,000 | 1,942,267 |
| 4.55% 4/17/26 | | 388,000 | 386,726 |
| 4.75% 3/17/32 (Reg. S)(d) | EUR | 1,093,000 | 1,284,026 |
| 5.428% 2/8/30(b)(d) | | 5,000,000 | 5,122,773 |
| 6.537% 8/12/33(b)(d) | | 10,000,000 | 10,846,033 |
| VFH Parent LLC / Valor Co-Issuer, Inc. 7.5% 6/15/31 (b) | | 290,000 | 300,848 |
| | | | 133,723,447 |
| Consumer Finance - 1.5% | | | |
| AerCap Ireland Capital Ltd./AerCap Global Aviation Trust: | | | |
| 1.65% 10/29/24 | | 622,000 | 617,996 |
| 2.45% 10/29/26 | | 868,000 | 827,277 |
| 3% 10/29/28 | | 3,909,000 | 3,655,887 |
| 3.3% 1/30/32 | | 5,872,000 | 5,219,485 |
| 4.45% 4/3/26 | | 561,000 | 556,842 |
| 5.75% 6/6/28 | | 2,000,000 | 2,068,443 |
| 6.45% 4/15/27 | | 4,752,000 | 4,944,588 |
| 6.5% 7/15/25 | | 731,000 | 738,042 |
| Ally Financial, Inc.: | | | |
| 4.75% 6/9/27 | | 2,500,000 | 2,491,028 |
| 5.125% 9/30/24 | | 465,000 | 464,675 |
| 5.75% 11/20/25 | | 1,560,000 | 1,564,146 |
| 5.8% 5/1/25 | | 1,072,000 | 1,074,145 |
| 6.992% 6/13/29(d) | | 2,000,000 | 2,121,211 |
| 7.1% 11/15/27 | | 2,060,000 | 2,187,670 |
| 8% 11/1/31 | | 2,549,000 | 2,909,182 |
| Capital One Financial Corp.: | | | |
| 2.636% 3/3/26(d) | | 1,062,000 | 1,047,030 |
| 3.273% 3/1/30(d) | | 1,358,000 | 1,265,301 |
| 3.65% 5/11/27 | | 2,746,000 | 2,678,938 |
| 3.8% 1/31/28 | | 877,000 | 850,886 |
| 4.927% 5/10/28(d) | | 2,786,000 | 2,799,684 |
| 4.985% 7/24/26(d) | | 1,448,000 | 1,444,846 |
| 5.247% 7/26/30(d) | | 2,210,000 | 2,232,653 |
| 6.312% 6/8/29(d) | | 5,000,000 | 5,230,110 |
| 7.624% 10/30/31(d) | | 7,238,000 | 8,170,594 |
| Capstone Borrower, Inc. 8% 6/15/30 (b) | | 125,000 | 131,661 |
| Discover Financial Services: | | | |
| 3.95% 11/6/24 | | 4,380,000 | 4,365,860 |
| 4.1% 2/9/27 | | 284,000 | 279,106 |
| 4.5% 1/30/26 | | 803,000 | 798,128 |
| 6.7% 11/29/32 | | 361,000 | 393,435 |
| Encore Capital Group, Inc.: | | | |
| 8.5% 5/15/30(b) | | 655,000 | 685,407 |
| 9.25% 4/1/29(b) | | 190,000 | 202,255 |
| Ford Motor Credit Co. LLC: | | | |
| 4.063% 11/1/24 | | 4,206,000 | 4,193,382 |
| 4.445% 2/14/30 | EUR | 212,000 | 236,939 |
| 6.8% 5/12/28 | | 2,000,000 | 2,098,233 |
| 6.86% 6/5/26 | GBP | 304,000 | 408,004 |
| 7.122% 11/7/33 | | 4,000,000 | 4,321,101 |
| Navient Corp.: | | | |
| 5.625% 8/1/33 | | 80,000 | 69,004 |
| 6.75% 6/15/26(c) | | 1,555,000 | 1,581,827 |
| OneMain Finance Corp.: | | | |
| 3.5% 1/15/27 | | 490,000 | 464,507 |
| 7.125% 3/15/26 | | 315,000 | 320,964 |
| 7.125% 11/15/31 | | 750,000 | 757,822 |
| 7.5% 5/15/31 | | 40,000 | 41,382 |
| 7.875% 3/15/30 | | 410,000 | 428,810 |
| PRA Group, Inc. 8.875% 1/31/30 (b) | | 180,000 | 186,047 |
| Shriram Finance Ltd.: | | | |
| 4.15% 7/18/25(b) | | 215,000 | 211,104 |
| 6.625% 4/22/27(b) | | 90,000 | 90,844 |
| SLM Corp. 4.2% 10/29/25 | | 184,000 | 181,864 |
| Synchrony Financial: | | | |
| 3.95% 12/1/27 | | 3,042,000 | 2,931,108 |
| 5.15% 3/19/29 | | 1,483,000 | 1,477,055 |
| | | | 84,016,508 |
| Financial Services - 0.8% | | | |
| Abu Dhabi Developmental Holding Co. PJSC 5.5% 5/8/34 (b) | | 200,000 | 210,876 |
| Block, Inc.: | | | |
| 2.75% 6/1/26 | | 180,000 | 172,870 |
| 6.5% 5/15/32(b) | | 1,335,000 | 1,384,412 |
| CBRE Global Investors Pan European Core Fund 4.75% 3/27/34 (Reg. S) | EUR | 289,000 | 335,135 |
| Corebridge Financial, Inc.: | | | |
| 3.5% 4/4/25 | | 445,000 | 440,365 |
| 3.65% 4/5/27 | | 1,551,000 | 1,518,591 |
| 3.85% 4/5/29 | | 623,000 | 601,468 |
| 3.9% 4/5/32 | | 9,241,000 | 8,555,758 |
| 4.35% 4/5/42 | | 169,000 | 145,402 |
| 4.4% 4/5/52 | | 498,000 | 413,803 |
| Cosan Luxembourg SA 7.25% 6/27/31 (b) | | 320,000 | 331,600 |
| Cruise Yacht Upper Holdco Ltd. 11.875% 7/5/28 | | 200,000 | 204,000 |
| Equitable Holdings, Inc. 4.572% 2/15/29 (b) | | 265,000 | 262,569 |
| GGAM Finance Ltd.: | | | |
| 6.875% 4/15/29(b) | | 1,090,000 | 1,124,820 |
| 7.75% 5/15/26(b) | | 440,000 | 451,479 |
| 8% 2/15/27(b) | | 275,000 | 286,681 |
| Global Aircraft Leasing Co. Ltd. 8.75% 9/1/27 (b) | | 340,000 | 343,403 |
| Gn Bondco LLC 9.5% 10/15/31 (b)(c) | | 390,000 | 396,970 |
| Icahn Enterprises LP/Icahn Enterprises Finance Corp.: | | | |
| 5.25% 5/15/27 | | 1,050,000 | 1,011,938 |
| 6.25% 5/15/26 | | 1,580,000 | 1,570,936 |
| 9% 6/15/30(b) | | 120,000 | 121,416 |
| Jackson Financial, Inc.: | | | |
| 3.125% 11/23/31 | | 194,000 | 167,883 |
| 5.17% 6/8/27 | | 682,000 | 691,274 |
| 5.67% 6/8/32 | | 734,000 | 757,706 |
| Jbs U.S.A. Holding Lux/ Jbs U.S.A. F: | | | |
| 2.5% 1/15/27 | | 1,945,000 | 1,846,675 |
| 3% 5/15/32 | | 6,955,000 | 5,943,990 |
| 3.625% 1/15/32 | | 353,000 | 317,201 |
| 5.125% 2/1/28 | | 735,000 | 738,707 |
| 5.5% 1/15/30 | | 342,000 | 344,479 |
| 5.75% 4/1/33 | | 6,910,000 | 7,073,484 |
| KfW: | | | |
| 0% 3/31/27 (Reg. S) | EUR | 316,000 | 327,621 |
| 0.75% 1/15/29 (Reg. S) | EUR | 957,000 | 980,947 |
| 2.875% 5/29/26 (Reg. S) | EUR | 497,000 | 551,658 |
| Leighton Finance U.S.A. Pty Ltd. 1.5% 5/28/29 (Reg. S) | EUR | 528,000 | 515,686 |
| Liberty Costa Rica SR SF 10.875% 1/15/31 (b) | | 170,000 | 182,856 |
| MDGH GMTN RSC Ltd.: | | | |
| 2.875% 11/7/29(b) | | 240,000 | 223,222 |
| 4.375% 11/22/33(b) | | 120,000 | 116,850 |
| 5.084% 5/22/53(b) | | 330,000 | 326,288 |
| 5.5% 4/28/33(b) | | 125,000 | 131,992 |
| Pine Street Trust II 5.568% 2/15/49 (b) | | 1,000,000 | 965,444 |
| PTT Treasury Center Co. Ltd. 3.7% 7/16/70 (b) | | 105,000 | 74,306 |
| Raizen Fuels Finance SA 6.95% 3/5/54 (b) | | 270,000 | 287,456 |
| Shift4 Payments LLC / Shift4 Payments Finance Sub, Inc. 6.75% 8/15/32 (b) | | 340,000 | 350,766 |
| | | | 42,800,983 |
| Insurance - 0.3% | | | |
| Acrisure LLC / Acrisure Finance, Inc.: | | | |
| 6% 8/1/29(b) | | 225,000 | 214,879 |
| 7.5% 11/6/30(b) | | 270,000 | 277,129 |
| 8.25% 2/1/29(b) | | 125,000 | 128,655 |
| 8.5% 6/15/29(b) | | 120,000 | 124,617 |
| Admiral Group PLC 8.5% 1/6/34 (Reg. S) | GBP | 385,000 | 569,459 |
| Alliant Holdings Intermediate LLC/Alliant Holdings Co.-Issuer: | | | |
| 4.25% 10/15/27(b) | | 250,000 | 240,947 |
| 6.75% 10/15/27(b) | | 500,000 | 497,563 |
| American International Group, Inc. 5.125% 3/27/33 | | 1,500,000 | 1,529,690 |
| AmWINS Group, Inc. 4.875% 6/30/29 (b) | | 400,000 | 381,307 |
| Argentum Netherlands BV: | | | |
| 5.625% 8/15/52 (Reg. S)(d) | | 393,000 | 392,684 |
| 5.75% 8/15/50 (Reg. S)(d) | | 775,000 | 773,244 |
| Cloverie PLC 4.5% 9/11/44 (Reg. S) (d) | | 1,354,000 | 1,352,308 |
| Fidelidade-Companhia de Seguros SA 4.25% 9/4/31 (Reg. S) (d) | EUR | 300,000 | 323,734 |
| Five Corners Funding Trust II 2.85% 5/15/30 (b) | | 6,287,000 | 5,738,078 |
| Jones DesLauriers Insurance Management, Inc. 10.5% 12/15/30 (b) | | 55,000 | 59,778 |
| Marsh & McLennan Companies, Inc. 4.375% 3/15/29 | | 678,000 | 680,516 |
| Pacific LifeCorp 5.125% 1/30/43 (b) | | 950,000 | 911,431 |
| Panther Escrow Issuer LLC 7.125% 6/1/31 (b) | | 250,000 | 260,403 |
| Pricoa Global Funding I 5.375% 5/15/45 (d) | | 1,045,000 | 1,037,777 |
| Prudential Funding Asia PLC 2.95% 11/3/33 (Reg. S) (d) | | 690,000 | 631,970 |
| QBE Insurance Group Ltd.: | | | |
| 2.5% 9/13/38 (Reg. S)(d) | GBP | 318,000 | 367,581 |
| 6.75% 12/2/44 (Reg. S)(d) | | 540,000 | 540,000 |
| Sagicor Financial Co. Ltd. 5.3% 5/13/28 (b) | | 150,000 | 145,155 |
| Swiss Re Finance Luxembourg SA 5% 4/2/49 (b)(d) | | 200,000 | 199,660 |
| TIAA Asset Management Finance LLC 4.125% 11/1/24 (b) | | 80,000 | 79,803 |
| Unum Group: | | | |
| 3.875% 11/5/25 | | 50,000 | 49,385 |
| 4% 6/15/29 | | 852,000 | 828,001 |
| Zurich Finance (Ireland) DAC 3.5% 5/2/52 (Reg. S) (d) | | 374,000 | 324,822 |
| | | | 18,660,576 |
| Mortgage Real Estate Investment Trusts - 0.0% | | | |
| Rithm Capital Corp. 8% 4/1/29 (b) | | 125,000 | 124,406 |
| Starwood Property Trust, Inc.: | | | |
| 3.625% 7/15/26(b) | | 65,000 | 62,560 |
| 4.75% 3/15/25 | | 56,000 | 55,632 |
| | | | 242,598 |
TOTAL FINANCIALS | | | 517,336,987 |
| | | | |
| HEALTH CARE - 1.7% | | | |
| Biotechnology - 0.1% | | | |
| Amgen, Inc.: | | | |
| 5.25% 3/2/30 | | 828,000 | 857,723 |
| 5.25% 3/2/33 | | 1,934,000 | 1,987,528 |
| 5.6% 3/2/43 | | 888,000 | 907,564 |
| 5.65% 3/2/53 | | 1,441,000 | 1,482,087 |
| 5.75% 3/2/63 | | 804,000 | 824,605 |
| Emergent BioSolutions, Inc. 3.875% 8/15/28 (b) | | 1,066,000 | 791,477 |
| Grifols SA % (b) | | 145,000 | 137,741 |
| | | | 6,988,725 |
| Health Care Equipment & Supplies - 0.1% | | | |
| AdaptHealth LLC 5.125% 3/1/30 (b)(c) | | 750,000 | 685,743 |
| Avantor Funding, Inc. 4.625% 7/15/28 (b) | | 335,000 | 326,012 |
| Embecta Corp. 5% 2/15/30 (b) | | 120,000 | 108,193 |
| Medline Borrower LP / Medline Co. 6.25% 4/1/29 (b) | | 1,020,000 | 1,051,442 |
| Sotera Health Holdings LLC 7.375% 6/1/31 (b) | | 100,000 | 104,584 |
| Teleflex, Inc. 4.25% 6/1/28 (b) | | 155,000 | 148,958 |
| Werfenlife SA 4.625% 6/6/28 (Reg. S) | EUR | 600,000 | 686,077 |
| | | | 3,111,009 |
| Health Care Providers & Services - 1.2% | | | |
| 180 Medical, Inc. 3.875% 10/15/29 (b) | | 590,000 | 553,270 |
| Akumin, Inc. 8% 8/1/28 (b) | | 185,000 | 153,550 |
| Auna SA 10% 12/15/29 (b) | | 115,000 | 120,318 |
| Centene Corp.: | | | |
| 2.45% 7/15/28 | | 1,670,000 | 1,527,966 |
| 2.625% 8/1/31 | | 4,800,000 | 4,071,632 |
| 3% 10/15/30 | | 3,000,000 | 2,665,313 |
| 3.375% 2/15/30 | | 3,815,000 | 3,493,225 |
| 4.25% 12/15/27 | | 880,000 | 860,376 |
| 4.625% 12/15/29 | | 3,670,000 | 3,570,514 |
| CHS/Community Health Systems, Inc.: | | | |
| 4.75% 2/15/31(b) | | 1,410,000 | 1,202,625 |
| 5.25% 5/15/30(b) | | 1,745,000 | 1,564,627 |
| 5.625% 3/15/27(b) | | 775,000 | 750,004 |
| 6.125% 4/1/30(b) | | 720,000 | 570,172 |
| 6.875% 4/15/29(b) | | 720,000 | 619,582 |
| 10.875% 1/15/32(b) | | 470,000 | 508,785 |
| Cigna Group: | | | |
| 3.05% 10/15/27 | | 500,000 | 480,761 |
| 4.8% 8/15/38 | | 550,000 | 527,402 |
| CVS Health Corp.: | | | |
| 3% 8/15/26 | | 125,000 | 121,079 |
| 3.625% 4/1/27 | | 375,000 | 367,097 |
| 4.78% 3/25/38 | | 2,092,000 | 1,921,781 |
| 5% 1/30/29 | | 801,000 | 812,359 |
| 5.125% 2/21/30 | | 4,000,000 | 4,063,006 |
| 5.25% 1/30/31 | | 5,329,000 | 5,418,558 |
| DaVita, Inc.: | | | |
| 4.625% 6/1/30(b) | | 320,000 | 301,728 |
| 6.875% 9/1/32(b) | | 895,000 | 915,637 |
| HCA Holdings, Inc.: | | | |
| 3.5% 9/1/30 | | 8,709,000 | 8,120,082 |
| 3.625% 3/15/32 | | 195,000 | 177,284 |
| 5.5% 6/1/33 | | 2,000,000 | 2,046,437 |
| 5.625% 9/1/28 | | 1,054,000 | 1,086,963 |
| 5.875% 2/1/29 | | 981,000 | 1,019,159 |
| Humana, Inc.: | | | |
| 3.7% 3/23/29 | | 585,000 | 564,666 |
| 5.375% 4/15/31 | | 5,071,000 | 5,193,124 |
| LifePoint Health, Inc.: | | | |
| 5.375% 1/15/29(b) | | 433,000 | 404,166 |
| 10% 6/1/32(b) | | 135,000 | 146,519 |
| ModivCare Escrow Issuer, Inc. 5% 10/1/29 (b) | | 98,000 | 70,116 |
| Molina Healthcare, Inc. 3.875% 5/15/32 (b) | | 745,000 | 668,436 |
| Pediatrix Medical Group, Inc. 5.375% 2/15/30 (b) | | 500,000 | 478,139 |
| Prime Healthcare Services 9.375% 9/1/29 (b) | | 150,000 | 151,213 |
| Radiology Partners, Inc. 7.775% 1/31/29 pay-in-kind (b)(d) | | 600,822 | 577,540 |
| Sabra Health Care LP 3.2% 12/1/31 | | 4,971,000 | 4,311,610 |
| Surgery Center Holdings, Inc. 7.25% 4/15/32 (b) | | 335,000 | 351,857 |
| Tenet Healthcare Corp.: | | | |
| 4.625% 6/15/28 | | 1,625,000 | 1,587,888 |
| 5.125% 11/1/27 | | 1,255,000 | 1,244,079 |
| Toledo Hospital 5.325% 11/15/28 | | 319,000 | 313,418 |
| U.S. Acute Care Solutions 9.75% 5/15/29 (b) | | 185,000 | 189,256 |
| | | | 65,863,319 |
| Life Sciences Tools & Services - 0.0% | | | |
| Charles River Laboratories International, Inc. 3.75% 3/15/29 (b) | | 835,000 | 782,441 |
| Pharmaceuticals - 0.3% | | | |
| 1375209 BC Ltd. 9% 1/30/28 (b) | | 500,000 | 485,924 |
| Bausch Health Companies, Inc.: | | | |
| 4.875% 6/1/28(b) | | 370,000 | 276,390 |
| 5.25% 1/30/30(b) | | 240,000 | 120,000 |
| 5.5% 11/1/25(b) | | 1,201,000 | 1,156,101 |
| 11% 9/30/28(b) | | 230,000 | 210,450 |
| Bayer AG 4.625% 5/26/33 (Reg. S) | EUR | 200,000 | 231,607 |
| Bayer U.S. Finance II LLC 4.25% 12/15/25 (b) | | 3,209,000 | 3,172,056 |
| Bayer U.S. Finance LLC: | | | |
| 6.375% 11/21/30(b) | | 617,000 | 655,970 |
| 6.5% 11/21/33(b) | | 709,000 | 755,769 |
| Elanco Animal Health, Inc. 6.65% 8/28/28 (d) | | 194,000 | 200,892 |
| Jazz Securities DAC 4.375% 1/15/29 (b) | | 1,005,000 | 956,429 |
| Mylan NV 4.55% 4/15/28 | | 450,000 | 445,590 |
| Organon & Co. / Organon Foreign Debt Co-Issuer BV: | | | |
| 4.125% 4/30/28(b) | | 565,000 | 540,150 |
| 5.125% 4/30/31(b) | | 525,000 | 491,685 |
| 6.75% 5/15/34(b)(c) | | 90,000 | 93,270 |
| 7.875% 5/15/34(b) | | 200,000 | 210,736 |
| Teva Pharmaceutical Finance Netherlands III BV: | | | |
| 4.75% 5/9/27 | | 120,000 | 117,930 |
| 7.875% 9/15/29 | | 215,000 | 236,761 |
| Utah Acquisition Sub, Inc. 3.95% 6/15/26 | | 1,370,000 | 1,350,529 |
| Viatris, Inc. 2.7% 6/22/30 | | 4,571,000 | 4,023,920 |
| | | | 15,732,159 |
TOTAL HEALTH CARE | | | 92,477,653 |
| | | | |
| INDUSTRIALS - 1.4% | | | |
| Aerospace & Defense - 0.5% | | | |
| BAE Systems Holdings, Inc. 3.8% 10/7/24 (b) | | 1,040,000 | 1,038,205 |
| Bombardier, Inc.: | | | |
| 7% 6/1/32(b) | | 930,000 | 968,122 |
| 7.875% 4/15/27(b) | | 344,000 | 345,170 |
| BWX Technologies, Inc. 4.125% 6/30/28 (b) | | 500,000 | 482,499 |
| Embraer Netherlands Finance BV: | | | |
| 5.4% 2/1/27 | | 75,000 | 75,516 |
| 6.95% 1/17/28(b) | | 115,000 | 120,534 |
| 7% 7/28/30(b) | | 280,000 | 299,950 |
| Moog, Inc. 4.25% 12/15/27 (b) | | 730,000 | 703,125 |
| The Boeing Co.: | | | |
| 3.5% 3/1/39 | | 3,000,000 | 2,259,544 |
| 5.15% 5/1/30 | | 6,303,000 | 6,286,814 |
| 5.705% 5/1/40 | | 720,000 | 699,843 |
| 5.805% 5/1/50 | | 1,130,000 | 1,066,545 |
| 5.93% 5/1/60 | | 720,000 | 680,082 |
| 6.259% 5/1/27(b) | | 766,000 | 788,050 |
| 6.298% 5/1/29(b) | | 983,000 | 1,026,601 |
| 6.388% 5/1/31(b) | | 5,744,000 | 6,050,534 |
| 6.528% 5/1/34(b) | | 796,000 | 843,053 |
| 6.858% 5/1/54(b) | | 1,199,000 | 1,291,007 |
| 7.008% 5/1/64(b) | | 1,132,000 | 1,219,187 |
| TransDigm, Inc. 6.375% 3/1/29 (b) | | 1,085,000 | 1,118,159 |
| VistaJet Malta Finance PLC / XO Management Holding, Inc.: | | | |
| 6.375% 2/1/30(b) | | 1,130,000 | 926,613 |
| 7.875% 5/1/27(b) | | 399,000 | 374,477 |
| | | | 28,663,630 |
| Air Freight & Logistics - 0.0% | | | |
| Aercap Global Aviation Trust 6.5% 6/15/45 (b)(d) | | 250,000 | 249,218 |
| Aeropuerto Internacional de Tocumen SA 5.125% 8/11/61 (b) | | 90,000 | 70,707 |
| Cargo Aircraft Management, Inc. 4.75% 2/1/28 (b)(c) | | 530,000 | 506,150 |
| Rand Parent LLC 8.5% 2/15/30 (b)(c) | | 1,455,000 | 1,455,023 |
| | | | 2,281,098 |
| Building Products - 0.1% | | | |
| Advanced Drain Systems, Inc. 5% 9/30/27 (b) | | 940,000 | 925,468 |
| Builders FirstSource, Inc. 4.25% 2/1/32 (b) | | 985,000 | 899,942 |
| Carrier Global Corp.: | | | |
| 4.5% 11/29/32 | EUR | 164,000 | 192,798 |
| 5.9% 3/15/34 | | 223,000 | 240,549 |
| 6.2% 3/15/54 | | 138,000 | 156,470 |
| EMRLD Borrower LP / Emerald Co.: | | | |
| 6.625% 12/15/30(b) | | 1,420,000 | 1,454,128 |
| 6.75% 7/15/31(b) | | 595,000 | 613,143 |
| MasterBrand, Inc. 7% 7/15/32 (b) | | 195,000 | 200,851 |
| MIWD Holdco II LLC / MIWD Finance Corp. 5.5% 2/1/30 (b) | | 250,000 | 237,027 |
| Oscar Acquisition Co. LLC / Oscar Finance, Inc. 9.5% 4/15/30 (b) | | 385,000 | 361,514 |
| Sisecam UK PLC 8.625% 5/2/32 (b) | | 300,000 | 310,500 |
| Standard Industries, Inc./New Jersey 4.375% 7/15/30 (b) | | 1,245,000 | 1,164,044 |
| | | | 6,756,434 |
| Commercial Services & Supplies - 0.2% | | | |
| ADT Corp.: | | | |
| 4.125% 8/1/29(b)(c) | | 180,000 | 170,936 |
| 4.875% 7/15/32(b) | | 180,000 | 171,106 |
| Allied Universal Holdco LLC 7.875% 2/15/31 (b)(h) | | 1,160,000 | 1,177,729 |
| Allied Universal Holdco LLC / Allied Universal Finance Corp. 9.75% 7/15/27 (b) | | 690,000 | 691,622 |
| Artera Services LLC 8.5% 2/15/31 (b) | | 1,470,000 | 1,471,671 |
| Brand Industrial Services, Inc. 10.375% 8/1/30 (b) | | 270,000 | 294,184 |
| Cimpress PLC 7% 6/15/26 | | 55,000 | 54,825 |
| Clean Harbors, Inc. 6.375% 2/1/31 (b) | | 425,000 | 434,313 |
| CoreCivic, Inc.: | | | |
| 4.75% 10/15/27 | | 215,000 | 205,068 |
| 8.25% 4/15/29 | | 195,000 | 205,709 |
| Garda World Security Corp. 8.25% 8/1/32 (b) | | 250,000 | 254,088 |
| GFL Environmental, Inc. 6.75% 1/15/31 (b) | | 1,205,000 | 1,258,716 |
| Madison IAQ LLC 5.875% 6/30/29 (b) | | 475,000 | 452,632 |
| Neptune BidCo U.S., Inc. 9.29% 4/15/29 (b) | | 155,000 | 154,806 |
| Reworld Holding Corp. 4.875% 12/1/29 (b) | | 260,000 | 241,258 |
| The GEO Group, Inc.: | | | |
| 8.625% 4/15/29 | | 425,000 | 440,883 |
| 10.25% 4/15/31 | | 250,000 | 264,121 |
| Williams Scotsman, Inc. 6.625% 6/15/29 (b) | | 395,000 | 407,812 |
| Wrangler Holdco Corp. 6.625% 4/1/32 (b) | | 870,000 | 898,234 |
| | | | 9,249,713 |
| Construction & Engineering - 0.1% | | | |
| ATP Tower Holdings LLC/Andean Tower Partners 4.05% 4/27/26 (b) | | 520,000 | 497,492 |
| Greensaif Pipelines Bidco SARL: | | | |
| 5.8528% 2/23/36(b) | | 200,000 | 205,850 |
| 6.1027% 8/23/42(b) | | 200,000 | 204,250 |
| 6.129% 2/23/38(b) | | 400,000 | 420,250 |
| 6.51% 2/23/42(b) | | 120,000 | 128,213 |
| Pike Corp.: | | | |
| 5.5% 9/1/28(b) | | 400,000 | 389,647 |
| 8.625% 1/31/31(b) | | 500,000 | 539,769 |
| Railworks Holdings LP 8.25% 11/15/28 (b) | | 500,000 | 510,828 |
| | | | 2,896,299 |
| Electrical Equipment - 0.0% | | | |
| GrafTech Global Enterprises, Inc. 9.875% 12/15/28 (b) | | 125,000 | 100,298 |
| Sensata Technologies BV 4% 4/15/29 (b) | | 50,000 | 47,077 |
| | | | 147,375 |
| Ground Transportation - 0.1% | | | |
| Alpha Trains Finance SA 2.064% 6/30/30 | EUR | 233,000 | 251,112 |
| Genesee & Wyoming, Inc. 6.25% 4/15/32 (b) | | 545,000 | 557,028 |
| Mobico Group PLC 4.875% 9/26/31 (Reg. S) | EUR | 736,000 | 805,577 |
| Uber Technologies, Inc. 4.5% 8/15/29 (b)(c) | | 1,405,000 | 1,377,932 |
| XPO, Inc.: | | | |
| 6.25% 6/1/28(b) | | 280,000 | 285,662 |
| 7.125% 2/1/32(b) | | 150,000 | 156,926 |
| | | | 3,434,237 |
| Industrial Conglomerates - 0.0% | | | |
| GRUP KUO, S.A.B. de CV 5.75% 7/7/27 (b) | | 200,000 | 192,916 |
| Ladder Capital Finance Holdings LLLP/Ladder Capital Finance Corp.: | | | |
| 4.25% 2/1/27(b) | | 455,000 | 441,551 |
| 7% 7/15/31(b) | | 245,000 | 254,733 |
| | | | 889,200 |
| Machinery - 0.0% | | | |
| TK Elevator Holdco GmbH 7.625% 7/15/28 (b) | | 375,000 | 375,551 |
| Marine Transportation - 0.0% | | | |
| MISC Capital Two (Labuan) Ltd.: | | | |
| 3.625% 4/6/25(b) | | 155,000 | 153,692 |
| 3.75% 4/6/27(b) | | 370,000 | 360,880 |
| Seaspan Corp. 5.5% 8/1/29 (b) | | 265,000 | 252,410 |
| | | | 766,982 |
| Passenger Airlines - 0.1% | | | |
| American Airlines, Inc.: | | | |
| 7.25% 2/15/28(b)(c) | | 580,000 | 583,607 |
| 8.5% 5/15/29(b) | | 310,000 | 322,295 |
| American Airlines, Inc. / AAdvantage Loyalty IP Ltd. 5.5% 4/20/26 (b) | | 207,083 | 206,011 |
| Azul Secured Finance LLP: | | | |
| 11.5% 5/28/29(b) | | 285,000 | 173,776 |
| 11.93% 8/28/28(b) | | 120,000 | 110,700 |
| Hawaiian Brand Intellectual Property Ltd. / HawaiianMiles Loyalty Ltd. 11% 4/15/29 (b) | | 477,125 | 485,618 |
| JetBlue Airways Corp./JetBlue Loyalty LP 9.875% 9/20/31 (b) | | 340,000 | 336,046 |
| Spirit Loyalty Cayman Ltd. / Spirit IP Cayman Ltd. 8% 9/20/25 (b) | | 205,000 | 128,026 |
| United Airlines, Inc. 4.375% 4/15/26 (b) | | 1,090,000 | 1,063,697 |
| | | | 3,409,776 |
| Professional Services - 0.0% | | | |
| TriNet Group, Inc.: | | | |
| 3.5% 3/1/29(b) | | 300,000 | 277,523 |
| 7.125% 8/15/31(b) | | 180,000 | 186,678 |
| | | | 464,201 |
| Trading Companies & Distributors - 0.0% | | | |
| Air Lease Corp. 3.375% 7/1/25 | | 1,294,000 | 1,275,435 |
| Beacon Roofing Supply, Inc. 6.5% 8/1/30 (b) | | 195,000 | 200,249 |
| Fortress Transportation & Infrastructure Investors LLC: | | | |
| 7% 6/15/32(b) | | 245,000 | 256,317 |
| 7.875% 12/1/30(b) | | 275,000 | 295,127 |
| Foundation Building Materials, Inc. 6% 3/1/29 (b) | | 130,000 | 116,627 |
| Travis Perkins PLC 3.75% 2/17/26 (Reg. S) | GBP | 332,000 | 419,047 |
| | | | 2,562,802 |
| Transportation Infrastructure - 0.3% | | | |
| Aeropuertos Dominicanos Siglo XXI SA 7% 6/30/34 (b) | | 200,000 | 206,750 |
| Avolon Holdings Funding Ltd.: | | | |
| 4.25% 4/15/26(b) | | 290,000 | 285,503 |
| 4.375% 5/1/26(b) | | 880,000 | 866,816 |
| 5.75% 3/1/29(b) | | 3,000,000 | 3,072,271 |
| 5.75% 11/15/29(b) | | 3,135,000 | 3,209,488 |
| 6.375% 5/4/28(b) | | 4,704,000 | 4,889,710 |
| DP World Crescent Ltd. 3.7495% 1/30/30 (b) | | 170,000 | 162,297 |
| DP World Ltd. 5.625% 9/25/48 (b) | | 175,000 | 174,234 |
| Heathrow Funding Ltd. 6% 3/5/32 (Reg. S) | GBP | 505,000 | 668,488 |
| Holding d'Infrastructures et des Metiers de l'Environnement 0.625% 9/16/28 (Reg. S) | EUR | 249,000 | 237,268 |
| | | | 13,772,825 |
TOTAL INDUSTRIALS | | | 75,670,123 |
| | | | |
| INFORMATION TECHNOLOGY - 0.9% | | | |
| Communications Equipment - 0.1% | | | |
| CommScope, Inc.: | | | |
| 4.75% 9/1/29(b) | | 490,000 | 394,450 |
| 6% 3/1/26(b) | | 250,000 | 240,625 |
| HTA Group Ltd. 7.5% 6/4/29 (b) | | 1,365,000 | 1,373,804 |
| IHS Netherlands Holdco BV 8% 9/18/27 (b) | | 495,000 | 493,453 |
| ViaSat, Inc. 5.625% 9/15/25 (b) | | 516,000 | 510,859 |
| Viavi Solutions, Inc. 3.75% 10/1/29 (b) | | 365,000 | 324,753 |
| | | | 3,337,944 |
| Electronic Equipment, Instruments & Components - 0.0% | | | |
| Coherent Corp. 5% 12/15/29 (b)(c) | | 625,000 | 604,365 |
| CPI CG, Inc. 10% 7/15/29 (b) | | 130,000 | 136,726 |
| Dell International LLC/EMC Corp. 6.2% 7/15/30 | | 418,000 | 450,472 |
| Insight Enterprises, Inc. 6.625% 5/15/32 (b) | | 190,000 | 196,671 |
| Lightning Power LLC 7.25% 8/15/32 (b) | | 265,000 | 273,824 |
| Sensata Technologies, Inc.: | | | |
| 3.75% 2/15/31(b) | | 670,000 | 604,981 |
| 6.625% 7/15/32(b) | | 420,000 | 434,581 |
| TTM Technologies, Inc. 4% 3/1/29 (b) | | 595,000 | 561,537 |
| | | | 3,263,157 |
| IT Services - 0.1% | | | |
| Acuris Finance U.S.: | | | |
| 5% 5/1/28(b) | | 325,000 | 290,931 |
| 9% 8/1/29(b) | | 290,000 | 290,000 |
| Ahead DB Holdings LLC 6.625% 5/1/28 (b) | | 490,000 | 470,121 |
| Amentum Escrow Corp. 7.25% 8/1/32 (b) | | 295,000 | 308,452 |
| ASGN, Inc. 4.625% 5/15/28 (b) | | 790,000 | 763,274 |
| CA Magnum Holdings 5.375% 10/31/26 (b) | | 265,000 | 258,209 |
| Cogent Communications Group, Inc. 7% 6/15/27 (b) | | 430,000 | 434,985 |
| Gartner, Inc.: | | | |
| 3.75% 10/1/30(b) | | 265,000 | 245,384 |
| 4.5% 7/1/28(b) | | 345,000 | 338,823 |
| Go Daddy Operating Co. LLC / GD Finance Co., Inc.: | | | |
| 3.5% 3/1/29(b) | | 430,000 | 399,818 |
| 5.25% 12/1/27(b) | | 700,000 | 696,900 |
| Unisys Corp. 6.875% 11/1/27 (b) | | 70,000 | 65,522 |
| Virtusa Corp. 7.125% 12/15/28 (b) | | 50,000 | 47,060 |
| | | | 4,609,479 |
| Semiconductors & Semiconductor Equipment - 0.5% | | | |
| Broadcom, Inc.: | | | |
| 1.95% 2/15/28(b) | | 351,000 | 322,671 |
| 2.45% 2/15/31(b) | | 8,421,000 | 7,347,617 |
| 2.6% 2/15/33(b) | | 17,032,000 | 14,277,821 |
| 3.187% 11/15/36(b) | | 813,000 | 672,696 |
| 3.5% 2/15/41(b) | | 2,410,000 | 1,925,573 |
| Entegris, Inc.: | | | |
| 3.625% 5/1/29(b) | | 1,200,000 | 1,104,861 |
| 4.375% 4/15/28(b) | | 55,000 | 52,830 |
| ON Semiconductor Corp. 3.875% 9/1/28 (b) | | 310,000 | 294,612 |
| | | | 25,998,681 |
| Software - 0.2% | | | |
| Central Parent, Inc./Central Merger Sub, Inc. 7.25% 6/15/29 (b) | | 220,000 | 221,097 |
| Cloud Software Group, Inc.: | | | |
| 6.5% 3/31/29(b) | | 200,000 | 197,149 |
| 8.25% 6/30/32(b) | | 1,465,000 | 1,533,903 |
| 9% 9/30/29(b) | | 500,000 | 503,231 |
| CNT PRNT/CDK GLO II/FIN 8% 6/15/29 (b) | | 240,000 | 247,798 |
| Elastic NV 4.125% 7/15/29 (b) | | 205,000 | 190,997 |
| Gen Digital, Inc. 5% 4/15/25 (b) | | 500,000 | 498,077 |
| Helios Software Holdings, Inc. / ION Corporate Solutions Finance Sarl 8.75% 5/1/29 (b) | | 280,000 | 291,543 |
| ION Trading Technologies Ltd.: | | | |
| 5.75% 5/15/28(b) | | 375,000 | 352,971 |
| 9.5% 5/30/29(b) | | 195,000 | 207,057 |
| MicroStrategy, Inc. 6.125% 6/15/28 (b) | | 490,000 | 477,622 |
| Open Text Corp.: | | | |
| 3.875% 2/15/28(b) | | 885,000 | 839,087 |
| 3.875% 12/1/29(b) | | 600,000 | 553,147 |
| Oracle Corp.: | | | |
| 1.65% 3/25/26 | | 1,241,000 | 1,184,871 |
| 2.3% 3/25/28 | | 1,961,000 | 1,819,904 |
| UKG, Inc. 6.875% 2/1/31 (b) | | 200,000 | 206,884 |
| Veritas U.S., Inc./Veritas Bermuda Ltd. 7.5% 9/1/25 (b) | | 125,000 | 114,265 |
| | | | 9,439,603 |
| Technology Hardware, Storage & Peripherals - 0.0% | | | |
| Lenovo Group Ltd. 3.421% 11/2/30 (b) | | 220,000 | 200,956 |
| Seagate HDD Cayman: | | | |
| 5.75% 12/1/34 | | 300,000 | 300,171 |
| 8.25% 12/15/29 | | 1,535,000 | 1,663,817 |
| Western Digital Corp.: | | | |
| 2.85% 2/1/29 | | 419,000 | 375,917 |
| 3.1% 2/1/32 | | 400,000 | 336,581 |
| 4.75% 2/15/26 | | 31,000 | 30,720 |
| | | | 2,908,162 |
TOTAL INFORMATION TECHNOLOGY | | | 49,557,026 |
| | | | |
| MATERIALS - 0.9% | | | |
| Chemicals - 0.4% | | | |
| Axalta Coating Systems/Dutch Holding BV 4.75% 6/15/27 (b) | | 600,000 | 590,375 |
| Braskem Idesa SAPI: | | | |
| 6.99% 2/20/32(b) | | 180,000 | 140,344 |
| 7.45% 11/15/29(b) | | 260,000 | 218,239 |
| Braskem Netherlands BV: | | | |
| 5.875% 1/31/50(b) | | 120,000 | 92,100 |
| 7.25% 2/13/33(b) | | 350,000 | 344,470 |
| 8.5% 1/12/31(b) | | 235,000 | 245,270 |
| Celanese U.S. Holdings LLC: | | | |
| 6.35% 11/15/28 | | 1,024,000 | 1,077,364 |
| 6.379% 7/15/32 | | 6,000,000 | 6,342,256 |
| 6.55% 11/15/30 | | 1,038,000 | 1,113,152 |
| 6.7% 11/15/33 | | 607,000 | 656,167 |
| Consolidated Energy Finance SA 12% 2/15/31 (b) | | 425,000 | 418,296 |
| CVR Partners LP/CVR Nitrogen Finance Corp. 6.125% 6/15/28 (b) | | 250,000 | 242,681 |
| ENN Clean Energy International Investment Ltd. 3.375% 5/12/26 (b) | | 245,000 | 236,961 |
| Herens HoldCo Sarl 4.75% 5/15/28 (b) | | 140,000 | 122,101 |
| INEOS Quattro Finance 2 PLC 9.625% 3/15/29 (b) | | 123,000 | 132,667 |
| Kobe U.S. Midco 2, Inc. 9.25% 11/1/26 pay-in-kind (b)(d) | | 670,000 | 549,400 |
| MEGlobal BV: | | | |
| 2.625% 4/28/28(b) | | 125,000 | 115,430 |
| 4.25% 11/3/26(b) | | 100,000 | 98,438 |
| MEGlobal Canada, Inc. 5% 5/18/25 (b) | | 155,000 | 154,248 |
| Methanex Corp.: | | | |
| 5.125% 10/15/27 | | 795,000 | 782,535 |
| 5.25% 12/15/29 | | 315,000 | 309,599 |
| 5.65% 12/1/44 | | 451,000 | 402,836 |
| NOVA Chemicals Corp.: | | | |
| 5% 5/1/25(b) | | 1,000,000 | 993,956 |
| 5.25% 6/1/27(b) | | 595,000 | 587,343 |
| Nufarm Australia Ltd. 5% 1/27/30 (b) | | 450,000 | 417,074 |
| OCP SA: | | | |
| 3.75% 6/23/31(b) | | 160,000 | 143,300 |
| 6.75% 5/2/34(b) | | 255,000 | 271,894 |
| 6.875% 4/25/44(b) | | 160,000 | 161,280 |
| 7.5% 5/2/54(b) | | 80,000 | 85,716 |
| Olin Corp. 5% 2/1/30 | | 975,000 | 942,478 |
| Olympus Water U.S. Holding Corp.: | | | |
| 6.25% 10/1/29(b) | | 375,000 | 352,229 |
| 7.25% 6/15/31(b) | | 1,000,000 | 1,033,590 |
| 9.75% 11/15/28(b) | | 250,000 | 266,297 |
| Orbia Advance Corp. S.A.B. de CV: | | | |
| 1.875% 5/11/26(b) | | 275,000 | 259,875 |
| 2.875% 5/11/31(b) | | 140,000 | 118,318 |
| Sasol Financing U.S.A. LLC: | | | |
| 4.375% 9/18/26 | | 470,000 | 452,375 |
| 5.5% 3/18/31 | | 100,000 | 87,933 |
| SCIH Salt Holdings, Inc. 6.625% 5/1/29 (b) | | 250,000 | 239,244 |
| The Chemours Co. LLC: | | | |
| 4.625% 11/15/29(b)(c) | | 600,000 | 527,826 |
| 5.375% 5/15/27 | | 1,445,000 | 1,404,065 |
| Tronox, Inc. 4.625% 3/15/29 (b)(c) | | 550,000 | 501,231 |
| W.R. Grace Holding LLC: | | | |
| 4.875% 6/15/27(b) | | 620,000 | 606,297 |
| 5.625% 8/15/29(b) | | 130,000 | 120,541 |
| 7.375% 3/1/31(b) | | 65,000 | 67,515 |
| | | | 24,025,306 |
| Construction Materials - 0.1% | | | |
| Eco Material Technologies, Inc. 7.875% 1/31/27 (b) | | 500,000 | 506,427 |
| Knife River Holding Co. 7.75% 5/1/31 (b) | | 435,000 | 460,528 |
| Smyrna Ready Mix Concrete LLC 8.875% 11/15/31 (b) | | 335,000 | 359,589 |
| Summit Materials LLC/Summit Materials Finance Corp. 7.25% 1/15/31 (b) | | 1,205,000 | 1,266,756 |
| | | | 2,593,300 |
| Containers & Packaging - 0.1% | | | |
| Ardagh Metal Packaging Finance U.S.A. LLC/Ardagh Metal Packaging Finance PLC: | | | |
| 3.25% 9/1/28(b) | | 580,000 | 526,233 |
| 4% 9/1/29(b) | | 600,000 | 517,050 |
| 6% 6/15/27(b) | | 20,000 | 19,941 |
| Ardagh Packaging Finance PLC/Ardagh MP Holdings U.S.A., Inc. 4.125% 8/15/26 (b) | | 250,000 | 215,610 |
| Ball Corp.: | | | |
| 2.875% 8/15/30(c) | | 1,020,000 | 901,536 |
| 6% 6/15/29 | | 450,000 | 463,031 |
| Clydesdale Acquisition Holdings, Inc.: | | | |
| 6.875% 1/15/30(b) | | 285,000 | 286,051 |
| 8.75% 4/15/30(b) | | 625,000 | 623,601 |
| Crown Americas LLC/Crown Americas Capital Corp. IV 4.75% 2/1/26 | | 31,000 | 30,706 |
| Graham Packaging Co., Inc. 7.125% 8/15/28 (b) | | 100,000 | 98,833 |
| Graphic Packaging International, Inc.: | | | |
| 3.75% 2/1/30(b) | | 485,000 | 448,570 |
| 6.375% 7/15/32(b) | | 230,000 | 235,159 |
| OI European Group BV 4.75% 2/15/30 (b) | | 360,000 | 337,905 |
| Owens-Brockway Glass Container, Inc. 7.375% 6/1/32 (b)(c) | | 90,000 | 90,407 |
| Sealed Air Corp.: | | | |
| 5% 4/15/29(b)(c) | | 1,180,000 | 1,157,361 |
| 6.5% 7/15/32(b) | | 140,000 | 143,209 |
| 6.875% 7/15/33(b) | | 340,000 | 363,901 |
| Sealed Air Corp./Sealed Air Corp. U.S. 7.25% 2/15/31 (b) | | 360,000 | 378,321 |
| Trivium Packaging Finance BV: | | | |
| 5.5% 8/15/26(b) | | 260,000 | 256,701 |
| 8.5% 8/15/27(b) | | 375,000 | 374,516 |
| | | | 7,468,642 |
| Metals & Mining - 0.3% | | | |
| Alcoa Nederland Holding BV 7.125% 3/15/31 (b) | | 680,000 | 715,110 |
| Antofagasta PLC: | | | |
| 2.375% 10/14/30(b) | | 320,000 | 275,072 |
| 5.625% 5/13/32(b) | | 110,000 | 112,756 |
| Aris Mining Corp. 6.875% 8/9/26 (b) | | 275,000 | 267,267 |
| Cleveland-Cliffs, Inc.: | | | |
| 4.875% 3/1/31(b)(c) | | 960,000 | 881,648 |
| 6.75% 4/15/30(b)(c) | | 370,000 | 375,118 |
| 7% 3/15/32(b) | | 270,000 | 271,149 |
| Commercial Metals Co. 3.875% 2/15/31 | | 380,000 | 344,709 |
| Compania de Minas Buenaventura SAA 5.5% 7/23/26 (b) | | 150,000 | 146,625 |
| Constellium NV 6.375% 8/15/32 (b) | | 250,000 | 253,750 |
| Corporacion Nacional del Cobre de Chile (Codelco): | | | |
| 3% 9/30/29(b) | | 50,000 | 45,391 |
| 3.15% 1/14/30(b) | | 125,000 | 113,516 |
| 3.7% 1/30/50(b) | | 495,000 | 359,648 |
| 5.125% 2/2/33(b) | | 115,000 | 113,095 |
| 5.95% 1/8/34(b) | | 125,000 | 129,688 |
| 6.3% 9/8/53(b) | | 115,000 | 119,564 |
| 6.44% 1/26/36(b) | | 80,000 | 85,775 |
| CSN Inova Ventures 6.75% 1/28/28 (b) | | 195,000 | 186,591 |
| CSN Resources SA: | | | |
| 5.875% 4/8/32(b) | | 155,000 | 128,650 |
| 8.875% 12/5/30(b) | | 200,000 | 198,900 |
| Eldorado Gold Corp. 6.25% 9/1/29 (b) | | 154,000 | 152,110 |
| Endeavour Mining PLC 5% 10/14/26 (b) | | 295,000 | 283,283 |
| ERO Copper Corp. 6.5% 2/15/30 (b) | | 670,000 | 652,908 |
| First Quantum Minerals Ltd.: | | | |
| 6.875% 10/15/27(b) | | 480,000 | 474,749 |
| 8.625% 6/1/31(b) | | 235,000 | 235,073 |
| 9.375% 3/1/29(b) | | 630,000 | 670,323 |
| FMG Resources August 2006 Pty Ltd. 4.5% 9/15/27 (b) | | 950,000 | 918,823 |
| Fresnillo PLC 4.25% 10/2/50 (b) | | 155,000 | 118,401 |
| HudBay Minerals, Inc. 4.5% 4/1/26 (b) | | 65,000 | 64,102 |
| Kaiser Aluminum Corp. 4.625% 3/1/28 (b) | | 635,000 | 603,024 |
| Mineral Resources Ltd. 8% 11/1/27 (b) | | 1,210,000 | 1,229,028 |
| Nexa Resources SA: | | | |
| 6.5% 1/18/28(b) | | 160,000 | 164,550 |
| 6.75% 4/9/34(b) | | 60,000 | 62,925 |
| Novelis Corp. 3.875% 8/15/31 (b) | | 1,855,000 | 1,663,213 |
| POSCO: | | | |
| 5.75% 1/17/28(b) | | 240,000 | 247,664 |
| 5.875% 1/17/33(b) | | 70,000 | 73,824 |
| PT Freeport Indonesia: | | | |
| 4.763% 4/14/27(b) | | 95,000 | 94,927 |
| 5.315% 4/14/32(b) | | 265,000 | 265,663 |
| 6.2% 4/14/52(b) | | 110,000 | 114,469 |
| PT Indonesia Asahan Aluminium 5.45% 5/15/30 (b) | | 390,000 | 393,631 |
| Samarco Mineracao SA 9% 6/30/31 pay-in-kind (b)(d) | | 979,337 | 912,928 |
| Stillwater Mining Co. 4% 11/16/26 (b) | | 175,000 | 163,625 |
| Vale Overseas Ltd. 6.4% 6/28/54 | | 305,000 | 311,100 |
| Vibrantz Technologies, Inc. 9% 2/15/30 (b) | | 380,000 | 346,662 |
| Volcan Compania Minera SAA 4.375% 2/11/26 (b) | | 185,000 | 158,349 |
| | | | 15,499,376 |
| Paper & Forest Products - 0.0% | | | |
| Ahlstrom Holding 3 OY 4.875% 2/4/28 (b) | | 255,000 | 239,669 |
| Inversiones CMPC SA 3% 4/6/31 (b) | | 235,000 | 206,654 |
| LABL, Inc. 9.5% 11/1/28 (b) | | 100,000 | 102,201 |
| Mercer International, Inc. 5.125% 2/1/29 | | 150,000 | 122,617 |
| Suzano Austria GmbH 3.75% 1/15/31 | | 95,000 | 86,422 |
| | | | 757,563 |
TOTAL MATERIALS | | | 50,344,187 |
| | | | |
| REAL ESTATE - 1.8% | | | |
| Equity Real Estate Investment Trusts (REITs) - 1.5% | | | |
| Alexandria Real Estate Equities, Inc. 4.9% 12/15/30 | | 857,000 | 866,558 |
| American Homes 4 Rent LP: | | | |
| 2.375% 7/15/31 | | 153,000 | 129,205 |
| 3.625% 4/15/32 | | 3,681,000 | 3,347,407 |
| 5.5% 2/1/34 | | 387,000 | 394,108 |
| American Tower Corp. 5.45% 2/15/34 | | 160,000 | 165,233 |
| Boston Properties, Inc.: | | | |
| 2.9% 3/15/30 | | 2,000,000 | 1,764,617 |
| 3.25% 1/30/31 | | 792,000 | 697,270 |
| 4.5% 12/1/28 | | 605,000 | 589,400 |
| 6.75% 12/1/27 | | 1,120,000 | 1,170,643 |
| Brixmor Operating Partnership LP: | | | |
| 3.85% 2/1/25 | | 2,100,000 | 2,084,543 |
| 4.05% 7/1/30 | | 1,055,000 | 1,010,630 |
| 4.125% 5/15/29 | | 2,000,000 | 1,939,963 |
| 5.5% 2/15/34 | | 3,000,000 | 3,034,320 |
| Corporate Office Properties LP: | | | |
| 2% 1/15/29 | | 1,000,000 | 879,498 |
| 2.25% 3/15/26 | | 348,000 | 333,656 |
| 2.75% 4/15/31 | | 235,000 | 201,568 |
| 2.9% 12/1/33 | | 5,000,000 | 4,089,597 |
| Healthcare Realty Holdings LP: | | | |
| 3.1% 2/15/30 | | 260,000 | 236,538 |
| 3.5% 8/1/26 | | 270,000 | 263,793 |
| Healthpeak OP, LLC: | | | |
| 3.25% 7/15/26 | | 113,000 | 110,255 |
| 3.5% 7/15/29 | | 129,000 | 122,592 |
| Hudson Pacific Properties LP 4.65% 4/1/29 | | 1,473,000 | 1,217,704 |
| Invitation Homes Operating Partnership LP: | | | |
| 2.3% 11/15/28 | | 1,000,000 | 907,137 |
| 4.15% 4/15/32 | | 1,126,000 | 1,060,950 |
| Kite Realty Group Trust 4.75% 9/15/30 | | 79,000 | 78,244 |
| LXP Industrial Trust (REIT): | | | |
| 2.375% 10/1/31 | | 1,000,000 | 824,306 |
| 2.7% 9/15/30 | | 387,000 | 339,324 |
| MPT Operating Partnership LP/MPT Finance Corp.: | | | |
| 3.5% 3/15/31 | | 605,000 | 413,247 |
| 5% 10/15/27(c) | | 1,835,000 | 1,557,407 |
| 5.25% 8/1/26(c) | | 940,000 | 884,210 |
| Omega Healthcare Investors, Inc.: | | | |
| 3.25% 4/15/33 | | 10,029,000 | 8,485,824 |
| 3.375% 2/1/31 | | 6,201,000 | 5,527,751 |
| 3.625% 10/1/29 | | 2,155,000 | 2,005,424 |
| 4.75% 1/15/28 | | 3,349,000 | 3,320,086 |
| Park Intermediate Holdings LLC / PK Domestic Property LLC / PK Finance Co.-Issuer 7% 2/1/30 (b) | | 160,000 | 164,004 |
| Piedmont Operating Partnership LP 2.75% 4/1/32 | | 297,000 | 233,372 |
| Prologis International Funding II SA 4.375% 7/1/36 (Reg. S) | EUR | 100,000 | 113,917 |
| Realty Income Corp.: | | | |
| 2.2% 6/15/28 | | 172,000 | 158,277 |
| 2.85% 12/15/32 | | 211,000 | 181,420 |
| 3.25% 1/15/31 | | 213,000 | 195,624 |
| 3.4% 1/15/28 | | 320,000 | 308,957 |
| Safehold Operating Partnership LP: | | | |
| 2.85% 1/15/32 | | 250,000 | 214,285 |
| 6.1% 4/1/34 | | 145,000 | 150,826 |
| SBA Communications Corp.: | | | |
| 3.125% 2/1/29 | | 1,355,000 | 1,246,893 |
| 3.875% 2/15/27 | | 355,000 | 343,422 |
| Simon Property Group LP 2.45% 9/13/29 | | 333,000 | 302,910 |
| Store Capital LLC: | | | |
| 2.75% 11/18/30 | | 424,000 | 366,626 |
| 4.625% 3/15/29 | | 315,000 | 306,442 |
| Sun Communities Operating LP: | | | |
| 2.3% 11/1/28 | | 341,000 | 308,413 |
| 2.7% 7/15/31 | | 880,000 | 753,601 |
| 4.2% 4/15/32 | | 6,100,000 | 5,657,373 |
| Uniti Group LP/Uniti Fiber Holdings, Inc./CSL Capital LLC 6% 1/15/30 (b) | | 450,000 | 329,661 |
| Uniti Group LP/Uniti Group Finance, Inc./CSL Capital LLC: | | | |
| 4.75% 4/15/28(b) | | 815,000 | 716,595 |
| 6.5% 2/15/29(b) | | 1,185,000 | 907,214 |
| 10.5% 2/15/28(b) | | 970,000 | 995,274 |
| 10.5% 2/15/28(b) | | 320,000 | 328,338 |
| Ventas Realty LP: | | | |
| 3% 1/15/30 | | 1,531,000 | 1,401,140 |
| 3.5% 2/1/25 | | 1,265,000 | 1,253,382 |
| 4% 3/1/28 | | 218,000 | 213,256 |
| 4.75% 11/15/30 | | 2,100,000 | 2,099,038 |
| VICI Properties LP: | | | |
| 4.375% 5/15/25 | | 176,000 | 174,340 |
| 4.75% 2/15/28 | | 1,390,000 | 1,384,530 |
| 4.95% 2/15/30 | | 4,092,000 | 4,077,316 |
| 5.125% 5/15/32 | | 6,485,000 | 6,410,436 |
| 5.75% 4/1/34 | | 411,000 | 423,353 |
| VICI Properties LP / VICI Note Co.: | | | |
| 4.25% 12/1/26(b) | | 365,000 | 360,314 |
| 4.625% 6/15/25(b) | | 160,000 | 158,586 |
| Vornado Realty LP 2.15% 6/1/26 | | 374,000 | 353,812 |
| WP Carey, Inc.: | | | |
| 3.85% 7/15/29 | | 246,000 | 236,756 |
| 4.25% 7/23/32 | EUR | 100,000 | 112,659 |
| | | | 82,995,370 |
| Real Estate Management & Development - 0.3% | | | |
| ACCENTRO Real Estate AG 5.625% 2/13/26 (Reg. S) | EUR | 504,000 | 225,913 |
| AGPS BondCo PLC 4.625% 1/14/26 (Reg. S) (d) | EUR | 1,800,000 | 617,311 |
| Alpha Star Holding VIII Ltd. 8.375% 4/12/27 (Reg. S) | | 200,000 | 206,688 |
| Blackstone Property Partners Europe LP: | | | |
| 1% 5/4/28 (Reg. S) | EUR | 1,093,000 | 1,086,296 |
| 1.75% 3/12/29 (Reg. S) | EUR | 617,000 | 615,894 |
| 2.625% 10/20/28 (Reg. S) | GBP | 254,000 | 296,211 |
| Brandywine Operating Partnership LP: | | | |
| 3.95% 11/15/27 | | 421,000 | 394,404 |
| 4.55% 10/1/29 | | 260,000 | 238,231 |
| 8.05% 3/15/28 | | 1,521,000 | 1,618,463 |
| CBRE Group, Inc. 2.5% 4/1/31 | | 1,070,000 | 922,140 |
| CPI Property Group SA 7% 5/7/29 (Reg. S) | EUR | 355,000 | 395,607 |
| Essex Portfolio LP 5.5% 4/1/34 | | 5,681,000 | 5,831,051 |
| Extra Space Storage LP 5.4% 2/1/34 | | 260,000 | 264,672 |
| Greystar Real Estate Partners 7.75% 9/1/30 (b) | | 85,000 | 90,447 |
| GTC Aurora Luxembourg SA 2.25% 6/23/26 (Reg. S) | EUR | 568,000 | 556,045 |
| Heimstaden AB 4.375% 3/6/27 (Reg. S) | EUR | 700,000 | 621,732 |
| Howard Hughes Corp. 4.375% 2/1/31 (b) | | 190,000 | 170,306 |
| Kennedy-Wilson, Inc. 4.75% 2/1/30 | | 360,000 | 317,677 |
| Logicor Financing SARL: | | | |
| 1.625% 1/17/30 (Reg. S) | EUR | 181,000 | 176,116 |
| 2% 1/17/34 (Reg. S) | EUR | 428,000 | 391,940 |
| 4.25% 7/18/29 (Reg. S) | EUR | 100,000 | 111,543 |
| Realogy Group LLC/Realogy Co-Issuer Corp. 5.75% 1/15/29 (b) | | 195,000 | 139,959 |
| Samhallsbyggnadsbolaget I Norden AB 2.25% 8/12/27 (Reg. S) | EUR | 135,000 | 114,906 |
| Sirius Real Estate Ltd. 1.125% 6/22/26 (Reg. S) | EUR | 400,000 | 421,093 |
| Tanger Properties LP: | | | |
| 2.75% 9/1/31 | | 897,000 | 764,345 |
| 3.125% 9/1/26 | | 2,775,000 | 2,668,915 |
| Taylor Morrison Communities, Inc./Monarch Communities, Inc. 5.75% 1/15/28 (b) | | 365,000 | 368,038 |
| Tritax EuroBox PLC 0.95% 6/2/26 (Reg. S) | EUR | 235,000 | 247,757 |
| | | | 19,873,700 |
TOTAL REAL ESTATE | | | 102,869,070 |
| | | | |
| UTILITIES - 1.2% | | | |
| Electric Utilities - 0.7% | | | |
| Alabama Power Co. 3.05% 3/15/32 | | 1,447,000 | 1,298,889 |
| Amprion GmbH: | | | |
| 3.125% 8/27/30 (Reg. S) | EUR | 200,000 | 218,378 |
| 3.625% 5/21/31 (Reg. S) | EUR | 100,000 | 111,944 |
| Chile Electricity LUX MPC SARL 6.01% 1/20/33 (b) | | 67,550 | 69,788 |
| Clearway Energy Operating LLC: | | | |
| 3.75% 2/15/31(b) | | 680,000 | 617,016 |
| 4.75% 3/15/28(b) | | 95,000 | 92,293 |
| Cleco Corporate Holdings LLC: | | | |
| 3.375% 9/15/29 | | 2,173,000 | 1,981,349 |
| 3.743% 5/1/26 | | 1,337,000 | 1,309,740 |
| DPL, Inc. 4.35% 4/15/29 | | 400,000 | 373,978 |
| Duke Energy Corp.: | | | |
| 2.45% 6/1/30 | | 565,000 | 505,034 |
| 3.85% 6/15/34 | EUR | 349,000 | 381,620 |
| 4.5% 8/15/32 | | 7,000,000 | 6,819,162 |
| Duquesne Light Holdings, Inc.: | | | |
| 2.532% 10/1/30(b) | | 276,000 | 238,773 |
| 2.775% 1/7/32(b) | | 935,000 | 790,519 |
| Edison International 5.75% 6/15/27 | | 2,985,000 | 3,058,722 |
| Electricite de France SA: | | | |
| 4.75% 10/12/34 (Reg. S) | EUR | 400,000 | 473,332 |
| 5.5% 1/25/35 (Reg. S) | GBP | 400,000 | 513,521 |
| EnBW Energie Baden-Wuerttemberg AG 1.375% 8/31/81 (Reg. S) (d) | EUR | 600,000 | 591,295 |
| EnBW International Finance BV 3.5% 7/22/31 (Reg. S) | EUR | 200,000 | 222,252 |
| ENEL Finance International NV 5.5% 6/26/34 (b) | | 300,000 | 304,551 |
| Entergy Corp. 2.8% 6/15/30 | | 580,000 | 524,564 |
| Eskom Holdings SOC Ltd.: | | | |
| 6.35% 8/10/28(b) | | 240,000 | 240,074 |
| 7.125% 2/11/25(b) | | 395,000 | 395,123 |
| 8.45% 8/10/28(b) | | 95,000 | 98,508 |
| Exelon Corp.: | | | |
| 3.35% 3/15/32 | | 389,000 | 354,394 |
| 4.05% 4/15/30 | | 7,865,000 | 7,666,752 |
| 4.1% 3/15/52 | | 288,000 | 232,935 |
| Israel Electric Corp. Ltd. 3.75% 2/22/32 (Reg. S) (b) | | 260,000 | 223,267 |
| Lamar Funding Ltd. 3.958% 5/7/25 (b) | | 205,000 | 203,089 |
| Mong Duong Finance Holdings BV 5.125% 5/7/29 (b) | | 303,581 | 292,291 |
| NextEra Energy Partners LP: | | | |
| 4.25% 9/15/24(b) | | 75,000 | 74,357 |
| 7.25% 1/15/29(b)(c) | | 395,000 | 413,553 |
| NGG Finance PLC 2.125% 9/5/82 (Reg. S) (d) | EUR | 555,000 | 574,564 |
| NRG Energy, Inc.: | | | |
| 5.25% 6/15/29(b) | | 925,000 | 914,370 |
| 5.75% 1/15/28 | | 660,000 | 660,149 |
| 6.625% 1/15/27 | | 170,000 | 170,231 |
| PG&E Corp.: | | | |
| 5% 7/1/28 | | 1,025,000 | 1,003,919 |
| 5.25% 7/1/30 | | 1,175,000 | 1,150,423 |
| Scottish Hydro Electric Transmission PLC 3.375% 9/4/32 (Reg. S) | EUR | 375,000 | 411,557 |
| Southern Co. 1.875% 9/15/81 (d) | EUR | 437,000 | 443,256 |
| Vistra Operations Co. LLC: | | | |
| 5% 7/31/27(b) | | 1,855,000 | 1,836,071 |
| 5.5% 9/1/26(b) | | 1,030,000 | 1,027,828 |
| 5.625% 2/15/27(b) | | 480,000 | 479,278 |
| 7.75% 10/15/31(b) | | 305,000 | 324,526 |
| | | | 39,687,235 |
| Gas Utilities - 0.0% | | | |
| ENN Energy Holdings Ltd. 4.625% 5/17/27 (b) | | 270,000 | 268,481 |
| Independent Power and Renewable Electricity Producers - 0.3% | | | |
| Aydem Yenilenebilir Enerji A/S 7.75% 2/2/27 (b) | | 155,000 | 153,111 |
| Buffalo Energy Mexico Holdings 7.875% 2/15/39 (b) | | 125,000 | 134,028 |
| Calpine Corp.: | | | |
| 4.625% 2/1/29(b) | | 125,000 | 119,227 |
| 5.125% 3/15/28(b) | | 57,000 | 55,620 |
| Energo-Pro A/S 8.5% 2/4/27 (b) | | 200,000 | 201,188 |
| EnfraGen Energia Sur SA 5.375% 12/30/30 (b) | | 540,000 | 461,700 |
| Investment Energy Resources Ltd. 6.25% 4/26/29 (b) | | 220,000 | 217,318 |
| PT Pertamina Geothermal Energy 5.15% 4/27/28 (b) | | 80,000 | 80,725 |
| RWE Finance U.S. LLC 5.875% 4/16/34 (b) | | 782,000 | 807,300 |
| Sunnova Energy Corp.: | | | |
| 5.875% 9/1/26(b) | | 475,000 | 446,239 |
| 11.75% 10/1/28(b) | | 165,000 | 153,199 |
| Termocandelaria Power Ltd. 7.875% 1/30/29 (b) | | 182,000 | 183,764 |
| The AES Corp.: | | | |
| 2.45% 1/15/31 | | 2,504,000 | 2,135,369 |
| 3.3% 7/15/25(b) | | 3,530,000 | 3,460,660 |
| 3.95% 7/15/30(b) | | 8,288,000 | 7,824,711 |
| TransAlta Corp. 6.5% 3/15/40 | | 275,000 | 285,629 |
| | | | 16,719,788 |
| Multi-Utilities - 0.2% | | | |
| Abu Dhabi National Energy Co. PJSC: | | | |
| 4% 10/3/49(b) | | 195,000 | 164,898 |
| 4.696% 4/24/33(b) | | 135,000 | 136,139 |
| 4.875% 4/23/30(b) | | 85,000 | 87,356 |
| Berkshire Hathaway Energy Co. 4.05% 4/15/25 | | 2,556,000 | 2,541,818 |
| E.ON SE 3.375% 1/15/31 (Reg. S) | EUR | 231,000 | 256,917 |
| Engie SA: | | | |
| 3.875% 3/6/36 (Reg. S) | EUR | 300,000 | 334,521 |
| 4.25% 9/6/34 (Reg. S) | EUR | 400,000 | 460,119 |
| NiSource, Inc.: | | | |
| 2.95% 9/1/29 | | 1,708,000 | 1,582,302 |
| 3.6% 5/1/30 | | 4,000,000 | 3,793,071 |
| Puget Energy, Inc.: | | | |
| 4.1% 6/15/30 | | 683,000 | 650,877 |
| 4.224% 3/15/32 | | 1,329,000 | 1,225,507 |
| | | | 11,233,525 |
| Water Utilities - 0.0% | | | |
| Aegea Finance SARL 9% 1/20/31 (b) | | 70,000 | 75,075 |
| Anglian Water (Osprey) Financing PLC 2% 7/31/28 (Reg. S) | GBP | 179,000 | 183,060 |
| Anglian Water Services Financing PLC: | | | |
| 5.875% 6/20/31 (Reg. S) | GBP | 100,000 | 133,181 |
| 6.293% 7/30/30 (Reg. S) | GBP | 305,000 | 418,197 |
| Severn Trent Utilities Finance PLC 4.625% 11/30/34 (Reg. S) | GBP | 348,000 | 427,803 |
| Southern Water Services Finance Ltd.: | | | |
| 1.625% 3/30/27 (Reg. S) | GBP | 222,000 | 242,105 |
| 2.375% 5/28/28 (Reg. S) | GBP | 240,000 | 252,051 |
| SW Finance I PLC 7.375% 12/12/41 (Reg. S) | GBP | 246,000 | 282,663 |
| | | | 2,014,135 |
TOTAL UTILITIES | | | 69,923,164 |
| | | | |
| TOTAL NONCONVERTIBLE BONDS | | | 1,401,041,293 |
| TOTAL CORPORATE BONDS (Cost $1,391,558,413) | | | 1,404,441,919 |
| | | | |
| U.S. Treasury Obligations - 37.4% |
| | | Principal Amount (a) | Value ($) |
| U.S. Treasury Bonds: | | | |
| 1.125% 5/15/40 | | 8,834,000 | 5,717,944 |
| 1.125% 8/15/40 | | 578,000 | 370,823 |
| 1.75% 8/15/41 | | 11,769,000 | 8,180,834 |
| 1.875% 11/15/51 | | 34,881,000 | 21,402,764 |
| 2% 11/15/41 | | 11,400,000 | 8,228,039 |
| 2% 8/15/51 | | 38,514,000 | 24,417,274 |
| 2.25% 8/15/46 | | 73,000 | 51,317 |
| 2.25% 2/15/52 | | 24,090,000 | 16,207,112 |
| 2.875% 5/15/52 (i) | | 24,724,000 | 19,107,016 |
| 3% 2/15/47 | | 17,645,000 | 14,218,699 |
| 3.25% 5/15/42 | | 9,695,000 | 8,447,526 |
| 3.625% 2/15/53 (j) | | 15,396,000 | 13,810,092 |
| 3.625% 5/15/53 | | 19,116,000 | 17,158,850 |
| 3.875% 5/15/43 (k) | | 1,812,000 | 1,710,357 |
| 4.125% 8/15/53 | | 32,681,000 | 32,092,487 |
| 4.25% 2/15/54 | | 177,011,000 | 177,702,449 |
| 4.25% 8/15/54 | | 1,860,000 | 1,871,625 |
| 4.375% 8/15/43 | | 1,251,000 | 1,263,315 |
| 4.5% 2/15/44 | | 1,270,000 | 1,301,750 |
| 4.625% 5/15/44 | | 10,855,000 | 11,304,465 |
| 4.625% 5/15/54 | | 105,640,000 | 112,902,750 |
| 6.25% 5/15/30 | | 2,216,000 | 2,494,991 |
| U.S. Treasury Notes: | | | |
| 1% 7/31/28 (j) | | 2,120,000 | 1,908,248 |
| 2.75% 4/30/27 | | 700,000 | 681,160 |
| 2.875% 4/30/29 | | 5,411,700 | 5,208,973 |
| 2.875% 5/15/32 | | 3,200,400 | 2,994,124 |
| 3.625% 3/31/30 | | 390,000 | 386,999 |
| 3.75% 8/15/27 | | 3,220,000 | 3,216,478 |
| 3.75% 12/31/28 | | 125,190,000 | 125,175,329 |
| 3.75% 5/31/30 | | 537,000 | 536,119 |
| 3.75% 12/31/30 | | 33,017,000 | 32,922,850 |
| 3.875% 8/15/33 | | 40,616,000 | 40,525,566 |
| 3.875% 8/15/34 | | 35,510,000 | 35,376,763 |
| 4% 1/15/27 | | 2,670,000 | 2,678,031 |
| 4% 2/29/28 | | 600,000 | 604,406 |
| 4% 6/30/28 (j) | | 7,000,000 | 7,059,883 |
| 4% 1/31/29 | | 1,812,000 | 1,830,332 |
| 4% 7/31/29 | | 100,000,000 | 101,169,330 |
| 4% 2/28/30 | | 326,000 | 329,642 |
| 4% 1/31/31 | | 25,000,000 | 25,274,414 |
| 4% 2/15/34 | | 59,845,000 | 60,219,031 |
| 4.125% 2/15/27 | | 8,300,000 | 8,351,551 |
| 4.125% 3/31/31 | | 80,315,000 | 81,795,808 |
| 4.125% 7/31/31 | | 107,000,000 | 108,980,238 |
| 4.25% 3/15/27 | | 60,000 | 60,609 |
| 4.25% 2/28/29 | | 26,602,000 | 27,165,214 |
| 4.25% 2/28/31 | | 161,520,000 | 165,633,713 |
| 4.25% 6/30/31 | | 200,010,000 | 205,260,227 |
| 4.375% 10/31/24 | | 1,400,000 | 1,398,004 |
| 4.375% 11/30/28 | | 1,079,000 | 1,105,006 |
| 4.375% 5/15/34 | | 144,300,000 | 149,530,875 |
| 4.5% 5/31/29 | | 1,860,000 | 1,921,395 |
| 4.5% 11/15/33 | | 132,200,000 | 138,205,805 |
| 4.625% 2/28/25 | | 1,500,000 | 1,498,852 |
| 4.625% 3/15/26 | | 1,010,000 | 1,017,891 |
| 4.625% 11/15/26 | | 12,568,000 | 12,758,975 |
| 4.625% 6/15/27 | | 3,530,000 | 3,606,116 |
| 4.625% 9/30/28 | | 168,000 | 173,434 |
| 4.625% 4/30/29 | | 66,030,000 | 68,495,808 |
| 4.625% 9/30/30 | | 160,000 | 167,156 |
| 4.625% 4/30/31 | | 147,000,000 | 153,993,984 |
| 4.875% 10/31/28 | | 732,000 | 763,139 |
| TOTAL U.S. TREASURY OBLIGATIONS (Cost $2,089,881,778) | | | 2,079,943,957 |
| | | | |
| U.S. Government Agency - Mortgage Securities - 26.2% |
| | | Principal Amount (a) | Value ($) |
| Fannie Mae - 5.3% | | | |
| FTSE USD IBOR Consumer Cash Fallbacks Term 1Y + 1.360% 5.873% 10/1/35 (d)(e) | | 2,726 | 2,798 |
| FTSE USD IBOR Consumer Cash Fallbacks Term 1Y + 1.440% 5.945% 4/1/37 (d)(e) | | 633 | 648 |
| FTSE USD IBOR Consumer Cash Fallbacks Term 1Y + 1.460% 6.085% 1/1/35 (d)(e) | | 1,352 | 1,384 |
| FTSE USD IBOR Consumer Cash Fallbacks Term 1Y + 1.480% 7.48% 7/1/34 (d)(e) | | 186 | 191 |
| FTSE USD IBOR Consumer Cash Fallbacks Term 1Y + 1.500% 6.755% 1/1/35 (d)(e) | | 990 | 1,004 |
| FTSE USD IBOR Consumer Cash Fallbacks Term 1Y + 1.510% 7.26% 2/1/33 (d)(e) | | 172 | 174 |
| FTSE USD IBOR Consumer Cash Fallbacks Term 1Y + 1.530% 6.461% 12/1/34 (d)(e) | | 349 | 354 |
| FTSE USD IBOR Consumer Cash Fallbacks Term 1Y + 1.550% 6.803% 5/1/44 (d)(e) | | 17 | 18 |
| FTSE USD IBOR Consumer Cash Fallbacks Term 1Y + 1.550% 7.125% 9/1/33 (d)(e) | | 10,511 | 10,659 |
| FTSE USD IBOR Consumer Cash Fallbacks Term 1Y + 1.550% 7.428% 6/1/36 (d)(e) | | 1,568 | 1,613 |
| FTSE USD IBOR Consumer Cash Fallbacks Term 1Y + 1.560% 6.065% 3/1/37 (d)(e) | | 5,164 | 5,297 |
| FTSE USD IBOR Consumer Cash Fallbacks Term 1Y + 1.570% 6.175% 4/1/44 (d)(e) | | 1,873 | 1,926 |
| FTSE USD IBOR Consumer Cash Fallbacks Term 1Y + 1.580% 5.83% 1/1/44 (d)(e) | | 1,033 | 1,063 |
| FTSE USD IBOR Consumer Cash Fallbacks Term 1Y + 1.580% 6.08% 4/1/44 (d)(e) | | 729 | 749 |
| FTSE USD IBOR Consumer Cash Fallbacks Term 1Y + 1.630% 5.815% 9/1/36 (d)(e) | | 150 | 154 |
| FTSE USD IBOR Consumer Cash Fallbacks Term 1Y + 1.640% 6.413% 5/1/35 (d)(e) | | 1,155 | 1,187 |
| FTSE USD IBOR Consumer Cash Fallbacks Term 1Y + 1.640% 6.414% 3/1/33 (d)(e) | | 3,315 | 3,390 |
| FTSE USD IBOR Consumer Cash Fallbacks Term 1Y + 1.640% 6.837% 11/1/36 (d)(e) | | 1,771 | 1,819 |
| FTSE USD IBOR Consumer Cash Fallbacks Term 1Y + 1.680% 7.061% 5/1/36 (d)(e) | | 1,117 | 1,148 |
| FTSE USD IBOR Consumer Cash Fallbacks Term 1Y + 1.690% 6.406% 7/1/43 (d)(e) | | 9,374 | 9,644 |
| FTSE USD IBOR Consumer Cash Fallbacks Term 1Y + 1.700% 7.167% 6/1/42 (d)(e) | | 6,040 | 6,214 |
| FTSE USD IBOR Consumer Cash Fallbacks Term 1Y + 1.730% 6.028% 3/1/40 (d)(e) | | 4,610 | 4,742 |
| FTSE USD IBOR Consumer Cash Fallbacks Term 1Y + 1.750% 6.434% 8/1/41 (d)(e) | | 2,047 | 2,105 |
| FTSE USD IBOR Consumer Cash Fallbacks Term 1Y + 1.750% 6.439% 7/1/35 (d)(e) | | 2,916 | 2,996 |
| FTSE USD IBOR Consumer Cash Fallbacks Term 1Y + 1.770% 5.994% 2/1/37 (d)(e) | | 11,457 | 11,786 |
| FTSE USD IBOR Consumer Cash Fallbacks Term 1Y + 1.800% 6.055% 1/1/42 (d)(e) | | 22,423 | 23,068 |
| FTSE USD IBOR Consumer Cash Fallbacks Term 1Y + 1.800% 6.444% 12/1/40 (d)(e) | | 35,752 | 36,780 |
| FTSE USD IBOR Consumer Cash Fallbacks Term 1Y + 1.800% 7.635% 7/1/41 (d)(e) | | 1,853 | 1,907 |
| FTSE USD IBOR Consumer Cash Fallbacks Term 1Y + 1.810% 6.06% 12/1/39 (d)(e) | | 421 | 433 |
| FTSE USD IBOR Consumer Cash Fallbacks Term 1Y + 1.810% 6.068% 9/1/41 (d)(e) | | 2,704 | 2,782 |
| FTSE USD IBOR Consumer Cash Fallbacks Term 1Y + 1.810% 6.297% 2/1/42 (d)(e) | | 9,971 | 10,257 |
| FTSE USD IBOR Consumer Cash Fallbacks Term 1Y + 1.810% 7.64% 7/1/41 (d)(e) | | 3,678 | 3,784 |
| FTSE USD IBOR Consumer Cash Fallbacks Term 1Y + 1.820% 6.297% 2/1/35 (d)(e) | | 1,720 | 1,768 |
| FTSE USD IBOR Consumer Cash Fallbacks Term 1Y + 1.830% 6.08% 10/1/41 (d)(e) | | 2,387 | 2,422 |
| FTSE USD IBOR Consumer Cash Fallbacks Term 1Y + 1.850% 6.429% 4/1/36 (d)(e) | | 8,903 | 9,159 |
| FTSE USD IBOR Consumer Cash Fallbacks Term 1Y + 1.890% 6.522% 8/1/35 (d)(e) | | 5,173 | 5,293 |
| FTSE USD IBOR Consumer Cash Fallbacks Term 1Y + 1.950% 7.703% 7/1/37 (d)(e) | | 1,959 | 2,015 |
| FTSE USD IBOR Consumer Cash Fallbacks Term 1Y + 1.960% 6.418% 9/1/35 (d)(e) | | 173 | 178 |
| U.S. TREASURY 1 YEAR INDEX + 2.150% 6.429% 7/1/36 (d)(e) | | 968 | 979 |
| U.S. TREASURY 1 YEAR INDEX + 2.200% 6.583% 3/1/35 (d)(e) | | 512 | 520 |
| U.S. TREASURY 1 YEAR INDEX + 2.270% 6.395% 6/1/36 (d)(e) | | 921 | 936 |
| U.S. TREASURY 1 YEAR INDEX + 2.280% 6.402% 10/1/33 (d)(e) | | 833 | 846 |
| U.S. TREASURY 1 YEAR INDEX + 2.460% 7.177% 7/1/34 (d)(e) | | 926 | 944 |
| 1.5% 9/1/35 to 6/1/51 | | 10,677,933 | 9,015,298 |
| 2% 2/1/28 to 3/1/52 (j) | | 60,370,784 | 51,908,940 |
| 2.5% 11/1/29 to 5/1/53 | | 81,668,145 | 71,646,309 |
| 3% 2/1/31 to 3/1/52 | | 36,864,997 | 33,563,913 |
| 3.5% 9/1/33 to 9/1/52 | | 35,269,775 | 33,141,522 |
| 4% 3/1/36 to 4/1/52 | | 23,880,413 | 23,143,253 |
| 4.5% to 4.5% 6/1/25 to 2/1/53 | | 19,241,198 | 18,791,185 |
| 5% 7/1/33 to 4/1/53 | | 3,007,094 | 3,032,297 |
| 5.288% 8/1/41 (d) | | 24,468 | 24,721 |
| 5.5% 8/1/25 to 8/1/54 | | 20,967,013 | 21,200,728 |
| 6% to 6% 9/1/29 to 7/1/54 (j) | | 17,621,491 | 18,010,083 |
| 6.5% 7/1/32 to 7/1/54 | | 11,868,176 | 12,289,193 |
| 6.723% 2/1/39 (d) | | 9,928 | 10,259 |
| 7% to 7% 8/1/25 to 6/1/32 | | 3,883 | 4,039 |
| 7.5% 3/1/26 to 11/1/31 | | 3,089 | 3,161 |
TOTAL FANNIE MAE | | | 295,962,035 |
| Freddie Mac - 2.8% | | | |
| FTSE USD IBOR Consumer Cash Fallbacks Term 1Y + 1.320% 5.575% 1/1/36 (d)(e) | | 2,796 | 2,837 |
| FTSE USD IBOR Consumer Cash Fallbacks Term 1Y + 1.370% 5.625% 3/1/36 (d)(e) | | 1,915 | 1,952 |
| FTSE USD IBOR Consumer Cash Fallbacks Term 1Y + 1.500% 5.824% 3/1/36 (d)(e) | | 1,464 | 1,494 |
| FTSE USD IBOR Consumer Cash Fallbacks Term 1Y + 1.660% 6.04% 7/1/36 (d)(e) | | 9,446 | 9,654 |
| FTSE USD IBOR Consumer Cash Fallbacks Term 1Y + 1.660% 6.165% 1/1/37 (d)(e) | | 2,291 | 2,331 |
| FTSE USD IBOR Consumer Cash Fallbacks Term 1Y + 1.660% 7.415% 7/1/35 (d)(e) | | 1,664 | 1,690 |
| FTSE USD IBOR Consumer Cash Fallbacks Term 1Y + 1.750% 6% 12/1/40 (d)(e) | | 13,546 | 13,935 |
| FTSE USD IBOR Consumer Cash Fallbacks Term 1Y + 1.750% 6% 9/1/41 (d)(e) | | 40,774 | 41,946 |
| FTSE USD IBOR Consumer Cash Fallbacks Term 1Y + 1.750% 7.567% 7/1/41 (d)(e) | | 3,372 | 3,469 |
| FTSE USD IBOR Consumer Cash Fallbacks Term 1Y + 1.860% 6.422% 10/1/36 (d)(e) | | 11,850 | 12,087 |
| FTSE USD IBOR Consumer Cash Fallbacks Term 1Y + 1.860% 7.239% 4/1/36 (d)(e) | | 1,005 | 1,034 |
| FTSE USD IBOR Consumer Cash Fallbacks Term 1Y + 1.880% 6.13% 9/1/41 (d)(e) | | 3,795 | 3,904 |
| FTSE USD IBOR Consumer Cash Fallbacks Term 1Y + 1.880% 6.13% 10/1/41 (d)(e) | | 26,983 | 27,759 |
| FTSE USD IBOR Consumer Cash Fallbacks Term 1Y + 1.880% 7.255% 4/1/41 (d)(e) | | 877 | 903 |
| FTSE USD IBOR Consumer Cash Fallbacks Term 1Y + 1.910% 7.155% 5/1/41 (d)(e) | | 7,085 | 7,289 |
| FTSE USD IBOR Consumer Cash Fallbacks Term 1Y + 1.910% 7.54% 5/1/41 (d)(e) | | 6,946 | 7,146 |
| FTSE USD IBOR Consumer Cash Fallbacks Term 1Y + 1.910% 7.628% 6/1/41 (d)(e) | | 6,823 | 7,020 |
| FTSE USD IBOR Consumer Cash Fallbacks Term 1Y + 1.910% 7.785% 6/1/41 (d)(e) | | 2,768 | 2,847 |
| FTSE USD IBOR Consumer Cash Fallbacks Term 1Y + 1.920% 6.601% 10/1/42 (d)(e) | | 16,205 | 16,671 |
| FTSE USD IBOR Consumer Cash Fallbacks Term 1Y + 1.990% 7% 10/1/35 (d)(e) | | 8,298 | 8,457 |
| FTSE USD IBOR Consumer Cash Fallbacks Term 1Y + 2.010% 7.635% 5/1/37 (d)(e) | | 1,599 | 1,637 |
| FTSE USD IBOR Consumer Cash Fallbacks Term 1Y + 2.020% 6.936% 4/1/38 (d)(e) | | 837 | 861 |
| FTSE USD IBOR Consumer Cash Fallbacks Term 1Y + 2.020% 7.635% 6/1/37 (d)(e) | | 3,445 | 3,528 |
| FTSE USD IBOR Consumer Cash Fallbacks Term 1Y + 2.030% 6.158% 3/1/33 (d)(e) | | 33 | 34 |
| FTSE USD IBOR Consumer Cash Fallbacks Term 1Y + 2.040% 7.91% 7/1/36 (d)(e) | | 7,224 | 7,432 |
| FTSE USD IBOR Consumer Cash Fallbacks Term 1Y + 2.200% 6.45% 12/1/36 (d)(e) | | 1,199 | 1,234 |
| FTSE USD IBOR Consumer Cash Fallbacks Term 1Y + 3.010% 8.637% 10/1/35 (d)(e) | | 518 | 533 |
| U.S. TREASURY 1 YEAR INDEX + 2.030% 6.782% 6/1/33 (d)(e) | | 11,253 | 11,352 |
| U.S. TREASURY 1 YEAR INDEX + 2.230% 6.969% 4/1/34 (d)(e) | | 3,678 | 3,727 |
| U.S. TREASURY 1 YEAR INDEX + 2.260% 7.127% 6/1/33 (d)(e) | | 3,018 | 3,055 |
| U.S. TREASURY 1 YEAR INDEX + 2.460% 6.899% 3/1/35 (d)(e) | | 5,256 | 5,342 |
| U.S. TREASURY 1 YEAR INDEX + 2.540% 7.588% 7/1/35 (d)(e) | | 6,474 | 6,608 |
| 1.5% 8/1/35 to 4/1/51 | | 14,750,915 | 12,166,658 |
| 2% 12/1/35 to 3/1/52 | | 56,460,067 | 47,679,742 |
| 2.5% 1/1/31 to 1/1/52 | | 26,338,888 | 23,426,466 |
| 3% 12/1/30 to 6/1/52 | | 12,820,276 | 11,518,267 |
| 3.5% 3/1/32 to 4/1/52 | | 11,513,186 | 10,898,989 |
| 4% 1/1/36 to 10/1/52 | | 3,467,754 | 3,364,109 |
| 4% 4/1/48 | | 1,114 | 1,074 |
| 4.5% 7/1/25 to 1/1/54 | | 1,424,677 | 1,407,797 |
| 5% 8/1/33 to 8/1/53 | | 6,946,615 | 6,984,250 |
| 5.5% 11/1/52 to 2/1/54 (k) | | 5,980,784 | 6,099,913 |
| 6% 5/1/29 to 4/1/54 | | 25,181,624 | 26,014,759 |
| 6.5% 1/1/32 to 1/1/54 | | 4,479,057 | 4,667,306 |
| 7% 8/1/26 to 9/1/36 | | 8,050 | 8,397 |
| 7.5% 1/1/27 | | 9 | 9 |
| 8% 7/1/30 to 8/1/30 | | 142 | 148 |
| 8.5% 8/1/27 | | 65 | 66 |
TOTAL FREDDIE MAC | | | 154,457,718 |
| Ginnie Mae - 7.3% | | | |
| 3.5% 11/20/41 to 12/20/49 | | 930,133 | 881,477 |
| 4% 8/15/39 to 10/20/52 | | 3,721,296 | 3,584,049 |
| 4.5% 6/20/33 to 5/20/54 | | 4,753,042 | 4,661,427 |
| 5.5% 10/15/35 to 9/15/39 | | 18,052 | 18,607 |
| 7% to 7% 4/15/28 to 8/15/32 | | 4,135 | 4,270 |
| 7.5% to 7.5% 4/15/27 to 1/15/31 | | 934 | 955 |
| 8% 7/15/25 to 7/15/27 | | 15 | 15 |
| 8.5% 8/15/29 to 7/15/30 | | 31 | 33 |
| 2% 10/20/50 to 4/20/52 | | 57,844,373 | 48,677,941 |
| 2% 9/1/54 (h) | | 2,850,000 | 2,399,550 |
| 2% 9/1/54 (h) | | 7,100,000 | 5,977,826 |
| 2% 9/1/54 (h) | | 7,200,000 | 6,062,021 |
| 2% 9/1/54 (h) | | 2,150,000 | 1,810,187 |
| 2% 9/1/54 (h) | | 2,600,000 | 2,189,063 |
| 2% 9/1/54 (h) | | 6,900,000 | 5,809,436 |
| 2% 9/1/54 (h) | | 3,150,000 | 2,652,134 |
| 2% 9/1/54 (h) | | 3,450,000 | 2,904,718 |
| 2% 10/1/54 (h) | | 5,250,000 | 4,425,145 |
| 2.5% 12/20/50 to 5/20/52 | | 43,169,203 | 37,574,390 |
| 2.5% 9/1/54 (h) | | 16,000,000 | 13,981,557 |
| 3% 2/20/31 to 2/20/50 | | 2,150,251 | 2,066,400 |
| 3% 9/1/54 (h) | | 4,625,000 | 4,182,456 |
| 3% 9/1/54 (h) | | 13,900,000 | 12,569,976 |
| 3% 9/1/54 (h) | | 1,600,000 | 1,446,904 |
| 3% 9/1/54 (h) | | 1,600,000 | 1,446,904 |
| 3% 9/1/54 (h) | | 1,600,000 | 1,446,904 |
| 3% 9/1/54 (h) | | 3,900,000 | 3,526,828 |
| 3% 9/1/54 (h) | | 8,650,000 | 7,822,323 |
| 3% 9/1/54 (h) | | 1,475,000 | 1,333,864 |
| 3% 10/1/54 (h) | | 4,000,000 | 3,620,072 |
| 3% 10/1/54 (h) | | 7,800,000 | 7,059,140 |
| 3.5% 9/1/54 (h) | | 10,500,000 | 9,771,585 |
| 3.5% 9/1/54 (h) | | 800,000 | 744,502 |
| 3.5% 9/1/54 (h) | | 7,075,000 | 6,584,187 |
| 3.5% 9/1/54 (h) | | 5,250,000 | 4,885,792 |
| 3.5% 9/1/54 (h) | | 5,225,000 | 4,862,527 |
| 4% 9/1/54 (h) | | 10,600,000 | 10,128,948 |
| 4.5% 9/1/54 (h) | | 2,450,000 | 2,398,132 |
| 4.5% 9/1/54 (h) | | 250,000 | 244,707 |
| 5% 9/20/33 to 4/20/48 | | 326,274 | 332,246 |
| 5% 9/1/54 (h) | | 5,150,000 | 5,139,116 |
| 5% 9/1/54 (h) | | 700,000 | 698,521 |
| 5% 9/1/54 (h) | | 6,300,000 | 6,286,686 |
| 5% 9/1/54 (h) | | 3,350,000 | 3,342,920 |
| 5% 9/1/54 (h) | | 2,225,000 | 2,220,298 |
| 5% 10/1/54 (h) | | 7,950,000 | 7,922,019 |
| 5% 10/1/54 (h) | | 6,250,000 | 6,228,003 |
| 5% 10/1/54 (h) | | 3,525,000 | 3,512,593 |
| 5.47% 8/20/59 (d)(l) | | 174 | 168 |
| 5.5% 9/1/54 (h) | | 4,400,000 | 4,428,145 |
| 5.5% 9/1/54 (h) | | 2,750,000 | 2,767,591 |
| 5.5% 9/1/54 (h) | | 4,350,000 | 4,377,825 |
| 5.5% 9/1/54 (h) | | 4,400,000 | 4,428,145 |
| 5.5% 9/1/54 (h) | | 13,600,000 | 13,686,994 |
| 5.5% 10/1/54 (h) | | 15,575,000 | 15,670,976 |
| 6% 11/20/31 to 5/15/40 | | 186,227 | 192,725 |
| 6% 9/1/54 (h) | | 2,700,000 | 2,739,155 |
| 6% 9/1/54 (h) | | 250,000 | 253,625 |
| 6% 9/1/54 (h) | | 125,000 | 126,813 |
| 6% 9/1/54 (h) | | 3,400,000 | 3,449,306 |
| 6% 9/1/54 (h) | | 2,025,000 | 2,054,366 |
| 6% 9/1/54 (h) | | 1,500,000 | 1,521,753 |
| 6% 9/1/54 (h) | | 8,000,000 | 8,116,015 |
| 6% 9/1/54 (h) | | 8,550,000 | 8,673,991 |
| 6% 9/1/54 (h) | | 2,750,000 | 2,789,880 |
| 6% 9/1/54 (h) | | 23,100,000 | 23,434,994 |
| 6% 10/1/54 (h) | | 21,850,000 | 22,157,480 |
| 6.5% 3/20/31 to 9/15/34 | | 605 | 626 |
| 6.5% 9/1/54 (h) | | 2,325,000 | 2,373,796 |
| 6.5% 9/1/54 (h) | | 4,125,000 | 4,211,573 |
| 6.5% 9/1/54 (h) | | 3,650,000 | 3,726,604 |
| 6.5% 9/1/54 (h) | | 10,300,000 | 10,516,171 |
TOTAL GINNIE MAE | | | 407,138,071 |
| Uniform Mortgage Backed Securities - 10.8% | | | |
| 2% 9/1/39 (h) | | 4,700,000 | 4,250,195 |
| 2% 9/1/39 (h) | | 8,325,000 | 7,528,272 |
| 2% 10/1/39 (h) | | 5,650,000 | 5,116,340 |
| 2% 9/1/54 (h) | | 95,800,000 | 78,353,919 |
| 2% 9/1/54 (h) | | 9,350,000 | 7,647,277 |
| 2% 9/1/54 (h) | | 9,350,000 | 7,647,277 |
| 2% 9/1/54 (h) | | 9,550,000 | 7,810,855 |
| 2% 9/1/54 (h) | | 2,750,000 | 2,249,199 |
| 2% 9/1/54 (h) | | 3,775,000 | 3,087,537 |
| 2% 9/1/54 (h) | | 18,700,000 | 15,294,554 |
| 2% 9/1/54 (h) | | 15,300,000 | 12,513,726 |
| 2% 9/1/54 (h) | | 32,500,000 | 26,581,445 |
| 2% 9/1/54 (h) | | 200,000 | 163,578 |
| 2% 10/1/54 (h) | | 43,550,000 | 35,666,766 |
| 2% 10/1/54 (h) | | 45,400,000 | 37,181,887 |
| 2.5% 9/1/39 (h) | | 4,300,000 | 3,987,074 |
| 2.5% 9/1/54 (h) | | 26,950,000 | 22,973,821 |
| 2.5% 9/1/54 (h) | | 8,200,000 | 6,990,179 |
| 2.5% 9/1/54 (h) | | 8,000,000 | 6,819,687 |
| 2.5% 9/1/54 (h) | | 4,550,000 | 3,878,697 |
| 2.5% 9/1/54 (h) | | 3,500,000 | 2,983,613 |
| 2.5% 9/1/54 (h) | | 31,800,000 | 27,108,257 |
| 2.5% 9/1/54 (h) | | 350,000 | 298,361 |
| 2.5% 10/1/54 (h) | | 31,650,000 | 27,012,534 |
| 3% 9/1/54 (h) | | 25,850,000 | 22,918,651 |
| 3% 10/1/54 (h) | | 14,200,000 | 12,601,945 |
| 3.5% 9/1/54 (h) | | 8,375,000 | 7,708,599 |
| 4% 9/1/54 (h) | | 8,125,000 | 7,705,102 |
| 4% 9/1/54 (h) | | 825,000 | 782,364 |
| 4.5% 9/1/54 (h) | | 3,050,000 | 2,968,151 |
| 5% 9/1/39 (h) | | 5,000,000 | 5,034,961 |
| 5% 9/1/39 (h) | | 5,750,000 | 5,790,205 |
| 5% 9/1/39 (h) | | 4,450,000 | 4,481,115 |
| 5.5% 9/1/39 (h) | | 16,000,000 | 16,245,000 |
| 5.5% 9/1/54 (h) | | 9,350,000 | 9,413,916 |
| 5.5% 9/1/54 (h) | | 14,850,000 | 14,951,513 |
| 5.5% 9/1/54 (h) | | 28,400,000 | 28,594,140 |
| 6% 9/1/54 (h) | | 1,150,000 | 1,171,158 |
| 6% 9/1/54 (h) | | 1,350,000 | 1,374,838 |
| 6% 9/1/54 (h) | | 1,300,000 | 1,323,918 |
| 6% 9/1/54 (h) | | 350,000 | 356,439 |
| 6% 9/1/54 (h) | | 14,200,000 | 14,461,257 |
| 6% 9/1/54 (h) | | 31,900,000 | 32,486,909 |
| 6% 9/1/54 (h) | | 1,600,000 | 1,629,437 |
| 6% 9/1/54 (h) | | 7,000,000 | 7,128,789 |
| 6.5% 9/1/54 (h) | | 11,725,000 | 12,072,627 |
| 6.5% 9/1/54 (h) | | 21,000,000 | 21,622,616 |
| 6.5% 9/1/54 (h) | | 12,800,000 | 13,179,500 |
TOTAL UNIFORM MORTGAGE BACKED SECURITIES | | | 599,148,200 |
| TOTAL U.S. GOVERNMENT AGENCY - MORTGAGE SECURITIES (Cost $1,441,354,982) | | | 1,456,706,024 |
| | | | |
| Asset-Backed Securities - 6.9% |
| | | Principal Amount (a) | Value ($) |
| Aaset 2024-1 U.S. Ltd. / Aaset 20 Series 2024-1A: | | | |
| Class A1, 6.261% 5/16/49 (b) | | 2,140,064 | 2,210,631 |
| Class A2, 6.261% 5/16/49 (b) | | 2,032,419 | 2,099,436 |
| AASET Trust: | | | |
| Series 2018-1A Class A, 3.844% 1/16/38 (b) | | 264,268 | 189,479 |
| Series 2019-1 Class A, 3.844% 5/15/39 (b) | | 51,085 | 49,299 |
| Series 2019-2: | | | |
Class A, 3.376% 10/16/39 (b) | | 673,430 | 642,323 |
Class B, 4.458% 10/16/39 (b) | | 220,258 | 132,157 |
| Series 2021-1A Class A, 2.95% 11/16/41 (b) | | 6,553,777 | 6,093,354 |
| Series 2021-2A Class A, 2.798% 1/15/47 (b) | | 1,803,804 | 1,635,049 |
| AASET, Ltd. Series 2022-1A Class A, 6% 5/16/47 (b) | | 1,301,170 | 1,301,523 |
| Affirm Asset Securitization Trust: | | | |
| Series 2024-A Class 1A, 5.61% 2/15/29 (b) | | 600,000 | 605,535 |
| Series 2024-X1 Class A, 6.27% 5/15/29 (b) | | 752,416 | 754,448 |
| Aimco: | | | |
| Series 2024-10A Class ARR, CME Term SOFR 3 Month Index + 1.410% 6.692% 7/22/37 (b)(d)(e) | | 1,558,000 | 1,563,791 |
| Series 2024-BA Class ARR, CME Term SOFR 3 Month Index + 1.500% 6.7861% 4/16/37 (b)(d)(e) | | 2,803,000 | 2,811,361 |
| Aimco Clo 17 Ltd. / Aimco Clo 1 Series 2024-17A Class A1R, CME Term SOFR 3 Month Index + 1.350% 6.632% 7/20/37 (b)(d)(e) | | 3,344,966 | 3,346,100 |
| Aimco Clo 22 Ltd. / Aimco Clo 2 Series 2024-22A Class A, CME Term SOFR 3 Month Index + 1.500% 6.8266% 4/19/37 (b)(d)(e) | | 4,549,000 | 4,566,536 |
| AIMCO CLO Ltd. Series 2024-11A Class A1R2, CME Term SOFR 3 Month Index + 1.340% 6.5839% 7/17/37 (b)(d)(e) | | 3,208,000 | 3,207,952 |
| AIMCO CLO Ltd. / AIMCO CLO LLC Series 2021-14A Class A, CME Term SOFR 3 Month Index + 1.250% 6.5336% 4/20/34 (b)(d)(e) | | 2,222,000 | 2,223,180 |
| Allegro Clo Xii Ltd. Series 2024-1A Class A1R, CME Term SOFR 3 Month Index + 1.440% 6.7236% 7/21/37 (b)(d)(e) | | 4,615,000 | 4,621,923 |
| Allegro CLO XV, Ltd. / Allegro CLO VX LLC Series 2022-1A Class A, CME Term SOFR 3 Month Index + 1.500% 6.782% 7/20/35 (b)(d)(e) | | 1,188,000 | 1,188,757 |
| Allegro CLO, Ltd. Series 2021-1A Class A, CME Term SOFR 3 Month Index + 1.400% 6.6836% 7/20/34 (b)(d)(e) | | 992,000 | 990,756 |
| Ally Auto Receivables Trust Series 2024-1 Class A3, 5.08% 12/15/28 | | 1,530,000 | 1,542,952 |
| American Express Credit Account Master Trust Series 2023-1 Class A, 4.87% 5/15/28 | | 1,220,000 | 1,228,049 |
| Apollo Aviation Securitization Equity Trust Series 2020-1A: | | | |
| Class A, 3.351% 1/16/40 (b) | | 243,158 | 232,218 |
| Class B, 4.335% 1/16/40 (b) | | 138,939 | 114,959 |
| Ares CLO Series 2024-54A Class AR, CME Term SOFR 3 Month Index + 1.270% 6.5714% 10/15/32 (b)(d)(e) | | 3,193,000 | 3,193,619 |
| Ares LIX CLO Ltd. Series 2021-59A Class A, CME Term SOFR 3 Month Index + 1.290% 6.5762% 4/25/34 (b)(d)(e) | | 657,000 | 657,048 |
| Ares Ln Funding V Ltd. / Ares Ln Fund Series 2024-ALF5A Class A1, CME Term SOFR 3 Month Index + 1.500% 6.8235% 7/27/37 (b)(d)(e) | | 2,845,000 | 2,852,326 |
| Ares Loan Funding Vii Ltd. Series 2024-ALF7 Class E, CME Term SOFR 3 Month Index + 6.250% 6.25% 10/22/37 (b)(d)(e)(h) | | 100,000 | 100,000 |
| Ares LV CLO Ltd. Series 2021-55A Class A1R, CME Term SOFR 3 Month Index + 1.390% 6.693% 7/15/34 (b)(d)(e) | | 923,000 | 924,019 |
| Ares LVIII CLO LLC Series 2022-58A Class AR, CME Term SOFR 3 Month Index + 1.330% 6.6314% 1/15/35 (b)(d)(e) | | 1,808,000 | 1,809,237 |
| Ares XLI CLO Ltd. / Ares XLI CLO LLC Series 2021-41A Class AR2, CME Term SOFR 3 Month Index + 1.330% 6.633% 4/15/34 (b)(d)(e) | | 3,233,000 | 3,233,521 |
| Ari Fleet Lease Trust 2024-B Series 2024-B Class A2, 5.54% 4/15/33 (b) | | 797,000 | 804,398 |
| Babson CLO Ltd. Series 2021-1A Class AR, CME Term SOFR 3 Month Index + 1.410% 6.713% 10/15/36 (b)(d)(e) | | 860,000 | 860,808 |
| Barings CLO Ltd.: | | | |
| Series 2021-1A Class A, CME Term SOFR 3 Month Index + 1.280% 6.5662% 4/25/34 (b)(d)(e) | | 1,437,000 | 1,437,568 |
| Series 2021-4A Class A, CME Term SOFR 3 Month Index + 1.480% 6.7636% 1/20/32 (b)(d)(e) | | 978,614 | 978,614 |
| Series 2024-4A Class AR, 0% 10/20/37 (b)(d) | | 2,246,000 | 2,246,000 |
| Barings CLO Ltd. 2023-IV Series 2024-4A Class A, CME Term SOFR 3 Month Index + 1.750% 7.032% 1/20/37 (b)(d)(e) | | 2,868,000 | 2,901,392 |
| Bbam U.S. Clo Iv Ltd. Series 2024-4A Class D, CME Term SOFR 3 Month Index + 6.250% 11.5729% 7/15/39 (b)(d)(e) | | 250,000 | 247,802 |
| Beechwood Park CLO Ltd. Series 2022-1A Class A1R, CME Term SOFR 3 Month Index + 1.300% 6.5858% 1/17/35 (b)(d)(e) | | 1,857,000 | 1,857,297 |
| BETHP Series 2021-1A Class A, CME Term SOFR 3 Month Index + 1.390% 6.693% 1/15/35 (b)(d)(e) | | 1,299,000 | 1,300,337 |
| Birch Grove Clo 4 Ltd. Series 2024-4A Class ER, CME Term SOFR 3 Month Index + 6.500% 11.8014% 7/15/37 (b)(d)(e) | | 250,000 | 245,030 |
| Blackbird Capital Aircraft Series 2021-1A Class A, 2.443% 7/15/46 (b) | | 1,676,096 | 1,526,200 |
| Blueberry Park Clo Ltd. Series 2024-1A Class A, CME Term SOFR 3 Month Index + 1.350% 1.35% 10/20/37 (b)(d)(e)(h) | | 3,992,000 | 3,993,357 |
| Bofa Auto Trust 2024-1 Series 2024-1A Class A3, 5.35% 11/15/28 (b) | | 638,000 | 648,368 |
| Bristol Park CLO, Ltd. Series 2020-1A Class AR, CME Term SOFR 3 Month Index + 1.250% 6.553% 4/15/29 (b)(d)(e) | | 183,911 | 184,027 |
| Carlyle U.S. CLO Ltd. Series 2024-11A Class A1R, CME Term SOFR 3 Month Index + 1.410% 6.7329% 7/25/37 (b)(d)(e) | | 3,813,000 | 3,813,183 |
| Carmax Auto Owner Trust Series 2024-2 Class A3, 5.5% 1/16/29 | | 1,162,000 | 1,185,826 |
| Carmax Auto Owner Trust 2023-4 Series 2023-4 Class A3, 6% 7/17/28 | | 1,036,000 | 1,058,699 |
| Carmax Select Receivables Trust Series 2024-A: | | | |
| Class A2A, 5.78% 9/15/27 | | 593,000 | 595,454 |
| Class A3, 5.4% 11/15/28 | | 471,000 | 477,588 |
| Castlelake Aircraft Securitization Trust Series 2019-1A: | | | |
| Class A, 3.967% 4/15/39 (b) | | 628,814 | 575,385 |
| Class B, 5.095% 4/15/39 (b) | | 488,890 | 333,779 |
| Castlelake Aircraft Structured Trust: | | | |
| Series 2018-1 Class A, 4.125% 6/15/43 (b) | | 130,201 | 121,421 |
| Series 2021-1A Class A, 3.474% 1/15/46 (b) | | 167,300 | 160,730 |
| Cedar Funding Series 2024-18A Class A, CME Term SOFR 3 Month Index + 1.550% 6.833% 4/23/37 (b)(d)(e) | | 7,100,000 | 7,136,899 |
| Cedar Funding Ltd.: | | | |
| Series 2021-10A Class AR, CME Term SOFR 3 Month Index + 1.360% 6.6436% 10/20/32 (b)(d)(e) | | 1,037,000 | 1,037,190 |
| Series 2021-12A Class A1R, CME Term SOFR 3 Month Index + 1.390% 6.6762% 10/25/34 (b)(d)(e) | | 838,000 | 838,604 |
| Series 2022-15A Class A, CME Term SOFR 3 Month Index + 1.320% 6.602% 4/20/35 (b)(d)(e) | | 1,721,000 | 1,720,883 |
| Cedar Funding Xvii Clo Ltd. Series 2023-17A Class A, CME Term SOFR 3 Month Index + 1.850% 7.132% 7/20/36 (b)(d)(e) | | 1,424,000 | 1,429,900 |
| CEDF Series 2021-6A Class ARR, CME Term SOFR 3 Month Index + 1.310% 6.5936% 4/20/34 (b)(d)(e) | | 1,199,000 | 1,198,741 |
| CFMT LLC Series 2023 HB12 Class A, 4.25% 4/25/33 (b) | | 378,437 | 371,325 |
| Chase Auto Owner Trust Series 2024-1A Class A3, 5.13% 5/25/29 (b) | | 1,000,000 | 1,014,002 |
| Chesapeake Funding II LLC: | | | |
| Series 2023-2A Class A1, 6.16% 10/15/35 (b) | | 571,108 | 579,382 |
| Series 2024-1A Class A1, 5.52% 5/15/36 (b) | | 1,302,192 | 1,315,004 |
| Citizens Auto Receivables Trust Series 2024-2 Class A3, 5.33% 8/15/28 (b) | | 900,000 | 910,990 |
| Columbia Cent CLO 29 Ltd./Columbia Cent CLO 29 Corp. Series 2021-29A Class AR, CME Term SOFR 3 Month Index + 1.430% 6.7136% 10/20/34 (b)(d)(e) | | 4,015,000 | 4,019,011 |
| Columbia Cent CLO 31 Ltd. Series 2021-31A Class A1, CME Term SOFR 3 Month Index + 1.460% 6.7436% 4/20/34 (b)(d)(e) | | 1,620,000 | 1,621,234 |
| Croton Pk Clo Ltd. CME Term SOFR 3 Month Index + 0.550% 0% 10/15/36 (b)(d)(e)(h) | | 150,000 | 150,000 |
| Cyrusone Data Centers Issuer I Series 2024-3A Class A2, 4.65% 5/20/49 (b) | | 360,000 | 334,650 |
| Daimler Trucks Retail Trust 20 Series 2023-1 Class A2, 6.03% 9/15/25 | | 1,077,503 | 1,078,819 |
| DB Master Finance LLC: | | | |
| Series 2017-1A Class A2II, 4.03% 11/20/47 (b) | | 446,930 | 433,838 |
| Series 2019-1A Class A23, 4.352% 5/20/49 (b) | | 5,414,050 | 5,249,528 |
| Series 2021-1A: | | | |
Class A23, 2.791% 11/20/51 (b) | | 9,243,613 | 7,944,757 |
Class A2I, 2.045% 11/20/51 (b) | | 1,582,258 | 1,482,622 |
Class A2II, 2.493% 11/20/51 (b) | | 2,158,950 | 1,951,292 |
| Discover Card Execution Note Trust Series 2023 A1 Class A, 4.31% 3/15/28 | | 700,000 | 697,591 |
| Dllaa 2023-1A Series 2023-1A: | | | |
| Class A2, 5.93% 7/20/26 (b) | | 359,978 | 361,214 |
| Class A3, 5.64% 2/22/28 (b) | | 421,000 | 428,868 |
| DLLAD: | | | |
| Series 2023-1A Class A3, 4.79% 1/20/28 (b) | | 700,000 | 701,604 |
| Series 2024-1A Class A3, 5.3% 7/20/29 (b) | | 529,000 | 539,950 |
| Dllmt 2024-1 LLC Series 2024-1A Class A3, 4.84% 8/21/28 (b) | | 1,500,000 | 1,503,730 |
| Dominos Pizza Master Issuer LLC: | | | |
| Series 2018-1A Class A2II, 4.328% 7/25/48 (b) | | 1,626,858 | 1,596,830 |
| Series 2019-1A Class A2, 3.668% 10/25/49 (b) | | 2,321,280 | 2,176,907 |
| Series 2021-1A: | | | |
Class A2I, 2.662% 4/25/51 (b) | | 148,793 | 135,884 |
Class A2II, 3.151% 4/25/51 (b) | | 12,328,383 | 10,976,473 |
| Dryden 108 Clo Ltd. / Dryden 10 Series 2024-108A Class A1R, CME Term SOFR 3 Month Index + 1.360% 6.6386% 7/18/37 (b)(d)(e) | | 5,608,000 | 5,609,677 |
| Dryden 98 CLO Ltd. Series 2022-98A Class A, CME Term SOFR 3 Month Index + 1.300% 6.582% 4/20/35 (b)(d)(e) | | 2,199,000 | 2,203,185 |
| Dryden CLO, Ltd. Series 2024-83A Class AR, CME Term SOFR 3 Month Index + 1.530% 6.8642% 4/18/37 (b)(d)(e) | | 2,761,000 | 2,763,921 |
| Dryden CLO, Ltd. / Dryden CLO, LLC Series 2021-86A Class A1R, CME Term SOFR 3 Month Index + 1.360% 6.6474% 7/17/34 (b)(d)(e) | | 9,421,000 | 9,434,660 |
| Dryden Senior Loan Fund: | | | |
| Series 2021-90A Class A1A, CME Term SOFR 3 Month Index + 1.390% 6.52% 2/20/35 (b)(d)(e) | | 1,503,000 | 1,505,248 |
| Series 2024-78A Class A1R, CME Term SOFR 3 Month Index + 1.530% 6.8158% 4/17/37 (b)(d)(e) | | 3,479,000 | 3,490,644 |
| Series 2024-85A Class A1R2, CME Term SOFR 3 Month Index + 1.380% 6.6814% 7/15/37 (b)(d)(e) | | 3,032,000 | 3,036,697 |
| Eaton Vance CLO, Ltd.: | | | |
| Series 2021-2A Class AR, CME Term SOFR 3 Month Index + 1.410% 6.713% 1/15/35 (b)(d)(e) | | 1,578,000 | 1,578,549 |
| Series 2024-1A: | | | |
Class AR2, CME Term SOFR 3 Month Index + 1.510% 6.8399% 7/15/37 (b)(d)(e) | | 2,790,000 | 2,803,752 |
Class ARR, CME Term SOFR 3 Month Index + 1.390% 6.6914% 10/15/37 (b)(d)(e) | | 3,618,000 | 3,631,756 |
Class D2, CME Term SOFR 3 Month Index + 4.500% 9.8014% 10/15/37 (b)(d)(e) | | 200,000 | 200,029 |
| Eaton Vance CLO, Ltd. / Eaton Vance CLO LLC Series 2021-1A Class A13R, CME Term SOFR 3 Month Index + 1.510% 6.813% 1/15/34 (b)(d)(e) | | 4,175,000 | 4,175,501 |
| Enterprise Fleet Financing Series 2024-2: | | | |
| Class A2, 5.74% 12/20/26 (b) | | 1,561,000 | 1,575,529 |
| Class A3, 5.61% 4/20/28 (b) | | 1,066,000 | 1,091,701 |
| Enterprise Fleet Financing 2023-3 L Series 2023-3 Class A2, 6.4% 3/20/30 (b) | | 1,571,238 | 1,600,502 |
| Flatiron CLO Ltd.: | | | |
| Series 2021-1A: | | | |
Class A1, CME Term SOFR 3 Month Index + 1.370% 6.6511% 7/19/34 (b)(d)(e) | | 902,000 | 903,431 |
Class AR, CME Term SOFR 3 Month Index + 1.340% 6.4371% 11/16/34 (b)(d)(e) | | 798,000 | 796,030 |
| Series 2024-1A Class A1R, 0% 10/19/37 (b)(d) | | 2,487,000 | 2,487,000 |
| Flatiron CLO Ltd. / Flatiron CLO LLC Series 2024-1A Class AR, CME Term SOFR 3 Month Index + 1.380% 6.5084% 5/20/36 (b)(d)(e) | | 4,613,000 | 4,616,667 |
| Ford Credit Floorplan Master Owner Trust: | | | |
| Series 2023-1 Class A1, 4.92% 5/15/28 (b) | | 3,045,000 | 3,061,468 |
| Series 2024-1 Class A1, 5.29% 4/15/29 (b) | | 1,600,000 | 1,630,936 |
| GM Financial Automobile Leasing Trust Series 2023-2 Class A2A, 5.44% 10/20/25 | | 122,108 | 122,120 |
| Gm Financial Consumer Automobile Re Series 2023-3 Class A3, 5.45% 6/16/28 | | 869,000 | 879,061 |
| Gm Financial Leasing Trust 202 Series 2023-3 Class A3, 5.38% 11/20/26 | | 419,000 | 421,244 |
| Gm Financial Revolving Receiva Series 2024-1 Class A, 4.98% 12/11/36 (b) | | 1,624,000 | 1,653,055 |
| Goldentree Loan Management U.S. CLO 21, Ltd. Series 2024-21A Class E, CME Term SOFR 3 Month Index + 5.700% 11.0251% 7/20/37 (b)(d)(e) | | 250,000 | 249,407 |
| Golub Capital Partners Clo 76 B Lt Series 2024-76A Class E, CME Term SOFR 3 Month Index + 5.750% 0% 10/25/37 (b)(d)(e)(h) | | 175,000 | 175,000 |
| Honda Auto Receivables Series 2023-2 Class A3, 4.93% 11/15/27 | | 834,000 | 836,451 |
| Honda Auto Receivables 2023-3 Series 2023-3 Class A3, 5.41% 2/18/28 | | 500,000 | 504,648 |
| Horizon Aircraft Finance I Ltd. Series 2018-1 Class A, 4.458% 12/15/38 (b) | | 301,028 | 278,450 |
| Horizon Aircraft Finance Ltd. Series 2019-1 Class A, 3.721% 7/15/39 (b) | | 1,230,449 | 1,138,162 |
| HPEFS Equipment Trust Series 2024-2A Class A3, 5.36% 10/20/31 (b) | | 700,000 | 708,957 |
| Hyundai Auto Lease Securitizat Series 2024-B Class A3, 5.41% 5/17/27 (b) | | 2,400,000 | 2,432,956 |
| Hyundai Auto Receivables Trust Series 2024-A Class A3, 4.99% 2/15/29 | | 1,629,000 | 1,648,499 |
| Invesco CLO Ltd. Series 2021-3A Class A, CME Term SOFR 3 Month Index + 1.390% 6.6736% 10/22/34 (b)(d)(e) | | 960,000 | 961,043 |
| Invesco U.S. Clo 2024-1 Ltd. Series 2024-1RA Class AR, CME Term SOFR 3 Month Index + 1.550% 6.8514% 4/15/37 (b)(d)(e) | | 2,354,000 | 2,363,124 |
| Invesco U.S. CLO Ltd. Series 2024-3A Class A, CME Term SOFR 3 Month Index + 1.510% 6.8292% 7/20/37 (b)(d)(e) | | 2,253,000 | 2,271,013 |
| KKR CLO Ltd. Series 2022-41A Class A1, CME Term SOFR 3 Month Index + 1.330% 6.6314% 4/15/35 (b)(d)(e) | | 2,253,000 | 2,254,115 |
| Kubota Credit Owner Trust Series 2024-2A Class A3, 5.26% 11/15/28 (b) | | 1,500,000 | 1,529,558 |
| Madison Park Funding Series 2024-19A Class AR3, CME Term SOFR 3 Month Index + 1.600% 6.882% 1/22/37 (b)(d)(e) | | 7,328,000 | 7,369,989 |
| Madison Park Funding L Ltd. / Madison Park Funding L LLC Series 2021-50A Class A, CME Term SOFR 3 Month Index + 1.400% 6.6811% 4/19/34 (b)(d)(e) | | 1,690,000 | 1,690,483 |
| Madison Park Funding LII Ltd. / Madison Park Funding LII LLC Series 2021-52A Class A, CME Term SOFR 3 Month Index + 1.360% 6.6436% 1/22/35 (b)(d)(e) | | 1,540,000 | 1,540,634 |
| Madison Park Funding XLV Ltd./Madison Park Funding XLV LLC Series 2021-45A Class AR, CME Term SOFR 3 Month Index + 1.380% 6.683% 7/15/34 (b)(d)(e) | | 1,325,000 | 1,324,988 |
| Madison Pk Funding Lxvii Ltd. / Mad Series 2024-67A Class A1, CME Term SOFR 3 Month Index + 1.510% 6.8002% 4/25/37 (b)(d)(e) | | 2,929,000 | 2,931,832 |
| Magnetite CLO LTD Series 2023-36A Class A, CME Term SOFR 3 Month Index + 1.800% 7.082% 4/22/36 (b)(d)(e) | | 881,000 | 885,525 |
| Magnetite CLO Ltd. Series 2021-27A Class AR, CME Term SOFR 3 Month Index + 1.400% 6.6836% 10/20/34 (b)(d)(e) | | 305,000 | 305,469 |
| Magnetite IX, Ltd. / Magnetite IX LLC Series 2021-30A Class A, CME Term SOFR 3 Month Index + 1.390% 6.6762% 10/25/34 (b)(d)(e) | | 1,565,000 | 1,567,534 |
| Magnetite XXI Ltd. Series 2021-21A Class AR, CME Term SOFR 3 Month Index + 1.280% 6.5636% 4/20/34 (b)(d)(e) | | 1,158,000 | 1,159,481 |
| Magnetite XXIII, Ltd. Series 2021-23A Class AR, CME Term SOFR 3 Month Index + 1.390% 6.6762% 1/25/35 (b)(d)(e) | | 1,132,000 | 1,133,760 |
| Magnetite XXIX, Ltd. / Magnetite XXIX LLC Series 2024-29A Class AR, CME Term SOFR 3 Month Index + 1.350% 6.5917% 7/15/37 (b)(d)(e) | | 2,024,000 | 2,024,164 |
| Marlette Funding Trust 2023-3 Series 2023-3A Class A, 6.49% 9/15/33 (b) | | 202,620 | 202,795 |
| Mercedes-Benz Auto Lease Trust Series 2024-A Class A3, 5.32% 1/18/28 | | 1,895,000 | 1,929,059 |
| Merchants Fleet Funding LLC: | | | |
| Series 2023-1A Class A, 7.21% 5/20/36 (b) | | 751,933 | 760,756 |
| Series 2024-1A Class A, 5.82% 4/20/37 (b) | | 1,600,000 | 1,620,514 |
| Midocean Credit Clo Xv Ltd. Series 2024-15A Class E, CME Term SOFR 3 Month Index + 6.250% 11.5923% 7/21/37 (b)(d)(e) | | 250,000 | 249,400 |
| Milos CLO, Ltd. Series 2020-1A Class AR, CME Term SOFR 3 Month Index + 1.330% 6.6136% 10/20/30 (b)(d)(e) | | 844,910 | 846,189 |
| Neuberger Berman Loan Advisers Series 2024-25A Class AR2, CME Term SOFR 3 Month Index + 1.400% 6.723% 7/18/38 (b)(d)(e) | | 2,803,000 | 2,805,867 |
| Oak Hill Credit Partners: | | | |
| Series 2024-13A Class AR, CME Term SOFR 3 Month Index + 1.350% 6.632% 7/20/37 (b)(d)(e) | | 5,028,000 | 5,029,704 |
| Series 2024-18A: | | | |
Class A1, 6.7917% 4/20/37 (b)(d) | | 3,375,000 | 3,384,703 |
Class A2, CME Term SOFR 3 Month Index + 1.650% 6.9417% 4/20/37 (b)(d)(e) | | 250,000 | 251,061 |
| Ocp Clo 2017-14 Ltd. Series 2024-14A Class ER, CME Term SOFR 3 Month Index + 6.550% 11.2908% 7/20/37 (b)(d)(e) | | 200,000 | 199,180 |
| Orchard Park Clo Ltd. Series 2024-1A Class E, CME Term SOFR 3 Month Index + 5.600% 0% 10/20/37 (b)(d)(e)(h) | | 100,000 | 100,000 |
| Palmer Square Clo 2024-2 Ltd. Series 2024-2A Class E, CME Term SOFR 3 Month Index + 5.700% 10.9939% 7/20/37 (b)(d)(e) | | 500,000 | 499,990 |
| Peace Park CLO, Ltd. Series 2021-1A Class A, CME Term SOFR 3 Month Index + 1.390% 6.6736% 10/20/34 (b)(d)(e) | | 1,254,000 | 1,254,662 |
| Peebles Park CLO Ltd. Series 2024-1A Class A, CME Term SOFR 3 Month Index + 1.500% 6.8043% 4/21/37 (b)(d)(e) | | 18,000,000 | 18,068,976 |
| PK ALIFT Loan Funding 3 LP Series 2024-1 Class A1, 5.842% 9/15/39 (b) | | 679,000 | 692,001 |
| Planet Fitness Master Issuer LLC: | | | |
| Series 2019-1A Class A2, 3.858% 12/5/49 (b) | | 924,440 | 861,329 |
| Series 2022-1A: | | | |
Class A2I, 3.251% 12/5/51 (b) | | 1,273,683 | 1,218,218 |
Class A2II, 4.008% 12/5/51 (b) | | 981,410 | 903,795 |
| Project Silver Series 2019-1 Class A, 3.967% 7/15/44 (b) | | 686,141 | 631,263 |
| Prpm 2023-Rcf2 LLC Series 2023-RCF2 Class A1, 4% 11/25/53 (b) | | 527,877 | 515,681 |
| Retained Vantage Data Ctrs Iss Series 2023-1A Class B, 5.75% 9/15/48 (b) | | 250,000 | 242,913 |
| Rockland Park CLO Ltd. Series 2021-1A Class A, CME Term SOFR 3 Month Index + 1.380% 6.6636% 4/20/34 (b)(d)(e) | | 1,717,000 | 1,718,514 |
| Rr 31 Ltd. Series 2024-31A Class D, CME Term SOFR 3 Month Index + 6.000% 6% 10/15/39 (b)(d)(e)(h) | | 125,000 | 125,000 |
| RR Ltd. Series 2022-7A Class A1AB, CME Term SOFR 3 Month Index + 1.340% 6.6414% 1/15/37 (b)(d)(e) | | 1,862,000 | 1,862,780 |
| RR Ltd. / RR 28 LLC Series 2024-28RA Class A1R, CME Term SOFR 3 Month Index + 1.550% 6.8514% 4/15/37 (b)(d)(e) | | 17,800,000 | 17,830,580 |
| Rram 2022-24A Series 2023-24A Class A1AR, CME Term SOFR 3 Month Index + 1.730% 7.0314% 1/15/36 (b)(d)(e) | | 7,000,000 | 7,026,733 |
| Sapphire Aviation Finance Series 2020-1A: | | | |
| Class A, 3.228% 3/15/40 (b) | | 795,509 | 730,126 |
| Class B, 4.335% 3/15/40 (b) | | 184,322 | 145,660 |
| SBA Tower Trust: | | | |
| Series 2019, 2.836% 1/15/50 (b) | | 1,211,000 | 1,198,661 |
| 1.884% 7/15/50 (b) | | 498,000 | 476,588 |
| 2.328% 7/15/52 (b) | | 381,000 | 349,099 |
| Sbna Auto Lease Trust Series 2024-B Class A3, 5.56% 11/22/27 (b) | | 1,600,000 | 1,623,095 |
| Sfs Auto Receivables Securitiz Series 2023-1A Class A2A, 5.89% 3/22/27 (b) | | 318,885 | 319,476 |
| Sfs Auto Receivables Securitization Trust Series 2024-2A Class A3, 5.33% 11/20/29 (b) | | 953,000 | 971,104 |
| Subway Funding LLC Issuer Series 2024-1A: | | | |
| Class A23, 6.505% 7/30/54 (b) | | 8,453,000 | 8,832,557 |
| Class A2I, 6.028% 7/30/54 (b) | | 9,130,000 | 9,367,411 |
| Class A2II, 6.268% 7/30/54 (b) | | 5,805,000 | 6,017,821 |
| Switch Abs Issuer LLC Series 2024-2A Class C, 10.033% 6/25/54 (b) | | 750,000 | 766,083 |
| SYMP Series 2022-32A Class A1, CME Term SOFR 3 Month Index + 1.320% 6.603% 4/23/35 (b)(d)(e) | | 1,936,000 | 1,932,416 |
| Symphony Clo 43 Ltd. Series 2024-43A Class A1, CME Term SOFR 3 Month Index + 1.520% 6.8465% 4/15/37 (b)(d)(e) | | 2,102,000 | 2,111,303 |
| Symphony CLO XXVI Ltd. / Symphony CLO XXVI LLC Series 2021-26A Class AR, CME Term SOFR 3 Month Index + 1.340% 6.6236% 4/20/33 (b)(d)(e) | | 1,785,228 | 1,787,013 |
| Tesla Series 2024-A Class A2A, 5.37% 6/22/26 (b) | | 636,582 | 636,876 |
| Tesla Auto Lease Trust 2023-B Series 2023-B: | | | |
| Class A2, 6.02% 9/22/25 (b) | | 1,193,702 | 1,195,530 |
| Class A3, 6.13% 9/21/26 (b) | | 1,200,000 | 1,210,596 |
| Tesla Auto Lease Trust 23-A Series 2023-A Class A3, 5.89% 6/22/26 (b) | | 1,000,000 | 1,003,447 |
| Thunderbolt Aircraft Lease Ltd. Series 2018-A Class A, 4.147% 9/15/38 (b)(d) | | 571,985 | 526,244 |
| Thunderbolt III Aircraft Lease Ltd. Series 2019-1 Class A, 3.671% 11/15/39 (b) | | 1,051,540 | 946,386 |
| Toyota Lease Owner Trust: | | | |
| Series 2023 A Class A3, 4.93% 4/20/26 (b) | | 891,000 | 889,818 |
| Series 2024-A Class A3, 5.25% 4/20/27 (b) | | 1,100,000 | 1,110,377 |
| Usaa Auto Owner Trust 2024-A Series 2024-A Class A3, 5.03% 3/15/29 (b) | | 1,300,000 | 1,314,994 |
| VB-S1 Issuer LLC Series 2024-1A: | | | |
| Class D, 6.644% 5/15/54 (b) | | 1,500,000 | 1,545,588 |
| Class F, 8.871% 5/15/54 (b) | | 340,000 | 352,352 |
| Verizon Master Trust Series 2023-4 Class A1A, 5.16% 6/20/29 | | 550,000 | 556,016 |
| Volkswagen Auto Lease Trust 2024- Series 2024-A Class A3, 5.21% 6/21/27 | | 1,010,000 | 1,023,246 |
| Voya Clo 2023-1 Ltd. Series 2023-1A Class A1, CME Term SOFR 3 Month Index + 1.800% 7.082% 1/20/37 (b)(d)(e) | | 2,007,000 | 2,026,839 |
| Voya Clo Ltd. Series 2024-1A Class A1, CME Term SOFR 3 Month Index + 1.520% 6.8461% 4/15/37 (b)(d)(e) | | 2,051,000 | 2,051,769 |
| Voya CLO Ltd./Voya CLO LLC: | | | |
| Series 2021-2A Class A1R, CME Term SOFR 3 Month Index + 1.420% 6.7011% 7/19/34 (b)(d)(e) | | 432,000 | 432,089 |
| Series 2021-3A Class AR, CME Term SOFR 3 Month Index + 1.410% 6.6936% 10/20/34 (b)(d)(e) | | 4,736,000 | 4,736,260 |
| Wheels Fleet Lease Funding 1 L: | | | |
| Series 2023-2A Class A, 6.46% 8/18/38 (b) | | 1,739,970 | 1,751,897 |
| Series 2024-1A Class A1, 5.49% 2/18/39 (b) | | 1,400,000 | 1,413,969 |
| Series 2024-2A Class A1, 4.87% 6/21/39 (b) | | 3,132,000 | 3,145,318 |
| Willis Engine Structured Trust Vi Series 2023-A Class A, 8% 10/15/48 (b) | | 805,026 | 855,255 |
| World Omni Auto Receivables Trust: | | | |
| Series 2023 B Class A3, 4.66% 5/15/28 | | 944,000 | 943,170 |
| Series 2023-C Class A3, 5.15% 11/15/28 | | 514,000 | 517,495 |
| World Omni Automobile Lease Series 2023-A Class A2A, 5.47% 11/17/25 | | 304,980 | 305,042 |
| TOTAL ASSET-BACKED SECURITIES (Cost $381,551,181) | | | 383,120,777 |
| | | | |
| Collateralized Mortgage Obligations - 1.6% |
| | | Principal Amount (a) | Value ($) |
| Private Sponsor - 0.2% | | | |
| Brass PLC Series 2021-10A Class A1, 0.669% 4/16/69 (b)(d) | | 90,753 | 89,834 |
| Bravo Residential Funding Trust sequential payer Series 2023-RPL1 Class A1, 5% 5/25/63 (b) | | 1,077,431 | 1,078,661 |
| CFMT Series 2022-HB10 Class A, 3.25% 11/25/35 (b) | | 558,194 | 550,366 |
| Cfmt 2024-Hb15 LLC sequential payer Series 2024-HB15 Class A, 4% 8/25/34 (b)(d) | | 912,000 | 894,581 |
| Cfmt LLC floater sequential payer Series 2024-HB13 Class A, 3% 5/25/34 (b)(d) | | 1,304,679 | 1,247,696 |
| Gs Mtg-Backed Securities Trust 2024-Rpl Series 2024-RPL2 Class A1, 3.75% 7/25/61 (b) | | 381,735 | 369,736 |
| MFA Trust sequential payer Series 2022-RPL1 Class A1, 3.3% 8/25/61 (b) | | 364,073 | 341,752 |
| Mfra Trst sequential payer Series 2024-RPL1 Class A1, 4.25% 2/25/66 (b)(d) | | 595,517 | 564,051 |
| New Residential Mortgage Loan Trust Series 2020-1A Class A1B, 3.5% 10/25/59 (b) | | 367,201 | 343,423 |
| NYMT Loan Trust sequential payer Series 2021-CP1 Class A1, 2.0424% 7/25/61 (b) | | 197,296 | 181,721 |
| Nymt Loan Trust 2024-Cp1 sequential payer Series 2024-CP1 Class A1, 3.75% 2/25/68 (b) | | 472,745 | 443,951 |
| Ocwen Ln Investment Trust 2023-Hb1 Series 2023-HB1 Class A, 3% 6/25/36 (b) | | 141,966 | 138,288 |
| Ocwen Loan Invest Trust Series 2024-HB1 Class A, 3% 2/25/37 (b) | | 179,632 | 174,313 |
| Preston Ridge Partners Mortgage Trust Series 2021-RPL2 Class A1, 1.455% 10/25/51 (b)(d) | | 298,270 | 270,431 |
| Pret 2024-Rpl1 Trust sequential payer Series 2024-RPL1 Class A1, 3.9% 10/25/63 (b) | | 939,341 | 894,749 |
| Prmi Securitization Trust 2024-Cm floater Series 2024-CMG1 Class A1, U.S. 30-Day Avg. Secured Overnight Fin. Rate (SOFR) Index + 1.300% 6.8012% 7/25/54 (b)(d)(e) | | 1,136,991 | 1,133,476 |
| Prpm 2024-Rcf3 LLC Series 2024-RCF3 Class A1, 4% 5/25/54 (b) | | 1,200,188 | 1,173,247 |
| Prpm 2024-Rpl2 LLC Series 2024-RPL2 Class A1, 3.5% 5/25/54 (b)(d) | | 1,266,440 | 1,220,512 |
| PRPM, LLC Series 2024-RPL1 Class A1, 4.2% 12/25/64 (b) | | 2,707,475 | 2,632,776 |
| Towd Point Mortgage Trust sequential payer Series 2022-K147 Class A2, 3.75% 7/25/62 (b) | | 615,004 | 582,611 |
TOTAL PRIVATE SPONSOR | | | 14,326,175 |
| U.S. Government Agency - 1.4% | | | |
| Fannie Mae: | | | |
| floater: | | | |
Series 2001-38 Class QF, U.S. 30-Day Avg. Secured Overnight Fin. Rate (SOFR) Index + 1.090% 6.4433% 8/25/31 (d)(e) | | 1,859 | 1,873 |
Series 2002-18 Class FD, U.S. 30-Day Avg. Secured Overnight Fin. Rate (SOFR) Index + 0.910% 6.2633% 2/25/32 (d)(e) | | 215 | 215 |
Series 2002-39 Class FD, U.S. 30-Day Avg. Secured Overnight Fin. Rate (SOFR) Index + 1.110% 6.4677% 3/18/32 (d)(e) | | 392 | 395 |
Series 2002-60 Class FV, U.S. 30-Day Avg. Secured Overnight Fin. Rate (SOFR) Index + 1.110% 6.4633% 4/25/32 (d)(e) | | 806 | 813 |
Series 2002-63 Class FN, U.S. 30-Day Avg. Secured Overnight Fin. Rate (SOFR) Index + 1.110% 6.4633% 10/25/32 (d)(e) | | 521 | 526 |
Series 2002-7 Class FC, U.S. 30-Day Avg. Secured Overnight Fin. Rate (SOFR) Index + 0.860% 6.2133% 1/25/32 (d)(e) | | 197 | 198 |
Series 2002-74 Class FV, U.S. 30-Day Avg. Secured Overnight Fin. Rate (SOFR) Index + 0.560% 5.9133% 11/25/32 (d)(e) | | 4,604 | 4,601 |
Series 2002-75 Class FA, U.S. 30-Day Avg. Secured Overnight Fin. Rate (SOFR) Index + 1.110% 6.4633% 11/25/32 (d)(e) | | 789 | 796 |
Series 2003-118 Class S, 7.980% - U.S. 30-Day Avg. Secured Overnight Fin. Rate (SOFR) Index 2.6367% 12/25/33 (d)(m)(n) | | 7,935 | 1,190 |
Series 2006-104 Class GI, 6.560% - U.S. 30-Day Avg. Secured Overnight Fin. Rate (SOFR) Index 1.2167% 11/25/36 (d)(m)(n) | | 5,852 | 622 |
Series 2010-15 Class FJ, U.S. 30-Day Avg. Secured Overnight Fin. Rate (SOFR) Index + 1.040% 6.3933% 6/25/36 (d)(e) | | 164,143 | 165,397 |
Series 2012-70 Class FB, U.S. 30-Day Avg. Secured Overnight Fin. Rate (SOFR) Index + 0.560% 5.9133% 7/25/42 (d)(e) | | 1,468,343 | 1,455,674 |
| planned amortization class: | | | |
Series 1999-17 Class PG, 6% 4/25/29 | | 1,650 | 1,678 |
Series 1999-32 Class PL, 6% 7/25/29 | | 2,323 | 2,363 |
Series 1999-33 Class PK, 6% 7/25/29 | | 1,688 | 1,716 |
Series 2001-52 Class YZ, 6.5% 10/25/31 | | 349 | 360 |
Series 2003-70 Class BJ, 5% 7/25/33 | | 13,051 | 13,059 |
Series 2005-68 Class CZ, 5.5% 8/25/35 | | 175,013 | 179,491 |
Series 2005-81 Class PC, 5.5% 9/25/35 | | 4,500 | 4,626 |
Series 2006-12 Class BO 10/25/35 (o) | | 5,237 | 4,624 |
Series 2006-15 Class OP 3/25/36 (o) | | 7,840 | 6,661 |
Series 2006-45 Class OP 6/25/36 (o) | | 2,430 | 2,017 |
Series 2006-62 Class KP 4/25/36 (o) | | 3,808 | 3,179 |
Series 2010-118 Class PB, 4.5% 10/25/40 | | 136,715 | 137,519 |
Series 2012-149: | | | |
Class DA, 1.75% 1/25/43 | | 41,489 | 38,482 |
Class GA, 1.75% 6/25/42 | | 49,953 | 46,236 |
Series 2017-32 Class PA, 2.7% 5/25/47 | | 5,272,388 | 4,802,763 |
Series 2017-37 Class AB, 2.55% 9/25/46 | | 1,042,015 | 956,167 |
Series 2019-76 Class FC, U.S. 30-Day Avg. Secured Overnight Fin. Rate (SOFR) Index + 0.610% 5.9633% 12/25/49 (d)(e) | | 763,848 | 748,153 |
Series 2021-45 Class DA, 3% 7/25/51 | | 376,828 | 339,904 |
Series 2021-69 Class JK, 1.5% 10/25/51 | | 197,340 | 166,687 |
Series 2022-2 Class TH, 2.5% 2/25/52 | | 150,974 | 138,886 |
Series 2022-20 Class HC, 2.5% 4/25/52 | | 1,980,069 | 1,811,914 |
| sequential payer: | | | |
Series 1997-41 Class J, 7.5% 6/18/27 | | 270 | 277 |
Series 1999-25 Class Z, 6% 6/25/29 | | 1,847 | 1,857 |
Series 2001-20 Class Z, 6% 5/25/31 | | 2,205 | 2,252 |
Series 2001-31 Class ZC, 6.5% 7/25/31 | | 980 | 994 |
Series 2002-16 Class ZD, 6.5% 4/25/32 | | 1,016 | 1,051 |
Series 2002-74 Class SV, 7.430% - U.S. 30-Day Avg. Secured Overnight Fin. Rate (SOFR) Index 2.0867% 11/25/32 (d)(m)(n) | | 959 | 24 |
Series 2004-52 Class KZ, 5.5% 7/25/34 | | 61,178 | 61,948 |
Series 2004-91 Class Z, 5% 12/25/34 | | 139,057 | 139,153 |
Series 2005-117 Class JN, 4.5% 1/25/36 | | 10,710 | 10,609 |
Series 2005-14 Class ZB, 5% 3/25/35 | | 42,945 | 42,976 |
Series 2006-72 Class CY, 6% 8/25/26 | | 7,681 | 7,700 |
Series 2009-59 Class HB, 5% 8/25/39 | | 76,328 | 76,840 |
Series 2012-67 Class AI, 4.5% 7/25/27 (m) | | 558 | 7 |
Series 2020-43 Class MA, 2% 1/25/45 | | 616,879 | 569,558 |
Series 2020-47 Class DG, 2% 4/25/42 | | 3,736,549 | 3,517,307 |
Series 2020-49: | | | |
Class JA, 2% 8/25/44 | | 102,345 | 95,025 |
Class LA, 2% 3/25/43 | | 2,742,191 | 2,581,479 |
Series 2020-51 Class BA, 2% 6/25/46 | | 746,492 | 660,127 |
Series 2020-56 Class AH, 2% 5/25/45 | | 714,799 | 668,193 |
Series 2020-80 Class BA, 1.5% 3/25/45 | | 385,814 | 339,732 |
Series 2021-85 Class L, 2.5% 8/25/48 | | 117,506 | 104,701 |
Series 2021-95: | | | |
Class 0, 2.5% 9/25/48 | | 578,917 | 517,094 |
Class BA, 2.5% 6/25/49 | | 880,261 | 782,233 |
Series 2021-96: | | | |
Class AH, 2.5% 3/25/49 | | 4,258,955 | 3,838,791 |
Class HA, 2.5% 2/25/50 | | 189,241 | 168,408 |
Series 2022-1 Class KA, 3% 5/25/48 | | 181,541 | 168,800 |
Series 2022-11 Class B, 3% 6/25/49 | | 222,480 | 207,992 |
Series 2022-13: | | | |
Class HA, 3% 8/25/46 | | 210,507 | 198,722 |
Class JA, 3% 5/25/48 | | 396,889 | 372,190 |
Class MA, 3% 5/25/44 | | 3,242,541 | 3,093,743 |
Series 2022-15 Class GC, 3% 1/25/47 | | 193,509 | 181,909 |
Series 2022-17 Class BH, 3% 5/25/47 | | 211,362 | 200,622 |
Series 2022-25 Class AB, 4% 9/25/47 | | 374,694 | 367,592 |
Series 2022-3: | | | |
Class D, 2% 2/25/48 | | 851,853 | 766,257 |
Class N, 2% 10/25/47 | | 2,156,549 | 1,930,954 |
Series 2022-30 Class E, 4.5% 7/25/48 | | 472,504 | 466,619 |
Series 2022-4 Class B, 2.5% 5/25/49 | | 137,573 | 122,943 |
Series 2022-49 Class TC, 4% 12/25/48 | | 148,105 | 143,569 |
Series 2022-5: | | | |
Class 0, 2.5% 6/25/48 | | 278,354 | 252,732 |
Class BA, 2.5% 12/25/49 | | 352,366 | 308,275 |
Class DA, 2.25% 11/25/47 | | 771,570 | 696,538 |
Series 2022-69 Class AB, 4.5% 1/25/44 | | 634,852 | 624,638 |
Series 2022-7: | | | |
Class A, 3% 5/25/48 | | 258,573 | 240,438 |
Class E, 2.5% 11/25/47 | | 845,144 | 772,033 |
Series 2022-9 Class BA, 3% 5/25/48 | | 218,583 | 203,266 |
| Series 06-116 Class SG, 6.520% - U.S. 30-Day Avg. Secured Overnight Fin. Rate (SOFR) Index 1.1767% 12/25/36 (d)(m)(n) | | 3,950 | 423 |
| Series 07-40 Class SE, 6.320% - U.S. 30-Day Avg. Secured Overnight Fin. Rate (SOFR) Index 0.9767% 5/25/37 (d)(m)(n) | | 1,936 | 230 |
| Series 2003-21 Class SK, 7.980% - U.S. 30-Day Avg. Secured Overnight Fin. Rate (SOFR) Index 2.6367% 3/25/33 (d)(m)(n) | | 418 | 46 |
| Series 2005-72 Class ZC, 5.5% 8/25/35 | | 31,858 | 32,367 |
| Series 2005-79 Class ZC, 5.9% 9/25/35 | | 19,017 | 19,392 |
| Series 2007-66 Class SA, 38.910% x U.S. 30-Day Avg. Secured Overnight Fin. Rate (SOFR) Index 6.8201% 7/25/37 (d)(e)(n) | | 2,456 | 3,131 |
| Series 2010-135 Class ZA, 4.5% 12/25/40 | | 8,405 | 8,524 |
| Series 2010-150 Class ZC, 4.75% 1/25/41 | | 75,641 | 75,889 |
| Series 2010-39 Class FG, U.S. 30-Day Avg. Secured Overnight Fin. Rate (SOFR) Index + 1.030% 6.3833% 3/25/36 (d)(e) | | 114,107 | 114,981 |
| Series 2010-95 Class ZC, 5% 9/25/40 | | 157,109 | 159,138 |
| Series 2011-39 Class ZA, 6% 11/25/32 | | 9,156 | 9,519 |
| Series 2011-4 Class PZ, 5% 2/25/41 | | 25,614 | 25,183 |
| Series 2011-67 Class AI, 4% 7/25/26 (m) | | 2,229 | 33 |
| Series 2012-100 Class WI, 3% 9/25/27 (m) | | 18,666 | 544 |
| Series 2012-9 Class SH, 6.430% - U.S. 30-Day Avg. Secured Overnight Fin. Rate (SOFR) Index 1.0867% 6/25/41 (d)(m)(n) | | 782 | 3 |
| Series 2013-133 Class IB, 3% 4/25/32 (m) | | 4,407 | 51 |
| Series 2013-134 Class SA, 5.930% - U.S. 30-Day Avg. Secured Overnight Fin. Rate (SOFR) Index 0.5867% 1/25/44 (d)(m)(n) | | 9,591 | 1,077 |
| Series 2013-N1 Class A, 6.600% - U.S. 30-Day Avg. Secured Overnight Fin. Rate (SOFR) Index 1.2567% 6/25/35 (d)(m)(n) | | 10,191 | 821 |
| Series 2015-42 Class IL, 6% 6/25/45 (m) | | 53,379 | 8,529 |
| Series 2015-70 Class JC, 3% 10/25/45 | | 60,981 | 58,158 |
| Series 2017-30 Class AI, 5.5% 5/25/47 (m) | | 29,906 | 4,817 |
| Series 2018-45 Class GI, 4% 6/25/48 (m) | | 381,359 | 79,700 |
| Series 2020-39 Class MG, 1.5% 6/25/40 | | 1,087,854 | 919,244 |
| Series 2020-45: | | | |
Class JC, 1.5% 7/25/40 | | 1,109,610 | 937,621 |
Class JL, 3% 7/25/40 | | 18,806 | 17,293 |
| Series 2020-59 Class MC, 1.5% 8/25/40 | | 1,219,974 | 1,030,363 |
| Series 2021-21 Class HG, 2% 11/25/47 | | 2,113,244 | 1,884,252 |
| Series 2021-59 Class H, 2% 6/25/48 | | 123,480 | 102,645 |
| Series 2021-66: | | | |
Class DA, 2% 1/25/48 | | 132,364 | 110,541 |
Class DM, 2% 1/25/48 | | 140,665 | 117,474 |
| Series 2022-28 Class A, 2.5% 2/25/52 | | 693,261 | 654,498 |
| Series 2023-13 Class CK, 1.5% 11/25/50 | | 1,297,469 | 1,050,204 |
| Fannie Mae Stripped Mortgage-Backed Securities: | | | |
| Series 339 Class 5, 5.5% 7/25/33 (m) | | 1,992 | 300 |
| Series 343 Class 16, 5.5% 5/25/34 (m) | | 1,858 | 282 |
| Series 348 Class 14, 6.5% 8/25/34 (d)(m) | | 1,208 | 222 |
| Series 351 Class 13, 6% 3/25/34 (m) | | 1,156 | 201 |
| Series 384 Class 6, 5% 7/25/37 (m) | | 7,739 | 1,273 |
| Freddie Mac: | | | |
| floater: | | | |
Series 2412 Class FK, U.S. 30-Day Avg. Secured Overnight Fin. Rate (SOFR) Index + 0.910% 6.268% 1/15/32 (d)(e) | | 156 | 156 |
Series 2423 Class FA, U.S. 30-Day Avg. Secured Overnight Fin. Rate (SOFR) Index + 1.010% 6.368% 3/15/32 (d)(e) | | 226 | 227 |
Series 2424 Class FM, U.S. 30-Day Avg. Secured Overnight Fin. Rate (SOFR) Index + 1.110% 6.468% 3/15/32 (d)(e) | | 211 | 213 |
Series 2432: | | | |
Class FE, U.S. 30-Day Avg. Secured Overnight Fin. Rate (SOFR) Index + 1.010% 6.368% 6/15/31 (d)(e) | | 362 | 363 |
Class FG, U.S. 30-Day Avg. Secured Overnight Fin. Rate (SOFR) Index + 1.010% 6.368% 3/15/32 (d)(e) | | 131 | 131 |
Series 2526 Class FC, U.S. 30-Day Avg. Secured Overnight Fin. Rate (SOFR) Index + 0.510% 5.868% 11/15/32 (d)(e) | | 2,524 | 2,516 |
Series 2711 Class FC, U.S. 30-Day Avg. Secured Overnight Fin. Rate (SOFR) Index + 1.010% 6.368% 2/15/33 (d)(e) | | 43,762 | 44,008 |
| floater planned amortization class Series 2770 Class FH, U.S. 30-Day Avg. Secured Overnight Fin. Rate (SOFR) Index + 0.510% 5.868% 3/15/34 (d)(e) | | 60,721 | 60,218 |
| planned amortization class: | | | |
Series 2021-5141 Class JM, 1.5% 4/25/51 | | 145,761 | 123,585 |
Series 2021-5148: | | | |
Class AD, 1.5% 10/25/51 | | 195,984 | 165,936 |
Class PC, 1.5% 10/25/51 | | 193,701 | 162,410 |
Series 2022-5214 Class CG, 3.5% 4/25/52 | | 276,366 | 263,987 |
Series 2022-5220 Class PK, 3.5% 1/25/51 | | 443,684 | 421,320 |
Series 2095 Class PE, 6% 11/15/28 | | 2,196 | 2,234 |
Series 2101 Class PD, 6% 11/15/28 | | 1,205 | 1,228 |
Series 2121 Class MG, 6% 2/15/29 | | 948 | 965 |
Series 2131 Class BG, 6% 3/15/29 | | 6,682 | 6,810 |
Series 2137 Class PG, 6% 3/15/29 | | 1,113 | 1,134 |
Series 2154 Class PT, 6% 5/15/29 | | 1,729 | 1,762 |
Series 2162 Class PH, 6% 6/15/29 | | 332 | 338 |
Series 2520 Class BE, 6% 11/15/32 | | 3,877 | 4,008 |
Series 2693 Class MD, 5.5% 10/15/33 | | 8,638 | 8,761 |
Series 2802 Class OB, 6% 5/15/34 | | 6,279 | 6,437 |
Series 2996 Class MK, 5.5% 6/15/35 | | 2,014 | 2,055 |
Series 3002 Class NE, 5% 7/15/35 | | 9,121 | 9,287 |
Series 3110 Class OP 9/15/35 (o) | | 1,194 | 1,146 |
Series 3119 Class PO 2/15/36 (o) | | 9,174 | 7,502 |
Series 3123 Class LO 3/15/36 (o) | | 5,049 | 4,167 |
Series 3189 Class PD, 6% 7/15/36 | | 8,334 | 8,734 |
Series 3258 Class PM, 5.5% 12/15/36 | | 2,879 | 2,959 |
Series 3415 Class PC, 5% 12/15/37 | | 29,071 | 29,355 |
Series 3832 Class PE, 5% 3/15/41 | | 37,258 | 37,950 |
Series 3857 Class ZP, 5% 5/15/41 | | 324,624 | 331,363 |
Series 4135 Class AB, 1.75% 6/15/42 | | 38,462 | 35,808 |
| sequential payer: | | | |
Series 1929 Class EZ, 7.5% 2/17/27 | | 611 | 614 |
Series 2017-4690 Class CA, 3% 11/15/36 | | 1,850,417 | 1,778,132 |
Series 2020-4993 Class LA, 2% 8/25/44 | | 585,596 | 544,009 |
Series 2020-5018: | | | |
Class LC, 3% 10/25/40 | | 127,277 | 117,281 |
Class LY, 3% 10/25/40 | | 96,686 | 89,069 |
Series 2020-5058 Class BE, 3% 11/25/50 | | 429,968 | 381,183 |
Series 2021-5083 Class BA, 2.5% 5/25/32 | | 707,979 | 694,702 |
Series 2021-5115 Class A, 2% 3/25/40 | | 532,391 | 475,904 |
Series 2021-5139 Class JC, 2% 8/25/40 | | 509,094 | 449,990 |
Series 2021-5147 Class WN, 2% 1/25/40 | | 547,343 | 484,825 |
Series 2021-5169: | | | |
Class BA, 2.5% 5/25/49 | | 553,930 | 492,129 |
Class TP, 2.5% 6/25/49 | | 198,354 | 176,069 |
Series 2021-5175 Class CB, 2.5% 4/25/50 | | 684,073 | 607,500 |
Series 2021-5178: | | | |
Class CT, 2% 11/25/40 | | 555,663 | 489,211 |
Class TP, 2.5% 4/25/49 | | 476,708 | 424,422 |
Series 2021-5180 Class KA, 2.5% 10/25/47 | | 136,535 | 124,260 |
Series 2022-5189: | | | |
Class DA, 2.5% 5/25/49 | | 122,140 | 108,904 |
Class TP, 2.5% 5/25/49 | | 309,556 | 276,347 |
Series 2022-5190: | | | |
Class BA, 2.5% 11/25/47 | | 134,368 | 122,168 |
Class CA, 2.5% 5/25/49 | | 258,795 | 231,007 |
Series 2022-5191 Class CA, 2.5% 4/25/50 | | 160,277 | 141,433 |
Series 2022-5197: | | | |
Class A, 2.5% 6/25/49 | | 258,795 | 231,007 |
Class DA, 2.5% 11/25/47 | | 101,998 | 92,843 |
Series 2022-5198 Class BA, 2.5% 11/25/47 | | 422,277 | 386,142 |
Series 2022-5200 Class LA, 3% 10/25/48 | | 556,110 | 516,449 |
Series 2022-5202: | | | |
Class AG, 3% 1/25/49 | | 137,128 | 127,054 |
Class BC, 3% 5/25/48 | | 562,675 | 523,250 |
Class LB, 2.5% 10/25/47 | | 109,326 | 99,589 |
Class UA, 3% 4/25/50 | | 211,289 | 194,757 |
Series 2022-5210 Class TA, 3.5% 11/25/46 | | 126,135 | 119,856 |
Series 2135 Class JE, 6% 3/15/29 | | 361 | 369 |
Series 2145 Class MZ, 6.5% 4/15/29 | | 6,936 | 7,051 |
Series 2274 Class ZM, 6.5% 1/15/31 | | 656 | 665 |
Series 2281 Class ZB, 6% 3/15/30 | | 1,175 | 1,201 |
Series 2303 Class ZV, 6% 4/15/31 | | 3,579 | 3,674 |
Series 2357 Class ZB, 6.5% 9/15/31 | | 12,163 | 12,503 |
Series 2502 Class ZC, 6% 9/15/32 | | 1,506 | 1,556 |
Series 2519 Class ZD, 5.5% 11/15/32 | | 2,096 | 2,147 |
Series 2877 Class ZD, 5% 10/15/34 | | 172,323 | 172,649 |
Series 2998 Class LY, 5.5% 7/15/25 | | 329 | 329 |
Series 3007 Class EW, 5.5% 7/15/25 | | 1,019 | 1,017 |
| Series 06-3115 Class SM, 6.480% - U.S. 30-Day Avg. Secured Overnight Fin. Rate (SOFR) Index 1.132% 2/15/36 (d)(m)(n) | | 2,718 | 267 |
| Series 2013-4281 Class AI, 4% 12/15/28 (m) | | 234 | 2 |
| Series 2017-4683 Class LM, 3% 5/15/47 | | 76,389 | 73,328 |
| Series 2020-5000 Class BA, 2% 4/25/45 | | 541,544 | 496,853 |
| Series 2020-5041: | | | |
Class LA, 1.5% 11/25/40 | | 1,264,763 | 1,065,855 |
Class LB, 3% 11/25/40 | | 216,589 | 199,724 |
| Series 2020-5046 Class PT, 1.5% 11/25/40 | | 960,789 | 809,583 |
| Series 2021-5077 Class ME, 2% 8/15/48 | | 5,277,668 | 4,538,234 |
| Series 2021-5083 Class VA, 1% 8/15/38 | | 431,627 | 407,827 |
| Series 2021-5092 Class CL, 3% 4/25/41 | | 1,472,739 | 1,334,870 |
| Series 2021-5182 Class A, 2.5% 10/25/48 | | 898,016 | 801,168 |
| Series 2022-5213 Class AH, 2.25% 4/25/37 | | 487,977 | 455,739 |
| Series 2022-5214 Class CB, 3.25% 4/25/52 | | 844,450 | 799,703 |
| Series 2022-5236 Class P, 5% 4/25/48 | | 247,784 | 249,180 |
| Series 2022-5266 Class CD, 4.5% 10/25/44 | | 536,329 | 533,510 |
| Series 2933 Class ZM, 5.75% 2/15/35 | | 41,300 | 42,813 |
| Series 2947 Class XZ, 6% 3/15/35 | | 16,815 | 17,515 |
| Series 2996 Class ZD, 5.5% 6/15/35 | | 27,573 | 28,347 |
| Series 3237 Class C, 5.5% 11/15/36 | | 36,864 | 37,805 |
| Series 3244 Class SG, 6.540% - U.S. 30-Day Avg. Secured Overnight Fin. Rate (SOFR) Index 1.192% 11/15/36 (d)(m)(n) | | 11,959 | 1,117 |
| Series 3336 Class LI, 6.460% - U.S. 30-Day Avg. Secured Overnight Fin. Rate (SOFR) Index 1.112% 6/15/37 (d)(m)(n) | | 7,678 | 927 |
| Series 3843 Class PZ, 5% 4/15/41 | | 228,027 | 231,528 |
| Series 3949 Class MK, 4.5% 10/15/34 | | 6,224 | 6,207 |
| Series 4055 Class BI, 3.5% 5/15/31 (m) | | 1,371 | 3 |
| Series 4314 Class AI, 5% 3/15/34 (m) | | 445 | 6 |
| Series 4427 Class LI, 3.5% 2/15/34 (m) | | 24,609 | 1,093 |
| Series 4471 Class PA 4% 12/15/40 | | 21,043 | 20,789 |
| target amortization class: | | | |
Series 2007-3366 Class FD, U.S. 30-Day Avg. Secured Overnight Fin. Rate (SOFR) Index + 0.360% 5.718% 5/15/37 (d)(e) | | 9,693 | 9,446 |
Series 2156 Class TC, 6.25% 5/15/29 | | 306 | 306 |
| Freddie Mac Manufactured Housing participation certificates guaranteed sequential payer: | | | |
| Series 2043 Class ZH, 6% 4/15/28 | | 611 | 621 |
| Series 2056 Class Z, 6% 5/15/28 | | 1,765 | 1,797 |
| Freddie Mac Multi-family Structured pass-thru certificates: | | | |
| planned amortization class Series 2021-5165 Class PC, 1.5% 11/25/51 | | 247,865 | 210,256 |
| sequential payer: | | | |
Series 2021-5159: | | | |
Class EA, 2.5% 8/25/48 | | 195,655 | 174,410 |
Class GC, 2% 11/25/47 | | 109,308 | 97,420 |
Series 2021-5164 Class M, 2.5% 7/25/48 | | 199,419 | 177,844 |
Series 4341 Class ML, 3.5% 11/15/31 | | 149,395 | 145,320 |
| Series 4386 Class AZ, 4.5% 11/15/40 | | 89,993 | 88,490 |
| Ginnie Mae guaranteed REMIC pass-thru certificates: | | | |
| floater: | | | |
Series 2007-37 Class TS, 6.570% - CME Term SOFR 1 Month Index 1.2369% 6/16/37 (d)(m)(n) | | 5,009 | 542 |
Series 2007-59 Class FC, CME Term SOFR 1 Month Index + 0.610% 5.9502% 7/20/37 (d)(e) | | 37,939 | 37,700 |
Series 2008-2 Class FD, CME Term SOFR 1 Month Index + 0.590% 5.9302% 1/20/38 (d)(e) | | 9,662 | 9,592 |
Series 2008-73 Class FA, CME Term SOFR 1 Month Index + 0.970% 6.3102% 8/20/38 (d)(e) | | 54,262 | 54,703 |
Series 2008-83 Class FB, CME Term SOFR 1 Month Index + 1.010% 6.3502% 9/20/38 (d)(e) | | 38,917 | 39,291 |
Series 2009-108 Class CF, CME Term SOFR 1 Month Index + 0.710% 6.0531% 11/16/39 (d)(e) | | 51,168 | 50,969 |
Series 2009-116 Class KF, CME Term SOFR 1 Month Index + 0.640% 5.9831% 12/16/39 (d)(e) | | 30,570 | 30,382 |
Series 2010-H03 Class FA, CME Term SOFR 1 Month Index + 0.660% 6.0116% 3/20/60 (d)(e)(l) | | 25,942 | 25,905 |
Series 2010-H17 Class FA, CME Term SOFR 1 Month Index + 0.440% 5.7916% 7/20/60 (d)(e)(l) | | 303,490 | 302,406 |
Series 2010-H18 Class AF, CME Term SOFR 1 Month Index + 0.410% 5.7464% 9/20/60 (d)(e)(l) | | 259,007 | 257,560 |
Series 2010-H19 Class FG, CME Term SOFR 1 Month Index + 0.410% 5.7464% 8/20/60 (d)(e)(l) | | 241,311 | 240,206 |
Series 2010-H27 Class FA, CME Term SOFR 1 Month Index + 0.380% 5.8264% 12/20/60 (d)(e)(l) | | 128,409 | 127,936 |
Series 2011-H05 Class FA, CME Term SOFR 1 Month Index + 0.610% 5.9464% 12/20/60 (d)(e)(l) | | 96,047 | 95,853 |
Series 2011-H07 Class FA, CME Term SOFR 1 Month Index + 0.610% 5.9464% 2/20/61 (d)(e)(l) | | 97,328 | 97,095 |
Series 2011-H12 Class FA, CME Term SOFR 1 Month Index + 0.600% 5.9364% 2/20/61 (d)(e)(l) | | 112,196 | 111,878 |
Series 2011-H13 Class FA, CME Term SOFR 1 Month Index + 0.610% 5.9464% 4/20/61 (d)(e)(l) | | 106,026 | 105,835 |
Series 2011-H14: | | | |
Class FB, CME Term SOFR 1 Month Index + 0.610% 5.9464% 5/20/61 (d)(e)(l) | | 100,695 | 100,443 |
Class FC, CME Term SOFR 1 Month Index + 0.610% 5.9464% 5/20/61 (d)(e)(l) | | 109,628 | 109,435 |
Series 2011-H17 Class FA, CME Term SOFR 1 Month Index + 0.640% 5.9764% 6/20/61 (d)(e)(l) | | 118,052 | 117,886 |
Series 2011-H20 Class FA, CME Term SOFR 1 Month Index + 0.660% 5.9964% 9/20/61 (d)(e)(l) | | 39,288 | 39,236 |
Series 2011-H21 Class FA, CME Term SOFR 1 Month Index + 0.710% 6.0464% 10/20/61 (d)(e)(l) | | 111,271 | 111,185 |
Series 2012-98 Class FA, CME Term SOFR 1 Month Index + 0.510% 5.8502% 8/20/42 (d)(e) | | 41,006 | 40,283 |
Series 2012-H01 Class FA, CME Term SOFR 1 Month Index + 0.810% 6.1464% 11/20/61 (d)(e)(l) | | 136,129 | 136,220 |
Series 2012-H03 Class FA, CME Term SOFR 1 Month Index + 0.810% 6.1464% 1/20/62 (d)(e)(l) | | 63,594 | 63,634 |
Series 2012-H06 Class FA, CME Term SOFR 1 Month Index + 0.740% 6.0764% 1/20/62 (d)(e)(l) | | 127,751 | 127,691 |
Series 2012-H07 Class FA, CME Term SOFR 1 Month Index + 0.740% 6.0764% 3/20/62 (d)(e)(l) | | 64,365 | 64,252 |
Series 2012-H21 Class DF, CME Term SOFR 1 Month Index + 0.760% 6.0964% 5/20/61 (d)(e)(l) | | 2,171 | 2,165 |
Series 2013-H19 Class FC, CME Term SOFR 1 Month Index + 0.600% 6.0464% 8/20/63 (d)(e)(l) | | 4,471 | 4,468 |
Series 2014-H03 Class FA, CME Term SOFR 1 Month Index + 0.710% 6.0464% 1/20/64 (d)(e)(l) | | 8,169 | 8,163 |
Series 2014-H05 Class FB, CME Term SOFR 1 Month Index + 0.710% 6.0464% 12/20/63 (d)(e)(l) | | 12,552 | 12,538 |
Series 2014-H11 Class BA, CME Term SOFR 1 Month Index + 0.610% 5.9464% 6/20/64 (d)(e)(l) | | 28,564 | 28,507 |
Series 2015-H13 Class FL, CME Term SOFR 1 Month Index + 0.390% 5.7264% 5/20/63 (d)(e)(l) | | 3,131 | 3,092 |
Series 2015-H19 Class FA, CME Term SOFR 1 Month Index + 0.310% 5.6464% 4/20/63 (d)(e)(l) | | 3,031 | 2,993 |
Series 2016-H20 Class FM, CME Term SOFR 1 Month Index + 0.510% 5.8464% 12/20/62 (d)(e)(l) | | 1,678 | 1,660 |
| planned amortization class: | | | |
Series 2010-31 Class BP, 5% 3/20/40 | | 227,071 | 232,521 |
Series 2011-136 Class WI, 4.5% 5/20/40 (m) | | 11,562 | 618 |
Series 2011-68 Class EC, 3.5% 4/20/41 | | 19,510 | 19,050 |
Series 2016-69 Class WA, 3% 2/20/46 | | 43,581 | 40,857 |
Series 2017-134 Class BA, 2.5% 11/20/46 | | 58,570 | 53,956 |
Series 2017-153 Class GA, 3% 9/20/47 | | 117,434 | 108,097 |
Series 2017-182 Class KA, 3% 10/20/47 | | 93,368 | 86,575 |
Series 2018-13 Class Q, 3% 4/20/47 | | 111,646 | 105,543 |
| sequential payer: | | | |
Series 2004-24 Class ZM, 5% 4/20/34 | | 13,569 | 13,502 |
Series 2010-160 Class DY, 4% 12/20/40 | | 111,496 | 109,510 |
Series 2010-170 Class B, 4% 12/20/40 | | 24,580 | 24,118 |
Series 2011-69 Class GX, 4.5% 5/16/40 | | 141,898 | 140,985 |
Series 2014-H04 Class HA, 2.75% 2/20/64 (l) | | 59,378 | 58,730 |
Series 2017-139 Class BA, 3% 9/20/47 | | 207,197 | 189,144 |
Series 2018-H12 Class HA, 3.25% 8/20/68 (l) | | 385,652 | 372,984 |
| Series 2004-22 Class M1, 5.5% 4/20/34 | | 88,857 | 93,490 |
| Series 2004-32 Class GS, 6.380% - CME Term SOFR 1 Month Index 1.0469% 5/16/34 (d)(m)(n) | | 2,811 | 203 |
| Series 2010-116 Class QB, 4% 9/16/40 | | 8,183 | 7,901 |
| Series 2010-169 Class Z, 4.5% 12/20/40 | | 395,933 | 372,434 |
| Series 2010-H10 Class FA, CME Term SOFR 1 Month Index + 0.440% 5.7916% 5/20/60 (d)(e)(l) | | 17,538 | 17,479 |
| Series 2010-H16 Class BA, 3.55% 7/20/60 (l) | | 22,885 | 22,112 |
| Series 2011-94 Class SA, 5.980% - CME Term SOFR 1 Month Index 0.6498% 7/20/41 (d)(m)(n) | | 10,237 | 1,044 |
| Series 2013-149 Class MA, 2.5% 5/20/40 | | 60,398 | 58,853 |
| Series 2013-H01 Class FA, 1.65% 1/20/63 (l) | | 1 | 1 |
| Series 2013-H04 Class BA, 1.65% 2/20/63 (l) | | 173 | 159 |
| Series 2014-2 Class BA, 3% 1/20/44 | | 221,010 | 205,394 |
| Series 2014-21 Class HA, 3% 2/20/44 | | 82,319 | 77,071 |
| Series 2014-25 Class HC, 3% 2/20/44 | | 140,305 | 130,037 |
| Series 2014-5 Class A, 3% 1/20/44 | | 114,028 | 105,945 |
| Series 2015-H13 Class HA, 2.5% 8/20/64 (l) | | 652 | 628 |
| Series 2015-H30 Class HA, 1.75% 9/20/62 (d)(l) | | 13,158 | 12,717 |
| Series 2016-H13 Class FB, U.S. TREASURY 1 YEAR INDEX + 0.500% 5.6% 5/20/66 (d)(e)(l) | | 128,497 | 127,965 |
| Series 2017-186 Class HK, 3% 11/16/45 | | 120,398 | 112,206 |
| Series 2017-H06 Class FA, U.S. TREASURY 1 YEAR INDEX + 0.350% 5.45% 8/20/66 (d)(e)(l) | | 222,035 | 220,984 |
| Series 2090-118 Class XZ, 5% 12/20/39 | | 833,765 | 851,401 |
| Prpm 2024-Rcf4 LLC Series 2024-RCF4 Class A1, 4% 7/25/54 (b) | | 385,157 | 374,236 |
TOTAL U.S. GOVERNMENT AGENCY | | | 76,398,319 |
| TOTAL COLLATERALIZED MORTGAGE OBLIGATIONS (Cost $88,611,841) | | | 90,724,494 |
| | | | |
| Commercial Mortgage Securities - 4.6% |
| | | Principal Amount (a) | Value ($) |
| Arbor Multifamily Mortgage Securities Trust sequential payer Series 2021-MF2 Class ASB, 2.2446% 6/15/54 (b) | | 1,500,000 | 1,374,490 |
| BAMLL Commercial Mortgage Securities Trust: | | | |
| floater Series 2022-DKLX: | | | |
Class A, CME Term SOFR 1 Month Index + 1.150% 6.487% 1/15/39 (b)(d)(e) | | 1,005,000 | 990,721 |
Class B, CME Term SOFR 1 Month Index + 1.550% 6.887% 1/15/39 (b)(d)(e) | | 190,000 | 186,479 |
Class C, CME Term SOFR 1 Month Index + 2.150% 7.487% 1/15/39 (b)(d)(e) | | 136,000 | 133,185 |
| sequential payer Series 2019-BPR: | | | |
Class AMP, 3.287% 11/5/32 (b) | | 1,500,000 | 1,451,250 |
Class ANM, 3.112% 11/5/32 (b) | | 778,000 | 723,540 |
| Series 2019-BPR: | | | |
Class BNM, 3.465% 11/5/32 (b) | | 132,000 | 113,850 |
Class CNM, 3.8425% 11/5/32 (b)(d) | | 100,000 | 72,750 |
| BANK: | | | |
| sequential payer: | | | |
Series 2017-BNK9 Class A4, 3.538% 11/15/54 | | 800,000 | 769,937 |
Series 2018-BN10: | | | |
| Class A5, 3.688% 2/15/61 | | 690,000 | 666,839 |
| Class ASB, 3.641% 2/15/61 | | 346,588 | 340,485 |
Series 2018-BN14 Class A4, 4.231% 9/15/60 | | 1,600,000 | 1,569,430 |
Series 2019-BN19 Class ASB, 3.071% 8/15/61 | | 629,996 | 603,720 |
Series 2019-BN20 Class ASB, 2.933% 9/15/62 | | 100,000 | 95,499 |
Series 2019-BN21 Class A5, 2.851% 10/17/52 | | 962,049 | 868,251 |
Series 2019-BN23 Class ASB, 2.846% 12/15/52 | | 100,000 | 95,505 |
| Series 2023-BNK45 Class B, 6.148% 2/15/56 (d) | | 200,000 | 205,116 |
| Bank 2018-Bnk13 sequential payer Series 2018-BN13 Class A4, 3.953% 8/15/61 | | 300,000 | 291,022 |
| Bank of America Commercial Mortgage Trust Series 2016-UB10 Class C, 4.9847% 7/15/49 (d) | | 713,000 | 677,055 |
| BANK Trust sequential payer Series 2017-BNK5 Class A5, 3.39% 6/15/60 | | 1,000,000 | 963,280 |
| Bank5 2023-5Yr3 sequential payer Series 2023-5YR3 Class A3, 6.724% 9/15/56 | | 600,000 | 638,997 |
| BBCMS Mortgage Trust: | | | |
| sequential payer: | | | |
Series 2023-C21 Class A3, 6.5064% 9/15/56 (d) | | 400,000 | 431,155 |
Series 2024-C26 Class C, 6% 5/15/57 | | 150,000 | 149,589 |
| Series 2020-C7 Class B, 3.152% 4/15/53 | | 500,000 | 413,758 |
| Series 2022-C16 Class B, 4.6% 6/15/55 | | 200,000 | 182,880 |
| Bbcms Trust sequential payer Series 2024-5C27 Class C, 6.7% 7/15/57 (d) | | 500,000 | 506,146 |
| Benchmark 2024-V9 Mortgage Tru sequential payer Series 2024-V9 Class A3, 5.6019% 8/15/57 | | 1,200,000 | 1,236,674 |
| Benchmark Mortgage Trust: | | | |
| sequential payer: | | | |
Series 2018-B2 Class ASB, 3.7802% 2/15/51 | | 723,797 | 712,115 |
Series 2018-B4 Class A5, 4.121% 7/15/51 | | 4,151,000 | 4,035,817 |
Series 2019-B15 Class AAB, 2.859% 12/15/72 | | 1,800,000 | 1,720,595 |
Series 2021-B28 Class ASB, 1.9804% 8/15/54 | | 2,000,000 | 1,787,309 |
Series 2021-B29 Class ASB, 2.205% 9/15/54 | | 5,200,000 | 4,703,641 |
| Series 2019-B12 Class XA, 1.2096% 8/15/52 (d)(m) | | 7,419,614 | 256,329 |
| Series 2019-B14 Class XA, 0.8924% 12/15/62 (d)(m) | | 4,498,525 | 102,839 |
| Series 2020-B18 Class AGNG, 4.5348% 7/15/53 (b)(d) | | 600,000 | 555,218 |
| Bfld 2024-Wrhs floater Series 2024-WRHS Class E, CME Term SOFR 1 Month Index + 3.680% 9.0258% 8/15/26 (b)(d)(e) | | 500,000 | 496,126 |
| BLP Commercial Mortgage Trust sequential payer Series 2024-IND2 Class A, CME Term SOFR 1 Month Index + 1.340% 6.679% 3/15/41 (b)(d)(e) | | 3,227,000 | 3,210,865 |
| BMP floater Series 2024-MF23: | | | |
| Class A, CME Term SOFR 1 Month Index + 1.370% 6.7088% 6/15/41 (b)(d)(e) | | 2,072,000 | 2,063,583 |
| Class B, CME Term SOFR 1 Month Index + 1.640% 6.9785% 6/15/41 (b)(d)(e) | | 1,023,000 | 1,015,333 |
| Class C, CME Term SOFR 1 Month Index + 1.840% 7.1782% 6/15/41 (b)(d)(e) | | 723,000 | 716,674 |
| BPR Trust floater Series 2022-OANA: | | | |
| Class A, CME Term SOFR 1 Month Index + 1.890% 7.2349% 4/15/37 (b)(d)(e) | | 3,387,000 | 3,391,234 |
| Class B, CME Term SOFR 1 Month Index + 2.440% 7.7839% 4/15/37 (b)(d)(e) | | 900,000 | 901,125 |
| BX Commercial Mortgage Trust: | | | |
| floater: | | | |
Series 2019-IMC: | | | |
| Class B, CME Term SOFR 1 Month Index + 1.340% 6.6833% 4/15/34 (b)(d)(e) | | 614,000 | 604,803 |
| Class C, CME Term SOFR 1 Month Index + 1.640% 6.9833% 4/15/34 (b)(d)(e) | | 406,000 | 398,399 |
| Class D, CME Term SOFR 1 Month Index + 1.940% 7.2833% 4/15/34 (b)(d)(e) | | 426,000 | 416,429 |
Series 2021-LBA: | | | |
| Class AJV, CME Term SOFR 1 Month Index + 0.910% 6.2515% 2/15/36 (b)(d)(e) | | 200,000 | 198,063 |
| Class EJV, CME Term SOFR 1 Month Index + 2.110% 7.4515% 2/15/36 (b)(d)(e) | | 1,345,000 | 1,306,752 |
Series 2021-PAC: | | | |
| Class A, CME Term SOFR 1 Month Index + 0.800% 6.1406% 10/15/36 (b)(d)(e) | | 2,316,000 | 2,293,564 |
| Class B, CME Term SOFR 1 Month Index + 1.010% 6.3503% 10/15/36 (b)(d)(e) | | 268,000 | 262,808 |
| Class C, CME Term SOFR 1 Month Index + 1.210% 6.5501% 10/15/36 (b)(d)(e) | | 2,044,000 | 1,998,010 |
| Class D, CME Term SOFR 1 Month Index + 1.410% 6.7498% 10/15/36 (b)(d)(e) | | 349,000 | 339,621 |
| Class E, CME Term SOFR 1 Month Index + 2.060% 7.399% 10/15/36 (b)(d)(e) | | 2,036,000 | 1,995,280 |
Series 2021-SOAR: | | | |
| Class D, CME Term SOFR 1 Month Index + 1.510% 6.8515% 6/15/38 (b)(d)(e) | | 1,227,433 | 1,204,035 |
| Class E, CME Term SOFR 1 Month Index + 1.910% 7.2515% 6/15/38 (b)(d)(e) | | 2,873,070 | 2,820,995 |
| Class G, CME Term SOFR 1 Month Index + 2.910% 8.2515% 6/15/38 (b)(d)(e) | | 1,315,107 | 1,286,688 |
Series 2021-VOLT: | | | |
| Class D, CME Term SOFR 1 Month Index + 1.760% 7.1014% 9/15/36 (b)(d)(e) | | 1,000,000 | 983,804 |
| Class E, CME Term SOFR 1 Month Index + 2.110% 7.4514% 9/15/36 (b)(d)(e) | | 1,000,000 | 982,870 |
| Class G, CME Term SOFR 1 Month Index + 2.960% 8.3014% 9/15/36 (b)(d)(e) | | 500,000 | 488,717 |
Series 2022-IND Class A, CME Term SOFR 1 Month Index + 1.490% 6.8279% 4/15/37 (b)(d)(e) | | 1,810,736 | 1,804,003 |
Series 2022-LP2: | | | |
| Class A, CME Term SOFR 1 Month Index + 1.010% 6.3498% 2/15/39 (b)(d)(e) | | 1,938,328 | 1,920,157 |
| Class B, CME Term SOFR 1 Month Index + 1.310% 6.6492% 2/15/39 (b)(d)(e) | | 741,773 | 730,183 |
| Class C, CME Term SOFR 1 Month Index + 1.560% 6.8986% 2/15/39 (b)(d)(e) | | 583,852 | 574,000 |
| Class D, CME Term SOFR 1 Month Index + 1.960% 7.2977% 2/15/39 (b)(d)(e) | | 583,852 | 573,452 |
Series 2023-VLT3 Class C, CME Term SOFR 1 Month Index + 3.430% 8.7749% 11/15/28 (b)(d)(e) | | 1,000,000 | 988,561 |
Series 2023-XL3: | | | |
| Class A, CME Term SOFR 1 Month Index + 1.760% 7.0983% 12/9/40 (b)(d)(e) | | 1,429,030 | 1,432,603 |
| Class B, CME Term SOFR 1 Month Index + 2.190% 7.5277% 12/9/40 (b)(d)(e) | | 321,140 | 321,039 |
| Class C, CME Term SOFR 1 Month Index + 2.640% 7.9771% 12/9/40 (b)(d)(e) | | 170,889 | 170,676 |
| floater sequential payer: | | | |
Series 2019-IMC Class A, CME Term SOFR 1 Month Index + 1.040% 6.3833% 4/15/34 (b)(d)(e) | | 383,377 | 379,788 |
Series 2021-SOAR Class A, CME Term SOFR 1 Month Index + 0.780% 6.1215% 6/15/38 (b)(d)(e) | | 4,473,116 | 4,424,192 |
Series 2024-XL5 Class A, CME Term SOFR 1 Month Index + 1.390% 6.7285% 3/15/41 (b)(d)(e) | | 11,952,759 | 11,915,406 |
| Series 2019-OC11: | | | |
Class E, 4.0755% 12/9/41 (b)(d) | | 1,363,000 | 1,202,274 |
Class XA, 0.8735% 12/9/41 (b)(d)(m) | | 50,900,000 | 1,744,272 |
| Series 2020-VIVA Class D, 3.667% 3/11/44 (b)(d) | | 170,000 | 149,144 |
| BX Commercial Mortgage Trust 2024-Xl4: | | | |
| floater: | | | |
Series 2024-XL4 Class B, CME Term SOFR 1 Month Index + 1.790% 7.1284% 2/15/39 (b)(d)(e) | | 569,305 | 565,747 |
Series 2024-XL5: | | | |
| Class B, CME Term SOFR 1 Month Index + 1.690% 7.0281% 3/15/41 (b)(d)(e) | | 1,257,226 | 1,246,234 |
| Class C, CME Term SOFR 1 Month Index + 1.940% 7.2778% 3/15/41 (b)(d)(e) | | 1,668,630 | 1,649,872 |
| floater sequential payer Series 2024-XL4 Class A, CME Term SOFR 1 Month Index + 1.440% 6.7789% 2/15/39 (b)(d)(e) | | 4,314,112 | 4,308,719 |
| BX Commercial Mtg Trust floater Series 2024-MDHS: | | | |
| Class A, 6.9782% 5/15/41 (b)(d) | | 6,740,882 | 6,728,251 |
| Class E, CME Term SOFR 1 Month Index + 3.680% 9.0252% 5/15/41 (b)(d)(e) | | 945,956 | 927,769 |
| Bx Commercial Mtg Trust 2024-King floater Series 2024-KING Class E, CME Term SOFR 1 Month Index + 3.680% 9.0248% 5/15/34 (b)(d)(e) | | 2,025,000 | 1,992,497 |
| BX Trust floater: | | | |
| Series 2021-ACNT Class G, CME Term SOFR 1 Month Index + 3.400% 8.7465% 11/15/38 (b)(d)(e) | | 563,239 | 551,624 |
| Series 2022-GPA Class A, CME Term SOFR 1 Month Index + 2.160% 7.5019% 8/15/39 (b)(d)(e) | | 2,309,395 | 2,312,279 |
| Series 2022-IND: | | | |
Class B, CME Term SOFR 1 Month Index + 1.940% 7.2769% 4/15/37 (b)(d)(e) | | 688,287 | 686,578 |
Class C, CME Term SOFR 1 Month Index + 2.290% 7.6269% 4/15/37 (b)(d)(e) | | 155,587 | 155,297 |
Class D, CME Term SOFR 1 Month Index + 2.830% 8.1759% 4/15/37 (b)(d)(e) | | 130,397 | 130,153 |
| Series 2022-VAMF Class F, CME Term SOFR 1 Month Index + 3.290% 8.6359% 1/15/39 (b)(d)(e) | | 823,000 | 809,813 |
| Series 2024-CNYN: | | | |
Class A, CME Term SOFR 1 Month Index + 1.440% 6.7788% 4/15/41 (b)(d)(e) | | 4,923,612 | 4,902,016 |
Class B, CME Term SOFR 1 Month Index + 1.690% 7.0284% 4/15/41 (b)(d)(e) | | 784,336 | 774,777 |
Class C, CME Term SOFR 1 Month Index + 1.940% 7.2781% 4/15/41 (b)(d)(e) | | 651,800 | 638,764 |
| Series 2024-VLT4: | | | |
Class E, CME Term SOFR 1 Month Index + 2.880% 8.2263% 7/15/29 (b)(d)(e) | | 657,000 | 651,457 |
Class F, CME Term SOFR 1 Month Index + 3.930% 9.2748% 7/15/29 (b)(d)(e) | | 1,750,000 | 1,723,769 |
| CAMB Commercial Mortgage Trust floater Series 2019-LIFE Class A, CME Term SOFR 1 Month Index + 1.360% 6.704% 12/15/37 (b)(d)(e) | | 100,000 | 99,938 |
| CF Hippolyta Issuer LLC sequential payer Series 2021-1A Class A1, 1.53% 3/15/61 (b) | | 1,833,060 | 1,706,998 |
| CFCRE Commercial Mortgage Trust sequential payer: | | | |
| Series 2016-C7 Class A2, 3.5853% 12/10/54 | | 228,740 | 221,120 |
| Series 2017-C8 Class A3, 3.3048% 6/15/50 | | 245,012 | 235,350 |
| Cgms Commercial Mortgage Trust sequential payer Series 2017-B1 Class A3, 3.197% 8/15/50 | | 290,294 | 279,011 |
| Citigroup Commercial Mortgage Trust: | | | |
| sequential payer: | | | |
Series 2016-C1 Class A4, 3.209% 5/10/49 | | 400,000 | 388,235 |
Series 2018-B2 Class A4, 4.009% 3/10/51 | | 1,700,000 | 1,652,480 |
Series 2019-GC41 Class AAB, 2.7198% 8/10/56 | | 866,971 | 824,229 |
Series 2020-GC46 Class AAB, 2.614% 2/15/53 | | 500,000 | 472,241 |
| Series 2015-GC27 Class A5, 3.137% 2/10/48 | | 400,000 | 398,137 |
| Series 2015-GC29 Class XA, 1.1463% 4/10/48 (d)(m) | | 2,613,823 | 6,851 |
| Series 2020-420K: | | | |
Class D, 3.4222% 11/10/42 (b)(d) | | 375,000 | 324,504 |
Class E, 3.4222% 11/10/42 (b)(d) | | 600,000 | 485,627 |
| Series 2023-PRM3 Class C, 6.5717% 7/10/28 (b)(d) | | 632,000 | 638,916 |
| Series 2023-SMRT Class C, 6.0475% 10/12/40 (b)(d) | | 150,000 | 149,019 |
| COMM Mortgage Trust: | | | |
| sequential payer Series 2015-DC1 Class A4, 3.078% 2/10/48 | | 975,965 | 972,391 |
| Series 2014-CR20 Class C, 4.5346% 11/10/47 (d) | | 145,000 | 138,217 |
| Series 2014-LC17 Class XA, 0.6896% 10/10/47 (d)(m) | | 1,138,629 | 20 |
| Series 2015-DC1: | | | |
Class B, 4.035% 2/10/48 (d) | | 275,000 | 260,052 |
Class C, 4.4163% 2/10/48 (d) | | 398,000 | 349,758 |
| Series 2015-LC19 Class C, 4.3787% 2/10/48 (d) | | 255,000 | 238,277 |
| Computershare Corporate Trust Series 2018-C48 Class A5, 4.302% 1/15/52 | | 824,434 | 810,304 |
| Cone Trust 2024-Dfw1 floater Series 2024-DFW1 Class E, CME Term SOFR 1 Month Index + 3.880% 9.2254% 8/15/41 (b)(d)(e) | | 175,000 | 174,491 |
| CPT Mortgage Trust sequential payer Series 2019-CPT Class E, 3.0967% 11/13/39 (b)(d) | | 100,000 | 72,850 |
| Credit Suisse Mortgage Trust sequential payer Series 2020-NET Class A, 2.2569% 8/15/37 (b) | | 223,434 | 212,948 |
| CSAIL 2018-CX12 Commercial Mortgage Trust sequential payer Series 2018-CX12 Class A3, 3.9585% 8/15/51 | | 280,000 | 271,742 |
| CSAIL Commercial Mortgage Trust: | | | |
| sequential payer: | | | |
Series 2017-CX10 Class ASB, 3.3269% 11/15/50 | | 489,420 | 480,723 |
Series 2019-C15 Class A4, 4.0529% 3/15/52 | | 4,481,768 | 4,333,052 |
| Series 2017-C8 Class C, 4.4093% 6/15/50 (d) | | 490,000 | 412,256 |
| CSMC Trust Series 2017-PFHP Class D, CME Term SOFR 1 Month Index + 2.290% 7.634% 12/15/30 (b)(d)(e) | | 1,296,000 | 1,210,572 |
| DC Commercial Mortgage Trust Series 2023-DC Class D, 7.3785% 9/12/40 (b)(d) | | 184,000 | 184,610 |
| DTP Commercial Mortgage Trust 2023-Ste2 sequential payer Series 2023-STE2: | | | |
| Class A, 6.038% 1/15/41 (b)(d) | | 524,000 | 536,034 |
| Class D, 6.9552% 1/15/41 (b)(d) | | 1,100,000 | 1,110,816 |
| ELP Commercial Mortgage Trust floater Series 2021-ELP: | | | |
| Class A, CME Term SOFR 1 Month Index + 0.810% 6.1525% 11/15/38 (b)(d)(e) | | 8,091,582 | 7,985,380 |
| Class B, CME Term SOFR 1 Month Index + 1.230% 6.5717% 11/15/38 (b)(d)(e) | | 1,134,679 | 1,115,555 |
| Class J, CME Term SOFR 1 Month Index + 3.720% 9.0664% 11/15/38 (b)(d)(e) | | 1,498,256 | 1,445,002 |
| Eqt Trust 2024-Extr: | | | |
| sequential payer Series 2024-EXTR Class A, 5.3308% 7/5/41 (b)(d) | | 2,221,000 | 2,261,782 |
| Series 2024-EXTR: | | | |
Class B, 1 month U.S. LIBOR + 0.000% 5.6546% 7/5/41 (b)(d)(e) | | 158,000 | 160,945 |
Class C, 6.0464% 7/5/41 (b)(d) | | 133,000 | 135,171 |
Class D, 6.6819% 7/5/41 (b)(d) | | 100,000 | 101,606 |
| Extended Stay America Trust floater Series 2021-ESH: | | | |
| Class A, CME Term SOFR 1 Month Index + 1.190% 6.5315% 7/15/38 (b)(d)(e) | | 4,325,335 | 4,306,411 |
| Class B, CME Term SOFR 1 Month Index + 1.490% 6.8315% 7/15/38 (b)(d)(e) | | 3,373,545 | 3,344,056 |
| Class C, CME Term SOFR 1 Month Index + 1.810% 7.1515% 7/15/38 (b)(d)(e) | | 2,988,511 | 2,962,410 |
| Class D, CME Term SOFR 1 Month Index + 2.360% 7.7015% 7/15/38 (b)(d)(e) | | 613,535 | 610,471 |
| Class F, CME Term SOFR 1 Month Index + 3.810% 9.1515% 7/15/38 (b)(d)(e) | | 539,767 | 539,430 |
| Freddie Mac sequential payer: | | | |
| Series 2015-K043 Class A2, 3.062% 12/25/24 | | 1,052,459 | 1,044,181 |
| Series 2015-K049 Class A2, 3.01% 7/25/25 | | 155,696 | 153,191 |
| Series 2016-K055 Class A2, 2.673% 3/25/26 | | 2,600,000 | 2,528,758 |
| Series 2019-K736 Class A2, 2.282% 7/25/26 | | 1,400,000 | 1,351,204 |
| Series 2023-K751 Class A2, 4.412% 3/25/30 | | 300,000 | 303,228 |
| Series K058 Class A2, 2.653% 8/25/26 | | 1,126,000 | 1,090,782 |
| FS Commercial Mortgage Trust Series 2023-4SZN Class D, 9.3827% 11/10/39 (b)(d) | | 500,000 | 523,491 |
| GS Mortgage Securities Trust: | | | |
| floater: | | | |
Series 2018-3PCK Class A, CME Term SOFR 1 Month Index + 2.060% 7.4015% 9/15/31 (b)(d)(e) | | 648,090 | 644,548 |
Series 2021-IP: | | | |
| Class A, CME Term SOFR 1 Month Index + 1.060% 6.4015% 10/15/36 (b)(d)(e) | | 2,253,000 | 2,219,247 |
| Class B, CME Term SOFR 1 Month Index + 1.260% 6.6015% 10/15/36 (b)(d)(e) | | 160,000 | 156,060 |
| Class C, CME Term SOFR 1 Month Index + 1.660% 7.0015% 10/15/36 (b)(d)(e) | | 132,000 | 128,704 |
| sequential payer: | | | |
Series 2017-GS6 Class A2, 3.164% 5/10/50 | | 95,259 | 90,833 |
Series 2018-GS9 Class A4, 3.992% 3/10/51 | | 200,000 | 192,977 |
Series 2019-GSA1 Class A4, 3.0479% 11/10/52 | | 700,000 | 648,598 |
| Series 2019-GC42 Class C, 3.8256% 9/10/52 (d) | | 441,000 | 362,823 |
| Gs Mtg Securities Corp. Trust 2024-Rvr sequential payer Series 2024-RVR Class B, 5.7226% 8/10/29 (b)(d) | | 100,000 | 99,923 |
| Hilton U.S.A. Trust Series 2016-HHV: | | | |
| Class E, 4.3333% 11/5/38 (b)(d) | | 1,000,000 | 950,794 |
| Class F, 4.3333% 11/5/38 (b)(d) | | 1,000,000 | 943,995 |
| Intown Mortgage Trust floater sequential payer Series 2022-STAY Class A, CME Term SOFR 1 Month Index + 2.480% 7.8256% 8/15/39 (b)(d)(e) | | 2,256,000 | 2,258,115 |
| JPMBB Commercial Mortgage Securities Trust: | | | |
| sequential payer Series 2015-C33 Class A3, 3.5043% 12/15/48 | | 282,040 | 277,365 |
| Series 2014-C26 Class D, 3.9904% 1/15/48 (b)(d) | | 300,000 | 235,896 |
| JPMDB Commercial Mortgage Securities Trust sequential payer Series 2016-C4: | | | |
| Class A2, 2.8822% 12/15/49 | | 212,105 | 204,077 |
| Class ASB, 2.9941% 12/15/49 | | 281,821 | 275,375 |
| JPMorgan Chase Commercial Mortgage Securities Trust Series 2018-WPT: | | | |
| Class AFX, 4.2475% 7/5/33 (b) | | 476,000 | 434,915 |
| Class CFX, 4.9498% 7/5/33 (b) | | 103,000 | 79,576 |
| Class DFX, 5.3503% 7/5/33 (b) | | 159,000 | 115,225 |
| Class XAFX, 1.2948% 7/5/33 (b)(d)(m) | | 2,000,000 | 39,583 |
| Ksl Commercial Mtg Trust 2023-Ht floater Series 2023-HT Class A, CME Term SOFR 1 Month Index + 2.290% 7.6271% 12/15/36 (b)(d)(e) | | 2,700,000 | 2,707,594 |
| LBA Trust floater Series 2024-BOLT: | | | |
| Class E, CME Term SOFR 1 Month Index + 3.680% 9.025% 6/15/26 (b)(d)(e) | | 1,000,000 | 982,705 |
| Class F, CME Term SOFR 1 Month Index + 4.430% 9.7739% 6/15/26 (b)(d)(e) | | 215,000 | 211,207 |
| LCCM Mortgage Loan Trust sequential payer Series 2017-LC26 Class A3, 3.289% 7/12/50 (b) | | 1,261,810 | 1,207,006 |
| Life Financial Services Trust floater Series 2022-BMR2: | | | |
| Class A1, CME Term SOFR 1 Month Index + 1.290% 6.6321% 5/15/39 (b)(d)(e) | | 2,726,000 | 2,666,935 |
| Class B, CME Term SOFR 1 Month Index + 1.790% 7.1308% 5/15/39 (b)(d)(e) | | 1,630,000 | 1,560,859 |
| Class C, CME Term SOFR 1 Month Index + 2.090% 7.43% 5/15/39 (b)(d)(e) | | 913,000 | 859,178 |
| Class D, CME Term SOFR 1 Month Index + 2.540% 7.8788% 5/15/39 (b)(d)(e) | | 812,000 | 756,883 |
| LIFE Mortgage Trust floater Series 2021-BMR: | | | |
| Class A, CME Term SOFR 1 Month Index + 0.810% 6.1515% 3/15/38 (b)(d)(e) | | 967,624 | 949,843 |
| Class B, CME Term SOFR 1 Month Index + 0.990% 6.3315% 3/15/38 (b)(d)(e) | | 267,286 | 260,793 |
| Class C, CME Term SOFR 1 Month Index + 1.210% 6.5515% 3/15/38 (b)(d)(e) | | 168,144 | 163,484 |
| Class D, CME Term SOFR 1 Month Index + 1.510% 6.8515% 3/15/38 (b)(d)(e) | | 233,975 | 227,646 |
| Class E, CME Term SOFR 1 Month Index + 1.860% 7.2015% 3/15/38 (b)(d)(e) | | 204,629 | 196,470 |
| MCR Mortgage Trust sequential payer Series 2024-TWA Class F, 10.382% 6/12/39 (b) | | 200,000 | 202,524 |
| Merit floater Series 2021-STOR: | | | |
| Class A, CME Term SOFR 1 Month Index + 0.810% 6.1515% 7/15/38 (b)(d)(e) | | 200,000 | 197,813 |
| Class G, CME Term SOFR 1 Month Index + 2.860% 8.2015% 7/15/38 (b)(d)(e) | | 1,500,000 | 1,479,697 |
| MHC Commercial Mortgage Trust floater Series 2021-MHC Class F, CME Term SOFR 1 Month Index + 2.710% 8.0524% 4/15/38 (b)(d)(e) | | 1,509,978 | 1,476,057 |
| MHP Commercial Mortgage Trust floater Series 2022-MHIL: | | | |
| Class F, CME Term SOFR 1 Month Index + 3.250% 8.5961% 1/15/27 (b)(d)(e) | | 895,205 | 882,476 |
| Class G, CME Term SOFR 1 Month Index + 3.950% 9.2944% 1/15/27 (b)(d)(e) | | 1,115,815 | 1,101,408 |
| Morgan Stanley Bank of America Merrill Lynch Trust sequential payer Series 2017-C34 Class ASB, 3.354% 11/15/52 | | 794,431 | 777,393 |
| Morgan Stanley Capital sequential payer Series 2016-UB11 Class A4, 2.782% 8/15/49 | | 1,000,000 | 955,397 |
| Morgan Stanley Capital I Trust: | | | |
| sequential payer: | | | |
Series 2017-H1 Class A4, 3.259% 6/15/50 | | 500,000 | 482,947 |
Series 2017-HR2 Class A4, 3.587% 12/15/50 | | 270,000 | 259,179 |
Series 2018-L1 Class A3, 4.139% 10/15/51 | | 1,070,000 | 1,052,760 |
Series 2019-L2 Class A3, 3.806% 3/15/52 | | 391,713 | 375,676 |
Series 2019-MEAD Class A, 3.17% 11/10/36 (b) | | 1,798,000 | 1,721,842 |
Series 2024-BPR2 Class A, 7.291% 5/5/29 (b) | | 209,548 | 217,159 |
| Series 2017 H1 Class B, 4.075% 6/15/50 | | 515,000 | 481,179 |
| Series 2017-H1 Class C, 4.281% 6/15/50 | | 180,000 | 163,944 |
| Series 2017-HR2 Class D, 2.73% 12/15/50 | | 296,000 | 249,196 |
| Series 2018-H4 Class A4, 4.31% 12/15/51 | | 5,485,000 | 5,346,828 |
| Series 2019-MEAD: | | | |
Class B, 3.283% 11/10/36 (b)(d) | | 246,000 | 233,120 |
Class C, 3.283% 11/10/36 (b)(d) | | 235,000 | 219,171 |
| Series 2024-BPR2 Class X, 1.0727% 5/5/29 (b)(d)(m) | | 7,990,073 | 290,299 |
| Open Trust 2023-Air sequential payer Series 2023-AIR: | | | |
| Class A, CME Term SOFR 1 Month Index + 3.080% 8.426% 10/15/28 (b)(d)(e) | | 1,283,189 | 1,294,417 |
| Class B, CME Term SOFR 1 Month Index + 3.830% 9.1749% 10/15/28 (b)(d)(e) | | 3,019,268 | 3,030,560 |
| OPG Trust floater Series 2021-PORT: | | | |
| Class A, CME Term SOFR 1 Month Index + 0.590% 5.9355% 10/15/36 (b)(d)(e) | | 175,065 | 172,165 |
| Class B, CME Term SOFR 1 Month Index + 0.820% 6.1645% 10/15/36 (b)(d)(e) | | 905,450 | 885,360 |
| Class C, CME Term SOFR 1 Month Index + 0.940% 6.2835% 10/15/36 (b)(d)(e) | | 1,576,250 | 1,535,366 |
| Class G, CME Term SOFR 1 Month Index + 2.510% 7.8495% 10/15/36 (b)(d)(e) | | 975,000 | 952,987 |
| SPGN Mortgage Trust floater Series 2022-TFLM: | | | |
| Class B, CME Term SOFR 1 Month Index + 2.000% 7.3369% 2/15/39 (b)(d)(e) | | 457,000 | 447,327 |
| Class C, CME Term SOFR 1 Month Index + 2.650% 7.9869% 2/15/39 (b)(d)(e) | | 237,000 | 230,360 |
| SREIT Trust floater: | | | |
| Series 2021-FLWR Class F, CME Term SOFR 1 Month Index + 2.780% 8.124% 7/15/36 (b)(d)(e) | | 1,000,000 | 985,850 |
| Series 2021-MFP: | | | |
Class A, CME Term SOFR 1 Month Index + 0.840% 6.1822% 11/15/38 (b)(d)(e) | | 12,516,724 | 12,364,176 |
Class B, CME Term SOFR 1 Month Index + 1.190% 6.5312% 11/15/38 (b)(d)(e) | | 4,748,910 | 4,689,621 |
Class C, CME Term SOFR 1 Month Index + 1.440% 6.7804% 11/15/38 (b)(d)(e) | | 578,902 | 570,229 |
Class D, CME Term SOFR 1 Month Index + 1.690% 7.0296% 11/15/38 (b)(d)(e) | | 380,831 | 373,215 |
Class G, CME Term SOFR 1 Month Index + 3.080% 8.4252% 11/15/38 (b)(d)(e) | | 956,863 | 938,943 |
| STWD Trust floater sequential payer Series 2021-LIH Class F, CME Term SOFR 1 Month Index + 3.660% 9.002% 11/15/36 (b)(d)(e) | | 1,230,000 | 1,206,587 |
| UBS Commercial Mortgage Trust: | | | |
| sequential payer: | | | |
Series 2017-C7 Class ASB, 3.586% 12/15/50 | | 1,493,725 | 1,464,162 |
Series 2018-C12 Class A4, 4.0299% 8/15/51 | | 5,000,000 | 4,898,932 |
| Series 2017-C7 Class XA, 1.1325% 12/15/50 (d)(m) | | 1,137,979 | 29,773 |
| VLS Commercial Mortgage Trust: | | | |
| sequential payer Series 2020-LAB Class A, 2.13% 10/10/42 (b) | | 1,382,000 | 1,129,727 |
| Series 2020-LAB Class B, 2.453% 10/10/42 (b) | | 1,276,000 | 1,041,774 |
| Wells Fargo Commercial Mortage Trust 20 floater Series 2024-MGP: | | | |
| Class A11, CME Term SOFR 1 Month Index + 1.990% 7.3407% 8/15/41 (b)(d)(e) | | 400,000 | 398,957 |
| Class A12, CME Term SOFR 1 Month Index + 1.690% 7.0412% 8/15/41 (b)(d)(e) | | 1,500,000 | 1,496,088 |
| Wells Fargo Commercial Mortgag Series 2024-1CHI Class E, 7.5743% 7/15/35 (b)(d) | | 173,000 | 173,071 |
| Wells Fargo Commercial Mortgage Trust: | | | |
| floater: | | | |
Series 2016-C35 Class A4FL, CME Term SOFR 1 Month Index + 1.160% 6.5031% 7/15/48 (b)(d)(e) | | 2,800,000 | 2,798,524 |
Series 2021-FCMT Class A, CME Term SOFR 1 Month Index + 1.310% 6.6515% 5/15/31 (b)(d)(e) | | 953,000 | 928,722 |
Series 2021-SAVE Class D, CME Term SOFR 1 Month Index + 2.610% 7.9515% 2/15/40 (b)(d)(e) | | 460,800 | 453,897 |
| sequential payer: | | | |
Series 2017-C38 Class ASB, 3.261% 7/15/50 | | 479,956 | 471,465 |
Series 2017-C42 Class ASB, 3.488% 12/15/50 | | 490,892 | 482,721 |
| Series 2016-NXS6 Class C, 4.5379% 11/15/49 (d) | | 320,000 | 293,553 |
| Series 2017-C42 Class XA, 1.004% 12/15/50 (d)(m) | | 3,482,159 | 80,191 |
| Series 2018-C46 Class XA, 1.0782% 8/15/51 (d)(m) | | 2,285,847 | 52,313 |
| Wells Fargo Commercial Mtg Trust sequential payer Series 2016-C37, Class A4, 3.525% 12/15/49 | | 917,635 | 894,305 |
| Wells Fargo Commercial Mtg Trust 2020-C sequential payer Series 2020-C55 Class ASB, 2.651% 2/15/53 | | 400,000 | 379,117 |
| WF-RBS Commercial Mortgage Trust Series 2014-C21 Class XA, 0.7162% 8/15/47 (d)(m) | | 80,284 | 1 |
| TOTAL COMMERCIAL MORTGAGE SECURITIES (Cost $258,153,088) | | | 258,121,186 |
| | | | |
| Foreign Government and Government Agency Obligations - 1.2% |
| | | Principal Amount (a) | Value ($) |
| Abu Dhabi National Energy Co. PJSC 4.375% 1/24/29 (b) | | 125,000 | 125,195 |
| Angola Republic: | | | |
| 8.25% 5/9/28 (b) | | 245,000 | 234,205 |
| 8.75% 4/14/32 (b) | | 200,000 | 181,626 |
| 9.375% 5/8/48 (b) | | 200,000 | 172,000 |
| 9.5% 11/12/25 (b) | | 315,000 | 320,808 |
| Arab Republic of Egypt: | | | |
| 7.5% 1/31/27 (b) | | 305,000 | 298,328 |
| 7.5% 2/16/61 (b) | | 410,000 | 283,028 |
| 7.6003% 3/1/29 (b) | | 200,000 | 188,125 |
| 7.625% 5/29/32 (b) | | 135,000 | 115,594 |
| 7.903% 2/21/48 (b) | | 200,000 | 147,250 |
| 8.5% 1/31/47 (b) | | 295,000 | 228,164 |
| 8.7002% 3/1/49 (b) | | 200,000 | 156,374 |
| Argentine Republic: | | | |
| 0.75% 7/9/30 (f) | | 3,412,810 | 1,940,182 |
| 1% 7/9/29 | | 405,245 | 243,755 |
| 3.5% 7/9/41 (f) | | 460,000 | 191,590 |
| 4.125% 7/9/35 (f) | | 3,099,989 | 1,374,845 |
| 5% 1/9/38 (f) | | 825,000 | 401,363 |
| Bahamian Republic 6% 11/21/28 (b) | | 200,000 | 184,750 |
| Bahrain Kingdom: | | | |
| 5.625% 5/18/34 (b) | | 150,000 | 140,625 |
| 7.5% 2/12/36 (b) | | 100,000 | 105,719 |
| Bank Gospodarstwa Krajowego: | | | |
| 5.375% 5/22/33 (b) | | 75,000 | 76,776 |
| 6.25% 10/31/28 (b) | | 70,000 | 74,654 |
| 6.25% 7/9/54 (b) | | 300,000 | 323,979 |
| Barbados Government 6.5% 10/1/29 (b) | | 275,000 | 263,313 |
| Bermuda Government: | | | |
| 3.375% 8/20/50 (b) | | 100,000 | 72,719 |
| 3.717% 1/25/27 (b) | | 300,000 | 292,406 |
| 4.75% 2/15/29 (b) | | 200,000 | 198,776 |
| 5% 7/15/32 (b) | | 140,000 | 140,306 |
| Bonos para la Reconstruccion de una Argentina Libre 0% 6/30/25 | | 342,507 | 278,342 |
| Brazilian Federative Republic: | | | |
| 3.875% 6/12/30 | | 270,000 | 247,725 |
| 6% 10/20/33 | | 200,000 | 200,260 |
| 7.125% 1/20/37 | | 340,000 | 369,284 |
| 7.125% 5/13/54 | | 100,000 | 102,402 |
| 8.25% 1/20/34 | | 475,000 | 550,478 |
| Canadian Government 2.75% 6/1/33 | CAD | 400,000 | 288,573 |
| Chilean Republic: | | | |
| 2.45% 1/31/31 | | 670,000 | 592,950 |
| 2.75% 1/31/27 | | 200,000 | 191,688 |
| 3.1% 1/22/61 | | 480,000 | 315,120 |
| 4.34% 3/7/42 | | 200,000 | 180,100 |
| 5.33% 1/5/54 | | 200,000 | 198,376 |
| Colombian Republic: | | | |
| 3% 1/30/30 | | 345,000 | 292,043 |
| 3.125% 4/15/31 | | 240,000 | 196,200 |
| 3.25% 4/22/32 | | 200,000 | 159,400 |
| 4.125% 5/15/51 | | 200,000 | 125,190 |
| 5% 6/15/45 | | 590,000 | 427,721 |
| 5.2% 5/15/49 | | 285,000 | 209,176 |
| 7.375% 9/18/37 | | 100,000 | 100,650 |
| 8% 4/20/33 | | 130,000 | 138,515 |
| 8% 11/14/35 | | 1,055,000 | 1,119,355 |
| 8.75% 11/14/53 | | 1,350,000 | 1,468,733 |
| Costa Rican Republic: | | | |
| 5.625% 4/30/43 (b) | | 200,000 | 185,000 |
| 7.3% 11/13/54 (b) | | 200,000 | 216,562 |
| Democratic Socialist Republic of Sri Lanka: | | | |
| 6.2% (b)(g) | | 200,000 | 104,438 |
| 6.825% (b)(g) | | 200,000 | 105,626 |
| 6.85% (b)(g) | | 85,000 | 45,581 |
| 7.55% (b)(g) | | 200,000 | 105,500 |
| 7.85% (b)(g) | | 225,000 | 119,602 |
| Dominican Republic: | | | |
| 4.5% 1/30/30 (b) | | 1,350,000 | 1,278,734 |
| 4.875% 9/23/32 (b) | | 705,000 | 663,581 |
| 5.875% 1/30/60 (b) | | 150,000 | 137,700 |
| 5.95% 1/25/27 (b) | | 3,105,000 | 3,132,169 |
| 6% 7/19/28 (b) | | 715,000 | 728,857 |
| 6.5% 2/15/48 (b) | | 150,000 | 151,782 |
| 6.6% 6/1/36 (b) | | 135,000 | 141,885 |
| 6.85% 1/27/45 (b) | | 135,000 | 142,004 |
| 6.875% 1/29/26 (b) | | 295,000 | 299,978 |
| 7.05% 2/3/31 (b) | | 150,000 | 160,575 |
| 7.45% 4/30/44 (b) | | 145,000 | 161,993 |
| Ecuador Republic: | | | |
| 5.5% 7/31/35 (b)(f) | | 420,000 | 232,050 |
| 6.9% 7/31/30 (b) | | 415,000 | 295,273 |
| El Salvador Republic: | | | |
| 0.25% 4/17/30 (b) | | 150,000 | 3,825 |
| 6.375% 1/18/27 (b) | | 30,000 | 28,106 |
| 7.1246% 1/20/50 (b) | | 150,000 | 103,922 |
| 7.65% 6/15/35 (b) | | 60,000 | 47,010 |
| 9.25% 4/17/30 (b) | | 150,000 | 141,781 |
| Emirate of Abu Dhabi: | | | |
| 3% 9/15/51 (b) | | 400,000 | 285,252 |
| 3.125% 9/30/49 (b) | | 890,000 | 654,150 |
| 3.875% 4/16/50 (b) | | 285,000 | 239,936 |
| 5.5% 4/30/54 (b) | | 200,000 | 214,625 |
| Emirate of Dubai: | | | |
| 3.9% 9/9/50 (Reg. S) | | 305,000 | 234,698 |
| 5.25% 1/30/43 (Reg. S) | | 200,000 | 198,500 |
| Export Credit Bank of Turkey 9% 1/28/27 (b) | | 120,000 | 126,900 |
| Gabonese Republic: | | | |
| 6.625% 2/6/31 (b) | | 200,000 | 152,813 |
| 7% 11/24/31 (b) | | 200,000 | 152,500 |
| Georgia Republic 2.75% 4/22/26 (b) | | 200,000 | 187,938 |
| German Federal Republic: | | | |
| 2.1% 11/15/29(Reg. S) | EUR | 1,400,000 | 1,541,515 |
| 2.5% 7/4/44 | EUR | 1,596,000 | 1,748,406 |
| 3.25% 7/4/42 | EUR | 1,674,000 | 2,029,853 |
| Ghana Republic: | | | |
| 7.75% (b)(g) | | 200,000 | 104,750 |
| 10.75% 10/14/30 (b) | | 200,000 | 136,626 |
| Guatemalan Republic: | | | |
| 6.125% 6/1/50 (b) | | 200,000 | 190,125 |
| 6.6% 6/13/36 (b) | | 200,000 | 208,602 |
| Hungarian Republic: | | | |
| 3.125% 9/21/51 (b) | | 200,000 | 132,250 |
| 5.25% 6/16/29 (b) | | 200,000 | 201,950 |
| 5.5% 6/16/34 (b) | | 280,000 | 283,413 |
| 6.25% 9/22/32 (b) | | 140,000 | 149,849 |
| 6.75% 9/25/52 (b) | | 100,000 | 112,625 |
| Indonesian Republic: | | | |
| 3.2% 9/23/61 | | 200,000 | 136,938 |
| 3.85% 10/15/30 | | 125,000 | 120,313 |
| 4.2% 10/15/50 | | 2,100,000 | 1,840,781 |
| 4.35% 1/11/48 | | 200,000 | 180,938 |
| 5.125% 1/15/45 (b) | | 500,000 | 506,415 |
| 5.25% 1/17/42 (b) | | 200,000 | 205,125 |
| 5.95% 1/8/46 (b) | | 200,000 | 220,500 |
| 6.75% 1/15/44 (b) | | 200,000 | 241,000 |
| 7.75% 1/17/38 (b) | | 350,000 | 443,078 |
| 8.5% 10/12/35 (b) | | 515,000 | 669,629 |
| Islamic Republic of Pakistan: | | | |
| 6% 4/8/26 (b) | | 305,000 | 279,838 |
| 7.375% 4/8/31 (b) | | 400,000 | 318,500 |
| Israeli State: | | | |
| 3.375% 1/15/50 | | 270,000 | 182,319 |
| 5.75% 3/12/54 | | 200,000 | 192,000 |
| Ivory Coast: | | | |
| 5.875% 10/17/31 (b) | EUR | 365,000 | 375,716 |
| 6.125% 6/15/33 (b) | | 260,000 | 237,656 |
| 6.375% 3/3/28 (b) | | 220,000 | 218,464 |
| 8.25% 1/30/37 (b) | | 200,000 | 199,250 |
| Jordanian Kingdom: | | | |
| 4.95% 7/7/25 (b) | | 260,000 | 255,369 |
| 7.375% 10/10/47 (b) | | 100,000 | 90,750 |
| 7.75% 1/15/28 (b) | | 200,000 | 204,724 |
| Kingdom of Saudi Arabia: | | | |
| 2.25% 2/2/33 (b) | | 305,000 | 252,578 |
| 3.25% 10/22/30 (b) | | 595,000 | 554,683 |
| 3.45% 2/2/61 (b) | | 450,000 | 312,188 |
| 3.625% 3/4/28 (b) | | 200,000 | 195,063 |
| 3.75% 1/21/55 (b) | | 210,000 | 156,647 |
| 4.5% 10/26/46 (b) | | 275,000 | 242,258 |
| 4.5% 4/22/60 (b) | | 590,000 | 502,422 |
| 4.625% 10/4/47 (b) | | 200,000 | 179,188 |
| 5% 1/18/53 (b) | | 200,000 | 185,500 |
| 5.75% 1/16/54 (b) | | 200,000 | 204,000 |
| Lebanese Republic: | | | |
| 5.8% (g) | | 290,000 | 18,760 |
| 6.375% (g) | | 365,000 | 23,497 |
| Moroccan Kingdom 6.5% 9/8/33 (b) | | 200,000 | 213,518 |
| Panamanian Republic: | | | |
| 2.252% 9/29/32 | | 200,000 | 149,700 |
| 3.298% 1/19/33 | | 200,000 | 162,230 |
| 3.87% 7/23/60 | | 255,000 | 155,629 |
| 4.5% 5/15/47 | | 200,000 | 145,986 |
| 4.5% 4/16/50 | | 335,000 | 238,051 |
| 7.875% 3/1/57 | | 200,000 | 219,126 |
| 8% 3/1/38 | | 200,000 | 220,438 |
| Peruvian Republic: | | | |
| 2.783% 1/23/31 | | 270,000 | 238,714 |
| 3% 1/15/34 | | 190,000 | 161,263 |
| 3.3% 3/11/41 | | 170,000 | 132,813 |
| Philippine Republic: | | | |
| 2.65% 12/10/45 | | 200,000 | 137,125 |
| 5.5% 1/17/48 | | 125,000 | 130,625 |
| 5.6% 5/14/49 | | 200,000 | 211,375 |
| 5.609% 4/13/33 | | 200,000 | 211,875 |
| 5.95% 10/13/47 | | 205,000 | 226,397 |
| Polish Government: | | | |
| 5.5% 4/4/53 | | 85,000 | 86,824 |
| 5.5% 3/18/54 | | 115,000 | 117,682 |
| 5.75% 11/16/32 | | 175,000 | 187,836 |
| Provincia de Cordoba: | | | |
| 6.875% 12/10/25 (b) | | 50,001 | 47,556 |
| 6.99% 6/1/27 (b) | | 225,000 | 195,264 |
| Republic of Armenia 3.6% 2/2/31 (b) | | 200,000 | 168,125 |
| Republic of Benin: | | | |
| 4.875% 1/19/32 (b) | EUR | 145,000 | 140,196 |
| 7.96% 2/13/38 (b) | | 200,000 | 191,438 |
| Republic of Kenya: | | | |
| 6.3% 1/23/34 (b) | | 90,000 | 69,075 |
| 9.75% 2/16/31 (b) | | 200,000 | 193,750 |
| Republic of Montenegro 7.25% 3/12/31 (b) | | 200,000 | 206,563 |
| Republic of Nigeria: | | | |
| 6.125% 9/28/28 (b) | | 590,000 | 531,000 |
| 6.5% 11/28/27 (b) | | 125,000 | 116,406 |
| 7.143% 2/23/30 (b) | | 200,000 | 180,938 |
| 7.625% 11/21/25 (b) | | 205,000 | 205,384 |
| 7.696% 2/23/38 (b) | | 200,000 | 160,250 |
| 7.875% 2/16/32 (b) | | 200,000 | 178,000 |
| Republic of Paraguay: | | | |
| 2.739% 1/29/33 (b) | | 125,000 | 105,313 |
| 4.95% 4/28/31 (b) | | 220,000 | 217,388 |
| 5.4% 3/30/50 (b) | | 125,000 | 114,495 |
| Republic of Senegal 6.25% 5/23/33 (b) | | 200,000 | 173,563 |
| Republic of Serbia: | | | |
| 2.125% 12/1/30 (b) | | 435,000 | 358,331 |
| 6% 6/12/34 (b) | | 150,000 | 151,931 |
| 6.5% 9/26/33 (b) | | 200,000 | 208,650 |
| Republic of Uzbekistan 3.9% 10/19/31 (b) | | 200,000 | 169,125 |
| Romanian Republic: | | | |
| 3% 2/27/27 (b) | | 105,000 | 99,540 |
| 3% 2/14/31 (b) | | 375,000 | 322,414 |
| 3.625% 3/27/32 (b) | | 200,000 | 175,750 |
| 4% 2/14/51 (b) | | 210,000 | 149,969 |
| 6.625% 2/17/28 (b) | | 90,000 | 93,555 |
| 7.125% 1/17/33 (b) | | 30,000 | 32,466 |
| Rwanda Republic 5.5% 8/9/31 (b) | | 240,000 | 192,825 |
| South African Republic: | | | |
| 4.85% 9/27/27 | | 200,000 | 197,356 |
| 5% 10/12/46 | | 200,000 | 150,356 |
| 5.65% 9/27/47 | | 150,000 | 121,017 |
| 5.75% 9/30/49 | | 250,000 | 201,250 |
| 5.875% 4/20/32 | | 200,000 | 194,506 |
| State of Qatar: | | | |
| 4.4% 4/16/50 (b) | | 530,000 | 487,600 |
| 4.625% 6/2/46 (b) | | 480,000 | 461,100 |
| 4.817% 3/14/49 (b) | | 370,000 | 363,641 |
| 5.103% 4/23/48 (b) | | 410,000 | 417,688 |
| 9.75% 6/15/30 (b) | | 135,000 | 173,939 |
| Sultanate of Oman: | | | |
| 5.625% 1/17/28 (b) | | 395,000 | 403,270 |
| 6% 8/1/29 (b) | | 365,000 | 379,965 |
| 6.25% 1/25/31 (b) | | 200,000 | 212,558 |
| 6.5% 3/8/47 (b) | | 125,000 | 132,031 |
| 6.75% 1/17/48 (b) | | 490,000 | 531,497 |
| Turkish Republic: | | | |
| 4.25% 4/14/26 | | 345,000 | 339,286 |
| 4.75% 1/26/26 | | 435,000 | 431,194 |
| 4.875% 10/9/26 | | 430,000 | 424,759 |
| 4.875% 4/16/43 | | 355,000 | 260,481 |
| 5.125% 2/17/28 | | 460,000 | 448,931 |
| 5.25% 3/13/30 | | 85,000 | 80,499 |
| 5.75% 5/11/47 | | 200,000 | 158,000 |
| 6% 1/14/41 | | 470,000 | 404,347 |
| 6.625% 2/17/45 | | 200,000 | 177,375 |
| 7.125% 7/17/32 | | 250,000 | 251,875 |
| 7.625% 5/15/34 | | 200,000 | 208,000 |
| 9.125% 7/13/30 | | 200,000 | 223,250 |
| 9.375% 3/14/29 | | 400,000 | 446,500 |
| 9.375% 1/19/33 | | 335,000 | 383,994 |
| 9.875% 1/15/28 | | 410,000 | 456,638 |
| Ukraine Government: | | | |
| 0% 2/1/30 (b)(p) | | 56,743 | 23,974 |
| 0% 2/1/34 (b)(p) | | 212,044 | 65,204 |
| 0% 2/1/35 (b)(p) | | 179,193 | 71,677 |
| 0% 2/1/36 (b)(p) | | 149,326 | 59,133 |
| 0% 8/1/41 (b)(d) | | 160,000 | 110,400 |
| 1.75% 2/1/29 (b)(f) | | 372,960 | 221,911 |
| 1.75% 2/1/34 (b)(f) | | 337,180 | 147,516 |
| 1.75% 2/1/35 (b)(f) | | 192,200 | 82,646 |
| 1.75% 2/1/36 (b)(f) | | 136,460 | 57,996 |
| United Mexican States: | | | |
| 2.659% 5/24/31 | | 160,000 | 135,900 |
| 3.25% 4/16/30 | | 300,000 | 272,250 |
| 3.5% 2/12/34 | | 260,000 | 219,050 |
| 3.75% 1/11/28 | | 300,000 | 290,344 |
| 3.75% 4/19/71 | | 360,000 | 226,463 |
| 4.875% 5/19/33 | | 200,000 | 189,750 |
| 5.75% 10/12/2110 | | 385,000 | 329,656 |
| 6% 5/7/36 | | 340,000 | 343,188 |
| 6.05% 1/11/40 | | 305,000 | 305,381 |
| 6.338% 5/4/53 | | 200,000 | 196,438 |
| 6.35% 2/9/35 | | 200,000 | 207,875 |
| Uruguay Republic: | | | |
| 5.1% 6/18/50 | | 305,000 | 302,713 |
| 5.75% 10/28/34 | | 120,000 | 129,975 |
| Venezuelan Republic: | | | |
| 9.25% (g) | | 1,285,000 | 204,636 |
| 11.95% (Reg. S) (g) | | 560,000 | 87,360 |
| 12.75% (g) | | 105,000 | 16,800 |
| TOTAL FOREIGN GOVERNMENT AND GOVERNMENT AGENCY OBLIGATIONS (Cost $64,534,491) | | | 66,113,239 |
| | | | |
| Supranational Obligations - 0.0% |
| | | Principal Amount (a) | Value ($) |
European Investment Bank 3% 11/15/28 (Reg. S) (Cost $1,423,959) | EUR | 1,330,000 | 1,498,615 |
| | | | |
| Bank Loan Obligations - 0.2% |
| | | Principal Amount (a) | Value ($) |
| COMMUNICATION SERVICES - 0.0% | | | |
| Media - 0.0% | | | |
| Diamond Sports Group LLC 1LN, term loan CME Term SOFR 1 Month Index + 8.000% 15.4423% 5/25/26 (d)(e)(q) | | 270,000 | 245,892 |
| CONSUMER DISCRETIONARY - 0.1% | | | |
| Automobile Components - 0.0% | | | |
| Power Stop LLC 1LN, term loan CME Term SOFR 3 Month Index + 4.750% 9.9072% 1/26/29 (d)(e)(q) | | 169,561 | 162,778 |
| Diversified Consumer Services - 0.0% | | | |
| Spin Holdco, Inc. Tranche B 1LN, term loan CME Term SOFR 3 Month Index + 4.000% 9.6001% 3/4/28 (d)(e)(q) | | 1,088,711 | 921,594 |
| TKC Holdings, Inc. 1LN, term loan 13.5% 2/14/27 (d)(q) | | 208,163 | 172,254 |
| | | | 1,093,848 |
| Hotels, Restaurants & Leisure - 0.1% | | | |
| Bulldog Purchaser, Inc. Tranche B 2LN, term loan CME Term SOFR 3 Month Index + 6.750% 12.0846% 6/14/32 (d)(e)(q) | | 50,000 | 49,584 |
| City Football Group Ltd. Tranche B 1LN, term loan CME Term SOFR 1 Month Index + 3.500% 8.3924% 7/21/30 (d)(e)(q) | | 1,069,000 | 1,063,655 |
| United PF Holdings LLC 1LN, term loan CME Term SOFR 3 Month Index + 4.000% 9.5137% 12/30/26 (d)(e)(q) | | 628,672 | 571,463 |
| | | | 1,684,702 |
| Household Durables - 0.0% | | | |
| Mattress Firm, Inc. Tranche B 1LN, term loan CME Term SOFR 3 Month Index + 4.250% 9.8462% 9/24/28 (d)(e)(q) | | 140,000 | 139,924 |
| Specialty Retail - 0.0% | | | |
| LBM Acquisition LLC Tranche B 1LN, term loan CME Term SOFR 1 Month Index + 3.750% 9.1395% 6/6/31 (d)(e)(q) | | 1,105,000 | 1,071,220 |
| Staples, Inc. Tranche B 1LN, term loan CME Term SOFR 3 Month Index + 5.750% 11.0844% 9/10/29 (d)(e)(q) | | 265,000 | 241,150 |
| | | | 1,312,370 |
TOTAL CONSUMER DISCRETIONARY | | | 4,393,622 |
| ENERGY - 0.0% | | | |
| Oil, Gas & Consumable Fuels - 0.0% | | | |
| EG America LLC Tranche BC 1LN, term loan CME Term SOFR 1 Month Index + 5.500% 11.0716% 2/7/28 (d)(e)(q) | | 404,980 | 403,631 |
| FINANCIALS - 0.0% | | | |
| Financial Services - 0.0% | | | |
| Nexus Buyer LLC Tranche B 1LN, term loan CME Term SOFR 1 Month Index + 4.000% 9.3437% 7/18/31 (d)(e)(q) | | 200,000 | 198,042 |
| HEALTH CARE - 0.0% | | | |
| Health Care Providers & Services - 0.0% | | | |
| Modivcare, Inc. Tranche B 1LN, term loan CME Term SOFR 3 Month Index + 4.750% 10.0816% 7/1/31 (d)(e)(q) | | 230,000 | 223,963 |
| INDUSTRIALS - 0.0% | | | |
| Building Products - 0.0% | | | |
| Acproducts Holdings, Inc. Tranche B 1LN, term loan CME Term SOFR 3 Month Index + 4.250% 9.8462% 5/17/28 (d)(e)(q) | | 264,319 | 198,406 |
| Commercial Services & Supplies - 0.0% | | | |
| Brand Industrial Services, Inc. Tranche B 1LN, term loan CME Term SOFR 3 Month Index + 4.500% 9.7477% 8/1/30 (d)(e)(q) | | 35,000 | 34,694 |
| Professional Services - 0.0% | | | |
| CoreLogic, Inc. Tranche B 1LN, term loan CME Term SOFR 1 Month Index + 3.500% 8.8612% 6/2/28 (d)(e)(q) | | 473,782 | 467,268 |
TOTAL INDUSTRIALS | | | 700,368 |
| INFORMATION TECHNOLOGY - 0.0% | | | |
| Software - 0.0% | | | |
| Leia Finco U.S. LLC: | | | |
| 1LN, term loan CME Term SOFR 1 Month Index + 3.250% 7/2/31 (e)(q)(r) | | 190,000 | 188,140 |
| 2LN, term loan CME Term SOFR 1 Month Index + 5.250% 7/2/32 (e)(q)(r) | | 120,000 | 117,400 |
| Polaris Newco LLC: | | | |
| 2LN, term loan CME Term SOFR 1 Month Index + 2.000% 7.4321% 6/4/29 (d)(e)(q) | | 180,000 | 177,019 |
| Tranche B 1LN, term loan CME Term SOFR 3 Month Index + 4.000% 9.5137% 6/2/28 (d)(e)(q) | | 70,000 | 69,414 |
| | | | 551,973 |
| MATERIALS - 0.1% | | | |
| Chemicals - 0.1% | | | |
| American Rock Salt Co. LLC 1LN, term loan CME Term SOFR 3 Month Index + 4.000% 9.3188% 6/4/28 (d)(e)(q) | | 259,332 | 204,353 |
| Hexion Holdings Corp. 1LN, term loan CME Term SOFR 3 Month Index + 4.500% 9.7711% 3/15/29 (d)(e)(q) | | 620,000 | 616,348 |
| Hexion, Inc. 2LN, term loan CME Term SOFR 1 Month Index + 7.430% 12.7842% 3/15/30 (d)(e)(q) | | 70,000 | 62,708 |
| M2S Group Intermediate Holding Tranche B 1LN, term loan CME Term SOFR 1 Month Index + 4.750% 9.8518% 8/25/31 (d)(e)(q) | | 340,000 | 318,750 |
| | | | 1,202,159 |
| UTILITIES - 0.0% | | | |
| Electric Utilities - 0.0% | | | |
| Brookfield WEC Holdings, Inc. Tranche B 1LN, term loan CME Term SOFR 1 Month Index + 2.750% 7.9967% 1/20/31 (d)(e)(q) | | 165,000 | 165,096 |
| Independent Power and Renewable Electricity Producers - 0.0% | | | |
| Enstall Group BV Tranche B 1LN, term loan CME Term SOFR 3 Month Index + 4.750% 10.5962% 8/27/28 (d)(e)(q)(s) | | 315,531 | 298,177 |
| Win Waste Innovations Holdings Tranche B 1LN, term loan CME Term SOFR 1 Month Index + 2.750% 8.1112% 3/25/28 (d)(e)(q) | | 170,000 | 158,761 |
| | | | 456,938 |
TOTAL UTILITIES | | | 622,034 |
| TOTAL BANK LOAN OBLIGATIONS (Cost $8,613,724) | | | 8,541,684 |
| | | | |
| Bank Notes - 0.0% |
| | | Principal Amount (a) | Value ($) |
| Discover Bank ICE IBA - USD SOFR SPREAD-ADJ + 1.730% 5.974% 8/9/28 (d)(e) | | 401,000 | 411,976 |
| Regions Bank 6.45% 6/26/37 | | 250,000 | 266,199 |
| TOTAL BANK NOTES (Cost $692,886) | | | 678,175 |
| | | | |
| Fixed-Income Funds - 4.8% |
| | | Shares | Value ($) |
| Fidelity Floating Rate Central Fund (t) | | 2,509,222 | 245,326,654 |
| iShares Broad USD High Yield Corporate Bond ETF | | 410,734 | 15,312,164 |
| iShares iBoxx $ High Yield Corporate Bond ETF | | 64,350 | 5,105,529 |
| TOTAL FIXED-INCOME FUNDS (Cost $266,766,754) | | | 265,744,347 |
| | | | |
| Preferred Securities - 0.3% |
| | | Principal Amount (a) | Value ($) |
| COMMUNICATION SERVICES - 0.0% | | | |
| Diversified Telecommunication Services - 0.0% | | | |
| CAS Capital No 1 Ltd. 4% (Reg. S) (d)(u) | | 275,000 | 264,306 |
| CONSUMER DISCRETIONARY - 0.0% | | | |
| Automobiles - 0.0% | | | |
| Volkswagen International Finance NV 3.875% (Reg. S) (d)(u) | EUR | 900,000 | 943,173 |
| CONSUMER STAPLES - 0.0% | | | |
| Food Products - 0.0% | | | |
| Cosan Overseas Ltd. 8.25% (u) | | 180,000 | 185,028 |
| Tobacco - 0.0% | | | |
| British American Tobacco PLC 3% (Reg. S) (d)(u) | EUR | 975,000 | 1,058,436 |
TOTAL CONSUMER STAPLES | | | 1,243,464 |
| ENERGY - 0.0% | | | |
| Oil, Gas & Consumable Fuels - 0.0% | | | |
| Energy Transfer LP 6.625% (d)(u) | | 170,000 | 165,855 |
| EnLink Midstream Partners LP CME Term SOFR 3 Month Index + 4.370% 9.7156% (d)(e)(u) | | 280,000 | 285,163 |
| Plains All American Pipeline LP CME Term SOFR 3 Month Index + 4.110% 9.4897% (d)(e)(u) | | 680,000 | 679,646 |
| | | | 1,130,664 |
| FINANCIALS - 0.1% | | | |
| Banks - 0.1% | | | |
| AIB Group PLC 6.25% (Reg. S) (d)(u) | EUR | 200,000 | 225,520 |
| Banco de Credito e Inversiones 8.75% (b)(d)(u) | | 115,000 | 123,850 |
| Banco del Estado de Chile 7.95% (b)(d)(u) | | 105,000 | 113,280 |
| Banco Do Brasil SA 10-Year Treasury Constant Maturity Rate + 4.390% 8.748% (b)(d)(e)(u) | | 250,000 | 261,196 |
| Banco Mercantil del Norte SA: | | | |
| 6.75% (b)(d)(u) | | 145,000 | 146,348 |
| 7.625% (b)(d)(u) | | 440,000 | 448,726 |
| Bank of America Corp. 5.875% (d)(u) | | 240,000 | 244,850 |
| Barclays PLC 8.875% (d)(u) | GBP | 270,000 | 373,756 |
| BBVA Bancomer SA Texas Branch: | | | |
| 5.125% 1/18/33 (b)(d) | | 110,000 | 104,949 |
| 5.35% 11/12/29 (b)(d) | | 80,000 | 80,320 |
| 8.45% 6/29/38 (b)(d) | | 220,000 | 239,674 |
| Citigroup, Inc. 7.125% (d)(u) | | 245,000 | 255,209 |
| JPMorgan Chase & Co.: | | | |
| 4.6% (d)(u) | | 235,000 | 234,666 |
| 6.1% (d)(u) | | 230,000 | 235,826 |
| M&T Bank Corp.: | | | |
| 3.5% (d)(u) | | 55,000 | 48,654 |
| 5.125% (d)(u) | | 110,000 | 108,876 |
| NBK Tier 1 Ltd. 3.625% (b)(d)(u) | | 105,000 | 99,492 |
| Wells Fargo & Co.: | | | |
| 6.85% (d)(u) | | 250,000 | 258,765 |
| 7.625% (c)(d)(u) | | 270,000 | 294,560 |
| | | | 3,898,517 |
| Capital Markets - 0.0% | | | |
| UBS Group AG 7% (Reg. S) (d)(u) | | 200,000 | 207,618 |
| Consumer Finance - 0.0% | | | |
| Ally Financial, Inc.: | | | |
| 4.7% (d)(u) | | 1,310,000 | 1,193,386 |
| 4.7% (d)(u) | | 555,000 | 463,267 |
| | | | 1,656,653 |
TOTAL FINANCIALS | | | 5,762,788 |
| INDUSTRIALS - 0.1% | | | |
| Ground Transportation - 0.0% | | | |
| Mobico Group PLC 4.25% (Reg. S) (d)(u) | GBP | 202,000 | 250,518 |
| Marine Transportation - 0.0% | | | |
| DP World Salaam 6% (Reg. S) (d)(u) | | 450,000 | 452,524 |
| Trading Companies & Distributors - 0.1% | | | |
| AerCap Holdings NV 5.875% 10/10/79 (d) | | 976,000 | 997,259 |
| Air Lease Corp. 4.125% (d)(u) | | 500,000 | 460,321 |
| Aircastle Ltd. 5.25% (b)(d)(u) | | 510,000 | 513,447 |
| | | | 1,971,027 |
TOTAL INDUSTRIALS | | | 2,674,069 |
| INFORMATION TECHNOLOGY - 0.0% | | | |
| IT Services - 0.0% | | | |
| Network i2i Ltd.: | | | |
| 3.975% (b)(d)(u) | | 105,000 | 102,154 |
| 5.65% (b)(d)(u) | | 250,000 | 254,583 |
| | | | 356,737 |
| MATERIALS - 0.0% | | | |
| Construction Materials - 0.0% | | | |
| CEMEX S.A.B. de CV: | | | |
| 5.125% (b)(d)(u) | | 555,000 | 557,166 |
| 9.125% (b)(d)(u) | | 150,000 | 166,079 |
| | | | 723,245 |
| REAL ESTATE - 0.1% | | | |
| Real Estate Management & Development - 0.1% | | | |
| Aroundtown SA 3.375% (Reg. S) (d)(u) | EUR | 1,200,000 | 953,068 |
| Citycon Oyj 7.875% (Reg. S) (d)(u) | EUR | 218,000 | 202,568 |
| CPI Property Group SA 3.75% (Reg. S) (d)(u) | EUR | 501,000 | 364,785 |
| Grand City Properties SA 1.5% (Reg. S) (d)(u) | EUR | 800,000 | 720,228 |
| Heimstaden Bostad AB 3.248% (Reg. S) (d)(u) | EUR | 582,000 | 577,282 |
| Samhallsbyggnadsbolaget I Norden AB 2.624% (Reg. S) (d)(g)(u) | EUR | 310,000 | 120,793 |
| | | | 2,938,724 |
| UTILITIES - 0.0% | | | |
| Electric Utilities - 0.0% | | | |
| SSE PLC 3.74% (Reg. S) (d)(u) | GBP | 335,000 | 434,890 |
| TOTAL PREFERRED SECURITIES (Cost $15,438,548) | | | 16,472,060 |
| | | | |
| Money Market Funds - 6.2% |
| | | Shares | Value ($) |
| Fidelity Cash Central Fund 5.39% (v) | | 332,770,952 | 332,837,506 |
| Fidelity Securities Lending Cash Central Fund 5.39% (v)(w) | | 14,735,306 | 14,736,780 |
| TOTAL MONEY MARKET FUNDS (Cost $347,573,541) | | | 347,574,286 |
| | | | |
| Purchased Swaptions - 0.1% |
| | Expiration Date | Notional Amount (a) | Value ($) |
| Put Options - 0.0% | | | | |
| Option on an interest rate swap with Bank of America N.A. to pay annually a fixed rate of 4.05% and receive annually a floating rate based on the U.S. Secured Overnight Fin. Rate (SOFR) Index, expiring April 2034. | 4/23/29 | | 3,800,000 | 114,367 |
| Option on an interest rate swap with Citibank N.A. to pay a fixed rate of 3.694% and receive annually a floating rate based on the U.S. Secured Overnight Fin. Rate (SOFR) Index, expiring December 2033. | 12/12/28 | | 5,500,000 | 184,524 |
| Option on an interest rate swap with Citibank N.A. to pay annually a fixed rate of 3.755% and receive annually a floating rate based on the U.S. Secured Overnight Fin. Rate (SOFR) Index, expiring March 2034. | 3/19/29 | | 4,200,000 | 142,068 |
| Option on an interest rate swap with Goldman Sachs Bank U.S.A. to pay annually a fixed rate of 3.386% and receive annually a floating rate based on the U.S. Secured Overnight Fin. Rate (SOFR) Index, expiring August 2035. | 8/18/25 | | 26,700,000 | 891,751 |
| Option on an interest rate swap with Goldman Sachs Bank U.S.A. to pay annually a fixed rate of 3.455% and receive annually a floating rate based on the U.S. Secured Overnight Fin. Rate (SOFR) Index, expiring August 2034. | 8/29/29 | | 9,500,000 | 381,865 |
| Option on an interest rate swap with Goldman Sachs Bank U.S.A. to pay annually a fixed rate of 3.53% and receive annually a floating rate based on the U.S. Secured Overnight Fin. Rate (SOFR) Index, expiring August 2034. | 8/01/29 | | 8,400,000 | 324,447 |
| Option on an interest rate swap with Goldman Sachs Bank U.S.A. to pay annually a fixed rate of 3.865% and receive annually a floating rate based on the U.S. Secured Overnight Fin. Rate (SOFR) Index, expiring May 2035. | 5/15/25 | | 5,600,000 | 80,157 |
| Option on an interest rate swap with JPMorgan Chase Bank N.A. to pay annually a fixed rate of 3.8225% and receive annually a floating rate based on the U.S. Secured Overnight Fin. Rate (SOFR) Index, expiring February 2035. | 2/24/25 | | 9,500,000 | 108,269 |
| | | | | |
| TOTAL PUT OPTIONS | | | | 2,227,448 |
| Call Options - 0.1% | | | | |
| Option on an interest rate swap with Bank of America N.A. to receive annually a fixed rate of 4.05% and pay annually a floating rate based on the U.S. Secured Overnight Fin. Rate (SOFR) Index, expiring April 2034. | 4/23/29 | | 3,800,000 | 199,789 |
| Option on an interest rate swap with Citibank N.A. to receive annually a fixed rate of 3.694% and pay a floating rate based on the U.S. Secured Overnight Fin. Rate (SOFR) Index, expiring December 2033. | 12/12/28 | | 5,500,000 | 237,490 |
| Option on an interest rate swap with Citibank N.A. to receive annually a fixed rate of 3.755% and pay annually a floating rate based on the U.S. Secured Overnight Fin. Rate (SOFR) Index, expiring March 2034. | 3/19/29 | | 4,200,000 | 189,130 |
| Option on an interest rate swap with Goldman Sachs Bank U.S.A. to receive annually a fixed rate of 3.386% and pay annually a floating rate based on the U.S. Secured Overnight Fin. Rate (SOFR) Index, expiring August 2035. | 8/18/25 | | 26,700,000 | 904,287 |
| Option on an interest rate swap with Goldman Sachs Bank U.S.A. to receive annually a fixed rate of 3.455% and pay annually a floating rate based on the U.S. Secured Overnight Fin. Rate (SOFR) Index, expiring August 2034. | 8/29/29 | | 9,500,000 | 365,133 |
| Option on an interest rate swap with Goldman Sachs Bank U.S.A. to receive annually a fixed rate of 3.53% and pay annually a floating rate based on the U.S. Secured Overnight Fin. Rate (SOFR) Index, expiring August 2034. | 8/01/29 | | 8,400,000 | 335,749 |
| Option on an interest rate swap with Goldman Sachs Bank U.S.A. to receive annually a fixed rate of 3.865% and pay annually a floating rate based on the U.S. Secured Overnight Fin. Rate (SOFR) Index, expiring May 2035. | 5/15/25 | | 5,600,000 | 304,259 |
| Option on an interest rate swap with JPMorgan Chase Bank N.A. to receive annually a fixed rate of 3.8225% and pay annually a floating rate based on the U.S. Secured Overnight Fin. Rate (SOFR) Index, expiring February 2035. | 2/24/25 | | 9,500,000 | 450,946 |
| | | | | |
| TOTAL CALL OPTIONS | | | | 2,986,783 |
TOTAL PURCHASED SWAPTIONS (Cost $5,432,624) | | | | 5,214,231 |
| TOTAL INVESTMENT IN SECURITIES - 114.7% (Cost $6,361,587,810) | 6,384,894,994 |
NET OTHER ASSETS (LIABILITIES) - (14.7)% | (818,407,731) |
| NET ASSETS - 100.0% | 5,566,487,263 |
| | |
| TBA Sale Commitments |
| | Principal Amount (a) | Value ($) |
| Ginnie Mae | | |
| 2% 9/1/54 | (5,250,000) | (4,420,225) |
| 3% 9/1/54 | (4,000,000) | (3,617,259) |
| 3% 9/1/54 | (7,800,000) | (7,053,655) |
| 3.5% 9/1/54 | (1,000,000) | (930,627) |
| 5% 9/1/54 | (7,950,000) | (7,933,198) |
| 5% 9/1/54 | (6,250,000) | (6,236,791) |
| 5% 9/1/54 | (3,525,000) | (3,517,550) |
| 5.5% 9/1/54 | (15,575,000) | (15,674,627) |
| 6% 9/1/54 | (21,850,000) | (22,166,867) |
| | | |
| TOTAL GINNIE MAE | | (71,550,799) |
| | | |
| Uniform Mortgage Backed Securities | | |
| 2% 9/1/39 | (2,800,000) | (2,532,031) |
| 2% 9/1/39 | (5,650,000) | (5,109,277) |
| 2% 9/1/54 | (43,550,000) | (35,619,136) |
| 2% 9/1/54 | (3,775,000) | (3,087,537) |
| 2% 9/1/54 | (3,775,000) | (3,087,537) |
| 2% 9/1/54 | (18,700,000) | (15,294,554) |
| 2% 9/1/54 | (15,300,000) | (12,513,726) |
| 2% 9/1/54 | (45,400,000) | (37,132,233) |
| 2% 9/1/54 | (7,100,000) | (5,807,023) |
| 2% 9/1/54 | (4,400,000) | (3,598,719) |
| 2% 9/1/54 | (3,600,000) | (2,944,406) |
| 2% 9/1/54 | (7,000,000) | (5,725,234) |
| 2.5% 9/1/54 | (31,650,000) | (26,980,387) |
| 2.5% 9/1/54 | (16,000,000) | (13,639,374) |
| 2.5% 9/1/54 | (7,000,000) | (5,967,226) |
| 2.5% 9/1/54 | (8,100,000) | (6,904,933) |
| 3% 9/1/54 | (125,000) | (110,825) |
| 3% 9/1/54 | (14,200,000) | (12,589,743) |
| 3% 9/1/54 | (1,700,000) | (1,507,223) |
| 3.5% 9/1/54 | (2,700,000) | (2,485,160) |
| 4% 9/1/54 | (2,600,000) | (2,465,633) |
| 5.5% 9/1/54 | (5,000,000) | (5,034,180) |
| 5.5% 9/1/54 | (13,600,000) | (13,692,968) |
| 6% 9/1/54 | (5,450,000) | (5,550,271) |
| 6% 9/1/54 | (1,750,000) | (1,782,197) |
| 6% 9/1/54 | (23,100,000) | (23,525,003) |
| 6.5% 9/1/54 | (10,300,000) | (10,605,379) |
| | | |
| TOTAL UNIFORM MORTGAGE BACKED SECURITIES | | (265,291,915) |
| | | |
TOTAL TBA SALE COMMITMENTS (Proceeds $334,748,026) | | (336,842,714) |
| Futures Contracts |
| | Number of contracts | Expiration Date | Notional Amount ($) | Value ($) | Unrealized Appreciation/ (Depreciation) ($) |
| Purchased | | | | | |
| | | | | | |
| Bond Index Contracts | | | | | |
| TME 10 Year Canadian Note Contracts (Canada) | 36 | Dec 2024 | 3,287,322 | (33,447) | (33,447) |
| | | | | | |
| Treasury Contracts | | | | | |
| ASX 10 Year Treasury Bond Index Contracts (Australia) | 12 | Sep 2024 | 946,852 | 24,310 | 24,310 |
| CBOT 10-Year U.S. Treasury Note Contracts (United States) | 3 | Dec 2024 | 340,688 | (2,771) | (2,771) |
| CBOT 2-Year U.S. Treasury Note Contracts (United States) | 22 | Dec 2024 | 4,566,031 | (5,034) | (5,034) |
| CBOT 5-Year U.S. Treasury Note Contracts (United States) | 1,985 | Dec 2024 | 217,155,898 | (933,888) | (933,888) |
| CBOT Long Term U.S. Treasury Bond Contracts (United States) | 32 | Dec 2024 | 3,940,000 | (76,046) | (76,046) |
| | | | | | |
| TOTAL TREASURY CONTRACTS | | | | | (993,429) |
| | | | | | |
| TOTAL PURCHASED | | | | | (1,026,876) |
| | | | | | |
| Sold | | | | | |
| | | | | | |
| Bond Index Contracts | | | | | |
| ICE Long Gilt Contracts (United Kingdom) | 10 | Dec 2024 | 1,296,227 | 8,813 | 8,813 |
| | | | | | |
| Treasury Contracts | | | | | |
| CBOT 10-Year U.S. Treasury Note Contracts (United States) | 263 | Dec 2024 | 29,866,938 | 239,906 | 239,906 |
| CBOT 5-Year U.S. Treasury Note Contracts (United States) | 147 | Dec 2024 | 16,081,570 | 68,044 | 68,044 |
| CBOT Long Term U.S. Treasury Bond Contracts (United States) | 45 | Dec 2024 | 5,540,625 | 109,600 | 109,600 |
| | | | | | |
| TOTAL TREASURY CONTRACTS | | | | | 417,550 |
| | | | | | |
| TOTAL SOLD | | | | | 426,363 |
| | | | | | |
| TOTAL FUTURES CONTRACTS | | | | | (600,513) |
| The notional amount of futures purchased as a percentage of Net Assets is 4.2% |
| The notional amount of futures sold as a percentage of Net Assets is 0.9% |
| Forward Foreign Currency Contracts |
Currency Purchased
| Currency Sold | Counterparty | Settlement Date | Unrealized Appreciation/ (Depreciation) ($) |
| | | | | | | |
| EUR | 73,000 | USD | 80,828 | BNP Paribas S.A. | 9/04/24 | (134) |
| USD | 43,560 | AUD | 65,000 | UBS AG | 10/03/24 | (467) |
| USD | 355,128 | CAD | 485,000 | Bank of America, N.A. | 10/03/24 | (5,090) |
| USD | 299,349 | EUR | 270,000 | BNP Paribas S.A. | 10/03/24 | 494 |
| USD | 48,956,136 | EUR | 44,286,000 | Bank of America, N.A. | 10/03/24 | (62,637) |
| USD | 19,104,713 | GBP | 14,745,000 | State Street Bank and Trust Co | 10/03/24 | (265,140) |
| | | | | | | |
| TOTAL FORWARD FOREIGN CURRENCY CONTRACTS | | (332,974) |
| Unrealized Appreciation | | | 494 |
| Unrealized Depreciation | | | (333,468) |
| Credit Default Swaps |
| Underlying Reference | Rating(1) | Maturity Date | Clearinghouse / Counterparty(2) | Fixed Payment Received/ (Paid) | Payment Frequency | Notional Amount(3)(4) | Value ($)(1) | Upfront Premium Received/ (Paid) ($)(5) | Unrealized Appreciation/ (Depreciation) ($) |
| Buy Protection | | | | | | | | | | |
| AXA SA | | Jun 2029 | Goldman Sachs Bank USA | (1%) | Quarterly | EUR | 220,000 | (2,785) | 2,619 | (166) |
| AXA SA | | Jun 2029 | Goldman Sachs Bank USA | (1%) | Quarterly | EUR | 220,000 | (2,785) | 2,619 | (166) |
| AXA SA | | Jun 2029 | Goldman Sachs Bank USA | (1%) | Quarterly | EUR | 460,000 | (5,823) | 5,477 | (346) |
| Assicurazioni Generali SpA | | Jun 2029 | BNP Paribas S.A. | (1%) | Quarterly | EUR | 550,000 | 965 | (2,616) | (1,651) |
| BMW Finance NV | | Jun 2029 | BNP Paribas S.A. | (1%) | Quarterly | EUR | 1,300,000 | (37,091) | 32,239 | (4,852) |
| CMBX N.A. AAA Index Series 13 | | Dec 2072 | Citigroup Global Markets Ltd. | (0.5%) | Monthly | | 40,000 | 132 | (427) | (295) |
| CMBX N.A. AAA Index Series 15 | | Nov 2064 | JPMorgan Securities LLC | (0.5%) | Monthly | | 2,900,000 | 30,797 | (34,538) | (3,741) |
| CMBX N.A. AAA Index Series 15 | | Nov 2064 | JPMorgan Securities LLC | (0.5%) | Monthly | | 1,800,000 | 19,116 | (20,630) | (1,514) |
| CMBX N.A. AAA Index Series 15 | | Nov 2064 | Morgan Stanley Capital Services LLC | (0.5%) | Monthly | | 4,800,000 | 50,975 | (91,427) | (40,452) |
| CMBX N.A. BBB- Index Series 16 | | Apr 2065 | Citigroup Global Markets Ltd. | (3%) | Monthly | | 140,000 | 20,666 | (39,775) | (19,109) |
| CMBX N.A. BBB- Index Series 16 | | Apr 2065 | Citigroup Global Markets Ltd. | (3%) | Monthly | | 280,000 | 41,331 | (62,590) | (21,259) |
| CMBX N.A. BBB- Index Series 16 | | Apr 2065 | Citigroup Global Markets Ltd. | (3%) | Monthly | | 100,000 | 14,761 | (24,304) | (9,543) |
| CMBX N.A. BBB- Index Series 16 | | Apr 2065 | Citigroup Global Markets Ltd. | (3%) | Monthly | | 190,000 | 28,046 | (46,006) | (17,960) |
| CMBX N.A. BBB- Index Series 16 | | Apr 2065 | Citigroup Global Markets Ltd. | (3%) | Monthly | | 80,000 | 11,809 | (21,866) | (10,057) |
| CMBX N.A. BBB- Index Series 16 | | Apr 2065 | Citigroup Global Markets Ltd. | (3%) | Monthly | | 160,000 | 23,618 | (41,849) | (18,231) |
| CMBX N.A. BBB- Index Series 16 | | Apr 2065 | Goldman Sachs & Co. LLC | (3%) | Monthly | | 160,000 | 23,618 | (45,942) | (22,324) |
| CMBX N.A. BBB- Index Series 16 | | Apr 2065 | Goldman Sachs & Co. LLC | (3%) | Monthly | | 200,000 | 29,522 | (59,150) | (29,628) |
| CMBX N.A. BBB- Index Series 16 | | Apr 2065 | Goldman Sachs & Co. LLC | (3%) | Monthly | | 600,000 | 88,567 | (115,761) | (27,194) |
| CMBX N.A. BBB- Index Series 16 | | Apr 2065 | Goldman Sachs & Co. LLC | (3%) | Monthly | | 460,000 | 67,902 | (134,034) | (66,132) |
| CMBX N.A. BBB- Index Series 16 | | Apr 2065 | Goldman Sachs & Co. LLC | (3%) | Monthly | | 130,000 | 19,190 | (31,630) | (12,440) |
| CMBX N.A. BBB- Index Series 16 | | Apr 2065 | Goldman Sachs & Co. LLC | (3%) | Monthly | | 60,000 | 8,857 | (14,318) | (5,461) |
| CMBX N.A. BBB- Index Series 16 | | Apr 2065 | Goldman Sachs & Co. LLC | (3%) | Monthly | | 150,000 | 22,142 | (38,184) | (16,042) |
| CMBX N.A. BBB- Index Series 16 | | Apr 2065 | Goldman Sachs & Co. LLC | (3%) | Monthly | | 40,000 | 5,905 | (10,457) | (4,552) |
| CMBX N.A. BBB- Index Series 16 | | Apr 2065 | JPMorgan Securities LLC | (3%) | Monthly | | 90,000 | 13,285 | (27,086) | (13,801) |
| CMBX N.A. BBB- Index Series 16 | | Apr 2065 | JPMorgan Securities LLC | (3%) | Monthly | | 70,000 | 10,333 | (19,659) | (9,326) |
| CMBX N.A. BBB- Index Series 16 | | Apr 2065 | JPMorgan Securities LLC | (3%) | Monthly | | 140,000 | 20,666 | (38,982) | (18,316) |
| CMBX N.A. BBB- Index Series 16 | | Apr 2065 | Morgan Stanley Capital Services LLC | (3%) | Monthly | | 140,000 | 20,666 | (32,035) | (11,369) |
| CMBX N.A. BBB- Index Series 16 | | Apr 2065 | Morgan Stanley Capital Services LLC | (3%) | Monthly | | 100,000 | 14,761 | (16,626) | (1,865) |
| CMBX N.A. BBB- Index Series 16 | | Apr 2065 | Morgan Stanley Capital Services LLC | (3%) | Monthly | | 300,000 | 44,284 | (50,255) | (5,971) |
| CMBX N.A. BBB- Index Series 16 | | Apr 2065 | Morgan Stanley Capital Services LLC | (3%) | Monthly | | 190,000 | 28,046 | (45,274) | (17,228) |
| CMBX N.A. BBB- Index Series 16 | | Apr 2065 | Morgan Stanley Capital Services LLC | (3%) | Monthly | | 130,000 | 19,190 | (31,954) | (12,764) |
| CMBX N.A. BBB- Index Series 16 | | Apr 2065 | Morgan Stanley Capital Services LLC | (3%) | Monthly | | 190,000 | 28,046 | (46,933) | (18,887) |
| CMBX N.A. BBB- Index Series 16 | | Apr 2065 | Morgan Stanley Capital Services LLC | (3%) | Monthly | | 170,000 | 25,094 | (42,750) | (17,656) |
| CMBX N.A. BBB- Index Series 16 | | Apr 2065 | Morgan Stanley Capital Services LLC | (3%) | Monthly | | 150,000 | 22,142 | (35,271) | (13,129) |
| CMBX N.A. BBB- Index Series 17 | | Dec 2056 | Citigroup Global Markets Ltd. | (3%) | Monthly | | 300,000 | 33,016 | (35,616) | (2,600) |
| CMBX N.A. BBB- Index Series 17 | | Dec 2056 | Citigroup Global Markets Ltd. | (3%) | Monthly | | 150,000 | 16,508 | (24,259) | (7,751) |
| CMBX N.A. BBB- Index Series 17 | | Dec 2056 | Goldman Sachs & Co. LLC | (3%) | Monthly | | 400,000 | 44,022 | (57,095) | (13,073) |
| CMBX N.A. BBB- Index Series 17 | | Dec 2056 | Goldman Sachs & Co. LLC | (3%) | Monthly | | 500,000 | 55,027 | (64,606) | (9,579) |
| CMBX N.A. BBB- Index Series 17 | | Dec 2056 | Goldman Sachs & Co. LLC | (3%) | Monthly | | 300,000 | 33,016 | (36,949) | (3,933) |
| CMBX N.A. BBB- Index Series 17 | | Dec 2056 | JPMorgan Securities LLC | (3%) | Monthly | | 400,000 | 44,022 | (52,665) | (8,643) |
| CMBX N.A. BBB- Index Series 17 | | Dec 2056 | Morgan Stanley Capital Services LLC | (3%) | Monthly | | 100,000 | 11,005 | (13,926) | (2,921) |
| CMBX N.A. BBB- Index Series 17 | | Dec 2056 | Morgan Stanley Capital Services LLC | (3%) | Monthly | | 200,000 | 22,011 | (28,547) | (6,536) |
| Heidelberg Materials AG | | Jun 2029 | BNP Paribas S.A. | (5%) | Quarterly | EUR | 600,000 | (131,572) | 118,322 | (13,250) |
| Intesa Sanpaolo SpA | | Jun 2029 | JPMorgan Chase Bank, N.A. | (1%) | Quarterly | EUR | 550,000 | 7,717 | (11,784) | (4,067) |
| Societe Generale | | Jun 2029 | Goldman Sachs Bank USA | (1%) | Quarterly | EUR | 600,000 | 7,309 | (3,952) | 3,357 |
| UniCredit SpA | | Jun 2029 | Goldman Sachs Bank USA | (1%) | Quarterly | EUR | 500,000 | 6,958 | (10,483) | (3,525) |
| | | | | | | | | | | |
| TOTAL BUY PROTECTION | | | | | | | | 854,987 | (1,400,935) | (545,948) |
| Sell Protection | | | | | | | | | | |
| 5-Year CDX N.A. EM Series 41 | NR | Jun 2029 | ICE | 1% | Quarterly | | 2,600,000 | 21,480 | 0 | 21,480 |
| CMBX N.A. AAA Index Series 13 | NR | Dec 2072 | Morgan Stanley Capital Services LLC | 0.5% | Monthly | | 40,000 | (132) | 927 | 795 |
| CMBX N.A. AAA Index Series 16 | NR | Apr 2065 | Citigroup Global Markets Ltd. | 0.5% | Monthly | | 1,800,000 | (26,673) | 36,242 | 9,569 |
| CMBX N.A. AAA Index Series 17 | NR | Dec 2056 | Citigroup Global Markets Ltd. | 0.5% | Monthly | | 2,800,000 | (55,865) | 63,853 | 7,988 |
| CMBX N.A. AAA Index Series 17 | NR | Dec 2056 | Citigroup Global Markets Ltd. | 0.5% | Monthly | | 800,000 | (15,961) | 16,731 | 770 |
| CMBX N.A. AAA Index Series 17 | NR | Dec 2056 | Citigroup Global Markets Ltd. | 0.5% | Monthly | | 1,600,000 | (31,923) | 39,940 | 8,017 |
| CMBX N.A. AAA Index Series 17 | NR | Dec 2056 | Citigroup Global Markets Ltd. | 0.5% | Monthly | | 4,600,000 | (91,778) | 115,561 | 23,783 |
| | | | | | | | | | | |
| TOTAL SELL PROTECTION | | | | | | | | (200,852) | 273,254 | 72,402 |
| TOTAL CREDIT DEFAULT SWAPS | | | | | | | | 654,135 | (1,127,681) | (473,546) |
(1)Ratings are presented for credit default swaps in which the Fund has sold protection on the underlying referenced debt. Ratings for an underlying index represent a weighted average of the ratings of all securities included in the index. The credit rating or value can be measures of the current payment/performance risk. Ratings are from Moody's Investors Service, Inc. Where Moody's® ratings are not available, S&P® ratings are disclosed and are indicated as such. All ratings are as of the report date and do not reflect subsequent changes.
(2)Swaps with Intercontinental Exchange (ICE) are centrally cleared swaps.
(3)The notional amount of each credit default swap where the Fund has sold protection approximates the maximum potential amount of future payments that the Fund could be required to make if a credit event were to occur.
(4)Notional amount is stated in U.S. Dollars unless otherwise noted.
(5)Any premiums for centrally cleared swaps are recorded periodically throughout the term of the swap to variation margin and included in unrealized appreciation (depreciation).
| Interest Rate Swaps |
| Payment Received | Payment Frequency | Payment Paid | Payment Frequency | Clearinghouse / Counterparty(1) | Maturity Date | Notional Amount(2) | Value ($) | Upfront Premium Received/ (Paid) ($)(3) | Unrealized Appreciation/ (Depreciation) ($) |
U.S. Secured Overnight Fin. Rate (SOFR) Index(4) | Annual | 3.75% | Annual | LCH | Sep 2026 | | 32,090,000 | (376,484) | 0 | (376,484) |
U.S. Secured Overnight Fin. Rate (SOFR) Index(4) | Annual | 3.5% | Annual | LCH | Sep 2027 | | 44,062,000 | (374,889) | 0 | (374,889) |
U.S. Secured Overnight Fin. Rate (SOFR) Index(4) | Annual | 3.5% | Annual | LCH | Sep 2029 | | 4,878,000 | (98,527) | 0 | (98,527) |
U.S. Secured Overnight Fin. Rate (SOFR) Index(4) | Annual | 3.5% | Annual | LCH | Sep 2031 | | 23,544,000 | (540,854) | 0 | (540,854) |
U.S. Secured Overnight Fin. Rate (SOFR) Index(4) | Annual | 3.75% | Annual | LCH | Sep 2044 | | 9,012,000 | (159,718) | 0 | (159,718) |
| 3.5% | Annual | U.S. Secured Overnight Fin. Rate (SOFR) Index(4) | Annual | LCH | Sep 2054 | | 1,008,000 | 28,949 | 0 | 28,949 |
| TOTAL INTEREST RATE SWAPS | | | | | | | | (1,521,523) | 0 | (1,521,523) |
| | | | | | | | | | | |
(1)Swaps with LCH Clearnet Group (LCH) are centrally cleared swaps.
(2)Notional amount is stated in U.S. Dollars unless otherwise noted.
(3)Any premiums for centrally cleared swaps are recorded periodically throughout the term of the swap to variation margin and included in unrealized appreciation (depreciation).
(4)Represents floating rate.
Currency Abbreviations
| AUD | - | Australian dollar |
| CAD | - | Canadian dollar |
| EUR | - | European Monetary Unit |
| GBP | - | British pound sterling |
| USD | - | U.S. dollar |
Security Type Abbreviations
Legend
| (a) | Amount is stated in United States dollars unless otherwise noted. |
| (b) | Security exempt from registration under Rule 144A of the Securities Act of 1933. These securities may be resold in transactions exempt from registration, normally to qualified institutional buyers. At the end of the period, the value of these securities amounted to $990,111,954 or 17.8% of net assets. |
| (c) | Security or a portion of the security is on loan at period end. |
| (d) | Coupon rates for floating and adjustable rate securities reflect the rates in effect at period end. |
| (e) | Coupon is indexed to a floating interest rate which may be multiplied by a specified factor and/or subject to caps or floors. |
| (f) | Security initially issued at one coupon which converts to a higher coupon at a specified date. The rate shown is the rate at period end. |
| (g) | Non-income producing - Security is in default. |
| (h) | Security or a portion of the security purchased on a delayed delivery or when-issued basis. |
| (i) | Security or a portion of the security was pledged to cover margin requirements for centrally cleared swaps. At period end, the value of securities pledged amounted to $351,527. |
| (j) | Security or a portion of the security was pledged to cover margin requirements for futures contracts. At period end, the value of securities pledged amounted to $4,121,854. |
| (k) | Security or a portion of the security has been segregated as collateral for open forward foreign currency contracts, options and bi-lateral over the counter (OTC) swaps. At period end, the value of securities pledged amounted to $385,399. |
| (l) | Represents an investment in an underlying pool of reverse mortgages which typically do not require regular principal and interest payments as repayment is deferred until a maturity event. |
| (m) | Interest Only (IO) security represents the right to receive only monthly interest payments on an underlying pool of mortgages or assets. Principal shown is the outstanding par amount of the pool as of the end of the period. |
| (n) | Coupon is inversely indexed to a floating interest rate multiplied by a specified factor. The price may be considerably more volatile than the price of a comparable fixed rate security. |
| (o) | Principal Only Strips represent the right to receive the monthly principal payments on an underlying pool of mortgage loans. |
| (p) | Security initially issued in zero coupon form which converts to coupon form at a specified rate and date. The rate shown is the rate at period end. |
| (q) | Remaining maturities of bank loan obligations may be less than the stated maturities shown as a result of contractual or optional prepayments by the borrower. Such prepayments cannot be predicted with certainty. |
| (r) | The coupon rate will be determined upon settlement of the loan after period end. |
| (t) | Affiliated fund that is generally available only to investment companies and other accounts managed by Fidelity Investments. A complete unaudited schedule of portfolio holdings for each Fidelity Central Fund is filed with the SEC for the first and third quarters of each fiscal year on Form N-PORT and is available upon request or at the SEC's website at www.sec.gov. An unaudited holdings listing for the Fund, which presents direct holdings as well as the pro-rata share of securities and other investments held indirectly through its investment in underlying non-money market Fidelity Central Funds, is available at fidelity.com and/or institutional.fidelity.com, as applicable. In addition, each Fidelity Central Fund's financial statements,which are not covered by the Fund's Report of Independent Registered Public Accounting Firm, are available on the SEC's website or upon request. |
| (u) | Security is perpetual in nature with no stated maturity date. |
| (v) | Affiliated fund that is generally available only to investment companies and other accounts managed by Fidelity Investments. The rate quoted is the annualized seven-day yield of the fund at period end. A complete unaudited listing of the fund's holdings as of its most recent quarter end is available upon request. In addition, each Fidelity Central Fund's financial statements, which are not covered by the Fund's Report of Independent Registered Public Accounting Firm, are available on the SEC's website or upon request. |
| (w) | Investment made with cash collateral received from securities on loan. |
Affiliated Central Funds
Fiscal year to date information regarding the Fund's investments in Fidelity Central Funds, including the ownership percentage, is presented below.
| Affiliate | Value, beginning of period ($) | Purchases ($) | Sales Proceeds ($) | Dividend Income ($) | Realized Gain (loss) ($) | Change in Unrealized appreciation (depreciation) ($) | Value, end of period ($) | % ownership, end of period |
| Fidelity Cash Central Fund 5.39% | 84,973,598 | 3,296,085,438 | 3,048,225,605 | 10,264,830 | 4,075 | - | 332,837,506 | 0.7% |
| Fidelity Emerging Markets Debt Central Fund | 42,002,712 | 42,268,963 | 86,899,124 | 2,655,819 | (7,430,938) | 10,058,387 | - | 0.0% |
| Fidelity Floating Rate Central Fund | 157,041,077 | 89,271,667 | - | 19,272,162 | - | (986,090) | 245,326,654 | 16.8% |
| Fidelity International Credit Central Fund | 50,413,382 | 42,435,508 | 95,472,483 | 2,435,508 | (11,550,128) | 14,173,721 | - | 0.0% |
| Fidelity Securities Lending Cash Central Fund 5.39% | 50,201,734 | 1,418,361,029 | 1,453,825,983 | 65,469 | - | - | 14,736,780 | 0.1% |
| Fidelity Specialized High Income Central Fund | 144,791,683 | 81,257,382 | 228,742,015 | 7,252,524 | (15,106,950) | 17,799,900 | - | 0.0% |
| Total | 529,424,186 | 4,969,679,987 | 4,913,165,210 | 41,946,312 | (34,083,941) | 41,045,918 | 592,900,940 | |
| | | | | | | | | |
Amounts in the dividend income column in the above table include any capital gain distributions from underlying funds, which are presented in the corresponding line item in the Statement of Operations, if applicable.
Amounts in the dividend income column for Fidelity Securities Lending Cash Central Fund represents the income earned on investing cash collateral, less rebates paid to borrowers and any lending agent fees associated with the loan, plus any premium payments received for lending certain types of securities.
Amounts included in the purchases and sales proceeds columns may include in-kind transactions, if applicable.
Investment Valuation
The following is a summary of the inputs used, as of August 31, 2024, involving the Fund's assets and liabilities carried at fair value. The inputs or methodology used for valuing securities may not be an indication of the risk associated with investing in those securities. For more information on valuation inputs, and their aggregation into the levels used below, please refer to the Investment Valuation section in the accompanying Notes to Financial Statements.
| Valuation Inputs at Reporting Date: |
| Description | Total ($) | Level 1 ($) | Level 2 ($) | Level 3 ($) |
Investments in Securities: | | | | |
|
| Corporate Bonds | 1,404,441,919 | - | 1,404,441,919 | - |
|
| U.S. Government and Government Agency Obligations | 2,079,943,957 | - | 2,079,943,957 | - |
|
| U.S. Government Agency - Mortgage Securities | 1,456,706,024 | - | 1,456,706,024 | - |
|
| Asset-Backed Securities | 383,120,777 | - | 383,120,777 | - |
|
| Collateralized Mortgage Obligations | 90,724,494 | - | 90,724,494 | - |
|
| Commercial Mortgage Securities | 258,121,186 | - | 258,121,186 | - |
|
| Foreign Government and Government Agency Obligations | 66,113,239 | - | 66,113,239 | - |
|
| Supranational Obligations | 1,498,615 | - | 1,498,615 | - |
|
| Bank Loan Obligations | 8,541,684 | - | 8,243,507 | 298,177 |
|
| Bank Notes | 678,175 | - | 678,175 | - |
|
| Fixed-Income Funds | 265,744,347 | 265,744,347 | - | - |
|
| Preferred Securities | 16,472,060 | - | 16,472,060 | - |
|
| Money Market Funds | 347,574,286 | 347,574,286 | - | - |
|
| Purchased Swaptions | 5,214,231 | - | 5,214,231 | - |
| Total Investments in Securities: | 6,384,894,994 | 613,318,633 | 5,771,278,184 | 298,177 |
Derivative Instruments: Assets | | | | |
Futures Contracts | 450,673 | 450,673 | - | - |
Forward Foreign Currency Contracts | 494 | - | 494 | - |
Swaps | 1,085,472 | - | 1,085,472 | - |
| Total Assets | 1,536,639 | 450,673 | 1,085,966 | - |
| Liabilities | | | | |
Futures Contracts | (1,051,186) | (1,051,186) | - | - |
Forward Foreign Currency Contracts | (333,468) | - | (333,468) | - |
Swaps | (1,952,860) | - | (1,952,860) | - |
| Total Liabilities | (3,337,514) | (1,051,186) | (2,286,328) | - |
| Total Derivative Instruments: | (1,800,875) | (600,513) | (1,200,362) | - |
Other Financial Instruments: | | | | |
TBA Sale Commitments | (336,842,714) | - | (336,842,714) | - |
| Total Other Financial Instruments: | (336,842,714) | - | (336,842,714) | - |
Value of Derivative Instruments
The following table is a summary of the Fund's value of derivative instruments by primary risk exposure as of August 31, 2024. For additional information on derivative instruments, please refer to the Derivative Instruments section in the accompanying Notes to Financial Statements.
Primary Risk Exposure / Derivative Type | Value |
| Asset ($) | Liability ($) |
| Credit Risk | | |
Swaps (a)(b) | 1,056,523 | (402,388) |
| Total Credit Risk | 1,056,523 | (402,388) |
| Foreign Exchange Risk | | |
Forward Foreign Currency Contracts (c) | 494 | (333,468) |
| Total Foreign Exchange Risk | 494 | (333,468) |
| Interest Rate Risk | | |
Futures Contracts (d) | 450,673 | (1,051,186) |
Purchased Swaptions (e) | 5,214,231 | 0 |
Swaps (a) | 28,949 | (1,550,472) |
| Total Interest Rate Risk | 5,693,853 | (2,601,658) |
| Total Value of Derivatives | 6,750,870 | (3,337,514) |
(a)For centrally cleared swaps, reflects gross cumulative appreciation (depreciation) as presented in the Schedule of Investments. In the Statement of Assets and Liabilities, the period end daily variation margin for centrally cleared swaps is included in receivable or payable for daily variation margin on centrally cleared swaps, and the net cumulative appreciation (depreciation) for centrally cleared swaps is included in Total accumulated earnings (loss).
(b)For bi-lateral over-the-counter (OTC) swaps, reflects gross value which is presented in the Statement of Assets and Liabilities in the bi-lateral OTC swaps, at value line-items.
(c)Gross value is presented in the Statement of Assets and Liabilities in the unrealized appreciation/depreciation on forward foreign currency contracts line-items.
(d)Reflects gross cumulative appreciation (depreciation) on futures contracts as presented in the Schedule of Investments. In the Statement of Assets and Liabilities, the period end daily variation margin is included in receivable or payable for daily variation margin on futures contracts, and the net cumulative appreciation (depreciation) is included in Total accumulated earnings (loss).
(e)Gross value is presented in the Statement of Assets and Liabilities in the Investments in Securities at value line-item.
Financial Statements
| Statement of Assets and Liabilities |
As of August 31, 2024 |
| Assets | | | | |
| Investment in securities, at value (including securities loaned of $14,203,677) - See accompanying schedule: | | | | |
Unaffiliated issuers (cost $5,767,157,503) | $ | 5,791,994,054 | | |
Fidelity Central Funds (cost $594,430,307) | | 592,900,940 | | |
| | | | | |
| | | | | |
| Total Investment in Securities (cost $6,361,587,810) | | | $ | 6,384,894,994 |
| Segregated cash with brokers for derivative instruments | | | | 3,325,185 |
| Cash | | | | 874,993 |
| Foreign currency held at value (cost $1,323,068) | | | | 1,322,626 |
| Receivable for investments sold | | | | |
Regular delivery | | | | 907,103 |
Delayed delivery | | | | 4,974 |
| Receivable for TBA sale commitments | | | | 334,748,026 |
| Unrealized appreciation on forward foreign currency contracts | | | | 494 |
| Receivable for fund shares sold | | | | 127,657,036 |
| Interest receivable | | | | 45,577,393 |
| Distributions receivable from Fidelity Central Funds | | | | 1,354,218 |
| Receivable for daily variation margin on centrally cleared swaps | | | | 178,592 |
| Bi-lateral OTC swaps, at value | | | | 1,035,043 |
Total assets | | | | 6,901,880,677 |
| Liabilities | | | | |
| Payable for investments purchased | | | | |
Regular delivery | $ | 74,426,648 | | |
Delayed delivery | | 902,671,065 | | |
| TBA sale commitments, at value | | 336,842,714 | | |
| Unrealized depreciation on forward foreign currency contracts | | 333,468 | | |
| Payable for fund shares redeemed | | 3,874,689 | | |
| Distributions payable | | 475,495 | | |
| Bi-lateral OTC swaps, at value | | 402,388 | | |
| Accrued management fee | | 1,330,200 | | |
| Payable for daily variation margin on futures contracts | | 299,220 | | |
| Other payables and accrued expenses | | 747 | | |
| Collateral on securities loaned | | 14,736,780 | | |
| Total liabilities | | | | 1,335,393,414 |
| Net Assets | | | $ | 5,566,487,263 |
| Net Assets consist of: | | | | |
| Paid in capital | | | $ | 5,687,671,116 |
| Total accumulated earnings (loss) | | | | (121,183,853) |
| Net Assets | | | $ | 5,566,487,263 |
Net Asset Value, offering price and redemption price per share ($5,566,487,263 ÷ 620,497,085 shares) | | | $ | 8.97 |
| Statement of Operations |
| Year ended August 31, 2024 |
| Investment Income | | | | |
| Dividends | | | $ | 285,468 |
| Interest | | | | 151,212,274 |
| Income from Fidelity Central Funds (including $65,469 from security lending) | | | | 41,946,312 |
| Total income | | | | 193,444,054 |
| Expenses | | | | |
| Management fee | $ | 11,115,971 | | |
| Independent trustees' fees and expenses | | 10,058 | | |
| Miscellaneous | | 7,119 | | |
| Total expenses before reductions | | 11,133,148 | | |
| Expense reductions | | (8,017) | | |
| Total expenses after reductions | | | | 11,125,131 |
| Net Investment income (loss) | | | | 182,318,923 |
| Realized and Unrealized Gain (Loss) | | | | |
| Net realized gain (loss) on: | | | | |
| Investment Securities: | | | | |
| Unaffiliated issuers | | (33,310,117) | | |
| Fidelity Central Funds | | (34,083,941) | | |
| Forward foreign currency contracts | | (1,821,561) | | |
| Foreign currency transactions | | (10,180) | | |
| Futures contracts | | 1,076,580 | | |
| Swaps | | (567,238) | | |
| Total net realized gain (loss) | | | | (68,716,457) |
| Change in net unrealized appreciation (depreciation) on: | | | | |
| Investment Securities: | | | | |
| Unaffiliated issuers | | 180,053,369 | | |
| Fidelity Central Funds | | 41,045,918 | | |
| Forward foreign currency contracts | | (332,974) | | |
| Assets and liabilities in foreign currencies | | 38,162 | | |
| Futures contracts | | (186,805) | | |
| Swaps | | (1,855,029) | | |
| TBA Sale commitments | | (1,442,480) | | |
| Total change in net unrealized appreciation (depreciation) | | | | 217,320,161 |
| Net gain (loss) | | | | 148,603,704 |
| Net increase (decrease) in net assets resulting from operations | | | $ | 330,922,627 |
| Statement of Changes in Net Assets |
| |
| | Year ended August 31, 2024 | | Year ended August 31, 2023 |
| Increase (Decrease) in Net Assets | | | | |
| Operations | | | | |
| Net investment income (loss) | $ | 182,318,923 | $ | 87,478,805 |
| Net realized gain (loss) | | (68,716,457) | | (56,178,803) |
| Change in net unrealized appreciation (depreciation) | | 217,320,161 | | (23,885,692) |
| Net increase (decrease) in net assets resulting from operations | | 330,922,627 | | 7,414,310 |
| Distributions to shareholders | | (172,264,230) | | (85,467,263) |
| | | | | |
| Share transactions | | | | |
| Proceeds from sales of shares | | 4,028,174,598 | | 1,404,417,066 |
| Reinvestment of distributions | | 168,517,346 | | 84,724,456 |
| Cost of shares redeemed | | (1,285,849,465) | | (734,401,848) |
| | | | | |
Net increase (decrease) in net assets resulting from share transactions | | 2,910,842,479 | | 754,739,674 |
| Total increase (decrease) in net assets | | 3,069,500,876 | | 676,686,721 |
| | | | | |
| Net Assets | | | | |
| Beginning of period | | 2,496,986,387 | | 1,820,299,666 |
| End of period | $ | 5,566,487,263 | $ | 2,496,986,387 |
| | | | | |
| Other Information | | | | |
| Shares | | | | |
| Sold | | 461,101,298 | | 159,841,049 |
| Issued in reinvestment of distributions | | 19,311,983 | | 9,662,098 |
| Redeemed | | (147,620,778) | | (83,442,462) |
| Net increase (decrease) | | 332,792,503 | | 86,060,685 |
| | | | | |
Financial Highlights
Fidelity® Total Bond K6 Fund |
| |
| Years ended August 31, | | 2024 | | 2023 | | 2022 | | 2021 | | 2020 |
Selected Per-Share Data | | | | | | | | | | |
| Net asset value, beginning of period | $ | 8.68 | $ | 9.03 | $ | 10.45 | $ | 10.82 | $ | 10.34 |
| Income from Investment Operations | | | | | | | | | | |
Net investment income (loss) A,B | | .426 | | .376 | | .248 | | .247 | | .293 |
| Net realized and unrealized gain (loss) | | .268 | | (.357) | | (1.388) | | .013 | | .494 |
| Total from investment operations | | .694 | | .019 | | (1.140) | | .260 | | .787 |
| Distributions from net investment income | | (.404) | | (.369) | | (.244) | | (.240) | | (.287) |
| Distributions from net realized gain | | - | | - | | (.036) | | (.390) | | (.020) |
| Total distributions | | (.404) | | (.369) | | (.280) | | (.630) | | (.307) |
| Net asset value, end of period | $ | 8.97 | $ | 8.68 | $ | 9.03 | $ | 10.45 | $ | 10.82 |
Total Return C | | | | .25% | | (11.07)% | | 2.53% | | 7.77% |
Ratios to Average Net Assets B,D,E | | | | | | | | | | |
| Expenses before reductions | | .30% | | .30% | | .30% | | .30% | | .30% |
| Expenses net of fee waivers, if any | | | | .30% | | .30% | | .30% | | .30% |
| Expenses net of all reductions | | .30% | | .30% | | .30% | | .30% | | .30% |
| Net investment income (loss) | | 4.92% | | 4.30% | | 2.55% | | 2.37% | | 2.82% |
| Supplemental Data | | | | | | | | | | |
| Net assets, end of period (000 omitted) | $ | 5,566,487 | $ | 2,496,986 | $ | 1,820,300 | $ | 1,833,077 | $ | 1,647,610 |
Portfolio turnover rate F | | | | 203% | | 108% | | 137% | | 167% |
ACalculated based on average shares outstanding during the period.
BNet investment income (loss) is affected by the timing of the declaration of dividends by any underlying mutual funds or exchange-traded funds (ETFs). Net investment income (loss) of any mutual funds or ETFs is not included in the Fund's net investment income (loss) ratio.
CTotal returns would have been lower if certain expenses had not been reduced during the applicable periods shown.
DFees and expenses of any underlying mutual funds or exchange-traded funds (ETFs) are not included in the Fund's expense ratio. The Fund indirectly bears its proportionate share of these expenses. For additional expense information related to investments in Fidelity Central Funds, please refer to the "Investments in Fidelity Central Funds" note found in the Notes to Financial Statements section of the most recent Annual or Semi-Annual report.
EExpense ratios reflect operating expenses of the class. Expenses before reductions do not reflect amounts reimbursed, waived, or reduced through arrangements with the investment adviser, brokerage services, or other offset arrangements, if applicable, and do not represent the amount paid by the class during periods when reimbursements, waivers or reductions occur.
FAmount does not include the portfolio activity of any underlying mutual funds or exchange-traded funds (ETFs).
Notes to Financial Statements
For the period ended August 31, 2024
1. Organization.
Fidelity Total Bond K6 Fund (the Fund) is a fund of Fidelity Income Fund (the Trust) and is authorized to issue an unlimited number of shares. Share transactions on the Statement of Changes in Net Assets may contain exchanges between affiliated funds. The Trust is registered under the Investment Company Act of 1940, as amended (the 1940 Act), as an open-end management investment company organized as a Massachusetts business trust. Shares generally are available only to employer-sponsored retirement plans that are recordkept by Fidelity, or to certain employer-sponsored retirement plans that are not recordkept by Fidelity.
2. Investments in Fidelity Central Funds.
Funds may invest in Fidelity Central Funds, which are open-end investment companies generally available only to other investment companies and accounts managed by the investment adviser and its affiliates. The Schedule of Investments lists any Fidelity Central Funds held as an investment as of period end, but does not include the underlying holdings of each Fidelity Central Fund. An investing fund indirectly bears its proportionate share of the expenses of the underlying Fidelity Central Funds.
Based on its investment objective, each Fidelity Central Fund may invest or participate in various investment vehicles or strategies that are similar to those of the investing fund. These strategies are consistent with the investment objectives of the investing fund and may involve certain economic risks which may cause a decline in value of each of the Fidelity Central Funds and thus a decline in the value of the investing fund.
| Fidelity Central Fund | Investment Manager | Investment Objective | Investment Practices | Expense RatioA |
| Fidelity Floating Rate Central Fund | Fidelity Management & Research Company LLC (FMR) | Seeks a high level of income by normally investing in floating rate loans and other floating rate securities. | Loans & Direct Debt Instruments Restricted Securities | .01% |
| Fidelity Money Market Central Funds | Fidelity Management & Research Company LLC (FMR) | Each fund seeks to obtain a high level of current income consistent with the preservation of capital and liquidity. | Short-term Investments | Less than .005% |
A Expenses expressed as a percentage of average net assets and are as of each underlying Central Fund's most recent annual or semi-annual shareholder report.
An unaudited holdings listing for the investing fund, which presents direct holdings as well as the pro-rata share of any securities and other investments held indirectly through its investment in underlying non-money market Fidelity Central Funds, is available at fidelity.com and/or institutional.fidelity.com, as applicable. A complete unaudited list of holdings for each Fidelity Central Fund is available upon request or at the Securities and Exchange Commission website at www.sec.gov. In addition, the financial statements of the Fidelity Central Funds which contain the significant accounting policies (including investment valuation policies) of those funds, and are not covered by the Report of Independent Registered Public Accounting Firm, are available on the Securities and Exchange Commission website or upon request.
3. Significant Accounting Policies.
The Fund is an investment company and applies the accounting and reporting guidance of the Financial Accounting Standards Board (FASB) Accounting Standards Codification Topic 946 Financial Services - Investment Companies. The financial statements have been prepared in conformity with accounting principles generally accepted in the United States of America (GAAP), which require management to make certain estimates and assumptions at the date of the financial statements. Actual results could differ from those estimates. Subsequent events, if any, through the date that the financial statements were issued have been evaluated in the preparation of the financial statements. The Fund's Schedule of Investments lists any underlying mutual funds or exchange-traded funds (ETFs) but does not include the underlying holdings of these funds. The following summarizes the significant accounting policies of the Fund:
Investment Valuation. Investments are valued as of 4:00 p.m. Eastern time on the last calendar day of the period. The Board of Trustees (the Board) has designated the Fund's investment adviser as the valuation designee responsible for the fair valuation function and performing fair value determinations as needed. The investment adviser has established a Fair Value Committee (the Committee) to carry out the day-to-day fair valuation responsibilities and has adopted policies and procedures to govern the fair valuation process and the activities of the Committee. In accordance with these fair valuation policies and procedures, which have been approved by the Board, the Fund attempts to obtain prices from one or more third party pricing services or brokers to value its investments. When current market prices, quotations or currency exchange rates are not readily available or reliable, investments will be fair valued in good faith by the Committee, in accordance with the policies and procedures. Factors used in determining fair value vary by investment type and may include market or investment specific events, transaction data, estimated cash flows, and market observations of comparable investments. The frequency that the fair valuation procedures are used cannot be predicted and they may be utilized to a significant extent. The Committee manages the Fund's fair valuation practices and maintains the fair valuation policies and procedures. The Fund's investment adviser reports to the Board information regarding the fair valuation process and related material matters.
The Fund categorizes the inputs to valuation techniques used to value its investments into a disclosure hierarchy consisting of three levels as shown below:
Level 1 - unadjusted quoted prices in active markets for identical investments
Level 2 - other significant observable inputs (including quoted prices for similar investments, interest rates, prepayment speeds, etc.)
Level 3 - unobservable inputs (including the Fund's own assumptions based on the best information available)
Valuation techniques used to value the Fund's investments by major category are as follows:
Debt securities, including restricted securities, are valued based on evaluated prices received from third party pricing services or from brokers who make markets in such securities. Corporate bonds, bank notes, bank loan obligations, foreign government and government agency obligations, preferred securities, supranational obligations and U.S. government and government agency obligations are valued by pricing services who utilize matrix pricing which considers yield or price of bonds of comparable quality, coupon, maturity and type or by broker-supplied prices. Asset backed securities, collateralized mortgage obligations, commercial mortgage securities, U.S. government agency mortgage securities, are valued by pricing services who utilize matrix pricing which considers prepayment speed assumptions, attributes of the collateral, yield or price of bonds of comparable quality, coupon, maturity and type or by broker-supplied prices. Swaps are marked-to-market daily based on valuations from third party pricing services, registered derivatives clearing organizations (clearinghouses) or broker-supplied valuations. These pricing sources may utilize inputs such as interest rate curves, credit spread curves, default possibilities and recovery rates. When independent prices are unavailable or unreliable, debt securities and swaps may be valued utilizing pricing methodologies which consider similar factors that would be used by third party pricing services. Debt securities and swaps are generally categorized as Level 2 in the hierarchy but may be Level 3 depending on the circumstances.
The U.S. dollar value of forward foreign currency contracts is determined using currency exchange rates supplied by a pricing service and are categorized as Level 2 in the hierarchy. Futures contracts are valued at the settlement price established each day by the board of trade or exchange on which they are traded and are categorized as Level 1 in the hierarchy. Options traded over-the-counter are valued using service or broker-supplied valuations and are categorized as Level 2 in the hierarchy. Investments in open-end mutual funds, including the Fidelity Central Funds, are valued at their closing net asset value (NAV) each business day and are categorized as Level 1 in the hierarchy.
Changes in valuation techniques may result in transfers in or out of an assigned level within the disclosure hierarchy. The aggregate value of investments by input level as of August 31, 2024 is included at the end of the Fund's Schedule of Investments.
Foreign Currency. Foreign-denominated assets, including investment securities, and liabilities are translated into U.S. dollars at the exchange rates at period end. Purchases and sales of investment securities, income and dividends received, and expenses denominated in foreign currencies are translated into U.S. dollars at the exchange rate in effect on the transaction date.
The effects of exchange rate fluctuations on investments are included with the net realized and unrealized gain (loss) on investment securities. Other foreign currency transactions resulting in realized and unrealized gain (loss) are disclosed separately.
Realized gains and losses on foreign currency transactions arise from the disposition of foreign currency, realized changes in the value of foreign currency between the trade and settlement dates on security transactions, and the difference between the amounts of dividends, interest and foreign withholding taxes recorded on transaction date and the U.S. dollar equivalent of the amounts actually received or paid. Unrealized gains and losses on assets and liabilities in foreign currencies arise from changes in the value of foreign currency, and from assets and liabilities denominated in foreign currencies, other than investments, which are held at period end.
Investment Transactions and Income. For financial reporting purposes, the Fund's investment holdings and NAV include trades executed through the end of the last business day of the period. The NAV per share for processing shareholder transactions is calculated as of the close of business of the New York Stock Exchange (NYSE), normally 4:00 p.m. Eastern time and includes trades executed through the end of the prior business day. Gains and losses on securities sold are determined on the basis of identified cost and include proceeds received from litigation. Commissions paid to certain brokers with whom the investment adviser, or its affiliates, places trades on behalf of a fund include an amount in addition to trade execution, which may be rebated back to a fund. Any such rebates are included in net realized gain (loss) on investments in the Statement of Operations. Dividend income is recorded on the ex-dividend date. Income and capital gain distributions from Fidelity Central Funds, if any, are recorded on the ex-dividend date. Interest income is accrued as earned and includes coupon interest and amortization of premium and accretion of discount on debt securities as applicable. Paid in Kind (PIK) income is recorded at the fair market value of the securities received. Investment income is recorded net of foreign taxes withheld where recovery of such taxes is uncertain. Debt obligations may be placed on non-accrual status and related interest income may be reduced by ceasing current accruals and writing off interest receivables when the collection of all or a portion of interest has become doubtful based on consistently applied procedures. A debt obligation is removed from non-accrual status when the issuer resumes interest payments or when collectability of interest is reasonably assured. Funds may file withholding tax reclaims in certain jurisdictions to recover a portion of amounts previously withheld. Any withholding tax reclaims income is included in the Statement of Operations in interest. Any receivables for withholding tax reclaims are included in the Statement of Assets and Liabilities in interest receivable.
Expenses. Expenses directly attributable to a fund are charged to that fund. Expenses attributable to more than one fund are allocated among the respective funds on the basis of relative net assets or other appropriate methods. Expenses included in the accompanying financial statements reflect the expenses of that fund and do not include any expenses associated with any underlying mutual funds or exchange-traded funds. Although not included in a fund's expenses, a fund indirectly bears its proportionate share of these expenses through the net asset value of each underlying mutual fund or exchange-traded fund. Expense estimates are accrued in the period to which they relate and adjustments are made when actual amounts are known.
Income Tax Information and Distributions to Shareholders. Each year, the Fund intends to qualify as a regulated investment company under Subchapter M of the Internal Revenue Code, including distributing substantially all of its taxable income and realized gains. As a result, no provision for U.S. Federal income taxes is required. As of August 31, 2024, the Fund did not have any unrecognized tax benefits in the financial statements; nor is the Fund aware of any tax positions for which it is reasonably possible that the total amounts of unrecognized tax benefits will significantly change in the next twelve months. The Fund files a U.S. federal tax return, in addition to state and local tax returns as required. The Fund's federal income tax returns are subject to examination by the Internal Revenue Service (IRS) for a period of three fiscal years after they are filed. State and local tax returns may be subject to examination for an additional fiscal year depending on the jurisdiction. Foreign taxes are provided for based on the Fund's understanding of the tax rules and rates that exist in the foreign markets in which it invests.
Distributions are declared and recorded daily and paid monthly from net investment income. Distributions from realized gains, if any, are declared and recorded on the ex-dividend date. Income and capital gain distributions are determined in accordance with income tax regulations, which may differ from GAAP.
Capital accounts within the financial statements are adjusted for permanent book-tax differences. These adjustments have no impact on net assets or the results of operations. Capital accounts are not adjusted for temporary book-tax differences which will reverse in a subsequent period.
Book-tax differences are primarily due to futures contracts, swaps, passive foreign investment companies (PFIC), market discount, partnerships, contingent interest, capital loss carryforwards and losses deferred due to wash sales and futures contracts.
As of period end, the cost and unrealized appreciation (depreciation) in securities, and derivatives if applicable, for federal income tax purposes were as follows:
| Gross unrealized appreciation | $125,239,398 |
| Gross unrealized depreciation | (103,197,255) |
| Net unrealized appreciation (depreciation) | $22,042,143 |
| Tax Cost | $6,356,263,960 |
The tax-based components of distributable earnings as of period end were as follows:
| Undistributed ordinary income | $5,687,822 |
| Capital loss carryforward | $(136,594,390) |
| Net unrealized appreciation (depreciation) on securities and other investments | $9,722,715 |
Capital loss carryforwards are only available to offset future capital gains of the Fund to the extent provided by regulations and may be limited. The capital loss carryforward information presented below, including any applicable limitation, is estimated as of fiscal period end and is subject to adjustment.
Short-term | $(48,248,670) |
Long-term | (88,345,720) |
| Total capital loss carryforward | $(136,594,390) |
The tax character of distributions paid was as follows:
| | August 31, 2024 | August 31, 2023 |
| Ordinary Income | $172,264,230 | $85,467,263 |
| Total | $172,264,230 | $85,467,263 |
Delayed Delivery Transactions and When-Issued Securities. During the period, certain Funds transacted in securities on a delayed delivery or when-issued basis. Payment and delivery may take place after the customary settlement period for that security. The price of the underlying securities and the date when the securities will be delivered and paid for are fixed at the time the transaction is negotiated. Securities purchased on a delayed delivery or when-issued basis are identified as such in the Schedule of Investments. Compensation for interest forgone in the purchase of a delayed delivery or when-issued debt security may be received. With respect to purchase commitments, each applicable Fund identifies securities as segregated in its records with a value at least equal to the amount of the commitment. Payables and receivables associated with the purchases and sales of delayed delivery securities having the same coupon, settlement date and broker are offset. Delayed delivery or when-issued securities that have been purchased from and sold to different brokers are reflected as both payables and receivables in the Statement of Assets and Liabilities under the caption "Delayed delivery", as applicable. Losses may arise due to changes in the value of the underlying securities or if the counterparty does not perform under the contract's terms, or if the issuer does not issue the securities due to political, economic, or other factors.
To-Be-Announced (TBA) Securities and Mortgage Dollar Rolls. TBA securities involve buying or selling mortgage-backed securities (MBS) on a forward commitment basis. A TBA transaction typically does not designate the actual security to be delivered and only includes an approximate principal amount; however delivered securities must meet specified terms defined by industry guidelines, including issuer, rate and current principal amount outstanding on underlying mortgage pools. Funds may enter into a TBA transaction with the intent to take possession of or deliver the underlying MBS, or a fund may elect to extend the settlement by entering into either a mortgage or reverse mortgage dollar roll. Mortgage dollar rolls are transactions where a fund sells TBA securities and simultaneously agrees to repurchase MBS on a later date at a lower price and with the same counterparty. Reverse mortgage dollar rolls involve the purchase and simultaneous agreement to sell TBA securities on a later date at a lower price. Transactions in mortgage dollar rolls and reverse mortgage dollar rolls are accounted for as purchases and sales and may result in an increase to a fund's portfolio turnover rate.
Purchases and sales of TBA securities involve risks similar to those discussed above for delayed delivery and when-issued securities. Also, if the counterparty in a mortgage dollar roll or a reverse mortgage dollar roll transaction files for bankruptcy or becomes insolvent, a fund's right to repurchase or sell securities may be limited. Additionally, when a fund sells TBA securities without already owning or having the right to obtain the deliverable securities (an uncovered forward commitment to sell), it incurs a risk of loss because it could have to purchase the securities at a price that is higher than the price at which it sold them. A fund may be unable to purchase the deliverable securities if the corresponding market is illiquid.
TBA securities subject to a forward commitment to sell at period end are included at the end of the Schedule of Investments under the caption "TBA Sale Commitments." The value of these commitments and proceeds to be received at contractual settlement date are reflected in the Statement of Assets and Liabilities as "TBA sale commitments, at value" and "Receivable for TBA sale commitments," respectively. If the TBA sale commitment is closed through the acquisition of an offsetting TBA purchase commitment, a fund realizes a gain or loss. If a fund delivers securities under the commitment, a fund realizes a gain or loss from the sale of the securities based upon the price established at the date the commitment was entered into.
Restricted Securities (including Private Placements). Funds may invest in securities that are subject to legal or contractual restrictions on resale. These securities generally may be resold in transactions exempt from registration or to the public if the securities are registered. Disposal of these securities may involve time-consuming negotiations and expense, and prompt sale at an acceptable price may be difficult. Information regarding restricted securities held at period end is included at the end of the Schedule of Investments, if applicable.
Loans and Other Direct Debt Instruments. Direct debt instruments are interests in amounts owed to lenders by corporate or other borrowers. These instruments may be in the form of loans, trade claims or other receivables and may include standby financing commitments such as revolving credit facilities that obligate a fund to supply additional cash to the borrower on demand. Loans may be acquired through assignment, participation, or may be made directly to a borrower. Such instruments are presented in the Bank Loan Obligations section in the Schedule of Investments. Certain funds may also invest in unfunded loan commitments, which are contractual obligations for future funding. Information regarding unfunded commitments is included at the end of the Schedule of Investments, if applicable.
4. Derivative Instruments.
Risk Exposures and the Use of Derivative Instruments. The Fund's investment objectives allow for various types of derivative instruments, including futures contracts, forward foreign currency contracts, options and swaps. Derivatives are investments whose value is primarily derived from underlying assets, indices or reference rates and may be transacted on an exchange or over-the-counter (OTC). Derivatives may involve a future commitment to buy or sell a specified asset based on specified terms, to exchange future cash flows at periodic intervals based on a notional principal amount, or for one party to make one or more payments upon the occurrence of specified events in exchange for periodic payments from the other party.
Derivatives were used to increase returns, to gain exposure to certain types of assets, to facilitate transactions in foreign-denominated securities and to manage exposure to certain risks as defined below. The success of any strategy involving derivatives depends on analysis of numerous economic factors, and if the strategies for investment do not work as intended, the objectives may not be achieved.
Derivatives were used to increase or decrease exposure to the following risk(s):
| | |
| Credit Risk | Credit risk relates to the ability of the issuer of a financial instrument to make further principal or interest payments on an obligation or commitment that it has to a fund. |
| Foreign Exchange Risk | Foreign exchange rate risk relates to fluctuations in the value of an asset or liability due to changes in currency exchange rates. |
| Interest Rate Risk | Interest rate risk relates to the fluctuations in the value of interest-bearing securities due to changes in the prevailing levels of market interest rates. |
Funds are also exposed to additional risks from investing in derivatives, such as liquidity risk and counterparty credit risk. Liquidity risk is the risk that a fund will be unable to close out the derivative in the open market in a timely manner. Counterparty credit risk is the risk that the counterparty will not be able to fulfill its obligation to a fund. Derivative counterparty credit risk is managed through formal evaluation of the creditworthiness of all potential counterparties. On certain OTC derivatives such as forward foreign currency contracts, options and bi-lateral swaps, a fund attempts to reduce its exposure to counterparty credit risk by entering into an International Swaps and Derivatives Association, Inc. (ISDA) Master Agreement with each of its counterparties. The ISDA Master Agreement gives a fund the right to terminate all transactions traded under such agreement upon the deterioration in the credit quality of the counterparty beyond specified levels. The ISDA Master Agreement gives each party the right, upon an event of default by the other party or a termination of the agreement, to close out all transactions traded under such agreement and to net amounts owed under each transaction to one net payable by one party to the other. To mitigate counterparty credit risk on bi-lateral OTC derivatives, a fund receives collateral in the form of cash or securities once net unrealized appreciation on outstanding derivative contracts under an ISDA Master Agreement exceeds certain applicable thresholds, subject to certain minimum transfer provisions. The collateral received is held in segregated accounts with the custodian bank in accordance with the collateral agreements entered into between a fund, the counterparty and the custodian bank. A fund could experience delays and costs in gaining access to the collateral even though it is held by the custodian bank. The maximum risk of loss to a fund from counterparty credit risk related to bi-lateral OTC derivatives is generally the aggregate unrealized appreciation and unpaid counterparty payments in excess of any collateral pledged by the counterparty to a fund. A fund may be required to pledge collateral for the benefit of the counterparties on bi-lateral OTC derivatives in an amount not less than each counterparty's unrealized appreciation on outstanding derivative contracts, subject to certain minimum transfer provisions, and any such pledged collateral is identified in the Schedule of Investments. Exchange-traded contracts are not covered by the ISDA Master Agreement; however counterparty credit risk related to these contracts may be mitigated by the protection provided by the exchange on which they trade. Counterparty credit risk related to centrally cleared swaps may be mitigated by the protection provided by the clearinghouse.
Investing in derivatives may involve greater risks than investing in the underlying assets directly and, to varying degrees, may involve risk of loss in excess of any initial investment and collateral received and amounts recognized in the Statement of Assets and Liabilities. In addition, there may be the risk that the change in value of the derivative contract does not correspond to the change in value of the underlying instrument.
Net Realized Gain (Loss) and Change in Net Unrealized Appreciation (Depreciation) on Derivatives. The table below, which reflects the impacts of derivatives on the financial performance, summarizes the net realized gain (loss) and change in net unrealized appreciation (depreciation) for derivatives during the period as presented in the Statement of Operations.
| Primary Risk Exposure / Derivative Type | Net Realized Gain (Loss)($) | Change in Net Unrealized Appreciation (Depreciation)($) |
| Fidelity Total Bond K6 Fund | | |
| Credit Risk | | |
| Swaps | 3,053 | (385,630) |
| Total Credit Risk | 3,053 | (385,630) |
| Foreign Exchange Risk | | |
| Forward Foreign Currency Contracts | (1,821,561) | (332,974) |
| Total Foreign Exchange Risk | (1,821,561) | (332,974) |
| Interest Rate Risk | | |
| Futures Contracts | 1,076,580 | (186,805) |
| Purchased Options | (8,232) | (209,942) |
| Swaps | (570,291) | (1,469,399) |
| Total Interest Rate Risk | 498,057 | (1,866,146) |
| Totals | (1,320,451) | (2,584,750) |
If there are any open positions at period end, a summary of the value of derivatives by primary risk exposure is included at the end of the Schedule of Investments.
Forward Foreign Currency Contracts. Forward foreign currency contracts represent obligations to purchase or sell foreign currency on a specified future date at a price fixed at the time the contracts are entered into. Forward foreign currency contracts were used to facilitate transactions in foreign-denominated securities and to manage exposure to certain foreign currencies.
Forward foreign currency contracts are valued daily and fluctuations in exchange rates on open contracts are recorded as unrealized appreciation or (depreciation) and reflected in total accumulated earnings (loss) in the Statement of Assets and Liabilities. When the contract is closed, a gain or loss is realized equal to the difference between the closing value and the value at the time it was opened. Non-deliverable forward foreign currency exchange contracts are settled with the counterparty in cash without the delivery of foreign currency. The net realized gain (loss) and change in net unrealized appreciation (depreciation) on forward foreign currency contracts during the period is presented in the Statement of Operations.
Any open forward foreign currency contracts at period end are presented in the Schedule of Investments under the caption "Forward Foreign Currency Contracts." The contract amount and unrealized appreciation (depreciation) reflects each contract's exposure to the underlying currency at period end, and is representative of volume of activity during the period unless an average contract value is presented.
Futures Contracts. A futures contract is an agreement between two parties to buy or sell a specified underlying instrument for a fixed price at a specified future date. Futures contracts were used to manage exposure to the bond market and fluctuations in interest rates.
Upon entering into a futures contract, a fund is required to deposit either cash or securities (initial margin) with a clearing broker in an amount equal to a certain percentage of the face value of the contract. Futures contracts are marked-to-market daily and subsequent daily payments are made or received by a fund depending on the daily fluctuations in the value of the futures contracts and are recorded as unrealized appreciation or (depreciation). This receivable and/or payable, if any, is included in daily variation margin on futures contracts in the Statement of Assets and Liabilities. Realized gain or (loss) is recorded upon the expiration or closing of a futures contract. The net realized gain (loss) and change in net unrealized appreciation (depreciation) on futures contracts during the period is presented in the Statement of Operations.
Any open futures contracts at period end are presented in the Schedule of Investments under the caption "Futures Contracts". The notional amount at value reflects each contract's exposure to the underlying instrument or index at period end, and is representative of volume of activity during the period unless an average notional amount is presented. Any securities deposited to meet initial margin requirements are identified in the Schedule of Investments. Any cash deposited to meet initial margin requirements is presented as segregated cash with brokers for derivative instruments in the Statement of Assets and Liabilities.
Options. Options give the purchaser the right, but not the obligation, to buy (call) or sell (put) an underlying security or financial instrument at an agreed exercise or strike price between or on certain dates. Options obligate the seller (writer) to buy (put) or sell (call) an underlying instrument at the exercise or strike price or cash settle an underlying derivative instrument if the holder exercises the option on or before the expiration date. OTC options, such as swaptions, which are options where the underlying instrument is a swap, were used to manage exposure to fluctuations in interest rates.
Upon entering into an options contract, a fund will pay or receive a premium. Premiums paid on purchased options are reflected as cost of investments and premiums received on written options are reflected as a liability on the Statement of Assets and Liabilities. Certain options may be purchased or written with premiums to be paid or received on a future date. Options are valued daily and any unrealized appreciation (depreciation) is reflected in total accumulated earnings (loss) in the Statement of Assets and Liabilities. When an option is exercised, the cost or proceeds of the underlying instrument purchased or sold is adjusted by the amount of the premium. When an option is closed, a gain or loss is realized depending on whether the proceeds or amount paid for the closing sale transaction is greater or less than the premium received or paid. When an option expires, gains and losses are realized to the extent of premiums received and paid, respectively. The net realized and unrealized gains (losses) on purchased options are included in the Statement of Operations in net realized gain (loss) and change in net unrealized appreciation (depreciation) on investment securities. The net realized gain (loss) and change in net unrealized appreciation (depreciation) on written options are presented in the Statement of Operations.
Any open options at period end are presented in the Schedule of Investments under the captions "Purchased Options," "Purchased Swaptions," "Written Options" and "Written Swaptions," as applicable, and are representative of volume of activity during the period unless an average notional amount is presented.
Writing puts and buying calls tend to increase exposure to the underlying instrument while buying puts and writing calls tend to decrease exposure to the underlying instrument. For purchased options, risk of loss is limited to the premium paid, and for written options, risk of loss is the change in value in excess of the premium received.
Swaps. A swap is a contract between two parties to exchange future cash flows at periodic intervals based on a notional principal amount. A bi-lateral OTC swap is a transaction between a fund and a dealer counterparty where cash flows are exchanged between the two parties for the life of the swap. A centrally cleared swap is a transaction executed between a fund and a dealer counterparty, then cleared by a futures commission merchant (FCM) through a clearinghouse. Once cleared, the clearinghouse serves as a central counterparty, with whom a fund exchanges cash flows for the life of the transaction, similar to transactions in futures contracts.
Bi-lateral OTC swaps are marked-to-market daily and changes in value are reflected in the Statement of Assets and Liabilities in the bi-lateral OTC swaps at value line items. Any upfront premiums paid or received upon entering a bi-lateral OTC swap to compensate for differences between stated terms of the swap and prevailing market conditions (e.g. credit spreads, interest rates or other factors) are recorded in total accumulated earnings (loss) in the Statement of Assets and Liabilities and amortized to realized gain or (loss) ratably over the term of the swap. Any unamortized upfront premiums are presented in the Schedule of Investments.
Centrally cleared swaps require a fund to deposit either cash or securities (initial margin) with the FCM, at the instruction of and for the benefit of the clearinghouse. Any securities deposited to meet initial margin requirements are identified in the Schedule of Investments. Any cash deposited to meet initial margin requirements is presented in segregated cash with brokers for derivative instruments in the Statement of Assets and Liabilities. Centrally cleared swaps are marked-to-market daily and subsequent payments (variation margin) are made or received depending on the daily fluctuations in the value of the swaps and are recorded as unrealized appreciation or (depreciation). These daily payments, if any, are included in receivable or payable for daily variation margin on centrally cleared swaps in the Statement of Assets and Liabilities. Any premiums for centrally cleared swaps are recorded periodically throughout the term of the swap to variation margin and included in total accumulated earnings (loss) in the Statement of Assets and Liabilities. Any premiums are recognized as realized gain (loss) upon termination or maturity of the swap.
For both bi-lateral and centrally cleared swaps, payments are exchanged at specified intervals, accrued daily commencing with the effective date of the contract and recorded as realized gain or (loss). Some swaps may be terminated prior to the effective date and realize a gain or loss upon termination. The net realized gain (loss) and change in net unrealized appreciation (depreciation) on swaps during the period is presented in the Statement of Operations.
Any open swaps at period end are included in the Schedule of Investments under the caption "Swaps", and are representative of volume of activity during the period unless an average notional amount is presented.
Credit Default Swaps. Credit default swaps enable a fund to buy or sell protection against specified credit events on a single-name issuer or a traded credit index. Under the terms of a credit default swap the buyer of protection (buyer) receives credit protection in exchange for making periodic payments to the seller of protection (seller) based on a fixed percentage applied to a notional principal amount. In return for these payments, the seller will be required to make a payment upon the occurrence of one or more specified credit events. A fund enters into credit default swaps as a seller to gain credit exposure to an issuer and/or as a buyer to obtain a measure of protection against defaults of an issuer. Periodic payments are made over the life of the contract by the buyer provided that no credit event occurs.
For credit default swaps on most corporate and sovereign issuers, credit events include bankruptcy, failure to pay or repudiation/moratorium. For credit default swaps on corporate or sovereign issuers, the obligation that may be put to the seller is not limited to the specific reference obligation described in the Schedule of Investments. For credit default swaps on asset-backed securities, a credit event may be triggered by events such as failure to pay principal, maturity extension, rating downgrade or write-down. For credit default swaps on asset-backed securities, the reference obligation described represents the security that may be put to the seller. For credit default swaps on a traded credit index, a specified credit event may affect all or individual underlying securities included in the index.
As a seller, if an underlying credit event occurs, a fund will pay a net settlement amount of cash equal to the notional amount of the swap less the recovery value of the reference obligation or underlying securities comprising an index. Only in the event of the industry's inability to value the underlying asset will a fund be required to take delivery of the reference obligation or underlying securities comprising an index and pay an amount equal to the notional amount of the swap.
As a buyer, if an underlying credit event occurs, a fund will receive a net settlement amount of cash equal to the notional amount of the swap less the recovery value of the reference obligation or underlying securities comprising an index. Only in the event of the industry's inability to value the underlying asset will a fund be required to deliver the reference obligation or underlying securities comprising an index in exchange for payment of an amount equal to the notional amount of the swap.
Typically, the value of each credit default swap and credit rating disclosed for each reference obligation in the Schedule of Investments, where a fund is the seller, can be used as measures of the current payment/performance risk of the swap. As the value of the swap changes as a positive or negative percentage of the total notional amount, the payment/performance risk may decrease or increase, respectively. In addition to these measures, the investment adviser monitors a variety of factors including cash flow assumptions, market activity and market sentiment as part of its ongoing process of assessing payment/performance risk.
Interest Rate Swaps. Interest rate swaps are agreements between counterparties to exchange cash flows, one based on a fixed rate, and the other on a floating rate. A fund enters into interest rate swaps to manage its exposure to interest rate changes. Changes in interest rates can have an effect on both the value of bond holdings as well as the amount of interest income earned. In general, the value of bonds can fall when interest rates rise and can rise when interest rates fall.
5. Purchases and Sales of Investments.
Purchases and sales of securities, other than short-term securities, U.S. government securities and in-kind transactions, as applicable, are noted in the table below.
| | Purchases ($) | Sales ($) |
| Fidelity Total Bond K6 Fund | 8,087,784,756 | 6,728,291,914 |
6. Fees and Other Transactions with Affiliates.
Management Fee. Fidelity Management & Research Company LLC (the investment adviser) and its affiliates provide the Fund with investment management related services for which the Fund pays a monthly management fee that is based on an annual rate of .30% of average net assets. Under the management contract, the investment adviser or an affiliate pays all other expenses of the Fund, excluding fees and expenses of the independent Trustees, and certain miscellaneous expenses such as proxy and shareholder meeting expenses.
Interfund Trades. Funds may purchase from or sell securities to other Fidelity Funds under procedures adopted by the Board. The procedures have been designed to ensure these interfund trades are executed in accordance with Rule 17a-7 of the 1940 Act. Any interfund trades are included within the respective purchases and sales amounts shown in the Purchases and Sales of Investments note. During the period, there were no interfund trades.
Affiliated Exchanges In-Kind. During the period, the Fund redeemed shares of Fidelity Emerging Markets Debt Central Fund, Fidelity Specialized High Income Central Fund, and Fidelity International Credit Central Fund in exchange for investments and cash, if any, as noted in the following table. The Fund had a net realized loss of $34,088,016 on the Fund's redemptions of Fidelity Emerging Markets Debt Central Fund, Fidelity Specialized High Income Central Fund, and Fidelity International Credit Central Fund, which is included in "Net Realized gain (loss): Fidelity Central Funds" in the accompanying Statement of Operations. The Fund recognized a net loss on the exchanges for federal income tax purposes.
| Fund Name | Value of Investments($) | Net realized gain (loss) ($) | Shares redeemed |
| Fidelity Emerging Markets Debt Central Fund | 86,899,124 | (7,430,938) | 11,140,913 |
| Fidelity Specialized High Income Central Fund | 228,742,015 | (15,106,950) | 2,687,289 |
| Fidelity International Credit Central Fund | 95,472,483 | (11,550,128) | 1,208,359 |
Sub-Advisory Arrangements. Effective March 1, 2024, the Fund's sub-advisory agreements with FMR Investment Management (UK) Limited, Fidelity Management & Research (Hong Kong) Limited, and Fidelity Management & Research (Japan) Limited were amended to provide that the investment adviser pays each sub-adviser monthly fees equal to 110% of the sub-adviser's costs for providing sub-advisory services.
7. Committed Line of Credit.
Certain Funds participate with other funds managed by the investment adviser or an affiliate in a $4.25 billion credit facility (the "line of credit") to be utilized for temporary or emergency purposes to fund shareholder redemptions or for other short-term liquidity purposes. The commitment fees on the pro-rata portion of the line of credit are borne by the investment adviser. During the period, there were no borrowings on this line of credit.
8. Security Lending.
Funds lend portfolio securities from time to time in order to earn additional income. Lending agents are used, including National Financial Services (NFS), an affiliate of the investment adviser. Pursuant to a securities lending agreement, NFS will receive a fee, which is capped at 9.9% of a fund's daily lending revenue, for its services as lending agent. A fund may lend securities to certain qualified borrowers, including NFS. On the settlement date of the loan, a fund receives collateral (in the form of U.S. Treasury obligations, letters of credit and/or cash) against the loaned securities and maintains collateral in an amount not less than 100% of the market value of the loaned securities during the period of the loan. The market value of the loaned securities is determined at the close of business of a fund and any additional required collateral is delivered to a fund on the next business day. A fund or borrower may terminate the loan at any time, and if the borrower defaults on its obligation to return the securities loaned because of insolvency or other reasons, a fund may apply collateral received from the borrower against the obligation. A fund may experience delays and costs in recovering the securities loaned. Any cash collateral received is invested in the Fidelity Securities Lending Cash Central Fund. Any loaned securities are identified as such in the Schedule of Investments, and the value of loaned securities and cash collateral at period end, as applicable, are presented in the Statement of Assets and Liabilities. Security lending income represents the income earned on investing cash collateral, less rebates paid to borrowers and any lending agent fees associated with the loan, plus any premium payments received for lending certain types of securities. Security lending income is presented in the Statement of Operations as a component of income from Fidelity Central Funds. Affiliated security lending activity, if any, was as follows:
| | Total Security Lending Fees Paid to NFS ($) | Security Lending Income From Securities Loaned to NFS ($) | Value of Securities Loaned to NFS at Period End ($) |
| Fidelity Total Bond K6 Fund | 6,974 | - | - |
9. Expense Reductions.
Through arrangements with the Fund's custodian, credits realized as a result of certain uninvested cash balances were used to reduce the Fund's expenses by $8,017.
10. Other.
A fund's organizational documents provide former and current trustees and officers with a limited indemnification against liabilities arising in connection with the performance of their duties to the fund. In the normal course of business, a fund may also enter into contracts that provide general indemnifications. A fund's maximum exposure under these arrangements is unknown as this would be dependent on future claims that may be made against a fund. The risk of material loss from such claims is considered remote.
11. Risk and Uncertainties.
Many factors affect a fund's performance. Developments that disrupt global economies and financial markets, such as pandemics, epidemics, outbreaks of infectious diseases, war, terrorism, and environmental disasters, may significantly affect a fund's investment performance. The effects of these developments to a fund will be impacted by the types of securities in which a fund invests, the financial condition, industry, economic sector, and geographic location of an issuer, and a fund's level of investment in the securities of that issuer. Significant concentrations in security types, issuers, industries, sectors, and geographic locations may magnify the factors that affect a fund's performance.
Report of Independent Registered Public Accounting Firm
To the Board of Trustees of Fidelity Income Fund and the Shareholders of Fidelity Total Bond K6 Fund:
Opinion on the Financial Statements and Financial Highlights
We have audited the accompanying statement of assets and liabilities of Fidelity Total Bond K6 Fund (the "Fund"), a fund of Fidelity Income Fund, including the schedule of investments, as of August 31, 2024, the related statement of operations for the year then ended, the statement of changes in net assets for each of the two years in the period then ended, the financial highlights for each of the five years in the period then ended, and the related notes. In our opinion, the financial statements and financial highlights present fairly, in all material respects, the financial position of the Fund as of August 31, 2024, and the results of its operations for the year then ended, the changes in its net assets for each of the two years in the period then ended, and the financial highlights for each of the five years in the period then ended in conformity with accounting principles generally accepted in the United States of America.
Basis for Opinion
These financial statements and financial highlights are the responsibility of the Fund's management. Our responsibility is to express an opinion on the Fund's financial statements and financial highlights based on our audits. We are a public accounting firm registered with the Public Company Accounting Oversight Board (United States) (PCAOB) and are required to be independent with respect to the Fund in accordance with the U.S. federal securities laws and the applicable rules and regulations of the Securities and Exchange Commission and the PCAOB.
We conducted our audits in accordance with the standards of the PCAOB. Those standards require that we plan and perform the audit to obtain reasonable assurance about whether the financial statements and financial highlights are free of material misstatement, whether due to error or fraud. The Fund is not required to have, nor were we engaged to perform, an audit of its internal control over financial reporting. As part of our audits, we are required to obtain an understanding of internal control over financial reporting but not for the purpose of expressing an opinion on the effectiveness of the Fund's internal control over financial reporting. Accordingly, we express no such opinion.
Our audits included performing procedures to assess the risks of material misstatement of the financial statements and financial highlights, whether due to error or fraud, and performing procedures that respond to those risks. Such procedures included examining, on a test basis, evidence regarding the amounts and disclosures in the financial statements and financial highlights. Our audits also included evaluating the accounting principles used and significant estimates made by management, as well as evaluating the overall presentation of the financial statements and financial highlights. Our procedures included confirmation of securities owned as of August 31, 2024, by correspondence with the custodian and brokers, and agent banks; when replies were not received from brokers or agent banks, we performed other auditing procedures. We believe that our audits provide a reasonable basis for our opinion.
/s/ Deloitte & Touche LLP
Boston, Massachusetts
October 16, 2024
We have served as the auditor of one or more of the Fidelity investment companies since 1999.
Distributions
(Unaudited)
The dividend and capital gains distributions for the fund(s) are available on Fidelity.com or Institutional.Fidelity.com.
A total of 29.68% of the dividends distributed during the fiscal year was derived from interest on U.S. Government securities which is generally exempt from state income tax.
The fund designates $172,264,230 of distributions paid during the fiscal year ended 2024 as qualifying to be taxed as section 163(j) interest dividends.
The fund will notify shareholders in January 2025 of amounts for use in preparing 2024 income tax returns.
Item 8: Changes in and Disagreements with Accountants for Open-End Management Investment Companies
(Unaudited)
Note: This is not applicable for any fund included in this document.
Item 9: Proxy Disclosures for Open-End Management Investment Companies
(Unaudited)
| A special meeting of shareholders was held on October 18, 2023. The results of votes taken among shareholders on the proposal before them are reported below. Each vote reported represents one dollar of net asset value held on the record date for the meeting. |
| Proposal 1 |
| To elect a Board of Trustees. |
| | # of Votes | % of Votes |
| Abigail P. Johnson |
| Affirmative | 29,408,520,731.18 | 96.84 |
| Withheld | 958,659,352.64 | 3.16 |
| TOTAL | 30,367,180,083.82 | 100.00 |
| Jennifer Toolin McAuliffe |
| Affirmative | 29,484,249,185.02 | 97.09 |
| Withheld | 882,930,898.80 | 2.91 |
| TOTAL | 30,367,180,083.82 | 100.00 |
| Christine J. Thompson |
| Affirmative | 29,483,889,948.58 | 97.09 |
| Withheld | 883,290,135.24 | 2.91 |
| TOTAL | 30,367,180,083.82 | 100.00 |
| Elizabeth S. Acton |
| Affirmative | 29,471,265,000.64 | 97.05 |
| Withheld | 895,915,083.18 | 2.95 |
| TOTAL | 30,367,180,083.82 | 100.00 |
| Laura M. Bishop |
| Affirmative | 29,508,015,754.27 | 97.17 |
| Withheld | 859,164,329.55 | 2.83 |
| TOTAL | 30,367,180,083.82 | 100.00 |
| Ann E. Dunwoody |
| Affirmative | 29,470,432,034.14 | 97.05 |
| Withheld | 896,748,049.68 | 2.95 |
| TOTAL | 30,367,180,083.82 | 100.00 |
| John Engler |
| Affirmative | 29,326,181,411.39 | 96.57 |
| Withheld | 1,040,998,672.43 | 3.43 |
| TOTAL | 30,367,180,083.82 | 100.00 |
| Robert F. Gartland |
| Affirmative | 29,422,803,481.93 | 96.89 |
| Withheld | 944,376,601.89 | 3.11 |
| TOTAL | 30,367,180,083.82 | 100.00 |
| Robert W. Helm |
| Affirmative | 29,445,540,968.38 | 96.97 |
| Withheld | 921,639,115.44 | 3.03 |
| TOTAL | 30,367,180,083.82 | 100.00 |
| Arthur E. Johnson |
| Affirmative | 29,395,582,286.37 | 96.80 |
| Withheld | 971,597,797.45 | 3.20 |
| TOTAL | 30,367,180,083.82 | 100.00 |
| Michael E. Kenneally |
| Affirmative | 29,420,582,069.08 | 96.88 |
| Withheld | 946,598,014.74 | 3.12 |
| TOTAL | 30,367,180,083.82 | 100.00 |
| Mark A. Murray |
| Affirmative | 29,446,384,581.44 | 96.97 |
| Withheld | 920,795,502.38 | 3.03 |
| TOTAL | 30,367,180,083.82 | 100.00 |
| Carol J. Zierhoffer |
| Affirmative | 29,510,392,522.55 | 97.18 |
| Withheld | 856,787,561.27 | 2.82 |
| TOTAL | 30,367,180,083.82 | 100.00 |
| | | |
| Proposal 1 reflects trust-wide proposal and voting results. |
Item 10: Remuneration Paid to Directors, Officers, and others of Open-End Management Investment Companies
(Unaudited)
Note: This information is disclosed as part of the financial statements for each Fund as part of Item 7: Financial Statements and Financial Highlights for Open-End Management Investment companies.
Item 11: Statement Regarding Basis for Approval of Investment Advisory Contract
(Unaudited)
Note: This is not applicable for any fund included in this document.
1.9884015.107
TBDK6-ANN-1024
Fidelity® Government Income Fund
Annual Report
August 31, 2024
Includes Fidelity and Fidelity Advisor share classes
Contents
To view a fund's proxy voting guidelines and proxy voting record for the 12-month period ended June 30, visit http://www.fidelity.com/proxyvotingresults or visit the Securities and Exchange Commission's (SEC) web site at http://www.sec.gov.
You may also call 1-800-544-8544 if you're an individual investing directly with Fidelity, call 1-800-835-5092 if you're a plan sponsor or participant with Fidelity as your recordkeeper or call 1-877-208-0098 on institutional accounts or if you're an advisor or invest through one to request a free copy of the proxy voting guidelines.
Standard & Poor's, S&P and S&P 500 are registered service marks of The McGraw-Hill Companies, Inc. and have been licensed for use by Fidelity Distributors Corporation.
Other third-party marks appearing herein are the property of their respective owners.
All other marks appearing herein are registered or unregistered trademarks or service marks of FMR LLC or an affiliated company. © 2024 FMR LLC. All rights reserved.
This report and the financial statements contained herein are submitted for the general information of the shareholders of the Fund. This report is not authorized for distribution to prospective investors in the Fund unless preceded or accompanied by an effective prospectus.
A fund files its complete schedule of portfolio holdings with the SEC for the first and third quarters of each fiscal year on Form N-PORT. Forms N-PORT are available on the SEC's web site at http://www.sec.gov. A fund's Forms N-PORT may be reviewed and copied at the SEC's Public Reference Room in Washington, DC. Information regarding the operation of the SEC's Public Reference Room may be obtained by calling 1-800-SEC-0330.
For a complete list of a fund's portfolio holdings, view the most recent holdings listing, semiannual report, or annual report on Fidelity's web site at http://www.fidelity.com, http://www.institutional.fidelity.com, or http://www.401k.com, as applicable.
NOT FDIC INSURED •MAY LOSE VALUE •NO BANK GUARANTEE
Neither the Fund nor Fidelity Distributors Corporation is a bank.
Item 7: Financial Statements and Financial Highlights for Open-End Management Investment Companies (Annual Report)
Fidelity® Government Income Fund
Schedule of Investments August 31, 2024
Showing Percentage of Net Assets
| U.S. Government and Government Agency Obligations - 43.5% |
| | | Principal Amount (a) (000s) | Value ($) (000s) |
| U.S. Government Agency Obligations - 0.2% | | | |
| Tennessee Valley Authority: | | | |
| 5.25% 9/15/39 | | 2,235 | 2,400 |
| 5.375% 4/1/56 | | 2,737 | 3,012 |
TOTAL U.S. GOVERNMENT AGENCY OBLIGATIONS | | | 5,412 |
| U.S. Treasury Obligations - 42.9% | | | |
| U.S. Treasury Bonds: | | | |
| 2% 8/15/51 | | 56,172 | 35,612 |
| 2.375% 2/15/42 | | 353 | 270 |
| 2.5% 2/15/45 | | 6,151 | 4,619 |
| 2.875% 5/15/49 | | 4,458 | 3,460 |
| 3% 2/15/49 | | 95,774 | 76,189 |
| 3.625% 2/15/53 | | 86,159 | 77,284 |
| 3.625% 5/15/53 | | 11,120 | 9,982 |
| 4.125% 8/15/53 | | 9,358 | 9,189 |
| 4.25% 2/15/54 | | 33,340 | 33,470 |
| 4.25% 8/15/54 | | 6,530 | 6,571 |
| 4.375% 8/15/43 | | 85,314 | 86,154 |
| 4.625% 5/15/44 | | 12,000 | 12,497 |
| 4.625% 5/15/54 | | 15,120 | 16,160 |
| 4.75% 2/15/37 | | 2,223 | 2,401 |
| U.S. Treasury Notes: | | | |
| 1.125% 8/31/28 | | 94,478 | 85,322 |
| 1.5% 1/31/27 | | 22,230 | 21,034 |
| 1.625% 9/30/26 | | 1,028 | 981 |
| 2.5% 3/31/27 | | 46,600 | 45,113 |
| 2.625% 5/31/27 | | 45,180 | 43,788 |
| 2.625% 7/31/29 | | 25,679 | 24,389 |
| 2.75% 4/30/27 | | 40,000 | 38,923 |
| 2.75% 7/31/27 | | 33,510 | 32,539 |
| 2.75% 8/15/32 | | 1,800 | 1,665 |
| 3.5% 1/31/28 | | 5,750 | 5,698 |
| 3.75% 5/31/30 | | 55,440 | 55,349 |
| 3.75% 6/30/30 | | 26,780 | 26,729 |
| 3.875% 8/15/34 (b) | | 18,770 | 18,700 |
| 4% 1/15/27 | | 1,260 | 1,264 |
| 4% 7/31/30 | | 6,990 | 7,068 |
| 4% 1/31/31 | | 5,660 | 5,722 |
| 4.125% 2/15/27 | | 45,050 | 45,330 |
| 4.125% 10/31/27 | | 24,500 | 24,738 |
| 4.125% 8/31/30 | | 1,950 | 1,985 |
| 4.25% 3/15/27 | | 49,820 | 50,326 |
| 4.25% 2/28/31 | | 40,720 | 41,757 |
| 4.25% 6/30/31 | | 4,940 | 5,070 |
| 4.375% 12/15/26 | | 350 | 354 |
| 4.375% 7/15/27 | | 38,630 | 39,219 |
TOTAL U.S. TREASURY OBLIGATIONS | | | 996,921 |
| Other Government Related - 0.4% | | | |
| Private Export Funding Corp. Secured 1.75% 11/15/24 | | 8,660 | 8,594 |
| TOTAL U.S. GOVERNMENT AND GOVERNMENT AGENCY OBLIGATIONS (Cost $1,060,896) | | | 1,010,927 |
| | | | |
| U.S. Government Agency - Mortgage Securities - 34.9% |
| | | Principal Amount (a) (000s) | Value ($) (000s) |
| Fannie Mae - 14.4% | | | |
| FTSE USD IBOR Consumer Cash Fallbacks Term 1Y + 1.360% 5.873% 10/1/35 (c)(d) | | 5 | 5 |
| FTSE USD IBOR Consumer Cash Fallbacks Term 1Y + 1.440% 5.945% 4/1/37 (c)(d) | | 1 | 1 |
| FTSE USD IBOR Consumer Cash Fallbacks Term 1Y + 1.460% 6.085% 1/1/35 (c)(d) | | 3 | 3 |
| FTSE USD IBOR Consumer Cash Fallbacks Term 1Y + 1.470% 6.058% 10/1/33 (c)(d) | | 13 | 13 |
| FTSE USD IBOR Consumer Cash Fallbacks Term 1Y + 1.480% 7.48% 7/1/34 (c)(d) | | 6 | 6 |
| FTSE USD IBOR Consumer Cash Fallbacks Term 1Y + 1.500% 6.755% 1/1/35 (c)(d) | | 2 | 2 |
| FTSE USD IBOR Consumer Cash Fallbacks Term 1Y + 1.510% 7.26% 2/1/33 (c)(d) | | 11 | 11 |
| FTSE USD IBOR Consumer Cash Fallbacks Term 1Y + 1.530% 6.461% 12/1/34 (c)(d) | | 14 | 14 |
| FTSE USD IBOR Consumer Cash Fallbacks Term 1Y + 1.530% 6.785% 3/1/35 (c)(d) | | 12 | 12 |
| FTSE USD IBOR Consumer Cash Fallbacks Term 1Y + 1.550% 5.975% 2/1/44 (c)(d) | | 19 | 20 |
| FTSE USD IBOR Consumer Cash Fallbacks Term 1Y + 1.550% 6.803% 5/1/44 (c)(d) | | 1 | 1 |
| FTSE USD IBOR Consumer Cash Fallbacks Term 1Y + 1.550% 7.125% 9/1/33 (c)(d) | | 21 | 21 |
| FTSE USD IBOR Consumer Cash Fallbacks Term 1Y + 1.550% 7.174% 10/1/33 (c)(d) | | 6 | 6 |
| FTSE USD IBOR Consumer Cash Fallbacks Term 1Y + 1.550% 7.428% 6/1/36 (c)(d) | | 14 | 15 |
| FTSE USD IBOR Consumer Cash Fallbacks Term 1Y + 1.560% 5.939% 2/1/44 (c)(d) | | 52 | 53 |
| FTSE USD IBOR Consumer Cash Fallbacks Term 1Y + 1.560% 6.065% 3/1/37 (c)(d) | | 76 | 78 |
| FTSE USD IBOR Consumer Cash Fallbacks Term 1Y + 1.560% 7.315% 7/1/35 (c)(d) | | 9 | 9 |
| FTSE USD IBOR Consumer Cash Fallbacks Term 1Y + 1.570% 6.175% 4/1/44 (c)(d) | | 95 | 98 |
| FTSE USD IBOR Consumer Cash Fallbacks Term 1Y + 1.580% 5.83% 1/1/44 (c)(d) | | 52 | 54 |
| FTSE USD IBOR Consumer Cash Fallbacks Term 1Y + 1.580% 6.08% 4/1/44 (c)(d) | | 37 | 38 |
| FTSE USD IBOR Consumer Cash Fallbacks Term 1Y + 1.590% 5.971% 3/1/36 (c)(d) | | 46 | 47 |
| FTSE USD IBOR Consumer Cash Fallbacks Term 1Y + 1.630% 5.815% 9/1/36 (c)(d) | | 0 | 0 |
| FTSE USD IBOR Consumer Cash Fallbacks Term 1Y + 1.640% 6.413% 5/1/35 (c)(d) | | 2 | 2 |
| FTSE USD IBOR Consumer Cash Fallbacks Term 1Y + 1.640% 6.414% 3/1/33 (c)(d) | | 6 | 7 |
| FTSE USD IBOR Consumer Cash Fallbacks Term 1Y + 1.640% 6.837% 11/1/36 (c)(d) | | 10 | 11 |
| FTSE USD IBOR Consumer Cash Fallbacks Term 1Y + 1.680% 7.061% 5/1/36 (c)(d) | | 11 | 12 |
| FTSE USD IBOR Consumer Cash Fallbacks Term 1Y + 1.690% 6.406% 7/1/43 (c)(d) | | 18 | 19 |
| FTSE USD IBOR Consumer Cash Fallbacks Term 1Y + 1.700% 7.167% 6/1/42 (c)(d) | | 35 | 36 |
| FTSE USD IBOR Consumer Cash Fallbacks Term 1Y + 1.730% 6.028% 3/1/40 (c)(d) | | 124 | 128 |
| FTSE USD IBOR Consumer Cash Fallbacks Term 1Y + 1.750% 6.434% 8/1/41 (c)(d) | | 4 | 4 |
| FTSE USD IBOR Consumer Cash Fallbacks Term 1Y + 1.750% 6.439% 7/1/35 (c)(d) | | 20 | 21 |
| FTSE USD IBOR Consumer Cash Fallbacks Term 1Y + 1.770% 5.994% 2/1/37 (c)(d) | | 22 | 23 |
| FTSE USD IBOR Consumer Cash Fallbacks Term 1Y + 1.800% 6.055% 1/1/42 (c)(d) | | 126 | 129 |
| FTSE USD IBOR Consumer Cash Fallbacks Term 1Y + 1.800% 6.444% 12/1/40 (c)(d) | | 70 | 72 |
| FTSE USD IBOR Consumer Cash Fallbacks Term 1Y + 1.800% 7.635% 7/1/41 (c)(d) | | 11 | 11 |
| FTSE USD IBOR Consumer Cash Fallbacks Term 1Y + 1.810% 6.06% 12/1/39 (c)(d) | | 1 | 1 |
| FTSE USD IBOR Consumer Cash Fallbacks Term 1Y + 1.810% 6.068% 9/1/41 (c)(d) | | 16 | 16 |
| FTSE USD IBOR Consumer Cash Fallbacks Term 1Y + 1.810% 6.297% 2/1/42 (c)(d) | | 55 | 56 |
| FTSE USD IBOR Consumer Cash Fallbacks Term 1Y + 1.810% 7.64% 7/1/41 (c)(d) | | 21 | 22 |
| FTSE USD IBOR Consumer Cash Fallbacks Term 1Y + 1.820% 6.297% 2/1/35 (c)(d) | | 3 | 3 |
| FTSE USD IBOR Consumer Cash Fallbacks Term 1Y + 1.830% 6.08% 10/1/41 (c)(d) | | 13 | 14 |
| FTSE USD IBOR Consumer Cash Fallbacks Term 1Y + 1.850% 6.429% 4/1/36 (c)(d) | | 17 | 18 |
| FTSE USD IBOR Consumer Cash Fallbacks Term 1Y + 1.890% 6.522% 8/1/35 (c)(d) | | 10 | 10 |
| FTSE USD IBOR Consumer Cash Fallbacks Term 1Y + 1.950% 7.703% 7/1/37 (c)(d) | | 4 | 4 |
| FTSE USD IBOR Consumer Cash Fallbacks Term 1Y + 1.960% 6.418% 9/1/35 (c)(d) | | 0 | 0 |
| U.S. TREASURY 1 YEAR INDEX + 2.150% 6.429% 7/1/36 (c)(d) | | 2 | 2 |
| U.S. TREASURY 1 YEAR INDEX + 2.200% 6.583% 3/1/35 (c)(d) | | 11 | 11 |
| U.S. TREASURY 1 YEAR INDEX + 2.270% 6.395% 6/1/36 (c)(d) | | 2 | 2 |
| U.S. TREASURY 1 YEAR INDEX + 2.280% 6.402% 10/1/33 (c)(d) | | 17 | 17 |
| U.S. TREASURY 1 YEAR INDEX + 2.460% 7.177% 7/1/34 (c)(d) | | 2 | 2 |
| 1.5% 11/1/35 to 3/1/41 | | 10,946 | 9,279 |
| 2% 2/1/28 to 2/1/52 | | 122,529 | 108,014 |
| 2.5% 5/1/31 to 12/1/51 | | 54,778 | 49,133 |
| 3% 1/1/28 to 2/1/52 | | 57,501 | 52,390 |
| 3.4% 8/1/42 to 9/1/42 | | 24 | 23 |
| 3.5% 5/1/35 to 3/1/52 (e) | | 61,683 | 57,345 |
| 4% 3/1/36 to 4/1/49 | | 6,145 | 5,955 |
| 4.25% 11/1/41 | | 5 | 5 |
| 4.5% to 4.5% 6/1/25 to 2/1/49 | | 2,643 | 2,631 |
| 5% 10/1/29 to 12/1/52 | | 21,213 | 21,349 |
| 5.288% 8/1/41 (c) | | 48 | 48 |
| 5.5% 8/1/25 to 6/1/54 | | 3,894 | 3,932 |
| 6% to 6% 9/1/29 to 6/1/54 | | 17,250 | 17,748 |
| 6.5% 7/1/32 to 6/1/54 | | 6,587 | 6,856 |
| 6.723% 2/1/39 (c) | | 19 | 20 |
| 7% to 7% 8/1/25 to 10/1/32 | | 12 | 13 |
| 7.5% to 7.5% 9/1/25 to 11/1/31 | | 7 | 7 |
TOTAL FANNIE MAE | | | 335,908 |
| Freddie Mac - 10.2% | | | |
| FTSE USD IBOR Consumer Cash Fallbacks Term 1Y + 1.120% 6.029% 8/1/37 (c)(d) | | 2 | 2 |
| FTSE USD IBOR Consumer Cash Fallbacks Term 1Y + 1.320% 5.575% 1/1/36 (c)(d) | | 5 | 6 |
| FTSE USD IBOR Consumer Cash Fallbacks Term 1Y + 1.370% 5.625% 3/1/36 (c)(d) | | 4 | 4 |
| FTSE USD IBOR Consumer Cash Fallbacks Term 1Y + 1.500% 5.824% 3/1/36 (c)(d) | | 3 | 3 |
| FTSE USD IBOR Consumer Cash Fallbacks Term 1Y + 1.660% 6.04% 7/1/36 (c)(d) | | 18 | 19 |
| FTSE USD IBOR Consumer Cash Fallbacks Term 1Y + 1.660% 6.165% 1/1/37 (c)(d) | | 4 | 5 |
| FTSE USD IBOR Consumer Cash Fallbacks Term 1Y + 1.660% 7.415% 7/1/35 (c)(d) | | 3 | 3 |
| FTSE USD IBOR Consumer Cash Fallbacks Term 1Y + 1.750% 6% 12/1/40 (c)(d) | | 26 | 27 |
| FTSE USD IBOR Consumer Cash Fallbacks Term 1Y + 1.750% 6% 9/1/41 (c)(d) | | 216 | 222 |
| FTSE USD IBOR Consumer Cash Fallbacks Term 1Y + 1.750% 7.567% 7/1/41 (c)(d) | | 7 | 7 |
| FTSE USD IBOR Consumer Cash Fallbacks Term 1Y + 1.860% 6.422% 10/1/36 (c)(d) | | 23 | 24 |
| FTSE USD IBOR Consumer Cash Fallbacks Term 1Y + 1.860% 7.239% 4/1/36 (c)(d) | | 2 | 2 |
| FTSE USD IBOR Consumer Cash Fallbacks Term 1Y + 1.880% 6.13% 9/1/41 (c)(d) | | 22 | 22 |
| FTSE USD IBOR Consumer Cash Fallbacks Term 1Y + 1.880% 6.13% 10/1/41 (c)(d) | | 296 | 304 |
| FTSE USD IBOR Consumer Cash Fallbacks Term 1Y + 1.880% 7.255% 4/1/41 (c)(d) | | 5 | 5 |
| FTSE USD IBOR Consumer Cash Fallbacks Term 1Y + 1.910% 7.155% 5/1/41 (c)(d) | | 40 | 42 |
| FTSE USD IBOR Consumer Cash Fallbacks Term 1Y + 1.910% 7.54% 5/1/41 (c)(d) | | 40 | 41 |
| FTSE USD IBOR Consumer Cash Fallbacks Term 1Y + 1.910% 7.628% 6/1/41 (c)(d) | | 39 | 40 |
| FTSE USD IBOR Consumer Cash Fallbacks Term 1Y + 1.910% 7.785% 6/1/41 (c)(d) | | 16 | 16 |
| FTSE USD IBOR Consumer Cash Fallbacks Term 1Y + 1.920% 6.601% 10/1/42 (c)(d) | | 88 | 91 |
| FTSE USD IBOR Consumer Cash Fallbacks Term 1Y + 1.990% 7% 10/1/35 (c)(d) | | 16 | 17 |
| FTSE USD IBOR Consumer Cash Fallbacks Term 1Y + 2.010% 7.635% 5/1/37 (c)(d) | | 3 | 3 |
| FTSE USD IBOR Consumer Cash Fallbacks Term 1Y + 2.020% 6.936% 4/1/38 (c)(d) | | 2 | 2 |
| FTSE USD IBOR Consumer Cash Fallbacks Term 1Y + 2.020% 7.635% 6/1/37 (c)(d) | | 7 | 7 |
| FTSE USD IBOR Consumer Cash Fallbacks Term 1Y + 2.030% 6.158% 3/1/33 (c)(d) | | 1 | 1 |
| FTSE USD IBOR Consumer Cash Fallbacks Term 1Y + 2.040% 7.91% 7/1/36 (c)(d) | | 102 | 105 |
| FTSE USD IBOR Consumer Cash Fallbacks Term 1Y + 2.200% 6.45% 12/1/36 (c)(d) | | 2 | 2 |
| FTSE USD IBOR Consumer Cash Fallbacks Term 1Y + 3.010% 8.637% 10/1/35 (c)(d) | | 5 | 5 |
| U.S. TREASURY 1 YEAR INDEX + 2.030% 6.782% 6/1/33 (c)(d) | | 22 | 22 |
| U.S. TREASURY 1 YEAR INDEX + 2.230% 6.969% 4/1/34 (c)(d) | | 7 | 7 |
| U.S. TREASURY 1 YEAR INDEX + 2.260% 7.127% 6/1/33 (c)(d) | | 6 | 6 |
| U.S. TREASURY 1 YEAR INDEX + 2.460% 6.899% 3/1/35 (c)(d) | | 10 | 10 |
| U.S. TREASURY 1 YEAR INDEX + 2.540% 7.588% 7/1/35 (c)(d) | | 120 | 123 |
| 1.5% 11/1/35 to 4/1/41 | | 10,489 | 8,856 |
| 2% 5/1/35 to 4/1/52 | | 35,247 | 30,801 |
| 2.5% 5/1/30 to 1/1/52 | | 63,866 | 57,016 |
| 3% 6/1/31 to 3/1/52 | | 20,666 | 18,708 |
| 3.5% 3/1/32 to 3/1/52 | | 32,753 | 30,762 |
| 4% 1/1/36 to 2/1/50 | | 5,690 | 5,535 |
| 4% 4/1/48 | | 2 | 2 |
| 4.5% 6/1/25 to 10/1/48 | | 1,699 | 1,692 |
| 5% 8/1/33 to 12/1/52 | | 21,006 | 21,120 |
| 5.5% 3/1/53 (f)(g) | | 13,843 | 14,186 |
| 6% 2/1/29 to 11/1/53 | | 17,676 | 18,196 |
| 6.5% 1/1/32 to 10/1/53 | | 26,967 | 28,157 |
| 7% 8/1/26 to 9/1/36 | | 16 | 17 |
| 7.5% 1/1/27 to 11/1/30 | | 0 | 0 |
| 8% 2/1/30 to 8/1/30 | | 0 | 0 |
| 8.5% 8/1/26 to 8/1/27 | | 0 | 0 |
TOTAL FREDDIE MAC | | | 236,243 |
| Ginnie Mae - 5.6% | | | |
| 3.5% 11/15/40 to 12/20/49 | | 2,051 | 1,944 |
| 4% 8/15/39 to 5/20/49 | | 7,572 | 7,346 |
| 4.5% 6/20/33 to 6/20/41 | | 1,241 | 1,236 |
| 5.5% 10/15/35 to 9/15/39 | | 37 | 38 |
| 7% to 7% 1/15/28 to 8/15/32 | | 10 | 11 |
| 7.5% to 7.5% 9/15/25 to 1/15/31 | | 3 | 3 |
| 8% 7/15/25 to 12/15/27 | | 0 | 0 |
| 8.5% 8/15/29 to 1/15/31 | | 0 | 0 |
| 2% 10/20/50 to 1/20/52 | | 43,641 | 36,743 |
| 2.5% 6/20/51 to 12/20/51 | | 39,094 | 33,822 |
| 3% 5/15/42 to 2/20/50 | | 841 | 771 |
| 5% 9/20/33 to 4/20/48 | | 685 | 698 |
| 5.47% 8/20/59 (c)(h) | | 1 | 1 |
| 5.5% 9/1/54 (i) | | 16,500 | 16,606 |
| 5.5% 10/1/54 (i) | | 8,725 | 8,779 |
| 6% 11/20/31 to 5/15/40 | | 1,217 | 1,258 |
| 6% 9/1/54 (i) | | 3,700 | 3,754 |
| 6% 9/1/54 (i) | | 300 | 304 |
| 6% 9/1/54 (i) | | 150 | 152 |
| 6% 9/1/54 (i) | | 4,750 | 4,819 |
| 6% 9/1/54 (i) | | 2,875 | 2,917 |
| 6% 9/1/54 (i) | | 2,125 | 2,156 |
| 6% 10/1/54 (i) | | 5,800 | 5,882 |
| 6.5% 3/20/31 to 8/15/36 | | 6 | 6 |
TOTAL GINNIE MAE | | | 129,246 |
| Uniform Mortgage Backed Securities - 4.7% | | | |
| 2% 9/1/54 (i) | | 26,100 | 21,347 |
| 2% 9/1/54 (i) | | 3,750 | 3,067 |
| 2% 9/1/54 (i) | | 3,800 | 3,108 |
| 2% 9/1/54 (i) | | 3,750 | 3,067 |
| 2% 9/1/54 (i) | | 7,675 | 6,277 |
| 2% 9/1/54 (i) | | 7,550 | 6,175 |
| 2% 9/1/54 (i) | | 26,100 | 21,347 |
| 2% 9/1/54 (i) | | 11,425 | 9,344 |
| 2% 9/1/54 (i) | | 1,750 | 1,431 |
| 2.5% 9/1/54 (i) | | 1,350 | 1,151 |
| 2.5% 9/1/54 (i) | | 1,300 | 1,108 |
| 2.5% 9/1/54 (i) | | 1,300 | 1,108 |
| 2.5% 9/1/54 (i) | | 14,200 | 12,105 |
| 2.5% 9/1/54 (i) | | 3,450 | 2,941 |
| 2.5% 10/1/54 (i) | | 3,700 | 3,158 |
| 3.5% 9/1/54 (i) | | 1,250 | 1,151 |
| 5.5% 9/1/54 (i) | | 9,450 | 9,515 |
| 6% 9/1/54 (i) | | 2,000 | 2,037 |
| 6.5% 9/1/54 (i) | | 25 | 26 |
TOTAL UNIFORM MORTGAGE BACKED SECURITIES | | | 109,463 |
| TOTAL U.S. GOVERNMENT AGENCY - MORTGAGE SECURITIES (Cost $822,474) | | | 810,860 |
| | | | |
| Collateralized Mortgage Obligations - 12.7% |
| | | Principal Amount (a) (000s) | Value ($) (000s) |
| Private Sponsor - 0.1% | | | |
| Fannie Mae Series 2022-66, Class KA, 5% 10/25/52 | | 2,395 | 2,388 |
| U.S. Government Agency - 12.6% | | | |
| Fannie Mae: | | | |
| floater: | | | |
Series 2001-38 Class QF, U.S. 30-Day Avg. Secured Overnight Fin. Rate (SOFR) Index + 1.090% 6.4433% 8/25/31 (c)(d) | | 19 | 20 |
Series 2002-18 Class FD, U.S. 30-Day Avg. Secured Overnight Fin. Rate (SOFR) Index + 0.910% 6.2633% 2/25/32 (c)(d) | | 0 | 0 |
Series 2002-39 Class FD, U.S. 30-Day Avg. Secured Overnight Fin. Rate (SOFR) Index + 1.110% 6.4677% 3/18/32 (c)(d) | | 1 | 1 |
Series 2002-49 Class FB, U.S. 30-Day Avg. Secured Overnight Fin. Rate (SOFR) Index + 0.710% 6.0677% 11/18/31 (c)(d) | | 15 | 15 |
Series 2002-60 Class FV, U.S. 30-Day Avg. Secured Overnight Fin. Rate (SOFR) Index + 1.110% 6.4633% 4/25/32 (c)(d) | | 8 | 8 |
Series 2002-63 Class FN, U.S. 30-Day Avg. Secured Overnight Fin. Rate (SOFR) Index + 1.110% 6.4633% 10/25/32 (c)(d) | | 1 | 1 |
Series 2002-7 Class FC, U.S. 30-Day Avg. Secured Overnight Fin. Rate (SOFR) Index + 0.860% 6.2133% 1/25/32 (c)(d) | | 0 | 0 |
Series 2002-74 Class FV, U.S. 30-Day Avg. Secured Overnight Fin. Rate (SOFR) Index + 0.560% 5.9133% 11/25/32 (c)(d) | | 9 | 9 |
Series 2002-75 Class FA, U.S. 30-Day Avg. Secured Overnight Fin. Rate (SOFR) Index + 1.110% 6.4633% 11/25/32 (c)(d) | | 14 | 14 |
Series 2003-118 Class S, 7.980% - U.S. 30-Day Avg. Secured Overnight Fin. Rate (SOFR) Index 2.6367% 12/25/33 (c)(j)(k) | | 16 | 2 |
Series 2006-104 Class GI, 6.560% - U.S. 30-Day Avg. Secured Overnight Fin. Rate (SOFR) Index 1.2167% 11/25/36 (c)(j)(k) | | 11 | 1 |
Series 2010-15 Class FJ, U.S. 30-Day Avg. Secured Overnight Fin. Rate (SOFR) Index + 1.040% 6.3933% 6/25/36 (c)(d) | | 1,352 | 1,362 |
| planned amortization class: | | | |
Series 1999-17 Class PG, 6% 4/25/29 | | 3 | 3 |
Series 1999-32 Class PL, 6% 7/25/29 | | 5 | 5 |
Series 1999-33 Class PK, 6% 7/25/29 | | 3 | 3 |
Series 2001-52 Class YZ, 6.5% 10/25/31 | | 1 | 1 |
Series 2003-70 Class BJ, 5% 7/25/33 | | 26 | 26 |
Series 2005-102 Class CO 11/25/35 (l) | | 3 | 2 |
Series 2005-68 Class CZ, 5.5% 8/25/35 | | 1,250 | 1,282 |
Series 2005-73 Class SA, 17.500% x U.S. 30-Day Avg. Secured Overnight Fin. Rate (SOFR) Index 3.3454% 8/25/35 (c)(d)(k) | | 0 | 0 |
Series 2005-81 Class PC, 5.5% 9/25/35 | | 9 | 9 |
Series 2006-12 Class BO 10/25/35 (l) | | 10 | 9 |
Series 2006-15 Class OP 3/25/36 (l) | | 15 | 13 |
Series 2006-37 Class OW 5/25/36 (l) | | 2 | 1 |
Series 2006-45 Class OP 6/25/36 (l) | | 147 | 122 |
Series 2006-62 Class KP 4/25/36 (l) | | 7 | 6 |
Series 2010-118 Class PB, 4.5% 10/25/40 | | 1,422 | 1,431 |
Series 2012-149: | | | |
Class DA, 1.75% 1/25/43 | | 242 | 225 |
Class GA, 1.75% 6/25/42 | | 291 | 270 |
Series 2012-93 Class QW, 5% 1/25/42 | | 57 | 57 |
Series 2017-1 Class JP, 3.5% 4/25/45 | | 395 | 385 |
Series 2017-22 Class JN, 4.5% 4/25/46 | | 900 | 893 |
Series 2019-52 Class M, 3.5% 3/25/49 | | 130 | 126 |
Series 2019-64 Class MJ, 4.5% 6/25/49 | | 1,719 | 1,683 |
Series 2019-74 Class LB, 3% 10/25/49 | | 749 | 687 |
Series 2021-26 Class HC, 1% 11/25/49 | | 7,312 | 6,313 |
Series 2022-2 Class TH, 2.5% 2/25/52 | | 1,057 | 972 |
| sequential payer: | | | |
Series 1997-41 Class J, 7.5% 6/18/27 | | 1 | 1 |
Series 1999-25 Class Z, 6% 6/25/29 | | 4 | 4 |
Series 2001-20 Class Z, 6% 5/25/31 | | 4 | 4 |
Series 2001-31 Class ZC, 6.5% 7/25/31 | | 2 | 2 |
Series 2002-16 Class ZD, 6.5% 4/25/32 | | 2 | 2 |
Series 2002-74 Class SV, 7.430% - U.S. 30-Day Avg. Secured Overnight Fin. Rate (SOFR) Index 2.0867% 11/25/32 (c)(j)(k) | | 2 | 0 |
Series 2004-52 Class KZ, 5.5% 7/25/34 | | 120 | 121 |
Series 2004-91 Class Z, 5% 12/25/34 | | 1,193 | 1,194 |
Series 2005-117 Class JN, 4.5% 1/25/36 | | 56 | 55 |
Series 2005-14 Class ZB, 5% 3/25/35 | | 368 | 368 |
Series 2006-72 Class CY, 6% 8/25/26 | | 145 | 145 |
Series 2009-59 Class HB, 5% 8/25/39 | | 571 | 575 |
Series 2012-67 Class AI, 4.5% 7/25/27 (j) | | 1 | 0 |
Series 2017-89 Class KV, 3.5% 8/25/47 | | 1,859 | 1,831 |
Series 2020-49 Class JA, 2% 8/25/44 | | 963 | 895 |
Series 2020-51 Class BA, 2% 6/25/46 | | 3,135 | 2,773 |
Series 2020-67 Class KZ, 3.25% 9/25/40 | | 10,368 | 9,682 |
Series 2021-85 Class L, 2.5% 8/25/48 | | 1,106 | 986 |
Series 2021-96 Class HA, 2.5% 2/25/50 | | 1,781 | 1,585 |
Series 2022-1 Class KA, 3% 5/25/48 | | 1,778 | 1,653 |
Series 2022-3: | | | |
Class G, 2% 11/25/47 | | 46,291 | 41,089 |
Class N, 2% 10/25/47 | | 14,233 | 12,744 |
Series 2022-4 Class B, 2.5% 5/25/49 | | 1,295 | 1,157 |
Series 2022-49 Class TE, 4.5% 12/25/48 | | 13,189 | 12,967 |
Series 2022-5: | | | |
Class 0, 2.5% 6/25/48 | | 1,856 | 1,685 |
Class BA, 2.5% 12/25/49 | | 1,526 | 1,335 |
Series 2022-65 Class GA, 5% 4/25/46 | | 13,432 | 13,282 |
Series 2022-7 Class A, 3% 5/25/48 | | 2,532 | 2,354 |
| Series 06-116 Class SG, 6.520% - U.S. 30-Day Avg. Secured Overnight Fin. Rate (SOFR) Index 1.1767% 12/25/36 (c)(j)(k) | | 8 | 1 |
| Series 07-40 Class SE, 6.320% - U.S. 30-Day Avg. Secured Overnight Fin. Rate (SOFR) Index 0.9767% 5/25/37 (c)(j)(k) | | 4 | 0 |
| Series 2003-21 Class SK, 7.980% - U.S. 30-Day Avg. Secured Overnight Fin. Rate (SOFR) Index 2.6367% 3/25/33 (c)(j)(k) | | 1 | 0 |
| Series 2005-72 Class ZC, 5.5% 8/25/35 | | 62 | 63 |
| Series 2005-79 Class ZC, 5.9% 9/25/35 | | 37 | 38 |
| Series 2007-57 Class SA, 40.600% x U.S. 30-Day Avg. Secured Overnight Fin. Rate (SOFR) Index 7.8401% 6/25/37 (c)(d)(k) | | 3 | 4 |
| Series 2007-66: | | | |
Class SA, 38.910% x U.S. 30-Day Avg. Secured Overnight Fin. Rate (SOFR) Index 6.8201% 7/25/37 (c)(d)(k) | | 5 | 6 |
Class SB, 38.910% x U.S. 30-Day Avg. Secured Overnight Fin. Rate (SOFR) Index 6.8201% 7/25/37 (c)(d)(k) | | 1 | 1 |
| Series 2010-135 Class ZA, 4.5% 12/25/40 | | 16 | 17 |
| Series 2010-150 Class ZC, 4.75% 1/25/41 | | 148 | 148 |
| Series 2010-39 Class FG, U.S. 30-Day Avg. Secured Overnight Fin. Rate (SOFR) Index + 1.030% 6.3833% 3/25/36 (c)(d) | | 938 | 945 |
| Series 2010-95 Class ZC, 5% 9/25/40 | | 307 | 311 |
| Series 2011-39 Class ZA, 6% 11/25/32 | | 18 | 19 |
| Series 2011-4 Class PZ, 5% 2/25/41 | | 50 | 49 |
| Series 2011-67 Class AI, 4% 7/25/26 (j) | | 4 | 0 |
| Series 2012-100 Class WI, 3% 9/25/27 (j) | | 36 | 1 |
| Series 2012-27 Class EZ, 4.25% 3/25/42 | | 2,430 | 2,351 |
| Series 2012-9 Class SH, 6.430% - U.S. 30-Day Avg. Secured Overnight Fin. Rate (SOFR) Index 1.0867% 6/25/41 (c)(j)(k) | | 2 | 0 |
| Series 2013-133 Class IB, 3% 4/25/32 (j) | | 9 | 0 |
| Series 2013-134 Class SA, 5.930% - U.S. 30-Day Avg. Secured Overnight Fin. Rate (SOFR) Index 0.5867% 1/25/44 (c)(j)(k) | | 19 | 2 |
| Series 2013-51 Class GI, 3% 10/25/32 (j) | | 17 | 1 |
| Series 2013-N1 Class A, 6.600% - U.S. 30-Day Avg. Secured Overnight Fin. Rate (SOFR) Index 1.2567% 6/25/35 (c)(j)(k) | | 20 | 2 |
| Series 2015-42 Class IL, 6% 6/25/45 (j) | | 104 | 17 |
| Series 2015-70 Class JC, 3% 10/25/45 | | 119 | 114 |
| Series 2016-26 Class CG, 3% 5/25/46 | | 3,930 | 3,760 |
| Series 2017-30 Class AI, 5.5% 5/25/47 (j) | | 58 | 9 |
| Series 2018-45 Class GI, 4% 6/25/48 (j) | | 745 | 156 |
| Series 2020-45 Class JL, 3% 7/25/40 | | 638 | 586 |
| Series 2021-59 Class H, 2% 6/25/48 | | 1,162 | 966 |
| Series 2021-66: | | | |
Class DA, 2% 1/25/48 | | 1,246 | 1,041 |
Class DM, 2% 1/25/48 | | 1,324 | 1,106 |
| Fannie Mae Stripped Mortgage-Backed Securities: | | | |
| Series 339 Class 5, 5.5% 7/25/33 (j) | | 4 | 1 |
| Series 343 Class 16, 5.5% 5/25/34 (j) | | 4 | 1 |
| Series 348 Class 14, 6.5% 8/25/34 (c)(j) | | 2 | 0 |
| Series 351: | | | |
Class 12, 5.5% 4/25/34 (c)(j) | | 2 | 0 |
Class 13, 6% 3/25/34 (j) | | 2 | 0 |
| Series 359 Class 19, 6% 7/25/35 (c)(j) | | 1 | 0 |
| Series 384 Class 6, 5% 7/25/37 (j) | | 15 | 2 |
| Freddie Mac: | | | |
| floater: | | | |
Series 2412 Class FK, U.S. 30-Day Avg. Secured Overnight Fin. Rate (SOFR) Index + 0.910% 6.268% 1/15/32 (c)(d) | | 0 | 0 |
Series 2423 Class FA, U.S. 30-Day Avg. Secured Overnight Fin. Rate (SOFR) Index + 1.010% 6.368% 3/15/32 (c)(d) | | 0 | 0 |
Series 2424 Class FM, U.S. 30-Day Avg. Secured Overnight Fin. Rate (SOFR) Index + 1.110% 6.468% 3/15/32 (c)(d) | | 0 | 0 |
Series 2432: | | | |
Class FE, U.S. 30-Day Avg. Secured Overnight Fin. Rate (SOFR) Index + 1.010% 6.368% 6/15/31 (c)(d) | | 1 | 1 |
Class FG, U.S. 30-Day Avg. Secured Overnight Fin. Rate (SOFR) Index + 1.010% 6.368% 3/15/32 (c)(d) | | 0 | 0 |
Series 2526 Class FC, U.S. 30-Day Avg. Secured Overnight Fin. Rate (SOFR) Index + 0.510% 5.868% 11/15/32 (c)(d) | | 5 | 5 |
Series 2530 Class FE, U.S. 30-Day Avg. Secured Overnight Fin. Rate (SOFR) Index + 0.710% 6.068% 2/15/32 (c)(d) | | 9 | 9 |
Series 2682 Class FB, U.S. 30-Day Avg. Secured Overnight Fin. Rate (SOFR) Index + 1.010% 6.368% 10/15/33 (c)(d) | | 483 | 486 |
Series 2711 Class FC, U.S. 30-Day Avg. Secured Overnight Fin. Rate (SOFR) Index + 1.010% 6.368% 2/15/33 (c)(d) | | 341 | 343 |
| floater planned amortization class Series 2770 Class FH, U.S. 30-Day Avg. Secured Overnight Fin. Rate (SOFR) Index + 0.510% 5.868% 3/15/34 (c)(d) | | 119 | 118 |
| planned amortization class: | | | |
Series 2021-5122 Class TE, 1.5% 6/25/51 | | 4,029 | 3,385 |
Series 2022-5213 Class JM, 3.5% 9/25/51 | | 6,095 | 5,878 |
Series 2022-5214 Class CG, 3.5% 4/25/52 | | 2,027 | 1,936 |
Series 2022-5220 Class PK, 3.5% 1/25/51 | | 2,751 | 2,612 |
Series 2022-5224 Class DQ, 3.75% 8/25/44 | | 3,421 | 3,300 |
Series 2095 Class PE, 6% 11/15/28 | | 4 | 4 |
Series 2101 Class PD, 6% 11/15/28 | | 2 | 2 |
Series 2121 Class MG, 6% 2/15/29 | | 2 | 2 |
Series 2131 Class BG, 6% 3/15/29 | | 13 | 13 |
Series 2137 Class PG, 6% 3/15/29 | | 2 | 2 |
Series 2154 Class PT, 6% 5/15/29 | | 3 | 3 |
Series 2162 Class PH, 6% 6/15/29 | | 1 | 1 |
Series 2520 Class BE, 6% 11/15/32 | | 8 | 8 |
Series 2682 Class LD, 4.5% 10/15/33 | | 110 | 110 |
Series 2693 Class MD, 5.5% 10/15/33 | | 17 | 17 |
Series 2802 Class OB, 6% 5/15/34 | | 12 | 13 |
Series 2996 Class MK, 5.5% 6/15/35 | | 4 | 4 |
Series 3002 Class NE, 5% 7/15/35 | | 18 | 18 |
Series 3110 Class OP 9/15/35 (l) | | 2 | 2 |
Series 3119 Class PO 2/15/36 (l) | | 18 | 15 |
Series 3121 Class KO 3/15/36 (l) | | 3 | 3 |
Series 3123 Class LO 3/15/36 (l) | | 10 | 8 |
Series 3145 Class GO 4/15/36 (l) | | 11 | 9 |
Series 3189 Class PD, 6% 7/15/36 | | 16 | 17 |
Series 3225 Class EO 10/15/36 (l) | | 5 | 4 |
Series 3258 Class PM, 5.5% 12/15/36 | | 6 | 6 |
Series 3415 Class PC, 5% 12/15/37 | | 159 | 160 |
Series 3832 Class PE, 5% 3/15/41 | | 73 | 74 |
Series 3857 Class ZP, 5% 5/15/41 | | 3,953 | 4,035 |
Series 4135 Class AB, 1.75% 6/15/42 | | 224 | 209 |
| sequential payer: | | | |
Series 1929 Class EZ, 7.5% 2/17/27 | | 1 | 1 |
Series 2004-2802 Class ZG, 5.5% 5/15/34 | | 1,499 | 1,540 |
Series 2020-5018: | | | |
Class LC, 3% 10/25/40 | | 4,301 | 3,963 |
Class LT, 3.25% 10/25/40 | | 10,642 | 10,023 |
Class LY, 3% 10/25/40 | | 3,268 | 3,010 |
Series 2021-5137 Class TA, 2% 3/25/39 | | 10,239 | 9,254 |
Series 2021-5175 Class CB, 2.5% 4/25/50 | | 6,440 | 5,719 |
Series 2021-5180 Class KA, 2.5% 10/25/47 | | 1,285 | 1,170 |
Series 2022-5189 Class DA, 2.5% 5/25/49 | | 1,384 | 1,234 |
Series 2022-5190 Class BA, 2.5% 11/25/47 | | 1,316 | 1,196 |
Series 2022-5191 Class CA, 2.5% 4/25/50 | | 1,509 | 1,331 |
Series 2022-5197 Class DA, 2.5% 11/25/47 | | 999 | 909 |
Series 2022-5198 Class BA, 2.5% 11/25/47 | | 4,817 | 4,405 |
Series 2022-5200 Class LA, 3% 10/25/48 | | 2,363 | 2,195 |
Series 2022-5202 Class LB, 2.5% 10/25/47 | | 1,070 | 975 |
Series 2135 Class JE, 6% 3/15/29 | | 1 | 1 |
Series 2145 Class MZ, 6.5% 4/15/29 | | 14 | 14 |
Series 2274 Class ZM, 6.5% 1/15/31 | | 1 | 1 |
Series 2281 Class ZB, 6% 3/15/30 | | 2 | 2 |
Series 2303 Class ZV, 6% 4/15/31 | | 7 | 7 |
Series 2357 Class ZB, 6.5% 9/15/31 | | 24 | 24 |
Series 2502 Class ZC, 6% 9/15/32 | | 3 | 3 |
Series 2519 Class ZD, 5.5% 11/15/32 | | 4 | 4 |
Series 2587 Class AD, 4.71% 3/15/33 | | 349 | 350 |
Series 2877 Class ZD, 5% 10/15/34 | | 1,476 | 1,479 |
Series 2998 Class LY, 5.5% 7/15/25 | | 1 | 1 |
Series 3007 Class EW, 5.5% 7/15/25 | | 66 | 66 |
Series 3889 Class DZ, 4% 1/15/41 | | 10,994 | 10,684 |
| Series 06-3115 Class SM, 6.480% - U.S. 30-Day Avg. Secured Overnight Fin. Rate (SOFR) Index 1.132% 2/15/36 (c)(j)(k) | | 5 | 1 |
| Series 2013-4281 Class AI, 4% 12/15/28 (j) | | 0 | 0 |
| Series 2017-4683 Class LM, 3% 5/15/47 | | 149 | 143 |
| Series 2020-5041 Class LB, 3% 11/25/40 | | 7,320 | 6,750 |
| Series 2021-5083 Class VA, 1% 8/15/38 | | 11,716 | 11,070 |
| Series 2021-5182 Class A, 2.5% 10/25/48 | | 8,454 | 7,542 |
| Series 2022-5236 Class P, 5% 4/25/48 | | 2,065 | 2,077 |
| Series 2022-5266 Class CD, 4.5% 10/25/44 | | 1,417 | 1,410 |
| Series 2933 Class ZM, 5.75% 2/15/35 | | 81 | 84 |
| Series 2947 Class XZ, 6% 3/15/35 | | 33 | 34 |
| Series 2996 Class ZD, 5.5% 6/15/35 | | 54 | 55 |
| Series 3237 Class C, 5.5% 11/15/36 | | 72 | 74 |
| Series 3244 Class SG, 6.540% - U.S. 30-Day Avg. Secured Overnight Fin. Rate (SOFR) Index 1.192% 11/15/36 (c)(j)(k) | | 23 | 2 |
| Series 3336 Class LI, 6.460% - U.S. 30-Day Avg. Secured Overnight Fin. Rate (SOFR) Index 1.112% 6/15/37 (c)(j)(k) | | 15 | 2 |
| Series 3843 Class PZ, 5% 4/15/41 | | 2,434 | 2,471 |
| Series 3949 Class MK, 4.5% 10/15/34 | | 12 | 12 |
| Series 4055 Class BI, 3.5% 5/15/31 (j) | | 3 | 0 |
| Series 4314 Class AI, 5% 3/15/34 (j) | | 1 | 0 |
| Series 4427 Class LI, 3.5% 2/15/34 (j) | | 48 | 2 |
| Series 4471 Class PA 4% 12/15/40 | | 41 | 41 |
| target amortization class: | | | |
Series 2007-3366 Class FD, U.S. 30-Day Avg. Secured Overnight Fin. Rate (SOFR) Index + 0.360% 5.718% 5/15/37 (c)(d) | | 19 | 18 |
Series 2156 Class TC, 6.25% 5/15/29 | | 1 | 1 |
| Freddie Mac Manufactured Housing participation certificates guaranteed sequential payer: | | | |
| Series 2043 Class ZH, 6% 4/15/28 | | 1 | 1 |
| Series 2056 Class Z, 6% 5/15/28 | | 3 | 4 |
| Freddie Mac Multi-family Structured pass-thru certificates: | | | |
| sequential payer: | | | |
Series 2021-5159 Class GC, 2% 11/25/47 | | 1,029 | 917 |
Series 4341 Class ML, 3.5% 11/15/31 | | 1,715 | 1,668 |
| Series 4386 Class AZ, 4.5% 11/15/40 | | 176 | 173 |
| Ginnie Mae guaranteed REMIC pass-thru certificates: | | | |
| floater: | | | |
Series 2007-37 Class TS, 6.570% - CME Term SOFR 1 Month Index 1.2369% 6/16/37 (c)(j)(k) | | 10 | 1 |
Series 2007-59 Class FC, CME Term SOFR 1 Month Index + 0.610% 5.9502% 7/20/37 (c)(d) | | 74 | 74 |
Series 2008-2 Class FD, CME Term SOFR 1 Month Index + 0.590% 5.9302% 1/20/38 (c)(d) | | 73 | 73 |
Series 2008-73 Class FA, CME Term SOFR 1 Month Index + 0.970% 6.3102% 8/20/38 (c)(d) | | 516 | 520 |
Series 2008-83 Class FB, CME Term SOFR 1 Month Index + 1.010% 6.3502% 9/20/38 (c)(d) | | 370 | 373 |
Series 2009-108 Class CF, CME Term SOFR 1 Month Index + 0.710% 6.0531% 11/16/39 (c)(d) | | 375 | 374 |
Series 2009-116 Class KF, CME Term SOFR 1 Month Index + 0.640% 5.9831% 12/16/39 (c)(d) | | 60 | 59 |
Series 2010-H03 Class FA, CME Term SOFR 1 Month Index + 0.660% 6.0116% 3/20/60 (c)(d)(h) | | 51 | 51 |
Series 2010-H17 Class FA, CME Term SOFR 1 Month Index + 0.440% 5.7916% 7/20/60 (c)(d)(h) | | 593 | 591 |
Series 2010-H18 Class AF, CME Term SOFR 1 Month Index + 0.410% 5.7464% 9/20/60 (c)(d)(h) | | 506 | 503 |
Series 2010-H19 Class FG, CME Term SOFR 1 Month Index + 0.410% 5.7464% 8/20/60 (c)(d)(h) | | 472 | 469 |
Series 2010-H27 Class FA, CME Term SOFR 1 Month Index + 0.380% 5.8264% 12/20/60 (c)(d)(h) | | 251 | 250 |
Series 2011-H05 Class FA, CME Term SOFR 1 Month Index + 0.610% 5.9464% 12/20/60 (c)(d)(h) | | 188 | 187 |
Series 2011-H07 Class FA, CME Term SOFR 1 Month Index + 0.610% 5.9464% 2/20/61 (c)(d)(h) | | 190 | 190 |
Series 2011-H12 Class FA, CME Term SOFR 1 Month Index + 0.600% 5.9364% 2/20/61 (c)(d)(h) | | 219 | 219 |
Series 2011-H13 Class FA, CME Term SOFR 1 Month Index + 0.610% 5.9464% 4/20/61 (c)(d)(h) | | 207 | 207 |
Series 2011-H14: | | | |
Class FB, CME Term SOFR 1 Month Index + 0.610% 5.9464% 5/20/61 (c)(d)(h) | | 197 | 196 |
Class FC, CME Term SOFR 1 Month Index + 0.610% 5.9464% 5/20/61 (c)(d)(h) | | 214 | 214 |
Series 2011-H17 Class FA, CME Term SOFR 1 Month Index + 0.640% 5.9764% 6/20/61 (c)(d)(h) | | 231 | 230 |
Series 2011-H20 Class FA, CME Term SOFR 1 Month Index + 0.660% 5.9964% 9/20/61 (c)(d)(h) | | 1,062 | 1,061 |
Series 2011-H21 Class FA, CME Term SOFR 1 Month Index + 0.710% 6.0464% 10/20/61 (c)(d)(h) | | 684 | 684 |
Series 2012-98 Class FA, CME Term SOFR 1 Month Index + 0.510% 5.8502% 8/20/42 (c)(d) | | 80 | 79 |
Series 2012-H01 Class FA, CME Term SOFR 1 Month Index + 0.810% 6.1464% 11/20/61 (c)(d)(h) | | 832 | 833 |
Series 2012-H03 Class FA, CME Term SOFR 1 Month Index + 0.810% 6.1464% 1/20/62 (c)(d)(h) | | 385 | 385 |
Series 2012-H06 Class FA, CME Term SOFR 1 Month Index + 0.740% 6.0764% 1/20/62 (c)(d)(h) | | 768 | 767 |
Series 2012-H07 Class FA, CME Term SOFR 1 Month Index + 0.740% 6.0764% 3/20/62 (c)(d)(h) | | 385 | 384 |
Series 2012-H21 Class DF, CME Term SOFR 1 Month Index + 0.760% 6.0964% 5/20/61 (c)(d)(h) | | 18 | 18 |
Series 2013-H19 Class FC, CME Term SOFR 1 Month Index + 0.600% 6.0464% 8/20/63 (c)(d)(h) | | 50 | 50 |
Series 2014-H02 Class FB, CME Term SOFR 1 Month Index + 0.650% 6.0964% 12/20/63 (c)(d)(h) | | 1,831 | 1,831 |
Series 2014-H03 Class FA, CME Term SOFR 1 Month Index + 0.710% 6.0464% 1/20/64 (c)(d)(h) | | 820 | 819 |
Series 2014-H05 Class FB, CME Term SOFR 1 Month Index + 0.710% 6.0464% 12/20/63 (c)(d)(h) | | 25 | 24 |
Series 2014-H11 Class BA, CME Term SOFR 1 Month Index + 0.610% 5.9464% 6/20/64 (c)(d)(h) | | 56 | 56 |
Series 2015-H13 Class FL, CME Term SOFR 1 Month Index + 0.390% 5.7264% 5/20/63 (c)(d)(h) | | 26 | 26 |
Series 2015-H19 Class FA, CME Term SOFR 1 Month Index + 0.310% 5.6464% 4/20/63 (c)(d)(h) | | 25 | 25 |
Series 2016-H20 Class FM, CME Term SOFR 1 Month Index + 0.510% 5.8464% 12/20/62 (c)(d)(h) | | 37 | 36 |
| planned amortization class: | | | |
Series 2010-31 Class BP, 5% 3/20/40 | | 3,673 | 3,761 |
Series 2011-136 Class WI, 4.5% 5/20/40 (j) | | 23 | 1 |
Series 2011-68 Class EC, 3.5% 4/20/41 | | 38 | 37 |
Series 2016-69 Class WA, 3% 2/20/46 | | 85 | 80 |
Series 2017-134 Class BA, 2.5% 11/20/46 | | 319 | 294 |
Series 2017-153 Class GA, 3% 9/20/47 | | 229 | 211 |
Series 2017-182 Class KA, 3% 10/20/47 | | 182 | 169 |
Series 2018-13 Class Q, 3% 4/20/47 | | 218 | 206 |
| sequential payer: | | | |
Series 2004-24 Class ZM, 5% 4/20/34 | | 27 | 26 |
Series 2010-160 Class DY, 4% 12/20/40 | | 218 | 214 |
Series 2010-170 Class B, 4% 12/20/40 | | 48 | 47 |
Series 2011-69 Class GX, 4.5% 5/16/40 | | 1,435 | 1,426 |
Series 2014-H04 Class HA, 2.75% 2/20/64 (h) | | 266 | 263 |
Series 2017-139 Class BA, 3% 9/20/47 | | 3,210 | 2,931 |
Series 2018-H12 Class HA, 3.25% 8/20/68 (h) | | 754 | 729 |
| Series 2004-22 Class M1, 5.5% 4/20/34 | | 857 | 902 |
| Series 2004-32 Class GS, 6.380% - CME Term SOFR 1 Month Index 1.0469% 5/16/34 (c)(j)(k) | | 5 | 0 |
| Series 2004-73 Class AL, 7.080% - CME Term SOFR 1 Month Index 1.7469% 8/17/34 (c)(j)(k) | | 5 | 0 |
| Series 2010-116 Class QB, 4% 9/16/40 | | 16 | 15 |
| Series 2010-169 Class Z, 4.5% 12/20/40 | | 4,258 | 4,005 |
| Series 2010-H10 Class FA, CME Term SOFR 1 Month Index + 0.440% 5.7916% 5/20/60 (c)(d)(h) | | 34 | 34 |
| Series 2010-H16 Class BA, 3.55% 7/20/60 (h) | | 45 | 43 |
| Series 2011-94 Class SA, 5.980% - CME Term SOFR 1 Month Index 0.6498% 7/20/41 (c)(j)(k) | | 20 | 2 |
| Series 2013-149 Class MA, 2.5% 5/20/40 | | 118 | 115 |
| Series 2013-H01 Class FA, 1.65% 1/20/63 (h) | | 0 | 0 |
| Series 2013-H04 Class BA, 1.65% 2/20/63 (h) | | 0 | 0 |
| Series 2014-2 Class BA, 3% 1/20/44 | | 432 | 401 |
| Series 2014-21 Class HA, 3% 2/20/44 | | 161 | 151 |
| Series 2014-25 Class HC, 3% 2/20/44 | | 274 | 254 |
| Series 2014-5 Class A, 3% 1/20/44 | | 223 | 207 |
| Series 2015-H13 Class HA, 2.5% 8/20/64 (h) | | 1 | 1 |
| Series 2015-H30 Class HA, 1.75% 9/20/62 (c)(h) | | 129 | 125 |
| Series 2016-H13 Class FB, U.S. TREASURY 1 YEAR INDEX + 0.500% 5.6% 5/20/66 (c)(d)(h) | | 1,117 | 1,112 |
| Series 2017-186 Class HK, 3% 11/16/45 | | 235 | 219 |
| Series 2017-H06 Class FA, U.S. TREASURY 1 YEAR INDEX + 0.350% 5.45% 8/20/66 (c)(d)(h) | | 1,694 | 1,686 |
| Series 2090-118 Class XZ, 5% 12/20/39 | | 8,543 | 8,724 |
TOTAL U.S. GOVERNMENT AGENCY | | | 293,339 |
| TOTAL COLLATERALIZED MORTGAGE OBLIGATIONS (Cost $290,866) | | | 295,727 |
| | | | |
| Commercial Mortgage Securities - 10.6% |
| | | Principal Amount (a) (000s) | Value ($) (000s) |
| Freddie Mac: | | | |
| floater Series 2024-K523 Class A/S, U.S. 30-Day Avg. Secured Overnight Fin. Rate (SOFR) Index + 0.550% 5.9012% 4/25/29 (c)(d) | | 12,499 | 12,499 |
| sequential payer: | | | |
Series 2015-K043 Class A2, 3.062% 12/25/24 | | 10,346 | 10,265 |
Series 2015-K049 Class A2, 3.01% 7/25/25 | | 16,610 | 16,342 |
Series 2015-K050 Class A2, 3.334% 8/25/25 (c) | | 14,994 | 14,782 |
Series 2015-K051 Class A2, 3.308% 9/25/25 | | 12,483 | 12,295 |
Series 2015-KPLB Class A, 2.77% 5/25/25 | | 8,620 | 8,470 |
Series 2016-K052 Class A2, 3.151% 11/25/25 | | 16,081 | 15,805 |
Series 2016-K055 Class A2, 2.673% 3/25/26 | | 3,050 | 2,966 |
Series 2016-K060 Class A2, 3.3% 10/25/26 | | 2,000 | 1,960 |
Series 2017-K066 Class A2, 3.117% 6/25/27 | | 2,370 | 2,304 |
Series 2017-K729 Class A2, 3.136% 10/25/24 | | 4,952 | 4,925 |
Series 2018-K732 Class A2, 3.7% 5/25/25 | | 13,753 | 13,618 |
Series 2018-K733 Class A2, 3.75% 8/25/25 | | 17,212 | 17,019 |
Series 2019-K735 Class A2, 2.862% 5/25/26 | | 6,107 | 5,954 |
Series 2019-K736 Class A2, 2.282% 7/25/26 | | 7,700 | 7,432 |
Series 2022-K747 Class A2, 2.05% 11/25/28 | | 4,300 | 3,955 |
Series K058 Class A2, 2.653% 8/25/26 | | 11,075 | 10,729 |
Series K073 Class A2, 3.35% 1/25/28 | | 2,470 | 2,408 |
| Series 2016-K059 Class A2, 3.12% 9/25/26 (c) | | 2,200 | 2,150 |
| Series K047 Class A2, 3.329% 5/25/25 | | 2,478 | 2,448 |
| Series K053 Class A2, 2.995% 12/25/25 | | 18,820 | 18,449 |
| Series K056 Class A2, 2.525% 5/25/26 | | 29,400 | 28,509 |
| Series K063 Class A2, 3.43% 1/25/27 | | 1,700 | 1,669 |
| Series K734 Class A2, 3.208% 2/25/26 | | 7,400 | 7,267 |
| Freddie Mac Multi-family Structured pass-thru certificates Series K044 Class A2, 2.811% 1/25/25 | | 7,743 | 7,668 |
| FREMF 2015-KPLB Mortgage Trust Series 2015-KPLB Class B, 2.5% 5/25/25 (m) | | 15,200 | 14,853 |
| TOTAL COMMERCIAL MORTGAGE SECURITIES (Cost $245,723) | | | 246,741 |
| | | | |
| Money Market Funds - 5.7% |
| | | Shares | Value ($) (000s) |
| Fidelity Cash Central Fund 5.39% (n) | | 114,487,263 | 114,510 |
| Fidelity Securities Lending Cash Central Fund 5.39% (n)(o) | | 18,230,374 | 18,232 |
| TOTAL MONEY MARKET FUNDS (Cost $132,740) | | | 132,742 |
| | | | |
| Purchased Swaptions - 0.0% |
| | Expiration Date | Notional Amount (a) (000s) | Value ($) (000s) |
| Put Options - 0.0% | | | | |
| Option on an interest rate swap with Citibank N.A. to pay annually a fixed rate of 3.755% and receive annually a floating rate based on the U.S. Secured Overnight Fin. Rate (SOFR) Index, expiring March 2034. | 3/19/29 | | 7,700 | 260 |
| | | | | |
| Call Options - 0.0% | | | | |
| Option on an interest rate swap with Citibank N.A. to receive annually a fixed rate of 3.755% and pay annually a floating rate based on the U.S. Secured Overnight Fin. Rate (SOFR) Index, expiring March 2034. | 3/19/29 | | 7,700 | 347 |
| | | | | |
TOTAL PURCHASED SWAPTIONS (Cost $634) | | | | 607 |
| TOTAL INVESTMENT IN SECURITIES - 107.4% (Cost $2,553,333) | 2,497,604 |
NET OTHER ASSETS (LIABILITIES) - (7.4)% | (172,646) |
| NET ASSETS - 100.0% | 2,324,958 |
| | |
| TBA Sale Commitments |
| | Principal Amount (a) (000s) | Value ($) (000s) |
| Ginnie Mae | | |
| 5.5% 9/1/54 | (8,725) | (8,781) |
| 6% 9/1/54 | (5,800) | (5,884) |
| | | |
| TOTAL GINNIE MAE | | (14,665) |
| | | |
| Uniform Mortgage Backed Securities | | |
| 2% 9/1/54 | (45,075) | (36,866) |
| 2% 9/1/54 | (7,550) | (6,175) |
| 2% 9/1/54 | (26,100) | (21,347) |
| 2% 9/1/54 | (11,425) | (9,344) |
| 2% 9/1/54 | (1,750) | (1,431) |
| 2.5% 9/1/54 | (3,700) | (3,154) |
| 2.5% 9/1/54 | (21,650) | (18,456) |
| 2.5% 10/1/54 | (14,200) | (12,119) |
| 3% 9/1/54 | (21,300) | (18,885) |
| 3% 9/1/54 | (11,100) | (9,841) |
| 3% 9/1/54 | (22,000) | (19,505) |
| 3.5% 9/1/54 | (2,000) | (1,841) |
| 3.5% 9/1/54 | (22,700) | (20,894) |
| 4% 9/1/54 | (5,600) | (5,311) |
| 5% 9/1/54 | (42,475) | (42,165) |
| 5.5% 9/1/54 | (18,800) | (18,929) |
| 6% 9/1/54 | (10,350) | (10,540) |
| 6.5% 9/1/54 | (17,700) | (18,225) |
| | | |
| TOTAL UNIFORM MORTGAGE BACKED SECURITIES | | (275,028) |
| | | |
TOTAL TBA SALE COMMITMENTS (Proceeds $287,390) | | (289,693) |
| Futures Contracts |
| | Number of contracts | Expiration Date | Notional Amount ($) (000s) | Value ($) (000s) | Unrealized Appreciation/ (Depreciation) ($) (000s) |
| Purchased | | | | | |
| | | | | | |
| Treasury Contracts | | | | | |
| CBOT 10-Year U.S. Treasury Note Contracts (United States) | 2,039 | Dec 2024 | 231,554 | (1,742) | (1,742) |
| CBOT 2-Year U.S. Treasury Note Contracts (United States) | 1,822 | Dec 2024 | 378,150 | (457) | (457) |
| CBOT 5-Year U.S. Treasury Note Contracts (United States) | 428 | Dec 2024 | 46,823 | (201) | (201) |
| CBOT Long Term U.S. Treasury Bond Contracts (United States) | 72 | Dec 2024 | 8,865 | (176) | (176) |
| CBOT Ultra Long Term U.S. Treasury Bond Contracts (United States) | 57 | Dec 2024 | 7,520 | (188) | (188) |
| | | | | | |
| TOTAL FUTURES CONTRACTS | | | | | (2,764) |
| The notional amount of futures purchased as a percentage of Net Assets is 29.0% |
For the period, the average monthly notional amount at value for futures contracts in the aggregate was $608,455,000.
| Interest Rate Swaps |
| Payment Received | Payment Frequency | Payment Paid | Payment Frequency | Clearinghouse / Counterparty(1) | Maturity Date | Notional Amount (000s)(2) | Value ($) (000s) | Upfront Premium Received/ (Paid) ($) (000s)(3) | Unrealized Appreciation/ (Depreciation) ($) (000s) |
U.S. Secured Overnight Fin. Rate (SOFR) Index(4) | Annual | 3.75% | Annual | LCH | Sep 2026 | | 52,809 | (620) | 0 | (620) |
U.S. Secured Overnight Fin. Rate (SOFR) Index(4) | Annual | 3.5% | Annual | LCH | Sep 2027 | | 96,764 | (1,525) | 0 | (1,525) |
U.S. Secured Overnight Fin. Rate (SOFR) Index(4) | Annual | 3.5% | Annual | LCH | Sep 2029 | | 1,200 | (24) | 0 | (24) |
U.S. Secured Overnight Fin. Rate (SOFR) Index(4) | Annual | 3.5% | Annual | LCH | Sep 2031 | | 88,765 | (2,029) | 0 | (2,029) |
| 3.75% | Annual | U.S. Secured Overnight Fin. Rate (SOFR) Index(4) | Annual | LCH | Sep 2034 | | 24,652 | 649 | 0 | 649 |
U.S. Secured Overnight Fin. Rate (SOFR) Index(4) | Annual | 3.75% | Annual | LCH | Sep 2044 | | 12,735 | 69 | 0 | 69 |
| TOTAL INTEREST RATE SWAPS | | | | | | | | (3,480) | 0 | (3,480) |
| | | | | | | | | | | |
(1)Swaps with LCH Clearnet Group (LCH) are centrally cleared swaps.
(2)Notional amount is stated in U.S. Dollars unless otherwise noted.
(3)Any premiums for centrally cleared swaps are recorded periodically throughout the term of the swap to variation margin and included in unrealized appreciation (depreciation).
(4)Represents floating rate.
For the period, the average monthly notional amount at value for swaps in the aggregate was $315,528,000.
Any values shown as $0 in the Schedule of Investments may reflect amounts less than $500.
Legend
| (a) | Amount is stated in United States dollars unless otherwise noted. |
| (b) | Security or a portion of the security is on loan at period end. |
| (c) | Coupon rates for floating and adjustable rate securities reflect the rates in effect at period end. |
| (d) | Coupon is indexed to a floating interest rate which may be multiplied by a specified factor and/or subject to caps or floors. |
| (e) | Security or a portion of the security was pledged to cover margin requirements for centrally cleared swaps. At period end, the value of securities pledged amounted to $6,622,000. |
| (f) | Security or a portion of the security was pledged to cover margin requirements for futures contracts. At period end, the value of securities pledged amounted to $7,947,000. |
| (g) | Security or a portion of the security has been segregated as collateral for mortgage-backed or asset-backed securities purchased on a delayed delivery or when-issued basis. At period end, the value of securities pledged amounted to $1,925,000. |
| (h) | Represents an investment in an underlying pool of reverse mortgages which typically do not require regular principal and interest payments as repayment is deferred until a maturity event. |
| (i) | Security or a portion of the security purchased on a delayed delivery or when-issued basis. |
| (j) | Interest Only (IO) security represents the right to receive only monthly interest payments on an underlying pool of mortgages or assets. Principal shown is the outstanding par amount of the pool as of the end of the period. |
| (k) | Coupon is inversely indexed to a floating interest rate multiplied by a specified factor. The price may be considerably more volatile than the price of a comparable fixed rate security. |
| (l) | Principal Only Strips represent the right to receive the monthly principal payments on an underlying pool of mortgage loans. |
| (m) | Security exempt from registration under Rule 144A of the Securities Act of 1933. These securities may be resold in transactions exempt from registration, normally to qualified institutional buyers. At the end of the period, the value of these securities amounted to $14,853,000 or 0.6% of net assets. |
| (n) | Affiliated fund that is generally available only to investment companies and other accounts managed by Fidelity Investments. The rate quoted is the annualized seven-day yield of the fund at period end. A complete unaudited listing of the fund's holdings as of its most recent quarter end is available upon request. In addition, each Fidelity Central Fund's financial statements, which are not covered by the Fund's Report of Independent Registered Public Accounting Firm, are available on the SEC's website or upon request. |
| (o) | Investment made with cash collateral received from securities on loan. |
Affiliated Central Funds
Fiscal year to date information regarding the Fund's investments in Fidelity Central Funds, including the ownership percentage, is presented below.
| Affiliate (Amounts in thousands) | Value, beginning of period ($) | Purchases ($) | Sales Proceeds ($) | Dividend Income ($) | Realized Gain (loss) ($) | Change in Unrealized appreciation (depreciation) ($) | Value, end of period ($) | % ownership, end of period |
| Fidelity Cash Central Fund 5.39% | 83,962 | 1,293,244 | 1,262,697 | 2,581 | 1 | - | 114,510 | 0.3% |
| Fidelity Securities Lending Cash Central Fund 5.39% | - | 524,453 | 506,221 | 22 | - | - | 18,232 | 0.1% |
| Total | 83,962 | 1,817,697 | 1,768,918 | 2,603 | 1 | - | 132,742 | |
| | | | | | | | | |
Amounts in the dividend income column in the above table include any capital gain distributions from underlying funds, which are presented in the corresponding line item in the Statement of Operations, if applicable.
Amounts in the dividend income column for Fidelity Securities Lending Cash Central Fund represents the income earned on investing cash collateral, less rebates paid to borrowers and any lending agent fees associated with the loan, plus any premium payments received for lending certain types of securities.
Amounts included in the purchases and sales proceeds columns may include in-kind transactions, if applicable.
Investment Valuation
The following is a summary of the inputs used, as of August 31, 2024, involving the Fund's assets and liabilities carried at fair value. The inputs or methodology used for valuing securities may not be an indication of the risk associated with investing in those securities. For more information on valuation inputs, and their aggregation into the levels used below, please refer to the Investment Valuation section in the accompanying Notes to Financial Statements.
| Valuation Inputs at Reporting Date: |
Description (Amounts in thousands) | Total ($) | Level 1 ($) | Level 2 ($) | Level 3 ($) |
Investments in Securities: | | | | |
|
| U.S. Government and Government Agency Obligations | 1,010,927 | - | 1,010,927 | - |
|
| U.S. Government Agency - Mortgage Securities | 810,860 | - | 810,860 | - |
|
| Collateralized Mortgage Obligations | 295,727 | - | 295,727 | - |
|
| Commercial Mortgage Securities | 246,741 | - | 246,741 | - |
|
| Money Market Funds | 132,742 | 132,742 | - | - |
|
| Purchased Swaptions | 607 | - | 607 | - |
| Total Investments in Securities: | 2,497,604 | 132,742 | 2,364,862 | - |
Derivative Instruments: Assets | | | | |
Swaps | 718 | - | 718 | - |
| Total Assets | 718 | - | 718 | - |
| Liabilities | | | | |
Futures Contracts | (2,764) | (2,764) | - | - |
Swaps | (4,198) | - | (4,198) | - |
| Total Liabilities | (6,962) | (2,764) | (4,198) | - |
| Total Derivative Instruments: | (6,244) | (2,764) | (3,480) | - |
Other Financial Instruments: | | | | |
TBA Sale Commitments | (289,693) | - | (289,693) | - |
| Total Other Financial Instruments: | (289,693) | - | (289,693) | - |
Value of Derivative Instruments
The following table is a summary of the Fund's value of derivative instruments by primary risk exposure as of August 31, 2024. For additional information on derivative instruments, please refer to the Derivative Instruments section in the accompanying Notes to Financial Statements.
Primary Risk Exposure / Derivative Type | Value |
| (Amounts in thousands) | Asset ($) | Liability ($) |
| Interest Rate Risk | | |
Futures Contracts (a) | 0 | (2,764) |
Purchased Swaptions (b) | 607 | 0 |
Swaps (c) | 718 | (4,198) |
| Total Interest Rate Risk | 1,325 | (6,962) |
| Total Value of Derivatives | 1,325 | (6,962) |
(a)Reflects gross cumulative appreciation (depreciation) on futures contracts as presented in the Schedule of Investments. In the Statement of Assets and Liabilities, the period end daily variation margin is included in receivable or payable for daily variation margin on futures contracts, and the net cumulative appreciation (depreciation) is included in Total accumulated earnings (loss).
(b)Gross value is presented in the Statement of Assets and Liabilities in the Investments in Securities at value line-item.
(c)For centrally cleared swaps, reflects gross cumulative appreciation (depreciation) as presented in the Schedule of Investments. In the Statement of Assets and Liabilities, the period end daily variation margin for centrally cleared swaps is included in receivable or payable for daily variation margin on centrally cleared swaps, and the net cumulative appreciation (depreciation) for centrally cleared swaps is included in Total accumulated earnings (loss).
Financial Statements
| Statement of Assets and Liabilities |
As of August 31, 2024 Amounts in thousands (except per-share amounts) |
| Assets | | | | |
| Investment in securities, at value (including securities loaned of $17,767) - See accompanying schedule: | | | | |
Unaffiliated issuers (cost $2,420,593) | $ | 2,364,862 | | |
Fidelity Central Funds (cost $132,740) | | 132,742 | | |
| | | | | |
| | | | | |
| Total Investment in Securities (cost $2,553,333) | | | $ | 2,497,604 |
| Receivable for investments sold | | | | |
Regular delivery | | | | 42 |
Delayed delivery | | | | 28 |
| Receivable for TBA sale commitments | | | | 287,390 |
| Receivable for fund shares sold | | | | 1,126 |
| Interest receivable | | | | 9,870 |
| Distributions receivable from Fidelity Central Funds | | | | 416 |
| Receivable for daily variation margin on centrally cleared swaps | | | | 302 |
| Receivable from investment adviser for expense reductions | | | | 14 |
| Other receivables | | | | 4 |
Total assets | | | | 2,796,796 |
| Liabilities | | | | |
| Payable for investments purchased | | | | |
Regular delivery | $ | 7,220 | | |
Delayed delivery | | 152,967 | | |
| TBA sale commitments, at value | | 289,693 | | |
| Payable for fund shares redeemed | | 1,383 | | |
| Distributions payable | | 308 | | |
| Accrued management fee | | 547 | | |
| Distribution and service plan fees payable | | 49 | | |
| Payable for daily variation margin on futures contracts | | 1,115 | | |
| Other affiliated payables | | 324 | | |
| Collateral on securities loaned | | 18,232 | | |
| Total liabilities | | | | 471,838 |
| Net Assets | | | $ | 2,324,958 |
| Net Assets consist of: | | | | |
| Paid in capital | | | $ | 2,828,390 |
| Total accumulated earnings (loss) | | | | (503,432) |
| Net Assets | | | $ | 2,324,958 |
| | | | | |
| Net Asset Value and Maximum Offering Price | | | | |
| Class A : | | | | |
Net Asset Value and redemption price per share ($97,177 ÷ 10,397 shares)(a) | | | $ | 9.35 |
| Maximum offering price per share (100/96.00 of $9.35) | | | $ | 9.74 |
| Class M : | | | | |
Net Asset Value and redemption price per share ($73,033 ÷ 7,815 shares)(a) | | | $ | 9.35 |
| Maximum offering price per share (100/96.00 of $9.35) | | | $ | 9.74 |
| Class C : | | | | |
Net Asset Value and offering price per share ($15,725 ÷ 1,693 shares)(a) | | | $ | 9.29 |
| Government Income : | | | | |
Net Asset Value, offering price and redemption price per share ($1,474,666 ÷ 157,999 shares) | | | $ | 9.33 |
| Class I : | | | | |
Net Asset Value, offering price and redemption price per share ($174,237 ÷ 18,641 shares) | | | $ | 9.35 |
| Class Z : | | | | |
Net Asset Value, offering price and redemption price per share ($490,120 ÷ 52,406 shares) | | | $ | 9.35 |
(a)Redemption price per share is equal to net asset value less any applicable contingent deferred sales charge. |
| Statement of Operations |
| Year ended August 31, 2024 Amounts in thousands |
| Investment Income | | | | |
| Interest | | | $ | 106,789 |
| Income from Fidelity Central Funds (including $22 from security lending) | | | | 2,603 |
| Total income | | | | 109,392 |
| Expenses | | | | |
| Management fee | $ | 8,234 | | |
| Transfer agent fees | | 2,596 | | |
| Distribution and service plan fees | | 635 | | |
| Fund wide operations fee | | 1,703 | | |
| Independent trustees' fees and expenses | | 9 | | |
| Total expenses before reductions | | 13,177 | | |
| Expense reductions | | (400) | | |
| Total expenses after reductions | | | | 12,777 |
| Net Investment income (loss) | | | | 96,615 |
| Realized and Unrealized Gain (Loss) | | | | |
| Net realized gain (loss) on: | | | | |
| Investment Securities: | | | | |
| Unaffiliated issuers | | (168,081) | | |
| Fidelity Central Funds | | 1 | | |
| Futures contracts | | (377) | | |
| Swaps | | (1,638) | | |
| Total net realized gain (loss) | | | | (170,095) |
| Change in net unrealized appreciation (depreciation) on: | | | | |
| Investment Securities: | | | | |
| Unaffiliated issuers | | 245,878 | | |
| Futures contracts | | (4,135) | | |
| Swaps | | (3,069) | | |
| TBA Sale commitments | | (1,718) | | |
| Total change in net unrealized appreciation (depreciation) | | | | 236,956 |
| Net gain (loss) | | | | 66,861 |
| Net increase (decrease) in net assets resulting from operations | | | $ | 163,476 |
| Statement of Changes in Net Assets |
| |
| Amount in thousands | | Year ended August 31, 2024 | | Year ended August 31, 2023 |
| Increase (Decrease) in Net Assets | | | | |
| Operations | | | | |
| Net investment income (loss) | $ | 96,615 | $ | 83,700 |
| Net realized gain (loss) | | (170,095) | | (132,679) |
| Change in net unrealized appreciation (depreciation) | | 236,956 | | (44,414) |
| Net increase (decrease) in net assets resulting from operations | | 163,476 | | (93,393) |
| Distributions to shareholders | | (88,201) | | (79,823) |
| | | | | |
| Share transactions - net increase (decrease) | | (1,413,478) | | 240,581 |
| Total increase (decrease) in net assets | | (1,338,203) | | 67,365 |
| | | | | |
| Net Assets | | | | |
| Beginning of period | | 3,663,161 | | 3,595,796 |
| End of period | $ | 2,324,958 | $ | 3,663,161 |
| | | | | |
| | | | | |
Financial Highlights
Fidelity Advisor® Government Income Fund Class A |
| |
| Years ended August 31, | | 2024 | | 2023 | | 2022 | | 2021 | | 2020 |
Selected Per-Share Data | | | | | | | | | | |
| Net asset value, beginning of period | $ | 9.06 | $ | 9.51 | $ | 10.78 | $ | 11.17 | $ | 10.70 |
| Income from Investment Operations | | | | | | | | | | |
Net investment income (loss) A,B | | .277 | | .189 | | .076 | | .052 | | .117 |
| Net realized and unrealized gain (loss) | | .266 | | (.461) | | (1.269) | | (.255) | | .477 |
| Total from investment operations | | .543 | | (.272) | | (1.193) | | (.203) | | .594 |
| Distributions from net investment income | | (.253) | | (.178) | | (.077) | | (.046) | | (.124) |
| Distributions from net realized gain | | - | | - | | - | | (.141) | | - |
| Total distributions | | (.253) | | (.178) | | (.077) | | (.187) | | (.124) |
| Net asset value, end of period | $ | 9.35 | $ | 9.06 | $ | 9.51 | $ | 10.78 | $ | 11.17 |
Total Return C,D | | | | (2.87)% | | (11.11)% | | (1.84)% | | 5.59% |
Ratios to Average Net Assets B,E,F | | | | | | | | | | |
| Expenses before reductions | | .79% | | .79% | | .77% | | .76% | | .77% |
| Expenses net of fee waivers, if any | | | | .79% | | .77% | | .76% | | .77% |
| Expenses net of all reductions | | .79% | | .79% | | .77% | | .76% | | .77% |
| Net investment income (loss) | | 3.06% | | 2.05% | | .74% | | .48% | | 1.08% |
| Supplemental Data | | | | | | | | | | |
| Net assets, end of period (in millions) | $ | 97 | $ | 103 | $ | 119 | $ | 185 | $ | 215 |
Portfolio turnover rate G | | | | 354% | | 318% H | | 223% | | 255% H |
ACalculated based on average shares outstanding during the period.
BNet investment income (loss) is affected by the timing of the declaration of dividends by any underlying mutual funds or exchange-traded funds (ETFs). Net investment income (loss) of any mutual funds or ETFs is not included in the Fund's net investment income (loss) ratio.
CTotal returns would have been lower if certain expenses had not been reduced during the applicable periods shown.
DTotal returns do not include the effect of the sales charges.
EFees and expenses of any underlying mutual funds or exchange-traded funds (ETFs) are not included in the Fund's expense ratio. The Fund indirectly bears its proportionate share of these expenses. For additional expense information related to investments in Fidelity Central Funds, please refer to the "Investments in Fidelity Central Funds" note found in the Notes to Financial Statements section of the most recent Annual or Semi-Annual report.
FExpense ratios reflect operating expenses of the class. Expenses before reductions do not reflect amounts reimbursed, waived, or reduced through arrangements with the investment adviser, brokerage services, or other offset arrangements, if applicable, and do not represent the amount paid by the class during periods when reimbursements, waivers or reductions occur.
GAmount does not include the portfolio activity of any underlying mutual funds or exchange-traded funds (ETFs).
HPortfolio turnover rate excludes securities received or delivered in-kind.
Fidelity Advisor® Government Income Fund Class M |
| |
| Years ended August 31, | | 2024 | | 2023 | | 2022 | | 2021 | | 2020 |
Selected Per-Share Data | | | | | | | | | | |
| Net asset value, beginning of period | $ | 9.06 | $ | 9.51 | $ | 10.77 | $ | 11.17 | $ | 10.70 |
| Income from Investment Operations | | | | | | | | | | |
Net investment income (loss) A,B | | .280 | | .191 | | .077 | | .052 | | .118 |
| Net realized and unrealized gain (loss) | | .265 | | (.460) | | (1.259) | | (.265) | | .477 |
| Total from investment operations | | .545 | | (.269) | | (1.182) | | (.213) | | .595 |
| Distributions from net investment income | | (.255) | | (.181) | | (.078) | | (.046) | | (.125) |
| Distributions from net realized gain | | - | | - | | - | | (.141) | | - |
| Total distributions | | (.255) | | (.181) | | (.078) | | (.187) | | (.125) |
| Net asset value, end of period | $ | 9.35 | $ | 9.06 | $ | 9.51 | $ | 10.77 | $ | 11.17 |
Total Return C,D | | | | (2.85)% | | (11.01)% | | (1.92)% | | 5.61% |
Ratios to Average Net Assets B,E,F | | | | | | | | | | |
| Expenses before reductions | | .76% | | .76% | | .76% | | .75% | | .76% |
| Expenses net of fee waivers, if any | | | | .76% | | .76% | | .75% | | .76% |
| Expenses net of all reductions | | .76% | | .76% | | .76% | | .75% | | .76% |
| Net investment income (loss) | | 3.09% | | 2.07% | | .75% | | .48% | | 1.09% |
| Supplemental Data | | | | | | | | | | |
| Net assets, end of period (in millions) | $ | 73 | $ | 83 | $ | 95 | $ | 128 | $ | 151 |
Portfolio turnover rate G | | | | 354% | | 318% H | | 223% | | 255% H |
ACalculated based on average shares outstanding during the period.
BNet investment income (loss) is affected by the timing of the declaration of dividends by any underlying mutual funds or exchange-traded funds (ETFs). Net investment income (loss) of any mutual funds or ETFs is not included in the Fund's net investment income (loss) ratio.
CTotal returns would have been lower if certain expenses had not been reduced during the applicable periods shown.
DTotal returns do not include the effect of the sales charges.
EFees and expenses of any underlying mutual funds or exchange-traded funds (ETFs) are not included in the Fund's expense ratio. The Fund indirectly bears its proportionate share of these expenses. For additional expense information related to investments in Fidelity Central Funds, please refer to the "Investments in Fidelity Central Funds" note found in the Notes to Financial Statements section of the most recent Annual or Semi-Annual report.
FExpense ratios reflect operating expenses of the class. Expenses before reductions do not reflect amounts reimbursed, waived, or reduced through arrangements with the investment adviser, brokerage services, or other offset arrangements, if applicable, and do not represent the amount paid by the class during periods when reimbursements, waivers or reductions occur.
GAmount does not include the portfolio activity of any underlying mutual funds or exchange-traded funds (ETFs).
HPortfolio turnover rate excludes securities received or delivered in-kind.
Fidelity Advisor® Government Income Fund Class C |
| |
| Years ended August 31, | | 2024 | | 2023 | | 2022 | | 2021 | | 2020 |
Selected Per-Share Data | | | | | | | | | | |
| Net asset value, beginning of period | $ | 9.01 | $ | 9.45 | $ | 10.73 | $ | 11.16 | $ | 10.70 |
| Income from Investment Operations | | | | | | | | | | |
Net investment income (loss) A,B | | .208 | | .119 | | (.002) | | (.032) | | .034 |
| Net realized and unrealized gain (loss) | | .256 | | (.451) | | (1.261) | | (.257) | | .472 |
| Total from investment operations | | .464 | | (.332) | | (1.263) | | (.289) | | .506 |
| Distributions from net investment income | | (.184) | | (.108) | | (.017) | | - C | | (.046) |
| Distributions from net realized gain | | - | | - | | - | | (.141) | | - |
| Total distributions | | (.184) | | (.108) | | (.017) | | (.141) | | (.046) |
| Net asset value, end of period | $ | 9.29 | $ | 9.01 | $ | 9.45 | $ | 10.73 | $ | 11.16 |
Total Return D,E | | | | (3.52)% | | (11.78)% | | (2.61)% | | 4.75% |
Ratios to Average Net Assets B,F,G | | | | | | | | | | |
| Expenses before reductions | | 1.54% | | 1.54% | | 1.53% | | 1.53% | | 1.53% |
| Expenses net of fee waivers, if any | | | | 1.54% | | 1.53% | | 1.53% | | 1.53% |
| Expenses net of all reductions | | 1.54% | | 1.54% | | 1.53% | | 1.53% | | 1.53% |
| Net investment income (loss) | | 2.31% | | 1.29% | | (.02)% | | (.29)% | | .31% |
| Supplemental Data | | | | | | | | | | |
| Net assets, end of period (in millions) | $ | 16 | $ | 26 | $ | 33 | $ | 48 | $ | 80 |
Portfolio turnover rate H | | | | 354% | | 318% I | | 223% | | 255% I |
ACalculated based on average shares outstanding during the period.
BNet investment income (loss) is affected by the timing of the declaration of dividends by any underlying mutual funds or exchange-traded funds (ETFs). Net investment income (loss) of any mutual funds or ETFs is not included in the Fund's net investment income (loss) ratio.
CAmount represents less than $.0005 per share.
DTotal returns would have been lower if certain expenses had not been reduced during the applicable periods shown.
ETotal returns do not include the effect of the contingent deferred sales charge.
FFees and expenses of any underlying mutual funds or exchange-traded funds (ETFs) are not included in the Fund's expense ratio. The Fund indirectly bears its proportionate share of these expenses. For additional expense information related to investments in Fidelity Central Funds, please refer to the "Investments in Fidelity Central Funds" note found in the Notes to Financial Statements section of the most recent Annual or Semi-Annual report.
GExpense ratios reflect operating expenses of the class. Expenses before reductions do not reflect amounts reimbursed, waived, or reduced through arrangements with the investment adviser, brokerage services, or other offset arrangements, if applicable, and do not represent the amount paid by the class during periods when reimbursements, waivers or reductions occur.
HAmount does not include the portfolio activity of any underlying mutual funds or exchange-traded funds (ETFs).
IPortfolio turnover rate excludes securities received or delivered in-kind.
Fidelity® Government Income Fund |
| |
| Years ended August 31, | | 2024 | | 2023 | | 2022 | | 2021 | | 2020 |
Selected Per-Share Data | | | | | | | | | | |
| Net asset value, beginning of period | $ | 9.05 | $ | 9.49 | $ | 10.76 | $ | 11.15 | $ | 10.68 |
| Income from Investment Operations | | | | | | | | | | |
Net investment income (loss) A,B | | .307 | | .220 | | .108 | | .085 | | .152 |
| Net realized and unrealized gain (loss) | | .256 | | (.451) | | (1.269) | | (.257) | | .476 |
| Total from investment operations | | .563 | | (.231) | | (1.161) | | (.172) | | .628 |
| Distributions from net investment income | | (.283) | | (.209) | | (.109) | | (.077) | | (.158) |
| Distributions from net realized gain | | - | | - | | - | | (.141) | | - |
| Total distributions | | (.283) | | (.209) | | (.109) | | (.218) | | (.158) |
| Net asset value, end of period | $ | 9.33 | $ | 9.05 | $ | 9.49 | $ | 10.76 | $ | 11.15 |
Total Return C | | | | (2.44)% | | (10.84)% | | (1.56)% | | 5.94% |
Ratios to Average Net Assets B,D,E | | | | | | | | | | |
| Expenses before reductions | | .45% | | .45% | | .45% | | .45% | | .45% |
| Expenses net of fee waivers, if any | | | | .45% | | .45% | | .45% | | .45% |
| Expenses net of all reductions | | .45% | | .45% | | .45% | | .45% | | .45% |
| Net investment income (loss) | | 3.40% | | 2.38% | | 1.06% | | .79% | | 1.39% |
| Supplemental Data | | | | | | | | | | |
| Net assets, end of period (in millions) | $ | 1,475 | $ | 1,556 | $ | 1,756 | $ | 2,130 | $ | 2,743 |
Portfolio turnover rate F | | | | 354% | | 318% G | | 223% | | 255% G |
ACalculated based on average shares outstanding during the period.
BNet investment income (loss) is affected by the timing of the declaration of dividends by any underlying mutual funds or exchange-traded funds (ETFs). Net investment income (loss) of any mutual funds or ETFs is not included in the Fund's net investment income (loss) ratio.
CTotal returns would have been lower if certain expenses had not been reduced during the applicable periods shown.
DFees and expenses of any underlying mutual funds or exchange-traded funds (ETFs) are not included in the Fund's expense ratio. The Fund indirectly bears its proportionate share of these expenses. For additional expense information related to investments in Fidelity Central Funds, please refer to the "Investments in Fidelity Central Funds" note found in the Notes to Financial Statements section of the most recent Annual or Semi-Annual report.
EExpense ratios reflect operating expenses of the class. Expenses before reductions do not reflect amounts reimbursed, waived, or reduced through arrangements with the investment adviser, brokerage services, or other offset arrangements, if applicable, and do not represent the amount paid by the class during periods when reimbursements, waivers or reductions occur.
FAmount does not include the portfolio activity of any underlying mutual funds or exchange-traded funds (ETFs).
GPortfolio turnover rate excludes securities received or delivered in-kind.
Fidelity Advisor® Government Income Fund Class I |
| |
| Years ended August 31, | | 2024 | | 2023 | | 2022 | | 2021 | | 2020 |
Selected Per-Share Data | | | | | | | | | | |
| Net asset value, beginning of period | $ | 9.06 | $ | 9.51 | $ | 10.78 | $ | 11.17 | $ | 10.70 |
| Income from Investment Operations | | | | | | | | | | |
Net investment income (loss) A,B | | .304 | | .215 | | .105 | | .081 | | .148 |
| Net realized and unrealized gain (loss) | | .265 | | (.460) | | (1.270) | | (.257) | | .477 |
| Total from investment operations | | .569 | | (.245) | | (1.165) | | (.176) | | .625 |
| Distributions from net investment income | | (.279) | | (.205) | | (.105) | | (.073) | | (.155) |
| Distributions from net realized gain | | - | | - | | - | | (.141) | | - |
| Total distributions | | (.279) | | (.205) | | (.105) | | (.214) | | (.155) |
| Net asset value, end of period | $ | 9.35 | $ | 9.06 | $ | 9.51 | $ | 10.78 | $ | 11.17 |
Total Return C | | | | (2.59)% | | (10.85)% | | (1.59)% | | 5.89% |
Ratios to Average Net Assets B,D,E | | | | | | | | | | |
| Expenses before reductions | | .50% | | .50% | | .49% | | .49% | | .49% |
| Expenses net of fee waivers, if any | | | | .50% | | .49% | | .49% | | .49% |
| Expenses net of all reductions | | .50% | | .50% | | .49% | | .49% | | .49% |
| Net investment income (loss) | | 3.35% | | 2.34% | | 1.02% | | .75% | | 1.36% |
| Supplemental Data | | | | | | | | | | |
| Net assets, end of period (in millions) | $ | 174 | $ | 195 | $ | 199 | $ | 280 | $ | 411 |
Portfolio turnover rate F | | | | 354% | | 318% G | | 223% | | 255% G |
ACalculated based on average shares outstanding during the period.
BNet investment income (loss) is affected by the timing of the declaration of dividends by any underlying mutual funds or exchange-traded funds (ETFs). Net investment income (loss) of any mutual funds or ETFs is not included in the Fund's net investment income (loss) ratio.
CTotal returns would have been lower if certain expenses had not been reduced during the applicable periods shown.
DFees and expenses of any underlying mutual funds or exchange-traded funds (ETFs) are not included in the Fund's expense ratio. The Fund indirectly bears its proportionate share of these expenses. For additional expense information related to investments in Fidelity Central Funds, please refer to the "Investments in Fidelity Central Funds" note found in the Notes to Financial Statements section of the most recent Annual or Semi-Annual report.
EExpense ratios reflect operating expenses of the class. Expenses before reductions do not reflect amounts reimbursed, waived, or reduced through arrangements with the investment adviser, brokerage services, or other offset arrangements, if applicable, and do not represent the amount paid by the class during periods when reimbursements, waivers or reductions occur.
FAmount does not include the portfolio activity of any underlying mutual funds or exchange-traded funds (ETFs).
GPortfolio turnover rate excludes securities received or delivered in-kind.
Fidelity Advisor® Government Income Fund Class Z |
| |
| Years ended August 31, | | 2024 | | 2023 | | 2022 | | 2021 | | 2020 |
Selected Per-Share Data | | | | | | | | | | |
| Net asset value, beginning of period | $ | 9.07 | $ | 9.51 | $ | 10.78 | $ | 11.18 | $ | 10.70 |
| Income from Investment Operations | | | | | | | | | | |
Net investment income (loss) A,B | | .318 | | .228 | | .116 | | .095 | | .163 |
| Net realized and unrealized gain (loss) | | .254 | | (.450) | | (1.268) | | (.267) | | .485 |
| Total from investment operations | | .572 | | (.222) | | (1.152) | | (.172) | | .648 |
| Distributions from net investment income | | (.292) | | (.218) | | (.118) | | (.087) | | (.168) |
| Distributions from net realized gain | | - | | - | | - | | (.141) | | - |
| Total distributions | | (.292) | | (.218) | | (.118) | | (.228) | | (.168) |
| Net asset value, end of period | $ | 9.35 | $ | 9.07 | $ | 9.51 | $ | 10.78 | $ | 11.18 |
Total Return C | | | | (2.35)% | | (10.74)% | | (1.55)% | | 6.12% |
Ratios to Average Net Assets B,D,E | | | | | | | | | | |
| Expenses before reductions | | .40% | | .40% | | .40% | | .40% | | .40% |
| Expenses net of fee waivers, if any | | | | .36% | | .36% | | .36% | | .36% |
| Expenses net of all reductions | | .36% | | .36% | | .36% | | .36% | | .36% |
| Net investment income (loss) | | 3.49% | | 2.47% | | 1.15% | | .88% | | 1.48% |
| Supplemental Data | | | | | | | | | | |
| Net assets, end of period (in millions) | $ | 490 | $ | 1,699 | $ | 1,394 | $ | 735 | $ | 937 |
Portfolio turnover rate F | | | | 354% | | 318% G | | 223% | | 255% G |
ACalculated based on average shares outstanding during the period.
BNet investment income (loss) is affected by the timing of the declaration of dividends by any underlying mutual funds or exchange-traded funds (ETFs). Net investment income (loss) of any mutual funds or ETFs is not included in the Fund's net investment income (loss) ratio.
CTotal returns would have been lower if certain expenses had not been reduced during the applicable periods shown.
DFees and expenses of any underlying mutual funds or exchange-traded funds (ETFs) are not included in the Fund's expense ratio. The Fund indirectly bears its proportionate share of these expenses. For additional expense information related to investments in Fidelity Central Funds, please refer to the "Investments in Fidelity Central Funds" note found in the Notes to Financial Statements section of the most recent Annual or Semi-Annual report.
EExpense ratios reflect operating expenses of the class. Expenses before reductions do not reflect amounts reimbursed, waived, or reduced through arrangements with the investment adviser, brokerage services, or other offset arrangements, if applicable, and do not represent the amount paid by the class during periods when reimbursements, waivers or reductions occur.
FAmount does not include the portfolio activity of any underlying mutual funds or exchange-traded funds (ETFs).
GPortfolio turnover rate excludes securities received or delivered in-kind.
Notes to Financial Statements
For the period ended August 31, 2024
(Amounts in thousands except percentages)
1. Organization.
Fidelity Government Income Fund (the Fund) is a fund of Fidelity Income Fund (the Trust) and is authorized to issue an unlimited number of shares. The Trust is registered under the Investment Company Act of 1940, as amended (the 1940 Act), as an open-end management investment company organized as a Massachusetts business trust. The Fund offers Class A, Class M, Class C, Government Income, Class I and Class Z shares, each of which has equal rights as to assets and voting privileges. Class A, Class M, Class C, Class I and Class Z are Fidelity Advisor classes. Each class has exclusive voting rights with respect to matters that affect that class. Class C shares will automatically convert to Class A shares after a holding period of eight years from the initial date of purchase, with certain exceptions.
2. Investments in Fidelity Central Funds.
Funds may invest in Fidelity Central Funds, which are open-end investment companies generally available only to other investment companies and accounts managed by the investment adviser and its affiliates. The Schedule of Investments lists any Fidelity Central Funds held as an investment as of period end, but does not include the underlying holdings of each Fidelity Central Fund. An investing fund indirectly bears its proportionate share of the expenses of the underlying Fidelity Central Funds.
Based on its investment objective, each Fidelity Central Fund may invest or participate in various investment vehicles or strategies that are similar to those of the investing fund. These strategies are consistent with the investment objectives of the investing fund and may involve certain economic risks which may cause a decline in value of each of the Fidelity Central Funds and thus a decline in the value of the investing fund.
| Fidelity Central Fund | Investment Manager | Investment Objective | Investment Practices | Expense RatioA |
| Fidelity Money Market Central Funds | Fidelity Management & Research Company LLC (FMR) | Each fund seeks to obtain a high level of current income consistent with the preservation of capital and liquidity. | Short-term Investments | Less than .005% |
A Expenses expressed as a percentage of average net assets and are as of each underlying Central Fund's most recent annual or semi-annual shareholder report.
A complete unaudited list of holdings for each Fidelity Central Fund is available upon request or at the Securities and Exchange Commission website at www.sec.gov. In addition, the financial statements of the Fidelity Central Funds which contain the significant accounting policies (including investment valuation policies) of those funds, and are not covered by the Report of Independent Registered Public Accounting Firm, are available on the Securities and Exchange Commission website or upon request.
3. Significant Accounting Policies.
The Fund is an investment company and applies the accounting and reporting guidance of the Financial Accounting Standards Board (FASB) Accounting Standards Codification Topic 946 Financial Services - Investment Companies. The financial statements have been prepared in conformity with accounting principles generally accepted in the United States of America (GAAP), which require management to make certain estimates and assumptions at the date of the financial statements. Actual results could differ from those estimates. Subsequent events, if any, through the date that the financial statements were issued have been evaluated in the preparation of the financial statements. The Fund's Schedule of Investments lists any underlying mutual funds or exchange-traded funds (ETFs) but does not include the underlying holdings of these funds. The following summarizes the significant accounting policies of the Fund:
Investment Valuation. Investments are valued as of 4:00 p.m. Eastern time on the last calendar day of the period. The Board of Trustees (the Board) has designated the Fund's investment adviser as the valuation designee responsible for the fair valuation function and performing fair value determinations as needed. The investment adviser has established a Fair Value Committee (the Committee) to carry out the day-to-day fair valuation responsibilities and has adopted policies and procedures to govern the fair valuation process and the activities of the Committee. In accordance with these fair valuation policies and procedures, which have been approved by the Board, the Fund attempts to obtain prices from one or more third party pricing services or brokers to value its investments. When current market prices, quotations or currency exchange rates are not readily available or reliable, investments will be fair valued in good faith by the Committee, in accordance with the policies and procedures. Factors used in determining fair value vary by investment type and may include market or investment specific events, transaction data, estimated cash flows, and market observations of comparable investments. The frequency that the fair valuation procedures are used cannot be predicted and they may be utilized to a significant extent. The Committee manages the Fund's fair valuation practices and maintains the fair valuation policies and procedures. The Fund's investment adviser reports to the Board information regarding the fair valuation process and related material matters.
The Fund categorizes the inputs to valuation techniques used to value its investments into a disclosure hierarchy consisting of three levels as shown below:
Level 1 - unadjusted quoted prices in active markets for identical investments
Level 2 - other significant observable inputs (including quoted prices for similar investments, interest rates, prepayment speeds, etc.)
Level 3 - unobservable inputs (including the Fund's own assumptions based on the best information available)
Valuation techniques used to value the Fund's investments by major category are as follows:
Debt securities, including restricted securities, are valued based on evaluated prices received from third party pricing services or from brokers who make markets in such securities. U.S. government and government agency obligations are valued by pricing services who utilize matrix pricing which considers yield or price of bonds of comparable quality, coupon, maturity and type or by broker-supplied prices. Collateralized mortgage obligations, commercial mortgage securities and U.S. government agency mortgage securities are valued by pricing services who utilize matrix pricing which considers prepayment speed assumptions, attributes of the collateral, yield or price of bonds of comparable quality, coupon, maturity and type or by broker-supplied prices. Swaps are marked-to-market daily based on valuations from third party pricing services, registered derivatives clearing organizations (clearinghouses) or broker-supplied valuations. These pricing sources may utilize inputs such as interest rate curves, credit spread curves, default possibilities and recovery rates. When independent prices are unavailable or unreliable, debt securities and swaps may be valued utilizing pricing methodologies which consider similar factors that would be used by third party pricing services. Debt securities and swaps are generally categorized as Level 2 in the hierarchy but may be Level 3 depending on the circumstances.
Futures contracts are valued at the settlement price established each day by the board of trade or exchange on which they are traded and are categorized as Level 1 in the hierarchy. Options traded over-the-counter are valued using service or broker-supplied valuations and are categorized as Level 2 in the hierarchy. Investments in open-end mutual funds, including the Fidelity Central Funds, are valued at their closing net asset value (NAV) each business day and are categorized as Level 1 in the hierarchy.
Changes in valuation techniques may result in transfers in or out of an assigned level within the disclosure hierarchy. The aggregate value of investments by input level as of August 31, 2024 is included at the end of the Fund's Schedule of Investments.
Investment Transactions and Income. For financial reporting purposes, the Fund's investment holdings and NAV include trades executed through the end of the last business day of the period. The NAV per share for processing shareholder transactions is calculated as of the close of business of the New York Stock Exchange (NYSE), normally 4:00 p.m. Eastern time and includes trades executed through the end of the prior business day. Gains and losses on securities sold are determined on the basis of identified cost and include proceeds received from litigation. Income and capital gain distributions from Fidelity Central Funds, if any, are recorded on the ex-dividend date. Interest income is accrued as earned and includes coupon interest and amortization of premium and accretion of discount on debt securities as applicable.
Class Allocations and Expenses. Investment income, realized and unrealized capital gains and losses, common expenses of a fund, and certain fund-level expense reductions, if any, are allocated daily on a pro-rata basis to each class based on the relative net assets of each class to the total net assets of a fund. Each class differs with respect to transfer agent and distribution and service plan fees incurred, as applicable. Certain expense reductions may also differ by class, if applicable. For the reporting period, the allocated portion of income and expenses to each class as a percent of its average net assets may vary due to the timing of recording these transactions in relation to fluctuating net assets of the classes. Expenses directly attributable to a fund are charged to that fund. Expenses attributable to more than one fund are allocated among the respective funds on the basis of relative net assets or other appropriate methods. Expenses included in the accompanying financial statements reflect the expenses of that fund and do not include any expenses associated with any underlying mutual funds or exchange-traded funds (ETFs). Although not included in a fund's expenses, a fund indirectly bears its proportionate share of these expenses through the net asset value of each underlying mutual fund or exchange-traded fund (ETF). Expense estimates are accrued in the period to which they relate and adjustments are made when actual amounts are known.
Income Tax Information and Distributions to Shareholders. Each year, the Fund intends to qualify as a regulated investment company under Subchapter M of the Internal Revenue Code, including distributing substantially all of its taxable income and realized gains. As a result, no provision for U.S. Federal income taxes is required. As of August 31, 2024, the Fund did not have any unrecognized tax benefits in the financial statements; nor is the Fund aware of any tax positions for which it is reasonably possible that the total amounts of unrecognized tax benefits will significantly change in the next twelve months. The Fund files a U.S. federal tax return, in addition to state and local tax returns as required. The Fund's federal income tax returns are subject to examination by the Internal Revenue Service (IRS) for a period of three fiscal years after they are filed. State and local tax returns may be subject to examination for an additional fiscal year depending on the jurisdiction.
Distributions are declared and recorded daily and paid monthly from net investment income. Distributions from realized gains, if any, are declared and recorded on the ex-dividend date. Income and capital gain distributions are declared separately for each class. Income and capital gain distributions are determined in accordance with income tax regulations, which may differ from GAAP.
Capital accounts within the financial statements are adjusted for permanent book-tax differences. These adjustments have no impact on net assets or the results of operations. Capital accounts are not adjusted for temporary book-tax differences which will reverse in a subsequent period.
Book-tax differences are primarily due to futures contracts, swaps, market discount, capital loss carryforwards and losses deferred due to wash sales and futures contracts.
As of period end, the cost and unrealized appreciation (depreciation) in securities, and derivatives if applicable, for federal income tax purposes were as follows:
| Gross unrealized appreciation | $40,442 |
| Gross unrealized depreciation | (96,185) |
| Net unrealized appreciation (depreciation) | $(55,743) |
| Tax Cost | $2,546,704 |
The tax-based components of distributable earnings as of period end were as follows:
| Undistributed ordinary income | $6,519 |
| Capital loss carryforward | $(446,669) |
| Net unrealized appreciation (depreciation) on securities and other investments | $(63,282) |
Capital loss carryforwards are only available to offset future capital gains of the Fund to the extent provided by regulations and may be limited. The capital loss carryforward information presented below, including any applicable limitation, is estimated as of fiscal period end and is subject to adjustment.
Short-term | $(202,701) |
Long-term | (243,968) |
| Total capital loss carryforward | $(446,669) |
The tax character of distributions paid was as follows:
| | August 31, 2024 | August 31, 2023 |
| Ordinary Income | $88,201 | $ 79,823 |
| Total | $88,201 | $ 79,823 |
Delayed Delivery Transactions and When-Issued Securities. During the period, certain Funds transacted in securities on a delayed delivery or when-issued basis. Payment and delivery may take place after the customary settlement period for that security. The price of the underlying securities and the date when the securities will be delivered and paid for are fixed at the time the transaction is negotiated. Securities purchased on a delayed delivery or when-issued basis are identified as such in the Schedule of Investments. Compensation for interest forgone in the purchase of a delayed delivery or when-issued debt security may be received. With respect to purchase commitments, each applicable Fund identifies securities as segregated in its records with a value at least equal to the amount of the commitment. Payables and receivables associated with the purchases and sales of delayed delivery securities having the same coupon, settlement date and broker are offset. Delayed delivery or when-issued securities that have been purchased from and sold to different brokers are reflected as both payables and receivables in the Statement of Assets and Liabilities under the caption "Delayed delivery", as applicable. Losses may arise due to changes in the value of the underlying securities or if the counterparty does not perform under the contract's terms, or if the issuer does not issue the securities due to political, economic, or other factors.
To-Be-Announced (TBA) Securities and Mortgage Dollar Rolls. TBA securities involve buying or selling mortgage-backed securities (MBS) on a forward commitment basis. A TBA transaction typically does not designate the actual security to be delivered and only includes an approximate principal amount; however delivered securities must meet specified terms defined by industry guidelines, including issuer, rate and current principal amount outstanding on underlying mortgage pools. Funds may enter into a TBA transaction with the intent to take possession of or deliver the underlying MBS, or a fund may elect to extend the settlement by entering into either a mortgage or reverse mortgage dollar roll. Mortgage dollar rolls are transactions where a fund sells TBA securities and simultaneously agrees to repurchase MBS on a later date at a lower price and with the same counterparty. Reverse mortgage dollar rolls involve the purchase and simultaneous agreement to sell TBA securities on a later date at a lower price. Transactions in mortgage dollar rolls and reverse mortgage dollar rolls are accounted for as purchases and sales and may result in an increase to a fund's portfolio turnover rate.
Purchases and sales of TBA securities involve risks similar to those discussed above for delayed delivery and when-issued securities. Also, if the counterparty in a mortgage dollar roll or a reverse mortgage dollar roll transaction files for bankruptcy or becomes insolvent, a fund's right to repurchase or sell securities may be limited. Additionally, when a fund sells TBA securities without already owning or having the right to obtain the deliverable securities (an uncovered forward commitment to sell), it incurs a risk of loss because it could have to purchase the securities at a price that is higher than the price at which it sold them. A fund may be unable to purchase the deliverable securities if the corresponding market is illiquid.
TBA securities subject to a forward commitment to sell at period end are included at the end of the Schedule of Investments under the caption "TBA Sale Commitments." The value of these commitments and proceeds to be received at contractual settlement date are reflected in the Statement of Assets and Liabilities as "TBA sale commitments, at value" and "Receivable for TBA sale commitments," respectively. If the TBA sale commitment is closed through the acquisition of an offsetting TBA purchase commitment, a fund realizes a gain or loss. If a fund delivers securities under the commitment, a fund realizes a gain or loss from the sale of the securities based upon the price established at the date the commitment was entered into.
Restricted Securities (including Private Placements). Funds may invest in securities that are subject to legal or contractual restrictions on resale. These securities generally may be resold in transactions exempt from registration or to the public if the securities are registered. Disposal of these securities may involve time-consuming negotiations and expense, and prompt sale at an acceptable price may be difficult. Information regarding restricted securities held at period end is included at the end of the Schedule of Investments, if applicable.
4. Derivative Instruments.
Risk Exposures and the Use of Derivative Instruments. The Fund's investment objectives allow for various types of derivative instruments, including futures contracts, swaps and options. Derivatives are investments whose value is primarily derived from underlying assets, indices or reference rates and may be transacted on an exchange or over-the-counter (OTC). Derivatives may involve a future commitment to buy or sell a specified asset based on specified terms, to exchange future cash flows at periodic intervals based on a notional principal amount, or for one party to make one or more payments upon the occurrence of specified events in exchange for periodic payments from the other party.
Derivatives were used to increase returns, to gain exposure to certain types of assets and to manage exposure to certain risks as defined below. The success of any strategy involving derivatives depends on analysis of numerous economic factors, and if the strategies for investment do not work as intended, the objectives may not be achieved.
Derivatives were used to increase or decrease exposure to the following risk(s):
| | |
| Interest Rate Risk | Interest rate risk relates to the fluctuations in the value of interest-bearing securities due to changes in the prevailing levels of market interest rates. |
Funds are also exposed to additional risks from investing in derivatives, such as liquidity risk and counterparty credit risk. Liquidity risk is the risk that a fund will be unable to close out the derivative in the open market in a timely manner. Counterparty credit risk is the risk that the counterparty will not be able to fulfill its obligation to a fund. Derivative counterparty credit risk is managed through formal evaluation of the creditworthiness of all potential counterparties. On certain OTC derivatives such as options, a fund attempts to reduce its exposure to counterparty credit risk by entering into an International Swaps and Derivatives Association, Inc. (ISDA) Master Agreement with each of its counterparties. The ISDA Master Agreement gives a fund the right to terminate all transactions traded under such agreement upon the deterioration in the credit quality of the counterparty beyond specified levels. The ISDA Master Agreement gives each party the right, upon an event of default by the other party or a termination of the agreement, to close out all transactions traded under such agreement and to net amounts owed under each transaction to one net payable by one party to the other. To mitigate counterparty credit risk on bi-lateral OTC derivatives, a fund receives collateral in the form of cash or securities once net unrealized appreciation on outstanding derivative contracts under an ISDA Master Agreement exceeds certain applicable thresholds, subject to certain minimum transfer provisions. The collateral received is held in segregated accounts with the custodian bank in accordance with the collateral agreements entered into between a fund, the counterparty and the custodian bank. A fund could experience delays and costs in gaining access to the collateral even though it is held by the custodian bank. The maximum risk of loss to a fund from counterparty credit risk related to bi-lateral OTC derivatives is generally the aggregate unrealized appreciation and unpaid counterparty payments in excess of any collateral pledged by the counterparty to a fund. A fund may be required to pledge collateral for the benefit of the counterparties on bi-lateral OTC derivatives in an amount not less than each counterparty's unrealized appreciation on outstanding derivative contracts, subject to certain minimum transfer provisions, and any such pledged collateral is identified in the Schedule of Investments. Exchange-traded contracts are not covered by the ISDA Master Agreement; however counterparty credit risk related to these contracts may be mitigated by the protection provided by the exchange on which they trade. Counterparty credit risk related to centrally cleared swaps may be mitigated by the protection provided by the clearinghouse.
Investing in derivatives may involve greater risks than investing in the underlying assets directly and, to varying degrees, may involve risk of loss in excess of any initial investment and collateral received and amounts recognized in the Statement of Assets and Liabilities. In addition, there may be the risk that the change in value of the derivative contract does not correspond to the change in value of the underlying instrument.
Net Realized Gain (Loss) and Change in Net Unrealized Appreciation (Depreciation) on Derivatives. The table below, which reflects the impacts of derivatives on the financial performance, summarizes the net realized gain (loss) and change in net unrealized appreciation (depreciation) for derivatives during the period as presented in the Statement of Operations.
| Primary Risk Exposure / Derivative Type | Net Realized Gain (Loss)($) | Change in Net Unrealized Appreciation (Depreciation)($) |
| Fidelity Government Income Fund | | |
| Interest Rate Risk | | |
| Futures Contracts | (377) | (4,135) |
| Purchased Options | (319) | (27) |
| Swaps | (1,638) | (3,069) |
| Total Interest Rate Risk | (2,334) | (7,231) |
| Totals | (2,334) | (7,231) |
If there are any open positions at period end, a summary of the value of derivatives by primary risk exposure is included at the end of the Schedule of Investments.
Futures Contracts. A futures contract is an agreement between two parties to buy or sell a specified underlying instrument for a fixed price at a specified future date. Futures contracts were used to manage exposure to the bond market and fluctuations in interest rates.
Upon entering into a futures contract, a fund is required to deposit either cash or securities (initial margin) with a clearing broker in an amount equal to a certain percentage of the face value of the contract. Futures contracts are marked-to-market daily and subsequent daily payments are made or received by a fund depending on the daily fluctuations in the value of the futures contracts and are recorded as unrealized appreciation or (depreciation). This receivable and/or payable, if any, is included in daily variation margin on futures contracts in the Statement of Assets and Liabilities. Realized gain or (loss) is recorded upon the expiration or closing of a futures contract. The net realized gain (loss) and change in net unrealized appreciation (depreciation) on futures contracts during the period is presented in the Statement of Operations.
Any open futures contracts at period end are presented in the Schedule of Investments under the caption "Futures Contracts". The notional amount at value reflects each contract's exposure to the underlying instrument or index at period end, and is representative of volume of activity during the period unless an average notional amount is presented. Any securities deposited to meet initial margin requirements are identified in the Schedule of Investments. Any cash deposited to meet initial margin requirements is presented as segregated cash with brokers for derivative instruments in the Statement of Assets and Liabilities.
Options. Options give the purchaser the right, but not the obligation, to buy (call) or sell (put) an underlying security or financial instrument at an agreed exercise or strike price between or on certain dates. Options obligate the seller (writer) to buy (put) or sell (call) an underlying instrument at the exercise or strike price or cash settle an underlying derivative instrument if the holder exercises the option on or before the expiration date. OTC options, such as swaptions, which are options where the underlying instrument is a swap, were used to manage exposure to fluctuations in interest rates.
Upon entering into an options contract, a fund will pay or receive a premium. Premiums paid on purchased options are reflected as cost of investments and premiums received on written options are reflected as a liability on the Statement of Assets and Liabilities. Certain options may be purchased or written with premiums to be paid or received on a future date. Options are valued daily and any unrealized appreciation (depreciation) is reflected in total accumulated earnings (loss) in the Statement of Assets and Liabilities. When an option is exercised, the cost or proceeds of the underlying instrument purchased or sold is adjusted by the amount of the premium. When an option is closed, a gain or loss is realized depending on whether the proceeds or amount paid for the closing sale transaction is greater or less than the premium received or paid. When an option expires, gains and losses are realized to the extent of premiums received and paid, respectively. The net realized and unrealized gains (losses) on purchased options are included in the Statement of Operations in net realized gain (loss) and change in net unrealized appreciation (depreciation) on investment securities. The net realized gain (loss) and change in net unrealized appreciation (depreciation) on written options are presented in the Statement of Operations.
Any open options at period end are presented in the Schedule of Investments under the captions "Purchased Options," "Purchased Swaptions," "Written Options" and "Written Swaptions," as applicable, and are representative of volume of activity during the period unless an average notional amount is presented.
Writing puts and buying calls tend to increase exposure to the underlying instrument while buying puts and writing calls tend to decrease exposure to the underlying instrument. For purchased options, risk of loss is limited to the premium paid, and for written options, risk of loss is the change in value in excess of the premium received.
Swaps. A swap is a contract between two parties to exchange future cash flows at periodic intervals based on a notional principal amount. A centrally cleared swap is a transaction executed between a fund and a dealer counterparty, then cleared by a futures commission merchant (FCM) through a clearinghouse. Once cleared, the clearinghouse serves as a central counterparty, with whom a fund exchanges cash flows for the life of the transaction, similar to transactions in futures contracts.
Centrally cleared swaps require a fund to deposit either cash or securities (initial margin) with the FCM, at the instruction of and for the benefit of the clearinghouse. Any securities deposited to meet initial margin requirements are identified in the Schedule of Investments. Any cash deposited to meet initial margin requirements is presented in segregated cash with brokers for derivative instruments in the Statement of Assets and Liabilities. Centrally cleared swaps are marked-to-market daily and subsequent payments (variation margin) are made or received depending on the daily fluctuations in the value of the swaps and are recorded as unrealized appreciation or (depreciation). These daily payments, if any, are included in receivable or payable for daily variation margin on centrally cleared swaps in the Statement of Assets and Liabilities. Any premiums for centrally cleared swaps are recorded periodically throughout the term of the swap to variation margin and included in total accumulated earnings (loss) in the Statement of Assets and Liabilities. Any premiums are recognized as realized gain (loss) upon termination or maturity of the swap.
Payments are exchanged at specified intervals, accrued daily commencing with the effective date of the contract and recorded as realized gain or (loss). Some swaps may be terminated prior to the effective date and realize a gain or loss upon termination. The net realized gain (loss) and change in net unrealized appreciation (depreciation) on swaps during the period is presented in the Statement of Operations.
Any open swaps at period end are included in the Schedule of Investments under the caption "Swaps", and are representative of volume of activity during the period unless an average notional amount is presented.
Interest Rate Swaps. Interest rate swaps are agreements between counterparties to exchange cash flows, one based on a fixed rate, and the other on a floating rate. A fund enters into interest rate swaps to manage its exposure to interest rate changes. Changes in interest rates can have an effect on both the value of bond holdings as well as the amount of interest income earned. In general, the value of bonds can fall when interest rates rise and can rise when interest rates fall.
5. Purchases and Sales of Investments.
Purchases and sales of securities, other than short-term securities, U.S. government securities and in-kind transactions, as applicable, are noted in the table below.
| | Purchases ($) | Sales ($) |
| Fidelity Government Income Fund | 6,500,115 | 6,739,347 |
6. Fees and Other Transactions with Affiliates.
Management Fee. Fidelity Management & Research Company LLC (the investment adviser) and its affiliates provide the Fund with investment management related services for which the Fund pays a monthly management fee. Effective March 1, 2024, the Fund pays a monthly management fee that is based on an annual rate of .282% of the Fund's average net assets.
Prior to March 1, 2024, the management fee was the sum of an individual fund fee rate that was based on an annual rate of .20% of the Fund's average net assets and an annualized group fee rate that averaged .10% during the period. The group fee rate was based upon the monthly average net assets of a group of registered investment companies with which the investment adviser has management contracts. The group fee rate decreased as assets under management increased and increased as assets under management decreased.
For the reporting period, the total annual management fee rate was .29% of the Fund's average net assets.
In addition, under the expense contract, the investment adviser pays class-level expenses for Government Income, so that the total expenses, except the compensation of the independent Trustees and certain other expenses such as interest expense do not exceed .45% of the Class' average net assets. This agreement does not apply to any of the other classes and any change or modification that would increase expenses can only be made with shareholder approval.
Distribution and Service Plan Fees. In accordance with Rule 12b-1 of the 1940 Act, the Fund has adopted separate Distribution and Service Plans for each class of shares. Certain classes pay Fidelity Distributors Company LLC (FDC), an affiliate of the investment adviser, separate Distribution and Service Fees, each of which is based on an annual percentage of each class' average net assets. In addition, FDC may pay financial intermediaries for selling shares of the Fund and providing shareholder support services. For the period, the Distribution and Service Fee rates, total fees and amounts retained by FDC were as follows:
| | Distribution Fee | Service Fee | Total Fees ($) | Retained by FDC ($) |
| Class A | - % | .25% | 241 | 3 |
| Class M | - % | .25% | 192 | - |
| Class C | .75% | .25% | 202 | 16 |
| | | | 635 | 19 |
Sales Load. FDC may receive a front-end sales charge of up to 4.00% for selling Class A shares and Class M shares, some of which is paid to financial intermediaries for selling shares of the Fund. Depending on the holding period, FDC may receive contingent deferred sales charges levied on Class A, Class M and Class C redemptions. The deferred sales charges are 1.00% for Class C shares, .75% for certain purchases of Class A shares and .25% for certain purchases of Class M shares.
For the period, sales charge amounts retained by FDC were as follows:
| | Retained by FDC ($) |
| Class A | 9 |
| Class M | 1 |
Class CA | 1 |
| | 11 |
A When Class C shares are initially sold, FDC pays commissions from its own resources to financial intermediaries through which the sales are made.
Transfer Agent Fees. Fidelity Investments Institutional Operations Company LLC (FIIOC), an affiliate of the investment adviser, is the transfer, dividend disbursing and shareholder servicing agent for each class of the Fund. FIIOC receives account fees and asset-based fees that vary according to the account size and type of account of the shareholders of each respective class of the Fund, with the exception of Government Income and Class Z. FIIOC receives an asset-based fee of Government Income's and Class Z's average net assets. FIIOC pays for typesetting, printing and mailing of shareholder reports, except proxy statements. For the period, transfer agent fees for each class were as follows:
| | Amount ($) | % of Class-Level Average Net Assets |
| Class A | 183 | .19 |
| Class M | 124 | .16 |
| Class C | 38 | .19 |
| Government Income | 1,484 | .10 |
| Class I | 277 | .15 |
| Class Z | 490 | .05 |
| | 2,596 | |
Fund Wide Operations Fee. Pursuant to the Fund Wide Operations and Expense Agreement (FWOE), the investment adviser has agreed to provide for fund-level expenses (which may not include transfer agent, the compensation of the independent Trustees, interest, taxes or extraordinary expenses, as applicable) in return for a FWOE fee equal to .35% of fund-level average net assets less the total amount of the management fee. The FWOE paid by a fund is reduced by an amount equal to the fees and expenses paid to the independent Trustees. For the period, the FWOE fees were equivalent to the following annual rate expressed as a percentage of average net assets:
| Fidelity Government Income Fund | .06% |
Interfund Trades. Funds may purchase from or sell securities to other Fidelity Funds under procedures adopted by the Board. The procedures have been designed to ensure these interfund trades are executed in accordance with Rule 17a-7 of the 1940 Act. Any interfund trades are included within the respective purchases and sales amounts shown in the Purchases and Sales of Investments note. During the period, there were no interfund trades.
Sub-Advisory Arrangements. Effective March 1, 2024, the Fund's sub-advisory agreements with FMR Investment Management (UK) Limited, Fidelity Management & Research (Hong Kong) Limited, and Fidelity Management & Research (Japan) Limited were amended to provide that the investment adviser pays each sub-adviser monthly fees equal to 110% of the sub-adviser's costs for providing sub-advisory services.
7. Committed Line of Credit.
Certain Funds participate with other funds managed by the investment adviser or an affiliate in a $4.25 billion credit facility (the "line of credit") to be utilized for temporary or emergency purposes to fund shareholder redemptions or for other short-term liquidity purposes. The commitment fees on the pro-rata portion of the line of credit are borne by the investment adviser. During the period, there were no borrowings on this line of credit.
8. Security Lending.
Funds lend portfolio securities from time to time in order to earn additional income. Lending agents are used, including National Financial Services (NFS), an affiliate of the investment adviser. Pursuant to a securities lending agreement, NFS will receive a fee, which is capped at 9.9% of a fund's daily lending revenue, for its services as lending agent. A fund may lend securities to certain qualified borrowers, including NFS. On the settlement date of the loan, a fund receives collateral (in the form of U.S. Treasury obligations, letters of credit and/or cash) against the loaned securities and maintains collateral in an amount not less than 100% of the market value of the loaned securities during the period of the loan. The market value of the loaned securities is determined at the close of business of a fund and any additional required collateral is delivered to a fund on the next business day. A fund or borrower may terminate the loan at any time, and if the borrower defaults on its obligation to return the securities loaned because of insolvency or other reasons, a fund may apply collateral received from the borrower against the obligation. A fund may experience delays and costs in recovering the securities loaned. Any cash collateral received is invested in the Fidelity Securities Lending Cash Central Fund. Any loaned securities are identified as such in the Schedule of Investments, and the value of loaned securities and cash collateral at period end, as applicable, are presented in the Statement of Assets and Liabilities. Security lending income represents the income earned on investing cash collateral, less rebates paid to borrowers and any lending agent fees associated with the loan, plus any premium payments received for lending certain types of securities. Security lending income is presented in the Statement of Operations as a component of income from Fidelity Central Funds. Affiliated security lending activity, if any, was as follows:
| | Total Security Lending Fees Paid to NFS ($) | Security Lending Income From Securities Loaned to NFS ($) | Value of Securities Loaned to NFS at Period End ($) |
| Fidelity Government Income Fund | 2 | - | - |
9. Expense Reductions.
The investment adviser contractually agreed to reimburse expenses of each class to the extent annual operating expenses exceeded certain levels of class-level average net assets as noted in the table below. This reimbursement will remain in place through December 31, 2025. Some expenses, for example the compensation of the independent Trustees, and certain other expenses such as interest expense, are excluded from this reimbursement.
The following classes were in reimbursement during the period:
| | Expense Limitations | Reimbursement ($) |
| Class Z | .36% | 391 |
Through arrangements with the Fund's custodian and each class' transfer agent, credits realized as a result of certain uninvested cash balances were used to reduce the Fund's expenses. During the period, custodian credits reduced the Fund's expenses by $9. During the period, transfer agent credits reduced each class' expenses as noted in the table below.
| | Expense reductionA |
| | |
| Class M | $- |
A Amount represents less than $500.
10. Distributions to Shareholders.
Distributions to shareholders of each class were as follows:
| | Year ended August 31, 2024 | Year ended August 31, 2023 |
| Fidelity Government Income Fund | | |
| Distributions to shareholders | | |
| Class A | $2,679 | $2,110 |
| Class M | 2,160 | 1,702 |
| Class C | 407 | 336 |
| Government Income | 46,389 | 37,026 |
| Class I | 5,685 | 4,277 |
| Class Z | 30,881 | 34,372 |
Total | $88,201 | $79,823 |
11. Share Transactions.
Share transactions for each class were as follows and may contain in-kind transactions, automatic conversions between classes or exchanges between affiliated funds:
| | Shares | Shares | Dollars | Dollars |
| | Year ended August 31, 2024 | Year ended August 31, 2023 | Year ended August 31, 2024 | Year ended August 31, 2023 |
| Fidelity Government Income Fund | | | | |
| Class A | | | | |
| Shares sold | 2,075 | 1,513 | $18,906 | $13,966 |
| Reinvestment of distributions | 284 | 220 | 2,576 | 2,022 |
| Shares redeemed | (3,372) | (2,876) | (30,459) | (26,482) |
| Net increase (decrease) | (1,013) | (1,143) | $(8,977) | $(10,494) |
| Class M | | | | |
| Shares sold | 1,664 | 2,172 | $15,069 | $20,012 |
| Reinvestment of distributions | 222 | 169 | 2,015 | 1,558 |
| Shares redeemed | (3,240) | (3,211) | (29,248) | (29,618) |
| Net increase (decrease) | (1,354) | (870) | $(12,164) | $(8,048) |
| Class C | | | | |
| Shares sold | 156 | 357 | $1,407 | $3,270 |
| Reinvestment of distributions | 45 | 36 | 402 | 332 |
| Shares redeemed | (1,406) | (959) | (12,592) | (8,788) |
| Net increase (decrease) | (1,205) | (566) | $(10,783) | $(5,186) |
| Government Income | | | | |
| Shares sold | 31,604 | 38,534 | $286,126 | $355,883 |
| Reinvestment of distributions | 4,803 | 3,764 | 43,457 | 34,583 |
| Shares redeemed | (50,452) | (55,194) | (455,613) | (507,770) |
| Net increase (decrease) | (14,045) | (12,896) | $(126,030) | $(117,304) |
| Class I | | | | |
| Shares sold | 9,816 | 10,672 | $89,336 | $98,225 |
| Reinvestment of distributions | 613 | 455 | 5,554 | 4,187 |
| Shares redeemed | (13,352) | (10,495) | (120,324) | (96,612) |
| Net increase (decrease) | (2,923) | 632 | $(25,434) | $5,800 |
| Class Z | | | | |
| Shares sold | 18,503 | 72,658 | $167,382 | $672,939 |
| Reinvestment of distributions | 3,321 | 3,658 | 29,991 | 33,676 |
| Shares redeemed | (156,809) | (35,436) | (1,427,463) | (330,802) |
| Net increase (decrease) | (134,985) | 40,880 | $(1,230,090) | $375,813 |
12. Other.
A fund's organizational documents provide former and current trustees and officers with a limited indemnification against liabilities arising in connection with the performance of their duties to the fund. In the normal course of business, a fund may also enter into contracts that provide general indemnifications. A fund's maximum exposure under these arrangements is unknown as this would be dependent on future claims that may be made against a fund. The risk of material loss from such claims is considered remote.
13. Risk and Uncertainties.
Many factors affect a fund's performance. Developments that disrupt global economies and financial markets, such as pandemics, epidemics, outbreaks of infectious diseases, war, terrorism, and environmental disasters, may significantly affect a fund's investment performance. The effects of these developments to a fund will be impacted by the types of securities in which a fund invests, the financial condition, industry, economic sector, and geographic location of an issuer, and a fund's level of investment in the securities of that issuer. Significant concentrations in security types, issuers, industries, sectors, and geographic locations may magnify the factors that affect a fund's performance.
Report of Independent Registered Public Accounting Firm
To the Board of Trustees of Fidelity Income Fund and Shareholders of Fidelity Government Income Fund
Opinion on the Financial Statements
We have audited the accompanying statement of assets and liabilities, including the schedule of investments, of Fidelity Government Income Fund (one of the funds constituting Fidelity Income Fund, referred to hereafter as the "Fund") as of August 31, 2024, the related statement of operations for the year ended August 31, 2024, the statement of changes in net assets for each of the two years in the period ended August 31, 2024, including the related notes, and the financial highlights for each of the five years in the period ended August 31, 2024 (collectively referred to as the "financial statements"). In our opinion, the financial statements present fairly, in all material respects, the financial position of the Fund as of August 31, 2024, the results of its operations for the year then ended, the changes in its net assets for each of the two years in the period ended August 31, 2024 and the financial highlights for each of the five years in the period ended August 31, 2024 in conformity with accounting principles generally accepted in the United States of America.
Basis for Opinion
These financial statements are the responsibility of the Fund's management. Our responsibility is to express an opinion on the Fund's financial statements based on our audits. We are a public accounting firm registered with the Public Company Accounting Oversight Board (United States) (PCAOB) and are required to be independent with respect to the Fund in accordance with the U.S. federal securities laws and the applicable rules and regulations of the Securities and Exchange Commission and the PCAOB.
We conducted our audits of these financial statements in accordance with the standards of the PCAOB. Those standards require that we plan and perform the audit to obtain reasonable assurance about whether the financial statements are free of material misstatement, whether due to error or fraud.
Our audits included performing procedures to assess the risks of material misstatement of the financial statements, whether due to error or fraud, and performing procedures that respond to those risks. Such procedures included examining, on a test basis, evidence regarding the amounts and disclosures in the financial statements. Our audits also included evaluating the accounting principles used and significant estimates made by management, as well as evaluating the overall presentation of the financial statements. Our procedures included confirmation of securities owned as of August 31, 2024 by correspondence with the custodian and brokers; when replies were not received from brokers, we performed other auditing procedures. We believe that our audits provide a reasonable basis for our opinion.
/s/ PricewaterhouseCoopers LLP
Boston, Massachusetts
October 16, 2024
We have served as the auditor of one or more investment companies in the Fidelity group of funds since 1932.
Distributions
(Unaudited)The dividend and capital gains distributions for the fund(s) are available on Fidelity.com or Institutional.Fidelity.com.
A total of 45.78% of the dividends distributed during the fiscal year was derived from interest on U.S. Government securities which is generally exempt from state income tax.
The fund designates $89,710,958 of distributions paid in the calendar year 2023 as qualifying to be taxed as interest-related dividends for nonresident alien shareholders.
The fund designates $88,200,921 of distributions paid during the fiscal year ended 2024 as qualifying to be taxed as section 163(j) interest dividends.
The fund will notify shareholders in January 2025 of amounts for use in preparing 2024 income tax returns.
Item 8: Changes in and Disagreements with Accountants for Open-End Management Investment Companies
(Unaudited)
Note: This is not applicable for any fund included in this document.
Item 9: Proxy Disclosures for Open-End Management Investment Companies
(Unaudited)
| A special meeting of shareholders was held on October 18, 2023. The results of votes taken among shareholders on the proposal before them are reported below. Each vote reported represents one dollar of net asset value held on the record date for the meeting. |
| Proposal 1 |
| To elect a Board of Trustees. |
| | # of Votes | % of Votes |
| Abigail P. Johnson |
| Affirmative | 29,408,520,731.18 | 96.84 |
| Withheld | 958,659,352.64 | 3.16 |
| TOTAL | 30,367,180,083.82 | 100.00 |
| Jennifer Toolin McAuliffe |
| Affirmative | 29,484,249,185.02 | 97.09 |
| Withheld | 882,930,898.80 | 2.91 |
| TOTAL | 30,367,180,083.82 | 100.00 |
| Christine J. Thompson |
| Affirmative | 29,483,889,948.58 | 97.09 |
| Withheld | 883,290,135.24 | 2.91 |
| TOTAL | 30,367,180,083.82 | 100.00 |
| Elizabeth S. Acton |
| Affirmative | 29,471,265,000.64 | 97.05 |
| Withheld | 895,915,083.18 | 2.95 |
| TOTAL | 30,367,180,083.82 | 100.00 |
| Laura M. Bishop |
| Affirmative | 29,508,015,754.27 | 97.17 |
| Withheld | 859,164,329.55 | 2.83 |
| TOTAL | 30,367,180,083.82 | 100.00 |
| Ann E. Dunwoody |
| Affirmative | 29,470,432,034.14 | 97.05 |
| Withheld | 896,748,049.68 | 2.95 |
| TOTAL | 30,367,180,083.82 | 100.00 |
| John Engler |
| Affirmative | 29,326,181,411.39 | 96.57 |
| Withheld | 1,040,998,672.43 | 3.43 |
| TOTAL | 30,367,180,083.82 | 100.00 |
| Robert F. Gartland |
| Affirmative | 29,422,803,481.93 | 96.89 |
| Withheld | 944,376,601.89 | 3.11 |
| TOTAL | 30,367,180,083.82 | 100.00 |
| Robert W. Helm |
| Affirmative | 29,445,540,968.38 | 96.97 |
| Withheld | 921,639,115.44 | 3.03 |
| TOTAL | 30,367,180,083.82 | 100.00 |
| Arthur E. Johnson |
| Affirmative | 29,395,582,286.37 | 96.80 |
| Withheld | 971,597,797.45 | 3.20 |
| TOTAL | 30,367,180,083.82 | 100.00 |
| Michael E. Kenneally |
| Affirmative | 29,420,582,069.08 | 96.88 |
| Withheld | 946,598,014.74 | 3.12 |
| TOTAL | 30,367,180,083.82 | 100.00 |
| Mark A. Murray |
| Affirmative | 29,446,384,581.44 | 96.97 |
| Withheld | 920,795,502.38 | 3.03 |
| TOTAL | 30,367,180,083.82 | 100.00 |
| Carol J. Zierhoffer |
| Affirmative | 29,510,392,522.55 | 97.18 |
| Withheld | 856,787,561.27 | 2.82 |
| TOTAL | 30,367,180,083.82 | 100.00 |
| | | |
| Proposal 1 reflects trust-wide proposal and voting results. |
Item 10: Remuneration Paid to Directors, Officers, and others of Open-End Management Investment Companies
(Unaudited)
Note: This information is disclosed as part of the financial statements for each Fund as part of Item 7: Financial Statements and Financial Highlights for Open-End Management Investment companies.
Item 11: Statement Regarding Basis for Approval of Investment Advisory Contract
(Unaudited)
Note: This is not applicable for any fund included in this document.
1.537760.128
GOV-ANN-1024
Fidelity® Intermediate Government Income Fund
Annual Report
August 31, 2024
Contents
To view a fund's proxy voting guidelines and proxy voting record for the 12-month period ended June 30, visit http://www.fidelity.com/proxyvotingresults or visit the Securities and Exchange Commission's (SEC) web site at http://www.sec.gov.
You may also call 1-800-544-8544 to request a free copy of the proxy voting guidelines.
Standard & Poor's, S&P and S&P 500 are registered service marks of The McGraw-Hill Companies, Inc. and have been licensed for use by Fidelity Distributors Corporation.
Other third-party marks appearing herein are the property of their respective owners.
All other marks appearing herein are registered or unregistered trademarks or service marks of FMR LLC or an affiliated company. © 2024 FMR LLC. All rights reserved.
This report and the financial statements contained herein are submitted for the general information of the shareholders of the Fund. This report is not authorized for distribution to prospective investors in the Fund unless preceded or accompanied by an effective prospectus.
A fund files its complete schedule of portfolio holdings with the SEC for the first and third quarters of each fiscal year on Form N-PORT. Forms N-PORT are available on the SEC's web site at http://www.sec.gov. A fund's Forms N-PORT may be reviewed and copied at the SEC's Public Reference Room in Washington, DC. Information regarding the operation of the SEC's Public Reference Room may be obtained by calling 1-800-SEC-0330.
For a complete list of a fund's portfolio holdings, view the most recent holdings listing, semiannual report, or annual report on Fidelity's web site at http://www.fidelity.com, http://www.institutional.fidelity.com, or http://www.401k.com, as applicable.
NOT FDIC INSURED •MAY LOSE VALUE •NO BANK GUARANTEE
Neither the Fund nor Fidelity Distributors Corporation is a bank.
Item 7: Financial Statements and Financial Highlights for Open-End Management Investment Companies (Annual Report)
Fidelity® Intermediate Government Income Fund
Schedule of Investments August 31, 2024
Showing Percentage of Net Assets
| U.S. Government and Government Agency Obligations - 76.1% |
| | | Principal Amount (a) (000s) | Value ($) (000s) |
| U.S. Treasury Obligations - 75.7% | | | |
| U.S. Treasury Bonds: | | | |
| 4.125% 8/15/53 | | 3,026 | 2,972 |
| 4.25% 2/15/54 | | 350 | 351 |
| 4.25% 8/15/54 | | 1,170 | 1,177 |
| 4.625% 5/15/44 | | 340 | 354 |
| 4.625% 5/15/54 | | 2,030 | 2,170 |
| U.S. Treasury Notes: | | | |
| 0.25% 7/31/25 | | 6,029 | 5,806 |
| 0.25% 10/31/25 | | 840 | 802 |
| 0.375% 12/31/25 | | 4,210 | 4,005 |
| 0.75% 8/31/26 | | 12,364 | 11,616 |
| 1.125% 8/31/28 | | 53,595 | 48,403 |
| 1.25% 12/31/26 | | 3,278 | 3,090 |
| 1.25% 9/30/28 | | 580 | 525 |
| 1.5% 1/31/27 | | 5,049 | 4,777 |
| 1.875% 2/28/27 | | 5,600 | 5,341 |
| 2% 8/15/25 | | 34,301 | 33,533 |
| 2.5% 2/28/26 | | 9,441 | 9,223 |
| 2.625% 7/31/29 | | 410 | 389 |
| 2.75% 7/31/27 | | 2,880 | 2,797 |
| 2.75% 5/31/29 | | 2,897 | 2,771 |
| 2.75% 8/15/32 | | 13,693 | 12,663 |
| 2.875% 11/30/25 | | 6,513 | 6,406 |
| 2.875% 4/30/29 | | 600 | 578 |
| 2.875% 5/15/32 | | 2,646 | 2,475 |
| 3.125% 11/15/28 | | 8,510 | 8,298 |
| 3.375% 5/15/33 | | 290 | 279 |
| 3.5% 1/31/28 | | 1,920 | 1,903 |
| 3.5% 2/15/33 | | 730 | 710 |
| 3.625% 5/15/26 | | 2,030 | 2,016 |
| 3.625% 3/31/30 | | 4,740 | 4,704 |
| 3.75% 6/30/30 | | 18,410 | 18,375 |
| 3.875% 1/15/26 | | 1,680 | 1,674 |
| 3.875% 12/31/27 | | 1,800 | 1,806 |
| 3.875% 8/15/34 | | 2,820 | 2,809 |
| 4% 1/15/27 | | 4,740 | 4,754 |
| 4% 6/30/28 | | 8,620 | 8,694 |
| 4% 7/31/29 | | 200 | 202 |
| 4% 10/31/29 | | 6,300 | 6,369 |
| 4% 7/31/30 | | 2,560 | 2,588 |
| 4% 1/31/31 | | 700 | 708 |
| 4.125% 2/15/27 | | 22,940 | 23,082 |
| 4.125% 8/31/30 | | 3,770 | 3,838 |
| 4.125% 3/31/31 | | 3,670 | 3,738 |
| 4.125% 11/15/32 | | 3,130 | 3,189 |
| 4.25% 12/31/25 | | 2,030 | 2,031 |
| 4.25% 3/15/27 | | 9,250 | 9,344 |
| 4.25% 6/30/29 | | 3,960 | 4,047 |
| 4.25% 2/28/31 | | 4,250 | 4,358 |
| 4.25% 6/30/31 | | 4,920 | 5,049 |
| 4.375% 7/31/26 | | 1,000 | 1,008 |
| 4.375% 12/15/26 | | 760 | 768 |
| 4.375% 11/30/28 | | 6,350 | 6,503 |
| 4.375% 11/30/30 | | 2,016 | 2,080 |
| 4.375% 5/15/34 | | 670 | 694 |
| 4.5% 11/15/25 | | 2,400 | 2,407 |
| 4.5% 3/31/26 | | 3,237 | 3,257 |
| 4.625% 3/15/26 | | 620 | 625 |
| 4.625% 11/15/26 | | 12,958 | 13,155 |
| 4.625% 9/30/28 | | 10,550 | 10,891 |
| 4.625% 9/30/30 | | 11,400 | 11,910 |
| 4.875% 10/31/28 | | 258 | 269 |
| 4.875% 10/31/30 | | 12,410 | 13,143 |
TOTAL U.S. TREASURY OBLIGATIONS | | | 353,499 |
| Other Government Related - 0.4% | | | |
| Private Export Funding Corp. Secured 1.75% 11/15/24 | | 1,640 | 1,627 |
| TOTAL U.S. GOVERNMENT AND GOVERNMENT AGENCY OBLIGATIONS (Cost $360,930) | | | 355,126 |
| | | | |
| U.S. Government Agency - Mortgage Securities - 6.8% |
| | | Principal Amount (a) (000s) | Value ($) (000s) |
| Fannie Mae - 2.6% | | | |
| 1.5% 11/1/40 to 3/1/41 | | 1,049 | 878 |
| 2% 2/1/28 to 12/1/41 | | 3,733 | 3,262 |
| 2.5% 7/1/40 to 12/1/51 (b) | | 2,282 | 2,010 |
| 3% 2/1/31 to 2/1/52 (c) | | 3,182 | 2,989 |
| 3.5% 3/1/52 | | 442 | 408 |
| 5% 10/1/52 to 12/1/52 (c) | | 1,272 | 1,278 |
| 5.5% 6/1/53 | | 106 | 109 |
| 6% 6/1/53 to 3/1/54 (b)(c) | | 885 | 910 |
| 6.5% 3/1/54 | | 149 | 154 |
TOTAL FANNIE MAE | | | 11,998 |
| Freddie Mac - 2.2% | | | |
| 1.5% 12/1/40 to 4/1/41 | | 561 | 469 |
| 2% 2/1/41 to 7/1/41 | | 1,278 | 1,112 |
| 2.5% 1/1/41 to 2/1/42 | | 4,705 | 4,226 |
| 3% 12/1/30 to 9/1/34 | | 337 | 324 |
| 3.5% 1/1/34 to 3/1/52 (b)(c) | | 1,942 | 1,813 |
| 5% 10/1/52 to 12/1/52 (b) | | 1,195 | 1,201 |
| 5.5% 9/1/52 | | 248 | 252 |
| 6% 9/1/53 | | 47 | 48 |
| 6.5% 10/1/53 | | 706 | 738 |
TOTAL FREDDIE MAC | | | 10,183 |
| Ginnie Mae - 0.6% | | | |
| 2% 9/1/54 (d) | | 50 | 42 |
| 2% 9/1/54 (d) | | 200 | 168 |
| 2% 9/1/54 (d) | | 50 | 42 |
| 2% 9/1/54 (d) | | 100 | 84 |
| 2% 9/1/54 (d) | | 100 | 84 |
| 2% 9/1/54 (d) | | 50 | 42 |
| 2% 9/1/54 (d) | | 75 | 63 |
| 2% 10/1/54 (d) | | 100 | 84 |
| 2.5% 8/20/51 to 12/20/51 | | 1,331 | 1,148 |
| 6% 9/1/54 (d) | | 200 | 203 |
| 6% 9/1/54 (d) | | 350 | 355 |
| 6% 9/1/54 (d) | | 200 | 203 |
| 6% 9/1/54 (d) | | 150 | 152 |
| 6% 10/1/54 (d) | | 400 | 406 |
TOTAL GINNIE MAE | | | 3,076 |
| Uniform Mortgage Backed Securities - 1.4% | | | |
| 2% 9/1/54 (d) | | 150 | 123 |
| 2.5% 9/1/54 (d) | | 2,250 | 1,918 |
| 2.5% 9/1/54 (d) | | 550 | 469 |
| 2.5% 9/1/54 (d) | | 300 | 256 |
| 3% 9/1/54 (d) | | 3,700 | 3,280 |
| 3.5% 9/1/54 (d) | | 550 | 506 |
TOTAL UNIFORM MORTGAGE BACKED SECURITIES | | | 6,552 |
| TOTAL U.S. GOVERNMENT AGENCY - MORTGAGE SECURITIES (Cost $32,165) | | | 31,809 |
| | | | |
| Collateralized Mortgage Obligations - 3.4% |
| | | Principal Amount (a) (000s) | Value ($) (000s) |
| Private Sponsor - 0.1% | | | |
| Fannie Mae Series 2022-66, Class KA, 5% 10/25/52 | | 309 | 308 |
| U.S. Government Agency - 3.3% | | | |
| Fannie Mae: | | | |
| planned amortization class Series 2017-37 Class AB, 2.55% 9/25/46 | | 1,423 | 1,306 |
| sequential payer: | | | |
Series 2020-49 Class JA, 2% 8/25/44 | | 88 | 82 |
Series 2020-51 Class BA, 2% 6/25/46 | | 448 | 396 |
Series 2020-67 Class KZ, 3.25% 9/25/40 | | 411 | 384 |
Series 2021-85 Class L, 2.5% 8/25/48 | | 101 | 90 |
Series 2021-96 Class HA, 2.5% 2/25/50 | | 163 | 145 |
Series 2022-1 Class KA, 3% 5/25/48 | | 166 | 155 |
Series 2022-13 Class MA, 3% 5/25/44 | | 665 | 634 |
Series 2022-3: | | | |
Class G, 2% 11/25/47 | | 1,834 | 1,628 |
Class N, 2% 10/25/47 | | 1,294 | 1,159 |
Series 2022-4 Class B, 2.5% 5/25/49 | | 119 | 106 |
Series 2022-49 Class TE, 4.5% 12/25/48 | | 1,239 | 1,219 |
Series 2022-5: | | | |
Class 0, 2.5% 6/25/48 | | 186 | 168 |
Class BA, 2.5% 12/25/49 | | 234 | 205 |
Series 2022-65 Class GA, 5% 4/25/46 | | 1,302 | 1,288 |
Series 2022-7 Class A, 3% 5/25/48 | | 237 | 220 |
| Series 2020-45 Class JL, 3% 7/25/40 | | 30 | 28 |
| Series 2021-59 Class H, 2% 6/25/48 | | 106 | 88 |
| Series 2021-66: | | | |
Class DA, 2% 1/25/48 | | 114 | 95 |
Class DM, 2% 1/25/48 | | 121 | 101 |
| Freddie Mac: | | | |
| planned amortization class: | | | |
Series 2021-5122 Class TE, 1.5% 6/25/51 | | 486 | 409 |
Series 2022-5213 Class JM, 3.5% 9/25/51 | | 783 | 755 |
Series 2022-5214 Class CG, 3.5% 4/25/52 | | 276 | 264 |
Series 2022-5220 Class PK, 3.5% 1/25/51 | | 355 | 337 |
Series 2022-5224 Class DQ, 3.75% 8/25/44 | | 439 | 424 |
| sequential payer: | | | |
Series 2020-5018: | | | |
Class LC, 3% 10/25/40 | | 204 | 188 |
Class LT, 3.25% 10/25/40 | | 422 | 397 |
Class LY, 3% 10/25/40 | | 155 | 142 |
Series 2021-5175 Class CB, 2.5% 4/25/50 | | 590 | 524 |
Series 2021-5180 Class KA, 2.5% 10/25/47 | | 118 | 107 |
Series 2022-5189 Class DA, 2.5% 5/25/49 | | 122 | 109 |
Series 2022-5190 Class BA, 2.5% 11/25/47 | | 123 | 112 |
Series 2022-5191 Class CA, 2.5% 4/25/50 | | 138 | 122 |
Series 2022-5197 Class DA, 2.5% 11/25/47 | | 93 | 85 |
Series 2022-5198 Class BA, 2.5% 11/25/47 | | 422 | 386 |
Series 2022-5200 Class LA, 3% 10/25/48 | | 278 | 258 |
Series 2022-5202 Class LB, 2.5% 10/25/47 | | 100 | 91 |
| Series 2020-5041 Class LB, 3% 11/25/40 | | 347 | 320 |
| Series 2021-5083 Class VA, 1% 8/15/38 | | 1,110 | 1,049 |
| Freddie Mac Multi-family Structured pass-thru certificates sequential payer Series 2021-5159 Class GC, 2% 11/25/47 | | 94 | 84 |
TOTAL U.S. GOVERNMENT AGENCY | | | 15,660 |
| TOTAL COLLATERALIZED MORTGAGE OBLIGATIONS (Cost $15,496) | | | 15,968 |
| | | | |
| Commercial Mortgage Securities - 10.0% |
| | | Principal Amount (a) (000s) | Value ($) (000s) |
| Freddie Mac: | | | |
| floater Series 2024-K523 Class A/S, U.S. 30-Day Avg. Secured Overnight Fin. Rate (SOFR) Index + 0.550% 5.9012% 4/25/29 (e)(f) | | 2,300 | 2,300 |
| sequential payer: | | | |
Series 2015-K043 Class A2, 3.062% 12/25/24 | | 1,252 | 1,242 |
Series 2015-K049 Class A2, 3.01% 7/25/25 | | 1,069 | 1,052 |
Series 2015-K050 Class A2, 3.334% 8/25/25 (e) | | 1,148 | 1,132 |
Series 2015-K051 Class A2, 3.308% 9/25/25 | | 2,243 | 2,209 |
Series 2015-KPLB Class A, 2.77% 5/25/25 | | 1,300 | 1,277 |
Series 2016-K052 Class A2, 3.151% 11/25/25 | | 4,195 | 4,123 |
Series 2016-K055 Class A2, 2.673% 3/25/26 | | 2,200 | 2,140 |
Series 2017-K066 Class A2, 3.117% 6/25/27 | | 300 | 292 |
Series 2017-K729 Class A2, 3.136% 10/25/24 | | 586 | 583 |
Series 2018-K731 Class A2, 3.6% 2/25/25 | | 303 | 300 |
Series 2018-K732 Class A2, 3.7% 5/25/25 | | 1,707 | 1,690 |
Series 2018-K733 Class A2, 3.75% 8/25/25 | | 1,859 | 1,838 |
Series 2019-K735 Class A2, 2.862% 5/25/26 | | 1,066 | 1,040 |
Series 2019-K736 Class A2, 2.282% 7/25/26 | | 1,000 | 965 |
Series 2022-K747 Class A2, 2.05% 11/25/28 | | 500 | 460 |
Series K058 Class A2, 2.653% 8/25/26 | | 1,400 | 1,356 |
Series K073 Class A2, 3.35% 1/25/28 | | 300 | 292 |
| Series 2016-K059 Class A2, 3.12% 9/25/26 (e) | | 500 | 489 |
| Series K048 Class A2, 3.284% 6/25/25 (e) | | 8,934 | 8,820 |
| Series K053 Class A2, 2.995% 12/25/25 | | 2,300 | 2,255 |
| Series K056 Class A2, 2.525% 5/25/26 | | 2,000 | 1,939 |
| Series K063 Class A2, 3.43% 1/25/27 | | 500 | 491 |
| Series K734 Class A2, 3.208% 2/25/26 | | 900 | 884 |
| Freddie Mac Multi-family Structured pass-thru certificates: | | | |
| sequential payer Series 2015 K045 Class A2, 3.023% 1/25/25 | | 2,679 | 2,652 |
| Series K044 Class A2, 2.811% 1/25/25 | | 718 | 711 |
| FREMF 2015-KPLB Mortgage Trust Series 2015-KPLB Class B, 2.5% 5/25/25 (g) | | 4,350 | 4,251 |
| TOTAL COMMERCIAL MORTGAGE SECURITIES (Cost $46,647) | | | 46,783 |
| | | | |
| Money Market Funds - 5.2% |
| | | Shares | Value ($) (000s) |
Fidelity Cash Central Fund 5.39% (h) (Cost $24,364) | | 24,359,455 | 24,364 |
| | | | |
| TOTAL INVESTMENT IN SECURITIES - 101.5% (Cost $479,602) | 474,050 |
NET OTHER ASSETS (LIABILITIES) - (1.5)% | (7,034) |
| NET ASSETS - 100.0% | 467,016 |
| | |
| TBA Sale Commitments |
| | Principal Amount (a) (000s) | Value ($) (000s) |
| Ginnie Mae | | |
| 2% 9/1/54 | (100) | (84) |
| 2.5% 9/1/54 | (1,400) | (1,223) |
| 6% 9/1/54 | (400) | (406) |
| | | |
| TOTAL GINNIE MAE | | (1,713) |
| | | |
| Uniform Mortgage Backed Securities | | |
| 2% 9/1/54 | (150) | (123) |
| 2.5% 9/1/54 | (1,975) | (1,684) |
| 2.5% 9/1/54 | (5,900) | (5,030) |
| 2.5% 10/1/54 | (2,250) | (1,920) |
| 3% 9/1/54 | (3,700) | (3,280) |
| 3% 10/1/54 | (3,700) | (3,284) |
| 3.5% 9/1/54 | (550) | (506) |
| 3.5% 9/1/54 | (2,300) | (2,117) |
| 5% 9/1/54 | (1,100) | (1,092) |
| 5.5% 9/1/54 | (8,400) | (8,457) |
| | | |
| TOTAL UNIFORM MORTGAGE BACKED SECURITIES | | (27,493) |
| | | |
TOTAL TBA SALE COMMITMENTS (Proceeds $29,182) | | (29,206) |
| Futures Contracts |
| | Number of contracts | Expiration Date | Notional Amount ($) (000s) | Value ($) (000s) | Unrealized Appreciation/ (Depreciation) ($) (000s) |
| Purchased | | | | | |
| | | | | | |
| Treasury Contracts | | | | | |
| CBOT 10-Year U.S. Treasury Note Contracts (United States) | 412 | Dec 2024 | 46,788 | (361) | (361) |
| CBOT 2-Year U.S. Treasury Note Contracts (United States) | 451 | Dec 2024 | 93,604 | (109) | (109) |
| CBOT Long Term U.S. Treasury Bond Contracts (United States) | 21 | Dec 2024 | 2,586 | (51) | (51) |
| | | | | | |
| TOTAL PURCHASED | | | | | (521) |
| | | | | | |
| Sold | | | | | |
| | | | | | |
| Treasury Contracts | | | | | |
| CBOT 5-Year U.S. Treasury Note Contracts (United States) | 34 | Dec 2024 | 3,720 | 16 | 16 |
| | | | | | |
| TOTAL FUTURES CONTRACTS | | | | | (505) |
| The notional amount of futures purchased as a percentage of Net Assets is 30.6% |
| The notional amount of futures sold as a percentage of Net Assets is 0.8% |
For the period, the average monthly notional amount at value for futures contracts in the aggregate was $122,017,000.
| Interest Rate Swaps |
| Payment Received | Payment Frequency | Payment Paid | Payment Frequency | Clearinghouse / Counterparty(1) | Maturity Date | Notional Amount (000s)(2) | Value ($) (000s) | Upfront Premium Received/ (Paid) ($) (000s)(3) | Unrealized Appreciation/ (Depreciation) ($) (000s) |
| 3.75% | Annual | U.S. Secured Overnight Fin. Rate (SOFR) Index(4) | Annual | LCH | Sep 2026 | | 1,978 | 25 | 0 | 25 |
U.S. Secured Overnight Fin. Rate (SOFR) Index(4) | Annual | 3.5% | Annual | LCH | Sep 2027 | | 31,662 | (507) | 0 | (507) |
U.S. Secured Overnight Fin. Rate (SOFR) Index(4) | Annual | 3.5% | Annual | LCH | Sep 2031 | | 5,180 | (118) | 0 | (118) |
U.S. Secured Overnight Fin. Rate (SOFR) Index(4) | Annual | 3.75% | Annual | LCH | Sep 2044 | | 2,827 | 23 | 0 | 23 |
| TOTAL INTEREST RATE SWAPS | | | | | | | | (577) | 0 | (577) |
| | | | | | | | | | | |
(1)Swaps with LCH Clearnet Group (LCH) are centrally cleared swaps.
(2)Notional amount is stated in U.S. Dollars unless otherwise noted.
(3)Any premiums for centrally cleared swaps are recorded periodically throughout the term of the swap to variation margin and included in unrealized appreciation (depreciation).
(4)Represents floating rate.
Any values shown as $0 in the Schedule of Investments may reflect amounts less than $500.
Legend
| (a) | Amount is stated in United States dollars unless otherwise noted. |
| (b) | Security or a portion of the security was pledged to cover margin requirements for centrally cleared swaps. At period end, the value of securities pledged amounted to $1,249,000. |
| (c) | Security or a portion of the security was pledged to cover margin requirements for futures contracts. At period end, the value of securities pledged amounted to $1,509,000. |
| (d) | Security or a portion of the security purchased on a delayed delivery or when-issued basis. |
| (e) | Coupon rates for floating and adjustable rate securities reflect the rates in effect at period end. |
| (f) | Coupon is indexed to a floating interest rate which may be multiplied by a specified factor and/or subject to caps or floors. |
| (g) | Security exempt from registration under Rule 144A of the Securities Act of 1933. These securities may be resold in transactions exempt from registration, normally to qualified institutional buyers. At the end of the period, the value of these securities amounted to $4,251,000 or 0.9% of net assets. |
| (h) | Affiliated fund that is generally available only to investment companies and other accounts managed by Fidelity Investments. The rate quoted is the annualized seven-day yield of the fund at period end. A complete unaudited listing of the fund's holdings as of its most recent quarter end is available upon request. In addition, each Fidelity Central Fund's financial statements, which are not covered by the Fund's Report of Independent Registered Public Accounting Firm, are available on the SEC's website or upon request. |
Affiliated Central Funds
Fiscal year to date information regarding the Fund's investments in Fidelity Central Funds, including the ownership percentage, is presented below.
| Affiliate (Amounts in thousands) | Value, beginning of period ($) | Purchases ($) | Sales Proceeds ($) | Dividend Income ($) | Realized Gain (loss) ($) | Change in Unrealized appreciation (depreciation) ($) | Value, end of period ($) | % ownership, end of period |
| Fidelity Cash Central Fund 5.39% | 27,215 | 159,868 | 162,719 | 745 | - | - | 24,364 | 0.1% |
| Fidelity Securities Lending Cash Central Fund 5.39% | - | 75,656 | 75,656 | 1 | - | - | - | 0.0% |
| Total | 27,215 | 235,524 | 238,375 | 746 | - | - | 24,364 | |
| | | | | | | | | |
Amounts in the dividend income column in the above table include any capital gain distributions from underlying funds, which are presented in the corresponding line item in the Statement of Operations, if applicable.
Amounts in the dividend income column for Fidelity Securities Lending Cash Central Fund represents the income earned on investing cash collateral, less rebates paid to borrowers and any lending agent fees associated with the loan, plus any premium payments received for lending certain types of securities.
Amounts included in the purchases and sales proceeds columns may include in-kind transactions, if applicable.
Investment Valuation
The following is a summary of the inputs used, as of August 31, 2024, involving the Fund's assets and liabilities carried at fair value. The inputs or methodology used for valuing securities may not be an indication of the risk associated with investing in those securities. For more information on valuation inputs, and their aggregation into the levels used below, please refer to the Investment Valuation section in the accompanying Notes to Financial Statements.
| Valuation Inputs at Reporting Date: |
Description (Amounts in thousands) | Total ($) | Level 1 ($) | Level 2 ($) | Level 3 ($) |
Investments in Securities: | | | | |
|
| U.S. Government and Government Agency Obligations | 355,126 | - | 355,126 | - |
|
| U.S. Government Agency - Mortgage Securities | 31,809 | - | 31,809 | - |
|
| Collateralized Mortgage Obligations | 15,968 | - | 15,968 | - |
|
| Commercial Mortgage Securities | 46,783 | - | 46,783 | - |
|
| Money Market Funds | 24,364 | 24,364 | - | - |
| Total Investments in Securities: | 474,050 | 24,364 | 449,686 | - |
Derivative Instruments: Assets | | | | |
Futures Contracts | 16 | 16 | - | - |
Swaps | 48 | - | 48 | - |
| Total Assets | 64 | 16 | 48 | - |
| Liabilities | | | | |
Futures Contracts | (521) | (521) | - | - |
Swaps | (625) | - | (625) | - |
| Total Liabilities | (1,146) | (521) | (625) | - |
| Total Derivative Instruments: | (1,082) | (505) | (577) | - |
Other Financial Instruments: | | | | |
TBA Sale Commitments | (29,206) | - | (29,206) | - |
| Total Other Financial Instruments: | (29,206) | - | (29,206) | - |
Value of Derivative Instruments
The following table is a summary of the Fund's value of derivative instruments by primary risk exposure as of August 31, 2024. For additional information on derivative instruments, please refer to the Derivative Instruments section in the accompanying Notes to Financial Statements.
Primary Risk Exposure / Derivative Type | Value |
| (Amounts in thousands) | Asset ($) | Liability ($) |
| Interest Rate Risk | | |
Futures Contracts (a) | 16 | (521) |
Swaps (b) | 48 | (625) |
| Total Interest Rate Risk | 64 | (1,146) |
| Total Value of Derivatives | 64 | (1,146) |
(a)Reflects gross cumulative appreciation (depreciation) on futures contracts as presented in the Schedule of Investments. In the Statement of Assets and Liabilities, the period end daily variation margin is included in receivable or payable for daily variation margin on futures contracts, and the net cumulative appreciation (depreciation) is included in Total accumulated earnings (loss).
(b)For centrally cleared swaps, reflects gross cumulative appreciation (depreciation) as presented in the Schedule of Investments. In the Statement of Assets and Liabilities, the period end daily variation margin for centrally cleared swaps is included in receivable or payable for daily variation margin on centrally cleared swaps, and the net cumulative appreciation (depreciation) for centrally cleared swaps is included in Total accumulated earnings (loss).
Financial Statements
| Statement of Assets and Liabilities |
As of August 31, 2024 Amounts in thousands (except per-share amount) |
| Assets | | | | |
| Investment in securities, at value - See accompanying schedule: | | | | |
Unaffiliated issuers (cost $455,238) | $ | 449,686 | | |
Fidelity Central Funds (cost $24,364) | | 24,364 | | |
| | | | | |
| | | | | |
| Total Investment in Securities (cost $479,602) | | | $ | 474,050 |
| Receivable for TBA sale commitments | | | | 29,182 |
| Receivable for fund shares sold | | | | 392 |
| Interest receivable | | | | 3,096 |
| Distributions receivable from Fidelity Central Funds | | | | 102 |
| Receivable for daily variation margin on centrally cleared swaps | | | | 48 |
Total assets | | | | 506,870 |
| Liabilities | | | | |
| Payable for investments purchased | | | | |
Regular delivery | $ | 1,180 | | |
Delayed delivery | | 8,511 | | |
| TBA sale commitments, at value | | 29,206 | | |
| Payable for fund shares redeemed | | 263 | | |
| Distributions payable | | 315 | | |
| Accrued management fee | | 109 | | |
| Payable for daily variation margin on futures contracts | | 204 | | |
| Other affiliated payables | | 66 | | |
| Total liabilities | | | | 39,854 |
| Net Assets | | | $ | 467,016 |
| Net Assets consist of: | | | | |
| Paid in capital | | | $ | 492,097 |
| Total accumulated earnings (loss) | | | | (25,081) |
| Net Assets | | | $ | 467,016 |
Net Asset Value, offering price and redemption price per share ($467,016 ÷ 47,396 shares) | | | $ | 9.85 |
| Statement of Operations |
| Year ended August 31, 2024 Amounts in thousands |
| Investment Income | | | | |
| Interest | | | $ | 14,091 |
| Income from Fidelity Central Funds (including $1 from security lending) | | | | 746 |
| Total income | | | | 14,837 |
| Expenses | | | | |
| Management fee | $ | 1,256 | | |
| Transfer agent fees | | 435 | | |
| Fund wide operations fee | | 266 | | |
| Independent trustees' fees and expenses | | 2 | | |
| Total expenses before reductions | | 1,959 | | |
| Expense reductions | | (4) | | |
| Total expenses after reductions | | | | 1,955 |
| Net Investment income (loss) | | | | 12,882 |
| Realized and Unrealized Gain (Loss) | | | | |
| Net realized gain (loss) on: | | | | |
| Investment Securities: | | | | |
| Unaffiliated issuers | | (3,391) | | |
| Futures contracts | | 744 | | |
| Swaps | | (129) | | |
| Total net realized gain (loss) | | | | (2,776) |
| Change in net unrealized appreciation (depreciation) on: | | | | |
| Investment Securities: | | | | |
| Unaffiliated issuers | | 17,310 | | |
| Futures contracts | | (825) | | |
| Swaps | | (576) | | |
| TBA Sale commitments | | (25) | | |
| Total change in net unrealized appreciation (depreciation) | | | | 15,884 |
| Net gain (loss) | | | | 13,108 |
| Net increase (decrease) in net assets resulting from operations | | | $ | 25,990 |
| Statement of Changes in Net Assets |
| |
| Amount in thousands | | Year ended August 31, 2024 | | Year ended August 31, 2023 |
| Increase (Decrease) in Net Assets | | | | |
| Operations | | | | |
| Net investment income (loss) | $ | 12,882 | $ | 6,349 |
| Net realized gain (loss) | | (2,776) | | (7,559) |
| Change in net unrealized appreciation (depreciation) | | 15,884 | | (1,621) |
| Net increase (decrease) in net assets resulting from operations | | 25,990 | | (2,831) |
| Distributions to shareholders | | (11,712) | | (5,994) |
| | | | | |
| Share transactions | | | | |
| Proceeds from sales of shares | | 139,038 | | 140,404 |
| Reinvestment of distributions | | 8,499 | | 5,201 |
| Cost of shares redeemed | | (89,662) | | (88,892) |
| | | | | |
Net increase (decrease) in net assets resulting from share transactions | | 57,875 | | 56,713 |
| Total increase (decrease) in net assets | | 72,153 | | 47,888 |
| | | | | |
| Net Assets | | | | |
| Beginning of period | | 394,863 | | 346,975 |
| End of period | $ | 467,016 | $ | 394,863 |
| | | | | |
| Other Information | | | | |
| Shares | | | | |
| Sold | | 14,532 | | 14,589 |
| Issued in reinvestment of distributions | | 884 | | 541 |
| Redeemed | | (9,367) | | (9,243) |
| Net increase (decrease) | | 6,049 | | 5,887 |
| | | | | |
Financial Highlights
Fidelity® Intermediate Government Income Fund |
| |
| Years ended August 31, | | 2024 | | 2023 | | 2022 | | 2021 | | 2020 |
Selected Per-Share Data | | | | | | | | | | |
| Net asset value, beginning of period | $ | 9.55 | $ | 9.79 | $ | 10.78 | $ | 11.15 | $ | 10.77 |
| Income from Investment Operations | | | | | | | | | | |
Net investment income (loss) A,B | | .284 | | .180 | | .115 | | .102 | | .166 |
| Net realized and unrealized gain (loss) | | .274 | | (.251) | | (.989) | | (.220) | | .376 |
| Total from investment operations | | .558 | | (.071) | | (.874) | | (.118) | | .542 |
| Distributions from net investment income | | (.258) | | (.169) | | (.109) | | (.091) | | (.162) |
| Distributions from net realized gain | | - | | - | | (.007) | | (.161) | | - |
| Total distributions | | (.258) | | (.169) | | (.116) | | (.252) | | (.162) |
| Net asset value, end of period | $ | 9.85 | $ | 9.55 | $ | 9.79 | $ | 10.78 | $ | 11.15 |
Total Return C | | | | (.72)% | | (8.15)% | | (1.07)% | | 5.07% |
Ratios to Average Net Assets B,D,E | | | | | | | | | | |
| Expenses before reductions | | .45% | | .45% | | .45% | | .45% | | .45% |
| Expenses net of fee waivers, if any | | | | .45% | | .45% | | .45% | | .45% |
| Expenses net of all reductions | | .45% | | .45% | | .45% | | .45% | | .45% |
| Net investment income (loss) | | 2.96% | | 1.88% | | 1.11% | | .94% | | 1.52% |
| Supplemental Data | | | | | | | | | | |
| Net assets, end of period (in millions) | $ | 467 | $ | 395 | $ | 347 | $ | 454 | $ | 551 |
Portfolio turnover rate F | | | | 113% | | 159% | | 220% | | 287% |
ACalculated based on average shares outstanding during the period.
BNet investment income (loss) is affected by the timing of the declaration of dividends by any underlying mutual funds or exchange-traded funds (ETFs). Net investment income (loss) of any mutual funds or ETFs is not included in the Fund's net investment income (loss) ratio.
CTotal returns would have been lower if certain expenses had not been reduced during the applicable periods shown.
DFees and expenses of any underlying mutual funds or exchange-traded funds (ETFs) are not included in the Fund's expense ratio. The Fund indirectly bears its proportionate share of these expenses. For additional expense information related to investments in Fidelity Central Funds, please refer to the "Investments in Fidelity Central Funds" note found in the Notes to Financial Statements section of the most recent Annual or Semi-Annual report.
EExpense ratios reflect operating expenses of the class. Expenses before reductions do not reflect amounts reimbursed, waived, or reduced through arrangements with the investment adviser, brokerage services, or other offset arrangements, if applicable, and do not represent the amount paid by the class during periods when reimbursements, waivers or reductions occur.
FAmount does not include the portfolio activity of any underlying mutual funds or exchange-traded funds (ETFs).
Notes to Financial Statements
For the period ended August 31, 2024
(Amounts in thousands except percentages)
1. Organization.
Fidelity Intermediate Government Income Fund (the Fund) is a fund of Fidelity Income Fund (the Trust) and is authorized to issue an unlimited number of shares. Share transactions on the Statement of Changes in Net Assets may contain exchanges between affiliated funds. The Trust is registered under the Investment Company Act of 1940, as amended (the 1940 Act), as an open-end management investment company organized as a Massachusetts business trust.
2. Investments in Fidelity Central Funds.
Funds may invest in Fidelity Central Funds, which are open-end investment companies generally available only to other investment companies and accounts managed by the investment adviser and its affiliates. The Schedule of Investments lists any Fidelity Central Funds held as an investment as of period end, but does not include the underlying holdings of each Fidelity Central Fund. An investing fund indirectly bears its proportionate share of the expenses of the underlying Fidelity Central Funds.
Based on its investment objective, each Fidelity Central Fund may invest or participate in various investment vehicles or strategies that are similar to those of the investing fund. These strategies are consistent with the investment objectives of the investing fund and may involve certain economic risks which may cause a decline in value of each of the Fidelity Central Funds and thus a decline in the value of the investing fund.
| Fidelity Central Fund | Investment Manager | Investment Objective | Investment Practices | Expense RatioA |
| Fidelity Money Market Central Funds | Fidelity Management & Research Company LLC (FMR) | Each fund seeks to obtain a high level of current income consistent with the preservation of capital and liquidity. | Short-term Investments | Less than .005% |
A Expenses expressed as a percentage of average net assets and are as of each underlying Central Fund's most recent annual or semi-annual shareholder report.
A complete unaudited list of holdings for each Fidelity Central Fund is available upon request or at the Securities and Exchange Commission website at www.sec.gov. In addition, the financial statements of the Fidelity Central Funds which contain the significant accounting policies (including investment valuation policies) of those funds, and are not covered by the Report of Independent Registered Public Accounting Firm, are available on the Securities and Exchange Commission website or upon request.
3. Significant Accounting Policies.
The Fund is an investment company and applies the accounting and reporting guidance of the Financial Accounting Standards Board (FASB) Accounting Standards Codification Topic 946 Financial Services - Investment Companies. The financial statements have been prepared in conformity with accounting principles generally accepted in the United States of America (GAAP), which require management to make certain estimates and assumptions at the date of the financial statements. Actual results could differ from those estimates. Subsequent events, if any, through the date that the financial statements were issued have been evaluated in the preparation of the financial statements. The Fund's Schedule of Investments lists any underlying mutual funds or exchange-traded funds (ETFs) but does not include the underlying holdings of these funds. The following summarizes the significant accounting policies of the Fund:
Investment Valuation. Investments are valued as of 4:00 p.m. Eastern time on the last calendar day of the period. The Board of Trustees (the Board) has designated the Fund's investment adviser as the valuation designee responsible for the fair valuation function and performing fair value determinations as needed. The investment adviser has established a Fair Value Committee (the Committee) to carry out the day-to-day fair valuation responsibilities and has adopted policies and procedures to govern the fair valuation process and the activities of the Committee. In accordance with these fair valuation policies and procedures, which have been approved by the Board, the Fund attempts to obtain prices from one or more third party pricing services or brokers to value its investments. When current market prices, quotations or currency exchange rates are not readily available or reliable, investments will be fair valued in good faith by the Committee, in accordance with the policies and procedures. Factors used in determining fair value vary by investment type and may include market or investment specific events, transaction data, estimated cash flows, and market observations of comparable investments. The frequency that the fair valuation procedures are used cannot be predicted and they may be utilized to a significant extent. The Committee manages the Fund's fair valuation practices and maintains the fair valuation policies and procedures. The Fund's investment adviser reports to the Board information regarding the fair valuation process and related material matters.
The Fund categorizes the inputs to valuation techniques used to value its investments into a disclosure hierarchy consisting of three levels as shown below:
Level 1 - unadjusted quoted prices in active markets for identical investments
Level 2 - other significant observable inputs (including quoted prices for similar investments, interest rates, prepayment speeds, etc.)
Level 3 - unobservable inputs (including the Fund's own assumptions based on the best information available)
Valuation techniques used to value the Fund's investments by major category are as follows:
Debt securities, including restricted securities, are valued based on evaluated prices received from third party pricing services or from brokers who make markets in such securities. U.S. government and government agency obligations are valued by pricing services who utilize matrix pricing which considers yield or price of bonds of comparable quality, coupon, maturity and type or by broker-supplied prices. Collateralized mortgage obligations, commercial mortgage securities, and U.S. government agency mortgage securities are valued by pricing services who utilize matrix pricing which considers prepayment speed assumptions, attributes of the collateral, yield or price of bonds of comparable quality, coupon, maturity and type or by broker-supplied prices. Swaps are marked-to-market daily based on valuations from third party pricing services, registered derivatives clearing organizations (clearinghouses) or broker-supplied valuations. These pricing sources may utilize inputs such as interest rate curves, credit spread curves, default possibilities and recovery rates. When independent prices are unavailable or unreliable, debt securities and swaps may be valued utilizing pricing methodologies which consider similar factors that would be used by third party pricing services. Debt securities and swaps are generally categorized as Level 2 in the hierarchy but may be Level 3 depending on the circumstances.
Futures contracts are valued at the settlement price established each day by the board of trade or exchange on which they are traded and are categorized as Level 1 in the hierarchy. Investments in open-end mutual funds, including the Fidelity Central Funds, are valued at their closing net asset value (NAV) each business day and are categorized as Level 1 in the hierarchy.
Changes in valuation techniques may result in transfers in or out of an assigned level within the disclosure hierarchy. The aggregate value of investments by input level as of August 31, 2024 is included at the end of the Fund's Schedule of Investments.
Investment Transactions and Income. For financial reporting purposes, the Fund's investment holdings and NAV include trades executed through the end of the last business day of the period. The NAV per share for processing shareholder transactions is calculated as of the close of business of the New York Stock Exchange (NYSE), normally 4:00 p.m. Eastern time and includes trades executed through the end of the prior business day. Gains and losses on securities sold are determined on the basis of identified cost and include proceeds received from litigation. Income and capital gain distributions from Fidelity Central Funds, if any, are recorded on the ex-dividend date. Interest income is accrued as earned and includes coupon interest and amortization of premium and accretion of discount on debt securities as applicable.
Expenses. Expenses directly attributable to a fund are charged to that fund. Expenses attributable to more than one fund are allocated among the respective funds on the basis of relative net assets or other appropriate methods. Expenses included in the accompanying financial statements reflect the expenses of that fund and do not include any expenses associated with any underlying mutual funds or exchange-traded funds. Although not included in a fund's expenses, a fund indirectly bears its proportionate share of these expenses through the net asset value of each underlying mutual fund or exchange-traded fund. Expense estimates are accrued in the period to which they relate and adjustments are made when actual amounts are known.
Income Tax Information and Distributions to Shareholders. Each year, the Fund intends to qualify as a regulated investment company under Subchapter M of the Internal Revenue Code, including distributing substantially all of its taxable income and realized gains. As a result, no provision for U.S. Federal income taxes is required. As of August 31, 2024, the Fund did not have any unrecognized tax benefits in the financial statements; nor is the Fund aware of any tax positions for which it is reasonably possible that the total amounts of unrecognized tax benefits will significantly change in the next twelve months. The Fund files a U.S. federal tax return, in addition to state and local tax returns as required. The Fund's federal income tax returns are subject to examination by the Internal Revenue Service (IRS) for a period of three fiscal years after they are filed. State and local tax returns may be subject to examination for an additional fiscal year depending on the jurisdiction.
Distributions are declared and recorded daily and paid monthly from net investment income. Distributions from realized gains, if any, are declared and recorded on the ex-dividend date. Income and capital gain distributions are determined in accordance with income tax regulations, which may differ from GAAP.
Capital accounts within the financial statements are adjusted for permanent book-tax differences. These adjustments have no impact on net assets or the results of operations. Capital accounts are not adjusted for temporary book-tax differences which will reverse in a subsequent period.
Book-tax differences are primarily due to futures contracts, swaps, market discount, capital loss carryforwards and losses deferred due to wash sales and futures contracts.
As of period end, the cost and unrealized appreciation (depreciation) in securities, and derivatives if applicable, for federal income tax purposes were as follows:
| Gross unrealized appreciation | $5,376 |
| Gross unrealized depreciation | (9,852) |
| Net unrealized appreciation (depreciation) | $(4,476) |
| Tax Cost | $477,782 |
The tax-based components of distributable earnings as of period end were as follows:
| Undistributed ordinary income | $458 |
| Capital loss carryforward | $(20,972) |
| Net unrealized appreciation (depreciation) on securities and other investments | $(4,568) |
Capital loss carryforwards are only available to offset future capital gains of the Fund to the extent provided by regulations and may be limited. The capital loss carryforward information presented below, including any applicable limitation, is estimated as of fiscal period end and is subject to adjustment.
Short-term | $(10,064) |
Long-term | (10,908) |
| Total capital loss carryforward | $(20,972) |
The tax character of distributions paid was as follows:
| | August 31, 2024 | August 31, 2023 |
| Ordinary Income | $11,712 | $5,994 |
| Total | $11,712 | $5,994 |
Delayed Delivery Transactions and When-Issued Securities. During the period, certain Funds transacted in securities on a delayed delivery or when-issued basis. Payment and delivery may take place after the customary settlement period for that security. The price of the underlying securities and the date when the securities will be delivered and paid for are fixed at the time the transaction is negotiated. Securities purchased on a delayed delivery or when-issued basis are identified as such in the Schedule of Investments. Compensation for interest forgone in the purchase of a delayed delivery or when-issued debt security may be received. With respect to purchase commitments, each applicable Fund identifies securities as segregated in its records with a value at least equal to the amount of the commitment. Payables and receivables associated with the purchases and sales of delayed delivery securities having the same coupon, settlement date and broker are offset. Delayed delivery or when-issued securities that have been purchased from and sold to different brokers are reflected as both payables and receivables in the Statement of Assets and Liabilities under the caption "Delayed delivery", as applicable. Losses may arise due to changes in the value of the underlying securities or if the counterparty does not perform under the contract's terms, or if the issuer does not issue the securities due to political, economic, or other factors.
To-Be-Announced (TBA) Securities and Mortgage Dollar Rolls. TBA securities involve buying or selling mortgage-backed securities (MBS) on a forward commitment basis. A TBA transaction typically does not designate the actual security to be delivered and only includes an approximate principal amount; however delivered securities must meet specified terms defined by industry guidelines, including issuer, rate and current principal amount outstanding on underlying mortgage pools. Funds may enter into a TBA transaction with the intent to take possession of or deliver the underlying MBS, or a fund may elect to extend the settlement by entering into either a mortgage or reverse mortgage dollar roll. Mortgage dollar rolls are transactions where a fund sells TBA securities and simultaneously agrees to repurchase MBS on a later date at a lower price and with the same counterparty. Reverse mortgage dollar rolls involve the purchase and simultaneous agreement to sell TBA securities on a later date at a lower price. Transactions in mortgage dollar rolls and reverse mortgage dollar rolls are accounted for as purchases and sales and may result in an increase to a fund's portfolio turnover rate.
Purchases and sales of TBA securities involve risks similar to those discussed above for delayed delivery and when-issued securities. Also, if the counterparty in a mortgage dollar roll or a reverse mortgage dollar roll transaction files for bankruptcy or becomes insolvent, a fund's right to repurchase or sell securities may be limited. Additionally, when a fund sells TBA securities without already owning or having the right to obtain the deliverable securities (an uncovered forward commitment to sell), it incurs a risk of loss because it could have to purchase the securities at a price that is higher than the price at which it sold them. A fund may be unable to purchase the deliverable securities if the corresponding market is illiquid.
TBA securities subject to a forward commitment to sell at period end are included at the end of the Schedule of Investments under the caption "TBA Sale Commitments." The value of these commitments and proceeds to be received at contractual settlement date are reflected in the Statement of Assets and Liabilities as "TBA sale commitments, at value" and "Receivable for TBA sale commitments," respectively. If the TBA sale commitment is closed through the acquisition of an offsetting TBA purchase commitment, a fund realizes a gain or loss. If a fund delivers securities under the commitment, a fund realizes a gain or loss from the sale of the securities based upon the price established at the date the commitment was entered into.
Restricted Securities (including Private Placements). Funds may invest in securities that are subject to legal or contractual restrictions on resale. These securities generally may be resold in transactions exempt from registration or to the public if the securities are registered. Disposal of these securities may involve time-consuming negotiations and expense, and prompt sale at an acceptable price may be difficult. Information regarding restricted securities held at period end is included at the end of the Schedule of Investments, if applicable.
4. Derivative Instruments.
Risk Exposures and the Use of Derivative Instruments. The Fund's investment objectives allow for various types of derivative instruments, including futures contracts, swaps and options. Derivatives are investments whose value is primarily derived from underlying assets, indices or reference rates and may be transacted on an exchange or over-the-counter (OTC). Derivatives may involve a future commitment to buy or sell a specified asset based on specified terms, to exchange future cash flows at periodic intervals based on a notional principal amount, or for one party to make one or more payments upon the occurrence of specified events in exchange for periodic payments from the other party.
Derivatives were used to increase returns, to gain exposure to certain types of assets and to manage exposure to certain risks as defined below. The success of any strategy involving derivatives depends on analysis of numerous economic factors, and if the strategies for investment do not work as intended, the objectives may not be achieved.
Derivatives were used to increase or decrease exposure to the following risk(s):
| | |
| Interest Rate Risk | Interest rate risk relates to the fluctuations in the value of interest-bearing securities due to changes in the prevailing levels of market interest rates. |
Funds are also exposed to additional risks from investing in derivatives, such as liquidity risk and counterparty credit risk. Liquidity risk is the risk that a fund will be unable to close out the derivative in the open market in a timely manner. Counterparty credit risk is the risk that the counterparty will not be able to fulfill its obligation to a fund. Derivative counterparty credit risk is managed through formal evaluation of the creditworthiness of all potential counterparties. On certain OTC derivatives such as options, a fund attempts to reduce its exposure to counterparty credit risk by entering into an International Swaps and Derivatives Association, Inc. (ISDA) Master Agreement with each of its counterparties. The ISDA Master Agreement gives a fund the right to terminate all transactions traded under such agreement upon the deterioration in the credit quality of the counterparty beyond specified levels. The ISDA Master Agreement gives each party the right, upon an event of default by the other party or a termination of the agreement, to close out all transactions traded under such agreement and to net amounts owed under each transaction to one net payable by one party to the other. To mitigate counterparty credit risk on bi-lateral OTC derivatives, a fund receives collateral in the form of cash or securities once net unrealized appreciation on outstanding derivative contracts under an ISDA Master Agreement exceeds certain applicable thresholds, subject to certain minimum transfer provisions. The collateral received is held in segregated accounts with the custodian bank in accordance with the collateral agreements entered into between a fund, the counterparty and the custodian bank. A fund could experience delays and costs in gaining access to the collateral even though it is held by the custodian bank. The maximum risk of loss to a fund from counterparty credit risk related to bi-lateral OTC derivatives is generally the aggregate unrealized appreciation and unpaid counterparty payments in excess of any collateral pledged by the counterparty to a fund. A fund may be required to pledge collateral for the benefit of the counterparties on bi-lateral OTC derivatives in an amount not less than each counterparty's unrealized appreciation on outstanding derivative contracts, subject to certain minimum transfer provisions, and any such pledged collateral is identified in the Schedule of Investments. Exchange-traded contracts are not covered by the ISDA Master Agreement; however counterparty credit risk related to these contracts may be mitigated by the protection provided by the exchange on which they trade. Counterparty credit risk related to centrally cleared swaps may be mitigated by the protection provided by the clearinghouse.
Investing in derivatives may involve greater risks than investing in the underlying assets directly and, to varying degrees, may involve risk of loss in excess of any initial investment and collateral received and amounts recognized in the Statement of Assets and Liabilities. In addition, there may be the risk that the change in value of the derivative contract does not correspond to the change in value of the underlying instrument.
Net Realized Gain (Loss) and Change in Net Unrealized Appreciation (Depreciation) on Derivatives. The table below, which reflects the impacts of derivatives on the financial performance, summarizes the net realized gain (loss) and change in net unrealized appreciation (depreciation) for derivatives during the period as presented in the Statement of Operations.
| Primary Risk Exposure / Derivative Type | Net Realized Gain (Loss)($) | Change in Net Unrealized Appreciation (Depreciation)($) |
| Fidelity Intermediate Government Income Fund | | |
| Interest Rate Risk | | |
| Futures Contracts | 744 | (825) |
| Purchased Options | (11) | - |
| Swaps | (129) | (576) |
| Total Interest Rate Risk | 604 | (1,401) |
| Totals | 604 | (1,401) |
If there are any open positions at period end, a summary of the value of derivatives by primary risk exposure is included at the end of the Schedule of Investments.
Futures Contracts. A futures contract is an agreement between two parties to buy or sell a specified underlying instrument for a fixed price at a specified future date. Futures contracts were used to manage exposure to the bond market and fluctuations in interest rates.
Upon entering into a futures contract, a fund is required to deposit either cash or securities (initial margin) with a clearing broker in an amount equal to a certain percentage of the face value of the contract. Futures contracts are marked-to-market daily and subsequent daily payments are made or received by a fund depending on the daily fluctuations in the value of the futures contracts and are recorded as unrealized appreciation or (depreciation). This receivable and/or payable, if any, is included in daily variation margin on futures contracts in the Statement of Assets and Liabilities. Realized gain or (loss) is recorded upon the expiration or closing of a futures contract. The net realized gain (loss) and change in net unrealized appreciation (depreciation) on futures contracts during the period is presented in the Statement of Operations.
Any open futures contracts at period end are presented in the Schedule of Investments under the caption "Futures Contracts". The notional amount at value reflects each contract's exposure to the underlying instrument or index at period end, and is representative of volume of activity during the period unless an average notional amount is presented. Any securities deposited to meet initial margin requirements are identified in the Schedule of Investments. Any cash deposited to meet initial margin requirements is presented as segregated cash with brokers for derivative instruments in the Statement of Assets and Liabilities.
Options. Options give the purchaser the right, but not the obligation, to buy (call) or sell (put) an underlying security or financial instrument at an agreed exercise or strike price between or on certain dates. Options obligate the seller (writer) to buy (put) or sell (call) an underlying instrument at the exercise or strike price or cash settle an underlying derivative instrument if the holder exercises the option on or before the expiration date. OTC options, such as swaptions, which are options where the underlying instrument is a swap, were used to manage exposure to fluctuations in interest rates.
Upon entering into an options contract, a fund will pay or receive a premium. Premiums paid on purchased options are reflected as cost of investments and premiums received on written options are reflected as a liability on the Statement of Assets and Liabilities. Certain options may be purchased or written with premiums to be paid or received on a future date. Options are valued daily and any unrealized appreciation (depreciation) is reflected in total accumulated earnings (loss) in the Statement of Assets and Liabilities. When an option is exercised, the cost or proceeds of the underlying instrument purchased or sold is adjusted by the amount of the premium. When an option is closed, a gain or loss is realized depending on whether the proceeds or amount paid for the closing sale transaction is greater or less than the premium received or paid. When an option expires, gains and losses are realized to the extent of premiums received and paid, respectively. The net realized and unrealized gains (losses) on purchased options are included in the Statement of Operations in net realized gain (loss) and change in net unrealized appreciation (depreciation) on investment securities. The net realized gain (loss) and change in net unrealized appreciation (depreciation) on written options are presented in the Statement of Operations.
Any open options at period end are presented in the Schedule of Investments under the captions "Purchased Options," "Purchased Swaptions," "Written Options" and "Written Swaptions," as applicable, and are representative of volume of activity during the period unless an average notional amount is presented.
Writing puts and buying calls tend to increase exposure to the underlying instrument while buying puts and writing calls tend to decrease exposure to the underlying instrument. For purchased options, risk of loss is limited to the premium paid, and for written options, risk of loss is the change in value in excess of the premium received.
Swaps. A swap is a contract between two parties to exchange future cash flows at periodic intervals based on a notional principal amount. A centrally cleared swap is a transaction executed between a fund and a dealer counterparty, then cleared by a futures commission merchant (FCM) through a clearinghouse. Once cleared, the clearinghouse serves as a central counterparty, with whom a fund exchanges cash flows for the life of the transaction, similar to transactions in futures contracts.
Centrally cleared swaps require a fund to deposit either cash or securities (initial margin) with the FCM, at the instruction of and for the benefit of the clearinghouse. Any securities deposited to meet initial margin requirements are identified in the Schedule of Investments. Any cash deposited to meet initial margin requirements is presented in segregated cash with brokers for derivative instruments in the Statement of Assets and Liabilities. Centrally cleared swaps are marked-to-market daily and subsequent payments (variation margin) are made or received depending on the daily fluctuations in the value of the swaps and are recorded as unrealized appreciation or (depreciation). These daily payments, if any, are included in receivable or payable for daily variation margin on centrally cleared swaps in the Statement of Assets and Liabilities. Any premiums for centrally cleared swaps are recorded periodically throughout the term of the swap to variation margin and included in total accumulated earnings (loss) in the Statement of Assets and Liabilities. Any premiums are recognized as realized gain (loss) upon termination or maturity of the swap.
Payments are exchanged at specified intervals, accrued daily commencing with the effective date of the contract and recorded as realized gain or (loss). Some swaps may be terminated prior to the effective date and realize a gain or loss upon termination. The net realized gain (loss) and change in net unrealized appreciation (depreciation) on swaps during the period is presented in the Statement of Operations.
Any open swaps at period end are included in the Schedule of Investments under the caption "Swaps", and are representative of volume of activity during the period unless an average notional amount is presented.
Interest Rate Swaps. Interest rate swaps are agreements between counterparties to exchange cash flows, one based on a fixed rate, and the other on a floating rate. A fund enters into interest rate swaps to manage its exposure to interest rate changes. Changes in interest rates can have an effect on both the value of bond holdings as well as the amount of interest income earned. In general, the value of bonds can fall when interest rates rise and can rise when interest rates fall.
5. Purchases and Sales of Investments.
Purchases and sales of securities, other than short-term securities, U.S. government securities and in-kind transactions, as applicable, are noted in the table below.
| | Purchases ($) | Sales ($) |
| Fidelity Intermediate Government Income Fund | 435,691 | 453,938 |
6. Fees and Other Transactions with Affiliates.
Management Fee. Fidelity Management & Research Company LLC (the investment adviser) and its affiliates provide the Fund with investment management related services for which the Fund pays a monthly management fee. Effective March 1, 2024, the Fund pays a monthly management fee that is based on an annual rate of .282% of the Fund's average net assets.
Prior to March 1, 2024, the management fee was the sum of an individual fund fee rate that was based on an annual rate of .20% of the Fund's average net assets and an annualized group fee rate that averaged .10% during the period. The group fee rate was based upon the monthly average net assets of a group of registered investment companies with which the investment adviser has management contracts. The group fee rate decreased as assets under management increased and increased as assets under management decreased.
For the reporting period, the total annual management fee rate was .29% of the Fund's average net assets.
Transfer Agent Fees. Fidelity Investments Institutional Operations Company LLC (FIIOC), an affiliate of the investment adviser, is the Fund's transfer, dividend disbursing and shareholder servicing agent. FIIOC receives an asset-based fee of .10% of the Fund's average net assets. FIIOC pays for typesetting, printing and mailing of shareholder reports, except proxy statements.
Fund Wide Operations Fee. Pursuant to the Fund Wide Operations and Expense Agreement (FWOE), the investment adviser has agreed to provide for fund-level expenses (which may not include transfer agent, the compensation of the independent Trustees, interest, taxes or extraordinary expenses, as applicable) in return for a FWOE fee equal to .35% of fund-level average net assets less the total amount of the management fee. The FWOE paid by a fund is reduced by an amount equal to the fees and expenses paid to the independent Trustees. For the period, the FWOE fees were equivalent to the following annual rate expressed as a percentage of average net assets:
| Fidelity Intermediate Government Income Fund | .06% |
Interfund Trades. Funds may purchase from or sell securities to other Fidelity Funds under procedures adopted by the Board. The procedures have been designed to ensure these interfund trades are executed in accordance with Rule 17a-7 of the 1940 Act. Any interfund trades are included within the respective purchases and sales amounts shown in the Purchases and Sales of Investments note. During the period, there were no interfund trades.
Sub-Advisory Arrangements. Effective March 1, 2024, each Fund's sub-advisory agreements with FMR Investment Management (UK) Limited, Fidelity Management & Research (Hong Kong) Limited, and Fidelity Management & Research (Japan) Limited were amended to provide that the investment adviser pays each sub-adviser monthly fees equal to 110% of the sub-adviser's costs for providing sub-advisory services.
7. Committed Line of Credit.
Certain Funds participate with other funds managed by the investment adviser or an affiliate in a $4.25 billion credit facility (the "line of credit") to be utilized for temporary or emergency purposes to fund shareholder redemptions or for other short-term liquidity purposes. The commitment fees on the pro-rata portion of the line of credit are borne by the investment adviser. During the period, there were no borrowings on this line of credit.
8. Security Lending.
Funds lend portfolio securities from time to time in order to earn additional income. Lending agents are used, including National Financial Services (NFS), an affiliate of the investment adviser. Pursuant to a securities lending agreement, NFS will receive a fee, which is capped at 9.9% of a fund's daily lending revenue, for its services as lending agent. A fund may lend securities to certain qualified borrowers, including NFS. On the settlement date of the loan, a fund receives collateral (in the form of U.S. Treasury obligations, letters of credit and/or cash) against the loaned securities and maintains collateral in an amount not less than 100% of the market value of the loaned securities during the period of the loan. The market value of the loaned securities is determined at the close of business of a fund and any additional required collateral is delivered to a fund on the next business day. A fund or borrower may terminate the loan at any time, and if the borrower defaults on its obligation to return the securities loaned because of insolvency or other reasons, a fund may apply collateral received from the borrower against the obligation. A fund may experience delays and costs in recovering the securities loaned. Any cash collateral received is invested in the Fidelity Securities Lending Cash Central Fund. Any loaned securities are identified as such in the Schedule of Investments, and the value of loaned securities and cash collateral at period end, as applicable, are presented in the Statement of Assets and Liabilities. Security lending income represents the income earned on investing cash collateral, less rebates paid to borrowers and any lending agent fees associated with the loan, plus any premium payments received for lending certain types of securities. Security lending income is presented in the Statement of Operations as a component of income from Fidelity Central Funds. Affiliated security lending activity, if any, was as follows:
| | Total Security Lending Fees Paid to NFS ($) | Security Lending Income From Securities Loaned to NFS ($) | Value of Securities Loaned to NFS at Period End ($) |
| Fidelity Intermediate Government Income Fund | - A | - | - |
A Amount represents less than five hundred dollars.
9. Expense Reductions.
Through arrangements with the Fund's custodian, credits realized as a result of certain uninvested cash balances were used to reduce the Fund's expenses by $4.
10. Other.
A fund's organizational documents provide former and current trustees and officers with a limited indemnification against liabilities arising in connection with the performance of their duties to the fund. In the normal course of business, a fund may also enter into contracts that provide general indemnifications. A fund's maximum exposure under these arrangements is unknown as this would be dependent on future claims that may be made against a fund. The risk of material loss from such claims is considered remote.
11. Risk and Uncertainties.
Many factors affect a fund's performance. Developments that disrupt global economies and financial markets, such as pandemics, epidemics, outbreaks of infectious diseases, war, terrorism, and environmental disasters, may significantly affect a fund's investment performance. The effects of these developments to a fund will be impacted by the types of securities in which a fund invests, the financial condition, industry, economic sector, and geographic location of an issuer, and a fund's level of investment in the securities of that issuer. Significant concentrations in security types, issuers, industries, sectors, and geographic locations may magnify the factors that affect a fund's performance.
Report of Independent Registered Public Accounting Firm
To the Board of Trustees of Fidelity Income Fund and Shareholders of Fidelity Intermediate Government Income Fund
Opinion on the Financial Statements
We have audited the accompanying statement of assets and liabilities, including the schedule of investments, of Fidelity Intermediate Government Income Fund (one of the funds constituting Fidelity Income Fund, referred to hereafter as the "Fund") as of August 31, 2024, the related statement of operations for the year ended August 31, 2024, the statement of changes in net assets for each of the two years in the period ended August 31, 2024, including the related notes, and the financial highlights for each of the five years in the period ended August 31, 2024 (collectively referred to as the "financial statements"). In our opinion, the financial statements present fairly, in all material respects, the financial position of the Fund as of August 31, 2024, the results of its operations for the year then ended, the changes in its net assets for each of the two years in the period ended August 31, 2024 and the financial highlights for each of the five years in the period ended August 31, 2024 in conformity with accounting principles generally accepted in the United States of America.
Basis for Opinion
These financial statements are the responsibility of the Fund's management. Our responsibility is to express an opinion on the Fund's financial statements based on our audits. We are a public accounting firm registered with the Public Company Accounting Oversight Board (United States) (PCAOB) and are required to be independent with respect to the Fund in accordance with the U.S. federal securities laws and the applicable rules and regulations of the Securities and Exchange Commission and the PCAOB.
We conducted our audits of these financial statements in accordance with the standards of the PCAOB. Those standards require that we plan and perform the audit to obtain reasonable assurance about whether the financial statements are free of material misstatement, whether due to error or fraud.
Our audits included performing procedures to assess the risks of material misstatement of the financial statements, whether due to error or fraud, and performing procedures that respond to those risks. Such procedures included examining, on a test basis, evidence regarding the amounts and disclosures in the financial statements. Our audits also included evaluating the accounting principles used and significant estimates made by management, as well as evaluating the overall presentation of the financial statements. Our procedures included confirmation of securities owned as of August 31, 2024 by correspondence with the custodian and brokers. We believe that our audits provide a reasonable basis for our opinion.
/s/ PricewaterhouseCoopers LLP
Boston, Massachusetts
October 16, 2024
We have served as the auditor of one or more investment companies in the Fidelity group of funds since 1932.
Distributions
(Unaudited)
The dividend and capital gains distributions for the fund(s) are available on Fidelity.com or Institutional.Fidelity.com.
A total of 71.65% of the dividends distributed during the fiscal year was derived from interest on U.S. Government securities which is generally exempt from state income tax.
The fund designates $7,763,709 of distributions paid in the calendar year 2023 as qualifying to be taxed as interest-related dividends for nonresident alien shareholders.
The fund designates $11,712,453 of distributions paid during the fiscal year ended 2024 as qualifying to be taxed as section 163(j) interest dividends.
The fund will notify shareholders in January 2025 of amounts for use in preparing 2024 income tax returns.
Item 8: Changes in and Disagreements with Accountants for Open-End Management Investment Companies
(Unaudited)
Note: This is not applicable for any fund included in this document.
Item 9: Proxy Disclosures for Open-End Management Investment Companies
(Unaudited)
| A special meeting of shareholders was held on October 18, 2023. The results of votes taken among shareholders on the proposal before them are reported below. Each vote reported represents one dollar of net asset value held on the record date for the meeting. |
| Proposal 1 |
| To elect a Board of Trustees. |
| | # of Votes | % of Votes |
| Abigail P. Johnson |
| Affirmative | 29,408,520,731.18 | 96.84 |
| Withheld | 958,659,352.64 | 3.16 |
| TOTAL | 30,367,180,083.82 | 100.00 |
| Jennifer Toolin McAuliffe |
| Affirmative | 29,484,249,185.02 | 97.09 |
| Withheld | 882,930,898.80 | 2.91 |
| TOTAL | 30,367,180,083.82 | 100.00 |
| Christine J. Thompson |
| Affirmative | 29,483,889,948.58 | 97.09 |
| Withheld | 883,290,135.24 | 2.91 |
| TOTAL | 30,367,180,083.82 | 100.00 |
| Elizabeth S. Acton |
| Affirmative | 29,471,265,000.64 | 97.05 |
| Withheld | 895,915,083.18 | 2.95 |
| TOTAL | 30,367,180,083.82 | 100.00 |
| Laura M. Bishop |
| Affirmative | 29,508,015,754.27 | 97.17 |
| Withheld | 859,164,329.55 | 2.83 |
| TOTAL | 30,367,180,083.82 | 100.00 |
| Ann E. Dunwoody |
| Affirmative | 29,470,432,034.14 | 97.05 |
| Withheld | 896,748,049.68 | 2.95 |
| TOTAL | 30,367,180,083.82 | 100.00 |
| John Engler |
| Affirmative | 29,326,181,411.39 | 96.57 |
| Withheld | 1,040,998,672.43 | 3.43 |
| TOTAL | 30,367,180,083.82 | 100.00 |
| Robert F. Gartland |
| Affirmative | 29,422,803,481.93 | 96.89 |
| Withheld | 944,376,601.89 | 3.11 |
| TOTAL | 30,367,180,083.82 | 100.00 |
| Robert W. Helm |
| Affirmative | 29,445,540,968.38 | 96.97 |
| Withheld | 921,639,115.44 | 3.03 |
| TOTAL | 30,367,180,083.82 | 100.00 |
| Arthur E. Johnson |
| Affirmative | 29,395,582,286.37 | 96.80 |
| Withheld | 971,597,797.45 | 3.20 |
| TOTAL | 30,367,180,083.82 | 100.00 |
| Michael E. Kenneally |
| Affirmative | 29,420,582,069.08 | 96.88 |
| Withheld | 946,598,014.74 | 3.12 |
| TOTAL | 30,367,180,083.82 | 100.00 |
| Mark A. Murray |
| Affirmative | 29,446,384,581.44 | 96.97 |
| Withheld | 920,795,502.38 | 3.03 |
| TOTAL | 30,367,180,083.82 | 100.00 |
| Carol J. Zierhoffer |
| Affirmative | 29,510,392,522.55 | 97.18 |
| Withheld | 856,787,561.27 | 2.82 |
| TOTAL | 30,367,180,083.82 | 100.00 |
| | | |
| Proposal 1 reflects trust-wide proposal and voting results. |
Item 10: Remuneration Paid to Directors, Officers, and others of Open-End Management Investment Companies
(Unaudited)
Note: This information is disclosed as part of the financial statements for each Fund as part of Item 7: Financial Statements and Financial Highlights for Open-End Management Investment companies.
Item 11: Statement Regarding Basis for Approval of Investment Advisory Contract
(Unaudited)
Note: This is not applicable for any fund included in this document.
1.844593.119
SLM-ANN-1024
Fidelity® Series Government Bond Index Fund
Annual Report
August 31, 2024
Contents
To view a fund's proxy voting guidelines and proxy voting record for the 12-month period ended June 30, visit http://www.fidelity.com/proxyvotingresults or visit the Securities and Exchange Commission's (SEC) web site at http://www.sec.gov.
You may also call 1-800-544-8544 to request a free copy of the proxy voting guidelines.
BLOOMBERG ® is a trademark and service mark of Bloomberg Finance L.P. and its affiliates (collectively "Bloomberg"). Bloomberg or Bloomberg's licensors own all proprietary rights in the Bloomberg Indices. Neither Bloomberg nor Bloomberg's licensors approves or endorses this material, or guarantees the accuracy or completeness of any information herein, or makes any warranty, express or implied, as to the results to be obtained therefrom and, to the maximum extent allowed by law, neither shall have any liability or responsibility for injury or damages arising in connection therewith.
Standard & Poor's, S&P and S&P 500 are registered service marks of The McGraw-Hill Companies, Inc. and have been licensed for use by Fidelity Distributors Corporation.
Other third-party marks appearing herein are the property of their respective owners.
All other marks appearing herein are registered or unregistered trademarks or service marks of FMR LLC or an affiliated company. © 2024 FMR LLC. All rights reserved.
This report and the financial statements contained herein are submitted for the general information of the shareholders of the Fund. This report is not authorized for distribution to prospective investors in the Fund unless preceded or accompanied by an effective prospectus.
A fund files its complete schedule of portfolio holdings with the SEC for the first and third quarters of each fiscal year on Form N-PORT. Forms N-PORT are available on the SEC's web site at http://www.sec.gov. A fund's Forms N-PORT may be reviewed and copied at the SEC's Public Reference Room in Washington, DC. Information regarding the operation of the SEC's Public Reference Room may be obtained by calling 1-800-SEC-0330.
For a complete list of a fund's portfolio holdings, view the most recent holdings listing, semiannual report, or annual report on Fidelity's web site at http://www.fidelity.com, http://www.institutional.fidelity.com, or http://www.401k.com, as applicable.
NOT FDIC INSURED •MAY LOSE VALUE •NO BANK GUARANTEE
Neither the Fund nor Fidelity Distributors Corporation is a bank.
Item 7: Financial Statements and Financial Highlights for Open-End Management Investment Companies (Annual Report)
Fidelity® Series Government Bond Index Fund
Schedule of Investments August 31, 2024
Showing Percentage of Net Assets
| U.S. Government and Government Agency Obligations - 98.8% |
| | | Principal Amount (a) | Value ($) |
| U.S. Government Agency Obligations - 2.2% | | | |
| Fannie Mae: | | | |
| 0.5% 6/17/25 | | 5,000 | 4,844 |
| 0.625% 4/22/25 | | 814,000 | 793,930 |
| 0.875% 12/18/26 | | 1,200,000 | 1,116,129 |
| 0.875% 8/5/30 | | 1,057,000 | 891,280 |
| 1.625% 1/7/25 | | 15,000 | 14,825 |
| 1.875% 9/24/26 | | 674,000 | 646,614 |
| 2.125% 4/24/26 | | 221,000 | 214,387 |
| 2.625% 9/6/24 | | 9,000 | 8,998 |
| 5.625% 7/15/37 | | 163,000 | 185,578 |
| 6.25% 5/15/29 | | 71,000 | 78,638 |
| 7.125% 1/15/30 | | 6,000 | 6,949 |
| 7.25% 5/15/30 | | 866,000 | 1,014,655 |
| Federal Farm Credit Bank: | | | |
| 0.72% 10/27/26 | | 500,000 | 465,545 |
| 1% 10/7/26 | | 1,000,000 | 938,352 |
| 1.3% 3/30/27 | | 130,000 | 121,641 |
| 3% 8/3/26 | | 1,560,000 | 1,530,917 |
| 5.125% 10/10/25 | | 800,000 | 806,995 |
| Federal Home Loan Bank: | | | |
| 1% 12/20/24 | | 330,000 | 325,993 |
| 1% 3/23/26 | | 994,500 | 946,758 |
| 1.25% 10/26/26 | | 1,060,000 | 999,015 |
| 3.25% 11/16/28 | | 1,850,000 | 1,811,629 |
| 5.5% 7/15/36 | | 100,000 | 112,275 |
| Freddie Mac: | | | |
| 0.375% 9/23/25 | | 3,210,000 | 3,078,516 |
| 6.25% 7/15/32 | | 585,000 | 676,318 |
| 6.75% 9/15/29 | | 185,000 | 210,207 |
| 6.75% 3/15/31 | | 173,000 | 200,940 |
| Tennessee Valley Authority: | | | |
| 4.625% 9/15/60 | | 2,440,000 | 2,344,350 |
| 4.875% 1/15/48 | | 630,000 | 645,988 |
TOTAL U.S. GOVERNMENT AGENCY OBLIGATIONS | | | 20,192,266 |
| U.S. Treasury Obligations - 96.6% | | | |
| U.S. Treasury Bonds: | | | |
| 1.125% 5/15/40 | | 2,031,000 | 1,314,596 |
| 1.125% 8/15/40 | | 1,674,000 | 1,073,976 |
| 1.25% 5/15/50 | | 5,591,000 | 2,937,241 |
| 1.375% 11/15/40 | | 12,447,000 | 8,266,558 |
| 1.375% 8/15/50 | | 645,000 | 349,308 |
| 1.625% 11/15/50 | | 10,384,000 | 6,004,467 |
| 1.75% 8/15/41 | | 6,948,000 | 4,829,674 |
| 1.875% 2/15/41 | | 3,726,000 | 2,679,518 |
| 1.875% 2/15/51 | | 4,303,000 | 2,653,573 |
| 1.875% 11/15/51 | | 5,819,000 | 3,570,502 |
| 2% 11/15/41 | | 5,551,000 | 4,006,478 |
| 2% 2/15/50 | | 5,143,000 | 3,292,725 |
| 2% 8/15/51 | | 12,301,000 | 7,798,642 |
| 2.25% 5/15/41 | | 3,180,000 | 2,417,173 |
| 2.25% 8/15/46 | | 1,700,000 | 1,195,047 |
| 2.25% 8/15/49 | | 2,544,000 | 1,731,113 |
| 2.25% 2/15/52 | | 8,250,000 | 5,550,381 |
| 2.375% 2/15/42 | | 9,280,000 | 7,084,230 |
| 2.375% 11/15/49 | | 259,000 | 180,885 |
| 2.375% 5/15/51 | | 5,419,000 | 3,760,066 |
| 2.5% 2/15/45 | | 930,000 | 698,445 |
| 2.5% 2/15/46 | | 2,660,000 | 1,974,946 |
| 2.75% 8/15/42 | | 3,058,000 | 2,467,304 |
| 2.75% 11/15/42 | | 370,000 | 297,388 |
| 2.75% 8/15/47 | | 9,501,000 | 7,281,626 |
| 2.75% 11/15/47 | | 450,000 | 344,145 |
| 2.875% 5/15/43 | | 4,159,000 | 3,383,899 |
| 2.875% 8/15/45 | | 66,000 | 52,725 |
| 2.875% 11/15/46 | | 3,491,000 | 2,757,072 |
| 2.875% 5/15/49 | | 1,225,000 | 950,667 |
| 2.875% 5/15/52 | | 6,670,000 | 5,154,659 |
| 3% 5/15/42 | | 3,938,000 | 3,312,535 |
| 3% 11/15/44 | | 2,025,000 | 1,660,105 |
| 3% 5/15/45 | | 303,000 | 247,703 |
| 3% 11/15/45 | | 3,672,000 | 2,990,959 |
| 3% 2/15/47 | | 5,615,000 | 4,524,681 |
| 3% 5/15/47 | | 8,000 | 6,436 |
| 3% 2/15/48 | | 1,326,000 | 1,060,230 |
| 3% 8/15/48 | | 519,000 | 413,740 |
| 3% 8/15/52 | | 8,700,000 | 6,901,207 |
| 3.125% 11/15/41 | | 500,000 | 432,891 |
| 3.125% 2/15/42 | | 70,000 | 60,296 |
| 3.125% 2/15/43 | | 137,000 | 116,236 |
| 3.125% 8/15/44 | | 2,393,000 | 2,005,166 |
| 3.125% 5/15/48 | | 5,311,000 | 4,338,216 |
| 3.25% 5/15/42 | | 3,260,000 | 2,840,530 |
| 3.375% 8/15/42 | | 3,690,000 | 3,265,073 |
| 3.375% 5/15/44 | | 4,699,000 | 4,100,795 |
| 3.375% 11/15/48 | | 710,000 | 605,025 |
| 3.625% 8/15/43 | | 2,541,000 | 2,311,020 |
| 3.625% 2/15/44 | | 2,000,000 | 1,814,297 |
| 3.625% 2/15/53 | | 1,480,000 | 1,327,548 |
| 3.625% 5/15/53 | | 1,040,000 | 933,522 |
| 3.75% 8/15/41 | | 275,000 | 260,219 |
| 3.75% 11/15/43 | | 4,495,000 | 4,156,646 |
| 3.875% 8/15/40 | | 2,366,000 | 2,296,961 |
| 3.875% 2/15/43 | | 480,000 | 454,256 |
| 4% 11/15/42 | | 2,340,000 | 2,257,734 |
| 4% 11/15/52 | | 7,560,000 | 7,255,238 |
| 4.125% 8/15/53 | | 1,340,000 | 1,315,870 |
| 4.25% 11/15/40 | | 92,000 | 93,305 |
| 4.25% 2/15/54 | | 3,770,000 | 3,784,727 |
| 4.25% 8/15/54 | | 1,440,000 | 1,449,000 |
| 4.375% 2/15/38 | | 410,000 | 426,576 |
| 4.375% 11/15/39 | | 523,000 | 539,854 |
| 4.375% 8/15/43 | | 2,560,000 | 2,585,200 |
| 4.5% 2/15/36 (b) | | 2,211,000 | 2,342,537 |
| 4.5% 2/15/44 | | 2,440,000 | 2,501,000 |
| 4.625% 2/15/40 | | 1,569,000 | 1,664,182 |
| 4.625% 5/15/54 | | 2,730,000 | 2,917,688 |
| 4.75% 2/15/41 | | 432,000 | 464,383 |
| 4.75% 11/15/53 | | 3,000,000 | 3,268,125 |
| 5% 5/15/37 | | 1,471,000 | 1,624,248 |
| 5.25% 11/15/28 | | 2,005,000 | 2,122,167 |
| 5.25% 2/15/29 | | 10,944,000 | 11,655,787 |
| 5.375% 2/15/31 | | 1,960,000 | 2,143,061 |
| 5.5% 8/15/28 | | 4,147,000 | 4,425,627 |
| 6.25% 5/15/30 | | 6,070,000 | 6,834,204 |
| 6.375% 8/15/27 | | 1,460,000 | 1,567,333 |
| 6.5% 11/15/26 | | 980,000 | 1,040,829 |
| U.S. Treasury Notes: | | | |
| 0.25% 6/30/25 | | 273,000 | 263,722 |
| 0.25% 8/31/25 | | 1,460,000 | 1,401,737 |
| 0.25% 9/30/25 | | 7,888,000 | 7,552,452 |
| 0.25% 10/31/25 | | 1,882,000 | 1,796,942 |
| 0.375% 11/30/25 | | 1,170,000 | 1,115,705 |
| 0.375% 12/31/25 | | 12,964,000 | 12,331,499 |
| 0.375% 1/31/26 | | 10,300,000 | 9,772,125 |
| 0.375% 7/31/27 | | 23,102,000 | 20,940,700 |
| 0.375% 9/30/27 | | 1,530,000 | 1,379,869 |
| 0.5% 2/28/26 | | 8,512,000 | 8,071,105 |
| 0.5% 4/30/27 | | 8,887,000 | 8,146,880 |
| 0.5% 5/31/27 | | 5,115,000 | 4,677,228 |
| 0.5% 6/30/27 | | 4,825,000 | 4,401,116 |
| 0.5% 8/31/27 | | 4,183,000 | 3,797,216 |
| 0.5% 10/31/27 | | 5,860,000 | 5,290,481 |
| 0.625% 7/31/26 | | 10,650,000 | 10,001,432 |
| 0.625% 3/31/27 | | 4,626,000 | 4,264,232 |
| 0.625% 11/30/27 | | 6,368,000 | 5,759,309 |
| 0.625% 12/31/27 | | 2,957,000 | 2,667,537 |
| 0.625% 5/15/30 | | 3,797,000 | 3,188,887 |
| 0.625% 8/15/30 | | 11,548,000 | 9,622,732 |
| 0.75% 3/31/26 | | 10,784,000 | 10,241,430 |
| 0.75% 4/30/26 | | 15,816,000 | 14,986,896 |
| 0.75% 5/31/26 | | 10,550,000 | 9,975,107 |
| 0.75% 8/31/26 | | 16,762,000 | 15,747,768 |
| 0.75% 1/31/28 | | 2,797,000 | 2,528,226 |
| 0.875% 6/30/26 | | 26,656,000 | 25,207,618 |
| 0.875% 9/30/26 | | 256,000 | 240,720 |
| 0.875% 11/15/30 | | 16,129,000 | 13,560,331 |
| 1% 7/31/28 | | 1,010,000 | 909,118 |
| 1.125% 10/31/26 | | 6,850,000 | 6,459,871 |
| 1.125% 2/28/27 | | 5,768,000 | 5,398,713 |
| 1.125% 8/31/28 | | 1,748,000 | 1,578,594 |
| 1.25% 11/30/26 | | 5,578,000 | 5,265,981 |
| 1.25% 12/31/26 | | 1,130,000 | 1,065,246 |
| 1.25% 3/31/28 | | 1,660,000 | 1,520,651 |
| 1.25% 4/30/28 | | 8,813,000 | 8,058,731 |
| 1.25% 5/31/28 | | 9,250,000 | 8,442,793 |
| 1.25% 6/30/28 | | 14,120,000 | 12,861,886 |
| 1.25% 9/30/28 | | 2,220,000 | 2,011,095 |
| 1.25% 8/15/31 | | 13,164,000 | 11,112,267 |
| 1.375% 8/31/26 | | 9,588,000 | 9,121,709 |
| 1.375% 10/31/28 | | 3,480,000 | 3,162,722 |
| 1.375% 12/31/28 | | 8,811,000 | 7,982,215 |
| 1.375% 11/15/31 | | 10,563,000 | 8,943,065 |
| 1.5% 8/15/26 | | 192,000 | 183,255 |
| 1.5% 1/31/27 | | 4,376,000 | 4,140,619 |
| 1.5% 11/30/28 | | 14,516,000 | 13,241,881 |
| 1.5% 2/15/30 | | 7,882,000 | 7,005,128 |
| 1.625% 2/15/26 | | 10,000 | 9,650 |
| 1.625% 5/15/26 | | 12,822,000 | 12,319,137 |
| 1.625% 9/30/26 | | 2,159,000 | 2,061,339 |
| 1.625% 10/31/26 | | 3,500,000 | 3,336,348 |
| 1.625% 8/15/29 | | 6,158,000 | 5,578,763 |
| 1.625% 5/15/31 | | 14,413,000 | 12,562,956 |
| 1.75% 1/31/29 | | 1,050,000 | 965,016 |
| 1.75% 11/15/29 | | 2,449,000 | 2,220,363 |
| 1.875% 7/31/26 | | 105,000 | 101,013 |
| 1.875% 2/28/27 | | 4,800,000 | 4,577,625 |
| 1.875% 2/28/29 | | 5,390,000 | 4,975,223 |
| 1.875% 2/15/32 | | 7,440,000 | 6,496,042 |
| 2% 2/15/25 | | 56,000 | 55,292 |
| 2% 8/15/25 | | 6,432,000 | 6,287,983 |
| 2% 11/15/26 | | 2,652,000 | 2,547,267 |
| 2.25% 2/15/27 | | 1,829,000 | 1,760,627 |
| 2.25% 8/15/27 | | 1,597,000 | 1,528,628 |
| 2.25% 11/15/27 | | 4,563,000 | 4,352,139 |
| 2.375% 4/30/26 | | 626,000 | 609,421 |
| 2.375% 5/15/27 | | 4,000 | 3,851 |
| 2.375% 3/31/29 | | 3,930,000 | 3,702,950 |
| 2.375% 5/15/29 | | 3,505,000 | 3,298,944 |
| 2.5% 2/28/26 | | 1,670,000 | 1,631,446 |
| 2.625% 12/31/25 | | 10,697,000 | 10,481,806 |
| 2.625% 1/31/26 | | 4,318,000 | 4,228,604 |
| 2.625% 5/31/27 | | 3,380,000 | 3,275,827 |
| 2.625% 2/15/29 | | 4,831,000 | 4,608,510 |
| 2.625% 7/31/29 | | 1,681,000 | 1,596,556 |
| 2.75% 8/31/25 | | 17,000 | 16,730 |
| 2.75% 4/30/27 | | 4,700,000 | 4,573,504 |
| 2.75% 7/31/27 | | 4,416,000 | 4,288,005 |
| 2.75% 2/15/28 | | 1,089,000 | 1,052,501 |
| 2.75% 5/31/29 | | 880,000 | 841,844 |
| 2.75% 8/15/32 | | 6,420,000 | 5,937,246 |
| 2.875% 4/30/25 | | 47,000 | 46,458 |
| 2.875% 5/31/25 | | 104,000 | 102,743 |
| 2.875% 11/30/25 | | 629,000 | 618,705 |
| 2.875% 5/15/28 | | 5,922,000 | 5,738,788 |
| 2.875% 8/15/28 | | 13,312,000 | 12,875,720 |
| 2.875% 4/30/29 | | 13,630,000 | 13,119,407 |
| 2.875% 5/15/32 | | 9,020,000 | 8,438,633 |
| 3% 9/30/25 | | 2,655,000 | 2,617,975 |
| 3% 10/31/25 | | 9,000 | 8,871 |
| 3.125% 8/15/25 | | 270,000 | 266,768 |
| 3.125% 8/31/27 | | 4,070,000 | 3,993,370 |
| 3.125% 11/15/28 | | 4,238,000 | 4,132,216 |
| 3.125% 8/31/29 | | 7,290,000 | 7,082,121 |
| 3.25% 6/30/27 | | 3,060,000 | 3,015,056 |
| 3.25% 6/30/29 | | 8,430,000 | 8,241,971 |
| 3.375% 5/15/33 | | 7,830,000 | 7,534,540 |
| 3.5% 9/15/25 | | 4,690,000 | 4,648,779 |
| 3.5% 1/31/30 | | 1,560,000 | 1,539,098 |
| 3.5% 2/15/33 | | 8,820,000 | 8,580,206 |
| 3.625% 8/31/29 | | 3,970,000 | 3,953,872 |
| 3.625% 3/31/30 | | 4,420,000 | 4,385,987 |
| 3.75% 6/30/30 | | 2,020,000 | 2,016,134 |
| 3.875% 11/30/27 | | 1,690,000 | 1,694,357 |
| 3.875% 12/31/27 | | 5,820,000 | 5,838,395 |
| 3.875% 9/30/29 | | 2,070,000 | 2,080,997 |
| 3.875% 11/30/29 | | 930,000 | 934,904 |
| 3.875% 12/31/29 | | 1,410,000 | 1,416,995 |
| 3.875% 8/15/33 | | 6,030,000 | 6,016,574 |
| 3.875% 8/15/34 | | 2,730,000 | 2,719,757 |
| 4% 2/15/26 | | 5,430,000 | 5,421,091 |
| 4% 1/15/27 | | 6,490,000 | 6,509,521 |
| 4% 2/29/28 | | 2,430,000 | 2,447,845 |
| 4% 10/31/29 | | 5,800,000 | 5,863,438 |
| 4% 2/28/30 | | 1,500,000 | 1,516,758 |
| 4% 1/31/31 | | 3,400,000 | 3,437,320 |
| 4% 2/15/34 | | 14,210,000 | 14,298,813 |
| 4.125% 10/31/27 | | 10,520,000 | 10,622,323 |
| 4.125% 8/31/30 | | 1,700,000 | 1,730,480 |
| 4.125% 11/15/32 | | 6,120,000 | 6,234,511 |
| 4.25% 10/15/25 | | 830,000 | 829,481 |
| 4.25% 1/31/26 | | 5,050,000 | 5,056,510 |
| 4.25% 2/28/31 | | 15,680,000 | 16,079,350 |
| 4.375% 8/31/28 | | 2,290,000 | 2,341,793 |
| 4.375% 5/15/34 | | 6,070,000 | 6,290,038 |
| 4.5% 5/31/29 | | 4,050,000 | 4,183,682 |
| 4.5% 11/15/33 | | 8,960,000 | 9,367,050 |
| 4.625% 9/30/30 | | 70,000 | 73,131 |
| 4.625% 4/30/31 | | 3,390,000 | 3,551,290 |
| 4.875% 10/31/28 | | 4,800,000 | 5,004,187 |
| 4.875% 10/31/30 | | 770,000 | 815,478 |
TOTAL U.S. TREASURY OBLIGATIONS | | | 907,387,182 |
| TOTAL U.S. GOVERNMENT AND GOVERNMENT AGENCY OBLIGATIONS (Cost $974,659,226) | | | 927,579,448 |
| | | | |
| Money Market Funds - 0.6% |
| | | Shares | Value ($) |
| Fidelity Cash Central Fund 5.39% (c) | | 4,770,775 | 4,771,729 |
| Fidelity Securities Lending Cash Central Fund 5.39% (c)(d) | | 1,209,179 | 1,209,300 |
| TOTAL MONEY MARKET FUNDS (Cost $5,981,029) | | | 5,981,029 |
| | | | |
| TOTAL INVESTMENT IN SECURITIES - 99.4% (Cost $980,640,255) | 933,560,477 |
NET OTHER ASSETS (LIABILITIES) - 0.6% | 5,714,512 |
| NET ASSETS - 100.0% | 939,274,989 |
| | |
Legend
| (a) | Amount is stated in United States dollars unless otherwise noted. |
| (b) | Security or a portion of the security is on loan at period end. |
| (c) | Affiliated fund that is generally available only to investment companies and other accounts managed by Fidelity Investments. The rate quoted is the annualized seven-day yield of the fund at period end. A complete unaudited listing of the fund's holdings as of its most recent quarter end is available upon request. In addition, each Fidelity Central Fund's financial statements, which are not covered by the Fund's Report of Independent Registered Public Accounting Firm, are available on the SEC's website or upon request. |
| (d) | Investment made with cash collateral received from securities on loan. |
Affiliated Central Funds
Fiscal year to date information regarding the Fund's investments in Fidelity Central Funds, including the ownership percentage, is presented below.
| Affiliate | Value, beginning of period ($) | Purchases ($) | Sales Proceeds ($) | Dividend Income ($) | Realized Gain (loss) ($) | Change in Unrealized appreciation (depreciation) ($) | Value, end of period ($) | % ownership, end of period |
| Fidelity Cash Central Fund 5.39% | 2,506,491 | 81,523,869 | 79,258,835 | 130,999 | 204 | - | 4,771,729 | 0.0% |
| Fidelity Securities Lending Cash Central Fund 5.39% | 204,375 | 78,707,006 | 77,702,081 | 5,750 | - | - | 1,209,300 | 0.0% |
| Total | 2,710,866 | 160,230,875 | 156,960,916 | 136,749 | 204 | - | 5,981,029 | |
| | | | | | | | | |
Amounts in the dividend income column in the above table include any capital gain distributions from underlying funds, which are presented in the corresponding line item in the Statement of Operations, if applicable.
Amounts in the dividend income column for Fidelity Securities Lending Cash Central Fund represents the income earned on investing cash collateral, less rebates paid to borrowers and any lending agent fees associated with the loan, plus any premium payments received for lending certain types of securities.
Amounts included in the purchases and sales proceeds columns may include in-kind transactions, if applicable.
Investment Valuation
The following is a summary of the inputs used, as of August 31, 2024, involving the Fund's assets and liabilities carried at fair value. The inputs or methodology used for valuing securities may not be an indication of the risk associated with investing in those securities. For more information on valuation inputs, and their aggregation into the levels used below, please refer to the Investment Valuation section in the accompanying Notes to Financial Statements.
| Valuation Inputs at Reporting Date: |
| Description | Total ($) | Level 1 ($) | Level 2 ($) | Level 3 ($) |
Investments in Securities: | | | | |
|
| U.S. Government and Government Agency Obligations | 927,579,448 | - | 927,579,448 | - |
|
| Money Market Funds | 5,981,029 | 5,981,029 | - | - |
| Total Investments in Securities: | 933,560,477 | 5,981,029 | 927,579,448 | - |
Financial Statements
| Statement of Assets and Liabilities |
As of August 31, 2024 |
| Assets | | | | |
| Investment in securities, at value (including securities loaned of $1,178,153) - See accompanying schedule: | | | | |
Unaffiliated issuers (cost $974,659,226) | $ | 927,579,448 | | |
Fidelity Central Funds (cost $5,981,029) | | 5,981,029 | | |
| | | | | |
| | | | | |
| Total Investment in Securities (cost $980,640,255) | | | $ | 933,560,477 |
| Receivable for investments sold | | | | 21,091,724 |
| Receivable for fund shares sold | | | | 1,564,856 |
| Interest receivable | | | | 5,115,439 |
| Distributions receivable from Fidelity Central Funds | | | | 20,919 |
Total assets | | | | 961,353,415 |
| Liabilities | | | | |
| Payable for investments purchased | $ | 16,797,152 | | |
| Payable for fund shares redeemed | | 4,067,730 | | |
| Other payables and accrued expenses | | 4,244 | | |
| Collateral on securities loaned | | 1,209,300 | | |
| Total liabilities | | | | 22,078,426 |
| Net Assets | | | $ | 939,274,989 |
| Net Assets consist of: | | | | |
| Paid in capital | | | $ | 1,013,932,220 |
| Total accumulated earnings (loss) | | | | (74,657,231) |
| Net Assets | | | $ | 939,274,989 |
Net Asset Value, offering price and redemption price per share ($939,274,989 ÷ 101,005,741 shares) | | | $ | 9.30 |
| Statement of Operations |
| Year ended August 31, 2024 |
| Investment Income | | | | |
| Interest | | | $ | 26,428,225 |
| Income from Fidelity Central Funds (including $5,750 from security lending) | | | | 136,749 |
| Total income | | | | 26,564,974 |
| Expenses | | | | |
| Custodian fees and expenses | $ | 10,000 | | |
| Independent trustees' fees and expenses | | 2,425 | | |
| Total expenses | | | | 12,425 |
| Net Investment income (loss) | | | | 26,552,549 |
| Realized and Unrealized Gain (Loss) | | | | |
| Net realized gain (loss) on: | | | | |
| Investment Securities: | | | | |
| Unaffiliated issuers | | (7,222,494) | | |
| Fidelity Central Funds | | 204 | | |
| Total net realized gain (loss) | | | | (7,222,290) |
| Change in net unrealized appreciation (depreciation) on investment securities | | | | 32,383,836 |
| Net gain (loss) | | | | 25,161,546 |
| Net increase (decrease) in net assets resulting from operations | | | $ | 51,714,095 |
| Statement of Changes in Net Assets |
| |
| | Year ended August 31, 2024 | | Year ended August 31, 2023 |
| Increase (Decrease) in Net Assets | | | | |
| Operations | | | | |
| Net investment income (loss) | $ | 26,552,549 | $ | 16,468,412 |
| Net realized gain (loss) | | (7,222,290) | | (9,872,885) |
| Change in net unrealized appreciation (depreciation) | | 32,383,836 | | (19,174,841) |
| Net increase (decrease) in net assets resulting from operations | | 51,714,095 | | (12,579,314) |
| Distributions to shareholders | | (26,552,320) | | (16,468,381) |
| | | | | |
| Share transactions | | | | |
| Proceeds from sales of shares | | 273,539,519 | | 278,231,194 |
| Reinvestment of distributions | | 26,547,116 | | 16,432,999 |
| Cost of shares redeemed | | (141,329,574) | | (100,002,628) |
| | | | | |
Net increase (decrease) in net assets resulting from share transactions | | 158,757,061 | | 194,661,565 |
| Total increase (decrease) in net assets | | 183,918,836 | | 165,613,870 |
| | | | | |
| Net Assets | | | | |
| Beginning of period | | 755,356,153 | | 589,742,283 |
| End of period | $ | 939,274,989 | $ | 755,356,153 |
| | | | | |
| Other Information | | | | |
| Shares | | | | |
| Sold | | 30,204,345 | | 30,192,350 |
| Issued in reinvestment of distributions | | 2,932,623 | | 1,787,752 |
| Redeemed | | (15,568,212) | | (10,873,343) |
| Net increase (decrease) | | 17,568,756 | | 21,106,759 |
| | | | | |
Financial Highlights
Fidelity® Series Government Bond Index Fund |
| |
| Years ended August 31, | | 2024 | | 2023 | | 2022 | | 2021 | | 2020 |
Selected Per-Share Data | | | | | | | | | | |
| Net asset value, beginning of period | $ | 9.05 | $ | 9.46 | $ | 10.73 | $ | 11.23 | $ | 10.76 |
| Income from Investment Operations | | | | | | | | | | |
Net investment income (loss) A,B | | .291 | | .228 | | .133 | | .118 | | .197 |
| Net realized and unrealized gain (loss) | | .250 | | (.412) | | (1.270) | | (.323) | | .504 |
| Total from investment operations | | .541 | | (.184) | | (1.137) | | (.205) | | .701 |
| Distributions from net investment income | | (.291) | | (.226) | | (.133) | | (.125) | | (.200) |
| Distributions from net realized gain | | - | | - | | - | | (.170) | | (.031) |
| Total distributions | | (.291) | | (.226) | | (.133) | | (.295) | | (.231) |
| Net asset value, end of period | $ | 9.30 | $ | 9.05 | $ | 9.46 | $ | 10.73 | $ | 11.23 |
Total Return C | | | | (1.96)% | | (10.66)% | | (1.85)% | | 6.60% |
Ratios to Average Net Assets B,D,E | | | | | | | | | | |
Expenses before reductions F | | -% | | -% | | -% | | -% | | -% |
Expenses net of fee waivers, if any F | | | | -% | | -% | | -% | | -% |
Expenses net of all reductions F | | -% | | -% | | -% | | -% | | -% |
| Net investment income (loss) | | 3.22% | | 2.48% | | 1.32% | | 1.11% | | 1.80% |
| Supplemental Data | | | | | | | | | | |
| Net assets, end of period (000 omitted) | $ | 939,275 | $ | 755,356 | $ | 589,742 | $ | 570,934 | $ | 240,514 |
Portfolio turnover rate G | | | | 26% | | 41% | | 23% | | 37% |
ACalculated based on average shares outstanding during the period.
BNet investment income (loss) is affected by the timing of the declaration of dividends by any underlying mutual funds or exchange-traded funds (ETFs). Net investment income (loss) of any mutual funds or ETFs is not included in the Fund's net investment income (loss) ratio.
CTotal returns would have been lower if certain expenses had not been reduced during the applicable periods shown.
DFees and expenses of any underlying mutual funds or exchange-traded funds (ETFs) are not included in the Fund's expense ratio. The Fund indirectly bears its proportionate share of these expenses. For additional expense information related to investments in Fidelity Central Funds, please refer to the "Investments in Fidelity Central Funds" note found in the Notes to Financial Statements section of the most recent Annual or Semi-Annual report.
EExpense ratios reflect operating expenses of the class. Expenses before reductions do not reflect amounts reimbursed, waived, or reduced through arrangements with the investment adviser, brokerage services, or other offset arrangements, if applicable, and do not represent the amount paid by the class during periods when reimbursements, waivers or reductions occur.
FAmount represents less than .005%.
GAmount does not include the portfolio activity of any underlying mutual funds or exchange-traded funds (ETFs).
Notes to Financial Statements
For the period ended August 31, 2024
1. Organization.
Fidelity Series Government Bond Index Fund (the Fund) is a fund of Fidelity Income Fund (the Trust) and is authorized to issue an unlimited number of shares. Shares are offered only to certain other Fidelity funds, Fidelity managed 529 plans, and Fidelity managed collective investment trusts. The Trust is registered under the Investment Company Act of 1940, as amended (the 1940 Act), as an open-end management investment company organized as a Massachusetts business trust.
2. Investments in Fidelity Central Funds.
Funds may invest in Fidelity Central Funds, which are open-end investment companies generally available only to other investment companies and accounts managed by the investment adviser and its affiliates. The Schedule of Investments lists any Fidelity Central Funds held as an investment as of period end, but does not include the underlying holdings of each Fidelity Central Fund. An investing fund indirectly bears its proportionate share of the expenses of the underlying Fidelity Central Funds.
Based on its investment objective, each Fidelity Central Fund may invest or participate in various investment vehicles or strategies that are similar to those of the investing fund. These strategies are consistent with the investment objectives of the investing fund and may involve certain economic risks which may cause a decline in value of each of the Fidelity Central Funds and thus a decline in the value of the investing fund.
| Fidelity Central Fund | Investment Manager | Investment Objective | Investment Practices | Expense RatioA |
| Fidelity Money Market Central Funds | Fidelity Management & Research Company LLC (FMR) | Each fund seeks to obtain a high level of current income consistent with the preservation of capital and liquidity. | Short-term Investments | Less than .005% |
A Expenses expressed as a percentage of average net assets and are as of each underlying Central Fund's most recent annual or semi-annual shareholder report.
A complete unaudited list of holdings for each Fidelity Central Fund is available upon request or at the Securities and Exchange Commission website at www.sec.gov. In addition, the financial statements of the Fidelity Central Funds which contain the significant accounting policies (including investment valuation policies) of those funds, and are not covered by the Report of Independent Registered Public Accounting Firm, are available on the Securities and Exchange Commission website or upon request.
3. Significant Accounting Policies.
The Fund is an investment company and applies the accounting and reporting guidance of the Financial Accounting Standards Board (FASB) Accounting Standards Codification Topic 946 Financial Services - Investment Companies. The financial statements have been prepared in conformity with accounting principles generally accepted in the United States of America (GAAP), which require management to make certain estimates and assumptions at the date of the financial statements. Actual results could differ from those estimates. Subsequent events, if any, through the date that the financial statements were issued have been evaluated in the preparation of the financial statements. The Fund's Schedule of Investments lists any underlying mutual funds or exchange-traded funds (ETFs) but does not include the underlying holdings of these funds. The following summarizes the significant accounting policies of the Fund:
Investment Valuation. Investments are valued as of 4:00 p.m. Eastern time on the last calendar day of the period. The Board of Trustees (the Board) has designated the Fund's investment adviser as the valuation designee responsible for the fair valuation function and performing fair value determinations as needed. The investment adviser has established a Fair Value Committee (the Committee) to carry out the day-to-day fair valuation responsibilities and has adopted policies and procedures to govern the fair valuation process and the activities of the Committee. In accordance with these fair valuation policies and procedures, which have been approved by the Board, the Fund attempts to obtain prices from one or more third party pricing services or brokers to value its investments. When current market prices, quotations or currency exchange rates are not readily available or reliable, investments will be fair valued in good faith by the Committee, in accordance with the policies and procedures. Factors used in determining fair value vary by investment type and may include market or investment specific events, transaction data, estimated cash flows, and market observations of comparable investments. The frequency that the fair valuation procedures are used cannot be predicted and they may be utilized to a significant extent. The Committee manages the Fund's fair valuation practices and maintains the fair valuation policies and procedures. The Fund's investment adviser reports to the Board information regarding the fair valuation process and related material matters.
The Fund categorizes the inputs to valuation techniques used to value its investments into a disclosure hierarchy consisting of three levels as shown below:
Level 1 - unadjusted quoted prices in active markets for identical investments
Level 2 - other significant observable inputs (including quoted prices for similar investments, interest rates, prepayment speeds, etc.)
Level 3 - unobservable inputs (including the Fund's own assumptions based on the best information available)
Valuation techniques used to value the Fund's investments by major category are as follows:
Debt securities, including restricted securities, are valued based on evaluated prices received from third party pricing services or from brokers who make markets in such securities. U.S. government and government agency obligations are valued by pricing services who utilize matrix pricing which considers yield or price of bonds of comparable quality, coupon, maturity and type or by broker-supplied prices. When independent prices are unavailable or unreliable, debt securities may be valued utilizing pricing methodologies which consider similar factors that would be used by third party pricing services. Debt securities are generally categorized as Level 2 in the hierarchy but may be Level 3 depending on the circumstances.
Investments in open-end mutual funds, including the Fidelity Central Funds, are valued at their closing net asset value (NAV) each business day and are categorized as Level 1 in the hierarchy.
Changes in valuation techniques may result in transfers in or out of an assigned level within the disclosure hierarchy. The aggregate value of investments by input level as of August 31, 2024 is included at the end of the Fund's Schedule of Investments.
Investment Transactions and Income. For financial reporting purposes, the Fund's investment holdings and NAV include trades executed through the end of the last business day of the period. The NAV per share for processing shareholder transactions is calculated as of the close of business of the New York Stock Exchange (NYSE), normally 4:00 p.m. Eastern time and includes trades executed through the end of the prior business day. Gains and losses on securities sold are determined on the basis of identified cost. Income and capital gain distributions from Fidelity Central Funds, if any, are recorded on the ex-dividend date. Interest income is accrued as earned and includes coupon interest and amortization of premium and accretion of discount on debt securities as applicable.
Expenses. Expenses directly attributable to a fund are charged to that fund. Expenses attributable to more than one fund are allocated among the respective funds on the basis of relative net assets or other appropriate methods. Expenses included in the accompanying financial statements reflect the expenses of that fund and do not include any expenses associated with any underlying mutual funds or exchange-traded funds. Although not included in a fund's expenses, a fund indirectly bears its proportionate share of these expenses through the net asset value of each underlying mutual fund or exchange-traded fund. Expense estimates are accrued in the period to which they relate and adjustments are made when actual amounts are known.
Income Tax Information and Distributions to Shareholders. Each year, the Fund intends to qualify as a regulated investment company under Subchapter M of the Internal Revenue Code, including distributing substantially all of its taxable income and realized gains. As a result, no provision for U.S. Federal income taxes is required. As of August 31, 2024, the Fund did not have any unrecognized tax benefits in the financial statements; nor is the Fund aware of any tax positions for which it is reasonably possible that the total amounts of unrecognized tax benefits will significantly change in the next twelve months. The Fund files a U.S. federal tax return, in addition to state and local tax returns as required. The Fund's federal income tax returns are subject to examination by the Internal Revenue Service (IRS) for a period of three fiscal years after they are filed. State and local tax returns may be subject to examination for an additional fiscal year depending on the jurisdiction.
Distributions are declared and recorded daily and paid monthly from net investment income. Distributions from realized gains, if any, are declared and recorded on the ex-dividend date. Income and capital gain distributions are determined in accordance with income tax regulations, which may differ from GAAP.
Capital accounts within the financial statements are adjusted for permanent book-tax differences. These adjustments have no impact on net assets or the results of operations. Capital accounts are not adjusted for temporary book-tax differences which will reverse in a subsequent period.
Book-tax differences are primarily due to capital loss carryforwards and losses deferred due to wash sales.
As of period end, the cost and unrealized appreciation (depreciation) in securities, and derivatives if applicable, for federal income tax purposes were as follows:
| Gross unrealized appreciation | $8,549,395 |
| Gross unrealized depreciation | (56,140,978) |
| Net unrealized appreciation (depreciation) | $(47,591,583) |
| Tax Cost | $981,152,060 |
The tax-based components of distributable earnings as of period end were as follows:
| Capital loss carryforward | $(27,027,935) |
| Net unrealized appreciation (depreciation) on securities and other investments | $(47,591,583) |
Capital loss carryforwards are only available to offset future capital gains of the Fund to the extent provided by regulations and may be limited. The capital loss carryforward information presented below, including any applicable limitation, is estimated as of fiscal period end and is subject to adjustment.
Short-term | $(6,062,827) |
Long-term | (20,965,108) |
| Total capital loss carryforward | $(27,027,935) |
The tax character of distributions paid was as follows:
| | August 31, 2024 | August 31, 2023 |
| Ordinary Income | $26,552,320 | $ 16,468,381 |
4. Fees and Other Transactions with Affiliates.
Management Fee. Fidelity Management & Research Company LLC (the investment adviser) and its affiliates provide the Fund with investment management related services for which the Fund does not pay a management fee. Under the management contract, the investment adviser or an affiliate pays all ordinary operating expenses of the Fund, except custody fees, fees and expenses of the independent Trustees, and certain miscellaneous expenses such as proxy and shareholder meeting expenses.
Interfund Trades. Funds may purchase from or sell securities to other Fidelity Funds under procedures adopted by the Board. The procedures have been designed to ensure these interfund trades are executed in accordance with Rule 17a-7 of the 1940 Act. During the period, there were no interfund trades.
Sub-Advisory Arrangements. Effective March 1, 2024, the Fund's sub-advisory agreements with FMR Investment Management (UK) Limited, Fidelity Management & Research (Hong Kong) Limited, and Fidelity Management & Research (Japan) Limited were amended to provide that the investment adviser pays each sub-adviser monthly fees equal to 110% of the sub-adviser's costs for providing sub-advisory services.
5. Committed Line of Credit.
Certain Funds participate with other funds managed by the investment adviser or an affiliate in a $4.25 billion credit facility (the "line of credit") to be utilized for temporary or emergency purposes to fund shareholder redemptions or for other short-term liquidity purposes. The commitment fees on the pro-rata portion of the line of credit are borne by the investment adviser. During the period, there were no borrowings on this line of credit.
6. Security Lending.
Funds lend portfolio securities from time to time in order to earn additional income. Lending agents are used, including National Financial Services (NFS), an affiliate of the investment adviser. Pursuant to a securities lending agreement, NFS will receive a fee, which is capped at 9.9% of a fund's daily lending revenue, for its services as lending agent. A fund may lend securities to certain qualified borrowers, including NFS. On the settlement date of the loan, a fund receives collateral (in the form of U.S. Treasury obligations, letters of credit and/or cash) against the loaned securities and maintains collateral in an amount not less than 100% of the market value of the loaned securities during the period of the loan. The market value of the loaned securities is determined at the close of business of a fund and any additional required collateral is delivered to a fund on the next business day. A fund or borrower may terminate the loan at any time, and if the borrower defaults on its obligation to return the securities loaned because of insolvency or other reasons, a fund may apply collateral received from the borrower against the obligation. A fund may experience delays and costs in recovering the securities loaned. Any cash collateral received is invested in the Fidelity Securities Lending Cash Central Fund. Any loaned securities are identified as such in the Schedule of Investments, and the value of loaned securities and cash collateral at period end, as applicable, are presented in the Statement of Assets and Liabilities. Security lending income represents the income earned on investing cash collateral, less rebates paid to borrowers and any lending agent fees associated with the loan, plus any premium payments received for lending certain types of securities. Security lending income is presented in the Statement of Operations as a component of income from Fidelity Central Funds. Affiliated security lending activity, if any, was as follows:
| | Total Security Lending Fees Paid to NFS ($) | Security Lending Income From Securities Loaned to NFS ($) | Value of Securities Loaned to NFS at Period End ($) |
| Fidelity Series Government Bond Index Fund | 621 | - | - |
7. Other.
A fund's organizational documents provide former and current trustees and officers with a limited indemnification against liabilities arising in connection with the performance of their duties to the fund. In the normal course of business, a fund may also enter into contracts that provide general indemnifications. A fund's maximum exposure under these arrangements is unknown as this would be dependent on future claims that may be made against a fund. The risk of material loss from such claims is considered remote.
At the end of the period, mutual funds and accounts managed by the investment adviser or its affiliates were the owners of record of all of the outstanding shares of the Fund.
8. Risk and Uncertainties.
Many factors affect a fund's performance. Developments that disrupt global economies and financial markets, such as pandemics, epidemics, outbreaks of infectious diseases, war, terrorism, and environmental disasters, may significantly affect a fund's investment performance. The effects of these developments to a fund will be impacted by the types of securities in which a fund invests, the financial condition, industry, economic sector, and geographic location of an issuer, and a fund's level of investment in the securities of that issuer. Significant concentrations in security types, issuers, industries, sectors, and geographic locations may magnify the factors that affect a fund's performance.
Report of Independent Registered Public Accounting Firm
To the Board of Trustees of Fidelity Income Fund and Shareholders of Fidelity Series Government Bond Index Fund
Opinion on the Financial Statements
We have audited the accompanying statement of assets and liabilities, including the schedule of investments, of Fidelity Series Government Bond Index Fund (one of the funds constituting Fidelity Income Fund, referred to hereafter as the "Fund") as of August 31, 2024, the related statement of operations for the year ended August 31, 2024, the statement of changes in net assets for each of the two years in the period ended August 31, 2024, including the related notes, and the financial highlights for each of the five years in the period ended August 31, 2024 (collectively referred to as the "financial statements"). In our opinion, the financial statements present fairly, in all material respects, the financial position of the Fund as of August 31, 2024, the results of its operations for the year then ended, the changes in its net assets for each of the two years in the period ended August 31, 2024 and the financial highlights for each of the five years in the period ended August 31, 2024 in conformity with accounting principles generally accepted in the United States of America.
Basis for Opinion
These financial statements are the responsibility of the Fund's management. Our responsibility is to express an opinion on the Fund's financial statements based on our audits. We are a public accounting firm registered with the Public Company Accounting Oversight Board (United States) (PCAOB) and are required to be independent with respect to the Fund in accordance with the U.S. federal securities laws and the applicable rules and regulations of the Securities and Exchange Commission and the PCAOB.
We conducted our audits of these financial statements in accordance with the standards of the PCAOB. Those standards require that we plan and perform the audit to obtain reasonable assurance about whether the financial statements are free of material misstatement, whether due to error or fraud.
Our audits included performing procedures to assess the risks of material misstatement of the financial statements, whether due to error or fraud, and performing procedures that respond to those risks. Such procedures included examining, on a test basis, evidence regarding the amounts and disclosures in the financial statements. Our audits also included evaluating the accounting principles used and significant estimates made by management, as well as evaluating the overall presentation of the financial statements. Our procedures included confirmation of securities owned as of August 31, 2024 by correspondence with the custodian and brokers; when replies were not received from brokers, we performed other auditing procedures. We believe that our audits provide a reasonable basis for our opinion.
/s/ PricewaterhouseCoopers LLP
Boston, Massachusetts
October 16, 2024
We have served as the auditor of one or more investment companies in the Fidelity group of funds since 1932.
Distributions
(Unaudited)
The dividend and capital gains distributions for the fund(s) are available on Fidelity.com or Institutional.Fidelity.com.
A total of 98.55% of the dividends distributed during the fiscal year was derived from interest on U.S. Government securities which is generally exempt from state income tax.
The fund designates $26,552,320 of distributions paid during the fiscal year ended 2024 as qualifying to be taxed as section 163(j) interest dividends.
The fund will notify shareholders in January 2025 of amounts for use in preparing 2024 income tax returns.
Item 8: Changes in and Disagreements with Accountants for Open-End Management Investment Companies
(Unaudited)
Note: This is not applicable for any fund included in this document.
Item 9: Proxy Disclosures for Open-End Management Investment Companies
(Unaudited)
| A special meeting of shareholders was held on October 18, 2023. The results of votes taken among shareholders on the proposal before them are reported below. Each vote reported represents one dollar of net asset value held on the record date for the meeting. |
| Proposal 1 |
| To elect a Board of Trustees. |
| | # of Votes | % of Votes |
| Abigail P. Johnson |
| Affirmative | 29,408,520,731.18 | 96.84 |
| Withheld | 958,659,352.64 | 3.16 |
| TOTAL | 30,367,180,083.82 | 100.00 |
| Jennifer Toolin McAuliffe |
| Affirmative | 29,484,249,185.02 | 97.09 |
| Withheld | 882,930,898.80 | 2.91 |
| TOTAL | 30,367,180,083.82 | 100.00 |
| Christine J. Thompson |
| Affirmative | 29,483,889,948.58 | 97.09 |
| Withheld | 883,290,135.24 | 2.91 |
| TOTAL | 30,367,180,083.82 | 100.00 |
| Elizabeth S. Acton |
| Affirmative | 29,471,265,000.64 | 97.05 |
| Withheld | 895,915,083.18 | 2.95 |
| TOTAL | 30,367,180,083.82 | 100.00 |
| Laura M. Bishop |
| Affirmative | 29,508,015,754.27 | 97.17 |
| Withheld | 859,164,329.55 | 2.83 |
| TOTAL | 30,367,180,083.82 | 100.00 |
| Ann E. Dunwoody |
| Affirmative | 29,470,432,034.14 | 97.05 |
| Withheld | 896,748,049.68 | 2.95 |
| TOTAL | 30,367,180,083.82 | 100.00 |
| John Engler |
| Affirmative | 29,326,181,411.39 | 96.57 |
| Withheld | 1,040,998,672.43 | 3.43 |
| TOTAL | 30,367,180,083.82 | 100.00 |
| Robert F. Gartland |
| Affirmative | 29,422,803,481.93 | 96.89 |
| Withheld | 944,376,601.89 | 3.11 |
| TOTAL | 30,367,180,083.82 | 100.00 |
| Robert W. Helm |
| Affirmative | 29,445,540,968.38 | 96.97 |
| Withheld | 921,639,115.44 | 3.03 |
| TOTAL | 30,367,180,083.82 | 100.00 |
| Arthur E. Johnson |
| Affirmative | 29,395,582,286.37 | 96.80 |
| Withheld | 971,597,797.45 | 3.20 |
| TOTAL | 30,367,180,083.82 | 100.00 |
| Michael E. Kenneally |
| Affirmative | 29,420,582,069.08 | 96.88 |
| Withheld | 946,598,014.74 | 3.12 |
| TOTAL | 30,367,180,083.82 | 100.00 |
| Mark A. Murray |
| Affirmative | 29,446,384,581.44 | 96.97 |
| Withheld | 920,795,502.38 | 3.03 |
| TOTAL | 30,367,180,083.82 | 100.00 |
| Carol J. Zierhoffer |
| Affirmative | 29,510,392,522.55 | 97.18 |
| Withheld | 856,787,561.27 | 2.82 |
| TOTAL | 30,367,180,083.82 | 100.00 |
| | | |
| Proposal 1 reflects trust-wide proposal and voting results. |
Item 10: Remuneration Paid to Directors, Officers, and others of Open-End Management Investment Companies
(Unaudited)
Note: This information is disclosed as part of the financial statements for each Fund as part of Item 7: Financial Statements and Financial Highlights for Open-End Management Investment companies.
Item 11: Statement Regarding Basis for Approval of Investment Advisory Contract
(Unaudited)
Note: This is not applicable for any fund included in this document.
1.9891225.106
XGB-ANN-1024
Item 8.
Changes in and Disagreements with Accountants for Open-End Management Investment Companies
See Item 7.
Item 9.
Proxy Disclosures for Open-End Management Investment Companies
See Item 7.
Item 10.
Remuneration Paid to Directors, Officers, and Others of Open-End Management Investment Companies
See Item 7.
Item 11.
Statement Regarding Basis for Approval of Investment Advisory Contract
See Item 7.
Item 12.
Disclosure of Proxy Voting Policies and Procedures for Closed-End Management Investment Companies
Not applicable.
Item 13.
Portfolio Managers of Closed-End Management Investment Companies
Not applicable.
Item 14.
Purchase of Equity Securities by Closed-End Management Investment Company and Affiliated Purchasers
Not applicable.
Item 15.
Submission of Matters to a Vote of Security Holders
There were no material changes to the procedures by which shareholders may recommend nominees to the trust’s Board of Trustees.
Item 16.
Controls and Procedures
(a)(i) The President and Treasurer and the Chief Financial Officer have concluded that the trust’s disclosure controls and procedures (as defined in Rule 30a-3(c) under the Investment Company Act) provide reasonable assurances that material information relating to the trust is made known to them by the appropriate persons, based on their evaluation of these controls and procedures as of a date within 90 days of the filing date of this report.
(a)(ii) There was no change in the trust’s internal control over financial reporting (as defined in Rule 30a-3(d) under the Investment Company Act) that occurred during the period covered by this report that has materially affected, or is reasonably likely to materially affect, the trust’s internal control over financial reporting.
Item 17.
Disclosure of Securities Lending Activities for Closed-End Management Investment Companies
Not applicable.
Item 18.
Recovery of Erroneously Awarded Compensation
(a)
Not applicable.
(b)
Not applicable.
Item 19.
Exhibits
SIGNATURES
Pursuant to the requirements of the Securities Exchange Act of 1934 and the Investment Company Act of 1940, the registrant has duly caused this report to be signed on its behalf by the undersigned, thereunto duly authorized.
Fidelity Income Fund
|
By: | /s/Laura M. Del Prato |
| Laura M. Del Prato |
| President and Treasurer (Principal Executive Officer) |
|
|
Date: | October 23, 2024 |
Pursuant to the requirements of the Securities Exchange Act of 1934 and the Investment Company Act of 1940, this report has been signed below by the following persons on behalf of the registrant and in the capacities and on the dates indicated.
|
By: | /s/Laura M. Del Prato |
| Laura M. Del Prato |
| President and Treasurer (Principal Executive Officer) |
|
|
Date: | October 23, 2024 |
|
By: | /s/John J. Burke III |
| John J. Burke III |
| Chief Financial Officer (Principal Financial Officer) |
|
|
Date: | October 23, 2024 |