UNITED STATES
SECURITIES AND EXCHANGE COMMISSION
Washington, D.C. 20549
FORM N-CSR
CERTIFIED SHAREHOLDER REPORT OF REGISTERED
MANAGEMENT INVESTMENT COMPANIES
Investment Company Act file number 811-4085
Fidelity Income Fund
(Exact name of registrant as specified in charter)
245 Summer St., Boston, Massachusetts 02210
(Address of principal executive offices) (Zip code)
Marc Bryant, Secretary
245 Summer St.
Boston, Massachusetts 02210
(Name and address of agent for service)
Registrant's telephone number, including area code:
617-563-7000
| |
Date of fiscal year end: | August 31 |
| |
Date of reporting period: | August 31, 2017 |
Item 1.
Reports to Stockholders
Fidelity Advisor® Total Bond Fund - Class A, Class M (formerly Class T), Class C, Class I and Class Z
Annual Report August 31, 2017 Class A, Class M, Class C, Class I and Class Z are classes of Fidelity® Total Bond Fund |
 |
Contents
To view a fund's proxy voting guidelines and proxy voting record for the 12-month period ended June 30, visit http://www.fidelity.com/proxyvotingresults or visit the Securities and Exchange Commission's (SEC) web site at http://www.sec.gov.
You may also call 1-800-835-5095 (plan accounts) or 1-877-208-0098 (all other accounts) to request a free copy of the proxy voting guidelines.
Standard & Poor's, S&P and S&P 500 are registered service marks of The McGraw-Hill Companies, Inc. and have been licensed for use by Fidelity Distributors Corporation.
Other third-party marks appearing herein are the property of their respective owners.
All other marks appearing herein are registered or unregistered trademarks or service marks of FMR LLC or an affiliated company. © 2017 FMR LLC. All rights reserved.
This report and the financial statements contained herein are submitted for the general information of the shareholders of the Fund. This report is not authorized for distribution to prospective investors in the Fund unless preceded or accompanied by an effective prospectus.
A fund files its complete schedule of portfolio holdings with the SEC for the first and third quarters of each fiscal year on Form N-Q. Forms N-Q are available on the SEC’s web site at http://www.sec.gov. A fund's Forms N-Q may be reviewed and copied at the SEC’s Public Reference Room in Washington, DC. Information regarding the operation of the SEC's Public Reference Room may be obtained by calling 1-800-SEC-0330.
For a complete list of a fund's portfolio holdings, view the most recent holdings listing, semiannual report, or annual report on Fidelity's web site at http://www.fidelity.com, http://www.institutional.fidelity.com, or http://www.401k.com, as applicable.
NOT FDIC INSURED •MAY LOSE VALUE •NO BANK GUARANTEE
Neither the Fund nor Fidelity Distributors Corporation is a bank.
Performance: The Bottom Line
Average annual total return reflects the change in the value of an investment, assuming reinvestment of distributions from dividend income and capital gains (the profits earned upon the sale of securities that have grown in value, if any) and assuming a constant rate of performance each year. The hypothetical investment and the average annual total returns do not reflect the deduction of taxes that a shareholder would pay on fund distributions or the redemption of fund shares. During periods of reimbursement by Fidelity, a fund’s total return will be greater than it would be had the reimbursement not occurred. How a fund did yesterday is no guarantee of how it will do tomorrow.
Average Annual Total Returns
| For the periods ended August 31, 2017 | Past 1 year | Past 5 years | Past 10 years |
| Class A (incl. 4.00% sales charge) | (2.30)% | 1.84% | 4.39% |
| Class M (incl. 4.00% sales charge) | (2.31)% | 1.82% | 4.37% |
| Class C (incl. contingent deferred sales charge) | 0.00% | 1.90% | 4.05% |
| Class I | 2.02% | 2.95% | 5.09% |
| Class Z | 2.16% | 3.02% | 5.13% |
Class C shares' contingent deferred sales charges included in the past one year, past five years and past ten years total return figures are 1%, 0% and 0%, respectively.
The initial offering of Class Z shares took place on December 22, 2014. Returns prior to December 22, 2014, are those of Class I.
$10,000 Over 10 Years
Let's say hypothetically that $10,000 was invested in Fidelity Advisor® Total Bond Fund - Class A on August 31, 2007, and the current 4.00% sales charge was paid.
The chart shows how the value of your investment would have changed, and also shows how the Bloomberg Barclays U.S. Aggregate Bond Index performed over the same period.
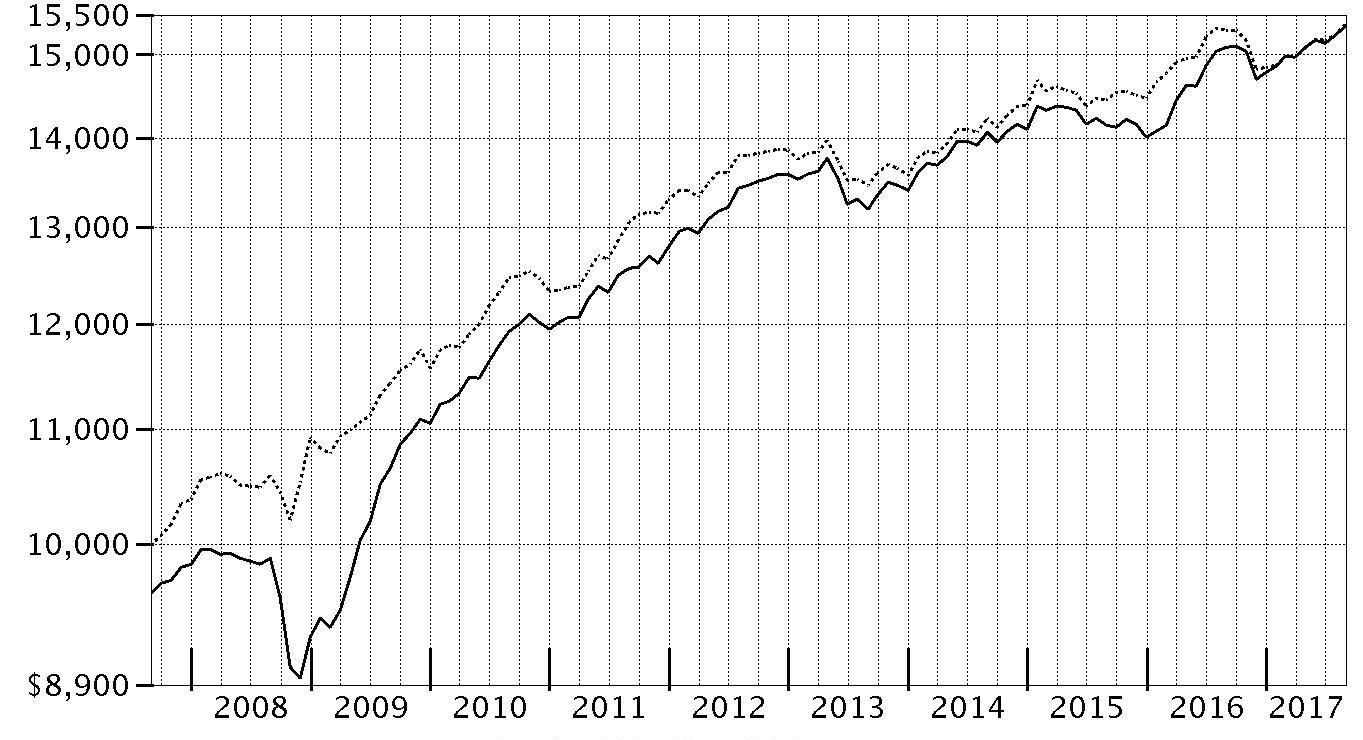
| Period Ending Values |
| $15,361 | Fidelity Advisor® Total Bond Fund - Class A |
| $15,385 | Bloomberg Barclays U.S. Aggregate Bond Index |
Effective August 24, 2016, all Barclays benchmark indices were co-branded as the Bloomberg Barclays Indices for a period of five years.
Management's Discussion of Fund Performance
Market Recap: U.S. taxable investment-grade bonds rose slightly for the 12 months ending August 31, 2017, as yields increased markedly following the U.S. presidential election then moderated as the period progressed. The Bloomberg Barclays U.S. Aggregate Bond Index gained 0.49% for the year. Bond yields rose slightly early in the period, prior to the U.S. election, then surged in November and December, as many investors viewed then-President-elect Donald Trump’s economic agenda as stimulative and potentially inflationary. Yields also rode the Fed’s decision in December to raise policy interest rates. Longer-term bond yields declined slightly in the first half of 2017, even though the Fed raised rates in June 2017 for the third time in as many quarters, as it became clear that changes to tax, health care and fiscal policies would take time to develop and implement. Fairly cool inflation readings also held back yields late in the period. Within the Bloomberg Barclays index, investment-grade corporate bonds led all major market segments, up 2.13%, while U.S. Treasuries returned -0.95%. Securitized sectors advanced more modestly than corporates. Outside the index, riskier, non-core fixed-income segments led the broader market, while Treasury Inflation-Protected Securities (TIPS) rose 0.46%, according to Bloomberg Barclays.
Comments from Lead Portfolio Manager Ford O'Neil: For the fiscal year, the fund’s share classes (excluding sales charges, if applicable) gained roughly 1% to 2%, outpacing, net of fees, the benchmark Bloomberg Barclays U.S. Aggregate Bond Index. Versus the benchmark, an emphasis on bonds in credit-sensitive spread sectors provided the biggest boost, as they outpaced U.S. government bonds and agency mortgage-backed securities – more-conservative investments in which the fund was underweighted. Specifically, larger-than-benchmark exposure to high-yield bonds and, to a lesser extent, leveraged loans added value. The fund enjoyed good results from investing in sovereign-debt holdings from Mexico and Brazil. Holding 10- and 30-year TIPS (Treasury Inflation-Protected Securities) and certain taxable municipal bonds also contributed, as did a small overweighting in commercial mortgage-backed securities. A significant overweighting in investment-grade credit further helped, led by selections among financials. Conversely, detractors included underweightings in certain industrial segments, namely technology and basic industry.
The views expressed above reflect those of the portfolio manager(s) only through the end of the period as stated on the cover of this report and do not necessarily represent the views of Fidelity or any other person in the Fidelity organization. Any such views are subject to change at any time based upon market or other conditions and Fidelity disclaims any responsibility to update such views. These views may not be relied on as investment advice and, because investment decisions for a Fidelity fund are based on numerous factors, may not be relied on as an indication of trading intent on behalf of any Fidelity fund.
Note to shareholders: On September 30, 2017, Celso Munoz assumed Co-Manager responsibilities for the fund, joining Co-Managers Matthew Conti, Jeff Moore and Michael Foggin, and Lead Manager Ford O’Neil.
Investment Summary (Unaudited)
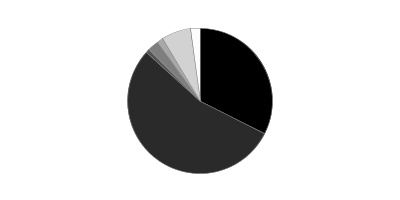
Quality Diversification (% of fund's net assets)
| As of August 31, 2017 |
| | U.S. Government and U.S. Government Agency Obligations | 54.2% |
| | AAA | 0.8% |
| | AA | 1.1% |
| | A | 5.3% |
| | BBB | 20.0% |
| | BB and Below | 15.0% |
| | Not Rated | 1.6% |
| | Short-Term Investments and Net Other Assets | 2.0% |

| As of February 28, 2017 |
| | U.S. Government and U.S. Government Agency Obligations | 49.3% |
| | AAA | 1.4% |
| | AA | 1.3% |
| | A | 5.4% |
| | BBB | 21.7% |
| | BB and Below | 17.8% |
| | Not Rated | 1.0% |
| | Short-Term Investments and Net Other Assets | 2.1% |

We have used ratings from Moody's Investors Service, Inc. Where Moody's® ratings are not available, we have used S&P® ratings. All ratings are as of the date indicated and do not reflect subsequent changes. Securities rated BB or below were rated investment grade at the time of acquisition.
Asset Allocation (% of fund's net assets)
| As of August 31, 2017*,** |
| | Corporate Bonds | 32.5% |
| | U.S. Government and U.S. Government Agency Obligations | 54.2% |
| | Asset-Backed Securities | 0.9% |
| | CMOs and Other Mortgage Related Securities | 2.4% |
| | Municipal Bonds | 1.4% |
| | Other Investments | 6.6% |
| | Short-Term Investments and Net Other Assets (Liabilities) | 2.0% |
* Foreign investments - 10.3%
** Futures and Swaps - 0.5%
| As of February 28, 2017*,** |
| | Corporate Bonds | 35.5% |
| | U.S. Government and U.S. Government Agency Obligations | 49.3% |
| | Asset-Backed Securities | 0.7% |
| | CMOs and Other Mortgage Related Securities | 3.1% |
| | Municipal Bonds | 1.6% |
| | Other Investments | 7.7% |
| | Short-Term Investments and Net Other Assets (Liabilities) | 2.1% |

* Foreign investments - 11.4%
** Futures and Swaps - 0.0%
Percentages in the above tables are adjusted for the effect of TBA Sale Commitments.
Percentages shown as 0.0% may reflect amounts less than 0.05%.
Investments August 31, 2017
Showing Percentage of Net Assets
| Nonconvertible Bonds - 32.5% | | | |
| | | Principal Amount(a) | Value |
| CONSUMER DISCRETIONARY - 3.3% | | | |
| Auto Components - 0.1% | | | |
| J.B. Poindexter & Co., Inc. 9% 4/1/22 (b) | | $3,045,000 | $3,189,638 |
| Metalsa SA de CV 4.9% 4/24/23 (b) | | 4,955,000 | 4,992,163 |
| Samvardhana Motherson Automotive Systems Group BV 1.8% 7/6/24 (Reg. S) | EUR | 2,100,000 | 2,437,446 |
| Tenedora Nemak SA de CV 5.5% 2/28/23 (b) | | 3,010,000 | 3,085,250 |
| Tenneco, Inc. 5% 7/15/26 | | 2,271,000 | 2,293,710 |
| Tupy Overseas SA 6.625% 7/17/24 (b) | | 530,000 | 553,797 |
| | | | 16,552,004 |
| Automobiles - 0.6% | | | |
| General Motors Co.: | | | |
| 3.5% 10/2/18 | | 9,215,000 | 9,366,402 |
| 5.2% 4/1/45 | | 3,030,000 | 2,997,741 |
| General Motors Financial Co., Inc.: | | | |
| 3.15% 1/15/20 | | 27,252,000 | 27,807,663 |
| 3.2% 7/13/20 | | 20,200,000 | 20,626,856 |
| 3.25% 5/15/18 | | 4,810,000 | 4,857,956 |
| 3.5% 7/10/19 | | 10,761,000 | 11,024,740 |
| 4% 1/15/25 | | 18,085,000 | 18,319,883 |
| 4.2% 3/1/21 | | 26,269,000 | 27,660,321 |
| 4.25% 5/15/23 | | 5,420,000 | 5,649,677 |
| 4.375% 9/25/21 | | 47,963,000 | 50,858,547 |
| Volkswagen International Finance NV: | | | |
| 1.125% 10/2/23 (Reg. S) | EUR | 2,600,000 | 3,110,355 |
| 2.7%(Reg. S) (c)(d) | EUR | 3,200,000 | 3,761,822 |
| | | | 186,041,963 |
| Diversified Consumer Services - 0.1% | | | |
| Ingersoll-Rand Global Holding Co. Ltd.: | | | |
| 2.875% 1/15/19 | | 1,206,000 | 1,221,882 |
| 4.25% 6/15/23 | | 8,466,000 | 9,174,522 |
| Laureate Education, Inc. 8.25% 5/1/25 (b) | | 4,615,000 | 5,018,813 |
| | | | 15,415,217 |
| Hotels, Restaurants & Leisure - 0.4% | | | |
| 1011778 BC Unlimited Liability Co./New Red Finance, Inc.: | | | |
| 4.25% 5/15/24 (b) | | 5,035,000 | 5,097,938 |
| 5% 10/15/25 (b) | | 3,080,000 | 3,160,850 |
| Aramark Services, Inc.: | | | |
| 4.75% 6/1/26 | | 7,225,000 | 7,570,355 |
| 5.125% 1/15/24 | | 2,520,000 | 2,677,500 |
| Carlson Travel, Inc. 9.5% 12/15/24 (b) | | 3,895,000 | 3,807,363 |
| ESH Hospitality, Inc. 5.25% 5/1/25 (b) | | 1,100,000 | 1,133,000 |
| FelCor Lodging LP 5.625% 3/1/23 | | 135,000 | 140,063 |
| Hilton Escrow Issuer LLC 4.25% 9/1/24 | | 7,280,000 | 7,437,102 |
| Hilton Grand Vacations Borrower LLC/Hilton Grand Vacations Borrower, Inc. 6.125% 12/1/24 (b) | | 1,380,000 | 1,514,550 |
| Hilton Worldwide Finance LLC/Hilton Worldwide Finance Corp.: | | | |
| 4.625% 4/1/25 | | 2,580,000 | 2,695,842 |
| 4.875% 4/1/27 | | 1,530,000 | 1,621,800 |
| KFC Holding Co./Pizza Hut Holding LLC: | | | |
| 4.75% 6/1/27 (b) | | 1,580,000 | 1,621,475 |
| 5% 6/1/24 (b) | | 4,515,000 | 4,719,530 |
| 5.25% 6/1/26 (b) | | 1,790,000 | 1,886,213 |
| McDonald's Corp.: | | | |
| 2.75% 12/9/20 | | 3,638,000 | 3,726,454 |
| 3.7% 1/30/26 | | 9,591,000 | 10,096,450 |
| MCE Finance Ltd. 4.875% 6/6/25 (b) | | 3,410,000 | 3,423,582 |
| MGM Growth Properties Operating Partnership LP 4.5% 9/1/26 | | 13,345,000 | 13,578,538 |
| RHP Hotel Properties LP/RHP Finance Corp. 5% 4/15/23 | | 540,000 | 556,200 |
| Scientific Games Corp.: | | | |
| 6.625% 5/15/21 | | 6,270,000 | 6,489,450 |
| 7% 1/1/22 (b) | | 1,700,000 | 1,814,750 |
| Silversea Cruises 7.25% 2/1/25 (b) | | 1,395,000 | 1,503,113 |
| Studio City Co. Ltd.: | | | |
| 5.875% 11/30/19 (b) | | 2,555,000 | 2,695,525 |
| 7.25% 11/30/21 (b) | | 4,925,000 | 5,287,731 |
| Times Square Hotel Trust 8.528% 8/1/26 (b) | | 1,023,831 | 1,223,873 |
| Wynn Las Vegas LLC/Wynn Las Vegas Capital Corp. 5.25% 5/15/27 (b) | | 4,730,000 | 4,777,300 |
| Wynn Macau Ltd. 5.25% 10/15/21 (b) | | 33,480,000 | 34,199,820 |
| Yum! Brands, Inc. 5.35% 11/1/43 | | 1,720,000 | 1,612,483 |
| | | | 136,068,850 |
| Household Durables - 0.2% | | | |
| CalAtlantic Group, Inc.: | | | |
| 5% 6/15/27 | | 3,810,000 | 3,819,525 |
| 5.25% 6/1/26 | | 4,285,000 | 4,413,550 |
| 5.875% 11/15/24 | | 1,775,000 | 1,925,875 |
| Lennar Corp. 4.125% 1/15/22 | | 2,950,000 | 3,038,500 |
| M/I Homes, Inc.: | | | |
| 5.625% 8/1/25 (b) | | 1,060,000 | 1,075,900 |
| 6.75% 1/15/21 | | 4,265,000 | 4,456,925 |
| PulteGroup, Inc. 5% 1/15/27 | | 2,625,000 | 2,703,750 |
| Reynolds Group Issuer, Inc./Reynolds Group Issuer LLC/Reynolds Group Issuer (Luxembourg) SA: | | | |
| 3 month U.S. LIBOR + 3.500% 4.8036% 7/15/21 (b)(d)(e) | | 3,930,000 | 4,003,688 |
| 5.125% 7/15/23 (b) | | 5,170,000 | 5,388,122 |
| 5.75% 10/15/20 | | 2,935,000 | 2,989,708 |
| SEB SA 1.5% 5/31/24 (Reg. S) | EUR | 1,900,000 | 2,306,391 |
| Taylor Morrison Communities, Inc./Monarch Communities, Inc. 5.875% 4/15/23 (b) | | 1,495,000 | 1,584,700 |
| Toll Brothers Finance Corp. 4.875% 3/15/27 | | 1,348,000 | 1,385,070 |
| TRI Pointe Homes, Inc. 5.25% 6/1/27 | | 2,800,000 | 2,835,000 |
| William Lyon Homes, Inc.: | | | |
| 5.75% 4/15/19 | | 4,175,000 | 4,227,188 |
| 7% 8/15/22 | | 4,250,000 | 4,409,375 |
| | | | 50,563,267 |
| Internet & Direct Marketing Retail - 0.1% | | | |
| Netflix, Inc. 4.375% 11/15/26 (b) | | 3,830,000 | 3,734,250 |
| Zayo Group LLC/Zayo Capital, Inc.: | | | |
| 5.75% 1/15/27 (b) | | 5,975,000 | 6,340,849 |
| 6.375% 5/15/25 | | 8,115,000 | 8,721,109 |
| | | | 18,796,208 |
| Media - 1.8% | | | |
| 21st Century Fox America, Inc.: | | | |
| 6.15% 3/1/37 | | 4,759,000 | 6,055,783 |
| 7.75% 12/1/45 | | 3,932,000 | 5,978,630 |
| Altice SA 7.75% 5/15/22 (b) | | 38,580,000 | 40,943,025 |
| Altice U.S. Finance SA: | | | |
| 5.375% 7/15/23 (b) | | 2,560,000 | 2,681,600 |
| 5.5% 5/15/26 (b) | | 5,035,000 | 5,327,659 |
| AMC Networks, Inc.: | | | |
| 4.75% 12/15/22 | | 1,675,000 | 1,727,344 |
| 4.75% 8/1/25 | | 3,780,000 | 3,794,175 |
| Cablevision SA 6.5% 6/15/21 (b) | | 430,000 | 459,317 |
| Cablevision Systems Corp. 7.75% 4/15/18 | | 2,110,000 | 2,173,300 |
| CCO Holdings LLC/CCO Holdings Capital Corp.: | | | |
| 5% 2/1/28 (b) | | 3,845,000 | 3,909,904 |
| 5.125% 2/15/23 | | 1,130,000 | 1,168,138 |
| 5.125% 5/1/23 (b) | | 11,215,000 | 11,732,348 |
| 5.125% 5/1/27 (b) | | 9,395,000 | 9,676,850 |
| 5.5% 5/1/26 (b) | | 9,005,000 | 9,398,969 |
| 5.75% 2/15/26 (b) | | 3,370,000 | 3,562,730 |
| Charter Communications Operating LLC/Charter Communications Operating Capital Corp.: | | | |
| 4.464% 7/23/22 | | 20,419,000 | 21,609,130 |
| 4.908% 7/23/25 | | 20,419,000 | 21,874,901 |
| 5.375% 5/1/47 (b) | | 27,358,000 | 27,927,908 |
| 6.484% 10/23/45 | | 8,199,000 | 9,429,731 |
| Clear Channel International BV 8.75% 12/15/20 (b) | | 530,000 | 553,850 |
| Columbus International, Inc. 7.375% 3/30/21 (b) | | 10,093,000 | 10,797,491 |
| Comcast Corp. 6.45% 3/15/37 | | 2,196,000 | 2,898,568 |
| CSC Holdings LLC 6.75% 11/15/21 | | 8,225,000 | 9,091,093 |
| CSC Holdings, Inc. 5.5% 4/15/27 (b) | | 4,045,000 | 4,221,969 |
| E.W. Scripps Co. 5.125% 5/15/25 (b) | | 520,000 | 526,500 |
| Globo Comunicacao e Participacoes SA: | | | |
| 4.843% 6/8/25 (b) | | 1,820,000 | 1,878,968 |
| 4.875% 4/11/22 (b) | | 565,000 | 589,126 |
| Grupo Televisa SA de CV 6.625% 3/18/25 | | 440,000 | 531,255 |
| Lagardere S.C.A. 1.625% 6/21/24 (Reg. S) | EUR | 3,100,000 | 3,686,443 |
| MDC Partners, Inc. 6.5% 5/1/24 (b) | | 5,960,000 | 5,937,650 |
| MHGE Parent LLC/MHGE Parent Finance, Inc. 8.5% 8/1/19 pay-in-kind (b)(d) | | 9,210,000 | 9,210,000 |
| Myriad International Holding BV 5.5% 7/21/25 (b) | | 1,490,000 | 1,634,530 |
| NBCUniversal, Inc. 5.15% 4/30/20 | | 11,614,000 | 12,620,386 |
| New Cotai LLC/New Cotai Capital Corp. 10.625% 5/1/19 pay-in-kind (b)(d) | | 4,708,372 | 4,643,632 |
| Sirius XM Radio, Inc.: | | | |
| 3.875% 8/1/22 (b) | | 6,090,000 | 6,196,575 |
| 5% 8/1/27 (b) | | 5,730,000 | 5,887,575 |
| SKY PLC 2.25% 11/17/25 (Reg. S) | EUR | 2,650,000 | 3,382,190 |
| Time Warner Cable, Inc.: | | | |
| 4% 9/1/21 | | 20,277,000 | 21,127,845 |
| 4.5% 9/15/42 | | 54,497,000 | 50,321,608 |
| 5.5% 9/1/41 | | 12,973,000 | 13,288,656 |
| 5.875% 11/15/40 | | 16,544,000 | 17,745,985 |
| 6.55% 5/1/37 | | 38,302,000 | 44,275,774 |
| 6.75% 7/1/18 | | 13,763,000 | 14,296,316 |
| 7.3% 7/1/38 | | 38,728,000 | 47,742,661 |
| 8.25% 4/1/19 | | 24,391,000 | 26,646,013 |
| Time Warner, Inc.: | | | |
| 3.6% 7/15/25 | | 6,406,000 | 6,476,994 |
| 6.2% 3/15/40 | | 11,792,000 | 13,913,865 |
| TV Azteca SA de CV 7.625% 9/18/20 (Reg S.) | | 3,260,000 | 3,361,875 |
| Unitymedia Hessen GmbH & Co. KG/Unitymedia NRW GmbH 5% 1/15/25 (b) | | 2,920,000 | 3,080,600 |
| Virgin Media Secured Finance PLC: | | | |
| 5.5% 1/15/25 (b) | | 2,500,000 | 2,609,375 |
| 5.5% 8/15/26 (b) | | 4,335,000 | 4,584,263 |
| VTR Finance BV 6.875% 1/15/24 (b) | | 2,680,000 | 2,847,500 |
| Ziggo Bond Finance BV: | | | |
| 5.875% 1/15/25 (b) | | 3,100,000 | 3,212,375 |
| 6% 1/15/27 (b) | | 5,605,000 | 5,752,131 |
| Ziggo Secured Finance BV 5.5% 1/15/27 (b) | | 4,540,000 | 4,681,875 |
| | | | 559,684,954 |
| Multiline Retail - 0.0% | | | |
| JC Penney Corp., Inc.: | | | |
| 5.65% 6/1/20 | | 4,860,000 | 4,809,213 |
| 5.875% 7/1/23 (b) | | 980,000 | 983,675 |
| 7.4% 4/1/37 | | 12,160,000 | 9,241,600 |
| | | | 15,034,488 |
| Specialty Retail - 0.0% | | | |
| L Brands, Inc. 6.75% 7/1/36 | | 1,555,000 | 1,472,818 |
| PetSmart, Inc.: | | | |
| 5.875% 6/1/25 (b) | | 3,670,000 | 3,275,475 |
| 8.875% 6/1/25 (b) | | 1,000,000 | 832,500 |
| | | | 5,580,793 |
|
| TOTAL CONSUMER DISCRETIONARY | | | 1,003,737,744 |
|
| CONSUMER STAPLES - 1.8% | | | |
| Beverages - 0.7% | | | |
| Anheuser-Busch InBev Finance, Inc.: | | | |
| 2.65% 2/1/21 | | 38,614,000 | 39,340,365 |
| 3.3% 2/1/23 | | 41,589,000 | 43,142,597 |
| 4.7% 2/1/36 | | 42,171,000 | 46,751,361 |
| 4.9% 2/1/46 | | 45,032,000 | 51,311,422 |
| Anheuser-Busch InBev SA NV 1.75% 3/7/25 (Reg. S) | GBP | 3,600,000 | 4,693,193 |
| Anheuser-Busch InBev Worldwide, Inc. 3.75% 1/15/22 | | 10,217,000 | 10,863,912 |
| Central American Bottling Corp. 5.75% 1/31/27 (b) | | 450,000 | 476,316 |
| Constellation Brands, Inc.: | | | |
| 3.875% 11/15/19 | | 2,360,000 | 2,452,083 |
| 4.25% 5/1/23 | | 5,205,000 | 5,612,264 |
| 6% 5/1/22 | | 21,795,000 | 25,077,810 |
| Cott Holdings, Inc. 5.5% 4/1/25 (b) | | 2,025,000 | 2,116,125 |
| | | | 231,837,448 |
| Food & Staples Retailing - 0.3% | | | |
| Albertsons Companies LLC/Safeway, Inc./New Albertson's, Inc./Albertson's LLC: | | | |
| 5.75% 3/15/25 | | 4,430,000 | 3,992,538 |
| 6.625% 6/15/24 | | 2,215,000 | 2,114,218 |
| Albertsons, Inc.: | | | |
| 6.625% 6/1/28 | | 705,000 | 585,150 |
| 7.45% 8/1/29 | | 645,000 | 562,956 |
| 7.75% 6/15/26 | | 765,000 | 699,975 |
| 8% 5/1/31 | | 4,040,000 | 3,524,900 |
| 8.7% 5/1/30 | | 560,000 | 513,800 |
| C&S Group Enterprises LLC 5.375% 7/15/22 (b) | | 3,335,000 | 3,272,469 |
| CVS Health Corp.: | | | |
| 2.8% 7/20/20 | | 15,202,000 | 15,528,582 |
| 3.5% 7/20/22 | | 8,944,000 | 9,352,665 |
| 4% 12/5/23 | | 8,525,000 | 9,124,845 |
| ESAL GmbH 6.25% 2/5/23 (b) | | 6,210,000 | 6,039,225 |
| FAGE International SA/FAGE U.S.A. Dairy Industry, Inc. 5.625% 8/15/26 (b) | | 895,000 | 912,900 |
| Minerva Luxembourg SA: | | | |
| 6.5% 9/20/26 (b) | | 1,500,000 | 1,504,575 |
| 7.75% 1/31/23 (Reg. S) | | 2,144,000 | 2,240,480 |
| Tesco PLC: | | | |
| 5% 3/24/23 | GBP | 1,100,000 | 1,587,979 |
| 6.15% 11/15/37 (b) | | 7,300,000 | 7,656,751 |
| Tops Holding LLC/Tops Markets II Corp. 8% 6/15/22 (b) | | 5,155,000 | 3,776,038 |
| Walgreens Boots Alliance, Inc.: | | | |
| 2.7% 11/18/19 | | 8,473,000 | 8,615,943 |
| 3.3% 11/18/21 | | 10,050,000 | 10,410,479 |
| | | | 92,016,468 |
| Food Products - 0.1% | | | |
| CF Industries Holdings, Inc.: | | | |
| 3.4% 12/1/21 (b) | | 1,915,000 | 1,950,021 |
| 3.45% 6/1/23 | | 3,115,000 | 3,029,338 |
| 4.5% 12/1/26 (b) | | 1,380,000 | 1,436,144 |
| 5.15% 3/15/34 | | 280,000 | 263,900 |
| Gruma S.A.B. de CV: | | | |
| 4.875% 12/1/24 (b) | | 625,000 | 677,344 |
| 4.875% 12/1/24 (Reg. S) | | 800,000 | 867,000 |
| JBS Investments GmbH: | | | |
| 7.25% 4/3/24 (b) | | 3,880,000 | 3,918,800 |
| 7.75% 10/28/20 (b) | | 1,005,000 | 1,030,125 |
| JBS U.S.A. LLC/JBS U.S.A. Finance, Inc. 5.875% 7/15/24 (b) | | 3,075,000 | 3,113,438 |
| Lamb Weston Holdings, Inc.: | | | |
| 4.625% 11/1/24 (b) | | 2,145,000 | 2,212,031 |
| 4.875% 11/1/26 (b) | | 1,555,000 | 1,613,546 |
| MHP SA 8.25% 4/2/20 (b) | | 275,000 | 294,250 |
| Post Holdings, Inc.: | | | |
| 5% 8/15/26 (b) | | 1,675,000 | 1,675,000 |
| 5.75% 3/1/27 (b) | | 2,690,000 | 2,784,150 |
| | | | 24,865,087 |
| Household Products - 0.0% | | | |
| Edgewell Personal Care Co. 5.5% 6/15/25 (b) | | 630,000 | 661,500 |
| Tobacco - 0.7% | | | |
| Altria Group, Inc.: | | | |
| 2.85% 8/9/22 | | 9,573,000 | 9,798,359 |
| 4% 1/31/24 | | 6,408,000 | 6,883,707 |
| Bat Capital Corp. 2.125% 8/15/25 | GBP | 3,050,000 | 3,964,657 |
| Imperial Tobacco Finance PLC: | | | |
| 2.05% 2/11/18 (b) | | 19,975,000 | 19,977,967 |
| 2.05% 7/20/18 (b) | | 8,743,000 | 8,746,663 |
| 2.95% 7/21/20 (b) | | 20,000,000 | 20,368,273 |
| 3.75% 7/21/22 (b) | | 20,300,000 | 21,162,591 |
| 4.25% 7/21/25 (b) | | 18,467,000 | 19,612,206 |
| 8.125% 3/15/24 | GBP | 1,850,000 | 3,267,764 |
| Reynolds American, Inc.: | | | |
| 2.3% 6/12/18 | | 7,358,000 | 7,386,108 |
| 3.25% 6/12/20 | | 3,274,000 | 3,373,442 |
| 4% 6/12/22 | | 11,386,000 | 12,077,113 |
| 4.45% 6/12/25 | | 14,753,000 | 15,944,246 |
| 5.7% 8/15/35 | | 4,237,000 | 4,961,320 |
| 5.85% 8/15/45 | | 35,690,000 | 43,135,368 |
| 6.15% 9/15/43 | | 4,511,000 | 5,594,325 |
| 7.25% 6/15/37 | | 5,056,000 | 6,948,109 |
| Vector Group Ltd. 6.125% 2/1/25 (b) | | 7,705,000 | 7,897,625 |
| | | | 221,099,843 |
|
| TOTAL CONSUMER STAPLES | | | 570,480,346 |
|
| ENERGY - 6.5% | | | |
| Energy Equipment & Services - 0.4% | | | |
| Borets Finance DAC 6.5% 4/7/22 (b) | | 1,345,000 | 1,429,278 |
| Calfrac Holdings LP 7.5% 12/1/20 (b) | | 3,560,000 | 3,186,200 |
| Diamond Offshore Drilling, Inc. 7.875% 8/15/25 | | 2,910,000 | 2,910,000 |
| El Paso Pipeline Partners Operating Co. LLC: | | | |
| 5% 10/1/21 | | 18,884,000 | 20,439,229 |
| 6.5% 4/1/20 | | 738,000 | 810,358 |
| Ensco PLC: | | | |
| 4.5% 10/1/24 | | 3,615,000 | 2,638,950 |
| 5.2% 3/15/25 | | 16,510,000 | 12,299,950 |
| 5.75% 10/1/44 | | 7,801,000 | 5,012,143 |
| 8% 1/31/24 | | 3,943,000 | 3,548,700 |
| Exterran Energy Solutions LP 8.125% 5/1/25 (b) | | 1,920,000 | 1,977,600 |
| Exterran Partners LP/EXLP Finance Corp.: | | | |
| 6% 4/1/21 | | 3,210,000 | 3,137,775 |
| 6% 10/1/22 | | 995,000 | 962,663 |
| Forum Energy Technologies, Inc. 6.25% 10/1/21 | | 3,780,000 | 3,723,300 |
| FTS International, Inc.: | | | |
| 3 month U.S. LIBOR + 7.500% 8.7456% 6/15/20 (b)(d)(e) | | 1,625,000 | 1,649,375 |
| 6.25% 5/1/22 | | 1,780,000 | 1,539,700 |
| Halliburton Co.: | | | |
| 3.8% 11/15/25 | | 9,790,000 | 10,114,021 |
| 4.85% 11/15/35 | | 8,550,000 | 9,269,756 |
| Nabors Industries, Inc. 5.5% 1/15/23 | | 2,412,000 | 2,262,146 |
| Noble Holding International Ltd.: | | | |
| 4.625% 3/1/21 | | 3,493,000 | 2,977,783 |
| 5.25% 3/15/42 | | 1,890,000 | 1,067,850 |
| 5.75% 3/16/18 | | 1,187,000 | 1,195,665 |
| 7.7% 4/1/25 (d) | | 10,335,000 | 7,699,575 |
| 7.75% 1/15/24 | | 5,390,000 | 4,163,667 |
| 8.7% 4/1/45 (d) | | 7,307,000 | 5,223,774 |
| Precision Drilling Corp.: | | | |
| 5.25% 11/15/24 | | 1,290,000 | 1,125,525 |
| 6.5% 12/15/21 | | 1,240,000 | 1,202,800 |
| SESI LLC 7.75% 9/15/24 (b) | | 1,220,000 | 1,232,200 |
| Southern Gas Corridor CJSC 6.875% 3/24/26 (b) | | 2,555,000 | 2,856,746 |
| Summit Midstream Holdings LLC 5.75% 4/15/25 | | 1,650,000 | 1,654,125 |
| | | | 117,310,854 |
| Oil, Gas & Consumable Fuels - 6.1% | | | |
| Afren PLC: | | | |
| 6.625% 12/9/20 (b)(f)(g) | | 770,910 | 154 |
| 10.25% 4/8/19 (Reg. S) (f)(g) | | 2,024,860 | 405 |
| Anadarko Finance Co. 7.5% 5/1/31 | | 29,585,000 | 37,165,181 |
| Anadarko Petroleum Corp.: | | | |
| 4.85% 3/15/21 | | 6,730,000 | 7,153,839 |
| 5.55% 3/15/26 | | 13,807,000 | 15,412,180 |
| 6.45% 9/15/36 | | 4,370,000 | 5,106,981 |
| 6.6% 3/15/46 | | 22,460,000 | 27,171,034 |
| Antero Resources Corp.: | | | |
| 5% 3/1/25 | | 4,530,000 | 4,439,400 |
| 5.125% 12/1/22 | | 8,335,000 | 8,355,838 |
| 5.625% 6/1/23 (Reg. S) | | 4,310,000 | 4,385,425 |
| Antero Resources Finance Corp. 5.375% 11/1/21 | | 3,675,000 | 3,739,313 |
| California Resources Corp. 8% 12/15/22 (b) | | 5,050,000 | 2,783,813 |
| Canadian Natural Resources Ltd.: | | | |
| 1.75% 1/15/18 | | 6,049,000 | 6,046,343 |
| 3.9% 2/1/25 | | 24,997,000 | 25,636,005 |
| 5.85% 2/1/35 | | 10,897,000 | 12,163,046 |
| Cenovus Energy, Inc.: | | | |
| 4.25% 4/15/27 (b) | | 31,079,000 | 29,999,975 |
| 5.7% 10/15/19 | | 5,453,000 | 5,731,648 |
| Cheniere Corpus Christi Holdings LLC: | | | |
| 5.125% 6/30/27 (b) | | 3,595,000 | 3,720,825 |
| 5.875% 3/31/25 | | 5,295,000 | 5,692,125 |
| 7% 6/30/24 | | 4,155,000 | 4,726,313 |
| Chesapeake Energy Corp.: | | | |
| 4.875% 4/15/22 | | 3,735,000 | 3,305,475 |
| 5.75% 3/15/23 | | 3,405,000 | 3,009,169 |
| 6.125% 2/15/21 | | 3,895,000 | 3,709,988 |
| 8% 12/15/22 (b) | | 7,770,000 | 8,032,238 |
| 8% 1/15/25 (b) | | 4,665,000 | 4,495,894 |
| 8% 6/15/27 (b) | | 3,700,000 | 3,515,000 |
| Columbia Pipeline Group, Inc.: | | | |
| 2.45% 6/1/18 | | 3,149,000 | 3,160,069 |
| 3.3% 6/1/20 | | 15,490,000 | 15,934,220 |
| 4.5% 6/1/25 | | 4,707,000 | 5,055,439 |
| Concho Resources, Inc. 4.375% 1/15/25 | | 7,200,000 | 7,488,000 |
| Consolidated Energy Finance SA: | | | |
| 3 month U.S. LIBOR + 3.750% 4.9817% 6/15/22 (b)(d)(e) | | 12,775,000 | 12,775,056 |
| 6.875% 6/15/25 (b) | | 4,700,000 | 4,888,000 |
| Continental Resources, Inc.: | | | |
| 3.8% 6/1/24 | | 4,150,000 | 3,859,500 |
| 4.5% 4/15/23 | | 8,290,000 | 8,165,650 |
| 4.9% 6/1/44 | | 1,255,000 | 1,061,228 |
| Covey Park Energy LLC 7.5% 5/15/25 (b) | | 3,920,000 | 3,934,700 |
| CVR Refining LLC/Coffeyville Finance, Inc. 6.5% 11/1/22 | | 5,745,000 | 5,816,813 |
| DCP Midstream LLC: | | | |
| 4.75% 9/30/21 (b) | | 11,333,000 | 11,616,325 |
| 5.85% 5/21/43 (b)(d) | | 6,758,000 | 6,268,045 |
| DCP Midstream Operating LP 3.875% 3/15/23 | | 5,532,000 | 5,386,785 |
| Denbury Resources, Inc. 9% 5/15/21 (b) | | 4,000,000 | 3,580,000 |
| Dolphin Energy Ltd. 5.5% 12/15/21 (b) | | 550,000 | 605,374 |
| Duke Energy Field Services 6.45% 11/3/36 (b) | | 13,741,000 | 14,462,403 |
| EDC Finance Ltd. 4.875% 4/17/20 (b) | | 695,000 | 710,721 |
| El Paso Corp. 6.5% 9/15/20 | | 16,140,000 | 17,992,806 |
| Empresa Nacional de Petroleo 4.375% 10/30/24 (b) | | 9,045,000 | 9,505,919 |
| Enable Midstream Partners LP: | | | |
| 2.4% 5/15/19 (d) | | 4,028,000 | 4,010,164 |
| 3.9% 5/15/24 (d) | | 4,249,000 | 4,256,087 |
| Enbridge Energy Partners LP: | | | |
| 4.2% 9/15/21 | | 13,331,000 | 14,068,984 |
| 4.375% 10/15/20 | | 11,319,000 | 11,915,479 |
| Enbridge, Inc.: | | | |
| 4.25% 12/1/26 | | 7,730,000 | 8,141,495 |
| 5.5% 12/1/46 | | 8,922,000 | 10,233,636 |
| Endeavor Energy Resources LP/EER Finance, Inc. 7% 8/15/21 (b) | | 8,190,000 | 8,456,175 |
| Enterprise Products Operating LP: | | | |
| 2.55% 10/15/19 | | 2,971,000 | 2,995,934 |
| 3.75% 2/15/25 | | 9,982,000 | 10,404,481 |
| EP Energy LLC/Everest Acquisition Finance, Inc. 8% 11/29/24 (b) | | 2,990,000 | 2,922,725 |
| Extraction Oil & Gas, Inc. 7.375% 5/15/24 (b) | | 2,770,000 | 2,783,850 |
| Georgian Oil & Gas Corp. 6.75% 4/26/21 (b) | | 1,875,000 | 1,980,469 |
| Gibson Energy, Inc. 6.75% 7/15/21 (b) | | 639,000 | 661,365 |
| Global Partners LP/GLP Finance Corp.: | | | |
| 6.25% 7/15/22 | | 5,165,000 | 5,203,738 |
| 7% 6/15/23 | | 9,970,000 | 9,994,925 |
| Hilcorp Energy I LP/Hilcorp Finance Co.: | | | |
| 5% 12/1/24 (b) | | 3,855,000 | 3,642,975 |
| 5.75% 10/1/25 (b) | | 2,135,000 | 2,060,275 |
| Indika Energy Capital II Pte. Ltd. 6.875% 4/10/22 (b) | | 1,405,000 | 1,418,165 |
| Kinder Morgan Energy Partners LP: | | | |
| 3.5% 3/1/21 | | 11,339,000 | 11,645,106 |
| 5.5% 3/1/44 | | 42,953,000 | 44,935,482 |
| 6.55% 9/15/40 | | 1,889,000 | 2,196,656 |
| Kinder Morgan, Inc.: | | | |
| 5% 2/15/21 (b) | | 10,606,000 | 11,379,054 |
| 5.05% 2/15/46 | | 4,854,000 | 4,834,589 |
| Kosmos Energy Ltd.: | | | |
| 7.875% 8/1/21 (b) | | 1,300,000 | 1,342,250 |
| 7.875% 8/1/21 (b) | | 1,045,000 | 1,078,963 |
| Marathon Petroleum Corp. 5.125% 3/1/21 | | 10,178,000 | 11,041,265 |
| Nakilat, Inc. 6.067% 12/31/33 (b) | | 1,975,000 | 2,323,193 |
| Newfield Exploration Co. 5.375% 1/1/26 | | 1,260,000 | 1,316,700 |
| NGL Energy Partners LP/NGL Energy Finance Corp. 6.125% 3/1/25 | | 2,685,000 | 2,389,650 |
| NGPL PipeCo LLC: | | | |
| 4.375% 8/15/22 (b) | | 505,000 | 518,888 |
| 4.875% 8/15/27 (b) | | 505,000 | 520,150 |
| Nostrum Oil & Gas Finance BV: | | | |
| 6.375% 2/14/19 (b) | | 3,555,000 | 3,561,968 |
| 8% 7/25/22 (b) | | 3,890,000 | 3,966,509 |
| Pacific Exploration and Production Corp.: | | | |
| 10% 11/2/21 pay-in-kind (d) | | 1,204,000 | 1,342,460 |
| 10% 11/2/21 pay-in-kind (b)(d) | | 840,000 | 936,600 |
| Pan American Energy LLC 7.875% 5/7/21 (b) | | 2,858,000 | 3,089,498 |
| Parsley Energy LLC/Parsley: | | | |
| 5.25% 8/15/25 (b) | | 1,420,000 | 1,420,000 |
| 5.375% 1/15/25 (b) | | 3,335,000 | 3,351,675 |
| PBF Holding Co. LLC/PBF Finance Corp. 7% 11/15/23 | | 1,310,000 | 1,313,275 |
| PBF Logistics LP/PBF Logistics Finance, Inc. 6.875% 5/15/23 | | 4,365,000 | 4,474,562 |
| Pemex Project Funding Master Trust 6.625% 6/15/35 | | 5,140,000 | 5,602,600 |
| Petro-Canada 6.05% 5/15/18 | | 3,850,000 | 3,967,689 |
| Petrobras Energia SA 7.375% 7/21/23 (b) | | 560,000 | 605,360 |
| Petrobras Global Finance BV: | | | |
| 4.375% 5/20/23 | | 20,096,000 | 19,673,984 |
| 4.75% 1/14/25 | EUR | 450,000 | 561,965 |
| 5.625% 5/20/43 | | 18,504,000 | 16,228,008 |
| 6.125% 1/17/22 | | 9,120,000 | 9,667,200 |
| 6.25% 3/17/24 | | 21,380,000 | 22,659,593 |
| 7.25% 3/17/44 | | 45,050,000 | 46,401,500 |
| 7.375% 1/17/27 | | 41,110,000 | 45,436,416 |
| 8.375% 5/23/21 | | 58,745,000 | 66,704,948 |
| 8.75% 5/23/26 | | 53,840,000 | 64,446,480 |
| Petrobras International Finance Co. Ltd.: | | | |
| 5.375% 1/27/21 | | 44,755,000 | 46,285,621 |
| 5.75% 1/20/20 | | 1,650,000 | 1,734,975 |
| 5.875% 3/7/22 | EUR | 200,000 | 268,150 |
| 6.875% 1/20/40 | | 1,220,000 | 1,218,414 |
| Petroleos de Venezuela SA: | | | |
| 5.375% 4/12/27 | | 975,000 | 294,938 |
| 5.5% 4/12/37 | | 1,520,000 | 457,900 |
| 6% 5/16/24 (b) | | 1,845,000 | 553,500 |
| 6% 11/15/26 (b) | | 2,385,000 | 715,500 |
| 8.5% 10/27/20 (b) | | 1,115,000 | 824,989 |
| 9.75% 5/17/35 (b) | | 6,375,000 | 2,263,125 |
| 12.75% 2/17/22 (b) | | 270,000 | 122,040 |
| Petroleos Mexicanos: | | | |
| 3.5% 7/23/20 | | 13,960,000 | 14,329,940 |
| 3.5% 1/30/23 | | 11,169,000 | 11,071,271 |
| 3.75% 2/21/24 (Reg. S) | EUR | 4,200,000 | 5,233,685 |
| 4.5% 1/23/26 | | 46,043,000 | 46,491,919 |
| 4.625% 9/21/23 | | 80,440,000 | 83,738,040 |
| 4.875% 1/24/22 | | 12,482,000 | 13,118,582 |
| 4.875% 1/18/24 | | 13,872,000 | 14,447,688 |
| 5.125% 3/15/23 (Reg. S) | EUR | 1,900,000 | 2,562,908 |
| 5.5% 1/21/21 | | 12,189,000 | 13,066,608 |
| 5.5% 6/27/44 | | 10,807,000 | 10,169,387 |
| 5.625% 1/23/46 | | 35,710,000 | 33,576,328 |
| 6% 3/5/20 | | 6,145,000 | 6,627,383 |
| 6.375% 2/4/21 | | 785,000 | 866,248 |
| 6.375% 1/23/45 | | 29,907,000 | 30,834,117 |
| 6.5% 3/13/27 (b) | | 33,960,000 | 38,035,200 |
| 6.5% 3/13/27 (b) | | 57,927,000 | 64,878,240 |
| 6.5% 6/2/41 | | 27,982,000 | 29,562,983 |
| 6.625% (b)(c) | | 2,985,000 | 3,028,283 |
| 6.75% 9/21/47 (b) | | 24,580,000 | 26,425,958 |
| 6.75% 9/21/47 | | 25,666,000 | 27,593,517 |
| 6.875% 8/4/26 | | 41,650,000 | 47,889,170 |
| 8% 5/3/19 | | 8,600,000 | 9,417,000 |
| Phillips 66 Co. 4.3% 4/1/22 | | 12,618,000 | 13,569,886 |
| Phillips 66 Partners LP 2.646% 2/15/20 | | 1,316,000 | 1,321,172 |
| Plains All American Pipeline LP/PAA Finance Corp. 3.65% 6/1/22 | | 5,217,000 | 5,277,238 |
| PT Pertamina Persero 6.5% 5/27/41 (b) | | 1,010,000 | 1,190,742 |
| Range Resources Corp.: | | | |
| 4.875% 5/15/25 | | 2,960,000 | 2,834,200 |
| 5% 8/15/22 (b) | | 1,725,000 | 1,694,813 |
| 5% 3/15/23 (b) | | 5,270,000 | 5,204,125 |
| Rice Energy, Inc.: | | | |
| 6.25% 5/1/22 | | 12,725,000 | 13,234,000 |
| 7.25% 5/1/23 | | 8,289,000 | 8,858,869 |
| Sabine Pass Liquefaction LLC 5.75% 5/15/24 | | 1,440,000 | 1,601,475 |
| Sinopec Group Overseas Development (2015) Ltd. 1% 4/28/22 (Reg. S) | EUR | 2,675,000 | 3,234,870 |
| Southwestern Energy Co.: | | | |
| 5.8% 1/23/20 (d) | | 38,142,000 | 39,286,260 |
| 6.7% 1/23/25 (d) | | 35,947,000 | 35,048,325 |
| Spectra Energy Partners LP 2.95% 9/25/18 | | 1,960,000 | 1,979,847 |
| Sunoco LP/Sunoco Finance Corp.: | | | |
| 5.5% 8/1/20 | | 1,445,000 | 1,487,339 |
| 6.375% 4/1/23 | | 6,650,000 | 7,007,438 |
| Targa Resources Partners LP/Targa Resources Partners Finance Corp.: | | | |
| 5.125% 2/1/25 (b) | | 1,210,000 | 1,243,275 |
| 5.25% 5/1/23 | | 685,000 | 700,413 |
| 6.75% 3/15/24 | | 4,420,000 | 4,784,650 |
| Teekay Corp. 8.5% 1/15/20 | | 585,000 | 590,850 |
| Teine Energy Ltd. 6.875% 9/30/22 (b) | | 2,265,000 | 2,265,000 |
| The Williams Companies, Inc.: | | | |
| 3.7% 1/15/23 | | 3,730,000 | 3,702,025 |
| 4.55% 6/24/24 | | 38,986,000 | 39,863,185 |
| 5.75% 6/24/44 | | 19,187,000 | 19,906,513 |
| Transportadora de Gas del Sur SA 9.625% 5/14/20(b) | | 3,668,817 | 3,951,793 |
| Western Gas Partners LP: | | | |
| 4.65% 7/1/26 | | 4,876,000 | 5,070,710 |
| 5.375% 6/1/21 | | 24,990,000 | 26,992,595 |
| Whiting Petroleum Corp.: | | | |
| 5% 3/15/19 | | 2,595,000 | 2,569,050 |
| 5.75% 3/15/21 | | 1,350,000 | 1,269,000 |
| Williams Partners LP: | | | |
| 3.6% 3/15/22 | | 10,817,000 | 11,153,122 |
| 3.9% 1/15/25 | | 26,667,000 | 27,401,859 |
| 4% 11/15/21 | | 6,716,000 | 7,048,211 |
| 4% 9/15/25 | | 3,000,000 | 3,100,860 |
| 4.125% 11/15/20 | | 2,399,000 | 2,517,010 |
| 4.3% 3/4/24 | | 40,932,000 | 43,390,479 |
| 4.5% 11/15/23 | | 7,325,000 | 7,848,350 |
| WPX Energy, Inc.: | | | |
| 5.25% 9/15/24 | | 7,085,000 | 6,943,300 |
| 6% 1/15/22 | | 2,480,000 | 2,557,500 |
| 7.5% 8/1/20 | | 4,492,000 | 4,851,360 |
| YPF SA: | | | |
| 8.5% 3/23/21 (b) | | 4,950,000 | 5,623,200 |
| 8.5% 3/23/21 (Reg. S) | | 1,500,000 | 1,704,000 |
| 8.75% 4/4/24 (b) | | 5,290,000 | 6,121,165 |
| 8.875% 12/19/18 (Reg. S) | | 2,150,000 | 2,311,250 |
| | | | 1,879,864,749 |
|
| TOTAL ENERGY | | | 1,997,175,603 |
|
| FINANCIALS - 11.1% | | | |
| Banks - 4.9% | | | |
| ABN AMRO Bank NV 4.4% 3/27/28 (Reg. S) (d) | | 5,400,000 | 5,606,204 |
| Akbank T.A.S. 6.5% 3/9/18 (Reg. S) | | 3,100,000 | 3,158,652 |
| Akbank TAS/Ak Finansal Kiralama A/S 7.2% 3/16/27 (b)(d) | | 695,000 | 735,892 |
| Allied Irish Banks PLC 4.125% 11/26/25 (Reg. S) (d) | EUR | 3,450,000 | 4,399,680 |
| Banco de Bogota SA 6.25% 5/12/26 (b) | | 690,000 | 746,925 |
| Banco de Reservas de La Republica Dominicana 7% 2/1/23 (b) | | 1,675,000 | 1,758,750 |
| Banco Espirito Santo SA 4% 1/21/19 (Reg. S) (f) | EUR | 1,300,000 | 466,210 |
| Banco Hipotecario SA 9.75% 11/30/20 (b) | | 5,205,000 | 5,915,430 |
| Banco Macro SA 6.75% 11/4/26 (b)(d) | | 1,645,000 | 1,714,962 |
| Banco Nacional de Desenvolvimento Economico e Social: | | | |
| 4% 4/14/19 (b) | | 1,393,000 | 1,420,331 |
| 5.75% 9/26/23 (b) | | 10,130,000 | 10,975,349 |
| 6.369% 6/16/18 (b) | | 1,125,000 | 1,158,896 |
| Bank of America Corp.: | | | |
| 1.776% 5/4/27 (Reg. S) (d) | EUR | 4,350,000 | 5,306,158 |
| 2% 1/11/18 | | 50,000,000 | 50,071,653 |
| 2.25% 4/21/20 | | 66,694,000 | 67,009,835 |
| 2.6% 1/15/19 | | 8,068,000 | 8,148,196 |
| 3.3% 1/11/23 | | 901,000 | 926,702 |
| 3.5% 4/19/26 | | 20,559,000 | 20,938,038 |
| 3.705% 4/24/28 (d) | | 32,549,000 | 33,299,731 |
| 3.875% 8/1/25 | | 22,129,000 | 23,264,291 |
| 3.95% 4/21/25 | | 17,156,000 | 17,716,614 |
| 4.1% 7/24/23 | | 11,481,000 | 12,276,987 |
| 4.2% 8/26/24 | | 40,532,000 | 42,685,909 |
| 4.25% 10/22/26 | | 14,724,000 | 15,445,373 |
| 5.65% 5/1/18 | | 8,780,000 | 9,000,368 |
| 5.75% 12/1/17 | | 21,955,000 | 22,169,553 |
| 5.875% 1/5/21 | | 6,530,000 | 7,286,038 |
| Banque Centrale de Tunisie 5.75% 1/30/25 (b) | | 905,000 | 889,163 |
| Barclays Bank PLC 6.75% 1/16/23 (d) | GBP | 1,250,000 | 1,647,878 |
| Barclays PLC: | | | |
| 2.75% 11/8/19 | | 12,249,000 | 12,396,515 |
| 3.25% 1/12/21 | | 21,116,000 | 21,579,792 |
| 4.375% 1/12/26 | | 25,086,000 | 26,376,524 |
| BBVA Bancomer SA: | | | |
| 7.25% 4/22/20 (b) | | 975,000 | 1,064,700 |
| 7.25% 4/22/20 (Reg. S) | | 3,300,000 | 3,603,600 |
| Biz Finance PLC 9.75% 1/22/25 (b) | | 300,000 | 316,656 |
| BTA Bank JSC 5.5% 12/21/22 (b) | | 915,000 | 894,705 |
| CBOM Finance PLC 7.5% 10/5/27 (b)(d) | | 1,260,000 | 1,184,712 |
| Citigroup, Inc.: | | | |
| 1.8% 2/5/18 | | 33,287,000 | 33,308,382 |
| 1.85% 11/24/17 | | 33,365,000 | 33,385,709 |
| 2.4% 2/18/20 | | 60,588,000 | 61,136,617 |
| 2.65% 10/26/20 | | 20,000,000 | 20,281,976 |
| 4.05% 7/30/22 | | 5,303,000 | 5,587,623 |
| 4.4% 6/10/25 | | 40,790,000 | 43,135,042 |
| 4.45% 9/29/27 | | 10,000,000 | 10,572,966 |
| 5.125% 12/12/18 | GBP | 1,875,000 | 2,550,034 |
| 5.5% 9/13/25 | | 20,027,000 | 22,652,694 |
| Citizens Bank NA 2.55% 5/13/21 | | 6,564,000 | 6,621,119 |
| Citizens Financial Group, Inc. 4.15% 9/28/22 (b) | | 15,987,000 | 16,839,639 |
| Credit Suisse Group Funding Guernsey Ltd.: | | | |
| 2.75% 3/26/20 | | 19,455,000 | 19,727,850 |
| 3.75% 3/26/25 | | 19,450,000 | 19,935,627 |
| 3.8% 9/15/22 | | 30,700,000 | 32,093,704 |
| 3.8% 6/9/23 | | 36,648,000 | 38,212,719 |
| CYBG PLC 3.125% 6/22/25 (Reg. S) (d) | GBP | 1,300,000 | 1,706,731 |
| Discover Bank: | | | |
| 4.2% 8/8/23 | | 17,852,000 | 19,072,579 |
| 7% 4/15/20 | | 2,030,000 | 2,249,241 |
| Export Credit Bank of Turkey 5.875% 4/24/19 (b) | | 280,000 | 290,822 |
| Fidelity Bank PLC 6.875% 5/9/18 (b) | | 340,000 | 329,868 |
| Fifth Third Bancorp: | | | |
| 4.5% 6/1/18 | | 798,000 | 814,399 |
| 8.25% 3/1/38 | | 4,667,000 | 7,165,058 |
| GTB Finance BV 6% 11/8/18 (b) | | 1,155,000 | 1,171,528 |
| HBOS PLC 6.75% 5/21/18 (b) | | 6,067,000 | 6,268,616 |
| HSBC Bank PLC 5% 3/20/23 (d) | GBP | 967,000 | 1,275,536 |
| HSBC Holdings PLC: | | | |
| 4.25% 3/14/24 | | 6,192,000 | 6,518,484 |
| 6.375% 10/18/22 (d) | GBP | 8,550,000 | 11,117,277 |
| HSBC U.S.A., Inc. 1.625% 1/16/18 | | 11,125,000 | 11,127,893 |
| Huntington Bancshares, Inc. 7% 12/15/20 | | 2,851,000 | 3,270,242 |
| Intesa Sanpaolo SpA 5.71% 1/15/26 (b) | | 28,396,000 | 30,010,585 |
| Itau Unibanco Holding SA: | | | |
| 5.125% 5/13/23 (Reg. S) | | 1,650,000 | 1,719,300 |
| 5.5% 8/6/22 (b) | | 1,155,000 | 1,217,370 |
| 6.2% 12/21/21 (Reg. S) | | 980,000 | 1,062,075 |
| JPMorgan Chase & Co.: | | | |
| 1.625% 5/15/18 | | 12,580,000 | 12,585,708 |
| 2.2% 10/22/19 | | 7,268,000 | 7,337,018 |
| 2.25% 1/23/20 | | 40,000,000 | 40,330,974 |
| 2.35% 1/28/19 | | 6,857,000 | 6,923,736 |
| 2.95% 10/1/26 | | 18,480,000 | 18,196,780 |
| 3.25% 9/23/22 | | 18,423,000 | 19,074,973 |
| 3.875% 9/10/24 | | 35,791,000 | 37,471,260 |
| 4.125% 12/15/26 | | 32,416,000 | 34,147,600 |
| 4.25% 10/15/20 | | 6,995,000 | 7,451,024 |
| 4.35% 8/15/21 | | 20,267,000 | 21,840,835 |
| 4.5% 1/24/22 | | 22,046,000 | 23,965,362 |
| 4.625% 5/10/21 | | 6,879,000 | 7,459,518 |
| 4.95% 3/25/20 | | 22,079,000 | 23,706,565 |
| JSC BGEO Group 6% 7/26/23 (b) | | 2,110,000 | 2,168,025 |
| Kazkommertsbank Jsc Mtn Bank Ent 8.5% 5/11/18 (b) | | 1,975,000 | 2,028,286 |
| Nykredit Realkredit A/S 4% 6/3/36 (Reg. S) (d) | EUR | 200,000 | 256,732 |
| Rabobank Nederland 4.375% 8/4/25 | | 25,937,000 | 27,534,944 |
| Regions Bank 6.45% 6/26/37 | | 24,618,000 | 30,883,910 |
| Regions Financial Corp. 3.2% 2/8/21 | | 11,916,000 | 12,234,189 |
| Royal Bank of Scotland Group PLC: | | | |
| 4.8% 4/5/26 | | 50,452,000 | 54,009,137 |
| 5.125% 5/28/24 | | 64,006,000 | 67,515,190 |
| 6% 12/19/23 | | 25,897,000 | 28,697,695 |
| 6.1% 6/10/23 | | 31,961,000 | 35,319,727 |
| 6.125% 12/15/22 | | 42,557,000 | 46,866,035 |
| SB Capital SA 5.5% 2/26/24 (b)(d) | | 1,360,000 | 1,391,729 |
| Trade and Development Bank of Mongolia LLC 9.375% 5/19/20 (b) | | 1,745,000 | 1,886,886 |
| Turkiye Garanti Bankasi A/S 6.125% 5/24/27 (b)(d) | | 1,020,000 | 1,031,075 |
| Turkiye Halk Bankasi A/S: | | | |
| 3.875% 2/5/20 (b) | | 2,000,000 | 1,968,000 |
| 4.75% 6/4/19 (b) | | 980,000 | 990,225 |
| Turkiye Is Bankasi A/S: | | | |
| 5.5% 4/21/19 (b) | | 415,000 | 426,027 |
| 5.5% 4/21/22 (b) | | 1,425,000 | 1,457,456 |
| Turkiye Vakiflar Bankasi TAO 6.875% 2/3/25 (Reg. S) (d) | | 2,925,000 | 2,992,199 |
| UniCredit Luxembourg 6% 10/31/17 (Reg. S) | | 2,300,000 | 2,311,403 |
| UniCredit SpA 6.375% 5/2/23 (Reg. S) (d) | | 1,350,000 | 1,382,956 |
| Zenith Bank PLC: | | | |
| 6.25% 4/22/19 (b) | | 4,970,000 | 5,029,342 |
| 7.375% 5/30/22 (b) | | 2,865,000 | 2,925,165 |
| | | | 1,507,783,963 |
| Capital Markets - 3.5% | | | |
| Affiliated Managers Group, Inc.: | | | |
| 3.5% 8/1/25 | | 21,008,000 | 21,488,726 |
| 4.25% 2/15/24 | | 14,661,000 | 15,574,458 |
| Argos Merger Sub, Inc. 7.125% 3/15/23 (b) | | 3,790,000 | 3,088,850 |
| Compass Group International BV 0.625% 7/3/24 (Reg. S) | EUR | 3,200,000 | 3,788,953 |
| Credit Suisse AG 6% 2/15/18 | | 18,058,000 | 18,390,618 |
| Credit Suisse Group AG 5.75% 9/18/25 (Reg. S) (d) | EUR | 5,950,000 | 7,968,575 |
| Deutsche Bank AG 4.5% 4/1/25 | | 80,571,000 | 81,354,413 |
| Deutsche Bank AG London Branch: | | | |
| 1.875% 2/13/18 | | 37,777,000 | 37,803,280 |
| 2.85% 5/10/19 | | 47,570,000 | 48,104,937 |
| Goldman Sachs Group, Inc.: | | | |
| 1.25% 5/1/25 (Reg. S) | EUR | 2,100,000 | 2,495,640 |
| 1.748% 9/15/17 | | 42,024,000 | 42,027,882 |
| 2% 7/27/23 (Reg. S) | EUR | 5,550,000 | 7,025,577 |
| 2.55% 10/23/19 | | 33,080,000 | 33,473,755 |
| 2.625% 1/31/19 | | 50,400,000 | 50,920,568 |
| 2.9% 7/19/18 | | 17,494,000 | 17,666,514 |
| 3.691% 6/5/28 (d) | | 200,926,000 | 204,401,395 |
| 3.75% 5/22/25 | | 20,000,000 | 20,631,888 |
| 5.25% 7/27/21 | | 17,105,000 | 18,843,117 |
| 5.95% 1/18/18 | | 4,975,000 | 5,052,772 |
| IntercontinentalExchange, Inc. 2.75% 12/1/20 | | 6,489,000 | 6,634,344 |
| Lazard Group LLC 4.25% 11/14/20 | | 10,151,000 | 10,780,344 |
| Merrill Lynch & Co., Inc. 5.5% 11/22/21 | GBP | 1,100,000 | 1,646,272 |
| Moody's Corp.: | | | |
| 3.25% 1/15/28 (b) | | 11,520,000 | 11,613,234 |
| 4.875% 2/15/24 | | 10,818,000 | 12,065,424 |
| Morgan Stanley: | | | |
| 1% 12/2/22 | EUR | 2,350,000 | 2,849,908 |
| 2.125% 4/25/18 | | 12,586,000 | 12,622,281 |
| 2.375% 3/31/21 (Reg. S) | EUR | 3,000,000 | 3,846,223 |
| 2.8% 6/16/20 | | 30,000,000 | 30,544,358 |
| 3.125% 7/27/26 | | 108,849,000 | 107,434,542 |
| 3.7% 10/23/24 | | 37,479,000 | 39,041,580 |
| 4.875% 11/1/22 | | 26,240,000 | 28,577,182 |
| 5% 11/24/25 | | 3,189,000 | 3,510,037 |
| 5.5% 1/26/20 | | 88,000,000 | 94,995,896 |
| 5.625% 9/23/19 | | 12,714,000 | 13,626,611 |
| 5.75% 1/25/21 | | 19,879,000 | 22,085,772 |
| MSCI, Inc.: | | | |
| 4.75% 8/1/26 (b) | | 4,145,000 | 4,300,438 |
| 5.25% 11/15/24 (b) | | 4,420,000 | 4,707,300 |
| Thomson Reuters Corp. 3.85% 9/29/24 | | 11,394,000 | 12,028,153 |
| UBS Group Funding Ltd. 4.125% 9/24/25 (b) | | 18,881,000 | 20,028,598 |
| | | | 1,083,040,415 |
| Consumer Finance - 0.8% | | | |
| AerCap Ireland Capital Ltd./AerCap Global Aviation Trust 3.5% 5/26/22 | | 7,478,000 | 7,684,898 |
| Capital One Financial Corp. 2.45% 4/24/19 | | 10,550,000 | 10,628,257 |
| Credito Real S.A.B. de CV 7.5% 3/13/19 (b) | | 1,465,000 | 1,516,275 |
| Discover Financial Services: | | | |
| 3.85% 11/21/22 | | 34,849,000 | 36,239,176 |
| 3.95% 11/6/24 | | 14,738,000 | 15,231,072 |
| 5.2% 4/27/22 | | 12,545,000 | 13,738,332 |
| Ford Motor Credit Co. LLC: | | | |
| 1.724% 12/6/17 | | 18,742,000 | 18,753,280 |
| 2.24% 6/15/18 | | 19,162,000 | 19,235,723 |
| 2.597% 11/4/19 | | 52,209,000 | 52,692,209 |
| 2.875% 10/1/18 | | 13,000,000 | 13,129,995 |
| Hyundai Capital America: | | | |
| 2.125% 10/2/17 (b) | | 18,524,000 | 18,529,055 |
| 2.875% 8/9/18 (b) | | 5,276,000 | 5,319,910 |
| SLM Corp.: | | | |
| 5.5% 1/15/19 | | 725,000 | 750,593 |
| 5.5% 1/25/23 | | 2,640,000 | 2,666,400 |
| Synchrony Financial: | | | |
| 3% 8/15/19 | | 4,907,000 | 4,978,115 |
| 3.75% 8/15/21 | | 7,409,000 | 7,658,000 |
| 4.25% 8/15/24 | | 7,458,000 | 7,808,971 |
| | | | 236,560,261 |
| Diversified Financial Services - 0.6% | | | |
| 1MDB Global Investments Ltd. 4.4% 3/9/23 | | 1,000,000 | 931,400 |
| Annington Funding PLC 2.646% 7/12/25 (Reg. S) | GBP | 2,100,000 | 2,791,783 |
| Brixmor Operating Partnership LP: | | | |
| 3.25% 9/15/23 | | 25,518,000 | 25,481,570 |
| 3.85% 2/1/25 | | 14,325,000 | 14,349,404 |
| 3.875% 8/15/22 | | 21,027,000 | 21,741,109 |
| 4.125% 6/15/26 | | 8,647,000 | 8,773,449 |
| Chobani LLC/Finance Corp., Inc. 7.5% 4/15/25 (b) | | 2,820,000 | 3,066,750 |
| Cimpor Financial Operations BV 5.75% 7/17/24 (b) | | 1,350,000 | 1,221,345 |
| Icahn Enterprises LP/Icahn Enterprises Finance Corp.: | | | |
| 4.875% 3/15/19 | | 12,570,000 | 12,695,700 |
| 5.875% 2/1/22 | | 25,766,000 | 26,499,043 |
| 6% 8/1/20 | | 2,810,000 | 2,894,300 |
| 6.25% 2/1/22 | | 1,105,000 | 1,139,531 |
| 6.75% 2/1/24 | | 2,000,000 | 2,105,600 |
| ILFC E-Capital Trust I 3 month U.S. LIBOR + 1.550% 4.34% 12/21/65 (b)(d)(e) | | 11,760,000 | 11,172,000 |
| ILFC E-Capital Trust II 3 month U.S. LIBOR + 1.800% 4.59% 12/21/65 (b)(d)(e) | | 6,710,000 | 6,366,113 |
| Inception Merger Sub, Inc./Rackspace Hosting, Inc. 8.625% 11/15/24 (b) | | 3,550,000 | 3,767,438 |
| j2 Cloud Services LLC/j2 Global Communications, Inc. 6% 7/15/25 (b) | | 1,375,000 | 1,417,969 |
| Pontis IV Ltd. 5.125% 3/31/27 (b) | | 580,000 | 582,900 |
| PT Bukit Makmur Mandiri Utama 7.75% 2/13/22 (b) | | 1,395,000 | 1,465,164 |
| Radiate Holdco LLC/Radiate Financial Service Ltd. 6.625% 2/15/25 (b) | | 2,080,000 | 2,056,600 |
| Sistema International Funding SA 6.95% 5/17/19 (b) | | 945,000 | 909,260 |
| Solera LLC/Solera Finance, Inc. 10.5% 3/1/24 (b) | | 6,270,000 | 7,139,963 |
| Sparc Em Spc 0% 12/5/22 (b) | | 205,000 | 185,628 |
| Tempo Acquisition LLC / Tempo 6.75% 6/1/25 (b) | | 1,815,000 | 1,855,838 |
| TMK Capital SA 6.75% 4/3/20 (Reg. S) | | 560,000 | 587,830 |
| Voya Financial, Inc. 3.125% 7/15/24 | | 13,804,000 | 13,769,031 |
| | | | 174,966,718 |
| Insurance - 1.3% | | | |
| AIA Group Ltd. 2.25% 3/11/19 (b) | | 2,566,000 | 2,568,803 |
| American International Group, Inc.: | | | |
| 2.3% 7/16/19 | | 6,461,000 | 6,509,579 |
| 3.3% 3/1/21 | | 9,614,000 | 9,950,041 |
| 3.875% 1/15/35 | | 19,041,000 | 18,727,021 |
| 4.875% 6/1/22 | | 18,193,000 | 20,111,087 |
| Aon Corp. 5% 9/30/20 | | 3,854,000 | 4,174,229 |
| Aquarius + Investments PLC for Swiss Reinsurance Co. Ltd. 6.375% 9/1/24 (d) | | 3,050,000 | 3,221,898 |
| Assicurazioni Generali SpA 5.5% 10/27/47 (Reg. S) (d) | EUR | 2,450,000 | 3,366,780 |
| AXA SA 3.941%(Reg. S) (c)(d) | EUR | 1,270,000 | 1,668,904 |
| Demeter Investments BV 5.625% 8/15/52 (Reg. S) (d) | | 2,250,000 | 2,433,224 |
| Great-West Life & Annuity Insurance Co. 3 month U.S. LIBOR + 2.538% 3.8522% 5/16/46 (b)(d)(e) | | 1,859,000 | 1,831,115 |
| Hartford Financial Services Group, Inc. 5.125% 4/15/22 | | 14,787,000 | 16,517,376 |
| Liberty Mutual Group, Inc. 5% 6/1/21 (b) | | 12,644,000 | 13,808,599 |
| Marsh & McLennan Companies, Inc. 4.8% 7/15/21 | | 7,090,000 | 7,746,395 |
| Massachusetts Mutual Life Insurance Co. 4.5% 4/15/65 (b) | | 30,523,000 | 31,914,682 |
| MetLife, Inc.: | | | |
| 1.903% 12/15/17 (d) | | 2,987,000 | 2,990,717 |
| 3.048% 12/15/22 (d) | | 12,433,000 | 12,854,237 |
| 4.75% 2/8/21 | | 4,032,000 | 4,392,897 |
| Metropolitan Life Global Funding I 3% 1/10/23 (b) | | 7,896,000 | 8,109,649 |
| Pacific Life Insurance Co. 9.25% 6/15/39 (b) | | 7,041,000 | 11,617,370 |
| Pacific LifeCorp: | | | |
| 5.125% 1/30/43 (b) | | 33,774,000 | 37,879,175 |
| 6% 2/10/20 (b) | | 15,416,000 | 16,738,450 |
| Pricoa Global Funding I 5.375% 5/15/45 (d) | | 17,492,000 | 18,760,170 |
| Prudential Financial, Inc.: | | | |
| 2.3% 8/15/18 | | 1,622,000 | 1,633,108 |
| 6.2% 11/15/40 | | 4,318,000 | 5,671,825 |
| 7.375% 6/15/19 | | 3,230,000 | 3,541,607 |
| Teachers Insurance & Annuity Association of America 4.9% 9/15/44 (b) | | 18,083,000 | 20,529,776 |
| TIAA Asset Management Finance LLC: | | | |
| 2.95% 11/1/19 (b) | | 4,172,000 | 4,242,454 |
| 4.125% 11/1/24 (b) | | 6,048,000 | 6,434,440 |
| Unum Group: | | | |
| 3.875% 11/5/25 | | 21,587,000 | 22,432,704 |
| 4% 3/15/24 | | 20,000,000 | 21,124,776 |
| 5.625% 9/15/20 | | 8,386,000 | 9,195,242 |
| 5.75% 8/15/42 | | 25,545,000 | 30,841,229 |
| USIS Merger Sub, Inc. 6.875% 5/1/25 (b) | | 2,370,000 | 2,414,438 |
| | | | 385,953,997 |
| Mortgage Real Estate Investment Trusts - 0.0% | | | |
| Starwood Property Trust, Inc. 5% 12/15/21 | | 4,120,000 | 4,269,350 |
| Thrifts & Mortgage Finance - 0.0% | | | |
| Leeds Building Society 0.5% 7/3/24 (Reg. S) | EUR | 4,800,000 | 5,692,509 |
| Prime Securities Services Borrower LLC/Prime Finance, Inc. 9.25% 5/15/23 (b) | | 1,000,000 | 1,105,000 |
| | | | 6,797,509 |
|
| TOTAL FINANCIALS | | | 3,399,372,213 |
|
| HEALTH CARE - 1.5% | | | |
| Biotechnology - 0.2% | | | |
| AbbVie, Inc.: | | | |
| 2.9% 11/6/22 | | 24,855,000 | 25,215,951 |
| 4.5% 5/14/35 | | 23,238,000 | 24,858,427 |
| AMAG Pharmaceuticals, Inc. 7.875% 9/1/23 (b) | | 3,815,000 | 3,817,861 |
| | | | 53,892,239 |
| Health Care Equipment & Supplies - 0.1% | | | |
| Becton, Dickinson & Co. 2.675% 12/15/19 | | 3,954,000 | 4,010,977 |
| Mallinckrodt International Finance SA/Mallinckrodt CB LLC 5.5% 4/15/25 (b) | | 2,395,000 | 2,233,338 |
| Ortho-Clinical Diagnostics, Inc. 6.625% 5/15/22 (b) | | 1,415,000 | 1,386,700 |
| Teleflex, Inc. 4.875% 6/1/26 | | 6,975,000 | 7,184,250 |
| | | | 14,815,265 |
| Health Care Providers & Services - 0.5% | | | |
| Aetna, Inc. 2.75% 11/15/22 | | 2,010,000 | 2,041,051 |
| Community Health Systems, Inc.: | | | |
| 6.25% 3/31/23 | | 4,705,000 | 4,740,288 |
| 6.875% 2/1/22 | | 14,070,000 | 11,660,513 |
| HCA Holdings, Inc.: | | | |
| 3.75% 3/15/19 | | 18,722,000 | 19,049,635 |
| 4.25% 10/15/19 | | 7,590,000 | 7,827,188 |
| 4.5% 2/15/27 | | 5,270,000 | 5,342,463 |
| 4.75% 5/1/23 | | 595,000 | 627,606 |
| 5% 3/15/24 | | 6,375,000 | 6,773,438 |
| 5.25% 6/15/26 | | 11,470,000 | 12,344,588 |
| 5.875% 3/15/22 | | 715,000 | 792,149 |
| 5.875% 2/15/26 | | 7,310,000 | 7,885,663 |
| 6.5% 2/15/20 | | 30,303,000 | 32,999,361 |
| HealthSouth Corp. 5.125% 3/15/23 | | 4,745,000 | 4,851,763 |
| Kindred Healthcare, Inc. 8% 1/15/20 | | 1,145,000 | 1,136,413 |
| Medco Health Solutions, Inc. 4.125% 9/15/20 | | 7,486,000 | 7,898,554 |
| Sabra Health Care LP/Sabra Capital Corp.: | | | |
| 5.375% 6/1/23 | | 500,000 | 517,350 |
| 5.5% 2/1/21 | | 1,555,000 | 1,617,200 |
| Tenet Healthcare Corp.: | | | |
| 4.375% 10/1/21 | | 3,825,000 | 3,887,156 |
| 4.625% 7/15/24 (b) | | 6,810,000 | 6,808,638 |
| 6.75% 6/15/23 | | 6,140,000 | 6,091,494 |
| 7.5% 1/1/22 (b) | | 775,000 | 835,063 |
| THC Escrow Corp. III: | | | |
| 5.125% 5/1/25 (b) | | 6,125,000 | 6,162,975 |
| 7% 8/1/25 (b) | | 3,670,000 | 3,595,462 |
| Wellcare Health Plans, Inc. 5.25% 4/1/25 | | 1,675,000 | 1,754,563 |
| WellPoint, Inc. 3.3% 1/15/23 | | 6,442,000 | 6,671,587 |
| | | | 163,912,161 |
| Health Care Technology - 0.0% | | | |
| IMS Health, Inc. 5% 10/15/26 (b) | | 2,715,000 | 2,843,963 |
| Life Sciences Tools & Services - 0.0% | | | |
| Thermo Fisher Scientific, Inc.: | | | |
| 2.4% 2/1/19 | | 1,959,000 | 1,973,280 |
| 4.15% 2/1/24 | | 3,010,000 | 3,248,005 |
| | | | 5,221,285 |
| Pharmaceuticals - 0.7% | | | |
| Actavis Funding SCS: | | | |
| 3% 3/12/20 | | 13,777,000 | 14,060,531 |
| 3.45% 3/15/22 | | 48,347,000 | 50,230,284 |
| Mylan N.V.: | | | |
| 2.25% 11/22/24 (Reg. S) | EUR | 1,650,000 | 2,025,026 |
| 2.5% 6/7/19 | | 16,423,000 | 16,476,508 |
| 3.15% 6/15/21 | | 21,235,000 | 21,536,960 |
| 3.95% 6/15/26 | | 11,126,000 | 11,334,591 |
| Perrigo Finance PLC: | | | |
| 3.5% 12/15/21 | | 1,541,000 | 1,597,392 |
| 3.9% 12/15/24 | | 5,449,000 | 5,618,253 |
| Teva Pharmaceutical Finance IV BV 2.875% 4/15/19 | EUR | 1,050,000 | 1,293,622 |
| Teva Pharmaceutical Finance Netherlands III BV: | | | |
| 1.25% 3/31/23 (Reg. S) | EUR | 1,500,000 | 1,720,301 |
| 2.2% 7/21/21 | | 15,311,000 | 14,570,916 |
| 2.8% 7/21/23 | | 10,972,000 | 10,340,219 |
| 3.15% 10/1/26 | | 12,782,000 | 11,696,405 |
| Valeant Pharmaceuticals International, Inc.: | | | |
| 5.375% 3/15/20 (b) | | 4,690,000 | 4,631,375 |
| 5.625% 12/1/21 (b) | | 8,980,000 | 8,239,150 |
| 5.875% 5/15/23 (b) | | 9,480,000 | 8,081,700 |
| 6.125% 4/15/25 (b) | | 9,290,000 | 7,838,438 |
| 6.5% 3/15/22 (b) | | 2,500,000 | 2,621,875 |
| VPI Escrow Corp. 6.375% 10/15/20 (b) | | 1,865,000 | 1,846,910 |
| Zoetis, Inc.: | | | |
| 1.875% 2/1/18 | | 2,006,000 | 2,005,941 |
| 3.25% 2/1/23 | | 4,892,000 | 5,061,033 |
| 3.45% 11/13/20 | | 5,179,000 | 5,383,703 |
| | | | 208,211,133 |
|
| TOTAL HEALTH CARE | | | 448,896,046 |
|
| INDUSTRIALS - 0.9% | | | |
| Aerospace & Defense - 0.1% | | | |
| BAE Systems Holdings, Inc.: | | | |
| 3.8% 10/7/24 (b) | | 9,122,000 | 9,634,201 |
| 6.375% 6/1/19 (b) | | 8,071,000 | 8,673,950 |
| DAE Funding LLC: | | | |
| 4% 8/1/20 (b) | | 1,425,000 | 1,439,250 |
| 4.5% 8/1/22 (b) | | 1,970,000 | 2,009,400 |
| 5% 8/1/24 (b) | | 4,820,000 | 4,928,450 |
| TransDigm, Inc.: | | | |
| 5.5% 10/15/20 | | 3,580,000 | 3,634,774 |
| 6% 7/15/22 | | 420,000 | 434,700 |
| 6.375% 6/15/26 | | 2,060,000 | 2,119,225 |
| 6.5% 5/15/25 | | 4,460,000 | 4,593,800 |
| | | | 37,467,750 |
| Air Freight & Logistics - 0.0% | | | |
| Rumo Luxembourg Sarl 7.375% 2/9/24 (b) | | 3,045,000 | 3,259,673 |
| Airlines - 0.1% | | | |
| Air Canada 7.75% 4/15/21 (b) | | 1,470,000 | 1,681,827 |
| Air Canada Trust Series 2015-1 equipment trust certificate Class C, 5% 3/15/20 (b) | | 5,685,000 | 5,740,713 |
| Allegiant Travel Co. 5.5% 7/15/19 | | 4,985,000 | 5,122,088 |
| American Airlines Group, Inc. 4.625% 3/1/20 (b) | | 1,650,000 | 1,695,375 |
| American Airlines, Inc. pass-thru trust certificates 5.625% 7/15/22 (b) | | 184,258 | 193,852 |
| Continental Airlines, Inc.: | | | |
| pass-thru trust certificates 9.798% 4/1/21 | | 152,523 | 167,394 |
| 6.648% 9/15/17 | | 130,533 | 130,533 |
| 6.9% 1/2/18 | | 40,005 | 40,405 |
| U.S. Airways Group, Inc. 6.125% 6/1/18 | | 895,000 | 920,731 |
| U.S. Airways pass-thru certificates: | | | |
| Series 2012-2C, 5.45% 6/3/18 | | 1,690,000 | 1,717,463 |
| Series 2013-1 Class B, 5.375% 11/15/21 | | 281,261 | 298,137 |
| U.S. Airways pass-thru trust certificates: | | | |
| 6.85% 1/30/18 | | 234,608 | 239,300 |
| 8.36% 1/20/19 | | 209,681 | 209,681 |
| United Air Lines, Inc. pass-thru trust certificates Class B, 7.336% 7/2/19 | | 514,957 | 551,004 |
| United Continental Holdings, Inc. 6% 12/1/20 | | 605,000 | 654,913 |
| | | | 19,363,416 |
| Building Products - 0.1% | | | |
| Building Materials Corp. of America: | | | |
| 5% 2/15/27 (b) | | 4,295,000 | 4,402,375 |
| 5.125% 2/15/21 (b) | | 4,870,000 | 5,040,450 |
| 5.375% 11/15/24 (b) | | 3,095,000 | 3,234,275 |
| 6% 10/15/25 (b) | | 3,630,000 | 3,902,250 |
| HD Supply, Inc. 5.75% 4/15/24 (b) | | 2,440,000 | 2,616,900 |
| | | | 19,196,250 |
| Commercial Services & Supplies - 0.2% | | | |
| ADS Waste Holdings, Inc. 5.625% 11/15/24 (b) | | 2,035,000 | 2,116,400 |
| APX Group, Inc.: | | | |
| 6.375% 12/1/19 | | 5,657,000 | 5,783,434 |
| 7.625% 9/1/23 (b) | | 3,860,000 | 3,908,250 |
| 7.875% 12/1/22 | | 1,150,000 | 1,247,750 |
| 8.75% 12/1/20 | | 10,732,000 | 11,053,960 |
| Brand Energy & Infrastructure Services, Inc. 8.5% 7/15/25 (b) | | 3,845,000 | 4,142,988 |
| CD&R Waterworks Merger Sub LLC 6.125% 8/15/25 (b) | | 795,000 | 810,900 |
| Cenveo Corp. 6% 8/1/19 (b) | | 325,000 | 267,313 |
| LBC Tank Terminals Holding Netherlands BV 6.875% 5/15/23 (b) | | 3,420,000 | 3,591,000 |
| Prime Security One MS, Inc. 4.875% 7/15/32 (b) | | 2,490,000 | 2,306,363 |
| Securitas AB 1.125% 2/20/24 (Reg. S) | EUR | 5,350,000 | 6,429,227 |
| | | | 41,657,585 |
| Construction & Engineering - 0.0% | | | |
| Cementos Progreso Trust 7.125% 11/6/23 (b) | | 920,000 | 978,650 |
| Odebrecht Finance Ltd.: | | | |
| 4.375% 4/25/25 (b) | | 2,575,000 | 1,030,000 |
| 7.125% 6/26/42 (b) | | 1,425,000 | 577,125 |
| | | | 2,585,775 |
| Electrical Equipment - 0.0% | | | |
| Sensata Technologies BV 5% 10/1/25 (b) | | 4,285,000 | 4,488,538 |
| Vestas Wind Systems A/S 2.75% 3/11/22 (Reg. S) | EUR | 2,740,000 | 3,516,028 |
| | | | 8,004,566 |
| Industrial Conglomerates - 0.0% | | | |
| Alfa SA de CV 5.25% 3/25/24 (b) | | 450,000 | 489,375 |
| Machinery - 0.0% | | | |
| Xerium Technologies, Inc. 9.5% 8/15/21 | | 2,500,000 | 2,587,500 |
| Marine - 0.0% | | | |
| Navios Maritime Acquisition Corp./Navios Acquisition Finance U.S., Inc. 8.125% 11/15/21 (b) | | 10,660,000 | 8,821,150 |
| Navios Maritime Holdings, Inc. 7.375% 1/15/22 (b) | | 1,520,000 | 1,235,000 |
| | | | 10,056,150 |
| Road & Rail - 0.0% | | | |
| Alpha Trains Finance SA 2.064% 6/30/25 | EUR | 4,000,000 | 4,810,008 |
| JSC Georgian Railway 7.75% 7/11/22 (b) | | 650,000 | 715,039 |
| Lima Metro Line 2 Finance Ltd. 5.875% 7/5/34 (b) | | 570,000 | 630,420 |
| | | | 6,155,467 |
| Trading Companies & Distributors - 0.4% | | | |
| Air Lease Corp.: | | | |
| 2.125% 1/15/18 | | 7,271,000 | 7,281,123 |
| 2.625% 9/4/18 | | 16,438,000 | 16,573,498 |
| 3.375% 6/1/21 | | 10,493,000 | 10,824,213 |
| 3.75% 2/1/22 | | 26,396,000 | 27,743,562 |
| 3.875% 4/1/21 | | 14,814,000 | 15,512,301 |
| 4.25% 9/15/24 | | 12,030,000 | 12,755,487 |
| 4.75% 3/1/20 | | 11,796,000 | 12,530,579 |
| Ashtead Capital, Inc.: | | | |
| 4.125% 8/15/25 (b) | | 1,490,000 | 1,527,742 |
| 4.375% 8/15/27 (b) | | 1,575,000 | 1,606,500 |
| FLY Leasing Ltd. 6.375% 10/15/21 | | 6,000,000 | 6,285,000 |
| Travis Perkins PLC: | | | |
| 4.375% 9/15/21 (Reg. S) | GBP | 203,000 | 276,246 |
| 4.5% 9/7/23 (Reg. S) | GBP | 1,950,000 | 2,628,988 |
| | | | 115,545,239 |
| Transportation Infrastructure - 0.0% | | | |
| Aeropuertos Argentina 2000 SA 6.875% 2/1/27 (b) | | 1,960,000 | 2,067,330 |
| Brisa Concessao Rodoviaria SA 2.375% 5/10/27 | EUR | 900,000 | 1,112,973 |
| Global Ports Finance PLC 6.872% 1/25/22 (b) | | 1,410,000 | 1,485,006 |
| Heathrow Funding Ltd. 6% 3/20/20 | GBP | 3,800,000 | 5,502,991 |
| | | | 10,168,300 |
|
| TOTAL INDUSTRIALS | | | 276,537,046 |
|
| INFORMATION TECHNOLOGY - 0.4% | | | |
| Communications Equipment - 0.0% | | | |
| Banglalink Digital Communications Ltd.: | | | |
| 8.625% 5/6/19 (b) | | 3,955,000 | 4,128,625 |
| 8.625% 5/6/19 (Reg. S) | | 200,000 | 208,780 |
| CommScope Technologies Finance LLC 5% 3/15/27 (b) | | 2,305,000 | 2,297,048 |
| Proven Glory Capital Ltd. 3.25% 2/21/22 (Reg. S) | | 3,300,000 | 3,338,330 |
| | | | 9,972,783 |
| Electronic Equipment & Components - 0.0% | | | |
| Belden, Inc. 5.25% 7/15/24 (b) | | 865,000 | 890,950 |
| Diamond 1 Finance Corp./Diamond 2 Finance Corp.: | | | |
| 3.48% 6/1/19 (b) | | 796,000 | 813,516 |
| 4.42% 6/15/21 (b) | | 2,400,000 | 2,529,020 |
| Tyco Electronics Group SA: | | | |
| 2.375% 12/17/18 | | 2,244,000 | 2,256,965 |
| 6.55% 10/1/17 | | 1,383,000 | 1,387,744 |
| | | | 7,878,195 |
| Internet Software & Services - 0.1% | | | |
| Gogo Intermediate Holdings LLC/Gogo Finance Co., Inc. 12.5% 7/1/22 (b) | | 5,095,000 | 5,859,250 |
| VeriSign, Inc.: | | | |
| 4.75% 7/15/27 (b) | | 1,955,000 | 1,989,017 |
| 5.25% 4/1/25 | | 2,730,000 | 2,921,100 |
| | | | 10,769,367 |
| IT Services - 0.0% | | | |
| Ceridian HCM Holding, Inc. 11% 3/15/21 (b) | | 440,000 | 465,850 |
| Gartner, Inc. 5.125% 4/1/25 (b) | | 1,335,000 | 1,406,756 |
| | | | 1,872,606 |
| Semiconductors & Semiconductor Equipment - 0.2% | | | |
| Micron Technology, Inc.: | | | |
| 5.25% 8/1/23 (b) | | 1,730,000 | 1,801,363 |
| 5.25% 1/15/24 (b) | | 2,650,000 | 2,756,000 |
| 5.5% 2/1/25 | | 1,675,000 | 1,769,135 |
| 5.625% 1/15/26 (b) | | 1,285,000 | 1,355,521 |
| NXP BV/NXP Funding LLC: | | | |
| 3.875% 9/1/22 (b) | | 10,645,000 | 11,017,575 |
| 4.125% 6/1/21 (b) | | 9,955,000 | 10,412,930 |
| 4.625% 6/15/22 (b) | | 4,875,000 | 5,204,063 |
| 4.625% 6/1/23 (b) | | 2,480,000 | 2,651,244 |
| Qorvo, Inc. 7% 12/1/25 | | 5,885,000 | 6,664,763 |
| Sensata Technologies UK Financing Co. PLC 6.25% 2/15/26 (b) | | 3,025,000 | 3,304,813 |
| Versum Materials, Inc. 5.5% 9/30/24 (b) | | 2,715,000 | 2,857,538 |
| | | | 49,794,945 |
| Software - 0.1% | | | |
| CDK Global, Inc. 4.875% 6/1/27 (b) | | 1,820,000 | 1,847,300 |
| Greeneden U.S. Holdings II LLC 10% 11/30/24 (b) | | 3,810,000 | 4,333,875 |
| Nuance Communications, Inc. 5.375% 8/15/20 (b) | | 1,939,000 | 1,968,085 |
| Open Text Corp. 5.875% 6/1/26 (b) | | 11,080,000 | 12,007,950 |
| Symantec Corp. 5% 4/15/25 (b) | | 4,470,000 | 4,680,984 |
| | | | 24,838,194 |
| Technology Hardware, Storage & Peripherals - 0.0% | | | |
| Hewlett Packard Enterprise Co. 6.35% 10/15/45 (d) | | 4,836,000 | 5,135,114 |
|
| TOTAL INFORMATION TECHNOLOGY | | | 110,261,204 |
|
| MATERIALS - 0.9% | | | |
| Chemicals - 0.2% | | | |
| Axalta Coating Systems 4.875% 8/15/24 (b) | | 1,287,000 | 1,315,958 |
| Braskem Finance Ltd.: | | | |
| 5.375% 5/2/22 (b) | | 1,560,000 | 1,645,800 |
| 5.75% 4/15/21 (b) | | 830,000 | 884,988 |
| 6.45% 2/3/24 | | 680,000 | 763,300 |
| Evolution Escrow Issuer LLC 7.5% 3/15/22 (b) | | 3,730,000 | 3,907,175 |
| Kraton Polymers LLC/Kraton Polymers Capital Corp. 7% 4/15/25 (b) | | 5,185,000 | 5,573,875 |
| NOVA Chemicals Corp.: | | | |
| 4.875% 6/1/24 (b) | | 3,820,000 | 3,820,000 |
| 5.25% 6/1/27 (b) | | 2,985,000 | 2,977,538 |
| Nufarm Australia Ltd. 6.375% 10/15/19 (b) | | 3,605,000 | 3,681,606 |
| OCP SA 5.625% 4/25/24 (b) | | 390,000 | 421,532 |
| Olin Corp. 5.125% 9/15/27 | | 5,750,000 | 5,951,250 |
| SunCoke Energy Partners LP/SunCoke Energy Partners Finance Corp. 7.5% 6/15/25 (b) | | 4,255,000 | 4,340,100 |
| The Chemours Co. LLC 5.375% 5/15/27 | | 855,000 | 891,338 |
| The Dow Chemical Co.: | | | |
| 4.125% 11/15/21 | | 10,888,000 | 11,632,606 |
| 4.25% 11/15/20 | | 3,653,000 | 3,878,863 |
| Trinseo Materials Operating SCA/Trinseo Materials Finance, Inc. 5.375% 9/1/25 (b) | | 4,650,000 | 4,754,625 |
| Valvoline, Inc. 4.375% 8/15/25 (b) | | 3,845,000 | 3,878,644 |
| | | | 60,319,198 |
| Construction Materials - 0.1% | | | |
| CEMEX Finance LLC: | | | |
| 4.625% 6/15/24 | EUR | 200,000 | 257,756 |
| 6% 4/1/24 (b) | | 5,665,000 | 5,998,102 |
| 9.375% 10/12/22 (b) | | 985,000 | 1,037,205 |
| CEMEX S.A.B. de CV: | | | |
| 4.375% 3/5/23 (Reg. S) | EUR | 250,000 | 314,011 |
| 4.75% 1/11/22 (Reg. S) | EUR | 1,675,000 | 2,063,794 |
| 5.7% 1/11/25 (b) | | 1,960,000 | 2,101,120 |
| 7.75% 4/16/26 (b) | | 4,100,000 | 4,709,875 |
| Eagle Materials, Inc. 4.5% 8/1/26 | | 4,180,000 | 4,357,650 |
| Summit Materials LLC/Summit Materials Finance Corp. 5.125% 6/1/25 (b) | | 870,000 | 887,400 |
| Union Andina de Cementos SAA 5.875% 10/30/21 (b) | | 635,000 | 663,702 |
| | | | 22,390,615 |
| Containers & Packaging - 0.1% | | | |
| Ardagh Packaging Finance PLC/Ardagh MP Holdings U.S.A., Inc.: | | | |
| 4.25% 9/15/22 (b) | | 3,145,000 | 3,223,625 |
| 4.625% 5/15/23 (b) | | 6,305,000 | 6,478,388 |
| 6% 2/15/25 (b) | | 9,765,000 | 10,399,725 |
| Crown Americas LLC/Crown Americas Capital Corp. V 4.25% 9/30/26 | | 5,350,000 | 5,376,750 |
| Owens-Brockway Glass Container, Inc. 5.375% 1/15/25 (b) | | 3,930,000 | 4,205,100 |
| Silgan Holdings, Inc. 4.75% 3/15/25 (b) | | 2,945,000 | 3,018,625 |
| | | | 32,702,213 |
| Metals & Mining - 0.5% | | | |
| Anglo American Capital PLC 2.5% 9/18/18 | EUR | 2,850,000 | 3,473,500 |
| BHP Billiton Financial (U.S.A.) Ltd.: | | | |
| 6.25% 10/19/75 (b)(d) | | 7,018,000 | 7,693,833 |
| 6.75% 10/19/75 (b)(d) | | 17,432,000 | 20,221,120 |
| Big River Steel LLC/BRS Finance Corp. 7.25% 9/1/25 (b) | | 1,585,000 | 1,660,288 |
| Cliffs Natural Resources, Inc. 5.75% 3/1/25 (b) | | 4,720,000 | 4,615,688 |
| Commercial Metals Co. 5.375% 7/15/27 | | 5,020,000 | 5,233,350 |
| Compania Minera Ares SAC 7.75% 1/23/21 (b) | | 2,130,000 | 2,255,138 |
| Corporacion Nacional del Cobre de Chile (Codelco): | | | |
| 3.625% 8/1/27 (b) | | 8,277,000 | 8,382,035 |
| 4.5% 8/1/47 (b) | | 6,545,000 | 6,719,097 |
| EVRAZ Group SA: | | | |
| 5.375% 3/20/23 (b) | | 2,495,000 | 2,563,613 |
| 6.5% 4/22/20 (b) | | 459,000 | 488,835 |
| 8.25% 1/28/21 (Reg. S) | | 2,635,000 | 2,960,502 |
| Evraz, Inc. NA Canada 7.5% 11/15/19 (b) | | 38,000 | 38,570 |
| Ferrexpo Finance PLC: | | | |
| 10.375% 4/7/19 (b) | | 200,000 | 212,250 |
| 10.375% 4/7/19 (b) | | 1,167,000 | 1,238,479 |
| 10.375% 4/7/19 (Reg. S) | | 275,000 | 291,844 |
| First Quantum Minerals Ltd.: | | | |
| 7.25% 5/15/22 (b) | | 2,220,000 | 2,281,050 |
| 7.25% 4/1/23 (b) | | 9,340,000 | 9,596,850 |
| 7.5% 4/1/25 (b) | | 3,325,000 | 3,403,969 |
| FMG Resources (August 2006) Pty Ltd.: | | | |
| 4.75% 5/15/22 (b) | | 1,360,000 | 1,404,200 |
| 5.125% 5/15/24 (b) | | 3,895,000 | 4,041,063 |
| Freeport-McMoRan, Inc.: | | | |
| 3.55% 3/1/22 | | 10,100,000 | 9,935,875 |
| 3.875% 3/15/23 | | 3,080,000 | 3,049,200 |
| 4.55% 11/14/24 | | 9,320,000 | 9,296,700 |
| Gold Fields Orogen Holding BVI Ltd.: | | | |
| 4.875% 10/7/20 (b) | | 2,055,000 | 2,120,246 |
| 4.875% 10/7/20 (Reg. S) | | 200,000 | 206,350 |
| GTL Trade Finance, Inc. 5.893% 4/29/24 (b) | | 850,000 | 901,000 |
| Lundin Mining Corp.: | | | |
| 7.5% 11/1/20 (b) | | 5,125,000 | 5,349,219 |
| 7.875% 11/1/22 (b) | | 3,615,000 | 3,940,350 |
| Metalloinvest Finance Designated Activity Co. 4.85% 5/2/24 (b) | | 620,000 | 626,428 |
| Metinvest BV 9.3725% 12/31/21 pay-in-kind (d) | | 7,819,600 | 7,710,126 |
| Murray Energy Corp. 11.25% 4/15/21 (b) | | 1,725,000 | 1,000,500 |
| Polyus Finance PLC 5.25% 2/7/23 (b) | | 840,000 | 871,500 |
| Southern Copper Corp. 7.5% 7/27/35 | | 1,210,000 | 1,564,048 |
| Steel Dynamics, Inc.: | | | |
| 5.125% 10/1/21 | | 2,205,000 | 2,262,771 |
| 5.25% 4/15/23 | | 3,040,000 | 3,146,400 |
| Stillwater Mining Co.: | | | |
| 6.125% 6/27/22 (b) | | 3,225,000 | 3,263,700 |
| 7.125% 6/27/25 (b) | | 1,200,000 | 1,228,200 |
| Vale Overseas Ltd.: | | | |
| 4.375% 1/11/22 | | 13,150,000 | 13,856,813 |
| 5.875% 6/10/21 | | 575,000 | 637,503 |
| 6.875% 11/21/36 | | 640,000 | 731,840 |
| Vedanta Resources PLC: | | | |
| 6.375% 7/30/22 (b) | | 1,425,000 | 1,482,000 |
| 8.25% 6/7/21 (b) | | 1,400,000 | 1,568,000 |
| VM Holding SA 5.375% 5/4/27 (b) | | 2,245,000 | 2,359,495 |
| | | | 165,883,538 |
| Paper & Forest Products - 0.0% | | | |
| Sino-Forest Corp. 6.25% 10/21/17 (b)(f)(g) | | 1,365,000 | 0 |
|
| TOTAL MATERIALS | | | 281,295,564 |
|
| REAL ESTATE - 2.7% | | | |
| Equity Real Estate Investment Trusts (REITs) - 1.5% | | | |
| Alexandria Real Estate Equities, Inc.: | | | |
| 2.75% 1/15/20 | | 2,884,000 | 2,916,206 |
| 4.6% 4/1/22 | | 4,896,000 | 5,264,744 |
| alstria office REIT-AG: | | | |
| 2.125% 4/12/23 (Reg. S) | EUR | 2,400,000 | 3,058,647 |
| 2.25% 3/24/21 (Reg. S) | EUR | 2,800,000 | 3,541,085 |
| American Campus Communities Operating Partnership LP 3.75% 4/15/23 | | 3,491,000 | 3,629,231 |
| AvalonBay Communities, Inc. 3.625% 10/1/20 | | 5,005,000 | 5,218,282 |
| Boston Properties, Inc. 3.85% 2/1/23 | | 5,829,000 | 6,205,358 |
| Camden Property Trust: | | | |
| 2.95% 12/15/22 | | 6,621,000 | 6,675,665 |
| 4.25% 1/15/24 | | 9,191,000 | 9,789,496 |
| CBL & Associates LP 4.6% 10/15/24 | | 272,000 | 259,392 |
| CommonWealth REIT 5.875% 9/15/20 | | 2,130,000 | 2,281,395 |
| Corporate Office Properties LP 5% 7/1/25 | | 8,095,000 | 8,732,120 |
| CTR Partnership LP/CareTrust Capital Corp. 5.25% 6/1/25 | | 3,510,000 | 3,624,075 |
| DDR Corp.: | | | |
| 3.625% 2/1/25 | | 9,949,000 | 9,724,357 |
| 3.9% 8/15/24 | | 3,606,000 | 3,650,191 |
| 4.25% 2/1/26 | | 22,796,000 | 23,005,820 |
| 4.625% 7/15/22 | | 20,268,000 | 21,455,553 |
| 4.7% 6/1/27 | | 840,000 | 871,054 |
| 7.875% 9/1/20 | | 323,000 | 378,330 |
| Duke Realty LP: | | | |
| 3.625% 4/15/23 | | 6,287,000 | 6,536,677 |
| 3.75% 12/1/24 | | 5,408,000 | 5,657,494 |
| 3.875% 10/15/22 | | 17,388,000 | 18,384,613 |
| Equinix, Inc. 5.375% 5/15/27 | | 1,680,000 | 1,808,100 |
| Equity One, Inc. 3.75% 11/15/22 | | 18,100,000 | 18,812,798 |
| ERP Operating LP: | | | |
| 2.375% 7/1/19 | | 8,777,000 | 8,864,476 |
| 4.75% 7/15/20 | | 7,700,000 | 8,224,668 |
| Federal Realty Investment Trust 5.9% 4/1/20 | | 2,504,000 | 2,740,523 |
| Health Care REIT, Inc.: | | | |
| 2.25% 3/15/18 | | 5,151,000 | 5,159,781 |
| 4.7% 9/15/17 | | 1,538,000 | 1,539,193 |
| iStar Financial, Inc. 6% 4/1/22 | | 775,000 | 796,313 |
| Lexington Corporate Properties Trust 4.4% 6/15/24 | | 4,608,000 | 4,680,409 |
| MPT Operating Partnership LP/MPT Finance Corp.: | | | |
| 5.25% 8/1/26 | | 4,930,000 | 5,114,875 |
| 6.375% 3/1/24 | | 2,250,000 | 2,444,063 |
| Omega Healthcare Investors, Inc.: | | | |
| 4.375% 8/1/23 | | 42,087,000 | 43,964,439 |
| 4.5% 1/15/25 | | 10,686,000 | 10,986,121 |
| 4.5% 4/1/27 | | 50,980,000 | 51,755,233 |
| 4.75% 1/15/28 | | 29,482,000 | 30,015,898 |
| 4.95% 4/1/24 | | 17,495,000 | 18,560,072 |
| 5.25% 1/15/26 | | 29,233,000 | 31,370,937 |
| Retail Opportunity Investments Partnership LP: | | | |
| 4% 12/15/24 | | 3,376,000 | 3,302,259 |
| 5% 12/15/23 | | 2,030,000 | 2,130,408 |
| SBA Communications Corp. 4.875% 9/1/24 | | 8,675,000 | 8,956,938 |
| Senior Housing Properties Trust 6.75% 4/15/20 | | 250,000 | 270,668 |
| VEREIT Operating Partnership LP: | | | |
| 4.125% 6/1/21 | | 1,770,000 | 1,858,659 |
| 4.875% 6/1/26 | | 1,770,000 | 1,901,169 |
| Weingarten Realty Investors 3.375% 10/15/22 | | 2,729,000 | 2,800,247 |
| WP Carey, Inc. 4% 2/1/25 | | 34,017,000 | 34,772,088 |
| | | | 453,690,120 |
| Real Estate Management & Development - 1.2% | | | |
| Akelius Residential Property AB 1.75% 2/7/25 (Reg. S) | EUR | 2,750,000 | 3,314,374 |
| Brandywine Operating Partnership LP: | | | |
| 3.95% 2/15/23 | | 26,418,000 | 27,023,820 |
| 4.1% 10/1/24 | | 15,881,000 | 16,139,972 |
| 4.55% 10/1/29 | | 17,155,000 | 17,673,669 |
| 4.95% 4/15/18 | | 12,690,000 | 12,901,443 |
| CBRE Group, Inc. 5% 3/15/23 | | 465,000 | 483,600 |
| Deutsche Annington Finance BV 5% 10/2/23 (b) | | 5,800,000 | 6,267,755 |
| Digital Realty Trust LP: | | | |
| 3.4% 10/1/20 | | 17,707,000 | 18,327,238 |
| 3.625% 10/1/22 | | 9,206,000 | 9,634,126 |
| 3.95% 7/1/22 | | 11,840,000 | 12,563,459 |
| 4.75% 10/1/25 | | 30,612,000 | 33,379,459 |
| 5.25% 3/15/21 | | 5,708,000 | 6,231,442 |
| Essex Portfolio LP 3.875% 5/1/24 | | 8,802,000 | 9,209,644 |
| Host Hotels & Resorts LP 4.75% 3/1/23 | | 150,000 | 162,140 |
| Howard Hughes Corp. 5.375% 3/15/25 (b) | | 4,440,000 | 4,442,930 |
| Hunt Companies, Inc. 9.625% 3/1/21 (b) | | 870,000 | 913,500 |
| Inversiones y Representaciones SA 11.5% 7/20/20 (Reg. S) | | 5,000 | 5,744 |
| IRSA Propiedades Comerciales SA 8.75% 3/23/23 (b) | | 770,000 | 866,358 |
| Liberty Property LP: | | | |
| 3.375% 6/15/23 | | 8,174,000 | 8,359,999 |
| 4.125% 6/15/22 | | 14,880,000 | 15,760,594 |
| 4.4% 2/15/24 | | 13,017,000 | 14,015,121 |
| 4.75% 10/1/20 | | 11,282,000 | 12,018,751 |
| Mack-Cali Realty LP: | | | |
| 2.5% 12/15/17 | | 9,223,000 | 9,233,134 |
| 3.15% 5/15/23 | | 14,735,000 | 14,062,076 |
| 4.5% 4/18/22 | | 17,365,000 | 17,874,063 |
| Mattamy Group Corp. 6.875% 12/15/23 (b) | | 850,000 | 864,875 |
| Post Apartment Homes LP 3.375% 12/1/22 | | 2,570,000 | 2,645,222 |
| Realogy Group LLC/Realogy Co.-Issuer Corp. 4.5% 4/15/19 (b) | | 235,000 | 242,050 |
| SELP Finance SARL 1.25% 10/25/23 (Reg. S) | EUR | 4,285,000 | 5,092,503 |
| Tanger Properties LP: | | | |
| 3.125% 9/1/26 | | 11,019,000 | 10,479,320 |
| 3.75% 12/1/24 | | 21,455,000 | 21,821,138 |
| 3.875% 12/1/23 | | 4,812,000 | 4,949,054 |
| Ventas Realty LP: | | | |
| 3.125% 6/15/23 | | 5,458,000 | 5,515,334 |
| 3.5% 2/1/25 | | 5,961,000 | 6,053,410 |
| 3.75% 5/1/24 | | 25,000,000 | 25,859,010 |
| 4.125% 1/15/26 | | 5,557,000 | 5,848,072 |
| Ventas Realty LP/Ventas Capital Corp.: | | | |
| 2% 2/15/18 | | 8,050,000 | 8,058,234 |
| 4% 4/30/19 | | 3,747,000 | 3,855,558 |
| 4.25% 3/1/22 | | 300,000 | 319,545 |
| | | | 372,467,736 |
|
| TOTAL REAL ESTATE | | | 826,157,856 |
|
| TELECOMMUNICATION SERVICES - 1.4% | | | |
| Diversified Telecommunication Services - 1.1% | | | |
| Altice Financing SA: | | | |
| 6.5% 1/15/22 (b) | | 6,250,000 | 6,500,000 |
| 6.625% 2/15/23 (b) | | 2,780,000 | 2,939,850 |
| 7.5% 5/15/26 (b) | | 8,720,000 | 9,550,144 |
| Altice Finco SA 7.625% 2/15/25 (b) | | 3,995,000 | 4,219,719 |
| AT&T, Inc.: | | | |
| 2.45% 6/30/20 | | 11,294,000 | 11,390,494 |
| 3% 6/30/22 | | 29,259,000 | 29,589,264 |
| 3.4% 5/15/25 | | 39,520,000 | 39,256,777 |
| 3.6% 2/17/23 | | 27,844,000 | 28,690,753 |
| 5.875% 10/1/19 | | 5,944,000 | 6,401,578 |
| 6.3% 1/15/38 | | 16,665,000 | 19,565,288 |
| BellSouth Capital Funding Corp. 7.875% 2/15/30 | | 40,000 | 53,434 |
| C&W Senior Financing Designated Activity Co. 6.875% 9/15/27 (b) | | 820,000 | 850,750 |
| GTH Finance BV: | | | |
| 6.25% 4/26/20 (b) | | 1,240,000 | 1,315,404 |
| 7.25% 4/26/23 (b) | | 4,795,000 | 5,425,159 |
| Sable International Finance Ltd. 6.875% 8/1/22 (b) | | 4,575,000 | 4,923,844 |
| SFR Group SA: | | | |
| 6% 5/15/22 (b) | | 4,550,000 | 4,794,472 |
| 6.25% 5/15/24 (b) | | 3,140,000 | 3,304,850 |
| 7.375% 5/1/26 (b) | | 2,380,000 | 2,570,448 |
| Sprint Capital Corp. 6.875% 11/15/28 | | 17,555,000 | 19,310,500 |
| TalkTalk Telecom Group PLC 5.375% 1/15/22 (Reg. S) | GBP | 410,000 | 550,052 |
| TDC A/S 3.5% 2/26/3015 (Reg. S) (d) | EUR | 1,550,000 | 1,898,247 |
| Telecom Italia Capital SA: | | | |
| 6% 9/30/34 | | 2,425,000 | 2,679,625 |
| 6.375% 11/15/33 | | 3,785,000 | 4,324,363 |
| Telecom Italia SpA 5.303% 5/30/24 (b) | | 1,065,000 | 1,152,863 |
| Telefonica Celular del Paraguay SA 6.75% 12/13/22 (b) | | 1,650,000 | 1,710,605 |
| Verizon Communications, Inc.: | | | |
| 2.625% 2/21/20 | | 12,550,000 | 12,806,207 |
| 4.5% 9/15/20 | | 36,000,000 | 38,617,232 |
| 5.012% 4/15/49 | | 2,831,000 | 2,843,069 |
| 5.012% 8/21/54 | | 55,038,000 | 54,111,871 |
| 5.5% 3/16/47 | | 18,149,000 | 19,612,360 |
| Wind Acquisition Finance SA: | | | |
| 4.75% 7/15/20 (b) | | 2,035,000 | 2,060,438 |
| 7% 4/23/21 (Reg S.) | EUR | 4,300,000 | 5,326,149 |
| | | | 348,345,809 |
| Wireless Telecommunication Services - 0.3% | | | |
| America Movil S.A.B. de CV 3.125% 7/16/22 | | 9,218,000 | 9,549,931 |
| Comcel Trust 6.875% 2/6/24 (b) | | 725,000 | 771,567 |
| Digicel Group Ltd. 6.75% 3/1/23 (b) | | 560,000 | 536,900 |
| Inmarsat Finance PLC 4.875% 5/15/22 (b) | | 2,105,000 | 2,141,838 |
| Millicom International Cellular SA: | | | |
| 6% 3/15/25 (b) | | 1,375,000 | 1,471,525 |
| 6.625% 10/15/21 (b) | | 2,975,000 | 3,075,406 |
| Sprint Communications, Inc.: | | | |
| 6% 11/15/22 | | 4,840,000 | 5,148,550 |
| 9% 11/15/18 (b) | | 2,225,000 | 2,403,000 |
| Sprint Corp.: | | | |
| 7.25% 9/15/21 | | 7,925,000 | 8,737,313 |
| 7.625% 2/15/25 | | 4,740,000 | 5,356,200 |
| 7.875% 9/15/23 | | 12,075,000 | 13,797,257 |
| T-Mobile U.S.A., Inc.: | | | |
| 4% 4/15/22 | | 5,110,000 | 5,263,300 |
| 6% 3/1/23 | | 4,060,000 | 4,278,225 |
| 6.375% 3/1/25 | | 4,860,000 | 5,233,613 |
| 6.5% 1/15/24 | | 6,085,000 | 6,495,738 |
| 6.625% 4/1/23 | | 12,185,000 | 12,839,944 |
| Telesat Canada/Telesat LLC 8.875% 11/15/24 (b) | | 3,705,000 | 4,149,600 |
| Vodafone Group PLC 7.875% 2/15/30 | | 1,850,000 | 2,524,778 |
| | | | 93,774,685 |
|
| TOTAL TELECOMMUNICATION SERVICES | | | 442,120,494 |
|
| UTILITIES - 2.0% | | | |
| Electric Utilities - 1.1% | | | |
| American Electric Power Co., Inc.: | | | |
| 1.65% 12/15/17 | | 5,213,000 | 5,213,669 |
| 2.95% 12/15/22 | | 4,935,000 | 5,062,652 |
| DPL, Inc. 6.75% 10/1/19 | | 2,490,000 | 2,608,275 |
| Duquesne Light Holdings, Inc.: | | | |
| 5.9% 12/1/21 (b) | | 29,344,000 | 33,244,162 |
| 6.4% 9/15/20 (b) | | 25,897,000 | 29,023,954 |
| Edison International 3.75% 9/15/17 | | 6,674,000 | 6,677,375 |
| Eversource Energy: | | | |
| 1.45% 5/1/18 | | 3,325,000 | 3,322,894 |
| 2.8% 5/1/23 | | 15,104,000 | 15,304,009 |
| Exelon Corp. 2.85% 6/15/20 | | 4,888,000 | 4,995,396 |
| FirstEnergy Corp.: | | | |
| 4.25% 3/15/23 | | 31,243,000 | 33,153,439 |
| 7.375% 11/15/31 | | 64,123,000 | 86,540,400 |
| FirstEnergy Solutions Corp. 6.05% 8/15/21 | | 20,194,000 | 9,238,755 |
| InterGen NV 7% 6/30/23 (b) | | 2,690,000 | 2,636,200 |
| IPALCO Enterprises, Inc.: | | | |
| 3.45% 7/15/20 | | 27,495,000 | 27,769,950 |
| 3.7% 9/1/24 (b) | | 10,462,000 | 10,551,811 |
| Israel Electric Corp. Ltd. 7.75% 12/15/27 (Reg. S) | | 600,000 | 767,406 |
| LG&E and KU Energy LLC 3.75% 11/15/20 | | 1,450,000 | 1,516,678 |
| Monongahela Power Co. 4.1% 4/15/24 (b) | | 3,982,000 | 4,290,691 |
| Nevada Power Co. 6.5% 5/15/18 | | 790,000 | 816,071 |
| NRG Yield Operating LLC 5% 9/15/26 | | 3,945,000 | 4,033,763 |
| NSG Holdings II LLC/NSG Holdings, Inc. 7.75% 12/15/25 (b) | | 8,546,353 | 9,208,695 |
| NV Energy, Inc. 6.25% 11/15/20 | | 3,500,000 | 3,936,357 |
| Pampa Holding SA 7.5% 1/24/27 (b) | | 1,390,000 | 1,487,300 |
| Pennsylvania Electric Co. 6.05% 9/1/17 | | 764,000 | 764,000 |
| PG&E Corp. 2.4% 3/1/19 | | 1,683,000 | 1,694,598 |
| PPL Capital Funding, Inc. 3.4% 6/1/23 | | 7,184,000 | 7,456,000 |
| Progress Energy, Inc. 4.4% 1/15/21 | | 12,059,000 | 12,844,520 |
| TECO Finance, Inc. 5.15% 3/15/20 | | 3,761,000 | 4,017,570 |
| Western Power Distribution 3.875% 10/17/24 (Reg. S) | GBP | 1,200,000 | 1,769,550 |
| Western Power Distribution Holdings Ltd. 5.25% 1/17/23 | GBP | 3,300,000 | 5,076,809 |
| | | | 335,022,949 |
| Gas Utilities - 0.0% | | | |
| Southern Natural Gas Co./Southern Natural Issuing Corp. 4.4% 6/15/21 | | 3,646,000 | 3,854,358 |
| Independent Power and Renewable Electricity Producers - 0.4% | | | |
| Dolphin Subsidiary II, Inc. 7.25% 10/15/21 | | 67,644,000 | 73,562,850 |
| Dynegy, Inc.: | | | |
| 7.625% 11/1/24 | | 8,010,000 | 8,260,313 |
| 8.125% 1/30/26 (b) | | 3,095,000 | 3,195,588 |
| Emera U.S. Finance LP: | | | |
| 2.15% 6/15/19 | | 5,136,000 | 5,143,575 |
| 2.7% 6/15/21 | | 5,055,000 | 5,107,023 |
| 3.55% 6/15/26 | | 8,087,000 | 8,239,621 |
| Listrindo Capital BV 4.95% 9/14/26 (b) | | 820,000 | 830,086 |
| NRG Energy, Inc.: | | | |
| 6.25% 5/1/24 | | 4,510,000 | 4,667,850 |
| 6.625% 1/15/27 | | 1,695,000 | 1,779,750 |
| TerraForm Power Operating LLC 6.375% 2/1/23 (b)(d) | | 4,980,000 | 5,154,300 |
| The AES Corp.: | | | |
| 3 month U.S. LIBOR + 3.000% 4.2018% 6/1/19 (d)(e) | | 1,359,000 | 1,360,699 |
| 4.875% 5/15/23 | | 9,515,000 | 9,729,088 |
| 5.125% 9/1/27 | | 1,595,000 | 1,622,913 |
| 6% 5/15/26 | | 1,545,000 | 1,649,288 |
| Three Gorges Finance II (Cayman Islands) Ltd. 1.3% 6/21/24 (Reg. S) | EUR | 2,500,000 | 3,014,425 |
| | | | 133,317,369 |
| Multi-Utilities - 0.5% | | | |
| Berkshire Hathaway Energy Co. 2% 11/15/18 | | 12,172,000 | 12,216,744 |
| Dominion Resources, Inc.: | | | |
| 3 month U.S. LIBOR + 2.300% 3.5964% 9/30/66 (d)(e) | | 35,229,000 | 32,301,470 |
| 3 month U.S. LIBOR + 2.825% 4.1214% 6/30/66 (d)(e) | | 10,345,000 | 10,021,719 |
| NiSource Finance Corp.: | | | |
| 5.25% 2/15/43 | | 12,739,000 | 14,980,306 |
| 5.8% 2/1/42 | | 6,336,000 | 7,687,378 |
| 5.95% 6/15/41 | | 11,832,000 | 14,938,850 |
| 6.8% 1/15/19 | | 1,039,000 | 1,105,190 |
| Puget Energy, Inc.: | | | |
| 6% 9/1/21 | | 15,565,000 | 17,575,319 |
| 6.5% 12/15/20 | | 5,125,000 | 5,757,386 |
| RWE AG 7% 10/12/72 (Reg. S) (d) | | 3,650,000 | 3,668,615 |
| Sempra Energy: | | | |
| 2.875% 10/1/22 | | 5,760,000 | 5,828,483 |
| 6% 10/15/39 | | 15,009,000 | 19,373,730 |
| Wisconsin Energy Corp. 3 month U.S. LIBOR + 2.113% 3.4275% 5/15/67 (d)(e) | | 3,860,000 | 3,734,550 |
| | | | 149,189,740 |
|
| TOTAL UTILITIES | | | 621,384,416 |
|
| TOTAL NONCONVERTIBLE BONDS | | | |
| (Cost $9,520,414,565) | | | 9,977,418,532 |
|
| U.S. Government and Government Agency Obligations - 37.5% | | | |
| U.S. Treasury Inflation-Protected Obligations - 7.1% | | | |
| U.S. Treasury Inflation-Indexed Bonds: | | | |
| 0.75% 2/15/45 | | $234,051,750 | $226,638,246 |
| 0.875% 2/15/47 | | 20,295,200 | 20,331,186 |
| 1% 2/15/46 | | 146,160,058 | 150,581,810 |
| 1.375% 2/15/44 | | 139,241,779 | 155,878,562 |
| U.S. Treasury Inflation-Indexed Notes: | | | |
| 0.125% 7/15/24 | | 170,488,616 | 169,946,977 |
| 0.125% 7/15/26 | | 196,310,832 | 192,961,701 |
| 0.25% 1/15/25 | | 77,565,000 | 77,405,465 |
| 0.375% 7/15/25 | | 409,759,034 | 413,467,011 |
| 0.375% 1/15/27 | | 402,034,228 | 401,818,834 |
| 0.375% 7/15/27 | | 150,207,000 | 150,576,985 |
| 0.625% 1/15/26 | | 206,182,000 | 211,043,541 |
|
| TOTAL U.S. TREASURY INFLATION-PROTECTED OBLIGATIONS | | | 2,170,650,318 |
|
| U.S. Treasury Obligations - 30.4% | | | |
| U.S. Treasury Bonds: | | | |
| 2.5% 2/15/45 (h)(i) | | 2,045,000 | 1,957,209 |
| 2.5% 2/15/46 (j) | | 1,762,000 | 1,681,196 |
| 3% 5/15/45 | | 145,382,000 | 153,502,948 |
| 3% 11/15/45 | | 207,323,000 | 218,741,961 |
| 3% 2/15/47 | | 658,626,000 | 695,004,799 |
| 3% 5/15/47 | | 103,797,000 | 109,582,872 |
| 5% 5/15/37 (h) | | 775,000 | 1,083,971 |
| U.S. Treasury Notes: | | | |
| 0.75% 2/15/19 (j) | | 12,650,000 | 12,551,172 |
| 1.125% 6/30/21 | | 1,125,000 | 1,105,884 |
| 1.25% 3/31/21 | | 1,180,775,000 | 1,168,598,258 |
| 1.25% 10/31/21 | | 453,470,000 | 446,561,666 |
| 1.375% 4/30/21 | | 484,800,000 | 481,599,564 |
| 1.5% 5/15/20 | | 408,760,000 | 409,797,866 |
| 1.5% 8/15/26 | | 221,635,000 | 210,916,869 |
| 1.625% 7/31/20 (j) | | 4,593,000 | 4,619,194 |
| 1.625% 2/15/26 (h)(j) | | 2,949,000 | 2,847,974 |
| 1.625% 5/15/26 | | 25,750,000 | 24,814,551 |
| 1.75% 12/31/20 | | 600,000,000 | 604,687,500 |
| 1.75% 6/30/22 | | 952,845,000 | 954,594,366 |
| 1.875% 3/31/22 | | 1,455,761,000 | 1,468,100,747 |
| 1.875% 8/31/24 | | 729,808,000 | 726,215,885 |
| 2% 12/31/21 | | 906,934,000 | 920,077,460 |
| 2% 4/30/24 | | 25,000,000 | 25,124,024 |
| 2% 8/15/25 (h)(j) | | 5,305,000 | 5,292,774 |
| 2% 11/15/26 | | 17,577,000 | 17,417,022 |
| 2.125% 7/31/24 | | 649,329,000 | 656,963,687 |
| 2.25% 11/15/25 (h)(j) | | 1,800,000 | 1,827,633 |
|
| TOTAL U.S. TREASURY OBLIGATIONS | | | 9,325,269,052 |
|
| TOTAL U.S. GOVERNMENT AND GOVERNMENT AGENCY OBLIGATIONS | | | |
| (Cost $11,443,155,377) | | | 11,495,919,370 |
|
| U.S. Government Agency - Mortgage Securities - 15.7% | | | |
| Fannie Mae - 9.3% | | | |
| 12 month U.S. LIBOR + 1.445% 3.195% 4/1/37 (d)(e) | | 58,538 | 61,224 |
| 12 month U.S. LIBOR + 1.480% 3.14% 7/1/34 (d)(e) | | 27,057 | 28,283 |
| 12 month U.S. LIBOR + 1.495% 2.963% 1/1/35 (d)(e) | | 119,957 | 124,647 |
| 12 month U.S. LIBOR + 1.507% 3.2% 7/1/37 (d)(e) | | 16,464 | 17,235 |
| 12 month U.S. LIBOR + 1.553% 3.338% 6/1/36 (d)(e) | | 89,059 | 92,030 |
| 12 month U.S. LIBOR + 1.565% 3.315% 3/1/37 (d)(e) | | 25,292 | 26,579 |
| 12 month U.S. LIBOR + 1.594% 3.448% 5/1/36 (d)(e) | | 120,427 | 126,084 |
| 12 month U.S. LIBOR + 1.617% 3.172% 3/1/33 (d)(e) | | 65,981 | 69,137 |
| 12 month U.S. LIBOR + 1.641% 2.862% 9/1/36 (d)(e) | | 68,109 | 71,384 |
| 12 month U.S. LIBOR + 1.643% 2.815% 9/1/36 (d)(e) | | 33,332 | 34,876 |
| 12 month U.S. LIBOR + 1.645% 3.309% 6/1/47 (d)(e) | | 61,972 | 65,732 |
| 12 month U.S. LIBOR + 1.718% 3.01% 5/1/35 (d)(e) | | 161,999 | 170,688 |
| 12 month U.S. LIBOR + 1.725% 2.583% 6/1/42 (d)(e) | | 207,898 | 214,865 |
| 12 month U.S. LIBOR + 1.728% 3.314% 11/1/36 (d)(e) | | 55,682 | 58,750 |
| 12 month U.S. LIBOR + 1.741% 3.332% 3/1/40 (d)(e) | | 284,424 | 301,782 |
| 12 month U.S. LIBOR + 1.745% 3.374% 7/1/35 (d)(e) | | 73,514 | 77,553 |
| 12 month U.S. LIBOR + 1.750% 3.031% 8/1/41 (d)(e) | | 652,797 | 691,199 |
| 12 month U.S. LIBOR + 1.788% 3.413% 2/1/36 (d)(e) | | 229,221 | 238,208 |
| 12 month U.S. LIBOR + 1.800% 2.759% 1/1/42 (d)(e) | | 1,041,856 | 1,094,269 |
| 12 month U.S. LIBOR + 1.800% 3.558% 7/1/41 (d)(e) | | 198,969 | 207,285 |
| 12 month U.S. LIBOR + 1.805% 3.029% 10/1/41 (d)(e) | | 64,272 | 68,146 |
| 12 month U.S. LIBOR + 1.810% 3.435% 12/1/39 (d)(e) | | 132,367 | 137,855 |
| 12 month U.S. LIBOR + 1.812% 3.471% 12/1/40 (d)(e) | | 7,157,940 | 7,474,741 |
| 12 month U.S. LIBOR + 1.815% 2.944% 11/1/40 (d)(e) | | 79,405 | 83,133 |
| 12 month U.S. LIBOR + 1.815% 3.109% 9/1/41 (d)(e) | | 215,818 | 224,947 |
| 12 month U.S. LIBOR + 1.818% 2.695% 2/1/42 (d)(e) | | 1,133,758 | 1,189,958 |
| 12 month U.S. LIBOR + 1.818% 3.023% 9/1/41 (d)(e) | | 123,969 | 131,517 |
| 12 month U.S. LIBOR + 1.818% 3.249% 7/1/41 (d)(e) | | 164,120 | 171,352 |
| 12 month U.S. LIBOR + 1.820% 3.445% 12/1/35 (d)(e) | | 213,655 | 226,472 |
| 12 month U.S. LIBOR + 1.830% 3.38% 10/1/41 (d)(e) | | 111,552 | 118,438 |
| 12 month U.S. LIBOR + 1.851% 3.573% 5/1/36 (d)(e) | | 100,000 | 106,100 |
| 12 month U.S. LIBOR + 1.900% 3.606% 7/1/37 (d)(e) | | 113,509 | 118,413 |
| 6 month U.S. LIBOR + 1.375% 2.75% 10/1/34 (d)(e) | | 1,296 | 1,338 |
| 6 month U.S. LIBOR + 1.475% 2.85% 10/1/33 (d)(e) | | 1,223 | 1,261 |
| 6 month U.S. LIBOR + 1.505% 2.846% 1/1/35 (d)(e) | | 177,810 | 183,610 |
| 6 month U.S. LIBOR + 1.505% 2.88% 1/1/35 (d)(e) | | 773 | 803 |
| 6 month U.S. LIBOR + 1.510% 2.854% 2/1/33 (d)(e) | | 773 | 797 |
| 6 month U.S. LIBOR + 1.535% 2.833% 3/1/35 (d)(e) | | 15,626 | 16,156 |
| 6 month U.S. LIBOR + 1.535% 2.884% 12/1/34 (d)(e) | | 39,188 | 40,501 |
| 6 month U.S. LIBOR + 1.556% 2.922% 10/1/33 (d)(e) | | 12,017 | 12,424 |
| 6 month U.S. LIBOR + 1.565% 2.845% 7/1/35 (d)(e) | | 16,635 | 17,221 |
| 6 month U.S. LIBOR + 1.740% 3.115% 12/1/34 (d)(e) | | 3,918 | 4,096 |
| 6 month U.S. LIBOR + 1.960% 3.335% 9/1/35 (d)(e) | | 25,761 | 27,136 |
| U.S. TREASURY 1 YEAR INDEX + 1.945% 2.52% 10/1/33 (d)(e) | | 289,120 | 300,901 |
| U.S. TREASURY 1 YEAR INDEX + 2.208% 3.083% 3/1/35 (d)(e) | | 37,194 | 39,340 |
| U.S. TREASURY 1 YEAR INDEX + 2.270% 2.899% 6/1/36 (d)(e) | | 207,468 | 219,067 |
| U.S. TREASURY 1 YEAR INDEX + 2.295% 2.798% 10/1/33 (d)(e) | | 75,874 | 80,103 |
| U.S. TREASURY 1 YEAR INDEX + 2.447% 3.167% 7/1/34 (d)(e) | | 177,919 | 188,901 |
| 2.5% 9/1/32 (k) | | 13,500,000 | 13,688,591 |
| 2.5% 12/1/42 to 8/1/43 | | 12,769,435 | 12,578,664 |
| 3% 11/1/23 to 8/1/47 | | 800,001,453 | 816,284,920 |
| 3% 9/1/32 (k) | | 74,000,000 | 76,402,573 |
| 3% 9/1/32 (k) | | 65,950,000 | 68,091,212 |
| 3% 9/1/32 (k) | | 119,200,000 | 123,070,090 |
| 3% 9/1/32 (k) | | 31,950,000 | 32,987,327 |
| 3% 9/1/32 (k) | | 31,650,000 | 32,677,587 |
| 3.5% 3/1/25 to 10/1/56 | | 537,374,966 | 559,778,167 |
| 3.5% 9/1/47 (k) | | 113,050,000 | 117,128,109 |
| 3.5% 9/1/47 (k) | | 107,850,000 | 111,740,527 |
| 3.5% 9/1/47 (k) | | 35,300,000 | 36,573,395 |
| 4% 9/1/24 to 10/1/46 | | 345,647,010 | 367,338,353 |
| 4% 9/1/47 (k) | | 14,400,000 | 15,213,983 |
| 4.5% 6/1/33 to 8/1/56 | | 122,768,410 | 133,089,361 |
| 5% 3/1/18 to 8/1/56 | | 214,023,690 | 235,302,454 |
| 5.255% 8/1/41 | | 2,319,440 | 2,573,710 |
| 5.5% 12/1/17 to 3/1/41 | | 24,273,241 | 26,939,744 |
| 6% 7/1/19 to 1/1/42 | | 17,006,196 | 19,428,979 |
| 6.309% 2/1/39 | | 4,119,120 | 4,480,466 |
| 6.5% 10/1/17 to 8/1/39 | | 27,643,987 | 32,058,735 |
| 7% 9/1/21 to 7/1/37 | | 1,228,024 | 1,418,053 |
| 7.5% 6/1/25 to 2/1/32 | | 541,939 | 631,303 |
| 8% 7/1/29 to 3/1/37 | | 13,668 | 16,511 |
| 8.5% 12/1/19 to 6/1/22 | | 279 | 307 |
| 9.5% 6/1/18 to 9/1/21 | | 4,398 | 4,550 |
|
| TOTAL FANNIE MAE | | | 2,854,454,208 |
|
| Freddie Mac - 3.5% | | | |
| 12 month U.S. LIBOR + 1.325% 2.79% 1/1/36 (d)(e) | | 51,763 | 53,562 |
| 12 month U.S. LIBOR + 1.325% 2.95% 3/1/37 (d)(e) | | 16,431 | 17,015 |
| 12 month U.S. LIBOR + 1.375% 2.854% 3/1/36 (d)(e) | | 136,088 | 141,095 |
| 12 month U.S. LIBOR + 1.500% 3.129% 3/1/36 (d)(e) | | 163,318 | 170,779 |
| 12 month U.S. LIBOR + 1.515% 2.93% 11/1/35 (d)(e) | | 79,311 | 82,636 |
| 12 month U.S. LIBOR + 1.750% 3.249% 7/1/41 (d)(e) | | 739,532 | 777,281 |
| 12 month U.S. LIBOR + 1.750% 3.394% 12/1/40 (d)(e) | | 3,825,013 | 3,981,255 |
| 12 month U.S. LIBOR + 1.754% 3.098% 9/1/41 (d)(e) | | 1,196,444 | 1,265,875 |
| 12 month U.S. LIBOR + 1.793% 3.32% 4/1/37 (d)(e) | | 36,081 | 38,196 |
| 12 month U.S. LIBOR + 1.864% 3.614% 4/1/36 (d)(e) | | 81,087 | 84,273 |
| 12 month U.S. LIBOR + 1.874% 3.432% 10/1/42 (d)(e) | | 1,120,147 | 1,174,625 |
| 12 month U.S. LIBOR + 1.877% 3.215% 4/1/41 (d)(e) | | 109,482 | 113,732 |
| 12 month U.S. LIBOR + 1.880% 3.222% 9/1/41 (d)(e) | | 128,428 | 136,287 |
| 12 month U.S. LIBOR + 1.910% 3.282% 6/1/41 (d)(e) | | 146,070 | 152,513 |
| 12 month U.S. LIBOR + 1.910% 3.421% 5/1/41 (d)(e) | | 121,731 | 129,245 |
| 12 month U.S. LIBOR + 1.910% 3.625% 5/1/41 (d)(e) | | 166,467 | 174,291 |
| 12 month U.S. LIBOR + 1.910% 3.647% 6/1/41 (d)(e) | | 157,945 | 165,333 |
| 12 month U.S. LIBOR + 1.920% 3.67% 6/1/36 (d)(e) | | 20,585 | 21,855 |
| 12 month U.S. LIBOR + 1.993% 5.165% 4/1/38 (d)(e) | | 118,329 | 125,633 |
| 12 month U.S. LIBOR + 2.045% 3.81% 7/1/36 (d)(e) | | 62,928 | 66,812 |
| 12 month U.S. LIBOR + 2.197% 3.537% 3/1/33 (d)(e) | | 1,850 | 1,959 |
| 12 month U.S. LIBOR + 2.200% 3.7% 12/1/36 (d)(e) | | 111,536 | 116,719 |
| 6 month U.S. LIBOR + 1.125% 2.5% 8/1/37 (d)(e) | | 33,931 | 34,551 |
| 6 month U.S. LIBOR + 1.445% 2.82% 3/1/35 (d)(e) | | 44,988 | 46,303 |
| 6 month U.S. LIBOR + 1.608% 2.955% 12/1/35 (d)(e) | | 81,195 | 84,038 |
| 6 month U.S. LIBOR + 1.647% 3.025% 2/1/37 (d)(e) | | 147,020 | 153,168 |
| 6 month U.S. LIBOR + 1.675% 3.05% 6/1/37 (d)(e) | | 28,135 | 29,360 |
| 6 month U.S. LIBOR + 1.720% 3.095% 8/1/37 (d)(e) | | 52,497 | 54,046 |
| 6 month U.S. LIBOR + 1.746% 2.967% 5/1/37 (d)(e) | | 26,162 | 27,118 |
| 6 month U.S. LIBOR + 1.932% 3.25% 10/1/36 (d)(e) | | 236,127 | 245,974 |
| 6 month U.S. LIBOR + 1.976% 3.34% 10/1/35 (d)(e) | | 118,275 | 124,219 |
| 6 month U.S. LIBOR + 2.010% 3.385% 6/1/37 (d)(e) | | 23,779 | 25,111 |
| 6 month U.S. LIBOR + 2.040% 3.415% 6/1/37 (d)(e) | | 116,681 | 121,039 |
| 6 month U.S. LIBOR + 2.066% 3.428% 6/1/37 (d)(e) | | 39,420 | 41,686 |
| 6 month U.S. LIBOR + 2.755% 4.096% 10/1/35 (d)(e) | | 115,245 | 122,358 |
| U.S. TREASURY 1 YEAR INDEX + 2.035% 2.889% 6/1/33 (d)(e) | | 168,915 | 176,130 |
| U.S. TREASURY 1 YEAR INDEX + 2.267% 3.214% 6/1/33 (d)(e) | | 421,157 | 442,218 |
| U.S. TREASURY 1 YEAR INDEX + 2.418% 3.104% 3/1/35 (d)(e) | | 769,741 | 817,254 |
| 2.5% 7/1/31 | | 6,484,780 | 6,583,984 |
| 3% 3/1/32 to 2/1/47 | | 225,921,785 | 229,155,466 |
| 3.5% 1/1/32 to 9/1/46 (h)(i)(l) | | 394,567,566 | 412,025,754 |
| 3.5% 8/1/47 | | 37,576,350 | 38,974,427 |
| 3.5% 9/1/47 (k) | | 8,600,000 | 8,912,583 |
| 4% 7/1/31 to 6/1/47 | | 281,141,176 | 298,817,945 |
| 4.5% 6/1/25 to 1/1/45 | | 21,419,366 | 23,213,948 |
| 5% 6/1/20 to 7/1/41 | | 22,161,115 | 24,398,372 |
| 5.5% 10/1/17 to 3/1/41 | | 8,109,725 | 8,986,308 |
| 6% 9/1/17 to 12/1/37 | | 2,411,948 | 2,736,461 |
| 6.5% 5/1/18 to 9/1/39 | | 3,257,038 | 3,739,623 |
| 7% 6/1/21 to 9/1/36 | | 1,105,531 | 1,284,032 |
| 7.5% 1/1/27 to 4/1/32 | | 21,775 | 25,536 |
| 8% 7/1/24 to 1/1/37 | | 33,931 | 40,397 |
| 8.5% 9/1/19 to 1/1/28 | | 28,764 | 33,240 |
| 9% 10/1/20 | | 22 | 24 |
| 9.5% 5/1/21 to 7/1/21 | | 137 | 145 |
| 10% 2/1/20 to 11/1/20 | | 53 | 56 |
| 11% 7/1/19 to 9/1/20 | | 16 | 17 |
|
| TOTAL FREDDIE MAC | | | 1,070,463,862 |
|
| Ginnie Mae - 2.9% | | | |
| 3% 5/20/42 to 8/20/47 | | 320,590,314 | 327,742,426 |
| 3% 9/1/47 (k) | | 20,000,000 | 20,413,590 |
| 3.5% 11/15/40 to 6/20/46 (h) | | 276,278,729 | 289,534,921 |
| 3.5% 9/1/47 (k) | | 11,300,000 | 11,783,020 |
| 3.5% 9/1/47 (k) | | 11,780,000 | 12,283,537 |
| 4% 5/20/33 to 4/20/47 | | 134,266,559 | 143,313,620 |
| 4.5% 6/20/33 to 8/15/41 | | 55,115,448 | 59,834,673 |
| 5% 12/15/32 to 9/15/41 | | 23,732,729 | 26,364,364 |
| 5.5% 7/15/33 to 9/15/39 | | 1,944,703 | 2,193,397 |
| 6% 10/15/30 to 11/15/39 | | 571,325 | 655,138 |
| 6.5% 3/20/31 to 11/15/37 | | 330,092 | 383,194 |
| 7% 10/15/22 to 3/15/33 | | 1,122,401 | 1,321,613 |
| 7.5% 8/15/21 to 9/15/31 | | 484,218 | 555,499 |
| 8% 11/15/21 to 11/15/29 | | 155,947 | 177,484 |
| 8.5% 10/15/21 to 1/15/31 | | 30,834 | 36,414 |
| 9% 8/15/19 to 1/15/23 | | 950 | 1,013 |
| 9.5% 12/15/20 to 2/15/25 | | 364 | 393 |
| 11% 9/20/19 | | 353 | 374 |
|
| TOTAL GINNIE MAE | | | 896,594,670 |
|
| TOTAL U.S. GOVERNMENT AGENCY - MORTGAGE SECURITIES | | | |
| (Cost $4,811,433,248) | | | 4,821,512,740 |
|
| Asset-Backed Securities - 1.1% | | | |
| Accredited Mortgage Loan Trust Series 2005-1 Class M1, 1 month U.S. LIBOR + 0.705% 1.9394% 4/25/35 (d)(e) | | $664,344 | $654,660 |
| ACE Securities Corp. Home Equity Loan Trust Series 2004-HE1 Class M2, 1 month U.S. LIBOR + 1.650% 2.8844% 3/25/34 (d)(e) | | 207,834 | 207,435 |
| Airspeed Ltd. Series 2007-1A Class C1, 1 month U.S. LIBOR + 2.500% 3.7267% 6/15/32 (b)(d)(e)(g) | | 2,946,522 | 942,887 |
| American Credit Acceptance Receivable Trust Series 2016-1A Class A, 2.37% 5/12/20 (b) | | 930,196 | 930,587 |
| American Homes 4 Rent: | | | |
| Series 2014-SFR2 Class E, 6.231% 10/17/36 (b) | | 147,000 | 167,296 |
| Series 2014-SFR3 Class E, 6.418% 12/17/36 (b) | | 428,000 | 492,330 |
| Series 2015-SFR1 Class E, 5.639% 4/17/52 (b) | | 599,438 | 661,805 |
| Series 2015-SFR2: | | | |
| Class E, 6.07% 10/17/45 (b) | | 981,000 | 1,117,653 |
| Class XS, 0% 10/17/45 (b)(d)(g)(m) | | 687,019 | 7 |
| Ameriquest Mortgage Securities, Inc. pass-thru certificates: | | | |
| Series 2003-10 Class M1, 1 month U.S. LIBOR + 1.050% 2.2844% 12/25/33 (d)(e) | | 34,111 | 32,910 |
| Series 2004-R2 Class M3, 1 month U.S. LIBOR + 0.825% 2.0594% 4/25/34 (d)(e) | | 89,819 | 79,820 |
| Argent Securities, Inc. pass-thru certificates: | | | |
| Series 2003-W7 Class A2, 1 month U.S. LIBOR + 0.780% 2.0144% 3/25/34 (d)(e) | | 47,932 | 45,248 |
| Series 2004-W11 Class M2, 1 month U.S. LIBOR + 1.050% 2.2844% 11/25/34 (d)(e) | | 461,974 | 460,017 |
| Series 2004-W7 Class M1, 1 month U.S. LIBOR + 0.825% 2.0594% 5/25/34 (d)(e) | | 1,209,950 | 1,160,988 |
| Series 2006-W4 Class A2C, 1 month U.S. LIBOR + 0.160% 1.3944% 5/25/36 (d)(e) | | 1,087,400 | 422,147 |
| Asset Backed Securities Corp. Home Equity Loan Trust: | | | |
| Series 2004-HE2 Class M1, 1 month U.S. LIBOR + 0.825% 2.0594% 4/25/34 (d)(e) | | 1,383,062 | 1,297,258 |
| Series 2006-HE2 Class M1, 1 month U.S. LIBOR + 0.370% 1.6044% 3/25/36 (d)(e) | | 18,309 | 6,685 |
| Avis Budget Rental Car Funding (AESOP) LLC Series 2012-3A Class A, 2.1% 3/20/19 (b) | | 9,200,000 | 9,209,314 |
| Blackbird Capital Aircraft Series 2016-1A: | | | |
| Class A, 4.213% 12/16/41 (b) | | 44,452,031 | 46,058,350 |
| Class AA, 2.487% 12/16/41 (b) | | 10,285,063 | 10,347,041 |
| CAM Mortgage Trust Series 2017-1 Class A1, 3.22% 8/1/57 (b) | | 18,470,696 | 18,488,241 |
| Carrington Mortgage Loan Trust Series 2007-RFC1 Class A3, 1 month U.S. LIBOR + 0.140% 1.3744% 12/25/36 (d)(e) | | 1,802,588 | 1,500,975 |
| Citi Mortgage Loan Trust Series 2007-1 Class 1A, 1 month U.S. LIBOR + 1.350% 2.5844% 10/25/37 (b)(d)(e) | | 20,158,172 | 20,023,334 |
| CLUB Credit Trust Series 2017-NP1 Class A, 2.39% 4/17/23 (b) | | 6,200,569 | 6,203,718 |
| Countrywide Home Loans, Inc.: | | | |
| Series 2003-BC1 Class B1, 1 month U.S. LIBOR + 5.250% 6.4844% 3/25/32 (d)(e) | | 3,192 | 3,189 |
| Series 2004-3 Class M4, 1 month U.S. LIBOR + 1.455% 2.6894% 4/25/34 (d)(e) | | 52,056 | 49,074 |
| Series 2004-4 Class M2, 1 month U.S. LIBOR + 0.795% 2.0294% 6/25/34 (d)(e) | | 78,667 | 78,146 |
| Series 2004-7 Class AF5, 5.868% 1/25/35 | | 1,196,869 | 1,213,709 |
| Series 2005-3 Class MV4, 1 month U.S. LIBOR + 0.620% 1.8544% 8/25/35 (d)(e) | | 2,910,898 | 2,913,740 |
| Credit Suisse First Boston Mortgage Securities Corp.: | | | |
| Series 2003-2 Class M1, 1 month U.S. LIBOR + 1.320% 2.5544% 8/25/33 (d)(e) | | 212,195 | 209,067 |
| Series 2003-3 Class M1, 1 month U.S. LIBOR + 1.290% 2.5244% 8/25/33 (d)(e) | | 342,895 | 333,597 |
| Series 2003-5 Class A2, 1 month U.S. LIBOR + 0.700%1.9322% 12/25/33 (d)(e) | | 32,929 | 31,902 |
| Deutsche Financial Capital Securitization LLC Series 1997-I Class M, 7.275% 9/15/27 | | 173,987 | 178,967 |
| Exeter Automobile Receivables Trust Series 2017-2A Class A, 2.22% 6/15/21 (b) | | 15,750,314 | 15,783,058 |
| Fannie Mae: | | | |
| Series 2004-T5 Class AB3, 1 month U.S. LIBOR + 0.392% 1.9452% 5/28/35 (d)(e) | | 38,916 | 37,480 |
| Series 2017-T1 Class A, 2.898% 6/25/27 | | 52,094,771 | 52,748,795 |
| Fieldstone Mortgage Investment Corp. Series 2004-3 Class M5, 1 month U.S. LIBOR + 2.175% 3.4094% 8/25/34 (d)(e) | | 217,152 | 211,059 |
| First Franklin Mortgage Loan Trust Series 2004-FF2 Class M3, 1 month U.S. LIBOR + 0.825% 2.0594% 3/25/34 (d)(e) | | 2,512 | 2,190 |
| Flagship Credit Auto Trust Series 2015-3 Class A, 2.38% 10/15/20 (b) | | 3,645,006 | 3,648,916 |
| Fremont Home Loan Trust Series 2005-A: | | | |
| Class M3, 1 month U.S. LIBOR + 0.735% 1.9694% 1/25/35 (d)(e) | | 948,695 | 927,869 |
| Class M4, 1 month U.S. LIBOR + 1.020% 2.2544% 1/25/35 (d)(e) | | 347,133 | 202,886 |
| GCO Education Loan Funding Master Trust II Series 2007-1A Class C1L, 3 month U.S. LIBOR + 0.380% 1.6972% 2/25/47 (b)(d)(e) | | 490,944 | 464,681 |
| GE Business Loan Trust Series 2006-2A: | | | |
| Class A, 1 month U.S. LIBOR + 0.180% 1.4089% 11/15/34 (b)(d)(e) | | 442,002 | 427,793 |
| Class B, 1 month U.S. LIBOR + 0.280% 1.5067% 11/15/34 (b)(d)(e) | | 159,664 | 149,361 |
| Class C, 1 month U.S. LIBOR + 0.380% 1.6067% 11/15/34 (b)(d)(e) | | 265,356 | 246,006 |
| Class D, 1 month U.S. LIBOR + 0.750% 1.9767% 11/15/34 (b)(d)(e) | | 100,764 | 91,871 |
| GSAMP Trust Series 2004-AR1 Class B4, 5.5% 6/25/34 (b) | | 75,390 | 6,325 |
| HSI Asset Securitization Corp. Trust Series 2007-HE1 Class 2A3, 1 month U.S. LIBOR + 0.190% 1.4244% 1/25/37 (d)(e) | | 1,465,853 | 1,043,464 |
| Invitation Homes Trust: | | | |
| Series 2014-SFR3 Class E, 1 month U.S. LIBOR + 4.500% 5.7256% 12/17/31 (b)(d)(e) | | 40,436 | 40,436 |
| Series 2014-SRF2 Class F, 1 month U.S. LIBOR + 4.000% 5.2094% 9/17/31 (b)(d)(e) | | 335,000 | 335,612 |
| Series 2015-SFR2 Class E, 1 month U.S. LIBOR + 3.150% 4.376% 6/17/32 (b)(d)(e) | | 485,000 | 490,142 |
| Series 2015-SRF1 Class E, 1 month U.S. LIBOR + 4.300% 5.4256% 3/17/32 (b)(d)(e) | | 624,000 | 634,504 |
| Keycorp Student Loan Trust Series 2006-A Class 2C, 3 month U.S. LIBOR + 1.150% 2.4433% 3/27/42 (d)(e) | | 3,243,000 | 2,239,276 |
| Long Beach Mortgage Loan Trust Series 2006-10 Class 2A3, 1 month U.S. LIBOR + 0.160% 1.3944% 11/25/36 (d)(e) | | 4,199,797 | 2,120,766 |
| MASTR Asset Backed Securities Trust Series 2007-HE1 Class M1, 1 month U.S. LIBOR + 0.300% 1.5344% 5/25/37 (d)(e) | | 275,754 | 82,485 |
| Meritage Mortgage Loan Trust Series 2004-1 Class M1, 1 month U.S. LIBOR + 0.750% 1.9844% 7/25/34 (d)(e) | | 88,697 | 83,505 |
| Merrill Lynch Mortgage Investors Trust: | | | |
| Series 2003-OPT1 Class M1, 1 month U.S. LIBOR + 0.975% 2.2094% 7/25/34 (d)(e) | | 132,889 | 128,495 |
| Series 2006-FF1 Class M2, 1 month U.S. LIBOR + 0.290% 1.5244% 8/25/36 (d)(e) | | 13,300,000 | 13,223,312 |
| Series 2006-FM1 Class A2B, 1 month U.S. LIBOR + 0.110% 1.3444% 4/25/37 (d)(e) | | 2,706 | 1,658 |
| Series 2006-OPT1 Class A1A, 1 month U.S. LIBOR + 0.520% 1.7544% 6/25/35 (d)(e) | | 1,160,779 | 1,125,584 |
| Morgan Stanley ABS Capital I Trust: | | | |
| Series 2004-HE6 Class A2, 1 month U.S. LIBOR + 0.680% 1.9144% 8/25/34 (d)(e) | | 57,368 | 51,034 |
| Series 2004-NC6 Class M3, 1 month U.S. LIBOR + 2.175% 3.4094% 7/25/34 (d)(e) | | 12,838 | 12,363 |
| Series 2004-NC8 Class M6, 1 month U.S. LIBOR + 1.875% 3.1094% 9/25/34 (d)(e) | | 14,735 | 14,526 |
| Series 2005-NC1 Class M1, 1 month U.S. LIBOR + 0.660% 1.8944% 1/25/35 (d)(e) | | 122,347 | 117,943 |
| Series 2005-NC2 Class B1, 1 month U.S. LIBOR + 1.755% 2.9894% 3/25/35 (d)(e) | | 124,884 | 4,080 |
| Nationstar HECM Loan Trust Series 2017-1A Class A, 1.9679% 5/25/27 (b)(g) | | 22,578,519 | 22,576,035 |
| New Century Home Equity Loan Trust Series 2005-4 Class M2, 1 month U.S. LIBOR + 0.510% 1.7444% 9/25/35 (d)(e) | | 1,426,957 | 1,398,621 |
| OneMain Financial Issuance Trust Series 2014-1A Class A, 2.43% 6/18/24 (b) | | 143,487 | 143,497 |
| Park Place Securities, Inc.: | | | |
| Series 2004-WCW1: | | | |
| Class M3, 1 month U.S. LIBOR + 1.875% 3.1072% 9/25/34 (d)(e) | | 479,652 | 474,894 |
| Class M4, 1 month U.S. LIBOR + 2.175% 3.4072% 9/25/34 (d)(e) | | 683,353 | 551,303 |
| Series 2005-WCH1 Class M4, 1 month U.S. LIBOR + 1.245% 2.4794% 1/25/36 (d)(e) | | 1,475,804 | 1,453,558 |
| Progress Residential Trust: | | | |
| Series 2015-SFR3 Class F, 6.643% 11/12/32 (b) | | 168,000 | 177,228 |
| Series 2017-SFR1 Class F, 6.511% 8/17/34 (b) | | 160,000 | 163,649 |
| Prosper Marketplace Issuance Trust Series 2017-1A Class A, 2.56% 6/15/23 (b) | | 13,027,119 | 13,067,163 |
| Salomon Brothers Mortgage Securities VII, Inc. Series 2003-HE1 Class A, 1 month U.S. LIBOR + 0.800% 2.0344% 4/25/33 (d)(e) | | 5,108 | 4,646 |
| Saxon Asset Securities Trust Series 2004-1 Class M1, 1 month U.S. LIBOR + 0.795% 2.0294% 3/25/35 (d)(e) | | 482,983 | 473,774 |
| SLM Private Credit Student Loan Trust Series 2004-A Class C, 3 month U.S. LIBOR + 0.950% 2.1956% 6/15/33 (d)(e) | | 181,533 | 181,358 |
| Structured Asset Investment Loan Trust Series 2004-8 Class M5, 1 month U.S. LIBOR + 1.725% 2.9594% 9/25/34 (d)(e) | | 32,987 | 30,496 |
| Terwin Mortgage Trust Series 2003-4HE Class A1, 1 month U.S. LIBOR + 0.860% 2.0944% 9/25/34 (d)(e) | | 28,819 | 27,345 |
| Thunderbolt Aircraft Lease Ltd. Series 2017-A Class A, 4.212% 5/17/32 (b) | | 25,377,589 | 26,255,306 |
| Towd Point Mortgage Trust Series 2017-1 Class A1, 2.75% 10/25/56 (b)(d) | | 31,358,793 | 31,736,055 |
| Trapeza CDO XII Ltd./Trapeza CDO XII, Inc. Series 2007-12A Class B, 3 month U.S. LIBOR + 0.560% 1.7098% 4/6/42 (b)(d)(e)(g) | | 2,573,000 | 1,299,365 |
| Tricon American Homes Series 2017-SFR1 Class F, 5.151% 9/17/34 (b) | | 1,092,000 | 1,097,052 |
| Tricon American Homes Trust Series 2016-SFR1: | | | |
| Class B, 2.989% 11/17/33 (b) | | 517,000 | 519,242 |
| Class F, 5.769% 11/17/33 (b) | | 456,000 | 474,674 |
| Vericrest Opportunity Loan Trust Series 2014-NP11 Class A1, 3.875% 4/25/55 (b) | | 1,188,166 | 1,188,474 |
| Wrightwood Capital Real Estate CDO Ltd. Series 2005-1A Class D, 3 month U.S. LIBOR + 0.850% 2.0217% 11/21/40 (b)(d)(e) | | 305,000 | 266,113 |
| TOTAL ASSET-BACKED SECURITIES | | | |
| (Cost $314,269,482) | | | 325,779,420 |
|
| Collateralized Mortgage Obligations - 2.3% | | | |
| Private Sponsor - 0.7% | | | |
| Banc of America Funding Corp. Series 2015-R3 Class 10A1, 1 month U.S. LIBOR + 0.140% 1.3561% 6/27/36 (b)(d)(e) | | 10,533,198 | 10,263,548 |
| Banc of America Funding Trust sequential payer Series 2010-R3 Class 1A1, 3.3685% 12/26/35 (b)(d) | | 1,705,900 | 1,710,506 |
| BCAP LLC Trust sequential payer: | | | |
| Series 2012-RR5 Class 8A5, 1.4122% 7/26/36 (b)(d) | | 1,698,253 | 1,639,324 |
| Series 2013-RR4 Class 2A1, 3.6531% 5/26/47 (b)(d) | | 3,109,963 | 3,123,078 |
| Bear Stearns ALT-A Trust floater Series 2005-1 Class A1, 1 month U.S. LIBOR + 0.560% 1.7944% 1/25/35 (d)(e) | | 554,318 | 558,889 |
| Citigroup Mortgage Loan Trust sequential payer Series 2014-8 Class 2A1, 3.45% 6/27/37 (b)(d) | | 7,826,661 | 7,816,487 |
| Citigroup Mortgage Loan Trust, Inc. sequential payer Series 2009-5 Class 5A1, 3.4927% 1/25/37 (b)(d) | | 2,789,921 | 2,846,278 |
| Credit Suisse Commercial Mortgage Trust Series 2014-15R Class 7A3, 1.8991% 10/26/37 (b)(d) | | 32,962 | 32,883 |
| Credit Suisse Mortgage Trust Series 2010-9R Class 2A5, 4% 2/27/38 (b) | | 8,442,173 | 8,666,735 |
| CSMC: | | | |
| floater Series 2015-1R Class 6A1, 1 month U.S. LIBOR + 0.280% 1.4945% 5/27/37 (b)(d)(e) | | 8,183,109 | 7,840,237 |
| Series 2011-2R Class 2A1, 3.3199% 7/27/36 (b)(d) | | 984,648 | 983,171 |
| Series 2014-3R Class 2A1, 1 month U.S. LIBOR + 0.700% 1.9161% 5/27/37 (b)(d)(e) | | 879,958 | 850,655 |
| First Horizon Mortgage pass-thru Trust Series 2004-AR5 Class 2A1, 3.1125% 10/25/34 (d) | | 310,928 | 312,543 |
| Freddie Mac Seasoned Credit Risk Transfer Series sequential payer Series 2017-1 Class MA, 3% 1/25/56 | | 17,976,374 | 18,289,511 |
| FREMF Mortgage Trust: | | | |
| Series 2010-K6 Class B, 5.367% 12/25/46 (b)(d) | | 910,000 | 973,050 |
| Series 2010-K7 Class B, 5.4999% 4/25/20 (b)(d) | | 1,000,000 | 1,077,880 |
| GSR Mortgage Loan Trust floater Series 2007-AR1 Class 6A1, 2.9833% 3/25/37 (d) | | 559,514 | 558,773 |
| JP Morgan Resecuritization Trust floater Series 2012-2 Class 6A1, 1 month U.S. LIBOR + 0.210% 1.4182% 6/21/36 (b)(d)(e) | | 5,924,776 | 5,859,011 |
| JPMorgan Mortgage Trust sequential payer Series 2006-A5 Class 3A5, 3.4234% 8/25/36 (d) | | 791,788 | 760,158 |
| Merrill Lynch Alternative Note Asset Trust floater Series 2007-OAR1 Class A1, 1 month U.S. LIBOR + 0.170% 1.3861% 2/25/37 (d)(e) | | 1,690,220 | 1,645,352 |
| Mortgage Repurchase Agreement Funding Trust floater Series 2016-5 Class A, 1 month U.S. LIBOR + 1.170% 2.4006% 6/10/19 (b)(d)(e) | | 45,638,000 | 45,565,481 |
| Nomura Resecuritization Trust sequential payer Series 2011-3RA Class 2A1, 3.2922% 3/26/37 (b)(d) | | 1,922,088 | 1,924,395 |
| Opteum Mortgage Acceptance Corp. floater Series 2005-3 Class APT, 1 month U.S. LIBOR + 0.290% 1.5244% 7/25/35 (d)(e) | | 466,181 | 460,261 |
| RBSSP Resecuritization Trust sequential payer Series 2010-1 Class 2A1, 3.4027% 7/26/45 (b)(d) | | 9,048,050 | 9,181,056 |
| RESI Finance LP/RESI Finance DE Corp. floater Series 2003-B: | | | |
| Class B5, 1 month U.S. LIBOR + 2.350% 3.5744% 6/10/35 (b)(d)(e) | | 216,834 | 154,088 |
| Class B6, 1 month U.S. LIBOR + 2.850% 4.0744% 6/10/35 (b)(d)(e) | | 48,346 | 26,720 |
| Sequoia Mortgage Trust floater Series 2004-6 Class A3B, 6 month U.S. LIBOR + 0.880% 2.3127% 7/20/34 (d)(e) | | 19,256 | 19,008 |
| Structured Asset Securities Corp. Series 2003-15A Class 4A, 3.368% 4/25/33 (d) | | 53,601 | 53,234 |
| Thornburg Mortgage Securities Trust floater Series 2003-4 Class A1, 1 month U.S. LIBOR + 0.640% 1.8744% 9/25/43 (d)(e) | | 8,192,668 | 7,912,551 |
| Towd Point Mortgage Trust: | | | |
| Series 2015-5 Class A1B, 2.75% 5/25/55 (b) | | 4,713,967 | 4,763,647 |
| Series 2017-2 Class A1, 2.75% 4/25/57 (b)(d) | | 31,563,041 | 31,896,971 |
| Wells Fargo Mortgage Backed Securities Trust: | | | |
| Series 2004-BB Class A2, 3.0826% 1/25/35 (d) | | 1,759,971 | 1,765,789 |
| Series 2005-AR10 Class 2A15, 3.1989% 6/25/35 (d) | | 9,509,506 | 9,598,370 |
| Series 2005-AR2: | | | |
| Class 1A2, 3.1522% 3/25/35 (d) | | 1,182,323 | 1,181,960 |
| Class 3A1, 3.1468% 3/25/35 (d) | | 15,268,708 | 15,495,649 |
| Wells Fargo Mortgage Loan Trust sequential payer Series 2011-RR4: | | | |
| Class 1A1, 3.5051% 6/27/36 (b)(d) | | 1,380,142 | 1,380,971 |
| Class 2A1, 3.3412% 6/27/36 (b)(d) | | 1,552,886 | 1,548,383 |
|
| TOTAL PRIVATE SPONSOR | | | 208,736,603 |
|
| U.S. Government Agency - 1.6% | | | |
| Fannie Mae: | | | |
| floater: | | | |
| Series 2002-18 Class FD, 1 month U.S. LIBOR + 0.800% 2.0344% 2/25/32 (d)(e) | | 22,220 | 22,555 |
| Series 2002-39 Class FD, 1 month U.S. LIBOR + 1.000% 2.2283% 3/18/32 (d)(e) | | 39,054 | 39,841 |
| Series 2002-60 Class FV, 1 month U.S. LIBOR + 1.000% 2.2344% 4/25/32 (d)(e) | | 47,358 | 48,294 |
| Series 2002-63 Class FN, 1 month U.S. LIBOR + 1.000% 2.2344% 10/25/32 (d)(e) | | 63,001 | 64,225 |
| Series 2002-7 Class FC, 1 month U.S. LIBOR + 0.750% 1.9844% 1/25/32 (d)(e) | | 23,081 | 23,408 |
| Series 2002-94 Class FB, 1 month U.S. LIBOR + 0.400% 1.6344% 1/25/18 (d)(e) | | 2,737 | 2,738 |
| Series 2003-118 Class S, 8.100% - 1 month U.S. LIBOR 6.8656% 12/25/33 (d)(m)(n) | | 754,122 | 182,834 |
| Series 2006-104 Class GI, 6.680% - 1 month U.S. LIBOR 5.4456% 11/25/36 (d)(m)(n) | | 563,555 | 105,270 |
| planned amortization class: | | | |
| Series 1992-168 Class KB, 7% 10/25/22 | | 26,909 | 28,635 |
| Series 1993-207 Class H, 6.5% 11/25/23 | | 380,233 | 415,418 |
| Series 1996-28 Class PK, 6.5% 7/25/25 | | 122,040 | 133,774 |
| Series 1999-17 Class PG, 6% 4/25/29 | | 342,380 | 378,561 |
| Series 1999-32 Class PL, 6% 7/25/29 | | 333,286 | 368,960 |
| Series 1999-33 Class PK, 6% 7/25/29 | | 229,737 | 254,720 |
| Series 2001-52 Class YZ, 6.5% 10/25/31 | | 28,603 | 33,087 |
| Series 2003-28 Class KG, 5.5% 4/25/23 | | 218,911 | 233,241 |
| Series 2005-102 Class CO 11/25/35 (o) | | 187,480 | 169,148 |
| Series 2005-73 Class SA, 17.500% - 1 month U.S. LIBOR 14.3404% 8/25/35 (d)(n) | | 65,393 | 82,197 |
| Series 2005-81 Class PC, 5.5% 9/25/35 | | 427,876 | 473,170 |
| Series 2006-12 Class BO 10/25/35 (o) | | 838,147 | 757,016 |
| Series 2006-37 Class OW 5/25/36 (o) | | 83,877 | 74,743 |
| Series 2006-45 Class OP 6/25/36 (o) | | 251,777 | 224,093 |
| Series 2006-62 Class KP 4/25/36 (o) | | 406,465 | 361,838 |
| sequential payer: | | | |
| Series 1997-41 Class J, 7.5% 6/18/27 | | 70,504 | 81,513 |
| Series 1999-25 Class Z, 6% 6/25/29 | | 266,311 | 297,953 |
| Series 2001-20 Class Z, 6% 5/25/31 | | 370,924 | 407,899 |
| Series 2001-31 Class ZC, 6.5% 7/25/31 | | 201,511 | 229,207 |
| Series 2002-16 Class ZD, 6.5% 4/25/32 | | 103,174 | 119,438 |
| Series 2002-74 Class SV, 1 month U.S. LIBOR + 7.550% 6.3156% 11/25/32 (d)(e)(m) | | 480,126 | 79,411 |
| Series 2012-67 Class AI, 4.5% 7/25/27 (m) | | 2,376,819 | 251,126 |
| Series 06-116 Class SG, 6.640% - 1 month U.S. LIBOR 5.4056% 12/25/36 (d)(m)(n) | | 384,259 | 81,741 |
| Series 07-40 Class SE, 6.440% - 1 month U.S. LIBOR 5.2056% 5/25/37 (d)(m)(n) | | 209,416 | 38,455 |
| Series 1993-165 Class SH, 19.800% - 1 month U.S. LIBOR 16.3081% 9/25/23 (d)(n) | | 16,316 | 20,569 |
| Series 2003-21 Class SK, 8.100% - 1 month U.S. LIBOR 6.8656% 3/25/33(d)(m)(n) | | 54,218 | 11,521 |
| Series 2003-35 Class TQ, 7.500% - 1 month U.S. LIBOR 6.2656% 5/25/18 (d)(m)(n) | | 5,164 | 82 |
| Series 2005-72 Class ZC, 5.5% 8/25/35 | | 2,669,661 | 2,933,270 |
| Series 2005-79 Class ZC, 5.9% 9/25/35 | | 1,658,772 | 1,908,641 |
| Series 2007-57 Class SA, 40.600% - 1 month U.S. LIBOR 33.2134% 6/25/37 (d)(n) | | 179,397 | 362,630 |
| Series 2007-66: | | | |
| Class SA, 39.600% - 1 month U.S. LIBOR 32.1934% 7/25/37 (d)(n) | | 269,263 | 537,974 |
| Class SB, 39.600% - 1 month U.S. LIBOR 32.1934% 7/25/37 (d)(n) | | 113,507 | 207,468 |
| Series 2007-75 Class JI, 1 month U.S. LIBOR + 6.545% 5.3106% 8/25/37 (d)(e)(m) | | 8,020,733 | 1,464,822 |
| Series 2008-12 Class SG, 6.350% - 1 month U.S. LIBOR 5.1156% 3/25/38 (d)(m)(n) | | 1,443,851 | 247,135 |
| Series 2009-16 Class SA, 6.250% - 1 month U.S. LIBOR 5.0156% 3/25/24 (d)(m)(n) | | 744 | 6 |
| Series 2009-76 Class MI, 5.5% 9/25/24 (m) | | 19,495 | 463 |
| Series 2009-85 Class IB, 4.5% 8/25/24 (m) | | 93,864 | 4,152 |
| Series 2009-93 Class IC, 4.5% 9/25/24 (m) | | 134,937 | 5,679 |
| Series 2010-112 Class SG, 6.360% - 1 month U.S. LIBOR 5.1256% 6/25/21 (d)(m)(n) | | 88,272 | 3,080 |
| Series 2010-12 Class AI, 5% 12/25/18 (m) | | 139,664 | 1,914 |
| Series 2010-135 Class LS, 6.050% - 1 month U.S. LIBOR 4.8156% 12/25/40 (d)(m)(n) | | 1,357,102 | 222,120 |
| Series 2010-139 Class NI, 4.5% 2/25/40 (m) | | 1,257,141 | 137,111 |
| Series 2010-150 Class ZC, 4.75% 1/25/41 | | 5,540,749 | 6,190,589 |
| Series 2010-17 Class DI, 4.5% 6/25/21 (m) | | 67,429 | 2,063 |
| Series 2010-23: | | | |
| Class AI, 5% 12/25/18 (m) | | 39,936 | 479 |
| Class HI, 4.5% 10/25/18 (m) | | 51,667 | 815 |
| Series 2010-29 Class LI, 4.5% 6/25/19 (m) | | 132,196 | 1,888 |
| Series 2010-95 Class ZC, 5% 9/25/40 | | 11,723,312 | 13,196,415 |
| Series 2010-97 Class CI, 4.5% 8/25/25 (m) | | 347,662 | 19,990 |
| Series 2011-110 Class SA, 6.610% - 1 month U.S. LIBOR 5.3756% 4/25/41 (d)(m)(n) | | 3,636,515 | 521,473 |
| Series 2011-112 Class SA, 6.550% - 1 month U.S. LIBOR 5.3156% 11/25/41 (d)(m)(n) | | 3,711,538 | 650,475 |
| Series 2011-123 Class SD, 6.600% - 1 month U.S. LIBOR 5.3656% 8/25/39 (d)(m)(n) | | 3,088,487 | 402,025 |
| Series 2011-39 Class ZA, 6% 11/25/32 | | 953,996 | 1,081,809 |
| Series 2011-4 Class PZ, 5% 2/25/41 | | 2,442,106 | 2,787,933 |
| Series 2011-67 Class AI, 4% 7/25/26 (m) | | 384,961 | 36,114 |
| Series 2011-83 Class DI, 6% 9/25/26 (m) | | 543,020 | 53,980 |
| Series 2012-100 Class WI, 3% 9/25/27 (m) | | 6,155,314 | 565,544 |
| Series 2012-14 Class JS, 6.650% - 1 month U.S. LIBOR 5.4156% 12/25/30 (d)(m)(n) | | 2,054,751 | 264,024 |
| Series 2012-47 Class SD, 6.450% - 1 month U.S. LIBOR 5.2156% 5/25/42 (d)(m)(n) | | 9,132,909 | 1,741,246 |
| Series 2012-9 Class SH, 6.550% - 1 month U.S. LIBOR 5.3156% 6/25/41 (d)(m)(n) | | 2,787,002 | 402,101 |
| Series 2013-133 Class IB, 3% 4/25/32 (m) | | 3,819,479 | 352,692 |
| Series 2013-134 Class SA, 6.050% - 1 month U.S. LIBOR 4.8156% 1/25/44 (d)(m)(n) | | 2,031,136 | 338,359 |
| Series 2013-51 Class GI, 3% 10/25/32 (m) | | 5,592,204 | 602,623 |
| Series 2013-N1 Class A, 6.720% - 1 month U.S. LIBOR 5.4856% 6/25/35 (d)(m)(n) | | 1,155,721 | 217,248 |
| Series 2015-42: | | | |
| Class IL, 6% 6/25/45 (m) | | 8,556,748 | 1,991,223 |
| Class LS, 6.200% - 1 month U.S. LIBOR 4.9656% 6/25/45 (d)(m)(n) | | 14,275,292 | 2,362,511 |
| Series 2015-70 Class JC, 3% 10/25/45 | | 7,479,683 | 7,681,002 |
| Series 2016-78 Class CS, 6.100% - 1 month U.S. LIBOR 4.8656% 5/25/39 (d)(m)(n) | | 16,611,608 | 2,911,007 |
| Series 2017-30 Class AI, 5.5% 5/25/47 (m) | | 4,444,901 | 995,613 |
| Fannie Mae Stripped Mortgage-Backed Securities: | | | |
| Series 339: | | | |
| Class 29, 5.5% 8/25/18 (m) | | 7,235 | 65 |
| Class 5, 5.5% 7/25/33 (m) | | 203,849 | 39,472 |
| Series 343 Class 16, 5.5% 5/25/34 (m) | | 173,359 | 31,190 |
| Series 348 Class 14, 6.5% 8/25/34 (d)(m) | | 126,293 | 29,436 |
| Series 351: | | | |
| Class 12, 5.5% 4/25/34 (d)(m) | | 80,866 | 13,637 |
| Class 13, 6% 3/25/34 (m) | | 111,829 | 22,168 |
| Series 359 Class 19, 6% 7/25/35 (d)(m) | | 73,617 | 13,950 |
| Series 384 Class 6, 5% 7/25/37 (m) | | 899,460 | 159,151 |
| Freddie Mac: | | | |
| floater: | | | |
| Series 2412 Class FK, 1 month U.S. LIBOR + 0.800% 2.0267% 1/15/32 (d)(e) | | 17,410 | 17,669 |
| Series 2423 Class FA, 1 month U.S. LIBOR + 0.900% 2.1267% 3/15/32 (d)(e) | | 24,524 | 24,950 |
| Series 2424 Class FM, 1 month U.S. LIBOR + 1.000% 2.2267% 3/15/32 (d)(e) | | 26,785 | 27,294 |
| Series 2432: | | | |
| Class FE, 1 month U.S. LIBOR + 0.900% 2.1267% 6/15/31 (d)(e) | | 45,875 | 46,631 |
| Class FG, 1 month U.S. LIBOR + 0.900% 2.1267% 3/15/32 (d)(e) | | 14,560 | 14,806 |
| floater target amortization class Series 3366 Class FD, 1 month U.S. LIBOR + 0.250% 1.4767% 5/15/37 (d)(e) | | 1,048,880 | 1,047,182 |
| planned amortization class: | | | |
| Series 2006-15 Class OP 3/25/36 (o) | | 737,545 | 656,298 |
| Series 2095 Class PE, 6% 11/15/28 | | 381,346 | 423,063 |
| Series 2101 Class PD, 6% 11/15/28 | | 37,067 | 39,818 |
| Series 2121 Class MG, 6% 2/15/29 | | 159,207 | 176,620 |
| Series 2131 Class BG, 6% 3/15/29 | | 1,085,826 | 1,206,653 |
| Series 2137 Class PG, 6% 3/15/29 | | 175,578 | 193,359 |
| Series 2154 Class PT, 6% 5/15/29 | | 277,544 | 308,743 |
| Series 2162 Class PH, 6% 6/15/29 | | 64,290 | 70,328 |
| Series 2520 Class BE, 6% 11/15/32 | | 347,594 | 375,331 |
| Series 2585 Class KS, 7.600% - 1 month U.S. LIBOR 6.3733% 3/15/23 (d)(m)(n) | | 19,249 | 1,693 |
| Series 2693 Class MD, 5.5% 10/15/33 | | 4,042,145 | 4,505,670 |
| Series 2802 Class OB, 6% 5/15/34 | | 636,967 | 698,779 |
| Series 2937 Class KC, 4.5% 2/15/20 | | 412,807 | 419,168 |
| Series 2962 Class BE, 4.5% 4/15/20 | | 541,200 | 554,821 |
| Series 3002 Class NE, 5% 7/15/35 | | 986,887 | 1,075,389 |
| Series 3110 Class OP 9/15/35 (o) | | 465,968 | 432,918 |
| Series 3119 Class PO 2/15/36 (o) | | 850,626 | 754,830 |
| Series 3121 Class KO 3/15/36 (o) | | 149,032 | 133,228 |
| Series 3123 Class LO 3/15/36 (o) | | 471,923 | 419,914 |
| Series 3145 Class GO 4/15/36 (o) | | 452,827 | 403,015 |
| Series 3189 Class PD, 6% 7/15/36 | | 938,936 | 1,075,745 |
| Series 3225 Class EO 10/15/36 (o) | | 266,976 | 237,720 |
| Series 3258 Class PM, 5.5% 12/15/36 | | 456,208 | 503,999 |
| Series 3415 Class PC, 5% 12/15/37 | | 351,849 | 383,738 |
| Series 3786 Class HI, 4% 3/15/38 (m) | | 1,177,757 | 93,462 |
| Series 3806 Class UP, 4.5% 2/15/41 | | 2,583,776 | 2,759,574 |
| Series 3832 Class PE, 5% 3/15/41 | | 2,375,210 | 2,660,879 |
| sequential payer: | | | |
| Series 2135 Class JE, 6% 3/15/29 | | 79,691 | 88,638 |
| Series 2274 Class ZM, 6.5% 1/15/31 | | 88,769 | 101,328 |
| Series 2281 Class ZB, 6% 3/15/30 | | 215,515 | 230,881 |
| Series 2303 Class ZV, 6% 4/15/31 | | 90,106 | 100,414 |
| Series 2357 Class ZB, 6.5% 9/15/31 | | 656,673 | 759,604 |
| Series 2502 Class ZC, 6% 9/15/32 | | 181,595 | 197,150 |
| Series 2519 Class ZD, 5.5% 11/15/32 | | 310,262 | 332,818 |
| Series 2546 Class MJ, 5.5% 3/15/23 | | 135,979 | 143,091 |
| Series 2601 Class TB, 5.5% 4/15/23 | | 64,915 | 69,389 |
| Series 2998 Class LY, 5.5% 7/15/25 | | 198,186 | 213,647 |
| Series 3871 Class KB, 5.5% 6/15/41 | | 4,329,000 | 5,037,143 |
| Series 06-3115 Class SM, 6.600% - 1 month U.S. LIBOR 5.3733% 2/15/36 (d)(m)(n) | | 308,589 | 62,733 |
| Series 2013-4281 Class AI, 4% 12/15/28 (m) | | 3,980,572 | 347,727 |
| Series 2017-4683 Class LM, 3% 5/15/47 | | 9,849,332 | 10,116,538 |
| Series 2844: | | | |
| Class SC, 46.800% - 1 month U.S. LIBOR 38.8266% 8/15/24 (d)(n) | | 7,749 | 11,255 |
| Class SD, 86.400% - 1 month U.S. LIBOR 70.5033% 8/15/24 (d)(n) | | 11,400 | 21,714 |
| Series 2933 Class ZM, 5.75% 2/15/35 | | 3,119,530 | 3,630,792 |
| Series 2935 Class ZK, 5.5% 2/15/35 | | 3,835,105 | 4,328,543 |
| Series 2947 Class XZ, 6% 3/15/35 | | 1,200,995 | 1,337,061 |
| Series 2996 Class ZD, 5.5% 6/15/35 | | 2,510,286 | 2,881,644 |
| Series 3055 Class CS, 1 month U.S. LIBOR + 6.590% 5.3633% 10/15/35 (d)(e)(m) | | 450,202 | 88,870 |
| Series 3237 Class C, 5.5% 11/15/36 | | 3,548,164 | 4,035,764 |
| Series 3244 Class SG, 6.660% - 1 month U.S. LIBOR 5.4333% 11/15/36 (d)(m)(n) | | 1,065,796 | 209,369 |
| Series 3284 Class CI, 1 month U.S. LIBOR + 6.120% 4.8933% 3/15/37 (d)(e)(m) | | 2,441,881 | 466,456 |
| Series 3287 Class SD, 6.750% - 1 month U.S. LIBOR 5.5233% 3/15/37 (d)(m)(n) | | 1,565,787 | 324,212 |
| Series 3297 Class BI, 6.760% - 1 month U.S. LIBOR 5.5333% 4/15/37 (d)(m)(n) | | 2,361,605 | 503,276 |
| Series 3336 Class LI, 1 month U.S. LIBOR + 6.580% 5.3533% 6/15/37 (d)(e)(m) | | 749,148 | 132,583 |
| Series 3772 Class BI, 4.5% 10/15/18 (m) | | 184,934 | 2,891 |
| Series 3949 Class MK, 4.5% 10/15/34 | | 708,005 | 759,469 |
| Series 3955: | | | |
| Class GS, 5.950% - 1 month U.S. LIBOR 4.7233% 9/15/41 (d)(m)(n) | | 3,806,681 | 594,828 |
| Class YI, 3% 11/15/21 (m) | | 1,884,108 | 82,336 |
| Series 4055 Class BI, 3.5% 5/15/31 (m) | | 3,503,241 | 342,177 |
| Series 4149 Class IO, 3% 1/15/33 (m) | | 2,381,717 | 299,687 |
| Series 4314 Class AI, 5% 3/15/34 (m) | | 1,272,832 | 139,203 |
| Series 4427 Class LI, 3.5% 2/15/34 (m) | | 6,450,457 | 753,052 |
| Series 4471 Class PA 4% 12/15/40 | | 8,819,644 | 9,240,298 |
| target amortization class Series 2156 Class TC, 6.25% 5/15/29 | | 214,237 | 230,391 |
| Freddie Mac Manufactured Housing participation certificates guaranteed: | | | |
| floater Series 1686 Class FA, 1 month U.S. LIBOR + 0.900% 2.1267% 2/15/24 (d)(e) | | 86,126 | 87,039 |
| sequential payer: | | | |
| Series 2043 Class ZH, 6% 4/15/28 | | 144,395 | 160,036 |
| Series 2056 Class Z, 6% 5/15/28 | | 310,539 | 344,205 |
| Freddie Mac Multi-family Structured pass-thru certificates Series 4386 Class AZ, 4.5% 11/15/40 | | 7,885,477 | 8,447,298 |
| Ginnie Mae guaranteed REMIC pass-thru certificates: | | | |
| floater: | | | |
| Series 2007-37 Class TS, 6.690% - 1 month U.S. LIBOR 5.4622% 6/16/37 (d)(m)(n) | | 466,567 | 96,736 |
| Series 2010-H03 Class FA, 1 month U.S. LIBOR + 0.550% 1.7828% 3/20/60 (d)(e)(p) | | 5,853,140 | 5,863,559 |
| Series 2010-H17 Class FA, 1 month U.S. LIBOR + 0.330% 1.5628% 7/20/60 (d)(e)(p) | | 653,445 | 648,920 |
| Series 2010-H18 Class AF, 1 month U.S. LIBOR + 0.300% 1.5239% 9/20/60 (d)(e)(p) | | 809,140 | 802,929 |
| Series 2010-H19 Class FG, 1 month U.S. LIBOR + 0.300% 1.5239% 8/20/60 (d)(e)(p) | | 900,696 | 895,271 |
| Series 2010-H27 Series FA, 1 month U.S. LIBOR + 0.380% 1.6039% 12/20/60 (d)(e)(p) | | 1,615,213 | 1,606,540 |
| Series 2011-H05 Class FA, 1 month U.S. LIBOR + 0.500% 1.7239% 12/20/60 (d)(e)(p) | | 2,525,306 | 2,526,128 |
| Series 2011-H07 Class FA, 1 month U.S. LIBOR + 0.500% 1.7239% 2/20/61 (d)(e)(p) | | 5,057,664 | 5,058,981 |
| Series 2011-H12 Class FA, 1 month U.S. LIBOR + 0.490% 1.7139% 2/20/61 (d)(e)(p) | | 6,586,196 | 6,586,255 |
| Series 2011-H13 Class FA, 1 month U.S. LIBOR + 0.500% 1.7239% 4/20/61 (d)(e)(p) | | 2,321,142 | 2,321,910 |
| Series 2011-H14: | | | |
| Class FB, 1 month U.S. LIBOR + 0.500% 1.7239% 5/20/61 (d)(e)(p) | | 2,680,710 | 2,677,356 |
| Class FC, 1 month U.S. LIBOR + 0.500% 1.7239% 5/20/61 (d)(e)(p) | | 2,455,364 | 2,453,975 |
| Series 2011-H17 Class FA, 1 month U.S. LIBOR + 0.530% 1.7539% 6/20/61 (d)(e)(p) | | 3,170,874 | 3,174,515 |
| Series 2011-H21 Class FA, 1 month U.S. LIBOR + 0.600% 1.8239% 10/20/61 (d)(e)(p) | | 6,270,977 | 6,291,458 |
| Series 2012-H01 Class FA, 1 month U.S. LIBOR + 0.700% 1.9239% 11/20/61 (d)(e)(p) | | 3,080,731 | 3,097,863 |
| Series 2012-H03 Class FA, 1 month U.S. LIBOR + 0.700% 1.9239% 1/20/62 (d)(e)(p) | | 1,999,012 | 2,010,158 |
| Series 2012-H06 Class FA, 1 month U.S. LIBOR + 0.630% 1.8539% 1/20/62 (d)(e)(p) | | 2,925,148 | 2,934,977 |
| Series 2012-H07 Class FA, 1 month U.S. LIBOR + 0.630% 1.8539% 3/20/62 (d)(e)(p) | | 1,881,977 | 1,889,364 |
| Series 2012-H21 Class DF, 1 month U.S. LIBOR + 0.650% 1.8739% 5/20/61 (d)(e)(p) | | 3,855,293 | 3,863,819 |
| Series 2012-H23 Class WA, 1 month U.S. LIBOR + 0.520% 1.7439% 10/20/62 (d)(e)(p) | | 1,552,994 | 1,554,574 |
| Series 2012-H26, Class CA, 1 month U.S. LIBOR + 0.530% 1.7539% 7/20/60 (d)(e)(p) | | 5,355,350 | 5,367,590 |
| Series 2013-H07 Class BA, 1 month U.S. LIBOR + 0.360% 1.5839% 3/20/63 (d)(e)(p) | | 2,483,002 | 2,467,748 |
| Series 2014-H03 Class FA, 1 month U.S. LIBOR + 0.600% 1.8239% 1/20/64 (d)(e)(p) | | 2,941,361 | 2,951,451 |
| Series 2014-H05 Class FB, 1 month U.S. LIBOR + 0.600% 1.8239% 12/20/63 (d)(e)(p) | | 7,666,918 | 7,683,603 |
| Series 2014-H11 Class BA, 1 month U.S. LIBOR + 0.500% 1.7239% 6/20/64 (d)(e)(p) | | 11,578,850 | 11,564,620 |
| Series 2014-H20 Class BF, 1 month U.S. LIBOR + 0.500% 1.7239% 9/20/64 (d)(e)(p) | | 36,499,774 | 36,453,558 |
| Series 2016-H20 Class FM, 1 month U.S. LIBOR + 0.400% 1.6239% 12/20/62 (d)(e)(p) | | 14,131,679 | 14,142,854 |
| planned amortization class: | | | |
| Series 1993-13 Class PD, 6% 5/20/29 | | 388,444 | 438,486 |
| Series 1997-8 Class PE, 7.5% 5/16/27 | | 169,675 | 197,371 |
| Series 2011-136 Class WI, 4.5% 5/20/40 (m) | | 867,348 | 99,787 |
| sequential payer: | | | |
| Series 2004-24 Class ZM, 5% 4/20/34 | | 1,509,309 | 1,653,124 |
| Series 2010-160 Class DY, 4% 12/20/40 | | 17,965,153 | 19,249,580 |
| Series 2010-170 Class B, 4% 12/20/40 | | 4,066,798 | 4,357,629 |
| Series 2004-32 Class GS, 6.500% - 1 month U.S. LIBOR 5.2722% 5/16/34 (d)(m)(n) | | 255,528 | 46,980 |
| Series 2004-73 Class AL, 7.200% - 1 month U.S. LIBOR 5.9722% 8/17/34 (d)(m)(n) | | 310,712 | 70,801 |
| Series 2007-35 Class SC, 40.200% - 1 month U.S. LIBOR 32.8333% 6/16/37 (d)(n) | | 19,040 | 35,277 |
| Series 2010-116 Class QB, 4% 9/16/40 | | 38,726,775 | 41,432,619 |
| Series 2010-H10 Class FA, 1 month U.S. LIBOR + 0.330% 1.5628% 5/20/60 (d)(e)(p) | | 2,045,887 | 2,031,852 |
| Series 2011-94 Class SA, 6.100% - 1 month U.S. LIBOR 4.8694% 7/20/41 (d)(m)(n) | | 1,577,536 | 260,603 |
| Series 2012-76 Class GS, 6.700% - 1 month U.S. LIBOR 5.4722% 6/16/42 (d)(m)(n) | | 940,560 | 180,581 |
| Series 2013-124: | | | |
| Class ES, 8.667% - 1 month U.S. LIBOR 7.0259% 4/20/39 (d)(n) | | 3,011,341 | 3,170,317 |
| Class ST, 8.800% - 1 month U.S. LIBOR 7.1593% 8/20/39 (d)(n) | | 6,982,004 | 7,497,219 |
| Series 2013-149 Class MA, 2.5% 5/20/40 | | 21,568,846 | 21,742,648 |
| Series 2015-H13 Class HA, 2.5% 8/20/64 (p) | | 26,328,119 | 26,531,204 |
| Series 2015-H17 Class HA, 2.5% 5/20/65 (p) | | 23,457,916 | 23,642,127 |
| Series 2015-H21: | | | |
| Class HA, 2.5% 6/20/63 (p) | | 4,953,922 | 4,987,817 |
| Class JA, 2.5% 6/20/65 (p) | | 22,724,360 | 22,893,786 |
| Series 2017-H06 Class FA, U.S. TREASURY 1 YEAR INDEX + 0.350% 1.57% 8/20/66 (d)(e)(p) | | 25,879,767 | 25,939,756 |
|
| TOTAL U.S. GOVERNMENT AGENCY | | | 482,258,569 |
|
| TOTAL COLLATERALIZED MORTGAGE OBLIGATIONS | | | |
| (Cost $688,726,417) | | | 690,995,172 |
|
| Commercial Mortgage Securities - 1.7% | | | |
| Americold LLC Trust Series 2010-ARTA Class D, 7.443% 1/14/29 (b) | | 180,000 | 202,103 |
| Asset Securitization Corp.: | | | |
| Series 1997-D4 Class B5, 7.525% 4/14/29 | | 129,000 | 128,823 |
| Series 1997-D5 Class PS1, 1.6895% 2/14/43 (d)(m) | | 62,066 | 536 |
| Aventura Mall Trust Series 2013-AVM Class E, 3.7427% 12/5/32 (b)(d) | | 692,000 | 708,615 |
| BAMLL Trust Series 2015-200P Class F, 3.7157% 4/14/33 (b)(d) | | 767,000 | 751,835 |
| Banc of America Commercial Mortgage Trust: | | | |
| sequential payer Series 2007-5 Class A1A, 5.361% 2/10/51 | | 8,682,773 | 8,676,876 |
| Series 2004-1 Class F, 5.279% 11/10/39 (b)(d) | | 2,006 | 2,004 |
| Series 2008-1 Class D, 6.3087% 2/10/51 (b)(d)(g) | | 125,000 | 37,419 |
| BANK: | | | |
| Series 2017-BNK4 Class D, 3.357% 5/15/50 (b) | | 1,323,000 | 1,098,850 |
| Series 2017-BNK6 Class D, 3.1% 7/15/60 (b) | | 765,000 | 627,227 |
| Bank of America Commercial Mortgage Securities Trust Series 2017-BNK3: | | | |
| Class C, 4.352% 2/15/50 (d) | | 957,000 | 995,932 |
| Class D, 3.25% 2/15/50 (b) | | 667,000 | 548,708 |
| Bank of America Commercial Mortgage Trust Series 2016-UB10 Class XA, 2.0018% 7/15/49 (d)(m) | | 46,077,521 | 5,273,135 |
| Barclays Commercial Mortgage Securities LLC Series 2015-STP: | | | |
| Class A, 3.3228% 9/10/28 (b) | | 4,373,964 | 4,511,414 |
| Class E, 4.2844% 9/10/28 (b)(d) | | 1,786,000 | 1,755,128 |
| Bayview Commercial Asset Trust: | | | |
| floater: | | | |
| Series 2003-2 Class M1, 1 month U.S. LIBOR + 0.850% 2.5094% 12/25/33 (b)(d)(e) | | 21,150 | 20,036 |
| Series 2005-4A: | | | |
| Class A2, 1 month U.S. LIBOR + 0.390% 1.6244% 1/25/36 (b)(d)(e) | | 577,392 | 534,896 |
| Class B1, 1 month U.S. LIBOR + 1.400% 2.6344% 1/25/36 (b)(d)(e) | | 25,907 | 21,226 |
| Class M1, 1 month U.S. LIBOR + 0.450% 1.6844% 1/25/36 (b)(d)(e) | | 186,256 | 172,805 |
| Class M2, 1 month U.S. LIBOR + 0.470% 1.7044% 1/25/36 (b)(d)(e) | | 55,877 | 49,640 |
| Class M3, 1 month U.S. LIBOR + 0.500% 1.7344% 1/25/36 (b)(d)(e) | | 81,604 | 67,309 |
| Class M4, 1 month U.S. LIBOR + 0.610% 1.8444% 1/25/36 (b)(d)(e) | | 45,131 | 41,023 |
| Class M5, 1 month U.S. LIBOR + 0.650% 1.8844% 1/25/36 (b)(d)(e) | | 45,131 | 34,432 |
| Class M6, 1 month U.S. LIBOR + 0.700% 1.9344% 1/25/36 (b)(d)(e) | | 47,934 | 36,814 |
| Series 2006-3A Class M4, 1 month U.S. LIBOR + 0.430% 1.6644% 10/25/36 (b)(d)(e) | | 25,269 | 19,735 |
| Series 2007-1 Class A2, 1 month U.S. LIBOR + 0.270% 1.5044% 3/25/37 (b)(d)(e) | | 373,250 | 330,571 |
| Series 2007-2A: | | | |
| Class A1, 1 month U.S. LIBOR + 0.270% 1.4861% 7/25/37 (b)(d)(e) | | 385,447 | 363,449 |
| Class A2, 1 month U.S. LIBOR + 0.320% 1.5361% 7/25/37 (b)(d)(e) | | 360,148 | 331,308 |
| Class M1, 1 month U.S. LIBOR + 0.370% 1.5861% 7/25/37 (b)(d)(e) | | 126,464 | 100,907 |
| Class M2, 1 month U.S. LIBOR + 0.410% 1.6261% 7/25/37 (b)(d)(e) | | 69,105 | 55,257 |
| Class M3, 1 month U.S. LIBOR + 0.490% 1.7061% 7/25/37 (b)(d)(e) | | 54,471 | 45,321 |
| Series 2007-3: | | | |
| Class A2, 1 month U.S. LIBOR + 0.290% 1.5061% 7/25/37 (b)(d)(e) | | 348,605 | 324,896 |
| Class M1, 1 month U.S. LIBOR + 0.310% 1.5261% 7/25/37 (b)(d)(e) | | 75,714 | 67,905 |
| Class M2, 1 month U.S. LIBOR + 0.340% 1.5561% 7/25/37 (b)(d)(e) | | 81,151 | 72,320 |
| Class M3, 1 month U.S. LIBOR + 0.370% 1.5861% 7/25/37 (b)(d)(e) | | 127,875 | 97,665 |
| Class M4, 1 month U.S. LIBOR + 0.500% 1.7161% 7/25/37 (b)(d)(e) | | 200,782 | 137,554 |
| Class M5, 1 month U.S. LIBOR + 0.600% 1.8161% 7/25/37 (b)(d)(e) | | 75,516 | 40,975 |
| Series 2007-4A Class M1, 1 month U.S. LIBOR + 0.950% 2.1844% 9/25/37 (b)(d)(e) | | 9,384 | 3,491 |
| Series 2006-3A, Class IO, 0% 10/25/36 (b)(d)(g)(m) | | 3,866,213 | 0 |
| BBCMS Mortgage Trust Series 2016-ETC: | | | |
| Class D, 3.6089% 8/14/36 (b)(d) | | 1,000,000 | 980,167 |
| Class E, 3.6089% 8/14/36 (b)(d) | | 1,000,000 | 906,385 |
| Bear Stearns Commercial Mortgage Securities Trust Series 2006-T22 Class B, 5.7134% 4/12/38 (b)(d) | | 99,897 | 100,772 |
| Beckman Coulter, Inc. sequential payer Series 2000-A Class A, 7.4975% 12/15/18 (b) | | 584,551 | 604,637 |
| BWAY Mortgage Trust Series 2015-1740 Class E, 3.8241% 1/10/35 (b)(d) | | 1,000,000 | 999,281 |
| CCRESG Commercial Mortgage Trust Series 2016-HEAT Class E, 5.4883% 4/10/29 (b)(d) | | 606,000 | 596,296 |
| CD Mortgage Trust Series 2017-CD3: | | | |
| Class C, 4.563% 2/10/50 | | 1,360,000 | 1,459,082 |
| Class D, 3.25% 2/10/50 (b) | | 754,000 | 625,605 |
| CFCRE Commercial Mortgage Trust Series 2011-C2 Class B, 5.7535% 12/15/47 (b)(d) | | 750,000 | 841,387 |
| CG-CCRE Commercial Mortgage Trust: | | | |
| Series 2014-FL1: | | | |
| Class YTC2, 1 month U.S. LIBOR + 2.489% 3.7146% 6/15/31 (b)(d)(e) | | 435,090 | 404,437 |
| Class YTC3, 1 month U.S. LIBOR + 2.489% 3.7146% 6/15/31 (b)(d)(e) | | 156,667 | 143,886 |
| Series 2014-FL1, 1 month U.S. LIBOR + 2.489% 3.7146% 6/15/31 (b)(d)(e) | | 435,090 | 408,123 |
| CGBAM Commercial Mortgage Trust Series 2015-SMRT: | | | |
| Class E, 3.7859% 4/10/28 (b)(d) | | 162,000 | 163,303 |
| Class F, 3.7859% 4/10/28 (b)(d) | | 1,133,000 | 1,120,819 |
| CGDB Commercial Mortgage Trust: | | | |
| 1 month U.S. LIBOR + 2.500% 3.726% 5/15/30 (b)(d)(e) | | 260,000 | 259,561 |
| Series 2017-BIO Class F, 1 month U.S. LIBOR + 3.250% 4.476% 5/15/30 (b)(d)(e) | | 134,000 | 133,761 |
| Chase Commercial Mortgage Securities Corp.: | | | |
| Series 1998-1 Class H, 6.34% 5/18/30 (b) | | 679,444 | 685,393 |
| Series 1998-2 Class J, 6.39% 11/18/30 (b) | | 487,111 | 487,545 |
| Citigroup Commercial Mortgage Trust: | | | |
| Series 2013-375P Class E, 3.5176% 5/10/35 (b)(d) | | 1,205,000 | 1,187,293 |
| Series 2013-GC15 Class D, 5.0996% 9/10/46 (b)(d) | | 1,927,000 | 1,878,281 |
| Series 2015-GC33 Class XA, 0.968% 9/10/58 (d)(m) | | 92,482,159 | 5,470,421 |
| Series 2015-SHP2 Class E, 1 month U.S. LIBOR + 4.100% 5.577% 7/15/27 (b)(d)(e) | | 693,000 | 697,278 |
| Series 2016-C3 Class D, 3% 11/15/49 (b) | | 1,451,000 | 1,081,795 |
| Series 2016-P6 Class XA, 0.8365% 12/10/49 (d)(m) | | 83,372,568 | 4,125,858 |
| Series 2016-SMPL Class E, 4.509% 9/10/31 (b) | | 756,000 | 771,735 |
| Claregold Trust Series 2007-2A: | | | |
| Class G, 5.01% 5/15/44 (b)(d) | CAD | 9,530 | 7,601 |
| Class H, 5.01% 5/15/44 (b)(d) | CAD | 20,000 | 15,921 |
| Class J, 5.01% 5/15/44 (b)(d) | CAD | 20,000 | 15,862 |
| Class K, 5.01% 5/15/44 (b)(d) | CAD | 10,000 | 7,917 |
| Class L, 5.01% 5/15/44 (b)(d) | CAD | 36,000 | 28,397 |
| Class M, 5.01% 5/15/44 (b)(d) | CAD | 165,000 | 129,454 |
| COMM Mortgage Trust: | | | |
| floater Series 2014-PAT Class E, 1 month U.S. LIBOR + 3.150% 4.1391% 8/13/27 (b)(d)(e) | | 735,000 | 738,181 |
| sequential payer Series 2013-LC6 Class E, 3.5% 1/10/46 (b) | | 1,410,000 | 1,054,483 |
| Series 2012-CR1: | | | |
| Class C, 5.3199% 5/15/45 (d) | | 850,000 | 904,668 |
| Class D, 5.3199% 5/15/45 (b)(d) | | 1,510,000 | 1,491,372 |
| Class G, 2.462% 5/15/45 (b) | | 231,000 | 138,224 |
| Series 2012-CR5 Class D, 4.3306% 12/10/45 (b)(d) | | 740,000 | 720,537 |
| Series 2012-LC4: | | | |
| Class C, 5.5892% 12/10/44 (d) | | 260,000 | 280,729 |
| Class D, 5.5892% 12/10/44 (b)(d) | | 1,437,000 | 1,409,229 |
| Series 2013-CCRE6 Class E, 4.1285% 3/10/46 (b)(d) | | 42,000 | 31,828 |
| Series 2013-CR10: | | | |
| Class C, 4.7885% 8/10/46 (b)(d) | | 270,000 | 279,407 |
| Class D, 4.7885% 8/10/46 (b)(d) | | 1,578,000 | 1,387,463 |
| Series 2013-CR12 Class D, 5.0822% 10/10/46 (b)(d) | | 1,680,000 | 1,430,905 |
| Series 2013-CR6 Class F, 4.1285% 3/10/46 (b)(d) | | 418,000 | 276,007 |
| Series 2013-CR9: | | | |
| Class C, 4.2549% 7/10/45 (b)(d) | | 525,000 | 527,898 |
| Class D, 4.2549% 7/10/45 (b)(d) | | 252,000 | 216,919 |
| Series 2013-LC6 Class D, 4.2828% 1/10/46 (b)(d) | | 1,405,000 | 1,297,886 |
| Series 2014-CR15 Class D, 4.7595% 2/10/47 (b)(d) | | 258,000 | 236,449 |
| Series 2014-CR17: | | | |
| Class D, 4.7987% 5/10/47 (b)(d) | | 799,000 | 706,553 |
| Class E, 4.7987% 5/10/47 (b)(d) | | 182,000 | 126,858 |
| Series 2014-CR19 Class XA, 1.2398% 8/10/47 (d)(m) | | 123,050,039 | 6,671,355 |
| Series 2014-CR20 Class XA, 1.1713% 11/10/47 (d)(m) | | 126,269,383 | 7,349,800 |
| Series 2014-LC17 Class XA, 1.143% 10/10/47 (d)(m) | | 109,134,194 | 4,253,778 |
| Series 2014-UBS2 Class D, 5.0147% 3/10/47 (b)(d) | | 844,000 | 730,529 |
| Series 2014-UBS4 Class XA, 1.2342% 8/10/47 (d)(m) | | 113,422,253 | 6,417,987 |
| Series 2014-UBS6 Class XA, 1.0295% 12/10/47 (d)(m) | | 153,099,636 | 7,598,243 |
| Series 2015-3BP Class F, 3.2384% 2/10/35 (b)(d) | | 1,500,000 | 1,378,092 |
| Series 2015-CR23 Class CME, 3.6845% 5/10/48 (b)(d) | | 483,000 | 481,868 |
| Series 2015-DC1 Class XA, 1.1664% 2/10/48 (d)(m) | | 156,271,592 | 8,949,346 |
| Series 2016-CD1 Class D, 2.7717% 8/10/49 (b)(d) | | 1,006,000 | 771,057 |
| Series 2017-CD4 Class D, 3.3% 5/10/50 (b) | | 772,000 | 637,126 |
| COMM Mortgage Trust pass-thru certificates Series 2005-LP5 Class F, 4.6147% 5/10/43 (b)(d) | | 1,290,000 | 1,291,474 |
| Commercial Mortgage Asset Trust Series 1999-C2 Class H, 6% 11/17/32 (b) | | 704,911 | 713,450 |
| Commercial Mortgage Trust Series 2016-CD2: | | | |
| Class C, 3.031% 11/10/49 | | 971,000 | 998,841 |
| Class D, 2.7812% 11/10/49 (d) | | 508,000 | 401,290 |
| Commercial Mortgage Trust pass-thru certificates: | | | |
| Series 2012-CR2: | | | |
| Class E, 4.8405% 8/15/45 (b)(d) | | 1,727,000 | 1,693,884 |
| Class F, 4.25% 8/15/45 (b) | | 1,418,000 | 1,156,983 |
| Series 2014-CR2 Class G, 4.25% 8/15/45 (b) | | 496,000 | 311,810 |
| Core Industrial Trust: | | | |
| Series 2015-CALW Class G, 3.8504% 2/10/34 (b)(d) | | 625,000 | 615,707 |
| Series 2015-TEXW Class F, 3.8487% 2/10/34 (b)(d) | | 493,000 | 479,451 |
| Series 2015-WEST Class F, 4.2268% 2/10/37 (b)(d) | | 1,566,000 | 1,500,407 |
| Cosmopolitan Hotel Trust floater Series 2016-CSMO Class C, 1 month U.S. LIBOR + 2.750% 3.877% 11/15/33 (b)(d)(e) | | 693,000 | 699,637 |
| Credit Suisse First Boston Mortgage Securities Corp.: | | | |
| Series 1998-C1: | | | |
| Class F, 6% 5/17/40 (b) | | 426,275 | 430,220 |
| Class H, 6% 5/17/40 (b) | | 90,315 | 71,561 |
| Series 1998-C2 Class G, 6.75% 11/15/30 (b) | | 129,511 | 130,694 |
| CSAIL Commercial Mortgage Trust Series 2017-C8 Class D, 4.47% 6/15/50 (b) | | 862,000 | 789,844 |
| CSMC Series 2015-TOWN: | | | |
| Class A, 1 month U.S. LIBOR + 1.250% 2.4756% 3/15/28 (b)(d)(e) | | 9,866,000 | 9,858,420 |
| Class B, 1 month U.S. LIBOR + 1.900% 3.1256% 3/15/28 (b)(d)(e) | | 3,043,000 | 3,042,738 |
| Class C, 1 month U.S. LIBOR + 2.250% 3.4756% 3/15/28 (b)(d)(e) | | 2,964,000 | 2,964,738 |
| Class D, 1 month U.S. LIBOR + 3.200% 4.4256% 3/15/28 (b)(d)(e) | | 4,485,000 | 4,484,999 |
| Class E, 1 month U.S. LIBOR + 4.150% 5.3756% 3/15/28 (b)(d)(e) | | 20,318,000 | 20,343,444 |
| CSMC Trust: | | | |
| floater Series 2015-DEAL: | | | |
| Class E, 1 month U.S. LIBOR + 4.000% 5.227% 4/15/29 (b)(d)(e) | | 1,109,000 | 1,113,861 |
| Class F, 1 month U.S. LIBOR + 4.750% 5.977% 4/15/29 (b)(d)(e) | | 989,000 | 992,096 |
| Series 2016-MFF Class F, 1 month U.S. LIBOR + 7.250% 8.4756% 11/15/33 (b)(d)(e) | | 968,000 | 976,568 |
| Series 2017-MOON Class E, 3.303% 7/10/34 (b)(d) | | 377,000 | 378,707 |
| DBCCRE Mortgage Trust Series 2014-ARCP Class E, 4.9345% 1/10/34 (b)(d) | | 1,449,000 | 1,333,470 |
| DBUBS Mortgage Trust: | | | |
| Series 2011-LC1A: | | | |
| Class E, 5.6848% 11/10/46 (b)(d) | | 1,810,000 | 1,919,685 |
| Class F, 5.6848% 11/10/46 (b)(d) | | 1,560,000 | 1,524,565 |
| Class G, 4.652% 11/10/46 (b) | | 1,948,000 | 1,731,550 |
| Class XB, 0.3005% 11/10/46 (b)(d)(m) | | 20,920,000 | 202,273 |
| Series 2011-LC3A Class D, 5.3457% 8/10/44 (b)(d) | | 812,000 | 845,619 |
| Deutsche Bank Commercial Mortgage Trust Series 2016-C3 Class C, 3.4943% 9/10/49 (d) | | 600,000 | 586,192 |
| Freddie Mac: | | | |
| pass-thru certificates: | | | |
| Series K011 Class X3, 2.5769% 12/25/43 (d)(m) | | 1,640,000 | 129,187 |
| Series K012 Class X3, 2.2519% 1/25/41 (d)(m) | | 1,770,272 | 124,474 |
| Series K013 Class X3, 2.9089% 1/25/43 (d)(m) | | 820,000 | 73,786 |
| Series KAIV Class X2, 3.6147% 6/25/46 (d)(m) | | 420,000 | 50,778 |
| FREMF Mortgage Trust: | | | |
| Series 2010-K9 Class B, 5.2029% 9/25/45 (b)(d) | | 1,815,000 | 1,960,864 |
| Series 2011-K10 Class B, 4.625% 11/25/49 (b)(d) | | 500,000 | 533,126 |
| Series 2011-K11 Class B, 4.4236% 12/25/48 (b)(d) | | 750,000 | 794,877 |
| GAHR Commercial Mortgage Trust Series 2015-NRF: | | | |
| Class BFX, 3.3822% 12/15/34 (b)(d) | | 18,910,000 | 19,358,487 |
| Class CFX, 3.3822% 12/15/34 (b)(d) | | 14,152,000 | 14,440,222 |
| Class DFX, 3.3822% 12/15/34 (b)(d) | | 27,804,000 | 28,185,076 |
| Class EFX, 3.3822% 12/15/34 (b)(d) | | 1,750,000 | 1,761,657 |
| Class FFX, 3.3822% 12/15/34 (b)(d) | | 1,915,000 | 1,911,888 |
| Class GFX, 3.3822% 12/15/34 (b)(d) | | 1,096,000 | 1,084,760 |
| GE Capital Commercial Mortgage Corp. Series 2007-C1 Class A1A, 5.483% 12/10/49 | | 1,643,960 | 1,642,157 |
| GMAC Commercial Mortgage Securities, Inc.: | | | |
| Series 1997-C1 Class H, 6.6% 7/15/29 | | 183,677 | 177,156 |
| Series 1997-C2 Class G, 6.75% 4/15/29 (d) | | 59,855 | 60,238 |
| Series 1999-C2I Class K, 6.481% 9/15/33 | | 835,000 | 766,641 |
| GP Portfolio Trust Series 2014-GPP: | | | |
| Class D, 1 month U.S. LIBOR + 3.000% 4.1589% 2/15/27 (b)(d)(e) | | 291,000 | 291,777 |
| Class E, 1 month U.S. LIBOR + 4.100% 5.2589% 2/15/27 (b)(d)(e) | | 378,000 | 369,584 |
| Grace Mortgage Trust Series 2014-GRCE Class F, 3.5901% 6/10/28 (b)(d) | | 357,000 | 362,759 |
| GS Mortgage Securities Corp. II Series 2010-C1: | | | |
| Class D, 6.0552% 8/10/43 (b)(d) | | 617,000 | 639,164 |
| Class F, 4% 8/10/43 (b) | | 516,000 | 414,978 |
| Class X, 1.3949% 8/10/43 (b)(d)(m) | | 4,805,470 | 157,093 |
| GS Mortgage Securities Trust: | | | |
| Series 2010-C2: | | | |
| Class D, 5.1832% 12/10/43 (b)(d) | | 720,000 | 741,443 |
| Class XA, 0.1326% 12/10/43 (b)(d)(m) | | 3,208,430 | 13,199 |
| Series 2011-GC3 Class D, 5.6323% 3/10/44 (b)(d) | | 294,000 | 310,457 |
| Series 2011-GC5: | | | |
| Class C, 5.399% 8/10/44 (b)(d) | | 1,050,000 | 1,137,958 |
| Class D, 5.399% 8/10/44 (b)(d) | | 1,500,000 | 1,447,545 |
| Class E, 5.399% 8/10/44 (b)(d) | | 711,000 | 575,317 |
| Class F, 4.5% 8/10/44 (b) | | 1,020,000 | 718,893 |
| Series 2012-GC6: | | | |
| Class D, 5.6522% 1/10/45 (b)(d) | | 1,156,000 | 1,116,605 |
| Class E, 5% 1/10/45 (b)(d) | | 412,000 | 355,444 |
| Series 2012-GC6I Class F, 5% 1/10/45 (d) | | 390,000 | 258,886 |
| Series 2012-GCJ7: | | | |
| Class C, 5.7016% 5/10/45 (d) | | 630,000 | 671,007 |
| Class D, 5.7016% 5/10/45 (b)(d) | | 2,204,000 | 2,170,380 |
| Class E, 5% 5/10/45 (b) | | 1,311,000 | 1,067,436 |
| Class F, 5% 5/10/45 (b) | | 2,079,000 | 1,246,217 |
| Series 2012-GCJ9: | | | |
| Class D, 4.833% 11/10/45 (b)(d) | | 1,972,000 | 1,889,391 |
| Class E, 4.833% 11/10/45 (b)(d) | | 1,290,000 | 1,159,410 |
| Series 2013-GC10 Class D, 4.4098% 2/10/46 (b)(d) | | 920,000 | 896,157 |
| Series 2013-GC12: | | | |
| Class D, 4.4464% 6/10/46 (b)(d) | | 219,000 | 190,330 |
| Class XA, 1.5475% 6/10/46 (d)(m) | | 30,275,933 | 1,844,386 |
| Series 2013-GC13 Class D, 4.2029% 7/10/46 (b)(d) | | 1,858,000 | 1,740,561 |
| Series 2013-GC16: | | | |
| Class C, 5.3202% 11/10/46 (d) | | 662,844 | 729,013 |
| Class D, 5.3202% 11/10/46 (b)(d) | | 1,009,000 | 970,380 |
| Class F, 3.5% 11/10/46 (b) | | 999,000 | 708,254 |
| Series 2014-GC20 Class XA, 1.0078% 4/10/47 (d)(m) | | 183,738,667 | 9,454,898 |
| Series 2015-GC34 Class XA, 1.3631% 10/10/48 (d)(m) | | 29,269,603 | 2,412,345 |
| Series 2016-GS2 Class C, 4.5297% 5/10/49 (d) | | 699,000 | 751,425 |
| Series 2016-GS3 Class D, 2.728% 10/10/49 (b) | | 1,776,000 | 1,372,711 |
| Series 2016-GS4 Class C, 3.8041% 11/10/49 | | 728,000 | 732,798 |
| Series 2016-REMZ Class MZB, 7.727% 2/10/21 (b) | | 1,113,000 | 1,089,137 |
| Series 2016-RENT: | | | |
| Class E, 4.0667% 2/10/29 (b)(d) | | 495,000 | 504,062 |
| Class F, 4.0667% 2/10/29 (b)(d) | | 1,520,000 | 1,435,350 |
| Series 2017-GS6 Class D, 3.331% 5/10/50 (b) | | 1,113,000 | 908,676 |
| Hilton U.S.A. Trust: | | | |
| floater Series 2014-ORL Class E, 1 month U.S. LIBOR + 3.350% 4.4756% 7/15/29 (b)(d)(e) | | 617,000 | 621,780 |
| Series 2016-HHV Class F, 4.1935% 11/5/38 (b)(d) | | 1,134,000 | 902,003 |
| Series 2016-SFP Class F, 6.0801% 11/5/35 (b) | | 567,000 | 568,379 |
| Home Partners of America Credit Trust Series 2017-1: | | | |
| Class E, 1 month U.S. LIBOR + 2.650% 3.8767% 7/17/34 (b)(d)(e) | | 229,000 | 232,701 |
| Class F, 1 month U.S. LIBOR + 3.539% 4.7657% 7/17/34 (b)(d)(e) | | 332,000 | 335,425 |
| IMT Trust Series 2017-APTS: | | | |
| Class EFL, 1 month U.S. LIBOR + 2.150% 3.15% 6/15/34 (b)(d)(e) | | 336,000 | 336,868 |
| Class FFL, 1 month U.S. LIBOR + 2.850% 3.85% 6/15/34 (b)(d)(e) | | 108,000 | 108,274 |
| JPMBB Commercial Mortgage Securities Trust: | | | |
| Series 2014-C19 Class XA, 1.1728% 4/15/47 (d)(m) | | 23,691,215 | 704,700 |
| Series 2014-C22 Class D, 4.5594% 9/15/47 (b)(d) | | 525,000 | 444,466 |
| Series 2014-C23 Class UH5, 4.7094% 9/15/47 (b) | | 179,000 | 161,489 |
| Series 2014-C26 Class D, 3.9251% 1/15/48 (b)(d) | | 707,000 | 604,257 |
| Series 2015-C30 Class XA, 0.6938% 7/15/48 (d)(m) | | 83,775,475 | 2,832,968 |
| Series 2015-C32 Class C, 4.6678% 11/15/48 (d) | | 1,907,000 | 1,921,445 |
| JPMCC Commercial Mortgage Securities Trust Series 2016-JP4 Class D, 3.4619% 12/15/49 (b) | | 1,462,000 | 1,181,866 |
| JPMDB Commercial Mortgage Securities Trust Series 2016-C4: | | | |
| Class C, 3.0971% 12/15/49 | | 946,000 | 896,782 |
| Class D, 3.0962% 12/15/49 (b)(d) | | 1,148,000 | 894,203 |
| JPMorgan Chase Commercial Mortgage Securities Corp.: | | | |
| sequential payer Series 2010-CNTR Class A2, 4.311% 8/5/32 (b) | | 440,000 | 458,507 |
| Series 2003-C1 Class F, 5.4834% 1/12/37 (b)(d) | | 203,055 | 201,980 |
| Series 2009-IWST: | | | |
| Class C, 7.4453% 12/5/27 (b)(d) | | 380,000 | 423,994 |
| Class D, 7.4453% 12/5/27 (b)(d) | | 1,885,000 | 2,076,352 |
| Series 2010-CNTR Class D, 6.1838% 8/5/32 (b)(d) | | 695,000 | 749,464 |
| Series 2012-CBX: | | | |
| Class C, 5.2132% 6/15/45 (d) | | 250,000 | 265,504 |
| Class D, 5.2132% 6/16/45 (b)(d) | | 690,000 | 711,308 |
| Class E, 5.2132% 6/15/45 (b)(d) | | 1,043,000 | 1,059,620 |
| Class F, 4% 6/15/45 (b) | | 988,000 | 799,219 |
| Class G 4% 6/15/45 (b) | | 1,079,000 | 679,874 |
| JPMorgan Chase Commercial Mortgage Securities Trust: | | | |
| Series 2004-CBX Class D, 5.097% 1/12/37 (d) | | 170,000 | 174,979 |
| Series 2004-LN2 Class D, 5.3686% 7/15/41 (d) | | 420,000 | 4,776 |
| Series 2005-LDP2: | | | |
| Class E, 4.981% 7/15/42 (d) | | 462,000 | 465,115 |
| Class F, 5.01% 7/15/42 (d) | | 189,000 | 190,503 |
| Series 2011-C3: | | | |
| Class E, 5.6136% 2/15/46 (b)(d) | | 700,000 | 703,014 |
| Class H, 4.409% 2/15/46 (b)(d) | | 756,000 | 546,108 |
| Class J, 4.409% 2/15/46 (b)(d) | | 106,000 | 65,190 |
| Series 2011-C4: | | | |
| Class E, 5.5344% 7/15/46 (b)(d) | | 1,130,000 | 1,171,090 |
| Class F, 3.873% 7/15/46 (b) | | 105,000 | 88,732 |
| Class H, 3.873% 7/15/46 (b) | | 674,250 | 477,604 |
| Class NR, 3.873% 7/15/46 (b) | | 385,000 | 236,303 |
| Class TAC1, 7.99% 7/15/46 (b) | | 725,430 | 726,889 |
| Class TAC2, 7.99% 7/15/46 (b) | | 671,000 | 667,976 |
| Series 2011-C5: | | | |
| Class B. 5.4073% 8/15/46 (b)(d) | | 1,140,000 | 1,256,021 |
| Class C, 5.4073% 8/15/46 (b)(d) | | 650,648 | 711,153 |
| Series 2013-LC11: | | | |
| Class C, 3.9582% 4/15/46 (d) | | 1,163,000 | 1,172,625 |
| Class D, 4.2599% 4/15/46 (d) | | 1,800,000 | 1,667,514 |
| Class F, 3.25% 4/15/46 (b)(d)(g) | | 1,682,000 | 953,161 |
| Series 2014-DSTY: | | | |
| Class D, 3.8046% 6/10/27 (b)(d) | | 816,000 | 779,049 |
| Class E, 3.8046% 6/10/27 (b)(d) | | 1,169,000 | 1,103,875 |
| Series 2015-UES Class F, 3.621% 9/5/32 (b)(d) | | 1,155,000 | 1,140,910 |
| Series 2016-WP Class TA, 1 month U.S. LIBOR + 1.450% 2.6089% 10/15/33 (b)(d)(e) | | 15,063,000 | 15,124,706 |
| Ladder Capital Commercial Mortgage Securities Trust Series 2014-909 Class E, 3.8979% 5/15/31 (b)(d) | | 1,218,000 | 1,200,817 |
| LB-UBS Commercial Mortgage Trust: | | | |
| Series 2004-C2 Class G, 4.595% 3/15/36 (b)(d) | | 14,775 | 14,744 |
| Series 2007-C7 Class A3, 5.866% 9/15/45 | | 3,554,300 | 3,556,478 |
| Liberty Street Trust Series 2016-225L: | | | |
| Class D, 4.6485% 2/10/36 (b)(d) | | 588,000 | 641,760 |
| Class E, 4.6485% 2/10/36 (b)(d) | | 1,050,000 | 1,070,302 |
| Lone Star Portfolio Trust floater Series 2015-LSP Class A1A2, 1 month U.S. LIBOR + 1.800% 3.0256% 9/15/28 (b)(d)(e) | | 9,947,721 | 9,977,060 |
| LSTAR Commercial Mortgage Trust Series 2014-2: | | | |
| Class D, 4.9066% 1/20/41 (b)(d) | | 256,000 | 258,916 |
| Class E, 4.9066% 1/20/41 (b)(d) | | 400,000 | 373,478 |
| Merrill Lynch Mortgage Investors Trust Series 1997-C2 Class F, 6.25% 12/10/29 (d) | | 78,610 | 78,309 |
| Merrill Lynch Mortgage Trust: | | | |
| Series 2006-C1 Class AJ, 5.5659% 5/12/39 (d) | | 508,018 | 511,170 |
| Series 2008-C1 Class A4, 5.69% 2/12/51 | | 678,968 | 679,137 |
| Morgan Stanley BAML Trust: | | | |
| sequential payer Series 2014-C18 Class 300E, 4.6896% 8/15/31 (b) | | 750,000 | 736,471 |
| Series 2012-C5 Class E, 4.6895% 8/15/45 (b)(d) | | 150,000 | 145,477 |
| Series 2012-C6 Class D, 4.6094% 11/15/45 (b)(d) | | 1,357,000 | 1,369,130 |
| Series 2013-C12 Class D, 4.7643% 10/15/46 (b)(d) | | 1,000,000 | 957,186 |
| Series 2013-C13: | | | |
| Class D, 4.8901% 11/15/46 (b)(d) | | 1,019,000 | 977,703 |
| Class E, 4.8901% 11/15/46 (b)(d) | | 887,000 | 703,343 |
| Series 2013-C7: | | | |
| Class D, 4.2591% 2/15/46 (b)(d) | | 1,111,000 | 1,043,013 |
| Class E, 4.2591% 2/15/46 (b)(d) | | 340,000 | 262,188 |
| Series 2013-C8 Class D, 4.0614% 12/15/48 (b)(d) | | 400,000 | 366,570 |
| Series 2013-C9: | | | |
| Class C, 4.0394% 5/15/46 (d) | | 790,000 | 799,034 |
| Class D, 4.1274% 5/15/46 (b)(d) | | 1,747,000 | 1,627,908 |
| Series 2014-C17 Class XA, 1.2428% 8/15/47 (d)(m) | | 175,770,233 | 8,862,739 |
| Series 2015-C25 Class XA, 1.14% 10/15/48 (d)(m) | | 47,445,537 | 3,255,272 |
| Series 2016-C30: | | | |
| Class C, 4.1325% 9/15/49 (d) | | 417,000 | 423,720 |
| Class D, 3% 9/15/49 (b) | | 452,000 | 343,806 |
| Series 2016-C31: | | | |
| Class C, 4.3205% 11/15/49 (d) | | 946,000 | 962,490 |
| Class D, 3% 11/15/49 (b)(d) | | 703,000 | 513,750 |
| Series 2016-C32: | | | |
| Class C, 4.296% 12/15/49 | | 651,000 | 671,584 |
| Class D, 3.396% 12/15/49 (b) | | 924,000 | 699,560 |
| Series 2017-C33 Class D, 3.25% 5/15/50 (b) | | 879,000 | 713,595 |
| Morgan Stanley Capital I Trust: | | | |
| sequential payer Series 2012-C4 Class E, 5.4207% 3/15/45 (b)(d) | | 1,483,000 | 1,321,500 |
| Series 1997-RR Class F, 7.51% 4/30/39 (b)(d) | | 24,218 | 24,109 |
| Series 1998-CF1 Class G, 7.35% 7/15/32 (b) | | 147,337 | 143,653 |
| Series 1999-WF1: | | | |
| Class N, 5.91% 11/15/31 (b) | | 194,876 | 194,573 |
| Class O, 5.91% 11/15/31 (b) | | 160,561 | 139,810 |
| Series 2011-C1: | | | |
| Class D, 5.4143% 9/15/47 (b)(d) | | 1,760,000 | 1,887,527 |
| Class E, 5.4143% 9/15/47 (b)(d) | | 573,100 | 614,472 |
| Series 2011-C2: | | | |
| Class D, 5.483% 6/15/44 (b)(d) | | 1,272,000 | 1,328,820 |
| Class E, 5.483% 6/15/44 (b)(d) | | 600,000 | 574,046 |
| Class F, 5.483% 6/15/44 (b)(d) | | 550,000 | 469,005 |
| Class XB, 0.5345% 6/15/44 (b)(d)(m) | | 9,001,008 | 163,324 |
| Series 2011-C3: | | | |
| Class C, 5.155% 7/15/49 (b)(d) | | 1,000,000 | 1,076,928 |
| Class D, 5.155% 7/15/49 (b)(d) | | 1,130,000 | 1,172,553 |
| Class E, 5.155% 7/15/49 (b)(d) | | 505,000 | 505,866 |
| Class G, 5.155% 7/15/49 (b)(d) | | 957,000 | 835,872 |
| Series 2012-C4: | | | |
| Class D, 5.4207% 3/15/45 (b)(d) | | 330,000 | 343,969 |
| Class F, 3.07% 3/15/45 (b) | | 623,000 | 449,205 |
| Series 2014-150E: | | | |
| Class C, 4.295% 9/9/32 (b)(d) | | 656,000 | 703,564 |
| Class F, 4.295% 9/9/32 (b)(d) | | 651,000 | 657,251 |
| Series 2014-CPT Class F, 3.4455% 7/13/29 (b)(d) | | 1,436,000 | 1,430,211 |
| Series 2015-MS1: | | | |
| Class C, 4.0299% 5/15/48 (d) | | 734,000 | 734,914 |
| Class D, 4.0299% 5/15/48 (b)(d) | | 1,260,000 | 1,094,608 |
| Series 2015-UBS8 Class D, 3.18% 12/15/48 (b) | | 798,000 | 641,653 |
| Series 2016-BNK2: | | | |
| Class C, 3% 11/15/49 (b) | | 1,350,000 | 1,094,653 |
| Class D, 3.9111% 11/15/49 (d) | | 946,000 | 962,571 |
| Morgan Stanley Dean Witter Capital I Trust Series 2001-TOP3 Class E, 7.5741% 7/15/33 (b)(d) | | 102,509 | 106,457 |
| Motel 6 Trust: | | | |
| Series 2017-M6MZ, 1 month U.S. LIBOR + 6.927% 8.1565% 8/15/19 (b)(d)(e) | | 500,000 | 499,051 |
| Series 2017-MTL6, 1 month U.S. LIBOR + 4.250% 5.48% 8/15/34 (b)(d)(e) | | 2,961,000 | 2,953,694 |
| MSCG Trust Series 2016-SNR: | | | |
| Class A, 3.348% 11/15/34 (b)(d) | | 23,867,000 | 24,111,928 |
| Class B, 4.181% 11/15/34 (b) | | 8,435,000 | 8,584,275 |
| Class C, 5.205% 11/15/34 (b) | | 5,900,000 | 6,088,566 |
| Class D, 6.55% 11/15/34 (b) | | 2,209,000 | 2,221,601 |
| Class E, 6.8087% 11/15/34 (b) | | 615,000 | 584,982 |
| MSJP Commercial Securities Mortgage Trust Series 2015-HAUL Class E, 4.851% 9/5/47 (b)(d) | | 278,000 | 270,160 |
| NationsLink Funding Corp. Series 1999-LTL1 Class D, 6.45% 1/22/26 (b) | | 369,357 | 381,907 |
| Providence Place Group Ltd. Partnership Series 2000-C1 Class A2, 7.75% 7/20/28 (b) | | 972,724 | 1,197,910 |
| Real Estate Asset Liquidity Trust: | | | |
| Series 2006-2: | | | |
| Class J, 4.456% 9/12/38 (b) | CAD | 25,051 | 19,877 |
| Class K, 4.456% 9/12/38 (b) | CAD | 18,000 | 14,190 |
| Class L, 4.456% 9/12/38 (b) | CAD | 26,000 | 20,322 |
| Class M, 4.456% 9/12/38 (b) | CAD | 104,391 | 79,099 |
| Series 2007-1 Class M, 4.57% 4/12/23 | CAD | 109,733 | 86,077 |
| SCG Trust Series 2013-SRP1 Class D, 1 month U.S. LIBOR + 3.344% 4.5704% 11/15/26 (b)(d)(e)�� | | 1,698,000 | 1,624,011 |
| Starwood Retail Property Trust Series 2014-STAR Class D, 1 month U.S. LIBOR + 3.250% 4.4756% 11/15/27 (b)(d)(e) | | 1,683,000 | 1,669,040 |
| TIAA Seasoned Commercial Mortgage Trust: | | | |
| sequential payer Series 2007-C4 Class AJ, 5.4751% 8/15/39 (d) | | 23,315 | 23,530 |
| Series 2007-C4 Class F, 5.4751% 8/15/39 (d) | | 820,000 | 757,999 |
| UBS Commercial Mortgage Trust Series 2012-C1: | | | |
| Class D, 5.5456% 5/10/45 (b)(d) | | 1,197,000 | 1,219,328 |
| Class E, 5% 5/10/45 (b)(d) | | 537,000 | 459,391 |
| Class F, 5% 5/10/45 (b)(d) | | 682,700 | 464,415 |
| UBS-BAMLL Trust: | | | |
| Series 12-WRM Class D, 4.238% 6/10/30 (b)(d) | | 310,000 | 308,915 |
| Series 2012-WRM Class E, 4.238% 6/10/30 (b)(d) | | 970,000 | 939,208 |
| VNO Mortgage Trust Series 2012-6AVE Class D, 3.3372% 11/15/30 (b)(d) | | 1,299,000 | 1,278,912 |
| Vornado DP LLC Series 2010-VNO Class D, 6.3555% 9/13/28 (b) | | 180,000 | 195,950 |
| Wells Fargo Commercial Mortgage Trust: | | | |
| Series 2010-C1 Class XB, 0.5836% 11/15/43 (b)(d)(m) | | 20,614,217 | 358,135 |
| Series 2012-LC5: | | | |
| Class C, 4.693% 10/15/45 (d) | | 569,000 | 597,003 |
| Class D, 4.7706% 10/15/45 (b)(d) | | 1,621,000 | 1,582,855 |
| Class E, 4.7706% 10/15/45 (b)(d) | | 284,000 | 235,310 |
| Series 2013-LC12 Class C, 4.2949% 7/15/46 (d) | | 760,000 | 774,780 |
| Series 2015-C31 Class XA, 1.1023% 11/15/48 (d)(m) | | 38,245,325 | 2,554,313 |
| Series 2015-NXS4 Class E, 3.601% 12/15/48 (b)(d) | | 588,000 | 443,184 |
| Series 2016-BNK1: | | | |
| Class C, 3.071% 8/15/49 | | 700,000 | 663,361 |
| Class D, 3% 8/15/49 (b) | | 447,000 | 366,761 |
| Series 2016-C34 Class XA, 2.1801% 6/15/49 (d)(m) | | 34,403,357 | 4,378,563 |
| Series 2016-C35 Class D, 3.142% 7/15/48 (b) | | 1,596,000 | 1,161,727 |
| Series 2016-LC25 Class C, 4.4365% 12/15/59 (d) | | 903,000 | 908,377 |
| Series 2016-NXS6 Class D, 3.059% 11/15/49 (b) | | 1,218,000 | 933,285 |
| Series 2017-C38 Class D, 3% 7/15/50 (b)(d) | | 1,364,000 | 1,099,260 |
| Series 2017-RB1 Class D, 3.401% 3/15/50 (b) | | 556,000 | 466,266 |
| WF-RBS Commercial Mortgage Trust: | | | |
| sequential payer Series 2011-C4I Class G, 5% 6/15/44 (b) | | 325,000 | 213,297 |
| Series 2011-C3: | | | |
| Class C, 5.335% 3/15/44 (b) | | 360,000 | 383,054 |
| Class D, 5.6401% 3/15/44 (b)(d) | | 800,000 | 747,035 |
| Class E, 5% 3/15/44 (b) | | 890,000 | 800,911 |
| Class F, 5% 3/15/44 (b) | | 693,000 | 482,507 |
| Series 2011-C4: | | | |
| Class D, 5.2472% 6/15/44 (b)(d) | | 408,000 | 405,075 |
| Class E, 5.2472% 6/15/44 (b)(d) | | 439,432 | 428,159 |
| Series 2011-C5: | | | |
| Class C, 5.6722% 11/15/44 (b)(d) | | 260,000 | 286,903 |
| Class D, 5.6722% 11/15/44 (b)(d) | | 600,000 | 628,023 |
| Class E, 5.6722% 11/15/44 (b)(d) | | 1,853,000 | 1,912,001 |
| Class F, 5.25% 11/15/44 (b)(d) | | 933,000 | 816,353 |
| Class G, 5.25% 11/15/44 (b)(d) | | 329,000 | 268,477 |
| Class XA, 1.7625% 11/15/44 (b)(d)(m) | | 4,030,409 | 233,906 |
| Series 2012-C10: | | | |
| Class E, 4.4564% 12/15/45 (b)(d) | | 1,190,000 | 903,064 |
| Class F, 4.4564% 12/15/45 (b)(d) | | 1,726,000 | 949,795 |
| Series 2012-C6 Class D, 5.5804% 4/15/45 (b)(d) | | 540,000 | 546,623 |
| Series 2012-C7: | | | |
| Class C, 4.8297% 6/15/45 (d) | | 1,270,000 | 1,310,390 |
| Class E, 4.8297% 6/15/45 (b)(d) | | 2,501,000 | 2,135,891 |
| Class F, 4.5% 6/15/45 (b) | | 357,000 | 266,376 |
| Class G, 4.5% 6/15/45 (b) | | 1,076,000 | 679,036 |
| Series 2012-C8: | | | |
| Class D, 4.8926% 8/15/45 (b)(d) | | 650,000 | 652,736 |
| Class E, 4.8926% 8/15/45 (b)(d) | | 335,000 | 328,241 |
| Series 2013-C11: | | | |
| Class D, 4.2069% 3/15/45 (b)(d) | | 870,000 | 798,989 |
| Class E, 4.2069% 3/15/45 (b)(d) | | 1,750,000 | 1,355,591 |
| Series 2013-C13 Class D, 4.1386% 5/15/45 (b)(d) | | 600,000 | 561,871 |
| Series 2013-C16 Class D, 4.9803% 9/15/46 (b)(d) | | 193,000 | 187,662 |
| Series 2013-UBS1 Class D, 4.6251% 3/15/46 (b)(d) | | 756,000 | 714,692 |
| Series 2014-C21 Class XA, 1.1412% 8/15/47 (d)(m) | | 105,878,755 | 5,772,743 |
| Series 2014-C24 Class XA, 0.9591% 11/15/47 (d)(m) | | 34,755,336 | 1,738,695 |
| WFCG Commercial Mortgage Trust floater Series 2015-BXRP: | | | |
| Class F, 1 month U.S. LIBOR + 3.721% 4.9459% 11/15/29 (b)(d)(e) | | 1,054,900 | 1,056,878 |
| Class G, 1 month U.S. LIBOR + 3.001% 4.2456% 11/15/29 (b)(d)(e) | | 456,347 | 448,999 |
| WP Glimcher Mall Trust Series 2015-WPG: | | | |
| Class PR1, 3.516% 6/5/35 (b)(d) | | 489,000 | 381,678 |
| Class PR2, 3.516% 6/5/35 (b)(d) | | 1,260,000 | 929,851 |
| TOTAL COMMERCIAL MORTGAGE SECURITIES | | | |
| (Cost $500,984,281) | | | 506,587,713 |
|
| Municipal Securities - 1.4% | | | |
| California Gen. Oblig.: | | | |
| Series 2009, 7.35% 11/1/39 | | $2,650,000 | $3,955,576 |
| 7.3% 10/1/39 | | 27,595,000 | 40,949,048 |
| 7.5% 4/1/34 | | 9,105,000 | 13,420,679 |
| 7.55% 4/1/39 | | 18,745,000 | 29,153,161 |
| 7.6% 11/1/40 | | 14,220,000 | 22,584,773 |
| 7.625% 3/1/40 | | 10,110,000 | 15,718,320 |
| Chicago Gen. Oblig. (Taxable Proj.): | | | |
| Series 2008 B, 5.63% 1/1/22 | | 2,410,000 | 2,464,587 |
| Series 2010 C1, 7.781% 1/1/35 | | 13,950,000 | 16,483,878 |
| Series 2012 B, 5.432% 1/1/42 | | 3,285,000 | 3,250,639 |
| Series 2014 B, 6.314% 1/1/44 | | 16,855,000 | 18,070,246 |
| Illinois Gen. Oblig.: | | | |
| Series 2003: | | | |
| 4.35% 6/1/18 | | 3,508,000 | 3,549,429 |
| 4.95% 6/1/23 | | 24,240,000 | 25,205,722 |
| 5.1% 6/1/33 | | 63,045,000 | 63,344,464 |
| Series 2010-1, 6.63% 2/1/35 | | 11,945,000 | 13,181,785 |
| Series 2010-3: | | | |
| 5.547% 4/1/19 | | 330,000 | 341,441 |
| 6.725% 4/1/35 | | 17,810,000 | 19,600,261 |
| 7.35% 7/1/35 | | 8,165,000 | 9,414,082 |
| Series 2010-5, 6.2% 7/1/21 | | 6,528,000 | 6,918,636 |
| Series 2011: | | | |
| 5.665% 3/1/18 | | 21,275,000 | 21,627,527 |
| 5.877% 3/1/19 | | 77,850,000 | 81,016,160 |
| Series 2013: | | | |
| 2.69% 12/1/17 | | 3,365,000 | 3,367,995 |
| 3.14% 12/1/18 | | 3,490,000 | 3,500,191 |
| TOTAL MUNICIPAL SECURITIES | | | |
| (Cost $395,133,512) | | | 417,118,600 |
|
| Foreign Government and Government Agency Obligations - 0.8% | | | |
| Arab Republic 5.875% 6/11/25 (b) | | $535,000 | $542,860 |
| Arab Republic of Egypt: | | | |
| 5.875% 6/11/25 | | 1,125,000 | 1,141,529 |
| 6.125% 1/31/22 (b) | | 3,100,000 | 3,227,106 |
| 7.5% 1/31/27 (b) | | 600,000 | 661,800 |
| 8.5% 1/31/47 (b) | | 2,780,000 | 3,113,600 |
| Argentine Republic: | | | |
| 5.625% 1/26/22 | | 2,030,000 | 2,123,380 |
| 6.875% 4/22/21 | | 12,240,000 | 13,304,880 |
| 7.125% 6/28/2117 (b) | | 1,355,000 | 1,336,708 |
| 7.5% 4/22/26 | | 425,000 | 475,150 |
| Barbados Government: | | | |
| 7% 8/4/22 (b) | | 825,000 | 746,625 |
| 7.25% 12/15/21 (b) | | 90,000 | 82,800 |
| Belarus Republic: | | | |
| 6.875% 2/28/23 (b) | | 1,910,000 | 2,045,801 |
| 7.625% 6/29/27 (b) | | 955,000 | 1,051,646 |
| 8.95% 1/26/18 | | 5,940,000 | 6,081,206 |
| Brazilian Federative Republic: | | | |
| 4.25% 1/7/25 | | 10,005,000 | 10,105,050 |
| 5.625% 1/7/41 | | 13,135,000 | 13,151,419 |
| 7.125% 1/20/37 | | 4,785,000 | 5,658,263 |
| 8.25% 1/20/34 | | 5,895,000 | 7,634,025 |
| Buenos Aires Province: | | | |
| 6.5% 2/15/23 (b) | | 1,350,000 | 1,410,480 |
| 9.95% 6/9/21 (b) | | 2,815,000 | 3,241,473 |
| 10.875% 1/26/21 (b) | | 1,125,000 | 1,288,125 |
| 10.875% 1/26/21 (Reg. S) | | 6,025,000 | 6,898,625 |
| Cameroon Republic 9.5% 11/19/25 (b) | | 300,000 | 353,862 |
| City of Buenos Aires 8.95% 2/19/21 (b) | | 810,000 | 901,125 |
| Colombian Republic: | | | |
| 6.125% 1/18/41 | | 5,000 | 5,931 |
| 7.375% 9/18/37 | | 1,320,000 | 1,749,000 |
| 10.375% 1/28/33 | | 1,875,000 | 2,864,063 |
| Costa Rican Republic 7% 4/4/44 (b) | | 1,150,000 | 1,208,938 |
| Croatia Republic: | | | |
| 5.5% 4/4/23 (b) | | 660,000 | 733,080 |
| 6% 1/26/24 (b) | | 600,000 | 684,072 |
| Democratic Socialist Republic of Sri Lanka: | | | |
| 6.2% 5/11/27 (b) | | 355,000 | 373,275 |
| 6.25% 10/4/20 (b) | | 330,000 | 353,074 |
| 6.25% 7/27/21 (b) | | 360,000 | 387,558 |
| Dominican Republic: | | | |
| 5.95% 1/25/27 (b) | | 1,505,000 | 1,632,925 |
| 6.6% 1/28/24 (b) | | 520,000 | 585,000 |
| 6.85% 1/27/45 (b) | | 745,000 | 838,125 |
| 6.875% 1/29/26 (b) | | 1,220,000 | 1,403,000 |
| 7.45% 4/30/44 (b) | | 1,265,000 | 1,514,838 |
| Ecuador Republic: | | | |
| 8.75% 6/2/23 (b) | | 575,000 | 585,781 |
| 9.65% 12/13/26 (b) | | 575,000 | 603,031 |
| 10.5% 3/24/20 (b) | | 425,000 | 454,219 |
| El Salvador Republic: | | | |
| 7.375% 12/1/19 (b) | | 565,000 | 583,363 |
| 7.65% 6/15/35 (Reg. S) | | 50,000 | 49,875 |
| 8.625% 2/28/29 (b) | | 280,000 | 306,950 |
| German Federal Republic: | | | |
| 0% 8/15/26(Reg. S) | EUR | 300,000 | 350,455 |
| 2.5% 8/15/46 | EUR | 815,000 | 1,298,982 |
| 4% 1/4/37 | EUR | 1,645,000 | 3,063,177 |
| Indonesian Republic: | | | |
| 2.625% 6/14/23 | EUR | 7,700,000 | 9,685,287 |
| 7.75% 1/17/38 (b) | | 2,445,000 | 3,492,399 |
| 8.5% 10/12/35 (Reg. S) | | 2,385,000 | 3,545,834 |
| Islamic Republic of Pakistan: | | | |
| 6.75% 12/3/19 (b) | | 200,000 | 209,149 |
| 7.25% 4/15/19 (b) | | 2,530,000 | 2,642,398 |
| 8.25% 4/15/24 (b) | | 625,000 | 703,893 |
| Lebanese Republic: | | | |
| 4% 12/31/17 | | 1,239,250 | 1,236,400 |
| 5% 10/12/17 | | 2,045,000 | 2,045,000 |
| 5.15% 6/12/18 | | 2,720,000 | 2,734,993 |
| 5.15% 11/12/18 | | 1,260,000 | 1,268,127 |
| 5.45% 11/28/19 | | 1,370,000 | 1,374,768 |
| 6% 5/20/19 | | 1,785,000 | 1,808,444 |
| Mongolian People's Republic 8.75% 3/9/24 (b) | | 1,930,000 | 2,181,288 |
| Panamanian Republic 9.375% 4/1/29 | | 365,000 | 552,063 |
| Peruvian Republic 4% 3/7/27 (g)(q) | | 1,360,000 | 1,347,708 |
| Province of Santa Fe 7% 3/23/23 (b) | | 2,780,000 | 2,926,562 |
| Provincia de Cordoba: | | | |
| 7.125% 6/10/21 (b) | | 3,480,000 | 3,718,380 |
| 7.45% 9/1/24 (b) | | 1,920,000 | 2,062,656 |
| Republic of Angola 7% 8/17/19 (Issued by Northern Lights III BV for Republic of Angola) (Reg. S) | | 700,000 | 724,003 |
| Republic of Armenia: | | | |
| 6% 9/30/20 (b) | | 2,381,000 | 2,524,670 |
| 7.15% 3/26/25 (b) | | 995,000 | 1,108,729 |
| Republic of Iraq: | | | |
| 5.8% 1/15/28 (Reg. S) | | 5,350,000 | 5,075,149 |
| 6.75% 3/9/23 (b) | | 1,245,000 | 1,266,788 |
| Republic of Kenya 6.875% 6/24/24 (b) | | 885,000 | 928,321 |
| Republic of Nigeria 6.75% 1/28/21 (b) | | 240,000 | 257,400 |
| Republic of Serbia: | | | |
| 6.75% 11/1/24 (b) | | 1,147,044 | 1,173,344 |
| 7.25% 9/28/21 (b) | | 1,250,000 | 1,448,438 |
| Russian Federation: | | | |
| 5.25% 6/23/47 (b) | | 1,600,000 | 1,664,973 |
| 5.625% 4/4/42 (b) | | 850,000 | 960,568 |
| 5.875% 9/16/43 (b) | | 755,000 | 879,575 |
| 12.75% 6/24/28 (Reg. S) | | 5,610,000 | 9,899,518 |
| Rwanda Rep 6.625% 5/2/23 (b) | | 930,000 | 971,850 |
| State of Qatar 9.75% 6/15/30 (b) | | 390,000 | 624,000 |
| Sultanate of Oman 6.5% 3/8/47 (b) | | 770,000 | 804,650 |
| Turkish Republic: | | | |
| 3.25% 3/23/23 | | 245,000 | 234,898 |
| 5.125% 3/25/22 | | 1,590,000 | 1,675,214 |
| 5.625% 3/30/21 | | 1,600,000 | 1,710,618 |
| 6% 3/25/27 | | 975,000 | 1,067,625 |
| 6.25% 9/26/22 | | 3,130,000 | 3,453,786 |
| 6.75% 5/30/40 | | 550,000 | 633,820 |
| 6.875% 3/17/36 | | 1,795,000 | 2,086,580 |
| 7% 6/5/20 | | 3,840,000 | 4,225,344 |
| 7.25% 3/5/38 | | 1,150,000 | 1,393,800 |
| 7.375% 2/5/25 | | 1,495,000 | 1,765,595 |
| 8% 2/14/34 | | 760,000 | 971,797 |
| 11.875% 1/15/30 | | 1,455,000 | 2,357,246 |
| Turkiye Ihracat Kredi Bankasi A/S 5.375% 2/8/21 (b) | | 895,000 | 934,137 |
| Ukraine Government: | | | |
| 7.75% 9/1/21 (b) | | 8,899,000 | 9,277,741 |
| 7.75% 9/1/22 (b) | | 7,759,000 | 8,080,999 |
| 7.75% 9/1/23 (b) | | 719,000 | 746,408 |
| United Kingdom, Great Britain and Northern Ireland: | | | |
| 1.5% 7/22/26(Reg. S) | GBP | 200,000 | 271,034 |
| 1.5% 7/22/47 | GBP | 2,000,000 | 2,465,409 |
| 2% 9/7/25(Reg. S) | GBP | 1,285,000 | 1,816,365 |
| 4.25% 3/7/36 | GBP | 745,000 | 1,373,115 |
| 4.5% 9/7/34 | GBP | 2,135,000 | 3,986,550 |
| Uruguay Republic 7.875% 1/15/33 pay-in-kind | | 1,015,000 | 1,426,075 |
| Venezuelan Republic: | | | |
| 9.25% 9/15/27 | | 4,270,000 | 1,675,975 |
| 11.95% 8/5/31 (Reg. S) | | 2,145,000 | 879,450 |
| 12.75% 8/23/22 | | 905,000 | 409,513 |
| Vietnamese Socialist Republic: | | | |
| 6 month U.S. LIBOR + 0.813% 2.25% 3/13/28 (d)(e)(g) | | 195,000 | 173,856 |
| 4% 3/12/28 (g)(q) | | 6,043,500 | 5,999,745 |
| 4.8% 11/19/24 (b) | | 550,000 | 583,799 |
| 6.75% 1/29/20 (b) | | 750,000 | 819,571 |
| TOTAL FOREIGN GOVERNMENT AND GOVERNMENT AGENCY OBLIGATIONS | | | |
| (Cost $227,848,594) | | | 244,549,640 |
| | | Shares | Value |
|
| Common Stocks - 0.0% | | | |
| CONSUMER DISCRETIONARY - 0.0% | | | |
| Media - 0.0% | | | |
| Tribune Media Co. Class A | | 21,200 | 849,484 |
| ENERGY - 0.0% | | | |
| Energy Equipment & Services - 0.0% | | | |
| Forbes Energy Services Ltd. | | 154,425 | 1,775,888 |
| Oil, Gas & Consumable Fuels - 0.0% | | | |
| Pacific Exploration and Production Corp. | | 67,596 | 2,056,975 |
| Southwestern Energy Co. (r) | | 81,258 | 442,856 |
| Warrior Met Coal, Inc. Class A | | 31,922 | 827,594 |
| | | | 3,327,425 |
|
| TOTAL ENERGY | | | 5,103,313 |
|
| MATERIALS - 0.0% | | | |
| Chemicals - 0.0% | | | |
| LyondellBasell Industries NV Class A | | 31,400 | 2,844,526 |
| TELECOMMUNICATION SERVICES - 0.0% | | | |
| Diversified Telecommunication Services - 0.0% | | | |
| Consolidated Communications Holdings, Inc. | | 14,162 | 261,289 |
| Wireless Telecommunication Services - 0.0% | | | |
| CUI Acquisition Corp. Class E (g)(r) | | 1 | 34,600 |
|
| TOTAL TELECOMMUNICATION SERVICES | | | 295,889 |
|
| TOTAL COMMON STOCKS | | | |
| (Cost $22,084,574) | | | 9,093,212 |
|
| Preferred Stocks - 0.0% | | | |
| Convertible Preferred Stocks - 0.0% | | | |
| ENERGY - 0.0% | | | |
| Oil, Gas & Consumable Fuels - 0.0% | | | |
| Southwestern Energy Co. Series B 6.25% | | 243,900 | 3,231,675 |
| REAL ESTATE - 0.0% | | | |
| Equity Real Estate Investment Trusts (REITs) - 0.0% | | | |
| Alexandria Real Estate Equities, Inc. Series D, 7.00% | | 9,000 | 331,110 |
| FelCor Lodging Trust, Inc. Series A, 1.95% | | 17,900 | 500,921 |
| | | | 832,031 |
|
| TOTAL CONVERTIBLE PREFERRED STOCKS | | | 4,063,706 |
|
| Nonconvertible Preferred Stocks - 0.0% | | | |
| FINANCIALS - 0.0% | | | |
| Mortgage Real Estate Investment Trusts - 0.0% | | | |
| Annaly Capital Management, Inc. Series C, 7.625% | | 27,600 | 708,492 |
| CYS Investments, Inc. Series B, 7.50% | | 17,000 | 425,000 |
| MFA Financial, Inc. Series B, 7.50% | | 22,500 | 569,250 |
| | | | 1,702,742 |
| REAL ESTATE - 0.0% | | | |
| Equity Real Estate Investment Trusts (REITs) - 0.0% | | | |
| American Homes 4 Rent Series D, 6.50% | | 24,500 | 661,500 |
| Boston Properties, Inc. 5.25% | | 17,500 | 456,750 |
| CBL & Associates Properties, Inc. Series D, 7.375% | | 7,720 | 188,908 |
| Cedar Realty Trust, Inc.: | | | |
| Series B, 7.25% | | 8,113 | 204,123 |
| Series C 6.50% | | 10,000 | 247,500 |
| DDR Corp. Series K, 6.25% | | 17,823 | 454,487 |
| Equity Lifestyle Properties, Inc. Series C, 6.75% | | 39,667 | 1,005,955 |
| Public Storage Series F 5.15% | | 37,000 | 937,580 |
| Retail Properties America, Inc. Series A, 7.00% | | 24,109 | 615,985 |
| Sabra Health Care REIT, Inc. Series A, 7.125% | | 18,495 | 475,691 |
| Sun Communities, Inc. Series A, 7.125% | | 34,701 | 885,570 |
| Taubman Centers, Inc. Series J, 6.50% | | 11,338 | 287,418 |
| | | | 6,421,467 |
|
| TOTAL NONCONVERTIBLE PREFERRED STOCKS | | | 8,124,209 |
|
| TOTAL PREFERRED STOCKS | | | |
| (Cost $12,902,246) | | | 12,187,915 |
| | | Principal Amount(a) | Value |
|
| Bank Loan Obligations - 4.8% | | | |
| CONSUMER DISCRETIONARY - 1.4% | | | |
| Auto Components - 0.0% | | | |
| North American Lifting Holdings, Inc.: | | | |
| Tranche 1LN, term loan 3 month U.S. LIBOR + 4.500% 5.7964% 11/27/20 (d)(e) | | 4,541,481 | 4,223,577 |
| Tranche 2LN, term loan 3 month U.S. LIBOR + 9.000% 10.2964% 11/27/21 (d)(e) | | 1,594,000 | 1,265,907 |
| | | | 5,489,484 |
| Automobiles - 0.0% | | | |
| Caliber Holdings Corp.: | | | |
| Tranche 1LN, term loan 3 month U.S. LIBOR + 3.000% 4.2339% 2/1/24 (d)(e) | | 1,408,167 | 1,412,856 |
| Tranche 2LN, term loan 3 month U.S. LIBOR + 7.250% 8.4839% 2/1/25 (d)(e) | | 385,000 | 392,700 |
| Chrysler Group LLC term loan 3 month U.S. LIBOR + 2.000% 3.23% 12/31/18 (d)(e) | | 750,577 | 751,988 |
| UOS LLC Tranche B 1LN, term loan 3 month U.S. LIBOR + 5.500% 6.7986% 4/18/23 (d)(e) | | 1,110,000 | 1,130,124 |
| | | | 3,687,668 |
| Diversified Consumer Services - 0.2% | | | |
| Bright Horizons Family Solutions Tranche B, term loan 3 month U.S. LIBOR + 2.250% 3.4839% 11/7/23 (d)(e) | | 1,504,391 | 1,509,281 |
| Coinmach Service Corp. Tranche B, term loan 3 month U.S. LIBOR + 3.750% 5.0139% 11/14/22 (d)(e) | | 7,289,232 | 7,305,632 |
| Creative Artists Agency LLC Tranche B, term loan 3 month U.S. LIBOR + 3.500% 4.7267% 2/15/24 (d)(e) | | 1,990,000 | 2,000,786 |
| CSM Bakery Supplies Tranche B 1LN, term loan 3 month U.S. LIBOR + 4.000% 5.3% 7/3/20 (d)(e) | | 1,148,725 | 1,091,771 |
| KUEHG Corp.: | | | |
| Tranche B 1LN, term loan 3 month U.S. LIBOR + 3.750% 5.0464% 8/13/22 (d)(e) | | 4,442,675 | 4,427,392 |
| Tranche B, term loan 3 month U.S. LIBOR + 8.250% 9.5139% 8/22/25 (d)(e) | | 1,000,000 | 995,000 |
| Laureate Education, Inc. Tranche B 1LN, term loan 3 month U.S. LIBOR + 4.500% 5.7389% 4/26/24 (d)(e) | | 23,476,163 | 23,564,198 |
| Nord Anglia Education Tranche B, term loan 3 month U.S. LIBOR + 3.500% 4.7018% 3/31/21 (d)(e) | | 6,790,296 | 6,790,296 |
| Seminole Tribe Florida Tranche B, term loan 3 month U.S. LIBOR + 2.000% 3.456% 7/6/24 (d)(e) | | 2,500,000 | 2,505,850 |
| The ServiceMaster Co. Tranche B, term loan 3 month U.S. LIBOR + 2.500% 3.7339% 11/8/23 (d)(e) | | 2,985,000 | 2,987,239 |
| Wash Multifamily Acquisition, Inc.: | | | |
| Tranche B 1LN, term loan 3 month U.S. LIBOR + 3.250% 4.4889% 5/14/22 (d)(e) | | 4,777,766 | 4,762,859 |
| Tranche B 2LN, term loan 3 month U.S. LIBOR + 7.000% 8.2389% 5/14/23 (d)(e)(g) | | 360,000 | 356,400 |
| Weight Watchers International, Inc. Tranche B 2LN, term loan 3 month U.S. LIBOR + 3.250% 4.5288% 4/2/20 (d)(e) | | 5,696,274 | 5,563,038 |
| Zodiac Pool Solutions LLC Tranche B, term loan 3 month U.S. LIBOR + 4.000% 5.2964% 12/20/23 (d)(e) | | 1,990,013 | 2,008,679 |
| | | | 65,868,421 |
| Hotels, Restaurants & Leisure - 0.5% | | | |
| 24 Hour Fitness Worldwide, Inc. Tranche B, term loan 3 month U.S. LIBOR + 3.750% 5.0464% 5/30/21 (d)(e) | | 2,935,970 | 2,926,810 |
| Affinity Gaming LLC Tranche B, term loan 3 month U.S. LIBOR + 3.500% 4.7339% 7/1/23 (d)(e) | | 1,927,903 | 1,929,349 |
| American Casino & Entertainment Properties LLC Tranche B, term loan 3 month U.S. LIBOR + 3.250% 4.4839% 7/7/22 (d)(e) | | 885,254 | 885,812 |
| AP Gaming I LLC term loan 3 month U.S. LIBOR + 5.500% 6.7339% 2/15/24 (d)(e) | | 1,205,000 | 1,220,063 |
| Aristocrat Technologies, Inc. Tranche B 2LN, term loan 3 month U.S. LIBOR + 2.250% 3.5569% 10/20/21 (d)(e) | | 4,125,923 | 4,124,685 |
| Boyd Gaming Corp. Tranche B 1LN, term loan 3 month U.S. LIBOR + 2.500% 3.6967% 9/15/23 (d)(e) | | 2,212,060 | 2,214,404 |
| Burger King Worldwide, Inc. Tranche B, term loan 3 month U.S. LIBOR + 2.250% 3.5113% 2/17/24 (d)(e) | | 5,944,968 | 5,924,517 |
| Caesars Entertainment Resort Properties LLC Tranche B 1LN, term loan 3 month U.S. LIBOR + 3.500% 4.7389% 10/11/20 (d)(e) | | 12,562,641 | 12,615,028 |
| Caesars Growth Properties Holdings LLC Tranche 1LN, term loan 3 month U.S. LIBOR + 3.000% 4.2389% 5/8/21 (d)(e) | | 15,460,150 | 15,495,554 |
| CCM Merger, Inc. Tranche B, term loan 3 month U.S. LIBOR + 2.750% 3.9889% 8/8/21 (d)(e) | | 2,722,891 | 2,728,010 |
| CEC Entertainment, Inc. Tranche B, term loan 3 month U.S. LIBOR + 3.000% 4.2389% 2/14/21 (d)(e) | | 1,691,885 | 1,678,282 |
| Cedar Fair LP Tranche B, term loan 3 month U.S. LIBOR + 2.250% 3.4839% 4/13/24 (d)(e) | | 416,500 | 419,624 |
| CityCenter Holdings LLC Tranche B, term loan 3 month U.S. LIBOR + 2.500% 3.7344% 4/18/24 (d)(e) | | 3,145,000 | 3,149,718 |
| Cyan Blue Holdco 3 Ltd. Tranche B, term loan 3 month U.S. LIBOR + 3.500% 4.8328% 7/25/24 (d)(e) | | 1,645,000 | 1,654,261 |
| Delta 2 SARL Tranche B, term loan 3 month U.S. LIBOR + 3.250% 4.5044% 2/1/24 (d)(e) | | 7,795,000 | 7,840,445 |
| Eldorado Resorts, Inc. Tranche B, term loan 3 month U.S. LIBOR + 2.250% 3.5625% 4/17/24 (d)(e) | | 4,847,850 | 4,823,611 |
| Equinox Holdings, Inc.: | | | |
| Tranche 2LN, term loan 3 month U.S. LIBOR + 7.000% 8.2317% 9/8/24 (d)(e) | | 940,000 | 955,670 |
| Tranche B 1LN, term loan 3 month U.S. LIBOR + 3.250% 4.4839% 3/8/24 (d)(e) | | 2,244,375 | 2,246,238 |
| ESH Hospitality, Inc. Tranche B, term loan 3 month U.S. LIBOR + 2.500% 3.7339% 8/30/23 (d)(e) | | 3,003,820 | 3,014,153 |
| Fitness International LLC Tranche B, term loan 3 month U.S. LIBOR + 4.250% 5.4839% 7/1/20 (d)(e) | | 1,251,851 | 1,262,805 |
| Four Seasons Holdings, Inc. Tranche B, term loan 3 month U.S. LIBOR + 2.500% 3.7339% 11/30/23 (d)(e) | | 6,455,281 | 6,477,681 |
| Gateway Casinos & Entertainment Ltd. term loan 3 month U.S. LIBOR + 3.750% 5.0464% 2/22/23 (d)(e) | | 3,005,000 | 3,012,513 |
| Golden Entertainment, Inc. term loan: | | | |
| 3 month U.S. LIBOR + 3.000% 8/11/24 (e)(s) | | 9,600,000 | 9,556,032 |
| 3 month U.S. LIBOR + 7.000% 8/11/25 (e)(s) | | 2,700,000 | 2,700,000 |
| Golden Nugget, Inc. Tranche B, term loan: | | | |
| 3 month U.S. LIBOR + 3.500% 4.74% 11/21/19 (d)(e) | | 4,741,491 | 4,756,331 |
| 3 month U.S. LIBOR + 3.500% 4.74% 11/21/19 (d)(e) | | 2,031,693 | 2,038,052 |
| Greektown Holdings LLC Tranche B, term loan 3 month U.S. LIBOR + 3.000% 4.2339% 4/25/24 (d)(e) | | 1,110,000 | 1,107,569 |
| Hilton Worldwide Finance LLC Tranche B 2LN, term loan 3 month U.S. LIBOR + 2.000% 3.2344% 10/25/23 (d)(e) | | 4,980,616 | 4,995,458 |
| Intrawest Resorts Holdings, Inc. Tranche B 1LN, term loan 3 month U.S. LIBOR + 3.250% 4.4839% 7/31/24 (d)(e) | | 3,000,000 | 3,000,000 |
| La Quinta Intermediate Holdings LLC Tranche B LN, term loan 3 month U.S. LIBOR + 2.750% 4.0539% 4/14/21 (d)(e) | | 3,539,259 | 3,545,913 |
| Landry's Acquisition Co. Tranche B 1LN, term loan 3 month U.S. LIBOR + 2.750% 3.9844% 10/4/23 (d)(e) | | 5,911,154 | 5,853,875 |
| LTF Merger Sub, Inc. Tranche B, term loan 3 month U.S. LIBOR + 3.000% 4.2339% 6/10/22 (d)(e) | | 3,552,315 | 3,558,674 |
| MGM Mirage, Inc. Tranche A, term loan 3 month U.S. LIBOR + 2.250% 3.4839% 4/25/21 (d)(e) | | 1,794,000 | 1,794,000 |
| Mohegan Tribal Gaming Authority Tranche B, term loan 3 month U.S. LIBOR + 4.000% 5.2339% 10/14/23 (d)(e) | | 1,985,000 | 2,002,369 |
| Penn National Gaming, Inc. Tranche B, term loan 3 month U.S. LIBOR + 2.500% 3.7964% 1/19/24 (d)(e) | | 753,113 | 755,402 |
| Playa Resorts Holding BV Tranche B, term loan 3 month U.S. LIBOR + 3.000% 4.32% 4/27/24 (d)(e) | | 3,640,000 | 3,638,471 |
| Red Lobster Hospitality LLC Tranche B, term loan 3 month U.S. LIBOR + 5.250% 6.4856% 7/28/21 (d)(e) | | 2,051,709 | 2,067,097 |
| Ryman Hospitality Properties, Inc. Tranche B, term loan 3 month U.S. LIBOR + 2.250% 3.56% 5/11/24 (d)(e) | | 294,263 | 295,734 |
| Scientific Games Corp. Tranche B, term loan 3 month U.S. LIBOR + 3.500% 4.5122% 8/14/24 (d)(e) | | 11,040,000 | 11,114,520 |
| SeaWorld Parks & Entertainment, Inc. Tranche B 5LN, term loan 3 month U.S. LIBOR + 3.000% 4.2964% 3/31/24 (d)(e) | | 1,092,263 | 1,060,270 |
| SMG Tranche B 1LN, term loan 3 month U.S. LIBOR + 3.500% 4.8367% 2/27/20 (d)(e) | | 1,534,022 | 1,533,071 |
| Station Casinos LLC Tranche B, term loan 3 month U.S. LIBOR + 2.500% 3.74% 6/8/23 (d)(e) | | 5,175,863 | 5,167,995 |
| Tropicana Entertainment, Inc. Tranche B, term loan 3 month U.S. LIBOR + 3.000% 4.2964% 11/27/20 (d)(e) | | 1,481,519 | 1,488,927 |
| Yonkers Racing Corp. Tranche B 1LN, term loan 3 month U.S. LIBOR + 3.250% 4.49% 5/31/24 (d)(e) | | 2,000,000 | 2,000,000 |
| | | | 160,628,993 |
| Internet & Direct Marketing Retail - 0.1% | | | |
| Bass Pro Group LLC: | | | |
| term loan 3 month U.S. LIBOR + 4.750% 6.0464% 6/9/18 (d)(e) | | 2,000,000 | 2,001,260 |
| Tranche B, term loan 3 month U.S. LIBOR + 3.250% 4.4789% 6/5/20 (d)(e) | | 2,364,871 | 2,351,084 |
| Bass Pro Shops LLC. Tranche B, term loan 3 month U.S. LIBOR + 5.000% 6.2964% 12/16/23 (d)(e) | | 15,464,576 | 14,623,767 |
| Harbor Freight Tools U.S.A., Inc. Tranche B, term loan 3 month U.S. LIBOR + 3.250% 4.4839% 8/19/23 (d)(e) | | 2,462,500 | 2,470,823 |
| | | | 21,446,934 |
| Leisure Products - 0.0% | | | |
| Hayward Industries, Inc. term loan 3 month U.S. LIBOR + 3.500% 4.4806% 8/4/24 (d)(e) | | 1,615,000 | 1,622,074 |
| SRAM LLC. Tranche B, term loan 3 month U.S. LIBOR + 3.500% 4.7572% 3/15/24 (d)(e) | | 1,325,523 | 1,332,151 |
| | | | 2,954,225 |
| Media - 0.4% | | | |
| Acosta, Inc. Tranche B, term loan 3 month U.S. LIBOR + 3.250% 4.4889% 9/26/21 (d)(e) | | 2,635,897 | 2,352,538 |
| Altice U.S. Finance SA Tranche B, term loan 3 month U.S. LIBOR + 2.250% 3.4839% 7/28/25 (d)(e) | | 1,995,000 | 1,979,419 |
| AMC Entertainment Holdings, Inc. Tranche B, term loan 3 month U.S. LIBOR + 2.250% 3.4783% 12/15/23 (d)(e) | | 995,000 | 990,025 |
| AMC Entertainment, Inc. Tranche B, term loan 3 month U.S. LIBOR + 2.250% 3.4783% 12/15/22 (d)(e) | | 1,965,000 | 1,953,544 |
| Cable One, Inc. Tranche B, term loan 3 month U.S. LIBOR + 2.250% 3.57% 5/1/24 (d)(e) | | 1,020,000 | 1,022,550 |
| CBS Radio, Inc. term loan 3 month U.S. LIBOR + 3.500% 4.7361% 10/17/23 (d)(e) | | 3,602,642 | 3,622,168 |
| CDS U.S. Intermediate Holdings, Inc.: | | | |
| Tranche B 1LN, term loan 3 month U.S. LIBOR + 3.750% 5.05% 7/8/22 (d)(e) | | 1,820,563 | 1,813,735 |
| Tranche B 2LN, term loan 3 month U.S. LIBOR + 8.250% 9.5464% 7/8/23 (d)(e) | | 465,000 | 464,419 |
| Cengage Learning, Inc. Tranche B, term loan 3 month U.S. LIBOR + 4.250% 5.4806% 6/7/23 (d)(e) | | 6,067,375 | 5,630,039 |
| Charter Communication Operating LLC: | | | |
| term loan: | | | |
| 3 month U.S. LIBOR + 2.000% 3.24% 7/1/20 (d)(e) | | 1,462,904 | 1,466,561 |
| 3 month U.S. LIBOR + 2.000% 3.24% 1/3/21 (d)(e) | | 4,369,714 | 4,379,415 |
| Tranche H, term loan 3 month U.S. LIBOR + 2.000% 3.24% 1/15/22 (d)(e) | | 987,500 | 990,097 |
| Tranche I, term loan 3 month U.S. LIBOR + 2.250% 3.49% 1/15/24 (d)(e) | | 6,255,813 | 6,283,588 |
| Clear Channel Communications, Inc. Tranche D, term loan 3 month U.S. LIBOR + 6.750% 7.9889% 1/30/19 (d)(e) | | 10,365,000 | 8,292,000 |
| Emerald Exposit Holding, Inc. Tranche B, term loan 3 month U.S. LIBOR + 3.000% 4.2964% 5/22/24 (d)(e) | | 1,440,000 | 1,450,800 |
| Entercom Radio, LLC Tranche B, term loan 3 month U.S. LIBOR + 3.500% 4.7152% 11/1/23 (d)(e) | | 1,431,250 | 1,432,323 |
| Getty Images, Inc. Tranche B, term loan 3 month U.S. LIBOR + 3.500% 4.7964% 10/18/19 (d)(e) | | 5,115,118 | 4,417,365 |
| Houghton Mifflin Harcourt Publishing, Inc. Tranche B, term loan 3 month U.S. LIBOR + 3.000% 4.2389% 5/29/21 (d)(e) | | 4,595,606 | 4,423,270 |
| ION Media Networks, Inc. Tranche B, term loan 3 month U.S. LIBOR + 3.000% 4.26% 12/18/20 (d)(e) | | 5,588,474 | 5,595,460 |
| Karman Buyer Corp.: | | | |
| Tranche 1LN, term loan 3 month U.S. LIBOR + 3.250% 4.5464% 7/25/21 (d)(e) | | 1,458,338 | 1,401,098 |
| Tranche 2LN, term loan 3 month U.S. LIBOR + 6.500% 7.7964% 7/25/22 (d)(e) | | 1,620,000 | 1,475,723 |
| Liberty Cablevision of Puerto Rico Tranche 1LN, term loan 3 month U.S. LIBOR + 3.500% 4.8036% 1/7/22 (d)(e) | | 3,620,000 | 3,597,375 |
| Lions Gate Entertainment Corp. term loan 3 month U.S. LIBOR + 3.000% 4.2339% 12/8/23 (d)(e) | | 2,350,000 | 2,367,625 |
| McGraw-Hill Global Education Holdings, LLC term loan 3 month U.S. LIBOR + 4.000% 5.2339% 5/4/22 (d)(e) | | 6,816,150 | 6,686,234 |
| Montreign Operating Co. LLC Tranche B 1LN, term loan 3 month U.S. LIBOR + 8.250% 9.4839% 1/19/23 (d)(e) | | 2,770,000 | 2,790,775 |
| Neptune Finco Corp. Tranche B, term loan 3 month U.S. LIBOR + 2.250% 3.4783% 7/17/25 (d)(e) | | 2,644,896 | 2,626,170 |
| Nielsen Finance LLC Tranche B 4LN, term loan 3 month U.S. LIBOR + 2.000% 3.2289% 10/4/23 (d)(e) | | 5,063,559 | 5,062,952 |
| Proquest LLC Tranche B, term loan 3 month U.S. LIBOR + 3.750% 4.9889% 10/24/21 (d)(e) | | 3,917,591 | 3,953,515 |
| Raycom Media, Inc. Tranche B, term loan 3 month U.S. LIBOR + 2.750% 3.9856% 8/23/24 (d)(e) | | 2,060,000 | 2,070,300 |
| Springer Science+Business Media Deutschland GmbH Tranche B 9LN, term loan 3 month U.S. LIBOR + 3.500% 4.7964% 8/14/20 (d)(e) | | 8,627,193 | 8,639,788 |
| Unitymedia Finance LLC Tranche B, term loan 3 month U.S. LIBOR + 2.250% 3.4867% 9/30/25 (d)(e) | | 4,130,000 | 4,109,350 |
| Virgin Media Bristol LLC Tranche 1LN, term loan 3 month U.S. LIBOR + 2.750% 3.9767% 1/31/25 (d)(e) | | 5,000,000 | 5,009,700 |
| WideOpenWest Finance LLC Tranche B, term loan 3 month U.S. LIBOR + 3.250% 4.4783% 8/19/23 (d)(e) | | 9,075,000 | 9,050,044 |
| Ziggo Secured Finance Partnership Tranche E, term loan 3 month U.S. LIBOR + 2.500% 3.7267% 4/15/25 (d)(e) | | 4,610,000 | 4,596,170 |
| | | | 121,996,135 |
| Multiline Retail - 0.1% | | | |
| JC Penney Corp., Inc. Tranche B, term loan 3 month U.S. LIBOR + 4.250% 5.5678% 6/23/23 (d)(e) | | 11,732,859 | 11,547,127 |
| Specialty Retail - 0.1% | | | |
| ABB Optical Group LLC Tranche B, term loan 3 month U.S. LIBOR + 5.000% 6.243% 6/15/23 (d)(e) | | 1,334,913 | 1,336,581 |
| Academy Ltd. Tranche B, term loan 3 month U.S. LIBOR + 4.000% 5.2423% 7/2/22 (d)(e) | | 5,150,094 | 3,429,963 |
| Davids Bridal, Inc. Tranche B, term loan 3 month U.S. LIBOR + 4.000% 5.3% 10/11/19 (d)(e) | | 1,860,847 | 1,452,633 |
| Party City Holdings, Inc. term loan 3 month U.S. LIBOR + 3.000% 4.3187% 8/19/22 (d)(e) | | 4,686,512 | 4,688,715 |
| PETCO Animal Supplies, Inc. Tranche B 1LN, term loan 3 month U.S. LIBOR + 3.000% 4.3111% 1/26/23 (d)(e) | | 5,608,934 | 4,708,700 |
| PetSmart, Inc. term loan 3 month U.S. LIBOR + 3.000% 4.24% 3/11/22 (d)(e) | | 14,155,206 | 12,430,111 |
| Sports Authority, Inc. Tranche B, term loan 3 month U.S. LIBOR + 6.000% 0% 11/16/17 (e)(f) | | 2,089,734 | 87,079 |
| | | | 28,133,782 |
| Textiles, Apparel & Luxury Goods - 0.0% | | | |
| Hercules Achievement, Inc. Tranche B, term loan 3 month U.S. LIBOR + 3.500% 4.7317% 12/11/21 (d)(e) | | 4,554,353 | 4,577,124 |
|
| TOTAL CONSUMER DISCRETIONARY | | | 426,329,893 |
|
| CONSUMER STAPLES - 0.3% | | | |
| Beverages - 0.0% | | | |
| Arterra Wines Canada, Inc. Tranche B, term loan 3 month U.S. LIBOR + 2.750% 4.0572% 12/16/23 (d)(e) | | 1,990,000 | 1,997,463 |
| Food & Staples Retailing - 0.2% | | | |
| Albertson's LLC Tranche B, term loan: | | | |
| 3 month U.S. LIBOR + 2.750% 3.9839% 8/25/21 (d)(e) | | 15,535,240 | 15,063,591 |
| 3 month U.S. LIBOR + 3.000% 4.2933% 12/21/22 (d)(e) | | 6,619,403 | 6,419,431 |
| 3 month U.S. LIBOR + 3.000% 4.3172% 6/22/23 (d)(e) | | 4,823,800 | 4,683,090 |
| BJ's Wholesale Club, Inc.: | | | |
| Tranche 2LN, term loan 3 month U.S. LIBOR + 7.500% 8.71% 2/3/25 (d)(e) | | 2,865,000 | 2,748,853 |
| Tranche B 1LN, term loan 3 month U.S. LIBOR + 3.750% 4.9681% 2/3/24 (d)(e) | | 8,830,325 | 8,496,009 |
| CTI Foods Holdings Co. LLC Tranche 1LN, term loan 3 month U.S. LIBOR + 3.500% 4.74% 6/28/20 (d)(e) | | 1,072,224 | 1,002,530 |
| GOBP Holdings, Inc. Tranche B, term loan 3 month U.S. LIBOR + 3.500% 4.7964% 10/21/21 (d)(e) | | 3,853,871 | 3,839,419 |
| Pizza Hut Holdings LLC Tranche B, term loan 3 month U.S. LIBOR + 2.000% 3.2283% 6/16/23 (d)(e) | | 6,239,363 | 6,265,006 |
| Shearer's Foods, Inc.: | | | |
| Tranche 2LN, term loan 3 month U.S. LIBOR + 6.750% 8.0464% 6/30/22 (d)(e) | | 2,913,000 | 2,752,785 |
| Tranche B 1LN, term loan 3 month U.S. LIBOR + 3.938% 5.2339% 6/30/21 (d)(e) | | 3,332,336 | 3,330,936 |
| Smart & Final, Inc. Tranche B, term loan 3 month U.S. LIBOR + 3.500% 4.7721% 11/15/22 (d)(e) | | 4,033,000 | 3,864,945 |
| U.S. Foods, Inc. Tranche B, term loan 3 month U.S. LIBOR + 2.750% 3.99% 6/27/23 (d)(e) | | 3,465,000 | 3,475,776 |
| | | | 61,942,371 |
| Food Products - 0.1% | | | |
| Arctic Glacier Group Holdings, Inc. Tranche B, term loan 3 month U.S. LIBOR + 4.250% 5.4839% 3/20/24 (d)(e) | | 807,975 | 811,005 |
| Chobani LLC Tranche B, term loan 3 month U.S. LIBOR + 4.250% 5.4839% 10/7/23 (d)(e) | | 4,335,357 | 4,363,797 |
| Hostess Brands LLC Tranche B 1LN, term loan 3 month U.S. LIBOR + 2.500% 3.7339% 8/3/22 (d)(e) | | 1,056,652 | 1,059,029 |
| JBS U.S.A. Lux SA Tranche B, term loan 3 month U.S. LIBOR + 2.500% 3.8038% 10/30/22 (d)(e) | | 4,234,388 | 4,183,236 |
| Post Holdings, Inc. Tranche B, term loan 3 month U.S. LIBOR + 2.250% 3.49% 5/24/24 (d)(e) | | 5,840,000 | 5,846,249 |
| | | | 16,263,316 |
| Personal Products - 0.0% | | | |
| Prestige Brands, Inc. term loan 3 month U.S. LIBOR + 2.750% 3.9839% 1/26/24 (d)(e) | | 2,084,842 | 2,087,115 |
|
| TOTAL CONSUMER STAPLES | | | 82,290,265 |
|
| ENERGY - 0.2% | | | |
| Energy Equipment & Services - 0.0% | | | |
| Cactus Wellhead LLC Tranche B, term loan 3 month U.S. LIBOR + 6.000% 7.3169% 7/31/20 (d)(e) | | 3,371,806 | 3,262,222 |
| Expro Finservices SARL Tranche B, term loan 3 month U.S. LIBOR + 4.750% 5.96% 9/2/21 (d)(e) | | 6,065,149 | 3,899,891 |
| Forbes Energy Services LLC Tranche B, term loan 12% 4/13/21 (d) | | 1,493,878 | 1,505,082 |
| FTS International, Inc. Tranche B, term loan 3 month U.S. LIBOR + 4.750% 5.9889% 4/16/21 (d)(e) | | 2,335,000 | 2,092,744 |
| Pacific Drilling SA Tranche B, term loan 3 month U.S. LIBOR + 3.500% 4.75% 6/3/18 (d)(e) | | 1,340,501 | 447,727 |
| Seadrill Operating LP Tranche B, term loan 3 month U.S. LIBOR + 3.000% 4.2964% 2/21/21 (d)(e) | | 3,071,204 | 1,974,201 |
| Summit Midstream Partners LP Tranche B, term loan 3 month U.S. LIBOR + 6.000% 7.2339% 5/16/22 (d)(e) | | 3,000,000 | 3,037,500 |
| | | | 16,219,367 |
| Oil, Gas & Consumable Fuels - 0.2% | | | |
| Alon U.S.A. Partners LP term loan 3 month U.S. LIBOR + 8.000% 9.25% 11/26/18 (d)(e) | | 2,127,522 | 2,136,032 |
| Arctic LNG Carriers Ltd. Tranche B 1LN, term loan 3 month U.S. LIBOR + 4.500% 5.7339% 5/18/23 (d)(e) | | 2,000,000 | 2,010,000 |
| Bcp Raptor LLC Tranche B, term loan 3 month U.S. LIBOR + 4.250% 5.5072% 6/22/24 (d)(e) | | 5,470,000 | 5,501,890 |
| California Resources Corp. Tranche 1LN, term loan 3 month U.S. LIBOR + 10.375% 11.6033% 12/31/21 (d)(e) | | 4,480,000 | 4,741,318 |
| Chesapeake Energy Corp. Tranche 1LN, term loan 3 month U.S. LIBOR + 7.500% 8.8144% 8/23/21 (d)(e) | | 5,900,000 | 6,263,853 |
| Chief Exploration & Development, LLC. Tranche 2LN, term loan 3 month U.S. LIBOR + 6.500% 7.9324% 5/16/21 (d)(e) | | 2,832,000 | 2,750,580 |
| Citgo Holding, Inc. Tranche B, term loan 3 month U.S. LIBOR + 8.500% 9.7964% 5/12/18 (d)(e) | | 2,569,041 | 2,585,097 |
| Citgo Petroleum Corp. Tranche B, term loan 3 month U.S. LIBOR + 3.500% 4.7964% 7/29/21 (d)(e) | | 522,566 | 522,457 |
| Crestwood Holdings Partners LLC Tranche B, term loan 3 month U.S. LIBOR + 8.000% 9.2283% 6/19/19 (d)(e) | | 5,527,140 | 5,496,077 |
| Foresight Energy LLC Tranche B 1LN, term loan 3 month U.S. LIBOR + 5.750% 7.0464% 3/28/22 (d)(e) | | 1,995,000 | 1,866,981 |
| Gavilan Resources LLC Tranche 2LN, term loan 3 month U.S. LIBOR + 6.000% 7.2306% 3/1/24 (d)(e) | | 2,500,000 | 2,353,125 |
| Houston Fuel Oil Terminal Co. Tranche B, term loan 3 month U.S. LIBOR + 3.500% 4.8% 8/19/21 (d)(e) | | 7,208,121 | 7,136,040 |
| Limetree Bay Terminals LLC term loan 3 month U.S. LIBOR + 4.000% 5.2283% 2/15/24 (d)(e) | | 2,857,838 | 2,897,133 |
| Moxie Patriot LLC Tranche B, term loan 3 month U.S. LIBOR + 5.750% 7.0464% 12/19/20 (d)(e) | | 6,172,692 | 5,720,048 |
| Panda Temple Power, LLC term loan 3 month U.S. LIBOR + 6.000% 7.2964% 4/3/19 (d)(e) | | 1,004,700 | 954,465 |
| Peabody Energy Corp. term loan 3 month U.S. LIBOR + 4.500% 5.7339% 3/31/22 (d)(e) | | 3,358,421 | 3,381,090 |
| | | | 56,316,186 |
|
| TOTAL ENERGY | | | 72,535,553 |
|
| FINANCIALS - 0.3% | | | |
| Capital Markets - 0.0% | | | |
| Cypress Intermediate Holdings, Inc. Tranche B 1LN, term loan 3 month U.S. LIBOR + 3.000% 4.24% 4/27/24 (d)(e) | | 3,045,000 | 3,038,149 |
| HarbourVest Partners LLC Tranche B, term loan 3 month U.S. LIBOR + 2.500% 3.8039% 2/4/21 (d)(e) | | 756,307 | 755,362 |
| IBC Capital U.S. LLC: | | | |
| Tranche 2LN, term loan 3 month U.S. LIBOR + 7.000% 8.2281% 9/11/22 (d)(e) | | 2,505,000 | 2,379,750 |
| Tranche B 1LN, term loan 3 month U.S. LIBOR + 3.750% 4.9781% 9/11/21 (d)(e) | | 1,949,135 | 1,928,026 |
| Jane Street Group LLC Tranche B, term loan 3 month U.S. LIBOR + 4.500% 5.7344% 8/25/22 (d)(e) | | 2,000,000 | 2,017,500 |
| | | | 10,118,787 |
| Diversified Financial Services - 0.1% | | | |
| Avolon TLB Borrower 1 (U.S.) LLC Tranche B 2LN, term loan 3 month U.S. LIBOR + 2.750% 3.9806% 3/20/22 (d)(e) | | 4,300,000 | 4,311,696 |
| Delos Finance SARL Tranche B, term loan 3 month U.S. LIBOR + 2.000% 3.2964% 10/6/23 (d)(e) | | 4,118,000 | 4,138,590 |
| Extell Boston 5.154% 8/31/21 (d) | | 1,137,495 | 1,142,841 |
| Finco I LLC Tranche B, term loan 3 month U.S. LIBOR + 2.750% 1.375% 7/14/22 (d)(e) | | 3,000,000 | 3,024,000 |
| Flying Fortress Holdings, Inc. Tranche B, term loan 3 month U.S. LIBOR + 2.000% 3.2964% 10/30/22 (d)(e) | | 2,000,000 | 2,007,500 |
| Focus Financial Partners LLC Tranche B 1LN, term loan 3 month U.S. LIBOR + 3.250% 4.5486% 7/3/24 (d)(e) | | 1,385,000 | 1,400,581 |
| Kingpin Intermediate Holdings LLC Tranche B, term loan 3 month U.S. LIBOR + 4.250% 5.49% 7/3/24 (d)(e) | | 1,000,000 | 1,007,080 |
| Nab Holdings LLC Tranche B, term loan 3 month U.S. LIBOR + 3.500% 4.7992% 6/30/24 (d)(e) | | 1,755,000 | 1,761,581 |
| Onvoy LLC Tranche B 1LN, term loan 3 month U.S. LIBOR + 4.500% 5.7964% 2/10/24 (d)(e) | | 2,743,125 | 2,736,267 |
| Peak 10 Holding Corp. term loan 3 month U.S. LIBOR + 3.500% 4.8106% 8/1/24 (d)(e) | | 1,000,000 | 996,250 |
| TransUnion LLC Tranche B, term loan 3 month U.S. LIBOR + 2.000% 3.2339% 4/9/23 (d)(e) | | 4,893,918 | 4,895,142 |
| UFC Holdings LLC Tranche B 1LN, term loan 3 month U.S. LIBOR + 3.250% 4.49% 8/18/23 (d)(e) | | 2,973,769 | 2,981,203 |
| VF Holdings Corp. term loan 3 month U.S. LIBOR + 3.250% 4.5464% 6/30/23 (d)(e) | | 1,488,750 | 1,493,216 |
| | | | 31,895,947 |
| Insurance - 0.2% | | | |
| Acrisure LLC Tranche B 1LN, term loan 3 month U.S. LIBOR + 5.000% 6.2964% 11/22/23 (d)(e) | | 5,715,675 | 5,779,976 |
| Alliant Holdings Intermediate LLC Tranche B, term loan 3 month U.S. LIBOR + 3.250% 4.5639% 8/14/22 (d)(e) | | 3,934,884 | 3,931,775 |
| AmWINS Group, Inc.: | | | |
| Tranche 2LN, term loan 3 month U.S. LIBOR + 6.750% 7.9839% 1/25/25 (d)(e) | | 275,000 | 280,500 |
| Tranche B 1LN, term loan 3 month U.S. LIBOR + 2.750% 4.1759% 1/25/24 (d)(e) | | 1,492,500 | 1,493,440 |
| Asurion LLC: | | | |
| term loan 3 month U.S. LIBOR + 6.000% 7.2389% 8/4/25 (d)(e) | | 3,935,000 | 4,015,353 |
| Tranche B 5LN, term loan 3 month U.S. LIBOR + 3.000% 4.2389% 11/3/23 (d)(e) | | 7,640,624 | 7,669,276 |
| Tranche B, term loan 3 month U.S. LIBOR + 2.750% 3.9806% 8/4/22 (d)(e) | | 4,692,706 | 4,702,983 |
| HUB International Ltd. Tranche B 1LN, term loan 3 month U.S. LIBOR + 3.000% 4.3115% 10/2/20 (d)(e) | | 4,800,547 | 4,814,853 |
| USI, Inc.: | | | |
| Tranche B, term loan 3 month U.S. LIBOR + 3.000% 5/16/24 (e)(s) | | 4,895,000 | 4,856,232 |
| Tranche, term loan 3 month U.S. LIBOR + 3.000% 4.3142% 5/16/24 (d)(e) | | 4,680,000 | 4,651,733 |
| | | | 42,196,121 |
| Real Estate Management & Development - 0.0% | | | |
| DTZ U.S. Borrower LLC Tranche B 1LN, term loan 3 month U.S. LIBOR + 3.250% 4.5643% 11/4/21 (d)(e) | | 5,259,168 | 5,267,635 |
| MGM Growth Properties Operating Partner LP Tranche B, term loan 3 month U.S. LIBOR + 2.250% 3.4839% 4/25/23 (d)(e) | | 4,810,385 | 4,818,418 |
| | | | 10,086,053 |
| Thrifts & Mortgage Finance - 0.0% | | | |
| Ocwen Loan Servicing LLC Tranche B, term loan 3 month U.S. LIBOR + 5.000% 6.2306% 12/5/20 (d)(e) | | 1,278,608 | 1,270,936 |
|
| TOTAL FINANCIALS | | | 95,567,844 |
|
| HEALTH CARE - 0.4% | | | |
| Health Care Equipment & Supplies - 0.1% | | | |
| Alere, Inc. Tranche B, term loan 3 month U.S. LIBOR + 3.250% 4.48% 6/18/22 (d)(e) | | 1,848,209 | 1,843,977 |
| American Renal Holdings, Inc. Tranche B, term loan 3 month U.S. LIBOR + 3.250% 4.4839% 6/22/24 (d)(e) | | 2,825,000 | 2,808,530 |
| CPI Holdco LLC Tranche B 1LN, term loan 3 month U.S. LIBOR + 4.000% 5.3% 3/21/24 (d)(e) | | 1,910,213 | 1,917,376 |
| Ortho-Clinical Diagnostics, Inc. Tranche B, term loan 3 month U.S. LIBOR + 3.750% 5.0464% 6/30/21 (d)(e) | | 8,960,017 | 8,976,682 |
| | | | 15,546,565 |
| Health Care Providers & Services - 0.2% | | | |
| Community Health Systems, Inc.: | | | |
| Tranche G, term loan 3 month U.S. LIBOR + 2.750% 4.0669% 12/31/19 (d)(e) | | 1,474,840 | 1,470,475 |
| Tranche H, term loan 3 month U.S. LIBOR + 3.000% 4.3169% 1/27/21 (d)(e) | | 10,722,179 | 10,663,421 |
| Envision Healthcare Corp. Tranche B, term loan 3 month U.S. LIBOR + 3.000% 4.3% 12/1/23 (d)(e) | | 11,474,844 | 11,552,299 |
| Equian LLC Tranche DD, term loan 3 month U.S. LIBOR + 3.750% 5.0156% 5/19/24 (d)(e)(t) | | 631,765 | 637,293 |
| Ghx Ultimate Parent Corp. Tranche B, term loan 3 month U.S. LIBOR + 3.250% 4.5464% 6/30/24 (d)(e) | | 1,260,000 | 1,257,896 |
| HCA Holdings, Inc.: | | | |
| Tranche B 8LN, term loan 3 month U.S. LIBOR + 2.250% 3.4839% 2/15/24 (d)(e) | | 2,985,019 | 2,997,824 |
| Tranche B 9LN, term loan 3 month U.S. LIBOR + 2.000% 3.2339% 3/18/23 (d)(e) | | 7,920,150 | 7,942,406 |
| Kindred Healthcare, Inc. Tranche B, term loan 3 month U.S. LIBOR + 3.500% 4.8125% 4/9/21 (d)(e) | | 3,502,491 | 3,490,442 |
| Milk Specialties Co. Tranche B, term loan 3 month U.S. LIBOR + 4.000% 5.2964% 8/16/23 (d)(e) | | 659,863 | 664,812 |
| MPH Acquisition Holdings LLC Tranche B, term loan 3 month U.S. LIBOR + 3.000% 4.2964% 6/7/23 (d)(e) | | 2,273,055 | 2,281,101 |
| Onex Schumacher Finance LP Tranche B 1LN, term loan 3 month U.S. LIBOR + 4.000% 5.2389% 7/31/22 (d)(e) | | 1,169,032 | 1,167,571 |
| Precyse Acquisition Corp. Tranche B, term loan 3 month U.S. LIBOR + 4.500% 5.7339% 10/20/22 (d)(e) | | 505,000 | 506,894 |
| U.S. Anesthesia Partners, Inc. Tranche B, term loan 3 month U.S. LIBOR + 3.250% 4.4861% 6/23/24 (d)(e) | | 1,000,000 | 993,750 |
| U.S. Renal Care, Inc.: | | | |
| Tranche 2LN, term loan 3 month U.S. LIBOR + 8.000% 9.2964% 12/31/23 (d)(e) | | 3,000,000 | 2,925,000 |
| Tranche B 1LN, term loan 3 month U.S. LIBOR + 4.250% 5.5464% 12/31/22 (d)(e) | | 7,411,363 | 7,235,343 |
| Vizient, Inc. Tranche B 3LN, term loan 3 month U.S. LIBOR + 3.500% 4.7339% 2/11/23 (d)(e) | | 3,519,412 | 3,554,606 |
| | | | 59,341,133 |
| Health Care Technology - 0.0% | | | |
| Press Ganey Holdings, Inc.: | | | |
| Tranche 2LN, term loan 3 month U.S. LIBOR + 7.250% 8.4839% 10/21/24 (d)(e) | | 1,000,000 | 1,018,750 |
| Tranche B 1LN, term loan 3 month U.S. LIBOR + 3.250% 4.4839% 10/21/23 (d)(e) | | 2,985,000 | 2,996,194 |
| Project Ruby Ultimate Parent Corp. Tranche B, term loan 3 month U.S. LIBOR + 3.750% 4.9839% 2/9/24 (d)(e) | | 996,819 | 1,000,138 |
| | | | 5,015,082 |
| Life Sciences Tools & Services - 0.0% | | | |
| Albany Molecular Research, Inc. term loan: | | | |
| 3 month U.S. LIBOR + 3.250% 4.4889% 7/27/24 (d)(e) | | 1,105,000 | 1,105,000 |
| 3 month U.S. LIBOR + 7.000% 8.2389% 7/27/25 (d)(e) | | 580,000 | 587,250 |
| PAREXEL International Corp. Tranche B, term loan 3 month U.S. LIBOR + 3.000% 8/11/24 (e)(s) | | 5,000,000 | 5,010,000 |
| | | | 6,702,250 |
| Pharmaceuticals - 0.1% | | | |
| HLF Financing U.S. LLC Tranche B, term loan 3 month U.S. LIBOR + 5.500% 6.7339% 2/15/23 (d)(e) | | 2,486,844 | 2,497,736 |
| Innoviva, Inc. Tranche B, term loan 3 month U.S. LIBOR + 4.500% 5.8167% 8/18/22 (d)(e) | | 2,540,000 | 2,546,350 |
| RPI Finance Trust Tranche B 6LN, term loan 3 month U.S. LIBOR + 2.000% 3.2964% 3/27/23 (d)(e) | | 4,000,000 | 4,014,360 |
| Valeant Pharmaceuticals International, Inc. Tranche B, term loan 3 month U.S. LIBOR + 4.750% 5.99% 4/1/22 (d)(e) | | 15,327,281 | 15,582,787 |
| | | | 24,641,233 |
|
| TOTAL HEALTH CARE | | | 111,246,263 |
|
| INDUSTRIALS - 0.5% | | | |
| Aerospace & Defense - 0.1% | | | |
| DigitalGlobe, Inc. Tranche B, term loan 3 month U.S. LIBOR + 2.750% 3.9839% 1/15/24 (d)(e) | | 1,641,750 | 1,639,698 |
| Gemini HDPE LLC Tranche B, term loan 3 month U.S. LIBOR + 3.000% 4.3111% 8/7/21 (d)(e) | | 982,217 | 984,673 |
| TransDigm, Inc.: | | | |
| Tranche B, term loan 3 month U.S. LIBOR + 3.000% 4.2639% 8/22/24 (d)(e) | | 7,770,000 | 7,776,915 |
| Tranche D, term loan 3 month U.S. LIBOR + 3.000% 4.2928% 6/4/21 (d)(e) | | 4,955,713 | 4,961,362 |
| Tranche E, term loan 3 month U.S. LIBOR + 3.000% 4.258% 5/14/22 (d)(e) | | 983,262 | 984,265 |
| Tranche F, term loan 3 month U.S. LIBOR + 3.000% 4.2339% 6/9/23 (d)(e) | | 13,158,886 | 13,173,887 |
| | | | 29,520,800 |
| Airlines - 0.1% | | | |
| American Airlines, Inc.: | | | |
| Tranche B, term loan 3 month U.S. LIBOR + 2.000% 3.2306% 10/10/21 (d)(e) | | 6,241,462 | 6,241,462 |
| Tranche B, term loan 3 month U.S. LIBOR + 2.500% 3.7267% 12/14/23 (d)(e) | | 4,445,000 | 4,454,735 |
| | | | 10,696,197 |
| Building Products - 0.0% | | | |
| GYP Holdings III Corp. Tranche B, term loan 3 month U.S. LIBOR + 3.000% 4.3111% 4/1/23 (d)(e) | | 3,805,343 | 3,814,856 |
| HD Supply, Inc. Tranche B 4LN, term loan 3 month U.S. LIBOR + 2.500% 3.7389% 10/17/23 (d)(e) | | 992,500 | 993,989 |
| Jeld-Wen, Inc. Tranche B 3LN, term loan 3 month U.S. LIBOR + 3.000% 4.2964% 7/1/22 (d)(e) | | 1,722,982 | 1,732,028 |
| | | | 6,540,873 |
| Commercial Services & Supplies - 0.2% | | | |
| Brand Energy & Infrastructure Services, Inc. Tranche B, term loan 3 month U.S. LIBOR + 4.250% 5.5217% 6/21/24 (d)(e) | | 9,075,000 | 9,096,417 |
| Garda World Security Corp. Tranche B, term loan 3 month U.S. LIBOR + 4.000% 5.3154% 5/26/24 (d)(e) | | 854,322 | 858,952 |
| GCA Services Group, Inc. Tranche B 1LN, term loan 3 month U.S. LIBOR + 4.750% 6.0052% 3/1/23 (d)(e) | | 2,203,799 | 2,209,308 |
| Harland Clarke Holdings Corp.: | | | |
| Tranche B 5LN, term loan 3 month U.S. LIBOR + 6.000% 7.2964% 12/31/21 (d)(e) | | 2,983,255 | 2,995,934 |
| Tranche B 6LN, term loan 3 month U.S. LIBOR + 5.500% 6.7964% 2/9/22 (d)(e) | | 1,366,171 | 1,370,160 |
| Hd Supply Waterworks Ltd. term loan 3 month U.S. LIBOR + 3.000% 4.455% 8/1/24 (d)(e) | | 3,055,000 | 3,058,819 |
| KAR Auction Services, Inc. Tranche B, term loan 3 month U.S. LIBOR + 2.500% 3.8125% 3/9/23 (d)(e) | | 1,121,765 | 1,125,971 |
| Lineage Logistics Holdings, LLC. Tranche B, term loan 3 month U.S. LIBOR + 3.500% 4.7389% 4/7/21 (d)(e) | | 14,409,122 | 14,418,200 |
| Merrill Communications LLC Tranche B, term loan 3 month U.S. LIBOR + 5.250% 6.5611% 6/1/22 (d)(e) | | 1,825,904 | 1,835,033 |
| Metal Services LLC Tranche B, term loan 3 month U.S. LIBOR + 7.500% 8.7964% 6/30/19 (d)(e) | | 1,088,986 | 1,097,153 |
| Optiv Security, Inc. Tranche B 1LN, term loan 3 month U.S. LIBOR + 3.250% 4.5625% 2/1/24 (d)(e) | | 1,350,582 | 1,226,774 |
| Prime Security Services Borrower LLC Tranche B 1LN, term loan 3 month U.S. LIBOR + 2.750% 3.9839% 5/2/22 (d)(e) | | 11,280,902 | 11,332,004 |
| SAI Global GP Tranche B, term loan 3 month U.S. LIBOR + 4.500% 5.7964% 12/8/23 (d)(e)(g) | | 2,487,500 | 2,512,375 |
| The Brickman Group, Ltd. Tranche B 1LN, term loan 3 month U.S. LIBOR + 3.000% 4.2342% 12/18/20 (d)(e) | | 2,687,755 | 2,695,496 |
| Thomson Reuters IP&S Tranche B 1LN, term loan 3 month U.S. LIBOR + 3.500% 4.7339% 10/3/23 (d)(e) | | 3,786,435 | 3,801,316 |
| WTG Holdings III Corp. Tranche B 1LN, term loan 3 month U.S. LIBOR + 3.750% 5.0464% 1/15/21 (d)(e) | | 2,496,496 | 2,521,461 |
| | | | 62,155,373 |
| Construction & Engineering - 0.0% | | | |
| Ventia Deco LLC Tranche B, term loan 3 month U.S. LIBOR + 3.500% 4.7964% 5/21/22 (d)(e) | | 3,160,131 | 3,168,031 |
| Electrical Equipment - 0.0% | | | |
| Cortes NP Acquisition Corp. Tranche B, term loan 3 month U.S. LIBOR + 4.000% 5.2389% 11/30/23 (d)(e) | | 3,225,981 | 3,244,788 |
| Machinery - 0.1% | | | |
| Doosan Bobcat Tranche B, term loan 3 month U.S. LIBOR + 2.750% 4.0128% 5/18/24 (d)(e) | | 1,735,650 | 1,738,549 |
| Gardner Denver, Inc. Tranche B, term loan 3 month U.S. LIBOR + 2.750% 4.0122% 7/30/24 (d)(e) | | 1,030,000 | 1,028,589 |
| NN, Inc. term loan 3 month U.S. LIBOR + 3.750% 4.9839% 4/3/21 (d)(e) | | 1,485,000 | 1,492,425 |
| Onex Wizard U.S. Acquisition, Inc. Tranche B, term loan 3 month U.S. LIBOR + 3.000% 4.2389% 3/13/22 (d)(e) | | 3,784,855 | 3,799,049 |
| The Gates Corp. Tranche B 1LN, term loan 3 month U.S. LIBOR + 3.250% 4.5464% 3/31/24 (d)(e) | | 393,004 | 394,164 |
| | | | 8,452,776 |
| Marine - 0.0% | | | |
| International Seaways Operatin Tranche B, term loan 3 month U.S. LIBOR + 5.500% 6.79% 6/22/22 (d)(e) | | 2,990,000 | 2,967,575 |
| Navios Maritime Partners LP Tranche B, term loan 3 month U.S. LIBOR + 5.000% 6.23% 9/14/20 (d)(e) | | 2,962,500 | 2,947,688 |
| | | | 5,915,263 |
| Professional Services - 0.0% | | | |
| AlixPartners LLP Tranche B, term loan 3 month U.S. LIBOR + 3.000% 4.2964% 4/4/24 (d)(e) | | 3,366,563 | 3,381,981 |
| Science Applications International Corp. Tranche B, term loan 3 month U.S. LIBOR + 2.500% 3.8125% 5/4/22 (d)(e) | | 1,405,732 | 1,412,760 |
| | | | 4,794,741 |
| Trading Companies & Distributors - 0.0% | | | |
| Fly Funding II SARL Tranche B, term loan 3 month U.S. LIBOR + 2.250% 3.5614% 2/9/23 (d)(e) | | 2,097,368 | 2,098,249 |
| Transportation Infrastructure - 0.0% | | | |
| American Commercial Barge Line Tranche B 1LN, term loan 3 month U.S. LIBOR + 8.750% 9.9889% 11/12/20 (d)(e) | | 1,155,345 | 915,611 |
| DAE Aviation Holdings, Inc. Tranche B, term loan 3 month U.S. LIBOR + 3.750% 4.99% 7/7/22 (d)(e) | | 1,994,924 | 2,010,385 |
| Standardaero Aviation Holdings In term loan 3 month U.S. LIBOR + 3.750% 7/7/22 (e)(s) | | 1,290,000 | 1,293,225 |
| | | | 4,219,221 |
|
| TOTAL INDUSTRIALS | | | 140,806,312 |
|
| INFORMATION TECHNOLOGY - 0.8% | | | |
| Communications Equipment - 0.0% | | | |
| Polycom, Inc. Tranche B, term loan 3 month U.S. LIBOR + 5.250% 6.4839% 9/27/23 (d)(e) | | 2,599,750 | 2,631,597 |
| Radiate Holdco LLC Tranche B, term loan 3 month U.S. LIBOR + 3.000% 4.2389% 2/1/24 (d)(e) | | 5,516,175 | 5,438,011 |
| Zayo Group LLC term loan 3 month U.S. LIBOR + 2.000% 3.2306% 1/19/21 (d)(e) | | 1,960,088 | 1,958,872 |
| | | | 10,028,480 |
| Electronic Equipment & Components - 0.0% | | | |
| Electro Rent Corp. Tranche B 1LN, term loan 3 month U.S. LIBOR + 5.000% 6.2339% 1/31/24 (d)(e) | | 1,990,000 | 2,007,413 |
| Go Daddy Operating Co. LLC Tranche B, term loan 3 month U.S. LIBOR + 2.500% 3.7339% 2/15/24 (d)(e) | | 6,747,748 | 6,759,017 |
| Infor U.S., Inc. Tranche B 6LN, term loan 3 month U.S. LIBOR + 2.750% 4.0464% 2/1/22 (d)(e) | | 2,202,901 | 2,195,830 |
| Lux FinCo U.S. SPV: | | | |
| Tranche 2LN, term loan 3 month U.S. LIBOR + 8.500% 9.7344% 10/16/23 (d)(e) | | 405,000 | 384,750 |
| Tranche B 3LN, term loan 3 month U.S. LIBOR + 3.500% 4.7344% 10/16/22 (d)(e) | | 1,913,099 | 1,889,185 |
| TTM Technologies, Inc. Tranche B 1LN, term loan 3 month U.S. LIBOR + 4.250% 5.4889% 5/31/21 (d)(e) | | 2,517,744 | 2,546,068 |
| | | | 15,782,263 |
| Internet Software & Services - 0.2% | | | |
| Abacus Innovations Corp. Tranche B, term loan 3 month U.S. LIBOR + 2.250% 3.25% 8/16/23 (d)(e) | | 1,820,426 | 1,823,157 |
| Ancestry.Com Operations, Inc.: | | | |
| Tranche 2LN, term loan 3 month U.S. LIBOR + 8.250% 9.49% 10/19/24 (d)(e) | | 725,000 | 733,156 |
| Tranche B 1LN, term loan 3 month U.S. LIBOR + 3.250% 4.48% 10/19/23 (d)(e) | | 4,950,000 | 4,971,681 |
| Blucora, Inc. Tranche B, term loan 3 month U.S. LIBOR + 3.750% 5.0372% 5/22/24 (d)(e) | | 1,440,000 | 1,454,400 |
| Datapipe, Inc. Tranche B 1LN, term loan 3 month U.S. LIBOR + 4.750% 6.0464% 3/15/19 (d)(e) | | 6,207,974 | 6,223,494 |
| EIG Investors Corp. Tranche B, term loan 3 month U.S. LIBOR + 4.000% 5.3171% 2/9/23 (d)(e) | | 10,932,436 | 11,039,464 |
| Mh Sub I LLC Tranche B, term loan 3 month U.S. LIBOR + 3.750% 4.82% 8/16/24 (d)(e) | | 2,000,000 | 1,988,340 |
| Rackspace Hosting, Inc. Tranche B, term loan 3 month U.S. LIBOR + 3.000% 4.3104% 11/3/23 (d)(e) | | 10,705,075 | 10,713,960 |
| Travelclick, Inc. Tranche B 1LN, term loan 3 month U.S. LIBOR + 4.000% 5.2339% 5/12/21 (d)(e) | | 927,717 | 932,356 |
| Uber Technologies, Inc. Tranche B, term loan 3 month U.S. LIBOR + 4.000% 5.2361% 7/13/23 (d)(e) | | 12,862,934 | 12,834,764 |
| Vfh Parent LLC Tranche B, term loan 3 month U.S. LIBOR + 3.750% 5.0606% 12/30/21 (d)(e) | | 1,575,000 | 1,586,813 |
| | | | 54,301,585 |
| IT Services - 0.2% | | | |
| Ceridian HCM Holding, Inc. Tranche B 2LN, term loan 3 month U.S. LIBOR + 3.500% 4.7017% 9/15/20 (d)(e) | | 7,588,745 | 7,576,071 |
| Cologix Holdings, Inc. Tranche B 1LN, term loan 3 month U.S. LIBOR + 3.000% 4.4561% 3/20/24 (d)(e) | | 1,995,000 | 1,991,668 |
| Equian LLC Tranche B, term loan 3 month U.S. LIBOR + 3.750% 5.0664% 5/19/24 (d)(e) | | 2,053,235 | 2,071,201 |
| First Data Corp. Tranche B, term loan 3 month U.S. LIBOR + 2.250% 3.4861% 7/10/22 (d)(e) | | 12,488,329 | 12,472,719 |
| Global Payments, Inc. Tranche B 2LN, term loan 3 month U.S. LIBOR + 2.000% 3.2339% 4/22/23 (d)(e) | | 1,241,499 | 1,241,499 |
| Information Resources, Inc.: | | | |
| Tranche 2LN, term loan 3 month U.S. LIBOR + 8.250% 9.4861% 1/18/25 (d)(e) | | 1,000,000 | 996,250 |
| Tranche B 1LN, term loan 3 month U.S. LIBOR + 4.250% 5.4861% 1/18/24 (d)(e) | | 3,097,238 | 3,116,595 |
| Inmar, Inc.: | | | |
| Tranche 2LN, term loan 3 month U.S. LIBOR + 8.000% 9.2556% 5/1/25 (d)(e) | | 290,000 | 291,088 |
| Tranche B 1LN, term loan 3 month U.S. LIBOR + 3.500% 4.7556% 5/1/24 (d)(e) | | 1,025,000 | 1,025,646 |
| Neustar, Inc.: | | | |
| Tranche 2LN, term loan 3 month U.S. LIBOR + 8.000% 9.3119% 8/8/25 (d)(e) | | 700,000 | 707,000 |
| Tranche B1 1LN, term loan 3 month U.S. LIBOR + 3.250% 4.5585% 1/8/20 (d)(e) | | 429,456 | 431,200 |
| Tranche B2 1LN, term loan 3 month U.S. LIBOR + 3.750% 5.0619% 8/8/24 (d)(e) | | 2,440,000 | 2,458,300 |
| RP Crown Parent, LLC Tranche B, term loan 3 month U.S. LIBOR + 3.500% 4.7339% 10/12/23 (d)(e) | | 4,397,900 | 4,427,762 |
| Tempo Acquisition LLC Tranche B, term loan 3 month U.S. LIBOR + 3.000% 4.2317% 5/1/24 (d)(e) | | 5,370,000 | 5,386,110 |
| WEX, Inc. term loan 3 month U.S. LIBOR + 2.750% 3.9839% 7/1/23 (d)(e) | | 3,210,642 | 3,231,929 |
| Xerox Business Services LLC Tranche B, term loan 3 month U.S. LIBOR + 4.000% 5.2339% 12/7/23 (d)(e) | | 3,507,375 | 3,535,434 |
| | | | 50,960,472 |
| Semiconductors & Semiconductor Equipment - 0.0% | | | |
| Bright Bidco BV Tranche B, term loan 3 month U.S. LIBOR + 4.500% 5.7964% 6/30/24 (d)(e) | | 2,500,000 | 2,515,625 |
| Cavium, Inc. Tranche B 1LN, term loan 3 month U.S. LIBOR + 2.250% 3.4844% 8/16/22 (d)(e) | | 1,569,984 | 1,571,946 |
| Microsemi Corp. Tranche B, term loan 3 month U.S. LIBOR + 2.250% 3.553% 1/15/23 (d)(e) | | 1,474,097 | 1,476,559 |
| | | | 5,564,130 |
| Software - 0.4% | | | |
| Almonde, Inc.: | | | |
| Tranche 2LN, term loan 3 month U.S. LIBOR + 7.250% 8.4589% 6/13/25 (d)(e) | | 1,705,000 | 1,733,508 |
| Tranche B 1LN, term loan 3 month U.S. LIBOR + 3.500% 4.8169% 6/13/24 (d)(e) | | 7,915,000 | 7,948,639 |
| Applied Systems, Inc. Tranche B 1LN, term loan 3 month U.S. LIBOR + 3.250% 4.5464% 1/23/21 (d)(e) | | 995,659 | 1,001,882 |
| Aptean, Inc.: | | | |
| Tranche 2LN, term loan 3 month U.S. LIBOR + 9.500% 10.8% 12/20/23 (d)(e) | | 685,000 | 683,719 |
| Tranche B 1LN, term loan 3 month U.S. LIBOR + 4.250% 5.55% 12/20/22 (d)(e) | | 1,925,175 | 1,938,420 |
| Compuware Corp.: | | | |
| term loan 3 month U.S. LIBOR + 8.250% 9.55% 12/15/22 (d)(e) | | 743,561 | 750,535 |
| Tranche B 3LN, term loan 3 month U.S. LIBOR + 4.250% 5.55% 12/15/21 (d)(e) | | 5,229,381 | 5,281,675 |
| Epicor Software Corp. Tranche B, term loan 3 month U.S. LIBOR + 3.750% 4.99% 6/1/22 (d)(e) | | 7,876,713 | 7,890,813 |
| Evo Payments International LLC Tranche B 1LN, term loan 3 month U.S. LIBOR + 5.000% 6.24% 12/20/23 (d)(e) | | 2,493,750 | 2,521,805 |
| Greeneden U.S. Holdings II LLC Tranche B, term loan 3 month U.S. LIBOR + 3.750% 5.0067% 12/1/23 (d)(e) | | 6,517,504 | 6,551,265 |
| Hyland Software, Inc.: | | | |
| Tranche 2LN, term loan 3 month U.S. LIBOR + 7.000% 8.2339% 7/7/25 (d)(e) | | 290,000 | 294,713 |
| Tranche B 1LN, term loan 3 month U.S. LIBOR + 3.250% 4.4839% 7/1/22 (d)(e) | | 1,550,000 | 1,561,625 |
| Kronos, Inc.: | | | |
| term loan 3 month U.S. LIBOR + 8.250% 9.5606% 11/1/24 (d)(e) | | 5,095,000 | 5,260,588 |
| Tranche B 1LN, term loan 3 month U.S. LIBOR + 3.500% 4.8113% 11/1/23 (d)(e) | | 14,542,016 | 14,653,263 |
| Landesk Group, Inc. term loan: | | | |
| 3 month U.S. LIBOR + 4.250% 5.49% 1/20/24 (d)(e) | | 6,510,421 | 6,420,903 |
| 3 month U.S. LIBOR + 9.000% 10.24% 1/20/25 (d)(e) | | 2,445,000 | 2,415,660 |
| MA FinanceCo. LLC Tranche B 3LN, term loan: | | | |
| 3 month U.S. LIBOR + 2.750% 3.9806% 6/21/24 (d)(e) | | 1,052,102 | 1,050,787 |
| 3 month U.S. LIBOR + 2.750% 4.0302% 6/21/24 (d)(e) | | 7,012,898 | 7,004,132 |
| Quest Software U.S. Holdings, Inc. Tranche B, term loan 3 month U.S. LIBOR + 6.000% 7.2572% 10/31/22 (d)(e) | | 2,974,824 | 3,016,352 |
| Renaissance Learning, Inc.: | | | |
| Tranche 1LN, term loan 3 month U.S. LIBOR + 3.750% 5.0464% 4/9/21 (d)(e) | | 6,386,379 | 6,423,612 |
| Tranche 2LN, term loan 3 month U.S. LIBOR + 7.000% 8.2964% 4/9/22 (d)(e) | | 2,813,000 | 2,813,000 |
| SolarWinds Holdings, Inc. Tranche B, term loan 3 month U.S. LIBOR + 3.500% 4.7339% 2/5/23 (d)(e) | | 2,970,075 | 2,980,797 |
| Solera LLC Tranche B, term loan 3 month U.S. LIBOR + 3.250% 4.5072% 3/3/23 (d)(e) | | 4,915,735 | 4,928,270 |
| Sophia L.P. term loan 3 month U.S. LIBOR + 3.250% 4.5464% 9/30/22 (d)(e) | | 4,889,988 | 4,881,577 |
| SS&C Technologies, Inc.: | | | |
| Tranche B 1LN, term loan 3 month U.S. LIBOR + 2.250% 3.4839% 7/8/22 (d)(e) | | 1,721,784 | 1,727,931 |
| Tranche B 2LN, term loan 3 month U.S. LIBOR + 2.250% 3.4839% 7/8/22 (d)(e) | | 89,795 | 90,115 |
| Sybil Software LLC. Tranche B, term loan 3 month U.S. LIBOR + 3.250% 4.5031% 9/30/23 (d)(e) | | 3,786,107 | 3,805,833 |
| TIBCO Software, Inc. term loan 3 month U.S. LIBOR + 3.500% 4.74% 12/4/20 (d)(e) | | 777,115 | 778,638 |
| Veritas U.S., Inc. Tranche B, term loan 3 month U.S. LIBOR + 4.500% 5.7964% 1/27/23 (d)(e) | | 6,640,227 | 6,687,240 |
| | | | 113,097,297 |
| Technology Hardware, Storage & Peripherals - 0.0% | | | |
| Dell International LLC: | | | |
| Tranche A 1LN, term loan 3 month U.S. LIBOR + 2.000% 3.24% 12/31/18 (d)(e) | | 55,200 | 55,212 |
| Tranche B, term loan 3 month U.S. LIBOR + 2.500% 3.74% 9/7/23 (d)(e) | | 1,756,175 | 1,762,690 |
| | | | 1,817,902 |
|
| TOTAL INFORMATION TECHNOLOGY | | | 251,552,129 |
|
| MATERIALS - 0.3% | | | |
| Chemicals - 0.1% | | | |
| American Rock Salt Co. LLC Tranche B 1LN, term loan 3 month U.S. LIBOR + 3.750% 4.9839% 5/20/21 (d)(e) | | 2,730,600 | 2,727,187 |
| Ashland LLC Tranche B, term loan 3 month U.S. LIBOR + 2.000% 3.2374% 5/17/24 (d)(e) | | 2,545,000 | 2,551,363 |
| ASP Chromaflo Intermediate Holdings, Inc. Tranche B 1LN, term loan 3 month U.S. LIBOR + 4.000% 5.2339% 11/18/23 (d)(e) | | 1,810,900 | 1,816,568 |
| Ineos Styrolution U.S. Holding LLC Tranche B, term loan 3 month U.S. LIBOR + 2.750% 4.0464% 3/30/24 (d)(e) | | 1,447,734 | 1,450,456 |
| Jade Germany GmbH Tranche B, term loan 3 month U.S. LIBOR + 5.500% 6.7964% 5/31/23 (d)(e) | | 3,000,000 | 3,003,750 |
| Kraton Polymers LLC Tranche B, term loan 3 month U.S. LIBOR + 3.000% 4.2278% 1/6/22 (d)(e) | | 1,617,371 | 1,627,479 |
| MacDermid, Inc.: | | | |
| Tranche B 5LN, term loan 3 month U.S. LIBOR + 3.500% 4.7339% 6/7/20 (d)(e) | | 2,609,271 | 2,625,579 |
| Tranche B 6LN, term loan 3 month U.S. LIBOR + 3.000% 4% 6/7/23 (d)(e) | | 3,329,959 | 3,340,382 |
| Methanol Holdings (TRINIDAD) Ltd. Tranche B, term loan 3 month U.S. LIBOR + 3.500% 4.7339% 6/30/22 (d)(e) | | 2,583,410 | 2,596,327 |
| Royal Holdings, Inc.: | | | |
| Tranche B 1LN, term loan 3 month U.S. LIBOR + 3.250% 4.5464% 6/19/22 (d)(e) | | 2,097,718 | 2,108,206 |
| Tranche B 2LN, term loan 3 month U.S. LIBOR + 7.500% 8.7964% 6/19/23 (d)(e) | | 96,552 | 96,310 |
| The Chemours Co. LLC Tranche B, term loan 3 month U.S. LIBOR + 2.500% 3.74% 5/12/22 (d)(e) | | 2,375,061 | 2,380,262 |
| Trinseo Materials Operating SCA/Trinseo Materials Finance, Inc.: | | | |
| Tranche B 1LN, term loan 3 month U.S. LIBOR + 3.250% 4.4856% 11/5/21 (d)(e) | | 1,137,600 | 1,138,078 |
| Tranche B, term loan 3 month U.S. LIBOR + 2.500% 3.735% 8/16/24 (d)(e) | | 2,000,000 | 2,008,760 |
| Tronox Pigments (Netherlands) B.V. Tranche B, term loan 3 month U.S. LIBOR + 3.500% 4.7964% 3/19/20 (d)(e) | | 1,004,308 | 1,004,780 |
| U.S. Coatings Acquisition, Inc. Tranche B, term loan 3 month U.S. LIBOR + 2.000% 3.2964% 6/1/24 (d)(e) | | 2,000,000 | 2,004,380 |
| Univar, Inc. term loan 3 month U.S. LIBOR + 2.750% 3.9839% 7/1/22 (d)(e) | | 1,213,465 | 1,214,605 |
| Venator Materials LLC Tranche B, term loan 3 month U.S. LIBOR + 3.000% 4.3119% 8/8/24 (d)(e) | | 1,260,000 | 1,265,519 |
| | | | 34,959,991 |
| Construction Materials - 0.0% | | | |
| Unifrax I LLC Tranche B, term loan 3 month U.S. LIBOR + 3.750% 5.0464% 4/4/24 (d)(e) | | 1,000,000 | 1,003,330 |
| Containers & Packaging - 0.1% | | | |
| Anchor Glass Container Corp. Tranche 2LN, term loan 3 month U.S. LIBOR + 7.750% 8.9806% 12/7/24 (d)(e) | | 1,180,000 | 1,195,729 |
| Berlin Packaging, LLC: | | | |
| Tranche 2LN, term loan 3 month U.S. LIBOR + 6.750% 7.99% 10/1/22 (d)(e) | | 1,129,000 | 1,132,760 |
| Tranche B, term loan 3 month U.S. LIBOR + 3.250% 4.5166% 10/1/21 (d)(e) | | 5,353,211 | 5,368,093 |
| Berry Global, Inc. Tranche M, term loan 3 month U.S. LIBOR + 2.250% 3.4806% 10/1/22 (d)(e) | | 4,956,562 | 4,957,206 |
| Berry Plastics Corp. Tranche L, term loan 3 month U.S. LIBOR + 2.250% 3.4806% 1/6/21 (d)(e) | | 3,552,000 | 3,552,000 |
| BWAY Holding Co. Tranche B, term loan 3 month U.S. LIBOR + 3.250% 4.4806% 4/3/24 (d)(e) | | 1,000,000 | 1,000,310 |
| Caraustar Industries, Inc. Tranche B, term loan 3 month U.S. LIBOR + 5.500% 6.7964% 3/14/22 (d)(e) | | 3,501,225 | 3,462,712 |
| Charter Nex U.S., Inc. Tranche B 1LN, term loan 3 month U.S. LIBOR + 3.250% 4.4839% 5/16/24 (d)(e) | | 1,235,000 | 1,236,161 |
| Consolidated Container Co. Tranche B 1LN, term loan 3 month U.S. LIBOR + 3.500% 4.7389% 5/22/24 (d)(e) | | 2,290,000 | 2,301,450 |
| Flex Acquisition Co., Inc. Tranche B 1LN, term loan 3 month U.S. LIBOR + 3.000% 4.2986% 12/29/23 (d)(e) | | 4,538,625 | 4,529,548 |
| Printpack Holdings, Inc. Tranche B, term loan 3 month U.S. LIBOR + 3.000% 4.25% 7/26/23 (d)(e) | | 1,071,900 | 1,075,920 |
| Reynolds Group Holdings, Inc. Tranche B, term loan 3 month U.S. LIBOR + 3.000% 4.2389% 2/5/23 (d)(e) | | 12,779,830 | 12,785,964 |
| | | | 42,597,853 |
| Metals & Mining - 0.1% | | | |
| Gulf Finance LLC Tranche B 1LN, term loan 3 month U.S. LIBOR + 5.250% 6.55% 8/25/23 (d)(e) | | 7,220,356 | 6,522,365 |
| JMC Steel Group, Inc. Tranche B, term loan 3 month U.S. LIBOR + 3.500% 4.7894% 6/14/21 (d)(e) | | 2,865,718 | 2,868,097 |
| Murray Energy Corp. Tranche B 2LN, term loan 3 month U.S. LIBOR + 7.250% 8.5464% 4/16/20 (d)(e) | | 11,745,501 | 10,717,770 |
| Walter Energy, Inc. Tranche B, term loan 3 month U.S. LIBOR + 4.800% 0% 4/1/18 (e)(f)(g) | | 2,107,367 | 0 |
| | | | 20,108,232 |
|
| TOTAL MATERIALS | | | 98,669,406 |
|
| REAL ESTATE - 0.0% | | | |
| Equity Real Estate Investment Trusts (REITs) - 0.0% | | | |
| Communications Sales & Leasing, Inc. Tranche B, term loan 3 month U.S. LIBOR + 3.000% 4.2339% 10/24/22 (d)(e) | | 3,643,536 | 3,519,037 |
| iStar Financial, Inc. Tranche B, term loan 3 month U.S. LIBOR + 3.750% 4.9806% 7/1/20 (d)(e) | | 1,161,476 | 1,168,736 |
| The GEO Group, Inc. Tranche B, term loan 3 month U.S. LIBOR + 2.250% 3.49% 3/23/24 (d)(e) | | 1,471,313 | 1,471,930 |
| | | | 6,159,703 |
| Real Estate Management & Development - 0.0% | | | |
| Americold Realty Operating Partnership LP Tranche B, term loan 3 month U.S. LIBOR + 3.750% 4.9839% 12/1/22 (d)(e) | | 2,475,718 | 2,503,570 |
| Capital Automotive LP: | | | |
| Tranche 2LN, term loan 3 month U.S. LIBOR + 6.000% 7.24% 3/24/25 (d)(e) | | 922,138 | 931,359 |
| Tranche B 1LN, term loan 3 month U.S. LIBOR + 3.000% 4.24% 3/24/24 (d)(e) | | 171,605 | 172,342 |
| RE/MAX LLC Tranche B, term loan 3 month U.S. LIBOR + 2.750% 4.0464% 12/15/23 (d)(e) | | 1,081,825 | 1,084,530 |
| Realogy Group LLC term loan 3 month U.S. LIBOR + 2.250% 3.4839% 7/20/22 (d)(e) | | 4,958,735 | 4,974,256 |
| Simply Storage Management LLC 8.2375% 9/6/21 (d)(g) | | 1,305,000 | 1,305,000 |
| | | | 10,971,057 |
|
| TOTAL REAL ESTATE | | | 17,130,760 |
|
| TELECOMMUNICATION SERVICES - 0.4% | | | |
| Diversified Telecommunication Services - 0.2% | | | |
| Altice Financing SA Tranche B, term loan 3 month U.S. LIBOR + 2.750% 4.0539% 7/15/25 (d)(e) | | 3,142,125 | 3,137,066 |
| Cincinnati Bell, Inc. Tranche B, term loan 3 month U.S. LIBOR + 3.750% 8/18/24 (e)(s) | | 2,000,000 | 2,000,620 |
| Consolidated Communications, Inc. Tranche B 2LN, term loan 3 month U.S. LIBOR + 3.000% 4.24% 10/5/23 (d)(e) | | 2,000,000 | 1,962,500 |
| Level 3 Financing, Inc. Tranche B, term loan 3 month U.S. LIBOR + 2.250% 3.485% 2/22/24 (d)(e) | | 12,065,000 | 12,053,659 |
| LTS Buyer LLC Tranche B 1LN, term loan 3 month U.S. LIBOR + 3.250% 4.5464% 4/11/20 (d)(e) | | 8,256,774 | 8,265,031 |
| Sable International Finance Ltd. Tranche B, term loan 3 month U.S. LIBOR + 3.500% 4.7339% 1/31/25 (d)(e) | | 6,880,000 | 6,838,445 |
| Securus Technologies Holdings, Inc.: | | | |
| Tranche 2LN, term loan 3 month U.S. LIBOR + 7.750% 9% 4/30/21 (d)(e) | | 5,224,000 | 5,237,060 |
| Tranche B 1LN, term loan 3 month U.S. LIBOR + 3.500% 4.75% 4/30/20 (d)(e) | | 2,774,325 | 2,781,261 |
| Securus Technologies, Inc.: | | | |
| Tranche B, term loan: | | | |
| 3 month U.S. LIBOR + 4.500% 6/15/24 (e)(s) | | 9,580,000 | 9,653,862 |
| 3 month U.S. LIBOR + 8.250% 6/15/25 (e)(s) | | 3,360,000 | 3,365,040 |
| Tranche B2 1LN, term loan 3 month U.S. LIBOR + 4.250% 5.4467% 4/30/20 (d)(e) | | 2,761,920 | 2,768,825 |
| SFR Group SA Tranche B 11LN, term loan 3 month U.S. LIBOR + 2.750% 4.0611% 7/31/25 (d)(e) | | 8,423,888 | 8,375,450 |
| | | | 66,438,819 |
| Wireless Telecommunication Services - 0.2% | | | |
| Digicel International Finance Ltd. Tranche B, term loan 3 month U.S. LIBOR + 3.750% 5.07% 5/25/24 (d)(e) | | 4,955,000 | 5,000,140 |
| Intelsat Jackson Holdings SA Tranche B 2LN, term loan 3 month U.S. LIBOR + 2.750% 4.0003% 6/30/19 (d)(e) | | 11,760,000 | 11,706,492 |
| Sprint Communications, Inc. Tranche B, term loan 3 month U.S. LIBOR + 2.500% 3.75% 2/3/24 (d)(e) | | 12,713,138 | 12,713,138 |
| Syniverse Holdings, Inc. Tranche B, term loan 3 month U.S. LIBOR + 3.000% 4.2964% 4/23/19 (d)(e) | | 4,011,549 | 3,841,058 |
| Telesat LLC Tranche B 4LN, term loan 3 month U.S. LIBOR + 3.000% 4.3% 11/17/23 (d)(e) | | 7,578,169 | 7,629,625 |
| Xplornet Communications, Inc. Tranche B, term loan 3 month U.S. LIBOR + 6.000% 7.2964% 9/9/21 (d)(e) | | 2,144,510 | 2,165,955 |
| | | | 43,056,408 |
|
| TOTAL TELECOMMUNICATION SERVICES | | | 109,495,227 |
|
| UTILITIES - 0.2% | | | |
| Electric Utilities - 0.1% | | | |
| Calpine Construction Finance Co. LP Tranche B 1LN, term loan 3 month U.S. LIBOR + 2.250% 3.49% 5/3/20 (d)(e) | | 2,950,126 | 2,941,836 |
| Empire Generating Co. LLC: | | | |
| Tranche B, term loan 3 month U.S. LIBOR + 4.250% 5.57% 3/14/21 (d)(e) | | 884,825 | 825,100 |
| Tranche C, term loan 3 month U.S. LIBOR + 4.250% 5.57% 3/14/21 (d)(e) | | 87,227 | 81,339 |
| Exgen Texas Power LLC Tranche B, term loan 3 month U.S. LIBOR + 4.750% 6.0464% 9/18/21 (d)(e) | | 4,484,918 | 3,016,107 |
| Green Energy Partners/Stonewall LLC Tranche B 1LN, term loan 3 month U.S. LIBOR + 5.500% 6.7964% 11/13/21 (d)(e) | | 3,042,000 | 2,829,060 |
| InterGen NV Tranche B, term loan 3 month U.S. LIBOR + 4.500% 5.8% 6/13/20 (d)(e) | | 6,278,188 | 6,262,493 |
| Lightstone Holdco LLC: | | | |
| Tranche B, term loan 3 month U.S. LIBOR + 4.500% 5.7339% 1/30/24 (d)(e) | | 2,542,861 | 2,525,239 |
| Tranche C, term loan 3 month U.S. LIBOR + 4.500% 5.7339% 1/30/24 (d)(e) | | 158,446 | 157,348 |
| Longview Power LLC Tranche B, term loan 3 month U.S. LIBOR + 6.000% 7.24% 4/13/21 (d)(e) | | 1,960,000 | 1,103,892 |
| Tex Operations Co. LLC: | | | |
| Tranche B, term loan 3 month U.S. LIBOR + 2.750% 3.9834% 8/4/23 (d)(e) | | 6,481,714 | 6,480,807 |
| Tranche C, term loan 3 month U.S. LIBOR + 2.750% 3.9817% 8/4/23 (d)(e) | | 1,485,714 | 1,485,506 |
| USIC Holdings, Inc. Tranche B, term loan 3 month U.S. LIBOR + 3.500% 4.9232% 12/9/23 (d)(e) | | 1,492,500 | 1,496,858 |
| Vistra Operations Co. LLC Tranche B 2LN, term loan 3 month U.S. LIBOR + 2.750% 3.9792% 12/14/23 (d)(e) | | 1,492,500 | 1,494,634 |
| | | | 30,700,219 |
| Independent Power and Renewable Electricity Producers - 0.1% | | | |
| APLP Holdings LP Tranche B, term loan 3 month U.S. LIBOR + 4.250% 5.4839% 4/13/23 (d)(e) | | 2,518,834 | 2,544,023 |
| Calpine Corp. Tranche B, term loan 3 month U.S. LIBOR + 1.750% 2.99% 11/30/17 (d)(e) | | 2,240,909 | 2,236,001 |
| Dynegy, Inc. Tranche C, term loan 3 month U.S. LIBOR + 3.250% 4.4839% 2/7/24 (d)(e) | | 6,806,790 | 6,814,890 |
| Energy Future Holdings Corp. Tranche B, term loan 3 month U.S. LIBOR + 3.000% 4.2339% 6/30/18 (d)(e) | | 13,500,000 | 13,554,000 |
| MRP Generation Holdings LLC Tranche B, term loan 3 month U.S. LIBOR + 7.000% 8.2964% 10/18/22 (d)(e) | | 1,554,380 | 1,437,802 |
| Terra-Gen Finance Co. LLC Tranche B, term loan 3 month U.S. LIBOR + 4.250% 5.49% 12/9/21 (d)(e) | | 2,718,089 | 2,459,871 |
| TerraForm AP Acquisition Holdings LLC Tranche B, term loan 3 month U.S. LIBOR + 4.500% 5.7964% 6/26/22 (d)(e) | | 2,709,512 | 2,756,928 |
| The AES Corp. Tranche B, term loan 3 month U.S. LIBOR + 2.000% 3.3172% 5/24/22 (d)(e) | | 4,059,825 | 4,059,825 |
| | | | 35,863,340 |
|
| TOTAL UTILITIES | | | 66,563,559 |
|
| TOTAL BANK LOAN OBLIGATIONS | | | |
| (Cost $1,474,618,320) | | | 1,472,187,211 |
|
| Sovereign Loan Participations - 0.0% | | | |
| Indonesian Republic loan participation: | | | |
| Citibank 2.1875% 12/14/19 (d)(g) | | 502,384 | 497,360 |
| Goldman Sachs 2.1875% 12/14/19 (d)(g) | | 430,556 | 426,250 |
| Mizuho 2.1875% 12/14/19 (d)(g) | | 201,880 | 199,861 |
| TOTAL SOVEREIGN LOAN PARTICIPATIONS | | | |
| (Cost $1,082,814) | | | 1,123,471 |
|
| Bank Notes - 0.5% | | | |
| Capital One NA: | | | |
| 1.65% 2/5/18 | | $18,801,000 | $18,796,029 |
| 2.95% 7/23/21 | | 18,827,000 | 19,138,973 |
| Discover Bank: | | | |
| (Delaware) 3.2% 8/9/21 | | 25,781,000 | 26,456,905 |
| 3.1% 6/4/20 | | 22,584,000 | 23,138,986 |
| 8.7% 11/18/19 | | 2,958,000 | 3,336,110 |
| JPMorgan Chase Bank 6% 10/1/17 | | 11,313,000 | 11,347,917 |
| KeyBank NA 6.95% 2/1/28 | | 1,977,000 | 2,523,075 |
| RBS Citizens NA 2.5% 3/14/19 | | 11,319,000 | 11,420,985 |
| Regions Bank 7.5% 5/15/18 | | 24,647,000 | 25,599,497 |
| UBS AG Stamford Branch 1.8% 3/26/18 | | 24,142,000 | 24,181,747 |
| Wachovia Bank NA 6% 11/15/17 | | 2,243,000 | 2,262,498 |
| TOTAL BANK NOTES | | | |
| (Cost $165,139,689) | | | 168,202,722 |
|
| Preferred Securities - 0.5% | | | |
| CONSUMER DISCRETIONARY - 0.0% | | | |
| Automobiles - 0.0% | | | |
| Volkswagen International Finance NV 2.5%(Reg. S) (c)(d) | EUR | $1,525,000 | $1,811,445 |
| CONSUMER STAPLES - 0.0% | | | |
| Food Products - 0.0% | | | |
| Cosan Overseas Ltd. 8.25% (c) | | 3,587,000 | 3,644,582 |
| ENERGY - 0.0% | | | |
| Oil, Gas & Consumable Fuels - 0.0% | | | |
| Total SA 2.625% (Reg. S) (c)(d) | EUR | 2,150,000 | 2,590,690 |
| FINANCIALS - 0.5% | | | |
| Banks - 0.5% | | | |
| Alfa Bond Issuance PLC 8% (Reg. S) (c)(d) | | 1,860,000 | 1,963,796 |
| Banco Do Brasil SA 9% (b)(c)(d) | | 2,050,000 | 2,208,245 |
| Banco Mercantil del Norte SA 7.625% (b)(c)(d) | | 1,130,000 | 1,230,356 |
| Bank of America Corp.: | | | |
| 6.1% (c)(d) | | 8,141,000 | 9,151,280 |
| 6.25% (c)(d) | | 5,325,000 | 6,014,964 |
| 6.5% (c)(d) | | 3,000,000 | 3,452,295 |
| Barclays Bank PLC: | | | |
| 6% (c)(d) | GBP | 1,330,000 | 1,789,687 |
| 7.625% 11/21/22 | | 30,445,000 | 35,623,365 |
| Barclays PLC: | | | |
| 6.625% (c)(d) | | 13,935,000 | 14,410,715 |
| 7.25% (Reg. S) (c)(d) | GBP | 1,350,000 | 1,918,932 |
| 8.25% (c)(d) | | 500,000 | 538,903 |
| CBOM Finance PLC 8.875% (b)(c)(d) | | 1,935,000 | 1,806,501 |
| Citigroup, Inc.: | | | |
| 5.875% (c)(d) | | 4,305,000 | 4,607,315 |
| 5.95% (c)(d) | | 5,290,000 | 5,806,429 |
| 5.95% (c)(d) | | 2,285,000 | 2,418,384 |
| Credit Agricole SA: | | | |
| 6.625% (b)(c)(d) | | 13,700,000 | 14,283,646 |
| 7.875% (b)(c)(d) | | 4,250,000 | 4,834,288 |
| 8.125% 9/19/33 (Reg. S) (d) | | 2,500,000 | 2,734,726 |
| Danske Bank A/S 6.125% (Reg. S) (c)(d) | | 1,600,000 | 1,759,810 |
| Erste Group Bank AG 6.5% (Reg. S) (c)(d) | EUR | 2,200,000 | 2,919,618 |
| HSBC Holdings PLC 4.75% (Reg. S) (c)(d) | EUR | 2,050,000 | 2,520,566 |
| Royal Bank of Scotland Group PLC: | | | |
| 7.5% (c)(d) | | 9,170,000 | 9,792,090 |
| 8.625% (c)(d) | | 3,665,000 | 4,113,104 |
| Stichting AK Rabobank Certificaten 6.5% (Reg. S) (c) | EUR | 2,050,000 | 2,932,837 |
| | | | 138,831,852 |
| Capital Markets - 0.0% | | | |
| UBS AG 4.75% 2/12/26 (Reg. S) (d) | EUR | 2,800,000 | 3,753,776 |
| Diversified Financial Services - 0.0% | | | |
| Magnesita Finance Ltd.: | | | |
| 8.625% (b)(c) | | 985,000 | 1,003,329 |
| 8.625% (Reg. S) (c) | | 200,000 | 203,721 |
| | | | 1,207,050 |
| Insurance - 0.0% | | | |
| Assicurazioni Generali SpA 6.416% (c)(d) | GBP | 1,150,000 | 1,674,487 |
| Aviva PLC 6.125% (c)(d) | GBP | 2,200,000 | 3,372,383 |
| Credit Agricole Assurances SA 4.25% (Reg. S) (c)(d) | EUR | 2,600,000 | 3,418,347 |
| | | | 8,465,217 |
|
| TOTAL FINANCIALS | | | 152,257,895 |
|
| INDUSTRIALS - 0.0% | | | |
| Construction & Engineering - 0.0% | | | |
| Odebrecht Finance Ltd.: | | | |
| 7.5% (b)(c) | | 6,875,000 | 2,963,811 |
| 7.5% (Reg. S) (c) | | 100,000 | 43,110 |
| | | | 3,006,921 |
| MATERIALS - 0.0% | | | |
| Metals & Mining - 0.0% | | | |
| CSN Islands XII Corp. 7% (Reg. S) (c) | | 2,410,000 | 1,658,830 |
| TOTAL PREFERRED SECURITIES | | | |
| (Cost $154,214,292) | | | 164,970,363 |
| | | Shares | Value |
|
| Money Market Funds - 3.1% | | | |
| Fidelity Cash Central Fund, 1.11% (u) | | | |
| (Cost $958,169,986) | | 958,058,657 | 958,250,269 |
| Purchased Swaptions - 0.0% | | | | |
| | | Expiration Date | Notional Amount(a) | Value |
| Put Options - 0.0% | | | | |
| Option on a credit default swap with Credit Suisse Intl to buy protection on the 5-Year iTraxx Europe Crossover Series 27 Index expiring June 2022 exercise rate 2.500% | | 9/20/17 | EUR 19,150,000 | $48,474 |
| Option on a credit default swap with Credit Suisse Intl to buy protection on the 5-Year iTraxx Europe Crossover Series 27 Index expiring June 2022 exercise rate 2.625% | | 12/20/17 | EUR 38,300,000 | 438,152 |
|
| TOTAL PUT OPTIONS | | | | 486,626 |
|
| TOTAL PURCHASED SWAPTIONS | | | | |
| (Cost $552,575) | | | | 486,626 |
| TOTAL INVESTMENT IN SECURITIES - 101.9% | | | | |
| (Cost $30,690,729,972) | | | | 31,266,382,976 |
| NET OTHER ASSETS (LIABILITIES) - (1.9)% | | | | (579,568,269) |
| NET ASSETS - 100% | | | | $30,686,814,707 |
| TBA Sale Commitments | | |
| | Principal Amount(a) | Value |
| Fannie Mae | | |
| 3% 9/1/47 | $(6,400,000) | $(6,473,368) |
| 3% 9/1/47 | (17,000,000) | (17,194,883) |
| 3.5% 9/1/47 | (35,300,000) | (36,573,395) |
| 3.5% 9/1/47 | (35,300,000) | (36,573,395) |
| 3.5% 9/1/47 | (108,400,000) | (112,310,367) |
|
| TOTAL FANNIE MAE | | (209,125,408) |
|
| Ginnie Mae | | |
| 3.5% 9/1/47 | (23,000,000) | (23,983,137) |
| TOTAL TBA SALE COMMITMENTS | | |
| (Proceeds $232,422,180) | | $(233,108,545) |
| Futures Contracts | | | | | |
| | Number of contracts | Expiration Date | Notional amount | Value | Unrealized Appreciation/(Depreciation) |
| Purchased | | | | | |
| Bond Index Contracts | | | | | |
| ASX 10 Year Treasury Bond Index Contracts (Australia) | 29 | Sept. 2017 | $2,965,845 | $(53,594) | $(53,594) |
| Eurex Euro-Bund Contracts (Germany) | 7 | Sept. 2017 | 1,375,636 | 26,334 | 26,334 |
| Eurex Euro-Buxl 30 Year Bond Contracts (Germany) | 16 | Sept. 2017 | 3,206,406 | 20,949 | 20,949 |
| TSE 10 Year Japanese Government Bond Index Contracts (Japan) | 3 | Sept. 2017 | 4,123,891 | 16,643 | 16,643 |
| TOTAL BOND INDEX CONTRACTS | | | | | 10,332 |
| Treasury Contracts | | | | | |
| CBOT 10-Year U.S. Treasury Note Contracts (United States) | 149 | Dec. 2017 | 18,920,672 | 50,906 | 50,906 |
| CBOT 2-Year U.S. Treasury Note Contracts (United States) | 195 | Dec. 2017 | 42,180,938 | 917 | 917 |
| CBOT 5-Year U.S. Treasury Note Contracts (United States) | 223 | Dec. 2017 | 26,425,500 | 34,070 | 34,070 |
| CBOT Long Term U.S. Treasury Bond Contracts (United States) | 23 | Dec. 2017 | 3,590,156 | 33,913 | 33,913 |
| CBOT Ultra 10-Year U.S. Treasury Note Contracts (United States) | 32 | Dec. 2017 | 4,369,000 | 29,433 | 29,433 |
| CBOT Ultra Long Term U.S. Treasury Bond Contracts (United States) | 56 | Dec. 2017 | 9,467,500 | 51,955 | 51,955 |
| TME 10 Year Canadian Note Contracts (Canada) | 67 | Dec. 2017 | 7,417,618 | 14,839 | 14,839 |
| TOTAL TREASURY CONTRACTS | | | | | 216,033 |
|
| TOTAL PURCHASED | | | | | 226,365 |
|
| Sold | | | | | |
| Bond Index Contracts | | | | | |
| Eurex Euro-Bobl Contracts (Germany) | 330 | Sept. 2017 | 52,303,849 | (216,345) | (216,345) |
| ICE Long Gilt Contracts (United Kingdom) | 39 | Dec. 2017 | 6,419,854 | 21,125 | 21,125 |
| ICE Medium Gilt Contracts (United Kingdom) | 100 | Dec. 2017 | 14,901,684 | (10,437) | (10,437) |
| TOTAL BOND INDEX CONTRACTS | | | | | (205,657) |
| Treasury Contracts | | | | | |
| CBOT 10-Year U.S. Treasury Note Contracts (United States) | 1,026 | Dec. 2017 | 130,285,969 | (434,167) | (434,167) |
| CBOT 2-Year U.S. Treasury Note Contracts (United States) | 463 | Dec. 2017 | 100,152,688 | (29,840) | (29,840) |
| CBOT Long Term U.S. Treasury Bond Contracts (United States) | 58 | Dec. 2017 | 9,053,438 | (67,640) | (67,640) |
| TOTAL TREASURY CONTRACTS | | | | | (531,647) |
|
| TOTAL SOLD | | | | | (737,304) |
|
| TOTAL FUTURES CONTRACTS | | | | | $(510,939) |
The notional amount of futures purchased as a percentage of Net Assets is 0.4%
The notional amount of futures sold as a percentage of Net Assets is 1.0%
| Forward Foreign Currency Contracts | | | | | | |
| Currency Purchased | Currency Sold | Counterparty | Settlement Date | Unrealized Appreciation/(Depreciation) |
| EUR | 322,000 | USD | 380,259 | Goldman Sachs Bank USA | 11/17/17 | $4,578 |
| USD | 111,062 | AUD | 140,000 | Brown Brothers Harriman & Co. | 11/17/17 | (128) |
| USD | 554,859 | EUR | 468,000 | Barclays Bank PLC | 11/17/17 | (4,470) |
| USD | 163,960,699 | EUR | 138,128,000 | Brown Brothers Harriman & Co. | 11/17/17 | (1,122,497) |
| USD | 1,739,006 | EUR | 1,472,000 | Goldman Sachs Bank USA | 11/17/17 | (20,250) |
| USD | 744,846 | EUR | 625,000 | Goldman Sachs Bank USA | 11/17/17 | (2,120) |
| USD | 72,507,302 | GBP | 56,030,000 | Brown Brothers Harriman & Co. | 11/17/17 | (121,893) |
| USD | 408,009 | GBP | 316,000 | State Street Bank And Trust Co. | 11/17/17 | (1,608) |
| USD | 36,486 | JPY | 3,950,000 | Goldman Sachs Bank USA | 11/17/17 | 432 |
| TOTAL FORWARD FOREIGN CURRENCY CONTRACTS | | | | | | $(1,267,956) |
| | | | | | Unrealized Appreciation | 5,010 |
| | | | | | Unrealized Depreciation | (1,272,966) |
Swaps
| Underlying Reference | Rating(1) | Maturity Date | Clearinghouse / Counterparty(2) | Fixed Payment Received/(Paid) | Payment Frequency | Notional Amount(3) | Value(1) | Upfront Premium Received/(Paid)(4) | Unrealized Appreciation/(Depreciation) |
| Credit Default Swaps | | | | | | | | | |
| Buy Protection | | | | | | | | | |
| 5-Year iTraxx Europe Series 25 Index | | Jun. 2021 | ICE | (1%) | Quarterly | EUR 8,300,000 | $(121,970) | $0 | $(121,970) |
| Accor SA | | Jun. 2022 | Citibank, N.A. | (1%) | Quarterly | EUR 4,200,000 | (90,900) | 89,448 | (1,452) |
| Assicurazioni Generali SpA | | Dec. 2021 | JPMorgan Chase Bank, N.A. | (1%) | Quarterly | EUR 1,800,000 | 55,218 | (132,242) | (77,024) |
| Carlsberg Breweries A/S | | Jun. 2022 | BNP Paribas SA | (1%) | Quarterly | EUR 4,150,000 | (149,507) | 153,099 | 3,592 |
| Energias De Portugal SA | | Jun. 2022 | JPMorgan Chase Bank, N.A. | (5%) | Quarterly | EUR 3,550,000 | (905,381) | 836,474 | (68,907) |
| Gas Natural Capital Markets SA | | Jun. 2022 | BNP Paribas SA | (1%) | Quarterly | EUR 4,200,000 | (107,365) | 109,836 | 2,471 |
| Kering SA | | Sep. 2018 | Morgan Stanley Capital Group, Inc. | (1%) | Quarterly | EUR 3,500,000 | (48,013) | 3,851 | (44,162) |
| Royal Bank Of Scotland Grp PLC (Ungtd) | | Jun. 2022 | BNP Paribas SA | (1%) | Quarterly | EUR 4,600,000 | (68,398) | (120,495) | (188,893) |
| Santander Central Hispano Issuances Ltd | | Dec. 2021 | Citibank, N.A. | (1%) | Quarterly | EUR 1,750,000 | 24,185 | (126,437) | (102,252) |
| Standard Chartered PLC | | Jun. 2021 | Goldman Sachs Bank USA | (1%) | Quarterly | EUR 1,550,000 | (31,018) | (122,820) | (153,838) |
| TOTAL BUY PROTECTION | | | | | | | (1,443,149) | 690,714 | (752,435) |
| Sell Protection | | | | | | | | | |
| 5-Year iTraxx Europe Senior Financials Series 25 Index | NR | Jun. 2021 | ICE | 1% | Quarterly | EUR 8,300,000 | 264,036 | 0 | 264,036 |
| Intesa Sanpaolo SpA | Ba1 | Jun. 2022 | BNP Paribas SA | 1% | Quarterly | EUR 1,850,000 | (131,473) | 184,686 | 53,213 |
| TOTAL SELL PROTECTION | | | | | | | 132,563 | 184,686 | 317,249 |
|
| TOTAL CREDIT DEFAULT SWAPS | | | | | | | $(1,310,586) | $875,400 | $(435,186) |
|
(1) Ratings are presented for credit default swaps in which the Fund has sold protection on the underlying referenced debt. Ratings for an underlying index represent a weighted average of the ratings of all securities included in the index. The credit rating or value can be measures of the current payment/performance risk. Ratings are from Moody's Investors Service, Inc. Where Moody's® ratings are not available, S&P® ratings are disclosed and are indicated as such. All ratings are as of the report date and do not reflect subsequent changes.
(2) Swaps with Intercontinental Exchange (ICE) are centrally cleared over-the-counter (OTC) swaps.
(3) The notional amount of each credit default swap where the Fund has sold protection approximates the maximum potential amount of future payments that the Fund could be required to make if a credit event were to occur.
(4) Any premiums for centrally cleared over-the-counter (OTC) swaps are recorded periodically throughout the term of the swap to variation margin and included in unrealized appreciation (depreciation).
Swaps
| Payment Received | Payment Frequency | Payment Paid | Payment Frequency | Clearinghouse / Counterparty(1) | Maturity Date | Notional Amount | Value | Upfront Premium Received/(Paid)(4) | Unrealized Appreciation/(Depreciation) |
| Interest Rate Swaps | | | | | | | | | |
| 3-month LIBOR(3) | Quarterly | 2.5% | Semi - annual | LCH | Sep. 2027 | $17,100,000 | $(165,261) | $0 | $(165,261) |
| 3-month LIBOR(3) | Quarterly | 2.5% | Semi - annual | LCH | Sep. 2047 | 3,100,000 | (39,965) | 0 | (39,965) |
|
| TOTAL INTEREST RATE SWAPS | | | | | | | $(205,226) | $0 | $(205,226) |
|
(1) Swaps with LCH Clearnet Group (LCH) are centrally cleared over-the-counter (OTC) swaps.
(2) Any premiums for centrally cleared over-the-counter (OTC) swaps are recorded periodically throughout the term of the swap to variation margin and included in unrealized appreciation (depreciation).
(3) Represents floating rate.
Currency Abbreviations
AUD – Australian dollar
CAD – Canadian dollar
EUR – European Monetary Unit
GBP – British pound
JPY – Japanese yen
USD – U.S. dollar
Legend
(a) Amount is stated in United States dollars unless otherwise noted.
(b) Security exempt from registration under Rule 144A of the Securities Act of 1933. These securities may be resold in transactions exempt from registration, normally to qualified institutional buyers. At the end of the period, the value of these securities amounted to $2,666,116,467 or 8.7% of net assets.
(c) Security is perpetual in nature with no stated maturity date.
(d) Coupon rates for floating and adjustable rate securities reflect the rates in effect at period end.
(e) Coupon is indexed to a floating interest rate which may be multiplied by a specified factor and/or subject to caps or floors.
(f) Non-income producing - Security is in default.
(g) Level 3 instrument
(h) Security or a portion of the security was pledged to cover margin requirements for futures contracts. At period end, the value of securities pledged amounted to $2,460,675.
(i) Security or a portion of the security was pledged to cover margin requirements for centrally cleared OTC swaps. At period end, the value of securities pledged amounted to $1,811,591.
(j) Security or a portion of the security has been segregated as collateral for open forward foreign currency contracts and bi-lateral over-the-counter (OTC) swaps. At period end, the value of securities pledged amounted to $2,644,604.
(k) Security or a portion of the security purchased on a delayed delivery or when-issued basis.
(l) Security or a portion of the security has been segregated as collateral for mortgage-backed or asset-backed securities purchased on a delayed delivery or when-issued basis. At period end, the value of securities pledged amounted to $139,528.
(m) Security represents right to receive monthly interest payments on an underlying pool of mortgages or assets. Principal shown is the outstanding par amount of the pool as of the end of the period.
(n) Coupon is inversely indexed to a floating interest rate multiplied by a specified factor. The price may be considerably more volatile than the price of a comparable fixed rate security.
(o) Principal Only Strips represent the right to receive the monthly principal payments on an underlying pool of mortgage loans.
(p) Represents an investment in an underlying pool of reverse mortgages which typically do not require regular principal and interest payments as repayment is deferred until a maturity event.
(q) Security initially issued at one coupon which converts to a higher coupon at a specified date. The rate shown is the rate at period end.
(r) Non-income producing
(s) The coupon rate will be determined upon settlement of the loan after period end.
(t) Position or a portion of the position represents an unfunded loan commitment. At period end, the total principal amount and market value of unfunded commitments totaled $315,882 and $318,646, respectively.
(u) Affiliated fund that is generally available only to investment companies and other accounts managed by Fidelity Investments. The rate quoted is the annualized seven-day yield of the fund at period end. A complete unaudited listing of the fund's holdings as of its most recent quarter end is available upon request. In addition, each Fidelity Central Fund's financial statements, which are not covered by the Fund's Report of Independent Registered Public Accounting Firm, are available on the SEC's website or upon request.
Affiliated Central Funds
Information regarding fiscal year to date income earned by the Fund from investments in Fidelity Central Funds is as follows:
| Fund | Income earned |
| Fidelity Cash Central Fund | $8,039,538 |
| Total | $8,039,538 |
Investment Valuation
The following is a summary of the inputs used, as of August 31, 2017, involving the Fund's assets and liabilities carried at fair value. The inputs or methodology used for valuing securities may not be an indication of the risk associated with investing in those securities. For more information on valuation inputs, and their aggregation into the levels used below, please refer to the Investment Valuation section in the accompanying Notes to Financial Statements.
| | Valuation Inputs at Reporting Date: |
| Description | Total | Level 1 | Level 2 | Level 3 |
| Investments in Securities: | | | | |
| Equities: | | | | |
| Consumer Discretionary | $849,484 | $849,484 | $-- | $-- |
| Energy | 8,334,988 | 4,275,719 | 4,059,269 | -- |
| Financials | 1,702,742 | 1,702,742 | -- | -- |
| Materials | 2,844,526 | 2,844,526 | -- | -- |
| Real Estate | 7,253,498 | 6,752,577 | 500,921 | -- |
| Telecommunication Services | 295,889 | 261,289 | -- | 34,600 |
| Corporate Bonds | 9,977,418,532 | -- | 9,976,075,513 | 1,343,019 |
| U.S. Government and Government Agency Obligations | 11,495,919,370 | -- | 11,495,919,370 | -- |
| U.S. Government Agency - Mortgage Securities | 4,821,512,740 | -- | 4,821,512,740 | -- |
| Asset-Backed Securities | 325,779,420 | -- | 300,961,126 | 24,818,294 |
| Collateralized Mortgage Obligations | 690,995,172 | -- | 690,995,172 | -- |
| Commercial Mortgage Securities | 506,587,713 | -- | 505,597,133 | 990,580 |
| Municipal Securities | 417,118,600 | -- | 417,118,600 | -- |
| Foreign Government and Government Agency Obligations | 244,549,640 | -- | 237,028,331 | 7,521,309 |
| Bank Loan Obligations | 1,472,187,211 | -- | 1,466,508,354 | 5,678,857 |
| Sovereign Loan Participations | 1,123,471 | -- | -- | 1,123,471 |
| Bank Notes | 168,202,722 | -- | 168,202,722 | -- |
| Preferred Securities | 164,970,363 | -- | 164,970,363 | -- |
| Money Market Funds | 958,250,269 | 958,250,269 | -- | -- |
| Purchased Swaptions | 486,626 | -- | 486,626 | -- |
| Total Investments in Securities: | $31,266,382,976 | $974,936,606 | $30,249,936,240 | $41,510,130 |
| Derivative Instruments: | | | | |
| Assets | | | | |
| Forward Foreign Currency Contracts | $5,010 | $-- | $5,010 | $-- |
| Futures Contracts | 301,084 | 301,084 | -- | -- |
| Swaps | 343,439 | -- | 343,439 | -- |
| Total Assets | $649,533 | $301,084 | $348,449 | $-- |
| Liabilities | | | | |
| Forward Foreign Currency Contracts | $(1,272,966) | $-- | $(1,272,966 ) | $-- |
| Futures Contracts | (812,023) | (812,023) | -- | -- |
| Swaps | (1,859,251) | -- | (1,859,251) | -- |
| Total Liabilities | $(3,944,240) | $(812,023) | $(3,132,217) | $-- |
| Total Derivative Instruments: | $(3,294,707) | $(510,939) | $(2,783,768) | $-- |
| Other Financial Instruments: | | | | |
| TBA Sale Commitments | $(233,108,545) | $-- | $(233,108,545) | $-- |
| Total Other Financial Instruments: | $(233,108,545) | $-- | $(233,108,545) | $-- |
Value of Derivative Instruments
The following table is a summary of the Fund's value of derivative instruments by primary risk exposure as of August 31, 2017. For additional information on derivative instruments, please refer to the Derivative Instruments section in the accompanying Notes to Financial Statements.
| Primary Risk Exposure / Derivative Type | Value |
| | Asset | Liability |
| Credit Risk | | |
| Purchased Swaptions(a) | $486,626 | $0 |
| Swaps(b) | 343,439 | (1,654,025) |
| Total Credit Risk | 830,065 | (1,654,025) |
| Foreign Exchange Risk | | |
| Forward Foreign Currency Contracts(c) | 5,010 | (1,272,966) |
| Total Foreign Exchange Risk | 5,010 | (1,272,966) |
| Interest Rate Risk | | |
| Futures Contracts(d) | 301,084 | (812,023) |
| Swaps(b) | 0 | (205,226) |
| Total Interest Rate Risk | 301,084 | (1,017,249) |
| Total Value of Derivatives | $1,136,159 | $(3,944,240) |
(a) Gross value is included in the Statement of Assets and Liabilities in the investments, at value line-item.
(b) For bi-lateral over-the-counter (OTC) swaps, reflects gross value which is presented in the Statement of Assets and Liabilities in the bi-lateral OTC swaps, at value line-items. For centrally cleared OTC swaps, reflects gross cumulative appreciation (depreciation) as presented in the Schedule of Investments. In the Statement of Assets and Liabilities, the period end daily variation margin for centrally cleared OTC swaps is included in receivable or payable for daily variation margin on centrally cleared OTC swaps, and the net cumulative appreciation (depreciation) for centrally cleared OTC swaps is included in net unrealized appreciation (depreciation).
(c) Gross value is presented in the Statement of Assets and Liabilities in the unrealized appreciation/depreciation on forward foreign currency contracts line-items.
(d) Reflects gross cumulative appreciation (depreciation) on futures contracts as presented in the Schedule of Investments. In the Statement of Assets and Liabilities, the period end daily variation margin is included in receivable or payable for daily variation margin on futures contracts, and the net cumulative appreciation (depreciation) is included in net unrealized appreciation (depreciation).
Other Information
Distribution of investments by country or territory of incorporation, as a percentage of Total Net Assets, is as follows (Unaudited):
| United States of America | 89.7% |
| Mexico | 2.2% |
| United Kingdom | 1.9% |
| Netherlands | 1.8% |
| Others (Individually Less Than 1%) | 4.4% |
| | 100.0% |
See accompanying notes which are an integral part of the financial statements.
Financial Statements
Statement of Assets and Liabilities
| | | August 31, 2017 |
| Assets | | |
Investment in securities, at value — See accompanying schedule:
Unaffiliated issuers (cost $29,732,559,986) | $30,308,132,707 | |
| Fidelity Central Funds (cost $958,169,986) | 958,250,269 | |
| Total Investment in Securities (cost $30,690,729,972) | | $31,266,382,976 |
| Cash | | 2,961,260 |
| Foreign currency held at value (cost $744,842) | | 749,017 |
| Receivable for investments sold | | 756,683,712 |
| Receivable for TBA sale commitments | | 232,422,180 |
| Unrealized appreciation on forward foreign currency contracts | | 5,010 |
| Receivable for fund shares sold | | 34,259,345 |
| Dividends receivable | | 29,855 |
| Interest receivable | | 200,080,849 |
| Distributions receivable from Fidelity Central Funds | | 712,292 |
| Bi-lateral OTC swaps, at value | | 79,403 |
| Other receivables | | 174,280 |
| Total assets | | 32,494,540,179 |
| Liabilities | | |
| Payable for investments purchased | | |
| Regular delivery | $858,334,102 | |
| Delayed delivery | 678,613,271 | |
| TBA sale commitments, at value | 233,108,545 | |
| Unrealized depreciation on forward foreign currency contracts | 1,272,966 | |
| Payable for fund shares redeemed | 19,852,546 | |
| Distributions payable | 2,981,531 | |
| Bi-lateral OTC swaps, at value | 1,532,055 | |
| Accrued management fee | 7,741,068 | |
| Distribution and service plan fees payable | 322,254 | |
| Payable for daily variation margin on futures contracts | 76,786 | |
| Payable for daily variation margin on centrally cleared OTC swaps | 52,183 | |
| Other affiliated payables | 3,669,020 | |
| Other payables and accrued expenses | 169,145 | |
| Total liabilities | | 1,807,725,472 |
| Net Assets | | $30,686,814,707 |
| Net Assets consist of: | | |
| Paid in capital | | $30,051,708,899 |
| Undistributed net investment income | | 75,408,591 |
| Accumulated undistributed net realized gain (loss) on investments and foreign currency transactions | | (12,978,582) |
| Net unrealized appreciation (depreciation) on investments and assets and liabilities in foreign currencies | | 572,675,799 |
| Net Assets | | $30,686,814,707 |
| Calculation of Maximum Offering Price | | |
| Class A: | | |
| Net Asset Value and redemption price per share ($521,556,531 ÷ 48,436,750 shares) | | $10.77 |
| Maximum offering price per share (100/96.00 of $10.77) | | $11.22 |
| Class M: | | |
| Net Asset Value and redemption price per share ($287,111,214 ÷ 26,710,885 shares) | | $10.75 |
| Maximum offering price per share (100/96.00 of $10.75) | | $11.20 |
| Class C: | | |
| Net Asset Value and offering price per share ($190,272,706 ÷ 17,664,771 shares)(a) | | $10.77 |
| Total Bond: | | |
| Net Asset Value, offering price and redemption price per share ($23,732,155,846 ÷ 2,204,851,985 shares) | | $10.76 |
| Class I: | | |
| Net Asset Value, offering price and redemption price per share ($4,481,724,927 ÷ 417,020,311 shares) | | $10.75 |
| Class Z: | | |
| Net Asset Value, offering price and redemption price per share ($1,473,993,483 ÷ 137,143,400 shares) | | $10.75 |
(a) Redemption price per share is equal to net asset value less any applicable contingent deferred sales charge.
See accompanying notes which are an integral part of the financial statements.
Statement of Operations
| | | Year ended August 31, 2017 |
| Investment Income | | |
| Dividends | | $13,698,805 |
| Interest | | 883,295,281 |
| Income from Fidelity Central Funds | | 8,039,538 |
| Total income | | 905,033,624 |
| Expenses | | |
| Management fee | $85,064,637 | |
| Transfer agent fees | 28,873,471 | |
| Distribution and service plan fees | 4,485,429 | |
| Fund wide operations fee | 11,243,438 | |
| Independent trustees' fees and expenses | 106,598 | |
| Legal | 328 | |
| Miscellaneous | 87,092 | |
| Total expenses before reductions | 129,860,993 | |
| Expense reductions | (130,904) | 129,730,089 |
| Net investment income (loss) | | 775,303,535 |
| Realized and Unrealized Gain (Loss) | | |
| Net realized gain (loss) on: | | |
| Investment securities: | | |
| Unaffiliated issuers | 36,962,512 | |
| Fidelity Central Funds | 238,489 | |
| Forward foreign currency contracts | (3,031,949) | |
| Foreign currency transactions | (1,234,691) | |
| Futures contracts | 1,594,426 | |
| Swaps | 1,651,830 | |
| Total net realized gain (loss) | | 36,180,617 |
| Change in net unrealized appreciation (depreciation) on: | | |
| Investment securities: | | |
| Unaffiliated issuers | (183,867,410) | |
| Fidelity Central Funds | 80,283 | |
| Forward foreign currency contracts | (2,063,717) | |
| Assets and liabilities in foreign currencies | 186,262 | |
| Futures contracts | (1,058,889) | |
| Swaps | 339,492 | |
| Delayed delivery commitments | (661,826) | |
| Total change in net unrealized appreciation (depreciation) | | (187,045,805) |
| Net gain (loss) | | (150,865,188) |
| Net increase (decrease) in net assets resulting from operations | | $624,438,347 |
See accompanying notes which are an integral part of the financial statements.
Statement of Changes in Net Assets
| | Year ended August 31, 2017 | Year ended August 31, 2016 |
| Increase (Decrease) in Net Assets | | |
| Operations | | |
| Net investment income (loss) | $775,303,535 | $735,703,076 |
| Net realized gain (loss) | 36,180,617 | 29,226,743 |
| Change in net unrealized appreciation (depreciation) | (187,045,805) | 815,523,532 |
| Net increase (decrease) in net assets resulting from operations | 624,438,347 | 1,580,453,351 |
| Distributions to shareholders from net investment income | (739,976,289) | (690,311,363) |
| Distributions to shareholders from net realized gain | (67,918,257) | (113,897,060) |
| Total distributions | (807,894,546) | (804,208,423) |
| Share transactions - net increase (decrease) | 5,166,571,919 | 4,657,836,676 |
| Total increase (decrease) in net assets | 4,983,115,720 | 5,434,081,604 |
| Net Assets | | |
| Beginning of period | 25,703,698,987 | 20,269,617,383 |
| End of period | $30,686,814,707 | $25,703,698,987 |
| Other Information | | |
| Undistributed net investment income end of period | $75,408,591 | $61,951,817 |
See accompanying notes which are an integral part of the financial statements.
Financial Highlights — Fidelity Total Bond Fund Class A
| Years ended August 31, | 2017 | 2016 | 2015 | 2014 | 2013 |
| Selected Per–Share Data | | | | | |
| Net asset value, beginning of period | $10.87 | $10.53 | $10.77 | $10.48 | $11.29 |
| Income from Investment Operations | | | | | |
| Net investment income (loss)A | .272 | .312 | .287 | .292 | .263 |
| Net realized and unrealized gain (loss) | (.086) | .377 | (.224) | .382 | (.468) |
| Total from investment operations | .186 | .689 | .063 | .674 | (.205) |
| Distributions from net investment income | (.258) | (.290) | (.270) | (.275) | (.250) |
| Distributions from net realized gain | (.028) | (.059) | (.033) | (.109) | (.355) |
| Total distributions | (.286) | (.349) | (.303) | (.384) | (.605) |
| Net asset value, end of period | $10.77 | $10.87 | $10.53 | $10.77 | $10.48 |
| Total ReturnB,C | 1.77% | 6.71% | .58% | 6.56% | (1.94)% |
| Ratios to Average Net AssetsD,E | | | | | |
| Expenses before reductions | .75% | .75% | .75% | .76% | .79% |
| Expenses net of fee waivers, if any | .75% | .75% | .75% | .76% | .79% |
| Expenses net of all reductions | .75% | .75% | .75% | .76% | .79% |
| Net investment income (loss) | 2.53% | 2.95% | 2.69% | 2.76% | 2.41% |
| Supplemental Data | | | | | |
| Net assets, end of period (000 omitted) | $521,557 | $1,233,806 | $852,243 | $639,235 | $517,259 |
| Portfolio turnover rateF | 137% | 134% | 140%G | 108% | 201% |
A Calculated based on average shares outstanding during the period.
B Total returns would have been lower if certain expenses had not been reduced during the applicable periods shown.
C Total returns do not include the effect of the sales charges.
D Fees and expenses of any underlying Fidelity Central Funds are not included in the Fund's expense ratio. The Fund indirectly bears its proportionate share of the expenses of any underlying Fidelity Central Funds.
E Expense ratios reflect operating expenses of the class. Expenses before reductions do not reflect amounts reimbursed by the investment adviser or reductions from brokerage service arrangements or reductions from other expense offset arrangements and do not represent the amount paid by the class during periods when reimbursements or reductions occur. Expenses net of fee waivers reflect expenses after reimbursement by the investment adviser but prior to reductions from brokerage service arrangements or other expense offset arrangements. Expenses net of all reductions represent the net expenses paid by the class.
F Amount does not include the portfolio activity of any underlying Fidelity Central Funds.
G Portfolio turnover rate excludes securities received or delivered in-kind.
See accompanying notes which are an integral part of the financial statements.
Financial Highlights — Fidelity Total Bond Fund Class M
| Years ended August 31, | 2017 | 2016 | 2015 | 2014 | 2013 |
| Selected Per–Share Data | | | | | |
| Net asset value, beginning of period | $10.85 | $10.51 | $10.76 | $10.46 | $11.28 |
| Income from Investment Operations | | | | | |
| Net investment income (loss)A | .267 | .309 | .285 | .290 | .265 |
| Net realized and unrealized gain (loss) | (.083) | .378 | (.234) | .392 | (.477) |
| Total from investment operations | .184 | .687 | .051 | .682 | (.212) |
| Distributions from net investment income | (.256) | (.288) | (.268) | (.273) | (.253) |
| Distributions from net realized gain | (.028) | (.059) | (.033) | (.109) | (.355) |
| Total distributions | (.284) | (.347) | (.301) | (.382) | (.608) |
| Net asset value, end of period | $10.75 | $10.85 | $10.51 | $10.76 | $10.46 |
| Total ReturnB,C | 1.76% | 6.71% | .47% | 6.65% | (2.01)% |
| Ratios to Average Net AssetsD,E | | | | | |
| Expenses before reductions | .76% | .77% | .77% | .78% | .76% |
| Expenses net of fee waivers, if any | .76% | .77% | .77% | .78% | .76% |
| Expenses net of all reductions | .76% | .77% | .77% | .78% | .76% |
| Net investment income (loss) | 2.53% | 2.94% | 2.67% | 2.74% | 2.44% |
| Supplemental Data | | | | | |
| Net assets, end of period (000 omitted) | $287,111 | $155,518 | $101,673 | $57,972 | $52,848 |
| Portfolio turnover rateF | 137% | 134% | 140%G | 108% | 201% |
A Calculated based on average shares outstanding during the period.
B Total returns would have been lower if certain expenses had not been reduced during the applicable periods shown.
C Total returns do not include the effect of the sales charges.
D Fees and expenses of any underlying Fidelity Central Funds are not included in the Fund's expense ratio. The Fund indirectly bears its proportionate share of the expenses of any underlying Fidelity Central Funds.
E Expense ratios reflect operating expenses of the class. Expenses before reductions do not reflect amounts reimbursed by the investment adviser or reductions from brokerage service arrangements or reductions from other expense offset arrangements and do not represent the amount paid by the class during periods when reimbursements or reductions occur. Expenses net of fee waivers reflect expenses after reimbursement by the investment adviser but prior to reductions from brokerage service arrangements or other expense offset arrangements. Expenses net of all reductions represent the net expenses paid by the class.
F Amount does not include the portfolio activity of any underlying Fidelity Central Funds.
G Portfolio turnover rate excludes securities received or delivered in-kind.
See accompanying notes which are an integral part of the financial statements.
Financial Highlights — Fidelity Total Bond Fund Class C
| Years ended August 31, | 2017 | 2016 | 2015 | 2014 | 2013 |
| Selected Per–Share Data | | | | | |
| Net asset value, beginning of period | $10.87 | $10.53 | $10.77�� | $10.48 | $11.29 |
| Income from Investment Operations | | | | | |
| Net investment income (loss)A | .188 | .231 | .205 | .211 | .185 |
| Net realized and unrealized gain (loss) | (.084) | .378 | (.225) | .382 | (.469) |
| Total from investment operations | .104 | .609 | (.020) | .593 | (.284) |
| Distributions from net investment income | (.176) | (.210) | (.187) | (.194) | (.171) |
| Distributions from net realized gain | (.028) | (.059) | (.033) | (.109) | (.355) |
| Total distributions | (.204) | (.269) | (.220) | (.303) | (.526) |
| Net asset value, end of period | $10.77 | $10.87 | $10.53 | $10.77 | $10.48 |
| Total ReturnB,C | .99% | 5.90% | (.20)% | 5.75% | (2.65)% |
| Ratios to Average Net AssetsD,E | | | | | |
| Expenses before reductions | 1.52% | 1.52% | 1.53% | 1.53% | 1.51% |
| Expenses net of fee waivers, if any | 1.52% | 1.52% | 1.53% | 1.53% | 1.51% |
| Expenses net of all reductions | 1.52% | 1.52% | 1.53% | 1.53% | 1.51% |
| Net investment income (loss) | 1.77% | 2.19% | 1.92% | 1.99% | 1.69% |
| Supplemental Data | | | | | |
| Net assets, end of period (000 omitted) | $190,273 | $186,380 | $139,264 | $83,818 | $79,711 |
| Portfolio turnover rateF | 137% | 134% | 140%G | 108% | 201% |
A Calculated based on average shares outstanding during the period.
B Total returns would have been lower if certain expenses had not been reduced during the applicable periods shown.
C Total returns do not include the effect of the contingent deferred sales charge.
D Fees and expenses of any underlying Fidelity Central Funds are not included in the Fund's expense ratio. The Fund indirectly bears its proportionate share of the expenses of any underlying Fidelity Central Funds.
E Expense ratios reflect operating expenses of the class. Expenses before reductions do not reflect amounts reimbursed by the investment adviser or reductions from brokerage service arrangements or reductions from other expense offset arrangements and do not represent the amount paid by the class during periods when reimbursements or reductions occur. Expenses net of fee waivers reflect expenses after reimbursement by the investment adviser but prior to reductions from brokerage service arrangements or other expense offset arrangements. Expenses net of all reductions represent the net expenses paid by the class.
F Amount does not include the portfolio activity of any underlying Fidelity Central Funds.
G Portfolio turnover rate excludes securities received or delivered in-kind.
See accompanying notes which are an integral part of the financial statements.
Financial Highlights — Fidelity Total Bond Fund
| Years ended August 31, | 2017 | 2016 | 2015 | 2014 | 2013 |
| Selected Per–Share Data | | | | | |
| Net asset value, beginning of period | $10.86 | $10.53 | $10.77 | $10.47 | $11.29 |
| Income from Investment Operations | | | | | |
| Net investment income (loss)A | .302 | .343 | .320 | .326 | .300 |
| Net realized and unrealized gain (loss) | (.085) | .368 | (.224) | .392 | (.478) |
| Total from investment operations | .217 | .711 | .096 | .718 | (.178) |
| Distributions from net investment income | (.289) | (.322) | (.303) | (.309) | (.287) |
| Distributions from net realized gain | (.028) | (.059) | (.033) | (.109) | (.355) |
| Total distributions | (.317) | (.381) | (.336) | (.418) | (.642) |
| Net asset value, end of period | $10.76 | $10.86 | $10.53 | $10.77 | $10.47 |
| Total ReturnB | 2.07% | 6.94% | .88% | 7.00% | (1.70)% |
| Ratios to Average Net AssetsC,D | | | | | |
| Expenses before reductions | .45% | .45% | .45% | .45% | .45% |
| Expenses net of fee waivers, if any | .45% | .45% | .45% | .45% | .45% |
| Expenses net of all reductions | .45% | .45% | .45% | .45% | .45% |
| Net investment income (loss) | 2.84% | 3.25% | 2.99% | 3.07% | 2.75% |
| Supplemental Data | | | | | |
| Net assets, end of period (000 omitted) | $23,732,156 | $20,469,677 | $17,359,294 | $14,547,801 | $11,526,014 |
| Portfolio turnover rateE | 137% | 134% | 140%F | 108% | 201% |
A Calculated based on average shares outstanding during the period.
B Total returns would have been lower if certain expenses had not been reduced during the applicable periods shown.
C Fees and expenses of any underlying Fidelity Central Funds are not included in the Fund's expense ratio. The Fund indirectly bears its proportionate share of the expenses of any underlying Fidelity Central Funds.
D Expense ratios reflect operating expenses of the class. Expenses before reductions do not reflect amounts reimbursed by the investment adviser or reductions from brokerage service arrangements or reductions from other expense offset arrangements and do not represent the amount paid by the class during periods when reimbursements or reductions occur. Expenses net of fee waivers reflect expenses after reimbursement by the investment adviser but prior to reductions from brokerage service arrangements or other expense offset arrangements. Expenses net of all reductions represent the net expenses paid by the class.
E Amount does not include the portfolio activity of any underlying Fidelity Central Funds.
F Portfolio turnover rate excludes securities received or delivered in-kind.
See accompanying notes which are an integral part of the financial statements.
Financial Highlights — Fidelity Total Bond Fund Class I
| Years ended August 31, | 2017 | 2016 | 2015 | 2014 | 2013 |
| Selected Per–Share Data | | | | | |
| Net asset value, beginning of period | $10.85 | $10.51 | $10.76 | $10.46 | $11.27 |
| Income from Investment Operations | | | | | |
| Net investment income (loss)A | .295 | .337 | .313 | .319 | .295 |
| Net realized and unrealized gain (loss) | (.083) | .378 | (.233) | .393 | (.469) |
| Total from investment operations | .212 | .715 | .080 | .712 | (.174) |
| Distributions from net investment income | (.284) | (.316) | (.297) | (.303) | (.281) |
| Distributions from net realized gain | (.028) | (.059) | (.033) | (.109) | (.355) |
| Total distributions | (.312) | (.375) | (.330) | (.412) | (.636) |
| Net asset value, end of period | $10.75 | $10.85 | $10.51 | $10.76 | $10.46 |
| Total ReturnB | 2.02% | 6.99% | .73% | 6.95% | (1.67)% |
| Ratios to Average Net AssetsC,D | | | | | |
| Expenses before reductions | .50% | .50% | .50% | .51% | .51% |
| Expenses net of fee waivers, if any | .50% | .50% | .50% | .51% | .51% |
| Expenses net of all reductions | .50% | .50% | .50% | .51% | .51% |
| Net investment income (loss) | 2.79% | 3.20% | 2.94% | 3.02% | 2.69% |
| Supplemental Data | | | | | |
| Net assets, end of period (000 omitted) | $4,481,725 | $2,846,878 | $1,266,870 | $573,410 | $244,911 |
| Portfolio turnover rateE | 137% | 134% | 140%F | 108% | 201% |
A Calculated based on average shares outstanding during the period.
B Total returns would have been lower if certain expenses had not been reduced during the applicable periods shown.
C Fees and expenses of any underlying Fidelity Central Funds are not included in the Fund's expense ratio. The Fund indirectly bears its proportionate share of the expenses of any underlying Fidelity Central Funds.
D Expense ratios reflect operating expenses of the class. Expenses before reductions do not reflect amounts reimbursed by the investment adviser or reductions from brokerage service arrangements or reductions from other expense offset arrangements and do not represent the amount paid by the class during periods when reimbursements or reductions occur. Expenses net of fee waivers reflect expenses after reimbursement by the investment adviser but prior to reductions from brokerage service arrangements or other expense offset arrangements. Expenses net of all reductions represent the net expenses paid by the class.
E Amount does not include the portfolio activity of any underlying Fidelity Central Funds.
F Portfolio turnover rate excludes securities received or delivered in-kind.
See accompanying notes which are an integral part of the financial statements.
Financial Highlights — Fidelity Total Bond Fund Class Z
| Years ended August 31, | 2017 | 2016 | 2015 A |
| Selected Per–Share Data | | | |
| Net asset value, beginning of period | $10.85 | $10.51 | $10.66 |
| Income from Investment Operations | | | |
| Net investment income (loss)B | .310 | .352 | .234 |
| Net realized and unrealized gain (loss) | (.083) | .378 | (.167) |
| Total from investment operations | .227 | .730 | .067 |
| Distributions from net investment income | (.299) | (.331) | (.217) |
| Distributions from net realized gain | (.028) | (.059) | – |
| Total distributions | (.327) | (.390) | (.217) |
| Net asset value, end of period | $10.75 | $10.85 | $10.51 |
| Total ReturnC,D | 2.16% | 7.14% | .59% |
| Ratios to Average Net AssetsE,F | | | |
| Expenses before reductions | .36% | .36% | .36%G |
| Expenses net of fee waivers, if any | .36% | .36% | .36%G |
| Expenses net of all reductions | .36% | .36% | .36%G |
| Net investment income (loss) | 2.93% | 3.34% | 3.29%G |
| Supplemental Data | | | |
| Net assets, end of period (000 omitted) | $1,473,993 | $811,440 | $546,968 |
| Portfolio turnover rateH | 137% | 134% | 140%I |
A For the period December 22, 2014 (commencement of sale of shares) to August 31, 2015.
B Calculated based on average shares outstanding during the period.
C Total returns for periods of less than one year are not annualized.
D Total returns would have been lower if certain expenses had not been reduced during the applicable periods shown.
E Fees and expenses of any underlying Fidelity Central Funds are not included in the Fund's expense ratio. The Fund indirectly bears its proportionate share of the expenses of any underlying Fidelity Central Funds.
F Expense ratios reflect operating expenses of the class. Expenses before reductions do not reflect amounts reimbursed by the investment adviser or reductions from brokerage service arrangements or reductions from other expense offset arrangements and do not represent the amount paid by the class during periods when reimbursements or reductions occur. Expense ratios before reductions for start-up periods may not be representative of longer-term operating periods. Expenses net of fee waivers reflect expenses after reimbursement by the investment adviser but prior to reductions from brokerage service arrangements or other expense offset arrangements. Expenses net of all reductions represent the net expenses paid by the class.
G Annualized
H Amount does not include the portfolio activity of any underlying Fidelity Central Funds.
I Portfolio turnover rate excludes securities received or delivered in-kind.
See accompanying notes which are an integral part of the financial statements.
Notes to Financial Statements
For the period ended August 31, 2017
1. Organization.
Fidelity Total Bond Fund (the Fund) is a fund of Fidelity Income Fund (the Trust) and is authorized to issue an unlimited number of shares. The Trust is registered under the Investment Company Act of 1940, as amended (the 1940 Act), as an open-end management investment company organized as a Massachusetts business trust. The Fund offers Class A, Class M (formerly Class T), Class C, Total Bond, Class I and Class Z shares, each of which has equal rights as to assets and voting privileges. Each class has exclusive voting rights with respect to matters that affect that class.
After the close of business on June 24, 2016, all outstanding Class B shares were converted to Class A shares. All prior fiscal period dollar and share amounts for Class B presented in the Notes to Financial Statements are for the period September 1, 2015 through June 24, 2016.
2. Investments in Fidelity Central Funds.
The Fund invests in Fidelity Central Funds, which are open-end investment companies generally available only to other investment companies and accounts managed by the investment adviser and its affiliates. The Fund's Schedule of Investments lists each of the Fidelity Central Funds held as of period end, if any, as an investment of the Fund, but does not include the underlying holdings of each Fidelity Central Fund. As an Investing Fund, the Fund indirectly bears its proportionate share of the expenses of the underlying Fidelity Central Funds.
The Money Market Central Funds seek preservation of capital and current income and are managed by Fidelity Investments Money Management, Inc. (FIMM), an affiliate of the investment adviser. Annualized expenses of the Money Market Central Funds as of their most recent shareholder report date are less than .005%.
A complete unaudited list of holdings for each Fidelity Central Fund is available upon request or at the Securities and Exchange Commission (the SEC) website at www.sec.gov. In addition, the financial statements of the Fidelity Central Funds, which are not covered by the Fund's Report of Independent Registered Public Accounting Firm, are available on the SEC website or upon request.
3. Significant Accounting Policies.
The Fund is an investment company and applies the accounting and reporting guidance of the Financial Accounting Standards Board (FASB) Accounting Standards Codification Topic 946 Financial Services – Investments Companies. The financial statements have been prepared in conformity with accounting principles generally accepted in the United States of America (GAAP), which require management to make certain estimates and assumptions at the date of the financial statements. Actual results could differ from those estimates. Subsequent events, if any, through the date that the financial statements were issued have been evaluated in the preparation of the financial statements. The following summarizes the significant accounting policies of the Fund:
Investment Valuation. Investments are valued as of 4:00 p.m. Eastern time on the last calendar day of the period. The Board of Trustees (the Board) has delegated the day to day responsibility for the valuation of the Fund's investments to the Fair Value Committee (the Committee) established by the Fund's investment adviser. In accordance with valuation policies and procedures approved by the Board, the Fund attempts to obtain prices from one or more third party pricing vendors or brokers to value its investments. When current market prices, quotations or currency exchange rates are not readily available or reliable, investments will be fair valued in good faith by the Committee, in accordance with procedures adopted by the Board. Factors used in determining fair value vary by investment type and may include market or investment specific events, changes in interest rates and credit quality. The frequency with which these procedures are used cannot be predicted and they may be utilized to a significant extent. The Committee oversees the Fund's valuation policies and procedures and reports to the Board on the Committee's activities and fair value determinations. The Board monitors the appropriateness of the procedures used in valuing the Fund's investments and ratifies the fair value determinations of the Committee.
The Fund categorizes the inputs to valuation techniques used to value its investments into a disclosure hierarchy consisting of three levels as shown below:
- Level 1 – quoted prices in active markets for identical investments
- Level 2 – other significant observable inputs (including quoted prices for similar investments, interest rates, prepayment speeds, etc.)
- Level 3 – unobservable inputs (including the Fund's own assumptions based on the best information available)
Valuation techniques used to value the Fund's investments by major category are as follows:
Debt securities, including restricted securities, are valued based on evaluated prices received from third party pricing vendors or from brokers who make markets in such securities. Corporate bonds, bank notes, bank loan obligations, foreign government and government agency obligations, municipal securities, preferred securities, U.S. government and government agency obligations and sovereign loan participations are valued by pricing vendors who utilize matrix pricing which considers yield or price of bonds of comparable quality, coupon, maturity and type or by broker-supplied prices. Asset backed securities, collateralized mortgage obligations, commercial mortgage securities and U.S. government agency mortgage securities are valued by pricing vendors who utilize matrix pricing which considers prepayment speed assumptions, attributes of the collateral, yield or price of bonds of comparable quality, coupon, maturity and type or by broker-supplied prices. Swaps are marked-to-market daily based on valuations from third party pricing vendors, registered derivatives clearing organizations (clearinghouses) or broker-supplied valuations. These pricing sources may utilize inputs such as interest rate curves, credit spread curves, default possibilities and recovery rates. When independent prices are unavailable or unreliable, debt securities and swaps may be valued utilizing pricing methodologies which consider similar factors that would be used by third party pricing vendors. For foreign debt securities, when significant market or security specific events arise, valuations may be determined in good faith in accordance with procedures adopted by the Board. Debt securities and swaps are generally categorized as Level 2 in the hierarchy but may be Level 3 depending on the circumstances.
Equity securities, including restricted securities, for which market quotations are readily available, are valued at the last reported sale price or official closing price as reported by a third party pricing vendor on the primary market or exchange on which they are traded and are categorized as Level 1 in the hierarchy. In the event there were no sales during the day or closing prices are not available, securities are valued at the last quoted bid price or may be valued using the last available price and are generally categorized as Level 2 in the hierarchy. For foreign equity securities, when market or security specific events arise, comparisons to the valuation of American Depositary Receipts (ADRs), futures contracts, Exchange-Traded Funds (ETFs) and certain indexes as well as quoted prices for similar securities may be used and would be categorized as Level 2 in the hierarchy. Utilizing these techniques may result in transfers between Level 1 and Level 2. For equity securities, including restricted securities, where observable inputs are limited, assumptions about market activity and risk are used and these securities may be categorized as Level 3 in the hierarchy.
The U.S. dollar value of foreign currency contracts is determined using currency exchange rates supplied by a pricing service and are categorized as Level 2 in the hierarchy. Futures contracts are valued at the settlement price established each day by the board of trade or exchange on which they are traded and are categorized as Level 1 in the hierarchy. Options traded over-the-counter are valued using vendor or broker-supplied valuations and are categorized as Level 2 in the hierarchy. Investments in open-end mutual funds, including the Fidelity Central Funds, are valued at their closing net asset value (NAV) each business day and are categorized as Level 1 in the hierarchy.
Changes in valuation techniques may result in transfers in or out of an assigned level within the disclosure hierarchy. The aggregate value of investments by input level as of August 31, 2017 is included at the end of the Fund's Schedule of Investments.
Foreign Currency. Foreign-denominated assets, including investment securities, and liabilities are translated into U.S. dollars at the exchange rates at period end. Purchases and sales of investment securities, income and dividends received and expenses denominated in foreign currencies are translated into U.S. dollars at the exchange rate in effect on the transaction date.
The effects of exchange rate fluctuations on investments are included with the net realized and unrealized gain (loss) on investment securities. Other foreign currency transactions resulting in realized and unrealized gain (loss) are disclosed separately.
Realized gains and losses on foreign currency transactions arise from the disposition of foreign currency, realized changes in the value of foreign currency between the trade and settlement dates on security transactions, and the difference between the amounts of dividends, interest and foreign withholding taxes recorded on transaction date and the U.S. dollar equivalent of the amounts actually received or paid. Unrealized gains and losses on assets and liabilities in foreign currencies arise from changes in the value of foreign currency, and from assets and liabilities denominated in foreign currencies, other than investments, which are held at period end.
Investment Transactions and Income. For financial reporting purposes, the Fund's investment holdings and NAV include trades executed through the end of the last business day of the period. The NAV per share for processing shareholder transactions is calculated as of the close of business of the New York Stock Exchange (NYSE), normally 4:00 p.m. Eastern time and includes trades executed through the end of the prior business day. Gains and losses on securities sold are determined on the basis of identified cost and may include proceeds received from litigation. Dividend income is recorded on the ex-dividend date, except for certain dividends from foreign securities where the ex-dividend date may have passed, which are recorded as soon as the Fund is informed of the ex-dividend date. Non-cash dividends included in dividend income, if any, are recorded at the fair market value of the securities received. Income and capital gain distributions from Fidelity Central Funds, if any, are recorded on the ex-dividend date. Certain distributions received by the Fund represent a return of capital or capital gain. The Fund determines the components of these distributions subsequent to the ex-dividend date, based upon receipt of tax filings or other correspondence relating to the underlying investment. These distributions are recorded as a reduction of cost of investments and/or as a realized gain. Interest income is accrued as earned and includes coupon interest and amortization of premium and accretion of discount on debt securities as applicable. Paid in Kind (PIK) income is recorded at the fair market value of the securities received. Investment income is recorded net of foreign taxes withheld where recovery of such taxes is uncertain. Debt obligations may be placed on non-accrual status and related interest income may be reduced by ceasing current accruals and writing off interest receivables when the collection of all or a portion of interest has become doubtful based on consistently applied procedures. A debt obligation is removed from non-accrual status when the issuer resumes interest payments or when collectability of interest is reasonably assured.
Class Allocations and Expenses. Investment income, realized and unrealized capital gains and losses, common expenses of the Fund, and certain fund-level expense reductions, if any, are allocated daily on a pro-rata basis to each class based on the relative net assets of each class to the total net assets of the Fund. Each class differs with respect to transfer agent and distribution and service plan fees incurred. Certain expense reductions may also differ by class. For the reporting period, the allocated portion of income and expenses to each class as a percent of its average net assets may vary due to the timing of recording these transactions in relation to fluctuating net assets of the classes. Expenses directly attributable to a fund are charged to that fund. Expenses attributable to more than one fund are allocated among the respective funds on the basis of relative net assets or other appropriate methods. Expense estimates are accrued in the period to which they relate and adjustments are made when actual amounts are known.
Deferred Trustee Compensation. Under a Deferred Compensation Plan (the Plan), independent Trustees may elect to defer receipt of a portion of their annual compensation. Deferred amounts are invested in a cross-section of Fidelity funds, are marked-to-market and remain in the Fund until distributed in accordance with the Plan. The investment of deferred amounts and the offsetting payable to the Trustees are included in the accompanying Statement of Assets and Liabilities.
Income Tax Information and Distributions to Shareholders. Each year, the Fund intends to qualify as a regulated investment company under Subchapter M of the Internal Revenue Code, including distributing substantially all of its taxable income and realized gains. As a result, no provision for U.S. Federal income taxes is required. As of August 31, 2017, the Fund did not have any unrecognized tax benefits in the financial statements; nor is the Fund aware of any tax positions for which it is reasonably possible that the total amounts of unrecognized tax benefits will significantly change in the next twelve months. The Fund files a U.S. federal tax return, in addition to state and local tax returns as required. The Fund's federal income tax returns are subject to examination by the Internal Revenue Service (IRS) for a period of three fiscal years after they are filed. State and local tax returns may be subject to examination for an additional fiscal year depending on the jurisdiction. Foreign taxes are provided for based on the Fund's understanding of the tax rules and rates that exist in the foreign markets in which it invests.
Dividends are declared and recorded daily and paid monthly from net investment income. Distributions from realized gains, if any, are declared and recorded on the ex-dividend date. Income dividends and capital gain distributions are declared separately for each class. Income and capital gain distributions are determined in accordance with income tax regulations, which may differ from GAAP. In addition, the Fund claimed a portion of the payment made to redeeming shareholders as a distribution for income tax purposes.
Capital accounts within the financial statements are adjusted for permanent book-tax differences. These adjustments have no impact on net assets or the results of operations. Capital accounts are not adjusted for temporary book-tax differences which will reverse in a subsequent period.
Book-tax differences are primarily due to futures contracts, swaps, foreign currency transactions, defaulted bonds, certain conversion ratio adjustments, market discount, deferred trustees compensation and losses deferred due to wash sales and excise tax regulations.
As of period end, the cost and unrealized appreciation (depreciation) in securities, and derivatives if applicable, for federal income tax purposes were as follows:
| Gross unrealized appreciation | $793,080,160 |
| Gross unrealized depreciation | (188,993,869) |
| Net unrealized appreciation (depreciation) | $604,086,291 |
| Tax Cost | $30,659,936,797 |
The tax-based components of distributable earnings as of period end were as follows:
| Undistributed ordinary income | $32,121,732 |
| Undistributed long-term capital gain | $68,811,082 |
| Net unrealized appreciation (depreciation) on securities and other investments | $583,387,936 |
The Fund intends to elect to defer to its next fiscal year $49,045,791 of capital losses recognized during the period November 1, 2016 to August 31, 2017.
The tax character of distributions paid was as follows:
| | August 31, 2017 | August 31, 2016 |
| Ordinary Income | $773,871,373 | $ 736,642,371 |
| Long-term Capital Gains | 34,023,173 | 67,566,052 |
| Total | $807,894,546 | $ 804,208,423 |
Delayed Delivery Transactions and When-Issued Securities. During the period, the Fund transacted in securities on a delayed delivery or when-issued basis. Payment and delivery may take place after the customary settlement period for that security. The price of the underlying securities and the date when the securities will be delivered and paid for are fixed at the time the transaction is negotiated. The securities purchased on a delayed delivery or when-issued basis are identified as such in the Fund's Schedule of Investments. The Fund may receive compensation for interest forgone in the purchase of a delayed delivery or when-issued security. With respect to purchase commitments, the Fund identifies securities as segregated in its records with a value at least equal to the amount of the commitment. Losses may arise due to changes in the value of the underlying securities or if the counterparty does not perform under the contract's terms, or if the issuer does not issue the securities due to political, economic, or other factors.
To-Be-Announced (TBA) Securities and Mortgage Dollar Rolls. During the period, the Fund transacted in TBA securities that involved buying or selling mortgage-backed securities (MBS) on a forward commitment basis. A TBA transaction typically does not designate the actual security to be delivered and only includes an approximate principal amount; however delivered securities must meet specified terms defined by industry guidelines, including issuer, rate and current principal amount outstanding on underlying mortgage pools. The Fund may enter into a TBA transaction with the intent to take possession of or deliver the underlying MBS, or the Fund may elect to extend the settlement by entering into either a mortgage or reverse mortgage dollar roll. Mortgage dollar rolls are transactions where a fund sells TBA securities and simultaneously agrees to repurchase MBS on a later date at a lower price and with the same counterparty. Reverse mortgage dollar rolls involve the purchase and simultaneous agreement to sell TBA securities on a later date at a lower price. Transactions in mortgage dollar rolls and reverse mortgage dollar rolls are accounted for as purchases and sales and may result in an increase to the Fund's portfolio turnover rate.
Purchases and sales of TBA securities involve risks similar to those discussed above for delayed delivery and when-issued securities. Also, if the counterparty in a mortgage dollar roll or a reverse mortgage dollar roll transaction files for bankruptcy or becomes insolvent, the Fund's right to repurchase or sell securities may be limited. Additionally, when a fund sells TBA securities without already owning or having the right to obtain the deliverable securities (an uncovered forward commitment to sell), it incurs a risk of loss because it could have to purchase the securities at a price that is higher than the price at which it sold them. A fund may be unable to purchase the deliverable securities if the corresponding market is illiquid.
TBA securities subject to a forward commitment to sell at period end are included at the end of the Fund's Schedule of Investments under the caption "TBA Sale Commitments." The proceeds and value of these commitments are reflected in the Fund's Statement of Assets and Liabilities as Receivable for TBA sale commitments and TBA sale commitments, at value, respectively.
Restricted Securities. The Fund may invest in securities that are subject to legal or contractual restrictions on resale. These securities generally may be resold in transactions exempt from registration or to the public if the securities are registered. Disposal of these securities may involve time-consuming negotiations and expense, and prompt sale at an acceptable price may be difficult. Information regarding restricted securities is included at the end of the Fund's Schedule of Investments.
Loans and Other Direct Debt Instruments. The Fund invests in direct debt instruments which are interests in amounts owed to lenders by corporate or other borrowers. These instruments may be in the form of loans, trade claims or other receivables and may include standby financing commitments such as revolving credit facilities that obligate the Fund to supply additional cash to the borrower on demand. Loans may be acquired through assignment or participation. The Fund also invests in unfunded loan commitments, which are contractual obligations for future funding. Information regarding unfunded commitments is included at the end of the Fund's Schedule of Investments.
New Accounting Pronouncement. In March 2017, the Financial Accounting Standards Board (FASB) issued an Accounting Standards Update (ASU), ASU 2017-08, which amends the amortization period for certain callable debt securities that are held at a premium. The amendment requires the premium to be amortized to the earliest call date. The amendments do not require an accounting change for securities held at a discount. The ASU is effective for annual periods beginning after December 15, 2018. Management is currently evaluating the potential impact of these changes to the financial statements.
4. Derivative Instruments.
Risk Exposures and the Use of Derivative Instruments. The Fund's investment objective allows the Fund to enter into various types of derivative contracts, including futures contracts, forward foreign currency contracts, options and swaps. Derivatives are investments whose value is primarily derived from underlying assets, indices or reference rates and may be transacted on an exchange or over-the-counter (OTC). Derivatives may involve a future commitment to buy or sell a specified asset based on specified terms, to exchange future cash flows at periodic intervals based on a notional principal amount, or for one party to make one or more payments upon the occurrence of specified events in exchange for periodic payments from the other party.
The Fund used derivatives to increase returns, to gain exposure to certain types of assets, to facilitate transactions in foreign-denominated securities and to manage exposure to certain risks as defined below. The success of any strategy involving derivatives depends on analysis of numerous economic factors, and if the strategies for investment do not work as intended, the Fund may not achieve its objectives.
The Fund's use of derivatives increased or decreased its exposure to the following risks:
| Credit Risk | Credit risk relates to the ability of the issuer of a financial instrument to make further principal or interest payments on an obligation or commitment that it has to the Fund.
|
| Foreign Exchange Risk | Foreign exchange rate risk relates to fluctuations in the value of an asset or liability due to changes in currency exchange rates.
|
| Interest Rate Risk | Interest rate risk relates to the fluctuations in the value of interest-bearing securities due to changes in the prevailing levels of market interest rates. |
The Fund is also exposed to additional risks from investing in derivatives, such as liquidity risk and counterparty credit risk. Liquidity risk is the risk that the Fund will be unable to close out the derivative in the open market in a timely manner. Counterparty credit risk is the risk that the counterparty will not be able to fulfill its obligation to the Fund. Derivative counterparty credit risk is managed through formal evaluation of the creditworthiness of all potential counterparties. On certain OTC derivatives such as forward foreign currency contracts, options and bi-lateral swaps, the Fund attempts to reduce its exposure to counterparty credit risk by entering into an International Swaps and Derivatives Association, Inc. (ISDA) Master Agreement with each of its counterparties. The ISDA Master Agreement gives the Fund the right to terminate all transactions traded under such agreement upon the deterioration in the credit quality of the counterparty beyond specified levels. The ISDA Master Agreement gives each party the right, upon an event of default by the other party or a termination of the agreement, to close out all transactions traded under such agreement and to net amounts owed under each transaction to one net payable by one party to the other. To mitigate counterparty credit risk on bi-lateral OTC derivatives, the Fund receives collateral in the form of cash or securities once the Fund's net unrealized appreciation on outstanding derivative contracts under an ISDA Master Agreement exceeds certain applicable thresholds, subject to certain minimum transfer provisions. The collateral received is held in segregated accounts with the Fund's custodian bank in accordance with the collateral agreements entered into between the Fund, the counterparty and the Fund's custodian bank. The Fund could experience delays and costs in gaining access to the collateral even though it is held by the Fund's custodian bank. The Fund's maximum risk of loss from counterparty credit risk related to bi-lateral OTC derivatives is generally the aggregate unrealized appreciation and unpaid counterparty payments in excess of any collateral pledged by the counterparty to the Fund. The Fund may be required to pledge collateral for the benefit of the counterparties on bi-lateral OTC derivatives in an amount not less than each counterparty's unrealized appreciation on outstanding derivative contracts, subject to certain minimum transfer provisions, and any such pledged collateral is identified in the Schedule of Investments. Exchange-traded futures contracts are not covered by the ISDA Master Agreement; however counterparty credit risk related to exchange-traded futures contracts may be mitigated by the protection provided by the exchange on which they trade. Counterparty credit risk related to centrally cleared OTC swaps may be mitigated by the protection provided by the clearinghouse.
Investing in derivatives may involve greater risks than investing in the underlying assets directly and, to varying degrees, may involve risk of loss in excess of any initial investment and collateral received and amounts recognized in the Statement of Assets and Liabilities. In addition, there may be the risk that the change in value of the derivative contract does not correspond to the change in value of the underlying instrument.
Net Realized Gain (Loss) and Change in Net Unrealized Appreciation (Depreciation) on Derivatives. The table below, which reflects the impacts of derivatives on the financial performance of the Fund, summarizes the net realized gain (loss) and change in net unrealized appreciation (depreciation) for derivatives during the period as presented in the Statement of Operations.
| Primary Risk Exposure / Derivative Type | Net Realized Gain (Loss) | Change in Net Unrealized Appreciation (Depreciation) |
| Credit Risk | | |
| Purchased Options | $(2,893,722) | $304,630 |
| Swaps | 815,808 | (96,974) |
| Total Credit Risk | (2,077,914) | 207,656 |
| Foreign Exchange Risk | | |
| Forward Foreign Currency Contracts | (3,031,949) | (2,063,717) |
| Interest Rate Risk | | |
| Futures Contracts | 1,594,426 | (1,058,889) |
| Swaps | 836,022 | 436,466 |
| Total Interest Rate Risk | 2,430,448 | (622,423) |
| Totals | $(2,679,415) | $(2,478,484) |
A summary of the value of derivatives by primary risk exposure as of period end is included at the end of the Schedule of Investments.
Forward Foreign Currency Contracts. Forward foreign currency contracts represent obligations to purchase or sell foreign currency on a specified future date at a price fixed at the time the contracts are entered into. The Fund used forward foreign currency contracts to facilitate transactions in foreign-denominated securities and to manage exposure to certain foreign currencies.
Forward foreign currency contracts are valued daily and fluctuations in exchange rates on open contracts are recorded as unrealized appreciation or (depreciation) and reflected in the Statement of Assets and Liabilities. When the contract is closed, the Fund realizes a gain or loss equal to the difference between the closing value and the value at the time it was opened. Non-deliverable forward foreign currency exchange contracts are settled with the counterparty in cash without the delivery of foreign currency. The net realized gain (loss) and change in net unrealized appreciation (depreciation) on forward foreign currency contracts during the period is presented in the Statement of Operations.
Any open forward foreign currency contracts at period end are presented in the Schedule of Investments under the caption "Forward Foreign Currency Contracts." The contract amount and unrealized appreciation (depreciation) reflects each contract's exposure to the underlying currency at period end, and is representative of volume of activity during the period.
Futures Contracts. A futures contract is an agreement between two parties to buy or sell a specified underlying instrument for a fixed price at a specified future date. The Fund used futures contracts to manage its exposure to the bond market and fluctuations in interest rates.
Upon entering into a futures contract, a fund is required to deposit either cash or securities (initial margin) with a clearing broker in an amount equal to a certain percentage of the face value of the contract. Futures contracts are marked-to-market daily and subsequent daily payments (variation margin) are made or received by a fund depending on the daily fluctuations in the value of the futures contracts and are recorded as unrealized appreciation or (depreciation). This receivable and/or payable, if any, is included in daily variation margin on futures contracts in the Statement of Assets and Liabilities. Realized gain or (loss) is recorded upon the expiration or closing of a futures contract. The net realized gain (loss) and change in net unrealized appreciation (depreciation) on futures contracts during the period is included in the Statement of Operations.
Any open futures contracts at period end are presented in the Schedule of Investments under the caption "Futures Contracts". The underlying face amount at value reflects each contract's exposure to the underlying instrument or index at period end and is representative of volume of activity during the period. Securities deposited to meet initial margin requirements are identified in the Schedule of Investments.
Options. Options give the purchaser the right, but not the obligation, to buy (call) or sell (put) an underlying security or financial instrument at an agreed exercise or strike price between or on certain dates. Options obligate the seller (writer) to buy (put) or sell (call) an underlying instrument at the exercise or strike price or cash settle an underlying derivative instrument if the holder exercises the option on or before the expiration date. The Fund uses OTC options, such as swaptions, which are options where the underlying instrument is a swap, to manage its exposure to potential credit events.
Upon entering into an options contract, a fund will pay or receive a premium. Premiums paid on purchased options are reflected as cost of investments and premiums received on written options are reflected as a liability on the Statement of Assets and Liabilities. Certain options may be purchased or written with premiums to be paid or received on a future date. Options are valued daily and any unrealized appreciation (depreciation) is reflected on the Statement of Assets and Liabilities. When an option is exercised, the cost or proceeds of the underlying instrument purchased or sold is adjusted by the amount of the premium. When an option is closed the Fund will realize a gain or loss depending on whether the proceeds or amount paid for the closing sale transaction is greater or less than the premium received or paid. When an option expires, gains and losses are realized to the extent of premiums received and paid, respectively. The net realized and unrealized gains (losses) on purchased options are included on the Statement of Operations in net realized gain (loss) and change in net unrealized appreciation (depreciation) on investment securities. The net realized gain (loss) and change in net unrealized appreciation (depreciation) on written options are reflected separately on the Statement of Operations.
Any open options at period end are presented in the Schedule of Investments under the captions "Purchased Options," "Purchased Swaptions," "Written Options" and "Written Swaptions," as applicable, and are representative of volume of activity during the period.
Writing puts and buying calls tend to increase exposure to the underlying instrument while buying puts and writing calls tend to decrease exposure to the underlying instrument. For purchased options, risk of loss is limited to the premium paid, and for written options, risk of loss is the change in value in excess of the premium received.
Swaps. A swap is a contract between two parties to exchange future cash flows at periodic intervals based on a notional principal amount. A bi-lateral OTC swap is a transaction between a fund and a dealer counterparty where cash flows are exchanged between the two parties for the life of the swap. A centrally cleared OTC swap is a transaction executed between a fund and a dealer counterparty, then cleared by a futures commission merchant (FCM) through a clearinghouse. Once cleared, the clearinghouse serves as a central counterparty, with whom a fund exchanges cash flows for the life of the transaction, similar to transactions in futures contracts.
Bi-lateral OTC swaps are marked-to-market daily and changes in value are reflected in the Statement of Assets and Liabilities in the bi-lateral OTC swaps at value line items. Any upfront premiums paid or received upon entering a bi-lateral OTC swap to compensate for differences between stated terms of the swap and prevailing market conditions (e.g. credit spreads, interest rates or other factors) are recorded in net unrealized appreciation (depreciation) in the Statement of Assets and Liabilities and amortized to realized gain or (loss) ratably over the term of the swap. Any unamortized upfront premiums are presented in the Schedule of Investments.
Centrally cleared OTC swaps require a fund to deposit either cash or securities (initial margin) with the FCM, at the instruction of and for the benefit of the clearinghouse. Securities deposited to meet initial margin requirements are identified in the Schedule of Investments. Centrally cleared OTC swaps are marked-to-market daily and subsequent payments (variation margin) are made or received depending on the daily fluctuations in the value of the swaps and are recorded as unrealized appreciation or (depreciation). These daily payments, if any, are included in receivable or payable for daily variation margin on centrally cleared OTC swaps in the Statement of Assets and Liabilities. Any premiums for centrally cleared OTC swaps are recorded periodically throughout the term of the swap to variation margin and included in unrealized appreciation (depreciation) in the Statement of Assets and Liabilities. Any premiums are recognized as realized gain (loss) upon termination or maturity of the swap.
For both bi-lateral and centrally cleared OTC swaps, payments are exchanged at specified intervals, accrued daily commencing with the effective date of the contract and recorded as realized gain or (loss). Some swaps may be terminated prior to the effective date and realize a gain or loss upon termination. The net realized gain (loss) and change in net unrealized appreciation (depreciation) on swaps during the period is included in the Statement of Operations.
Any open swaps at period end are included in the Schedule of Investments under the caption "Swaps" and are representative of volume of activity during the period.
Credit Default Swaps. Credit default swaps enable the Fund to buy or sell protection against specified credit events on a single-name issuer or a traded credit index. Under the terms of a credit default swap the buyer of protection (buyer) receives credit protection in exchange for making periodic payments to the seller of protection (seller) based on a fixed percentage applied to a notional principal amount. In return for these payments, the seller will be required to make a payment upon the occurrence of one or more specified credit events. The Fund enters into credit default swaps as a seller to gain credit exposure to an issuer and/or as a buyer to obtain a measure of protection against defaults of an issuer. Periodic payments are made over the life of the contract by the buyer provided that no credit event occurs.
For credit default swaps on most corporate and sovereign issuers, credit events include bankruptcy, failure to pay or repudiation/moratorium. For credit default swaps on corporate or sovereign issuers, the obligation that may be put to the seller is not limited to the specific reference obligation described in the Schedule of Investments. For credit default swaps on asset-backed securities, a credit event may be triggered by events such as failure to pay principal, maturity extension, rating downgrade or write-down. For credit default swaps on asset-backed securities, the reference obligation described represents the security that may be put to the seller. For credit default swaps on a traded credit index, a specified credit event may affect all or individual underlying securities included in the index.
As a seller, if an underlying credit event occurs, the Fund will pay a net settlement amount of cash equal to the notional amount of the swap less the recovery value of the reference obligation or underlying securities comprising an index. Only in the event of the industry's inability to value the underlying asset will the Fund be required to take delivery of the reference obligation or underlying securities comprising an index and pay an amount equal to the notional amount of the swap.
As a buyer, if an underlying credit event occurs, the Fund will receive a net settlement amount of cash equal to the notional amount of the swap less the recovery value of the reference obligation or underlying securities comprising an index. Only in the event of the industry's inability to value the underlying asset will the Fund be required to deliver the reference obligation or underlying securities comprising an index in exchange for payment of an amount equal to the notional amount of the swap.
Typically, the value of each credit default swap and credit rating disclosed for each reference obligation in the Schedule of Investments, where the Fund is the seller, can be used as measures of the current payment/performance risk of the swap. As the value of the swap changes as a positive or negative percentage of the total notional amount, the payment/performance risk may decrease or increase, respectively. In addition to these measures, the investment adviser monitors a variety of factors including cash flow assumptions, market activity and market sentiment as part of its ongoing process of assessing payment/performance risk.
Interest Rate Swaps. Interest rate swaps are agreements between counterparties to exchange cash flows, one based on a fixed rate, and the other on a floating rate. The Fund entered into interest rate swaps to manage its exposure to interest rate changes. Changes in interest rates can have an effect on both the value of bond holdings as well as the amount of interest income earned. In general, the value of bonds can fall when interest rates rise and can rise when interest rates fall.
5. Purchases and Sales of Investments.
Purchases and sales of securities, other than short-term securities and U.S. government securities, aggregated $4,453,589,602 and $5,564,261,911, respectively.
6. Fees and Other Transactions with Affiliates.
Management Fee. Fidelity Management & Research Company (the investment adviser) and its affiliates provide the Fund with investment management related services for which the Fund pays a monthly management fee. The management fee is the sum of an individual fund fee rate that is based on an annual rate of .20% of the Fund's average net assets and an annualized group fee rate that averaged .11% during the period. The group fee rate is based upon the average net assets of all the mutual funds advised by the investment adviser, including any mutual funds previously advised by the investment adviser that are currently advised by Fidelity SelectCo, LLC, an affiliate of the investment adviser. The group fee rate decreases as assets under management increase and increases as assets under management decrease. For the reporting period, the total annual management fee rate was .31% of the Fund's average net assets.
Distribution and Service Plan Fees. In accordance with Rule 12b-1 of the 1940 Act, the Fund has adopted separate Distribution and Service Plans for each class of shares. Certain classes pay Fidelity Distributors Corporation (FDC), an affiliate of the investment adviser, separate Distribution and Service Fees, each of which is based on an annual percentage of each class' average net assets. In addition, FDC may pay financial intermediaries for selling shares of the Fund and providing shareholder support services. For the period, the Distribution and Service Fee rates, total fees and amounts retained by FDC were as follows:
| | Distribution
Fee | Service
Fee | Total Fees | Retained
by FDC |
| Class A | -% | .25% | $2,187,833 | $45,734 |
| Class M | -% | .25% | 459,616 | – |
| Class C | .75% | .25% | 1,837,980 | 439,039 |
| | | | $4,485,429 | $484,773 |
Sales Load. FDC may receive a front-end sales charge of up to 4.00% for selling Class A shares and Class M shares, some of which is paid to financial intermediaries for selling shares of the Fund. Depending on the holding period, FDC may receive contingent deferred sales charges levied on Class A, Class M and Class C redemptions. The deferred sales charges are 1.00% for Class C shares, .75% for certain purchases of Class A shares and .25% for certain purchases of Class M shares.
For the period, sales charge amounts retained by FDC were as follows:
| | Retained
by FDC |
| Class A | $82,367 |
| Class M | 12,239 |
| Class C(a) | 40,478 |
| | $135,084 |
(a) When Class C shares are initially sold, FDC pays commissions from its own resources to financial intermediaries through which the sales are made.
Transfer Agent Fees. Fidelity Investments Institutional Operations Company, Inc., (FIIOC), an affiliate of the investment adviser, is the transfer, dividend disbursing and shareholder servicing agent for each class of the Fund. FIIOC receives an asset-based fee of .10% of Total Bond's average net assets. FIIOC pays for typesetting, printing and mailing of shareholder reports, except proxy statements. For the period, transfer agent fees for each class were as follows:
| | Amount | % of
Class-Level Average
Net Assets |
| Class A | $1,330,914 | .15 |
| Class M | 293,015 | .16 |
| Class C | 307,738 | .17 |
| Total Bond | 21,619,174 | .10 |
| Class I | 5,206,681 | .15 |
| Class Z | 115,949 | .01 |
| | $28,873,471 | |
Fund Wide Operations Fee. Pursuant to the Fund Wide Operations and Expense Agreement (FWOE), the investment adviser has agreed to provide for fund level expenses (which do not include transfer agent, Rule 12b-1 fees, compensation of the independent Trustees, interest (including commitment fees), taxes or extraordinary expenses, if any) in return for a FWOE fee equal to .35% of the Fund's average net assets less the total amount of the management fee. The FWOE paid by the Fund is reduced by an amount equal to the fees and expenses paid to the independent Trustees. For the period, the FWOE fee was equivalent to an annual rate of .04% of average net assets.
Interfund Trades. The Fund may purchase from or sell securities to other Fidelity Funds under procedures adopted by the Board. The procedures have been designed to ensure these interfund trades are executed in accordance with Rule 17a-7 of the 1940 Act. Interfund trades are included within the respective purchases and sales amounts shown in the Purchases and Sales of Investments note.
Other. During the period, the investment adviser reimbursed the Fund for certain losses in the amount of $8,916.
7. Committed Line of Credit.
The Fund participates with other funds managed by the investment adviser or an affiliate in a $4.25 billion credit facility (the "line of credit") to be utilized for temporary or emergency purposes to fund shareholder redemptions or for other short-term liquidity purposes. The Fund has agreed to pay commitment fees on its pro-rata portion of the line of credit, which amounted to $87,044 and is reflected in Miscellaneous expenses on the Statement of Operations. During the period, the Fund did not borrow on this line of credit.
8. Security Lending.
The Fund lends portfolio securities from time to time in order to earn additional income. On the settlement date of the loan, the Fund receives collateral (in the form of U.S. Treasury obligations, letters of credit and/or cash) against the loaned securities and maintains collateral in an amount not less than 100% of the market value of the loaned securities during the period of the loan. The market value of the loaned securities is determined at the close of business of the Fund and any additional required collateral is delivered to the Fund on the next business day. The Fund or borrower may terminate the loan at any time, and if the borrower defaults on its obligation to return the securities loaned because of insolvency or other reasons, the Fund may apply collateral received from the borrower against the obligation. The Fund may experience delays and costs in recovering the securities loaned. Any cash collateral received is maintained at the Fund's custodian and/or invested in cash equivalents. At period end, there were no security loans outstanding. Security lending income represents the income earned on investing cash collateral, less rebates paid to borrowers, plus any premium payments received for lending certain types of securities. Security lending income is presented in the Statement of Operations as a component of interest income. Total security lending income during the period amounted to $1,309,950.
9. Expense Reductions.
Through arrangements with the Fund's custodian, credits realized as a result of certain uninvested cash balances were used to reduce the Fund's expenses. During the period, these credits reduced the Fund's expenses by $130,904.
10. Distributions to Shareholders.
Distributions to shareholders of each class were as follows:
| | Year ended
August 31, 2017 | Year ended
August 31, 2016 |
| From net investment income | | |
| Class A | $21,656,972 | $31,727,561 |
| Class M | 4,370,911 | 3,400,558 |
| Class B | – | 52,324 |
| Class C | 3,033,896 | 3,143,821 |
| Total Bond | 586,137,135 | 559,720,907 |
| Class I | 93,037,515 | 70,886,754 |
| Class Z | 31,739,860 | 21,379,438 |
| Total | $739,976,289 | $690,311,363 |
| From net realized gain | | |
| Class A | $3,152,995 | $5,050,640 |
| Class M | 416,240 | 600,521 |
| Class B | – | 17,887 |
| Class C | 491,517 | 809,224 |
| Total Bond | 54,284,285 | 97,033,225 |
| Class I | 7,617,861 | 7,167,426 |
| Class Z | 1,955,359 | 3,218,137 |
| Total | $67,918,257 | $113,897,060 |
11. Share Transactions.
Share transactions for each class were as follows and may contain automatic conversions between classes or exchanges between affiliated funds:
| | Shares | Shares | Dollars | Dollars |
| | Year ended August 31, 2017 | Year ended August 31, 2016 | Year ended August 31, 2017 | Year ended August 31, 2016 |
| Class A | | | | |
| Shares sold | 35,580,281 | 79,582,385 | $378,631,170 | $836,125,573 |
| Reinvestment of distributions | 2,271,068 | 3,397,092 | 24,175,284 | 35,693,646 |
| Shares redeemed | (102,937,028) | (50,390,515) | (1,089,228,226) | (531,503,136) |
| Net increase (decrease) | (65,085,679) | 32,588,962 | $(686,421,772) | $340,316,083 |
| Class M | | | | |
| Shares sold | 17,161,400 | 7,797,143 | $182,620,103 | $81,948,331 |
| Reinvestment of distributions | 442,288 | 371,455 | 4,706,740 | 3,901,602 |
| Shares redeemed | (5,227,159) | (3,506,111) | (55,482,738) | (36,795,670) |
| Net increase (decrease) | 12,376,529 | 4,662,487 | $131,844,105 | $49,054,263 |
| Class B | | | | |
| Shares sold | – | 52,386 | $– | $545,030 |
| Reinvestment of distributions | – | 5,304 | – | 55,384 |
| Shares redeemed | – | (371,399) | – | (3,942,186) |
| Net increase (decrease) | – | (313,709) | $– | $(3,341,772) |
| Class C | | | | |
| Shares sold | 5,742,872 | 7,989,480 | $61,343,735 | $84,112,756 |
| Reinvestment of distributions | 311,520 | 338,212 | 3,319,847 | 3,555,483 |
| Shares redeemed | (5,532,987) | (4,407,873) | (58,835,524) | (46,363,403) |
| Net increase (decrease) | 521,405 | 3,919,819 | $5,828,058 | $41,304,836 |
| Total Bond | | | | |
| Shares sold | 715,776,478 | 564,396,562 | $7,613,246,265 | $5,943,329,183 |
| Reinvestment of distributions | 57,507,306 | 59,893,089 | 612,532,396 | 629,464,263 |
| Shares redeemed | (452,613,004) | (389,085,832) | (4,806,739,429) | (4,072,787,679) |
| Net increase (decrease) | 320,670,780 | 235,203,819 | $3,419,039,232 | $2,500,005,767 |
| Class I | | | | |
| Shares sold | 245,139,592 | 202,861,513 | $2,596,745,220 | $2,130,458,698 |
| Reinvestment of distributions | 8,911,840 | 7,026,236 | 94,805,632 | 73,778,315 |
| Shares redeemed | (99,475,433) | (67,965,246) | (1,055,508,510) | (713,298,115) |
| Net increase (decrease) | 154,575,999 | 141,922,503 | $1,636,042,342 | $1,490,938,898 |
| Class Z | | | | |
| Shares sold | 155,922,153 | 31,568,440 | $1,656,237,293 | $331,880,727 |
| Reinvestment of distributions | 2,946,230 | 2,342,277 | 31,368,596 | 24,597,125 |
| Shares redeemed | (96,526,329) | (11,141,442) | (1,027,365,935) | (116,919,251) |
| Net increase (decrease) | 62,342,054 | 22,769,275 | $660,239,954 | $239,558,601 |
12. Other.
The Fund's organizational documents provide former and current trustees and officers with a limited indemnification against liabilities arising in connection with the performance of their duties to the Fund. In the normal course of business, the Fund may also enter into contracts that provide general indemnifications. The Fund's maximum exposure under these arrangements is unknown as this would be dependent on future claims that may be made against the Fund. The risk of material loss from such claims is considered remote.
At the end of the period, Strategic Advisers Core Income Fund was the owner of record of approximately 20% of the total outstanding shares of the Fund.
13. Credit Risk.
The Fund invests a portion of its assets in structured securities of issuers backed by commercial and residential mortgage loans, credit card receivables and automotive loans. The value and related income of these securities is sensitive to changes in economic conditions, including delinquencies and/or defaults.
Report of Independent Registered Public Accounting Firm
To the Trustees of Fidelity Income Fund and Shareholders of Fidelity Total Bond Fund:
In our opinion, the accompanying statement of assets and liabilities, including the schedule of investments, and the related statements of operations and of changes in net assets and the financial highlights present fairly, in all material respects, the financial position of Fidelity Total Bond Fund (a fund of Fidelity Income Fund) as of August 31, 2017, the results of its operations for the year then ended, the changes in its net assets for each of the two years in the period then ended and the financial highlights for each of the five years in the period then ended, in conformity with accounting principles generally accepted in the United States of America. These financial statements and financial highlights (hereafter referred to as “financial statements”) are the responsibility of the Fidelity Total Bond Fund’s management. Our responsibility is to express an opinion on these financial statements based on our audits. We conducted our audits of these financial statements in accordance with the standards of the Public Company Accounting Oversight Board (United States). Those standards require that we plan and perform the audit to obtain reasonable assurance about whether the financial statements are free of material misstatement. An audit includes examining, on a test basis, evidence supporting the amounts and disclosures in the financial statements, assessing the accounting principles used and significant estimates made by management, and evaluating the overall financial statement presentation. Our procedures included confirmation of securities owned as of August 31, 2017 by correspondence with the custodians and brokers; when replies were not received from brokers, we performed other auditing procedures. We believe that our audits provide a reasonable basis for our opinion.
PricewaterhouseCoopers LLP
Boston, Massachusetts
October 19, 2017
Trustees and Officers
The Trustees, Members of the Advisory Board (if any), and officers of the trust and fund, as applicable, are listed below. The Board of Trustees governs the fund and is responsible for protecting the interests of shareholders. The Trustees are experienced executives who meet periodically throughout the year to oversee the fund's activities, review contractual arrangements with companies that provide services to the fund, oversee management of the risks associated with such activities and contractual arrangements, and review the fund's performance. Each of the Trustees oversees 246 funds.
The Trustees hold office without limit in time except that (a) any Trustee may resign; (b) any Trustee may be removed by written instrument, signed by at least two-thirds of the number of Trustees prior to such removal; (c) any Trustee who requests to be retired or who has become incapacitated by illness or injury may be retired by written instrument signed by a majority of the other Trustees; and (d) any Trustee may be removed at any special meeting of shareholders by a two-thirds vote of the outstanding voting securities of the trust. Each Trustee who is not an interested person (as defined in the 1940 Act) of the trust and the fund is referred to herein as an Independent Trustee. Each Independent Trustee shall retire not later than the last day of the calendar year in which his or her 75th birthday occurs. The Independent Trustees may waive this mandatory retirement age policy with respect to individual Trustees. Officers and Advisory Board Members hold office without limit in time, except that any officer or Advisory Board Member may resign or may be removed by a vote of a majority of the Trustees at any regular meeting or any special meeting of the Trustees. Except as indicated, each individual has held the office shown or other offices in the same company for the past five years.
The fund’s Statement of Additional Information (SAI) includes more information about the Trustees. To request a free copy, call Fidelity at 1-800-835-5095 (plan accounts) or 1-877-208-0098 (all other accounts).
Experience, Skills, Attributes, and Qualifications of the Trustees. The Governance and Nominating Committee has adopted a statement of policy that describes the experience, qualifications, attributes, and skills that are necessary and desirable for potential Independent Trustee candidates (Statement of Policy). The Board believes that each Trustee satisfied at the time he or she was initially elected or appointed a Trustee, and continues to satisfy, the standards contemplated by the Statement of Policy. The Governance and Nominating Committee also engages professional search firms to help identify potential Independent Trustee candidates who have the experience, qualifications, attributes, and skills consistent with the Statement of Policy. From time to time, additional criteria based on the composition and skills of the current Independent Trustees, as well as experience or skills that may be appropriate in light of future changes to board composition, business conditions, and regulatory or other developments, have also been considered by the professional search firms and the Governance and Nominating Committee. In addition, the Board takes into account the Trustees' commitment and participation in Board and committee meetings, as well as their leadership of standing and ad hoc committees throughout their tenure.
In determining that a particular Trustee was and continues to be qualified to serve as a Trustee, the Board has considered a variety of criteria, none of which, in isolation, was controlling. The Board believes that, collectively, the Trustees have balanced and diverse experience, qualifications, attributes, and skills, which allow the Board to operate effectively in governing the fund and protecting the interests of shareholders. Information about the specific experience, skills, attributes, and qualifications of each Trustee, which in each case led to the Board's conclusion that the Trustee should serve (or continue to serve) as a trustee of the fund, is provided below.
Board Structure and Oversight Function. Abigail P. Johnson is an interested person and currently serves as Chairman. The Trustees have determined that an interested Chairman is appropriate and benefits shareholders because an interested Chairman has a personal and professional stake in the quality and continuity of services provided to the fund. Independent Trustees exercise their informed business judgment to appoint an individual of their choosing to serve as Chairman, regardless of whether the Trustee happens to be independent or a member of management. The Independent Trustees have determined that they can act independently and effectively without having an Independent Trustee serve as Chairman and that a key structural component for assuring that they are in a position to do so is for the Independent Trustees to constitute a substantial majority for the Board. The Independent Trustees also regularly meet in executive session. Marie L. Knowles serves as Chairman of the Independent Trustees and as such (i) acts as a liaison between the Independent Trustees and management with respect to matters important to the Independent Trustees and (ii) with management prepares agendas for Board meetings.
Fidelity® funds are overseen by different Boards of Trustees. The fund's Board oversees Fidelity's investment-grade bond, money market, asset allocation and certain equity funds, and other Boards oversee Fidelity's high income, sector and other equity funds. The asset allocation funds may invest in Fidelity® funds that are overseen by such other Boards. The use of separate Boards, each with its own committee structure, allows the Trustees of each group of Fidelity® funds to focus on the unique issues of the funds they oversee, including common research, investment, and operational issues. On occasion, the separate Boards establish joint committees to address issues of overlapping consequences for the Fidelity® funds overseen by each Board.
The Trustees operate using a system of committees to facilitate the timely and efficient consideration of all matters of importance to the Trustees, the fund, and fund shareholders and to facilitate compliance with legal and regulatory requirements and oversight of the fund's activities and associated risks. The Board, acting through its committees, has charged FMR and its affiliates with (i) identifying events or circumstances the occurrence of which could have demonstrably adverse effects on the fund's business and/or reputation; (ii) implementing processes and controls to lessen the possibility that such events or circumstances occur or to mitigate the effects of such events or circumstances if they do occur; and (iii) creating and maintaining a system designed to evaluate continuously business and market conditions in order to facilitate the identification and implementation processes described in (i) and (ii) above. Because the day-to-day operations and activities of the fund are carried out by or through FMR, its affiliates, and other service providers, the fund's exposure to risks is mitigated but not eliminated by the processes overseen by the Trustees. While each of the Board's committees has responsibility for overseeing different aspects of the fund's activities, oversight is exercised primarily through the Operations and Audit Committees. In addition, an ad hoc Board committee of Independent Trustees has worked with FMR to enhance the Board's oversight of investment and financial risks, legal and regulatory risks, technology risks, and operational risks, including the development of additional risk reporting to the Board. Appropriate personnel, including but not limited to the fund's Chief Compliance Officer (CCO), FMR's internal auditor, the independent accountants, the fund's Treasurer and portfolio management personnel, make periodic reports to the Board's committees, as appropriate, including an annual review of Fidelity's risk management program for the Fidelity® funds. The responsibilities of each standing committee, including their oversight responsibilities, are described further under "Standing Committees of the Trustees."
Interested Trustees*:
Correspondence intended for a Trustee who is an interested person may be sent to Fidelity Investments, 245 Summer Street, Boston, Massachusetts 02210.
Name, Year of Birth; Principal Occupations and Other Relevant Experience+
Abigail P. Johnson (1961)
Year of Election or Appointment: 2009
Trustee
Chairman of the Board of Trustees
Ms. Johnson also serves as Trustee of other Fidelity® funds. Ms. Johnson serves as Chairman (2016-present), Chief Executive Officer (2014-present), and Director (2007-present) of FMR LLC (diversified financial services company), President of Fidelity Financial Services (2012-present) and President of Personal, Workplace and Institutional Services (2005-present). Ms. Johnson is Chairman and Director of FMR Co., Inc. (investment adviser firm, 2011-present) and Chairman and Director of FMR (investment adviser firm, 2011-present). Previously, Ms. Johnson served as Vice Chairman (2007-2016) and President (2013-2016) of FMR LLC, President and a Director of FMR (2001-2005), a Trustee of other investment companies advised by FMR, Fidelity Investments Money Management, Inc. (investment adviser firm), and FMR Co., Inc. (2001-2005), Senior Vice President of the Fidelity® funds (2001-2005), and managed a number of Fidelity® funds. Ms. Abigail P. Johnson and Mr. Arthur E. Johnson are not related.
Jennifer Toolin McAuliffe (1959)
Year of Election or Appointment: 2016
Trustee
Ms. McAuliffe also serves as Trustee of other Fidelity® funds. Ms. McAuliffe previously served as a Member of the Advisory Board of certain Fidelity® funds (2016) and as Co-Head of Fixed Income of Fidelity Investments Limited (now known as FIL Limited (FIL)) (diversified financial services company). Earlier roles at FIL included Director of Research for FIL’s credit and quantitative teams in London, Hong Kong and Tokyo. Ms. McAuliffe also was the Director of Research for taxable and municipal bonds at Fidelity Investments Money Management, Inc. Ms. McAuliffe is also a director or trustee of several not-for-profit entities.
* Determined to be an “Interested Trustee” by virtue of, among other things, his or her affiliation with the trust or various entities under common control with FMR.
+ The information includes the Trustee's principal occupation during the last five years and other information relating to the experience, attributes, and skills relevant to the Trustee's qualifications to serve as a Trustee, which led to the conclusion that the Trustee should serve as a Trustee for the fund.
Independent Trustees:
Correspondence intended for an Independent Trustee may be sent to Fidelity Investments, P.O. Box 55235, Boston, Massachusetts 02205-5235.
Name, Year of Birth; Principal Occupations and Other Relevant Experience+
Elizabeth S. Acton (1951)
Year of Election or Appointment: 2013
Trustee
Ms. Acton also serves as Trustee of other Fidelity® funds. Prior to her retirement in April 2012, Ms. Acton was Executive Vice President, Finance (2011-2012), Executive Vice President, Chief Financial Officer (2002-2011), and Treasurer (2004-2005) of Comerica Incorporated (financial services). Prior to joining Comerica, Ms. Acton held a variety of positions at Ford Motor Company (1983-2002), including Vice President and Treasurer (2000-2002) and Executive Vice President and Chief Financial Officer of Ford Motor Credit Company (1998-2000). Ms. Acton currently serves as a member of the Board of Directors and Audit and Finance Committees of Beazer Homes USA, Inc. (homebuilding, 2012-present). Previously, Ms. Acton served as a Member of the Advisory Board of certain Fidelity® funds (2013-2016).
John Engler (1948)
Year of Election or Appointment: 2014
Trustee
Mr. Engler also serves as Trustee of other Fidelity® funds. He serves on the board of directors for Universal Forest Products (manufacturer and distributor of wood and wood-alternative products, 2003-present) and K12 Inc. (technology-based education company, 2012-present). Previously, Mr. Engler served as a Member of the Advisory Board of certain Fidelity® funds (2014-2016), president of the Business Roundtable (2011-2017), a trustee of The Munder Funds (2003-2014), president and CEO of the National Association of Manufacturers (2004-2011), member of the Board of Trustees of the Annie E. Casey Foundation (2004-2015), and as governor of Michigan (1991-2003). He is a past chairman of the National Governors Association.
Albert R. Gamper, Jr. (1942)
Year of Election or Appointment: 2006
Trustee
Mr. Gamper also serves as Trustee of other Fidelity® funds. Prior to his retirement in December 2004, Mr. Gamper served as Chairman of the Board of CIT Group Inc. (commercial finance). During his tenure with CIT Group Inc. Mr. Gamper served in numerous senior management positions, including Chairman (1987-1989; 1999-2001; 2002-2004), Chief Executive Officer (1987-2004), and President (2002-2003). Mr. Gamper currently serves as a member of the Board of Directors of Public Service Enterprise Group (utilities, 2000-present), and Member of the Board of Trustees of Barnabas Health Care System (1997-present). Previously, Mr. Gamper served as Chairman (2012-2015) and Vice Chairman (2011-2012) of the Independent Trustees of certain Fidelity® funds and as Chairman of the Board of Governors, Rutgers University (2004-2007).
Robert F. Gartland (1951)
Year of Election or Appointment: 2010
Trustee
Mr. Gartland also serves as Trustee of other Fidelity® funds. Mr. Gartland is Chairman and an investor in Gartland & Mellina Group Corp. (consulting, 2009-present). Previously, Mr. Gartland served as a partner and investor of Vietnam Partners LLC (investments and consulting, 2008-2011). Prior to his retirement, Mr. Gartland held a variety of positions at Morgan Stanley (financial services, 1979-2007) including Managing Director (1987-2007).
Arthur E. Johnson (1947)
Year of Election or Appointment: 2008
Trustee
Vice Chairman of the Independent Trustees
Mr. Johnson also serves as Trustee of other Fidelity® funds. Mr. Johnson serves as a member of the Board of Directors of Eaton Corporation plc (diversified power management, 2009-present) and Booz Allen Hamilton (management consulting, 2011-present). Prior to his retirement, Mr. Johnson served as Senior Vice President of Corporate Strategic Development of Lockheed Martin Corporation (defense contractor, 1999-2009). He previously served on the Board of Directors of IKON Office Solutions, Inc. (1999-2008), AGL Resources, Inc. (holding company, 2002-2016), and Delta Airlines (2005-2007). Mr. Arthur E. Johnson is not related to Ms. Abigail P. Johnson.
Michael E. Kenneally (1954)
Year of Election or Appointment: 2009
Trustee
Mr. Kenneally also serves as Trustee of other Fidelity® funds. Prior to his retirement, Mr. Kenneally served as Chairman and Global Chief Executive Officer of Credit Suisse Asset Management. Before joining Credit Suisse, he was an Executive Vice President and Chief Investment Officer for Bank of America Corporation. Earlier roles at Bank of America included Director of Research, Senior Portfolio Manager and Research Analyst, and Mr. Kenneally was awarded the Chartered Financial Analyst (CFA) designation in 1991.
Marie L. Knowles (1946)
Year of Election or Appointment: 2001
Trustee
Chairman of the Independent Trustees
Ms. Knowles also serves as Trustee of other Fidelity® funds. Prior to Ms. Knowles' retirement in June 2000, she served as Executive Vice President and Chief Financial Officer of Atlantic Richfield Company (ARCO) (diversified energy, 1996-2000). From 1993 to 1996, she was a Senior Vice President of ARCO and President of ARCO Transportation Company (pipeline and tanker operations). Ms. Knowles currently serves as a Director and Chairman of the Audit Committee of McKesson Corporation (healthcare service, since 2002). Ms. Knowles is a member of the Board of the Santa Catalina Island Company (real estate, 2009-present). Ms. Knowles is a Member of the Investment Company Institute Board of Governors and a Member of the Governing Council of the Independent Directors Council (2014-present). She also serves as a member of the Advisory Board for the School of Engineering of the University of Southern California. Previously, Ms. Knowles served as a Director of Phelps Dodge Corporation (copper mining and manufacturing, 1994-2007), URS Corporation (engineering and construction, 2000-2003) and America West (airline, 1999-2002). Ms. Knowles previously served as Vice Chairman of the Independent Trustees of certain Fidelity® funds (2012-2015).
Mark A. Murray (1954)
Year of Election or Appointment: 2016
Trustee
Mr. Murray also serves as Trustee of other Fidelity® funds. Mr. Murray is Vice Chairman (2013-present) of Meijer, Inc. (regional retail chain). Previously, Mr. Murray served as a Member of the Advisory Board of certain Fidelity® funds (2016) and as Co-Chief Executive Officer (2013-2016) and President (2006-2013) of Meijer, Inc. Mr. Murray serves as a member of the Board of Directors and Nuclear Review and Public Policy and Responsibility Committees of DTE Energy Company (diversified energy company, 2009-present). Mr. Murray also serves as a member of the Board of Directors of Spectrum Health (not-for-profit health system, 2015-present). Mr. Murray previously served as President of Grand Valley State University (2001-2006), Treasurer for the State of Michigan (1999-2001), Vice President of Finance and Administration for Michigan State University (1998-1999), and a member of the Board of Directors and Audit Committee and Chairman of the Nominating and Corporate Governance Committee of Universal Forest Products, Inc. (manufacturer and distributor of wood and wood-alternative products, 2004-2016). Mr. Murray is also a director or trustee of many community and professional organizations.
+ The information includes the Trustee's principal occupation during the last five years and other information relating to the experience, attributes, and skills relevant to the Trustee's qualifications to serve as a Trustee, which led to the conclusion that the Trustee should serve as a Trustee for the fund.
Advisory Board Members and Officers:
Correspondence intended for an officer may be sent to Fidelity Investments, 245 Summer Street, Boston, Massachusetts 02210. Officers appear below in alphabetical order.
Name, Year of Birth; Principal Occupation
Elizabeth Paige Baumann (1968)
Year of Election or Appointment: 2017
Anti-Money Laundering (AML) Officer
Ms. Baumann also serves as AML Officer of other funds. She is Chief AML Officer (2012-present) and Senior Vice President (2014-present) of FMR LLC (diversified financial services company) and is an employee of Fidelity Investments. Previously, Ms. Baumann served as AML Officer of the funds (2012-2016), and Vice President (2007-2014) and Deputy Anti-Money Laundering Officer (2007-2012) of FMR LLC.
Marc R. Bryant (1966)
Year of Election or Appointment: 2015
Secretary and Chief Legal Officer (CLO)
Mr. Bryant also serves as Secretary and CLO of other funds. Mr. Bryant serves as CLO, Secretary, and Senior Vice President of Fidelity Management & Research Company (investment adviser firm, 2015-present) and FMR Co., Inc. (investment adviser firm, 2015-present); Secretary of Fidelity SelectCo, LLC (investment adviser firm, 2015-present) and Fidelity Investments Money Management, Inc. (investment adviser firm, 2015-present); and CLO of Fidelity Management & Research (Hong Kong) Limited and FMR Investment Management (UK) Limited (investment adviser firms, 2015-present) and Fidelity Management & Research (Japan) Limited (investment adviser firm, 2016-present). He is Senior Vice President and Deputy General Counsel of FMR LLC (diversified financial services company). Previously, Mr. Bryant served as Secretary and CLO of Fidelity Rutland Square Trust II (2010-2014) and Assistant Secretary of Fidelity's Fixed Income and Asset Allocation Funds (2013-2015). Prior to joining Fidelity Investments, Mr. Bryant served as a Senior Vice President and the Head of Global Retail Legal for AllianceBernstein L.P. (2006-2010), and as the General Counsel for ProFund Advisors LLC (2001-2006).
Jonathan Davis (1968)
Year of Election or Appointment: 2010
Assistant Treasurer
Mr. Davis also serves as Assistant Treasurer of other funds, and is an employee of Fidelity Investments. Previously, Mr. Davis served as Vice President and Associate General Counsel of FMR LLC (diversified financial services company, 2003-2010).
Adrien E. Deberghes (1967)
Year of Election or Appointment: 2010
Assistant Treasurer
Mr. Deberghes also serves as an officer of other funds. He serves as Executive Vice President of Fidelity Investments Money Management, Inc. (FIMM) (investment adviser firm, 2016-present) and is an employee of Fidelity Investments (2008-present). Prior to joining Fidelity Investments, Mr. Deberghes was Senior Vice President of Mutual Fund Administration at State Street Corporation (2007-2008), Senior Director of Mutual Fund Administration at Investors Bank & Trust (2005-2007), and Director of Finance for Dunkin' Brands (2000-2005). Previously, Mr. Deberghes served in other fund officer roles.
Stephanie J. Dorsey (1969)
Year of Election or Appointment: 2013
President and Treasurer
Ms. Dorsey also serves as an officer of other funds. She is an employee of Fidelity Investments (2008-present) and has served in other fund officer roles. Prior to joining Fidelity Investments, Ms. Dorsey served as Treasurer (2004-2008) of the JPMorgan Mutual Funds and Vice President (2004-2008) of JPMorgan Chase Bank.
Howard J. Galligan III (1966)
Year of Election or Appointment: 2014
Chief Financial Officer
Mr. Galligan also serves as Chief Financial Officer of other funds. Mr. Galligan serves as President of Fidelity Pricing and Cash Management Services (FPCMS) (2014-present) and as a Director of Strategic Advisers, Inc. (investment adviser firm, 2008-present). Previously, Mr. Galligan served as Chief Administrative Officer of Asset Management (2011-2014) and Chief Operating Officer and Senior Vice President of Investment Support for Strategic Advisers, Inc. (2003-2011).
Colm A. Hogan (1973)
Year of Election or Appointment: 2016
Assistant Treasurer
Mr. Hogan also serves as an officer of other funds. Mr. Hogan is an employee of Fidelity Investments (2005-present).
Chris Maher (1972)
Year of Election or Appointment: 2013
Assistant Treasurer
Mr. Maher serves as Assistant Treasurer of other funds. Mr. Maher is Vice President of Valuation Oversight and is an employee of Fidelity Investments. Previously, Mr. Maher served as Vice President of Asset Management Compliance (2013), Vice President of the Program Management Group of FMR (investment adviser firm, 2010-2013), and Vice President of Valuation Oversight (2008-2010).
John B. McGinty, Jr. (1962)
Year of Election or Appointment: 2016
Chief Compliance Officer
Mr. McGinty also serves as Chief Compliance Officer of other funds. Mr. McGinty is Senior Vice President of Asset Management Compliance for Fidelity Investments and is an employee of Fidelity Investments (2016-present). Mr. McGinty previously served as Vice President, Senior Attorney at Eaton Vance Management (investment management firm, 2015-2016), and prior to Eaton Vance as global CCO for all firm operations and registered investment companies at GMO LLC (investment management firm, 2009-2015). Before joining GMO LLC, Mr. McGinty served as Senior Vice President, Deputy General Counsel for Fidelity Investments (2007-2009).
Rieco E. Mello (1969)
Year of Election or Appointment: 2017
Assistant Treasurer
Mr. Mello also serves as Assistant Treasurer of other funds. Mr. Mello is an employee of Fidelity Investments (1995-present).
Jamie Pagliocco (1964)
Year of Election or Appointment: 2017
Vice President
Mr. Pagliocco also serves as Vice President of other funds. Mr. Pagliocco serves as Chief Investment Officer of FMR's Bond Group (2017-present) and is an employee of Fidelity Investments (2001-present).
Jason P. Pogorelec (1975)
Year of Election or Appointment: 2015
Assistant Secretary
Mr. Pogorelec also serves as Assistant Secretary of other funds. Mr. Pogorelec serves as Vice President, Associate General Counsel (2010-present) and is an employee of Fidelity Investments (2006-present).
Nancy D. Prior (1967)
Year of Election or Appointment: 2014
Vice President
Ms. Prior also serves as Vice President of other funds. Ms. Prior serves as a Director of FMR Investment Management (UK) Limited (investment adviser firm, 2015-present), President (2016-present) and Director (2014-present) of Fidelity Investments Money Management, Inc. (FIMM) (investment adviser firm), President, Fixed Income (2014-present), Vice Chairman of FIAM LLC (investment adviser firm, 2014-present), and is an employee of Fidelity Investments (2002-present). Previously, Ms. Prior served as Vice President of Fidelity's Money Market Funds (2012-2014), President, Money Market and Short Duration Bond Group of Fidelity Management & Research (FMR) (investment adviser firm, 2013-2014), President, Money Market Group of FMR (2011-2013), Managing Director of Research (2009-2011), Senior Vice President and Deputy General Counsel (2007-2009), and Assistant Secretary of certain Fidelity® funds (2008-2009).
Stacie M. Smith (1974)
Year of Election or Appointment: 2013
Assistant Treasurer
Ms. Smith also serves as an officer of other funds. She is an employee of Fidelity Investments (2009-present) and has served in other fund officer roles. Prior to joining Fidelity Investments, Ms. Smith served as Senior Audit Manager of Ernst & Young LLP (accounting firm, 1996-2009). Previously, Ms. Smith served as Deputy Treasurer of certain Fidelity® funds (2013-2016).
Marc L. Spector (1972)
Year of Election or Appointment: 2016
Deputy Treasurer
Mr. Spector also serves as an officer of other funds. Mr. Spector is an employee of Fidelity Investments (2016-present). Prior to joining Fidelity Investments, Mr. Spector served as Director at the Siegfried Group (accounting firm, 2013-2016), and prior to Siegfried Group as audit senior manager at Deloitte & Touche (accounting firm, 2005-2013).
Renee Stagnone (1975)
Year of Election or Appointment: 2016
Assistant Treasurer
Ms. Stagnone also serves as an officer of other funds. Ms. Stagnone is an employee of Fidelity Investments (1997-present). Previously, Ms. Stagnone served as Deputy Treasurer of certain Fidelity® funds (2013-2016).
Christine J. Thompson (1958)
Year of Election or Appointment: 2015
Vice President of Fidelity's Bond Funds
Ms. Thompson also serves as Vice President of other funds. Ms. Thompson also serves as Chief Investment Officer of FMR's Bond Group (2010-present) and is an employee of Fidelity Investments (1985-present). Previously, Ms. Thompson served as Vice President of Fidelity's Bond Funds (2010-2012).
Shareholder Expense Example
As a shareholder of the Fund, you incur two types of costs: (1) transaction costs, including sales charges (loads) on purchase payments or redemption proceeds, and (2) ongoing costs, including management fees, distribution and/or service (12b-1) fees and other Fund expenses. This Example is intended to help you understand your ongoing costs (in dollars) of investing in the Fund and to compare these costs with the ongoing costs of investing in other mutual funds.
The Example is based on an investment of $1,000 invested at the beginning of the period and held for the entire period (March 1, 2017 to August 31, 2017).
Actual Expenses
The first line of the accompanying table for each class of the Fund provides information about actual account values and actual expenses. You may use the information in this line, together with the amount you invested, to estimate the expenses that you paid over the period. Simply divide your account value by $1,000.00 (for example, an $8,600 account value divided by $1,000.00 = 8.6), then multiply the result by the number in the first line for a class of the Fund under the heading entitled "Expenses Paid During Period" to estimate the expenses you paid on your account during this period. A small balance maintenance fee of $12.00 that is charged once a year may apply for certain accounts with a value of less than $2,000. This fee is not included in the table below. If it was, the estimate of expenses you paid during the period would be higher, and your ending account value lower, by this amount. In addition, the Fund, as a shareholder in the underlying Fidelity Central Funds, will indirectly bear its pro-rata share of the fees and expenses incurred by the underlying Fidelity Central Funds. These fees and expenses are not included in the Fund's annualized expense ratio used to calculate the expense estimate in the table below.
Hypothetical Example for Comparison Purposes
The second line of the accompanying table for each class of the Fund provides information about hypothetical account values and hypothetical expenses based on a Class' actual expense ratio and an assumed rate of return of 5% per year before expenses, which is not the Class' actual return. The hypothetical account values and expenses may not be used to estimate the actual ending account balance or expenses you paid for the period. You may use this information to compare the ongoing costs of investing in the Fund and other funds. To do so, compare this 5% hypothetical example with the 5% hypothetical examples that appear in the shareholder reports of the other funds. A small balance maintenance fee of $12.00 that is charged once a year may apply for certain accounts with a value of less than $2,000. This fee is not included in the table below. If it was, the estimate of expenses you paid during the period would be higher, and your ending account value lower, by this amount. In addition, the Fund, as a shareholder in the underlying Fidelity Central Funds, will indirectly bear its pro-rata share of the fees and expenses incurred by the underlying Fidelity Central Funds. These fees and expenses are not included in the Fund's annualized expense ratio used to calculate the expense estimate in the table below.
Please note that the expenses shown in the table are meant to highlight your ongoing costs only and do not reflect any transaction costs. Therefore, the second line of the table is useful in comparing ongoing costs only, and will not help you determine the relative total costs of owning different funds. In addition, if these transactional costs were included, your costs would have been higher.
| | Annualized Expense Ratio-A | Beginning
Account Value
March 1, 2017 | Ending
Account Value
August 31, 2017 | Expenses Paid
During Period-B
March 1, 2017
to August 31, 2017 |
| Class A | .74% | | | |
| Actual | | $1,000.00 | $1,025.70 | $3.78 |
| Hypothetical-C | | $1,000.00 | $1,021.48 | $3.77 |
| Class M | .75% | | | |
| Actual | | $1,000.00 | $1,025.60 | $3.83 |
| Hypothetical-C | | $1,000.00 | $1,021.42 | $3.82 |
| Class C | 1.50% | | | |
| Actual | | $1,000.00 | $1,021.70 | $7.64 |
| Hypothetical-C | | $1,000.00 | $1,017.64 | $7.63 |
| Total Bond | .45% | | | |
| Actual | | $1,000.00 | $1,027.20 | $2.30 |
| Hypothetical-C | | $1,000.00 | $1,022.94 | $2.29 |
| Class I | .49% | | | |
| Actual | | $1,000.00 | $1,026.90 | $2.50 |
| Hypothetical-C | | $1,000.00 | $1,022.74 | $2.50 |
| Class Z | .36% | | | |
| Actual | | $1,000.00 | $1,027.60 | $1.84 |
| Hypothetical-C | | $1,000.00 | $1,023.39 | $1.84 |
A Annualized expense ratio reflects expenses net of applicable fee waivers.
B Expenses are equal to each Class' annualized expense ratio, multiplied by the average account value over the period, multiplied by 184/365 (to reflect the one-half year period).
C 5% return per year before expenses
Distributions (Unaudited)
The Board of Trustees of Fidelity Total Bond Fund voted to pay to shareholders of record at the opening of business on record date, the following distributions per share derived from capital gains realized from sales of portfolio securities:
| | Pay Date | Record Date | Capital Gains |
| Fidelity Total Bond Fund | | | |
| Class A | 10/16/17 | 10/13/17 | $0.025 |
| Class M | 10/16/17 | 10/13/17 | $0.025 |
| Class C | 10/16/17 | 10/13/17 | $0.025 |
| Total Bond Fund | 10/16/17 | 10/13/17 | $0.025 |
| Class I | 10/16/17 | 10/13/17 | $0.025 |
| Class Z | 10/16/17 | 10/13/17 | $0.025 |
|
The fund hereby designates as a capital gain dividend with respect to the taxable year ended August 31, 2017, $96,299,631, or, if subsequently determined to be different, the net capital gain of such year.
A total of 14.21% of the dividends distributed during the fiscal year was derived from interest on U.S. Government securities which is generally exempt from state income tax.
The fund designates $425,514,865 of distributions paid during the period January 1, 2017 to August 31, 2017 as qualifying to be taxed as interest-related dividends for nonresident alien shareholders.
The fund will notify shareholders in January 2018 of amounts for use in preparing 2017 income tax returns.

ATB-ANN-1017
1.804575.114
Fidelity® Total Bond K6 Fund
Annual Report August 31, 2017 |
|
Contents
To view a fund's proxy voting guidelines and proxy voting record for the 12-month period ended June 30, visit http://www.fidelity.com/proxyvotingresults or visit the Securities and Exchange Commission's (SEC) web site at http://www.sec.gov.
You may also call 1-800-835-5092 to request a free copy of the proxy voting guidelines.
Standard & Poor's, S&P and S&P 500 are registered service marks of The McGraw-Hill Companies, Inc. and have been licensed for use by Fidelity Distributors Corporation.
Other third-party marks appearing herein are the property of their respective owners.
All other marks appearing herein are registered or unregistered trademarks or service marks of FMR LLC or an affiliated company. © 2017 FMR LLC. All rights reserved.
This report and the financial statements contained herein are submitted for the general information of the shareholders of the Fund. This report is not authorized for distribution to prospective investors in the Fund unless preceded or accompanied by an effective prospectus.
A fund files its complete schedule of portfolio holdings with the SEC for the first and third quarters of each fiscal year on Form N-Q. Forms N-Q are available on the SEC’s web site at http://www.sec.gov. A fund's Forms N-Q may be reviewed and copied at the SEC’s Public Reference Room in Washington, DC. Information regarding the operation of the SEC's Public Reference Room may be obtained by calling 1-800-SEC-0330.
For a complete list of a fund's portfolio holdings, view the most recent holdings listing, semiannual report, or annual report on Fidelity's web site at http://www.fidelity.com, http://www.institutional.fidelity.com, or http://www.401k.com, as applicable.
NOT FDIC INSURED •MAY LOSE VALUE •NO BANK GUARANTEE
Neither the Fund nor Fidelity Distributors Corporation is a bank.
Investment Summary (Unaudited)
The information in the following tables is based on the combined investments of the Fund and its pro-rata share of the investments of Fidelity's Fixed-Income Central Funds.
Quality Diversification (% of fund's net assets)
| As of August 31, 2017 |
| | U.S. Government and U.S. Government Agency Obligations | 57.9% |
| | AAA | 0.1% |
| | AA | 0.2% |
| | A | 5.2% |
| | BBB | 13.7% |
| | BB and Below | 18.1% |
| | Not Rated | 0.5% |
| | Short-Term Investments and Net Other Assets | 4.3% |

We have used ratings from Moody's Investors Service, Inc. Where Moody's® ratings are not available, we have used S&P® ratings. All ratings are as of the date indicated and do not reflect subsequent changes. Securities rated BB or below were rated investment grade at the time of acquisition.
Asset Allocation (% of fund's net assets)
| As of August 31, 2017*,** |
| | Corporate Bonds | 30.6% |
| | U.S. Government and U.S. Government Agency Obligations | 57.9% |
| | Asset-Backed Securities | 0.3% |
| | Municipal Bonds | 1.0% |
| | Other Investments | 5.9% |
| | Short-Term Investments and Net Other Assets (Liabilities) | 4.3% |

* Foreign investments - 7.7%
** Futures and Swaps - 0.3%
An unaudited holdings listing for the Fund, which presents direct holdings as well as the pro-rata share of any securities and other investments held indirectly through its investment in underlying non-money market Fidelity Central Funds, is available at fidelity.com.
Percentages in the above tables are adjusted for the effect of TBA Sale Commitments.
Investments August 31, 2017
Showing Percentage of Net Assets
| Nonconvertible Bonds - 24.0% | | | |
| | | Principal Amount | Value |
| CONSUMER DISCRETIONARY - 2.4% | | | |
| Automobiles - 0.9% | | | |
| General Motors Financial Co., Inc. 4.375% 9/25/21 | | $3,950,000 | $4,188,463 |
| Media - 1.5% | | | |
| 21st Century Fox America, Inc. 7.75% 12/1/45 | | 370,000 | 562,587 |
| Charter Communications Operating LLC/Charter Communications Operating Capital Corp. 4.908% 7/23/25 | | 945,000 | 1,012,380 |
| Comcast Corp. 6.45% 3/15/37 | | 365,000 | 481,775 |
| Time Warner Cable, Inc.: | | | |
| 4% 9/1/21 | | 1,480,000 | 1,542,102 |
| 7.3% 7/1/38 | | 2,420,000 | 2,983,300 |
| Time Warner, Inc. 6.2% 3/15/40 | | 840,000 | 991,150 |
| | | | 7,573,294 |
|
| TOTAL CONSUMER DISCRETIONARY | | | 11,761,757 |
|
| CONSUMER STAPLES - 0.6% | | | |
| Beverages - 0.6% | | | |
| Anheuser-Busch InBev Finance, Inc.: | | | |
| 2.65% 2/1/21 | | 45,000 | 45,846 |
| 4.7% 2/1/36 | | 2,325,000 | 2,577,528 |
| | | | 2,623,374 |
| Tobacco - 0.0% | | | |
| Reynolds American, Inc. 7.25% 6/15/37 | | 75,000 | 103,067 |
|
| TOTAL CONSUMER STAPLES | | | 2,726,441 |
|
| ENERGY - 5.4% | | | |
| Oil, Gas & Consumable Fuels - 5.4% | | | |
| Anadarko Finance Co. 7.5% 5/1/31 | | 790,000 | 992,411 |
| Anadarko Petroleum Corp.: | | | |
| 5.55% 3/15/26 | | 515,000 | 574,873 |
| 6.6% 3/15/46 | | 630,000 | 762,144 |
| Canadian Natural Resources Ltd.: | | | |
| 3.9% 2/1/25 | | 525,000 | 538,421 |
| 5.85% 2/1/35 | | 525,000 | 585,996 |
| Cenovus Energy, Inc. 4.25% 4/15/27 (a) | | 534,000 | 515,460 |
| Columbia Pipeline Group, Inc.: | | | |
| 4.5% 6/1/25 | | 25,000 | 26,851 |
| 5.8% 6/1/45 | | 10,000 | 12,167 |
| DCP Midstream LLC 5.85% 5/21/43 (a)(b) | | 570,000 | 528,675 |
| DCP Midstream Operating LP 3.875% 3/15/23 | | 520,000 | 506,350 |
| Enbridge, Inc.: | | | |
| 4.25% 12/1/26 | | 525,000 | 552,948 |
| 5.5% 12/1/46 | | 525,000 | 602,181 |
| Enterprise Products Operating LP 3.75% 2/15/25 | | 20,000 | 20,846 |
| Kinder Morgan Energy Partners LP 6.55% 9/15/40 | | 1,365,000 | 1,587,314 |
| Marathon Petroleum Corp. 5.125% 3/1/21 | | 35,000 | 37,969 |
| Petrobras Global Finance BV: | | | |
| 6.125% 1/17/22 | | 2,730,000 | 2,893,800 |
| 7.25% 3/17/44 | | 1,300,000 | 1,339,000 |
| 7.375% 1/17/27 | | 1,460,000 | 1,613,650 |
| Petroleos Mexicanos: | | | |
| 4.625% 9/21/23 | | 6,000,000 | 6,246,000 |
| 6.375% 1/23/45 | | 2,300,000 | 2,371,300 |
| 6.5% 3/13/27 (a) | | 20,000 | 22,400 |
| 6.75% 9/21/47 | | 100,000 | 107,510 |
| 6.75% 9/21/47 (a) | | 20,000 | 21,502 |
| The Williams Companies, Inc.: | | | |
| 3.7% 1/15/23 | | 2,000,000 | 1,985,000 |
| 4.55% 6/24/24 | | 70,000 | 71,575 |
| 5.75% 6/24/44 | | 35,000 | 36,313 |
| Western Gas Partners LP 4.65% 7/1/26 | | 35,000 | 36,398 |
| Williams Partners LP 4.3% 3/4/24 | | 2,000,000 | 2,120,125 |
| | | | 26,709,179 |
| FINANCIALS - 10.5% | | | |
| Banks - 5.0% | | | |
| Bank of America Corp.: | | | |
| 3.5% 4/19/26 | | 2,630,000 | 2,678,488 |
| 3.705% 4/24/28 (b) | | 528,000 | 540,178 |
| 5.65% 5/1/18 | | 110,000 | 112,761 |
| 5.875% 1/5/21 | | 1,810,000 | 2,019,560 |
| Barclays PLC 4.375% 1/12/26 | | 900,000 | 946,300 |
| Citigroup, Inc.: | | | |
| 1.8% 2/5/18 | | 100,000 | 100,064 |
| 2.4% 2/18/20 | | 1,585,000 | 1,599,352 |
| 4.4% 6/10/25 | | 1,970,000 | 2,083,257 |
| Credit Suisse Group Funding Guernsey Ltd.: | | | |
| 3.75% 3/26/25 | | 1,200,000 | 1,229,962 |
| 3.8% 6/9/23 | | 1,250,000 | 1,303,370 |
| Intesa Sanpaolo SpA 5.71% 1/15/26 (a) | | 500,000 | 528,430 |
| JPMorgan Chase & Co.: | | | |
| 2.35% 1/28/19 | | 35,000 | 35,341 |
| 2.95% 10/1/26 | | 3,085,000 | 3,037,720 |
| 4.35% 8/15/21 | | 2,425,000 | 2,613,313 |
| Rabobank Nederland 4.375% 8/4/25 | | 500,000 | 530,804 |
| Regions Bank 6.45% 6/26/37 | | 250,000 | 313,631 |
| Royal Bank of Scotland Group PLC 6.125% 12/15/22 | | 4,745,000 | 5,225,447 |
| | | | 24,897,978 |
| Capital Markets - 3.9% | | | |
| Affiliated Managers Group, Inc. 4.25% 2/15/24 | | 390,000 | 414,299 |
| Deutsche Bank AG 4.5% 4/1/25 | | 1,500,000 | 1,514,585 |
| Deutsche Bank AG London Branch 4.1% 1/13/26 | | 1,100,000 | 1,142,551 |
| Goldman Sachs Group, Inc.: | | | |
| 2.625% 1/31/19 | | 170,000 | 171,756 |
| 2.625% 4/25/21 | | 3,035,000 | 3,055,701 |
| 3.691% 6/5/28 (b) | | 3,160,000 | 3,214,658 |
| 3.75% 5/22/25 | | 525,000 | 541,587 |
| Moody's Corp.: | | | |
| 3.25% 1/15/28 (a) | | 10,000 | 10,081 |
| 4.875% 2/15/24 | | 9,000 | 10,038 |
| Morgan Stanley: | | | |
| 3.125% 7/27/26 | | 2,621,000 | 2,586,941 |
| 5.625% 9/23/19 | | 100,000 | 107,178 |
| 5.75% 1/25/21 | | 4,650,000 | 5,166,198 |
| UBS Group Funding AG 2.859% 8/15/23 (a)(b) | | 1,000,000 | 999,210 |
| UBS Group Funding Ltd. 4.125% 9/24/25 (a) | | 500,000 | 530,390 |
| | | | 19,465,173 |
| Consumer Finance - 0.7% | | | |
| Capital One Financial Corp. 2.5% 5/12/20 | | 625,000 | 630,654 |
| Discover Financial Services 3.95% 11/6/24 | | 2,580,000 | 2,666,316 |
| | | | 3,296,970 |
| Diversified Financial Services - 0.4% | | | |
| Brixmor Operating Partnership LP 3.25% 9/15/23 | | 1,035,000 | 1,033,522 |
| Voya Financial, Inc. 3.125% 7/15/24 | | 812,000 | 809,943 |
| | | | 1,843,465 |
| Insurance - 0.5% | | | |
| Pacific LifeCorp 5.125% 1/30/43 (a) | | 950,000 | 1,065,471 |
| Pricoa Global Funding I 5.375% 5/15/45 (b) | | 1,045,000 | 1,120,763 |
| TIAA Asset Management Finance LLC 4.125% 11/1/24 (a) | | 80,000 | 85,112 |
| Unum Group 3.875% 11/5/25 | | 50,000 | 51,959 |
| | | | 2,323,305 |
|
| TOTAL FINANCIALS | | | 51,826,891 |
|
| HEALTH CARE - 1.0% | | | |
| Biotechnology - 0.1% | | | |
| AbbVie, Inc. 4.5% 5/14/35 | | 525,000 | 561,609 |
| Health Care Providers & Services - 0.2% | | | |
| HCA Holdings, Inc. 6.5% 2/15/20 | | 950,000 | 1,034,531 |
| Pharmaceuticals - 0.7% | | | |
| Actavis Funding SCS 3.45% 3/15/22 | | 40,000 | 41,558 |
| Mylan N.V.: | | | |
| 3.15% 6/15/21 | | 50,000 | 50,711 |
| 3.95% 6/15/26 | | 1,370,000 | 1,395,685 |
| Teva Pharmaceutical Finance Netherlands III BV: | | | |
| 2.8% 7/21/23 | | 1,055,000 | 994,252 |
| 3.15% 10/1/26 | | 785,000 | 718,329 |
| Zoetis, Inc. 3.45% 11/13/20 | | 15,000 | 15,593 |
| | | | 3,216,128 |
|
| TOTAL HEALTH CARE | | | 4,812,268 |
|
| INDUSTRIALS - 0.2% | | | |
| Aerospace & Defense - 0.2% | | | |
| BAE Systems Holdings, Inc. 3.8% 10/7/24 (a) | | 1,040,000 | 1,098,396 |
| MATERIALS - 0.2% | | | |
| Metals & Mining - 0.2% | | | |
| Corporacion Nacional del Cobre de Chile (Codelco): | | | |
| 3.625% 8/1/27 (a) | | 500,000 | 506,345 |
| 4.5% 8/1/47 (a) | | 500,000 | 513,300 |
| | | | 1,019,645 |
| REAL ESTATE - 1.6% | | | |
| Equity Real Estate Investment Trusts (REITs) - 0.8% | | | |
| Corporate Office Properties LP 5.25% 2/15/24 | | 146,000 | 158,654 |
| DDR Corp. 3.9% 8/15/24 | | 61,000 | 61,748 |
| Duke Realty LP 3.625% 4/15/23 | | 50,000 | 51,986 |
| Omega Healthcare Investors, Inc.: | | | |
| 4.375% 8/1/23 | | 1,665,000 | 1,739,273 |
| 4.75% 1/15/28 | | 1,527,000 | 1,554,653 |
| WP Carey, Inc. 4% 2/1/25 | | 489,000 | 499,855 |
| | | | 4,066,169 |
| Real Estate Management & Development - 0.8% | | | |
| Brandywine Operating Partnership LP: | | | |
| 3.95% 2/15/23 | | 100,000 | 102,293 |
| 4.1% 10/1/24 | | 833,000 | 846,584 |
| Digital Realty Trust LP: | | | |
| 4.75% 10/1/25 | | 1,445,000 | 1,575,634 |
| 5.25% 3/15/21 | | 30,000 | 32,751 |
| Liberty Property LP 4.4% 2/15/24 | | 40,000 | 43,067 |
| Ventas Realty LP 3.5% 2/1/25 | | 1,265,000 | 1,284,611 |
| | | | 3,884,940 |
|
| TOTAL REAL ESTATE | | | 7,951,109 |
|
| TELECOMMUNICATION SERVICES - 1.3% | | | |
| Diversified Telecommunication Services - 1.3% | | | |
| AT&T, Inc.: | | | |
| 3.6% 2/17/23 | | 2,000,000 | 2,060,821 |
| 6.3% 1/15/38 | | 1,100,000 | 1,291,438 |
| Verizon Communications, Inc.: | | | |
| 4.5% 9/15/20 | | 950,000 | 1,019,066 |
| 5.012% 8/21/54 | | 1,585,000 | 1,558,329 |
| 5.5% 3/16/47 | | 461,000 | 498,171 |
| | | | 6,427,825 |
| UTILITIES - 0.8% | | | |
| Electric Utilities - 0.6% | | | |
| FirstEnergy Corp.: | | | |
| 4.25% 3/15/23 | | 45,000 | 47,752 |
| 7.375% 11/15/31 | | 1,985,000 | 2,678,956 |
| IPALCO Enterprises, Inc. 3.7% 9/1/24 (a) | | 172,000 | 173,477 |
| | | | 2,900,185 |
| Independent Power and Renewable Electricity Producers - 0.2% | | | |
| Dolphin Subsidiary II, Inc. 7.25% 10/15/21 | | 950,000 | 1,033,125 |
|
| TOTAL UTILITIES | | | 3,933,310 |
|
| TOTAL NONCONVERTIBLE BONDS | | | |
| (Cost $118,096,929) | | | 118,266,821 |
|
| U.S. Government and Government Agency Obligations - 38.6% | | | |
| U.S. Treasury Inflation-Protected Obligations - 6.3% | | | |
| U.S. Treasury Inflation-Indexed Bonds 0.875% 2/15/47 | | 8,101,438 | 8,115,803 |
| U.S. Treasury Inflation-Indexed Notes 0.375% 1/15/27 | | 22,824,158 | 22,811,930 |
|
| TOTAL U.S. TREASURY INFLATION-PROTECTED OBLIGATIONS | | | 30,927,733 |
|
| U.S. Treasury Obligations - 32.3% | | | |
| U.S. Treasury Bonds 3% 2/15/47 | | 18,886,000 | 19,929,157 |
| U.S. Treasury Notes: | | | |
| 1.5% 5/15/20 | | $38,929,000 | $39,027,843 |
| 1.75% 6/30/22 | | 227,000 | 227,417 |
| 1.875% 3/31/22 | | 77,961,000 | 78,621,841 |
| 1.875% 8/31/24 | | 10,552,000 | 10,500,063 |
| 2% 4/30/24 | | 1,427,000 | 1,434,079 |
| 2.125% 7/31/24 | | 9,389,000 | 9,499,394 |
|
| TOTAL U.S. TREASURY OBLIGATIONS | | | 159,239,794 |
|
| TOTAL U.S. GOVERNMENT AND GOVERNMENT AGENCY OBLIGATIONS | | | |
| (Cost $188,428,981) | | | 190,167,527 |
|
| U.S. Government Agency - Mortgage Securities - 0.2% | | | |
| Fannie Mae - 0.2% | | | |
| 3.5% 9/1/47 (c) | | 450,000 | 466,233 |
| 3.5% 9/1/47 (c) | | 450,000 | 466,233 |
| TOTAL U.S. GOVERNMENT AGENCY - MORTGAGE SECURITIES | | | |
| (Cost $927,704) | | | 932,466 |
|
| Asset-Backed Securities - 0.2% | | | |
| Prosper Marketplace Issuance Trust Series 2017-2A Class A, 2.42% 9/15/23(a) | | | $ |
| (Cost $856,950) | | 857,000 | 858,503 |
|
| Commercial Mortgage Securities - 0.0% | | | |
| COMM Mortgage Trust Series 2014-LC17 Class XA, 1.143% 10/10/47(b)(d) | | | |
| (Cost $164,730) | | 4,196,096 | 163,553 |
|
| Municipal Securities - 1.0% | | | |
| California Gen. Oblig.: | | | |
| Series 2009, 7.35% 11/1/39 | | $90,000 | $134,340 |
| 7.5% 4/1/34 | | 700,000 | 1,031,793 |
| Chicago Gen. Oblig. (Taxable Proj.) Series 2014 B, 6.314% 1/1/44 | | 430,000 | 461,003 |
| Illinois Gen. Oblig.: | | | |
| Series 2003, 5.1% 6/1/33 | | 2,525,000 | 2,536,994 |
| Series 2011, 5.877% 3/1/19 | | 970,000 | 1,009,450 |
| TOTAL MUNICIPAL SECURITIES | | | |
| (Cost $5,127,750) | | | 5,173,580 |
|
| Foreign Government and Government Agency Obligations - 0.0% | | | |
| Dominican Republic 5.95% 1/25/27(a) | | $ | $ |
| (Cost $106,278) | | 100,000 | 108,500 |
| | | Shares | Value |
|
| Fixed-Income Funds - 31.1% | | | |
| Fidelity Floating Rate Central Fund (e) | | 239,634 | 24,715,867 |
| Fidelity Mortgage Backed Securities Central Fund (e) | | 819,148 | 89,098,772 |
| Fidelity Specialized High Income Central Fund (e) | | 378,240 | 39,575,278 |
| TOTAL FIXED-INCOME FUNDS | | | |
| (Cost $153,217,938) | | | 153,389,917 |
| | | Principal Amount | Value |
|
| Preferred Securities - 0.2% | | | |
| FINANCIALS - 0.2% | | | |
| Banks - 0.2% | | | |
Barclays Bank PLC 7.625% 11/21/22
(Cost $763,711) | | 650,000 | 760,520 |
| | | Shares | Value |
|
| Money Market Funds - 4.5% | | | |
| Fidelity Cash Central Fund, 1.11% (f) | | | |
| (Cost $22,431,644) | | 22,427,158 | 22,431,644 |
| TOTAL INVESTMENT IN SECURITIES - 99.8% | | | |
| (Cost $490,122,615) | | | 492,253,031 |
| NET OTHER ASSETS (LIABILITIES) - 0.2% | | | 991,530 |
| NET ASSETS - 100% | | | $493,244,561 |
Legend
(a) Security exempt from registration under Rule 144A of the Securities Act of 1933. These securities may be resold in transactions exempt from registration, normally to qualified institutional buyers. At the end of the period, the value of these securities amounted to $7,565,252 or 1.5% of net assets.
(b) Coupon rates for floating and adjustable rate securities reflect the rates in effect at period end.
(c) Security or a portion of the security purchased on a delayed delivery or when-issued basis.
(d) Security represents right to receive monthly interest payments on an underlying pool of mortgages or assets. Principal shown is the outstanding par amount of the pool as of the end of the period.
(e) Affiliated fund that is generally available only to investment companies and other accounts managed by Fidelity Investments. A complete unaudited schedule of portfolio holdings for each Fidelity Central Fund is filed with the SEC for the first and third quarters of each fiscal year on Form N-Q and is available upon request or at the SEC's website at www.sec.gov. An unaudited holdings listing for the Fund, which presents direct holdings as well as the pro-rata share of securities and other investments held indirectly through its investment in underlying non-money market Fidelity Central Funds, is available at fidelity.com and/or institutional.fidelity.com, as applicable. In addition, each Fidelity Central Fund's financial statements, which are not covered by the Fund's Report of Independent Registered Public Accounting Firm, are available on the SEC's website or upon request.
(f) Affiliated fund that is generally available only to investment companies and other accounts managed by Fidelity Investments. The rate quoted is the annualized seven-day yield of the fund at period end. A complete unaudited listing of the fund's holdings as of its most recent quarter end is available upon request. In addition, each Fidelity Central Fund's financial statements, which are not covered by the Fund's Report of Independent Registered Public Accounting Firm, are available on the SEC's website or upon request.
Affiliated Central Funds
Information regarding fiscal year to date income earned by the Fund from investments in Fidelity Central Funds is as follows:
| Fund | Income earned |
| Fidelity Cash Central Fund | $32,879 |
| Fidelity Floating Rate Central Fund | 119,619 |
| Fidelity Mortgage Backed Securities Central Fund | 205,088 |
| Fidelity Specialized High Income Central Fund | 193,722 |
| Total | $551,308 |
Additional information regarding the Fund's fiscal year to date purchases and sales, including the ownership percentage, of the non Money Market Central Funds is as follows:
| Fund | Value, beginning of period | Purchases | Sales Proceeds | Realized Gain/Loss | Change in Unrealized appreciation (depreciation) | Value, end of period | % ownership, end of period |
| Fidelity Floating Rate Central Fund | $-- | $24,869,619 | $-- | $-- | $(153,752) | $24,715,867 | 1.5% |
| Fidelity Mortgage Backed Securities Central Fund | -- | 89,678,883 | 1,000,000 | (369) | 420,258 | 89,098,772 | 1.3% |
| Fidelity Specialized High Income Central Fund | -- | 39,669,805 | -- | -- | (94,527) | 39,575,278 | 5.1% |
| Total | $-- | $154,218,307 | $1,000,000 | $(369) | $171,979 | $153,389,917 | |
Investment Valuation
The following is a summary of the inputs used, as of August 31, 2017, involving the Fund's assets and liabilities carried at fair value. The inputs or methodology used for valuing securities may not be an indication of the risk associated with investing in those securities. For more information on valuation inputs, and their aggregation into the levels used below, please refer to the Investment Valuation section in the accompanying Notes to Financial Statements.
| | Valuation Inputs at Reporting Date: |
| Description | Total | Level 1 | Level 2 | Level 3 |
| Investments in Securities: | | | | |
| Corporate Bonds | $118,266,821 | $-- | $118,266,821 | $-- |
| U.S. Government and Government Agency Obligations | 190,167,527 | -- | 190,167,527 | -- |
| U.S. Government Agency - Mortgage Securities | 932,466 | -- | 932,466 | -- |
| Asset-Backed Securities | 858,503 | -- | 858,503 | -- |
| Commercial Mortgage Securities | 163,553 | -- | 163,553 | -- |
| Municipal Securities | 5,173,580 | -- | 5,173,580 | -- |
| Foreign Government and Government Agency Obligations | 108,500 | -- | 108,500 | -- |
| Fixed-Income Funds | 153,389,917 | 153,389,917 | -- | -- |
| Preferred Securities | 760,520 | -- | 760,520 | -- |
| Money Market Funds | 22,431,644 | 22,431,644 | -- | -- |
| Total Investments in Securities: | $492,253,031 | $175,821,561 | $316,431,470 | $-- |
See accompanying notes which are an integral part of the financial statements.
Financial Statements
Statement of Assets and Liabilities
| | | August 31, 2017 |
| Assets | | |
Investment in securities, at value — See accompanying schedule:
Unaffiliated issuers (cost $314,473,033) | $316,431,470 | |
| Fidelity Central Funds (cost $175,649,582) | 175,821,561 | |
| Total Investment in Securities (cost $490,122,615) | | $492,253,031 |
| Cash | | 23,996 |
| Receivable for investments sold | | 10,669,476 |
| Receivable for fund shares sold | | 91,910 |
| Interest receivable | | 2,285,420 |
| Distributions receivable from Fidelity Central Funds | | 28,406 |
| Total assets | | 505,352,239 |
| Liabilities | | |
| Payable for investments purchased | | |
| Regular delivery | $10,493,500 | |
| Delayed delivery | 927,703 | |
| Payable for fund shares redeemed | 562,923 | |
| Accrued management fee | 123,552 | |
| Total liabilities | | 12,107,678 |
| Net Assets | | $493,244,561 |
| Net Assets consist of: | | |
| Paid in capital | | $490,953,157 |
| Undistributed net investment income | | 53,179 |
| Accumulated undistributed net realized gain (loss) on investments | | 107,809 |
| Net unrealized appreciation (depreciation) on investments | | 2,130,416 |
| Net Assets, for 49,001,192 shares outstanding | | $493,244,561 |
| Net Asset Value, offering price and redemption price per share ($493,244,561 ÷ 49,001,192 shares) | | $10.07 |
See accompanying notes which are an integral part of the financial statements.
Statement of Operations
| | | For the period
May 25, 2017 (commencement of operations) to
August 31, 2017 |
| Investment Income | | |
| Interest | | $766,498 |
| Income from Fidelity Central Funds | | 551,308 |
| Total income | | 1,317,806 |
| Expenses | | |
| Management fee | $143,154 | |
| Independent trustees' fees and expenses | 28 | |
| Total expenses | | 143,182 |
| Net investment income (loss) | | 1,174,624 |
| Realized and Unrealized Gain (Loss) | | |
| Net realized gain (loss) on: | | |
| Investment securities: | | |
| Unaffiliated issuers | 107,977 | |
| Fidelity Central Funds | (369) | |
| Total net realized gain (loss) | | 107,608 |
| Change in net unrealized appreciation (depreciation) on: | | |
| Investment securities: | | |
| Unaffiliated issuers | 1,958,437 | |
| Fidelity Central Funds | 171,979 | |
| Total change in net unrealized appreciation (depreciation) | | 2,130,416 |
| Net gain (loss) | | 2,238,024 |
| Net increase (decrease) in net assets resulting from operations | | $3,412,648 |
See accompanying notes which are an integral part of the financial statements.
Statement of Changes in Net Assets
| | For the period
May 25, 2017 (commencement of operations) to
August 31, 2017 |
| Increase (Decrease) in Net Assets | |
| Operations | |
| Net investment income (loss) | $1,174,624 |
| Net realized gain (loss) | 107,608 |
| Change in net unrealized appreciation (depreciation) | 2,130,416 |
| Net increase (decrease) in net assets resulting from operations | 3,412,648 |
| Distributions to shareholders from net investment income | (1,121,245) |
| Share transactions | |
| Proceeds from sales of shares | 513,311,762 |
| Reinvestment of distributions | 1,121,245 |
| Cost of shares redeemed | (23,479,849) |
| Net increase (decrease) in net assets resulting from share transactions | 490,953,158 |
| Total increase (decrease) in net assets | 493,244,561 |
| Net Assets | |
| Beginning of period | – |
| End of period | $493,244,561 |
| Other Information | |
| Undistributed net investment income end of period | $53,179 |
| Shares | |
| Sold | 51,231,377 |
| Issued in reinvestment of distributions | 111,440 |
| Redeemed | (2,341,625) |
| Net increase (decrease) | 49,001,192 |
See accompanying notes which are an integral part of the financial statements.
Financial Highlights — Fidelity Total Bond K6 Fund
| Years ended August 31, | 2017 A |
| Selected Per–Share Data | |
| Net asset value, beginning of period | $10.00 |
| Income from Investment Operations | |
| Net investment income (loss)B | .061 |
| Net realized and unrealized gain (loss) | .073 |
| Total from investment operations | .134 |
| Distributions from net investment income | (.064) |
| Total distributions | (.064) |
| Net asset value, end of period | $10.07 |
| Total ReturnC | 1.35% |
| Ratios to Average Net AssetsD,E | |
| Expenses before reductions | .30%F |
| Expenses net of fee waivers, if any | .30%F |
| Expenses net of all reductions | .30%F |
| Net investment income (loss) | 2.45%F |
| Supplemental Data | |
| Net assets, end of period (000 omitted) | $493,245 |
| Portfolio turnover rateG | 51%H |
A For the period May 25, 2017 (commencement of operations) to August 31, 2017.
B Calculated based on average shares outstanding during the period.
C Total returns for periods of less than one year are not annualized.
D Fees and expenses of any underlying Fidelity Central Funds are not included in the Fund's expense ratio. The Fund indirectly bears its proportionate share of the expenses of any underlying Fidelity Central Funds. Based on their most recent shareholder report date, the expenses of any underlying non-money market Fidelity Central Funds ranged from less than .005% to .05% .
E Expense ratios reflect operating expenses of the Fund. Expenses before reductions do not reflect amounts reimbursed by the investment adviser or reductions from expense offset arrangements and do not represent the amount paid by the Fund during periods when reimbursements or reductions occur. Expense ratios before reductions for start-up periods may not be representative of longer term operating periods. Expenses net of fee waivers reflect expenses after reimbursement by the investment adviser but prior to reductions from expense offset arrangements. Expenses net of all reductions represent the net expenses paid by the Fund.
F Annualized
G Amount does not include the portfolio activity of any underlying Fidelity Central Funds.
H Amount not annualized.
See accompanying notes which are an integral part of the financial statements.
Notes to Financial Statements
For the period ended August 31, 2017
1. Organization.
Fidelity Total Bond K6 Fund (the Fund) is a fund of Fidelity Income Fund (the Trust) and is authorized to issue an unlimited number of shares. Share transactions on the Statement of Changes in Net Assets may contain exchanges between affiliated funds. The Trust is registered under the Investment Company Act of 1940, as amended (the 1940 Act), as an open-end management investment company organized as a Massachusetts business trust. Shares generally are available only to employer-sponsored retirement plans that are recordkept by Fidelity.
2. Investments in Fidelity Central Funds.
The Fund invests in Fidelity Central Funds, which are open-end investment companies generally available only to other investment companies and accounts managed by the investment adviser and its affiliates. The Fund's Schedule of Investments lists each of the Fidelity Central Funds held as of period end, if any, as an investment of the Fund, but does not include the underlying holdings of each Fidelity Central Fund. As an Investing Fund, the Fund indirectly bears its proportionate share of the expenses of the underlying Fidelity Central Funds.
Based on its investment objective, each Fidelity Central Fund may invest or participate in various investment vehicles or strategies that are similar to those of the Fund. These strategies are consistent with the investment objectives of the Fund and may involve certain economic risks which may cause a decline in value of each of the Fidelity Central Funds and thus a decline in the value of the Fund. The Money Market Central Funds seek preservation of capital and current income and are managed by Fidelity Investments Money Management, Inc. (FIMM), an affiliate of the investment adviser. Annualized expenses of the Money Market Central Funds as of their most recent shareholder report date are less than .005%. The following summarizes the Fund's investment in each non-money market Fidelity Central Fund.
| Fidelity Central Fund | Investment Manager | Investment Objective | Investment Practices | Expense Ratio(a) |
| Fidelity Floating Rate Central Fund | FMR Co., Inc. (FMRC) | Seeks a high level of income by normally investing in floating rate loans and other floating rate securities. | Loans & Direct Debt Instruments
Restricted Securities
| .05% |
| Fidelity Mortgage Backed Securities Central Fund | FIMM | Seeks a high level of income by normally investing in investment-grade mortgage-related securities and repurchase agreements for those securities. | Delayed Delivery & When Issued Securities
Futures
Swaps | Less than .005% |
| Fidelity Specialized High Income Central Fund | FMRC | Seeks a high level of current income by normally investing in income-producing debt securities, with an emphasis on lower-quality debt securities. | Loans & Direct Debt Instruments
Restricted Securities
| Less than .005% |
(a) Expenses expressed as a percentage of average net assets and are as of each underlying Central Fund's most recent annual or semi-annual shareholder report.
An unaudited holdings listing for the Fund, which presents direct holdings as well as the pro-rata share of any securities and other investments held indirectly through its investment in underlying non-money market Fidelity Central Funds, is available at fidelity.com. A complete unaudited list of holdings for each Fidelity Central Fund is available upon request or at the Securities and Exchange Commission (the SEC) website at www.sec.gov. In addition, the financial statements of the Fidelity Central Funds which contain the significant accounting policies (including investment valuation policies) of those funds, which are not covered by the Fund's Report of Independent Registered Public Accounting Firm, are available on the SEC website or upon request.
3. Significant Accounting Policies.
The Fund is an investment company and applies the accounting and reporting guidance of the Financial Accounting Standards Board (FASB) Accounting Standards Codification Topic 946 Financial Services – Investments Companies. The financial statements have been prepared in conformity with accounting principles generally accepted in the United States of America (GAAP), which require management to make certain estimates and assumptions at the date of the financial statements. Actual results could differ from those estimates. Subsequent events, if any, through the date that the financial statements were issued have been evaluated in the preparation of the financial statements. The following summarizes the significant accounting policies of the Fund:
Investment Valuation. Investments are valued as of 4:00 p.m. Eastern time on the last calendar day of the period. The Board of Trustees (the Board) has delegated the day to day responsibility for the valuation of the Fund's investments to the Fair Value Committee (the Committee) established by the Fund's investment adviser. In accordance with valuation policies and procedures approved by the Board, the Fund attempts to obtain prices from one or more third party pricing vendors or brokers to value its investments. When current market prices, quotations or currency exchange rates are not readily available or reliable, investments will be fair valued in good faith by the Committee, in accordance with procedures adopted by the Board. Factors used in determining fair value vary by investment type and may include market or investment specific events, changes in interest rates and credit quality. The frequency with which these procedures are used cannot be predicted and they may be utilized to a significant extent. The Committee oversees the Fund's valuation policies and procedures and reports to the Board on the Committee's activities and fair value determinations. The Board monitors the appropriateness of the procedures used in valuing the Fund's investments and ratifies the fair value determinations of the Committee.
The Fund categorizes the inputs to valuation techniques used to value its investments into a disclosure hierarchy consisting of three levels as shown below:
- Level 1 – quoted prices in active markets for identical investments
- Level 2 – other significant observable inputs (including quoted prices for similar investments, interest rates, prepayment speeds, etc.)
- Level 3 – unobservable inputs (including the Fund's own assumptions based on the best information available)
Valuation techniques used to value the Fund's investments by major category are as follows:
Debt securities, including restricted securities, are valued based on evaluated prices received from third party pricing vendors or from brokers who make markets in such securities. Corporate bonds, foreign government and government agency obligations, municipal securities, preferred securities and U.S. government and government agency obligations are valued by pricing vendors who utilize matrix pricing which considers yield or price of bonds of comparable quality, coupon, maturity and type or by broker-supplied prices. Asset backed securities, commercial mortgage securities and U.S. government agency mortgage securities are valued by pricing vendors who utilize matrix pricing which considers prepayment speed assumptions, attributes of the collateral, yield or price of bonds of comparable quality, coupon, maturity and type or by broker-supplied prices. When independent prices are unavailable or unreliable, debt securities may be valued utilizing pricing methodologies which consider similar factors that would be used by third party pricing vendors. For foreign debt securities, when significant market or security specific events arise, valuations may be determined in good faith in accordance with procedures adopted by the Board. Debt securities are generally categorized as Level 2 in the hierarchy but may be Level 3 depending on the circumstances.
Investments in open-end mutual funds, including the Fidelity Central Funds, are valued at their closing net asset value (NAV) each business day and are categorized as Level 1 in the hierarchy.
Changes in valuation techniques may result in transfers in or out of an assigned level within the disclosure hierarchy. The aggregate value of investments by input level as of August 31, 2017 is included at the end of the Fund's Schedule of Investments.
Investment Transactions and Income. For financial reporting purposes, the Fund's investment holdings and NAV include trades executed through the end of the last business day of the period. The NAV per share for processing shareholder transactions is calculated as of the close of business of the New York Stock Exchange (NYSE), normally 4:00 p.m. Eastern time and includes trades executed through the end of the prior business day. Gains and losses on securities sold are determined on the basis of identified cost. Income and capital gain distributions from Fidelity Central Funds, if any, are recorded on the ex-dividend date. Interest income is accrued as earned and includes coupon interest and amortization of premium and accretion of discount on debt securities as applicable. Debt obligations may be placed on non-accrual status and related interest income may be reduced by ceasing current accruals and writing off interest receivables when the collection of all or a portion of interest has become doubtful based on consistently applied procedures. A debt obligation is removed from non-accrual status when the issuer resumes interest payments or when collectability of interest is reasonably assured.
Expenses. Expenses directly attributable to a fund are charged to that fund. Expenses attributable to more than one fund are allocated among the respective funds on the basis of relative net assets or other appropriate methods. Expense estimates are accrued in the period to which they relate and adjustments are made when actual amounts are known.
Income Tax Information and Distributions to Shareholders. Each year, the Fund intends to qualify as a regulated investment company under Subchapter M of the Internal Revenue Code, including distributing substantially all of its taxable income and realized gains. As a result, no provision for U.S. Federal income taxes is required. As of August 31, 2017, the Fund did not have any unrecognized tax benefits in the financial statements; nor is the Fund aware of any tax positions for which it is reasonably possible that the total amounts of unrecognized tax benefits will significantly change in the next twelve months. The Fund files a U.S. federal tax return, in addition to state and local tax returns as required. The Fund's federal income tax returns are subject to examination by the Internal Revenue Service (IRS) for a period of three fiscal years after they are filed. State and local tax returns may be subject to examination for an additional fiscal year depending on the jurisdiction.
Dividends are declared and recorded daily and paid monthly from net investment income. Distributions from realized gains, if any, are declared and recorded on the ex-dividend date. Income and capital gain distributions are determined in accordance with income tax regulations, which may differ from GAAP.
Capital accounts within the financial statements are adjusted for permanent book-tax differences. These adjustments have no impact on net assets or the results of operations. Capital accounts are not adjusted for temporary book-tax differences which will reverse in a subsequent period.
Book-tax differences are primarily due to market discount and losses deferred due to wash sales.
As of period end, the cost and unrealized appreciation (depreciation) in securities, and derivatives if applicable, for federal income tax purposes were as follows:
| Gross unrealized appreciation | $2,805,019 |
| Gross unrealized depreciation | (678,885) |
| Net unrealized appreciation (depreciation) | $2,126,134 |
| Tax Cost | $490,126,897 |
The tax-based components of distributable earnings as of period end were as follows:
| Undistributed ordinary income | $165,269 |
| Net unrealized appreciation (depreciation) on securities and other investments | $2,126,134 |
The tax character of distributions paid was as follows:
| | August 31, 2017(a) |
| Ordinary Income | $1,121,245 |
(a) For the period May 25, 2017 (commencement of operations) to August 31, 2017.
Delayed Delivery Transactions and When-Issued Securities. During the period, the Fund transacted in securities on a delayed delivery or when-issued basis. Payment and delivery may take place after the customary settlement period for that security. The price of the underlying securities and the date when the securities will be delivered and paid for are fixed at the time the transaction is negotiated. The securities purchased on a delayed delivery or when-issued basis are identified as such in the Fund's Schedule of Investments. The Fund may receive compensation for interest forgone in the purchase of a delayed delivery or when-issued security. With respect to purchase commitments, the Fund identifies securities as segregated in its records with a value at least equal to the amount of the commitment. Losses may arise due to changes in the value of the underlying securities or if the counterparty does not perform under the contract's terms, or if the issuer does not issue the securities due to political, economic, or other factors.
To-Be-Announced (TBA) Securities and Mortgage Dollar Rolls. During the period, the Fund transacted in TBA securities that involved buying or selling mortgage-backed securities (MBS) on a forward commitment basis. A TBA transaction typically does not designate the actual security to be delivered and only includes an approximate principal amount; however delivered securities must meet specified terms defined by industry guidelines, including issuer, rate and current principal amount outstanding on underlying mortgage pools. The Fund may enter into a TBA transaction with the intent to take possession of or deliver the underlying MBS, or the Fund may elect to extend the settlement by entering into either a mortgage or reverse mortgage dollar roll. Mortgage dollar rolls are transactions where a fund sells TBA securities and simultaneously agrees to repurchase MBS on a later date at a lower price and with the same counterparty. Reverse mortgage dollar rolls involve the purchase and simultaneous agreement to sell TBA securities on a later date at a lower price. Transactions in mortgage dollar rolls and reverse mortgage dollar rolls are accounted for as purchases and sales and may result in an increase to the Fund's portfolio turnover rate.
Purchases and sales of TBA securities involve risks similar to those discussed above for delayed delivery and when-issued securities. Also, if the counterparty in a mortgage dollar roll or a reverse mortgage dollar roll transaction files for bankruptcy or becomes insolvent, the Fund's right to repurchase or sell securities may be limited. Additionally, when a fund sells TBA securities without already owning or having the right to obtain the deliverable securities (an uncovered forward commitment to sell), it incurs a risk of loss because it could have to purchase the securities at a price that is higher than the price at which it sold them. A fund may be unable to purchase the deliverable securities if the corresponding market is illiquid.
Restricted Securities. The Fund may invest in securities that are subject to legal or contractual restrictions on resale. These securities generally may be resold in transactions exempt from registration or to the public if the securities are registered. Disposal of these securities may involve time-consuming negotiations and expense, and prompt sale at an acceptable price may be difficult. Information regarding restricted securities is included at the end of the Fund's Schedule of Investments.
New Accounting Pronouncement. In March 2017, the Financial Accounting Standards Board (FASB) issued an Accounting Standards Update (ASU), ASU 2017-08, which amends the amortization period for certain callable debt securities that are held at a premium. The amendment requires the premium to be amortized to the earliest call date. The amendments do not require an accounting change for securities held at a discount. The ASU is effective for annual periods beginning after December 15, 2018. Management is currently evaluating the potential impact of these changes to the financial statements.
4. Purchases and Sales of Investments.
Purchases and sales of securities (including the Fixed-Income Central Funds), other than short-term securities and U.S. government securities, aggregated $279,258,978 and $1,075,296, respectively.
5. Fees and Other Transactions with Affiliates.
Management Fee. Fidelity Management & Research Company (the investment adviser) and its affiliates provide the Fund with investment management related services for which the Fund pays a monthly management fee that is based on an annual rate of .30% of average net assets. Under the management contract, the investment adviser or an affiliate pays all other expenses of the Fund, excluding fees and expenses of the independent Trustees, and certain miscellaneous expenses such as proxy and shareholder meeting expenses.
Interfund Trades. The Fund may purchase from or sell securities to other Fidelity Funds under procedures adopted by the Board. The procedures have been designed to ensure these interfund trades are executed in accordance with Rule 17a-7 of the 1940 Act. Interfund trades are included within the respective purchases and sales amounts shown in the Purchases and Sales of Investments note.
6. Other.
The Fund's organizational documents provide former and current trustees and officers with a limited indemnification against liabilities arising in connection with the performance of their duties to the Fund. In the normal course of business, the Fund may also enter into contracts that provide general indemnifications. The Fund's maximum exposure under these arrangements is unknown as this would be dependent on future claims that may be made against the Fund. The risk of material loss from such claims is considered remote.
At the end of the period, the investment adviser or its affiliates were owners of record of 99% of the total outstanding shares of the Fund.
Report of Independent Registered Public Accounting Firm
To the Trustees of Fidelity Income Fund and Shareholders of Fidelity Total Bond K6 Fund:
We have audited the accompanying statement of assets and liabilities of Fidelity Total Bond K6 Fund (the Fund), a fund of Fidelity Income Fund, including the schedule of investments, as of August 31, 2017, and the related statement of operations, the statement of changes in net assets and the financial highlights for the period from May 25, 2017 (commencement of operations) to August 31, 2017. These financial statements and financial highlights are the responsibility of the Fund's management. Our responsibility is to express an opinion on these financial statements and financial highlights based on our audit.
We conducted our audit in accordance with the standards of the Public Company Accounting Oversight Board (United States). Those standards require that we plan and perform the audit to obtain reasonable assurance about whether the financial statements and financial highlights are free of material misstatement. The Fund is not required to have, nor were we engaged to perform, an audit of its internal control over financial reporting. Our audits included consideration of internal control over financial reporting as a basis for designing audit procedures that are appropriate in the circumstances, but not for the purpose of expressing an opinion on the effectiveness of the Fund's internal control over financial reporting. Accordingly, we express no such opinion. An audit also includes examining, on a test basis, evidence supporting the amounts and disclosures in the financial statements, assessing the accounting principles used and significant estimates made by management, as well as evaluating the overall financial statement presentation. Our procedures included confirmation of securities owned as of August 31, 2017, by correspondence with the custodians and brokers; when replies were not received from brokers, we performed other auditing procedures. We believe that our audit provides a reasonable basis for our opinion.
In our opinion, such financial statements and financial highlights referred to above present fairly, in all material respects, the financial position of Fidelity Total Bond K6 Fund as of August 31, 2017, and the results of its operations, the changes in its net assets and the financial highlights for the period from May 25, 2017 (commencement of operations) to August 31, 2017, in conformity with accounting principles generally accepted in the United States of America.
DELOITTE & TOUCHE LLP
Boston, Massachusetts
October 18, 2017
Trustees and Officers
The Trustees, Members of the Advisory Board (if any), and officers of the trust and fund, as applicable, are listed below. The Board of Trustees governs the fund and is responsible for protecting the interests of shareholders. The Trustees are experienced executives who meet periodically throughout the year to oversee the fund's activities, review contractual arrangements with companies that provide services to the fund, oversee management of the risks associated with such activities and contractual arrangements, and review the fund's performance. Each of the Trustees oversees 246 funds.
The Trustees hold office without limit in time except that (a) any Trustee may resign; (b) any Trustee may be removed by written instrument, signed by at least two-thirds of the number of Trustees prior to such removal; (c) any Trustee who requests to be retired or who has become incapacitated by illness or injury may be retired by written instrument signed by a majority of the other Trustees; and (d) any Trustee may be removed at any special meeting of shareholders by a two-thirds vote of the outstanding voting securities of the trust. Each Trustee who is not an interested person (as defined in the 1940 Act) of the trust and the fund is referred to herein as an Independent Trustee. Each Independent Trustee shall retire not later than the last day of the calendar year in which his or her 75th birthday occurs. The Independent Trustees may waive this mandatory retirement age policy with respect to individual Trustees. Officers and Advisory Board Members hold office without limit in time, except that any officer or Advisory Board Member may resign or may be removed by a vote of a majority of the Trustees at any regular meeting or any special meeting of the Trustees. Except as indicated, each individual has held the office shown or other offices in the same company for the past five years.
The fund’s Statement of Additional Information (SAI) includes more information about the Trustees. To request a free copy, call Fidelity at 1-800-835-5092.
Experience, Skills, Attributes, and Qualifications of the Trustees. The Governance and Nominating Committee has adopted a statement of policy that describes the experience, qualifications, attributes, and skills that are necessary and desirable for potential Independent Trustee candidates (Statement of Policy). The Board believes that each Trustee satisfied at the time he or she was initially elected or appointed a Trustee, and continues to satisfy, the standards contemplated by the Statement of Policy. The Governance and Nominating Committee also engages professional search firms to help identify potential Independent Trustee candidates who have the experience, qualifications, attributes, and skills consistent with the Statement of Policy. From time to time, additional criteria based on the composition and skills of the current Independent Trustees, as well as experience or skills that may be appropriate in light of future changes to board composition, business conditions, and regulatory or other developments, have also been considered by the professional search firms and the Governance and Nominating Committee. In addition, the Board takes into account the Trustees' commitment and participation in Board and committee meetings, as well as their leadership of standing and ad hoc committees throughout their tenure.
In determining that a particular Trustee was and continues to be qualified to serve as a Trustee, the Board has considered a variety of criteria, none of which, in isolation, was controlling. The Board believes that, collectively, the Trustees have balanced and diverse experience, qualifications, attributes, and skills, which allow the Board to operate effectively in governing the fund and protecting the interests of shareholders. Information about the specific experience, skills, attributes, and qualifications of each Trustee, which in each case led to the Board's conclusion that the Trustee should serve (or continue to serve) as a trustee of the fund, is provided below.
Board Structure and Oversight Function. Abigail P. Johnson is an interested person and currently serves as Chairman. The Trustees have determined that an interested Chairman is appropriate and benefits shareholders because an interested Chairman has a personal and professional stake in the quality and continuity of services provided to the fund. Independent Trustees exercise their informed business judgment to appoint an individual of their choosing to serve as Chairman, regardless of whether the Trustee happens to be independent or a member of management. The Independent Trustees have determined that they can act independently and effectively without having an Independent Trustee serve as Chairman and that a key structural component for assuring that they are in a position to do so is for the Independent Trustees to constitute a substantial majority for the Board. The Independent Trustees also regularly meet in executive session. Marie L. Knowles serves as Chairman of the Independent Trustees and as such (i) acts as a liaison between the Independent Trustees and management with respect to matters important to the Independent Trustees and (ii) with management prepares agendas for Board meetings.
Fidelity® funds are overseen by different Boards of Trustees. The fund's Board oversees Fidelity's investment-grade bond, money market, asset allocation and certain equity funds, and other Boards oversee Fidelity's high income, sector and other equity funds. The asset allocation funds may invest in Fidelity® funds that are overseen by such other Boards. The use of separate Boards, each with its own committee structure, allows the Trustees of each group of Fidelity® funds to focus on the unique issues of the funds they oversee, including common research, investment, and operational issues. On occasion, the separate Boards establish joint committees to address issues of overlapping consequences for the Fidelity® funds overseen by each Board.
The Trustees operate using a system of committees to facilitate the timely and efficient consideration of all matters of importance to the Trustees, the fund, and fund shareholders and to facilitate compliance with legal and regulatory requirements and oversight of the fund's activities and associated risks. The Board, acting through its committees, has charged FMR and its affiliates with (i) identifying events or circumstances the occurrence of which could have demonstrably adverse effects on the fund's business and/or reputation; (ii) implementing processes and controls to lessen the possibility that such events or circumstances occur or to mitigate the effects of such events or circumstances if they do occur; and (iii) creating and maintaining a system designed to evaluate continuously business and market conditions in order to facilitate the identification and implementation processes described in (i) and (ii) above. Because the day-to-day operations and activities of the fund are carried out by or through FMR, its affiliates, and other service providers, the fund's exposure to risks is mitigated but not eliminated by the processes overseen by the Trustees. While each of the Board's committees has responsibility for overseeing different aspects of the fund's activities, oversight is exercised primarily through the Operations and Audit Committees. In addition, an ad hoc Board committee of Independent Trustees has worked with FMR to enhance the Board's oversight of investment and financial risks, legal and regulatory risks, technology risks, and operational risks, including the development of additional risk reporting to the Board. Appropriate personnel, including but not limited to the fund's Chief Compliance Officer (CCO), FMR's internal auditor, the independent accountants, the fund's Treasurer and portfolio management personnel, make periodic reports to the Board's committees, as appropriate, including an annual review of Fidelity's risk management program for the Fidelity® funds. The responsibilities of each standing committee, including their oversight responsibilities, are described further under "Standing Committees of the Trustees."
Interested Trustees*:
Correspondence intended for a Trustee who is an interested person may be sent to Fidelity Investments, 245 Summer Street, Boston, Massachusetts 02210.
Name, Year of Birth; Principal Occupations and Other Relevant Experience+
Abigail P. Johnson (1961)
Year of Election or Appointment: 2009
Trustee
Chairman of the Board of Trustees
Ms. Johnson also serves as Trustee of other Fidelity® funds. Ms. Johnson serves as Chairman (2016-present), Chief Executive Officer (2014-present), and Director (2007-present) of FMR LLC (diversified financial services company), President of Fidelity Financial Services (2012-present) and President of Personal, Workplace and Institutional Services (2005-present). Ms. Johnson is Chairman and Director of FMR Co., Inc. (investment adviser firm, 2011-present) and Chairman and Director of FMR (investment adviser firm, 2011-present). Previously, Ms. Johnson served as Vice Chairman (2007-2016) and President (2013-2016) of FMR LLC, President and a Director of FMR (2001-2005), a Trustee of other investment companies advised by FMR, Fidelity Investments Money Management, Inc. (investment adviser firm), and FMR Co., Inc. (2001-2005), Senior Vice President of the Fidelity® funds (2001-2005), and managed a number of Fidelity® funds. Ms. Abigail P. Johnson and Mr. Arthur E. Johnson are not related.
Jennifer Toolin McAuliffe (1959)
Year of Election or Appointment: 2016
Trustee
Ms. McAuliffe also serves as Trustee of other Fidelity® funds. Ms. McAuliffe previously served as a Member of the Advisory Board of certain Fidelity® funds (2016) and as Co-Head of Fixed Income of Fidelity Investments Limited (now known as FIL Limited (FIL)) (diversified financial services company). Earlier roles at FIL included Director of Research for FIL’s credit and quantitative teams in London, Hong Kong and Tokyo. Ms. McAuliffe also was the Director of Research for taxable and municipal bonds at Fidelity Investments Money Management, Inc. Ms. McAuliffe is also a director or trustee of several not-for-profit entities.
* Determined to be an “Interested Trustee” by virtue of, among other things, his or her affiliation with the trust or various entities under common control with FMR.
+ The information includes the Trustee's principal occupation during the last five years and other information relating to the experience, attributes, and skills relevant to the Trustee's qualifications to serve as a Trustee, which led to the conclusion that the Trustee should serve as a Trustee for the fund.
Independent Trustees:
Correspondence intended for an Independent Trustee may be sent to Fidelity Investments, P.O. Box 55235, Boston, Massachusetts 02205-5235.
Name, Year of Birth; Principal Occupations and Other Relevant Experience+
Elizabeth S. Acton (1951)
Year of Election or Appointment: 2013
Trustee
Ms. Acton also serves as Trustee of other Fidelity® funds. Prior to her retirement in April 2012, Ms. Acton was Executive Vice President, Finance (2011-2012), Executive Vice President, Chief Financial Officer (2002-2011), and Treasurer (2004-2005) of Comerica Incorporated (financial services). Prior to joining Comerica, Ms. Acton held a variety of positions at Ford Motor Company (1983-2002), including Vice President and Treasurer (2000-2002) and Executive Vice President and Chief Financial Officer of Ford Motor Credit Company (1998-2000). Ms. Acton currently serves as a member of the Board of Directors and Audit and Finance Committees of Beazer Homes USA, Inc. (homebuilding, 2012-present). Previously, Ms. Acton served as a Member of the Advisory Board of certain Fidelity® funds (2013-2016).
John Engler (1948)
Year of Election or Appointment: 2014
Trustee
Mr. Engler also serves as Trustee of other Fidelity® funds. He serves on the board of directors for Universal Forest Products (manufacturer and distributor of wood and wood-alternative products, 2003-present) and K12 Inc. (technology-based education company, 2012-present). Previously, Mr. Engler served as a Member of the Advisory Board of certain Fidelity® funds (2014-2016), president of the Business Roundtable (2011-2017), a trustee of The Munder Funds (2003-2014), president and CEO of the National Association of Manufacturers (2004-2011), member of the Board of Trustees of the Annie E. Casey Foundation (2004-2015), and as governor of Michigan (1991-2003). He is a past chairman of the National Governors Association.
Albert R. Gamper, Jr. (1942)
Year of Election or Appointment: 2006
Trustee
Mr. Gamper also serves as Trustee of other Fidelity® funds. Prior to his retirement in December 2004, Mr. Gamper served as Chairman of the Board of CIT Group Inc. (commercial finance). During his tenure with CIT Group Inc. Mr. Gamper served in numerous senior management positions, including Chairman (1987-1989; 1999-2001; 2002-2004), Chief Executive Officer (1987-2004), and President (2002-2003). Mr. Gamper currently serves as a member of the Board of Directors of Public Service Enterprise Group (utilities, 2000-present), and Member of the Board of Trustees of Barnabas Health Care System (1997-present). Previously, Mr. Gamper served as Chairman (2012-2015) and Vice Chairman (2011-2012) of the Independent Trustees of certain Fidelity® funds and as Chairman of the Board of Governors, Rutgers University (2004-2007).
Robert F. Gartland (1951)
Year of Election or Appointment: 2010
Trustee
Mr. Gartland also serves as Trustee of other Fidelity® funds. Mr. Gartland is Chairman and an investor in Gartland & Mellina Group Corp. (consulting, 2009-present). Previously, Mr. Gartland served as a partner and investor of Vietnam Partners LLC (investments and consulting, 2008-2011). Prior to his retirement, Mr. Gartland held a variety of positions at Morgan Stanley (financial services, 1979-2007) including Managing Director (1987-2007).
Arthur E. Johnson (1947)
Year of Election or Appointment: 2008
Trustee
Vice Chairman of the Independent Trustees
Mr. Johnson also serves as Trustee of other Fidelity® funds. Mr. Johnson serves as a member of the Board of Directors of Eaton Corporation plc (diversified power management, 2009-present) and Booz Allen Hamilton (management consulting, 2011-present). Prior to his retirement, Mr. Johnson served as Senior Vice President of Corporate Strategic Development of Lockheed Martin Corporation (defense contractor, 1999-2009). He previously served on the Board of Directors of IKON Office Solutions, Inc. (1999-2008), AGL Resources, Inc. (holding company, 2002-2016), and Delta Airlines (2005-2007). Mr. Arthur E. Johnson is not related to Ms. Abigail P. Johnson.
Michael E. Kenneally (1954)
Year of Election or Appointment: 2009
Trustee
Mr. Kenneally also serves as Trustee of other Fidelity® funds. Prior to his retirement, Mr. Kenneally served as Chairman and Global Chief Executive Officer of Credit Suisse Asset Management. Before joining Credit Suisse, he was an Executive Vice President and Chief Investment Officer for Bank of America Corporation. Earlier roles at Bank of America included Director of Research, Senior Portfolio Manager and Research Analyst, and Mr. Kenneally was awarded the Chartered Financial Analyst (CFA) designation in 1991.
Marie L. Knowles (1946)
Year of Election or Appointment: 2001
Trustee
Chairman of the Independent Trustees
Ms. Knowles also serves as Trustee of other Fidelity® funds. Prior to Ms. Knowles' retirement in June 2000, she served as Executive Vice President and Chief Financial Officer of Atlantic Richfield Company (ARCO) (diversified energy, 1996-2000). From 1993 to 1996, she was a Senior Vice President of ARCO and President of ARCO Transportation Company (pipeline and tanker operations). Ms. Knowles currently serves as a Director and Chairman of the Audit Committee of McKesson Corporation (healthcare service, since 2002). Ms. Knowles is a member of the Board of the Santa Catalina Island Company (real estate, 2009-present). Ms. Knowles is a Member of the Investment Company Institute Board of Governors and a Member of the Governing Council of the Independent Directors Council (2014-present). She also serves as a member of the Advisory Board for the School of Engineering of the University of Southern California. Previously, Ms. Knowles served as a Director of Phelps Dodge Corporation (copper mining and manufacturing, 1994-2007), URS Corporation (engineering and construction, 2000-2003) and America West (airline, 1999-2002). Ms. Knowles previously served as Vice Chairman of the Independent Trustees of certain Fidelity® funds (2012-2015).
Mark A. Murray (1954)
Year of Election or Appointment: 2016
Trustee
Mr. Murray also serves as Trustee of other Fidelity® funds. Mr. Murray is Vice Chairman (2013-present) of Meijer, Inc. (regional retail chain). Previously, Mr. Murray served as a Member of the Advisory Board of certain Fidelity® funds (2016) and as Co-Chief Executive Officer (2013-2016) and President (2006-2013) of Meijer, Inc. Mr. Murray serves as a member of the Board of Directors and Nuclear Review and Public Policy and Responsibility Committees of DTE Energy Company (diversified energy company, 2009-present). Mr. Murray also serves as a member of the Board of Directors of Spectrum Health (not-for-profit health system, 2015-present). Mr. Murray previously served as President of Grand Valley State University (2001-2006), Treasurer for the State of Michigan (1999-2001), Vice President of Finance and Administration for Michigan State University (1998-1999), and a member of the Board of Directors and Audit Committee and Chairman of the Nominating and Corporate Governance Committee of Universal Forest Products, Inc. (manufacturer and distributor of wood and wood-alternative products, 2004-2016). Mr. Murray is also a director or trustee of many community and professional organizations.
+ The information includes the Trustee's principal occupation during the last five years and other information relating to the experience, attributes, and skills relevant to the Trustee's qualifications to serve as a Trustee, which led to the conclusion that the Trustee should serve as a Trustee for the fund.
Advisory Board Members and Officers:
Correspondence intended for an officer may be sent to Fidelity Investments, 245 Summer Street, Boston, Massachusetts 02210. Officers appear below in alphabetical order.
Name, Year of Birth; Principal Occupation
Elizabeth Paige Baumann (1968)
Year of Election or Appointment: 2017
Anti-Money Laundering (AML) Officer
Ms. Baumann also serves as AML Officer of other funds. She is Chief AML Officer (2012-present) and Senior Vice President (2014-present) of FMR LLC (diversified financial services company) and is an employee of Fidelity Investments. Previously, Ms. Baumann served as AML Officer of the funds (2012-2016), and Vice President (2007-2014) and Deputy Anti-Money Laundering Officer (2007-2012) of FMR LLC.
Marc R. Bryant (1966)
Year of Election or Appointment: 2015
Secretary and Chief Legal Officer (CLO)
Mr. Bryant also serves as Secretary and CLO of other funds. Mr. Bryant serves as CLO, Secretary, and Senior Vice President of Fidelity Management & Research Company (investment adviser firm, 2015-present) and FMR Co., Inc. (investment adviser firm, 2015-present); Secretary of Fidelity SelectCo, LLC (investment adviser firm, 2015-present) and Fidelity Investments Money Management, Inc. (investment adviser firm, 2015-present); and CLO of Fidelity Management & Research (Hong Kong) Limited and FMR Investment Management (UK) Limited (investment adviser firms, 2015-present) and Fidelity Management & Research (Japan) Limited (investment adviser firm, 2016-present). He is Senior Vice President and Deputy General Counsel of FMR LLC (diversified financial services company). Previously, Mr. Bryant served as Secretary and CLO of Fidelity Rutland Square Trust II (2010-2014) and Assistant Secretary of Fidelity's Fixed Income and Asset Allocation Funds (2013-2015). Prior to joining Fidelity Investments, Mr. Bryant served as a Senior Vice President and the Head of Global Retail Legal for AllianceBernstein L.P. (2006-2010), and as the General Counsel for ProFund Advisors LLC (2001-2006).
Jonathan Davis (1968)
Year of Election or Appointment: 2010
Assistant Treasurer
Mr. Davis also serves as Assistant Treasurer of other funds, and is an employee of Fidelity Investments. Previously, Mr. Davis served as Vice President and Associate General Counsel of FMR LLC (diversified financial services company, 2003-2010).
Adrien E. Deberghes (1967)
Year of Election or Appointment: 2010
Assistant Treasurer
Mr. Deberghes also serves as an officer of other funds. He serves as Executive Vice President of Fidelity Investments Money Management, Inc. (FIMM) (investment adviser firm, 2016-present) and is an employee of Fidelity Investments (2008-present). Prior to joining Fidelity Investments, Mr. Deberghes was Senior Vice President of Mutual Fund Administration at State Street Corporation (2007-2008), Senior Director of Mutual Fund Administration at Investors Bank & Trust (2005-2007), and Director of Finance for Dunkin' Brands (2000-2005). Previously, Mr. Deberghes served in other fund officer roles.
Stephanie J. Dorsey (1969)
Year of Election or Appointment: 2013
President and Treasurer
Ms. Dorsey also serves as an officer of other funds. She is an employee of Fidelity Investments (2008-present) and has served in other fund officer roles. Prior to joining Fidelity Investments, Ms. Dorsey served as Treasurer (2004-2008) of the JPMorgan Mutual Funds and Vice President (2004-2008) of JPMorgan Chase Bank.
Howard J. Galligan III (1966)
Year of Election or Appointment: 2014
Chief Financial Officer
Mr. Galligan also serves as Chief Financial Officer of other funds. Mr. Galligan serves as President of Fidelity Pricing and Cash Management Services (FPCMS) (2014-present) and as a Director of Strategic Advisers, Inc. (investment adviser firm, 2008-present). Previously, Mr. Galligan served as Chief Administrative Officer of Asset Management (2011-2014) and Chief Operating Officer and Senior Vice President of Investment Support for Strategic Advisers, Inc. (2003-2011).
Colm A. Hogan (1973)
Year of Election or Appointment: 2016
Assistant Treasurer
Mr. Hogan also serves as an officer of other funds. Mr. Hogan is an employee of Fidelity Investments (2005-present).
Chris Maher (1972)
Year of Election or Appointment: 2013
Assistant Treasurer
Mr. Maher serves as Assistant Treasurer of other funds. Mr. Maher is Vice President of Valuation Oversight and is an employee of Fidelity Investments. Previously, Mr. Maher served as Vice President of Asset Management Compliance (2013), Vice President of the Program Management Group of FMR (investment adviser firm, 2010-2013), and Vice President of Valuation Oversight (2008-2010).
John B. McGinty, Jr. (1962)
Year of Election or Appointment: 2016
Chief Compliance Officer
Mr. McGinty also serves as Chief Compliance Officer of other funds. Mr. McGinty is Senior Vice President of Asset Management Compliance for Fidelity Investments and is an employee of Fidelity Investments (2016-present). Mr. McGinty previously served as Vice President, Senior Attorney at Eaton Vance Management (investment management firm, 2015-2016), and prior to Eaton Vance as global CCO for all firm operations and registered investment companies at GMO LLC (investment management firm, 2009-2015). Before joining GMO LLC, Mr. McGinty served as Senior Vice President, Deputy General Counsel for Fidelity Investments (2007-2009).
Rieco E. Mello (1969)
Year of Election or Appointment: 2017
Assistant Treasurer
Mr. Mello also serves as Assistant Treasurer of other funds. Mr. Mello is an employee of Fidelity Investments (1995-present).
Jamie Pagliocco (1964)
Year of Election or Appointment: 2017
Vice President
Mr. Pagliocco also serves as Vice President of other funds. Mr. Pagliocco serves as Chief Investment Officer of FMR's Bond Group (2017-present) and is an employee of Fidelity Investments (2001-present).
Jason P. Pogorelec (1975)
Year of Election or Appointment: 2015
Assistant Secretary
Mr. Pogorelec also serves as Assistant Secretary of other funds. Mr. Pogorelec serves as Vice President, Associate General Counsel (2010-present) and is an employee of Fidelity Investments (2006-present).
Nancy D. Prior (1967)
Year of Election or Appointment: 2014
Vice President
Ms. Prior also serves as Vice President of other funds. Ms. Prior serves as a Director of FMR Investment Management (UK) Limited (investment adviser firm, 2015-present), President (2016-present) and Director (2014-present) of Fidelity Investments Money Management, Inc. (FIMM) (investment adviser firm), President, Fixed Income (2014-present), Vice Chairman of FIAM LLC (investment adviser firm, 2014-present), and is an employee of Fidelity Investments (2002-present). Previously, Ms. Prior served as Vice President of Fidelity's Money Market Funds (2012-2014), President, Money Market and Short Duration Bond Group of Fidelity Management & Research (FMR) (investment adviser firm, 2013-2014), President, Money Market Group of FMR (2011-2013), Managing Director of Research (2009-2011), Senior Vice President and Deputy General Counsel (2007-2009), and Assistant Secretary of certain Fidelity® funds (2008-2009).
Stacie M. Smith (1974)
Year of Election or Appointment: 2013
Assistant Treasurer
Ms. Smith also serves as an officer of other funds. She is an employee of Fidelity Investments (2009-present) and has served in other fund officer roles. Prior to joining Fidelity Investments, Ms. Smith served as Senior Audit Manager of Ernst & Young LLP (accounting firm, 1996-2009). Previously, Ms. Smith served as Deputy Treasurer of certain Fidelity® funds (2013-2016).
Marc L. Spector (1972)
Year of Election or Appointment: 2016
Deputy Treasurer
Mr. Spector also serves as an officer of other funds. Mr. Spector is an employee of Fidelity Investments (2016-present). Prior to joining Fidelity Investments, Mr. Spector served as Director at the Siegfried Group (accounting firm, 2013-2016), and prior to Siegfried Group as audit senior manager at Deloitte & Touche (accounting firm, 2005-2013).
Renee Stagnone (1975)
Year of Election or Appointment: 2016
Assistant Treasurer
Ms. Stagnone also serves as an officer of other funds. Ms. Stagnone is an employee of Fidelity Investments (1997-present). Previously, Ms. Stagnone served as Deputy Treasurer of certain Fidelity® funds (2013-2016).
Christine J. Thompson (1958)
Year of Election or Appointment: 2015
Vice President of Fidelity's Bond Funds
Ms. Thompson also serves as Vice President of other funds. Ms. Thompson also serves as Chief Investment Officer of FMR's Bond Group (2010-present) and is an employee of Fidelity Investments (1985-present). Previously, Ms. Thompson served as Vice President of Fidelity's Bond Funds (2010-2012).
Shareholder Expense Example
As a shareholder of the Fund, you incur two types of costs: (1) transaction costs and (2) ongoing costs, including management fees and other Fund expenses. This Example is intended to help you understand your ongoing costs (in dollars) of investing in the Fund and to compare these costs with the ongoing costs of investing in other mutual funds.
The actual expense Example is based on an investment of $1,000 invested at the beginning of the period and held for the entire period (May 25, 2017 to August 31, 2017). The hypothetical expense Example is based on an investment of $1,000 invested for the one-half year period (March 1, 2017 to August 31, 2017).
Actual Expenses
The first line of the accompanying table provides information about actual account values and actual expenses. You may use the information in this line, together with the amount you invested, to estimate the expenses that you paid over the period. Simply divide your account value by $1,000.00 (for example, an $8,600 account value divided by $1,000.00 = 8.6), then multiply the result by the number in the first line under the heading entitled "Expenses Paid During Period" to estimate the expenses you paid on your account during this period. In addition, the Fund, as a shareholder in the underlying Fidelity Central Funds, will indirectly bear its pro-rata share of the fees and expenses incurred by the underlying Fidelity Central Funds. These fees and expenses are not included in the Fund's annualized expense ratio used to calculate the expense estimate in the table below.
Hypothetical Example for Comparison Purposes
The second line of the accompanying table provides information about hypothetical account values and hypothetical expenses based on the Fund's actual expense ratio and an assumed rate of return of 5% per year before expenses, which is not the Fund's actual return. The hypothetical account values and expenses may not be used to estimate the actual ending account balance or expenses you paid for the period. You may use this information to compare the ongoing costs of investing in the Fund and other funds. To do so, compare this 5% hypothetical example with the 5% hypothetical examples that appear in the shareholder reports of the other funds. In addition, the Fund, as a shareholder in the underlying Fidelity Central Funds, will indirectly bear its pro-rata share of the fees and expenses incurred by the underlying Fidelity Central Funds. These fees and expenses are not included in the Fund's annualized expense ratio used to calculate the expense estimate in the table below.
Please note that the expenses shown in the table are meant to highlight your ongoing costs only and do not reflect any transaction costs. Therefore, the second line of the table is useful in comparing ongoing costs only, and will not help you determine the relative total costs of owning different funds.
| | Annualized Expense Ratio-A | Beginning
Account Value | Ending
Account Value
August 31, 2017 | Expenses Paid
During PeriodB |
| Actual | .30% | $1,000.00 | $1,013.50 | .82C |
| Hypothetical-D�� | | $1,000.00 | $1,023.69 | 1.53E |
A Annualized expense ratio reflects expenses net of applicable fee waivers.
B The fees and expenses of the underlying Fidelity Central Funds in which the Fund invests are not included in the Fund's annualized expense ratio. In addition to the expenses noted above, the Fund also indirectly bears its proportional share of the expenses of the underlying Fidelity Central Funds. Annualized expenses of the underlying non-money market Fidelity Central Funds as of their most recent fiscal half year ranged from less than .005% to .05%.
C Actual expenses are equal to the Fund's annualized expense ratio, multiplied by the average account value over the period, multiplied by 99/365 (to reflect the period May 25, 2017 to August 31, 2017).
D 5% return per year before expenses
E Hypothetical expenses are equal to the Fund's annualized expense ratio, multiplied by the average account value over the period, multiplied by 184/365 (to reflect the one-half year period).
Distributions (Unaudited)
The Board of Trustees of Fidelity Total Bond K6 Fund voted to pay on October 16, 2017, to shareholders of record at the opening of business on October 13, 2017, a distribution of $0.004 per share derived from capital gains realized from sales of portfolio securities.
A total of 25.64% of the dividends distributed during the fiscal year was derived from interest on U.S. Government securities which is generally exempt from state income tax.
The fund will notify shareholders in January 2018 of amounts for use in preparing 2017 income tax returns.
Board Approval of Investment Advisory Contracts and Management Fees
Fidelity Total Bond K6 Fund
On January 18, 2017 the Board of Trustees, including the Independent Trustees (together, the Board), voted to approve the management contract with Fidelity Management & Research Company (FMR) and the sub-advisory agreements with affiliates of FMR (together, the Advisory Contracts) for the fund. The Board, assisted by the advice of fund counsel and Independent Trustees' counsel, considered a broad range of information.
Nature, Extent, and Quality of Services Provided. The Board considered Fidelity's staffing as it relates to the fund, including the backgrounds of investment personnel of Fidelity, and also considered the fund's investment objective, strategies, and related investment philosophy. The Board considered the structure of the investment personnel compensation program and whether this structure provides appropriate incentives to act in the best interests of the fund.
Resources Dedicated to Investment Management and Support Services. The Board reviewed the general qualifications and capabilities of Fidelity's investment staff, including its size, education, experience, and resources, as well as Fidelity's approach to recruiting, managing, and compensating investment personnel. The Board noted that Fidelity has continued to increase the resources devoted to non-U.S. offices, including expansion of Fidelity's global investment organization. The Board also noted that Fidelity's analysts have extensive resources, tools and capabilities that allow them to conduct sophisticated quantitative and fundamental analysis, as well as credit analysis of issuers, counterparties and guarantors. Further, the Board considered that Fidelity's investment professionals have sufficient access to global information and data so as to provide competitive investment results over time, and that those professionals also have access to sophisticated tools that permit them to assess portfolio construction and risk and performance attribution characteristics continuously, as well as to transmit new information and research conclusions rapidly around the world. Additionally, in its deliberations, the Board considered Fidelity's trading, risk management, compliance, and technology and operationscapabilities and resources, which are integral parts of the investment management process.
Shareholder and Administrative Services. The Board considered the nature, extent, quality, and cost of advisory, administrative, and shareholder services to be performed by FMR, the sub-advisers (together with FMR, the Investment Advisers), and their affiliates under the Advisory Contracts and under separate agreements covering transfer agency, pricing and bookkeeping and securities lending services for the fund. The Board also considered the nature and extent of the supervision of third party service providers, principally custodians, subcustodians, and pricing vendors.
The Board noted that the growth of fund assets over time across the complex allows Fidelity to reinvest in the development of services designed to enhance the value or convenience of the Fidelity funds as investment vehicles. These services include 24-hour access to account information and market information through telephone representatives and over the Internet, investor education materials and asset allocation tools, and the expanded availability of Fidelity Investor Centers.
Investment Performance. The fund is a new fund and therefore had no historical performance for the Board to review at the time it approved the fund's Advisory Contracts. The Board considered the Investment Advisers' strength in fundamental, research-driven security selection, which the Board is familiar with through its supervision of other Fidelity funds, including funds with identical investment objectives as the fund.
Based on its review, the Board concluded that the nature, extent, and quality of services to be provided to the fund under the Advisory Contracts should benefit the shareholders of the fund.
Competitiveness of Management Fee and Total Expense Ratio. The Board considered the fund's proposed management fee out of which FMR will pay all operating expenses, with certain limited exceptions, and the projected total expense ratio of the fund in reviewing the Advisory Contracts. The Board noted that the fund's proposed management fee rate is lower than the median fee rate of funds with similar Lipper investment objective categories and comparable investment mandates, regardless of whether their management fee structures are comparable. The Board also considered that the projected total expense ratio of the fund is below the median of those funds and classes used by the Board for management fee comparisons that have a similar sales load structure.
Based on its review, the Board concluded that the fund's management fee and projected total expense ratio were reasonable in light of the services that the fund and its shareholders will receive and the other factors considered.
Costs of the Services and Profitability. The fund is a new fund and therefore no revenue, cost, or profitability data was available for the Board to review in respect of the fund at the time it approved the Advisory Contracts. In connection with its future renewal of the fund's Advisory Contracts, the Board will consider the revenues earned and the expenses incurred by Fidelity in conducting the business of developing, marketing, distributing, managing, administering and servicing the fund and servicing the fund's shareholders.
Economies of Scale. The Board will consider economies of scale when there is operating experience to permit assessment thereof. It noted that, notwithstanding the entrepreneurial risk associated with a new fund, the management fee was at a level normally associated, by comparison with competitors, with very high fund net assets, and Fidelity asserted to the Board that the level of the fee anticipated economies of scale at lower asset levels even before, if ever, economies of scale are achieved. The Board also noted that the fund and its shareholders would have access to the very considerable number and variety of services available through Fidelity and its affiliates.
Based on its evaluation of all of the conclusions noted above, and after considering all factors it believed relevant, the Board concluded that the advisory fee structures are fair and reasonable, and that the fund's Advisory Contracts should be approved.
Corporate Headquarters
245 Summer St.
Boston, MA 02210
www.fidelity.com
TBDK6-ANN-1017
1.9884015.100
Fidelity Advisor® Government Income Fund - Class A, Class M (formerly Class T), Class C and Class I
Annual Report August 31, 2017 Class A, Class M, Class C and Class I are classes of Fidelity® Government Income Fund |
|
Contents
To view a fund's proxy voting guidelines and proxy voting record for the 12-month period ended June 30, visit http://www.fidelity.com/proxyvotingresults or visit the Securities and Exchange Commission's (SEC) web site at http://www.sec.gov.
You may also call 1-877-208-0098 to request a free copy of the proxy voting guidelines.
Standard & Poor's, S&P and S&P 500 are registered service marks of The McGraw-Hill Companies, Inc. and have been licensed for use by Fidelity Distributors Corporation.
Other third-party marks appearing herein are the property of their respective owners.
All other marks appearing herein are registered or unregistered trademarks or service marks of FMR LLC or an affiliated company. © 2017 FMR LLC. All rights reserved.
This report and the financial statements contained herein are submitted for the general information of the shareholders of the Fund. This report is not authorized for distribution to prospective investors in the Fund unless preceded or accompanied by an effective prospectus.
A fund files its complete schedule of portfolio holdings with the SEC for the first and third quarters of each fiscal year on Form N-Q. Forms N-Q are available on the SEC’s web site at http://www.sec.gov. A fund's Forms N-Q may be reviewed and copied at the SEC’s Public Reference Room in Washington, DC. Information regarding the operation of the SEC's Public Reference Room may be obtained by calling 1-800-SEC-0330.
For a complete list of a fund's portfolio holdings, view the most recent holdings listing, semiannual report, or annual report on Fidelity's web site at http://www.fidelity.com, http://www.institutional.fidelity.com, or http://www.401k.com, as applicable.
NOT FDIC INSURED •MAY LOSE VALUE •NO BANK GUARANTEE
Neither the Fund nor Fidelity Distributors Corporation is a bank.
Performance: The Bottom Line
Average annual total return reflects the change in the value of an investment, assuming reinvestment of distributions from dividend income and capital gains (the profits earned upon the sale of securities that have grown in value, if any) and assuming a constant rate of performance each year. The hypothetical investment and the average annual total returns do not reflect the deduction of taxes that a shareholder would pay on fund distributions or the redemption of fund shares. During periods of reimbursement by Fidelity, a fund’s total return will be greater than it would be had the reimbursement not occurred. How a fund did yesterday is no guarantee of how it will do tomorrow.
Average Annual Total Returns
| For the periods ended August 31, 2017 | Past 1 year | Past 5 years | Past 10 years |
| Class A (incl. 4.00% sales charge) | (4.70)% | 0.27% | 3.13% |
| Class M (incl. 4.00% sales charge) | (4.70)% | 0.28% | 3.14% |
| Class C (incl. contingent deferred sales charge) | (2.46)% | 0.34% | 2.77% |
| Class I | (0.46)% | 1.36% | 3.82% |
Class C shares' contingent deferred sales charges included in the past one year, past five years and past ten years total return figures are 1%, 0% and 0%, respectively.
$10,000 Over 10 Years
Let's say hypothetically that $10,000 was invested in Fidelity Advisor® Government Income Fund - Class A on August 31, 2007, and the current 4.00% sales charge was paid.
The chart shows how the value of your investment would have changed, and also shows how the Bloomberg Barclays U.S. Government Bond Index performed over the same period.
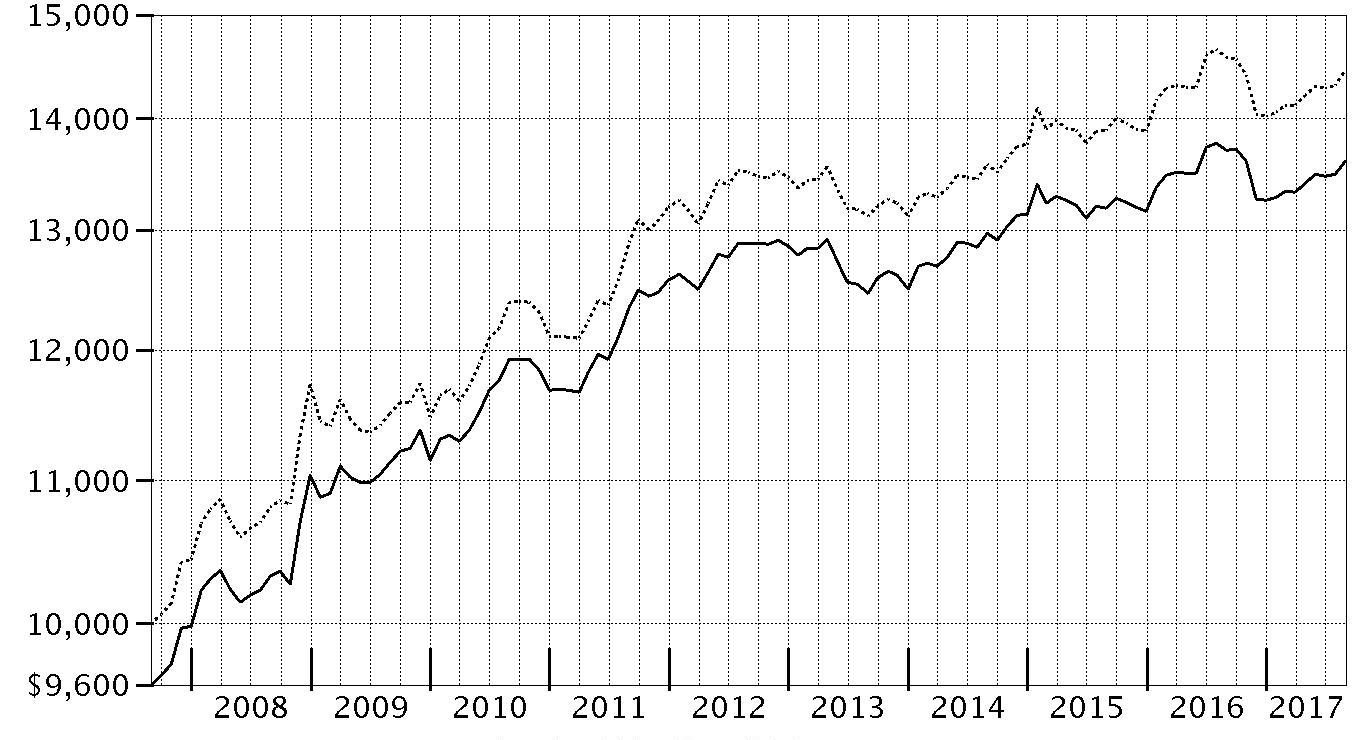
| Period Ending Values |
| $13,607 | Fidelity Advisor® Government Income Fund - Class A |
| $14,462 | Bloomberg Barclays U.S. Government Bond Index |
Effective August 24, 2016, all Barclays benchmark indices were co-branded as the Bloomberg Barclays Indices for a period of five years.
Management's Discussion of Fund Performance
Market Recap: U.S. taxable investment-grade bonds rose slightly for the 12 months ending August 31, 2017, as yields increased markedly following the U.S. presidential election then moderated as the period progressed. The Bloomberg Barclays U.S. Aggregate Bond Index gained 0.49% for the year. Bond yields rose slightly early in the period, prior to the U.S. election, then surged in November and December, as many investors viewed then-President-elect Donald Trump’s economic agenda as stimulative and potentially inflationary. Yields also rode the Fed’s decision in December to raise policy interest rates. Longer-term bond yields declined slightly in the first half of 2017, even though the Fed raised rates in June 2017 for the third time in as many quarters, as it became clear that changes to tax, health care and fiscal policies would take time to develop and implement. Fairly cool inflation readings also held back yields late in the period. Within the Bloomberg Barclays index, investment-grade corporate bonds led all major market segments, up 2.13%, while U.S. Treasuries returned -0.95%. Securitized sectors advanced more modestly than corporates. Outside the index, riskier, non-core fixed-income segments led the broader market, while Treasury Inflation-Protected Securities (TIPS) rose 0.46%, according to Bloomberg Barclays.
Comments from Lead Portfolio Manager William Irving and Co-Portfolio Manager Franco Castagliuolo: For the fiscal year, the fund’s shares classes (excluding sales charges, if applicable) returned about -1%, about in line, net of fees, with the -0.84% return of the benchmark Bloomberg Barclays 75% U.S. Government/25% U.S. MBS Blended Index. We continued to execute our strategy of attempting to exploit market inefficiencies to enhance longer-term results. Versus the benchmark, owning reverse-mortgage securities – which were not in the benchmark – aided performance. Our non-benchmark holdings in commercial mortgage-backed securities issued by Freddie Mac also contributed, as did positioning within the government-agency debenture sector. This period, we ventured beyond the government issuers that make up the bulk of this sector – Fannie Mae, Freddie Mac and the Federal Home Loan Banks – into a few higher-yielding niche segments. Specifically, we had more exposure to securities issued by the U.S. Agency for International Development. Security selection worked particularly well in the agency mortgage-backed securities sector. Our larger-than-benchmark stake in securities made up of loans with low remaining balances was beneficial. In contrast, holding Treasury Inflation-Protected Securities, or TIPS, slightly detracted from the fund’s results versus the benchmark. They performed poorly as inflation remained subdued.
The views expressed above reflect those of the portfolio manager(s) only through the end of the period as stated on the cover of this report and do not necessarily represent the views of Fidelity or any other person in the Fidelity organization. Any such views are subject to change at any time based upon market or other conditions and Fidelity disclaims any responsibility to update such views. These views may not be relied on as investment advice and, because investment decisions for a Fidelity fund are based on numerous factors, may not be relied on as an indication of trading intent on behalf of any Fidelity fund.
Investment Summary (Unaudited)
The information in the following tables is based on the combined investments of the Fund and its pro-rata share of the investments of Fidelity's Fixed-Income Central Funds.
Coupon Distribution as of August 31, 2017
| | % of fund's investments | % of fund's investments 6 months ago |
| Zero coupon bonds | 0.0 | 0.0 |
| 0.01 - 0.99% | 1.7 | 1.9 |
| 1 - 1.99% | 33.9 | 31.8 |
| 2 - 2.99% | 20.1 | 22.1 |
| 3 - 3.99% | 21.7 | 22.4 |
| 4 - 4.99% | 12.2 | 12.8 |
| 5 - 5.99% | 8.0 | 8.3 |
| 6 - 6.99% | 0.5 | 0.6 |
| 7 - 7.99% | 0.5 | 0.5 |
| 8% and above | 0.0 | 0.0 |
Coupon distribution shows the range of stated interest rates on the fund's investments, excluding short-term investments.
Asset Allocation (% of fund's net assets)
| As of August 31, 2017*,** |
| | Mortgage Securities | 21.3% |
| | CMOs and Other Mortgage Related Securities | 23.5% |
| | U.S. Treasury Obligations | 45.5% |
| | U.S. Government Agency Obligations*** | 2.0% |
| | Foreign Government & Government Agency Obligations | 3.9% |
| | Asset-Backed Securities | 2.2% |
| | Short-Term Investments and Net Other Assets (Liabilities) | 1.6% |
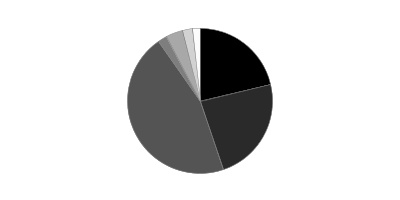
* Foreign investments – 3.9%
** Futures and Swaps – 7.8%
*** Includes NCUA Guaranteed Notes
| As of February 28, 2017*,** |
| | Mortgage Securities | 24.8% |
| | CMOs and Other Mortgage Related Securities | 24.1% |
| | U.S. Treasury Obligations | 44.8% |
| | U.S. Government Agency Obligations*** | 2.7% |
| | Foreign Government & Government Agency Obligations | 4.3% |
| | Short-Term Investments and Net Other Assets (Liabilities)† | (0.7)% |

* Foreign investments – 4.3%
** Futures and Swaps – 5.7%
*** Includes NCUA Guaranteed Notes
† Short-Term Investments and Net Other Assets (Liabilities) are not included in the pie chart
An unaudited holdings listing for the Fund, which presents direct holdings as well as the pro-rata share of any securities and other investments held indirectly through its investment in underlying non-money market Fidelity Central Funds, is available at fidelity.com and/or institutional.fidelity.com, as applicable.
Percentages in the above tables are adjusted for the effect of TBA Sale Commitments.
Percentages shown as 0.0% may reflect amounts less than 0.05%.
Investments August 31, 2017
Showing Percentage of Net Assets
| U.S. Government and Government Agency Obligations - 47.5% | | | |
| | | Principal Amount (000s) | Value (000s) |
| U.S. Government Agency Obligations - 0.2% | | | |
| Fannie Mae: | | | |
| 0.875% 8/2/19 | | $131 | $130 |
| 1% 2/26/19 | | 326 | 324 |
| 1.125% 12/14/18 | | 240 | 239 |
| Tennessee Valley Authority: | | | |
| 5.25% 9/15/39 | | 2,807 | 3,759 |
| 5.375% 4/1/56 | | 3,438 | 4,773 |
| | | | 9,225 |
| U.S. Treasury Inflation-Protected Obligations - 0.6% | | | |
| U.S. Treasury Inflation-Indexed Bonds 1% 2/15/46 | | 23,700 | 24,417 |
| U.S. Treasury Obligations - 44.9% | | | |
| U.S. Treasury Bonds: | | | |
| 2.5% 2/15/46 | | 28,232 | 26,937 |
| 2.75% 8/15/47 | | 6,000 | 6,027 |
| 2.875% 8/15/45 | | 112,441 | 115,819 |
| 3% 11/15/44 | | 29,032 | 30,684 |
| 3% 11/15/45 | | 40,000 | 42,203 |
| 3% 2/15/47 | | 27,506 | 29,025 |
| 3% 5/15/47 | | 15,900 | 16,786 |
| 3.625% 2/15/44 | | 45,031 | 53,047 |
| 4.375% 5/15/40 | | 3,000 | 3,915 |
| 4.75% 2/15/37 | | 62,168 | 84,505 |
| 5% 5/15/37 (a)(b)(c) | | 36,142 | 50,551 |
| U.S. Treasury Notes: | | | |
| 0.875% 9/15/19 | | 56,901 | 56,381 |
| 1.125% 9/30/21 | | 119,876 | 117,549 |
| 1.375% 7/31/19 | | 120,000 | 120,113 |
| 1.375% 2/29/20 | | 33,681 | 33,680 |
| 1.375% 4/30/20 | | 75,553 | 75,512 |
| 1.375% 8/31/20 | | 5,000 | 4,990 |
| 1.375% 1/31/21 | | 27,500 | 27,369 |
| 1.375% 4/30/21 | | 20,000 | 19,868 |
| 1.375% 5/31/21 | | 20,000 | 19,854 |
| 1.5% 4/15/20 | | 4,775 | 4,788 |
| 1.5% 5/15/20 | | 34,416 | 34,503 |
| 1.5% 7/15/20 | | 22,703 | 22,752 |
| 1.5% 8/15/26 | | 9,629 | 9,163 |
| 1.625% 6/30/20 | | 4,710 | 4,736 |
| 1.625% 7/31/20 | | 30,000 | 30,171 |
| 1.625% 8/31/22 | | 35,000 | 34,861 |
| 1.75% 10/31/20 | | 18,000 | 18,150 |
| 1.75% 12/31/20 | | 59,701 | 60,167 |
| 1.75% 6/30/22 | | 56,910 | 57,014 |
| 1.875% 1/31/22 | | 45,770 | 46,181 |
| 1.875% 3/31/22 | | 56,661 | 57,141 |
| 1.875% 7/31/22 | | 86,000 | 86,642 |
| 1.875% 8/31/24 | | 112,983 | 112,427 |
| 2% 9/30/20 | | 31,153 | 31,657 |
| 2% 10/31/21 | | 19,497 | 19,785 |
| 2% 12/31/21 | | 60,103 | 60,974 |
| 2% 7/31/22 | | 18,845 | 19,091 |
| 2% 8/15/25 | | 38,778 | 38,689 |
| 2% 11/15/26 | | 70,025 | 69,388 |
| 2.125% 6/30/21 | | 22,000 | 22,442 |
| 2.125% 12/31/21 | | 2,000 | 2,039 |
| 2.125% 6/30/22 | | 146 | 149 |
| 2.125% 7/31/24 | | 100,525 | 101,707 |
| 2.125% 5/15/25 | | 18,702 | 18,853 |
| 2.25% 7/31/21 | | 26,021 | 26,661 |
| 2.25% 2/15/27 | | 3,000 | 3,034 |
| 2.375% 5/15/27 | | 29,946 | 30,596 |
| | | | 1,958,576 |
| Other Government Related - 1.8% | | | |
| National Credit Union Administration Guaranteed Notes: | | | |
| Series 2010-A1 Class A, 1 month U.S. LIBOR + 0.350% 1.5789% 12/7/20 (NCUA Guaranteed) (d)(e) | | 2,576 | 2,578 |
| Series 2011-R4 Class 1A, 1 month U.S. LIBOR + 0.380% 1.6072% 3/6/20 (NCUA Guaranteed) (d)(e) | | 196 | 196 |
| National Credit Union Administration Guaranteed Notes Master Trust 3.45% 6/12/21 (NCUA Guaranteed) | | 74,000 | 78,204 |
| | | | 80,978 |
| TOTAL U.S. GOVERNMENT AND GOVERNMENT AGENCY OBLIGATIONS | | | |
| (Cost $2,049,786) | | | 2,073,196 |
|
| U.S. Government Agency - Mortgage Securities - 3.6% | | | |
| Fannie Mae - 2.3% | | | |
| 12 month U.S. LIBOR + 1.415% 2.915% 11/1/33 (d)(e) | | 79 | 82 |
| 12 month U.S. LIBOR + 1.480% 3.14% 7/1/34 (d)(e) | | 90 | 94 |
| 12 month U.S. LIBOR + 1.523% 3.219% 3/1/36 (d)(e) | | 348 | 364 |
| 12 month U.S. LIBOR + 1.551% 2.506% 2/1/44 (d)(e) | | 347 | 361 |
| 12 month U.S. LIBOR + 1.553% 2.596% 5/1/44 (d)(e) | | 1,105 | 1,135 |
| 12 month U.S. LIBOR + 1.553% 3.338% 6/1/36 (d)(e) | | 100 | 104 |
| 12 month U.S. LIBOR + 1.558% 2.458% 2/1/44 (d)(e) | | 436 | 455 |
| 12 month U.S. LIBOR + 1.565% 3.315% 3/1/37 (d)(e) | | 113 | 119 |
| 12 month U.S. LIBOR + 1.570% 2.567% 5/1/44 (d)(e) | | 633 | 650 |
| 12 month U.S. LIBOR + 1.574% 2.646% 4/1/44 (d)(e) | | 1,574 | 1,641 |
| 12 month U.S. LIBOR + 1.580% 2.451% 4/1/44 (d)(e) | | 653 | 679 |
| 12 month U.S. LIBOR + 1.580% 2.575% 1/1/44 (d)(e) | | 710 | 741 |
| 12 month U.S. LIBOR + 1.725% 2.583% 6/1/42 (d)(e) | | 255 | 263 |
| 12 month U.S. LIBOR + 1.728% 3.314% 11/1/36 (d)(e) | | 63 | 66 |
| 12 month U.S. LIBOR + 1.741% 3.332% 3/1/40 (d)(e) | | 1,290 | 1,369 |
| 12 month U.S. LIBOR + 1.745% 3.374% 7/1/35 (d)(e) | | 155 | 163 |
| 12 month U.S. LIBOR + 1.800% 2.759% 1/1/42 (d)(e) | | 966 | 1,014 |
| 12 month U.S. LIBOR + 1.800% 3.558% 7/1/41 (d)(e) | | 241 | 251 |
| 12 month U.S. LIBOR + 1.805% 3.029% 10/1/41 (d)(e) | | 79 | 84 |
| 12 month U.S. LIBOR + 1.815% 2.944% 11/1/40 (d)(e) | | 95 | 100 |
| 12 month U.S. LIBOR + 1.818% 2.695% 2/1/42 (d)(e) | | 1,352 | 1,419 |
| 12 month U.S. LIBOR + 1.818% 3.023% 9/1/41 (d)(e) | | 149 | 158 |
| 12 month U.S. LIBOR + 1.818% 3.249% 7/1/41 (d)(e) | | 199 | 207 |
| 12 month U.S. LIBOR + 1.830% 3.38% 10/1/41 (d)(e) | | 133 | 141 |
| 12 month U.S. LIBOR + 1.851% 3.573% 5/1/36 (d)(e) | | 96 | 101 |
| 6 month U.S. LIBOR + 1.475% 2.85% 10/1/33 (d)(e) | | 72 | 74 |
| 6 month U.S. LIBOR + 1.510% 2.854% 2/1/33 (d)(e) | | 48 | 50 |
| 6 month U.S. LIBOR + 1.535% 2.833% 3/1/35 (d)(e) | | 55 | 56 |
| 6 month U.S. LIBOR + 1.535% 2.884% 12/1/34 (d)(e) | | 134 | 138 |
| 6 month U.S. LIBOR + 1.556% 2.922% 10/1/33 (d)(e) | | 40 | 41 |
| 6 month U.S. LIBOR + 1.565% 2.845% 7/1/35 (d)(e) | | 55 | 57 |
| U.S. TREASURY 1 YEAR INDEX + 1.965% 2.84% 2/1/36 (d)(e) | | 47 | 49 |
| U.S. TREASURY 1 YEAR INDEX + 2.208% 3.083% 3/1/35 (d)(e) | | 50 | 53 |
| U.S. TREASURY 1 YEAR INDEX + 2.295% 2.798% 10/1/33 (d)(e) | | 95 | 100 |
| 4% 5/1/29 to 7/1/47 | | 56,854 | 60,241 |
| 4% 9/1/47 (f) | | 5,250 | 5,547 |
| 4.5% 11/1/25 to 6/1/41 | | 8,281 | 8,875 |
| 5% 7/1/35 to 6/1/39 | | 7,844 | 8,634 |
| 6% 1/1/34 to 6/1/36 | | 4,881 | 5,572 |
| 6.5% 3/1/22 to 5/1/27 | | 250 | 281 |
| 9.5% 10/1/20 | | 4 | 4 |
| 11.5% 1/15/21 | | 1 | 1 |
| | | | 101,534 |
| Freddie Mac - 0.6% | | | |
| 12 month U.S. LIBOR + 1.754% 3.098% 9/1/41 (d)(e) | | 1,421 | 1,503 |
| 12 month U.S. LIBOR + 1.874% 3.432% 10/1/42 (d)(e) | | 814 | 854 |
| 12 month U.S. LIBOR + 1.877% 3.215% 4/1/41 (d)(e) | | 133 | 139 |
| 12 month U.S. LIBOR + 1.880% 3.03% 10/1/41 (d)(e) | | 1,987 | 2,059 |
| 12 month U.S. LIBOR + 1.880% 3.222% 9/1/41 (d)(e) | | 154 | 164 |
| 12 month U.S. LIBOR + 1.910% 3.282% 6/1/41 (d)(e) | | 175 | 183 |
| 12 month U.S. LIBOR + 1.910% 3.421% 5/1/41 (d)(e) | | 148 | 158 |
| 12 month U.S. LIBOR + 1.910% 3.625% 5/1/41 (d)(e) | | 200 | 209 |
| 12 month U.S. LIBOR + 1.910% 3.647% 6/1/41 (d)(e) | | 192 | 201 |
| 12 month U.S. LIBOR + 2.045% 3.81% 7/1/36 (d)(e) | | 270 | 287 |
| 12 month U.S. LIBOR + 2.197% 3.537% 3/1/33 (d)(e) | | 7 | 7 |
| 6 month U.S. LIBOR + 1.445% 2.82% 3/1/35 (d)(e) | | 193 | 199 |
| 6 month U.S. LIBOR + 1.746% 2.967% 5/1/37 (d)(e) | | 112 | 116 |
| 6 month U.S. LIBOR + 2.755% 4.096% 10/1/35 (d)(e) | | 131 | 139 |
| U.S. TREASURY 1 YEAR INDEX + 2.383% 3.075% 2/1/36 (d)(e) | | 15 | 15 |
| U.S. TREASURY 1 YEAR INDEX + 2.548% 3.548% 7/1/35 (d)(e) | | 582 | 609 |
| 3% 2/1/31 | | 10,198 | 10,549 |
| 4% 5/1/47 to 7/1/47 | | 4,716 | 4,992 |
| 4.5% 5/1/39 to 10/1/41 | | 2,649 | 2,888 |
| 5.5% 7/1/29 | | 17 | 19 |
| 6% 1/1/24 | | 945 | 1,018 |
| 9.5% 6/1/18 to 8/1/21 | | 3 | 3 |
| | | | 26,311 |
| Ginnie Mae - 0.7% | | | |
| 4.3% 8/20/61 (g) | | 2,305 | 2,340 |
| 4.649% 2/20/62 (g) | | 2,209 | 2,280 |
| 4.682% 2/20/62 (g) | | 3,078 | 3,153 |
| 4.684% 1/20/62 (g) | | 17,385 | 17,825 |
| 5.47% 8/20/59 (g) | | 42 | 43 |
| 6% 6/15/36 | | 3,886 | 4,542 |
| | | | 30,183 |
| TOTAL U.S. GOVERNMENT AGENCY - MORTGAGE SECURITIES | | | |
| (Cost $157,346) | | | 158,028 |
|
| Asset-Backed Securities - 1.9% | | | |
| Fannie Mae Series 2017-T1 Class A, 2.898% 6/25/27 | | $46,895 | $47,484 |
| Goal Capital Funding Trust Series 2005-2 Class A3, 3 month U.S. LIBOR + 0.170% 1.4872% 5/28/30 (d)(e) | | 4,749 | 4,746 |
| Illinois Student Assistance Commission Student Loan Rev. Series 2010-1 Class A2, 3 month U.S. LIBOR + 1.050% 2.2062% 4/25/22 (d)(e) | | 1,732 | 1,740 |
| Navient Student Loan Trust Series 2017-3A: | | | |
| Class A1, 1 month U.S. LIBOR + 0.300% 1.5344% 7/26/66 (d)(e)(h) | | 12,854 | 12,855 |
| Class A2, 1 month U.S. LIBOR + 0.600% 1.8344% 7/26/66 (d)(e)(h) | | 14,550 | 14,617 |
| Small Business Administration guaranteed development participation certificates: | | | |
| Series 2002-20J Class 1, 4.75% 10/1/22 | | 649 | 674 |
| Series 2002-20K Class 1, 5.08% 11/1/22 | | 959 | 1,008 |
| Series 2004-20H Class 1, 5.17% 8/1/24 | | 424 | 448 |
| TOTAL ASSET-BACKED SECURITIES | | | |
| (Cost $82,813) | | | 83,572 |
|
| Collateralized Mortgage Obligations - 17.2% | | | |
| U.S. Government Agency - 17.2% | | | |
| Fannie Mae: | | | |
| floater: | | $ | $ |
| Series 2001-38 Class QF, 1 month U.S. LIBOR + 0.980% 2.2144% 8/25/31 (d)(e) | | 84 | 86 |
| Series 2002-49 Class FB, 1 month U.S. LIBOR + 0.600% 1.8283% 11/18/31 (d)(e) | | 80 | 81 |
| Series 2002-60 Class FV, 1 month U.S. LIBOR + 1.000% 2.2344% 4/25/32 (d)(e) | | 34 | 34 |
| Series 2002-75 Class FA, 1 month U.S. LIBOR + 1.000% 2.2344% 11/25/32 (d)(e) | | 69 | 70 |
| Series 2010-15 Class FJ, 1 month U.S. LIBOR + 0.930% 2.1644% 6/25/36 (d)(e) | | 5,219 | 5,303 |
| planned amortization class: | | | |
| Series 2005-19 Class PA, 5.5% 7/25/34 | | 1,263 | 1,317 |
| Series 2005-27 Class NE, 5.5% 5/25/34 | | 311 | 313 |
| Series 2005-64 Class PX, 5.5% 6/25/35 | | 1,488 | 1,608 |
| Series 2005-68 Class CZ, 5.5% 8/25/35 | | 4,105 | 4,625 |
| Series 2006-45 Class OP 6/25/36 (i) | | 721 | 641 |
| Series 2010-118 Class PB, 4.5% 10/25/40 | | 6,041 | 6,429 |
| sequential payer: | | | |
| Series 2003-117 Class MD, 5% 12/25/23 | | 772 | 820 |
| Series 2004-91 Class Z, 5% 12/25/34 | | 4,999 | 5,506 |
| Series 2005-117 Class JN, 4.5% 1/25/36 | | 412 | 438 |
| Series 2005-14 Class ZB, 5% 3/25/35 | | 1,536 | 1,689 |
| Series 2006-72 Class CY, 6% 8/25/26 | | 3,103 | 3,361 |
| Series 2009-59 Class HB, 5% 8/25/39 | | 2,263 | 2,499 |
| Series 201-75 Class AL, 3.5% 8/25/26 | | 11,851 | 12,473 |
| Series 2010-97 Class CX, 4.5% 9/25/25 | | 10,927 | 11,755 |
| Series 2011-80: | | | |
| Class HE, 3.5% 8/25/26 | | 4,160 | 4,419 |
| Class KB, 3.5% 8/25/26 | | 6,462 | 6,817 |
| Series 2009-85 Class IB, 4.5% 8/25/24 (j) | | 222 | 10 |
| Series 2009-93 Class IC, 4.5% 9/25/24 (j) | | 319 | 13 |
| Series 2010-139 Class NI, 4.5% 2/25/40 (j) | | 3,352 | 366 |
| Series 2010-39 Class FG, 1 month U.S. LIBOR + 0.920% 2.1544% 3/25/36 (d)(e) | | 3,244 | 3,319 |
| Series 2010-97 Class CI, 4.5% 8/25/25 (j) | | 818 | 47 |
| Series 2012-27 Class EZ, 4.25% 3/25/42 | | 7,199 | 7,801 |
| Series 2016-26 Class CG, 3% 5/25/46 | | 20,879 | 21,458 |
| Freddie Mac: | | | |
| floater: | | | |
| Series 2530 Class FE, 1 month U.S. LIBOR + 0.600% 1.8267% 2/15/32 (d)(e) | | 45 | 46 |
| Series 2630 Class FL, 1 month U.S. LIBOR + 0.500% 1.7267% 6/15/18 (d)(e) | | 9 | 9 |
| Series 2682 Class FB, 1 month U.S. LIBOR + 0.900% 2.1267% 10/15/33 (d)(e) | | 2,770 | 2,813 |
| Series 2711 Class FC, 1 month U.S. LIBOR + 0.900% 2.1267% 2/15/33 (d)(e) | | 1,547 | 1,575 |
| planned amortization class: | | | |
| Series 1141 Class G, 9% 9/15/21 | | 30 | 33 |
| Series 2682 Class LD, 4.5% 10/15/33 | | 661 | 711 |
| Series 3415 Class PC, 5% 12/15/37 | | 458 | 499 |
| Series 3763 Class QA, 4% 4/15/34 | | 323 | 324 |
| Series 3840 Class VA, 4.5% 9/15/27 | | 3,863 | 3,977 |
| Series 3857 Class ZP, 5% 5/15/41 | | 2,991 | 3,586 |
| sequential payer: | | | |
| Series 2004-2802 Class ZG, 5.5% 5/15/34 | | 7,242 | 8,128 |
| Series 2587 Class AD, 4.71% 3/15/33 | | 2,663 | 2,826 |
| Series 2773 Class HC, 4.5% 4/15/19 | | 124 | 125 |
| Series 2877 Class ZD, 5% 10/15/34 | | 6,101 | 6,701 |
| Series 3007 Class EW, 5.5% 7/15/25 | | 4,904 | 5,298 |
| Series 3745 Class KV, 4.5% 12/15/26 | | 6,293 | 6,784 |
| Series 3806 Class L, 3.5% 2/15/26 | | 8,900 | 9,478 |
| Series 3862 Class MB, 3.5% 5/15/26 | | 6,893 | 7,264 |
| Series 3871 Class KB, 5.5% 6/15/41 | | 13,870 | 16,139 |
| Series 3889 Class DZ, 4% 1/15/41 | | 34,795 | 37,740 |
| Series 3843 Class PZ, 5% 4/15/41 | | 2,559 | 3,015 |
| Freddie Mac Multi-family Structured pass-thru certificates sequential payer: | | | |
| Series 4335 Class AL, 4.25% 3/15/40 | | 7,217 | 7,583 |
| Series 4341 Class ML, 3.5% 11/15/31 | | 9,808 | 10,286 |
| Ginnie Mae guaranteed REMIC pass-thru certificates: | | | |
| floater: | | | |
| Series 2008-2 Class FD, 1 month U.S. LIBOR + 0.480% 1.7106% 1/20/38 (d)(e) | | 236 | 237 |
| Series 2008-73 Class FA, 1 month U.S. LIBOR + 0.860% 2.0906% 8/20/38 (d)(e) | | 1,768 | 1,795 |
| Series 2008-83 Class FB, 1 month U.S. LIBOR + 0.900% 2.1306% 9/20/38 (d)(e) | | 1,559 | 1,594 |
| Series 2009-108 Class CF, 1 month U.S. LIBOR + 0.600% 1.8278% 11/16/39 (d)(e) | | 996 | 1,004 |
| Series 2011-H20 Class FA, 1 month U.S. LIBOR + 0.550% 1.7739% 9/20/61 (d)(e)(g) | | 8,720 | 8,738 |
| Series 2011-H21 Class FA, 1 month U.S. LIBOR + 0.600% 1.8239% 10/20/61 (d)(e)(g) | | 5,768 | 5,786 |
| Series 2012-H01 Class FA, 1 month U.S. LIBOR + 0.700% 1.9239% 11/20/61 (d)(e)(g) | | 4,911 | 4,938 |
| Series 2012-H03 Class FA, 1 month U.S. LIBOR + 0.700% 1.9239% 1/20/62 (d)(e)(g) | | 3,151 | 3,169 |
| Series 2012-H06 Class FA, 1 month U.S. LIBOR + 0.630% 1.8539% 1/20/62 (d)(e)(g) | | 4,583 | 4,598 |
| Series 2012-H07 Class FA, 1 month U.S. LIBOR + 0.630% 1.8539% 3/20/62 (d)(e)(g) | | 2,938 | 2,950 |
| Series 2012-H21 Class DF, 1 month U.S. LIBOR + 0.650% 1.8739% 5/20/61 (d)(e)(g) | | 3,813 | 3,821 |
| Series 2013-H19: | | | |
| Class FC, 1 month U.S. LIBOR + 0.600% 1.8239% 8/20/63 (d)(e)(g) | | 1,141 | 1,144 |
| Class FD, 1 month U.S. LIBOR + 0.600% 1.8239% 8/20/63 (d)(e)(g) | | 2,878 | 2,887 |
| Series 2014-H02 Class FB, 1 month U.S. LIBOR + 0.650% 1.8739% 12/20/63 (d)(e)(g) | | 36,459 | 36,604 |
| Series 2014-H03 Class FA, 1 month U.S. LIBOR + 0.600% 1.8239% 1/20/64 (d)(e)(g) | | 14,163 | 14,211 |
| Series 2015-H07 Class FA, 1 month U.S. LIBOR + 0.300% 0.3% 3/20/65 (d)(e)(g) | | 13,084 | 13,084 |
| Series 2015-H13 Class FL, 1 month U.S. LIBOR + 0.280% 1.5039% 5/20/63 (d)(e)(g) | | 13,022 | 13,019 |
| Series 2015-H19 Class FA, 1 month U.S. LIBOR + 0.200% 1.4239% 4/20/63 (d)(e)(g) | | 12,918 | 12,906 |
| Series 2016-H20 Class FM, 1 month U.S. LIBOR + 0.400% 1.6239% 12/20/62 (d)(e)(g) | | 14,252 | 14,263 |
| planned amortization class Series 2010-31 Class BP, 5% 3/20/40 | | 11,191 | 12,793 |
| sequential payer: | | | |
| Series 2011-69 Class GX, 4.5% 5/16/40 | | 10,205 | 11,123 |
| Series 2013-H06 Class HA, 1.65% 1/20/63 (g) | | 4,927 | 4,911 |
| Series 2013-H26 Class HA, 3.5% 9/20/63 (g) | | 41,163 | 42,205 |
| Series 2014-H12 Class KA, 2.75% 5/20/64 (g) | | 5,642 | 5,714 |
| Series 2016-H02 Class FM, 1 month U.S. LIBOR + 0.500% 1.7239% 9/20/62 (d)(e)(g) | | 20,809 | 20,865 |
| Series 2016-H04 Class FE, 1 month U.S. LIBOR + 0.650% 1.8739% 11/20/65 (d)(e)(g) | | 4,304 | 4,319 |
| Series 2004-22 Class M1, 5.5% 4/20/34 | | 584 | 757 |
| Series 2010-116 Class QB, 4% 9/16/40 | | 6,076 | 6,501 |
| Series 2010-169 Class Z, 4.5% 12/20/40 | | 6,825 | 7,465 |
| Series 2010-H15 Class TP, 5.15% 8/20/60 (g) | | 12,899 | 13,356 |
| Series 2010-H17 Class XP, 5.2967% 7/20/60 (d)(g) | | 14,591 | 15,078 |
| Series 2010-H18 Class PL, 5.01% 9/20/60 (d)(g) | | 12,151 | 12,533 |
| Series 2012-64 Class KI, 3.5% 11/20/36 (j) | | 1,159 | 80 |
| Series 2013-124: | | | |
| Class ES, 8.667% - 1 month U.S. LIBOR 7.0259% 4/20/39 (d)(k) | | 4,633 | 4,877 |
| Class ST, 8.800% - 1 month U.S. LIBOR 7.1593% 8/20/39 (d)(k) | | 10,741 | 11,534 |
| Series 2013-H07 Class JA, 1.75% 3/20/63 (g) | | 26,125 | 26,053 |
| Series 2015-H17 Class HA, 2.5% 5/20/65 (g) | | 14,283 | 14,395 |
| Series 2015-H21: | | | |
| Class HA, 2.5% 6/20/63 (g) | | 41,546 | 41,831 |
| Class JA, 2.5% 6/20/65 (g) | | 4,839 | 4,875 |
| Series 2015-H30 Class HA, 1.75% 9/20/62 (d)(g) | | 41,942 | 41,857 |
| Series 2016-H13 Class FB, U.S. TREASURY 1 YEAR INDEX + 0.500% 1.65% 5/20/66 (d)(e)(g) | | 25,196 | 25,362 |
| Series 2017-H06 Class FA, U.S. TREASURY 1 YEAR INDEX + 0.350% 1.57% 8/20/66 (d)(e)(g) | | 22,540 | 22,592 |
| Series 2090-118 Class XZ, 5% 12/20/39 | | 14,092 | 16,208 |
| | | | 752,270 |
| TOTAL COLLATERALIZED MORTGAGE OBLIGATIONS | | | |
| (Cost $752,295) | | | 752,270 |
|
| Commercial Mortgage Securities - 4.1% | | | |
| Freddie Mac: | | | |
| pass-thru certificates sequential payer Series K011 Class A2, 4.084% 11/25/20 | | 3,740 | 3,985 |
| sequential payer: | | | |
| Series K009 Class A2, 3.808% 8/25/20 | | 5,591 | 5,889 |
| Series K034 Class A1, 2.669% 2/25/23 | | 11,850 | 12,075 |
| Series K709 Class A2, 2.086% 3/25/19 | | 17,210 | 17,310 |
| Series K710 Class A2, 1.883% 5/25/19 | | 16,814 | 16,875 |
| Series K713 Class A2, 2.313% 3/25/20 | | 5,437 | 5,505 |
| Series K717 Class A2, 2.991% 9/25/21 | | 12,968 | 13,490 |
| Series K032 Class A1, 3.016% 2/25/23 | | 20,015 | 20,599 |
| Series K504 Class A2, 2.566% 9/25/20 | | 3,629 | 3,699 |
| Series K704 Class A2, 2.412% 8/25/18 | | 4,832 | 4,852 |
| Series K706 Class A2, 2.323% 10/25/18 | | 9,474 | 9,532 |
| Series K724 Class A1, 2.776% 3/25/23 | | 16,089 | 16,580 |
| Series K726 Class A1, 2.596% 7/25/49 | | 4,875 | 4,981 |
| Freddie Mac Multi-family floater Series 2017-KT01 Class A, 1 month U.S. LIBOR + 0.320% 1.5522% 2/25/20 (d)(e) | | 43,722 | 43,819 |
| TOTAL COMMERCIAL MORTGAGE SECURITIES | | | |
| (Cost $178,607) | | | 179,191 |
|
| Foreign Government and Government Agency Obligations - 3.9% | | | |
| Israeli State: | | | |
| (guaranteed by U.S. Government through Agency for International Development): | | | |
| 5.5% 9/18/23 | | 72,266 | 86,445 |
| 5.5% 12/4/23 | | 48 | 58 |
| 5.5% 4/26/24 | | 6,065 | 7,325 |
| Jordanian Kingdom: | | | |
| 2.503% 10/30/20 | | 19,881 | 20,443 |
| 3% 6/30/25 | | 19,267 | 20,269 |
| Ukraine Government 1.471% 9/29/21 | | 34,809 | 34,374 |
| TOTAL FOREIGN GOVERNMENT AND GOVERNMENT AGENCY OBLIGATIONS | | | |
| (Cost $155,889) | | | 168,914 |
| | | Shares | Value (000s) |
|
| Fixed-Income Funds - 21.5% | | | |
| Fidelity Mortgage Backed Securities Central Fund (l) | | | |
| (Cost $899,702) | | 8,632,953 | 939,005 |
|
| Money Market Funds - 0.2% | | | |
| Fidelity Cash Central Fund, 1.11% (m) | | | |
| (Cost $6,876) | | 6,874,372 | 6,876 |
| Purchased Swaptions - 0.0% | | | | |
| | | Expiration Date | Notional Amount (000s) | Value (000s) |
| Put Options - 0.0% | | | | |
| Option on an interest rate swap with JPMorgan Chase Bank NA to pay semi-annually a fixed rate of 1.960% and receive quarterly a floating rate based on 3-month LIBOR, expiring December 2024 | | 11/30/17 | 15,000 | $120 |
| Call Options - 0.0% | | | | |
| Option on an interest rate swap with JPMorgan Chase Bank NA to receive semi-annually a fixed rate of 1.960% and pay quarterly a floating rate based on 3-month LIBOR, expiring December 2024 | | 11/30/17 | 15,000 | 120 |
| TOTAL PURCHASED SWAPTIONS | | | | |
| (Cost $240) | | | | 240 |
| TOTAL INVESTMENT IN SECURITIES - 99.9% | | | | |
| (Cost $4,283,554) | | | | 4,361,292 |
| NET OTHER ASSETS (LIABILITIES) - 0.1% | | | | 3,992 |
| NET ASSETS - 100% | | | | $4,365,284 |
| TBA Sale Commitments | | |
| | Principal Amount (000s) | Value (000s) |
| Fannie Mae | | |
| 3.5% 9/1/47 | | |
| (Proceeds $100,767) | $(98,100) | $(101,639) |
| Futures Contracts | | | | | |
| | Number of contracts | Expiration Date | Notional amount (000s) | Value (000s) | Unrealized Appreciation/(Depreciation) (000s) |
| Purchased | | | | | |
| Treasury Contracts | | | | | |
| CBOT 10-Year U.S. Treasury Note Contracts (United States) | 625 | Dec. 2017 | $79,365 | $214 | $214 |
| CBOT 2-Year U.S. Treasury Note Contracts (United States) | 755 | Dec. 2017 | 163,316 | (1) | (1) |
| CBOT 5-Year U.S. Treasury Note Contracts (United States) | 350 | Dec. 2017 | 41,475 | (9) | (9) |
| CBOT Long Term U.S. Treasury Bond Contracts (United States) | 238 | Dec. 2017 | 37,150 | 350 | 350 |
| TOTAL FUTURES CONTRACTS | | | | | $554 |
The notional amount of futures purchased as a percentage of Net Assets is 7.4%
Swaps
| Payment Received | Payment Frequency | Payment Paid | Payment Frequency | Clearinghouse / Counterparty(1) | Maturity Date | Notional Amount (000s)(1) | Value (000s) | Upfront Premium Received/(Paid) (000s)(2) | Unrealized Appreciation/(Depreciation) (000s) |
| Interest Rate Swaps | | | | | | | | | |
| 2.5% | Semi - annual | 3-month LIBOR(3) | Quarterly | CME | Sep. 2047 | $1,200 | $16 | $0 | $16 |
(1) Swaps with CME Group (CME) are centrally cleared over-the-counter (OTC) swaps.
(2) Any premiums for centrally cleared over-the-counter (OTC) swaps are recorded periodically throughout the term of the swap to variation margin and included in unrealized appreciation (depreciation).
(3) Represents floating rate.
Legend
(a) Security or a portion of the security was pledged to cover margin requirements for futures contracts. At period end, the value of securities pledged amounted to $1,905,000.
(b) Security or a portion of the security was pledged to cover margin requirements for centrally cleared OTC swaps. At period end, the value of securities pledged amounted to $104,000.
(c) Security or a portion of the security has been segregated as collateral for mortgage-backed or asset-backed securities purchased on a delayed delivery or when-issued basis. At period end, the value of securities pledged amounted to $809,000.
(d) Coupon rates for floating and adjustable rate securities reflect the rates in effect at period end.
(e) Coupon is indexed to a floating interest rate which may be multiplied by a specified factor and/or subject to caps or floors.
(f) Security or a portion of the security purchased on a delayed delivery or when-issued basis.
(g) Represents an investment in an underlying pool of reverse mortgages which typically do not require regular principal and interest payments as repayment is deferred until a maturity event.
(h) Security exempt from registration under Rule 144A of the Securities Act of 1933. These securities may be resold in transactions exempt from registration, normally to qualified institutional buyers. At the end of the period, the value of these securities amounted to $27,472,000 or 0.6% of net assets.
(i) Principal Only Strips represent the right to receive the monthly principal payments on an underlying pool of mortgage loans.
(j) Security represents right to receive monthly interest payments on an underlying pool of mortgages or assets. Principal shown is the outstanding par amount of the pool as of the end of the period.
(k) Coupon is inversely indexed to a floating interest rate multiplied by a specified factor. The price may be considerably more volatile than the price of a comparable fixed rate security.
(l) Affiliated fund that is generally available only to investment companies and other accounts managed by Fidelity Investments. A complete unaudited schedule of portfolio holdings for each Fidelity Central Fund is filed with the SEC for the first and third quarters of each fiscal year on Form N-Q and is available upon request or at the SEC's website at www.sec.gov. An unaudited holdings listing for the Fund, which presents direct holdings as well as the pro-rata share of securities and other investments held indirectly through its investment in underlying non-money market Fidelity Central Funds, is available at fidelity.com and/or institutional.fidelity.com, as applicable. In addition, each Fidelity Central Fund's financial statements, which are not covered by the Fund's Report of Independent Registered Public Accounting Firm, are available on the SEC's website or upon request.
(m) Affiliated fund that is generally available only to investment companies and other accounts managed by Fidelity Investments. The rate quoted is the annualized seven-day yield of the fund at period end. A complete unaudited listing of the fund's holdings as of its most recent quarter end is available upon request. In addition, each Fidelity Central Fund's financial statements, which are not covered by the Fund's Report of Independent Registered Public Accounting Firm, are available on the SEC's website or upon request.
Affiliated Central Funds
Information regarding fiscal year to date income earned by the Fund from investments in Fidelity Central Funds is as follows:
| Fund | Income earned |
| | (Amounts in thousands) |
| Fidelity Cash Central Fund | $254 |
| Fidelity Mortgage Backed Securities Central Fund | 29,169 |
| Total | $29,423 |
Additional information regarding the Fund's fiscal year to date purchases and sales, including the ownership percentage, of the non Money Market Central Funds is as follows:
| Fund (Amounts in thousands) | Value, beginning of period | Purchases | Sales Proceeds | Realized Gain/Loss | Change in Unrealized appreciation (depreciation) | Value, end of period | % ownership, end of period |
| Fidelity Mortgage Backed Securities Central Fund | $1,224,994 | $31,257 | $293,900 | $1,393 | $(24,739) | $939,005 | 14.0% |
| Total | $1,224,994 | $31,257 | $293,900 | $1,393 | $(24,739) | $939,005 | |
Investment Valuation
The following is a summary of the inputs used, as of August 31, 2017, involving the Fund's assets and liabilities carried at fair value. The inputs or methodology used for valuing securities may not be an indication of the risk associated with investing in those securities. For more information on valuation inputs, and their aggregation into the levels used below, please refer to the Investment Valuation section in the accompanying Notes to Financial Statements.
| | Valuation Inputs at Reporting Date: |
| Description | Total | Level 1 | Level 2 | Level 3 |
| (Amounts in thousands) | | | | |
| Investments in Securities: | | | | |
| U.S. Government and Government Agency Obligations | $2,073,196 | $-- | $2,073,196 | $-- |
| U.S. Government Agency - Mortgage Securities | 158,028 | -- | 158,028 | -- |
| Asset-Backed Securities | 83,572 | -- | 83,572 | -- |
| Collateralized Mortgage Obligations | 752,270 | -- | 752,270 | -- |
| Commercial Mortgage Securities | 179,191 | -- | 179,191 | -- |
| Foreign Government and Government Agency Obligations | 168,914 | -- | 168,914 | -- |
| Fixed-Income Funds | 939,005 | 939,005 | -- | -- |
| Money Market Funds | 6,876 | 6,876 | -- | -- |
| Purchased Swaptions | 240 | -- | 240 | -- |
| Total Investments in Securities: | $4,361,292 | $945,881 | $3,415,411 | $-- |
| Derivative Instruments: | | | | |
| Assets | | | | |
| Futures Contracts | $564 | $564 | $-- | $-- |
| Swaps | 16 | -- | 16 | -- |
| Total Assets | $580 | $564 | $16 | $-- |
| Liabilities | | | | |
| Futures Contracts | $(10) | $(10) | $-- | $-- |
| Total Liabilities | $(10) | $(10) | $-- | $-- |
| Total Derivative Instruments: | $570 | $554 | $16 | $-- |
| Other Financial Instruments: | | | | |
| TBA Sale Commitments | $(101,639) | $-- | $(101,639) | $-- |
| Total Other Financial Instruments: | $(101,639) | $-- | $(101,639) | $-- |
Value of Derivative Instruments
The following table is a summary of the Fund's value of derivative instruments by primary risk exposure as of August 31, 2017. For additional information on derivative instruments, please refer to the Derivative Instruments section in the accompanying Notes to Financial Statements.
| Primary Risk Exposure / Derivative Type | Value |
| | Asset | Liability |
| (Amounts in thousands) | | |
| Interest Rate Risk | | |
| Futures Contracts(a) | $564 | $(10) |
| Purchased Swaptions(b) | 240 | 0 |
| Swaps(c) | 16 | 0 |
| Total Interest Rate Risk | 820 | (10) |
| Total Value of Derivatives | $820 | $(10) |
(a) Reflects gross cumulative appreciation (depreciation) on futures contracts as presented in the Schedule of Investments. In the Statement of Assets and Liabilities, the period end daily variation margin is included in receivable or payable for daily variation margin on futures contracts, and the net cumulative appreciation (depreciation) is included in net unrealized appreciation (depreciation).
(b) Gross value is included in the Statement of Assets and Liabilities in the investments, at value line-item.
(c) For centrally cleared over-the-counter (OTC) swaps, reflects gross cumulative appreciation (depreciation) as presented in the Schedule of Investments. In the Statement of Assets and Liabilities, the period end daily variation margin for centrally cleared OTC swaps is included in receivable or payable for daily variation margin on centrally cleared OTC swaps, and the net cumulative appreciation (depreciation) for centrally cleared OTC swaps is included in net unrealized appreciation (depreciation).
See accompanying notes which are an integral part of the financial statements.
Financial Statements
Statement of Assets and Liabilities
| Amounts in thousands (except per-share amounts) | | August 31, 2017 |
| Assets | | |
Investment in securities, at value — See accompanying schedule:
Unaffiliated issuers (cost $3,376,976) | $3,415,411 | |
| Fidelity Central Funds (cost $906,578) | 945,881 | |
| Total Investment in Securities (cost $4,283,554) | | $4,361,292 |
| Cash | | 19,434 |
| Receivable for investments sold | | 151,697 |
| Receivable for TBA sale commitments | | 100,767 |
| Receivable for fund shares sold | | 2,242 |
| Interest receivable | | 12,509 |
| Distributions receivable from Fidelity Central Funds | | 21 |
| Receivable for daily variation margin on futures contracts | | 214 |
| Receivable for daily variation margin on centrally cleared OTC swaps | | 6 |
| Other receivables | | 61 |
| Total assets | | 4,648,243 |
| Liabilities | | |
| Payable for investments purchased | | |
| Regular delivery | $150,321 | |
| Delayed delivery | 5,527 | |
| TBA sale commitments, at value | 101,639 | |
| Payable for fund shares redeemed | 3,966 | |
| Distributions payable | 246 | |
| Accrued management fee | 1,120 | |
| Distribution and service plan fees payable | 129 | |
| Other affiliated payables | 559 | |
| Other payables and accrued expenses | 60 | |
| Collateral on securities loaned | 19,392 | |
| Total liabilities | | 282,959 |
| Net Assets | | $4,365,284 |
| Net Assets consist of: | | |
| Paid in capital | | $4,358,602 |
| Distributions in excess of net investment income | | (7,544) |
| Accumulated undistributed net realized gain (loss) on investments | | (63,210) |
| Net unrealized appreciation (depreciation) on investments | | 77,436 |
| Net Assets | | $4,365,284 |
| Calculation of Maximum Offering Price | | |
| Class A: | | |
| Net Asset Value and redemption price per share ($174,194 ÷ 16,810 shares) | | $10.36 |
| Maximum offering price per share (100/96.00 of $10.36) | | $10.79 |
| Class M: | | |
| Net Asset Value and redemption price per share ($156,513 ÷ 15,106 shares) | | $10.36 |
| Maximum offering price per share (100/96.00 of $10.36) | | $10.79 |
| Class C: | | |
| Net Asset Value and offering price per share ($71,524 ÷ 6,904 shares)(a) | | $10.36 |
| Government Income: | | |
| Net Asset Value, offering price and redemption price per share ($3,467,149 ÷ 335,131 shares) | | $10.35 |
| Class I: | | |
| Net Asset Value, offering price and redemption price per share ($495,904 ÷ 47,860 shares) | | $10.36 |
(a) Redemption price per share is equal to net asset value less any applicable contingent deferred sales charge.
See accompanying notes which are an integral part of the financial statements.
Statement of Operations
| Amounts in thousands | | Year ended August 31, 2017 |
| Investment Income | | |
| Interest | | $70,135 |
| Income from Fidelity Central Funds | | 29,423 |
| Total income | | 99,558 |
| Expenses | | |
| Management fee | $13,933 | |
| Transfer agent fees | 5,032 | |
| Distribution and service plan fees | 1,772 | |
| Fund wide operations fee | 1,837 | |
| Independent trustees' fees and expenses | 18 | |
| Miscellaneous | 16 | |
| Total expenses before reductions | 22,608 | |
| Expense reductions | (11) | 22,597 |
| Net investment income (loss) | | 76,961 |
| Realized and Unrealized Gain (Loss) | | |
| Net realized gain (loss) on: | | |
| Investment securities: | | |
| Unaffiliated issuers | (1,059) | |
| Fidelity Central Funds | 1,395 | |
| Futures contracts | 661 | |
| Swaps | (1,365) | |
| Capital gain distributions from Fidelity Central Funds | 2,091 | |
| Total net realized gain (loss) | | 1,723 |
| Change in net unrealized appreciation (depreciation) on: | | |
| Investment securities: | | |
| Unaffiliated issuers | (89,641) | |
| Fidelity Central Funds | (24,739) | |
| Futures contracts | 566 | |
| Swaps | (449) | |
| Delayed delivery commitments | (904) | |
| Total change in net unrealized appreciation (depreciation) | | (115,167) |
| Net gain (loss) | | (113,444) |
| Net increase (decrease) in net assets resulting from operations | | $(36,483) |
See accompanying notes which are an integral part of the financial statements.
Statement of Changes in Net Assets
| Amounts in thousands | Year ended August 31, 2017 | Year ended August 31, 2016 |
| Increase (Decrease) in Net Assets | | |
| Operations | | |
| Net investment income (loss) | $76,961 | $71,092 |
| Net realized gain (loss) | 1,723 | 16,993 |
| Change in net unrealized appreciation (depreciation) | (115,167) | 104,347 |
| Net increase (decrease) in net assets resulting from operations | (36,483) | 192,432 |
| Distributions to shareholders from net investment income | (74,479) | (77,548) |
| Distributions to shareholders from net realized gain | (34,956) | (39,904) |
| Total distributions | (109,435) | (117,452) |
| Share transactions - net increase (decrease) | (430,132) | 502,872 |
| Total increase (decrease) in net assets | (576,050) | 577,852 |
| Net Assets | | |
| Beginning of period | 4,941,334 | 4,363,482 |
| End of period | $4,365,284 | $4,941,334 |
| Other Information | | |
| Distributions in excess of net investment income end of period | $(7,544) | $(8,402) |
See accompanying notes which are an integral part of the financial statements.
Financial Highlights — Fidelity Government Income Fund Class A
| Years ended August 31, | 2017 | 2016 | 2015 | 2014 | 2013 |
| Selected Per–Share Data | | | | | |
| Net asset value, beginning of period | $10.66 | $10.50 | $10.47 | $10.20 | $10.97 |
| Income from Investment Operations | | | | | |
| Net investment income (loss)A | .149 | .135 | .126 | .138 | .105 |
| Net realized and unrealized gain (loss) | (.230) | .270 | .048 | .278 | (.454) |
| Total from investment operations | (.081) | .405 | .174 | .416 | (.349) |
| Distributions from net investment income | (.143) | (.150) | (.116) | (.139) | (.099) |
| Distributions from net realized gain | (.076) | (.095) | (.028) | (.007) | (.322) |
| Total distributions | (.219) | (.245) | (.144) | (.146) | (.421) |
| Net asset value, end of period | $10.36 | $10.66 | $10.50 | $10.47 | $10.20 |
| Total ReturnB,C | (.73)% | 3.92% | 1.67% | 4.10% | (3.29)% |
| Ratios to Average Net AssetsD,E | | | | | |
| Expenses before reductions | .77% | .76% | .77% | .77% | .77% |
| Expenses net of fee waivers, if any | .77% | .76% | .77% | .77% | .77% |
| Expenses net of all reductions | .77% | .76% | .77% | .77% | .77% |
| Net investment income (loss) | 1.44% | 1.28% | 1.20% | 1.34% | .99% |
| Supplemental Data | | | | | |
| Net assets, end of period (in millions) | $174 | $261 | $222 | $246 | $291 |
| Portfolio turnover rateF | 157% | 93% | 83% | 131% | 192% |
A Calculated based on average shares outstanding during the period.
B Total returns would have been lower if certain expenses had not been reduced during the applicable periods shown.
C Total returns do not include the effect of the sales charges.
D Fees and expenses of any underlying Fidelity Central Funds are not included in the Fund's expense ratio. The Fund indirectly bears its proportionate share of the expenses of any underlying Fidelity Central Funds. Based on their most recent shareholder report date, the expenses of any underlying non-money market Fidelity Central Funds were less than .005%.
E Expense ratios reflect operating expenses of the class. Expenses before reductions do not reflect amounts reimbursed by the investment adviser or reductions from expense offset arrangements and do not represent the amount paid by the class during periods when reimbursements or reductions occur. Expenses net of fee waivers reflect expenses after reimbursement by the investment adviser but prior to reductions from expense offset arrangements. Expenses net of all reductions represent the net expenses paid by the class.
F Amount does not include the portfolio activity of any underlying Fidelity Central Funds.
See accompanying notes which are an integral part of the financial statements.
Financial Highlights — Fidelity Government Income Fund Class M
| Years ended August 31, | 2017 | 2016 | 2015 | 2014 | 2013 |
| Selected Per–Share Data | | | | | |
| Net asset value, beginning of period | $10.66 | $10.50 | $10.47 | $10.20 | $10.97 |
| Income from Investment Operations | | | | | |
| Net investment income (loss)A | .149 | .135 | .127 | .140 | .107 |
| Net realized and unrealized gain (loss) | (.229) | .270 | .048 | .277 | (.454) |
| Total from investment operations | (.080) | .405 | .175 | .417 | (.347) |
| Distributions from net investment income | (.144) | (.150) | (.117) | (.140) | (.101) |
| Distributions from net realized gain | (.076) | (.095) | (.028) | (.007) | (.322) |
| Total distributions | (.220) | (.245) | (.145) | (.147) | (.423) |
| Net asset value, end of period | $10.36 | $10.66 | $10.50 | $10.47 | $10.20 |
| Total ReturnB,C | (.73)% | 3.92% | 1.68% | 4.12% | (3.27)% |
| Ratios to Average Net AssetsD,E | | | | | |
| Expenses before reductions | .76% | .76% | .76% | .76% | .75% |
| Expenses net of fee waivers, if any | .76% | .76% | .76% | .76% | .75% |
| Expenses net of all reductions | .76% | .76% | .76% | .76% | .75% |
| Net investment income (loss) | 1.44% | 1.28% | 1.20% | 1.36% | 1.01% |
| Supplemental Data | | | | | |
| Net assets, end of period (in millions) | $157 | $197 | $181 | $196 | $228 |
| Portfolio turnover rateF | 157% | 93% | 83% | 131% | 192% |
A Calculated based on average shares outstanding during the period.
B Total returns would have been lower if certain expenses had not been reduced during the applicable periods shown.
C Total returns do not include the effect of the sales charges.
D Fees and expenses of any underlying Fidelity Central Funds are not included in the Fund's expense ratio. The Fund indirectly bears its proportionate share of the expenses of any underlying Fidelity Central Funds. Based on their most recent shareholder report date, the expenses of any underlying non-money market Fidelity Central Funds were less than .005%.
E Expense ratios reflect operating expenses of the class. Expenses before reductions do not reflect amounts reimbursed by the investment adviser or reductions from expense offset arrangements and do not represent the amount paid by the class during periods when reimbursements or reductions occur. Expenses net of fee waivers reflect expenses after reimbursement by the investment adviser but prior to reductions from expense offset arrangements. Expenses net of all reductions represent the net expenses paid by the class.
F Amount does not include the portfolio activity of any underlying Fidelity Central Funds.
See accompanying notes which are an integral part of the financial statements.
Financial Highlights — Fidelity Government Income Fund Class C
| Years ended August 31, | 2017 | 2016 | 2015 | 2014 | 2013 |
| Selected Per–Share Data | | | | | |
| Net asset value, beginning of period | $10.66 | $10.50 | $10.47 | $10.20 | $10.96 |
| Income from Investment Operations | | | | | |
| Net investment income (loss)A | .069 | .053 | .044 | .059 | .025 |
| Net realized and unrealized gain (loss) | (.229) | .270 | .048 | .278 | (.443) |
| Total from investment operations | (.160) | .323 | .092 | .337 | (.418) |
| Distributions from net investment income | (.064) | (.068) | (.034) | (.060) | (.020) |
| Distributions from net realized gain | (.076) | (.095) | (.028) | (.007) | (.322) |
| Total distributions | (.140) | (.163) | (.062) | (.067) | (.342) |
| Net asset value, end of period | $10.36 | $10.66 | $10.50 | $10.47 | $10.20 |
| Total ReturnB,C | (1.49)% | 3.12% | .88% | 3.32% | (3.93)% |
| Ratios to Average Net AssetsD,E | | | | | |
| Expenses before reductions | 1.54% | 1.54% | 1.55% | 1.54% | 1.52% |
| Expenses net of fee waivers, if any | 1.54% | 1.54% | 1.55% | 1.54% | 1.52% |
| Expenses net of all reductions | 1.54% | 1.54% | 1.55% | 1.54% | 1.52% |
| Net investment income (loss) | .67% | .50% | .42% | .57% | .24% |
| Supplemental Data | | | | | |
| Net assets, end of period (in millions) | $72 | $94 | $54 | $58 | $73 |
| Portfolio turnover rateF | 157% | 93% | 83% | 131% | 192% |
A Calculated based on average shares outstanding during the period.
B Total returns would have been lower if certain expenses had not been reduced during the applicable periods shown.
C Total returns do not include the effect of the contingent deferred sales charge.
D Fees and expenses of any underlying Fidelity Central Funds are not included in the Fund's expense ratio. The Fund indirectly bears its proportionate share of the expenses of any underlying Fidelity Central Funds. Based on their most recent shareholder report date, the expenses of any underlying non-money market Fidelity Central Funds were less than .005%.
E Expense ratios reflect operating expenses of the class. Expenses before reductions do not reflect amounts reimbursed by the investment adviser or reductions from expense offset arrangements and do not represent the amount paid by the class during periods when reimbursements or reductions occur. Expenses net of fee waivers reflect expenses after reimbursement by the investment adviser but prior to reductions from expense offset arrangements. Expenses net of all reductions represent the net expenses paid by the class.
F Amount does not include the portfolio activity of any underlying Fidelity Central Funds.
See accompanying notes which are an integral part of the financial statements.
Financial Highlights — Fidelity Government Income Fund
| Years ended August 31, | 2017 | 2016 | 2015 | 2014 | 2013 |
| Selected Per–Share Data | | | | | |
| Net asset value, beginning of period | $10.65 | $10.48 | $10.45 | $10.18 | $10.95 |
| Income from Investment Operations | | | | | |
| Net investment income (loss)A | .181 | .167 | .159 | .171 | .138 |
| Net realized and unrealized gain (loss) | (.229) | .281 | .048 | .278 | (.453) |
| Total from investment operations | (.048) | .448 | .207 | .449 | (.315) |
| Distributions from net investment income | (.176) | (.183) | (.149) | (.172) | (.133) |
| Distributions from net realized gain | (.076) | (.095) | (.028) | (.007) | (.322) |
| Total distributions | (.252) | (.278) | (.177) | (.179) | (.455) |
| Net asset value, end of period | $10.35 | $10.65 | $10.48 | $10.45 | $10.18 |
| Total ReturnB | (.42)% | 4.35% | 1.99% | 4.45% | (2.99)% |
| Ratios to Average Net AssetsC,D | | | | | |
| Expenses before reductions | .45% | .45% | .45% | .45% | .45% |
| Expenses net of fee waivers, if any | .45% | .45% | .45% | .45% | .45% |
| Expenses net of all reductions | .45% | .45% | .45% | .45% | .45% |
| Net investment income (loss) | 1.76% | 1.59% | 1.51% | 1.66% | 1.31% |
| Supplemental Data | | | | | |
| Net assets, end of period (in millions) | $3,467 | $3,896 | $3,489 | $3,157 | $3,412 |
| Portfolio turnover rateE | 157% | 93% | 83% | 131% | 192% |
A Calculated based on average shares outstanding during the period.
B Total returns would have been lower if certain expenses had not been reduced during the applicable periods shown.
C Fees and expenses of any underlying Fidelity Central Funds are not included in the Fund's expense ratio. The Fund indirectly bears its proportionate share of the expenses of any underlying Fidelity Central Funds. Based on their most recent shareholder report date, the expenses of any underlying non-money market Fidelity Central Funds were less than .005%.
D Expense ratios reflect operating expenses of the class. Expenses before reductions do not reflect amounts reimbursed by the investment adviser or reductions from expense offset arrangements and do not represent the amount paid by the class during periods when reimbursements or reductions occur. Expenses net of fee waivers reflect expenses after reimbursement by the investment adviser but prior to reductions from expense offset arrangements. Expenses net of all reductions represent the net expenses paid by the class.
E Amount does not include the portfolio activity of any underlying Fidelity Central Funds.
See accompanying notes which are an integral part of the financial statements.
Financial Highlights — Fidelity Government Income Fund Class I
| Years ended August 31, | 2017 | 2016 | 2015 | 2014 | 2013 |
| Selected Per–Share Data | | | | | |
| Net asset value, beginning of period | $10.66 | $10.50 | $10.47 | $10.20 | $10.97 |
| Income from Investment Operations | | | | | |
| Net investment income (loss)A | .177 | .162 | .154 | .166 | .133 |
| Net realized and unrealized gain (loss) | (.230) | .271 | .048 | .277 | (.454) |
| Total from investment operations | (.053) | .433 | .202 | .443 | (.321) |
| Distributions from net investment income | (.171) | (.178) | (.144) | (.166) | (.127) |
| Distributions from net realized gain | (.076) | (.095) | (.028) | (.007) | (.322) |
| Total distributions | (.247) | (.273) | (.172) | (.173) | (.449) |
| Net asset value, end of period | $10.36 | $10.66 | $10.50 | $10.47 | $10.20 |
| Total ReturnB | (.46)% | 4.19% | 1.94% | 4.38% | (3.03)% |
| Ratios to Average Net AssetsC,D | | | | | |
| Expenses before reductions | .49% | .50% | .50% | .51% | .51% |
| Expenses net of fee waivers, if any | .49% | .50% | .50% | .51% | .51% |
| Expenses net of all reductions | .49% | .50% | .50% | .51% | .51% |
| Net investment income (loss) | 1.71% | 1.54% | 1.46% | 1.61% | 1.26% |
| Supplemental Data | | | | | |
| Net assets, end of period (in millions) | $496 | $494 | $412 | $298 | $296 |
| Portfolio turnover rateE | 157% | 93% | 83% | 131% | 192% |
A Calculated based on average shares outstanding during the period.
B Total returns would have been lower if certain expenses had not been reduced during the applicable periods shown.
C Fees and expenses of any underlying Fidelity Central Funds are not included in the Fund's expense ratio. The Fund indirectly bears its proportionate share of the expenses of any underlying Fidelity Central Funds. Based on their most recent shareholder report date, the expenses of any underlying non-money market Fidelity Central Funds were less than .005%.
D Expense ratios reflect operating expenses of the class. Expenses before reductions do not reflect amounts reimbursed by the investment adviser or reductions from expense offset arrangements and do not represent the amount paid by the class during periods when reimbursements or reductions occur. Expenses net of fee waivers reflect expenses after reimbursement by the investment adviser but prior to reductions from expense offset arrangements. Expenses net of all reductions represent the net expenses paid by the class.
E Amount does not include the portfolio activity of any underlying Fidelity Central Funds.
See accompanying notes which are an integral part of the financial statements.
Notes to Financial Statements
For the period ended August 31, 2017
(Amounts in thousands except percentages)
1. Organization.
Fidelity Government Income Fund (the Fund) is a fund of Fidelity Income Fund (the Trust) and is authorized to issue an unlimited number of shares. The Trust is registered under the Investment Company Act of 1940, as amended (the 1940 Act), as an open-end management investment company organized as a Massachusetts business trust. The Fund offers Class A, Class M (formerly Class T), Class C, Government Income and Class I shares, each of which has equal rights as to assets and voting privileges. Each class has exclusive voting rights with respect to matters that affect that class.
After the close of business on June 24, 2016, all outstanding Class B shares were converted to Class A shares. All prior fiscal period dollar and share amounts for Class B presented in the Notes to Financial Statements are for the period September 1, 2015 through June 24, 2016.
2. Investments in Fidelity Central Funds.
The Fund invests in Fidelity Central Funds, which are open-end investment companies generally available only to other investment companies and accounts managed by the investment adviser and its affiliates. The Fund's Schedule of Investments lists each of the Fidelity Central Funds held as of period end, if any, as an investment of the Fund, but does not include the underlying holdings of each Fidelity Central Fund. As an Investing Fund, the Fund indirectly bears its proportionate share of the expenses of the underlying Fidelity Central Funds.
Based on its investment objective, each Fidelity Central Fund may invest or participate in various investment vehicles or strategies that are similar to those of the Fund. These strategies are consistent with the investment objectives of the Fund and may involve certain economic risks which may cause a decline in value of each of the Fidelity Central Funds and thus a decline in the value of the Fund. The Money Market Central Funds seek preservation of capital and current income and are managed by Fidelity Investments Money Management, Inc. (FIMM), an affiliate of the investment adviser. Annualized expenses of the Money Market Central Funds as of their most recent shareholder report date are less than .005%. The following summarizes the Fund's investment in each non-money market Fidelity Central Fund.
| Fidelity Central Fund | Investment Manager | Investment Objective | Investment Practices | Expense Ratio(a) |
| Fidelity Mortgage Backed Securities Central Fund | FIMM | Seeks a high level of income by normally investing in investment-grade mortgage-related securities and repurchase agreements for those securities. | Delayed Delivery & When Issued Securities
Futures
Swap Agreements
| Less than .005% |
(a) Expenses expressed as a percentage of average net assets and are as of each underlying Central Fund's most recent annual or semi-annual shareholder report.
An unaudited holdings listing for the Fund, which presents direct holdings as well as the pro-rata share of any securities and other investments held indirectly through its investment in underlying non-money market Fidelity Central Funds, is available at fidelity.com and/or institutional.fidelity.com, as applicable. A complete unaudited list of holdings for each Fidelity Central Fund is available upon request or at the Securities and Exchange Commission (the SEC) website at www.sec.gov. In addition, the financial statements of the Fidelity Central Funds which contain the significant accounting policies (including investment valuation policies) of those funds, which are not covered by the Fund's Report of Independent Registered Public Accounting Firm, are available on the SEC website or upon request.
3. Significant Accounting Policies.
The Fund is an investment company and applies the accounting and reporting guidance of the Financial Accounting Standards Board (FASB) Accounting Standards Codification Topic 946 Financial Services – Investments Companies. The financial statements have been prepared in conformity with accounting principles generally accepted in the United States of America (GAAP), which require management to make certain estimates and assumptions at the date of the financial statements. Actual results could differ from those estimates. Subsequent events, if any, through the date that the financial statements were issued have been evaluated in the preparation of the financial statements. The following summarizes the significant accounting policies of the Fund:
Investment Valuation. Investments are valued as of 4:00 p.m. Eastern time on the last calendar day of the period. The Board of Trustees (the Board) has delegated the day to day responsibility for the valuation of the Fund's investments to the Fair Value Committee (the Committee) established by the Fund's investment adviser. In accordance with valuation policies and procedures approved by the Board, the Fund attempts to obtain prices from one or more third party pricing vendors or brokers to value its investments. When current market prices, quotations or currency exchange rates are not readily available or reliable, investments will be fair valued in good faith by the Committee, in accordance with procedures adopted by the Board. Factors used in determining fair value vary by investment type and may include market or investment specific events, changes in interest rates and credit quality. The frequency with which these procedures are used cannot be predicted and they may be utilized to a significant extent. The Committee oversees the Fund's valuation policies and procedures and reports to the Board on the Committee's activities and fair value determinations. The Board monitors the appropriateness of the procedures used in valuing the Fund's investments and ratifies the fair value determinations of the Committee.
The Fund categorizes the inputs to valuation techniques used to value its investments into a disclosure hierarchy consisting of three levels as shown below:
- Level 1 – quoted prices in active markets for identical investments
- Level 2 – other significant observable inputs (including quoted prices for similar investments, interest rates, prepayment speeds, etc.)
- Level 3 – unobservable inputs (including the Fund's own assumptions based on the best information available)
Valuation techniques used to value the Fund's investments by major category are as follows:
Debt securities, including restricted securities, are valued based on evaluated prices received from third party pricing vendors or from brokers who make markets in such securities. Foreign government and government agency obligations and U.S. government and government agency obligations are valued by pricing vendors who utilize matrix pricing which considers yield or price of bonds of comparable quality, coupon, maturity and type or by broker-supplied prices. Asset backed securities, collateralized mortgage obligations, commercial mortgage securities and U.S. government agency mortgage securities are valued by pricing vendors who utilize matrix pricing which considers prepayment speed assumptions, attributes of the collateral, yield or price of bonds of comparable quality, coupon, maturity and type or by broker-supplied prices. Swaps are marked-to-market daily based on valuations from third party pricing vendors, registered derivatives clearing organizations (clearinghouses) or broker-supplied valuations. These pricing sources may utilize inputs such as interest rate curves, credit spread curves, default possibilities and recovery rates. When independent prices are unavailable or unreliable, debt securities and swaps may be valued utilizing pricing methodologies which consider similar factors that would be used by third party pricing vendors. Debt securities and swaps are generally categorized as Level 2 in the hierarchy but may be Level 3 depending on the circumstances.
Futures contracts are valued at the settlement price established each day by the board of trade or exchange on which they are traded and are categorized as Level 1 in the hierarchy. Options traded over-the-counter are valued using vendor or broker-supplied valuations and are categorized as Level 2 in the hierarchy. Investments in open-end mutual funds, including the Fidelity Central Funds, are valued at their closing net asset value (NAV) each business day and are categorized as Level 1 in the hierarchy.
Changes in valuation techniques may result in transfers in or out of an assigned level within the disclosure hierarchy. The aggregate value of investments by input level as of August 31, 2017, is included at the end of the Fund's Schedule of Investments.
Investment Transactions and Income. For financial reporting purposes, the Fund's investment holdings and NAV include trades executed through the end of the last business day of the period. The NAV per share for processing shareholder transactions is calculated as of the close of business of the New York Stock Exchange (NYSE), normally 4:00 p.m. Eastern time and includes trades executed through the end of the prior business day. Gains and losses on securities sold are determined on the basis of identified cost. Income and capital gain distributions from Fidelity Central Funds, if any, are recorded on the ex-dividend date. Interest income is accrued as earned and includes coupon interest and amortization of premium and accretion of discount on debt securities as applicable. The principal amount on inflation-indexed securities is periodically adjusted to the rate of inflation and interest is accrued based on the principal amount. The adjustments to principal due to inflation are reflected as increases or decreases to Interest in the accompanying Statement of Operations.
Class Allocations and Expenses. Investment income, realized and unrealized capital gains and losses, common expenses of the Fund, and certain fund-level expense reductions, if any, are allocated daily on a pro-rata basis to each class based on the relative net assets of each class to the total net assets of the Fund. Each class differs with respect to transfer agent and distribution and service plan fees incurred. Certain expense reductions may also differ by class. For the reporting period, the allocated portion of income and expenses to each class as a percent of its average net assets may vary due to the timing of recording these transactions in relation to fluctuating net assets of the classes. Expenses directly attributable to a fund are charged to that fund. Expenses attributable to more than one fund are allocated among the respective funds on the basis of relative net assets or other appropriate methods. Expense estimates are accrued in the period to which they relate and adjustments are made when actual amounts are known.
Deferred Trustee Compensation. Under a Deferred Compensation Plan (the Plan), independent Trustees may elect to defer receipt of a portion of their annual compensation. Deferred amounts are invested in a cross-section of Fidelity funds, are marked-to-market and remain in the Fund until distributed in accordance with the Plan. The investment of deferred amounts and the offsetting payable to the Trustees are included in the accompanying Statement of Assets and Liabilities.
Income Tax Information and Distributions to Shareholders. Each year, the Fund intends to qualify as a regulated investment company under Subchapter M of the Internal Revenue Code, including distributing substantially all of its taxable income and realized gains. As a result, no provision for U.S. Federal income taxes is required. As of August 31, 2017, the Fund did not have any unrecognized tax benefits in the financial statements; nor is the Fund aware of any tax positions for which it is reasonably possible that the total amounts of unrecognized tax benefits will significantly change in the next twelve months. The Fund files a U.S. federal tax return, in addition to state and local tax returns as required. The Fund's federal income tax returns are subject to examination by the Internal Revenue Service (IRS) for a period of three fiscal years after they are filed. State and local tax returns may be subject to examination for an additional fiscal year depending on the jurisdiction.
Dividends are declared and recorded daily and paid monthly from net investment income. Distributions from realized gains, if any, are declared and recorded on the ex-dividend date. Income dividends and capital gain distributions are declared separately for each class. Income and capital gain distributions are determined in accordance with income tax regulations, which may differ from GAAP.
Capital accounts within the financial statements are adjusted for permanent book-tax differences. These adjustments have no impact on net assets or the results of operations. Capital accounts are not adjusted for temporary book-tax differences which will reverse in a subsequent period.
Book-tax differences are primarily due to the short-term gain distributions from the Fidelity Central Funds, futures contracts, swaps, market discount, partnerships (including allocations from Fidelity Central Funds), deferred trustees compensation and losses deferred due to wash sales and excise tax regulations.
As of period end, the cost and unrealized appreciation (depreciation) in securities, and derivatives if applicable, for federal income tax purposes were as follows:
| Gross unrealized appreciation | $48,233 |
| Gross unrealized depreciation | (25,833) |
| Net unrealized appreciation (depreciation) | $22,400 |
| Tax Cost | $4,338,034 |
The tax-based components of distributable earnings as of period end were as follows:
| Net unrealized appreciation (depreciation) on securities and other investments | $22,400 |
The Fund intends to elect to defer to its next fiscal year $14,932 of capital losses recognized during the period November 1, 2016 to August 31, 2017.
The tax character of distributions paid was as follows:
| | August 31, 2017 | August 31, 2016 |
| Ordinary Income | $ 89,228 | $ 96,027 |
| Long-term Capital Gains | 20,207 | 21,425 |
| Total | $ 109,435 | $ 117,452 |
Delayed Delivery Transactions and When-Issued Securities. During the period, the Fund transacted in securities on a delayed delivery or when-issued basis. Payment and delivery may take place after the customary settlement period for that security. The price of the underlying securities and the date when the securities will be delivered and paid for are fixed at the time the transaction is negotiated. The securities purchased on a delayed delivery or when-issued basis are identified as such in the Fund's Schedule of Investments. The Fund may receive compensation for interest forgone in the purchase of a delayed delivery or when-issued security. With respect to purchase commitments, the Fund identifies securities as segregated in its records with a value at least equal to the amount of the commitment. Losses may arise due to changes in the value of the underlying securities or if the counterparty does not perform under the contract's terms, or if the issuer does not issue the securities due to political, economic, or other factors.
To-Be-Announced (TBA) Securities and Mortgage Dollar Rolls. During the period, the Fund transacted in TBA securities that involved buying or selling mortgage-backed securities (MBS) on a forward commitment basis. A TBA transaction typically does not designate the actual security to be delivered and only includes an approximate principal amount; however delivered securities must meet specified terms defined by industry guidelines, including issuer, rate and current principal amount outstanding on underlying mortgage pools. The Fund may enter into a TBA transaction with the intent to take possession of or deliver the underlying MBS, or the Fund may elect to extend the settlement by entering into either a mortgage or reverse mortgage dollar roll. Mortgage dollar rolls are transactions where a fund sells TBA securities and simultaneously agrees to repurchase MBS on a later date at a lower price and with the same counterparty. Reverse mortgage dollar rolls involve the purchase and simultaneous agreement to sell TBA securities on a later date at a lower price. Transactions in mortgage dollar rolls and reverse mortgage dollar rolls are accounted for as purchases and sales and may result in an increase to the Fund's portfolio turnover rate.
Purchases and sales of TBA securities involve risks similar to those discussed above for delayed delivery and when-issued securities. Also, if the counterparty in a mortgage dollar roll or a reverse mortgage dollar roll transaction files for bankruptcy or becomes insolvent, the Funds' right to repurchase or sell securities may be limited. Additionally, when a fund sells TBA securities without already owning or having the right to obtain the deliverable securities (an uncovered forward commitment to sell), it incurs a risk of loss because it could have to purchase the securities at a price that is higher than the price at which it sold them. A fund may be unable to purchase the deliverable securities if the corresponding market is illiquid.
TBA securities subject to a forward commitment to sell at period end are included at the end of the Fund's Schedule of Investments under the caption "TBA Sale Commitments." The proceeds and value of these commitments are reflected in the Fund's Statement of Assets and Liabilities as Receivable for TBA sale commitments and TBA sale commitments, at value, respectively.
Restricted Securities. The Fund may invest in securities that are subject to legal or contractual restrictions on resale. These securities generally may be resold in transactions exempt from registration or to the public if the securities are registered. Disposal of these securities may involve time-consuming negotiations and expense, and prompt sale at an acceptable price may be difficult. Information regarding restricted securities is included at the end of the Fund's Schedule of Investments.
New Accounting Pronouncement. In March 2017, the Financial Accounting Standards Board (FASB) issued an Accounting Standards Update (ASU), ASU 2017-08, which amends the amortization period for certain callable debt securities that are held at a premium. The amendment requires the premium to be amortized to the earliest call date. The amendments do not require an accounting change for securities held at a discount. The ASU is effective for annual periods beginning after December 15, 2018. Management is currently evaluating the potential impact of these changes to the financial statements.
4. Derivative Instruments.
Risk Exposures and the Use of Derivative Instruments. The Fund's investment objective allows the Fund to enter into various types of derivative contracts, including futures contracts, options and swaps. Derivatives are investments whose value is primarily derived from underlying assets, indices or reference rates and may be transacted on an exchange or over-the-counter (OTC). Derivatives may involve a future commitment to buy or sell a specified asset based on specified terms, to exchange future cash flows at periodic intervals based on a notional principal amount, or for one party to make one or more payments upon the occurrence of specified events in exchange for periodic payments from the other party.
The Fund used derivatives to increase returns, to gain exposure to certain types of assets and to manage exposure to certain risks as defined below. The success of any strategy involving derivatives depends on analysis of numerous economic factors, and if the strategies for investment do not work as intended, the Fund may not achieve its objectives.
The Fund's use of derivatives increased or decreased its exposure to the following risk:
| Interest Rate Risk | Interest rate risk relates to the fluctuations in the value of interest-bearing securities due to changes in the prevailing levels of market interest rates. |
The Fund is also exposed to additional risks from investing in derivatives, such as liquidity risk and counterparty credit risk. Liquidity risk is the risk that the Fund will be unable to close out the derivative in the open market in a timely manner. Counterparty credit risk is the risk that the counterparty will not be able to fulfill its obligation to the Fund. Derivative counterparty credit risk is managed through formal evaluation of the creditworthiness of all potential counterparties. On certain OTC derivatives such as options, the Fund attempts to reduce its exposure to counterparty credit risk by entering into an International Swaps and Derivatives Association, Inc. (ISDA) Master Agreement with each of its counterparties. The ISDA Master Agreement gives the Fund the right to terminate all transactions traded under such agreement upon the deterioration in the credit quality of the counterparty beyond specified levels. The ISDA Master Agreement gives each party the right, upon an event of default by the other party or a termination of the agreement, to close out all transactions traded under such agreement and to net amounts owed under each transaction to one net payable by one party to the other. To mitigate counterparty credit risk on bi-lateral OTC derivatives, the Fund receives collateral in the form of cash or securities once the Fund's net unrealized appreciation on outstanding derivative contracts under an ISDA Master Agreement exceeds certain applicable thresholds, subject to certain minimum transfer provisions. The collateral received is held in segregated accounts with the Fund's custodian bank in accordance with the collateral agreements entered into between the Fund, the counterparty and the Fund's custodian bank. The Fund could experience delays and costs in gaining access to the collateral even though it is held by the Fund's custodian bank. The Fund's maximum risk of loss from counterparty credit risk related to bi-lateral OTC derivatives is generally the aggregate unrealized appreciation and unpaid counterparty payments in excess of any collateral pledged by the counterparty to the Fund. For OTC written options with upfront premiums received, the Fund is obligated to perform and therefore does not have counterparty risk. For OTC written options with premiums to be received at a future date, the maximum risk of loss from counterparty credit risk is the amount of the premium in excess of any collateral pledged by the counterparty. The Fund may be required to pledge collateral for the benefit of the counterparties on bi-lateral OTC derivatives in an amount not less than each counterparty's unrealized appreciation on outstanding derivative contracts, subject to certain minimum transfer provisions, and any such pledged collateral is identified in the Schedule of Investments. Exchange-traded futures contracts are not covered by the ISDA Master Agreement; however counterparty credit risk related to exchange-traded futures contracts may be mitigated by the protection provided by the exchange on which they trade. Counterparty credit risk related to centrally cleared OTC swaps may be mitigated by the protection provided by the clearinghouse.
Investing in derivatives may involve greater risks than investing in the underlying assets directly and, to varying degrees, may involve risk of loss in excess of any initial investment and collateral received and amounts recognized in the Statement of Assets and Liabilities. In addition, there may be the risk that the change in value of the derivative contract does not correspond to the change in value of the underlying instrument.
Net Realized Gain (Loss) and Change in Net Unrealized Appreciation (Depreciation) on Derivatives. The table below, which reflects the impacts of derivatives on the financial performance of the Fund, summarizes the net realized gain (loss) and change in net unrealized appreciation (depreciation) for derivatives during the period as presented in the Statement of Operations.
| Primary Risk Exposure / Derivative Type | Net Realized Gain (Loss) | Change in Net Unrealized Appreciation (Depreciation) |
| Interest Rate Risk | | |
| Futures Contracts | $661 | $566 |
| Purchased Swaptions | – | – |
| Swaps | (1,365) | (449) |
| Totals | $(704) | $117 |
A summary of the value of derivatives by primary risk exposure as of period end is included at the end of the Schedule of Investments.
Futures Contracts. A futures contract is an agreement between two parties to buy or sell a specified underlying instrument for a fixed price at a specified future date. The Fund used futures contracts to manage its exposure to the bond market and fluctuations in interest rates.
Upon entering into a futures contract, a fund is required to deposit either cash or securities (initial margin) with a clearing broker in an amount equal to a certain percentage of the face value of the contract. Futures contracts are marked-to-market daily and subsequent daily payments (variation margin) are made or received by a fund depending on the daily fluctuations in the value of the futures contracts and are recorded as unrealized appreciation or (depreciation). This receivable and/or payable, if any, is included in daily variation margin on futures contracts in the Statement of Assets and Liabilities. Realized gain or (loss) is recorded upon the expiration or closing of a futures contract. The net realized gain (loss) and change in net unrealized appreciation (depreciation) on futures contracts during the period is included in the Statement of Operations.
Any open futures contracts at period end are presented in the Schedule of Investments under the caption "Futures Contracts". The underlying face amount at value reflects each contract's exposure to the underlying instrument or index at period end and is representative of volume of activity during the period. Securities deposited to meet initial margin requirements are identified in the Schedule of Investments.
Options. Options give the purchaser the right, but not the obligation, to buy (call) or sell (put) an underlying security or financial instrument at an agreed exercise or strike price between or on certain dates. Options obligate the seller (writer) to buy (put) or sell (call) an underlying instrument at the exercise or strike price or cash settle an underlying derivative instrument if the holder exercises the option on or before the expiration date. The Fund uses OTC options, such as swaptions, which are options where the underlying instrument is a swap, to manage its exposure to fluctuations in interest rates.
Upon entering into an options contract, a fund will pay or receive a premium. Premiums paid on purchased options are reflected as cost of investments and premiums received on written options are reflected as a liability on the Statement of Assets and Liabilities. Certain options may be purchased or written with premiums to be paid or received on a future date. Options are valued daily and any unrealized appreciation (depreciation) is reflected on the Statement of Assets and Liabilities. When an option is exercised, the cost or proceeds of the underlying instrument purchased or sold is adjusted by the amount of the premium. When an option is closed the Fund will realize a gain or loss depending on whether the proceeds or amount paid for the closing sale transaction is greater or less than the premium received or paid. When an option expires, gains and losses are realized to the extent of premiums received and paid, respectively. The net realized and unrealized gains (losses) on purchased options are included on the Statement of Operations in net realized gain (loss) and change in net unrealized appreciation (depreciation) on investment securities. The net realized gain (loss) and change in net unrealized appreciation (depreciation) on written options are reflected separately on the Statement of Operations.
Any open options at period end are presented in the Schedule of Investments under the captions "Purchased Options," "Purchased Swaptions," "Written Options" and "Written Swaptions," as applicable, and are representative of volume of activity during the period.
Writing puts and buying calls tend to increase exposure to the underlying instrument while buying puts and writing calls tend to decrease exposure to the underlying instrument. For purchased options, risk of loss is limited to the premium paid, and for written options, risk of loss is the change in value in excess of the premium received.
Swaps. A swap is a contract between two parties to exchange future cash flows at periodic intervals based on a notional principal amount. A centrally cleared OTC swap is a transaction executed between a fund and a dealer counterparty, then cleared by a futures commission merchant (FCM) through a clearinghouse. Once cleared, the clearinghouse serves as a central counterparty, with whom a fund exchanges cash flows for the life of the transaction, similar to transactions in futures contracts.
Centrally cleared OTC swaps require a fund to deposit either cash or securities (initial margin) with the FCM, at the instruction of and for the benefit of the clearinghouse. Securities deposited to meet initial margin requirements are identified in the Schedule of Investments. Centrally cleared OTC swaps are marked-to-market daily and subsequent payments (variation margin) are made or received depending on the daily fluctuations in the value of the swaps and are recorded as unrealized appreciation or (depreciation). These daily payments, if any, are included in receivable or payable for daily variation margin on centrally cleared OTC swaps in the Statement of Assets and Liabilities. Any premiums for centrally cleared OTC swaps are recorded periodically throughout the term of the swap to variation margin and included in unrealized appreciation (depreciation) in the Statement of Assets and Liabilities. Any premiums are recognized as realized gain (loss) upon termination or maturity of the swap.
Payments are exchanged at specified intervals, accrued daily commencing with the effective date of the contract and recorded as realized gain or (loss). Some swaps may be terminated prior to the effective date and realize a gain or loss upon termination. The net realized gain (loss) and change in net unrealized appreciation (depreciation) on swaps during the period is included in the Statement of Operations.
Any open swaps at period end are included in the Schedule of Investments under the caption "Swaps" and are representative of volume of activity during the period.
Interest Rate Swaps. Interest rate swaps are agreements between counterparties to exchange cash flows, one based on a fixed rate, and the other on a floating rate. The Fund entered into interest rate swaps to manage its exposure to interest rate changes. Changes in interest rates can have an effect on both the value of bond holdings as well as the amount of interest income earned. In general, the value of bonds can fall when interest rates rise and can rise when interest rates fall.
5. Purchases and Sales of Investments.
Purchases and sales of securities (including the Fixed-Income Central Funds), other than short-term securities and U.S. government securities, aggregated $133,943 and $349,643, respectively.
6. Fees and Other Transactions with Affiliates.
Management Fee and Expense Contract. Fidelity Management & Research Company (the investment adviser) and its affiliates provide the Fund with investment management related services for which the Fund pays a monthly management fee. The management fee is the sum of an individual fund fee rate that is based on an annual rate of .20% of the Fund's average net assets and an annualized group fee rate that averaged .11% during the period. The group fee rate is based upon the average net assets of all the mutual funds advised by the investment adviser, including any mutual funds previously advised by the investment adviser that are currently advised by Fidelity SelectCo, LLC, an affiliate of the investment adviser. The group fee rate decreases as assets under management increase and increases as assets under management decrease. For the reporting period, the total annual management fee rate was .31% of the Fund's average net assets.
In addition, under the expense contract, the investment adviser pays class-level expenses for Government Income, so that the total expenses, except the compensation of the independent Trustees and certain other expenses such as interest expense, including commitment fees do not exceed .45% of the Class' average net assets. This agreement does not apply to any of the other classes and any change or modification that would increase expenses can only be made with shareholder approval.
Distribution and Service Plan Fees. In accordance with Rule 12b-1 of the 1940 Act, the Fund has adopted separate Distribution and Service Plans for each class of shares. Certain classes pay Fidelity Distributors Corporation (FDC), an affiliate of the investment adviser, separate Distribution and Service Fees, each of which is based on an annual percentage of each class' average net assets. In addition, FDC may pay financial intermediaries for selling shares of the Fund and providing shareholder support services. For the period, the Distribution and Service Fee rates, total fees and amounts retained by FDC were as follows:
| | Distribution
Fee | Service
Fee | Total Fees | Retained
by FDC |
| Class A | -% | .25% | $543 | $9 |
| Class M | -% | .25% | 424 | 1 |
| Class C | .75% | .25% | 805 | 143 |
| | | | $1,772 | $153 |
Sales Load. FDC may receive a front-end sales charge of up to 4.00% for selling Class A shares and Class M shares, some of which is paid to financial intermediaries for selling shares of the Fund. Depending on the holding period, FDC may receive contingent deferred sales charges levied on Class A, Class M and Class C redemptions. The deferred sales charges are 1.00% for Class C shares, .75% for certain purchases of Class A shares and .25% for certain purchases of Class M shares.
For the period, sales charge amounts retained by FDC were as follows:
| | Retained
by FDC |
| Class A | $24 |
| Class M | 3 |
| Class C(a) | 12 |
| | $39 |
(a) When Class C shares are initially sold, FDC pays commissions from its own resources to financial intermediaries through which the sales are made.
Transfer Agent Fees. Fidelity Investments Institutional Operations Company, Inc., (FIIOC), an affiliate of the investment adviser, is the transfer, dividend disbursing and shareholder servicing agent for each class of the Fund. FIIOC receives account fees and asset-based fees that vary according to the account size and type of account of the shareholders of each respective class of the Fund, with the exception of Government Income. FIIOC receives an asset-based fee of .10% of Government Income's average net assets. FIIOC pays for typesetting, printing and mailing of shareholder reports, except proxy statements. For the period, transfer agent fees for each class were as follows:
| | Amount | % of
Class-Level Average
Net Assets |
| Class A | $360 | .17 |
| Class M | 274 | .16 |
| Class C | 150 | .19 |
| Government Income | 3,561 | .10 |
| Class I | 687 | .14 |
| | $5,032 | |
Fund Wide Operations Fee. Pursuant to the Fund Wide Operations and Expense Agreement (FWOE), the investment adviser has agreed to provide for fund level expenses (which do not include transfer agent, Rule 12b-1 fees, compensation of the independent Trustees, interest (including commitment fees), taxes or extraordinary expenses, if any) in return for a FWOE fee equal to .35% of the Fund's average net assets less the total amount of the management fee. The FWOE paid by the Fund is reduced by an amount equal to the fees and expenses paid to the independent Trustees. For the period, the FWOE fee was equivalent to an annual rate of .04% of average net assets.
Interfund Trades. The Fund may purchase from or sell securities to other Fidelity Funds under procedures adopted by the Board. The procedures have been designed to ensure these interfund trades are executed in accordance with Rule 17a-7 of the 1940 Act. Interfund trades are included within the respective purchases and sales amounts shown in the Purchases and Sales of Investments note.
7. Committed Line of Credit.
The Fund participates with other funds managed by the investment adviser or an affiliate in a $4.25 billion credit facility (the "line of credit") to be utilized for temporary or emergency purposes to fund shareholder redemptions or for other short-term liquidity purposes. The Fund has agreed to pay commitment fees on its pro-rata portion of the line of credit, which amounted to $15 and is reflected in Miscellaneous expenses on the Statement of Operations. During the period, the Fund did not borrow on this line of credit.
8. Security Lending.
The Fund lends portfolio securities from time to time in order to earn additional income. On the settlement date of the loan, the Fund receives collateral (in the form of U.S. Treasury obligations, letters of credit and/or cash) against the loaned securities and maintains collateral in an amount not less than 100% of the market value of the loaned securities during the period of the loan. The market value of the loaned securities is determined at the close of business of the Fund and any additional required collateral is delivered to the Fund on the next business day. The Fund or borrower may terminate the loan at any time, and if the borrower defaults on its obligation to return the securities loaned because of insolvency or other reasons, the Fund may apply collateral received from the borrower against the obligation. The Fund may experience delays and costs in recovering the securities loaned. Any cash collateral received is maintained at the Fund's custodian and/or invested in cash equivalents. At period end, there were no security loans outstanding. Security lending income represents the income earned on investing cash collateral, less rebates paid to borrowers, plus any premium payments received for lending certain types of securities. Security lending income is presented in the Statement of Operations as a component of interest income. Total security lending income during the period amounted to $165.
9. Expense Reductions.
Through arrangements with the Fund's custodian, credits realized as a result of certain uninvested cash balances were used to reduce the Fund's expenses. During the period, these credits reduced the Fund's expenses $11.
10. Distributions to Shareholders.
Distributions to shareholders of each class were as follows:
| | Year ended August 31, 2017 | Year ended August 31, 2016 |
| From net investment income | | |
| Class A | $3,003 | $3,406 |
| Class M | 2,353 | 2,723 |
| Class B | – | 26 |
| Class C | 492 | 480 |
| Government Income | 60,593 | 63,334 |
| Class I | 8,038 | 7,579 |
| Total | $74,479 | $77,548 |
| From net realized gain | | |
| Class A | $1,831 | $2,025 |
| Class M | 1,339 | 1,660 |
| Class B | – | 49 |
| Class C | 658 | 503 |
| Government Income | 27,600 | 31,846 |
| Class I | 3,528 | 3,821 |
| Total | $34,956 | $39,904 |
11. Share Transactions.
Share transactions for each class were as follows and may contain automatic conversions between classes or exchanges between affiliated funds:
| | Shares | Shares | Dollars | Dollars |
| | Year ended August 31, 2017 | Year ended August 31, 2016 | Year ended August 31, 2017 | Year ended August 31, 2016 |
| Class A | | | | |
| Shares sold | 4,084 | 12,026 | $42,226 | $126,485 |
| Reinvestment of distributions | 450 | 498 | 4,652 | 5,224 |
| Shares redeemed | (12,230) | (9,122) | (125,628) | (95,982) |
| Net increase (decrease) | (7,696) | 3,402 | $(78,750) | $35,727 |
| Class M | | | | |
| Shares sold | 3,752 | 6,849 | $38,695 | $71,986 |
| Reinvestment of distributions | 338 | 404 | 3,499 | 4,234 |
| Shares redeemed | (7,416) | (6,031) | (76,589) | (63,433) |
| Net increase (decrease) | (3,326) | 1,222 | $(34,395) | $12,787 |
| Class B | | | | |
| Shares sold | – | 17 | $– | $174 |
| Reinvestment of distributions | – | 6 | – | 62 |
| Shares redeemed | – | (584) | – | (6,152) |
| Net increase (decrease) | – | (561) | $– | $(5,916) |
| Class C | | | | |
| Shares sold | 1,245 | 5,790 | $12,880 | $60,776 |
| Reinvestment of distributions | 102 | 81 | 1,056 | 844 |
| Shares redeemed | (3,261) | (2,223) | (33,484) | (23,431) |
| Net increase (decrease) | (1,914) | 3,648 | $(19,548) | $38,189 |
| Government Income | | | | |
| Shares sold | 78,457 | 91,465 | $805,428 | $961,380 |
| Reinvestment of distributions | 8,206 | 8,754 | 84,659 | 91,724 |
| Shares redeemed | (117,437) | (67,217) | (1,203,566) | (705,341) |
| Net increase (decrease) | (30,774) | 33,002 | $(313,479) | $347,763 |
| Class I | | | | |
| Shares sold | 13,696 | 14,937 | $140,776 | $157,175 |
| Reinvestment of distributions | 1,085 | 1,055 | 11,211 | 11,077 |
| Shares redeemed | (13,214) | (8,950) | (135,947) | (93,930) |
| Net increase (decrease) | 1,567 | 7,042 | $16,040 | $74,322 |
12. Other.
The Fund's organizational documents provide former and current trustees and officers with a limited indemnification against liabilities arising in connection with the performance of their duties to the Fund. In the normal course of business, the Fund may also enter into contracts that provide general indemnifications. The Fund's maximum exposure under these arrangements is unknown as this would be dependent on future claims that may be made against the Fund. The risk of material loss from such claims is considered remote.
Report of Independent Registered Public Accounting Firm
To the Trustees of Fidelity Income Fund and Shareholders of Fidelity Government Income Fund:
In our opinion, the accompanying statement of assets and liabilities, including the schedule of investments, and the related statements of operations and of changes in net assets and the financial highlights present fairly, in all material respects, the financial position of Fidelity Government Income Fund (a fund of Fidelity Income Fund) as of August 31, 2017, the results of its operations for the year then ended, the changes in its net assets for each of the two years in the period then ended and the financial highlights for each of the periods indicated, in conformity with accounting principles generally accepted in the United States of America. These financial statements and financial highlights (hereafter referred to as “financial statements”) are the responsibility of the Fidelity Government Income Fund’s management. Our responsibility is to express an opinion on these financial statements based on our audits. We conducted our audits of these financial statements in accordance with the standards of the Public Company Accounting Oversight Board (United States). Those standards require that we plan and perform the audit to obtain reasonable assurance about whether the financial statements are free of material misstatement. An audit includes examining, on a test basis, evidence supporting the amounts and disclosures in the financial statements, assessing the accounting principles used and significant estimates made by management, and evaluating the overall financial statement presentation. Our procedures included confirmation of securities owned as of August 31, 2017 by correspondence with the custodian and brokers; when replies were not received from brokers, we performed other auditing procedures. We believe that our audits provide a reasonable basis for our opinion.
PricewaterhouseCoopers LLP
Boston, Massachusetts
October 19, 2017
Trustees and Officers
The Trustees, Members of the Advisory Board (if any), and officers of the trust and fund, as applicable, are listed below. The Board of Trustees governs the fund and is responsible for protecting the interests of shareholders. The Trustees are experienced executives who meet periodically throughout the year to oversee the fund's activities, review contractual arrangements with companies that provide services to the fund, oversee management of the risks associated with such activities and contractual arrangements, and review the fund's performance. Each of the Trustees oversees 246 funds.
The Trustees hold office without limit in time except that (a) any Trustee may resign; (b) any Trustee may be removed by written instrument, signed by at least two-thirds of the number of Trustees prior to such removal; (c) any Trustee who requests to be retired or who has become incapacitated by illness or injury may be retired by written instrument signed by a majority of the other Trustees; and (d) any Trustee may be removed at any special meeting of shareholders by a two-thirds vote of the outstanding voting securities of the trust. Each Trustee who is not an interested person (as defined in the 1940 Act) of the trust and the fund is referred to herein as an Independent Trustee. Each Independent Trustee shall retire not later than the last day of the calendar year in which his or her 75th birthday occurs. The Independent Trustees may waive this mandatory retirement age policy with respect to individual Trustees. Officers and Advisory Board Members hold office without limit in time, except that any officer or Advisory Board Member may resign or may be removed by a vote of a majority of the Trustees at any regular meeting or any special meeting of the Trustees. Except as indicated, each individual has held the office shown or other offices in the same company for the past five years.
The fund’s Statement of Additional Information (SAI) includes more information about the Trustees. To request a free copy, call Fidelity at 1-877-208-0098.
Experience, Skills, Attributes, and Qualifications of the Trustees. The Governance and Nominating Committee has adopted a statement of policy that describes the experience, qualifications, attributes, and skills that are necessary and desirable for potential Independent Trustee candidates (Statement of Policy). The Board believes that each Trustee satisfied at the time he or she was initially elected or appointed a Trustee, and continues to satisfy, the standards contemplated by the Statement of Policy. The Governance and Nominating Committee also engages professional search firms to help identify potential Independent Trustee candidates who have the experience, qualifications, attributes, and skills consistent with the Statement of Policy. From time to time, additional criteria based on the composition and skills of the current Independent Trustees, as well as experience or skills that may be appropriate in light of future changes to board composition, business conditions, and regulatory or other developments, have also been considered by the professional search firms and the Governance and Nominating Committee. In addition, the Board takes into account the Trustees' commitment and participation in Board and committee meetings, as well as their leadership of standing and ad hoc committees throughout their tenure.
In determining that a particular Trustee was and continues to be qualified to serve as a Trustee, the Board has considered a variety of criteria, none of which, in isolation, was controlling. The Board believes that, collectively, the Trustees have balanced and diverse experience, qualifications, attributes, and skills, which allow the Board to operate effectively in governing the fund and protecting the interests of shareholders. Information about the specific experience, skills, attributes, and qualifications of each Trustee, which in each case led to the Board's conclusion that the Trustee should serve (or continue to serve) as a trustee of the fund, is provided below.
Board Structure and Oversight Function. Abigail P. Johnson is an interested person and currently serves as Chairman. The Trustees have determined that an interested Chairman is appropriate and benefits shareholders because an interested Chairman has a personal and professional stake in the quality and continuity of services provided to the fund. Independent Trustees exercise their informed business judgment to appoint an individual of their choosing to serve as Chairman, regardless of whether the Trustee happens to be independent or a member of management. The Independent Trustees have determined that they can act independently and effectively without having an Independent Trustee serve as Chairman and that a key structural component for assuring that they are in a position to do so is for the Independent Trustees to constitute a substantial majority for the Board. The Independent Trustees also regularly meet in executive session. Marie L. Knowles serves as Chairman of the Independent Trustees and as such (i) acts as a liaison between the Independent Trustees and management with respect to matters important to the Independent Trustees and (ii) with management prepares agendas for Board meetings.
Fidelity® funds are overseen by different Boards of Trustees. The fund's Board oversees Fidelity's investment-grade bond, money market, asset allocation and certain equity funds, and other Boards oversee Fidelity's high income, sector and other equity funds. The asset allocation funds may invest in Fidelity® funds that are overseen by such other Boards. The use of separate Boards, each with its own committee structure, allows the Trustees of each group of Fidelity® funds to focus on the unique issues of the funds they oversee, including common research, investment, and operational issues. On occasion, the separate Boards establish joint committees to address issues of overlapping consequences for the Fidelity® funds overseen by each Board.
The Trustees operate using a system of committees to facilitate the timely and efficient consideration of all matters of importance to the Trustees, the fund, and fund shareholders and to facilitate compliance with legal and regulatory requirements and oversight of the fund's activities and associated risks. The Board, acting through its committees, has charged FMR and its affiliates with (i) identifying events or circumstances the occurrence of which could have demonstrably adverse effects on the fund's business and/or reputation; (ii) implementing processes and controls to lessen the possibility that such events or circumstances occur or to mitigate the effects of such events or circumstances if they do occur; and (iii) creating and maintaining a system designed to evaluate continuously business and market conditions in order to facilitate the identification and implementation processes described in (i) and (ii) above. Because the day-to-day operations and activities of the fund are carried out by or through FMR, its affiliates, and other service providers, the fund's exposure to risks is mitigated but not eliminated by the processes overseen by the Trustees. While each of the Board's committees has responsibility for overseeing different aspects of the fund's activities, oversight is exercised primarily through the Operations and Audit Committees. In addition, an ad hoc Board committee of Independent Trustees has worked with FMR to enhance the Board's oversight of investment and financial risks, legal and regulatory risks, technology risks, and operational risks, including the development of additional risk reporting to the Board. Appropriate personnel, including but not limited to the fund's Chief Compliance Officer (CCO), FMR's internal auditor, the independent accountants, the fund's Treasurer and portfolio management personnel, make periodic reports to the Board's committees, as appropriate, including an annual review of Fidelity's risk management program for the Fidelity® funds. The responsibilities of each standing committee, including their oversight responsibilities, are described further under "Standing Committees of the Trustees."
Interested Trustees*:
Correspondence intended for a Trustee who is an interested person may be sent to Fidelity Investments, 245 Summer Street, Boston, Massachusetts 02210.
Name, Year of Birth; Principal Occupations and Other Relevant Experience+
Abigail P. Johnson (1961)
Year of Election or Appointment: 2009
Trustee
Chairman of the Board of Trustees
Ms. Johnson also serves as Trustee of other Fidelity® funds. Ms. Johnson serves as Chairman (2016-present), Chief Executive Officer (2014-present), and Director (2007-present) of FMR LLC (diversified financial services company), President of Fidelity Financial Services (2012-present) and President of Personal, Workplace and Institutional Services (2005-present). Ms. Johnson is Chairman and Director of FMR Co., Inc. (investment adviser firm, 2011-present) and Chairman and Director of FMR (investment adviser firm, 2011-present). Previously, Ms. Johnson served as Vice Chairman (2007-2016) and President (2013-2016) of FMR LLC, President and a Director of FMR (2001-2005), a Trustee of other investment companies advised by FMR, Fidelity Investments Money Management, Inc. (investment adviser firm), and FMR Co., Inc. (2001-2005), Senior Vice President of the Fidelity® funds (2001-2005), and managed a number of Fidelity® funds. Ms. Abigail P. Johnson and Mr. Arthur E. Johnson are not related.
Jennifer Toolin McAuliffe (1959)
Year of Election or Appointment: 2016
Trustee
Ms. McAuliffe also serves as Trustee of other Fidelity® funds. Ms. McAuliffe previously served as a Member of the Advisory Board of certain Fidelity® funds (2016) and as Co-Head of Fixed Income of Fidelity Investments Limited (now known as FIL Limited (FIL)) (diversified financial services company). Earlier roles at FIL included Director of Research for FIL’s credit and quantitative teams in London, Hong Kong and Tokyo. Ms. McAuliffe also was the Director of Research for taxable and municipal bonds at Fidelity Investments Money Management, Inc. Ms. McAuliffe is also a director or trustee of several not-for-profit entities.
* Determined to be an “Interested Trustee” by virtue of, among other things, his or her affiliation with the trust or various entities under common control with FMR.
+ The information includes the Trustee's principal occupation during the last five years and other information relating to the experience, attributes, and skills relevant to the Trustee's qualifications to serve as a Trustee, which led to the conclusion that the Trustee should serve as a Trustee for the fund.
Independent Trustees:
Correspondence intended for an Independent Trustee may be sent to Fidelity Investments, P.O. Box 55235, Boston, Massachusetts 02205-5235.
Name, Year of Birth; Principal Occupations and Other Relevant Experience+
Elizabeth S. Acton (1951)
Year of Election or Appointment: 2013
Trustee
Ms. Acton also serves as Trustee of other Fidelity® funds. Prior to her retirement in April 2012, Ms. Acton was Executive Vice President, Finance (2011-2012), Executive Vice President, Chief Financial Officer (2002-2011), and Treasurer (2004-2005) of Comerica Incorporated (financial services). Prior to joining Comerica, Ms. Acton held a variety of positions at Ford Motor Company (1983-2002), including Vice President and Treasurer (2000-2002) and Executive Vice President and Chief Financial Officer of Ford Motor Credit Company (1998-2000). Ms. Acton currently serves as a member of the Board of Directors and Audit and Finance Committees of Beazer Homes USA, Inc. (homebuilding, 2012-present). Previously, Ms. Acton served as a Member of the Advisory Board of certain Fidelity® funds (2013-2016).
John Engler (1948)
Year of Election or Appointment: 2014
Trustee
Mr. Engler also serves as Trustee of other Fidelity® funds. He serves on the board of directors for Universal Forest Products (manufacturer and distributor of wood and wood-alternative products, 2003-present) and K12 Inc. (technology-based education company, 2012-present). Previously, Mr. Engler served as a Member of the Advisory Board of certain Fidelity® funds (2014-2016), president of the Business Roundtable (2011-2017), a trustee of The Munder Funds (2003-2014), president and CEO of the National Association of Manufacturers (2004-2011), member of the Board of Trustees of the Annie E. Casey Foundation (2004-2015), and as governor of Michigan (1991-2003). He is a past chairman of the National Governors Association.
Albert R. Gamper, Jr. (1942)
Year of Election or Appointment: 2006
Trustee
Mr. Gamper also serves as Trustee of other Fidelity® funds. Prior to his retirement in December 2004, Mr. Gamper served as Chairman of the Board of CIT Group Inc. (commercial finance). During his tenure with CIT Group Inc. Mr. Gamper served in numerous senior management positions, including Chairman (1987-1989; 1999-2001; 2002-2004), Chief Executive Officer (1987-2004), and President (2002-2003). Mr. Gamper currently serves as a member of the Board of Directors of Public Service Enterprise Group (utilities, 2000-present), and Member of the Board of Trustees of Barnabas Health Care System (1997-present). Previously, Mr. Gamper served as Chairman (2012-2015) and Vice Chairman (2011-2012) of the Independent Trustees of certain Fidelity® funds and as Chairman of the Board of Governors, Rutgers University (2004-2007).
Robert F. Gartland (1951)
Year of Election or Appointment: 2010
Trustee
Mr. Gartland also serves as Trustee of other Fidelity® funds. Mr. Gartland is Chairman and an investor in Gartland & Mellina Group Corp. (consulting, 2009-present). Previously, Mr. Gartland served as a partner and investor of Vietnam Partners LLC (investments and consulting, 2008-2011). Prior to his retirement, Mr. Gartland held a variety of positions at Morgan Stanley (financial services, 1979-2007) including Managing Director (1987-2007).
Arthur E. Johnson (1947)
Year of Election or Appointment: 2008
Trustee
Vice Chairman of the Independent Trustees
Mr. Johnson also serves as Trustee of other Fidelity® funds. Mr. Johnson serves as a member of the Board of Directors of Eaton Corporation plc (diversified power management, 2009-present) and Booz Allen Hamilton (management consulting, 2011-present). Prior to his retirement, Mr. Johnson served as Senior Vice President of Corporate Strategic Development of Lockheed Martin Corporation (defense contractor, 1999-2009). He previously served on the Board of Directors of IKON Office Solutions, Inc. (1999-2008), AGL Resources, Inc. (holding company, 2002-2016), and Delta Airlines (2005-2007). Mr. Arthur E. Johnson is not related to Ms. Abigail P. Johnson.
Michael E. Kenneally (1954)
Year of Election or Appointment: 2009
Trustee
Mr. Kenneally also serves as Trustee of other Fidelity® funds. Prior to his retirement, Mr. Kenneally served as Chairman and Global Chief Executive Officer of Credit Suisse Asset Management. Before joining Credit Suisse, he was an Executive Vice President and Chief Investment Officer for Bank of America Corporation. Earlier roles at Bank of America included Director of Research, Senior Portfolio Manager and Research Analyst, and Mr. Kenneally was awarded the Chartered Financial Analyst (CFA) designation in 1991.
Marie L. Knowles (1946)
Year of Election or Appointment: 2001
Trustee
Chairman of the Independent Trustees
Ms. Knowles also serves as Trustee of other Fidelity® funds. Prior to Ms. Knowles' retirement in June 2000, she served as Executive Vice President and Chief Financial Officer of Atlantic Richfield Company (ARCO) (diversified energy, 1996-2000). From 1993 to 1996, she was a Senior Vice President of ARCO and President of ARCO Transportation Company (pipeline and tanker operations). Ms. Knowles currently serves as a Director and Chairman of the Audit Committee of McKesson Corporation (healthcare service, since 2002). Ms. Knowles is a member of the Board of the Santa Catalina Island Company (real estate, 2009-present). Ms. Knowles is a Member of the Investment Company Institute Board of Governors and a Member of the Governing Council of the Independent Directors Council (2014-present). She also serves as a member of the Advisory Board for the School of Engineering of the University of Southern California. Previously, Ms. Knowles served as a Director of Phelps Dodge Corporation (copper mining and manufacturing, 1994-2007), URS Corporation (engineering and construction, 2000-2003) and America West (airline, 1999-2002). Ms. Knowles previously served as Vice Chairman of the Independent Trustees of certain Fidelity® funds (2012-2015).
Mark A. Murray (1954)
Year of Election or Appointment: 2016
Trustee
Mr. Murray also serves as Trustee of other Fidelity® funds. Mr. Murray is Vice Chairman (2013-present) of Meijer, Inc. (regional retail chain). Previously, Mr. Murray served as a Member of the Advisory Board of certain Fidelity® funds (2016) and as Co-Chief Executive Officer (2013-2016) and President (2006-2013) of Meijer, Inc. Mr. Murray serves as a member of the Board of Directors and Nuclear Review and Public Policy and Responsibility Committees of DTE Energy Company (diversified energy company, 2009-present). Mr. Murray also serves as a member of the Board of Directors of Spectrum Health (not-for-profit health system, 2015-present). Mr. Murray previously served as President of Grand Valley State University (2001-2006), Treasurer for the State of Michigan (1999-2001), Vice President of Finance and Administration for Michigan State University (1998-1999), and a member of the Board of Directors and Audit Committee and Chairman of the Nominating and Corporate Governance Committee of Universal Forest Products, Inc. (manufacturer and distributor of wood and wood-alternative products, 2004-2016). Mr. Murray is also a director or trustee of many community and professional organizations.
+ The information includes the Trustee's principal occupation during the last five years and other information relating to the experience, attributes, and skills relevant to the Trustee's qualifications to serve as a Trustee, which led to the conclusion that the Trustee should serve as a Trustee for the fund.
Advisory Board Members and Officers:
Correspondence intended for an officer may be sent to Fidelity Investments, 245 Summer Street, Boston, Massachusetts 02210. Officers appear below in alphabetical order.
Name, Year of Birth; Principal Occupation
Elizabeth Paige Baumann (1968)
Year of Election or Appointment: 2017
Anti-Money Laundering (AML) Officer
Ms. Baumann also serves as AML Officer of other funds. She is Chief AML Officer (2012-present) and Senior Vice President (2014-present) of FMR LLC (diversified financial services company) and is an employee of Fidelity Investments. Previously, Ms. Baumann served as AML Officer of the funds (2012-2016), and Vice President (2007-2014) and Deputy Anti-Money Laundering Officer (2007-2012) of FMR LLC.
Marc R. Bryant (1966)
Year of Election or Appointment: 2015
Secretary and Chief Legal Officer (CLO)
Mr. Bryant also serves as Secretary and CLO of other funds. Mr. Bryant serves as CLO, Secretary, and Senior Vice President of Fidelity Management & Research Company (investment adviser firm, 2015-present) and FMR Co., Inc. (investment adviser firm, 2015-present); Secretary of Fidelity SelectCo, LLC (investment adviser firm, 2015-present) and Fidelity Investments Money Management, Inc. (investment adviser firm, 2015-present); and CLO of Fidelity Management & Research (Hong Kong) Limited and FMR Investment Management (UK) Limited (investment adviser firms, 2015-present) and Fidelity Management & Research (Japan) Limited (investment adviser firm, 2016-present). He is Senior Vice President and Deputy General Counsel of FMR LLC (diversified financial services company). Previously, Mr. Bryant served as Secretary and CLO of Fidelity Rutland Square Trust II (2010-2014) and Assistant Secretary of Fidelity's Fixed Income and Asset Allocation Funds (2013-2015). Prior to joining Fidelity Investments, Mr. Bryant served as a Senior Vice President and the Head of Global Retail Legal for AllianceBernstein L.P. (2006-2010), and as the General Counsel for ProFund Advisors LLC (2001-2006).
Jonathan Davis (1968)
Year of Election or Appointment: 2010
Assistant Treasurer
Mr. Davis also serves as Assistant Treasurer of other funds, and is an employee of Fidelity Investments. Previously, Mr. Davis served as Vice President and Associate General Counsel of FMR LLC (diversified financial services company, 2003-2010).
Adrien E. Deberghes (1967)
Year of Election or Appointment: 2010
Assistant Treasurer
Mr. Deberghes also serves as an officer of other funds. He serves as Executive Vice President of Fidelity Investments Money Management, Inc. (FIMM) (investment adviser firm, 2016-present) and is an employee of Fidelity Investments (2008-present). Prior to joining Fidelity Investments, Mr. Deberghes was Senior Vice President of Mutual Fund Administration at State Street Corporation (2007-2008), Senior Director of Mutual Fund Administration at Investors Bank & Trust (2005-2007), and Director of Finance for Dunkin' Brands (2000-2005). Previously, Mr. Deberghes served in other fund officer roles.
Stephanie J. Dorsey (1969)
Year of Election or Appointment: 2013
President and Treasurer
Ms. Dorsey also serves as an officer of other funds. She is an employee of Fidelity Investments (2008-present) and has served in other fund officer roles. Prior to joining Fidelity Investments, Ms. Dorsey served as Treasurer (2004-2008) of the JPMorgan Mutual Funds and Vice President (2004-2008) of JPMorgan Chase Bank.
Howard J. Galligan III (1966)
Year of Election or Appointment: 2014
Chief Financial Officer
Mr. Galligan also serves as Chief Financial Officer of other funds. Mr. Galligan serves as President of Fidelity Pricing and Cash Management Services (FPCMS) (2014-present) and as a Director of Strategic Advisers, Inc. (investment adviser firm, 2008-present). Previously, Mr. Galligan served as Chief Administrative Officer of Asset Management (2011-2014) and Chief Operating Officer and Senior Vice President of Investment Support for Strategic Advisers, Inc. (2003-2011).
Colm A. Hogan (1973)
Year of Election or Appointment: 2016
Assistant Treasurer
Mr. Hogan also serves as an officer of other funds. Mr. Hogan is an employee of Fidelity Investments (2005-present).
Chris Maher (1972)
Year of Election or Appointment: 2013
Assistant Treasurer
Mr. Maher serves as Assistant Treasurer of other funds. Mr. Maher is Vice President of Valuation Oversight and is an employee of Fidelity Investments. Previously, Mr. Maher served as Vice President of Asset Management Compliance (2013), Vice President of the Program Management Group of FMR (investment adviser firm, 2010-2013), and Vice President of Valuation Oversight (2008-2010).
John B. McGinty, Jr. (1962)
Year of Election or Appointment: 2016
Chief Compliance Officer
Mr. McGinty also serves as Chief Compliance Officer of other funds. Mr. McGinty is Senior Vice President of Asset Management Compliance for Fidelity Investments and is an employee of Fidelity Investments (2016-present). Mr. McGinty previously served as Vice President, Senior Attorney at Eaton Vance Management (investment management firm, 2015-2016), and prior to Eaton Vance as global CCO for all firm operations and registered investment companies at GMO LLC (investment management firm, 2009-2015). Before joining GMO LLC, Mr. McGinty served as Senior Vice President, Deputy General Counsel for Fidelity Investments (2007-2009).
Rieco E. Mello (1969)
Year of Election or Appointment: 2017
Assistant Treasurer
Mr. Mello also serves as Assistant Treasurer of other funds. Mr. Mello is an employee of Fidelity Investments (1995-present).
Jamie Pagliocco (1964)
Year of Election or Appointment: 2017
Vice President
Mr. Pagliocco also serves as Vice President of other funds. Mr. Pagliocco serves as Chief Investment Officer of FMR's Bond Group (2017-present) and is an employee of Fidelity Investments (2001-present).
Jason P. Pogorelec (1975)
Year of Election or Appointment: 2015
Assistant Secretary
Mr. Pogorelec also serves as Assistant Secretary of other funds. Mr. Pogorelec serves as Vice President, Associate General Counsel (2010-present) and is an employee of Fidelity Investments (2006-present).
Nancy D. Prior (1967)
Year of Election or Appointment: 2014
Vice President
Ms. Prior also serves as Vice President of other funds. Ms. Prior serves as a Director of FMR Investment Management (UK) Limited (investment adviser firm, 2015-present), President (2016-present) and Director (2014-present) of Fidelity Investments Money Management, Inc. (FIMM) (investment adviser firm), President, Fixed Income (2014-present), Vice Chairman of FIAM LLC (investment adviser firm, 2014-present), and is an employee of Fidelity Investments (2002-present). Previously, Ms. Prior served as Vice President of Fidelity's Money Market Funds (2012-2014), President, Money Market and Short Duration Bond Group of Fidelity Management & Research (FMR) (investment adviser firm, 2013-2014), President, Money Market Group of FMR (2011-2013), Managing Director of Research (2009-2011), Senior Vice President and Deputy General Counsel (2007-2009), and Assistant Secretary of certain Fidelity® funds (2008-2009).
Stacie M. Smith (1974)
Year of Election or Appointment: 2013
Assistant Treasurer
Ms. Smith also serves as an officer of other funds. She is an employee of Fidelity Investments (2009-present) and has served in other fund officer roles. Prior to joining Fidelity Investments, Ms. Smith served as Senior Audit Manager of Ernst & Young LLP (accounting firm, 1996-2009). Previously, Ms. Smith served as Deputy Treasurer of certain Fidelity® funds (2013-2016).
Marc L. Spector (1972)
Year of Election or Appointment: 2016
Deputy Treasurer
Mr. Spector also serves as an officer of other funds. Mr. Spector is an employee of Fidelity Investments (2016-present). Prior to joining Fidelity Investments, Mr. Spector served as Director at the Siegfried Group (accounting firm, 2013-2016), and prior to Siegfried Group as audit senior manager at Deloitte & Touche (accounting firm, 2005-2013).
Renee Stagnone (1975)
Year of Election or Appointment: 2016
Assistant Treasurer
Ms. Stagnone also serves as an officer of other funds. Ms. Stagnone is an employee of Fidelity Investments (1997-present). Previously, Ms. Stagnone served as Deputy Treasurer of certain Fidelity® funds (2013-2016).
Christine J. Thompson (1958)
Year of Election or Appointment: 2015
Vice President of Fidelity's Bond Funds
Ms. Thompson also serves as Vice President of other funds. Ms. Thompson also serves as Chief Investment Officer of FMR's Bond Group (2010-present) and is an employee of Fidelity Investments (1985-present). Previously, Ms. Thompson served as Vice President of Fidelity's Bond Funds (2010-2012).
Shareholder Expense Example
As a shareholder of the Fund, you incur two types of costs: (1) transaction costs, including sales charges (loads) on purchase payments or redemption proceeds, and (2) ongoing costs, including management fees, distribution and/or service (12b-1) fees and other Fund expenses. This Example is intended to help you understand your ongoing costs (in dollars) of investing in the Fund and to compare these costs with the ongoing costs of investing in other mutual funds.
The Example is based on an investment of $1,000 invested at the beginning of the period and held for the entire period (March 1, 2017 to August 31, 2017).
Actual Expenses
The first line of the accompanying table for each class of the Fund provides information about actual account values and actual expenses. You may use the information in this line, together with the amount you invested, to estimate the expenses that you paid over the period. Simply divide your account value by $1,000.00 (for example, an $8,600 account value divided by $1,000.00 = 8.6), then multiply the result by the number in the first line for a class of the Fund under the heading entitled "Expenses Paid During Period" to estimate the expenses you paid on your account during this period. A small balance maintenance fee of $12.00 that is charged once a year may apply for certain accounts with a value of less than $2,000. This fee is not included in the table below. If it was, the estimate of expenses you paid during the period would be higher, and your ending account value lower, by this amount. In addition, the Fund, as a shareholder in the underlying Fidelity Central Funds, will indirectly bear its pro-rata share of the fees and expenses incurred by the underlying Fidelity Central Funds. These fees and expenses are not included in the Fund's annualized expense ratio used to calculate the expense estimate in the table below.
Hypothetical Example for Comparison Purposes
The second line of the accompanying table for each class of the Fund provides information about hypothetical account values and hypothetical expenses based on a Class' actual expense ratio and an assumed rate of return of 5% per year before expenses, which is not the Class' actual return. The hypothetical account values and expenses may not be used to estimate the actual ending account balance or expenses you paid for the period. You may use this information to compare the ongoing costs of investing in the Fund and other funds. To do so, compare this 5% hypothetical example with the 5% hypothetical examples that appear in the shareholder reports of the other funds. A small balance maintenance fee of $12.00 that is charged once a year may apply for certain accounts with a value of less than $2,000. This fee is not included in the table below. If it was, the estimate of expenses you paid during the period would be higher, and your ending account value lower, by this amount. In addition, the Fund, as a shareholder in the underlying Fidelity Central Funds, will indirectly bear its pro-rata share of the fees and expenses incurred by the underlying Fidelity Central Funds. These fees and expenses are not included in the Fund's annualized expense ratio used to calculate the expense estimate in the table below.
Please note that the expenses shown in the table are meant to highlight your ongoing costs only and do not reflect any transaction costs. Therefore, the second line of the table is useful in comparing ongoing costs only, and will not help you determine the relative total costs of owning different funds. In addition, if these transactional costs were included, your costs would have been higher.
| | Annualized Expense Ratio-A | Beginning
Account Value
March 1, 2017 | Ending
Account Value
August 31, 2017 | Expenses Paid
During Period-B
March 1, 2017
to August 31, 2017 |
| Class A | .76% | | | |
| Actual | | $1,000.00 | $1,020.10 | $3.87 |
| Hypothetical-C | | $1,000.00 | $1,021.37 | $3.87 |
| Class M | .76% | | | |
| Actual | | $1,000.00 | $1,021.10 | $3.87 |
| Hypothetical-C | | $1,000.00 | $1,021.37 | $3.87 |
| Class C | 1.52% | | | |
| Actual | | $1,000.00 | $1,017.10 | $7.73 |
| Hypothetical-C | | $1,000.00 | $1,017.54 | $7.73 |
| Government Income | .45% | | | |
| Actual | | $1,000.00 | $1,022.70 | $2.29 |
| Hypothetical-C | | $1,000.00 | $1,022.94 | $2.29 |
| Class I | .49% | | | |
| Actual | | $1,000.00 | $1,021.40 | $2.50 |
| Hypothetical-C | | $1,000.00 | $1,022.74 | $2.50 |
A Annualized expense ratio reflects expenses net of applicable fee waivers.
B Expenses are equal to each Class' annualized expense ratio, multiplied by the average account value over the period, multiplied by 184/365 (to reflect the one-half year period). The fees and expenses of the underlying Fidelity Central Funds in which the Fund invests are not included in each Class' annualized expense ratio. In addition to the expenses noted above, the Fund also indirectly bears its proportional share of the expenses of the underlying Fidelity Central Funds. Annualized expenses of the underlying non-money market Fidelity Central Funds as of their most recent fiscal half year were less than .005%.
C 5% return per year before expenses
Distributions (Unaudited)
The fund hereby designates as a capital gain dividend with respect to the taxable year ended August 31, 2017, $9,453,771, or, if subsequently determined to be different, the net capital gain of such year.
A total of 34.99% of the dividends distributed during the fiscal year was derived from interest on U.S. Government securities which is generally exempt from state income tax.
The fund designates $50,080,464 of distributions paid during the period January 1, 2017 to August 31, 2017 as qualifying to be taxed as interest-related dividends for nonresident alien shareholders.
The fund will notify shareholders in January 2018 of amounts for use in preparing 2017 income tax returns.
AGVT-ANN-1017
1.834242.111
Fidelity® Government Income Fund
Annual Report August 31, 2017 |
|
Contents
To view a fund's proxy voting guidelines and proxy voting record for the 12-month period ended June 30, visit http://www.fidelity.com/proxyvotingresults or visit the Securities and Exchange Commission's (SEC) web site at http://www.sec.gov.
You may also call 1-800-544-8544 to request a free copy of the proxy voting guidelines.
Standard & Poor's, S&P and S&P 500 are registered service marks of The McGraw-Hill Companies, Inc. and have been licensed for use by Fidelity Distributors Corporation.
Other third-party marks appearing herein are the property of their respective owners.
All other marks appearing herein are registered or unregistered trademarks or service marks of FMR LLC or an affiliated company. © 2017 FMR LLC. All rights reserved.
This report and the financial statements contained herein are submitted for the general information of the shareholders of the Fund. This report is not authorized for distribution to prospective investors in the Fund unless preceded or accompanied by an effective prospectus.
A fund files its complete schedule of portfolio holdings with the SEC for the first and third quarters of each fiscal year on Form N-Q. Forms N-Q are available on the SEC’s web site at http://www.sec.gov. A fund's Forms N-Q may be reviewed and copied at the SEC’s Public Reference Room in Washington, DC. Information regarding the operation of the SEC's Public Reference Room may be obtained by calling 1-800-SEC-0330.
For a complete list of a fund's portfolio holdings, view the most recent holdings listing, semiannual report, or annual report on Fidelity's web site at http://www.fidelity.com, http://www.institutional.fidelity.com, or http://www.401k.com, as applicable.
NOT FDIC INSURED •MAY LOSE VALUE •NO BANK GUARANTEE
Neither the Fund nor Fidelity Distributors Corporation is a bank.
Performance: The Bottom Line
Average annual total return reflects the change in the value of an investment, assuming reinvestment of distributions from dividend income and capital gains (the profits earned upon the sale of securities that have grown in value, if any) and assuming a constant rate of performance each year. The hypothetical investment and the average annual total returns do not reflect the deduction of taxes that a shareholder would pay on fund distributions or the redemption of fund shares. During periods of reimbursement by Fidelity, a fund’s total return will be greater than it would be had the reimbursement not occurred. How a fund did yesterday is no guarantee of how it will do tomorrow.
Average Annual Total Returns
| For the periods ended August 31, 2017 | Past 1 year | Past 5 years | Past 10 years |
| Fidelity® Government Income Fund | (0.42)% | 1.44% | 3.89% |
$10,000 Over 10 Years
Let's say hypothetically that $10,000 was invested in Fidelity® Government Income Fund, a class of the fund, on August 31, 2007.
The chart shows how the value of your investment would have changed, and also shows how the Bloomberg Barclays U.S. Government Bond Index performed over the same period.
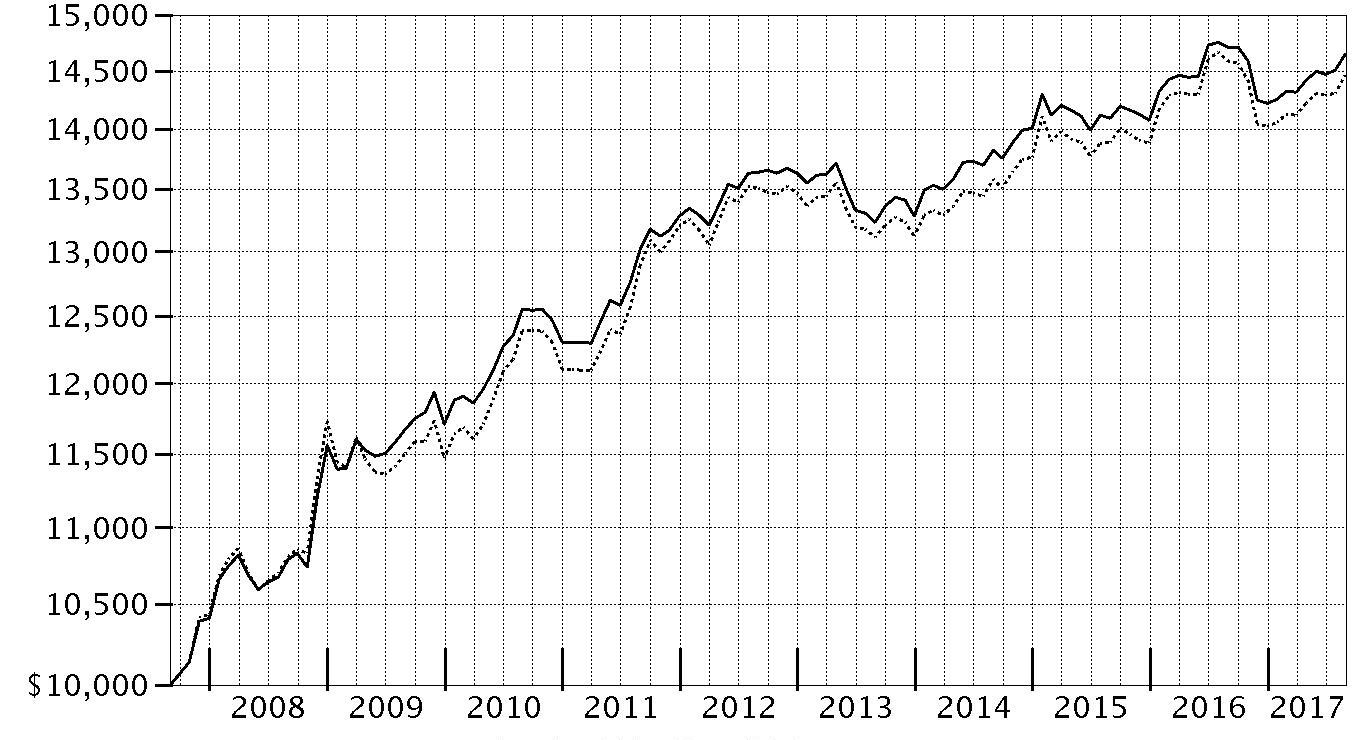
| Period Ending Values |
| $14,644 | Fidelity® Government Income Fund |
| $14,462 | Bloomberg Barclays U.S. Government Bond Index |
Effective August 24, 2016, all Barclays benchmark indices were co-branded as the Bloomberg Barclays Indices for a period of five years.
Management's Discussion of Fund Performance
Market Recap: U.S. taxable investment-grade bonds rose slightly for the 12 months ending August 31, 2017, as yields increased markedly following the U.S. presidential election then moderated as the period progressed. The Bloomberg Barclays U.S. Aggregate Bond Index gained 0.49% for the year. Bond yields rose slightly early in the period, prior to the U.S. election, then surged in November and December, as many investors viewed then-President-elect Donald Trump’s economic agenda as stimulative and potentially inflationary. Yields also rode the Fed’s decision in December to raise policy interest rates. Longer-term bond yields declined slightly in the first half of 2017, even though the Fed raised rates in June 2017 for the third time in as many quarters, as it became clear that changes to tax, health care and fiscal policies would take time to develop and implement. Fairly cool inflation readings also held back yields late in the period. Within the Bloomberg Barclays index, investment-grade corporate bonds led all major market segments, up 2.13%, while U.S. Treasuries returned -0.95%. Securitized sectors advanced more modestly than corporates. Outside the index, riskier, non-core fixed-income segments led the broader market, while Treasury Inflation-Protected Securities (TIPS) rose 0.46%, according to Bloomberg Barclays.
Comments from Lead Portfolio Manager William Irving and Co-Portfolio Manager Franco Castagliuolo: For the fiscal year, the fund’s shares classes (excluding sales charges, if applicable) returned about -1%, about in line, net of fees, with the -0.84% return of the benchmark Bloomberg Barclays 75% U.S. Government/25% U.S. MBS Blended Index. We continued to execute our strategy of attempting to exploit market inefficiencies to enhance longer-term results. Versus the benchmark, owning reverse-mortgage securities – which were not in the benchmark – aided performance. Our non-benchmark holdings in commercial mortgage-backed securities issued by Freddie Mac also contributed, as did positioning within the government-agency debenture sector. This period, we ventured beyond the government issuers that make up the bulk of this sector – Fannie Mae, Freddie Mac and the Federal Home Loan Banks – into a few higher-yielding niche segments. Specifically, we had more exposure to securities issued by the U.S. Agency for International Development. Security selection worked particularly well in the agency mortgage-backed securities sector. Our larger-than-benchmark stake in securities made up of loans with low remaining balances was beneficial. In contrast, holding Treasury Inflation-Protected Securities, or TIPS, slightly detracted from the fund’s results versus the benchmark. They performed poorly as inflation remained subdued.
The views expressed above reflect those of the portfolio manager(s) only through the end of the period as stated on the cover of this report and do not necessarily represent the views of Fidelity or any other person in the Fidelity organization. Any such views are subject to change at any time based upon market or other conditions and Fidelity disclaims any responsibility to update such views. These views may not be relied on as investment advice and, because investment decisions for a Fidelity fund are based on numerous factors, may not be relied on as an indication of trading intent on behalf of any Fidelity fund.
Investment Summary (Unaudited)
The information in the following tables is based on the combined investments of the Fund and its pro-rata share of the investments of Fidelity's Fixed-Income Central Funds.
Coupon Distribution as of August 31, 2017
| | % of fund's investments | % of fund’s investments 6 months ago |
| Zero coupon bonds | 0.0 | 0.0 |
| 0.01 - 0.99% | 1.7 | 1.9 |
| 1 - 1.99% | 33.9 | 31.8 |
| 2 - 2.99% | 20.1 | 22.1 |
| 3 - 3.99% | 21.7 | 22.4 |
| 4 - 4.99% | 12.2 | 12.8 |
| 5 - 5.99% | 8.0 | 8.3 |
| 6 - 6.99% | 0.5 | 0.6 |
| 7 - 7.99% | 0.5 | 0.5 |
| 8% and above | 0.0 | 0.0 |
Coupon distribution shows the range of stated interest rates on the fund's investments, excluding short-term investments.
Asset Allocation (% of fund's net assets)
| As of August 31, 2017*,** |
| | Mortgage Securities | 21.3% |
| | CMOs and Other Mortgage Related Securities | 23.5% |
| | U.S. Treasury Obligations | 45.5% |
| | U.S. Government Agency Obligations*** | 2.0% |
| | Foreign Government & Government Agency Obligations | 3.9% |
| | Asset-Backed Securities | 2.2% |
| | Short-Term Investments and Net Other Assets (Liabilities) | 1.6% |

* Foreign investments – 3.9%
** Futures and Swaps – 7.8%
*** Includes NCUA Guaranteed Notes
| As of February 28, 2017*,** |
| | Mortgage Securities | 24.8% |
| | CMOs and Other Mortgage Related Securities | 24.1% |
| | U.S. Treasury Obligations | 44.8% |
| | U.S. Government Agency Obligations*** | 2.7% |
| | Foreign Government & Government Agency Obligations | 4.3% |
| | Short-Term Investments and Net Other Assets (Liabilities)† | (0.7)% |

* Foreign investments – 4.3%
** Futures and Swaps – 5.7%
*** Includes NCUA Guaranteed Notes
† Short-Term Investments and Net Other Assets (Liabilities) are not included in the pie chart
An unaudited holdings listing for the Fund, which presents direct holdings as well as the pro-rata share of any securities and other investments held indirectly through its investment in underlying non-money market Fidelity Central Funds, is available at fidelity.com and/or institutional.fidelity.com, as applicable.
Percentages in the above tables are adjusted for the effect of TBA Sale Commitments.
Percentages shown as 0.0% may reflect amounts less than 0.05%.
Investments August 31, 2017
Showing Percentage of Net Assets
| U.S. Government and Government Agency Obligations - 47.5% | | | |
| | | Principal Amount (000s) | Value (000s) |
| U.S. Government Agency Obligations - 0.2% | | | |
| Fannie Mae: | | | |
| 0.875% 8/2/19 | | $131 | $130 |
| 1% 2/26/19 | | 326 | 324 |
| 1.125% 12/14/18 | | 240 | 239 |
| Tennessee Valley Authority: | | | |
| 5.25% 9/15/39 | | 2,807 | 3,759 |
| 5.375% 4/1/56 | | 3,438 | 4,773 |
| | | | 9,225 |
| U.S. Treasury Inflation-Protected Obligations - 0.6% | | | |
| U.S. Treasury Inflation-Indexed Bonds 1% 2/15/46 | | 23,700 | 24,417 |
| U.S. Treasury Obligations - 44.9% | | | |
| U.S. Treasury Bonds: | | | |
| 2.5% 2/15/46 | | 28,232 | 26,937 |
| 2.75% 8/15/47 | | 6,000 | 6,027 |
| 2.875% 8/15/45 | | 112,441 | 115,819 |
| 3% 11/15/44 | | 29,032 | 30,684 |
| 3% 11/15/45 | | 40,000 | 42,203 |
| 3% 2/15/47 | | 27,506 | 29,025 |
| 3% 5/15/47 | | 15,900 | 16,786 |
| 3.625% 2/15/44 | | 45,031 | 53,047 |
| 4.375% 5/15/40 | | 3,000 | 3,915 |
| 4.75% 2/15/37 | | 62,168 | 84,505 |
| 5% 5/15/37 (a)(b)(c) | | 36,142 | 50,551 |
| U.S. Treasury Notes: | | | |
| 0.875% 9/15/19 | | 56,901 | 56,381 |
| 1.125% 9/30/21 | | 119,876 | 117,549 |
| 1.375% 7/31/19 | | 120,000 | 120,113 |
| 1.375% 2/29/20 | | 33,681 | 33,680 |
| 1.375% 4/30/20 | | 75,553 | 75,512 |
| 1.375% 8/31/20 | | 5,000 | 4,990 |
| 1.375% 1/31/21 | | 27,500 | 27,369 |
| 1.375% 4/30/21 | | 20,000 | 19,868 |
| 1.375% 5/31/21 | | 20,000 | 19,854 |
| 1.5% 4/15/20 | | 4,775 | 4,788 |
| 1.5% 5/15/20 | | 34,416 | 34,503 |
| 1.5% 7/15/20 | | 22,703 | 22,752 |
| 1.5% 8/15/26 | | 9,629 | 9,163 |
| 1.625% 6/30/20 | | 4,710 | 4,736 |
| 1.625% 7/31/20 | | 30,000 | 30,171 |
| 1.625% 8/31/22 | | 35,000 | 34,861 |
| 1.75% 10/31/20 | | 18,000 | 18,150 |
| 1.75% 12/31/20 | | 59,701 | 60,167 |
| 1.75% 6/30/22 | | 56,910 | 57,014 |
| 1.875% 1/31/22 | | 45,770 | 46,181 |
| 1.875% 3/31/22 | | 56,661 | 57,141 |
| 1.875% 7/31/22 | | 86,000 | 86,642 |
| 1.875% 8/31/24 | | 112,983 | 112,427 |
| 2% 9/30/20 | | 31,153 | 31,657 |
| 2% 10/31/21 | | 19,497 | 19,785 |
| 2% 12/31/21 | | 60,103 | 60,974 |
| 2% 7/31/22 | | 18,845 | 19,091 |
| 2% 8/15/25 | | 38,778 | 38,689 |
| 2% 11/15/26 | | 70,025 | 69,388 |
| 2.125% 6/30/21 | | 22,000 | 22,442 |
| 2.125% 12/31/21 | | 2,000 | 2,039 |
| 2.125% 6/30/22 | | 146 | 149 |
| 2.125% 7/31/24 | | 100,525 | 101,707 |
| 2.125% 5/15/25 | | 18,702 | 18,853 |
| 2.25% 7/31/21 | | 26,021 | 26,661 |
| 2.25% 2/15/27 | | 3,000 | 3,034 |
| 2.375% 5/15/27 | | 29,946 | 30,596 |
| | | | 1,958,576 |
| Other Government Related - 1.8% | | | |
| National Credit Union Administration Guaranteed Notes: | | | |
| Series 2010-A1 Class A, 1 month U.S. LIBOR + 0.350% 1.5789% 12/7/20 (NCUA Guaranteed) (d)(e) | | 2,576 | 2,578 |
| Series 2011-R4 Class 1A, 1 month U.S. LIBOR + 0.380% 1.6072% 3/6/20 (NCUA Guaranteed) (d)(e) | | 196 | 196 |
| National Credit Union Administration Guaranteed Notes Master Trust 3.45% 6/12/21 (NCUA Guaranteed) | | 74,000 | 78,204 |
| | | | 80,978 |
| TOTAL U.S. GOVERNMENT AND GOVERNMENT AGENCY OBLIGATIONS | | | |
| (Cost $2,049,786) | | | 2,073,196 |
|
| U.S. Government Agency - Mortgage Securities - 3.6% | | | |
| Fannie Mae - 2.3% | | | |
| 12 month U.S. LIBOR + 1.415% 2.915% 11/1/33 (d)(e) | | 79 | 82 |
| 12 month U.S. LIBOR + 1.480% 3.14% 7/1/34 (d)(e) | | 90 | 94 |
| 12 month U.S. LIBOR + 1.523% 3.219% 3/1/36 (d)(e) | | 348 | 364 |
| 12 month U.S. LIBOR + 1.551% 2.506% 2/1/44 (d)(e) | | 347 | 361 |
| 12 month U.S. LIBOR + 1.553% 2.596% 5/1/44 (d)(e) | | 1,105 | 1,135 |
| 12 month U.S. LIBOR + 1.553% 3.338% 6/1/36 (d)(e) | | 100 | 104 |
| 12 month U.S. LIBOR + 1.558% 2.458% 2/1/44 (d)(e) | | 436 | 455 |
| 12 month U.S. LIBOR + 1.565% 3.315% 3/1/37 (d)(e) | | 113 | 119 |
| 12 month U.S. LIBOR + 1.570% 2.567% 5/1/44 (d)(e) | | 633 | 650 |
| 12 month U.S. LIBOR + 1.574% 2.646% 4/1/44 (d)(e) | | 1,574 | 1,641 |
| 12 month U.S. LIBOR + 1.580% 2.451% 4/1/44 (d)(e) | | 653 | 679 |
| 12 month U.S. LIBOR + 1.580% 2.575% 1/1/44 (d)(e) | | 710 | 741 |
| 12 month U.S. LIBOR + 1.725% 2.583% 6/1/42 (d)(e) | | 255 | 263 |
| 12 month U.S. LIBOR + 1.728% 3.314% 11/1/36 (d)(e) | | 63 | 66 |
| 12 month U.S. LIBOR + 1.741% 3.332% 3/1/40 (d)(e) | | 1,290 | 1,369 |
| 12 month U.S. LIBOR + 1.745% 3.374% 7/1/35 (d)(e) | | 155 | 163 |
| 12 month U.S. LIBOR + 1.800% 2.759% 1/1/42 (d)(e) | | 966 | 1,014 |
| 12 month U.S. LIBOR + 1.800% 3.558% 7/1/41 (d)(e) | | 241 | 251 |
| 12 month U.S. LIBOR + 1.805% 3.029% 10/1/41 (d)(e) | | 79 | 84 |
| 12 month U.S. LIBOR + 1.815% 2.944% 11/1/40 (d)(e) | | 95 | 100 |
| 12 month U.S. LIBOR + 1.818% 2.695% 2/1/42 (d)(e) | | 1,352 | 1,419 |
| 12 month U.S. LIBOR + 1.818% 3.023% 9/1/41 (d)(e) | | 149 | 158 |
| 12 month U.S. LIBOR + 1.818% 3.249% 7/1/41 (d)(e) | | 199 | 207 |
| 12 month U.S. LIBOR + 1.830% 3.38% 10/1/41 (d)(e) | | 133 | 141 |
| 12 month U.S. LIBOR + 1.851% 3.573% 5/1/36 (d)(e) | | 96 | 101 |
| 6 month U.S. LIBOR + 1.475% 2.85% 10/1/33 (d)(e) | | 72 | 74 |
| 6 month U.S. LIBOR + 1.510% 2.854% 2/1/33 (d)(e) | | 48 | 50 |
| 6 month U.S. LIBOR + 1.535% 2.833% 3/1/35 (d)(e) | | 55 | 56 |
| 6 month U.S. LIBOR + 1.535% 2.884% 12/1/34 (d)(e) | | 134 | 138 |
| 6 month U.S. LIBOR + 1.556% 2.922% 10/1/33 (d)(e) | | 40 | 41 |
| 6 month U.S. LIBOR + 1.565% 2.845% 7/1/35 (d)(e) | | 55 | 57 |
| U.S. TREASURY 1 YEAR INDEX + 1.965% 2.84% 2/1/36 (d)(e) | | 47 | 49 |
| U.S. TREASURY 1 YEAR INDEX + 2.208% 3.083% 3/1/35 (d)(e) | | 50 | 53 |
| U.S. TREASURY 1 YEAR INDEX + 2.295% 2.798% 10/1/33 (d)(e) | | 95 | 100 |
| 4% 5/1/29 to 7/1/47 | | 56,854 | 60,241 |
| 4% 9/1/47 (f) | | 5,250 | 5,547 |
| 4.5% 11/1/25 to 6/1/41 | | 8,281 | 8,875 |
| 5% 7/1/35 to 6/1/39 | | 7,844 | 8,634 |
| 6% 1/1/34 to 6/1/36 | | 4,881 | 5,572 |
| 6.5% 3/1/22 to 5/1/27 | | 250 | 281 |
| 9.5% 10/1/20 | | 4 | 4 |
| 11.5% 1/15/21 | | 1 | 1 |
| | | | 101,534 |
| Freddie Mac - 0.6% | | | |
| 12 month U.S. LIBOR + 1.754% 3.098% 9/1/41 (d)(e) | | 1,421 | 1,503 |
| 12 month U.S. LIBOR + 1.874% 3.432% 10/1/42 (d)(e) | | 814 | 854 |
| 12 month U.S. LIBOR + 1.877% 3.215% 4/1/41 (d)(e) | | 133 | 139 |
| 12 month U.S. LIBOR + 1.880% 3.03% 10/1/41 (d)(e) | | 1,987 | 2,059 |
| 12 month U.S. LIBOR + 1.880% 3.222% 9/1/41 (d)(e) | | 154 | 164 |
| 12 month U.S. LIBOR + 1.910% 3.282% 6/1/41 (d)(e) | | 175 | 183 |
| 12 month U.S. LIBOR + 1.910% 3.421% 5/1/41 (d)(e) | | 148 | 158 |
| 12 month U.S. LIBOR + 1.910% 3.625% 5/1/41 (d)(e) | | 200 | 209 |
| 12 month U.S. LIBOR + 1.910% 3.647% 6/1/41 (d)(e) | | 192 | 201 |
| 12 month U.S. LIBOR + 2.045% 3.81% 7/1/36 (d)(e) | | 270 | 287 |
| 12 month U.S. LIBOR + 2.197% 3.537% 3/1/33 (d)(e) | | 7 | 7 |
| 6 month U.S. LIBOR + 1.445% 2.82% 3/1/35 (d)(e) | | 193 | 199 |
| 6 month U.S. LIBOR + 1.746% 2.967% 5/1/37 (d)(e) | | 112 | 116 |
| 6 month U.S. LIBOR + 2.755% 4.096% 10/1/35 (d)(e) | | 131 | 139 |
| U.S. TREASURY 1 YEAR INDEX + 2.383% 3.075% 2/1/36 (d)(e) | | 15 | 15 |
| U.S. TREASURY 1 YEAR INDEX + 2.548% 3.548% 7/1/35 (d)(e) | | 582 | 609 |
| 3% 2/1/31 | | 10,198 | 10,549 |
| 4% 5/1/47 to 7/1/47 | | 4,716 | 4,992 |
| 4.5% 5/1/39 to 10/1/41 | | 2,649 | 2,888 |
| 5.5% 7/1/29 | | 17 | 19 |
| 6% 1/1/24 | | 945 | 1,018 |
| 9.5% 6/1/18 to 8/1/21 | | 3 | 3 |
| | | | 26,311 |
| Ginnie Mae - 0.7% | | | |
| 4.3% 8/20/61 (g) | | 2,305 | 2,340 |
| 4.649% 2/20/62 (g) | | 2,209 | 2,280 |
| 4.682% 2/20/62 (g) | | 3,078 | 3,153 |
| 4.684% 1/20/62 (g) | | 17,385 | 17,825 |
| 5.47% 8/20/59 (g) | | 42 | 43 |
| 6% 6/15/36 | | 3,886 | 4,542 |
| | | | 30,183 |
| TOTAL U.S. GOVERNMENT AGENCY - MORTGAGE SECURITIES | | | |
| (Cost $157,346) | | | 158,028 |
|
| Asset-Backed Securities - 1.9% | | | |
| Fannie Mae Series 2017-T1 Class A, 2.898% 6/25/27 | | $46,895 | $47,484 |
| Goal Capital Funding Trust Series 2005-2 Class A3, 3 month U.S. LIBOR + 0.170% 1.4872% 5/28/30 (d)(e) | | 4,749 | 4,746 |
| Illinois Student Assistance Commission Student Loan Rev. Series 2010-1 Class A2, 3 month U.S. LIBOR + 1.050% 2.2062% 4/25/22 (d)(e) | | 1,732 | 1,740 |
| Navient Student Loan Trust Series 2017-3A: | | | |
| Class A1, 1 month U.S. LIBOR + 0.300% 1.5344% 7/26/66 (d)(e)(h) | | 12,854 | 12,855 |
| Class A2, 1 month U.S. LIBOR + 0.600% 1.8344% 7/26/66 (d)(e)(h) | | 14,550 | 14,617 |
| Small Business Administration guaranteed development participation certificates: | | | |
| Series 2002-20J Class 1, 4.75% 10/1/22 | | 649 | 674 |
| Series 2002-20K Class 1, 5.08% 11/1/22 | | 959 | 1,008 |
| Series 2004-20H Class 1, 5.17% 8/1/24 | | 424 | 448 |
| TOTAL ASSET-BACKED SECURITIES | | | |
| (Cost $82,813) | | | 83,572 |
|
| Collateralized Mortgage Obligations - 17.2% | | | |
| U.S. Government Agency - 17.2% | | | |
| Fannie Mae: | | | |
| floater: | | $ | $ |
| Series 2001-38 Class QF, 1 month U.S. LIBOR + 0.980% 2.2144% 8/25/31 (d)(e) | | 84 | 86 |
| Series 2002-49 Class FB, 1 month U.S. LIBOR + 0.600% 1.8283% 11/18/31 (d)(e) | | 80 | 81 |
| Series 2002-60 Class FV, 1 month U.S. LIBOR + 1.000% 2.2344% 4/25/32 (d)(e) | | 34 | 34 |
| Series 2002-75 Class FA, 1 month U.S. LIBOR + 1.000% 2.2344% 11/25/32 (d)(e) | | 69 | 70 |
| Series 2010-15 Class FJ, 1 month U.S. LIBOR + 0.930% 2.1644% 6/25/36 (d)(e) | | 5,219 | 5,303 |
| planned amortization class: | | | |
| Series 2005-19 Class PA, 5.5% 7/25/34 | | 1,263 | 1,317 |
| Series 2005-27 Class NE, 5.5% 5/25/34 | | 311 | 313 |
| Series 2005-64 Class PX, 5.5% 6/25/35 | | 1,488 | 1,608 |
| Series 2005-68 Class CZ, 5.5% 8/25/35 | | 4,105 | 4,625 |
| Series 2006-45 Class OP 6/25/36 (i) | | 721 | 641 |
| Series 2010-118 Class PB, 4.5% 10/25/40 | | 6,041 | 6,429 |
| sequential payer: | | | |
| Series 2003-117 Class MD, 5% 12/25/23 | | 772 | 820 |
| Series 2004-91 Class Z, 5% 12/25/34 | | 4,999 | 5,506 |
| Series 2005-117 Class JN, 4.5% 1/25/36 | | 412 | 438 |
| Series 2005-14 Class ZB, 5% 3/25/35 | | 1,536 | 1,689 |
| Series 2006-72 Class CY, 6% 8/25/26 | | 3,103 | 3,361 |
| Series 2009-59 Class HB, 5% 8/25/39 | | 2,263 | 2,499 |
| Series 201-75 Class AL, 3.5% 8/25/26 | | 11,851 | 12,473 |
| Series 2010-97 Class CX, 4.5% 9/25/25 | | 10,927 | 11,755 |
| Series 2011-80: | | | |
| Class HE, 3.5% 8/25/26 | | 4,160 | 4,419 |
| Class KB, 3.5% 8/25/26 | | 6,462 | 6,817 |
| Series 2009-85 Class IB, 4.5% 8/25/24 (j) | | 222 | 10 |
| Series 2009-93 Class IC, 4.5% 9/25/24 (j) | | 319 | 13 |
| Series 2010-139 Class NI, 4.5% 2/25/40 (j) | | 3,352 | 366 |
| Series 2010-39 Class FG, 1 month U.S. LIBOR + 0.920% 2.1544% 3/25/36 (d)(e) | | 3,244 | 3,319 |
| Series 2010-97 Class CI, 4.5% 8/25/25 (j) | | 818 | 47 |
| Series 2012-27 Class EZ, 4.25% 3/25/42 | | 7,199 | 7,801 |
| Series 2016-26 Class CG, 3% 5/25/46 | | 20,879 | 21,458 |
| Freddie Mac: | | | |
| floater: | | | |
| Series 2530 Class FE, 1 month U.S. LIBOR + 0.600% 1.8267% 2/15/32 (d)(e) | | 45 | 46 |
| Series 2630 Class FL, 1 month U.S. LIBOR + 0.500% 1.7267% 6/15/18 (d)(e) | | 9 | 9 |
| Series 2682 Class FB, 1 month U.S. LIBOR + 0.900% 2.1267% 10/15/33 (d)(e) | | 2,770 | 2,813 |
| Series 2711 Class FC, 1 month U.S. LIBOR + 0.900% 2.1267% 2/15/33 (d)(e) | | 1,547 | 1,575 |
| planned amortization class: | | | |
| Series 1141 Class G, 9% 9/15/21 | | 30 | 33 |
| Series 2682 Class LD, 4.5% 10/15/33 | | 661 | 711 |
| Series 3415 Class PC, 5% 12/15/37 | | 458 | 499 |
| Series 3763 Class QA, 4% 4/15/34 | | 323 | 324 |
| Series 3840 Class VA, 4.5% 9/15/27 | | 3,863 | 3,977 |
| Series 3857 Class ZP, 5% 5/15/41 | | 2,991 | 3,586 |
| sequential payer: | | | |
| Series 2004-2802 Class ZG, 5.5% 5/15/34 | | 7,242 | 8,128 |
| Series 2587 Class AD, 4.71% 3/15/33 | | 2,663 | 2,826 |
| Series 2773 Class HC, 4.5% 4/15/19 | | 124 | 125 |
| Series 2877 Class ZD, 5% 10/15/34 | | 6,101 | 6,701 |
| Series 3007 Class EW, 5.5% 7/15/25 | | 4,904 | 5,298 |
| Series 3745 Class KV, 4.5% 12/15/26 | | 6,293 | 6,784 |
| Series 3806 Class L, 3.5% 2/15/26 | | 8,900 | 9,478 |
| Series 3862 Class MB, 3.5% 5/15/26 | | 6,893 | 7,264 |
| Series 3871 Class KB, 5.5% 6/15/41 | | 13,870 | 16,139 |
| Series 3889 Class DZ, 4% 1/15/41 | | 34,795 | 37,740 |
| Series 3843 Class PZ, 5% 4/15/41 | | 2,559 | 3,015 |
| Freddie Mac Multi-family Structured pass-thru certificates sequential payer: | | | |
| Series 4335 Class AL, 4.25% 3/15/40 | | 7,217 | 7,583 |
| Series 4341 Class ML, 3.5% 11/15/31 | | 9,808 | 10,286 |
| Ginnie Mae guaranteed REMIC pass-thru certificates: | | | |
| floater: | | | |
| Series 2008-2 Class FD, 1 month U.S. LIBOR + 0.480% 1.7106% 1/20/38 (d)(e) | | 236 | 237 |
| Series 2008-73 Class FA, 1 month U.S. LIBOR + 0.860% 2.0906% 8/20/38 (d)(e) | | 1,768 | 1,795 |
| Series 2008-83 Class FB, 1 month U.S. LIBOR + 0.900% 2.1306% 9/20/38 (d)(e) | | 1,559 | 1,594 |
| Series 2009-108 Class CF, 1 month U.S. LIBOR + 0.600% 1.8278% 11/16/39 (d)(e) | | 996 | 1,004 |
| Series 2011-H20 Class FA, 1 month U.S. LIBOR + 0.550% 1.7739% 9/20/61 (d)(e)(g) | | 8,720 | 8,738 |
| Series 2011-H21 Class FA, 1 month U.S. LIBOR + 0.600% 1.8239% 10/20/61 (d)(e)(g) | | 5,768 | 5,786 |
| Series 2012-H01 Class FA, 1 month U.S. LIBOR + 0.700% 1.9239% 11/20/61 (d)(e)(g) | | 4,911 | 4,938 |
| Series 2012-H03 Class FA, 1 month U.S. LIBOR + 0.700% 1.9239% 1/20/62 (d)(e)(g) | | 3,151 | 3,169 |
| Series 2012-H06 Class FA, 1 month U.S. LIBOR + 0.630% 1.8539% 1/20/62 (d)(e)(g) | | 4,583 | 4,598 |
| Series 2012-H07 Class FA, 1 month U.S. LIBOR + 0.630% 1.8539% 3/20/62 (d)(e)(g) | | 2,938 | 2,950 |
| Series 2012-H21 Class DF, 1 month U.S. LIBOR + 0.650% 1.8739% 5/20/61 (d)(e)(g) | | 3,813 | 3,821 |
| Series 2013-H19: | | | |
| Class FC, 1 month U.S. LIBOR + 0.600% 1.8239% 8/20/63 (d)(e)(g) | | 1,141 | 1,144 |
| Class FD, 1 month U.S. LIBOR + 0.600% 1.8239% 8/20/63 (d)(e)(g) | | 2,878 | 2,887 |
| Series 2014-H02 Class FB, 1 month U.S. LIBOR + 0.650% 1.8739% 12/20/63 (d)(e)(g) | | 36,459 | 36,604 |
| Series 2014-H03 Class FA, 1 month U.S. LIBOR + 0.600% 1.8239% 1/20/64 (d)(e)(g) | | 14,163 | 14,211 |
| Series 2015-H07 Class FA, 1 month U.S. LIBOR + 0.300% 0.3% 3/20/65 (d)(e)(g) | | 13,084 | 13,084 |
| Series 2015-H13 Class FL, 1 month U.S. LIBOR + 0.280% 1.5039% 5/20/63 (d)(e)(g) | | 13,022 | 13,019 |
| Series 2015-H19 Class FA, 1 month U.S. LIBOR + 0.200% 1.4239% 4/20/63 (d)(e)(g) | | 12,918 | 12,906 |
| Series 2016-H20 Class FM, 1 month U.S. LIBOR + 0.400% 1.6239% 12/20/62 (d)(e)(g) | | 14,252 | 14,263 |
| planned amortization class Series 2010-31 Class BP, 5% 3/20/40 | | 11,191 | 12,793 |
| sequential payer: | | | |
| Series 2011-69 Class GX, 4.5% 5/16/40 | | 10,205 | 11,123 |
| Series 2013-H06 Class HA, 1.65% 1/20/63 (g) | | 4,927 | 4,911 |
| Series 2013-H26 Class HA, 3.5% 9/20/63 (g) | | 41,163 | 42,205 |
| Series 2014-H12 Class KA, 2.75% 5/20/64 (g) | | 5,642 | 5,714 |
| Series 2016-H02 Class FM, 1 month U.S. LIBOR + 0.500% 1.7239% 9/20/62 (d)(e)(g) | | 20,809 | 20,865 |
| Series 2016-H04 Class FE, 1 month U.S. LIBOR + 0.650% 1.8739% 11/20/65 (d)(e)(g) | | 4,304 | 4,319 |
| Series 2004-22 Class M1, 5.5% 4/20/34 | | 584 | 757 |
| Series 2010-116 Class QB, 4% 9/16/40 | | 6,076 | 6,501 |
| Series 2010-169 Class Z, 4.5% 12/20/40 | | 6,825 | 7,465 |
| Series 2010-H15 Class TP, 5.15% 8/20/60 (g) | | 12,899 | 13,356 |
| Series 2010-H17 Class XP, 5.2967% 7/20/60 (d)(g) | | 14,591 | 15,078 |
| Series 2010-H18 Class PL, 5.01% 9/20/60 (d)(g) | | 12,151 | 12,533 |
| Series 2012-64 Class KI, 3.5% 11/20/36 (j) | | 1,159 | 80 |
| Series 2013-124: | | | |
| Class ES, 8.667% - 1 month U.S. LIBOR 7.0259% 4/20/39 (d)(k) | | 4,633 | 4,877 |
| Class ST, 8.800% - 1 month U.S. LIBOR 7.1593% 8/20/39 (d)(k) | | 10,741 | 11,534 |
| Series 2013-H07 Class JA, 1.75% 3/20/63 (g) | | 26,125 | 26,053 |
| Series 2015-H17 Class HA, 2.5% 5/20/65 (g) | | 14,283�� | 14,395 |
| Series 2015-H21: | | | |
| Class HA, 2.5% 6/20/63 (g) | | 41,546 | 41,831 |
| Class JA, 2.5% 6/20/65 (g) | | 4,839 | 4,875 |
| Series 2015-H30 Class HA, 1.75% 9/20/62 (d)(g) | | 41,942 | 41,857 |
| Series 2016-H13 Class FB, U.S. TREASURY 1 YEAR INDEX + 0.500% 1.65% 5/20/66 (d)(e)(g) | | 25,196 | 25,362 |
| Series 2017-H06 Class FA, U.S. TREASURY 1 YEAR INDEX + 0.350% 1.57% 8/20/66 (d)(e)(g) | | 22,540 | 22,592 |
| Series 2090-118 Class XZ, 5% 12/20/39 | | 14,092 | 16,208 |
| | | | 752,270 |
| TOTAL COLLATERALIZED MORTGAGE OBLIGATIONS | | | |
| (Cost $752,295) | | | 752,270 |
|
| Commercial Mortgage Securities - 4.1% | | | |
| Freddie Mac: | | | |
| pass-thru certificates sequential payer Series K011 Class A2, 4.084% 11/25/20 | | 3,740 | 3,985 |
| sequential payer: | | | |
| Series K009 Class A2, 3.808% 8/25/20 | | 5,591 | 5,889 |
| Series K034 Class A1, 2.669% 2/25/23 | | 11,850 | 12,075 |
| Series K709 Class A2, 2.086% 3/25/19 | | 17,210 | 17,310 |
| Series K710 Class A2, 1.883% 5/25/19 | | 16,814 | 16,875 |
| Series K713 Class A2, 2.313% 3/25/20 | | 5,437 | 5,505 |
| Series K717 Class A2, 2.991% 9/25/21 | | 12,968 | 13,490 |
| Series K032 Class A1, 3.016% 2/25/23 | | 20,015 | 20,599 |
| Series K504 Class A2, 2.566% 9/25/20 | | 3,629 | 3,699 |
| Series K704 Class A2, 2.412% 8/25/18 | | 4,832 | 4,852 |
| Series K706 Class A2, 2.323% 10/25/18 | | 9,474 | 9,532 |
| Series K724 Class A1, 2.776% 3/25/23 | | 16,089 | 16,580 |
| Series K726 Class A1, 2.596% 7/25/49 | | 4,875 | 4,981 |
| Freddie Mac Multi-family floater Series 2017-KT01 Class A, 1 month U.S. LIBOR + 0.320% 1.5522% 2/25/20 (d)(e) | | 43,722 | 43,819 |
| TOTAL COMMERCIAL MORTGAGE SECURITIES | | | |
| (Cost $178,607) | | | 179,191 |
|
| Foreign Government and Government Agency Obligations - 3.9% | | | |
| Israeli State: | | | |
| (guaranteed by U.S. Government through Agency for International Development): | | | |
| 5.5% 9/18/23 | | 72,266 | 86,445 |
| 5.5% 12/4/23 | | 48 | 58 |
| 5.5% 4/26/24 | | 6,065 | 7,325 |
| Jordanian Kingdom: | | | |
| 2.503% 10/30/20 | | 19,881 | 20,443 |
| 3% 6/30/25 | | 19,267 | 20,269 |
| Ukraine Government 1.471% 9/29/21 | | 34,809 | 34,374 |
| TOTAL FOREIGN GOVERNMENT AND GOVERNMENT AGENCY OBLIGATIONS | | | |
| (Cost $155,889) | | | 168,914 |
| | | Shares | Value (000s) |
|
| Fixed-Income Funds - 21.5% | | | |
| Fidelity Mortgage Backed Securities Central Fund (l) | | | |
| (Cost $899,702) | | 8,632,953 | 939,005 |
|
| Money Market Funds - 0.2% | | | |
| Fidelity Cash Central Fund, 1.11% (m) | | | |
| (Cost $6,876) | | 6,874,372 | 6,876 |
| Purchased Swaptions - 0.0% | | | | |
| | | Expiration Date | Notional Amount (000s) | Value (000s) |
| Put Options - 0.0% | | | | |
| Option on an interest rate swap with JPMorgan Chase Bank NA to pay semi-annually a fixed rate of 1.960% and receive quarterly a floating rate based on 3-month LIBOR, expiring December 2024 | | 11/30/17 | 15,000 | $120 |
| Call Options - 0.0% | | | | |
| Option on an interest rate swap with JPMorgan Chase Bank NA to receive semi-annually a fixed rate of 1.960% and pay quarterly a floating rate based on 3-month LIBOR, expiring December 2024 | | 11/30/17 | 15,000 | 120 |
| TOTAL PURCHASED SWAPTIONS | | | | |
| (Cost $240) | | | | 240 |
| TOTAL INVESTMENT IN SECURITIES - 99.9% | | | | |
| (Cost $4,283,554) | | | | 4,361,292 |
| NET OTHER ASSETS (LIABILITIES) - 0.1% | | | | 3,992 |
| NET ASSETS - 100% | | | | $4,365,284 |
| TBA Sale Commitments | | |
| | Principal Amount (000s) | Value (000s) |
| Fannie Mae | | |
| 3.5% 9/1/47 | | |
| (Proceeds $100,767) | $(98,100) | $(101,639) |
| Futures Contracts | | | | | |
| | Number of contracts | Expiration Date | Notional amount (000s) | Value (000s) | Unrealized Appreciation/(Depreciation) (000s) |
| Purchased | | | | | |
| Treasury Contracts | | | | | |
| CBOT 10-Year U.S. Treasury Note Contracts (United States) | 625 | Dec. 2017 | $79,365 | $214 | $214 |
| CBOT 2-Year U.S. Treasury Note Contracts (United States) | 755 | Dec. 2017 | 163,316 | (1) | (1) |
| CBOT 5-Year U.S. Treasury Note Contracts (United States) | 350 | Dec. 2017 | 41,475 | (9) | (9) |
| CBOT Long Term U.S. Treasury Bond Contracts (United States) | 238 | Dec. 2017 | 37,150 | 350 | 350 |
| TOTAL FUTURES CONTRACTS | | | | | $554 |
The notional amount of futures purchased as a percentage of Net Assets is 7.4%
Swaps
| Payment Received | Payment Frequency | Payment Paid | Payment Frequency | Clearinghouse / Counterparty(1) | Maturity Date | Notional Amount (000s)(1) | Value (000s) | Upfront Premium Received/(Paid) (000s)(2) | Unrealized Appreciation/(Depreciation) (000s) |
| Interest Rate Swaps | | | | | | | | | |
| 2.5% | Semi - annual | 3-month LIBOR(3) | Quarterly | CME | Sep. 2047 | $1,200 | $16 | $0 | $16 |
(1) Swaps with CME Group (CME) are centrally cleared over-the-counter (OTC) swaps.
(2) Any premiums for centrally cleared over-the-counter (OTC) swaps are recorded periodically throughout the term of the swap to variation margin and included in unrealized appreciation (depreciation).
(3) Represents floating rate.
Legend
(a) Security or a portion of the security was pledged to cover margin requirements for futures contracts. At period end, the value of securities pledged amounted to $1,905,000.
(b) Security or a portion of the security was pledged to cover margin requirements for centrally cleared OTC swaps. At period end, the value of securities pledged amounted to $104,000.
(c) Security or a portion of the security has been segregated as collateral for mortgage-backed or asset-backed securities purchased on a delayed delivery or when-issued basis. At period end, the value of securities pledged amounted to $809,000.
(d) Coupon rates for floating and adjustable rate securities reflect the rates in effect at period end.
(e) Coupon is indexed to a floating interest rate which may be multiplied by a specified factor and/or subject to caps or floors.
(f) Security or a portion of the security purchased on a delayed delivery or when-issued basis.
(g) Represents an investment in an underlying pool of reverse mortgages which typically do not require regular principal and interest payments as repayment is deferred until a maturity event.
(h) Security exempt from registration under Rule 144A of the Securities Act of 1933. These securities may be resold in transactions exempt from registration, normally to qualified institutional buyers. At the end of the period, the value of these securities amounted to $27,472,000 or 0.6% of net assets.
(i) Principal Only Strips represent the right to receive the monthly principal payments on an underlying pool of mortgage loans.
(j) Security represents right to receive monthly interest payments on an underlying pool of mortgages or assets. Principal shown is the outstanding par amount of the pool as of the end of the period.
(k) Coupon is inversely indexed to a floating interest rate multiplied by a specified factor. The price may be considerably more volatile than the price of a comparable fixed rate security.
(l) Affiliated fund that is generally available only to investment companies and other accounts managed by Fidelity Investments. A complete unaudited schedule of portfolio holdings for each Fidelity Central Fund is filed with the SEC for the first and third quarters of each fiscal year on Form N-Q and is available upon request or at the SEC's website at www.sec.gov. An unaudited holdings listing for the Fund, which presents direct holdings as well as the pro-rata share of securities and other investments held indirectly through its investment in underlying non-money market Fidelity Central Funds, is available at fidelity.com and/or institutional.fidelity.com, as applicable. In addition, each Fidelity Central Fund's financial statements, which are not covered by the Fund's Report of Independent Registered Public Accounting Firm, are available on the SEC's website or upon request.
(m) Affiliated fund that is generally available only to investment companies and other accounts managed by Fidelity Investments. The rate quoted is the annualized seven-day yield of the fund at period end. A complete unaudited listing of the fund's holdings as of its most recent quarter end is available upon request. In addition, each Fidelity Central Fund's financial statements, which are not covered by the Fund's Report of Independent Registered Public Accounting Firm, are available on the SEC's website or upon request.
Affiliated Central Funds
Information regarding fiscal year to date income earned by the Fund from investments in Fidelity Central Funds is as follows:
| Fund | Income earned |
| | (Amounts in thousands) |
| Fidelity Cash Central Fund | $254 |
| Fidelity Mortgage Backed Securities Central Fund | 29,169 |
| Total | $29,423 |
Additional information regarding the Fund's fiscal year to date purchases and sales, including the ownership percentage, of the non Money Market Central Funds is as follows:
| Fund (Amounts in thousands) | Value, beginning of period | Purchases | Sales Proceeds | Realized Gain/Loss | Change in Unrealized appreciation (depreciation) | Value, end of period | % ownership, end of period |
| Fidelity Mortgage Backed Securities Central Fund | $1,224,994 | $31,257 | $293,900 | $1,393 | $(24,739) | $939,005 | 14.0% |
| Total | $1,224,994 | $31,257 | $293,900 | $1,393 | $(24,739) | $939,005 | |
Investment Valuation
The following is a summary of the inputs used, as of August 31, 2017, involving the Fund's assets and liabilities carried at fair value. The inputs or methodology used for valuing securities may not be an indication of the risk associated with investing in those securities. For more information on valuation inputs, and their aggregation into the levels used below, please refer to the Investment Valuation section in the accompanying Notes to Financial Statements.
| | Valuation Inputs at Reporting Date: |
| Description | Total | Level 1 | Level 2 | Level 3 |
| (Amounts in thousands) | | | | |
| Investments in Securities: | | | | |
| U.S. Government and Government Agency Obligations | $2,073,196 | $-- | $2,073,196 | $-- |
| U.S. Government Agency - Mortgage Securities | 158,028 | -- | 158,028 | -- |
| Asset-Backed Securities | 83,572 | -- | 83,572 | -- |
| Collateralized Mortgage Obligations | 752,270 | -- | 752,270 | -- |
| Commercial Mortgage Securities | 179,191 | -- | 179,191 | -- |
| Foreign Government and Government Agency Obligations | 168,914 | -- | 168,914 | -- |
| Fixed-Income Funds | 939,005 | 939,005 | -- | -- |
| Money Market Funds | 6,876 | 6,876 | -- | -- |
| Purchased Swaptions | 240 | -- | 240 | -- |
| Total Investments in Securities: | $4,361,292 | $945,881 | $3,415,411 | $-- |
| Derivative Instruments: | | | | |
| Assets | | | | |
| Futures Contracts | $564 | $564 | $-- | $-- |
| Swaps | 16 | -- | 16 | -- |
| Total Assets | $580 | $564 | $16 | $-- |
| Liabilities | | | | |
| Futures Contracts | $(10) | $(10) | $-- | $-- |
| Total Liabilities | $(10) | $(10) | $-- | $-- |
| Total Derivative Instruments: | $570 | $554 | $16 | $-- |
| Other Financial Instruments: | | | | |
| TBA Sale Commitments | $(101,639) | $-- | $(101,639) | $-- |
| Total Other Financial Instruments: | $(101,639) | $-- | $(101,639) | $-- |
Value of Derivative Instruments
The following table is a summary of the Fund's value of derivative instruments by primary risk exposure as of August 31, 2017. For additional information on derivative instruments, please refer to the Derivative Instruments section in the accompanying Notes to Financial Statements.
| Primary Risk Exposure / Derivative Type | Value |
| | Asset | Liability |
| (Amounts in thousands) | | |
| Interest Rate Risk | | |
| Futures Contracts(a) | $564 | $(10) |
| Purchased Swaptions(b) | 240 | 0 |
| Swaps(c) | 16 | 0 |
| Total Interest Rate Risk | 820 | (10) |
| Total Value of Derivatives | $820 | $(10) |
(a) Reflects gross cumulative appreciation (depreciation) on futures contracts as presented in the Schedule of Investments. In the Statement of Assets and Liabilities, the period end daily variation margin is included in receivable or payable for daily variation margin on futures contracts, and the net cumulative appreciation (depreciation) is included in net unrealized appreciation (depreciation).
(b) Gross value is included in the Statement of Assets and Liabilities in the investments, at value line-item.
(c) For centrally cleared over-the-counter (OTC) swaps, reflects gross cumulative appreciation (depreciation) as presented in the Schedule of Investments. In the Statement of Assets and Liabilities, the period end daily variation margin for centrally cleared OTC swaps is included in receivable or payable for daily variation margin on centrally cleared OTC swaps, and the net cumulative appreciation (depreciation) for centrally cleared OTC swaps is included in net unrealized appreciation (depreciation).
See accompanying notes which are an integral part of the financial statements.
Financial Statements
Statement of Assets and Liabilities
| Amounts in thousands (except per-share amounts) | | August 31, 2017 |
| Assets | | |
Investment in securities, at value — See accompanying schedule:
Unaffiliated issuers (cost $3,376,976) | $3,415,411 | |
| Fidelity Central Funds (cost $906,578) | 945,881 | |
| Total Investment in Securities (cost $4,283,554) | | $4,361,292 |
| Cash | | 19,434 |
| Receivable for investments sold | | 151,697 |
| Receivable for TBA sale commitments | | 100,767 |
| Receivable for fund shares sold | | 2,242 |
| Interest receivable | | 12,509 |
| Distributions receivable from Fidelity Central Funds | | 21 |
| Receivable for daily variation margin on futures contracts | | 214 |
| Receivable for daily variation margin on centrally cleared OTC swaps | | 6 |
| Other receivables | | 61 |
| Total assets | | 4,648,243 |
| Liabilities | | |
| Payable for investments purchased | | |
| Regular delivery | $150,321 | |
| Delayed delivery | 5,527 | |
| TBA sale commitments, at value | 101,639 | |
| Payable for fund shares redeemed | 3,966 | |
| Distributions payable | 246 | |
| Accrued management fee | 1,120 | |
| Distribution and service plan fees payable | 129 | |
| Other affiliated payables | 559 | |
| Other payables and accrued expenses | 60 | |
| Collateral on securities loaned | 19,392 | |
| Total liabilities | | 282,959 |
| Net Assets | | $4,365,284 |
| Net Assets consist of: | | |
| Paid in capital | | $4,358,602 |
| Distributions in excess of net investment income | | (7,544) |
| Accumulated undistributed net realized gain (loss) on investments | | (63,210) |
| Net unrealized appreciation (depreciation) on investments | | 77,436 |
| Net Assets | | $4,365,284 |
| Calculation of Maximum Offering Price | | |
| Class A: | | |
| Net Asset Value and redemption price per share ($174,194 ÷ 16,810 shares) | | $10.36 |
| Maximum offering price per share (100/96.00 of $10.36) | | $10.79 |
| Class M: | | |
| Net Asset Value and redemption price per share ($156,513 ÷ 15,106 shares) | | $10.36 |
| Maximum offering price per share (100/96.00 of $10.36) | | $10.79 |
| Class C: | | |
| Net Asset Value and offering price per share ($71,524 ÷ 6,904 shares)(a) | | $10.36 |
| Government Income: | | |
| Net Asset Value, offering price and redemption price per share ($3,467,149 ÷ 335,131 shares) | | $10.35 |
| Class I: | | |
| Net Asset Value, offering price and redemption price per share ($495,904 ÷ 47,860 shares) | | $10.36 |
(a) Redemption price per share is equal to net asset value less any applicable contingent deferred sales charge.
See accompanying notes which are an integral part of the financial statements.
Statement of Operations
| Amounts in thousands | | Year ended August 31, 2017 |
| Investment Income | | |
| Interest | | $70,135 |
| Income from Fidelity Central Funds | | 29,423 |
| Total income | | 99,558 |
| Expenses | | |
| Management fee | $13,933 | |
| Transfer agent fees | 5,032 | |
| Distribution and service plan fees | 1,772 | |
| Fund wide operations fee | 1,837 | |
| Independent trustees' fees and expenses | 18 | |
| Miscellaneous | 16 | |
| Total expenses before reductions | 22,608 | |
| Expense reductions | (11) | 22,597 |
| Net investment income (loss) | | 76,961 |
| Realized and Unrealized Gain (Loss) | | |
| Net realized gain (loss) on: | | |
| Investment securities: | | |
| Unaffiliated issuers | (1,059) | |
| Fidelity Central Funds | 1,395 | |
| Futures contracts | 661 | |
| Swaps | (1,365) | |
| Capital gain distributions from Fidelity Central Funds | 2,091 | |
| Total net realized gain (loss) | | 1,723 |
| Change in net unrealized appreciation (depreciation) on: | | |
| Investment securities: | | |
| Unaffiliated issuers | (89,641) | |
| Fidelity Central Funds | (24,739) | |
| Futures contracts | 566 | |
| Swaps | (449) | |
| Delayed delivery commitments | (904) | |
| Total change in net unrealized appreciation (depreciation) | | (115,167) |
| Net gain (loss) | | (113,444) |
| Net increase (decrease) in net assets resulting from operations | | $(36,483) |
See accompanying notes which are an integral part of the financial statements.
Statement of Changes in Net Assets
| Amounts in thousands | Year ended August 31, 2017 | Year ended August 31, 2016 |
| Increase (Decrease) in Net Assets | | |
| Operations | | |
| Net investment income (loss) | $76,961 | $71,092 |
| Net realized gain (loss) | 1,723 | 16,993 |
| Change in net unrealized appreciation (depreciation) | (115,167) | 104,347 |
| Net increase (decrease) in net assets resulting from operations | (36,483) | 192,432 |
| Distributions to shareholders from net investment income | (74,479) | (77,548) |
| Distributions to shareholders from net realized gain | (34,956) | (39,904) |
| Total distributions | (109,435) | (117,452) |
| Share transactions - net increase (decrease) | (430,132) | 502,872 |
| Total increase (decrease) in net assets | (576,050) | 577,852 |
| Net Assets | | |
| Beginning of period | 4,941,334 | 4,363,482 |
| End of period | $4,365,284 | $4,941,334 |
| Other Information | | |
| Distributions in excess of net investment income end of period | $(7,544) | $(8,402) |
See accompanying notes which are an integral part of the financial statements.
Financial Highlights — Fidelity Government Income Fund Class A
| Years ended August 31, | 2017 | 2016 | 2015 | 2014 | 2013 |
| Selected Per–Share Data | | | | | |
| Net asset value, beginning of period | $10.66 | $10.50 | $10.47 | $10.20 | $10.97 |
| Income from Investment Operations | | | | | |
| Net investment income (loss)A | .149 | .135 | .126 | .138 | .105 |
| Net realized and unrealized gain (loss) | (.230) | .270 | .048 | .278 | (.454) |
| Total from investment operations | (.081) | .405 | .174 | .416 | (.349) |
| Distributions from net investment income | (.143) | (.150) | (.116) | (.139) | (.099) |
| Distributions from net realized gain | (.076) | (.095) | (.028) | (.007) | (.322) |
| Total distributions | (.219) | (.245) | (.144) | (.146) | (.421) |
| Net asset value, end of period | $10.36 | $10.66 | $10.50 | $10.47 | $10.20 |
| Total ReturnB,C | (.73)% | 3.92% | 1.67% | 4.10% | (3.29)% |
| Ratios to Average Net AssetsD,E | | | | | |
| Expenses before reductions | .77% | .76% | .77% | .77% | .77% |
| Expenses net of fee waivers, if any | .77% | .76% | .77% | .77% | .77% |
| Expenses net of all reductions | .77% | .76% | .77% | .77% | .77% |
| Net investment income (loss) | 1.44% | 1.28% | 1.20% | 1.34% | .99% |
| Supplemental Data | | | | | |
| Net assets, end of period (in millions) | $174 | $261 | $222 | $246 | $291 |
| Portfolio turnover rateF | 157% | 93% | 83% | 131% | 192% |
A Calculated based on average shares outstanding during the period.
B Total returns would have been lower if certain expenses had not been reduced during the applicable periods shown.
C Total returns do not include the effect of the sales charges.
D Fees and expenses of any underlying Fidelity Central Funds are not included in the Fund's expense ratio. The Fund indirectly bears its proportionate share of the expenses of any underlying Fidelity Central Funds. Based on their most recent shareholder report date, the expenses of any underlying non-money market Fidelity Central Funds were less than .005%.
E Expense ratios reflect operating expenses of the class. Expenses before reductions do not reflect amounts reimbursed by the investment adviser or reductions from expense offset arrangements and do not represent the amount paid by the class during periods when reimbursements or reductions occur. Expenses net of fee waivers reflect expenses after reimbursement by the investment adviser but prior to reductions from expense offset arrangements. Expenses net of all reductions represent the net expenses paid by the class.
F Amount does not include the portfolio activity of any underlying Fidelity Central Funds.
See accompanying notes which are an integral part of the financial statements.
Financial Highlights — Fidelity Government Income Fund Class M
| Years ended August 31, | 2017 | 2016 | 2015 | 2014 | 2013 |
| Selected Per–Share Data | | | | | |
| Net asset value, beginning of period | $10.66 | $10.50 | $10.47 | $10.20 | $10.97 |
| Income from Investment Operations | | | | | |
| Net investment income (loss)A | .149 | .135 | .127 | .140 | .107 |
| Net realized and unrealized gain (loss) | (.229) | .270 | .048 | .277 | (.454) |
| Total from investment operations | (.080) | .405 | .175 | .417 | (.347) |
| Distributions from net investment income | (.144) | (.150) | (.117) | (.140) | (.101) |
| Distributions from net realized gain | (.076) | (.095) | (.028) | (.007) | (.322) |
| Total distributions | (.220) | (.245) | (.145) | (.147) | (.423) |
| Net asset value, end of period | $10.36 | $10.66 | $10.50 | $10.47 | $10.20 |
| Total ReturnB,C | (.73)% | 3.92% | 1.68% | 4.12% | (3.27)% |
| Ratios to Average Net AssetsD,E | | | | | |
| Expenses before reductions | .76% | .76% | .76% | .76% | .75% |
| Expenses net of fee waivers, if any | .76% | .76% | .76% | .76% | .75% |
| Expenses net of all reductions | .76% | .76% | .76% | .76% | .75% |
| Net investment income (loss) | 1.44% | 1.28% | 1.20% | 1.36% | 1.01% |
| Supplemental Data | | | | | |
| Net assets, end of period (in millions) | $157 | $197 | $181 | $196 | $228 |
| Portfolio turnover rateF | 157% | 93% | 83% | 131% | 192% |
A Calculated based on average shares outstanding during the period.
B Total returns would have been lower if certain expenses had not been reduced during the applicable periods shown.
C Total returns do not include the effect of the sales charges.
D Fees and expenses of any underlying Fidelity Central Funds are not included in the Fund's expense ratio. The Fund indirectly bears its proportionate share of the expenses of any underlying Fidelity Central Funds. Based on their most recent shareholder report date, the expenses of any underlying non-money market Fidelity Central Funds were less than .005%.
E Expense ratios reflect operating expenses of the class. Expenses before reductions do not reflect amounts reimbursed by the investment adviser or reductions from expense offset arrangements and do not represent the amount paid by the class during periods when reimbursements or reductions occur. Expenses net of fee waivers reflect expenses after reimbursement by the investment adviser but prior to reductions from expense offset arrangements. Expenses net of all reductions represent the net expenses paid by the class.
F Amount does not include the portfolio activity of any underlying Fidelity Central Funds.
See accompanying notes which are an integral part of the financial statements.
Financial Highlights — Fidelity Government Income Fund Class C
| Years ended August 31, | 2017 | 2016 | 2015 | 2014 | 2013 |
| Selected Per–Share Data | | | | | |
| Net asset value, beginning of period | $10.66 | $10.50 | $10.47 | $10.20 | $10.96 |
| Income from Investment Operations | | | | | |
| Net investment income (loss)A | .069 | .053 | .044 | .059 | .025 |
| Net realized and unrealized gain (loss) | (.229) | .270 | .048 | .278 | (.443) |
| Total from investment operations | (.160) | .323 | .092 | .337 | (.418) |
| Distributions from net investment income | (.064) | (.068) | (.034) | (.060) | (.020) |
| Distributions from net realized gain | (.076) | (.095) | (.028) | (.007) | (.322) |
| Total distributions | (.140) | (.163) | (.062) | (.067) | (.342) |
| Net asset value, end of period | $10.36 | $10.66 | $10.50 | $10.47 | $10.20 |
| Total ReturnB,C | (1.49)% | 3.12% | .88% | 3.32% | (3.93)% |
| Ratios to Average Net AssetsD,E | | | | | |
| Expenses before reductions | 1.54% | 1.54% | 1.55% | 1.54% | 1.52% |
| Expenses net of fee waivers, if any | 1.54% | 1.54% | 1.55% | 1.54% | 1.52% |
| Expenses net of all reductions | 1.54% | 1.54% | 1.55% | 1.54% | 1.52% |
| Net investment income (loss) | .67% | .50% | .42% | .57% | .24% |
| Supplemental Data | | | | | |
| Net assets, end of period (in millions) | $72 | $94 | $54 | $58 | $73 |
| Portfolio turnover rateF | 157% | 93% | 83% | 131% | 192% |
A Calculated based on average shares outstanding during the period.
B Total returns would have been lower if certain expenses had not been reduced during the applicable periods shown.
C Total returns do not include the effect of the contingent deferred sales charge.
D Fees and expenses of any underlying Fidelity Central Funds are not included in the Fund's expense ratio. The Fund indirectly bears its proportionate share of the expenses of any underlying Fidelity Central Funds. Based on their most recent shareholder report date, the expenses of any underlying non-money market Fidelity Central Funds were less than .005%.
E Expense ratios reflect operating expenses of the class. Expenses before reductions do not reflect amounts reimbursed by the investment adviser or reductions from expense offset arrangements and do not represent the amount paid by the class during periods when reimbursements or reductions occur. Expenses net of fee waivers reflect expenses after reimbursement by the investment adviser but prior to reductions from expense offset arrangements. Expenses net of all reductions represent the net expenses paid by the class.
F Amount does not include the portfolio activity of any underlying Fidelity Central Funds.
See accompanying notes which are an integral part of the financial statements.
Financial Highlights — Fidelity Government Income Fund
| Years ended August 31, | 2017 | 2016 | 2015 | 2014 | 2013 |
| Selected Per–Share Data | | | | | |
| Net asset value, beginning of period | $10.65 | $10.48 | $10.45 | $10.18 | $10.95 |
| Income from Investment Operations | | | | | |
| Net investment income (loss)A | .181 | .167 | .159 | .171 | .138 |
| Net realized and unrealized gain (loss) | (.229) | .281 | .048 | .278 | (.453) |
| Total from investment operations | (.048) | .448 | .207 | .449 | (.315) |
| Distributions from net investment income | (.176) | (.183) | (.149) | (.172) | (.133) |
| Distributions from net realized gain | (.076) | (.095) | (.028) | (.007) | (.322) |
| Total distributions | (.252) | (.278) | (.177) | (.179) | (.455) |
| Net asset value, end of period | $10.35 | $10.65 | $10.48 | $10.45 | $10.18 |
| Total ReturnB | (.42)% | 4.35% | 1.99% | 4.45% | (2.99)% |
| Ratios to Average Net AssetsC,D | | | | | |
| Expenses before reductions | .45% | .45% | .45% | .45% | .45% |
| Expenses net of fee waivers, if any | .45% | .45% | .45% | .45% | .45% |
| Expenses net of all reductions | .45% | .45% | .45% | .45% | .45% |
| Net investment income (loss) | 1.76% | 1.59% | 1.51% | 1.66% | 1.31% |
| Supplemental Data | | | | | |
| Net assets, end of period (in millions) | $3,467 | $3,896 | $3,489 | $3,157 | $3,412 |
| Portfolio turnover rateE | 157% | 93% | 83% | 131% | 192% |
A Calculated based on average shares outstanding during the period.
B Total returns would have been lower if certain expenses had not been reduced during the applicable periods shown.
C Fees and expenses of any underlying Fidelity Central Funds are not included in the Fund's expense ratio. The Fund indirectly bears its proportionate share of the expenses of any underlying Fidelity Central Funds. Based on their most recent shareholder report date, the expenses of any underlying non-money market Fidelity Central Funds were less than .005%.
D Expense ratios reflect operating expenses of the class. Expenses before reductions do not reflect amounts reimbursed by the investment adviser or reductions from expense offset arrangements and do not represent the amount paid by the class during periods when reimbursements or reductions occur. Expenses net of fee waivers reflect expenses after reimbursement by the investment adviser but prior to reductions from expense offset arrangements. Expenses net of all reductions represent the net expenses paid by the class.
E Amount does not include the portfolio activity of any underlying Fidelity Central Funds.
See accompanying notes which are an integral part of the financial statements.
Financial Highlights — Fidelity Government Income Fund Class I
| Years ended August 31, | 2017 | 2016 | 2015 | 2014 | 2013 |
| Selected Per–Share Data | | | | | |
| Net asset value, beginning of period | $10.66 | $10.50 | $10.47 | $10.20 | $10.97 |
| Income from Investment Operations | | | | | |
| Net investment income (loss)A | .177 | .162 | .154 | .166 | .133 |
| Net realized and unrealized gain (loss) | (.230) | .271 | .048 | .277 | (.454) |
| Total from investment operations | (.053) | .433 | .202 | .443 | (.321) |
| Distributions from net investment income | (.171) | (.178) | (.144) | (.166) | (.127) |
| Distributions from net realized gain | (.076) | (.095) | (.028) | (.007) | (.322) |
| Total distributions | (.247) | (.273) | (.172) | (.173) | (.449) |
| Net asset value, end of period | $10.36 | $10.66 | $10.50 | $10.47 | $10.20 |
| Total ReturnB | (.46)% | 4.19% | 1.94% | 4.38% | (3.03)% |
| Ratios to Average Net AssetsC,D | | | | | |
| Expenses before reductions | .49% | .50% | .50% | .51% | .51% |
| Expenses net of fee waivers, if any | .49% | .50% | .50% | .51% | .51% |
| Expenses net of all reductions | .49% | .50% | .50% | .51% | .51% |
| Net investment income (loss) | 1.71% | 1.54% | 1.46% | 1.61% | 1.26% |
| Supplemental Data | | | | | |
| Net assets, end of period (in millions) | $496 | $494 | $412 | $298 | $296 |
| Portfolio turnover rateE | 157% | 93% | 83% | 131% | 192% |
A Calculated based on average shares outstanding during the period.
B Total returns would have been lower if certain expenses had not been reduced during the applicable periods shown.
C Fees and expenses of any underlying Fidelity Central Funds are not included in the Fund's expense ratio. The Fund indirectly bears its proportionate share of the expenses of any underlying Fidelity Central Funds. Based on their most recent shareholder report date, the expenses of any underlying non-money market Fidelity Central Funds were less than .005%.
D Expense ratios reflect operating expenses of the class. Expenses before reductions do not reflect amounts reimbursed by the investment adviser or reductions from expense offset arrangements and do not represent the amount paid by the class during periods when reimbursements or reductions occur. Expenses net of fee waivers reflect expenses after reimbursement by the investment adviser but prior to reductions from expense offset arrangements. Expenses net of all reductions represent the net expenses paid by the class.
E Amount does not include the portfolio activity of any underlying Fidelity Central Funds.
See accompanying notes which are an integral part of the financial statements.
Notes to Financial Statements
For the period ended August 31, 2017
(Amounts in thousands except percentages)
1. Organization.
Fidelity Government Income Fund (the Fund) is a fund of Fidelity Income Fund (the Trust) and is authorized to issue an unlimited number of shares. The Trust is registered under the Investment Company Act of 1940, as amended (the 1940 Act), as an open-end management investment company organized as a Massachusetts business trust. The Fund offers Class A, Class M (formerly Class T), Class C, Government Income and Class I shares, each of which has equal rights as to assets and voting privileges. Each class has exclusive voting rights with respect to matters that affect that class.
After the close of business on June 24, 2016, all outstanding Class B shares were converted to Class A shares. All prior fiscal period dollar and share amounts for Class B presented in the Notes to Financial Statements are for the period September 1, 2015 through June 24, 2016.
2. Investments in Fidelity Central Funds.
The Fund invests in Fidelity Central Funds, which are open-end investment companies generally available only to other investment companies and accounts managed by the investment adviser and its affiliates. The Fund's Schedule of Investments lists each of the Fidelity Central Funds held as of period end, if any, as an investment of the Fund, but does not include the underlying holdings of each Fidelity Central Fund. As an Investing Fund, the Fund indirectly bears its proportionate share of the expenses of the underlying Fidelity Central Funds.
Based on its investment objective, each Fidelity Central Fund may invest or participate in various investment vehicles or strategies that are similar to those of the Fund. These strategies are consistent with the investment objectives of the Fund and may involve certain economic risks which may cause a decline in value of each of the Fidelity Central Funds and thus a decline in the value of the Fund. The Money Market Central Funds seek preservation of capital and current income and are managed by Fidelity Investments Money Management, Inc. (FIMM), an affiliate of the investment adviser. Annualized expenses of the Money Market Central Funds as of their most recent shareholder report date are less than .005%. The following summarizes the Fund's investment in each non-money market Fidelity Central Fund.
| Fidelity Central Fund | Investment Manager | Investment Objective | Investment Practices | Expense Ratio(a) |
| Fidelity Mortgage Backed Securities Central Fund | FIMM | Seeks a high level of income by normally investing in investment-grade mortgage-related securities and repurchase agreements for those securities. | Delayed Delivery & When Issued Securities
Futures
Swap Agreements
| Less than .005% |
(a) Expenses expressed as a percentage of average net assets and are as of each underlying Central Fund's most recent annual or semi-annual shareholder report.
An unaudited holdings listing for the Fund, which presents direct holdings as well as the pro-rata share of any securities and other investments held indirectly through its investment in underlying non-money market Fidelity Central Funds, is available at fidelity.com and/or institutional.fidelity.com, as applicable. A complete unaudited list of holdings for each Fidelity Central Fund is available upon request or at the Securities and Exchange Commission (the SEC) website at www.sec.gov. In addition, the financial statements of the Fidelity Central Funds which contain the significant accounting policies (including investment valuation policies) of those funds, which are not covered by the Fund's Report of Independent Registered Public Accounting Firm, are available on the SEC website or upon request.
3. Significant Accounting Policies.
The Fund is an investment company and applies the accounting and reporting guidance of the Financial Accounting Standards Board (FASB) Accounting Standards Codification Topic 946 Financial Services – Investments Companies. The financial statements have been prepared in conformity with accounting principles generally accepted in the United States of America (GAAP), which require management to make certain estimates and assumptions at the date of the financial statements. Actual results could differ from those estimates. Subsequent events, if any, through the date that the financial statements were issued have been evaluated in the preparation of the financial statements. The following summarizes the significant accounting policies of the Fund:
Investment Valuation. Investments are valued as of 4:00 p.m. Eastern time on the last calendar day of the period. The Board of Trustees (the Board) has delegated the day to day responsibility for the valuation of the Fund's investments to the Fair Value Committee (the Committee) established by the Fund's investment adviser. In accordance with valuation policies and procedures approved by the Board, the Fund attempts to obtain prices from one or more third party pricing vendors or brokers to value its investments. When current market prices, quotations or currency exchange rates are not readily available or reliable, investments will be fair valued in good faith by the Committee, in accordance with procedures adopted by the Board. Factors used in determining fair value vary by investment type and may include market or investment specific events, changes in interest rates and credit quality. The frequency with which these procedures are used cannot be predicted and they may be utilized to a significant extent. The Committee oversees the Fund's valuation policies and procedures and reports to the Board on the Committee's activities and fair value determinations. The Board monitors the appropriateness of the procedures used in valuing the Fund's investments and ratifies the fair value determinations of the Committee.
The Fund categorizes the inputs to valuation techniques used to value its investments into a disclosure hierarchy consisting of three levels as shown below:
- Level 1 – quoted prices in active markets for identical investments
- Level 2 – other significant observable inputs (including quoted prices for similar investments, interest rates, prepayment speeds, etc.)
- Level 3 – unobservable inputs (including the Fund's own assumptions based on the best information available)
Valuation techniques used to value the Fund's investments by major category are as follows:
Debt securities, including restricted securities, are valued based on evaluated prices received from third party pricing vendors or from brokers who make markets in such securities. Foreign government and government agency obligations and U.S. government and government agency obligations are valued by pricing vendors who utilize matrix pricing which considers yield or price of bonds of comparable quality, coupon, maturity and type or by broker-supplied prices. Asset backed securities, collateralized mortgage obligations, commercial mortgage securities and U.S. government agency mortgage securities are valued by pricing vendors who utilize matrix pricing which considers prepayment speed assumptions, attributes of the collateral, yield or price of bonds of comparable quality, coupon, maturity and type or by broker-supplied prices. Swaps are marked-to-market daily based on valuations from third party pricing vendors, registered derivatives clearing organizations (clearinghouses) or broker-supplied valuations. These pricing sources may utilize inputs such as interest rate curves, credit spread curves, default possibilities and recovery rates. When independent prices are unavailable or unreliable, debt securities and swaps may be valued utilizing pricing methodologies which consider similar factors that would be used by third party pricing vendors. Debt securities and swaps are generally categorized as Level 2 in the hierarchy but may be Level 3 depending on the circumstances.
Futures contracts are valued at the settlement price established each day by the board of trade or exchange on which they are traded and are categorized as Level 1 in the hierarchy. Options traded over-the-counter are valued using vendor or broker-supplied valuations and are categorized as Level 2 in the hierarchy. Investments in open-end mutual funds, including the Fidelity Central Funds, are valued at their closing net asset value (NAV) each business day and are categorized as Level 1 in the hierarchy.
Changes in valuation techniques may result in transfers in or out of an assigned level within the disclosure hierarchy. The aggregate value of investments by input level as of August 31, 2017, is included at the end of the Fund's Schedule of Investments.
Investment Transactions and Income. For financial reporting purposes, the Fund's investment holdings and NAV include trades executed through the end of the last business day of the period. The NAV per share for processing shareholder transactions is calculated as of the close of business of the New York Stock Exchange (NYSE), normally 4:00 p.m. Eastern time and includes trades executed through the end of the prior business day. Gains and losses on securities sold are determined on the basis of identified cost. Income and capital gain distributions from Fidelity Central Funds, if any, are recorded on the ex-dividend date. Interest income is accrued as earned and includes coupon interest and amortization of premium and accretion of discount on debt securities as applicable. The principal amount on inflation-indexed securities is periodically adjusted to the rate of inflation and interest is accrued based on the principal amount. The adjustments to principal due to inflation are reflected as increases or decreases to Interest in the accompanying Statement of Operations.
Class Allocations and Expenses. Investment income, realized and unrealized capital gains and losses, common expenses of the Fund, and certain fund-level expense reductions, if any, are allocated daily on a pro-rata basis to each class based on the relative net assets of each class to the total net assets of the Fund. Each class differs with respect to transfer agent and distribution and service plan fees incurred. Certain expense reductions may also differ by class. For the reporting period, the allocated portion of income and expenses to each class as a percent of its average net assets may vary due to the timing of recording these transactions in relation to fluctuating net assets of the classes. Expenses directly attributable to a fund are charged to that fund. Expenses attributable to more than one fund are allocated among the respective funds on the basis of relative net assets or other appropriate methods. Expense estimates are accrued in the period to which they relate and adjustments are made when actual amounts are known.
Deferred Trustee Compensation. Under a Deferred Compensation Plan (the Plan), independent Trustees may elect to defer receipt of a portion of their annual compensation. Deferred amounts are invested in a cross-section of Fidelity funds, are marked-to-market and remain in the Fund until distributed in accordance with the Plan. The investment of deferred amounts and the offsetting payable to the Trustees are included in the accompanying Statement of Assets and Liabilities.
Income Tax Information and Distributions to Shareholders. Each year, the Fund intends to qualify as a regulated investment company under Subchapter M of the Internal Revenue Code, including distributing substantially all of its taxable income and realized gains. As a result, no provision for U.S. Federal income taxes is required. As of August 31, 2017, the Fund did not have any unrecognized tax benefits in the financial statements; nor is the Fund aware of any tax positions for which it is reasonably possible that the total amounts of unrecognized tax benefits will significantly change in the next twelve months. The Fund files a U.S. federal tax return, in addition to state and local tax returns as required. The Fund's federal income tax returns are subject to examination by the Internal Revenue Service (IRS) for a period of three fiscal years after they are filed. State and local tax returns may be subject to examination for an additional fiscal year depending on the jurisdiction.
Dividends are declared and recorded daily and paid monthly from net investment income. Distributions from realized gains, if any, are declared and recorded on the ex-dividend date. Income dividends and capital gain distributions are declared separately for each class. Income and capital gain distributions are determined in accordance with income tax regulations, which may differ from GAAP.
Capital accounts within the financial statements are adjusted for permanent book-tax differences. These adjustments have no impact on net assets or the results of operations. Capital accounts are not adjusted for temporary book-tax differences which will reverse in a subsequent period.
Book-tax differences are primarily due to the short-term gain distributions from the Fidelity Central Funds, futures contracts, swaps, market discount, partnerships (including allocations from Fidelity Central Funds), deferred trustees compensation and losses deferred due to wash sales and excise tax regulations.
As of period end, the cost and unrealized appreciation (depreciation) in securities, and derivatives if applicable, for federal income tax purposes were as follows:
| Gross unrealized appreciation | $48,233 |
| Gross unrealized depreciation | (25,833) |
| Net unrealized appreciation (depreciation) | $22,400 |
| Tax Cost | $4,338,034 |
The tax-based components of distributable earnings as of period end were as follows:
| Net unrealized appreciation (depreciation) on securities and other investments | $22,400 |
The Fund intends to elect to defer to its next fiscal year $14,932 of capital losses recognized during the period November 1, 2016 to August 31, 2017.
The tax character of distributions paid was as follows:
| | August 31, 2017 | August 31, 2016 |
| Ordinary Income | $ 89,228 | $ 96,027 |
| Long-term Capital Gains | 20,207 | 21,425 |
| Total | $ 109,435 | $ 117,452 |
Delayed Delivery Transactions and When-Issued Securities. During the period, the Fund transacted in securities on a delayed delivery or when-issued basis. Payment and delivery may take place after the customary settlement period for that security. The price of the underlying securities and the date when the securities will be delivered and paid for are fixed at the time the transaction is negotiated. The securities purchased on a delayed delivery or when-issued basis are identified as such in the Fund's Schedule of Investments. The Fund may receive compensation for interest forgone in the purchase of a delayed delivery or when-issued security. With respect to purchase commitments, the Fund identifies securities as segregated in its records with a value at least equal to the amount of the commitment. Losses may arise due to changes in the value of the underlying securities or if the counterparty does not perform under the contract's terms, or if the issuer does not issue the securities due to political, economic, or other factors.
To-Be-Announced (TBA) Securities and Mortgage Dollar Rolls. During the period, the Fund transacted in TBA securities that involved buying or selling mortgage-backed securities (MBS) on a forward commitment basis. A TBA transaction typically does not designate the actual security to be delivered and only includes an approximate principal amount; however delivered securities must meet specified terms defined by industry guidelines, including issuer, rate and current principal amount outstanding on underlying mortgage pools. The Fund may enter into a TBA transaction with the intent to take possession of or deliver the underlying MBS, or the Fund may elect to extend the settlement by entering into either a mortgage or reverse mortgage dollar roll. Mortgage dollar rolls are transactions where a fund sells TBA securities and simultaneously agrees to repurchase MBS on a later date at a lower price and with the same counterparty. Reverse mortgage dollar rolls involve the purchase and simultaneous agreement to sell TBA securities on a later date at a lower price. Transactions in mortgage dollar rolls and reverse mortgage dollar rolls are accounted for as purchases and sales and may result in an increase to the Fund's portfolio turnover rate.
Purchases and sales of TBA securities involve risks similar to those discussed above for delayed delivery and when-issued securities. Also, if the counterparty in a mortgage dollar roll or a reverse mortgage dollar roll transaction files for bankruptcy or becomes insolvent, the Funds' right to repurchase or sell securities may be limited. Additionally, when a fund sells TBA securities without already owning or having the right to obtain the deliverable securities (an uncovered forward commitment to sell), it incurs a risk of loss because it could have to purchase the securities at a price that is higher than the price at which it sold them. A fund may be unable to purchase the deliverable securities if the corresponding market is illiquid.
TBA securities subject to a forward commitment to sell at period end are included at the end of the Fund's Schedule of Investments under the caption "TBA Sale Commitments." The proceeds and value of these commitments are reflected in the Fund's Statement of Assets and Liabilities as Receivable for TBA sale commitments and TBA sale commitments, at value, respectively.
Restricted Securities. The Fund may invest in securities that are subject to legal or contractual restrictions on resale. These securities generally may be resold in transactions exempt from registration or to the public if the securities are registered. Disposal of these securities may involve time-consuming negotiations and expense, and prompt sale at an acceptable price may be difficult. Information regarding restricted securities is included at the end of the Fund's Schedule of Investments.
New Accounting Pronouncement. In March 2017, the Financial Accounting Standards Board (FASB) issued an Accounting Standards Update (ASU), ASU 2017-08, which amends the amortization period for certain callable debt securities that are held at a premium. The amendment requires the premium to be amortized to the earliest call date. The amendments do not require an accounting change for securities held at a discount. The ASU is effective for annual periods beginning after December 15, 2018. Management is currently evaluating the potential impact of these changes to the financial statements.
4. Derivative Instruments.
Risk Exposures and the Use of Derivative Instruments. The Fund's investment objective allows the Fund to enter into various types of derivative contracts, including futures contracts, options and swaps. Derivatives are investments whose value is primarily derived from underlying assets, indices or reference rates and may be transacted on an exchange or over-the-counter (OTC). Derivatives may involve a future commitment to buy or sell a specified asset based on specified terms, to exchange future cash flows at periodic intervals based on a notional principal amount, or for one party to make one or more payments upon the occurrence of specified events in exchange for periodic payments from the other party.
The Fund used derivatives to increase returns, to gain exposure to certain types of assets and to manage exposure to certain risks as defined below. The success of any strategy involving derivatives depends on analysis of numerous economic factors, and if the strategies for investment do not work as intended, the Fund may not achieve its objectives.
The Fund's use of derivatives increased or decreased its exposure to the following risk:
| Interest Rate Risk | Interest rate risk relates to the fluctuations in the value of interest-bearing securities due to changes in the prevailing levels of market interest rates. |
The Fund is also exposed to additional risks from investing in derivatives, such as liquidity risk and counterparty credit risk. Liquidity risk is the risk that the Fund will be unable to close out the derivative in the open market in a timely manner. Counterparty credit risk is the risk that the counterparty will not be able to fulfill its obligation to the Fund. Derivative counterparty credit risk is managed through formal evaluation of the creditworthiness of all potential counterparties. On certain OTC derivatives such as options, the Fund attempts to reduce its exposure to counterparty credit risk by entering into an International Swaps and Derivatives Association, Inc. (ISDA) Master Agreement with each of its counterparties. The ISDA Master Agreement gives the Fund the right to terminate all transactions traded under such agreement upon the deterioration in the credit quality of the counterparty beyond specified levels. The ISDA Master Agreement gives each party the right, upon an event of default by the other party or a termination of the agreement, to close out all transactions traded under such agreement and to net amounts owed under each transaction to one net payable by one party to the other. To mitigate counterparty credit risk on bi-lateral OTC derivatives, the Fund receives collateral in the form of cash or securities once the Fund's net unrealized appreciation on outstanding derivative contracts under an ISDA Master Agreement exceeds certain applicable thresholds, subject to certain minimum transfer provisions. The collateral received is held in segregated accounts with the Fund's custodian bank in accordance with the collateral agreements entered into between the Fund, the counterparty and the Fund's custodian bank. The Fund could experience delays and costs in gaining access to the collateral even though it is held by the Fund's custodian bank. The Fund's maximum risk of loss from counterparty credit risk related to bi-lateral OTC derivatives is generally the aggregate unrealized appreciation and unpaid counterparty payments in excess of any collateral pledged by the counterparty to the Fund. For OTC written options with upfront premiums received, the Fund is obligated to perform and therefore does not have counterparty risk. For OTC written options with premiums to be received at a future date, the maximum risk of loss from counterparty credit risk is the amount of the premium in excess of any collateral pledged by the counterparty. The Fund may be required to pledge collateral for the benefit of the counterparties on bi-lateral OTC derivatives in an amount not less than each counterparty's unrealized appreciation on outstanding derivative contracts, subject to certain minimum transfer provisions, and any such pledged collateral is identified in the Schedule of Investments. Exchange-traded futures contracts are not covered by the ISDA Master Agreement; however counterparty credit risk related to exchange-traded futures contracts may be mitigated by the protection provided by the exchange on which they trade. Counterparty credit risk related to centrally cleared OTC swaps may be mitigated by the protection provided by the clearinghouse.
Investing in derivatives may involve greater risks than investing in the underlying assets directly and, to varying degrees, may involve risk of loss in excess of any initial investment and collateral received and amounts recognized in the Statement of Assets and Liabilities. In addition, there may be the risk that the change in value of the derivative contract does not correspond to the change in value of the underlying instrument.
Net Realized Gain (Loss) and Change in Net Unrealized Appreciation (Depreciation) on Derivatives. The table below, which reflects the impacts of derivatives on the financial performance of the Fund, summarizes the net realized gain (loss) and change in net unrealized appreciation (depreciation) for derivatives during the period as presented in the Statement of Operations.
| Primary Risk Exposure / Derivative Type | Net Realized Gain (Loss) | Change in Net Unrealized Appreciation (Depreciation) |
| Interest Rate Risk | | |
| Futures Contracts | $661 | $566 |
| Purchased Swaptions | – | – |
| Swaps | (1,365) | (449) |
| Totals | $(704) | $117 |
A summary of the value of derivatives by primary risk exposure as of period end is included at the end of the Schedule of Investments.
Futures Contracts. A futures contract is an agreement between two parties to buy or sell a specified underlying instrument for a fixed price at a specified future date. The Fund used futures contracts to manage its exposure to the bond market and fluctuations in interest rates.
Upon entering into a futures contract, a fund is required to deposit either cash or securities (initial margin) with a clearing broker in an amount equal to a certain percentage of the face value of the contract. Futures contracts are marked-to-market daily and subsequent daily payments (variation margin) are made or received by a fund depending on the daily fluctuations in the value of the futures contracts and are recorded as unrealized appreciation or (depreciation). This receivable and/or payable, if any, is included in daily variation margin on futures contracts in the Statement of Assets and Liabilities. Realized gain or (loss) is recorded upon the expiration or closing of a futures contract. The net realized gain (loss) and change in net unrealized appreciation (depreciation) on futures contracts during the period is included in the Statement of Operations.
Any open futures contracts at period end are presented in the Schedule of Investments under the caption "Futures Contracts". The underlying face amount at value reflects each contract's exposure to the underlying instrument or index at period end and is representative of volume of activity during the period. Securities deposited to meet initial margin requirements are identified in the Schedule of Investments.
Options. Options give the purchaser the right, but not the obligation, to buy (call) or sell (put) an underlying security or financial instrument at an agreed exercise or strike price between or on certain dates. Options obligate the seller (writer) to buy (put) or sell (call) an underlying instrument at the exercise or strike price or cash settle an underlying derivative instrument if the holder exercises the option on or before the expiration date. The Fund uses OTC options, such as swaptions, which are options where the underlying instrument is a swap, to manage its exposure to fluctuations in interest rates.
Upon entering into an options contract, a fund will pay or receive a premium. Premiums paid on purchased options are reflected as cost of investments and premiums received on written options are reflected as a liability on the Statement of Assets and Liabilities. Certain options may be purchased or written with premiums to be paid or received on a future date. Options are valued daily and any unrealized appreciation (depreciation) is reflected on the Statement of Assets and Liabilities. When an option is exercised, the cost or proceeds of the underlying instrument purchased or sold is adjusted by the amount of the premium. When an option is closed the Fund will realize a gain or loss depending on whether the proceeds or amount paid for the closing sale transaction is greater or less than the premium received or paid. When an option expires, gains and losses are realized to the extent of premiums received and paid, respectively. The net realized and unrealized gains (losses) on purchased options are included on the Statement of Operations in net realized gain (loss) and change in net unrealized appreciation (depreciation) on investment securities. The net realized gain (loss) and change in net unrealized appreciation (depreciation) on written options are reflected separately on the Statement of Operations.
Any open options at period end are presented in the Schedule of Investments under the captions "Purchased Options," "Purchased Swaptions," "Written Options" and "Written Swaptions," as applicable, and are representative of volume of activity during the period.
Writing puts and buying calls tend to increase exposure to the underlying instrument while buying puts and writing calls tend to decrease exposure to the underlying instrument. For purchased options, risk of loss is limited to the premium paid, and for written options, risk of loss is the change in value in excess of the premium received.
Swaps. A swap is a contract between two parties to exchange future cash flows at periodic intervals based on a notional principal amount. A centrally cleared OTC swap is a transaction executed between a fund and a dealer counterparty, then cleared by a futures commission merchant (FCM) through a clearinghouse. Once cleared, the clearinghouse serves as a central counterparty, with whom a fund exchanges cash flows for the life of the transaction, similar to transactions in futures contracts.
Centrally cleared OTC swaps require a fund to deposit either cash or securities (initial margin) with the FCM, at the instruction of and for the benefit of the clearinghouse. Securities deposited to meet initial margin requirements are identified in the Schedule of Investments. Centrally cleared OTC swaps are marked-to-market daily and subsequent payments (variation margin) are made or received depending on the daily fluctuations in the value of the swaps and are recorded as unrealized appreciation or (depreciation). These daily payments, if any, are included in receivable or payable for daily variation margin on centrally cleared OTC swaps in the Statement of Assets and Liabilities. Any premiums for centrally cleared OTC swaps are recorded periodically throughout the term of the swap to variation margin and included in unrealized appreciation (depreciation) in the Statement of Assets and Liabilities. Any premiums are recognized as realized gain (loss) upon termination or maturity of the swap.
Payments are exchanged at specified intervals, accrued daily commencing with the effective date of the contract and recorded as realized gain or (loss). Some swaps may be terminated prior to the effective date and realize a gain or loss upon termination. The net realized gain (loss) and change in net unrealized appreciation (depreciation) on swaps during the period is included in the Statement of Operations.
Any open swaps at period end are included in the Schedule of Investments under the caption "Swaps" and are representative of volume of activity during the period.
Interest Rate Swaps. Interest rate swaps are agreements between counterparties to exchange cash flows, one based on a fixed rate, and the other on a floating rate. The Fund entered into interest rate swaps to manage its exposure to interest rate changes. Changes in interest rates can have an effect on both the value of bond holdings as well as the amount of interest income earned. In general, the value of bonds can fall when interest rates rise and can rise when interest rates fall.
5. Purchases and Sales of Investments.
Purchases and sales of securities (including the Fixed-Income Central Funds), other than short-term securities and U.S. government securities, aggregated $133,943 and $349,643, respectively.
6. Fees and Other Transactions with Affiliates.
Management Fee and Expense Contract. Fidelity Management & Research Company (the investment adviser) and its affiliates provide the Fund with investment management related services for which the Fund pays a monthly management fee. The management fee is the sum of an individual fund fee rate that is based on an annual rate of .20% of the Fund's average net assets and an annualized group fee rate that averaged .11% during the period. The group fee rate is based upon the average net assets of all the mutual funds advised by the investment adviser, including any mutual funds previously advised by the investment adviser that are currently advised by Fidelity SelectCo, LLC, an affiliate of the investment adviser. The group fee rate decreases as assets under management increase and increases as assets under management decrease. For the reporting period, the total annual management fee rate was .31% of the Fund's average net assets.
In addition, under the expense contract, the investment adviser pays class-level expenses for Government Income, so that the total expenses, except the compensation of the independent Trustees and certain other expenses such as interest expense, including commitment fees do not exceed .45% of the Class' average net assets. This agreement does not apply to any of the other classes and any change or modification that would increase expenses can only be made with shareholder approval.
Distribution and Service Plan Fees. In accordance with Rule 12b-1 of the 1940 Act, the Fund has adopted separate Distribution and Service Plans for each class of shares. Certain classes pay Fidelity Distributors Corporation (FDC), an affiliate of the investment adviser, separate Distribution and Service Fees, each of which is based on an annual percentage of each class' average net assets. In addition, FDC may pay financial intermediaries for selling shares of the Fund and providing shareholder support services. For the period, the Distribution and Service Fee rates, total fees and amounts retained by FDC were as follows:
| | Distribution
Fee | Service
Fee | Total Fees | Retained
by FDC |
| Class A | -% | .25% | $543 | $9 |
| Class M | -% | .25% | 424 | 1 |
| Class C | .75% | .25% | 805 | 143 |
| | | | $1,772 | $153 |
Sales Load. FDC may receive a front-end sales charge of up to 4.00% for selling Class A shares and Class M shares, some of which is paid to financial intermediaries for selling shares of the Fund. Depending on the holding period, FDC may receive contingent deferred sales charges levied on Class A, Class M and Class C redemptions. The deferred sales charges are 1.00% for Class C shares, .75% for certain purchases of Class A shares and .25% for certain purchases of Class M shares.
For the period, sales charge amounts retained by FDC were as follows:
| | Retained
by FDC |
| Class A | $24 |
| Class M | 3 |
| Class C(a) | 12 |
| | $39 |
(a) When Class C shares are initially sold, FDC pays commissions from its own resources to financial intermediaries through which the sales are made.
Transfer Agent Fees. Fidelity Investments Institutional Operations Company, Inc., (FIIOC), an affiliate of the investment adviser, is the transfer, dividend disbursing and shareholder servicing agent for each class of the Fund. FIIOC receives account fees and asset-based fees that vary according to the account size and type of account of the shareholders of each respective class of the Fund, with the exception of Government Income. FIIOC receives an asset-based fee of .10% of Government Income's average net assets. FIIOC pays for typesetting, printing and mailing of shareholder reports, except proxy statements. For the period, transfer agent fees for each class were as follows:
| | Amount | % of
Class-Level Average
Net Assets |
| Class A | $360 | .17 |
| Class M | 274 | .16 |
| Class C | 150 | .19 |
| Government Income | 3,561 | .10 |
| Class I | 687 | .14 |
| | $5,032 | |
Fund Wide Operations Fee. Pursuant to the Fund Wide Operations and Expense Agreement (FWOE), the investment adviser has agreed to provide for fund level expenses (which do not include transfer agent, Rule 12b-1 fees, compensation of the independent Trustees, interest (including commitment fees), taxes or extraordinary expenses, if any) in return for a FWOE fee equal to .35% of the Fund's average net assets less the total amount of the management fee. The FWOE paid by the Fund is reduced by an amount equal to the fees and expenses paid to the independent Trustees. For the period, the FWOE fee was equivalent to an annual rate of .04% of average net assets.
Interfund Trades. The Fund may purchase from or sell securities to other Fidelity Funds under procedures adopted by the Board. The procedures have been designed to ensure these interfund trades are executed in accordance with Rule 17a-7 of the 1940 Act. Interfund trades are included within the respective purchases and sales amounts shown in the Purchases and Sales of Investments note.
7. Committed Line of Credit.
The Fund participates with other funds managed by the investment adviser or an affiliate in a $4.25 billion credit facility (the "line of credit") to be utilized for temporary or emergency purposes to fund shareholder redemptions or for other short-term liquidity purposes. The Fund has agreed to pay commitment fees on its pro-rata portion of the line of credit, which amounted to $15 and is reflected in Miscellaneous expenses on the Statement of Operations. During the period, the Fund did not borrow on this line of credit.
8. Security Lending.
The Fund lends portfolio securities from time to time in order to earn additional income. On the settlement date of the loan, the Fund receives collateral (in the form of U.S. Treasury obligations, letters of credit and/or cash) against the loaned securities and maintains collateral in an amount not less than 100% of the market value of the loaned securities during the period of the loan. The market value of the loaned securities is determined at the close of business of the Fund and any additional required collateral is delivered to the Fund on the next business day. The Fund or borrower may terminate the loan at any time, and if the borrower defaults on its obligation to return the securities loaned because of insolvency or other reasons, the Fund may apply collateral received from the borrower against the obligation. The Fund may experience delays and costs in recovering the securities loaned. Any cash collateral received is maintained at the Fund's custodian and/or invested in cash equivalents. At period end, there were no security loans outstanding. Security lending income represents the income earned on investing cash collateral, less rebates paid to borrowers, plus any premium payments received for lending certain types of securities. Security lending income is presented in the Statement of Operations as a component of interest income. Total security lending income during the period amounted to $165.
9. Expense Reductions.
Through arrangements with the Fund's custodian, credits realized as a result of certain uninvested cash balances were used to reduce the Fund's expenses. During the period, these credits reduced the Fund's expenses $11.
10. Distributions to Shareholders.
Distributions to shareholders of each class were as follows:
| | Year ended August 31, 2017 | Year ended August 31, 2016 |
| From net investment income | | |
| Class A | $3,003 | $3,406 |
| Class M | 2,353 | 2,723 |
| Class B | – | 26 |
| Class C | 492 | 480 |
| Government Income | 60,593 | 63,334 |
| Class I | 8,038 | 7,579 |
| Total | $74,479 | $77,548 |
| From net realized gain | | |
| Class A | $1,831 | $2,025 |
| Class M | 1,339 | 1,660 |
| Class B | – | 49 |
| Class C | 658 | 503 |
| Government Income | 27,600 | 31,846 |
| Class I | 3,528 | 3,821 |
| Total | $34,956 | $39,904 |
11. Share Transactions.
Share transactions for each class were as follows and may contain automatic conversions between classes or exchanges between affiliated funds:
| | Shares | Shares | Dollars | Dollars |
| | Year ended August 31, 2017 | Year ended August 31, 2016 | Year ended August 31, 2017 | Year ended August 31, 2016 |
| Class A | | | | |
| Shares sold | 4,084 | 12,026 | $42,226 | $126,485 |
| Reinvestment of distributions | 450 | 498 | 4,652 | 5,224 |
| Shares redeemed | (12,230) | (9,122) | (125,628) | (95,982) |
| Net increase (decrease) | (7,696) | 3,402 | $(78,750) | $35,727 |
| Class M | | | | |
| Shares sold | 3,752 | 6,849 | $38,695 | $71,986 |
| Reinvestment of distributions | 338 | 404 | 3,499 | 4,234 |
| Shares redeemed | (7,416) | (6,031) | (76,589) | (63,433) |
| Net increase (decrease) | (3,326) | 1,222 | $(34,395) | $12,787 |
| Class B | | | | |
| Shares sold | – | 17 | $– | $174 |
| Reinvestment of distributions | – | 6 | – | 62 |
| Shares redeemed | – | (584) | – | (6,152) |
| Net increase (decrease) | – | (561) | $– | $(5,916) |
| Class C | | | | |
| Shares sold | 1,245 | 5,790 | $12,880 | $60,776 |
| Reinvestment of distributions | 102 | 81 | 1,056 | 844 |
| Shares redeemed | (3,261) | (2,223) | (33,484) | (23,431) |
| Net increase (decrease) | (1,914) | 3,648 | $(19,548) | $38,189 |
| Government Income | | | | |
| Shares sold | 78,457 | 91,465 | $805,428 | $961,380 |
| Reinvestment of distributions | 8,206 | 8,754 | 84,659 | 91,724 |
| Shares redeemed | (117,437) | (67,217) | (1,203,566) | (705,341) |
| Net increase (decrease) | (30,774) | 33,002 | $(313,479) | $347,763 |
| Class I | | | | |
| Shares sold | 13,696 | 14,937 | $140,776 | $157,175 |
| Reinvestment of distributions | 1,085 | 1,055 | 11,211 | 11,077 |
| Shares redeemed | (13,214) | (8,950) | (135,947) | (93,930) |
| Net increase (decrease) | 1,567 | 7,042 | $16,040 | $74,322 |
12. Other.
The Fund's organizational documents provide former and current trustees and officers with a limited indemnification against liabilities arising in connection with the performance of their duties to the Fund. In the normal course of business, the Fund may also enter into contracts that provide general indemnifications. The Fund's maximum exposure under these arrangements is unknown as this would be dependent on future claims that may be made against the Fund. The risk of material loss from such claims is considered remote.
Report of Independent Registered Public Accounting Firm
To the Trustees of Fidelity Income Fund and Shareholders of Fidelity Government Income Fund:
In our opinion, the accompanying statement of assets and liabilities, including the schedule of investments, and the related statements of operations and of changes in net assets and the financial highlights present fairly, in all material respects, the financial position of Fidelity Government Income Fund (a fund of Fidelity Income Fund) as of August 31, 2017, the results of its operations for the year then ended, the changes in its net assets for each of the two years in the period then ended and the financial highlights for each of the periods indicated, in conformity with accounting principles generally accepted in the United States of America. These financial statements and financial highlights (hereafter referred to as “financial statements”) are the responsibility of the Fidelity Government Income Fund’s management. Our responsibility is to express an opinion on these financial statements based on our audits. We conducted our audits of these financial statements in accordance with the standards of the Public Company Accounting Oversight Board (United States). Those standards require that we plan and perform the audit to obtain reasonable assurance about whether the financial statements are free of material misstatement. An audit includes examining, on a test basis, evidence supporting the amounts and disclosures in the financial statements, assessing the accounting principles used and significant estimates made by management, and evaluating the overall financial statement presentation. Our procedures included confirmation of securities owned as of August 31, 2017 by correspondence with the custodian and brokers; when replies were not received from brokers, we performed other auditing procedures. We believe that our audits provide a reasonable basis for our opinion.
PricewaterhouseCoopers LLP
Boston, Massachusetts
October 19, 2017
Trustees and Officers
The Trustees, Members of the Advisory Board (if any), and officers of the trust and fund, as applicable, are listed below. The Board of Trustees governs the fund and is responsible for protecting the interests of shareholders. The Trustees are experienced executives who meet periodically throughout the year to oversee the fund's activities, review contractual arrangements with companies that provide services to the fund, oversee management of the risks associated with such activities and contractual arrangements, and review the fund's performance. Each of the Trustees oversees 246 funds.
The Trustees hold office without limit in time except that (a) any Trustee may resign; (b) any Trustee may be removed by written instrument, signed by at least two-thirds of the number of Trustees prior to such removal; (c) any Trustee who requests to be retired or who has become incapacitated by illness or injury may be retired by written instrument signed by a majority of the other Trustees; and (d) any Trustee may be removed at any special meeting of shareholders by a two-thirds vote of the outstanding voting securities of the trust. Each Trustee who is not an interested person (as defined in the 1940 Act) of the trust and the fund is referred to herein as an Independent Trustee. Each Independent Trustee shall retire not later than the last day of the calendar year in which his or her 75th birthday occurs. The Independent Trustees may waive this mandatory retirement age policy with respect to individual Trustees. Officers and Advisory Board Members hold office without limit in time, except that any officer or Advisory Board Member may resign or may be removed by a vote of a majority of the Trustees at any regular meeting or any special meeting of the Trustees. Except as indicated, each individual has held the office shown or other offices in the same company for the past five years.
The fund’s Statement of Additional Information (SAI) includes more information about the Trustees. To request a free copy, call Fidelity at 1-800-544-8544.
Experience, Skills, Attributes, and Qualifications of the Trustees. The Governance and Nominating Committee has adopted a statement of policy that describes the experience, qualifications, attributes, and skills that are necessary and desirable for potential Independent Trustee candidates (Statement of Policy). The Board believes that each Trustee satisfied at the time he or she was initially elected or appointed a Trustee, and continues to satisfy, the standards contemplated by the Statement of Policy. The Governance and Nominating Committee also engages professional search firms to help identify potential Independent Trustee candidates who have the experience, qualifications, attributes, and skills consistent with the Statement of Policy. From time to time, additional criteria based on the composition and skills of the current Independent Trustees, as well as experience or skills that may be appropriate in light of future changes to board composition, business conditions, and regulatory or other developments, have also been considered by the professional search firms and the Governance and Nominating Committee. In addition, the Board takes into account the Trustees' commitment and participation in Board and committee meetings, as well as their leadership of standing and ad hoc committees throughout their tenure.
In determining that a particular Trustee was and continues to be qualified to serve as a Trustee, the Board has considered a variety of criteria, none of which, in isolation, was controlling. The Board believes that, collectively, the Trustees have balanced and diverse experience, qualifications, attributes, and skills, which allow the Board to operate effectively in governing the fund and protecting the interests of shareholders. Information about the specific experience, skills, attributes, and qualifications of each Trustee, which in each case led to the Board's conclusion that the Trustee should serve (or continue to serve) as a trustee of the fund, is provided below.
Board Structure and Oversight Function. Abigail P. Johnson is an interested person and currently serves as Chairman. The Trustees have determined that an interested Chairman is appropriate and benefits shareholders because an interested Chairman has a personal and professional stake in the quality and continuity of services provided to the fund. Independent Trustees exercise their informed business judgment to appoint an individual of their choosing to serve as Chairman, regardless of whether the Trustee happens to be independent or a member of management. The Independent Trustees have determined that they can act independently and effectively without having an Independent Trustee serve as Chairman and that a key structural component for assuring that they are in a position to do so is for the Independent Trustees to constitute a substantial majority for the Board. The Independent Trustees also regularly meet in executive session. Marie L. Knowles serves as Chairman of the Independent Trustees and as such (i) acts as a liaison between the Independent Trustees and management with respect to matters important to the Independent Trustees and (ii) with management prepares agendas for Board meetings.
Fidelity® funds are overseen by different Boards of Trustees. The fund's Board oversees Fidelity's investment-grade bond, money market, asset allocation and certain equity funds, and other Boards oversee Fidelity's high income, sector and other equity funds. The asset allocation funds may invest in Fidelity® funds that are overseen by such other Boards. The use of separate Boards, each with its own committee structure, allows the Trustees of each group of Fidelity® funds to focus on the unique issues of the funds they oversee, including common research, investment, and operational issues. On occasion, the separate Boards establish joint committees to address issues of overlapping consequences for the Fidelity® funds overseen by each Board.
The Trustees operate using a system of committees to facilitate the timely and efficient consideration of all matters of importance to the Trustees, the fund, and fund shareholders and to facilitate compliance with legal and regulatory requirements and oversight of the fund's activities and associated risks. The Board, acting through its committees, has charged FMR and its affiliates with (i) identifying events or circumstances the occurrence of which could have demonstrably adverse effects on the fund's business and/or reputation; (ii) implementing processes and controls to lessen the possibility that such events or circumstances occur or to mitigate the effects of such events or circumstances if they do occur; and (iii) creating and maintaining a system designed to evaluate continuously business and market conditions in order to facilitate the identification and implementation processes described in (i) and (ii) above. Because the day-to-day operations and activities of the fund are carried out by or through FMR, its affiliates, and other service providers, the fund's exposure to risks is mitigated but not eliminated by the processes overseen by the Trustees. While each of the Board's committees has responsibility for overseeing different aspects of the fund's activities, oversight is exercised primarily through the Operations and Audit Committees. In addition, an ad hoc Board committee of Independent Trustees has worked with FMR to enhance the Board's oversight of investment and financial risks, legal and regulatory risks, technology risks, and operational risks, including the development of additional risk reporting to the Board. Appropriate personnel, including but not limited to the fund's Chief Compliance Officer (CCO), FMR's internal auditor, the independent accountants, the fund's Treasurer and portfolio management personnel, make periodic reports to the Board's committees, as appropriate, including an annual review of Fidelity's risk management program for the Fidelity® funds. The responsibilities of each standing committee, including their oversight responsibilities, are described further under "Standing Committees of the Trustees."
Interested Trustees*:
Correspondence intended for a Trustee who is an interested person may be sent to Fidelity Investments, 245 Summer Street, Boston, Massachusetts 02210.
Name, Year of Birth; Principal Occupations and Other Relevant Experience+
Abigail P. Johnson (1961)
Year of Election or Appointment: 2009
Trustee
Chairman of the Board of Trustees
Ms. Johnson also serves as Trustee of other Fidelity® funds. Ms. Johnson serves as Chairman (2016-present), Chief Executive Officer (2014-present), and Director (2007-present) of FMR LLC (diversified financial services company), President of Fidelity Financial Services (2012-present) and President of Personal, Workplace and Institutional Services (2005-present). Ms. Johnson is Chairman and Director of FMR Co., Inc. (investment adviser firm, 2011-present) and Chairman and Director of FMR (investment adviser firm, 2011-present). Previously, Ms. Johnson served as Vice Chairman (2007-2016) and President (2013-2016) of FMR LLC, President and a Director of FMR (2001-2005), a Trustee of other investment companies advised by FMR, Fidelity Investments Money Management, Inc. (investment adviser firm), and FMR Co., Inc. (2001-2005), Senior Vice President of the Fidelity® funds (2001-2005), and managed a number of Fidelity® funds. Ms. Abigail P. Johnson and Mr. Arthur E. Johnson are not related.
Jennifer Toolin McAuliffe (1959)
Year of Election or Appointment: 2016
Trustee
Ms. McAuliffe also serves as Trustee of other Fidelity® funds. Ms. McAuliffe previously served as a Member of the Advisory Board of certain Fidelity® funds (2016) and as Co-Head of Fixed Income of Fidelity Investments Limited (now known as FIL Limited (FIL)) (diversified financial services company). Earlier roles at FIL included Director of Research for FIL’s credit and quantitative teams in London, Hong Kong and Tokyo. Ms. McAuliffe also was the Director of Research for taxable and municipal bonds at Fidelity Investments Money Management, Inc. Ms. McAuliffe is also a director or trustee of several not-for-profit entities.
* Determined to be an “Interested Trustee” by virtue of, among other things, his or her affiliation with the trust or various entities under common control with FMR.
+ The information includes the Trustee's principal occupation during the last five years and other information relating to the experience, attributes, and skills relevant to the Trustee's qualifications to serve as a Trustee, which led to the conclusion that the Trustee should serve as a Trustee for the fund.
Independent Trustees:
Correspondence intended for an Independent Trustee may be sent to Fidelity Investments, P.O. Box 55235, Boston, Massachusetts 02205-5235.
Name, Year of Birth; Principal Occupations and Other Relevant Experience+
Elizabeth S. Acton (1951)
Year of Election or Appointment: 2013
Trustee
Ms. Acton also serves as Trustee of other Fidelity® funds. Prior to her retirement in April 2012, Ms. Acton was Executive Vice President, Finance (2011-2012), Executive Vice President, Chief Financial Officer (2002-2011), and Treasurer (2004-2005) of Comerica Incorporated (financial services). Prior to joining Comerica, Ms. Acton held a variety of positions at Ford Motor Company (1983-2002), including Vice President and Treasurer (2000-2002) and Executive Vice President and Chief Financial Officer of Ford Motor Credit Company (1998-2000). Ms. Acton currently serves as a member of the Board of Directors and Audit and Finance Committees of Beazer Homes USA, Inc. (homebuilding, 2012-present). Previously, Ms. Acton served as a Member of the Advisory Board of certain Fidelity® funds (2013-2016).
John Engler (1948)
Year of Election or Appointment: 2014
Trustee
Mr. Engler also serves as Trustee of other Fidelity® funds. He serves on the board of directors for Universal Forest Products (manufacturer and distributor of wood and wood-alternative products, 2003-present) and K12 Inc. (technology-based education company, 2012-present). Previously, Mr. Engler served as a Member of the Advisory Board of certain Fidelity® funds (2014-2016), president of the Business Roundtable (2011-2017), a trustee of The Munder Funds (2003-2014), president and CEO of the National Association of Manufacturers (2004-2011), member of the Board of Trustees of the Annie E. Casey Foundation (2004-2015), and as governor of Michigan (1991-2003). He is a past chairman of the National Governors Association.
Albert R. Gamper, Jr. (1942)
Year of Election or Appointment: 2006
Trustee
Mr. Gamper also serves as Trustee of other Fidelity® funds. Prior to his retirement in December 2004, Mr. Gamper served as Chairman of the Board of CIT Group Inc. (commercial finance). During his tenure with CIT Group Inc. Mr. Gamper served in numerous senior management positions, including Chairman (1987-1989; 1999-2001; 2002-2004), Chief Executive Officer (1987-2004), and President (2002-2003). Mr. Gamper currently serves as a member of the Board of Directors of Public Service Enterprise Group (utilities, 2000-present), and Member of the Board of Trustees of Barnabas Health Care System (1997-present). Previously, Mr. Gamper served as Chairman (2012-2015) and Vice Chairman (2011-2012) of the Independent Trustees of certain Fidelity® funds and as Chairman of the Board of Governors, Rutgers University (2004-2007).
Robert F. Gartland (1951)
Year of Election or Appointment: 2010
Trustee
Mr. Gartland also serves as Trustee of other Fidelity® funds. Mr. Gartland is Chairman and an investor in Gartland & Mellina Group Corp. (consulting, 2009-present). Previously, Mr. Gartland served as a partner and investor of Vietnam Partners LLC (investments and consulting, 2008-2011). Prior to his retirement, Mr. Gartland held a variety of positions at Morgan Stanley (financial services, 1979-2007) including Managing Director (1987-2007).
Arthur E. Johnson (1947)
Year of Election or Appointment: 2008
Trustee
Vice Chairman of the Independent Trustees
Mr. Johnson also serves as Trustee of other Fidelity® funds. Mr. Johnson serves as a member of the Board of Directors of Eaton Corporation plc (diversified power management, 2009-present) and Booz Allen Hamilton (management consulting, 2011-present). Prior to his retirement, Mr. Johnson served as Senior Vice President of Corporate Strategic Development of Lockheed Martin Corporation (defense contractor, 1999-2009). He previously served on the Board of Directors of IKON Office Solutions, Inc. (1999-2008), AGL Resources, Inc. (holding company, 2002-2016), and Delta Airlines (2005-2007). Mr. Arthur E. Johnson is not related to Ms. Abigail P. Johnson.
Michael E. Kenneally (1954)
Year of Election or Appointment: 2009
Trustee
Mr. Kenneally also serves as Trustee of other Fidelity® funds. Prior to his retirement, Mr. Kenneally served as Chairman and Global Chief Executive Officer of Credit Suisse Asset Management. Before joining Credit Suisse, he was an Executive Vice President and Chief Investment Officer for Bank of America Corporation. Earlier roles at Bank of America included Director of Research, Senior Portfolio Manager and Research Analyst, and Mr. Kenneally was awarded the Chartered Financial Analyst (CFA) designation in 1991.
Marie L. Knowles (1946)
Year of Election or Appointment: 2001
Trustee
Chairman of the Independent Trustees
Ms. Knowles also serves as Trustee of other Fidelity® funds. Prior to Ms. Knowles' retirement in June 2000, she served as Executive Vice President and Chief Financial Officer of Atlantic Richfield Company (ARCO) (diversified energy, 1996-2000). From 1993 to 1996, she was a Senior Vice President of ARCO and President of ARCO Transportation Company (pipeline and tanker operations). Ms. Knowles currently serves as a Director and Chairman of the Audit Committee of McKesson Corporation (healthcare service, since 2002). Ms. Knowles is a member of the Board of the Santa Catalina Island Company (real estate, 2009-present). Ms. Knowles is a Member of the Investment Company Institute Board of Governors and a Member of the Governing Council of the Independent Directors Council (2014-present). She also serves as a member of the Advisory Board for the School of Engineering of the University of Southern California. Previously, Ms. Knowles served as a Director of Phelps Dodge Corporation (copper mining and manufacturing, 1994-2007), URS Corporation (engineering and construction, 2000-2003) and America West (airline, 1999-2002). Ms. Knowles previously served as Vice Chairman of the Independent Trustees of certain Fidelity® funds (2012-2015).
Mark A. Murray (1954)
Year of Election or Appointment: 2016
Trustee
Mr. Murray also serves as Trustee of other Fidelity® funds. Mr. Murray is Vice Chairman (2013-present) of Meijer, Inc. (regional retail chain). Previously, Mr. Murray served as a Member of the Advisory Board of certain Fidelity® funds (2016) and as Co-Chief Executive Officer (2013-2016) and President (2006-2013) of Meijer, Inc. Mr. Murray serves as a member of the Board of Directors and Nuclear Review and Public Policy and Responsibility Committees of DTE Energy Company (diversified energy company, 2009-present). Mr. Murray also serves as a member of the Board of Directors of Spectrum Health (not-for-profit health system, 2015-present). Mr. Murray previously served as President of Grand Valley State University (2001-2006), Treasurer for the State of Michigan (1999-2001), Vice President of Finance and Administration for Michigan State University (1998-1999), and a member of the Board of Directors and Audit Committee and Chairman of the Nominating and Corporate Governance Committee of Universal Forest Products, Inc. (manufacturer and distributor of wood and wood-alternative products, 2004-2016). Mr. Murray is also a director or trustee of many community and professional organizations.
+ The information includes the Trustee's principal occupation during the last five years and other information relating to the experience, attributes, and skills relevant to the Trustee's qualifications to serve as a Trustee, which led to the conclusion that the Trustee should serve as a Trustee for the fund.
Advisory Board Members and Officers:
Correspondence intended for an officer may be sent to Fidelity Investments, 245 Summer Street, Boston, Massachusetts 02210. Officers appear below in alphabetical order.
Name, Year of Birth; Principal Occupation
Elizabeth Paige Baumann (1968)
Year of Election or Appointment: 2017
Anti-Money Laundering (AML) Officer
Ms. Baumann also serves as AML Officer of other funds. She is Chief AML Officer (2012-present) and Senior Vice President (2014-present) of FMR LLC (diversified financial services company) and is an employee of Fidelity Investments. Previously, Ms. Baumann served as AML Officer of the funds (2012-2016), and Vice President (2007-2014) and Deputy Anti-Money Laundering Officer (2007-2012) of FMR LLC.
Marc R. Bryant (1966)
Year of Election or Appointment: 2015
Secretary and Chief Legal Officer (CLO)
Mr. Bryant also serves as Secretary and CLO of other funds. Mr. Bryant serves as CLO, Secretary, and Senior Vice President of Fidelity Management & Research Company (investment adviser firm, 2015-present) and FMR Co., Inc. (investment adviser firm, 2015-present); Secretary of Fidelity SelectCo, LLC (investment adviser firm, 2015-present) and Fidelity Investments Money Management, Inc. (investment adviser firm, 2015-present); and CLO of Fidelity Management & Research (Hong Kong) Limited and FMR Investment Management (UK) Limited (investment adviser firms, 2015-present) and Fidelity Management & Research (Japan) Limited (investment adviser firm, 2016-present). He is Senior Vice President and Deputy General Counsel of FMR LLC (diversified financial services company). Previously, Mr. Bryant served as Secretary and CLO of Fidelity Rutland Square Trust II (2010-2014) and Assistant Secretary of Fidelity's Fixed Income and Asset Allocation Funds (2013-2015). Prior to joining Fidelity Investments, Mr. Bryant served as a Senior Vice President and the Head of Global Retail Legal for AllianceBernstein L.P. (2006-2010), and as the General Counsel for ProFund Advisors LLC (2001-2006).
Jonathan Davis (1968)
Year of Election or Appointment: 2010
Assistant Treasurer
Mr. Davis also serves as Assistant Treasurer of other funds, and is an employee of Fidelity Investments. Previously, Mr. Davis served as Vice President and Associate General Counsel of FMR LLC (diversified financial services company, 2003-2010).
Adrien E. Deberghes (1967)
Year of Election or Appointment: 2010
Assistant Treasurer
Mr. Deberghes also serves as an officer of other funds. He serves as Executive Vice President of Fidelity Investments Money Management, Inc. (FIMM) (investment adviser firm, 2016-present) and is an employee of Fidelity Investments (2008-present). Prior to joining Fidelity Investments, Mr. Deberghes was Senior Vice President of Mutual Fund Administration at State Street Corporation (2007-2008), Senior Director of Mutual Fund Administration at Investors Bank & Trust (2005-2007), and Director of Finance for Dunkin' Brands (2000-2005). Previously, Mr. Deberghes served in other fund officer roles.
Stephanie J. Dorsey (1969)
Year of Election or Appointment: 2013
President and Treasurer
Ms. Dorsey also serves as an officer of other funds. She is an employee of Fidelity Investments (2008-present) and has served in other fund officer roles. Prior to joining Fidelity Investments, Ms. Dorsey served as Treasurer (2004-2008) of the JPMorgan Mutual Funds and Vice President (2004-2008) of JPMorgan Chase Bank.
Howard J. Galligan III (1966)
Year of Election or Appointment: 2014
Chief Financial Officer
Mr. Galligan also serves as Chief Financial Officer of other funds. Mr. Galligan serves as President of Fidelity Pricing and Cash Management Services (FPCMS) (2014-present) and as a Director of Strategic Advisers, Inc. (investment adviser firm, 2008-present). Previously, Mr. Galligan served as Chief Administrative Officer of Asset Management (2011-2014) and Chief Operating Officer and Senior Vice President of Investment Support for Strategic Advisers, Inc. (2003-2011).
Colm A. Hogan (1973)
Year of Election or Appointment: 2016
Assistant Treasurer
Mr. Hogan also serves as an officer of other funds. Mr. Hogan is an employee of Fidelity Investments (2005-present).
Chris Maher (1972)
Year of Election or Appointment: 2013
Assistant Treasurer
Mr. Maher serves as Assistant Treasurer of other funds. Mr. Maher is Vice President of Valuation Oversight and is an employee of Fidelity Investments. Previously, Mr. Maher served as Vice President of Asset Management Compliance (2013), Vice President of the Program Management Group of FMR (investment adviser firm, 2010-2013), and Vice President of Valuation Oversight (2008-2010).
John B. McGinty, Jr. (1962)
Year of Election or Appointment: 2016
Chief Compliance Officer
Mr. McGinty also serves as Chief Compliance Officer of other funds. Mr. McGinty is Senior Vice President of Asset Management Compliance for Fidelity Investments and is an employee of Fidelity Investments (2016-present). Mr. McGinty previously served as Vice President, Senior Attorney at Eaton Vance Management (investment management firm, 2015-2016), and prior to Eaton Vance as global CCO for all firm operations and registered investment companies at GMO LLC (investment management firm, 2009-2015). Before joining GMO LLC, Mr. McGinty served as Senior Vice President, Deputy General Counsel for Fidelity Investments (2007-2009).
Rieco E. Mello (1969)
Year of Election or Appointment: 2017
Assistant Treasurer
Mr. Mello also serves as Assistant Treasurer of other funds. Mr. Mello is an employee of Fidelity Investments (1995-present).
Jamie Pagliocco (1964)
Year of Election or Appointment: 2017
Vice President
Mr. Pagliocco also serves as Vice President of other funds. Mr. Pagliocco serves as Chief Investment Officer of FMR's Bond Group (2017-present) and is an employee of Fidelity Investments (2001-present).
Jason P. Pogorelec (1975)
Year of Election or Appointment: 2015
Assistant Secretary
Mr. Pogorelec also serves as Assistant Secretary of other funds. Mr. Pogorelec serves as Vice President, Associate General Counsel (2010-present) and is an employee of Fidelity Investments (2006-present).
Nancy D. Prior (1967)
Year of Election or Appointment: 2014
Vice President
Ms. Prior also serves as Vice President of other funds. Ms. Prior serves as a Director of FMR Investment Management (UK) Limited (investment adviser firm, 2015-present), President (2016-present) and Director (2014-present) of Fidelity Investments Money Management, Inc. (FIMM) (investment adviser firm), President, Fixed Income (2014-present), Vice Chairman of FIAM LLC (investment adviser firm, 2014-present), and is an employee of Fidelity Investments (2002-present). Previously, Ms. Prior served as Vice President of Fidelity's Money Market Funds (2012-2014), President, Money Market and Short Duration Bond Group of Fidelity Management & Research (FMR) (investment adviser firm, 2013-2014), President, Money Market Group of FMR (2011-2013), Managing Director of Research (2009-2011), Senior Vice President and Deputy General Counsel (2007-2009), and Assistant Secretary of certain Fidelity® funds (2008-2009).
Stacie M. Smith (1974)
Year of Election or Appointment: 2013
Assistant Treasurer
Ms. Smith also serves as an officer of other funds. She is an employee of Fidelity Investments (2009-present) and has served in other fund officer roles. Prior to joining Fidelity Investments, Ms. Smith served as Senior Audit Manager of Ernst & Young LLP (accounting firm, 1996-2009). Previously, Ms. Smith served as Deputy Treasurer of certain Fidelity® funds (2013-2016).
Marc L. Spector (1972)
Year of Election or Appointment: 2016
Deputy Treasurer
Mr. Spector also serves as an officer of other funds. Mr. Spector is an employee of Fidelity Investments (2016-present). Prior to joining Fidelity Investments, Mr. Spector served as Director at the Siegfried Group (accounting firm, 2013-2016), and prior to Siegfried Group as audit senior manager at Deloitte & Touche (accounting firm, 2005-2013).
Renee Stagnone (1975)
Year of Election or Appointment: 2016
Assistant Treasurer
Ms. Stagnone also serves as an officer of other funds. Ms. Stagnone is an employee of Fidelity Investments (1997-present). Previously, Ms. Stagnone served as Deputy Treasurer of certain Fidelity® funds (2013-2016).
Christine J. Thompson (1958)
Year of Election or Appointment: 2015
Vice President of Fidelity's Bond Funds
Ms. Thompson also serves as Vice President of other funds. Ms. Thompson also serves as Chief Investment Officer of FMR's Bond Group (2010-present) and is an employee of Fidelity Investments (1985-present). Previously, Ms. Thompson served as Vice President of Fidelity's Bond Funds (2010-2012).
Shareholder Expense Example
As a shareholder of the Fund, you incur two types of costs: (1) transaction costs, including sales charges (loads) on purchase payments or redemption proceeds, and (2) ongoing costs, including management fees, distribution and/or service (12b-1) fees and other Fund expenses. This Example is intended to help you understand your ongoing costs (in dollars) of investing in the Fund and to compare these costs with the ongoing costs of investing in other mutual funds.
The Example is based on an investment of $1,000 invested at the beginning of the period and held for the entire period (March 1, 2017 to August 31, 2017).
Actual Expenses
The first line of the accompanying table for each class of the Fund provides information about actual account values and actual expenses. You may use the information in this line, together with the amount you invested, to estimate the expenses that you paid over the period. Simply divide your account value by $1,000.00 (for example, an $8,600 account value divided by $1,000.00 = 8.6), then multiply the result by the number in the first line for a class of the Fund under the heading entitled "Expenses Paid During Period" to estimate the expenses you paid on your account during this period. A small balance maintenance fee of $12.00 that is charged once a year may apply for certain accounts with a value of less than $2,000. This fee is not included in the table below. If it was, the estimate of expenses you paid during the period would be higher, and your ending account value lower, by this amount. In addition, the Fund, as a shareholder in the underlying Fidelity Central Funds, will indirectly bear its pro-rata share of the fees and expenses incurred by the underlying Fidelity Central Funds. These fees and expenses are not included in the Fund's annualized expense ratio used to calculate the expense estimate in the table below.
Hypothetical Example for Comparison Purposes
The second line of the accompanying table for each class of the Fund provides information about hypothetical account values and hypothetical expenses based on a Class' actual expense ratio and an assumed rate of return of 5% per year before expenses, which is not the Class' actual return. The hypothetical account values and expenses may not be used to estimate the actual ending account balance or expenses you paid for the period. You may use this information to compare the ongoing costs of investing in the Fund and other funds. To do so, compare this 5% hypothetical example with the 5% hypothetical examples that appear in the shareholder reports of the other funds. A small balance maintenance fee of $12.00 that is charged once a year may apply for certain accounts with a value of less than $2,000. This fee is not included in the table below. If it was, the estimate of expenses you paid during the period would be higher, and your ending account value lower, by this amount. In addition, the Fund, as a shareholder in the underlying Fidelity Central Funds, will indirectly bear its pro-rata share of the fees and expenses incurred by the underlying Fidelity Central Funds. These fees and expenses are not included in the Fund's annualized expense ratio used to calculate the expense estimate in the table below.
Please note that the expenses shown in the table are meant to highlight your ongoing costs only and do not reflect any transaction costs. Therefore, the second line of the table is useful in comparing ongoing costs only, and will not help you determine the relative total costs of owning different funds. In addition, if these transactional costs were included, your costs would have been higher.
| | Annualized Expense Ratio-A | Beginning
Account Value
March 1, 2017 | Ending
Account Value
August 31, 2017 | Expenses Paid
During Period-B
March 1, 2017
to August 31, 2017 |
| Class A | .76% | | | |
| Actual | | $1,000.00 | $1,020.10 | $3.87 |
| Hypothetical-C | | $1,000.00 | $1,021.37 | $3.87 |
| Class M | .76% | | | |
| Actual | | $1,000.00 | $1,021.10 | $3.87 |
| Hypothetical-C | | $1,000.00 | $1,021.37 | $3.87 |
| Class C | 1.52% | | | |
| Actual | | $1,000.00 | $1,017.10 | $7.73 |
| Hypothetical-C | | $1,000.00 | $1,017.54 | $7.73 |
| Government Income | .45% | | | |
| Actual | | $1,000.00 | $1,022.70 | $2.29 |
| Hypothetical-C | | $1,000.00 | $1,022.94 | $2.29 |
| Class I | .49% | | | |
| Actual | | $1,000.00 | $1,021.40 | $2.50 |
| Hypothetical-C | | $1,000.00 | $1,022.74 | $2.50 |
A Annualized expense ratio reflects expenses net of applicable fee waivers.
B Expenses are equal to each Class' annualized expense ratio, multiplied by the average account value over the period, multiplied by 184/365 (to reflect the one-half year period). The fees and expenses of the underlying Fidelity Central Funds in which the Fund invests are not included in each Class' annualized expense ratio. In addition to the expenses noted above, the Fund also indirectly bears its proportional share of the expenses of the underlying Fidelity Central Funds. Annualized expenses of the underlying non-money market Fidelity Central Funds as of their most recent fiscal half year were less than .005%.
C 5% return per year before expenses
Distributions (Unaudited)
The fund hereby designates as a capital gain dividend with respect to the taxable year ended August 31, 2017, $9,453,771, or, if subsequently determined to be different, the net capital gain of such year.
A total of 34.99% of the dividends distributed during the fiscal year was derived from interest on U.S. Government securities which is generally exempt from state income tax.
The fund designates $50,080,464 of distributions paid during the period January 1, 2017 to August 31, 2017 as qualifying to be taxed as interest-related dividends for nonresident alien shareholders.
The fund will notify shareholders in January 2018 of amounts for use in preparing 2017 income tax returns.
Corporate Headquarters
245 Summer St.
Boston, MA 02210
www.fidelity.com
GOV-ANN-1017
1.537760.121
Fidelity® Intermediate Government Income Fund
Annual Report August 31, 2017 |
|
Contents
To view a fund's proxy voting guidelines and proxy voting record for the 12-month period ended June 30, visit http://www.fidelity.com/proxyvotingresults or visit the Securities and Exchange Commission's (SEC) web site at http://www.sec.gov.
You may also call 1-800-544-8544 to request a free copy of the proxy voting guidelines.
Standard & Poor's, S&P and S&P 500 are registered service marks of The McGraw-Hill Companies, Inc. and have been licensed for use by Fidelity Distributors Corporation.
Other third-party marks appearing herein are the property of their respective owners.
All other marks appearing herein are registered or unregistered trademarks or service marks of FMR LLC or an affiliated company. © 2017 FMR LLC. All rights reserved.
This report and the financial statements contained herein are submitted for the general information of the shareholders of the Fund. This report is not authorized for distribution to prospective investors in the Fund unless preceded or accompanied by an effective prospectus.
A fund files its complete schedule of portfolio holdings with the SEC for the first and third quarters of each fiscal year on Form N-Q. Forms N-Q are available on the SEC’s web site at http://www.sec.gov. A fund's Forms N-Q may be reviewed and copied at the SEC’s Public Reference Room in Washington, DC. Information regarding the operation of the SEC's Public Reference Room may be obtained by calling 1-800-SEC-0330.
For a complete list of a fund's portfolio holdings, view the most recent holdings listing, semiannual report, or annual report on Fidelity's web site at http://www.fidelity.com, http://www.institutional.fidelity.com, or http://www.401k.com, as applicable.
NOT FDIC INSURED •MAY LOSE VALUE •NO BANK GUARANTEE
Neither the Fund nor Fidelity Distributors Corporation is a bank.
Performance: The Bottom Line
Average annual total return reflects the change in the value of an investment, assuming reinvestment of distributions from dividend income and capital gains (the profits earned upon the sale of securities that have grown in value, if any) and assuming a constant rate of performance each year. The hypothetical investment and the average annual total returns do not reflect the deduction of taxes that a shareholder would pay on fund distributions or the redemption of fund shares. During periods of reimbursement by Fidelity, a fund’s total return will be greater than it would be had the reimbursement not occurred. How a fund did yesterday is no guarantee of how it will do tomorrow.
Average Annual Total Returns
| For the periods ended August 31, 2017 | Past 1 year | Past 5 years | Past 10 years |
| Fidelity® Intermediate Government Income Fund | 0.08% | 1.04% | 3.20% |
$10,000 Over 10 Years
Let's say hypothetically that $10,000 was invested in Fidelity® Intermediate Government Income Fund on August 31, 2007.
The chart shows how the value of your investment would have changed, and also shows how the Bloomberg Barclays U.S. Intermediate Government Bond Index performed over the same period.
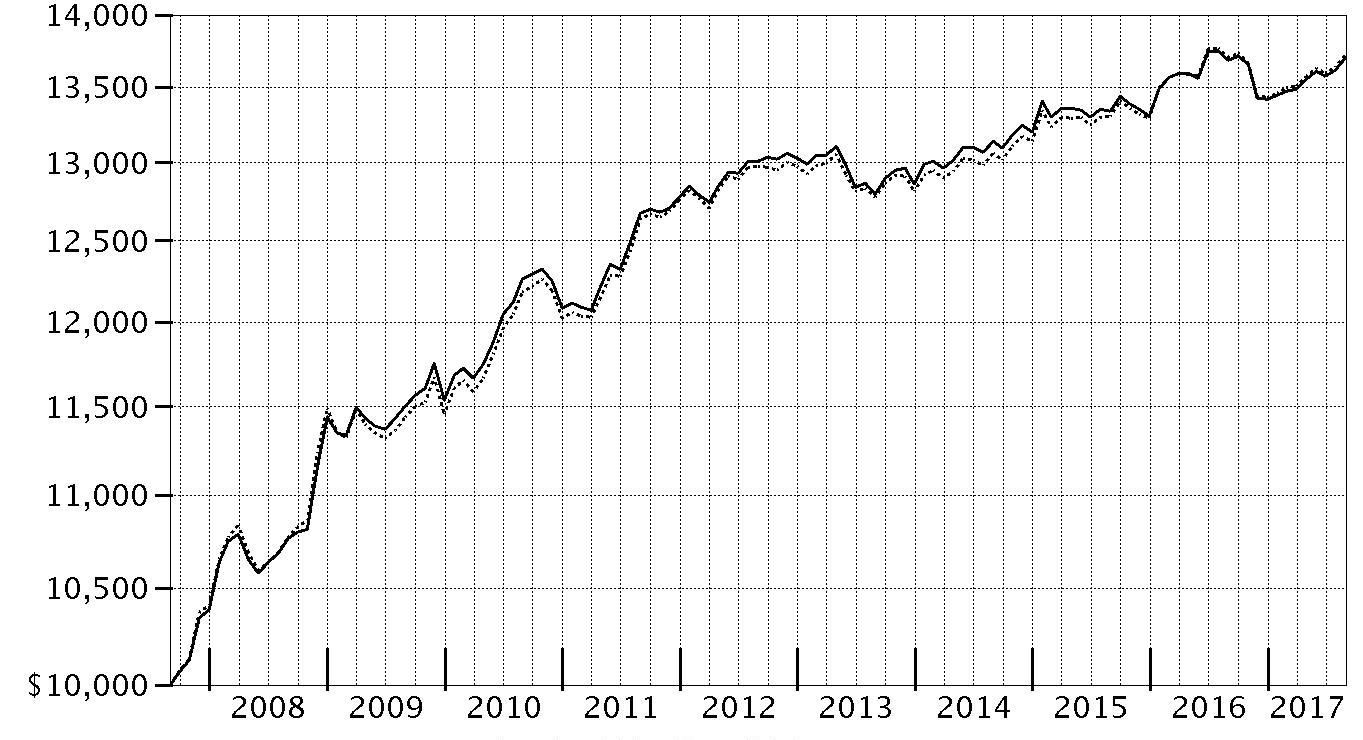
| Period Ending Values |
| $13,699 | Fidelity® Intermediate Government Income Fund |
| $13,721 | Bloomberg Barclays U.S. Intermediate Government Bond Index |
Effective August 24, 2016, all Barclays benchmark indices were co-branded as the Bloomberg Barclays Indices for a period of five years.
Management's Discussion of Fund Performance
Market Recap: U.S. taxable investment-grade bonds rose slightly for the 12 months ending August 31, 2017, as yields increased markedly following the U.S. presidential election then moderated as the period progressed. The Bloomberg Barclays U.S. Aggregate Bond Index gained 0.49% for the year. Bond yields posted slight gains early in the period, prior to the U.S. election, then rallied strongly in November and December, as many investors viewed then-President-elect Donald Trump’s economic agenda as stimulative and potentially inflationary. Yields also rode the Fed’s decision in December to raise policy interest rates. Longer-term bond yields declined slightly in the first half of 2017, even though the Fed raised rates in June 2017 for the third time in as many quarters, as it became clear that changes to tax, health care and fiscal policies would take time to develop and implement. Fairly cool inflation readings also held back yields late in the period. Within the Bloomberg Barclays index, investment-grade corporate bonds led all major market segments, up 2.13%, while U.S. Treasuries returned -0.95%. Securitized sectors advanced more modestly than corporates. Outside the index, riskier, non-core fixed-income segments led the broader market, while Treasury Inflation-Protected Securities (TIPS) rose 0.46%, according to Bloomberg Barclays.
Comments from Lead Portfolio Manager Franco Castagliuolo and Co-Portfolio Manager William Irving: For the fiscal year, the fund returned 0.08%, net of fees, about in line with the 0.09% return of the benchmark Bloomberg Barclays U.S. Intermediate Government Bond Index. We continued to execute our strategy of attempting to exploit market inefficiencies to enhance longer-term results. Our decision to invest in government agency mortgage-backed securities (MBS) – which are not in the benchmark – and underweight U.S. Treasury securities, boosted the fund’s relative performance. Other mortgage-related decisions, particularly security selection, were helpful as well. For example, our larger-than-benchmark stake in securities made up of loans with low remaining balances added value. Owning reverse-mortgage securities was a plus, while our non-benchmark holdings in commercial mortgage-backed securities issued by Freddie Mac contributed. Positioning within other areas of the government bond market also aided relative performance. We ventured beyond the government issuers that make of the bulk of this sector – Fannie Mae, Freddie Mac and the Federal Home Loan Banks – into a few higher-yielding niche segments. Specifically, we had more exposure to securities issued by the U.S. Agency for International Development. In contrast, exposure to Treasury Inflation-Protected Securities, or TIPS, detracted from the fund’s return versus the index.
The views expressed above reflect those of the portfolio manager(s) only through the end of the period as stated on the cover of this report and do not necessarily represent the views of Fidelity or any other person in the Fidelity organization. Any such views are subject to change at any time based upon market or other conditions and Fidelity disclaims any responsibility to update such views. These views may not be relied on as investment advice and, because investment decisions for a Fidelity fund are based on numerous factors, may not be relied on as an indication of trading intent on behalf of any Fidelity fund.
Investment Summary (Unaudited)
Coupon Distribution as of August 31, 2017
| | % of fund's investments | % of fund's investments 6 months ago |
| 0.01 - 0.99% | 1.5 | 6.2 |
| 1 - 1.99% | 51.4 | 40.1 |
| 2 - 2.99% | 25.5 | 32.5 |
| 3 - 3.99% | 5.9 | 5.3 |
| 4 - 4.99% | 3.1 | 3.7 |
| 5 - 5.99% | 8.3 | 8.4 |
| 6 - 6.99% | 0.8 | 0.7 |
| 7 - 7.99% | 0.7 | 0.7 |
| 8% and above | 0.0 | 0.0 |
Coupon distribution shows the range of stated interest rates on the fund's investments, excluding short-term investments.
Asset Allocation (% of fund's net assets)
| As of August 31, 2017*,** |
| | Mortgage Securities | 3.8% |
| | CMOs and Other Mortgage Related Securities | 26.3% |
| | U.S. Treasury Obligations | 58.7% |
| | U.S. Government Agency Obligations*** | 2.6% |
| | Foreign Government & Government Agency Obligations | 5.0% |
| | Asset-Backed Securities | 2.0% |
| | Short-Term Investments and Net Other Assets (Liabilities) | 1.6% |
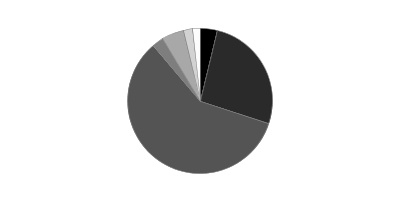
* Foreign investments – 5.0%
** Futures and Swaps – 9.2%
*** Includes NCUA Guaranteed Notes
| As of February 28, 2017*,** |
| | Mortgage Securities | 4.9% |
| | CMOs and Other Mortgage Related Securities | 26.0% |
| | U.S. Treasury Obligations | 60.1% |
| | U.S. Government Agency Obligations*** | 3.3% |
| | Foreign Government & Government Agency Obligations | 5.4% |
| | Short-Term Investments and Net Other Assets (Liabilities) | 0.3% |
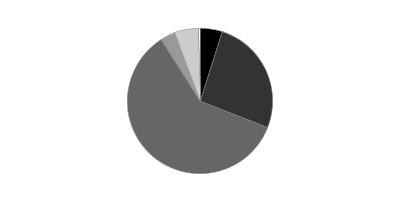
* Foreign investments – 5.4%
** Futures and Swaps – 7.9%
*** Includes NCUA Guaranteed Notes
Percentages in the above tables are adjusted for the effect of TBA Sale Commitments.
Percentages shown as 0.0% may reflect amounts less than 0.05%.
Investments August 31, 2017
Showing Percentage of Net Assets
| U.S. Government and Government Agency Obligations - 61.3% | | | |
| | | Principal Amount (000s) | Value (000s) |
| U.S. Treasury Inflation-Protected Obligations - 1.5% | | | |
| U.S. Treasury Inflation-Indexed Notes 0.375% 1/15/27 | | 8,742 | 8,738 |
| U.S. Treasury Obligations - 57.2% | | | |
| U.S. Treasury Bonds 3% 2/15/47 | | 35 | 37 |
| U.S. Treasury Notes: | | | |
| 1.125% 9/30/21 | | $22,860 | $22,416 |
| 1.375% 7/31/19 | | 22,838 | 22,859 |
| 1.375% 2/29/20 (a) | | 1,733 | 1,733 |
| 1.375% 1/31/21 | | 10,000 | 9,952 |
| 1.5% 4/15/20 | | 14,767 | 14,808 |
| 1.5% 5/15/20 | | 15,141 | 15,179 |
| 1.5% 7/15/20 | | 4,762 | 4,772 |
| 1.5% 8/15/20 | | 9,500 | 9,518 |
| 1.5% 8/15/26 | | 174 | 166 |
| 1.625% 7/31/20 | | 3,000 | 3,017 |
| 1.625% 8/31/22 | | 7,000 | 6,972 |
| 1.75% 10/31/20 | | 5,000 | 5,042 |
| 1.75% 12/31/20 | | 12,412 | 12,509 |
| 1.75% 4/30/22 | | 2,240 | 2,246 |
| 1.75% 6/30/22 | | 3,000 | 3,006 |
| 1.875% 1/31/22 | | 29,140 | 29,402 |
| 1.875% 3/31/22 | | 22,608 | 22,800 |
| 1.875% 7/31/22 | | 15,520 | 15,636 |
| 1.875% 8/31/24 | | 20,361 | 20,261 |
| 2% 10/31/21 | | 1,272 | 1,291 |
| 2% 8/15/25 | | 41,631 | 41,536 |
| 2.125% 6/30/22 | | 327 | 333 |
| 2.125% 7/31/24 | | 18,117 | 18,330 |
| 2.125% 5/15/25 | | 1,053 | 1,062 |
| 2.25% 7/31/21 | | 35,982 | 36,867 |
| 2.25% 2/15/27 | | 1,920 | 1,942 |
| 2.25% 8/15/27 | | 1,500 | 1,517 |
| 2.375% 5/15/27 | | 4,000 | 4,087 |
| | | | 329,296 |
| Other Government Related - 2.6% | | | |
| National Credit Union Administration Guaranteed Notes: | | | |
| Series 2010-A1 Class A, 1 month U.S. LIBOR + 0.350% 1.5789% 12/7/20 (NCUA Guaranteed) (b)(c) | | 607 | 608 |
| Series 2011-R1 Class 1A, 1 month U.S. LIBOR + 0.450% 1.6733% 1/8/20 (NCUA Guaranteed) (b)(c) | | 1,457 | 1,459 |
| Series 2011-R4 Class 1A, 1 month U.S. LIBOR + 0.380% 1.6072% 3/6/20 (NCUA Guaranteed) (b)(c) | | 42 | 42 |
| National Credit Union Administration Guaranteed Notes Master Trust 3.45% 6/12/21 (NCUA Guaranteed) | | 12,000 | 12,682 |
| | | | 14,791 |
| TOTAL U.S. GOVERNMENT AND GOVERNMENT AGENCY OBLIGATIONS | | | |
| (Cost $350,980) | | | 352,825 |
|
| U.S. Government Agency - Mortgage Securities - 6.2% | | | |
| Fannie Mae - 4.6% | | | |
| 12 month U.S. LIBOR + 1.365% 2.75% 10/1/35 (b)(c) | | 9 | 9 |
| 12 month U.S. LIBOR + 1.415% 2.915% 11/1/33 (b)(c) | | 8 | 9 |
| 12 month U.S. LIBOR + 1.480% 3.14% 7/1/34 (b)(c) | | 10 | 11 |
| 12 month U.S. LIBOR + 1.495% 2.963% 1/1/35 (b)(c) | | 51 | 53 |
| 12 month U.S. LIBOR + 1.551% 2.506% 2/1/44 (b)(c) | | 56 | 59 |
| 12 month U.S. LIBOR + 1.553% 2.596% 5/1/44 (b)(c) | | 180 | 184 |
| 12 month U.S. LIBOR + 1.553% 3.338% 6/1/36 (b)(c) | | 9 | 10 |
| 12 month U.S. LIBOR + 1.558% 2.458% 2/1/44 (b)(c) | | 71 | 74 |
| 12 month U.S. LIBOR + 1.565% 3.315% 3/1/37 (b)(c) | | 11 | 11 |
| 12 month U.S. LIBOR + 1.570% 2.567% 5/1/44 (b)(c) | | 103 | 106 |
| 12 month U.S. LIBOR + 1.574% 2.646% 4/1/44 (b)(c) | | 256 | 267 |
| 12 month U.S. LIBOR + 1.580% 2.451% 4/1/44 (b)(c) | | 106 | 110 |
| 12 month U.S. LIBOR + 1.580% 2.575% 1/1/44 (b)(c) | | 115 | 120 |
| 12 month U.S. LIBOR + 1.617% 3.172% 3/1/33 (b)(c) | | 26 | 27 |
| 12 month U.S. LIBOR + 1.643% 2.815% 9/1/36 (b)(c) | | 14 | 14 |
| 12 month U.S. LIBOR + 1.645% 3.309% 6/1/47 (b)(c) | | 26 | 28 |
| 12 month U.S. LIBOR + 1.728% 3.314% 11/1/36 (b)(c) | | 63 | 67 |
| 12 month U.S. LIBOR + 1.741% 3.332% 3/1/40 (b)(c) | | 299 | 317 |
| 12 month U.S. LIBOR + 1.745% 3.374% 7/1/35 (b)(c) | | 12 | 13 |
| 12 month U.S. LIBOR + 1.760% 3.336% 2/1/37 (b)(c) | | 138 | 146 |
| 12 month U.S. LIBOR + 1.800% 2.759% 1/1/42 (b)(c) | | 256 | 269 |
| 12 month U.S. LIBOR + 1.818% 2.695% 2/1/42 (b)(c) | | 366 | 384 |
| 12 month U.S. LIBOR + 1.851% 3.573% 5/1/36 (b)(c) | | 9 | 10 |
| 12 month U.S. LIBOR + 1.885% 3.633% 4/1/36 (b)(c) | | 73 | 78 |
| 12 month U.S. LIBOR + 2.176% 3.624% 8/1/35 (b)(c) | | 105 | 111 |
| 6 month U.S. LIBOR + 1.510% 2.854% 2/1/33 (b)(c) | | 5 | 5 |
| 6 month U.S. LIBOR + 1.535% 2.833% 3/1/35 (b)(c) | | 7 | 7 |
| 6 month U.S. LIBOR + 1.535% 2.884% 12/1/34 (b)(c) | | 13 | 14 |
| 6 month U.S. LIBOR + 1.556% 2.922% 10/1/33 (b)(c) | | 5 | 5 |
| 6 month U.S. LIBOR + 1.565% 2.845% 7/1/35 (b)(c) | | 6 | 7 |
| U.S. TREASURY 1 YEAR INDEX + 1.965% 2.84% 2/1/36 (b)(c) | | 4 | 5 |
| U.S. TREASURY 1 YEAR INDEX + 2.146% 2.78% 7/1/36 (b)(c) | | 51 | 53 |
| U.S. TREASURY 1 YEAR INDEX + 2.208% 3.083% 3/1/35 (b)(c) | | 6 | 6 |
| U.S. TREASURY 1 YEAR INDEX + 2.295% 2.798% 10/1/33 (b)(c) | | 12 | 13 |
| 4% 5/1/29 | | 3,862 | 4,098 |
| 4% 9/1/47 (d) | | 5,872 | 6,204 |
| 4% 9/1/47 (d) | | 599 | 633 |
| 4% 9/1/47 (d) | | 6,471 | 6,837 |
| 4.5% 11/1/25 to 6/1/41 | | 1,676 | 1,801 |
| 5% 1/1/22 to 6/1/39 | | 1,526 | 1,679 |
| 5.5% 10/1/20 to 8/1/25 | | 704 | 741 |
| 6% 1/1/34 to 6/1/36 | | 972 | 1,108 |
| 6.5% 2/1/22 to 8/1/36 | | 1,003 | 1,162 |
| | | | 26,865 |
| Freddie Mac - 0.5% | | | |
| 12 month U.S. LIBOR + 1.325% 2.95% 3/1/37 (b)(c) | | 7 | 7 |
| 12 month U.S. LIBOR + 1.515% 2.93% 11/1/35 (b)(c) | | 41 | 42 |
| 12 month U.S. LIBOR + 1.600% 3.35% 7/1/35 (b)(c) | | 44 | 46 |
| 12 month U.S. LIBOR + 1.754% 3.098% 9/1/41 (b)(c) | | 400 | 423 |
| 12 month U.S. LIBOR + 1.793% 3.32% 4/1/37 (b)(c) | | 15 | 16 |
| 12 month U.S. LIBOR + 1.874% 3.432% 10/1/42 (b)(c) | | 220 | 230 |
| 12 month U.S. LIBOR + 1.880% 3.03% 10/1/41 (b)(c) | | 322 | 333 |
| 12 month U.S. LIBOR + 2.045% 3.81% 7/1/36 (b)(c) | | 26 | 28 |
| 12 month U.S. LIBOR + 2.197% 3.537% 3/1/33 (b)(c) | | 1 | 1 |
| 6 month U.S. LIBOR + 1.445% 2.82% 3/1/35 (b)(c) | | 19 | 19 |
| 6 month U.S. LIBOR + 1.647% 3.025% 2/1/37 (b)(c) | | 18 | 19 |
| 6 month U.S. LIBOR + 1.665% 3.04% 7/1/35 (b)(c) | | 320 | 331 |
| 6 month U.S. LIBOR + 1.675% 3.05% 6/1/37 (b)(c) | | 12 | 12 |
| 6 month U.S. LIBOR + 1.720% 3.095% 8/1/37 (b)(c) | | 22 | 22 |
| 6 month U.S. LIBOR + 1.746% 2.967% 5/1/37 (b)(c) | | 11 | 11 |
| 6 month U.S. LIBOR + 1.932% 3.25% 10/1/36 (b)(c) | | 93 | 97 |
| 6 month U.S. LIBOR + 1.976% 3.34% 10/1/35 (b)(c) | | 50 | 53 |
| 6 month U.S. LIBOR + 2.010% 3.385% 5/1/37 (b)(c) | | 188 | 195 |
| 6 month U.S. LIBOR + 2.010% 3.385% 5/1/37 (b)(c) | | 74 | 79 |
| 6 month U.S. LIBOR + 2.040% 3.415% 6/1/37 (b)(c) | | 48 | 50 |
| 6 month U.S. LIBOR + 2.755% 4.096% 10/1/35 (b)(c) | | 13 | 13 |
| U.S. TREASURY 1 YEAR INDEX + 2.035% 2.889% 6/1/33 (b)(c) | | 71 | 74 |
| U.S. TREASURY 1 YEAR INDEX + 2.230% 2.996% 4/1/34 (b)(c) | | 236 | 247 |
| U.S. TREASURY 1 YEAR INDEX + 2.383% 3.075% 2/1/36 (b)(c) | | 2 | 2 |
| U.S. TREASURY 1 YEAR INDEX + 2.548% 3.548% 7/1/35 (b)(c) | | 59 | 62 |
| 6% 1/1/24 | | 200 | 216 |
| 6.5% 12/1/21 | | 52 | 55 |
| 9.5% 5/1/20 to 6/1/21 | | 6 | 6 |
| 10% 11/1/18 to 3/1/21 | | 6 | 6 |
| 10.5% 1/1/21 | | 0 | 0 |
| 11% 9/1/20 | | 0 | 1 |
| | | | 2,696 |
| Ginnie Mae - 1.1% | | | |
| 4.3% 8/20/61 (e) | | 482 | 489 |
| 4.649% 2/20/62 (e) | | 465 | 480 |
| 4.682% 2/20/62 (e) | | 643 | 659 |
| 4.684% 1/20/62 (e) | | 3,742 | 3,837 |
| 5.47% 8/20/59 (e) | | 9 | 9 |
| 6% 6/15/36 | | 807 | 943 |
| 8% 12/15/23 | | 56 | 62 |
| 10.5% 12/15/17 to 10/15/21 | | 22 | 23 |
| 11% 7/20/18 to 1/20/21 | | 4 | 5 |
| | | | 6,507 |
| TOTAL U.S. GOVERNMENT AGENCY - MORTGAGE SECURITIES | | | |
| (Cost $35,725) | | | 36,068 |
|
| Asset-Backed Securities - 2.0% | | | |
| Fannie Mae Series 2017-T1 Class A, 2.898% 6/25/27 | | $6,499 | $6,581 |
| Goal Capital Funding Trust Series 2005-2 Class A3, 3 month U.S. LIBOR + 0.170% 1.4872% 5/28/30 (b)(c) | | 656 | 655 |
| Illinois Student Assistance Commission Student Loan Rev. Series 2010-1 Class A2, 3 month U.S. LIBOR + 1.050% 2.2062% 4/25/22 (b)(c) | | 236 | 237 |
| Navient Student Loan Trust Series 2017-3A: | | | |
| Class A1, 1 month U.S. LIBOR + 0.300% 1.5344% 7/26/66 (b)(c)(f) | | 1,778 | 1,778 |
| Class A2, 1 month U.S. LIBOR + 0.600% 1.8344% 7/26/66 (b)(c)(f) | | 2,013 | 2,022 |
| Small Business Administration guaranteed development participation certificates Series 2004-20H Class 1, 5.17% 8/1/24 | | 82 | 86 |
| TOTAL ASSET-BACKED SECURITIES | | | |
| (Cost $11,264) | | | 11,359 |
|
| Collateralized Mortgage Obligations - 21.8% | | | |
| U.S. Government Agency - 21.8% | | | |
| Fannie Mae: | | | |
| floater: | | $ | $ |
| Series 1994-42 Class FK, 10-Year Treasury Constant Maturity Rate - 0.500% 1.66% 4/25/24 (b)(c) | | 383 | 385 |
| Series 2001-38 Class QF, 1 month U.S. LIBOR + 0.980% 2.2144% 8/25/31 (b)(c) | | 79 | 80 |
| Series 2002-60 Class FV, 1 month U.S. LIBOR + 1.000% 2.2344% 4/25/32 (b)(c) | | 17 | 17 |
| Series 2002-74 Class FV, 1 month U.S. LIBOR + 0.450% 1.6844% 11/25/32 (b)(c) | | 895 | 899 |
| Series 2002-75 Class FA, 1 month U.S. LIBOR + 1.000% 2.2344% 11/25/32 (b)(c) | | 35 | 35 |
| Series 2010-15 Class FJ, 1 month U.S. LIBOR + 0.930% 2.1644% 6/25/36 (b)(c) | | 1,129 | 1,148 |
| planned amortization class: | | | |
| Series 1988-21 Class G, 9.5% 8/25/18 | | 0 | 0 |
| Series 2003-28 Class KG, 5.5% 4/25/23 | | 161 | 172 |
| Series 2005-19 Class PA, 5.5% 7/25/34 | | 272 | 284 |
| Series 2005-27 Class NE, 5.5% 5/25/34 | | 65 | 66 |
| Series 2005-64 Class PX, 5.5% 6/25/35 | | 321 | 347 |
| Series 2005-68 Class CZ, 5.5% 8/25/35 | | 837 | 943 |
| sequential payer: | | | |
| Series 2002-57 Class BD, 5.5% 9/25/17 | | 0 | 0 |
| Series 2003-117 Class MD, 5% 12/25/23 | | 163 | 172 |
| Series 2004-52 Class KZ, 5.5% 7/25/34 | | 1,921 | 2,144 |
| Series 2004-91 Class Z, 5% 12/25/34 | | 1,106 | 1,218 |
| Series 2009-59 Class HB, 5% 8/25/39 | | 473 | 523 |
| Series 201-75 Class AL, 3.5% 8/25/26 | | 1,561 | 1,643 |
| Series 2010-97 Class CX, 4.5% 9/25/25 | | 1,693 | 1,821 |
| Series 2011-80: | | | |
| Class HE, 3.5% 8/25/26 | | 548 | 582 |
| Class KB, 3.5% 8/25/26 | | 851 | 898 |
| Series 2010-139 Class NI, 4.5% 2/25/40 (g) | | 773 | 84 |
| Series 2010-39 Class FG, 1 month U.S. LIBOR + 0.920% 2.1544% 3/25/36 (b)(c) | | 699 | 715 |
| Series 2011-67 Class AI, 4% 7/25/26 (g) | | 200 | 19 |
| Series 2016-26 Class CG, 3% 5/25/46 | | 2,667 | 2,741 |
| Freddie Mac: | | | |
| floater: | | | |
| Series 2526 Class FC, 1 month U.S. LIBOR + 0.400% 1.6267% 11/15/32 (b)(c) | | 149 | 150 |
| Series 2630 Class FL, 1 month U.S. LIBOR + 0.500% 1.7267% 6/15/18 (b)(c) | | 1 | 1 |
| Series 2711 Class FC, 1 month U.S. LIBOR + 0.900% 2.1267% 2/15/33 (b)(c) | | 334 | 340 |
| floater planned amortization class Series 2770 Class FH, 1 month U.S. LIBOR + 0.400% 1.6267% 3/15/34 (b)(c) | | 348 | 349 |
| planned amortization class: | | | |
| Series 2802 Class OB, 6% 5/15/34 | | 415 | 455 |
| Series 3415 Class PC, 5% 12/15/37 | | 129 | 140 |
| Series 3763 Class QA, 4% 4/15/34 | | 67 | 68 |
| Series 3840 Class VA, 4.5% 9/15/27 | | 647 | 666 |
| sequential payer: | | | |
| Series 1929 Class EZ, 7.5% 2/17/27 | | 450 | 492 |
| Series 2004-2802 Class ZG, 5.5% 5/15/34 | | 1,518 | 1,704 |
| Series 2004-2862 Class NE, 5% 9/15/24 | | 2,900 | 3,067 |
| Series 2145 Class MZ, 6.5% 4/15/29 | | 468 | 533 |
| Series 2357 Class ZB, 6.5% 9/15/31 | | 270 | 312 |
| Series 2877 Class ZD, 5% 10/15/34 | | 1,345 | 1,477 |
| Series 2998 Class LY, 5.5% 7/15/25 | | 146 | 157 |
| Series 3007 Class EW, 5.5% 7/15/25 | | 622 | 672 |
| Series 3745 Class KV, 4.5% 12/15/26 | | 1,076 | 1,160 |
| Series 3806 Class L, 3.5% 2/15/26 | | 1,400 | 1,491 |
| Series 3862 Class MB, 3.5% 5/15/26 | | 908 | 957 |
| Freddie Mac Multi-family Structured pass-thru certificates sequential payer: | | | |
| Series 4335 Class AL, 4.25% 3/15/40 | | 1,093 | 1,149 |
| Series 4341 Class ML, 3.5% 11/15/31 | | 1,432 | 1,502 |
| Ginnie Mae guaranteed REMIC pass-thru certificates: | | | |
| floater: | | | |
| Series 2007-59 Class FC, 1 month U.S. LIBOR + 0.500% 1.7306% 7/20/37 (b)(c) | | 204 | 205 |
| Series 2008-2 Class FD, 1 month U.S. LIBOR + 0.480% 1.7106% 1/20/38 (b)(c) | | 50 | 50 |
| Series 2009-108 Class CF, 1 month U.S. LIBOR + 0.600% 1.8278% 11/16/39 (b)(c) | | 206 | 208 |
| Series 2009-116 Class KF, 1 month U.S. LIBOR + 0.530% 1.7578% 12/16/39 (b)(c) | | 157 | 158 |
| Series 2010-H17 Class FA, 1 month U.S. LIBOR + 0.330% 1.5628% 7/20/60 (b)(c)(e) | | 2,315 | 2,299 |
| Series 2010-H18 Class AF, 1 month U.S. LIBOR + 0.300% 1.5239% 9/20/60 (b)(c)(e) | | 2,800 | 2,778 |
| Series 2010-H19 Class FG, 1 month U.S. LIBOR + 0.300% 1.5239% 8/20/60 (b)(c)(e) | | 3,122 | 3,103 |
| Series 2010-H27 Series FA, 1 month U.S. LIBOR + 0.380% 1.6039% 12/20/60 (b)(c)(e) | | 831 | 827 |
| Series 2011-H05 Class FA, 1 month U.S. LIBOR + 0.500% 1.7239% 12/20/60 (b)(c)(e) | | 1,577 | 1,577 |
| Series 2011-H07 Class FA, 1 month U.S. LIBOR + 0.500% 1.7239% 2/20/61 (b)(c)(e) | | 3,120 | 3,120 |
| Series 2011-H12 Class FA, 1 month U.S. LIBOR + 0.490% 1.7139% 2/20/61 (b)(c)(e) | | 3,510 | 3,510 |
| Series 2011-H13 Class FA, 1 month U.S. LIBOR + 0.500% 1.7239% 4/20/61 (b)(c)(e) | | 1,244 | 1,244 |
| Series 2011-H14: | | | |
| Class FB, 1 month U.S. LIBOR + 0.500% 1.7239% 5/20/61 (b)(c)(e) | | 1,419 | 1,417 |
| Class FC, 1 month U.S. LIBOR + 0.500% 1.7239% 5/20/61 (b)(c)(e) | | 1,301 | 1,301 |
| Series 2011-H17 Class FA, 1 month U.S. LIBOR + 0.530% 1.7539% 6/20/61 (b)(c)(e) | | 1,646 | 1,648 |
| Series 2011-H21 Class FA, 1 month U.S. LIBOR + 0.600% 1.8239% 10/20/61 (b)(c)(e) | | 1,656 | 1,661 |
| Series 2012-H01 Class FA, 1 month U.S. LIBOR + 0.700% 1.9239% 11/20/61 (b)(c)(e) | | 1,409 | 1,417 |
| Series 2012-H03 Class FA, 1 month U.S. LIBOR + 0.700% 1.9239% 1/20/62 (b)(c)(e) | | 908 | 913 |
| Series 2012-H06 Class FA, 1 month U.S. LIBOR + 0.630% 1.8539% 1/20/62 (b)(c)(e) | | 1,314 | 1,318 |
| Series 2012-H07 Class FA, 1 month U.S. LIBOR + 0.630% 1.8539% 3/20/62 (b)(c)(e) | | 846 | 849 |
| Series 2012-H21 Class DF, 1 month U.S. LIBOR + 0.650% 1.8739% 5/20/61 (b)(c)(e) | | 561 | 562 |
| Series 2015-H13 Class FL, 1 month U.S. LIBOR + 0.280% 1.5039% 5/20/63 (b)(c)(e) | | 2,245 | 2,244 |
| Series 2015-H19 Class FA, 1 month U.S. LIBOR + 0.200% 1.4239% 4/20/63 (b)(c)(e) | | 2,213 | 2,211 |
| planned amortization class: | | | |
| Series 2010-31 Class BP, 5% 3/20/40 | | 1,810 | 2,069 |
| Series 2011-136 Class WI, 4.5% 5/20/40 (g) | | 456 | 53 |
| Series 2011-68 Class EC, 3.5% 4/20/41 | | 946 | 988 |
| sequential payer: | | | |
| Series 2013-H06 Class HA, 1.65% 1/20/63 (e) | | 797 | 795 |
| Series 2014-H12 Class KA, 2.75% 5/20/64 (e) | | 946 | 958 |
| Series 2016-H02 Class FM, 1 month U.S. LIBOR + 0.500% 1.7239% 9/20/62 (b)(c)(e) | | 3,159 | 3,168 |
| Series 2016-H04 Class FE, 1 month U.S. LIBOR + 0.650% 1.8739% 11/20/65 (b)(c)(e) | | 833 | 836 |
| Series 2010-169 Class Z, 4.5% 12/20/40 | | 996 | 1,090 |
| Series 2010-H15 Class TP, 5.15% 8/20/60 (e) | | 2,789 | 2,888 |
| Series 2010-H17 Class XP, 5.2967% 7/20/60 (b)(e) | | 3,088 | 3,191 |
| Series 2010-H18 Class PL, 5.01% 9/20/60 (b)(e) | | 2,558 | 2,638 |
| Series 2012-64 Class KI, 3.5% 11/20/36 (g) | | 249 | 17 |
| Series 2013-124: | | | |
| Class ES, 8.667% - 1 month U.S. LIBOR 7.0259% 4/20/39 (b)(h) | | 945 | 995 |
| Class ST, 8.800% - 1 month U.S. LIBOR 7.1593% 8/20/39 (b)(h) | | 2,192 | 2,354 |
| Series 2013-H04 Class BA, 1.65% 2/20/63 (e) | | 1,335 | 1,329 |
| Series 2013-H07 Class JA, 1.75% 3/20/63 (e) | | 3,630 | 3,620 |
| Series 2015-H17 Class HA, 2.5% 5/20/65 (e) | | 3,228 | 3,253 |
| Series 2015-H21: | | | |
| Class HA, 2.5% 6/20/63 (e) | | 8,989 | 9,050 |
| Class JA, 2.5% 6/20/65 (e) | | 819 | 825 |
| Series 2015-H30 Class HA, 1.75% 9/20/62 (b)(e) | | 7,013 | 6,999 |
| Series 2016-H13 Class FB, U.S. TREASURY 1 YEAR INDEX + 0.500% 1.65% 5/20/66 (b)(c)(e) | | 3,851 | 3,877 |
| Series 2017-H06 Class FA, U.S. TREASURY 1 YEAR INDEX + 0.350% 1.57% 8/20/66 (b)(c)(e) | | 3,549 | 3,557 |
| Series 2090-118 Class XZ, 5% 12/20/39 | | 2,233 | 2,568 |
| | | | 125,516 |
| TOTAL COLLATERALIZED MORTGAGE OBLIGATIONS | | | |
| (Cost $125,479) | | | 125,516 |
|
| Commercial Mortgage Securities - 4.5% | | | |
| Freddie Mac: | | | |
| pass-thru certificates sequential payer Series K011 Class A2, 4.084% 11/25/20 | | 780 | 831 |
| sequential payer: | | | |
| Series K034 Class A1, 2.669% 2/25/23 | | 2,523 | 2,571 |
| Series K709 Class A2, 2.086% 3/25/19 | | 2,390 | 2,404 |
| Series K710 Class A2, 1.883% 5/25/19 | | 2,438 | 2,447 |
| Series K713 Class A2, 2.313% 3/25/20 | | 804 | 814 |
| Series K717 Class A2, 2.991% 9/25/21 | | 670 | 697 |
| Series K032 Class A1, 3.016% 2/25/23 | | 4,261 | 4,385 |
| Series K504 Class A2, 2.566% 9/25/20 | | 367 | 374 |
| Series K704 Class A2, 2.412% 8/25/18 | | 663 | 666 |
| Series K706 Class A2, 2.323% 10/25/18 | | 1,295 | 1,303 |
| Series K724 Class A1, 2.776% 3/25/23 | | 2,366 | 2,438 |
| Series K726 Class A1, 2.596% 7/25/49 | | 666 | 680 |
| Freddie Mac Multi-family floater Series 2017-KT01 Class A, 1 month U.S. LIBOR + 0.320% 1.5522% 2/25/20 (b)(c) | | 6,130 | 6,144 |
| TOTAL COMMERCIAL MORTGAGE SECURITIES | | | |
| (Cost $25,653) | | | 25,754 |
|
| Foreign Government and Government Agency Obligations - 5.0% | | | |
| Israeli State: | | | |
| (guaranteed by U.S. Government through Agency for International Development): | | | |
| 5.5% 9/18/23 | | 4,551 | 5,444 |
| 5.5% 12/4/23 | | 10,710 | 12,880 |
| 5.5% 4/26/24 | | 1,100 | 1,328 |
| Jordanian Kingdom: | | | |
| 2.503% 10/30/20 | | 4,169 | 4,287 |
| 3% 6/30/25 | | 3,329 | 3,502 |
| Ukraine Government 1.471% 9/29/21 | | 1,400 | 1,383 |
| TOTAL FOREIGN GOVERNMENT AND GOVERNMENT AGENCY OBLIGATIONS | | | |
| (Cost $26,887) | | | 28,824 |
| | | Shares | Value (000s) |
|
| Money Market Funds - 0.4% | | | |
| Fidelity Cash Central Fund, 1.11% (i) | | | |
| (Cost $2,262) | | 2,261,840 | 2,262 |
| Purchased Swaptions - 0.0% | | | | |
| | | Expiration Date | Notional Amount (000s) | Value (000s) |
| Put Options - 0.0% | | | | |
| Option on an interest rate swap with JPMorgan Chase Bank NA to pay semi-annually a fixed rate of 1.960% and receive quarterly a floating rate based on 3-month LIBOR, expiring December 2024 | | 11/30/17 | 6,700 | $54 |
| Call Options - 0.0% | | | | |
| Option on an interest rate swap with JPMorgan Chase Bank NA to receive semi-annually a fixed rate of 1.960% and pay quarterly a floating rate based on 3-month LIBOR, expiring December 2024 | | 11/30/17 | 6,700 | 54 |
| TOTAL PURCHASED SWAPTIONS | | | | |
| (Cost $108) | | | | 108 |
| TOTAL INVESTMENT IN SECURITIES - 101.2% | | | | |
| (Cost $578,358) | | | | 582,716 |
| NET OTHER ASSETS (LIABILITIES) - (1.2)% | | | | (6,969) |
| NET ASSETS - 100% | | | | $575,747 |
| TBA Sale Commitments | | |
| | Principal Amount (000s) | Value (000s) |
| Fannie Mae | | |
| 4% 9/1/47 | $(6,471) | $(6,837) |
| 4% 9/1/47 | (6,471) | (6,836) |
| TOTAL TBA SALE COMMITMENTS | | |
| (Proceeds $13,641) | | $(13,673) |
| Futures Contracts | | | | | |
| | Number of contracts | Expiration Date | Notional amount (000s) | Value (000s) | Unrealized Appreciation/(Depreciation) (000s) |
| Purchased | | | | | |
| Treasury Contracts | | | | | |
| CBOT 2-Year U.S. Treasury Note Contracts (United States) | 214 | Dec. 2017 | $46,291 | $0 | $0 |
| CBOT 5-Year U.S. Treasury Note Contracts (United States) | 54 | Dec. 2017 | 6,399 | 8 | 8 |
| TOTAL FUTURES CONTRACTS | | | | | $8 |
The notional amount of futures purchased as a percentage of Net Assets is 9.2%
Legend
(a) Security or a portion of the security was pledged to cover margin requirements for futures contracts. At period end, the value of securities pledged amounted to $146,000.
(b) Coupon rates for floating and adjustable rate securities reflect the rates in effect at period end.
(c) Coupon is indexed to a floating interest rate which may be multiplied by a specified factor and/or subject to caps or floors.
(d) Security or a portion of the security purchased on a delayed delivery or when-issued basis.
(e) Represents an investment in an underlying pool of reverse mortgages which typically do not require regular principal and interest payments as repayment is deferred until a maturity event.
(f) Security exempt from registration under Rule 144A of the Securities Act of 1933. These securities may be resold in transactions exempt from registration, normally to qualified institutional buyers. At the end of the period, the value of these securities amounted to $3,800,000 or 0.7% of net assets.
(g) Security represents right to receive monthly interest payments on an underlying pool of mortgages or assets. Principal shown is the outstanding par amount of the pool as of the end of the period.
(h) Coupon is inversely indexed to a floating interest rate multiplied by a specified factor. The price may be considerably more volatile than the price of a comparable fixed rate security.
(i) Affiliated fund that is generally available only to investment companies and other accounts managed by Fidelity Investments. The rate quoted is the annualized seven-day yield of the fund at period end. A complete unaudited listing of the fund's holdings as of its most recent quarter end is available upon request. In addition, each Fidelity Central Fund's financial statements, which are not covered by the Fund's Report of Independent Registered Public Accounting Firm, are available on the SEC's website or upon request.
Affiliated Central Funds
Information regarding fiscal year to date income earned by the Fund from investments in Fidelity Central Funds is as follows:
| Fund | Income earned |
| | (Amounts in thousands) |
| Fidelity Cash Central Fund | $37 |
| Total | $37 |
Investment Valuation
The following is a summary of the inputs used, as of August 31, 2017, involving the Fund's assets and liabilities carried at fair value. The inputs or methodology used for valuing securities may not be an indication of the risk associated with investing in those securities. For more information on valuation inputs, and their aggregation into the levels used below, please refer to the Investment Valuation section in the accompanying Notes to Financial Statements.
| | Valuation Inputs at Reporting Date: |
| Description | Total | Level 1 | Level 2 | Level 3 |
| (Amounts in thousands) | | | | |
| Investments in Securities: | | | | |
| U.S. Government and Government Agency Obligations | $352,825 | $-- | $352,825 | $-- |
| U.S. Government Agency - Mortgage Securities | 36,068 | -- | 36,068 | -- |
| Asset-Backed Securities | 11,359 | -- | 11,359 | -- |
| Collateralized Mortgage Obligations | 125,516 | -- | 125,516 | -- |
| Commercial Mortgage Securities | 25,754 | -- | 25,754 | -- |
| Foreign Government and Government Agency Obligations | 28,824 | -- | 28,824 | -- |
| Money Market Funds | 2,262 | 2,262 | -- | -- |
| Purchased Swaptions | 108 | -- | 108 | -- |
| Total Investments in Securities: | $582,716 | $2,262 | $580,454 | $-- |
| Derivative Instruments: | | | | |
| Assets | | | | |
| Futures Contracts | $8 | $8 | $-- | $-- |
| Total Assets | $8 | $8 | $-- | $-- |
| Liabilities | | | | |
| Futures Contracts | $0 | $0 | $-- | $-- |
| Total Liabilities | $0 | $0 | $-- | $-- |
| Total Derivative Instruments: | $8 | $8 | $-- | $-- |
| Other Financial Instruments: | | | | |
| TBA Sale Commitments | $(13,673) | $-- | $(13,673) | $-- |
| Total Other Financial Instruments: | $(13,673) | $-- | $(13,673) | $-- |
Value of Derivative Instruments
The following table is a summary of the Fund's value of derivative instruments by primary risk exposure as of August 31, 2017. For additional information on derivative instruments, please refer to the Derivative Instruments section in the accompanying Notes to Financial Statements.
| Primary Risk Exposure / Derivative Type | Value (000s) |
| | Asset | Liability |
| Interest Rate Risk | | |
| Futures Contracts(a) | $8 | $0 |
| Purchased Swaptions(b) | 108 | 0 |
| Total Interest Rate Risk | 116 | 0 |
| Total Value of Derivatives | $116 | $0 |
(a) Reflects gross cumulative appreciation (depreciation) on futures contracts as presented in the Schedule of Investments. In the Statement of Assets and Liabilities, the period end daily variation margin is included in receivable or payable for daily variation margin on futures contracts, and the net cumulative appreciation (depreciation) is included in net unrealized appreciation (depreciation).
(b) Gross value is included in the Statement of Assets and Liabilities in the investments, at value line-item.
Values shown as $0 may reflect amounts less than $500.
See accompanying notes which are an integral part of the financial statements.
Financial Statements
Statement of Assets and Liabilities
| Amounts in thousands (except per-share amount) | | August 31, 2017 |
| Assets | | |
Investment in securities, at value — See accompanying schedule:
Unaffiliated issuers (cost $576,096) | $580,454 | |
| Fidelity Central Funds (cost $2,262) | 2,262 | |
| Total Investment in Securities (cost $578,358) | | $582,716 |
| Receivable for investments sold | | 42,364 |
| Receivable for TBA sale commitments | | 13,641 |
| Receivable for fund shares sold | | 263 |
| Interest receivable | | 1,781 |
| Distributions receivable from Fidelity Central Funds | | 3 |
| Receivable for daily variation margin on futures contracts | | 7 |
| Total assets | | 640,775 |
| Liabilities | | |
| Payable for investments purchased | | |
| Regular delivery | $36,845 | |
| Delayed delivery | 13,646 | |
| TBA sale commitments, at value | 13,673 | |
| Payable for fund shares redeemed | 591 | |
| Distributions payable | 55 | |
| Accrued management fee | 148 | |
| Other affiliated payables | 70 | |
| Total liabilities | | 65,028 |
| Net Assets | | $575,747 |
| Net Assets consist of: | | |
| Paid in capital | | $575,296 |
| Distributions in excess of net investment income | | (257) |
| Accumulated undistributed net realized gain (loss) on investments | | (3,626) |
| Net unrealized appreciation (depreciation) on investments | | 4,334 |
| Net Assets, for 54,477 shares outstanding | | $575,747 |
| Net Asset Value, offering price and redemption price per share ($575,747 ÷ 54,477 shares) | | $10.57 |
See accompanying notes which are an integral part of the financial statements.
Statement of Operations
| Amounts in thousands | | Year ended August 31, 2017 |
| Investment Income | | |
| Interest | | $11,437 |
| Income from Fidelity Central Funds | | 37 |
| Total income | | 11,474 |
| Expenses | | |
| Management fee | $1,955 | |
| Transfer agent fees | 633 | |
| Fund wide operations fee | 258 | |
| Independent trustees' fees and expenses | 3 | |
| Miscellaneous | 3 | |
| Total expenses before reductions | 2,852 | |
| Expense reductions | (1) | 2,851 |
| Net investment income (loss) | | 8,623 |
| Realized and Unrealized Gain (Loss) | | |
| Net realized gain (loss) on: | | |
| Investment securities: | | |
| Unaffiliated issuers | (3,059) | |
| Fidelity Central Funds | (1) | |
| Futures contracts | (18) | |
| Total net realized gain (loss) | | (3,078) |
| Change in net unrealized appreciation (depreciation) on: | | |
| Investment securities: | | |
| Unaffiliated issuers | (7,229) | |
| Futures contracts | 33 | |
| Delayed delivery commitments | (32) | |
| Total change in net unrealized appreciation (depreciation) | | (7,228) |
| Net gain (loss) | | (10,306) |
| Net increase (decrease) in net assets resulting from operations | | $(1,683) |
See accompanying notes which are an integral part of the financial statements.
Statement of Changes in Net Assets
| Amounts in thousands | Year ended August 31, 2017 | Year ended August 31, 2016 |
| Increase (Decrease) in Net Assets | | |
| Operations | | |
| Net investment income (loss) | $8,623 | $8,847 |
| Net realized gain (loss) | (3,078) | 6,218 |
| Change in net unrealized appreciation (depreciation) | (7,228) | 3,497 |
| Net increase (decrease) in net assets resulting from operations | (1,683) | 18,562 |
| Distributions to shareholders from net investment income | (8,262) | (9,192) |
| Distributions to shareholders from net realized gain | (5,795) | (4,324) |
| Total distributions | (14,057) | (13,516) |
| Share transactions | | |
| Proceeds from sales of shares | 41,033 | 154,812 |
| Reinvestment of distributions | 13,123 | 12,650 |
| Cost of shares redeemed | (183,806) | (191,359) |
| Net increase (decrease) in net assets resulting from share transactions | (129,650) | (23,897) |
| Total increase (decrease) in net assets | (145,390) | (18,851) |
| Net Assets | | |
| Beginning of period | 721,137 | 739,988 |
| End of period | $575,747 | $721,137 |
| Other Information | | |
| Distributions in excess of net investment income end of period | $(257) | $(316) |
| Shares | | |
| Sold | 3,886 | 14,435 |
| Issued in reinvestment of distributions | 1,240 | 1,181 |
| Redeemed | (17,480) | (17,853) |
| Net increase (decrease) | (12,354) | (2,237) |
See accompanying notes which are an integral part of the financial statements.
Financial Highlights — Fidelity Intermediate Government Income Fund
| Years ended August 31, | 2017 | 2016 | 2015 | 2014 | 2013 |
| Selected Per–Share Data | | | | | |
| Net asset value, beginning of period | $10.79 | $10.71 | $10.68 | $10.58 | $11.09 |
| Income from Investment Operations | | | | | |
| Net investment income (loss)A | .144 | .130 | .144 | .133 | .116 |
| Net realized and unrealized gain (loss) | (.138) | .148 | .016 | .153 | (.294) |
| Total from investment operations | .006 | .278 | .160 | .286 | (.178) |
| Distributions from net investment income | (.138) | (.135) | (.130) | (.130) | (.116) |
| Distributions from net realized gain | (.088) | (.063) | – | (.056) | (.216) |
| Total distributions | (.226) | (.198) | (.130) | (.186) | (.332) |
| Net asset value, end of period | $10.57 | $10.79 | $10.71 | $10.68 | $10.58 |
| Total ReturnB | .08% | 2.62% | 1.50% | 2.72% | (1.66)% |
| Ratios to Average Net AssetsC,D | | | | | |
| Expenses before reductions | .45% | .45% | .45% | .45% | .45% |
| Expenses net of fee waivers, if any | .45% | .45% | .45% | .45% | .45% |
| Expenses net of all reductions | .45% | .45% | .45% | .45% | .45% |
| Net investment income (loss) | 1.36% | 1.21% | 1.34% | 1.25% | 1.07% |
| Supplemental Data | | | | | |
| Net assets, end of period (in millions) | $576 | $721 | $740 | $823 | $916 |
| Portfolio turnover rateE | 149% | 117% | 71% | 153% | 179% |
A Calculated based on average shares outstanding during the period.
B Total returns would have been lower if certain expenses had not been reduced during the applicable periods shown.
C Fees and expenses of any underlying Fidelity Central Funds are not included in the Fund's expense ratio. The Fund indirectly bears its proportionate share of the expenses of any underlying Fidelity Central Funds.
D Expense ratios reflect operating expenses of the Fund. Expenses before reductions do not reflect amounts reimbursed by the investment adviser or reductions from expense offset arrangements and do not represent the amount paid by the Fund during periods when reimbursements or reductions occur. Expenses net of fee waivers reflect expenses after reimbursement by the investment adviser but prior to reductions from expense offset arrangements. Expenses net of all reductions represent the net expenses paid by the Fund.
E Amount does not include the portfolio activity of any underlying Fidelity Central Funds.
See accompanying notes which are an integral part of the financial statements.
Notes to Financial Statements
For the period ended August 31, 2017
(Amounts in thousands except percentages)
1. Organization.
Fidelity Intermediate Government Income Fund (the Fund) is a fund of Fidelity Income Fund (the Trust) and is authorized to issue an unlimited number of shares. Share transactions on the Statement of Changes in Net Assets may contain exchanges between affiliated funds. The Trust is registered under the Investment Company Act of 1940, as amended (the 1940 Act), as an open-end management investment company organized as a Massachusetts business trust.
2. Investments in Fidelity Central Funds.
The Fund invests in Fidelity Central Funds, which are open-end investment companies generally available only to other investment companies and accounts managed by the investment adviser and its affiliates. The Fund's Schedule of Investments lists each of the Fidelity Central Funds held as of period end, if any, as an investment of the Fund, but does not include the underlying holdings of each Fidelity Central Fund. As an Investing Fund, the Fund indirectly bears its proportionate share of the expenses of the underlying Fidelity Central Funds.
The Money Market Central Funds seek preservation of capital and current income and are managed by Fidelity Investments Money Management, Inc. (FIMM), an affiliate of the investment adviser. Annualized expenses of the Money Market Central Funds as of their most recent shareholder report date are less than .005%.
A complete unaudited list of holdings for each Fidelity Central Fund is available upon request or at the Securities and Exchange Commission (the SEC) website at www.sec.gov. In addition, the financial statements of the Fidelity Central Funds, which are not covered by the Fund's Report of Independent Registered Public Accounting Firm, are available on the SEC website or upon request.
3. Significant Accounting Policies.
The Fund is an investment company and applies the accounting and reporting guidance of the Financial Accounting Standards Board (FASB) Accounting Standards Codification Topic 946 Financial Services – Investments Companies. The financial statements have been prepared in conformity with accounting principles generally accepted in the United States of America (GAAP), which require management to make certain estimates and assumptions at the date of the financial statements. Actual results could differ from those estimates. Subsequent events, if any, through the date that the financial statements were issued have been evaluated in the preparation of the financial statements. The following summarizes the significant accounting policies of the Fund:
Investment Valuation. Investments are valued as of 4:00 p.m. Eastern time on the last calendar day of the period. The Board of Trustees (the Board) has delegated the day to day responsibility for the valuation of the Fund's investments to the Fair Value Committee (the Committee) established by the Fund's investment adviser. In accordance with valuation policies and procedures approved by the Board, the Fund attempts to obtain prices from one or more third party pricing vendors or brokers to value its investments. When current market prices, quotations or currency exchange rates are not readily available or reliable, investments will be fair valued in good faith by the Committee, in accordance with procedures adopted by the Board. Factors used in determining fair value vary by investment type and may include market or investment specific events, changes in interest rates and credit quality. The frequency with which these procedures are used cannot be predicted and they may be utilized to a significant extent. The Committee oversees the Fund's valuation policies and procedures and reports to the Board on the Committee's activities and fair value determinations. The Board monitors the appropriateness of the procedures used in valuing the Fund's investments and ratifies the fair value determinations of the Committee.
The Fund categorizes the inputs to valuation techniques used to value its investments into a disclosure hierarchy consisting of three levels as shown below:
- Level 1 – quoted prices in active markets for identical investments
- Level 2 – other significant observable inputs (including quoted prices for similar investments, interest rates, prepayment speeds, etc.)
- Level 3 – unobservable inputs (including the Fund's own assumptions based on the best information available)
Valuation techniques used to value the Fund's investments by major category are as follows:
Debt securities, including restricted securities, are valued based on evaluated prices received from third party pricing vendors or from brokers who make markets in such securities. Foreign government and government agency obligations and U.S. government and government agency obligations are valued by pricing vendors who utilize matrix pricing which considers yield or price of bonds of comparable quality, coupon, maturity and type or by broker-supplied prices. Asset backed securities, collateralized mortgage obligations, commercial mortgage securities and U.S. government agency mortgage securities are valued by pricing vendors who utilize matrix pricing which considers prepayment speed assumptions, attributes of the collateral, yield or price of bonds of comparable quality, coupon, maturity and type or by broker-supplied prices. When independent prices are unavailable or unreliable, debt securities may be valued utilizing pricing methodologies which consider similar factors that would be used by third party pricing vendors. Debt securities are generally categorized as Level 2 in the hierarchy but may be Level 3 depending on the circumstances.
Futures contracts are valued at the settlement price established each day by the board of trade or exchange on which they are traded and are categorized as Level 1 in the hierarchy. Options traded over-the-counter are valued using vendor or broker-supplied valuations and are categorized as Level 2 in the hierarchy. Investments in open-end mutual funds, including the Fidelity Central Funds, are valued at their closing net asset value (NAV) each business day and are categorized as Level 1 in the hierarchy.
Changes in valuation techniques may result in transfers in or out of an assigned level within the disclosure hierarchy. The aggregate value of investments by input level as of August 31, 2017 is included at the end of the Fund's Schedule of Investments.
Investment Transactions and Income. For financial reporting purposes, the Fund's investment holdings and NAV include trades executed through the end of the last business day of the period. The NAV per share for processing shareholder transactions is calculated as of the close of business of the New York Stock Exchange (NYSE), normally 4:00 p.m. Eastern time and includes trades executed through the end of the prior business day. Gains and losses on securities sold are determined on the basis of identified cost. Income and capital gain distributions from Fidelity Central Funds, if any, are recorded on the ex-dividend date. Interest income is accrued as earned and includes coupon interest and amortization of premium and accretion of discount on debt securities as applicable. The principal amount on inflation-indexed securities is periodically adjusted to the rate of inflation and interest is accrued based on the principal amount. The adjustments to principal due to inflation are reflected as increases or decreases to Interest in the accompanying Statement of Operations.
Expenses. Expenses directly attributable to a fund are charged to that fund. Expenses attributable to more than one fund are allocated among the respective funds on the basis of relative net assets or other appropriate methods. Expense estimates are accrued in the period to which they relate and adjustments are made when actual amounts are known.
Income Tax Information and Distributions to Shareholders. Each year, the Fund intends to qualify as a regulated investment company under Subchapter M of the Internal Revenue Code, including distributing substantially all of its taxable income and realized gains. As a result, no provision for U.S. Federal income taxes is required. As of August 31, 2017, the Fund did not have any unrecognized tax benefits in the financial statements; nor is the Fund aware of any tax positions for which it is reasonably possible that the total amounts of unrecognized tax benefits will significantly change in the next twelve months. The Fund files a U.S. federal tax return, in addition to state and local tax returns as required. The Fund's federal income tax returns are subject to examination by the Internal Revenue Service (IRS) for a period of three fiscal years after they are filed. State and local tax returns may be subject to examination for an additional fiscal year depending on the jurisdiction.
Dividends are declared and recorded daily and paid monthly from net investment income. Distributions from realized gains, if any, are declared and recorded on the ex-dividend date. Income and capital gain distributions are determined in accordance with income tax regulations, which may differ from GAAP. In addition, the Fund claimed a portion of the payment made to redeeming shareholders as a distribution for income tax purposes.
Capital accounts within the financial statements are adjusted for permanent book-tax differences. These adjustments have no impact on net assets or the results of operations. Capital accounts are not adjusted for temporary book-tax differences which will reverse in a subsequent period.
Book-tax differences are primarily due to futures contracts, market discount, deferred trustees compensation and losses deferred due to wash sales, futures contracts and excise tax regulations.
As of period end, the cost and unrealized appreciation (depreciation) in securities, and derivatives if applicable, for federal income tax purposes were as follows:
| Gross unrealized appreciation | $5,421 |
| Gross unrealized depreciation | (1,451) |
| Net unrealized appreciation (depreciation) | $3,970 |
| Tax Cost | $578,715 |
The tax-based components of distributable earnings as of period end were as follows:
| Undistributed ordinary income | $97 |
| Net unrealized appreciation (depreciation) on securities and other investments | $3,970 |
The Fund intends to elect to defer to its next fiscal year $3,614 of capital losses recognized during the period November 1, 2016 to August 31, 2017.
The tax character of distributions paid was as follows:
| | August 31, 2017 | August 31, 2016 |
| Ordinary Income | $9,242 | $ 10,433 |
| Long-term Capital Gains | 4,815 | 3,083 |
| Total | $14,057 | $ 13,516 |
Delayed Delivery Transactions and When-Issued Securities. During the period, the Fund transacted in securities on a delayed delivery or when-issued basis. Payment and delivery may take place after the customary settlement period for that security. The price of the underlying securities and the date when the securities will be delivered and paid for are fixed at the time the transaction is negotiated. The securities purchased on a delayed delivery or when-issued basis are identified as such in the Fund's Schedule of Investments. The Fund may receive compensation for interest forgone in the purchase of a delayed delivery or when-issued security. With respect to purchase commitments, the Fund identifies securities as segregated in its records with a value at least equal to the amount of the commitment. Losses may arise due to changes in the value of the underlying securities or if the counterparty does not perform under the contract's terms, or if the issuer does not issue the securities due to political, economic, or other factors.
To-Be-Announced (TBA) Securities and Mortgage Dollar Rolls. During the period, the Fund transacted in TBA securities that involved buying or selling mortgage-backed securities (MBS) on a forward commitment basis. A TBA transaction typically does not designate the actual security to be delivered and only includes an approximate principal amount; however delivered securities must meet specified terms defined by industry guidelines, including issuer, rate and current principal amount outstanding on underlying mortgage pools. The Fund may enter into a TBA transaction with the intent to take possession of or deliver the underlying MBS, or the Fund may elect to extend the settlement by entering into either a mortgage or reverse mortgage dollar roll. Mortgage dollar rolls are transactions where a fund sells TBA securities and simultaneously agrees to repurchase MBS on a later date at a lower price and with the same counterparty. Reverse mortgage dollar rolls involve the purchase and simultaneous agreement to sell TBA securities on a later date at a lower price. Transactions in mortgage dollar rolls and reverse mortgage dollar rolls are accounted for as purchases and sales and may result in an increase to the Fund's portfolio turnover rate.
Purchases and sales of TBA securities involve risks similar to those discussed above for delayed delivery and when-issued securities. Also, if the counterparty in a mortgage dollar roll or a reverse mortgage dollar roll transaction files for bankruptcy or becomes insolvent, the Fund's right to repurchase or sell securities may be limited. Additionally, when a fund sells TBA securities without already owning or having the right to obtain the deliverable securities (an uncovered forward commitment to sell), it incurs a risk of loss because it could have to purchase the securities at a price that is higher than the price at which it sold them. A fund may be unable to purchase the deliverable securities if the corresponding market is illiquid.
TBA securities subject to a forward commitment to sell at period end are included at the end of the Fund's Schedule of Investments under the caption "TBA Sale Commitments". The proceeds and value of these commitments are reflected in the Fund's Statement of Assets and Liabilities as Receivable for TBA sale commitments and TBA sale commitments, at value, respectively.
Restricted Securities. The Fund may invest in securities that are subject to legal or contractual restrictions on resale. These securities generally may be resold in transactions exempt from registration or to the public if the securities are registered. Disposal of these securities may involve time-consuming negotiations and expense, and prompt sale at an acceptable price may be difficult. Information regarding restricted securities is included at the end of the Fund's Schedule of Investments.
New Accounting Pronouncement. In March 2017, the Financial Accounting Standards Board (FASB) issued an Accounting Standards Update (ASU), ASU 2017-08, which amends the amortization period for certain callable debt securities that are held at a premium. The amendment requires the premium to be amortized to the earliest call date. The amendments do not require an accounting change for securities held at a discount. The ASU is effective for annual periods beginning after December 15, 2018. Management is currently evaluating the potential impact of these changes to the financial statements.
4. Derivative Instruments.
Risk Exposures and the Use of Derivative Instruments. The Fund's investment objective allows the Fund to enter into various types of derivative contracts, including futures contracts and options. Derivatives are investments whose value is primarily derived from underlying assets, indices or reference rates and may be transacted on an exchange or over-the-counter (OTC). Derivatives may involve a future commitment to buy or sell a specified asset based on specified terms, to exchange future cash flows at periodic intervals based on a notional principal amount, or for one party to make one or more payments upon the occurrence of specified events in exchange for periodic payments from the other party.
The Fund used derivatives to increase returns and to manage exposure to certain risks as defined below. The success of any strategy involving derivatives depends on analysis of numerous economic factors, and if the strategies for investment do not work as intended, the Fund may not achieve its objectives.
The Fund's use of derivatives increased or decreased its exposure to the following risk:
| Interest Rate Risk | Interest rate risk relates to the fluctuations in the value of interest-bearing securities due to changes in the prevailing levels of market interest rates. |
The Fund is also exposed to additional risks from investing in derivatives, such as liquidity risk and counterparty credit risk. Liquidity risk is the risk that the Fund will be unable to close out the derivative in the open market in a timely manner. Counterparty credit risk is the risk that the counterparty will not be able to fulfill its obligation to the Fund. Derivative counterparty credit risk is managed through formal evaluation of the creditworthiness of all potential counterparties. On certain OTC derivatives such as options, the Fund attempts to reduce its exposure to counterparty credit risk by entering into an International Swaps and Derivatives Association, Inc. (ISDA) Master Agreement with each of its counterparties. The ISDA Master Agreement gives the Fund the right to terminate all transactions traded under such agreement upon the deterioration in the credit quality of the counterparty beyond specified levels. The ISDA Master Agreement gives each party the right, upon an event of default by the other party or a termination of the agreement, to close out all transactions traded under such agreement and to net amounts owed under each transaction to one net payable by one party to the other. To mitigate counterparty credit risk on bi-lateral OTC derivatives, the Fund receives collateral in the form of cash or securities once the Fund's net unrealized appreciation on outstanding derivative contracts under an ISDA Master Agreement exceeds certain applicable thresholds, subject to certain minimum transfer provisions. The collateral received is held in segregated accounts with the Fund's custodian bank in accordance with the collateral agreements entered into between the Fund, the counterparty and the Fund's custodian bank. The Fund could experience delays and costs in gaining access to the collateral even though it is held by the Fund's custodian bank. The Fund's maximum risk of loss from counterparty credit risk related to bi-lateral OTC derivatives is generally the aggregate unrealized appreciation and unpaid counterparty payments in excess of any collateral pledged by the counterparty to the Fund. For OTC written options with upfront premiums received, the Fund is obligated to perform and therefore does not have counterparty risk. For OTC written options with premiums to be received at a future date, the maximum risk of loss from counterparty credit risk is the amount of the premium in excess of any collateral pledged by the counterparty. The Fund may be required to pledge collateral for the benefit of the counterparties on bi-lateral OTC derivatives in an amount not less than each counterparty's unrealized appreciation on outstanding derivative contracts, subject to certain minimum transfer provisions, and any such pledged collateral is identified in the Schedule of Investments. Exchange-traded futures contracts are not covered by the ISDA Master Agreement; however counterparty credit risk related to exchange-traded futures contracts may be mitigated by the protection provided by the exchange on which they trade.
Investing in derivatives may involve greater risks than investing in the underlying assets directly and, to varying degrees, may involve risk of loss in excess of any initial investment and collateral received and amounts recognized in the Statement of Assets and Liabilities. In addition, there may be the risk that the change in value of the derivative contract does not correspond to the change in value of the underlying instrument.
Net Realized Gain (Loss) and Change in Net Unrealized Appreciation (Depreciation) on Derivatives. The table below, which reflects the impacts of derivatives on the financial performance of the Fund, summarizes the net realized gain (loss) and change in net unrealized appreciation (depreciation) for derivatives during the period as presented in the Statement of Operations.
| Primary Risk Exposure / Derivative Type | Net Realized Gain (Loss) | Change in Net Unrealized Appreciation (Depreciation) |
| Interest Rate Risk | | |
| Futures Contracts | $(18) | $33 |
| Purchased Options | – | – |
| Totals | $(18) | $33 |
A summary of the value of derivatives by primary risk exposure as of period end is included at the end of the Schedule of Investments.
Futures Contracts. A futures contract is an agreement between two parties to buy or sell a specified underlying instrument for a fixed price at a specified future date. The Fund used futures contracts to manage its exposure to the bond market and fluctuations in interest rates.
Upon entering into a futures contract, a fund is required to deposit either cash or securities (initial margin) with a clearing broker in an amount equal to a certain percentage of the face value of the contract. Futures contracts are marked-to-market daily and subsequent daily payments (variation margin) are made or received by a fund depending on the daily fluctuations in the value of the futures contracts and are recorded as unrealized appreciation or (depreciation). This receivable and/or payable, if any, is included in daily variation margin on futures contracts in the Statement of Assets and Liabilities. Realized gain or (loss) is recorded upon the expiration or closing of a futures contract. The net realized gain (loss) and change in net unrealized appreciation (depreciation) on futures contracts during the period is included in the Statement of Operations.
Any open futures contracts at period end are presented in the Schedule of Investments under the caption "Futures Contracts". The underlying face amount at value reflects each contract's exposure to the underlying instrument or index at period end and is representative of volume of activity during the period. Securities deposited to meet initial margin requirements are identified in the Schedule of Investments.
Options. Options give the purchaser the right, but not the obligation, to buy (call) or sell (put) an underlying security or financial instrument at an agreed exercise or strike price between or on certain dates. Options obligate the seller (writer) to buy (put) or sell (call) an underlying instrument at the exercise or strike price or cash settle an underlying derivative instrument if the holder exercises the option on or before the expiration date. The Fund uses OTC options, such as swaptions, which are options where the underlying instrument is a swap, to manage its exposure to fluctuations in interest rates.
Upon entering into an options contract, a fund will pay or receive a premium. Premiums paid on purchased options are reflected as cost of investments and premiums received on written options are reflected as a liability on the Statement of Assets and Liabilities. Certain options may be purchased or written with premiums to be paid or received on a future date. Options are valued daily and any unrealized appreciation (depreciation) is reflected on the Statement of Assets and Liabilities. When an option is exercised, the cost or proceeds of the underlying instrument purchased or sold is adjusted by the amount of the premium. When an option is closed the Fund will realize a gain or loss depending on whether the proceeds or amount paid for the closing sale transaction is greater or less than the premium received or paid. When an option expires, gains and losses are realized to the extent of premiums received and paid, respectively. The net realized and unrealized gains (losses) on purchased options are included on the Statement of Operations in net realized gain (loss) and change in net unrealized appreciation (depreciation) on investment securities. The net realized gain (loss) and change in net unrealized appreciation (depreciation) on written options are reflected separately on the Statement of Operations.
Any open options at period end are presented in the Schedule of Investments under the captions "Purchased Options," "Purchased Swaptions," "Written Options" and "Written Swaptions," as applicable, and are representative of volume of activity during the period.
Writing puts and buying calls tend to increase exposure to the underlying instrument while buying puts and writing calls tend to decrease exposure to the underlying instrument. For purchased options, risk of loss is limited to the premium paid, and for written options, risk of loss is the change in value in excess of the premium received.
5. Purchases and Sales of Investments.
Purchases and sales of securities, other than short-term securities and U.S. government securities, aggregated $11,311 and $9,789, respectively.
6. Fees and Other Transactions with Affiliates.
Management Fee. Fidelity Management & Research Company (the investment adviser) and its affiliates provide the Fund with investment management related services for which the Fund pays a monthly management fee. The management fee is the sum of an individual fund fee rate that is based on an annual rate of .20% of the Fund's average net assets and an annualized group fee rate that averaged .11% during the period. The group fee rate is based upon the average net assets of all the mutual funds advised by the investment adviser, including any mutual funds previously advised by the investment adviser that are currently advised by Fidelity SelectCo, LLC, an affiliate of the investment adviser. The group fee rate decreases as assets under management increase and increases as assets under management decrease. For the reporting period, the total annual management fee rate was .31% of the Fund's average net assets.
Transfer Agent Fees. Fidelity Investments Institutional Operations Company, Inc. (FIIOC), an affiliate of the investment adviser, is the Fund's transfer, dividend disbursing and shareholder servicing agent. FIIOC receives an asset-based fee of .10% of the Fund's average net assets. FIIOC pays for typesetting, printing and mailing of shareholder reports, except proxy statements.
Fund Wide Operations Fee. Pursuant to the Fund Wide Operations and Expense Agreement (FWOE), the investment adviser has agreed to provide for fund level expenses (which do not include transfer agent, compensation of the independent Trustees, interest (including commitment fees), taxes or extraordinary expenses, if any) in return for a FWOE fee equal to .35% of the Fund's average net assets less the total amount of the management fee. The FWOE paid by the Fund is reduced by an amount equal to the fees and expenses paid to the independent Trustees. For the period, the FWOE fee was equivalent to an annual rate of .04% of average net assets.
Interfund Trades. The Fund may purchase from or sell securities to other Fidelity Funds under procedures adopted by the Board. The procedures have been designed to ensure these interfund trades are executed in accordance with Rule 17a-7 of the 1940 Act. Interfund trades are included within the respective purchases and sales amounts shown in the Purchases and Sales of Investments note.
7. Committed Line of Credit.
The Fund participates with other funds managed by the investment adviser or an affiliate in a $4.25 billion credit facility (the "line of credit") to be utilized for temporary or emergency purposes to fund shareholder redemptions or for other short-term liquidity purposes. The Fund has agreed to pay commitment fees on its pro-rata portion of the line of credit, which amounted to $2 and is reflected in Miscellaneous expenses on the Statement of Operations. During the period, the Fund did not borrow on this line of credit.
8. Security Lending.
The Fund lends portfolio securities from time to time in order to earn additional income. On the settlement date of the loan, the Fund receives collateral (in the form of U.S. Treasury obligations, letters of credit and/or cash) against the loaned securities and maintains collateral in an amount not less than 100% of the market value of the loaned securities during the period of the loan. The market value of the loaned securities is determined at the close of business of the Fund and any additional required collateral is delivered to the Fund on the next business day. The Fund or borrower may terminate the loan at any time, and if the borrower defaults on its obligation to return the securities loaned because of insolvency or other reasons, the Fund may apply collateral received from the borrower against the obligation. The Fund may experience delays and costs in recovering the securities loaned. Any cash collateral received is maintained at the Fund's custodian and/or invested in cash equivalents. At period end, there were no security loans outstanding. Security lending income represents the income earned on investing cash collateral, less rebates paid to borrowers, plus any premium payments received for lending certain types of securities. Security lending income is presented in the Statement of Operations as a component of interest income. Total security lending income during the period amounted to $7.
9. Expense Reductions.
Through arrangements with the Fund's custodian, credits realized as a result of certain uninvested cash balances were used to reduce the Fund's expenses. During the period, these credits reduced the Fund's expenses by $1.
10. Other.
The Fund's organizational documents provide former and current trustees and officers with a limited indemnification against liabilities arising in connection with the performance of their duties to the Fund. In the normal course of business, the Fund may also enter into contracts that provide general indemnifications. The Fund's maximum exposure under these arrangements is unknown as this would be dependent on future claims that may be made against the Fund. The risk of material loss from such claims is considered remote.
Report of Independent Registered Public Accounting Firm
To the Trustees of Fidelity Income Fund and Shareholders of Fidelity Intermediate Government Income Fund:
In our opinion, the accompanying statement of assets and liabilities, including the schedule of investments, and the related statements of operations and of changes in net assets and the financial highlights present fairly, in all material respects, the financial position of Fidelity Intermediate Government Income Fund (a fund of Fidelity Income Fund) as of August 31, 2017, the results of its operations for the year then ended, the changes in its net assets for each of the two years in the period then ended and the financial highlights for each of the periods indicated, in conformity with accounting principles generally accepted in the United States of America. These financial statements and financial highlights (hereafter referred to as “financial statements”) are the responsibility of the Fidelity Intermediate Government Income Fund’s management. Our responsibility is to express an opinion on these financial statements based on our audits. We conducted our audits of these financial statements in accordance with the standards of the Public Company Accounting Oversight Board (United States). Those standards require that we plan and perform the audit to obtain reasonable assurance about whether the financial statements are free of material misstatement. An audit includes examining, on a test basis, evidence supporting the amounts and disclosures in the financial statements, assessing the accounting principles used and significant estimates made by management, and evaluating the overall financial statement presentation. Our procedures included confirmation of securities owned as of August 31, 2017 by correspondence with the custodian and brokers; when replies were not received from brokers, we performed other auditing procedures. We believe that our audits provide a reasonable basis for our opinion.
PricewaterhouseCoopers LLP
Boston, Massachusetts
October 17, 2017
Trustees and Officers
The Trustees, Members of the Advisory Board (if any), and officers of the trust and fund, as applicable, are listed below. The Board of Trustees governs the fund and is responsible for protecting the interests of shareholders. The Trustees are experienced executives who meet periodically throughout the year to oversee the fund's activities, review contractual arrangements with companies that provide services to the fund, oversee management of the risks associated with such activities and contractual arrangements, and review the fund's performance. Each of the Trustees oversees 246 funds.
The Trustees hold office without limit in time except that (a) any Trustee may resign; (b) any Trustee may be removed by written instrument, signed by at least two-thirds of the number of Trustees prior to such removal; (c) any Trustee who requests to be retired or who has become incapacitated by illness or injury may be retired by written instrument signed by a majority of the other Trustees; and (d) any Trustee may be removed at any special meeting of shareholders by a two-thirds vote of the outstanding voting securities of the trust. Each Trustee who is not an interested person (as defined in the 1940 Act) of the trust and the fund is referred to herein as an Independent Trustee. Each Independent Trustee shall retire not later than the last day of the calendar year in which his or her 75th birthday occurs. The Independent Trustees may waive this mandatory retirement age policy with respect to individual Trustees. Officers and Advisory Board Members hold office without limit in time, except that any officer or Advisory Board Member may resign or may be removed by a vote of a majority of the Trustees at any regular meeting or any special meeting of the Trustees. Except as indicated, each individual has held the office shown or other offices in the same company for the past five years.
The fund’s Statement of Additional Information (SAI) includes more information about the Trustees. To request a free copy, call Fidelity at 1-800-544-8544.
Experience, Skills, Attributes, and Qualifications of the Trustees. The Governance and Nominating Committee has adopted a statement of policy that describes the experience, qualifications, attributes, and skills that are necessary and desirable for potential Independent Trustee candidates (Statement of Policy). The Board believes that each Trustee satisfied at the time he or she was initially elected or appointed a Trustee, and continues to satisfy, the standards contemplated by the Statement of Policy. The Governance and Nominating Committee also engages professional search firms to help identify potential Independent Trustee candidates who have the experience, qualifications, attributes, and skills consistent with the Statement of Policy. From time to time, additional criteria based on the composition and skills of the current Independent Trustees, as well as experience or skills that may be appropriate in light of future changes to board composition, business conditions, and regulatory or other developments, have also been considered by the professional search firms and the Governance and Nominating Committee. In addition, the Board takes into account the Trustees' commitment and participation in Board and committee meetings, as well as their leadership of standing and ad hoc committees throughout their tenure.
In determining that a particular Trustee was and continues to be qualified to serve as a Trustee, the Board has considered a variety of criteria, none of which, in isolation, was controlling. The Board believes that, collectively, the Trustees have balanced and diverse experience, qualifications, attributes, and skills, which allow the Board to operate effectively in governing the fund and protecting the interests of shareholders. Information about the specific experience, skills, attributes, and qualifications of each Trustee, which in each case led to the Board's conclusion that the Trustee should serve (or continue to serve) as a trustee of the fund, is provided below.
Board Structure and Oversight Function. Abigail P. Johnson is an interested person and currently serves as Chairman. The Trustees have determined that an interested Chairman is appropriate and benefits shareholders because an interested Chairman has a personal and professional stake in the quality and continuity of services provided to the fund. Independent Trustees exercise their informed business judgment to appoint an individual of their choosing to serve as Chairman, regardless of whether the Trustee happens to be independent or a member of management. The Independent Trustees have determined that they can act independently and effectively without having an Independent Trustee serve as Chairman and that a key structural component for assuring that they are in a position to do so is for the Independent Trustees to constitute a substantial majority for the Board. The Independent Trustees also regularly meet in executive session. Marie L. Knowles serves as Chairman of the Independent Trustees and as such (i) acts as a liaison between the Independent Trustees and management with respect to matters important to the Independent Trustees and (ii) with management prepares agendas for Board meetings.
Fidelity® funds are overseen by different Boards of Trustees. The fund's Board oversees Fidelity's investment-grade bond, money market, asset allocation and certain equity funds, and other Boards oversee Fidelity's high income, sector and other equity funds. The asset allocation funds may invest in Fidelity® funds that are overseen by such other Boards. The use of separate Boards, each with its own committee structure, allows the Trustees of each group of Fidelity® funds to focus on the unique issues of the funds they oversee, including common research, investment, and operational issues. On occasion, the separate Boards establish joint committees to address issues of overlapping consequences for the Fidelity® funds overseen by each Board.
The Trustees operate using a system of committees to facilitate the timely and efficient consideration of all matters of importance to the Trustees, the fund, and fund shareholders and to facilitate compliance with legal and regulatory requirements and oversight of the fund's activities and associated risks. The Board, acting through its committees, has charged FMR and its affiliates with (i) identifying events or circumstances the occurrence of which could have demonstrably adverse effects on the fund's business and/or reputation; (ii) implementing processes and controls to lessen the possibility that such events or circumstances occur or to mitigate the effects of such events or circumstances if they do occur; and (iii) creating and maintaining a system designed to evaluate continuously business and market conditions in order to facilitate the identification and implementation processes described in (i) and (ii) above. Because the day-to-day operations and activities of the fund are carried out by or through FMR, its affiliates, and other service providers, the fund's exposure to risks is mitigated but not eliminated by the processes overseen by the Trustees. While each of the Board's committees has responsibility for overseeing different aspects of the fund's activities, oversight is exercised primarily through the Operations and Audit Committees. In addition, an ad hoc Board committee of Independent Trustees has worked with FMR to enhance the Board's oversight of investment and financial risks, legal and regulatory risks, technology risks, and operational risks, including the development of additional risk reporting to the Board. Appropriate personnel, including but not limited to the fund's Chief Compliance Officer (CCO), FMR's internal auditor, the independent accountants, the fund's Treasurer and portfolio management personnel, make periodic reports to the Board's committees, as appropriate, including an annual review of Fidelity's risk management program for the Fidelity® funds. The responsibilities of each standing committee, including their oversight responsibilities, are described further under "Standing Committees of the Trustees."
Interested Trustees*:
Correspondence intended for a Trustee who is an interested person may be sent to Fidelity Investments, 245 Summer Street, Boston, Massachusetts 02210.
Name, Year of Birth; Principal Occupations and Other Relevant Experience+
Abigail P. Johnson (1961)
Year of Election or Appointment: 2009
Trustee
Chairman of the Board of Trustees
Ms. Johnson also serves as Trustee of other Fidelity® funds. Ms. Johnson serves as Chairman (2016-present), Chief Executive Officer (2014-present), and Director (2007-present) of FMR LLC (diversified financial services company), President of Fidelity Financial Services (2012-present) and President of Personal, Workplace and Institutional Services (2005-present). Ms. Johnson is Chairman and Director of FMR Co., Inc. (investment adviser firm, 2011-present) and Chairman and Director of FMR (investment adviser firm, 2011-present). Previously, Ms. Johnson served as Vice Chairman (2007-2016) and President (2013-2016) of FMR LLC, President and a Director of FMR (2001-2005), a Trustee of other investment companies advised by FMR, Fidelity Investments Money Management, Inc. (investment adviser firm), and FMR Co., Inc. (2001-2005), Senior Vice President of the Fidelity® funds (2001-2005), and managed a number of Fidelity® funds. Ms. Abigail P. Johnson and Mr. Arthur E. Johnson are not related.
Jennifer Toolin McAuliffe (1959)
Year of Election or Appointment: 2016
Trustee
Ms. McAuliffe also serves as Trustee of other Fidelity® funds. Ms. McAuliffe previously served as a Member of the Advisory Board of certain Fidelity® funds (2016) and as Co-Head of Fixed Income of Fidelity Investments Limited (now known as FIL Limited (FIL)) (diversified financial services company). Earlier roles at FIL included Director of Research for FIL’s credit and quantitative teams in London, Hong Kong and Tokyo. Ms. McAuliffe also was the Director of Research for taxable and municipal bonds at Fidelity Investments Money Management, Inc. Ms. McAuliffe is also a director or trustee of several not-for-profit entities.
* Determined to be an “Interested Trustee” by virtue of, among other things, his or her affiliation with the trust or various entities under common control with FMR.
+ The information includes the Trustee's principal occupation during the last five years and other information relating to the experience, attributes, and skills relevant to the Trustee's qualifications to serve as a Trustee, which led to the conclusion that the Trustee should serve as a Trustee for the fund.
Independent Trustees:
Correspondence intended for an Independent Trustee may be sent to Fidelity Investments, P.O. Box 55235, Boston, Massachusetts 02205-5235.
Name, Year of Birth; Principal Occupations and Other Relevant Experience+
Elizabeth S. Acton (1951)
Year of Election or Appointment: 2013
Trustee
Ms. Acton also serves as Trustee of other Fidelity® funds. Prior to her retirement in April 2012, Ms. Acton was Executive Vice President, Finance (2011-2012), Executive Vice President, Chief Financial Officer (2002-2011), and Treasurer (2004-2005) of Comerica Incorporated (financial services). Prior to joining Comerica, Ms. Acton held a variety of positions at Ford Motor Company (1983-2002), including Vice President and Treasurer (2000-2002) and Executive Vice President and Chief Financial Officer of Ford Motor Credit Company (1998-2000). Ms. Acton currently serves as a member of the Board of Directors and Audit and Finance Committees of Beazer Homes USA, Inc. (homebuilding, 2012-present). Previously, Ms. Acton served as a Member of the Advisory Board of certain Fidelity® funds (2013-2016).
John Engler (1948)
Year of Election or Appointment: 2014
Trustee
Mr. Engler also serves as Trustee of other Fidelity® funds. He serves on the board of directors for Universal Forest Products (manufacturer and distributor of wood and wood-alternative products, 2003-present) and K12 Inc. (technology-based education company, 2012-present). Previously, Mr. Engler served as a Member of the Advisory Board of certain Fidelity® funds (2014-2016), president of the Business Roundtable (2011-2017), a trustee of The Munder Funds (2003-2014), president and CEO of the National Association of Manufacturers (2004-2011), member of the Board of Trustees of the Annie E. Casey Foundation (2004-2015), and as governor of Michigan (1991-2003). He is a past chairman of the National Governors Association.
Albert R. Gamper, Jr. (1942)
Year of Election or Appointment: 2006
Trustee
Mr. Gamper also serves as Trustee of other Fidelity® funds. Prior to his retirement in December 2004, Mr. Gamper served as Chairman of the Board of CIT Group Inc. (commercial finance). During his tenure with CIT Group Inc. Mr. Gamper served in numerous senior management positions, including Chairman (1987-1989; 1999-2001; 2002-2004), Chief Executive Officer (1987-2004), and President (2002-2003). Mr. Gamper currently serves as a member of the Board of Directors of Public Service Enterprise Group (utilities, 2000-present), and Member of the Board of Trustees of Barnabas Health Care System (1997-present). Previously, Mr. Gamper served as Chairman (2012-2015) and Vice Chairman (2011-2012) of the Independent Trustees of certain Fidelity® funds and as Chairman of the Board of Governors, Rutgers University (2004-2007).
Robert F. Gartland (1951)
Year of Election or Appointment: 2010
Trustee
Mr. Gartland also serves as Trustee of other Fidelity® funds. Mr. Gartland is Chairman and an investor in Gartland & Mellina Group Corp. (consulting, 2009-present). Previously, Mr. Gartland served as a partner and investor of Vietnam Partners LLC (investments and consulting, 2008-2011). Prior to his retirement, Mr. Gartland held a variety of positions at Morgan Stanley (financial services, 1979-2007) including Managing Director (1987-2007).
Arthur E. Johnson (1947)
Year of Election or Appointment: 2008
Trustee
Vice Chairman of the Independent Trustees
Mr. Johnson also serves as Trustee of other Fidelity® funds. Mr. Johnson serves as a member of the Board of Directors of Eaton Corporation plc (diversified power management, 2009-present) and Booz Allen Hamilton (management consulting, 2011-present). Prior to his retirement, Mr. Johnson served as Senior Vice President of Corporate Strategic Development of Lockheed Martin Corporation (defense contractor, 1999-2009). He previously served on the Board of Directors of IKON Office Solutions, Inc. (1999-2008), AGL Resources, Inc. (holding company, 2002-2016), and Delta Airlines (2005-2007). Mr. Arthur E. Johnson is not related to Ms. Abigail P. Johnson.
Michael E. Kenneally (1954)
Year of Election or Appointment: 2009
Trustee
Mr. Kenneally also serves as Trustee of other Fidelity® funds. Prior to his retirement, Mr. Kenneally served as Chairman and Global Chief Executive Officer of Credit Suisse Asset Management. Before joining Credit Suisse, he was an Executive Vice President and Chief Investment Officer for Bank of America Corporation. Earlier roles at Bank of America included Director of Research, Senior Portfolio Manager and Research Analyst, and Mr. Kenneally was awarded the Chartered Financial Analyst (CFA) designation in 1991.
Marie L. Knowles (1946)
Year of Election or Appointment: 2001
Trustee
Chairman of the Independent Trustees
Ms. Knowles also serves as Trustee of other Fidelity® funds. Prior to Ms. Knowles' retirement in June 2000, she served as Executive Vice President and Chief Financial Officer of Atlantic Richfield Company (ARCO) (diversified energy, 1996-2000). From 1993 to 1996, she was a Senior Vice President of ARCO and President of ARCO Transportation Company (pipeline and tanker operations). Ms. Knowles currently serves as a Director and Chairman of the Audit Committee of McKesson Corporation (healthcare service, since 2002). Ms. Knowles is a member of the Board of the Santa Catalina Island Company (real estate, 2009-present). Ms. Knowles is a Member of the Investment Company Institute Board of Governors and a Member of the Governing Council of the Independent Directors Council (2014-present). She also serves as a member of the Advisory Board for the School of Engineering of the University of Southern California. Previously, Ms. Knowles served as a Director of Phelps Dodge Corporation (copper mining and manufacturing, 1994-2007), URS Corporation (engineering and construction, 2000-2003) and America West (airline, 1999-2002). Ms. Knowles previously served as Vice Chairman of the Independent Trustees of certain Fidelity® funds (2012-2015).
Mark A. Murray (1954)
Year of Election or Appointment: 2016
Trustee
Mr. Murray also serves as Trustee of other Fidelity® funds. Mr. Murray is Vice Chairman (2013-present) of Meijer, Inc. (regional retail chain). Previously, Mr. Murray served as a Member of the Advisory Board of certain Fidelity® funds (2016) and as Co-Chief Executive Officer (2013-2016) and President (2006-2013) of Meijer, Inc. Mr. Murray serves as a member of the Board of Directors and Nuclear Review and Public Policy and Responsibility Committees of DTE Energy Company (diversified energy company, 2009-present). Mr. Murray also serves as a member of the Board of Directors of Spectrum Health (not-for-profit health system, 2015-present). Mr. Murray previously served as President of Grand Valley State University (2001-2006), Treasurer for the State of Michigan (1999-2001), Vice President of Finance and Administration for Michigan State University (1998-1999), and a member of the Board of Directors and Audit Committee and Chairman of the Nominating and Corporate Governance Committee of Universal Forest Products, Inc. (manufacturer and distributor of wood and wood-alternative products, 2004-2016). Mr. Murray is also a director or trustee of many community and professional organizations.
+ The information includes the Trustee's principal occupation during the last five years and other information relating to the experience, attributes, and skills relevant to the Trustee's qualifications to serve as a Trustee, which led to the conclusion that the Trustee should serve as a Trustee for the fund.
Advisory Board Members and Officers:
Correspondence intended for an officer may be sent to Fidelity Investments, 245 Summer Street, Boston, Massachusetts 02210. Officers appear below in alphabetical order.
Name, Year of Birth; Principal Occupation
Elizabeth Paige Baumann (1968)
Year of Election or Appointment: 2017
Anti-Money Laundering (AML) Officer
Ms. Baumann also serves as AML Officer of other funds. She is Chief AML Officer (2012-present) and Senior Vice President (2014-present) of FMR LLC (diversified financial services company) and is an employee of Fidelity Investments. Previously, Ms. Baumann served as AML Officer of the funds (2012-2016), and Vice President (2007-2014) and Deputy Anti-Money Laundering Officer (2007-2012) of FMR LLC.
Marc R. Bryant (1966)
Year of Election or Appointment: 2015
Secretary and Chief Legal Officer (CLO)
Mr. Bryant also serves as Secretary and CLO of other funds. Mr. Bryant serves as CLO, Secretary, and Senior Vice President of Fidelity Management & Research Company (investment adviser firm, 2015-present) and FMR Co., Inc. (investment adviser firm, 2015-present); Secretary of Fidelity SelectCo, LLC (investment adviser firm, 2015-present) and Fidelity Investments Money Management, Inc. (investment adviser firm, 2015-present); and CLO of Fidelity Management & Research (Hong Kong) Limited and FMR Investment Management (UK) Limited (investment adviser firms, 2015-present) and Fidelity Management & Research (Japan) Limited (investment adviser firm, 2016-present). He is Senior Vice President and Deputy General Counsel of FMR LLC (diversified financial services company). Previously, Mr. Bryant served as Secretary and CLO of Fidelity Rutland Square Trust II (2010-2014) and Assistant Secretary of Fidelity's Fixed Income and Asset Allocation Funds (2013-2015). Prior to joining Fidelity Investments, Mr. Bryant served as a Senior Vice President and the Head of Global Retail Legal for AllianceBernstein L.P. (2006-2010), and as the General Counsel for ProFund Advisors LLC (2001-2006).
Jonathan Davis (1968)
Year of Election or Appointment: 2010
Assistant Treasurer
Mr. Davis also serves as Assistant Treasurer of other funds, and is an employee of Fidelity Investments. Previously, Mr. Davis served as Vice President and Associate General Counsel of FMR LLC (diversified financial services company, 2003-2010).
Adrien E. Deberghes (1967)
Year of Election or Appointment: 2010
Assistant Treasurer
Mr. Deberghes also serves as an officer of other funds. He serves as Executive Vice President of Fidelity Investments Money Management, Inc. (FIMM) (investment adviser firm, 2016-present) and is an employee of Fidelity Investments (2008-present). Prior to joining Fidelity Investments, Mr. Deberghes was Senior Vice President of Mutual Fund Administration at State Street Corporation (2007-2008), Senior Director of Mutual Fund Administration at Investors Bank & Trust (2005-2007), and Director of Finance for Dunkin' Brands (2000-2005). Previously, Mr. Deberghes served in other fund officer roles.
Stephanie J. Dorsey (1969)
Year of Election or Appointment: 2013
President and Treasurer
Ms. Dorsey also serves as an officer of other funds. She is an employee of Fidelity Investments (2008-present) and has served in other fund officer roles. Prior to joining Fidelity Investments, Ms. Dorsey served as Treasurer (2004-2008) of the JPMorgan Mutual Funds and Vice President (2004-2008) of JPMorgan Chase Bank.
Howard J. Galligan III (1966)
Year of Election or Appointment: 2014
Chief Financial Officer
Mr. Galligan also serves as Chief Financial Officer of other funds. Mr. Galligan serves as President of Fidelity Pricing and Cash Management Services (FPCMS) (2014-present) and as a Director of Strategic Advisers, Inc. (investment adviser firm, 2008-present). Previously, Mr. Galligan served as Chief Administrative Officer of Asset Management (2011-2014) and Chief Operating Officer and Senior Vice President of Investment Support for Strategic Advisers, Inc. (2003-2011).
Colm A. Hogan (1973)
Year of Election or Appointment: 2016
Assistant Treasurer
Mr. Hogan also serves as an officer of other funds. Mr. Hogan is an employee of Fidelity Investments (2005-present).
Chris Maher (1972)
Year of Election or Appointment: 2013
Assistant Treasurer
Mr. Maher serves as Assistant Treasurer of other funds. Mr. Maher is Vice President of Valuation Oversight and is an employee of Fidelity Investments. Previously, Mr. Maher served as Vice President of Asset Management Compliance (2013), Vice President of the Program Management Group of FMR (investment adviser firm, 2010-2013), and Vice President of Valuation Oversight (2008-2010).
John B. McGinty, Jr. (1962)
Year of Election or Appointment: 2016
Chief Compliance Officer
Mr. McGinty also serves as Chief Compliance Officer of other funds. Mr. McGinty is Senior Vice President of Asset Management Compliance for Fidelity Investments and is an employee of Fidelity Investments (2016-present). Mr. McGinty previously served as Vice President, Senior Attorney at Eaton Vance Management (investment management firm, 2015-2016), and prior to Eaton Vance as global CCO for all firm operations and registered investment companies at GMO LLC (investment management firm, 2009-2015). Before joining GMO LLC, Mr. McGinty served as Senior Vice President, Deputy General Counsel for Fidelity Investments (2007-2009).
Rieco E. Mello (1969)
Year of Election or Appointment: 2017
Assistant Treasurer
Mr. Mello also serves as Assistant Treasurer of other funds. Mr. Mello is an employee of Fidelity Investments (1995-present).
Jamie Pagliocco (1964)
Year of Election or Appointment: 2017
Vice President
Mr. Pagliocco also serves as Vice President of other funds. Mr. Pagliocco serves as Chief Investment Officer of FMR's Bond Group (2017-present) and is an employee of Fidelity Investments (2001-present).
Jason P. Pogorelec (1975)
Year of Election or Appointment: 2015
Assistant Secretary
Mr. Pogorelec also serves as Assistant Secretary of other funds. Mr. Pogorelec serves as Vice President, Associate General Counsel (2010-present) and is an employee of Fidelity Investments (2006-present).
Nancy D. Prior (1967)
Year of Election or Appointment: 2014
Vice President
Ms. Prior also serves as Vice President of other funds. Ms. Prior serves as a Director of FMR Investment Management (UK) Limited (investment adviser firm, 2015-present), President (2016-present) and Director (2014-present) of Fidelity Investments Money Management, Inc. (FIMM) (investment adviser firm), President, Fixed Income (2014-present), Vice Chairman of FIAM LLC (investment adviser firm, 2014-present), and is an employee of Fidelity Investments (2002-present). Previously, Ms. Prior served as Vice President of Fidelity's Money Market Funds (2012-2014), President, Money Market and Short Duration Bond Group of Fidelity Management & Research (FMR) (investment adviser firm, 2013-2014), President, Money Market Group of FMR (2011-2013), Managing Director of Research (2009-2011), Senior Vice President and Deputy General Counsel (2007-2009), and Assistant Secretary of certain Fidelity® funds (2008-2009).
Stacie M. Smith (1974)
Year of Election or Appointment: 2013
Assistant Treasurer
Ms. Smith also serves as an officer of other funds. She is an employee of Fidelity Investments (2009-present) and has served in other fund officer roles. Prior to joining Fidelity Investments, Ms. Smith served as Senior Audit Manager of Ernst & Young LLP (accounting firm, 1996-2009). Previously, Ms. Smith served as Deputy Treasurer of certain Fidelity® funds (2013-2016).
Marc L. Spector (1972)
Year of Election or Appointment: 2016
Deputy Treasurer
Mr. Spector also serves as an officer of other funds. Mr. Spector is an employee of Fidelity Investments (2016-present). Prior to joining Fidelity Investments, Mr. Spector served as Director at the Siegfried Group (accounting firm, 2013-2016), and prior to Siegfried Group as audit senior manager at Deloitte & Touche (accounting firm, 2005-2013).
Renee Stagnone (1975)
Year of Election or Appointment: 2016
Assistant Treasurer
Ms. Stagnone also serves as an officer of other funds. Ms. Stagnone is an employee of Fidelity Investments (1997-present). Previously, Ms. Stagnone served as Deputy Treasurer of certain Fidelity® funds (2013-2016).
Christine J. Thompson (1958)
Year of Election or Appointment: 2015
Vice President of Fidelity's Bond Funds
Ms. Thompson also serves as Vice President of other funds. Ms. Thompson also serves as Chief Investment Officer of FMR's Bond Group (2010-present) and is an employee of Fidelity Investments (1985-present). Previously, Ms. Thompson served as Vice President of Fidelity's Bond Funds (2010-2012).
Shareholder Expense Example
As a shareholder of the Fund, you incur two types of costs: (1) transaction costs, and (2) ongoing costs, including management fees and other Fund expenses. This Example is intended to help you understand your ongoing costs (in dollars) of investing in the Fund and to compare these costs with the ongoing costs of investing in other mutual funds.
The Example is based on an investment of $1,000 invested at the beginning of the period and held for the entire period (March 1, 2017 to August 31, 2017).
Actual Expenses
The first line of the accompanying table provides information about actual account values and actual expenses. You may use the information in this line, together with the amount you invested, to estimate the expenses that you paid over the period. Simply divide your account value by $1,000.00 (for example, an $8,600 account value divided by $1,000.00 = 8.6), then multiply the result by the number in the first line under the heading entitled "Expenses Paid During Period" to estimate the expenses you paid on your account during this period. A small balance maintenance fee of $12.00 that is charged once a year may apply for certain accounts with a value of less than $2,000. This fee is not included in the table below. If it was, the estimate of expenses you paid during the period would be higher, and your ending account value lower, by this amount. In addition, the Fund, as a shareholder in the underlying Fidelity Central Funds, will indirectly bear its pro-rata share of the fees and expenses incurred by the underlying Fidelity Central Funds. These fees and expenses are not included in the Fund's annualized expense ratio used to calculate the expense estimate in the table below.
Hypothetical Example for Comparison Purposes
The second line of the accompanying table provides information about hypothetical account values and hypothetical expenses based on the Fund's actual expense ratio and an assumed rate of return of 5% per year before expenses, which is not the Fund's actual return. The hypothetical account values and expenses may not be used to estimate the actual ending account balance or expenses you paid for the period. You may use this information to compare the ongoing costs of investing in the Fund and other funds. To do so, compare this 5% hypothetical example with the 5% hypothetical examples that appear in the shareholder reports of the other funds. A small balance maintenance fee of $12.00 that is charged once a year may apply for certain accounts with a value of less than $2,000. This fee is not included in the table below. If it was, the estimate of expenses you paid during the period would be higher, and your ending account value lower, by this amount. In addition, the Fund, as a shareholder in the underlying Fidelity Central Funds, will indirectly bear its pro-rata share of the fees and expenses incurred by the underlying Fidelity Central Funds. These fees and expenses are not included in the Fund's annualized expense ratio used to calculate the expense estimate in the table below.
Please note that the expenses shown in the table are meant to highlight your ongoing costs only and do not reflect any transaction costs. Therefore, the second line of the table is useful in comparing ongoing costs only, and will not help you determine the relative total costs of owning different funds.
| | Annualized Expense Ratio-A | Beginning
Account Value
March 1, 2017 | Ending
Account Value
August 31, 2017 | Expenses Paid
During Period-B
March 1, 2017
to August 31, 2017 |
| Actual | .45% | $1,000.00 | $1,016.60 | $2.29 |
| Hypothetical-C | | $1,000.00 | $1,022.94 | $2.29 |
A Annualized expense ratio reflects expenses net of applicable fee waivers.
B Expenses are equal to the Fund's annualized expense ratio, multiplied by the average account value over the period, multiplied by 184/365 (to reflect the one-half year period).
C 5% return per year before expenses
Distributions (Unaudited)
The fund hereby designates as a capital gain dividend with respect to the taxable year ended August 31, 2017, $204,997, or, if subsequently determined to be different, the net capital gain of such year.
A total of 48.31% of the dividends distributed during the fiscal year was derived from interest on U.S. Government securities which is generally exempt from state income tax.
The fund designates $5,262,209 of distributions paid during the period September 1, 2016 to August 31, 2017 as qualifying to be taxed as interest-related dividends for nonresident alien shareholders.
The fund will notify shareholders in January 2018 of amounts for use in preparing 2017 income tax returns.
Corporate Headquarters
245 Summer St.
Boston, MA 02210
www.fidelity.com
SLM-ANN-1017
1.844593.112
Fidelity Flex℠ Funds Fidelity Flex℠ Core Bond Fund
Annual Report August 31, 2017 |
|
Contents
To view a fund's proxy voting guidelines and proxy voting record for the 12-month period ended June 30, visit http://www.fidelity.com/proxyvotingresults or visit the Securities and Exchange Commission's (SEC) web site at http://www.sec.gov.
You may also call 1-800-835-5092 to request a free copy of the proxy voting guidelines.
Standard & Poor's, S&P and S&P 500 are registered service marks of The McGraw-Hill Companies, Inc. and have been licensed for use by Fidelity Distributors Corporation.
Other third-party marks appearing herein are the property of their respective owners.
All other marks appearing herein are registered or unregistered trademarks or service marks of FMR LLC or an affiliated company. © 2017 FMR LLC. All rights reserved.
This report and the financial statements contained herein are submitted for the general information of the shareholders of the Fund. This report is not authorized for distribution to prospective investors in the Fund unless preceded or accompanied by an effective prospectus.
A fund files its complete schedule of portfolio holdings with the SEC for the first and third quarters of each fiscal year on Form N-Q. Forms N-Q are available on the SEC’s web site at http://www.sec.gov. A fund's Forms N-Q may be reviewed and copied at the SEC’s Public Reference Room in Washington, DC. Information regarding the operation of the SEC's Public Reference Room may be obtained by calling 1-800-SEC-0330.
For a complete list of a fund's portfolio holdings, view the most recent holdings listing, semiannual report, or annual report on Fidelity's web site at http://www.fidelity.com, http://www.institutional.fidelity.com, or http://www.401k.com, as applicable.
NOT FDIC INSURED •MAY LOSE VALUE •NO BANK GUARANTEE
Neither the Fund nor Fidelity Distributors Corporation is a bank.
Investment Summary (Unaudited)
The information in the following tables is based on the combined investments of the Fund and its pro-rata share of the investments of Fidelity's Fixed-Income Central Funds.
Quality Diversification (% of fund's net assets)
| As of August 31, 2017 |
| | U.S. Government and U.S. Government Agency Obligations | 55.6% |
| | AA | 0.5% |
| | A | 5.1% |
| | BBB | 17.6% |
| | BB and Below | 15.8% |
| | Not Rated | 0.2% |
| | Short-Term Investments and Net Other Assets | 5.2% |

We have used ratings from Moody's Investors Service, Inc. Where Moody's® ratings are not available, we have used S&P® ratings. All ratings are as of the date indicated and do not reflect subsequent changes.
Asset Allocation (% of fund's net assets)
| As of August 31, 2017*,** |
| | Corporate Bonds | 32.2% |
| | U.S. Government and U.S. Government Agency Obligations | 55.6% |
| | CMOs and Other Mortgage Related Securities | 0.5% |
| | Municipal Bonds | 1.2% |
| | Other Investments | 5.3% |
| | Short-Term Investments and Net Other Assets (Liabilities) | 5.2% |
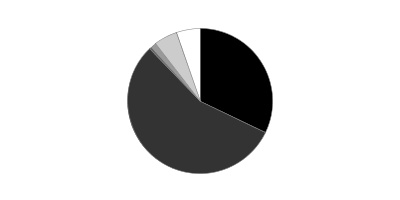
* Foreign investments - 7.6%
** Futures and Swaps - 0.3%
An unaudited holdings listing for the Fund, which presents direct holdings as well as the pro-rata share of any securities and other investments held indirectly through its investment in underlying non-money market Fidelity Central Funds, is available at fidelity.com.
Percentages in the above tables are adjusted for the effect of TBA Sale Commitments.
Investments August 31, 2017
Showing Percentage of Net Assets
| Nonconvertible Bonds - 26.3% | | | |
| | | Principal Amount | Value |
| CONSUMER DISCRETIONARY - 2.2% | | | |
| Automobiles - 0.8% | | | |
| General Motors Financial Co., Inc. 4.375% 9/25/21 | | $200,000 | $212,074 |
| Media - 1.4% | | | |
| 21st Century Fox America, Inc. 7.75% 12/1/45 | | 20,000 | 30,410 |
| Charter Communications Operating LLC/Charter Communications Operating Capital Corp.: | | | |
| 4.908% 7/23/25 | | 45,000 | 48,209 |
| 5.375% 5/1/47 (a) | | 30,000 | 30,625 |
| Comcast Corp. 6.45% 3/15/37 | | 15,000 | 19,799 |
| Time Warner Cable, Inc.: | | | |
| 4% 9/1/21 | | 80,000 | 83,357 |
| 7.3% 7/1/38 | | 120,000 | 147,932 |
| Time Warner, Inc. 6.2% 3/15/40 | | 40,000 | 47,198 |
| | | | 407,530 |
|
| TOTAL CONSUMER DISCRETIONARY | | | 619,604 |
|
| CONSUMER STAPLES - 1.0% | | | |
| Beverages - 0.6% | | | |
| Anheuser-Busch InBev Finance, Inc.: | | | |
| 2.65% 2/1/21 | | 45,000 | 45,846 |
| 4.7% 2/1/36 | | 125,000 | 138,577 |
| | | | 184,423 |
| Tobacco - 0.4% | | | |
| Reynolds American, Inc. 7.25% 6/15/37 | | 75,000 | 103,067 |
|
| TOTAL CONSUMER STAPLES | | | 287,490 |
|
| ENERGY - 5.3% | | | |
| Oil, Gas & Consumable Fuels - 5.3% | | | |
| Anadarko Finance Co. 7.5% 5/1/31 | | 40,000 | 50,249 |
| Anadarko Petroleum Corp.: | | | |
| 5.55% 3/15/26 | | 40,000 | 44,650 |
| 6.6% 3/15/46 | | 30,000 | 36,293 |
| Canadian Natural Resources Ltd.: | | | |
| 3.9% 2/1/25 | | 25,000 | 25,639 |
| 5.85% 2/1/35 | | 25,000 | 27,905 |
| Cenovus Energy, Inc. 4.25% 4/15/27 (a) | | 24,000 | 23,167 |
| Columbia Pipeline Group, Inc.: | | | |
| 4.5% 6/1/25 | | 25,000 | 26,851 |
| 5.8% 6/1/45 | | 10,000 | 12,167 |
| DCP Midstream LLC 5.85% 5/21/43 (a)(b) | | 20,000 | 18,550 |
| DCP Midstream Operating LP 3.875% 3/15/23 | | 20,000 | 19,475 |
| Enbridge, Inc.: | | | |
| 4.25% 12/1/26 | | 25,000 | 26,331 |
| 5.5% 12/1/46 | | 25,000 | 28,675 |
| Enterprise Products Operating LP 3.75% 2/15/25 | | 20,000 | 20,846 |
| Kinder Morgan Energy Partners LP 6.55% 9/15/40 | | 65,000 | 75,586 |
| Marathon Petroleum Corp. 5.125% 3/1/21 | | 35,000 | 37,969 |
| Petrobras Global Finance BV: | | | |
| 5.625% 5/20/43 | | 50,000 | 43,850 |
| 6.125% 1/17/22 | | 145,000 | 153,700 |
| 7.25% 3/17/44 | | 50,000 | 51,500 |
| 7.375% 1/17/27 | | 60,000 | 66,314 |
| Petroleos Mexicanos: | | | |
| 4.625% 9/21/23 | | 330,000 | 343,530 |
| 6.5% 3/13/27 (a) | | 20,000 | 22,400 |
| 6.75% 9/21/47 | | 100,000 | 107,510 |
| 6.75% 9/21/47 (a) | | 20,000 | 21,502 |
| The Williams Companies, Inc.: | | | |
| 4.55% 6/24/24 | | 70,000 | 71,575 |
| 5.75% 6/24/44 | | 35,000 | 36,313 |
| Western Gas Partners LP 4.65% 7/1/26 | | 35,000 | 36,398 |
| Williams Partners LP 4.3% 3/4/24 | | 100,000 | 106,006 |
| | | | 1,534,951 |
| FINANCIALS - 11.5% | | | |
| Banks - 5.9% | | | |
| Bank of America Corp.: | | | |
| 3.5% 4/19/26 | | 160,000 | 162,950 |
| 3.705% 4/24/28 (b) | | 29,000 | 29,669 |
| 5.65% 5/1/18 | | 110,000 | 112,761 |
| 5.875% 1/5/21 | | 60,000 | 66,947 |
| Barclays PLC 4.375% 1/12/26 | | 200,000 | 210,289 |
| Citigroup, Inc.: | | | |
| 1.8% 2/5/18 | | 100,000 | 100,064 |
| 2.4% 2/18/20 | | 85,000 | 85,770 |
| 2.876% 7/24/23 (b) | | 43,000 | 43,249 |
| 4.4% 6/10/25 | | 70,000 | 74,024 |
| Credit Suisse Group Funding Guernsey Ltd. 3.8% 6/9/23 | | 250,000 | 260,674 |
| JPMorgan Chase & Co.: | | | |
| 2.35% 1/28/19 | | 35,000 | 35,341 |
| 2.95% 10/1/26 | | 135,000 | 132,931 |
| 4.35% 8/15/21 | | 125,000 | 134,707 |
| Royal Bank of Scotland Group PLC: | | | |
| 5.125% 5/28/24 | | 165,000 | 174,046 |
| 6.125% 12/15/22 | | 80,000 | 88,100 |
| | | | 1,711,522 |
| Capital Markets - 3.6% | | | |
| Affiliated Managers Group, Inc. 4.25% 2/15/24 | | 22,000 | 23,371 |
| Deutsche Bank AG London Branch 4.1% 1/13/26 | | 100,000 | 103,868 |
| Goldman Sachs Group, Inc.: | | | |
| 2.625% 1/31/19 | | 170,000 | 171,756 |
| 2.625% 4/25/21 | | 35,000 | 35,239 |
| 3.691% 6/5/28 (b) | | 170,000 | 172,940 |
| 3.75% 5/22/25 | | 50,000 | 51,580 |
| Moody's Corp.: | | | |
| 3.25% 1/15/28 (a) | | 10,000 | 10,081 |
| 4.875% 2/15/24 | | 9,000 | 10,038 |
| Morgan Stanley: | | | |
| 3.125% 7/27/26 | | 171,000 | 168,778 |
| 5.625% 9/23/19 | | 100,000 | 107,178 |
| 5.75% 1/25/21 | | 150,000 | 166,652 |
| | | | 1,021,481 |
| Consumer Finance - 0.9% | | | |
| Capital One Financial Corp. 2.5% 5/12/20 | | 125,000 | 126,131 |
| Discover Financial Services: | | | |
| 3.95% 11/6/24 | | 80,000 | 82,676 |
| 4.1% 2/9/27 | | 50,000 | 51,219 |
| | | | 260,026 |
| Diversified Financial Services - 0.3% | | | |
| Brixmor Operating Partnership LP: | | | |
| 3.25% 9/15/23 | | 35,000 | 34,950 |
| 3.85% 2/1/25 | | 40,000 | 40,068 |
| Voya Financial, Inc. 3.125% 7/15/24 | | 12,000 | 11,970 |
| | | | 86,988 |
| Insurance - 0.8% | | | |
| Pacific LifeCorp 5.125% 1/30/43 (a) | | 50,000 | 56,077 |
| Pricoa Global Funding I 5.375% 5/15/45 (b) | | 45,000 | 48,263 |
| TIAA Asset Management Finance LLC 4.125% 11/1/24 (a) | | 80,000 | 85,112 |
| Unum Group 3.875% 11/5/25 | | 50,000 | 51,959 |
| | | | 241,411 |
|
| TOTAL FINANCIALS | | | 3,321,428 |
|
| HEALTH CARE - 1.1% | | | |
| Biotechnology - 0.1% | | | |
| AbbVie, Inc. 4.5% 5/14/35 | | 25,000 | 26,743 |
| Health Care Providers & Services - 0.2% | | | |
| HCA Holdings, Inc. 6.5% 2/15/20 | | 50,000 | 54,449 |
| Pharmaceuticals - 0.8% | | | |
| Actavis Funding SCS 3.45% 3/15/22 | | 40,000 | 41,558 |
| Mylan N.V.: | | | |
| 3.15% 6/15/21 | | 50,000 | 50,711 |
| 3.95% 6/15/26 | | 20,000 | 20,375 |
| Teva Pharmaceutical Finance Netherlands III BV: | | | |
| 2.8% 7/21/23 | | 55,000 | 51,833 |
| 3.15% 10/1/26 | | 65,000 | 59,479 |
| Zoetis, Inc. 3.45% 11/13/20 | | 15,000 | 15,593 |
| | | | 239,549 |
|
| TOTAL HEALTH CARE | | | 320,741 |
|
| INDUSTRIALS - 0.2% | | | |
| Aerospace & Defense - 0.2% | | | |
| BAE Systems Holdings, Inc. 3.8% 10/7/24 (a) | | 40,000 | 42,246 |
| REAL ESTATE - 3.0% | | | |
| Equity Real Estate Investment Trusts (REITs) - 1.8% | | | |
| Corporate Office Properties LP 5.25% 2/15/24 | | 157,000 | 170,608 |
| DDR Corp.: | | | |
| 3.9% 8/15/24 | | 4,000 | 4,049 |
| 4.625% 7/15/22 | | 65,000 | 68,809 |
| Duke Realty LP 3.625% 4/15/23 | | 50,000 | 51,986 |
| Omega Healthcare Investors, Inc.: | | | |
| 4.375% 8/1/23 | | 165,000 | 172,360 |
| 4.5% 1/15/25 | | 6,000 | 6,169 |
| 4.75% 1/15/28 | | 27,000 | 27,489 |
| WP Carey, Inc. 4% 2/1/25 | | 28,000 | 28,622 |
| | | | 530,092 |
| Real Estate Management & Development - 1.2% | | | |
| Brandywine Operating Partnership LP 3.95% 2/15/23 | | 100,000 | 102,293 |
| Digital Realty Trust LP: | | | |
| 4.75% 10/1/25 | | 45,000 | 49,068 |
| 5.25% 3/15/21 | | 30,000 | 32,751 |
| Liberty Property LP 4.4% 2/15/24 | | 40,000 | 43,067 |
| Mack-Cali Realty LP 3.15% 5/15/23 | | 50,000 | 47,717 |
| Ventas Realty LP 3.5% 2/1/25 | | 65,000 | 66,008 |
| | | | 340,904 |
|
| TOTAL REAL ESTATE | | | 870,996 |
|
| TELECOMMUNICATION SERVICES - 1.2% | | | |
| Diversified Telecommunication Services - 1.2% | | | |
| AT&T, Inc.: | | | |
| 3.6% 2/17/23 | | 100,000 | 103,041 |
| 6.3% 1/15/38 | | 50,000 | 58,702 |
| Verizon Communications, Inc.: | | | |
| 4.5% 9/15/20 | | 50,000 | 53,635 |
| 5.012% 4/15/49 | | 30,000 | 30,128 |
| 5.012% 8/21/54 | | 85,000 | 83,570 |
| 5.5% 3/16/47 | | 11,000 | 11,887 |
| | | | 340,963 |
| UTILITIES - 0.8% | | | |
| Electric Utilities - 0.6% | | | |
| FirstEnergy Corp.: | | | |
| 4.25% 3/15/23 | | 45,000 | 47,752 |
| 7.375% 11/15/31 | | 85,000 | 114,716 |
| IPALCO Enterprises, Inc. 3.7% 9/1/24 (a) | | 10,000 | 10,086 |
| | | | 172,554 |
| Independent Power and Renewable Electricity Producers - 0.2% | | | |
| Dolphin Subsidiary II, Inc. 7.25% 10/15/21 | | 50,000 | 54,375 |
|
| TOTAL UTILITIES | | | 226,929 |
|
| TOTAL NONCONVERTIBLE BONDS | | | |
| (Cost $7,391,242) | | | 7,565,348 |
|
| U.S. Government and Government Agency Obligations - 38.0% | | | |
| U.S. Treasury Inflation-Protected Obligations - 6.4% | | | |
| U.S. Treasury Inflation-Indexed Bonds 0.875% 2/15/47 | | 507,380 | 508,280 |
| U.S. Treasury Inflation-Indexed Notes 0.375% 1/15/27 | | 1,343,630 | 1,342,910 |
|
| TOTAL U.S. TREASURY INFLATION-PROTECTED OBLIGATIONS | | | 1,851,190 |
|
| U.S. Treasury Obligations - 31.6% | | | |
| U.S. Treasury Bonds: | | | |
| 3% 2/15/47 | | $947,000 | $999,307 |
| 3% 5/15/47 | | 100,000 | 105,574 |
| U.S. Treasury Notes: | | | |
| 1.125% 2/28/19 | | 1,211,000 | 1,208,067 |
| 1.875% 3/31/22 | | 6,166,000 | 6,218,260 |
| 2.25% 2/15/27 | | 561,000 | 567,311 |
|
| TOTAL U.S. TREASURY OBLIGATIONS | | | 9,098,519 |
|
| TOTAL U.S. GOVERNMENT AND GOVERNMENT AGENCY OBLIGATIONS | | | |
| (Cost $10,826,986) | | | 10,949,709 |
|
| Commercial Mortgage Securities - 0.5% | | | |
| GAHR Commercial Mortgage Trust Series 2015-NRF Class DFX, 3.3822% 12/15/34 (a)(b) | | $125,000 | $126,713 |
| MSCG Trust Series 2016-SNR Class C, 5.205% 11/15/34 (a) | | 25,000 | 25,799 |
| TOTAL COMMERCIAL MORTGAGE SECURITIES | | | |
| (Cost $152,221) | | | 152,512 |
|
| Municipal Securities - 1.2% | | | |
| California Gen. Oblig. Series 2009, 7.35% 11/1/39 | | 90,000 | 134,340 |
| Illinois Gen. Oblig.: | | | |
| Series 2003, 5.1% 6/1/33 | | $125,000 | $125,594 |
| Series 2010-3, 5.547% 4/1/19 | | 70,000 | 72,427 |
| TOTAL MUNICIPAL SECURITIES | | | |
| (Cost $313,226) | | | 332,361 |
|
| Foreign Government and Government Agency Obligations - 0.4% | | | |
| Dominican Republic 5.95% 1/25/27(a) | | $ | $ |
| (Cost $106,278) | | 100,000 | $108,500 |
| | | Shares | Value |
|
| Fixed-Income Funds - 27.9% | | | |
| Fidelity Floating Rate Central Fund (c) | | 12,065 | 1,244,345 |
| Fidelity Mortgage Backed Securities Central Fund (c) | | 43,811 | 4,765,339 |
| Fidelity Specialized High Income Central Fund (c) | | 19,448 | 2,034,874 |
| TOTAL FIXED-INCOME FUNDS | | | |
| (Cost $7,963,472) | | | 8,044,558 |
|
| Money Market Funds - 4.7% | | | |
| Fidelity Cash Central Fund, 1.11% (d) | | | |
| (Cost $1,355,873) | | 1,355,602 | 1,355,873 |
| TOTAL INVESTMENT IN SECURITIES - 99.0% | | | |
| (Cost $28,109,298) | | | 28,508,861 |
| NET OTHER ASSETS (LIABILITIES) - 1.0% | | | 293,828 |
| NET ASSETS - 100% | | | $28,802,689 |
Legend
(a) Security exempt from registration under Rule 144A of the Securities Act of 1933. These securities may be resold in transactions exempt from registration, normally to qualified institutional buyers. At the end of the period, the value of these securities amounted to $580,858 or 2.0% of net assets.
(b) Coupon rates for floating and adjustable rate securities reflect the rates in effect at period end.
(c) Affiliated fund that is generally available only to investment companies and other accounts managed by Fidelity Investments. A complete unaudited schedule of portfolio holdings for each Fidelity Central Fund is filed with the SEC for the first and third quarters of each fiscal year on Form N-Q and is available upon request or at the SEC's website at www.sec.gov. An unaudited holdings listing for the Fund, which presents direct holdings as well as the pro-rata share of securities and other investments held indirectly through its investment in underlying non-money market Fidelity Central Funds, is available at fidelity.com and/or institutional.fidelity.com, as applicable. In addition, each Fidelity Central Fund's financial statements, which are not covered by the Fund's Report of Independent Registered Public Accounting Firm, are available on the SEC's website or upon request.
(d) Affiliated fund that is generally available only to investment companies and other accounts managed by Fidelity Investments. The rate quoted is the annualized seven-day yield of the fund at period end. A complete unaudited listing of the fund's holdings as of its most recent quarter end is available upon request. In addition, each Fidelity Central Fund's financial statements, which are not covered by the Fund's Report of Independent Registered Public Accounting Firm, are available on the SEC's website or upon request.
Affiliated Central Funds
Information regarding fiscal year to date income earned by the Fund from investments in Fidelity Central Funds is as follows:
| Fund | Income earned |
| Fidelity Cash Central Fund | $7,792 |
| Fidelity Floating Rate Central Fund | 29,880 |
| Fidelity Mortgage Backed Securities Central Fund | 58,089 |
| Fidelity Specialized High Income Central Fund | 50,658 |
| Total | $146,419 |
Additional information regarding the Fund's fiscal year to date purchases and sales, including the ownership percentage, of the non Money Market Central Funds is as follows:
| Fund | Value, beginning of period | Purchases | Sales Proceeds | Realized Gain/Loss | Change in Unrealized appreciation (depreciation) | Value, end of period | % ownership, end of period |
| Fidelity Floating Rate Central Fund | $-- | $1,255,278 | $-- | $-- | $(10,933) | $1,244,345 | 0.1% |
| Fidelity Mortgage Backed Securities Central Fund | -- | 4,699,463 | -- | -- | 65,876 | 4,765,339 | 0.1% |
| Fidelity Specialized High Income Central Fund | -- | 2,008,731 | -- | -- | 26,143 | 2,034,874 | 0.3% |
| Total | $-- | $7,963,472 | $-- | $-- | $81,086 | $8,044,558 | |
Investment Valuation
The following is a summary of the inputs used, as of August 31, 2017, involving the Fund's assets and liabilities carried at fair value. The inputs or methodology used for valuing securities may not be an indication of the risk associated with investing in those securities. For more information on valuation inputs, and their aggregation into the levels used below, please refer to the Investment Valuation section in the accompanying Notes to Financial Statements.
| | Valuation Inputs at Reporting Date: |
| Description | Total | Level 1 | Level 2 | Level 3 |
| Investments in Securities: | | | | |
| Corporate Bonds | $7,565,348 | $-- | $7,565,348 | $-- |
| U.S. Government and Government Agency Obligations | 10,949,709 | -- | 10,949,709 | -- |
| Commercial Mortgage Securities | 152,512 | -- | 152,512 | -- |
| Municipal Securities | 332,361 | -- | 332,361 | -- |
| Foreign Government and Government Agency Obligations | 108,500 | -- | 108,500 | -- |
| Fixed-Income Funds | 8,044,558 | 8,044,558 | -- | -- |
| Money Market Funds | 1,355,873 | 1,355,873 | -- | -- |
| Total Investments in Securities: | $28,508,861 | $9,400,431 | $19,108,430 | $-- |
See accompanying notes which are an integral part of the financial statements.
Financial Statements
Statement of Assets and Liabilities
| | | August 31, 2017 |
| Assets | | |
Investment in securities, at value — See accompanying schedule:
Unaffiliated issuers (cost $18,789,953) | $19,108,430 | |
| Fidelity Central Funds (cost $9,319,345) | 9,400,431 | |
| Total Investment in Securities (cost $28,109,298) | | $28,508,861 |
| Cash | | 152,139 |
| Receivable for fund shares sold | | 497 |
| Interest receivable | | 139,952 |
| Distributions receivable from Fidelity Central Funds | | 1,240 |
| Total assets | | 28,802,689 |
| Net Assets | | $28,802,689 |
| Net Assets consist of: | | |
| Paid in capital | | $28,238,993 |
| Undistributed net investment income | | 28,153 |
| Accumulated undistributed net realized gain (loss) on investments | | 135,980 |
| Net unrealized appreciation (depreciation) on investments | | 399,563 |
| Net Assets, for 2,819,266 shares outstanding | | $28,802,689 |
| Net Asset Value, offering price and redemption price per share ($28,802,689 ÷ 2,819,266 shares) | | $10.22 |
See accompanying notes which are an integral part of the financial statements.
Statement of Operations
| | | For the period
March 7, 2017 (commencement of operations) to
August 31, 2017 |
| Investment Income | | |
| Interest | | $228,290 |
| Income from Fidelity Central Funds | | 146,419 |
| Total income | | 374,709 |
| Expenses | | |
| Independent trustees' fees and expenses | $38 | |
| Miscellaneous | 25 | |
| Total expenses before reductions | 63 | |
| Expense reductions | (1) | 62 |
| Net investment income (loss) | | 374,647 |
| Realized and Unrealized Gain (Loss) | | |
| Net realized gain (loss) on: | | |
| Investment securities: | | |
| Unaffiliated issuers | 134,165 | |
| Total net realized gain (loss) | | 134,165 |
| Change in net unrealized appreciation (depreciation) on: | | |
| Investment securities: | | |
| Unaffiliated issuers | 318,477 | |
| Fidelity Central Funds | 81,086 | |
| Total change in net unrealized appreciation (depreciation) | | 399,563 |
| Net gain (loss) | | 533,728 |
| Net increase (decrease) in net assets resulting from operations | | $908,375 |
See accompanying notes which are an integral part of the financial statements.
Statement of Changes in Net Assets
| | For the period
March 7, 2017 (commencement of operations) to
August 31, 2017 |
| Increase (Decrease) in Net Assets | |
| Operations | |
| Net investment income (loss) | $374,647 |
| Net realized gain (loss) | 134,165 |
| Change in net unrealized appreciation (depreciation) | 399,563 |
| Net increase (decrease) in net assets resulting from operations | 908,375 |
| Distributions to shareholders from net investment income | (344,679) |
| Share transactions | |
| Proceeds from sales of shares | 27,990,779 |
| Reinvestment of distributions | 344,679 |
| Cost of shares redeemed | (96,465) |
| Net increase (decrease) in net assets resulting from share transactions | 28,238,993 |
| Total increase (decrease) in net assets | 28,802,689 |
| Net Assets | |
| Beginning of period | – |
| End of period | $28,802,689 |
| Other Information | |
| Undistributed net investment income end of period | $28,153 |
| Shares | |
| Sold | 2,794,789 |
| Issued in reinvestment of distributions | 33,972 |
| Redeemed | (9,495) |
| Net increase (decrease) | 2,819,266 |
See accompanying notes which are an integral part of the financial statements.
Financial Highlights — Fidelity Flex Core Bond Fund
| Years ended August 31, | 2017 A |
| Selected Per–Share Data | |
| Net asset value, beginning of period | $10.00 |
| Income from Investment Operations | |
| Net investment income (loss)B | .145 |
| Net realized and unrealized gain (loss) | .209 |
| Total from investment operations | .354 |
| Distributions from net investment income | (.134) |
| Total distributions | (.134) |
| Net asset value, end of period | $10.22 |
| Total ReturnC,D | 3.55% |
| Ratios to Average Net AssetsE,F | |
| Expenses before reductions | - %G,H |
| Expenses net of fee waivers, if any | - %G,H |
| Expenses net of all reductions | - %G,H |
| Net investment income (loss) | 2.94%G |
| Supplemental Data | |
| Net assets, end of period (000 omitted) | $28,803 |
| Portfolio turnover rateI | 60%J |
A For the period March 7, 2017 (commencement of operations) to August 31, 2017.
B Calculated based on average shares outstanding during the period.
C Total returns for periods of less than one year are not annualized.
D Total returns would have been lower if certain expenses had not been reduced during the applicable periods shown.
E Fees and expenses of any underlying Fidelity Central Funds are not included in the Fund's expense ratio. The Fund indirectly bears its proportionate share of the expenses of any underlying Fidelity Central Funds. Based on their most recent shareholder report date, the expenses of any underlying non-money market Fidelity Central Funds ranged from less than .005% to .05% .
F Expense ratios reflect operating expenses of the Fund. Expenses before reductions do not reflect amounts reimbursed by the investment adviser or reductions from expense offset arrangements and do not represent the amount paid by the Fund during periods when reimbursements or reductions occur. Expense ratios before reductions for start-up periods may not be representative of longer term operating periods. Expenses net of fee waivers reflect expenses after reimbursement by the investment adviser but prior to reductions from expense offset arrangements. Expenses net of all reductions represent the net expenses paid by the Fund.
G Annualized
H Amount represents less than .005%.
I Amount does not include the portfolio activity of any underlying Fidelity Central Funds.
J Amount not annualized.
See accompanying notes which are an integral part of the financial statements.
Notes to Financial Statements
For the period ended August 31, 2017
1. Organization.
Fidelity Flex Core Bond Fund (the Fund) is a fund of Fidelity Income Fund (the Trust) and is authorized to issue an unlimited number of shares. Share transactions on the Statement of Changes in Net Assets may contain exchanges between affiliated funds. The Trust is registered under the Investment Company Act of 1940, as amended (the 1940 Act), as an open-end management investment company organized as a Massachusetts business trust. The Fund is available only to certain fee-based accounts offered by Fidelity.
2. Investments in Fidelity Central Funds.
The Fund invests in Fidelity Central Funds, which are open-end investment companies generally available only to other investment companies and accounts managed by the investment adviser and its affiliates. The Fund's Schedule of Investments lists each of the Fidelity Central Funds held as of period end, if any, as an investment of the Fund, but do not include the underlying holdings of each Fidelity Central Fund. As an Investing Fund, the Fund indirectly bears its proportionate share of the expenses of the underlying Fidelity Central Funds.
Based on its investment objective, each Fidelity Central Fund may invest or participate in various investment vehicles or strategies that are similar to those of the Fund. These strategies are consistent with the investment objectives of the Fund and may involve certain economic risks which may cause a decline in value of each of the Fidelity Central Funds and thus a decline in the value of the Fund. The Money Market Central Funds seek preservation of capital and current income and are managed by Fidelity Investments Money Management, Inc. (FIMM), an affiliate of the investment adviser. Annualized expenses of the Money Market Central Funds as of their most recent shareholder report date are less than .005%. The following summarizes the Fund's investment in each non-money market Fidelity Central Fund.
| Fidelity Central Fund | Investment Manager | Investment Objective | Investment Practices | Expense Ratio(a) |
| Fidelity Floating Rate Central Fund | FMR Co., Inc. (FMRC) | Seeks a high level of income by normally investing in floating rate loans and other floating rate securities. | Loans & Direct Debt Instruments
Restricted Securities
| .05% |
| Fidelity Mortgage Backed Securities Central Fund | FIMM | Seeks a high level of income by normally investing in investment-grade mortgage-related securities and repurchase agreements for those securities. | Delayed Delivery & When Issued Securities
Futures
Swaps | Less than .005% |
| Fidelity Specialized High Income Central Fund | FMRC | Seeks a high level of current income by normally investing in income-producing debt securities, with an emphasis on lower-quality debt securities. | Loans & Direct Debt Instruments
Restricted Securities
| Less than .005% |
(a) Expenses expressed as a percentage of average net assets and are as of each underlying Central Fund's most recent annual or semi-annual shareholder report.
An unaudited holdings listing for the Fund, which presents direct holdings as well as the pro-rata share of any securities and other investments held indirectly through its investment in underlying non-money market Fidelity Central Funds, is available at fidelity.com. A complete unaudited list of holdings for each Fidelity Central Fund is available upon request or at the Securities and Exchange Commission (the SEC) website at www.sec.gov. In addition, the financial statements of the Fidelity Central Funds which contain the significant accounting policies (including investment valuation policies) of those funds, which are not covered by the Fund's Report of Independent Registered Public Accounting Firm, are available on the SEC website or upon request.
3. Significant Accounting Policies.
The Fund is an investment company and applies the accounting and reporting guidance of the Financial Accounting Standards Board (FASB) Accounting Standards Codification Topic 946 Financial Services – Investments Companies. The financial statements have been prepared in conformity with accounting principles generally accepted in the United States of America (GAAP), which require management to make certain estimates and assumptions at the date of the financial statements. Actual results could differ from those estimates. Subsequent events, if any, through the date that the financial statements were issued have been evaluated in the preparation of the financial statements. The following summarizes the significant accounting policies of the Fund:
Investment Valuation. Investments are valued as of 4:00 p.m. Eastern time on the last calendar day of the period. The Board of Trustees (the Board) has delegated the day to day responsibility for the valuation of the Fund's investments to the Fair Value Committee (the Committee) established by the Fund's investment adviser. In accordance with valuation policies and procedures approved by the Board, the Fund attempts to obtain prices from one or more third party pricing vendors or brokers to value its investments. When current market prices, quotations or currency exchange rates are not readily available or reliable, investments will be fair valued in good faith by the Committee, in accordance with procedures adopted by the Board. Factors used in determining fair value vary by investment type and may include market or investment specific events, changes in interest rates and credit quality. The frequency with which these procedures are used cannot be predicted and they may be utilized to a significant extent. The Committee oversees the Fund's valuation policies and procedures and reports to the Board on the Committee's activities and fair value determinations. The Board monitors the appropriateness of the procedures used in valuing the Fund's investments and ratifies the fair value determinations of the Committee.
The Fund categorizes the inputs to valuation techniques used to value its investments into a disclosure hierarchy consisting of three levels as shown below:
- Level 1 – quoted prices in active markets for identical investments
- Level 2 – other significant observable inputs (including quoted prices for similar investments, interest rates, prepayment speeds, etc.)
- Level 3 – unobservable inputs (including the Fund's own assumptions based on the best information available)
Valuation techniques used to value the Fund's investments by major category are as follows:
Debt securities, including restricted securities, are valued based on evaluated prices received from third party pricing vendors or from brokers who make markets in such securities. Corporate bonds, foreign government and government agency obligations, municipal securities and U.S. government and government agency obligations are valued by pricing vendors who utilize matrix pricing which considers yield or price of bonds of comparable quality, coupon, maturity and type or by broker-supplied prices. Commercial mortgage securities are valued by pricing vendors who utilize matrix pricing which considers prepayment speed assumptions, attributes of the collateral, yield or price of bonds of comparable quality, coupon, maturity and type or by broker-supplied prices. When independent prices are unavailable or unreliable, debt securities may be valued utilizing pricing methodologies which consider similar factors that would be used by third party pricing vendors. Debt securities are generally categorized as Level 2 in the hierarchy but may be Level 3 depending on the circumstances.
Investments in open-end mutual funds, including the Fidelity Central Funds, are valued at their closing net asset value (NAV) each business day and are categorized as Level 1 in the hierarchy.
Changes in valuation techniques may result in transfers in or out of an assigned level within the disclosure hierarchy. The aggregate value of investments by input level as of August 31, 2017 is included at the end of the Fund's Schedule of Investments.
Investment Transactions and Income. For financial reporting purposes, the Fund's investment holdings and NAV include trades executed through the end of the last business day of the period. The NAV per share for processing shareholder transactions is calculated as of the close of business of the New York Stock Exchange (NYSE), normally 4:00 p.m. Eastern time and includes trades executed through the end of the prior business day. Gains and losses on securities sold are determined on the basis of identified cost. Income and capital gain distributions from Fidelity Central Funds, if any, are recorded on the ex-dividend date. Interest income is accrued as earned and includes coupon interest and amortization of premium and accretion of discount on debt securities as applicable. Debt obligations may be placed on non-accrual status and related interest income may be reduced by ceasing current accruals and writing off interest receivables when the collection of all or a portion of interest has become doubtful based on consistently applied procedures. A debt obligation is removed from non-accrual status when the issuer resumes interest payments or when collectability of interest is reasonably assured.
Expenses. Expenses directly attributable to a fund are charged to that fund. Expenses attributable to more than one fund are allocated among the respective funds on the basis of relative net assets or other appropriate methods. Expense estimates are accrued in the period to which they relate and adjustments are made when actual amounts are known.
Income Tax Information and Distributions to Shareholders. Each year, the Fund intends to qualify as a regulated investment company under Subchapter M of the Internal Revenue Code, including distributing substantially all of its taxable income and realized gains. As a result, no provision for U.S. Federal income taxes is required. As of August 31, 2017, the Fund did not have any unrecognized tax benefits in the financial statements; nor is the Fund aware of any tax positions for which it is reasonably possible that the total amounts of unrecognized tax benefits will significantly change in the next twelve months. The Fund files a U.S. federal tax return, in addition to state and local tax returns as required. The Fund's federal income tax returns are subject to examination by the Internal Revenue Service (IRS) for a period of three fiscal years after they are filed. State and local tax returns may be subject to examination for an additional fiscal year depending on the jurisdiction.
Dividends are declared and recorded daily and paid monthly from net investment income. Distributions from realized gains, if any, are declared and recorded on the ex-dividend date. Income and capital gain distributions are determined in accordance with income tax regulations, which may differ from GAAP.
Capital accounts within the financial statements are adjusted for permanent book-tax differences. These adjustments have no impact on net assets or the results of operations. Capital accounts are not adjusted for temporary book-tax differences which will reverse in a subsequent period.
Book-tax differences are primarily due to market discount.
As of period end, the cost and unrealized appreciation (depreciation) in securities, and derivatives if applicable, for federal income tax purposes were as follows:
| Gross unrealized appreciation | $421,411 |
| Gross unrealized depreciation | (17,985) |
| Net unrealized appreciation (depreciation) | $403,426 |
| Tax Cost | $28,105,435 |
The tax-based components of distributable earnings as of period end were as follows:
| Undistributed ordinary income | $160,270 |
| Net unrealized appreciation (depreciation) on securities and other investments | $403,426 |
The tax character of distributions paid was as follows:
| | August 31, 2017(a) |
| Ordinary Income | $344,679 |
(a) For the period March 7, 2017 (commencement of operations) to August 31, 2017.
Restricted Securities. The Fund may invest in securities that are subject to legal or contractual restrictions on resale. These securities generally may be resold in transactions exempt from registration or to the public if the securities are registered. Disposal of these securities may involve time-consuming negotiations and expense, and prompt sale at an acceptable price may be difficult. Information regarding restricted securities is included at the end of the Fund's Schedule of Investments.
New Accounting Pronouncement. In March 2017, the Financial Accounting Standards Board (FASB) issued an Accounting Standards Update (ASU), ASU 2017-08, which amends the amortization period for certain callable debt securities that are held at a premium. The amendment requires the premium to be amortized to the earliest call date. The amendments do not require an accounting change for securities held at a discount. The ASU is effective for annual periods beginning after December 15, 2018. Management is currently evaluating the potential impact of these changes to the financial statements.
4. Purchases and Sales of Investments.
Purchases and sales of securities (including the Fixed-Income Central Funds), other than short-term securities and U.S. government securities, aggregated $15,900,278 and $58,138, respectively.
5. Fees and Other Transactions with Affiliates.
Management Fee. Fidelity Management & Research Company (the investment adviser) and its affiliates provide the Fund with investment management related services and the Fund does not pay any fees for these services. Under the management contract, the investment adviser or an affiliate pays all other expenses of the Fund, excluding fees and expenses of the independent Trustees, and certain miscellaneous expenses such as proxy and shareholder meeting expenses.
Interfund Trades. The Fund may purchase from or sell securities to other Fidelity Funds under procedures adopted by the Board. The procedures have been designed to ensure these interfund trades are executed in accordance with Rule 17a-7 of the 1940 Act. Interfund trades are included within the respective purchases and sales amounts shown in the Purchases and Sales of Investments note.
6. Committed Line of Credit.
The Fund participates with other funds managed by the investment adviser or an affiliate in a $4.25 billion credit facility (the "line of credit") to be utilized for temporary or emergency purposes to fund shareholder redemptions or for other short-term liquidity purposes. The Fund has agreed to pay commitment fees on its pro-rata portion of the line of credit, which amounted to $25 and is reflected in Miscellaneous expenses on the Statement of Operations. During the period, the Fund did not borrow on this line of credit.
7. Expense Reductions.
Through arrangements with the Fund's custodian, credits realized as a result of certain uninvested cash balances were used to reduce the Fund's expenses. During the period, these credits reduced the Fund's expenses by $1.
8. Other.
The Fund's organizational documents provide former and current trustees and officers with a limited indemnification against liabilities arising in connection with the performance of their duties to the Fund. In the normal course of business, the Fund may also enter into contracts that provide general indemnifications. The Fund's maximum exposure under these arrangements is unknown as this would be dependent on future claims that may be made against the Fund. The risk of material loss from such claims is considered remote.
At the end of the period, the investment advisor or its affiliates were the owners of record of 90% of the total outstanding shares of the Fund.
Report of Independent Registered Public Accounting Firm
To the Trustees of Fidelity Income Fund and Shareholders of Fidelity Flex Core Bond Fund:
In our opinion, the accompanying statement of assets and liabilities, including the schedule of investments, and the related statements of operations and of changes in net assets and the financial highlights present fairly, in all material respects, the financial position of Fidelity Flex Core Bond Fund (a fund of Fidelity Income Fund) as of August 31, 2017, and the results of its operations, the changes in its net assets, and the financial highlights for the period March 7, 2017 (commencement of operations) through August 31, 2017, in conformity with accounting principles generally accepted in the United States of America. These financial statements and financial highlights (hereafter referred to as “financial statements”) are the responsibility of the Fidelity Flex Core Bond Fund’s management. Our responsibility is to express an opinion on these financial statements based on our audit. We conducted our audit of these financial statements in accordance with the standards of the Public Company Accounting Oversight Board (United States). Those standards require that we plan and perform the audit to obtain reasonable assurance about whether the financial statements are free of material misstatement. An audit includes examining, on a test basis, evidence supporting the amounts and disclosures in the financial statements, assessing the accounting principles used and significant estimates made by management, and evaluating the overall financial statement presentation. Our procedures included confirmation of securities owned as of August 31, 2017 by correspondence with the custodians and brokers; when replies were not received from brokers, we performed other auditing procedures. We believe that our audit provides a reasonable basis for our opinion.
PricewaterhouseCoopers LLP
Boston, Massachusetts
October 18, 2017
Trustees and Officers
The Trustees, Members of the Advisory Board (if any), and officers of the trust and fund, as applicable, are listed below. The Board of Trustees governs the fund and is responsible for protecting the interests of shareholders. The Trustees are experienced executives who meet periodically throughout the year to oversee the fund's activities, review contractual arrangements with companies that provide services to the fund, oversee management of the risks associated with such activities and contractual arrangements, and review the fund's performance. Each of the Trustees oversees 246 funds.
The Trustees hold office without limit in time except that (a) any Trustee may resign; (b) any Trustee may be removed by written instrument, signed by at least two-thirds of the number of Trustees prior to such removal; (c) any Trustee who requests to be retired or who has become incapacitated by illness or injury may be retired by written instrument signed by a majority of the other Trustees; and (d) any Trustee may be removed at any special meeting of shareholders by a two-thirds vote of the outstanding voting securities of the trust. Each Trustee who is not an interested person (as defined in the 1940 Act) of the trust and the fund is referred to herein as an Independent Trustee. Each Independent Trustee shall retire not later than the last day of the calendar year in which his or her 75th birthday occurs. The Independent Trustees may waive this mandatory retirement age policy with respect to individual Trustees. Officers and Advisory Board Members hold office without limit in time, except that any officer or Advisory Board Member may resign or may be removed by a vote of a majority of the Trustees at any regular meeting or any special meeting of the Trustees. Except as indicated, each individual has held the office shown or other offices in the same company for the past five years.
The fund’s Statement of Additional Information (SAI) includes more information about the Trustees. To request a free copy, call Fidelity at 1-800-835-5092.
Experience, Skills, Attributes, and Qualifications of the Trustees. The Governance and Nominating Committee has adopted a statement of policy that describes the experience, qualifications, attributes, and skills that are necessary and desirable for potential Independent Trustee candidates (Statement of Policy). The Board believes that each Trustee satisfied at the time he or she was initially elected or appointed a Trustee, and continues to satisfy, the standards contemplated by the Statement of Policy. The Governance and Nominating Committee also engages professional search firms to help identify potential Independent Trustee candidates who have the experience, qualifications, attributes, and skills consistent with the Statement of Policy. From time to time, additional criteria based on the composition and skills of the current Independent Trustees, as well as experience or skills that may be appropriate in light of future changes to board composition, business conditions, and regulatory or other developments, have also been considered by the professional search firms and the Governance and Nominating Committee. In addition, the Board takes into account the Trustees' commitment and participation in Board and committee meetings, as well as their leadership of standing and ad hoc committees throughout their tenure.
In determining that a particular Trustee was and continues to be qualified to serve as a Trustee, the Board has considered a variety of criteria, none of which, in isolation, was controlling. The Board believes that, collectively, the Trustees have balanced and diverse experience, qualifications, attributes, and skills, which allow the Board to operate effectively in governing the fund and protecting the interests of shareholders. Information about the specific experience, skills, attributes, and qualifications of each Trustee, which in each case led to the Board's conclusion that the Trustee should serve (or continue to serve) as a trustee of the fund, is provided below.
Board Structure and Oversight Function. Abigail P. Johnson is an interested person and currently serves as Chairman. The Trustees have determined that an interested Chairman is appropriate and benefits shareholders because an interested Chairman has a personal and professional stake in the quality and continuity of services provided to the fund. Independent Trustees exercise their informed business judgment to appoint an individual of their choosing to serve as Chairman, regardless of whether the Trustee happens to be independent or a member of management. The Independent Trustees have determined that they can act independently and effectively without having an Independent Trustee serve as Chairman and that a key structural component for assuring that they are in a position to do so is for the Independent Trustees to constitute a substantial majority for the Board. The Independent Trustees also regularly meet in executive session. Marie L. Knowles serves as Chairman of the Independent Trustees and as such (i) acts as a liaison between the Independent Trustees and management with respect to matters important to the Independent Trustees and (ii) with management prepares agendas for Board meetings.
Fidelity® funds are overseen by different Boards of Trustees. The fund's Board oversees Fidelity's investment-grade bond, money market, asset allocation and certain equity funds, and other Boards oversee Fidelity's high income, sector and other equity funds. The asset allocation funds may invest in Fidelity® funds that are overseen by such other Boards. The use of separate Boards, each with its own committee structure, allows the Trustees of each group of Fidelity® funds to focus on the unique issues of the funds they oversee, including common research, investment, and operational issues. On occasion, the separate Boards establish joint committees to address issues of overlapping consequences for the Fidelity® funds overseen by each Board.
The Trustees operate using a system of committees to facilitate the timely and efficient consideration of all matters of importance to the Trustees, the fund, and fund shareholders and to facilitate compliance with legal and regulatory requirements and oversight of the fund's activities and associated risks. The Board, acting through its committees, has charged FMR and its affiliates with (i) identifying events or circumstances the occurrence of which could have demonstrably adverse effects on the fund's business and/or reputation; (ii) implementing processes and controls to lessen the possibility that such events or circumstances occur or to mitigate the effects of such events or circumstances if they do occur; and (iii) creating and maintaining a system designed to evaluate continuously business and market conditions in order to facilitate the identification and implementation processes described in (i) and (ii) above. Because the day-to-day operations and activities of the fund are carried out by or through FMR, its affiliates, and other service providers, the fund's exposure to risks is mitigated but not eliminated by the processes overseen by the Trustees. While each of the Board's committees has responsibility for overseeing different aspects of the fund's activities, oversight is exercised primarily through the Operations and Audit Committees. In addition, an ad hoc Board committee of Independent Trustees has worked with FMR to enhance the Board's oversight of investment and financial risks, legal and regulatory risks, technology risks, and operational risks, including the development of additional risk reporting to the Board. Appropriate personnel, including but not limited to the fund's Chief Compliance Officer (CCO), FMR's internal auditor, the independent accountants, the fund's Treasurer and portfolio management personnel, make periodic reports to the Board's committees, as appropriate, including an annual review of Fidelity's risk management program for the Fidelity® funds. The responsibilities of each standing committee, including their oversight responsibilities, are described further under "Standing Committees of the Trustees."
Interested Trustees*:
Correspondence intended for a Trustee who is an interested person may be sent to Fidelity Investments, 245 Summer Street, Boston, Massachusetts 02210.
Name, Year of Birth; Principal Occupations and Other Relevant Experience+
Abigail P. Johnson (1961)
Year of Election or Appointment: 2009
Trustee
Chairman of the Board of Trustees
Ms. Johnson also serves as Trustee of other Fidelity® funds. Ms. Johnson serves as Chairman (2016-present), Chief Executive Officer (2014-present), and Director (2007-present) of FMR LLC (diversified financial services company), President of Fidelity Financial Services (2012-present) and President of Personal, Workplace and Institutional Services (2005-present). Ms. Johnson is Chairman and Director of FMR Co., Inc. (investment adviser firm, 2011-present) and Chairman and Director of FMR (investment adviser firm, 2011-present). Previously, Ms. Johnson served as Vice Chairman (2007-2016) and President (2013-2016) of FMR LLC, President and a Director of FMR (2001-2005), a Trustee of other investment companies advised by FMR, Fidelity Investments Money Management, Inc. (investment adviser firm), and FMR Co., Inc. (2001-2005), Senior Vice President of the Fidelity® funds (2001-2005), and managed a number of Fidelity® funds. Ms. Abigail P. Johnson and Mr. Arthur E. Johnson are not related.
Jennifer Toolin McAuliffe (1959)
Year of Election or Appointment: 2016
Trustee
Ms. McAuliffe also serves as Trustee of other Fidelity® funds. Ms. McAuliffe previously served as a Member of the Advisory Board of certain Fidelity® funds (2016) and as Co-Head of Fixed Income of Fidelity Investments Limited (now known as FIL Limited (FIL)) (diversified financial services company). Earlier roles at FIL included Director of Research for FIL’s credit and quantitative teams in London, Hong Kong and Tokyo. Ms. McAuliffe also was the Director of Research for taxable and municipal bonds at Fidelity Investments Money Management, Inc. Ms. McAuliffe is also a director or trustee of several not-for-profit entities.
* Determined to be an “Interested Trustee” by virtue of, among other things, his or her affiliation with the trust or various entities under common control with FMR.
+ The information includes the Trustee's principal occupation during the last five years and other information relating to the experience, attributes, and skills relevant to the Trustee's qualifications to serve as a Trustee, which led to the conclusion that the Trustee should serve as a Trustee for the fund.
Independent Trustees:
Correspondence intended for an Independent Trustee may be sent to Fidelity Investments, P.O. Box 55235, Boston, Massachusetts 02205-5235.
Name, Year of Birth; Principal Occupations and Other Relevant Experience+
Elizabeth S. Acton (1951)
Year of Election or Appointment: 2013
Trustee
Ms. Acton also serves as Trustee of other Fidelity® funds. Prior to her retirement in April 2012, Ms. Acton was Executive Vice President, Finance (2011-2012), Executive Vice President, Chief Financial Officer (2002-2011), and Treasurer (2004-2005) of Comerica Incorporated (financial services). Prior to joining Comerica, Ms. Acton held a variety of positions at Ford Motor Company (1983-2002), including Vice President and Treasurer (2000-2002) and Executive Vice President and Chief Financial Officer of Ford Motor Credit Company (1998-2000). Ms. Acton currently serves as a member of the Board of Directors and Audit and Finance Committees of Beazer Homes USA, Inc. (homebuilding, 2012-present). Previously, Ms. Acton served as a Member of the Advisory Board of certain Fidelity® funds (2013-2016).
John Engler (1948)
Year of Election or Appointment: 2014
Trustee
Mr. Engler also serves as Trustee of other Fidelity® funds. He serves on the board of directors for Universal Forest Products (manufacturer and distributor of wood and wood-alternative products, 2003-present) and K12 Inc. (technology-based education company, 2012-present). Previously, Mr. Engler served as a Member of the Advisory Board of certain Fidelity® funds (2014-2016), president of the Business Roundtable (2011-2017), a trustee of The Munder Funds (2003-2014), president and CEO of the National Association of Manufacturers (2004-2011), member of the Board of Trustees of the Annie E. Casey Foundation (2004-2015), and as governor of Michigan (1991-2003). He is a past chairman of the National Governors Association.
Albert R. Gamper, Jr. (1942)
Year of Election or Appointment: 2006
Trustee
Mr. Gamper also serves as Trustee of other Fidelity® funds. Prior to his retirement in December 2004, Mr. Gamper served as Chairman of the Board of CIT Group Inc. (commercial finance). During his tenure with CIT Group Inc. Mr. Gamper served in numerous senior management positions, including Chairman (1987-1989; 1999-2001; 2002-2004), Chief Executive Officer (1987-2004), and President (2002-2003). Mr. Gamper currently serves as a member of the Board of Directors of Public Service Enterprise Group (utilities, 2000-present), and Member of the Board of Trustees of Barnabas Health Care System (1997-present). Previously, Mr. Gamper served as Chairman (2012-2015) and Vice Chairman (2011-2012) of the Independent Trustees of certain Fidelity® funds and as Chairman of the Board of Governors, Rutgers University (2004-2007).
Robert F. Gartland (1951)
Year of Election or Appointment: 2010
Trustee
Mr. Gartland also serves as Trustee of other Fidelity® funds. Mr. Gartland is Chairman and an investor in Gartland & Mellina Group Corp. (consulting, 2009-present). Previously, Mr. Gartland served as a partner and investor of Vietnam Partners LLC (investments and consulting, 2008-2011). Prior to his retirement, Mr. Gartland held a variety of positions at Morgan Stanley (financial services, 1979-2007) including Managing Director (1987-2007).
Arthur E. Johnson (1947)
Year of Election or Appointment: 2008
Trustee
Vice Chairman of the Independent Trustees
Mr. Johnson also serves as Trustee of other Fidelity® funds. Mr. Johnson serves as a member of the Board of Directors of Eaton Corporation plc (diversified power management, 2009-present) and Booz Allen Hamilton (management consulting, 2011-present). Prior to his retirement, Mr. Johnson served as Senior Vice President of Corporate Strategic Development of Lockheed Martin Corporation (defense contractor, 1999-2009). He previously served on the Board of Directors of IKON Office Solutions, Inc. (1999-2008), AGL Resources, Inc. (holding company, 2002-2016), and Delta Airlines (2005-2007). Mr. Arthur E. Johnson is not related to Ms. Abigail P. Johnson.
Michael E. Kenneally (1954)
Year of Election or Appointment: 2009
Trustee
Mr. Kenneally also serves as Trustee of other Fidelity® funds. Prior to his retirement, Mr. Kenneally served as Chairman and Global Chief Executive Officer of Credit Suisse Asset Management. Before joining Credit Suisse, he was an Executive Vice President and Chief Investment Officer for Bank of America Corporation. Earlier roles at Bank of America included Director of Research, Senior Portfolio Manager and Research Analyst, and Mr. Kenneally was awarded the Chartered Financial Analyst (CFA) designation in 1991.
Marie L. Knowles (1946)
Year of Election or Appointment: 2001
Trustee
Chairman of the Independent Trustees
Ms. Knowles also serves as Trustee of other Fidelity® funds. Prior to Ms. Knowles' retirement in June 2000, she served as Executive Vice President and Chief Financial Officer of Atlantic Richfield Company (ARCO) (diversified energy, 1996-2000). From 1993 to 1996, she was a Senior Vice President of ARCO and President of ARCO Transportation Company (pipeline and tanker operations). Ms. Knowles currently serves as a Director and Chairman of the Audit Committee of McKesson Corporation (healthcare service, since 2002). Ms. Knowles is a member of the Board of the Santa Catalina Island Company (real estate, 2009-present). Ms. Knowles is a Member of the Investment Company Institute Board of Governors and a Member of the Governing Council of the Independent Directors Council (2014-present). She also serves as a member of the Advisory Board for the School of Engineering of the University of Southern California. Previously, Ms. Knowles served as a Director of Phelps Dodge Corporation (copper mining and manufacturing, 1994-2007), URS Corporation (engineering and construction, 2000-2003) and America West (airline, 1999-2002). Ms. Knowles previously served as Vice Chairman of the Independent Trustees of certain Fidelity® funds (2012-2015).
Mark A. Murray (1954)
Year of Election or Appointment: 2016
Trustee
Mr. Murray also serves as Trustee of other Fidelity® funds. Mr. Murray is Vice Chairman (2013-present) of Meijer, Inc. (regional retail chain). Previously, Mr. Murray served as a Member of the Advisory Board of certain Fidelity® funds (2016) and as Co-Chief Executive Officer (2013-2016) and President (2006-2013) of Meijer, Inc. Mr. Murray serves as a member of the Board of Directors and Nuclear Review and Public Policy and Responsibility Committees of DTE Energy Company (diversified energy company, 2009-present). Mr. Murray also serves as a member of the Board of Directors of Spectrum Health (not-for-profit health system, 2015-present). Mr. Murray previously served as President of Grand Valley State University (2001-2006), Treasurer for the State of Michigan (1999-2001), Vice President of Finance and Administration for Michigan State University (1998-1999), and a member of the Board of Directors and Audit Committee and Chairman of the Nominating and Corporate Governance Committee of Universal Forest Products, Inc. (manufacturer and distributor of wood and wood-alternative products, 2004-2016). Mr. Murray is also a director or trustee of many community and professional organizations.
+ The information includes the Trustee's principal occupation during the last five years and other information relating to the experience, attributes, and skills relevant to the Trustee's qualifications to serve as a Trustee, which led to the conclusion that the Trustee should serve as a Trustee for the fund.
Advisory Board Members and Officers:
Correspondence intended for an officer may be sent to Fidelity Investments, 245 Summer Street, Boston, Massachusetts 02210. Officers appear below in alphabetical order.
Name, Year of Birth; Principal Occupation
Elizabeth Paige Baumann (1968)
Year of Election or Appointment: 2017
Anti-Money Laundering (AML) Officer
Ms. Baumann also serves as AML Officer of other funds. She is Chief AML Officer (2012-present) and Senior Vice President (2014-present) of FMR LLC (diversified financial services company) and is an employee of Fidelity Investments. Previously, Ms. Baumann served as AML Officer of the funds (2012-2016), and Vice President (2007-2014) and Deputy Anti-Money Laundering Officer (2007-2012) of FMR LLC.
Marc R. Bryant (1966)
Year of Election or Appointment: 2015
Secretary and Chief Legal Officer (CLO)
Mr. Bryant also serves as Secretary and CLO of other funds. Mr. Bryant serves as CLO, Secretary, and Senior Vice President of Fidelity Management & Research Company (investment adviser firm, 2015-present) and FMR Co., Inc. (investment adviser firm, 2015-present); Secretary of Fidelity SelectCo, LLC (investment adviser firm, 2015-present) and Fidelity Investments Money Management, Inc. (investment adviser firm, 2015-present); and CLO of Fidelity Management & Research (Hong Kong) Limited and FMR Investment Management (UK) Limited (investment adviser firms, 2015-present) and Fidelity Management & Research (Japan) Limited (investment adviser firm, 2016-present). He is Senior Vice President and Deputy General Counsel of FMR LLC (diversified financial services company). Previously, Mr. Bryant served as Secretary and CLO of Fidelity Rutland Square Trust II (2010-2014) and Assistant Secretary of Fidelity's Fixed Income and Asset Allocation Funds (2013-2015). Prior to joining Fidelity Investments, Mr. Bryant served as a Senior Vice President and the Head of Global Retail Legal for AllianceBernstein L.P. (2006-2010), and as the General Counsel for ProFund Advisors LLC (2001-2006).
Jonathan Davis (1968)
Year of Election or Appointment: 2010
Assistant Treasurer
Mr. Davis also serves as Assistant Treasurer of other funds, and is an employee of Fidelity Investments. Previously, Mr. Davis served as Vice President and Associate General Counsel of FMR LLC (diversified financial services company, 2003-2010).
Adrien E. Deberghes (1967)
Year of Election or Appointment: 2010
Assistant Treasurer
Mr. Deberghes also serves as an officer of other funds. He serves as Executive Vice President of Fidelity Investments Money Management, Inc. (FIMM) (investment adviser firm, 2016-present) and is an employee of Fidelity Investments (2008-present). Prior to joining Fidelity Investments, Mr. Deberghes was Senior Vice President of Mutual Fund Administration at State Street Corporation (2007-2008), Senior Director of Mutual Fund Administration at Investors Bank & Trust (2005-2007), and Director of Finance for Dunkin' Brands (2000-2005). Previously, Mr. Deberghes served in other fund officer roles.
Stephanie J. Dorsey (1969)
Year of Election or Appointment: 2013
President and Treasurer
Ms. Dorsey also serves as an officer of other funds. She is an employee of Fidelity Investments (2008-present) and has served in other fund officer roles. Prior to joining Fidelity Investments, Ms. Dorsey served as Treasurer (2004-2008) of the JPMorgan Mutual Funds and Vice President (2004-2008) of JPMorgan Chase Bank.
Howard J. Galligan III (1966)
Year of Election or Appointment: 2014
Chief Financial Officer
Mr. Galligan also serves as Chief Financial Officer of other funds. Mr. Galligan serves as President of Fidelity Pricing and Cash Management Services (FPCMS) (2014-present) and as a Director of Strategic Advisers, Inc. (investment adviser firm, 2008-present). Previously, Mr. Galligan served as Chief Administrative Officer of Asset Management (2011-2014) and Chief Operating Officer and Senior Vice President of Investment Support for Strategic Advisers, Inc. (2003-2011).
Colm A. Hogan (1973)
Year of Election or Appointment: 2016
Assistant Treasurer
Mr. Hogan also serves as an officer of other funds. Mr. Hogan is an employee of Fidelity Investments (2005-present).
Chris Maher (1972)
Year of Election or Appointment: 2013
Assistant Treasurer
Mr. Maher serves as Assistant Treasurer of other funds. Mr. Maher is Vice President of Valuation Oversight and is an employee of Fidelity Investments. Previously, Mr. Maher served as Vice President of Asset Management Compliance (2013), Vice President of the Program Management Group of FMR (investment adviser firm, 2010-2013), and Vice President of Valuation Oversight (2008-2010).
John B. McGinty, Jr. (1962)
Year of Election or Appointment: 2016
Chief Compliance Officer
Mr. McGinty also serves as Chief Compliance Officer of other funds. Mr. McGinty is Senior Vice President of Asset Management Compliance for Fidelity Investments and is an employee of Fidelity Investments (2016-present). Mr. McGinty previously served as Vice President, Senior Attorney at Eaton Vance Management (investment management firm, 2015-2016), and prior to Eaton Vance as global CCO for all firm operations and registered investment companies at GMO LLC (investment management firm, 2009-2015). Before joining GMO LLC, Mr. McGinty served as Senior Vice President, Deputy General Counsel for Fidelity Investments (2007-2009).
Rieco E. Mello (1969)
Year of Election or Appointment: 2017
Assistant Treasurer
Mr. Mello also serves as Assistant Treasurer of other funds. Mr. Mello is an employee of Fidelity Investments (1995-present).
Jamie Pagliocco (1964)
Year of Election or Appointment: 2017
Vice President
Mr. Pagliocco also serves as Vice President of other funds. Mr. Pagliocco serves as Chief Investment Officer of FMR's Bond Group (2017-present) and is an employee of Fidelity Investments (2001-present).
Jason P. Pogorelec (1975)
Year of Election or Appointment: 2015
Assistant Secretary
Mr. Pogorelec also serves as Assistant Secretary of other funds. Mr. Pogorelec serves as Vice President, Associate General Counsel (2010-present) and is an employee of Fidelity Investments (2006-present).
Nancy D. Prior (1967)
Year of Election or Appointment: 2014
Vice President
Ms. Prior also serves as Vice President of other funds. Ms. Prior serves as a Director of FMR Investment Management (UK) Limited (investment adviser firm, 2015-present), President (2016-present) and Director (2014-present) of Fidelity Investments Money Management, Inc. (FIMM) (investment adviser firm), President, Fixed Income (2014-present), Vice Chairman of FIAM LLC (investment adviser firm, 2014-present), and is an employee of Fidelity Investments (2002-present). Previously, Ms. Prior served as Vice President of Fidelity's Money Market Funds (2012-2014), President, Money Market and Short Duration Bond Group of Fidelity Management & Research (FMR) (investment adviser firm, 2013-2014), President, Money Market Group of FMR (2011-2013), Managing Director of Research (2009-2011), Senior Vice President and Deputy General Counsel (2007-2009), and Assistant Secretary of certain Fidelity® funds (2008-2009).
Stacie M. Smith (1974)
Year of Election or Appointment: 2013
Assistant Treasurer
Ms. Smith also serves as an officer of other funds. She is an employee of Fidelity Investments (2009-present) and has served in other fund officer roles. Prior to joining Fidelity Investments, Ms. Smith served as Senior Audit Manager of Ernst & Young LLP (accounting firm, 1996-2009). Previously, Ms. Smith served as Deputy Treasurer of certain Fidelity® funds (2013-2016).
Marc L. Spector (1972)
Year of Election or Appointment: 2016
Deputy Treasurer
Mr. Spector also serves as an officer of other funds. Mr. Spector is an employee of Fidelity Investments (2016-present). Prior to joining Fidelity Investments, Mr. Spector served as Director at the Siegfried Group (accounting firm, 2013-2016), and prior to Siegfried Group as audit senior manager at Deloitte & Touche (accounting firm, 2005-2013).
Renee Stagnone (1975)
Year of Election or Appointment: 2016
Assistant Treasurer
Ms. Stagnone also serves as an officer of other funds. Ms. Stagnone is an employee of Fidelity Investments (1997-present). Previously, Ms. Stagnone served as Deputy Treasurer of certain Fidelity® funds (2013-2016).
Christine J. Thompson (1958)
Year of Election or Appointment: 2015
Vice President of Fidelity's Bond Funds
Ms. Thompson also serves as Vice President of other funds. Ms. Thompson also serves as Chief Investment Officer of FMR's Bond Group (2010-present) and is an employee of Fidelity Investments (1985-present). Previously, Ms. Thompson served as Vice President of Fidelity's Bond Funds (2010-2012).
Shareholder Expense Example
As a shareholder of the Fund, you incur two types of costs: (1) transaction costs and (2) ongoing costs, including other Fund expenses. This Example is intended to help you understand your ongoing costs (in dollars) of investing in the Fund and to compare these costs with the ongoing costs of investing in other mutual funds.
The actual expense Example is based on an investment of $1,000 invested at the beginning of the period and held for the entire period (March 7, 2017 to August 31, 2017). The hypothetical expense Example is based on an investment of $1,000 invested for the one-half year period (March 1, 2017 to August 31, 2017).
Actual Expenses
The first line of the accompanying table provides information about actual account values and actual expenses. You may use the information in this line, together with the amount you invested, to estimate the expenses that you paid over the period. Simply divide your account value by $1,000.00 (for example, an $8,600 account value divided by $1,000.00 = 8.6), then multiply the result by the number in the first line under the heading entitled "Expenses Paid During Period" to estimate the expenses you paid on your account during this period. In addition, the Fund, as a shareholder in the underlying Fidelity Central Funds, will indirectly bear its pro-rata share of the fees and expenses incurred by the underlying Fidelity Central Funds. These fees and expenses are not included in the Fund's annualized expense ratio used to calculate the expense estimate in the table below.
Hypothetical Example for Comparison Purposes
The second line of the accompanying table provides information about hypothetical account values and hypothetical expenses based on the Fund's actual expense ratio and an assumed rate of return of 5% per year before expenses, which is not the Fund's actual return. The hypothetical account values and expenses may not be used to estimate the actual ending account balance or expenses you paid for the period. You may use this information to compare the ongoing costs of investing in the Fund and other funds. To do so, compare this 5% hypothetical example with the 5% hypothetical examples that appear in the shareholder reports of the other funds. In addition, the Fund, as a shareholder in the underlying Fidelity Central Funds, will indirectly bear its pro-rata share of the fees and expenses incurred by the underlying Fidelity Central Funds. These fees and expenses are not included in the Fund's annualized expense ratio used to calculate the expense estimate in the table below.
Please note that the expenses shown in the table are meant to highlight your ongoing costs only and do not reflect any transaction costs. Therefore, the second line of the table is useful in comparing ongoing costs only, and will not help you determine the relative total costs of owning different funds.
| | Annualized Expense Ratio-A | Beginning
Account Value | Ending
Account Value | Expenses Paid
During PeriodB |
| Actual | - %C | $1,000.00 | $1,035.50 | $-D |
| Hypothetical-E | | $1,000.00 | $1,025.21 | $-F |
A Annualized expense ratio reflects expenses net of applicable fee waivers.
B The fees and expenses of the underlying Fidelity Central Funds in which the Fund invests are not included in the Fund's annualized expense ratio. In addition to the expenses noted above, the Fund also indirectly bears its proportional share of the expenses of the underlying Fidelity Central Funds. Annualized expenses of the underlying non-money market Fidelity Central Funds as of their most recent fiscal half year ranged from less than .005% to .05%.
C Amount represents less than .005%.
D Actual expenses are equal to the Fund's annualized expense ratio, multiplied by the average account value over the period, multiplied by 178/365 (to reflect the period March 7, 2017 to August 31, 2017).
E 5% return per year before expenses
F Hypothetical expenses are equal to the Fund's annualized expense ratio, multiplied by the average account value over the period, multiplied by 184/365 (to reflect the one-half year period).
Distributions (Unaudited)
The Board of Trustees of Fidelity Flex Core Bond Fund voted to pay on October 16, 2017, to shareholders of record at the opening of business on October 13, 2017, a distribution of $0.046 per share derived from capital gains realized from sales of portfolio securities.
A total of 24.90% of the dividends distributed during the fiscal year was derived from interest on U.S. Government securities which is generally exempt from state income tax.
The fund will notify shareholders in January 2018 of amounts for use in preparing 2017 income tax returns.
Board Approval of Investment Advisory Contracts and Management Fees
Fidelity Flex Core Bond Fund
On January 18, 2017, the Board of Trustees, including the Independent Trustees (together, the Board), voted to approve the management contract with Fidelity Management & Research Company (FMR) and the sub-advisory agreements with affiliates of FMR (together, the Advisory Contracts) for the fund. The Board, assisted by the advice of fund counsel and Independent Trustees' counsel, considered a broad range of information.
Nature, Extent, and Quality of Services Provided. The Board considered Fidelity's staffing as it relates to the fund, including the backgrounds of investment personnel of Fidelity, and also considered the fund's investment objective, strategies, and related investment philosophy. The Board considered the structure of the investment personnel compensation program and whether this structure provides appropriate incentives to act in the best interests of the fund.
Resources Dedicated to Investment Management and Support Services. The Board reviewed the general qualifications and capabilities of Fidelity's investment staff, including its size, education, experience, and resources, as well as Fidelity's approach to recruiting, managing, and compensating investment personnel. The Board noted that Fidelity has continued to increase the resources devoted to non-U.S. offices, including expansion of Fidelity's global investment organization. The Board also noted that Fidelity's analysts have extensive resources, tools and capabilities that allow them to conduct sophisticated quantitative and fundamental analysis, as well as credit analysis of issuers, counterparties and guarantors. Further, the Board considered that Fidelity's investment professionals have sufficient access to global information and data so as to provide competitive investment results over time, and that those professionals also have access to sophisticated tools that permit them to assess portfolio construction and risk and performance attribution characteristics continuously, as well as to transmit new information and research conclusions rapidly around the world. Additionally, in its deliberations, the Board considered Fidelity's trading, risk management, compliance, and technology and operations capabilities and resources, which are integral parts of the investment management process.
Shareholder and Administrative Services. The Board considered the nature, extent, quality, and cost of advisory, administrative, and shareholder services to be performed by FMR, the sub-advisers (together with FMR, the Investment Advisers), and their affiliates under the Advisory Contracts and under separate agreements covering transfer agency, pricing and bookkeeping, and securities lending services for the fund. The Board also considered the nature and extent of the supervision of third party service providers, principally custodians, subcustodians, and pricing vendors.
The Board noted that the growth of fund assets over time across the complex allows Fidelity to reinvest in the development of services designed to enhance the value or convenience of the Fidelity funds as investment vehicles. These services include 24-hour access to account information and market information through telephone representatives and over the Internet, investor education materials and asset allocation tools, and the expanded availability of Fidelity Investor Centers.
Investment Performance. The fund is a new fund and therefore had no historical performance for the Board to review at the time it approved the fund's Advisory Contracts. The Board considered the Investment Advisers' strength in fundamental, research-driven security selection, which the Board is familiar with through its supervision of other Fidelity funds.
Based on its review, the Board concluded that the nature, extent, and quality of services to be provided to the fund under the Advisory Contracts should benefit the shareholders of the fund.
Competitiveness of Management Fee and Total Expense Ratio. The Board noted that the fund is available exclusively to retirement plans offered through certain Fidelity fee-based programs. The Board considered that while the fund does not pay a management fee, FMR is indirectly compensated for its services out of the program fee. The Board noted that FMR pays all operating expenses, with certain limited exceptions, on behalf of the fund. Based on its review, the Board concluded that the fund's fee structure was reasonable in light of the services that the fund and its shareholders will receive and the other factors considered.
Costs of the Services and Profitability. The fund is a new fund and therefore no revenue, cost, or profitability data was available for the Board to review in respect of the fund at the time it approved the Advisory Contracts. In connection with its future renewal of the fund's Advisory Contracts, the Board will consider the revenues earned and the expenses incurred by Fidelity in conducting the business of developing, marketing, distributing, managing, administering and servicing the fund and servicing the fund's shareholders.
Economies of Scale. The Board will consider economies of scale when there is operating experience to permit assessment thereof. It noted, however, that because the fund pays no advisory fees and FMR bears most expenses of the fund, economies of scale cannot be realized by the fund.
Based on its evaluation of all of the conclusions noted above, and after considering all factors it believed relevant, the Board concluded that the advisory fee structures are fair and reasonable, and that the fund's Advisory Contracts should be approved.
Corporate Headquarters
245 Summer St.
Boston, MA 02210
www.fidelity.com
ZCD-ANN-1017
1.9881607.100
Fidelity® Total Bond Fund
Annual Report August 31, 2017 |
|
Contents
To view a fund's proxy voting guidelines and proxy voting record for the 12-month period ended June 30, visit http://www.fidelity.com/proxyvotingresults or visit the Securities and Exchange Commission's (SEC) web site at http://www.sec.gov.
You may also call 1-800-544-8544 to request a free copy of the proxy voting guidelines.
Standard & Poor's, S&P and S&P 500 are registered service marks of The McGraw-Hill Companies, Inc. and have been licensed for use by Fidelity Distributors Corporation.
Other third-party marks appearing herein are the property of their respective owners.
All other marks appearing herein are registered or unregistered trademarks or service marks of FMR LLC or an affiliated company. © 2017 FMR LLC. All rights reserved.
This report and the financial statements contained herein are submitted for the general information of the shareholders of the Fund. This report is not authorized for distribution to prospective investors in the Fund unless preceded or accompanied by an effective prospectus.
A fund files its complete schedule of portfolio holdings with the SEC for the first and third quarters of each fiscal year on Form N-Q. Forms N-Q are available on the SEC’s web site at http://www.sec.gov. A fund's Forms N-Q may be reviewed and copied at the SEC’s Public Reference Room in Washington, DC. Information regarding the operation of the SEC's Public Reference Room may be obtained by calling 1-800-SEC-0330.
For a complete list of a fund's portfolio holdings, view the most recent holdings listing, semiannual report, or annual report on Fidelity's web site at http://www.fidelity.com, http://www.institutional.fidelity.com, or http://www.401k.com, as applicable.
NOT FDIC INSURED •MAY LOSE VALUE •NO BANK GUARANTEE
Neither the Fund nor Fidelity Distributors Corporation is a bank.
Performance: The Bottom Line
Average annual total return reflects the change in the value of an investment, assuming reinvestment of distributions from dividend income and capital gains (the profits earned upon the sale of securities that have grown in value, if any) and assuming a constant rate of performance each year. The hypothetical investment and the average annual total returns do not reflect the deduction of taxes that a shareholder would pay on fund distributions or the redemption of fund shares. During periods of reimbursement by Fidelity, a fund’s total return will be greater than it would be had the reimbursement not occurred. How a fund did yesterday is no guarantee of how it will do tomorrow.
Average Annual Total Returns
| For the periods ended August 31, 2017 | Past 1 year | Past 5 years | Past 10 years |
| Fidelity® Total Bond Fund | 2.07% | 2.98% | 5.15% |
$10,000 Over 10 Years
Let's say hypothetically that $10,000 was invested in Fidelity® Total Bond Fund, a class of the fund, on August 31, 2007.
The chart shows how the value of your investment would have changed, and also shows how the Bloomberg Barclays U.S. Aggregate Bond Index performed over the same period.
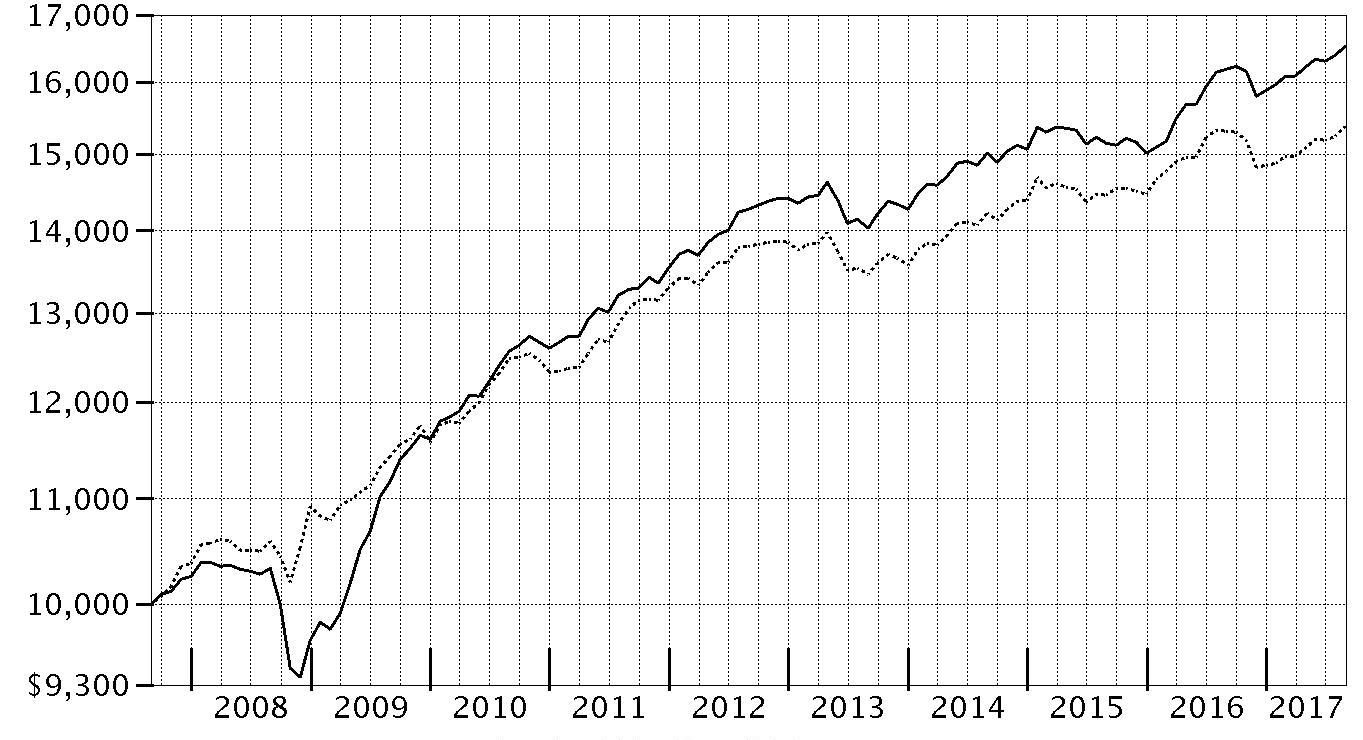
| Period Ending Values |
| $16,527 | Fidelity® Total Bond Fund |
| $15,385 | Bloomberg Barclays U.S. Aggregate Bond Index |
Effective August 24, 2016, all Barclays benchmark indices were co-branded as the Bloomberg Barclays Indices for a period of five years.
Management's Discussion of Fund Performance
Market Recap: U.S. taxable investment-grade bonds rose slightly for the 12 months ending August 31, 2017, as yields increased markedly following the U.S. presidential election then moderated as the period progressed. The Bloomberg Barclays U.S. Aggregate Bond Index gained 0.49% for the year. Bond yields rose slightly early in the period, prior to the U.S. election, then surged in November and December, as many investors viewed then-President-elect Donald Trump’s economic agenda as stimulative and potentially inflationary. Yields also rode the Fed’s decision in December to raise policy interest rates. Longer-term bond yields declined slightly in the first half of 2017, even though the Fed raised rates in June 2017 for the third time in as many quarters, as it became clear that changes to tax, health care and fiscal policies would take time to develop and implement. Fairly cool inflation readings also held back yields late in the period. Within the Bloomberg Barclays index, investment-grade corporate bonds led all major market segments, up 2.13%, while U.S. Treasuries returned -0.95%. Securitized sectors advanced more modestly than corporates. Outside the index, riskier, non-core fixed-income segments led the broader market, while Treasury Inflation-Protected Securities (TIPS) rose 0.46%, according to Bloomberg Barclays.
Comments from Lead Portfolio Manager Ford O'Neil: For the fiscal year, the fund’s share classes (excluding sales charges, if applicable) gained roughly 1% to 2%, outpacing, net of fees, the benchmark Bloomberg Barclays U.S. Aggregate Bond Index. Versus the benchmark, an emphasis on bonds in credit-sensitive spread sectors provided the biggest boost, as they outpaced U.S. government bonds and agency mortgage-backed securities – more-conservative investments in which the fund was underweighted. Specifically, larger-than-benchmark exposure to high-yield bonds and, to a lesser extent, leveraged loans added value. The fund enjoyed good results from investing in sovereign-debt holdings from Mexico and Brazil. Holding 10- and 30-year TIPS (Treasury Inflation-Protected Securities) and certain taxable municipal bonds also contributed, as did a small overweighting in commercial mortgage-backed securities. A significant overweighting in investment-grade credit further helped, led by selections among financials. Conversely, detractors included underweightings in certain industrial segments, namely technology and basic industry.
The views expressed above reflect those of the portfolio manager(s) only through the end of the period as stated on the cover of this report and do not necessarily represent the views of Fidelity or any other person in the Fidelity organization. Any such views are subject to change at any time based upon market or other conditions and Fidelity disclaims any responsibility to update such views. These views may not be relied on as investment advice and, because investment decisions for a Fidelity fund are based on numerous factors, may not be relied on as an indication of trading intent on behalf of any Fidelity fund.
Note to shareholders: On September 30, 2017, Celso Munoz assumed Co-Manager responsibilities for the fund, joining Co-Managers Matthew Conti, Jeff Moore and Michael Foggin, and Lead Manager Ford O’Neil.
Investment Summary (Unaudited)
Quality Diversification (% of fund's net assets)
| As of August 31, 2017 |
| | U.S. Government and U.S. Government Agency Obligations | 54.2% |
| | AAA | 0.8% |
| | AA | 1.1% |
| | A | 5.3% |
| | BBB | 20.0% |
| | BB and Below | 15.0% |
| | Not Rated | 1.6% |
| | Short-Term Investments and Net Other Assets | 2.0% |

| As of February 28, 2017 |
| | U.S. Government and U.S. Government Agency Obligations | 49.3% |
| | AAA | 1.4% |
| | AA | 1.3% |
| | A | 5.4% |
| | BBB | 21.7% |
| | BB and Below | 17.8% |
| | Not Rated | 1.0% |
| | Short-Term Investments and Net Other Assets | 2.1% |

We have used ratings from Moody's Investors Service, Inc. Where Moody's® ratings are not available, we have used S&P® ratings. All ratings are as of the date indicated and do not reflect subsequent changes. Securities rated BB or below were rated investment grade at the time of acquisition.
Asset Allocation (% of fund's net assets)
| As of August 31, 2017*,** |
| | Corporate Bonds | 32.5% |
| | U.S. Government and U.S. Government Agency Obligations | 54.2% |
| | Asset-Backed Securities | 0.9% |
| | CMOs and Other Mortgage Related Securities | 2.4% |
| | Municipal Bonds | 1.4% |
| | Other Investments | 6.6% |
| | Short-Term Investments and Net Other Assets (Liabilities) | 2.0% |

* Foreign investments - 10.3%
** Futures and Swaps - 0.5%
| As of February 28, 2017*,** |
| | Corporate Bonds | 35.5% |
| | U.S. Government and U.S. Government Agency Obligations | 49.3% |
| | Asset-Backed Securities | 0.7% |
| | CMOs and Other Mortgage Related Securities | 3.1% |
| | Municipal Bonds | 1.6% |
| | Other Investments | 7.7% |
| | Short-Term Investments and Net Other Assets (Liabilities) | 2.1% |
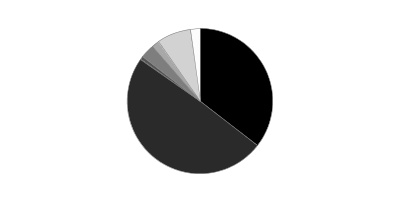
* Foreign investments - 11.4%
** Futures and Swaps - 0.0%
Percentages in the above tables are adjusted for the effect of TBA Sale Commitments.
Percentages shown as 0.0% may reflect amounts less than 0.05%.
Investments August 31, 2017
Showing Percentage of Net Assets
| Nonconvertible Bonds - 32.5% | | | |
| | | Principal Amount(a) | Value |
| CONSUMER DISCRETIONARY - 3.3% | | | |
| Auto Components - 0.1% | | | |
| J.B. Poindexter & Co., Inc. 9% 4/1/22 (b) | | $3,045,000 | $3,189,638 |
| Metalsa SA de CV 4.9% 4/24/23 (b) | | 4,955,000 | 4,992,163 |
| Samvardhana Motherson Automotive Systems Group BV 1.8% 7/6/24 (Reg. S) | EUR | 2,100,000 | 2,437,446 |
| Tenedora Nemak SA de CV 5.5% 2/28/23 (b) | | 3,010,000 | 3,085,250 |
| Tenneco, Inc. 5% 7/15/26 | | 2,271,000 | 2,293,710 |
| Tupy Overseas SA 6.625% 7/17/24 (b) | | 530,000 | 553,797 |
| | | | 16,552,004 |
| Automobiles - 0.6% | | | |
| General Motors Co.: | | | |
| 3.5% 10/2/18 | | 9,215,000 | 9,366,402 |
| 5.2% 4/1/45 | | 3,030,000 | 2,997,741 |
| General Motors Financial Co., Inc.: | | | |
| 3.15% 1/15/20 | | 27,252,000 | 27,807,663 |
| 3.2% 7/13/20 | | 20,200,000 | 20,626,856 |
| 3.25% 5/15/18 | | 4,810,000 | 4,857,956 |
| 3.5% 7/10/19 | | 10,761,000 | 11,024,740 |
| 4% 1/15/25 | | 18,085,000 | 18,319,883 |
| 4.2% 3/1/21 | | 26,269,000 | 27,660,321 |
| 4.25% 5/15/23 | | 5,420,000 | 5,649,677 |
| 4.375% 9/25/21 | | 47,963,000 | 50,858,547 |
| Volkswagen International Finance NV: | | | |
| 1.125% 10/2/23 (Reg. S) | EUR | 2,600,000 | 3,110,355 |
| 2.7%(Reg. S) (c)(d) | EUR | 3,200,000 | 3,761,822 |
| | | | 186,041,963 |
| Diversified Consumer Services - 0.1% | | | |
| Ingersoll-Rand Global Holding Co. Ltd.: | | | |
| 2.875% 1/15/19 | | 1,206,000 | 1,221,882 |
| 4.25% 6/15/23 | | 8,466,000 | 9,174,522 |
| Laureate Education, Inc. 8.25% 5/1/25 (b) | | 4,615,000 | 5,018,813 |
| | | | 15,415,217 |
| Hotels, Restaurants & Leisure - 0.4% | | | |
| 1011778 BC Unlimited Liability Co./New Red Finance, Inc.: | | | |
| 4.25% 5/15/24 (b) | | 5,035,000 | 5,097,938 |
| 5% 10/15/25 (b) | | 3,080,000 | 3,160,850 |
| Aramark Services, Inc.: | | | |
| 4.75% 6/1/26 | | 7,225,000 | 7,570,355 |
| 5.125% 1/15/24 | | 2,520,000 | 2,677,500 |
| Carlson Travel, Inc. 9.5% 12/15/24 (b) | | 3,895,000 | 3,807,363 |
| ESH Hospitality, Inc. 5.25% 5/1/25 (b) | | 1,100,000 | 1,133,000 |
| FelCor Lodging LP 5.625% 3/1/23 | | 135,000 | 140,063 |
| Hilton Escrow Issuer LLC 4.25% 9/1/24 | | 7,280,000 | 7,437,102 |
| Hilton Grand Vacations Borrower LLC/Hilton Grand Vacations Borrower, Inc. 6.125% 12/1/24 (b) | | 1,380,000 | 1,514,550 |
| Hilton Worldwide Finance LLC/Hilton Worldwide Finance Corp.: | | | |
| 4.625% 4/1/25 | | 2,580,000 | 2,695,842 |
| 4.875% 4/1/27 | | 1,530,000 | 1,621,800 |
| KFC Holding Co./Pizza Hut Holding LLC: | | | |
| 4.75% 6/1/27 (b) | | 1,580,000 | 1,621,475 |
| 5% 6/1/24 (b) | | 4,515,000 | 4,719,530 |
| 5.25% 6/1/26 (b) | | 1,790,000 | 1,886,213 |
| McDonald's Corp.: | | | |
| 2.75% 12/9/20 | | 3,638,000 | 3,726,454 |
| 3.7% 1/30/26 | | 9,591,000 | 10,096,450 |
| MCE Finance Ltd. 4.875% 6/6/25 (b) | | 3,410,000 | 3,423,582 |
| MGM Growth Properties Operating Partnership LP 4.5% 9/1/26 | | 13,345,000 | 13,578,538 |
| RHP Hotel Properties LP/RHP Finance Corp. 5% 4/15/23 | | 540,000 | 556,200 |
| Scientific Games Corp.: | | | |
| 6.625% 5/15/21 | | 6,270,000 | 6,489,450 |
| 7% 1/1/22 (b) | | 1,700,000 | 1,814,750 |
| Silversea Cruises 7.25% 2/1/25 (b) | | 1,395,000 | 1,503,113 |
| Studio City Co. Ltd.: | | | |
| 5.875% 11/30/19 (b) | | 2,555,000 | 2,695,525 |
| 7.25% 11/30/21 (b) | | 4,925,000 | 5,287,731 |
| Times Square Hotel Trust 8.528% 8/1/26 (b) | | 1,023,831 | 1,223,873 |
| Wynn Las Vegas LLC/Wynn Las Vegas Capital Corp. 5.25% 5/15/27 (b) | | 4,730,000 | 4,777,300 |
| Wynn Macau Ltd. 5.25% 10/15/21 (b) | | 33,480,000 | 34,199,820 |
| Yum! Brands, Inc. 5.35% 11/1/43 | | 1,720,000 | 1,612,483 |
| | | | 136,068,850 |
| Household Durables - 0.2% | | | |
| CalAtlantic Group, Inc.: | | | |
| 5% 6/15/27 | | 3,810,000 | 3,819,525 |
| 5.25% 6/1/26 | | 4,285,000 | 4,413,550 |
| 5.875% 11/15/24 | | 1,775,000 | 1,925,875 |
| Lennar Corp. 4.125% 1/15/22 | | 2,950,000 | 3,038,500 |
| M/I Homes, Inc.: | | | |
| 5.625% 8/1/25 (b) | | 1,060,000 | 1,075,900 |
| 6.75% 1/15/21 | | 4,265,000 | 4,456,925 |
| PulteGroup, Inc. 5% 1/15/27 | | 2,625,000 | 2,703,750 |
| Reynolds Group Issuer, Inc./Reynolds Group Issuer LLC/Reynolds Group Issuer (Luxembourg) SA: | | | |
| 3 month U.S. LIBOR + 3.500% 4.8036% 7/15/21 (b)(d)(e) | | 3,930,000 | 4,003,688 |
| 5.125% 7/15/23 (b) | | 5,170,000 | 5,388,122 |
| 5.75% 10/15/20 | | 2,935,000 | 2,989,708 |
| SEB SA 1.5% 5/31/24 (Reg. S) | EUR | 1,900,000 | 2,306,391 |
| Taylor Morrison Communities, Inc./Monarch Communities, Inc. 5.875% 4/15/23 (b) | | 1,495,000 | 1,584,700 |
| Toll Brothers Finance Corp. 4.875% 3/15/27 | | 1,348,000 | 1,385,070 |
| TRI Pointe Homes, Inc. 5.25% 6/1/27 | | 2,800,000 | 2,835,000 |
| William Lyon Homes, Inc.: | | | |
| 5.75% 4/15/19 | | 4,175,000 | 4,227,188 |
| 7% 8/15/22 | | 4,250,000 | 4,409,375 |
| | | | 50,563,267 |
| Internet & Direct Marketing Retail - 0.1% | | | |
| Netflix, Inc. 4.375% 11/15/26 (b) | | 3,830,000 | 3,734,250 |
| Zayo Group LLC/Zayo Capital, Inc.: | | | |
| 5.75% 1/15/27 (b) | | 5,975,000 | 6,340,849 |
| 6.375% 5/15/25 | | 8,115,000 | 8,721,109 |
| | | | 18,796,208 |
| Media - 1.8% | | | |
| 21st Century Fox America, Inc.: | | | |
| 6.15% 3/1/37 | | 4,759,000 | 6,055,783 |
| 7.75% 12/1/45 | | 3,932,000 | 5,978,630 |
| Altice SA 7.75% 5/15/22 (b) | | 38,580,000 | 40,943,025 |
| Altice U.S. Finance SA: | | | |
| 5.375% 7/15/23 (b) | | 2,560,000 | 2,681,600 |
| 5.5% 5/15/26 (b) | | 5,035,000 | 5,327,659 |
| AMC Networks, Inc.: | | | |
| 4.75% 12/15/22 | | 1,675,000 | 1,727,344 |
| 4.75% 8/1/25 | | 3,780,000 | 3,794,175 |
| Cablevision SA 6.5% 6/15/21 (b) | | 430,000 | 459,317 |
| Cablevision Systems Corp. 7.75% 4/15/18 | | 2,110,000 | 2,173,300 |
| CCO Holdings LLC/CCO Holdings Capital Corp.: | | | |
| 5% 2/1/28 (b) | | 3,845,000 | 3,909,904 |
| 5.125% 2/15/23 | | 1,130,000 | 1,168,138 |
| 5.125% 5/1/23 (b) | | 11,215,000 | 11,732,348 |
| 5.125% 5/1/27 (b) | | 9,395,000 | 9,676,850 |
| 5.5% 5/1/26 (b) | | 9,005,000 | 9,398,969 |
| 5.75% 2/15/26 (b) | | 3,370,000 | 3,562,730 |
| Charter Communications Operating LLC/Charter Communications Operating Capital Corp.: | | | |
| 4.464% 7/23/22 | | 20,419,000 | 21,609,130 |
| 4.908% 7/23/25 | | 20,419,000 | 21,874,901 |
| 5.375% 5/1/47 (b) | | 27,358,000 | 27,927,908 |
| 6.484% 10/23/45 | | 8,199,000 | 9,429,731 |
| Clear Channel International BV 8.75% 12/15/20 (b) | | 530,000 | 553,850 |
| Columbus International, Inc. 7.375% 3/30/21 (b) | | 10,093,000 | 10,797,491 |
| Comcast Corp. 6.45% 3/15/37 | | 2,196,000 | 2,898,568 |
| CSC Holdings LLC 6.75% 11/15/21 | | 8,225,000 | 9,091,093 |
| CSC Holdings, Inc. 5.5% 4/15/27 (b) | | 4,045,000 | 4,221,969 |
| E.W. Scripps Co. 5.125% 5/15/25 (b) | | 520,000 | 526,500 |
| Globo Comunicacao e Participacoes SA: | | | |
| 4.843% 6/8/25 (b) | | 1,820,000 | 1,878,968 |
| 4.875% 4/11/22 (b) | | 565,000 | 589,126 |
| Grupo Televisa SA de CV 6.625% 3/18/25 | | 440,000 | 531,255 |
| Lagardere S.C.A. 1.625% 6/21/24 (Reg. S) | EUR | 3,100,000 | 3,686,443 |
| MDC Partners, Inc. 6.5% 5/1/24 (b) | | 5,960,000 | 5,937,650 |
| MHGE Parent LLC/MHGE Parent Finance, Inc. 8.5% 8/1/19 pay-in-kind (b)(d) | | 9,210,000 | 9,210,000 |
| Myriad International Holding BV 5.5% 7/21/25 (b) | | 1,490,000 | 1,634,530 |
| NBCUniversal, Inc. 5.15% 4/30/20 | | 11,614,000 | 12,620,386 |
| New Cotai LLC/New Cotai Capital Corp. 10.625% 5/1/19 pay-in-kind (b)(d) | | 4,708,372 | 4,643,632 |
| Sirius XM Radio, Inc.: | | | |
| 3.875% 8/1/22 (b) | | 6,090,000 | 6,196,575 |
| 5% 8/1/27 (b) | | 5,730,000 | 5,887,575 |
| SKY PLC 2.25% 11/17/25 (Reg. S) | EUR | 2,650,000 | 3,382,190 |
| Time Warner Cable, Inc.: | | | |
| 4% 9/1/21 | | 20,277,000 | 21,127,845 |
| 4.5% 9/15/42 | | 54,497,000 | 50,321,608 |
| 5.5% 9/1/41 | | 12,973,000 | 13,288,656 |
| 5.875% 11/15/40 | | 16,544,000 | 17,745,985 |
| 6.55% 5/1/37 | | 38,302,000 | 44,275,774 |
| 6.75% 7/1/18 | | 13,763,000 | 14,296,316 |
| 7.3% 7/1/38 | | 38,728,000 | 47,742,661 |
| 8.25% 4/1/19 | | 24,391,000 | 26,646,013 |
| Time Warner, Inc.: | | | |
| 3.6% 7/15/25 | | 6,406,000 | 6,476,994 |
| 6.2% 3/15/40 | | 11,792,000 | 13,913,865 |
| TV Azteca SA de CV 7.625% 9/18/20 (Reg S.) | | 3,260,000 | 3,361,875 |
| Unitymedia Hessen GmbH & Co. KG/Unitymedia NRW GmbH 5% 1/15/25 (b) | | 2,920,000 | 3,080,600 |
| Virgin Media Secured Finance PLC: | | | |
| 5.5% 1/15/25 (b) | | 2,500,000 | 2,609,375 |
| 5.5% 8/15/26 (b) | | 4,335,000 | 4,584,263 |
| VTR Finance BV 6.875% 1/15/24 (b) | | 2,680,000 | 2,847,500 |
| Ziggo Bond Finance BV: | | | |
| 5.875% 1/15/25 (b) | | 3,100,000 | 3,212,375 |
| 6% 1/15/27 (b) | | 5,605,000 | 5,752,131 |
| Ziggo Secured Finance BV 5.5% 1/15/27 (b) | | 4,540,000 | 4,681,875 |
| | | | 559,684,954 |
| Multiline Retail - 0.0% | | | |
| JC Penney Corp., Inc.: | | | |
| 5.65% 6/1/20 | | 4,860,000 | 4,809,213 |
| 5.875% 7/1/23 (b) | | 980,000 | 983,675 |
| 7.4% 4/1/37 | | 12,160,000 | 9,241,600 |
| | | | 15,034,488 |
| Specialty Retail - 0.0% | | | |
| L Brands, Inc. 6.75% 7/1/36 | | 1,555,000 | 1,472,818 |
| PetSmart, Inc.: | | | |
| 5.875% 6/1/25 (b) | | 3,670,000 | 3,275,475 |
| 8.875% 6/1/25 (b) | | 1,000,000 | 832,500 |
| | | | 5,580,793 |
|
| TOTAL CONSUMER DISCRETIONARY | | | 1,003,737,744 |
|
| CONSUMER STAPLES - 1.8% | | | |
| Beverages - 0.7% | | | |
| Anheuser-Busch InBev Finance, Inc.: | | | |
| 2.65% 2/1/21 | | 38,614,000 | 39,340,365 |
| 3.3% 2/1/23 | | 41,589,000 | 43,142,597 |
| 4.7% 2/1/36 | | 42,171,000 | 46,751,361 |
| 4.9% 2/1/46 | | 45,032,000 | 51,311,422 |
| Anheuser-Busch InBev SA NV 1.75% 3/7/25 (Reg. S) | GBP | 3,600,000 | 4,693,193 |
| Anheuser-Busch InBev Worldwide, Inc. 3.75% 1/15/22 | | 10,217,000 | 10,863,912 |
| Central American Bottling Corp. 5.75% 1/31/27 (b) | | 450,000 | 476,316 |
| Constellation Brands, Inc.: | | | |
| 3.875% 11/15/19 | | 2,360,000 | 2,452,083 |
| 4.25% 5/1/23 | | 5,205,000 | 5,612,264 |
| 6% 5/1/22 | | 21,795,000 | 25,077,810 |
| Cott Holdings, Inc. 5.5% 4/1/25 (b) | | 2,025,000 | 2,116,125 |
| | | | 231,837,448 |
| Food & Staples Retailing - 0.3% | | | |
| Albertsons Companies LLC/Safeway, Inc./New Albertson's, Inc./Albertson's LLC: | | | |
| 5.75% 3/15/25 | | 4,430,000 | 3,992,538 |
| 6.625% 6/15/24 | | 2,215,000 | 2,114,218 |
| Albertsons, Inc.: | | | |
| 6.625% 6/1/28 | | 705,000 | 585,150 |
| 7.45% 8/1/29 | | 645,000 | 562,956 |
| 7.75% 6/15/26 | | 765,000 | 699,975 |
| 8% 5/1/31 | | 4,040,000 | 3,524,900 |
| 8.7% 5/1/30 | | 560,000 | 513,800 |
| C&S Group Enterprises LLC 5.375% 7/15/22 (b) | | 3,335,000 | 3,272,469 |
| CVS Health Corp.: | | | |
| 2.8% 7/20/20 | | 15,202,000 | 15,528,582 |
| 3.5% 7/20/22 | | 8,944,000 | 9,352,665 |
| 4% 12/5/23 | | 8,525,000 | 9,124,845 |
| ESAL GmbH 6.25% 2/5/23 (b) | | 6,210,000 | 6,039,225 |
| FAGE International SA/FAGE U.S.A. Dairy Industry, Inc. 5.625% 8/15/26 (b) | | 895,000 | 912,900 |
| Minerva Luxembourg SA: | | | |
| 6.5% 9/20/26 (b) | | 1,500,000 | 1,504,575 |
| 7.75% 1/31/23 (Reg. S) | | 2,144,000 | 2,240,480 |
| Tesco PLC: | | | |
| 5% 3/24/23 | GBP | 1,100,000 | 1,587,979 |
| 6.15% 11/15/37 (b) | | 7,300,000 | 7,656,751 |
| Tops Holding LLC/Tops Markets II Corp. 8% 6/15/22 (b) | | 5,155,000 | 3,776,038 |
| Walgreens Boots Alliance, Inc.: | | | |
| 2.7% 11/18/19 | | 8,473,000 | 8,615,943 |
| 3.3% 11/18/21 | | 10,050,000 | 10,410,479 |
| | | | 92,016,468 |
| Food Products - 0.1% | | | |
| CF Industries Holdings, Inc.: | | | |
| 3.4% 12/1/21 (b) | | 1,915,000 | 1,950,021 |
| 3.45% 6/1/23 | | 3,115,000 | 3,029,338 |
| 4.5% 12/1/26 (b) | | 1,380,000 | 1,436,144 |
| 5.15% 3/15/34 | | 280,000 | 263,900 |
| Gruma S.A.B. de CV: | | | |
| 4.875% 12/1/24 (b) | | 625,000 | 677,344 |
| 4.875% 12/1/24 (Reg. S) | | 800,000 | 867,000 |
| JBS Investments GmbH: | | | |
| 7.25% 4/3/24 (b) | | 3,880,000 | 3,918,800 |
| 7.75% 10/28/20 (b) | | 1,005,000 | 1,030,125 |
| JBS U.S.A. LLC/JBS U.S.A. Finance, Inc. 5.875% 7/15/24 (b) | | 3,075,000 | 3,113,438 |
| Lamb Weston Holdings, Inc.: | | | |
| 4.625% 11/1/24 (b) | | 2,145,000 | 2,212,031 |
| 4.875% 11/1/26 (b) | | 1,555,000 | 1,613,546 |
| MHP SA 8.25% 4/2/20 (b) | | 275,000 | 294,250 |
| Post Holdings, Inc.: | | | |
| 5% 8/15/26 (b) | | 1,675,000 | 1,675,000 |
| 5.75% 3/1/27 (b) | | 2,690,000 | 2,784,150 |
| | | | 24,865,087 |
| Household Products - 0.0% | | | |
| Edgewell Personal Care Co. 5.5% 6/15/25 (b) | | 630,000 | 661,500 |
| Tobacco - 0.7% | | | |
| Altria Group, Inc.: | | | |
| 2.85% 8/9/22 | | 9,573,000 | 9,798,359 |
| 4% 1/31/24 | | 6,408,000 | 6,883,707 |
| Bat Capital Corp. 2.125% 8/15/25 | GBP | 3,050,000 | 3,964,657 |
| Imperial Tobacco Finance PLC: | | | |
| 2.05% 2/11/18 (b) | | 19,975,000 | 19,977,967 |
| 2.05% 7/20/18 (b) | | 8,743,000 | 8,746,663 |
| 2.95% 7/21/20 (b) | | 20,000,000 | 20,368,273 |
| 3.75% 7/21/22 (b) | | 20,300,000 | 21,162,591 |
| 4.25% 7/21/25 (b) | | 18,467,000 | 19,612,206 |
| 8.125% 3/15/24 | GBP | 1,850,000 | 3,267,764 |
| Reynolds American, Inc.: | | | |
| 2.3% 6/12/18 | | 7,358,000 | 7,386,108 |
| 3.25% 6/12/20 | | 3,274,000 | 3,373,442 |
| 4% 6/12/22 | | 11,386,000 | 12,077,113 |
| 4.45% 6/12/25 | | 14,753,000 | 15,944,246 |
| 5.7% 8/15/35 | | 4,237,000 | 4,961,320 |
| 5.85% 8/15/45 | | 35,690,000 | 43,135,368 |
| 6.15% 9/15/43 | | 4,511,000 | 5,594,325 |
| 7.25% 6/15/37 | | 5,056,000 | 6,948,109 |
| Vector Group Ltd. 6.125% 2/1/25 (b) | | 7,705,000 | 7,897,625 |
| | | | 221,099,843 |
|
| TOTAL CONSUMER STAPLES | | | 570,480,346 |
|
| ENERGY - 6.5% | | | |
| Energy Equipment & Services - 0.4% | | | |
| Borets Finance DAC 6.5% 4/7/22 (b) | | 1,345,000 | 1,429,278 |
| Calfrac Holdings LP 7.5% 12/1/20 (b) | | 3,560,000 | 3,186,200 |
| Diamond Offshore Drilling, Inc. 7.875% 8/15/25 | | 2,910,000 | 2,910,000 |
| El Paso Pipeline Partners Operating Co. LLC: | | | |
| 5% 10/1/21 | | 18,884,000 | 20,439,229 |
| 6.5% 4/1/20 | | 738,000 | 810,358 |
| Ensco PLC: | | | |
| 4.5% 10/1/24 | | 3,615,000 | 2,638,950 |
| 5.2% 3/15/25 | | 16,510,000 | 12,299,950 |
| 5.75% 10/1/44 | | 7,801,000 | 5,012,143 |
| 8% 1/31/24 | | 3,943,000 | 3,548,700 |
| Exterran Energy Solutions LP 8.125% 5/1/25 (b) | | 1,920,000 | 1,977,600 |
| Exterran Partners LP/EXLP Finance Corp.: | | | |
| 6% 4/1/21 | | 3,210,000 | 3,137,775 |
| 6% 10/1/22 | | 995,000 | 962,663 |
| Forum Energy Technologies, Inc. 6.25% 10/1/21 | | 3,780,000 | 3,723,300 |
| FTS International, Inc.: | | | |
| 3 month U.S. LIBOR + 7.500% 8.7456% 6/15/20 (b)(d)(e) | | 1,625,000 | 1,649,375 |
| 6.25% 5/1/22 | | 1,780,000 | 1,539,700 |
| Halliburton Co.: | | | |
| 3.8% 11/15/25 | | 9,790,000 | 10,114,021 |
| 4.85% 11/15/35 | | 8,550,000 | 9,269,756 |
| Nabors Industries, Inc. 5.5% 1/15/23 | | 2,412,000 | 2,262,146 |
| Noble Holding International Ltd.: | | | |
| 4.625% 3/1/21 | | 3,493,000 | 2,977,783 |
| 5.25% 3/15/42 | | 1,890,000 | 1,067,850 |
| 5.75% 3/16/18 | | 1,187,000 | 1,195,665 |
| 7.7% 4/1/25 (d) | | 10,335,000 | 7,699,575 |
| 7.75% 1/15/24 | | 5,390,000 | 4,163,667 |
| 8.7% 4/1/45 (d) | | 7,307,000 | 5,223,774 |
| Precision Drilling Corp.: | | | |
| 5.25% 11/15/24 | | 1,290,000 | 1,125,525 |
| 6.5% 12/15/21 | | 1,240,000 | 1,202,800 |
| SESI LLC 7.75% 9/15/24 (b) | | 1,220,000 | 1,232,200 |
| Southern Gas Corridor CJSC 6.875% 3/24/26 (b) | | 2,555,000 | 2,856,746 |
| Summit Midstream Holdings LLC 5.75% 4/15/25 | | 1,650,000 | 1,654,125 |
| | | | 117,310,854 |
| Oil, Gas & Consumable Fuels - 6.1% | | | |
| Afren PLC: | | | |
| 6.625% 12/9/20 (b)(f)(g) | | 770,910 | 154 |
| 10.25% 4/8/19 (Reg. S) (f)(g) | | 2,024,860 | 405 |
| Anadarko Finance Co. 7.5% 5/1/31 | | 29,585,000 | 37,165,181 |
| Anadarko Petroleum Corp.: | | | |
| 4.85% 3/15/21 | | 6,730,000 | 7,153,839 |
| 5.55% 3/15/26 | | 13,807,000 | 15,412,180 |
| 6.45% 9/15/36 | | 4,370,000 | 5,106,981 |
| 6.6% 3/15/46 | | 22,460,000 | 27,171,034 |
| Antero Resources Corp.: | | | |
| 5% 3/1/25 | | 4,530,000 | 4,439,400 |
| 5.125% 12/1/22 | | 8,335,000 | 8,355,838 |
| 5.625% 6/1/23 (Reg. S) | | 4,310,000 | 4,385,425 |
| Antero Resources Finance Corp. 5.375% 11/1/21 | | 3,675,000 | 3,739,313 |
| California Resources Corp. 8% 12/15/22 (b) | | 5,050,000 | 2,783,813 |
| Canadian Natural Resources Ltd.: | | | |
| 1.75% 1/15/18 | | 6,049,000 | 6,046,343 |
| 3.9% 2/1/25 | | 24,997,000 | 25,636,005 |
| 5.85% 2/1/35 | | 10,897,000 | 12,163,046 |
| Cenovus Energy, Inc.: | | | |
| 4.25% 4/15/27 (b) | | 31,079,000 | 29,999,975 |
| 5.7% 10/15/19 | | 5,453,000 | 5,731,648 |
| Cheniere Corpus Christi Holdings LLC: | | | |
| 5.125% 6/30/27 (b) | | 3,595,000 | 3,720,825 |
| 5.875% 3/31/25 | | 5,295,000 | 5,692,125 |
| 7% 6/30/24 | | 4,155,000 | 4,726,313 |
| Chesapeake Energy Corp.: | | | |
| 4.875% 4/15/22 | | 3,735,000 | 3,305,475 |
| 5.75% 3/15/23 | | 3,405,000 | 3,009,169 |
| 6.125% 2/15/21 | | 3,895,000 | 3,709,988 |
| 8% 12/15/22 (b) | | 7,770,000 | 8,032,238 |
| 8% 1/15/25 (b) | | 4,665,000 | 4,495,894 |
| 8% 6/15/27 (b) | | 3,700,000 | 3,515,000 |
| Columbia Pipeline Group, Inc.: | | | |
| 2.45% 6/1/18 | | 3,149,000 | 3,160,069 |
| 3.3% 6/1/20 | | 15,490,000 | 15,934,220 |
| 4.5% 6/1/25 | | 4,707,000 | 5,055,439 |
| Concho Resources, Inc. 4.375% 1/15/25 | | 7,200,000 | 7,488,000 |
| Consolidated Energy Finance SA: | | | |
| 3 month U.S. LIBOR + 3.750% 4.9817% 6/15/22 (b)(d)(e) | | 12,775,000 | 12,775,056 |
| 6.875% 6/15/25 (b) | | 4,700,000 | 4,888,000 |
| Continental Resources, Inc.: | | | |
| 3.8% 6/1/24 | | 4,150,000 | 3,859,500 |
| 4.5% 4/15/23 | | 8,290,000 | 8,165,650 |
| 4.9% 6/1/44 | | 1,255,000 | 1,061,228 |
| Covey Park Energy LLC 7.5% 5/15/25 (b) | | 3,920,000 | 3,934,700 |
| CVR Refining LLC/Coffeyville Finance, Inc. 6.5% 11/1/22 | | 5,745,000 | 5,816,813 |
| DCP Midstream LLC: | | | |
| 4.75% 9/30/21 (b) | | 11,333,000 | 11,616,325 |
| 5.85% 5/21/43 (b)(d) | | 6,758,000 | 6,268,045 |
| DCP Midstream Operating LP 3.875% 3/15/23 | | 5,532,000 | 5,386,785 |
| Denbury Resources, Inc. 9% 5/15/21 (b) | | 4,000,000 | 3,580,000 |
| Dolphin Energy Ltd. 5.5% 12/15/21 (b) | | 550,000 | 605,374 |
| Duke Energy Field Services 6.45% 11/3/36 (b) | | 13,741,000 | 14,462,403 |
| EDC Finance Ltd. 4.875% 4/17/20 (b) | | 695,000 | 710,721 |
| El Paso Corp. 6.5% 9/15/20 | | 16,140,000 | 17,992,806 |
| Empresa Nacional de Petroleo 4.375% 10/30/24 (b) | | 9,045,000 | 9,505,919 |
| Enable Midstream Partners LP: | | | |
| 2.4% 5/15/19 (d) | | 4,028,000 | 4,010,164 |
| 3.9% 5/15/24 (d) | | 4,249,000 | 4,256,087 |
| Enbridge Energy Partners LP: | | | |
| 4.2% 9/15/21 | | 13,331,000 | 14,068,984 |
| 4.375% 10/15/20 | | 11,319,000 | 11,915,479 |
| Enbridge, Inc.: | | | |
| 4.25% 12/1/26 | | 7,730,000 | 8,141,495 |
| 5.5% 12/1/46 | | 8,922,000 | 10,233,636 |
| Endeavor Energy Resources LP/EER Finance, Inc. 7% 8/15/21 (b) | | 8,190,000 | 8,456,175 |
| Enterprise Products Operating LP: | | | |
| 2.55% 10/15/19 | | 2,971,000 | 2,995,934 |
| 3.75% 2/15/25 | | 9,982,000 | 10,404,481 |
| EP Energy LLC/Everest Acquisition Finance, Inc. 8% 11/29/24 (b) | | 2,990,000 | 2,922,725 |
| Extraction Oil & Gas, Inc. 7.375% 5/15/24 (b) | | 2,770,000 | 2,783,850 |
| Georgian Oil & Gas Corp. 6.75% 4/26/21 (b) | | 1,875,000 | 1,980,469 |
| Gibson Energy, Inc. 6.75% 7/15/21 (b) | | 639,000 | 661,365 |
| Global Partners LP/GLP Finance Corp.: | | | |
| 6.25% 7/15/22 | | 5,165,000 | 5,203,738 |
| 7% 6/15/23 | | 9,970,000 | 9,994,925 |
| Hilcorp Energy I LP/Hilcorp Finance Co.: | | | |
| 5% 12/1/24 (b) | | 3,855,000 | 3,642,975 |
| 5.75% 10/1/25 (b) | | 2,135,000 | 2,060,275 |
| Indika Energy Capital II Pte. Ltd. 6.875% 4/10/22 (b) | | 1,405,000 | 1,418,165 |
| Kinder Morgan Energy Partners LP: | | | |
| 3.5% 3/1/21 | | 11,339,000 | 11,645,106 |
| 5.5% 3/1/44 | | 42,953,000 | 44,935,482 |
| 6.55% 9/15/40 | | 1,889,000 | 2,196,656 |
| Kinder Morgan, Inc.: | | | |
| 5% 2/15/21 (b) | | 10,606,000 | 11,379,054 |
| 5.05% 2/15/46 | | 4,854,000 | 4,834,589 |
| Kosmos Energy Ltd.: | | | |
| 7.875% 8/1/21 (b) | | 1,300,000 | 1,342,250 |
| 7.875% 8/1/21 (b) | | 1,045,000 | 1,078,963 |
| Marathon Petroleum Corp. 5.125% 3/1/21 | | 10,178,000 | 11,041,265 |
| Nakilat, Inc. 6.067% 12/31/33 (b) | | 1,975,000 | 2,323,193 |
| Newfield Exploration Co. 5.375% 1/1/26 | | 1,260,000 | 1,316,700 |
| NGL Energy Partners LP/NGL Energy Finance Corp. 6.125% 3/1/25 | | 2,685,000 | 2,389,650 |
| NGPL PipeCo LLC: | | | |
| 4.375% 8/15/22 (b) | | 505,000 | 518,888 |
| 4.875% 8/15/27 (b) | | 505,000 | 520,150 |
| Nostrum Oil & Gas Finance BV: | | | |
| 6.375% 2/14/19 (b) | | 3,555,000 | 3,561,968 |
| 8% 7/25/22 (b) | | 3,890,000 | 3,966,509 |
| Pacific Exploration and Production Corp.: | | | |
| 10% 11/2/21 pay-in-kind (d) | | 1,204,000 | 1,342,460 |
| 10% 11/2/21 pay-in-kind (b)(d) | | 840,000 | 936,600 |
| Pan American Energy LLC 7.875% 5/7/21 (b) | | 2,858,000 | 3,089,498 |
| Parsley Energy LLC/Parsley: | | | |
| 5.25% 8/15/25 (b) | | 1,420,000 | 1,420,000 |
| 5.375% 1/15/25 (b) | | 3,335,000 | 3,351,675 |
| PBF Holding Co. LLC/PBF Finance Corp. 7% 11/15/23 | | 1,310,000 | 1,313,275 |
| PBF Logistics LP/PBF Logistics Finance, Inc. 6.875% 5/15/23 | | 4,365,000 | 4,474,562 |
| Pemex Project Funding Master Trust 6.625% 6/15/35 | | 5,140,000 | 5,602,600 |
| Petro-Canada 6.05% 5/15/18 | | 3,850,000 | 3,967,689 |
| Petrobras Energia SA 7.375% 7/21/23 (b) | | 560,000 | 605,360 |
| Petrobras Global Finance BV: | | | |
| 4.375% 5/20/23 | | 20,096,000 | 19,673,984 |
| 4.75% 1/14/25 | EUR | 450,000 | 561,965 |
| 5.625% 5/20/43 | | 18,504,000 | 16,228,008 |
| 6.125% 1/17/22 | | 9,120,000 | 9,667,200 |
| 6.25% 3/17/24 | | 21,380,000 | 22,659,593 |
| 7.25% 3/17/44 | | 45,050,000 | 46,401,500 |
| 7.375% 1/17/27 | | 41,110,000 | 45,436,416 |
| 8.375% 5/23/21 | | 58,745,000 | 66,704,948 |
| 8.75% 5/23/26 | | 53,840,000 | 64,446,480 |
| Petrobras International Finance Co. Ltd.: | | | |
| 5.375% 1/27/21 | | 44,755,000 | 46,285,621 |
| 5.75% 1/20/20 | | 1,650,000 | 1,734,975 |
| 5.875% 3/7/22 | EUR | 200,000 | 268,150 |
| 6.875% 1/20/40 | | 1,220,000 | 1,218,414 |
| Petroleos de Venezuela SA: | | | |
| 5.375% 4/12/27 | | 975,000 | 294,938 |
| 5.5% 4/12/37 | | 1,520,000 | 457,900 |
| 6% 5/16/24 (b) | | 1,845,000 | 553,500 |
| 6% 11/15/26 (b) | | 2,385,000 | 715,500 |
| 8.5% 10/27/20 (b) | | 1,115,000 | 824,989 |
| 9.75% 5/17/35 (b) | | 6,375,000 | 2,263,125 |
| 12.75% 2/17/22 (b) | | 270,000 | 122,040 |
| Petroleos Mexicanos: | | | |
| 3.5% 7/23/20 | | 13,960,000 | 14,329,940 |
| 3.5% 1/30/23 | | 11,169,000 | 11,071,271 |
| 3.75% 2/21/24 (Reg. S) | EUR | 4,200,000 | 5,233,685 |
| 4.5% 1/23/26 | | 46,043,000 | 46,491,919 |
| 4.625% 9/21/23 | | 80,440,000 | 83,738,040 |
| 4.875% 1/24/22 | | 12,482,000 | 13,118,582 |
| 4.875% 1/18/24 | | 13,872,000 | 14,447,688 |
| 5.125% 3/15/23 (Reg. S) | EUR | 1,900,000 | 2,562,908 |
| 5.5% 1/21/21 | | 12,189,000 | 13,066,608 |
| 5.5% 6/27/44 | | 10,807,000 | 10,169,387 |
| 5.625% 1/23/46 | | 35,710,000 | 33,576,328 |
| 6% 3/5/20 | | 6,145,000 | 6,627,383 |
| 6.375% 2/4/21 | | 785,000 | 866,248 |
| 6.375% 1/23/45 | | 29,907,000 | 30,834,117 |
| 6.5% 3/13/27 (b) | | 33,960,000 | 38,035,200 |
| 6.5% 3/13/27 (b) | | 57,927,000 | 64,878,240 |
| 6.5% 6/2/41 | | 27,982,000 | 29,562,983 |
| 6.625% (b)(c) | | 2,985,000 | 3,028,283 |
| 6.75% 9/21/47 (b) | | 24,580,000 | 26,425,958 |
| 6.75% 9/21/47 | | 25,666,000 | 27,593,517 |
| 6.875% 8/4/26 | | 41,650,000 | 47,889,170 |
| 8% 5/3/19 | | 8,600,000 | 9,417,000 |
| Phillips 66 Co. 4.3% 4/1/22 | | 12,618,000 | 13,569,886 |
| Phillips 66 Partners LP 2.646% 2/15/20 | | 1,316,000 | 1,321,172 |
| Plains All American Pipeline LP/PAA Finance Corp. 3.65% 6/1/22 | | 5,217,000 | 5,277,238 |
| PT Pertamina Persero 6.5% 5/27/41 (b) | | 1,010,000 | 1,190,742 |
| Range Resources Corp.: | | | |
| 4.875% 5/15/25 | | 2,960,000 | 2,834,200 |
| 5% 8/15/22 (b) | | 1,725,000 | 1,694,813 |
| 5% 3/15/23 (b) | | 5,270,000 | 5,204,125 |
| Rice Energy, Inc.: | | | |
| 6.25% 5/1/22 | | 12,725,000 | 13,234,000 |
| 7.25% 5/1/23 | | 8,289,000 | 8,858,869 |
| Sabine Pass Liquefaction LLC 5.75% 5/15/24 | | 1,440,000 | 1,601,475 |
| Sinopec Group Overseas Development (2015) Ltd. 1% 4/28/22 (Reg. S) | EUR | 2,675,000 | 3,234,870 |
| Southwestern Energy Co.: | | | |
| 5.8% 1/23/20 (d) | | 38,142,000 | 39,286,260 |
| 6.7% 1/23/25 (d) | | 35,947,000 | 35,048,325 |
| Spectra Energy Partners LP 2.95% 9/25/18 | | 1,960,000 | 1,979,847 |
| Sunoco LP/Sunoco Finance Corp.: | | | |
| 5.5% 8/1/20 | | 1,445,000 | 1,487,339 |
| 6.375% 4/1/23 | | 6,650,000 | 7,007,438 |
| Targa Resources Partners LP/Targa Resources Partners Finance Corp.: | | | |
| 5.125% 2/1/25 (b) | | 1,210,000 | 1,243,275 |
| 5.25% 5/1/23 | | 685,000 | 700,413 |
| 6.75% 3/15/24 | | 4,420,000 | 4,784,650 |
| Teekay Corp. 8.5% 1/15/20 | | 585,000 | 590,850 |
| Teine Energy Ltd. 6.875% 9/30/22 (b) | | 2,265,000 | 2,265,000 |
| The Williams Companies, Inc.: | | | |
| 3.7% 1/15/23 | | 3,730,000 | 3,702,025 |
| 4.55% 6/24/24 | | 38,986,000 | 39,863,185 |
| 5.75% 6/24/44 | | 19,187,000 | 19,906,513 |
| Transportadora de Gas del Sur SA 9.625% 5/14/20(b) | | 3,668,817 | 3,951,793 |
| Western Gas Partners LP: | | | |
| 4.65% 7/1/26 | | 4,876,000 | 5,070,710 |
| 5.375% 6/1/21 | | 24,990,000 | 26,992,595 |
| Whiting Petroleum Corp.: | | | |
| 5% 3/15/19 | | 2,595,000 | 2,569,050 |
| 5.75% 3/15/21 | | 1,350,000 | 1,269,000 |
| Williams Partners LP: | | | |
| 3.6% 3/15/22 | | 10,817,000 | 11,153,122 |
| 3.9% 1/15/25 | | 26,667,000 | 27,401,859 |
| 4% 11/15/21 | | 6,716,000 | 7,048,211 |
| 4% 9/15/25 | | 3,000,000 | 3,100,860 |
| 4.125% 11/15/20 | | 2,399,000 | 2,517,010 |
| 4.3% 3/4/24 | | 40,932,000 | 43,390,479 |
| 4.5% 11/15/23 | | 7,325,000 | 7,848,350 |
| WPX Energy, Inc.: | | | |
| 5.25% 9/15/24 | | 7,085,000 | 6,943,300 |
| 6% 1/15/22 | | 2,480,000 | 2,557,500 |
| 7.5% 8/1/20 | | 4,492,000 | 4,851,360 |
| YPF SA: | | | |
| 8.5% 3/23/21 (b) | | 4,950,000 | 5,623,200 |
| 8.5% 3/23/21 (Reg. S) | | 1,500,000 | 1,704,000 |
| 8.75% 4/4/24 (b) | | 5,290,000 | 6,121,165 |
| 8.875% 12/19/18 (Reg. S) | | 2,150,000 | 2,311,250 |
| | | | 1,879,864,749 |
|
| TOTAL ENERGY | | | 1,997,175,603 |
|
| FINANCIALS - 11.1% | | | |
| Banks - 4.9% | | | |
| ABN AMRO Bank NV 4.4% 3/27/28 (Reg. S) (d) | | 5,400,000 | 5,606,204 |
| Akbank T.A.S. 6.5% 3/9/18 (Reg. S) | | 3,100,000 | 3,158,652 |
| Akbank TAS/Ak Finansal Kiralama A/S 7.2% 3/16/27 (b)(d) | | 695,000 | 735,892 |
| Allied Irish Banks PLC 4.125% 11/26/25 (Reg. S) (d) | EUR | 3,450,000 | 4,399,680 |
| Banco de Bogota SA 6.25% 5/12/26 (b) | | 690,000 | 746,925 |
| Banco de Reservas de La Republica Dominicana 7% 2/1/23 (b) | | 1,675,000 | 1,758,750 |
| Banco Espirito Santo SA 4% 1/21/19 (Reg. S) (f) | EUR | 1,300,000 | 466,210 |
| Banco Hipotecario SA 9.75% 11/30/20 (b) | | 5,205,000 | 5,915,430 |
| Banco Macro SA 6.75% 11/4/26 (b)(d) | | 1,645,000 | 1,714,962 |
| Banco Nacional de Desenvolvimento Economico e Social: | | | |
| 4% 4/14/19 (b) | | 1,393,000 | 1,420,331 |
| 5.75% 9/26/23 (b) | | 10,130,000 | 10,975,349 |
| 6.369% 6/16/18 (b) | | 1,125,000 | 1,158,896 |
| Bank of America Corp.: | | | |
| 1.776% 5/4/27 (Reg. S) (d) | EUR | 4,350,000 | 5,306,158 |
| 2% 1/11/18 | | 50,000,000 | 50,071,653 |
| 2.25% 4/21/20 | | 66,694,000 | 67,009,835 |
| 2.6% 1/15/19 | | 8,068,000 | 8,148,196 |
| 3.3% 1/11/23 | | 901,000 | 926,702 |
| 3.5% 4/19/26 | | 20,559,000 | 20,938,038 |
| 3.705% 4/24/28 (d) | | 32,549,000 | 33,299,731 |
| 3.875% 8/1/25 | | 22,129,000 | 23,264,291 |
| 3.95% 4/21/25 | | 17,156,000 | 17,716,614 |
| 4.1% 7/24/23 | | 11,481,000 | 12,276,987 |
| 4.2% 8/26/24 | | 40,532,000 | 42,685,909 |
| 4.25% 10/22/26 | | 14,724,000 | 15,445,373 |
| 5.65% 5/1/18 | | 8,780,000 | 9,000,368 |
| 5.75% 12/1/17 | | 21,955,000 | 22,169,553 |
| 5.875% 1/5/21 | | 6,530,000 | 7,286,038 |
| Banque Centrale de Tunisie 5.75% 1/30/25 (b) | | 905,000 | 889,163 |
| Barclays Bank PLC 6.75% 1/16/23 (d) | GBP | 1,250,000 | 1,647,878 |
| Barclays PLC: | | | |
| 2.75% 11/8/19 | | 12,249,000 | 12,396,515 |
| 3.25% 1/12/21 | | 21,116,000 | 21,579,792 |
| 4.375% 1/12/26 | | 25,086,000 | 26,376,524 |
| BBVA Bancomer SA: | | | |
| 7.25% 4/22/20 (b) | | 975,000 | 1,064,700 |
| 7.25% 4/22/20 (Reg. S) | | 3,300,000 | 3,603,600 |
| Biz Finance PLC 9.75% 1/22/25 (b) | | 300,000 | 316,656 |
| BTA Bank JSC 5.5% 12/21/22 (b) | | 915,000 | 894,705 |
| CBOM Finance PLC 7.5% 10/5/27 (b)(d) | | 1,260,000 | 1,184,712 |
| Citigroup, Inc.: | | | |
| 1.8% 2/5/18 | | 33,287,000 | 33,308,382 |
| 1.85% 11/24/17 | | 33,365,000 | 33,385,709 |
| 2.4% 2/18/20 | | 60,588,000 | 61,136,617 |
| 2.65% 10/26/20 | | 20,000,000 | 20,281,976 |
| 4.05% 7/30/22 | | 5,303,000 | 5,587,623 |
| 4.4% 6/10/25 | | 40,790,000 | 43,135,042 |
| 4.45% 9/29/27 | | 10,000,000 | 10,572,966 |
| 5.125% 12/12/18 | GBP | 1,875,000 | 2,550,034 |
| 5.5% 9/13/25 | | 20,027,000 | 22,652,694 |
| Citizens Bank NA 2.55% 5/13/21 | | 6,564,000 | 6,621,119 |
| Citizens Financial Group, Inc. 4.15% 9/28/22 (b) | | 15,987,000 | 16,839,639 |
| Credit Suisse Group Funding Guernsey Ltd.: | | | |
| 2.75% 3/26/20 | | 19,455,000 | 19,727,850 |
| 3.75% 3/26/25 | | 19,450,000 | 19,935,627 |
| 3.8% 9/15/22 | | 30,700,000 | 32,093,704 |
| 3.8% 6/9/23 | | 36,648,000 | 38,212,719 |
| CYBG PLC 3.125% 6/22/25 (Reg. S) (d) | GBP | 1,300,000 | 1,706,731 |
| Discover Bank: | | | |
| 4.2% 8/8/23 | | 17,852,000 | 19,072,579 |
| 7% 4/15/20 | | 2,030,000 | 2,249,241 |
| Export Credit Bank of Turkey 5.875% 4/24/19 (b) | | 280,000 | 290,822 |
| Fidelity Bank PLC 6.875% 5/9/18 (b) | | 340,000 | 329,868 |
| Fifth Third Bancorp: | | | |
| 4.5% 6/1/18 | | 798,000 | 814,399 |
| 8.25% 3/1/38 | | 4,667,000 | 7,165,058 |
| GTB Finance BV 6% 11/8/18 (b) | | 1,155,000 | 1,171,528 |
| HBOS PLC 6.75% 5/21/18 (b) | | 6,067,000 | 6,268,616 |
| HSBC Bank PLC 5% 3/20/23 (d) | GBP | 967,000 | 1,275,536 |
| HSBC Holdings PLC: | | | |
| 4.25% 3/14/24 | | 6,192,000 | 6,518,484 |
| 6.375% 10/18/22 (d) | GBP | 8,550,000 | 11,117,277 |
| HSBC U.S.A., Inc. 1.625% 1/16/18 | | 11,125,000 | 11,127,893 |
| Huntington Bancshares, Inc. 7% 12/15/20 | | 2,851,000 | 3,270,242 |
| Intesa Sanpaolo SpA 5.71% 1/15/26 (b) | | 28,396,000 | 30,010,585 |
| Itau Unibanco Holding SA: | | | |
| 5.125% 5/13/23 (Reg. S) | | 1,650,000 | 1,719,300 |
| 5.5% 8/6/22 (b) | | 1,155,000 | 1,217,370 |
| 6.2% 12/21/21 (Reg. S) | | 980,000 | 1,062,075 |
| JPMorgan Chase & Co.: | | | |
| 1.625% 5/15/18 | | 12,580,000 | 12,585,708 |
| 2.2% 10/22/19 | | 7,268,000 | 7,337,018 |
| 2.25% 1/23/20 | | 40,000,000 | 40,330,974 |
| 2.35% 1/28/19 | | 6,857,000 | 6,923,736 |
| 2.95% 10/1/26 | | 18,480,000 | 18,196,780 |
| 3.25% 9/23/22 | | 18,423,000 | 19,074,973 |
| 3.875% 9/10/24 | | 35,791,000 | 37,471,260 |
| 4.125% 12/15/26 | | 32,416,000 | 34,147,600 |
| 4.25% 10/15/20 | | 6,995,000 | 7,451,024 |
| 4.35% 8/15/21 | | 20,267,000 | 21,840,835 |
| 4.5% 1/24/22 | | 22,046,000 | 23,965,362 |
| 4.625% 5/10/21 | | 6,879,000 | 7,459,518 |
| 4.95% 3/25/20 | | 22,079,000 | 23,706,565 |
| JSC BGEO Group 6% 7/26/23 (b) | | 2,110,000 | 2,168,025 |
| Kazkommertsbank Jsc Mtn Bank Ent 8.5% 5/11/18 (b) | | 1,975,000 | 2,028,286 |
| Nykredit Realkredit A/S 4% 6/3/36 (Reg. S) (d) | EUR | 200,000 | 256,732 |
| Rabobank Nederland 4.375% 8/4/25 | | 25,937,000 | 27,534,944 |
| Regions Bank 6.45% 6/26/37 | | 24,618,000 | 30,883,910 |
| Regions Financial Corp. 3.2% 2/8/21 | | 11,916,000 | 12,234,189 |
| Royal Bank of Scotland Group PLC: | | | |
| 4.8% 4/5/26 | | 50,452,000 | 54,009,137 |
| 5.125% 5/28/24 | | 64,006,000 | 67,515,190 |
| 6% 12/19/23 | | 25,897,000 | 28,697,695 |
| 6.1% 6/10/23 | | 31,961,000 | 35,319,727 |
| 6.125% 12/15/22 | | 42,557,000 | 46,866,035 |
| SB Capital SA 5.5% 2/26/24 (b)(d) | | 1,360,000 | 1,391,729 |
| Trade and Development Bank of Mongolia LLC 9.375% 5/19/20 (b) | | 1,745,000 | 1,886,886 |
| Turkiye Garanti Bankasi A/S 6.125% 5/24/27 (b)(d) | | 1,020,000 | 1,031,075 |
| Turkiye Halk Bankasi A/S: | | | |
| 3.875% 2/5/20 (b) | | 2,000,000 | 1,968,000 |
| 4.75% 6/4/19 (b) | | 980,000 | 990,225 |
| Turkiye Is Bankasi A/S: | | | |
| 5.5% 4/21/19 (b) | | 415,000 | 426,027 |
| 5.5% 4/21/22 (b) | | 1,425,000 | 1,457,456 |
| Turkiye Vakiflar Bankasi TAO 6.875% 2/3/25 (Reg. S) (d) | | 2,925,000 | 2,992,199 |
| UniCredit Luxembourg 6% 10/31/17 (Reg. S) | | 2,300,000 | 2,311,403 |
| UniCredit SpA 6.375% 5/2/23 (Reg. S) (d) | | 1,350,000 | 1,382,956 |
| Zenith Bank PLC: | | | |
| 6.25% 4/22/19 (b) | | 4,970,000 | 5,029,342 |
| 7.375% 5/30/22 (b) | | 2,865,000 | 2,925,165 |
| | | | 1,507,783,963 |
| Capital Markets - 3.5% | | | |
| Affiliated Managers Group, Inc.: | | | |
| 3.5% 8/1/25 | | 21,008,000 | 21,488,726 |
| 4.25% 2/15/24 | | 14,661,000 | 15,574,458 |
| Argos Merger Sub, Inc. 7.125% 3/15/23 (b) | | 3,790,000 | 3,088,850 |
| Compass Group International BV 0.625% 7/3/24 (Reg. S) | EUR | 3,200,000 | 3,788,953 |
| Credit Suisse AG 6% 2/15/18 | | 18,058,000 | 18,390,618 |
| Credit Suisse Group AG 5.75% 9/18/25 (Reg. S) (d) | EUR | 5,950,000 | 7,968,575 |
| Deutsche Bank AG 4.5% 4/1/25 | | 80,571,000 | 81,354,413 |
| Deutsche Bank AG London Branch: | | | |
| 1.875% 2/13/18 | | 37,777,000 | 37,803,280 |
| 2.85% 5/10/19 | | 47,570,000 | 48,104,937 |
| Goldman Sachs Group, Inc.: | | | |
| 1.25% 5/1/25 (Reg. S) | EUR | 2,100,000 | 2,495,640 |
| 1.748% 9/15/17 | | 42,024,000 | 42,027,882 |
| 2% 7/27/23 (Reg. S) | EUR | 5,550,000 | 7,025,577 |
| 2.55% 10/23/19 | | 33,080,000 | 33,473,755 |
| 2.625% 1/31/19 | | 50,400,000 | 50,920,568 |
| 2.9% 7/19/18 | | 17,494,000 | 17,666,514 |
| 3.691% 6/5/28 (d) | | 200,926,000 | 204,401,395 |
| 3.75% 5/22/25 | | 20,000,000 | 20,631,888 |
| 5.25% 7/27/21 | | 17,105,000 | 18,843,117 |
| 5.95% 1/18/18 | | 4,975,000 | 5,052,772 |
| IntercontinentalExchange, Inc. 2.75% 12/1/20 | | 6,489,000 | 6,634,344 |
| Lazard Group LLC 4.25% 11/14/20 | | 10,151,000 | 10,780,344 |
| Merrill Lynch & Co., Inc. 5.5% 11/22/21 | GBP | 1,100,000 | 1,646,272 |
| Moody's Corp.: | | | |
| 3.25% 1/15/28 (b) | | 11,520,000 | 11,613,234 |
| 4.875% 2/15/24 | | 10,818,000 | 12,065,424 |
| Morgan Stanley: | | | |
| 1% 12/2/22 | EUR | 2,350,000 | 2,849,908 |
| 2.125% 4/25/18 | | 12,586,000 | 12,622,281 |
| 2.375% 3/31/21 (Reg. S) | EUR | 3,000,000 | 3,846,223 |
| 2.8% 6/16/20 | | 30,000,000 | 30,544,358 |
| 3.125% 7/27/26 | | 108,849,000 | 107,434,542 |
| 3.7% 10/23/24 | | 37,479,000 | 39,041,580 |
| 4.875% 11/1/22 | | 26,240,000 | 28,577,182 |
| 5% 11/24/25 | | 3,189,000 | 3,510,037 |
| 5.5% 1/26/20 | | 88,000,000 | 94,995,896 |
| 5.625% 9/23/19 | | 12,714,000 | 13,626,611 |
| 5.75% 1/25/21 | | 19,879,000 | 22,085,772 |
| MSCI, Inc.: | | | |
| 4.75% 8/1/26 (b) | | 4,145,000 | 4,300,438 |
| 5.25% 11/15/24 (b) | | 4,420,000 | 4,707,300 |
| Thomson Reuters Corp. 3.85% 9/29/24 | | 11,394,000 | 12,028,153 |
| UBS Group Funding Ltd. 4.125% 9/24/25 (b) | | 18,881,000 | 20,028,598 |
| | | | 1,083,040,415 |
| Consumer Finance - 0.8% | | | |
| AerCap Ireland Capital Ltd./AerCap Global Aviation Trust 3.5% 5/26/22 | | 7,478,000 | 7,684,898 |
| Capital One Financial Corp. 2.45% 4/24/19 | | 10,550,000 | 10,628,257 |
| Credito Real S.A.B. de CV 7.5% 3/13/19 (b) | | 1,465,000 | 1,516,275 |
| Discover Financial Services: | | | |
| 3.85% 11/21/22 | | 34,849,000 | 36,239,176 |
| 3.95% 11/6/24 | | 14,738,000 | 15,231,072 |
| 5.2% 4/27/22 | | 12,545,000 | 13,738,332 |
| Ford Motor Credit Co. LLC: | | | |
| 1.724% 12/6/17 | | 18,742,000 | 18,753,280 |
| 2.24% 6/15/18 | | 19,162,000 | 19,235,723 |
| 2.597% 11/4/19 | | 52,209,000 | 52,692,209 |
| 2.875% 10/1/18 | | 13,000,000 | 13,129,995 |
| Hyundai Capital America: | | | |
| 2.125% 10/2/17 (b) | | 18,524,000 | 18,529,055 |
| 2.875% 8/9/18 (b) | | 5,276,000 | 5,319,910 |
| SLM Corp.: | | | |
| 5.5% 1/15/19 | | 725,000 | 750,593 |
| 5.5% 1/25/23 | | 2,640,000 | 2,666,400 |
| Synchrony Financial: | | | |
| 3% 8/15/19 | | 4,907,000 | 4,978,115 |
| 3.75% 8/15/21 | | 7,409,000 | 7,658,000 |
| 4.25% 8/15/24 | | 7,458,000 | 7,808,971 |
| | | | 236,560,261 |
| Diversified Financial Services - 0.6% | | | |
| 1MDB Global Investments Ltd. 4.4% 3/9/23 | | 1,000,000 | 931,400 |
| Annington Funding PLC 2.646% 7/12/25 (Reg. S) | GBP | 2,100,000 | 2,791,783 |
| Brixmor Operating Partnership LP: | | | |
| 3.25% 9/15/23 | | 25,518,000 | 25,481,570 |
| 3.85% 2/1/25 | | 14,325,000 | 14,349,404 |
| 3.875% 8/15/22 | | 21,027,000 | 21,741,109 |
| 4.125% 6/15/26 | | 8,647,000 | 8,773,449 |
| Chobani LLC/Finance Corp., Inc. 7.5% 4/15/25 (b) | | 2,820,000 | 3,066,750 |
| Cimpor Financial Operations BV 5.75% 7/17/24 (b) | | 1,350,000 | 1,221,345 |
| Icahn Enterprises LP/Icahn Enterprises Finance Corp.: | | | |
| 4.875% 3/15/19 | | 12,570,000 | 12,695,700 |
| 5.875% 2/1/22 | | 25,766,000 | 26,499,043 |
| 6% 8/1/20 | | 2,810,000 | 2,894,300 |
| 6.25% 2/1/22 | | 1,105,000 | 1,139,531 |
| 6.75% 2/1/24 | | 2,000,000 | 2,105,600 |
| ILFC E-Capital Trust I 3 month U.S. LIBOR + 1.550% 4.34% 12/21/65 (b)(d)(e) | | 11,760,000 | 11,172,000 |
| ILFC E-Capital Trust II 3 month U.S. LIBOR + 1.800% 4.59% 12/21/65 (b)(d)(e) | | 6,710,000 | 6,366,113 |
| Inception Merger Sub, Inc./Rackspace Hosting, Inc. 8.625% 11/15/24 (b) | | 3,550,000 | 3,767,438 |
| j2 Cloud Services LLC/j2 Global Communications, Inc. 6% 7/15/25 (b) | | 1,375,000 | 1,417,969 |
| Pontis IV Ltd. 5.125% 3/31/27 (b) | | 580,000 | 582,900 |
| PT Bukit Makmur Mandiri Utama 7.75% 2/13/22 (b) | | 1,395,000 | 1,465,164 |
| Radiate Holdco LLC/Radiate Financial Service Ltd. 6.625% 2/15/25 (b) | | 2,080,000 | 2,056,600 |
| Sistema International Funding SA 6.95% 5/17/19 (b) | | 945,000 | 909,260 |
| Solera LLC/Solera Finance, Inc. 10.5% 3/1/24 (b) | | 6,270,000 | 7,139,963 |
| Sparc Em Spc 0% 12/5/22 (b) | | 205,000 | 185,628 |
| Tempo Acquisition LLC / Tempo 6.75% 6/1/25 (b) | | 1,815,000 | 1,855,838 |
| TMK Capital SA 6.75% 4/3/20 (Reg. S) | | 560,000 | 587,830 |
| Voya Financial, Inc. 3.125% 7/15/24 | | 13,804,000 | 13,769,031 |
| | | | 174,966,718 |
| Insurance - 1.3% | | | |
| AIA Group Ltd. 2.25% 3/11/19 (b) | | 2,566,000 | 2,568,803 |
| American International Group, Inc.: | | | |
| 2.3% 7/16/19 | | 6,461,000 | 6,509,579 |
| 3.3% 3/1/21 | | 9,614,000 | 9,950,041 |
| 3.875% 1/15/35 | | 19,041,000 | 18,727,021 |
| 4.875% 6/1/22 | | 18,193,000 | 20,111,087 |
| Aon Corp. 5% 9/30/20 | | 3,854,000 | 4,174,229 |
| Aquarius + Investments PLC for Swiss Reinsurance Co. Ltd. 6.375% 9/1/24 (d) | | 3,050,000 | 3,221,898 |
| Assicurazioni Generali SpA 5.5% 10/27/47 (Reg. S) (d) | EUR | 2,450,000 | 3,366,780 |
| AXA SA 3.941%(Reg. S) (c)(d) | EUR | 1,270,000 | 1,668,904 |
| Demeter Investments BV 5.625% 8/15/52 (Reg. S) (d) | | 2,250,000 | 2,433,224 |
| Great-West Life & Annuity Insurance Co. 3 month U.S. LIBOR + 2.538% 3.8522% 5/16/46 (b)(d)(e) | | 1,859,000 | 1,831,115 |
| Hartford Financial Services Group, Inc. 5.125% 4/15/22 | | 14,787,000 | 16,517,376 |
| Liberty Mutual Group, Inc. 5% 6/1/21 (b) | | 12,644,000 | 13,808,599 |
| Marsh & McLennan Companies, Inc. 4.8% 7/15/21 | | 7,090,000 | 7,746,395 |
| Massachusetts Mutual Life Insurance Co. 4.5% 4/15/65 (b) | | 30,523,000 | 31,914,682 |
| MetLife, Inc.: | | | |
| 1.903% 12/15/17 (d) | | 2,987,000 | 2,990,717 |
| 3.048% 12/15/22 (d) | | 12,433,000 | 12,854,237 |
| 4.75% 2/8/21 | | 4,032,000 | 4,392,897 |
| Metropolitan Life Global Funding I 3% 1/10/23 (b) | | 7,896,000 | 8,109,649 |
| Pacific Life Insurance Co. 9.25% 6/15/39 (b) | | 7,041,000 | 11,617,370 |
| Pacific LifeCorp: | | | |
| 5.125% 1/30/43 (b) | | 33,774,000 | 37,879,175 |
| 6% 2/10/20 (b) | | 15,416,000 | 16,738,450 |
| Pricoa Global Funding I 5.375% 5/15/45 (d) | | 17,492,000 | 18,760,170 |
| Prudential Financial, Inc.: | | | |
| 2.3% 8/15/18 | | 1,622,000 | 1,633,108 |
| 6.2% 11/15/40 | | 4,318,000 | 5,671,825 |
| 7.375% 6/15/19 | | 3,230,000 | 3,541,607 |
| Teachers Insurance & Annuity Association of America 4.9% 9/15/44 (b) | | 18,083,000 | 20,529,776 |
| TIAA Asset Management Finance LLC: | | | |
| 2.95% 11/1/19 (b) | | 4,172,000 | 4,242,454 |
| 4.125% 11/1/24 (b) | | 6,048,000 | 6,434,440 |
| Unum Group: | | | |
| 3.875% 11/5/25 | | 21,587,000 | 22,432,704 |
| 4% 3/15/24 | | 20,000,000 | 21,124,776 |
| 5.625% 9/15/20 | | 8,386,000 | 9,195,242 |
| 5.75% 8/15/42 | | 25,545,000 | 30,841,229 |
| USIS Merger Sub, Inc. 6.875% 5/1/25 (b) | | 2,370,000 | 2,414,438 |
| | | | 385,953,997 |
| Mortgage Real Estate Investment Trusts - 0.0% | | | |
| Starwood Property Trust, Inc. 5% 12/15/21 | | 4,120,000 | 4,269,350 |
| Thrifts & Mortgage Finance - 0.0% | | | |
| Leeds Building Society 0.5% 7/3/24 (Reg. S) | EUR | 4,800,000 | 5,692,509 |
| Prime Securities Services Borrower LLC/Prime Finance, Inc. 9.25% 5/15/23 (b) | | 1,000,000 | 1,105,000 |
| | | | 6,797,509 |
|
| TOTAL FINANCIALS | | | 3,399,372,213 |
|
| HEALTH CARE - 1.5% | | | |
| Biotechnology - 0.2% | | | |
| AbbVie, Inc.: | | | |
| 2.9% 11/6/22 | | 24,855,000 | 25,215,951 |
| 4.5% 5/14/35 | | 23,238,000 | 24,858,427 |
| AMAG Pharmaceuticals, Inc. 7.875% 9/1/23 (b) | | 3,815,000 | 3,817,861 |
| | | | 53,892,239 |
| Health Care Equipment & Supplies - 0.1% | | | |
| Becton, Dickinson & Co. 2.675% 12/15/19 | | 3,954,000 | 4,010,977 |
| Mallinckrodt International Finance SA/Mallinckrodt CB LLC 5.5% 4/15/25 (b) | | 2,395,000 | 2,233,338 |
| Ortho-Clinical Diagnostics, Inc. 6.625% 5/15/22 (b) | | 1,415,000 | 1,386,700 |
| Teleflex, Inc. 4.875% 6/1/26 | | 6,975,000 | 7,184,250 |
| | | | 14,815,265 |
| Health Care Providers & Services - 0.5% | | | |
| Aetna, Inc. 2.75% 11/15/22 | | 2,010,000 | 2,041,051 |
| Community Health Systems, Inc.: | | | |
| 6.25% 3/31/23 | | 4,705,000 | 4,740,288 |
| 6.875% 2/1/22 | | 14,070,000 | 11,660,513 |
| HCA Holdings, Inc.: | | | |
| 3.75% 3/15/19 | | 18,722,000 | 19,049,635 |
| 4.25% 10/15/19 | | 7,590,000 | 7,827,188 |
| 4.5% 2/15/27 | | 5,270,000 | 5,342,463 |
| 4.75% 5/1/23 | | 595,000 | 627,606 |
| 5% 3/15/24 | | 6,375,000 | 6,773,438 |
| 5.25% 6/15/26 | | 11,470,000 | 12,344,588 |
| 5.875% 3/15/22 | | 715,000 | 792,149 |
| 5.875% 2/15/26 | | 7,310,000 | 7,885,663 |
| 6.5% 2/15/20 | | 30,303,000 | 32,999,361 |
| HealthSouth Corp. 5.125% 3/15/23 | | 4,745,000 | 4,851,763 |
| Kindred Healthcare, Inc. 8% 1/15/20 | | 1,145,000 | 1,136,413 |
| Medco Health Solutions, Inc. 4.125% 9/15/20 | | 7,486,000 | 7,898,554 |
| Sabra Health Care LP/Sabra Capital Corp.: | | | |
| 5.375% 6/1/23 | | 500,000 | 517,350 |
| 5.5% 2/1/21 | | 1,555,000 | 1,617,200 |
| Tenet Healthcare Corp.: | | | |
| 4.375% 10/1/21 | | 3,825,000 | 3,887,156 |
| 4.625% 7/15/24 (b) | | 6,810,000 | 6,808,638 |
| 6.75% 6/15/23 | | 6,140,000 | 6,091,494 |
| 7.5% 1/1/22 (b) | | 775,000 | 835,063 |
| THC Escrow Corp. III: | | | |
| 5.125% 5/1/25 (b) | | 6,125,000 | 6,162,975 |
| 7% 8/1/25 (b) | | 3,670,000 | 3,595,462 |
| Wellcare Health Plans, Inc. 5.25% 4/1/25 | | 1,675,000 | 1,754,563 |
| WellPoint, Inc. 3.3% 1/15/23 | | 6,442,000 | 6,671,587 |
| | | | 163,912,161 |
| Health Care Technology - 0.0% | | | |
| IMS Health, Inc. 5% 10/15/26 (b) | | 2,715,000 | 2,843,963 |
| Life Sciences Tools & Services - 0.0% | | | |
| Thermo Fisher Scientific, Inc.: | | | |
| 2.4% 2/1/19 | | 1,959,000 | 1,973,280 |
| 4.15% 2/1/24 | | 3,010,000 | 3,248,005 |
| | | | 5,221,285 |
| Pharmaceuticals - 0.7% | | | |
| Actavis Funding SCS: | | | |
| 3% 3/12/20 | | 13,777,000 | 14,060,531 |
| 3.45% 3/15/22 | | 48,347,000 | 50,230,284 |
| Mylan N.V.: | | | |
| 2.25% 11/22/24 (Reg. S) | EUR | 1,650,000 | 2,025,026 |
| 2.5% 6/7/19 | | 16,423,000 | 16,476,508 |
| 3.15% 6/15/21 | | 21,235,000 | 21,536,960 |
| 3.95% 6/15/26 | | 11,126,000 | 11,334,591 |
| Perrigo Finance PLC: | | | |
| 3.5% 12/15/21 | | 1,541,000 | 1,597,392 |
| 3.9% 12/15/24 | | 5,449,000 | 5,618,253 |
| Teva Pharmaceutical Finance IV BV 2.875% 4/15/19 | EUR | 1,050,000 | 1,293,622 |
| Teva Pharmaceutical Finance Netherlands III BV: | | | |
| 1.25% 3/31/23 (Reg. S) | EUR | 1,500,000 | 1,720,301 |
| 2.2% 7/21/21 | | 15,311,000 | 14,570,916 |
| 2.8% 7/21/23 | | 10,972,000 | 10,340,219 |
| 3.15% 10/1/26 | | 12,782,000 | 11,696,405 |
| Valeant Pharmaceuticals International, Inc.: | | | |
| 5.375% 3/15/20 (b) | | 4,690,000 | 4,631,375 |
| 5.625% 12/1/21 (b) | | 8,980,000 | 8,239,150 |
| 5.875% 5/15/23 (b) | | 9,480,000 | 8,081,700 |
| 6.125% 4/15/25 (b) | | 9,290,000 | 7,838,438 |
| 6.5% 3/15/22 (b) | | 2,500,000 | 2,621,875 |
| VPI Escrow Corp. 6.375% 10/15/20 (b) | | 1,865,000 | 1,846,910 |
| Zoetis, Inc.: | | | |
| 1.875% 2/1/18 | | 2,006,000 | 2,005,941 |
| 3.25% 2/1/23 | | 4,892,000 | 5,061,033 |
| 3.45% 11/13/20 | | 5,179,000 | 5,383,703 |
| | | | 208,211,133 |
|
| TOTAL HEALTH CARE | | | 448,896,046 |
|
| INDUSTRIALS - 0.9% | | | |
| Aerospace & Defense - 0.1% | | | |
| BAE Systems Holdings, Inc.: | | | |
| 3.8% 10/7/24 (b) | | 9,122,000 | 9,634,201 |
| 6.375% 6/1/19 (b) | | 8,071,000 | 8,673,950 |
| DAE Funding LLC: | | | |
| 4% 8/1/20 (b) | | 1,425,000 | 1,439,250 |
| 4.5% 8/1/22 (b) | | 1,970,000 | 2,009,400 |
| 5% 8/1/24 (b) | | 4,820,000 | 4,928,450 |
| TransDigm, Inc.: | | | |
| 5.5% 10/15/20 | | 3,580,000 | 3,634,774 |
| 6% 7/15/22 | | 420,000 | 434,700 |
| 6.375% 6/15/26 | | 2,060,000 | 2,119,225 |
| 6.5% 5/15/25 | | 4,460,000 | 4,593,800 |
| | | | 37,467,750 |
| Air Freight & Logistics - 0.0% | | | |
| Rumo Luxembourg Sarl 7.375% 2/9/24 (b) | | 3,045,000 | 3,259,673 |
| Airlines - 0.1% | | | |
| Air Canada 7.75% 4/15/21 (b) | | 1,470,000 | 1,681,827 |
| Air Canada Trust Series 2015-1 equipment trust certificate Class C, 5% 3/15/20 (b) | | 5,685,000 | 5,740,713 |
| Allegiant Travel Co. 5.5% 7/15/19 | | 4,985,000 | 5,122,088 |
| American Airlines Group, Inc. 4.625% 3/1/20 (b) | | 1,650,000 | 1,695,375 |
| American Airlines, Inc. pass-thru trust certificates 5.625% 7/15/22 (b) | | 184,258 | 193,852 |
| Continental Airlines, Inc.: | | | |
| pass-thru trust certificates 9.798% 4/1/21 | | 152,523 | 167,394 |
| 6.648% 9/15/17 | | 130,533 | 130,533 |
| 6.9% 1/2/18 | | 40,005 | 40,405 |
| U.S. Airways Group, Inc. 6.125% 6/1/18 | | 895,000 | 920,731 |
| U.S. Airways pass-thru certificates: | | | |
| Series 2012-2C, 5.45% 6/3/18 | | 1,690,000 | 1,717,463 |
| Series 2013-1 Class B, 5.375% 11/15/21 | | 281,261 | 298,137 |
| U.S. Airways pass-thru trust certificates: | | | |
| 6.85% 1/30/18 | | 234,608 | 239,300 |
| 8.36% 1/20/19 | | 209,681 | 209,681 |
| United Air Lines, Inc. pass-thru trust certificates Class B, 7.336% 7/2/19 | | 514,957 | 551,004 |
| United Continental Holdings, Inc. 6% 12/1/20 | | 605,000 | 654,913 |
| | | | 19,363,416 |
| Building Products - 0.1% | | | |
| Building Materials Corp. of America: | | | |
| 5% 2/15/27 (b) | | 4,295,000 | 4,402,375 |
| 5.125% 2/15/21 (b) | | 4,870,000 | 5,040,450 |
| 5.375% 11/15/24 (b) | | 3,095,000 | 3,234,275 |
| 6% 10/15/25 (b) | | 3,630,000 | 3,902,250 |
| HD Supply, Inc. 5.75% 4/15/24 (b) | | 2,440,000 | 2,616,900 |
| | | | 19,196,250 |
| Commercial Services & Supplies - 0.2% | | | |
| ADS Waste Holdings, Inc. 5.625% 11/15/24 (b) | | 2,035,000 | 2,116,400 |
| APX Group, Inc.: | | | |
| 6.375% 12/1/19 | | 5,657,000 | 5,783,434 |
| 7.625% 9/1/23 (b) | | 3,860,000 | 3,908,250 |
| 7.875% 12/1/22 | | 1,150,000 | 1,247,750 |
| 8.75% 12/1/20 | | 10,732,000 | 11,053,960 |
| Brand Energy & Infrastructure Services, Inc. 8.5% 7/15/25 (b) | | 3,845,000 | 4,142,988 |
| CD&R Waterworks Merger Sub LLC 6.125% 8/15/25 (b) | | 795,000 | 810,900 |
| Cenveo Corp. 6% 8/1/19 (b) | | 325,000 | 267,313 |
| LBC Tank Terminals Holding Netherlands BV 6.875% 5/15/23 (b) | | 3,420,000 | 3,591,000 |
| Prime Security One MS, Inc. 4.875% 7/15/32 (b) | | 2,490,000 | 2,306,363 |
| Securitas AB 1.125% 2/20/24 (Reg. S) | EUR | 5,350,000 | 6,429,227 |
| | | | 41,657,585 |
| Construction & Engineering - 0.0% | | | |
| Cementos Progreso Trust 7.125% 11/6/23 (b) | | 920,000 | 978,650 |
| Odebrecht Finance Ltd.: | | | |
| 4.375% 4/25/25 (b) | | 2,575,000 | 1,030,000 |
| 7.125% 6/26/42 (b) | | 1,425,000 | 577,125 |
| | | | 2,585,775 |
| Electrical Equipment - 0.0% | | | |
| Sensata Technologies BV 5% 10/1/25 (b) | | 4,285,000 | 4,488,538 |
| Vestas Wind Systems A/S 2.75% 3/11/22 (Reg. S) | EUR | 2,740,000 | 3,516,028 |
| | | | 8,004,566 |
| Industrial Conglomerates - 0.0% | | | |
| Alfa SA de CV 5.25% 3/25/24 (b) | | 450,000 | 489,375 |
| Machinery - 0.0% | | | |
| Xerium Technologies, Inc. 9.5% 8/15/21 | | 2,500,000 | 2,587,500 |
| Marine - 0.0% | | | |
| Navios Maritime Acquisition Corp./Navios Acquisition Finance U.S., Inc. 8.125% 11/15/21 (b) | | 10,660,000 | 8,821,150 |
| Navios Maritime Holdings, Inc. 7.375% 1/15/22 (b) | | 1,520,000 | 1,235,000 |
| | | | 10,056,150 |
| Road & Rail - 0.0% | | | |
| Alpha Trains Finance SA 2.064% 6/30/25 | EUR | 4,000,000 | 4,810,008 |
| JSC Georgian Railway 7.75% 7/11/22 (b) | | 650,000 | 715,039 |
| Lima Metro Line 2 Finance Ltd. 5.875% 7/5/34 (b) | | 570,000 | 630,420 |
| | | | 6,155,467 |
| Trading Companies & Distributors - 0.4% | | | |
| Air Lease Corp.: | | | |
| 2.125% 1/15/18 | | 7,271,000 | 7,281,123 |
| 2.625% 9/4/18 | | 16,438,000 | 16,573,498 |
| 3.375% 6/1/21 | | 10,493,000 | 10,824,213 |
| 3.75% 2/1/22 | | 26,396,000 | 27,743,562 |
| 3.875% 4/1/21 | | 14,814,000 | 15,512,301 |
| 4.25% 9/15/24 | | 12,030,000 | 12,755,487 |
| 4.75% 3/1/20 | | 11,796,000 | 12,530,579 |
| Ashtead Capital, Inc.: | | | |
| 4.125% 8/15/25 (b) | | 1,490,000 | 1,527,742 |
| 4.375% 8/15/27 (b) | | 1,575,000 | 1,606,500 |
| FLY Leasing Ltd. 6.375% 10/15/21 | | 6,000,000 | 6,285,000 |
| Travis Perkins PLC: | | | |
| 4.375% 9/15/21 (Reg. S) | GBP | 203,000 | 276,246 |
| 4.5% 9/7/23 (Reg. S) | GBP | 1,950,000 | 2,628,988 |
| | | | 115,545,239 |
| Transportation Infrastructure - 0.0% | | | |
| Aeropuertos Argentina 2000 SA 6.875% 2/1/27 (b) | | 1,960,000 | 2,067,330 |
| Brisa Concessao Rodoviaria SA 2.375% 5/10/27 | EUR | 900,000 | 1,112,973 |
| Global Ports Finance PLC 6.872% 1/25/22 (b) | | 1,410,000 | 1,485,006 |
| Heathrow Funding Ltd. 6% 3/20/20 | GBP | 3,800,000 | 5,502,991 |
| | | | 10,168,300 |
|
| TOTAL INDUSTRIALS | | | 276,537,046 |
|
| INFORMATION TECHNOLOGY - 0.4% | | | |
| Communications Equipment - 0.0% | | | |
| Banglalink Digital Communications Ltd.: | | | |
| 8.625% 5/6/19 (b) | | 3,955,000 | 4,128,625 |
| 8.625% 5/6/19 (Reg. S) | | 200,000 | 208,780 |
| CommScope Technologies Finance LLC 5% 3/15/27 (b) | | 2,305,000 | 2,297,048 |
| Proven Glory Capital Ltd. 3.25% 2/21/22 (Reg. S) | | 3,300,000 | 3,338,330 |
| | | | 9,972,783 |
| Electronic Equipment & Components - 0.0% | | | |
| Belden, Inc. 5.25% 7/15/24 (b) | | 865,000 | 890,950 |
| Diamond 1 Finance Corp./Diamond 2 Finance Corp.: | | | |
| 3.48% 6/1/19 (b) | | 796,000 | 813,516 |
| 4.42% 6/15/21 (b) | | 2,400,000 | 2,529,020 |
| Tyco Electronics Group SA: | | | |
| 2.375% 12/17/18 | | 2,244,000 | 2,256,965 |
| 6.55% 10/1/17 | | 1,383,000 | 1,387,744 |
| | | | 7,878,195 |
| Internet Software & Services - 0.1% | | | |
| Gogo Intermediate Holdings LLC/Gogo Finance Co., Inc. 12.5% 7/1/22 (b) | | 5,095,000 | 5,859,250 |
| VeriSign, Inc.: | | | |
| 4.75% 7/15/27 (b) | | 1,955,000 | 1,989,017 |
| 5.25% 4/1/25 | | 2,730,000 | 2,921,100 |
| | | | 10,769,367 |
| IT Services - 0.0% | | | |
| Ceridian HCM Holding, Inc. 11% 3/15/21 (b) | | 440,000 | 465,850 |
| Gartner, Inc. 5.125% 4/1/25 (b) | | 1,335,000 | 1,406,756 |
| | | | 1,872,606 |
| Semiconductors & Semiconductor Equipment - 0.2% | | | |
| Micron Technology, Inc.: | | | |
| 5.25% 8/1/23 (b) | | 1,730,000 | 1,801,363 |
| 5.25% 1/15/24 (b) | | 2,650,000 | 2,756,000 |
| 5.5% 2/1/25 | | 1,675,000 | 1,769,135 |
| 5.625% 1/15/26 (b) | | 1,285,000 | 1,355,521 |
| NXP BV/NXP Funding LLC: | | | |
| 3.875% 9/1/22 (b) | | 10,645,000 | 11,017,575 |
| 4.125% 6/1/21 (b) | | 9,955,000 | 10,412,930 |
| 4.625% 6/15/22 (b) | | 4,875,000 | 5,204,063 |
| 4.625% 6/1/23 (b) | | 2,480,000 | 2,651,244 |
| Qorvo, Inc. 7% 12/1/25 | | 5,885,000 | 6,664,763 |
| Sensata Technologies UK Financing Co. PLC 6.25% 2/15/26 (b) | | 3,025,000 | 3,304,813 |
| Versum Materials, Inc. 5.5% 9/30/24 (b) | | 2,715,000 | 2,857,538 |
| | | | 49,794,945 |
| Software - 0.1% | | | |
| CDK Global, Inc. 4.875% 6/1/27 (b) | | 1,820,000 | 1,847,300 |
| Greeneden U.S. Holdings II LLC 10% 11/30/24 (b) | | 3,810,000 | 4,333,875 |
| Nuance Communications, Inc. 5.375% 8/15/20 (b) | | 1,939,000 | 1,968,085 |
| Open Text Corp. 5.875% 6/1/26 (b) | | 11,080,000 | 12,007,950 |
| Symantec Corp. 5% 4/15/25 (b) | | 4,470,000 | 4,680,984 |
| | | | 24,838,194 |
| Technology Hardware, Storage & Peripherals - 0.0% | | | |
| Hewlett Packard Enterprise Co. 6.35% 10/15/45 (d) | | 4,836,000 | 5,135,114 |
|
| TOTAL INFORMATION TECHNOLOGY | | | 110,261,204 |
|
| MATERIALS - 0.9% | | | |
| Chemicals - 0.2% | | | |
| Axalta Coating Systems 4.875% 8/15/24 (b) | | 1,287,000 | 1,315,958 |
| Braskem Finance Ltd.: | | | |
| 5.375% 5/2/22 (b) | | 1,560,000 | 1,645,800 |
| 5.75% 4/15/21 (b) | | 830,000 | 884,988 |
| 6.45% 2/3/24 | | 680,000 | 763,300 |
| Evolution Escrow Issuer LLC 7.5% 3/15/22 (b) | | 3,730,000 | 3,907,175 |
| Kraton Polymers LLC/Kraton Polymers Capital Corp. 7% 4/15/25 (b) | | 5,185,000 | 5,573,875 |
| NOVA Chemicals Corp.: | | | |
| 4.875% 6/1/24 (b) | | 3,820,000 | 3,820,000 |
| 5.25% 6/1/27 (b) | | 2,985,000 | 2,977,538 |
| Nufarm Australia Ltd. 6.375% 10/15/19 (b) | | 3,605,000 | 3,681,606 |
| OCP SA 5.625% 4/25/24 (b) | | 390,000 | 421,532 |
| Olin Corp. 5.125% 9/15/27 | | 5,750,000 | 5,951,250 |
| SunCoke Energy Partners LP/SunCoke Energy Partners Finance Corp. 7.5% 6/15/25 (b) | | 4,255,000 | 4,340,100 |
| The Chemours Co. LLC 5.375% 5/15/27 | | 855,000 | 891,338 |
| The Dow Chemical Co.: | | | |
| 4.125% 11/15/21 | | 10,888,000 | 11,632,606 |
| 4.25% 11/15/20 | | 3,653,000 | 3,878,863 |
| Trinseo Materials Operating SCA/Trinseo Materials Finance, Inc. 5.375% 9/1/25 (b) | | 4,650,000 | 4,754,625 |
| Valvoline, Inc. 4.375% 8/15/25 (b) | | 3,845,000 | 3,878,644 |
| | | | 60,319,198 |
| Construction Materials - 0.1% | | | |
| CEMEX Finance LLC: | | | |
| 4.625% 6/15/24 | EUR | 200,000 | 257,756 |
| 6% 4/1/24 (b) | | 5,665,000 | 5,998,102 |
| 9.375% 10/12/22 (b) | | 985,000 | 1,037,205 |
| CEMEX S.A.B. de CV: | | | |
| 4.375% 3/5/23 (Reg. S) | EUR | 250,000 | 314,011 |
| 4.75% 1/11/22 (Reg. S) | EUR | 1,675,000 | 2,063,794 |
| 5.7% 1/11/25 (b) | | 1,960,000 | 2,101,120 |
| 7.75% 4/16/26 (b) | | 4,100,000 | 4,709,875 |
| Eagle Materials, Inc. 4.5% 8/1/26 | | 4,180,000 | 4,357,650 |
| Summit Materials LLC/Summit Materials Finance Corp. 5.125% 6/1/25 (b) | | 870,000 | 887,400 |
| Union Andina de Cementos SAA 5.875% 10/30/21 (b) | | 635,000 | 663,702 |
| | | | 22,390,615 |
| Containers & Packaging - 0.1% | | | |
| Ardagh Packaging Finance PLC/Ardagh MP Holdings U.S.A., Inc.: | | | |
| 4.25% 9/15/22 (b) | | 3,145,000 | 3,223,625 |
| 4.625% 5/15/23 (b) | | 6,305,000 | 6,478,388 |
| 6% 2/15/25 (b) | | 9,765,000 | 10,399,725 |
| Crown Americas LLC/Crown Americas Capital Corp. V 4.25% 9/30/26 | | 5,350,000 | 5,376,750 |
| Owens-Brockway Glass Container, Inc. 5.375% 1/15/25 (b) | | 3,930,000 | 4,205,100 |
| Silgan Holdings, Inc. 4.75% 3/15/25 (b) | | 2,945,000 | 3,018,625 |
| | | | 32,702,213 |
| Metals & Mining - 0.5% | | | |
| Anglo American Capital PLC 2.5% 9/18/18 | EUR | 2,850,000 | 3,473,500 |
| BHP Billiton Financial (U.S.A.) Ltd.: | | | |
| 6.25% 10/19/75 (b)(d) | | 7,018,000 | 7,693,833 |
| 6.75% 10/19/75 (b)(d) | | 17,432,000 | 20,221,120 |
| Big River Steel LLC/BRS Finance Corp. 7.25% 9/1/25 (b) | | 1,585,000 | 1,660,288 |
| Cliffs Natural Resources, Inc. 5.75% 3/1/25 (b) | | 4,720,000 | 4,615,688 |
| Commercial Metals Co. 5.375% 7/15/27 | | 5,020,000 | 5,233,350 |
| Compania Minera Ares SAC 7.75% 1/23/21 (b) | | 2,130,000 | 2,255,138 |
| Corporacion Nacional del Cobre de Chile (Codelco): | | | |
| 3.625% 8/1/27 (b) | | 8,277,000 | 8,382,035 |
| 4.5% 8/1/47 (b) | | 6,545,000 | 6,719,097 |
| EVRAZ Group SA: | | | |
| 5.375% 3/20/23 (b) | | 2,495,000 | 2,563,613 |
| 6.5% 4/22/20 (b) | | 459,000 | 488,835 |
| 8.25% 1/28/21 (Reg. S) | | 2,635,000 | 2,960,502 |
| Evraz, Inc. NA Canada 7.5% 11/15/19 (b) | | 38,000 | 38,570 |
| Ferrexpo Finance PLC: | | | |
| 10.375% 4/7/19 (b) | | 200,000 | 212,250 |
| 10.375% 4/7/19 (b) | | 1,167,000 | 1,238,479 |
| 10.375% 4/7/19 (Reg. S) | | 275,000 | 291,844 |
| First Quantum Minerals Ltd.: | | | |
| 7.25% 5/15/22 (b) | | 2,220,000 | 2,281,050 |
| 7.25% 4/1/23 (b) | | 9,340,000 | 9,596,850 |
| 7.5% 4/1/25 (b) | | 3,325,000 | 3,403,969 |
| FMG Resources (August 2006) Pty Ltd.: | | | |
| 4.75% 5/15/22 (b) | | 1,360,000 | 1,404,200 |
| 5.125% 5/15/24 (b) | | 3,895,000 | 4,041,063 |
| Freeport-McMoRan, Inc.: | | | |
| 3.55% 3/1/22 | | 10,100,000 | 9,935,875 |
| 3.875% 3/15/23 | | 3,080,000 | 3,049,200 |
| 4.55% 11/14/24 | | 9,320,000 | 9,296,700 |
| Gold Fields Orogen Holding BVI Ltd.: | | | |
| 4.875% 10/7/20 (b) | | 2,055,000 | 2,120,246 |
| 4.875% 10/7/20 (Reg. S) | | 200,000 | 206,350 |
| GTL Trade Finance, Inc. 5.893% 4/29/24 (b) | | 850,000 | 901,000 |
| Lundin Mining Corp.: | | | |
| 7.5% 11/1/20 (b) | | 5,125,000 | 5,349,219 |
| 7.875% 11/1/22 (b) | | 3,615,000 | 3,940,350 |
| Metalloinvest Finance Designated Activity Co. 4.85% 5/2/24 (b) | | 620,000 | 626,428 |
| Metinvest BV 9.3725% 12/31/21 pay-in-kind (d) | | 7,819,600 | 7,710,126 |
| Murray Energy Corp. 11.25% 4/15/21 (b) | | 1,725,000 | 1,000,500 |
| Polyus Finance PLC 5.25% 2/7/23 (b) | | 840,000 | 871,500 |
| Southern Copper Corp. 7.5% 7/27/35 | | 1,210,000 | 1,564,048 |
| Steel Dynamics, Inc.: | | | |
| 5.125% 10/1/21 | | 2,205,000 | 2,262,771 |
| 5.25% 4/15/23 | | 3,040,000 | 3,146,400 |
| Stillwater Mining Co.: | | | |
| 6.125% 6/27/22 (b) | | 3,225,000 | 3,263,700 |
| 7.125% 6/27/25 (b) | | 1,200,000 | 1,228,200 |
| Vale Overseas Ltd.: | | | |
| 4.375% 1/11/22 | | 13,150,000 | 13,856,813 |
| 5.875% 6/10/21 | | 575,000 | 637,503 |
| 6.875% 11/21/36 | | 640,000 | 731,840 |
| Vedanta Resources PLC: | | | |
| 6.375% 7/30/22 (b) | | 1,425,000 | 1,482,000 |
| 8.25% 6/7/21 (b) | | 1,400,000 | 1,568,000 |
| VM Holding SA 5.375% 5/4/27 (b) | | 2,245,000 | 2,359,495 |
| | | | 165,883,538 |
| Paper & Forest Products - 0.0% | | | |
| Sino-Forest Corp. 6.25% 10/21/17 (b)(f)(g) | | 1,365,000 | 0 |
|
| TOTAL MATERIALS | | | 281,295,564 |
|
| REAL ESTATE - 2.7% | | | |
| Equity Real Estate Investment Trusts (REITs) - 1.5% | | | |
| Alexandria Real Estate Equities, Inc.: | | | |
| 2.75% 1/15/20 | | 2,884,000 | 2,916,206 |
| 4.6% 4/1/22 | | 4,896,000 | 5,264,744 |
| alstria office REIT-AG: | | | |
| 2.125% 4/12/23 (Reg. S) | EUR | 2,400,000 | 3,058,647 |
| 2.25% 3/24/21 (Reg. S) | EUR | 2,800,000 | 3,541,085 |
| American Campus Communities Operating Partnership LP 3.75% 4/15/23 | | 3,491,000 | 3,629,231 |
| AvalonBay Communities, Inc. 3.625% 10/1/20 | | 5,005,000 | 5,218,282 |
| Boston Properties, Inc. 3.85% 2/1/23 | | 5,829,000 | 6,205,358 |
| Camden Property Trust: | | | |
| 2.95% 12/15/22 | | 6,621,000 | 6,675,665 |
| 4.25% 1/15/24 | | 9,191,000 | 9,789,496 |
| CBL & Associates LP 4.6% 10/15/24 | | 272,000 | 259,392 |
| CommonWealth REIT 5.875% 9/15/20 | | 2,130,000 | 2,281,395 |
| Corporate Office Properties LP 5% 7/1/25 | | 8,095,000 | 8,732,120 |
| CTR Partnership LP/CareTrust Capital Corp. 5.25% 6/1/25 | | 3,510,000 | 3,624,075 |
| DDR Corp.: | | | |
| 3.625% 2/1/25 | | 9,949,000 | 9,724,357 |
| 3.9% 8/15/24 | | 3,606,000 | 3,650,191 |
| 4.25% 2/1/26 | | 22,796,000 | 23,005,820 |
| 4.625% 7/15/22 | | 20,268,000 | 21,455,553 |
| 4.7% 6/1/27 | | 840,000 | 871,054 |
| 7.875% 9/1/20 | | 323,000 | 378,330 |
| Duke Realty LP: | | | |
| 3.625% 4/15/23 | | 6,287,000 | 6,536,677 |
| 3.75% 12/1/24 | | 5,408,000 | 5,657,494 |
| 3.875% 10/15/22 | | 17,388,000 | 18,384,613 |
| Equinix, Inc. 5.375% 5/15/27 | | 1,680,000 | 1,808,100 |
| Equity One, Inc. 3.75% 11/15/22 | | 18,100,000 | 18,812,798 |
| ERP Operating LP: | | | |
| 2.375% 7/1/19 | | 8,777,000 | 8,864,476 |
| 4.75% 7/15/20 | | 7,700,000 | 8,224,668 |
| Federal Realty Investment Trust 5.9% 4/1/20 | | 2,504,000 | 2,740,523 |
| Health Care REIT, Inc.: | | | |
| 2.25% 3/15/18 | | 5,151,000 | 5,159,781 |
| 4.7% 9/15/17 | | 1,538,000 | 1,539,193 |
| iStar Financial, Inc. 6% 4/1/22 | | 775,000 | 796,313 |
| Lexington Corporate Properties Trust 4.4% 6/15/24 | | 4,608,000 | 4,680,409 |
| MPT Operating Partnership LP/MPT Finance Corp.: | | | |
| 5.25% 8/1/26 | | 4,930,000 | 5,114,875 |
| 6.375% 3/1/24 | | 2,250,000 | 2,444,063 |
| Omega Healthcare Investors, Inc.: | | | |
| 4.375% 8/1/23 | | 42,087,000 | 43,964,439 |
| 4.5% 1/15/25 | | 10,686,000 | 10,986,121 |
| 4.5% 4/1/27 | | 50,980,000 | 51,755,233 |
| 4.75% 1/15/28 | | 29,482,000 | 30,015,898 |
| 4.95% 4/1/24 | | 17,495,000 | 18,560,072 |
| 5.25% 1/15/26 | | 29,233,000 | 31,370,937 |
| Retail Opportunity Investments Partnership LP: | | | |
| 4% 12/15/24 | | 3,376,000 | 3,302,259 |
| 5% 12/15/23 | | 2,030,000 | 2,130,408 |
| SBA Communications Corp. 4.875% 9/1/24 | | 8,675,000 | 8,956,938 |
| Senior Housing Properties Trust 6.75% 4/15/20 | | 250,000 | 270,668 |
| VEREIT Operating Partnership LP: | | | |
| 4.125% 6/1/21 | | 1,770,000 | 1,858,659 |
| 4.875% 6/1/26 | | 1,770,000 | 1,901,169 |
| Weingarten Realty Investors 3.375% 10/15/22 | | 2,729,000 | 2,800,247 |
| WP Carey, Inc. 4% 2/1/25 | | 34,017,000 | 34,772,088 |
| | | | 453,690,120 |
| Real Estate Management & Development - 1.2% | | | |
| Akelius Residential Property AB 1.75% 2/7/25 (Reg. S) | EUR | 2,750,000 | 3,314,374 |
| Brandywine Operating Partnership LP: | | | |
| 3.95% 2/15/23 | | 26,418,000 | 27,023,820 |
| 4.1% 10/1/24 | | 15,881,000 | 16,139,972 |
| 4.55% 10/1/29 | | 17,155,000 | 17,673,669 |
| 4.95% 4/15/18 | | 12,690,000 | 12,901,443 |
| CBRE Group, Inc. 5% 3/15/23 | | 465,000 | 483,600 |
| Deutsche Annington Finance BV 5% 10/2/23 (b) | | 5,800,000 | 6,267,755 |
| Digital Realty Trust LP: | | | |
| 3.4% 10/1/20 | | 17,707,000 | 18,327,238 |
| 3.625% 10/1/22 | | 9,206,000 | 9,634,126 |
| 3.95% 7/1/22 | | 11,840,000 | 12,563,459 |
| 4.75% 10/1/25 | | 30,612,000 | 33,379,459 |
| 5.25% 3/15/21 | | 5,708,000 | 6,231,442 |
| Essex Portfolio LP 3.875% 5/1/24 | | 8,802,000 | 9,209,644 |
| Host Hotels & Resorts LP 4.75% 3/1/23 | | 150,000 | 162,140 |
| Howard Hughes Corp. 5.375% 3/15/25 (b) | | 4,440,000 | 4,442,930 |
| Hunt Companies, Inc. 9.625% 3/1/21 (b) | | 870,000 | 913,500 |
| Inversiones y Representaciones SA 11.5% 7/20/20 (Reg. S) | | 5,000 | 5,744 |
| IRSA Propiedades Comerciales SA 8.75% 3/23/23 (b) | | 770,000 | 866,358 |
| Liberty Property LP: | | | |
| 3.375% 6/15/23 | | 8,174,000 | 8,359,999 |
| 4.125% 6/15/22 | | 14,880,000 | 15,760,594 |
| 4.4% 2/15/24 | | 13,017,000 | 14,015,121 |
| 4.75% 10/1/20 | | 11,282,000 | 12,018,751 |
| Mack-Cali Realty LP: | | | |
| 2.5% 12/15/17 | | 9,223,000 | 9,233,134 |
| 3.15% 5/15/23 | | 14,735,000 | 14,062,076 |
| 4.5% 4/18/22 | | 17,365,000 | 17,874,063 |
| Mattamy Group Corp. 6.875% 12/15/23 (b) | | 850,000 | 864,875 |
| Post Apartment Homes LP 3.375% 12/1/22 | | 2,570,000 | 2,645,222 |
| Realogy Group LLC/Realogy Co.-Issuer Corp. 4.5% 4/15/19 (b) | | 235,000 | 242,050 |
| SELP Finance SARL 1.25% 10/25/23 (Reg. S) | EUR | 4,285,000 | 5,092,503 |
| Tanger Properties LP: | | | |
| 3.125% 9/1/26 | | 11,019,000 | 10,479,320 |
| 3.75% 12/1/24 | | 21,455,000 | 21,821,138 |
| 3.875% 12/1/23 | | 4,812,000 | 4,949,054 |
| Ventas Realty LP: | | | |
| 3.125% 6/15/23 | | 5,458,000 | 5,515,334 |
| 3.5% 2/1/25 | | 5,961,000 | 6,053,410 |
| 3.75% 5/1/24 | | 25,000,000 | 25,859,010 |
| 4.125% 1/15/26 | | 5,557,000 | 5,848,072 |
| Ventas Realty LP/Ventas Capital Corp.: | | | |
| 2% 2/15/18 | | 8,050,000 | 8,058,234 |
| 4% 4/30/19 | | 3,747,000 | 3,855,558 |
| 4.25% 3/1/22 | | 300,000 | 319,545 |
| | | | 372,467,736 |
|
| TOTAL REAL ESTATE | | | 826,157,856 |
|
| TELECOMMUNICATION SERVICES - 1.4% | | | |
| Diversified Telecommunication Services - 1.1% | | | |
| Altice Financing SA: | | | |
| 6.5% 1/15/22 (b) | | 6,250,000 | 6,500,000 |
| 6.625% 2/15/23 (b) | | 2,780,000 | 2,939,850 |
| 7.5% 5/15/26 (b) | | 8,720,000 | 9,550,144 |
| Altice Finco SA 7.625% 2/15/25 (b) | | 3,995,000 | 4,219,719 |
| AT&T, Inc.: | | | |
| 2.45% 6/30/20 | | 11,294,000 | 11,390,494 |
| 3% 6/30/22 | | 29,259,000 | 29,589,264 |
| 3.4% 5/15/25 | | 39,520,000 | 39,256,777 |
| 3.6% 2/17/23 | | 27,844,000 | 28,690,753 |
| 5.875% 10/1/19 | | 5,944,000 | 6,401,578 |
| 6.3% 1/15/38 | | 16,665,000 | 19,565,288 |
| BellSouth Capital Funding Corp. 7.875% 2/15/30 | | 40,000 | 53,434 |
| C&W Senior Financing Designated Activity Co. 6.875% 9/15/27 (b) | | 820,000 | 850,750 |
| GTH Finance BV: | | | |
| 6.25% 4/26/20 (b) | | 1,240,000 | 1,315,404 |
| 7.25% 4/26/23 (b) | | 4,795,000 | 5,425,159 |
| Sable International Finance Ltd. 6.875% 8/1/22 (b) | | 4,575,000 | 4,923,844 |
| SFR Group SA: | | | |
| 6% 5/15/22 (b) | | 4,550,000 | 4,794,472 |
| 6.25% 5/15/24 (b) | | 3,140,000 | 3,304,850 |
| 7.375% 5/1/26 (b) | | 2,380,000 | 2,570,448 |
| Sprint Capital Corp. 6.875% 11/15/28 | | 17,555,000 | 19,310,500 |
| TalkTalk Telecom Group PLC 5.375% 1/15/22 (Reg. S) | GBP | 410,000 | 550,052 |
| TDC A/S 3.5% 2/26/3015 (Reg. S) (d) | EUR | 1,550,000 | 1,898,247 |
| Telecom Italia Capital SA: | | | |
| 6% 9/30/34 | | 2,425,000 | 2,679,625 |
| 6.375% 11/15/33 | | 3,785,000 | 4,324,363 |
| Telecom Italia SpA 5.303% 5/30/24 (b) | | 1,065,000 | 1,152,863 |
| Telefonica Celular del Paraguay SA 6.75% 12/13/22 (b) | | 1,650,000 | 1,710,605 |
| Verizon Communications, Inc.: | | | |
| 2.625% 2/21/20 | | 12,550,000 | 12,806,207 |
| 4.5% 9/15/20 | | 36,000,000 | 38,617,232 |
| 5.012% 4/15/49 | | 2,831,000 | 2,843,069 |
| 5.012% 8/21/54 | | 55,038,000 | 54,111,871 |
| 5.5% 3/16/47 | | 18,149,000 | 19,612,360 |
| Wind Acquisition Finance SA: | | | |
| 4.75% 7/15/20 (b) | | 2,035,000 | 2,060,438 |
| 7% 4/23/21 (Reg S.) | EUR | 4,300,000 | 5,326,149 |
| | | | 348,345,809 |
| Wireless Telecommunication Services - 0.3% | | | |
| America Movil S.A.B. de CV 3.125% 7/16/22 | | 9,218,000 | 9,549,931 |
| Comcel Trust 6.875% 2/6/24 (b) | | 725,000 | 771,567 |
| Digicel Group Ltd. 6.75% 3/1/23 (b) | | 560,000 | 536,900 |
| Inmarsat Finance PLC 4.875% 5/15/22 (b) | | 2,105,000 | 2,141,838 |
| Millicom International Cellular SA: | | | |
| 6% 3/15/25 (b) | | 1,375,000 | 1,471,525 |
| 6.625% 10/15/21 (b) | | 2,975,000 | 3,075,406 |
| Sprint Communications, Inc.: | | | |
| 6% 11/15/22 | | 4,840,000 | 5,148,550 |
| 9% 11/15/18 (b) | | 2,225,000 | 2,403,000 |
| Sprint Corp.: | | | |
| 7.25% 9/15/21 | | 7,925,000 | 8,737,313 |
| 7.625% 2/15/25 | | 4,740,000 | 5,356,200 |
| 7.875% 9/15/23 | | 12,075,000 | 13,797,257 |
| T-Mobile U.S.A., Inc.: | | | |
| 4% 4/15/22 | | 5,110,000 | 5,263,300 |
| 6% 3/1/23 | | 4,060,000 | 4,278,225 |
| 6.375% 3/1/25 | | 4,860,000 | 5,233,613 |
| 6.5% 1/15/24 | | 6,085,000 | 6,495,738 |
| 6.625% 4/1/23 | | 12,185,000 | 12,839,944 |
| Telesat Canada/Telesat LLC 8.875% 11/15/24 (b) | | 3,705,000 | 4,149,600 |
| Vodafone Group PLC 7.875% 2/15/30 | | 1,850,000 | 2,524,778 |
| | | | 93,774,685 |
|
| TOTAL TELECOMMUNICATION SERVICES | | | 442,120,494 |
|
| UTILITIES - 2.0% | | | |
| Electric Utilities - 1.1% | | | |
| American Electric Power Co., Inc.: | | | |
| 1.65% 12/15/17 | | 5,213,000 | 5,213,669 |
| 2.95% 12/15/22 | | 4,935,000 | 5,062,652 |
| DPL, Inc. 6.75% 10/1/19 | | 2,490,000 | 2,608,275 |
| Duquesne Light Holdings, Inc.: | | | |
| 5.9% 12/1/21 (b) | | 29,344,000 | 33,244,162 |
| 6.4% 9/15/20 (b) | | 25,897,000 | 29,023,954 |
| Edison International 3.75% 9/15/17 | | 6,674,000 | 6,677,375 |
| Eversource Energy: | | | |
| 1.45% 5/1/18 | | 3,325,000 | 3,322,894 |
| 2.8% 5/1/23 | | 15,104,000 | 15,304,009 |
| Exelon Corp. 2.85% 6/15/20 | | 4,888,000 | 4,995,396 |
| FirstEnergy Corp.: | | | |
| 4.25% 3/15/23 | | 31,243,000 | 33,153,439 |
| 7.375% 11/15/31 | | 64,123,000 | 86,540,400 |
| FirstEnergy Solutions Corp. 6.05% 8/15/21 | | 20,194,000 | 9,238,755 |
| InterGen NV 7% 6/30/23 (b) | | 2,690,000 | 2,636,200 |
| IPALCO Enterprises, Inc.: | | | |
| 3.45% 7/15/20 | | 27,495,000 | 27,769,950 |
| 3.7% 9/1/24 (b) | | 10,462,000 | 10,551,811 |
| Israel Electric Corp. Ltd. 7.75% 12/15/27 (Reg. S) | | 600,000 | 767,406 |
| LG&E and KU Energy LLC 3.75% 11/15/20 | | 1,450,000 | 1,516,678 |
| Monongahela Power Co. 4.1% 4/15/24 (b) | | 3,982,000 | 4,290,691 |
| Nevada Power Co. 6.5% 5/15/18 | | 790,000 | 816,071 |
| NRG Yield Operating LLC 5% 9/15/26 | | 3,945,000 | 4,033,763 |
| NSG Holdings II LLC/NSG Holdings, Inc. 7.75% 12/15/25 (b) | | 8,546,353 | 9,208,695 |
| NV Energy, Inc. 6.25% 11/15/20 | | 3,500,000 | 3,936,357 |
| Pampa Holding SA 7.5% 1/24/27 (b) | | 1,390,000 | 1,487,300 |
| Pennsylvania Electric Co. 6.05% 9/1/17 | | 764,000 | 764,000 |
| PG&E Corp. 2.4% 3/1/19 | | 1,683,000 | 1,694,598 |
| PPL Capital Funding, Inc. 3.4% 6/1/23 | | 7,184,000 | 7,456,000 |
| Progress Energy, Inc. 4.4% 1/15/21 | | 12,059,000 | 12,844,520 |
| TECO Finance, Inc. 5.15% 3/15/20 | | 3,761,000 | 4,017,570 |
| Western Power Distribution 3.875% 10/17/24 (Reg. S) | GBP | 1,200,000 | 1,769,550 |
| Western Power Distribution Holdings Ltd. 5.25% 1/17/23 | GBP | 3,300,000 | 5,076,809 |
| | | | 335,022,949 |
| Gas Utilities - 0.0% | | | |
| Southern Natural Gas Co./Southern Natural Issuing Corp. 4.4% 6/15/21 | | 3,646,000 | 3,854,358 |
| Independent Power and Renewable Electricity Producers - 0.4% | | | |
| Dolphin Subsidiary II, Inc. 7.25% 10/15/21 | | 67,644,000 | 73,562,850 |
| Dynegy, Inc.: | | | |
| 7.625% 11/1/24 | | 8,010,000 | 8,260,313 |
| 8.125% 1/30/26 (b) | | 3,095,000 | 3,195,588 |
| Emera U.S. Finance LP: | | | |
| 2.15% 6/15/19 | | 5,136,000 | 5,143,575 |
| 2.7% 6/15/21 | | 5,055,000 | 5,107,023 |
| 3.55% 6/15/26 | | 8,087,000 | 8,239,621 |
| Listrindo Capital BV 4.95% 9/14/26 (b) | | 820,000 | 830,086 |
| NRG Energy, Inc.: | | | |
| 6.25% 5/1/24 | | 4,510,000 | 4,667,850 |
| 6.625% 1/15/27 | | 1,695,000 | 1,779,750 |
| TerraForm Power Operating LLC 6.375% 2/1/23 (b)(d) | | 4,980,000 | 5,154,300 |
| The AES Corp.: | | | |
| 3 month U.S. LIBOR + 3.000% 4.2018% 6/1/19 (d)(e) | | 1,359,000 | 1,360,699 |
| 4.875% 5/15/23 | | 9,515,000 | 9,729,088 |
| 5.125% 9/1/27 | | 1,595,000 | 1,622,913 |
| 6% 5/15/26 | | 1,545,000 | 1,649,288 |
| Three Gorges Finance II (Cayman Islands) Ltd. 1.3% 6/21/24 (Reg. S) | EUR | 2,500,000 | 3,014,425 |
| | | | 133,317,369 |
| Multi-Utilities - 0.5% | | | |
| Berkshire Hathaway Energy Co. 2% 11/15/18 | | 12,172,000 | 12,216,744 |
| Dominion Resources, Inc.: | | | |
| 3 month U.S. LIBOR + 2.300% 3.5964% 9/30/66 (d)(e) | | 35,229,000 | 32,301,470 |
| 3 month U.S. LIBOR + 2.825% 4.1214% 6/30/66 (d)(e) | | 10,345,000 | 10,021,719 |
| NiSource Finance Corp.: | | | |
| 5.25% 2/15/43 | | 12,739,000 | 14,980,306 |
| 5.8% 2/1/42 | | 6,336,000 | 7,687,378 |
| 5.95% 6/15/41 | | 11,832,000 | 14,938,850 |
| 6.8% 1/15/19 | | 1,039,000 | 1,105,190 |
| Puget Energy, Inc.: | | | |
| 6% 9/1/21 | | 15,565,000 | 17,575,319 |
| 6.5% 12/15/20 | | 5,125,000 | 5,757,386 |
| RWE AG 7% 10/12/72 (Reg. S) (d) | | 3,650,000 | 3,668,615 |
| Sempra Energy: | | | |
| 2.875% 10/1/22 | | 5,760,000 | 5,828,483 |
| 6% 10/15/39 | | 15,009,000 | 19,373,730 |
| Wisconsin Energy Corp. 3 month U.S. LIBOR + 2.113% 3.4275% 5/15/67 (d)(e) | | 3,860,000 | 3,734,550 |
| | | | 149,189,740 |
|
| TOTAL UTILITIES | | | 621,384,416 |
|
| TOTAL NONCONVERTIBLE BONDS | | | |
| (Cost $9,520,414,565) | | | 9,977,418,532 |
|
| U.S. Government and Government Agency Obligations - 37.5% | | | |
| U.S. Treasury Inflation-Protected Obligations - 7.1% | | | |
| U.S. Treasury Inflation-Indexed Bonds: | | | |
| 0.75% 2/15/45 | | $234,051,750 | $226,638,246 |
| 0.875% 2/15/47 | | 20,295,200 | 20,331,186 |
| 1% 2/15/46 | | 146,160,058 | 150,581,810 |
| 1.375% 2/15/44 | | 139,241,779 | 155,878,562 |
| U.S. Treasury Inflation-Indexed Notes: | | | |
| 0.125% 7/15/24 | | 170,488,616 | 169,946,977 |
| 0.125% 7/15/26 | | 196,310,832 | 192,961,701 |
| 0.25% 1/15/25 | | 77,565,000 | 77,405,465 |
| 0.375% 7/15/25 | | 409,759,034 | 413,467,011 |
| 0.375% 1/15/27 | | 402,034,228 | 401,818,834 |
| 0.375% 7/15/27 | | 150,207,000 | 150,576,985 |
| 0.625% 1/15/26 | | 206,182,000 | 211,043,541 |
|
| TOTAL U.S. TREASURY INFLATION-PROTECTED OBLIGATIONS | | | 2,170,650,318 |
|
| U.S. Treasury Obligations - 30.4% | | | |
| U.S. Treasury Bonds: | | | |
| 2.5% 2/15/45 (h)(i) | | 2,045,000 | 1,957,209 |
| 2.5% 2/15/46 (j) | | 1,762,000 | 1,681,196 |
| 3% 5/15/45 | | 145,382,000 | 153,502,948 |
| 3% 11/15/45 | | 207,323,000 | 218,741,961 |
| 3% 2/15/47 | | 658,626,000 | 695,004,799 |
| 3% 5/15/47 | | 103,797,000 | 109,582,872 |
| 5% 5/15/37 (h) | | 775,000 | 1,083,971 |
| U.S. Treasury Notes: | | | |
| 0.75% 2/15/19 (j) | | 12,650,000 | 12,551,172 |
| 1.125% 6/30/21 | | 1,125,000 | 1,105,884 |
| 1.25% 3/31/21 | | 1,180,775,000 | 1,168,598,258 |
| 1.25% 10/31/21 | | 453,470,000 | 446,561,666 |
| 1.375% 4/30/21 | | 484,800,000 | 481,599,564 |
| 1.5% 5/15/20 | | 408,760,000 | 409,797,866 |
| 1.5% 8/15/26 | | 221,635,000 | 210,916,869 |
| 1.625% 7/31/20 (j) | | 4,593,000 | 4,619,194 |
| 1.625% 2/15/26 (h)(j) | | 2,949,000 | 2,847,974 |
| 1.625% 5/15/26 | | 25,750,000 | 24,814,551 |
| 1.75% 12/31/20 | | 600,000,000 | 604,687,500 |
| 1.75% 6/30/22 | | 952,845,000 | 954,594,366 |
| 1.875% 3/31/22 | | 1,455,761,000 | 1,468,100,747 |
| 1.875% 8/31/24 | | 729,808,000 | 726,215,885 |
| 2% 12/31/21 | | 906,934,000 | 920,077,460 |
| 2% 4/30/24 | | 25,000,000 | 25,124,024 |
| 2% 8/15/25 (h)(j) | | 5,305,000 | 5,292,774 |
| 2% 11/15/26 | | 17,577,000 | 17,417,022 |
| 2.125% 7/31/24 | | 649,329,000 | 656,963,687 |
| 2.25% 11/15/25 (h)(j) | | 1,800,000 | 1,827,633 |
|
| TOTAL U.S. TREASURY OBLIGATIONS | | | 9,325,269,052 |
|
| TOTAL U.S. GOVERNMENT AND GOVERNMENT AGENCY OBLIGATIONS | | | |
| (Cost $11,443,155,377) | | | 11,495,919,370 |
|
| U.S. Government Agency - Mortgage Securities - 15.7% | | | |
| Fannie Mae - 9.3% | | | |
| 12 month U.S. LIBOR + 1.445% 3.195% 4/1/37 (d)(e) | | 58,538 | 61,224 |
| 12 month U.S. LIBOR + 1.480% 3.14% 7/1/34 (d)(e) | | 27,057 | 28,283 |
| 12 month U.S. LIBOR + 1.495% 2.963% 1/1/35 (d)(e) | | 119,957 | 124,647 |
| 12 month U.S. LIBOR + 1.507% 3.2% 7/1/37 (d)(e) | | 16,464 | 17,235 |
| 12 month U.S. LIBOR + 1.553% 3.338% 6/1/36 (d)(e) | | 89,059 | 92,030 |
| 12 month U.S. LIBOR + 1.565% 3.315% 3/1/37 (d)(e) | | 25,292 | 26,579 |
| 12 month U.S. LIBOR + 1.594% 3.448% 5/1/36 (d)(e) | | 120,427 | 126,084 |
| 12 month U.S. LIBOR + 1.617% 3.172% 3/1/33 (d)(e) | | 65,981 | 69,137 |
| 12 month U.S. LIBOR + 1.641% 2.862% 9/1/36 (d)(e) | | 68,109 | 71,384 |
| 12 month U.S. LIBOR + 1.643% 2.815% 9/1/36 (d)(e) | | 33,332 | 34,876 |
| 12 month U.S. LIBOR + 1.645% 3.309% 6/1/47 (d)(e) | | 61,972 | 65,732 |
| 12 month U.S. LIBOR + 1.718% 3.01% 5/1/35 (d)(e) | | 161,999 | 170,688 |
| 12 month U.S. LIBOR + 1.725% 2.583% 6/1/42 (d)(e) | | 207,898 | 214,865 |
| 12 month U.S. LIBOR + 1.728% 3.314% 11/1/36 (d)(e) | | 55,682 | 58,750 |
| 12 month U.S. LIBOR + 1.741% 3.332% 3/1/40 (d)(e) | | 284,424 | 301,782 |
| 12 month U.S. LIBOR + 1.745% 3.374% 7/1/35 (d)(e) | | 73,514 | 77,553 |
| 12 month U.S. LIBOR + 1.750% 3.031% 8/1/41 (d)(e) | | 652,797 | 691,199 |
| 12 month U.S. LIBOR + 1.788% 3.413% 2/1/36 (d)(e) | | 229,221 | 238,208 |
| 12 month U.S. LIBOR + 1.800% 2.759% 1/1/42 (d)(e) | | 1,041,856 | 1,094,269 |
| 12 month U.S. LIBOR + 1.800% 3.558% 7/1/41 (d)(e) | | 198,969 | 207,285 |
| 12 month U.S. LIBOR + 1.805% 3.029% 10/1/41 (d)(e) | | 64,272 | 68,146 |
| 12 month U.S. LIBOR + 1.810% 3.435% 12/1/39 (d)(e) | | 132,367 | 137,855 |
| 12 month U.S. LIBOR + 1.812% 3.471% 12/1/40 (d)(e) | | 7,157,940 | 7,474,741 |
| 12 month U.S. LIBOR + 1.815% 2.944% 11/1/40 (d)(e) | | 79,405 | 83,133 |
| 12 month U.S. LIBOR + 1.815% 3.109% 9/1/41 (d)(e) | | 215,818 | 224,947 |
| 12 month U.S. LIBOR + 1.818% 2.695% 2/1/42 (d)(e) | | 1,133,758 | 1,189,958 |
| 12 month U.S. LIBOR + 1.818% 3.023% 9/1/41 (d)(e) | | 123,969 | 131,517 |
| 12 month U.S. LIBOR + 1.818% 3.249% 7/1/41 (d)(e) | | 164,120 | 171,352 |
| 12 month U.S. LIBOR + 1.820% 3.445% 12/1/35 (d)(e) | | 213,655 | 226,472 |
| 12 month U.S. LIBOR + 1.830% 3.38% 10/1/41 (d)(e) | | 111,552 | 118,438 |
| 12 month U.S. LIBOR + 1.851% 3.573% 5/1/36 (d)(e) | | 100,000 | 106,100 |
| 12 month U.S. LIBOR + 1.900% 3.606% 7/1/37 (d)(e) | | 113,509 | 118,413 |
| 6 month U.S. LIBOR + 1.375% 2.75% 10/1/34 (d)(e) | | 1,296 | 1,338 |
| 6 month U.S. LIBOR + 1.475% 2.85% 10/1/33 (d)(e) | | 1,223 | 1,261 |
| 6 month U.S. LIBOR + 1.505% 2.846% 1/1/35 (d)(e) | | 177,810 | 183,610 |
| 6 month U.S. LIBOR + 1.505% 2.88% 1/1/35 (d)(e) | | 773 | 803 |
| 6 month U.S. LIBOR + 1.510% 2.854% 2/1/33 (d)(e) | | 773 | 797 |
| 6 month U.S. LIBOR + 1.535% 2.833% 3/1/35 (d)(e) | | 15,626 | 16,156 |
| 6 month U.S. LIBOR + 1.535% 2.884% 12/1/34 (d)(e) | | 39,188 | 40,501 |
| 6 month U.S. LIBOR + 1.556% 2.922% 10/1/33 (d)(e) | | 12,017 | 12,424 |
| 6 month U.S. LIBOR + 1.565% 2.845% 7/1/35 (d)(e) | | 16,635 | 17,221 |
| 6 month U.S. LIBOR + 1.740% 3.115% 12/1/34 (d)(e) | | 3,918 | 4,096 |
| 6 month U.S. LIBOR + 1.960% 3.335% 9/1/35 (d)(e) | | 25,761 | 27,136 |
| U.S. TREASURY 1 YEAR INDEX + 1.945% 2.52% 10/1/33 (d)(e) | | 289,120 | 300,901 |
| U.S. TREASURY 1 YEAR INDEX + 2.208% 3.083% 3/1/35 (d)(e) | | 37,194 | 39,340 |
| U.S. TREASURY 1 YEAR INDEX + 2.270% 2.899% 6/1/36 (d)(e) | | 207,468 | 219,067 |
| U.S. TREASURY 1 YEAR INDEX + 2.295% 2.798% 10/1/33 (d)(e) | | 75,874 | 80,103 |
| U.S. TREASURY 1 YEAR INDEX + 2.447% 3.167% 7/1/34 (d)(e) | | 177,919 | 188,901 |
| 2.5% 9/1/32 (k) | | 13,500,000 | 13,688,591 |
| 2.5% 12/1/42 to 8/1/43 | | 12,769,435 | 12,578,664 |
| 3% 11/1/23 to 8/1/47 | | 800,001,453 | 816,284,920 |
| 3% 9/1/32 (k) | | 74,000,000 | 76,402,573 |
| 3% 9/1/32 (k) | | 65,950,000 | 68,091,212 |
| 3% 9/1/32 (k) | | 119,200,000 | 123,070,090 |
| 3% 9/1/32 (k) | | 31,950,000 | 32,987,327 |
| 3% 9/1/32 (k) | | 31,650,000 | 32,677,587 |
| 3.5% 3/1/25 to 10/1/56 | | 537,374,966 | 559,778,167 |
| 3.5% 9/1/47 (k) | | 113,050,000 | 117,128,109 |
| 3.5% 9/1/47 (k) | | 107,850,000 | 111,740,527 |
| 3.5% 9/1/47 (k) | | 35,300,000 | 36,573,395 |
| 4% 9/1/24 to 10/1/46 | | 345,647,010 | 367,338,353 |
| 4% 9/1/47 (k) | | 14,400,000 | 15,213,983 |
| 4.5% 6/1/33 to 8/1/56 | | 122,768,410 | 133,089,361 |
| 5% 3/1/18 to 8/1/56 | | 214,023,690 | 235,302,454 |
| 5.255% 8/1/41 | | 2,319,440 | 2,573,710 |
| 5.5% 12/1/17 to 3/1/41 | | 24,273,241 | 26,939,744 |
| 6% 7/1/19 to 1/1/42 | | 17,006,196 | 19,428,979 |
| 6.309% 2/1/39 | | 4,119,120 | 4,480,466 |
| 6.5% 10/1/17 to 8/1/39 | | 27,643,987 | 32,058,735 |
| 7% 9/1/21 to 7/1/37 | | 1,228,024 | 1,418,053 |
| 7.5% 6/1/25 to 2/1/32 | | 541,939 | 631,303 |
| 8% 7/1/29 to 3/1/37 | | 13,668 | 16,511 |
| 8.5% 12/1/19 to 6/1/22 | | 279 | 307 |
| 9.5% 6/1/18 to 9/1/21 | | 4,398 | 4,550 |
|
| TOTAL FANNIE MAE | | | 2,854,454,208 |
|
| Freddie Mac - 3.5% | | | |
| 12 month U.S. LIBOR + 1.325% 2.79% 1/1/36 (d)(e) | | 51,763 | 53,562 |
| 12 month U.S. LIBOR + 1.325% 2.95% 3/1/37 (d)(e) | | 16,431 | 17,015 |
| 12 month U.S. LIBOR + 1.375% 2.854% 3/1/36 (d)(e) | | 136,088 | 141,095 |
| 12 month U.S. LIBOR + 1.500% 3.129% 3/1/36 (d)(e) | | 163,318 | 170,779 |
| 12 month U.S. LIBOR + 1.515% 2.93% 11/1/35 (d)(e) | | 79,311 | 82,636 |
| 12 month U.S. LIBOR + 1.750% 3.249% 7/1/41 (d)(e) | | 739,532 | 777,281 |
| 12 month U.S. LIBOR + 1.750% 3.394% 12/1/40 (d)(e) | | 3,825,013 | 3,981,255 |
| 12 month U.S. LIBOR + 1.754% 3.098% 9/1/41 (d)(e) | | 1,196,444 | 1,265,875 |
| 12 month U.S. LIBOR + 1.793% 3.32% 4/1/37 (d)(e) | | 36,081 | 38,196 |
| 12 month U.S. LIBOR + 1.864% 3.614% 4/1/36 (d)(e) | | 81,087 | 84,273 |
| 12 month U.S. LIBOR + 1.874% 3.432% 10/1/42 (d)(e) | | 1,120,147 | 1,174,625 |
| 12 month U.S. LIBOR + 1.877% 3.215% 4/1/41 (d)(e) | | 109,482 | 113,732 |
| 12 month U.S. LIBOR + 1.880% 3.222% 9/1/41 (d)(e) | | 128,428 | 136,287 |
| 12 month U.S. LIBOR + 1.910% 3.282% 6/1/41 (d)(e) | | 146,070 | 152,513 |
| 12 month U.S. LIBOR + 1.910% 3.421% 5/1/41 (d)(e) | | 121,731 | 129,245 |
| 12 month U.S. LIBOR + 1.910% 3.625% 5/1/41 (d)(e) | | 166,467 | 174,291 |
| 12 month U.S. LIBOR + 1.910% 3.647% 6/1/41 (d)(e) | | 157,945 | 165,333 |
| 12 month U.S. LIBOR + 1.920% 3.67% 6/1/36 (d)(e) | | 20,585 | 21,855 |
| 12 month U.S. LIBOR + 1.993% 5.165% 4/1/38 (d)(e) | | 118,329 | 125,633 |
| 12 month U.S. LIBOR + 2.045% 3.81% 7/1/36 (d)(e) | | 62,928 | 66,812 |
| 12 month U.S. LIBOR + 2.197% 3.537% 3/1/33 (d)(e) | | 1,850 | 1,959 |
| 12 month U.S. LIBOR + 2.200% 3.7% 12/1/36 (d)(e) | | 111,536 | 116,719 |
| 6 month U.S. LIBOR + 1.125% 2.5% 8/1/37 (d)(e) | | 33,931 | 34,551 |
| 6 month U.S. LIBOR + 1.445% 2.82% 3/1/35 (d)(e) | | 44,988 | 46,303 |
| 6 month U.S. LIBOR + 1.608% 2.955% 12/1/35 (d)(e) | | 81,195 | 84,038 |
| 6 month U.S. LIBOR + 1.647% 3.025% 2/1/37 (d)(e) | | 147,020 | 153,168 |
| 6 month U.S. LIBOR + 1.675% 3.05% 6/1/37 (d)(e) | | 28,135 | 29,360 |
| 6 month U.S. LIBOR + 1.720% 3.095% 8/1/37 (d)(e) | | 52,497 | 54,046 |
| 6 month U.S. LIBOR + 1.746% 2.967% 5/1/37 (d)(e) | | 26,162 | 27,118 |
| 6 month U.S. LIBOR + 1.932% 3.25% 10/1/36 (d)(e) | | 236,127 | 245,974 |
| 6 month U.S. LIBOR + 1.976% 3.34% 10/1/35 (d)(e) | | 118,275 | 124,219 |
| 6 month U.S. LIBOR + 2.010% 3.385% 6/1/37 (d)(e) | | 23,779 | 25,111 |
| 6 month U.S. LIBOR + 2.040% 3.415% 6/1/37 (d)(e) | | 116,681�� | 121,039 |
| 6 month U.S. LIBOR + 2.066% 3.428% 6/1/37 (d)(e) | | 39,420 | 41,686 |
| 6 month U.S. LIBOR + 2.755% 4.096% 10/1/35 (d)(e) | | 115,245 | 122,358 |
| U.S. TREASURY 1 YEAR INDEX + 2.035% 2.889% 6/1/33 (d)(e) | | 168,915 | 176,130 |
| U.S. TREASURY 1 YEAR INDEX + 2.267% 3.214% 6/1/33 (d)(e) | | 421,157 | 442,218 |
| U.S. TREASURY 1 YEAR INDEX + 2.418% 3.104% 3/1/35 (d)(e) | | 769,741 | 817,254 |
| 2.5% 7/1/31 | | 6,484,780 | 6,583,984 |
| 3% 3/1/32 to 2/1/47 | | 225,921,785 | 229,155,466 |
| 3.5% 1/1/32 to 9/1/46 (h)(i)(l) | | 394,567,566 | 412,025,754 |
| 3.5% 8/1/47 | | 37,576,350 | 38,974,427 |
| 3.5% 9/1/47 (k) | | 8,600,000 | 8,912,583 |
| 4% 7/1/31 to 6/1/47 | | 281,141,176 | 298,817,945 |
| 4.5% 6/1/25 to 1/1/45 | | 21,419,366 | 23,213,948 |
| 5% 6/1/20 to 7/1/41 | | 22,161,115 | 24,398,372 |
| 5.5% 10/1/17 to 3/1/41 | | 8,109,725 | 8,986,308 |
| 6% 9/1/17 to 12/1/37 | | 2,411,948 | 2,736,461 |
| 6.5% 5/1/18 to 9/1/39 | | 3,257,038 | 3,739,623 |
| 7% 6/1/21 to 9/1/36 | | 1,105,531 | 1,284,032 |
| 7.5% 1/1/27 to 4/1/32 | | 21,775 | 25,536 |
| 8% 7/1/24 to 1/1/37 | | 33,931 | 40,397 |
| 8.5% 9/1/19 to 1/1/28 | | 28,764 | 33,240 |
| 9% 10/1/20 | | 22 | 24 |
| 9.5% 5/1/21 to 7/1/21 | | 137 | 145 |
| 10% 2/1/20 to 11/1/20 | | 53 | 56 |
| 11% 7/1/19 to 9/1/20 | | 16 | 17 |
|
| TOTAL FREDDIE MAC | | | 1,070,463,862 |
|
| Ginnie Mae - 2.9% | | | |
| 3% 5/20/42 to 8/20/47 | | 320,590,314 | 327,742,426 |
| 3% 9/1/47 (k) | | 20,000,000 | 20,413,590 |
| 3.5% 11/15/40 to 6/20/46 (h) | | 276,278,729 | 289,534,921 |
| 3.5% 9/1/47 (k) | | 11,300,000 | 11,783,020 |
| 3.5% 9/1/47 (k) | | 11,780,000 | 12,283,537 |
| 4% 5/20/33 to 4/20/47 | | 134,266,559 | 143,313,620 |
| 4.5% 6/20/33 to 8/15/41 | | 55,115,448 | 59,834,673 |
| 5% 12/15/32 to 9/15/41 | | 23,732,729 | 26,364,364 |
| 5.5% 7/15/33 to 9/15/39 | | 1,944,703 | 2,193,397 |
| 6% 10/15/30 to 11/15/39 | | 571,325 | 655,138 |
| 6.5% 3/20/31 to 11/15/37 | | 330,092 | 383,194 |
| 7% 10/15/22 to 3/15/33 | | 1,122,401 | 1,321,613 |
| 7.5% 8/15/21 to 9/15/31 | | 484,218 | 555,499 |
| 8% 11/15/21 to 11/15/29 | | 155,947 | 177,484 |
| 8.5% 10/15/21 to 1/15/31 | | 30,834 | 36,414 |
| 9% 8/15/19 to 1/15/23 | | 950 | 1,013 |
| 9.5% 12/15/20 to 2/15/25 | | 364 | 393 |
| 11% 9/20/19 | | 353 | 374 |
|
| TOTAL GINNIE MAE | | | 896,594,670 |
|
| TOTAL U.S. GOVERNMENT AGENCY - MORTGAGE SECURITIES | | | |
| (Cost $4,811,433,248) | | | 4,821,512,740 |
|
| Asset-Backed Securities - 1.1% | | | |
| Accredited Mortgage Loan Trust Series 2005-1 Class M1, 1 month U.S. LIBOR + 0.705% 1.9394% 4/25/35 (d)(e) | | $664,344 | $654,660 |
| ACE Securities Corp. Home Equity Loan Trust Series 2004-HE1 Class M2, 1 month U.S. LIBOR + 1.650% 2.8844% 3/25/34 (d)(e) | | 207,834 | 207,435 |
| Airspeed Ltd. Series 2007-1A Class C1, 1 month U.S. LIBOR + 2.500% 3.7267% 6/15/32 (b)(d)(e)(g) | | 2,946,522 | 942,887 |
| American Credit Acceptance Receivable Trust Series 2016-1A Class A, 2.37% 5/12/20 (b) | | 930,196 | 930,587 |
| American Homes 4 Rent: | | | |
| Series 2014-SFR2 Class E, 6.231% 10/17/36 (b) | | 147,000 | 167,296 |
| Series 2014-SFR3 Class E, 6.418% 12/17/36 (b) | | 428,000 | 492,330 |
| Series 2015-SFR1 Class E, 5.639% 4/17/52 (b) | | 599,438 | 661,805 |
| Series 2015-SFR2: | | | |
| Class E, 6.07% 10/17/45 (b) | | 981,000 | 1,117,653 |
| Class XS, 0% 10/17/45 (b)(d)(g)(m) | | 687,019 | 7 |
| Ameriquest Mortgage Securities, Inc. pass-thru certificates: | | | |
| Series 2003-10 Class M1, 1 month U.S. LIBOR + 1.050% 2.2844% 12/25/33 (d)(e) | | 34,111 | 32,910 |
| Series 2004-R2 Class M3, 1 month U.S. LIBOR + 0.825% 2.0594% 4/25/34 (d)(e) | | 89,819 | 79,820 |
| Argent Securities, Inc. pass-thru certificates: | | | |
| Series 2003-W7 Class A2, 1 month U.S. LIBOR + 0.780% 2.0144% 3/25/34 (d)(e) | | 47,932 | 45,248 |
| Series 2004-W11 Class M2, 1 month U.S. LIBOR + 1.050% 2.2844% 11/25/34 (d)(e) | | 461,974 | 460,017 |
| Series 2004-W7 Class M1, 1 month U.S. LIBOR + 0.825% 2.0594% 5/25/34 (d)(e) | | 1,209,950 | 1,160,988 |
| Series 2006-W4 Class A2C, 1 month U.S. LIBOR + 0.160% 1.3944% 5/25/36 (d)(e) | | 1,087,400 | 422,147 |
| Asset Backed Securities Corp. Home Equity Loan Trust: | | | |
| Series 2004-HE2 Class M1, 1 month U.S. LIBOR + 0.825% 2.0594% 4/25/34 (d)(e) | | 1,383,062 | 1,297,258 |
| Series 2006-HE2 Class M1, 1 month U.S. LIBOR + 0.370% 1.6044% 3/25/36 (d)(e) | | 18,309 | 6,685 |
| Avis Budget Rental Car Funding (AESOP) LLC Series 2012-3A Class A, 2.1% 3/20/19 (b) | | 9,200,000 | 9,209,314 |
| Blackbird Capital Aircraft Series 2016-1A: | | | |
| Class A, 4.213% 12/16/41 (b) | | 44,452,031 | 46,058,350 |
| Class AA, 2.487% 12/16/41 (b) | | 10,285,063 | 10,347,041 |
| CAM Mortgage Trust Series 2017-1 Class A1, 3.22% 8/1/57 (b) | | 18,470,696 | 18,488,241 |
| Carrington Mortgage Loan Trust Series 2007-RFC1 Class A3, 1 month U.S. LIBOR + 0.140% 1.3744% 12/25/36 (d)(e) | | 1,802,588 | 1,500,975 |
| Citi Mortgage Loan Trust Series 2007-1 Class 1A, 1 month U.S. LIBOR + 1.350% 2.5844% 10/25/37 (b)(d)(e) | | 20,158,172 | 20,023,334 |
| CLUB Credit Trust Series 2017-NP1 Class A, 2.39% 4/17/23 (b) | | 6,200,569 | 6,203,718 |
| Countrywide Home Loans, Inc.: | | | |
| Series 2003-BC1 Class B1, 1 month U.S. LIBOR + 5.250% 6.4844% 3/25/32 (d)(e) | | 3,192 | 3,189 |
| Series 2004-3 Class M4, 1 month U.S. LIBOR + 1.455% 2.6894% 4/25/34 (d)(e) | | 52,056 | 49,074 |
| Series 2004-4 Class M2, 1 month U.S. LIBOR + 0.795% 2.0294% 6/25/34 (d)(e) | | 78,667 | 78,146 |
| Series 2004-7 Class AF5, 5.868% 1/25/35 | | 1,196,869 | 1,213,709 |
| Series 2005-3 Class MV4, 1 month U.S. LIBOR + 0.620% 1.8544% 8/25/35 (d)(e) | | 2,910,898 | 2,913,740 |
| Credit Suisse First Boston Mortgage Securities Corp.: | | | |
| Series 2003-2 Class M1, 1 month U.S. LIBOR + 1.320% 2.5544% 8/25/33 (d)(e) | | 212,195 | 209,067 |
| Series 2003-3 Class M1, 1 month U.S. LIBOR + 1.290% 2.5244% 8/25/33 (d)(e) | | 342,895 | 333,597 |
| Series 2003-5 Class A2, 1 month U.S. LIBOR + 0.700%1.9322% 12/25/33 (d)(e) | | 32,929 | 31,902 |
| Deutsche Financial Capital Securitization LLC Series 1997-I Class M, 7.275% 9/15/27 | | 173,987 | 178,967 |
| Exeter Automobile Receivables Trust Series 2017-2A Class A, 2.22% 6/15/21 (b) | | 15,750,314 | 15,783,058 |
| Fannie Mae: | | | |
| Series 2004-T5 Class AB3, 1 month U.S. LIBOR + 0.392% 1.9452% 5/28/35 (d)(e) | | 38,916 | 37,480 |
| Series 2017-T1 Class A, 2.898% 6/25/27 | | 52,094,771 | 52,748,795 |
| Fieldstone Mortgage Investment Corp. Series 2004-3 Class M5, 1 month U.S. LIBOR + 2.175% 3.4094% 8/25/34 (d)(e) | | 217,152 | 211,059 |
| First Franklin Mortgage Loan Trust Series 2004-FF2 Class M3, 1 month U.S. LIBOR + 0.825% 2.0594% 3/25/34 (d)(e) | | 2,512 | 2,190 |
| Flagship Credit Auto Trust Series 2015-3 Class A, 2.38% 10/15/20 (b) | | 3,645,006 | 3,648,916 |
| Fremont Home Loan Trust Series 2005-A: | | | |
| Class M3, 1 month U.S. LIBOR + 0.735% 1.9694% 1/25/35 (d)(e) | | 948,695 | 927,869 |
| Class M4, 1 month U.S. LIBOR + 1.020% 2.2544% 1/25/35 (d)(e) | | 347,133 | 202,886 |
| GCO Education Loan Funding Master Trust II Series 2007-1A Class C1L, 3 month U.S. LIBOR + 0.380% 1.6972% 2/25/47 (b)(d)(e) | | 490,944 | 464,681 |
| GE Business Loan Trust Series 2006-2A: | | | |
| Class A, 1 month U.S. LIBOR + 0.180% 1.4089% 11/15/34 (b)(d)(e) | | 442,002 | 427,793 |
| Class B, 1 month U.S. LIBOR + 0.280% 1.5067% 11/15/34 (b)(d)(e) | | 159,664 | 149,361 |
| Class C, 1 month U.S. LIBOR + 0.380% 1.6067% 11/15/34 (b)(d)(e) | | 265,356 | 246,006 |
| Class D, 1 month U.S. LIBOR + 0.750% 1.9767% 11/15/34 (b)(d)(e) | | 100,764 | 91,871 |
| GSAMP Trust Series 2004-AR1 Class B4, 5.5% 6/25/34 (b) | | 75,390 | 6,325 |
| HSI Asset Securitization Corp. Trust Series 2007-HE1 Class 2A3, 1 month U.S. LIBOR + 0.190% 1.4244% 1/25/37 (d)(e) | | 1,465,853 | 1,043,464 |
| Invitation Homes Trust: | | | |
| Series 2014-SFR3 Class E, 1 month U.S. LIBOR + 4.500% 5.7256% 12/17/31 (b)(d)(e) | | 40,436 | 40,436 |
| Series 2014-SRF2 Class F, 1 month U.S. LIBOR + 4.000% 5.2094% 9/17/31 (b)(d)(e) | | 335,000 | 335,612 |
| Series 2015-SFR2 Class E, 1 month U.S. LIBOR + 3.150% 4.376% 6/17/32 (b)(d)(e) | | 485,000 | 490,142 |
| Series 2015-SRF1 Class E, 1 month U.S. LIBOR + 4.300% 5.4256% 3/17/32 (b)(d)(e) | | 624,000 | 634,504 |
| Keycorp Student Loan Trust Series 2006-A Class 2C, 3 month U.S. LIBOR + 1.150% 2.4433% 3/27/42 (d)(e) | | 3,243,000 | 2,239,276 |
| Long Beach Mortgage Loan Trust Series 2006-10 Class 2A3, 1 month U.S. LIBOR + 0.160% 1.3944% 11/25/36 (d)(e) | | 4,199,797 | 2,120,766 |
| MASTR Asset Backed Securities Trust Series 2007-HE1 Class M1, 1 month U.S. LIBOR + 0.300% 1.5344% 5/25/37 (d)(e) | | 275,754 | 82,485 |
| Meritage Mortgage Loan Trust Series 2004-1 Class M1, 1 month U.S. LIBOR + 0.750% 1.9844% 7/25/34 (d)(e) | | 88,697 | 83,505 |
| Merrill Lynch Mortgage Investors Trust: | | | |
| Series 2003-OPT1 Class M1, 1 month U.S. LIBOR + 0.975% 2.2094% 7/25/34 (d)(e) | | 132,889 | 128,495 |
| Series 2006-FF1 Class M2, 1 month U.S. LIBOR + 0.290% 1.5244% 8/25/36 (d)(e) | | 13,300,000 | 13,223,312 |
| Series 2006-FM1 Class A2B, 1 month U.S. LIBOR + 0.110% 1.3444% 4/25/37 (d)(e) | | 2,706 | 1,658 |
| Series 2006-OPT1 Class A1A, 1 month U.S. LIBOR + 0.520% 1.7544% 6/25/35 (d)(e) | | 1,160,779 | 1,125,584 |
| Morgan Stanley ABS Capital I Trust: | | | |
| Series 2004-HE6 Class A2, 1 month U.S. LIBOR + 0.680% 1.9144% 8/25/34 (d)(e) | | 57,368 | 51,034 |
| Series 2004-NC6 Class M3, 1 month U.S. LIBOR + 2.175% 3.4094% 7/25/34 (d)(e) | | 12,838 | 12,363 |
| Series 2004-NC8 Class M6, 1 month U.S. LIBOR + 1.875% 3.1094% 9/25/34 (d)(e) | | 14,735 | 14,526 |
| Series 2005-NC1 Class M1, 1 month U.S. LIBOR + 0.660% 1.8944% 1/25/35 (d)(e) | | 122,347 | 117,943 |
| Series 2005-NC2 Class B1, 1 month U.S. LIBOR + 1.755% 2.9894% 3/25/35 (d)(e) | | 124,884 | 4,080 |
| Nationstar HECM Loan Trust Series 2017-1A Class A, 1.9679% 5/25/27 (b)(g) | | 22,578,519 | 22,576,035 |
| New Century Home Equity Loan Trust Series 2005-4 Class M2, 1 month U.S. LIBOR + 0.510% 1.7444% 9/25/35 (d)(e) | | 1,426,957 | 1,398,621 |
| OneMain Financial Issuance Trust Series 2014-1A Class A, 2.43% 6/18/24 (b) | | 143,487 | 143,497 |
| Park Place Securities, Inc.: | | | |
| Series 2004-WCW1: | | | |
| Class M3, 1 month U.S. LIBOR + 1.875% 3.1072% 9/25/34 (d)(e) | | 479,652 | 474,894 |
| Class M4, 1 month U.S. LIBOR + 2.175% 3.4072% 9/25/34 (d)(e) | | 683,353 | 551,303 |
| Series 2005-WCH1 Class M4, 1 month U.S. LIBOR + 1.245% 2.4794% 1/25/36 (d)(e) | | 1,475,804 | 1,453,558 |
| Progress Residential Trust: | | | |
| Series 2015-SFR3 Class F, 6.643% 11/12/32 (b) | | 168,000 | 177,228 |
| Series 2017-SFR1 Class F, 6.511% 8/17/34 (b) | | 160,000 | 163,649 |
| Prosper Marketplace Issuance Trust Series 2017-1A Class A, 2.56% 6/15/23 (b) | | 13,027,119 | 13,067,163 |
| Salomon Brothers Mortgage Securities VII, Inc. Series 2003-HE1 Class A, 1 month U.S. LIBOR + 0.800% 2.0344% 4/25/33 (d)(e) | | 5,108 | 4,646 |
| Saxon Asset Securities Trust Series 2004-1 Class M1, 1 month U.S. LIBOR + 0.795% 2.0294% 3/25/35 (d)(e) | | 482,983 | 473,774 |
| SLM Private Credit Student Loan Trust Series 2004-A Class C, 3 month U.S. LIBOR + 0.950% 2.1956% 6/15/33 (d)(e) | | 181,533 | 181,358 |
| Structured Asset Investment Loan Trust Series 2004-8 Class M5, 1 month U.S. LIBOR + 1.725% 2.9594% 9/25/34 (d)(e) | | 32,987 | 30,496 |
| Terwin Mortgage Trust Series 2003-4HE Class A1, 1 month U.S. LIBOR + 0.860% 2.0944% 9/25/34 (d)(e) | | 28,819 | 27,345 |
| Thunderbolt Aircraft Lease Ltd. Series 2017-A Class A, 4.212% 5/17/32 (b) | | 25,377,589 | 26,255,306 |
| Towd Point Mortgage Trust Series 2017-1 Class A1, 2.75% 10/25/56 (b)(d) | | 31,358,793 | 31,736,055 |
| Trapeza CDO XII Ltd./Trapeza CDO XII, Inc. Series 2007-12A Class B, 3 month U.S. LIBOR + 0.560% 1.7098% 4/6/42 (b)(d)(e)(g) | | 2,573,000 | 1,299,365 |
| Tricon American Homes Series 2017-SFR1 Class F, 5.151% 9/17/34 (b) | | 1,092,000 | 1,097,052 |
| Tricon American Homes Trust Series 2016-SFR1: | | | |
| Class B, 2.989% 11/17/33 (b) | | 517,000 | 519,242 |
| Class F, 5.769% 11/17/33 (b) | | 456,000 | 474,674 |
| Vericrest Opportunity Loan Trust Series 2014-NP11 Class A1, 3.875% 4/25/55 (b) | | 1,188,166 | 1,188,474 |
| Wrightwood Capital Real Estate CDO Ltd. Series 2005-1A Class D, 3 month U.S. LIBOR + 0.850% 2.0217% 11/21/40 (b)(d)(e) | | 305,000 | 266,113 |
| TOTAL ASSET-BACKED SECURITIES | | | |
| (Cost $314,269,482) | | | 325,779,420 |
|
| Collateralized Mortgage Obligations - 2.3% | | | |
| Private Sponsor - 0.7% | | | |
| Banc of America Funding Corp. Series 2015-R3 Class 10A1, 1 month U.S. LIBOR + 0.140% 1.3561% 6/27/36 (b)(d)(e) | | 10,533,198 | 10,263,548 |
| Banc of America Funding Trust sequential payer Series 2010-R3 Class 1A1, 3.3685% 12/26/35 (b)(d) | | 1,705,900 | 1,710,506 |
| BCAP LLC Trust sequential payer: | | | |
| Series 2012-RR5 Class 8A5, 1.4122% 7/26/36 (b)(d) | | 1,698,253 | 1,639,324 |
| Series 2013-RR4 Class 2A1, 3.6531% 5/26/47 (b)(d) | | 3,109,963 | 3,123,078 |
| Bear Stearns ALT-A Trust floater Series 2005-1 Class A1, 1 month U.S. LIBOR + 0.560% 1.7944% 1/25/35 (d)(e) | | 554,318 | 558,889 |
| Citigroup Mortgage Loan Trust sequential payer Series 2014-8 Class 2A1, 3.45% 6/27/37 (b)(d) | | 7,826,661 | 7,816,487 |
| Citigroup Mortgage Loan Trust, Inc. sequential payer Series 2009-5 Class 5A1, 3.4927% 1/25/37 (b)(d) | | 2,789,921 | 2,846,278 |
| Credit Suisse Commercial Mortgage Trust Series 2014-15R Class 7A3, 1.8991% 10/26/37 (b)(d) | | 32,962 | 32,883 |
| Credit Suisse Mortgage Trust Series 2010-9R Class 2A5, 4% 2/27/38 (b) | | 8,442,173 | 8,666,735 |
| CSMC: | | | |
| floater Series 2015-1R Class 6A1, 1 month U.S. LIBOR + 0.280% 1.4945% 5/27/37 (b)(d)(e) | | 8,183,109 | 7,840,237 |
| Series 2011-2R Class 2A1, 3.3199% 7/27/36 (b)(d) | | 984,648 | 983,171 |
| Series 2014-3R Class 2A1, 1 month U.S. LIBOR + 0.700% 1.9161% 5/27/37 (b)(d)(e) | | 879,958 | 850,655 |
| First Horizon Mortgage pass-thru Trust Series 2004-AR5 Class 2A1, 3.1125% 10/25/34 (d) | | 310,928 | 312,543 |
| Freddie Mac Seasoned Credit Risk Transfer Series sequential payer Series 2017-1 Class MA, 3% 1/25/56 | | 17,976,374 | 18,289,511 |
| FREMF Mortgage Trust: | | | |
| Series 2010-K6 Class B, 5.367% 12/25/46 (b)(d) | | 910,000 | 973,050 |
| Series 2010-K7 Class B, 5.4999% 4/25/20 (b)(d) | | 1,000,000 | 1,077,880 |
| GSR Mortgage Loan Trust floater Series 2007-AR1 Class 6A1, 2.9833% 3/25/37 (d) | | 559,514 | 558,773 |
| JP Morgan Resecuritization Trust floater Series 2012-2 Class 6A1, 1 month U.S. LIBOR + 0.210% 1.4182% 6/21/36 (b)(d)(e) | | 5,924,776 | 5,859,011 |
| JPMorgan Mortgage Trust sequential payer Series 2006-A5 Class 3A5, 3.4234% 8/25/36 (d) | | 791,788 | 760,158 |
| Merrill Lynch Alternative Note Asset Trust floater Series 2007-OAR1 Class A1, 1 month U.S. LIBOR + 0.170% 1.3861% 2/25/37 (d)(e) | | 1,690,220 | 1,645,352 |
| Mortgage Repurchase Agreement Funding Trust floater Series 2016-5 Class A, 1 month U.S. LIBOR + 1.170% 2.4006% 6/10/19 (b)(d)(e) | | 45,638,000 | 45,565,481 |
| Nomura Resecuritization Trust sequential payer Series 2011-3RA Class 2A1, 3.2922% 3/26/37 (b)(d) | | 1,922,088 | 1,924,395 |
| Opteum Mortgage Acceptance Corp. floater Series 2005-3 Class APT, 1 month U.S. LIBOR + 0.290% 1.5244% 7/25/35 (d)(e) | | 466,181 | 460,261 |
| RBSSP Resecuritization Trust sequential payer Series 2010-1 Class 2A1, 3.4027% 7/26/45 (b)(d) | | 9,048,050 | 9,181,056 |
| RESI Finance LP/RESI Finance DE Corp. floater Series 2003-B: | | | |
| Class B5, 1 month U.S. LIBOR + 2.350% 3.5744% 6/10/35 (b)(d)(e) | | 216,834 | 154,088 |
| Class B6, 1 month U.S. LIBOR + 2.850% 4.0744% 6/10/35 (b)(d)(e) | | 48,346 | 26,720 |
| Sequoia Mortgage Trust floater Series 2004-6 Class A3B, 6 month U.S. LIBOR + 0.880% 2.3127% 7/20/34 (d)(e) | | 19,256 | 19,008 |
| Structured Asset Securities Corp. Series 2003-15A Class 4A, 3.368% 4/25/33 (d) | | 53,601 | 53,234 |
| Thornburg Mortgage Securities Trust floater Series 2003-4 Class A1, 1 month U.S. LIBOR + 0.640% 1.8744% 9/25/43 (d)(e) | | 8,192,668 | 7,912,551 |
| Towd Point Mortgage Trust: | | | |
| Series 2015-5 Class A1B, 2.75% 5/25/55 (b) | | 4,713,967 | 4,763,647 |
| Series 2017-2 Class A1, 2.75% 4/25/57 (b)(d) | | 31,563,041 | 31,896,971 |
| Wells Fargo Mortgage Backed Securities Trust: | | | |
| Series 2004-BB Class A2, 3.0826% 1/25/35 (d) | | 1,759,971 | 1,765,789 |
| Series 2005-AR10 Class 2A15, 3.1989% 6/25/35 (d) | | 9,509,506 | 9,598,370 |
| Series 2005-AR2: | | | |
| Class 1A2, 3.1522% 3/25/35 (d) | | 1,182,323 | 1,181,960 |
| Class 3A1, 3.1468% 3/25/35 (d) | | 15,268,708 | 15,495,649 |
| Wells Fargo Mortgage Loan Trust sequential payer Series 2011-RR4: | | | |
| Class 1A1, 3.5051% 6/27/36 (b)(d) | | 1,380,142 | 1,380,971 |
| Class 2A1, 3.3412% 6/27/36 (b)(d) | | 1,552,886 | 1,548,383 |
|
| TOTAL PRIVATE SPONSOR | | | 208,736,603 |
|
| U.S. Government Agency - 1.6% | | | |
| Fannie Mae: | | | |
| floater: | | | |
| Series 2002-18 Class FD, 1 month U.S. LIBOR + 0.800% 2.0344% 2/25/32 (d)(e) | | 22,220 | 22,555 |
| Series 2002-39 Class FD, 1 month U.S. LIBOR + 1.000% 2.2283% 3/18/32 (d)(e) | | 39,054 | 39,841 |
| Series 2002-60 Class FV, 1 month U.S. LIBOR + 1.000% 2.2344% 4/25/32 (d)(e) | | 47,358 | 48,294 |
| Series 2002-63 Class FN, 1 month U.S. LIBOR + 1.000% 2.2344% 10/25/32 (d)(e) | | 63,001 | 64,225 |
| Series 2002-7 Class FC, 1 month U.S. LIBOR + 0.750% 1.9844% 1/25/32 (d)(e) | | 23,081 | 23,408 |
| Series 2002-94 Class FB, 1 month U.S. LIBOR + 0.400% 1.6344% 1/25/18 (d)(e) | | 2,737 | 2,738 |
| Series 2003-118 Class S, 8.100% - 1 month U.S. LIBOR 6.8656% 12/25/33 (d)(m)(n) | | 754,122 | 182,834 |
| Series 2006-104 Class GI, 6.680% - 1 month U.S. LIBOR 5.4456% 11/25/36 (d)(m)(n) | | 563,555 | 105,270 |
| planned amortization class: | | | |
| Series 1992-168 Class KB, 7% 10/25/22 | | 26,909 | 28,635 |
| Series 1993-207 Class H, 6.5% 11/25/23 | | 380,233 | 415,418 |
| Series 1996-28 Class PK, 6.5% 7/25/25 | | 122,040 | 133,774 |
| Series 1999-17 Class PG, 6% 4/25/29 | | 342,380 | 378,561 |
| Series 1999-32 Class PL, 6% 7/25/29 | | 333,286 | 368,960 |
| Series 1999-33 Class PK, 6% 7/25/29 | | 229,737 | 254,720 |
| Series 2001-52 Class YZ, 6.5% 10/25/31 | | 28,603 | 33,087 |
| Series 2003-28 Class KG, 5.5% 4/25/23 | | 218,911 | 233,241 |
| Series 2005-102 Class CO 11/25/35 (o) | | 187,480 | 169,148 |
| Series 2005-73 Class SA, 17.500% - 1 month U.S. LIBOR 14.3404% 8/25/35 (d)(n) | | 65,393 | 82,197 |
| Series 2005-81 Class PC, 5.5% 9/25/35 | | 427,876 | 473,170 |
| Series 2006-12 Class BO 10/25/35 (o) | | 838,147 | 757,016 |
| Series 2006-37 Class OW 5/25/36 (o) | | 83,877 | 74,743 |
| Series 2006-45 Class OP 6/25/36 (o) | | 251,777 | 224,093 |
| Series 2006-62 Class KP 4/25/36 (o) | | 406,465 | 361,838 |
| sequential payer: | | | |
| Series 1997-41 Class J, 7.5% 6/18/27 | | 70,504 | 81,513 |
| Series 1999-25 Class Z, 6% 6/25/29 | | 266,311 | 297,953 |
| Series 2001-20 Class Z, 6% 5/25/31 | | 370,924 | 407,899 |
| Series 2001-31 Class ZC, 6.5% 7/25/31 | | 201,511 | 229,207 |
| Series 2002-16 Class ZD, 6.5% 4/25/32 | | 103,174 | 119,438 |
| Series 2002-74 Class SV, 1 month U.S. LIBOR + 7.550% 6.3156% 11/25/32 (d)(e)(m) | | 480,126 | 79,411 |
| Series 2012-67 Class AI, 4.5% 7/25/27 (m) | | 2,376,819 | 251,126 |
| Series 06-116 Class SG, 6.640% - 1 month U.S. LIBOR 5.4056% 12/25/36 (d)(m)(n) | | 384,259 | 81,741 |
| Series 07-40 Class SE, 6.440% - 1 month U.S. LIBOR 5.2056% 5/25/37 (d)(m)(n) | | 209,416 | 38,455 |
| Series 1993-165 Class SH, 19.800% - 1 month U.S. LIBOR 16.3081% 9/25/23 (d)(n) | | 16,316 | 20,569 |
| Series 2003-21 Class SK, 8.100% - 1 month U.S. LIBOR 6.8656% 3/25/33(d)(m)(n) | | 54,218 | 11,521 |
| Series 2003-35 Class TQ, 7.500% - 1 month U.S. LIBOR 6.2656% 5/25/18 (d)(m)(n) | | 5,164 | 82 |
| Series 2005-72 Class ZC, 5.5% 8/25/35 | | 2,669,661 | 2,933,270 |
| Series 2005-79 Class ZC, 5.9% 9/25/35 | | 1,658,772 | 1,908,641 |
| Series 2007-57 Class SA, 40.600% - 1 month U.S. LIBOR 33.2134% 6/25/37 (d)(n) | | 179,397 | 362,630 |
| Series 2007-66: | | | |
| Class SA, 39.600% - 1 month U.S. LIBOR 32.1934% 7/25/37 (d)(n) | | 269,263 | 537,974 |
| Class SB, 39.600% - 1 month U.S. LIBOR 32.1934% 7/25/37 (d)(n) | | 113,507 | 207,468 |
| Series 2007-75 Class JI, 1 month U.S. LIBOR + 6.545% 5.3106% 8/25/37 (d)(e)(m) | | 8,020,733 | 1,464,822 |
| Series 2008-12 Class SG, 6.350% - 1 month U.S. LIBOR 5.1156% 3/25/38 (d)(m)(n) | | 1,443,851 | 247,135 |
| Series 2009-16 Class SA, 6.250% - 1 month U.S. LIBOR 5.0156% 3/25/24 (d)(m)(n) | | 744 | 6 |
| Series 2009-76 Class MI, 5.5% 9/25/24 (m) | | 19,495 | 463 |
| Series 2009-85 Class IB, 4.5% 8/25/24 (m) | | 93,864 | 4,152 |
| Series 2009-93 Class IC, 4.5% 9/25/24 (m) | | 134,937 | 5,679 |
| Series 2010-112 Class SG, 6.360% - 1 month U.S. LIBOR 5.1256% 6/25/21 (d)(m)(n) | | 88,272 | 3,080 |
| Series 2010-12 Class AI, 5% 12/25/18 (m) | | 139,664 | 1,914 |
| Series 2010-135 Class LS, 6.050% - 1 month U.S. LIBOR 4.8156% 12/25/40 (d)(m)(n) | | 1,357,102 | 222,120 |
| Series 2010-139 Class NI, 4.5% 2/25/40 (m) | | 1,257,141 | 137,111 |
| Series 2010-150 Class ZC, 4.75% 1/25/41 | | 5,540,749 | 6,190,589 |
| Series 2010-17 Class DI, 4.5% 6/25/21 (m) | | 67,429 | 2,063 |
| Series 2010-23: | | | |
| Class AI, 5% 12/25/18 (m) | | 39,936 | 479 |
| Class HI, 4.5% 10/25/18 (m) | | 51,667 | 815 |
| Series 2010-29 Class LI, 4.5% 6/25/19 (m) | | 132,196 | 1,888 |
| Series 2010-95 Class ZC, 5% 9/25/40 | | 11,723,312 | 13,196,415 |
| Series 2010-97 Class CI, 4.5% 8/25/25 (m) | | 347,662 | 19,990 |
| Series 2011-110 Class SA, 6.610% - 1 month U.S. LIBOR 5.3756% 4/25/41 (d)(m)(n) | | 3,636,515 | 521,473 |
| Series 2011-112 Class SA, 6.550% - 1 month U.S. LIBOR 5.3156% 11/25/41 (d)(m)(n) | | 3,711,538 | 650,475 |
| Series 2011-123 Class SD, 6.600% - 1 month U.S. LIBOR 5.3656% 8/25/39 (d)(m)(n) | | 3,088,487 | 402,025 |
| Series 2011-39 Class ZA, 6% 11/25/32 | | 953,996 | 1,081,809 |
| Series 2011-4 Class PZ, 5% 2/25/41 | | 2,442,106 | 2,787,933 |
| Series 2011-67 Class AI, 4% 7/25/26 (m) | | 384,961 | 36,114 |
| Series 2011-83 Class DI, 6% 9/25/26 (m) | | 543,020 | 53,980 |
| Series 2012-100 Class WI, 3% 9/25/27 (m) | | 6,155,314 | 565,544 |
| Series 2012-14 Class JS, 6.650% - 1 month U.S. LIBOR 5.4156% 12/25/30 (d)(m)(n) | | 2,054,751 | 264,024 |
| Series 2012-47 Class SD, 6.450% - 1 month U.S. LIBOR 5.2156% 5/25/42 (d)(m)(n) | | 9,132,909 | 1,741,246 |
| Series 2012-9 Class SH, 6.550% - 1 month U.S. LIBOR 5.3156% 6/25/41 (d)(m)(n) | | 2,787,002 | 402,101 |
| Series 2013-133 Class IB, 3% 4/25/32 (m) | | 3,819,479 | 352,692 |
| Series 2013-134 Class SA, 6.050% - 1 month U.S. LIBOR 4.8156% 1/25/44 (d)(m)(n) | | 2,031,136 | 338,359 |
| Series 2013-51 Class GI, 3% 10/25/32 (m) | | 5,592,204 | 602,623 |
| Series 2013-N1 Class A, 6.720% - 1 month U.S. LIBOR 5.4856% 6/25/35 (d)(m)(n) | | 1,155,721 | 217,248 |
| Series 2015-42: | | | |
| Class IL, 6% 6/25/45 (m) | | 8,556,748 | 1,991,223 |
| Class LS, 6.200% - 1 month U.S. LIBOR 4.9656% 6/25/45 (d)(m)(n) | | 14,275,292 | 2,362,511 |
| Series 2015-70 Class JC, 3% 10/25/45 | | 7,479,683 | 7,681,002 |
| Series 2016-78 Class CS, 6.100% - 1 month U.S. LIBOR 4.8656% 5/25/39 (d)(m)(n) | | 16,611,608 | 2,911,007 |
| Series 2017-30 Class AI, 5.5% 5/25/47 (m) | | 4,444,901 | 995,613 |
| Fannie Mae Stripped Mortgage-Backed Securities: | | | |
| Series 339: | | | |
| Class 29, 5.5% 8/25/18 (m) | | 7,235 | 65 |
| Class 5, 5.5% 7/25/33 (m) | | 203,849 | 39,472 |
| Series 343 Class 16, 5.5% 5/25/34 (m) | | 173,359 | 31,190 |
| Series 348 Class 14, 6.5% 8/25/34 (d)(m) | | 126,293 | 29,436 |
| Series 351: | | | |
| Class 12, 5.5% 4/25/34 (d)(m) | | 80,866 | 13,637 |
| Class 13, 6% 3/25/34 (m) | | 111,829 | 22,168 |
| Series 359 Class 19, 6% 7/25/35 (d)(m) | | 73,617 | 13,950 |
| Series 384 Class 6, 5% 7/25/37 (m) | | 899,460 | 159,151 |
| Freddie Mac: | | | |
| floater: | | | |
| Series 2412 Class FK, 1 month U.S. LIBOR + 0.800% 2.0267% 1/15/32 (d)(e) | | 17,410 | 17,669 |
| Series 2423 Class FA, 1 month U.S. LIBOR + 0.900% 2.1267% 3/15/32 (d)(e) | | 24,524 | 24,950 |
| Series 2424 Class FM, 1 month U.S. LIBOR + 1.000% 2.2267% 3/15/32 (d)(e) | | 26,785 | 27,294 |
| Series 2432: | | | |
| Class FE, 1 month U.S. LIBOR + 0.900% 2.1267% 6/15/31 (d)(e) | | 45,875 | 46,631 |
| Class FG, 1 month U.S. LIBOR + 0.900% 2.1267% 3/15/32 (d)(e) | | 14,560 | 14,806 |
| floater target amortization class Series 3366 Class FD, 1 month U.S. LIBOR + 0.250% 1.4767% 5/15/37 (d)(e) | | 1,048,880 | 1,047,182 |
| planned amortization class: | | | |
| Series 2006-15 Class OP 3/25/36 (o) | | 737,545 | 656,298 |
| Series 2095 Class PE, 6% 11/15/28 | | 381,346 | 423,063 |
| Series 2101 Class PD, 6% 11/15/28 | | 37,067 | 39,818 |
| Series 2121 Class MG, 6% 2/15/29 | | 159,207 | 176,620 |
| Series 2131 Class BG, 6% 3/15/29 | | 1,085,826 | 1,206,653 |
| Series 2137 Class PG, 6% 3/15/29 | | 175,578 | 193,359 |
| Series 2154 Class PT, 6% 5/15/29 | | 277,544 | 308,743 |
| Series 2162 Class PH, 6% 6/15/29 | | 64,290 | 70,328 |
| Series 2520 Class BE, 6% 11/15/32 | | 347,594 | 375,331 |
| Series 2585 Class KS, 7.600% - 1 month U.S. LIBOR 6.3733% 3/15/23 (d)(m)(n) | | 19,249 | 1,693 |
| Series 2693 Class MD, 5.5% 10/15/33 | | 4,042,145 | 4,505,670 |
| Series 2802 Class OB, 6% 5/15/34 | | 636,967 | 698,779 |
| Series 2937 Class KC, 4.5% 2/15/20 | | 412,807 | 419,168 |
| Series 2962 Class BE, 4.5% 4/15/20 | | 541,200 | 554,821 |
| Series 3002 Class NE, 5% 7/15/35 | | 986,887 | 1,075,389 |
| Series 3110 Class OP 9/15/35 (o) | | 465,968 | 432,918 |
| Series 3119 Class PO 2/15/36 (o) | | 850,626 | 754,830 |
| Series 3121 Class KO 3/15/36 (o) | | 149,032 | 133,228 |
| Series 3123 Class LO 3/15/36 (o) | | 471,923 | 419,914 |
| Series 3145 Class GO 4/15/36 (o) | | 452,827 | 403,015 |
| Series 3189 Class PD, 6% 7/15/36 | | 938,936 | 1,075,745 |
| Series 3225 Class EO 10/15/36 (o) | | 266,976 | 237,720 |
| Series 3258 Class PM, 5.5% 12/15/36 | | 456,208 | 503,999 |
| Series 3415 Class PC, 5% 12/15/37 | | 351,849 | 383,738 |
| Series 3786 Class HI, 4% 3/15/38 (m) | | 1,177,757 | 93,462 |
| Series 3806 Class UP, 4.5% 2/15/41 | | 2,583,776 | 2,759,574 |
| Series 3832 Class PE, 5% 3/15/41 | | 2,375,210 | 2,660,879 |
| sequential payer: | | | |
| Series 2135 Class JE, 6% 3/15/29 | | 79,691 | 88,638 |
| Series 2274 Class ZM, 6.5% 1/15/31 | | 88,769 | 101,328 |
| Series 2281 Class ZB, 6% 3/15/30 | | 215,515 | 230,881 |
| Series 2303 Class ZV, 6% 4/15/31 | | 90,106 | 100,414 |
| Series 2357 Class ZB, 6.5% 9/15/31 | | 656,673 | 759,604 |
| Series 2502 Class ZC, 6% 9/15/32 | | 181,595 | 197,150 |
| Series 2519 Class ZD, 5.5% 11/15/32 | | 310,262 | 332,818 |
| Series 2546 Class MJ, 5.5% 3/15/23 | | 135,979 | 143,091 |
| Series 2601 Class TB, 5.5% 4/15/23 | | 64,915 | 69,389 |
| Series 2998 Class LY, 5.5% 7/15/25 | | 198,186 | 213,647 |
| Series 3871 Class KB, 5.5% 6/15/41 | | 4,329,000 | 5,037,143 |
| Series 06-3115 Class SM, 6.600% - 1 month U.S. LIBOR 5.3733% 2/15/36 (d)(m)(n) | | 308,589 | 62,733 |
| Series 2013-4281 Class AI, 4% 12/15/28 (m) | | 3,980,572 | 347,727 |
| Series 2017-4683 Class LM, 3% 5/15/47 | | 9,849,332 | 10,116,538 |
| Series 2844: | | | |
| Class SC, 46.800% - 1 month U.S. LIBOR 38.8266% 8/15/24 (d)(n) | | 7,749 | 11,255 |
| Class SD, 86.400% - 1 month U.S. LIBOR 70.5033% 8/15/24 (d)(n) | | 11,400 | 21,714 |
| Series 2933 Class ZM, 5.75% 2/15/35 | | 3,119,530 | 3,630,792 |
| Series 2935 Class ZK, 5.5% 2/15/35 | | 3,835,105 | 4,328,543 |
| Series 2947 Class XZ, 6% 3/15/35 | | 1,200,995 | 1,337,061 |
| Series 2996 Class ZD, 5.5% 6/15/35 | | 2,510,286 | 2,881,644 |
| Series 3055 Class CS, 1 month U.S. LIBOR + 6.590% 5.3633% 10/15/35 (d)(e)(m) | | 450,202 | 88,870 |
| Series 3237 Class C, 5.5% 11/15/36 | | 3,548,164 | 4,035,764 |
| Series 3244 Class SG, 6.660% - 1 month U.S. LIBOR 5.4333% 11/15/36 (d)(m)(n) | | 1,065,796 | 209,369 |
| Series 3284 Class CI, 1 month U.S. LIBOR + 6.120% 4.8933% 3/15/37 (d)(e)(m) | | 2,441,881 | 466,456 |
| Series 3287 Class SD, 6.750% - 1 month U.S. LIBOR 5.5233% 3/15/37 (d)(m)(n) | | 1,565,787 | 324,212 |
| Series 3297 Class BI, 6.760% - 1 month U.S. LIBOR 5.5333% 4/15/37 (d)(m)(n) | | 2,361,605 | 503,276 |
| Series 3336 Class LI, 1 month U.S. LIBOR + 6.580% 5.3533% 6/15/37 (d)(e)(m) | | 749,148 | 132,583 |
| Series 3772 Class BI, 4.5% 10/15/18 (m) | | 184,934 | 2,891 |
| Series 3949 Class MK, 4.5% 10/15/34 | | 708,005 | 759,469 |
| Series 3955: | | | |
| Class GS, 5.950% - 1 month U.S. LIBOR 4.7233% 9/15/41 (d)(m)(n) | | 3,806,681 | 594,828 |
| Class YI, 3% 11/15/21 (m) | | 1,884,108 | 82,336 |
| Series 4055 Class BI, 3.5% 5/15/31 (m) | | 3,503,241 | 342,177 |
| Series 4149 Class IO, 3% 1/15/33 (m) | | 2,381,717 | 299,687 |
| Series 4314 Class AI, 5% 3/15/34 (m) | | 1,272,832 | 139,203 |
| Series 4427 Class LI, 3.5% 2/15/34 (m) | | 6,450,457 | 753,052 |
| Series 4471 Class PA 4% 12/15/40 | | 8,819,644 | 9,240,298 |
| target amortization class Series 2156 Class TC, 6.25% 5/15/29 | | 214,237 | 230,391 |
| Freddie Mac Manufactured Housing participation certificates guaranteed: | | | |
| floater Series 1686 Class FA, 1 month U.S. LIBOR + 0.900% 2.1267% 2/15/24 (d)(e) | | 86,126 | 87,039 |
| sequential payer: | | | |
| Series 2043 Class ZH, 6% 4/15/28 | | 144,395 | 160,036 |
| Series 2056 Class Z, 6% 5/15/28 | | 310,539 | 344,205 |
| Freddie Mac Multi-family Structured pass-thru certificates Series 4386 Class AZ, 4.5% 11/15/40 | | 7,885,477 | 8,447,298 |
| Ginnie Mae guaranteed REMIC pass-thru certificates: | | | |
| floater: | | | |
| Series 2007-37 Class TS, 6.690% - 1 month U.S. LIBOR 5.4622% 6/16/37 (d)(m)(n) | | 466,567 | 96,736 |
| Series 2010-H03 Class FA, 1 month U.S. LIBOR + 0.550% 1.7828% 3/20/60 (d)(e)(p) | | 5,853,140 | 5,863,559 |
| Series 2010-H17 Class FA, 1 month U.S. LIBOR + 0.330% 1.5628% 7/20/60 (d)(e)(p) | | 653,445 | 648,920 |
| Series 2010-H18 Class AF, 1 month U.S. LIBOR + 0.300% 1.5239% 9/20/60 (d)(e)(p) | | 809,140 | 802,929 |
| Series 2010-H19 Class FG, 1 month U.S. LIBOR + 0.300% 1.5239% 8/20/60 (d)(e)(p) | | 900,696 | 895,271 |
| Series 2010-H27 Series FA, 1 month U.S. LIBOR + 0.380% 1.6039% 12/20/60 (d)(e)(p) | | 1,615,213 | 1,606,540 |
| Series 2011-H05 Class FA, 1 month U.S. LIBOR + 0.500% 1.7239% 12/20/60 (d)(e)(p) | | 2,525,306 | 2,526,128 |
| Series 2011-H07 Class FA, 1 month U.S. LIBOR + 0.500% 1.7239% 2/20/61 (d)(e)(p) | | 5,057,664 | 5,058,981 |
| Series 2011-H12 Class FA, 1 month U.S. LIBOR + 0.490% 1.7139% 2/20/61 (d)(e)(p) | | 6,586,196 | 6,586,255 |
| Series 2011-H13 Class FA, 1 month U.S. LIBOR + 0.500% 1.7239% 4/20/61 (d)(e)(p) | | 2,321,142 | 2,321,910 |
| Series 2011-H14: | | | |
| Class FB, 1 month U.S. LIBOR + 0.500% 1.7239% 5/20/61 (d)(e)(p) | | 2,680,710 | 2,677,356 |
| Class FC, 1 month U.S. LIBOR + 0.500% 1.7239% 5/20/61 (d)(e)(p) | | 2,455,364 | 2,453,975 |
| Series 2011-H17 Class FA, 1 month U.S. LIBOR + 0.530% 1.7539% 6/20/61 (d)(e)(p) | | 3,170,874 | 3,174,515 |
| Series 2011-H21 Class FA, 1 month U.S. LIBOR + 0.600% 1.8239% 10/20/61 (d)(e)(p) | | 6,270,977 | 6,291,458 |
| Series 2012-H01 Class FA, 1 month U.S. LIBOR + 0.700% 1.9239% 11/20/61 (d)(e)(p) | | 3,080,731 | 3,097,863 |
| Series 2012-H03 Class FA, 1 month U.S. LIBOR + 0.700% 1.9239% 1/20/62 (d)(e)(p) | | 1,999,012 | 2,010,158 |
| Series 2012-H06 Class FA, 1 month U.S. LIBOR + 0.630% 1.8539% 1/20/62 (d)(e)(p) | | 2,925,148 | 2,934,977 |
| Series 2012-H07 Class FA, 1 month U.S. LIBOR + 0.630% 1.8539% 3/20/62 (d)(e)(p) | | 1,881,977 | 1,889,364 |
| Series 2012-H21 Class DF, 1 month U.S. LIBOR + 0.650% 1.8739% 5/20/61 (d)(e)(p) | | 3,855,293 | 3,863,819 |
| Series 2012-H23 Class WA, 1 month U.S. LIBOR + 0.520% 1.7439% 10/20/62 (d)(e)(p) | | 1,552,994 | 1,554,574 |
| Series 2012-H26, Class CA, 1 month U.S. LIBOR + 0.530% 1.7539% 7/20/60 (d)(e)(p) | | 5,355,350 | 5,367,590 |
| Series 2013-H07 Class BA, 1 month U.S. LIBOR + 0.360% 1.5839% 3/20/63 (d)(e)(p) | | 2,483,002 | 2,467,748 |
| Series 2014-H03 Class FA, 1 month U.S. LIBOR + 0.600% 1.8239% 1/20/64 (d)(e)(p) | | 2,941,361 | 2,951,451 |
| Series 2014-H05 Class FB, 1 month U.S. LIBOR + 0.600% 1.8239% 12/20/63 (d)(e)(p) | | 7,666,918 | 7,683,603 |
| Series 2014-H11 Class BA, 1 month U.S. LIBOR + 0.500% 1.7239% 6/20/64 (d)(e)(p) | | 11,578,850 | 11,564,620 |
| Series 2014-H20 Class BF, 1 month U.S. LIBOR + 0.500% 1.7239% 9/20/64 (d)(e)(p) | | 36,499,774 | 36,453,558 |
| Series 2016-H20 Class FM, 1 month U.S. LIBOR + 0.400% 1.6239% 12/20/62 (d)(e)(p) | | 14,131,679 | 14,142,854 |
| planned amortization class: | | | |
| Series 1993-13 Class PD, 6% 5/20/29 | | 388,444 | 438,486 |
| Series 1997-8 Class PE, 7.5% 5/16/27 | | 169,675 | 197,371 |
| Series 2011-136 Class WI, 4.5% 5/20/40 (m) | | 867,348 | 99,787 |
| sequential payer: | | | |
| Series 2004-24 Class ZM, 5% 4/20/34 | | 1,509,309 | 1,653,124 |
| Series 2010-160 Class DY, 4% 12/20/40 | | 17,965,153 | 19,249,580 |
| Series 2010-170 Class B, 4% 12/20/40 | | 4,066,798 | 4,357,629 |
| Series 2004-32 Class GS, 6.500% - 1 month U.S. LIBOR 5.2722% 5/16/34 (d)(m)(n) | | 255,528 | 46,980 |
| Series 2004-73 Class AL, 7.200% - 1 month U.S. LIBOR 5.9722% 8/17/34 (d)(m)(n) | | 310,712 | 70,801 |
| Series 2007-35 Class SC, 40.200% - 1 month U.S. LIBOR 32.8333% 6/16/37 (d)(n) | | 19,040 | 35,277 |
| Series 2010-116 Class QB, 4% 9/16/40 | | 38,726,775 | 41,432,619 |
| Series 2010-H10 Class FA, 1 month U.S. LIBOR + 0.330% 1.5628% 5/20/60 (d)(e)(p) | | 2,045,887 | 2,031,852 |
| Series 2011-94 Class SA, 6.100% - 1 month U.S. LIBOR 4.8694% 7/20/41 (d)(m)(n) | | 1,577,536 | 260,603 |
| Series 2012-76 Class GS, 6.700% - 1 month U.S. LIBOR 5.4722% 6/16/42 (d)(m)(n) | | 940,560 | 180,581 |
| Series 2013-124: | | | |
| Class ES, 8.667% - 1 month U.S. LIBOR 7.0259% 4/20/39 (d)(n) | | 3,011,341 | 3,170,317 |
| Class ST, 8.800% - 1 month U.S. LIBOR 7.1593% 8/20/39 (d)(n) | | 6,982,004 | 7,497,219 |
| Series 2013-149 Class MA, 2.5% 5/20/40 | | 21,568,846 | 21,742,648 |
| Series 2015-H13 Class HA, 2.5% 8/20/64 (p) | | 26,328,119 | 26,531,204 |
| Series 2015-H17 Class HA, 2.5% 5/20/65 (p) | | 23,457,916 | 23,642,127 |
| Series 2015-H21: | | | |
| Class HA, 2.5% 6/20/63 (p) | | 4,953,922 | 4,987,817 |
| Class JA, 2.5% 6/20/65 (p) | | 22,724,360 | 22,893,786 |
| Series 2017-H06 Class FA, U.S. TREASURY 1 YEAR INDEX + 0.350% 1.57% 8/20/66 (d)(e)(p) | | 25,879,767 | 25,939,756 |
|
| TOTAL U.S. GOVERNMENT AGENCY | | | 482,258,569 |
|
| TOTAL COLLATERALIZED MORTGAGE OBLIGATIONS | | | |
| (Cost $688,726,417) | | | 690,995,172 |
|
| Commercial Mortgage Securities - 1.7% | | | |
| Americold LLC Trust Series 2010-ARTA Class D, 7.443% 1/14/29 (b) | | 180,000 | 202,103 |
| Asset Securitization Corp.: | | | |
| Series 1997-D4 Class B5, 7.525% 4/14/29 | | 129,000 | 128,823 |
| Series 1997-D5 Class PS1, 1.6895% 2/14/43 (d)(m) | | 62,066 | 536 |
| Aventura Mall Trust Series 2013-AVM Class E, 3.7427% 12/5/32 (b)(d) | | 692,000 | 708,615 |
| BAMLL Trust Series 2015-200P Class F, 3.7157% 4/14/33 (b)(d) | | 767,000 | 751,835 |
| Banc of America Commercial Mortgage Trust: | | | |
| sequential payer Series 2007-5 Class A1A, 5.361% 2/10/51 | | 8,682,773 | 8,676,876 |
| Series 2004-1 Class F, 5.279% 11/10/39 (b)(d) | | 2,006 | 2,004 |
| Series 2008-1 Class D, 6.3087% 2/10/51 (b)(d)(g) | | 125,000 | 37,419 |
| BANK: | | | |
| Series 2017-BNK4 Class D, 3.357% 5/15/50 (b) | | 1,323,000 | 1,098,850 |
| Series 2017-BNK6 Class D, 3.1% 7/15/60 (b) | | 765,000 | 627,227 |
| Bank of America Commercial Mortgage Securities Trust Series 2017-BNK3: | | | |
| Class C, 4.352% 2/15/50 (d) | | 957,000 | 995,932 |
| Class D, 3.25% 2/15/50 (b) | | 667,000 | 548,708 |
| Bank of America Commercial Mortgage Trust Series 2016-UB10 Class XA, 2.0018% 7/15/49 (d)(m) | | 46,077,521 | 5,273,135 |
| Barclays Commercial Mortgage Securities LLC Series 2015-STP: | | | |
| Class A, 3.3228% 9/10/28 (b) | | 4,373,964 | 4,511,414 |
| Class E, 4.2844% 9/10/28 (b)(d) | | 1,786,000 | 1,755,128 |
| Bayview Commercial Asset Trust: | | | |
| floater: | | | |
| Series 2003-2 Class M1, 1 month U.S. LIBOR + 0.850% 2.5094% 12/25/33 (b)(d)(e) | | 21,150 | 20,036 |
| Series 2005-4A: | | | |
| Class A2, 1 month U.S. LIBOR + 0.390% 1.6244% 1/25/36 (b)(d)(e) | | 577,392 | 534,896 |
| Class B1, 1 month U.S. LIBOR + 1.400% 2.6344% 1/25/36 (b)(d)(e) | | 25,907 | 21,226 |
| Class M1, 1 month U.S. LIBOR + 0.450% 1.6844% 1/25/36 (b)(d)(e) | | 186,256 | 172,805 |
| Class M2, 1 month U.S. LIBOR + 0.470% 1.7044% 1/25/36 (b)(d)(e) | | 55,877 | 49,640 |
| Class M3, 1 month U.S. LIBOR + 0.500% 1.7344% 1/25/36 (b)(d)(e) | | 81,604 | 67,309 |
| Class M4, 1 month U.S. LIBOR + 0.610% 1.8444% 1/25/36 (b)(d)(e) | | 45,131 | 41,023 |
| Class M5, 1 month U.S. LIBOR + 0.650% 1.8844% 1/25/36 (b)(d)(e) | | 45,131 | 34,432 |
| Class M6, 1 month U.S. LIBOR + 0.700% 1.9344% 1/25/36 (b)(d)(e) | | 47,934 | 36,814 |
| Series 2006-3A Class M4, 1 month U.S. LIBOR + 0.430% 1.6644% 10/25/36 (b)(d)(e) | | 25,269 | 19,735 |
| Series 2007-1 Class A2, 1 month U.S. LIBOR + 0.270% 1.5044% 3/25/37 (b)(d)(e) | | 373,250 | 330,571 |
| Series 2007-2A: | | | |
| Class A1, 1 month U.S. LIBOR + 0.270% 1.4861% 7/25/37 (b)(d)(e) | | 385,447 | 363,449 |
| Class A2, 1 month U.S. LIBOR + 0.320% 1.5361% 7/25/37 (b)(d)(e) | | 360,148 | 331,308 |
| Class M1, 1 month U.S. LIBOR + 0.370% 1.5861% 7/25/37 (b)(d)(e) | | 126,464 | 100,907 |
| Class M2, 1 month U.S. LIBOR + 0.410% 1.6261% 7/25/37 (b)(d)(e) | | 69,105 | 55,257 |
| Class M3, 1 month U.S. LIBOR + 0.490% 1.7061% 7/25/37 (b)(d)(e) | | 54,471 | 45,321 |
| Series 2007-3: | | | |
| Class A2, 1 month U.S. LIBOR + 0.290% 1.5061% 7/25/37 (b)(d)(e) | | 348,605 | 324,896 |
| Class M1, 1 month U.S. LIBOR + 0.310% 1.5261% 7/25/37 (b)(d)(e) | | 75,714 | 67,905 |
| Class M2, 1 month U.S. LIBOR + 0.340% 1.5561% 7/25/37 (b)(d)(e) | | 81,151 | 72,320 |
| Class M3, 1 month U.S. LIBOR + 0.370% 1.5861% 7/25/37 (b)(d)(e) | | 127,875 | 97,665 |
| Class M4, 1 month U.S. LIBOR + 0.500% 1.7161% 7/25/37 (b)(d)(e) | | 200,782 | 137,554 |
| Class M5, 1 month U.S. LIBOR + 0.600% 1.8161% 7/25/37 (b)(d)(e) | | 75,516 | 40,975 |
| Series 2007-4A Class M1, 1 month U.S. LIBOR + 0.950% 2.1844% 9/25/37 (b)(d)(e) | | 9,384 | 3,491 |
| Series 2006-3A, Class IO, 0% 10/25/36 (b)(d)(g)(m) | | 3,866,213 | 0 |
| BBCMS Mortgage Trust Series 2016-ETC: | | | |
| Class D, 3.6089% 8/14/36 (b)(d) | | 1,000,000 | 980,167 |
| Class E, 3.6089% 8/14/36 (b)(d) | | 1,000,000 | 906,385 |
| Bear Stearns Commercial Mortgage Securities Trust Series 2006-T22 Class B, 5.7134% 4/12/38 (b)(d) | | 99,897 | 100,772 |
| Beckman Coulter, Inc. sequential payer Series 2000-A Class A, 7.4975% 12/15/18 (b) | | 584,551 | 604,637 |
| BWAY Mortgage Trust Series 2015-1740 Class E, 3.8241% 1/10/35 (b)(d) | | 1,000,000 | 999,281 |
| CCRESG Commercial Mortgage Trust Series 2016-HEAT Class E, 5.4883% 4/10/29 (b)(d) | | 606,000 | 596,296 |
| CD Mortgage Trust Series 2017-CD3: | | | |
| Class C, 4.563% 2/10/50 | | 1,360,000 | 1,459,082 |
| Class D, 3.25% 2/10/50 (b) | | 754,000 | 625,605 |
| CFCRE Commercial Mortgage Trust Series 2011-C2 Class B, 5.7535% 12/15/47 (b)(d) | | 750,000 | 841,387 |
| CG-CCRE Commercial Mortgage Trust: | | | |
| Series 2014-FL1: | | | |
| Class YTC2, 1 month U.S. LIBOR + 2.489% 3.7146% 6/15/31 (b)(d)(e) | | 435,090 | 404,437 |
| Class YTC3, 1 month U.S. LIBOR + 2.489% 3.7146% 6/15/31 (b)(d)(e) | | 156,667 | 143,886 |
| Series 2014-FL1, 1 month U.S. LIBOR + 2.489% 3.7146% 6/15/31 (b)(d)(e) | | 435,090 | 408,123 |
| CGBAM Commercial Mortgage Trust Series 2015-SMRT: | | | |
| Class E, 3.7859% 4/10/28 (b)(d) | | 162,000 | 163,303 |
| Class F, 3.7859% 4/10/28 (b)(d) | | 1,133,000 | 1,120,819 |
| CGDB Commercial Mortgage Trust: | | | |
| 1 month U.S. LIBOR + 2.500% 3.726% 5/15/30 (b)(d)(e) | | 260,000 | 259,561 |
| Series 2017-BIO Class F, 1 month U.S. LIBOR + 3.250% 4.476% 5/15/30 (b)(d)(e) | | 134,000 | 133,761 |
| Chase Commercial Mortgage Securities Corp.: | | | |
| Series 1998-1 Class H, 6.34% 5/18/30 (b) | | 679,444 | 685,393 |
| Series 1998-2 Class J, 6.39% 11/18/30 (b) | | 487,111 | 487,545 |
| Citigroup Commercial Mortgage Trust: | | | |
| Series 2013-375P Class E, 3.5176% 5/10/35 (b)(d) | | 1,205,000 | 1,187,293 |
| Series 2013-GC15 Class D, 5.0996% 9/10/46 (b)(d) | | 1,927,000 | 1,878,281 |
| Series 2015-GC33 Class XA, 0.968% 9/10/58 (d)(m) | | 92,482,159 | 5,470,421 |
| Series 2015-SHP2 Class E, 1 month U.S. LIBOR + 4.100% 5.577% 7/15/27 (b)(d)(e) | | 693,000 | 697,278 |
| Series 2016-C3 Class D, 3% 11/15/49 (b) | | 1,451,000 | 1,081,795 |
| Series 2016-P6 Class XA, 0.8365% 12/10/49 (d)(m) | | 83,372,568 | 4,125,858 |
| Series 2016-SMPL Class E, 4.509% 9/10/31 (b) | | 756,000 | 771,735 |
| Claregold Trust Series 2007-2A: | | | |
| Class G, 5.01% 5/15/44 (b)(d) | CAD | 9,530 | 7,601 |
| Class H, 5.01% 5/15/44 (b)(d) | CAD | 20,000 | 15,921 |
| Class J, 5.01% 5/15/44 (b)(d) | CAD | 20,000 | 15,862 |
| Class K, 5.01% 5/15/44 (b)(d) | CAD | 10,000 | 7,917 |
| Class L, 5.01% 5/15/44 (b)(d) | CAD | 36,000 | 28,397 |
| Class M, 5.01% 5/15/44 (b)(d) | CAD | 165,000 | 129,454 |
| COMM Mortgage Trust: | | | |
| floater Series 2014-PAT Class E, 1 month U.S. LIBOR + 3.150% 4.1391% 8/13/27 (b)(d)(e) | | 735,000 | 738,181 |
| sequential payer Series 2013-LC6 Class E, 3.5% 1/10/46 (b) | | 1,410,000 | 1,054,483 |
| Series 2012-CR1: | | | |
| Class C, 5.3199% 5/15/45 (d) | | 850,000 | 904,668 |
| Class D, 5.3199% 5/15/45 (b)(d) | | 1,510,000 | 1,491,372 |
| Class G, 2.462% 5/15/45 (b) | | 231,000 | 138,224 |
| Series 2012-CR5 Class D, 4.3306% 12/10/45 (b)(d) | | 740,000 | 720,537 |
| Series 2012-LC4: | | | |
| Class C, 5.5892% 12/10/44 (d) | | 260,000 | 280,729 |
| Class D, 5.5892% 12/10/44 (b)(d) | | 1,437,000 | 1,409,229 |
| Series 2013-CCRE6 Class E, 4.1285% 3/10/46 (b)(d) | | 42,000 | 31,828 |
| Series 2013-CR10: | | | |
| Class C, 4.7885% 8/10/46 (b)(d) | | 270,000 | 279,407 |
| Class D, 4.7885% 8/10/46 (b)(d) | | 1,578,000 | 1,387,463 |
| Series 2013-CR12 Class D, 5.0822% 10/10/46 (b)(d) | | 1,680,000 | 1,430,905 |
| Series 2013-CR6 Class F, 4.1285% 3/10/46 (b)(d) | | 418,000 | 276,007 |
| Series 2013-CR9: | | | |
| Class C, 4.2549% 7/10/45 (b)(d) | | 525,000 | 527,898 |
| Class D, 4.2549% 7/10/45 (b)(d) | | 252,000 | 216,919 |
| Series 2013-LC6 Class D, 4.2828% 1/10/46 (b)(d) | | 1,405,000 | 1,297,886 |
| Series 2014-CR15 Class D, 4.7595% 2/10/47 (b)(d) | | 258,000 | 236,449 |
| Series 2014-CR17: | | | |
| Class D, 4.7987% 5/10/47 (b)(d) | | 799,000 | 706,553 |
| Class E, 4.7987% 5/10/47 (b)(d) | | 182,000 | 126,858 |
| Series 2014-CR19 Class XA, 1.2398% 8/10/47 (d)(m) | | 123,050,039 | 6,671,355 |
| Series 2014-CR20 Class XA, 1.1713% 11/10/47 (d)(m) | | 126,269,383 | 7,349,800 |
| Series 2014-LC17 Class XA, 1.143% 10/10/47 (d)(m) | | 109,134,194 | 4,253,778 |
| Series 2014-UBS2 Class D, 5.0147% 3/10/47 (b)(d) | | 844,000 | 730,529 |
| Series 2014-UBS4 Class XA, 1.2342% 8/10/47 (d)(m) | | 113,422,253 | 6,417,987 |
| Series 2014-UBS6 Class XA, 1.0295% 12/10/47 (d)(m) | | 153,099,636 | 7,598,243 |
| Series 2015-3BP Class F, 3.2384% 2/10/35 (b)(d) | | 1,500,000 | 1,378,092 |
| Series 2015-CR23 Class CME, 3.6845% 5/10/48 (b)(d) | | 483,000 | 481,868 |
| Series 2015-DC1 Class XA, 1.1664% 2/10/48 (d)(m) | | 156,271,592 | 8,949,346 |
| Series 2016-CD1 Class D, 2.7717% 8/10/49 (b)(d) | | 1,006,000 | 771,057 |
| Series 2017-CD4 Class D, 3.3% 5/10/50 (b) | | 772,000 | 637,126 |
| COMM Mortgage Trust pass-thru certificates Series 2005-LP5 Class F, 4.6147% 5/10/43 (b)(d) | | 1,290,000 | 1,291,474 |
| Commercial Mortgage Asset Trust Series 1999-C2 Class H, 6% 11/17/32 (b) | | 704,911 | 713,450 |
| Commercial Mortgage Trust Series 2016-CD2: | | | |
| Class C, 3.031% 11/10/49 | | 971,000 | 998,841 |
| Class D, 2.7812% 11/10/49 (d) | | 508,000 | 401,290 |
| Commercial Mortgage Trust pass-thru certificates: | | | |
| Series 2012-CR2: | | | |
| Class E, 4.8405% 8/15/45 (b)(d) | | 1,727,000 | 1,693,884 |
| Class F, 4.25% 8/15/45 (b) | | 1,418,000 | 1,156,983 |
| Series 2014-CR2 Class G, 4.25% 8/15/45 (b) | | 496,000 | 311,810 |
| Core Industrial Trust: | | | |
| Series 2015-CALW Class G, 3.8504% 2/10/34 (b)(d) | | 625,000 | 615,707 |
| Series 2015-TEXW Class F, 3.8487% 2/10/34 (b)(d) | | 493,000 | 479,451 |
| Series 2015-WEST Class F, 4.2268% 2/10/37 (b)(d) | | 1,566,000 | 1,500,407 |
| Cosmopolitan Hotel Trust floater Series 2016-CSMO Class C, 1 month U.S. LIBOR + 2.750% 3.877% 11/15/33 (b)(d)(e) | | 693,000 | 699,637 |
| Credit Suisse First Boston Mortgage Securities Corp.: | | | |
| Series 1998-C1: | | | |
| Class F, 6% 5/17/40 (b) | | 426,275 | 430,220 |
| Class H, 6% 5/17/40 (b) | | 90,315 | 71,561 |
| Series 1998-C2 Class G, 6.75% 11/15/30 (b) | | 129,511 | 130,694 |
| CSAIL Commercial Mortgage Trust Series 2017-C8 Class D, 4.47% 6/15/50 (b) | | 862,000 | 789,844 |
| CSMC Series 2015-TOWN: | | | |
| Class A, 1 month U.S. LIBOR + 1.250% 2.4756% 3/15/28 (b)(d)(e) | | 9,866,000 | 9,858,420 |
| Class B, 1 month U.S. LIBOR + 1.900% 3.1256% 3/15/28 (b)(d)(e) | | 3,043,000 | 3,042,738 |
| Class C, 1 month U.S. LIBOR + 2.250% 3.4756% 3/15/28 (b)(d)(e) | | 2,964,000 | 2,964,738 |
| Class D, 1 month U.S. LIBOR + 3.200% 4.4256% 3/15/28 (b)(d)(e) | | 4,485,000 | 4,484,999 |
| Class E, 1 month U.S. LIBOR + 4.150% 5.3756% 3/15/28 (b)(d)(e) | | 20,318,000 | 20,343,444 |
| CSMC Trust: | | | |
| floater Series 2015-DEAL: | | | |
| Class E, 1 month U.S. LIBOR + 4.000% 5.227% 4/15/29 (b)(d)(e) | | 1,109,000 | 1,113,861 |
| Class F, 1 month U.S. LIBOR + 4.750% 5.977% 4/15/29 (b)(d)(e) | | 989,000 | 992,096 |
| Series 2016-MFF Class F, 1 month U.S. LIBOR + 7.250% 8.4756% 11/15/33 (b)(d)(e) | | 968,000 | 976,568 |
| Series 2017-MOON Class E, 3.303% 7/10/34 (b)(d) | | 377,000 | 378,707 |
| DBCCRE Mortgage Trust Series 2014-ARCP Class E, 4.9345% 1/10/34 (b)(d) | | 1,449,000 | 1,333,470 |
| DBUBS Mortgage Trust: | | | |
| Series 2011-LC1A: | | | |
| Class E, 5.6848% 11/10/46 (b)(d) | | 1,810,000 | 1,919,685 |
| Class F, 5.6848% 11/10/46 (b)(d) | | 1,560,000 | 1,524,565 |
| Class G, 4.652% 11/10/46 (b) | | 1,948,000 | 1,731,550 |
| Class XB, 0.3005% 11/10/46 (b)(d)(m) | | 20,920,000 | 202,273 |
| Series 2011-LC3A Class D, 5.3457% 8/10/44 (b)(d) | | 812,000 | 845,619 |
| Deutsche Bank Commercial Mortgage Trust Series 2016-C3 Class C, 3.4943% 9/10/49 (d) | | 600,000 | 586,192 |
| Freddie Mac: | | | |
| pass-thru certificates: | | | |
| Series K011 Class X3, 2.5769% 12/25/43 (d)(m) | | 1,640,000 | 129,187 |
| Series K012 Class X3, 2.2519% 1/25/41 (d)(m) | | 1,770,272 | 124,474 |
| Series K013 Class X3, 2.9089% 1/25/43 (d)(m) | | 820,000 | 73,786 |
| Series KAIV Class X2, 3.6147% 6/25/46 (d)(m) | | 420,000 | 50,778 |
| FREMF Mortgage Trust: | | | |
| Series 2010-K9 Class B, 5.2029% 9/25/45 (b)(d) | | 1,815,000 | 1,960,864 |
| Series 2011-K10 Class B, 4.625% 11/25/49 (b)(d) | | 500,000 | 533,126 |
| Series 2011-K11 Class B, 4.4236% 12/25/48 (b)(d) | | 750,000 | 794,877 |
| GAHR Commercial Mortgage Trust Series 2015-NRF: | | | |
| Class BFX, 3.3822% 12/15/34 (b)(d) | | 18,910,000 | 19,358,487 |
| Class CFX, 3.3822% 12/15/34 (b)(d) | | 14,152,000 | 14,440,222 |
| Class DFX, 3.3822% 12/15/34 (b)(d) | | 27,804,000 | 28,185,076 |
| Class EFX, 3.3822% 12/15/34 (b)(d) | | 1,750,000 | 1,761,657 |
| Class FFX, 3.3822% 12/15/34 (b)(d) | | 1,915,000 | 1,911,888 |
| Class GFX, 3.3822% 12/15/34 (b)(d) | | 1,096,000 | 1,084,760 |
| GE Capital Commercial Mortgage Corp. Series 2007-C1 Class A1A, 5.483% 12/10/49 | | 1,643,960 | 1,642,157 |
| GMAC Commercial Mortgage Securities, Inc.: | | | |
| Series 1997-C1 Class H, 6.6% 7/15/29 | | 183,677 | 177,156 |
| Series 1997-C2 Class G, 6.75% 4/15/29 (d) | | 59,855 | 60,238 |
| Series 1999-C2I Class K, 6.481% 9/15/33 | | 835,000 | 766,641 |
| GP Portfolio Trust Series 2014-GPP: | | | |
| Class D, 1 month U.S. LIBOR + 3.000% 4.1589% 2/15/27 (b)(d)(e) | | 291,000 | 291,777 |
| Class E, 1 month U.S. LIBOR + 4.100% 5.2589% 2/15/27 (b)(d)(e) | | 378,000 | 369,584 |
| Grace Mortgage Trust Series 2014-GRCE Class F, 3.5901% 6/10/28 (b)(d) | | 357,000 | 362,759 |
| GS Mortgage Securities Corp. II Series 2010-C1: | | | |
| Class D, 6.0552% 8/10/43 (b)(d) | | 617,000 | 639,164 |
| Class F, 4% 8/10/43 (b) | | 516,000 | 414,978 |
| Class X, 1.3949% 8/10/43 (b)(d)(m) | | 4,805,470 | 157,093 |
| GS Mortgage Securities Trust: | | | |
| Series 2010-C2: | | | |
| Class D, 5.1832% 12/10/43 (b)(d) | | 720,000 | 741,443 |
| Class XA, 0.1326% 12/10/43 (b)(d)(m) | | 3,208,430 | 13,199 |
| Series 2011-GC3 Class D, 5.6323% 3/10/44 (b)(d) | | 294,000 | 310,457 |
| Series 2011-GC5: | | | |
| Class C, 5.399% 8/10/44 (b)(d) | | 1,050,000 | 1,137,958 |
| Class D, 5.399% 8/10/44 (b)(d) | | 1,500,000 | 1,447,545 |
| Class E, 5.399% 8/10/44 (b)(d) | | 711,000 | 575,317 |
| Class F, 4.5% 8/10/44 (b) | | 1,020,000 | 718,893 |
| Series 2012-GC6: | | | |
| Class D, 5.6522% 1/10/45 (b)(d) | | 1,156,000 | 1,116,605 |
| Class E, 5% 1/10/45 (b)(d) | | 412,000 | 355,444 |
| Series 2012-GC6I Class F, 5% 1/10/45 (d) | | 390,000 | 258,886 |
| Series 2012-GCJ7: | | | |
| Class C, 5.7016% 5/10/45 (d) | | 630,000 | 671,007 |
| Class D, 5.7016% 5/10/45 (b)(d) | | 2,204,000 | 2,170,380 |
| Class E, 5% 5/10/45 (b) | | 1,311,000 | 1,067,436 |
| Class F, 5% 5/10/45 (b) | | 2,079,000 | 1,246,217 |
| Series 2012-GCJ9: | | | |
| Class D, 4.833% 11/10/45 (b)(d) | | 1,972,000 | 1,889,391 |
| Class E, 4.833% 11/10/45 (b)(d) | | 1,290,000 | 1,159,410 |
| Series 2013-GC10 Class D, 4.4098% 2/10/46 (b)(d) | | 920,000 | 896,157 |
| Series 2013-GC12: | | | |
| Class D, 4.4464% 6/10/46 (b)(d) | | 219,000 | 190,330 |
| Class XA, 1.5475% 6/10/46 (d)(m) | | 30,275,933 | 1,844,386 |
| Series 2013-GC13 Class D, 4.2029% 7/10/46 (b)(d) | | 1,858,000 | 1,740,561 |
| Series 2013-GC16: | | | |
| Class C, 5.3202% 11/10/46 (d) | | 662,844 | 729,013 |
| Class D, 5.3202% 11/10/46 (b)(d) | | 1,009,000 | 970,380 |
| Class F, 3.5% 11/10/46 (b) | | 999,000 | 708,254 |
| Series 2014-GC20 Class XA, 1.0078% 4/10/47 (d)(m) | | 183,738,667 | 9,454,898 |
| Series 2015-GC34 Class XA, 1.3631% 10/10/48 (d)(m) | | 29,269,603 | 2,412,345 |
| Series 2016-GS2 Class C, 4.5297% 5/10/49 (d) | | 699,000 | 751,425 |
| Series 2016-GS3 Class D, 2.728% 10/10/49 (b) | | 1,776,000 | 1,372,711 |
| Series 2016-GS4 Class C, 3.8041% 11/10/49 | | 728,000 | 732,798 |
| Series 2016-REMZ Class MZB, 7.727% 2/10/21 (b) | | 1,113,000 | 1,089,137 |
| Series 2016-RENT: | | | |
| Class E, 4.0667% 2/10/29 (b)(d) | | 495,000 | 504,062 |
| Class F, 4.0667% 2/10/29 (b)(d) | | 1,520,000 | 1,435,350 |
| Series 2017-GS6 Class D, 3.331% 5/10/50 (b) | | 1,113,000 | 908,676 |
| Hilton U.S.A. Trust: | | | |
| floater Series 2014-ORL Class E, 1 month U.S. LIBOR + 3.350% 4.4756% 7/15/29 (b)(d)(e) | | 617,000 | 621,780 |
| Series 2016-HHV Class F, 4.1935% 11/5/38 (b)(d) | | 1,134,000 | 902,003 |
| Series 2016-SFP Class F, 6.0801% 11/5/35 (b) | | 567,000 | 568,379 |
| Home Partners of America Credit Trust Series 2017-1: | | | |
| Class E, 1 month U.S. LIBOR + 2.650% 3.8767% 7/17/34 (b)(d)(e) | | 229,000 | 232,701 |
| Class F, 1 month U.S. LIBOR + 3.539% 4.7657% 7/17/34 (b)(d)(e) | | 332,000 | 335,425 |
| IMT Trust Series 2017-APTS: | | | |
| Class EFL, 1 month U.S. LIBOR + 2.150% 3.15% 6/15/34 (b)(d)(e) | | 336,000 | 336,868 |
| Class FFL, 1 month U.S. LIBOR + 2.850% 3.85% 6/15/34 (b)(d)(e) | | 108,000 | 108,274 |
| JPMBB Commercial Mortgage Securities Trust: | | | |
| Series 2014-C19 Class XA, 1.1728% 4/15/47 (d)(m) | | 23,691,215 | 704,700 |
| Series 2014-C22 Class D, 4.5594% 9/15/47 (b)(d) | | 525,000 | 444,466 |
| Series 2014-C23 Class UH5, 4.7094% 9/15/47 (b) | | 179,000 | 161,489 |
| Series 2014-C26 Class D, 3.9251% 1/15/48 (b)(d) | | 707,000 | 604,257 |
| Series 2015-C30 Class XA, 0.6938% 7/15/48 (d)(m) | | 83,775,475 | 2,832,968 |
| Series 2015-C32 Class C, 4.6678% 11/15/48 (d) | | 1,907,000 | 1,921,445 |
| JPMCC Commercial Mortgage Securities Trust Series 2016-JP4 Class D, 3.4619% 12/15/49 (b) | | 1,462,000 | 1,181,866 |
| JPMDB Commercial Mortgage Securities Trust Series 2016-C4: | | | |
| Class C, 3.0971% 12/15/49 | | 946,000 | 896,782 |
| Class D, 3.0962% 12/15/49 (b)(d) | | 1,148,000 | 894,203 |
| JPMorgan Chase Commercial Mortgage Securities Corp.: | | | |
| sequential payer Series 2010-CNTR Class A2, 4.311% 8/5/32 (b) | | 440,000 | 458,507 |
| Series 2003-C1 Class F, 5.4834% 1/12/37 (b)(d) | | 203,055 | 201,980 |
| Series 2009-IWST: | | | |
| Class C, 7.4453% 12/5/27 (b)(d) | | 380,000 | 423,994 |
| Class D, 7.4453% 12/5/27 (b)(d) | | 1,885,000 | 2,076,352 |
| Series 2010-CNTR Class D, 6.1838% 8/5/32 (b)(d) | | 695,000 | 749,464 |
| Series 2012-CBX: | | | |
| Class C, 5.2132% 6/15/45 (d) | | 250,000 | 265,504 |
| Class D, 5.2132% 6/16/45 (b)(d) | | 690,000 | 711,308 |
| Class E, 5.2132% 6/15/45 (b)(d) | | 1,043,000 | 1,059,620 |
| Class F, 4% 6/15/45 (b) | | 988,000 | 799,219 |
| Class G 4% 6/15/45 (b) | | 1,079,000 | 679,874 |
| JPMorgan Chase Commercial Mortgage Securities Trust: | | | |
| Series 2004-CBX Class D, 5.097% 1/12/37 (d) | | 170,000 | 174,979 |
| Series 2004-LN2 Class D, 5.3686% 7/15/41 (d) | | 420,000 | 4,776 |
| Series 2005-LDP2: | | | |
| Class E, 4.981% 7/15/42 (d) | | 462,000 | 465,115 |
| Class F, 5.01% 7/15/42 (d) | | 189,000 | 190,503 |
| Series 2011-C3: | | | |
| Class E, 5.6136% 2/15/46 (b)(d) | | 700,000 | 703,014 |
| Class H, 4.409% 2/15/46 (b)(d) | | 756,000 | 546,108 |
| Class J, 4.409% 2/15/46 (b)(d) | | 106,000 | 65,190 |
| Series 2011-C4: | | | |
| Class E, 5.5344% 7/15/46 (b)(d) | | 1,130,000 | 1,171,090 |
| Class F, 3.873% 7/15/46 (b) | | 105,000 | 88,732 |
| Class H, 3.873% 7/15/46 (b) | | 674,250 | 477,604 |
| Class NR, 3.873% 7/15/46 (b) | | 385,000 | 236,303 |
| Class TAC1, 7.99% 7/15/46 (b) | | 725,430 | 726,889 |
| Class TAC2, 7.99% 7/15/46 (b) | | 671,000 | 667,976 |
| Series 2011-C5: | | | |
| Class B. 5.4073% 8/15/46 (b)(d) | | 1,140,000 | 1,256,021 |
| Class C, 5.4073% 8/15/46 (b)(d) | | 650,648 | 711,153 |
| Series 2013-LC11: | | | |
| Class C, 3.9582% 4/15/46 (d) | | 1,163,000 | 1,172,625 |
| Class D, 4.2599% 4/15/46 (d) | | 1,800,000 | 1,667,514 |
| Class F, 3.25% 4/15/46 (b)(d)(g) | | 1,682,000 | 953,161 |
| Series 2014-DSTY: | | | |
| Class D, 3.8046% 6/10/27 (b)(d) | | 816,000 | 779,049 |
| Class E, 3.8046% 6/10/27 (b)(d) | | 1,169,000 | 1,103,875 |
| Series 2015-UES Class F, 3.621% 9/5/32 (b)(d) | | 1,155,000 | 1,140,910 |
| Series 2016-WP Class TA, 1 month U.S. LIBOR + 1.450% 2.6089% 10/15/33 (b)(d)(e) | | 15,063,000 | 15,124,706 |
| Ladder Capital Commercial Mortgage Securities Trust Series 2014-909 Class E, 3.8979% 5/15/31 (b)(d) | | 1,218,000 | 1,200,817 |
| LB-UBS Commercial Mortgage Trust: | | | |
| Series 2004-C2 Class G, 4.595% 3/15/36 (b)(d) | | 14,775 | 14,744 |
| Series 2007-C7 Class A3, 5.866% 9/15/45 | | 3,554,300 | 3,556,478 |
| Liberty Street Trust Series 2016-225L: | | | |
| Class D, 4.6485% 2/10/36 (b)(d) | | 588,000 | 641,760 |
| Class E, 4.6485% 2/10/36 (b)(d) | | 1,050,000 | 1,070,302 |
| Lone Star Portfolio Trust floater Series 2015-LSP Class A1A2, 1 month U.S. LIBOR + 1.800% 3.0256% 9/15/28 (b)(d)(e) | | 9,947,721 | 9,977,060 |
| LSTAR Commercial Mortgage Trust Series 2014-2: | | | |
| Class D, 4.9066% 1/20/41 (b)(d) | | 256,000 | 258,916 |
| Class E, 4.9066% 1/20/41 (b)(d) | | 400,000 | 373,478 |
| Merrill Lynch Mortgage Investors Trust Series 1997-C2 Class F, 6.25% 12/10/29 (d) | | 78,610 | 78,309 |
| Merrill Lynch Mortgage Trust: | | | |
| Series 2006-C1 Class AJ, 5.5659% 5/12/39 (d) | | 508,018 | 511,170 |
| Series 2008-C1 Class A4, 5.69% 2/12/51 | | 678,968 | 679,137 |
| Morgan Stanley BAML Trust: | | | |
| sequential payer Series 2014-C18 Class 300E, 4.6896% 8/15/31 (b) | | 750,000 | 736,471 |
| Series 2012-C5 Class E, 4.6895% 8/15/45 (b)(d) | | 150,000 | 145,477 |
| Series 2012-C6 Class D, 4.6094% 11/15/45 (b)(d) | | 1,357,000 | 1,369,130 |
| Series 2013-C12 Class D, 4.7643% 10/15/46 (b)(d) | | 1,000,000 | 957,186 |
| Series 2013-C13: | | | |
| Class D, 4.8901% 11/15/46 (b)(d) | | 1,019,000 | 977,703 |
| Class E, 4.8901% 11/15/46 (b)(d) | | 887,000 | 703,343 |
| Series 2013-C7: | | | |
| Class D, 4.2591% 2/15/46 (b)(d) | | 1,111,000 | 1,043,013 |
| Class E, 4.2591% 2/15/46 (b)(d) | | 340,000 | 262,188 |
| Series 2013-C8 Class D, 4.0614% 12/15/48 (b)(d) | | 400,000 | 366,570 |
| Series 2013-C9: | | | |
| Class C, 4.0394% 5/15/46 (d) | | 790,000 | 799,034 |
| Class D, 4.1274% 5/15/46 (b)(d) | | 1,747,000 | 1,627,908 |
| Series 2014-C17 Class XA, 1.2428% 8/15/47 (d)(m) | | 175,770,233 | 8,862,739 |
| Series 2015-C25 Class XA, 1.14% 10/15/48 (d)(m) | | 47,445,537 | 3,255,272 |
| Series 2016-C30: | | | |
| Class C, 4.1325% 9/15/49 (d) | | 417,000 | 423,720 |
| Class D, 3% 9/15/49 (b) | | 452,000 | 343,806 |
| Series 2016-C31: | | | |
| Class C, 4.3205% 11/15/49 (d) | | 946,000 | 962,490 |
| Class D, 3% 11/15/49 (b)(d) | | 703,000 | 513,750 |
| Series 2016-C32: | | | |
| Class C, 4.296% 12/15/49 | | 651,000 | 671,584 |
| Class D, 3.396% 12/15/49 (b) | | 924,000 | 699,560 |
| Series 2017-C33 Class D, 3.25% 5/15/50 (b) | | 879,000 | 713,595 |
| Morgan Stanley Capital I Trust: | | | |
| sequential payer Series 2012-C4 Class E, 5.4207% 3/15/45 (b)(d) | | 1,483,000 | 1,321,500 |
| Series 1997-RR Class F, 7.51% 4/30/39 (b)(d) | | 24,218 | 24,109 |
| Series 1998-CF1 Class G, 7.35% 7/15/32 (b) | | 147,337 | 143,653 |
| Series 1999-WF1: | | | |
| Class N, 5.91% 11/15/31 (b) | | 194,876 | 194,573 |
| Class O, 5.91% 11/15/31 (b) | | 160,561 | 139,810 |
| Series 2011-C1: | | | |
| Class D, 5.4143% 9/15/47 (b)(d) | | 1,760,000 | 1,887,527 |
| Class E, 5.4143% 9/15/47 (b)(d) | | 573,100 | 614,472 |
| Series 2011-C2: | | | |
| Class D, 5.483% 6/15/44 (b)(d) | | 1,272,000 | 1,328,820 |
| Class E, 5.483% 6/15/44 (b)(d) | | 600,000 | 574,046 |
| Class F, 5.483% 6/15/44 (b)(d) | | 550,000 | 469,005 |
| Class XB, 0.5345% 6/15/44 (b)(d)(m) | | 9,001,008 | 163,324 |
| Series 2011-C3: | | | |
| Class C, 5.155% 7/15/49 (b)(d) | | 1,000,000 | 1,076,928 |
| Class D, 5.155% 7/15/49 (b)(d) | | 1,130,000 | 1,172,553 |
| Class E, 5.155% 7/15/49 (b)(d) | | 505,000 | 505,866 |
| Class G, 5.155% 7/15/49 (b)(d) | | 957,000 | 835,872 |
| Series 2012-C4: | | | |
| Class D, 5.4207% 3/15/45 (b)(d) | | 330,000 | 343,969 |
| Class F, 3.07% 3/15/45 (b) | | 623,000 | 449,205 |
| Series 2014-150E: | | | |
| Class C, 4.295% 9/9/32 (b)(d) | | 656,000 | 703,564 |
| Class F, 4.295% 9/9/32 (b)(d) | | 651,000 | 657,251 |
| Series 2014-CPT Class F, 3.4455% 7/13/29 (b)(d) | | 1,436,000 | 1,430,211 |
| Series 2015-MS1: | | | |
| Class C, 4.0299% 5/15/48 (d) | | 734,000 | 734,914 |
| Class D, 4.0299% 5/15/48 (b)(d) | | 1,260,000 | 1,094,608 |
| Series 2015-UBS8 Class D, 3.18% 12/15/48 (b) | | 798,000 | 641,653 |
| Series 2016-BNK2: | | | |
| Class C, 3% 11/15/49 (b) | | 1,350,000 | 1,094,653 |
| Class D, 3.9111% 11/15/49 (d) | | 946,000 | 962,571 |
| Morgan Stanley Dean Witter Capital I Trust Series 2001-TOP3 Class E, 7.5741% 7/15/33 (b)(d) | | 102,509 | 106,457 |
| Motel 6 Trust: | | | |
| Series 2017-M6MZ, 1 month U.S. LIBOR + 6.927% 8.1565% 8/15/19 (b)(d)(e) | | 500,000 | 499,051 |
| Series 2017-MTL6, 1 month U.S. LIBOR + 4.250% 5.48% 8/15/34 (b)(d)(e) | | 2,961,000 | 2,953,694 |
| MSCG Trust Series 2016-SNR: | | | |
| Class A, 3.348% 11/15/34 (b)(d) | | 23,867,000 | 24,111,928 |
| Class B, 4.181% 11/15/34 (b) | | 8,435,000 | 8,584,275 |
| Class C, 5.205% 11/15/34 (b) | | 5,900,000 | 6,088,566 |
| Class D, 6.55% 11/15/34 (b) | | 2,209,000 | 2,221,601 |
| Class E, 6.8087% 11/15/34 (b) | | 615,000 | 584,982 |
| MSJP Commercial Securities Mortgage Trust Series 2015-HAUL Class E, 4.851% 9/5/47 (b)(d) | | 278,000 | 270,160 |
| NationsLink Funding Corp. Series 1999-LTL1 Class D, 6.45% 1/22/26 (b) | | 369,357 | 381,907 |
| Providence Place Group Ltd. Partnership Series 2000-C1 Class A2, 7.75% 7/20/28 (b) | | 972,724 | 1,197,910 |
| Real Estate Asset Liquidity Trust: | | | |
| Series 2006-2: | | | |
| Class J, 4.456% 9/12/38 (b) | CAD | 25,051 | 19,877 |
| Class K, 4.456% 9/12/38 (b) | CAD | 18,000 | 14,190 |
| Class L, 4.456% 9/12/38 (b) | CAD | 26,000 | 20,322 |
| Class M, 4.456% 9/12/38 (b) | CAD | 104,391 | 79,099 |
| Series 2007-1 Class M, 4.57% 4/12/23 | CAD | 109,733 | 86,077 |
| SCG Trust Series 2013-SRP1 Class D, 1 month U.S. LIBOR + 3.344% 4.5704% 11/15/26 (b)(d)(e) | | 1,698,000 | 1,624,011 |
| Starwood Retail Property Trust Series 2014-STAR Class D, 1 month U.S. LIBOR + 3.250% 4.4756% 11/15/27 (b)(d)(e) | | 1,683,000 | 1,669,040 |
| TIAA Seasoned Commercial Mortgage Trust: | | | |
| sequential payer Series 2007-C4 Class AJ, 5.4751% 8/15/39 (d) | | 23,315 | 23,530 |
| Series 2007-C4 Class F, 5.4751% 8/15/39 (d) | | 820,000 | 757,999 |
| UBS Commercial Mortgage Trust Series 2012-C1: | | | |
| Class D, 5.5456% 5/10/45 (b)(d) | | 1,197,000 | 1,219,328 |
| Class E, 5% 5/10/45 (b)(d) | | 537,000 | 459,391 |
| Class F, 5% 5/10/45 (b)(d) | | 682,700 | 464,415 |
| UBS-BAMLL Trust: | | | |
| Series 12-WRM Class D, 4.238% 6/10/30 (b)(d) | | 310,000 | 308,915 |
| Series 2012-WRM Class E, 4.238% 6/10/30 (b)(d) | | 970,000 | 939,208 |
| VNO Mortgage Trust Series 2012-6AVE Class D, 3.3372% 11/15/30 (b)(d) | | 1,299,000 | 1,278,912 |
| Vornado DP LLC Series 2010-VNO Class D, 6.3555% 9/13/28 (b) | | 180,000 | 195,950 |
| Wells Fargo Commercial Mortgage Trust: | | | |
| Series 2010-C1 Class XB, 0.5836% 11/15/43 (b)(d)(m) | | 20,614,217 | 358,135 |
| Series 2012-LC5: | | | |
| Class C, 4.693% 10/15/45 (d) | | 569,000 | 597,003 |
| Class D, 4.7706% 10/15/45 (b)(d) | | 1,621,000 | 1,582,855 |
| Class E, 4.7706% 10/15/45 (b)(d) | | 284,000 | 235,310 |
| Series 2013-LC12 Class C, 4.2949% 7/15/46 (d) | | 760,000 | 774,780 |
| Series 2015-C31 Class XA, 1.1023% 11/15/48 (d)(m) | | 38,245,325 | 2,554,313 |
| Series 2015-NXS4 Class E, 3.601% 12/15/48 (b)(d) | | 588,000 | 443,184 |
| Series 2016-BNK1: | | | |
| Class C, 3.071% 8/15/49 | | 700,000 | 663,361 |
| Class D, 3% 8/15/49 (b) | | 447,000 | 366,761 |
| Series 2016-C34 Class XA, 2.1801% 6/15/49 (d)(m) | | 34,403,357 | 4,378,563 |
| Series 2016-C35 Class D, 3.142% 7/15/48 (b) | | 1,596,000 | 1,161,727 |
| Series 2016-LC25 Class C, 4.4365% 12/15/59 (d) | | 903,000 | 908,377 |
| Series 2016-NXS6 Class D, 3.059% 11/15/49 (b) | | 1,218,000 | 933,285 |
| Series 2017-C38 Class D, 3% 7/15/50 (b)(d) | | 1,364,000 | 1,099,260 |
| Series 2017-RB1 Class D, 3.401% 3/15/50 (b) | | 556,000 | 466,266 |
| WF-RBS Commercial Mortgage Trust: | | | |
| sequential payer Series 2011-C4I Class G, 5% 6/15/44 (b) | | 325,000 | 213,297 |
| Series 2011-C3: | | | |
| Class C, 5.335% 3/15/44 (b) | | 360,000 | 383,054 |
| Class D, 5.6401% 3/15/44 (b)(d) | | 800,000 | 747,035 |
| Class E, 5% 3/15/44 (b) | | 890,000 | 800,911 |
| Class F, 5% 3/15/44 (b) | | 693,000 | 482,507 |
| Series 2011-C4: | | | |
| Class D, 5.2472% 6/15/44 (b)(d) | | 408,000 | 405,075 |
| Class E, 5.2472% 6/15/44 (b)(d) | | 439,432 | 428,159 |
| Series 2011-C5: | | | |
| Class C, 5.6722% 11/15/44 (b)(d) | | 260,000 | 286,903 |
| Class D, 5.6722% 11/15/44 (b)(d) | | 600,000 | 628,023 |
| Class E, 5.6722% 11/15/44 (b)(d) | | 1,853,000 | 1,912,001 |
| Class F, 5.25% 11/15/44 (b)(d) | | 933,000 | 816,353 |
| Class G, 5.25% 11/15/44 (b)(d) | | 329,000 | 268,477 |
| Class XA, 1.7625% 11/15/44 (b)(d)(m) | | 4,030,409 | 233,906 |
| Series 2012-C10: | | | |
| Class E, 4.4564% 12/15/45 (b)(d) | | 1,190,000 | 903,064 |
| Class F, 4.4564% 12/15/45 (b)(d) | | 1,726,000 | 949,795 |
| Series 2012-C6 Class D, 5.5804% 4/15/45 (b)(d) | | 540,000 | 546,623 |
| Series 2012-C7: | | | |
| Class C, 4.8297% 6/15/45 (d) | | 1,270,000 | 1,310,390 |
| Class E, 4.8297% 6/15/45 (b)(d) | | 2,501,000 | 2,135,891 |
| Class F, 4.5% 6/15/45 (b) | | 357,000 | 266,376 |
| Class G, 4.5% 6/15/45 (b) | | 1,076,000 | 679,036 |
| Series 2012-C8: | | | |
| Class D, 4.8926% 8/15/45 (b)(d) | | 650,000 | 652,736 |
| Class E, 4.8926% 8/15/45 (b)(d) | | 335,000 | 328,241 |
| Series 2013-C11: | | | |
| Class D, 4.2069% 3/15/45 (b)(d) | | 870,000 | 798,989 |
| Class E, 4.2069% 3/15/45 (b)(d) | | 1,750,000 | 1,355,591 |
| Series 2013-C13 Class D, 4.1386% 5/15/45 (b)(d) | | 600,000 | 561,871 |
| Series 2013-C16 Class D, 4.9803% 9/15/46 (b)(d) | | 193,000 | 187,662 |
| Series 2013-UBS1 Class D, 4.6251% 3/15/46 (b)(d) | | 756,000 | 714,692 |
| Series 2014-C21 Class XA, 1.1412% 8/15/47 (d)(m) | | 105,878,755 | 5,772,743 |
| Series 2014-C24 Class XA, 0.9591% 11/15/47 (d)(m) | | 34,755,336 | 1,738,695 |
| WFCG Commercial Mortgage Trust floater Series 2015-BXRP: | | | |
| Class F, 1 month U.S. LIBOR + 3.721% 4.9459% 11/15/29 (b)(d)(e) | | 1,054,900 | 1,056,878 |
| Class G, 1 month U.S. LIBOR + 3.001% 4.2456% 11/15/29 (b)(d)(e) | | 456,347 | 448,999 |
| WP Glimcher Mall Trust Series 2015-WPG: | | | |
| Class PR1, 3.516% 6/5/35 (b)(d) | | 489,000 | 381,678 |
| Class PR2, 3.516% 6/5/35 (b)(d) | | 1,260,000 | 929,851 |
| TOTAL COMMERCIAL MORTGAGE SECURITIES | | | |
| (Cost $500,984,281) | | | 506,587,713 |
|
| Municipal Securities - 1.4% | | | |
| California Gen. Oblig.: | | | |
| Series 2009, 7.35% 11/1/39 | | $2,650,000 | $3,955,576 |
| 7.3% 10/1/39 | | 27,595,000 | 40,949,048 |
| 7.5% 4/1/34 | | 9,105,000 | 13,420,679 |
| 7.55% 4/1/39 | | 18,745,000 | 29,153,161 |
| 7.6% 11/1/40 | | 14,220,000 | 22,584,773 |
| 7.625% 3/1/40 | | 10,110,000 | 15,718,320 |
| Chicago Gen. Oblig. (Taxable Proj.): | | | |
| Series 2008 B, 5.63% 1/1/22 | | 2,410,000 | 2,464,587 |
| Series 2010 C1, 7.781% 1/1/35 | | 13,950,000 | 16,483,878 |
| Series 2012 B, 5.432% 1/1/42 | | 3,285,000 | 3,250,639 |
| Series 2014 B, 6.314% 1/1/44 | | 16,855,000 | 18,070,246 |
| Illinois Gen. Oblig.: | | | |
| Series 2003: | | | |
| 4.35% 6/1/18 | | 3,508,000 | 3,549,429 |
| 4.95% 6/1/23 | | 24,240,000 | 25,205,722 |
| 5.1% 6/1/33 | | 63,045,000 | 63,344,464 |
| Series 2010-1, 6.63% 2/1/35 | | 11,945,000 | 13,181,785 |
| Series 2010-3: | | | |
| 5.547% 4/1/19 | | 330,000 | 341,441 |
| 6.725% 4/1/35 | | 17,810,000 | 19,600,261 |
| 7.35% 7/1/35 | | 8,165,000 | 9,414,082 |
| Series 2010-5, 6.2% 7/1/21 | | 6,528,000 | 6,918,636 |
| Series 2011: | | | |
| 5.665% 3/1/18 | | 21,275,000 | 21,627,527 |
| 5.877% 3/1/19 | | 77,850,000 | 81,016,160 |
| Series 2013: | | | |
| 2.69% 12/1/17 | | 3,365,000 | 3,367,995 |
| 3.14% 12/1/18 | | 3,490,000 | 3,500,191 |
| TOTAL MUNICIPAL SECURITIES | | | |
| (Cost $395,133,512) | | | 417,118,600 |
|
| Foreign Government and Government Agency Obligations - 0.8% | | | |
| Arab Republic 5.875% 6/11/25 (b) | | $535,000 | $542,860 |
| Arab Republic of Egypt: | | | |
| 5.875% 6/11/25 | | 1,125,000 | 1,141,529 |
| 6.125% 1/31/22 (b) | | 3,100,000 | 3,227,106 |
| 7.5% 1/31/27 (b) | | 600,000 | 661,800 |
| 8.5% 1/31/47 (b) | | 2,780,000 | 3,113,600 |
| Argentine Republic: | | | |
| 5.625% 1/26/22 | | 2,030,000 | 2,123,380 |
| 6.875% 4/22/21 | | 12,240,000 | 13,304,880 |
| 7.125% 6/28/2117 (b) | | 1,355,000 | 1,336,708 |
| 7.5% 4/22/26 | | 425,000 | 475,150 |
| Barbados Government: | | | |
| 7% 8/4/22 (b) | | 825,000 | 746,625 |
| 7.25% 12/15/21 (b) | | 90,000 | 82,800 |
| Belarus Republic: | | | |
| 6.875% 2/28/23 (b) | | 1,910,000 | 2,045,801 |
| 7.625% 6/29/27 (b) | | 955,000 | 1,051,646 |
| 8.95% 1/26/18 | | 5,940,000 | 6,081,206 |
| Brazilian Federative Republic: | | | |
| 4.25% 1/7/25 | | 10,005,000 | 10,105,050 |
| 5.625% 1/7/41 | | 13,135,000 | 13,151,419 |
| 7.125% 1/20/37 | | 4,785,000 | 5,658,263 |
| 8.25% 1/20/34 | | 5,895,000 | 7,634,025 |
| Buenos Aires Province: | | | |
| 6.5% 2/15/23 (b) | | 1,350,000 | 1,410,480 |
| 9.95% 6/9/21 (b) | | 2,815,000 | 3,241,473 |
| 10.875% 1/26/21 (b) | | 1,125,000 | 1,288,125 |
| 10.875% 1/26/21 (Reg. S) | | 6,025,000 | 6,898,625 |
| Cameroon Republic 9.5% 11/19/25 (b) | | 300,000 | 353,862 |
| City of Buenos Aires 8.95% 2/19/21 (b) | | 810,000 | 901,125 |
| Colombian Republic: | | | |
| 6.125% 1/18/41 | | 5,000 | 5,931 |
| 7.375% 9/18/37 | | 1,320,000 | 1,749,000 |
| 10.375% 1/28/33 | | 1,875,000 | 2,864,063 |
| Costa Rican Republic 7% 4/4/44 (b) | | 1,150,000 | 1,208,938 |
| Croatia Republic: | | | |
| 5.5% 4/4/23 (b) | | 660,000 | 733,080 |
| 6% 1/26/24 (b) | | 600,000 | 684,072 |
| Democratic Socialist Republic of Sri Lanka: | | | |
| 6.2% 5/11/27 (b) | | 355,000 | 373,275 |
| 6.25% 10/4/20 (b) | | 330,000 | 353,074 |
| 6.25% 7/27/21 (b) | | 360,000 | 387,558 |
| Dominican Republic: | | | |
| 5.95% 1/25/27 (b) | | 1,505,000 | 1,632,925 |
| 6.6% 1/28/24 (b) | | 520,000 | 585,000 |
| 6.85% 1/27/45 (b) | | 745,000 | 838,125 |
| 6.875% 1/29/26 (b) | | 1,220,000 | 1,403,000 |
| 7.45% 4/30/44 (b) | | 1,265,000 | 1,514,838 |
| Ecuador Republic: | | | |
| 8.75% 6/2/23 (b) | | 575,000 | 585,781 |
| 9.65% 12/13/26 (b) | | 575,000 | 603,031 |
| 10.5% 3/24/20 (b) | | 425,000 | 454,219 |
| El Salvador Republic: | | | |
| 7.375% 12/1/19 (b) | | 565,000 | 583,363 |
| 7.65% 6/15/35 (Reg. S) | | 50,000 | 49,875 |
| 8.625% 2/28/29 (b) | | 280,000 | 306,950 |
| German Federal Republic: | | | |
| 0% 8/15/26(Reg. S) | EUR | 300,000 | 350,455 |
| 2.5% 8/15/46 | EUR | 815,000 | 1,298,982 |
| 4% 1/4/37 | EUR | 1,645,000 | 3,063,177 |
| Indonesian Republic: | | | |
| 2.625% 6/14/23 | EUR | 7,700,000 | 9,685,287 |
| 7.75% 1/17/38 (b) | | 2,445,000 | 3,492,399 |
| 8.5% 10/12/35 (Reg. S) | | 2,385,000 | 3,545,834 |
| Islamic Republic of Pakistan: | | | |
| 6.75% 12/3/19 (b) | | 200,000 | 209,149 |
| 7.25% 4/15/19 (b) | | 2,530,000 | 2,642,398 |
| 8.25% 4/15/24 (b) | | 625,000 | 703,893 |
| Lebanese Republic: | | | |
| 4% 12/31/17 | | 1,239,250 | 1,236,400 |
| 5% 10/12/17 | | 2,045,000 | 2,045,000 |
| 5.15% 6/12/18 | | 2,720,000 | 2,734,993 |
| 5.15% 11/12/18 | | 1,260,000 | 1,268,127 |
| 5.45% 11/28/19 | | 1,370,000 | 1,374,768 |
| 6% 5/20/19 | | 1,785,000 | 1,808,444 |
| Mongolian People's Republic 8.75% 3/9/24 (b) | | 1,930,000 | 2,181,288 |
| Panamanian Republic 9.375% 4/1/29 | | 365,000 | 552,063 |
| Peruvian Republic 4% 3/7/27 (g)(q) | | 1,360,000 | 1,347,708 |
| Province of Santa Fe 7% 3/23/23 (b) | | 2,780,000 | 2,926,562 |
| Provincia de Cordoba: | | | |
| 7.125% 6/10/21 (b) | | 3,480,000 | 3,718,380 |
| 7.45% 9/1/24 (b) | | 1,920,000 | 2,062,656 |
| Republic of Angola 7% 8/17/19 (Issued by Northern Lights III BV for Republic of Angola) (Reg. S) | | 700,000 | 724,003 |
| Republic of Armenia: | | | |
| 6% 9/30/20 (b) | | 2,381,000 | 2,524,670 |
| 7.15% 3/26/25 (b) | | 995,000 | 1,108,729 |
| Republic of Iraq: | | | |
| 5.8% 1/15/28 (Reg. S) | | 5,350,000 | 5,075,149 |
| 6.75% 3/9/23 (b) | | 1,245,000 | 1,266,788 |
| Republic of Kenya 6.875% 6/24/24 (b) | | 885,000 | 928,321 |
| Republic of Nigeria 6.75% 1/28/21 (b) | | 240,000 | 257,400 |
| Republic of Serbia: | | | |
| 6.75% 11/1/24 (b) | | 1,147,044 | 1,173,344 |
| 7.25% 9/28/21 (b) | | 1,250,000 | 1,448,438 |
| Russian Federation: | | | |
| 5.25% 6/23/47 (b) | | 1,600,000 | 1,664,973 |
| 5.625% 4/4/42 (b) | | 850,000 | 960,568 |
| 5.875% 9/16/43 (b) | | 755,000 | 879,575 |
| 12.75% 6/24/28 (Reg. S) | | 5,610,000 | 9,899,518 |
| Rwanda Rep 6.625% 5/2/23 (b) | | 930,000 | 971,850 |
| State of Qatar 9.75% 6/15/30 (b) | | 390,000 | 624,000 |
| Sultanate of Oman 6.5% 3/8/47 (b) | | 770,000 | 804,650 |
| Turkish Republic: | | | |
| 3.25% 3/23/23 | | 245,000 | 234,898 |
| 5.125% 3/25/22 | | 1,590,000 | 1,675,214 |
| 5.625% 3/30/21 | | 1,600,000 | 1,710,618 |
| 6% 3/25/27 | | 975,000 | 1,067,625 |
| 6.25% 9/26/22 | | 3,130,000 | 3,453,786 |
| 6.75% 5/30/40 | | 550,000 | 633,820 |
| 6.875% 3/17/36 | | 1,795,000 | 2,086,580 |
| 7% 6/5/20 | | 3,840,000 | 4,225,344 |
| 7.25% 3/5/38 | | 1,150,000 | 1,393,800 |
| 7.375% 2/5/25 | | 1,495,000 | 1,765,595 |
| 8% 2/14/34 | | 760,000 | 971,797 |
| 11.875% 1/15/30 | | 1,455,000 | 2,357,246 |
| Turkiye Ihracat Kredi Bankasi A/S 5.375% 2/8/21 (b) | | 895,000 | 934,137 |
| Ukraine Government: | | | |
| 7.75% 9/1/21 (b) | | 8,899,000 | 9,277,741 |
| 7.75% 9/1/22 (b) | | 7,759,000 | 8,080,999 |
| 7.75% 9/1/23 (b) | | 719,000 | 746,408 |
| United Kingdom, Great Britain and Northern Ireland: | | | |
| 1.5% 7/22/26(Reg. S) | GBP | 200,000 | 271,034 |
| 1.5% 7/22/47 | GBP | 2,000,000 | 2,465,409 |
| 2% 9/7/25(Reg. S) | GBP | 1,285,000 | 1,816,365 |
| 4.25% 3/7/36 | GBP | 745,000 | 1,373,115 |
| 4.5% 9/7/34 | GBP | 2,135,000 | 3,986,550 |
| Uruguay Republic 7.875% 1/15/33 pay-in-kind | | 1,015,000 | 1,426,075 |
| Venezuelan Republic: | | | |
| 9.25% 9/15/27 | | 4,270,000 | 1,675,975 |
| 11.95% 8/5/31 (Reg. S) | | 2,145,000 | 879,450 |
| 12.75% 8/23/22 | | 905,000 | 409,513 |
| Vietnamese Socialist Republic: | | | |
| 6 month U.S. LIBOR + 0.813% 2.25% 3/13/28 (d)(e)(g) | | 195,000 | 173,856 |
| 4% 3/12/28 (g)(q) | | 6,043,500 | 5,999,745 |
| 4.8% 11/19/24 (b) | | 550,000 | 583,799 |
| 6.75% 1/29/20 (b) | | 750,000 | 819,571 |
| TOTAL FOREIGN GOVERNMENT AND GOVERNMENT AGENCY OBLIGATIONS | | | |
| (Cost $227,848,594) | | | 244,549,640 |
| | | Shares | Value |
|
| Common Stocks - 0.0% | | | |
| CONSUMER DISCRETIONARY - 0.0% | | | |
| Media - 0.0% | | | |
| Tribune Media Co. Class A | | 21,200 | 849,484 |
| ENERGY - 0.0% | | | |
| Energy Equipment & Services - 0.0% | | | |
| Forbes Energy Services Ltd. | | 154,425 | 1,775,888 |
| Oil, Gas & Consumable Fuels - 0.0% | | | |
| Pacific Exploration and Production Corp. | | 67,596 | 2,056,975 |
| Southwestern Energy Co. (r) | | 81,258 | 442,856 |
| Warrior Met Coal, Inc. Class A | | 31,922 | 827,594 |
| | | | 3,327,425 |
|
| TOTAL ENERGY | | | 5,103,313 |
|
| MATERIALS - 0.0% | | | |
| Chemicals - 0.0% | | | |
| LyondellBasell Industries NV Class A | | 31,400 | 2,844,526 |
| TELECOMMUNICATION SERVICES - 0.0% | | | |
| Diversified Telecommunication Services - 0.0% | | | |
| Consolidated Communications Holdings, Inc. | | 14,162 | 261,289 |
| Wireless Telecommunication Services - 0.0% | | | |
| CUI Acquisition Corp. Class E (g)(r) | | 1 | 34,600 |
|
| TOTAL TELECOMMUNICATION SERVICES | | | 295,889 |
|
| TOTAL COMMON STOCKS | | | |
| (Cost $22,084,574) | | | 9,093,212 |
|
| Preferred Stocks - 0.0% | | | |
| Convertible Preferred Stocks - 0.0% | | | |
| ENERGY - 0.0% | | | |
| Oil, Gas & Consumable Fuels - 0.0% | | | |
| Southwestern Energy Co. Series B 6.25% | | 243,900 | 3,231,675 |
| REAL ESTATE - 0.0% | | | |
| Equity Real Estate Investment Trusts (REITs) - 0.0% | | | |
| Alexandria Real Estate Equities, Inc. Series D, 7.00% | | 9,000 | 331,110 |
| FelCor Lodging Trust, Inc. Series A, 1.95% | | 17,900 | 500,921 |
| | | | 832,031 |
|
| TOTAL CONVERTIBLE PREFERRED STOCKS | | | 4,063,706 |
|
| Nonconvertible Preferred Stocks - 0.0% | | | |
| FINANCIALS - 0.0% | | | |
| Mortgage Real Estate Investment Trusts - 0.0% | | | |
| Annaly Capital Management, Inc. Series C, 7.625% | | 27,600 | 708,492 |
| CYS Investments, Inc. Series B, 7.50% | | 17,000 | 425,000 |
| MFA Financial, Inc. Series B, 7.50% | | 22,500 | 569,250 |
| | | | 1,702,742 |
| REAL ESTATE - 0.0% | | | |
| Equity Real Estate Investment Trusts (REITs) - 0.0% | | | |
| American Homes 4 Rent Series D, 6.50% | | 24,500 | 661,500 |
| Boston Properties, Inc. 5.25% | | 17,500 | 456,750 |
| CBL & Associates Properties, Inc. Series D, 7.375% | | 7,720 | 188,908 |
| Cedar Realty Trust, Inc.: | | | |
| Series B, 7.25% | | 8,113 | 204,123 |
| Series C 6.50% | | 10,000 | 247,500 |
| DDR Corp. Series K, 6.25% | | 17,823 | 454,487 |
| Equity Lifestyle Properties, Inc. Series C, 6.75% | | 39,667 | 1,005,955 |
| Public Storage Series F 5.15% | | 37,000 | 937,580 |
| Retail Properties America, Inc. Series A, 7.00% | | 24,109 | 615,985 |
| Sabra Health Care REIT, Inc. Series A, 7.125% | | 18,495 | 475,691 |
| Sun Communities, Inc. Series A, 7.125% | | 34,701 | 885,570 |
| Taubman Centers, Inc. Series J, 6.50% | | 11,338 | 287,418 |
| | | | 6,421,467 |
|
| TOTAL NONCONVERTIBLE PREFERRED STOCKS | | | 8,124,209 |
|
| TOTAL PREFERRED STOCKS | | | |
| (Cost $12,902,246) | | | 12,187,915 |
| | | Principal Amount(a) | Value |
|
| Bank Loan Obligations - 4.8% | | | |
| CONSUMER DISCRETIONARY - 1.4% | | | |
| Auto Components - 0.0% | | | |
| North American Lifting Holdings, Inc.: | | | |
| Tranche 1LN, term loan 3 month U.S. LIBOR + 4.500% 5.7964% 11/27/20 (d)(e) | | 4,541,481 | 4,223,577 |
| Tranche 2LN, term loan 3 month U.S. LIBOR + 9.000% 10.2964% 11/27/21 (d)(e) | | 1,594,000 | 1,265,907 |
| | | | 5,489,484 |
| Automobiles - 0.0% | | | |
| Caliber Holdings Corp.: | | | |
| Tranche 1LN, term loan 3 month U.S. LIBOR + 3.000% 4.2339% 2/1/24 (d)(e) | | 1,408,167 | 1,412,856 |
| Tranche 2LN, term loan 3 month U.S. LIBOR + 7.250% 8.4839% 2/1/25 (d)(e) | | 385,000 | 392,700 |
| Chrysler Group LLC term loan 3 month U.S. LIBOR + 2.000% 3.23% 12/31/18 (d)(e) | | 750,577 | 751,988 |
| UOS LLC Tranche B 1LN, term loan 3 month U.S. LIBOR + 5.500% 6.7986% 4/18/23 (d)(e) | | 1,110,000 | 1,130,124 |
| | | | 3,687,668 |
| Diversified Consumer Services - 0.2% | | | |
| Bright Horizons Family Solutions Tranche B, term loan 3 month U.S. LIBOR + 2.250% 3.4839% 11/7/23 (d)(e) | | 1,504,391 | 1,509,281 |
| Coinmach Service Corp. Tranche B, term loan 3 month U.S. LIBOR + 3.750% 5.0139% 11/14/22 (d)(e) | | 7,289,232 | 7,305,632 |
| Creative Artists Agency LLC Tranche B, term loan 3 month U.S. LIBOR + 3.500% 4.7267% 2/15/24 (d)(e) | | 1,990,000 | 2,000,786 |
| CSM Bakery Supplies Tranche B 1LN, term loan 3 month U.S. LIBOR + 4.000% 5.3% 7/3/20 (d)(e) | | 1,148,725 | 1,091,771 |
| KUEHG Corp.: | | | |
| Tranche B 1LN, term loan 3 month U.S. LIBOR + 3.750% 5.0464% 8/13/22 (d)(e) | | 4,442,675 | 4,427,392 |
| Tranche B, term loan 3 month U.S. LIBOR + 8.250% 9.5139% 8/22/25 (d)(e) | | 1,000,000 | 995,000 |
| Laureate Education, Inc. Tranche B 1LN, term loan 3 month U.S. LIBOR + 4.500% 5.7389% 4/26/24 (d)(e) | | 23,476,163 | 23,564,198 |
| Nord Anglia Education Tranche B, term loan 3 month U.S. LIBOR + 3.500% 4.7018% 3/31/21 (d)(e) | | 6,790,296 | 6,790,296 |
| Seminole Tribe Florida Tranche B, term loan 3 month U.S. LIBOR + 2.000% 3.456% 7/6/24 (d)(e) | | 2,500,000 | 2,505,850 |
| The ServiceMaster Co. Tranche B, term loan 3 month U.S. LIBOR + 2.500% 3.7339% 11/8/23 (d)(e) | | 2,985,000 | 2,987,239 |
| Wash Multifamily Acquisition, Inc.: | | | |
| Tranche B 1LN, term loan 3 month U.S. LIBOR + 3.250% 4.4889% 5/14/22 (d)(e) | | 4,777,766 | 4,762,859 |
| Tranche B 2LN, term loan 3 month U.S. LIBOR + 7.000% 8.2389% 5/14/23 (d)(e)(g) | | 360,000 | 356,400 |
| Weight Watchers International, Inc. Tranche B 2LN, term loan 3 month U.S. LIBOR + 3.250% 4.5288% 4/2/20 (d)(e) | | 5,696,274 | 5,563,038 |
| Zodiac Pool Solutions LLC Tranche B, term loan 3 month U.S. LIBOR + 4.000% 5.2964% 12/20/23 (d)(e) | | 1,990,013 | 2,008,679 |
| | | | 65,868,421 |
| Hotels, Restaurants & Leisure - 0.5% | | | |
| 24 Hour Fitness Worldwide, Inc. Tranche B, term loan 3 month U.S. LIBOR + 3.750% 5.0464% 5/30/21 (d)(e) | | 2,935,970 | 2,926,810 |
| Affinity Gaming LLC Tranche B, term loan 3 month U.S. LIBOR + 3.500% 4.7339% 7/1/23 (d)(e) | | 1,927,903 | 1,929,349 |
| American Casino & Entertainment Properties LLC Tranche B, term loan 3 month U.S. LIBOR + 3.250% 4.4839% 7/7/22 (d)(e) | | 885,254 | 885,812 |
| AP Gaming I LLC term loan 3 month U.S. LIBOR + 5.500% 6.7339% 2/15/24 (d)(e) | | 1,205,000 | 1,220,063 |
| Aristocrat Technologies, Inc. Tranche B 2LN, term loan 3 month U.S. LIBOR + 2.250% 3.5569% 10/20/21 (d)(e) | | 4,125,923 | 4,124,685 |
| Boyd Gaming Corp. Tranche B 1LN, term loan 3 month U.S. LIBOR + 2.500% 3.6967% 9/15/23 (d)(e) | | 2,212,060 | 2,214,404 |
| Burger King Worldwide, Inc. Tranche B, term loan 3 month U.S. LIBOR + 2.250% 3.5113% 2/17/24 (d)(e) | | 5,944,968 | 5,924,517 |
| Caesars Entertainment Resort Properties LLC Tranche B 1LN, term loan 3 month U.S. LIBOR + 3.500% 4.7389% 10/11/20 (d)(e) | | 12,562,641 | 12,615,028 |
| Caesars Growth Properties Holdings LLC Tranche 1LN, term loan 3 month U.S. LIBOR + 3.000% 4.2389% 5/8/21 (d)(e) | | 15,460,150 | 15,495,554 |
| CCM Merger, Inc. Tranche B, term loan 3 month U.S. LIBOR + 2.750% 3.9889% 8/8/21 (d)(e) | | 2,722,891 | 2,728,010 |
| CEC Entertainment, Inc. Tranche B, term loan 3 month U.S. LIBOR + 3.000% 4.2389% 2/14/21 (d)(e) | | 1,691,885 | 1,678,282 |
| Cedar Fair LP Tranche B, term loan 3 month U.S. LIBOR + 2.250% 3.4839% 4/13/24 (d)(e) | | 416,500 | 419,624 |
| CityCenter Holdings LLC Tranche B, term loan 3 month U.S. LIBOR + 2.500% 3.7344% 4/18/24 (d)(e) | | 3,145,000 | 3,149,718 |
| Cyan Blue Holdco 3 Ltd. Tranche B, term loan 3 month U.S. LIBOR + 3.500% 4.8328% 7/25/24 (d)(e) | | 1,645,000 | 1,654,261 |
| Delta 2 SARL Tranche B, term loan 3 month U.S. LIBOR + 3.250% 4.5044% 2/1/24 (d)(e) | | 7,795,000 | 7,840,445 |
| Eldorado Resorts, Inc. Tranche B, term loan 3 month U.S. LIBOR + 2.250% 3.5625% 4/17/24 (d)(e) | | 4,847,850 | 4,823,611 |
| Equinox Holdings, Inc.: | | | |
| Tranche 2LN, term loan 3 month U.S. LIBOR + 7.000% 8.2317% 9/8/24 (d)(e) | | 940,000 | 955,670 |
| Tranche B 1LN, term loan 3 month U.S. LIBOR + 3.250% 4.4839% 3/8/24 (d)(e) | | 2,244,375 | 2,246,238 |
| ESH Hospitality, Inc. Tranche B, term loan 3 month U.S. LIBOR + 2.500% 3.7339% 8/30/23 (d)(e) | | 3,003,820 | 3,014,153 |
| Fitness International LLC Tranche B, term loan 3 month U.S. LIBOR + 4.250% 5.4839% 7/1/20 (d)(e) | | 1,251,851 | 1,262,805 |
| Four Seasons Holdings, Inc. Tranche B, term loan 3 month U.S. LIBOR + 2.500% 3.7339% 11/30/23 (d)(e) | | 6,455,281 | 6,477,681 |
| Gateway Casinos & Entertainment Ltd. term loan 3 month U.S. LIBOR + 3.750% 5.0464% 2/22/23 (d)(e) | | 3,005,000 | 3,012,513 |
| Golden Entertainment, Inc. term loan: | | | |
| 3 month U.S. LIBOR + 3.000% 8/11/24 (e)(s) | | 9,600,000 | 9,556,032 |
| 3 month U.S. LIBOR + 7.000% 8/11/25 (e)(s) | | 2,700,000 | 2,700,000 |
| Golden Nugget, Inc. Tranche B, term loan: | | | |
| 3 month U.S. LIBOR + 3.500% 4.74% 11/21/19 (d)(e) | | 4,741,491 | 4,756,331 |
| 3 month U.S. LIBOR + 3.500% 4.74% 11/21/19 (d)(e) | | 2,031,693 | 2,038,052 |
| Greektown Holdings LLC Tranche B, term loan 3 month U.S. LIBOR + 3.000% 4.2339% 4/25/24 (d)(e) | | 1,110,000 | 1,107,569 |
| Hilton Worldwide Finance LLC Tranche B 2LN, term loan 3 month U.S. LIBOR + 2.000% 3.2344% 10/25/23 (d)(e) | | 4,980,616 | 4,995,458 |
| Intrawest Resorts Holdings, Inc. Tranche B 1LN, term loan 3 month U.S. LIBOR + 3.250% 4.4839% 7/31/24 (d)(e) | | 3,000,000 | 3,000,000 |
| La Quinta Intermediate Holdings LLC Tranche B LN, term loan 3 month U.S. LIBOR + 2.750% 4.0539% 4/14/21 (d)(e) | | 3,539,259 | 3,545,913 |
| Landry's Acquisition Co. Tranche B 1LN, term loan 3 month U.S. LIBOR + 2.750% 3.9844% 10/4/23 (d)(e) | | 5,911,154 | 5,853,875 |
| LTF Merger Sub, Inc. Tranche B, term loan 3 month U.S. LIBOR + 3.000% 4.2339% 6/10/22 (d)(e) | | 3,552,315 | 3,558,674 |
| MGM Mirage, Inc. Tranche A, term loan 3 month U.S. LIBOR + 2.250% 3.4839% 4/25/21 (d)(e) | | 1,794,000 | 1,794,000 |
| Mohegan Tribal Gaming Authority Tranche B, term loan 3 month U.S. LIBOR + 4.000% 5.2339% 10/14/23 (d)(e) | | 1,985,000 | 2,002,369 |
| Penn National Gaming, Inc. Tranche B, term loan 3 month U.S. LIBOR + 2.500% 3.7964% 1/19/24 (d)(e) | | 753,113 | 755,402 |
| Playa Resorts Holding BV Tranche B, term loan 3 month U.S. LIBOR + 3.000% 4.32% 4/27/24 (d)(e) | | 3,640,000 | 3,638,471 |
| Red Lobster Hospitality LLC Tranche B, term loan 3 month U.S. LIBOR + 5.250% 6.4856% 7/28/21 (d)(e) | | 2,051,709 | 2,067,097 |
| Ryman Hospitality Properties, Inc. Tranche B, term loan 3 month U.S. LIBOR + 2.250% 3.56% 5/11/24 (d)(e) | | 294,263 | 295,734 |
| Scientific Games Corp. Tranche B, term loan 3 month U.S. LIBOR + 3.500% 4.5122% 8/14/24 (d)(e) | | 11,040,000 | 11,114,520 |
| SeaWorld Parks & Entertainment, Inc. Tranche B 5LN, term loan 3 month U.S. LIBOR + 3.000% 4.2964% 3/31/24 (d)(e) | | 1,092,263 | 1,060,270 |
| SMG Tranche B 1LN, term loan 3 month U.S. LIBOR + 3.500% 4.8367% 2/27/20 (d)(e) | | 1,534,022 | 1,533,071 |
| Station Casinos LLC Tranche B, term loan 3 month U.S. LIBOR + 2.500% 3.74% 6/8/23 (d)(e) | | 5,175,863 | 5,167,995 |
| Tropicana Entertainment, Inc. Tranche B, term loan 3 month U.S. LIBOR + 3.000% 4.2964% 11/27/20 (d)(e) | | 1,481,519 | 1,488,927 |
| Yonkers Racing Corp. Tranche B 1LN, term loan 3 month U.S. LIBOR + 3.250% 4.49% 5/31/24 (d)(e) | | 2,000,000 | 2,000,000 |
| | | | 160,628,993 |
| Internet & Direct Marketing Retail - 0.1% | | | |
| Bass Pro Group LLC: | | | |
| term loan 3 month U.S. LIBOR + 4.750% 6.0464% 6/9/18 (d)(e) | | 2,000,000 | 2,001,260 |
| Tranche B, term loan 3 month U.S. LIBOR + 3.250% 4.4789% 6/5/20 (d)(e) | | 2,364,871 | 2,351,084 |
| Bass Pro Shops LLC. Tranche B, term loan 3 month U.S. LIBOR + 5.000% 6.2964% 12/16/23 (d)(e) | | 15,464,576 | 14,623,767 |
| Harbor Freight Tools U.S.A., Inc. Tranche B, term loan 3 month U.S. LIBOR + 3.250% 4.4839% 8/19/23 (d)(e) | | 2,462,500 | 2,470,823 |
| | | | 21,446,934 |
| Leisure Products - 0.0% | | | |
| Hayward Industries, Inc. term loan 3 month U.S. LIBOR + 3.500% 4.4806% 8/4/24 (d)(e) | | 1,615,000 | 1,622,074 |
| SRAM LLC. Tranche B, term loan 3 month U.S. LIBOR + 3.500% 4.7572% 3/15/24 (d)(e) | | 1,325,523 | 1,332,151 |
| | | | 2,954,225 |
| Media - 0.4% | | | |
| Acosta, Inc. Tranche B, term loan 3 month U.S. LIBOR + 3.250% 4.4889% 9/26/21 (d)(e) | | 2,635,897 | 2,352,538 |
| Altice U.S. Finance SA Tranche B, term loan 3 month U.S. LIBOR + 2.250% 3.4839% 7/28/25 (d)(e) | | 1,995,000 | 1,979,419 |
| AMC Entertainment Holdings, Inc. Tranche B, term loan 3 month U.S. LIBOR + 2.250% 3.4783% 12/15/23 (d)(e) | | 995,000 | 990,025 |
| AMC Entertainment, Inc. Tranche B, term loan 3 month U.S. LIBOR + 2.250% 3.4783% 12/15/22 (d)(e) | | 1,965,000 | 1,953,544 |
| Cable One, Inc. Tranche B, term loan 3 month U.S. LIBOR + 2.250% 3.57% 5/1/24 (d)(e) | | 1,020,000 | 1,022,550 |
| CBS Radio, Inc. term loan 3 month U.S. LIBOR + 3.500% 4.7361% 10/17/23 (d)(e) | | 3,602,642 | 3,622,168 |
| CDS U.S. Intermediate Holdings, Inc.: | | | |
| Tranche B 1LN, term loan 3 month U.S. LIBOR + 3.750% 5.05% 7/8/22 (d)(e) | | 1,820,563 | 1,813,735 |
| Tranche B 2LN, term loan 3 month U.S. LIBOR + 8.250% 9.5464% 7/8/23 (d)(e) | | 465,000 | 464,419 |
| Cengage Learning, Inc. Tranche B, term loan 3 month U.S. LIBOR + 4.250% 5.4806% 6/7/23 (d)(e) | | 6,067,375 | 5,630,039 |
| Charter Communication Operating LLC: | | | |
| term loan: | | | |
| 3 month U.S. LIBOR + 2.000% 3.24% 7/1/20 (d)(e) | | 1,462,904 | 1,466,561 |
| 3 month U.S. LIBOR + 2.000% 3.24% 1/3/21 (d)(e) | | 4,369,714 | 4,379,415 |
| Tranche H, term loan 3 month U.S. LIBOR + 2.000% 3.24% 1/15/22 (d)(e) | | 987,500 | 990,097 |
| Tranche I, term loan 3 month U.S. LIBOR + 2.250% 3.49% 1/15/24 (d)(e) | | 6,255,813 | 6,283,588 |
| Clear Channel Communications, Inc. Tranche D, term loan 3 month U.S. LIBOR + 6.750% 7.9889% 1/30/19 (d)(e) | | 10,365,000 | 8,292,000 |
| Emerald Exposit Holding, Inc. Tranche B, term loan 3 month U.S. LIBOR + 3.000% 4.2964% 5/22/24 (d)(e) | | 1,440,000 | 1,450,800 |
| Entercom Radio, LLC Tranche B, term loan 3 month U.S. LIBOR + 3.500% 4.7152% 11/1/23 (d)(e) | | 1,431,250 | 1,432,323 |
| Getty Images, Inc. Tranche B, term loan 3 month U.S. LIBOR + 3.500% 4.7964% 10/18/19 (d)(e) | | 5,115,118 | 4,417,365 |
| Houghton Mifflin Harcourt Publishing, Inc. Tranche B, term loan 3 month U.S. LIBOR + 3.000% 4.2389% 5/29/21 (d)(e) | | 4,595,606 | 4,423,270 |
| ION Media Networks, Inc. Tranche B, term loan 3 month U.S. LIBOR + 3.000% 4.26% 12/18/20 (d)(e) | | 5,588,474 | 5,595,460 |
| Karman Buyer Corp.: | | | |
| Tranche 1LN, term loan 3 month U.S. LIBOR + 3.250% 4.5464% 7/25/21 (d)(e) | | 1,458,338 | 1,401,098 |
| Tranche 2LN, term loan 3 month U.S. LIBOR + 6.500% 7.7964% 7/25/22 (d)(e) | | 1,620,000 | 1,475,723 |
| Liberty Cablevision of Puerto Rico Tranche 1LN, term loan 3 month U.S. LIBOR + 3.500% 4.8036% 1/7/22 (d)(e) | | 3,620,000 | 3,597,375 |
| Lions Gate Entertainment Corp. term loan 3 month U.S. LIBOR + 3.000% 4.2339% 12/8/23 (d)(e) | | 2,350,000 | 2,367,625 |
| McGraw-Hill Global Education Holdings, LLC term loan 3 month U.S. LIBOR + 4.000% 5.2339% 5/4/22 (d)(e) | | 6,816,150 | 6,686,234 |
| Montreign Operating Co. LLC Tranche B 1LN, term loan 3 month U.S. LIBOR + 8.250% 9.4839% 1/19/23 (d)(e) | | 2,770,000 | 2,790,775 |
| Neptune Finco Corp. Tranche B, term loan 3 month U.S. LIBOR + 2.250% 3.4783% 7/17/25 (d)(e) | | 2,644,896 | 2,626,170 |
| Nielsen Finance LLC Tranche B 4LN, term loan 3 month U.S. LIBOR + 2.000% 3.2289% 10/4/23 (d)(e) | | 5,063,559 | 5,062,952 |
| Proquest LLC Tranche B, term loan 3 month U.S. LIBOR + 3.750% 4.9889% 10/24/21 (d)(e) | | 3,917,591 | 3,953,515 |
| Raycom Media, Inc. Tranche B, term loan 3 month U.S. LIBOR + 2.750% 3.9856% 8/23/24 (d)(e) | | 2,060,000 | 2,070,300 |
| Springer Science+Business Media Deutschland GmbH Tranche B 9LN, term loan 3 month U.S. LIBOR + 3.500% 4.7964% 8/14/20 (d)(e) | | 8,627,193 | 8,639,788 |
| Unitymedia Finance LLC Tranche B, term loan 3 month U.S. LIBOR + 2.250% 3.4867% 9/30/25 (d)(e) | | 4,130,000 | 4,109,350 |
| Virgin Media Bristol LLC Tranche 1LN, term loan 3 month U.S. LIBOR + 2.750% 3.9767% 1/31/25 (d)(e) | | 5,000,000 | 5,009,700 |
| WideOpenWest Finance LLC Tranche B, term loan 3 month U.S. LIBOR + 3.250% 4.4783% 8/19/23 (d)(e) | | 9,075,000 | 9,050,044 |
| Ziggo Secured Finance Partnership Tranche E, term loan 3 month U.S. LIBOR + 2.500% 3.7267% 4/15/25 (d)(e) | | 4,610,000 | 4,596,170 |
| | | | 121,996,135 |
| Multiline Retail - 0.1% | | | |
| JC Penney Corp., Inc. Tranche B, term loan 3 month U.S. LIBOR + 4.250% 5.5678% 6/23/23 (d)(e) | | 11,732,859 | 11,547,127 |
| Specialty Retail - 0.1% | | | |
| ABB Optical Group LLC Tranche B, term loan 3 month U.S. LIBOR + 5.000% 6.243% 6/15/23 (d)(e) | | 1,334,913 | 1,336,581 |
| Academy Ltd. Tranche B, term loan 3 month U.S. LIBOR + 4.000% 5.2423% 7/2/22 (d)(e) | | 5,150,094 | 3,429,963 |
| Davids Bridal, Inc. Tranche B, term loan 3 month U.S. LIBOR + 4.000% 5.3% 10/11/19 (d)(e) | | 1,860,847 | 1,452,633 |
| Party City Holdings, Inc. term loan 3 month U.S. LIBOR + 3.000% 4.3187% 8/19/22 (d)(e) | | 4,686,512 | 4,688,715 |
| PETCO Animal Supplies, Inc. Tranche B 1LN, term loan 3 month U.S. LIBOR + 3.000% 4.3111% 1/26/23 (d)(e) | | 5,608,934 | 4,708,700 |
| PetSmart, Inc. term loan 3 month U.S. LIBOR + 3.000% 4.24% 3/11/22 (d)(e) | | 14,155,206 | 12,430,111 |
| Sports Authority, Inc. Tranche B, term loan 3 month U.S. LIBOR + 6.000% 0% 11/16/17 (e)(f) | | 2,089,734 | 87,079 |
| | | | 28,133,782 |
| Textiles, Apparel & Luxury Goods - 0.0% | | | |
| Hercules Achievement, Inc. Tranche B, term loan 3 month U.S. LIBOR + 3.500% 4.7317% 12/11/21 (d)(e) | | 4,554,353 | 4,577,124 |
|
| TOTAL CONSUMER DISCRETIONARY | | | 426,329,893 |
|
| CONSUMER STAPLES - 0.3% | | | |
| Beverages - 0.0% | | | |
| Arterra Wines Canada, Inc. Tranche B, term loan 3 month U.S. LIBOR + 2.750% 4.0572% 12/16/23 (d)(e) | | 1,990,000 | 1,997,463 |
| Food & Staples Retailing - 0.2% | | | |
| Albertson's LLC Tranche B, term loan: | | | |
| 3 month U.S. LIBOR + 2.750% 3.9839% 8/25/21 (d)(e) | | 15,535,240 | 15,063,591 |
| 3 month U.S. LIBOR + 3.000% 4.2933% 12/21/22 (d)(e) | | 6,619,403 | 6,419,431 |
| 3 month U.S. LIBOR + 3.000% 4.3172% 6/22/23 (d)(e) | | 4,823,800 | 4,683,090 |
| BJ's Wholesale Club, Inc.: | | | |
| Tranche 2LN, term loan 3 month U.S. LIBOR + 7.500% 8.71% 2/3/25 (d)(e) | | 2,865,000 | 2,748,853 |
| Tranche B 1LN, term loan 3 month U.S. LIBOR + 3.750% 4.9681% 2/3/24 (d)(e) | | 8,830,325 | 8,496,009 |
| CTI Foods Holdings Co. LLC Tranche 1LN, term loan 3 month U.S. LIBOR + 3.500% 4.74% 6/28/20 (d)(e) | | 1,072,224 | 1,002,530 |
| GOBP Holdings, Inc. Tranche B, term loan 3 month U.S. LIBOR + 3.500% 4.7964% 10/21/21 (d)(e) | | 3,853,871 | 3,839,419 |
| Pizza Hut Holdings LLC Tranche B, term loan 3 month U.S. LIBOR + 2.000% 3.2283% 6/16/23 (d)(e) | | 6,239,363 | 6,265,006 |
| Shearer's Foods, Inc.: | | | |
| Tranche 2LN, term loan 3 month U.S. LIBOR + 6.750% 8.0464% 6/30/22 (d)(e) | | 2,913,000 | 2,752,785 |
| Tranche B 1LN, term loan 3 month U.S. LIBOR + 3.938% 5.2339% 6/30/21 (d)(e) | | 3,332,336 | 3,330,936 |
| Smart & Final, Inc. Tranche B, term loan 3 month U.S. LIBOR + 3.500% 4.7721% 11/15/22 (d)(e) | | 4,033,000 | 3,864,945 |
| U.S. Foods, Inc. Tranche B, term loan 3 month U.S. LIBOR + 2.750% 3.99% 6/27/23 (d)(e) | | 3,465,000 | 3,475,776 |
| | | | 61,942,371 |
| Food Products - 0.1% | | | |
| Arctic Glacier Group Holdings, Inc. Tranche B, term loan 3 month U.S. LIBOR + 4.250% 5.4839% 3/20/24 (d)(e) | | 807,975 | 811,005 |
| Chobani LLC Tranche B, term loan 3 month U.S. LIBOR + 4.250% 5.4839% 10/7/23 (d)(e) | | 4,335,357 | 4,363,797 |
| Hostess Brands LLC Tranche B 1LN, term loan 3 month U.S. LIBOR + 2.500% 3.7339% 8/3/22 (d)(e) | | 1,056,652 | 1,059,029 |
| JBS U.S.A. Lux SA Tranche B, term loan 3 month U.S. LIBOR + 2.500% 3.8038% 10/30/22 (d)(e) | | 4,234,388 | 4,183,236 |
| Post Holdings, Inc. Tranche B, term loan 3 month U.S. LIBOR + 2.250% 3.49% 5/24/24 (d)(e) | | 5,840,000 | 5,846,249 |
| | | | 16,263,316 |
| Personal Products - 0.0% | | | |
| Prestige Brands, Inc. term loan 3 month U.S. LIBOR + 2.750% 3.9839% 1/26/24 (d)(e) | | 2,084,842 | 2,087,115 |
|
| TOTAL CONSUMER STAPLES | | | 82,290,265 |
|
| ENERGY - 0.2% | | | |
| Energy Equipment & Services - 0.0% | | | |
| Cactus Wellhead LLC Tranche B, term loan 3 month U.S. LIBOR + 6.000% 7.3169% 7/31/20 (d)(e) | | 3,371,806 | 3,262,222 |
| Expro Finservices SARL Tranche B, term loan 3 month U.S. LIBOR + 4.750% 5.96% 9/2/21 (d)(e) | | 6,065,149 | 3,899,891 |
| Forbes Energy Services LLC Tranche B, term loan 12% 4/13/21 (d) | | 1,493,878 | 1,505,082 |
| FTS International, Inc. Tranche B, term loan 3 month U.S. LIBOR + 4.750% 5.9889% 4/16/21 (d)(e) | | 2,335,000 | 2,092,744 |
| Pacific Drilling SA Tranche B, term loan 3 month U.S. LIBOR + 3.500% 4.75% 6/3/18 (d)(e) | | 1,340,501 | 447,727 |
| Seadrill Operating LP Tranche B, term loan 3 month U.S. LIBOR + 3.000% 4.2964% 2/21/21 (d)(e) | | 3,071,204 | 1,974,201 |
| Summit Midstream Partners LP Tranche B, term loan 3 month U.S. LIBOR + 6.000% 7.2339% 5/16/22 (d)(e) | | 3,000,000 | 3,037,500 |
| | | | 16,219,367 |
| Oil, Gas & Consumable Fuels - 0.2% | | | |
| Alon U.S.A. Partners LP term loan 3 month U.S. LIBOR + 8.000% 9.25% 11/26/18 (d)(e) | | 2,127,522 | 2,136,032 |
| Arctic LNG Carriers Ltd. Tranche B 1LN, term loan 3 month U.S. LIBOR + 4.500% 5.7339% 5/18/23 (d)(e) | | 2,000,000 | 2,010,000 |
| Bcp Raptor LLC Tranche B, term loan 3 month U.S. LIBOR + 4.250% 5.5072% 6/22/24 (d)(e) | | 5,470,000 | 5,501,890 |
| California Resources Corp. Tranche 1LN, term loan 3 month U.S. LIBOR + 10.375% 11.6033% 12/31/21 (d)(e) | | 4,480,000 | 4,741,318 |
| Chesapeake Energy Corp. Tranche 1LN, term loan 3 month U.S. LIBOR + 7.500% 8.8144% 8/23/21 (d)(e) | | 5,900,000 | 6,263,853 |
| Chief Exploration & Development, LLC. Tranche 2LN, term loan 3 month U.S. LIBOR + 6.500% 7.9324% 5/16/21 (d)(e) | | 2,832,000 | 2,750,580 |
| Citgo Holding, Inc. Tranche B, term loan 3 month U.S. LIBOR + 8.500% 9.7964% 5/12/18 (d)(e) | | 2,569,041 | 2,585,097 |
| Citgo Petroleum Corp. Tranche B, term loan 3 month U.S. LIBOR + 3.500% 4.7964% 7/29/21 (d)(e) | | 522,566 | 522,457 |
| Crestwood Holdings Partners LLC Tranche B, term loan 3 month U.S. LIBOR + 8.000% 9.2283% 6/19/19 (d)(e) | | 5,527,140 | 5,496,077 |
| Foresight Energy LLC Tranche B 1LN, term loan 3 month U.S. LIBOR + 5.750% 7.0464% 3/28/22 (d)(e) | | 1,995,000 | 1,866,981 |
| Gavilan Resources LLC Tranche 2LN, term loan 3 month U.S. LIBOR + 6.000% 7.2306% 3/1/24 (d)(e) | | 2,500,000 | 2,353,125 |
| Houston Fuel Oil Terminal Co. Tranche B, term loan 3 month U.S. LIBOR + 3.500% 4.8% 8/19/21 (d)(e) | | 7,208,121 | 7,136,040 |
| Limetree Bay Terminals LLC term loan 3 month U.S. LIBOR + 4.000% 5.2283% 2/15/24 (d)(e) | | 2,857,838 | 2,897,133 |
| Moxie Patriot LLC Tranche B, term loan 3 month U.S. LIBOR + 5.750% 7.0464% 12/19/20 (d)(e) | | 6,172,692 | 5,720,048 |
| Panda Temple Power, LLC term loan 3 month U.S. LIBOR + 6.000% 7.2964% 4/3/19 (d)(e) | | 1,004,700 | 954,465 |
| Peabody Energy Corp. term loan 3 month U.S. LIBOR + 4.500% 5.7339% 3/31/22 (d)(e) | | 3,358,421 | 3,381,090 |
| | | | 56,316,186 |
|
| TOTAL ENERGY | | | 72,535,553 |
|
| FINANCIALS - 0.3% | | | |
| Capital Markets - 0.0% | | | |
| Cypress Intermediate Holdings, Inc. Tranche B 1LN, term loan 3 month U.S. LIBOR + 3.000% 4.24% 4/27/24 (d)(e) | | 3,045,000 | 3,038,149 |
| HarbourVest Partners LLC Tranche B, term loan 3 month U.S. LIBOR + 2.500% 3.8039% 2/4/21 (d)(e) | | 756,307 | 755,362 |
| IBC Capital U.S. LLC: | | | |
| Tranche 2LN, term loan 3 month U.S. LIBOR + 7.000% 8.2281% 9/11/22 (d)(e) | | 2,505,000 | 2,379,750 |
| Tranche B 1LN, term loan 3 month U.S. LIBOR + 3.750% 4.9781% 9/11/21 (d)(e) | | 1,949,135 | 1,928,026 |
| Jane Street Group LLC Tranche B, term loan 3 month U.S. LIBOR + 4.500% 5.7344% 8/25/22 (d)(e) | | 2,000,000 | 2,017,500 |
| | | | 10,118,787 |
| Diversified Financial Services - 0.1% | | | |
| Avolon TLB Borrower 1 (U.S.) LLC Tranche B 2LN, term loan 3 month U.S. LIBOR + 2.750% 3.9806% 3/20/22 (d)(e) | | 4,300,000 | 4,311,696 |
| Delos Finance SARL Tranche B, term loan 3 month U.S. LIBOR + 2.000% 3.2964% 10/6/23 (d)(e) | | 4,118,000 | 4,138,590 |
| Extell Boston 5.154% 8/31/21 (d) | | 1,137,495 | 1,142,841 |
| Finco I LLC Tranche B, term loan 3 month U.S. LIBOR + 2.750% 1.375% 7/14/22 (d)(e) | | 3,000,000 | 3,024,000 |
| Flying Fortress Holdings, Inc. Tranche B, term loan 3 month U.S. LIBOR + 2.000% 3.2964% 10/30/22 (d)(e) | | 2,000,000 | 2,007,500 |
| Focus Financial Partners LLC Tranche B 1LN, term loan 3 month U.S. LIBOR + 3.250% 4.5486% 7/3/24 (d)(e) | | 1,385,000 | 1,400,581 |
| Kingpin Intermediate Holdings LLC Tranche B, term loan 3 month U.S. LIBOR + 4.250% 5.49% 7/3/24 (d)(e) | | 1,000,000 | 1,007,080 |
| Nab Holdings LLC Tranche B, term loan 3 month U.S. LIBOR + 3.500% 4.7992% 6/30/24 (d)(e) | | 1,755,000 | 1,761,581 |
| Onvoy LLC Tranche B 1LN, term loan 3 month U.S. LIBOR + 4.500% 5.7964% 2/10/24 (d)(e) | | 2,743,125 | 2,736,267 |
| Peak 10 Holding Corp. term loan 3 month U.S. LIBOR + 3.500% 4.8106% 8/1/24 (d)(e) | | 1,000,000 | 996,250 |
| TransUnion LLC Tranche B, term loan 3 month U.S. LIBOR + 2.000% 3.2339% 4/9/23 (d)(e) | | 4,893,918 | 4,895,142 |
| UFC Holdings LLC Tranche B 1LN, term loan 3 month U.S. LIBOR + 3.250% 4.49% 8/18/23 (d)(e) | | 2,973,769 | 2,981,203 |
| VF Holdings Corp. term loan 3 month U.S. LIBOR + 3.250% 4.5464% 6/30/23 (d)(e) | | 1,488,750 | 1,493,216 |
| | | | 31,895,947 |
| Insurance - 0.2% | | | |
| Acrisure LLC Tranche B 1LN, term loan 3 month U.S. LIBOR + 5.000% 6.2964% 11/22/23 (d)(e) | | 5,715,675 | 5,779,976 |
| Alliant Holdings Intermediate LLC Tranche B, term loan 3 month U.S. LIBOR + 3.250% 4.5639% 8/14/22 (d)(e) | | 3,934,884 | 3,931,775 |
| AmWINS Group, Inc.: | | | |
| Tranche 2LN, term loan 3 month U.S. LIBOR + 6.750% 7.9839% 1/25/25 (d)(e) | | 275,000 | 280,500 |
| Tranche B 1LN, term loan 3 month U.S. LIBOR + 2.750% 4.1759% 1/25/24 (d)(e) | | 1,492,500 | 1,493,440 |
| Asurion LLC: | | | |
| term loan 3 month U.S. LIBOR + 6.000% 7.2389% 8/4/25 (d)(e) | | 3,935,000 | 4,015,353 |
| Tranche B 5LN, term loan 3 month U.S. LIBOR + 3.000% 4.2389% 11/3/23 (d)(e) | | 7,640,624 | 7,669,276 |
| Tranche B, term loan 3 month U.S. LIBOR + 2.750% 3.9806% 8/4/22 (d)(e) | | 4,692,706 | 4,702,983 |
| HUB International Ltd. Tranche B 1LN, term loan 3 month U.S. LIBOR + 3.000% 4.3115% 10/2/20 (d)(e) | | 4,800,547 | 4,814,853 |
| USI, Inc.: | | | |
| Tranche B, term loan 3 month U.S. LIBOR + 3.000% 5/16/24 (e)(s) | | 4,895,000 | 4,856,232 |
| Tranche, term loan 3 month U.S. LIBOR + 3.000% 4.3142% 5/16/24 (d)(e) | | 4,680,000 | 4,651,733 |
| | | | 42,196,121 |
| Real Estate Management & Development - 0.0% | | | |
| DTZ U.S. Borrower LLC Tranche B 1LN, term loan 3 month U.S. LIBOR + 3.250% 4.5643% 11/4/21 (d)(e) | | 5,259,168 | 5,267,635 |
| MGM Growth Properties Operating Partner LP Tranche B, term loan 3 month U.S. LIBOR + 2.250% 3.4839% 4/25/23 (d)(e) | | 4,810,385 | 4,818,418 |
| | | | 10,086,053 |
| Thrifts & Mortgage Finance - 0.0% | | | |
| Ocwen Loan Servicing LLC Tranche B, term loan 3 month U.S. LIBOR + 5.000% 6.2306% 12/5/20 (d)(e) | | 1,278,608 | 1,270,936 |
|
| TOTAL FINANCIALS | | | 95,567,844 |
|
| HEALTH CARE - 0.4% | | | |
| Health Care Equipment & Supplies - 0.1% | | | |
| Alere, Inc. Tranche B, term loan 3 month U.S. LIBOR + 3.250% 4.48% 6/18/22 (d)(e) | | 1,848,209 | 1,843,977 |
| American Renal Holdings, Inc. Tranche B, term loan 3 month U.S. LIBOR + 3.250% 4.4839% 6/22/24 (d)(e) | | 2,825,000 | 2,808,530 |
| CPI Holdco LLC Tranche B 1LN, term loan 3 month U.S. LIBOR + 4.000% 5.3% 3/21/24 (d)(e) | | 1,910,213 | 1,917,376 |
| Ortho-Clinical Diagnostics, Inc. Tranche B, term loan 3 month U.S. LIBOR + 3.750% 5.0464% 6/30/21 (d)(e) | | 8,960,017 | 8,976,682 |
| | | | 15,546,565 |
| Health Care Providers & Services - 0.2% | | | |
| Community Health Systems, Inc.: | | | |
| Tranche G, term loan 3 month U.S. LIBOR + 2.750% 4.0669% 12/31/19 (d)(e) | | 1,474,840 | 1,470,475 |
| Tranche H, term loan 3 month U.S. LIBOR + 3.000% 4.3169% 1/27/21 (d)(e) | | 10,722,179 | 10,663,421 |
| Envision Healthcare Corp. Tranche B, term loan 3 month U.S. LIBOR + 3.000% 4.3% 12/1/23 (d)(e) | | 11,474,844 | 11,552,299 |
| Equian LLC Tranche DD, term loan 3 month U.S. LIBOR + 3.750% 5.0156% 5/19/24 (d)(e)(t) | | 631,765 | 637,293 |
| Ghx Ultimate Parent Corp. Tranche B, term loan 3 month U.S. LIBOR + 3.250% 4.5464% 6/30/24 (d)(e) | | 1,260,000 | 1,257,896 |
| HCA Holdings, Inc.: | | | |
| Tranche B 8LN, term loan 3 month U.S. LIBOR + 2.250% 3.4839% 2/15/24 (d)(e) | | 2,985,019 | 2,997,824 |
| Tranche B 9LN, term loan 3 month U.S. LIBOR + 2.000% 3.2339% 3/18/23 (d)(e) | | 7,920,150 | 7,942,406 |
| Kindred Healthcare, Inc. Tranche B, term loan 3 month U.S. LIBOR + 3.500% 4.8125% 4/9/21 (d)(e) | | 3,502,491 | 3,490,442 |
| Milk Specialties Co. Tranche B, term loan 3 month U.S. LIBOR + 4.000% 5.2964% 8/16/23 (d)(e) | | 659,863 | 664,812 |
| MPH Acquisition Holdings LLC Tranche B, term loan 3 month U.S. LIBOR + 3.000% 4.2964% 6/7/23 (d)(e) | | 2,273,055 | 2,281,101 |
| Onex Schumacher Finance LP Tranche B 1LN, term loan 3 month U.S. LIBOR + 4.000% 5.2389% 7/31/22 (d)(e) | | 1,169,032 | 1,167,571 |
| Precyse Acquisition Corp. Tranche B, term loan 3 month U.S. LIBOR + 4.500% 5.7339% 10/20/22 (d)(e) | | 505,000 | 506,894 |
| U.S. Anesthesia Partners, Inc. Tranche B, term loan 3 month U.S. LIBOR + 3.250% 4.4861% 6/23/24 (d)(e) | | 1,000,000 | 993,750 |
| U.S. Renal Care, Inc.: | | | |
| Tranche 2LN, term loan 3 month U.S. LIBOR + 8.000% 9.2964% 12/31/23 (d)(e) | | 3,000,000 | 2,925,000 |
| Tranche B 1LN, term loan 3 month U.S. LIBOR + 4.250% 5.5464% 12/31/22 (d)(e) | | 7,411,363 | 7,235,343 |
| Vizient, Inc. Tranche B 3LN, term loan 3 month U.S. LIBOR + 3.500% 4.7339% 2/11/23 (d)(e) | | 3,519,412 | 3,554,606 |
| | | | 59,341,133 |
| Health Care Technology - 0.0% | | | |
| Press Ganey Holdings, Inc.: | | | |
| Tranche 2LN, term loan 3 month U.S. LIBOR + 7.250% 8.4839% 10/21/24 (d)(e) | | 1,000,000 | 1,018,750 |
| Tranche B 1LN, term loan 3 month U.S. LIBOR + 3.250% 4.4839% 10/21/23 (d)(e) | | 2,985,000 | 2,996,194 |
| Project Ruby Ultimate Parent Corp. Tranche B, term loan 3 month U.S. LIBOR + 3.750% 4.9839% 2/9/24 (d)(e) | | 996,819 | 1,000,138 |
| | | | 5,015,082 |
| Life Sciences Tools & Services - 0.0% | | | |
| Albany Molecular Research, Inc. term loan: | | | |
| 3 month U.S. LIBOR + 3.250% 4.4889% 7/27/24 (d)(e) | | 1,105,000 | 1,105,000 |
| 3 month U.S. LIBOR + 7.000% 8.2389% 7/27/25 (d)(e) | | 580,000 | 587,250 |
| PAREXEL International Corp. Tranche B, term loan 3 month U.S. LIBOR + 3.000% 8/11/24 (e)(s) | | 5,000,000 | 5,010,000 |
| | | | 6,702,250 |
| Pharmaceuticals - 0.1% | | | |
| HLF Financing U.S. LLC Tranche B, term loan 3 month U.S. LIBOR + 5.500% 6.7339% 2/15/23 (d)(e) | | 2,486,844 | 2,497,736 |
| Innoviva, Inc. Tranche B, term loan 3 month U.S. LIBOR + 4.500% 5.8167% 8/18/22 (d)(e) | | 2,540,000 | 2,546,350 |
| RPI Finance Trust Tranche B 6LN, term loan 3 month U.S. LIBOR + 2.000% 3.2964% 3/27/23 (d)(e) | | 4,000,000 | 4,014,360 |
| Valeant Pharmaceuticals International, Inc. Tranche B, term loan 3 month U.S. LIBOR + 4.750% 5.99% 4/1/22 (d)(e) | | 15,327,281 | 15,582,787 |
| | | | 24,641,233 |
|
| TOTAL HEALTH CARE | | | 111,246,263 |
|
| INDUSTRIALS - 0.5% | | | |
| Aerospace & Defense - 0.1% | | | |
| DigitalGlobe, Inc. Tranche B, term loan 3 month U.S. LIBOR + 2.750% 3.9839% 1/15/24 (d)(e) | | 1,641,750 | 1,639,698 |
| Gemini HDPE LLC Tranche B, term loan 3 month U.S. LIBOR + 3.000% 4.3111% 8/7/21 (d)(e) | | 982,217 | 984,673 |
| TransDigm, Inc.: | | | |
| Tranche B, term loan 3 month U.S. LIBOR + 3.000% 4.2639% 8/22/24 (d)(e) | | 7,770,000 | 7,776,915 |
| Tranche D, term loan 3 month U.S. LIBOR + 3.000% 4.2928% 6/4/21 (d)(e) | | 4,955,713 | 4,961,362 |
| Tranche E, term loan 3 month U.S. LIBOR + 3.000% 4.258% 5/14/22 (d)(e) | | 983,262 | 984,265 |
| Tranche F, term loan 3 month U.S. LIBOR + 3.000% 4.2339% 6/9/23 (d)(e) | | 13,158,886 | 13,173,887 |
| | | | 29,520,800 |
| Airlines - 0.1% | | | |
| American Airlines, Inc.: | | | |
| Tranche B, term loan 3 month U.S. LIBOR + 2.000% 3.2306% 10/10/21 (d)(e) | | 6,241,462 | 6,241,462 |
| Tranche B, term loan 3 month U.S. LIBOR + 2.500% 3.7267% 12/14/23 (d)(e) | | 4,445,000 | 4,454,735 |
| | | | 10,696,197 |
| Building Products - 0.0% | | | |
| GYP Holdings III Corp. Tranche B, term loan 3 month U.S. LIBOR + 3.000% 4.3111% 4/1/23 (d)(e) | | 3,805,343 | 3,814,856 |
| HD Supply, Inc. Tranche B 4LN, term loan 3 month U.S. LIBOR + 2.500% 3.7389% 10/17/23 (d)(e) | | 992,500 | 993,989 |
| Jeld-Wen, Inc. Tranche B 3LN, term loan 3 month U.S. LIBOR + 3.000% 4.2964% 7/1/22 (d)(e) | | 1,722,982 | 1,732,028 |
| | | | 6,540,873 |
| Commercial Services & Supplies - 0.2% | | | |
| Brand Energy & Infrastructure Services, Inc. Tranche B, term loan 3 month U.S. LIBOR + 4.250% 5.5217% 6/21/24 (d)(e) | | 9,075,000 | 9,096,417 |
| Garda World Security Corp. Tranche B, term loan 3 month U.S. LIBOR + 4.000% 5.3154% 5/26/24 (d)(e) | | 854,322 | 858,952 |
| GCA Services Group, Inc. Tranche B 1LN, term loan 3 month U.S. LIBOR + 4.750% 6.0052% 3/1/23 (d)(e) | | 2,203,799 | 2,209,308 |
| Harland Clarke Holdings Corp.: | | | |
| Tranche B 5LN, term loan 3 month U.S. LIBOR + 6.000% 7.2964% 12/31/21 (d)(e) | | 2,983,255 | 2,995,934 |
| Tranche B 6LN, term loan 3 month U.S. LIBOR + 5.500% 6.7964% 2/9/22 (d)(e) | | 1,366,171 | 1,370,160 |
| Hd Supply Waterworks Ltd. term loan 3 month U.S. LIBOR + 3.000% 4.455% 8/1/24 (d)(e) | | 3,055,000 | 3,058,819 |
| KAR Auction Services, Inc. Tranche B, term loan 3 month U.S. LIBOR + 2.500% 3.8125% 3/9/23 (d)(e) | | 1,121,765 | 1,125,971 |
| Lineage Logistics Holdings, LLC. Tranche B, term loan 3 month U.S. LIBOR + 3.500% 4.7389% 4/7/21 (d)(e) | | 14,409,122 | 14,418,200 |
| Merrill Communications LLC Tranche B, term loan 3 month U.S. LIBOR + 5.250% 6.5611% 6/1/22 (d)(e) | | 1,825,904 | 1,835,033 |
| Metal Services LLC Tranche B, term loan 3 month U.S. LIBOR + 7.500% 8.7964% 6/30/19 (d)(e) | | 1,088,986 | 1,097,153 |
| Optiv Security, Inc. Tranche B 1LN, term loan 3 month U.S. LIBOR + 3.250% 4.5625% 2/1/24 (d)(e) | | 1,350,582 | 1,226,774 |
| Prime Security Services Borrower LLC Tranche B 1LN, term loan 3 month U.S. LIBOR + 2.750% 3.9839% 5/2/22 (d)(e) | | 11,280,902 | 11,332,004 |
| SAI Global GP Tranche B, term loan 3 month U.S. LIBOR + 4.500% 5.7964% 12/8/23 (d)(e)(g) | | 2,487,500 | 2,512,375 |
| The Brickman Group, Ltd. Tranche B 1LN, term loan 3 month U.S. LIBOR + 3.000% 4.2342% 12/18/20 (d)(e) | | 2,687,755 | 2,695,496 |
| Thomson Reuters IP&S Tranche B 1LN, term loan 3 month U.S. LIBOR + 3.500% 4.7339% 10/3/23 (d)(e) | | 3,786,435 | 3,801,316 |
| WTG Holdings III Corp. Tranche B 1LN, term loan 3 month U.S. LIBOR + 3.750% 5.0464% 1/15/21 (d)(e) | | 2,496,496 | 2,521,461 |
| | | | 62,155,373 |
| Construction & Engineering - 0.0% | | | |
| Ventia Deco LLC Tranche B, term loan 3 month U.S. LIBOR + 3.500% 4.7964% 5/21/22 (d)(e) | | 3,160,131 | 3,168,031 |
| Electrical Equipment - 0.0% | | | |
| Cortes NP Acquisition Corp. Tranche B, term loan 3 month U.S. LIBOR + 4.000% 5.2389% 11/30/23 (d)(e) | | 3,225,981 | 3,244,788 |
| Machinery - 0.1% | | | |
| Doosan Bobcat Tranche B, term loan 3 month U.S. LIBOR + 2.750% 4.0128% 5/18/24 (d)(e) | | 1,735,650 | 1,738,549 |
| Gardner Denver, Inc. Tranche B, term loan 3 month U.S. LIBOR + 2.750% 4.0122% 7/30/24 (d)(e) | | 1,030,000 | 1,028,589 |
| NN, Inc. term loan 3 month U.S. LIBOR + 3.750% 4.9839% 4/3/21 (d)(e) | | 1,485,000 | 1,492,425 |
| Onex Wizard U.S. Acquisition, Inc. Tranche B, term loan 3 month U.S. LIBOR + 3.000% 4.2389% 3/13/22 (d)(e) | | 3,784,855 | 3,799,049 |
| The Gates Corp. Tranche B 1LN, term loan 3 month U.S. LIBOR + 3.250% 4.5464% 3/31/24 (d)(e) | | 393,004 | 394,164 |
| | | | 8,452,776 |
| Marine - 0.0% | | | |
| International Seaways Operatin Tranche B, term loan 3 month U.S. LIBOR + 5.500% 6.79% 6/22/22 (d)(e) | | 2,990,000 | 2,967,575 |
| Navios Maritime Partners LP Tranche B, term loan 3 month U.S. LIBOR + 5.000% 6.23% 9/14/20 (d)(e) | | 2,962,500 | 2,947,688 |
| | | | 5,915,263 |
| Professional Services - 0.0% | | | |
| AlixPartners LLP Tranche B, term loan 3 month U.S. LIBOR + 3.000% 4.2964% 4/4/24 (d)(e) | | 3,366,563 | 3,381,981 |
| Science Applications International Corp. Tranche B, term loan 3 month U.S. LIBOR + 2.500% 3.8125% 5/4/22 (d)(e) | | 1,405,732 | 1,412,760 |
| | | | 4,794,741 |
| Trading Companies & Distributors - 0.0% | | | |
| Fly Funding II SARL Tranche B, term loan 3 month U.S. LIBOR + 2.250% 3.5614% 2/9/23 (d)(e) | | 2,097,368 | 2,098,249 |
| Transportation Infrastructure - 0.0% | | | |
| American Commercial Barge Line Tranche B 1LN, term loan 3 month U.S. LIBOR + 8.750% 9.9889% 11/12/20 (d)(e) | | 1,155,345 | 915,611 |
| DAE Aviation Holdings, Inc. Tranche B, term loan 3 month U.S. LIBOR + 3.750% 4.99% 7/7/22 (d)(e) | | 1,994,924 | 2,010,385 |
| Standardaero Aviation Holdings In term loan 3 month U.S. LIBOR + 3.750% 7/7/22 (e)(s) | | 1,290,000 | 1,293,225 |
| | | | 4,219,221 |
|
| TOTAL INDUSTRIALS | | | 140,806,312 |
|
| INFORMATION TECHNOLOGY - 0.8% | | | |
| Communications Equipment - 0.0% | | | |
| Polycom, Inc. Tranche B, term loan 3 month U.S. LIBOR + 5.250% 6.4839% 9/27/23 (d)(e) | | 2,599,750 | 2,631,597 |
| Radiate Holdco LLC Tranche B, term loan 3 month U.S. LIBOR + 3.000% 4.2389% 2/1/24 (d)(e) | | 5,516,175 | 5,438,011 |
| Zayo Group LLC term loan 3 month U.S. LIBOR + 2.000% 3.2306% 1/19/21 (d)(e) | | 1,960,088 | 1,958,872 |
| | | | 10,028,480 |
| Electronic Equipment & Components - 0.0% | | | |
| Electro Rent Corp. Tranche B 1LN, term loan 3 month U.S. LIBOR + 5.000% 6.2339% 1/31/24 (d)(e) | | 1,990,000 | 2,007,413 |
| Go Daddy Operating Co. LLC Tranche B, term loan 3 month U.S. LIBOR + 2.500% 3.7339% 2/15/24 (d)(e) | | 6,747,748 | 6,759,017 |
| Infor U.S., Inc. Tranche B 6LN, term loan 3 month U.S. LIBOR + 2.750% 4.0464% 2/1/22 (d)(e) | | 2,202,901 | 2,195,830 |
| Lux FinCo U.S. SPV: | | | |
| Tranche 2LN, term loan 3 month U.S. LIBOR + 8.500% 9.7344% 10/16/23 (d)(e) | | 405,000 | 384,750 |
| Tranche B 3LN, term loan 3 month U.S. LIBOR + 3.500% 4.7344% 10/16/22 (d)(e) | | 1,913,099 | 1,889,185 |
| TTM Technologies, Inc. Tranche B 1LN, term loan 3 month U.S. LIBOR + 4.250% 5.4889% 5/31/21 (d)(e) | | 2,517,744 | 2,546,068 |
| | | | 15,782,263 |
| Internet Software & Services - 0.2% | | | |
| Abacus Innovations Corp. Tranche B, term loan 3 month U.S. LIBOR + 2.250% 3.25% 8/16/23 (d)(e) | | 1,820,426 | 1,823,157 |
| Ancestry.Com Operations, Inc.: | | | |
| Tranche 2LN, term loan 3 month U.S. LIBOR + 8.250% 9.49% 10/19/24 (d)(e) | | 725,000 | 733,156 |
| Tranche B 1LN, term loan 3 month U.S. LIBOR + 3.250% 4.48% 10/19/23 (d)(e) | | 4,950,000 | 4,971,681 |
| Blucora, Inc. Tranche B, term loan 3 month U.S. LIBOR + 3.750% 5.0372% 5/22/24 (d)(e) | | 1,440,000 | 1,454,400 |
| Datapipe, Inc. Tranche B 1LN, term loan 3 month U.S. LIBOR + 4.750% 6.0464% 3/15/19 (d)(e) | | 6,207,974 | 6,223,494 |
| EIG Investors Corp. Tranche B, term loan 3 month U.S. LIBOR + 4.000% 5.3171% 2/9/23 (d)(e) | | 10,932,436 | 11,039,464 |
| Mh Sub I LLC Tranche B, term loan 3 month U.S. LIBOR + 3.750% 4.82% 8/16/24 (d)(e) | | 2,000,000 | 1,988,340 |
| Rackspace Hosting, Inc. Tranche B, term loan 3 month U.S. LIBOR + 3.000% 4.3104% 11/3/23 (d)(e) | | 10,705,075 | 10,713,960 |
| Travelclick, Inc. Tranche B 1LN, term loan 3 month U.S. LIBOR + 4.000% 5.2339% 5/12/21 (d)(e) | | 927,717 | 932,356 |
| Uber Technologies, Inc. Tranche B, term loan 3 month U.S. LIBOR + 4.000% 5.2361% 7/13/23 (d)(e) | | 12,862,934 | 12,834,764 |
| Vfh Parent LLC Tranche B, term loan 3 month U.S. LIBOR + 3.750% 5.0606% 12/30/21 (d)(e) | | 1,575,000 | 1,586,813 |
| | | | 54,301,585 |
| IT Services - 0.2% | | | |
| Ceridian HCM Holding, Inc. Tranche B 2LN, term loan 3 month U.S. LIBOR + 3.500% 4.7017% 9/15/20 (d)(e) | | 7,588,745 | 7,576,071 |
| Cologix Holdings, Inc. Tranche B 1LN, term loan 3 month U.S. LIBOR + 3.000% 4.4561% 3/20/24 (d)(e) | | 1,995,000 | 1,991,668 |
| Equian LLC Tranche B, term loan 3 month U.S. LIBOR + 3.750% 5.0664% 5/19/24 (d)(e) | | 2,053,235 | 2,071,201 |
| First Data Corp. Tranche B, term loan 3 month U.S. LIBOR + 2.250% 3.4861% 7/10/22 (d)(e) | | 12,488,329 | 12,472,719 |
| Global Payments, Inc. Tranche B 2LN, term loan 3 month U.S. LIBOR + 2.000% 3.2339% 4/22/23 (d)(e) | | 1,241,499 | 1,241,499 |
| Information Resources, Inc.: | | | |
| Tranche 2LN, term loan 3 month U.S. LIBOR + 8.250% 9.4861% 1/18/25 (d)(e) | | 1,000,000 | 996,250 |
| Tranche B 1LN, term loan 3 month U.S. LIBOR + 4.250% 5.4861% 1/18/24 (d)(e) | | 3,097,238 | 3,116,595 |
| Inmar, Inc.: | | | |
| Tranche 2LN, term loan 3 month U.S. LIBOR + 8.000% 9.2556% 5/1/25 (d)(e) | | 290,000 | 291,088 |
| Tranche B 1LN, term loan 3 month U.S. LIBOR + 3.500% 4.7556% 5/1/24 (d)(e) | | 1,025,000 | 1,025,646 |
| Neustar, Inc.: | | | |
| Tranche 2LN, term loan 3 month U.S. LIBOR + 8.000% 9.3119% 8/8/25 (d)(e) | | 700,000 | 707,000 |
| Tranche B1 1LN, term loan 3 month U.S. LIBOR + 3.250% 4.5585% 1/8/20 (d)(e) | | 429,456 | 431,200 |
| Tranche B2 1LN, term loan 3 month U.S. LIBOR + 3.750% 5.0619% 8/8/24 (d)(e) | | 2,440,000 | 2,458,300 |
| RP Crown Parent, LLC Tranche B, term loan 3 month U.S. LIBOR + 3.500% 4.7339% 10/12/23 (d)(e) | | 4,397,900 | 4,427,762 |
| Tempo Acquisition LLC Tranche B, term loan 3 month U.S. LIBOR + 3.000% 4.2317% 5/1/24 (d)(e) | | 5,370,000 | 5,386,110 |
| WEX, Inc. term loan 3 month U.S. LIBOR + 2.750% 3.9839% 7/1/23 (d)(e) | | 3,210,642 | 3,231,929 |
| Xerox Business Services LLC Tranche B, term loan 3 month U.S. LIBOR + 4.000% 5.2339% 12/7/23 (d)(e) | | 3,507,375 | 3,535,434 |
| | | | 50,960,472 |
| Semiconductors & Semiconductor Equipment - 0.0% | | | |
| Bright Bidco BV Tranche B, term loan 3 month U.S. LIBOR + 4.500% 5.7964% 6/30/24 (d)(e) | | 2,500,000 | 2,515,625 |
| Cavium, Inc. Tranche B 1LN, term loan 3 month U.S. LIBOR + 2.250% 3.4844% 8/16/22 (d)(e) | | 1,569,984 | 1,571,946 |
| Microsemi Corp. Tranche B, term loan 3 month U.S. LIBOR + 2.250% 3.553% 1/15/23 (d)(e) | | 1,474,097 | 1,476,559 |
| | | | 5,564,130 |
| Software - 0.4% | | | |
| Almonde, Inc.: | | | |
| Tranche 2LN, term loan 3 month U.S. LIBOR + 7.250% 8.4589% 6/13/25 (d)(e) | | 1,705,000 | 1,733,508 |
| Tranche B 1LN, term loan 3 month U.S. LIBOR + 3.500% 4.8169% 6/13/24 (d)(e) | | 7,915,000 | 7,948,639 |
| Applied Systems, Inc. Tranche B 1LN, term loan 3 month U.S. LIBOR + 3.250% 4.5464% 1/23/21 (d)(e) | | 995,659 | 1,001,882 |
| Aptean, Inc.: | | | |
| Tranche 2LN, term loan 3 month U.S. LIBOR + 9.500% 10.8% 12/20/23 (d)(e) | | 685,000 | 683,719 |
| Tranche B 1LN, term loan 3 month U.S. LIBOR + 4.250% 5.55% 12/20/22 (d)(e) | | 1,925,175 | 1,938,420 |
| Compuware Corp.: | | | |
| term loan 3 month U.S. LIBOR + 8.250% 9.55% 12/15/22 (d)(e) | | 743,561 | 750,535 |
| Tranche B 3LN, term loan 3 month U.S. LIBOR + 4.250% 5.55% 12/15/21 (d)(e) | | 5,229,381 | 5,281,675 |
| Epicor Software Corp. Tranche B, term loan 3 month U.S. LIBOR + 3.750% 4.99% 6/1/22 (d)(e) | | 7,876,713 | 7,890,813 |
| Evo Payments International LLC Tranche B 1LN, term loan 3 month U.S. LIBOR + 5.000% 6.24% 12/20/23 (d)(e) | | 2,493,750 | 2,521,805 |
| Greeneden U.S. Holdings II LLC Tranche B, term loan 3 month U.S. LIBOR + 3.750% 5.0067% 12/1/23 (d)(e) | | 6,517,504 | 6,551,265 |
| Hyland Software, Inc.: | | | |
| Tranche 2LN, term loan 3 month U.S. LIBOR + 7.000% 8.2339% 7/7/25 (d)(e) | | 290,000 | 294,713 |
| Tranche B 1LN, term loan 3 month U.S. LIBOR + 3.250% 4.4839% 7/1/22 (d)(e) | | 1,550,000 | 1,561,625 |
| Kronos, Inc.: | | | |
| term loan 3 month U.S. LIBOR + 8.250% 9.5606% 11/1/24 (d)(e) | | 5,095,000 | 5,260,588 |
| Tranche B 1LN, term loan 3 month U.S. LIBOR + 3.500% 4.8113% 11/1/23 (d)(e) | | 14,542,016 | 14,653,263 |
| Landesk Group, Inc. term loan: | | | |
| 3 month U.S. LIBOR + 4.250% 5.49% 1/20/24 (d)(e) | | 6,510,421 | 6,420,903 |
| 3 month U.S. LIBOR + 9.000% 10.24% 1/20/25 (d)(e) | | 2,445,000 | 2,415,660 |
| MA FinanceCo. LLC Tranche B 3LN, term loan: | | | |
| 3 month U.S. LIBOR + 2.750% 3.9806% 6/21/24 (d)(e) | | 1,052,102 | 1,050,787 |
| 3 month U.S. LIBOR + 2.750% 4.0302% 6/21/24 (d)(e) | | 7,012,898 | 7,004,132 |
| Quest Software U.S. Holdings, Inc. Tranche B, term loan 3 month U.S. LIBOR + 6.000% 7.2572% 10/31/22 (d)(e) | | 2,974,824 | 3,016,352 |
| Renaissance Learning, Inc.: | | | |
| Tranche 1LN, term loan 3 month U.S. LIBOR + 3.750% 5.0464% 4/9/21 (d)(e) | | 6,386,379 | 6,423,612 |
| Tranche 2LN, term loan 3 month U.S. LIBOR + 7.000% 8.2964% 4/9/22 (d)(e) | | 2,813,000 | 2,813,000 |
| SolarWinds Holdings, Inc. Tranche B, term loan 3 month U.S. LIBOR + 3.500% 4.7339% 2/5/23 (d)(e) | | 2,970,075 | 2,980,797 |
| Solera LLC Tranche B, term loan 3 month U.S. LIBOR + 3.250% 4.5072% 3/3/23 (d)(e) | | 4,915,735 | 4,928,270 |
| Sophia L.P. term loan 3 month U.S. LIBOR + 3.250% 4.5464% 9/30/22 (d)(e) | | 4,889,988 | 4,881,577 |
| SS&C Technologies, Inc.: | | | |
| Tranche B 1LN, term loan 3 month U.S. LIBOR + 2.250% 3.4839% 7/8/22 (d)(e) | | 1,721,784 | 1,727,931 |
| Tranche B 2LN, term loan 3 month U.S. LIBOR + 2.250% 3.4839% 7/8/22 (d)(e) | | 89,795 | 90,115 |
| Sybil Software LLC. Tranche B, term loan 3 month U.S. LIBOR + 3.250% 4.5031% 9/30/23 (d)(e) | | 3,786,107 | 3,805,833 |
| TIBCO Software, Inc. term loan 3 month U.S. LIBOR + 3.500% 4.74% 12/4/20 (d)(e) | | 777,115 | 778,638 |
| Veritas U.S., Inc. Tranche B, term loan 3 month U.S. LIBOR + 4.500% 5.7964% 1/27/23 (d)(e) | | 6,640,227 | 6,687,240 |
| | | | 113,097,297 |
| Technology Hardware, Storage & Peripherals - 0.0% | | | |
| Dell International LLC: | | | |
| Tranche A 1LN, term loan 3 month U.S. LIBOR + 2.000% 3.24% 12/31/18 (d)(e) | | 55,200 | 55,212 |
| Tranche B, term loan 3 month U.S. LIBOR + 2.500% 3.74% 9/7/23 (d)(e) | | 1,756,175 | 1,762,690 |
| | | | 1,817,902 |
|
| TOTAL INFORMATION TECHNOLOGY | | | 251,552,129 |
|
| MATERIALS - 0.3% | | | |
| Chemicals - 0.1% | | | |
| American Rock Salt Co. LLC Tranche B 1LN, term loan 3 month U.S. LIBOR + 3.750% 4.9839% 5/20/21 (d)(e) | | 2,730,600 | 2,727,187 |
| Ashland LLC Tranche B, term loan 3 month U.S. LIBOR + 2.000% 3.2374% 5/17/24 (d)(e) | | 2,545,000 | 2,551,363 |
| ASP Chromaflo Intermediate Holdings, Inc. Tranche B 1LN, term loan 3 month U.S. LIBOR + 4.000% 5.2339% 11/18/23 (d)(e) | | 1,810,900 | 1,816,568 |
| Ineos Styrolution U.S. Holding LLC Tranche B, term loan 3 month U.S. LIBOR + 2.750% 4.0464% 3/30/24 (d)(e) | | 1,447,734 | 1,450,456 |
| Jade Germany GmbH Tranche B, term loan 3 month U.S. LIBOR + 5.500% 6.7964% 5/31/23 (d)(e) | | 3,000,000 | 3,003,750 |
| Kraton Polymers LLC Tranche B, term loan 3 month U.S. LIBOR + 3.000% 4.2278% 1/6/22 (d)(e) | | 1,617,371 | 1,627,479 |
| MacDermid, Inc.: | | | |
| Tranche B 5LN, term loan 3 month U.S. LIBOR + 3.500% 4.7339% 6/7/20 (d)(e) | | 2,609,271 | 2,625,579 |
| Tranche B 6LN, term loan 3 month U.S. LIBOR + 3.000% 4% 6/7/23 (d)(e) | | 3,329,959 | 3,340,382 |
| Methanol Holdings (TRINIDAD) Ltd. Tranche B, term loan 3 month U.S. LIBOR + 3.500% 4.7339% 6/30/22 (d)(e) | | 2,583,410 | 2,596,327 |
| Royal Holdings, Inc.: | | | |
| Tranche B 1LN, term loan 3 month U.S. LIBOR + 3.250% 4.5464% 6/19/22 (d)(e) | | 2,097,718 | 2,108,206 |
| Tranche B 2LN, term loan 3 month U.S. LIBOR + 7.500% 8.7964% 6/19/23 (d)(e) | | 96,552 | 96,310 |
| The Chemours Co. LLC Tranche B, term loan 3 month U.S. LIBOR + 2.500% 3.74% 5/12/22 (d)(e) | | 2,375,061 | 2,380,262 |
| Trinseo Materials Operating SCA/Trinseo Materials Finance, Inc.: | | | |
| Tranche B 1LN, term loan 3 month U.S. LIBOR + 3.250% 4.4856% 11/5/21 (d)(e) | | 1,137,600 | 1,138,078 |
| Tranche B, term loan 3 month U.S. LIBOR + 2.500% 3.735% 8/16/24 (d)(e) | | 2,000,000 | 2,008,760 |
| Tronox Pigments (Netherlands) B.V. Tranche B, term loan 3 month U.S. LIBOR + 3.500% 4.7964% 3/19/20 (d)(e) | | 1,004,308 | 1,004,780 |
| U.S. Coatings Acquisition, Inc. Tranche B, term loan 3 month U.S. LIBOR + 2.000% 3.2964% 6/1/24 (d)(e) | | 2,000,000 | 2,004,380 |
| Univar, Inc. term loan 3 month U.S. LIBOR + 2.750% 3.9839% 7/1/22 (d)(e) | | 1,213,465 | 1,214,605 |
| Venator Materials LLC Tranche B, term loan 3 month U.S. LIBOR + 3.000% 4.3119% 8/8/24 (d)(e) | | 1,260,000 | 1,265,519 |
| | | | 34,959,991 |
| Construction Materials - 0.0% | | | |
| Unifrax I LLC Tranche B, term loan 3 month U.S. LIBOR + 3.750% 5.0464% 4/4/24 (d)(e) | | 1,000,000 | 1,003,330 |
| Containers & Packaging - 0.1% | | | |
| Anchor Glass Container Corp. Tranche 2LN, term loan 3 month U.S. LIBOR + 7.750% 8.9806% 12/7/24 (d)(e) | | 1,180,000 | 1,195,729 |
| Berlin Packaging, LLC: | | | |
| Tranche 2LN, term loan 3 month U.S. LIBOR + 6.750% 7.99% 10/1/22 (d)(e) | | 1,129,000 | 1,132,760 |
| Tranche B, term loan 3 month U.S. LIBOR + 3.250% 4.5166% 10/1/21 (d)(e) | | 5,353,211 | 5,368,093 |
| Berry Global, Inc. Tranche M, term loan 3 month U.S. LIBOR + 2.250% 3.4806% 10/1/22 (d)(e) | | 4,956,562 | 4,957,206 |
| Berry Plastics Corp. Tranche L, term loan 3 month U.S. LIBOR + 2.250% 3.4806% 1/6/21 (d)(e) | | 3,552,000 | 3,552,000 |
| BWAY Holding Co. Tranche B, term loan 3 month U.S. LIBOR + 3.250% 4.4806% 4/3/24 (d)(e) | | 1,000,000 | 1,000,310 |
| Caraustar Industries, Inc. Tranche B, term loan 3 month U.S. LIBOR + 5.500% 6.7964% 3/14/22 (d)(e) | | 3,501,225 | 3,462,712 |
| Charter Nex U.S., Inc. Tranche B 1LN, term loan 3 month U.S. LIBOR + 3.250% 4.4839% 5/16/24 (d)(e) | | 1,235,000 | 1,236,161 |
| Consolidated Container Co. Tranche B 1LN, term loan 3 month U.S. LIBOR + 3.500% 4.7389% 5/22/24 (d)(e) | | 2,290,000 | 2,301,450 |
| Flex Acquisition Co., Inc. Tranche B 1LN, term loan 3 month U.S. LIBOR + 3.000% 4.2986% 12/29/23 (d)(e) | | 4,538,625 | 4,529,548 |
| Printpack Holdings, Inc. Tranche B, term loan 3 month U.S. LIBOR + 3.000% 4.25% 7/26/23 (d)(e) | | 1,071,900 | 1,075,920 |
| Reynolds Group Holdings, Inc. Tranche B, term loan 3 month U.S. LIBOR + 3.000% 4.2389% 2/5/23 (d)(e) | | 12,779,830 | 12,785,964 |
| | | | 42,597,853 |
| Metals & Mining - 0.1% | | | |
| Gulf Finance LLC Tranche B 1LN, term loan 3 month U.S. LIBOR + 5.250% 6.55% 8/25/23 (d)(e) | | 7,220,356 | 6,522,365 |
| JMC Steel Group, Inc. Tranche B, term loan 3 month U.S. LIBOR + 3.500% 4.7894% 6/14/21 (d)(e) | | 2,865,718 | 2,868,097 |
| Murray Energy Corp. Tranche B 2LN, term loan 3 month U.S. LIBOR + 7.250% 8.5464% 4/16/20 (d)(e) | | 11,745,501 | 10,717,770 |
| Walter Energy, Inc. Tranche B, term loan 3 month U.S. LIBOR + 4.800% 0% 4/1/18 (e)(f)(g) | | 2,107,367 | 0 |
| | | | 20,108,232 |
|
| TOTAL MATERIALS | | | 98,669,406 |
|
| REAL ESTATE - 0.0% | | | |
| Equity Real Estate Investment Trusts (REITs) - 0.0% | | | |
| Communications Sales & Leasing, Inc. Tranche B, term loan 3 month U.S. LIBOR + 3.000% 4.2339% 10/24/22 (d)(e) | | 3,643,536 | 3,519,037 |
| iStar Financial, Inc. Tranche B, term loan 3 month U.S. LIBOR + 3.750% 4.9806% 7/1/20 (d)(e) | | 1,161,476 | 1,168,736 |
| The GEO Group, Inc. Tranche B, term loan 3 month U.S. LIBOR + 2.250% 3.49% 3/23/24 (d)(e) | | 1,471,313 | 1,471,930 |
| | | | 6,159,703 |
| Real Estate Management & Development - 0.0% | | | |
| Americold Realty Operating Partnership LP Tranche B, term loan 3 month U.S. LIBOR + 3.750% 4.9839% 12/1/22 (d)(e) | | 2,475,718 | 2,503,570 |
| Capital Automotive LP: | | | |
| Tranche 2LN, term loan 3 month U.S. LIBOR + 6.000% 7.24% 3/24/25 (d)(e) | | 922,138 | 931,359 |
| Tranche B 1LN, term loan 3 month U.S. LIBOR + 3.000% 4.24% 3/24/24 (d)(e) | | 171,605 | 172,342 |
| RE/MAX LLC Tranche B, term loan 3 month U.S. LIBOR + 2.750% 4.0464% 12/15/23 (d)(e) | | 1,081,825 | 1,084,530 |
| Realogy Group LLC term loan 3 month U.S. LIBOR + 2.250% 3.4839% 7/20/22 (d)(e) | | 4,958,735 | 4,974,256 |
| Simply Storage Management LLC 8.2375% 9/6/21 (d)(g) | | 1,305,000 | 1,305,000 |
| | | | 10,971,057 |
|
| TOTAL REAL ESTATE | | | 17,130,760 |
|
| TELECOMMUNICATION SERVICES - 0.4% | | | |
| Diversified Telecommunication Services - 0.2% | | | |
| Altice Financing SA Tranche B, term loan 3 month U.S. LIBOR + 2.750% 4.0539% 7/15/25 (d)(e) | | 3,142,125 | 3,137,066 |
| Cincinnati Bell, Inc. Tranche B, term loan 3 month U.S. LIBOR + 3.750% 8/18/24 (e)(s) | | 2,000,000 | 2,000,620 |
| Consolidated Communications, Inc. Tranche B 2LN, term loan 3 month U.S. LIBOR + 3.000% 4.24% 10/5/23 (d)(e) | | 2,000,000 | 1,962,500 |
| Level 3 Financing, Inc. Tranche B, term loan 3 month U.S. LIBOR + 2.250% 3.485% 2/22/24 (d)(e) | | 12,065,000 | 12,053,659 |
| LTS Buyer LLC Tranche B 1LN, term loan 3 month U.S. LIBOR + 3.250% 4.5464% 4/11/20 (d)(e) | | 8,256,774 | 8,265,031 |
| Sable International Finance Ltd. Tranche B, term loan 3 month U.S. LIBOR + 3.500% 4.7339% 1/31/25 (d)(e) | | 6,880,000 | 6,838,445 |
| Securus Technologies Holdings, Inc.: | | | |
| Tranche 2LN, term loan 3 month U.S. LIBOR + 7.750% 9% 4/30/21 (d)(e) | | 5,224,000 | 5,237,060 |
| Tranche B 1LN, term loan 3 month U.S. LIBOR + 3.500% 4.75% 4/30/20 (d)(e) | | 2,774,325 | 2,781,261 |
| Securus Technologies, Inc.: | | | |
| Tranche B, term loan: | | | |
| 3 month U.S. LIBOR + 4.500% 6/15/24 (e)(s) | | 9,580,000 | 9,653,862 |
| 3 month U.S. LIBOR + 8.250% 6/15/25 (e)(s) | | 3,360,000 | 3,365,040 |
| Tranche B2 1LN, term loan 3 month U.S. LIBOR + 4.250% 5.4467% 4/30/20 (d)(e) | | 2,761,920 | 2,768,825 |
| SFR Group SA Tranche B 11LN, term loan 3 month U.S. LIBOR + 2.750% 4.0611% 7/31/25 (d)(e) | | 8,423,888 | 8,375,450 |
| | | | 66,438,819 |
| Wireless Telecommunication Services - 0.2% | | | |
| Digicel International Finance Ltd. Tranche B, term loan 3 month U.S. LIBOR + 3.750% 5.07% 5/25/24 (d)(e) | | 4,955,000 | 5,000,140 |
| Intelsat Jackson Holdings SA Tranche B 2LN, term loan 3 month U.S. LIBOR + 2.750% 4.0003% 6/30/19 (d)(e) | | 11,760,000 | 11,706,492 |
| Sprint Communications, Inc. Tranche B, term loan 3 month U.S. LIBOR + 2.500% 3.75% 2/3/24 (d)(e) | | 12,713,138 | 12,713,138 |
| Syniverse Holdings, Inc. Tranche B, term loan 3 month U.S. LIBOR + 3.000% 4.2964% 4/23/19 (d)(e) | | 4,011,549 | 3,841,058 |
| Telesat LLC Tranche B 4LN, term loan 3 month U.S. LIBOR + 3.000% 4.3% 11/17/23 (d)(e) | | 7,578,169 | 7,629,625 |
| Xplornet Communications, Inc. Tranche B, term loan 3 month U.S. LIBOR + 6.000% 7.2964% 9/9/21 (d)(e) | | 2,144,510 | 2,165,955 |
| | | | 43,056,408 |
|
| TOTAL TELECOMMUNICATION SERVICES | | | 109,495,227 |
|
| UTILITIES - 0.2% | | | |
| Electric Utilities - 0.1% | | | |
| Calpine Construction Finance Co. LP Tranche B 1LN, term loan 3 month U.S. LIBOR + 2.250% 3.49% 5/3/20 (d)(e) | | 2,950,126 | 2,941,836 |
| Empire Generating Co. LLC: | | | |
| Tranche B, term loan 3 month U.S. LIBOR + 4.250% 5.57% 3/14/21 (d)(e) | | 884,825 | 825,100 |
| Tranche C, term loan 3 month U.S. LIBOR + 4.250% 5.57% 3/14/21 (d)(e) | | 87,227 | 81,339 |
| Exgen Texas Power LLC Tranche B, term loan 3 month U.S. LIBOR + 4.750% 6.0464% 9/18/21 (d)(e) | | 4,484,918 | 3,016,107 |
| Green Energy Partners/Stonewall LLC Tranche B 1LN, term loan 3 month U.S. LIBOR + 5.500% 6.7964% 11/13/21 (d)(e) | | 3,042,000 | 2,829,060 |
| InterGen NV Tranche B, term loan 3 month U.S. LIBOR + 4.500% 5.8% 6/13/20 (d)(e) | | 6,278,188 | 6,262,493 |
| Lightstone Holdco LLC: | | | |
| Tranche B, term loan 3 month U.S. LIBOR + 4.500% 5.7339% 1/30/24 (d)(e) | | 2,542,861 | 2,525,239 |
| Tranche C, term loan 3 month U.S. LIBOR + 4.500% 5.7339% 1/30/24 (d)(e) | | 158,446 | 157,348 |
| Longview Power LLC Tranche B, term loan 3 month U.S. LIBOR + 6.000% 7.24% 4/13/21 (d)(e) | | 1,960,000 | 1,103,892 |
| Tex Operations Co. LLC: | | | |
| Tranche B, term loan 3 month U.S. LIBOR + 2.750% 3.9834% 8/4/23 (d)(e) | | 6,481,714 | 6,480,807 |
| Tranche C, term loan 3 month U.S. LIBOR + 2.750% 3.9817% 8/4/23 (d)(e) | | 1,485,714 | 1,485,506 |
| USIC Holdings, Inc. Tranche B, term loan 3 month U.S. LIBOR + 3.500% 4.9232% 12/9/23 (d)(e) | | 1,492,500 | 1,496,858 |
| Vistra Operations Co. LLC Tranche B 2LN, term loan 3 month U.S. LIBOR + 2.750% 3.9792% 12/14/23 (d)(e) | | 1,492,500 | 1,494,634 |
| | | | 30,700,219 |
| Independent Power and Renewable Electricity Producers - 0.1% | | | |
| APLP Holdings LP Tranche B, term loan 3 month U.S. LIBOR + 4.250% 5.4839% 4/13/23 (d)(e) | | 2,518,834 | 2,544,023 |
| Calpine Corp. Tranche B, term loan 3 month U.S. LIBOR + 1.750% 2.99% 11/30/17 (d)(e) | | 2,240,909 | 2,236,001 |
| Dynegy, Inc. Tranche C, term loan 3 month U.S. LIBOR + 3.250% 4.4839% 2/7/24 (d)(e) | | 6,806,790 | 6,814,890 |
| Energy Future Holdings Corp. Tranche B, term loan 3 month U.S. LIBOR + 3.000% 4.2339% 6/30/18 (d)(e) | | 13,500,000 | 13,554,000 |
| MRP Generation Holdings LLC Tranche B, term loan 3 month U.S. LIBOR + 7.000% 8.2964% 10/18/22 (d)(e) | | 1,554,380 | 1,437,802 |
| Terra-Gen Finance Co. LLC Tranche B, term loan 3 month U.S. LIBOR + 4.250% 5.49% 12/9/21 (d)(e) | | 2,718,089 | 2,459,871 |
| TerraForm AP Acquisition Holdings LLC Tranche B, term loan 3 month U.S. LIBOR + 4.500% 5.7964% 6/26/22 (d)(e) | | 2,709,512 | 2,756,928 |
| The AES Corp. Tranche B, term loan 3 month U.S. LIBOR + 2.000% 3.3172% 5/24/22 (d)(e) | | 4,059,825 | 4,059,825 |
| | | | 35,863,340 |
|
| TOTAL UTILITIES | | | 66,563,559 |
|
| TOTAL BANK LOAN OBLIGATIONS | | | |
| (Cost $1,474,618,320) | | | 1,472,187,211 |
|
| Sovereign Loan Participations - 0.0% | | | |
| Indonesian Republic loan participation: | | | |
| Citibank 2.1875% 12/14/19 (d)(g) | | 502,384 | 497,360 |
| Goldman Sachs 2.1875% 12/14/19 (d)(g) | | 430,556 | 426,250 |
| Mizuho 2.1875% 12/14/19 (d)(g) | | 201,880 | 199,861 |
| TOTAL SOVEREIGN LOAN PARTICIPATIONS | | | |
| (Cost $1,082,814) | | | 1,123,471 |
|
| Bank Notes - 0.5% | | | |
| Capital One NA: | | | |
| 1.65% 2/5/18 | | $18,801,000 | $18,796,029 |
| 2.95% 7/23/21 | | 18,827,000 | 19,138,973 |
| Discover Bank: | | | |
| (Delaware) 3.2% 8/9/21 | | 25,781,000 | 26,456,905 |
| 3.1% 6/4/20 | | 22,584,000 | 23,138,986 |
| 8.7% 11/18/19 | | 2,958,000 | 3,336,110 |
| JPMorgan Chase Bank 6% 10/1/17 | | 11,313,000 | 11,347,917 |
| KeyBank NA 6.95% 2/1/28 | | 1,977,000 | 2,523,075 |
| RBS Citizens NA 2.5% 3/14/19 | | 11,319,000 | 11,420,985 |
| Regions Bank 7.5% 5/15/18 | | 24,647,000 | 25,599,497 |
| UBS AG Stamford Branch 1.8% 3/26/18 | | 24,142,000 | 24,181,747 |
| Wachovia Bank NA 6% 11/15/17 | | 2,243,000 | 2,262,498 |
| TOTAL BANK NOTES | | | |
| (Cost $165,139,689) | | | 168,202,722 |
|
| Preferred Securities - 0.5% | | | |
| CONSUMER DISCRETIONARY - 0.0% | | | |
| Automobiles - 0.0% | | | |
| Volkswagen International Finance NV 2.5%(Reg. S) (c)(d) | EUR | $1,525,000 | $1,811,445 |
| CONSUMER STAPLES - 0.0% | | | |
| Food Products - 0.0% | | | |
| Cosan Overseas Ltd. 8.25% (c) | | 3,587,000 | 3,644,582 |
| ENERGY - 0.0% | | | |
| Oil, Gas & Consumable Fuels - 0.0% | | | |
| Total SA 2.625% (Reg. S) (c)(d) | EUR | 2,150,000 | 2,590,690 |
| FINANCIALS - 0.5% | | | |
| Banks - 0.5% | | | |
| Alfa Bond Issuance PLC 8% (Reg. S) (c)(d) | | 1,860,000 | 1,963,796 |
| Banco Do Brasil SA 9% (b)(c)(d) | | 2,050,000 | 2,208,245 |
| Banco Mercantil del Norte SA 7.625% (b)(c)(d) | | 1,130,000 | 1,230,356 |
| Bank of America Corp.: | | | |
| 6.1% (c)(d) | | 8,141,000 | 9,151,280 |
| 6.25% (c)(d) | | 5,325,000 | 6,014,964 |
| 6.5% (c)(d) | | 3,000,000 | 3,452,295 |
| Barclays Bank PLC: | | | |
| 6% (c)(d) | GBP | 1,330,000 | 1,789,687 |
| 7.625% 11/21/22 | | 30,445,000 | 35,623,365 |
| Barclays PLC: | | | |
| 6.625% (c)(d) | | 13,935,000 | 14,410,715 |
| 7.25% (Reg. S) (c)(d) | GBP | 1,350,000 | 1,918,932 |
| 8.25% (c)(d) | | 500,000 | 538,903 |
| CBOM Finance PLC 8.875% (b)(c)(d) | | 1,935,000 | 1,806,501 |
| Citigroup, Inc.: | | | |
| 5.875% (c)(d) | | 4,305,000 | 4,607,315 |
| 5.95% (c)(d) | | 5,290,000 | 5,806,429 |
| 5.95% (c)(d) | | 2,285,000 | 2,418,384 |
| Credit Agricole SA: | | | |
| 6.625% (b)(c)(d) | | 13,700,000 | 14,283,646 |
| 7.875% (b)(c)(d) | | 4,250,000 | 4,834,288 |
| 8.125% 9/19/33 (Reg. S) (d) | | 2,500,000 | 2,734,726 |
| Danske Bank A/S 6.125% (Reg. S) (c)(d) | | 1,600,000 | 1,759,810 |
| Erste Group Bank AG 6.5% (Reg. S) (c)(d) | EUR | 2,200,000 | 2,919,618 |
| HSBC Holdings PLC 4.75% (Reg. S) (c)(d) | EUR | 2,050,000 | 2,520,566 |
| Royal Bank of Scotland Group PLC: | | | |
| 7.5% (c)(d) | | 9,170,000 | 9,792,090 |
| 8.625% (c)(d) | | 3,665,000 | 4,113,104 |
| Stichting AK Rabobank Certificaten 6.5% (Reg. S) (c) | EUR | 2,050,000 | 2,932,837 |
| | | | 138,831,852 |
| Capital Markets - 0.0% | | | |
| UBS AG 4.75% 2/12/26 (Reg. S) (d) | EUR | 2,800,000 | 3,753,776 |
| Diversified Financial Services - 0.0% | | | |
| Magnesita Finance Ltd.: | | | |
| 8.625% (b)(c) | | 985,000 | 1,003,329 |
| 8.625% (Reg. S) (c) | | 200,000 | 203,721 |
| | | | 1,207,050 |
| Insurance - 0.0% | | | |
| Assicurazioni Generali SpA 6.416% (c)(d) | GBP | 1,150,000 | 1,674,487 |
| Aviva PLC 6.125% (c)(d) | GBP | 2,200,000 | 3,372,383 |
| Credit Agricole Assurances SA 4.25% (Reg. S) (c)(d) | EUR | 2,600,000 | 3,418,347 |
| | | | 8,465,217 |
|
| TOTAL FINANCIALS | | | 152,257,895 |
|
| INDUSTRIALS - 0.0% | | | |
| Construction & Engineering - 0.0% | | | |
| Odebrecht Finance Ltd.: | | | |
| 7.5% (b)(c) | | 6,875,000 | 2,963,811 |
| 7.5% (Reg. S) (c) | | 100,000 | 43,110 |
| | | | 3,006,921 |
| MATERIALS - 0.0% | | | |
| Metals & Mining - 0.0% | | | |
| CSN Islands XII Corp. 7% (Reg. S) (c) | | 2,410,000 | 1,658,830 |
| TOTAL PREFERRED SECURITIES | | | |
| (Cost $154,214,292) | | | 164,970,363 |
| | | Shares | Value |
|
| Money Market Funds - 3.1% | | | |
| Fidelity Cash Central Fund, 1.11% (u) | | | |
| (Cost $958,169,986) | | 958,058,657 | 958,250,269 |
| Purchased Swaptions - 0.0% | | | | |
| | | Expiration Date | Notional Amount(a) | Value |
| Put Options - 0.0% | | | | |
| Option on a credit default swap with Credit Suisse Intl to buy protection on the 5-Year iTraxx Europe Crossover Series 27 Index expiring June 2022 exercise rate 2.500% | | 9/20/17 | EUR 19,150,000 | $48,474 |
| Option on a credit default swap with Credit Suisse Intl to buy protection on the 5-Year iTraxx Europe Crossover Series 27 Index expiring June 2022 exercise rate 2.625% | | 12/20/17 | EUR 38,300,000 | 438,152 |
|
| TOTAL PUT OPTIONS | | | | 486,626 |
|
| TOTAL PURCHASED SWAPTIONS | | | | |
| (Cost $552,575) | | | | 486,626 |
| TOTAL INVESTMENT IN SECURITIES - 101.9% | | | | |
| (Cost $30,690,729,972) | | | | 31,266,382,976 |
| NET OTHER ASSETS (LIABILITIES) - (1.9)% | | | | (579,568,269) |
| NET ASSETS - 100% | | | | $30,686,814,707 |
| TBA Sale Commitments | | |
| | Principal Amount(a) | Value |
| Fannie Mae | | |
| 3% 9/1/47 | $(6,400,000) | $(6,473,368) |
| 3% 9/1/47 | (17,000,000) | (17,194,883) |
| 3.5% 9/1/47 | (35,300,000) | (36,573,395) |
| 3.5% 9/1/47 | (35,300,000) | (36,573,395) |
| 3.5% 9/1/47 | (108,400,000) | (112,310,367) |
|
| TOTAL FANNIE MAE | | (209,125,408) |
|
| Ginnie Mae | | |
| 3.5% 9/1/47 | (23,000,000) | (23,983,137) |
| TOTAL TBA SALE COMMITMENTS | | |
| (Proceeds $232,422,180) | | $(233,108,545) |
| Futures Contracts | | | | | |
| | Number of contracts | Expiration Date | Notional amount | Value | Unrealized Appreciation/(Depreciation) |
| Purchased | | | | | |
| Bond Index Contracts | | | | | |
| ASX 10 Year Treasury Bond Index Contracts (Australia) | 29 | Sept. 2017 | $2,965,845 | $(53,594) | $(53,594) |
| Eurex Euro-Bund Contracts (Germany) | 7 | Sept. 2017 | 1,375,636 | 26,334 | 26,334 |
| Eurex Euro-Buxl 30 Year Bond Contracts (Germany) | 16 | Sept. 2017 | 3,206,406 | 20,949 | 20,949 |
| TSE 10 Year Japanese Government Bond Index Contracts (Japan) | 3 | Sept. 2017 | 4,123,891 | 16,643 | 16,643 |
| TOTAL BOND INDEX CONTRACTS | | | | | 10,332 |
| Treasury Contracts | | | | | |
| CBOT 10-Year U.S. Treasury Note Contracts (United States) | 149 | Dec. 2017 | 18,920,672 | 50,906 | 50,906 |
| CBOT 2-Year U.S. Treasury Note Contracts (United States) | 195 | Dec. 2017 | 42,180,938 | 917 | 917 |
| CBOT 5-Year U.S. Treasury Note Contracts (United States) | 223 | Dec. 2017 | 26,425,500 | 34,070 | 34,070 |
| CBOT Long Term U.S. Treasury Bond Contracts (United States) | 23 | Dec. 2017 | 3,590,156 | 33,913 | 33,913 |
| CBOT Ultra 10-Year U.S. Treasury Note Contracts (United States) | 32 | Dec. 2017 | 4,369,000 | 29,433 | 29,433 |
| CBOT Ultra Long Term U.S. Treasury Bond Contracts (United States) | 56 | Dec. 2017 | 9,467,500 | 51,955 | 51,955 |
| TME 10 Year Canadian Note Contracts (Canada) | 67 | Dec. 2017 | 7,417,618 | 14,839 | 14,839 |
| TOTAL TREASURY CONTRACTS | | | | | 216,033 |
|
| TOTAL PURCHASED | | | | | 226,365 |
|
| Sold | | | | | |
| Bond Index Contracts | | | | | |
| Eurex Euro-Bobl Contracts (Germany) | 330 | Sept. 2017 | 52,303,849 | (216,345) | (216,345) |
| ICE Long Gilt Contracts (United Kingdom) | 39 | Dec. 2017 | 6,419,854 | 21,125 | 21,125 |
| ICE Medium Gilt Contracts (United Kingdom) | 100 | Dec. 2017 | 14,901,684 | (10,437) | (10,437) |
| TOTAL BOND INDEX CONTRACTS | | | | | (205,657) |
| Treasury Contracts | | | | | |
| CBOT 10-Year U.S. Treasury Note Contracts (United States) | 1,026 | Dec. 2017 | 130,285,969 | (434,167) | (434,167) |
| CBOT 2-Year U.S. Treasury Note Contracts (United States) | 463 | Dec. 2017 | 100,152,688 | (29,840) | (29,840) |
| CBOT Long Term U.S. Treasury Bond Contracts (United States) | 58 | Dec. 2017 | 9,053,438 | (67,640) | (67,640) |
| TOTAL TREASURY CONTRACTS | | | | | (531,647) |
|
| TOTAL SOLD | | | | | (737,304) |
|
| TOTAL FUTURES CONTRACTS | | | | | $(510,939) |
The notional amount of futures purchased as a percentage of Net Assets is 0.4%
The notional amount of futures sold as a percentage of Net Assets is 1.0%
| Forward Foreign Currency Contracts | | | | | | |
| Currency Purchased | Currency Sold | Counterparty | Settlement Date | Unrealized Appreciation/(Depreciation) |
| EUR | 322,000 | USD | 380,259 | Goldman Sachs Bank USA | 11/17/17 | $4,578 |
| USD | 111,062 | AUD | 140,000 | Brown Brothers Harriman & Co. | 11/17/17 | (128) |
| USD | 554,859 | EUR | 468,000 | Barclays Bank PLC | 11/17/17 | (4,470) |
| USD | 163,960,699 | EUR | 138,128,000 | Brown Brothers Harriman & Co. | 11/17/17 | (1,122,497) |
| USD | 1,739,006 | EUR | 1,472,000 | Goldman Sachs Bank USA | 11/17/17 | (20,250) |
| USD | 744,846 | EUR | 625,000 | Goldman Sachs Bank USA | 11/17/17 | (2,120) |
| USD | 72,507,302 | GBP | 56,030,000 | Brown Brothers Harriman & Co. | 11/17/17 | (121,893) |
| USD | 408,009 | GBP | 316,000 | State Street Bank And Trust Co. | 11/17/17 | (1,608) |
| USD | 36,486 | JPY | 3,950,000 | Goldman Sachs Bank USA | 11/17/17 | 432 |
| TOTAL FORWARD FOREIGN CURRENCY CONTRACTS | | | | | | $(1,267,956) |
| | | | | | Unrealized Appreciation | 5,010 |
| | | | | | Unrealized Depreciation | (1,272,966) |
Swaps
| Underlying Reference | Rating(1) | Maturity Date | Clearinghouse / Counterparty(2) | Fixed Payment Received/(Paid) | Payment Frequency | Notional Amount(3) | Value(1) | Upfront Premium Received/(Paid)(4) | Unrealized Appreciation/(Depreciation) |
| Credit Default Swaps | | | | | | | | | |
| Buy Protection | | | | | | | | | |
| 5-Year iTraxx Europe Series 25 Index | | Jun. 2021 | ICE | (1%) | Quarterly | EUR 8,300,000 | $(121,970) | $0 | $(121,970) |
| Accor SA | | Jun. 2022 | Citibank, N.A. | (1%) | Quarterly | EUR 4,200,000 | (90,900) | 89,448 | (1,452) |
| Assicurazioni Generali SpA | | Dec. 2021 | JPMorgan Chase Bank, N.A. | (1%) | Quarterly | EUR 1,800,000 | 55,218 | (132,242) | (77,024) |
| Carlsberg Breweries A/S | | Jun. 2022 | BNP Paribas SA | (1%) | Quarterly | EUR 4,150,000 | (149,507) | 153,099 | 3,592 |
| Energias De Portugal SA | | Jun. 2022 | JPMorgan Chase Bank, N.A. | (5%) | Quarterly | EUR 3,550,000 | (905,381) | 836,474 | (68,907) |
| Gas Natural Capital Markets SA | | Jun. 2022 | BNP Paribas SA | (1%) | Quarterly | EUR 4,200,000 | (107,365) | 109,836 | 2,471 |
| Kering SA | | Sep. 2018 | Morgan Stanley Capital Group, Inc. | (1%) | Quarterly | EUR 3,500,000 | (48,013) | 3,851 | (44,162) |
| Royal Bank Of Scotland Grp PLC (Ungtd) | | Jun. 2022 | BNP Paribas SA | (1%) | Quarterly | EUR 4,600,000 | (68,398) | (120,495) | (188,893) |
| Santander Central Hispano Issuances Ltd | | Dec. 2021 | Citibank, N.A. | (1%) | Quarterly | EUR 1,750,000 | 24,185 | (126,437) | (102,252) |
| Standard Chartered PLC | | Jun. 2021 | Goldman Sachs Bank USA | (1%) | Quarterly | EUR 1,550,000 | (31,018) | (122,820) | (153,838) |
| TOTAL BUY PROTECTION | | | | | | | (1,443,149) | 690,714 | (752,435) |
| Sell Protection | | | | | | | | | |
| 5-Year iTraxx Europe Senior Financials Series 25 Index | NR | Jun. 2021 | ICE | 1% | Quarterly | EUR 8,300,000 | 264,036 | 0 | 264,036 |
| Intesa Sanpaolo SpA | Ba1 | Jun. 2022 | BNP Paribas SA | 1% | Quarterly | EUR 1,850,000 | (131,473) | 184,686 | 53,213 |
| TOTAL SELL PROTECTION | | | | | | | 132,563 | 184,686 | 317,249 |
|
| TOTAL CREDIT DEFAULT SWAPS | | | | | | | $(1,310,586) | $875,400 | $(435,186) |
|
(1) Ratings are presented for credit default swaps in which the Fund has sold protection on the underlying referenced debt. Ratings for an underlying index represent a weighted average of the ratings of all securities included in the index. The credit rating or value can be measures of the current payment/performance risk. Ratings are from Moody's Investors Service, Inc. Where Moody's® ratings are not available, S&P® ratings are disclosed and are indicated as such. All ratings are as of the report date and do not reflect subsequent changes.
(2) Swaps with Intercontinental Exchange (ICE) are centrally cleared over-the-counter (OTC) swaps.
(3) The notional amount of each credit default swap where the Fund has sold protection approximates the maximum potential amount of future payments that the Fund could be required to make if a credit event were to occur.
(4) Any premiums for centrally cleared over-the-counter (OTC) swaps are recorded periodically throughout the term of the swap to variation margin and included in unrealized appreciation (depreciation).
Swaps
| Payment Received | Payment Frequency | Payment Paid | Payment Frequency | Clearinghouse / Counterparty(1) | Maturity Date | Notional Amount | Value | Upfront Premium Received/(Paid)(4) | Unrealized Appreciation/(Depreciation) |
| Interest Rate Swaps | | | | | | | | | |
| 3-month LIBOR(3) | Quarterly | 2.5% | Semi - annual | LCH | Sep. 2027 | $17,100,000 | $(165,261) | $0 | $(165,261) |
| 3-month LIBOR(3) | Quarterly | 2.5% | Semi - annual | LCH | Sep. 2047 | 3,100,000 | (39,965) | 0 | (39,965) |
|
| TOTAL INTEREST RATE SWAPS | | | | | | | $(205,226) | $0 | $(205,226) |
|
(1) Swaps with LCH Clearnet Group (LCH) are centrally cleared over-the-counter (OTC) swaps.
(2) Any premiums for centrally cleared over-the-counter (OTC) swaps are recorded periodically throughout the term of the swap to variation margin and included in unrealized appreciation (depreciation).
(3) Represents floating rate.
Currency Abbreviations
AUD – Australian dollar
CAD – Canadian dollar
EUR – European Monetary Unit
GBP – British pound
JPY – Japanese yen
USD – U.S. dollar
Legend
(a) Amount is stated in United States dollars unless otherwise noted.
(b) Security exempt from registration under Rule 144A of the Securities Act of 1933. These securities may be resold in transactions exempt from registration, normally to qualified institutional buyers. At the end of the period, the value of these securities amounted to $2,666,116,467 or 8.7% of net assets.
(c) Security is perpetual in nature with no stated maturity date.
(d) Coupon rates for floating and adjustable rate securities reflect the rates in effect at period end.
(e) Coupon is indexed to a floating interest rate which may be multiplied by a specified factor and/or subject to caps or floors.
(f) Non-income producing - Security is in default.
(g) Level 3 instrument
(h) Security or a portion of the security was pledged to cover margin requirements for futures contracts. At period end, the value of securities pledged amounted to $2,460,675.
(i) Security or a portion of the security was pledged to cover margin requirements for centrally cleared OTC swaps. At period end, the value of securities pledged amounted to $1,811,591.
(j) Security or a portion of the security has been segregated as collateral for open forward foreign currency contracts and bi-lateral over-the-counter (OTC) swaps. At period end, the value of securities pledged amounted to $2,644,604.
(k) Security or a portion of the security purchased on a delayed delivery or when-issued basis.
(l) Security or a portion of the security has been segregated as collateral for mortgage-backed or asset-backed securities purchased on a delayed delivery or when-issued basis. At period end, the value of securities pledged amounted to $139,528.
(m) Security represents right to receive monthly interest payments on an underlying pool of mortgages or assets. Principal shown is the outstanding par amount of the pool as of the end of the period.
(n) Coupon is inversely indexed to a floating interest rate multiplied by a specified factor. The price may be considerably more volatile than the price of a comparable fixed rate security.
(o) Principal Only Strips represent the right to receive the monthly principal payments on an underlying pool of mortgage loans.
(p) Represents an investment in an underlying pool of reverse mortgages which typically do not require regular principal and interest payments as repayment is deferred until a maturity event.
(q) Security initially issued at one coupon which converts to a higher coupon at a specified date. The rate shown is the rate at period end.
(r) Non-income producing
(s) The coupon rate will be determined upon settlement of the loan after period end.
(t) Position or a portion of the position represents an unfunded loan commitment. At period end, the total principal amount and market value of unfunded commitments totaled $315,882 and $318,646, respectively.
(u) Affiliated fund that is generally available only to investment companies and other accounts managed by Fidelity Investments. The rate quoted is the annualized seven-day yield of the fund at period end. A complete unaudited listing of the fund's holdings as of its most recent quarter end is available upon request. In addition, each Fidelity Central Fund's financial statements, which are not covered by the Fund's Report of Independent Registered Public Accounting Firm, are available on the SEC's website or upon request.
Affiliated Central Funds
Information regarding fiscal year to date income earned by the Fund from investments in Fidelity Central Funds is as follows:
| Fund | Income earned |
| Fidelity Cash Central Fund | $8,039,538 |
| Total | $8,039,538 |
Investment Valuation
The following is a summary of the inputs used, as of August 31, 2017, involving the Fund's assets and liabilities carried at fair value. The inputs or methodology used for valuing securities may not be an indication of the risk associated with investing in those securities. For more information on valuation inputs, and their aggregation into the levels used below, please refer to the Investment Valuation section in the accompanying Notes to Financial Statements.
| | Valuation Inputs at Reporting Date: |
| Description | Total | Level 1 | Level 2 | Level 3 |
| Investments in Securities: | | | | |
| Equities: | | | | |
| Consumer Discretionary | $849,484 | $849,484 | $-- | $-- |
| Energy | 8,334,988 | 4,275,719 | 4,059,269 | -- |
| Financials | 1,702,742 | 1,702,742 | -- | -- |
| Materials | 2,844,526 | 2,844,526 | -- | -- |
| Real Estate | 7,253,498 | 6,752,577 | 500,921 | -- |
| Telecommunication Services | 295,889 | 261,289 | -- | 34,600 |
| Corporate Bonds | 9,977,418,532 | -- | 9,976,075,513 | 1,343,019 |
| U.S. Government and Government Agency Obligations | 11,495,919,370 | -- | 11,495,919,370 | -- |
| U.S. Government Agency - Mortgage Securities | 4,821,512,740 | -- | 4,821,512,740 | -- |
| Asset-Backed Securities | 325,779,420 | -- | 300,961,126 | 24,818,294 |
| Collateralized Mortgage Obligations | 690,995,172 | -- | 690,995,172 | -- |
| Commercial Mortgage Securities | 506,587,713 | -- | 505,597,133 | 990,580 |
| Municipal Securities | 417,118,600 | -- | 417,118,600 | -- |
| Foreign Government and Government Agency Obligations | 244,549,640 | -- | 237,028,331 | 7,521,309 |
| Bank Loan Obligations | 1,472,187,211 | -- | 1,466,508,354 | 5,678,857 |
| Sovereign Loan Participations | 1,123,471 | -- | -- | 1,123,471 |
| Bank Notes | 168,202,722 | -- | 168,202,722 | -- |
| Preferred Securities | 164,970,363 | -- | 164,970,363 | -- |
| Money Market Funds | 958,250,269 | 958,250,269 | -- | -- |
| Purchased Swaptions | 486,626 | -- | 486,626 | -- |
| Total Investments in Securities: | $31,266,382,976 | $974,936,606 | $30,249,936,240 | $41,510,130 |
| Derivative Instruments: | | | | |
| Assets | | | | |
| Forward Foreign Currency Contracts | $5,010 | $-- | $5,010 | $-- |
| Futures Contracts | 301,084 | 301,084 | -- | -- |
| Swaps | 343,439 | -- | 343,439 | -- |
| Total Assets | $649,533 | $301,084 | $348,449 | $-- |
| Liabilities | | | | |
| Forward Foreign Currency Contracts | $(1,272,966) | $-- | $(1,272,966) | $-- |
| Futures Contracts | (812,023) | (812,023) | -- | -- |
| Swaps | (1,859,251) | -- | (1,859,251) | -- |
| Total Liabilities | $(3,944,240) | $(812,023) | $(3,132,217) | $-- |
| Total Derivative Instruments: | $(3,294,707) | $(510,939) | $(2,783,768) | $-- |
| Other Financial Instruments: | | | | |
| TBA Sale Commitments | $(233,108,545) | $-- | $(233,108,545) | $-- |
| Total Other Financial Instruments: | $(233,108,545) | $-- | $(233,108,545) | $-- |
Value of Derivative Instruments
The following table is a summary of the Fund's value of derivative instruments by primary risk exposure as of August 31, 2017. For additional information on derivative instruments, please refer to the Derivative Instruments section in the accompanying Notes to Financial Statements.
| Primary Risk Exposure / Derivative Type | Value |
| | Asset | Liability |
| Credit Risk | | |
| Purchased Swaptions(a) | $486,626 | $0 |
| Swaps(b) | 343,439 | (1,654,025) |
| Total Credit Risk | 830,065 | (1,654,025) |
| Foreign Exchange Risk | | |
| Forward Foreign Currency Contracts(c) | 5,010 | (1,272,966) |
| Total Foreign Exchange Risk | 5,010 | (1,272,966) |
| Interest Rate Risk | | |
| Futures Contracts(d) | 301,084 | (812,023) |
| Swaps(b) | 0 | (205,226) |
| Total Interest Rate Risk | 301,084 | (1,017,249) |
| Total Value of Derivatives | $1,136,159 | $(3,944,240) |
(a) Gross value is included in the Statement of Assets and Liabilities in the investments, at value line-item.
(b) For bi-lateral over-the-counter (OTC) swaps, reflects gross value which is presented in the Statement of Assets and Liabilities in the bi-lateral OTC swaps, at value line-items. For centrally cleared OTC swaps, reflects gross cumulative appreciation (depreciation) as presented in the Schedule of Investments. In the Statement of Assets and Liabilities, the period end daily variation margin for centrally cleared OTC swaps is included in receivable or payable for daily variation margin on centrally cleared OTC swaps, and the net cumulative appreciation (depreciation) for centrally cleared OTC swaps is included in net unrealized appreciation (depreciation).
(c) Gross value is presented in the Statement of Assets and Liabilities in the unrealized appreciation/depreciation on forward foreign currency contracts line-items.
(d) Reflects gross cumulative appreciation (depreciation) on futures contracts as presented in the Schedule of Investments. In the Statement of Assets and Liabilities, the period end daily variation margin is included in receivable or payable for daily variation margin on futures contracts, and the net cumulative appreciation (depreciation) is included in net unrealized appreciation (depreciation).
Other Information
Distribution of investments by country or territory of incorporation, as a percentage of Total Net Assets, is as follows (Unaudited):
| United States of America | 89.7% |
| Mexico | 2.2% |
| United Kingdom | 1.9% |
| Netherlands | 1.8% |
| Others (Individually Less Than 1%) | 4.4% |
| | 100.0% |
See accompanying notes which are an integral part of the financial statements.
Financial Statements
Statement of Assets and Liabilities
| | | August 31, 2017 |
| Assets | | |
Investment in securities, at value — See accompanying schedule:
Unaffiliated issuers (cost $29,732,559,986) | $30,308,132,707 | |
| Fidelity Central Funds (cost $958,169,986) | 958,250,269 | |
| Total Investment in Securities (cost $30,690,729,972) | | $31,266,382,976 |
| Cash | | 2,961,260 |
| Foreign currency held at value (cost $744,842) | | 749,017 |
| Receivable for investments sold | | 756,683,712 |
| Receivable for TBA sale commitments | | 232,422,180 |
| Unrealized appreciation on forward foreign currency contracts | | 5,010 |
| Receivable for fund shares sold | | 34,259,345 |
| Dividends receivable | | 29,855 |
| Interest receivable | | 200,080,849 |
| Distributions receivable from Fidelity Central Funds | | 712,292 |
| Bi-lateral OTC swaps, at value | | 79,403 |
| Other receivables | | 174,280 |
| Total assets | | 32,494,540,179 |
| Liabilities | | |
| Payable for investments purchased | | |
| Regular delivery | $858,334,102 | |
| Delayed delivery | 678,613,271 | |
| TBA sale commitments, at value | 233,108,545 | |
| Unrealized depreciation on forward foreign currency contracts | 1,272,966 | |
| Payable for fund shares redeemed | 19,852,546 | |
| Distributions payable | 2,981,531 | |
| Bi-lateral OTC swaps, at value | 1,532,055 | |
| Accrued management fee | 7,741,068 | |
| Distribution and service plan fees payable | 322,254 | |
| Payable for daily variation margin on futures contracts | 76,786 | |
| Payable for daily variation margin on centrally cleared OTC swaps | 52,183 | |
| Other affiliated payables | 3,669,020 | |
| Other payables and accrued expenses | 169,145 | |
| Total liabilities | | 1,807,725,472 |
| Net Assets | | $30,686,814,707 |
| Net Assets consist of: | | |
| Paid in capital | | $30,051,708,899 |
| Undistributed net investment income | | 75,408,591 |
| Accumulated undistributed net realized gain (loss) on investments and foreign currency transactions | | (12,978,582) |
| Net unrealized appreciation (depreciation) on investments and assets and liabilities in foreign currencies | | 572,675,799 |
| Net Assets | | $30,686,814,707 |
| Calculation of Maximum Offering Price | | |
| Class A: | | |
| Net Asset Value and redemption price per share ($521,556,531 ÷ 48,436,750 shares) | | $10.77 |
| Maximum offering price per share (100/96.00 of $10.77) | | $11.22 |
| Class M: | | |
| Net Asset Value and redemption price per share ($287,111,214 ÷ 26,710,885 shares) | | $10.75 |
| Maximum offering price per share (100/96.00 of $10.75) | | $11.20 |
| Class C: | | |
| Net Asset Value and offering price per share ($190,272,706 ÷ 17,664,771 shares)(a) | | $10.77 |
| Total Bond: | | |
| Net Asset Value, offering price and redemption price per share ($23,732,155,846 ÷ 2,204,851,985 shares) | | $10.76 |
| Class I: | | |
| Net Asset Value, offering price and redemption price per share ($4,481,724,927 ÷ 417,020,311 shares) | | $10.75 |
| Class Z: | | |
| Net Asset Value, offering price and redemption price per share ($1,473,993,483 ÷ 137,143,400 shares) | | $10.75 |
(a) Redemption price per share is equal to net asset value less any applicable contingent deferred sales charge.
See accompanying notes which are an integral part of the financial statements.
Statement of Operations
| | | Year ended August 31, 2017 |
| Investment Income | | |
| Dividends | | $13,698,805 |
| Interest | | 883,295,281 |
| Income from Fidelity Central Funds | | 8,039,538 |
| Total income | | 905,033,624 |
| Expenses | | |
| Management fee | $85,064,637 | |
| Transfer agent fees | 28,873,471 | |
| Distribution and service plan fees | 4,485,429 | |
| Fund wide operations fee | 11,243,438 | |
| Independent trustees' fees and expenses | 106,598 | |
| Legal | 328 | |
| Miscellaneous | 87,092 | |
| Total expenses before reductions | 129,860,993 | |
| Expense reductions | (130,904) | 129,730,089 |
| Net investment income (loss) | | 775,303,535 |
| Realized and Unrealized Gain (Loss) | | |
| Net realized gain (loss) on: | | |
| Investment securities: | | |
| Unaffiliated issuers | 36,962,512 | |
| Fidelity Central Funds | 238,489 | |
| Forward foreign currency contracts | (3,031,949) | |
| Foreign currency transactions | (1,234,691) | |
| Futures contracts | 1,594,426 | |
| Swaps | 1,651,830 | |
| Total net realized gain (loss) | | 36,180,617 |
| Change in net unrealized appreciation (depreciation) on: | | |
| Investment securities: | | |
| Unaffiliated issuers | (183,867,410) | |
| Fidelity Central Funds | 80,283 | |
| Forward foreign currency contracts | (2,063,717) | |
| Assets and liabilities in foreign currencies | 186,262 | |
| Futures contracts | (1,058,889) | |
| Swaps | 339,492 | |
| Delayed delivery commitments | (661,826) | |
| Total change in net unrealized appreciation (depreciation) | | (187,045,805) |
| Net gain (loss) | | (150,865,188) |
| Net increase (decrease) in net assets resulting from operations | | $624,438,347 |
See accompanying notes which are an integral part of the financial statements.
Statement of Changes in Net Assets
| | Year ended August 31, 2017 | Year ended August 31, 2016 |
| Increase (Decrease) in Net Assets | | |
| Operations | | |
| Net investment income (loss) | $775,303,535 | $735,703,076 |
| Net realized gain (loss) | 36,180,617 | 29,226,743 |
| Change in net unrealized appreciation (depreciation) | (187,045,805) | 815,523,532 |
| Net increase (decrease) in net assets resulting from operations | 624,438,347 | 1,580,453,351 |
| Distributions to shareholders from net investment income | (739,976,289) | (690,311,363) |
| Distributions to shareholders from net realized gain | (67,918,257) | (113,897,060) |
| Total distributions | (807,894,546) | (804,208,423) |
| Share transactions - net increase (decrease) | 5,166,571,919 | 4,657,836,676 |
| Total increase (decrease) in net assets | 4,983,115,720 | 5,434,081,604 |
| Net Assets | | |
| Beginning of period | 25,703,698,987 | 20,269,617,383 |
| End of period | $30,686,814,707 | $25,703,698,987 |
| Other Information | | |
| Undistributed net investment income end of period | $75,408,591 | $61,951,817 |
See accompanying notes which are an integral part of the financial statements.
Financial Highlights — Fidelity Total Bond Fund Class A
| Years ended August 31, | 2017 | 2016 | 2015 | 2014 | 2013 |
| Selected Per–Share Data | | | | | |
| Net asset value, beginning of period | $10.87 | $10.53 | $10.77 | $10.48 | $11.29 |
| Income from Investment Operations | | | | | |
| Net investment income (loss)A | .272 | .312 | .287 | .292 | .263 |
| Net realized and unrealized gain (loss) | (.086) | .377 | (.224) | .382 | (.468) |
| Total from investment operations | .186 | .689 | .063 | .674 | (.205) |
| Distributions from net investment income | (.258) | (.290) | (.270) | (.275) | (.250) |
| Distributions from net realized gain | (.028) | (.059) | (.033) | (.109) | (.355) |
| Total distributions | (.286) | (.349) | (.303) | (.384) | (.605) |
| Net asset value, end of period | $10.77 | $10.87 | $10.53 | $10.77 | $10.48 |
| Total ReturnB,C | 1.77% | 6.71% | .58% | 6.56% | (1.94)% |
| Ratios to Average Net AssetsD,E | | | | | |
| Expenses before reductions | .75% | .75% | .75% | .76% | .79% |
| Expenses net of fee waivers, if any | .75% | .75% | .75% | .76% | .79% |
| Expenses net of all reductions | .75% | .75% | .75% | .76% | .79% |
| Net investment income (loss) | 2.53% | 2.95% | 2.69% | 2.76% | 2.41% |
| Supplemental Data | | | | | |
| Net assets, end of period (000 omitted) | $521,557 | $1,233,806 | $852,243 | $639,235 | $517,259 |
| Portfolio turnover rateF | 137% | 134% | 140%G | 108% | 201% |
A Calculated based on average shares outstanding during the period.
B Total returns would have been lower if certain expenses had not been reduced during the applicable periods shown.
C Total returns do not include the effect of the sales charges.
D Fees and expenses of any underlying Fidelity Central Funds are not included in the Fund's expense ratio. The Fund indirectly bears its proportionate share of the expenses of any underlying Fidelity Central Funds.
E Expense ratios reflect operating expenses of the class. Expenses before reductions do not reflect amounts reimbursed by the investment adviser or reductions from brokerage service arrangements or reductions from other expense offset arrangements and do not represent the amount paid by the class during periods when reimbursements or reductions occur. Expenses net of fee waivers reflect expenses after reimbursement by the investment adviser but prior to reductions from brokerage service arrangements or other expense offset arrangements. Expenses net of all reductions represent the net expenses paid by the class.
F Amount does not include the portfolio activity of any underlying Fidelity Central Funds.
G Portfolio turnover rate excludes securities received or delivered in-kind.
See accompanying notes which are an integral part of the financial statements.
Financial Highlights — Fidelity Total Bond Fund Class M
| Years ended August 31, | 2017 | 2016 | 2015 | 2014 | 2013 |
| Selected Per–Share Data | | | | | |
| Net asset value, beginning of period | $10.85 | $10.51 | $10.76 | $10.46 | $11.28 |
| Income from Investment Operations | | | | | |
| Net investment income (loss)A | .267 | .309 | .285 | .290 | .265 |
| Net realized and unrealized gain (loss) | (.083) | .378 | (.234) | .392 | (.477) |
| Total from investment operations | .184 | .687 | .051 | .682 | (.212) |
| Distributions from net investment income | (.256) | (.288) | (.268) | (.273) | (.253) |
| Distributions from net realized gain | (.028) | (.059) | (.033) | (.109) | (.355) |
| Total distributions | (.284) | (.347) | (.301) | (.382) | (.608) |
| Net asset value, end of period | $10.75 | $10.85 | $10.51 | $10.76 | $10.46 |
| Total ReturnB,C | 1.76% | 6.71% | .47% | 6.65% | (2.01)% |
| Ratios to Average Net AssetsD,E | | | | | |
| Expenses before reductions | .76% | .77% | .77% | .78% | .76% |
| Expenses net of fee waivers, if any | .76% | .77% | .77% | .78% | .76% |
| Expenses net of all reductions | .76% | .77% | .77% | .78% | .76% |
| Net investment income (loss) | 2.53% | 2.94% | 2.67% | 2.74% | 2.44% |
| Supplemental Data | | | | | |
| Net assets, end of period (000 omitted) | $287,111 | $155,518 | $101,673 | $57,972 | $52,848 |
| Portfolio turnover rateF | 137% | 134% | 140%G | 108% | 201% |
A Calculated based on average shares outstanding during the period.
B Total returns would have been lower if certain expenses had not been reduced during the applicable periods shown.
C Total returns do not include the effect of the sales charges.
D Fees and expenses of any underlying Fidelity Central Funds are not included in the Fund's expense ratio. The Fund indirectly bears its proportionate share of the expenses of any underlying Fidelity Central Funds.
E Expense ratios reflect operating expenses of the class. Expenses before reductions do not reflect amounts reimbursed by the investment adviser or reductions from brokerage service arrangements or reductions from other expense offset arrangements and do not represent the amount paid by the class during periods when reimbursements or reductions occur. Expenses net of fee waivers reflect expenses after reimbursement by the investment adviser but prior to reductions from brokerage service arrangements or other expense offset arrangements. Expenses net of all reductions represent the net expenses paid by the class.
F Amount does not include the portfolio activity of any underlying Fidelity Central Funds.
G Portfolio turnover rate excludes securities received or delivered in-kind.
See accompanying notes which are an integral part of the financial statements.
Financial Highlights — Fidelity Total Bond Fund Class C
| Years ended August 31, | 2017 | 2016 | 2015 | 2014 | 2013 |
| Selected Per–Share Data | | | | | |
| Net asset value, beginning of period | $10.87 | $10.53 | $10.77 | $10.48 | $11.29 |
| Income from Investment Operations | | | | | |
| Net investment income (loss)A | .188 | .231 | .205 | .211 | .185 |
| Net realized and unrealized gain (loss) | (.084) | .378 | (.225) | .382 | (.469) |
| Total from investment operations | .104 | .609 | (.020) | .593 | (.284) |
| Distributions from net investment income | (.176) | (.210) | (.187) | (.194) | (.171) |
| Distributions from net realized gain | (.028) | (.059) | (.033) | (.109) | (.355) |
| Total distributions | (.204) | (.269) | (.220) | (.303) | (.526) |
| Net asset value, end of period | $10.77 | $10.87 | $10.53 | $10.77 | $10.48 |
| Total ReturnB,C | .99% | 5.90% | (.20)% | 5.75% | (2.65)% |
| Ratios to Average Net AssetsD,E | | | | | |
| Expenses before reductions | 1.52% | 1.52% | 1.53% | 1.53% | 1.51% |
| Expenses net of fee waivers, if any | 1.52% | 1.52% | 1.53% | 1.53% | 1.51% |
| Expenses net of all reductions | 1.52% | 1.52% | 1.53% | 1.53% | 1.51% |
| Net investment income (loss) | 1.77% | 2.19% | 1.92% | 1.99% | 1.69% |
| Supplemental Data | | | | | |
| Net assets, end of period (000 omitted) | $190,273 | $186,380 | $139,264 | $83,818 | $79,711 |
| Portfolio turnover rateF | 137% | 134% | 140%G | 108% | 201% |
A Calculated based on average shares outstanding during the period.
B Total returns would have been lower if certain expenses had not been reduced during the applicable periods shown.
C Total returns do not include the effect of the contingent deferred sales charge.
D Fees and expenses of any underlying Fidelity Central Funds are not included in the Fund's expense ratio. The Fund indirectly bears its proportionate share of the expenses of any underlying Fidelity Central Funds.
E Expense ratios reflect operating expenses of the class. Expenses before reductions do not reflect amounts reimbursed by the investment adviser or reductions from brokerage service arrangements or reductions from other expense offset arrangements and do not represent the amount paid by the class during periods when reimbursements or reductions occur. Expenses net of fee waivers reflect expenses after reimbursement by the investment adviser but prior to reductions from brokerage service arrangements or other expense offset arrangements. Expenses net of all reductions represent the net expenses paid by the class.
F Amount does not include the portfolio activity of any underlying Fidelity Central Funds.
G Portfolio turnover rate excludes securities received or delivered in-kind.
See accompanying notes which are an integral part of the financial statements.
Financial Highlights — Fidelity Total Bond Fund
| Years ended August 31, | 2017 | 2016 | 2015 | 2014 | 2013 |
| Selected Per–Share Data | | | | | |
| Net asset value, beginning of period | $10.86 | $10.53 | $10.77 | $10.47 | $11.29 |
| Income from Investment Operations | | | | | |
| Net investment income (loss)A | .302 | .343 | .320 | .326 | .300 |
| Net realized and unrealized gain (loss) | (.085) | .368 | (.224) | .392 | (.478) |
| Total from investment operations | .217 | .711 | .096 | .718 | (.178) |
| Distributions from net investment income | (.289) | (.322) | (.303) | (.309) | (.287) |
| Distributions from net realized gain | (.028) | (.059) | (.033) | (.109) | (.355) |
| Total distributions | (.317) | (.381) | (.336) | (.418) | (.642) |
| Net asset value, end of period | $10.76 | $10.86 | $10.53 | $10.77 | $10.47 |
| Total ReturnB | 2.07% | 6.94% | .88% | 7.00% | (1.70)% |
| Ratios to Average Net AssetsC,D | | | | | |
| Expenses before reductions | .45% | .45% | .45% | .45% | .45% |
| Expenses net of fee waivers, if any | .45% | .45% | .45% | .45% | .45% |
| Expenses net of all reductions | .45% | .45% | .45% | .45% | .45% |
| Net investment income (loss) | 2.84% | 3.25% | 2.99% | 3.07% | 2.75% |
| Supplemental Data | | | | | |
| Net assets, end of period (000 omitted) | $23,732,156 | $20,469,677 | $17,359,294 | $14,547,801 | $11,526,014 |
| Portfolio turnover rateE | 137% | 134% | 140%F | 108% | 201% |
A Calculated based on average shares outstanding during the period.
B Total returns would have been lower if certain expenses had not been reduced during the applicable periods shown.
C Fees and expenses of any underlying Fidelity Central Funds are not included in the Fund's expense ratio. The Fund indirectly bears its proportionate share of the expenses of any underlying Fidelity Central Funds.
D Expense ratios reflect operating expenses of the class. Expenses before reductions do not reflect amounts reimbursed by the investment adviser or reductions from brokerage service arrangements or reductions from other expense offset arrangements and do not represent the amount paid by the class during periods when reimbursements or reductions occur. Expenses net of fee waivers reflect expenses after reimbursement by the investment adviser but prior to reductions from brokerage service arrangements or other expense offset arrangements. Expenses net of all reductions represent the net expenses paid by the class.
E Amount does not include the portfolio activity of any underlying Fidelity Central Funds.
F Portfolio turnover rate excludes securities received or delivered in-kind.
See accompanying notes which are an integral part of the financial statements.
Financial Highlights — Fidelity Total Bond Fund Class I
| Years ended August 31, | 2017 | 2016 | 2015 | 2014 | 2013 |
| Selected Per–Share Data | | | | | |
| Net asset value, beginning of period | $10.85 | $10.51 | $10.76 | $10.46 | $11.27 |
| Income from Investment Operations | | | | | |
| Net investment income (loss)A | .295 | .337 | .313 | .319 | .295 |
| Net realized and unrealized gain (loss) | (.083) | .378 | (.233) | .393 | (.469) |
| Total from investment operations | .212 | .715 | .080 | .712 | (.174) |
| Distributions from net investment income | (.284) | (.316) | (.297) | (.303) | (.281) |
| Distributions from net realized gain | (.028) | (.059) | (.033) | (.109) | (.355) |
| Total distributions | (.312) | (.375) | (.330) | (.412) | (.636) |
| Net asset value, end of period | $10.75 | $10.85 | $10.51 | $10.76 | $10.46 |
| Total ReturnB | 2.02% | 6.99% | .73% | 6.95% | (1.67)% |
| Ratios to Average Net AssetsC,D | | | | | |
| Expenses before reductions | .50% | .50% | .50% | .51% | .51% |
| Expenses net of fee waivers, if any | .50% | .50% | .50% | .51% | .51% |
| Expenses net of all reductions | .50% | .50% | .50% | .51% | .51% |
| Net investment income (loss) | 2.79% | 3.20% | 2.94% | 3.02% | 2.69% |
| Supplemental Data | | | | | |
| Net assets, end of period (000 omitted) | $4,481,725 | $2,846,878 | $1,266,870 | $573,410 | $244,911 |
| Portfolio turnover rateE | 137% | 134% | 140%F | 108% | 201% |
A Calculated based on average shares outstanding during the period.
B Total returns would have been lower if certain expenses had not been reduced during the applicable periods shown.
C Fees and expenses of any underlying Fidelity Central Funds are not included in the Fund's expense ratio. The Fund indirectly bears its proportionate share of the expenses of any underlying Fidelity Central Funds.
D Expense ratios reflect operating expenses of the class. Expenses before reductions do not reflect amounts reimbursed by the investment adviser or reductions from brokerage service arrangements or reductions from other expense offset arrangements and do not represent the amount paid by the class during periods when reimbursements or reductions occur. Expenses net of fee waivers reflect expenses after reimbursement by the investment adviser but prior to reductions from brokerage service arrangements or other expense offset arrangements. Expenses net of all reductions represent the net expenses paid by the class.
E Amount does not include the portfolio activity of any underlying Fidelity Central Funds.
F Portfolio turnover rate excludes securities received or delivered in-kind.
See accompanying notes which are an integral part of the financial statements.
Financial Highlights — Fidelity Total Bond Fund Class Z
| Years ended August 31, | 2017 | 2016 | 2015 A |
| Selected Per–Share Data | | | |
| Net asset value, beginning of period | $10.85 | $10.51 | $10.66 |
| Income from Investment Operations | | | |
| Net investment income (loss)B | .310 | .352 | .234 |
| Net realized and unrealized gain (loss) | (.083) | .378 | (.167) |
| Total from investment operations | .227 | .730 | .067 |
| Distributions from net investment income | (.299) | (.331) | (.217) |
| Distributions from net realized gain | (.028) | (.059) | – |
| Total distributions | (.327) | (.390) | (.217) |
| Net asset value, end of period | $10.75 | $10.85 | $10.51 |
| Total ReturnC,D | 2.16% | 7.14% | .59% |
| Ratios to Average Net AssetsE,F | | | |
| Expenses before reductions | .36% | .36% | .36%G |
| Expenses net of fee waivers, if any | .36% | .36% | .36%G |
| Expenses net of all reductions | .36% | .36% | .36%G |
| Net investment income (loss) | 2.93% | 3.34% | 3.29%G |
| Supplemental Data | | | |
| Net assets, end of period (000 omitted) | $1,473,993 | $811,440 | $546,968 |
| Portfolio turnover rateH | 137% | 134% | 140%I |
A For the period December 22, 2014 (commencement of sale of shares) to August 31, 2015.
B Calculated based on average shares outstanding during the period.
C Total returns for periods of less than one year are not annualized.
D Total returns would have been lower if certain expenses had not been reduced during the applicable periods shown.
E Fees and expenses of any underlying Fidelity Central Funds are not included in the Fund's expense ratio. The Fund indirectly bears its proportionate share of the expenses of any underlying Fidelity Central Funds.
F Expense ratios reflect operating expenses of the class. Expenses before reductions do not reflect amounts reimbursed by the investment adviser or reductions from brokerage service arrangements or reductions from other expense offset arrangements and do not represent the amount paid by the class during periods when reimbursements or reductions occur. Expense ratios before reductions for start-up periods may not be representative of longer-term operating periods. Expenses net of fee waivers reflect expenses after reimbursement by the investment adviser but prior to reductions from brokerage service arrangements or other expense offset arrangements. Expenses net of all reductions represent the net expenses paid by the class.
G Annualized
H Amount does not include the portfolio activity of any underlying Fidelity Central Funds.
I Portfolio turnover rate excludes securities received or delivered in-kind.
See accompanying notes which are an integral part of the financial statements.
Notes to Financial Statements
For the period ended August 31, 2017
1. Organization.
Fidelity Total Bond Fund (the Fund) is a fund of Fidelity Income Fund (the Trust) and is authorized to issue an unlimited number of shares. The Trust is registered under the Investment Company Act of 1940, as amended (the 1940 Act), as an open-end management investment company organized as a Massachusetts business trust. The Fund offers Class A, Class M (formerly Class T), Class C, Total Bond, Class I and Class Z shares, each of which has equal rights as to assets and voting privileges. Each class has exclusive voting rights with respect to matters that affect that class.
After the close of business on June 24, 2016, all outstanding Class B shares were converted to Class A shares. All prior fiscal period dollar and share amounts for Class B presented in the Notes to Financial Statements are for the period September 1, 2015 through June 24, 2016.
2. Investments in Fidelity Central Funds.
The Fund invests in Fidelity Central Funds, which are open-end investment companies generally available only to other investment companies and accounts managed by the investment adviser and its affiliates. The Fund's Schedule of Investments lists each of the Fidelity Central Funds held as of period end, if any, as an investment of the Fund, but does not include the underlying holdings of each Fidelity Central Fund. As an Investing Fund, the Fund indirectly bears its proportionate share of the expenses of the underlying Fidelity Central Funds.
The Money Market Central Funds seek preservation of capital and current income and are managed by Fidelity Investments Money Management, Inc. (FIMM), an affiliate of the investment adviser. Annualized expenses of the Money Market Central Funds as of their most recent shareholder report date are less than .005%.
A complete unaudited list of holdings for each Fidelity Central Fund is available upon request or at the Securities and Exchange Commission (the SEC) website at www.sec.gov. In addition, the financial statements of the Fidelity Central Funds, which are not covered by the Fund's Report of Independent Registered Public Accounting Firm, are available on the SEC website or upon request.
3. Significant Accounting Policies.
The Fund is an investment company and applies the accounting and reporting guidance of the Financial Accounting Standards Board (FASB) Accounting Standards Codification Topic 946 Financial Services – Investments Companies. The financial statements have been prepared in conformity with accounting principles generally accepted in the United States of America (GAAP), which require management to make certain estimates and assumptions at the date of the financial statements. Actual results could differ from those estimates. Subsequent events, if any, through the date that the financial statements were issued have been evaluated in the preparation of the financial statements. The following summarizes the significant accounting policies of the Fund:
Investment Valuation. Investments are valued as of 4:00 p.m. Eastern time on the last calendar day of the period. The Board of Trustees (the Board) has delegated the day to day responsibility for the valuation of the Fund's investments to the Fair Value Committee (the Committee) established by the Fund's investment adviser. In accordance with valuation policies and procedures approved by the Board, the Fund attempts to obtain prices from one or more third party pricing vendors or brokers to value its investments. When current market prices, quotations or currency exchange rates are not readily available or reliable, investments will be fair valued in good faith by the Committee, in accordance with procedures adopted by the Board. Factors used in determining fair value vary by investment type and may include market or investment specific events, changes in interest rates and credit quality. The frequency with which these procedures are used cannot be predicted and they may be utilized to a significant extent. The Committee oversees the Fund's valuation policies and procedures and reports to the Board on the Committee's activities and fair value determinations. The Board monitors the appropriateness of the procedures used in valuing the Fund's investments and ratifies the fair value determinations of the Committee.
The Fund categorizes the inputs to valuation techniques used to value its investments into a disclosure hierarchy consisting of three levels as shown below:
- Level 1 – quoted prices in active markets for identical investments
- Level 2 – other significant observable inputs (including quoted prices for similar investments, interest rates, prepayment speeds, etc.)
- Level 3 – unobservable inputs (including the Fund's own assumptions based on the best information available)
Valuation techniques used to value the Fund's investments by major category are as follows:
Debt securities, including restricted securities, are valued based on evaluated prices received from third party pricing vendors or from brokers who make markets in such securities. Corporate bonds, bank notes, bank loan obligations, foreign government and government agency obligations, municipal securities, preferred securities, U.S. government and government agency obligations and sovereign loan participations are valued by pricing vendors who utilize matrix pricing which considers yield or price of bonds of comparable quality, coupon, maturity and type or by broker-supplied prices. Asset backed securities, collateralized mortgage obligations, commercial mortgage securities and U.S. government agency mortgage securities are valued by pricing vendors who utilize matrix pricing which considers prepayment speed assumptions, attributes of the collateral, yield or price of bonds of comparable quality, coupon, maturity and type or by broker-supplied prices. Swaps are marked-to-market daily based on valuations from third party pricing vendors, registered derivatives clearing organizations (clearinghouses) or broker-supplied valuations. These pricing sources may utilize inputs such as interest rate curves, credit spread curves, default possibilities and recovery rates. When independent prices are unavailable or unreliable, debt securities and swaps may be valued utilizing pricing methodologies which consider similar factors that would be used by third party pricing vendors. For foreign debt securities, when significant market or security specific events arise, valuations may be determined in good faith in accordance with procedures adopted by the Board. Debt securities and swaps are generally categorized as Level 2 in the hierarchy but may be Level 3 depending on the circumstances.
Equity securities, including restricted securities, for which market quotations are readily available, are valued at the last reported sale price or official closing price as reported by a third party pricing vendor on the primary market or exchange on which they are traded and are categorized as Level 1 in the hierarchy. In the event there were no sales during the day or closing prices are not available, securities are valued at the last quoted bid price or may be valued using the last available price and are generally categorized as Level 2 in the hierarchy. For foreign equity securities, when market or security specific events arise, comparisons to the valuation of American Depositary Receipts (ADRs), futures contracts, Exchange-Traded Funds (ETFs) and certain indexes as well as quoted prices for similar securities may be used and would be categorized as Level 2 in the hierarchy. Utilizing these techniques may result in transfers between Level 1 and Level 2. For equity securities, including restricted securities, where observable inputs are limited, assumptions about market activity and risk are used and these securities may be categorized as Level 3 in the hierarchy.
The U.S. dollar value of foreign currency contracts is determined using currency exchange rates supplied by a pricing service and are categorized as Level 2 in the hierarchy. Futures contracts are valued at the settlement price established each day by the board of trade or exchange on which they are traded and are categorized as Level 1 in the hierarchy. Options traded over-the-counter are valued using vendor or broker-supplied valuations and are categorized as Level 2 in the hierarchy. Investments in open-end mutual funds, including the Fidelity Central Funds, are valued at their closing net asset value (NAV) each business day and are categorized as Level 1 in the hierarchy.
Changes in valuation techniques may result in transfers in or out of an assigned level within the disclosure hierarchy. The aggregate value of investments by input level as of August 31, 2017 is included at the end of the Fund's Schedule of Investments.
Foreign Currency. Foreign-denominated assets, including investment securities, and liabilities are translated into U.S. dollars at the exchange rates at period end. Purchases and sales of investment securities, income and dividends received and expenses denominated in foreign currencies are translated into U.S. dollars at the exchange rate in effect on the transaction date.
The effects of exchange rate fluctuations on investments are included with the net realized and unrealized gain (loss) on investment securities. Other foreign currency transactions resulting in realized and unrealized gain (loss) are disclosed separately.
Realized gains and losses on foreign currency transactions arise from the disposition of foreign currency, realized changes in the value of foreign currency between the trade and settlement dates on security transactions, and the difference between the amounts of dividends, interest and foreign withholding taxes recorded on transaction date and the U.S. dollar equivalent of the amounts actually received or paid. Unrealized gains and losses on assets and liabilities in foreign currencies arise from changes in the value of foreign currency, and from assets and liabilities denominated in foreign currencies, other than investments, which are held at period end.
Investment Transactions and Income. For financial reporting purposes, the Fund's investment holdings and NAV include trades executed through the end of the last business day of the period. The NAV per share for processing shareholder transactions is calculated as of the close of business of the New York Stock Exchange (NYSE), normally 4:00 p.m. Eastern time and includes trades executed through the end of the prior business day. Gains and losses on securities sold are determined on the basis of identified cost and may include proceeds received from litigation. Dividend income is recorded on the ex-dividend date, except for certain dividends from foreign securities where the ex-dividend date may have passed, which are recorded as soon as the Fund is informed of the ex-dividend date. Non-cash dividends included in dividend income, if any, are recorded at the fair market value of the securities received. Income and capital gain distributions from Fidelity Central Funds, if any, are recorded on the ex-dividend date. Certain distributions received by the Fund represent a return of capital or capital gain. The Fund determines the components of these distributions subsequent to the ex-dividend date, based upon receipt of tax filings or other correspondence relating to the underlying investment. These distributions are recorded as a reduction of cost of investments and/or as a realized gain. Interest income is accrued as earned and includes coupon interest and amortization of premium and accretion of discount on debt securities as applicable. Paid in Kind (PIK) income is recorded at the fair market value of the securities received. Investment income is recorded net of foreign taxes withheld where recovery of such taxes is uncertain. Debt obligations may be placed on non-accrual status and related interest income may be reduced by ceasing current accruals and writing off interest receivables when the collection of all or a portion of interest has become doubtful based on consistently applied procedures. A debt obligation is removed from non-accrual status when the issuer resumes interest payments or when collectability of interest is reasonably assured.
Class Allocations and Expenses. Investment income, realized and unrealized capital gains and losses, common expenses of the Fund, and certain fund-level expense reductions, if any, are allocated daily on a pro-rata basis to each class based on the relative net assets of each class to the total net assets of the Fund. Each class differs with respect to transfer agent and distribution and service plan fees incurred. Certain expense reductions may also differ by class. For the reporting period, the allocated portion of income and expenses to each class as a percent of its average net assets may vary due to the timing of recording these transactions in relation to fluctuating net assets of the classes. Expenses directly attributable to a fund are charged to that fund. Expenses attributable to more than one fund are allocated among the respective funds on the basis of relative net assets or other appropriate methods. Expense estimates are accrued in the period to which they relate and adjustments are made when actual amounts are known.
Deferred Trustee Compensation. Under a Deferred Compensation Plan (the Plan), independent Trustees may elect to defer receipt of a portion of their annual compensation. Deferred amounts are invested in a cross-section of Fidelity funds, are marked-to-market and remain in the Fund until distributed in accordance with the Plan. The investment of deferred amounts and the offsetting payable to the Trustees are included in the accompanying Statement of Assets and Liabilities.
Income Tax Information and Distributions to Shareholders. Each year, the Fund intends to qualify as a regulated investment company under Subchapter M of the Internal Revenue Code, including distributing substantially all of its taxable income and realized gains. As a result, no provision for U.S. Federal income taxes is required. As of August 31, 2017, the Fund did not have any unrecognized tax benefits in the financial statements; nor is the Fund aware of any tax positions for which it is reasonably possible that the total amounts of unrecognized tax benefits will significantly change in the next twelve months. The Fund files a U.S. federal tax return, in addition to state and local tax returns as required. The Fund's federal income tax returns are subject to examination by the Internal Revenue Service (IRS) for a period of three fiscal years after they are filed. State and local tax returns may be subject to examination for an additional fiscal year depending on the jurisdiction. Foreign taxes are provided for based on the Fund's understanding of the tax rules and rates that exist in the foreign markets in which it invests.
Dividends are declared and recorded daily and paid monthly from net investment income. Distributions from realized gains, if any, are declared and recorded on the ex-dividend date. Income dividends and capital gain distributions are declared separately for each class. Income and capital gain distributions are determined in accordance with income tax regulations, which may differ from GAAP. In addition, the Fund claimed a portion of the payment made to redeeming shareholders as a distribution for income tax purposes.
Capital accounts within the financial statements are adjusted for permanent book-tax differences. These adjustments have no impact on net assets or the results of operations. Capital accounts are not adjusted for temporary book-tax differences which will reverse in a subsequent period.
Book-tax differences are primarily due to futures contracts, swaps, foreign currency transactions, defaulted bonds, certain conversion ratio adjustments, market discount, deferred trustees compensation and losses deferred due to wash sales and excise tax regulations.
As of period end, the cost and unrealized appreciation (depreciation) in securities, and derivatives if applicable, for federal income tax purposes were as follows:
| Gross unrealized appreciation | $793,080,160 |
| Gross unrealized depreciation | (188,993,869) |
| Net unrealized appreciation (depreciation) | $604,086,291 |
| Tax Cost | $30,659,936,797 |
The tax-based components of distributable earnings as of period end were as follows:
| Undistributed ordinary income | $32,121,732 |
| Undistributed long-term capital gain | $68,811,082 |
| Net unrealized appreciation (depreciation) on securities and other investments | $583,387,936 |
The Fund intends to elect to defer to its next fiscal year $49,045,791 of capital losses recognized during the period November 1, 2016 to August 31, 2017.
The tax character of distributions paid was as follows:
| | August 31, 2017 | August 31, 2016 |
| Ordinary Income | $773,871,373 | $ 736,642,371 |
| Long-term Capital Gains | 34,023,173 | 67,566,052 |
| Total | $807,894,546 | $ 804,208,423 |
Delayed Delivery Transactions and When-Issued Securities. During the period, the Fund transacted in securities on a delayed delivery or when-issued basis. Payment and delivery may take place after the customary settlement period for that security. The price of the underlying securities and the date when the securities will be delivered and paid for are fixed at the time the transaction is negotiated. The securities purchased on a delayed delivery or when-issued basis are identified as such in the Fund's Schedule of Investments. The Fund may receive compensation for interest forgone in the purchase of a delayed delivery or when-issued security. With respect to purchase commitments, the Fund identifies securities as segregated in its records with a value at least equal to the amount of the commitment. Losses may arise due to changes in the value of the underlying securities or if the counterparty does not perform under the contract's terms, or if the issuer does not issue the securities due to political, economic, or other factors.
To-Be-Announced (TBA) Securities and Mortgage Dollar Rolls. During the period, the Fund transacted in TBA securities that involved buying or selling mortgage-backed securities (MBS) on a forward commitment basis. A TBA transaction typically does not designate the actual security to be delivered and only includes an approximate principal amount; however delivered securities must meet specified terms defined by industry guidelines, including issuer, rate and current principal amount outstanding on underlying mortgage pools. The Fund may enter into a TBA transaction with the intent to take possession of or deliver the underlying MBS, or the Fund may elect to extend the settlement by entering into either a mortgage or reverse mortgage dollar roll. Mortgage dollar rolls are transactions where a fund sells TBA securities and simultaneously agrees to repurchase MBS on a later date at a lower price and with the same counterparty. Reverse mortgage dollar rolls involve the purchase and simultaneous agreement to sell TBA securities on a later date at a lower price. Transactions in mortgage dollar rolls and reverse mortgage dollar rolls are accounted for as purchases and sales and may result in an increase to the Fund's portfolio turnover rate.
Purchases and sales of TBA securities involve risks similar to those discussed above for delayed delivery and when-issued securities. Also, if the counterparty in a mortgage dollar roll or a reverse mortgage dollar roll transaction files for bankruptcy or becomes insolvent, the Fund's right to repurchase or sell securities may be limited. Additionally, when a fund sells TBA securities without already owning or having the right to obtain the deliverable securities (an uncovered forward commitment to sell), it incurs a risk of loss because it could have to purchase the securities at a price that is higher than the price at which it sold them. A fund may be unable to purchase the deliverable securities if the corresponding market is illiquid.
TBA securities subject to a forward commitment to sell at period end are included at the end of the Fund's Schedule of Investments under the caption "TBA Sale Commitments." The proceeds and value of these commitments are reflected in the Fund's Statement of Assets and Liabilities as Receivable for TBA sale commitments and TBA sale commitments, at value, respectively.
Restricted Securities. The Fund may invest in securities that are subject to legal or contractual restrictions on resale. These securities generally may be resold in transactions exempt from registration or to the public if the securities are registered. Disposal of these securities may involve time-consuming negotiations and expense, and prompt sale at an acceptable price may be difficult. Information regarding restricted securities is included at the end of the Fund's Schedule of Investments.
Loans and Other Direct Debt Instruments. The Fund invests in direct debt instruments which are interests in amounts owed to lenders by corporate or other borrowers. These instruments may be in the form of loans, trade claims or other receivables and may include standby financing commitments such as revolving credit facilities that obligate the Fund to supply additional cash to the borrower on demand. Loans may be acquired through assignment or participation. The Fund also invests in unfunded loan commitments, which are contractual obligations for future funding. Information regarding unfunded commitments is included at the end of the Fund's Schedule of Investments.
New Accounting Pronouncement. In March 2017, the Financial Accounting Standards Board (FASB) issued an Accounting Standards Update (ASU), ASU 2017-08, which amends the amortization period for certain callable debt securities that are held at a premium. The amendment requires the premium to be amortized to the earliest call date. The amendments do not require an accounting change for securities held at a discount. The ASU is effective for annual periods beginning after December 15, 2018. Management is currently evaluating the potential impact of these changes to the financial statements.
4. Derivative Instruments.
Risk Exposures and the Use of Derivative Instruments. The Fund's investment objective allows the Fund to enter into various types of derivative contracts, including futures contracts, forward foreign currency contracts, options and swaps. Derivatives are investments whose value is primarily derived from underlying assets, indices or reference rates and may be transacted on an exchange or over-the-counter (OTC). Derivatives may involve a future commitment to buy or sell a specified asset based on specified terms, to exchange future cash flows at periodic intervals based on a notional principal amount, or for one party to make one or more payments upon the occurrence of specified events in exchange for periodic payments from the other party.
The Fund used derivatives to increase returns, to gain exposure to certain types of assets, to facilitate transactions in foreign-denominated securities and to manage exposure to certain risks as defined below. The success of any strategy involving derivatives depends on analysis of numerous economic factors, and if the strategies for investment do not work as intended, the Fund may not achieve its objectives.
The Fund's use of derivatives increased or decreased its exposure to the following risks:
| Credit Risk | Credit risk relates to the ability of the issuer of a financial instrument to make further principal or interest payments on an obligation or commitment that it has to the Fund.
|
| Foreign Exchange Risk | Foreign exchange rate risk relates to fluctuations in the value of an asset or liability due to changes in currency exchange rates.
|
| Interest Rate Risk | Interest rate risk relates to the fluctuations in the value of interest-bearing securities due to changes in the prevailing levels of market interest rates. |
The Fund is also exposed to additional risks from investing in derivatives, such as liquidity risk and counterparty credit risk. Liquidity risk is the risk that the Fund will be unable to close out the derivative in the open market in a timely manner. Counterparty credit risk is the risk that the counterparty will not be able to fulfill its obligation to the Fund. Derivative counterparty credit risk is managed through formal evaluation of the creditworthiness of all potential counterparties. On certain OTC derivatives such as forward foreign currency contracts, options and bi-lateral swaps, the Fund attempts to reduce its exposure to counterparty credit risk by entering into an International Swaps and Derivatives Association, Inc. (ISDA) Master Agreement with each of its counterparties. The ISDA Master Agreement gives the Fund the right to terminate all transactions traded under such agreement upon the deterioration in the credit quality of the counterparty beyond specified levels. The ISDA Master Agreement gives each party the right, upon an event of default by the other party or a termination of the agreement, to close out all transactions traded under such agreement and to net amounts owed under each transaction to one net payable by one party to the other. To mitigate counterparty credit risk on bi-lateral OTC derivatives, the Fund receives collateral in the form of cash or securities once the Fund's net unrealized appreciation on outstanding derivative contracts under an ISDA Master Agreement exceeds certain applicable thresholds, subject to certain minimum transfer provisions. The collateral received is held in segregated accounts with the Fund's custodian bank in accordance with the collateral agreements entered into between the Fund, the counterparty and the Fund's custodian bank. The Fund could experience delays and costs in gaining access to the collateral even though it is held by the Fund's custodian bank. The Fund's maximum risk of loss from counterparty credit risk related to bi-lateral OTC derivatives is generally the aggregate unrealized appreciation and unpaid counterparty payments in excess of any collateral pledged by the counterparty to the Fund. The Fund may be required to pledge collateral for the benefit of the counterparties on bi-lateral OTC derivatives in an amount not less than each counterparty's unrealized appreciation on outstanding derivative contracts, subject to certain minimum transfer provisions, and any such pledged collateral is identified in the Schedule of Investments. Exchange-traded futures contracts are not covered by the ISDA Master Agreement; however counterparty credit risk related to exchange-traded futures contracts may be mitigated by the protection provided by the exchange on which they trade. Counterparty credit risk related to centrally cleared OTC swaps may be mitigated by the protection provided by the clearinghouse.
Investing in derivatives may involve greater risks than investing in the underlying assets directly and, to varying degrees, may involve risk of loss in excess of any initial investment and collateral received and amounts recognized in the Statement of Assets and Liabilities. In addition, there may be the risk that the change in value of the derivative contract does not correspond to the change in value of the underlying instrument.
Net Realized Gain (Loss) and Change in Net Unrealized Appreciation (Depreciation) on Derivatives. The table below, which reflects the impacts of derivatives on the financial performance of the Fund, summarizes the net realized gain (loss) and change in net unrealized appreciation (depreciation) for derivatives during the period as presented in the Statement of Operations.
| Primary Risk Exposure / Derivative Type | Net Realized Gain (Loss) | Change in Net Unrealized Appreciation (Depreciation) |
| Credit Risk | | |
| Purchased Options | $(2,893,722) | $304,630 |
| Swaps | 815,808 | (96,974) |
| Total Credit Risk | (2,077,914) | 207,656 |
| Foreign Exchange Risk | | |
| Forward Foreign Currency Contracts | (3,031,949) | (2,063,717) |
| Interest Rate Risk | | |
| Futures Contracts | 1,594,426 | (1,058,889) |
| Swaps | 836,022 | 436,466 |
| Total Interest Rate Risk | 2,430,448 | (622,423) |
| Totals | $(2,679,415) | $(2,478,484) |
A summary of the value of derivatives by primary risk exposure as of period end is included at the end of the Schedule of Investments.
Forward Foreign Currency Contracts. Forward foreign currency contracts represent obligations to purchase or sell foreign currency on a specified future date at a price fixed at the time the contracts are entered into. The Fund used forward foreign currency contracts to facilitate transactions in foreign-denominated securities and to manage exposure to certain foreign currencies.
Forward foreign currency contracts are valued daily and fluctuations in exchange rates on open contracts are recorded as unrealized appreciation or (depreciation) and reflected in the Statement of Assets and Liabilities. When the contract is closed, the Fund realizes a gain or loss equal to the difference between the closing value and the value at the time it was opened. Non-deliverable forward foreign currency exchange contracts are settled with the counterparty in cash without the delivery of foreign currency. The net realized gain (loss) and change in net unrealized appreciation (depreciation) on forward foreign currency contracts during the period is presented in the Statement of Operations.
Any open forward foreign currency contracts at period end are presented in the Schedule of Investments under the caption "Forward Foreign Currency Contracts." The contract amount and unrealized appreciation (depreciation) reflects each contract's exposure to the underlying currency at period end, and is representative of volume of activity during the period.
Futures Contracts. A futures contract is an agreement between two parties to buy or sell a specified underlying instrument for a fixed price at a specified future date. The Fund used futures contracts to manage its exposure to the bond market and fluctuations in interest rates.
Upon entering into a futures contract, a fund is required to deposit either cash or securities (initial margin) with a clearing broker in an amount equal to a certain percentage of the face value of the contract. Futures contracts are marked-to-market daily and subsequent daily payments (variation margin) are made or received by a fund depending on the daily fluctuations in the value of the futures contracts and are recorded as unrealized appreciation or (depreciation). This receivable and/or payable, if any, is included in daily variation margin on futures contracts in the Statement of Assets and Liabilities. Realized gain or (loss) is recorded upon the expiration or closing of a futures contract. The net realized gain (loss) and change in net unrealized appreciation (depreciation) on futures contracts during the period is included in the Statement of Operations.
Any open futures contracts at period end are presented in the Schedule of Investments under the caption "Futures Contracts". The underlying face amount at value reflects each contract's exposure to the underlying instrument or index at period end and is representative of volume of activity during the period. Securities deposited to meet initial margin requirements are identified in the Schedule of Investments.
Options. Options give the purchaser the right, but not the obligation, to buy (call) or sell (put) an underlying security or financial instrument at an agreed exercise or strike price between or on certain dates. Options obligate the seller (writer) to buy (put) or sell (call) an underlying instrument at the exercise or strike price or cash settle an underlying derivative instrument if the holder exercises the option on or before the expiration date. The Fund uses OTC options, such as swaptions, which are options where the underlying instrument is a swap, to manage its exposure to potential credit events.
Upon entering into an options contract, a fund will pay or receive a premium. Premiums paid on purchased options are reflected as cost of investments and premiums received on written options are reflected as a liability on the Statement of Assets and Liabilities. Certain options may be purchased or written with premiums to be paid or received on a future date. Options are valued daily and any unrealized appreciation (depreciation) is reflected on the Statement of Assets and Liabilities. When an option is exercised, the cost or proceeds of the underlying instrument purchased or sold is adjusted by the amount of the premium. When an option is closed the Fund will realize a gain or loss depending on whether the proceeds or amount paid for the closing sale transaction is greater or less than the premium received or paid. When an option expires, gains and losses are realized to the extent of premiums received and paid, respectively. The net realized and unrealized gains (losses) on purchased options are included on the Statement of Operations in net realized gain (loss) and change in net unrealized appreciation (depreciation) on investment securities. The net realized gain (loss) and change in net unrealized appreciation (depreciation) on written options are reflected separately on the Statement of Operations.
Any open options at period end are presented in the Schedule of Investments under the captions "Purchased Options," "Purchased Swaptions," "Written Options" and "Written Swaptions," as applicable, and are representative of volume of activity during the period.
Writing puts and buying calls tend to increase exposure to the underlying instrument while buying puts and writing calls tend to decrease exposure to the underlying instrument. For purchased options, risk of loss is limited to the premium paid, and for written options, risk of loss is the change in value in excess of the premium received.
Swaps. A swap is a contract between two parties to exchange future cash flows at periodic intervals based on a notional principal amount. A bi-lateral OTC swap is a transaction between a fund and a dealer counterparty where cash flows are exchanged between the two parties for the life of the swap. A centrally cleared OTC swap is a transaction executed between a fund and a dealer counterparty, then cleared by a futures commission merchant (FCM) through a clearinghouse. Once cleared, the clearinghouse serves as a central counterparty, with whom a fund exchanges cash flows for the life of the transaction, similar to transactions in futures contracts.
Bi-lateral OTC swaps are marked-to-market daily and changes in value are reflected in the Statement of Assets and Liabilities in the bi-lateral OTC swaps at value line items. Any upfront premiums paid or received upon entering a bi-lateral OTC swap to compensate for differences between stated terms of the swap and prevailing market conditions (e.g. credit spreads, interest rates or other factors) are recorded in net unrealized appreciation (depreciation) in the Statement of Assets and Liabilities and amortized to realized gain or (loss) ratably over the term of the swap. Any unamortized upfront premiums are presented in the Schedule of Investments.
Centrally cleared OTC swaps require a fund to deposit either cash or securities (initial margin) with the FCM, at the instruction of and for the benefit of the clearinghouse. Securities deposited to meet initial margin requirements are identified in the Schedule of Investments. Centrally cleared OTC swaps are marked-to-market daily and subsequent payments (variation margin) are made or received depending on the daily fluctuations in the value of the swaps and are recorded as unrealized appreciation or (depreciation). These daily payments, if any, are included in receivable or payable for daily variation margin on centrally cleared OTC swaps in the Statement of Assets and Liabilities. Any premiums for centrally cleared OTC swaps are recorded periodically throughout the term of the swap to variation margin and included in unrealized appreciation (depreciation) in the Statement of Assets and Liabilities. Any premiums are recognized as realized gain (loss) upon termination or maturity of the swap.
For both bi-lateral and centrally cleared OTC swaps, payments are exchanged at specified intervals, accrued daily commencing with the effective date of the contract and recorded as realized gain or (loss). Some swaps may be terminated prior to the effective date and realize a gain or loss upon termination. The net realized gain (loss) and change in net unrealized appreciation (depreciation) on swaps during the period is included in the Statement of Operations.
Any open swaps at period end are included in the Schedule of Investments under the caption "Swaps" and are representative of volume of activity during the period.
Credit Default Swaps. Credit default swaps enable the Fund to buy or sell protection against specified credit events on a single-name issuer or a traded credit index. Under the terms of a credit default swap the buyer of protection (buyer) receives credit protection in exchange for making periodic payments to the seller of protection (seller) based on a fixed percentage applied to a notional principal amount. In return for these payments, the seller will be required to make a payment upon the occurrence of one or more specified credit events. The Fund enters into credit default swaps as a seller to gain credit exposure to an issuer and/or as a buyer to obtain a measure of protection against defaults of an issuer. Periodic payments are made over the life of the contract by the buyer provided that no credit event occurs.
For credit default swaps on most corporate and sovereign issuers, credit events include bankruptcy, failure to pay or repudiation/moratorium. For credit default swaps on corporate or sovereign issuers, the obligation that may be put to the seller is not limited to the specific reference obligation described in the Schedule of Investments. For credit default swaps on asset-backed securities, a credit event may be triggered by events such as failure to pay principal, maturity extension, rating downgrade or write-down. For credit default swaps on asset-backed securities, the reference obligation described represents the security that may be put to the seller. For credit default swaps on a traded credit index, a specified credit event may affect all or individual underlying securities included in the index.
As a seller, if an underlying credit event occurs, the Fund will pay a net settlement amount of cash equal to the notional amount of the swap less the recovery value of the reference obligation or underlying securities comprising an index. Only in the event of the industry's inability to value the underlying asset will the Fund be required to take delivery of the reference obligation or underlying securities comprising an index and pay an amount equal to the notional amount of the swap.
As a buyer, if an underlying credit event occurs, the Fund will receive a net settlement amount of cash equal to the notional amount of the swap less the recovery value of the reference obligation or underlying securities comprising an index. Only in the event of the industry's inability to value the underlying asset will the Fund be required to deliver the reference obligation or underlying securities comprising an index in exchange for payment of an amount equal to the notional amount of the swap.
Typically, the value of each credit default swap and credit rating disclosed for each reference obligation in the Schedule of Investments, where the Fund is the seller, can be used as measures of the current payment/performance risk of the swap. As the value of the swap changes as a positive or negative percentage of the total notional amount, the payment/performance risk may decrease or increase, respectively. In addition to these measures, the investment adviser monitors a variety of factors including cash flow assumptions, market activity and market sentiment as part of its ongoing process of assessing payment/performance risk.
Interest Rate Swaps. Interest rate swaps are agreements between counterparties to exchange cash flows, one based on a fixed rate, and the other on a floating rate. The Fund entered into interest rate swaps to manage its exposure to interest rate changes. Changes in interest rates can have an effect on both the value of bond holdings as well as the amount of interest income earned. In general, the value of bonds can fall when interest rates rise and can rise when interest rates fall.
5. Purchases and Sales of Investments.
Purchases and sales of securities, other than short-term securities and U.S. government securities, aggregated $4,453,589,602 and $5,564,261,911, respectively.
6. Fees and Other Transactions with Affiliates.
Management Fee. Fidelity Management & Research Company (the investment adviser) and its affiliates provide the Fund with investment management related services for which the Fund pays a monthly management fee. The management fee is the sum of an individual fund fee rate that is based on an annual rate of .20% of the Fund's average net assets and an annualized group fee rate that averaged .11% during the period. The group fee rate is based upon the average net assets of all the mutual funds advised by the investment adviser, including any mutual funds previously advised by the investment adviser that are currently advised by Fidelity SelectCo, LLC, an affiliate of the investment adviser. The group fee rate decreases as assets under management increase and increases as assets under management decrease. For the reporting period, the total annual management fee rate was .31% of the Fund's average net assets.
Distribution and Service Plan Fees. In accordance with Rule 12b-1 of the 1940 Act, the Fund has adopted separate Distribution and Service Plans for each class of shares. Certain classes pay Fidelity Distributors Corporation (FDC), an affiliate of the investment adviser, separate Distribution and Service Fees, each of which is based on an annual percentage of each class' average net assets. In addition, FDC may pay financial intermediaries for selling shares of the Fund and providing shareholder support services. For the period, the Distribution and Service Fee rates, total fees and amounts retained by FDC were as follows:
| | Distribution
Fee | Service
Fee | Total Fees | Retained
by FDC |
| Class A | -% | .25% | $2,187,833 | $45,734 |
| Class M | -% | .25% | 459,616 | – |
| Class C | .75% | .25% | 1,837,980 | 439,039 |
| | | | $4,485,429 | $484,773 |
Sales Load. FDC may receive a front-end sales charge of up to 4.00% for selling Class A shares and Class M shares, some of which is paid to financial intermediaries for selling shares of the Fund. Depending on the holding period, FDC may receive contingent deferred sales charges levied on Class A, Class M and Class C redemptions. The deferred sales charges are 1.00% for Class C shares, .75% for certain purchases of Class A shares and .25% for certain purchases of Class M shares.
For the period, sales charge amounts retained by FDC were as follows:
| | Retained
by FDC |
| Class A | $82,367 |
| Class M | 12,239 |
| Class C(a) | 40,478 |
| | $135,084 |
(a) When Class C shares are initially sold, FDC pays commissions from its own resources to financial intermediaries through which the sales are made.
Transfer Agent Fees. Fidelity Investments Institutional Operations Company, Inc., (FIIOC), an affiliate of the investment adviser, is the transfer, dividend disbursing and shareholder servicing agent for each class of the Fund. FIIOC receives an asset-based fee of .10% of Total Bond's average net assets. FIIOC pays for typesetting, printing and mailing of shareholder reports, except proxy statements. For the period, transfer agent fees for each class were as follows:
| | Amount | % of
Class-Level Average
Net Assets |
| Class A | $1,330,914 | .15 |
| Class M | 293,015 | .16 |
| Class C | 307,738 | .17 |
| Total Bond | 21,619,174 | .10 |
| Class I | 5,206,681 | .15 |
| Class Z | 115,949 | .01 |
| | $28,873,471 | |
Fund Wide Operations Fee. Pursuant to the Fund Wide Operations and Expense Agreement (FWOE), the investment adviser has agreed to provide for fund level expenses (which do not include transfer agent, Rule 12b-1 fees, compensation of the independent Trustees, interest (including commitment fees), taxes or extraordinary expenses, if any) in return for a FWOE fee equal to .35% of the Fund's average net assets less the total amount of the management fee. The FWOE paid by the Fund is reduced by an amount equal to the fees and expenses paid to the independent Trustees. For the period, the FWOE fee was equivalent to an annual rate of .04% of average net assets.
Interfund Trades. The Fund may purchase from or sell securities to other Fidelity Funds under procedures adopted by the Board. The procedures have been designed to ensure these interfund trades are executed in accordance with Rule 17a-7 of the 1940 Act. Interfund trades are included within the respective purchases and sales amounts shown in the Purchases and Sales of Investments note.
Other. During the period, the investment adviser reimbursed the Fund for certain losses in the amount of $8,916.
7. Committed Line of Credit.
The Fund participates with other funds managed by the investment adviser or an affiliate in a $4.25 billion credit facility (the "line of credit") to be utilized for temporary or emergency purposes to fund shareholder redemptions or for other short-term liquidity purposes. The Fund has agreed to pay commitment fees on its pro-rata portion of the line of credit, which amounted to $87,044 and is reflected in Miscellaneous expenses on the Statement of Operations. During the period, the Fund did not borrow on this line of credit.
8. Security Lending.
The Fund lends portfolio securities from time to time in order to earn additional income. On the settlement date of the loan, the Fund receives collateral (in the form of U.S. Treasury obligations, letters of credit and/or cash) against the loaned securities and maintains collateral in an amount not less than 100% of the market value of the loaned securities during the period of the loan. The market value of the loaned securities is determined at the close of business of the Fund and any additional required collateral is delivered to the Fund on the next business day. The Fund or borrower may terminate the loan at any time, and if the borrower defaults on its obligation to return the securities loaned because of insolvency or other reasons, the Fund may apply collateral received from the borrower against the obligation. The Fund may experience delays and costs in recovering the securities loaned. Any cash collateral received is maintained at the Fund's custodian and/or invested in cash equivalents. At period end, there were no security loans outstanding. Security lending income represents the income earned on investing cash collateral, less rebates paid to borrowers, plus any premium payments received for lending certain types of securities. Security lending income is presented in the Statement of Operations as a component of interest income. Total security lending income during the period amounted to $1,309,950.
9. Expense Reductions.
Through arrangements with the Fund's custodian, credits realized as a result of certain uninvested cash balances were used to reduce the Fund's expenses. During the period, these credits reduced the Fund's expenses by $130,904.
10. Distributions to Shareholders.
Distributions to shareholders of each class were as follows:
| | Year ended
August 31, 2017 | Year ended
August 31, 2016 |
| From net investment income | | |
| Class A | $21,656,972 | $31,727,561 |
| Class M | 4,370,911 | 3,400,558 |
| Class B | – | 52,324 |
| Class C | 3,033,896 | 3,143,821 |
| Total Bond | 586,137,135 | 559,720,907 |
| Class I | 93,037,515 | 70,886,754 |
| Class Z | 31,739,860 | 21,379,438 |
| Total | $739,976,289 | $690,311,363 |
| From net realized gain | | |
| Class A | $3,152,995 | $5,050,640 |
| Class M | 416,240 | 600,521 |
| Class B | – | 17,887 |
| Class C | 491,517 | 809,224 |
| Total Bond | 54,284,285 | 97,033,225 |
| Class I | 7,617,861 | 7,167,426 |
| Class Z | 1,955,359 | 3,218,137 |
| Total | $67,918,257 | $113,897,060 |
11. Share Transactions.
Share transactions for each class were as follows and may contain automatic conversions between classes or exchanges between affiliated funds:
| | Shares | Shares | Dollars | Dollars |
| | Year ended August 31, 2017 | Year ended August 31, 2016 | Year ended August 31, 2017 | Year ended August 31, 2016 |
| Class A | | | | |
| Shares sold | 35,580,281 | 79,582,385 | $378,631,170 | $836,125,573 |
| Reinvestment of distributions | 2,271,068 | 3,397,092 | 24,175,284 | 35,693,646 |
| Shares redeemed | (102,937,028) | (50,390,515) | (1,089,228,226) | (531,503,136) |
| Net increase (decrease) | (65,085,679) | 32,588,962 | $(686,421,772) | $340,316,083 |
| Class M | | | | |
| Shares sold | 17,161,400 | 7,797,143 | $182,620,103 | $81,948,331 |
| Reinvestment of distributions | 442,288 | 371,455 | 4,706,740 | 3,901,602 |
| Shares redeemed | (5,227,159) | (3,506,111) | (55,482,738) | (36,795,670) |
| Net increase (decrease) | 12,376,529 | 4,662,487 | $131,844,105 | $49,054,263 |
| Class B | | | | |
| Shares sold | – | 52,386 | $– | $545,030 |
| Reinvestment of distributions | – | 5,304 | – | 55,384 |
| Shares redeemed | – | (371,399) | – | (3,942,186) |
| Net increase (decrease) | – | (313,709) | $– | $(3,341,772) |
| Class C | | | | |
| Shares sold | 5,742,872 | 7,989,480 | $61,343,735 | $84,112,756 |
| Reinvestment of distributions | 311,520 | 338,212 | 3,319,847 | 3,555,483 |
| Shares redeemed | (5,532,987) | (4,407,873) | (58,835,524) | (46,363,403) |
| Net increase (decrease) | 521,405 | 3,919,819 | $5,828,058 | $41,304,836 |
| Total Bond | | | | |
| Shares sold | 715,776,478 | 564,396,562 | $7,613,246,265 | $5,943,329,183 |
| Reinvestment of distributions | 57,507,306 | 59,893,089 | 612,532,396 | 629,464,263 |
| Shares redeemed | (452,613,004) | (389,085,832) | (4,806,739,429) | (4,072,787,679) |
| Net increase (decrease) | 320,670,780 | 235,203,819 | $3,419,039,232 | $2,500,005,767 |
| Class I | | | | |
| Shares sold | 245,139,592 | 202,861,513 | $2,596,745,220 | $2,130,458,698 |
| Reinvestment of distributions | 8,911,840 | 7,026,236 | 94,805,632 | 73,778,315 |
| Shares redeemed | (99,475,433) | (67,965,246) | (1,055,508,510) | (713,298,115) |
| Net increase (decrease) | 154,575,999 | 141,922,503 | $1,636,042,342 | $1,490,938,898 |
| Class Z | | | | |
| Shares sold | 155,922,153 | 31,568,440 | $1,656,237,293 | $331,880,727 |
| Reinvestment of distributions | 2,946,230 | 2,342,277 | 31,368,596 | 24,597,125 |
| Shares redeemed | (96,526,329) | (11,141,442) | (1,027,365,935) | (116,919,251) |
| Net increase (decrease) | 62,342,054 | 22,769,275 | $660,239,954 | $239,558,601 |
12. Other.
The Fund's organizational documents provide former and current trustees and officers with a limited indemnification against liabilities arising in connection with the performance of their duties to the Fund. In the normal course of business, the Fund may also enter into contracts that provide general indemnifications. The Fund's maximum exposure under these arrangements is unknown as this would be dependent on future claims that may be made against the Fund. The risk of material loss from such claims is considered remote.
At the end of the period, Strategic Advisers Core Income Fund was the owner of record of approximately 20% of the total outstanding shares of the Fund.
13. Credit Risk.
The Fund invests a portion of its assets in structured securities of issuers backed by commercial and residential mortgage loans, credit card receivables and automotive loans. The value and related income of these securities is sensitive to changes in economic conditions, including delinquencies and/or defaults.
Report of Independent Registered Public Accounting Firm
To the Trustees of Fidelity Income Fund and Shareholders of Fidelity Total Bond Fund:
In our opinion, the accompanying statement of assets and liabilities, including the schedule of investments, and the related statements of operations and of changes in net assets and the financial highlights present fairly, in all material respects, the financial position of Fidelity Total Bond Fund (a fund of Fidelity Income Fund) as of August 31, 2017, the results of its operations for the year then ended, the changes in its net assets for each of the two years in the period then ended and the financial highlights for each of the five years in the period then ended, in conformity with accounting principles generally accepted in the United States of America. These financial statements and financial highlights (hereafter referred to as “financial statements”) are the responsibility of the Fidelity Total Bond Fund’s management. Our responsibility is to express an opinion on these financial statements based on our audits. We conducted our audits of these financial statements in accordance with the standards of the Public Company Accounting Oversight Board (United States). Those standards require that we plan and perform the audit to obtain reasonable assurance about whether the financial statements are free of material misstatement. An audit includes examining, on a test basis, evidence supporting the amounts and disclosures in the financial statements, assessing the accounting principles used and significant estimates made by management, and evaluating the overall financial statement presentation. Our procedures included confirmation of securities owned as of August 31, 2017 by correspondence with the custodians and brokers; when replies were not received from brokers, we performed other auditing procedures. We believe that our audits provide a reasonable basis for our opinion.
PricewaterhouseCoopers LLP
Boston, Massachusetts
October 19, 2017
Trustees and Officers
The Trustees, Members of the Advisory Board (if any), and officers of the trust and fund, as applicable, are listed below. The Board of Trustees governs the fund and is responsible for protecting the interests of shareholders. The Trustees are experienced executives who meet periodically throughout the year to oversee the fund's activities, review contractual arrangements with companies that provide services to the fund, oversee management of the risks associated with such activities and contractual arrangements, and review the fund's performance. Each of the Trustees oversees 246 funds.
The Trustees hold office without limit in time except that (a) any Trustee may resign; (b) any Trustee may be removed by written instrument, signed by at least two-thirds of the number of Trustees prior to such removal; (c) any Trustee who requests to be retired or who has become incapacitated by illness or injury may be retired by written instrument signed by a majority of the other Trustees; and (d) any Trustee may be removed at any special meeting of shareholders by a two-thirds vote of the outstanding voting securities of the trust. Each Trustee who is not an interested person (as defined in the 1940 Act) of the trust and the fund is referred to herein as an Independent Trustee. Each Independent Trustee shall retire not later than the last day of the calendar year in which his or her 75th birthday occurs. The Independent Trustees may waive this mandatory retirement age policy with respect to individual Trustees. Officers and Advisory Board Members hold office without limit in time, except that any officer or Advisory Board Member may resign or may be removed by a vote of a majority of the Trustees at any regular meeting or any special meeting of the Trustees. Except as indicated, each individual has held the office shown or other offices in the same company for the past five years.
The fund’s Statement of Additional Information (SAI) includes more information about the Trustees. To request a free copy, call Fidelity at 1-800-544-8544.
Experience, Skills, Attributes, and Qualifications of the Trustees. The Governance and Nominating Committee has adopted a statement of policy that describes the experience, qualifications, attributes, and skills that are necessary and desirable for potential Independent Trustee candidates (Statement of Policy). The Board believes that each Trustee satisfied at the time he or she was initially elected or appointed a Trustee, and continues to satisfy, the standards contemplated by the Statement of Policy. The Governance and Nominating Committee also engages professional search firms to help identify potential Independent Trustee candidates who have the experience, qualifications, attributes, and skills consistent with the Statement of Policy. From time to time, additional criteria based on the composition and skills of the current Independent Trustees, as well as experience or skills that may be appropriate in light of future changes to board composition, business conditions, and regulatory or other developments, have also been considered by the professional search firms and the Governance and Nominating Committee. In addition, the Board takes into account the Trustees' commitment and participation in Board and committee meetings, as well as their leadership of standing and ad hoc committees throughout their tenure.
In determining that a particular Trustee was and continues to be qualified to serve as a Trustee, the Board has considered a variety of criteria, none of which, in isolation, was controlling. The Board believes that, collectively, the Trustees have balanced and diverse experience, qualifications, attributes, and skills, which allow the Board to operate effectively in governing the fund and protecting the interests of shareholders. Information about the specific experience, skills, attributes, and qualifications of each Trustee, which in each case led to the Board's conclusion that the Trustee should serve (or continue to serve) as a trustee of the fund, is provided below.
Board Structure and Oversight Function. Abigail P. Johnson is an interested person and currently serves as Chairman. The Trustees have determined that an interested Chairman is appropriate and benefits shareholders because an interested Chairman has a personal and professional stake in the quality and continuity of services provided to the fund. Independent Trustees exercise their informed business judgment to appoint an individual of their choosing to serve as Chairman, regardless of whether the Trustee happens to be independent or a member of management. The Independent Trustees have determined that they can act independently and effectively without having an Independent Trustee serve as Chairman and that a key structural component for assuring that they are in a position to do so is for the Independent Trustees to constitute a substantial majority for the Board. The Independent Trustees also regularly meet in executive session. Marie L. Knowles serves as Chairman of the Independent Trustees and as such (i) acts as a liaison between the Independent Trustees and management with respect to matters important to the Independent Trustees and (ii) with management prepares agendas for Board meetings.
Fidelity® funds are overseen by different Boards of Trustees. The fund's Board oversees Fidelity's investment-grade bond, money market, asset allocation and certain equity funds, and other Boards oversee Fidelity's high income, sector and other equity funds. The asset allocation funds may invest in Fidelity® funds that are overseen by such other Boards. The use of separate Boards, each with its own committee structure, allows the Trustees of each group of Fidelity® funds to focus on the unique issues of the funds they oversee, including common research, investment, and operational issues. On occasion, the separate Boards establish joint committees to address issues of overlapping consequences for the Fidelity® funds overseen by each Board.
The Trustees operate using a system of committees to facilitate the timely and efficient consideration of all matters of importance to the Trustees, the fund, and fund shareholders and to facilitate compliance with legal and regulatory requirements and oversight of the fund's activities and associated risks. The Board, acting through its committees, has charged FMR and its affiliates with (i) identifying events or circumstances the occurrence of which could have demonstrably adverse effects on the fund's business and/or reputation; (ii) implementing processes and controls to lessen the possibility that such events or circumstances occur or to mitigate the effects of such events or circumstances if they do occur; and (iii) creating and maintaining a system designed to evaluate continuously business and market conditions in order to facilitate the identification and implementation processes described in (i) and (ii) above. Because the day-to-day operations and activities of the fund are carried out by or through FMR, its affiliates, and other service providers, the fund's exposure to risks is mitigated but not eliminated by the processes overseen by the Trustees. While each of the Board's committees has responsibility for overseeing different aspects of the fund's activities, oversight is exercised primarily through the Operations and Audit Committees. In addition, an ad hoc Board committee of Independent Trustees has worked with FMR to enhance the Board's oversight of investment and financial risks, legal and regulatory risks, technology risks, and operational risks, including the development of additional risk reporting to the Board. Appropriate personnel, including but not limited to the fund's Chief Compliance Officer (CCO), FMR's internal auditor, the independent accountants, the fund's Treasurer and portfolio management personnel, make periodic reports to the Board's committees, as appropriate, including an annual review of Fidelity's risk management program for the Fidelity® funds. The responsibilities of each standing committee, including their oversight responsibilities, are described further under "Standing Committees of the Trustees."
Interested Trustees*:
Correspondence intended for a Trustee who is an interested person may be sent to Fidelity Investments, 245 Summer Street, Boston, Massachusetts 02210.
Name, Year of Birth; Principal Occupations and Other Relevant Experience+
Abigail P. Johnson (1961)
Year of Election or Appointment: 2009
Trustee
Chairman of the Board of Trustees
Ms. Johnson also serves as Trustee of other Fidelity® funds. Ms. Johnson serves as Chairman (2016-present), Chief Executive Officer (2014-present), and Director (2007-present) of FMR LLC (diversified financial services company), President of Fidelity Financial Services (2012-present) and President of Personal, Workplace and Institutional Services (2005-present). Ms. Johnson is Chairman and Director of FMR Co., Inc. (investment adviser firm, 2011-present) and Chairman and Director of FMR (investment adviser firm, 2011-present). Previously, Ms. Johnson served as Vice Chairman (2007-2016) and President (2013-2016) of FMR LLC, President and a Director of FMR (2001-2005), a Trustee of other investment companies advised by FMR, Fidelity Investments Money Management, Inc. (investment adviser firm), and FMR Co., Inc. (2001-2005), Senior Vice President of the Fidelity® funds (2001-2005), and managed a number of Fidelity® funds. Ms. Abigail P. Johnson and Mr. Arthur E. Johnson are not related.
Jennifer Toolin McAuliffe (1959)
Year of Election or Appointment: 2016
Trustee
Ms. McAuliffe also serves as Trustee of other Fidelity® funds. Ms. McAuliffe previously served as a Member of the Advisory Board of certain Fidelity® funds (2016) and as Co-Head of Fixed Income of Fidelity Investments Limited (now known as FIL Limited (FIL)) (diversified financial services company). Earlier roles at FIL included Director of Research for FIL’s credit and quantitative teams in London, Hong Kong and Tokyo. Ms. McAuliffe also was the Director of Research for taxable and municipal bonds at Fidelity Investments Money Management, Inc. Ms. McAuliffe is also a director or trustee of several not-for-profit entities.
* Determined to be an “Interested Trustee” by virtue of, among other things, his or her affiliation with the trust or various entities under common control with FMR.
+ The information includes the Trustee's principal occupation during the last five years and other information relating to the experience, attributes, and skills relevant to the Trustee's qualifications to serve as a Trustee, which led to the conclusion that the Trustee should serve as a Trustee for the fund.
Independent Trustees:
Correspondence intended for an Independent Trustee may be sent to Fidelity Investments, P.O. Box 55235, Boston, Massachusetts 02205-5235.
Name, Year of Birth; Principal Occupations and Other Relevant Experience+
Elizabeth S. Acton (1951)
Year of Election or Appointment: 2013
Trustee
Ms. Acton also serves as Trustee of other Fidelity® funds. Prior to her retirement in April 2012, Ms. Acton was Executive Vice President, Finance (2011-2012), Executive Vice President, Chief Financial Officer (2002-2011), and Treasurer (2004-2005) of Comerica Incorporated (financial services). Prior to joining Comerica, Ms. Acton held a variety of positions at Ford Motor Company (1983-2002), including Vice President and Treasurer (2000-2002) and Executive Vice President and Chief Financial Officer of Ford Motor Credit Company (1998-2000). Ms. Acton currently serves as a member of the Board of Directors and Audit and Finance Committees of Beazer Homes USA, Inc. (homebuilding, 2012-present). Previously, Ms. Acton served as a Member of the Advisory Board of certain Fidelity® funds (2013-2016).
John Engler (1948)
Year of Election or Appointment: 2014
Trustee
Mr. Engler also serves as Trustee of other Fidelity® funds. He serves on the board of directors for Universal Forest Products (manufacturer and distributor of wood and wood-alternative products, 2003-present) and K12 Inc. (technology-based education company, 2012-present). Previously, Mr. Engler served as a Member of the Advisory Board of certain Fidelity® funds (2014-2016), president of the Business Roundtable (2011-2017), a trustee of The Munder Funds (2003-2014), president and CEO of the National Association of Manufacturers (2004-2011), member of the Board of Trustees of the Annie E. Casey Foundation (2004-2015), and as governor of Michigan (1991-2003). He is a past chairman of the National Governors Association.
Albert R. Gamper, Jr. (1942)
Year of Election or Appointment: 2006
Trustee
Mr. Gamper also serves as Trustee of other Fidelity® funds. Prior to his retirement in December 2004, Mr. Gamper served as Chairman of the Board of CIT Group Inc. (commercial finance). During his tenure with CIT Group Inc. Mr. Gamper served in numerous senior management positions, including Chairman (1987-1989; 1999-2001; 2002-2004), Chief Executive Officer (1987-2004), and President (2002-2003). Mr. Gamper currently serves as a member of the Board of Directors of Public Service Enterprise Group (utilities, 2000-present), and Member of the Board of Trustees of Barnabas Health Care System (1997-present). Previously, Mr. Gamper served as Chairman (2012-2015) and Vice Chairman (2011-2012) of the Independent Trustees of certain Fidelity® funds and as Chairman of the Board of Governors, Rutgers University (2004-2007).
Robert F. Gartland (1951)
Year of Election or Appointment: 2010
Trustee
Mr. Gartland also serves as Trustee of other Fidelity® funds. Mr. Gartland is Chairman and an investor in Gartland & Mellina Group Corp. (consulting, 2009-present). Previously, Mr. Gartland served as a partner and investor of Vietnam Partners LLC (investments and consulting, 2008-2011). Prior to his retirement, Mr. Gartland held a variety of positions at Morgan Stanley (financial services, 1979-2007) including Managing Director (1987-2007).
Arthur E. Johnson (1947)
Year of Election or Appointment: 2008
Trustee
Vice Chairman of the Independent Trustees
Mr. Johnson also serves as Trustee of other Fidelity® funds. Mr. Johnson serves as a member of the Board of Directors of Eaton Corporation plc (diversified power management, 2009-present) and Booz Allen Hamilton (management consulting, 2011-present). Prior to his retirement, Mr. Johnson served as Senior Vice President of Corporate Strategic Development of Lockheed Martin Corporation (defense contractor, 1999-2009). He previously served on the Board of Directors of IKON Office Solutions, Inc. (1999-2008), AGL Resources, Inc. (holding company, 2002-2016), and Delta Airlines (2005-2007). Mr. Arthur E. Johnson is not related to Ms. Abigail P. Johnson.
Michael E. Kenneally (1954)
Year of Election or Appointment: 2009
Trustee
Mr. Kenneally also serves as Trustee of other Fidelity® funds. Prior to his retirement, Mr. Kenneally served as Chairman and Global Chief Executive Officer of Credit Suisse Asset Management. Before joining Credit Suisse, he was an Executive Vice President and Chief Investment Officer for Bank of America Corporation. Earlier roles at Bank of America included Director of Research, Senior Portfolio Manager and Research Analyst, and Mr. Kenneally was awarded the Chartered Financial Analyst (CFA) designation in 1991.
Marie L. Knowles (1946)
Year of Election or Appointment: 2001
Trustee
Chairman of the Independent Trustees
Ms. Knowles also serves as Trustee of other Fidelity® funds. Prior to Ms. Knowles' retirement in June 2000, she served as Executive Vice President and Chief Financial Officer of Atlantic Richfield Company (ARCO) (diversified energy, 1996-2000). From 1993 to 1996, she was a Senior Vice President of ARCO and President of ARCO Transportation Company (pipeline and tanker operations). Ms. Knowles currently serves as a Director and Chairman of the Audit Committee of McKesson Corporation (healthcare service, since 2002). Ms. Knowles is a member of the Board of the Santa Catalina Island Company (real estate, 2009-present). Ms. Knowles is a Member of the Investment Company Institute Board of Governors and a Member of the Governing Council of the Independent Directors Council (2014-present). She also serves as a member of the Advisory Board for the School of Engineering of the University of Southern California. Previously, Ms. Knowles served as a Director of Phelps Dodge Corporation (copper mining and manufacturing, 1994-2007), URS Corporation (engineering and construction, 2000-2003) and America West (airline, 1999-2002). Ms. Knowles previously served as Vice Chairman of the Independent Trustees of certain Fidelity® funds (2012-2015).
Mark A. Murray (1954)
Year of Election or Appointment: 2016
Trustee
Mr. Murray also serves as Trustee of other Fidelity® funds. Mr. Murray is Vice Chairman (2013-present) of Meijer, Inc. (regional retail chain). Previously, Mr. Murray served as a Member of the Advisory Board of certain Fidelity® funds (2016) and as Co-Chief Executive Officer (2013-2016) and President (2006-2013) of Meijer, Inc. Mr. Murray serves as a member of the Board of Directors and Nuclear Review and Public Policy and Responsibility Committees of DTE Energy Company (diversified energy company, 2009-present). Mr. Murray also serves as a member of the Board of Directors of Spectrum Health (not-for-profit health system, 2015-present). Mr. Murray previously served as President of Grand Valley State University (2001-2006), Treasurer for the State of Michigan (1999-2001), Vice President of Finance and Administration for Michigan State University (1998-1999), and a member of the Board of Directors and Audit Committee and Chairman of the Nominating and Corporate Governance Committee of Universal Forest Products, Inc. (manufacturer and distributor of wood and wood-alternative products, 2004-2016). Mr. Murray is also a director or trustee of many community and professional organizations.
+ The information includes the Trustee's principal occupation during the last five years and other information relating to the experience, attributes, and skills relevant to the Trustee's qualifications to serve as a Trustee, which led to the conclusion that the Trustee should serve as a Trustee for the fund.
Advisory Board Members and Officers:
Correspondence intended for an officer may be sent to Fidelity Investments, 245 Summer Street, Boston, Massachusetts 02210. Officers appear below in alphabetical order.
Name, Year of Birth; Principal Occupation
Elizabeth Paige Baumann (1968)
Year of Election or Appointment: 2017
Anti-Money Laundering (AML) Officer
Ms. Baumann also serves as AML Officer of other funds. She is Chief AML Officer (2012-present) and Senior Vice President (2014-present) of FMR LLC (diversified financial services company) and is an employee of Fidelity Investments. Previously, Ms. Baumann served as AML Officer of the funds (2012-2016), and Vice President (2007-2014) and Deputy Anti-Money Laundering Officer (2007-2012) of FMR LLC.
Marc R. Bryant (1966)
Year of Election or Appointment: 2015
Secretary and Chief Legal Officer (CLO)
Mr. Bryant also serves as Secretary and CLO of other funds. Mr. Bryant serves as CLO, Secretary, and Senior Vice President of Fidelity Management & Research Company (investment adviser firm, 2015-present) and FMR Co., Inc. (investment adviser firm, 2015-present); Secretary of Fidelity SelectCo, LLC (investment adviser firm, 2015-present) and Fidelity Investments Money Management, Inc. (investment adviser firm, 2015-present); and CLO of Fidelity Management & Research (Hong Kong) Limited and FMR Investment Management (UK) Limited (investment adviser firms, 2015-present) and Fidelity Management & Research (Japan) Limited (investment adviser firm, 2016-present). He is Senior Vice President and Deputy General Counsel of FMR LLC (diversified financial services company). Previously, Mr. Bryant served as Secretary and CLO of Fidelity Rutland Square Trust II (2010-2014) and Assistant Secretary of Fidelity's Fixed Income and Asset Allocation Funds (2013-2015). Prior to joining Fidelity Investments, Mr. Bryant served as a Senior Vice President and the Head of Global Retail Legal for AllianceBernstein L.P. (2006-2010), and as the General Counsel for ProFund Advisors LLC (2001-2006).
Jonathan Davis (1968)
Year of Election or Appointment: 2010
Assistant Treasurer
Mr. Davis also serves as Assistant Treasurer of other funds, and is an employee of Fidelity Investments. Previously, Mr. Davis served as Vice President and Associate General Counsel of FMR LLC (diversified financial services company, 2003-2010).
Adrien E. Deberghes (1967)
Year of Election or Appointment: 2010
Assistant Treasurer
Mr. Deberghes also serves as an officer of other funds. He serves as Executive Vice President of Fidelity Investments Money Management, Inc. (FIMM) (investment adviser firm, 2016-present) and is an employee of Fidelity Investments (2008-present). Prior to joining Fidelity Investments, Mr. Deberghes was Senior Vice President of Mutual Fund Administration at State Street Corporation (2007-2008), Senior Director of Mutual Fund Administration at Investors Bank & Trust (2005-2007), and Director of Finance for Dunkin' Brands (2000-2005). Previously, Mr. Deberghes served in other fund officer roles.
Stephanie J. Dorsey (1969)
Year of Election or Appointment: 2013
President and Treasurer
Ms. Dorsey also serves as an officer of other funds. She is an employee of Fidelity Investments (2008-present) and has served in other fund officer roles. Prior to joining Fidelity Investments, Ms. Dorsey served as Treasurer (2004-2008) of the JPMorgan Mutual Funds and Vice President (2004-2008) of JPMorgan Chase Bank.
Howard J. Galligan III (1966)
Year of Election or Appointment: 2014
Chief Financial Officer
Mr. Galligan also serves as Chief Financial Officer of other funds. Mr. Galligan serves as President of Fidelity Pricing and Cash Management Services (FPCMS) (2014-present) and as a Director of Strategic Advisers, Inc. (investment adviser firm, 2008-present). Previously, Mr. Galligan served as Chief Administrative Officer of Asset Management (2011-2014) and Chief Operating Officer and Senior Vice President of Investment Support for Strategic Advisers, Inc. (2003-2011).
Colm A. Hogan (1973)
Year of Election or Appointment: 2016
Assistant Treasurer
Mr. Hogan also serves as an officer of other funds. Mr. Hogan is an employee of Fidelity Investments (2005-present).
Chris Maher (1972)
Year of Election or Appointment: 2013
Assistant Treasurer
Mr. Maher serves as Assistant Treasurer of other funds. Mr. Maher is Vice President of Valuation Oversight and is an employee of Fidelity Investments. Previously, Mr. Maher served as Vice President of Asset Management Compliance (2013), Vice President of the Program Management Group of FMR (investment adviser firm, 2010-2013), and Vice President of Valuation Oversight (2008-2010).
John B. McGinty, Jr. (1962)
Year of Election or Appointment: 2016
Chief Compliance Officer
Mr. McGinty also serves as Chief Compliance Officer of other funds. Mr. McGinty is Senior Vice President of Asset Management Compliance for Fidelity Investments and is an employee of Fidelity Investments (2016-present). Mr. McGinty previously served as Vice President, Senior Attorney at Eaton Vance Management (investment management firm, 2015-2016), and prior to Eaton Vance as global CCO for all firm operations and registered investment companies at GMO LLC (investment management firm, 2009-2015). Before joining GMO LLC, Mr. McGinty served as Senior Vice President, Deputy General Counsel for Fidelity Investments (2007-2009).
Rieco E. Mello (1969)
Year of Election or Appointment: 2017
Assistant Treasurer
Mr. Mello also serves as Assistant Treasurer of other funds. Mr. Mello is an employee of Fidelity Investments (1995-present).
Jamie Pagliocco (1964)
Year of Election or Appointment: 2017
Vice President
Mr. Pagliocco also serves as Vice President of other funds. Mr. Pagliocco serves as Chief Investment Officer of FMR's Bond Group (2017-present) and is an employee of Fidelity Investments (2001-present).
Jason P. Pogorelec (1975)
Year of Election or Appointment: 2015
Assistant Secretary
Mr. Pogorelec also serves as Assistant Secretary of other funds. Mr. Pogorelec serves as Vice President, Associate General Counsel (2010-present) and is an employee of Fidelity Investments (2006-present).
Nancy D. Prior (1967)
Year of Election or Appointment: 2014
Vice President
Ms. Prior also serves as Vice President of other funds. Ms. Prior serves as a Director of FMR Investment Management (UK) Limited (investment adviser firm, 2015-present), President (2016-present) and Director (2014-present) of Fidelity Investments Money Management, Inc. (FIMM) (investment adviser firm), President, Fixed Income (2014-present), Vice Chairman of FIAM LLC (investment adviser firm, 2014-present), and is an employee of Fidelity Investments (2002-present). Previously, Ms. Prior served as Vice President of Fidelity's Money Market Funds (2012-2014), President, Money Market and Short Duration Bond Group of Fidelity Management & Research (FMR) (investment adviser firm, 2013-2014), President, Money Market Group of FMR (2011-2013), Managing Director of Research (2009-2011), Senior Vice President and Deputy General Counsel (2007-2009), and Assistant Secretary of certain Fidelity® funds (2008-2009).
Stacie M. Smith (1974)
Year of Election or Appointment: 2013
Assistant Treasurer
Ms. Smith also serves as an officer of other funds. She is an employee of Fidelity Investments (2009-present) and has served in other fund officer roles. Prior to joining Fidelity Investments, Ms. Smith served as Senior Audit Manager of Ernst & Young LLP (accounting firm, 1996-2009). Previously, Ms. Smith served as Deputy Treasurer of certain Fidelity® funds (2013-2016).
Marc L. Spector (1972)
Year of Election or Appointment: 2016
Deputy Treasurer
Mr. Spector also serves as an officer of other funds. Mr. Spector is an employee of Fidelity Investments (2016-present). Prior to joining Fidelity Investments, Mr. Spector served as Director at the Siegfried Group (accounting firm, 2013-2016), and prior to Siegfried Group as audit senior manager at Deloitte & Touche (accounting firm, 2005-2013).
Renee Stagnone (1975)
Year of Election or Appointment: 2016
Assistant Treasurer
Ms. Stagnone also serves as an officer of other funds. Ms. Stagnone is an employee of Fidelity Investments (1997-present). Previously, Ms. Stagnone served as Deputy Treasurer of certain Fidelity® funds (2013-2016).
Christine J. Thompson (1958)
Year of Election or Appointment: 2015
Vice President of Fidelity's Bond Funds
Ms. Thompson also serves as Vice President of other funds. Ms. Thompson also serves as Chief Investment Officer of FMR's Bond Group (2010-present) and is an employee of Fidelity Investments (1985-present). Previously, Ms. Thompson served as Vice President of Fidelity's Bond Funds (2010-2012).
Shareholder Expense Example
As a shareholder of the Fund, you incur two types of costs: (1) transaction costs, including sales charges (loads) on purchase payments or redemption proceeds, and (2) ongoing costs, including management fees, distribution and/or service (12b-1) fees and other Fund expenses. This Example is intended to help you understand your ongoing costs (in dollars) of investing in the Fund and to compare these costs with the ongoing costs of investing in other mutual funds.
The Example is based on an investment of $1,000 invested at the beginning of the period and held for the entire period (March 1, 2017 to August 31, 2017).
Actual Expenses
The first line of the accompanying table for each class of the Fund provides information about actual account values and actual expenses. You may use the information in this line, together with the amount you invested, to estimate the expenses that you paid over the period. Simply divide your account value by $1,000.00 (for example, an $8,600 account value divided by $1,000.00 = 8.6), then multiply the result by the number in the first line for a class of the Fund under the heading entitled "Expenses Paid During Period" to estimate the expenses you paid on your account during this period. A small balance maintenance fee of $12.00 that is charged once a year may apply for certain accounts with a value of less than $2,000. This fee is not included in the table below. If it was, the estimate of expenses you paid during the period would be higher, and your ending account value lower, by this amount. In addition, the Fund, as a shareholder in the underlying Fidelity Central Funds, will indirectly bear its pro-rata share of the fees and expenses incurred by the underlying Fidelity Central Funds. These fees and expenses are not included in the Fund's annualized expense ratio used to calculate the expense estimate in the table below.
Hypothetical Example for Comparison Purposes
The second line of the accompanying table for each class of the Fund provides information about hypothetical account values and hypothetical expenses based on a Class' actual expense ratio and an assumed rate of return of 5% per year before expenses, which is not the Class' actual return. The hypothetical account values and expenses may not be used to estimate the actual ending account balance or expenses you paid for the period. You may use this information to compare the ongoing costs of investing in the Fund and other funds. To do so, compare this 5% hypothetical example with the 5% hypothetical examples that appear in the shareholder reports of the other funds. A small balance maintenance fee of $12.00 that is charged once a year may apply for certain accounts with a value of less than $2,000. This fee is not included in the table below. If it was, the estimate of expenses you paid during the period would be higher, and your ending account value lower, by this amount. In addition, the Fund, as a shareholder in the underlying Fidelity Central Funds, will indirectly bear its pro-rata share of the fees and expenses incurred by the underlying Fidelity Central Funds. These fees and expenses are not included in the Fund's annualized expense ratio used to calculate the expense estimate in the table below.
Please note that the expenses shown in the table are meant to highlight your ongoing costs only and do not reflect any transaction costs. Therefore, the second line of the table is useful in comparing ongoing costs only, and will not help you determine the relative total costs of owning different funds. In addition, if these transactional costs were included, your costs would have been higher.
| | Annualized Expense Ratio-A | Beginning
Account Value
March 1, 2017 | Ending
Account Value
August 31, 2017 | Expenses Paid
During Period-B
March 1, 2017
to August 31, 2017 |
| Class A | .74% | | | |
| Actual | | $1,000.00 | $1,025.70 | $3.78 |
| Hypothetical-C | | $1,000.00 | $1,021.48 | $3.77 |
| Class M | .75% | | | |
| Actual | | $1,000.00 | $1,025.60 | $3.83 |
| Hypothetical-C | | $1,000.00 | $1,021.42 | $3.82 |
| Class C | 1.50% | | | |
| Actual | | $1,000.00 | $1,021.70 | $7.64 |
| Hypothetical-C | | $1,000.00 | $1,017.64 | $7.63 |
| Total Bond | .45% | | | |
| Actual | | $1,000.00 | $1,027.20 | $2.30 |
| Hypothetical-C | | $1,000.00 | $1,022.94 | $2.29 |
| Class I | .49% | | | |
| Actual | | $1,000.00 | $1,026.90 | $2.50 |
| Hypothetical-C | | $1,000.00 | $1,022.74 | $2.50 |
| Class Z | .36% | | | |
| Actual | | $1,000.00 | $1,027.60 | $1.84 |
| Hypothetical-C | | $1,000.00 | $1,023.39 | $1.84 |
A Annualized expense ratio reflects expenses net of applicable fee waivers.
B Expenses are equal to each Class' annualized expense ratio, multiplied by the average account value over the period, multiplied by 184/365 (to reflect the one-half year period).
C 5% return per year before expenses
Distributions (Unaudited)
The Board of Trustees of Fidelity Total Bond Fund voted to pay to shareholders of record at the opening of business on record date, the following distributions per share derived from capital gains realized from sales of portfolio securities:
| | Pay Date | Record Date | Capital Gains |
| Fidelity Total Bond Fund | | | |
| Class A | 10/16/17 | 10/13/17 | $0.025 |
| Class M | 10/16/17 | 10/13/17 | $0.025 |
| Class C | 10/16/17 | 10/13/17 | $0.025 |
| Total Bond Fund | 10/16/17 | 10/13/17 | $0.025 |
| Class I | 10/16/17 | 10/13/17 | $0.025 |
| Class Z | 10/16/17 | 10/13/17 | $0.025 |
|
The fund hereby designates as a capital gain dividend with respect to the taxable year ended August 31, 2017, $96,299,631, or, if subsequently determined to be different, the net capital gain of such year.
A total of 14.21% of the dividends distributed during the fiscal year was derived from interest on U.S. Government securities which is generally exempt from state income tax.
The fund designates $425,514,865 of distributions paid during the period January 1, 2017 to August 31, 2017 as qualifying to be taxed as interest-related dividends for nonresident alien shareholders.
The fund will notify shareholders in January 2018 of amounts for use in preparing 2017 income tax returns.
Corporate Headquarters
245 Summer St.
Boston, MA 02210
www.fidelity.com
TBD-ANN-1017
1.789692.115
Item 2.
Code of Ethics
As of the end of the period, August 31, 2017, Fidelity Income Fund (the trust) has adopted a code of ethics, as defined in Item 2 of Form N-CSR, that applies to its President and Treasurer and its Chief Financial Officer. A copy of the code of ethics is filed as an exhibit to this Form N-CSR.
Item 3.
Audit Committee Financial Expert
The Board of Trustees of the trust has determined that Elizabeth S. Acton is an audit committee financial expert, as defined in Item 3 of Form N-CSR. Ms. Acton is independent for purposes of Item 3 of Form N-CSR.
Item 4.
Principal Accountant Fees and Services
Fees and Services
The following table presents fees billed by PricewaterhouseCoopers LLP (“PwC”) in each of the last two fiscal years for services rendered to Fidelity Flex Core Bond Fund, Fidelity Government Income Fund, Fidelity Intermediate Government Income Fund and Fidelity Total Bond Fund (the “Funds”):
Services Billed by PwC
August 31, 2017 FeesA,B
| | | | |
| Audit Fees | Audit-Related Fees | Tax Fees | All Other Fees |
Fidelity Flex Core Bond Fund | $70,000 | $2,900 | $3,500 | $1,500 |
Fidelity Government Income Fund | $79,000 | $7,500 | $5,100 | $3,700 |
Fidelity Intermediate Government Income Fund | $78,000 | $7,400 | $3,500 | $3,600 |
Fidelity Total Bond Fund | $186,000 | $17,300 | $8,300 | $8,400 |
August 31, 2016 FeesA,B,C
| | | | |
| Audit Fees | Audit-Related Fees | Tax Fees | All Other Fees |
Fidelity Government Income Fund | $80,000 | $7,500 | $5,100 | $3,700 |
Fidelity Intermediate Government Income Fund | $78,000 | $6,400 | $3,500 | $3,200 |
Fidelity Total Bond Fund | $185,000 | $19,400 | $10,600 | $9,200 |
Fidelity Flex Core Bond Fund | $- | $- | $- | $- |
A Amounts may reflect rounding.
B Fidelity Flex Core Bond Fund commenced operations on March 7, 2017
C Certain amounts have been reclassified to align with current period presentation.
The following table presents fees billed by Deloitte & Touche LLP, the member firms of Deloitte Touche Tohmatsu, and their respective affiliates (collectively, “Deloitte Entities”) in each of the last two fiscal years for services rendered to Fidelity Total Bond K6 Fund (the “Fund”):
Services Billed by Deloitte Entities
August 31, 2017 FeesA,B
| | | | |
| Audit Fees | Audit-Related Fees | Tax Fees | All Other Fees |
Fidelity Total Bond K6 Fund | $67,000 | $- | $6,100 | $500 |
| | | | |
| Audit Fees | Audit-Related Fees | Tax Fees | All Other Fees |
Fidelity Total Bond K6 Fund | $- | $- | $- | $- |
A Amounts may reflect rounding.
B Fidelity Total Bond K6 Fund commenced operations on May 25, 2017.
The following table presents fees billed by PwC and Deloitte Entities that were required to be approved by the Audit Committee for services that relate directly to the operations and financial reporting of the Funds and that are rendered on behalf of Fidelity Management & Research Company (“FMR”) and entities controlling, controlled by, or under common control with FMR (not including any sub-adviser whose role is primarily portfolio management and is subcontracted with or overseen by another investment adviser) that provide ongoing services to the Funds (“Fund Service Providers”):
Services Billed by PwC
| | | |
| August 31, 2017A,B | August 31, 2016A,B,C | |
Audit-Related Fees | $9,815,000 | $5,530,000 | |
Tax Fees | $105,000 | $10,000 | |
All Other Fees | $- | $- | |
A Amounts may reflect rounding.
B May include amounts billed prior to the Fidelity Flex Core Bond Fund’s commencement of operations.
C Certain amounts have been reclassified to align with current period presentation.
Services Billed by Deloitte Entities
| | | |
| August 31, 2017A,B | August 31, 2016 A,B | |
Audit-Related Fees | $- | $35,000 | |
Tax Fees | $25,000 | $- | |
All Other Fees | $- | $- | |
A Amounts may reflect rounding.
B May include amounts billed prior to the Fidelity Total Bond K6 Fund’s commencement of operations.
“Audit-Related Fees” represent fees billed for assurance and related services that are reasonably related to the performance of the fund audit or the review of the fund's financial statements and that are not reported under Audit Fees.
“Tax Fees” represent fees billed for tax compliance, tax advice or tax planning that relate directly to the operations and financial reporting of the fund.
“All Other Fees” represent fees billed for services provided to the fund or Fund Service Provider, a significant portion of which are assurance related, that relate directly to the operations and financial reporting of the fund, excluding those services that are reported under Audit Fees, Audit-Related Fees or Tax Fees.
Assurance services must be performed by an independent public accountant.
* * *
The aggregate non-audit fees billed by PwC and Deloitte Entities for services rendered to the Funds, FMR (not including any sub-adviser whose role is primarily portfolio management and is subcontracted with or overseen by another investment adviser), and any Fund Service Provider for each of the last two fiscal years of the Funds are as follows:
| | | | |
Billed By | August 31, 2017A,B,C | August 31, 2016A,B,C,D | |
PwC | $13,040,00 | $6,595,000 | |
Deloitte Entities | $370,000 | $65,000 | |
| | | |
A Amounts may reflect rounding.
B May include amounts billed prior to the Fidelity Flex Core Bond Fund’s commencement of operations.
C May include amounts billed prior to the Fidelity Total Bond K6 Fund’s commencement of operations.
D Certain amounts have been reclassified to align with current period presentation.
The trust's Audit Committee has considered non-audit services that were not pre-approved that were provided by PwC and Deloitte Entities to Fund Service Providers to be compatible with maintaining the independence of PwC and Deloitte Entities in their audits of the Funds, taking into account representations from PwC and Deloitte Entities, in accordance with Public Company Accounting Oversight Board rules, regarding their independence from the Funds and their related entities and FMR’s review of the appropriateness and permissibility under applicable law of such non-audit services prior to their provision to the Fund Service Providers.
Audit Committee Pre-Approval Policies and Procedures
The trust’s Audit Committee must pre-approve all audit and non-audit services provided by a fund’s independent registered public accounting firm relating to the operations or financial reporting of the fund. Prior to the commencement of any audit or non-audit services to a fund, the Audit Committee reviews the services to determine whether they are appropriate and permissible under applicable law.
The Audit Committee has adopted policies and procedures to, among other purposes, provide a framework for the Committee’s consideration of non-audit services by the audit firms that audit the Fidelity funds. The policies and procedures require that any non-audit service provided by a fund audit firm to a Fidelity fund and any non-audit service provided by a fund auditor to a Fund Service Provider that relates directly to the operations and financial reporting of a Fidelity fund (“Covered Service”) are subject to approval by the Audit Committee before such service is provided.
All Covered Services must be approved in advance of provision of the service either: (i) by formal resolution of the Audit Committee, or (ii) by oral or written approval of the service by the Chair of the Audit Committee (or if the Chair is unavailable, such other member of the Audit Committee as may be designated by the Chair to act in the Chair’s absence). The approval contemplated by (ii) above is permitted where the Treasurer determines that action on such an engagement is necessary before the next meeting of the Audit Committee.
Non-audit services provided by a fund audit firm to a Fund Service Provider that do not relate directly to the operations and financial reporting of a Fidelity fund are reported to the Audit Committee on a periodic basis.
Non-Audit Services Approved Pursuant to Rule 2-01(c)(7)(i)(C) and (ii) of Regulation S-X (“De Minimis Exception”)
There were no non-audit services approved or required to be approved by the Audit Committee pursuant to the De Minimis Exception during the Funds’ last two fiscal years
relating to services provided to (i) the Funds or (ii) any Fund Service Provider that relate directly to the operations and financial reporting of the Funds.
Item 5.
Audit Committee of Listed Registrants
Not applicable.
Item 6.
Investments
(a)
Not applicable.
(b)
Not applicable
Item 7.
Disclosure of Proxy Voting Policies and Procedures for Closed-End Management Investment Companies
Not applicable.
Item 8.
Portfolio Managers of Closed-End Management Investment Companies
Not applicable.
Item 9.
Purchase of Equity Securities by Closed-End Management Investment Company and Affiliated Purchasers
Not applicable.
Item 10.
Submission of Matters to a Vote of Security Holders
There were no material changes to the procedures by which shareholders may recommend nominees to the trust’s Board of Trustees.
Item 11.
Controls and Procedures
(a)(i) The President and Treasurer and the Chief Financial Officer have concluded that the trust’s disclosure controls and procedures (as defined in Rule 30a-3(c) under the Investment Company Act) provide reasonable assurances that material information relating to the trust is made known to them by the appropriate persons, based on their evaluation of these controls and procedures as of a date within 90 days of the filing date of this report.
(a)(ii) There was no change in the trust’s internal control over financial reporting (as defined in Rule 30a-3(d) under the Investment Company Act) that occurred during the second fiscal quarter of the period covered by this report that has materially affected, or is reasonably likely to materially affect, the trust’s internal control over financial reporting.
Item 12.
Exhibits
| | |
(a) | (1) | Code of Ethics pursuant to Item 2 of Form N-CSR is filed and attached hereto as EX-99.CODE ETH. |
(a) | (2) | Certification pursuant to Rule 30a-2(a) under the Investment Company Act of 1940 (17 CFR 270.30a-2(a)) is filed and attached hereto as Exhibit 99.CERT. |
(a) | (3) | Not applicable. |
(b) | | Certification pursuant to Rule 30a-2(b) under the Investment Company Act of 1940 (17 CFR 270.30a-2(b)) is furnished and attached hereto as Exhibit 99.906CERT. |
SIGNATURES
Pursuant to the requirements of the Securities Exchange Act of 1934 and the Investment Company Act of 1940, the registrant has duly caused this report to be signed on its behalf by the undersigned, thereunto duly authorized.
Fidelity Income Fund
| |
By: | /s/ Stephanie J. Dorsey |
| Stephanie J. Dorsey |
| President and Treasurer |
| |
Date: | October 26, 2017 |
Pursuant to the requirements of the Securities Exchange Act of 1934 and the Investment Company Act of 1940, this report has been signed below by the following persons on behalf of the registrant and in the capacities and on the dates indicated.
| |
By: | /s/Stephanie J. Dorsey |
| Stephanie J. Dorsey |
| President and Treasurer |
| |
Date: | October 26, 2017 |
| |
By: | /s/Howard J. Galligan III |
| Howard J. Galligan III |
| Chief Financial Officer |
| |
Date: | October 26, 2017 |