UNITED STATES
SECURITIES AND EXCHANGE COMMISSION
Washington, D.C. 20549
FORM N-CSR
CERTIFIED SHAREHOLDER REPORT OF REGISTERED
MANAGEMENT INVESTMENT COMPANIES
Investment Company Act file number 811-4118
Fidelity Securities Fund
(Exact name of registrant as specified in charter)
245 Summer St., Boston, MA 02110
(Address of principal executive offices) (Zip code)
Marc Bryant, Secretary
245 Summer St.
Boston, Massachusetts 02110
(Name and address of agent for service)
Registrant's telephone number, including area code:
617-563-7000
| |
Date of fiscal year end: | July 31 |
|
|
Date of reporting period: | January 31, 2016 |
Item 1.
Reports to Stockholders
Fidelity Advisor® Small Cap Value Fund -
Class I
Semi-Annual Report January 31, 2016 Class I is a class of Fidelity® Small Cap Value Fund |
 |
Contents
To view a fund's proxy voting guidelines and proxy voting record for the 12-month period ended June 30, visit http://www.fidelity.com/proxyvotingresults or visit the Securities and Exchange Commission's (SEC) web site at http://www.sec.gov.
You may also call 1-877-208-0098 to request a free copy of the proxy voting guidelines.
Standard & Poor's, S&P and S&P 500 are registered service marks of The McGraw-Hill Companies, Inc. and have been licensed for use by Fidelity Distributors Corporation.
Other third-party marks appearing herein are the property of their respective owners.
All other marks appearing herein are registered or unregistered trademarks or service marks of FMR LLC or an affiliated company. © 2016 FMR LLC. All rights reserved.
This report and the financial statements contained herein are submitted for the general information of the shareholders of the Fund. This report is not authorized for distribution to prospective investors in the Fund unless preceded or accompanied by an effective prospectus.
A fund files its complete schedule of portfolio holdings with the SEC for the first and third quarters of each fiscal year on Form N-Q. Forms N-Q are available on the SEC’s web site at http://www.sec.gov. A fund's Forms N-Q may be reviewed and copied at the SEC’s Public Reference Room in Washington, DC. Information regarding the operation of the SEC's Public Reference Room may be obtained by calling 1-800-SEC-0330.
For a complete list of a fund's portfolio holdings, view the most recent holdings listing, semiannual report, or annual report on Fidelity's web site at http://www.fidelity.com, http://www.advisor.fidelity.com, or http://www.401k.com, as applicable.
NOT FDIC INSURED •MAY LOSE VALUE •NO BANK GUARANTEE
Neither the Fund nor Fidelity Distributors Corporation is a bank.
Investment Summary (Unaudited)
Top Ten Stocks as of January 31, 2016
| | % of fund's net assets | % of fund's net assets 6 months ago |
| Store Capital Corp. | 3.5 | 2.6 |
| ProAssurance Corp. | 2.8 | 2.4 |
| Silgan Holdings, Inc. | 2.7 | 2.6 |
| Universal Corp. | 2.7 | 2.4 |
| CVB Financial Corp. | 2.6 | 2.5 |
| First Niagara Financial Group, Inc. | 2.6 | 2.2 |
| World Fuel Services Corp. | 2.5 | 2.2 |
| Aspen Insurance Holdings Ltd. | 2.5 | 2.7 |
| Genesee & Wyoming, Inc. Class A | 2.4 | 0.0 |
| Allied World Assurance Co. Holdings AG | 2.4 | 0.0 |
| | 26.7 | |
Top Five Market Sectors as of January 31, 2016
| | % of fund's net assets | % of fund's net assets 6 months ago |
| Financials | 40.4 | 41.0 |
| Industrials | 13.0 | 13.2 |
| Consumer Discretionary | 12.0 | 9.3 |
| Information Technology | 11.3 | 12.9 |
| Health Care | 6.6 | 6.8 |
Asset Allocation (% of fund's net assets)
| As of January 31, 2016* |
| | Stocks | 99.4% |
| | Short-Term Investments and Net Other Assets (Liabilities) | 0.6% |

* Foreign investments - 14.2%
| As of July 31, 2015* |
| | Stocks | 99.2% |
| | Short-Term Investments and Net Other Assets (Liabilities) | 0.8% |

* Foreign investments - 11.2%
Percentages shown as 0.0% may reflect amounts less than 0.05%.
Investments January 31, 2016 (Unaudited)
Showing Percentage of Net Assets
| Common Stocks - 99.4% | | | |
| | | Shares | Value |
| CONSUMER DISCRETIONARY - 12.0% | | | |
| Auto Components - 1.7% | | | |
| Standard Motor Products, Inc. (a) | | 1,183,301 | $44,148,960 |
| Hotels, Restaurants & Leisure - 2.4% | | | |
| DineEquity, Inc. | | 750,000 | 63,690,000 |
| Multiline Retail - 2.2% | | | |
| Dillard's, Inc. Class A (b) | | 850,000 | 59,848,500 |
| Specialty Retail - 5.3% | | | |
| Aarons, Inc. Class A | | 2,045,100 | 46,791,888 |
| Genesco, Inc. (c) | | 616,728 | 40,790,390 |
| Hibbett Sports, Inc. (a)(b)(c) | | 1,625,600 | 52,279,296 |
| | | | 139,861,574 |
| Textiles, Apparel & Luxury Goods - 0.4% | | | |
| Vera Bradley, Inc. (c) | | 750,000 | 11,085,000 |
|
| TOTAL CONSUMER DISCRETIONARY | | | 318,634,034 |
|
| CONSUMER STAPLES - 3.4% | | | |
| Food Products - 0.7% | | | |
| Post Holdings, Inc. (c) | | 300,000 | 17,550,000 |
| Tobacco - 2.7% | | | |
| Universal Corp. (a)(b) | | 1,308,239 | 71,599,920 |
|
| TOTAL CONSUMER STAPLES | | | 89,149,920 |
|
| ENERGY - 4.7% | | | |
| Energy Equipment & Services - 2.0% | | | |
| Hornbeck Offshore Services, Inc. (b)(c) | | 1,600,000 | 13,008,000 |
| ShawCor Ltd. Class A | | 1,800,000 | 38,867,871 |
| | | | 51,875,871 |
| Oil, Gas & Consumable Fuels - 2.7% | | | |
| Northern Oil & Gas, Inc. (b)(c) | | 1,958,249 | 6,462,222 |
| World Fuel Services Corp. | | 1,700,000 | 66,215,000 |
| | | | 72,677,222 |
|
| TOTAL ENERGY | | | 124,553,093 |
|
| FINANCIALS - 40.4% | | | |
| Banks - 11.7% | | | |
| Associated Banc-Corp. | | 2,846,535 | 49,956,689 |
| CVB Financial Corp. (b) | | 4,500,010 | 68,895,153 |
| First Citizen Bancshares, Inc. | | 140,370 | 34,539,442 |
| First Citizen Bancshares, Inc. Class A (c) | | 180,954 | 44,525,541 |
| First Niagara Financial Group, Inc. | | 7,000,000 | 68,530,000 |
| UMB Financial Corp. | | 898,691 | 42,148,608 |
| | | | 308,595,433 |
| Capital Markets - 5.3% | | | |
| Federated Investors, Inc. Class B (non-vtg.) | | 2,199,963 | 55,637,064 |
| OM Asset Management Ltd. | | 3,200,001 | 36,192,011 |
| Waddell & Reed Financial, Inc. Class A | | 1,750,000 | 48,020,000 |
| | | | 139,849,075 |
| Insurance - 11.6% | | | |
| Allied World Assurance Co. Holdings AG | | 1,750,000 | 64,032,500 |
| Aspen Insurance Holdings Ltd. | | 1,413,257 | 65,730,583 |
| Endurance Specialty Holdings Ltd. | | 902,400 | 55,885,632 |
| First American Financial Corp. | | 1,421,287 | 48,849,634 |
| ProAssurance Corp. | | 1,468,200 | 73,586,184 |
| | | | 308,084,533 |
| Real Estate Investment Trusts - 7.9% | | | |
| National Retail Properties, Inc. (b) | | 450,000 | 19,323,000 |
| Potlatch Corp. | | 200,630 | 5,786,169 |
| Rouse Properties, Inc. (a)(b) | | 3,000,000 | 52,500,000 |
| Sabra Health Care REIT, Inc. | | 2,042,700 | 37,503,972 |
| Store Capital Corp. | | 3,750,000 | 92,962,501 |
| | | | 208,075,642 |
| Real Estate Management & Development - 2.0% | | | |
| Kennedy Wilson Europe Real Estate PLC | | 3,409,540 | 54,378,646 |
| Thrifts & Mortgage Finance - 1.9% | | | |
| Washington Federal, Inc. | | 2,323,600 | 49,608,860 |
|
| TOTAL FINANCIALS | | | 1,068,592,189 |
|
| HEALTH CARE - 6.6% | | | |
| Health Care Equipment & Supplies - 1.0% | | | |
| Integra LifeSciences Holdings Corp. (c) | | 439,597 | 27,013,236 |
| Health Care Providers & Services - 3.8% | | | |
| Civitas Solutions, Inc. (a)(c) | | 2,451,897 | 58,992,642 |
| Team Health Holdings, Inc. (c) | | 1,000,000 | 40,870,000 |
| | | | 99,862,642 |
| Health Care Technology - 0.7% | | | |
| Cegedim SA (c) | | 670,247 | 20,017,720 |
| Pharmaceuticals - 1.1% | | | |
| Innoviva, Inc. | | 2,831,853 | 28,375,167 |
|
| TOTAL HEALTH CARE | | | 175,268,765 |
|
| INDUSTRIALS - 13.0% | | | |
| Aerospace & Defense - 1.9% | | | |
| Moog, Inc. Class A (c) | | 1,100,000 | 50,963,000 |
| Commercial Services & Supplies - 1.4% | | | |
| Essendant, Inc. | | 1,242,998 | 37,115,920 |
| Electrical Equipment - 2.1% | | | |
| AZZ, Inc. | | 500,000 | 25,740,000 |
| EnerSys | | 600,000 | 29,058,000 |
| | | | 54,798,000 |
| Machinery - 3.7% | | | |
| Hillenbrand, Inc. | | 500,000 | 13,540,000 |
| Mueller Industries, Inc. | | 2,100,000 | 53,445,000 |
| Valmont Industries, Inc. (b) | | 295,000 | 31,444,050 |
| | | | 98,429,050 |
| Road & Rail - 2.4% | | | |
| Genesee & Wyoming, Inc. Class A (c) | | 1,300,000 | 64,454,000 |
| Trading Companies & Distributors - 1.5% | | | |
| WESCO International, Inc. (b)(c) | | 960,033 | 38,766,133 |
|
| TOTAL INDUSTRIALS | | | 344,526,103 |
|
| INFORMATION TECHNOLOGY - 11.3% | | | |
| Electronic Equipment & Components - 5.7% | | | |
| Ingram Micro, Inc. Class A | | 1,800,000 | 50,760,000 |
| SYNNEX Corp. | | 527,200 | 44,258,440 |
| Tech Data Corp. (c) | | 900,000 | 56,160,000 |
| | | | 151,178,440 |
| Internet Software & Services - 3.2% | | | |
| Cimpress NV (b)(c) | | 528,100 | 41,466,412 |
| j2 Global, Inc. | | 574,300 | 41,642,493 |
| | | | 83,108,905 |
| IT Services - 1.7% | | | |
| CACI International, Inc. Class A (c) | | 540,400 | 44,891,028 |
| Software - 0.7% | | | |
| SS&C Technologies Holdings, Inc. | | 300,000 | 19,287,000 |
|
| TOTAL INFORMATION TECHNOLOGY | | | 298,465,373 |
|
| MATERIALS - 3.5% | | | |
| Containers & Packaging - 2.7% | | | |
| Silgan Holdings, Inc. | | 1,370,000 | 72,431,900 |
| Metals & Mining - 0.8% | | | |
| Compass Minerals International, Inc. | | 290,052 | 21,710,392 |
|
| TOTAL MATERIALS | | | 94,142,292 |
|
| UTILITIES - 4.5% | | | |
| Electric Utilities - 4.5% | | | |
| El Paso Electric Co. | | 1,524,121 | 62,382,273 |
| IDACORP, Inc. | | 822,000 | 57,202,980 |
| | | | 119,585,253 |
| TOTAL COMMON STOCKS | | | |
| (Cost $2,511,983,311) | | | 2,632,917,022 |
|
| Money Market Funds - 5.0% | | | |
| Fidelity Cash Central Fund, 0.38% (d) | | 7,686,167 | 7,686,167 |
| Fidelity Securities Lending Cash Central Fund, 0.42% (d)(e) | | 124,346,925 | 124,346,925 |
| TOTAL MONEY MARKET FUNDS | | | |
| (Cost $132,033,092) | | | 132,033,092 |
| TOTAL INVESTMENT PORTFOLIO - 104.4% | | | |
| (Cost $2,644,016,403) | | | 2,764,950,114 |
| NET OTHER ASSETS (LIABILITIES) - (4.4)% | | | (117,765,989) |
| NET ASSETS - 100% | | | $2,647,184,125 |
Legend
(a) Affiliated company
(b) Security or a portion of the security is on loan at period end.
(c) Non-income producing
(d) Affiliated fund that is generally available only to investment companies and other accounts managed by Fidelity Investments. The rate quoted is the annualized seven-day yield of the fund at period end. A complete unaudited listing of the fund's holdings as of its most recent quarter end is available upon request. In addition, each Fidelity Central Fund's financial statements are available on the SEC's website or upon request.
(e) Investment made with cash collateral received from securities on loan.
Affiliated Central Funds
Information regarding fiscal year to date income earned by the Fund from investments in Fidelity Central Funds is as follows:
| Fund | Income earned |
| Fidelity Cash Central Fund | $25,747 |
| Fidelity Securities Lending Cash Central Fund | 917,702 |
| Total | $943,449 |
Other Affiliated Issuers
An affiliated company is a company in which the Fund has ownership of at least 5% of the voting securities. Fiscal year to date transactions with companies which are or were affiliates are as follows:
| Affiliate | Value, beginning of period | Purchases | Sales Proceeds | Dividend Income | Value, end of period |
| Civitas Solutions, Inc. | $66,136,343 | $-- | $13,660,090 | $-- | $58,992,642 |
| Hibbett Sports, Inc. | 11,341,950 | 55,985,079 | 2,178,105 | -- | 52,279,296 |
| Rouse Properties, Inc. | 76,560,000 | -- | 23,770,281 | 438,063 | 52,500,000 |
| Standard Motor Products, Inc. | 43,273,318 | -- | -- | 354,990 | 44,148,960 |
| Universal Corp. | 68,930,035 | 4,859,141 | -- | 1,373,651 | 71,599,920 |
| Total | $266,241,646 | $60,844,220 | $39,608,476 | $2,166,704 | $279,520,818 |
Investment Valuation
The following is a summary of the inputs used, as of January 31, 2016, involving the Fund's assets and liabilities carried at fair value. The inputs or methodology used for valuing securities may not be an indication of the risk associated with investing in those securities. For more information on valuation inputs, and their aggregation into the levels used below, please refer to the Investment Valuation section in the accompanying Notes to Financial Statements.
| | Valuation Inputs at Reporting Date: |
| Description | Total | Level 1 | Level 2 | Level 3 |
| Investments in Securities: | | | | |
| Equities: | | | | |
| Consumer Discretionary | $318,634,034 | $318,634,034 | $-- | $-- |
| Consumer Staples | 89,149,920 | 89,149,920 | -- | -- |
| Energy | 124,553,093 | 124,553,093 | -- | -- |
| Financials | 1,068,592,189 | 1,014,213,543 | 54,378,646 | -- |
| Health Care | 175,268,765 | 155,251,045 | 20,017,720 | -- |
| Industrials | 344,526,103 | 344,526,103 | -- | -- |
| Information Technology | 298,465,373 | 298,465,373 | -- | -- |
| Materials | 94,142,292 | 94,142,292 | -- | -- |
| Utilities | 119,585,253 | 119,585,253 | -- | -- |
| Money Market Funds | 132,033,092 | 132,033,092 | -- | -- |
| Total Investments in Securities: | $2,764,950,114 | $2,690,553,748 | $74,396,366 | $-- |
The following is a summary of transfers between Level 1 and Level 2 for the period ended January 31, 2016. Transfers are assumed to have occurred at the beginning of the period, and are primarily attributable to the valuation techniques used for foreign equity securities, as discussed in the accompanying Notes to Financial Statements:
| Transfers | Total |
| Level 1 to Level 2 | $76,991,539 |
| Level 2 to Level 1 | $0 |
Other Information
Distribution of investments by country or territory of incorporation, as a percentage of Total Net Assets, is as follows (Unaudited):
| United States of America | 85.8% |
| Bermuda | 4.6% |
| Switzerland | 2.4% |
| Bailiwick of Jersey | 2.0% |
| Netherlands | 1.6% |
| Canada | 1.5% |
| United Kingdom | 1.4% |
| Others (Individually Less Than 1%) | 0.7% |
| | 100.0% |
See accompanying notes which are an integral part of the financial statements.
Financial Statements
Statement of Assets and Liabilities
| | | January 31, 2016 (Unaudited) |
| Assets | | |
Investment in securities, at value (including securities loaned of $126,372,798) — See accompanying schedule:
Unaffiliated issuers (cost $2,257,670,042) | $2,353,396,204 | |
| Fidelity Central Funds (cost $132,033,092) | 132,033,092 | |
| Other affiliated issuers (cost $254,313,269) | 279,520,818 | |
| Total Investments (cost $2,644,016,403) | | $2,764,950,114 |
| Receivable for investments sold | | 46,449,057 |
| Receivable for fund shares sold | | 2,104,092 |
| Dividends receivable | | 1,972,351 |
| Distributions receivable from Fidelity Central Funds | | 184,289 |
| Prepaid expenses | | 4,733 |
| Other receivables | | 7,953 |
| Total assets | | 2,815,672,589 |
| Liabilities | | |
| Payable for investments purchased | $36,727,025 | |
| Payable for fund shares redeemed | 4,651,132 | |
| Accrued management fee | 2,025,863 | |
| Distribution and service plan fees payable | 122,582 | |
| Other affiliated payables | 582,300 | |
| Other payables and accrued expenses | 32,637 | |
| Collateral on securities loaned, at value | 124,346,925 | |
| Total liabilities | | 168,488,464 |
| Net Assets | | $2,647,184,125 |
| Net Assets consist of: | | |
| Paid in capital | | $2,404,244,806 |
| Undistributed net investment income | | 1,931,109 |
| Accumulated undistributed net realized gain (loss) on investments and foreign currency transactions | | 120,075,104 |
| Net unrealized appreciation (depreciation) on investments and assets and liabilities in foreign currencies | | 120,933,106 |
| Net Assets | | $2,647,184,125 |
| Calculation of Maximum Offering Price | | |
| Class A: | | |
| Net Asset Value and redemption price per share ($202,645,428 ÷ 12,830,231 shares) | | $15.79 |
| Maximum offering price per share (100/94.25 of $15.79) | | $16.75 |
| Class T: | | |
| Net Asset Value and redemption price per share ($79,395,746 ÷ 5,128,305 shares) | | $15.48 |
| Maximum offering price per share (100/96.50 of $15.48) | | $16.04 |
| Class B: | | |
| Net Asset Value and offering price per share ($2,463,431 ÷ 168,841 shares)(a) | | $14.59 |
| Class C: | | |
| Net Asset Value and offering price per share ($55,258,599 ÷ 3,778,811 shares)(a) | | $14.62 |
| Small Cap Value: | | |
| Net Asset Value, offering price and redemption price per share ($1,973,618,546 ÷ 122,989,122 shares) | | $16.05 |
| Class I: | | |
| Net Asset Value, offering price and redemption price per share ($333,802,375 ÷ 20,796,332 shares) | | $16.05 |
(a) Redemption price per share is equal to net asset value less any applicable contingent deferred sales charge.
See accompanying notes which are an integral part of the financial statements.
Statement of Operations
| | | Six months ended January 31, 2016 (Unaudited) |
| Investment Income | | |
| Dividends (including $2,166,704 earned from other affiliated issuers) | | $25,160,403 |
| Income from Fidelity Central Funds | | 943,449 |
| Total income | | 26,103,852 |
| Expenses | | |
| Management fee | | |
| Basic fee | $9,619,395 | |
| Performance adjustment | 3,197,803 | |
| Transfer agent fees | 3,125,757 | |
| Distribution and service plan fees | 809,143 | |
| Accounting and security lending fees | 416,808 | |
| Custodian fees and expenses | 14,720 | |
| Independent trustees' compensation | 6,108 | |
| Registration fees | 99,766 | |
| Audit | 33,967 | |
| Legal | 5,172 | |
| Miscellaneous | 7,530 | |
| Total expenses before reductions | 17,336,169 | |
| Expense reductions | (18,541) | 17,317,628 |
| Net investment income (loss) | | 8,786,224 |
| Realized and Unrealized Gain (Loss) | | |
| Net realized gain (loss) on: | | |
| Investment securities: | | |
| Unaffiliated issuers | 159,265,356 | |
| Other affiliated issuers | 5,363,625 | |
| Foreign currency transactions | (26,557) | |
| Total net realized gain (loss) | | 164,602,424 |
Change in net unrealized appreciation (depreciation) on:
Investment securities | (400,477,145) | |
| Assets and liabilities in foreign currencies | (606) | |
| Total change in net unrealized appreciation (depreciation) | | (400,477,751) |
| Net gain (loss) | | (235,875,327) |
| Net increase (decrease) in net assets resulting from operations | | $(227,089,103) |
See accompanying notes which are an integral part of the financial statements.
Statement of Changes in Net Assets
| | Six months ended January 31, 2016 (Unaudited) | Year ended July 31, 2015 |
| Increase (Decrease) in Net Assets | | |
| Operations | | |
| Net investment income (loss) | $8,786,224 | $20,225,902 |
| Net realized gain (loss) | 164,602,424 | 285,516,597 |
| Change in net unrealized appreciation (depreciation) | (400,477,751) | 14,012,997 |
| Net increase (decrease) in net assets resulting from operations | (227,089,103) | 319,755,496 |
| Distributions to shareholders from net investment income | (21,953,606) | (9,146,893) |
| Distributions to shareholders from net realized gain | (264,174,606) | (322,480,172) |
| Total distributions | (286,128,212) | (331,627,065) |
| Share transactions - net increase (decrease) | 351,373,003 | (16,898,248) |
| Redemption fees | 94,271 | 149,785 |
| Total increase (decrease) in net assets | (161,750,041) | (28,620,032) |
| Net Assets | | |
| Beginning of period | 2,808,934,166 | 2,837,554,198 |
| End of period (including undistributed net investment income of $1,931,109 and undistributed net investment income of $15,098,491, respectively) | $2,647,184,125 | $2,808,934,166 |
See accompanying notes which are an integral part of the financial statements.
Financial Highlights — Fidelity Small Cap Value Fund Class A
| | Six months ended (Unaudited) | Years ended July 31, | | | | |
| January 31, | 2016 | 2015 | 2014 | 2013 | 2012 | 2011 |
| Selected Per–Share Data | | | | | | |
| Net asset value, beginning of period | $19.14 | $19.29 | $19.96 | $14.86 | $15.48 | $13.45 |
| Income from Investment Operations | | | | | | |
| Net investment income (loss)A | .04 | .10B | .03 | .07 | .01 | .01C |
| Net realized and unrealized gain (loss) | (1.54) | 2.01 | 1.24 | 5.57 | .30 | 2.22 |
| Total from investment operations | (1.50) | 2.11 | 1.27 | 5.64 | .31 | 2.23 |
| Distributions from net investment income | (.11) | (.02) | (.01) | (.07) | (.01) | (.08) |
| Distributions from net realized gain | (1.75) | (2.25) | (1.93) | (.47) | (.93) | (.12) |
| Total distributions | (1.85)D | (2.26)E | (1.94) | (.54) | (.93)F | (.20) |
| Redemption fees added to paid in capitalA,G | – | – | – | – | – | – |
| Net asset value, end of period | $15.79 | $19.14 | $19.29 | $19.96 | $14.86 | $15.48 |
| Total ReturnH,I,J | (8.30)% | 11.86% | 6.83% | 39.09% | 3.24% | 16.72% |
| Ratios to Average Net AssetsK,L | | | | | | |
| Expenses before reductions | 1.44%M | 1.42% | 1.36% | 1.36% | 1.44% | 1.44% |
| Expenses net of fee waivers, if any | 1.44%M | 1.39% | 1.35% | 1.36% | 1.44% | 1.43% |
| Expenses net of all reductions | 1.44%M | 1.39% | 1.34% | 1.36% | 1.44% | 1.43% |
| Net investment income (loss) | .46%M | .52%B | .13% | .41% | .09% | .06%C |
| Supplemental Data | | | | | | |
| Net assets, end of period (000 omitted) | $202,645 | $235,844 | $258,183 | $275,265 | $150,285 | $140,707 |
| Portfolio turnover rateN | 33 %M | 34% | 26%O | 29% | 27% | 22% |
A Calculated based on average shares outstanding during the period.
B Net Investment income per share reflects a large, non-recurring dividend which amounted to $.05 per share. Excluding this non-recurring dividend, the ratio of net investment income (loss) to average net assets would have been .26%.
C Net Investment income per share reflects a large, non-recurring dividend which amounted to $.06 per share. Excluding this non-recurring dividend, the ratio of net investment income (loss) to average net assets would have been (.31) %.
D Total distributions of $1.85 per share is comprised of distributions from net investment income of $.105 and distributions from net realized gain of $1.747 per share.
E Total distributions of $2.26 per share is comprised of distributions from net investment income of $.016 and distributions from net realized gain of $2.248 per share.
F Total distributions of $.93 per share is comprised of distributions from net investment income of $.006 and distributions from net realized gain of $.925 per share.
G Amount represents less than $.005 per share.
H Total returns for periods of less than one year are not annualized.
I Total returns would have been lower if certain expenses had not been reduced during the applicable periods shown.
J Total returns do not include the effect of the sales charges.
K Fees and expenses of any underlying Fidelity Central Funds are not included in the Fund's expense ratio. The Fund indirectly bears its proportionate share of the expenses of any underlying Fidelity Central Funds.
L Expense ratios reflect operating expenses of the class. Expenses before reductions do not reflect amounts reimbursed by the investment adviser or reductions from brokerage service arrangements or reductions from other expense offset arrangements and do not represent the amount paid by the class during periods when reimbursements or reductions occur. Expenses net of fee waivers reflect expenses after reimbursement by the investment adviser but prior to reductions from brokerage service arrangements or other expense offset arrangements. Expenses net of all reductions represent the net expenses paid by the class.
M Annualized
N Amount does not include the portfolio activity of any underlying Fidelity Central Funds.
O Portfolio turnover rate excludes securities received or delivered in-kind.
See accompanying notes which are an integral part of the financial statements.
Financial Highlights — Fidelity Small Cap Value Fund Class T
| | Six months ended (Unaudited) | Years ended July 31, | | | | |
| January 31, | 2016 | 2015 | 2014 | 2013 | 2012 | 2011 |
| Selected Per–Share Data | | | | | | |
| Net asset value, beginning of period | $18.78 | $18.98 | $19.70 | $14.70 | $15.34 | $13.34 |
| Income from Investment Operations | | | | | | |
| Net investment income (loss)A | .02 | .05B | (.02) | .03 | (.02) | (.03)C |
| Net realized and unrealized gain (loss) | (1.51) | 1.98 | 1.23 | 5.50 | .31 | 2.20 |
| Total from investment operations | (1.49) | 2.03 | 1.21 | 5.53 | .29 | 2.17 |
| Distributions from net investment income | (.06) | – | – | (.06) | – | (.05) |
| Distributions from net realized gain | (1.75) | (2.23) | (1.93) | (.47) | (.93) | (.12) |
| Total distributions | (1.81) | (2.23) | (1.93) | (.53) | (.93) | (.17) |
| Redemption fees added to paid in capitalA,D | – | – | – | – | – | – |
| Net asset value, end of period | $15.48 | $18.78 | $18.98 | $19.70 | $14.70 | $15.34 |
| Total ReturnE,F,G | (8.42)% | 11.58% | 6.58% | 38.70% | 3.08% | 16.36% |
| Ratios to Average Net AssetsH,I | | | | | | |
| Expenses before reductions | 1.68%J | 1.67% | 1.61% | 1.60% | 1.67% | 1.70% |
| Expenses net of fee waivers, if any | 1.68%J | 1.64% | 1.59% | 1.60% | 1.67% | 1.69% |
| Expenses net of all reductions | 1.68%J | 1.63% | 1.59% | 1.59% | 1.67% | 1.69% |
| Net investment income (loss) | .21%J | .27%B | (.11)% | .18% | (.14)% | (.19)%C |
| Supplemental Data | | | | | | |
| Net assets, end of period (000 omitted) | $79,396 | $91,716 | $100,975 | $107,444 | $57,514 | $55,845 |
| Portfolio turnover rateK | 33 %J | 34% | 26%L | 29% | 27% | 22% |
A Calculated based on average shares outstanding during the period.
B Net Investment income per share reflects a large, non-recurring dividend which amounted to $.05 per share. Excluding this non-recurring dividend, the ratio of net investment income (loss) to average net assets would have been .01%.
C Net Investment income per share reflects a large, non-recurring dividend which amounted to $.06 per share. Excluding this non-recurring dividend, the ratio of net investment income (loss) to average net assets would have been (.57) %.
D Amount represents less than $.005 per share.
E Total returns for periods of less than one year are not annualized.
F Total returns would have been lower if certain expenses had not been reduced during the applicable periods shown.
G Total returns do not include the effect of the sales charges.
H Fees and expenses of any underlying Fidelity Central Funds are not included in the Fund's expense ratio. The Fund indirectly bears its proportionate share of the expenses of any underlying Fidelity Central Funds.
I Expense ratios reflect operating expenses of the class. Expenses before reductions do not reflect amounts reimbursed by the investment adviser or reductions from brokerage service arrangements or reductions from other expense offset arrangements and do not represent the amount paid by the class during periods when reimbursements or reductions occur. Expenses net of fee waivers reflect expenses after reimbursement by the investment adviser but prior to reductions from brokerage service arrangements or other expense offset arrangements. Expenses net of all reductions represent the net expenses paid by the class.
J Annualized
K Amount does not include the portfolio activity of any underlying Fidelity Central Funds.
L Portfolio turnover rate excludes securities received or delivered in-kind.
See accompanying notes which are an integral part of the financial statements.
Financial Highlights — Fidelity Small Cap Value Fund Class B
| | Six months ended (Unaudited) | Years ended July 31, | | | | |
| January 31, | 2016 | 2015 | 2014 | 2013 | 2012 | 2011 |
| Selected Per–Share Data | | | | | | |
| Net asset value, beginning of period | $17.79 | $18.18 | $19.06 | $14.27 | $15.00 | $13.08 |
| Income from Investment Operations | | | | | | |
| Net investment income (loss)A | (.03) | (.06)B | (.13) | (.06) | (.09) | (.10)C |
| Net realized and unrealized gain (loss) | (1.42) | 1.90 | 1.18 | 5.34 | .29 | 2.15 |
| Total from investment operations | (1.45) | 1.84 | 1.05 | 5.28 | .20 | 2.05 |
| Distributions from net investment income | – | – | – | (.02) | – | (.01) |
| Distributions from net realized gain | (1.75) | (2.23) | (1.93) | (.47) | (.93) | (.12) |
| Total distributions | (1.75) | (2.23) | (1.93) | (.49) | (.93) | (.13) |
| Redemption fees added to paid in capitalA,D | – | – | – | – | – | – |
| Net asset value, end of period | $14.59 | $17.79 | $18.18 | $19.06 | $14.27 | $15.00 |
| Total ReturnE,F,G | (8.68)% | 10.94% | 5.92% | 38.07% | 2.51% | 15.80% |
| Ratios to Average Net AssetsH,I | | | | | | |
| Expenses before reductions | 2.28%J | 2.25% | 2.18% | 2.15% | 2.19% | 2.20% |
| Expenses net of fee waivers, if any | 2.27%J | 2.23% | 2.17% | 2.15% | 2.19% | 2.19% |
| Expenses net of all reductions | 2.27%J | 2.22% | 2.16% | 2.14% | 2.19% | 2.19% |
| Net investment income (loss) | (.38)%J | (.32)%B | (.69)% | (.37)% | (.66)% | (.69)%C |
| Supplemental Data | | | | | | |
| Net assets, end of period (000 omitted) | $2,463 | $3,473 | $4,808 | $7,052 | $6,675 | $8,549 |
| Portfolio turnover rateK | 33 %J | 34% | 26%L | 29% | 27% | 22% |
A Calculated based on average shares outstanding during the period.
B Net Investment income per share reflects a large, non-recurring dividend which amounted to $.05 per share. Excluding this non-recurring dividend, the ratio of net investment income (loss) to average net assets would have been (.58) %.
C Net Investment income per share reflects a large, non-recurring dividend which amounted to $.06 per share. Excluding this non-recurring dividend, the ratio of net investment income (loss) to average net assets would have been (1.07) %.
D Amount represents less than $.005 per share.
E Total returns for periods of less than one year are not annualized.
F Total returns would have been lower if certain expenses had not been reduced during the applicable periods shown.
G Total returns do not include the effect of the contingent deferred sales charge.
H Fees and expenses of any underlying Fidelity Central Funds are not included in the Fund's expense ratio. The Fund indirectly bears its proportionate share of the expenses of any underlying Fidelity Central Funds.
I Expense ratios reflect operating expenses of the class. Expenses before reductions do not reflect amounts reimbursed by the investment adviser or reductions from brokerage service arrangements or reductions from other expense offset arrangements and do not represent the amount paid by the class during periods when reimbursements or reductions occur. Expenses net of fee waivers reflect expenses after reimbursement by the investment adviser but prior to reductions from brokerage service arrangements or other expense offset arrangements. Expenses net of all reductions represent the net expenses paid by the class.
J Annualized
K Amount does not include the portfolio activity of any underlying Fidelity Central Funds.
L Portfolio turnover rate excludes securities received or delivered in-kind.
See accompanying notes which are an integral part of the financial statements.
Financial Highlights — Fidelity Small Cap Value Fund Class C
| | Six months ended (Unaudited) | Years ended July 31, | | | | |
| January 31, | 2016 | 2015 | 2014 | 2013 | 2012 | 2011 |
| Selected Per–Share Data | | | | | | |
| Net asset value, beginning of period | $17.82 | $18.19 | $19.06 | $14.28 | $15.01 | $13.08 |
| Income from Investment Operations | | | | | | |
| Net investment income (loss)A | (.02) | (.04)B | (.12) | (.06) | (.09) | (.10)C |
| Net realized and unrealized gain (loss) | (1.43) | 1.90 | 1.18 | 5.34 | .29 | 2.17 |
| Total from investment operations | (1.45) | 1.86 | 1.06 | 5.28 | .20 | 2.07 |
| Distributions from net investment income | – | – | – | (.03) | – | (.02) |
| Distributions from net realized gain | (1.75) | (2.23) | (1.93) | (.47) | (.93) | (.12) |
| Total distributions | (1.75) | (2.23) | (1.93) | (.50) | (.93) | (.14) |
| Redemption fees added to paid in capitalA,D | – | – | – | – | – | – |
| Net asset value, end of period | $14.62 | $17.82 | $18.19 | $19.06 | $14.28 | $15.01 |
| Total ReturnE,F,G | (8.67)% | 11.05% | 5.97% | 38.00% | 2.52% | 15.91% |
| Ratios to Average Net AssetsH,I | | | | | | |
| Expenses before reductions | 2.20%J | 2.19% | 2.12% | 2.13% | 2.19% | 2.18% |
| Expenses net of fee waivers, if any | 2.20%J | 2.16% | 2.11% | 2.13% | 2.19% | 2.18% |
| Expenses net of all reductions | 2.20%J | 2.15% | 2.10% | 2.12% | 2.19% | 2.18% |
| Net investment income (loss) | (.30)%J | (.25)%B | (.63)% | (.35)% | (.66)% | (.68)%C |
| Supplemental Data | | | | | | |
| Net assets, end of period (000 omitted) | $55,259 | $64,928 | $70,541 | $76,018 | $47,265 | $47,457 |
| Portfolio turnover rateK | 33 %J | 34% | 26%L | 29% | 27% | 22% |
A Calculated based on average shares outstanding during the period.
B Net Investment income per share reflects a large, non-recurring dividend which amounted to $.05 per share. Excluding this non-recurring dividend, the ratio of net investment income (loss) to average net assets would have been (.51) %.
C Net Investment income per share reflects a large, non-recurring dividend which amounted to $.06 per share. Excluding this non-recurring dividend, the ratio of net investment income (loss) to average net assets would have been (1.06) %.
D Amount represents less than $.005 per share.
E Total returns for periods of less than one year are not annualized.
F Total returns would have been lower if certain expenses had not been reduced during the applicable periods shown.
G Total returns do not include the effect of the contingent deferred sales charge.
H Fees and expenses of any underlying Fidelity Central Funds are not included in the Fund's expense ratio. The Fund indirectly bears its proportionate share of the expenses of any underlying Fidelity Central Funds.
I Expense ratios reflect operating expenses of the class. Expenses before reductions do not reflect amounts reimbursed by the investment adviser or reductions from brokerage service arrangements or reductions from other expense offset arrangements and do not represent the amount paid by the class during periods when reimbursements or reductions occur. Expenses net of fee waivers reflect expenses after reimbursement by the investment adviser but prior to reductions from brokerage service arrangements or other expense offset arrangements. Expenses net of all reductions represent the net expenses paid by the class.
J Annualized
K Amount does not include the portfolio activity of any underlying Fidelity Central Funds.
L Portfolio turnover rate excludes securities received or delivered in-kind.
See accompanying notes which are an integral part of the financial statements.
Financial Highlights — Fidelity Small Cap Value Fund
| | Six months ended (Unaudited) | Years ended July 31, | | | | |
| January 31, | 2016 | 2015 | 2014 | 2013 | 2012 | 2011 |
| Selected Per–Share Data | | | | | | |
| Net asset value, beginning of period | $19.45 | $19.57 | $20.22 | $15.05 | $15.62 | $13.56 |
| Income from Investment Operations | | | | | | |
| Net investment income (loss)A | .06 | .15B | .08 | .12 | .06 | .06C |
| Net realized and unrealized gain (loss) | (1.56) | 2.05 | 1.26 | 5.63 | .32 | 2.23 |
| Total from investment operations | (1.50) | 2.20 | 1.34 | 5.75 | .38 | 2.29 |
| Distributions from net investment income | (.15) | (.07) | (.06) | (.11) | (.02) | (.10) |
| Distributions from net realized gain | (1.75) | (2.25) | (1.93) | (.47) | (.93) | (.13) |
| Total distributions | (1.90) | (2.32) | (1.99) | (.58) | (.95) | (.23) |
| Redemption fees added to paid in capitalA,D | – | – | – | – | – | – |
| Net asset value, end of period | $16.05 | $19.45 | $19.57 | $20.22 | $15.05 | $15.62 |
| Total ReturnE,F | (8.18)% | 12.18% | 7.12% | 39.45% | 3.67% | 17.03% |
| Ratios to Average Net AssetsG,H | | | | | | |
| Expenses before reductions | 1.21%I | 1.15% | 1.08% | 1.07% | 1.13% | 1.13% |
| Expenses net of fee waivers, if any | 1.21%I | 1.12% | 1.06% | 1.07% | 1.13% | 1.13% |
| Expenses net of all reductions | 1.21%I | 1.12% | 1.06% | 1.06% | 1.13% | 1.13% |
| Net investment income (loss) | .69%I | .78%B | .41% | .71% | .41% | .37%C |
| Supplemental Data | | | | | | |
| Net assets, end of period (000 omitted) | $1,973,619 | $2,036,157 | $2,060,546 | $2,672,854 | $1,756,962 | $1,899,805 |
| Portfolio turnover rateJ | 33 %I | 34% | 26%K | 29% | 27% | 22% |
A Calculated based on average shares outstanding during the period.
B Net Investment income per share reflects a large, non-recurring dividend which amounted to $.05 per share. Excluding this non-recurring dividend, the ratio of net investment income (loss) to average net assets would have been .53%.
C Net Investment income per share reflects a large, non-recurring dividend which amounted to $.06 per share. Excluding this non-recurring dividend, the ratio of net investment income (loss) to average net assets would have been (.01) %.
D Amount represents less than $.005 per share.
E Total returns for periods of less than one year are not annualized.
F Total returns would have been lower if certain expenses had not been reduced during the applicable periods shown.
G Fees and expenses of any underlying Fidelity Central Funds are not included in the Fund's expense ratio. The Fund indirectly bears its proportionate share of the expenses of any underlying Fidelity Central Funds.
H Expense ratios reflect operating expenses of the class. Expenses before reductions do not reflect amounts reimbursed by the investment adviser or reductions from brokerage service arrangements or reductions from other expense offset arrangements and do not represent the amount paid by the class during periods when reimbursements or reductions occur. Expenses net of fee waivers reflect expenses after reimbursement by the investment adviser but prior to reductions from brokerage service arrangements or other expense offset arrangements. Expenses net of all reductions represent the net expenses paid by the class.
I Annualized
J Amount does not include the portfolio activity of any underlying Fidelity Central Funds.
K Portfolio turnover rate excludes securities received or delivered in-kind.
See accompanying notes which are an integral part of the financial statements.
Financial Highlights — Fidelity Small Cap Value Fund Class I
| | Six months ended (Unaudited) | Years ended July 31, | | | | |
| January 31, | 2016 | 2015 | 2014 | 2013 | 2012 | 2011 |
| Selected Per–Share Data | | | | | | |
| Net asset value, beginning of period | $19.45 | $19.57 | $20.23 | $15.05 | $15.63 | $13.58 |
| Income from Investment Operations | | | | | | |
| Net investment income (loss)A | .06 | .15B | .08 | .12 | .06 | .06C |
| Net realized and unrealized gain (loss) | (1.56) | 2.05 | 1.25 | 5.65 | .31 | 2.23 |
| Total from investment operations | (1.50) | 2.20 | 1.33 | 5.77 | .37 | 2.29 |
| Distributions from net investment income | (.16) | (.07) | (.06) | (.12) | (.02) | (.11) |
| Distributions from net realized gain | (1.75) | (2.25) | (1.93) | (.47) | (.93) | (.13) |
| Total distributions | (1.90)D | (2.32) | (1.99) | (.59) | (.95) | (.24) |
| Redemption fees added to paid in capitalA,E | – | – | – | – | – | – |
| Net asset value, end of period | $16.05 | $19.45 | $19.57 | $20.23 | $15.05 | $15.63 |
| Total ReturnF,G | (8.17)% | 12.17% | 7.08% | 39.54% | 3.59% | 17.02% |
| Ratios to Average Net AssetsH,I | | | | | | |
| Expenses before reductions | 1.17%J | 1.15% | 1.09% | 1.07% | 1.14% | 1.10% |
| Expenses net of fee waivers, if any | 1.17%J | 1.12% | 1.07% | 1.07% | 1.14% | 1.10% |
| Expenses net of all reductions | 1.17%J | 1.12% | 1.07% | 1.06% | 1.14% | 1.10% |
| Net investment income (loss) | .73%J | .79%B | .40% | .70% | .39% | .39%C |
| Supplemental Data | | | | | | |
| Net assets, end of period (000 omitted) | $333,802 | $376,817 | $342,500 | $359,582 | $138,981 | $101,565 |
| Portfolio turnover rateK | 33 %J | 34% | 26%L | 29% | 27% | 22% |
A Calculated based on average shares outstanding during the period.
B Net Investment income per share reflects a large, non-recurring dividend which amounted to $.05 per share. Excluding this non-recurring dividend, the ratio of net investment income (loss) to average net assets would have been .53%.
C Net Investment income per share reflects a large, non-recurring dividend which amounted to $.06 per share. Excluding this non-recurring dividend, the ratio of net investment income (loss) to average net assets would have been .01%.
D Total distributions of $1.90 per share is comprised of distributions from net investment income of $.157 and distributions from net realized gain of $1.747 per share.
E Amount represents less than $.005 per share.
F Total returns for periods of less than one year are not annualized.
G Total returns would have been lower if certain expenses had not been reduced during the applicable periods shown.
H Fees and expenses of any underlying Fidelity Central Funds are not included in the Fund's expense ratio. The Fund indirectly bears its proportionate share of the expenses of any underlying Fidelity Central Funds.
I Expense ratios reflect operating expenses of the class. Expenses before reductions do not reflect amounts reimbursed by the investment adviser or reductions from brokerage service arrangements or reductions from other expense offset arrangements and do not represent the amount paid by the class during periods when reimbursements or reductions occur. Expenses net of fee waivers reflect expenses after reimbursement by the investment adviser but prior to reductions from brokerage service arrangements or other expense offset arrangements. Expenses net of all reductions represent the net expenses paid by the class.
J Annualized
K Amount does not include the portfolio activity of any underlying Fidelity Central Funds.
L Portfolio turnover rate excludes securities received or delivered in-kind.
See accompanying notes which are an integral part of the financial statements.
Notes to Financial Statements (Unaudited)
For the period ended January 31, 2016
1. Organization.
Fidelity Small Cap Value Fund (the Fund) is a fund of Fidelity Securities Fund (the Trust) and is authorized to issue an unlimited number of shares. The Trust is registered under the Investment Company Act of 1940, as amended (the 1940 Act), as an open-end management investment company organized as a Massachusetts business trust. The Fund offers Class A, Class T, Class C, Small Cap Value and Class I shares, each of which, along with Class B shares, has equal rights as to assets and voting privileges. Class B shares are closed to new accounts and additional purchases, except for exchanges and reinvestments. The Fund's other share classes are also closed to new accounts with certain exceptions. Each class has exclusive voting rights with respect to matters that affect that class. Class B shares will automatically convert to Class A shares after a holding period of seven years from the initial date of purchase.
During the period, the Board of Trustees approved the conversion of all existing Class B shares into Class A shares, effective on or about July 1, 2016, regardless of the length of times shares have been held.
2. Investments in Fidelity Central Funds.
The Fund invests in Fidelity Central Funds, which are open-end investment companies generally available only to other investment companies and accounts managed by the investment adviser and its affiliates. The Fund's Schedule of Investments lists each of the Fidelity Central Funds held as of period end, if any, as an investment of the Fund, but does not include the underlying holdings of each Fidelity Central Fund. As an Investing Fund, the Fund indirectly bears its proportionate share of the expenses of the underlying Fidelity Central Funds.
The Money Market Central Funds seek preservation of capital and current income and are managed by Fidelity Investments Money Management, Inc. (FIMM), an affiliate of the investment adviser. Annualized expenses of the Money Market Central Funds as of their most recent shareholder report date are less than .005%.
A complete unaudited list of holdings for each Fidelity Central Fund is available upon request or at the Securities and Exchange Commission (the SEC) website at www.sec.gov. In addition, the financial statements of the Fidelity Central Funds are available on the SEC website or upon request.
3. Significant Accounting Policies.
The financial statements have been prepared in conformity with accounting principles generally accepted in the United States of America (GAAP), which require management to make certain estimates and assumptions at the date of the financial statements. Actual results could differ from those estimates. Subsequent events, if any, through the date that the financial statements were issued have been evaluated in the preparation of the financial statements. The following summarizes the significant accounting policies of the Fund:
Investment Valuation. Investments are valued as of 4:00 p.m. Eastern time on the last calendar day of the period. The Board of Trustees (the Board) has delegated the day to day responsibility for the valuation of the Fund's investments to the Fidelity Management & Research Company (FMR) Fair Value Committee (the Committee). In accordance with valuation policies and procedures approved by the Board, the Fund attempts to obtain prices from one or more third party pricing vendors or brokers to value its investments. When current market prices, quotations or currency exchange rates are not readily available or reliable, investments will be fair valued in good faith by the Committee, in accordance with procedures adopted by the Board. Factors used in determining fair value vary by investment type and may include market or investment specific events. The frequency with which these procedures are used cannot be predicted and they may be utilized to a significant extent. The Committee oversees the Fund's valuation policies and procedures and reports to the Board on the Committee's activities and fair value determinations. The Board monitors the appropriateness of the procedures used in valuing the Fund's investments and ratifies the fair value determinations of the Committee.
The Fund categorizes the inputs to valuation techniques used to value its investments into a disclosure hierarchy consisting of three levels as shown below:
- Level 1 – quoted prices in active markets for identical investments
- Level 2 – other significant observable inputs (including quoted prices for similar investments, interest rates, prepayment speeds, etc.)
- Level 3 – unobservable inputs (including the Fund's own assumptions based on the best information available)
Valuation techniques used to value the Fund's investments by major category are as follows:
Equity securities, including restricted securities, for which market quotations are readily available, are valued at the last reported sale price or official closing price as reported by a third party pricing vendor on the primary market or exchange on which they are traded and are categorized as Level 1 in the hierarchy. In the event there were no sales during the day or closing prices are not available, securities are valued at the last quoted bid price or may be valued using the last available price and are generally categorized as Level 2 in the hierarchy. For foreign equity securities, when market or security specific events arise, comparisons to the valuation of American Depositary Receipts (ADRs), futures contracts, Exchange-Traded Funds (ETFs) and certain indexes as well as quoted prices for similar securities may be used and would be categorized as Level 2 in the hierarchy. Utilizing these techniques may result in transfers between Level 1 and Level 2. For equity securities, including restricted securities, where observable inputs are limited, assumptions about market activity and risk are used and these securities may be categorized as Level 3 in the hierarchy.
Investments in open-end mutual funds, including the Fidelity Central Funds, are valued at their closing net asset value (NAV) each business day and are categorized as Level 1 in the hierarchy.
Changes in valuation techniques may result in transfers in or out of an assigned level within the disclosure hierarchy. The aggregate value of investments by input level as of January 31, 2016, including information on transfers between Levels 1 and 2, is included at the end of the Fund's Schedule of Investments.
Foreign Currency. The Fund may use foreign currency contracts to facilitate transactions in foreign-denominated securities. Gains and losses from these transactions may arise from changes in the value of the foreign currency or if the counterparties do not perform under the contracts' terms.
Foreign-denominated assets, including investment securities, and liabilities are translated into U.S. dollars at the exchange rates at period end. Purchases and sales of investment securities, income and dividends received and expenses denominated in foreign currencies are translated into U.S. dollars at the exchange rate in effect on the transaction date.
The effects of exchange rate fluctuations on investments are included with the net realized and unrealized gain (loss) on investment securities. Other foreign currency transactions resulting in realized and unrealized gain (loss) are disclosed separately.
Investment Transactions and Income. For financial reporting purposes, the Fund's investment holdings and NAV include trades executed through the end of the last business day of the period. The NAV per share for processing shareholder transactions is calculated as of the close of business of the New York Stock Exchange (NYSE), normally 4:00 p.m. Eastern time and includes trades executed through the end of the prior business day. Gains and losses on securities sold are determined on the basis of identified cost. Dividend income is recorded on the ex-dividend date, except for certain dividends from foreign securities where the ex-dividend date may have passed, which are recorded as soon as the Fund is informed of the ex-dividend date. Non-cash dividends included in dividend income, if any, are recorded at the fair market value of the securities received. Income and capital gain distributions from Fidelity Central Funds, if any, are recorded on the ex-dividend date. Distributions received on securities that represent a return of capital or capital gain are recorded as a reduction of cost of investments and/or as a realized gain. Subsequent to ex-dividend date the Fund determines the components of these distributions, based upon receipt of tax filings or other correspondence relating to the underlying investment. Investment income is recorded net of foreign taxes withheld where recovery of such taxes is uncertain.
Class Allocations and Expenses. Investment income, realized and unrealized capital gains and losses, common expenses of the Fund, and certain fund-level expense reductions, if any, are allocated daily on a pro-rata basis to each class based on the relative net assets of each class to the total net assets of the Fund. Each class differs with respect to transfer agent and distribution and service plan fees incurred. Certain expense reductions may also differ by class. For the reporting period, the allocated portion of income and expenses to each class as a percent of its average net assets may vary due to the timing of recording these transactions in relation to fluctuating net assets of the classes. Expenses directly attributable to a fund are charged to that fund. Expenses attributable to more than one fund are allocated among the respective funds on the basis of relative net assets or other appropriate methods. Expense estimates are accrued in the period to which they relate and adjustments are made when actual amounts are known.
Income Tax Information and Distributions to Shareholders. Each year, the Fund intends to qualify as a regulated investment company under Subchapter M of the Internal Revenue Code, including distributing substantially all of its taxable income and realized gains. As a result, no provision for U.S. Federal income taxes is required. The Fund files a U.S. federal tax return, in addition to state and local tax returns as required. The Fund's federal income tax returns are subject to examination by the Internal Revenue Service (IRS) for a period of three fiscal years after they are filed. State and local tax returns may be subject to examination for an additional fiscal year depending on the jurisdiction. Foreign taxes are provided for based on the Fund's understanding of the tax rules and rates that exist in the foreign markets in which it invests.
Distributions are declared and recorded on the ex-dividend date. Income dividends and capital gain distributions are declared separately for each class. Income and capital gain distributions are determined in accordance with income tax regulations, which may differ from GAAP.
Capital accounts within the financial statements are adjusted for permanent book-tax differences. These adjustments have no impact on net assets or the results of operations. Capital accounts are not adjusted for temporary book-tax differences which will reverse in a subsequent period.
Book-tax differences are primarily due to foreign currency transactions, passive foreign investment companies (PFIC) and losses deferred due to wash sales.
The federal tax cost of investment securities and unrealized appreciation (depreciation) as of period end were as follows:
| Gross unrealized appreciation | $387,748,822 |
| Gross unrealized depreciation | (267,041,047) |
| Net unrealized appreciation (depreciation) on securities | $120,707,775 |
| Tax cost | $2,644,242,339 |
Short-Term Trading (Redemption) Fees. Shares held by investors in the Fund less than 90 days may have been subject to a redemption fee equal to 1.50% of the NAV of shares redeemed. All redemption fees, which reduce the proceeds of the shareholder redemption, are retained by the Fund and accounted for as an addition to paid in capital.
4. Purchases and Sales of Investments.
Purchases and sales of securities, other than short-term securities, aggregated $544,684,068 and $458,614,173, respectively.
5. Fees and Other Transactions with Affiliates.
Management Fee. Fidelity Management & Research Company (the investment adviser) and its affiliates provide the Fund with investment management related services for which the Fund pays a monthly management fee. The management fee is the sum of an individual fund fee rate that is based on an annual rate of .45% of the Fund's average net assets and an annualized group fee rate that averaged .25% during the period. The group fee rate is based upon the average net assets of all the mutual funds advised by the investment adviser, including any mutual funds previously advised by the investment adviser that are currently advised by Fidelity SelectCo, LLC, an affiliate of the investment adviser. The group fee rate decreases as assets under management increase and increases as assets under management decrease. In addition, the management fee is subject to a performance adjustment (up to a maximum of +/- .20% of the Fund's average net assets over a 36 month performance period). The upward or downward adjustment to the management fee is based on the relative investment performance of Small Cap Value as compared to its benchmark index, the Russell 2000 Value Index, over the same 36 month performance period. For the reporting period, the total annualized management fee rate, including the performance adjustment, was .93% of the Fund's average net assets. The performance adjustment included in the management fee rate may be higher or lower than the maximum performance adjustment rate due to the difference between the average net assets for the reporting and performance periods.
Distribution and Service Plan Fees. In accordance with Rule 12b-1 of the 1940 Act, the Fund has adopted separate Distribution and Service Plans for each class of shares. Certain classes pay Fidelity Distributors Corporation (FDC), an affiliate of the investment adviser, separate Distribution and Service Fees, each of which is based on an annual percentage of each class' average net assets. In addition, FDC may pay financial intermediaries for selling shares of the Fund and providing shareholder support services. For the period, the Distribution and Service Fee rates, total fees and amounts retained by FDC were as follows:
| | Distribution
Fee | Service
Fee | Total Fees | Retained
by FDC |
| Class A | -% | .25% | $276,222 | $– |
| Class T | .25% | .25% | 215,804 | – |
| Class B | .75% | .25% | 14,877 | 11,158 |
| Class C | .75% | .25% | 302,240 | – |
| | | | $809,143 | $11,158 |
Sales Load. FDC may receive a front-end sales charge of up to 5.75% for selling Class A shares and 3.50% for selling Class T shares, some of which is paid to financial intermediaries for selling shares of the Fund. Depending on the holding period, FDC may receive contingent deferred sales charges levied on Class A, Class T, Class B, and Class C redemptions. The deferred sales charges range from 5.00% to 1.00% for Class B shares, 1.00% for Class C shares, 1.00% for certain purchases of Class A shares and .25% for certain purchases of Class T shares.
For the period, sales charge amounts retained by FDC were as follows:
| | Retained
by FDC |
| Class A | $3,343 |
| Class T | 1,558 |
| Class B(a) | 600 |
| Class C(a) | 175 |
| | $5,676 |
(a) When Class B and Class C shares are initially sold, FDC pays commissions from its own resources to financial intermediaries through which the sales are made.
Transfer Agent Fees. Fidelity Investments Institutional Operations Company, Inc., (FIIOC), an affiliate of the investment adviser, is the transfer, dividend disbursing and shareholder servicing agent for each class of the Fund. FIIOC receives account fees and asset-based fees that vary according to the account size and type of account of the shareholders of the respective classes of the Fund.FIIOC pays for typesetting, printing and mailing of shareholder reports, except proxy statements.
For the period, transfer agent fees for each class were as follows:
| | Amount | % of
Class-Level Average
Net Assets(a) |
| Class A | $240,091 | .22 |
| Class T | 91,163 | .21 |
| Class B | 4,520 | .30 |
| Class C | 69,338 | .23 |
| Small Cap Value | 2,371,533 | .23 |
| Class I | 349,112 | .20 |
| | $3,125,757 | |
(a) Annualized
Accounting and Security Lending Fees. Fidelity Service Company, Inc. (FSC), an affiliate of the investment adviser, maintains the Fund's accounting records. The accounting fee is based on the level of average net assets for each month. Under a separate contract, FSC administers the security lending program. The security lending fee is based on the number and duration of lending transactions.
Brokerage Commissions. The Fund placed a portion of its portfolio transactions with brokerage firms which are affiliates of the investment adviser. Brokerage commissions are included in net realized gain (loss) and change in net unrealized appreciation (depreciation) in the Statement of Operations. The commissions paid to these affiliated firms were $12,094 for the period.
Interfund Trades. The Fund may purchase from or sell securities to other Fidelity Funds under procedures adopted by the Board. The procedures have been designed to ensure these interfund trades are executed in accordance with Rule 17a-7 of the 1940 Act. Interfund trades are included within the respective purchases and sales amounts shown in the Purchases and Sales of Investments note.
6. Committed Line of Credit.
The Fund participates with other funds managed by the investment adviser or an affiliate in a $4.25 billion credit facility (the "line of credit") to be utilized for temporary or emergency purposes to fund shareholder redemptions or for other short-term liquidity purposes. The Fund has agreed to pay commitment fees on its pro-rata portion of the line of credit, which amounted to $1,860 and is reflected in Miscellaneous expenses on the Statement of Operations. During the period, the Fund did not borrow on this line of credit.
7. Security Lending.
The Fund lends portfolio securities through a lending agent from time to time in order to earn additional income. For equity securities, a lending agent is used and may loan securities to certain qualified borrowers, including Fidelity Capital Markets (FCM), a broker-dealer affiliated with the Fund. On the settlement date of the loan, the Fund receives collateral (in the form of U.S. Treasury obligations, letters of credit and/or cash) against the loaned securities and maintains collateral in an amount not less than 100% of the market value of the loaned securities during the period of the loan. The market value of the loaned securities is determined at the close of business of the Fund and any additional required collateral is delivered to the Fund on the next business day. The Fund or borrower may terminate the loan at any time, and if the borrower defaults on its obligation to return the securities loaned because of insolvency or other reasons, the Fund may apply collateral received from the borrower against the obligation. The Fund may experience delays and costs in recovering the securities loaned. Any cash collateral received is the Fidelity Securities Lending Cash Central Fund. The value of loaned securities and cash collateral at period end are disclosed on the Fund's Statement of Assets and Liabilities. The value of securities loaned to FCM at period end was $142,275. Security lending income represents the income earned on investing cash collateral, less rebates paid to borrowers and any lending agent fees associated with the loan, plus any premium payments received for lending certain types of securities. Security lending income is presented in the Statement of Operations as a component of income from Fidelity Central Funds. Total security lending income during the period amounted to $917,702, including $1,535 from securities loaned to FCM.
8. Expense Reductions.
Commissions paid to certain brokers with whom the investment adviser, or its affiliates, places trades on behalf of the Fund include an amount in addition to trade execution, which may be rebated back to the Fund to offset certain expenses. This amount totaled $8,582 for the period. In addition, through arrangements with the Fund's custodian, credits realized as a result of certain uninvested cash balances were used to reduce the Fund's expenses. During the period, these credits reduced the Fund's expense by $110.
In addition, during the period the investment adviser reimbursed and/or waived a portion of fund-level operating expenses in the amount of $9,849.
9. Distributions to Shareholders.
Distributions to shareholders of each class were as follows:
| | Six months ended January 31, 2016 | Year ended July 31, 2015 |
| From net investment income | | |
| Class A | $1,294,370 | $207,059 |
| Class T | 298,011 | – |
| Small Cap Value | 17,252,984 | 7,655,420 |
| Class I | 3,108,241 | 1,284,414 |
| Total | $21,953,606 | $9,146,893 |
| From net realized gain | | |
| Class A | $21,315,531 | $29,002,450 |
| Class T | 8,511,334 | 11,758,984 |
| Class B | 317,311 | 573,044 |
| Class C | 6,297,703 | 8,461,258 |
| Small Cap Value | 193,461,328 | 233,242,234 |
| Class I | 34,271,399 | 39,442,202 |
| Total | $264,174,606 | $322,480,172 |
10. Share Transactions.
Share transactions for each class were as follows and may contain automatic conversions between classes or exchanges between affiliated funds:
| | Shares | Shares | Dollars | Dollars |
| | Six months ended January 31, 2016 | Year ended July 31, 2015 | Six months ended January 31, 2016 | Year ended July 31, 2015 |
| Class A | | | | |
| Shares sold | 975,320 | 1,619,679 | $16,612,607 | $30,035,137 |
| Reinvestment of distributions | 1,320,026 | 1,578,405 | 22,234,691 | 28,466,035 |
| Shares redeemed | (1,786,996) | (4,261,712) | (30,317,795) | (79,564,907) |
| Net increase (decrease) | 508,350 | (1,063,628) | $8,529,503 | $(21,063,735) |
| Class T | | | | |
| Shares sold | 310,224 | 599,331 | $5,203,698 | $10,911,777 |
| Reinvestment of distributions | 527,842 | 655,613 | 8,714,816 | 11,618,861 |
| Shares redeemed | (594,533) | (1,691,524) | (9,865,736) | (30,859,052) |
| Net increase (decrease) | 243,533 | (436,580) | $4,052,778 | $(8,328,414) |
| Class B | | | | |
| Shares sold | 2,263 | 5,056 | $34,845 | $89,676 |
| Reinvestment of distributions | 19,426 | 31,870 | 302,868 | 537,830 |
| Shares redeemed | (48,105) | (106,178) | (758,742) | (1,834,363) |
| Net increase (decrease) | (26,416) | (69,252) | $(421,029) | $(1,206,857) |
| Class C | | | | |
| Shares sold | 125,591 | 167,565 | $1,958,139 | $2,897,201 |
| Reinvestment of distributions | 367,680 | 447,025 | 5,744,375 | 7,553,140 |
| Shares redeemed | (358,789) | (847,704) | (5,654,174) | (14,671,382) |
| Net increase (decrease) | 134,482 | (233,114) | $2,048,340 | $(4,221,041) |
| Small Cap Value | | | | |
| Shares sold | 18,049,566 | 13,163,441 | $309,409,636 | $248,872,334 |
| Reinvestment of distributions | 11,459,014 | 12,098,173 | 196,112,754 | 221,448,638 |
| Shares redeemed | (11,230,058) | (25,848,809) | (192,654,407) | (487,056,437) |
| Net increase (decrease) | 18,278,522 | (587,195) | $312,867,983 | $(16,735,465) |
| Class I | | | | |
| Shares sold | 1,966,371 | 4,194,067 | $33,969,215 | $79,803,869 |
| Reinvestment of distributions | 1,907,860 | 1,996,970 | 32,653,194 | 36,554,847 |
| Shares redeemed | (2,451,782) | (4,316,971) | (42,326,981) | (81,701,452) |
| Net increase (decrease) | 1,422,449 | 1,874,066 | $24,295,428 | $34,657,264 |
11. Other.
The Fund's organizational documents provide former and current trustees and officers with a limited indemnification against liabilities arising in connection with the performance of their duties to the Fund. In the normal course of business, the Fund may also enter into contracts that provide general indemnifications. The Fund's maximum exposure under these arrangements is unknown as this would be dependent on future claims that may be made against the Fund. The risk of material loss from such claims is considered remote.
Shareholder Expense Example
As a shareholder of the Fund, you incur two types of costs: (1) transaction costs, including sales charges (loads) on purchase payments or redemption proceeds, redemption fees and (2) ongoing costs, including management fees, distribution and/or service (12b-1) fees and other Fund expenses. This Example is intended to help you understand your ongoing costs (in dollars) of investing in the Fund and to compare these costs with the ongoing costs of investing in other mutual funds.
The Example is based on an investment of $1,000 invested at the beginning of the period and held for the entire period (August 1, 2015 to January 31, 2016).
Actual Expenses
The first line of the accompanying table for each class of the Fund provides information about actual account values and actual expenses. You may use the information in this line, together with the amount you invested, to estimate the expenses that you paid over the period. Simply divide your account value by $1,000.00 (for example, an $8,600 account value divided by $1,000.00 = 8.6), then multiply the result by the number in the first line for a class of the Fund under the heading entitled "Expenses Paid During Period" to estimate the expenses you paid on your account during this period. A small balance maintenance fee of $12.00 that is charged once a year may apply for certain accounts with a value of less than $2,000. This fee is not included in the table below. If it was, the estimate of expenses you paid during the period would be higher, and your ending account value lower, by this amount. In addition, the Fund, as a shareholder in the underlying Fidelity Central Funds, will indirectly bear its pro-rata share of the fees and expenses incurred by the underlying Fidelity Central Funds. These fees and expenses are not included in the Fund's annualized expense ratio used to calculate the expense estimate in the table below.
Hypothetical Example for Comparison Purposes
The second line of the accompanying table for each class of the Fund provides information about hypothetical account values and hypothetical expenses based on a Class' actual expense ratio and an assumed rate of return of 5% per year before expenses, which is not the Class' actual return. The hypothetical account values and expenses may not be used to estimate the actual ending account balance or expenses you paid for the period. You may use this information to compare the ongoing costs of investing in the Fund and other funds. To do so, compare this 5% hypothetical example with the 5% hypothetical examples that appear in the shareholder reports of the other funds. A small balance maintenance fee of $12.00 that is charged once a year may apply for certain accounts with a value of less than $2,000. This fee is not included in the table below. If it was, the estimate of expenses you paid during the period would be higher, and your ending account value lower, by this amount. In addition, the Fund, as a shareholder in the underlying Fidelity Central Funds, will indirectly bear its pro-rata share of the fees and expenses incurred by the underlying Fidelity Central Funds. These fees and expenses are not included in the Fund's annualized expense ratio used to calculate the expense estimate in the table below.
Please note that the expenses shown in the table are meant to highlight your ongoing costs only and do not reflect any transaction costs. Therefore, the second line of the table is useful in comparing ongoing costs only, and will not help you determine the relative total costs of owning different funds. In addition, if these transactional costs were included, your costs would have been higher.
| | Annualized Expense Ratio-A | Beginning
Account Value
August 1, 2015 | Ending
Account Value
January 31, 2016 | Expenses Paid
During Period-B
August 1, 2015
to January 31, 2016 |
| Class A | 1.44% | | | |
| Actual | | $1,000.00 | $917.00 | $6.94 |
| Hypothetical-C | | $1,000.00 | $1,017.90 | $7.30 |
| Class T | 1.68% | | | |
| Actual | | $1,000.00 | $915.80 | $8.09 |
| Hypothetical-C | | $1,000.00 | $1,016.69 | $8.52 |
| Class B | 2.27% | | | |
| Actual | | $1,000.00 | $913.20 | $10.92 |
| Hypothetical-C | | $1,000.00 | $1,013.72 | $11.49 |
| Class C | 2.20% | | | |
| Actual | | $1,000.00 | $913.30 | $10.58 |
| Hypothetical-C | | $1,000.00 | $1,014.08 | $11.14 |
| Small Cap Value | 1.21% | | | |
| Actual | | $1,000.00 | $918.20 | $5.83 |
| Hypothetical-C | | $1,000.00 | $1,019.05 | $6.14 |
| Class I | 1.17% | | | |
| Actual | | $1,000.00 | $918.30 | $5.64 |
| Hypothetical-C | | $1,000.00 | $1,019.25 | $5.94 |
A Annualized expense ratio reflects expenses net of applicable fee waivers.
B Expenses are equal to each Class' annualized expense ratio, multiplied by the average account value over the period, multiplied by 184/366 (to reflect the one-half year period).
C 5% return per year before expenses

ASCVI-SANN-0316
1.803749.112
Fidelity® OTC Portfolio
Class K
Semi-Annual Report January 31, 2016 |
|
Contents
To view a fund's proxy voting guidelines and proxy voting record for the 12-month period ended June 30, visit http://www.fidelity.com/proxyvotingresults or visit the Securities and Exchange Commission's (SEC) web site at http://www.sec.gov.
You may also call 1-800-835-5092 to request a free copy of the proxy voting guidelines.
Standard & Poor's, S&P and S&P 500 are registered service marks of The McGraw-Hill Companies, Inc. and have been licensed for use by Fidelity Distributors Corporation.
Other third-party marks appearing herein are the property of their respective owners.
All other marks appearing herein are registered or unregistered trademarks or service marks of FMR LLC or an affiliated company. © 2016 FMR LLC. All rights reserved.
This report and the financial statements contained herein are submitted for the general information of the shareholders of the Fund. This report is not authorized for distribution to prospective investors in the Fund unless preceded or accompanied by an effective prospectus.
A fund files its complete schedule of portfolio holdings with the SEC for the first and third quarters of each fiscal year on Form N-Q. Forms N-Q are available on the SEC’s web site at http://www.sec.gov. A fund's Forms N-Q may be reviewed and copied at the SEC’s Public Reference Room in Washington, DC. Information regarding the operation of the SEC's Public Reference Room may be obtained by calling 1-800-SEC-0330.
For a complete list of a fund's portfolio holdings, view the most recent holdings listing, semiannual report, or annual report on Fidelity's web site at http://www.fidelity.com, http://www.advisor.fidelity.com, or http://www.401k.com, as applicable.
NOT FDIC INSURED •MAY LOSE VALUE •NO BANK GUARANTEE
Neither the Fund nor Fidelity Distributors Corporation is a bank.
Investment Summary (Unaudited)
Top Ten Stocks as of January 31, 2016
| | % of fund's net assets | % of fund's net assets 6 months ago |
| Apple, Inc. | 5.4 | 9.2 |
| Alphabet, Inc. Class A | 5.3 | 3.9 |
| Amazon.com, Inc. | 4.6 | 5.7 |
| Activision Blizzard, Inc. | 4.4 | 2.7 |
| Facebook, Inc. Class A | 4.2 | 2.8 |
| Alphabet, Inc. Class C | 4.0 | 4.0 |
| Microsoft Corp. | 4.0 | 3.5 |
| Tesla Motors, Inc. | 3.4 | 1.9 |
| NVIDIA Corp. | 3.0 | 1.8 |
| athenahealth, Inc. | 2.8 | 2.4 |
| | 41.1 | |
Top Five Market Sectors as of January 31, 2016
| | % of fund's net assets | % of fund's net assets 6 months ago |
| Information Technology | 50.1 | 47.2 |
| Health Care | 19.8 | 20.9 |
| Consumer Discretionary | 16.6 | 16.6 |
| Consumer Staples | 4.9 | 6.4 |
| Financials | 4.7 | 4.0 |
Asset Allocation (% of fund's net assets)
| As of January 31, 2016* |
| | Stocks | 96.6% |
| | Convertible Securities | 3.3% |
| | Short-Term Investments and Net Other Assets (Liabilities) | 0.1% |

* Foreign investments - 7.8%
| As of July 31, 2015* |
| | Stocks | 97.4% |
| | Convertible Securities | 2.4% |
| | Short-Term Investments and Net Other Assets (Liabilities) | 0.2% |

* Foreign investments - 9.6%
Investments January 31, 2016 (Unaudited)
Showing Percentage of Net Assets
| Common Stocks - 96.6% | | | |
| | | Shares | Value (000s) |
| CONSUMER DISCRETIONARY - 16.2% | | | |
| Automobiles - 3.4% | | | |
| Tesla Motors, Inc. (a)(b) | | 2,148,099 | $410,717 |
| Diversified Consumer Services - 0.2% | | | |
| 2U, Inc. (a)(b) | | 1,118,041 | 22,573 |
| Hotels, Restaurants & Leisure - 1.6% | | | |
| Buffalo Wild Wings, Inc. (a) | | 218,900 | 33,338 |
| Chipotle Mexican Grill, Inc. (a) | | 94,500 | 42,806 |
| Intrawest Resorts Holdings, Inc. (a) | | 726,835 | 6,113 |
| Panera Bread Co. Class A (a) | | 130,300 | 25,278 |
| Starbucks Corp. | | 1,289,420 | 78,358 |
| Vail Resorts, Inc. | | 85,500 | 10,688 |
| | | | 196,581 |
| Internet & Catalog Retail - 7.1% | | | |
| Amazon.com, Inc. (a) | | 928,398 | 544,970 |
| Etsy, Inc. (b) | | 1,870,275 | 14,513 |
| Groupon, Inc. Class A (a)(b)(c) | | 62,409,181 | 169,753 |
| Netflix, Inc. (a) | | 126,200 | 11,590 |
| Wayfair LLC Class A (a)(b) | | 2,482,768 | 112,221 |
| | | | 853,047 |
| Media - 2.3% | | | |
| Altice NV (a) | | 1,015,500 | 14,379 |
| Charter Communications, Inc. Class A (a)(b) | | 1,025,300 | 175,695 |
| Liberty Global PLC: | | | |
| Class A (a) | | 1,860,400 | 64,016 |
| LiLAC Class A (a) | | 23,980 | 844 |
| Twenty-First Century Fox, Inc. Class A | | 837,400 | 22,585 |
| | | | 277,519 |
| Specialty Retail - 0.5% | | | |
| Ross Stores, Inc. | | 1,001,900 | 56,367 |
| Textiles, Apparel & Luxury Goods - 1.1% | | | |
| lululemon athletica, Inc. (a)(b) | | 1,091,146 | 67,727 |
| Ralph Lauren Corp. | | 551,500 | 62,044 |
| | | | 129,771 |
|
| TOTAL CONSUMER DISCRETIONARY | | | 1,946,575 |
|
| CONSUMER STAPLES - 4.8% | | | |
| Beverages - 0.5% | | | |
| Monster Beverage Corp. | | 431,400 | 58,252 |
| Food & Staples Retailing - 3.2% | | | |
| Costco Wholesale Corp. | | 1,566,350 | 236,707 |
| Sprouts Farmers Market LLC (a) | | 501,000 | 11,423 |
| Walgreens Boots Alliance, Inc. | | 1,701,200 | 135,620 |
| | | | 383,750 |
| Food Products - 1.1% | | | |
| Mondelez International, Inc. | | 3,184,400 | 137,248 |
|
| TOTAL CONSUMER STAPLES | | | 579,250 |
|
| ENERGY - 0.4% | | | |
| Energy Equipment & Services - 0.1% | | | |
| Oceaneering International, Inc. | | 319,700 | 10,822 |
| Oil, Gas & Consumable Fuels - 0.3% | | | |
| Anadarko Petroleum Corp. | | 407,800 | 15,941 |
| Diamondback Energy, Inc. | | 111,100 | 8,394 |
| EOG Resources, Inc. | | 194,900 | 13,842 |
| | | | 38,177 |
|
| TOTAL ENERGY | | | 48,999 |
|
| FINANCIALS - 4.4% | | | |
| Banks - 2.9% | | | |
| Bank of America Corp. | | 3,897,600 | 55,112 |
| Citigroup, Inc. | | 1,526,000 | 64,977 |
| Commerce Bancshares, Inc. | | 784,189 | 32,254 |
| Fifth Third Bancorp | | 515,900 | 8,151 |
| Huntington Bancshares, Inc. | | 1,784,000 | 15,307 |
| JPMorgan Chase & Co. | | 811,400 | 48,278 |
| Signature Bank (a) | | 261,300 | 36,410 |
| UMB Financial Corp. | | 531,500 | 24,927 |
| Wells Fargo & Co. | | 1,324,900 | 66,550 |
| | | | 351,966 |
| Capital Markets - 0.4% | | | |
| Carlyle Group LP | | 630,500 | 8,625 |
| Northern Trust Corp. | | 537,600 | 33,374 |
| | | | 41,999 |
| Consumer Finance - 1.1% | | | |
| Capital One Financial Corp. | | 1,407,400 | 92,354 |
| LendingClub Corp. (a)(b) | | 5,370,400 | 39,634 |
| | | | 131,988 |
| Real Estate Management & Development - 0.0% | | | |
| WeWork Companies, Inc. Class A (d) | | 29,911 | 1,501 |
|
| TOTAL FINANCIALS | | | 527,454 |
|
| HEALTH CARE - 19.3% | | | |
| Biotechnology - 15.0% | | | |
| Acceleron Pharma, Inc. (a) | | 262,300 | 8,053 |
| Aduro Biotech, Inc. (e) | | 1,938,567 | 28,070 |
| Alexion Pharmaceuticals, Inc. (a) | | 1,132,389 | 165,250 |
| Alkermes PLC (a) | | 1,053,536 | 33,724 |
| Alnylam Pharmaceuticals, Inc. (a) | | 138,100 | 9,521 |
| Amgen, Inc. | | 875,400 | 133,700 |
| Anacor Pharmaceuticals, Inc. (a) | | 825,300 | 62,005 |
| Array BioPharma, Inc. (a)(b) | | 2,200,963 | 6,801 |
| Avalanche Biotechnologies, Inc. (a) | | 988,352 | 5,930 |
| BioCryst Pharmaceuticals, Inc. (a) | | 2,815,264 | 19,622 |
| Biogen, Inc. (a) | | 798,700 | 218,093 |
| BioMarin Pharmaceutical, Inc. (a) | | 1,773,956 | 131,308 |
| bluebird bio, Inc. (a) | | 164,013 | 6,784 |
| Blueprint Medicines Corp. (b) | | 382,300 | 6,010 |
| Celgene Corp. (a) | | 693,100 | 69,532 |
| Celldex Therapeutics, Inc. (a)(b) | | 1,273,285 | 10,568 |
| Cellectis SA sponsored ADR | | 371,100 | 8,298 |
| Chiasma, Inc. (a)(b) | | 349,820 | 3,603 |
| Chimerix, Inc. (a) | | 54,700 | 421 |
| Coherus BioSciences, Inc. (a)(b) | | 809,715 | 10,737 |
| CytomX Therapeutics, Inc. | | 244,269 | 3,646 |
| CytomX Therapeutics, Inc. (a)(b) | | 517,300 | 8,127 |
| Dicerna Pharmaceuticals, Inc. (a) | | 327,980 | 2,152 |
| Galapagos Genomics NV sponsored ADR (b) | | 554,000 | 27,102 |
| Genocea Biosciences, Inc. (a) | | 845,070 | 2,628 |
| Gilead Sciences, Inc. | | 2,516,599 | 208,878 |
| Heron Therapeutics, Inc. (a)(b) | | 428,983 | 9,004 |
| Intercept Pharmaceuticals, Inc. (a) | | 314,519 | 33,411 |
| Ionis Pharmaceuticals, Inc. (a) | | 148,537 | 5,783 |
| Ironwood Pharmaceuticals, Inc. Class A (a) | | 3,140,542 | 28,987 |
| Juno Therapeutics, Inc. (a)(b) | | 60,124 | 1,658 |
| Karyopharm Therapeutics, Inc. (a)(b) | | 614,200 | 3,820 |
| Lion Biotechnologies, Inc. (a)(b)(c) | | 2,913,500 | 17,452 |
| Medivation, Inc. (a) | | 490,000 | 16,023 |
| Neurocrine Biosciences, Inc. (a) | | 976,100 | 41,533 |
| Novavax, Inc. (a)(b) | | 10,970,600 | 56,499 |
| OvaScience, Inc. (a)(b) | | 981,623 | 5,546 |
| Portola Pharmaceuticals, Inc. (a)(c) | | 2,842,407 | 93,885 |
| ProNai Therapeutics, Inc. (a) | | 193,200 | 1,600 |
| Puma Biotechnology, Inc. (a)(b) | | 743,687 | 31,041 |
| Regeneron Pharmaceuticals, Inc. (a) | | 208,400 | 87,547 |
| Sage Therapeutics, Inc. (a) | | 15,800 | 531 |
| Seattle Genetics, Inc. (a)(b) | | 1,594,486 | 52,586 |
| Spark Therapeutics, Inc. (b) | | 268,480 | 7,563 |
| TESARO, Inc. (a) | | 462,000 | 15,957 |
| Trevena, Inc. (a)(c) | | 3,326,521 | 24,217 |
| Ultragenyx Pharmaceutical, Inc. (a) | | 401,496 | 22,544 |
| uniQure B.V. (a)(b) | | 302,200 | 5,509 |
| Versartis, Inc. (a)(b) | | 459,286 | 5,116 |
| Vertex Pharmaceuticals, Inc. (a) | | 382,600 | 34,721 |
| XOMA Corp. (a)(b) | | 1,194,513 | 1,206 |
| | | | 1,794,302 |
| Health Care Equipment & Supplies - 0.5% | | | |
| IDEXX Laboratories, Inc. (a) | | 393,804 | 27,621 |
| Novadaq Technologies, Inc. (a) | | 2,613,956 | 28,780 |
| | | | 56,401 |
| Health Care Providers & Services - 0.3% | | | |
| Accretive Health, Inc. (a)(b)(c) | | 6,962,302 | 18,241 |
| Diplomat Pharmacy, Inc. (a)(b) | | 574,900 | 15,643 |
| �� | | | 33,884 |
| Health Care Technology - 3.0% | | | |
| athenahealth, Inc. (a)(b)(c) | | 2,376,613 | 337,004 |
| Castlight Health, Inc. Class B (a)(b) | | 63,800 | 211 |
| Veeva Systems, Inc. Class A (a)(b) | | 939,100 | 22,632 |
| | | | 359,847 |
| Pharmaceuticals - 0.5% | | | |
| Achaogen, Inc. (a)(b) | | 805,700 | 2,917 |
| Flex Pharma, Inc. | | 376,179 | 3,130 |
| GW Pharmaceuticals PLC ADR (a) | | 127,027 | 6,372 |
| Innoviva, Inc. | | 78 | 1 |
| Intra-Cellular Therapies, Inc. (a) | | 324,200 | 12,021 |
| Jazz Pharmaceuticals PLC (a) | | 133,600 | 17,200 |
| Relypsa, Inc. (a)(b) | | 518,000 | 9,759 |
| The Medicines Company (a) | | 297,800 | 10,292 |
| | | | 61,692 |
|
| TOTAL HEALTH CARE | | | 2,306,126 |
|
| INDUSTRIALS - 3.2% | | | |
| Aerospace & Defense - 0.1% | | | |
| Space Exploration Technologies Corp. Class A (d) | | 110,610 | 9,844 |
| Airlines - 0.0% | | | |
| Wheels Up Partners Holdings LLC Series B unit (d)(f) | | 1,760,377 | 5,000 |
| Commercial Services & Supplies - 0.2% | | | |
| Regus PLC | | 887,884 | 3,753 |
| Stericycle, Inc. (a) | | 150,300 | 18,089 |
| | | | 21,842 |
| Electrical Equipment - 2.2% | | | |
| SolarCity Corp. (a)(b)(c) | | 7,218,748 | 257,348 |
| Professional Services - 0.1% | | | |
| TriNet Group, Inc. (a) | | 629,437 | 9,316 |
| Road & Rail - 0.6% | | | |
| J.B. Hunt Transport Services, Inc. | | 1,012,480 | 73,607 |
|
| TOTAL INDUSTRIALS | | | 376,957 |
|
| INFORMATION TECHNOLOGY - 48.2% | | | |
| Communications Equipment - 1.1% | | | |
| Cisco Systems, Inc. | | 98,400 | 2,341 |
| Qualcomm, Inc. | | 2,782,153 | 126,143 |
| | | | 128,484 |
| Electronic Equipment & Components - 0.3% | | | |
| Fitbit, Inc. (b) | | 2,337,056 | 38,795 |
| Internet Software & Services - 16.5% | | | |
| Alphabet, Inc.: | | | |
| Class A | | 829,627 | 631,637 |
| Class C | | 651,869 | 484,306 |
| Criteo SA sponsored ADR (a)(b) | | 5,430,471 | 160,633 |
| Dropbox, Inc. (a)(d) | | 331,524 | 3,992 |
| Facebook, Inc. Class A (a) | | 4,494,938 | 504,377 |
| GoDaddy, Inc. (a) | | 826,100 | 25,188 |
| Marketo, Inc. (a) | | 1,016,778 | 19,329 |
| New Relic, Inc. (a)(b) | | 1,000,196 | 28,226 |
| Opower, Inc. (a) | | 157,056 | 1,335 |
| Rackspace Hosting, Inc. (a) | | 4,996,030 | 100,970 |
| Shopify, Inc. Class A | | 19,200 | 446 |
| Wix.com Ltd. (a)(b) | | 868,336 | 17,731 |
| | | | 1,978,170 |
| IT Services - 1.2% | | | |
| Cognizant Technology Solutions Corp. Class A (a) | | 1,430,000 | 90,533 |
| PayPal Holdings, Inc. (a) | | 1,300,700 | 47,007 |
| Sabre Corp. | | 136,900 | 3,506 |
| Square, Inc. (a)(b) | | 483,500 | 4,240 |
| | | | 145,286 |
| Semiconductors & Semiconductor Equipment - 7.5% | | | |
| Avago Technologies Ltd. | | 683,100 | 91,337 |
| Broadcom Corp. Class A | | 50,600 | 2,766 |
| Cirrus Logic, Inc. (a) | | 676,030 | 23,472 |
| Marvell Technology Group Ltd. | | 5,136,900 | 45,462 |
| Micron Technology, Inc. (a) | | 13,947,700 | 153,843 |
| NVIDIA Corp. | | 12,240,461 | 358,523 |
| NXP Semiconductors NV (a) | | 1,093,600 | 81,779 |
| Qorvo, Inc. (a) | | 1,718,600 | 68,057 |
| SolarEdge Technologies, Inc. (b)(c) | | 2,437,000 | 68,894 |
| | | | 894,133 |
| Software - 14.7% | | | |
| Activision Blizzard, Inc. | | 15,072,239 | 524,815 |
| GameLoft SE (a)(b)(c) | | 7,537,787 | 41,371 |
| HubSpot, Inc. (a) | | 883,980 | 35,881 |
| Interactive Intelligence Group, Inc. (a) | | 211,287 | 5,046 |
| Microsoft Corp. | | 8,669,039 | 477,577 |
| NetSuite, Inc. (a)(b) | | 574,700 | 39,867 |
| Paylocity Holding Corp. (a) | | 345,500 | 10,752 |
| Salesforce.com, Inc. (a) | | 2,162,220 | 147,161 |
| Ubisoft Entertainment SA (a)(c) | | 10,178,905 | 279,592 |
| Workday, Inc. Class A (a) | | 1,206,800 | 76,040 |
| Xero Ltd. (a)(b) | | 628,814 | 6,837 |
| Zendesk, Inc. (a)(c) | | 5,252,784 | 115,614 |
| | | | 1,760,553 |
| Technology Hardware, Storage & Peripherals - 6.9% | | | |
| Apple, Inc. | | 6,658,620 | 648,145 |
| Nimble Storage, Inc. (a) | | 2,124,508 | 13,958 |
| Pure Storage, Inc.: | | | |
| Class A (a)(b) | | 118,400 | 1,540 |
| Class B | | 184,982 | 2,286 |
| Western Digital Corp. | | 3,424,800 | 164,322 |
| | | | 830,251 |
|
| TOTAL INFORMATION TECHNOLOGY | | | 5,775,672 |
|
| TELECOMMUNICATION SERVICES - 0.1% | | | |
| Diversified Telecommunication Services - 0.1% | | | |
| Cogent Communications Group, Inc. | | 252,500 | 8,436 |
| TOTAL COMMON STOCKS | | | |
| (Cost $10,211,607) | | | 11,569,469 |
|
| Convertible Preferred Stocks - 3.3% | | | |
| CONSUMER DISCRETIONARY - 0.4% | | | |
| Diversified Consumer Services - 0.0% | | | |
| Handy Technologies, Inc. Series C (d) | | 415,643 | 2,212 |
| Household Durables - 0.3% | | | |
| Roku, Inc.: | | | |
| Series F, 8.00% (a)(d) | | 16,562,507 | 25,322 |
| Series G, 8.00% (a)(d) | | 3,185,945 | 4,871 |
| Series H (d) | | 1,931,947 | 2,954 |
| | | | 33,147 |
| Internet & Catalog Retail - 0.1% | | | |
| One Kings Lane, Inc. Series E (a)(d) | | 648,635 | 2,990 |
| The Honest Co., Inc. Series D (d) | | 75,268 | 3,444 |
| | | | 6,434 |
| Media - 0.0% | | | |
| Turn, Inc. Series E (a)(d) | | 1,199,041 | 4,137 |
|
| TOTAL CONSUMER DISCRETIONARY | | | 45,930 |
|
| CONSUMER STAPLES - 0.1% | | | |
| Food & Staples Retailing - 0.1% | | | |
| Blue Apron, Inc. Series D (d) | | 866,669 | 12,047 |
| FINANCIALS - 0.3% | | | |
| Real Estate Management & Development - 0.3% | | | |
| Redfin Corp. Series G (a)(d) | | 6,064,833 | 20,257 |
| WeWork Companies, Inc. Series E (d) | | 269,198 | 13,512 |
| | | | 33,769 |
| HEALTH CARE - 0.5% | | | |
| Biotechnology - 0.2% | | | |
| 23andMe, Inc. Series E (d) | | 1,817,170 | 17,172 |
| Editas Medicine, Inc. Series B (d) | | 176,244 | 2,538 |
| Gensight Biologics Series B (d) | | 270,022 | 1,344 |
| Intellia Therapeutics, Inc. Series B (d) | | 402,664 | 2,114 |
| Jounce Therapeutics, Inc. Series B (d) | | 2,212,389 | 3,040 |
| Ovid Therapeutics, Inc. Series B (d) | | 314,408 | 1,170 |
| | | | 27,378 |
| Health Care Providers & Services - 0.3% | | | |
| Mulberry Health, Inc. Series A8 (d) | | 4,342,250 | 29,331 |
|
| TOTAL HEALTH CARE | | | 56,709 |
|
| INDUSTRIALS - 0.1% | | | |
| Aerospace & Defense - 0.1% | | | |
| Space Exploration Technologies Corp. Series G (d) | | 62,037 | 5,521 |
| Professional Services - 0.0% | | | |
| YourPeople, Inc. Series C (d) | | 335,546 | 2,319 |
|
| TOTAL INDUSTRIALS | | | 7,840 |
|
| INFORMATION TECHNOLOGY - 1.9% | | | |
| Internet Software & Services - 1.2% | | | |
| Jet.Com, Inc. Series B1 (d) | | 4,896,249 | 24,422 |
| Pinterest, Inc. Series G, 8.00% (d) | | 27,858 | 1,053 |
| Uber Technologies, Inc.: | | | |
| Series D, 8.00% (a)(d) | | 2,256,164 | 110,038 |
| Series E, 8.00% (a)(d) | | 150,072 | 7,319 |
| | | | 142,832 |
| IT Services - 0.2% | | | |
| AppNexus, Inc. Series E (a)(d) | | 1,416,796 | 22,683 |
| Nutanix, Inc. Series E (a)(d) | | 311,503 | 3,863 |
| | | | 26,546 |
| Software - 0.5% | | | |
| Bracket Computing, Inc. Series C (d) | | 1,877,241 | 14,766 |
| Cloudera, Inc. Series F (a)(d) | | 126,709 | 4,160 |
| Cloudflare, Inc. Series D (a)(d) | | 395,787 | 1,935 |
| Dataminr, Inc. Series D (d) | | 2,219,446 | 17,616 |
| Delphix Corp. Series D (d) | | 427,177 | 2,136 |
| Snapchat, Inc. Series F (d) | | 32,552 | 838 |
| Taboola.Com Ltd. Series E (a)(d) | | 1,918,392 | 15,577 |
| Twilio, Inc. Series E (d) | | 351,811 | 4,531 |
| | | | 61,559 |
|
| TOTAL INFORMATION TECHNOLOGY | | | 230,937 |
|
| TELECOMMUNICATION SERVICES - 0.0% | | | |
| Wireless Telecommunication Services - 0.0% | | | |
| Altiostar Networks, Inc. Series D (d) | | 1,220,504 | 6,896 |
| TOTAL CONVERTIBLE PREFERRED STOCKS | | | |
| (Cost $349,539) | | | 394,128 |
|
| Money Market Funds - 6.3% | | | |
| Fidelity Cash Central Fund, 0.38% (g) | | 53,239,744 | 53,240 |
| Fidelity Securities Lending Cash Central Fund, 0.42% (g)(h) | | 704,512,730 | 704,513 |
| TOTAL MONEY MARKET FUNDS | | | |
| (Cost $757,753) | | | 757,753 |
| TOTAL INVESTMENT PORTFOLIO - 106.2% | | | |
| (Cost $11,318,899) | | | 12,721,350 |
| NET OTHER ASSETS (LIABILITIES) - (6.2)% | | | (737,966) |
| NET ASSETS - 100% | | | $11,983,384 |
Legend
(a) Non-income producing
(b) Security or a portion of the security is on loan at period end.
(c) Affiliated company
(d) Restricted securities - Investment in securities not registered under the Securities Act of 1933 (excluding 144A issues). At the end of the period, the value of restricted securities (excluding 144A issues) amounted to $414,465,000 or 3.5% of net assets.
(e) Security exempt from registration under Rule 144A of the Securities Act of 1933. These securities may be resold in transactions exempt from registration, normally to qualified institutional buyers. At the end of the period, the value of these securities amounted to $28,070,000 or 0.2% of net assets.
(f) Investment is owned by an entity that is treated as a corporation for U.S. tax purposes and is wholly-owned by the Fund.
(g) Affiliated fund that is generally available only to investment companies and other accounts managed by Fidelity Investments. The rate quoted is the annualized seven-day yield of the fund at period end. A complete unaudited listing of the fund's holdings as of its most recent quarter end is available upon request. In addition, each Fidelity Central Fund's financial statements are available on the SEC's website or upon request.
(h) Investment made with cash collateral received from securities on loan.
Additional information on each restricted holding is as follows:
| Security | Acquisition Date | Acquisition Cost (000s) |
| 23andMe, Inc. Series E | 6/18/15 | $19,675 |
| Altiostar Networks, Inc. Series D | 1/7/15 | $15,000 |
| AppNexus, Inc. Series E | 8/1/14 - 9/17/14 | $28,382 |
| Blue Apron, Inc. Series D | 5/18/15 | $11,550 |
| Bracket Computing, Inc. Series C | 9/9/15 | $14,766 |
| Cloudera, Inc. Series F | 2/5/14 | $1,845 |
| Cloudflare, Inc. Series D | 11/5/14 | $2,424 |
| Dataminr, Inc. Series D | 2/18/15 - 3/6/15 | $28,298 |
| Delphix Corp. Series D | 7/10/15 | $3,845 |
| Dropbox, Inc. | 5/2/12 | $3,000 |
| Editas Medicine, Inc. Series B | 8/4/15 | $2,062 |
| Gensight Biologics Series B | 7/2/15 | $2,081 |
| Handy Technologies, Inc. Series C | 10/14/15 | $2,436 |
| Intellia Therapeutics, Inc. Series B | 8/20/15 | $2,114 |
| Jet.Com, Inc. Series B1 | 11/24/15 | $24,422 |
| Jounce Therapeutics, Inc. Series B | 4/17/15 | $5,000 |
| Mulberry Health, Inc. Series A8 | 1/20/16 | $29,331 |
| Nutanix, Inc. Series E | 8/26/14 | $4,173 |
| One Kings Lane, Inc. Series E | 1/29/14 | $10,000 |
| Ovid Therapeutics, Inc. Series B | 8/10/15 | $1,959 |
| Pinterest, Inc. Series G, 8.00% | 2/27/15 | $1,000 |
| Redfin Corp. Series G | 12/16/14 | $20,000 |
| Roku, Inc. Series F, 8.00% | 5/7/13 | $15,000 |
| Roku, Inc. Series G, 8.00% | 10/1/14 | $4,140 |
| Roku, Inc. Series H | 11/9/15 | $2,954 |
| Snapchat, Inc. Series F | 3/25/15 | $1,000 |
| Space Exploration Technologies Corp. Class A | 10/16/15 | $9,844 |
| Space Exploration Technologies Corp. Series G | 1/20/15 | $4,805 |
| Taboola.Com Ltd. Series E | 12/22/14 | $20,000 |
| The Honest Co., Inc. Series D | 8/3/15 | $3,444 |
| Turn, Inc. Series E | 12/30/13 | $10,000 |
| Twilio, Inc. Series E | 4/24/15 | $3,979 |
| Uber Technologies, Inc. Series D, 8.00% | 6/6/14 | $35,000 |
| Uber Technologies, Inc. Series E, 8.00% | 12/5/14 | $5,000 |
| WeWork Companies, Inc. Class A | 6/23/15 | $984 |
| WeWork Companies, Inc. Series E | 6/23/15 | $8,854 |
| Wheels Up Partners Holdings LLC Series B unit | 9/18/15 | $5,000 |
| YourPeople, Inc. Series C | 5/1/15 | $5,000 |
Affiliated Central Funds
Information regarding fiscal year to date income earned by the Fund from investments in Fidelity Central Funds is as follows:
| Fund | Income earned |
| | (Amounts in thousands) |
| Fidelity Cash Central Fund | $21 |
| Fidelity Securities Lending Cash Central Fund | 11,486 |
| Total | $11,507 |
Other Affiliated Issuers
An affiliated company is a company in which the Fund has ownership of at least 5% of the voting securities. Fiscal year to date transactions with companies which are or were affiliates are as follows:
| Affiliate (Amounts in thousands) | Value, beginning of period | Purchases | Sales Proceeds* | Dividend Income | Value, end of period |
| Accretive Health, Inc. | $18,789 | $-- | $703 | $-- | $18,241 |
| athenahealth, Inc. | 327,395 | 8,694 | 3,192 | -- | 337,004 |
| Criteo SA sponsored ADR | 291,470 | -- | 1,762 | -- | -- |
| GameLoft SE | 36,312 | -- | 496 | -- | 41,371 |
| Groupon, Inc. Class A | 317,266 | -- | 12,726 | -- | 169,753 |
| Lion Biotechnologies, Inc. | 25,788 | -- | 747 | -- | 17,452 |
| Portola Pharmaceuticals, Inc. | 140,217 | 4,896 | 4,712 | -- | 93,885 |
| SolarCity Corp. | 89,259 | 207,856 | 11,228 | -- | 257,348 |
| SolarEdge Technologies, Inc. | -- | 63,165 | -- | -- | 68,894 |
| Synchronoss Technologies, Inc. | 127,356 | 3,746 | 110,002 | -- | -- |
| Trevena, Inc. | 19,522 | -- | 310 | -- | 24,217 |
| Ubisoft Entertainment SA | 204,478 | -- | 9,994 | -- | 279,592 |
| Zendesk, Inc. | 106,272 | 3,035 | 989 | -- | 115,614 |
| Total | $1,704,124 | $291,392 | $156,861 | $-- | $1,423,371 |
* Includes the value of securities delivered through in-kind transactions, if applicable.
Investment Valuation
The following is a summary of the inputs used, as of January 31, 2016, involving the Fund's assets and liabilities carried at fair value. The inputs or methodology used for valuing securities may not be an indication of the risk associated with investing in those securities. For more information on valuation inputs, and their aggregation into the levels used below, please refer to the Investment Valuation section in the accompanying Notes to Financial Statements.
| | Valuation Inputs at Reporting Date: |
| Description | Total | Level 1 | Level 2 | Level 3 |
| (Amounts in thousands) | | | | |
| Investments in Securities: | | | | |
| Equities: | | | | |
| Consumer Discretionary | $1,992,505 | $1,932,196 | $-- | $60,309 |
| Consumer Staples | 591,297 | 579,250 | -- | 12,047 |
| Energy | 48,999 | 48,999 | -- | -- |
| Financials | 561,223 | 525,953 | -- | 35,270 |
| Health Care | 2,362,835 | 2,302,480 | 3,646 | 56,709 |
| Industrials | 384,797 | 358,360 | 3,753 | 22,684 |
| Information Technology | 6,006,609 | 5,448,431 | 323,249 | 234,929 |
| Telecommunication Services | 15,332 | 8,436 | -- | 6,896 |
| Money Market Funds | 757,753 | 757,753 | -- | -- |
| Total Investments in Securities: | $12,721,350 | $11,961,858 | $330,648 | $428,844 |
The following is a summary of transfers between Level 1 and Level 2 for the period ended January 31, 2016. Transfers are assumed to have occurred at the beginning of the period, and are primarily attributable to the valuation techniques used for foreign equity securities, as discussed in the accompanying Notes to Financial Statements:
| Transfers | Total (000s) |
| Level 1 to Level 2 | $251,265 |
| Level 2 to Level 1 | $0 |
The following is a reconciliation of Investments in Securities for which Level 3 inputs were used in determining value:
| (Amounts in thousands) | | | | |
| Investments in Securities: | |
| Equities - Information Technology | |
| Beginning Balance | $203,955 |
| Net Realized Gain (Loss) on Investment Securities | -- |
| Net Unrealized Gain (Loss) on Investment Securities | (6,932) |
| Cost of Purchases | 39,188 |
| Proceeds of Sales | (1,282) |
| Amortization/Accretion | -- |
| Transfers into Level 3 | -- |
| Transfers out of Level 3 | -- |
| Ending Balance | $234,929 |
| The change in unrealized gain (loss) for the period attributable to Level 3 securities held at January 31, 2016 | $(4,835) |
| Equities - Other Investments in Securities | |
| Beginning Balance | $133,963 |
| Net Realized Gain (Loss) on Investment Securities | -- |
| Net Unrealized Gain (Loss) on Investment Securities | (10,870) |
| Cost of Purchases | 73,105 |
| Proceeds of Sales | (2,283) |
| Amortization/Accretion | -- |
| Transfers into Level 3 | -- |
| Transfers out of Level 3 | -- |
| Ending Balance | $193,915 |
| The change in unrealized gain (loss) for the period attributable to Level 3 securities held at January 31, 2016 | $(10,870) |
The information used in the above reconciliations represents fiscal year to date activity for any Investments in Securities identified as using Level 3 inputs at either the beginning or the end of the current fiscal period. Transfers in or out of Level 3 represent the beginning value of any Security or Instrument where a change in the pricing level occurred from the beginning to the end of the period. The cost of purchases and the proceeds of sales may include securities received or delivered through corporate actions or exchanges. Realized and unrealized gains (losses) disclosed in the reconciliations are included in Net Gain (Loss) on the Fund's Statement of Operations.
See accompanying notes which are an integral part of the financial statements.
Financial Statements
Statement of Assets and Liabilities
| Amounts in thousands (except per-share amounts) | | January 31, 2016 (Unaudited) |
| Assets | | |
Investment in securities, at value (including securities loaned of $698,617) — See accompanying schedule:
Unaffiliated issuers (cost $9,054,478) | $10,540,226 | |
| Fidelity Central Funds (cost $757,753) | 757,753 | |
| Other affiliated issuers (cost $1,506,668) | 1,423,371 | |
| Total Investments (cost $11,318,899) | | $12,721,350 |
| Receivable for investments sold | | 277,059 |
| Receivable for fund shares sold | | 14,547 |
| Dividends receivable | | 999 |
| Distributions receivable from Fidelity Central Funds | | 2,631 |
| Prepaid expenses | | 22 |
| Other receivables | | 259 |
| Total assets | | 13,016,867 |
| Liabilities | | |
| Payable for investments purchased | $311,570 | |
| Payable for fund shares redeemed | 8,030 | |
| Accrued management fee | 7,505 | |
| Other affiliated payables | 1,568 | |
| Other payables and accrued expenses | 297 | |
| Collateral on securities loaned, at value | 704,513 | |
| Total liabilities | | 1,033,483 |
| Net Assets | | $11,983,384 |
| Net Assets consist of: | | |
| Paid in capital | | $10,560,184 |
| Accumulated net investment loss | | (7,652) |
| Accumulated undistributed net realized gain (loss) on investments and foreign currency transactions | | 28,433 |
| Net unrealized appreciation (depreciation) on investments and assets and liabilities in foreign currencies | | 1,402,419 |
| Net Assets | | $11,983,384 |
| OTC: | | |
| Net Asset Value, offering price and redemption price per share ($8,742,384 ÷ 120,065 shares) | | $72.81 |
| Class K: | | |
| Net Asset Value, offering price and redemption price per share ($3,241,000 ÷ 44,041 shares) | | $73.59 |
See accompanying notes which are an integral part of the financial statements.
Statement of Operations
| Amounts in thousands | | Six months ended January 31, 2016 (Unaudited) |
| Investment Income | | |
| Dividends | | $39,295 |
| Income from Fidelity Central Funds (including $11,486 from security lending) | | 11,507 |
| Total income | | 50,802 |
| Expenses | | |
| Management fee | | |
| Basic fee | $38,705 | |
| Performance adjustment | 10,143 | |
| Transfer agent fees | 8,494 | |
| Accounting and security lending fees | 766 | |
| Custodian fees and expenses | 230 | |
| Independent trustees' compensation | 29 | |
| Registration fees | 113 | |
| Audit | 53 | |
| Legal | 34 | |
| Interest | 14 | |
| Miscellaneous | 38 | |
| Total expenses before reductions | 58,619 | |
| Expense reductions | (300) | 58,319 |
| Net investment income (loss) | | (7,517) |
| Realized and Unrealized Gain (Loss) | | |
| Net realized gain (loss) on: | | |
| Investment securities: | | |
| Unaffiliated issuers | 167,693 | |
| Other affiliated issuers | 21,516 | |
| Foreign currency transactions | (7) | |
| Total net realized gain (loss) | | 189,202 |
Change in net unrealized appreciation (depreciation) on:
Investment securities | (1,746,920) | |
| Assets and liabilities in foreign currencies | (1) | |
| Total change in net unrealized appreciation (depreciation) | | (1,746,921) |
| Net gain (loss) | | (1,557,719) |
| Net increase (decrease) in net assets resulting from operations | | $(1,565,236) |
See accompanying notes which are an integral part of the financial statements.
Statement of Changes in Net Assets
| Amounts in thousands | Six months ended January 31, 2016 (Unaudited) | Year ended July 31, 2015 |
| Increase (Decrease) in Net Assets | | |
| Operations | | |
| Net investment income (loss) | $(7,517) | $(11,952) |
| Net realized gain (loss) | 189,202 | 1,282,162 |
| Change in net unrealized appreciation (depreciation) | (1,746,921) | 1,068,362 |
| Net increase (decrease) in net assets resulting from operations | (1,565,236) | 2,338,572 |
| Distributions to shareholders from net realized gain | (704,905) | (1,408,892) |
| Share transactions - net increase (decrease) | 706,677 | 1,841,344 |
| Total increase (decrease) in net assets | (1,563,464) | 2,771,024 |
| Net Assets | | |
| Beginning of period | 13,546,848 | 10,775,824 |
| End of period (including accumulated net investment loss of $7,652 and accumulated net investment loss of $135, respectively) | $11,983,384 | $13,546,848 |
See accompanying notes which are an integral part of the financial statements.
Financial Highlights — Fidelity OTC Portfolio
| | Six months ended (Unaudited) | Years ended July 31, | | | | |
| | 2016 | 2015 | 2014 | 2013 | 2012 | 2011 |
| Selected Per–Share Data | | | | | | |
| Net asset value, beginning of period | $86.98 | $81.23 | $78.98 | $57.53 | $59.28 | $45.00 |
| Income from Investment Operations | | | | | | |
| Net investment income (loss)A | (.06) | (.11) | (.06) | .36B | (.08)C | (.27) |
| Net realized and unrealized gain (loss) | (9.60) | 16.14 | 12.78 | 21.37 | (1.67) | 14.55 |
| Total from investment operations | (9.66) | 16.03 | 12.72 | 21.73 | (1.75) | 14.28 |
| Distributions from net investment income | – | – | (.05) | (.28) | – | – |
| Distributions from net realized gain | (4.51) | (10.28) | (10.42) | – | – | – |
| Total distributions | (4.51) | (10.28) | (10.47) | (.28) | – | – |
| Net asset value, end of period | $72.81 | $86.98 | $81.23 | $78.98 | $57.53 | $59.28 |
| Total ReturnD,E | (11.46)% | 21.34% | 17.96% | 37.93% | (2.95)% | 31.73% |
| Ratios to Average Net AssetsF,G | | | | | | |
| Expenses before reductions | .94%H | .83% | .77% | .76% | .91% | .94% |
| Expenses net of fee waivers, if any | .94%H | .83% | .77% | .76% | .91% | .94% |
| Expenses net of all reductions | .94%H | .83% | .76% | .74% | .90% | .92% |
| Net investment income (loss) | (.15)%H | (.13)% | (.08)% | .55%B | (.14)%C | (.49)% |
| Supplemental Data | | | | | | |
| Net assets, end of period (in millions) | $8,742 | $9,710 | $7,870 | $6,693 | $5,499 | $6,374 |
| Portfolio turnover rateI | 69%H,J | 66%J | 106% | 116% | 149% | 158% |
A Calculated based on average shares outstanding during the period.
B Net Investment income per share reflects a large, non-recurring dividend which amounted to $.10 per share. Excluding this non-recurring dividend, the ratio of net investment income (loss) to average net assets would have been .40%.
C Net Investment income per share reflects a large, non-recurring dividend which amounted to $.03 per share. Excluding this non-recurring dividend, the ratio of net investment income (loss) to average net assets would have been (.20) %.
D Total returns for periods of less than one year are not annualized.
E Total returns would have been lower if certain expenses had not been reduced during the applicable periods shown.
F Fees and expenses of any underlying Fidelity Central Funds are not included in the Fund's expense ratio. The Fund indirectly bears its proportionate share of the expenses of any underlying Fidelity Central Funds.
G Expense ratios reflect operating expenses of the class. Expenses before reductions do not reflect amounts reimbursed by the investment adviser or reductions from brokerage service arrangements or reductions from other expense offset arrangements and do not represent the amount paid by the class during periods when reimbursements or reductions occur. Expenses net of fee waivers reflect expenses after reimbursement by the investment adviser but prior to reductions from brokerage service arrangements or other expense offset arrangements. Expenses net of all reductions represent the net expenses paid by the class.
H Annualized
I Amount does not include the portfolio activity of any underlying Fidelity Central Funds.
J Portfolio turnover rate excludes securities received or delivered in-kind.
See accompanying notes which are an integral part of the financial statements.
Financial Highlights — Fidelity OTC Portfolio Class K
| | Six months ended (Unaudited) | Years ended July 31, | | | | |
| | 2016 | 2015 | 2014 | 2013 | 2012 | 2011 |
| Selected Per–Share Data | | | | | | |
| Net asset value, beginning of period | $87.87 | $81.96 | $79.60 | $57.94 | $59.61 | $45.19 |
| Income from Investment Operations | | | | | | |
| Net investment income (loss)A | (.01) | (.01) | .04 | .45B | –C,D | (.19) |
| Net realized and unrealized gain (loss) | (9.70) | 16.29 | 12.87 | 21.53 | (1.67) | 14.61 |
| Total from investment operations | (9.71) | 16.28 | 12.91 | 21.98 | (1.67) | 14.42 |
| Distributions from net investment income | – | – | (.10) | (.32) | – | – |
| Distributions from net realized gain | (4.57) | (10.37) | (10.46) | – | – | – |
| Total distributions | (4.57) | (10.37) | (10.55)E | (.32) | – | – |
| Net asset value, end of period | $73.59 | $87.87 | $81.96 | $79.60 | $57.94 | $59.61 |
| Total ReturnF,G | (11.41)% | 21.49% | 18.10% | 38.11% | (2.80)% | 31.91% |
| Ratios to Average Net AssetsH,I | | | | | | |
| Expenses before reductions | .82%J | .72% | .65% | .62% | .77% | .80% |
| Expenses net of fee waivers, if any | .82%J | .72% | .65% | .62% | .77% | .80% |
| Expenses net of all reductions | .82%J | .71% | .64% | .60% | .76% | .78% |
| Net investment income (loss) | (.03)%J | (.02)% | .05% | .69%B | - %C,K | (.35)% |
| Supplemental Data | | | | | | |
| Net assets, end of period (in millions) | $3,241 | $3,836 | $2,906 | $2,260 | $1,644 | $1,363 |
| Portfolio turnover rateL | 69%J,M | 66%M | 106% | 116% | 149% | 158% |
A Calculated based on average shares outstanding during the period.
B Net Investment income per share reflects a large, non-recurring dividend which amounted to $.10 per share. Excluding this non-recurring dividend, the ratio of net investment income (loss) to average net assets would have been .53%.
C Net Investment income per share reflects a large, non-recurring dividend which amounted to $.03 per share. Excluding this non-recurring dividend, the ratio of net investment income (loss) to average net assets would have been (.06) %.
D Amount represents less than $.005 per share.
E Total distributions of $10.55 per share is comprised of distributions from net investment income of $.098 and distributions from net realized gain of $10.456 per share.
F Total returns for periods of less than one year are not annualized.
G Total returns would have been lower if certain expenses had not been reduced during the applicable periods shown.
H Fees and expenses of any underlying Fidelity Central Funds are not included in the Fund's expense ratio. The Fund indirectly bears its proportionate share of the expenses of any underlying Fidelity Central Funds.
I Expense ratios reflect operating expenses of the class. Expenses before reductions do not reflect amounts reimbursed by the investment adviser or reductions from brokerage service arrangements or reductions from other expense offset arrangements and do not represent the amount paid by the class during periods when reimbursements or reductions occur. Expenses net of fee waivers reflect expenses after reimbursement by the investment adviser but prior to reductions from brokerage service arrangements or other expense offset arrangements. Expenses net of all reductions represent the net expenses paid by the class.
J Annualized
K Amount represents less than .005%.
L Amount does not include the portfolio activity of any underlying Fidelity Central Funds.
M Portfolio turnover rate excludes securities received or delivered in-kind.
See accompanying notes which are an integral part of the financial statements.
Notes to Financial Statements (Unaudited)
For the period ended January 31, 2016
(Amounts in thousands except percentages)
1. Organization.
Fidelity OTC Portfolio (the Fund) is a non-diversified fund of Fidelity Securities Fund (the Trust) and is authorized to issue an unlimited number of shares. The Trust is registered under the Investment Company Act of 1940, as amended (the 1940 Act), as an open-end management investment company organized as a Massachusetts business trust. The Fund offers OTC and Class K shares, each of which has equal rights as to assets and voting privileges. Each class has exclusive voting rights with respect to matters that affect that class.
2. Investments in Fidelity Central Funds.
The Fund invests in Fidelity Central Funds, which are open-end investment companies generally available only to other investment companies and accounts managed by the investment adviser and its affiliates. The Fund's Schedule of Investments lists each of the Fidelity Central Funds held as of period end, if any, as an investment of the Fund, but does not include the underlying holdings of each Fidelity Central Fund. As an Investing Fund, the Fund indirectly bears its proportionate share of the expenses of the underlying Fidelity Central Funds.
The Money Market Central Funds seek preservation of capital and current income and are managed by Fidelity Investments Money Management, Inc. (FIMM), an affiliate of the investment adviser. Annualized expenses of the Money Market Central Funds as of their most recent shareholder report date are less than .005%.
A complete unaudited list of holdings for each Fidelity Central Fund is available upon request or at the Securities and Exchange Commission (the SEC) website at www.sec.gov. In addition, the financial statements of the Fidelity Central Funds are available on the SEC website or upon request.
3. Significant Accounting Policies.
The financial statements have been prepared in conformity with accounting principles generally accepted in the United States of America (GAAP), which require management to make certain estimates and assumptions at the date of the financial statements. Actual results could differ from those estimates. Subsequent events, if any, through the date that the financial statements were issued have been evaluated in the preparation of the financial statements. The following summarizes the significant accounting policies of the Fund:
Investment Valuation. Investments are valued as of 4:00 p.m. Eastern time on the last calendar day of the period. The Board of Trustees (the Board) has delegated the day to day responsibility for the valuation of the Fund's investments to the Fidelity Management & Research Company (FMR) Fair Value Committee (the Committee). In accordance with valuation policies and procedures approved by the Board, the Fund attempts to obtain prices from one or more third party pricing vendors or brokers to value its investments. When current market prices, quotations or currency exchange rates are not readily available or reliable, investments will be fair valued in good faith by the Committee, in accordance with procedures adopted by the Board. Factors used in determining fair value vary by investment type and may include market or investment specific events. The frequency with which these procedures are used cannot be predicted and they may be utilized to a significant extent. The Committee oversees the Fund's valuation policies and procedures and reports to the Board on the Committee's activities and fair value determinations. The Board monitors the appropriateness of the procedures used in valuing the Fund's investments and ratifies the fair value determinations of the Committee.
The Fund categorizes the inputs to valuation techniques used to value its investments into a disclosure hierarchy consisting of three levels as shown below:
- Level 1 – quoted prices in active markets for identical investments
- Level 2 – other significant observable inputs (including quoted prices for similar investments, interest rates, prepayment speeds, etc.)
- Level 3 – unobservable inputs (including the Fund's own assumptions based on the best information available)
Valuation techniques used to value the Fund's investments by major category are as follows:
Equity securities, including restricted securities, for which market quotations are readily available, are valued at the last reported sale price or official closing price as reported by a third party pricing vendor on the primary market or exchange on which they are traded and are categorized as Level 1 in the hierarchy. In the event there were no sales during the day or closing prices are not available, securities are valued at the last quoted bid price or may be valued using the last available price and are generally categorized as Level 2 in the hierarchy. For foreign equity securities, when market or security specific events arise, comparisons to the valuation of American Depositary Receipts (ADRs), futures contracts, Exchange-Traded Funds (ETFs) and certain indexes as well as quoted prices for similar securities may be used and would be categorized as Level 2 in the hierarchy. Utilizing these techniques may result in transfers between Level 1 and Level 2. For equity securities, including restricted securities, where observable inputs are limited, assumptions about market activity and risk are used and these securities may be categorized as Level 3 in the hierarchy. Equity securities, including restricted securities, for which observable inputs are not available are valued using alternate valuation approaches, including the market approach and the income approach and are categorized as Level 3 in the hierarchy. The market approach generally consists of using comparable market transactions while the income approach generally consists of using the net present value of estimated future cash flows, adjusted as appropriate for liquidity, credit, market and/or other risk factors.
Investments in open-end mutual funds, including the Fidelity Central Funds, are valued at their closing net asset value (NAV) each business day and are categorized as Level 1 in the hierarchy.
The following provides information on Level 3 securities held by the Fund that were valued at period end based on unobservable inputs. These amounts exclude valuations provided by a broker.
| Asset Type | Fair Value at 01/31/16 (000s) | Valuation Technique(s) | Unobservable Input | Amount or Range/Weighted Average | Impact to Valuation from an Increase in Input(a) |
| Equities | $428,844 | Discount cash flow | Discount rate | 8.0% | Decrease |
| | | | Discount for lack of marketability | 20.0% | Decrease |
| | | | Growth rate | 2.5% - 3.0% / 2.5% | Increase |
| | | | Weighted average cost of capital | 11.5% - 40.0% / 14.7% | Decrease |
| | | Last transaction price | Transaction price | $1.53 - $89.00 / $30.32 | Increase |
| | | Market comparable | EV/Sales multiple | 1.2 – 11.1 / 3.3 | Increase |
| | | | Discount rate | 3.0% - 50.0% / 17.5% | Decrease |
| | | | Discount for lack of marketability | 10.0% - 30.0% / 19.9% | Decrease |
| | | | Premium rate | 10.0% - 86.4% / 26.6% | Increase |
| | | | EV/GP multiple | 4.2 | Increase |
| | | Proposed transactions price | Transaction price | $8.00 - $50.19 / $46.72 | Increase |
| | | | Discount rate | 10.0% | Decrease |
| | | | Index movement | 30.2% | Increase |
| | | Proxy adjustment | Proxy movement | 39.0% - 40.3% / 39.4% | Increase |
| | | Replacement cost | Liquidity preference | $8.34 | Increase |
(a) Represents the expected directional change in the fair value of the Level 3 investments that would result from an increase in the corresponding input. A decrease to the unobservable input would have the opposite effect. Significant changes in these inputs could result in significantly higher or lower fair value measurements.
Changes in valuation techniques may result in transfers in or out of an assigned level within the disclosure hierarchy. The aggregate value of investments by input level as of January 31, 2016, including information on transfers between Levels 1 and 2 , as well as a roll forward of Level 3 investments, is included at the end of the Fund's Schedule of Investments.
Foreign Currency. The Fund may use foreign currency contracts to facilitate transactions in foreign-denominated securities. Gains and losses from these transactions may arise from changes in the value of the foreign currency or if the counterparties do not perform under the contracts' terms.
Foreign-denominated assets, including investment securities, and liabilities are translated into U.S. dollars at the exchange rates at period end. Purchases and sales of investment securities, income and dividends received and expenses denominated in foreign currencies are translated into U.S. dollars at the exchange rate in effect on the transaction date.
The effects of exchange rate fluctuations on investments are included with the net realized and unrealized gain (loss) on investment securities. Other foreign currency transactions resulting in realized and unrealized gain (loss) are disclosed separately.
Investment Transactions and Income. For financial reporting purposes, the Fund's investment holdings and NAV include trades executed through the end of the last business day of the period. The NAV per share for processing shareholder transactions is calculated as of the close of business of the New York Stock Exchange (NYSE), normally 4:00 p.m. Eastern time and includes trades executed through the end of the prior business day. Gains and losses on securities sold are determined on the basis of identified cost and may include proceeds received from litigation. Dividend income is recorded on the ex-dividend date, except for certain dividends from foreign securities where the ex-dividend date may have passed, which are recorded as soon as the Fund is informed of the ex-dividend date. Non-cash dividends included in dividend income, if any, are recorded at the fair market value of the securities received. Income and capital gain distributions from Fidelity Central Funds, if any, are recorded on the ex-dividend date. Distributions received on securities that represent a return of capital or capital gain are recorded as a reduction of cost of investments and/or as a realized gain. Subsequent to ex-dividend date the Fund determines the components of these distributions, based upon receipt of tax filings or other correspondence relating to the underlying investment. Interest income is accrued as earned and includes coupon interest and amortization of premium and accretion of discount on debt securities as applicable. Investment income is recorded net of foreign taxes withheld where recovery of such taxes is uncertain.
Class Allocations and Expenses. Investment income, realized and unrealized capital gains and losses, common expenses of the Fund, and certain fund-level expense reductions, if any, are allocated daily on a pro-rata basis to each class based on the relative net assets of each class to the total net assets of the Fund. Each class differs with respect to transfer agent fees incurred. Certain expense reductions may also differ by class. For the reporting period, the allocated portion of income and expenses to each class as a percent of its average net assets may vary due to the timing of recording these transactions in relation to fluctuating net assets of the classes. Expenses directly attributable to a fund are charged to that fund. Expenses attributable to more than one fund are allocated among the respective funds on the basis of relative net assets or other appropriate methods. Expense estimates are accrued in the period to which they relate and adjustments are made when actual amounts are known.
Deferred Trustee Compensation. Under a Deferred Compensation Plan (the Plan), independent Trustees may elect to defer receipt of a portion of their annual compensation. Deferred amounts are invested in a cross-section of Fidelity funds, are marked-to-market and remain in the Fund until distributed in accordance with the Plan. The investment of deferred amounts and the offsetting payable to the Trustees are included in the accompanying Statement of Assets and Liabilities.
Income Tax Information and Distributions to Shareholders. Each year, the Fund intends to qualify as a regulated investment company under Subchapter M of the Internal Revenue Code, including distributing substantially all of its taxable income and realized gains. As a result, no provision for U.S. Federal income taxes is required. The Fund files a U.S. federal tax return, in addition to state and local tax returns as required. The Fund's federal income tax returns are subject to examination by the Internal Revenue Service (IRS) for a period of three fiscal years after they are filed. State and local tax returns may be subject to examination for an additional fiscal year depending on the jurisdiction. Foreign taxes are provided for based on the Fund's understanding of the tax rules and rates that exist in the foreign markets in which it invests.
Distributions are declared and recorded on the ex-dividend date. Income dividends and capital gain distributions are declared separately for each class. Income and capital gain distributions are determined in accordance with income tax regulations, which may differ from GAAP.
Capital accounts within the financial statements are adjusted for permanent book-tax differences. These adjustments have no impact on net assets or the results of operations. Capital accounts are not adjusted for temporary book-tax differences which will reverse in a subsequent period.
Book-tax differences are primarily due to redemptions in-kind, foreign currency transactions, passive foreign investment companies (PFIC), net operating losses, partnerships, deferred trustees compensation and losses deferred due to wash sales.
The federal tax cost of investment securities and unrealized appreciation (depreciation) as of period end were as follows:
| Gross unrealized appreciation | $3,197,874 |
| Gross unrealized depreciation | (1,846,819) |
| Net unrealized appreciation (depreciation) on securities | $1,351,055 |
| Tax cost | $11,370,295 |
Restricted Securities. The Fund may invest in securities that are subject to legal or contractual restrictions on resale. These securities generally may be resold in transactions exempt from registration or to the public if the securities are registered. Disposal of these securities may involve time-consuming negotiations and expense, and prompt sale at an acceptable price may be difficult. Information regarding restricted securities is included at the end of the Fund's Schedule of Investments.
4. Purchases and Sales of Investments.
Purchases and sales of securities, other than short-term securities and in-kind transactions, aggregated $4,554,570 and $4,443,603, respectively.
Redemptions In-Kind. During the period, 1,292 shares of the Fund held by an unaffiliated entity were redeemed in-kind for cash and investments with a value of $104,098. The net realized gain of $41,724 on investments delivered through the in-kind redemption is included in the accompanying Statement of Operations. The amount of in-kind redemptions is included in share transactions in the accompanying Statement of Changes in Net Assets as well as Note 11: Share Transactions. The Fund recognized no gain or loss for federal income tax purposes.
5. Fees and Other Transactions with Affiliates.
Management Fee. Fidelity Management & Research Company (the investment adviser) and its affiliates provide the Fund with investment management related services for which the Fund pays a monthly management fee. The management fee is the sum of an individual fund fee rate that is based on an annual rate of .35% of the Fund's average net assets and an annualized group fee rate that averaged .25% during the period. The group fee rate is based upon the average net assets of all the mutual funds advised by the investment adviser, including any mutual funds previously advised by the investment adviser that are currently advised by Fidelity SelectCo, LLC, an affiliate of the investment adviser. The group fee rate decreases as assets under management increase and increases as assets under management decrease. In addition, the management fee is subject to a performance adjustment (up to a maximum of +/- .20% of the Fund's average net assets over a 36 month performance period). The upward or downward adjustment to the management fee is based on the relative investment performance of OTC as compared to its benchmark index, the Nasdaq Composite Index, over the same 36 month performance period. For the reporting period, the total annualized management fee rate, including the performance adjustment, was .76% of the Fund's average net assets. The performance adjustment included in the management fee rate may be higher or lower than the maximum performance adjustment rate due to the difference between the average net assets for the reporting and performance periods.
Transfer Agent Fees. Fidelity Investments Institutional Operations Company, Inc., (FIIOC), an affiliate of the investment adviser, is the transfer, dividend disbursing and shareholder servicing agent for each class of the Fund. FIIOC receives account fees and asset-based fees that vary according to the account size and type of account of the shareholders of OTC. FIIOC receives an asset-based fee of Class K's average net assets. FIIOC pays for typesetting, printing and mailing of shareholder reports, except proxy statements.
For the period, transfer agent fees for each class were as follows:
| | Amount | % of
Class-Level Average
Net Assets(a) |
| OTC | $7,639 | .16 |
| Class K | 855 | .05 |
| | $8,494 | |
(a) Annualized
Accounting and Security Lending Fees. Fidelity Service Company, Inc. (FSC), an affiliate of the investment adviser, maintains the Fund's accounting records. The accounting fee is based on the level of average net assets for each month. Under a separate contract, FSC administers the security lending program. The security lending fee is based on the number and duration of lending transactions.
Brokerage Commissions. The Fund placed a portion of its portfolio transactions with brokerage firms which are affiliates of the investment adviser. Brokerage commissions are included in net realized gain (loss) and change in net unrealized appreciation (depreciation) in the Statement of Operations. The commissions paid to these affiliated firms were $93 for the period.
Interfund Lending Program. Pursuant to an Exemptive Order issued by the SEC, the Fund, along with other registered investment companies having management contracts with FMR or other affiliated entities of FMR, may participate in an interfund lending program. This program provides an alternative credit facility allowing the funds to borrow from, or lend money to, other participating affiliated funds. At period end, there were no interfund loans outstanding. The Fund's activity in this program during the period for which loans were outstanding was as follows:
| Borrower or Lender | Average Loan Balance | Weighted Average Interest Rate | Interest Expense |
| Borrower | $19,193 | .52% | $14 |
Interfund Trades. The Fund may purchase from or sell securities to other Fidelity Funds under procedures adopted by the Board. The procedures have been designed to ensure these interfund trades are executed in accordance with Rule 17a-7 of the 1940 Act. Interfund trades are included within the respective purchases and sales amounts shown in the Purchases and Sales of Investments note.
6. Committed Line of Credit.
The Fund participates with other funds managed by the investment adviser or an affiliate in a $4.25 billion credit facility (the "line of credit") to be utilized for temporary or emergency purposes to fund shareholder redemptions or for other short-term liquidity purposes. The Fund has agreed to pay commitment fees on its pro-rata portion of the line of credit, which amounted to $9 and is reflected in Miscellaneous expenses on the Statement of Operations. During the period, the Fund did not borrow on this line of credit.
7. Security Lending.
The Fund lends portfolio securities through a lending agent from time to time in order to earn additional income. For equity securities, a lending agent is used and may loan securities to certain qualified borrowers, including Fidelity Capital Markets (FCM), a broker-dealer affiliated with the Fund. On the settlement date of the loan, the Fund receives collateral (in the form of U.S. Treasury obligations, letters of credit and/or cash) against the loaned securities and maintains collateral in an amount not less than 100% of the market value of the loaned securities during the period of the loan. The market value of the loaned securities is determined at the close of business of the Fund and any additional required collateral is delivered to the Fund on the next business day. The Fund or borrower may terminate the loan at any time, and if the borrower defaults on its obligation to return the securities loaned because of insolvency or other reasons, the Fund may apply collateral received from the borrower against the obligation. The Fund may experience delays and costs in recovering the securities loaned. Any cash collateral received is invested in the Fidelity Securities Lending Cash Central Fund. The value of loaned securities and cash collateral at period end are disclosed on the Fund's Statement of Assets and Liabilities. The value of securities loaned to FCM at period end was $36,876. Security lending income represents the income earned on investing cash collateral, less rebates paid to borrowers and any lending agent fees associated with the loan, plus any premium payments received for lending certain types of securities. Security lending income is presented in the Statement of Operations as a component of income from Fidelity Central Funds and includes $1,352 from securities loaned to FCM.
8. Bank Borrowings.
The Fund is permitted to have bank borrowings for temporary or emergency purposes to fund shareholder redemptions or for other short-term liquidity requirements. The Fund has established borrowing arrangements with certain banks. The interest rate on the borrowings is the bank's base rate, as revised from time to time. The average loan balance during the period for which loans were outstanding amounted to $5,043. The weighted average interest rate was .64%. The interest expense amounted to less than five hundred dollars under the bank borrowing program. At period end, there were no bank borrowings outstanding.
9. Expense Reductions.
Commissions paid to certain brokers with whom the investment adviser, or its affiliates, places trades on behalf of the Fund include an amount in addition to trade execution, which may be rebated back to the Fund to offset certain expenses. This amount totaled $251 for the period.
In addition, during the period the investment adviser reimbursed and/or waived a portion of fund-level operating expenses in the amount of $49.
10. Distributions to Shareholders.
Distributions to shareholders of each class were as follows:
| | Six months ended January 31, 2016 | Year ended July 31, 2015 |
| From net realized gain | | |
| OTC | $505,475 | $1,012,327 |
| Class K | 199,430 | 396,565 |
| Total | $704,905 | $1,408,892 |
11. Share Transactions.
Share transactions for each class were as follows and may contain automatic conversions between classes or exchanges between affiliated funds:
| | Shares | Shares | Dollars | Dollars |
| | Six months ended January 31, 2016 | Year ended July 31, 2015 | Six months ended January 31, 2016 | Year ended July 31, 2015 |
| OTC | | | | |
| Shares sold | 14,519 | 22,946 | $1,162,995 | $1,893,100 |
| Reinvestment of distributions | 6,240 | 12,406 | 491,074 | 985,025 |
| Shares redeemed | (12,328) | (20,601) | (971,846) | (1,665,615) |
| Net increase (decrease) | 8,431 | 14,751 | $682,223 | $1,212,510 |
| Class K | | | | |
| Shares sold | 6,792 | 16,984 | $546,527 | $1,383,593 |
| Reinvestment of distributions | 2,509 | 4,953 | 199,430 | 396,565 |
| Shares redeemed | (8,920)(a) | (13,732)(b) | (721,503)(a) | (1,151,324)(b) |
| Net increase (decrease) | 381 | 8,205 | $24,454 | $628,834 |
(a) Amount includes in-kind redemptions (see Note 4: Redemptions In-Kind).
(b) Amount includes in-kind redemptions.
12. Other.
The Fund's organizational documents provide former and current trustees and officers with a limited indemnification against liabilities arising in connection with the performance of their duties to the Fund. In the normal course of business, the Fund may also enter into contracts that provide general indemnifications. The Fund's maximum exposure under these arrangements is unknown as this would be dependent on future claims that may be made against the Fund. The risk of material loss from such claims is considered remote.
Shareholder Expense Example
As a shareholder of the Fund, you incur two types of costs: (1) transaction costs, and (2) ongoing costs, including management fees and other Fund expenses. This Example is intended to help you understand your ongoing costs (in dollars) of investing in the Fund and to compare these costs with the ongoing costs of investing in other mutual funds.
The Example is based on an investment of $1,000 invested at the beginning of the period and held for the entire period (August 1, 2015 to January 31, 2016).
Actual Expenses
The first line of the accompanying table for each class of the Fund provides information about actual account values and actual expenses. You may use the information in this line, together with the amount you invested, to estimate the expenses that you paid over the period. Simply divide your account value by $1,000.00 (for example, an $8,600 account value divided by $1,000.00 = 8.6), then multiply the result by the number in the first line for a class of the Fund under the heading entitled "Expenses Paid During Period" to estimate the expenses you paid on your account during this period. A small balance maintenance fee of $12.00 that is charged once a year may apply for certain accounts with a value of less than $2,000. This fee is not included in the table below. If it was, the estimate of expenses you paid during the period would be higher, and your ending account value lower, by this amount. In addition, the Fund, as a shareholder in the underlying Fidelity Central Funds, will indirectly bear its pro-rata share of the fees and expenses incurred by the underlying Fidelity Central Funds. These fees and expenses are not included in the Fund's annualized expense ratio used to calculate the expense estimate in the table below.
Hypothetical Example for Comparison Purposes
The second line of the accompanying table for each class of the Fund provides information about hypothetical account values and hypothetical expenses based on a Class' actual expense ratio and an assumed rate of return of 5% per year before expenses, which is not the Class' actual return. The hypothetical account values and expenses may not be used to estimate the actual ending account balance or expenses you paid for the period. You may use this information to compare the ongoing costs of investing in the Fund and other funds. To do so, compare this 5% hypothetical example with the 5% hypothetical examples that appear in the shareholder reports of the other funds. A small balance maintenance fee of $12.00 that is charged once a year may apply for certain accounts with a value of less than $2,000. This fee is not included in the table below. If it was, the estimate of expenses you paid during the period would be higher, and your ending account value lower, by this amount. In addition, the Fund, as a shareholder in the underlying Fidelity Central Funds, will indirectly bear its pro-rata share of the fees and expenses incurred by the underlying Fidelity Central Funds. These fees and expenses are not included in the Fund's annualized expense ratio used to calculate the expense estimate in the table below.
Please note that the expenses shown in the table are meant to highlight your ongoing costs only and do not reflect any transaction costs. Therefore, the second line of the table is useful in comparing ongoing costs only, and will not help you determine the relative total costs of owning different funds.
| | Annualized Expense Ratio-A | Beginning
Account Value
August 1, 2015 | Ending
Account Value
January 31, 2016 | Expenses Paid
During Period-B
August 1, 2015
to January 31, 2016 |
| OTC | .94% | | | |
| Actual | | $1,000.00 | $885.40 | $4.45 |
| Hypothetical-C | | $1,000.00 | $1,020.41 | $4.77 |
| Class K | .82% | | | |
| Actual | | $1,000.00 | $885.90 | $3.89 |
| Hypothetical-C | | $1,000.00 | $1,021.01 | $4.17 |
A Annualized expense ratio reflects expenses net of applicable fee waivers.
B Expenses are equal to each Class' annualized expense ratio, multiplied by the average account value over the period, multiplied by 184/366 (to reflect the one-half year period).
C 5% return per year before expenses
Corporate Headquarters
245 Summer St.
Boston, MA 02210
www.fidelity.com
OTC-K-SANN-0316
1.863325.107
Fidelity® Growth & Income Portfolio
Semi-Annual Report January 31, 2016 |
|
Contents
To view a fund's proxy voting guidelines and proxy voting record for the 12-month period ended June 30, visit http://www.fidelity.com/proxyvotingresults or visit the Securities and Exchange Commission's (SEC) web site at http://www.sec.gov.
You may also call 1-800-544-8544 to request a free copy of the proxy voting guidelines.
Standard & Poor's, S&P and S&P 500 are registered service marks of The McGraw-Hill Companies, Inc. and have been licensed for use by Fidelity Distributors Corporation.
Other third-party marks appearing herein are the property of their respective owners.
All other marks appearing herein are registered or unregistered trademarks or service marks of FMR LLC or an affiliated company. © 2016 FMR LLC. All rights reserved.
This report and the financial statements contained herein are submitted for the general information of the shareholders of the Fund. This report is not authorized for distribution to prospective investors in the Fund unless preceded or accompanied by an effective prospectus.
A fund files its complete schedule of portfolio holdings with the SEC for the first and third quarters of each fiscal year on Form N-Q. Forms N-Q are available on the SEC’s web site at http://www.sec.gov. A fund's Forms N-Q may be reviewed and copied at the SEC’s Public Reference Room in Washington, DC. Information regarding the operation of the SEC's Public Reference Room may be obtained by calling 1-800-SEC-0330.
For a complete list of a fund's portfolio holdings, view the most recent holdings listing, semiannual report, or annual report on Fidelity's web site at http://www.fidelity.com, http://www.advisor.fidelity.com, or http://www.401k.com, as applicable.
NOT FDIC INSURED •MAY LOSE VALUE •NO BANK GUARANTEE
Neither the Fund nor Fidelity Distributors Corporation is a bank.
Investment Summary (Unaudited)
Top Ten Stocks as of January 31, 2016
| | % of fund's net assets | % of fund's net assets 6 months ago |
| JPMorgan Chase & Co. | 4.0 | 4.4 |
| Microsoft Corp.(a) | 3.6 | 2.9 |
| General Electric Co.(a) | 3.5 | 3.3 |
| Apple, Inc. | 2.9 | 3.5 |
| Bank of America Corp. | 2.8 | 2.7 |
| Procter & Gamble Co. | 2.5 | 2.0 |
| Chevron Corp. | 2.3 | 1.8 |
| Johnson & Johnson | 2.3 | 1.8 |
| Citigroup, Inc. | 2.3 | 2.8 |
| Target Corp.(a) | 2.0 | 2.2 |
| | 28.2 | |
(a) Security or a portion of the security is pledged as collateral for call options written.
Top Five Market Sectors as of January 31, 2016
| | % of fund's net assets | % of fund's net assets 6 months ago |
| Information Technology | 21.2 | 21.8 |
| Financials | 21.0 | 22.9 |
| Industrials | 12.8 | 12.7 |
| Health Care | 12.6 | 10.8 |
| Energy | 10.1 | 8.5 |
Asset Allocation (% of fund's net assets)
| As of January 31, 2016*,** |
| | Stocks | 98.8% |
| | Convertible Securities | 1.2% |

* Foreign investments - 12.0%
** Written options - (0.0)%
| As of July 31, 2015*,** |
| | Stocks | 98.8% |
| | Convertible Securities | 1.0% |
| | Other Investments | 0.1% |
| | Short-Term Investments and Net Other Assets (Liabilities) | 0.1% |

* Foreign investments - 11.9%
** Written options - (0.0)%
Percentages shown as 0.0% may reflect amounts less than 0.05%.
Investments January 31, 2016 (Unaudited)
Showing Percentage of Net Assets
| Common Stocks - 98.8% | | | |
| | | Shares | Value (000s) |
| CONSUMER DISCRETIONARY - 9.1% | | | |
| Automobiles - 0.1% | | | |
| General Motors Co. | | 106,900 | $3,169 |
| Harley-Davidson, Inc. | | 95,600 | 3,824 |
| | | | 6,993 |
| Diversified Consumer Services - 0.2% | | | |
| ServiceMaster Global Holdings, Inc. (a) | | 288,900 | 12,194 |
| Hotels, Restaurants & Leisure - 0.9% | | | |
| Cedar Fair LP (depositary unit) | | 6,000 | 325 |
| Dunkin' Brands Group, Inc. | | 187,000 | 7,360 |
| Las Vegas Sands Corp. | | 289,000 | 13,034 |
| Yum! Brands, Inc. | | 453,944 | 32,852 |
| | | | 53,571 |
| Household Durables - 0.1% | | | |
| Tupperware Brands Corp. | | 178,500 | 8,288 |
| Leisure Products - 0.2% | | | |
| Mattel, Inc. | | 201,900 | 5,570 |
| NJOY, Inc. (a)(b) | | 671,365 | 86 |
| Polaris Industries, Inc. | | 69,900 | 5,161 |
| | | | 10,817 |
| Media - 4.5% | | | |
| Comcast Corp. Class A | | 1,821,000 | 101,448 |
| Scripps Networks Interactive, Inc. Class A | | 583,889 | 35,600 |
| Sinclair Broadcast Group, Inc. Class A | | 385,061 | 12,707 |
| Time Warner, Inc. | | 1,075,017 | 75,724 |
| Viacom, Inc. Class B (non-vtg.) | | 792,300 | 36,161 |
| | | | 261,640 |
| Multiline Retail - 2.0% | | | |
| Dillard's, Inc. Class A | | 19,100 | 1,345 |
| Target Corp. (c) | | 1,577,275 | 114,226 |
| | | | 115,571 |
| Specialty Retail - 1.1% | | | |
| Lowe's Companies, Inc. (c) | | 875,979 | 62,773 |
|
| TOTAL CONSUMER DISCRETIONARY | | | 531,847 |
|
| CONSUMER STAPLES - 8.4% | | | |
| Beverages - 2.9% | | | |
| Britvic PLC | | 175,700 | 1,814 |
| Diageo PLC | | 1,118,799 | 30,120 |
| PepsiCo, Inc. | | 301,614 | 29,950 |
| The Coca-Cola Co. | | 2,579,603 | 110,717 |
| | | | 172,601 |
| Food & Staples Retailing - 1.0% | | | |
| CVS Health Corp. | | 410,704 | 39,670 |
| Walgreens Boots Alliance, Inc. | | 249,684 | 19,905 |
| | | | 59,575 |
| Food Products - 0.2% | | | |
| Mead Johnson Nutrition Co. Class A | | 118,700 | 8,605 |
| Household Products - 2.5% | | | |
| Procter & Gamble Co. | | 1,806,815 | 147,599 |
| Personal Products - 0.1% | | | |
| Edgewell Personal Care Co. (a) | | 47,800 | 3,538 |
| Estee Lauder Companies, Inc. Class A | | 7,200 | 614 |
| | | | 4,152 |
| Tobacco - 1.7% | | | |
| British American Tobacco PLC sponsored ADR | | 291,023 | 32,306 |
| Imperial Tobacco Group PLC | | 177,740 | 9,624 |
| Philip Morris International, Inc. | | 673,171 | 60,592 |
| | | | 102,522 |
|
| TOTAL CONSUMER STAPLES | | | 495,054 |
|
| ENERGY - 10.0% | | | |
| Energy Equipment & Services - 1.2% | | | |
| Baker Hughes, Inc. | | 255,800 | 11,130 |
| Helmerich & Payne, Inc. | | 126,400 | 6,421 |
| National Oilwell Varco, Inc. | | 396,800 | 12,912 |
| Oceaneering International, Inc. | | 654,000 | 22,138 |
| Schlumberger Ltd. | | 265,732 | 19,204 |
| | | | 71,805 |
| Oil, Gas & Consumable Fuels - 8.8% | | | |
| Apache Corp. | | 1,177,968 | 50,111 |
| Cabot Oil & Gas Corp. | | 110,700 | 2,297 |
| Cenovus Energy, Inc. | | 1,031,400 | 12,708 |
| Chevron Corp. | | 1,588,696 | 137,375 |
| ConocoPhillips Co. | | 731,800 | 28,599 |
| Energy Transfer Equity LP | | 554,600 | 4,814 |
| EQT Midstream Partners LP | | 91,802 | 6,249 |
| Golar LNG Ltd. | | 559,200 | 10,412 |
| Imperial Oil Ltd. | | 1,448,300 | 44,403 |
| Kinder Morgan, Inc. | | 1,690,100 | 27,802 |
| Legacy Reserves LP | | 1,050,368 | 1,376 |
| MPLX LP | | 496,947 | 15,291 |
| PrairieSky Royalty Ltd. (d) | | 690,973 | 9,835 |
| Suncor Energy, Inc. | | 3,305,750 | 78,296 |
| The Williams Companies, Inc. | | 2,144,272 | 41,384 |
| Williams Partners LP | | 2,064,285 | 45,456 |
| | | | 516,408 |
|
| TOTAL ENERGY | | | 588,213 |
|
| FINANCIALS - 21.0% | | | |
| Banks - 14.1% | | | |
| Bank of America Corp. | | 11,439,956 | 161,761 |
| Citigroup, Inc. | | 3,169,630 | 134,963 |
| Comerica, Inc. | | 601,200 | 20,621 |
| Commerce Bancshares, Inc. | | 180,415 | 7,420 |
| Fifth Third Bancorp | | 471,500 | 7,450 |
| JPMorgan Chase & Co. | | 3,920,192 | 233,248 |
| Lloyds Banking Group PLC | | 2,027,500 | 1,899 |
| M&T Bank Corp. | | 222,300 | 24,493 |
| PNC Financial Services Group, Inc. | | 372,354 | 32,264 |
| Regions Financial Corp. | | 3,778,700 | 30,683 |
| Standard Chartered PLC (United Kingdom) | | 1,791,655 | 12,087 |
| SunTrust Banks, Inc. | | 1,632,066 | 59,701 |
| U.S. Bancorp | | 1,850,773 | 74,142 |
| Wells Fargo & Co. | | 611,141 | 30,698 |
| | | | 831,430 |
| Capital Markets - 5.1% | | | |
| Apollo Global Management LLC Class A | | 482,300 | 6,550 |
| Ashmore Group PLC (d) | | 787,300 | 2,476 |
| Charles Schwab Corp. | | 1,320,743 | 33,719 |
| Franklin Resources, Inc. | | 226,700 | 7,857 |
| Invesco Ltd. | | 524,900 | 15,710 |
| KKR & Co. LP | | 2,392,343 | 32,608 |
| Morgan Stanley | | 1,478,197 | 38,256 |
| Northern Trust Corp. | | 796,264 | 49,432 |
| Oaktree Capital Group LLC Class A | | 258,700 | 11,321 |
| PJT Partners, Inc. (a) | | 954 | 25 |
| State Street Corp. | | 1,508,427 | 84,065 |
| T. Rowe Price Group, Inc. | | 7,300 | 518 |
| The Blackstone Group LP | | 657,500 | 17,273 |
| | | | 299,810 |
| Diversified Financial Services - 0.2% | | | |
| McGraw Hill Financial, Inc. | | 131,200 | 11,155 |
| Insurance - 1.0% | | | |
| Chubb Ltd. | | 39,200 | 4,432 |
| Marsh & McLennan Companies, Inc. | | 369,846 | 19,724 |
| MetLife, Inc. | | 435,140 | 19,429 |
| Principal Financial Group, Inc. | | 371,400 | 14,113 |
| Willis Group Holdings PLC | | 15,400 | 1,763 |
| | | | 59,461 |
| Real Estate Investment Trusts - 0.4% | | | |
| American Tower Corp. | | 84,700 | 7,991 |
| Crown Castle International Corp. | | 84,900 | 7,318 |
| First Potomac Realty Trust | | 57,018 | 558 |
| Sabra Health Care REIT, Inc. | | 223,000 | 4,094 |
| | | | 19,961 |
| Thrifts & Mortgage Finance - 0.2% | | | |
| Radian Group, Inc. | | 1,052,168 | 10,585 |
|
| TOTAL FINANCIALS | | | 1,232,402 |
|
| HEALTH CARE - 11.8% | | | |
| Biotechnology - 1.9% | | | |
| AbbVie, Inc. | | 580,500 | 31,869 |
| Amgen, Inc. (c) | | 266,403 | 40,688 |
| Biogen, Inc. (a) | | 113,800 | 31,074 |
| Celgene Corp. (a) | | 52,600 | 5,277 |
| Intercept Pharmaceuticals, Inc. (a) | | 39,826 | 4,231 |
| | | | 113,139 |
| Health Care Equipment & Supplies - 2.1% | | | |
| Abbott Laboratories | | 673,804 | 25,503 |
| Ansell Ltd. | | 396,877 | 5,704 |
| Medtronic PLC | | 868,230 | 65,916 |
| Zimmer Biomet Holdings, Inc. | | 281,910 | 27,982 |
| | | | 125,105 |
| Health Care Providers & Services - 1.1% | | | |
| McKesson Corp. | | 311,787 | 50,191 |
| Patterson Companies, Inc. | | 296,870 | 12,605 |
| | | | 62,796 |
| Life Sciences Tools & Services - 0.2% | | | |
| Agilent Technologies, Inc. | | 381,200 | 14,352 |
| Pharmaceuticals - 6.5% | | | |
| Astellas Pharma, Inc. | | 453,600 | 6,281 |
| Bristol-Myers Squibb Co. | | 190,900 | 11,866 |
| GlaxoSmithKline PLC sponsored ADR | | 2,375,122 | 98,069 |
| Innoviva, Inc. | | 289,100 | 2,897 |
| Johnson & Johnson | | 1,300,569 | 135,831 |
| Novartis AG sponsored ADR | | 6,744 | 526 |
| Sanofi SA | | 166,837 | 13,874 |
| Shire PLC sponsored ADR (d) | | 121,600 | 20,465 |
| Teva Pharmaceutical Industries Ltd. sponsored ADR | | 1,481,320 | 91,072 |
| | | | 380,881 |
|
| TOTAL HEALTH CARE | | | 696,273 |
|
| INDUSTRIALS - 12.7% | | | |
| Aerospace & Defense - 2.1% | | | |
| Meggitt PLC | | 330,468 | 1,719 |
| Rolls-Royce Group PLC | | 1,095,600 | 8,715 |
| The Boeing Co. | | 590,989 | 70,996 |
| United Technologies Corp. | | 465,282 | 40,801 |
| | | | 122,231 |
| Air Freight & Logistics - 2.1% | | | |
| C.H. Robinson Worldwide, Inc. | | 341,500 | 22,119 |
| PostNL NV (a) | | 4,588,400 | 16,698 |
| United Parcel Service, Inc. Class B | | 892,004 | 83,135 |
| | | | 121,952 |
| Airlines - 0.2% | | | |
| Copa Holdings SA Class A | | 265,854 | 12,522 |
| Building Products - 0.2% | | | |
| Lennox International, Inc. | | 80,700 | 9,669 |
| Commercial Services & Supplies - 0.3% | | | |
| ADT Corp. (d) | | 661,510 | 19,567 |
| Electrical Equipment - 0.9% | | | |
| Eaton Corp. PLC | | 238,000 | 12,021 |
| Emerson Electric Co. | | 560,200 | 25,758 |
| Hubbell, Inc. Class B | | 196,639 | 17,782 |
| | | | 55,561 |
| Industrial Conglomerates - 3.5% | | | |
| General Electric Co. (c) | | 7,176,480 | 208,836 |
| Machinery - 0.7% | | | |
| CLARCOR, Inc. | | 25,400 | 1,190 |
| Cummins, Inc. | | 22,500 | 2,023 |
| Deere & Co. (d) | | 192,900 | 14,855 |
| Donaldson Co., Inc. | | 311,900 | 8,789 |
| IMI PLC | | 206,300 | 2,382 |
| Pentair PLC | | 43,800 | 2,064 |
| Wabtec Corp. | | 46,100 | 2,948 |
| Xylem, Inc. | | 157,600 | 5,666 |
| | | | 39,917 |
| Professional Services - 0.1% | | | |
| Nielsen Holdings PLC | | 110,400 | 5,317 |
| Road & Rail - 2.1% | | | |
| CSX Corp. | | 1,854,620 | 42,693 |
| J.B. Hunt Transport Services, Inc. | | 528,040 | 38,389 |
| Kansas City Southern | | 244,500 | 17,330 |
| Norfolk Southern Corp. | | 210,899 | 14,868 |
| Union Pacific Corp. | | 131,000 | 9,432 |
| | | | 122,712 |
| Trading Companies & Distributors - 0.5% | | | |
| MSC Industrial Direct Co., Inc. Class A | | 67,100 | 4,349 |
| W.W. Grainger, Inc. (d) | | 18,100 | 3,560 |
| Watsco, Inc. | | 190,392 | 22,125 |
| | | | 30,034 |
|
| TOTAL INDUSTRIALS | | | 748,318 |
|
| INFORMATION TECHNOLOGY - 21.0% | | | |
| Communications Equipment - 3.2% | | | |
| Cisco Systems, Inc. (c) | | 3,284,352 | 78,135 |
| Qualcomm, Inc. | | 2,415,446 | 109,516 |
| | | | 187,651 |
| Internet Software & Services - 3.5% | | | |
| Alphabet, Inc.: | | | |
| Class A | | 144,007 | 109,640 |
| Class C | | 123,346 | 91,640 |
| Yahoo!, Inc. (a) | | 245,195 | 7,236 |
| | | | 208,516 |
| IT Services - 5.3% | | | |
| First Data Corp. | | 1,631,010 | 20,716 |
| First Data Corp. Class A (a) | | 80,900 | 1,082 |
| IBM Corp. | | 460,204 | 57,429 |
| MasterCard, Inc. Class A (c) | | 682,700 | 60,781 |
| Paychex, Inc. | | 1,486,052 | 71,122 |
| Unisys Corp. (a) | | 973,600 | 9,561 |
| Visa, Inc. Class A | | 1,191,384 | 88,746 |
| | | | 309,437 |
| Semiconductors & Semiconductor Equipment - 0.5% | | | |
| Marvell Technology Group Ltd. | | 292,300 | 2,587 |
| Maxim Integrated Products, Inc. | | 552,000 | 18,437 |
| Xilinx, Inc. | | 164,300 | 8,259 |
| | | | 29,283 |
| Software - 4.3% | | | |
| Microsoft Corp. (c) | | 3,792,999 | 208,956 |
| Oracle Corp. | | 1,123,353 | 40,789 |
| | | | 249,745 |
| Technology Hardware, Storage & Peripherals - 4.2% | | | |
| Apple, Inc. | | 1,784,494 | 173,703 |
| EMC Corp. | | 2,598,100 | 64,355 |
| HP, Inc. | | 59,800 | 581 |
| Western Digital Corp. | | 208,700 | 10,013 |
| | | | 248,652 |
|
| TOTAL INFORMATION TECHNOLOGY | | | 1,233,284 |
|
| MATERIALS - 3.1% | | | |
| Chemicals - 2.7% | | | |
| CF Industries Holdings, Inc. | | 362,400 | 10,872 |
| E.I. du Pont de Nemours & Co. | | 322,146 | 16,996 |
| LyondellBasell Industries NV Class A | | 186,300 | 14,526 |
| Monsanto Co. | | 749,415 | 67,897 |
| Potash Corp. of Saskatchewan, Inc. | | 1,266,200 | 20,644 |
| Syngenta AG (Switzerland) | | 79,559 | 29,295 |
| | | | 160,230 |
| Containers & Packaging - 0.4% | | | |
| Ball Corp. | | 65,300 | 4,364 |
| International Paper Co. | | 27,400 | 937 |
| Packaging Corp. of America | | 114,400 | 5,815 |
| WestRock Co. | | 357,700 | 12,620 |
| | | | 23,736 |
|
| TOTAL MATERIALS | | | 183,966 |
|
| TELECOMMUNICATION SERVICES - 1.1% | | | |
| Diversified Telecommunication Services - 1.1% | | | |
| Verizon Communications, Inc. (c) | | 1,243,374 | 62,131 |
| UTILITIES - 0.6% | | | |
| Electric Utilities - 0.6% | | | |
| Exelon Corp. | | 1,056,600 | 31,244 |
| PPL Corp. | | 77,500 | 2,717 |
| | | | 33,961 |
| Multi-Utilities - 0.0% | | | |
| Sempra Energy | | 33,600 | 3,184 |
|
| TOTAL UTILITIES | | | 37,145 |
|
| TOTAL COMMON STOCKS | | | |
| (Cost $5,739,188) | | | 5,808,633 |
|
| Preferred Stocks - 0.9% | | | |
| Convertible Preferred Stocks - 0.9% | | | |
| HEALTH CARE - 0.8% | | | |
| Health Care Equipment & Supplies - 0.8% | | | |
| Alere, Inc. 3.00% (a) | | 182,843 | 47,027 |
| INDUSTRIALS - 0.1% | | | |
| Commercial Services & Supplies - 0.1% | | | |
| Stericycle, Inc. 2.25% (a) | | 83,400 | 7,586 |
|
| TOTAL CONVERTIBLE PREFERRED STOCKS | | | 54,613 |
|
| Nonconvertible Preferred Stocks - 0.0% | | | |
| INDUSTRIALS - 0.0% | | | |
| Aerospace & Defense - 0.0% | | | |
| Rolls-Royce Group PLC (C Shares) (a) | | 32,482,080 | 46 |
| TOTAL PREFERRED STOCKS | | | |
| (Cost $53,077) | | | 54,659 |
| | | Principal Amount (000s) | Value (000s) |
|
| Convertible Bonds - 0.3% | | | |
| CONSUMER DISCRETIONARY - 0.0% | | | |
| Automobiles - 0.0% | | | |
| Tesla Motors, Inc. 1.25% 3/1/21 | | 3,470 | 2,789 |
| ENERGY - 0.1% | | | |
| Oil, Gas & Consumable Fuels - 0.1% | | | |
| Amyris, Inc.: | | | |
| 5% 10/15/18 (b) | | 3,094 | 2,655 |
| 9.5% 4/15/19 (e) | | 5,075 | 4,304 |
| Peabody Energy Corp. 4.75% 12/15/41 | | 7,660 | 230 |
| | | | 7,189 |
| INFORMATION TECHNOLOGY - 0.2% | | | |
| Internet Software & Services - 0.2% | | | |
| Twitter, Inc. 0.25% 9/15/19 | | 10,230 | 8,747 |
| TOTAL CONVERTIBLE BONDS | | | |
| (Cost $26,246) | | | 18,725 |
| | | Shares | Value (000s) |
|
| Money Market Funds - 0.9% | | | |
| Fidelity Securities Lending Cash Central Fund, 0.42% (f)(g) | | | |
| (Cost $52,906) | | 52,906,401 | 52,906 |
| TOTAL INVESTMENT PORTFOLIO - 100.9% | | | |
| (Cost $5,871,417) | | | 5,934,923 |
| NET OTHER ASSETS (LIABILITIES) - (0.9)% | | | (53,661) |
| NET ASSETS - 100% | | | $5,881,262 |
| Written Options | | | | |
| | Expiration Date/Exercise Price | Number of Contracts | Premium (000s) | Value (000s) |
| Call Options | | | | |
| Amgen, Inc. | 2/19/16 - $165.00 | 675 | $116 | $(21) |
| Cisco Systems, Inc. | 3/18/16 - $29.00 | 3,868 | 159 | (4) |
| General Electric Co. | 3/18/16 - $33.00 | 11,857 | 250 | (24) |
| Lowe's Companies, Inc. | 4/15/16 - $85.00 | 8,498 | 723 | (72) |
| MasterCard, Inc. Class A | 2/19/16 - $100.00 | 1,733 | 80 | (9) |
| Microsoft Corp. | 3/18/16 - $60.00 | 5,823 | 473 | (131) |
| Target Corp. | 2/19/16 - $77.50 | 2,402 | 180 | (12) |
| Verizon Communications, Inc. | 3/18/16 - $48.00 | 2,296 | 108 | (576) |
| TOTAL WRITTEN OPTIONS | | | $2,089 | $(849) |
Legend
(a) Non-income producing
(b) Restricted securities - Investment in securities not registered under the Securities Act of 1933 (excluding 144A issues). At the end of the period, the value of restricted securities (excluding 144A issues) amounted to $2,741,000 or 0.0% of net assets.
(c) Security or a portion of the security is pledged as collateral for call options written. At period end, the value of securities pledged amounted to $191,288,000.
(d) Security or a portion of the security is on loan at period end.
(e) Security exempt from registration under Rule 144A of the Securities Act of 1933. These securities may be resold in transactions exempt from registration, normally to qualified institutional buyers. At the end of the period, the value of these securities amounted to $4,304,000 or 0.1% of net assets.
(f) Affiliated fund that is generally available only to investment companies and other accounts managed by Fidelity Investments. The rate quoted is the annualized seven-day yield of the fund at period end. A complete unaudited listing of the fund's holdings as of its most recent quarter end is available upon request. In addition, each Fidelity Central Fund's financial statements are available on the SEC's website or upon request.
(g) Investment made with cash collateral received from securities on loan.
Additional information on each restricted holding is as follows:
| Security | Acquisition Date | Acquisition Cost (000s) |
| Amyris, Inc. 5% 10/15/18 | 10/16/13 - 10/15/15 | $3,094 |
| NJOY, Inc. | 2/14/14 | $1,164 |
Affiliated Central Funds
Information regarding fiscal year to date income earned by the Fund from investments in Fidelity Central Funds is as follows:
| Fund | Income earned |
| | (Amounts in thousands) |
| Fidelity Cash Central Fund | $5 |
| Fidelity Securities Lending Cash Central Fund | 283 |
| Total | $288 |
Investment Valuation
The following is a summary of the inputs used, as of January 31, 2016, involving the Fund's assets and liabilities carried at fair value. The inputs or methodology used for valuing securities may not be an indication of the risk associated with investing in those securities. For more information on valuation inputs, and their aggregation into the levels used below, please refer to the Investment Valuation section in the accompanying Notes to Financial Statements.
| | Valuation Inputs at Reporting Date: |
| Description | Total | Level 1 | Level 2 | Level 3 |
| (Amounts in thousands) | | | | |
| Investments in Securities: | | | | |
| Equities: | | | | |
| Consumer Discretionary | $531,847 | $531,761 | $-- | $86 |
| Consumer Staples | 495,054 | 453,496 | 41,558 | -- |
| Energy | 588,213 | 588,213 | -- | -- |
| Financials | 1,232,402 | 1,215,940 | 16,462 | -- |
| Health Care | 743,300 | 717,441 | 25,859 | -- |
| Industrials | 755,950 | 718,850 | 37,100 | -- |
| Information Technology | 1,233,284 | 1,212,568 | 20,716 | -- |
| Materials | 183,966 | 154,671 | 29,295 | -- |
| Telecommunication Services | 62,131 | 62,131 | -- | -- |
| Utilities | 37,145 | 37,145 | -- | -- |
| Corporate Bonds | 18,725 | -- | 18,725 | -- |
| Money Market Funds | 52,906 | 52,906 | -- | -- |
| Total Investments in Securities: | $5,934,923 | $5,745,122 | $189,715 | $86 |
| Derivative Instruments: | | | | |
| Liabilities | | | | �� |
| Written Options | $(849) | $(849) | $-- | $-- |
| Total Liabilities | $(849) | $(849) | $-- | $-- |
| Total Derivative Instruments: | $(849) | $(849) | $-- | $-- |
The following is a summary of transfers between Level 1 and Level 2 for the period ended January 31, 2016. Transfers are assumed to have occurred at the beginning of the period, and are primarily attributable to the valuation techniques used for foreign equity securities, as discussed in the accompanying Notes to Financial Statements:
| Transfers | Total (000s) |
| Level 1 to Level 2 | $119,518 |
| Level 2 to Level 1 | $0 |
Value of Derivative Instruments
The following table is a summary of the Fund's value of derivative instruments by primary risk exposure as of January 31, 2016. For additional information on derivative instruments, please refer to the Derivative Instruments section in the accompanying Notes to Financial Statements.
| Primary Risk Exposure / Derivative Type | Value (000s) |
| | Asset | Liability |
| Equity Risk | | |
| Written Options(a) | $0 | $(849) |
| Total Equity Risk | $0 | $(849) |
| Total Value of Derivatives | $0 | $(849) |
(a) Gross value is presented in the Statement of Assets and Liabilities in the written options, at value line-item.
Other Information
Distribution of investments by country or territory of incorporation, as a percentage of Total Net Assets, is as follows (Unaudited):
| United States of America | 88.0% |
| United Kingdom | 3.4% |
| Canada | 2.8% |
| Israel | 1.6% |
| Ireland | 1.3% |
| Others (Individually Less Than 1%) | 2.9% |
| | 100.0% |
See accompanying notes which are an integral part of the financial statements.
Financial Statements
Statement of Assets and Liabilities
| Amounts in thousands (except per-share amounts) | | January 31, 2016 (Unaudited) |
| Assets | | |
Investment in securities, at value (including securities loaned of $52,808) — See accompanying schedule:
Unaffiliated issuers (cost $5,818,511) | $5,882,017 | |
| Fidelity Central Funds (cost $52,906) | 52,906 | |
| Total Investments (cost $5,871,417) | | $5,934,923 |
| Receivable for investments sold | | 36,912 |
| Receivable for fund shares sold | | 968 |
| Dividends receivable | | 8,127 |
| Interest receivable | | 256 |
| Distributions receivable from Fidelity Central Funds | | 68 |
| Prepaid expenses | | 13 |
| Other receivables | | 674 |
| Total assets | | 5,981,941 |
| Liabilities | | |
| Payable to custodian bank | $2,084 | |
| Payable for investments purchased | 37,211 | |
| Payable for fund shares redeemed | 3,790 | |
| Accrued management fee | 2,187 | |
| Written options, at value (premium received $2,089) | 849 | |
| Other affiliated payables | 926 | |
| Other payables and accrued expenses | 726 | |
| Collateral on securities loaned, at value | 52,906 | |
| Total liabilities | | 100,679 |
| Net Assets | | $5,881,262 |
| Net Assets consist of: | | |
| Paid in capital | | $8,273,423 |
| Distributions in excess of net investment income | | (8,950) |
| Accumulated undistributed net realized gain (loss) on investments and foreign currency transactions | | (2,447,891) |
| Net unrealized appreciation (depreciation) on investments and assets and liabilities in foreign currencies | | 64,680 |
| Net Assets | | $5,881,262 |
| Growth and Income: | | |
| Net Asset Value, offering price and redemption price per share ($5,139,689 ÷ 190,272 shares) | | $27.01 |
| Class K: | | |
| Net Asset Value, offering price and redemption price per share ($741,573 ÷ 27,477 shares) | | $26.99 |
See accompanying notes which are an integral part of the financial statements.
Statement of Operations
| Amounts in thousands | | Six months ended January 31, 2016 (Unaudited) |
| Investment Income | | |
| Dividends | | $83,521 |
| Interest | | 668 |
| Income from Fidelity Central Funds | | 288 |
| Total income | | 84,477 |
| Expenses | | |
| Management fee | $14,673 | |
| Transfer agent fees | 5,088 | |
| Accounting and security lending fees | 577 | |
| Custodian fees and expenses | 84 | |
| Independent trustees' compensation | 15 | |
| Registration fees | 28 | |
| Audit | 45 | |
| Legal | 24 | |
| Interest | 7 | |
| Miscellaneous | 20 | |
| Total expenses before reductions | 20,561 | |
| Expense reductions | (68) | 20,493 |
| Net investment income (loss) | | 63,984 |
| Realized and Unrealized Gain (Loss) | | |
| Net realized gain (loss) on: | | |
| Investment securities: | | |
| Unaffiliated issuers | 231,502 | |
| Foreign currency transactions | (126) | |
| Written options | 186 | |
| Total net realized gain (loss) | | 231,562 |
Change in net unrealized appreciation (depreciation) on:
Investment securities | (1,115,546) | |
| Assets and liabilities in foreign currencies | (36) | |
| Written options | 1,240 | |
| Total change in net unrealized appreciation (depreciation) | | (1,114,342) |
| Net gain (loss) | | (882,780) |
| Net increase (decrease) in net assets resulting from operations | | $(818,796) |
See accompanying notes which are an integral part of the financial statements.
Statement of Changes in Net Assets
| Amounts in thousands | Six months ended January 31, 2016 (Unaudited) | Year ended July 31, 2015 |
| Increase (Decrease) in Net Assets | | |
| Operations | | |
| Net investment income (loss) | $63,984 | $140,160 |
| Net realized gain (loss) | 231,562 | 743,260 |
| Change in net unrealized appreciation (depreciation) | (1,114,342) | (281,519) |
| Net increase (decrease) in net assets resulting from operations | (818,796) | 601,901 |
| Distributions to shareholders from net investment income | (72,212) | (135,475) |
| Distributions to shareholders from net realized gain | (2,644) | – |
| Total distributions | (74,856) | (135,475) |
| Share transactions - net increase (decrease) | (649,281) | (551,906) |
| Total increase (decrease) in net assets | (1,542,933) | (85,480) |
| Net Assets | | |
| Beginning of period | 7,424,195 | 7,509,675 |
| End of period (including distributions in excess of net investment income of $8,950 and distributions in excess of net investment income of $722, respectively) | $5,881,262 | $7,424,195 |
See accompanying notes which are an integral part of the financial statements.
Financial Highlights — Fidelity Growth & Income Portfolio
| | Six months ended (Unaudited) | Years ended July 31, | | | | |
| January 31, | 2016 | 2015 | 2014 | 2013 | 2012 | 2011 |
| Selected Per–Share Data | | | | | | |
| Net asset value, beginning of period | $30.85 | $29.02 | $25.66 | $20.13 | $18.58 | $15.75 |
| Income from Investment Operations | | | | | | |
| Net investment income (loss)A | .28 | .55 | .51 | .46 | .36 | .20 |
| Net realized and unrealized gain (loss) | (3.79) | 1.82B | 3.35 | 5.54 | 1.55 | 2.82 |
| Total from investment operations | (3.51) | 2.37 | 3.86 | 6.00 | 1.91 | 3.02 |
| Distributions from net investment income | (.32) | (.54) | (.50) | (.44) | (.35) | (.19) |
| Distributions from net realized gain | (.01) | – | (.01) | (.03) | (.01) | – |
| Total distributions | (.33) | (.54) | (.50)C | (.47) | (.36) | (.19) |
| Net asset value, end of period | $27.01 | $30.85 | $29.02 | $25.66 | $20.13 | $18.58 |
| Total ReturnD,E | (11.41)% | 8.23%B | 15.16% | 30.15% | 10.45% | 19.16% |
| Ratios to Average Net AssetsF,G | | | | | | |
| Expenses before reductions | .64%H | .64% | .65% | .68% | .71% | .72% |
| Expenses net of fee waivers, if any | .64%H | .63% | .65% | .68% | .71% | .72% |
| Expenses net of all reductions | .64%H | .63% | .65% | .67% | .71% | .71% |
| Net investment income (loss) | 1.94%H | 1.83% | 1.86% | 2.04% | 1.95% | 1.09% |
| Supplemental Data | | | | | | |
| Net assets, end of period (in millions) | $5,140 | $6,563 | $6,550 | $6,060 | $4,863 | $5,052 |
| Portfolio turnover rateI | 35%H | 35% | 41%J | 49% | 62% | 129% |
A Calculated based on average shares outstanding during the period.
B Net realized and unrealized gain (loss) per share reflects proceeds from litigation which amounted to $.06 per share. Excluding these litigation proceeds, the total return would have been 8.03%.
C Total distributions of $.50 per share is comprised of distributions from net investment income of $.495 and distributions from net realized gain of $.006 per share.
D Total returns for periods of less than one year are not annualized.
E Total returns would have been lower if certain expenses had not been reduced during the applicable periods shown.
F Fees and expenses of any underlying Fidelity Central Funds are not included in the Fund's expense ratio. The Fund indirectly bears its proportionate share of the expenses of any underlying Fidelity Central Funds.
G Expense ratios reflect operating expenses of the class. Expenses before reductions do not reflect amounts reimbursed by the investment adviser or reductions from brokerage service arrangements or reductions from other expense offset arrangements and do not represent the amount paid by the class during periods when reimbursements or reductions occur. Expenses net of fee waivers reflect expenses after reimbursement by the investment adviser but prior to reductions from brokerage service arrangements or other expense offset arrangements. Expenses net of all reductions represent the net expenses paid by the class.
H Annualized
I Amount does not include the portfolio activity of any underlying Fidelity Central Funds.
J Portfolio turnover rate excludes securities received or delivered in-kind.
See accompanying notes which are an integral part of the financial statements.
Financial Highlights — Fidelity Growth & Income Portfolio Class K
| | Six months ended (Unaudited) | Years ended July 31, | | | | |
| January 31, | 2016 | 2015 | 2014 | 2013 | 2012 | 2011 |
| Selected Per–Share Data | | | | | | |
| Net asset value, beginning of period | $30.82 | $29.00 | $25.64 | $20.12 | $18.57 | $15.74 |
| Income from Investment Operations | | | | | | |
| Net investment income (loss)A | .30 | .59 | .54 | .50 | .40 | .23 |
| Net realized and unrealized gain (loss) | (3.78) | 1.81B | 3.36 | 5.52 | 1.54 | 2.82 |
| Total from investment operations | (3.48) | 2.40 | 3.90 | 6.02 | 1.94 | 3.05 |
| Distributions from net investment income | (.34) | (.58) | (.53) | (.47) | (.38) | (.22) |
| Distributions from net realized gain | (.01) | – | (.01) | (.03) | (.01) | – |
| Total distributions | (.35) | (.58) | (.54) | (.50) | (.39) | (.22) |
| Net asset value, end of period | $26.99 | $30.82 | $29.00 | $25.64 | $20.12 | $18.57 |
| Total ReturnC,D | (11.33)% | 8.34%B | 15.32% | 30.28% | 10.66% | 19.40% |
| Ratios to Average Net AssetsE,F | | | | | | |
| Expenses before reductions | .52%G | .52% | .52% | .53% | .54% | .54% |
| Expenses net of fee waivers, if any | .52%G | .52% | .52% | .53% | .54% | .54% |
| Expenses net of all reductions | .52%G | .52% | .52% | .52% | .54% | .53% |
| Net investment income (loss) | 2.06%G | 1.95% | 1.99% | 2.19% | 2.13% | 1.27% |
| Supplemental Data | | | | | | |
| Net assets, end of period (in millions) | $742 | $862 | $960 | $1,016 | $752 | $403 |
| Portfolio turnover rateH | 35%G | 35% | 41%I | 49% | 62% | 129% |
A Calculated based on average shares outstanding during the period.
B Net realized and unrealized gain (loss) per share reflects proceeds from litigation which amounted to $.06 per share. Excluding these litigation proceeds, the total return would have been 8.14%.
C Total returns for periods of less than one year are not annualized.
D Total returns would have been lower if certain expenses had not been reduced during the applicable periods shown.
E Fees and expenses of any underlying Fidelity Central Funds are not included in the Fund's expense ratio. The Fund indirectly bears its proportionate share of the expenses of any underlying Fidelity Central Funds.
F Expense ratios reflect operating expenses of the class. Expenses before reductions do not reflect amounts reimbursed by the investment adviser or reductions from brokerage service arrangements or reductions from other expense offset arrangements and do not represent the amount paid by the class during periods when reimbursements or reductions occur. Expenses net of fee waivers reflect expenses after reimbursement by the investment adviser but prior to reductions from brokerage service arrangements or other expense offset arrangements. Expenses net of all reductions represent the net expenses paid by the class.
G Annualized
H Amount does not include the portfolio activity of any underlying Fidelity Central Funds.
I Portfolio turnover rate excludes securities received or delivered in-kind.
See accompanying notes which are an integral part of the financial statements.
Notes to Financial Statements (Unaudited)
For the period ended January 31, 2016
(Amounts in thousands except percentages)
1. Organization.
Fidelity Growth & Income Portfolio (the Fund) is a fund of Fidelity Securities Fund (the Trust) and is authorized to issue an unlimited number of shares. The Trust is registered under the Investment Company Act of 1940, as amended (the 1940 Act), as an open-end management investment company organized as a Massachusetts business trust. The Fund offers Growth & Income, and Class K shares, each of which has equal rights as to assets and voting privileges. Each class has exclusive voting rights with respect to matters that affect that class.
2. Investments in Fidelity Central Funds.
The Fund invests in Fidelity Central Funds, which are open-end investment companies generally available only to other investment companies and accounts managed by the investment adviser and its affiliates. The Fund's Schedule of Investments lists each of the Fidelity Central Funds held as of period end, if any, as an investment of the Fund, but does not include the underlying holdings of each Fidelity Central Fund. As an Investing Fund, the Fund indirectly bears its proportionate share of the expenses of the underlying Fidelity Central Funds.
The Money Market Central Funds seek preservation of capital and current income and are managed by Fidelity Investments Money Management, Inc. (FIMM), an affiliate of the investment adviser. Annualized expenses of the Money Market Central Funds as of their most recent shareholder report date are less than .005%.
A complete unaudited list of holdings for each Fidelity Central Fund is available upon request or at the Securities and Exchange Commission (the SEC) website at www.sec.gov. In addition, the financial statements of the Fidelity Central Funds are available on the SEC website or upon request.
3. Significant Accounting Policies.
The financial statements have been prepared in conformity with accounting principles generally accepted in the United States of America (GAAP), which require management to make certain estimates and assumptions at the date of the financial statements. Actual results could differ from those estimates. Subsequent events, if any, through the date that the financial statements were issued have been evaluated in the preparation of the financial statements. The following summarizes the significant accounting policies of the Fund:
Investment Valuation. Investments are valued as of 4:00 p.m. Eastern time on the last calendar day of the period. The Board of Trustees (the Board) has delegated the day to day responsibility for the valuation of the Fund's investments to the Fidelity Management & Research Company (FMR) Fair Value Committee (the Committee). In accordance with valuation policies and procedures approved by the Board, the Fund attempts to obtain prices from one or more third party pricing vendors or brokers to value its investments. When current market prices, quotations or currency exchange rates are not readily available or reliable, investments will be fair valued in good faith by the Committee, in accordance with procedures adopted by the Board. Factors used in determining fair value vary by investment type and may include market or investment specific events, changes in interest rates and credit quality. The frequency with which these procedures are used cannot be predicted and they may be utilized to a significant extent. The Committee oversees the Fund's valuation policies and procedures and reports to the Board on the Committee's activities and fair value determinations. The Board monitors the appropriateness of the procedures used in valuing the Fund's investments and ratifies the fair value determinations of the Committee.
The Fund categorizes the inputs to valuation techniques used to value its investments into a disclosure hierarchy consisting of three levels as shown below:
- Level 1 – quoted prices in active markets for identical investments
- Level 2 – other significant observable inputs (including quoted prices for similar investments, interest rates, prepayment speeds, etc.)
- Level 3 – unobservable inputs (including the Fund's own assumptions based on the best information available)
Valuation techniques used to value the Fund's investments by major category are as follows:
Equity securities, including restricted securities, for which market quotations are readily available, are valued at the last reported sale price or official closing price as reported by a third party pricing vendor on the primary market or exchange on which they are traded and are categorized as Level 1 in the hierarchy. In the event there were no sales during the day or closing prices are not available, securities are valued at the last quoted bid price or may be valued using the last available price and are generally categorized as Level 2 in the hierarchy. For foreign equity securities, when market or security specific events arise, comparisons to the valuation of American Depositary Receipts (ADRs), futures contracts, Exchange-Traded Funds (ETFs) and certain indexes as well as quoted prices for similar securities may be used and would be categorized as Level 2 in the hierarchy. Utilizing these techniques may result in transfers between Level 1 and Level 2. For equity securities, including restricted securities, where observable inputs are limited, assumptions about market activity and risk are used and these securities may be categorized as Level 3 in the hierarchy.
Debt securities, including restricted securities, are valued based on evaluated prices received from third party pricing vendors or from brokers who make markets in such securities. Corporate bonds are valued by pricing vendors who utilize matrix pricing which considers yield or price of bonds of comparable quality, coupon, maturity and type or by broker-supplied prices. When independent prices are unavailable or unreliable, debt securities may be valued utilizing pricing methodologies which consider similar factors that would be used by third party pricing vendors. Debt securities are generally categorized as Level 2 in the hierarchy but may be Level 3 depending on the circumstances.
Exchange-traded options are valued using the last sale price or, in the absence of a sale, the last offering price and are categorized as Level 1 in the hierarchy. Investments in open-end mutual funds, including the Fidelity Central Funds, are valued at their closing net asset value (NAV) each business day and are categorized as Level 1 in the hierarchy.
Changes in valuation techniques may result in transfers in or out of an assigned level within the disclosure hierarchy. The aggregate value of investments by input level as of January 31, 2016, including information on transfers between Levels 1 and 2 is included at the end of the Fund's Schedule of Investments.
Foreign Currency. The Fund may use foreign currency contracts to facilitate transactions in foreign-denominated securities. Gains and losses from these transactions may arise from changes in the value of the foreign currency or if the counterparties do not perform under the contracts' terms.
Foreign-denominated assets, including investment securities, and liabilities are translated into U.S. dollars at the exchange rates at period end. Purchases and sales of investment securities, income and dividends received and expenses denominated in foreign currencies are translated into U.S. dollars at the exchange rate in effect on the transaction date.
The effects of exchange rate fluctuations on investments are included with the net realized and unrealized gain (loss) on investment securities. Other foreign currency transactions resulting in realized and unrealized gain (loss) are disclosed separately.
Investment Transactions and Income. For financial reporting purposes, the Fund's investment holdings and NAV include trades executed through the end of the last business day of the period. The NAV per share for processing shareholder transactions is calculated as of the close of business of the New York Stock Exchange (NYSE), normally 4:00 p.m. Eastern time and includes trades executed through the end of the prior business day. Gains and losses on securities sold are determined on the basis of identified cost and may include proceeds received from litigation. Dividend income is recorded on the ex-dividend date, except for certain dividends from foreign securities where the ex-dividend date may have passed, which are recorded as soon as the Fund is informed of the ex-dividend date. Non-cash dividends included in dividend income, if any, are recorded at the fair market value of the securities received. Income and capital gain distributions from Fidelity Central Funds, if any, are recorded on the ex-dividend date. Distributions received on securities that represent a return of capital or capital gain are recorded as a reduction of cost of investments and/or as a realized gain. Subsequent to ex-dividend date the Fund determines the components of these distributions, based upon receipt of tax filings or other correspondence relating to the underlying investment. Interest income is accrued as earned and includes coupon interest and amortization of premium and accretion of discount on debt securities as applicable. Investment income is recorded net of foreign taxes withheld where recovery of such taxes is uncertain.
Class Allocations and Expenses. Investment income, realized and unrealized capital gains and losses, common expenses of the Fund, and certain fund-level expense reductions, if any, are allocated daily on a pro-rata basis to each class based on the relative net assets of each class to the total net assets of the Fund. Each class differs with respect to transfer agent fees incurred. Certain expense reductions may also differ by class. For the reporting period, the allocated portion of income and expenses to each class as a percent of its average net assets may vary due to the timing of recording these transactions in relation to fluctuating net assets of the classes. Expenses directly attributable to a fund are charged to that fund. Expenses attributable to more than one fund are allocated among the respective funds on the basis of relative net assets or other appropriate methods. Expense estimates are accrued in the period to which they relate and adjustments are made when actual amounts are known.
Deferred Trustee Compensation. Under a Deferred Compensation Plan (the Plan), independent Trustees may elect to defer receipt of a portion of their annual compensation. Deferred amounts are invested in a cross-section of Fidelity funds, are marked-to-market and remain in the Fund until distributed in accordance with the Plan. The investment of deferred amounts and the offsetting payable to the Trustees are included in the accompanying Statement of Assets and Liabilities.
Income Tax Information and Distributions to Shareholders. Each year, the Fund intends to qualify as a regulated investment company under Subchapter M of the Internal Revenue Code, including distributing substantially all of its taxable income and realized gains. As a result, no provision for U.S. Federal income taxes is required. The Fund files a U.S. federal tax return, in addition to state and local tax returns as required. The Fund's federal income tax returns are subject to examination by the Internal Revenue Service (IRS) for a period of three fiscal years after they are filed. State and local tax returns may be subject to examination for an additional fiscal year depending on the jurisdiction. Foreign taxes are provided for based on the Fund's understanding of the tax rules and rates that exist in the foreign markets in which it invests.
Distributions are declared and recorded on the ex-dividend date. Income dividends and capital gain distributions are declared separately for each class. Income and capital gain distributions are determined in accordance with income tax regulations, which may differ from GAAP.
Capital accounts within the financial statements are adjusted for permanent book-tax differences. These adjustments have no impact on net assets or the results of operations. Capital accounts are not adjusted for temporary book-tax differences which will reverse in a subsequent period.
Book-tax differences are primarily due to foreign currency transactions, market discount, partnerships, deferred trustees compensation, certain conversion ratio adjustments, capital loss carryforwards and losses deferred due to wash sales.
The federal tax cost of investment securities and unrealized appreciation (depreciation) as of period end were as follows:
| Gross unrealized appreciation | $783,648 |
| Gross unrealized depreciation | (733,263) |
| Net unrealized appreciation (depreciation) on securities | $50,385 |
| Tax cost | $5,884,538 |
Capital loss carryforwards are only available to offset future capital gains of the Fund to the extent provided by regulations and may be limited. Under the Regulated Investment Company Modernization Act of 2010 (the Act), the Fund is permitted to carry forward capital losses incurred in taxable years beginning after December 22, 2010 for an unlimited period and such capital losses are required to be used prior to any losses that expire. The capital loss carryforward information presented below, including any applicable limitation, is estimated as of prior fiscal period end and is subject to adjustment.
| Fiscal year of expiration | |
| 2018 | $(2,680,247) |
Restricted Securities. The Fund may invest in securities that are subject to legal or contractual restrictions on resale. These securities generally may be resold in transactions exempt from registration or to the public if the securities are registered. Disposal of these securities may involve time-consuming negotiations and expense, and prompt sale at an acceptable price may be difficult. Information regarding restricted securities is included at the end of the Fund's Schedule of Investments.
4. Derivative Instruments.
Risk Exposures and the Use of Derivative Instruments. The Fund's investment objective allows the Fund to enter into various types of derivative contracts, including options. Derivatives are investments whose value is primarily derived from underlying assets, indices or reference rates and may be transacted on an exchange or over-the-counter (OTC). Derivatives may involve a future commitment to buy or sell a specified asset based on specified terms, to exchange future cash flows at periodic intervals based on a notional principal amount, or for one party to make one or more payments upon the occurrence of specified events in exchange for periodic payments from the other party.
The Fund used derivatives to increase returns and to manage exposure to certain risks as defined below. The success of any strategy involving derivatives depends on analysis of numerous economic factors, and if the strategies for investment do not work as intended, the Fund may not achieve its objectives.
The Fund's use of derivatives increased or decreased its exposure to the following risk:
| Equity Risk | Equity risk relates to the fluctuations in the value of financial instruments as a result of changes in market prices (other than those arising from interest rate risk or foreign exchange risk), whether caused by factors specific to an individual investment, its issuer, or all factors affecting all instruments traded in a market or market segment.
|
The Fund is also exposed to additional risks from investing in derivatives, such as liquidity risk and counterparty credit risk. Liquidity risk is the risk that the Fund will be unable to close out the derivative in the open market in a timely manner. Counterparty credit risk is the risk that the counterparty will not be able to fulfill its obligation to the Fund. Counterparty credit risk related to exchange-traded options may be mitigated by the protection provided by the exchange on which they trade.
Investing in derivatives may involve greater risks than investing in the underlying assets directly and, to varying degrees, may involve risk of loss in excess of any initial investment and collateral received and amounts recognized in the Statement of Assets and Liabilities. In addition, there may be the risk that the change in value of the derivative contract does not correspond to the change in value of the underlying instrument.
Options. Options give the purchaser the right, but not the obligation, to buy (call) or sell (put) an underlying security or financial instrument at an agreed exercise or strike price between or on certain dates. Options obligate the seller (writer) to buy (put) or sell (call) an underlying instrument at the exercise or strike price or cash settle an underlying derivative instrument if the holder exercises the option on or before the expiration date.
The Fund used exchange-traded written covered call options to manage its exposure to the market. When the Fund writes a covered call option, the Fund holds the underlying instrument which must be delivered to the holder upon the exercise of the option.
Upon entering into a written options contract, the Fund will receive a premium. Premiums received are reflected as a liability on the Statement of Assets and Liabilities. Options are valued daily and any unrealized appreciation (depreciation) is reflected on the Statement of Assets and Liabilities. When a written option is exercised, the premium is added to the proceeds from the sale of the underlying instrument in determining the gain or loss realized on that investment. When an option is closed the Fund will realize a gain or loss depending on whether the proceeds or amount paid for the closing sale transaction are greater or less than the premium received. When an option expires, gains and losses are realized to the extent of premiums received. The net realized gain (loss) on closed and expired written options and the change in net unrealized appreciation (depreciation) on written options are reflected separately on the Statement of Operations.
Writing call options tends to decrease exposure to the underlying instrument and risk of loss is the change in value in excess of the premium received.
Any open options at period end are presented in the Schedule of Investments under the caption "Written Options."
During the period, the Fund recognized net realized gain (loss) of $186 and a change in net unrealized appreciation (depreciation) of $1,240 related to its investment in written options. This amount is included in the Statement of Operations.
The following is a summary of the Fund's written options activity:
| | Number of Contracts | Amount of Premiums |
| Outstanding at beginning of period | – | $– |
| Options Opened | 41 | 2,275 |
| Options Exercised | – | – |
| Options Closed | – | – |
| Options Expired | (4) | (186) |
| Outstanding at end of period | 37 | $2,089 |
5. Purchases and Sales of Investments.
Purchases and sales of securities, other than short-term securities, aggregated $1,141,475 and $1,796,761, respectively.
6. Fees and Other Transactions with Affiliates.
Management Fee. Fidelity Management & Research Company (the investment adviser) and its affiliates provide the Fund with investment management related services for which the Fund pays a monthly management fee. The management fee is the sum of an individual fund fee rate that is based on an annual rate of .20% of the Fund's average net assets and an annualized group fee rate that averaged .25% during the period. The group fee rate is based upon the average net assets of all the mutual funds advised by the investment adviser, including any mutual funds previously advised by the investment adviser that are currently advised by Fidelity SelectCo, LLC, an affiliate of the investment adviser. The group fee rate decreases as assets under management increase and increases as assets under management decrease. For the reporting period, the total annualized management fee rate was .45% of the Fund's average net assets.
Transfer Agent Fees. Fidelity Investments Institutional Operations Company, Inc., (FIIOC), an affiliate of the investment adviser, is the transfer, dividend disbursing and shareholder servicing agent for each class of the Fund. FIIOC receives account fees and asset-based fees that vary according to the account size and type of account of the shareholders of Growth & Income, except for Class K. FIIOC receives an asset-based fee of Class K's average net assets. FIIOC pays for typesetting, printing and mailing of shareholder reports, except proxy statements.
For the period, transfer agent fees for each class were as follows:
| | Amount | % of
Class-Level Average
Net Assets(a) |
| Growth and Income | $4,901 | .17 |
| Class K | 187 | .05 |
| | $5,088 | |
(a) Annualized
Accounting and Security Lending Fees. Fidelity Service Company, Inc. (FSC), an affiliate of the investment adviser, maintains the Fund's accounting records. The accounting fee is based on the level of average net assets for each month. Under a separate contract, FSC administers the security lending program. The security lending fee is based on the number and duration of lending transactions.
Brokerage Commissions. The Fund placed a portion of its portfolio transactions with brokerage firms which are affiliates of the investment adviser. Brokerage commissions are included in net realized gain (loss) and change in net unrealized appreciation (depreciation) in the Statement of Operations. The commissions paid to these affiliated firms were $27 for the period.
Interfund Lending Program. Pursuant to an Exemptive Order issued by the SEC, the Fund, along with other registered investment companies having management contracts with FMR or other affiliated entities of FMR, may participate in an interfund lending program. This program provides an alternative credit facility allowing the funds to borrow from, or lend money to, other participating affiliated funds. At period end, there were no interfund loans outstanding. The Fund's activity in this program during the period for which loans were outstanding was as follows:
| Borrower or Lender | Average Loan Balance | Weighted Average Interest Rate | Interest Expense |
| Borrower | $5,789 | .40% | $5 |
Interfund Trades. The Fund may purchase from or sell securities to other Fidelity Funds under procedures adopted by the Board. The procedures have been designed to ensure these interfund trades are executed in accordance with Rule 17a-7 of the 1940 Act. Interfund trades are included within the respective purchases and sales amounts shown in the Purchases and Sales of Investments note.
Other. During the period, the investment adviser reimbursed the Fund for certain losses in the amount of $71.
7. Committed Line of Credit.
The Fund participates with other funds managed by the investment adviser or an affiliate in a $4.25 billion credit facility (the "line of credit") to be utilized for temporary or emergency purposes to fund shareholder redemptions or for other short-term liquidity purposes. The Fund has agreed to pay commitment fees on its pro-rata portion of the line of credit, which amounted to $5 and is reflected in Miscellaneous expenses on the Statement of Operations. During the period, the Fund did not borrow on this line of credit.
8. Security Lending.
The Fund lends portfolio securities through a lending agent from time to time in order to earn additional income. For equity securities, a lending agent is used and may loan securities to certain qualified borrowers, including Fidelity Capital Markets (FCM), a broker-dealer affiliated with the Fund. On the settlement date of the loan, the Fund receives collateral (in the form of U.S. Treasury obligations, letters of credit and/or cash) against the loaned securities and maintains collateral in an amount not less than 100% of the market value of the loaned securities during the period of the loan. The market value of the loaned securities is determined at the close of business of the Fund and any additional required collateral is delivered to the Fund on the next business day. The Fund or borrower may terminate the loan at any time, and if the borrower defaults on its obligation to return the securities loaned because of insolvency or other reasons, the Fund may apply collateral received from the borrower against the obligation. The Fund may experience delays and costs in recovering the securities loaned. Any cash collateral received is invested in the Fidelity Securities Lending Cash Central Fund. The value of loaned securities and cash collateral at period end are disclosed on the Fund's Statement of Assets and Liabilities. Security lending income represents the income earned on investing cash collateral, less rebates paid to borrowers and any lending agent fees associated with the loan, plus any premium payments received for lending certain types of securities. Security lending income is presented in the Statement of Operations as a component of income from Fidelity Central Funds. Total security lending income during the period amounted to $283. During the period, there were no securities loaned to FCM.
9. Bank Borrowings.
The Fund is permitted to have bank borrowings for temporary or emergency purposes to fund shareholder redemptions or for other short-term liquidity requirements. The Fund has established borrowing arrangements with certain banks. The interest rate on the borrowings is the bank's base rate, as revised from time to time. The average loan balance during the period for which loans were outstanding amounted to $5,281. The weighted average interest rate was .68%. The interest expense amounted to $2 under the bank borrowing program. At period end, there were no bank borrowings outstanding.
10. Expense Reductions.
Commissions paid to certain brokers with whom the investment adviser, or its affiliates, places trades on behalf of the Fund include an amount in addition to trade execution, which may be rebated back to the Fund to offset certain expenses. This amount totaled $45 for the period.
In addition, during the period the investment adviser reimbursed and/or waived a portion of fund-level operating expenses in the amount of $23.
11. Distributions to Shareholders.
Distributions to shareholders of each class were as follows:
| | Six months ended January 31, 2016 | Year ended July 31, 2015 |
| From net investment income | | |
| Growth and Income | $62,788 | $117,218 |
| Class K | 9,424 | 18,257 |
| Total | $72,212 | $135,475 |
| From net realized gain | | |
| Growth and Income | $2,314 | $– |
| Class K | 330 | – |
| Total | $2,644 | $– |
12. Share Transactions.
Share transactions for each class were as follows and may contain automatic conversions between classes or exchanges between affiliated funds:
| | Shares | Shares | Dollars | Dollars |
| | Six months ended January 31, 2016 | Year ended July 31, 2015 | Six months ended January 31, 2016 | Year ended July 31, 2015 |
| Growth and Income | | | | |
| Shares sold | 2,811 | 12,118 | $80,462 | $365,420 |
| Reinvestment of distributions | 2,203 | 3,750 | 62,034 | 111,890 |
| Shares redeemed | (27,486) | (28,824) | (777,051) | (872,624) |
| Net increase (decrease) | (22,472) | (12,956) | $(634,555) | $(395,314) |
| Class K | | | | |
| Shares sold | 2,132 | 4,866 | $60,021 | $146,512 |
| Reinvestment of distributions | 347 | 612 | 9,754 | 18,257 |
| Shares redeemed | (2,955) | (10,609) | (84,501) | (321,361) |
| Net increase (decrease) | (476) | (5,131) | $(14,726) | $(156,592) |
13. Other.
The Fund's organizational documents provide former and current trustees and officers with a limited indemnification against liabilities arising in connection with the performance of their duties to the Fund. In the normal course of business, the Fund may also enter into contracts that provide general indemnifications. The Fund's maximum exposure under these arrangements is unknown as this would be dependent on future claims that may be made against the Fund. The risk of material loss from such claims is considered remote.
Shareholder Expense Example
As a shareholder of the Fund, you incur two types of costs: (1) transaction costs, and (2) ongoing costs, including management fees and other Fund expenses. This Example is intended to help you understand your ongoing costs (in dollars) of investing in the Fund and to compare these costs with the ongoing costs of investing in other mutual funds.
The Example is based on an investment of $1,000 invested at the beginning of the period and held for the entire period (August 1, 2015 to January 31, 2016).
Actual Expenses
The first line of the accompanying table for each class of the Fund provides information about actual account values and actual expenses. You may use the information in this line, together with the amount you invested, to estimate the expenses that you paid over the period. Simply divide your account value by $1,000.00 (for example, an $8,600 account value divided by $1,000.00 = 8.6), then multiply the result by the number in the first line for a class of the Fund under the heading entitled "Expenses Paid During Period" to estimate the expenses you paid on your account during this period. A small balance maintenance fee of $12.00 that is charged once a year may apply for certain accounts with a value of less than $2,000. This fee is not included in the table below. If it was, the estimate of expenses you paid during the period would be higher, and your ending account value lower, by this amount. In addition, the Fund, as a shareholder in the underlying Fidelity Central Funds, will indirectly bear its pro-rata share of the fees and expenses incurred by the underlying Fidelity Central Funds. These fees and expenses are not included in the Fund's annualized expense ratio used to calculate the expense estimate in the table below.
Hypothetical Example for Comparison Purposes
The second line of the accompanying table for each class of the Fund provides information about hypothetical account values and hypothetical expenses based on a Class' actual expense ratio and an assumed rate of return of 5% per year before expenses, which is not the Class' actual return. The hypothetical account values and expenses may not be used to estimate the actual ending account balance or expenses you paid for the period. You may use this information to compare the ongoing costs of investing in the Fund and other funds. To do so, compare this 5% hypothetical example with the 5% hypothetical examples that appear in the shareholder reports of the other funds. A small balance maintenance fee of $12.00 that is charged once a year may apply for certain accounts with a value of less than $2,000. This fee is not included in the table below. If it was, the estimate of expenses you paid during the period would be higher, and your ending account value lower, by this amount. In addition, the Fund, as a shareholder in the underlying Fidelity Central Funds, will indirectly bear its pro-rata share of the fees and expenses incurred by the underlying Fidelity Central Funds. These fees and expenses are not included in the Fund's annualized expense ratio used to calculate the expense estimate in the table below.
Please note that the expenses shown in the table are meant to highlight your ongoing costs only and do not reflect any transaction costs. Therefore, the second line of the table is useful in comparing ongoing costs only, and will not help you determine the relative total costs of owning different funds.
| | Annualized Expense Ratio-A | Beginning
Account Value
August 1, 2015 | Ending
Account Value
January 31, 2016 | Expenses Paid
During Period-B
August 1, 2015
to January 31, 2016 |
| Growth and Income | .64% | | | |
| Actual | | $1,000.00 | $885.90 | $3.03 |
| Hypothetical-C | | $1,000.00 | $1,021.92 | $3.25 |
| Class K | .52% | | | |
| Actual | | $1,000.00 | $886.70 | $2.47 |
| Hypothetical-C | | $1,000.00 | $1,022.52 | $2.64 |
A Annualized expense ratio reflects expenses net of applicable fee waivers.
B Expenses are equal to each Class' annualized expense ratio, multiplied by the average account value over the period, multiplied by 184/366 (to reflect the one-half year period).
C 5% return per year before expenses
Corporate Headquarters
245 Summer St.
Boston, MA 02210
www.fidelity.com
GAI-SANN-0316
1.700483.119
Fidelity® Blue Chip Value Fund
Semi-Annual Report January 31, 2016 |
|
Contents
To view a fund's proxy voting guidelines and proxy voting record for the 12-month period ended June 30, visit http://www.fidelity.com/proxyvotingresults or visit the Securities and Exchange Commission's (SEC) web site at http://www.sec.gov.
You may also call 1-800-544-8544 to request a free copy of the proxy voting guidelines.
Standard & Poor's, S&P and S&P 500 are registered service marks of The McGraw-Hill Companies, Inc. and have been licensed for use by Fidelity Distributors Corporation.
Other third-party marks appearing herein are the property of their respective owners.
All other marks appearing herein are registered or unregistered trademarks or service marks of FMR LLC or an affiliated company. © 2016 FMR LLC. All rights reserved.
This report and the financial statements contained herein are submitted for the general information of the shareholders of the Fund. This report is not authorized for distribution to prospective investors in the Fund unless preceded or accompanied by an effective prospectus.
A fund files its complete schedule of portfolio holdings with the SEC for the first and third quarters of each fiscal year on Form N-Q. Forms N-Q are available on the SEC’s web site at http://www.sec.gov. A fund's Forms N-Q may be reviewed and copied at the SEC’s Public Reference Room in Washington, DC. Information regarding the operation of the SEC's Public Reference Room may be obtained by calling 1-800-SEC-0330.
For a complete list of a fund's portfolio holdings, view the most recent holdings listing, semiannual report, or annual report on Fidelity's web site at http://www.fidelity.com, http://www.advisor.fidelity.com, or http://www.401k.com, as applicable.
NOT FDIC INSURED •MAY LOSE VALUE •NO BANK GUARANTEE
Neither the Fund nor Fidelity Distributors Corporation is a bank.
Investment Summary (Unaudited)
Top Ten Stocks as of January 31, 2016
| | % of fund's net assets | % of fund's net assets 6 months ago |
| Teva Pharmaceutical Industries Ltd. sponsored ADR | 4.3 | 4.5 |
| EMC Corp. | 4.1 | 2.6 |
| Wells Fargo & Co. | 3.5 | 3.4 |
| JPMorgan Chase & Co. | 3.5 | 3.6 |
| Berkshire Hathaway, Inc. Class B | 3.5 | 3.1 |
| Johnson & Johnson | 3.4 | 3.2 |
| Alphabet, Inc. Class A | 3.1 | 3.0 |
| Oracle Corp. | 2.9 | 3.3 |
| SanDisk Corp. | 2.6 | 0.0 |
| Allergan PLC | 2.4 | 0.0 |
| | 33.3 | |
Top Five Market Sectors as of January 31, 2016
| | % of fund's net assets | % of fund's net assets 6 months ago |
| Financials | 25.6 | 27.0 |
| Information Technology | 21.1 | 18.9 |
| Health Care | 17.0 | 14.8 |
| Consumer Discretionary | 10.9 | 10.1 |
| Energy | 9.5 | 7.6 |
Asset Allocation (% of fund's net assets)
| As of January 31, 2016 * |
| | Stocks | 99.1% |
| | Short-Term Investments and Net Other Assets (Liabilities) | 0.9% |

* Foreign investments - 21.7%
| As of July 31, 2015* |
| | Stocks | 90.9% |
| | Short-Term Investments and Net Other Assets (Liabilities) | 9.1% |

* Foreign investments - 18.6%
Percentages shown as 0.0% may reflect amounts less than 0.05%.
Investments January 31, 2016 (Unaudited)
Showing Percentage of Net Assets
| Common Stocks - 99.1% | | | |
| | | Shares | Value |
| CONSUMER DISCRETIONARY - 10.9% | | | |
| Media - 10.0% | | | |
| Cablevision Systems Corp. - NY Group Class A | | 96,400 | $3,076,124 |
| CBS Corp. Class B | | 181,800 | 8,635,500 |
| Starz Series A (a) | | 167,900 | 4,773,397 |
| Time Warner Cable, Inc. | | 65,300 | 11,885,253 |
| Twenty-First Century Fox, Inc. Class A | | 324,500 | 8,751,765 |
| Viacom, Inc. Class B (non-vtg.) | | 249,400 | 11,382,616 |
| | | | 48,504,655 |
| Specialty Retail - 0.9% | | | |
| GNC Holdings, Inc. | | 162,300 | 4,546,023 |
|
| TOTAL CONSUMER DISCRETIONARY | | | 53,050,678 |
|
| CONSUMER STAPLES - 3.7% | | | |
| Beverages - 1.6% | | | |
| C&C Group PLC | | 2,046,814 | 7,963,711 |
| Food & Staples Retailing - 2.1% | | | |
| Rite Aid Corp. (a) | | 660,300 | 5,143,737 |
| Safeway, Inc.: | | | |
| rights | | 48,800 | 0 |
| rights | | 48,800 | 8,784 |
| Wal-Mart Stores, Inc. | | 76,100 | 5,049,996 |
| | | | 10,202,517 |
|
| TOTAL CONSUMER STAPLES | | | 18,166,228 |
|
| ENERGY - 9.5% | | | |
| Energy Equipment & Services - 2.2% | | | |
| Baker Hughes, Inc. | | 212,800 | 9,258,928 |
| BW Offshore Ltd. | | 7,014,500 | 1,725,380 |
| | | | 10,984,308 |
| Oil, Gas & Consumable Fuels - 7.3% | | | |
| Chevron Corp. | | 128,235 | 11,088,480 |
| Exxon Mobil Corp. | | 54,700 | 4,258,395 |
| Phillips 66 Co. | | 63,400 | 5,081,510 |
| Suncor Energy, Inc. | | 293,100 | 6,942,007 |
| Teekay Corp. | | 596,700 | 4,087,395 |
| Teekay LNG Partners LP | | 168,496 | 1,941,074 |
| Teekay Offshore Partners LP | | 431,175 | 1,948,911 |
| | | | 35,347,772 |
|
| TOTAL ENERGY | | | 46,332,080 |
|
| FINANCIALS - 25.6% | | | |
| Banks - 8.8% | | | |
| JPMorgan Chase & Co. | | 283,416 | 16,863,252 |
| U.S. Bancorp | | 218,797 | 8,765,008 |
| Wells Fargo & Co. | | 341,098 | 17,133,353 |
| | | | 42,761,613 |
| Capital Markets - 0.7% | | | |
| Goldman Sachs Group, Inc. | | 22,700 | 3,667,412 |
| Consumer Finance - 2.8% | | | |
| Capital One Financial Corp. | | 100,133 | 6,570,727 |
| Discover Financial Services | | 153,700 | 7,037,923 |
| | | | 13,608,650 |
| Diversified Financial Services - 3.5% | | | |
| Berkshire Hathaway, Inc. Class B (a) | | 129,600 | 16,818,192 |
| Insurance - 7.0% | | | |
| Allstate Corp. | | 118,700 | 7,193,220 |
| Chubb Ltd. | | 73,400 | 8,299,338 |
| Prudential PLC | | 462,037 | 9,077,264 |
| The Travelers Companies, Inc. | | 87,600 | 9,376,704 |
| | | | 33,946,526 |
| Real Estate Investment Trusts - 2.8% | | | |
| American Capital Agency Corp. | | 308,600 | 5,267,802 |
| Annaly Capital Management, Inc. | | 879,400 | 8,354,300 |
| | | | 13,622,102 |
|
| TOTAL FINANCIALS | | | 124,424,495 |
|
| HEALTH CARE - 17.0% | | | |
| Biotechnology - 2.2% | | | |
| Amgen, Inc. | | 65,600 | 10,019,088 |
| Dyax Corp. rights 12/31/19 | | 236,600 | 662,480 |
| | | | 10,681,568 |
| Health Care Providers & Services - 3.1% | | | |
| Cigna Corp. | | 66,800 | 8,924,480 |
| Express Scripts Holding Co. (a) | | 81,400 | 5,850,218 |
| | | | 14,774,698 |
| Pharmaceuticals - 11.7% | | | |
| Allergan PLC (a) | | 41,900 | 11,917,617 |
| Johnson & Johnson | | 159,400 | 16,647,736 |
| Sanofi SA sponsored ADR | | 185,400 | 7,720,056 |
| Teva Pharmaceutical Industries Ltd. sponsored ADR | | 337,300 | 20,737,206 |
| | | | 57,022,615 |
|
| TOTAL HEALTH CARE | | | 82,478,881 |
|
| INDUSTRIALS - 5.2% | | | |
| Aerospace & Defense - 0.9% | | | |
| United Technologies Corp. | | 50,600 | 4,437,114 |
| Machinery - 2.1% | | | |
| Deere & Co. (b) | | 130,700 | 10,065,207 |
| Professional Services - 1.4% | | | |
| Dun & Bradstreet Corp. | | 68,400 | 6,731,928 |
| Trading Companies & Distributors - 0.8% | | | |
| AerCap Holdings NV (a) | | 125,200 | 3,844,892 |
|
| TOTAL INDUSTRIALS | | | 25,079,141 |
|
| INFORMATION TECHNOLOGY - 21.1% | | | |
| Communications Equipment - 3.4% | | | |
| Cisco Systems, Inc. | | 322,585 | 7,674,297 |
| Harris Corp. | | 101,200 | 8,801,364 |
| | | | 16,475,661 |
| Internet Software & Services - 3.1% | | | |
| Alphabet, Inc. Class A | | 19,600 | 14,922,460 |
| IT Services - 1.3% | | | |
| The Western Union Co. | | 351,800 | 6,276,112 |
| Software - 3.4% | | | |
| Oracle Corp. | | 385,200 | 13,986,612 |
| VMware, Inc. Class A (a) | | 52,800 | 2,415,600 |
| | | | 16,402,212 |
| Technology Hardware, Storage & Peripherals - 9.9% | | | |
| Apple, Inc. | | 56,900 | 5,538,646 |
| EMC Corp. | | 800,500 | 19,828,385 |
| Samsung Electronics Co. Ltd. | | 10,882 | 10,447,563 |
| SanDisk Corp. | | 177,000 | 12,513,900 |
| | | | 48,328,494 |
|
| TOTAL INFORMATION TECHNOLOGY | | | 102,404,939 |
|
| MATERIALS - 4.2% | | | |
| Chemicals - 4.2% | | | |
| CF Industries Holdings, Inc. | | 355,500 | 10,665,000 |
| LyondellBasell Industries NV Class A | | 121,200 | 9,449,964 |
| | | | 20,114,964 |
| UTILITIES - 1.9% | | | |
| Electric Utilities - 1.7% | | | |
| Exelon Corp. | | 280,100 | 8,282,557 |
| Independent Power and Renewable Electricity Producers - 0.2% | | | |
| Vivint Solar, Inc. (a)(b) | | 137,969 | 1,145,143 |
|
| TOTAL UTILITIES | | | 9,427,700 |
|
| TOTAL COMMON STOCKS | | | |
| (Cost $507,252,356) | | | 481,479,106 |
|
| Money Market Funds - 5.1% | | | |
| Fidelity Cash Central Fund, 0.38% (c) | | 13,985,938 | 13,985,938 |
| Fidelity Securities Lending Cash Central Fund, 0.42% (c)(d) | | 10,574,850 | 10,574,850 |
| TOTAL MONEY MARKET FUNDS | | | |
| (Cost $24,560,788) | | | 24,560,788 |
| TOTAL INVESTMENT PORTFOLIO - 104.2% | | | |
| (Cost $531,813,144) | | | 506,039,894 |
| NET OTHER ASSETS (LIABILITIES) - (4.2)% | | | (20,301,862) |
| NET ASSETS - 100% | | | $485,738,032 |
Legend
(a) Non-income producing
(b) Security or a portion of the security is on loan at period end.
(c) Affiliated fund that is generally available only to investment companies and other accounts managed by Fidelity Investments. The rate quoted is the annualized seven-day yield of the fund at period end. A complete unaudited listing of the fund's holdings as of its most recent quarter end is available upon request. In addition, each Fidelity Central Fund's financial statements are available on the SEC's website or upon request.
(d) Investment made with cash collateral received from securities on loan.
Affiliated Central Funds
Information regarding fiscal year to date income earned by the Fund from investments in Fidelity Central Funds is as follows:
| Fund | Income earned |
| Fidelity Cash Central Fund | $30,243 |
| Fidelity Securities Lending Cash Central Fund | 18,447 |
| Total | $48,690 |
Investment Valuation
The following is a summary of the inputs used, as of January 31, 2016, involving the Fund's assets and liabilities carried at fair value. The inputs or methodology used for valuing securities may not be an indication of the risk associated with investing in those securities. For more information on valuation inputs, and their aggregation into the levels used below, please refer to the Investment Valuation section in the accompanying Notes to Financial Statements.
| | Valuation Inputs at Reporting Date: |
| Description | Total | Level 1 | Level 2 | Level 3 |
| Investments in Securities: | | | | |
| Equities: | | | | |
| Consumer Discretionary | $53,050,678 | $53,050,678 | $-- | $-- |
| Consumer Staples | 18,166,228 | 10,193,733 | 7,963,711 | 8,784 |
| Energy | 46,332,080 | 44,606,700 | 1,725,380 | -- |
| Financials | 124,424,495 | 115,347,231 | 9,077,264 | -- |
| Health Care | 82,478,881 | 81,816,401 | -- | 662,480 |
| Industrials | 25,079,141 | 25,079,141 | -- | -- |
| Information Technology | 102,404,939 | 91,957,376 | 10,447,563 | -- |
| Materials | 20,114,964 | 20,114,964 | -- | -- |
| Utilities | 9,427,700 | 9,427,700 | -- | -- |
| Money Market Funds | 24,560,788 | 24,560,788 | -- | -- |
| Total Investments in Securities: | $506,039,894 | $476,154,712 | $29,213,918 | $671,264 |
The following is a summary of transfers between Level 1 and Level 2 for the period ended January 31, 2016. Transfers are assumed to have occurred at the beginning of the period, and are primarily attributable to the valuation techniques used for foreign equity securities, as discussed in the accompanying Notes to Financial Statements:
| Transfers | Total |
| Level 1 to Level 2 | $20,096,935 |
| Level 2 to Level 1 | $0 |
Other Information
Distribution of investments by country or territory of incorporation, as a percentage of Total Net Assets, is as follows (Unaudited):
| United States of America | 78.3% |
| Israel | 4.3% |
| Ireland | 4.0% |
| Netherlands | 2.8% |
| Korea (South) | 2.1% |
| United Kingdom | 1.9% |
| Switzerland | 1.7% |
| Marshall Islands | 1.6% |
| France | 1.6% |
| Canada | 1.4% |
| Others (Individually Less Than 1%) | 0.3% |
| | 100.0% |
See accompanying notes which are an integral part of the financial statements.
Financial Statements
Statement of Assets and Liabilities
| | | January 31, 2016 (Unaudited) |
| Assets | | |
Investment in securities, at value (including securities loaned of $10,614,780) — See accompanying schedule:
Unaffiliated issuers (cost $507,252,356) | $481,479,106 | |
| Fidelity Central Funds (cost $24,560,788) | 24,560,788 | |
| Total Investments (cost $531,813,144) | | $506,039,894 |
| Receivable for investments sold | | 4,906,558 |
| Receivable for fund shares sold | | 1,255,281 |
| Dividends receivable | | 529,058 |
| Distributions receivable from Fidelity Central Funds | | 11,001 |
| Prepaid expenses | | 663 |
| Other receivables | | 1,731 |
| Total assets | | 512,744,186 |
| Liabilities | | |
| Payable for investments purchased | $15,788,984 | |
| Payable for fund shares redeemed | 258,907 | |
| Accrued management fee | 254,196 | |
| Other affiliated payables | 99,969 | |
| Other payables and accrued expenses | 29,248 | |
| Collateral on securities loaned, at value | 10,574,850 | |
| Total liabilities | | 27,006,154 |
| Net Assets | | $485,738,032 |
| Net Assets consist of: | | |
| Paid in capital | | $585,222,979 |
| Distributions in excess of net investment income | | (345,950) |
| Accumulated undistributed net realized gain (loss) on investments and foreign currency transactions | | (73,360,855) |
| Net unrealized appreciation (depreciation) on investments and assets and liabilities in foreign currencies | | (25,778,142) |
| Net Assets, for 32,425,333 shares outstanding | | $485,738,032 |
| Net Asset Value, offering price and redemption price per share ($485,738,032 ÷ 32,425,333 shares) | | $14.98 |
See accompanying notes which are an integral part of the financial statements.
Statement of Operations
| | | Six months ended January 31, 2016 (Unaudited) |
| Investment Income | | |
| Dividends | | $4,940,773 |
| Interest | | 104 |
| Income from Fidelity Central Funds | | 48,690 |
| Total income | | 4,989,567 |
| Expenses | | |
| Management fee | | |
| Basic fee | $1,270,402 | |
| Performance adjustment | 238,386 | |
| Transfer agent fees | 486,326 | |
| Accounting and security lending fees | 90,784 | |
| Custodian fees and expenses | 9,341 | |
| Independent trustees' compensation | 978 | |
| Registration fees | 19,483 | |
| Audit | 31,758 | |
| Legal | 1,167 | |
| Miscellaneous | 1,245 | |
| Total expenses before reductions | 2,149,870 | |
| Expense reductions | (5,251) | 2,144,619 |
| Net investment income (loss) | | 2,844,948 |
| Realized and Unrealized Gain (Loss) | | |
| Net realized gain (loss) on: | | |
| Investment securities: | | |
| Unaffiliated issuers | (1,478,020) | |
| Foreign currency transactions | (6,737) | |
| Futures contracts | (814,285) | |
| Total net realized gain (loss) | | (2,299,042) |
Change in net unrealized appreciation (depreciation) on:
Investment securities | (45,324,096) | |
| Assets and liabilities in foreign currencies | (4,749) | |
| Total change in net unrealized appreciation (depreciation) | | (45,328,845) |
| Net gain (loss) | | (47,627,887) |
| Net increase (decrease) in net assets resulting from operations | | $(44,782,939) |
See accompanying notes which are an integral part of the financial statements.
Statement of Changes in Net Assets
| | Six months ended January 31, 2016 (Unaudited) | Year ended July 31, 2015 |
| Increase (Decrease) in Net Assets | | |
| Operations | | |
| Net investment income (loss) | $2,844,948 | $7,735,773 |
| Net realized gain (loss) | (2,299,042) | 31,020,802 |
| Change in net unrealized appreciation (depreciation) | (45,328,845) | 2,266,425 |
| Net increase (decrease) in net assets resulting from operations | (44,782,939) | 41,023,000 |
| Distributions to shareholders from net investment income | (8,116,183) | (4,830,518) |
| Distributions to shareholders from net realized gain | (249,078) | – |
| Total distributions | (8,365,261) | (4,830,518) |
| Share transactions | | |
| Proceeds from sales of shares | 164,991,032 | 115,913,276 |
| Reinvestment of distributions | 8,172,884 | 4,701,954 |
| Cost of shares redeemed | (45,246,143) | (75,665,221) |
| Net increase (decrease) in net assets resulting from share transactions | 127,917,773 | 44,950,009 |
| Total increase (decrease) in net assets | 74,769,573 | 81,142,491 |
| Net Assets | | |
| Beginning of period | 410,968,459 | 329,825,968 |
| End of period (including distributions in excess of net investment income of $345,950 and undistributed net investment income of $4,925,285, respectively) | $485,738,032 | $410,968,459 |
| Other Information | | |
| Shares | | |
| Sold | 10,434,803 | 7,061,079 |
| Issued in reinvestment of distributions | 527,295 | 302,238 |
| Redeemed | (2,876,296) | (4,693,685) |
| Net increase (decrease) | 8,085,802 | 2,669,632 |
See accompanying notes which are an integral part of the financial statements.
Financial Highlights — Fidelity Blue Chip Value Fund
| | Six months ended (Unaudited) | Years ended July 31, | | | | |
| January 31, | 2016 | 2015 | 2014 | 2013 | 2012 | 2011 |
| Selected Per–Share Data | | | | | | |
| Net asset value, beginning of period | $16.88 | $15.22 | $13.32 | $10.26 | $10.86 | $9.82 |
| Income from Investment Operations | | | | | | |
| Net investment income (loss)A | .10 | .35B | .18 | .18 | .18 | .14 |
| Net realized and unrealized gain (loss) | (1.71) | 1.54 | 1.81 | 3.17 | (.62) | 1.04 |
| Total from investment operations | (1.61) | 1.89 | 1.99 | 3.35 | (.44) | 1.18 |
| Distributions from net investment income | (.28) | (.23) | (.09) | (.29) | (.16) | (.14) |
| Distributions from net realized gain | (.01) | – | – | – | – | (.01) |
| Total distributions | (.29) | (.23) | (.09) | (.29) | (.16) | (.14)C |
| Net asset value, end of period | $14.98 | $16.88 | $15.22 | $13.32 | $10.26 | $10.86 |
| Total ReturnD,E | (9.61)% | 12.52% | 14.99% | 33.33% | (3.95)% | 12.14% |
| Ratios to Average Net AssetsF,G | | | | | | |
| Expenses before reductions | .93%H | .82% | .66% | .64% | .77% | .75% |
| Expenses net of fee waivers, if any | .93%H | .82% | .66% | .64% | .77% | .75% |
| Expenses net of all reductions | .93%H | .82% | .66% | .62% | .76% | .74% |
| Net investment income (loss) | 1.23%H | 2.15%B | 1.28% | 1.58% | 1.76% | 1.31% |
| Supplemental Data | | | | | | |
| Net assets, end of period (000 omitted) | $485,738 | $410,968 | $329,826 | $281,860 | $238,132 | $433,047 |
| Portfolio turnover rateI | 39%H | 138% | 102%J | 88% | 102% | 141% |
A Calculated based on average shares outstanding during the period.
B Net Investment income per share reflects a large, non-recurring dividend which amounted to $.13 per share. Excluding this non-recurring dividend, the ratio of net investment income (loss) to average net assets would have been 1.35%.
C Total distributions of $.14 per share is comprised of distributions from net investment income of $.135 and distributions from net realized gain of $.005 per share.
D Total returns for periods of less than one year are not annualized.
E Total returns would have been lower if certain expenses had not been reduced during the applicable periods shown.
F Fees and expenses of any underlying Fidelity Central Funds are not included in the Fund's expense ratio. The Fund indirectly bears its proportionate share of the expenses of any underlying Fidelity Central Funds.
G Expense ratios reflect operating expenses of the Fund. Expenses before reductions do not reflect amounts reimbursed by the investment adviser or reductions from brokerage service arrangements or reductions from other expense offset arrangements and do not represent the amount paid by the Fund during periods when reimbursements or reductions occur. Expenses net of fee waivers reflect expenses after reimbursement by the investment adviser but prior to reductions from brokerage service arrangements or other expense offset arrangements. Expenses net of all reductions represent the net expenses paid by the Fund.
H Annualized
I Amount does not include the portfolio activity of any underlying Fidelity Central Funds.
J Portfolio turnover rate excludes securities received or delivered in-kind.
See accompanying notes which are an integral part of the financial statements.
Notes to Financial Statements (Unaudited)
For the period ended January 31, 2016
1. Organization.
Fidelity Blue Chip Value Fund (the Fund) is a fund of Fidelity Securities Fund (the Trust) and is authorized to issue an unlimited number of shares. Share transactions on the Statement of Changes in Net Assets may contain exchanges between affiliated funds. The Trust is registered under the Investment Company Act of 1940, as amended (the 1940 Act), as an open-end management investment company organized as a Massachusetts business trust.
2. Investments in Fidelity Central Funds.
The Fund invests in Fidelity Central Funds, which are open-end investment companies generally available only to other investment companies and accounts managed by the investment adviser and its affiliates. The Fund's Schedule of Investments lists each of the Fidelity Central Funds held as of period end, as an investment of the Fund, but does not include the underlying holdings of each Fidelity Central Fund. As an Investing Fund, the Fund indirectly bears its proportionate share of the expenses of the underlying Fidelity Central Funds.
The Money Market Central Funds seek preservation of capital and current income and are managed by Fidelity Investments Money Management, Inc. (FIMM), an affiliate of the investment adviser. Annualized expenses of the Money Market Central Funds as of their most recent shareholder report date are less than .005%.
A complete unaudited list of holdings for each Fidelity Central Fund is available upon request or at the Securities and Exchange Commission (the SEC) website at www.sec.gov. In addition, the financial statements of the Fidelity Central Funds are available on the SEC website or upon request.
3. Significant Accounting Policies.
The financial statements have been prepared in conformity with accounting principles generally accepted in the United States of America (GAAP), which require management to make certain estimates and assumptions at the date of the financial statements. Actual results could differ from those estimates. Subsequent events, if any, through the date that the financial statements were issued have been evaluated in the preparation of the financial statements. The following summarizes the significant accounting policies of the Fund:
Investment Valuation. Investments are valued as of 4:00 p.m. Eastern time on the last calendar day of the period. The Board of Trustees (the Board) has delegated the day to day responsibility for the valuation of the Fund's investments to the Fidelity Management & Research Company (FMR) Fair Value Committee (the Committee). In accordance with valuation policies and procedures approved by the Board, the Fund attempts to obtain prices from one or more third party pricing vendors or brokers to value its investments. When current market prices, quotations or currency exchange rates are not readily available or reliable, investments will be fair valued in good faith by the Committee, in accordance with procedures adopted by the Board. Factors used in determining fair value vary by investment type and may include market or investment specific events. The frequency with which these procedures are used cannot be predicted and they may be utilized to a significant extent. The Committee oversees the Fund's valuation policies and procedures and reports to the Board on the Committee's activities and fair value determinations. The Board monitors the appropriateness of the procedures used in valuing the Fund's investments and ratifies the fair value determinations of the Committee.
The Fund categorizes the inputs to valuation techniques used to value its investments into a disclosure hierarchy consisting of three levels as shown below:
- Level 1 – quoted prices in active markets for identical investments
- Level 2 – other significant observable inputs (including quoted prices for similar investments, interest rates, prepayment speeds, etc.)
- Level 3 – unobservable inputs (including the Fund's own assumptions based on the best information available)
Valuation techniques used to value the Fund's investments by major category are as follows:
Equity securities, including restricted securities, for which market quotations are readily available, are valued at the last reported sale price or official closing price as reported by a third party pricing vendor on the primary market or exchange on which they are traded and are categorized as Level 1 in the hierarchy. In the event there were no sales during the day or closing prices are not available, securities are valued at the last quoted bid price or may be valued using the last available price and are generally categorized as Level 2 in the hierarchy. For foreign equity securities, when market or security specific events arise, comparisons to the valuation of American Depositary Receipts (ADRs), futures contracts, Exchange-Traded Funds (ETFs) and certain indexes as well as quoted prices for similar securities may be used and would be categorized as Level 2 in the hierarchy. Utilizing these techniques may result in transfers between Level 1 and Level 2. For equity securities, including restricted securities, where observable inputs are limited, assumptions about market activity and risk are used and these securities may be categorized as Level 3 in the hierarchy.
Investments in open-end mutual funds, including the Fidelity Central Funds, are valued at their closing net asset value (NAV) each business day and are categorized as Level 1 in the hierarchy.
Changes in valuation techniques may result in transfers in or out of an assigned level within the disclosure hierarchy. The aggregate value of investments by input level as of January 31, 2016, including information on transfers between Levels 1 and 2, is included at the end of the Fund's Schedule of Investments.
Foreign Currency. The Fund may use foreign currency contracts to facilitate transactions in foreign-denominated securities. Gains and losses from these transactions may arise from changes in the value of the foreign currency or if the counterparties do not perform under the contracts' terms.
Foreign-denominated assets, including investment securities, and liabilities are translated into U.S. dollars at the exchange rates at period end. Purchases and sales of investment securities, income and dividends received and expenses denominated in foreign currencies are translated into U.S. dollars at the exchange rate in effect on the transaction date.
The effects of exchange rate fluctuations on investments are included with the net realized and unrealized gain (loss) on investment securities. Other foreign currency transactions resulting in realized and unrealized gain (loss) are disclosed separately.
Investment Transactions and Income. For financial reporting purposes, the Fund's investment holdings and NAV include trades executed through the end of the last business day of the period. The NAV per share for processing shareholder transactions is calculated as of the close of business of the New York Stock Exchange (NYSE), normally 4:00 p.m. Eastern time and includes trades executed through the end of the prior business day. Gains and losses on securities sold are determined on the basis of identified cost and may include proceeds received from litigation. Dividend income is recorded on the ex-dividend date, except for certain dividends from foreign securities where the ex-dividend date may have passed, which are recorded as soon as the Fund is informed of the ex-dividend date. Non-cash dividends included in dividend income, if any, are recorded at the fair market value of the securities received. Income and capital gain distributions from Fidelity Central Funds, if any, are recorded on the ex-dividend date. Distributions received on securities that represent a return of capital or capital gain are recorded as a reduction of cost of investments and/or as a realized gain. Subsequent to ex-dividend date the Fund determines the components of these distributions, based upon receipt of tax filings or other correspondence relating to the underlying investment. Interest income is accrued as earned and includes coupon interest and amortization of premium and accretion of discount on debt securities as applicable. Investment income is recorded net of foreign taxes withheld where recovery of such taxes is uncertain.
Expenses. Expenses directly attributable to a fund are charged to that fund. Expenses attributable to more than one fund are allocated among the respective funds on the basis of relative net assets or other appropriate methods. Expense estimates are accrued in the period to which they relate and adjustments are made when actual amounts are known.
Income Tax Information and Distributions to Shareholders. Each year, the Fund intends to qualify as a regulated investment company under Subchapter M of the Internal Revenue Code, including distributing substantially all of its taxable income and realized gains. As a result, no provision for U.S. Federal income taxes is required. The Fund files a U.S. federal tax return, in addition to state and local tax returns as required. The Fund's federal income tax returns are subject to examination by the Internal Revenue Service (IRS) for a period of three fiscal years after they are filed. State and local tax returns may be subject to examination for an additional fiscal year depending on the jurisdiction. Foreign taxes are provided for based on the Fund's understanding of the tax rules and rates that exist in the foreign markets in which it invests.
Distributions are declared and recorded on the ex-dividend date. Income and capital gain distributions are determined in accordance with income tax regulations, which may differ from GAAP.
Capital accounts within the financial statements are adjusted for permanent book-tax differences. These adjustments have no impact on net assets or the results of operations. Capital accounts are not adjusted for temporary book-tax differences which will reverse in a subsequent period.
Book-tax differences are primarily due to futures contracts, foreign currency transactions, partnerships, capital loss carryforwards and losses deferred due to wash sales.
The federal tax cost of investment securities and unrealized appreciation (depreciation) as of period end were as follows:
| Gross unrealized appreciation | $19,097,119 |
| Gross unrealized depreciation | (48,317,214) |
| Net unrealized appreciation (depreciation) on securities | $(29,220,095) |
| Tax cost | $535,259,989 |
Capital loss carryforwards are only available to offset future capital gains of the Fund to the extent provided by regulations and may be limited. Under the Regulated Investment Company Modernization Act of 2010 (the Act), the Fund is permitted to carry forward capital losses incurred in taxable years beginning after December 22, 2010 for an unlimited period and such capital losses are required to be used prior to any losses that expire. The capital loss carryforward information presented below, including any applicable limitation, is estimated as of prior fiscal period end and is subject to adjustment.
| Fiscal year of expiration | |
| 2017 | $(12,454,196) |
| 2018 | (55,500,128) |
| Total capital loss carryforward | $(67,954,324) |
4. Derivative Instruments.
Risk Exposures and the Use of Derivative Instruments. The Fund's investment objective allows the Fund to enter into various types of derivative contracts, including futures contracts. Derivatives are investments whose value is primarily derived from underlying assets, indices or reference rates and may be transacted on an exchange or over-the-counter (OTC). Derivatives may involve a future commitment to buy or sell a specified asset based on specified terms, to exchange future cash flows at periodic intervals based on a notional principal amount, or for one party to make one or more payments upon the occurrence of specified events in exchange for periodic payments from the other party.
The Fund used derivatives to increase returns and to manage exposure to certain risks as defined below. The success of any strategy involving derivatives depends on analysis of numerous economic factors, and if the strategies for investment do not work as intended, the Fund may not achieve its objectives.
The Fund's use of derivatives increased or decreased its exposure to the following risk:
| Equity Risk | Equity risk relates to the fluctuations in the value of financial instruments as a result of changes in market prices (other than those arising from interest rate risk or foreign exchange risk), whether caused by factors specific to an individual investment, its issuer, or all factors affecting all instruments traded in a market or market segment.
|
The Fund is also exposed to additional risks from investing in derivatives, such as liquidity risk and counterparty credit risk. Liquidity risk is the risk that the Fund will be unable to close out the derivative in the open market in a timely manner. Counterparty credit risk is the risk that the counterparty will not be able to fulfill its obligation to the Fund. Counterparty credit risk related to exchange-traded futures contracts may be mitigated by the protection provided by the exchange on which they trade.
Investing in derivatives may involve greater risks than investing in the underlying assets directly and, to varying degrees, may involve risk of loss in excess of any initial investment and collateral received and amounts recognized in the Statement of Assets and Liabilities. In addition, there may be the risk that the change in value of the derivative contract does not correspond to the change in value of the underlying instrument.
Futures Contracts. A futures contract is an agreement between two parties to buy or sell a specified underlying instrument for a fixed price at a specified future date. The Fund used futures contracts to manage its exposure to the stock market.
Upon entering into a futures contract, a fund is required to deposit either cash or securities (initial margin) with a clearing broker in an amount equal to a certain percentage of the face value of the contract. Futures contracts are marked-to-market daily and subsequent daily payments (variation margin) are made or received by a fund depending on the daily fluctuations in the value of the futures contracts and are recorded as unrealized appreciation or (depreciation). This receivable and/or payable, if any, is included in daily variation margin for derivative instruments in the Statement of Assets and Liabilities. Realized gain or (loss) is recorded upon the expiration or closing of a futures contract.
Any open futures contracts at period end are presented in the Schedule of Investments under the caption "Futures Contracts". The underlying face amount at value reflects each contract's exposure to the underlying instrument or index at period end.
During the period the Fund recognized net realized gain (loss) of $(814,285) related to its investment in futures contracts. This amount is included in the Statement of Operations.
5. Purchases and Sales of Investments.
Purchases and sales of securities, other than short-term securities, aggregated $240,003,400 and $84,911,181, respectively.
6. Fees and Other Transactions with Affiliates.
Management Fee. Fidelity Management & Research Company (the investment adviser) and its affiliates provide the Fund with investment management related services for which the Fund pays a monthly management fee. The management fee is the sum of an individual fund fee rate that is based on an annual rate of .30% of the Fund's average net assets and an annualized group fee rate that averaged .25% during the period. The group fee rate is based upon the average net assets of all the mutual funds advised by the investment adviser, including any mutual funds previously advised by the investment adviser that are currently advised by Fidelity SelectCo, LLC, an affiliate of the investment adviser. The group fee rate decreases as assets under management increase and increases as assets under management decrease. In addition, the management fee is subject to a performance adjustment (up to a maximum of +/- .20% of the Fund's average net assets over a 36 month performance period). The upward or downward adjustment to the management fee is based on the Fund's relative investment performance as compared to its benchmark index, the Russell 1000 Value Index, over the same 36 month performance period. For the reporting period, the total annualized management fee rate, including the performance adjustment, was .65% of the Fund's average net assets. The performance adjustment included in the management fee rate may be higher or lower than the maximum performance adjustment rate due to the difference between the average net assets for the reporting and performance periods.
Transfer Agent Fees. Fidelity Investments Institutional Operations Company, Inc. (FIIOC), an affiliate of the investment adviser, is the Fund's transfer, dividend disbursing and shareholder servicing agent. FIIOC receives account fees and asset-based fees that vary according to account size and type of account. FIIOC pays for typesetting, printing and mailing of shareholder reports, except proxy statements. For the period, the transfer agent fees were equivalent to an annualized rate of .21% of average net assets.
Accounting and Security Lending Fees. Fidelity Service Company, Inc. (FSC), an affiliate of the investment adviser, maintains the Fund's accounting records. The accounting fee is based on the level of average net assets for each month. Under a separate contract, FSC administers the security lending program. The security lending fee is based on the number and duration of lending transactions.
Brokerage Commissions. The Fund placed a portion of its portfolio transactions with brokerage firms which are affiliates of the investment adviser. Brokerage commissions are included in net realized gain (loss) and change in net unrealized appreciation (depreciation) in the Statement of Operations. The commissions paid to these affiliated firms were $3,101 for the period.
Interfund Trades. The Fund may purchase from or sell securities to other Fidelity Funds under procedures adopted by the Board. The procedures have been designed to ensure these interfund trades are executed in accordance with Rule 17a-7 of the 1940 Act. Interfund trades are included within the respective purchases and sales amounts shown in the Purchases and Sales of Investments note.
7. Committed Line of Credit.
The Fund participates with other funds managed by the investment adviser or an affiliate in a $4.25 billion credit facility (the "line of credit") to be utilized for temporary or emergency purposes to fund shareholder redemptions or for other short-term liquidity purposes. The Fund has agreed to pay commitment fees on its pro-rata portion of the line of credit, which amounted to $300 and is reflected in Miscellaneous expenses on the Statement of Operations. During the period, the Fund did not borrow on this line of credit.
8. Security Lending.
The Fund lends portfolio securities through a lending agent from time to time in order to earn additional income. For equity securities, a lending agent is used and may loan securities to certain qualified borrowers, including Fidelity Capital Markets (FCM), a broker-dealer affiliated with the Fund. On the settlement date of the loan, the Fund receives collateral (in the form of U.S. Treasury obligations, letters of credit and/or cash) against the loaned securities and maintains collateral in an amount not less than 100% of the market value of the loaned securities during the period of the loan. The market value of the loaned securities is determined at the close of business of the Fund and any additional required collateral is delivered to the Fund on the next business day. The Fund or borrower may terminate the loan at any time, and if the borrower defaults on its obligation to return the securities loaned because of insolvency or other reasons, the Fund may apply collateral received from the borrower against the obligation. The Fund may experience delays and costs in recovering the securities loaned. Any cash collateral received is the Fidelity Securities Lending Cash Central Fund. The value of loaned securities and cash collateral at period end are disclosed on the Fund's Statement of Assets and Liabilities. Security lending income represents the income earned on investing cash collateral, less rebates paid to borrowers and any lending agent fees associated with the loan, plus any premium payments received for lending certain types of securities. Security lending income is presented in the Statement of Operations as a component of income from Fidelity Central Funds. Total security lending income during the period amounted to $18,447. During the period, there were no securities loaned to FCM.
9. Expense Reductions.
Commissions paid to certain brokers with whom the investment adviser, or its affiliates, places trades on behalf of the Fund include an amount in addition to trade execution, which may be rebated back to the Fund to offset certain expenses. This amount totaled $3,454 for the period. In addition, through arrangements with the Fund's custodian, credits realized as a result of certain uninvested cash balances were used to reduce the Fund's expenses. During the period, these credits reduced the Fund's custody expenses by $22.
In addition, during the period the investment adviser reimbursed and/or waived a portion of operating expenses in the amount of $1,775.
10. Other.
The Fund's organizational documents provide former and current trustees and officers with a limited indemnification against liabilities arising in connection with the performance of their duties to the Fund. In the normal course of business, the Fund may also enter into contracts that provide general indemnifications. The Fund's maximum exposure under these arrangements is unknown as this would be dependent on future claims that may be made against the Fund. The risk of material loss from such claims is considered remote.
At the end of the period, VIP FundsManager 50% Portfolio was the owner of record of approximately 11% of the total outstanding shares of the Fund. Mutual funds managed by the investment adviser or its affiliates were the owners of record, in the aggregate, of approximately 24% of the total outstanding shares of the Fund.
Shareholder Expense Example
As a shareholder of the Fund, you incur two types of costs: (1) transaction costs, and (2) ongoing costs, including management fees and other Fund expenses. This Example is intended to help you understand your ongoing costs (in dollars) of investing in the Fund and to compare these costs with the ongoing costs of investing in other mutual funds.
The Example is based on an investment of $1,000 invested at the beginning of the period and held for the entire period (August 1, 2015 to January 31, 2016).
Actual Expenses
The first line of the accompanying table provides information about actual account values and actual expenses. You may use the information in this line, together with the amount you invested, to estimate the expenses that you paid over the period. Simply divide your account value by $1,000.00 (for example, an $8,600 account value divided by $1,000.00 = 8.6), then multiply the result by the number in the first line under the heading entitled "Expenses Paid During Period" to estimate the expenses you paid on your account during this period. A small balance maintenance fee of $12.00 that is charged once a year may apply for certain accounts with a value of less than $2,000. This fee is not included in the table below. If it was, the estimate of expenses you paid during the period would be higher, and your ending account value lower, by this amount. In addition, the Fund, as a shareholder in the underlying Fidelity Central Funds, will indirectly bear its pro-rata share of the fees and expenses incurred by the underlying Fidelity Central Funds. These fees and expenses are not included in the Fund's annualized expense ratio used to calculate the expense estimate in the table below.
Hypothetical Example for Comparison Purposes
The second line of the accompanying table provides information about hypothetical account values and hypothetical expenses based on the Fund's actual expense ratio and an assumed rate of return of 5% per year before expenses, which is not the Fund's actual return. The hypothetical account values and expenses may not be used to estimate the actual ending account balance or expenses you paid for the period. You may use this information to compare the ongoing costs of investing in the Fund and other funds. To do so, compare this 5% hypothetical example with the 5% hypothetical examples that appear in the shareholder reports of the other funds. A small balance maintenance fee of $12.00 that is charged once a year may apply for certain accounts with a value of less than $2,000. This fee is not included in the table below. If it was, the estimate of expenses you paid during the period would be higher, and your ending account value lower, by this amount. In addition, the Fund, as a shareholder in the underlying Fidelity Central Funds, will indirectly bear its pro-rata share of the fees and expenses incurred by the underlying Fidelity Central Funds. These fees and expenses are not included in the Fund's annualized expense ratio used to calculate the expense estimate in the table below.
Please note that the expenses shown in the table are meant to highlight your ongoing costs only and do not reflect any transaction costs. Therefore, the second line of the table is useful in comparing ongoing costs only, and will not help you determine the relative total costs of owning different funds.
| | Annualized Expense Ratio-A | Beginning
Account Value
August 1, 2015 | Ending
Account Value
January 31, 2016 | Expenses Paid
During Period-B
August 1, 2015
to January 31, 2016 |
| Actual | .93% | $1,000.00 | $903.90 | $4.45 |
| Hypothetical-C | | $1,000.00 | $1,020.46 | $4.72 |
A Annualized expense ratio reflects expenses net of applicable fee waivers.
B Expenses are equal to the Fund's annualized expense ratio, multiplied by the average account value over the period, multiplied by 184/366 (to reflect the one-half year period).
C 5% return per year before expenses
Corporate Headquarters
245 Summer St.
Boston, MA 02210
www.fidelity.com
BCV-SANN-0316
1.789715.113
Fidelity® Series Blue Chip Growth Fund
Fidelity® Series Blue Chip Growth Fund
Class F
Semi-Annual Report January 31, 2016 |
|
Contents
To view a fund's proxy voting guidelines and proxy voting record for the 12-month period ended June 30, visit http://www.fidelity.com/proxyvotingresults or visit the Securities and Exchange Commission's (SEC) web site at http://www.sec.gov.
You may also call 1-800-544-8544, or for Class F, call 1-800-835-5092, to request a free copy of the proxy voting guidelines.
Standard & Poor's, S&P and S&P 500 are registered service marks of The McGraw-Hill Companies, Inc. and have been licensed for use by Fidelity Distributors Corporation.
Other third-party marks appearing herein are the property of their respective owners.
All other marks appearing herein are registered or unregistered trademarks or service marks of FMR LLC or an affiliated company. © 2016 FMR LLC. All rights reserved.
This report and the financial statements contained herein are submitted for the general information of the shareholders of the Fund. This report is not authorized for distribution to prospective investors in the Fund unless preceded or accompanied by an effective prospectus.
A fund files its complete schedule of portfolio holdings with the SEC for the first and third quarters of each fiscal year on Form N-Q. Forms N-Q are available on the SEC’s web site at http://www.sec.gov. A fund's Forms N-Q may be reviewed and copied at the SEC’s Public Reference Room in Washington, DC. Information regarding the operation of the SEC's Public Reference Room may be obtained by calling 1-800-SEC-0330.
For a complete list of a fund's portfolio holdings, view the most recent holdings listing, semiannual report, or annual report on Fidelity's web site at http://www.fidelity.com, http://www.advisor.fidelity.com, or http://www.401k.com, as applicable.
NOT FDIC INSURED •MAY LOSE VALUE •NO BANK GUARANTEE
Neither the Fund nor Fidelity Distributors Corporation is a bank.
Investment Summary (Unaudited)
Top Ten Stocks as of January 31, 2016
| | % of fund's net assets | % of fund's net assets 6 months ago |
| Alphabet, Inc. Class A | 6.9 | 4.9 |
| Amazon.com, Inc. | 4.7 | 3.8 |
| Facebook, Inc. Class A | 4.0 | 3.0 |
| Apple, Inc. | 3.5 | 6.2 |
| Uber Technologies, Inc. Series D, 8.00% | 2.1 | 1.5 |
| The Coca-Cola Co. | 1.9 | 0.8 |
| Home Depot, Inc. | 1.8 | 1.7 |
| Visa, Inc. Class A | 1.8 | 1.8 |
| Salesforce.com, Inc. | 1.7 | 1.8 |
| Allergan PLC | 1.7 | 1.8 |
| | 30.1 | |
Top Five Market Sectors as of January 31, 2016
| | % of fund's net assets | % of fund's net assets 6 months ago |
| Information Technology | 37.0 | 34.5 |
| Consumer Discretionary | 25.5 | 24.9 |
| Health Care | 16.0 | 18.4 |
| Consumer Staples | 10.2 | 9.6 |
| Industrials | 4.8 | 5.5 |
Asset Allocation (% of fund's net assets)
| As of January 31, 2016* |
| | Stocks | 94.0% |
| | Convertible Securities | 3.4% |
| | Short-Term Investments and Net Other Assets (Liabilities) | 2.6% |

* Foreign investments 12.4%
| As of July 31, 2015* |
| | Stocks | 97.3% |
| | Convertible Securities | 2.6% |
| | Short-Term Investments and Net Other Assets (Liabilities) | 0.1% |

* Foreign investments 12.3%
Investments January 31, 2016 (Unaudited)
Showing Percentage of Net Assets
| Common Stocks - 93.9% | | | |
| | | Shares | Value |
| CONSUMER DISCRETIONARY - 25.3% | | | |
| Auto Components - 0.2% | | | |
| Delphi Automotive PLC | | 100,700 | $6,539,458 |
| Magna International, Inc. Class A (sub. vtg.) | | 173,150 | 6,015,569 |
| | | | 12,555,027 |
| Automobiles - 1.1% | | | |
| Tesla Motors, Inc. (a)(b) | | 340,737 | 65,148,914 |
| Hotels, Restaurants & Leisure - 5.6% | | | |
| Buffalo Wild Wings, Inc. (a)(b) | | 169,814 | 25,862,672 |
| Chipotle Mexican Grill, Inc. (a) | | 139,000 | 62,962,830 |
| Dave & Buster's Entertainment, Inc. (a) | | 527,100 | 19,117,917 |
| Domino's Pizza, Inc. | | 119,100 | 13,569,063 |
| Fiesta Restaurant Group, Inc. (a) | | 70,000 | 2,548,000 |
| Hilton Worldwide Holdings, Inc. | | 820,200 | 14,607,762 |
| McDonald's Corp. | | 789,900 | 97,773,822 |
| MGM Mirage, Inc. (a) | | 157,000 | 3,152,560 |
| Panera Bread Co. Class A (a) | | 6,600 | 1,280,400 |
| Royal Caribbean Cruises Ltd. | | 44,300 | 3,630,828 |
| Starbucks Corp. | | 1,368,420 | 83,158,883 |
| | | | 327,664,737 |
| Household Durables - 0.8% | | | |
| Jarden Corp. (a) | | 177,600 | 9,421,680 |
| Newell Rubbermaid, Inc. | | 89,400 | 3,466,932 |
| Sony Corp. | | 514,600 | 11,943,512 |
| Sony Corp. sponsored ADR | | 298,600 | 7,130,568 |
| Tempur Sealy International, Inc. (a) | | 44,800 | 2,703,232 |
| Whirlpool Corp. | | 113,300 | 15,226,387 |
| | | | 49,892,311 |
| Internet & Catalog Retail - 6.8% | | | |
| Amazon.com, Inc. (a) | | 468,880 | 275,232,560 |
| Ctrip.com International Ltd. sponsored ADR (a) | | 238,886 | 10,195,654 |
| Expedia, Inc. | | 280,377 | 28,329,292 |
| Groupon, Inc. Class A (a)(b) | | 2,166,400 | 5,892,608 |
| JD.com, Inc. sponsored ADR (a) | | 56,800 | 1,478,504 |
| Netflix, Inc. (a) | | 375,446 | 34,480,961 |
| Priceline Group, Inc. (a) | | 38,300 | 40,788,351 |
| The Honest Co., Inc. (a)(c) | | 71,609 | 3,276,470 |
| | | | 399,674,400 |
| Leisure Products - 0.3% | | | |
| Hasbro, Inc. | | 154,500 | 11,476,260 |
| Mattel, Inc. | | 91,100 | 2,513,449 |
| Spin Master Corp. (a) | | 148,900 | 2,124,713 |
| | | | 16,114,422 |
| Media - 1.5% | | | |
| Altice NV Class A (a) | | 554,039 | 7,990,349 |
| Charter Communications, Inc. Class A (a)(b) | | 47,500 | 8,139,600 |
| DreamWorks Animation SKG, Inc. Class A (a)(b) | | 169,300 | 4,340,852 |
| Lions Gate Entertainment Corp. | | 97,900 | 2,560,085 |
| Naspers Ltd. Class N | | 56,800 | 7,177,993 |
| Starz Series A (a) | | 82,300 | 2,339,789 |
| The Walt Disney Co. | | 575,617 | 55,155,621 |
| | | | 87,704,289 |
| Multiline Retail - 1.3% | | | |
| B&M European Value Retail S.A. | | 2,831,036 | 11,372,098 |
| Burlington Stores, Inc. (a) | | 185,300 | 9,956,169 |
| Dollar Tree, Inc. (a) | | 264,700 | 21,525,404 |
| Target Corp. | | 465,841 | 33,736,205 |
| | | | 76,589,876 |
| Specialty Retail - 4.6% | | | |
| AutoZone, Inc. (a) | | 5,100 | 3,913,689 |
| Home Depot, Inc. | | 859,100 | 108,040,416 |
| Inditex SA | | 163,238 | 5,372,038 |
| L Brands, Inc. | | 344,414 | 33,115,406 |
| Lowe's Companies, Inc. | | 66,100 | 4,736,726 |
| O'Reilly Automotive, Inc. (a) | | 10,000 | 2,609,000 |
| Restoration Hardware Holdings, Inc. (a)(b) | | 782,418 | 48,212,597 |
| Ross Stores, Inc. | | 244,976 | 13,782,350 |
| Signet Jewelers Ltd. | | 146,000 | 16,936,000 |
| TJX Companies, Inc. | | 381,900 | 27,206,556 |
| Ulta Salon, Cosmetics & Fragrance, Inc. (a) | | 27,400 | 4,964,058 |
| | | | 268,888,836 |
| Textiles, Apparel & Luxury Goods - 3.1% | | | |
| adidas AG | | 297,600 | 30,644,650 |
| Coach, Inc. | | 51,100 | 1,893,255 |
| Columbia Sportswear Co. | | 31,700 | 1,749,206 |
| G-III Apparel Group Ltd. (a) | | 186,680 | 9,214,525 |
| Kate Spade & Co. (a) | | 302,100 | 5,380,401 |
| lululemon athletica, Inc. (a) | | 458,065 | 28,432,095 |
| NIKE, Inc. Class B | | 589,700 | 36,567,297 |
| Pandora A/S | | 5,700 | 762,578 |
| PVH Corp. | | 229,200 | 16,818,696 |
| Ralph Lauren Corp. | | 11,400 | 1,282,500 |
| Regina Miracle International Holdings Ltd. (a) | | 1,958,693 | 3,205,924 |
| Skechers U.S.A., Inc. Class A (sub. vtg.) (a) | | 818,100 | 23,062,239 |
| Tory Burch LLC unit (c)(d) | | 106,817 | 5,589,905 |
| Under Armour, Inc. Class A (sub. vtg.) (a) | | 155,700 | 13,301,451 |
| Vera Bradley, Inc. (a) | | 263,000 | 3,887,140 |
| VF Corp. | | 46,100 | 2,885,860 |
| | | | 184,677,722 |
|
| TOTAL CONSUMER DISCRETIONARY | | | 1,488,910,534 |
|
| CONSUMER STAPLES - 10.0% | | | |
| Beverages - 3.9% | | | |
| Anheuser-Busch InBev SA NV ADR | | 74,600 | 9,387,664 |
| Coca-Cola Bottling Co. Consolidated | | 9,500 | 1,671,050 |
| Constellation Brands, Inc. Class A (sub. vtg.) | | 107,600 | 16,406,848 |
| Molson Coors Brewing Co. Class B | | 279,600 | 25,298,208 |
| Monster Beverage Corp. | | 299,881 | 40,492,931 |
| PepsiCo, Inc. | | 240,286 | 23,860,400 |
| The Coca-Cola Co. | | 2,591,481 | 111,226,365 |
| | | | 228,343,466 |
| Food & Staples Retailing - 2.7% | | | |
| Costco Wholesale Corp. | | 210,000 | 31,735,200 |
| CVS Health Corp. | | 484,000 | 46,749,560 |
| Kroger Co. | | 750,918 | 29,143,128 |
| Sprouts Farmers Market LLC (a) | | 500,523 | 11,411,924 |
| Wal-Mart Stores, Inc. | | 51,600 | 3,424,176 |
| Walgreens Boots Alliance, Inc. | | 223,700 | 17,833,364 |
| Whole Foods Market, Inc. | | 595,260 | 17,447,071 |
| | | | 157,744,423 |
| Food Products - 1.3% | | | |
| Amplify Snack Brands, Inc. | | 197,813 | 2,136,380 |
| Associated British Foods PLC | | 302,400 | 13,642,354 |
| Edita Food Industries SAE GDR (a)(e) | | 44,600 | 747,050 |
| Mondelez International, Inc. | | 847,700 | 36,535,870 |
| Premium Brands Holdings Corp. | | 22,800 | 683,561 |
| The Hain Celestial Group, Inc. (a) | | 265,100 | 9,644,338 |
| The Kraft Heinz Co. | | 92,300 | 7,204,938 |
| TreeHouse Foods, Inc. (a) | | 25,100 | 1,991,936 |
| WhiteWave Foods Co. (a) | | 109,429 | 4,130,945 |
| | | | 76,717,372 |
| Household Products - 0.2% | | | |
| Procter & Gamble Co. | | 167,900 | 13,715,751 |
| Personal Products - 1.3% | | | |
| Estee Lauder Companies, Inc. Class A | | 172,800 | 14,731,200 |
| Herbalife Ltd. (a) | | 872,238 | 40,306,118 |
| Nu Skin Enterprises, Inc. Class A (b) | | 670,800 | 21,230,820 |
| | | | 76,268,138 |
| Tobacco - 0.6% | | | |
| Imperial Tobacco Group PLC | | 60,886 | 3,296,712 |
| Reynolds American, Inc. | | 689,600 | 34,445,520 |
| | | | 37,742,232 |
|
| TOTAL CONSUMER STAPLES | | | 590,531,382 |
|
| ENERGY - 1.2% | | | |
| Energy Equipment & Services - 0.1% | | | |
| Baker Hughes, Inc. | | 41,500 | 1,805,665 |
| Schlumberger Ltd. | | 44,500 | 3,216,015 |
| | | | 5,021,680 |
| Oil, Gas & Consumable Fuels - 1.1% | | | |
| Anadarko Petroleum Corp. | | 172,978 | 6,761,710 |
| Cimarex Energy Co. | | 103,930 | 9,665,490 |
| Continental Resources, Inc. (a) | | 362,664 | 7,655,837 |
| Devon Energy Corp. | | 91,400 | 2,550,060 |
| Diamondback Energy, Inc. | | 12,900 | 974,595 |
| EOG Resources, Inc. | | 185,626 | 13,183,159 |
| Hess Corp. | | 63,200 | 2,686,000 |
| Noble Energy, Inc. | | 19,800 | 640,926 |
| Pioneer Natural Resources Co. | | 111,000 | 13,758,450 |
| Rice Energy, Inc. (a) | | 58,300 | 680,361 |
| SM Energy Co. | | 311,100 | 4,349,178 |
| Whiting Petroleum Corp. (a) | | 158,200 | 1,162,770 |
| | | | 64,068,536 |
|
| TOTAL ENERGY | | | 69,090,216 |
|
| FINANCIALS - 2.1% | | | |
| Banks - 1.5% | | | |
| Bank of America Corp. | | 1,334,100 | 18,864,174 |
| Citigroup, Inc. | | 460,789 | 19,620,396 |
| HDFC Bank Ltd. sponsored ADR | | 229,000 | 13,815,570 |
| JPMorgan Chase & Co. | | 623,272 | 37,084,684 |
| | | | 89,384,824 |
| Capital Markets - 0.4% | | | |
| BlackRock, Inc. Class A | | 46,800 | 14,707,368 |
| Charles Schwab Corp. | | 205,000 | 5,233,650 |
| Fairfax India Holdings Corp. (a) | | 427,900 | 4,321,790 |
| | | | 24,262,808 |
| Consumer Finance - 0.0% | | | |
| Synchrony Financial (a) | | 59,300 | 1,685,306 |
| Diversified Financial Services - 0.1% | | | |
| CME Group, Inc. | | 31,600 | 2,839,260 |
| Real Estate Investment Trusts - 0.1% | | | |
| Extra Space Storage, Inc. | | 91,400 | 8,289,066 |
|
| TOTAL FINANCIALS | | | 126,461,264 |
|
| HEALTH CARE - 15.8% | | | |
| Biotechnology - 10.1% | | | |
| AbbVie, Inc. | | 550,800 | 30,238,920 |
| ACADIA Pharmaceuticals, Inc. (a) | | 35,900 | 742,771 |
| Acceleron Pharma, Inc. (a) | | 51,300 | 1,574,910 |
| Aduro Biotech, Inc. | | 32,000 | 463,360 |
| Agios Pharmaceuticals, Inc. (a) | | 97,900 | 4,133,338 |
| Aimmune Therapeutics, Inc. (a) | | 126,100 | 1,725,048 |
| Alexion Pharmaceuticals, Inc. (a) | | 174,604 | 25,479,962 |
| Alkermes PLC (a) | | 374,000 | 11,971,740 |
| Alnylam Pharmaceuticals, Inc. (a) | | 339,100 | 23,377,554 |
| Amgen, Inc. | | 603,398 | 92,156,977 |
| Ascendis Pharma A/S sponsored ADR | | 119,400 | 2,273,376 |
| Avalanche Biotechnologies, Inc. (a) | | 40,500 | 243,000 |
| BioCryst Pharmaceuticals, Inc. (a) | | 320,373 | 2,233,000 |
| Biogen, Inc. (a) | | 208,200 | 56,851,092 |
| BioMarin Pharmaceutical, Inc. (a) | | 70,700 | 5,233,214 |
| bluebird bio, Inc. (a) | | 111,200 | 4,599,232 |
| Calithera Biosciences, Inc. (a) | | 121,000 | 605,000 |
| Catabasis Pharmaceuticals, Inc. | | 168,000 | 1,112,160 |
| Celgene Corp. (a) | | 895,000 | 89,786,400 |
| Cellectis SA sponsored ADR | | 25,300 | 565,708 |
| Chiasma, Inc. (e) | | 95,140 | 979,942 |
| Chiasma, Inc. warrants(a) | | 23,784 | 64,904 |
| Chiasma, Inc. (a)(b) | | 107,500 | 1,107,250 |
| Chimerix, Inc. (a) | | 31,200 | 240,240 |
| Coherus BioSciences, Inc. (a)(b) | | 153,000 | 2,028,780 |
| CytomX Therapeutics, Inc. | | 137,854 | 2,057,402 |
| CytomX Therapeutics, Inc. (a) | | 53,200 | 835,772 |
| DBV Technologies SA sponsored ADR (a) | | 38,700 | 1,005,813 |
| Dicerna Pharmaceuticals, Inc. (a) | | 78,600 | 515,616 |
| Edge Therapeutics, Inc. (a) | | 103,800 | 1,153,218 |
| Exelixis, Inc. (a) | | 1,012,000 | 4,675,440 |
| FibroGen, Inc. (a) | | 93,400 | 1,894,152 |
| Gilead Sciences, Inc. | | 990,335 | 82,197,805 |
| Global Blood Therapeutics, Inc. (a)(b) | | 161,515 | 3,057,479 |
| Heron Therapeutics, Inc. (a) | | 28,000 | 587,720 |
| Intercept Pharmaceuticals, Inc. (a) | | 54,900 | 5,832,027 |
| Intrexon Corp. (a)(b) | | 145,900 | 4,251,526 |
| Ionis Pharmaceuticals, Inc. (a) | | 62,200 | 2,421,446 |
| Ironwood Pharmaceuticals, Inc. Class A (a) | | 442,916 | 4,088,115 |
| Juno Therapeutics, Inc. (a) | | 67,500 | 1,861,650 |
| Kite Pharma, Inc. (a) | | 31,600 | 1,500,684 |
| Merrimack Pharmaceuticals, Inc. (a) | | 813,200 | 5,017,444 |
| Mirati Therapeutics, Inc. (a) | | 71,028 | 1,529,233 |
| Momenta Pharmaceuticals, Inc. (a) | | 35,500 | 440,910 |
| Neurocrine Biosciences, Inc. (a) | | 209,200 | 8,901,460 |
| Novavax, Inc. (a) | | 146,100 | 752,415 |
| Portola Pharmaceuticals, Inc. (a) | | 88,900 | 2,936,367 |
| ProNai Therapeutics, Inc. (a) | | 92,500 | 765,900 |
| Prothena Corp. PLC (a) | | 38,700 | 1,507,365 |
| Radius Health, Inc. (a) | | 30,500 | 976,915 |
| Regeneron Pharmaceuticals, Inc. (a) | | 122,680 | 51,536,641 |
| REGENXBIO, Inc. (a) | | 37,600 | 522,640 |
| Sage Therapeutics, Inc. (a) | | 37,800 | 1,269,324 |
| Seattle Genetics, Inc. (a) | | 125,200 | 4,129,096 |
| Seres Therapeutics, Inc. | | 17,900 | 482,047 |
| Spark Therapeutics, Inc. | | 34,300 | 966,231 |
| Trevena, Inc. (a) | | 317,700 | 2,312,856 |
| Ultragenyx Pharmaceutical, Inc. (a) | | 24,400 | 1,370,060 |
| uniQure B.V. (a) | | 146,459 | 2,669,948 |
| Versartis, Inc. (a) | | 67,600 | 753,064 |
| Vertex Pharmaceuticals, Inc. (a) | | 319,500 | 28,994,625 |
| Xencor, Inc. (a) | | 37,200 | 402,504 |
| | | | 595,960,788 |
| Health Care Equipment & Supplies - 1.2% | | | |
| Boston Scientific Corp. (a) | | 956,500 | 16,767,445 |
| DexCom, Inc. (a) | | 32,100 | 2,288,088 |
| Edwards Lifesciences Corp. (a) | | 8,100 | 633,501 |
| Glaukos Corp. (b) | | 22,711 | 370,644 |
| Intuitive Surgical, Inc. (a) | | 39,900 | 21,579,915 |
| Invuity, Inc. | | 163,300 | 1,254,144 |
| Medtronic PLC | | 200,125 | 15,193,490 |
| Nevro Corp. (a) | | 115,400 | 7,130,566 |
| Novocure Ltd. (a) | | 45,600 | 569,088 |
| Olympus Corp. | | 30,200 | 1,177,615 |
| | | | 66,964,496 |
| Health Care Providers & Services - 0.5% | | | |
| Adeptus Health, Inc. Class A (a)(b) | | 162,967 | 7,688,783 |
| AmSurg Corp. (a) | | 166,700 | 12,200,773 |
| Cardinal Health, Inc. | | 31,500 | 2,563,155 |
| Dr Lal Pathlabs Ltd. | | 2,393 | 27,594 |
| Teladoc, Inc. (b) | | 190,700 | 3,096,968 |
| UnitedHealth Group, Inc. | | 30,200 | 3,477,832 |
| | | | 29,055,105 |
| Health Care Technology - 0.1% | | | |
| athenahealth, Inc. (a) | | 36,700 | 5,204,060 |
| Castlight Health, Inc. Class B (a) | | 252,000 | 834,120 |
| Evolent Health, Inc. | | 77,800 | 767,886 |
| | | | 6,806,066 |
| Life Sciences Tools & Services - 0.1% | | | |
| Illumina, Inc. (a) | | 24,338 | 3,844,187 |
| Lonza Group AG | | 14,126 | 2,164,094 |
| | | | 6,008,281 |
| Pharmaceuticals - 3.8% | | | |
| Achaogen, Inc. (a) | | 161,500 | 584,630 |
| Allergan PLC (a) | | 345,572 | 98,291,044 |
| Bristol-Myers Squibb Co. | | 566,300 | 35,201,208 |
| Cempra, Inc. (a) | | 39,900 | 687,477 |
| CSPC Pharmaceutical Group Ltd. | | 786,000 | 664,734 |
| Dermira, Inc. (a) | | 151,700 | 4,247,600 |
| Endo Health Solutions, Inc. (a) | | 125,800 | 6,978,126 |
| GW Pharmaceuticals PLC ADR (a) | | 86,969 | 4,362,365 |
| Intra-Cellular Therapies, Inc. (a) | | 33,289 | 1,234,356 |
| Jazz Pharmaceuticals PLC (a) | | 87,900 | 11,316,246 |
| Johnson & Johnson | | 11,300 | 1,180,172 |
| Pacira Pharmaceuticals, Inc. (a) | | 34,900 | 2,073,758 |
| Teva Pharmaceutical Industries Ltd. sponsored ADR | | 456,500 | 28,065,620 |
| The Medicines Company (a) | | 160,900 | 5,560,704 |
| Valeant Pharmaceuticals International, Inc. (Canada) (a) | | 250,200 | 23,039,332 |
| | | | 223,487,372 |
|
| TOTAL HEALTH CARE | | | 928,282,108 |
|
| INDUSTRIALS - 4.7% | | | |
| Aerospace & Defense - 0.6% | | | |
| Honeywell International, Inc. | | 251,300 | 25,934,160 |
| Lockheed Martin Corp. | | 25,000 | 5,275,000 |
| Northrop Grumman Corp. | | 10,200 | 1,887,612 |
| Raytheon Co. | | 40,100 | 5,142,424 |
| | | | 38,239,196 |
| Airlines - 2.1% | | | |
| American Airlines Group, Inc. | | 14,400 | 561,456 |
| Delta Air Lines, Inc. | | 704,600 | 31,206,734 |
| InterGlobe Aviation Ltd. (a) | | 141,443 | 1,842,742 |
| JetBlue Airways Corp. (a) | | 193,100 | 4,114,961 |
| Southwest Airlines Co. | | 1,050,800 | 39,531,096 |
| Spirit Airlines, Inc. (a) | | 386,600 | 16,159,880 |
| United Continental Holdings, Inc. (a) | | 516,800 | 24,951,104 |
| Wizz Air Holdings PLC | | 108,003 | 2,924,391 |
| | | | 121,292,364 |
| Building Products - 0.1% | | | |
| Caesarstone Sdot-Yam Ltd. (a) | | 125,200 | 4,706,268 |
| Toto Ltd. | | 72,000 | 2,336,759 |
| | | | 7,043,027 |
| Construction & Engineering - 0.2% | | | |
| Dycom Industries, Inc. (a) | | 167,100 | 11,072,046 |
| Electrical Equipment - 0.7% | | | |
| Acuity Brands, Inc. | | 56,300 | 11,396,809 |
| SolarCity Corp. (a)(b) | | 774,626 | 27,615,417 |
| | | | 39,012,226 |
| Industrial Conglomerates - 0.7% | | | |
| Danaher Corp. | | 154,300 | 13,370,095 |
| General Electric Co. | | 865,013 | 25,171,878 |
| | | | 38,541,973 |
| Machinery - 0.0% | | | |
| Rational AG | | 5,400 | 2,421,656 |
| Professional Services - 0.1% | | | |
| Equifax, Inc. | | 7,400 | 782,920 |
| WageWorks, Inc. (a) | | 61,600 | 2,755,984 |
| | | | 3,538,904 |
| Road & Rail - 0.0% | | | |
| Swift Transporation Co. (a) | | 75,800 | 1,236,298 |
| Trading Companies & Distributors - 0.2% | | | |
| HD Supply Holdings, Inc. (a) | | 515,500 | 13,542,185 |
|
| TOTAL INDUSTRIALS | | | 275,939,875 |
|
| INFORMATION TECHNOLOGY - 34.3% | | | |
| Communications Equipment - 0.5% | | | |
| Palo Alto Networks, Inc. (a) | | 30,997 | 4,633,742 |
| Qualcomm, Inc. | | 582,500 | 26,410,550 |
| | | | 31,044,292 |
| Electronic Equipment & Components - 0.2% | | | |
| Fitbit, Inc. (b) | | 714,553 | 11,861,580 |
| Internet Software & Services - 13.9% | | | |
| 58.com, Inc. ADR (a) | | 91,500 | 5,133,150 |
| Alibaba Group Holding Ltd. sponsored ADR (a) | | 602,100 | 40,358,763 |
| Alphabet, Inc.: | | | |
| Class A | | 532,113 | 405,124,229 |
| Class C | | 50,253 | 37,335,466 |
| Facebook, Inc. Class A (a) | | 2,112,055 | 236,993,692 |
| Gogo, Inc. (a)(b) | | 552,200 | 8,034,510 |
| IAC/InterActiveCorp | | 43,900 | 2,280,166 |
| JUST EAT Ltd. (a) | | 1,092,003 | 5,848,454 |
| LinkedIn Corp. Class A (a) | | 89,500 | 17,712,945 |
| New Relic, Inc. (a) | | 8,700 | 245,514 |
| Rackspace Hosting, Inc. (a) | | 1,331,995 | 26,919,619 |
| Tencent Holdings Ltd. | | 839,300 | 15,767,678 |
| Twitter, Inc. (a) | | 707,200 | 11,880,960 |
| Yahoo!, Inc. (a) | | 115,700 | 3,414,307 |
| | | | 817,049,453 |
| IT Services - 4.2% | | | |
| Blackhawk Network Holdings, Inc. (a) | | 14,000 | 527,660 |
| Cognizant Technology Solutions Corp. Class A (a) | | 931,248 | 58,957,311 |
| EOH Holdings Ltd. | | 78,500 | 665,686 |
| MasterCard, Inc. Class A | | 734,100 | 65,356,923 |
| PayPal Holdings, Inc. (a) | | 239,800 | 8,666,372 |
| Sabre Corp. | | 263,200 | 6,740,552 |
| Total System Services, Inc. | | 54,400 | 2,184,704 |
| Visa, Inc. Class A | | 1,406,748 | 104,788,659 |
| | | | 247,887,867 |
| Semiconductors & Semiconductor Equipment - 5.0% | | | |
| Analog Devices, Inc. | | 869,288 | 46,819,852 |
| Avago Technologies Ltd. | | 656,800 | 87,820,728 |
| Cavium, Inc. (a) | | 314,155 | 18,148,734 |
| Cirrus Logic, Inc. (a) | | 947,000 | 32,879,840 |
| Monolithic Power Systems, Inc. | | 42,456 | 2,656,472 |
| NVIDIA Corp. | | 613,929 | 17,981,980 |
| NXP Semiconductors NV (a) | | 1,068,569 | 79,907,590 |
| Semtech Corp. (a) | | 93,400 | 1,877,340 |
| SolarEdge Technologies, Inc. (b) | | 182,700 | 5,164,929 |
| | | | 293,257,465 |
| Software - 6.8% | | | |
| 1-Page Ltd. (a)(b) | | 1,190,296 | 2,959,587 |
| Activision Blizzard, Inc. | | 2,609,528 | 90,863,765 |
| Adobe Systems, Inc. (a) | | 263,420 | 23,478,625 |
| Appirio, Inc. (c) | | 43,764 | 185,559 |
| Electronic Arts, Inc. (a) | | 856,400 | 55,276,338 |
| Ellie Mae, Inc. (a)(b) | | 66,900 | 4,671,627 |
| HubSpot, Inc. (a) | | 17,800 | 722,502 |
| Imperva, Inc. (a) | | 18,400 | 948,704 |
| Microsoft Corp. | | 1,144,300 | 63,039,487 |
| Mobileye NV (a)(b) | | 326,700 | 8,863,371 |
| Paycom Software, Inc. (a) | | 54,600 | 1,646,190 |
| Qlik Technologies, Inc. (a) | | 237,800 | 5,954,512 |
| Red Hat, Inc. (a) | | 123,700 | 8,665,185 |
| Salesforce.com, Inc. (a) | | 1,497,104 | 101,892,898 |
| SAP AG sponsored ADR (b) | | 51,100 | 4,077,780 |
| ServiceNow, Inc. (a) | | 7,400 | 460,354 |
| Tableau Software, Inc. (a) | | 73,800 | 5,921,712 |
| Workday, Inc. Class A (a) | | 214,700 | 13,528,247 |
| Zendesk, Inc. (a) | | 242,500 | 5,337,425 |
| | | | 398,493,868 |
| Technology Hardware, Storage & Peripherals - 3.7% | | | |
| Apple, Inc. | | 2,101,534 | 204,563,320 |
| SanDisk Corp. | | 84,900 | 6,002,430 |
| Western Digital Corp. | | 180,600 | 8,665,188 |
| | | | 219,230,938 |
|
| TOTAL INFORMATION TECHNOLOGY | | | 2,018,825,463 |
|
| MATERIALS - 0.5% | | | |
| Chemicals - 0.5% | | | |
| Albemarle Corp. U.S. | | 76,700 | 4,037,488 |
| CF Industries Holdings, Inc. | | 793,400 | 23,802,000 |
| LyondellBasell Industries NV Class A | | 7,700 | 600,369 |
| Sherwin-Williams Co. | | 2,300 | 588,041 |
| | | | 29,027,898 |
| Containers & Packaging - 0.0% | | | |
| Ball Corp. | | 28,100 | 1,877,923 |
|
| TOTAL MATERIALS | | | 30,905,821 |
|
| TOTAL COMMON STOCKS | | | |
| (Cost $4,770,381,589) | | | 5,528,946,663 |
|
| Preferred Stocks - 3.5% | | | |
| Convertible Preferred Stocks - 3.4% | | | |
| CONSUMER DISCRETIONARY - 0.1% | | | |
| Internet & Catalog Retail - 0.1% | | | |
| The Honest Co., Inc.: | | | |
| Series C (a)(c) | | 167,087 | 7,645,066 |
| Series D (c) | | 27,712 | 1,267,963 |
| | | | 8,913,029 |
| CONSUMER STAPLES - 0.2% | | | |
| Food & Staples Retailing - 0.1% | | | |
| Blue Apron, Inc. Series D (c) | | 285,138 | 3,963,418 |
| Food Products - 0.1% | | | |
| BLUE BOTTLE Coffee, Inc. Series C (c) | | 234,006 | 3,617,733 |
| Tobacco - 0.0% | | | |
| PAX Labs, Inc. Series C (c) | | 945,100 | 3,109,379 |
| TOTAL CONSUMER STAPLES | | | 10,690,530 |
| FINANCIALS - 0.1% | | | |
| Consumer Finance - 0.1% | | | |
| Oportun Finance Corp. Series H (c) | | 1,527,120 | 3,802,529 |
| HEALTH CARE - 0.2% | | | |
| Biotechnology - 0.1% | | | |
| AC Immune SA Series E (c) | | 192,250 | 1,375,357 |
| Editas Medicine, Inc. Series B (c) | | 96,289 | 1,386,562 |
| Gensight Biologics Series B (c) | | 154,470 | 769,082 |
| Immunocore Ltd. Series A (c) | | 4,035 | 564,489 |
| Intellia Therapeutics, Inc. Series B (c) | | 198,515 | 1,042,204 |
| Pronutria Biosciences, Inc. Series C (c) | | 248,015 | 1,775,291 |
| | | | 6,912,985 |
| Health Care Providers & Services - 0.1% | | | |
| Mulberry Health, Inc. Series A8 (c) | | 813,618 | 5,495,786 |
| TOTAL HEALTH CARE | | | 12,408,771 |
| INDUSTRIALS - 0.1% | | | |
| Aerospace & Defense - 0.1% | | | |
| Space Exploration Technologies Corp. Series G (c) | | 42,650 | 3,795,850 |
| Professional Services - 0.0% | | | |
| YourPeople, Inc. Series C (c) | | 253,888 | 1,754,366 |
| TOTAL INDUSTRIALS | | | 5,550,216 |
| INFORMATION TECHNOLOGY - 2.7% | | | |
| Internet Software & Services - 2.3% | | | |
| Jet.Com, Inc. Series B1 (c) | | 922,232 | 4,600,001 |
| Uber Technologies, Inc.: | | | |
| Series D, 8.00% (a)(c) | | 2,578,476 | 125,758,019 |
| Series E, 8.00% (a)(c) | | 47,420 | 2,312,779 |
| | | | 132,670,799 |
| IT Services - 0.1% | | | |
| AppNexus, Inc. Series E (a)(c) | | 307,049 | 4,915,854 |
| Nutanix, Inc. Series E (a)(c) | | 230,044 | 2,852,546 |
| | | | 7,768,400 |
| Software - 0.3% | | | |
| Appirio, Inc. Series E (c) | | 306,351 | 1,298,928 |
| Cloudflare, Inc. Series D (a)(c) | | 323,080 | 1,579,861 |
| Dataminr, Inc. Series D (c) | | 115,901 | 919,906 |
| Delphix Corp. Series D (c) | | 242,876 | 1,214,380 |
| Malwarebytes Corp. Series B (c) | | 329,349 | 3,416,996 |
| Snapchat, Inc. Series F (c) | | 247,231 | 6,366,198 |
| Taboola.Com Ltd. Series E (a)(c) | | 289,958 | 2,354,459 |
| | | | 17,150,728 |
| TOTAL INFORMATION TECHNOLOGY | | | 157,589,927 |
|
| TOTAL CONVERTIBLE PREFERRED STOCKS | | | 198,955,002 |
|
| Nonconvertible Preferred Stocks - 0.1% | | | |
| CONSUMER DISCRETIONARY - 0.1% | | | |
| Internet & Catalog Retail - 0.1% | | | |
| China Internet Plus Holdings Ltd. (c) | | 1,581,852 | 6,107,056 |
| TOTAL PREFERRED STOCKS | | | |
| (Cost $128,735,020) | | | 205,062,058 |
|
| Money Market Funds - 2.1% | | | |
| Fidelity Cash Central Fund, 0.38% (f) | | 31,654,085 | 31,654,085 |
| Fidelity Securities Lending Cash Central Fund, 0.42% (f)(g) | | 95,917,281 | 95,917,281 |
| TOTAL MONEY MARKET FUNDS | | | |
| (Cost $127,571,366) | | | 127,571,366 |
| TOTAL INVESTMENT PORTFOLIO - 99.5% | | | |
| (Cost $5,026,687,975) | | | 5,861,580,087 |
| NET OTHER ASSETS (LIABILITIES) - 0.5% | | | 26,649,958 |
| NET ASSETS - 100% | | | $5,888,230,045 |
Legend
(a) Non-income producing
(b) Security or a portion of the security is on loan at period end.
(c) Restricted securities - Investment in securities not registered under the Securities Act of 1933 (excluding 144A issues). At the end of the period, the value of restricted securities (excluding 144A issues) amounted to $214,113,992 or 3.6% of net assets.
(d) Investment is owned by an entity that is treated as a corporation for U.S. tax purposes and is wholly-owned by the Fund.
(e) Security exempt from registration under Rule 144A of the Securities Act of 1933. These securities may be resold in transactions exempt from registration, normally to qualified institutional buyers. At the end of the period, the value of these securities amounted to $1,726,992 or 0.0% of net assets.
(f) Affiliated fund that is generally available only to investment companies and other accounts managed by Fidelity Investments. The rate quoted is the annualized seven-day yield of the fund at period end. A complete unaudited listing of the fund's holdings as of its most recent quarter end is available upon request. In addition, each Fidelity Central Fund's financial statements are available on the SEC's website or upon request.
(g) Investment made with cash collateral received from securities on loan.
Additional information on each restricted holding is as follows:
| Security | Acquisition Date | Acquisition Cost |
| AC Immune SA Series E | 10/19/15 | $1,852,567 |
| Appirio, Inc. | 2/12/15 | $312,497 |
| Appirio, Inc. Series E | 2/12/15 | $2,187,499 |
| AppNexus, Inc. Series E | 8/1/14 | $6,150,867 |
| Blue Apron, Inc. Series D | 5/18/15 | $3,800,006 |
| BLUE BOTTLE Coffee, Inc. Series C | 5/29/15 | $7,797,080 |
| China Internet Plus Holdings Ltd. | 1/26/15 | $4,999,997 |
| Cloudflare, Inc. Series D | 11/5/14 - 6/24/15 | $2,010,032 |
| Dataminr, Inc. Series D | 3/6/15 | $1,477,738 |
| Delphix Corp. Series D | 7/10/15 | $2,185,884 |
| Editas Medicine, Inc. Series B | 8/4/15 | $1,126,589 |
| Gensight Biologics Series B | 7/2/15 | $1,190,323 |
| Immunocore Ltd. Series A | 7/27/15 | $759,303 |
| Intellia Therapeutics, Inc. Series B | 8/20/15 | $1,042,204 |
| Jet.Com, Inc. Series B1 | 11/24/15 | $4,600,001 |
| Malwarebytes Corp. Series B | 12/21/15 | $3,416,996 |
| Mulberry Health, Inc. Series A8 | 1/20/16 | $5,495,786 |
| Nutanix, Inc. Series E | 8/26/14 | $3,081,784 |
| Oportun Finance Corp. Series H | 2/6/15 | $4,348,169 |
| PAX Labs, Inc. Series C | 5/22/15 | $3,638,635 |
| Pronutria Biosciences, Inc. Series C | 1/30/15 | $2,499,991 |
| Snapchat, Inc. Series F | 3/25/15 | $7,594,936 |
| Space Exploration Technologies Corp. Series G | 1/20/15 | $3,303,669 |
| Taboola.Com Ltd. Series E | 12/22/14 | $3,022,928 |
| The Honest Co., Inc. | 8/21/14 | $1,937,546 |
| The Honest Co., Inc. Series C | 8/21/14 | $4,520,923 |
| The Honest Co., Inc. Series D | 8/3/15 | $1,267,963 |
| Tory Burch LLC unit | 5/14/15 | $7,600,030 |
| Uber Technologies, Inc. Series D, 8.00% | 6/6/14 | $40,000,027 |
| Uber Technologies, Inc. Series E, 8.00% | 12/5/14 | $1,579,919 |
| YourPeople, Inc. Series C | 5/1/15 | $3,783,205 |
Affiliated Central Funds
Information regarding fiscal year to date income earned by the Fund from investments in Fidelity Central Funds is as follows:
| Fund | Income earned |
| Fidelity Cash Central Fund | $19,969 |
| Fidelity Securities Lending Cash Central Fund | 1,922,899 |
| Total | $1,942,868 |
Investment Valuation
The following is a summary of the inputs used, as of January 31, 2016, involving the Fund's assets and liabilities carried at fair value. The inputs or methodology used for valuing securities may not be an indication of the risk associated with investing in those securities. For more information on valuation inputs, and their aggregation into the levels used below, please refer to the Investment Valuation section in the accompanying Notes to Financial Statements.
| | Valuation Inputs at Reporting Date: |
| Description | Total | Level 1 | Level 2 | Level 3 |
| Investments in Securities: | | | | |
| Equities: | | | | |
| Consumer Discretionary | $1,503,930,619 | $1,401,575,017 | $78,469,142 | $23,886,460 |
| Consumer Staples | 601,221,912 | 573,592,316 | 16,939,066 | 10,690,530 |
| Energy | 69,090,216 | 69,090,216 | -- | -- |
| Financials | 130,263,793 | 126,461,264 | -- | 3,802,529 |
| Health Care | 940,690,879 | 922,125,765 | 6,156,343 | 12,408,771 |
| Industrials | 281,490,091 | 266,414,327 | 9,525,548 | 5,550,216 |
| Information Technology | 2,176,415,390 | 1,993,398,499 | 25,241,405 | 157,775,486 |
| Materials | 30,905,821 | 30,905,821 | -- | -- |
| Money Market Funds | 127,571,366 | 127,571,366 | -- | -- |
| Total Investments in Securities: | $5,861,580,087 | $5,511,134,591 | $136,331,504 | $214,113,992 |
The following is a summary of transfers between Level 1 and Level 2 for the period ended January 31, 2016. Transfers are assumed to have occurred at the beginning of the period, and are primarily attributable to the valuation techniques used for foreign equity securities, as discussed in the accompanying Notes to Financial Statements:
| Transfers | Total |
| Level 1 to Level 2 | $61,034,357 |
| Level 2 to Level 1 | $0 |
The following is a reconciliation of Investments in Securities and Derivative Instruments for which Level 3 inputs were used in determining value:
| Investments in Securities: | |
| Equities - Other Investments in Securities | |
| Beginning Balance | $62,822,943 |
| Net Realized Gain (Loss) on Investment Securities | (1,347,394) |
| Net Unrealized Gain (Loss) on Investment Securities | (9,650,691) |
| Cost of Purchases | 15,821,205 |
| Proceeds of Sales | (11,307,557) |
| Amortization/Accretion | -- |
| Transfers into Level 3 | -- |
| Transfers out of Level 3 | -- |
| Ending Balance | $56,338,506 |
| The change in unrealized gain (loss) for the period attributable to Level 3 securities held at January 31, 2016 | $(10,261,580) |
| Equities - Information Technology | |
| Beginning Balance | $133,080,515 |
| Net Realized Gain (Loss) on Investment Securities | -- |
| Net Unrealized Gain (Loss) on Investment Securities | 16,677,974 |
| Cost of Purchases | 8,016,997 |
| Proceeds of Sales | -- |
| Amortization/Accretion | -- |
| Transfers into Level 3 | -- |
| Transfers out of Level 3 | -- |
| Ending Balance | $157,775,486 |
| The change in unrealized gain (loss) for the period attributable to Level 3 securities held at January 31, 2016 | $16,677,974 |
The information used in the above reconciliations represents fiscal year to date activity for any Investments in Securities identified as using Level 3 inputs at either the beginning or the end of the current fiscal period. Transfers in or out of Level 3 represent the beginning value of any Security or Instrument where a change in the pricing level occurred from the beginning to the end of the period. The cost of purchases and the proceeds of sales may include securities received or delivered through corporate actions or exchanges. Realized and unrealized gains (losses) disclosed in the reconciliations are included in Net Gain (Loss) on the Fund's Statement of Operations.
Other Information
Distribution of investments by country or territory of incorporation, as a percentage of Total Net Assets, is as follows (Unaudited):
| United States of America | 87.6% |
| Ireland | 2.5% |
| Cayman Islands | 2.2% |
| Netherlands | 1.8% |
| Singapore | 1.5% |
| Others (Individually Less Than 1%) | 4.4% |
| | 100.0% |
See accompanying notes which are an integral part of the financial statements.
Financial Statements
Statement of Assets and Liabilities
| | | January 31, 2016 (Unaudited) |
| Assets | | |
Investment in securities, at value (including securities loaned of $95,473,644) — See accompanying schedule:
Unaffiliated issuers (cost $4,899,116,609) | $5,734,008,721 | |
| Fidelity Central Funds (cost $127,571,366) | 127,571,366 | |
| Total Investments (cost $5,026,687,975) | | $5,861,580,087 |
| Receivable for investments sold | | 43,101,081 |
| Receivable for fund shares sold | | 129,461,799 |
| Dividends receivable | | 1,725,829 |
| Distributions receivable from Fidelity Central Funds | | 303,095 |
| Prepaid expenses | | 12,573 |
| Other receivables | | 55,992 |
| Total assets | | 6,036,240,456 |
| Liabilities | | |
| Payable for investments purchased | $48,617,919 | |
| Payable for fund shares redeemed | 265,445 | |
| Accrued management fee | 2,668,935 | |
| Other affiliated payables | 436,189 | |
| Other payables and accrued expenses | 104,642 | |
| Collateral on securities loaned, at value | 95,917,281 | |
| Total liabilities | | 148,010,411 |
| Net Assets | | $5,888,230,045 |
| Net Assets consist of: | | |
| Paid in capital | | $5,079,507,865 |
| Undistributed net investment income | | 2,872,104 |
| Accumulated undistributed net realized gain (loss) on investments and foreign currency transactions | | (29,000,983) |
| Net unrealized appreciation (depreciation) on investments and assets and liabilities in foreign currencies | | 834,851,059 |
| Net Assets | | $5,888,230,045 |
| Series Blue Chip Growth: | | |
| Net Asset Value, offering price and redemption price per share ($2,350,222,639 ÷ 225,296,171 shares) | | $10.43 |
| Class F: | | |
| Net Asset Value, offering price and redemption price per share ($3,538,007,406 ÷ 339,138,082 shares) | | $10.43 |
See accompanying notes which are an integral part of the financial statements.
Statement of Operations
| | | Six months ended January 31, 2016 (Unaudited) |
| Investment Income | | |
| Dividends | | $25,332,611 |
| Income from Fidelity Central Funds | | 1,942,868 |
| Total income | | 27,275,479 |
| Expenses | | |
| Management fee | | |
| Basic fee | $17,338,594 | |
| Performance adjustment | 2,017,492 | |
| Transfer agent fees | 2,077,975 | |
| Accounting and security lending fees | 581,388 | |
| Custodian fees and expenses | 106,318 | |
| Independent trustees' compensation | 14,451 | |
| Audit | 46,766 | |
| Legal | 12,865 | |
| Interest | 10,940 | |
| Miscellaneous | 19,318 | |
| Total expenses before reductions | 22,226,107 | |
| Expense reductions | (97,120) | 22,128,987 |
| Net investment income (loss) | | 5,146,492 |
| Realized and Unrealized Gain (Loss) | | |
| Net realized gain (loss) on: | | |
| Investment securities: | | |
| Unaffiliated issuers | 107,589,759 | |
| Foreign currency transactions | (100,085) | |
| Total net realized gain (loss) | | 107,489,674 |
Change in net unrealized appreciation (depreciation) on:
Investment securities (net of increase in deferred foreign taxes of $47,769) | (852,971,143) | |
| Assets and liabilities in foreign currencies | 3,048 | |
| Total change in net unrealized appreciation (depreciation) | | (852,968,095) |
| Net gain (loss) | | (745,478,421) |
| Net increase (decrease) in net assets resulting from operations | | $(740,331,929) |
See accompanying notes which are an integral part of the financial statements.
Statement of Changes in Net Assets
| | Six months ended January 31, 2016 (Unaudited) | Year ended July 31, 2015 |
| Increase (Decrease) in Net Assets | | |
| Operations | | |
| Net investment income (loss) | $5,146,492 | $24,084,478 |
| Net realized gain (loss) | 107,489,674 | 648,703,997 |
| Change in net unrealized appreciation (depreciation) | (852,968,095) | 876,323,552 |
| Net increase (decrease) in net assets resulting from operations | (740,331,929) | 1,549,112,027 |
| Distributions to shareholders from net investment income | (14,390,063) | (23,623,473) |
| Distributions to shareholders from net realized gain | (753,239,546) | (69,954,848) |
| Total distributions | (767,629,609) | (93,578,321) |
| Share transactions - net increase (decrease) | 500,238,533 | (2,451,650,515) |
| Total increase (decrease) in net assets | (1,007,723,005) | (996,116,809) |
| Net Assets | | |
| Beginning of period | 6,895,953,050 | 7,892,069,859 |
| End of period (including undistributed net investment income of $2,872,104 and undistributed net investment income of $12,115,675, respectively) | $5,888,230,045 | $6,895,953,050 |
See accompanying notes which are an integral part of the financial statements.
Financial Highlights — Fidelity Series Blue Chip Growth Fund
| | Six months ended (Unaudited) | Years ended July 31, | |
| January 31, | 2016 | 2015 | 2014 A |
| Selected Per–Share Data | | | |
| Net asset value, beginning of period | $13.36 | $11.18 | $10.00 |
| Income from Investment Operations | | | |
| Net investment income (loss)B | –C | .03 | .02 |
| Net realized and unrealized gain (loss) | (1.44) | 2.27 | 1.17 |
| Total from investment operations | (1.44) | 2.30 | 1.19 |
| Distributions from net investment income | (.02) | (.02) | (.01) |
| Distributions from net realized gain | (1.48) | (.10) | – |
| Total distributions | (1.49)D | (.12) | (.01) |
| Net asset value, end of period | $10.43 | $13.36 | $11.18 |
| Total ReturnE,F | (11.46)% | 20.74% | 11.90% |
| Ratios to Average Net AssetsG,H | | | |
| Expenses before reductions | .80%I | .79% | .74%I |
| Expenses net of fee waivers, if any | .80%I | .78% | .74%I |
| Expenses net of all reductions | .80%I | .78% | .74%I |
| Net investment income (loss) | .07%I | .20% | .26%I |
| Supplemental Data | | | |
| Net assets, end of period (000 omitted) | $2,350,223 | $2,831,293 | $3,288,708 |
| Portfolio turnover rateJ | 61%I | 57% | 67%I,K |
A For the period November 7, 2013 (commencement of operations) to July 31, 2014.
B Calculated based on average shares outstanding during the period.
C Amount represents less than $.005 per share.
D Total distributions of $1.49 per share is comprised of distributions from net investment income of $0.015 and distributions from net realized gain of $1.477 per share.
E Total returns for periods of less than one year are not annualized.
F Total returns would have been lower if certain expenses had not been reduced during the applicable periods shown.
G Fees and expenses of any underlying Fidelity Central Funds are not included in the Fund's expense ratio. The Fund indirectly bears its proportionate share of the expenses of any underlying Fidelity Central Funds.
H Expense ratios reflect operating expenses of the class. Expenses before reductions do not reflect amounts reimbursed by the investment adviser or reductions from brokerage service arrangements or reductions from other expense offset arrangements and do not represent the amount paid by the class during periods when reimbursements or reductions occur. Expense ratios before reductions for start-up periods may not be representative of longer-term operating periods. Expenses net of fee waivers reflect expenses after reimbursement by the investment adviser but prior to reductions from brokerage service arrangements or other expense offset arrangements. Expenses net of all reductions represent the net expenses paid by the class.
I Annualized
J Amount does not include the portfolio activity of any underlying Fidelity Central Funds.
K Portfolio turnover rate excludes securities received or delivered in-kind.
See accompanying notes which are an integral part of the financial statements.
Financial Highlights — Fidelity Series Blue Chip Growth Fund Class F
| | Six months ended (Unaudited) | Years ended July 31, | |
| January 31, | 2016 | 2015 | 2014 A |
| Selected Per–Share Data | | | |
| Net asset value, beginning of period | $13.38 | $11.19 | $10.00 |
| Income from Investment Operations | | | |
| Net investment income (loss)B | .01 | .05 | .03 |
| Net realized and unrealized gain (loss) | (1.45) | 2.28 | 1.17 |
| Total from investment operations | (1.44) | 2.33 | 1.20 |
| Distributions from net investment income | (.04) | (.04) | (.01) |
| Distributions from net realized gain | (1.48) | (.10) | – |
| Total distributions | (1.51)C | (.14) | (.01) |
| Net asset value, end of period | $10.43 | $13.38 | $11.19 |
| Total ReturnD,E | (11.43)% | 21.00% | 12.03% |
| Ratios to Average Net AssetsF,G | | | |
| Expenses before reductions | .64%H | .62% | .57%H |
| Expenses net of fee waivers, if any | .64%H | .62% | .57%H |
| Expenses net of all reductions | .63%H | .62% | .57%H |
| Net investment income (loss) | .23%H | .37% | .43%H |
| Supplemental Data | | | |
| Net assets, end of period (000 omitted) | $3,538,007 | $4,064,661 | $4,603,361 |
| Portfolio turnover rateI | 61%H | 57% | 67%H,J |
A For the period November 7, 2013 (commencement of operations) to July 31, 2014.
B Calculated based on average shares outstanding during the period.
C Total distributions of $1.51 per share is comprised of distributions from net investment income of $0.037 and distributions from net realized gain of $1.477 per share.
D Total returns for periods of less than one year are not annualized.
E Total returns would have been lower if certain expenses had not been reduced during the applicable periods shown.
F Fees and expenses of any underlying Fidelity Central Funds are not included in the Fund's expense ratio. The Fund indirectly bears its proportionate share of the expenses of any underlying Fidelity Central Funds.
G Expense ratios reflect operating expenses of the class. Expenses before reductions do not reflect amounts reimbursed by the investment adviser or reductions from brokerage service arrangements or reductions from other expense offset arrangements and do not represent the amount paid by the class during periods when reimbursements or reductions occur. Expense ratios before reductions for start-up periods may not be representative of longer-term operating periods. Expenses net of fee waivers reflect expenses after reimbursement by the investment adviser but prior to reductions from brokerage service arrangements or other expense offset arrangements. Expenses net of all reductions represent the net expenses paid by the class.
H Annualized
I Amount does not include the portfolio activity of any underlying Fidelity Central Funds.
J Portfolio turnover rate excludes securities received or delivered in-kind.
See accompanying notes which are an integral part of the financial statements.
Notes to Financial Statements (Unaudited)
For the period ended January 31, 2016
1. Organization.
Fidelity Series Blue Chip Growth Fund (the Fund) is a fund of Fidelity Securities Fund (the Trust) and is authorized to issue an unlimited number of shares. Shares of the Fund are only available for purchase by mutual funds for which Fidelity Management & Research Company (FMR) or an affiliate serves as an investment manager. The Trust is registered under the Investment Company Act of 1940, as amended (the 1940 Act), as an open-end management investment company organized as a Massachusetts business trust. The Fund offers Series Blue Chip Growth and Class F shares, each of which has equal rights as to assets and voting privileges. Each class has exclusive voting rights with respect to matters that affect that class.
2. Investments in Fidelity Central Funds.
The Fund invests in Fidelity Central Funds, which are open-end investment companies generally available only to other investment companies and accounts managed by the investment adviser and its affiliates. The Fund's Schedule of Investments lists each of the Fidelity Central Funds held as of period end, if any, as an investment of the Fund, but does not include the underlying holdings of each Fidelity Central Fund. As an Investing Fund, the Fund indirectly bears its proportionate share of the expenses of the underlying Fidelity Central Funds.
The Money Market Central Funds seek preservation of capital and current income and are managed by Fidelity Investments Money Management, Inc. (FIMM), an affiliate of the investment adviser. Annualized expenses of the Money Market Central Funds as of their most recent shareholder report date are less than .005%.
A complete unaudited list of holdings for each Fidelity Central Fund is available upon request or at the Securities and Exchange Commission (the SEC) website at www.sec.gov. In addition, the financial statements of the Fidelity Central Funds are available on the SEC website or upon request.
3. Significant Accounting Policies.
The financial statements have been prepared in conformity with accounting principles generally accepted in the United States of America (GAAP), which require management to make certain estimates and assumptions at the date of the financial statements. Actual results could differ from those estimates. Subsequent events, if any, through the date that the financial statements were issued have been evaluated in the preparation of the financial statements. The following summarizes the significant accounting policies of the Fund:
Investment Valuation. Investments are valued as of 4:00 p.m. Eastern time on the last calendar day of the period. The Board of Trustees (the Board) has delegated the day to day responsibility for the valuation of the Fund's investments to the FMR Fair Value Committee (the Committee). In accordance with valuation policies and procedures approved by the Board, the Fund attempts to obtain prices from one or more third party pricing vendors or brokers to value its investments. When current market prices, quotations or currency exchange rates are not readily available or reliable, investments will be fair valued in good faith by the Committee, in accordance with procedures adopted by the Board. Factors used in determining fair value vary by investment type and may include market or investment specific events. The frequency with which these procedures are used cannot be predicted and they may be utilized to a significant extent. The Committee oversees the Fund's valuation policies and procedures and reports to the Board on the Committee's activities and fair value determinations. The Board monitors the appropriateness of the procedures used in valuing the Fund's investments and ratifies the fair value determinations of the Committee.
The Fund categorizes the inputs to valuation techniques used to value its investments into a disclosure hierarchy consisting of three levels as shown below:
- Level 1 – quoted prices in active markets for identical investments
- Level 2 – other significant observable inputs (including quoted prices for similar investments, interest rates, prepayment speeds, etc.)
- Level 3 – unobservable inputs (including the Fund's own assumptions based on the best information available)
Valuation techniques used to value the Fund's investments by major category are as follows:
Equity securities, including restricted securities, for which market quotations are readily available, are valued at the last reported sale price or official closing price as reported by a third party pricing vendor on the primary market or exchange on which they are traded and are categorized as Level 1 in the hierarchy. In the event there were no sales during the day or closing prices are not available, securities are valued at the last quoted bid price or may be valued using the last available price and are generally categorized as Level 2 in the hierarchy. For foreign equity securities, when market or security specific events arise, comparisons to the valuation of American Depositary Receipts (ADRs), futures contracts, Exchange-Traded Funds (ETFs) and certain indexes as well as quoted prices for similar securities may be used and would be categorized as Level 2 in the hierarchy. Utilizing these techniques may result in transfers between Level 1 and Level 2. For equity securities, including restricted securities, where observable inputs are limited, assumptions about market activity and risk are used and these securities may be categorized as Level 3 in the hierarchy. Equity securities, including restricted securities, for which observable inputs are not available are valued using alternate valuation approaches, including the market approach and the income approach and are categorized as Level 3 in the hierarchy. The market approach generally consists of using comparable market transactions while the income approach generally consists of using the net present value of estimated future cash flows, adjusted as appropriate for liquidity, credit, market and/or other risk factors.
Investments in open-end mutual funds, including the Fidelity Central Funds, are valued at their closing net asset value (NAV) each business day and are categorized as Level 1 in the hierarchy.
The following provides information on Level 3 securities held by the Fund that were valued at period end based on unobservable inputs. These amounts exclude valuations provided by a broker.
| Asset Type | Fair Value at 01/31/16 | Valuation Technique(s) | Unobservable Input | Amount or Range/Weighted Average | Impact to
Valuation
from an
Increase
in Input(a) |
| Equities | $ 214,113,992 | Discount Cash Flow | Growth rate | 2.5% | Increase |
| | | | Weighted average cost of capital | 11.5% | Decrease |
| | | Last Transaction price | Transaction price | $3.86 - $140.00 / $43.80 | Increase |
| | | Market Comparable | EV/EBITDA multiple | 8.2 | Increase |
| | | | EV/Sales multiple | 1.2 – 11.1 / 4.8 | Increase |
| | | | Discount rate | 3.0% - 30.0% / 13.3% | Decrease |
| | | | P/E multiple | 12.1 – 12.7 / 12.5 | Increase |
| | | | Discount for lack of marketability | 10.0% - 25.0% / 16.2% | Decrease |
| | | | Premium rate | 1.0% - 86.4% / 40.0% | Increase |
| | | | EV/GP multiple | 4.2 | Increase |
| | | | Probability rate | 90.0% - 100.0% / 95.0% | Increase |
| | | Proposed transaction price | Transaction price | $8.00 | Increase |
| | | | Discount rate | 10.0% | Decrease |
| | | | Index movement | 30.2% | Increase |
| | | Proxy adjustment | Proxy movement | 25.8% - 29.9% / 28.0% | Increase |
(a) Represents the expected directional change in the fair value of the Level 3 investments that would result from an increase in the corresponding input. A decrease to the unobservable input would have the opposite effect. Significant changes in these inputs could result in significantly higher or lower fair value measurements.
Changes in valuation techniques may result in transfers in or out of an assigned level within the disclosure hierarchy. The aggregate value of investments by input level as of January 31, 2016, including information on transfers between Levels 1 and 2, as well as a roll forward of Level 3 investments, is included at the end of the Fund's Schedule of Investments.
Foreign Currency. The Fund may use foreign currency contracts to facilitate transactions in foreign-denominated securities. Gains and losses from these transactions may arise from changes in the value of the foreign currency or if the counterparties do not perform under the contracts' terms.
Foreign-denominated assets, including investment securities, and liabilities are translated into U.S. dollars at the exchange rates at period end. Purchases and sales of investment securities, income and dividends received and expenses denominated in foreign currencies are translated into U.S. dollars at the exchange rate in effect on the transaction date.
The effects of exchange rate fluctuations on investments are included with the net realized and unrealized gain (loss) on investment securities. Other foreign currency transactions resulting in realized and unrealized gain (loss) are disclosed separately.
Investment Transactions and Income. For financial reporting purposes, the Fund's investment holdings and NAV include trades executed through the end of the last business day of the period. The NAV per share for processing shareholder transactions is calculated as of the close of business of the New York Stock Exchange (NYSE, normally 4:00 p.m. Eastern time and includes trades executed through the end of the prior business day. Gains and losses on securities sold are determined on the basis of identified cost. Dividend income is recorded on the ex-dividend date, except for certain dividends from foreign securities where the ex-dividend date may have passed, which are recorded as soon as the Fund is informed of the ex-dividend date. Non-cash dividends included in dividend income, if any, are recorded at the fair market value of the securities received. Income and capital gain distributions from Fidelity Central Funds, if any, are recorded on the ex-dividend date. Distributions received on securities that represent a return of capital or capital gain are recorded as a reduction of cost of investments and/or as a realized gain. Subsequent to ex-dividend date the Fund determines the components of these distributions, based upon receipt of tax filings or other correspondence relating to the underlying investment. Investment income is recorded net of foreign taxes withheld where recovery of such taxes is uncertain.
Class Allocations and Expenses. Investment income, realized and unrealized capital gains and losses, common expenses of the Fund, and certain fund-level expense reductions, if any, are allocated daily on a pro-rata basis to each class based on the relative net assets of each class to the total net assets of the Fund. Each class differs with respect to transfer agent fees incurred. Certain expense reductions may also differ by class. For the reporting period, the allocated portion of income and expenses to each class as a percent of its average net assets may vary due to the timing of recording these transactions in relation to fluctuating net assets of the classes. Expenses directly attributable to a fund are charged to that fund. Expenses attributable to more than one fund are allocated among the respective funds on the basis of relative net assets or other appropriate methods. Expense estimates are accrued in the period to which they relate and adjustments are made when actual amounts are known.
Income Tax Information and Distributions to Shareholders. Each year, the Fund intends to qualify as a regulated investment company under Subchapter M of the Internal Revenue Code, including distributing substantially all of its taxable income and realized gains. As a result, no provision for U.S. Federal income taxes is required. The Fund files a U.S. federal tax return, in addition to state and local tax returns as required. The Fund's federal income tax returns are subject to examination by the Internal Revenue Service (IRS) for a period of three fiscal years after they are filed. State and local tax returns may be subject to examination for an additional fiscal year depending on the jurisdiction. Foreign taxes are provided for based on the Fund's understanding of the tax rules and rates that exist in the foreign markets in which it invests. The Fund is subject to a tax imposed on capital gains by certain countries in which it invests. An estimated deferred tax liability for net unrealized appreciation on the applicable securities is included in Other payables and accrued expenses on the Statement of Assets & Liabilities.
Distributions are declared and recorded on the ex-dividend date. Income dividends and capital gain distributions are declared separately for each class. Income and capital gain distributions are determined in accordance with income tax regulations, which may differ from GAAP.
Capital accounts within the financial statements are adjusted for permanent book-tax differences. These adjustments have no impact on net assets or the results of operations. Capital accounts are not adjusted for temporary book-tax differences which will reverse in a subsequent period.
Book-tax differences are primarily due to foreign currency transactions, passive foreign investment companies (PFIC), partnerships and losses deferred due to wash sales.
The federal tax cost of investment securities and unrealized appreciation (depreciation) as of period end were as follows:
| Gross unrealized appreciation | $1,196,146,814 |
| Gross unrealized depreciation | (404,573,867) |
| Net unrealized appreciation (depreciation) on securities | $791,572,947 |
| Tax cost | $5,070,007,140 |
Restricted Securities. The Fund may invest in securities that are subject to legal or contractual restrictions on resale. These securities generally may be resold in transactions exempt from registration or to the public if the securities are registered. Disposal of these securities may involve time-consuming negotiations and expense, and prompt sale at an acceptable price may be difficult. Information regarding restricted securities is included at the end of the Fund's Schedule of Investments.
4. Purchases and Sales of Investments.
Purchases and sales of securities, other than short-term securities, aggregated $1,921,504,719 and $2,326,334,185, respectively.
5. Fees and Other Transactions with Affiliates.
Management Fee. Fidelity Management & Research Company (the investment adviser) and its affiliates provide the Fund with investment management related services for which the Fund pays a monthly management fee. The management fee is the sum of an individual fund fee rate that is based on an annual rate of .30% of the Fund's average net assets and an annualized group fee rate that averaged .25% during the period. The group fee rate is based upon the average net assets of all the mutual funds advised by the investment adviser, including any mutual funds previously advised by the investment adviser that are currently advised by Fidelity SelectCo, LLC, an affiliate of the investment adviser. The group fee rate decreases as assets under management increase and increases as assets under management decrease. In addition, the management fee is subject to a performance adjustment (up to a maximum of +/- .20% of the Fund's average net assets over a 36 month performance period). The upward or downward adjustment to the management fee is based on the relative investment performance of Series Blue Chip Growth as compared to its benchmark index, the Russell 1000 Growth Index, over the same 36 month performance period. The Fund's performance adjustment took effect in November 2014. Subsequent months will be added until the performance period includes 36 months. For the reporting period, the total annualized management fee rate, including the performance adjustment, was .61% of the Fund's average net assets. The performance adjustment included in the management fee rate may be higher or lower than the maximum performance adjustment rate due to the difference between the average net assets for the reporting and performance periods.
Transfer Agent Fees. Fidelity Investments Institutional Operations Company, Inc., (FIIOC), an affiliate of the investment adviser, is the transfer, dividend disbursing and shareholder servicing agent for each class of the Fund. FIIOC receives account fees and asset-based fees that vary according to the account size and type of account of the shareholders of Series Blue Chip Growth. FIIOC receives no fees for providing transfer agency services to Class F. FIIOC pays for typesetting, printing and mailing of shareholder reports, except proxy statements.
For the period, transfer agent fees for each applicable class were as follows:
| | Amount | % of
Class-Level Average
Net Assets(a) |
| Series Blue Chip Growth | $2,077,975 | .16 |
(a) Annualized
Accounting and Security Lending Fees. Fidelity Service Company, Inc. (FSC), an affiliate of the investment adviser, maintains the Fund's accounting records. The accounting fee is based on the level of average net assets for each month. Under a separate contract, FSC administers the security lending program. The security lending fee is based on the number and duration of lending transactions.
Brokerage Commissions. The Fund placed a portion of its portfolio transactions with brokerage firms which are affiliates of the investment adviser Brokerage commissions are included in net realized gain (loss) and change in net unrealized appreciation (depreciation) in the Statement of Operations. The commissions paid to these affiliated firms were $35,048 for the period.
Interfund Lending Program. Pursuant to an Exemptive Order issued by the SEC, the Fund, along with other registered investment companies having management contracts with FMR or other affiliated entities of FMR, may participate in an interfund lending program. This program provides an alternative credit facility allowing the funds to borrow from, or lend money to, other participating affiliated funds. At period end, there were no interfund loans outstanding. The Fund's activity in this program during the period for which loans were outstanding was as follows:
| Borrower or Lender | Average Loan Balance | Weighted Average Interest Rate | Interest Expense |
| Borrower | $49,412,389 | .44% | $10,940 |
Interfund Trades. The Fund may purchase from or sell securities to other Fidelity Funds under procedures adopted by the Board. The procedures have been designed to ensure these interfund trades are executed in accordance with Rule 17a-7 of the 1940 Act. Interfund trades are included within the respective purchases and sales amounts shown in the Purchases and Sales of Investments note.
6. Committed Line of Credit.
The Fund participates with other funds managed by the investment adviser or an affiliate in a $4.25 billion credit facility (the "line of credit") to be utilized for temporary or emergency purposes to fund shareholder redemptions or for other short-term liquidity purposes. The Fund has agreed to pay commitment fees on its pro-rata portion of the line of credit, which amounted to $4,392 and is reflected in Miscellaneous expenses on the Statement of Operations. During the period, the Fund did not borrow on this line of credit.
7. Security Lending.
The Fund lends portfolio securities from time to time in order to earn additional income. For equity securities, a lending agent is used and may loan securities to certain qualified borrowers, including Fidelity Capital Markets (FCM), a broker-dealer affiliated with the Fund. On the settlement date of the loan, the Fund receives collateral (in the form of U.S. Treasury obligations, letters of credit and/or cash) against the loaned securities and maintains collateral in an amount not less than 100% of the market value of the loaned securities during the period of the loan. The market value of the loaned securities is determined at the close of business of the Fund and any additional required collateral is delivered to the Fund on the next business day. The Fund or borrower may terminate the loan at any time, and if the borrower defaults on its obligation to return the securities loaned because of insolvency or other reasons, the Fund may apply collateral received from the borrower against the obligation. The Fund may experience delays and costs in recovering the securities loaned. Any cash collateral received is invested in the Fidelity Securities Lending Cash Central Fund. The value of loaned securities at period end is disclosed on the Fund's Statement of Assets and Liabilities. Security lending income represents the income earned on investing cash collateral, less rebates paid to borrowers, plus any premium payments received for lending certain types of securities. Security lending income is presented in the Statement of Operations as a component of income from Fidelity Central Funds. Total security lending income during the period amounted to 1,922,899. During the period, there were no securities loaned to FCM.
8. Expense Reductions.
Commissions paid to certain brokers with whom the investment adviser, or its affiliates, places trades on behalf of the Fund include an amount in addition to trade execution, which may be rebated back to the Fund to offset certain expenses. This amount totaled $74,037 for the period.
In addition, during the period the investment adviser reimbursed and/or waived a portion of fund-level operating expenses in the amount of $23,083.
9. Distributions to Shareholders.
Distributions to shareholders of each class were as follows:
| | Six months ended January 31, 2016 | Year ended July 31, 2015 |
| From net investment income | | |
| Series Blue Chip Growth | $3,058,399 | $6,705,207 |
| Class F | 11,331,664 | 16,918,266 |
| Total | $14,390,063 | $23,623,473 |
| From net realized gain | | |
| Series Blue Chip Growth | $304,663,602 | $29,046,969 |
| Class F | 448,575,944 | 40,907,879 |
| Total | $753,239,546 | $69,954,848 |
10. Share Transactions.
Transactions for each class of shares were as follows:
| | Shares | Shares | Dollars | Dollars |
| | Six months ended January 31, 2016 | Year ended July 31, 2015 | Six months ended January 31, 2016 | Year ended July 31, 2015 |
| Series Blue Chip Growth | | | | |
| Shares sold | 16,087,250 | 26,920,810 | $178,155,562 | $331,819,807 |
| Reinvestment of distributions | 27,279,668 | 3,044,141 | 307,722,001 | 35,752,176 |
| Shares redeemed | (29,963,805) | (112,224,694) | (358,977,167) | (1,422,685,058) |
| Net increase (decrease) | 13,403,113 | (82,259,743) | $126,900,396 | $(1,055,113,075) |
| Class F | | | | |
| Shares sold | 37,325,081 | 62,307,299 | $417,424,770 | $764,020,110 |
| Reinvestment of distributions | 40,774,349 | 4,922,720 | 459,907,608 | 57,826,145 |
| Shares redeemed | (42,839,557) | (174,704,050) | (503,994,241) | (2,218,383,695) |
| Net increase (decrease) | 35,259,873 | (107,474,031) | $373,338,137 | $(1,396,537,440) |
11. Other.
The Fund's organizational documents provide former and current trustees and officers with a limited indemnification against liabilities arising in connection with the performance of their duties to the Fund. In the normal course of business, the Fund may also enter into contracts that provide general indemnifications. The Fund's maximum exposure under these arrangements is unknown as this would be dependent on future claims that may be made against the Fund. The risk of material loss from such claims is considered remote.
At the end of the period, mutual funds managed by the investment advisor or its affiliates were the owners of record of all of the outstanding shares of the Fund.
Shareholder Expense Example
As a shareholder of the Fund, you incur two types of costs: (1) transaction costs, and (2) ongoing costs, including management fees and other Fund expenses. This Example is intended to help you understand your ongoing costs (in dollars) of investing in the Fund and to compare these costs with the ongoing costs of investing in other mutual funds.
The Example is based on an investment of $1,000 invested at the beginning of the period and held for the entire period (August 1, 2015 to January 31, 2016).
Actual Expenses
The first line of the accompanying table for each class of the Fund provides information about actual account values and actual expenses. You may use the information in this line, together with the amount you invested, to estimate the expenses that you paid over the period. Simply divide your account value by $1,000.00 (for example, an $8,600 account value divided by $1,000.00 = 8.6), then multiply the result by the number in the first line for a class of the Fund under the heading entitled "Expenses Paid During Period" to estimate the expenses you paid on your account during this period. In addition, the Fund, as a shareholder in the underlying Fidelity Central Funds, will indirectly bear its pro-rata share of the fees and expenses incurred by the underlying Fidelity Central Funds. These fees and expenses are not included in the Fund's annualized expense ratio used to calculate the expense estimate in the table below.
Hypothetical Example for Comparison Purposes
The second line of the accompanying table for each class of the Fund provides information about hypothetical account values and hypothetical expenses based on a Class' actual expense ratio and an assumed rate of return of 5% per year before expenses, which is not the Class' actual return. The hypothetical account values and expenses may not be used to estimate the actual ending account balance or expenses you paid for the period. You may use this information to compare the ongoing costs of investing in the Fund and other funds. To do so, compare this 5% hypothetical example with the 5% hypothetical examples that appear in the shareholder reports of the other funds. In addition, the Fund, as a shareholder in the underlying Fidelity Central Funds, will indirectly bear its pro-rata share of the fees and expenses incurred by the underlying Fidelity Central Funds. These fees and expenses are not included in the Fund's annualized expense ratio used to calculate the expense estimate in the table below.
Please note that the expenses shown in the table are meant to highlight your ongoing costs only and do not reflect any transaction costs. Therefore, the second line of the table is useful in comparing ongoing costs only, and will not help you determine the relative total costs of owning different funds.
| | Annualized Expense Ratio-A | Beginning
Account Value
August 1, 2015 | Ending
Account Value
January 31, 2016 | Expenses Paid
During Period-B
August 1, 2015
to January 31, 2016 |
| Series Blue Chip Growth | .80% | | | |
| Actual | | $1,000.00 | $885.40 | $3.79 |
| Hypothetical-C | | $1,000.00 | $1,021.11 | $4.06 |
| Class F | .64% | | | |
| Actual | | $1,000.00 | $885.70 | $3.03 |
| Hypothetical-C | | $1,000.00 | $1,021.92 | $3.25 |
A Annualized expense ratio reflects expenses net of applicable fee waivers.
B Expenses are equal to each Class' annualized expense ratio, multiplied by the average account value over the period, multiplied by 184/366 (to reflect the one-half year period).
C 5% return per year before expenses
Corporate Headquarters
245 Summer St.
Boston, MA 02210
www.fidelity.com
XS1-SANN-0316
1.967988.102
Fidelity® Real Estate Income Fund
Semi-Annual Report January 31, 2016 |
|
Contents
To view a fund's proxy voting guidelines and proxy voting record for the 12-month period ended June 30, visit http://www.fidelity.com/proxyvotingresults or visit the Securities and Exchange Commission's (SEC) web site at http://www.sec.gov.
You may also call 1-800-544-8544 to request a free copy of the proxy voting guidelines.
Standard & Poor's, S&P and S&P 500 are registered service marks of The McGraw-Hill Companies, Inc. and have been licensed for use by Fidelity Distributors Corporation.
Other third-party marks appearing herein are the property of their respective owners.
All other marks appearing herein are registered or unregistered trademarks or service marks of FMR LLC or an affiliated company. © 2016 FMR LLC. All rights reserved.
This report and the financial statements contained herein are submitted for the general information of the shareholders of the Fund. This report is not authorized for distribution to prospective investors in the Fund unless preceded or accompanied by an effective prospectus.
A fund files its complete schedule of portfolio holdings with the SEC for the first and third quarters of each fiscal year on Form N-Q. Forms N-Q are available on the SEC’s web site at http://www.sec.gov. A fund's Forms N-Q may be reviewed and copied at the SEC’s Public Reference Room in Washington, DC. Information regarding the operation of the SEC's Public Reference Room may be obtained by calling 1-800-SEC-0330.
For a complete list of a fund's portfolio holdings, view the most recent holdings listing, semiannual report, or annual report on Fidelity's web site at http://www.fidelity.com, http://www.advisor.fidelity.com, or http://www.401k.com, as applicable.
NOT FDIC INSURED •MAY LOSE VALUE •NO BANK GUARANTEE
Neither the Fund nor Fidelity Distributors Corporation is a bank.
Investment Summary
Top Five Stocks as of January 31, 2016
| | % of fund's net assets | % of fund's net assets 6 months ago |
| Equity Lifestyle Properties, Inc. | 4.2 | 3.5 |
| Acadia Realty Trust (SBI) | 3.1 | 2.8 |
| MFA Financial, Inc. | 2.8 | 3.0 |
| Ventas, Inc. | 2.0 | 1.5 |
| WP Carey, Inc. | 1.2 | 1.1 |
| | 13.3 | |
Top 5 Bonds as of January 31, 2016
| | % of fund's net assets | % of fund's net assets 6 months ago |
| Realogy Group LLC Tranche B, term loan 3.75% 3/5/20 | 0.9 | 1.0 |
| IAS Operating Partnership LP 5% 3/15/18 | 0.8 | 0.7 |
| RAIT Financial Trust 4% 10/1/33 | 0.7 | 0.8 |
| iStar Financial, Inc. 5.875% 3/15/16 | 0.7 | 0.6 |
| RWT Holdings, Inc. 5.625% 11/15/19 | 0.6 | 0.4 |
| | 3.7 | |
Top Five REIT Sectors as of January 31, 2016
| | % of fund's net assets | % of fund's net assets 6 months ago |
| REITs - Mortgage | 17.7 | 17.9 |
| REITs - Health Care | 6.4 | 7.4 |
| REITs - Shopping Centers | 5.7 | 5.6 |
| REITs - Apartments | 5.3 | 5.0 |
| REITs - Manufactured Homes | 5.2 | 4.5 |
Asset Allocation (% of fund's net assets)
| As of January 31, 2016 * |
| | Common Stocks | 31.0% |
| | Preferred Stocks | 19.2% |
| | Bonds | 29.5% |
| | Convertible Securities | 5.7% |
| | Other Investments | 6.8% |
| | Short-Term Investments and Net Other Assets (Liabilities) | 7.8% |

* Foreign investments - 0.7%
| As of July 31, 2015 * |
| | Common Stocks | 30.0% |
| | Preferred Stocks | 19.5% |
| | Bonds | 31.8% |
| | Convertible Securities | 5.2% |
| | Other Investments | 7.3% |
| | Short-Term Investments and Net Other Assets (Liabilities) | 6.2% |

* Foreign investments - 0.9%
Investments January 31, 2016
Showing Percentage of Net Assets
| Common Stocks - 31.0% | | | |
| | | Shares | Value |
| CONSUMER DISCRETIONARY - 0.1% | | | |
| Household Durables - 0.1% | | | |
| Stanley Martin Communities LLC Class B (a)(b) | | 4,620 | $5,586,643 |
| FINANCIALS - 30.9% | | | |
| Capital Markets - 0.5% | | | |
| Ellington Financial LLC | | 1,140,284 | 18,484,004 |
| Real Estate Investment Trusts - 29.8% | | | |
| Acadia Realty Trust (SBI) (c) | | 3,755,649 | 128,067,631 |
| AG Mortgage Investment Trust, Inc. | | 781,700 | 9,169,341 |
| American Campus Communities, Inc. | | 386,900 | 16,327,180 |
| American Tower Corp. | | 194,100 | 18,311,394 |
| Annaly Capital Management, Inc. | | 1,666,900 | 15,835,550 |
| Anworth Mortgage Asset Corp. | | 1,148,310 | 4,891,801 |
| Apartment Investment & Management Co. Class A | | 985,000 | 38,562,750 |
| Arbor Realty Trust, Inc. (c) | | 3,058,527 | 20,002,767 |
| AvalonBay Communities, Inc. | | 115,200 | 19,755,648 |
| Boardwalk (REIT) | | 136,200 | 4,281,710 |
| Care Capital Properties, Inc. | | 97,603 | 2,922,234 |
| CBL & Associates Properties, Inc. | | 2,629,473 | 28,266,835 |
| Cedar Shopping Centers, Inc. | | 830,510 | 5,863,401 |
| Chimera Investment Corp. | | 213,900 | 2,650,221 |
| Community Healthcare Trust, Inc. | | 254,862 | 4,720,044 |
| CYS Investments, Inc. | | 1,758,539 | 12,116,334 |
| Douglas Emmett, Inc. | | 295,800 | 8,749,764 |
| Dynex Capital, Inc. (d) | | 2,052,086 | 12,312,516 |
| Ellington Residential Mortgage REIT | | 260,000 | 2,979,600 |
| Equity Lifestyle Properties, Inc. | | 2,627,460 | 173,202,143 |
| Extra Space Storage, Inc. | | 323,200 | 29,311,008 |
| First Potomac Realty Trust | | 1,324,144 | 12,963,370 |
| Five Oaks Investment Corp. (d) | | 479,100 | 2,232,606 |
| Great Ajax Corp. | | 500,000 | 5,510,000 |
| Hatteras Financial Corp. | | 746,600 | 9,153,316 |
| Invesco Mortgage Capital, Inc. | | 874,600 | 9,900,472 |
| Lexington Corporate Properties Trust | | 5,135,782 | 37,645,282 |
| MFA Financial, Inc. | | 17,978,622 | 114,164,250 |
| Mid-America Apartment Communities, Inc. | | 507,100 | 47,576,122 |
| Monmouth Real Estate Investment Corp. Class A (d) | | 612,473 | 6,296,222 |
| National Retail Properties, Inc. | | 244,200 | 10,485,948 |
| New Senior Investment Group, Inc. | | 1,942,525 | 17,851,805 |
| Newcastle Investment Corp. | | 1,840,830 | 6,553,355 |
| NorthStar Realty Europe Corp. | | 1,389 | 13,112 |
| NorthStar Realty Finance Corp. | | 1,370,000 | 16,261,900 |
| Potlatch Corp. | | 769,440 | 22,190,650 |
| Sabra Health Care REIT, Inc. | | 915,903 | 16,815,979 |
| Select Income REIT | | 456,800 | 8,633,520 |
| Senior Housing Properties Trust (SBI) | | 2,994,400 | 43,358,912 |
| Simon Property Group, Inc. | | 126,100 | 23,489,908 |
| Store Capital Corp. | | 833,600 | 20,664,944 |
| Terreno Realty Corp. | | 1,728,064 | 38,846,879 |
| The Macerich Co. | | 155,500 | 12,124,335 |
| Two Harbors Investment Corp. | | 2,370,280 | 18,014,128 |
| Ventas, Inc. | | 1,510,786 | 83,576,682 |
| VEREIT, Inc. | | 1,315,034 | 10,138,912 |
| Weyerhaeuser Co. | | 587,700 | 15,050,997 |
| WP Carey, Inc. | | 866,300 | 50,461,975 |
| WP Glimcher, Inc. | | 565,163 | 5,131,680 |
| | | | 1,223,407,133 |
| Real Estate Management & Development - 0.6% | | | |
| Brookfield Asset Management, Inc. Class A | | 414,000 | 12,497,723 |
| Kennedy-Wilson Holdings, Inc. | | 514,721 | 10,438,542 |
| The RMR Group, Inc. (a) | | 1 | 21 |
| | | | 22,936,286 |
|
| TOTAL FINANCIALS | | | 1,264,827,423 |
|
| TOTAL COMMON STOCKS | | | |
| (Cost $1,214,887,378) | | | 1,270,414,066 |
|
| Preferred Stocks - 19.9% | | | |
| Convertible Preferred Stocks - 0.7% | | | |
| FINANCIALS - 0.7% | | | |
| Real Estate Investment Trusts - 0.7% | | | |
| Alexandria Real Estate Equities, Inc. Series D 7.00% | | 236,759 | 6,396,186 |
| Equity Commonwealth 6.50% (a) | | 31,237 | 778,738 |
| Lexington Corporate Properties Trust Series C, 6.50% | | 468,742 | 22,206,652 |
| | | | 29,381,576 |
| Nonconvertible Preferred Stocks - 19.2% | | | |
| FINANCIALS - 19.2% | | | |
| Capital Markets - 0.1% | | | |
| Arlington Asset Investment Corp. 6.625% | | 182,517 | 3,259,754 |
| Real Estate Investment Trusts - 18.9% | | | |
| AG Mortgage Investment Trust, Inc.: | | | |
| 8.00% | | 587,287 | 12,744,128 |
| 8.25% | | 34,859 | 786,419 |
| Alexandria Real Estate Equities, Inc. Series E, 6.45% | | 145,913 | 3,782,065 |
| American Capital Agency Corp.: | | | |
| 8.00% | | 200,000 | 5,040,000 |
| Series B, 7.75% | | 360,200 | 8,500,720 |
| American Capital Mortgage Investment Corp. Series A, 8.125% | | 248,636 | 5,867,810 |
| American Home Mortgage Investment Corp.: | | | |
| Series A, 9.75% (a) | | 120,300 | 1 |
| Series B, 9.25% (a) | | 124,100 | 1 |
| American Homes 4 Rent: | | | |
| Series A, 5.00% | | 579,260 | 14,678,448 |
| Series B, 5.00% | | 373,880 | 9,601,238 |
| Series C, 5.50% | | 900,053 | 22,933,350 |
| Annaly Capital Management, Inc.: | | | |
| Series A, 7.875% | | 134,900 | 3,363,057 |
| Series C, 7.625% | | 325,332 | 7,720,128 |
| Series D, 7.50% | | 621,976 | 14,516,920 |
| Anworth Mortgage Asset Corp. Series A, 8.625% | | 309,630 | 7,616,898 |
| Apollo Commercial Real Estate Finance, Inc. Series A, 8.625% | | 375,101 | 9,272,497 |
| Apollo Residential Mortgage, Inc. Series A, 8.00% | | 284,843 | 6,181,093 |
| Arbor Realty Trust, Inc.: | | | |
| 7.375% (c) | | 430,605 | 9,714,449 |
| Series A, 8.25% (c) | | 189,089 | 4,350,938 |
| Series B, 7.75% (c) | | 240,000 | 5,143,200 |
| Series C, 8.50% (c) | | 100,000 | 2,380,000 |
| Armour Residential REIT, Inc. Series B, 7.875% | | 153,654 | 3,046,959 |
| Ashford Hospitality Trust, Inc.: | | | |
| Series D, 8.45% | | 47,000 | 1,040,110 |
| Series E, 9.00% | | 140,751 | 3,359,726 |
| Bluerock Residental Growth (REIT), Inc. Series A 8.25% (a) | | 120,000 | 3,042,000 |
| Brandywine Realty Trust Series E, 6.90% | | 95,000 | 2,437,700 |
| Campus Crest Communities, Inc. Series A, 8.00% | | 582,117 | 15,647,305 |
| Capstead Mortgage Corp. Series E, 7.50% | | 202,984 | 4,755,915 |
| CBL & Associates Properties, Inc.: | | | |
| Series D, 7.375% | | 289,876 | 7,043,987 |
| Series E, 6.625% | | 222,063 | 4,956,446 |
| Cedar Shopping Centers, Inc. Series B, 7.25% | | 415,750 | 10,393,750 |
| Chesapeake Lodging Trust Series A, 7.75% | | 266,916 | 6,801,020 |
| Colony Financial, Inc.: | | | |
| 7.125% | | 461,815 | 9,097,756 |
| Series A, 8.50% | | 283,920 | 6,856,668 |
| Series B, 7.50% | | 108,867 | 2,309,069 |
| Coresite Realty Corp. Series A, 7.25% | | 369,799 | 9,633,264 |
| Corporate Office Properties Trust Series L, 7.375% | | 167,140 | 4,248,699 |
| CubeSmart Series A, 7.75% | | 40,000 | 1,036,000 |
| CYS Investments, Inc.: | | | |
| Series A, 7.75% | | 117,824 | 2,709,952 |
| Series B, 7.50% | | 496,667 | 11,224,674 |
| DDR Corp.: | | | |
| Series J, 6.50% | | 340,721 | 8,674,757 |
| Series K, 6.25% | | 228,888 | 5,784,000 |
| Digital Realty Trust, Inc.: | | | |
| Series E, 7.00% | | 219,819 | 5,638,357 |
| Series G, 5.875% | | 145,444 | 3,615,738 |
| Series H, 7.375% | | 50,000 | 1,338,500 |
| DuPont Fabros Technology, Inc. Series B, 7.625% | | 381,202 | 9,652,035 |
| Dynex Capital, Inc.: | | | |
| Series A, 8.50% | | 362,932 | 8,220,410 |
| Series B, 7.625% | | 252,120 | 5,420,580 |
| Equity Commonwealth Series E, 7.25% | | 648,952 | 16,554,766 |
| Equity Lifestyle Properties, Inc. Series C, 6.75% | | 950,148 | 24,114,756 |
| Essex Property Trust, Inc. Series H, 7.125% | | 40,000 | 1,012,800 |
| First Potomac Realty Trust 7.75% | | 272,709 | 6,932,263 |
| Five Oaks Investment Corp. Series A, 8.75% | | 142,000 | 2,203,840 |
| General Growth Properties, Inc. Series A, 6.375% | | 166,463 | 4,269,776 |
| Gladstone Commercial Corp. Series C, 7.125% | | 232,238 | 5,887,233 |
| Hatteras Financial Corp. Series A, 7.625% | | 522,361 | 12,191,906 |
| Hersha Hospitality Trust: | | | |
| Series B, 8.00% | | 162,538 | 4,092,707 |
| Series C, 6.875% | | 50,000 | 1,248,500 |
| Hospitality Properties Trust Series D, 7.125% | | 40,800 | 1,059,168 |
| Inland Real Estate Corp.: | | | |
| Series A, 8.125% | | 466,000 | 11,701,260 |
| Series B, 6.95% | | 245,100 | 6,164,265 |
| Invesco Mortgage Capital, Inc.: | | | |
| Series A, 7.75% | | 123,342 | 2,651,853 |
| Series B, 7.75% | | 804,729 | 17,221,201 |
| Investors Real Estate Trust Series B, 7.95% | | 126,572 | 3,264,292 |
| iStar Financial, Inc.: | | | |
| Series D, 8.00% | | 70,367 | 1,455,893 |
| Series E, 7.875% | | 281,296 | 5,766,568 |
| Series F, 7.80% | | 451,476 | 9,210,110 |
| Series G, 7.65% | | 10,497 | 215,189 |
| Kilroy Realty Corp.: | | | |
| Series G, 6.875% | | 46,760 | 1,208,278 |
| Series H, 6.375% | | 143,296 | 3,629,688 |
| LaSalle Hotel Properties: | | | |
| Series H, 7.50% | | 141,308 | 3,560,962 |
| Series I, 6.375% | | 354,698 | 8,406,343 |
| LBA Realty Fund II Series B, 7.625% | | 31,240 | 697,043 |
| MFA Financial, Inc.: | | | |
| 8.00% | | 538,930 | 13,548,700 |
| Series B, 7.50% | | 616,232 | 14,783,406 |
| Monmouth Real Estate Investment Corp.: | | | |
| Series A, 7.625% | | 80,000 | 2,113,600 |
| Series B, 7.875% | | 95,000 | 2,527,000 |
| National Retail Properties, Inc.: | | | |
| 5.70% | | 315,498 | 7,925,310 |
| Series D, 6.625% | | 222,138 | 5,793,359 |
| New York Mortgage Trust, Inc.: | | | |
| 7.875% | | 196,925 | 3,970,008 |
| Series B, 7.75% | | 239,697 | 4,846,673 |
| NorthStar Realty Finance Corp.: | | | |
| Series A 8.75% | | 7,890 | 165,059 |
| Series B, 8.25% | | 373,313 | 7,216,140 |
| Series C, 8.875% | | 329,101 | 6,835,428 |
| Series D, 8.50% | | 238,715 | 4,678,814 |
| Series E, 8.75% | | 402,327 | 8,042,517 |
| Pebblebrook Hotel Trust: | | | |
| Series A, 7.875% | | 412,000 | 10,378,280 |
| Series B, 8.00% | | 185,085 | 4,728,922 |
| Series C, 6.50% | | 204,321 | 5,044,685 |
| Pennsylvania (REIT) 7.375% | | 100,510 | 2,537,878 |
| Prologis, Inc. Series Q, 8.54% | | 94,446 | 5,885,166 |
| PS Business Parks, Inc.: | | | |
| Series S, 6.45% | | 93,809 | 2,424,963 |
| Series T, 6.00% | | 198,899 | 5,061,980 |
| Series U, 5.75% | | 600 | 15,090 |
| Public Storage 6.375% | | 122,000 | 3,307,420 |
| RAIT Financial Trust: | | | |
| 7.125% | | 336,786 | 7,261,106 |
| 7.625% | | 224,590 | 4,166,145 |
| Regency Centers Corp.: | | | |
| Series 6, 6.625% | | 152,661 | 3,982,925 |
| Series 7, 6.00% | | 176,250 | 4,480,275 |
| Resource Capital Corp. 8.625% | | 156,870 | 2,643,260 |
| Retail Properties America, Inc. 7.00% | | 394,411 | 9,919,437 |
| Sabra Health Care REIT, Inc. Series A, 7.125% | | 318,623 | 8,048,417 |
| Saul Centers, Inc. Series C, 6.875% | | 315,478 | 8,139,332 |
| Stag Industrial, Inc.: | | | |
| Series A, 9.00% | | 280,000 | 7,198,800 |
| Series B, 6.625% | | 80,300 | 1,997,864 |
| Summit Hotel Properties, Inc.: | | | |
| Series A, 9.25% | | 138,340 | 3,591,306 |
| Series B, 7.875% | | 190,173 | 4,925,481 |
| Series C, 7.125% | | 153,212 | 3,700,070 |
| Sun Communities, Inc. Series A, 7.125% | | 375,000 | 9,697,500 |
| Sunstone Hotel Investors, Inc. Series D, 8.00% | | 129,723 | 3,275,506 |
| Taubman Centers, Inc. Series K, 6.25% | | 157,322 | 3,995,979 |
| Terreno Realty Corp. Series A, 7.75% | | 213,890 | 5,561,140 |
| UMH Properties, Inc.: | | | |
| 8.00% | | 156,000 | 4,271,280 |
| Series A, 8.25% | | 600,200 | 15,425,140 |
| Urstadt Biddle Properties, Inc.: | | | |
| 6.75% | | 160,000 | 4,100,800 |
| Series F, 7.125% | | 210,000 | 5,386,500 |
| VEREIT, Inc. Series F, 6.70% | | 1,980,249 | 47,922,026 |
| Wells Fargo Real Estate Investment Corp. 6.375% | | 137,600 | 3,657,408 |
| Welltower, Inc. 6.50% | | 81,600 | 2,144,448 |
| WP Glimcher, Inc.: | | | |
| 6.875% | | 256,115 | 6,300,429 |
| 7.50% | | 198,527 | 4,990,969 |
| | | | 775,513,338 |
| Real Estate Management & Development - 0.2% | | | |
| Kennedy-Wilson, Inc. 7.75% | | 321,574 | 8,167,980 |
| TOTAL FINANCIALS | | | 786,941,072 |
| TOTAL PREFERRED STOCKS | | | |
| (Cost $833,504,891) | | | 816,322,648 |
| | | Principal Amount | Value |
|
| Corporate Bonds - 18.1% | | | |
| Convertible Bonds - 5.0% | | | |
| FINANCIALS - 5.0% | | | |
| Consumer Finance - 0.0% | | | |
| Zais Financial Partners LP 8% 11/15/16 (e) | | 2,000,000 | 1,916,250 |
| Diversified Financial Services - 0.6% | | | |
| RWT Holdings, Inc. 5.625% 11/15/19 | | 27,540,000 | 24,613,875 |
| Real Estate Investment Trusts - 3.6% | | | |
| American Realty Capital Properties, Inc. 3.75% 12/15/20 | | 8,160,000 | 7,328,700 |
| Apollo Commercial Real Estate Finance, Inc. 5.5% 3/15/19 | | 5,600,000 | 5,544,000 |
| Blackstone Mortgage Trust, Inc. 5.25% 12/1/18 | | 7,750,000 | 7,648,281 |
| Campus Crest Communities Operating Partnership LP 4.75% 10/15/18 (e) | | 12,900,000 | 12,738,750 |
| Colony Financial, Inc.: | | | |
| 3.875% 1/15/21 | | 11,410,000 | 9,976,619 |
| 5% 4/15/23 | | 19,383,000 | 17,481,043 |
| Colony Starwood Homes 4.5% 10/15/17 | | 1,965,000 | 1,947,806 |
| PennyMac Corp. 5.375% 5/1/20 | | 18,000,000 | 16,560,000 |
| RAIT Financial Trust 4% 10/1/33 | | 39,190,000 | 29,221,044 |
| Redwood Trust, Inc. 4.625% 4/15/18 | | 14,700,000 | 13,560,750 |
| Resource Capital Corp.: | | | |
| 6% 12/1/18 | | 3,490,000 | 3,202,075 |
| 8% 1/15/20 | | 16,490,000 | 15,888,775 |
| Spirit Realty Capital, Inc. 3.75% 5/15/21 | | 2,400,000 | 2,322,000 |
| Starwood Property Trust, Inc. 3.75% 10/15/17 | | 3,230,000 | 3,161,363 |
| | | | 146,581,206 |
| Thrifts & Mortgage Finance - 0.8% | | | |
| IAS Operating Partnership LP 5% 3/15/18 (e) | | 34,810,000 | 32,764,913 |
| TOTAL FINANCIALS | | | 205,876,244 |
| Nonconvertible Bonds - 13.1% | | | |
| CONSUMER DISCRETIONARY - 3.8% | | | |
| Hotels, Restaurants & Leisure - 0.4% | | | |
| FelCor Lodging LP: | | | |
| 5.625% 3/1/23 | | 2,000,000 | 1,997,500 |
| 6% 6/1/25 | | 2,025,000 | 2,045,250 |
| Hilton Worldwide Finance LLC/Hilton Worldwide Finance Corp. 5.625% 10/15/21 | | 4,000,000 | 4,120,000 |
| Times Square Hotel Trust 8.528% 8/1/26 (e) | | 7,697,500 | 9,125,270 |
| | | | 17,288,020 |
| Household Durables - 3.4% | | | |
| Ashton Woods U.S.A. LLC/Ashton Woods Finance Co. 6.875% 2/15/21 (e) | | 12,145,000 | 10,323,250 |
| Brookfield Residential Properties, Inc./Brookfield Residential U.S. Corp. 6.125% 7/1/22 (e) | | 3,660,000 | 3,211,650 |
| Brookfield Residential Properties, Inc.: | | | |
| 6.375% 5/15/25 (e) | | 2,000,000 | 1,685,000 |
| 6.5% 12/15/20 (e) | | 1,615,000 | 1,461,575 |
| Calatlantic Group, Inc.: | | | |
| 5.875% 11/15/24 | | 3,250,000 | 3,371,875 |
| 8.375% 5/15/18 | | 13,458,000 | 14,837,445 |
| D.R. Horton, Inc.: | | | |
| 4.375% 9/15/22 | | 4,175,000 | 4,154,125 |
| 4.75% 5/15/17 | | 2,000,000 | 2,045,000 |
| 5.75% 8/15/23 | | 2,510,000 | 2,641,775 |
| KB Home: | | | |
| 8% 3/15/20 | | 8,465,000 | 8,655,463 |
| 9.1% 9/15/17 | | 4,985,000 | 5,333,950 |
| Lennar Corp.: | | | |
| 4.125% 12/1/18 | | 5,520,000 | 5,575,200 |
| 4.5% 6/15/19 | | 1,830,000 | 1,875,750 |
| 4.5% 11/15/19 | | 2,000,000 | 2,055,000 |
| 6.5% 4/15/16 | | 4,000,000 | 4,025,000 |
| 6.95% 6/1/18 | | 8,925,000 | 9,527,438 |
| Meritage Homes Corp.: | | | |
| 6% 6/1/25 | | 4,000,000 | 3,900,000 |
| 7% 4/1/22 | | 7,525,000 | 7,713,125 |
| 7.15% 4/15/20 | | 7,060,000 | 7,360,050 |
| Ryland Group, Inc.: | | | |
| 6.625% 5/1/20 | | 1,555,000 | 1,675,513 |
| 8.4% 5/15/17 | | 5,420,000 | 5,772,300 |
| Taylor Morrison Communities, Inc./Monarch Communities, Inc. 5.875% 4/15/23 (e) | | 4,100,000 | 3,833,500 |
| TRI Pointe Homes, Inc. 5.875% 6/15/24 | | 3,890,000 | 3,773,300 |
| WCI Communities, Inc. 6.875% 8/15/21 | | 1,845,000 | 1,881,900 |
| William Lyon Homes, Inc.: | | | |
| 7% 8/15/22 | | 4,180,000 | 4,012,800 |
| 7% 8/15/22 (e) | | 1,000,000 | 960,000 |
| 8.5% 11/15/20 | | 15,550,000 | 16,055,375 |
| | | | 137,717,359 |
| Media - 0.0% | | | |
| CBS Outdoor Americas Capital LLC/CBS Outdoor Americas Capital Corp. 5.625% 2/15/24 | | 1,300,000 | 1,329,250 |
| TOTAL CONSUMER DISCRETIONARY | | | 156,334,629 |
| CONSUMER STAPLES - 0.1% | | | |
| Food & Staples Retailing - 0.1% | | | |
| Ahold Lease Series 2001 A1 pass thru trust certificates 7.82% 1/2/20 | | 428,368 | 463,173 |
| C&S Group Enterprises LLC 5.375% 7/15/22 (e) | | 2,505,000 | 2,267,025 |
| | | | 2,730,198 |
| FINANCIALS - 8.6% | | | |
| Diversified Financial Services - 0.3% | | | |
| Icahn Enterprises LP/Icahn Enterprises Finance Corp.: | | | |
| 5.875% 2/1/22 | | 3,680,000 | 3,289,000 |
| 6% 8/1/20 | | 8,000,000 | 7,509,200 |
| | | | 10,798,200 |
| Real Estate Investment Trusts - 5.6% | | | |
| American Campus Communities Operating Partnership LP 4.125% 7/1/24 | | 2,000,000 | 2,024,816 |
| ARC Properties Operating Partnership LP 4.6% 2/6/24 | | 10,165,000 | 9,567,806 |
| CBL & Associates LP 5.25% 12/1/23 | | 1,000,000 | 981,678 |
| Corporate Office Properties LP 3.6% 5/15/23 | | 5,000,000 | 4,647,390 |
| Crown Castle International Corp. 5.25% 1/15/23 | | 4,000,000 | 4,260,000 |
| CTR Partnership LP/CareTrust Capital Corp. 5.875% 6/1/21 | | 4,955,000 | 4,932,703 |
| CubeSmart LP 4.8% 7/15/22 | | 2,000,000 | 2,179,114 |
| DDR Corp.: | | | |
| 7.5% 7/15/18 | | 8,756,000 | 9,807,289 |
| 7.875% 9/1/20 | | 4,637,000 | 5,617,424 |
| 9.625% 3/15/16 | | 3,836,000 | 3,873,708 |
| DuPont Fabros Technology LP 5.875% 9/15/21 | | 1,000,000 | 1,030,000 |
| Equity One, Inc. 6.25% 1/15/17 | | 3,000,000 | 3,114,576 |
| HCP, Inc. 4% 6/1/25 | | 1,000,000 | 982,552 |
| Health Care Property Investors, Inc.: | | | |
| 5.625% 5/1/17 | | 2,980,000 | 3,114,139 |
| 6% 1/30/17 | | 2,383,000 | 2,481,108 |
| Health Care REIT, Inc.: | | | |
| 4% 6/1/25 | | 1,551,000 | 1,545,148 |
| 4.125% 4/1/19 | | 2,000,000 | 2,095,970 |
| 6.2% 6/1/16 | | 2,750,000 | 2,793,799 |
| Healthcare Realty Trust, Inc.: | | | |
| 3.75% 4/15/23 | | 4,022,000 | 4,023,725 |
| 5.75% 1/15/21 | | 3,095,000 | 3,453,308 |
| Highwoods/Forsyth LP: | | | |
| 3.625% 1/15/23 | | 1,607,000 | 1,593,038 |
| 5.85% 3/15/17 | | 2,800,000 | 2,919,081 |
| Hospitality Properties Trust: | | | |
| 5% 8/15/22 | | 3,177,000 | 3,281,596 |
| 5.625% 3/15/17 | | 915,000 | 944,884 |
| HRPT Properties Trust: | | | |
| 6.25% 8/15/16 | | 9,675,000 | 9,688,245 |
| 6.25% 6/15/17 | | 1,055,000 | 1,089,462 |
| 6.65% 1/15/18 | | 4,246,000 | 4,499,270 |
| iStar Financial, Inc.: | | | |
| 3.875% 7/1/16 | | 2,855,000 | 2,840,725 |
| 4% 11/1/17 | | 15,210,000 | 14,335,425 |
| 5% 7/1/19 | | 15,000,000 | 14,100,000 |
| 5.85% 3/15/17 | | 3,587,000 | 3,649,773 |
| 5.875% 3/15/16 | | 27,070,000 | 27,036,163 |
| 7.125% 2/15/18 | | 5,725,000 | 5,682,063 |
| 9% 6/1/17 | | 9,175,000 | 9,381,438 |
| MPT Operating Partnership LP/MPT Finance Corp.: | | | |
| 6.375% 2/15/22 | | 3,610,000 | 3,664,150 |
| 6.875% 5/1/21 | | 2,000,000 | 2,070,000 |
| National Retail Properties, Inc. 3.3% 4/15/23 | | 2,000,000 | 1,949,982 |
| Omega Healthcare Investors, Inc.: | | | |
| 4.5% 4/1/27 | | 2,462,000 | 2,361,866 |
| 4.95% 4/1/24 | | 2,898,000 | 2,942,302 |
| Potlatch Corp. 7.5% 11/1/19 | | 1,000,000 | 1,095,000 |
| Reckson Operating Partnership LP/SL Green Realty Corp./SL Green Operating Partnership LP 7.75% 3/15/20 | | 2,000,000 | 2,357,732 |
| Select Income REIT 4.5% 2/1/25 | | 5,000,000 | 4,623,970 |
| Senior Housing Properties Trust: | | | |
| 3.25% 5/1/19 | | 2,882,000 | 2,905,370 |
| 4.75% 5/1/24 | | 3,988,000 | 3,941,057 |
| 6.75% 4/15/20 | | 13,624,000 | 15,249,098 |
| 6.75% 12/15/21 | | 8,000,000 | 9,099,688 |
| WP Carey, Inc. 4% 2/1/25 | | 5,000,000 | 4,779,490 |
| | | | 230,607,121 |
| Real Estate Management & Development - 2.1% | | | |
| BioMed Realty LP 3.85% 4/15/16 | | 2,000,000 | 2,010,694 |
| CBRE Group, Inc.: | | | |
| 5% 3/15/23 | | 6,020,000 | 6,072,344 |
| 5.25% 3/15/25 | | 3,295,000 | 3,403,906 |
| Forestar U.S.A. Real Estate Group 8.5% 6/1/22 (e) | | 16,365,000 | 15,014,888 |
| Host Hotels & Resorts LP 5.25% 3/15/22 | | 2,000,000 | 2,161,378 |
| Howard Hughes Corp. 6.875% 10/1/21 (e) | | 11,715,000 | 11,715,000 |
| Hunt Companies, Inc. 9.625% 3/1/21 (e) | | 7,460,000 | 6,676,700 |
| Kennedy-Wilson, Inc. 5.875% 4/1/24 | | 9,310,000 | 8,891,050 |
| Mid-America Apartments LP: | | | |
| 3.75% 6/15/24 | | 1,663,000 | 1,660,075 |
| 6.05% 9/1/16 | | 2,500,000 | 2,559,108 |
| Realogy Group LLC/Realogy Co.-Issuer Corp.: | | | |
| 4.5% 4/15/19 (e) | | 4,805,000 | 4,877,075 |
| 5.25% 12/1/21 (e) | | 6,620,000 | 6,744,125 |
| Regency Centers LP 5.875% 6/15/17 | | 300,000 | 316,422 |
| Taylor Morrison Communities, Inc./Monarch Communities, Inc.: | | | |
| 5.25% 4/15/21 (e) | | 7,000,000 | 6,580,000 |
| 5.625% 3/1/24 (e) | | 2,270,000 | 2,062,863 |
| Ventas Realty LP/Ventas Capital Corp. 4% 4/30/19 | | 2,262,000 | 2,373,286 |
| Wells Operating Partnership II LP 5.875% 4/1/18 | | 3,000,000 | 3,209,613 |
| | | | 86,328,527 |
| Thrifts & Mortgage Finance - 0.6% | | | |
| Cantor Commercial Real Estate Co. LP/CCRE Finance Corp. 7.75% 2/15/18 (e) | | 4,755,000 | 4,850,100 |
| Ocwen Financial Corp. 6.625% 5/15/19 | | 23,533,000 | 20,767,873 |
| | | | 25,617,973 |
| TOTAL FINANCIALS | | | 353,351,821 |
| HEALTH CARE - 0.4% | | | |
| Health Care Providers & Services - 0.4% | | | |
| Sabra Health Care LP/Sabra Capital Corp.: | | | |
| 5.375% 6/1/23 | | 2,795,000 | 2,801,988 |
| 5.5% 2/1/21 | | 12,305,000 | 12,551,100 |
| | | | 15,353,088 |
| INDUSTRIALS - 0.1% | | | |
| Industrial Conglomerates - 0.1% | | | |
| Ladder Capital Finance Holdings LLLP/Ladder Capital Finance Corp. 7.375% 10/1/17 | | 3,050,000 | 3,042,375 |
| INFORMATION TECHNOLOGY - 0.1% | | | |
| Internet Software & Services - 0.1% | | | |
| CyrusOne LP/CyrusOne Finance Corp. 6.375% 11/15/22 | | 4,000,000 | 4,060,000 |
|
| TOTAL NONCONVERTIBLE BONDS | | | 534,872,111 |
|
| TOTAL CORPORATE BONDS | | | |
| (Cost $753,065,588) | | | 740,748,355 |
|
| Asset-Backed Securities - 2.2% | | | |
| American Homes 4 Rent: | | | |
| Series 2014-SFR2 Class E, 6.231% 10/17/36 (e) | | 3,000,000 | 2,985,444 |
| Series 2014-SFR3 Class E, 6.418% 12/17/36 (e) | | 9,025,000 | 9,086,254 |
| Series 2015-SFR1: | | | |
| Class E, 5.639% 4/17/52 (e) | | 1,999,310 | 1,901,946 |
| Class F, 5.885% 4/17/52 (e) | | 2,000,000 | 1,827,407 |
| Series 2015-SFR2: | | | |
| Class E, 6.07% 10/17/45 (e) | | 7,327,000 | 7,140,349 |
| Class XS, 0% 10/17/45 (e)(f) | | 4,882,928 | 0 |
| Capital Trust RE CDO Ltd. Series 2005-1A Class D, 1.926% 3/20/50 (e)(g) | | 2,250,000 | 225 |
| CapLease CDO Ltd. Series 2005-1A Class A, 4.926% 1/29/40 (e) | | 759,673 | 767,270 |
| Conseco Finance Securitizations Corp. Series 2002-2 Class M2, 9.163% 3/1/33 | | 500,000 | 414,760 |
| Crest Clarendon Street Ltd./Crest Clarendon Corp. Series 2002-1A Class D, 9% 12/28/35 (e) | | 305,034 | 151,541 |
| Deutsche Financial Capital Securitization LLC Series 1997-I Class M, 7.275% 9/15/27 | | 5,337,922 | 5,552,900 |
| Green Tree Financial Corp.: | | | |
| Series 1996-4 Class M1, 7.75% 6/15/27 | | 1,450,222 | 1,424,947 |
| Series 1997-3 Class M1, 7.53% 3/15/28 | | 6,696,417 | 6,716,635 |
| Invitation Homes Trust: | | | |
| Series 2013-SFR1 Class F, 4.068% 12/17/30 (e)(g) | | 1,750,000 | 1,664,629 |
| Series 2014-SFR1: | | | |
| Class E, 3.6005% 6/17/31 (e)(g) | | 10,000,000 | 9,609,619 |
| Class F, 4.1005% 6/17/31 (e)(g) | | 9,504,000 | 8,987,591 |
| Series 2014-SFR3: | | | |
| Class E, 4.926% 12/17/31 (e)(g) | | 4,336,000 | 4,297,808 |
| Class F, 5.426% 12/17/31 (e)(g) | | 2,215,000 | 2,153,830 |
| Series 2015-SFR2 Class E, 3.5005% 6/17/32 (e)(g) | | 2,450,000 | 2,305,618 |
| Series 2015-SFR3 Class F, 5.1005% 8/17/32 (e)(g) | | 2,000,000 | 1,924,643 |
| Series 2015-SRF1 Class F, 4.6505% 3/17/32 (e)(g) | | 5,500,000 | 5,218,910 |
| Lehman ABS Manufactured Housing Contract Trust Series 2001-B Class M2, 7.17% 4/15/40 | | 940,050 | 631,947 |
| Merit Securities Corp. Series 13 Class M1, 7.8381% 12/28/33 (g) | | 1,923,000 | 2,008,306 |
| Progress Residential Trust: | | | |
| Series 2015-SFR1 Class E, 4.426% 2/17/32 (e)(g) | | 1,500,000 | 1,458,842 |
| Series 2015-SFR3 Class F, 6.643% 11/12/32 (e) | | 2,940,000 | 2,962,736 |
| Starwood Waypoint Residential Trust Series 2014-1 Class F, 4.9005% 1/17/32 (e)(g) | | 4,071,000 | 3,906,008 |
| Taberna Preferred Funding III Ltd. Series 2005-3A Class D, 2.9836% 2/5/36 (e)(g) | | 3,974,526 | 397 |
| Wrightwood Capital Real Estate CDO Ltd. Series 2005-1A: | | | |
| Class A1, 0.6976% 11/21/40 (e)(g) | | 3,699,927 | 3,570,430 |
| Class F, 2.3276% 11/21/40 (e)(g) | | 250,000 | 168,750 |
| TOTAL ASSET-BACKED SECURITIES | | | |
| (Cost $94,358,207) | | | 88,839,742 |
|
| Collateralized Mortgage Obligations - 0.2% | | | |
| Private Sponsor - 0.2% | | | |
| Countrywide Home Loans, Inc.: | | | |
| Series 2002-R2 Class 2B3, 3.6495% 7/25/33 (e)(g) | | 162,845 | 25,079 |
| Series 2003-R3 Class B2, 5.5% 11/25/33 (e) | | 634,005 | 24,646 |
| FREMF Mortgage Trust: | | | |
| Series 2010-K6 Class B, 5.3578% 12/25/46 (e)(g) | | 4,500,000 | 4,927,085 |
| Series 2010-K7 Class B, 5.4407% 4/25/20 (e)(g) | | 3,200,000 | 3,530,337 |
| Merrill Lynch Mortgage Investors Trust Series 1998-C3 Class F, 6% 12/15/30 (e) | | 585,313 | 594,503 |
| RESI Finance LP/RESI Finance DE Corp. floater Series 2003-B Class B9, 12.2431% 6/10/35 (e)(g) | | 99,022 | 103,504 |
| Residential Funding Securities Corp. Series 2002-RM1 Class BI1, 5.5% 12/25/17 (e) | | 9,277 | 8,611 |
| RESIX Finance Ltd. floater: | | | |
| Series 2003-D Class B8, 6.6945% 12/10/35 (e)(g) | | 120,789 | 23,521 |
| Series 2004-A Class B7, 4.4445% 2/10/36 (e)(g) | | 121,307 | 37,787 |
| Series 2004-B Class B7, 4.1945% 2/10/36 (e)(g) | | 151,064 | 49,350 |
|
| TOTAL PRIVATE SPONSOR | | | 9,324,423 |
|
| U.S. Government Agency - 0.0% | | | |
| Fannie Mae REMIC Trust: | | | |
| Series 2001-W3 subordinate REMIC pass thru certificates, Class B3, 7% 9/25/41 (b) | | 83,363 | 24,122 |
| Series 2002-W1 subordinate REMIC pass thru certificates, Class 3B3, 3.172% 2/25/42 (e)(g) | | 67,698 | 48,620 |
| Series 2003-W1 subordinate REMIC pass thru certificates, Class B3, 4.2244% 12/25/42 (b)(g) | | 111,429 | 15,918 |
| Series 2003-W10 subordinate REMIC pass thru certificates, Class 2B3, 3.1384% 6/25/43 (e)(g) | | 104,422 | 68,036 |
| Series 2003-W4 subordinate REMIC pass thru certificates, Class 2B3, 3.0163% 10/25/42 (e)(g) | | 46,599 | 12,307 |
|
| TOTAL U.S. GOVERNMENT AGENCY | | | 169,003 |
|
| TOTAL COLLATERALIZED MORTGAGE OBLIGATIONS | | | |
| (Cost $9,390,336) | | | 9,493,426 |
|
| Commercial Mortgage Securities - 14.0% | | | |
| Americold LLC Trust Series 2010-ARTA Class D, 7.443% 1/14/29 (e) | | 2,000,000 | 2,242,371 |
| Banc of America Commercial Mortgage Trust: | | | |
| Series 2005-1 Class CJ, 5.3381% 11/10/42 (g) | | 878,434 | 877,630 |
| Series 2005-5 Class D, 5.3813% 10/10/45 (g) | | 3,795,800 | 3,794,992 |
| Bank of America Commercial Mortgage Trust Series 2015-UBS7 Class D, 3.167% 9/15/48 | | 1,000,000 | 685,276 |
| Barclays Commercial Mortgage Securities LLC Series 2015-STP Class F, 4.2844% 9/10/28 (e)(g) | | 4,074,000 | 3,519,794 |
| Bear Stearns Commercial Mortgage Securities Trust Series 2006-T22 Class B, 5.62% 4/12/38 (e)(g) | | 2,520,000 | 2,581,207 |
| Bear Stearns Commercial Mortgage Securities Trust, Series 2006-PWR11 Class AJ, 5.5101% 3/11/39 (g) | | 5,700,000 | 5,696,496 |
| BLCP Hotel Trust: | | | |
| floater Series 2014-CLRN Class F, 3.4596% 8/15/29 (e)(g) | | 2,500,000 | 2,324,962 |
| Series 2014-CLMZ Class M, 6.1535% 8/15/29 (e)(g) | | 10,392,875 | 9,795,960 |
| Boca Hotel Portfolio Trust Series 2013-BOCA Class E, 4.1755% 8/15/26 (e)(g) | | 2,500,000 | 2,492,103 |
| Carefree Portfolio Trust floater Series 2014-CARE: | | | |
| Class E, 4.426% 11/15/19 (e)(g) | | 4,905,000 | 4,838,375 |
| Class F, 3.0097% 11/15/19 (e)(g) | | 1,650,000 | 1,573,272 |
| Class MZA, 6.4025% 11/15/19 (e)(g) | | 16,217,000 | 15,994,738 |
| CGBAM Commercial Mortgage Trust: | | | |
| floater Series 2014-HD Class E, 3.3305% 2/15/31 (e)(g) | | 5,769,000 | 5,758,603 |
| Series 2015-SMRT Class F, 3.7859% 4/10/28(e)(g) | | 5,746,000 | 5,264,023 |
| Citigroup Commercial Mortgage Trust: | | | |
| Series 2013-GC15 Class D, 5.1045% 9/10/46 (e)(g) | | 5,254,000 | 4,706,117 |
| Series 2015-SHP2 Class E, 4.681% 7/15/27 (e)(g) | | 2,933,000 | 2,859,071 |
| COMM Mortgage Trust: | | | |
| sequential payer Series 2013-LC6 Class E, 3.5% 1/10/46 (e) | | 7,300,000 | 5,509,079 |
| Series 2012-CR5 Class D, 4.3374% 12/10/45 (e)(g) | | 2,000,000 | 1,900,687 |
| Series 2013-CR10 Class D, 4.7911% 8/10/46 (e)(g) | | 2,000,000 | 1,760,587 |
| Series 2013-CR12 Class D, 5.0842% 10/10/46 (e)(g) | | 4,500,000 | 4,125,294 |
| Series 2013-CR9 Class D, 4.2572% 7/10/45 (e)(g) | | 4,255,000 | 3,722,473 |
| Series 2013-LC6 Class D, 4.2855% 1/10/46 (e)(g) | | 3,870,000 | 3,413,010 |
| Series 2014-UBS2 Class D, 5.0152% 3/10/47 (e)(g) | | 3,713,000 | 3,123,200 |
| Commercial Mortgage Acceptance Corp. Series 1998-C2 Class J, 5.44% 9/15/30 (e) | | 1,552,481 | 1,505,252 |
| Commercial Mortgage Trust pass-thru certificates: | | | |
| Series 2012-CR1: | | | |
| Class C, 5.3634% 5/15/45 (g) | | 1,000,000 | 1,062,188 |
| Class D, 5.3634% 5/15/45 (e)(g) | | 5,550,000 | 5,424,024 |
| Series 2012-CR2: | | | |
| Class D, 4.8548% 8/15/45 (e)(g) | | 4,500,000 | 4,455,666 |
| Class E, 4.8548% 8/15/45 (e)(g) | | 6,000,000 | 5,600,552 |
| Series 2012-LC4: | | | |
| Class C, 5.6447% 12/10/44 (g) | | 2,000,000 | 2,150,816 |
| Class D, 5.6447% 12/10/44 (e)(g) | | 8,000,000 | 7,902,581 |
| Core Industrial Trust Series 2015-TEXW Class F, 3.8487% 2/10/34 (e)(g) | | 6,565,000 | 5,858,272 |
| Credit Suisse First Boston Mortgage Securities Corp.: | | | |
| Series 1998-C1 Class F, 6% 5/17/40 (e) | | 971,589 | 1,006,474 |
| Series 1998-C2 Class F, 6.75% 11/15/30 (e) | | 1,060,301 | 1,070,607 |
| CSMC Trust floater Series 2015-DEAL: | | | |
| Class E, 4.426% 4/15/29 (e)(g) | | 2,000,000 | 1,894,887 |
| Class F, 5.176% 4/15/29 (e)(g) | | 5,053,000 | 4,841,413 |
| DBCCRE Mortgage Trust Series 2014-ARCP Class E, 4.9345% 1/10/34 (e)(g) | | 10,853,000 | 9,929,594 |
| DBUBS Mortgage Trust Series 2011-LC1A: | | | |
| Class E, 5.6634% 11/10/46 (e)(g) | | 12,490,000 | 12,957,365 |
| Class G, 4.652% 11/10/46 (e) | | 9,843,000 | 8,343,811 |
| Extended Stay America Trust Series 2013-ESH7 Class C7, 3.9017% 12/5/31 (e) | | 500,000 | 500,252 |
| Freddie Mac: | | | |
| pass-thru certificates: | | | |
| Series K011 Class X3, 2.5754% 12/25/43 (f)(g) | | 12,206,096 | 1,387,971 |
| Series K012 Class X3, 2.2509% 1/25/41 (f)(g) | | 20,716,172 | 2,141,698 |
| Series K013 Class X3, 2.9064% 1/25/43 (f)(g) | | 14,360,000 | 1,825,452 |
| Series KAIV Class X2, 3.6147% 6/25/46 (f)(g) | | 7,430,000�� | 1,241,023 |
| GAHR Commercial Mortgage Trust Series 2015-NRF: | | | |
| Class EFX, 3.3822% 12/15/19 (e)(g) | | 5,607,000 | 5,183,435 |
| Class FFX, 3.3822% 12/15/19 (e)(g) | | 8,032,000 | 7,169,205 |
| GMAC Commercial Mortgage Securities, Inc. Series 1997-C2 Class G, 6.75% 4/15/29 (g) | | 458,948 | 479,694 |
| GP Portfolio Trust Series 2014-GPP Class E, 4.1805% 2/15/27 (e)(g) | | 2,823,000 | 2,768,531 |
| Greenwich Capital Commercial Funding Corp. Series 2006-GG7 Class A4, 7.5684% 7/10/38 (g) | | 3,080,229 | 3,090,530 |
| GS Mortgage Securities Corp. II Series 2010-C1: | | | |
| Class D, 6.0789% 8/10/43 (e)(g) | | 4,000,000 | 4,106,028 |
| Class E, 4% 8/10/43 (e) | | 3,770,000 | 3,352,972 |
| GS Mortgage Securities Trust: | | | |
| Series 2010-C2 Class D, 5.1881% 12/10/43 (e)(g) | | 3,000,000 | 2,964,030 |
| Series 2011-GC5: | | | |
| Class C, 5.3078% 8/10/44 (e)(g) | | 9,000,000 | 9,627,137 |
| Class D, 5.3078% 8/10/44 (e)(g) | | 7,000,000 | 7,029,985 |
| Class E, 5.3078% 8/10/44 (e)(g) | | 4,049,000 | 3,765,560 |
| Class F, 4.5% 8/10/44 (e) | | 4,500,000 | 3,730,154 |
| Series 2012-GC6: | | | |
| Class C, 5.6314% 1/10/45 (e)(g) | | 3,600,000 | 3,808,214 |
| Class D, 5.6314% 1/10/45 (e)(g) | | 2,000,000 | 1,939,969 |
| Class E, 5% 1/10/45 (e)(g) | | 4,516,000 | 3,890,406 |
| Series 2012-GCJ7: | | | |
| Class C, 5.7229% 5/10/45 (g) | | 6,500,000 | 6,861,214 |
| Class D, 5.7229% 5/10/45 (e)(g) | | 5,500,000 | 5,312,630 |
| Class E, 5% 5/10/45 (e) | | 6,920,000 | 5,593,336 |
| Series 2012-GCJ9 Class D, 4.8524% 11/10/45 (e)(g) | | 4,504,000 | 4,107,122 |
| Series 2013-GC16: | | | |
| Class D, 5.3158% 11/10/46 (e)(g) | | 3,750,000 | 3,359,346 |
| Class F, 3.5% 11/10/46 (e) | | 7,303,000 | 5,227,035 |
| Hilton U.S.A. Trust: | | | |
| floater Series 2014-ORL Class E, 3.5805% 7/15/29 (e)(g) | | 7,241,000 | 6,947,886 |
| Series 2013-HLT Class EFX, 4.4533% 11/5/30 (e)(g) | | 5,000,000 | 4,993,814 |
| Invitation Homes Trust floater Series 2013-SFR1 Class E, 3.068% 12/17/30 (e)(g) | | 1,500,000 | 1,427,129 |
| JPMorgan Chase Commercial Mortgage Securities Corp.: | | | |
| Series 2003-C1 Class F, 5.4229% 1/12/37 (e)(g) | | 1,000,000 | 995,279 |
| Series 2009-IWST: | | | |
| Class C, 7.4453% 12/5/27 (e)(g) | | 3,000,000 | 3,498,814 |
| Class D, 7.4453% 12/5/27 (e)(g) | | 9,550,000 | 11,102,727 |
| Series 2010-CNTR: | | | |
| Class D, 6.1838% 8/5/32 (e)(g) | | 4,500,000 | 4,962,768 |
| Class XB, 0.9305% 8/5/32 (e)(f)(g) | | 32,655,000 | 1,072,965 |
| Series 2012-CBX: | | | |
| Class C, 5.2377% 6/15/45 (g) | | 4,530,000 | 4,667,393 |
| Class F, 4% 6/15/45 (e) | | 5,000,000 | 4,035,745 |
| Class G 4% 6/15/45 (e) | | 4,044,000 | 2,816,098 |
| JPMorgan Chase Commercial Mortgage Securities Trust: | | | |
| floater: | | | |
| Series 2014-FBLU Class E, 3.8305% 12/15/28 (e)(g) | | 2,406,000 | 2,370,857 |
| Series 2014-INN: | | | |
| Class E, 4.026% 6/15/29 (e)(g) | | 9,607,000 | 9,439,807 |
| Class F, 4.426% 6/15/29 (e)(g) | | 9,618,000 | 9,417,957 |
| Series 2005-LDP5 Class AJ, 5.4758% 12/15/44 (g) | | 54,979 | 54,945 |
| Series 2011-C4 Class F, 3.873% 7/15/46 (e) | | 1,400,000 | 1,227,673 |
| Series 2013-LC11: | | | |
| Class D, 4.2384% 4/15/46 (g) | | 5,250,000 | 4,543,023 |
| Class F, 3.25% 4/15/46 (e)(g) | | 2,518,000 | 1,647,056 |
| Series 2014-DSTY Class E, 3.8046% 6/10/27 (e)(g) | | 2,525,000 | 2,307,361 |
| Series 2015-UES Class F, 3.621% 9/5/32 (e)(g) | | 3,500,000 | 3,177,674 |
| JPMorgan Commercial Mortgage Finance Corp. Series 1999-C8 Class H, 6% 7/15/31 (e) | | 874,381 | 818,778 |
| LB-UBS Commercial Mortgage Trust: | | | |
| sequential payer Series 2006-C7 Class AM, 5.378% 11/15/38 | | 2,040,000 | 2,080,036 |
| Series 2006-C4: | | | |
| Class A4, 5.8201% 6/15/38 (g) | | 3,520,012 | 3,528,955 |
| Class AJ, 5.8401% 6/15/38 (g) | | 7,005,000 | 7,074,721 |
| Class AM, 5.8401% 6/15/38 (g) | | 6,700,000 | 6,792,603 |
| LSTAR Commercial Mortgage Trust Series 2014-2: | | | |
| Class D, 4.9783% 1/20/41 (e)(g) | | 3,000,000 | 2,737,147 |
| Class E, 4.9783% 1/20/41 (e)(g) | | 4,800,000 | 3,854,782 |
| Mach One Trust LLC Series 2004-1A Class H, 6.0648% 5/28/40 (e)(g) | | 479,012 | 477,815 |
| Merrill Lynch Mortgage Trust Series 2006-C1 Class AM, 5.6664% 5/12/39 (g) | | 1,200,000 | 1,204,301 |
| Mezz Capital Commercial Mortgage Trust Series 2004-C1 Class IO, 8.8661% 1/15/37 (e)(f)(g) | | 348,229 | 21,416 |
| Morgan Stanley BAML Trust: | | | |
| Series 2012-C6 Class D, 4.6573% 11/15/45 (e)(g) | | 2,000,000 | 1,840,773 |
| Series 2013-C12 Class D, 4.7664% 10/15/46 (e)(g) | | 3,250,000 | 2,961,700 |
| Series 2013-C13: | | | |
| Class D, 4.8939% 11/15/46 (e)(g) | | 3,100,000 | 2,834,372 |
| Class E, 4.8939% 11/15/46 (e)(g) | | 3,379,000 | 2,701,398 |
| Series 2013-C7 Class E, 4.2965% 2/15/46 (e)(g) | | 1,000,000 | 845,463 |
| Series 2013-C9 Class D, 4.1611% 5/15/46 (e)(g) | | 5,000,000 | 4,246,427 |
| Morgan Stanley Capital I Trust: | | | |
| sequential payer: | | | |
| Series 2006-HQ10 Class AM, 5.36% 11/12/41 | | 8,200,000 | 8,337,647 |
| Series 2012-C4 Class E, 5.5245% 3/15/45 (e)(g) | | 5,630,000 | 5,500,149 |
| Series 1997-RR Class F, 7.4216% 4/30/39 (e)(g) | | 740,663 | 727,702 |
| Series 1998-CF1 Class G, 7.35% 7/15/32 (e) | | 2,386,972 | 2,389,695 |
| Series 2006-IQ12 Class AMFX, 5.37% 12/15/43 | | 7,500,000 | 7,673,122 |
| Series 2011-C1 Class C, 5.4382% 9/15/47 (e)(g) | | 4,000,000 | 4,283,740 |
| Series 2011-C2: | | | |
| Class D, 5.3028% 6/15/44 (e)(g) | | 4,610,000 | 4,776,664 |
| Class E, 5.3028% 6/15/44 (e)(g) | | 9,600,000 | 9,594,948 |
| Class F, 5.3028% 6/15/44 (e)(g) | | 4,440,000 | 4,128,554 |
| Class XB, 0.4583% 6/15/44 (e)(f)(g) | | 63,708,222 | 1,589,170 |
| Series 2011-C3: | | | |
| Class C, 5.1783% 7/15/49 (e)(g) | | 2,000,000 | 2,117,105 |
| Class D, 5.1783% 7/15/49 (e)(g) | | 7,400,000 | 7,456,765 |
| Class G, 5.1783% 7/15/49 (e)(g) | | 3,283,000 | 2,675,801 |
| Series 2012-C4 Class D, 5.5245% 3/15/45 (e)(g) | | 6,310,000 | 6,364,725 |
| Series 2015-UBS8 Class D, 3.25% 12/15/48 (e) | | 5,013,000 | 3,491,237 |
| Motel 6 Trust Series 2015-MTL6: | | | |
| Class E, 5.2785% 2/5/30 (e) | | 5,778,000 | 5,548,489 |
| Class F, 5% 2/5/30 (e) | | 10,728,000 | 9,870,337 |
| MSJP Commercial Securities Mortgage Trust Series 2015-HAUL Class E, 4.851% 9/5/47 (e)(g) | | 1,500,000 | 1,247,609 |
| Providence Place Group Ltd. Partnership Series 2000-C1 Class A2, 7.75% 7/20/28 (e) | | 4,752,299 | 5,843,427 |
| SCG Trust Series 2013-SRP1 Class D, 3.6742% 11/15/26 (e)(g) | | 1,000,000 | 971,188 |
| TIAA Seasoned Commercial Mortgage Trust sequential payer Series 2007-C4 Class AJ, 5.5102% 8/15/39 (g) | | 884,336 | 887,598 |
| TimberStar Trust I Series 2006-1 Class F, 7.5296% 10/15/36 (e) | | 10,630,000 | 10,722,216 |
| UBS Commercial Mortgage Trust Series 2012-C1 Class D, 5.5344% 5/10/45 (e)(g) | | 3,235,000 | 3,197,398 |
| UBS-Barclays Commercial Mortgage Trust sequential payer Series 2012-C3 Class A1, 0.726% 8/10/49 | | 1,412,215�� | 1,402,675 |
| UBS-Citigroup Commercial Mortgage Trust Series 2011-C1 Class B, 5.8878% 1/10/45 (e)(g) | | 3,000,000 | 3,393,280 |
| Vornado DP LLC Series 2010-VNO Class D, 6.3555% 9/13/28 (e) | | 2,540,000 | 2,829,192 |
| Wachovia Bank Commercial Mortgage Trust Series 2004-C11 Class D, 5.1191% 1/15/41 (g) | | 5,177,000 | 5,257,930 |
| Wells Fargo Commercial Mortgage Trust Series 2012-LC5 Class D, 4.7768% 10/15/45 (e)(g) | | 9,999,000 | 9,260,385 |
| WF-RBS Commercial Mortgage Trust: | | | |
| sequential payer Series 2011-C4I Class G, 5% 6/15/44 (e) | | 4,000,000 | 3,066,684 |
| Series 2011-C3: | | | |
| Class C, 5.335% 3/15/44 (e) | | 4,900,000 | 5,159,663 |
| Class D, 5.5722% 3/15/44 (e)(g) | | 1,000,000 | 1,016,292 |
| Class E, 5% 3/15/44 (e) | | 3,000,000 | 2,678,416 |
| Series 2011-C5: | | | |
| Class F, 5.25% 11/15/44 (e)(g) | | 3,000,000 | 2,416,400 |
| Class G, 5.25% 11/15/44 (e)(g) | | 2,000,000 | 1,531,082 |
| Series 2012-C10 Class E, 4.4542% 12/15/45 (e)(g) | | 4,090,000 | 3,088,721 |
| Series 2012-C7: | | | |
| Class D, 4.8377% 6/15/45 (e)(g) | | 2,380,000 | 2,363,987 |
| Class F, 4.5% 6/15/45 (e) | | 2,000,000 | 1,688,720 |
| Series 2013-C11: | | | |
| Class D, 4.1794% 3/15/45 (e)(g) | | 5,830,000 | 5,041,972 |
| Class E, 4.1794% 3/15/45 (e)(g) | | 4,780,000 | 3,844,105 |
| Series 2013-C13 Class D, 4.1386% 5/15/45 (e)(g) | | 4,000,000 | 3,570,867 |
| Series 2013-UBS1 Class D, 4.6299% 3/15/46 (e)(g) | | 1,668,000 | 1,481,765 |
| WFCG Commercial Mortgage Trust floater Series 2015-BXRP: | | | |
| Class F, 4.0508% 11/15/29 (e)(g) | | 5,152,378 | 5,101,792 |
| Class G, 3.3505% 11/15/29 (e)(g) | | 3,391,668 | 3,083,539 |
| TOTAL COMMERCIAL MORTGAGE SECURITIES | | | |
| (Cost $560,702,920) | | | 574,426,162 |
|
| Bank Loan Obligations - 6.8% | | | |
| CONSUMER DISCRETIONARY - 2.8% | | | |
| Hotels, Restaurants & Leisure - 2.1% | | | |
| Caesars Entertainment Resort Properties LLC Tranche B 1LN, term loan 7% 10/11/20 (g) | | 13,170,905 | 11,452,101 |
| Caesars Growth Properties Holdings, LLC Tranche 1LN, term loan 6.25% 5/8/21 (g) | | 10,143,093 | 8,384,991 |
| Cooper Hotel Group 12% 11/6/17 | | 13,156,538 | 13,814,365 |
| ESH Hospitality, Inc. Tranche B, term loan 5% 6/24/19 (g) | | 14,218,748 | 14,254,294 |
| Four Seasons Holdings, Inc.: | | | |
| Tranche 2LN, term loan 6.25% 12/27/20 (g) | | 2,150,000 | 2,115,063 |
| Tranche B 1LN, term loan 3.5% 6/27/20 (g) | | 1,986,701 | 1,956,900 |
| Hilton Worldwide Finance, LLC Tranche B, term loan 3.5% 10/25/20 (g) | | 14,821,555 | 14,787,317 |
| La Quinta Intermediate Holdings LLC Tranche B LN, term loan 3.75% 4/14/21 (g) | | 13,115,812 | 12,574,785 |
| Playa Resorts Holding BV Tranche B, term loan 4% 8/9/19 (g) | | 6,438,522 | 6,213,174 |
| Ryman Hospitality Properties, Inc. Tranche B, term loan 3.5% 1/15/21 (g) | | 2,255,650 | 2,244,372 |
| | | | 87,797,362 |
| Media - 0.2% | | | |
| CBS Outdoor Americas Capital LLC/CBS Outdoor Americas Capital Corp. Tranche B, term loan 3% 1/31/21 (g) | | 7,776,563 | 7,672,046 |
| Multiline Retail - 0.4% | | | |
| JC Penney Corp., Inc. Tranche B, term loan 6% 5/22/18 (g) | | 15,306,656 | 14,943,123 |
| Specialty Retail - 0.1% | | | |
| The Pep Boys - Manny, Moe & Jack Tranche B, term loan 5.5% 10/11/18 (g) | | 6,181,627 | 6,173,900 |
|
| TOTAL CONSUMER DISCRETIONARY | | | 116,586,431 |
|
| CONSUMER STAPLES - 0.4% | | | |
| Food & Staples Retailing - 0.4% | | | |
| Albertson's LLC: | | | |
| Tranche B 2LN, term loan 5.5% 3/21/19 (g) | | 5,084,922 | 5,031,225 |
| Tranche B 3LN, term loan 5.125% 8/25/19 (g) | | 8,166,812 | 7,983,059 |
| Tranche B 5LN, term loan 12/21/22 (h) | | 5,005,000 | 4,886,131 |
| | | | 17,900,415 |
| ENERGY - 0.5% | | | |
| Oil, Gas & Consumable Fuels - 0.5% | | | |
| Moxie Patriot LLC Tranche B, term loan 6.75% 12/19/20 (g) | | 2,000,000 | 1,800,000 |
| Panda Sherman Power, LLC term loan 9% 9/14/18 (g) | | 7,112,245 | 6,223,215 |
| Panda Temple Power, LLC term loan 7.25% 4/3/19 (g) | | 8,580,000 | 7,293,000 |
| TPF II Power, LLC Tranche B, term loan 5.5% 10/2/21 (g) | | 4,190,353 | 4,014,903 |
| | | | 19,331,118 |
| FINANCIALS - 1.8% | | | |
| Real Estate Investment Trusts - 0.3% | | | |
| Starwood Property Trust, Inc. Tranche B, term loan 3.5% 4/17/20 (g) | | 10,767,409 | 10,583,501 |
| Real Estate Management & Development - 1.3% | | | |
| AmeriCold Reality Operating Partnership LP Tranche B, term loan 6.5% 12/1/22 (g) | | 8,345,000 | 8,324,138 |
| CityCenter 8.74% 7/12/16 (g) | | 2,220,904 | 2,220,904 |
| NorthStar Asset Management LP Tranche B 1LN, term loan 4.625% 1/29/23 (g) | | 5,010,000 | 4,834,650 |
| Realogy Corp. Credit-Linked Deposit 4.6795% 10/10/16 (g) | | 418,475 | 412,198 |
| Realogy Group LLC Tranche B, term loan 3.75% 3/5/20 (g) | | 37,814,057 | 37,511,545 |
| | | | 53,303,435 |
| Thrifts & Mortgage Finance - 0.2% | | | |
| Ocwen Loan Servicing, LLC Tranche B, term loan 5.5% 2/15/18 (g) | | 7,680,832 | 7,666,469 |
|
| TOTAL FINANCIALS | | | 71,553,405 |
|
| HEALTH CARE - 0.1% | | | |
| Health Care Providers & Services - 0.1% | | | |
| Community Health Systems, Inc.: | | | |
| Tranche F, term loan 3.6567% 12/31/18 (g) | | 1,985,000 | 1,951,632 |
| Tranche H, term loan 4% 1/27/21 (g) | | 3,104,062 | 2,983,779 |
| | | | 4,935,411 |
| INDUSTRIALS - 0.4% | | | |
| Commercial Services & Supplies - 0.3% | | | |
| Lineage Logistics Holdings, LLC. Tranche B, term loan 4.5% 4/7/21 (g) | | 3,930,000 | 3,507,525 |
| Pilot Travel Centers LLC Tranche B, term loan 3.75% 10/3/21 (g) | | 7,200,000 | 7,198,200 |
| | | | 10,705,725 |
| Construction & Engineering - 0.1% | | | |
| Drumm Investors LLC Tranche B, term loan 6.75% 5/4/18 (g) | | 5,635,081 | 5,547,061 |
|
| TOTAL INDUSTRIALS | | | 16,252,786 |
|
| UTILITIES - 0.8% | | | |
| Electric Utilities - 0.5% | | | |
| Calpine Construction Finance Co. LP Tranche B 2LN, term loan 3.25% 1/31/22 (g) | | 7,269,112 | 6,828,458 |
| Essential Power LLC Tranche B, term loan 4.75% 8/8/19 (g) | | 3,344,688 | 3,252,709 |
| La Frontera Generation, LLC Tranche B, term loan 4.5% 9/30/20 (g) | | 7,910,170 | 7,560,145 |
| Southeast Powergen LLC Tranche B, term loan 4.5% 12/2/21 (g) | | 2,742,300 | 2,701,166 |
| | | | 20,342,478 |
| Independent Power and Renewable Electricity Producers - 0.3% | | | |
| Calpine Corp. Tranche B 4LN, term loan 4% 10/31/20 (g) | | 1,960,000 | 1,900,220 |
| Tempus Public Foundation Generation Holdings LLC Tranche B, term loan 4.75% 12/31/17 (g) | | 11,427,742 | 10,099,267 |
| | | | 11,999,487 |
|
| TOTAL UTILITIES | | | 32,341,965 |
|
| TOTAL BANK LOAN OBLIGATIONS | | | |
| (Cost $288,225,610) | | | 278,901,531 |
|
| Preferred Securities - 0.0% | | | |
| FINANCIALS - 0.0% | | | |
| Diversified Financial Services - 0.0% | | | |
| Crest Dartmouth Street 2003 1 Ltd. Series 2003-1A Class PS, 6/28/38 (e) | | 1,220,000 | 236,558 |
| Thrifts & Mortgage Finance - 0.0% | | | |
| Crest Clarendon Street 2002-1 Ltd. Series 2002-1A Class PS, 12/28/35 (e) | | 500,000 | 250 |
| TOTAL FINANCIALS | | | |
| (Cost $1,297,768) | | | 236,808 |
| | | Shares | Value |
|
| Money Market Funds - 7.7% | | | |
| Fidelity Cash Central Fund, 0.38% (i) | | 315,432,448 | 315,432,448 |
| Fidelity Securities Lending Cash Central Fund, 0.42% (i)(j) | | 836,900 | 836,900 |
| TOTAL MONEY MARKET FUNDS | | | |
| (Cost $316,269,348) | | | 316,269,348 |
| TOTAL INVESTMENT PORTFOLIO - 99.9% | | | |
| (Cost $4,071,702,046) | | | 4,095,652,086 |
| NET OTHER ASSETS (LIABILITIES) - 0.1% | | | 4,270,263 |
| NET ASSETS - 100% | | | $4,099,922,349 |
Percentages shown as 0.0% may reflect amounts less than 0.05%.
Legend
(a) Non-income producing
(b) Restricted securities - Investment in securities not registered under the Securities Act of 1933 (excluding 144A issues). At the end of the period, the value of restricted securities (excluding 144A issues) amounted to $5,626,683 or 0.1% of net assets.
(c) Affiliated company
(d) Security or a portion of the security is on loan at period end.
(e) Security exempt from registration under Rule 144A of the Securities Act of 1933. These securities may be resold in transactions exempt from registration, normally to qualified institutional buyers. At the end of the period, the value of these securities amounted to $710,214,608 or 17.3% of net assets.
(f) Security represents right to receive monthly interest payments on an underlying pool of mortgages or assets. Principal shown is the outstanding par amount of the pool as of the end of the period.
(g) Coupon rates for floating and adjustable rate securities reflect the rates in effect at period end.
(h) The coupon rate will be determined upon settlement of the loan after period end.
(i) Affiliated fund that is generally available only to investment companies and other accounts managed by Fidelity Investments. The rate quoted is the annualized seven-day yield of the fund at period end. A complete unaudited listing of the fund's holdings as of its most recent quarter end is available upon request. In addition, each Fidelity Central Fund's financial statements, which are not covered by the Fund's Report of Independent Registered Public Accounting Firm, are available on the SEC's website or upon request.
(j) Investment made with cash collateral received from securities on loan.
Additional information on each restricted holding is as follows:
| Security | Acquisition Date | Acquisition Cost |
| Fannie Mae REMIC Trust Series 2001-W3 subordinate REMIC pass thru certificates, Class B3, 7% 9/25/41 | 5/21/03 | $72,239 |
| Fannie Mae REMIC Trust Series 2003-W1 subordinate REMIC pass thru certificates, Class B3, 4.2244% 12/25/42 | 3/25/03 | $66,253 |
| Stanley Martin Communities LLC Class B | 8/3/05 - 3/1/07 | $4,244,623 |
Affiliated Central Funds
Information regarding fiscal year to date income earned by the Fund from investments in Fidelity Central Funds is as follows:
| Fund | Income earned |
| Fidelity Cash Central Fund | $276,541 |
| Fidelity Securities Lending Cash Central Fund | 12,966 |
| Total | $289,507 |
Other Affiliated Issuers
An affiliated company is a company in which the Fund has ownership of at least 5% of the voting securities. Fiscal year to date transactions with companies which are or were affiliates are as follows:
| Affiliate | Value, beginning of period | Purchases | Sales Proceeds | Dividend Income | Value, end of period |
| Acadia Realty Trust (SBI) | $119,299,759 | $826,274 | $-- | $1,870,757 | $128,067,631 |
| Arbor Realty Trust, Inc. | 20,991,789 | -- | 75,982 | 920,693 | 20,002,767 |
| Arbor Realty Trust, Inc. 7.375% | 10,597,189 | -- | -- | 396,964 | 9,714,449 |
| Arbor Realty Trust, Inc. Series A, 8.25% | 4,814,206 | -- | -- | 194,998 | 4,350,938 |
| Arbor Realty Trust, Inc. Series B, 7.75% | 5,940,000 | -- | -- | 232,500 | 5,143,200 |
| Arbor Realty Trust, Inc. Series C, 8.50% | 2,578,000 | -- | -- | 106,250 | 2,380,000 |
| Total | $164,220,943 | $826,274 | $75,982 | $3,722,162 | $169,658,985 |
Investment Valuation
The following is a summary of the inputs used, as of January 31, 2016, involving the Fund's assets and liabilities carried at fair value. The inputs or methodology used for valuing securities may not be an indication of the risk associated with investing in those securities. For more information on valuation inputs, and their aggregation into the levels used below, please refer to the Investment Valuation section in the accompanying Notes to Financial Statements.
| | Valuation Inputs at Reporting Date: |
| Description | Total | Level 1 | Level 2 | Level 3 |
| Investments in Securities: | | | | |
| Equities: | | | | |
| Consumer Discretionary | $5,586,643 | $-- | $-- | $5,586,643 |
| Financials | 2,081,150,071 | 2,045,965,022 | 35,185,047 | 2 |
| Corporate Bonds | 740,748,355 | -- | 740,748,355 | -- |
| Asset-Backed Securities | 88,839,742 | -- | 84,316,452 | 4,523,290 |
| Collateralized Mortgage Obligations | 9,493,426 | -- | 9,164,040 | 329,386 |
| Commercial Mortgage Securities | 574,426,162 | -- | 574,404,746 | 21,416 |
| Bank Loan Obligations | 278,901,531 | -- | 262,454,064 | 16,447,467 |
| Preferred Securities | 236,808 | -- | -- | 236,808 |
| Money Market Funds | 316,269,348 | 316,269,348 | -- | -- |
| Total Investments in Securities: | $4,095,652,086 | $2,362,234,370 | $1,706,272,704 | $27,145,012 |
Other Information
The composition of credit quality ratings as a percentage of Total Net Assets is as follows (Unaudited):
| U.S. Government and U.S. Government Agency Obligations | 0.3% |
| AAA,AA,A | 3.2% |
| BBB | 7.7% |
| BB | 10.2% |
| B | 9.9% |
| CCC,CC,C | 0.8% |
| D | 0.0% |
| Not Rated | 9.2% |
| Equities | 50.9% |
| Short-Term Investments and Net Other Assets | 7.8% |
| | 100.0% |
We have used ratings from Moody's Investors Service, Inc. Where Moody's® ratings are not available, we have used S&P® ratings. All ratings are as of the date indicated and do not reflect subsequent changes.
See accompanying notes which are an integral part of the financial statements.
Financial Statements
Statement of Assets and Liabilities
| | | January 31, 2016 |
| Assets | | |
Investment in securities, at value (including securities loaned of $830,672) — See accompanying schedule:
Unaffiliated issuers (cost $3,629,713,380) | $3,609,723,753 | |
| Fidelity Central Funds (cost $316,269,348) | 316,269,348 | |
| Other affiliated issuers (cost $125,719,318) | 169,658,985 | |
| Total Investments (cost $4,071,702,046) | | $4,095,652,086 |
| Cash | | 406,585 |
| Receivable for investments sold | | 10,498,133 |
| Receivable for fund shares sold | | 6,810,879 |
| Dividends receivable | | 2,831,056 |
| Interest receivable | | 16,631,028 |
| Distributions receivable from Fidelity Central Funds | | 90,835 |
| Prepaid expenses | | 7,239 |
| Other receivables | | 6,404 |
| Total assets | | 4,132,934,245 |
| Liabilities | | |
| Payable for investments purchased | $22,893,903 | |
| Payable for fund shares redeemed | 6,090,145 | |
| Accrued management fee | 1,865,778 | |
| Distribution and service plan fees payable | 336,650 | |
| Other affiliated payables | 895,024 | |
| Other payables and accrued expenses | 93,496 | |
| Collateral on securities loaned, at value | 836,900 | |
| Total liabilities | | 33,011,896 |
| Net Assets | | $4,099,922,349 |
| Net Assets consist of: | | |
| Paid in capital | | $4,058,965,412 |
| Undistributed net investment income | | 5,433,035 |
| Accumulated undistributed net realized gain (loss) on investments and foreign currency transactions | | 11,573,767 |
| Net unrealized appreciation (depreciation) on investments and assets and liabilities in foreign currencies | | 23,950,135 |
| Net Assets | | $4,099,922,349 |
| Calculation of Maximum Offering Price | | |
| Class A: | | |
| Net Asset Value and redemption price per share ($502,555,910 ÷ 45,733,048 shares) | | $10.99 |
| Maximum offering price per share (100/96.00 of $10.99) | | $11.45 |
| Class T: | | |
| Net Asset Value and redemption price per share ($55,119,063 ÷ 5,012,997 shares) | | $11.00 |
| Maximum offering price per share (100/96.00 of $11.00) | | $11.46 |
| Class C: | | |
| Net Asset Value and offering price per share ($266,307,883 ÷ 24,437,854 shares)(a) | | $10.90 |
| Real Estate Income: | | |
| Net Asset Value, offering price and redemption price per share ($2,432,269,584 ÷ 220,305,689 shares) | | $11.04 |
| Class I: | | |
| Net Asset Value, offering price and redemption price per share ($843,669,909 ÷ 76,623,780 shares) | | $11.01 |
(a) Redemption price per share is equal to net asset value less any applicable contingent deferred sales charge.
See accompanying notes which are an integral part of the financial statements.
Statement of Operations
| | | Six months ended January 31, 2016 |
| Investment Income | | |
| Dividends (including $3,722,162 earned from other affiliated issuers) | | $57,796,227 |
| Interest | | 54,330,088 |
| Income from Fidelity Central Funds | | 289,507 |
| Total income | | 112,415,822 |
| Expenses | | |
| Management fee | $11,438,256 | |
| Transfer agent fees | 4,677,965 | |
| Distribution and service plan fees | 2,074,923 | |
| Accounting and security lending fees | 666,667 | |
| Custodian fees and expenses | 18,251 | |
| Independent trustees' compensation | 9,217 | |
| Registration fees | 92,142 | |
| Audit | 92,436 | |
| Legal | 8,157 | |
| Miscellaneous | 11,803 | |
| Total expenses before reductions | 19,089,817 | |
| Expense reductions | (38,726) | 19,051,091 |
| Net investment income (loss) | | 93,364,731 |
| Realized and Unrealized Gain (Loss) | | |
| Net realized gain (loss) on: | | |
| Investment securities: | | |
| Unaffiliated issuers | 27,697,024 | |
| Other affiliated issuers | (10,109) | |
| Foreign currency transactions | (103,705) | |
| Total net realized gain (loss) | | 27,583,210 |
Change in net unrealized appreciation (depreciation) on:
Investment securities | (192,848,074) | |
| Assets and liabilities in foreign currencies | 70,075 | |
| Total change in net unrealized appreciation (depreciation) | | (192,777,999) |
| Net gain (loss) | | (165,194,789) |
| Net increase (decrease) in net assets resulting from operations | | $(71,830,058) |
See accompanying notes which are an integral part of the financial statements.
Statement of Changes in Net Assets
| | Six months ended January 31, 2016 | Year ended July 31, 2015 |
| Increase (Decrease) in Net Assets | | |
| Operations | | |
| Net investment income (loss) | $93,364,731 | $200,528,467 |
| Net realized gain (loss) | 27,583,210 | 54,207,307 |
| Change in net unrealized appreciation (depreciation) | (192,777,999) | (52,184,229) |
| Net increase (decrease) in net assets resulting from operations | (71,830,058) | 202,551,545 |
| Distributions to shareholders from net investment income | (122,107,962) | (199,452,326) |
| Distributions to shareholders from net realized gain | (51,815,947) | (75,677,564) |
| Total distributions | (173,923,909) | (275,129,890) |
| Share transactions - net increase (decrease) | 28,537,379 | 215,193,161 |
| Redemption fees | 122,503 | 424,938 |
| Total increase (decrease) in net assets | (217,094,085) | 143,039,754 |
| Net Assets | | |
| Beginning of period | 4,317,016,434 | 4,173,976,680 |
| End of period (including undistributed net investment income of $5,433,035 and undistributed net investment income of $34,176,266, respectively) | $4,099,922,349 | $4,317,016,434 |
See accompanying notes which are an integral part of the financial statements.
Financial Highlights — Fidelity Real Estate Income Fund Class A
| | Six months ended | Years ended July 31, | | | | |
| January 31, | 2016 | 2015 | 2014 | 2013 | 2012 | 2011 |
| Selected Per–Share Data | | | | | | |
| Net asset value, beginning of period | $11.66 | $11.86 | $11.67 | $11.26 | $10.73 | $9.94 |
| Income from Investment Operations | | | | | | |
| Net investment income (loss)A | .25 | .52 | .49 | .54 | .52 | .53 |
| Net realized and unrealized gain (loss) | (.45) | .02 | .44 | .60 | .61 | .76 |
| Total from investment operations | (.20) | .54 | .93 | 1.14 | 1.13 | 1.29 |
| Distributions from net investment income | (.33) | (.52) | (.50) | (.53) | (.51) | (.50) |
| Distributions from net realized gain | (.14) | (.21) | (.24) | (.20) | (.10) | – |
| Total distributions | (.47) | (.74)B | (.74) | (.73) | (.60)C | (.50) |
| Redemption fees added to paid in capitalA,D | – | – | – | – | – | – |
| Net asset value, end of period | $10.99 | $11.66 | $11.86 | $11.67 | $11.26 | $10.73 |
| Total ReturnE,F,G | (1.74)% | 4.65% | 8.49% | 10.45% | 11.24% | 13.27% |
| Ratios to Average Net AssetsH,I | | | | | | |
| Expenses before reductions | 1.03%J | 1.04% | 1.06% | 1.08% | 1.12% | 1.13% |
| Expenses net of fee waivers, if any | 1.03%J | 1.03% | 1.05% | 1.08% | 1.12% | 1.13% |
| Expenses net of all reductions | 1.03%J | 1.03% | 1.05% | 1.07% | 1.11% | 1.12% |
| Net investment income (loss) | 4.36%J | 4.40% | 4.28% | 4.62% | 4.89% | 5.00% |
| Supplemental Data | | | | | | |
| Net assets, end of period (000 omitted) | $502,556 | $495,462 | $442,271 | $378,269 | $137,352 | $60,283 |
| Portfolio turnover rateK | 15%J | 19% | 29% | 26% | 27% | 25% |
A Calculated based on average shares outstanding during the period.
B Total distributions of $.74 per share is comprised of distributions from net investment income of $.523 and distributions from net realized gain of $.212 per share.
C Total distributions of $.60 per share is comprised of distributions from net investment income of $.505 and distributions from net realized gain of $.097 per share.
D Amount represents less than $.005 per share.
E Total returns for periods of less than one year are not annualized.
F Total returns would have been lower if certain expenses had not been reduced during the applicable periods shown.
G Total returns do not include the effect of the sales charges.
H Fees and expenses of any underlying Fidelity Central Funds are not included in the Fund's expense ratio. The Fund indirectly bears its proportionate share of the expenses of any underlying Fidelity Central Funds.
I Expense ratios reflect operating expenses of the class. Expenses before reductions do not reflect amounts reimbursed by the investment adviser or reductions from brokerage service arrangements or reductions from other expense offset arrangements and do not represent the amount paid by the class during periods when reimbursements or reductions occur. Expenses net of fee waivers reflect expenses after reimbursement by the investment adviser but prior to reductions from brokerage service arrangements or other expense offset arrangements. Expenses net of all reductions represent the net expenses paid by the class.
J Annualized
K Amount does not include the portfolio activity of any underlying Fidelity Central Funds.
See accompanying notes which are an integral part of the financial statements.
Financial Highlights — Fidelity Real Estate Income Fund Class T
| | Six months ended | Years ended July 31, | | | | |
| January 31, | 2016 | 2015 | 2014 | 2013 | 2012 | 2011 |
| Selected Per–Share Data | | | | | �� | |
| Net asset value, beginning of period | $11.66 | $11.86 | $11.67 | $11.26 | $10.72 | $9.94 |
| Income from Investment Operations | | | | | | |
| Net investment income (loss)A | .25 | .51 | .49 | .54 | .52 | .52 |
| Net realized and unrealized gain (loss) | (.44) | .02 | .43 | .60 | .62 | .76 |
| Total from investment operations | (.19) | .53 | .92 | 1.14 | 1.14 | 1.28 |
| Distributions from net investment income | (.32) | (.52) | (.50) | (.53) | (.50) | (.50) |
| Distributions from net realized gain | (.14) | (.21) | (.24) | (.20) | (.10) | – |
| Total distributions | (.47)B | (.73) | (.73)C | (.73) | (.60) | (.50) |
| Redemption fees added to paid in capitalA,D | – | – | – | – | – | – |
| Net asset value, end of period | $11.00 | $11.66 | $11.86 | $11.67 | $11.26 | $10.72 |
| Total ReturnE,F,G | (1.67)% | 4.62% | 8.44% | 10.42% | 11.33% | 13.11% |
| Ratios to Average Net AssetsH,I | | | | | | |
| Expenses before reductions | 1.07%J | 1.06% | 1.08% | 1.08% | 1.11% | 1.16% |
| Expenses net of fee waivers, if any | 1.07%J | 1.06% | 1.08% | 1.08% | 1.11% | 1.16% |
| Expenses net of all reductions | 1.07%J | 1.06% | 1.07% | 1.08% | 1.11% | 1.16% |
| Net investment income (loss) | 4.33%J | 4.37% | 4.26% | 4.61% | 4.90% | 4.96% |
| Supplemental Data | | | | | | |
| Net assets, end of period (000 omitted) | $55,119 | $55,424 | $48,164 | $46,198 | $26,143 | $7,626 |
| Portfolio turnover rateK | 15%J | 19% | 29% | 26% | 27% | 25% |
A Calculated based on average shares outstanding during the period.
B Total distributions of $.47 per share is comprised of distributions from net investment income of $.324 and distributions from net realized gain of $.142 per share.
C Total distributions of $.73 per share is comprised of distributions from net investment income of $.496 and distributions from net realized gain of $.236 per share.
D Amount represents less than $.005 per share.
E Total returns for periods of less than one year are not annualized.
F Total returns would have been lower if certain expenses had not been reduced during the applicable periods shown.
G Total returns do not include the effect of the sales charges.
H Fees and expenses of any underlying Fidelity Central Funds are not included in the Fund's expense ratio. The Fund indirectly bears its proportionate share of the expenses of any underlying Fidelity Central Funds.
I Expense ratios reflect operating expenses of the class. Expenses before reductions do not reflect amounts reimbursed by the investment adviser or reductions from brokerage service arrangements or reductions from other expense offset arrangements and do not represent the amount paid by the class during periods when reimbursements or reductions occur. Expenses net of fee waivers reflect expenses after reimbursement by the investment adviser but prior to reductions from brokerage service arrangements or other expense offset arrangements. Expenses net of all reductions represent the net expenses paid by the class.
J Annualized
K Amount does not include the portfolio activity of any underlying Fidelity Central Funds.
See accompanying notes which are an integral part of the financial statements.
See accompanying notes which are an integral part of the financial statements.
Financial Highlights — Fidelity Real Estate Income Fund Class C
| | Six months ended | Years ended July 31, | | | | |
| January 31, | 2016 | 2015 | 2014 | 2013 | 2012 | 2011 |
| Selected Per–Share Data | | | | | | |
| Net asset value, beginning of period | $11.55 | $11.77 | $11.59 | $11.20 | $10.67 | $9.93 |
| Income from Investment Operations | | | | | | |
| Net investment income (loss)A | .20 | .43 | .40 | .45 | .44 | .45 |
| Net realized and unrealized gain (loss) | (.43) | .01 | .43 | .60 | .62 | .74 |
| Total from investment operations | (.23) | .44 | .83 | 1.05 | 1.06 | 1.19 |
| Distributions from net investment income | (.28) | (.45) | (.42) | (.46) | (.43) | (.45) |
| Distributions from net realized gain | (.14) | (.21) | (.24) | (.20) | (.10) | – |
| Total distributions | (.42) | (.66) | (.65)B | (.66) | (.53) | (.45) |
| Redemption fees added to paid in capitalA,C | – | – | – | – | – | – |
| Net asset value, end of period | $10.90 | $11.55 | $11.77 | $11.59 | $11.20 | $10.67 |
| Total ReturnD,E,F | (2.02)% | 3.82% | 7.66% | 9.66% | 10.49% | 12.25% |
| Ratios to Average Net AssetsG,H | | | | | | |
| Expenses before reductions | 1.79%I | 1.79% | 1.79% | 1.81% | 1.87% | 1.89% |
| Expenses net of fee waivers, if any | 1.79%I | 1.78% | 1.79% | 1.81% | 1.87% | 1.89% |
| Expenses net of all reductions | 1.78%I | 1.78% | 1.79% | 1.81% | 1.87% | 1.89% |
| Net investment income (loss) | 3.61%I | 3.65% | 3.54% | 3.88% | 4.14% | 4.23% |
| Supplemental Data | | | | | | |
| Net assets, end of period (000 omitted) | $266,308 | $291,387 | $246,306 | $204,012 | $52,780 | $21,555 |
| Portfolio turnover rateJ | 15%I | 19% | 29% | 26% | 27% | 25% |
A Calculated based on average shares outstanding during the period.
B Total distributions of $.65 per share is comprised of distributions from net investment income of $.417 and distributions from net realized gain of $.236 per share.
C Amount represents less than $.005 per share.
D Total returns for periods of less than one year are not annualized.
E Total returns would have been lower if certain expenses had not been reduced during the applicable periods shown.
F Total returns do not include the effect of the contingent deferred sales charge.
G Fees and expenses of any underlying Fidelity Central Funds are not included in the Fund's expense ratio. The Fund indirectly bears its proportionate share of the expenses of any underlying Fidelity Central Funds.
H Expense ratios reflect operating expenses of the class. Expenses before reductions do not reflect amounts reimbursed by the investment adviser or reductions from brokerage service arrangements or reductions from other expense offset arrangements and do not represent the amount paid by the class during periods when reimbursements or reductions occur. Expenses net of fee waivers reflect expenses after reimbursement by the investment adviser but prior to reductions from brokerage service arrangements or other expense offset arrangements. Expenses net of all reductions represent the net expenses paid by the class.
I Annualized
J Amount does not include the portfolio activity of any underlying Fidelity Central Funds.
See accompanying notes which are an integral part of the financial statements.
Financial Highlights — Fidelity Real Estate Income Fund
| | Six months ended | Years ended July 31, | | | | |
| January 31, | 2016 | 2015 | 2014 | 2013 | 2012 | 2011 |
| Selected Per–Share Data | | | | | | |
| Net asset value, beginning of period | $11.71 | $11.91 | $11.71 | $11.29 | $10.75 | $9.95 |
| Income from Investment Operations | | | | | | |
| Net investment income (loss)A | .26 | .54 | .52 | .57 | .54 | .55 |
| Net realized and unrealized gain (loss) | (.45) | .02 | .44 | .60 | .62 | .76 |
| Total from investment operations | (.19) | .56 | .96 | 1.17 | 1.16 | 1.31 |
| Distributions from net investment income | (.34) | (.55) | (.53) | (.55) | (.52) | (.51) |
| Distributions from net realized gain | (.14) | (.21) | (.24) | (.20) | (.10) | – |
| Total distributions | (.48) | (.76) | (.76)B | (.75) | (.62) | (.51) |
| Redemption fees added to paid in capitalA,C | – | – | – | – | – | – |
| Net asset value, end of period | $11.04 | $11.71 | $11.91 | $11.71 | $11.29 | $10.75 |
| Total ReturnD,E | (1.61)% | 4.84% | 8.78% | 10.71% | 11.50% | 13.41% |
| Ratios to Average Net AssetsF,G | | | | | | |
| Expenses before reductions | .84%H | .83% | .83% | .84% | .90% | .92% |
| Expenses net of fee waivers, if any | .84%H | .82% | .83% | .84% | .89% | .92% |
| Expenses net of all reductions | .84%H | .82% | .83% | .84% | .89% | .92% |
| Net investment income (loss) | 4.55%H | 4.61% | 4.50% | 4.85% | 5.12% | 5.21% |
| Supplemental Data | | | | | | |
| Net assets, end of period (000 omitted) | $2,432,270 | $2,561,268 | $2,627,382 | $2,884,545 | $2,252,149 | $1,660,063 |
| Portfolio turnover rateI | 15%H | 19% | 29% | 26% | 27% | 25% |
A Calculated based on average shares outstanding during the period.
B Total distributions of $.76 per share is comprised of distributions from net investment income of $.525 and distributions from net realized gain of $.236 per share.
C Amount represents less than $.005 per share.
D Total returns for periods of less than one year are not annualized.
E Total returns would have been lower if certain expenses had not been reduced during the applicable periods shown.
F Fees and expenses of any underlying Fidelity Central Funds are not included in the Fund's expense ratio. The Fund indirectly bears its proportionate share of the expenses of any underlying Fidelity Central Funds.
G Expense ratios reflect operating expenses of the class. Expenses before reductions do not reflect amounts reimbursed by the investment adviser or reductions from brokerage service arrangements or reductions from other expense offset arrangements and do not represent the amount paid by the class during periods when reimbursements or reductions occur. Expenses net of fee waivers reflect expenses after reimbursement by the investment adviser but prior to reductions from brokerage service arrangements or other expense offset arrangements. Expenses net of all reductions represent the net expenses paid by the class.
H Annualized
I Amount does not include the portfolio activity of any underlying Fidelity Central Funds.
See accompanying notes which are an integral part of the financial statements.
Financial Highlights — Fidelity Real Estate Income Fund Class I
| | Six months ended | Years ended July 31, | | | | |
| January 31, | 2016 | 2015 | 2014 | 2013 | 2012 | 2011 |
| Selected Per–Share Data | | | | | | |
| Net asset value, beginning of period | $11.68 | $11.88 | $11.69 | $11.28 | $10.74 | $9.95 |
| Income from Investment Operations | | | | | | |
| Net investment income (loss)A | .26 | .55 | .52 | .57 | .55 | .55 |
| Net realized and unrealized gain (loss) | (.44) | .02 | .44 | .60 | .62 | .76 |
| Total from investment operations | (.18) | .57 | .96 | 1.17 | 1.17 | 1.31 |
| Distributions from net investment income | (.34) | (.55) | (.53) | (.56) | (.53) | (.52) |
| Distributions from net realized gain | (.14) | (.21) | (.24) | (.20) | (.10) | – |
| Total distributions | (.49)B | (.77)C | (.77) | (.76) | (.63) | (.52) |
| Redemption fees added to paid in capitalA,D | – | – | – | – | – | – |
| Net asset value, end of period | $11.01 | $11.68 | $11.88 | $11.69 | $11.28 | $10.74 |
| Total ReturnE,F | (1.58)% | 4.92% | 8.76% | 10.72% | 11.62% | 13.44% |
| Ratios to Average Net AssetsG,H | | | | | | |
| Expenses before reductions | .77%I | .77% | .78% | .80% | .84% | .89% |
| Expenses net of fee waivers, if any | .77%I | .77% | .78% | .80% | .84% | .89% |
| Expenses net of all reductions | .77%I | .77% | .78% | .80% | .84% | .89% |
| Net investment income (loss) | 4.62%I | 4.66% | 4.55% | 4.89% | 5.17% | 5.24% |
| Supplemental Data | | | | | | |
| Net assets, end of period (000 omitted) | $843,670 | $913,475 | $809,854 | $610,045 | $217,435 | $43,282 |
| Portfolio turnover rateJ | 15%I | 19% | 29% | 26% | 27% | 25% |
A Calculated based on average shares outstanding during the period.
B Total distributions of $.49 per share is comprised of distributions from net investment income of $.344 and distributions from net realized gain of $.142 per share.
C Total distributions of $.77 per share is comprised of distributions from net investment income of $.554 and distributions from net realized gain of $.212 per share.
D Amount represents less than $.005 per share.
E Total returns for periods of less than one year are not annualized.
F Total returns would have been lower if certain expenses had not been reduced during the applicable periods shown.
G Fees and expenses of any underlying Fidelity Central Funds are not included in the Fund's expense ratio. The Fund indirectly bears its proportionate share of the expenses of any underlying Fidelity Central Funds.
H Expense ratios reflect operating expenses of the class. Expenses before reductions do not reflect amounts reimbursed by the investment adviser or reductions from brokerage service arrangements or reductions from other expense offset arrangements and do not represent the amount paid by the class during periods when reimbursements or reductions occur. Expenses net of fee waivers reflect expenses after reimbursement by the investment adviser but prior to reductions from brokerage service arrangements or other expense offset arrangements. Expenses net of all reductions represent the net expenses paid by the class.
I Annualized
J Amount does not include the portfolio activity of any underlying Fidelity Central Funds.
See accompanying notes which are an integral part of the financial statements.
Notes to Financial Statements
For the period ended January 31, 2016
1. Organization.
Fidelity Real Estate Income Fund (the Fund) is a fund of Fidelity Securities Fund (the Trust) and is authorized to issue an unlimited number of shares. The Trust is registered under the Investment Company Act of 1940, as amended (the 1940 Act), as an open-end management investment company organized as a Massachusetts business trust. The Fund offers Class A, Class T, Class C, Real Estate Income and Class I shares, each of which has equal rights as to assets and voting privileges. Each class has exclusive voting rights with respect to matters that affect that class.
2. Investments in Fidelity Central Funds.
The Fund invests in Fidelity Central Funds, which are open-end investment companies generally available only to other investment companies and accounts managed by the investment adviser and its affiliates. The Fund's Schedule of Investments lists each of the Fidelity Central Funds held as of period end, if any, as an investment of the Fund, but does not include the underlying holdings of each Fidelity Central Fund. As an Investing Fund, the Fund indirectly bears its proportionate share of the expenses of the underlying Fidelity Central Funds.
The Money Market Central Funds seek preservation of capital and current income and are managed by Fidelity Investments Money Management, Inc. (FIMM), an affiliate of the investment adviser. Annualized expenses of the Money Market Central Funds as of their most recent shareholder report date are less than .005%.
A complete unaudited list of holdings for each Fidelity Central Fund is available upon request or at the Securities and Exchange Commission (the SEC) website at www.sec.gov. In addition, the financial statements of the Fidelity Central Funds, which are not covered by the Fund's Report of Independent Registered Public Accounting Firm, are available on the SEC website or upon request.
3. Significant Accounting Policies.
The financial statements have been prepared in conformity with accounting principles generally accepted in the United States of America (GAAP), which require management to make certain estimates and assumptions at the date of the financial statements. Actual results could differ from those estimates. Subsequent events, if any, through the date that the financial statements were issued have been evaluated in the preparation of the financial statements. The following summarizes the significant accounting policies of the Fund:
Investment Valuation. Investments are valued as of 4:00 p.m. Eastern time on the last calendar day of the period. The Board of Trustees (the Board) has delegated the day to day responsibility for the valuation of the Fund's investments to the Fidelity Management & Research Company (FMR) Fair Value Committee (the Committee). In accordance with valuation policies and procedures approved by the Board, the Fund attempts to obtain prices from one or more third party pricing vendors or brokers to value its investments. When current market prices, quotations or currency exchange rates are not readily available or reliable, investments will be fair valued in good faith by the Committee, in accordance with procedures adopted by the Board. Factors used in determining fair value vary by investment type and may include market or investment specific events, changes in interest rates and credit quality. The frequency with which these procedures are used cannot be predicted and they may be utilized to a significant extent. The Committee oversees the Fund's valuation policies and procedures and reports to the Board on the Committee's activities and fair value determinations. The Board monitors the appropriateness of the procedures used in valuing the Fund's investments and ratifies the fair value determinations of the Committee.
The Fund categorizes the inputs to valuation techniques used to value its investments into a disclosure hierarchy consisting of three levels as shown below:
- Level 1 – quoted prices in active markets for identical investments
- Level 2 – other significant observable inputs (including quoted prices for similar investments, interest rates, prepayment speeds, etc.)
- Level 3 – unobservable inputs (including the Fund's own assumptions based on the best information available)
Valuation techniques used to value the Fund's investments by major category are as follows:
Equity securities, including restricted securities, for which market quotations are readily available, are valued at the last reported sale price or official closing price as reported by a third party pricing vendor on the primary market or exchange on which they are traded and are categorized as Level 1 in the hierarchy. In the event there were no sales during the day or closing prices are not available, securities are valued at the last quoted bid price or may be valued using the last available price and are generally categorized as Level 2 in the hierarchy. For foreign equity securities, when market or security specific events arise, comparisons to the valuation of American Depositary Receipts (ADRs), futures contracts, Exchange-Traded Funds (ETFs) and certain indexes as well as quoted prices for similar securities may be used and would be categorized as Level 2 in the hierarchy. Utilizing these techniques may result in transfers between Level 1 and Level 2. For equity securities, including restricted securities, where observable inputs are limited, assumptions about market activity and risk are used and these securities may be categorized as Level 3 in the hierarchy.
Debt securities, including restricted securities, are valued based on evaluated prices received from third party pricing vendors or from brokers who make markets in such securities. Corporate bonds, bank loan obligations and preferred securities are valued by pricing vendors who utilize matrix pricing which considers yield or price of bonds of comparable quality, coupon, maturity and type or by broker-supplied prices. Asset backed securities, collateralized mortgage obligations and commercial mortgage securities are valued by pricing vendors who utilize matrix pricing which considers prepayment speed assumptions, attributes of the collateral, yield or price of bonds of comparable quality, coupon, maturity and type or by broker-supplied prices. When independent prices are unavailable or unreliable, debt securities may be valued utilizing pricing methodologies which consider similar factors that would be used by third party pricing vendors. Debt securities are generally categorized as Level 2 in the hierarchy but may be Level 3 depending on the circumstances.
Investments in open-end mutual funds, including the Fidelity Central Funds, are valued at their closing net asset value (NAV) each business day and are categorized as Level 1 in the hierarchy.
Changes in valuation techniques may result in transfers in or out of an assigned level within the disclosure hierarchy. The aggregate value of investments by input level as of January 31, 2016, is included at the end of the Fund's Schedule of Investments.
Foreign Currency. The Fund may use foreign currency contracts to facilitate transactions in foreign-denominated securities. Gains and losses from these transactions may arise from changes in the value of the foreign currency or if the counterparties do not perform under the contracts' terms.
Foreign-denominated assets, including investment securities, and liabilities are translated into U.S. dollars at the exchange rates at period end. Purchases and sales of investment securities, income and dividends received and expenses denominated in foreign currencies are translated into U.S. dollars at the exchange rate in effect on the transaction date.
The effects of exchange rate fluctuations on investments are included with the net realized and unrealized gain (loss) on investment securities. Other foreign currency transactions resulting in realized and unrealized gain (loss) are disclosed separately.
Investment Transactions and Income. For financial reporting purposes, the Fund's investment holdings and NAV include trades executed through the end of the last business day of the period. The NAV per share for processing shareholder transactions is calculated as of the close of business of the New York Stock Exchange (NYSE), normally 4:00 p.m. Eastern time and includes trades executed through the end of the prior business day. Gains and losses on securities sold are determined on the basis of identified cost. Dividend income is recorded on the ex-dividend date, except for certain dividends from foreign securities where the ex-dividend date may have passed, which are recorded as soon as the Fund is informed of the ex-dividend date. Non-cash dividends included in dividend income, if any, are recorded at the fair market value of the securities received. Income and capital gain distributions from Fidelity Central Funds, if any, are recorded on the ex-dividend date. Distributions received on securities that represent a return of capital or capital gain are recorded as a reduction of cost of investments and/or as a realized gain. Subsequent to ex-dividend date the Fund determines the components of these distributions, based upon receipt of tax filings or other correspondence relating to the underlying investment. Interest income is accrued as earned and includes coupon interest and amortization of premium and accretion of discount on debt securities as applicable. For certain lower credit quality securitized assets that have contractual cash flows (for example, asset backed securities, collateralized mortgage obligations and commercial mortgage-backed securities), changes in estimated cash flows are periodically evaluated and the estimated yield is adjusted on a prospective basis, resulting in increases or decreases to Interest Income in the accompanying Statement of Operations. Investment income is recorded net of foreign taxes withheld where recovery of such taxes is uncertain. Debt obligations may be placed on non-accrual status and related interest income may be reduced by ceasing current accruals and writing off interest receivables when the collection of all or a portion of interest has become doubtful based on consistently applied procedures. A debt obligation is removed from non-accrual status when the issuer resumes interest payments or when collectability of interest is reasonably assured.
Class Allocations and Expenses. Investment income, realized and unrealized capital gains and losses, common expenses of the Fund, and certain fund-level expense reductions, if any, are allocated daily on a pro-rata basis to each class based on the relative net assets of each class to the total net assets of the Fund. Each class differs with respect to transfer agent and distribution and service plan fees incurred. Certain expense reductions may also differ by class. For the reporting period, the allocated portion of income and expenses to each class as a percent of its average net assets may vary due to the timing of recording these transactions in relation to fluctuating net assets of the classes. Expenses directly attributable to a fund are charged to that fund. Expenses attributable to more than one fund are allocated among the respective funds on the basis of relative net assets or other appropriate methods. Expense estimates are accrued in the period to which they relate and adjustments are made when actual amounts are known.
Income Tax Information and Distributions to Shareholders. Each year, the Fund intends to qualify as a regulated investment company under Subchapter M of the Internal Revenue Code, including distributing substantially all of its taxable income and realized gains. As a result, no provision for U.S. Federal income taxes is required. The Fund files a U.S. federal tax return, in addition to state and local tax returns as required. The Fund's federal income tax returns are subject to examination by the Internal Revenue Service (IRS) for a period of three fiscal years after they are filed. State and local tax returns may be subject to examination for an additional fiscal year depending on the jurisdiction. Foreign taxes are provided for based on the Fund's understanding of the tax rules and rates that exist in the foreign markets in which it invests.
Distributions are declared and recorded on the ex-dividend date. Income dividends and capital gain distributions are declared separately for each class. Income and capital gain distributions are determined in accordance with income tax regulations, which may differ from GAAP.
Capital accounts within the financial statements are adjusted for permanent book-tax differences. These adjustments have no impact on net assets or the results of operations. Capital accounts are not adjusted for temporary book-tax differences which will reverse in a subsequent period.
Book-tax differences are primarily due to foreign currency transactions, passive foreign investment companies (PFIC), market discount, equity-debt classifications, certain conversion ratio adjustments, partnerships and losses deferred due to wash sales.
The federal tax cost of investment securities and unrealized appreciation (depreciation) as of period end were as follows:
| Gross unrealized appreciation | $334,852,544 |
| Gross unrealized depreciation | (312,097,638) |
| Net unrealized appreciation (depreciation) on securities | $22,754,906 |
| Tax cost | $4,072,897,180 |
Short-Term Trading (Redemption) Fees. Shares held by investors in the Fund less than 90 days may have been subject to a redemption fee equal to .75% of the NAV of shares redeemed. All redemption fees, which reduce the proceeds of the shareholder redemption, are retained by the Fund and accounted for as an addition to paid in capital.
Restricted Securities. The Fund may invest in securities that are subject to legal or contractual restrictions on resale. These securities generally may be resold in transactions exempt from registration or to the public if the securities are registered. Disposal of these securities may involve time-consuming negotiations and expense, and prompt sale at an acceptable price may be difficult. Information regarding restricted securities is included at the end of the Fund's Schedule of Investments.
Loans and Other Direct Debt Instruments. The Fund invests in direct debt instruments which are interests in amounts owed to lenders by corporate or other borrowers. These instruments may be in the form of loans, trade claims or other receivables and may include standby financing commitments such as revolving credit facilities that obligate the Fund to supply additional cash to the borrower on demand. Loans may be acquired through assignment or participation. The Fund did not have any unfunded loan commitments, which are contractual obligations for future funding, at period end.
4. Purchases and Sales of Investments.
Purchases and sales of securities, other than short-term securities and U.S. government securities, aggregated $297,303,556 and $387,535,386, respectively.
5. Fees and Other Transactions with Affiliates.
Management Fee. Fidelity Management & Research Company (the investment adviser) and its affiliates provide the Fund with investment management related services for which the Fund pays a monthly management fee. The management fee is the sum of an individual fund fee rate that is based on an annual rate of .30% of the Fund's average net assets and an annualized group fee rate that averaged .25% during the period. The group fee rate is based upon the average net assets of all the mutual funds advised by the investment adviser, including any mutual funds previously advised by the investment adviser that are currently advised by Fidelity SelectCo, LLC, an affiliate of the investment adviser. The group fee rate decreases as assets under management increase and increases as assets under management decrease. For the reporting period, the total annualized management fee rate was .55% of the Fund's average net assets.
Distribution and Service Plan Fees. In accordance with Rule 12b-1 of the 1940 Act, the Fund has adopted separate Distribution and Service Plans for each class of shares. Certain classes pay Fidelity Distributors Corporation (FDC), an affiliate of the investment adviser, separate Distribution and Service Fees, each of which is based on an annual percentage of each class' average net assets. In addition, FDC may pay financial intermediaries for selling shares of the Fund and providing shareholder support services. For the period, the Distribution and Service Fee rates, total fees and amounts retained by FDC were as follows:
| | Distribution
Fee | Service
Fee | Total Fees | Retained
by FDC |
| Class A | -% | .25% | $606,187 | $4,643 |
| Class T | -% | .25% | 69,476 | – |
| Class C | .75% | .25% | 1,399,260 | 254,178 |
| | | | $2,074,923 | $258,821 |
Sales Load. FDC may receive a front-end sales charge of up to 4.00% for selling Class A shares and Class T shares, some of which is paid to financial intermediaries for selling shares of the Fund. Depending on the holding period, FDC may receive contingent deferred sales charges levied on Class A, Class T, and Class C redemptions. The deferred sales charges are 1.00% for Class C shares, 1.00% for certain purchases of Class A shares and .25% for certain purchases of Class T shares.
For the period, sales charge amounts retained by FDC were as follows:
| | Retained
by FDC |
| Class A | $36,180 |
| Class T | 4,664 |
| Class C(a) | 17,718 |
| | $58,562 |
(a) When Class C shares are initially sold, FDC pays commissions from its own resources to financial intermediaries through which the sales are made.
Transfer Agent Fees. Fidelity Investments Institutional Operations Company, Inc., (FIIOC), an affiliate of the investment adviser, is the transfer, dividend disbursing and shareholder servicing agent for each class of the Fund. FIIOC receives account fees and asset-based fees that vary according to the account size and type of account of the shareholders of the respective classes of the Fund. FIIOC pays for typesetting, printing and mailing of shareholder reports, except proxy statements.
For the period, transfer agent fees for each class were as follows:
| | Amount | % of
Class-Level Average
Net Assets(a) |
| Class A | $465,764 | .19 |
| Class T | 62,806 | .23 |
| Class C | 272,734 | .19 |
| Real Estate Income | 3,114,175 | .25 |
| Class I | 762,486 | .18 |
| | $ 4,677,965 | |
(a) Annualized
Accounting and Security Lending Fees. Fidelity Service Company, Inc. (FSC), an affiliate of the investment adviser, maintains the Fund's accounting records. The accounting fee is based on the level of average net assets for each month. Under a separate contract, FSC administers the security lending program. The security lending fee is based on the number and duration of lending transactions.
Brokerage Commissions. The Fund placed a portion of its portfolio transactions with brokerage firms which are affiliates of the investment adviser. Brokerage commissions are included in net realized gain (loss) and change in net unrealized appreciation (depreciation) in the Statement of Operations. The commissions paid to these affiliated firms were $4,734 for the period.
Interfund Trades. The Fund may purchase from or sell securities to other Fidelity Funds under procedures adopted by the Board. The procedures have been designed to ensure these interfund trades are executed in accordance with Rule 17a-7 of the 1940 Act. Interfund trades are included within the respective purchases and sales amounts shown in the Purchases and Sales of Investments note.
6. Committed Line of Credit.
The Fund participates with other funds managed by the investment adviser or an affiliate in a $4.25 billion credit facility (the "line of credit") to be utilized for temporary or emergency purposes to fund shareholder redemptions or for other short-term liquidity purposes. The Fund has agreed to pay commitment fees on its pro-rata portion of the line of credit, which amounted to $2,805 and is reflected in Miscellaneous expenses on the Statement of Operations. During the period, the Fund did not borrow on this line of credit.
7. Security Lending.
The Fund lends portfolio securities through a lending agent from time to time in order to earn additional income. For equity securities, a lending agent is used and may loan securities to certain qualified borrowers, including Fidelity Capital Markets (FCM), a broker-dealer affiliated with the Fund. On the settlement date of the loan, the Fund receives collateral (in the form of U.S. Treasury obligations, letters of credit and/or cash) against the loaned securities and maintains collateral in an amount not less than 100% of the market value of the loaned securities during the period of the loan. The market value of the loaned securities is determined at the close of business of the Fund and any additional required collateral is delivered to the Fund on the next business day. The Fund or borrower may terminate the loan at any time, and if the borrower defaults on its obligation to return the securities loaned because of insolvency or other reasons, the Fund may apply collateral received from the borrower against the obligation. The Fund may experience delays and costs in recovering the securities loaned. Any cash collateral received is invested in the Fidelity Securities Lending Cash Central Fund. The value of loaned securities and cash collateral at period end are disclosed on the Fund's Statement of Assets and Liabilities. Security lending income represents the income earned on investing cash collateral, less rebates paid to borrowers and any lending agent fees associated with the loan, plus any premium payments received for lending certain types of securities. Security lending income is presented in the Statement of Operations as a component of income from Fidelity Central Funds. Total security lending income during the period amounted to $12,966. During the period, there were no securities loaned to FCM.
8. Expense Reductions.
Commissions paid to certain brokers with whom the investment adviser, or its affiliates, places trades on behalf of the Fund include an amount in addition to trade execution, which may be rebated back to the Fund to offset certain expenses. This amount totaled $22,145 for the period. In addition, through arrangements with the Fund's custodian, credits realized as a result of certain uninvested cash balances were used to reduce the Fund's expenses. During the period, these credits reduced the Fund's custody expenses by $1,735.
In addition, during the period the investment adviser reimbursed and/or waived a portion of fund-level operating expenses in the amount of $14,846.
9. Distributions to Shareholders.
Distributions to shareholders of each class were as follows:
| | Six months ended January 31, 2016 | Year ended July 31, 2015 |
| From net investment income | | |
| Class A | $13,783,244 | $21,010,715 |
| Class T | 1,575,598 | 2,305,119 |
| Class C | 6,852,507 | 10,465,476 |
| Real Estate Income | 74,108,924 | 122,206,251 |
| Class I | 25,787,689 | 43,464,765 |
| Total | $122,107,962 | $199,452,326 |
| From net realized gain | | |
| Class A | $6,008,169 | $7,958,848 |
| Class T | 680,042 | 875,220 |
| Class C | 3,527,228 | 4,645,932 |
| Real Estate Income | 30,805,486 | 46,720,433 |
| Class I | 10,795,022 | 15,477,131 |
| Total | $51,815,947 | $75,677,564 |
10. Share Transactions.
Share transactions for each class were as follows and may contain automatic conversions between classes or exchanges between affiliated funds:
| | Shares | Shares | Dollars | Dollars |
| | Six months ended January 31, 2016 | Year ended July 31, 2015 | Six months ended January 31, 2016 | Year ended July 31, 2015 |
| Class A | | | | |
| Shares sold | 8,833,232 | 17,614,783 | $99,136,860 | $207,492,435 |
| Reinvestment of distributions | 1,654,994 | 2,253,682 | 18,423,230 | 26,209,333 |
| Shares redeemed | (7,261,614) | (14,664,043) | (81,991,780) | (171,937,484) |
| Net increase (decrease) | 3,226,612 | 5,204,422 | $35,568,310 | $61,764,284 |
| Class T | | | | |
| Shares sold | 585,301 | 1,551,308 | $6,617,495 | $18,286,948 |
| Reinvestment of distributions | 187,688 | 251,652 | 2,090,146 | 2,927,374 |
| Shares redeemed | (512,341) | (1,110,729) | (5,798,010) | (13,074,996) |
| Net increase (decrease) | 260,648 | 692,231 | $2,909,631 | $8,139,326 |
| Class C | | | | |
| Shares sold | 2,124,908 | 7,875,459 | $23,840,323 | $92,082,413 |
| Reinvestment of distributions | 822,712 | 1,105,279 | 9,089,251 | 12,763,694 |
| Shares redeemed | (3,727,311) | (4,690,719) | (41,694,636) | (54,577,835) |
| Net increase (decrease) | (779,691) | 4,290,019 | $(8,765,062) | $50,268,272 |
| Real Estate Income | | | | |
| Shares sold | 22,973,738 | 51,184,144 | $261,251,386 | $605,520,317 |
| Reinvestment of distributions | 8,268,560 | 12,742,585 | 92,453,420 | 148,826,128 |
| Shares redeemed | (29,628,387) | (65,882,524) | (336,288,502) | (777,479,294) |
| Net increase (decrease) | 1,613,911 | (1,955,795) | $17,416,304 | $(23,132,849) |
| Class I | | | | |
| Shares sold | 16,198,203 | 38,671,974 | $182,574,922 | $455,469,590 |
| Reinvestment of distributions | 2,502,407 | 3,704,065 | 27,905,962 | 43,129,998 |
| Shares redeemed | (20,276,080) | (32,342,580) | (229,072,688) | (380,445,460) |
| Net increase (decrease) | (1,575,470) | 10,033,459 | $(18,591,804) | $118,154,128 |
11. Other.
The Fund's organizational documents provide former and current trustees and officers with a limited indemnification against liabilities arising in connection with the performance of their duties to the Fund. In the normal course of business, the Fund may also enter into contracts that provide general indemnifications. The Fund's maximum exposure under these arrangements is unknown as this would be dependent on future claims that may be made against the Fund. The risk of material loss from such claims is considered remote.
Report of Independent Registered Public Accounting Firm
To the Trustees of Fidelity Securities Fund and the Shareholders of Fidelity Real Estate Income Fund:
We have audited the accompanying statement of assets and liabilities of Fidelity Real Estate Income Fund (the Fund), a fund of Fidelity Securities Fund, including the schedule of investments, as of January 31, 2016, and the related statement of operations for the six months then ended, the statement of changes in net assets for the six months ended January 31, 2016 and for the year ended July 31, 2015, and the financial highlights for the six months ended January 31, 2016 and for each of the five years in the period ended July 31, 2015. These financial statements and financial highlights are the responsibility of the Fund's management. Our responsibility is to express an opinion on these financial statements and financial highlights based on our audits.
We conducted our audits in accordance with the standards of the Public Company Accounting Oversight Board (United States). Those standards require that we plan and perform the audit to obtain reasonable assurance about whether the financial statements and financial highlights are free of material misstatement. The Fund is not required to have, nor were we engaged to perform, an audit of its internal control over financial reporting. Our audits included consideration of internal control over financial reporting as a basis for designing audit procedures that are appropriate in the circumstances, but not for the purpose of expressing an opinion on the effectiveness of the Fund's internal control over financial reporting. Accordingly, we express no such opinion. An audit also includes examining, on a test basis, evidence supporting the amounts and disclosures in the financial statements, assessing the accounting principles used and significant estimates made by management, as well as evaluating the overall financial statement presentation. Our procedures included confirmation of securities owned as of January 31, 2016, by correspondence with the custodians and brokers; when replies were not received from brokers, we performed other auditing procedures. We believe that our audits provide a reasonable basis for our opinion.
In our opinion, such financial statements and financial highlights referred to above present fairly, in all material respects, the financial position of Fidelity Real Estate Income Fund as of January 31, 2016, the results of its operations for the six months then ended, the changes in its net assets for the six months ended January 31, 2016 and for the year ended July 31, 2015, and the financial highlights for the six months ended January 31, 2016 and for each of the five years in the period ended July 31, 2015, in conformity with accounting principles generally accepted in the United States of America.
DELOITTE & TOUCHE LLP
Boston, Massachusetts
March 18, 2016
Shareholder Expense Example
As a shareholder of the Fund, you incur two types of costs: (1) transaction costs, including sales charges (loads) on purchase payments or redemption proceeds, redemption fees and (2) ongoing costs, including management fees, distribution and/or service (12b-1) fees and other Fund expenses. This Example is intended to help you understand your ongoing costs (in dollars) of investing in the Fund and to compare these costs with the ongoing costs of investing in other mutual funds.
The Example is based on an investment of $1,000 invested at the beginning of the period and held for the entire period (August 1, 2015 to January 31, 2016).
Actual Expenses
The first line of the accompanying table for each class of the Fund provides information about actual account values and actual expenses. You may use the information in this line, together with the amount you invested, to estimate the expenses that you paid over the period. Simply divide your account value by $1,000.00 (for example, an $8,600 account value divided by $1,000.00 = 8.6), then multiply the result by the number in the first line for a class of the Fund under the heading entitled "Expenses Paid During Period" to estimate the expenses you paid on your account during this period. A small balance maintenance fee of $12.00 that is charged once a year may apply for certain accounts with a value of less than $2,000. This fee is not included in the table below. If it was, the estimate of expenses you paid during the period would be higher, and your ending account value lower, by this amount. In addition, the Fund, as a shareholder in the underlying Fidelity Central Funds, will indirectly bear its pro-rata share of the fees and expenses incurred by the underlying Fidelity Central Funds. These fees and expenses are not included in the Fund's annualized expense ratio used to calculate the expense estimate in the table below.
Hypothetical Example for Comparison Purposes
The second line of the accompanying table for each class of the Fund provides information about hypothetical account values and hypothetical expenses based on a Class' actual expense ratio and an assumed rate of return of 5% per year before expenses, which is not the Class' actual return. The hypothetical account values and expenses may not be used to estimate the actual ending account balance or expenses you paid for the period. You may use this information to compare the ongoing costs of investing in the Fund and other funds. To do so, compare this 5% hypothetical example with the 5% hypothetical examples that appear in the shareholder reports of the other funds. A small balance maintenance fee of $12.00 that is charged once a year may apply for certain accounts with a value of less than $2,000. This fee is not included in the table below. If it was, the estimate of expenses you paid during the period would be higher, and your ending account value lower, by this amount. In addition, the Fund, as a shareholder in the underlying Fidelity Central Funds, will indirectly bear its pro-rata share of the fees and expenses incurred by the underlying Fidelity Central Funds. These fees and expenses are not included in the Fund's annualized expense ratio used to calculate the expense estimate in the table below.
Please note that the expenses shown in the table are meant to highlight your ongoing costs only and do not reflect any transaction costs. Therefore, the second line of the table is useful in comparing ongoing costs only, and will not help you determine the relative total costs of owning different funds. In addition, if these transactional costs were included, your costs would have been higher.
| | Annualized Expense Ratio-A | Beginning
Account Value
August 1, 2015 | Ending
Account Value
January 31, 2016 | Expenses Paid
During Period-B
August 1, 2015
to January 31, 2016 |
| Class A | 1.03% | | | |
| Actual | | $1,000.00 | $982.60 | $5.13 |
| Hypothetical-C | | $1,000.00 | $1,019.96 | $5.23 |
| Class T | 1.07% | | | |
| Actual | | $1,000.00 | $983.30 | $5.33 |
| Hypothetical-C | | $1,000.00 | $1,019.76 | $5.43 |
| Class C | 1.79% | | | |
| Actual | | $1,000.00 | $979.80 | $8.91 |
| Hypothetical-C | | $1,000.00 | $1,016.14 | $9.07 |
| Real Estate Income | .84% | | | |
| Actual | | $1,000.00 | $983.90 | $4.19 |
| Hypothetical-C | | $1,000.00 | $1,020.91 | $4.27 |
| Class I | .77% | | | |
| Actual | | $1,000.00 | $984.20 | $3.84 |
| Hypothetical-C | | $1,000.00 | $1,021.27 | $3.91 |
A Annualized expense ratio reflects expenses net of applicable fee waivers.
B Expenses are equal to each Class' annualized expense ratio, multiplied by the average account value over the period, multiplied by 184/366 (to reflect the one-half year period).
C 5% return per year before expenses
Corporate Headquarters
245 Summer St.
Boston, MA 02210
www.fidelity.com
REI-SANN-0316
1.789716.112
Fidelity® Dividend Growth Fund
Class K
Semi-Annual Report January 31, 2016 |
|
Contents
To view a fund's proxy voting guidelines and proxy voting record for the 12-month period ended June 30, visit http://www.fidelity.com/proxyvotingresults or visit the Securities and Exchange Commission's (SEC) web site at http://www.sec.gov.
You may also call 1-800-835-5092 to request a free copy of the proxy voting guidelines.
Standard & Poor's, S&P and S&P 500 are registered service marks of The McGraw-Hill Companies, Inc. and have been licensed for use by Fidelity Distributors Corporation.
Other third-party marks appearing herein are the property of their respective owners.
All other marks appearing herein are registered or unregistered trademarks or service marks of FMR LLC or an affiliated company. © 2016 FMR LLC. All rights reserved.
This report and the financial statements contained herein are submitted for the general information of the shareholders of the Fund. This report is not authorized for distribution to prospective investors in the Fund unless preceded or accompanied by an effective prospectus.
A fund files its complete schedule of portfolio holdings with the SEC for the first and third quarters of each fiscal year on Form N-Q. Forms N-Q are available on the SEC’s web site at http://www.sec.gov. A fund's Forms N-Q may be reviewed and copied at the SEC’s Public Reference Room in Washington, DC. Information regarding the operation of the SEC's Public Reference Room may be obtained by calling 1-800-SEC-0330.
For a complete list of a fund's portfolio holdings, view the most recent holdings listing, semiannual report, or annual report on Fidelity's web site at http://www.fidelity.com, http://www.advisor.fidelity.com, or http://www.401k.com, as applicable.
NOT FDIC INSURED •MAY LOSE VALUE •NO BANK GUARANTEE
Neither the Fund nor Fidelity Distributors Corporation is a bank.
Investment Summary (Unaudited)
Top Ten Stocks as of January 31, 2016
| | % of fund's net assets | % of fund's net assets 6 months ago |
| Apple, Inc. | 4.2 | 4.7 |
| Microsoft Corp. | 3.5 | 2.5 |
| Johnson & Johnson | 3.4 | 2.6 |
| General Electric Co. | 2.9 | 2.6 |
| Wells Fargo & Co. | 2.5 | 2.5 |
| JPMorgan Chase & Co. | 2.5 | 2.9 |
| Exxon Mobil Corp. | 2.5 | 2.3 |
| Alphabet, Inc. Class C | 2.4 | 2.5 |
| Medtronic PLC | 2.2 | 2.0 |
| Chevron Corp. | 2.1 | 1.9 |
| | 28.2 | |
Top Five Market Sectors as of January 31, 2016
| | % of fund's net assets | % of fund's net assets 6 months ago |
| Information Technology | 23.0 | 23.3 |
| Financials | 15.7 | 17.3 |
| Consumer Staples | 14.9 | 12.0 |
| Health Care | 13.4 | 15.2 |
| Industrials | 9.6 | 9.6 |
Asset Allocation (% of fund's net assets)
| As of January 31, 2016* |
| | Stocks | 96.7% |
| | Convertible Securities | 0.1% |
| | Short-Term Investments and Net Other Assets (Liabilities) | 3.2% |

* Foreign investments - 15.9%
| As of July 31, 2015* |
| | Stocks | 97.5% |
| | Convertible Securities | 0.1% |
| | Short-Term Investments and Net Other Assets (Liabilities) | 2.4% |

* Foreign investments - 15.5%
Investments January 31, 2016 (Unaudited)
Showing Percentage of Net Assets
| Common Stocks - 96.7% | | | |
| | | Shares | Value (000s) |
| CONSUMER DISCRETIONARY - 9.0% | | | |
| Diversified Consumer Services - 0.8% | | | |
| H&R Block, Inc. | | 1,609,650 | $54,809 |
| Hotels, Restaurants & Leisure - 1.2% | | | |
| Las Vegas Sands Corp. | | 616,500 | 27,804 |
| Wyndham Worldwide Corp. | | 896,491 | 58,182 |
| | | | 85,986 |
| Leisure Products - 0.2% | | | |
| Vista Outdoor, Inc. (a) | | 260,300 | 12,549 |
| Media - 1.7% | | | |
| Altice NV Class A (a) | | 1,519,500 | 21,914 |
| Comcast Corp. Class A | | 1,858,496 | 103,537 |
| | | | 125,451 |
| Multiline Retail - 2.4% | | | |
| Dillard's, Inc. Class A (b) | | 758,900 | 53,434 |
| Target Corp. | | 1,649,500 | 119,457 |
| | | | 172,891 |
| Specialty Retail - 2.2% | | | |
| AutoZone, Inc. (a) | | 79,200 | 60,777 |
| Foot Locker, Inc. | | 1,343,979 | 90,799 |
| Staples, Inc. | | 884,700 | 7,892 |
| | | | 159,468 |
| Textiles, Apparel & Luxury Goods - 0.5% | | | |
| VF Corp. | | 583,100 | 36,502 |
|
| TOTAL CONSUMER DISCRETIONARY | | | 647,656 |
|
| CONSUMER STAPLES - 14.9% | | | |
| Beverages - 5.3% | | | |
| Constellation Brands, Inc. Class A (sub. vtg.) | | 438,200 | 66,817 |
| Dr. Pepper Snapple Group, Inc. | | 669,608 | 62,836 |
| PepsiCo, Inc. | | 1,307,600 | 129,845 |
| The Coca-Cola Co. | | 2,936,038 | 126,015 |
| | | | 385,513 |
| Food & Staples Retailing - 4.0% | | | |
| CVS Health Corp. | | 1,344,200 | 129,836 |
| Kroger Co. | | 1,150,318 | 44,644 |
| Rami Levi Chain Stores Hashikma Marketing 2006 Ltd. | | 556,301 | 24,017 |
| Walgreens Boots Alliance, Inc. | | 1,143,636 | 91,171 |
| | | | 289,668 |
| Food Products - 0.7% | | | |
| Greencore Group PLC | | 6,474,677 | 35,967 |
| Hilton Food Group PLC | | 1,939,905 | 14,488 |
| | | | 50,455 |
| Household Products - 2.1% | | | |
| Procter & Gamble Co. | | 1,812,600 | 148,071 |
| Personal Products - 0.2% | | | |
| Edgewell Personal Care Co. (a) | | 178,800 | 13,233 |
| Tobacco - 2.6% | | | |
| British American Tobacco PLC (United Kingdom) | | 1,013,603 | 56,482 |
| Imperial Tobacco Group PLC | | 956,063 | 51,767 |
| Reynolds American, Inc. | | 1,638,300 | 81,833 |
| | | | 190,082 |
|
| TOTAL CONSUMER STAPLES | | | 1,077,022 |
|
| ENERGY - 6.4% | | | |
| Energy Equipment & Services - 0.1% | | | |
| Baker Hughes, Inc. | | 265,200 | 11,539 |
| Oil, Gas & Consumable Fuels - 6.3% | | | |
| Chevron Corp. | | 1,722,700 | 148,962 |
| Emerald Oil, Inc. warrants 2/4/16 (a) | | 8,559 | 0 |
| Exxon Mobil Corp. | | 2,274,597 | 177,077 |
| Imperial Oil Ltd. | | 1,899,100 | 58,224 |
| Northern Oil & Gas, Inc. (a) | | 1,037,290 | 3,423 |
| PrairieSky Royalty Ltd. (b) | | 971,100 | 13,822 |
| Suncor Energy, Inc. | | 2,209,100 | 52,322 |
| | | | 453,830 |
|
| TOTAL ENERGY | | | 465,369 |
|
| FINANCIALS - 15.7% | | | |
| Banks - 10.8% | | | |
| Bank of America Corp. | | 8,479,217 | 119,896 |
| Citigroup, Inc. | | 2,158,161 | 91,894 |
| JPMorgan Chase & Co. | | 3,046,535 | 181,269 |
| PacWest Bancorp | | 1,236,200 | 45,381 |
| SunTrust Banks, Inc. | | 1,400,000 | 51,212 |
| U.S. Bancorp | | 2,678,069 | 107,283 |
| Wells Fargo & Co. | | 3,613,193 | 181,491 |
| | | | 778,426 |
| Capital Markets - 0.8% | | | |
| Diamond Hill Investment Group, Inc. | | 77,538 | 13,108 |
| Franklin Resources, Inc. | | 646,900 | 22,422 |
| The Blackstone Group LP | | 765,384 | 20,107 |
| | | | 55,637 |
| Consumer Finance - 0.5% | | | |
| American Express Co. | | 631,200 | 33,769 |
| Imperial Holdings, Inc. warrants 4/11/19 (a) | | 48,012 | 24 |
| | | | 33,793 |
| Diversified Financial Services - 1.5% | | | |
| McGraw Hill Financial, Inc. | | 965,827 | 82,115 |
| MSCI, Inc. Class A | | 428,800 | 29,519 |
| | | | 111,634 |
| Insurance - 1.4% | | | |
| Chubb Ltd. | | 632,000 | 71,460 |
| MetLife, Inc. | | 714,900 | 31,920 |
| | | | 103,380 |
| Real Estate Investment Trusts - 0.7% | | | |
| American Tower Corp. | | 576,800 | 54,415 |
|
| TOTAL FINANCIALS | | | 1,137,285 |
|
| HEALTH CARE - 13.4% | | | |
| Biotechnology - 2.3% | | | |
| AbbVie, Inc. | | 1,558,200 | 85,545 |
| Amgen, Inc. | | 535,810 | 81,834 |
| | | | 167,379 |
| Health Care Equipment & Supplies - 2.6% | | | |
| Medtronic PLC | | 2,113,603 | 160,465 |
| The Cooper Companies, Inc. | | 199,584 | 26,175 |
| | | | 186,640 |
| Health Care Providers & Services - 0.7% | | | |
| McKesson Corp. | | 292,858 | 47,144 |
| Health Care Technology - 0.3% | | | |
| CompuGroup Medical AG | | 552,022 | 22,201 |
| Pharmaceuticals - 7.5% | | | |
| Allergan PLC (a) | | 213,100 | 60,612 |
| Astellas Pharma, Inc. | | 2,833,000 | 39,227 |
| Johnson & Johnson | | 2,356,043 | 246,065 |
| Sanofi SA sponsored ADR | | 1,269,900 | 52,879 |
| Shire PLC | | 457,100 | 25,640 |
| Teva Pharmaceutical Industries Ltd. sponsored ADR | | 1,974,300 | 121,380 |
| | | | 545,803 |
|
| TOTAL HEALTH CARE | | | 969,167 |
|
| INDUSTRIALS - 9.6% | | | |
| Aerospace & Defense - 2.4% | | | |
| BWX Technologies, Inc. | | 2,487,600 | 74,479 |
| General Dynamics Corp. | | 221,200 | 29,590 |
| The Boeing Co. | | 550,100 | 66,084 |
| | | | 170,153 |
| Air Freight & Logistics - 0.4% | | | |
| C.H. Robinson Worldwide, Inc. | | 473,300 | 30,656 |
| Commercial Services & Supplies - 0.1% | | | |
| Deluxe Corp. | | 176,900 | 9,889 |
| Construction & Engineering - 0.1% | | | |
| Astaldi SpA | | 1,098,700 | 5,536 |
| Electrical Equipment - 0.8% | | | |
| AMETEK, Inc. | | 1,020,000 | 47,991 |
| EnerSys | | 176,900 | 8,567 |
| | | | 56,558 |
| Industrial Conglomerates - 5.7% | | | |
| Danaher Corp. | | 1,275,892 | 110,556 |
| General Electric Co. | | 7,077,900 | 205,967 |
| Roper Technologies, Inc. | | 538,544 | 94,606 |
| | | | 411,129 |
| Professional Services - 0.1% | | | |
| CEB, Inc. | | 163,600 | 9,649 |
|
| TOTAL INDUSTRIALS | | | 693,570 |
|
| INFORMATION TECHNOLOGY - 23.0% | | | |
| Communications Equipment - 2.7% | | | |
| Cisco Systems, Inc. | | 4,458,986 | 106,079 |
| Qualcomm, Inc. | | 1,899,283 | 86,113 |
| | | | 192,192 |
| Electronic Equipment & Components - 0.5% | | | |
| TE Connectivity Ltd. | | 584,494 | 33,410 |
| Internet Software & Services - 2.4% | | | |
| Alphabet, Inc. Class C | | 232,406 | 172,666 |
| IT Services - 5.4% | | | |
| Accenture PLC Class A | | 1,201,000 | 126,754 |
| ASAC II LP (a)(c) | | 2,514,134 | 59,897 |
| Fidelity National Information Services, Inc. | | 882,650 | 52,721 |
| IBM Corp. | | 594,300 | 74,163 |
| Leidos Holdings, Inc. | | 541,900 | 24,992 |
| Total System Services, Inc. | | 1,059,500 | 42,550 |
| Xerox Corp. | | 1,145,900 | 11,173 |
| | | | 392,250 |
| Software - 6.0% | | | |
| Activision Blizzard, Inc. | | 1,709,717 | 59,532 |
| Micro Focus International PLC | | 1,907,363 | 37,779 |
| Microsoft Corp. | | 4,547,016 | 250,495 |
| Oracle Corp. | | 2,433,460 | 88,359 |
| | | | 436,165 |
| Technology Hardware, Storage & Peripherals - 6.0% | | | |
| Apple, Inc. | | 3,127,618 | 304,443 |
| EMC Corp. | | 3,230,700 | 80,024 |
| HP, Inc. | | 3,446,600 | 33,466 |
| Western Digital Corp. | | 369,400 | 17,724 |
| | | | 435,657 |
|
| TOTAL INFORMATION TECHNOLOGY | | | 1,662,340 |
|
| MATERIALS - 2.8% | | | |
| Chemicals - 2.4% | | | |
| CF Industries Holdings, Inc. | | 1,004,800 | 30,144 |
| E.I. du Pont de Nemours & Co. | | 1,163,900 | 61,407 |
| LyondellBasell Industries NV Class A | | 799,000 | 62,298 |
| PPG Industries, Inc. | | 223,600 | 21,269 |
| | | | 175,118 |
| Containers & Packaging - 0.4% | | | |
| Ball Corp. | | 360,100 | 24,065 |
|
| TOTAL MATERIALS | | | 199,183 |
|
| TELECOMMUNICATION SERVICES - 1.9% | | | |
| Diversified Telecommunication Services - 1.9% | | | |
| AT&T, Inc. | | 3,831,300 | 138,157 |
| TOTAL COMMON STOCKS | | | |
| (Cost $6,259,314) | | | 6,989,749 |
| | | Principal Amount (000s) | Value (000s) |
|
| Convertible Bonds - 0.1% | | | |
| ENERGY - 0.1% | | | |
| Oil, Gas & Consumable Fuels - 0.1% | | | |
Amyris, Inc. 3% 2/27/17
(Cost $7,356) | | 7,356 | 6,779 |
| | | Shares | Value (000s) |
|
| Money Market Funds - 3.6% | | | |
| Fidelity Cash Central Fund, 0.38% (d) | | 232,465,069 | 232,465 |
| Fidelity Securities Lending Cash Central Fund, 0.42% (d)(e) | | 25,057,121 | 25,057 |
| TOTAL MONEY MARKET FUNDS | | | |
| (Cost $257,522) | | | 257,522 |
| TOTAL INVESTMENT PORTFOLIO - 100.4% | | | |
| (Cost $6,524,192) | | | 7,254,050 |
| NET OTHER ASSETS (LIABILITIES) - (0.4)% | | | (25,635) |
| NET ASSETS - 100% | | | $7,228,415 |
Values shown as $0 may reflect amounts less than $500.
Legend
(a) Non-income producing
(b) Security or a portion of the security is on loan at period end.
(c) Restricted securities - Investment in securities not registered under the Securities Act of 1933 (excluding 144A issues). At the end of the period, the value of restricted securities (excluding 144A issues) amounted to $59,897,000 or 0.8% of net assets.
(d) Affiliated fund that is generally available only to investment companies and other accounts managed by Fidelity Investments. The rate quoted is the annualized seven-day yield of the fund at period end. A complete unaudited listing of the fund's holdings as of its most recent quarter end is available upon request. In addition, each Fidelity Central Fund's financial statements are available on the SEC's website or upon request.
(e) Investment made with cash collateral received from securities on loan.
Additional information on each restricted holding is as follows:
| Security | Acquisition Date | Acquisition Cost (000s) |
| ASAC II LP | 10/10/13 | $25,141 |
Affiliated Central Funds
Information regarding fiscal year to date income earned by the Fund from investments in Fidelity Central Funds is as follows:
| Fund | Income earned |
| | (Amounts in thousands) |
| Fidelity Cash Central Fund | $287 |
| Fidelity Securities Lending Cash Central Fund | 165 |
| Total | $452 |
Investment Valuation
The following is a summary of the inputs used, as of January 31, 2016, involving the Fund's assets and liabilities carried at fair value. The inputs or methodology used for valuing securities may not be an indication of the risk associated with investing in those securities. For more information on valuation inputs, and their aggregation into the levels used below, please refer to the Investment Valuation section in the accompanying Notes to Financial Statements.
| | Valuation Inputs at Reporting Date: |
| Description | Total | Level 1 | Level 2 | Level 3 |
| (Amounts in thousands) | | | | |
| Investments in Securities: | | | | |
| Equities: | | | | |
| Consumer Discretionary | $647,656 | $625,742 | $21,914 | $-- |
| Consumer Staples | 1,077,022 | 918,318 | 158,704 | -- |
| Energy | 465,369 | 465,369 | -- | -- |
| Financials | 1,137,285 | 1,137,261 | 24 | -- |
| Health Care | 969,167 | 882,099 | 87,068 | -- |
| Industrials | 693,570 | 688,034 | 5,536 | -- |
| Information Technology | 1,662,340 | 1,564,664 | 37,779 | 59,897 |
| Materials | 199,183 | 199,183 | -- | -- |
| Telecommunication Services | 138,157 | 138,157 | -- | -- |
| Corporate Bonds | 6,779 | -- | 6,779 | -- |
| Money Market Funds | 257,522 | 257,522 | -- | -- |
| Total Investments in Securities: | $7,254,050 | $6,876,349 | $317,804 | $59,897 |
The following is a summary of transfers between Level 1 and Level 2 for the period ended January 31, 2016. Transfers are assumed to have occurred at the beginning of the period, and are primarily attributable to the valuation techniques used for foreign equity securities, as discussed in the accompanying Notes to Financial Statements:
| Transfers | Total (000s) |
| Level 1 to Level 2 | $196,126 |
| Level 2 to Level 1 | $0 |
Other Information
Distribution of investments by country or territory of incorporation, as a percentage of Total Net Assets, is as follows (Unaudited):
| United States of America | 84.1% |
| Ireland | 5.3% |
| United Kingdom | 2.2% |
| Israel | 2.0% |
| Canada | 1.7% |
| Switzerland | 1.5% |
| Netherlands | 1.2% |
| Others (Individually Less Than 1%) | 2.0% |
| | 100.0% |
See accompanying notes which are an integral part of the financial statements.
Financial Statements
Statement of Assets and Liabilities
| Amounts in thousands (except per-share amounts) | | January 31, 2016 (Unaudited) |
| Assets | | |
Investment in securities, at value (including securities loaned of $24,830) — See accompanying schedule:
Unaffiliated issuers (cost $6,266,670) | $6,996,528 | |
| Fidelity Central Funds (cost $257,522) | 257,522 | |
| Total Investments (cost $6,524,192) | | $7,254,050 |
| Receivable for fund shares sold | | 2,392 |
| Dividends receivable | | 6,837 |
| Interest receivable | | 94 |
| Distributions receivable from Fidelity Central Funds | | 97 |
| Prepaid expenses | | 14 |
| Other receivables | | 493 |
| Total assets | | 7,263,977 |
| Liabilities | | |
| Payable for fund shares redeemed | $6,500 | |
| Accrued management fee | 2,503 | |
| Other affiliated payables | 988 | |
| Other payables and accrued expenses | 514 | |
| Collateral on securities loaned, at value | 25,057 | |
| Total liabilities | | 35,562 |
| Net Assets | | $7,228,415 |
| Net Assets consist of: | | |
| Paid in capital | | $6,546,766 |
| Undistributed net investment income | | 6,417 |
| Accumulated undistributed net realized gain (loss) on investments and foreign currency transactions | | (54,589) |
| Net unrealized appreciation (depreciation) on investments and assets and liabilities in foreign currencies | | 729,821 |
| Net Assets | | $7,228,415 |
| Dividend Growth: | | |
| Net Asset Value, offering price and redemption price per share ($5,613,552 ÷ 195,116 shares) | | $28.77 |
| Class K: | | |
| Net Asset Value, offering price and redemption price per share ($1,614,863 ÷ 56,187 shares) | | $28.74 |
See accompanying notes which are an integral part of the financial statements.
Statement of Operations
| Amounts in thousands | | Six months ended January 31, 2016 (Unaudited) |
| Investment Income | | |
| Dividends | | $81,103 |
| Interest | | 110 |
| Income from Fidelity Central Funds | | 452 |
| Total income | | 81,665 |
| Expenses | | |
| Management fee | | |
| Basic fee | $21,268 | |
| Performance adjustment | (3,696) | |
| Transfer agent fees | 5,419 | |
| Accounting and security lending fees | 602 | |
| Custodian fees and expenses | 68 | |
| Independent trustees' compensation | 18 | |
| Registration fees | 30 | |
| Audit | 48 | |
| Legal | 21 | |
| Miscellaneous | 22 | |
| Total expenses before reductions | 23,800 | |
| Expense reductions | (105) | 23,695 |
| Net investment income (loss) | | 57,970 |
| Realized and Unrealized Gain (Loss) | | |
| Net realized gain (loss) on: | | |
| Investment securities: | | |
| Unaffiliated issuers | (4,132) | |
| Foreign currency transactions | (3) | |
| Total net realized gain (loss) | | (4,135) |
Change in net unrealized appreciation (depreciation) on:
Investment securities | (749,057) | |
| Assets and liabilities in foreign currencies | (17) | |
| Total change in net unrealized appreciation (depreciation) | | (749,074) |
| Net gain (loss) | | (753,209) |
| Net increase (decrease) in net assets resulting from operations | | $(695,239) |
See accompanying notes which are an integral part of the financial statements.
Statement of Changes in Net Assets
| Amounts in thousands | Six months ended January 31, 2016 (Unaudited) | Year ended July 31, 2015 |
| Increase (Decrease) in Net Assets | | |
| Operations | | |
| Net investment income (loss) | $57,970 | $125,774 |
| Net realized gain (loss) | (4,135) | 767,929 |
| Change in net unrealized appreciation (depreciation) | (749,074) | (102,174) |
| Net increase (decrease) in net assets resulting from operations | (695,239) | 791,529 |
| Distributions to shareholders from net investment income | (116,882) | (124,133) |
| Distributions to shareholders from net realized gain | (571,365) | (1,267,766) |
| Total distributions | (688,247) | (1,391,899) |
| Share transactions - net increase (decrease) | 195,516 | 479,167 |
| Total increase (decrease) in net assets | (1,187,970) | (121,203) |
| Net Assets | | |
| Beginning of period | 8,416,385 | 8,537,588 |
| End of period (including undistributed net investment income of $6,417 and undistributed net investment income of $65,329, respectively) | $7,228,415 | $8,416,385 |
See accompanying notes which are an integral part of the financial statements.
Financial Highlights — Fidelity Dividend Growth Fund
| | Six months ended (Unaudited) | Years ended July 31, | | | | |
| January 31, | 2016 | 2015 | 2014 | 2013 | 2012 | 2011 |
| Selected Per–Share Data | | | | | | |
| Net asset value, beginning of period | $34.46 | $37.27 | $35.33 | $28.61 | $28.96 | $23.84 |
| Income from Investment Operations | | | | | | |
| Net investment income (loss)A | .22 | .49 | .56 | .40 | .20 | .12 |
| Net realized and unrealized gain (loss) | (3.09) | 2.71 | 4.98 | 7.12 | (.41) | 5.23 |
| Total from investment operations | (2.87) | 3.20 | 5.54 | 7.52 | (.21) | 5.35 |
| Distributions from net investment income | (.47) | (.51) | (.37) | (.30) | (.12) | (.15) |
| Distributions from net realized gain | (2.36) | (5.49) | (3.23) | (.50) | (.02) | (.08) |
| Total distributions | (2.82)B | (6.01)C | (3.60) | (.80) | (.14) | (.23) |
| Net asset value, end of period | $28.77 | $34.46 | $37.27 | $35.33 | $28.61 | $28.96 |
| Total ReturnD,E | (8.46)% | 9.54% | 17.30% | 26.83% | (.67)% | 22.57% |
| Ratios to Average Net AssetsF,G | | | | | | |
| Expenses before reductions | .64%H | .69% | .56% | .63% | .91% | .93% |
| Expenses net of fee waivers, if any | .64%H | .68% | .56% | .63% | .91% | .93% |
| Expenses net of all reductions | .64%H | .68% | .56% | .62% | .91% | .93% |
| Net investment income (loss) | 1.47%H | 1.43% | 1.58% | 1.26% | .75% | .44% |
| Supplemental Data | | | | | | |
| Net assets, end of period (in millions) | $5,614 | $6,474 | $6,481 | $6,633 | $5,905 | $9,309 |
| Portfolio turnover rateI | 37%H | 64% | 99% | 69% | 63%J | 67% |
A Calculated based on average shares outstanding during the period.
B Total distributions of $2.82 per share is comprised of distributions from net investment income of $.465 and distributions from net realized gain of $2.358 per share.
C Total distributions of $6.01 per share is comprised of distributions from net investment income of $.512 and distributions from net realized gain of $5.493 per share.
D Total returns for periods of less than one year are not annualized.
E Total returns would have been lower if certain expenses had not been reduced during the applicable periods shown.
F Fees and expenses of any underlying Fidelity Central Funds are not included in the Fund's expense ratio. The Fund indirectly bears its proportionate share of the expenses of any underlying Fidelity Central Funds.
G Expense ratios reflect operating expenses of the class. Expenses before reductions do not reflect amounts reimbursed by the investment adviser or reductions from brokerage service arrangements or reductions from other expense offset arrangements and do not represent the amount paid by the class during periods when reimbursements or reductions occur. Expenses net of fee waivers reflect expenses after reimbursement by the investment adviser but prior to reductions from brokerage service arrangements or other expense offset arrangements. Expenses net of all reductions represent the net expenses paid by the class.
H Annualized
I Amount does not include the portfolio activity of any underlying Fidelity Central Funds.
J Portfolio turnover rate excludes securities received or delivered in-kind.
See accompanying notes which are an integral part of the financial statements.
Financial Highlights — Fidelity Dividend Growth Fund Class K
| | Six months ended (Unaudited) | Years ended July 31, | | | | |
| January 31, | 2016 | 2015 | 2014 | 2013 | 2012 | 2011 |
| Selected Per–Share Data | | | | | | |
| Net asset value, beginning of period | $34.45 | $37.27 | $35.34 | $28.62 | $28.98 | $23.86 |
| Income from Investment Operations | | | | | | |
| Net investment income (loss)A | .24 | .53 | .60 | .45 | .25 | .17 |
| Net realized and unrealized gain (loss) | (3.09) | 2.70 | 4.97 | 7.12 | (.43) | 5.22 |
| Total from investment operations | (2.85) | 3.23 | 5.57 | 7.57 | (.18) | 5.39 |
| Distributions from net investment income | (.50) | (.56) | (.42) | (.35) | (.17) | (.20) |
| Distributions from net realized gain | (2.36) | (5.49) | (3.23) | (.50) | (.02) | (.08) |
| Total distributions | (2.86) | (6.05) | (3.64)B | (.85) | (.18)C | (.27)D |
| Net asset value, end of period | $28.74 | $34.45 | $37.27 | $35.34 | $28.62 | $28.98 |
| Total ReturnE,F | (8.41)% | 9.65% | 17.44% | 27.04% | (.52)% | 22.79% |
| Ratios to Average Net AssetsG,H | | | | | | |
| Expenses before reductions | .52%I | .57% | .44% | .48% | .75% | .78% |
| Expenses net of fee waivers, if any | .52%I | .57% | .43% | .48% | .75% | .78% |
| Expenses net of all reductions | .52%I | .57% | .43% | .47% | .75% | .77% |
| Net investment income (loss) | 1.59%I | 1.54% | 1.70% | 1.41% | .91% | .60% |
| Supplemental Data | | | | | | |
| Net assets, end of period (in millions) | $1,615 | $1,942 | $2,057 | $1,639 | $1,221 | $634 |
| Portfolio turnover rateJ | 37%I | 64% | 99% | 69% | 63%K | 67% |
A Calculated based on average shares outstanding during the period.
B Total distributions of $3.64 per share is comprised of distributions from net investment income of $.419 and distributions from net realized gain of $3.225 per share.
C Total distributions of $.18 per share is comprised of distributions from net investment income of $.169 and distributions from net realized gain of $.015 per share.
D Total distributions of $.27 per share is comprised of distributions from net investment income of $.197 and distributions from net realized gain of $.077 per share.
E Total returns for periods of less than one year are not annualized.
F Total returns would have been lower if certain expenses had not been reduced during the applicable periods shown.
G Fees and expenses of any underlying Fidelity Central Funds are not included in the Fund's expense ratio. The Fund indirectly bears its proportionate share of the expenses of any underlying Fidelity Central Funds.
H Expense ratios reflect operating expenses of the class. Expenses before reductions do not reflect amounts reimbursed by the investment adviser or reductions from brokerage service arrangements or reductions from other expense offset arrangements and do not represent the amount paid by the class during periods when reimbursements or reductions occur. Expenses net of fee waivers reflect expenses after reimbursement by the investment adviser but prior to reductions from brokerage service arrangements or other expense offset arrangements. Expenses net of all reductions represent the net expenses paid by the class.
I Annualized
J Amount does not include the portfolio activity of any underlying Fidelity Central Funds.
K Portfolio turnover rate excludes securities received or delivered in-kind.
See accompanying notes which are an integral part of the financial statements.
Notes to Financial Statements (Unaudited)
For the period ended January 31, 2016
(Amounts in thousands except percentages)
1. Organization.
Fidelity Dividend Growth Fund (the Fund) is a fund of Fidelity Securities Fund (the Trust) and is authorized to issue an unlimited number of shares. The Trust is registered under the Investment Company Act of 1940, as amended (the 1940 Act), as an open-end management investment company organized as a Massachusetts business trust. The Fund offers Dividend Growth and Class K shares, each of which has equal rights as to assets and voting privileges. Each class has exclusive voting rights with respect to matters that affect that class.
2. Investments in Fidelity Central Funds.
The Fund invests in Fidelity Central Funds, which are open-end investment companies generally available only to other investment companies and accounts managed by the investment adviser and its affiliates. The Fund's Schedule of Investments lists each of the Fidelity Central Funds held as of period end, if any, as an investment of the Fund, but does not include the underlying holdings of each Fidelity Central Fund. As an Investing Fund, the Fund indirectly bears its proportionate share of the expenses of the underlying Fidelity Central Funds.
The Money Market Central Funds seek preservation of capital and current income and are managed by Fidelity Investments Money Management, Inc. (FIMM), an affiliate of the investment adviser. Annualized expenses of the Money Market Central Funds as of their most recent shareholder report date are less than .005%.
A complete unaudited list of holdings for each Fidelity Central Fund is available upon request or at the Securities and Exchange Commission (the SEC) website at www.sec.gov. In addition, the financial statements of the Fidelity Central Funds are available on the SEC website or upon request.
3. Significant Accounting Policies.
The financial statements have been prepared in conformity with accounting principles generally accepted in the United States of America (GAAP), which require management to make certain estimates and assumptions at the date of the financial statements. Actual results could differ from those estimates. Subsequent events, if any, through the date that the financial statements were issued have been evaluated in the preparation of the financial statements. The following summarizes the significant accounting policies of the Fund:
Investment Valuation. Investments are valued as of 4:00 p.m. Eastern time on the last calendar day of the period. The Board of Trustees (the Board) has delegated the day to day responsibility for the valuation of the Fund's investments to the Fidelity Management & Research Company (FMR) Fair Value Committee (the Committee). In accordance with valuation policies and procedures approved by the Board, the Fund attempts to obtain prices from one or more third party pricing vendors or brokers to value its investments. When current market prices, quotations or currency exchange rates are not readily available or reliable, investments will be fair valued in good faith by the Committee, in accordance with procedures adopted by the Board. Factors used in determining fair value vary by investment type and may include market or investment specific events, changes in interest rates and credit quality. The frequency with which these procedures are used cannot be predicted and they may be utilized to a significant extent. The Committee oversees the Fund's valuation policies and procedures and reports to the Board on the Committee's activities and fair value determinations. The Board monitors the appropriateness of the procedures used in valuing the Fund's investments and ratifies the fair value determinations of the Committee.
The Fund categorizes the inputs to valuation techniques used to value its investments into a disclosure hierarchy consisting of three levels as shown below:
- Level 1 – quoted prices in active markets for identical investments
- Level 2 – other significant observable inputs (including quoted prices for similar investments, interest rates, prepayment speeds, etc.)
- Level 3 – unobservable inputs (including the Fund's own assumptions based on the best information available)
Valuation techniques used to value the Fund's investments by major category are as follows:
Equity securities, including restricted securities, for which market quotations are readily available, are valued at the last reported sale price or official closing price as reported by a third party pricing vendor on the primary market or exchange on which they are traded and are categorized as Level 1 in the hierarchy. In the event there were no sales during the day or closing prices are not available, securities are valued at the last quoted bid price or may be valued using the last available price and are generally categorized as Level 2 in the hierarchy. For foreign equity securities, when market or security specific events arise, comparisons to the valuation of American Depositary Receipts (ADRs), futures contracts, Exchange-Traded Funds (ETFs) and certain indexes as well as quoted prices for similar securities may be used and would be categorized as Level 2 in the hierarchy. Utilizing these techniques may result in transfers between Level 1 and Level 2. For equity securities, including restricted securities, where observable inputs are limited, assumptions about market activity and risk are used and these securities may be categorized as Level 3 in the hierarchy.
Debt securities, including restricted securities, are valued based on evaluated prices received from third party pricing vendors or from brokers who make markets in such securities. Corporate bonds are valued by pricing vendors who utilize matrix pricing which considers yield or price of bonds of comparable quality, coupon, maturity and type or by broker-supplied prices. When independent prices are unavailable or unreliable, debt securities may be valued utilizing pricing methodologies which consider similar factors that would be used by third party pricing vendors. Debt securities are generally categorized as Level 2 in the hierarchy but may be Level 3 depending on the circumstances.
Investments in open-end mutual funds, including the Fidelity Central Funds, are valued at their closing net asset value (NAV) each business day and are categorized as Level 1 in the hierarchy.
Changes in valuation techniques may result in transfers in or out of an assigned level within the disclosure hierarchy. The aggregate value of investments by input level as of January 31, 2016, including information on transfers between Levels 1 and 2 is included at the end of the Fund's Schedule of Investments.
Foreign Currency. The Fund may use foreign currency contracts to facilitate transactions in foreign-denominated securities. Gains and losses from these transactions may arise from changes in the value of the foreign currency or if the counterparties do not perform under the contracts' terms.
Foreign-denominated assets, including investment securities, and liabilities are translated into U.S. dollars at the exchange rates at period end. Purchases and sales of investment securities, income and dividends received and expenses denominated in foreign currencies are translated into U.S. dollars at the exchange rate in effect on the transaction date.
The effects of exchange rate fluctuations on investments are included with the net realized and unrealized gain (loss) on investment securities. Other foreign currency transactions resulting in realized and unrealized gain (loss) are disclosed separately.
Investment Transactions and Income. For financial reporting purposes, the Fund's investment holdings and NAV include trades executed through the end of the last business day of the period. The NAV per share for processing shareholder transactions is calculated as of the close of business of the New York Stock Exchange (NYSE), normally 4:00 p.m. Eastern time and includes trades executed through the end of the prior business day. Gains and losses on securities sold are determined on the basis of identified cost and may include proceeds received from litigation. Dividend income is recorded on the ex-dividend date, except for certain dividends from foreign securities where the ex-dividend date may have passed, which are recorded as soon as the Fund is informed of the ex-dividend date. Non-cash dividends included in dividend income, if any, are recorded at the fair market value of the securities received. Income and capital gain distributions from Fidelity Central Funds, if any, are recorded on the ex-dividend date. Distributions received on securities that represent a return of capital or capital gain are recorded as a reduction of cost of investments and/or as a realized gain. Subsequent to ex-dividend date the Fund determines the components of these distributions, based upon receipt of tax filings or other correspondence relating to the underlying investment. Interest income is accrued as earned and includes coupon interest and amortization of premium and accretion of discount on debt securities as applicable. Investment income is recorded net of foreign taxes withheld where recovery of such taxes is uncertain.
Class Allocations and Expenses. Investment income, realized and unrealized capital gains and losses, common expenses of the Fund, and certain fund-level expense reductions, if any, are allocated daily on a pro-rata basis to each class based on the relative net assets of each class to the total net assets of the Fund. Each class differs with respect to transfer agent fees incurred. Certain expense reductions may also differ by class. For the reporting period, the allocated portion of income and expenses to each class as a percent of its average net assets may vary due to the timing of recording these transactions in relation to fluctuating net assets of the classes. Expenses directly attributable to a fund are charged to that fund. Expenses attributable to more than one fund are allocated among the respective funds on the basis of relative net assets or other appropriate methods. Expense estimates are accrued in the period to which they relate and adjustments are made when actual amounts are known.
Deferred Trustee Compensation. Under a Deferred Compensation Plan (the Plan), independent Trustees may elect to defer receipt of a portion of their annual compensation. Deferred amounts are invested in a cross-section of Fidelity funds, are marked-to-market and remain in the Fund until distributed in accordance with the Plan. The investment of deferred amounts and the offsetting payable to the Trustees are included in the accompanying Statement of Assets and Liabilities.
Income Tax Information and Distributions to Shareholders. Each year, the Fund intends to qualify as a regulated investment company under Subchapter M of the Internal Revenue Code, including distributing substantially all of its taxable income and realized gains. As a result, no provision for U.S. Federal income taxes is required. The Fund files a U.S. federal tax return, in addition to state and local tax returns as required. The Fund's federal income tax returns are subject to examination by the Internal Revenue Service (IRS) for a period of three fiscal years after they are filed. State and local tax returns may be subject to examination for an additional fiscal year depending on the jurisdiction. Foreign taxes are provided for based on the Fund's understanding of the tax rules and rates that exist in the foreign markets in which it invests.
Distributions are declared and recorded on the ex-dividend date. Income dividends and capital gain distributions are declared separately for each class. Income and capital gain distributions are determined in accordance with income tax regulations, which may differ from GAAP.
Capital accounts within the financial statements are adjusted for permanent book-tax differences. These adjustments have no impact on net assets or the results of operations. Capital accounts are not adjusted for temporary book-tax differences which will reverse in a subsequent period.
Book-tax differences are primarily due to futures contracts, foreign currency transactions, partnerships, deferred trustees compensation and losses deferred due to wash sales.
The federal tax cost of investment securities and unrealized appreciation (depreciation) as of period end were as follows:
| Gross unrealized appreciation | $1,230,601 |
| Gross unrealized depreciation | (510,032) |
| Net unrealized appreciation (depreciation) on securities | $720,569 |
| Tax cost | $6,533,481 |
Restricted Securities. The Fund may invest in securities that are subject to legal or contractual restrictions on resale. These securities generally may be resold in transactions exempt from registration or to the public if the securities are registered. Disposal of these securities may involve time-consuming negotiations and expense, and prompt sale at an acceptable price may be difficult. Information regarding restricted securities is included at the end of the Fund's Schedule of Investments.
4. Purchases and Sales of Investments.
Purchases and sales of securities, other than short-term securities, aggregated $1,410,109 and $1,871,807, respectively.
5. Fees and Other Transactions with Affiliates.
Management Fee. Fidelity Management & Research Company (the investment adviser) and its affiliates provide the Fund with investment management related services for which the Fund pays a monthly management fee. The management fee is the sum of an individual fund fee rate that is based on an annual rate of .30% of the Fund's average net assets and an annualized group fee rate that averaged .25% during the period. The group fee rate is based upon the average net assets of all the mutual funds advised by the investment adviser, including any mutual funds previously advised by the investment adviser that are currently advised by Fidelity SelectCo, LLC, an affiliate of the investment adviser. The group fee rate decreases as assets under management increase and increases as assets under management decrease. In addition, the management fee is subject to a performance adjustment (up to a maximum of +/- .20% of the Fund's average net assets over a 36 month performance period). The upward or downward adjustment to the management fee is based on the relative investment performance of Dividend Growth as compared to its benchmark index, the S&P 500 Index, over the same 36 month performance period. For the reporting period, the total annualized management fee rate, including the performance adjustment, was .45% of the Fund's average net assets. The performance adjustment included in the management fee rate may be higher or lower than the maximum performance adjustment rate due to the difference between the average net assets for the reporting and performance periods.
Transfer Agent Fees. Fidelity Investments Institutional Operations Company, Inc., (FIIOC), an affiliate of the investment adviser, is the transfer, dividend disbursing and shareholder servicing agent for each class of the Fund. FIIOC receives account fees and asset-based fees that vary according to the account size and type of account of the shareholders of Dividend Growth, except for Class K. FIIOC receives an asset-based fee of Class K's average net assets. FIIOC pays for typesetting, printing and mailing of shareholder reports, except proxy statements.
For the period, transfer agent fees for each class were as follows:
| | Amount | % of
Class-Level Average
Net Assets(a) |
| Dividend Growth | $5,005 | .17 |
| Class K | 414 | .05 |
| | $5,419 | |
(a) Annualized
Accounting and Security Lending Fees. Fidelity Service Company, Inc. (FSC), an affiliate of the investment adviser, maintains the Fund's accounting records. The accounting fee is based on the level of average net assets for each month. Under a separate contract, FSC administers the security lending program. The security lending fee is based on the number and duration of lending transactions.
Brokerage Commissions. The Fund placed a portion of its portfolio transactions with brokerage firms which are affiliates of the investment adviser. Brokerage commissions are included in net realized gain (loss) and change in net unrealized appreciation (depreciation) in the Statement of Operations. The commissions paid to these affiliated firms were $42 for the period.
Interfund Trades. The Fund may purchase from or sell securities to other Fidelity Funds under procedures adopted by the Board. The procedures have been designed to ensure these interfund trades are executed in accordance with Rule 17a-7 of the 1940 Act. Interfund trades are included within the respective purchases and sales amounts shown in the Purchases and Sales of Investments note.
6. Committed Line of Credit.
The Fund participates with other funds managed by the investment adviser or an affiliate in a $4.25 billion credit facility (the "line of credit") to be utilized for temporary or emergency purposes to fund shareholder redemptions or for other short-term liquidity purposes. The Fund has agreed to pay commitment fees on its pro-rata portion of the line of credit, which amounted to $5 and is reflected in Miscellaneous expenses on the Statement of Operations. During the period, the Fund did not borrow on this line of credit.
7. Security Lending.
The Fund lends portfolio securities through a lending agent from time to time in order to earn additional income. For equity securities, a lending agent is used and may loan securities to certain qualified borrowers, including Fidelity Capital Markets (FCM), a broker-dealer affiliated with the Fund. On the settlement date of the loan, the Fund receives collateral (in the form of U.S. Treasury obligations, letters of credit and/or cash) against the loaned securities and maintains collateral in an amount not less than 100% of the market value of the loaned securities during the period of the loan. The market value of the loaned securities is determined at the close of business of the Fund and any additional required collateral is delivered to the Fund on the next business day. The Fund or borrower may terminate the loan at any time, and if the borrower defaults on its obligation to return the securities loaned because of insolvency or other reasons, the Fund may apply collateral received from the borrower against the obligation. The Fund may experience delays and costs in recovering the securities loaned. Any cash collateral received is invested in the Fidelity Securities Lending Cash Central Fund. The value of loaned securities and cash collateral at period end are disclosed on the Fund's Statement of Assets and Liabilities. Security lending income represents the income earned on investing cash collateral, less rebates paid to borrowers and any lending agent fees associated with the loan, plus any premium payments received for lending certain types of securities. Security lending income is presented in the Statement of Operations as a component of income from Fidelity Central Funds. Total security lending income during the period amounted to $165. During the period, there were no securities loaned to FCM.
8. Expense Reductions.
Commissions paid to certain brokers with whom the investment adviser, or its affiliates, places trades on behalf of the Fund include an amount in addition to trade execution, which may be rebated back to the Fund to offset certain expenses. This amount totaled $76 for the period. In addition, through arrangements with the Fund's custodian, credits realized as a result of certain uninvested cash balances were used to reduce the Fund's expenses. During the period, these credits reduced the Fund's custody expenses by $1.
In addition, during the period the investment adviser reimbursed and/or waived a portion of fund-level operating expenses in the amount of $28.
9. Distributions to Shareholders.
Distributions to shareholders of each class were as follows:
| | Six months ended January 31, 2016 | Year ended July 31, 2015 |
| From net investment income | | |
| Dividend Growth | $88,523 | $92,079 |
| Class K | 28,359 | 32,054 |
| Total | $116,882 | $124,133 |
| From net realized gain | | |
| Dividend Growth | $440,809 | $962,404 |
| Class K | 130,556 | 305,362 |
| Total | $571,365 | $1,267,766 |
10. Share Transactions.
Share transactions for each class were as follows and may contain automatic conversions between classes or exchanges between affiliated funds:
| | Shares | Shares | Dollars | Dollars |
| | Six months ended January 31, 2016 | Year ended July 31, 2015 | Six months ended January 31, 2016 | Year ended July 31, 2015 |
| Dividend Growth | | | | |
| Shares sold | 4,183 | 10,859 | $128,328 | $370,250 |
| Reinvestment of distributions | 17,089 | 30,298 | 505,767 | 1,009,516 |
| Shares redeemed | (14,015) | (27,183) | (428,093) | (929,933) |
| Net increase (decrease) | 7,257 | 13,974 | $206,002 | $449,833 |
| Class K | | | | |
| Shares sold | 3,434 | 9,521 | $104,803 | $325,624 |
| Reinvestment of distributions | 5,375 | 10,135 | 158,915 | 337,416 |
| Shares redeemed | (8,996) | (18,467) | (274,204) | (633,706) |
| Net increase (decrease) | (187) | 1,189 | $(10,486) | $29,334 |
11. Other.
The Fund's organizational documents provide former and current trustees and officers with a limited indemnification against liabilities arising in connection with the performance of their duties to the Fund. In the normal course of business, the Fund may also enter into contracts that provide general indemnifications. The Fund's maximum exposure under these arrangements is unknown as this would be dependent on future claims that may be made against the Fund. The risk of material loss from such claims is considered remote.
Shareholder Expense Example
As a shareholder of the Fund, you incur two types of costs: (1) transaction costs, and (2) ongoing costs, including management fees and other Fund expenses. This Example is intended to help you understand your ongoing costs (in dollars) of investing in the Fund and to compare these costs with the ongoing costs of investing in other mutual funds.
The Example is based on an investment of $1,000 invested at the beginning of the period and held for the entire period (August 1, 2015 to January 31, 2016).
Actual Expenses
The first line of the accompanying table for each class of the Fund provides information about actual account values and actual expenses. You may use the information in this line, together with the amount you invested, to estimate the expenses that you paid over the period. Simply divide your account value by $1,000.00 (for example, an $8,600 account value divided by $1,000.00 = 8.6), then multiply the result by the number in the first line for a class of the Fund under the heading entitled "Expenses Paid During Period" to estimate the expenses you paid on your account during this period. A small balance maintenance fee of $12.00 that is charged once a year may apply for certain accounts with a value of less than $2,000. This fee is not included in the table below. If it was, the estimate of expenses you paid during the period would be higher, and your ending account value lower, by this amount. In addition, the Fund, as a shareholder in the underlying Fidelity Central Funds, will indirectly bear its pro-rata share of the fees and expenses incurred by the underlying Fidelity Central Funds. These fees and expenses are not included in the Fund's annualized expense ratio used to calculate the expense estimate in the table below.
Hypothetical Example for Comparison Purposes
The second line of the accompanying table for each class of the Fund provides information about hypothetical account values and hypothetical expenses based on a Class' actual expense ratio and an assumed rate of return of 5% per year before expenses, which is not the Class' actual return. The hypothetical account values and expenses may not be used to estimate the actual ending account balance or expenses you paid for the period. You may use this information to compare the ongoing costs of investing in the Fund and other funds. To do so, compare this 5% hypothetical example with the 5% hypothetical examples that appear in the shareholder reports of the other funds. A small balance maintenance fee of $12.00 that is charged once a year may apply for certain accounts with a value of less than $2,000. This fee is not included in the table below. If it was, the estimate of expenses you paid during the period would be higher, and your ending account value lower, by this amount. In addition, the Fund, as a shareholder in the underlying Fidelity Central Funds, will indirectly bear its pro-rata share of the fees and expenses incurred by the underlying Fidelity Central Funds. These fees and expenses are not included in the Fund's annualized expense ratio used to calculate the expense estimate in the table below.
Please note that the expenses shown in the table are meant to highlight your ongoing costs only and do not reflect any transaction costs. Therefore, the second line of the table is useful in comparing ongoing costs only, and will not help you determine the relative total costs of owning different funds.
| | Annualized Expense Ratio-A | Beginning
Account Value
August 1, 2015 | Ending
Account Value
January 31, 2016 | Expenses Paid
During Period-B
August 1, 2015
to January 31, 2016 |
| Dividend Growth | .64% | | | |
| Actual | | $1,000.00 | $915.40 | $3.08 |
| Hypothetical-C | | $1,000.00 | $1,021.92 | $3.25 |
| Class K | .52% | | | |
| Actual | | $1,000.00 | $915.90 | $2.50 |
| Hypothetical-C | | $1,000.00 | $1,022.52 | $2.64 |
A Annualized expense ratio reflects expenses net of applicable fee waivers.
B Expenses are equal to each Class' annualized expense ratio, multiplied by the average account value over the period, multiplied by 184/366 (to reflect the one-half year period).
C 5% return per year before expenses
Corporate Headquarters
245 Summer St.
Boston, MA 02210
www.fidelity.com
DGF-K-SANN-0316
1.863068.107
Fidelity® Small Cap Value Fund
Semi-Annual Report January 31, 2016 |
|
Contents
To view a fund's proxy voting guidelines and proxy voting record for the 12-month period ended June 30, visit http://www.fidelity.com/proxyvotingresults or visit the Securities and Exchange Commission's (SEC) web site at http://www.sec.gov.
You may also call 1-800-544-8544 to request a free copy of the proxy voting guidelines.
Standard & Poor's, S&P and S&P 500 are registered service marks of The McGraw-Hill Companies, Inc. and have been licensed for use by Fidelity Distributors Corporation.
Other third-party marks appearing herein are the property of their respective owners.
All other marks appearing herein are registered or unregistered trademarks or service marks of FMR LLC or an affiliated company. © 2016 FMR LLC. All rights reserved.
This report and the financial statements contained herein are submitted for the general information of the shareholders of the Fund. This report is not authorized for distribution to prospective investors in the Fund unless preceded or accompanied by an effective prospectus.
A fund files its complete schedule of portfolio holdings with the SEC for the first and third quarters of each fiscal year on Form N-Q. Forms N-Q are available on the SEC’s web site at http://www.sec.gov. A fund's Forms N-Q may be reviewed and copied at the SEC’s Public Reference Room in Washington, DC. Information regarding the operation of the SEC's Public Reference Room may be obtained by calling 1-800-SEC-0330.
For a complete list of a fund's portfolio holdings, view the most recent holdings listing, semiannual report, or annual report on Fidelity's web site at http://www.fidelity.com, http://www.advisor.fidelity.com, or http://www.401k.com, as applicable.
NOT FDIC INSURED •MAY LOSE VALUE •NO BANK GUARANTEE
Neither the Fund nor Fidelity Distributors Corporation is a bank.
Investment Summary (Unaudited)
Top Ten Stocks as of January 31, 2016
| | % of fund's net assets | % of fund's net assets 6 months ago |
| Store Capital Corp. | 3.5 | 2.6 |
| ProAssurance Corp. | 2.8 | 2.4 |
| Silgan Holdings, Inc. | 2.7 | 2.6 |
| Universal Corp. | 2.7 | 2.4 |
| CVB Financial Corp. | 2.6 | 2.5 |
| First Niagara Financial Group, Inc. | 2.6 | 2.2 |
| World Fuel Services Corp. | 2.5 | 2.2 |
| Aspen Insurance Holdings Ltd. | 2.5 | 2.7 |
| Genesee & Wyoming, Inc. Class A | 2.4 | 0.0 |
| Allied World Assurance Co. Holdings AG | 2.4 | 0.0 |
| | 26.7 | |
Top Five Market Sectors as of January 31, 2016
| | % of fund's net assets | % of fund's net assets 6 months ago |
| Financials | 40.4 | 41.0 |
| Industrials | 13.0 | 13.2 |
| Consumer Discretionary | 12.0 | 9.3 |
| Information Technology | 11.3 | 12.9 |
| Health Care | 6.6 | 6.8 |
Asset Allocation (% of fund's net assets)
| As of January 31, 2016* |
| | Stocks | 99.4% |
| | Short-Term Investments and Net Other Assets (Liabilities) | 0.6% |

* Foreign investments - 14.2%
| As of July 31, 2015* |
| | Stocks | 99.2% |
| | Short-Term Investments and Net Other Assets (Liabilities) | 0.8% |

* Foreign investments - 11.2%
Percentages shown as 0.0% may reflect amounts less than 0.05%.
Investments January 31, 2016 (Unaudited)
Showing Percentage of Net Assets
| Common Stocks - 99.4% | | | |
| | | Shares | Value |
| CONSUMER DISCRETIONARY - 12.0% | | | |
| Auto Components - 1.7% | | | |
| Standard Motor Products, Inc. (a) | | 1,183,301 | $44,148,960 |
| Hotels, Restaurants & Leisure - 2.4% | | | |
| DineEquity, Inc. | | 750,000 | 63,690,000 |
| Multiline Retail - 2.2% | | | |
| Dillard's, Inc. Class A (b) | | 850,000 | 59,848,500 |
| Specialty Retail - 5.3% | | | |
| Aarons, Inc. Class A | | 2,045,100 | 46,791,888 |
| Genesco, Inc. (c) | | 616,728 | 40,790,390 |
| Hibbett Sports, Inc. (a)(b)(c) | | 1,625,600 | 52,279,296 |
| | | | 139,861,574 |
| Textiles, Apparel & Luxury Goods - 0.4% | | | |
| Vera Bradley, Inc. (c) | | 750,000 | 11,085,000 |
|
| TOTAL CONSUMER DISCRETIONARY | | | 318,634,034 |
|
| CONSUMER STAPLES - 3.4% | | | |
| Food Products - 0.7% | | | |
| Post Holdings, Inc. (c) | | 300,000 | 17,550,000 |
| Tobacco - 2.7% | | | |
| Universal Corp. (a)(b) | | 1,308,239 | 71,599,920 |
|
| TOTAL CONSUMER STAPLES | | | 89,149,920 |
|
| ENERGY - 4.7% | | | |
| Energy Equipment & Services - 2.0% | | | |
| Hornbeck Offshore Services, Inc. (b)(c) | | 1,600,000 | 13,008,000 |
| ShawCor Ltd. Class A | | 1,800,000 | 38,867,871 |
| | | | 51,875,871 |
| Oil, Gas & Consumable Fuels - 2.7% | | | |
| Northern Oil & Gas, Inc. (b)(c) | | 1,958,249 | 6,462,222 |
| World Fuel Services Corp. | | 1,700,000 | 66,215,000 |
| | | | 72,677,222 |
|
| TOTAL ENERGY | | | 124,553,093 |
|
| FINANCIALS - 40.4% | | | |
| Banks - 11.7% | | | |
| Associated Banc-Corp. | | 2,846,535 | 49,956,689 |
| CVB Financial Corp. (b) | | 4,500,010 | 68,895,153 |
| First Citizen Bancshares, Inc. | | 140,370 | 34,539,442 |
| First Citizen Bancshares, Inc. Class A (c) | | 180,954 | 44,525,541 |
| First Niagara Financial Group, Inc. | | 7,000,000 | 68,530,000 |
| UMB Financial Corp. | | 898,691 | 42,148,608 |
| | | | 308,595,433 |
| Capital Markets - 5.3% | | | |
| Federated Investors, Inc. Class B (non-vtg.) | | 2,199,963 | 55,637,064 |
| OM Asset Management Ltd. | | 3,200,001 | 36,192,011 |
| Waddell & Reed Financial, Inc. Class A | | 1,750,000 | 48,020,000 |
| | | | 139,849,075 |
| Insurance - 11.6% | | | |
| Allied World Assurance Co. Holdings AG | | 1,750,000 | 64,032,500 |
| Aspen Insurance Holdings Ltd. | | 1,413,257 | 65,730,583 |
| Endurance Specialty Holdings Ltd. | | 902,400 | 55,885,632 |
| First American Financial Corp. | | 1,421,287 | 48,849,634 |
| ProAssurance Corp. | | 1,468,200 | 73,586,184 |
| | | | 308,084,533 |
| Real Estate Investment Trusts - 7.9% | | | |
| National Retail Properties, Inc. (b) | | 450,000 | 19,323,000 |
| Potlatch Corp. | | 200,630 | 5,786,169 |
| Rouse Properties, Inc. (a)(b) | | 3,000,000 | 52,500,000 |
| Sabra Health Care REIT, Inc. | | 2,042,700 | 37,503,972 |
| Store Capital Corp. | | 3,750,000 | 92,962,501 |
| | | | 208,075,642 |
| Real Estate Management & Development - 2.0% | | | |
| Kennedy Wilson Europe Real Estate PLC | | 3,409,540 | 54,378,646 |
| Thrifts & Mortgage Finance - 1.9% | | | |
| Washington Federal, Inc. | | 2,323,600 | 49,608,860 |
|
| TOTAL FINANCIALS | | | 1,068,592,189 |
|
| HEALTH CARE - 6.6% | | | |
| Health Care Equipment & Supplies - 1.0% | | | |
| Integra LifeSciences Holdings Corp. (c) | | 439,597 | 27,013,236 |
| Health Care Providers & Services - 3.8% | | | |
| Civitas Solutions, Inc. (a)(c) | | 2,451,897 | 58,992,642 |
| Team Health Holdings, Inc. (c) | | 1,000,000 | 40,870,000 |
| | | | 99,862,642 |
| Health Care Technology - 0.7% | | | |
| Cegedim SA (c) | | 670,247 | 20,017,720 |
| Pharmaceuticals - 1.1% | | | |
| Innoviva, Inc. | | 2,831,853 | 28,375,167 |
|
| TOTAL HEALTH CARE | | | 175,268,765 |
|
| INDUSTRIALS - 13.0% | | | |
| Aerospace & Defense - 1.9% | | | |
| Moog, Inc. Class A (c) | | 1,100,000 | 50,963,000 |
| Commercial Services & Supplies - 1.4% | | | |
| Essendant, Inc. | | 1,242,998 | 37,115,920 |
| Electrical Equipment - 2.1% | | | |
| AZZ, Inc. | | 500,000 | 25,740,000 |
| EnerSys | | 600,000 | 29,058,000 |
| | | | 54,798,000 |
| Machinery - 3.7% | | | |
| Hillenbrand, Inc. | | 500,000 | 13,540,000 |
| Mueller Industries, Inc. | | 2,100,000 | 53,445,000 |
| Valmont Industries, Inc. (b) | | 295,000 | 31,444,050 |
| | | | 98,429,050 |
| Road & Rail - 2.4% | | | |
| Genesee & Wyoming, Inc. Class A (c) | | 1,300,000 | 64,454,000 |
| Trading Companies & Distributors - 1.5% | | | |
| WESCO International, Inc. (b)(c) | | 960,033 | 38,766,133 |
|
| TOTAL INDUSTRIALS | | | 344,526,103 |
|
| INFORMATION TECHNOLOGY - 11.3% | | | |
| Electronic Equipment & Components - 5.7% | | | |
| Ingram Micro, Inc. Class A | | 1,800,000 | 50,760,000 |
| SYNNEX Corp. | | 527,200 | 44,258,440 |
| Tech Data Corp. (c) | | 900,000 | 56,160,000 |
| | | | 151,178,440 |
| Internet Software & Services - 3.2% | | | |
| Cimpress NV (b)(c) | | 528,100 | 41,466,412 |
| j2 Global, Inc. | | 574,300 | 41,642,493 |
| | | | 83,108,905 |
| IT Services - 1.7% | | | |
| CACI International, Inc. Class A (c) | | 540,400 | 44,891,028 |
| Software - 0.7% | | | |
| SS&C Technologies Holdings, Inc. | | 300,000 | 19,287,000 |
|
| TOTAL INFORMATION TECHNOLOGY | | | 298,465,373 |
|
| MATERIALS - 3.5% | | | |
| Containers & Packaging - 2.7% | | | |
| Silgan Holdings, Inc. | | 1,370,000 | 72,431,900 |
| Metals & Mining - 0.8% | | | |
| Compass Minerals International, Inc. | | 290,052 | 21,710,392 |
|
| TOTAL MATERIALS | | | 94,142,292 |
|
| UTILITIES - 4.5% | | | |
| Electric Utilities - 4.5% | | | |
| El Paso Electric Co. | | 1,524,121 | 62,382,273 |
| IDACORP, Inc. | | 822,000 | 57,202,980 |
| | | | 119,585,253 |
| TOTAL COMMON STOCKS | | | |
| (Cost $2,511,983,311) | | | 2,632,917,022 |
|
| Money Market Funds - 5.0% | | | |
| Fidelity Cash Central Fund, 0.38% (d) | | 7,686,167 | 7,686,167 |
| Fidelity Securities Lending Cash Central Fund, 0.42% (d)(e) | | 124,346,925 | 124,346,925 |
| TOTAL MONEY MARKET FUNDS | | | |
| (Cost $132,033,092) | | | 132,033,092 |
| TOTAL INVESTMENT PORTFOLIO - 104.4% | | | |
| (Cost $2,644,016,403) | | | 2,764,950,114 |
| NET OTHER ASSETS (LIABILITIES) - (4.4)% | | | (117,765,989) |
| NET ASSETS - 100% | | | $2,647,184,125 |
Legend
(a) Affiliated company
(b) Security or a portion of the security is on loan at period end.
(c) Non-income producing
(d) Affiliated fund that is generally available only to investment companies and other accounts managed by Fidelity Investments. The rate quoted is the annualized seven-day yield of the fund at period end. A complete unaudited listing of the fund's holdings as of its most recent quarter end is available upon request. In addition, each Fidelity Central Fund's financial statements are available on the SEC's website or upon request.
(e) Investment made with cash collateral received from securities on loan.
Affiliated Central Funds
Information regarding fiscal year to date income earned by the Fund from investments in Fidelity Central Funds is as follows:
| Fund | Income earned |
| Fidelity Cash Central Fund | $25,747 |
| Fidelity Securities Lending Cash Central Fund | 917,702 |
| Total | $943,449 |
Other Affiliated Issuers
An affiliated company is a company in which the Fund has ownership of at least 5% of the voting securities. Fiscal year to date transactions with companies which are or were affiliates are as follows:
| Affiliate | Value, beginning of period | Purchases | Sales Proceeds | Dividend Income | Value, end of period |
| Civitas Solutions, Inc. | $66,136,343 | $-- | $13,660,090 | $-- | $58,992,642 |
| Hibbett Sports, Inc. | 11,341,950 | 55,985,079 | 2,178,105 | -- | 52,279,296 |
| Rouse Properties, Inc. | 76,560,000 | -- | 23,770,281 | 438,063 | 52,500,000 |
| Standard Motor Products, Inc. | 43,273,318 | -- | -- | 354,990 | 44,148,960 |
| Universal Corp. | 68,930,035 | 4,859,141 | -- | 1,373,651 | 71,599,920 |
| Total | $266,241,646 | $60,844,220 | $39,608,476 | $2,166,704 | $279,520,818 |
Investment Valuation
The following is a summary of the inputs used, as of January 31, 2016, involving the Fund's assets and liabilities carried at fair value. The inputs or methodology used for valuing securities may not be an indication of the risk associated with investing in those securities. For more information on valuation inputs, and their aggregation into the levels used below, please refer to the Investment Valuation section in the accompanying Notes to Financial Statements.
| | Valuation Inputs at Reporting Date: |
| Description | Total | Level 1 | Level 2 | Level 3 |
| Investments in Securities: | | | | |
| Equities: | | | | |
| Consumer Discretionary | $318,634,034 | $318,634,034 | $-- | $-- |
| Consumer Staples | 89,149,920 | 89,149,920 | -- | -- |
| Energy | 124,553,093 | 124,553,093 | -- | -- |
| Financials | 1,068,592,189 | 1,014,213,543 | 54,378,646 | -- |
| Health Care | 175,268,765 | 155,251,045 | 20,017,720 | -- |
| Industrials | 344,526,103 | 344,526,103 | -- | -- |
| Information Technology | 298,465,373 | 298,465,373 | -- | -- |
| Materials | 94,142,292 | 94,142,292 | -- | -- |
| Utilities | 119,585,253 | 119,585,253 | -- | -- |
| Money Market Funds | 132,033,092 | 132,033,092 | -- | -- |
| Total Investments in Securities: | $2,764,950,114 | $2,690,553,748 | $74,396,366 | $-- |
The following is a summary of transfers between Level 1 and Level 2 for the period ended January 31, 2016. Transfers are assumed to have occurred at the beginning of the period, and are primarily attributable to the valuation techniques used for foreign equity securities, as discussed in the accompanying Notes to Financial Statements:
| Transfers | Total |
| Level 1 to Level 2 | $76,991,539 |
| Level 2 to Level 1 | $0 |
Other Information
Distribution of investments by country or territory of incorporation, as a percentage of Total Net Assets, is as follows (Unaudited):
| United States of America | 85.8% |
| Bermuda | 4.6% |
| Switzerland | 2.4% |
| Bailiwick of Jersey | 2.0% |
| Netherlands | 1.6% |
| Canada | 1.5% |
| United Kingdom | 1.4% |
| Others (Individually Less Than 1%) | 0.7% |
| | 100.0% |
See accompanying notes which are an integral part of the financial statements.
Financial Statements
Statement of Assets and Liabilities
| | | January 31, 2016 (Unaudited) |
| Assets | | |
Investment in securities, at value (including securities loaned of $126,372,798) — See accompanying schedule:
Unaffiliated issuers (cost $2,257,670,042) | $2,353,396,204 | |
| Fidelity Central Funds (cost $132,033,092) | 132,033,092 | |
| Other affiliated issuers (cost $254,313,269) | 279,520,818 | |
| Total Investments (cost $2,644,016,403) | | $2,764,950,114 |
| Receivable for investments sold | | 46,449,057 |
| Receivable for fund shares sold | | 2,104,092 |
| Dividends receivable | | 1,972,351 |
| Distributions receivable from Fidelity Central Funds | | 184,289 |
| Prepaid expenses | | 4,733 |
| Other receivables | | 7,953 |
| Total assets | | 2,815,672,589 |
| Liabilities | | |
| Payable for investments purchased | $36,727,025 | |
| Payable for fund shares redeemed | 4,651,132 | |
| Accrued management fee | 2,025,863 | |
| Distribution and service plan fees payable | 122,582 | |
| Other affiliated payables | 582,300 | |
| Other payables and accrued expenses | 32,637 | |
| Collateral on securities loaned, at value | 124,346,925 | |
| Total liabilities | | 168,488,464 |
| Net Assets | | $2,647,184,125 |
| Net Assets consist of: | | |
| Paid in capital | | $2,404,244,806 |
| Undistributed net investment income | | 1,931,109 |
| Accumulated undistributed net realized gain (loss) on investments and foreign currency transactions | | 120,075,104 |
| Net unrealized appreciation (depreciation) on investments and assets and liabilities in foreign currencies | | 120,933,106 |
| Net Assets | | $2,647,184,125 |
| Calculation of Maximum Offering Price | | |
| Class A: | | |
| Net Asset Value and redemption price per share ($202,645,428 ÷ 12,830,231 shares) | | $15.79 |
| Maximum offering price per share (100/94.25 of $15.79) | | $16.75 |
| Class T: | | |
| Net Asset Value and redemption price per share ($79,395,746 ÷ 5,128,305 shares) | | $15.48 |
| Maximum offering price per share (100/96.50 of $15.48) | | $16.04 |
| Class B: | | |
| Net Asset Value and offering price per share ($2,463,431 ÷ 168,841 shares)(a) | | $14.59 |
| Class C: | | |
| Net Asset Value and offering price per share ($55,258,599 ÷ 3,778,811 shares)(a) | | $14.62 |
| Small Cap Value: | | |
| Net Asset Value, offering price and redemption price per share ($1,973,618,546 ÷ 122,989,122 shares) | | $16.05 |
| Class I: | | |
| Net Asset Value, offering price and redemption price per share ($333,802,375 ÷ 20,796,332 shares) | | $16.05 |
(a) Redemption price per share is equal to net asset value less any applicable contingent deferred sales charge.
See accompanying notes which are an integral part of the financial statements.
Statement of Operations
| | | Six months ended January 31, 2016 (Unaudited) |
| Investment Income | | |
| Dividends (including $2,166,704 earned from other affiliated issuers) | | $25,160,403 |
| Income from Fidelity Central Funds | | 943,449 |
| Total income | | 26,103,852 |
| Expenses | | |
| Management fee | | |
| Basic fee | $9,619,395 | |
| Performance adjustment | 3,197,803 | |
| Transfer agent fees | 3,125,757 | |
| Distribution and service plan fees | 809,143 | |
| Accounting and security lending fees | 416,808 | |
| Custodian fees and expenses | 14,720 | |
| Independent trustees' compensation | 6,108 | |
| Registration fees | 99,766 | |
| Audit | 33,967 | |
| Legal | 5,172 | |
| Miscellaneous | 7,530 | |
| Total expenses before reductions | 17,336,169 | |
| Expense reductions | (18,541) | 17,317,628 |
| Net investment income (loss) | | 8,786,224 |
| Realized and Unrealized Gain (Loss) | | |
| Net realized gain (loss) on: | | |
| Investment securities: | | |
| Unaffiliated issuers | 159,265,356 | |
| Other affiliated issuers | 5,363,625 | |
| Foreign currency transactions | (26,557) | |
| Total net realized gain (loss) | | 164,602,424 |
Change in net unrealized appreciation (depreciation) on:
Investment securities | (400,477,145) | |
| Assets and liabilities in foreign currencies | (606) | |
| Total change in net unrealized appreciation (depreciation) | | (400,477,751) |
| Net gain (loss) | | (235,875,327) |
| Net increase (decrease) in net assets resulting from operations | | $(227,089,103) |
See accompanying notes which are an integral part of the financial statements.
Statement of Changes in Net Assets
| | Six months ended January 31, 2016 (Unaudited) | Year ended July 31, 2015 |
| Increase (Decrease) in Net Assets | | |
| Operations | | |
| Net investment income (loss) | $8,786,224 | $20,225,902 |
| Net realized gain (loss) | 164,602,424 | 285,516,597 |
| Change in net unrealized appreciation (depreciation) | (400,477,751) | 14,012,997 |
| Net increase (decrease) in net assets resulting from operations | (227,089,103) | 319,755,496 |
| Distributions to shareholders from net investment income | (21,953,606) | (9,146,893) |
| Distributions to shareholders from net realized gain | (264,174,606) | (322,480,172) |
| Total distributions | (286,128,212) | (331,627,065) |
| Share transactions - net increase (decrease) | 351,373,003 | (16,898,248) |
| Redemption fees | 94,271 | 149,785 |
| Total increase (decrease) in net assets | (161,750,041) | (28,620,032) |
| Net Assets | | |
| Beginning of period | 2,808,934,166 | 2,837,554,198 |
| End of period (including undistributed net investment income of $1,931,109 and undistributed net investment income of $15,098,491, respectively) | $2,647,184,125 | $2,808,934,166 |
See accompanying notes which are an integral part of the financial statements.
Financial Highlights — Fidelity Small Cap Value Fund Class A
| | Six months ended (Unaudited) | Years ended July 31, | | | | |
| January 31, | 2016 | 2015 | 2014 | 2013 | 2012 | 2011 |
| Selected Per–Share Data | | | | | | |
| Net asset value, beginning of period | $19.14 | $19.29 | $19.96 | $14.86 | $15.48 | $13.45 |
| Income from Investment Operations | | | | | | |
| Net investment income (loss)A | .04 | .10B | .03 | .07 | .01 | .01C |
| Net realized and unrealized gain (loss) | (1.54) | 2.01 | 1.24 | 5.57 | .30 | 2.22 |
| Total from investment operations | (1.50) | 2.11 | 1.27 | 5.64 | .31 | 2.23 |
| Distributions from net investment income | (.11) | (.02) | (.01) | (.07) | (.01) | (.08) |
| Distributions from net realized gain | (1.75) | (2.25) | (1.93) | (.47) | (.93) | (.12) |
| Total distributions | (1.85)D | (2.26)E | (1.94) | (.54) | (.93)F | (.20) |
| Redemption fees added to paid in capitalA,G | – | – | – | – | – | – |
| Net asset value, end of period | $15.79 | $19.14 | $19.29 | $19.96 | $14.86 | $15.48 |
| Total ReturnH,I,J | (8.30)% | 11.86% | 6.83% | 39.09% | 3.24% | 16.72% |
| Ratios to Average Net AssetsK,L | | | | | | |
| Expenses before reductions | 1.44%M | 1.42% | 1.36% | 1.36% | 1.44% | 1.44% |
| Expenses net of fee waivers, if any | 1.44%M | 1.39% | 1.35% | 1.36% | 1.44% | 1.43% |
| Expenses net of all reductions | 1.44%M | 1.39% | 1.34% | 1.36% | 1.44% | 1.43% |
| Net investment income (loss) | .46%M | .52%B | .13% | .41% | .09% | .06%C |
| Supplemental Data | | | | | | |
| Net assets, end of period (000 omitted) | $202,645 | $235,844 | $258,183 | $275,265 | $150,285 | $140,707 |
| Portfolio turnover rateN | 33 %M | 34% | 26%O | 29% | 27% | 22% |
A Calculated based on average shares outstanding during the period.
B Net Investment income per share reflects a large, non-recurring dividend which amounted to $.05 per share. Excluding this non-recurring dividend, the ratio of net investment income (loss) to average net assets would have been .26%.
C Net Investment income per share reflects a large, non-recurring dividend which amounted to $.06 per share. Excluding this non-recurring dividend, the ratio of net investment income (loss) to average net assets would have been (.31) %.
D Total distributions of $1.85 per share is comprised of distributions from net investment income of $.105 and distributions from net realized gain of $1.747 per share.
E Total distributions of $2.26 per share is comprised of distributions from net investment income of $.016 and distributions from net realized gain of $2.248 per share.
F Total distributions of $.93 per share is comprised of distributions from net investment income of $.006 and distributions from net realized gain of $.925 per share.
G Amount represents less than $.005 per share.
H Total returns for periods of less than one year are not annualized.
I Total returns would have been lower if certain expenses had not been reduced during the applicable periods shown.
J Total returns do not include the effect of the sales charges.
K Fees and expenses of any underlying Fidelity Central Funds are not included in the Fund's expense ratio. The Fund indirectly bears its proportionate share of the expenses of any underlying Fidelity Central Funds.
L Expense ratios reflect operating expenses of the class. Expenses before reductions do not reflect amounts reimbursed by the investment adviser or reductions from brokerage service arrangements or reductions from other expense offset arrangements and do not represent the amount paid by the class during periods when reimbursements or reductions occur. Expenses net of fee waivers reflect expenses after reimbursement by the investment adviser but prior to reductions from brokerage service arrangements or other expense offset arrangements. Expenses net of all reductions represent the net expenses paid by the class.
M Annualized
N Amount does not include the portfolio activity of any underlying Fidelity Central Funds.
O Portfolio turnover rate excludes securities received or delivered in-kind.
See accompanying notes which are an integral part of the financial statements.
Financial Highlights — Fidelity Small Cap Value Fund Class T
| | Six months ended (Unaudited) | Years ended July 31, | | | | |
| January 31, | 2016 | 2015 | 2014 | 2013 | 2012 | 2011 |
| Selected Per–Share Data | | | | | | |
| Net asset value, beginning of period | $18.78 | $18.98 | $19.70 | $14.70 | $15.34 | $13.34 |
| Income from Investment Operations | | | | | | |
| Net investment income (loss)A | .02 | .05B | (.02) | .03 | (.02) | (.03)C |
| Net realized and unrealized gain (loss) | (1.51) | 1.98 | 1.23 | 5.50 | .31 | 2.20 |
| Total from investment operations | (1.49) | 2.03 | 1.21 | 5.53 | .29 | 2.17 |
| Distributions from net investment income | (.06) | – | – | (.06) | – | (.05) |
| Distributions from net realized gain | (1.75) | (2.23) | (1.93) | (.47) | (.93) | (.12) |
| Total distributions | (1.81) | (2.23) | (1.93) | (.53) | (.93) | (.17) |
| Redemption fees added to paid in capitalA,D | – | – | – | – | – | – |
| Net asset value, end of period | $15.48 | $18.78 | $18.98 | $19.70 | $14.70 | $15.34 |
| Total ReturnE,F,G | (8.42)% | 11.58% | 6.58% | 38.70% | 3.08% | 16.36% |
| Ratios to Average Net AssetsH,I | | | | | | |
| Expenses before reductions | 1.68%J | 1.67% | 1.61% | 1.60% | 1.67% | 1.70% |
| Expenses net of fee waivers, if any | 1.68%J | 1.64% | 1.59% | 1.60% | 1.67% | 1.69% |
| Expenses net of all reductions | 1.68%J | 1.63% | 1.59% | 1.59% | 1.67% | 1.69% |
| Net investment income (loss) | .21%J | .27%B | (.11)% | .18% | (.14)% | (.19)%C |
| Supplemental Data | | | | | | |
| Net assets, end of period (000 omitted) | $79,396 | $91,716 | $100,975 | $107,444 | $57,514 | $55,845 |
| Portfolio turnover rateK | 33 %J | 34% | 26%L | 29% | 27% | 22% |
A Calculated based on average shares outstanding during the period.
B Net Investment income per share reflects a large, non-recurring dividend which amounted to $.05 per share. Excluding this non-recurring dividend, the ratio of net investment income (loss) to average net assets would have been .01%.
C Net Investment income per share reflects a large, non-recurring dividend which amounted to $.06 per share. Excluding this non-recurring dividend, the ratio of net investment income (loss) to average net assets would have been (.57) %.
D Amount represents less than $.005 per share.
E Total returns for periods of less than one year are not annualized.
F Total returns would have been lower if certain expenses had not been reduced during the applicable periods shown.
G Total returns do not include the effect of the sales charges.
H Fees and expenses of any underlying Fidelity Central Funds are not included in the Fund's expense ratio. The Fund indirectly bears its proportionate share of the expenses of any underlying Fidelity Central Funds.
I Expense ratios reflect operating expenses of the class. Expenses before reductions do not reflect amounts reimbursed by the investment adviser or reductions from brokerage service arrangements or reductions from other expense offset arrangements and do not represent the amount paid by the class during periods when reimbursements or reductions occur. Expenses net of fee waivers reflect expenses after reimbursement by the investment adviser but prior to reductions from brokerage service arrangements or other expense offset arrangements. Expenses net of all reductions represent the net expenses paid by the class.
J Annualized
K Amount does not include the portfolio activity of any underlying Fidelity Central Funds.
L Portfolio turnover rate excludes securities received or delivered in-kind.
See accompanying notes which are an integral part of the financial statements.
Financial Highlights — Fidelity Small Cap Value Fund Class B
| | Six months ended (Unaudited) | Years ended July 31, | | | | |
| January 31, | 2016 | 2015 | 2014 | 2013 | 2012 | 2011 |
| Selected Per–Share Data | | | | | | |
| Net asset value, beginning of period | $17.79 | $18.18 | $19.06 | $14.27 | $15.00 | $13.08 |
| Income from Investment Operations | | | | | | |
| Net investment income (loss)A | (.03) | (.06)B | (.13) | (.06) | (.09) | (.10)C |
| Net realized and unrealized gain (loss) | (1.42) | 1.90 | 1.18 | 5.34 | .29 | 2.15 |
| Total from investment operations | (1.45) | 1.84 | 1.05 | 5.28 | .20 | 2.05 |
| Distributions from net investment income | – | – | – | (.02) | – | (.01) |
| Distributions from net realized gain | (1.75) | (2.23) | (1.93) | (.47) | (.93) | (.12) |
| Total distributions | (1.75) | (2.23) | (1.93) | (.49) | (.93) | (.13) |
| Redemption fees added to paid in capitalA,D | – | – | – | – | – | – |
| Net asset value, end of period | $14.59 | $17.79 | $18.18 | $19.06 | $14.27 | $15.00 |
| Total ReturnE,F,G | (8.68)% | 10.94% | 5.92% | 38.07% | 2.51% | 15.80% |
| Ratios to Average Net AssetsH,I | | | | | | |
| Expenses before reductions | 2.28%J | 2.25% | 2.18% | 2.15% | 2.19% | 2.20% |
| Expenses net of fee waivers, if any | 2.27%J | 2.23% | 2.17% | 2.15% | 2.19% | 2.19% |
| Expenses net of all reductions | 2.27%J | 2.22% | 2.16% | 2.14% | 2.19% | 2.19% |
| Net investment income (loss) | (.38)%J | (.32)%B | (.69)% | (.37)% | (.66)% | (.69)%C |
| Supplemental Data | | | | | | |
| Net assets, end of period (000 omitted) | $2,463 | $3,473 | $4,808 | $7,052 | $6,675 | $8,549 |
| Portfolio turnover rateK | 33 %J | 34% | 26%L | 29% | 27% | 22% |
A Calculated based on average shares outstanding during the period.
B Net Investment income per share reflects a large, non-recurring dividend which amounted to $.05 per share. Excluding this non-recurring dividend, the ratio of net investment income (loss) to average net assets would have been (.58) %.
C Net Investment income per share reflects a large, non-recurring dividend which amounted to $.06 per share. Excluding this non-recurring dividend, the ratio of net investment income (loss) to average net assets would have been (1.07) %.
D Amount represents less than $.005 per share.
E Total returns for periods of less than one year are not annualized.
F Total returns would have been lower if certain expenses had not been reduced during the applicable periods shown.
G Total returns do not include the effect of the contingent deferred sales charge.
H Fees and expenses of any underlying Fidelity Central Funds are not included in the Fund's expense ratio. The Fund indirectly bears its proportionate share of the expenses of any underlying Fidelity Central Funds.
I Expense ratios reflect operating expenses of the class. Expenses before reductions do not reflect amounts reimbursed by the investment adviser or reductions from brokerage service arrangements or reductions from other expense offset arrangements and do not represent the amount paid by the class during periods when reimbursements or reductions occur. Expenses net of fee waivers reflect expenses after reimbursement by the investment adviser but prior to reductions from brokerage service arrangements or other expense offset arrangements. Expenses net of all reductions represent the net expenses paid by the class.
J Annualized
K Amount does not include the portfolio activity of any underlying Fidelity Central Funds.
L Portfolio turnover rate excludes securities received or delivered in-kind.
See accompanying notes which are an integral part of the financial statements.
Financial Highlights — Fidelity Small Cap Value Fund Class C
| | Six months ended (Unaudited) | Years ended July 31, | | | | |
| January 31, | 2016 | 2015 | 2014 | 2013 | 2012 | 2011 |
| Selected Per–Share Data | | | | | | |
| Net asset value, beginning of period | $17.82 | $18.19 | $19.06 | $14.28 | $15.01 | $13.08 |
| Income from Investment Operations | | | | | | |
| Net investment income (loss)A | (.02) | (.04)B | (.12) | (.06) | (.09) | (.10)C |
| Net realized and unrealized gain (loss) | (1.43) | 1.90 | 1.18 | 5.34 | .29 | 2.17 |
| Total from investment operations | (1.45) | 1.86 | 1.06 | 5.28 | .20 | 2.07 |
| Distributions from net investment income | – | – | – | (.03) | – | (.02) |
| Distributions from net realized gain | (1.75) | (2.23) | (1.93) | (.47) | (.93) | (.12) |
| Total distributions | (1.75) | (2.23) | (1.93) | (.50) | (.93) | (.14) |
| Redemption fees added to paid in capitalA,D | – | – | – | – | – | – |
| Net asset value, end of period | $14.62 | $17.82 | $18.19 | $19.06 | $14.28 | $15.01 |
| Total ReturnE,F,G | (8.67)% | 11.05% | 5.97% | 38.00% | 2.52% | 15.91% |
| Ratios to Average Net AssetsH,I | | | | | | |
| Expenses before reductions | 2.20%J | 2.19% | 2.12% | 2.13% | 2.19% | 2.18% |
| Expenses net of fee waivers, if any | 2.20%J | 2.16% | 2.11% | 2.13% | 2.19% | 2.18% |
| Expenses net of all reductions | 2.20%J | 2.15% | 2.10% | 2.12% | 2.19% | 2.18% |
| Net investment income (loss) | (.30)%J | (.25)%B | (.63)% | (.35)% | (.66)% | (.68)%C |
| Supplemental Data | | | | | | |
| Net assets, end of period (000 omitted) | $55,259 | $64,928 | $70,541 | $76,018 | $47,265 | $47,457 |
| Portfolio turnover rateK | 33 %J | 34% | 26%L | 29% | 27% | 22% |
A Calculated based on average shares outstanding during the period.
B Net Investment income per share reflects a large, non-recurring dividend which amounted to $.05 per share. Excluding this non-recurring dividend, the ratio of net investment income (loss) to average net assets would have been (.51) %.
C Net Investment income per share reflects a large, non-recurring dividend which amounted to $.06 per share. Excluding this non-recurring dividend, the ratio of net investment income (loss) to average net assets would have been (1.06) %.
D Amount represents less than $.005 per share.
E Total returns for periods of less than one year are not annualized.
F Total returns would have been lower if certain expenses had not been reduced during the applicable periods shown.
G Total returns do not include the effect of the contingent deferred sales charge.
H Fees and expenses of any underlying Fidelity Central Funds are not included in the Fund's expense ratio. The Fund indirectly bears its proportionate share of the expenses of any underlying Fidelity Central Funds.
I Expense ratios reflect operating expenses of the class. Expenses before reductions do not reflect amounts reimbursed by the investment adviser or reductions from brokerage service arrangements or reductions from other expense offset arrangements and do not represent the amount paid by the class during periods when reimbursements or reductions occur. Expenses net of fee waivers reflect expenses after reimbursement by the investment adviser but prior to reductions from brokerage service arrangements or other expense offset arrangements. Expenses net of all reductions represent the net expenses paid by the class.
J Annualized
K Amount does not include the portfolio activity of any underlying Fidelity Central Funds.
L Portfolio turnover rate excludes securities received or delivered in-kind.
See accompanying notes which are an integral part of the financial statements.
Financial Highlights — Fidelity Small Cap Value Fund
| | Six months ended (Unaudited) | Years ended July 31, | | | | |
| January 31, | 2016 | 2015 | 2014 | 2013 | 2012 | 2011 |
| Selected Per–Share Data | | | | | | |
| Net asset value, beginning of period | $19.45 | $19.57 | $20.22 | $15.05 | $15.62 | $13.56 |
| Income from Investment Operations | | | | | | |
| Net investment income (loss)A | .06 | .15B | .08 | .12 | .06 | .06C |
| Net realized and unrealized gain (loss) | (1.56) | 2.05 | 1.26 | 5.63 | .32 | 2.23 |
| Total from investment operations | (1.50) | 2.20 | 1.34 | 5.75 | .38 | 2.29 |
| Distributions from net investment income | (.15) | (.07) | (.06) | (.11) | (.02) | (.10) |
| Distributions from net realized gain | (1.75) | (2.25) | (1.93) | (.47) | (.93) | (.13) |
| Total distributions | (1.90) | (2.32) | (1.99) | (.58) | (.95) | (.23) |
| Redemption fees added to paid in capitalA,D | – | – | – | – | – | – |
| Net asset value, end of period | $16.05 | $19.45 | $19.57 | $20.22 | $15.05 | $15.62 |
| Total ReturnE,F | (8.18)% | 12.18% | 7.12% | 39.45% | 3.67% | 17.03% |
| Ratios to Average Net AssetsG,H | | | | | | |
| Expenses before reductions | 1.21%I | 1.15% | 1.08% | 1.07% | 1.13% | 1.13% |
| Expenses net of fee waivers, if any | 1.21%I | 1.12% | 1.06% | 1.07% | 1.13% | 1.13% |
| Expenses net of all reductions | 1.21%I | 1.12% | 1.06% | 1.06% | 1.13% | 1.13% |
| Net investment income (loss) | .69%I | .78%B | .41% | .71% | .41% | .37%C |
| Supplemental Data | | | | | | |
| Net assets, end of period (000 omitted) | $1,973,619 | $2,036,157 | $2,060,546 | $2,672,854 | $1,756,962 | $1,899,805 |
| Portfolio turnover rateJ | 33 %I | 34% | 26%K | 29% | 27% | 22% |
A Calculated based on average shares outstanding during the period.
B Net Investment income per share reflects a large, non-recurring dividend which amounted to $.05 per share. Excluding this non-recurring dividend, the ratio of net investment income (loss) to average net assets would have been .53%.
C Net Investment income per share reflects a large, non-recurring dividend which amounted to $.06 per share. Excluding this non-recurring dividend, the ratio of net investment income (loss) to average net assets would have been (.01) %.
D Amount represents less than $.005 per share.
E Total returns for periods of less than one year are not annualized.
F Total returns would have been lower if certain expenses had not been reduced during the applicable periods shown.
G Fees and expenses of any underlying Fidelity Central Funds are not included in the Fund's expense ratio. The Fund indirectly bears its proportionate share of the expenses of any underlying Fidelity Central Funds.
H Expense ratios reflect operating expenses of the class. Expenses before reductions do not reflect amounts reimbursed by the investment adviser or reductions from brokerage service arrangements or reductions from other expense offset arrangements and do not represent the amount paid by the class during periods when reimbursements or reductions occur. Expenses net of fee waivers reflect expenses after reimbursement by the investment adviser but prior to reductions from brokerage service arrangements or other expense offset arrangements. Expenses net of all reductions represent the net expenses paid by the class.
I Annualized
J Amount does not include the portfolio activity of any underlying Fidelity Central Funds.
K Portfolio turnover rate excludes securities received or delivered in-kind.
See accompanying notes which are an integral part of the financial statements.
Financial Highlights — Fidelity Small Cap Value Fund Class I
| | Six months ended (Unaudited) | Years ended July 31, | | | | |
| January 31, | 2016 | 2015 | 2014 | 2013 | 2012 | 2011 |
| Selected Per–Share Data | | | | | | |
| Net asset value, beginning of period | $19.45 | $19.57 | $20.23 | $15.05 | $15.63 | $13.58 |
| Income from Investment Operations | | | | | | |
| Net investment income (loss)A | .06 | .15B | .08 | .12 | .06 | .06C |
| Net realized and unrealized gain (loss) | (1.56) | 2.05 | 1.25 | 5.65 | .31 | 2.23 |
| Total from investment operations | (1.50) | 2.20 | 1.33 | 5.77 | .37 | 2.29 |
| Distributions from net investment income | (.16) | (.07) | (.06) | (.12) | (.02) | (.11) |
| Distributions from net realized gain | (1.75) | (2.25) | (1.93) | (.47) | (.93) | (.13) |
| Total distributions | (1.90)D | (2.32) | (1.99) | (.59) | (.95) | (.24) |
| Redemption fees added to paid in capitalA,E | – | – | – | – | – | – |
| Net asset value, end of period | $16.05 | $19.45 | $19.57 | $20.23 | $15.05 | $15.63 |
| Total ReturnF,G | (8.17)% | 12.17% | 7.08% | 39.54% | 3.59% | 17.02% |
| Ratios to Average Net AssetsH,I | | | | | | |
| Expenses before reductions | 1.17%J | 1.15% | 1.09% | 1.07% | 1.14% | 1.10% |
| Expenses net of fee waivers, if any | 1.17%J | 1.12% | 1.07% | 1.07% | 1.14% | 1.10% |
| Expenses net of all reductions | 1.17%J | 1.12% | 1.07% | 1.06% | 1.14% | 1.10% |
| Net investment income (loss) | .73%J | .79%B | .40% | .70% | .39% | .39%C |
| Supplemental Data | | | | | | |
| Net assets, end of period (000 omitted) | $333,802 | $376,817 | $342,500 | $359,582 | $138,981 | $101,565 |
| Portfolio turnover rateK | 33 %J | 34% | 26%L | 29% | 27% | 22% |
A Calculated based on average shares outstanding during the period.
B Net Investment income per share reflects a large, non-recurring dividend which amounted to $.05 per share. Excluding this non-recurring dividend, the ratio of net investment income (loss) to average net assets would have been .53%.
C Net Investment income per share reflects a large, non-recurring dividend which amounted to $.06 per share. Excluding this non-recurring dividend, the ratio of net investment income (loss) to average net assets would have been .01%.
D Total distributions of $1.90 per share is comprised of distributions from net investment income of $.157 and distributions from net realized gain of $1.747 per share.
E Amount represents less than $.005 per share.
F Total returns for periods of less than one year are not annualized.
G Total returns would have been lower if certain expenses had not been reduced during the applicable periods shown.
H Fees and expenses of any underlying Fidelity Central Funds are not included in the Fund's expense ratio. The Fund indirectly bears its proportionate share of the expenses of any underlying Fidelity Central Funds.
I Expense ratios reflect operating expenses of the class. Expenses before reductions do not reflect amounts reimbursed by the investment adviser or reductions from brokerage service arrangements or reductions from other expense offset arrangements and do not represent the amount paid by the class during periods when reimbursements or reductions occur. Expenses net of fee waivers reflect expenses after reimbursement by the investment adviser but prior to reductions from brokerage service arrangements or other expense offset arrangements. Expenses net of all reductions represent the net expenses paid by the class.
J Annualized
K Amount does not include the portfolio activity of any underlying Fidelity Central Funds.
L Portfolio turnover rate excludes securities received or delivered in-kind.
See accompanying notes which are an integral part of the financial statements.
Notes to Financial Statements (Unaudited)
For the period ended January 31, 2016
1. Organization.
Fidelity Small Cap Value Fund (the Fund) is a fund of Fidelity Securities Fund (the Trust) and is authorized to issue an unlimited number of shares. The Trust is registered under the Investment Company Act of 1940, as amended (the 1940 Act), as an open-end management investment company organized as a Massachusetts business trust. The Fund offers Class A, Class T, Class C, Small Cap Value and Class I shares, each of which, along with Class B shares, has equal rights as to assets and voting privileges. Class B shares are closed to new accounts and additional purchases, except for exchanges and reinvestments. The Fund's other share classes are also closed to new accounts with certain exceptions. Each class has exclusive voting rights with respect to matters that affect that class. Class B shares will automatically convert to Class A shares after a holding period of seven years from the initial date of purchase.
During the period, the Board of Trustees approved the conversion of all existing Class B shares into Class A shares, effective on or about July 1, 2016, regardless of the length of times shares have been held.
2. Investments in Fidelity Central Funds.
The Fund invests in Fidelity Central Funds, which are open-end investment companies generally available only to other investment companies and accounts managed by the investment adviser and its affiliates. The Fund's Schedule of Investments lists each of the Fidelity Central Funds held as of period end, if any, as an investment of the Fund, but does not include the underlying holdings of each Fidelity Central Fund. As an Investing Fund, the Fund indirectly bears its proportionate share of the expenses of the underlying Fidelity Central Funds.
The Money Market Central Funds seek preservation of capital and current income and are managed by Fidelity Investments Money Management, Inc. (FIMM), an affiliate of the investment adviser. Annualized expenses of the Money Market Central Funds as of their most recent shareholder report date are less than .005%.
A complete unaudited list of holdings for each Fidelity Central Fund is available upon request or at the Securities and Exchange Commission (the SEC) website at www.sec.gov. In addition, the financial statements of the Fidelity Central Funds are available on the SEC website or upon request.
3. Significant Accounting Policies.
The financial statements have been prepared in conformity with accounting principles generally accepted in the United States of America (GAAP), which require management to make certain estimates and assumptions at the date of the financial statements. Actual results could differ from those estimates. Subsequent events, if any, through the date that the financial statements were issued have been evaluated in the preparation of the financial statements. The following summarizes the significant accounting policies of the Fund:
Investment Valuation. Investments are valued as of 4:00 p.m. Eastern time on the last calendar day of the period. The Board of Trustees (the Board) has delegated the day to day responsibility for the valuation of the Fund's investments to the Fidelity Management & Research Company (FMR) Fair Value Committee (the Committee). In accordance with valuation policies and procedures approved by the Board, the Fund attempts to obtain prices from one or more third party pricing vendors or brokers to value its investments. When current market prices, quotations or currency exchange rates are not readily available or reliable, investments will be fair valued in good faith by the Committee, in accordance with procedures adopted by the Board. Factors used in determining fair value vary by investment type and may include market or investment specific events. The frequency with which these procedures are used cannot be predicted and they may be utilized to a significant extent. The Committee oversees the Fund's valuation policies and procedures and reports to the Board on the Committee's activities and fair value determinations. The Board monitors the appropriateness of the procedures used in valuing the Fund's investments and ratifies the fair value determinations of the Committee.
The Fund categorizes the inputs to valuation techniques used to value its investments into a disclosure hierarchy consisting of three levels as shown below:
- Level 1 – quoted prices in active markets for identical investments
- Level 2 – other significant observable inputs (including quoted prices for similar investments, interest rates, prepayment speeds, etc.)
- Level 3 – unobservable inputs (including the Fund's own assumptions based on the best information available)
Valuation techniques used to value the Fund's investments by major category are as follows:
Equity securities, including restricted securities, for which market quotations are readily available, are valued at the last reported sale price or official closing price as reported by a third party pricing vendor on the primary market or exchange on which they are traded and are categorized as Level 1 in the hierarchy. In the event there were no sales during the day or closing prices are not available, securities are valued at the last quoted bid price or may be valued using the last available price and are generally categorized as Level 2 in the hierarchy. For foreign equity securities, when market or security specific events arise, comparisons to the valuation of American Depositary Receipts (ADRs), futures contracts, Exchange-Traded Funds (ETFs) and certain indexes as well as quoted prices for similar securities may be used and would be categorized as Level 2 in the hierarchy. Utilizing these techniques may result in transfers between Level 1 and Level 2. For equity securities, including restricted securities, where observable inputs are limited, assumptions about market activity and risk are used and these securities may be categorized as Level 3 in the hierarchy.
Investments in open-end mutual funds, including the Fidelity Central Funds, are valued at their closing net asset value (NAV) each business day and are categorized as Level 1 in the hierarchy.
Changes in valuation techniques may result in transfers in or out of an assigned level within the disclosure hierarchy. The aggregate value of investments by input level as of January 31, 2016, including information on transfers between Levels 1 and 2, is included at the end of the Fund's Schedule of Investments.
Foreign Currency. The Fund may use foreign currency contracts to facilitate transactions in foreign-denominated securities. Gains and losses from these transactions may arise from changes in the value of the foreign currency or if the counterparties do not perform under the contracts' terms.
Foreign-denominated assets, including investment securities, and liabilities are translated into U.S. dollars at the exchange rates at period end. Purchases and sales of investment securities, income and dividends received and expenses denominated in foreign currencies are translated into U.S. dollars at the exchange rate in effect on the transaction date.
The effects of exchange rate fluctuations on investments are included with the net realized and unrealized gain (loss) on investment securities. Other foreign currency transactions resulting in realized and unrealized gain (loss) are disclosed separately.
Investment Transactions and Income. For financial reporting purposes, the Fund's investment holdings and NAV include trades executed through the end of the last business day of the period. The NAV per share for processing shareholder transactions is calculated as of the close of business of the New York Stock Exchange (NYSE), normally 4:00 p.m. Eastern time and includes trades executed through the end of the prior business day. Gains and losses on securities sold are determined on the basis of identified cost. Dividend income is recorded on the ex-dividend date, except for certain dividends from foreign securities where the ex-dividend date may have passed, which are recorded as soon as the Fund is informed of the ex-dividend date. Non-cash dividends included in dividend income, if any, are recorded at the fair market value of the securities received. Income and capital gain distributions from Fidelity Central Funds, if any, are recorded on the ex-dividend date. Distributions received on securities that represent a return of capital or capital gain are recorded as a reduction of cost of investments and/or as a realized gain. Subsequent to ex-dividend date the Fund determines the components of these distributions, based upon receipt of tax filings or other correspondence relating to the underlying investment. Investment income is recorded net of foreign taxes withheld where recovery of such taxes is uncertain.
Class Allocations and Expenses. Investment income, realized and unrealized capital gains and losses, common expenses of the Fund, and certain fund-level expense reductions, if any, are allocated daily on a pro-rata basis to each class based on the relative net assets of each class to the total net assets of the Fund. Each class differs with respect to transfer agent and distribution and service plan fees incurred. Certain expense reductions may also differ by class. For the reporting period, the allocated portion of income and expenses to each class as a percent of its average net assets may vary due to the timing of recording these transactions in relation to fluctuating net assets of the classes. Expenses directly attributable to a fund are charged to that fund. Expenses attributable to more than one fund are allocated among the respective funds on the basis of relative net assets or other appropriate methods. Expense estimates are accrued in the period to which they relate and adjustments are made when actual amounts are known.
Income Tax Information and Distributions to Shareholders. Each year, the Fund intends to qualify as a regulated investment company under Subchapter M of the Internal Revenue Code, including distributing substantially all of its taxable income and realized gains. As a result, no provision for U.S. Federal income taxes is required. The Fund files a U.S. federal tax return, in addition to state and local tax returns as required. The Fund's federal income tax returns are subject to examination by the Internal Revenue Service (IRS) for a period of three fiscal years after they are filed. State and local tax returns may be subject to examination for an additional fiscal year depending on the jurisdiction. Foreign taxes are provided for based on the Fund's understanding of the tax rules and rates that exist in the foreign markets in which it invests.
Distributions are declared and recorded on the ex-dividend date. Income dividends and capital gain distributions are declared separately for each class. Income and capital gain distributions are determined in accordance with income tax regulations, which may differ from GAAP.
Capital accounts within the financial statements are adjusted for permanent book-tax differences. These adjustments have no impact on net assets or the results of operations. Capital accounts are not adjusted for temporary book-tax differences which will reverse in a subsequent period.
Book-tax differences are primarily due to foreign currency transactions, passive foreign investment companies (PFIC) and losses deferred due to wash sales.
The federal tax cost of investment securities and unrealized appreciation (depreciation) as of period end were as follows:
| Gross unrealized appreciation | $387,748,822 |
| Gross unrealized depreciation | (267,041,047) |
| Net unrealized appreciation (depreciation) on securities | $120,707,775 |
| Tax cost | $2,644,242,339 |
Short-Term Trading (Redemption) Fees. Shares held by investors in the Fund less than 90 days may have been subject to a redemption fee equal to 1.50% of the NAV of shares redeemed. All redemption fees, which reduce the proceeds of the shareholder redemption, are retained by the Fund and accounted for as an addition to paid in capital.
4. Purchases and Sales of Investments.
Purchases and sales of securities, other than short-term securities, aggregated $544,684,068 and $458,614,173, respectively.
5. Fees and Other Transactions with Affiliates.
Management Fee. Fidelity Management & Research Company (the investment adviser) and its affiliates provide the Fund with investment management related services for which the Fund pays a monthly management fee. The management fee is the sum of an individual fund fee rate that is based on an annual rate of .45% of the Fund's average net assets and an annualized group fee rate that averaged .25% during the period. The group fee rate is based upon the average net assets of all the mutual funds advised by the investment adviser, including any mutual funds previously advised by the investment adviser that are currently advised by Fidelity SelectCo, LLC, an affiliate of the investment adviser. The group fee rate decreases as assets under management increase and increases as assets under management decrease. In addition, the management fee is subject to a performance adjustment (up to a maximum of +/- .20% of the Fund's average net assets over a 36 month performance period). The upward or downward adjustment to the management fee is based on the relative investment performance of Small Cap Value as compared to its benchmark index, the Russell 2000 Value Index, over the same 36 month performance period. For the reporting period, the total annualized management fee rate, including the performance adjustment, was .93% of the Fund's average net assets. The performance adjustment included in the management fee rate may be higher or lower than the maximum performance adjustment rate due to the difference between the average net assets for the reporting and performance periods.
Distribution and Service Plan Fees. In accordance with Rule 12b-1 of the 1940 Act, the Fund has adopted separate Distribution and Service Plans for each class of shares. Certain classes pay Fidelity Distributors Corporation (FDC), an affiliate of the investment adviser, separate Distribution and Service Fees, each of which is based on an annual percentage of each class' average net assets. In addition, FDC may pay financial intermediaries for selling shares of the Fund and providing shareholder support services. For the period, the Distribution and Service Fee rates, total fees and amounts retained by FDC were as follows:
| | Distribution
Fee | Service
Fee | Total Fees | Retained
by FDC |
| Class A | -% | .25% | $276,222 | $��� |
| Class T | .25% | .25% | 215,804 | – |
| Class B | .75% | .25% | 14,877 | 11,158 |
| Class C | .75% | .25% | 302,240 | – |
| | | | $809,143 | $11,158 |
Sales Load. FDC may receive a front-end sales charge of up to 5.75% for selling Class A shares and 3.50% for selling Class T shares, some of which is paid to financial intermediaries for selling shares of the Fund. Depending on the holding period, FDC may receive contingent deferred sales charges levied on Class A, Class T, Class B, and Class C redemptions. The deferred sales charges range from 5.00% to 1.00% for Class B shares, 1.00% for Class C shares, 1.00% for certain purchases of Class A shares and .25% for certain purchases of Class T shares.
For the period, sales charge amounts retained by FDC were as follows:
| | Retained
by FDC |
| Class A | $3,343 |
| Class T | 1,558 |
| Class B(a) | 600 |
| Class C(a) | 175 |
| | $5,676 |
(a) When Class B and Class C shares are initially sold, FDC pays commissions from its own resources to financial intermediaries through which the sales are made.
Transfer Agent Fees. Fidelity Investments Institutional Operations Company, Inc., (FIIOC), an affiliate of the investment adviser, is the transfer, dividend disbursing and shareholder servicing agent for each class of the Fund. FIIOC receives account fees and asset-based fees that vary according to the account size and type of account of the shareholders of the respective classes of the Fund.FIIOC pays for typesetting, printing and mailing of shareholder reports, except proxy statements.
For the period, transfer agent fees for each class were as follows:
| | Amount | % of
Class-Level Average
Net Assets(a) |
| Class A | $240,091 | .22 |
| Class T | 91,163 | .21 |
| Class B | 4,520 | .30 |
| Class C | 69,338 | .23 |
| Small Cap Value | 2,371,533 | .23 |
| Class I | 349,112 | .20 |
| | $3,125,757 | |
(a) Annualized
Accounting and Security Lending Fees. Fidelity Service Company, Inc. (FSC), an affiliate of the investment adviser, maintains the Fund's accounting records. The accounting fee is based on the level of average net assets for each month. Under a separate contract, FSC administers the security lending program. The security lending fee is based on the number and duration of lending transactions.
Brokerage Commissions. The Fund placed a portion of its portfolio transactions with brokerage firms which are affiliates of the investment adviser. Brokerage commissions are included in net realized gain (loss) and change in net unrealized appreciation (depreciation) in the Statement of Operations. The commissions paid to these affiliated firms were $12,094 for the period.
Interfund Trades. The Fund may purchase from or sell securities to other Fidelity Funds under procedures adopted by the Board. The procedures have been designed to ensure these interfund trades are executed in accordance with Rule 17a-7 of the 1940 Act. Interfund trades are included within the respective purchases and sales amounts shown in the Purchases and Sales of Investments note.
6. Committed Line of Credit.
The Fund participates with other funds managed by the investment adviser or an affiliate in a $4.25 billion credit facility (the "line of credit") to be utilized for temporary or emergency purposes to fund shareholder redemptions or for other short-term liquidity purposes. The Fund has agreed to pay commitment fees on its pro-rata portion of the line of credit, which amounted to $1,860 and is reflected in Miscellaneous expenses on the Statement of Operations. During the period, the Fund did not borrow on this line of credit.
7. Security Lending.
The Fund lends portfolio securities through a lending agent from time to time in order to earn additional income. For equity securities, a lending agent is used and may loan securities to certain qualified borrowers, including Fidelity Capital Markets (FCM), a broker-dealer affiliated with the Fund. On the settlement date of the loan, the Fund receives collateral (in the form of U.S. Treasury obligations, letters of credit and/or cash) against the loaned securities and maintains collateral in an amount not less than 100% of the market value of the loaned securities during the period of the loan. The market value of the loaned securities is determined at the close of business of the Fund and any additional required collateral is delivered to the Fund on the next business day. The Fund or borrower may terminate the loan at any time, and if the borrower defaults on its obligation to return the securities loaned because of insolvency or other reasons, the Fund may apply collateral received from the borrower against the obligation. The Fund may experience delays and costs in recovering the securities loaned. Any cash collateral received is the Fidelity Securities Lending Cash Central Fund. The value of loaned securities and cash collateral at period end are disclosed on the Fund's Statement of Assets and Liabilities. The value of securities loaned to FCM at period end was $142,275. Security lending income represents the income earned on investing cash collateral, less rebates paid to borrowers and any lending agent fees associated with the loan, plus any premium payments received for lending certain types of securities. Security lending income is presented in the Statement of Operations as a component of income from Fidelity Central Funds. Total security lending income during the period amounted to $917,702, including $1,535 from securities loaned to FCM.
8. Expense Reductions.
Commissions paid to certain brokers with whom the investment adviser, or its affiliates, places trades on behalf of the Fund include an amount in addition to trade execution, which may be rebated back to the Fund to offset certain expenses. This amount totaled $8,582 for the period. In addition, through arrangements with the Fund's custodian, credits realized as a result of certain uninvested cash balances were used to reduce the Fund's expenses. During the period, these credits reduced the Fund's expense by $110.
In addition, during the period the investment adviser reimbursed and/or waived a portion of fund-level operating expenses in the amount of $9,849.
9. Distributions to Shareholders.
Distributions to shareholders of each class were as follows:
| | Six months ended January 31, 2016 | Year ended July 31, 2015 |
| From net investment income | | |
| Class A | $1,294,370 | $207,059 |
| Class T | 298,011 | – |
| Small Cap Value | 17,252,984 | 7,655,420 |
| Class I | 3,108,241 | 1,284,414 |
| Total | $21,953,606 | $9,146,893 |
| From net realized gain | | |
| Class A | $21,315,531 | $29,002,450 |
| Class T | 8,511,334 | 11,758,984 |
| Class B | 317,311 | 573,044 |
| Class C | 6,297,703 | 8,461,258 |
| Small Cap Value | 193,461,328 | 233,242,234 |
| Class I | 34,271,399 | 39,442,202 |
| Total | $264,174,606 | $322,480,172 |
10. Share Transactions.
Share transactions for each class were as follows and may contain automatic conversions between classes or exchanges between affiliated funds:
| | Shares | Shares | Dollars | Dollars |
| | Six months ended January 31, 2016 | Year ended July 31, 2015 | Six months ended January 31, 2016 | Year ended July 31, 2015 |
| Class A | | | | |
| Shares sold | 975,320 | 1,619,679 | $16,612,607 | $30,035,137 |
| Reinvestment of distributions | 1,320,026 | 1,578,405 | 22,234,691 | 28,466,035 |
| Shares redeemed | (1,786,996) | (4,261,712) | (30,317,795) | (79,564,907) |
| Net increase (decrease) | 508,350 | (1,063,628) | $8,529,503 | $(21,063,735) |
| Class T | | | | |
| Shares sold | 310,224 | 599,331 | $5,203,698 | $10,911,777 |
| Reinvestment of distributions | 527,842 | 655,613 | 8,714,816 | 11,618,861 |
| Shares redeemed | (594,533) | (1,691,524) | (9,865,736) | (30,859,052) |
| Net increase (decrease) | 243,533 | (436,580) | $4,052,778 | $(8,328,414) |
| Class B | | | | |
| Shares sold | 2,263 | 5,056 | $34,845 | $89,676 |
| Reinvestment of distributions | 19,426 | 31,870 | 302,868 | 537,830 |
| Shares redeemed | (48,105) | (106,178) | (758,742) | (1,834,363) |
| Net increase (decrease) | (26,416) | (69,252) | $(421,029) | $(1,206,857) |
| Class C | | | | |
| Shares sold | 125,591 | 167,565 | $1,958,139 | $2,897,201 |
| Reinvestment of distributions | 367,680 | 447,025 | 5,744,375 | 7,553,140 |
| Shares redeemed | (358,789) | (847,704) | (5,654,174) | (14,671,382) |
| Net increase (decrease) | 134,482 | (233,114) | $2,048,340 | $(4,221,041) |
| Small Cap Value | | | | |
| Shares sold | 18,049,566 | 13,163,441 | $309,409,636 | $248,872,334 |
| Reinvestment of distributions | 11,459,014 | 12,098,173 | 196,112,754 | 221,448,638 |
| Shares redeemed | (11,230,058) | (25,848,809) | (192,654,407) | (487,056,437) |
| Net increase (decrease) | 18,278,522 | (587,195) | $312,867,983 | $(16,735,465) |
| Class I | | | | |
| Shares sold | 1,966,371 | 4,194,067 | $33,969,215 | $79,803,869 |
| Reinvestment of distributions | 1,907,860 | 1,996,970 | 32,653,194 | 36,554,847 |
| Shares redeemed | (2,451,782) | (4,316,971) | (42,326,981) | (81,701,452) |
| Net increase (decrease) | 1,422,449 | 1,874,066 | $24,295,428 | $34,657,264 |
11. Other.
The Fund's organizational documents provide former and current trustees and officers with a limited indemnification against liabilities arising in connection with the performance of their duties to the Fund. In the normal course of business, the Fund may also enter into contracts that provide general indemnifications. The Fund's maximum exposure under these arrangements is unknown as this would be dependent on future claims that may be made against the Fund. The risk of material loss from such claims is considered remote.
Shareholder Expense Example
As a shareholder of the Fund, you incur two types of costs: (1) transaction costs, including sales charges (loads) on purchase payments or redemption proceeds, redemption fees and (2) ongoing costs, including management fees, distribution and/or service (12b-1) fees and other Fund expenses. This Example is intended to help you understand your ongoing costs (in dollars) of investing in the Fund and to compare these costs with the ongoing costs of investing in other mutual funds.
The Example is based on an investment of $1,000 invested at the beginning of the period and held for the entire period (August 1, 2015 to January 31, 2016).
Actual Expenses
The first line of the accompanying table for each class of the Fund provides information about actual account values and actual expenses. You may use the information in this line, together with the amount you invested, to estimate the expenses that you paid over the period. Simply divide your account value by $1,000.00 (for example, an $8,600 account value divided by $1,000.00 = 8.6), then multiply the result by the number in the first line for a class of the Fund under the heading entitled "Expenses Paid During Period" to estimate the expenses you paid on your account during this period. A small balance maintenance fee of $12.00 that is charged once a year may apply for certain accounts with a value of less than $2,000. This fee is not included in the table below. If it was, the estimate of expenses you paid during the period would be higher, and your ending account value lower, by this amount. In addition, the Fund, as a shareholder in the underlying Fidelity Central Funds, will indirectly bear its pro-rata share of the fees and expenses incurred by the underlying Fidelity Central Funds. These fees and expenses are not included in the Fund's annualized expense ratio used to calculate the expense estimate in the table below.
Hypothetical Example for Comparison Purposes
The second line of the accompanying table for each class of the Fund provides information about hypothetical account values and hypothetical expenses based on a Class' actual expense ratio and an assumed rate of return of 5% per year before expenses, which is not the Class' actual return. The hypothetical account values and expenses may not be used to estimate the actual ending account balance or expenses you paid for the period. You may use this information to compare the ongoing costs of investing in the Fund and other funds. To do so, compare this 5% hypothetical example with the 5% hypothetical examples that appear in the shareholder reports of the other funds. A small balance maintenance fee of $12.00 that is charged once a year may apply for certain accounts with a value of less than $2,000. This fee is not included in the table below. If it was, the estimate of expenses you paid during the period would be higher, and your ending account value lower, by this amount. In addition, the Fund, as a shareholder in the underlying Fidelity Central Funds, will indirectly bear its pro-rata share of the fees and expenses incurred by the underlying Fidelity Central Funds. These fees and expenses are not included in the Fund's annualized expense ratio used to calculate the expense estimate in the table below.
Please note that the expenses shown in the table are meant to highlight your ongoing costs only and do not reflect any transaction costs. Therefore, the second line of the table is useful in comparing ongoing costs only, and will not help you determine the relative total costs of owning different funds. In addition, if these transactional costs were included, your costs would have been higher.
| | Annualized Expense Ratio-A | Beginning
Account Value
August 1, 2015 | Ending
Account Value
January 31, 2016 | Expenses Paid
During Period-B
August 1, 2015
to January 31, 2016 |
| Class A | 1.44% | | | |
| Actual | | $1,000.00 | $917.00 | $6.94 |
| Hypothetical-C | | $1,000.00 | $1,017.90 | $7.30 |
| Class T | 1.68% | | | |
| Actual | | $1,000.00 | $915.80 | $8.09 |
| Hypothetical-C | | $1,000.00 | $1,016.69 | $8.52 |
| Class B | 2.27% | | | |
| Actual | | $1,000.00 | $913.20 | $10.92 |
| Hypothetical-C | | $1,000.00 | $1,013.72 | $11.49 |
| Class C | 2.20% | | | |
| Actual | | $1,000.00 | $913.30 | $10.58 |
| Hypothetical-C | | $1,000.00 | $1,014.08 | $11.14 |
| Small Cap Value | 1.21% | | | |
| Actual | | $1,000.00 | $918.20 | $5.83 |
| Hypothetical-C | | $1,000.00 | $1,019.05 | $6.14 |
| Class I | 1.17% | | | |
| Actual | | $1,000.00 | $918.30 | $5.64 |
| Hypothetical-C | | $1,000.00 | $1,019.25 | $5.94 |
A Annualized expense ratio reflects expenses net of applicable fee waivers.
B Expenses are equal to each Class' annualized expense ratio, multiplied by the average account value over the period, multiplied by 184/366 (to reflect the one-half year period).
C 5% return per year before expenses
Corporate Headquarters
245 Summer St.
Boston, MA 02210
www.fidelity.com
SCV-SANN-0316
1.803709.111
Fidelity® Small Cap Growth Fund
Semi-Annual Report January 31, 2016 |
|
Contents
To view a fund's proxy voting guidelines and proxy voting record for the 12-month period ended June 30, visit http://www.fidelity.com/proxyvotingresults or visit the Securities and Exchange Commission's (SEC) web site at http://www.sec.gov.
You may also call 1-800-544-8544 to request a free copy of the proxy voting guidelines.
Standard & Poor's, S&P and S&P 500 are registered service marks of The McGraw-Hill Companies, Inc. and have been licensed for use by Fidelity Distributors Corporation.
Other third-party marks appearing herein are the property of their respective owners.
All other marks appearing herein are registered or unregistered trademarks or service marks of FMR LLC or an affiliated company. © 2016 FMR LLC. All rights reserved.
This report and the financial statements contained herein are submitted for the general information of the shareholders of the Fund. This report is not authorized for distribution to prospective investors in the Fund unless preceded or accompanied by an effective prospectus.
A fund files its complete schedule of portfolio holdings with the SEC for the first and third quarters of each fiscal year on Form N-Q. Forms N-Q are available on the SEC’s web site at http://www.sec.gov. A fund's Forms N-Q may be reviewed and copied at the SEC’s Public Reference Room in Washington, DC. Information regarding the operation of the SEC's Public Reference Room may be obtained by calling 1-800-SEC-0330.
For a complete list of a fund's portfolio holdings, view the most recent holdings listing, semiannual report, or annual report on Fidelity's web site at http://www.fidelity.com, http://www.advisor.fidelity.com, or http://www.401k.com, as applicable.
NOT FDIC INSURED •MAY LOSE VALUE •NO BANK GUARANTEE
Neither the Fund nor Fidelity Distributors Corporation is a bank.
Investment Summary (Unaudited)
Top Ten Stocks as of January 31, 2016
| | % of fund's net assets | % of fund's net assets 6 months ago |
| 2U, Inc. | 2.6 | 2.4 |
| Stamps.com, Inc. | 1.8 | 0.8 |
| Global Payments, Inc. | 1.8 | 1.4 |
| NxStage Medical, Inc. | 1.7 | 0.5 |
| Surgical Care Affiliates, Inc. | 1.7 | 0.9 |
| Gartner, Inc. Class A | 1.6 | 1.2 |
| Vail Resorts, Inc. | 1.6 | 1.2 |
| Bright Horizons Family Solutions, Inc. | 1.6 | 0.0 |
| Steris PLC | 1.5 | 0.0 |
| Tyler Technologies, Inc. | 1.3 | 0.0 |
| | 17.2 | |
Top Five Market Sectors as of January 31, 2016
| | % of fund's net assets | % of fund's net assets 6 months ago |
| Information Technology | 23.7 | 24.4 |
| Health Care | 22.7 | 29.2 |
| Consumer Discretionary | 15.7 | 17.3 |
| Industrials | 11.9 | 14.5 |
| Financials | 10.0 | 5.3 |
Asset Allocation (% of fund's net assets)
| As of January 31, 2016* |
| | Stocks | 92.8% |
| | Other Investments | 2.1% |
| | Short-Term Investments and Net Other Assets (Liabilities) | 5.1% |

* Foreign investments - 5.6%
| As of July 31, 2015* |
| | Stocks | 96.0% |
| | Other Investments | 1.9% |
| | Short-Term Investments and Net Other Assets (Liabilities) | 2.1% |

* Foreign investments - 3.6%
Percentages shown as 0.0% may reflect amounts less than 0.05%.
Investments January 31, 2016 (Unaudited)
Showing Percentage of Net Assets
| Common Stocks - 92.8% | | | |
| | | Shares | Value |
| CONSUMER DISCRETIONARY - 15.7% | | | |
| Auto Components - 0.8% | | | |
| Tenneco, Inc. (a) | | 285,288 | $10,900,854 |
| Visteon Corp. | | 69,100 | 4,621,408 |
| | | | 15,522,262 |
| Distributors - 0.6% | | | |
| Pool Corp. | | 120,000 | 10,140,000 |
| Diversified Consumer Services - 5.9% | | | |
| 2U, Inc. (a)(b)(c) | | 2,370,282 | 47,855,994 |
| Bright Horizons Family Solutions, Inc. (a) | | 402,100 | 28,215,357 |
| Service Corp. International | | 417,400 | 10,096,906 |
| ServiceMaster Global Holdings, Inc. (a) | | 480,000 | 20,260,800 |
| | | | 106,429,057 |
| Hotels, Restaurants & Leisure - 3.9% | | | |
| Dave & Buster's Entertainment, Inc. (a) | | 362,800 | 13,158,756 |
| DineEquity, Inc. | | 90,000 | 7,642,800 |
| Sonic Corp. | | 290,000 | 8,520,200 |
| Vail Resorts, Inc. | | 231,000 | 28,875,000 |
| Wingstop, Inc. (b) | | 520,800 | 12,634,608 |
| | | | 70,831,364 |
| Household Durables - 1.7% | | | |
| NACCO Industries, Inc. Class A | | 2,900 | 138,011 |
| Tempur Sealy International, Inc. (a) | | 210,560 | 12,705,190 |
| Universal Electronics, Inc. (a) | | 344,209 | 17,262,081 |
| | | | 30,105,282 |
| Leisure Products - 1.0% | | | |
| Malibu Boats, Inc. Class A (a) | | 529,100 | 6,915,337 |
| Vista Outdoor, Inc. (a) | | 250,000 | 12,052,500 |
| | | | 18,967,837 |
| Media - 0.8% | | | |
| Gray Television, Inc. (a) | | 66,841 | 878,959 |
| Live Nation Entertainment, Inc. (a) | | 410,200 | 9,311,540 |
| Starz Series A (a) | | 163,945 | 4,660,956 |
| | | | 14,851,455 |
| Specialty Retail - 0.2% | | | |
| Winmark Corp. | | 34,081 | 3,215,883 |
| Textiles, Apparel & Luxury Goods - 0.8% | | | |
| G-III Apparel Group Ltd. (a) | | 271,800 | 13,416,048 |
| Unifi, Inc. (a) | | 44,886 | 1,071,429 |
| | | | 14,487,477 |
|
| TOTAL CONSUMER DISCRETIONARY | | | 284,550,617 |
|
| CONSUMER STAPLES - 2.6% | | | |
| Food & Staples Retailing - 1.3% | | | |
| Casey's General Stores, Inc. | | 190,900 | 23,049,266 |
| Food Products - 1.3% | | | |
| Post Holdings, Inc. (a) | | 180,000 | 10,530,000 |
| TreeHouse Foods, Inc. (a) | | 165,000 | 13,094,400 |
| | | | 23,624,400 |
|
| TOTAL CONSUMER STAPLES | | | 46,673,666 |
|
| ENERGY - 1.8% | | | |
| Energy Equipment & Services - 1.7% | | | |
| Dril-Quip, Inc. (a) | | 83,700 | 4,908,168 |
| Frank's International NV | | 300,000 | 4,389,000 |
| Oil States International, Inc. (a) | | 390,000 | 11,009,700 |
| Superior Drilling Products, Inc. (a)(c) | | 1,133,901 | 2,551,277 |
| Tesco Corp. | | 972,960 | 6,616,128 |
| Xtreme Drilling & Coil Services Corp. (a) | | 1,289,000 | 1,536,605 |
| | | | 31,010,878 |
| Oil, Gas & Consumable Fuels - 0.1% | | | |
| StealthGas, Inc. (a) | | 859,100 | 2,319,570 |
|
| TOTAL ENERGY | | | 33,330,448 |
|
| FINANCIALS - 10.0% | | | |
| Banks - 2.9% | | | |
| Commerce Bancshares, Inc. | | 336,000 | 13,819,680 |
| Eagle Bancorp, Inc. (a) | | 150,000 | 7,086,000 |
| Investors Bancorp, Inc. | | 1,000,000 | 11,690,000 |
| Pacific Premier Bancorp, Inc. (a) | | 1,002,186 | 20,574,879 |
| | | | 53,170,559 |
| Consumer Finance - 0.4% | | | |
| Navient Corp. | | 720,000 | 6,883,200 |
| Diversified Financial Services - 1.5% | | | |
| FactSet Research Systems, Inc. | | 90,000 | 13,563,000 |
| MSCI, Inc. Class A | | 210,000 | 14,456,400 |
| | | | 28,019,400 |
| Insurance - 1.3% | | | |
| First American Financial Corp. | | 388,000 | 13,335,560 |
| ProAssurance Corp. | | 190,000 | 9,522,800 |
| | | | 22,858,360 |
| Real Estate Investment Trusts - 3.0% | | | |
| Coresite Realty Corp. | | 320,000 | 20,524,800 |
| Store Capital Corp. | | 772,300 | 19,145,317 |
| Sun Communities, Inc. | | 220,000 | 14,649,800 |
| | | | 54,319,917 |
| Thrifts & Mortgage Finance - 0.9% | | | |
| Meridian Bancorp, Inc. | | 1,216,834 | 17,096,518 |
|
| TOTAL FINANCIALS | | | 182,347,954 |
|
| HEALTH CARE - 22.7% | | | |
| Biotechnology - 5.3% | | | |
| Alder Biopharmaceuticals, Inc. (a) | | 100,000 | 2,418,000 |
| Amicus Therapeutics, Inc. (a)(b) | | 699,700 | 4,226,188 |
| Anacor Pharmaceuticals, Inc. (a) | | 145,486 | 10,930,363 |
| Blueprint Medicines Corp. (b) | | 250,000 | 3,930,000 |
| Cara Therapeutics, Inc. (a) | | 147,266 | 1,325,394 |
| Cellectis SA sponsored ADR | | 129,100 | 2,886,676 |
| Chimerix, Inc. (a) | | 210,100 | 1,617,770 |
| Coherus BioSciences, Inc. (a)(b) | | 306,150 | 4,059,549 |
| Curis, Inc. (a) | | 998,200 | 1,637,048 |
| DBV Technologies SA sponsored ADR (a) | | 154,188 | 4,007,346 |
| Dyax Corp. rights 12/31/19 | | 380,400 | 1,065,120 |
| Dynavax Technologies Corp. (a)(b) | | 391,625 | 9,434,246 |
| Edge Therapeutics, Inc. (a)(b) | | 181,800 | 2,019,798 |
| Heron Therapeutics, Inc. (a)(b) | | 262,200 | 5,503,578 |
| Insmed, Inc. (a) | | 223,400 | 2,948,880 |
| Intercept Pharmaceuticals, Inc. (a) | | 31,600 | 3,356,868 |
| La Jolla Pharmaceutical Co. (a) | | 152,622 | 2,702,936 |
| Lion Biotechnologies, Inc. (a)(b) | | 410,000 | 2,455,900 |
| Mirati Therapeutics, Inc. (a) | | 177,354 | 3,818,432 |
| Novavax, Inc. (a) | | 1,717,697 | 8,846,140 |
| OncoMed Pharmaceuticals, Inc. (a)(b) | | 80,739 | 746,836 |
| Portola Pharmaceuticals, Inc. (a) | | 180,000 | 5,945,400 |
| ProNai Therapeutics, Inc. (a)(b) | | 193,800 | 1,604,664 |
| TESARO, Inc. (a) | | 100,000 | 3,454,000 |
| Ultragenyx Pharmaceutical, Inc. (a) | | 110,000 | 6,176,500 |
| | | | 97,117,632 |
| Health Care Equipment & Supplies - 7.5% | | | |
| Cantel Medical Corp. | | 71,379 | 4,237,771 |
| CONMED Corp. | | 91,962 | 3,397,076 |
| Hill-Rom Holdings, Inc. | | 330,000 | 16,130,400 |
| Integra LifeSciences Holdings Corp. (a) | | 150,000 | 9,217,500 |
| Nevro Corp. (a) | | 221,200 | 13,667,948 |
| NxStage Medical, Inc. (a) | | 1,670,300 | 31,602,076 |
| Steris PLC | | 400,000 | 27,696,000 |
| Teleflex, Inc. | | 70,000 | 9,498,300 |
| The Spectranetics Corp. (a) | | 13,300 | 160,265 |
| Vascular Solutions, Inc. (a) | | 200,000 | 5,472,000 |
| Wright Medical Group NV (a) | | 772,129 | 15,403,974 |
| | | | 136,483,310 |
| Health Care Providers & Services - 4.8% | | | |
| Aceto Corp. | | 350,000 | 7,997,500 |
| Amedisys, Inc. (a) | | 220,000 | 7,865,000 |
| Civitas Solutions, Inc. (a) | | 116,883 | 2,812,205 |
| HealthEquity, Inc. (a) | | 468,000 | 10,085,400 |
| LHC Group, Inc. (a) | | 100,000 | 3,792,000 |
| Molina Healthcare, Inc. (a) | | 30,000 | 1,647,300 |
| Providence Service Corp. (a) | | 266,229 | 11,820,568 |
| Surgical Care Affiliates, Inc. (a) | | 720,917 | 30,761,528 |
| Teladoc, Inc. (b) | | 345,000 | 5,602,800 |
| VCA, Inc. (a) | | 90,000 | 4,614,300 |
| | | | 86,998,601 |
| Health Care Technology - 1.6% | | | |
| athenahealth, Inc. (a)(b) | | 110,557 | 15,676,983 |
| Nexus AG | | 4,600 | 87,144 |
| Press Ganey Holdings, Inc. (b) | | 230,000 | 6,796,500 |
| Veeva Systems, Inc. Class A (a) | | 55,047 | 1,326,633 |
| Vocera Communications, Inc. (a) | | 297,994 | 4,288,134 |
| | | | 28,175,394 |
| Life Sciences Tools & Services - 1.3% | | | |
| Accelerate Diagnostics, Inc. (a)(b) | | 590,000 | 8,737,900 |
| Bruker Corp. (a) | | 641,500 | 14,324,695 |
| | | | 23,062,595 |
| Pharmaceuticals - 2.2% | | | |
| DepoMed, Inc. (a)(b) | | 580,000 | 8,897,200 |
| Prestige Brands Holdings, Inc. (a) | | 304,175 | 14,198,889 |
| SCYNEXIS, Inc. (a) | | 476,100 | 2,175,777 |
| The Medicines Company (a) | | 200,000 | 6,912,000 |
| TherapeuticsMD, Inc. (a) | | 1,019,345 | 7,288,317 |
| | | | 39,472,183 |
|
| TOTAL HEALTH CARE | | | 411,309,715 |
|
| INDUSTRIALS - 11.9% | | | |
| Aerospace & Defense - 2.4% | | | |
| Aerojet Rocketdyne Holdings, Inc. (a) | | 430,013 | 7,073,714 |
| BWX Technologies, Inc. | | 561,000 | 16,796,340 |
| Huntington Ingalls Industries, Inc. | | 110,000 | 14,066,800 |
| Teledyne Technologies, Inc. (a) | | 60,000 | 4,875,000 |
| | | | 42,811,854 |
| Building Products - 1.8% | | | |
| A.O. Smith Corp. | | 95,000 | 6,635,750 |
| Gibraltar Industries, Inc. (a) | | 484,467 | 10,290,079 |
| Universal Forest Products, Inc. | | 240,000 | 16,533,600 |
| | | | 33,459,429 |
| Commercial Services & Supplies - 2.4% | | | |
| Deluxe Corp. | | 250,000 | 13,975,000 |
| Knoll, Inc. | | 907,500 | 16,652,625 |
| Matthews International Corp. Class A | | 240,018 | 11,979,298 |
| | | | 42,606,923 |
| Construction & Engineering - 0.2% | | | |
| Comfort Systems U.S.A., Inc. | | 138,782 | 3,933,082 |
| Electrical Equipment - 0.8% | | | |
| AZZ, Inc. | | 130,000 | 6,692,400 |
| EnerSys | | 160,000 | 7,748,800 |
| | | | 14,441,200 |
| Machinery - 1.2% | | | |
| Hillenbrand, Inc. | | 298,954 | 8,095,674 |
| Mueller Industries, Inc. | | 209,728 | 5,337,578 |
| Toro Co. | | 120,000 | 8,942,400 |
| | | | 22,375,652 |
| Marine - 0.6% | | | |
| Matson, Inc. | | 290,000 | 11,718,900 |
| Professional Services - 1.9% | | | |
| CBIZ, Inc. (a) | | 1,216,100 | 12,282,610 |
| Exponent, Inc. | | 200,000 | 10,262,000 |
| GP Strategies Corp. (a) | | 200,557 | 4,851,474 |
| On Assignment, Inc. (a) | | 180,000 | 6,957,000 |
| | | | 34,353,084 |
| Road & Rail - 0.6% | | | |
| Swift Transporation Co. (a)(b) | | 650,000 | 10,601,500 |
|
| TOTAL INDUSTRIALS | | | 216,301,624 |
|
| INFORMATION TECHNOLOGY - 23.7% | | | |
| Communications Equipment - 0.4% | | | |
| CommScope Holding Co., Inc. (a) | | 340,000 | 7,622,800 |
| Electronic Equipment & Components - 0.8% | | | |
| ePlus, Inc. (a) | | 150,000 | 14,206,500 |
| Internet Software & Services - 5.5% | | | |
| Cimpress NV (a)(b) | | 15,435 | 1,211,956 |
| Cvent, Inc. (a) | | 485,560 | 12,823,640 |
| Demandware, Inc. (a) | | 199,313 | 8,456,851 |
| GoDaddy, Inc. (a)(b) | | 400,000 | 12,196,000 |
| Gogo, Inc. (a)(b) | | 620,488 | 9,028,100 |
| New Relic, Inc. (a) | | 25,100 | 708,322 |
| Stamps.com, Inc. (a) | | 358,711 | 33,654,266 |
| WebMD Health Corp. (a)(b) | | 425,000 | 21,721,750 |
| | | | 99,800,885 |
| IT Services - 8.1% | | | |
| Broadridge Financial Solutions, Inc. | | 150,100 | 8,039,356 |
| CSG Systems International, Inc. | | 340,000 | 11,879,600 |
| Euronet Worldwide, Inc. (a) | | 215,000 | 17,150,550 |
| Gartner, Inc. Class A (a) | | 330,596 | 29,056,082 |
| Genpact Ltd. (a) | | 430,000 | 10,285,600 |
| Global Payments, Inc. | | 546,000 | 32,186,700 |
| Mattersight Corp. (a)(b)(c) | | 1,854,975 | 10,128,164 |
| Maximus, Inc. | | 189,167 | 10,095,843 |
| Perficient, Inc. (a) | | 449,112 | 8,555,584 |
| Virtusa Corp. (a) | | 200,000 | 8,944,000 |
| | | | 146,321,479 |
| Semiconductors & Semiconductor Equipment - 1.5% | | | |
| Cirrus Logic, Inc. (a)(b) | | 511,432 | 17,756,919 |
| Monolithic Power Systems, Inc. | | 150,000 | 9,385,500 |
| Semtech Corp. (a) | | 41,541 | 834,974 |
| | | | 27,977,393 |
| Software - 7.4% | | | |
| Atlassian Corp. PLC | | 255,300 | 5,302,581 |
| Blackbaud, Inc. | | 380,000 | 23,362,400 |
| Cadence Design Systems, Inc. (a) | | 886,200 | 17,334,072 |
| Callidus Software, Inc. (a) | | 232,512 | 3,587,660 |
| Fleetmatics Group PLC (a) | | 395,000 | 17,146,950 |
| HubSpot, Inc. (a) | | 477,490 | 19,381,319 |
| Paylocity Holding Corp. (a)(b) | | 233,400 | 7,263,408 |
| RealPage, Inc. (a) | | 470,000 | 9,066,300 |
| RingCentral, Inc. (a) | | 320,000 | 6,982,400 |
| Tyler Technologies, Inc. (a) | | 155,000 | 24,344,300 |
| | | | 133,771,390 |
|
| TOTAL INFORMATION TECHNOLOGY | | | 429,700,447 |
|
| MATERIALS - 3.1% | | | |
| Chemicals - 1.5% | | | |
| Axiall Corp. | | 800,000 | 14,344,000 |
| Codexis, Inc. (a) | | 442,129 | 1,790,622 |
| Innospec, Inc. | | 220,000 | 10,967,000 |
| | | | 27,101,622 |
| Containers & Packaging - 1.5% | | | |
| Aptargroup, Inc. | | 101,876 | 7,426,760 |
| Avery Dennison Corp. | | 125,000 | 7,611,250 |
| Graphic Packaging Holding Co. | | 1,050,200 | 11,930,272 |
| | | | 26,968,282 |
| Paper & Forest Products - 0.1% | | | |
| TFS Corp. Ltd. (b) | | 2,443,636 | 2,246,923 |
|
| TOTAL MATERIALS | | | 56,316,827 |
|
| TELECOMMUNICATION SERVICES - 1.3% | | | |
| Diversified Telecommunication Services - 1.3% | | | |
| 8x8, Inc. (a) | | 500,000 | 6,280,000 |
| inContact, Inc. (a) | | 1,214,000 | 10,501,100 |
| Vonage Holdings Corp. (a) | | 1,485,436 | 7,620,287 |
| | | | 24,401,387 |
| TOTAL COMMON STOCKS | | | |
| (Cost $1,714,294,780) | | | 1,684,932,685 |
|
| Money Market Funds - 12.9% | | | |
| Fidelity Cash Central Fund, 0.38% (d) | | 96,060,417 | 96,060,417 |
| Fidelity Securities Lending Cash Central Fund, 0.42% (d)(e) | | 138,061,480 | 138,061,480 |
| TOTAL MONEY MARKET FUNDS | | | |
| (Cost $234,121,897) | | | 234,121,897 |
|
| Equity Funds - 2.1% | | | |
| Small Growth Funds - 2.1% | | | |
| iShares Russell 2000 Growth Index ETF (b) | | | |
| (Cost $39,322,310) | | 315,000 | 39,223,800 |
| TOTAL INVESTMENT PORTFOLIO - 107.8% | | | |
| (Cost $1,987,738,987) | | | 1,958,278,382 |
| NET OTHER ASSETS (LIABILITIES) - (7.8)% | | | (142,440,221) |
| NET ASSETS - 100% | | | $1,815,838,161 |
Security Type Abbreviations
ETF – Exchange Traded Fund
Legend
(a) Non-income producing
(b) Security or a portion of the security is on loan at period end.
(c) Affiliated company
(d) Affiliated fund that is generally available only to investment companies and other accounts managed by Fidelity Investments. The rate quoted is the annualized seven-day yield of the fund at period end. A complete unaudited listing of the fund's holdings as of its most recent quarter end is available upon request. In addition, each Fidelity Central Fund's financial statements are available on the SEC's website or upon request.
(e) Investment made with cash collateral received from securities on loan.
Affiliated Central Funds
Information regarding fiscal year to date income earned by the Fund from investments in Fidelity Central Funds is as follows:
| Fund | Income earned |
| Fidelity Cash Central Fund | $82,098 |
| Fidelity Securities Lending Cash Central Fund | 1,453,834 |
| Total | $1,535,932 |
Other Affiliated Issuers
An affiliated company is a company in which the Fund has ownership of at least 5% of the voting securities. Fiscal year to date transactions with companies which are or were affiliates are as follows:
| Affiliate | Value, beginning of period | Purchases | Sales Proceeds | Dividend Income | Value, end of period |
| 2U, Inc. | $40,893,251 | $31,536,253 | $3,375,776 | $-- | $47,855,994 |
| Mattersight Corp. | 12,150,086 | -- | -- | -- | 10,128,164 |
| Superior Drilling Products, Inc. | 1,928,281 | -- | 37,522 | -- | 2,551,277 |
| Total | $54,971,618 | $31,536,253 | $3,413,298 | $-- | $60,535,435 |
Investment Valuation
The following is a summary of the inputs used, as of January 31, 2016, involving the Fund's assets and liabilities carried at fair value. The inputs or methodology used for valuing securities may not be an indication of the risk associated with investing in those securities. For more information on valuation inputs, and their aggregation into the levels used below, please refer to the Investment Valuation section in the accompanying Notes to Financial Statements.
| | Valuation Inputs at Reporting Date: |
| Description | Total | Level 1 | Level 2 | Level 3 |
| Investments in Securities: | | | | |
| Equities: | | | | |
| Consumer Discretionary | $284,550,617 | $284,550,617 | $-- | $-- |
| Consumer Staples | 46,673,666 | 46,673,666 | -- | -- |
| Energy | 33,330,448 | 33,330,448 | -- | -- |
| Financials | 182,347,954 | 182,347,954 | -- | -- |
| Health Care | 411,309,715 | 410,157,451 | 87,144 | 1,065,120 |
| Industrials | 216,301,624 | 216,301,624 | -- | -- |
| Information Technology | 429,700,447 | 429,700,447 | -- | -- |
| Materials | 56,316,827 | 54,069,904 | 2,246,923 | -- |
| Telecommunication Services | 24,401,387 | 24,401,387 | -- | -- |
| Money Market Funds | 234,121,897 | 234,121,897 | -- | -- |
| Equity Funds | 39,223,800 | 39,223,800 | -- | -- |
| Total Investments in Securities: | $1,958,278,382 | $1,954,879,195 | $2,334,067 | $1,065,120 |
See accompanying notes which are an integral part of the financial statements.
Financial Statements
Statement of Assets and Liabilities
| | | January 31, 2016 (Unaudited) |
| Assets | | |
Investment in securities, at value (including securities loaned of $138,209,768) — See accompanying schedule:
Unaffiliated issuers (cost $1,687,190,375) | $1,663,621,050 | |
| Fidelity Central Funds (cost $234,121,897) | 234,121,897 | |
| Other affiliated issuers (cost $66,426,715) | 60,535,435 | |
| Total Investments (cost $1,987,738,987) | | $1,958,278,382 |
| Cash | | 1,498,090 |
| Foreign currency held at value (cost $36,806) | | 36,608 |
| Receivable for investments sold | | 56,805,431 |
| Receivable for fund shares sold | | 3,869,354 |
| Dividends receivable | | 126,725 |
| Distributions receivable from Fidelity Central Funds | | 452,236 |
| Prepaid expenses | | 2,652 |
| Other receivables | | 38,176 |
| Total assets | | 2,021,107,654 |
| Liabilities | | |
| Payable for investments purchased | $61,818,193 | |
| Payable for fund shares redeemed | 3,519,273 | |
| Accrued management fee | 1,296,120 | |
| Distribution and service plan fees payable | 103,307 | |
| Other affiliated payables | 432,695 | |
| Other payables and accrued expenses | 38,425 | |
| Collateral on securities loaned, at value | 138,061,480 | |
| Total liabilities | | 205,269,493 |
| Net Assets | | $1,815,838,161 |
| Net Assets consist of: | | |
| Paid in capital | | $1,907,475,409 |
| Accumulated net investment loss | | (3,822,741) |
| Accumulated undistributed net realized gain (loss) on investments and foreign currency transactions | | (58,352,721) |
| Net unrealized appreciation (depreciation) on investments and assets and liabilities in foreign currencies | | (29,461,786) |
| Net Assets | | $1,815,838,161 |
| Calculation of Maximum Offering Price | | |
| Class A: | | |
| Net Asset Value and redemption price per share ($146,714,670 ÷ 8,965,749 shares) | | $16.36 |
| Maximum offering price per share (100/94.25 of $16.36) | | $17.36 |
| Class T: | | |
| Net Asset Value and redemption price per share ($47,555,183 ÷ 2,975,761 shares) | | $15.98 |
| Maximum offering price per share (100/96.50 of $15.98) | | $16.56 |
| Class B: | | |
| Net Asset Value and offering price per share ($1,471,270 ÷ 97,417 shares)(a) | | $15.10 |
| Class C: | | |
| Net Asset Value and offering price per share ($60,995,304 ÷ 4,062,692 shares)(a) | | $15.01 |
| Small Cap Growth: | | |
| Net Asset Value, offering price and redemption price per share ($1,430,546,797 ÷ 84,667,789 shares) | | $16.90 |
| Class I: | | |
| Net Asset Value, offering price and redemption price per share ($128,554,937 ÷ 7,592,754 shares) | | $16.93 |
(a) Redemption price per share is equal to net asset value less any applicable contingent deferred sales charge.
See accompanying notes which are an integral part of the financial statements.
Statement of Operations
| | | Six months ended January 31, 2016 (Unaudited) |
| Investment Income | | |
| Dividends | | $5,461,117 |
| Interest | | 15 |
| Income from Fidelity Central Funds (including $1,453,834 from security lending) | | 1,535,932 |
| Total income | | 6,997,064 |
| Expenses | | |
| Management fee | | |
| Basic fee | $6,324,712 | |
| Performance adjustment | 1,195,467 | |
| Transfer agent fees | 2,220,905 | |
| Distribution and service plan fees | 612,381 | |
| Accounting and security lending fees | 293,075 | |
| Custodian fees and expenses | 30,004 | |
| Independent trustees' compensation | 3,850 | |
| Registration fees | 166,949 | |
| Audit | 33,167 | |
| Legal | 3,375 | |
| Miscellaneous | 4,679 | |
| Total expenses before reductions | 10,888,564 | |
| Expense reductions | (68,759) | 10,819,805 |
| Net investment income (loss) | | (3,822,741) |
| Realized and Unrealized Gain (Loss) | | |
| Net realized gain (loss) on: | | |
| Investment securities: | | |
| Unaffiliated issuers | (52,952,176) | |
| Other affiliated issuers | (178,011) | |
| Foreign currency transactions | (11,321) | |
| Total net realized gain (loss) | | (53,141,508) |
Change in net unrealized appreciation (depreciation) on:
Investment securities | (276,851,624) | |
| Assets and liabilities in foreign currencies | 11,758 | |
| Total change in net unrealized appreciation (depreciation) | | (276,839,866) |
| Net gain (loss) | | (329,981,374) |
| Net increase (decrease) in net assets resulting from operations | | $(333,804,115) |
See accompanying notes which are an integral part of the financial statements.
Statement of Changes in Net Assets
| | Six months ended January 31, 2016 (Unaudited) | Year ended July 31, 2015 |
| Increase (Decrease) in Net Assets | | |
| Operations | | |
| Net investment income (loss) | $(3,822,741) | $(5,784,041) |
| Net realized gain (loss) | (53,141,508) | 108,754,619 |
| Change in net unrealized appreciation (depreciation) | (276,839,866) | 166,432,213 |
| Net increase (decrease) in net assets resulting from operations | (333,804,115) | 269,402,791 |
| Distributions to shareholders from net realized gain | (71,394,910) | (103,188,484) |
| Share transactions - net increase (decrease) | 542,860,559 | 214,155,809 |
| Redemption fees | 530,486 | 177,411 |
| Total increase (decrease) in net assets | 138,192,020 | 380,547,527 |
| Net Assets | | |
| Beginning of period | 1,677,646,141 | 1,297,098,614 |
| End of period (including accumulated net investment loss of $3,822,741 and undistributed net investment income of $0, respectively) | $1,815,838,161 | $1,677,646,141 |
See accompanying notes which are an integral part of the financial statements.
Financial Highlights — Fidelity Small Cap Growth Fund Class A
| | Six months ended (Unaudited) | Years ended July 31, | | | | |
| January 31, | 2016 | 2015 | 2014 | 2013 | 2012 | 2011 |
| Selected Per–Share Data | | | | | | |
| Net asset value, beginning of period | $20.55 | $17.99 | $19.66 | $15.87 | $16.42 | $12.66 |
| Income from Investment Operations | | | | | | |
| Net investment income (loss)A | (.06) | (.13) | (.12) | (.04) | (.07)B | (.07)C |
| Net realized and unrealized gain (loss) | (3.36) | 4.23 | 1.69 | 4.87 | (.16) | 3.84 |
| Total from investment operations | (3.42) | 4.10 | 1.57 | 4.83 | (.23) | 3.77 |
| Distributions from net realized gain | (.78) | (1.54) | (3.24) | (1.04) | (.32) | (.01)D |
| Redemption fees added to paid in capitalA | .01 | –E | –E | –E | –E | –E |
| Net asset value, end of period | $16.36 | $20.55 | $17.99 | $19.66 | $15.87 | $16.42 |
| Total ReturnF,G,H | (17.09)% | 24.46% | 8.58% | 32.20% | (1.14)% | 29.78% |
| Ratios to Average Net AssetsI,J | | | | | | |
| Expenses before reductions | 1.39%K | 1.21% | 1.22% | 1.24% | 1.35% | 1.25% |
| Expenses net of fee waivers, if any | 1.39%K | 1.21% | 1.22% | 1.24% | 1.35% | 1.25% |
| Expenses net of all reductions | 1.38%K | 1.20% | 1.22% | 1.22% | 1.34% | 1.23% |
| Net investment income (loss) | (.61)%K | (.67)% | (.62)% | (.26)% | (.49)%B | (.47)%C |
| Supplemental Data | | | | | | |
| Net assets, end of period (000 omitted) | $146,715 | $123,370 | $88,822 | $74,978 | $59,684 | $67,272 |
| Portfolio turnover rateL | 133%K | 156% | 148%M | 142% | 150% | 106% |
A Calculated based on average shares outstanding during the period.
B Net Investment income per share reflects a large, non-recurring dividend which amounted to $.01 per share. Excluding this non-recurring dividend, the ratio of net investment income (loss) to average net assets would have been (.57) %.
C Net Investment income per share reflects a large, non-recurring dividend which amounted to $.02 per share. Excluding this non-recurring dividend, the ratio of net investment income (loss) to average net assets would have been (.61) %.
D The amounts shown reflect certain reclassifications related to book to tax differences that were made in the year shown.
E Amount represents less than $.005 per share.
F Total returns for periods of less than one year are not annualized.
G Total returns would have been lower if certain expenses had not been reduced during the applicable periods shown.
H Total returns do not include the effect of the sales charges.
I Fees and expenses of any underlying Fidelity Central Funds are not included in the Fund's expense ratio. The Fund indirectly bears its proportionate share of the expenses of any underlying Fidelity Central Funds.
J Expense ratios reflect operating expenses of the class. Expenses before reductions do not reflect amounts reimbursed by the investment adviser or reductions from brokerage service arrangements or reductions from other expense offset arrangements and do not represent the amount paid by the class during periods when reimbursements or reductions occur. Expenses net of fee waivers reflect expenses after reimbursement by the investment adviser but prior to reductions from brokerage service arrangements or other expense offset arrangements. Expenses net of all reductions represent the net expenses paid by the class.
K Annualized
L Amount does not include the portfolio activity of any underlying Fidelity Central Funds.
M Portfolio turnover rate excludes securities received or delivered in-kind.
See accompanying notes which are an integral part of the financial statements.
Financial Highlights — Fidelity Small Cap Growth Fund Class T
| | Six months ended (Unaudited) | Years ended July 31, | | | | |
| January 31, | 2016 | 2015 | 2014 | 2013 | 2012 | 2011 |
| Selected Per–Share Data | | | | | | |
| Net asset value, beginning of period | $20.08 | $17.66 | $19.38 | $15.68 | $16.27 | $12.57 |
| Income from Investment Operations | | | | | | |
| Net investment income (loss)A | (.08) | (.17) | (.16) | (.09) | (.11)B | (.11)C |
| Net realized and unrealized gain (loss) | (3.28) | 4.13 | 1.66 | 4.82 | (.16) | 3.81 |
| Total from investment operations | (3.36) | 3.96 | 1.50 | 4.73 | (.27) | 3.70 |
| Distributions from net realized gain | (.75) | (1.54) | (3.22) | (1.03) | (.32) | – |
| Redemption fees added to paid in capitalA | .01 | –D | –D | –D | –D | –D |
| Net asset value, end of period | $15.98 | $20.08 | $17.66 | $19.38 | $15.68 | $16.27 |
| Total ReturnE,F,G | (17.19)% | 24.10% | 8.30% | 31.87% | (1.41)% | 29.44% |
| Ratios to Average Net AssetsH,I | | | | | | |
| Expenses before reductions | 1.67%J | 1.49% | 1.50% | 1.49% | 1.61% | 1.50% |
| Expenses net of fee waivers, if any | 1.67%J | 1.48% | 1.50% | 1.49% | 1.61% | 1.50% |
| Expenses net of all reductions | 1.66%J | 1.47% | 1.49% | 1.48% | 1.60% | 1.49% |
| Net investment income (loss) | (.89)%J | (.95)% | (.90)% | (.52)% | (.74)%B | (.73)%C |
| Supplemental Data | | | | | | |
| Net assets, end of period (000 omitted) | $47,555 | $52,667 | $42,586 | $34,686 | $27,658 | $30,764 |
| Portfolio turnover rateK | 133%J | 156% | 148%L | 142% | 150% | 106% |
A Calculated based on average shares outstanding during the period.
B Net Investment income per share reflects a large, non-recurring dividend which amounted to $.01 per share. Excluding this non-recurring dividend, the ratio of net investment income (loss) to average net assets would have been (.83) %.
C Net Investment income per share reflects a large, non-recurring dividend which amounted to $.02 per share. Excluding this non-recurring dividend, the ratio of net investment income (loss) to average net assets would have been (.86) %.
D Amount represents less than $.005 per share.
E Total returns for periods of less than one year are not annualized.
F Total returns would have been lower if certain expenses had not been reduced during the applicable periods shown.
G Total returns do not include the effect of the sales charges.
H Fees and expenses of any underlying Fidelity Central Funds are not included in the Fund's expense ratio. The Fund indirectly bears its proportionate share of the expenses of any underlying Fidelity Central Funds.
I Expense ratios reflect operating expenses of the class. Expenses before reductions do not reflect amounts reimbursed by the investment adviser or reductions from brokerage service arrangements or reductions from other expense offset arrangements and do not represent the amount paid by the class during periods when reimbursements or reductions occur. Expenses net of fee waivers reflect expenses after reimbursement by the investment adviser but prior to reductions from brokerage service arrangements or other expense offset arrangements. Expenses net of all reductions represent the net expenses paid by the class.
J Annualized
K Amount does not include the portfolio activity of any underlying Fidelity Central Funds.
L Portfolio turnover rate excludes securities received or delivered in-kind.
See accompanying notes which are an integral part of the financial statements.
Financial Highlights — Fidelity Small Cap Growth Fund Class B
| | Six months ended (Unaudited) | Years ended July 31, | | | | |
| January 31, | 2016 | 2015 | 2014 | 2013 | 2012 | 2011 |
| Selected Per–Share Data | | | | | | |
| Net asset value, beginning of period | $18.99 | $16.86 | $18.65 | $15.19 | $15.86 | $12.30 |
| Income from Investment Operations | | | | | | |
| Net investment income (loss)A | (.12) | (.25) | (.25) | (.16) | (.18)B | (.18)C |
| Net realized and unrealized gain (loss) | (3.11) | 3.92 | 1.60 | 4.64 | (.17) | 3.74 |
| Total from investment operations | (3.23) | 3.67 | 1.35 | 4.48 | (.35) | 3.56 |
| Distributions from net realized gain | (.67) | (1.54) | (3.14) | (1.02) | (.32) | – |
| Redemption fees added to paid in capitalA | .01 | –D | –D | –D | –D | –D |
| Net asset value, end of period | $15.10 | $18.99 | $16.86 | $18.65 | $15.19 | $15.86 |
| Total ReturnE,F,G | (17.43)% | 23.48% | 7.73% | 31.25% | (1.96)% | 28.94% |
| Ratios to Average Net AssetsH,I | | | | | | |
| Expenses before reductions | 2.19%J | 2.01% | 2.01% | 1.99% | 2.10% | 2.00% |
| Expenses net of fee waivers, if any | 2.19%J | 2.01% | 2.01% | 1.99% | 2.10% | 2.00% |
| Expenses net of all reductions | 2.18%J | 2.00% | 2.01% | 1.97% | 2.09% | 1.98% |
| Net investment income (loss) | (1.41)%J | (1.47)% | (1.41)% | (1.01)% | (1.23)%B | (1.22)%C |
| Supplemental Data | | | | | | |
| Net assets, end of period (000 omitted) | $1,471 | $2,357 | $2,764 | $3,486 | $4,123 | $5,295 |
| Portfolio turnover rateK | 133%J | 156% | 148%L | 142% | 150% | 106% |
A Calculated based on average shares outstanding during the period.
B Net Investment income per share reflects a large, non-recurring dividend which amounted to $.01 per share. Excluding this non-recurring dividend, the ratio of net investment income (loss) to average net assets would have been (1.32) %.
C Net Investment income per share reflects a large, non-recurring dividend which amounted to $.02 per share. Excluding this non-recurring dividend, the ratio of net investment income (loss) to average net assets would have been (1.36) %.
D Amount represents less than $.005 per share.
E Total returns for periods of less than one year are not annualized.
F Total returns would have been lower if certain expenses had not been reduced during the applicable periods shown.
G Total returns do not include the effect of the contingent deferred sales charge.
H Fees and expenses of any underlying Fidelity Central Funds are not included in the Fund's expense ratio. The Fund indirectly bears its proportionate share of the expenses of any underlying Fidelity Central Funds.
I Expense ratios reflect operating expenses of the class. Expenses before reductions do not reflect amounts reimbursed by the investment adviser or reductions from brokerage service arrangements or reductions from other expense offset arrangements and do not represent the amount paid by the class during periods when reimbursements or reductions occur. Expenses net of fee waivers reflect expenses after reimbursement by the investment adviser but prior to reductions from brokerage service arrangements or other expense offset arrangements. Expenses net of all reductions represent the net expenses paid by the class.
J Annualized
K Amount does not include the portfolio activity of any underlying Fidelity Central Funds.
L Portfolio turnover rate excludes securities received or delivered in-kind.
See accompanying notes which are an integral part of the financial statements.
Financial Highlights — Fidelity Small Cap Growth Fund Class C
| | Six months ended (Unaudited) | Years ended July 31, | | | | |
| January 31, | 2016 | 2015 | 2014 | 2013 | 2012 | 2011 |
| Selected Per–Share Data | | | | | | |
| Net asset value, beginning of period | $18.90 | $16.78 | $18.62 | $15.16 | $15.83 | $12.28 |
| Income from Investment Operations | | | | | | |
| Net investment income (loss)A | (.12) | (.25) | (.25) | (.16) | (.18)B | (.18)C |
| Net realized and unrealized gain (loss) | (3.08) | 3.91 | 1.59 | 4.64 | (.17) | 3.73 |
| Total from investment operations | (3.20) | 3.66 | 1.34 | 4.48 | (.35) | 3.55 |
| Distributions from net realized gain | (.69) | (1.54) | (3.18) | (1.02) | (.32) | – |
| Redemption fees added to paid in capitalA,D | – | – | – | – | – | – |
| Net asset value, end of period | $15.01 | $18.90 | $16.78 | $18.62 | $15.16 | $15.83 |
| Total ReturnE,F,G | (17.45)% | 23.53% | 7.70% | 31.32% | (1.96)% | 28.91% |
| Ratios to Average Net AssetsH,I | | | | | | |
| Expenses before reductions | 2.17%J | 2.00% | 2.01% | 1.99% | 2.10% | 2.00% |
| Expenses net of fee waivers, if any | 2.17%J | 2.00% | 2.00% | 1.99% | 2.10% | 2.00% |
| Expenses net of all reductions | 2.17%J | 1.99% | 2.00% | 1.97% | 2.09% | 1.98% |
| Net investment income (loss) | (1.39)%J | (1.46)% | (1.41)% | (1.01)% | (1.24)%B | (1.22)%C |
| Supplemental Data | | | | | | |
| Net assets, end of period (000 omitted) | $60,995 | $55,671 | $42,215 | $32,756 | $24,683 | $24,914 |
| Portfolio turnover rateK | 133%J | 156% | 148%L | 142% | 150% | 106% |
A Calculated based on average shares outstanding during the period.
B Net Investment income per share reflects a large, non-recurring dividend which amounted to $.01 per share. Excluding this non-recurring dividend, the ratio of net investment income (loss) to average net assets would have been (1.32) %.
C Net Investment income per share reflects a large, non-recurring dividend which amounted to $.02 per share. Excluding this non-recurring dividend, the ratio of net investment income (loss) to average net assets would have been (1.36) %.
D Amount represents less than $.005 per share.
E Total returns for periods of less than one year are not annualized.
F Total returns would have been lower if certain expenses had not been reduced during the applicable periods shown.
G Total returns do not include the effect of the contingent deferred sales charge.
H Fees and expenses of any underlying Fidelity Central Funds are not included in the Fund's expense ratio. The Fund indirectly bears its proportionate share of the expenses of any underlying Fidelity Central Funds.
I Expense ratios reflect operating expenses of the class. Expenses before reductions do not reflect amounts reimbursed by the investment adviser or reductions from brokerage service arrangements or reductions from other expense offset arrangements and do not represent the amount paid by the class during periods when reimbursements or reductions occur. Expenses net of fee waivers reflect expenses after reimbursement by the investment adviser but prior to reductions from brokerage service arrangements or other expense offset arrangements. Expenses net of all reductions represent the net expenses paid by the class.
J Annualized
K Amount does not include the portfolio activity of any underlying Fidelity Central Funds.
L Portfolio turnover rate excludes securities received or delivered in-kind.
See accompanying notes which are an integral part of the financial statements.
Financial Highlights — Fidelity Small Cap Growth Fund
| | Six months ended (Unaudited) | Years ended July 31, | | | | |
| January 31, | 2016 | 2015 | 2014 | 2013 | 2012 | 2011 |
| Selected Per–Share Data | | | | | | |
| Net asset value, beginning of period | $21.20 | $18.45 | $20.07 | $16.14 | $16.65 | $12.81 |
| Income from Investment Operations | | | | | | |
| Net investment income (loss)A | (.03) | (.07) | (.06) | .01 | (.03)B | (.03)C |
| Net realized and unrealized gain (loss) | (3.47) | 4.36 | 1.71 | 4.98 | (.16) | 3.90 |
| Total from investment operations | (3.50) | 4.29 | 1.65 | 4.99 | (.19) | 3.87 |
| Distributions from net realized gain | (.81) | (1.54) | (3.27) | (1.06) | (.32) | (.03)D |
| Redemption fees added to paid in capitalA | .01 | –E | –E | –E | –E | –E |
| Net asset value, end of period | $16.90 | $21.20 | $18.45 | $20.07 | $16.14 | $16.65 |
| Total ReturnF,G | (16.97)% | 24.91% | 8.87% | 32.74% | (.88)% | 30.20% |
| Ratios to Average Net AssetsH,I | | | | | | |
| Expenses before reductions | 1.14%J | .91% | .91% | .90% | 1.03% | .95% |
| Expenses net of fee waivers, if any | 1.13%J | .91% | .90% | .90% | 1.03% | .95% |
| Expenses net of all reductions | 1.13%J | .90% | .90% | .88% | 1.02% | .93% |
| Net investment income (loss) | (.35)%J | (.37)% | (.31)% | .08% | (.16)%B | (.17)%C |
| Supplemental Data | | | | | | |
| Net assets, end of period (000 omitted) | $1,430,547 | $1,345,684 | $1,069,105 | $1,315,659 | $1,166,101 | $1,382,688 |
| Portfolio turnover rateK | 133%J | 156% | 148%L | 142% | 150% | 106% |
A Calculated based on average shares outstanding during the period.
B Net Investment income per share reflects a large, non-recurring dividend which amounted to $.01 per share. Excluding this non-recurring dividend, the ratio of net investment income (loss) to average net assets would have been (.25) %.
C Net Investment income per share reflects a large, non-recurring dividend which amounted to $.02 per share. Excluding this non-recurring dividend, the ratio of net investment income (loss) to average net assets would have been (.31) %.
D The amounts shown reflect certain reclassifications related to book to tax differences that were made in the year shown.
E Amount represents less than $.005 per share.
F Total returns for periods of less than one year are not annualized.
G Total returns would have been lower if certain expenses had not been reduced during the applicable periods shown.
H Fees and expenses of any underlying Fidelity Central Funds are not included in the Fund's expense ratio. The Fund indirectly bears its proportionate share of the expenses of any underlying Fidelity Central Funds.
I Expense ratios reflect operating expenses of the class. Expenses before reductions do not reflect amounts reimbursed by the investment adviser or reductions from brokerage service arrangements or reductions from other expense offset arrangements and do not represent the amount paid by the class during periods when reimbursements or reductions occur. Expenses net of fee waivers reflect expenses after reimbursement by the investment adviser but prior to reductions from brokerage service arrangements or other expense offset arrangements. Expenses net of all reductions represent the net expenses paid by the class.
J Annualized
K Amount does not include the portfolio activity of any underlying Fidelity Central Funds.
L Portfolio turnover rate excludes securities received or delivered in-kind.
See accompanying notes which are an integral part of the financial statements.
Financial Highlights — Fidelity Small Cap Growth Fund Class I
| | Six months ended (Unaudited) | Years ended July 31, | | | | |
| January 31, | 2016 | 2015 | 2014 | 2013 | 2012 | 2011 |
| Selected Per–Share Data | | | | | | |
| Net asset value, beginning of period | $21.24 | $18.49 | $20.10 | $16.17 | $16.68 | $12.83 |
| Income from Investment Operations | | | | | | |
| Net investment income (loss)A | (.03) | (.07) | (.06) | .01 | (.03)B | (.03)C |
| Net realized and unrealized gain (loss) | (3.48) | 4.36 | 1.72 | 4.98 | (.16) | 3.91 |
| Total from investment operations | (3.51) | 4.29 | 1.66 | 4.99 | (.19) | 3.88 |
| Distributions from net realized gain | (.81) | (1.54) | (3.27) | (1.06) | (.32) | (.03)D |
| Redemption fees added to paid in capitalA | .01 | –E | –E | –E | –E | –E |
| Net asset value, end of period | $16.93 | $21.24 | $18.49 | $20.10 | $16.17 | $16.68 |
| Total ReturnF,G | (16.99)% | 24.85% | 8.89% | 32.65% | (.88)% | 30.24% |
| Ratios to Average Net AssetsH,I | | | | | | |
| Expenses before reductions | 1.10%J | .93% | .92% | .92% | 1.06% | .94% |
| Expenses net of fee waivers, if any | 1.10%J | .93% | .92% | .92% | 1.06% | .94% |
| Expenses net of all reductions | 1.09%J | .91% | .92% | .91% | 1.05% | .93% |
| Net investment income (loss) | (.32)%J | (.39)% | (.32)% | .06% | (.19)%B | (.17)%C |
| Supplemental Data | | | | | | |
| Net assets, end of period (000 omitted) | $128,555 | $97,897 | $51,607 | $51,158 | $36,694 | $41,440 |
| Portfolio turnover rateK | 133%J | 156% | 148%L | 142% | 150% | 106% |
A Calculated based on average shares outstanding during the period.
B Net Investment income per share reflects a large, non-recurring dividend which amounted to $.01 per share. Excluding this non-recurring dividend, the ratio of net investment income (loss) to average net assets would have been (.28) %.
C Net Investment income per share reflects a large, non-recurring dividend which amounted to $.02 per share. Excluding this non-recurring dividend, the ratio of net investment income (loss) to average net assets would have been (.30) %.
D The amounts shown reflect certain reclassifications related to book to tax differences that were made in the year shown.
E Amount represents less than $.005 per share.
F Total returns for periods of less than one year are not annualized.
G Total returns would have been lower if certain expenses had not been reduced during the applicable periods shown.
H Fees and expenses of any underlying Fidelity Central Funds are not included in the Fund's expense ratio. The Fund indirectly bears its proportionate share of the expenses of any underlying Fidelity Central Funds.
I Expense ratios reflect operating expenses of the class. Expenses before reductions do not reflect amounts reimbursed by the investment adviser or reductions from brokerage service arrangements or reductions from other expense offset arrangements and do not represent the amount paid by the class during periods when reimbursements or reductions occur. Expenses net of fee waivers reflect expenses after reimbursement by the investment adviser but prior to reductions from brokerage service arrangements or other expense offset arrangements. Expenses net of all reductions represent the net expenses paid by the class.
J Annualized
K Amount does not include the portfolio activity of any underlying Fidelity Central Funds.
L Portfolio turnover rate excludes securities received or delivered in-kind.
See accompanying notes which are an integral part of the financial statements.
Notes to Financial Statements (Unaudited)
For the period ended January 31, 2016
1. Organization.
Fidelity Small Cap Growth Fund (the Fund) is a fund of Fidelity Securities Fund (the Trust) and is authorized to issue an unlimited number of shares. The Trust is registered under the Investment Company Act of 1940, as amended (the 1940 Act), as an open-end management investment company organized as a Massachusetts business trust. The Fund offers Class A, Class T, Class C, Small Cap Growth and Class I shares, each of which, along with Class B shares, has equal rights as to assets and voting privileges. Class B shares are closed to new accounts and additional purchases, except for exchanges and reinvestments. Each class has exclusive voting rights with respect to matters that affect that class. Class B shares will automatically convert to Class A shares after a holding period of seven years from the initial date of purchase.
During the period, the Board of Trustees approved the conversion of all existing Class B shares into Class A shares, effective on or about July 1, 2016, regardless of the length of times shares have been held.
2. Investments in Fidelity Central Funds.
The Fund invests in Fidelity Central Funds, which are open-end investment companies generally available only to other investment companies and accounts managed by the investment adviser and its affiliates. The Fund's Schedule of Investments lists each of the Fidelity Central Funds held as of period end, if any, as an investment of the Fund, but does not include the underlying holdings of each Fidelity Central Fund. As an Investing Fund, the Fund indirectly bears its proportionate share of the expenses of the underlying Fidelity Central Funds.
The Money Market Central Funds seek preservation of capital and current income and are managed by Fidelity Investments Money Management, Inc. (FIMM), an affiliate of the investment adviser. Annualized expenses of the Money Market Central Funds as of their most recent shareholder report date are less than .005%.
A complete unaudited list of holdings for each Fidelity Central Fund is available upon request or at the Securities and Exchange Commission (the SEC) website at www.sec.gov. In addition, the financial statements of the Fidelity Central Funds are available on the SEC website or upon request.
3. Significant Accounting Policies.
The financial statements have been prepared in conformity with accounting principles generally accepted in the United States of America (GAAP), which require management to make certain estimates and assumptions at the date of the financial statements. Actual results could differ from those estimates. Subsequent events, if any, through the date that the financial statements were issued have been evaluated in the preparation of the financial statements. The following summarizes the significant accounting policies of the Fund:
Investment Valuation. Investments are valued as of 4:00 p.m. Eastern time on the last calendar day of the period. The Board of Trustees (the Board) has delegated the day to day responsibility for the valuation of the Fund's investments to the Fidelity Management & Research Company (FMR) Fair Value Committee (the Committee). In accordance with valuation policies and procedures approved by the Board, the Fund attempts to obtain prices from one or more third party pricing vendors or brokers to value its investments. When current market prices, quotations or currency exchange rates are not readily available or reliable, investments will be fair valued in good faith by the Committee, in accordance with procedures adopted by the Board. Factors used in determining fair value vary by investment type and may include market or investment specific events. The frequency with which these procedures are used cannot be predicted and they may be utilized to a significant extent. The Committee oversees the Fund's valuation policies and procedures and reports to the Board on the Committee's activities and fair value determinations. The Board monitors the appropriateness of the procedures used in valuing the Fund's investments and ratifies the fair value determinations of the Committee.
The Fund categorizes the inputs to valuation techniques used to value its investments into a disclosure hierarchy consisting of three levels as shown below:
- Level 1 – quoted prices in active markets for identical investments
- Level 2 – other significant observable inputs (including quoted prices for similar investments, interest rates, prepayment speeds, etc.)
- Level 3 – unobservable inputs (including the Fund's own assumptions based on the best information available)
Valuation techniques used to value the Fund's investments by major category are as follows:
Equity securities, including restricted securities, for which market quotations are readily available, are valued at the last reported sale price or official closing price as reported by a third party pricing vendor on the primary market or exchange on which they are traded and are categorized as Level 1 in the hierarchy. In the event there were no sales during the day or closing prices are not available, securities are valued at the last quoted bid price or may be valued using the last available price and are generally categorized as Level 2 in the hierarchy. For foreign equity securities, when market or security specific events arise, comparisons to the valuation of American Depositary Receipts (ADRs), futures contracts, Exchange-Traded Funds (ETFs) and certain indexes as well as quoted prices for similar securities may be used and would be categorized as Level 2 in the hierarchy. Utilizing these techniques may result in transfers between Level 1 and Level 2. For equity securities, including restricted securities, where observable inputs are limited, assumptions about market activity and risk are used and these securities may be categorized as Level 3 in the hierarchy.
ETFs are valued at their last sale price or official closing price as reported by a third party pricing vendor on the primary market or exchange on which they are traded and are categorized as Level 1 in the hierarchy. In the event there were no sales during the day but the exchange reports a closing bid level, ETFs are valued at the closing bid and would be categorized as Level 1 in the hierarchy. In the event there was no closing bid, ETFs may be valued by another method that the Board believes reflects fair value in accordance with the Board's fair value pricing policies and may be categorized as Level 2 in the hierarchy.
Investments in open-end mutual funds, including the Fidelity Central Funds, are valued at their closing net asset value (NAV) each business day and are categorized as Level 1 in the hierarchy.
Changes in valuation techniques may result in transfers in or out of an assigned level within the disclosure hierarchy. The aggregate value of investments by input level as of January 31, 2016 is included at the end of the Fund's Schedule of Investments.
Foreign Currency. The Fund may use foreign currency contracts to facilitate transactions in foreign-denominated securities. Gains and losses from these transactions may arise from changes in the value of the foreign currency or if the counterparties do not perform under the contracts' terms.
Foreign-denominated assets, including investment securities, and liabilities are translated into U.S. dollars at the exchange rates at period end. Purchases and sales of investment securities, income and dividends received and expenses denominated in foreign currencies are translated into U.S. dollars at the exchange rate in effect on the transaction date.
The effects of exchange rate fluctuations on investments are included with the net realized and unrealized gain (loss) on investment securities. Other foreign currency transactions resulting in realized and unrealized gain (loss) are disclosed separately.
Investment Transactions and Income. For financial reporting purposes, the Fund's investment holdings and NAV include trades executed through the end of the last business day of the period. The NAV per share for processing shareholder transactions is calculated as of the close of business of the New York Stock Exchange (NYSE), normally 4:00 p.m. Eastern time and includes trades executed through the end of the prior business day. Gains and losses on securities sold are determined on the basis of identified cost and may include proceeds received from litigation. Dividend income is recorded on the ex-dividend date, except for certain dividends from foreign securities where the ex-dividend date may have passed, which are recorded as soon as the Fund is informed of the ex-dividend date. Non-cash dividends included in dividend income, if any, are recorded at the fair market value of the securities received. Income and capital gain distributions from Fidelity Central Funds, if any, are recorded on the ex-dividend date. Distributions received on securities that represent a return of capital or capital gain are recorded as a reduction of cost of investments and/or as a realized gain. Subsequent to ex-dividend date the Fund determines the components of these distributions, based upon receipt of tax filings or other correspondence relating to the underlying investment. Interest income is accrued as earned and includes coupon interest and amortization of premium and accretion of discount on debt securities as applicable. Investment income is recorded net of foreign taxes withheld where recovery of such taxes is uncertain.
Class Allocations and Expenses. Investment income, realized and unrealized capital gains and losses, common expenses of the Fund, and certain fund-level expense reductions, if any, are allocated daily on a pro-rata basis to each class based on the relative net assets of each class to the total net assets of the Fund. Each class differs with respect to transfer agent and distribution and service plan fees incurred. Certain expense reductions may also differ by class. For the reporting period, the allocated portion of income and expenses to each class as a percent of its average net assets may vary due to the timing of recording these transactions in relation to fluctuating net assets of the classes. Expenses directly attributable to a fund are charged to that fund. Expenses attributable to more than one fund are allocated among the respective funds on the basis of relative net assets or other appropriate methods. Expense estimates are accrued in the period to which they relate and adjustments are made when actual amounts are known.
Income Tax Information and Distributions to Shareholders. Each year, the Fund intends to qualify as a regulated investment company under Subchapter M of the Internal Revenue Code, including distributing substantially all of its taxable income and realized gains. As a result, no provision for U.S. Federal income taxes is required. The Fund files a U.S. federal tax return, in addition to state and local tax returns as required. The Fund's federal income tax returns are subject to examination by the Internal Revenue Service (IRS) for a period of three fiscal years after they are filed. State and local tax returns may be subject to examination for an additional fiscal year depending on the jurisdiction. Foreign taxes are provided for based on the Fund's understanding of the tax rules and rates that exist in the foreign markets in which it invests.
Distributions are declared and recorded on the ex-dividend date. Income dividends and capital gain distributions are declared separately for each class. Income and capital gain distributions are determined in accordance with income tax regulations, which may differ from GAAP.
Capital accounts within the financial statements are adjusted for permanent book-tax differences. These adjustments have no impact on net assets or the results of operations. Capital accounts are not adjusted for temporary book-tax differences which will reverse in a subsequent period.
Book-tax differences are primarily due to foreign currency transactions, partnerships and losses deferred due to wash sales and excise tax regulations.
The federal tax cost of investment securities and unrealized appreciation (depreciation) as of period end were as follows:
| Gross unrealized appreciation | $140,469,918 |
| Gross unrealized depreciation | (179,315,659) |
| Net unrealized appreciation (depreciation) on securities | $(38,845,741) |
| Tax cost | $1,997,124,123 |
Short-Term Trading (Redemption) Fees. Shares held by investors in the Fund less than 90 days may have been subject to a redemption fee equal to 1.50% of the NAV of shares redeemed. All redemption fees, which reduce the proceeds of the shareholder redemption, are retained by the Fund and accounted for as an addition to paid in capital.
4. Purchases and Sales of Investments.
Purchases and sales of securities, other than short-term securities, aggregated $1,583,055,509 and $1,159,316,197, respectively.
5. Fees and Other Transactions with Affiliates.
Management Fee. Fidelity Management & Research Company (the investment adviser) and its affiliates provide the Fund with investment management related services for which the Fund pays a monthly management fee. The management fee is the sum of an individual fund fee rate that is based on an annual rate of .45% of the Fund's average net assets and an annualized group fee rate that averaged .25% during the period. The group fee rate is based upon the average net assets of all the mutual funds advised by the investment adviser, including any mutual funds previously advised by the investment adviser that are currently advised by Fidelity SelectCo, LLC, an affiliate of the investment adviser. The group fee rate decreases as assets under management increase and increases as assets under management decrease. In addition, the management fee is subject to a performance adjustment (up to a maximum of +/- .20% of the Fund's average net assets over a 36 month performance period). The upward or downward adjustment to the management fee is based on the Small Cap Growth as compared to its benchmark index, the Russell 2000 Growth Index, over the same 36 month performance period. For the reporting period, the total annualized management fee rate, including the performance adjustment, was .83% of the Fund's average net assets. The performance adjustment included in the management fee rate may be higher or lower than the maximum performance adjustment rate due to the difference between the average net assets for the reporting and performance periods.
Distribution and Service Plan Fees. In accordance with Rule 12b-1 of the 1940 Act, the Fund has adopted separate Distribution and Service Plans for each class of shares. Certain classes pay Fidelity Distributors Corporation (FDC), an affiliate of the investment adviser, separate Distribution and Service Fees, each of which is based on an annual percentage of each class' average net assets. In addition, FDC may pay financial intermediaries for selling shares of the Fund and providing shareholder support services. For the period, the Distribution and Service Fee rates, total fees and amounts retained by FDC were as follows:
| | Distribution
Fee | Service
Fee | Total Fees | Retained
by FDC |
| Class A | -% | .25% | $170,431 | $- |
| Class T | .25% | .25% | 126,693 | - |
| Class B | .75% | .25% | 9,477 | 7,108 |
| Class C | .75% | .25% | 305,780 | 89,202 |
| | | | $612,381 | $96,310 |
Sales Load. FDC may receive a front-end sales charge of up to 5.75% for selling Class A shares and 3.50% for selling Class T shares, some of which is paid to financial intermediaries for selling shares of the Fund. Depending on the holding period, FDC may receive contingent deferred sales charges levied on Class A, Class T, Class B, and Class C redemptions. The deferred sales charges range from 5.00% to 1.00% for Class B shares, 1.00% for Class C shares, 1.00% for certain purchases of Class A shares and .25% for certain purchases of Class T shares.
For the period, sales charge amounts retained by FDC were as follows:
| | Retained
by FDC |
| Class A | $75,745 |
| Class T | 9,304 |
| Class B(a) | 178 |
| Class C(a) | 5,760 |
| | $90,987 |
(a) When Class B and Class C shares are initially sold, FDC pays commissions from its own resources to financial intermediaries through which the sales are made.
Transfer Agent Fees. Fidelity Investments Institutional Operations Company, Inc., (FIIOC), an affiliate of the investment adviser, is the transfer, dividend disbursing and shareholder servicing agent for each class of the Fund. FIIOC receives account fees and asset-based fees that vary according to the account size and type of account of the shareholders of the respective classes of the Fund. FIIOC pays for typesetting, printing and mailing of shareholder reports, except proxy statements.
For the period, transfer agent fees for each class were as follows:
| | Amount | % of
Class-Level Average
Net Assets(a) |
| Class A | $168,349 | .25 |
| Class T | 70,180 | .28 |
| Class B | 2,888 | .30 |
| Class C | 86,626 | .28 |
| Small Cap Growth | 1,771,102 | .25 |
| Class I | 121,760 | .21 |
| | $2,220,905 | |
(a) Annualized
Accounting and Security Lending Fees. Fidelity Service Company, Inc. (FSC), an affiliate of the investment adviser, maintains the Fund's accounting records. The accounting fee is based on the level of average net assets for each month. Under a separate contract, FSC administers the security lending program. The security lending fee is based on the number and duration of lending transactions.
Brokerage Commissions. The Fund placed a portion of its portfolio transactions with brokerage firms which are affiliates of the investment adviser. Brokerage commissions are included in net realized gain (loss) and change in net unrealized appreciation (depreciation) in the Statement of Operations. The commissions paid to these affiliated firms were $41,003 for the period.
Interfund Trades. The Fund may purchase from or sell securities to other Fidelity Funds under procedures adopted by the Board. The procedures have been designed to ensure these interfund trades are executed in accordance with Rule 17a-7 of the 1940 Act. Interfund trades are included within the respective purchases and sales amounts shown in the Purchases and Sales of Investments note.
6. Committed Line of Credit.
The Fund participates with other funds managed by the investment adviser or an affiliate in a $4.25 billion credit facility (the "line of credit") to be utilized for temporary or emergency purposes to fund shareholder redemptions or for other short-term liquidity purposes. The Fund has agreed to pay commitment fees on its pro-rata portion of the line of credit, which amounted to $1,182 and is reflected in Miscellaneous expenses on the Statement of Operations. During the period, the Fund did not borrow on this line of credit.
7. Security Lending.
The Fund lends portfolio securities through a lending agent from time to time in order to earn additional income. For equity securities, a lending agent is used and may loan securities to certain qualified borrowers, including Fidelity Capital Markets (FCM), a broker-dealer affiliated with the Fund. On the settlement date of the loan, the Fund receives collateral (in the form of U.S. Treasury obligations, letters of credit and/or cash) against the loaned securities and maintains collateral in an amount not less than 100% of the market value of the loaned securities during the period of the loan. The market value of the loaned securities is determined at the close of business of the Fund and any additional required collateral is delivered to the Fund on the next business day. The Fund or borrower may terminate the loan at any time, and if the borrower defaults on its obligation to return the securities loaned because of insolvency or other reasons, the Fund may apply collateral received from the borrower against the obligation. The Fund may experience delays and costs in recovering the securities loaned. Any cash collateral received is invested in the Fidelity Securities Lending Cash Central Fund. The value of loaned securities and cash collateral at period end are disclosed on the Fund's Statement of Assets and Liabilities. The value of securities loaned to FCM at period end was $9,721,986. Security lending income represents the income earned on investing cash collateral, less rebates paid to borrowers and any lending agent fees associated with the loan, plus any premium payments received for lending certain types of securities. Security lending income is presented in the Statement of Operations as a component of income from Fidelity Central Funds, and includes $135,856 from securities loaned to FCM.
8. Expense Reductions.
Commissions paid to certain brokers with whom the investment adviser, or its affiliates, places trades on behalf of the Fund include an amount in addition to trade execution, which may be rebated back to the Fund to offset certain expenses. This amount totaled $61,599 for the period. In addition, through arrangements with the Fund's custodian, credits realized as a result of certain uninvested cash balances were used to reduce the Fund's expenses. During the period, these credits reduced the Fund's custody expenses by $211.
In addition, during the period the investment adviser reimbursed and/or waived a portion of fund-level operating expenses in the amount of $6,949.
9. Distributions to Shareholders.
Distributions to shareholders of each class were as follows:
| | Six months ended January 31, 2016 | Year ended July 31, 2015 |
| From net realized gain | | |
| Class A | $5,181,395 | $7,463,655 |
| Class T | 2,020,848 | 3,715,268 |
| Class B | 78,117 | 242,938 |
| Class C | 2,268,668 | 3,707,592 |
| Small Cap Growth | 57,632,579 | 83,762,458 |
| Class I | 4,213,303 | 4,296,573 |
| Total | $71,394,910 | $103,188,484 |
10. Share Transactions.
Share transactions for each class were as follows and may contain automatic conversions between classes or exchanges between affiliated funds:
| | Shares | Shares | Dollars | Dollars |
| | Six months ended January 31, 2016 | Year ended July 31, 2015 | Six months ended January 31, 2016 | Year ended July 31, 2015 |
| Class A | | | | |
| Shares sold | 3,788,380 | 2,167,593 | $69,322,533 | $41,925,439 |
| Reinvestment of distributions | 264,882 | 412,446 | 5,002,118 | 7,203,479 |
| Shares redeemed | (1,089,932) | (1,515,208) | (19,532,200) | (27,623,856) |
| Net increase (decrease) | 2,963,330 | 1,064,831 | $54,792,451 | $21,505,062 |
| Class T | | | | |
| Shares sold | 614,464 | 659,898 | $11,042,487 | $12,282,234 |
| Reinvestment of distributions | 107,630 | 211,200 | 1,987,314 | 3,613,802 |
| Shares redeemed | (368,566) | (660,724) | (6,582,314) | (11,765,139) |
| Net increase (decrease) | 353,528 | 210,374 | $6,447,487 | $4,130,897 |
| Class B | | | | |
| Shares sold | 5,563 | 11,802 | $90,672 | $209,809 |
| Reinvestment of distributions | 4,376 | 14,482 | 76,516 | 235,501 |
| Shares redeemed | (36,629) | (66,110) | (623,367) | (1,127,352) |
| Net increase (decrease) | (26,690) | (39,826) | $(456,179) | $(682,042) |
| Class C | | | | |
| Shares sold | 1,483,971 | 992,298 | $25,270,133 | $17,729,436 |
| Reinvestment of distributions | 125,336 | 216,825 | 2,178,654 | 3,508,500 |
| Shares redeemed | (492,824) | (778,826) | (7,982,478) | (13,034,787) |
| Net increase (decrease) | 1,116,483 | 430,297 | $19,466,309 | $8,203,149 |
| Small Cap Growth | | | | |
| Shares sold | 30,093,908 | 23,816,242 | $567,615,388 | $475,203,336 |
| Reinvestment of distributions | 2,848,706 | 4,527,816 | 55,506,569 | 81,276,349 |
| Shares redeemed | (11,760,847) | (22,793,867) | (217,402,735) | (412,013,233) |
| Net increase (decrease) | 21,181,767 | 5,550,191 | $405,719,222 | $144,466,452 |
| Class I | | | | |
| Shares sold | 4,395,489 | 2,387,318 | $82,906,484 | $47,676,724 |
| Reinvestment of distributions | 199,940 | 220,272 | 3,903,639 | 3,963,647 |
| Shares redeemed | (1,612,638) | (789,017) | (29,918,854) | (15,108,080) |
| Net increase (decrease) | 2,982,791 | 1,818,573 | $56,891,269 | $36,532,291 |
11. Other.
The Fund's organizational documents provide former and current trustees and officers with a limited indemnification against liabilities arising in connection with the performance of their duties to the Fund. In the normal course of business, the Fund may also enter into contracts that provide general indemnifications. The Fund's maximum exposure under these arrangements is unknown as this would be dependent on future claims that may be made against the Fund. The risk of material loss from such claims is considered remote.
Shareholder Expense Example
As a shareholder of the Fund, you incur two types of costs: (1) transaction costs, including sales charges (loads) on purchase payments or redemption proceeds, redemption fees and (2) ongoing costs, including management fees, distribution and/or service (12b-1) fees and other Fund expenses. This Example is intended to help you understand your ongoing costs (in dollars) of investing in the Fund and to compare these costs with the ongoing costs of investing in other mutual funds.
The Example is based on an investment of $1,000 invested at the beginning of the period and held for the entire period (August 1, 2015 to January 31, 2016).
Actual Expenses
The first line of the accompanying table for each class of the Fund provides information about actual account values and actual expenses. You may use the information in this line, together with the amount you invested, to estimate the expenses that you paid over the period. Simply divide your account value by $1,000.00 (for example, an $8,600 account value divided by $1,000.00 = 8.6), then multiply the result by the number in the first line for a class of the Fund under the heading entitled "Expenses Paid During Period" to estimate the expenses you paid on your account during this period. A small balance maintenance fee of $12.00 that is charged once a year may apply for certain accounts with a value of less than $2,000. This fee is not included in the table below. If it was, the estimate of expenses you paid during the period would be higher, and your ending account value lower, by this amount. In addition, the Fund, as a shareholder in the underlying Fidelity Central Funds, will indirectly bear its pro-rata share of the fees and expenses incurred by the underlying Fidelity Central Funds. These fees and expenses are not included in the Fund's annualized expense ratio used to calculate the expense estimate in the table below.
Hypothetical Example for Comparison Purposes
The second line of the accompanying table for each class of the Fund provides information about hypothetical account values and hypothetical expenses based on a Class' actual expense ratio and an assumed rate of return of 5% per year before expenses, which is not the Class' actual return. The hypothetical account values and expenses may not be used to estimate the actual ending account balance or expenses you paid for the period. You may use this information to compare the ongoing costs of investing in the Fund and other funds. To do so, compare this 5% hypothetical example with the 5% hypothetical examples that appear in the shareholder reports of the other funds. A small balance maintenance fee of $12.00 that is charged once a year may apply for certain accounts with a value of less than $2,000. This fee is not included in the table below. If it was, the estimate of expenses you paid during the period would be higher, and your ending account value lower, by this amount. In addition, the Fund, as a shareholder in the underlying Fidelity Central Funds, will indirectly bear its pro-rata share of the fees and expenses incurred by the underlying Fidelity Central Funds. These fees and expenses are not included in the Fund's annualized expense ratio used to calculate the expense estimate in the table below.
Please note that the expenses shown in the table are meant to highlight your ongoing costs only and do not reflect any transaction costs. Therefore, the second line of the table is useful in comparing ongoing costs only, and will not help you determine the relative total costs of owning different funds. In addition, if these transactional costs were included, your costs would have been higher.
| | Annualized Expense Ratio-A | Beginning
Account Value
August 1, 2015 | Ending
Account Value
January 31, 2016 | Expenses Paid
During Period-B
August 1, 2015
to January 31, 2016 |
| Class A | 1.39% | | | |
| Actual | | $1,000.00 | $829.10 | $6.39 |
| Hypothetical-C | | $1,000.00 | $1,018.15 | $7.05 |
| Class T | 1.67% | | | |
| Actual | | $1,000.00 | $828.10 | $7.67 |
| Hypothetical-C | | $1,000.00 | $1,016.74 | $8.47 |
| Class B | 2.19% | | | |
| Actual | | $1,000.00 | $825.70 | $10.05 |
| Hypothetical-C | | $1,000.00 | $1,014.13 | $11.09 |
| Class C | 2.17% | | | |
| Actual | | $1,000.00 | $825.50 | $9.96 |
| Hypothetical-C | | $1,000.00 | $1,014.23 | $10.99 |
| Small Cap Growth | 1.13% | | | |
| Actual | | $1,000.00 | $830.30 | $5.20 |
| Hypothetical-C | | $1,000.00 | $1,019.46 | $5.74 |
| Class I | 1.10% | | | |
| Actual | | $1,000.00 | $830.10 | $5.06 |
| Hypothetical-C | | $1,000.00 | $1,019.61 | $5.58 |
A Annualized expense ratio reflects expenses net of applicable fee waivers.
B Expenses are equal to each Class' annualized expense ratio, multiplied by the average account value over the period, multiplied by 184/366 (to reflect the one-half year period).
C 5% return per year before expenses
Corporate Headquarters
245 Summer St.
Boston, MA 02210
www.fidelity.com
SCP-SANN-0316
1.803700.111
Fidelity® Blue Chip Growth Fund
Class K
Semi-Annual Report January 31, 2016 |
|
Contents
To view a fund's proxy voting guidelines and proxy voting record for the 12-month period ended June 30, visit http://www.fidelity.com/proxyvotingresults or visit the Securities and Exchange Commission's (SEC) web site at http://www.sec.gov.
You may also call 1-800-835-5092 to request a free copy of the proxy voting guidelines.
Standard & Poor's, S&P and S&P 500 are registered service marks of The McGraw-Hill Companies, Inc. and have been licensed for use by Fidelity Distributors Corporation.
Other third-party marks appearing herein are the property of their respective owners.
All other marks appearing herein are registered or unregistered trademarks or service marks of FMR LLC or an affiliated company. © 2016 FMR LLC. All rights reserved.
This report and the financial statements contained herein are submitted for the general information of the shareholders of the Fund. This report is not authorized for distribution to prospective investors in the Fund unless preceded or accompanied by an effective prospectus.
A fund files its complete schedule of portfolio holdings with the SEC for the first and third quarters of each fiscal year on Form N-Q. Forms N-Q are available on the SEC’s web site at http://www.sec.gov. A fund's Forms N-Q may be reviewed and copied at the SEC’s Public Reference Room in Washington, DC. Information regarding the operation of the SEC's Public Reference Room may be obtained by calling 1-800-SEC-0330.
For a complete list of a fund's portfolio holdings, view the most recent holdings listing, semiannual report, or annual report on Fidelity's web site at http://www.fidelity.com, http://www.advisor.fidelity.com, or http://www.401k.com, as applicable.
NOT FDIC INSURED •MAY LOSE VALUE •NO BANK GUARANTEE
Neither the Fund nor Fidelity Distributors Corporation is a bank.
Investment Summary (Unaudited)
Top Ten Stocks as of January 31, 2016
| | % of fund's net assets | % of fund's net assets 6 months ago |
| Alphabet, Inc. Class A | 5.7 | 4.3 |
| Amazon.com, Inc. | 4.9 | 3.9 |
| Facebook, Inc. Class A | 4.1 | 2.9 |
| Apple, Inc. | 4.1 | 6.4 |
| Alphabet, Inc. Class C | 2.4 | 2.0 |
| Home Depot, Inc. | 2.1 | 1.8 |
| The Coca-Cola Co. | 2.0 | 1.0 |
| Visa, Inc. Class A | 2.0 | 1.8 |
| Salesforce.com, Inc. | 1.9 | 1.8 |
| Allergan PLC | 1.8 | 1.8 |
| | 31.0 | |
Top Five Market Sectors as of January 31, 2016
| | % of fund's net assets | % of fund's net assets 6 months ago |
| Information Technology | 37.4 | 34.2 |
| Consumer Discretionary | 26.4 | 24.9 |
| Health Care | 16.1 | 18.0 |
| Consumer Staples | 10.8 | 9.8 |
| Industrials | 4.9 | 5.5 |
Asset Allocation (% of fund's net assets)
| As of January 31, 2016 * |
| | Stocks | 97.6% |
| | Convertible Securities | 2.4% |

* Foreign investments - 12.2%
| As of July 31, 2015 * |
| | Stocks | 98.1% |
| | Convertible Securities | 1.9% |

* Foreign investments - 12.5%
Investments January 31, 2016
Showing Percentage of Net Assets
| Common Stocks - 97.5% | | | |
| | | Shares | Value (000s) |
| CONSUMER DISCRETIONARY - 26.2% | | | |
| Auto Components - 0.2% | | | |
| Delphi Automotive PLC | | 343,451 | $22,304 |
| Magna International, Inc. Class A (sub. vtg.) | | 593,150 | 20,607 |
| | | | 42,911 |
| Automobiles - 1.2% | | | |
| Tesla Motors, Inc. (a)(b) | | 1,166,133 | 222,965 |
| Hotels, Restaurants & Leisure - 5.9% | | | |
| Buffalo Wild Wings, Inc. (a)(b) | | 463,809 | 70,638 |
| Chipotle Mexican Grill, Inc. (a) | | 474,570 | 214,966 |
| Dave & Buster's Entertainment, Inc. (a) | | 1,736,913 | 62,998 |
| Domino's Pizza, Inc. | | 389,471 | 44,372 |
| Fiesta Restaurant Group, Inc. (a) | | 233,800 | 8,510 |
| Hilton Worldwide Holdings, Inc. | | 2,857,776 | 50,897 |
| Jubilant Foodworks Ltd. | | 63,454 | 1,197 |
| McDonald's Corp. | | 2,725,375 | 337,347 |
| MGM Mirage, Inc. (a) | | 531,642 | 10,675 |
| Panera Bread Co. Class A (a) | | 21,700 | 4,210 |
| Royal Caribbean Cruises Ltd. | | 146,600 | 12,015 |
| Starbucks Corp. | | 5,164,647 | 313,856 |
| | | | 1,131,681 |
| Household Durables - 0.9% | | | |
| Jarden Corp. (a) | | 613,766 | 32,560 |
| Newell Rubbermaid, Inc. | | 298,337 | 11,570 |
| Sony Corp. | | 1,790,700 | 41,561 |
| Sony Corp. sponsored ADR | | 995,475 | 23,772 |
| Tempur Sealy International, Inc. (a) | | 147,999 | 8,930 |
| Whirlpool Corp. | | 405,332 | 54,473 |
| | | | 172,866 |
| Internet & Catalog Retail - 7.0% | | | |
| Amazon.com, Inc. (a) | | 1,600,987 | 939,779 |
| Ctrip.com International Ltd. sponsored ADR (a) | | 799,533 | 34,124 |
| Expedia, Inc. | | 698,499 | 70,576 |
| Groupon, Inc. Class A (a)(b) | | 4,483,314 | 12,195 |
| JD.com, Inc. sponsored ADR (a) | | 182,652 | 4,754 |
| Netflix, Inc. (a) | | 1,348,248 | 123,823 |
| Priceline Group, Inc. (a) | | 137,905 | 146,865 |
| The Honest Co., Inc. (a)(c) | | 150,143 | 6,870 |
| | | | 1,338,986 |
| Leisure Products - 0.3% | | | |
| Hasbro, Inc. | | 532,239 | 39,535 |
| Mattel, Inc. | | 301,588 | 8,321 |
| NJOY, Inc. (a)(c) | | 8,088,440 | 1,035 |
| Spin Master Corp. (a) | | 412,100 | 5,880 |
| | | | 54,771 |
| Media - 1.6% | | | |
| Altice NV Class A (a) | | 1,849,008 | 26,666 |
| Charter Communications, Inc. Class A (a) | | 154,935 | 26,550 |
| DreamWorks Animation SKG, Inc. Class A (a)(b) | | 566,929 | 14,536 |
| Lions Gate Entertainment Corp. | | 319,865 | 8,364 |
| Naspers Ltd. Class N | | 198,800 | 25,123 |
| Starz Series A (a) | | 324,159 | 9,216 |
| The Walt Disney Co. | | 1,997,851 | 191,434 |
| | | | 301,889 |
| Multiline Retail - 1.4% | | | |
| B&M European Value Retail S.A. | | 8,179,226 | 32,855 |
| Burlington Stores, Inc. (a) | | 670,971 | 36,051 |
| Dollar Tree, Inc. (a) | | 946,965 | 77,007 |
| Target Corp. | | 1,600,646 | 115,919 |
| | | | 261,832 |
| Specialty Retail - 4.7% | | | |
| AutoZone, Inc. (a) | | 16,577 | 12,721 |
| Home Depot, Inc. | | 3,227,524 | 405,893 |
| Inditex SA | | 561,709 | 18,485 |
| L Brands, Inc. | | 1,148,336 | 110,413 |
| Lowe's Companies, Inc. | | 221,610 | 15,881 |
| O'Reilly Automotive, Inc. (a) | | 31,457 | 8,207 |
| Restoration Hardware Holdings, Inc. (a)(b) | | 1,727,774 | 106,465 |
| Ross Stores, Inc. | | 977,149 | 54,974 |
| Signet Jewelers Ltd. | | 481,524 | 55,857 |
| TJX Companies, Inc. | | 1,505,267 | 107,235 |
| Ulta Salon, Cosmetics & Fragrance, Inc. (a) | | 94,384 | 17,100 |
| | | | 913,231 |
| Textiles, Apparel & Luxury Goods - 3.0% | | | |
| adidas AG | | 997,300 | 102,695 |
| Coach, Inc. | | 164,819 | 6,107 |
| Columbia Sportswear Co. | | 105,804 | 5,838 |
| G-III Apparel Group Ltd. (a) | | 608,239 | 30,023 |
| Kate Spade & Co. (a) | | 1,001,102 | 17,830 |
| lululemon athletica, Inc. (a)(b) | | 1,294,472 | 80,348 |
| NIKE, Inc. Class B | | 2,174,144 | 134,819 |
| Pandora A/S | | 18,275 | 2,445 |
| PVH Corp. | | 792,781 | 58,174 |
| Ralph Lauren Corp. | | 36,950 | 4,157 |
| Regina Miracle International Holdings Ltd. (a) | | 6,171,551 | 10,101 |
| Skechers U.S.A., Inc. Class A (sub. vtg.) (a) | | 1,854,582 | 52,281 |
| Tory Burch LLC unit (c)(d) | | 293,611 | 15,356 |
| Under Armour, Inc. Class A (sub. vtg.) (a) | | 518,665 | 44,310 |
| Vera Bradley, Inc. (a) | | 878,600 | 12,986 |
| VF Corp. | | 150,995 | 9,452 |
| | | | 586,922 |
|
| TOTAL CONSUMER DISCRETIONARY | | | 5,028,054 |
|
| CONSUMER STAPLES - 10.6% | | | |
| Beverages - 4.2% | | | |
| Anheuser-Busch InBev SA NV ADR | | 306,974 | 38,630 |
| Coca-Cola Bottling Co. Consolidated | | 30,858 | 5,428 |
| Constellation Brands, Inc. Class A (sub. vtg.) | | 362,427 | 55,263 |
| Molson Coors Brewing Co. Class B | | 919,655 | 83,210 |
| Monster Beverage Corp. | | 1,130,295 | 152,624 |
| PepsiCo, Inc. | | 801,191 | 79,558 |
| The Coca-Cola Co. | | 9,100,465 | 390,592 |
| United Spirits Ltd. (a) | | 41,658 | 1,535 |
| | | | 806,840 |
| Food & Staples Retailing - 3.0% | | | |
| Costco Wholesale Corp. | | 799,297 | 120,790 |
| CVS Health Corp. | | 1,815,506 | 175,360 |
| Kroger Co. | | 2,888,050 | 112,085 |
| Sprouts Farmers Market LLC (a) | | 1,732,222 | 39,495 |
| Wal-Mart Stores, Inc. | | 172,865 | 11,471 |
| Walgreens Boots Alliance, Inc. | | 750,280 | 59,812 |
| Whole Foods Market, Inc. | | 1,955,118 | 57,305 |
| | | | 576,318 |
| Food Products - 1.3% | | | |
| Amplify Snack Brands, Inc. | | 659,687 | 7,125 |
| Associated British Foods PLC | | 1,086,100 | 48,998 |
| Edita Food Industries SAE GDR (a)(e) | | 129,600 | 2,171 |
| Mondelez International, Inc. | | 2,771,433 | 119,449 |
| Premium Brands Holdings Corp. | | 73,200 | 2,195 |
| The Hain Celestial Group, Inc. (a) | | 944,971 | 34,378 |
| The Kraft Heinz Co. | | 315,571 | 24,633 |
| TreeHouse Foods, Inc. (a) | | 83,900 | 6,658 |
| WhiteWave Foods Co. (a) | | 366,371 | 13,831 |
| | | | 259,438 |
| Household Products - 0.2% | | | |
| Procter & Gamble Co. | | 515,964 | 42,149 |
| Personal Products - 1.2% | | | |
| Estee Lauder Companies, Inc. Class A | | 609,272 | 51,940 |
| Herbalife Ltd. (a) | | 2,128,165 | 98,343 |
| Nu Skin Enterprises, Inc. Class A (b) | | 2,576,924 | 81,560 |
| | | | 231,843 |
| Tobacco - 0.7% | | | |
| Imperial Tobacco Group PLC | | 204,055 | 11,049 |
| Reynolds American, Inc. | | 2,309,361 | 115,353 |
| | | | 126,402 |
|
| TOTAL CONSUMER STAPLES | | | 2,042,990 |
|
| ENERGY - 1.2% | | | |
| Energy Equipment & Services - 0.1% | | | |
| Baker Hughes, Inc. | | 138,500 | 6,026 |
| Schlumberger Ltd. | | 148,900 | 10,761 |
| | | | 16,787 |
| Oil, Gas & Consumable Fuels - 1.1% | | | |
| Anadarko Petroleum Corp. | | 565,132 | 22,091 |
| Cimarex Energy Co. | | 359,750 | 33,457 |
| Continental Resources, Inc. (a)(b) | | 1,215,841 | 25,666 |
| Devon Energy Corp. | | 305,600 | 8,526 |
| Diamondback Energy, Inc. | | 43,100 | 3,256 |
| EOG Resources, Inc. | | 698,058 | 49,576 |
| Hess Corp. | | 211,000 | 8,968 |
| Noble Energy, Inc. | | 66,100 | 2,140 |
| Pioneer Natural Resources Co. | | 390,126 | 48,356 |
| Rice Energy, Inc. (a) | | 194,700 | 2,272 |
| SM Energy Co. (b) | | 1,039,753 | 14,536 |
| Whiting Petroleum Corp. (a) | | 527,800 | 3,879 |
| | | | 222,723 |
|
| TOTAL ENERGY | | | 239,510 |
|
| FINANCIALS - 2.5% | | | |
| Banks - 1.7% | | | |
| Bank of America Corp. | | 5,319,921 | 75,224 |
| Citigroup, Inc. | | 1,831,521 | 77,986 |
| HDFC Bank Ltd. sponsored ADR | | 649,917 | 39,209 |
| JPMorgan Chase & Co. | | 2,346,136 | 139,595 |
| | | | 332,014 |
| Capital Markets - 0.4% | | | |
| BlackRock, Inc. Class A | | 167,664 | 52,690 |
| Charles Schwab Corp. | | 705,841 | 18,020 |
| Fairfax India Holdings Corp. (a) | | 911,500 | 9,206 |
| | | | 79,916 |
| Consumer Finance - 0.0% | | | |
| Synchrony Financial (a) | | 197,900 | 5,624 |
| Diversified Financial Services - 0.1% | | | |
| CME Group, Inc. | | 105,257 | 9,457 |
| Multi Commodity Exchange of India Ltd. (a) | | 4,622 | 59 |
| | | | 9,516 |
| Real Estate Investment Trusts - 0.2% | | | |
| Extra Space Storage, Inc. | | 304,087 | 27,578 |
| Real Estate Management & Development - 0.0% | | | |
| Parsvnath Developers Ltd. (a)(f) | | 21,771,340 | 6,148 |
| Thrifts & Mortgage Finance - 0.1% | | | |
| Housing Development Finance Corp. Ltd. | | 697,722 | 12,214 |
| Indiabulls Housing Finance Ltd. | | 604,148 | 6,337 |
| LIC Housing Finance Ltd. (a) | | 351,944 | 2,494 |
| | | | 21,045 |
|
| TOTAL FINANCIALS | | | 481,841 |
|
| HEALTH CARE - 15.9% | | | |
| Biotechnology - 9.9% | | | |
| AbbVie, Inc. | | 1,860,412 | 102,137 |
| ACADIA Pharmaceuticals, Inc. (a) | | 119,000 | 2,462 |
| Acceleron Pharma, Inc. (a) | | 144,143 | 4,425 |
| Aduro Biotech, Inc. (b) | | 85,684 | 1,241 |
| Agios Pharmaceuticals, Inc. (a)(b) | | 192,578 | 8,131 |
| Aimmune Therapeutics, Inc. (a) | | 399,157 | 5,460 |
| Alexion Pharmaceuticals, Inc. (a) | | 655,869 | 95,711 |
| Alkermes PLC (a) | | 963,547 | 30,843 |
| Alnylam Pharmaceuticals, Inc. (a) | | 679,240 | 46,827 |
| Amgen, Inc. | | 1,850,286 | 282,594 |
| Ascendis Pharma A/S sponsored ADR | | 330,551 | 6,294 |
| Avalanche Biotechnologies, Inc. (a) | | 88,979 | 534 |
| BioCryst Pharmaceuticals, Inc. (a) | | 1,028,402 | 7,168 |
| Biogen, Inc. (a) | | 725,190 | 198,020 |
| BioMarin Pharmaceutical, Inc. (a) | | 259,887 | 19,237 |
| bluebird bio, Inc. (a) | | 244,767 | 10,124 |
| Calithera Biosciences, Inc. (a)(b) | | 262,144 | 1,311 |
| Catabasis Pharmaceuticals, Inc. | | 520,393 | 3,445 |
| Celgene Corp. (a) | | 2,830,872 | 283,993 |
| Cellectis SA sponsored ADR | | 66,709 | 1,492 |
| Chiasma, Inc. (a)(b) | | 298,351 | 3,073 |
| Chiasma, Inc. (e) | | 221,566 | 2,282 |
| Chiasma, Inc. warrants (a) | | 55,391 | 151 |
| Chimerix, Inc. (a) | | 84,785 | 653 |
| Coherus BioSciences, Inc. (a)(b) | | 484,489 | 6,424 |
| CytomX Therapeutics, Inc. | | 378,621 | 5,651 |
| CytomX Therapeutics, Inc. (a) | | 164,776 | 2,589 |
| DBV Technologies SA sponsored ADR (a) | | 107,154 | 2,785 |
| Dicerna Pharmaceuticals, Inc. (a) | | 158,644 | 1,041 |
| Edge Therapeutics, Inc. (a) | | 338,839 | 3,765 |
| Exelixis, Inc. (a)(b) | | 2,801,991 | 12,945 |
| FibroGen, Inc. (a) | | 368,341 | 7,470 |
| Gilead Sciences, Inc. | | 3,767,727 | 312,721 |
| Global Blood Therapeutics, Inc. (a)(b) | | 508,233 | 9,621 |
| Heron Therapeutics, Inc. (a) | | 87,877 | 1,845 |
| Intercept Pharmaceuticals, Inc. (a) | | 142,207 | 15,107 |
| Intrexon Corp. (a)(b) | | 472,617 | 13,772 |
| Ionis Pharmaceuticals, Inc. (a) | | 125,729 | 4,895 |
| Ironwood Pharmaceuticals, Inc. Class A (a) | | 893,167 | 8,244 |
| Juno Therapeutics, Inc. (a)(b) | | 221,037 | 6,096 |
| Kite Pharma, Inc. (a)(b) | | 97,468 | 4,629 |
| Merrimack Pharmaceuticals, Inc. (a)(b) | | 1,569,525 | 9,684 |
| Mirati Therapeutics, Inc. (a) | | 220,034 | 4,737 |
| Momenta Pharmaceuticals, Inc. (a) | | 96,669 | 1,201 |
| Neurocrine Biosciences, Inc. (a) | | 627,247 | 26,689 |
| Novavax, Inc. (a) | | 438,504 | 2,258 |
| Portola Pharmaceuticals, Inc. (a) | | 300,825 | 9,936 |
| ProNai Therapeutics, Inc. (a) | | 292,403 | 2,421 |
| Prothena Corp. PLC (a) | | 103,459 | 4,030 |
| Radius Health, Inc. (a) | | 84,485 | 2,706 |
| Regeneron Pharmaceuticals, Inc. (a) | | 426,508 | 179,172 |
| REGENXBIO, Inc. (a)(b) | | 118,439 | 1,646 |
| Sage Therapeutics, Inc. (a) | | 119,767 | 4,022 |
| Seattle Genetics, Inc. (a) | | 372,893 | 12,298 |
| Seres Therapeutics, Inc. (b) | | 48,933 | 1,318 |
| Spark Therapeutics, Inc. | | 98,965 | 2,788 |
| Trevena, Inc. (a) | | 1,033,895 | 7,527 |
| Ultragenyx Pharmaceutical, Inc. (a) | | 58,720 | 3,297 |
| uniQure B.V. (a)(b) | | 300,878 | 5,485 |
| Versartis, Inc. (a)(b) | | 159,453 | 1,776 |
| Vertex Pharmaceuticals, Inc. (a) | | 1,061,002 | 96,286 |
| Xencor, Inc. (a) | | 110,350 | 1,194 |
| | | | 1,917,679 |
| Health Care Equipment & Supplies - 1.2% | | | |
| Boston Scientific Corp. (a) | | 3,061,638 | 53,671 |
| DexCom, Inc. (a) | | 103,329 | 7,365 |
| Edwards Lifesciences Corp. (a) | | 26,500 | 2,073 |
| Glaukos Corp. (b) | | 75,218 | 1,228 |
| Intuitive Surgical, Inc. (a) | | 146,941 | 79,473 |
| Invuity, Inc. | | 507,111 | 3,895 |
| Medtronic PLC | | 660,925 | 50,177 |
| Nevro Corp. (a) | | 377,795 | 23,344 |
| Novocure Ltd. (a)(b) | | 143,904 | 1,796 |
| Olympus Corp. | | 101,400 | 3,954 |
| | | | 226,976 |
| Health Care Providers & Services - 0.6% | | | |
| Adeptus Health, Inc. Class A (a) | | 506,235 | 23,884 |
| AmSurg Corp. (a) | | 555,956 | 40,690 |
| Apollo Hospitals Enterprise Ltd. (a) | | 936,371 | 20,409 |
| Cardinal Health, Inc. | | 114,049 | 9,280 |
| Dr Lal Pathlabs Ltd. | | 7,779 | 90 |
| Teladoc, Inc. (b) | | 656,907 | 10,668 |
| UnitedHealth Group, Inc. | | 101,362 | 11,673 |
| | | | 116,694 |
| Health Care Technology - 0.1% | | | |
| athenahealth, Inc. (a) | | 75,273 | 10,674 |
| Castlight Health, Inc. Class B (a) | | 508,709 | 1,684 |
| Evolent Health, Inc. | | 241,372 | 2,382 |
| | | | 14,740 |
| Life Sciences Tools & Services - 0.1% | | | |
| Illumina, Inc. (a) | | 93,862 | 14,826 |
| Lonza Group AG | | 37,805 | 5,792 |
| | | | 20,618 |
| Pharmaceuticals - 4.0% | | | |
| Achaogen, Inc. (a) | | 325,957 | 1,180 |
| Allergan PLC (a) | | 1,233,475 | 350,837 |
| Bristol-Myers Squibb Co. | | 2,053,785 | 127,663 |
| Cempra, Inc. (a)(b) | | 132,400 | 2,281 |
| CSPC Pharmaceutical Group Ltd. | | 2,108,000 | 1,783 |
| Dermira, Inc. (a) | | 406,148 | 11,372 |
| Endo Health Solutions, Inc. (a) | | 407,846 | 22,623 |
| GW Pharmaceuticals PLC ADR (a)(b) | | 261,411 | 13,112 |
| Intra-Cellular Therapies, Inc. (a) | | 105,204 | 3,901 |
| Jazz Pharmaceuticals PLC (a) | | 188,344 | 24,247 |
| Johnson & Johnson | | 37,600 | 3,927 |
| Pacira Pharmaceuticals, Inc. (a) | | 114,684 | 6,815 |
| Teva Pharmaceutical Industries Ltd. sponsored ADR | | 1,545,799 | 95,036 |
| The Medicines Company (a) | | 497,424 | 17,191 |
| Valeant Pharmaceuticals International, Inc. (Canada) (a) | | 899,100 | 82,792 |
| | | | 764,760 |
|
| TOTAL HEALTH CARE | | | 3,061,467 |
|
| INDUSTRIALS - 4.8% | | | |
| Aerospace & Defense - 0.8% | | | |
| Honeywell International, Inc. | | 879,698 | 90,785 |
| Lockheed Martin Corp. | | 84,997 | 17,934 |
| Northrop Grumman Corp. | | 33,169 | 6,138 |
| Raytheon Co. | | 136,215 | 17,468 |
| Space Exploration Technologies Corp. Class A (c) | | 160,303 | 14,267 |
| | | | 146,592 |
| Airlines - 1.9% | | | |
| American Airlines Group, Inc. | | 48,000 | 1,872 |
| Azul-Linhas Aereas Brasileiras warrants (a)(c) | | 165,571 | 0 |
| Delta Air Lines, Inc. | | 2,318,749 | 102,697 |
| InterGlobe Aviation Ltd. (a) | | 257,728 | 3,358 |
| JetBlue Airways Corp. (a) | | 646,400 | 13,775 |
| Southwest Airlines Co. | | 3,402,173 | 127,990 |
| Spirit Airlines, Inc. (a) | | 778,342 | 32,535 |
| United Continental Holdings, Inc. (a) | | 1,634,834 | 78,930 |
| Wizz Air Holdings PLC | | 268,021 | 7,257 |
| | | | 368,414 |
| Building Products - 0.1% | | | |
| Caesarstone Sdot-Yam Ltd. (a) | | 208,417 | 7,834 |
| Toto Ltd. | | 232,800 | 7,556 |
| | | | 15,390 |
| Construction & Engineering - 0.2% | | | |
| Dycom Industries, Inc. (a) | | 556,900 | 36,900 |
| Electrical Equipment - 0.7% | | | |
| Acuity Brands, Inc. | | 182,840 | 37,012 |
| SolarCity Corp. (a)(b) | | 2,616,654 | 93,284 |
| | | | 130,296 |
| Industrial Conglomerates - 0.7% | | | |
| Danaher Corp. | | 618,359 | 53,581 |
| General Electric Co. | | 2,939,843 | 85,549 |
| | | | 139,130 |
| Machinery - 0.1% | | | |
| Eicher Motors Ltd. (a) | | 14,288 | 3,502 |
| Rational AG | | 16,438 | 7,372 |
| | | | 10,874 |
| Professional Services - 0.1% | | | |
| Equifax, Inc. | | 42,542 | 4,501 |
| WageWorks, Inc. (a) | | 187,645 | 8,395 |
| | | | 12,896 |
| Road & Rail - 0.0% | | | |
| Swift Transporation Co. (a) | | 253,100 | 4,128 |
| Trading Companies & Distributors - 0.2% | | | |
| HD Supply Holdings, Inc. (a) | | 1,845,147 | 48,472 |
|
| TOTAL INDUSTRIALS | | | 913,092 |
|
| INFORMATION TECHNOLOGY - 35.6% | | | |
| Communications Equipment - 0.5% | | | |
| Palo Alto Networks, Inc. (a) | | 107,028 | 16,000 |
| Qualcomm, Inc. | | 1,942,653 | 88,080 |
| | | | 104,080 |
| Electronic Equipment & Components - 0.2% | | | |
| Fitbit, Inc. (b) | | 2,357,613 | 39,136 |
| Internet Software & Services - 14.7% | | | |
| 58.com, Inc. ADR (a) | | 294,400 | 16,516 |
| Alibaba Group Holding Ltd. sponsored ADR (a) | | 1,946,816 | 130,495 |
| Alphabet, Inc.: | | | |
| Class A | | 1,430,536 | 1,089,134 |
| Class C | | 622,484 | 462,474 |
| Dropbox, Inc. (a)(c) | | 1,003,814 | 12,086 |
| Facebook, Inc. Class A (a) | | 7,023,784 | 788,139 |
| Gogo, Inc. (a)(b) | | 1,808,342 | 26,311 |
| IAC/InterActiveCorp | | 146,900 | 7,630 |
| Info Edge India Ltd. | | 151,831 | 1,786 |
| JUST EAT Ltd. (a) | | 3,725,262 | 19,951 |
| LinkedIn Corp. Class A (a) | | 300,192 | 59,411 |
| New Relic, Inc. (a) | | 173,681 | 4,901 |
| Rackspace Hosting, Inc. (a) | | 4,410,905 | 89,144 |
| Tencent Holdings Ltd. | | 3,115,100 | 58,522 |
| Twitter, Inc. (a)(b) | | 2,593,816 | 43,576 |
| Yahoo!, Inc. (a) | | 386,100 | 11,394 |
| | | | 2,821,470 |
| IT Services - 4.7% | | | |
| Blackhawk Network Holdings, Inc. (a) | | 45,139 | 1,701 |
| Cognizant Technology Solutions Corp. Class A (a) | | 3,518,764 | 222,773 |
| EOH Holdings Ltd. | | 179,900 | 1,526 |
| MasterCard, Inc. Class A | | 2,655,183 | 236,391 |
| PayPal Holdings, Inc. (a) | | 839,913 | 30,354 |
| Sabre Corp. | | 897,777 | 22,992 |
| Total System Services, Inc. | | 163,278 | 6,557 |
| Visa, Inc. Class A | | 5,072,585 | 377,857 |
| | | | 900,151 |
| Semiconductors & Semiconductor Equipment - 4.8% | | | |
| Analog Devices, Inc. | | 2,913,408 | 156,916 |
| Avago Technologies Ltd. | | 2,106,359 | 281,641 |
| Cavium, Inc. (a) | | 943,519 | 54,507 |
| Cirrus Logic, Inc. (a)(b) | | 2,582,827 | 89,676 |
| Monolithic Power Systems, Inc. | | 187,949 | 11,760 |
| NVIDIA Corp. | | 1,487,948 | 43,582 |
| NXP Semiconductors NV (a) | | 3,606,558 | 269,698 |
| Semtech Corp. (a) | | 312,100 | 6,273 |
| SolarEdge Technologies, Inc. (b) | | 600,439 | 16,974 |
| | | | 931,027 |
| Software - 6.4% | | | |
| 1-Page Ltd. (a)(b) | | 3,708,397 | 9,221 |
| Activision Blizzard, Inc. | | 5,264,487 | 183,309 |
| Adobe Systems, Inc. (a) | | 991,602 | 88,381 |
| Appirio, Inc. (c) | | 87,529 | 371 |
| Electronic Arts, Inc. (a) | | 2,636,571 | 170,177 |
| Ellie Mae, Inc. (a)(b) | | 222,697 | 15,551 |
| HubSpot, Inc. (a) | | 52,029 | 2,112 |
| Imperva, Inc. (a) | | 58,021 | 2,992 |
| Microsoft Corp. | | 3,751,601 | 206,676 |
| Mobileye NV (a)(b) | | 1,072,976 | 29,110 |
| Paycom Software, Inc. (a) | | 172,565 | 5,203 |
| Qlik Technologies, Inc. (a) | | 825,071 | 20,660 |
| Red Hat, Inc. (a) | | 433,411 | 30,360 |
| Salesforce.com, Inc. (a) | | 5,288,541 | 359,938 |
| SAP AG sponsored ADR (b) | | 171,000 | 13,646 |
| ServiceNow, Inc. (a) | | 24,800 | 1,543 |
| Tableau Software, Inc. (a) | | 276,324 | 22,172 |
| Workday, Inc. Class A (a) | | 723,454 | 45,585 |
| Zendesk, Inc. (a) | | 602,381 | 13,258 |
| | | | 1,220,265 |
| Technology Hardware, Storage & Peripherals - 4.3% | | | |
| Apple, Inc. | | 8,021,826 | 780,845 |
| SanDisk Corp. | | 289,670 | 20,480 |
| Western Digital Corp. | | 591,196 | 28,366 |
| | | | 829,691 |
|
| TOTAL INFORMATION TECHNOLOGY | | | 6,845,820 |
|
| MATERIALS - 0.6% | | | |
| Chemicals - 0.5% | | | |
| Albemarle Corp. U.S. | | 254,316 | 13,387 |
| CF Industries Holdings, Inc. | | 2,760,957 | 82,829 |
| LyondellBasell Industries NV Class A | | 25,600 | 1,996 |
| Sherwin-Williams Co. | | 7,600 | 1,943 |
| | | | 100,155 |
| Construction Materials - 0.0% | | | |
| Prism Cement Ltd. (a) | | 2,498,232 | 2,811 |
| Containers & Packaging - 0.1% | | | |
| Ball Corp. | | 90,876 | 6,073 |
|
| TOTAL MATERIALS | | | 109,039 |
|
| TELECOMMUNICATION SERVICES - 0.1% | | | |
| Wireless Telecommunication Services - 0.1% | | | |
| Bharti Infratel Ltd. | | 4,892,590 | 26,202 |
| TOTAL COMMON STOCKS | | | |
| (Cost $14,027,259) | | | 18,748,015 |
|
| Preferred Stocks - 2.5% | | | |
| Convertible Preferred Stocks - 2.4% | | | |
| CONSUMER DISCRETIONARY - 0.1% | | | |
| Internet & Catalog Retail - 0.1% | | | |
| The Honest Co., Inc.: | | | |
| Series C (a)(c) | | 350,333 | 16,029 |
| Series D (c) | | 77,448 | 3,544 |
| | | | 19,573 |
| CONSUMER STAPLES - 0.2% | | | |
| Food & Staples Retailing - 0.1% | | | |
| Blue Apron, Inc. Series D (c) | | 780,377 | 10,847 |
| Food Products - 0.1% | | | |
| BLUE BOTTLE Coffee, Inc. Series C (c) | | 632,822 | 9,783 |
| Tobacco - 0.0% | | | |
| PAX Labs, Inc. Series C (c) | | 2,555,833 | 8,409 |
| TOTAL CONSUMER STAPLES | | | 29,039 |
| FINANCIALS - 0.0% | | | |
| Consumer Finance - 0.0% | | | |
| Oportun Finance Corp. Series H (c) | | 3,552,125 | 8,845 |
| HEALTH CARE - 0.2% | | | |
| Biotechnology - 0.1% | | | |
| AC Immune SA Series E (c) | | 603,000 | 4,314 |
| Editas Medicine, Inc. Series B (c) | | 276,353 | 3,979 |
| Gensight Biologics Series B (c) | | 423,803 | 2,110 |
| Immunocore Ltd. Series A (c) | | 11,275 | 1,577 |
| Intellia Therapeutics, Inc. Series B (c) | | 634,094 | 3,329 |
| Pronutria Biosciences, Inc. Series C (c) | | 545,634 | 3,906 |
| | | | 19,215 |
| Health Care Providers & Services - 0.1% | | | |
| Mulberry Health, Inc. Series A8 (c) | | 2,728,716 | 18,432 |
| Pharmaceuticals - 0.0% | | | |
| Corvus Pharmaceuticals, Inc. Series B (c) | | 338,682 | 4,745 |
| TOTAL HEALTH CARE | | | 42,392 |
| INDUSTRIALS - 0.1% | | | |
| Aerospace & Defense - 0.1% | | | |
| Space Exploration Technologies Corp. Series G (c) | | 97,277 | 8,658 |
| Airlines - 0.0% | | | |
| Azul-Linhas Aereas Brasileiras Series B (a)(c) | | 165,571 | 6,209 |
| Professional Services - 0.0% | | | |
| YourPeople, Inc. Series C (c) | | 692,196 | 4,783 |
| TOTAL INDUSTRIALS | | | 19,650 |
| INFORMATION TECHNOLOGY - 1.8% | | | |
| Internet Software & Services - 1.4% | | | |
| Jet.Com, Inc. Series B1 (c) | | 2,928,086 | 14,605 |
| Uber Technologies, Inc.: | | | |
| Series D, 8.00% (a)(c) | | 5,156,948 | 251,516 |
| Series E, 8.00% (a)(c) | | 102,648 | 5,006 |
| | | | 271,127 |
| IT Services - 0.1% | | | |
| AppNexus, Inc. Series E (a)(c) | | 646,522 | 10,351 |
| Nutanix, Inc. Series E (a)(c) | | 482,746 | 5,986 |
| | | | 16,337 |
| Software - 0.3% | | | |
| Appirio, Inc. Series E (c) | | 612,702 | 2,598 |
| Bracket Computing, Inc. Series C (c) | | 1,207,761 | 9,500 |
| Cloudera, Inc. Series F (a)(c) | | 186,078 | 6,109 |
| Cloudflare, Inc. Series D (a)(c) | | 696,025 | 3,404 |
| Dataminr, Inc. Series D (c) | | 277,250 | 2,201 |
| Delphix Corp. Series D (c) | | 675,445 | 3,377 |
| Malwarebytes Corp. Series B (c) | | 1,056,193 | 10,958 |
| Snapchat, Inc. Series F (c) | | 661,195 | 17,026 |
| Taboola.Com Ltd. Series E (a)(c) | | 634,902 | 5,155 |
| | | | 60,328 |
| TOTAL INFORMATION TECHNOLOGY | | | 347,792 |
|
| TOTAL CONVERTIBLE PREFERRED STOCKS | | | 467,291 |
|
| Nonconvertible Preferred Stocks - 0.1% | | | |
| CONSUMER DISCRETIONARY - 0.1% | | | |
| Internet & Catalog Retail - 0.1% | | | |
| China Internet Plus Holdings Ltd. (c) | | 3,163,704 | 12,214 |
| TOTAL PREFERRED STOCKS | | | |
| (Cost $331,652) | | | 479,505 |
|
| Money Market Funds - 2.0% | | | |
| Fidelity Cash Central Fund, 0.38% (g) | | 11,683,561 | 11,684 |
| Fidelity Securities Lending Cash Central Fund, 0.42% (g)(h) | | 374,522,697 | 374,523 |
| TOTAL MONEY MARKET FUNDS | | | |
| (Cost $386,207) | | | 386,207 |
| TOTAL INVESTMENT PORTFOLIO - 102.0% | | | |
| (Cost $14,745,118) | | | 19,613,727 |
| NET OTHER ASSETS (LIABILITIES) - (2.0)% | | | (384,585) |
| NET ASSETS - 100% | | | $19,229,142 |
Values shown as $0 may reflect amounts less than $500.
Legend
(a) Non-income producing
(b) Security or a portion of the security is on loan at period end.
(c) Restricted securities - Investment in securities not registered under the Securities Act of 1933 (excluding 144A issues). At the end of the period, the value of restricted securities (excluding 144A issues) amounted to $529,490,000 or 2.8% of net assets.
(d) Investment is owned by an entity that is treated as a corporation for U.S. tax purposes and is wholly-owned by the Fund.
(e) Security exempt from registration under Rule 144A of the Securities Act of 1933. These securities may be resold in transactions exempt from registration, normally to qualified institutional buyers. At the end of the period, the value of these securities amounted to $4,453,000 or 0.0% of net assets.
(f) Affiliated company
(g) Affiliated fund that is generally available only to investment companies and other accounts managed by Fidelity Investments. The rate quoted is the annualized seven-day yield of the fund at period end. A complete unaudited listing of the fund's holdings as of its most recent quarter end is available upon request. In addition, each Fidelity Central Fund's financial statements, which are not covered by the Fund's Report of Independent Registered Public Accounting Firm, are available on the SEC's website or upon request.
(h) Investment made with cash collateral received from securities on loan.
Additional information on each restricted holding is as follows:
| Security | Acquisition Date | Acquisition Cost (000s) |
| AC Immune SA Series E | 10/19/15 | $5,811 |
| Appirio, Inc. | 2/12/15 | $625 |
| Appirio, Inc. Series E | 2/12/15 | $4,375 |
| AppNexus, Inc. Series E | 8/1/14 | $12,951 |
| Azul-Linhas Aereas Brasileiras Series B | 12/24/13 | $7,023 |
| Azul-Linhas Aereas Brasileiras warrants | 12/24/13 | $0 |
| Blue Apron, Inc. Series D | 5/18/15 | $10,400 |
| BLUE BOTTLE Coffee, Inc. Series C | 5/29/15 | $21,086 |
| Bracket Computing, Inc. Series C | 9/9/15 | $9,500 |
| China Internet Plus Holdings Ltd. | 1/26/15 | $10,000 |
| Cloudera, Inc. Series F | 2/5/14 | $2,709 |
| Cloudflare, Inc. Series D | 11/5/14 - 6/24/15 | $4,349 |
| Corvus Pharmaceuticals, Inc. Series B | 9/16/15 | $4,745 |
| Dataminr, Inc. Series D | 3/6/15 | $3,535 |
| Delphix Corp. Series D | 7/10/15 | $6,079 |
| Dropbox, Inc. | 5/2/12 | $9,084 |
| Editas Medicine, Inc. Series B | 8/4/15 | $3,233 |
| Gensight Biologics Series B | 7/2/15 | $3,266 |
| Immunocore Ltd. Series A | 7/27/15 | $2,122 |
| Intellia Therapeutics, Inc. Series B | 8/20/15 | $3,329 |
| Jet.Com, Inc. Series B1 | 11/24/15 | $14,605 |
| Malwarebytes Corp. Series B | 12/21/15 | $10,958 |
| Mulberry Health, Inc. Series A8 | 1/20/16 | $18,432 |
| NJOY, Inc. | 6/7/13 - 2/14/14 | $16,957 |
| Nutanix, Inc. Series E | 8/26/14 | $6,467 |
| Oportun Finance Corp. Series H | 2/6/15 | $10,114 |
| PAX Labs, Inc. Series C | 5/22/15 | $9,840 |
| Pronutria Biosciences, Inc. Series C | 1/30/15 | $5,500 |
| Snapchat, Inc. Series F | 3/25/15 | $20,312 |
| Space Exploration Technologies Corp. Class A | 10/16/15 | $14,267 |
| Space Exploration Technologies Corp. Series G | 1/20/15 | $7,535 |
| Taboola.Com Ltd. Series E | 12/22/14 | $6,619 |
| The Honest Co., Inc. | 8/21/14 | $4,062 |
| The Honest Co., Inc. Series C | 8/21/14 | $9,479 |
| The Honest Co., Inc. Series D | 8/3/15 | $3,544 |
| Tory Burch LLC unit | 5/14/15 | $20,890 |
| Uber Technologies, Inc. Series D, 8.00% | 6/6/14 | $80,000 |
| Uber Technologies, Inc. Series E, 8.00% | 12/5/14 | $3,420 |
| YourPeople, Inc. Series C | 5/1/15 | $10,314 |
Affiliated Central Funds
Information regarding fiscal year to date income earned by the Fund from investments in Fidelity Central Funds is as follows:
| Fund | Income earned |
| | (Amounts in thousands) |
| Fidelity Cash Central Fund | $33 |
| Fidelity Securities Lending Cash Central Fund | 7,700 |
| Total | $7,733 |
Other Affiliated Issuers
An affiliated company is a company in which the Fund has ownership of at least 5% of the voting securities. Fiscal year to date transactions with companies which are or were affiliates are as follows:
| Affiliate (Amounts in thousands) | Value, beginning of period | Purchases | Sales Proceeds* | Dividend Income | Value, end of period |
| Nu Skin Enterprises, Inc. Class A | $134,517 | $16,005 | $38,070 | $2,678 | $-- |
| Parsvnath Developers Ltd. | 6,516 | -- | -- | -- | 6,148 |
| Total | $141,033 | $16,005 | $38,070 | $2,678 | $6,148 |
* Includes the value of securities delivered through in-kind transactions, if applicable.
Investment Valuation
The following is a summary of the inputs used, as of January 31, 2016, involving the Fund's assets and liabilities carried at fair value. The inputs or methodology used for valuing securities may not be an indication of the risk associated with investing in those securities. For more information on valuation inputs, and their aggregation into the levels used below, please refer to the Investment Valuation section in the accompanying Notes to Financial Statements.
| | Valuation Inputs at Reporting Date: |
| Description | Total | Level 1 | Level 2 | Level 3 |
| (Amounts in thousands) | | | | |
| Investments in Securities: | | | | |
| Equities: | | | | |
| Consumer Discretionary | $5,059,841 | $4,743,665 | $261,128 | $55,048 |
| Consumer Staples | 2,072,029 | 1,981,408 | 61,582 | 29,039 |
| Energy | 239,510 | 239,510 | -- | -- |
| Financials | 490,686 | 454,589 | 27,252 | 8,845 |
| Health Care | 3,103,859 | 3,023,637 | 37,830 | 42,392 |
| Industrials | 932,742 | 869,780 | 29,045 | 33,917 |
| Information Technology | 7,193,612 | 6,742,357 | 91,006 | 360,249 |
| Materials | 109,039 | 106,228 | 2,811 | -- |
| Telecommunication Services | 26,202 | -- | 26,202 | -- |
| Money Market Funds | 386,207 | 386,207 | -- | -- |
| Total Investments in Securities: | $19,613,727 | $18,547,381 | $536,856 | $529,490 |
The following is a summary of transfers between Level 1 and Level 2 for the period ended January 31, 2016. Transfers are assumed to have occurred at the beginning of the period, and are primarily attributable to the valuation techniques used for foreign equity securities, as discussed in the accompanying Notes to Financial Statements:
| Transfers | Total (000s) |
| Level 1 to Level 2 | $290,982 |
| Level 2 to Level 1 | $0 |
The following is a reconciliation of Investments in Securities for which Level 3 inputs were used in determining value:
| (Amounts in thousands) | | | | |
| Investments in Securities: | |
| Equities - Information Technology | |
| Beginning Balance | $298,720 |
| Net Realized Gain (Loss) on Investment Securities | -- |
| Net Unrealized Gain (Loss) on Investment Securities | 26,466 |
| Cost of Purchases | 35,063 |
| Proceeds of Sales | -- |
| Amortization/Accretion | -- |
| Transfers into Level 3 | -- |
| Transfers out of Level 3 | -- |
| Ending Balance | $360,249 |
| The change in unrealized gain (loss) for the period attributable to Level 3 securities held at January 31, 2016 | $26,466 |
| Equities - Other Investments in Securities | |
| Beginning Balance | $161,801 |
| Net Realized Gain (Loss) on Investment Securities | (3,712) |
| Net Unrealized Gain (Loss) on Investment Securities | (24,841) |
| Cost of Purchases | 70,926 |
| Proceeds of Sales | (34,933) |
| Amortization/Accretion | -- |
| Transfers into Level 3 | -- |
| Transfers out of Level 3 | -- |
| Ending Balance | $169,241 |
| The change in unrealized gain (loss) for the period attributable to Level 3 securities held at January 31, 2016 | $(26,661) |
The information used in the above reconciliations represents fiscal year to date activity for any Investments in Securities identified as using Level 3 inputs at either the beginning or the end of the current fiscal period. Transfers in or out of Level 3 represent the beginning value of any Security or Instrument where a change in the pricing level occurred from the beginning to the end of the period. The cost of purchases and the proceeds of sales may include securities received or delivered through corporate actions or exchanges. Realized and unrealized gains (losses) disclosed in the reconciliations are included in Net Gain (Loss) on the Fund's Statement of Operations.
Other Information
Distribution of investments by country or territory of incorporation, as a percentage of Total Net Assets, is as follows (Unaudited):
| United States of America | 87.8% |
| Ireland | 2.5% |
| Cayman Islands | 2.0% |
| Netherlands | 1.6% |
| Singapore | 1.5% |
| Others (Individually Less Than 1%) | 4.6% |
| | 100.0% |
See accompanying notes which are an integral part of the financial statements.
Financial Statements
Statement of Assets and Liabilities
| Amounts in thousands (except per-share amounts) | | January 31, 2016 |
| Assets | | |
Investment in securities, at value (including securities loaned of $373,149) — See accompanying schedule:
Unaffiliated issuers (cost $14,328,060) | $19,221,372 | |
| Fidelity Central Funds (cost $386,207) | 386,207 | |
| Other affiliated issuers (cost $30,851) | 6,148 | |
| Total Investments (cost $14,745,118) | | $19,613,727 |
| Cash | | 643 |
| Foreign currency held at value (cost $1,938) | | 1,940 |
| Receivable for investments sold | | 144,610 |
| Receivable for fund shares sold | | 30,282 |
| Dividends receivable | | 6,247 |
| Distributions receivable from Fidelity Central Funds | | 1,532 |
| Prepaid expenses | | 35 |
| Other receivables | | 887 |
| Total assets | | 19,799,903 |
| Liabilities | | |
| Payable for investments purchased | $162,758 | |
| Payable for fund shares redeemed | 19,598 | |
| Accrued management fee | 10,570 | |
| Other affiliated payables | 2,455 | |
| Other payables and accrued expenses | 857 | |
| Collateral on securities loaned, at value | 374,523 | |
| Total liabilities | | 570,761 |
| Net Assets | | $19,229,142 |
| Net Assets consist of: | | |
| Paid in capital | | $14,378,109 |
| Undistributed net investment income | | 3,899 |
| Accumulated undistributed net realized gain (loss) on investments and foreign currency transactions | | (21,478) |
| Net unrealized appreciation (depreciation) on investments and assets and liabilities in foreign currencies | | 4,868,612 |
| Net Assets | | $19,229,142 |
| Blue Chip Growth: | | |
| Net Asset Value, offering price and redemption price per share ($14,218,071 ÷ 224,760 shares) | | $63.26 |
| Class K: | | |
| Net Asset Value, offering price and redemption price per share ($5,011,071 ÷ 79,093 shares) | | $63.36 |
See accompanying notes which are an integral part of the financial statements.
Statement of Operations
| Amounts in thousands | | Six months ended January 31, 2016 |
| Investment Income | | |
| Dividends (including $2,678 earned from other affiliated issuers) | | $85,017 |
| Income from Fidelity Central Funds (including $7,700 from security lending) | | 7,733 |
| Total income | | 92,750 |
| Expenses | | |
| Management fee | | |
| Basic fee | $55,737 | |
| Performance adjustment | 16,955 | |
| Transfer agent fees | 13,596 | |
| Accounting and security lending fees | 907 | |
| Custodian fees and expenses | 197 | |
| Independent trustees' compensation | 46 | |
| Registration fees | 248 | |
| Audit | 76 | |
| Legal | 38 | |
| Interest | 5 | |
| Miscellaneous | 59 | |
| Total expenses before reductions | 87,864 | |
| Expense reductions | (338) | 87,526 |
| Net investment income (loss) | | 5,224 |
| Realized and Unrealized Gain (Loss) | | |
| Net realized gain (loss) on: | | |
| Investment securities: | | |
| Unaffiliated issuers | 129,515 | |
| Other affiliated issuers | (26,101) | |
| Foreign currency transactions | (304) | |
| Total net realized gain (loss) | | 103,110 |
Change in net unrealized appreciation (depreciation) on:
Investment securities (net of decrease in deferred foreign taxes of $1,459) | (2,563,680) | |
| Total change in net unrealized appreciation (depreciation) | | (2,563,680) |
| Net gain (loss) | | (2,460,570) |
| Net increase (decrease) in net assets resulting from operations | | $(2,455,346) |
See accompanying notes which are an integral part of the financial statements.
Statement of Changes in Net Assets
| Amounts in thousands | Six months ended January 31, 2016 | Year ended July 31, 2015 |
| Increase (Decrease) in Net Assets | | |
| Operations | | |
| Net investment income (loss) | $5,224 | $20,601 |
| Net realized gain (loss) | 103,110 | 1,230,303 |
| Change in net unrealized appreciation (depreciation) | (2,563,680) | 2,175,419 |
| Net increase (decrease) in net assets resulting from operations | (2,455,346) | 3,426,323 |
| Distributions to shareholders from net investment income | (10,672) | (27,789) |
| Distributions to shareholders from net realized gain | (1,033,010) | (1,011,245) |
| Total distributions | (1,043,682) | (1,039,034) |
| Share transactions - net increase (decrease) | 1,483,954 | 2,274,956 |
| Total increase (decrease) in net assets | (2,015,074) | 4,662,245 |
| Net Assets | | |
| Beginning of period | 21,244,216 | 16,581,971 |
| End of period (including undistributed net investment income of $3,899 and undistributed net investment income of $9,347, respectively) | $19,229,142 | $21,244,216 |
See accompanying notes which are an integral part of the financial statements.
Financial Highlights — Fidelity Blue Chip Growth Fund
| | Six months ended | Years ended July 31, | | | | |
| January 31, | 2016 | 2015 | 2014 | 2013 | 2012 | 2011 |
| Selected Per–Share Data | | | | | | |
| Net asset value, beginning of period | $75.25 | $66.72 | $59.65 | $47.38 | $48.17 | $37.63 |
| Income from Investment Operations | | | | | | |
| Net investment income (loss)A | .01 | .05 | .15 | .39 | .10 | (.03) |
| Net realized and unrealized gain (loss) | (8.34) | 12.56 | 11.63 | 12.79 | .75 | 10.61 |
| Total from investment operations | (8.33) | 12.61 | 11.78 | 13.18 | .85 | 10.58 |
| Distributions from net investment income | (.03) | (.09) | (.24) | (.23) | (.04) | –B,C |
| Distributions from net realized gain | (3.63) | (3.99) | (4.47) | (.68) | (1.60) | (.04)B |
| Total distributions | (3.66) | (4.08) | (4.71) | (.91) | (1.64) | (.04) |
| Net asset value, end of period | $63.26 | $75.25 | $66.72 | $59.65 | $47.38 | $48.17 |
| Total ReturnD,E | (11.37)% | 19.72% | 21.07% | 28.25% | 2.27% | 28.12% |
| Ratios to Average Net AssetsF,G | | | | | | |
| Expenses before reductions | .90%H | .89% | .80% | .76% | .90% | .94% |
| Expenses net of fee waivers, if any | .90%H | .89% | .80% | .76% | .90% | .94% |
| Expenses net of all reductions | .89%H | .88% | .80% | .74% | .89% | .92% |
| Net investment income (loss) | .02%H | .07% | .23% | .75% | .21% | (.06)% |
| Supplemental Data | | | | | | |
| Net assets, end of period (in millions) | $14,218 | $15,346 | $11,970 | $12,927 | $10,595 | $12,024 |
| Portfolio turnover rateI | 51%H,J | 51%J | 57%J | 75% | 95% | 132% |
A Calculated based on average shares outstanding during the period.
B The amounts shown reflect certain reclassifications related to book to tax differences that were made in the year shown.
C Amount represents less than $.005 per share.
D Total returns for periods of less than one year are not annualized.
E Total returns would have been lower if certain expenses had not been reduced during the applicable periods shown.
F Fees and expenses of any underlying Fidelity Central Funds are not included in the Fund's expense ratio. The Fund indirectly bears its proportionate share of the expenses of any underlying Fidelity Central Funds.
G Expense ratios reflect operating expenses of the class. Expenses before reductions do not reflect amounts reimbursed by the investment adviser or reductions from brokerage service arrangements or reductions from other expense offset arrangements and do not represent the amount paid by the class during periods when reimbursements or reductions occur. Expenses net of fee waivers reflect expenses after reimbursement by the investment adviser but prior to reductions from brokerage service arrangements or other expense offset arrangements. Expenses net of all reductions represent the net expenses paid by the class.
H Annualized
I Amount does not include the portfolio activity of any underlying Fidelity Central Funds.
J Portfolio turnover rate excludes securities received or delivered in-kind.
See accompanying notes which are an integral part of the financial statements.
Financial Highlights — Fidelity Blue Chip Growth Fund Class K
| | Six months ended | Years ended July 31, | | | | |
| January 31, | 2016 | 2015 | 2014 | 2013 | 2012 | 2011 |
| Selected Per–Share Data | | | | | | |
| Net asset value, beginning of period | $75.36 | $66.82 | $59.74 | $47.46 | $48.21 | $37.66 |
| Income from Investment Operations | | | | | | |
| Net investment income (loss)A | .05 | .13 | .23 | .47 | .17 | .05 |
| Net realized and unrealized gain (loss) | (8.35) | 12.57 | 11.64 | 12.79 | .75 | 10.62 |
| Total from investment operations | (8.30) | 12.70 | 11.87 | 13.26 | .92 | 10.67 |
| Distributions from net investment income | (.07) | (.17) | (.33) | (.30) | (.08) | (.05)B |
| Distributions from net realized gain | (3.63) | (3.99) | (4.47) | (.68) | (1.60) | (.07)B |
| Total distributions | (3.70) | (4.16) | (4.79)C | (.98) | (1.67)D | (.12) |
| Net asset value, end of period | $63.36 | $75.36 | $66.82 | $59.74 | $47.46 | $48.21 |
| Total ReturnE,F | (11.31)% | 19.84% | 21.23% | 28.42% | 2.43% | 28.37% |
| Ratios to Average Net AssetsG,H | | | | | | |
| Expenses before reductions | .78%I | .78% | .68% | .61% | .74% | .77% |
| Expenses net of fee waivers, if any | .78%I | .77% | .68% | .61% | .74% | .77% |
| Expenses net of all reductions | .77%I | .77% | .67% | .60% | .73% | .76% |
| Net investment income (loss) | .14%I | .19% | .36% | .89% | .37% | .11% |
| Supplemental Data | | | | | | |
| Net assets, end of period (in millions) | $5,011 | $5,898 | $4,612 | $3,506 | $2,467 | $1,455 |
| Portfolio turnover rateJ | 51%I,K | 51%K | 57%K | 75% | 95% | 132% |
A Calculated based on average shares outstanding during the period.
B The amounts shown reflect certain reclassifications related to book to tax differences that were made in the year shown.
C Total distributions of $4.79 per share is comprised of distributions from net investment income of $.325 and distributions from net realized gain of $4.466 per share.
D Total distributions of $1.67 per share is comprised of distributions from net investment income of $.076 and distributions from net realized gain of $1.598 per share.
E Total returns for periods of less than one year are not annualized.
F Total returns would have been lower if certain expenses had not been reduced during the applicable periods shown.
G Fees and expenses of any underlying Fidelity Central Funds are not included in the Fund's expense ratio. The Fund indirectly bears its proportionate share of the expenses of any underlying Fidelity Central Funds.
H Expense ratios reflect operating expenses of the class. Expenses before reductions do not reflect amounts reimbursed by the investment adviser or reductions from brokerage service arrangements or reductions from other expense offset arrangements and do not represent the amount paid by the class during periods when reimbursements or reductions occur. Expenses net of fee waivers reflect expenses after reimbursement by the investment adviser but prior to reductions from brokerage service arrangements or other expense offset arrangements. Expenses net of all reductions represent the net expenses paid by the class.
I Annualized
J Amount does not include the portfolio activity of any underlying Fidelity Central Funds.
K Portfolio turnover rate excludes securities received or delivered in-kind.
See accompanying notes which are an integral part of the financial statements.
See accompanying notes which are an integral part of the financial statements.
Notes to Financial Statements
For the period ended January 31, 2016
(Amounts in thousands except percentages)
1. Organization.
Fidelity Blue Chip Growth Fund (the Fund) is a fund of Fidelity Securities Fund (the Trust) and is authorized to issue an unlimited number of shares. The Trust is registered under the Investment Company Act of 1940, as amended (the 1940 Act), as an open-end management investment company organized as a Massachusetts business trust. The Fund offers Blue Chip Growth and Class K shares, each of which has equal rights as to assets and voting privileges. Each class has exclusive voting rights with respect to matters that affect that class.
2. Investments in Fidelity Central Funds.
The Fund invests in Fidelity Central Funds, which are open-end investment companies generally available only to other investment companies and accounts managed by the investment adviser and its affiliates. The Fund's Schedule of Investments lists each of the Fidelity Central Funds held as of period end, if any, as an investment of the Fund, but does not include the underlying holdings of each Fidelity Central Fund. As an Investing Fund, the Fund indirectly bears its proportionate share of the expenses of the underlying Fidelity Central Funds.
The Money Market Central Funds seek preservation of capital and current income and are managed by Fidelity Investments Money Management, Inc. (FIMM), an affiliate of the investment adviser. Annualized expenses of the Money Market Central Funds as of their most recent shareholder report date are less than .005%.
A complete unaudited list of holdings for each Fidelity Central Fund is available upon request or at the Securities and Exchange Commission (the SEC) website at www.sec.gov. In addition, the financial statements of the Fidelity Central Funds, which are not covered by the Fund's Report of Independent Registered Public Accounting Firm, are available on the SEC website or upon request.
3. Significant Accounting Policies.
The financial statements have been prepared in conformity with accounting principles generally accepted in the United States of America (GAAP), which require management to make certain estimates and assumptions at the date of the financial statements. Actual results could differ from those estimates. Subsequent events, if any, through the date that the financial statements were issued have been evaluated in the preparation of the financial statements. The following summarizes the significant accounting policies of the Fund:
Investment Valuation. Investments are valued as of 4:00 p.m. Eastern time on the last calendar day of the period. The Board of Trustees (the Board) has delegated the day to day responsibility for the valuation of the Fund's investments to the Fidelity Management & Research Company (FMR) Fair Value Committee (the Committee). In accordance with valuation policies and procedures approved by the Board, the Fund attempts to obtain prices from one or more third party pricing vendors or brokers to value its investments. When current market prices, quotations or currency exchange rates are not readily available or reliable, investments will be fair valued in good faith by the Committee, in accordance with procedures adopted by the Board. Factors used in determining fair value vary by investment type and may include market or investment specific events. The frequency with which these procedures are used cannot be predicted and they may be utilized to a significant extent. The Committee oversees the Fund's valuation policies and procedures and reports to the Board on the Committee's activities and fair value determinations. The Board monitors the appropriateness of the procedures used in valuing the Fund's investments and ratifies the fair value determinations of the Committee.
The Fund categorizes the inputs to valuation techniques used to value its investments into a disclosure hierarchy consisting of three levels as shown below:
- Level 1 – quoted prices in active markets for identical investments
- Level 2 – other significant observable inputs (including quoted prices for similar investments, interest rates, prepayment speeds, etc.)
- Level 3 – unobservable inputs (including the Fund's own assumptions based on the best information available)
Valuation techniques used to value the Fund's investments by major category are as follows:
Equity securities, including restricted securities, for which market quotations are readily available, are valued at the last reported sale price or official closing price as reported by a third party pricing vendor on the primary market or exchange on which they are traded and are categorized as Level 1 in the hierarchy. In the event there were no sales during the day or closing prices are not available, securities are valued at the last quoted bid price or may be valued using the last available price and are generally categorized as Level 2 in the hierarchy. For foreign equity securities, when market or security specific events arise, comparisons to the valuation of American Depositary Receipts (ADRs), futures contracts, Exchange-Traded Funds (ETFs) and certain indexes as well as quoted prices for similar securities may be used and would be categorized as Level 2 in the hierarchy. Utilizing these techniques may result in transfers between Level 1 and Level 2. For equity securities, including restricted securities, where observable inputs are limited, assumptions about market activity and risk are used and these securities may be categorized as Level 3 in the hierarchy. Equity securities, including restricted securities, for which observable inputs are not available are valued using alternate valuation approaches, including the market approach and the income approach and are categorized as Level 3 in the hierarchy. The market approach generally consists of using comparable market transactions while the income approach generally consists of using the net present value of estimated future cash flows, adjusted as appropriate for liquidity, credit, market and/or other risk factors.
Investments in open-end mutual funds, including the Fidelity Central Funds, are valued at their closing net asset value (NAV) each business day and are categorized as Level 1 in the hierarchy.
The following provides information on Level 3 securities held by the Fund that were valued at period end based on unobservable inputs. These amounts exclude valuations provided by a broker.
| Asset Type | Fair Value at 01/31/16 | Valuation Technique(s) | Unobservable Input | Amount or Range/Weighted Average | Impact to Valuation from an Increase in Input(a) |
| Equities | $ 529,490 | Discount cash flow | Growth rate | 2.5% | Increase |
| | | | Weighted average cost of capital | 11.5% | Decrease |
| | | Last transaction price | Transaction price | $0.00 - $140.00 / $43.20 | Increase |
| | | | Discount rate | 15.0% | Decrease |
| | | | Put premium | 38.0% | Increase |
| | | Market comparable | EV/EBITDA multiple | 8.2 | Increase |
| | | | EV/Sales multiple | 1.2 - 11.1 / 5.1 | Increase |
| | | | Discount rate | 3.0% - 30.0% / 12.8% | Decrease |
| | | | P/E multiple | 12.1 - 12.7 / 12.6 | Increase |
| | | | Discount for lack of marketability | 10.0% - 25.0% / 15.9% | Decrease |
| | | | Premium rate | 1.0% - 86.4% / 40.4% | Increase |
| | | | EV/GP multiple | 4.2 | Increase |
| | | | Probability rate | 90.0% - 100.0% / 95.0% | Increase |
| | | Proposed transaction price | Transaction price | $8.00 | Increase |
| | | | Discount rate | 10.0% | Decrease |
| | | | Index movement | 30.2% | Increase |
| | | Proxy adjustment | Proxy movement | 25.8% - 29.9% / 27.7% | Increase |
(a) Represents the expected directional change in the fair value of the Level 3 investments that would result from an increase in the corresponding input. A decrease to the unobservable input would have the opposite effect. Significant changes in these inputs could result in significantly higher or lower fair value measurements.
Changes in valuation techniques may result in transfers in or out of an assigned level within the disclosure hierarchy. The aggregate value of investments by input level as of January 31, 2016, including information on transfers between Levels 1 and 2, as well as a roll forward of Level 3 investments, is included at the end of the Fund's Schedule of Investments.
Foreign Currency. The Fund may use foreign currency contracts to facilitate transactions in foreign-denominated securities. Gains and losses from these transactions may arise from changes in the value of the foreign currency or if the counterparties do not perform under the contracts' terms.
Foreign-denominated assets, including investment securities, and liabilities are translated into U.S. dollars at the exchange rates at period end. Purchases and sales of investment securities, income and dividends received and expenses denominated in foreign currencies are translated into U.S. dollars at the exchange rate in effect on the transaction date.
The effects of exchange rate fluctuations on investments are included with the net realized and unrealized gain (loss) on investment securities. Other foreign currency transactions resulting in realized and unrealized gain (loss) are disclosed separately.
Investment Transactions and Income. For financial reporting purposes, the Fund's investment holdings and NAV include trades executed through the end of the last business day of the period. The NAV per share for processing shareholder transactions is calculated as of the close of business of the New York Stock Exchange (NYSE), normally 4:00 p.m. Eastern time and includes trades executed through the end of the prior business day. Gains and losses on securities sold are determined on the basis of identified cost and may include proceeds received from litigation. Dividend income is recorded on the ex-dividend date, except for certain dividends from foreign securities where the ex-dividend date may have passed, which are recorded as soon as the Fund is informed of the ex-dividend date. Non-cash dividends included in dividend income, if any, are recorded at the fair market value of the securities received. Income and capital gain distributions from Fidelity Central Funds, if any, are recorded on the ex-dividend date. Distributions received on securities that represent a return of capital or capital gain are recorded as a reduction of cost of investments and/or as a realized gain. Subsequent to ex-dividend date the Fund determines the components of these distributions, based upon receipt of tax filings or other correspondence relating to the underlying investment. Investment income is recorded net of foreign taxes withheld where recovery of such taxes is uncertain.
Class Allocations and Expenses. Investment income, realized and unrealized capital gains and losses, common expenses of the Fund, and certain fund-level expense reductions, if any, are allocated daily on a pro-rata basis to each class based on the relative net assets of each class to the total net assets of the Fund. Each class differs with respect to transfer agent fees incurred. Certain expense reductions may also differ by class. For the reporting period, the allocated portion of income and expenses to each class as a percent of its average net assets may vary due to the timing of recording these transactions in relation to fluctuating net assets of the classes. Expenses directly attributable to a fund are charged to that fund. Expenses attributable to more than one fund are allocated among the respective funds on the basis of relative net assets or other appropriate methods. Expense estimates are accrued in the period to which they relate and adjustments are made when actual amounts are known.
Deferred Trustee Compensation. Under a Deferred Compensation Plan (the Plan), independent Trustees may elect to defer receipt of a portion of their annual compensation. Deferred amounts are invested in a cross-section of Fidelity funds, are marked-to-market and remain in the Fund until distributed in accordance with the Plan. The investment of deferred amounts and the offsetting payable to the Trustees are included in the accompanying Statement of Assets and Liabilities.
Income Tax Information and Distributions to Shareholders. Each year, the Fund intends to qualify as a regulated investment company under Subchapter M of the Internal Revenue Code, including distributing substantially all of its taxable income and realized gains. As a result, no provision for U.S. Federal income taxes is required. The Fund files a U.S. federal tax return, in addition to state and local tax returns as required. The Fund's federal income tax returns are subject to examination by the Internal Revenue Service (IRS) for a period of three fiscal years after they are filed. State and local tax returns may be subject to examination for an additional fiscal year depending on the jurisdiction. Foreign taxes are provided for based on the Fund's understanding of the tax rules and rates that exist in the foreign markets in which it invests.
Distributions are declared and recorded on the ex-dividend date. Income dividends and capital gain distributions are declared separately for each class. Income and capital gain distributions are determined in accordance with income tax regulations, which may differ from GAAP.
Capital accounts within the financial statements are adjusted for permanent book-tax differences. These adjustments have no impact on net assets or the results of operations. Capital accounts are not adjusted for temporary book-tax differences which will reverse in a subsequent period.
Book-tax differences are primarily due to foreign currency transactions, passive foreign investment companies (PFIC), redemptions in kind, partnerships, deferred trustees compensation and losses deferred due to wash sales.
The federal tax cost of investment securities and unrealized appreciation (depreciation) as of period end were as follows:
| Gross unrealized appreciation | $6,078,270 |
| Gross unrealized depreciation | (1,312,022) |
| Net unrealized appreciation (depreciation) on securities | $4,766,248 |
| Tax cost | $14,847,479 |
Restricted Securities. The Fund may invest in securities that are subject to legal or contractual restrictions on resale. These securities generally may be resold in transactions exempt from registration or to the public if the securities are registered. Disposal of these securities may involve time-consuming negotiations and expense, and prompt sale at an acceptable price may be difficult. Information regarding restricted securities is included at the end of the Fund's Schedule of Investments.
4. Purchases and Sales of Investments.
Purchases and sales of securities, other than short-term securities and in-kind transactions, aggregated $5,876,876 and $5,221,442, respectively.
Redemptions In-Kind. During the period, 2,731 shares of the Fund held by unaffiliated entities were redeemed in-kind for cash and investments with a value of $184,152. The net realized gain of $89,282 on investments delivered through the in-kind redemption is included in the accompanying Statement of Operations. The amount of in-kind redemptions is included in share transactions in the accompanying Statement of Changes in Net Assets as well as Note 10: Share Transactions. The Fund recognized no gain or loss for federal income tax purposes.
5. Fees and Other Transactions with Affiliates.
Management Fee. Fidelity Management & Research Company (the investment adviser) and its affiliates provide the Fund with investment management related services for which the Fund pays a monthly management fee. The management fee is the sum of an individual fund fee rate that is based on an annual rate of .30% of the Fund's average net assets and an annualized group fee rate that averaged .25% during the period. The group fee rate is based upon the average net assets of all the mutual funds advised by the investment adviser, including any mutual funds previously advised by the investment adviser that are currently advised by Fidelity SelectCo, LLC, an affiliate of the investment adviser. The group fee rate decreases as assets under management increase and increases as assets under management decrease. In addition, the management fee is subject to a performance adjustment (up to a maximum of +/- .20% of the Fund's average net assets over a 36 month performance period). The upward or downward adjustment to the management fee is based on the relative investment performance of Blue Chip Growth as compared to its benchmark index, the Russell 1000 Growth Index, over the same 36 month performance period. For the reporting period, the total annualized management fee rate, including the performance adjustment, was .72% of the Fund's average net assets. The performance adjustment included in the management fee rate may be higher or lower than the maximum performance adjustment rate due to the difference between the average net assets for the reporting and performance periods.
Transfer Agent Fees. Fidelity Investments Institutional Operations Company, Inc., (FIIOC), an affiliate of the investment adviser, is the transfer, dividend disbursing and shareholder servicing agent for each class of the Fund. FIIOC receives account fees and asset-based fees that vary according to the account size and type of account of the shareholders of Blue Chip Growth, except for Class K. FIIOC receives an asset-based fee of Class K's average net assets. FIIOC pays for typesetting, printing and mailing of shareholder reports, except proxy statements.
For the period, transfer agent fees for each class were as follows:
| | Amount | % of
Class-Level Average
Net Assets(a) |
| Blue Chip Growth | $12,319 | .17 |
| Class K | 1,277 | .05 |
| | $ 13,596 | |
��(a) Annualized
Accounting and Security Lending Fees. Fidelity Service Company, Inc. (FSC), an affiliate of the investment adviser, maintains the Fund's accounting records. The accounting fee is based on the level of average net assets for each month. Under a separate contract, FSC administers the security lending program. The security lending fee is based on the number and duration of lending transactions.
Brokerage Commissions. The Fund placed a portion of its portfolio transactions with brokerage firms which are affiliates of the investment adviser. Brokerage commissions are included in net realized gain (loss) and change in net unrealized appreciation (depreciation) in the Statement of Operations. The commissions paid to these affiliated firms were $89 for the period.
Interfund Lending Program. Pursuant to an Exemptive Order issued by the SEC, the Fund, along with other registered investment companies having management contracts with FMR or other affiliated entities of FMR, may participate in an interfund lending program. This program provides an alternative credit facility allowing the funds to borrow from, or lend money to, other participating affiliated funds. At period end, there were no interfund loans outstanding. The Fund's activity in this program during the period for which loans were outstanding was as follows:
| Borrower or Lender | Average Loan Balance | Weighted Average Interest Rate | Interest Expense |
| Borrower | $35,619 | .55% | $5 |
Interfund Trades. The Fund may purchase from or sell securities to other Fidelity Funds under procedures adopted by the Board. The procedures have been designed to ensure these interfund trades are executed in accordance with Rule 17a-7 of the 1940 Act. Interfund trades are included within the respective purchases and sales amounts shown in the Purchases and Sales of Investments note.
6. Committed Line of Credit.
The Fund participates with other funds managed by the investment adviser or an affiliate in a $4.25 billion credit facility (the "line of credit") to be utilized for temporary or emergency purposes to fund shareholder redemptions or for other short-term liquidity purposes. The Fund has agreed to pay commitment fees on its pro-rata portion of the line of credit, which amounted to $14 and is reflected in Miscellaneous expenses on the Statement of Operations. During the period, the Fund did not borrow on this line of credit.
7. Security Lending.
The Fund lends portfolio securities through a lending agent from time to time in order to earn additional income. For equity securities, a lending agent is used and may loan securities to certain qualified borrowers, including Fidelity Capital Markets (FCM), a broker-dealer affiliated with the Fund. On the settlement date of the loan, the Fund receives collateral (in the form of U.S. Treasury obligations, letters of credit and/or cash) against the loaned securities and maintains collateral in an amount not less than 100% of the market value of the loaned securities during the period of the loan. The market value of the loaned securities is determined at the close of business of the Fund and any additional required collateral is delivered to the Fund on the next business day. The Fund or borrower may terminate the loan at any time, and if the borrower defaults on its obligation to return the securities loaned because of insolvency or other reasons, the Fund may apply collateral received from the borrower against the obligation. The Fund may experience delays and costs in recovering the securities loaned. Any cash collateral received is invested in the Fidelity Securities Lending Cash Central Fund. The value of loaned securities and cash collateral at period end are disclosed on the Fund's Statement of Assets and Liabilities. The value of securities loaned to FCM at period end was $24,265. Security lending income represents the income earned on investing cash collateral, less rebates paid to borrowers and any lending agent fees associated with the loan, plus any premium payments received for lending certain types of securities. Security lending income is presented in the Statement of Operations as a component of income from Fidelity Central Funds, and includes $955 from securities loaned to FCM.
8. Expense Reductions.
Commissions paid to certain brokers with whom the investment adviser, or its affiliates, places trades on behalf of the Fund include an amount in addition to trade execution, which may be rebated back to the Fund to offset certain expenses. This amount totaled $262 for the period. In addition, through arrangements with the Fund's custodian, credits realized as a result of certain uninvested cash balances were used to reduce the Fund's expenses. During the period, these credits reduced the Fund's custody expenses by $1.
In addition, during the period the investment adviser reimbursed and/or waived a portion of fund-level operating expenses in the amount of $75.
9. Distributions to Shareholders.
Distributions to shareholders of each class were as follows:
| | Six months ended January 31, 2016 | Year ended July 31, 2015 |
| From net investment income | | |
| Blue Chip Growth | $5,376 | $15,581 |
| Class K | 5,296 | 12,208 |
| Total | $10,672 | $27,789 |
| From net realized gain | | |
| Blue Chip Growth | $753,870 | $722,639 |
| Class K | 279,140 | 288,606 |
| Total | $1,033,010 | $1,011,245 |
10. Share Transactions.
Share transactions for each class were as follows and may contain automatic conversions between classes or exchanges between affiliated funds:
| | Shares | Shares | Dollars | Dollars |
| | Six months ended January 31, 2016 | Year ended July 31, 2015 | Six months ended January 31, 2016 | Year ended July 31, 2015 |
| Blue Chip Growth | | | | |
| Shares sold | 29,784 | 45,258 | $2,028,783 | $3,161,935 |
| Reinvestment of distributions | 10,852 | 10,699 | 732,286 | 715,067 |
| Shares redeemed | (19,806) | (31,433) | (1,336,794) | (2,196,025) |
| Net increase (decrease) | 20,830 | 24,524 | $1,424,275 | $1,680,977 |
| Class K | | | | |
| Shares sold | 9,577 | 26,108 | $652,724 | $1,808,830 |
| Reinvestment of distributions | 4,210 | 4,497 | 284,436 | 300,814 |
| Shares redeemed | (12,959)(a) | (21,373)(b) | (877,481)(a) | (1,515,665)(b) |
| Net increase (decrease) | 828 | 9,232 | $59,679 | $593,979 |
(a) Amount includes in-kind redemptions (See Note 4: Redemptions In-Kind).
(b) Amount includes in-kind redemptions.
11. Other.
The Fund's organizational documents provide former and current trustees and officers with a limited indemnification against liabilities arising in connection with the performance of their duties to the Fund. In the normal course of business, the Fund may also enter into contracts that provide general indemnifications. The Fund's maximum exposure under these arrangements is unknown as this would be dependent on future claims that may be made against the Fund. The risk of material loss from such claims is considered remote.
Report of Independent Registered Public Accounting Firm
To the Trustees of Fidelity Securities Fund and the Shareholders of Fidelity Blue Chip Growth Fund:
We have audited the accompanying statement of assets and liabilities of Fidelity® Blue Chip Growth Fund (the Fund), a fund of Fidelity Securities Fund, including the schedule of investments, as of January 31, 2016, and the related statement of operations for the six months then ended, the statement of changes in net assets for the six months ended January 31, 2016 and for the year ended July 31, 2015, and the financial highlights for the six months ended January 31, 2016 and for each of the five years in the period ended July 31, 2015. These financial statements and financial highlights are the responsibility of the Fund's management. Our responsibility is to express an opinion on these financial statements and financial highlights based on our audits.
We conducted our audits in accordance with the standards of the Public Company Accounting Oversight Board (United States). Those standards require that we plan and perform the audit to obtain reasonable assurance about whether the financial statements and financial highlights are free of material misstatement. The Fund is not required to have, nor were we engaged to perform, an audit of its internal control over financial reporting. Our audits included consideration of internal control over financial reporting as a basis for designing audit procedures that are appropriate in the circumstances, but not for the purpose of expressing an opinion on the effectiveness of the Fund's internal control over financial reporting. Accordingly, we express no such opinion. An audit also includes examining, on a test basis, evidence supporting the amounts and disclosures in the financial statements, assessing the accounting principles used and significant estimates made by management, as well as evaluating the overall financial statement presentation. Our procedures included confirmation of securities owned as of January 31, 2016, by correspondence with the custodians and brokers; when replies were not received from brokers, we performed other auditing procedures. We believe that our audits provide a reasonable basis for our opinion.
In our opinion, such financial statements and financial highlights referred to above present fairly, in all material respects, the financial position of Fidelity® Blue Chip Growth Fund as of January 31, 2016, the results of its operations for the six months then ended, the changes in its net assets for the six months ended January 31, 2016 and for the year ended July 31, 2015, and the financial highlights for the six months ended January 31, 2016 and for each of the five years in the period then ended July 31, 2015, in conformity with accounting principles generally accepted in the United States of America.
DELOITTE & TOUCHE LLP
Boston, Massachusetts
March 17, 2016
Shareholder Expense Example
As a shareholder of the Fund, you incur two types of costs: (1) transaction costs and (2) ongoing costs, including management fees and other Fund expenses. This Example is intended to help you understand your ongoing costs (in dollars) of investing in the Fund and to compare these costs with the ongoing costs of investing in other mutual funds.
The Example is based on an investment of $1,000 invested at the beginning of the period and held for the entire period (August 1, 2015 to January 31, 2016).
Actual Expenses
The first line of the accompanying table for each class of the Fund provides information about actual account values and actual expenses. You may use the information in this line, together with the amount you invested, to estimate the expenses that you paid over the period. Simply divide your account value by $1,000.00 (for example, an $8,600 account value divided by $1,000.00 = 8.6), then multiply the result by the number in the first line for a class of the Fund under the heading entitled "Expenses Paid During Period" to estimate the expenses you paid on your account during this period. A small balance maintenance fee of $12.00 that is charged once a year may apply for certain accounts with a value of less than $2,000. This fee is not included in the table below. If it was, the estimate of expenses you paid during the period would be higher, and your ending account value lower, by this amount. In addition, the Fund, as a shareholder in the underlying Fidelity Central Funds, will indirectly bear its pro-rata share of the fees and expenses incurred by the underlying Fidelity Central Funds. These fees and expenses are not included in the Fund's annualized expense ratio used to calculate the expense estimate in the table below.
Hypothetical Example for Comparison Purposes
The second line of the accompanying table for each class of the Fund provides information about hypothetical account values and hypothetical expenses based on a Class' actual expense ratio and an assumed rate of return of 5% per year before expenses, which is not the Class' actual return. The hypothetical account values and expenses may not be used to estimate the actual ending account balance or expenses you paid for the period. You may use this information to compare the ongoing costs of investing in the Fund and other funds. To do so, compare this 5% hypothetical example with the 5% hypothetical examples that appear in the shareholder reports of the other funds. A small balance maintenance fee of $12.00 that is charged once a year may apply for certain accounts with a value of less than $2,000. This fee is not included in the table below. If it was, the estimate of expenses you paid during the period would be higher, and your ending account value lower, by this amount. In addition, the Fund, as a shareholder in the underlying Fidelity Central Funds, will indirectly bear its pro-rata share of the fees and expenses incurred by the underlying Fidelity Central Funds. These fees and expenses are not included in the Fund's annualized expense ratio used to calculate the expense estimate in the table below.
Please note that the expenses shown in the table are meant to highlight your ongoing costs only and do not reflect any transaction costs. Therefore, the second line of the table is useful in comparing ongoing costs only, and will not help you determine the relative total costs of owning different funds.
| | Annualized Expense Ratio-A | Beginning
Account Value
August 1, 2015 | Ending
Account Value
January 31, 2016 | Expenses Paid
During Period-B
August 1, 2015
to January 31, 2016 |
| Blue Chip Growth | .90% | | | |
| Actual | | $1,000.00 | $886.30 | $4.27 |
| Hypothetical-C | | $1,000.00 | $1,020.61 | $4.57 |
| Class K | .78% | | | |
| Actual | | $1,000.00 | $886.90 | $3.70 |
| Hypothetical-C | | $1,000.00 | $1,021.22 | $3.96 |
A Annualized expense ratio reflects expenses net of applicable fee waivers.
B Expenses are equal to each Class' annualized expense ratio, multiplied by the average account value over the period, multiplied by 184/366 (to reflect the one-half year period).
C 5% return per year before expenses
Corporate Headquarters
245 Summer St.
Boston, MA 02210
www.fidelity.com
BCF-K-SANN-0316
1.863116.107
Fidelity® Series Real Estate Equity Fund
Fidelity® Series Real Estate Equity Fund
Class F
Semi-Annual Report January 31, 2016 |
|
Contents
To view a fund's proxy voting guidelines and proxy voting record for the 12-month period ended June 30, visit http://www.fidelity.com/proxyvotingresults or visit the Securities and Exchange Commission's (SEC) web site at http://www.sec.gov.
You may also call 1-800-544-8544, or for Class F, call 1-800-835-5092, to request a free copy of the proxy voting guidelines.
Standard & Poor's, S&P and S&P 500 are registered service marks of The McGraw-Hill Companies, Inc. and have been licensed for use by Fidelity Distributors Corporation.
Other third-party marks appearing herein are the property of their respective owners.
All other marks appearing herein are registered or unregistered trademarks or service marks of FMR LLC or an affiliated company. © 2016 FMR LLC. All rights reserved.
This report and the financial statements contained herein are submitted for the general information of the shareholders of the Fund. This report is not authorized for distribution to prospective investors in the Fund unless preceded or accompanied by an effective prospectus.
A fund files its complete schedule of portfolio holdings with the SEC for the first and third quarters of each fiscal year on Form N-Q. Forms N-Q are available on the SEC’s web site at http://www.sec.gov. A fund's Forms N-Q may be reviewed and copied at the SEC’s Public Reference Room in Washington, DC. Information regarding the operation of the SEC's Public Reference Room may be obtained by calling 1-800-SEC-0330.
For a complete list of a fund's portfolio holdings, view the most recent holdings listing, semiannual report, or annual report on Fidelity's web site at http://www.fidelity.com, http://www.advisor.fidelity.com, or http://www.401k.com, as applicable.
NOT FDIC INSURED •MAY LOSE VALUE •NO BANK GUARANTEE
Neither the Fund nor Fidelity Distributors Corporation is a bank.
Investment Summary (Unaudited)
Top Ten Stocks as of January 31, 2016
| | % of fund's net assets | % of fund's net assets 6 months ago |
| Simon Property Group, Inc. | 11.7 | 10.2 |
| Boston Properties, Inc. | 5.4 | 5.6 |
| Public Storage | 5.3 | 4.5 |
| Ventas, Inc. | 4.9 | 3.3 |
| Extra Space Storage, Inc. | 4.7 | 3.4 |
| Essex Property Trust, Inc. | 4.6 | 5.1 |
| UDR, Inc. | 3.9 | 3.9 |
| Federal Realty Investment Trust (SBI) | 3.5 | 3.2 |
| Equity Residential (SBI) | 3.4 | 2.2 |
| Mid-America Apartment Communities, Inc. | 3.3 | 0.2 |
| | 50.7 | |
Top Five REIT Sectors as of January 31, 2016
| | % of fund's net assets | % of fund's net assets 6 months ago |
| REITs - Apartments | 18.2 | 18.0 |
| REITs - Regional Malls | 16.1 | 15.7 |
| REITs - Office Property | 13.0 | 16.6 |
| REITs - Health Care | 10.4 | 11.4 |
| REITs - Storage | 10.0 | 7.9 |
Asset Allocation (% of fund's net assets)
| As of January 31, 2016 |
| | Stocks | 98.1% |
| | Short-Term Investments and Net Other Assets (Liabilities) | 1.9% |

| As of July 31, 2015 |
| | Stocks | 99.2% |
| | Short-Term Investments and Net Other Assets (Liabilities) | 0.8% |

Investments January 31, 2016 (Unaudited)
Showing Percentage of Net Assets
| Common Stocks - 98.1% | | | |
| | | Shares | Value |
| Hotels, Restaurants & Leisure - 0.8% | | | |
| Hotels, Resorts & Cruise Lines - 0.8% | | | |
| Hilton Worldwide Holdings, Inc. | | 549,100 | $9,779,471 |
| Real Estate Investment Trusts - 97.3% | | | |
| REITs - Apartments - 18.2% | | | |
| AvalonBay Communities, Inc. | | 207,735 | 35,624,475 |
| Equity Residential (SBI) | | 517,351 | 39,882,589 |
| Essex Property Trust, Inc. | | 251,667 | 53,632,754 |
| Mid-America Apartment Communities, Inc. | | 407,900 | 38,269,178 |
| UDR, Inc. | | 1,271,300 | 45,245,567 |
| | | | 212,654,563 |
| REITs - Diversified - 5.9% | | | |
| Cousins Properties, Inc. | | 981,126 | 8,457,306 |
| DuPont Fabros Technology, Inc. | | 705,300 | 23,394,801 |
| Forest City Realty Trust, Inc. (a) | | 1,159,642 | 22,844,947 |
| Liberty Property Trust (SBI) | | 326,700 | 9,578,844 |
| Vornado Realty Trust | | 52,700 | 4,661,842 |
| | | | 68,937,740 |
| REITs - Health Care - 10.4% | | | |
| HCP, Inc. | | 284,559 | 10,227,050 |
| Healthcare Realty Trust, Inc. | | 1,040,000 | 30,201,600 |
| Healthcare Trust of America, Inc. | | 141,500 | 3,967,660 |
| Sabra Health Care REIT, Inc. | | 501,113 | 9,200,435 |
| Ventas, Inc. | | 1,047,537 | 57,949,747 |
| Welltower, Inc. | | 164,249 | 10,219,573 |
| | | | 121,766,065 |
| REITs - Hotels - 4.7% | | | |
| Ashford Hospitality Prime, Inc. | | 364,583 | 4,006,767 |
| Chesapeake Lodging Trust | | 180,800 | 4,541,696 |
| FelCor Lodging Trust, Inc. | | 2,756,313 | 19,183,938 |
| Host Hotels & Resorts, Inc. | | 1,751,000 | 24,251,350 |
| Pebblebrook Hotel Trust | | 99,900 | 2,439,558 |
| | | | 54,423,309 |
| REITs - Management/Investment - 2.5% | | | |
| Coresite Realty Corp. | | 92,700 | 5,945,778 |
| Empire State Realty Trust, Inc. | | 1,411,700 | 23,363,635 |
| | | | 29,309,413 |
| REITs - Manufactured Homes - 2.4% | | | |
| Equity Lifestyle Properties, Inc. | | 65,700 | 4,330,944 |
| Sun Communities, Inc. | | 356,158 | 23,716,561 |
| | | | 28,047,505 |
| REITs - Office Property - 13.0% | | | |
| Alexandria Real Estate Equities, Inc. | | 145,708 | 11,537,159 |
| Boston Properties, Inc. | | 547,349 | 63,607,427 |
| Mack-Cali Realty Corp. | | 1,727,000 | 35,904,330 |
| New York (REIT), Inc. | | 318,900 | 3,278,292 |
| Parkway Properties, Inc. | | 1,128,500 | 15,200,895 |
| SL Green Realty Corp. | | 234,432 | 22,648,476 |
| | | | 152,176,579 |
| REITs - Regional Malls - 16.1% | | | |
| General Growth Properties, Inc. | | 731,400 | 20,508,456 |
| Simon Property Group, Inc. | | 736,523 | 137,199,506 |
| Taubman Centers, Inc. | | 160,422 | 11,396,379 |
| The Macerich Co. | | 247,100 | 19,266,387 |
| | | | 188,370,728 |
| REITs - Shopping Centers - 9.5% | | | |
| Cedar Shopping Centers, Inc. | | 1,755,284 | 12,392,305 |
| Federal Realty Investment Trust (SBI) | | 271,452 | 40,943,105 |
| Inland Real Estate Corp. | | 310,434 | 3,324,748 |
| Kite Realty Group Trust | | 320,650 | 8,497,225 |
| Ramco-Gershenson Properties Trust (SBI) | | 528,421 | 9,030,715 |
| Urban Edge Properties | | 1,483,450 | 36,047,835 |
| | | | 110,235,933 |
| REITs - Storage - 10.0% | | | |
| Extra Space Storage, Inc. | | 604,700 | 54,840,243 |
| Public Storage | | 246,087 | 62,397,820 |
| | | | 117,238,063 |
| REITs - Warehouse/Industrial - 4.6% | | | |
| DCT Industrial Trust, Inc. | | 946,275 | 33,867,182 |
| Prologis, Inc. | | 317,206 | 12,520,121 |
| Terreno Realty Corp. | | 330,867 | 7,437,890 |
| | | | 53,825,193 |
|
| TOTAL REAL ESTATE INVESTMENT TRUSTS | | | 1,136,985,091 |
|
| TOTAL COMMON STOCKS | | | |
| (Cost $967,842,083) | | | 1,146,764,562 |
|
| Money Market Funds - 2.8% | | | |
| Fidelity Cash Central Fund, 0.38% (b) | | | |
| (Cost $32,470,086) | | 32,470,086 | 32,470,086 |
| TOTAL INVESTMENT PORTFOLIO - 100.9% | | | |
| (Cost $1,000,312,169) | | | 1,179,234,648 |
| NET OTHER ASSETS (LIABILITIES) - (0.9)% | | | (10,569,024) |
| NET ASSETS - 100% | | | $1,168,665,624 |
Legend
(a) Non-income producing
(b) Affiliated fund that is generally available only to investment companies and other accounts managed by Fidelity Investments. The rate quoted is the annualized seven-day yield of the fund at period end. A complete unaudited listing of the fund's holdings as of its most recent quarter end is available upon request. In addition, each Fidelity Central Fund's financial statements are available on the SEC's website or upon request.
Affiliated Central Funds
Information regarding fiscal year to date income earned by the Fund from investments in Fidelity Central Funds is as follows:
| Fund | Income earned |
| Fidelity Cash Central Fund | $28,515 |
| Fidelity Securities Lending Cash Central Fund | 273 |
| Total | $28,788 |
Investment Valuation
All investments are categorized as Level 1 under the Fair Value Hierarchy. The inputs or methodology used for valuing securities may not be an indication of the risk associated with investing in those securities. For more information on valuation inputs please refer to the Investment Valuation section in the accompanying Notes to Financial Statements.
See accompanying notes which are an integral part of the financial statements.
Financial Statements
Statement of Assets and Liabilities
| | | January 31, 2016 (Unaudited) |
| Assets | | |
Investment in securities, at value — See accompanying schedule:
Unaffiliated issuers (cost $967,842,083) | $1,146,764,562 | |
| Fidelity Central Funds (cost $32,470,086) | 32,470,086 | |
| Total Investments (cost $1,000,312,169) | | $1,179,234,648 |
| Receivable for investments sold | | 18,719,471 |
| Receivable for fund shares sold | | 496,382 |
| Dividends receivable | | 413,863 |
| Distributions receivable from Fidelity Central Funds | | 8,821 |
| Prepaid expenses | | 2,020 |
| Other receivables | | 27,304 |
| Total assets | | 1,198,902,509 |
| Liabilities | | |
| Payable to custodian bank | $4,302,151 | |
| Payable for investments purchased | 10,564,060 | |
| Payable for fund shares redeemed | 14,686,066 | |
| Accrued management fee | 542,864 | |
| Other affiliated payables | 109,337 | |
| Other payables and accrued expenses | 32,407 | |
| Total liabilities | | 30,236,885 |
| Net Assets | | $1,168,665,624 |
| Net Assets consist of: | | |
| Paid in capital | | $994,861,840 |
| Undistributed net investment income | | 1,212,502 |
| Accumulated undistributed net realized gain (loss) on investments | | (6,331,197) |
| Net unrealized appreciation (depreciation) on investments | | 178,922,479 |
| Net Assets | | $1,168,665,624 |
| Series Real Estate Equity: | | |
| Net Asset Value, offering price and redemption price per share ($533,675,627 ÷ 41,477,393 shares) | | $12.87 |
| Class F: | | |
| Net Asset Value, offering price and redemption price per share ($634,989,997 ÷ 49,343,621 shares) | | $12.87 |
See accompanying notes which are an integral part of the financial statements.
Statement of Operations
| | | Six months ended January 31, 2016 (Unaudited) |
| Investment Income | | |
| Dividends | | $17,199,281 |
| Income from Fidelity Central Funds | | 28,788 |
| Total income | | 17,228,069 |
| Expenses | | |
| Management fee | $3,341,289 | |
| Transfer agent fees | 467,685 | |
| Accounting and security lending fees | 195,956 | |
| Custodian fees and expenses | 19,870 | |
| Independent trustees' compensation | 2,666 | |
| Audit | 24,366 | |
| Legal | 2,208 | |
| Interest | 286 | |
| Miscellaneous | 3,340 | |
| Total expenses before reductions | 4,057,666 | |
| Expense reductions | (43,806) | 4,013,860 |
| Net investment income (loss) | | 13,214,209 |
| Realized and Unrealized Gain (Loss) | | |
| Net realized gain (loss) on: | | |
| Investment securities: | | |
| Unaffiliated issuers | (3,711,536) | |
| Total net realized gain (loss) | | (3,711,536) |
| Change in net unrealized appreciation (depreciation) on investment securities | | (17,533,132) |
| Net gain (loss) | | (21,244,668) |
| Net increase (decrease) in net assets resulting from operations | | $(8,030,459) |
See accompanying notes which are an integral part of the financial statements.
Statement of Changes in Net Assets
| | Six months ended January 31, 2016 (Unaudited) | Year ended July 31, 2015 |
| Increase (Decrease) in Net Assets | | |
| Operations | | |
| Net investment income (loss) | $13,214,209 | $22,287,763 |
| Net realized gain (loss) | (3,711,536) | 105,851,825 |
| Change in net unrealized appreciation (depreciation) | (17,533,132) | 7,806,315 |
| Net increase (decrease) in net assets resulting from operations | (8,030,459) | 135,945,903 |
| Distributions to shareholders from net investment income | (16,165,094) | (22,136,162) |
| Distributions to shareholders from net realized gain | (87,069,592) | (71,866,191) |
| Total distributions | (103,234,686) | (94,002,353) |
| Share transactions - net increase (decrease) | 50,392,663 | (57,207,882) |
| Total increase (decrease) in net assets | (60,872,482) | (15,264,332) |
| Net Assets | | |
| Beginning of period | 1,229,538,106 | 1,244,802,438 |
| End of period (including undistributed net investment income of $1,212,502 and undistributed net investment income of $4,163,387, respectively) | $1,168,665,624 | $1,229,538,106 |
See accompanying notes which are an integral part of the financial statements.
Financial Highlights — Fidelity Series Real Estate Equity Fund
| | Six months ended (Unaudited) | Years ended July 31, | | | |
| January 31, | 2016 | 2015 | 2014 | 2013 | 2012 A |
| Selected Per–Share Data | | | | | |
| Net asset value, beginning of period | $14.18 | $13.85 | $12.87�� | $12.39 | $10.00 |
| Income from Investment Operations | | | | | |
| Net investment income (loss)B | .14 | .24 | .23 | .18 | .11 |
| Net realized and unrealized gain (loss) | (.30) | 1.11 | 1.31 | .78 | 2.38 |
| Total from investment operations | (.16) | 1.35 | 1.54 | .96 | 2.49 |
| Distributions from net investment income | (.17) | (.23) | (.21) | (.17) | (.08) |
| Distributions from net realized gain | (.98) | (.79) | (.35) | (.31) | (.02) |
| Total distributions | (1.15) | (1.02) | (.56) | (.48) | (.10) |
| Net asset value, end of period | $12.87 | $14.18 | $13.85 | $12.87 | $12.39 |
| Total ReturnC,D | (.67)% | 10.04% | 12.72% | 8.06% | 25.03% |
| Ratios to Average Net AssetsE,F | | | | | |
| Expenses before reductions | .76%G | .76% | .77% | .79% | .81%G |
| Expenses net of fee waivers, if any | .76%G | .75% | .77% | .79% | .81%G |
| Expenses net of all reductions | .75%G | .74% | .76% | .78% | .81%G |
| Net investment income (loss) | 2.08%G | 1.69% | 1.84% | 1.44% | 1.27%G |
| Supplemental Data | | | | | |
| Net assets, end of period (000 omitted) | $533,676 | $577,786 | $598,298 | $531,188 | $475,392 |
| Portfolio turnover rateH | 69%G | 60% | 69% | 48% | 40%G |
A For the period October 20, 2011 (commencement of operations) to July 31, 2012.
B Calculated based on average shares outstanding during the period.
C Total returns for periods of less than one year are not annualized.
D Total returns would have been lower if certain expenses had not been reduced during the applicable periods shown.
E Fees and expenses of any underlying Fidelity Central Funds are not included in the Fund's expense ratio. The Fund indirectly bears its proportionate share of the expenses of any underlying Fidelity Central Funds.
F Expense ratios reflect operating expenses of the class. Expenses before reductions do not reflect amounts reimbursed by the investment adviser or reductions from brokerage service arrangements or reductions from other expense offset arrangements and do not represent the amount paid by the class during periods when reimbursements or reductions occur. Expense ratios before reductions for start-up periods may not be representative of longer-term operating periods. Expenses net of fee waivers reflect expenses after reimbursement by the investment adviser but prior to reductions from brokerage service arrangements or other expense offset arrangements. Expenses net of all reductions represent the net expenses paid by the class.
G Annualized
H Amount does not include the portfolio activity of any underlying Fidelity Central Funds.
See accompanying notes which are an integral part of the financial statements.
Financial Highlights — Fidelity Series Real Estate Equity Fund Class F
| | Six months ended (Unaudited) | Years ended July 31, | | | |
| January 31, | 2016 | 2015 | 2014 | 2013 | 2012 A |
| Selected Per–Share Data | | | | | |
| Net asset value, beginning of period | $14.19 | $13.86 | $12.87 | $12.39 | $10.00 |
| Income from Investment Operations | | | | | |
| Net investment income (loss)B | .15 | .26 | .26 | .21 | .13 |
| Net realized and unrealized gain (loss) | (.30) | 1.11 | 1.31 | .78 | 2.37 |
| Total from investment operations | (.15) | 1.37 | 1.57 | .99 | 2.50 |
| Distributions from net investment income | (.18) | (.25) | (.23) | (.20) | (.09) |
| Distributions from net realized gain | (.98) | (.79) | (.35) | (.31) | (.02) |
| Total distributions | (1.17)C | (1.04) | (.58) | (.51) | (.11) |
| Net asset value, end of period | $12.87 | $14.19 | $13.86 | $12.87 | $12.39 |
| Total ReturnD,E | (.65)% | 10.23% | 13.01% | 8.27% | 25.16% |
| Ratios to Average Net AssetsF,G | | | | | |
| Expenses before reductions | .59%H | .59% | .59% | .60% | .61%H |
| Expenses net of fee waivers, if any | .59%H | .59% | .59% | .60% | .61%H |
| Expenses net of all reductions | .58%H | .58% | .59% | .59% | .61%H |
| Net investment income (loss) | 2.25%H | 1.86% | 2.02% | 1.63% | 1.47%H |
| Supplemental Data | | | | | |
| Net assets, end of period (000 omitted) | $634,990 | $651,752 | $646,504 | $493,761 | $323,523 |
| Portfolio turnover rateI | 69%H | 60% | 69% | 48% | 40%H |
A For the period October 20, 2011 (commencement of operations) to July 31, 2012.
B Calculated based on average shares outstanding during the period.
C Total distributions of $1.17 per share is comprised of distributions from net investment income of $.183 and distributions from net realized gain of $.983 per share.
D Total returns for periods of less than one year are not annualized.
E Total returns would have been lower if certain expenses had not been reduced during the applicable periods shown.
F Fees and expenses of any underlying Fidelity Central Funds are not included in the Fund's expense ratio. The Fund indirectly bears its proportionate share of the expenses of any underlying Fidelity Central Funds.
G Expense ratios reflect operating expenses of the class. Expenses before reductions do not reflect amounts reimbursed by the investment adviser or reductions from brokerage service arrangements or reductions from other expense offset arrangements and do not represent the amount paid by the class during periods when reimbursements or reductions occur. Expense ratios before reductions for start-up periods may not be representative of longer-term operating periods. Expenses net of fee waivers reflect expenses after reimbursement by the investment adviser but prior to reductions from brokerage service arrangements or other expense offset arrangements. Expenses net of all reductions represent the net expenses paid by the class.
H Annualized
I Amount does not include the portfolio activity of any underlying Fidelity Central Funds.
See accompanying notes which are an integral part of the financial statements.
Notes to Financial Statements (Unaudited)
For the period ended January 31, 2016
1. Organization.
Fidelity Series Real Estate Equity Fund (the Fund) is a non-diversified fund of Fidelity Securities Fund (the Trust) and is authorized to issue an unlimited number of shares. Shares of the Fund are only available for purchase by mutual funds for which Fidelity Management & Research Company (FMR) or an affiliate serves as an investment manager. The Trust is registered under the Investment Company Act of 1940, as amended (the 1940 Act), as an open-end management investment company organized as a Massachusetts business trust. The Fund offers Series Real Estate Equity and Class F shares, each of which has equal rights as to assets and voting privileges. Each class has exclusive voting rights with respect to matters that affect that class.
2. Investments in Fidelity Central Funds.
The Fund invests in Fidelity Central Funds, which are open-end investment companies generally available only to other investment companies and accounts managed by the investment adviser and its affiliates. The Fund's Schedule of Investments lists each of the Fidelity Central Funds held as of period end, if any, as an investment of the Fund, but does not include the underlying holdings of each Fidelity Central Fund. As an Investing Fund, the Fund indirectly bears its proportionate share of the expenses of the underlying Fidelity Central Funds.
The Money Market Central Funds seek preservation of capital and current income and are managed by Fidelity Investments Money Management, Inc. (FIMM), an affiliate of the investment adviser. Annualized expenses of the Money Market Central Funds as of their most recent shareholder report date are less than .005%.
A complete unaudited list of holdings for each Fidelity Central Fund is available upon request or at the Securities and Exchange Commission (the SEC) website at www.sec.gov. In addition, the financial statements of the Fidelity Central Funds are available on the SEC website or upon request.
3. Significant Accounting Policies.
The financial statements have been prepared in conformity with accounting principles generally accepted in the United States of America (GAAP), which require management to make certain estimates and assumptions at the date of the financial statements. Actual results could differ from those estimates. Subsequent events, if any, through the date that the financial statements were issued have been evaluated in the preparation of the financial statements. The following summarizes the significant accounting policies of the Fund:
Investment Valuation. Investments are valued as of 4:00 p.m. Eastern time on the last calendar day of the period. The Board of Trustees (the Board) has delegated the day to day responsibility for the valuation of the Fund's investments to the FMR Fair Value Committee (the Committee). In accordance with valuation policies and procedures approved by the Board, the Fund attempts to obtain prices from one or more third party pricing vendors or brokers to value its investments. When current market prices, quotations or currency exchange rates are not readily available or reliable, investments will be fair valued in good faith by the Committee, in accordance with procedures adopted by the Board. Factors used in determining fair value vary by investment type and may include market or investment specific events. The frequency with which these procedures are used cannot be predicted and they may be utilized to a significant extent. The Committee oversees the Fund's valuation policies and procedures and reports to the Board on the Committee's activities and fair value determinations. The Board monitors the appropriateness of the procedures used in valuing the Fund's investments and ratifies the fair value determinations of the Committee.
The Fund categorizes the inputs to valuation techniques used to value its investments into a disclosure hierarchy consisting of three levels as shown below:
- Level 1 – quoted prices in active markets for identical investments
- Level 2 – other significant observable inputs (including quoted prices for similar investments, interest rates, prepayment speeds, etc.)
- Level 3 – unobservable inputs (including the Fund's own assumptions based on the best information available)
Valuation techniques used to value the Fund's investments by major category are as follows:
Equity securities, including restricted securities, for which market quotations are readily available, are valued at the last reported sale price or official closing price as reported by a third party pricing vendor on the primary market or exchange on which they are traded and are categorized as Level 1 in the hierarchy. In the event there were no sales during the day or closing prices are not available, securities are valued at the last quoted bid price or may be valued using the last available price and are generally categorized as Level 2 in the hierarchy. For foreign equity securities, when market or security specific events arise, comparisons to the valuation of American Depositary Receipts (ADRs), futures contracts, Exchange-Traded Funds (ETFs) and certain indexes as well as quoted prices for similar securities may be used and would be categorized as Level 2 in the hierarchy. Utilizing these techniques may result in transfers between Level 1 and Level 2. For equity securities, including restricted securities, where observable inputs are limited, assumptions about market activity and risk are used and these securities may be categorized as Level 3 in the hierarchy.
Investments in open-end mutual funds, including the Fidelity Central Funds, are valued at their closing net asset value (NAV) each business day and are categorized as Level 1 in the hierarchy.
Changes in valuation techniques may result in transfers in or out of an assigned level within the disclosure hierarchy.
Investment Transactions and Income. For financial reporting purposes, the Fund's investment holdings and NAV include trades executed through the end of the last business day of the period. The NAV per share for processing shareholder transactions is calculated as of the close of business of the New York Stock Exchange (NYSE), normally 4:00 p.m. Eastern time and includes trades executed through the end of the prior business day. Gains and losses on securities sold are determined on the basis of identified cost. Dividend income is recorded on the ex-dividend date, except for certain dividends from foreign securities where the ex-dividend date may have passed, which are recorded as soon as the Fund is informed of the ex-dividend date. Non-cash dividends included in dividend income, if any, are recorded at the fair market value of the securities received. Income and capital gain distributions from Fidelity Central Funds, if any, are recorded on the ex-dividend date. Distributions received on securities that represent a return of capital or capital gain are recorded as a reduction of cost of investments and/or as a realized gain. Subsequent to ex-dividend date the Fund determines the components of these distributions, based upon receipt of tax filings or other correspondence relating to the underlying investment.
Class Allocations and Expenses. Investment income, realized and unrealized capital gains and losses, common expenses of the Fund, and certain fund-level expense reductions, if any, are allocated daily on a pro-rata basis to each class based on the relative net assets of each class to the total net assets of the Fund. Each class differs with respect to transfer agent fees incurred. Certain expense reductions may also differ by class. For the reporting period, the allocated portion of income and expenses to each class as a percent of its average net assets may vary due to the timing of recording these transactions in relation to fluctuating net assets of the classes. Expenses directly attributable to a fund are charged to that fund. Expenses attributable to more than one fund are allocated among the respective funds on the basis of relative net assets or other appropriate methods. Expense estimates are accrued in the period to which they relate and adjustments are made when actual amounts are known.
Income Tax Information and Distributions to Shareholders. Each year, the Fund intends to qualify as a regulated investment company under Subchapter M of the Internal Revenue Code, including distributing substantially all of its taxable income and realized gains. As a result, no provision for U.S. Federal income taxes is required. The Fund files a U.S. federal tax return, in addition to state and local tax returns as required. The Fund's federal income tax returns are subject to examination by the Internal Revenue Service (IRS) for a period of three fiscal years after they are filed. State and local tax returns may be subject to examination for an additional fiscal year depending on the jurisdiction.
Distributions are declared and recorded on the ex-dividend date. Income dividends and capital gain distributions are declared separately for each class. Income and capital gain distributions are determined in accordance with income tax regulations, which may differ from GAAP.
Capital accounts within the financial statements are adjusted for permanent book-tax differences. These adjustments have no impact on net assets or the results of operations. Capital accounts are not adjusted for temporary book-tax differences which will reverse in a subsequent period.
Book-tax differences are primarily due to losses deferred due to wash sales.
The federal tax cost of investment securities and unrealized appreciation (depreciation) as of period end were as follows:
| Gross unrealized appreciation | $212,817,572 |
| Gross unrealized depreciation | (36,616,996) |
| Net unrealized appreciation (depreciation) on securities | $176,200,576 |
| Tax cost | $1,003,034,072 |
4. Purchases and Sales of Investments.
Purchases and sales of securities, other than short-term securities, aggregated $411,941,595 and $459,396,575, respectively.
5. Fees and Other Transactions with Affiliates.
Management Fee. Fidelity Management & Research Company (the investment adviser) and its affiliates provide the Fund with investment management related services for which the Fund pays a monthly management fee. The management fee is the sum of an individual fund fee rate that is based on an annual rate of .30% of the Fund's average net assets and an annualized group fee rate that averaged .25% during the period. The group fee rate is based upon the average net assets of all the mutual funds advised by the investment adviser, including any mutual funds previously advised by the investment adviser that are currently advised by Fidelity SelectCo, LLC, an affiliate of the investment adviser. The group fee rate decreases as assets under management increase and increases as assets under management decrease. For the reporting period, the total annualized management fee rate was .55% of the Fund's average net assets.
Transfer Agent Fees. Fidelity Investments Institutional Operations Company, Inc., (FIIOC), an affiliate of the investment adviser, is the transfer, dividend disbursing and shareholder servicing agent for each class of the Fund. FIIOC receives account fees and asset-based fees that vary according to the account size and type of account of the shareholders of Series Real Estate Equity. FIIOC receives no fees for providing transfer agency services to Class F. FIIOC pays for typesetting, printing and mailing of shareholder reports, except proxy statements.
For the period, transfer agent fees for each applicable class were as follows:
| | Amount | % of
Class-Level Average
Net Assets(a) |
| Series Real Estate Equity | $467,685 | .17 |
(a) Annualized
Accounting and Security Lending Fees. Fidelity Service Company, Inc. (FSC), an affiliate of the investment adviser, maintains the Fund's accounting records. The accounting fee is based on the level of average net assets for each month. Under a separate contract, FSC administers the security lending program. The security lending fee is based on the number and duration of lending transactions.
Brokerage Commissions. The Fund placed a portion of its portfolio transactions with brokerage firms which are affiliates of the investment adviser. Brokerage commissions are included in net realized gain (loss) and change in net unrealized appreciation (depreciation) in the Statement of Operations. The commissions paid to these affiliated firms were $1,696 for the period.
Interfund Lending Program. Pursuant to an Exemptive Order issued by the SEC, the Fund, along with other registered investment companies having management contracts with FMR or other affiliated entities of FMR, may participate in an interfund lending program. This program provides an alternative credit facility allowing the funds to borrow from, or lend money to, other participating affiliated funds. At period end, there were no interfund loans outstanding. The Fund's activity in this program during the period for which loans were outstanding was as follows:
| Borrower or Lender | Average Loan Balance | Weighted Average Interest Rate | Interest Expense |
| Borrower | $7,094,750 | .36% | $286 |
Interfund Trades. The Fund may purchase from or sell securities to other Fidelity Funds under procedures adopted by the Board. The procedures have been designed to ensure these interfund trades are executed in accordance with Rule 17a-7 of the 1940 Act. Interfund trades are included within the respective purchases and sales amounts shown in the Purchases and Sales of Investments note.
6. Committed Line of Credit.
The Fund participates with other funds managed by the investment adviser or an affiliate in a $4.25 billion credit facility (the "line of credit") to be utilized for temporary or emergency purposes to fund shareholder redemptions or for other short-term liquidity purposes. The Fund has agreed to pay commitment fees on its pro-rata portion of the line of credit, which amounted to $813 and is reflected in Miscellaneous expenses on the Statement of Operations. During the period, the Fund did not borrow on this line of credit.
7. Security Lending.
The Fund lends portfolio securities through a lending agent from time to time in order to earn additional income. For equity securities, a lending agent is used and may loan securities to certain qualified borrowers, including Fidelity Capital Markets (FCM), a broker-dealer affiliated with the Fund. On the settlement date of the loan, the Fund receives collateral (in the form of U.S. Treasury obligations, letters of credit and/or cash) against the loaned securities and maintains collateral in an amount not less than 100% of the market value of the loaned securities during the period of the loan. The market value of the loaned securities is determined at the close of business of the Fund and any additional required collateral is delivered to the Fund on the next business day. The Fund or borrower may terminate the loan at any time, and if the borrower defaults on its obligation to return the securities loaned because of insolvency or other reasons, the Fund may apply collateral received from the borrower against the obligation. The Fund may experience delays and costs in recovering the securities loaned. Any cash collateral received is the Fidelity Securities Lending Cash Central Fund. At period end, there were no security loans outstanding. Security lending income represents the income earned on investing cash collateral, less rebates paid to borrowers and any lending agent fees associated with the loan, plus any premium payments received for lending certain types of securities. Security lending income is presented in the Statement of Operations as a component of income from Fidelity Central Funds. Total security lending income during the period amounted to $273. During the period, there were no securities loaned to FCM.
8. Expense Reductions.
Commissions paid to certain brokers with whom the investment adviser, or its affiliates, places trades on behalf of the Fund include an amount in addition to trade execution, which may be rebated back to the Fund to offset certain expenses. This amount totaled $39,382 for the period.
In addition, during the period the investment adviser reimbursed and/or waived a portion of fund-level operating expenses in the amount of $4,424.
9. Distributions to Shareholders.
Distributions to shareholders of each class were as follows:
| | Six months ended January 31, 2016 | Year ended July 31, 2015 |
| From net investment income | | |
| Series Real Estate Equity | $7,156,674 | $9,854,635 |
| Class F | 9,008,420 | 12,281,527 |
| Total | $16,165,094 | $22,136,162 |
| From net realized gain | | |
| Series Real Estate Equity | $40,417,572 | $34,110,116 |
| Class F | 46,652,020 | 37,756,075 |
| Total | $87,069,592 | $71,866,191 |
10. Share Transactions.
Transactions for each class of shares were as follows:
| | Shares | Shares | Dollars | Dollars |
| | Six months ended January 31, 2016 | Year ended July 31, 2015 | Six months ended January 31, 2016 | Year ended July 31, 2015 |
| Series Real Estate Equity | | | | |
| Shares sold | 2,476,053 | 5,563,053 | $33,327,877 | $79,011,834 |
| Reinvestment of distributions | 3,860,939 | 3,171,934 | 47,574,246 | 43,964,751 |
| Shares redeemed | (5,592,814) | (11,198,553) | (73,074,418) | (163,372,510) |
| Net increase (decrease) | 744,178 | (2,463,566) | $7,827,705 | $(40,395,925) |
| Class F | | | | |
| Shares sold | 4,373,861 | 8,500,030 | $58,482,713 | $120,305,866 |
| Reinvestment of distributions | 4,514,673 | 3,607,000 | 55,660,440 | 50,037,602 |
| Shares redeemed | (5,481,388) | (12,831,072) | (71,578,195) | (187,155,425) |
| Net increase (decrease) | 3,407,146 | (724,042) | $42,564,958 | $(16,811,957) |
11. Other.
The Fund's organizational documents provide former and current trustees and officers with a limited indemnification against liabilities arising in connection with the performance of their duties to the Fund. In the normal course of business, the Fund may also enter into contracts that provide general indemnifications. The Fund's maximum exposure under these arrangements is unknown as this would be dependent on future claims that may be made against the Fund. The risk of material loss from such claims is considered remote.
At the end of the period, mutual funds managed by the investment adviser or its affiliates were the owners of record of all the outstanding shares of the Fund.
Shareholder Expense Example
As a shareholder of the Fund, you incur two types of costs: (1) transaction costs, and (2) ongoing costs, including management fees and other Fund expenses. This Example is intended to help you understand your ongoing costs (in dollars) of investing in the Fund and to compare these costs with the ongoing costs of investing in other mutual funds.
The Example is based on an investment of $1,000 invested at the beginning of the period and held for the entire period (August 1, 2015 to January 31, 2016).
Actual Expenses
The first line of the accompanying table for each class of the Fund provides information about actual account values and actual expenses. You may use the information in this line, together with the amount you invested, to estimate the expenses that you paid over the period. Simply divide your account value by $1,000.00 (for example, an $8,600 account value divided by $1,000.00 = 8.6), then multiply the result by the number in the first line for a class of the Fund under the heading entitled "Expenses Paid During Period" to estimate the expenses you paid on your account during this period. In addition, the Fund, as a shareholder in the underlying Fidelity Central Funds, will indirectly bear its pro-rata share of the fees and expenses incurred by the underlying Fidelity Central Funds. These fees and expenses are not included in the Fund's annualized expense ratio used to calculate the expense estimate in the table below.
Hypothetical Example for Comparison Purposes
The second line of the accompanying table for each class of the Fund provides information about hypothetical account values and hypothetical expenses based on a Class' actual expense ratio and an assumed rate of return of 5% per year before expenses, which is not the Class' actual return. The hypothetical account values and expenses may not be used to estimate the actual ending account balance or expenses you paid for the period. You may use this information to compare the ongoing costs of investing in the Fund and other funds. To do so, compare this 5% hypothetical example with the 5% hypothetical examples that appear in the shareholder reports of the other funds. In addition, the Fund, as a shareholder in the underlying Fidelity Central Funds, will indirectly bear its pro-rata share of the fees and expenses incurred by the underlying Fidelity Central Funds. These fees and expenses are not included in the Fund's annualized expense ratio used to calculate the expense estimate in the table below.
Please note that the expenses shown in the table are meant to highlight your ongoing costs only and do not reflect any transaction costs. Therefore, the second line of the table is useful in comparing ongoing costs only, and will not help you determine the relative total costs of owning different funds.
| | Annualized Expense Ratio-A | Beginning
Account Value
August 1, 2015 | Ending
Account Value
January 31, 2016 | Expenses Paid
During Period-B
August 1, 2015
to January 31, 2016 |
| Series Real Estate Equity | .76% | | | |
| Actual | | $1,000.00 | $993.30 | $3.81 |
| Hypothetical-C | | $1,000.00 | $1,021.32 | $3.86 |
| Class F | .59% | | | |
| Actual | | $1,000.00 | $993.50 | $2.96 |
| Hypothetical-C | | $1,000.00 | $1,022.17 | $3.00 |
A Annualized expense ratio reflects expenses net of applicable fee waivers.
B Expenses are equal to each Class' annualized expense ratio, multiplied by the average account value over the period, multiplied by 184/366 (to reflect the one-half year period).
C 5% return per year before expenses
Corporate Headquarters
245 Summer St.
Boston, MA 02210
www.fidelity.com
SLE-SANN-0316
1.930456.104
Fidelity® Series Small Cap Opportunities Fund
Fidelity® Series Small Cap Opportunities Fund
Class F
Semi-Annual Report January 31, 2016 |
|
Contents
To view a fund's proxy voting guidelines and proxy voting record for the 12-month period ended June 30, visit http://www.fidelity.com/proxyvotingresults or visit the Securities and Exchange Commission's (SEC) web site at http://www.sec.gov.
You may also call 1-800-544-8544, or for Class F, call 1-800-835-5092, to request a free copy of the proxy voting guidelines.
Standard & Poor's, S&P and S&P 500 are registered service marks of The McGraw-Hill Companies, Inc. and have been licensed for use by Fidelity Distributors Corporation.
Other third-party marks appearing herein are the property of their respective owners.
All other marks appearing herein are registered or unregistered trademarks or service marks of FMR LLC or an affiliated company. © 2016 FMR LLC. All rights reserved.
This report and the financial statements contained herein are submitted for the general information of the shareholders of the Fund. This report is not authorized for distribution to prospective investors in the Fund unless preceded or accompanied by an effective prospectus.
A fund files its complete schedule of portfolio holdings with the SEC for the first and third quarters of each fiscal year on Form N-Q. Forms N-Q are available on the SEC’s web site at http://www.sec.gov. A fund's Forms N-Q may be reviewed and copied at the SEC’s Public Reference Room in Washington, DC. Information regarding the operation of the SEC's Public Reference Room may be obtained by calling 1-800-SEC-0330.
For a complete list of a fund's portfolio holdings, view the most recent holdings listing, semiannual report, or annual report on Fidelity's web site at http://www.fidelity.com, http://www.advisor.fidelity.com, or http://www.401k.com, as applicable.
NOT FDIC INSURED •MAY LOSE VALUE •NO BANK GUARANTEE
Neither the Fund nor Fidelity Distributors Corporation is a bank.
Investment Summary (Unaudited)
Top Ten Stocks as of January 31, 2016
| | % of fund's net assets | % of fund's net assets 6 months ago |
| Bank of the Ozarks, Inc. | 1.3 | 1.4 |
| Global Payments, Inc. | 1.3 | 1.3 |
| MB Financial, Inc. | 1.3 | 1.1 |
| Allied World Assurance Co. Holdings AG | 1.3 | 1.2 |
| PacWest Bancorp | 1.2 | 1.3 |
| Mid-America Apartment Communities, Inc. | 1.2 | 1.1 |
| WSFS Financial Corp. | 1.1 | 1.0 |
| Associated Banc-Corp. | 1.1 | 1.1 |
| Banner Corp. | 1.0 | 1.1 |
| Coresite Realty Corp. | 1.0 | 0.0 |
| | 11.8 | |
Top Five Market Sectors as of January 31, 2016
| | % of fund's net assets | % of fund's net assets 6 months ago |
| Financials | 23.7 | 23.2 |
| Information Technology | 18.3 | 16.4 |
| Health Care | 13.5 | 15.5 |
| Consumer Discretionary | 12.7 | 13.7 |
| Industrials | 12.3 | 12.6 |
Asset Allocation (% of fund's net assets)
| As of January 31, 2016* |
| | Stocks and Equity Futures | 97.2% |
| | Short-Term Investments and Net Other Assets (Liabilities) | 2.8% |

* Foreign investments - 9.4%
| As of July 31, 2015* |
| | Stocks and Equity Futures | 95.8% |
| | Short-Term Investments and Net Other Assets (Liabilities) | 4.2% |

* Foreign investments - 7.7%
Percentages shown as 0.0% may reflect amounts less than 0.05%.
Investments January 31, 2016 (Unaudited)
Showing Percentage of Net Assets
| Common Stocks - 93.6% | | | |
| | | Shares | Value |
| CONSUMER DISCRETIONARY - 12.7% | | | |
| Auto Components - 1.8% | | | |
| Cooper Tire & Rubber Co. | | 650,080 | $23,701,917 |
| Standard Motor Products, Inc. | | 446,634 | 16,663,915 |
| Tenneco, Inc. (a) | | 839,086 | 32,061,476 |
| Visteon Corp. | | 246,300 | 16,472,544 |
| | | | 88,899,852 |
| Diversified Consumer Services - 0.6% | | | |
| Service Corp. International | | 1,203,400 | 29,110,246 |
| Hotels, Restaurants & Leisure - 2.4% | | | |
| Bloomin' Brands, Inc. | | 985,516 | 17,404,213 |
| Buffalo Wild Wings, Inc. (a) | | 188,300 | 28,678,090 |
| Dave & Buster's Entertainment, Inc. (a) | | 281,332 | 10,203,912 |
| Domino's Pizza, Inc. | | 212,400 | 24,198,732 |
| Texas Roadhouse, Inc. Class A | | 996,043 | 36,684,264 |
| | | | 117,169,211 |
| Household Durables - 1.8% | | | |
| Ethan Allen Interiors, Inc. | | 1,308,735 | 34,943,225 |
| Helen of Troy Ltd. (a) | | 238,700 | 21,332,619 |
| Jarden Corp. (a) | | 621,322 | 32,961,132 |
| | | | 89,236,976 |
| Leisure Products - 1.1% | | | |
| Brunswick Corp. | | 586,500 | 23,372,025 |
| Vista Outdoor, Inc. (a) | | 660,348 | 31,835,377 |
| | | | 55,207,402 |
| Media - 1.1% | | | |
| Nexstar Broadcasting Group, Inc. Class A | | 709,417 | 32,072,743 |
| Starz Series A (a) | | 716,300 | 20,364,409 |
| | | | 52,437,152 |
| Multiline Retail - 0.3% | | | |
| Dillard's, Inc. Class A | | 224,644 | 15,817,184 |
| Specialty Retail - 1.3% | | | |
| Genesco, Inc. (a) | | 358,525 | 23,712,844 |
| Murphy U.S.A., Inc. (a) | | 311,900 | 18,043,415 |
| Sally Beauty Holdings, Inc. (a) | | 803,800 | 22,152,728 |
| | | | 63,908,987 |
| Textiles, Apparel & Luxury Goods - 2.3% | | | |
| Deckers Outdoor Corp. (a) | | 555,500 | 27,475,030 |
| G-III Apparel Group Ltd. (a) | | 843,174 | 41,619,069 |
| Steven Madden Ltd. (a) | | 1,249,739 | 40,354,072 |
| | | | 109,448,171 |
|
| TOTAL CONSUMER DISCRETIONARY | | | 621,235,181 |
|
| CONSUMER STAPLES - 3.1% | | | |
| Beverages - 0.3% | | | |
| Coca-Cola Bottling Co. Consolidated | | 82,955 | 14,591,785 |
| Food & Staples Retailing - 0.6% | | | |
| Casey's General Stores, Inc. | | 265,050 | 32,002,137 |
| Food Products - 1.5% | | | |
| Greencore Group PLC | | 3,389,309 | 18,827,528 |
| Ingredion, Inc. | | 163,900 | 16,508,008 |
| J&J Snack Foods Corp. | | 197,050 | 21,277,459 |
| Pinnacle Foods, Inc. | | 343,900 | 14,749,871 |
| | | | 71,362,866 |
| Personal Products - 0.7% | | | |
| Coty, Inc. Class A (b) | | 543,900 | 13,385,379 |
| Inter Parfums, Inc. | | 722,300 | 19,393,755 |
| | | | 32,779,134 |
|
| TOTAL CONSUMER STAPLES | | | 150,735,922 |
|
| ENERGY - 2.7% | | | |
| Energy Equipment & Services - 0.6% | | | |
| Bristow Group, Inc. | | 550,949 | 12,815,074 |
| Rowan Companies PLC | | 365,300 | 4,621,045 |
| Total Energy Services, Inc. | | 1,266,170 | 12,969,905 |
| | | | 30,406,024 |
| Oil, Gas & Consumable Fuels - 2.1% | | | |
| Boardwalk Pipeline Partners, LP | | 1,455,647 | 15,881,109 |
| Diamondback Energy, Inc. | | 314,493 | 23,759,946 |
| Newfield Exploration Co. (a) | | 606,512 | 17,631,304 |
| PDC Energy, Inc. (a) | | 406,400 | 23,111,968 |
| Western Refining, Inc. | | 586,712 | 19,302,825 |
| | | | 99,687,152 |
|
| TOTAL ENERGY | | | 130,093,176 |
|
| FINANCIALS - 23.7% | | | |
| Banks - 9.9% | | | |
| Associated Banc-Corp. | | 2,966,913 | 52,069,323 |
| BancFirst Corp. | | 484,678 | 27,112,887 |
| Bank of the Ozarks, Inc. | | 1,437,774 | 63,750,894 |
| Banner Corp. | | 1,241,471 | 51,521,047 |
| BBCN Bancorp, Inc. | | 3,078,210 | 46,788,792 |
| Community Bank System, Inc. | | 781,388 | 29,411,444 |
| Huntington Bancshares, Inc. | | 4,887,600 | 41,935,608 |
| Investors Bancorp, Inc. | | 4,151,300 | 48,528,697 |
| MB Financial, Inc. | | 2,020,200 | 62,868,624 |
| PacWest Bancorp | | 1,638,988 | 60,167,249 |
| | | | 484,154,565 |
| Capital Markets - 2.2% | | | |
| AURELIUS AG | | 882,535 | 44,556,877 |
| OM Asset Management Ltd. | | 2,831,524 | 32,024,536 |
| Raymond James Financial, Inc. | | 675,100 | 29,576,131 |
| | | | 106,157,544 |
| Insurance - 3.2% | | | |
| Allied World Assurance Co. Holdings AG | | 1,677,013 | 61,361,906 |
| Aspen Insurance Holdings Ltd. | | 760,690 | 35,379,692 |
| James River Group Holdings Ltd. | | 530,910 | 18,008,467 |
| Primerica, Inc. (b) | | 877,605 | 39,501,001 |
| | | | 154,251,066 |
| Real Estate Investment Trusts - 7.3% | | | |
| Coresite Realty Corp. | | 787,900 | 50,535,906 |
| Cousins Properties, Inc. | | 2,968,220 | 25,586,056 |
| Equity Lifestyle Properties, Inc. | | 754,200 | 49,716,864 |
| Kite Realty Group Trust | | 1,467,098 | 38,878,097 |
| Mid-America Apartment Communities, Inc. | | 599,400 | 56,235,708 |
| National Retail Properties, Inc. (b) | | 1,114,741 | 47,866,979 |
| Ramco-Gershenson Properties Trust (SBI) | | 2,795,450 | 47,774,241 |
| Store Capital Corp. | | 1,592,703 | 39,483,107 |
| | | | 356,076,958 |
| Thrifts & Mortgage Finance - 1.1% | | | |
| WSFS Financial Corp. (c) | | 1,847,253 | 53,681,172 |
|
| TOTAL FINANCIALS | | | 1,154,321,305 |
|
| HEALTH CARE - 13.5% | | | |
| Biotechnology - 6.5% | | | |
| ACADIA Pharmaceuticals, Inc. (a)(b) | | 715,727 | 14,808,392 |
| Advanced Accelerator Applications SA sponsored ADR | | 158,961 | 3,954,950 |
| Agios Pharmaceuticals, Inc. (a)(b) | | 164,063 | 6,926,740 |
| Anacor Pharmaceuticals, Inc. (a) | | 267,700 | 20,112,301 |
| Ascendis Pharma A/S: | | | |
| ADR (d) | | 788,429 | 14,261,104 |
| sponsored ADR | | 197,024 | 3,751,337 |
| Bellicum Pharmaceuticals, Inc. (a)(b) | | 901,300 | 10,184,690 |
| BioMarin Pharmaceutical, Inc. (a) | | 155,444 | 11,505,965 |
| Biotie Therapies Corp. sponsored ADR (b) | | 843,943 | 20,862,271 |
| bluebird bio, Inc. (a) | | 143,968 | 5,954,516 |
| Cellectis SA sponsored ADR | | 448,095 | 10,019,404 |
| Chimerix, Inc. (a) | | 467,290 | 3,598,133 |
| Coherus BioSciences, Inc. (a)(b) | | 654,111 | 8,673,512 |
| Curis, Inc. (a) | | 5,529,951 | 9,069,120 |
| CytomX Therapeutics, Inc. | | 105,499 | 1,574,520 |
| CytomX Therapeutics, Inc. (a) | | 267,300 | 4,199,283 |
| DBV Technologies SA sponsored ADR (a) | | 3,100 | 80,569 |
| Five Prime Therapeutics, Inc. (a) | | 328,835 | 11,821,618 |
| Genocea Biosciences, Inc. (a)(b) | | 968,028 | 3,010,567 |
| Heron Therapeutics, Inc. (a)(b) | | 531,800 | 11,162,482 |
| Insmed, Inc. (a) | | 710,135 | 9,373,782 |
| Intercept Pharmaceuticals, Inc. (a) | | 71,798 | 7,627,102 |
| Ionis Pharmaceuticals, Inc. (a) | | 275,872 | 10,739,697 |
| La Jolla Pharmaceutical Co. (a) | | 583,191 | 10,328,313 |
| Mirati Therapeutics, Inc. (a)(b) | | 585,269 | 12,600,842 |
| Neurocrine Biosciences, Inc. (a) | | 609,582 | 25,937,714 |
| Novavax, Inc. (a) | | 2,137,462 | 11,007,929 |
| ProNai Therapeutics, Inc. (a)(b) | | 580,144 | 4,803,592 |
| Sage Therapeutics, Inc. (a) | | 34,700 | 1,165,226 |
| Spark Therapeutics, Inc. | | 312,600 | 8,805,942 |
| TESARO, Inc. (a) | | 416,200 | 14,375,548 |
| Ultragenyx Pharmaceutical, Inc. (a) | | 282,800 | 15,879,220 |
| Xencor, Inc. (a) | | 870,300 | 9,416,646 |
| | | | 317,593,027 |
| Health Care Equipment & Supplies - 3.4% | | | |
| CONMED Corp. | | 118,177 | 4,365,458 |
| Integra LifeSciences Holdings Corp. (a) | | 542,368 | 33,328,514 |
| NxStage Medical, Inc. (a) | | 1,678,000 | 31,747,760 |
| Sirona Dental Systems, Inc. (a) | | 196,900 | 20,928,501 |
| Steris PLC | | 259,567 | 17,972,419 |
| Teleflex, Inc. | | 205,300 | 27,857,157 |
| Wright Medical Group NV (a) | | 1,441,552 | 28,758,962 |
| | | | 164,958,771 |
| Health Care Providers & Services - 2.3% | | | |
| Amedisys, Inc. (a) | | 315,400 | 11,275,550 |
| AmSurg Corp. (a) | | 377,500 | 27,629,225 |
| Molina Healthcare, Inc. (a)(b) | | 316,400 | 17,373,524 |
| Surgical Care Affiliates, Inc. (a) | | 1,030,436 | 43,968,704 |
| Team Health Holdings, Inc. (a) | | 267,100 | 10,916,377 |
| | | | 111,163,380 |
| Health Care Technology - 0.2% | | | |
| Press Ganey Holdings, Inc. | | 286,350 | 8,461,643 |
| Life Sciences Tools & Services - 0.6% | | | |
| Bruker Corp. (a) | | 1,321,303 | 29,504,696 |
| Pharmaceuticals - 0.5% | | | |
| Innoviva, Inc. | | 1,126,649 | 11,289,023 |
| Prestige Brands Holdings, Inc. (a) | | 305,854 | 14,277,265 |
| | | | 25,566,288 |
|
| TOTAL HEALTH CARE | | | 657,247,805 |
|
| INDUSTRIALS - 12.3% | | | |
| Aerospace & Defense - 1.9% | | | |
| Moog, Inc. Class A (a) | | 449,817 | 20,840,022 |
| Orbital ATK, Inc. | | 408,366 | 36,846,864 |
| Teledyne Technologies, Inc. (a) | | 451,634 | 36,695,263 |
| | | | 94,382,149 |
| Air Freight & Logistics - 0.7% | | | |
| Hub Group, Inc. Class A (a) | | 1,104,163 | 33,643,847 |
| Airlines - 0.6% | | | |
| JetBlue Airways Corp. (a) | | 1,262,100 | 26,895,351 |
| Building Products - 0.3% | | | |
| Allegion PLC | | 271,300 | 16,429,928 |
| Commercial Services & Supplies - 2.8% | | | |
| Deluxe Corp. | | 700,000 | 39,130,000 |
| Interface, Inc. | | 1,266,100 | 21,384,429 |
| Multi-Color Corp. | | 420,700 | 26,516,721 |
| Progressive Waste Solution Ltd. (Canada) | | 742,400 | 20,874,535 |
| West Corp. | | 1,561,800 | 28,284,198 |
| | | | 136,189,883 |
| Construction & Engineering - 0.9% | | | |
| EMCOR Group, Inc. | | 973,800 | 44,502,660 |
| Electrical Equipment - 0.4% | | | |
| OSRAM Licht AG | | 378,720 | 16,908,508 |
| Machinery - 2.2% | | | |
| AGCO Corp. (b) | | 575,200 | 28,052,504 |
| ITT Corp. | | 166,743 | 5,410,810 |
| Kornit Digital Ltd. (a)(b) | | 1,318,900 | 15,114,594 |
| KUKA AG (b) | | 193,500 | 14,876,454 |
| TriMas Corp. (a) | | 859,137 | 14,854,479 |
| Valmont Industries, Inc. | | 287,800 | 30,676,602 |
| | | | 108,985,443 |
| Professional Services - 0.5% | | | |
| Dun & Bradstreet Corp. | | 257,006 | 25,294,531 |
| Trading Companies & Distributors - 2.0% | | | |
| Kaman Corp. | | 806,480 | 32,130,163 |
| Titan Machinery, Inc. (a)(b)(c) | | 1,609,419 | 13,663,967 |
| Watsco, Inc. | | 352,800 | 40,998,888 |
| WESCO International, Inc. (a)(b) | | 305,500 | 12,336,090 |
| | | | 99,129,108 |
|
| TOTAL INDUSTRIALS | | | 602,361,408 |
|
| INFORMATION TECHNOLOGY - 18.3% | | | |
| Communications Equipment - 0.7% | | | |
| F5 Networks, Inc. (a) | | 141,200 | 13,241,736 |
| Ixia (a) | | 1,663,169 | 15,916,527 |
| Radware Ltd. (a) | | 436,301 | 5,828,981 |
| | | | 34,987,244 |
| Electronic Equipment & Components - 1.8% | | | |
| CDW Corp. | | 867,300 | 33,347,685 |
| Fitbit, Inc. (b) | | 477,000 | 7,918,200 |
| Jabil Circuit, Inc. | | 1,199,000 | 23,872,090 |
| Trimble Navigation Ltd. (a) | | 1,214,600 | 23,429,634 |
| | | | 88,567,609 |
| Internet Software & Services - 3.5% | | | |
| Bankrate, Inc. (a) | | 2,592,001 | 29,652,491 |
| Demandware, Inc. (a) | | 352,200 | 14,943,846 |
| EarthLink Holdings Corp. | | 34 | 201 |
| Gogo, Inc. (a)(b) | | 1,975,000 | 28,736,250 |
| MINDBODY, Inc. (b) | | 492,217 | 5,818,005 |
| NIC, Inc. | | 1,053,047 | 20,839,800 |
| Pandora Media, Inc. (a) | | 910,600 | 8,851,032 |
| Rackspace Hosting, Inc. (a) | | 976,817 | 19,741,472 |
| Stamps.com, Inc. (a) | | 220,502 | 20,687,498 |
| Web.com Group, Inc. (a) | | 1,171,541 | 22,060,117 |
| | | | 171,330,712 |
| IT Services - 4.8% | | | |
| EPAM Systems, Inc. (a) | | 205,700 | 15,406,930 |
| ExlService Holdings, Inc. (a) | | 971,452 | 42,413,594 |
| Global Payments, Inc. | | 1,067,700 | 62,940,915 |
| Maximus, Inc. | | 900,304 | 48,049,224 |
| Virtusa Corp. (a) | | 925,329 | 41,380,713 |
| WEX, Inc. (a) | | 323,400 | 23,482,074 |
| | | | 233,673,450 |
| Semiconductors & Semiconductor Equipment - 2.0% | | | |
| Cirrus Logic, Inc. (a) | | 771,500 | 26,786,480 |
| Intersil Corp. Class A | | 1,815,600 | 23,602,800 |
| Monolithic Power Systems, Inc. | | 563,670 | 35,268,832 |
| Qorvo, Inc. (a) | | 243,150 | 9,628,740 |
| | | | 95,286,852 |
| Software - 3.9% | | | |
| BroadSoft, Inc. (a)(b) | | 351,249 | 12,016,228 |
| CommVault Systems, Inc. (a) | | 837,577 | 31,425,889 |
| Fair Isaac Corp. | | 282,500 | 26,998,525 |
| Fleetmatics Group PLC (a) | | 498,300 | 21,631,203 |
| HubSpot, Inc. (a) | | 27,314 | 1,108,675 |
| NetSuite, Inc. (a)(b) | | 186,200 | 12,916,694 |
| Pegasystems, Inc. | | 620,700 | 14,586,450 |
| Qlik Technologies, Inc. (a) | | 575,100 | 14,400,504 |
| RealPage, Inc. (a) | | 703,100 | 13,562,799 |
| RingCentral, Inc. (a) | | 342,100 | 7,464,622 |
| Rovi Corp. (a) | | 418,759 | 8,149,050 |
| Synchronoss Technologies, Inc. (a) | | 911,561 | 27,930,229 |
| | | | 192,190,868 |
| Technology Hardware, Storage & Peripherals - 1.6% | | | |
| Electronics for Imaging, Inc. (a) | | 458,025 | 18,953,075 |
| Nimble Storage, Inc. (a) | | 1,398,800 | 9,190,116 |
| Quantum Corp. (a) | | 11,030,511 | 5,241,699 |
| Silicon Graphics International Corp. (a)(b)(c) | | 2,151,349 | 12,639,175 |
| Super Micro Computer, Inc. (a)(b) | | 1,071,270 | 31,902,421 |
| | | | 77,926,486 |
|
| TOTAL INFORMATION TECHNOLOGY | | | 893,963,221 |
|
| MATERIALS - 3.3% | | | |
| Chemicals - 1.3% | | | |
| Chase Corp. | | 102,000 | 4,686,900 |
| Innospec, Inc. | | 415,408 | 20,708,089 |
| PolyOne Corp. | | 468,001 | 12,664,107 |
| Sensient Technologies Corp. | | 464,100 | 27,692,847 |
| | | | 65,751,943 |
| Containers & Packaging - 1.5% | | | |
| Avery Dennison Corp. | | 280,000 | 17,049,200 |
| Berry Plastics Group, Inc. (a) | | 1,057,260 | 32,880,786 |
| Silgan Holdings, Inc. | | 394,500 | 20,857,215 |
| | | | 70,787,201 |
| Metals & Mining - 0.5% | | | |
| Compass Minerals International, Inc. | | 233,400 | 17,469,990 |
| Steel Dynamics, Inc. | | 466,400 | 8,558,440 |
| | | | 26,028,430 |
|
| TOTAL MATERIALS | | | 162,567,574 |
|
| TELECOMMUNICATION SERVICES - 0.3% | | | |
| Diversified Telecommunication Services - 0.3% | | | |
| Cogent Communications Group, Inc. | | 367,500 | 12,278,175 |
| Towerstream Corp. (a)(b)(c) | | 5,386,878 | 1,158,179 |
| | | | 13,436,354 |
| UTILITIES - 3.7% | | | |
| Electric Utilities - 1.9% | | | |
| El Paso Electric Co. | | 520,380 | 21,299,153 |
| Great Plains Energy, Inc. | | 617,280 | 17,209,766 |
| IDACORP, Inc. | | 374,600 | 26,068,414 |
| Portland General Electric Co. | | 706,732 | 27,470,673 |
| | | | 92,048,006 |
| Gas Utilities - 1.8% | | | |
| Atmos Energy Corp. | | 278,286 | 19,262,957 |
| Laclede Group, Inc. | | 452,700 | 28,945,638 |
| New Jersey Resources Corp. | | 427,100 | 15,042,462 |
| Southwest Gas Corp. | | 394,600 | 23,214,318 |
| | | | 86,465,375 |
|
| TOTAL UTILITIES | | | 178,513,381 |
|
| TOTAL COMMON STOCKS | | | |
| (Cost $4,450,396,543) | | | 4,564,475,327 |
| | | Principal Amount | Value |
|
| U.S. Treasury Obligations - 0.1% | | | |
| U.S. Treasury Bills, yield at date of purchase 0.08% to 0.25% 2/4/16 to 4/7/16 (e) | | | |
| (Cost $4,188,671) | | 4,190,000 | 4,188,327 |
| | | Shares | Value |
|
| Money Market Funds - 7.2% | | | |
| Fidelity Cash Central Fund, 0.38% (f) | | 207,036,690 | $207,036,690 |
| Fidelity Securities Lending Cash Central Fund, 0.42% (f)(g) | | 144,664,053 | 144,664,053 |
| TOTAL MONEY MARKET FUNDS | | | |
| (Cost $351,700,743) | | | 351,700,743 |
| TOTAL INVESTMENT PORTFOLIO - 100.9% | | | |
| (Cost $4,806,285,957) | | | 4,920,364,397 |
| NET OTHER ASSETS (LIABILITIES) - (0.9)% | | | (44,433,835) |
| NET ASSETS - 100% | | | $4,875,930,562 |
| Futures Contracts | | | |
| | Expiration Date | Underlying Face Amount at Value | Unrealized Appreciation/(Depreciation) |
| Purchased | | | |
| Equity Index Contracts | | | |
| 1,695 ICE Russell 2000 Index Contracts (United States) | March 2016 | 174,822,300 | $(2,397,559) |
The face value of futures purchased as a percentage of Net Assets is 3.6%
Legend
(a) Non-income producing
(b) Security or a portion of the security is on loan at period end.
(c) Affiliated company
(d) Restricted securities - Investment in securities not registered under the Securities Act of 1933 (excluding 144A issues). At the end of the period, the value of restricted securities (excluding 144A issues) amounted to $14,261,104 or 0.3% of net assets.
(e) Security or a portion of the security was pledged to cover margin requirements for futures contracts. At period end, the value of securities pledged amounted to $3,495,667.
(f) Affiliated fund that is generally available only to investment companies and other accounts managed by Fidelity Investments. The rate quoted is the annualized seven-day yield of the fund at period end. A complete unaudited listing of the fund's holdings as of its most recent quarter end is available upon request. In addition, each Fidelity Central Fund's financial statements are available on the SEC's website or upon request.
(g) Investment made with cash collateral received from securities on loan.
Additional information on each restricted holding is as follows:
| Security | Acquisition Date | Acquisition Cost |
| Ascendis Pharma A/S ADR | 12/14/15 | $13,797,508 |
Affiliated Central Funds
Information regarding fiscal year to date income earned by the Fund from investments in Fidelity Central Funds is as follows:
| Fund | Income earned |
| Fidelity Cash Central Fund | $305,701 |
| Fidelity Securities Lending Cash Central Fund | 1,538,191 |
| Total | $1,843,892 |
Other Affiliated Issuers
An affiliated company is a company in which the Fund has ownership of at least 5% of the voting securities. Fiscal year to date transactions with companies which are or were affiliates are as follows:
| Affiliate | Value, beginning of period | Purchases | Sales Proceeds | Dividend Income | Value, end of period |
| Banner Corp. | $59,301,956 | $7,593,413 | $7,388,033 | $468,943 | $-- |
| Datalink Corp. | 11,285,581 | -- | 8,966,446 | -- | -- |
| MINDBODY, Inc. | 5,160,680 | -- | 619,335 | -- | -- |
| Silicon Graphics International Corp. | 11,178,886 | -- | 253,209 | -- | 12,639,175 |
| Titan Machinery, Inc. | 22,265,302 | 309,663 | 5,721 | -- | 13,663,967 |
| Towerstream Corp. | 8,511,267 | -- | -- | -- | 1,158,179 |
| WSFS Financial Corp. | 56,720,998 | 1,199,460 | 5,206,273 | 216,110 | 53,681,172 |
| Total | $174,424,670 | $9,102,536 | $22,439,017 | $685,053 | $81,142,493 |
Investment Valuation
The following is a summary of the inputs used, as of January 31, 2016, involving the Fund's assets and liabilities carried at fair value. The inputs or methodology used for valuing securities may not be an indication of the risk associated with investing in those securities. For more information on valuation inputs, and their aggregation into the levels used below, please refer to the Investment Valuation section in the accompanying Notes to Financial Statements.
| | Valuation Inputs at Reporting Date: |
| Description | Total | Level 1 | Level 2 | Level 3 |
| Investments in Securities: | | | | |
| Equities: | | | | |
| Consumer Discretionary | $621,235,181 | $621,235,181 | $-- | $-- |
| Consumer Staples | 150,735,922 | 131,908,394 | 18,827,528 | -- |
| Energy | 130,093,176 | 130,093,176 | -- | -- |
| Financials | 1,154,321,305 | 1,109,764,428 | 44,556,877 | -- |
| Health Care | 657,247,805 | 641,412,181 | 15,835,624 | -- |
| Industrials | 602,361,408 | 570,576,446 | 31,784,962 | -- |
| Information Technology | 893,963,221 | 893,963,221 | -- | -- |
| Materials | 162,567,574 | 162,567,574 | -- | -- |
| Telecommunication Services | 13,436,354 | 13,436,354 | -- | -- |
| Utilities | 178,513,381 | 178,513,381 | -- | -- |
| U.S. Government and Government Agency Obligations | 4,188,327 | -- | 4,188,327 | -- |
| Money Market Funds | 351,700,743 | 351,700,743 | -- | -- |
| Total Investments in Securities: | $4,920,364,397 | $4,805,171,079 | $115,193,318 | $-- |
| Derivative Instruments: | | | | |
| Liabilities | | | | |
| Futures Contracts | $(2,397,559) | $(2,397,559) | $-- | $-- |
| Total Liabilities | $(2,397,559) | $(2,397,559) | $-- | $-- |
| Total Derivative Instruments: | $(2,397,559) | $(2,397,559) | $-- | $-- |
The following is a summary of transfers between Level 1 and Level 2 for the period ended January 31, 2016. Transfers are assumed to have occurred at the beginning of the period, and are primarily attributable to the valuation techniques used for foreign equity securities, as discussed in the accompanying Notes to Financial Statements:
| Transfers | Total |
| Level 1 to Level 2 | $105,774,037 |
| Level 2 to Level 1 | $0 |
Value of Derivative Instruments
The following table is a summary of the Fund's value of derivative instruments by primary risk exposure as of January 31, 2016. For additional information on derivative instruments, please refer to the Derivative Instruments section in the accompanying Notes to Financial Statements.
| Primary Risk Exposure / Derivative Type | Value |
| | Asset | Liability |
| Equity Risk | | |
| Futures Contracts(a) | $0 | $(2,397,559) |
| Total Equity Risk | 0 | (2,397,559) |
| Total Value of Derivatives | $0 | $(2,397,559) |
(a) Reflects gross cumulative appreciation (depreciation) on futures contracts as presented in the Schedule of Investments. Only the period end receivable or payable for daily variation margin and net unrealized appreciation (depreciation) are presented in the Statement of Assets and Liabilities.
See accompanying notes which are an integral part of the financial statements.
Financial Statements
Statement of Assets and Liabilities
| | | January 31, 2016 (Unaudited) |
| Assets | | |
Investment in securities, at value (including securities loaned of $145,693,164) — See accompanying schedule:
Unaffiliated issuers (cost $4,341,856,902) | $4,487,521,161 | |
| Fidelity Central Funds (cost $351,700,743) | 351,700,743 | |
| Other affiliated issuers (cost $112,728,312) | 81,142,493 | |
| Total Investments (cost $4,806,285,957) | | $4,920,364,397 |
| Cash | | 1,552,690 |
| Receivable for investments sold | | 32,472,765 |
| Receivable for fund shares sold | | 109,902,202 |
| Dividends receivable | | 1,238,192 |
| Distributions receivable from Fidelity Central Funds | | 371,752 |
| Receivable for daily variation margin for derivative instruments | | 1,986,429 |
| Prepaid expenses | | 9,263 |
| Other receivables | | 101,577 |
| Total assets | | 5,067,999,267 |
| Liabilities | | |
| Payable for investments purchased | $43,877,688 | |
| Payable for fund shares redeemed | 230,343 | |
| Accrued management fee | 2,826,084 | |
| Other affiliated payables | 423,216 | |
| Other payables and accrued expenses | 47,321 | |
| Collateral on securities loaned, at value | 144,664,053 | |
| Total liabilities | | 192,068,705 |
| Net Assets | | $4,875,930,562 |
| Net Assets consist of: | | |
| Paid in capital | | $4,822,538,482 |
| Distributions in excess of net investment income | | (119,269) |
| Accumulated undistributed net realized gain (loss) on investments and foreign currency transactions | | (58,135,432) |
| Net unrealized appreciation (depreciation) on investments and assets and liabilities in foreign currencies | | 111,646,781 |
| Net Assets | | $4,875,930,562 |
| Series Small Cap Opportunities: | | |
| Net Asset Value, offering price and redemption price per share ($2,258,474,682 ÷ 199,650,391 shares) | | $11.31 |
| Class F: | | |
| Net Asset Value, offering price and redemption price per share ($2,617,455,880 ÷ 230,050,039 shares) | | $11.38 |
See accompanying notes which are an integral part of the financial statements.
Statement of Operations
| | | Six months ended January 31, 2016 (Unaudited) |
| Investment Income | | |
| Dividends (including $685,053 earned from other affiliated issuers) | | $29,898,557 |
| Interest | | 1,470 |
| Income from Fidelity Central Funds | | 1,843,892 |
| Total income | | 31,743,919 |
| Expenses | | |
| Management fee | | |
| Basic fee | $18,359,921 | |
| Performance adjustment | (1,476,036) | |
| Transfer agent fees | 2,042,248 | |
| Accounting and security lending fees | 559,575 | |
| Custodian fees and expenses | 44,700 | |
| Independent trustees' compensation | 11,796 | |
| Audit | 33,992 | |
| Legal | 10,733 | |
| Miscellaneous | 15,164 | |
| Total expenses before reductions | 19,602,093 | |
| Expense reductions | (194,851) | 19,407,242 |
| Net investment income (loss) | | 12,336,677 |
| Realized and Unrealized Gain (Loss) | | |
| Net realized gain (loss) on: | | |
| Investment securities: | | |
| Unaffiliated issuers | (44,759,766) | |
| Other affiliated issuers | (9,108,115) | |
| Foreign currency transactions | (72,274) | |
| Futures contracts | (2,034,812) | |
| Total net realized gain (loss) | | (55,974,967) |
Change in net unrealized appreciation (depreciation) on:
Investment securities | (689,546,896) | |
| Assets and liabilities in foreign currencies | 5,803 | |
| Futures contracts | (1,549,577) | |
| Total change in net unrealized appreciation (depreciation) | | (691,090,670) |
| Net gain (loss) | | (747,065,637) |
| Net increase (decrease) in net assets resulting from operations | | $(734,728,960) |
See accompanying notes which are an integral part of the financial statements.
Statement of Changes in Net Assets
| | Six months ended January 31, 2016 (Unaudited) | Year ended July 31, 2015 |
| Increase (Decrease) in Net Assets | | |
| Operations | | |
| Net investment income (loss) | $12,336,677 | $27,929,552 |
| Net realized gain (loss) | (55,974,967) | 299,741,252 |
| Change in net unrealized appreciation (depreciation) | (691,090,670) | 340,925,005 |
| Net increase (decrease) in net assets resulting from operations | (734,728,960) | 668,595,809 |
| Distributions to shareholders from net investment income | (25,267,159) | (23,180,446) |
| Distributions to shareholders from net realized gain | (274,804,438) | (274,549,615) |
| Total distributions | (300,071,597) | (297,730,061) |
| Share transactions - net increase (decrease) | 342,217,256 | 171,463,697 |
| Total increase (decrease) in net assets | (692,583,301) | 542,329,445 |
| Net Assets | | |
| Beginning of period | 5,568,513,863 | 5,026,184,418 |
| End of period (including distributions in excess of net investment income of $119,269 and undistributed net investment income of $12,811,213, respectively) | $4,875,930,562 | $5,568,513,863 |
See accompanying notes which are an integral part of the financial statements.
Financial Highlights — Fidelity Series Small Cap Opportunities Fund
| | Six months ended (Unaudited) | Years ended July 31, | | | | |
| January 31, | 2016 | 2015 | 2014 | 2013 | 2012 | 2011 |
| Selected Per–Share Data | | | | | | |
| Net asset value, beginning of period | $13.83 | $12.96 | $13.55 | $10.93 | $11.22 | $8.76 |
| Income from Investment Operations | | | | | | |
| Net investment income (loss)A | .02 | .05 | .02 | .04 | –B | –B,C |
| Net realized and unrealized gain (loss) | (1.81) | 1.53 | .77 | 3.20 | (.17) | 2.50 |
| Total from investment operations | (1.79) | 1.58 | .79 | 3.24 | (.17) | 2.50 |
| Distributions from net investment income | (.05) | (.04) | –B | (.05) | –B | –D |
| Distributions from net realized gain | (.68) | (.66) | (1.38) | (.57) | (.11) | (.04)D |
| Total distributions | (.73) | (.71)E | (1.38) | (.62) | (.12)F | (.04) |
| Net asset value, end of period | $11.31 | $13.83 | $12.96 | $13.55 | $10.93 | $11.22 |
| Total ReturnG,H | (13.42)% | 12.66% | 6.29% | 30.91% | (1.41)% | 28.50% |
| Ratios to Average Net AssetsI,J | | | | | | |
| Expenses before reductions | .83%K | .77% | .82% | .98% | 1.12% | 1.10% |
| Expenses net of fee waivers, if any | .83%K | .76% | .82% | .98% | 1.12% | 1.10% |
| Expenses net of all reductions | .83%K | .76% | .82% | .96% | 1.11% | 1.09% |
| Net investment income (loss) | .38%K | .41% | .19% | .30% | .04% | (.04)%C |
| Supplemental Data | | | | | | |
| Net assets, end of period (000 omitted) | $2,258,475 | $2,647,013 | $2,425,973 | $1,602,664 | $1,329,447 | $1,415,570 |
| Portfolio turnover rateL | 51%K | 59% | 90%M | 77% | 66% | 73% |
A Calculated based on average shares outstanding during the period.
B Amount represents less than $.005 per share.
C Net Investment income per share reflects a large, non-recurring dividend which amounted to $.02 per share. Excluding this non-recurring dividend, the ratio of net investment income (loss) to average net assets would have been (.27)%.
D The amounts shown reflect certain reclassifications related to book to tax differences that were made in the year shown.
E Total distributions of $.71 per share is comprised of distributions from net investment income of $.042 and distributions from net realized gain of $.664 per share.
F Total distributions of $.12 per share is comprised of distributions from net investment income of $.003 and distributions from net realized gain of $.113 per share.
G Total returns for periods of less than one year are not annualized.
H Total returns would have been lower if certain expenses had not been reduced during the applicable periods shown.
I Fees and expenses of any underlying Fidelity Central Funds are not included in the Fund's expense ratio. The Fund indirectly bears its proportionate share of the expenses of any underlying Fidelity Central Funds.
J Expense ratios reflect operating expenses of the class. Expenses before reductions do not reflect amounts reimbursed by the investment adviser or reductions from brokerage service arrangements or reductions from other expense offset arrangements and do not represent the amount paid by the class during periods when reimbursements or reductions occur. Expenses net of fee waivers reflect expenses after reimbursement by the investment adviser but prior to reductions from brokerage service arrangements or other expense offset arrangements. Expenses net of all reductions represent the net expenses paid by the class.
K Annualized
L Amount does not include the portfolio activity of any underlying Fidelity Central Funds.
M Portfolio turnover rate excludes securities received or delivered in-kind.
See accompanying notes which are an integral part of the financial statements.
Financial Highlights — Fidelity Series Small Cap Opportunities Fund Class F
| | Six months ended (Unaudited) | Years ended July 31, | | | | |
| January 31, | 2016 | 2015 | 2014 | 2013 | 2012 | 2011 |
| Selected Per–Share Data | | | | | | |
| Net asset value, beginning of period | $13.92 | $13.04 | $13.62 | $10.99 | $11.27 | $8.79 |
| Income from Investment Operations | | | | | | |
| Net investment income (loss)A | .03 | .08 | .05 | .06 | .03 | .02B |
| Net realized and unrealized gain (loss) | (1.82) | 1.53 | .77 | 3.21 | (.18) | 2.50 |
| Total from investment operations | (1.79) | 1.61 | .82 | 3.27 | (.15) | 2.52 |
| Distributions from net investment income | (.07) | (.07) | (.01) | (.07) | (.01) | –C |
| Distributions from net realized gain | (.68) | (.66) | (1.39) | (.57) | (.11) | (.04)C |
| Total distributions | (.75) | (.73) | (1.40) | (.64) | (.13)D | (.04) |
| Net asset value, end of period | $11.38 | $13.92 | $13.04 | $13.62 | $10.99 | $11.27 |
| Total ReturnE,F | (13.33)% | 12.87% | 6.52% | 31.09% | (1.23)% | 28.74% |
| Ratios to Average Net AssetsG,H | | | | | | |
| Expenses before reductions | .67%I | .60% | .65% | .79% | .91% | .89% |
| Expenses net of fee waivers, if any | .67%I | .60% | .65% | .79% | .91% | .89% |
| Expenses net of all reductions | .66%I | .59% | .65% | .77% | .91% | .88% |
| Net investment income (loss) | .55%I | .58% | .36% | .49% | .24% | .17%B |
| Supplemental Data | | | | | | |
| Net assets, end of period (000 omitted) | $2,617,456 | $2,921,501 | $2,600,212 | $1,351,926 | $923,975 | $478,821 |
| Portfolio turnover rateJ | 51%I | 59% | 90%K | 77% | 66% | 73% |
A Calculated based on average shares outstanding during the period.
B Net Investment income per share reflects a large, non-recurring dividend which amounted to $.02 per share. Excluding this non-recurring dividend, the ratio of net investment income (loss) to average net assets would have been (.06)%.
C The amounts shown reflect certain reclassifications related to book to tax differences that were made in the year shown.
D Total distributions of $.13 per share is comprised of distributions from net investment income of $.012 and distributions from net realized gain of $.113 per share.
E Total returns for periods of less than one year are not annualized.
F Total returns would have been lower if certain expenses had not been reduced during the applicable periods shown.
G Fees and expenses of any underlying Fidelity Central Funds are not included in the Fund's expense ratio. The Fund indirectly bears its proportionate share of the expenses of any underlying Fidelity Central Funds.
H Expense ratios reflect operating expenses of the class. Expenses before reductions do not reflect amounts reimbursed by the investment adviser or reductions from brokerage service arrangements or reductions from other expense offset arrangements and do not represent the amount paid by the class during periods when reimbursements or reductions occur. Expenses net of fee waivers reflect expenses after reimbursement by the investment adviser but prior to reductions from brokerage service arrangements or other expense offset arrangements. Expenses net of all reductions represent the net expenses paid by the class.
I Annualized
J Amount does not include the portfolio activity of any underlying Fidelity Central Funds.
K Portfolio turnover rate excludes securities received or delivered in-kind.
See accompanying notes which are an integral part of the financial statements.
Notes to Financial Statements (Unaudited)
For the period ended January 31, 2016
1. Organization.
Fidelity Series Small Cap Opportunities Fund (the Fund) is a fund of Fidelity Securities Fund (the Trust) and is authorized to issue an unlimited number of shares. Shares of the Fund are only available for purchase by mutual funds for which Fidelity Management & Research Company (FMR) or an affiliate serves as an investment manager and, for shares of Series Small Cap Opportunities, FMR investment professionals. The Trust is registered under the Investment Company Act of 1940, as amended (the 1940 Act), as an open-end management investment company organized as a Massachusetts business trust. The Fund offers Series Small Cap Opportunities and Class F shares, each of which has equal rights as to assets and voting privileges. Each class has exclusive voting rights with respect to matters that affect that class.
2. Investments in Fidelity Central Funds.
The Fund invests in Fidelity Central Funds, which are open-end investment companies generally available only to other investment companies and accounts managed by the investment adviser and its affiliates. The Fund's Schedule of Investments lists each of the Fidelity Central Funds held as of period end, if any, as an investment of the Fund, but does not include the underlying holdings of each Fidelity Central Fund. As an Investing Fund, the Fund indirectly bears its proportionate share of the expenses of the underlying Fidelity Central Funds.
The Money Market Central Funds seek preservation of capital and current income and are managed by Fidelity Investments Money Management, Inc. (FIMM), an affiliate of the investment adviser. Annualized expenses of the Money Market Central Funds as of their most recent shareholder report date are less than .005%.
A complete unaudited list of holdings for each Fidelity Central Fund is available upon request or at the Securities and Exchange Commission (the SEC) website at www.sec.gov. In addition, the financial statements of the Fidelity Central Funds are available on the SEC website or upon request.
3. Significant Accounting Policies.
The financial statements have been prepared in conformity with accounting principles generally accepted in the United States of America (GAAP), which require management to make certain estimates and assumptions at the date of the financial statements. Actual results could differ from those estimates. Subsequent events, if any, through the date that the financial statements were issued have been evaluated in the preparation of the financial statements. The following summarizes the significant accounting policies of the Fund:
Investment Valuation. Investments are valued as of 4:00 p.m. Eastern time on the last calendar day of the period. The Board of Trustees (the Board) has delegated the day to day responsibility for the valuation of the Fund's investments to the FMR Fair Value Committee (the Committee). In accordance with valuation policies and procedures approved by the Board, the Fund attempts to obtain prices from one or more third party pricing vendors or brokers to value its investments. When current market prices, quotations or currency exchange rates are not readily available or reliable, investments will be fair valued in good faith by the Committee, in accordance with procedures adopted by the Board. Factors used in determining fair value vary by investment type and may include market or investment specific events, changes in interest rates and credit quality. The frequency with which these procedures are used cannot be predicted and they may be utilized to a significant extent. The Committee oversees the Fund's valuation policies and procedures and reports to the Board on the Committee's activities and fair value determinations. The Board monitors the appropriateness of the procedures used in valuing the Fund's investments and ratifies the fair value determinations of the Committee.
The Fund categorizes the inputs to valuation techniques used to value its investments into a disclosure hierarchy consisting of three levels as shown below:
- Level 1 – quoted prices in active markets for identical investments
- Level 2 – other significant observable inputs (including quoted prices for similar investments, interest rates, prepayment speeds, etc.)
- Level 3 – unobservable inputs (including the Fund's own assumptions based on the best information available)
Valuation techniques used to value the Fund's investments by major category are as follows:
Equity securities, including restricted securities, for which market quotations are readily available, are valued at the last reported sale price or official closing price as reported by a third party pricing vendor on the primary market or exchange on which they are traded and are categorized as Level 1 in the hierarchy. In the event there were no sales during the day or closing prices are not available, securities are valued at the last quoted bid price or may be valued using the last available price and are generally categorized as Level 2 in the hierarchy. For foreign equity securities, when market or security specific events arise, comparisons to the valuation of American Depositary Receipts (ADRs), futures contracts, Exchange-Traded Funds (ETFs) and certain indexes as well as quoted prices for similar securities may be used and would be categorized as Level 2 in the hierarchy. Utilizing these techniques may result in transfers between Level 1 and Level 2. For equity securities, including restricted securities, where observable inputs are limited, assumptions about market activity and risk are used and these securities may be categorized as Level 3 in the hierarchy.
Debt securities, including restricted securities, are valued based on evaluated prices received from third party pricing vendors or from brokers who make markets in such securities. U.S. government and government agency obligations are valued by pricing vendors who utilize matrix pricing which considers yield or price of bonds of comparable quality, coupon, maturity and type or by broker-supplied prices. When independent prices are unavailable or unreliable, debt securities may be valued utilizing pricing methodologies which consider similar factors that would be used by third party pricing vendors. Debt securities are generally categorized as Level 2 in the hierarchy but may be Level 3 depending on the circumstances.
Futures contracts are valued at the settlement price established each day by the board of trade or exchange on which they are traded and are categorized as Level 1 in the hierarchy. Investments in open-end mutual funds, including the Fidelity Central Funds, are valued at their closing net asset value (NAV) each business day and are categorized as Level 1 in the hierarchy.
Changes in valuation techniques may result in transfers in or out of an assigned level within the disclosure hierarchy. The aggregate value of investments by input level as of January 31, 2016, including information on transfers between Levels 1 and 2, is included at the end of the Fund's Schedule of Investments.
Foreign Currency. The Fund may use foreign currency contracts to facilitate transactions in foreign-denominated securities. Gains and losses from these transactions may arise from changes in the value of the foreign currency or if the counterparties do not perform under the contracts' terms.
Foreign-denominated assets, including investment securities, and liabilities are translated into U.S. dollars at the exchange rates at period end. Purchases and sales of investment securities, income and dividends received and expenses denominated in foreign currencies are translated into U.S. dollars at the exchange rate in effect on the transaction date.
The effects of exchange rate fluctuations on investments are included with the net realized and unrealized gain (loss) on investment securities. Other foreign currency transactions resulting in realized and unrealized gain (loss) are disclosed separately.
Investment Transactions and Income. For financial reporting purposes, the Fund's investment holdings and NAV include trades executed through the end of the last business day of the period. The NAV per share for processing shareholder transactions is calculated as of the close of business of the New York Stock Exchange (NYSE), normally 4:00 p.m. Eastern time and includes trades executed through the end of the prior business day. Gains and losses on securities sold are determined on the basis of identified cost and may include proceeds received from litigation. Dividend income is recorded on the ex-dividend date, except for certain dividends from foreign securities where the ex-dividend date may have passed, which are recorded as soon as the Fund is informed of the ex-dividend date. Non-cash dividends included in dividend income, if any, are recorded at the fair market value of the securities received. Income and capital gain distributions from Fidelity Central Funds, if any, are recorded on the ex-dividend date. Distributions received on securities that represent a return of capital or capital gain are recorded as a reduction of cost of investments and/or as a realized gain. Subsequent to ex-dividend date the Fund determines the components of these distributions, based upon receipt of tax filings or other correspondence relating to the underlying investment. Interest income is accrued as earned and includes coupon interest and amortization of premium and accretion of discount on debt securities as applicable. Investment income is recorded net of foreign taxes withheld where recovery of such taxes is uncertain.
Class Allocations and Expenses. Investment income, realized and unrealized capital gains and losses, common expenses of the Fund, and certain fund-level expense reductions, if any, are allocated daily on a pro-rata basis to each class based on the relative net assets of each class to the total net assets of the Fund. Each class differs with respect to transfer agent fees incurred. Certain expense reductions may also differ by class. For the reporting period, the allocated portion of income and expenses to each class as a percent of its average net assets may vary due to the timing of recording these transactions in relation to fluctuating net assets of the classes. Expenses directly attributable to a fund are charged to that fund. Expenses attributable to more than one fund are allocated among the respective funds on the basis of relative net assets or other appropriate methods. Expense estimates are accrued in the period to which they relate and adjustments are made when actual amounts are known.
Income Tax Information and Distributions to Shareholders. Each year, the Fund intends to qualify as a regulated investment company under Subchapter M of the Internal Revenue Code, including distributing substantially all of its taxable income and realized gains. As a result, no provision for U.S. Federal income taxes is required. The Fund files a U.S. federal tax return, in addition to state and local tax returns as required. The Fund's federal income tax returns are subject to examination by the Internal Revenue Service (IRS) for a period of three fiscal years after they are filed. State and local tax returns may be subject to examination for an additional fiscal year depending on the jurisdiction. Foreign taxes are provided for based on the Fund's understanding of the tax rules and rates that exist in the foreign markets in which it invests.
Distributions are declared and recorded on the ex-dividend date. Income dividends and capital gain distributions are declared separately for each class. Income and capital gain distributions are determined in accordance with income tax regulations, which may differ from GAAP.
Capital accounts within the financial statements are adjusted for permanent book-tax differences. These adjustments have no impact on net assets or the results of operations. Capital accounts are not adjusted for temporary book-tax differences which will reverse in a subsequent period.
Book-tax differences are primarily due to futures transactions, foreign currency transactions, market discount, partnerships and losses deferred due to wash sales.
The federal tax cost of investment securities and unrealized appreciation (depreciation) as of period end were as follows:
| Gross unrealized appreciation | $667,096,153 |
| Gross unrealized depreciation | (562,873,171) |
| Net unrealized appreciation (depreciation) on securities | $104,222,982 |
| Tax cost | $4,816,141,415 |
Restricted Securities. The Fund may invest in securities that are subject to legal or contractual restrictions on resale. These securities generally may be resold in transactions exempt from registration or to the public if the securities are registered. Disposal of these securities may involve time-consuming negotiations and expense, and prompt sale at an acceptable price may be difficult. Information regarding restricted securities is included at the end of the Fund's Schedule of Investments.
4. Derivative Instruments.
Risk Exposures and the Use of Derivative Instruments. The Fund's investment objective allows the Fund to enter into various types of derivative contracts, including futures contracts. Derivatives are investments whose value is primarily derived from underlying assets, indices or reference rates and may be transacted on an exchange or over-the-counter (OTC). Derivatives may involve a future commitment to buy or sell a specified asset based on specified terms, to exchange future cash flows at periodic intervals based on a notional principal amount, or for one party to make one or more payments upon the occurrence of specified events in exchange for periodic payments from the other party.
The Fund used derivatives to increase returns and to manage exposure to certain risks as defined below. The success of any strategy involving derivatives depends on analysis of numerous economic factors, and if the strategies for investment do not work as intended, the Fund may not achieve its objectives.
The Fund's use of derivatives increased or decreased its exposure to the following risk:
| Equity Risk | Equity risk relates to the fluctuations in the value of financial instruments as a result of changes in market prices (other than those arising from interest rate risk or foreign exchange risk), whether caused by factors specific to an individual investment, its issuer, or all factors affecting all instruments traded in a market or market segment.
|
The Fund is also exposed to additional risks from investing in derivatives, such as liquidity risk and counterparty credit risk. Liquidity risk is the risk that the Fund will be unable to close out the derivative in the open market in a timely manner. Counterparty credit risk is the risk that the counterparty will not be able to fulfill its obligation to the Fund. Counterparty credit risk related to exchange-traded futures contracts may be mitigated by the protection provided by the exchange on which they trade.
Investing in derivatives may involve greater risks than investing in the underlying assets directly and, to varying degrees, may involve risk of loss in excess of any initial investment and collateral received and amounts recognized in the Statement of Assets and Liabilities. In addition, there may be the risk that the change in value of the derivative contract does not correspond to the change in value of the underlying instrument.
Futures Contracts. A futures contract is an agreement between two parties to buy or sell a specified underlying instrument for a fixed price at a specified future date. The Fund used futures contracts to manage its exposure to the stock market.
Upon entering into a futures contract, a fund is required to deposit either cash or securities (initial margin) with a clearing broker in an amount equal to a certain percentage of the face value of the contract. Futures contracts are marked-to-market daily and subsequent daily payments (variation margin) are made or received by a fund depending on the daily fluctuations in the value of the futures contracts and are recorded as unrealized appreciation or (depreciation). This receivable and/or payable, if any, is included in daily variation margin for derivative instruments in the Statement of Assets and Liabilities. Realized gain or (loss) is recorded upon the expiration or closing of a futures contract.
Any open futures contracts at period end are presented in the Schedule of Investments under the caption "Futures Contracts". The underlying face amount at value reflects each contract's exposure to the underlying instrument or index at period end and is representative of volume of activity during the period. Securities deposited to meet initial margin requirements are identified in the Schedule of Investments.
During the period the Fund recognized net realized gain (loss) of $(2,034,812) and a change in net unrealized appreciation (depreciation) of $(1,549,577) related to its investment in futures contracts. These amounts are included in the Statement of Operations.
5. Purchases and Sales of Investments.
Purchases and sales of securities, other than short-term securities, aggregated $1,375,562,220 and $1,274,393,559, respectively.
6. Fees and Other Transactions with Affiliates.
Management Fee. Fidelity Management & Research Company (the investment adviser) and its affiliates provide the Fund with investment management related services for which the Fund pays a monthly management fee. The management fee is the sum of an individual fund fee rate that is based on an annual rate of .45% of the Fund's average net assets and an annualized group fee rate that averaged .25% during the period. The group fee rate is based upon the average net assets of all the mutual funds advised by the investment adviser, including any mutual funds previously advised by the investment adviser that are currently advised by Fidelity SelectCo, LLC, an affiliate of the investment adviser. The group fee rate decreases as assets under management increase and increases as assets under management decrease. In addition, the management fee is subject to a performance adjustment (up to a maximum of +/- .20% of the Fund's average net assets over a 36 month performance period). The upward or downward adjustment to the management fee is based on the relative investment performance of Series Small Cap Opportunities as compared to its benchmark index, the Russell 2000 Index, over the same 36 month performance period. For the reporting period, the total annualized management fee rate, including the performance adjustment, was .64% of the Fund's average net assets. The performance adjustment included in the management fee rate may be higher or lower than the maximum performance adjustment rate due to the difference between the average net assets for the reporting and performance periods.
Transfer Agent Fees. Fidelity Investments Institutional Operations Company, Inc., (FIIOC), an affiliate of the investment adviser, is the transfer, dividend disbursing and shareholder servicing agent for each class of the Fund. FIIOC receives account fees and asset-based fees that vary according to the account size and type of account of the shareholders of Series Small Cap Opportunities. FIIOC receives no fees for providing transfer agency services to Class F. FIIOC pays for typesetting, printing and mailing of shareholder reports, except proxy statements.
For the period, transfer agent fees for each applicable class were as follows:
| | Amount | % of
Class-Level Average
Net Assets(a) |
| Series Small Cap Opportunities | $2,042,248 | .17 |
(a) Annualized
Accounting and Security Lending Fees. Fidelity Service Company, Inc. (FSC), an affiliate of the investment adviser, maintains the Fund's accounting records. The accounting fee is based on the level of average net assets for each month. Under a separate contract, FSC administers the security lending program. The security lending fee is based on the number and duration of lending transactions.
Brokerage Commissions. The Fund placed a portion of its portfolio transactions with brokerage firms which are affiliates of the investment adviser. Brokerage commissions are included in net realized gain (loss) and change in net unrealized appreciation (depreciation) in the Statement of Operations. The commissions paid to these affiliated firms were $38,295 for the period.
Interfund Trades. The Fund may purchase from or sell securities to other Fidelity Funds under procedures adopted by the Board. The procedures have been designed to ensure these interfund trades are executed in accordance with Rule 17a-7 of the 1940 Act. Interfund trades are included within the respective purchases and sales amounts shown in the Purchases and Sales of Investments note.
7. Committed Line of Credit.
The Fund participates with other funds managed by the investment adviser or an affiliate in a $4.25 billion credit facility (the "line of credit") to be utilized for temporary or emergency purposes to fund shareholder redemptions or for other short-term liquidity purposes. The Fund has agreed to pay commitment fees on its pro-rata portion of the line of credit, which amounted to $3,590 and is reflected in Miscellaneous expenses on the Statement of Operations. During the period, the Fund did not borrow on this line of credit.
8. Security Lending.
The Fund lends portfolio securities through a lending agent from time to time in order to earn additional income. For equity securities, a lending agent is used and may loan securities to certain qualified borrowers, including Fidelity Capital Markets (FCM), a broker-dealer affiliated with the Fund. On the settlement date of the loan, the Fund receives collateral (in the form of U.S. Treasury obligations, letters of credit and/or cash) against the loaned securities and maintains collateral in an amount not less than 100% of the market value of the loaned securities during the period of the loan. The market value of the loaned securities is determined at the close of business of the Fund and any additional required collateral is delivered to the Fund on the next business day. The Fund or borrower may terminate the loan at any time, and if the borrower defaults on its obligation to return the securities loaned because of insolvency or other reasons, the Fund may apply collateral received from the borrower against the obligation. The Fund may experience delays and costs in recovering the securities loaned. Any cash collateral received is invested in Fidelity Securities Lending Cash Central Fund. The value of loaned securities and cash collateral at period end are disclosed on the Fund's Statement of Assets and Liabilities. The value of securities loaned to FCM at period end was $3,715,226. Security lending income represents the income earned on investing cash collateral, less rebates paid to borrowers and any lending agent fees associated with the loan, plus any premium payments received for lending certain types of securities. Security lending income is presented in the Statement of Operations as a component of income from Fidelity Central Funds. Total security lending income during the period amounted to $1,538,191, including $345,209 from securities loaned to FCM.
9. Expense Reductions.
Commissions paid to certain brokers with whom the investment adviser, or its affiliates, places trades on behalf of the Fund include an amount in addition to trade execution, which may be rebated back to the Fund to offset certain expenses. This amount totaled $175,349 for the period. In addition, through arrangements with the Fund's custodian, credits realized as a result of certain uninvested cash balances were used to reduce the Fund's expenses. During the period, these credits reduced the Fund's custody expenses by $462.
In addition, during the period the investment adviser reimbursed and/or waived a portion of fund-level operating expenses in the amount of $19,040.
10. Distributions to Shareholders.
Distributions to shareholders of each class were as follows:
| | Six months ended January 31, 2016 | Year ended July 31, 2015 |
| From net investment income | | |
| Series Small Cap Opportunities | $9,533,676 | $8,552,160 |
| Class F | 15,733,483 | 14,628,286 |
| Total | $25,267,159 | $23,180,446 |
| From net realized gain | | |
| Series Small Cap Opportunities | $129,456,186 | $131,736,083 |
| Class F | 145,348,252 | 142,813,532 |
| Total | $274,804,438 | $274,549,615 |
11. Share Transactions.
Transactions for each class of shares were as follows:
| | Shares | Shares | Dollars | Dollars |
| | Six months ended January 31, 2016 | Year ended July 31, 2015 | Six months ended January 31, 2016 | Year ended July 31, 2015 |
| Series Small Cap Opportunities | | | | |
| Shares sold | 15,589,793 | 28,483,380 | $187,645,618 | $373,867,989 |
| Reinvestment of distributions | 11,216,113 | 11,011,697 | 138,989,862 | 140,288,243 |
| Shares redeemed | (18,573,857) | (35,222,232) | (232,100,377) | (467,728,523) |
| Net increase (decrease) | 8,232,049 | 4,272,845 | $94,535,103 | $46,427,709 |
| Class F | | | | |
| Shares sold | 26,035,176 | 42,361,309 | $317,726,021 | $560,257,508 |
| Reinvestment of distributions | 12,929,264 | 12,293,383 | 161,081,735 | 157,441,818 |
| Shares redeemed | (18,847,817) | (44,064,466) | (231,125,603) | (592,663,338) |
| Net increase (decrease) | 20,116,623 | 10,590,226 | $247,682,153 | $125,035,988 |
12. Other.
The Fund's organizational documents provide former and current trustees and officers with a limited indemnification against liabilities arising in connection with the performance of their duties to the Fund. In the normal course of business, the Fund may also enter into contracts that provide general indemnifications. The Fund's maximum exposure under these arrangements is unknown as this would be dependent on future claims that may be made against the Fund. The risk of material loss from such claims is considered remote.
At the end of the period, mutual funds managed by the investment adviser or its affiliates were the owners of record of all of the outstanding shares of the Fund.
Shareholder Expense Example
As a shareholder of the Fund, you incur two types of costs: (1) transaction costs, and (2) ongoing costs, including management fees and other Fund expenses. This Example is intended to help you understand your ongoing costs (in dollars) of investing in the Fund and to compare these costs with the ongoing costs of investing in other mutual funds.
The Example is based on an investment of $1,000 invested at the beginning of the period and held for the entire period (August 1, 2015 to January 31, 2016).
Actual Expenses
The first line of the accompanying table for each class of the Fund provides information about actual account values and actual expenses. You may use the information in this line, together with the amount you invested, to estimate the expenses that you paid over the period. Simply divide your account value by $1,000.00 (for example, an $8,600 account value divided by $1,000.00 = 8.6), then multiply the result by the number in the first line for a class of the Fund under the heading entitled "Expenses Paid During Period" to estimate the expenses you paid on your account during this period. In addition, the Fund, as a shareholder in the underlying Fidelity Central Funds, will indirectly bear its pro-rata share of the fees and expenses incurred by the underlying Fidelity Central Funds. These fees and expenses are not included in the Fund's annualized expense ratio used to calculate the expense estimate in the table below.
Hypothetical Example for Comparison Purposes
The second line of the accompanying table for each class of the Fund provides information about hypothetical account values and hypothetical expenses based on a Class' actual expense ratio and an assumed rate of return of 5% per year before expenses, which is not the Class' actual return. The hypothetical account values and expenses may not be used to estimate the actual ending account balance or expenses you paid for the period. You may use this information to compare the ongoing costs of investing in the Fund and other funds. To do so, compare this 5% hypothetical example with the 5% hypothetical examples that appear in the shareholder reports of the other funds. In addition, the Fund, as a shareholder in the underlying Fidelity Central Funds, will indirectly bear its pro-rata share of the fees and expenses incurred by the underlying Fidelity Central Funds. These fees and expenses are not included in the Fund's annualized expense ratio used to calculate the expense estimate in the table below.
Please note that the expenses shown in the table are meant to highlight your ongoing costs only and do not reflect any transaction costs. Therefore, the second line of the table is useful in comparing ongoing costs only, and will not help you determine the relative total costs of owning different funds.
| | Annualized Expense Ratio-A | Beginning
Account Value
August 1, 2015 | Ending
Account Value
January 31, 2016 | Expenses Paid
During Period-B
August 1, 2015
to January 31, 2016 |
| Series Small Cap Opportunities | .83% | | | |
| Actual | | $1,000.00 | $865.80 | $3.89 |
| Hypothetical-C | | $1,000.00 | $1,020.96 | $4.22 |
| Class F | .67% | | | |
| Actual | | $1,000.00 | $866.70 | $3.14 |
| Hypothetical-C | | $1,000.00 | $1,021.77 | $3.40 |
A Annualized expense ratio reflects expenses net of applicable fee waivers.
B Expenses are equal to each Class' annualized expense ratio, multiplied by the average account value over the period, multiplied by 184/366 (to reflect the one-half year period).
C 5% return per year before expenses
Corporate Headquarters
245 Summer St.
Boston, MA 02210
www.fidelity.com
SMO-SANN-0316
1.839810.108
Fidelity Advisor® Real Estate Income Fund -
Class I
Semi-Annual Report January 31, 2016 Class I is a class of Fidelity® Real Estate Income Fund |
|
Contents
To view a fund's proxy voting guidelines and proxy voting record for the 12-month period ended June 30, visit http://www.fidelity.com/proxyvotingresults or visit the Securities and Exchange Commission's (SEC) web site at http://www.sec.gov.
You may also call 1-877-208-0098 to request a free copy of the proxy voting guidelines.
Standard & Poor's, S&P and S&P 500 are registered service marks of The McGraw-Hill Companies, Inc. and have been licensed for use by Fidelity Distributors Corporation.
Other third-party marks appearing herein are the property of their respective owners.
All other marks appearing herein are registered or unregistered trademarks or service marks of FMR LLC or an affiliated company. © 2016 FMR LLC. All rights reserved.
This report and the financial statements contained herein are submitted for the general information of the shareholders of the Fund. This report is not authorized for distribution to prospective investors in the Fund unless preceded or accompanied by an effective prospectus.
A fund files its complete schedule of portfolio holdings with the SEC for the first and third quarters of each fiscal year on Form N-Q. Forms N-Q are available on the SEC’s web site at http://www.sec.gov. A fund's Forms N-Q may be reviewed and copied at the SEC’s Public Reference Room in Washington, DC. Information regarding the operation of the SEC's Public Reference Room may be obtained by calling 1-800-SEC-0330.
For a complete list of a fund's portfolio holdings, view the most recent holdings listing, semiannual report, or annual report on Fidelity's web site at http://www.fidelity.com, http://www.advisor.fidelity.com, or http://www.401k.com, as applicable.
NOT FDIC INSURED •MAY LOSE VALUE •NO BANK GUARANTEE
Neither the Fund nor Fidelity Distributors Corporation is a bank.
Investment Summary
Top Five Stocks as of January 31, 2016
| | % of fund's net assets | % of fund's net assets 6 months ago |
| Equity Lifestyle Properties, Inc. | 4.2 | 3.5 |
| Acadia Realty Trust (SBI) | 3.1 | 2.8 |
| MFA Financial, Inc. | 2.8 | 3.0 |
| Ventas, Inc. | 2.0 | 1.5 |
| WP Carey, Inc. | 1.2 | 1.1 |
| | 13.3 | |
Top 5 Bonds as of January 31, 2016
| | % of fund's net assets | % of fund's net assets 6 months ago |
| Realogy Group LLC Tranche B, term loan 3.75% 3/5/20 | 0.9 | 1.0 |
| IAS Operating Partnership LP 5% 3/15/18 | 0.8 | 0.7 |
| RAIT Financial Trust 4% 10/1/33 | 0.7 | 0.8 |
| iStar Financial, Inc. 5.875% 3/15/16 | 0.7 | 0.6 |
| RWT Holdings, Inc. 5.625% 11/15/19 | 0.6 | 0.4 |
| | 3.7 | |
Top Five REIT Sectors as of January 31, 2016
| | % of fund's net assets | % of fund's net assets 6 months ago |
| REITs - Mortgage | 17.7 | 17.9 |
| REITs - Health Care | 6.4 | 7.4 |
| REITs - Shopping Centers | 5.7 | 5.6 |
| REITs - Apartments | 5.3 | 5.0 |
| REITs - Manufactured Homes | 5.2 | 4.5 |
Asset Allocation (% of fund's net assets)
| As of January 31, 2016 * |
| | Common Stocks | 31.0% |
| | Preferred Stocks | 19.2% |
| | Bonds | 29.5% |
| | Convertible Securities | 5.7% |
| | Other Investments | 6.8% |
| | Short-Term Investments and Net Other Assets (Liabilities) | 7.8% |

* Foreign investments - 0.7%
| As of July 31, 2015 * |
| | Common Stocks | 30.0% |
| | Preferred Stocks | 19.5% |
| | Bonds | 31.8% |
| | Convertible Securities | 5.2% |
| | Other Investments | 7.3% |
| | Short-Term Investments and Net Other Assets (Liabilities) | 6.2% |

* Foreign investments - 0.9%
Investments January 31, 2016
Showing Percentage of Net Assets
| Common Stocks - 31.0% | | | |
| | | Shares | Value |
| CONSUMER DISCRETIONARY - 0.1% | | | |
| Household Durables - 0.1% | | | |
| Stanley Martin Communities LLC Class B (a)(b) | | 4,620 | $5,586,643 |
| FINANCIALS - 30.9% | | | |
| Capital Markets - 0.5% | | | |
| Ellington Financial LLC | | 1,140,284 | 18,484,004 |
| Real Estate Investment Trusts - 29.8% | | | |
| Acadia Realty Trust (SBI) (c) | | 3,755,649 | 128,067,631 |
| AG Mortgage Investment Trust, Inc. | | 781,700 | 9,169,341 |
| American Campus Communities, Inc. | | 386,900 | 16,327,180 |
| American Tower Corp. | | 194,100 | 18,311,394 |
| Annaly Capital Management, Inc. | | 1,666,900 | 15,835,550 |
| Anworth Mortgage Asset Corp. | | 1,148,310 | 4,891,801 |
| Apartment Investment & Management Co. Class A | | 985,000 | 38,562,750 |
| Arbor Realty Trust, Inc. (c) | | 3,058,527 | 20,002,767 |
| AvalonBay Communities, Inc. | | 115,200 | 19,755,648 |
| Boardwalk (REIT) | | 136,200 | 4,281,710 |
| Care Capital Properties, Inc. | | 97,603 | 2,922,234 |
| CBL & Associates Properties, Inc. | | 2,629,473 | 28,266,835 |
| Cedar Shopping Centers, Inc. | | 830,510 | 5,863,401 |
| Chimera Investment Corp. | | 213,900 | 2,650,221 |
| Community Healthcare Trust, Inc. | | 254,862 | 4,720,044 |
| CYS Investments, Inc. | | 1,758,539 | 12,116,334 |
| Douglas Emmett, Inc. | | 295,800 | 8,749,764 |
| Dynex Capital, Inc. (d) | | 2,052,086 | 12,312,516 |
| Ellington Residential Mortgage REIT | | 260,000 | 2,979,600 |
| Equity Lifestyle Properties, Inc. | | 2,627,460 | 173,202,143 |
| Extra Space Storage, Inc. | | 323,200 | 29,311,008 |
| First Potomac Realty Trust | | 1,324,144 | 12,963,370 |
| Five Oaks Investment Corp. (d) | | 479,100 | 2,232,606 |
| Great Ajax Corp. | | 500,000 | 5,510,000 |
| Hatteras Financial Corp. | | 746,600 | 9,153,316 |
| Invesco Mortgage Capital, Inc. | | 874,600 | 9,900,472 |
| Lexington Corporate Properties Trust | | 5,135,782 | 37,645,282 |
| MFA Financial, Inc. | | 17,978,622 | 114,164,250 |
| Mid-America Apartment Communities, Inc. | | 507,100 | 47,576,122 |
| Monmouth Real Estate Investment Corp. Class A (d) | | 612,473 | 6,296,222 |
| National Retail Properties, Inc. | | 244,200 | 10,485,948 |
| New Senior Investment Group, Inc. | | 1,942,525 | 17,851,805 |
| Newcastle Investment Corp. | | 1,840,830 | 6,553,355 |
| NorthStar Realty Europe Corp. | | 1,389 | 13,112 |
| NorthStar Realty Finance Corp. | | 1,370,000 | 16,261,900 |
| Potlatch Corp. | | 769,440 | 22,190,650 |
| Sabra Health Care REIT, Inc. | | 915,903 | 16,815,979 |
| Select Income REIT | | 456,800 | 8,633,520 |
| Senior Housing Properties Trust (SBI) | | 2,994,400 | 43,358,912 |
| Simon Property Group, Inc. | | 126,100 | 23,489,908 |
| Store Capital Corp. | | 833,600 | 20,664,944 |
| Terreno Realty Corp. | | 1,728,064 | 38,846,879 |
| The Macerich Co. | | 155,500 | 12,124,335 |
| Two Harbors Investment Corp. | | 2,370,280 | 18,014,128 |
| Ventas, Inc. | | 1,510,786 | 83,576,682 |
| VEREIT, Inc. | | 1,315,034 | 10,138,912 |
| Weyerhaeuser Co. | | 587,700 | 15,050,997 |
| WP Carey, Inc. | | 866,300 | 50,461,975 |
| WP Glimcher, Inc. | | 565,163 | 5,131,680 |
| | | | 1,223,407,133 |
| Real Estate Management & Development - 0.6% | | | |
| Brookfield Asset Management, Inc. Class A | | 414,000 | 12,497,723 |
| Kennedy-Wilson Holdings, Inc. | | 514,721 | 10,438,542 |
| The RMR Group, Inc. (a) | | 1 | 21 |
| | | | 22,936,286 |
|
| TOTAL FINANCIALS | | | 1,264,827,423 |
|
| TOTAL COMMON STOCKS | | | |
| (Cost $1,214,887,378) | | | 1,270,414,066 |
|
| Preferred Stocks - 19.9% | | | |
| Convertible Preferred Stocks - 0.7% | | | |
| FINANCIALS - 0.7% | | | |
| Real Estate Investment Trusts - 0.7% | | | |
| Alexandria Real Estate Equities, Inc. Series D 7.00% | | 236,759 | 6,396,186 |
| Equity Commonwealth 6.50% (a) | | 31,237 | 778,738 |
| Lexington Corporate Properties Trust Series C, 6.50% | | 468,742 | 22,206,652 |
| | | | 29,381,576 |
| Nonconvertible Preferred Stocks - 19.2% | | | |
| FINANCIALS - 19.2% | | | |
| Capital Markets - 0.1% | | | |
| Arlington Asset Investment Corp. 6.625% | | 182,517 | 3,259,754 |
| Real Estate Investment Trusts - 18.9% | | | |
| AG Mortgage Investment Trust, Inc.: | | | |
| 8.00% | | 587,287 | 12,744,128 |
| 8.25% | | 34,859 | 786,419 |
| Alexandria Real Estate Equities, Inc. Series E, 6.45% | | 145,913 | 3,782,065 |
| American Capital Agency Corp.: | | | |
| 8.00% | | 200,000 | 5,040,000 |
| Series B, 7.75% | | 360,200 | 8,500,720 |
| American Capital Mortgage Investment Corp. Series A, 8.125% | | 248,636 | 5,867,810 |
| American Home Mortgage Investment Corp.: | | | |
| Series A, 9.75% (a) | | 120,300 | 1 |
| Series B, 9.25% (a) | | 124,100 | 1 |
| American Homes 4 Rent: | | | |
| Series A, 5.00% | | 579,260 | 14,678,448 |
| Series B, 5.00% | | 373,880 | 9,601,238 |
| Series C, 5.50% | | 900,053 | 22,933,350 |
| Annaly Capital Management, Inc.: | | | |
| Series A, 7.875% | | 134,900 | 3,363,057 |
| Series C, 7.625% | | 325,332 | 7,720,128 |
| Series D, 7.50% | | 621,976 | 14,516,920 |
| Anworth Mortgage Asset Corp. Series A, 8.625% | | 309,630 | 7,616,898 |
| Apollo Commercial Real Estate Finance, Inc. Series A, 8.625% | | 375,101 | 9,272,497 |
| Apollo Residential Mortgage, Inc. Series A, 8.00% | | 284,843 | 6,181,093 |
| Arbor Realty Trust, Inc.: | | | |
| 7.375% (c) | | 430,605 | 9,714,449 |
| Series A, 8.25% (c) | | 189,089 | 4,350,938 |
| Series B, 7.75% (c) | | 240,000 | 5,143,200 |
| Series C, 8.50% (c) | | 100,000 | 2,380,000 |
| Armour Residential REIT, Inc. Series B, 7.875% | | 153,654 | 3,046,959 |
| Ashford Hospitality Trust, Inc.: | | | |
| Series D, 8.45% | | 47,000 | 1,040,110 |
| Series E, 9.00% | | 140,751 | 3,359,726 |
| Bluerock Residental Growth (REIT), Inc. Series A 8.25% (a) | | 120,000 | 3,042,000 |
| Brandywine Realty Trust Series E, 6.90% | | 95,000 | 2,437,700 |
| Campus Crest Communities, Inc. Series A, 8.00% | | 582,117 | 15,647,305 |
| Capstead Mortgage Corp. Series E, 7.50% | | 202,984 | 4,755,915 |
| CBL & Associates Properties, Inc.: | | | |
| Series D, 7.375% | | 289,876 | 7,043,987 |
| Series E, 6.625% | | 222,063 | 4,956,446 |
| Cedar Shopping Centers, Inc. Series B, 7.25% | | 415,750 | 10,393,750 |
| Chesapeake Lodging Trust Series A, 7.75% | | 266,916 | 6,801,020 |
| Colony Financial, Inc.: | | | |
| 7.125% | | 461,815 | 9,097,756 |
| Series A, 8.50% | | 283,920 | 6,856,668 |
| Series B, 7.50% | | 108,867 | 2,309,069 |
| Coresite Realty Corp. Series A, 7.25% | | 369,799 | 9,633,264 |
| Corporate Office Properties Trust Series L, 7.375% | | 167,140 | 4,248,699 |
| CubeSmart Series A, 7.75% | | 40,000 | 1,036,000 |
| CYS Investments, Inc.: | | | |
| Series A, 7.75% | | 117,824 | 2,709,952 |
| Series B, 7.50% | | 496,667 | 11,224,674 |
| DDR Corp.: | | | |
| Series J, 6.50% | | 340,721 | 8,674,757 |
| Series K, 6.25% | | 228,888 | 5,784,000 |
| Digital Realty Trust, Inc.: | | | |
| Series E, 7.00% | | 219,819 | 5,638,357 |
| Series G, 5.875% | | 145,444 | 3,615,738 |
| Series H, 7.375% | | 50,000 | 1,338,500 |
| DuPont Fabros Technology, Inc. Series B, 7.625% | | 381,202 | 9,652,035 |
| Dynex Capital, Inc.: | | | |
| Series A, 8.50% | | 362,932 | 8,220,410 |
| Series B, 7.625% | | 252,120 | 5,420,580 |
| Equity Commonwealth Series E, 7.25% | | 648,952 | 16,554,766 |
| Equity Lifestyle Properties, Inc. Series C, 6.75% | | 950,148 | 24,114,756 |
| Essex Property Trust, Inc. Series H, 7.125% | | 40,000 | 1,012,800 |
| First Potomac Realty Trust 7.75% | | 272,709 | 6,932,263 |
| Five Oaks Investment Corp. Series A, 8.75% | | 142,000 | 2,203,840 |
| General Growth Properties, Inc. Series A, 6.375% | | 166,463 | 4,269,776 |
| Gladstone Commercial Corp. Series C, 7.125% | | 232,238 | 5,887,233 |
| Hatteras Financial Corp. Series A, 7.625% | | 522,361 | 12,191,906 |
| Hersha Hospitality Trust: | | | |
| Series B, 8.00% | | 162,538 | 4,092,707 |
| Series C, 6.875% | | 50,000 | 1,248,500 |
| Hospitality Properties Trust Series D, 7.125% | | 40,800 | 1,059,168 |
| Inland Real Estate Corp.: | | | |
| Series A, 8.125% | | 466,000 | 11,701,260 |
| Series B, 6.95% | | 245,100 | 6,164,265 |
| Invesco Mortgage Capital, Inc.: | | | |
| Series A, 7.75% | | 123,342 | 2,651,853 |
| Series B, 7.75% | | 804,729 | 17,221,201 |
| Investors Real Estate Trust Series B, 7.95% | | 126,572 | 3,264,292 |
| iStar Financial, Inc.: | | | |
| Series D, 8.00% | | 70,367 | 1,455,893 |
| Series E, 7.875% | | 281,296 | 5,766,568 |
| Series F, 7.80% | | 451,476 | 9,210,110 |
| Series G, 7.65% | | 10,497 | 215,189 |
| Kilroy Realty Corp.: | | | |
| Series G, 6.875% | | 46,760 | 1,208,278 |
| Series H, 6.375% | | 143,296 | 3,629,688 |
| LaSalle Hotel Properties: | | | |
| Series H, 7.50% | | 141,308 | 3,560,962 |
| Series I, 6.375% | | 354,698 | 8,406,343 |
| LBA Realty Fund II Series B, 7.625% | | 31,240 | 697,043 |
| MFA Financial, Inc.: | | | |
| 8.00% | | 538,930 | 13,548,700 |
| Series B, 7.50% | | 616,232 | 14,783,406 |
| Monmouth Real Estate Investment Corp.: | | | |
| Series A, 7.625% | | 80,000 | 2,113,600 |
| Series B, 7.875% | | 95,000 | 2,527,000 |
| National Retail Properties, Inc.: | | | |
| 5.70% | | 315,498 | 7,925,310 |
| Series D, 6.625% | | 222,138 | 5,793,359 |
| New York Mortgage Trust, Inc.: | | | |
| 7.875% | | 196,925 | 3,970,008 |
| Series B, 7.75% | | 239,697 | 4,846,673 |
| NorthStar Realty Finance Corp.: | | | |
| Series A 8.75% | | 7,890 | 165,059 |
| Series B, 8.25% | | 373,313 | 7,216,140 |
| Series C, 8.875% | | 329,101 | 6,835,428 |
| Series D, 8.50% | | 238,715 | 4,678,814 |
| Series E, 8.75% | | 402,327 | 8,042,517 |
| Pebblebrook Hotel Trust: | | | |
| Series A, 7.875% | | 412,000 | 10,378,280 |
| Series B, 8.00% | | 185,085 | 4,728,922 |
| Series C, 6.50% | | 204,321 | 5,044,685 |
| Pennsylvania (REIT) 7.375% | | 100,510 | 2,537,878 |
| Prologis, Inc. Series Q, 8.54% | | 94,446 | 5,885,166 |
| PS Business Parks, Inc.: | | | |
| Series S, 6.45% | | 93,809 | 2,424,963 |
| Series T, 6.00% | | 198,899 | 5,061,980 |
| Series U, 5.75% | | 600 | 15,090 |
| Public Storage 6.375% | | 122,000 | 3,307,420 |
| RAIT Financial Trust: | | | |
| 7.125% | | 336,786 | 7,261,106 |
| 7.625% | | 224,590 | 4,166,145 |
| Regency Centers Corp.: | | | |
| Series 6, 6.625% | | 152,661 | 3,982,925 |
| Series 7, 6.00% | | 176,250 | 4,480,275 |
| Resource Capital Corp. 8.625% | | 156,870 | 2,643,260 |
| Retail Properties America, Inc. 7.00% | | 394,411 | 9,919,437 |
| Sabra Health Care REIT, Inc. Series A, 7.125% | | 318,623 | 8,048,417 |
| Saul Centers, Inc. Series C, 6.875% | | 315,478 | 8,139,332 |
| Stag Industrial, Inc.: | | | |
| Series A, 9.00% | | 280,000 | 7,198,800 |
| Series B, 6.625% | | 80,300 | 1,997,864 |
| Summit Hotel Properties, Inc.: | | | |
| Series A, 9.25% | | 138,340 | 3,591,306 |
| Series B, 7.875% | | 190,173 | 4,925,481 |
| Series C, 7.125% | | 153,212 | 3,700,070 |
| Sun Communities, Inc. Series A, 7.125% | | 375,000 | 9,697,500 |
| Sunstone Hotel Investors, Inc. Series D, 8.00% | | 129,723 | 3,275,506 |
| Taubman Centers, Inc. Series K, 6.25% | | 157,322 | 3,995,979 |
| Terreno Realty Corp. Series A, 7.75% | | 213,890 | 5,561,140 |
| UMH Properties, Inc.: | | | |
| 8.00% | | 156,000 | 4,271,280 |
| Series A, 8.25% | | 600,200 | 15,425,140 |
| Urstadt Biddle Properties, Inc.: | | | |
| 6.75% | | 160,000 | 4,100,800 |
| Series F, 7.125% | | 210,000 | 5,386,500 |
| VEREIT, Inc. Series F, 6.70% | | 1,980,249 | 47,922,026 |
| Wells Fargo Real Estate Investment Corp. 6.375% | | 137,600 | 3,657,408 |
| Welltower, Inc. 6.50% | | 81,600 | 2,144,448 |
| WP Glimcher, Inc.: | | | |
| 6.875% | | 256,115 | 6,300,429 |
| 7.50% | | 198,527 | 4,990,969 |
| | | | 775,513,338 |
| Real Estate Management & Development - 0.2% | | | |
| Kennedy-Wilson, Inc. 7.75% | | 321,574 | 8,167,980 |
| TOTAL FINANCIALS | | | 786,941,072 |
| TOTAL PREFERRED STOCKS | | | |
| (Cost $833,504,891) | | | 816,322,648 |
| | | Principal Amount | Value |
|
| Corporate Bonds - 18.1% | | | |
| Convertible Bonds - 5.0% | | | |
| FINANCIALS - 5.0% | | | |
| Consumer Finance - 0.0% | | | |
| Zais Financial Partners LP 8% 11/15/16 (e) | | 2,000,000 | 1,916,250 |
| Diversified Financial Services - 0.6% | | | |
| RWT Holdings, Inc. 5.625% 11/15/19 | | 27,540,000 | 24,613,875 |
| Real Estate Investment Trusts - 3.6% | | | |
| American Realty Capital Properties, Inc. 3.75% 12/15/20 | | 8,160,000 | 7,328,700 |
| Apollo Commercial Real Estate Finance, Inc. 5.5% 3/15/19 | | 5,600,000 | 5,544,000 |
| Blackstone Mortgage Trust, Inc. 5.25% 12/1/18 | | 7,750,000 | 7,648,281 |
| Campus Crest Communities Operating Partnership LP 4.75% 10/15/18 (e) | | 12,900,000 | 12,738,750 |
| Colony Financial, Inc.: | | | |
| 3.875% 1/15/21 | | 11,410,000 | 9,976,619 |
| 5% 4/15/23 | | 19,383,000 | 17,481,043 |
| Colony Starwood Homes 4.5% 10/15/17 | | 1,965,000 | 1,947,806 |
| PennyMac Corp. 5.375% 5/1/20 | | 18,000,000 | 16,560,000 |
| RAIT Financial Trust 4% 10/1/33 | | 39,190,000 | 29,221,044 |
| Redwood Trust, Inc. 4.625% 4/15/18 | | 14,700,000 | 13,560,750 |
| Resource Capital Corp.: | | | |
| 6% 12/1/18 | | 3,490,000 | 3,202,075 |
| 8% 1/15/20 | | 16,490,000 | 15,888,775 |
| Spirit Realty Capital, Inc. 3.75% 5/15/21 | | 2,400,000 | 2,322,000 |
| Starwood Property Trust, Inc. 3.75% 10/15/17 | | 3,230,000 | 3,161,363 |
| | | | 146,581,206 |
| Thrifts & Mortgage Finance - 0.8% | | | |
| IAS Operating Partnership LP 5% 3/15/18 (e) | | 34,810,000 | 32,764,913 |
| TOTAL FINANCIALS | | | 205,876,244 |
| Nonconvertible Bonds - 13.1% | | | |
| CONSUMER DISCRETIONARY - 3.8% | | | |
| Hotels, Restaurants & Leisure - 0.4% | | | |
| FelCor Lodging LP: | | | |
| 5.625% 3/1/23 | | 2,000,000 | 1,997,500 |
| 6% 6/1/25 | | 2,025,000 | 2,045,250 |
| Hilton Worldwide Finance LLC/Hilton Worldwide Finance Corp. 5.625% 10/15/21 | | 4,000,000 | 4,120,000 |
| Times Square Hotel Trust 8.528% 8/1/26 (e) | | 7,697,500 | 9,125,270 |
| | | | 17,288,020 |
| Household Durables - 3.4% | | | |
| Ashton Woods U.S.A. LLC/Ashton Woods Finance Co. 6.875% 2/15/21 (e) | | 12,145,000 | 10,323,250 |
| Brookfield Residential Properties, Inc./Brookfield Residential U.S. Corp. 6.125% 7/1/22 (e) | | 3,660,000 | 3,211,650 |
| Brookfield Residential Properties, Inc.: | | | |
| 6.375% 5/15/25 (e) | | 2,000,000 | 1,685,000 |
| 6.5% 12/15/20 (e) | | 1,615,000 | 1,461,575 |
| Calatlantic Group, Inc.: | | | |
| 5.875% 11/15/24 | | 3,250,000 | 3,371,875 |
| 8.375% 5/15/18 | | 13,458,000 | 14,837,445 |
| D.R. Horton, Inc.: | | | |
| 4.375% 9/15/22 | | 4,175,000 | 4,154,125 |
| 4.75% 5/15/17 | | 2,000,000 | 2,045,000 |
| 5.75% 8/15/23 | | 2,510,000 | 2,641,775 |
| KB Home: | | | |
| 8% 3/15/20 | | 8,465,000 | 8,655,463 |
| 9.1% 9/15/17 | | 4,985,000 | 5,333,950 |
| Lennar Corp.: | | | |
| 4.125% 12/1/18 | | 5,520,000 | 5,575,200 |
| 4.5% 6/15/19 | | 1,830,000 | 1,875,750 |
| 4.5% 11/15/19 | | 2,000,000 | 2,055,000 |
| 6.5% 4/15/16 | | 4,000,000 | 4,025,000 |
| 6.95% 6/1/18 | | 8,925,000 | 9,527,438 |
| Meritage Homes Corp.: | | | |
| 6% 6/1/25 | | 4,000,000 | 3,900,000 |
| 7% 4/1/22 | | 7,525,000 | 7,713,125 |
| 7.15% 4/15/20 | | 7,060,000 | 7,360,050 |
| Ryland Group, Inc.: | | | |
| 6.625% 5/1/20 | | 1,555,000 | 1,675,513 |
| 8.4% 5/15/17 | | 5,420,000 | 5,772,300 |
| Taylor Morrison Communities, Inc./Monarch Communities, Inc. 5.875% 4/15/23 (e) | | 4,100,000 | 3,833,500 |
| TRI Pointe Homes, Inc. 5.875% 6/15/24 | | 3,890,000 | 3,773,300 |
| WCI Communities, Inc. 6.875% 8/15/21 | | 1,845,000 | 1,881,900 |
| William Lyon Homes, Inc.: | | | |
| 7% 8/15/22 | | 4,180,000 | 4,012,800 |
| 7% 8/15/22 (e) | | 1,000,000 | 960,000 |
| 8.5% 11/15/20 | | 15,550,000 | 16,055,375 |
| | | | 137,717,359 |
| Media - 0.0% | | | |
| CBS Outdoor Americas Capital LLC/CBS Outdoor Americas Capital Corp. 5.625% 2/15/24 | | 1,300,000 | 1,329,250 |
| TOTAL CONSUMER DISCRETIONARY | | | 156,334,629 |
| CONSUMER STAPLES - 0.1% | | | |
| Food & Staples Retailing - 0.1% | | | |
| Ahold Lease Series 2001 A1 pass thru trust certificates 7.82% 1/2/20 | | 428,368 | 463,173 |
| C&S Group Enterprises LLC 5.375% 7/15/22 (e) | | 2,505,000 | 2,267,025 |
| | | | 2,730,198 |
| FINANCIALS - 8.6% | | | |
| Diversified Financial Services - 0.3% | | | |
| Icahn Enterprises LP/Icahn Enterprises Finance Corp.: | | | |
| 5.875% 2/1/22 | | 3,680,000 | 3,289,000 |
| 6% 8/1/20 | | 8,000,000 | 7,509,200 |
| | | | 10,798,200 |
| Real Estate Investment Trusts - 5.6% | | | |
| American Campus Communities Operating Partnership LP 4.125% 7/1/24 | | 2,000,000 | 2,024,816 |
| ARC Properties Operating Partnership LP 4.6% 2/6/24 | | 10,165,000 | 9,567,806 |
| CBL & Associates LP 5.25% 12/1/23 | | 1,000,000 | 981,678 |
| Corporate Office Properties LP 3.6% 5/15/23 | | 5,000,000 | 4,647,390 |
| Crown Castle International Corp. 5.25% 1/15/23 | | 4,000,000 | 4,260,000 |
| CTR Partnership LP/CareTrust Capital Corp. 5.875% 6/1/21 | | 4,955,000 | 4,932,703 |
| CubeSmart LP 4.8% 7/15/22 | | 2,000,000 | 2,179,114 |
| DDR Corp.: | | | |
| 7.5% 7/15/18 | | 8,756,000 | 9,807,289 |
| 7.875% 9/1/20 | | 4,637,000 | 5,617,424 |
| 9.625% 3/15/16 | | 3,836,000 | 3,873,708 |
| DuPont Fabros Technology LP 5.875% 9/15/21 | | 1,000,000 | 1,030,000 |
| Equity One, Inc. 6.25% 1/15/17 | | 3,000,000 | 3,114,576 |
| HCP, Inc. 4% 6/1/25 | | 1,000,000 | 982,552 |
| Health Care Property Investors, Inc.: | | | |
| 5.625% 5/1/17 | | 2,980,000 | 3,114,139 |
| 6% 1/30/17 | | 2,383,000 | 2,481,108 |
| Health Care REIT, Inc.: | | | |
| 4% 6/1/25 | | 1,551,000 | 1,545,148 |
| 4.125% 4/1/19 | | 2,000,000 | 2,095,970 |
| 6.2% 6/1/16 | | 2,750,000 | 2,793,799 |
| Healthcare Realty Trust, Inc.: | | | |
| 3.75% 4/15/23 | | 4,022,000 | 4,023,725 |
| 5.75% 1/15/21 | | 3,095,000 | 3,453,308 |
| Highwoods/Forsyth LP: | | | |
| 3.625% 1/15/23 | | 1,607,000 | 1,593,038 |
| 5.85% 3/15/17 | | 2,800,000 | 2,919,081 |
| Hospitality Properties Trust: | | | |
| 5% 8/15/22 | | 3,177,000 | 3,281,596 |
| 5.625% 3/15/17 | | 915,000 | 944,884 |
| HRPT Properties Trust: | | | |
| 6.25% 8/15/16 | | 9,675,000 | 9,688,245 |
| 6.25% 6/15/17 | | 1,055,000 | 1,089,462 |
| 6.65% 1/15/18 | | 4,246,000 | 4,499,270 |
| iStar Financial, Inc.: | | | |
| 3.875% 7/1/16 | | 2,855,000 | 2,840,725 |
| 4% 11/1/17 | | 15,210,000 | 14,335,425 |
| 5% 7/1/19 | | 15,000,000 | 14,100,000 |
| 5.85% 3/15/17 | | 3,587,000 | 3,649,773 |
| 5.875% 3/15/16 | | 27,070,000 | 27,036,163 |
| 7.125% 2/15/18 | | 5,725,000 | 5,682,063 |
| 9% 6/1/17 | | 9,175,000 | 9,381,438 |
| MPT Operating Partnership LP/MPT Finance Corp.: | | | |
| 6.375% 2/15/22 | | 3,610,000 | 3,664,150 |
| 6.875% 5/1/21 | | 2,000,000 | 2,070,000 |
| National Retail Properties, Inc. 3.3% 4/15/23 | | 2,000,000 | 1,949,982 |
| Omega Healthcare Investors, Inc.: | | | |
| 4.5% 4/1/27 | | 2,462,000 | 2,361,866 |
| 4.95% 4/1/24 | | 2,898,000 | 2,942,302 |
| Potlatch Corp. 7.5% 11/1/19 | | 1,000,000 | 1,095,000 |
| Reckson Operating Partnership LP/SL Green Realty Corp./SL Green Operating Partnership LP 7.75% 3/15/20 | | 2,000,000 | 2,357,732 |
| Select Income REIT 4.5% 2/1/25 | | 5,000,000 | 4,623,970 |
| Senior Housing Properties Trust: | | | |
| 3.25% 5/1/19 | | 2,882,000 | 2,905,370 |
| 4.75% 5/1/24 | | 3,988,000 | 3,941,057 |
| 6.75% 4/15/20 | | 13,624,000 | 15,249,098 |
| 6.75% 12/15/21 | | 8,000,000 | 9,099,688 |
| WP Carey, Inc. 4% 2/1/25 | | 5,000,000 | 4,779,490 |
| | | | 230,607,121 |
| Real Estate Management & Development - 2.1% | | | |
| BioMed Realty LP 3.85% 4/15/16 | | 2,000,000 | 2,010,694 |
| CBRE Group, Inc.: | | | |
| 5% 3/15/23 | | 6,020,000 | 6,072,344 |
| 5.25% 3/15/25 | | 3,295,000 | 3,403,906 |
| Forestar U.S.A. Real Estate Group 8.5% 6/1/22 (e) | | 16,365,000 | 15,014,888 |
| Host Hotels & Resorts LP 5.25% 3/15/22 | | 2,000,000 | 2,161,378 |
| Howard Hughes Corp. 6.875% 10/1/21 (e) | | 11,715,000 | 11,715,000 |
| Hunt Companies, Inc. 9.625% 3/1/21 (e) | | 7,460,000 | 6,676,700 |
| Kennedy-Wilson, Inc. 5.875% 4/1/24 | | 9,310,000 | 8,891,050 |
| Mid-America Apartments LP: | | | |
| 3.75% 6/15/24 | | 1,663,000 | 1,660,075 |
| 6.05% 9/1/16 | | 2,500,000 | 2,559,108 |
| Realogy Group LLC/Realogy Co.-Issuer Corp.: | | | |
| 4.5% 4/15/19 (e) | | 4,805,000 | 4,877,075 |
| 5.25% 12/1/21 (e) | | 6,620,000 | 6,744,125 |
| Regency Centers LP 5.875% 6/15/17 | | 300,000 | 316,422 |
| Taylor Morrison Communities, Inc./Monarch Communities, Inc.: | | | |
| 5.25% 4/15/21 (e) | | 7,000,000 | 6,580,000 |
| 5.625% 3/1/24 (e) | | 2,270,000 | 2,062,863 |
| Ventas Realty LP/Ventas Capital Corp. 4% 4/30/19 | | 2,262,000 | 2,373,286 |
| Wells Operating Partnership II LP 5.875% 4/1/18 | | 3,000,000 | 3,209,613 |
| | | | 86,328,527 |
| Thrifts & Mortgage Finance - 0.6% | | | |
| Cantor Commercial Real Estate Co. LP/CCRE Finance Corp. 7.75% 2/15/18 (e) | | 4,755,000 | 4,850,100 |
| Ocwen Financial Corp. 6.625% 5/15/19 | | 23,533,000 | 20,767,873 |
| | | | 25,617,973 |
| TOTAL FINANCIALS | | | 353,351,821 |
| HEALTH CARE - 0.4% | | | |
| Health Care Providers & Services - 0.4% | | | |
| Sabra Health Care LP/Sabra Capital Corp.: | | | |
| 5.375% 6/1/23 | | 2,795,000 | 2,801,988 |
| 5.5% 2/1/21 | | 12,305,000 | 12,551,100 |
| | | | 15,353,088 |
| INDUSTRIALS - 0.1% | | | |
| Industrial Conglomerates - 0.1% | | | |
| Ladder Capital Finance Holdings LLLP/Ladder Capital Finance Corp. 7.375% 10/1/17 | | 3,050,000 | 3,042,375 |
| INFORMATION TECHNOLOGY - 0.1% | | | |
| Internet Software & Services - 0.1% | | | |
| CyrusOne LP/CyrusOne Finance Corp. 6.375% 11/15/22 | | 4,000,000 | 4,060,000 |
|
| TOTAL NONCONVERTIBLE BONDS | | | 534,872,111 |
|
| TOTAL CORPORATE BONDS | | | |
| (Cost $753,065,588) | | | 740,748,355 |
|
| Asset-Backed Securities - 2.2% | | | |
| American Homes 4 Rent: | | | |
| Series 2014-SFR2 Class E, 6.231% 10/17/36 (e) | | 3,000,000 | 2,985,444 |
| Series 2014-SFR3 Class E, 6.418% 12/17/36 (e) | | 9,025,000 | 9,086,254 |
| Series 2015-SFR1: | | | |
| Class E, 5.639% 4/17/52 (e) | | 1,999,310 | 1,901,946 |
| Class F, 5.885% 4/17/52 (e) | | 2,000,000 | 1,827,407 |
| Series 2015-SFR2: | | | |
| Class E, 6.07% 10/17/45 (e) | | 7,327,000 | 7,140,349 |
| Class XS, 0% 10/17/45 (e)(f) | | 4,882,928 | 0 |
| Capital Trust RE CDO Ltd. Series 2005-1A Class D, 1.926% 3/20/50 (e)(g) | | 2,250,000 | 225 |
| CapLease CDO Ltd. Series 2005-1A Class A, 4.926% 1/29/40 (e) | | 759,673 | 767,270 |
| Conseco Finance Securitizations Corp. Series 2002-2 Class M2, 9.163% 3/1/33 | | 500,000 | 414,760 |
| Crest Clarendon Street Ltd./Crest Clarendon Corp. Series 2002-1A Class D, 9% 12/28/35 (e) | | 305,034 | 151,541 |
| Deutsche Financial Capital Securitization LLC Series 1997-I Class M, 7.275% 9/15/27 | | 5,337,922 | 5,552,900 |
| Green Tree Financial Corp.: | | | |
| Series 1996-4 Class M1, 7.75% 6/15/27 | | 1,450,222 | 1,424,947 |
| Series 1997-3 Class M1, 7.53% 3/15/28 | | 6,696,417 | 6,716,635 |
| Invitation Homes Trust: | | | |
| Series 2013-SFR1 Class F, 4.068% 12/17/30 (e)(g) | | 1,750,000 | 1,664,629 |
| Series 2014-SFR1: | | | |
| Class E, 3.6005% 6/17/31 (e)(g) | | 10,000,000 | 9,609,619 |
| Class F, 4.1005% 6/17/31 (e)(g) | | 9,504,000 | 8,987,591 |
| Series 2014-SFR3: | | | |
| Class E, 4.926% 12/17/31 (e)(g) | | 4,336,000 | 4,297,808 |
| Class F, 5.426% 12/17/31 (e)(g) | | 2,215,000 | 2,153,830 |
| Series 2015-SFR2 Class E, 3.5005% 6/17/32 (e)(g) | | 2,450,000 | 2,305,618 |
| Series 2015-SFR3 Class F, 5.1005% 8/17/32 (e)(g) | | 2,000,000 | 1,924,643 |
| Series 2015-SRF1 Class F, 4.6505% 3/17/32 (e)(g) | | 5,500,000 | 5,218,910 |
| Lehman ABS Manufactured Housing Contract Trust Series 2001-B Class M2, 7.17% 4/15/40 | | 940,050 | 631,947 |
| Merit Securities Corp. Series 13 Class M1, 7.8381% 12/28/33 (g) | | 1,923,000 | 2,008,306 |
| Progress Residential Trust: | | | |
| Series 2015-SFR1 Class E, 4.426% 2/17/32 (e)(g) | | 1,500,000 | 1,458,842 |
| Series 2015-SFR3 Class F, 6.643% 11/12/32 (e) | | 2,940,000 | 2,962,736 |
| Starwood Waypoint Residential Trust Series 2014-1 Class F, 4.9005% 1/17/32 (e)(g) | | 4,071,000 | 3,906,008 |
| Taberna Preferred Funding III Ltd. Series 2005-3A Class D, 2.9836% 2/5/36 (e)(g) | | 3,974,526 | 397 |
| Wrightwood Capital Real Estate CDO Ltd. Series 2005-1A: | | | |
| Class A1, 0.6976% 11/21/40 (e)(g) | | 3,699,927 | 3,570,430 |
| Class F, 2.3276% 11/21/40 (e)(g) | | 250,000 | 168,750 |
| TOTAL ASSET-BACKED SECURITIES | | | |
| (Cost $94,358,207) | | | 88,839,742 |
|
| Collateralized Mortgage Obligations - 0.2% | | | |
| Private Sponsor - 0.2% | | | |
| Countrywide Home Loans, Inc.: | | | |
| Series 2002-R2 Class 2B3, 3.6495% 7/25/33 (e)(g) | | 162,845 | 25,079 |
| Series 2003-R3 Class B2, 5.5% 11/25/33 (e) | | 634,005 | 24,646 |
| FREMF Mortgage Trust: | | | |
| Series 2010-K6 Class B, 5.3578% 12/25/46 (e)(g) | | 4,500,000 | 4,927,085 |
| Series 2010-K7 Class B, 5.4407% 4/25/20 (e)(g) | | 3,200,000 | 3,530,337 |
| Merrill Lynch Mortgage Investors Trust Series 1998-C3 Class F, 6% 12/15/30 (e) | | 585,313 | 594,503 |
| RESI Finance LP/RESI Finance DE Corp. floater Series 2003-B Class B9, 12.2431% 6/10/35 (e)(g) | | 99,022 | 103,504 |
| Residential Funding Securities Corp. Series 2002-RM1 Class BI1, 5.5% 12/25/17 (e) | | 9,277 | 8,611 |
| RESIX Finance Ltd. floater: | | | |
| Series 2003-D Class B8, 6.6945% 12/10/35 (e)(g) | | 120,789 | 23,521 |
| Series 2004-A Class B7, 4.4445% 2/10/36 (e)(g) | | 121,307 | 37,787 |
| Series 2004-B Class B7, 4.1945% 2/10/36 (e)(g) | | 151,064 | 49,350 |
|
| TOTAL PRIVATE SPONSOR | | | 9,324,423 |
|
| U.S. Government Agency - 0.0% | | | |
| Fannie Mae REMIC Trust: | | | |
| Series 2001-W3 subordinate REMIC pass thru certificates, Class B3, 7% 9/25/41 (b) | | 83,363 | 24,122 |
| Series 2002-W1 subordinate REMIC pass thru certificates, Class 3B3, 3.172% 2/25/42 (e)(g) | | 67,698 | 48,620 |
| Series 2003-W1 subordinate REMIC pass thru certificates, Class B3, 4.2244% 12/25/42 (b)(g) | | 111,429 | 15,918 |
| Series 2003-W10 subordinate REMIC pass thru certificates, Class 2B3, 3.1384% 6/25/43 (e)(g) | | 104,422 | 68,036 |
| Series 2003-W4 subordinate REMIC pass thru certificates, Class 2B3, 3.0163% 10/25/42 (e)(g) | | 46,599 | 12,307 |
|
| TOTAL U.S. GOVERNMENT AGENCY | | | 169,003 |
|
| TOTAL COLLATERALIZED MORTGAGE OBLIGATIONS | | | |
| (Cost $9,390,336) | | | 9,493,426 |
|
| Commercial Mortgage Securities - 14.0% | | | |
| Americold LLC Trust Series 2010-ARTA Class D, 7.443% 1/14/29 (e) | | 2,000,000 | 2,242,371 |
| Banc of America Commercial Mortgage Trust: | | | |
| Series 2005-1 Class CJ, 5.3381% 11/10/42 (g) | | 878,434 | 877,630 |
| Series 2005-5 Class D, 5.3813% 10/10/45 (g) | | 3,795,800 | 3,794,992 |
| Bank of America Commercial Mortgage Trust Series 2015-UBS7 Class D, 3.167% 9/15/48 | | 1,000,000 | 685,276 |
| Barclays Commercial Mortgage Securities LLC Series 2015-STP Class F, 4.2844% 9/10/28 (e)(g) | | 4,074,000 | 3,519,794 |
| Bear Stearns Commercial Mortgage Securities Trust Series 2006-T22 Class B, 5.62% 4/12/38 (e)(g) | | 2,520,000 | 2,581,207 |
| Bear Stearns Commercial Mortgage Securities Trust, Series 2006-PWR11 Class AJ, 5.5101% 3/11/39 (g) | | 5,700,000 | 5,696,496 |
| BLCP Hotel Trust: | | | |
| floater Series 2014-CLRN Class F, 3.4596% 8/15/29 (e)(g) | | 2,500,000 | 2,324,962 |
| Series 2014-CLMZ Class M, 6.1535% 8/15/29 (e)(g) | | 10,392,875 | 9,795,960 |
| Boca Hotel Portfolio Trust Series 2013-BOCA Class E, 4.1755% 8/15/26 (e)(g) | | 2,500,000 | 2,492,103 |
| Carefree Portfolio Trust floater Series 2014-CARE: | | | |
| Class E, 4.426% 11/15/19 (e)(g) | | 4,905,000 | 4,838,375 |
| Class F, 3.0097% 11/15/19 (e)(g) | | 1,650,000 | 1,573,272 |
| Class MZA, 6.4025% 11/15/19 (e)(g) | | 16,217,000 | 15,994,738 |
| CGBAM Commercial Mortgage Trust: | | | |
| floater Series 2014-HD Class E, 3.3305% 2/15/31 (e)(g) | | 5,769,000 | 5,758,603 |
| Series 2015-SMRT Class F, 3.7859% 4/10/28(e)(g) | | 5,746,000 | 5,264,023 |
| Citigroup Commercial Mortgage Trust: | | | |
| Series 2013-GC15 Class D, 5.1045% 9/10/46 (e)(g) | | 5,254,000 | 4,706,117 |
| Series 2015-SHP2 Class E, 4.681% 7/15/27 (e)(g) | | 2,933,000 | 2,859,071 |
| COMM Mortgage Trust: | | | |
| sequential payer Series 2013-LC6 Class E, 3.5% 1/10/46 (e) | | 7,300,000 | 5,509,079 |
| Series 2012-CR5 Class D, 4.3374% 12/10/45 (e)(g) | | 2,000,000 | 1,900,687 |
| Series 2013-CR10 Class D, 4.7911% 8/10/46 (e)(g) | | 2,000,000 | 1,760,587 |
| Series 2013-CR12 Class D, 5.0842% 10/10/46 (e)(g) | | 4,500,000 | 4,125,294 |
| Series 2013-CR9 Class D, 4.2572% 7/10/45 (e)(g) | | 4,255,000 | 3,722,473 |
| Series 2013-LC6 Class D, 4.2855% 1/10/46 (e)(g) | | 3,870,000 | 3,413,010 |
| Series 2014-UBS2 Class D, 5.0152% 3/10/47 (e)(g) | | 3,713,000 | 3,123,200 |
| Commercial Mortgage Acceptance Corp. Series 1998-C2 Class J, 5.44% 9/15/30 (e) | | 1,552,481 | 1,505,252 |
| Commercial Mortgage Trust pass-thru certificates: | | | |
| Series 2012-CR1: | | | |
| Class C, 5.3634% 5/15/45 (g) | | 1,000,000 | 1,062,188 |
| Class D, 5.3634% 5/15/45 (e)(g) | | 5,550,000 | 5,424,024 |
| Series 2012-CR2: | | | |
| Class D, 4.8548% 8/15/45 (e)(g) | | 4,500,000 | 4,455,666 |
| Class E, 4.8548% 8/15/45 (e)(g) | | 6,000,000 | 5,600,552 |
| Series 2012-LC4: | | | |
| Class C, 5.6447% 12/10/44 (g) | | 2,000,000 | 2,150,816 |
| Class D, 5.6447% 12/10/44 (e)(g) | | 8,000,000 | 7,902,581 |
| Core Industrial Trust Series 2015-TEXW Class F, 3.8487% 2/10/34 (e)(g) | | 6,565,000 | 5,858,272 |
| Credit Suisse First Boston Mortgage Securities Corp.: | | | |
| Series 1998-C1 Class F, 6% 5/17/40 (e) | | 971,589 | 1,006,474 |
| Series 1998-C2 Class F, 6.75% 11/15/30 (e) | | 1,060,301 | 1,070,607 |
| CSMC Trust floater Series 2015-DEAL: | | | |
| Class E, 4.426% 4/15/29 (e)(g) | | 2,000,000 | 1,894,887 |
| Class F, 5.176% 4/15/29 (e)(g) | | 5,053,000 | 4,841,413 |
| DBCCRE Mortgage Trust Series 2014-ARCP Class E, 4.9345% 1/10/34 (e)(g) | | 10,853,000 | 9,929,594 |
| DBUBS Mortgage Trust Series 2011-LC1A: | | | |
| Class E, 5.6634% 11/10/46 (e)(g) | | 12,490,000 | 12,957,365 |
| Class G, 4.652% 11/10/46 (e) | | 9,843,000 | 8,343,811 |
| Extended Stay America Trust Series 2013-ESH7 Class C7, 3.9017% 12/5/31 (e) | | 500,000 | 500,252 |
| Freddie Mac: | | | |
| pass-thru certificates: | | | |
| Series K011 Class X3, 2.5754% 12/25/43 (f)(g) | | 12,206,096 | 1,387,971 |
| Series K012 Class X3, 2.2509% 1/25/41 (f)(g) | | 20,716,172 | 2,141,698 |
| Series K013 Class X3, 2.9064% 1/25/43 (f)(g) | | 14,360,000 | 1,825,452 |
| Series KAIV Class X2, 3.6147% 6/25/46 (f)(g) | | 7,430,000 | 1,241,023 |
| GAHR Commercial Mortgage Trust Series 2015-NRF: | | | |
| Class EFX, 3.3822% 12/15/19 (e)(g) | | 5,607,000 | 5,183,435 |
| Class FFX, 3.3822% 12/15/19 (e)(g) | | 8,032,000 | 7,169,205 |
| GMAC Commercial Mortgage Securities, Inc. Series 1997-C2 Class G, 6.75% 4/15/29 (g) | | 458,948 | 479,694 |
| GP Portfolio Trust Series 2014-GPP Class E, 4.1805% 2/15/27 (e)(g) | | 2,823,000 | 2,768,531 |
| Greenwich Capital Commercial Funding Corp. Series 2006-GG7 Class A4, 7.5684% 7/10/38 (g) | | 3,080,229 | 3,090,530 |
| GS Mortgage Securities Corp. II Series 2010-C1: | | | |
| Class D, 6.0789% 8/10/43 (e)(g) | | 4,000,000 | 4,106,028 |
| Class E, 4% 8/10/43 (e) | | 3,770,000 | 3,352,972 |
| GS Mortgage Securities Trust: | | | |
| Series 2010-C2 Class D, 5.1881% 12/10/43 (e)(g) | | 3,000,000 | 2,964,030 |
| Series 2011-GC5: | | | |
| Class C, 5.3078% 8/10/44 (e)(g) | | 9,000,000 | 9,627,137 |
| Class D, 5.3078% 8/10/44 (e)(g) | | 7,000,000 | 7,029,985 |
| Class E, 5.3078% 8/10/44 (e)(g) | | 4,049,000 | 3,765,560 |
| Class F, 4.5% 8/10/44 (e) | | 4,500,000 | 3,730,154 |
| Series 2012-GC6: | | | |
| Class C, 5.6314% 1/10/45 (e)(g) | | 3,600,000 | 3,808,214 |
| Class D, 5.6314% 1/10/45 (e)(g) | | 2,000,000 | 1,939,969 |
| Class E, 5% 1/10/45 (e)(g) | | 4,516,000 | 3,890,406 |
| Series 2012-GCJ7: | | | |
| Class C, 5.7229% 5/10/45 (g) | | 6,500,000 | 6,861,214 |
| Class D, 5.7229% 5/10/45 (e)(g) | | 5,500,000 | 5,312,630 |
| Class E, 5% 5/10/45 (e) | | 6,920,000 | 5,593,336 |
| Series 2012-GCJ9 Class D, 4.8524% 11/10/45 (e)(g) | | 4,504,000 | 4,107,122 |
| Series 2013-GC16: | | | |
| Class D, 5.3158% 11/10/46 (e)(g) | | 3,750,000 | 3,359,346 |
| Class F, 3.5% 11/10/46 (e) | | 7,303,000 | 5,227,035 |
| Hilton U.S.A. Trust: | | | |
| floater Series 2014-ORL Class E, 3.5805% 7/15/29 (e)(g) | | 7,241,000 | 6,947,886 |
| Series 2013-HLT Class EFX, 4.4533% 11/5/30 (e)(g) | | 5,000,000 | 4,993,814 |
| Invitation Homes Trust floater Series 2013-SFR1 Class E, 3.068% 12/17/30 (e)(g) | | 1,500,000 | 1,427,129 |
| JPMorgan Chase Commercial Mortgage Securities Corp.: | | | |
| Series 2003-C1 Class F, 5.4229% 1/12/37 (e)(g) | | 1,000,000 | 995,279 |
| Series 2009-IWST: | | | |
| Class C, 7.4453% 12/5/27 (e)(g) | | 3,000,000 | 3,498,814 |
| Class D, 7.4453% 12/5/27 (e)(g) | | 9,550,000 | 11,102,727 |
| Series 2010-CNTR: | | | |
| Class D, 6.1838% 8/5/32 (e)(g) | | 4,500,000 | 4,962,768 |
| Class XB, 0.9305% 8/5/32 (e)(f)(g) | | 32,655,000 | 1,072,965 |
| Series 2012-CBX: | | | |
| Class C, 5.2377% 6/15/45 (g) | | 4,530,000 | 4,667,393 |
| Class F, 4% 6/15/45 (e) | | 5,000,000 | 4,035,745 |
| Class G 4% 6/15/45 (e) | | 4,044,000 | 2,816,098 |
| JPMorgan Chase Commercial Mortgage Securities Trust: | | | |
| floater: | | | |
| Series 2014-FBLU Class E, 3.8305% 12/15/28 (e)(g) | | 2,406,000 | 2,370,857 |
| Series 2014-INN: | | | |
| Class E, 4.026% 6/15/29 (e)(g) | | 9,607,000 | 9,439,807 |
| Class F, 4.426% 6/15/29 (e)(g) | | 9,618,000 | 9,417,957 |
| Series 2005-LDP5 Class AJ, 5.4758% 12/15/44 (g) | | 54,979 | 54,945 |
| Series 2011-C4 Class F, 3.873% 7/15/46 (e) | | 1,400,000 | 1,227,673 |
| Series 2013-LC11: | | | |
| Class D, 4.2384% 4/15/46 (g) | | 5,250,000 | 4,543,023 |
| Class F, 3.25% 4/15/46 (e)(g) | | 2,518,000 | 1,647,056 |
| Series 2014-DSTY Class E, 3.8046% 6/10/27 (e)(g) | | 2,525,000 | 2,307,361 |
| Series 2015-UES Class F, 3.621% 9/5/32 (e)(g) | | 3,500,000 | 3,177,674 |
| JPMorgan Commercial Mortgage Finance Corp. Series 1999-C8 Class H, 6% 7/15/31 (e) | | 874,381 | 818,778 |
| LB-UBS Commercial Mortgage Trust: | | | |
| sequential payer Series 2006-C7 Class AM, 5.378% 11/15/38 | | 2,040,000 | 2,080,036 |
| Series 2006-C4: | | | |
| Class A4, 5.8201% 6/15/38 (g) | | 3,520,012 | 3,528,955 |
| Class AJ, 5.8401% 6/15/38 (g) | | 7,005,000 | 7,074,721 |
| Class AM, 5.8401% 6/15/38 (g) | | 6,700,000 | 6,792,603 |
| LSTAR Commercial Mortgage Trust Series 2014-2: | | | |
| Class D, 4.9783% 1/20/41 (e)(g) | | 3,000,000 | 2,737,147 |
| Class E, 4.9783% 1/20/41 (e)(g) | | 4,800,000 | 3,854,782 |
| Mach One Trust LLC Series 2004-1A Class H, 6.0648% 5/28/40 (e)(g) | | 479,012 | 477,815 |
| Merrill Lynch Mortgage Trust Series 2006-C1 Class AM, 5.6664% 5/12/39 (g) | | 1,200,000 | 1,204,301 |
| Mezz Capital Commercial Mortgage Trust Series 2004-C1 Class IO, 8.8661% 1/15/37 (e)(f)(g) | | 348,229 | 21,416 |
| Morgan Stanley BAML Trust: | | | |
| Series 2012-C6 Class D, 4.6573% 11/15/45 (e)(g) | | 2,000,000 | 1,840,773 |
| Series 2013-C12 Class D, 4.7664% 10/15/46 (e)(g) | | 3,250,000 | 2,961,700 |
| Series 2013-C13: | | | |
| Class D, 4.8939% 11/15/46 (e)(g) | | 3,100,000 | 2,834,372 |
| Class E, 4.8939% 11/15/46 (e)(g) | | 3,379,000 | 2,701,398 |
| Series 2013-C7 Class E, 4.2965% 2/15/46 (e)(g) | | 1,000,000 | 845,463 |
| Series 2013-C9 Class D, 4.1611% 5/15/46 (e)(g) | | 5,000,000 | 4,246,427 |
| Morgan Stanley Capital I Trust: | | | |
| sequential payer: | | | |
| Series 2006-HQ10 Class AM, 5.36% 11/12/41 | | 8,200,000 | 8,337,647 |
| Series 2012-C4 Class E, 5.5245% 3/15/45 (e)(g) | | 5,630,000 | 5,500,149 |
| Series 1997-RR Class F, 7.4216% 4/30/39 (e)(g) | | 740,663 | 727,702 |
| Series 1998-CF1 Class G, 7.35% 7/15/32 (e) | | 2,386,972 | 2,389,695 |
| Series 2006-IQ12 Class AMFX, 5.37% 12/15/43 | | 7,500,000 | 7,673,122 |
| Series 2011-C1 Class C, 5.4382% 9/15/47 (e)(g) | | 4,000,000 | 4,283,740 |
| Series 2011-C2: | | | |
| Class D, 5.3028% 6/15/44 (e)(g) | | 4,610,000 | 4,776,664 |
| Class E, 5.3028% 6/15/44 (e)(g) | | 9,600,000 | 9,594,948 |
| Class F, 5.3028% 6/15/44 (e)(g) | | 4,440,000 | 4,128,554 |
| Class XB, 0.4583% 6/15/44 (e)(f)(g) | | 63,708,222 | 1,589,170 |
| Series 2011-C3: | | | |
| Class C, 5.1783% 7/15/49 (e)(g) | | 2,000,000 | 2,117,105 |
| Class D, 5.1783% 7/15/49 (e)(g) | | 7,400,000 | 7,456,765 |
| Class G, 5.1783% 7/15/49 (e)(g) | | 3,283,000 | 2,675,801 |
| Series 2012-C4 Class D, 5.5245% 3/15/45 (e)(g) | | 6,310,000 | 6,364,725 |
| Series 2015-UBS8 Class D, 3.25% 12/15/48 (e) | | 5,013,000 | 3,491,237 |
| Motel 6 Trust Series 2015-MTL6: | | | |
| Class E, 5.2785% 2/5/30 (e) | | 5,778,000 | 5,548,489 |
| Class F, 5% 2/5/30 (e) | | 10,728,000 | 9,870,337 |
| MSJP Commercial Securities Mortgage Trust Series 2015-HAUL Class E, 4.851% 9/5/47 (e)(g) | | 1,500,000 | 1,247,609 |
| Providence Place Group Ltd. Partnership Series 2000-C1 Class A2, 7.75% 7/20/28 (e) | | 4,752,299 | 5,843,427 |
| SCG Trust Series 2013-SRP1 Class D, 3.6742% 11/15/26 (e)(g) | | 1,000,000 | 971,188 |
| TIAA Seasoned Commercial Mortgage Trust sequential payer Series 2007-C4 Class AJ, 5.5102% 8/15/39 (g) | | 884,336 | 887,598 |
| TimberStar Trust I Series 2006-1 Class F, 7.5296% 10/15/36 (e) | | 10,630,000 | 10,722,216 |
| UBS Commercial Mortgage Trust Series 2012-C1 Class D, 5.5344% 5/10/45 (e)(g) | | 3,235,000 | 3,197,398 |
| UBS-Barclays Commercial Mortgage Trust sequential payer Series 2012-C3 Class A1, 0.726% 8/10/49 | | 1,412,215 | 1,402,675 |
| UBS-Citigroup Commercial Mortgage Trust Series 2011-C1 Class B, 5.8878% 1/10/45 (e)(g) | | 3,000,000 | 3,393,280 |
| Vornado DP LLC Series 2010-VNO Class D, 6.3555% 9/13/28 (e) | | 2,540,000 | 2,829,192 |
| Wachovia Bank Commercial Mortgage Trust Series 2004-C11 Class D, 5.1191% 1/15/41 (g) | | 5,177,000 | 5,257,930 |
| Wells Fargo Commercial Mortgage Trust Series 2012-LC5 Class D, 4.7768% 10/15/45 (e)(g) | | 9,999,000 | 9,260,385 |
| WF-RBS Commercial Mortgage Trust: | | | |
| sequential payer Series 2011-C4I Class G, 5% 6/15/44 (e) | | 4,000,000 | 3,066,684 |
| Series 2011-C3: | | | |
| Class C, 5.335% 3/15/44 (e) | | 4,900,000 | 5,159,663 |
| Class D, 5.5722% 3/15/44 (e)(g) | | 1,000,000 | 1,016,292 |
| Class E, 5% 3/15/44 (e) | | 3,000,000 | 2,678,416 |
| Series 2011-C5: | | | |
| Class F, 5.25% 11/15/44 (e)(g) | | 3,000,000 | 2,416,400 |
| Class G, 5.25% 11/15/44 (e)(g) | | 2,000,000 | 1,531,082 |
| Series 2012-C10 Class E, 4.4542% 12/15/45 (e)(g) | | 4,090,000 | 3,088,721 |
| Series 2012-C7: | | | |
| Class D, 4.8377% 6/15/45 (e)(g) | | 2,380,000 | 2,363,987 |
| Class F, 4.5% 6/15/45 (e) | | 2,000,000 | 1,688,720 |
| Series 2013-C11: | | | |
| Class D, 4.1794% 3/15/45 (e)(g) | | 5,830,000 | 5,041,972 |
| Class E, 4.1794% 3/15/45 (e)(g) | | 4,780,000 | 3,844,105 |
| Series 2013-C13 Class D, 4.1386% 5/15/45 (e)(g) | | 4,000,000 | 3,570,867 |
| Series 2013-UBS1 Class D, 4.6299% 3/15/46 (e)(g) | | 1,668,000 | 1,481,765 |
| WFCG Commercial Mortgage Trust floater Series 2015-BXRP: | | | |
| Class F, 4.0508% 11/15/29 (e)(g) | | 5,152,378 | 5,101,792 |
| Class G, 3.3505% 11/15/29 (e)(g) | | 3,391,668 | 3,083,539 |
| TOTAL COMMERCIAL MORTGAGE SECURITIES | | | |
| (Cost $560,702,920) | | | 574,426,162 |
|
| Bank Loan Obligations - 6.8% | | | |
| CONSUMER DISCRETIONARY - 2.8% | | | |
| Hotels, Restaurants & Leisure - 2.1% | | | |
| Caesars Entertainment Resort Properties LLC Tranche B 1LN, term loan 7% 10/11/20 (g) | | 13,170,905 | 11,452,101 |
| Caesars Growth Properties Holdings, LLC Tranche 1LN, term loan 6.25% 5/8/21 (g) | | 10,143,093 | 8,384,991 |
| Cooper Hotel Group 12% 11/6/17 | | 13,156,538 | 13,814,365 |
| ESH Hospitality, Inc. Tranche B, term loan 5% 6/24/19 (g) | | 14,218,748 | 14,254,294 |
| Four Seasons Holdings, Inc.: | | | |
| Tranche 2LN, term loan 6.25% 12/27/20 (g) | | 2,150,000 | 2,115,063 |
| Tranche B 1LN, term loan 3.5% 6/27/20 (g) | | 1,986,701 | 1,956,900 |
| Hilton Worldwide Finance, LLC Tranche B, term loan 3.5% 10/25/20 (g) | | 14,821,555 | 14,787,317 |
| La Quinta Intermediate Holdings LLC Tranche B LN, term loan 3.75% 4/14/21 (g) | | 13,115,812 | 12,574,785 |
| Playa Resorts Holding BV Tranche B, term loan 4% 8/9/19 (g) | | 6,438,522 | 6,213,174 |
| Ryman Hospitality Properties, Inc. Tranche B, term loan 3.5% 1/15/21 (g) | | 2,255,650 | 2,244,372 |
| | | | 87,797,362 |
| Media - 0.2% | | | |
| CBS Outdoor Americas Capital LLC/CBS Outdoor Americas Capital Corp. Tranche B, term loan 3% 1/31/21 (g) | | 7,776,563 | 7,672,046 |
| Multiline Retail - 0.4% | | | |
| JC Penney Corp., Inc. Tranche B, term loan 6% 5/22/18 (g) | | 15,306,656 | 14,943,123 |
| Specialty Retail - 0.1% | | | |
| The Pep Boys - Manny, Moe & Jack Tranche B, term loan 5.5% 10/11/18 (g) | | 6,181,627 | 6,173,900 |
|
| TOTAL CONSUMER DISCRETIONARY | | | 116,586,431 |
|
| CONSUMER STAPLES - 0.4% | | | |
| Food & Staples Retailing - 0.4% | | | |
| Albertson's LLC: | | | |
| Tranche B 2LN, term loan 5.5% 3/21/19 (g) | | 5,084,922 | 5,031,225 |
| Tranche B 3LN, term loan 5.125% 8/25/19 (g) | | 8,166,812 | 7,983,059 |
| Tranche B 5LN, term loan 12/21/22 (h) | | 5,005,000 | 4,886,131 |
| | | | 17,900,415 |
| ENERGY - 0.5% | | | |
| Oil, Gas & Consumable Fuels - 0.5% | | | |
| Moxie Patriot LLC Tranche B, term loan 6.75% 12/19/20 (g) | | 2,000,000 | 1,800,000 |
| Panda Sherman Power, LLC term loan 9% 9/14/18 (g) | | 7,112,245 | 6,223,215 |
| Panda Temple Power, LLC term loan 7.25% 4/3/19 (g) | | 8,580,000 | 7,293,000 |
| TPF II Power, LLC Tranche B, term loan 5.5% 10/2/21 (g) | | 4,190,353 | 4,014,903 |
| | | | 19,331,118 |
| FINANCIALS - 1.8% | | | |
| Real Estate Investment Trusts - 0.3% | | | |
| Starwood Property Trust, Inc. Tranche B, term loan 3.5% 4/17/20 (g) | | 10,767,409 | 10,583,501 |
| Real Estate Management & Development - 1.3% | | | |
| AmeriCold Reality Operating Partnership LP Tranche B, term loan 6.5% 12/1/22 (g) | | 8,345,000 | 8,324,138 |
| CityCenter 8.74% 7/12/16 (g) | | 2,220,904 | 2,220,904 |
| NorthStar Asset Management LP Tranche B 1LN, term loan 4.625% 1/29/23 (g) | | 5,010,000 | 4,834,650 |
| Realogy Corp. Credit-Linked Deposit 4.6795% 10/10/16 (g) | | 418,475 | 412,198 |
| Realogy Group LLC Tranche B, term loan 3.75% 3/5/20 (g) | | 37,814,057 | 37,511,545 |
| | | | 53,303,435 |
| Thrifts & Mortgage Finance - 0.2% | | | |
| Ocwen Loan Servicing, LLC Tranche B, term loan 5.5% 2/15/18 (g) | | 7,680,832 | 7,666,469 |
|
| TOTAL FINANCIALS | | | 71,553,405 |
|
| HEALTH CARE - 0.1% | | | |
| Health Care Providers & Services - 0.1% | | | |
| Community Health Systems, Inc.: | | | |
| Tranche F, term loan 3.6567% 12/31/18 (g) | | 1,985,000 | 1,951,632 |
| Tranche H, term loan 4% 1/27/21 (g) | | 3,104,062 | 2,983,779 |
| | | | 4,935,411 |
| INDUSTRIALS - 0.4% | | | |
| Commercial Services & Supplies - 0.3% | | | |
| Lineage Logistics Holdings, LLC. Tranche B, term loan 4.5% 4/7/21 (g) | | 3,930,000 | 3,507,525 |
| Pilot Travel Centers LLC Tranche B, term loan 3.75% 10/3/21 (g) | | 7,200,000 | 7,198,200 |
| | | | 10,705,725 |
| Construction & Engineering - 0.1% | | | |
| Drumm Investors LLC Tranche B, term loan 6.75% 5/4/18 (g) | | 5,635,081 | 5,547,061 |
|
| TOTAL INDUSTRIALS | | | 16,252,786 |
|
| UTILITIES - 0.8% | | | |
| Electric Utilities - 0.5% | | | |
| Calpine Construction Finance Co. LP Tranche B 2LN, term loan 3.25% 1/31/22 (g) | | 7,269,112 | 6,828,458 |
| Essential Power LLC Tranche B, term loan 4.75% 8/8/19 (g) | | 3,344,688 | 3,252,709 |
| La Frontera Generation, LLC Tranche B, term loan 4.5% 9/30/20 (g) | | 7,910,170 | 7,560,145 |
| Southeast Powergen LLC Tranche B, term loan 4.5% 12/2/21 (g) | | 2,742,300 | 2,701,166 |
| | | | 20,342,478 |
| Independent Power and Renewable Electricity Producers - 0.3% | | | |
| Calpine Corp. Tranche B 4LN, term loan 4% 10/31/20 (g) | | 1,960,000 | 1,900,220 |
| Tempus Public Foundation Generation Holdings LLC Tranche B, term loan 4.75% 12/31/17 (g) | | 11,427,742 | 10,099,267 |
| | | | 11,999,487 |
|
| TOTAL UTILITIES | | | 32,341,965 |
|
| TOTAL BANK LOAN OBLIGATIONS | | | |
| (Cost $288,225,610) | | | 278,901,531 |
|
| Preferred Securities - 0.0% | | | |
| FINANCIALS - 0.0% | | | |
| Diversified Financial Services - 0.0% | | | |
| Crest Dartmouth Street 2003 1 Ltd. Series 2003-1A Class PS, 6/28/38 (e) | | 1,220,000 | 236,558 |
| Thrifts & Mortgage Finance - 0.0% | | | |
| Crest Clarendon Street 2002-1 Ltd. Series 2002-1A Class PS, 12/28/35 (e) | | 500,000 | 250 |
| TOTAL FINANCIALS | | | |
| (Cost $1,297,768) | | | 236,808 |
| | | Shares | Value |
|
| Money Market Funds - 7.7% | | | |
| Fidelity Cash Central Fund, 0.38% (i) | | 315,432,448 | 315,432,448 |
| Fidelity Securities Lending Cash Central Fund, 0.42% (i)(j) | | 836,900 | 836,900 |
| TOTAL MONEY MARKET FUNDS | | | |
| (Cost $316,269,348) | | | 316,269,348 |
| TOTAL INVESTMENT PORTFOLIO - 99.9% | | | |
| (Cost $4,071,702,046) | | | 4,095,652,086 |
| NET OTHER ASSETS (LIABILITIES) - 0.1% | | | 4,270,263 |
| NET ASSETS - 100% | | | $4,099,922,349 |
Percentages shown as 0.0% may reflect amounts less than 0.05%.
Legend
(a) Non-income producing
(b) Restricted securities - Investment in securities not registered under the Securities Act of 1933 (excluding 144A issues). At the end of the period, the value of restricted securities (excluding 144A issues) amounted to $5,626,683 or 0.1% of net assets.
(c) Affiliated company
(d) Security or a portion of the security is on loan at period end.
(e) Security exempt from registration under Rule 144A of the Securities Act of 1933. These securities may be resold in transactions exempt from registration, normally to qualified institutional buyers. At the end of the period, the value of these securities amounted to $710,214,608 or 17.3% of net assets.
(f) Security represents right to receive monthly interest payments on an underlying pool of mortgages or assets. Principal shown is the outstanding par amount of the pool as of the end of the period.
(g) Coupon rates for floating and adjustable rate securities reflect the rates in effect at period end.
(h) The coupon rate will be determined upon settlement of the loan after period end.
(i) Affiliated fund that is generally available only to investment companies and other accounts managed by Fidelity Investments. The rate quoted is the annualized seven-day yield of the fund at period end. A complete unaudited listing of the fund's holdings as of its most recent quarter end is available upon request. In addition, each Fidelity Central Fund's financial statements, which are not covered by the Fund's Report of Independent Registered Public Accounting Firm, are available on the SEC's website or upon request.
(j) Investment made with cash collateral received from securities on loan.
Additional information on each restricted holding is as follows:
| Security | Acquisition Date | Acquisition Cost |
| Fannie Mae REMIC Trust Series 2001-W3 subordinate REMIC pass thru certificates, Class B3, 7% 9/25/41 | 5/21/03 | $72,239 |
| Fannie Mae REMIC Trust Series 2003-W1 subordinate REMIC pass thru certificates, Class B3, 4.2244% 12/25/42 | 3/25/03 | $66,253 |
| Stanley Martin Communities LLC Class B | 8/3/05 - 3/1/07 | $4,244,623 |
Affiliated Central Funds
Information regarding fiscal year to date income earned by the Fund from investments in Fidelity Central Funds is as follows:
| Fund | Income earned |
| Fidelity Cash Central Fund | $276,541 |
| Fidelity Securities Lending Cash Central Fund | 12,966 |
| Total | $289,507 |
Other Affiliated Issuers
An affiliated company is a company in which the Fund has ownership of at least 5% of the voting securities. Fiscal year to date transactions with companies which are or were affiliates are as follows:
| Affiliate | Value, beginning of period | Purchases | Sales Proceeds | Dividend Income | Value, end of period |
| Acadia Realty Trust (SBI) | $119,299,759 | $826,274 | $-- | $1,870,757 | $128,067,631 |
| Arbor Realty Trust, Inc. | 20,991,789 | -- | 75,982 | 920,693 | 20,002,767 |
| Arbor Realty Trust, Inc. 7.375% | 10,597,189 | -- | -- | 396,964 | 9,714,449 |
| Arbor Realty Trust, Inc. Series A, 8.25% | 4,814,206 | -- | -- | 194,998 | 4,350,938 |
| Arbor Realty Trust, Inc. Series B, 7.75% | 5,940,000 | -- | -- | 232,500 | 5,143,200 |
| Arbor Realty Trust, Inc. Series C, 8.50% | 2,578,000 | -- | -- | 106,250 | 2,380,000 |
| Total | $164,220,943 | $826,274 | $75,982 | $3,722,162 | $169,658,985 |
Investment Valuation
The following is a summary of the inputs used, as of January 31, 2016, involving the Fund's assets and liabilities carried at fair value. The inputs or methodology used for valuing securities may not be an indication of the risk associated with investing in those securities. For more information on valuation inputs, and their aggregation into the levels used below, please refer to the Investment Valuation section in the accompanying Notes to Financial Statements.
| | Valuation Inputs at Reporting Date: |
| Description | Total | Level 1 | Level 2 | Level 3 |
| Investments in Securities: | | | | |
| Equities: | | | | |
| Consumer Discretionary | $5,586,643 | $-- | $-- | $5,586,643 |
| Financials | 2,081,150,071 | 2,045,965,022 | 35,185,047 | 2 |
| Corporate Bonds | 740,748,355 | -- | 740,748,355 | -- |
| Asset-Backed Securities | 88,839,742 | -- | 84,316,452 | 4,523,290 |
| Collateralized Mortgage Obligations | 9,493,426 | -- | 9,164,040 | 329,386 |
| Commercial Mortgage Securities | 574,426,162 | -- | 574,404,746 | 21,416 |
| Bank Loan Obligations | 278,901,531 | -- | 262,454,064 | 16,447,467 |
| Preferred Securities | 236,808 | -- | -- | 236,808 |
| Money Market Funds | 316,269,348 | 316,269,348 | -- | -- |
| Total Investments in Securities: | $4,095,652,086 | $2,362,234,370 | $1,706,272,704 | $27,145,012 |
Other Information
The composition of credit quality ratings as a percentage of Total Net Assets is as follows (Unaudited):
| U.S. Government and U.S. Government Agency Obligations | 0.3% |
| AAA,AA,A | 3.2% |
| BBB | 7.7% |
| BB | 10.2% |
| B | 9.9% |
| CCC,CC,C | 0.8% |
| D | 0.0% |
| Not Rated | 9.2% |
| Equities | 50.9% |
| Short-Term Investments and Net Other Assets | 7.8% |
| | 100.0% |
We have used ratings from Moody's Investors Service, Inc. Where Moody's® ratings are not available, we have used S&P® ratings. All ratings are as of the date indicated and do not reflect subsequent changes.
See accompanying notes which are an integral part of the financial statements.
Financial Statements
Statement of Assets and Liabilities
| | | January 31, 2016 |
| Assets | | |
Investment in securities, at value (including securities loaned of $830,672) — See accompanying schedule:
Unaffiliated issuers (cost $3,629,713,380) | $3,609,723,753 | |
| Fidelity Central Funds (cost $316,269,348) | 316,269,348 | |
| Other affiliated issuers (cost $125,719,318) | 169,658,985 | |
| Total Investments (cost $4,071,702,046) | | $4,095,652,086 |
| Cash | | 406,585 |
| Receivable for investments sold | | 10,498,133 |
| Receivable for fund shares sold | | 6,810,879 |
| Dividends receivable | | 2,831,056 |
| Interest receivable | | 16,631,028 |
| Distributions receivable from Fidelity Central Funds | | 90,835 |
| Prepaid expenses | | 7,239 |
| Other receivables | | 6,404 |
| Total assets | | 4,132,934,245 |
| Liabilities | | |
| Payable for investments purchased | $22,893,903 | |
| Payable for fund shares redeemed | 6,090,145 | |
| Accrued management fee | 1,865,778 | |
| Distribution and service plan fees payable | 336,650 | |
| Other affiliated payables | 895,024 | |
| Other payables and accrued expenses | 93,496 | |
| Collateral on securities loaned, at value | 836,900 | |
| Total liabilities | | 33,011,896 |
| Net Assets | | $4,099,922,349 |
| Net Assets consist of: | | |
| Paid in capital | | $4,058,965,412 |
| Undistributed net investment income | | 5,433,035 |
| Accumulated undistributed net realized gain (loss) on investments and foreign currency transactions | | 11,573,767 |
| Net unrealized appreciation (depreciation) on investments and assets and liabilities in foreign currencies | | 23,950,135 |
| Net Assets | | $4,099,922,349 |
| Calculation of Maximum Offering Price | | |
| Class A: | | |
| Net Asset Value and redemption price per share ($502,555,910 ÷ 45,733,048 shares) | | $10.99 |
| Maximum offering price per share (100/96.00 of $10.99) | | $11.45 |
| Class T: | | |
| Net Asset Value and redemption price per share ($55,119,063 ÷ 5,012,997 shares) | | $11.00 |
| Maximum offering price per share (100/96.00 of $11.00) | | $11.46 |
| Class C: | | |
| Net Asset Value and offering price per share ($266,307,883 ÷ 24,437,854 shares)(a) | | $10.90 |
| Real Estate Income: | | |
| Net Asset Value, offering price and redemption price per share ($2,432,269,584 ÷ 220,305,689 shares) | | $11.04 |
| Class I: | | |
| Net Asset Value, offering price and redemption price per share ($843,669,909 ÷ 76,623,780 shares) | | $11.01 |
(a) Redemption price per share is equal to net asset value less any applicable contingent deferred sales charge.
See accompanying notes which are an integral part of the financial statements.
Statement of Operations
| | | Six months ended January 31, 2016 |
| Investment Income | | |
| Dividends (including $3,722,162 earned from other affiliated issuers) | | $57,796,227 |
| Interest | | 54,330,088 |
| Income from Fidelity Central Funds | | 289,507 |
| Total income | | 112,415,822 |
| Expenses | | |
| Management fee | $11,438,256 | |
| Transfer agent fees | 4,677,965 | |
| Distribution and service plan fees | 2,074,923 | |
| Accounting and security lending fees | 666,667 | |
| Custodian fees and expenses | 18,251 | |
| Independent trustees' compensation | 9,217 | |
| Registration fees | 92,142 | |
| Audit | 92,436 | |
| Legal | 8,157 | |
| Miscellaneous | 11,803 | |
| Total expenses before reductions | 19,089,817 | |
| Expense reductions | (38,726) | 19,051,091 |
| Net investment income (loss) | | 93,364,731 |
| Realized and Unrealized Gain (Loss) | | |
| Net realized gain (loss) on: | | |
| Investment securities: | | |
| Unaffiliated issuers | 27,697,024 | |
| Other affiliated issuers | (10,109) | |
| Foreign currency transactions | (103,705) | |
| Total net realized gain (loss) | | 27,583,210 |
Change in net unrealized appreciation (depreciation) on:
Investment securities | (192,848,074) | |
| Assets and liabilities in foreign currencies | 70,075 | |
| Total change in net unrealized appreciation (depreciation) | | (192,777,999) |
| Net gain (loss) | | (165,194,789) |
| Net increase (decrease) in net assets resulting from operations | | $(71,830,058) |
See accompanying notes which are an integral part of the financial statements.
Statement of Changes in Net Assets
| | Six months ended January 31, 2016 | Year ended July 31, 2015 |
| Increase (Decrease) in Net Assets | | |
| Operations | | |
| Net investment income (loss) | $93,364,731 | $200,528,467 |
| Net realized gain (loss) | 27,583,210 | 54,207,307 |
| Change in net unrealized appreciation (depreciation) | (192,777,999) | (52,184,229) |
| Net increase (decrease) in net assets resulting from operations | (71,830,058) | 202,551,545 |
| Distributions to shareholders from net investment income | (122,107,962) | (199,452,326) |
| Distributions to shareholders from net realized gain | (51,815,947) | (75,677,564) |
| Total distributions | (173,923,909) | (275,129,890) |
| Share transactions - net increase (decrease) | 28,537,379 | 215,193,161 |
| Redemption fees | 122,503 | 424,938 |
| Total increase (decrease) in net assets | (217,094,085) | 143,039,754 |
| Net Assets | | |
| Beginning of period | 4,317,016,434 | 4,173,976,680 |
| End of period (including undistributed net investment income of $5,433,035 and undistributed net investment income of $34,176,266, respectively) | $4,099,922,349 | $4,317,016,434 |
See accompanying notes which are an integral part of the financial statements.
Financial Highlights — Fidelity Real Estate Income Fund Class A
| | Six months ended | Years ended July 31, | | | | |
| January 31, | 2016 | 2015 | 2014 | 2013 | 2012 | 2011 |
| Selected Per–Share Data | | | | | | |
| Net asset value, beginning of period | $11.66 | $11.86 | $11.67 | $11.26 | $10.73 | $9.94 |
| Income from Investment Operations | | | | | | |
| Net investment income (loss)A | .25 | .52 | .49 | .54 | .52 | .53 |
| Net realized and unrealized gain (loss) | (.45) | .02 | .44 | .60 | .61 | .76 |
| Total from investment operations | (.20) | .54 | .93 | 1.14 | 1.13 | 1.29 |
| Distributions from net investment income | (.33) | (.52) | (.50) | (.53) | (.51) | (.50) |
| Distributions from net realized gain | (.14) | (.21) | (.24) | (.20) | (.10) | – |
| Total distributions | (.47) | (.74)B | (.74) | (.73) | (.60)C | (.50) |
| Redemption fees added to paid in capitalA,D | – | – | – | – | – | – |
| Net asset value, end of period | $10.99 | $11.66 | $11.86 | $11.67 | $11.26 | $10.73 |
| Total ReturnE,F,G | (1.74)% | 4.65% | 8.49% | 10.45% | 11.24% | 13.27% |
| Ratios to Average Net AssetsH,I | | | | | | |
| Expenses before reductions | 1.03%J | 1.04% | 1.06% | 1.08% | 1.12% | 1.13% |
| Expenses net of fee waivers, if any | 1.03%J | 1.03% | 1.05% | 1.08% | 1.12% | 1.13% |
| Expenses net of all reductions | 1.03%J | 1.03% | 1.05% | 1.07% | 1.11% | 1.12% |
| Net investment income (loss) | 4.36%J | 4.40% | 4.28% | 4.62% | 4.89% | 5.00% |
| Supplemental Data | | | | | | |
| Net assets, end of period (000 omitted) | $502,556 | $495,462 | $442,271 | $378,269 | $137,352 | $60,283 |
| Portfolio turnover rateK | 15%J | 19% | 29% | 26% | 27% | 25% |
A Calculated based on average shares outstanding during the period.
B Total distributions of $.74 per share is comprised of distributions from net investment income of $.523 and distributions from net realized gain of $.212 per share.
C Total distributions of $.60 per share is comprised of distributions from net investment income of $.505 and distributions from net realized gain of $.097 per share.
D Amount represents less than $.005 per share.
E Total returns for periods of less than one year are not annualized.
F Total returns would have been lower if certain expenses had not been reduced during the applicable periods shown.
G Total returns do not include the effect of the sales charges.
H Fees and expenses of any underlying Fidelity Central Funds are not included in the Fund's expense ratio. The Fund indirectly bears its proportionate share of the expenses of any underlying Fidelity Central Funds.
I Expense ratios reflect operating expenses of the class. Expenses before reductions do not reflect amounts reimbursed by the investment adviser or reductions from brokerage service arrangements or reductions from other expense offset arrangements and do not represent the amount paid by the class during periods when reimbursements or reductions occur. Expenses net of fee waivers reflect expenses after reimbursement by the investment adviser but prior to reductions from brokerage service arrangements or other expense offset arrangements. Expenses net of all reductions represent the net expenses paid by the class.
J Annualized
K Amount does not include the portfolio activity of any underlying Fidelity Central Funds.
See accompanying notes which are an integral part of the financial statements.
Financial Highlights — Fidelity Real Estate Income Fund Class T
| | Six months ended | Years ended July 31, | | | | |
| January 31, | 2016 | 2015 | 2014 | 2013 | 2012 | 2011 |
| Selected Per–Share Data | | | | | | |
| Net asset value, beginning of period | $11.66 | $11.86 | $11.67 | $11.26 | $10.72 | $9.94 |
| Income from Investment Operations | | | | | | |
| Net investment income (loss)A | .25 | .51 | .49 | .54 | .52 | .52 |
| Net realized and unrealized gain (loss) | (.44) | .02 | .43 | .60 | .62 | .76 |
| Total from investment operations | (.19) | .53 | .92 | 1.14 | 1.14 | 1.28 |
| Distributions from net investment income | (.32) | (.52) | (.50) | (.53) | (.50) | (.50) |
| Distributions from net realized gain | (.14) | (.21) | (.24) | (.20) | (.10) | – |
| Total distributions | (.47)B | (.73) | (.73)C | (.73) | (.60) | (.50) |
| Redemption fees added to paid in capitalA,D | – | – | – | – | – | – |
| Net asset value, end of period | $11.00 | $11.66 | $11.86 | $11.67 | $11.26 | $10.72 |
| Total ReturnE,F,G | (1.67)% | 4.62% | 8.44% | 10.42% | 11.33% | 13.11% |
| Ratios to Average Net AssetsH,I | | | | | | |
| Expenses before reductions | 1.07%J | 1.06% | 1.08% | 1.08% | 1.11% | 1.16% |
| Expenses net of fee waivers, if any | 1.07%J | 1.06% | 1.08% | 1.08% | 1.11% | 1.16% |
| Expenses net of all reductions | 1.07%J | 1.06% | 1.07% | 1.08% | 1.11% | 1.16% |
| Net investment income (loss) | 4.33%J | 4.37% | 4.26% | 4.61% | 4.90% | 4.96% |
| Supplemental Data | | | | | | |
| Net assets, end of period (000 omitted) | $55,119 | $55,424 | $48,164 | $46,198 | $26,143 | $7,626 |
| Portfolio turnover rateK | 15%J | 19% | 29% | 26% | 27% | 25% |
A Calculated based on average shares outstanding during the period.
B Total distributions of $.47 per share is comprised of distributions from net investment income of $.324 and distributions from net realized gain of $.142 per share.
C Total distributions of $.73 per share is comprised of distributions from net investment income of $.496 and distributions from net realized gain of $.236 per share.
D Amount represents less than $.005 per share.
E Total returns for periods of less than one year are not annualized.
F Total returns would have been lower if certain expenses had not been reduced during the applicable periods shown.
G Total returns do not include the effect of the sales charges.
H Fees and expenses of any underlying Fidelity Central Funds are not included in the Fund's expense ratio. The Fund indirectly bears its proportionate share of the expenses of any underlying Fidelity Central Funds.
I Expense ratios reflect operating expenses of the class. Expenses before reductions do not reflect amounts reimbursed by the investment adviser or reductions from brokerage service arrangements or reductions from other expense offset arrangements and do not represent the amount paid by the class during periods when reimbursements or reductions occur. Expenses net of fee waivers reflect expenses after reimbursement by the investment adviser but prior to reductions from brokerage service arrangements or other expense offset arrangements. Expenses net of all reductions represent the net expenses paid by the class.
J Annualized
K Amount does not include the portfolio activity of any underlying Fidelity Central Funds.
See accompanying notes which are an integral part of the financial statements.
See accompanying notes which are an integral part of the financial statements.
Financial Highlights — Fidelity Real Estate Income Fund Class C
| | Six months ended | Years ended July 31, | | | | |
| January 31, | 2016 | 2015 | 2014 | 2013 | 2012 | 2011 |
| Selected Per–Share Data | | | | | | |
| Net asset value, beginning of period | $11.55 | $11.77 | $11.59 | $11.20 | $10.67 | $9.93 |
| Income from Investment Operations | | | | | | |
| Net investment income (loss)A | .20 | .43 | .40 | .45 | .44 | .45 |
| Net realized and unrealized gain (loss) | (.43) | .01 | .43 | .60 | .62 | .74 |
| Total from investment operations | (.23) | .44 | .83 | 1.05 | 1.06 | 1.19 |
| Distributions from net investment income | (.28) | (.45) | (.42) | (.46) | (.43) | (.45) |
| Distributions from net realized gain | (.14) | (.21) | (.24) | (.20) | (.10) | – |
| Total distributions | (.42) | (.66) | (.65)B | (.66) | (.53) | (.45) |
| Redemption fees added to paid in capitalA,C | – | – | – | – | – | – |
| Net asset value, end of period | $10.90 | $11.55 | $11.77 | $11.59 | $11.20 | $10.67 |
| Total ReturnD,E,F | (2.02)% | 3.82% | 7.66% | 9.66% | 10.49% | 12.25% |
| Ratios to Average Net AssetsG,H | | | | | | |
| Expenses before reductions | 1.79%I | 1.79% | 1.79% | 1.81% | 1.87% | 1.89% |
| Expenses net of fee waivers, if any | 1.79%I | 1.78% | 1.79% | 1.81% | 1.87% | 1.89% |
| Expenses net of all reductions | 1.78%I | 1.78% | 1.79% | 1.81% | 1.87% | 1.89% |
| Net investment income (loss) | 3.61%I | 3.65% | 3.54% | 3.88% | 4.14% | 4.23% |
| Supplemental Data | | | | | | |
| Net assets, end of period (000 omitted) | $266,308 | $291,387 | $246,306 | $204,012 | $52,780 | $21,555 |
| Portfolio turnover rateJ | 15%I | 19% | 29% | 26% | 27% | 25% |
A Calculated based on average shares outstanding during the period.
B Total distributions of $.65 per share is comprised of distributions from net investment income of $.417 and distributions from net realized gain of $.236 per share.
C Amount represents less than $.005 per share.
D Total returns for periods of less than one year are not annualized.
E Total returns would have been lower if certain expenses had not been reduced during the applicable periods shown.
F Total returns do not include the effect of the contingent deferred sales charge.
G Fees and expenses of any underlying Fidelity Central Funds are not included in the Fund's expense ratio. The Fund indirectly bears its proportionate share of the expenses of any underlying Fidelity Central Funds.
H Expense ratios reflect operating expenses of the class. Expenses before reductions do not reflect amounts reimbursed by the investment adviser or reductions from brokerage service arrangements or reductions from other expense offset arrangements and do not represent the amount paid by the class during periods when reimbursements or reductions occur. Expenses net of fee waivers reflect expenses after reimbursement by the investment adviser but prior to reductions from brokerage service arrangements or other expense offset arrangements. Expenses net of all reductions represent the net expenses paid by the class.
I Annualized
J Amount does not include the portfolio activity of any underlying Fidelity Central Funds.
See accompanying notes which are an integral part of the financial statements.
Financial Highlights — Fidelity Real Estate Income Fund
| | Six months ended | Years ended July 31, | | | | |
| January 31, | 2016 | 2015 | 2014 | 2013 | 2012 | 2011 |
| Selected Per–Share Data | | | | | | |
| Net asset value, beginning of period | $11.71 | $11.91 | $11.71 | $11.29 | $10.75 | $9.95 |
| Income from Investment Operations | | | | | | |
| Net investment income (loss)A | .26 | .54 | .52 | .57 | .54 | .55 |
| Net realized and unrealized gain (loss) | (.45) | .02 | .44 | .60 | .62 | .76 |
| Total from investment operations | (.19) | .56 | .96 | 1.17 | 1.16 | 1.31 |
| Distributions from net investment income | (.34) | (.55) | (.53) | (.55) | (.52) | (.51) |
| Distributions from net realized gain | (.14) | (.21) | (.24) | (.20) | (.10) | – |
| Total distributions | (.48) | (.76) | (.76)B | (.75) | (.62) | (.51) |
| Redemption fees added to paid in capitalA,C | – | – | – | – | – | – |
| Net asset value, end of period | $11.04 | $11.71 | $11.91 | $11.71 | $11.29 | $10.75 |
| Total ReturnD,E | (1.61)% | 4.84% | 8.78% | 10.71% | 11.50% | 13.41% |
| Ratios to Average Net AssetsF,G | | | | | | |
| Expenses before reductions | .84%H | .83% | .83% | .84% | .90% | .92% |
| Expenses net of fee waivers, if any | .84%H | .82% | .83% | .84% | .89% | .92% |
| Expenses net of all reductions | .84%H | .82% | .83% | .84% | .89% | .92% |
| Net investment income (loss) | 4.55%H | 4.61% | 4.50% | 4.85% | 5.12% | 5.21% |
| Supplemental Data | | | | | | |
| Net assets, end of period (000 omitted) | $2,432,270 | $2,561,268 | $2,627,382 | $2,884,545 | $2,252,149 | $1,660,063 |
| Portfolio turnover rateI | 15%H | 19% | 29% | 26% | 27% | 25% |
A Calculated based on average shares outstanding during the period.
B Total distributions of $.76 per share is comprised of distributions from net investment income of $.525 and distributions from net realized gain of $.236 per share.
C Amount represents less than $.005 per share.
D Total returns for periods of less than one year are not annualized.
E Total returns would have been lower if certain expenses had not been reduced during the applicable periods shown.
F Fees and expenses of any underlying Fidelity Central Funds are not included in the Fund's expense ratio. The Fund indirectly bears its proportionate share of the expenses of any underlying Fidelity Central Funds.
G Expense ratios reflect operating expenses of the class. Expenses before reductions do not reflect amounts reimbursed by the investment adviser or reductions from brokerage service arrangements or reductions from other expense offset arrangements and do not represent the amount paid by the class during periods when reimbursements or reductions occur. Expenses net of fee waivers reflect expenses after reimbursement by the investment adviser but prior to reductions from brokerage service arrangements or other expense offset arrangements. Expenses net of all reductions represent the net expenses paid by the class.
H Annualized
I Amount does not include the portfolio activity of any underlying Fidelity Central Funds.
See accompanying notes which are an integral part of the financial statements.
Financial Highlights — Fidelity Real Estate Income Fund Class I
| | Six months ended | Years ended July 31, | | | | |
| January 31, | 2016 | 2015 | 2014 | 2013 | 2012 | 2011 |
| Selected Per–Share Data | | | | | | |
| Net asset value, beginning of period | $11.68 | $11.88 | $11.69 | $11.28 | $10.74 | $9.95 |
| Income from Investment Operations | | | | | | |
| Net investment income (loss)A | .26 | .55 | .52 | .57 | .55 | .55 |
| Net realized and unrealized gain (loss) | (.44) | .02 | .44 | .60 | .62 | .76 |
| Total from investment operations | (.18) | .57 | .96 | 1.17 | 1.17 | 1.31 |
| Distributions from net investment income | (.34) | (.55) | (.53) | (.56) | (.53) | (.52) |
| Distributions from net realized gain | (.14) | (.21) | (.24) | (.20) | (.10) | – |
| Total distributions | (.49)B | (.77)C | (.77) | (.76) | (.63) | (.52) |
| Redemption fees added to paid in capitalA,D | – | – | – | – | – | – |
| Net asset value, end of period | $11.01 | $11.68 | $11.88 | $11.69 | $11.28 | $10.74 |
| Total ReturnE,F | (1.58)% | 4.92% | 8.76% | 10.72% | 11.62% | 13.44% |
| Ratios to Average Net AssetsG,H | | | | | | |
| Expenses before reductions | .77%I | .77% | .78% | .80% | .84% | .89% |
| Expenses net of fee waivers, if any | .77%I | .77% | .78% | .80% | .84% | .89% |
| Expenses net of all reductions | .77%I | .77% | .78% | .80% | .84% | .89% |
| Net investment income (loss) | 4.62%I | 4.66% | 4.55% | 4.89% | 5.17% | 5.24% |
| Supplemental Data | | | | | | |
| Net assets, end of period (000 omitted) | $843,670 | $913,475 | $809,854 | $610,045 | $217,435 | $43,282 |
| Portfolio turnover rateJ | 15%I | 19% | 29% | 26% | 27% | 25% |
A Calculated based on average shares outstanding during the period.
B Total distributions of $.49 per share is comprised of distributions from net investment income of $.344 and distributions from net realized gain of $.142 per share.
C Total distributions of $.77 per share is comprised of distributions from net investment income of $.554 and distributions from net realized gain of $.212 per share.
D Amount represents less than $.005 per share.
E Total returns for periods of less than one year are not annualized.
F Total returns would have been lower if certain expenses had not been reduced during the applicable periods shown.
G Fees and expenses of any underlying Fidelity Central Funds are not included in the Fund's expense ratio. The Fund indirectly bears its proportionate share of the expenses of any underlying Fidelity Central Funds.
H Expense ratios reflect operating expenses of the class. Expenses before reductions do not reflect amounts reimbursed by the investment adviser or reductions from brokerage service arrangements or reductions from other expense offset arrangements and do not represent the amount paid by the class during periods when reimbursements or reductions occur. Expenses net of fee waivers reflect expenses after reimbursement by the investment adviser but prior to reductions from brokerage service arrangements or other expense offset arrangements. Expenses net of all reductions represent the net expenses paid by the class.
I Annualized
J Amount does not include the portfolio activity of any underlying Fidelity Central Funds.
See accompanying notes which are an integral part of the financial statements.
Notes to Financial Statements
For the period ended January 31, 2016
1. Organization.
Fidelity Real Estate Income Fund (the Fund) is a fund of Fidelity Securities Fund (the Trust) and is authorized to issue an unlimited number of shares. The Trust is registered under the Investment Company Act of 1940, as amended (the 1940 Act), as an open-end management investment company organized as a Massachusetts business trust. The Fund offers Class A, Class T, Class C, Real Estate Income and Class I shares, each of which has equal rights as to assets and voting privileges. Each class has exclusive voting rights with respect to matters that affect that class.
2. Investments in Fidelity Central Funds.
The Fund invests in Fidelity Central Funds, which are open-end investment companies generally available only to other investment companies and accounts managed by the investment adviser and its affiliates. The Fund's Schedule of Investments lists each of the Fidelity Central Funds held as of period end, if any, as an investment of the Fund, but does not include the underlying holdings of each Fidelity Central Fund. As an Investing Fund, the Fund indirectly bears its proportionate share of the expenses of the underlying Fidelity Central Funds.
The Money Market Central Funds seek preservation of capital and current income and are managed by Fidelity Investments Money Management, Inc. (FIMM), an affiliate of the investment adviser. Annualized expenses of the Money Market Central Funds as of their most recent shareholder report date are less than .005%.
A complete unaudited list of holdings for each Fidelity Central Fund is available upon request or at the Securities and Exchange Commission (the SEC) website at www.sec.gov. In addition, the financial statements of the Fidelity Central Funds, which are not covered by the Fund's Report of Independent Registered Public Accounting Firm, are available on the SEC website or upon request.
3. Significant Accounting Policies.
The financial statements have been prepared in conformity with accounting principles generally accepted in the United States of America (GAAP), which require management to make certain estimates and assumptions at the date of the financial statements. Actual results could differ from those estimates. Subsequent events, if any, through the date that the financial statements were issued have been evaluated in the preparation of the financial statements. The following summarizes the significant accounting policies of the Fund:
Investment Valuation. Investments are valued as of 4:00 p.m. Eastern time on the last calendar day of the period. The Board of Trustees (the Board) has delegated the day to day responsibility for the valuation of the Fund's investments to the Fidelity Management & Research Company (FMR) Fair Value Committee (the Committee). In accordance with valuation policies and procedures approved by the Board, the Fund attempts to obtain prices from one or more third party pricing vendors or brokers to value its investments. When current market prices, quotations or currency exchange rates are not readily available or reliable, investments will be fair valued in good faith by the Committee, in accordance with procedures adopted by the Board. Factors used in determining fair value vary by investment type and may include market or investment specific events, changes in interest rates and credit quality. The frequency with which these procedures are used cannot be predicted and they may be utilized to a significant extent. The Committee oversees the Fund's valuation policies and procedures and reports to the Board on the Committee's activities and fair value determinations. The Board monitors the appropriateness of the procedures used in valuing the Fund's investments and ratifies the fair value determinations of the Committee.
The Fund categorizes the inputs to valuation techniques used to value its investments into a disclosure hierarchy consisting of three levels as shown below:
- Level 1 – quoted prices in active markets for identical investments
- Level 2 – other significant observable inputs (including quoted prices for similar investments, interest rates, prepayment speeds, etc.)
- Level 3 – unobservable inputs (including the Fund's own assumptions based on the best information available)
Valuation techniques used to value the Fund's investments by major category are as follows:
Equity securities, including restricted securities, for which market quotations are readily available, are valued at the last reported sale price or official closing price as reported by a third party pricing vendor on the primary market or exchange on which they are traded and are categorized as Level 1 in the hierarchy. In the event there were no sales during the day or closing prices are not available, securities are valued at the last quoted bid price or may be valued using the last available price and are generally categorized as Level 2 in the hierarchy. For foreign equity securities, when market or security specific events arise, comparisons to the valuation of American Depositary Receipts (ADRs), futures contracts, Exchange-Traded Funds (ETFs) and certain indexes as well as quoted prices for similar securities may be used and would be categorized as Level 2 in the hierarchy. Utilizing these techniques may result in transfers between Level 1 and Level 2. For equity securities, including restricted securities, where observable inputs are limited, assumptions about market activity and risk are used and these securities may be categorized as Level 3 in the hierarchy.
Debt securities, including restricted securities, are valued based on evaluated prices received from third party pricing vendors or from brokers who make markets in such securities. Corporate bonds, bank loan obligations and preferred securities are valued by pricing vendors who utilize matrix pricing which considers yield or price of bonds of comparable quality, coupon, maturity and type or by broker-supplied prices. Asset backed securities, collateralized mortgage obligations and commercial mortgage securities are valued by pricing vendors who utilize matrix pricing which considers prepayment speed assumptions, attributes of the collateral, yield or price of bonds of comparable quality, coupon, maturity and type or by broker-supplied prices. When independent prices are unavailable or unreliable, debt securities may be valued utilizing pricing methodologies which consider similar factors that would be used by third party pricing vendors. Debt securities are generally categorized as Level 2 in the hierarchy but may be Level 3 depending on the circumstances.
Investments in open-end mutual funds, including the Fidelity Central Funds, are valued at their closing net asset value (NAV) each business day and are categorized as Level 1 in the hierarchy.
Changes in valuation techniques may result in transfers in or out of an assigned level within the disclosure hierarchy. The aggregate value of investments by input level as of January 31, 2016, is included at the end of the Fund's Schedule of Investments.
Foreign Currency. The Fund may use foreign currency contracts to facilitate transactions in foreign-denominated securities. Gains and losses from these transactions may arise from changes in the value of the foreign currency or if the counterparties do not perform under the contracts' terms.
Foreign-denominated assets, including investment securities, and liabilities are translated into U.S. dollars at the exchange rates at period end. Purchases and sales of investment securities, income and dividends received and expenses denominated in foreign currencies are translated into U.S. dollars at the exchange rate in effect on the transaction date.
The effects of exchange rate fluctuations on investments are included with the net realized and unrealized gain (loss) on investment securities. Other foreign currency transactions resulting in realized and unrealized gain (loss) are disclosed separately.
Investment Transactions and Income. For financial reporting purposes, the Fund's investment holdings and NAV include trades executed through the end of the last business day of the period. The NAV per share for processing shareholder transactions is calculated as of the close of business of the New York Stock Exchange (NYSE), normally 4:00 p.m. Eastern time and includes trades executed through the end of the prior business day. Gains and losses on securities sold are determined on the basis of identified cost. Dividend income is recorded on the ex-dividend date, except for certain dividends from foreign securities where the ex-dividend date may have passed, which are recorded as soon as the Fund is informed of the ex-dividend date. Non-cash dividends included in dividend income, if any, are recorded at the fair market value of the securities received. Income and capital gain distributions from Fidelity Central Funds, if any, are recorded on the ex-dividend date. Distributions received on securities that represent a return of capital or capital gain are recorded as a reduction of cost of investments and/or as a realized gain. Subsequent to ex-dividend date the Fund determines the components of these distributions, based upon receipt of tax filings or other correspondence relating to the underlying investment. Interest income is accrued as earned and includes coupon interest and amortization of premium and accretion of discount on debt securities as applicable. For certain lower credit quality securitized assets that have contractual cash flows (for example, asset backed securities, collateralized mortgage obligations and commercial mortgage-backed securities), changes in estimated cash flows are periodically evaluated and the estimated yield is adjusted on a prospective basis, resulting in increases or decreases to Interest Income in the accompanying Statement of Operations. Investment income is recorded net of foreign taxes withheld where recovery of such taxes is uncertain. Debt obligations may be placed on non-accrual status and related interest income may be reduced by ceasing current accruals and writing off interest receivables when the collection of all or a portion of interest has become doubtful based on consistently applied procedures. A debt obligation is removed from non-accrual status when the issuer resumes interest payments or when collectability of interest is reasonably assured.
Class Allocations and Expenses. Investment income, realized and unrealized capital gains and losses, common expenses of the Fund, and certain fund-level expense reductions, if any, are allocated daily on a pro-rata basis to each class based on the relative net assets of each class to the total net assets of the Fund. Each class differs with respect to transfer agent and distribution and service plan fees incurred. Certain expense reductions may also differ by class. For the reporting period, the allocated portion of income and expenses to each class as a percent of its average net assets may vary due to the timing of recording these transactions in relation to fluctuating net assets of the classes. Expenses directly attributable to a fund are charged to that fund. Expenses attributable to more than one fund are allocated among the respective funds on the basis of relative net assets or other appropriate methods. Expense estimates are accrued in the period to which they relate and adjustments are made when actual amounts are known.
Income Tax Information and Distributions to Shareholders. Each year, the Fund intends to qualify as a regulated investment company under Subchapter M of the Internal Revenue Code, including distributing substantially all of its taxable income and realized gains. As a result, no provision for U.S. Federal income taxes is required. The Fund files a U.S. federal tax return, in addition to state and local tax returns as required. The Fund's federal income tax returns are subject to examination by the Internal Revenue Service (IRS) for a period of three fiscal years after they are filed. State and local tax returns may be subject to examination for an additional fiscal year depending on the jurisdiction. Foreign taxes are provided for based on the Fund's understanding of the tax rules and rates that exist in the foreign markets in which it invests.
Distributions are declared and recorded on the ex-dividend date. Income dividends and capital gain distributions are declared separately for each class. Income and capital gain distributions are determined in accordance with income tax regulations, which may differ from GAAP.
Capital accounts within the financial statements are adjusted for permanent book-tax differences. These adjustments have no impact on net assets or the results of operations. Capital accounts are not adjusted for temporary book-tax differences which will reverse in a subsequent period.
Book-tax differences are primarily due to foreign currency transactions, passive foreign investment companies (PFIC), market discount, equity-debt classifications, certain conversion ratio adjustments, partnerships and losses deferred due to wash sales.
The federal tax cost of investment securities and unrealized appreciation (depreciation) as of period end were as follows:
| Gross unrealized appreciation | $334,852,544 |
| Gross unrealized depreciation | (312,097,638) |
| Net unrealized appreciation (depreciation) on securities | $22,754,906 |
| Tax cost | $4,072,897,180 |
Short-Term Trading (Redemption) Fees. Shares held by investors in the Fund less than 90 days may have been subject to a redemption fee equal to .75% of the NAV of shares redeemed. All redemption fees, which reduce the proceeds of the shareholder redemption, are retained by the Fund and accounted for as an addition to paid in capital.
Restricted Securities. The Fund may invest in securities that are subject to legal or contractual restrictions on resale. These securities generally may be resold in transactions exempt from registration or to the public if the securities are registered. Disposal of these securities may involve time-consuming negotiations and expense, and prompt sale at an acceptable price may be difficult. Information regarding restricted securities is included at the end of the Fund's Schedule of Investments.
Loans and Other Direct Debt Instruments. The Fund invests in direct debt instruments which are interests in amounts owed to lenders by corporate or other borrowers. These instruments may be in the form of loans, trade claims or other receivables and may include standby financing commitments such as revolving credit facilities that obligate the Fund to supply additional cash to the borrower on demand. Loans may be acquired through assignment or participation. The Fund did not have any unfunded loan commitments, which are contractual obligations for future funding, at period end.
4. Purchases and Sales of Investments.
Purchases and sales of securities, other than short-term securities and U.S. government securities, aggregated $297,303,556 and $387,535,386, respectively.
5. Fees and Other Transactions with Affiliates.
Management Fee. Fidelity Management & Research Company (the investment adviser) and its affiliates provide the Fund with investment management related services for which the Fund pays a monthly management fee. The management fee is the sum of an individual fund fee rate that is based on an annual rate of .30% of the Fund's average net assets and an annualized group fee rate that averaged .25% during the period. The group fee rate is based upon the average net assets of all the mutual funds advised by the investment adviser, including any mutual funds previously advised by the investment adviser that are currently advised by Fidelity SelectCo, LLC, an affiliate of the investment adviser. The group fee rate decreases as assets under management increase and increases as assets under management decrease. For the reporting period, the total annualized management fee rate was .55% of the Fund's average net assets.
Distribution and Service Plan Fees. In accordance with Rule 12b-1 of the 1940 Act, the Fund has adopted separate Distribution and Service Plans for each class of shares. Certain classes pay Fidelity Distributors Corporation (FDC), an affiliate of the investment adviser, separate Distribution and Service Fees, each of which is based on an annual percentage of each class' average net assets. In addition, FDC may pay financial intermediaries for selling shares of the Fund and providing shareholder support services. For the period, the Distribution and Service Fee rates, total fees and amounts retained by FDC were as follows:
| | Distribution
Fee | Service
Fee | Total Fees | Retained
by FDC |
| Class A | -% | .25% | $606,187 | $4,643 |
| Class T | -% | .25% | 69,476 | – |
| Class C | .75% | .25% | 1,399,260 | 254,178 |
| | | | $2,074,923 | $258,821 |
Sales Load. FDC may receive a front-end sales charge of up to 4.00% for selling Class A shares and Class T shares, some of which is paid to financial intermediaries for selling shares of the Fund. Depending on the holding period, FDC may receive contingent deferred sales charges levied on Class A, Class T, and Class C redemptions. The deferred sales charges are 1.00% for Class C shares, 1.00% for certain purchases of Class A shares and .25% for certain purchases of Class T shares.
For the period, sales charge amounts retained by FDC were as follows:
| | Retained
by FDC |
| Class A | $36,180 |
| Class T | 4,664 |
| Class C(a) | 17,718 |
| | $58,562 |
(a) When Class C shares are initially sold, FDC pays commissions from its own resources to financial intermediaries through which the sales are made.
Transfer Agent Fees. Fidelity Investments Institutional Operations Company, Inc., (FIIOC), an affiliate of the investment adviser, is the transfer, dividend disbursing and shareholder servicing agent for each class of the Fund. FIIOC receives account fees and asset-based fees that vary according to the account size and type of account of the shareholders of the respective classes of the Fund. FIIOC pays for typesetting, printing and mailing of shareholder reports, except proxy statements.
For the period, transfer agent fees for each class were as follows:
| | Amount | % of
Class-Level Average
Net Assets(a) |
| Class A | $465,764 | .19 |
| Class T | 62,806 | .23 |
| Class C | 272,734 | .19 |
| Real Estate Income | 3,114,175 | .25 |
| Class I | 762,486 | .18 |
| | $ 4,677,965 | |
(a) Annualized
Accounting and Security Lending Fees. Fidelity Service Company, Inc. (FSC), an affiliate of the investment adviser, maintains the Fund's accounting records. The accounting fee is based on the level of average net assets for each month. Under a separate contract, FSC administers the security lending program. The security lending fee is based on the number and duration of lending transactions.
Brokerage Commissions. The Fund placed a portion of its portfolio transactions with brokerage firms which are affiliates of the investment adviser. Brokerage commissions are included in net realized gain (loss) and change in net unrealized appreciation (depreciation) in the Statement of Operations. The commissions paid to these affiliated firms were $4,734 for the period.
Interfund Trades. The Fund may purchase from or sell securities to other Fidelity Funds under procedures adopted by the Board. The procedures have been designed to ensure these interfund trades are executed in accordance with Rule 17a-7 of the 1940 Act. Interfund trades are included within the respective purchases and sales amounts shown in the Purchases and Sales of Investments note.
6. Committed Line of Credit.
The Fund participates with other funds managed by the investment adviser or an affiliate in a $4.25 billion credit facility (the "line of credit") to be utilized for temporary or emergency purposes to fund shareholder redemptions or for other short-term liquidity purposes. The Fund has agreed to pay commitment fees on its pro-rata portion of the line of credit, which amounted to $2,805 and is reflected in Miscellaneous expenses on the Statement of Operations. During the period, the Fund did not borrow on this line of credit.
7. Security Lending.
The Fund lends portfolio securities through a lending agent from time to time in order to earn additional income. For equity securities, a lending agent is used and may loan securities to certain qualified borrowers, including Fidelity Capital Markets (FCM), a broker-dealer affiliated with the Fund. On the settlement date of the loan, the Fund receives collateral (in the form of U.S. Treasury obligations, letters of credit and/or cash) against the loaned securities and maintains collateral in an amount not less than 100% of the market value of the loaned securities during the period of the loan. The market value of the loaned securities is determined at the close of business of the Fund and any additional required collateral is delivered to the Fund on the next business day. The Fund or borrower may terminate the loan at any time, and if the borrower defaults on its obligation to return the securities loaned because of insolvency or other reasons, the Fund may apply collateral received from the borrower against the obligation. The Fund may experience delays and costs in recovering the securities loaned. Any cash collateral received is invested in the Fidelity Securities Lending Cash Central Fund. The value of loaned securities and cash collateral at period end are disclosed on the Fund's Statement of Assets and Liabilities. Security lending income represents the income earned on investing cash collateral, less rebates paid to borrowers and any lending agent fees associated with the loan, plus any premium payments received for lending certain types of securities. Security lending income is presented in the Statement of Operations as a component of income from Fidelity Central Funds. Total security lending income during the period amounted to $12,966. During the period, there were no securities loaned to FCM.
8. Expense Reductions.
Commissions paid to certain brokers with whom the investment adviser, or its affiliates, places trades on behalf of the Fund include an amount in addition to trade execution, which may be rebated back to the Fund to offset certain expenses. This amount totaled $22,145 for the period. In addition, through arrangements with the Fund's custodian, credits realized as a result of certain uninvested cash balances were used to reduce the Fund's expenses. During the period, these credits reduced the Fund's custody expenses by $1,735.
In addition, during the period the investment adviser reimbursed and/or waived a portion of fund-level operating expenses in the amount of $14,846.
9. Distributions to Shareholders.
Distributions to shareholders of each class were as follows:
| | Six months ended January 31, 2016 | Year ended July 31, 2015 |
| From net investment income | | |
| Class A | $13,783,244 | $21,010,715 |
| Class T | 1,575,598 | 2,305,119 |
| Class C | 6,852,507 | 10,465,476 |
| Real Estate Income | 74,108,924 | 122,206,251 |
| Class I | 25,787,689 | 43,464,765 |
| Total | $122,107,962 | $199,452,326 |
| From net realized gain | | |
| Class A | $6,008,169 | $7,958,848 |
| Class T | 680,042 | 875,220 |
| Class C | 3,527,228 | 4,645,932 |
| Real Estate Income | 30,805,486 | 46,720,433 |
| Class I | 10,795,022 | 15,477,131 |
| Total | $51,815,947 | $75,677,564 |
10. Share Transactions.
Share transactions for each class were as follows and may contain automatic conversions between classes or exchanges between affiliated funds:
| | Shares | Shares | Dollars | Dollars |
| | Six months ended January 31, 2016 | Year ended July 31, 2015 | Six months ended January 31, 2016 | Year ended July 31, 2015 |
| Class A | | | | |
| Shares sold | 8,833,232 | 17,614,783 | $99,136,860 | $207,492,435 |
| Reinvestment of distributions | 1,654,994 | 2,253,682 | 18,423,230 | 26,209,333 |
| Shares redeemed | (7,261,614) | (14,664,043) | (81,991,780) | (171,937,484) |
| Net increase (decrease) | 3,226,612 | 5,204,422 | $35,568,310 | $61,764,284 |
| Class T | | | | |
| Shares sold | 585,301 | 1,551,308 | $6,617,495 | $18,286,948 |
| Reinvestment of distributions | 187,688 | 251,652 | 2,090,146 | 2,927,374 |
| Shares redeemed | (512,341) | (1,110,729) | (5,798,010) | (13,074,996) |
| Net increase (decrease) | 260,648 | 692,231 | $2,909,631 | $8,139,326 |
| Class C | | | | |
| Shares sold | 2,124,908 | 7,875,459 | $23,840,323 | $92,082,413 |
| Reinvestment of distributions | 822,712 | 1,105,279 | 9,089,251 | 12,763,694 |
| Shares redeemed | (3,727,311) | (4,690,719) | (41,694,636) | (54,577,835) |
| Net increase (decrease) | (779,691) | 4,290,019 | $(8,765,062) | $50,268,272 |
| Real Estate Income | | | | |
| Shares sold | 22,973,738 | 51,184,144 | $261,251,386 | $605,520,317 |
| Reinvestment of distributions | 8,268,560 | 12,742,585 | 92,453,420 | 148,826,128 |
| Shares redeemed | (29,628,387) | (65,882,524) | (336,288,502) | (777,479,294) |
| Net increase (decrease) | 1,613,911 | (1,955,795) | $17,416,304 | $(23,132,849) |
| Class I | | | | |
| Shares sold | 16,198,203 | 38,671,974 | $182,574,922 | $455,469,590 |
| Reinvestment of distributions | 2,502,407 | 3,704,065 | 27,905,962 | 43,129,998 |
| Shares redeemed | (20,276,080) | (32,342,580) | (229,072,688) | (380,445,460) |
| Net increase (decrease) | (1,575,470) | 10,033,459 | $(18,591,804) | $118,154,128 |
11. Other.
The Fund's organizational documents provide former and current trustees and officers with a limited indemnification against liabilities arising in connection with the performance of their duties to the Fund. In the normal course of business, the Fund may also enter into contracts that provide general indemnifications. The Fund's maximum exposure under these arrangements is unknown as this would be dependent on future claims that may be made against the Fund. The risk of material loss from such claims is considered remote.
Report of Independent Registered Public Accounting Firm
To the Trustees of Fidelity Securities Fund and the Shareholders of Fidelity Real Estate Income Fund:
We have audited the accompanying statement of assets and liabilities of Fidelity Real Estate Income Fund (the Fund), a fund of Fidelity Securities Fund, including the schedule of investments, as of January 31, 2016, and the related statement of operations for the six months then ended, the statement of changes in net assets for the six months ended January 31, 2016 and for the year ended July 31, 2015, and the financial highlights for the six months ended January 31, 2016 and for each of the five years in the period ended July 31, 2015. These financial statements and financial highlights are the responsibility of the Fund's management. Our responsibility is to express an opinion on these financial statements and financial highlights based on our audits.
We conducted our audits in accordance with the standards of the Public Company Accounting Oversight Board (United States). Those standards require that we plan and perform the audit to obtain reasonable assurance about whether the financial statements and financial highlights are free of material misstatement. The Fund is not required to have, nor were we engaged to perform, an audit of its internal control over financial reporting. Our audits included consideration of internal control over financial reporting as a basis for designing audit procedures that are appropriate in the circumstances, but not for the purpose of expressing an opinion on the effectiveness of the Fund's internal control over financial reporting. Accordingly, we express no such opinion. An audit also includes examining, on a test basis, evidence supporting the amounts and disclosures in the financial statements, assessing the accounting principles used and significant estimates made by management, as well as evaluating the overall financial statement presentation. Our procedures included confirmation of securities owned as of January 31, 2016, by correspondence with the custodians and brokers; when replies were not received from brokers, we performed other auditing procedures. We believe that our audits provide a reasonable basis for our opinion.
In our opinion, such financial statements and financial highlights referred to above present fairly, in all material respects, the financial position of Fidelity Real Estate Income Fund as of January 31, 2016, the results of its operations for the six months then ended, the changes in its net assets for the six months ended January 31, 2016 and for the year ended July 31, 2015, and the financial highlights for the six months ended January 31, 2016 and for each of the five years in the period ended July 31, 2015, in conformity with accounting principles generally accepted in the United States of America.
DELOITTE & TOUCHE LLP
Boston, Massachusetts
March 18, 2016
Shareholder Expense Example
As a shareholder of the Fund, you incur two types of costs: (1) transaction costs, including sales charges (loads) on purchase payments or redemption proceeds, redemption fees and (2) ongoing costs, including management fees, distribution and/or service (12b-1) fees and other Fund expenses. This Example is intended to help you understand your ongoing costs (in dollars) of investing in the Fund and to compare these costs with the ongoing costs of investing in other mutual funds.
The Example is based on an investment of $1,000 invested at the beginning of the period and held for the entire period (August 1, 2015 to January 31, 2016).
Actual Expenses
The first line of the accompanying table for each class of the Fund provides information about actual account values and actual expenses. You may use the information in this line, together with the amount you invested, to estimate the expenses that you paid over the period. Simply divide your account value by $1,000.00 (for example, an $8,600 account value divided by $1,000.00 = 8.6), then multiply the result by the number in the first line for a class of the Fund under the heading entitled "Expenses Paid During Period" to estimate the expenses you paid on your account during this period. A small balance maintenance fee of $12.00 that is charged once a year may apply for certain accounts with a value of less than $2,000. This fee is not included in the table below. If it was, the estimate of expenses you paid during the period would be higher, and your ending account value lower, by this amount. In addition, the Fund, as a shareholder in the underlying Fidelity Central Funds, will indirectly bear its pro-rata share of the fees and expenses incurred by the underlying Fidelity Central Funds. These fees and expenses are not included in the Fund's annualized expense ratio used to calculate the expense estimate in the table below.
Hypothetical Example for Comparison Purposes
The second line of the accompanying table for each class of the Fund provides information about hypothetical account values and hypothetical expenses based on a Class' actual expense ratio and an assumed rate of return of 5% per year before expenses, which is not the Class' actual return. The hypothetical account values and expenses may not be used to estimate the actual ending account balance or expenses you paid for the period. You may use this information to compare the ongoing costs of investing in the Fund and other funds. To do so, compare this 5% hypothetical example with the 5% hypothetical examples that appear in the shareholder reports of the other funds. A small balance maintenance fee of $12.00 that is charged once a year may apply for certain accounts with a value of less than $2,000. This fee is not included in the table below. If it was, the estimate of expenses you paid during the period would be higher, and your ending account value lower, by this amount. In addition, the Fund, as a shareholder in the underlying Fidelity Central Funds, will indirectly bear its pro-rata share of the fees and expenses incurred by the underlying Fidelity Central Funds. These fees and expenses are not included in the Fund's annualized expense ratio used to calculate the expense estimate in the table below.
Please note that the expenses shown in the table are meant to highlight your ongoing costs only and do not reflect any transaction costs. Therefore, the second line of the table is useful in comparing ongoing costs only, and will not help you determine the relative total costs of owning different funds. In addition, if these transactional costs were included, your costs would have been higher.
| | Annualized Expense Ratio-A | Beginning
Account Value
August 1, 2015 | Ending
Account Value
January 31, 2016 | Expenses Paid
During Period-B
August 1, 2015
to January 31, 2016 |
| Class A | 1.03% | | | |
| Actual | | $1,000.00 | $982.60 | $5.13 |
| Hypothetical-C | | $1,000.00 | $1,019.96 | $5.23 |
| Class T | 1.07% | | | |
| Actual | | $1,000.00 | $983.30 | $5.33 |
| Hypothetical-C | | $1,000.00 | $1,019.76 | $5.43 |
| Class C | 1.79% | | | |
| Actual | | $1,000.00 | $979.80 | $8.91 |
| Hypothetical-C | | $1,000.00 | $1,016.14 | $9.07 |
| Real Estate Income | .84% | | | |
| Actual | | $1,000.00 | $983.90 | $4.19 |
| Hypothetical-C | | $1,000.00 | $1,020.91 | $4.27 |
| Class I | .77% | | | |
| Actual | | $1,000.00 | $984.20 | $3.84 |
| Hypothetical-C | | $1,000.00 | $1,021.27 | $3.91 |
A Annualized expense ratio reflects expenses net of applicable fee waivers.
B Expenses are equal to each Class' annualized expense ratio, multiplied by the average account value over the period, multiplied by 184/366 (to reflect the one-half year period).
C 5% return per year before expenses
REII-SANN-0316
1.907544.105
Fidelity® Leveraged Company Stock Fund
Semi-Annual Report January 31, 2016 |
|
Contents
To view a fund's proxy voting guidelines and proxy voting record for the 12-month period ended June 30, visit http://www.fidelity.com/proxyvotingresults or visit the Securities and Exchange Commission's (SEC) web site at http://www.sec.gov.
You may also call 1-800-544-8544 to request a free copy of the proxy voting guidelines.
Standard & Poor's, S&P and S&P 500 are registered service marks of The McGraw-Hill Companies, Inc. and have been licensed for use by Fidelity Distributors Corporation.
Other third-party marks appearing herein are the property of their respective owners.
All other marks appearing herein are registered or unregistered trademarks or service marks of FMR LLC or an affiliated company. © 2016 FMR LLC. All rights reserved.
This report and the financial statements contained herein are submitted for the general information of the shareholders of the Fund. This report is not authorized for distribution to prospective investors in the Fund unless preceded or accompanied by an effective prospectus.
A fund files its complete schedule of portfolio holdings with the SEC for the first and third quarters of each fiscal year on Form N-Q. Forms N-Q are available on the SEC’s web site at http://www.sec.gov. A fund's Forms N-Q may be reviewed and copied at the SEC’s Public Reference Room in Washington, DC. Information regarding the operation of the SEC's Public Reference Room may be obtained by calling 1-800-SEC-0330.
For a complete list of a fund's portfolio holdings, view the most recent holdings listing, semiannual report, or annual report on Fidelity's web site at http://www.fidelity.com, http://www.advisor.fidelity.com, or http://www.401k.com, as applicable.
NOT FDIC INSURED •MAY LOSE VALUE •NO BANK GUARANTEE
Neither the Fund nor Fidelity Distributors Corporation is a bank.
Investment Summary (Unaudited)
Top Ten Stocks as of January 31, 2016
| | % of fund's net assets | % of fund's net assets 6 months ago |
| LyondellBasell Industries NV Class A | 8.1 | 9.0 |
| Service Corp. International | 6.2 | 6.2 |
| Boston Scientific Corp. | 4.3 | 3.4 |
| Delta Air Lines, Inc. | 3.2 | 2.4 |
| Bank of America Corp. | 3.0 | 2.9 |
| Comcast Corp. Class A | 2.7 | 2.3 |
| General Motors Co. | 2.7 | 2.2 |
| WestRock Co. | 2.6 | 3.1 |
| Tenet Healthcare Corp. | 2.3 | 1.7 |
| Newell Rubbermaid, Inc. | 2.3 | 1.9 |
| | 37.4 | |
Top Five Market Sectors as of January 31, 2016
| | % of fund's net assets | % of fund's net assets 6 months ago |
| Consumer Discretionary | 24.9 | 26.0 |
| Health Care | 14.8 | 14.6 |
| Materials | 13.9 | 14.3 |
| Industrials | 12.4 | 10.2 |
| Financials | 11.6 | 12.1 |
Asset Allocation (% of fund's net assets)
| As of January 31, 2016 * |
| | Stocks | 97.8% |
| | Bonds | 0.2% |
| | Short-Term Investments and Net Other Assets (Liabilities) | 2.0% |

* Foreign investments - 14.8%
| As of July 31, 2015 * |
| | Stocks | 96.9% |
| | Bonds | 0.3% |
| | Short-Term Investments and Net Other Assets (Liabilities) | 2.8% |

* Foreign investments - 16.2%
Investments January 31, 2016 (Unaudited)
Showing Percentage of Net Assets
| Common Stocks - 97.5% | | | |
| | | Shares | Value (000s) |
| CONSUMER DISCRETIONARY - 24.9% | | | |
| Auto Components - 1.7% | | | |
| Delphi Automotive PLC | | 490,700 | $31,866 |
| Tenneco, Inc. (a) | | 674,800 | 25,784 |
| | | | 57,650 |
| Automobiles - 5.2% | | | |
| Ford Motor Co. | | 6,012,933 | 71,794 |
| General Motors Co. | | 3,133,537 | 92,878 |
| General Motors Co.: | | | |
| warrants 7/10/16 (a) | | 482,521 | 9,482 |
| warrants 7/10/19 (a) | | 482,521 | 5,790 |
| | | | 179,944 |
| Diversified Consumer Services - 6.2% | | | |
| Service Corp. International | | 8,875,127 | 214,689 |
| Hotels, Restaurants & Leisure - 1.0% | | | |
| ARAMARK Holdings Corp. | | 987,744 | 31,558 |
| Penn National Gaming, Inc. (a) | | 360,340 | 5,092 |
| Station Holdco LLC unit (a)(b)(c) | | 146,846 | 79 |
| | | | 36,729 |
| Household Durables - 3.2% | | | |
| Hovnanian Enterprises, Inc. Class A (a)(d) | | 1,419,000 | 2,185 |
| Lennar Corp. Class A (d) | | 677,100 | 28,540 |
| Newell Rubbermaid, Inc. | | 2,037,747 | 79,024 |
| | | | 109,749 |
| Media - 6.5% | | | |
| AMC Networks, Inc. Class A (a) | | 446,400 | 32,493 |
| Cinemark Holdings, Inc. | | 1,853,345 | 54,655 |
| Comcast Corp. Class A | | 1,672,234 | 93,160 |
| Gray Television, Inc. (a) | | 2,889,565 | 37,998 |
| Nexstar Broadcasting Group, Inc. Class A | | 178,698 | 8,079 |
| | | | 226,385 |
| Specialty Retail - 1.1% | | | |
| GameStop Corp. Class A (d) | | 620,207 | 16,256 |
| Sally Beauty Holdings, Inc. (a) | | 808,000 | 22,268 |
| | | | 38,524 |
|
| TOTAL CONSUMER DISCRETIONARY | | | 863,670 |
|
| CONSUMER STAPLES - 1.8% | | | |
| Food Products - 1.3% | | | |
| ConAgra Foods, Inc. | | 541,700 | 22,556 |
| Darling International, Inc. (a) | | 2,698,383 | 24,258 |
| | | | 46,814 |
| Personal Products - 0.5% | | | |
| Revlon, Inc. (a) | | 553,261 | 16,448 |
|
| TOTAL CONSUMER STAPLES | | | 63,262 |
|
| ENERGY - 6.0% | | | |
| Energy Equipment & Services - 1.6% | | | |
| Ensco PLC Class A | | 110,000 | 1,076 |
| Halliburton Co. | | 1,126,593 | 35,814 |
| Oil States International, Inc. (a) | | 270,466 | 7,635 |
| SAExploration Holdings, Inc. (a)(e) | | 1,257,304 | 2,100 |
| Schlumberger Ltd. | | 109,400 | 7,906 |
| | | | 54,531 |
| Oil, Gas & Consumable Fuels - 4.4% | | | |
| Continental Resources, Inc. (a)(d) | | 807,474 | 17,046 |
| Hess Corp. | | 825,110 | 35,067 |
| QEP Resources, Inc. | | 901,000 | 11,551 |
| Range Resources Corp. (d) | | 247,200 | 7,307 |
| Valero Energy Corp. | | 1,056,166 | 71,682 |
| Whiting Petroleum Corp. (a) | | 1,439,895 | 10,583 |
| | | | 153,236 |
|
| TOTAL ENERGY | | | 207,767 |
|
| FINANCIALS - 11.3% | | | |
| Banks - 8.4% | | | |
| Bank of America Corp. | | 7,243,199 | 102,419 |
| Barclays PLC sponsored ADR | | 2,083,121 | 22,456 |
| CIT Group, Inc. | | 229,310 | 6,730 |
| Citigroup, Inc. | | 1,169,047 | 49,778 |
| Huntington Bancshares, Inc. | | 4,806,680 | 41,241 |
| Regions Financial Corp. | | 4,496,280 | 36,510 |
| SunTrust Banks, Inc. | | 895,500 | 32,757 |
| | | | 291,891 |
| Capital Markets - 0.1% | | | |
| Motors Liquidation Co. GUC Trust (a) | | 123,112 | 1,988 |
| Consumer Finance - 0.8% | | | |
| American Express Co. | | 542,948 | 29,048 |
| Insurance - 0.5% | | | |
| Lincoln National Corp. | | 435,700 | 17,193 |
| Real Estate Investment Trusts - 1.0% | | | |
| Gaming & Leisure Properties | | 430,875 | 11,237 |
| Host Hotels & Resorts, Inc. | | 1,016,122 | 14,073 |
| Sabra Health Care REIT, Inc. | | 547,507 | 10,052 |
| | | | 35,362 |
| Real Estate Management & Development - 0.4% | | | |
| Realogy Holdings Corp. (a) | | 463,840 | 15,214 |
| Thrifts & Mortgage Finance - 0.1% | | | |
| MGIC Investment Corp. (a) | | 441,300 | 2,921 |
|
| TOTAL FINANCIALS | | | 393,617 |
|
| HEALTH CARE - 14.8% | | | |
| Health Care Equipment & Supplies - 4.3% | | | |
| Boston Scientific Corp. (a) | | 8,457,056 | 148,252 |
| Health Care Providers & Services - 6.2% | | | |
| Community Health Systems, Inc. (a) | | 1,213,027 | 26,056 |
| DaVita HealthCare Partners, Inc. (a) | | 532,952 | 35,772 |
| HCA Holdings, Inc. (a) | | 532,479 | 37,050 |
| Tenet Healthcare Corp. (a) | | 2,965,644 | 80,428 |
| Universal Health Services, Inc. Class B | | 334,505 | 37,679 |
| | | | 216,985 |
| Life Sciences Tools & Services - 0.8% | | | |
| PRA Health Sciences, Inc. (a) | | 651,400 | 28,062 |
| Pharmaceuticals - 3.5% | | | |
| Johnson & Johnson | | 153,000 | 15,979 |
| Merck & Co., Inc. | | 1,390,800 | 70,472 |
| Sanofi SA sponsored ADR | | 819,934 | 34,142 |
| | | | 120,593 |
|
| TOTAL HEALTH CARE | | | 513,892 |
|
| INDUSTRIALS - 12.4% | | | |
| Aerospace & Defense - 2.7% | | | |
| Honeywell International, Inc. | | 426,776 | 44,043 |
| Huntington Ingalls Industries, Inc. | | 210,260 | 26,888 |
| Textron, Inc. | | 602,700 | 20,624 |
| | | | 91,555 |
| Airlines - 4.8% | | | |
| American Airlines Group, Inc. | | 860,580 | 33,554 |
| Delta Air Lines, Inc. | | 2,531,601 | 112,125 |
| Southwest Airlines Co. | | 571,283 | 21,492 |
| | | | 167,171 |
| Building Products - 0.7% | | | |
| Allegion PLC | | 246,500 | 14,928 |
| Armstrong World Industries, Inc. (a) | | 273,500 | 10,579 |
| | | | 25,507 |
| Commercial Services & Supplies - 1.0% | | | |
| Civeo Corp. (a) | | 540,932 | 584 |
| Deluxe Corp. | | 431,413 | 24,116 |
| Tyco International Ltd. | | 328,233 | 11,288 |
| | | | 35,988 |
| Electrical Equipment - 0.6% | | | |
| Emerson Electric Co. | | 163,500 | 7,518 |
| Generac Holdings, Inc. (a)(d) | | 490,557 | 13,942 |
| | | | 21,460 |
| Industrial Conglomerates - 0.9% | | | |
| General Electric Co. | | 1,103,883 | 32,123 |
| Machinery - 1.1% | | | |
| Ingersoll-Rand PLC | | 648,800 | 33,394 |
| Pentair PLC | | 78,757 | 3,711 |
| | | | 37,105 |
| Marine - 0.1% | | | |
| Genco Shipping & Trading Ltd. (a) | | 565,366 | 571 |
| Genco Shipping & Trading Ltd. (a) | | 8,314 | 8 |
| Navios Maritime Holdings, Inc. (d) | | 2,162,794 | 2,107 |
| | | | 2,686 |
| Road & Rail - 0.3% | | | |
| Hertz Global Holdings, Inc. (a) | | 1,200,900 | 10,904 |
| Trading Companies & Distributors - 0.2% | | | |
| United Rentals, Inc. (a) | | 147,000 | 7,043 |
|
| TOTAL INDUSTRIALS | | | 431,542 |
|
| INFORMATION TECHNOLOGY - 9.4% | | | |
| Electronic Equipment & Components - 1.8% | | | |
| Avnet, Inc. | | 594,313 | 23,725 |
| Belden, Inc. | | 510,764 | 21,820 |
| Corning, Inc. | | 726,800 | 13,526 |
| TTM Technologies, Inc. (a) | | 381,564 | 2,225 |
| | | | 61,296 |
| Internet Software & Services - 0.4% | | | |
| VeriSign, Inc. (a)(d) | | 194,300 | 14,689 |
| IT Services - 0.1% | | | |
| Everi Holdings, Inc. (a) | | 1,851,000 | 5,201 |
| Semiconductors & Semiconductor Equipment - 3.8% | | | |
| Intersil Corp. Class A | | 1,460,387 | 18,985 |
| Micron Technology, Inc. (a) | | 2,079,945 | 22,942 |
| NXP Semiconductors NV (a) | | 940,864 | 70,358 |
| ON Semiconductor Corp. (a) | | 2,134,568 | 18,272 |
| | | | 130,557 |
| Software - 2.6% | | | |
| Citrix Systems, Inc. (a) | | 230,899 | 16,269 |
| Microsoft Corp. | | 1,324,668 | 72,976 |
| | | | 89,245 |
| Technology Hardware, Storage & Peripherals - 0.7% | | | |
| NCR Corp. (a) | | 1,117,931 | 23,857 |
|
| TOTAL INFORMATION TECHNOLOGY | | | 324,845 |
|
| MATERIALS - 13.9% | | | |
| Chemicals - 9.1% | | | |
| H.B. Fuller Co. | | 461,829 | 17,189 |
| LyondellBasell Industries NV Class A | | 3,619,555 | 282,220 |
| OMNOVA Solutions, Inc. (a)(e) | | 3,114,962 | 16,354 |
| Phosphate Holdings, Inc. (a) | | 307,500 | 10 |
| | | | 315,773 |
| Containers & Packaging - 3.2% | | | |
| Sealed Air Corp. | | 483,434 | 19,594 |
| WestRock Co. | | 2,590,728 | 91,401 |
| | | | 110,995 |
| Metals & Mining - 0.0% | | | |
| Ormet Corp.(a)(e) | | 1,075,000 | 0 |
| Paper & Forest Products - 1.6% | | | |
| Kapstone Paper & Packaging Corp. | | 989,200 | 14,620 |
| Louisiana-Pacific Corp. (a) | | 1,563,090 | 24,572 |
| Neenah Paper, Inc. | | 266,200 | 16,089 |
| | | | 55,281 |
|
| TOTAL MATERIALS | | | 482,049 |
|
| TELECOMMUNICATION SERVICES - 1.6% | | | |
| Diversified Telecommunication Services - 1.6% | | | |
| Frontier Communications Corp. (d) | | 5,528,256 | 25,154 |
| Intelsat SA (a)(d) | | 1,144,700 | 3,823 |
| Level 3 Communications, Inc. (a) | | 514,400 | 25,108 |
| | | | 54,085 |
| UTILITIES - 1.4% | | | |
| Electric Utilities - 0.4% | | | |
| FirstEnergy Corp. | | 421,304 | 13,928 |
| Independent Power and Renewable Electricity Producers - 1.0% | | | |
| Calpine Corp. (a) | | 2,167,700 | 33,187 |
|
| TOTAL UTILITIES | | | 47,115 |
|
| TOTAL COMMON STOCKS | | | |
| (Cost $2,485,910) | | | 3,381,844 |
|
| Nonconvertible Preferred Stocks - 0.3% | | | |
| FINANCIALS - 0.3% | | | |
| Capital Markets - 0.3% | | | |
| GMAC Capital Trust I Series 2, 8.125% | | | |
| (Cost $10,975) | | 439,013 | 11,173 |
| | | Principal Amount (000s) | Value (000s) |
|
| Nonconvertible Bonds - 0.2% | | | |
| ENERGY - 0.2% | | | |
| Energy Equipment & Services - 0.2% | | | |
| Gulfmark Offshore, Inc. 6.375% 3/15/22 | | 5,786 | 1,794 |
| SAExploration Holdings, Inc. 10% 7/15/19 | | 9,032 | 5,238 |
|
| | | | 7,032 |
|
| TOTAL NONCONVERTIBLE BONDS | | | |
| (Cost $11,680) | | | 7,032 |
| | | Shares | Value (000s) |
|
| Money Market Funds - 5.0% | | | |
| Fidelity Cash Central Fund, 0.38% (f) | | 70,796,283 | 70,796 |
| Fidelity Securities Lending Cash Central Fund, 0.42% (f)(g) | | 103,343,912 | 103,344 |
| TOTAL MONEY MARKET FUNDS | | | |
| (Cost $174,140) | | | 174,140 |
| TOTAL INVESTMENT PORTFOLIO - 103.0% | | | |
| (Cost $2,682,705) | | | 3,574,189 |
| NET OTHER ASSETS (LIABILITIES) - (3.0)% | | | (103,625) |
| NET ASSETS - 100% | | | $3,470,564 |
Values shown as $0 may reflect amounts less than $500.
Legend
(a) Non-income producing
(b) Investment is owned by an entity that is treated as a U.S. Corporation for tax purposes in which the Fund holds a percentage ownership.
(c) Restricted securities - Investment in securities not registered under the Securities Act of 1933 (excluding 144A issues). At the end of the period, the value of restricted securities (excluding 144A issues) amounted to $79,000 or 0.0% of net assets.
(d) Security or a portion of the security is on loan at period end.
(e) Affiliated company
(f) Affiliated fund that is generally available only to investment companies and other accounts managed by Fidelity Investments. The rate quoted is the annualized seven-day yield of the fund at period end. A complete unaudited listing of the fund's holdings as of its most recent quarter end is available upon request. In addition, each Fidelity Central Fund's financial statements are available on the SEC's website or upon request.
(g) Investment made with cash collateral received from securities on loan.
Additional information on each restricted holding is as follows:
| Security | Acquisition Date | Acquisition Cost (000s) |
| Station Holdco LLC unit | 10/28/08 - 12/1/08 | $5,990 |
Affiliated Central Funds
Information regarding fiscal year to date income earned by the Fund from investments in Fidelity Central Funds is as follows:
| Fund | Income earned |
| | (Amounts in thousands) |
| Fidelity Cash Central Fund | $117 |
| Fidelity Securities Lending Cash Central Fund | 914 |
| Total | $1,031 |
Other Affiliated Issuers
An affiliated company is a company in which the Fund has ownership of at least 5% of the voting securities. Fiscal year to date transactions with companies which are or were affiliates are as follows:
| Affiliate (Amounts in thousands) | Value, beginning of period | Purchases | Sales Proceeds | Dividend Income | Value, end of period |
| Gray Television, Inc. | $63,611 | $-- | $10,795 | $-- | $-- |
| OMNOVA Solutions, Inc. | 20,154 | -- | -- | -- | 16,354 |
| Ormet Corp. | 5 | -- | -- | -- | -- |
| SAExploration Holdings, Inc. | -- | -- | -- | -- | 2,100 |
| Total | $83,770 | $-- | $10,795 | $-- | $18,454 |
Investment Valuation
The following is a summary of the inputs used, as of January 31, 2016, involving the Fund's assets and liabilities carried at fair value. The inputs or methodology used for valuing securities may not be an indication of the risk associated with investing in those securities. For more information on valuation inputs, and their aggregation into the levels used below, please refer to the Investment Valuation section in the accompanying Notes to Financial Statements.
| | Valuation Inputs at Reporting Date: |
| Description | Total | Level 1 | Level 2 | Level 3 |
| (Amounts in thousands) | | | | |
| Investments in Securities: | | | | |
| Equities: | | | | |
| Consumer Discretionary | $863,670 | $863,591 | $-- | $79 |
| Consumer Staples | 63,262 | 63,262 | -- | -- |
| Energy | 207,767 | 207,767 | -- | -- |
| Financials | 404,790 | 404,790 | -- | -- |
| Health Care | 513,892 | 513,892 | -- | -- |
| Industrials | 431,542 | 431,542 | -- | -- |
| Information Technology | 324,845 | 324,845 | -- | -- |
| Materials | 482,049 | 482,039 | -- | 10 |
| Telecommunication Services | 54,085 | 54,085 | -- | -- |
| Utilities | 47,115 | 47,115 | -- | -- |
| Corporate Bonds | 7,032 | -- | 7,032 | -- |
| Money Market Funds | 174,140 | 174,140 | -- | -- |
| Total Investments in Securities: | $3,574,189 | $3,567,068 | $7,032 | $89 |
Other Information
Distribution of investments by country or territory of incorporation, as a percentage of Total Net Assets, is as follows (Unaudited):
| United States of America | 85.2% |
| Netherlands | 10.1% |
| Ireland | 1.8% |
| France | 1.0% |
| Others (Individually Less Than 1%) | 1.9% |
| | 100.0% |
See accompanying notes which are an integral part of the financial statements.
Financial Statements
Statement of Assets and Liabilities
| Amounts in thousands (except per-share amounts) | | January 31, 2016 (Unaudited) |
| Assets | | |
Investment in securities, at value (including securities loaned of $102,909) — See accompanying schedule:
Unaffiliated issuers (cost $2,479,750) | $3,381,595 | |
| Fidelity Central Funds (cost $174,140) | 174,140 | |
| Other affiliated issuers (cost $28,815) | 18,454 | |
| Total Investments (cost $2,682,705) | | $3,574,189 |
| Receivable for investments sold | | 2,803 |
| Receivable for fund shares sold | | 1,306 |
| Dividends receivable | | 3,243 |
| Interest receivable | | 179 |
| Distributions receivable from Fidelity Central Funds | | 105 |
| Prepaid expenses | | 8 |
| Other receivables | | 23 |
| Total assets | | 3,581,856 |
| Liabilities | | |
| Payable for investments purchased | $1,610 | |
| Payable for fund shares redeemed | 3,986 | |
| Accrued management fee | 1,754 | |
| Other affiliated payables | 561 | |
| Other payables and accrued expenses | 37 | |
| Collateral on securities loaned, at value | 103,344 | |
| Total liabilities | | 111,292 |
| Net Assets | | $3,470,564 |
| Net Assets consist of: | | |
| Paid in capital | | $2,486,221 |
| Undistributed net investment income | | 6,058 |
| Accumulated undistributed net realized gain (loss) on investments | | 86,801 |
| Net unrealized appreciation (depreciation) on investments | | 891,484 |
| Net Assets | | $3,470,564 |
| Leveraged Company Stock: | | |
| Net Asset Value, offering price and redemption price per share ($2,813,418 ÷ 78,326 shares) | | $35.92 |
| Class K: | | |
| Net Asset Value, offering price and redemption price per share ($657,146 ÷ 18,269 shares) | | $35.97 |
See accompanying notes which are an integral part of the financial statements.
Statement of Operations
| Amounts in thousands | | Six months ended January 31, 2016 (Unaudited) |
| Investment Income | | |
| Dividends | | $34,966 |
| Interest | | 789 |
| Income from Fidelity Central Funds | | 1,031 |
| Total income | | 36,786 |
| Expenses | | |
| Management fee | $12,307 | |
| Transfer agent fees | 2,962 | |
| Accounting and security lending fees | 539 | |
| Custodian fees and expenses | 16 | |
| Independent trustees' compensation | 10 | |
| Registration fees | 35 | |
| Audit | 35 | |
| Legal | 14 | |
| Miscellaneous | 11 | |
| Total expenses before reductions | 15,929 | |
| Expense reductions | (40) | 15,889 |
| Net investment income (loss) | | 20,897 |
| Realized and Unrealized Gain (Loss) | | |
| Net realized gain (loss) on: | | |
| Investment securities: | | |
| Unaffiliated issuers | 173,913 | |
| Other affiliated issuers | (7,200) | |
| Total net realized gain (loss) | | 166,713 |
| Change in net unrealized appreciation (depreciation) on investment securities | | (997,191) |
| Net gain (loss) | | (830,478) |
| Net increase (decrease) in net assets resulting from operations | | $(809,581) |
See accompanying notes which are an integral part of the financial statements.
Statement of Changes in Net Assets
| Amounts in thousands | Six months ended January 31, 2016 (Unaudited) | Year ended July 31, 2015 |
| Increase (Decrease) in Net Assets | | |
| Operations | | |
| Net investment income (loss) | $20,897 | $45,844 |
| Net realized gain (loss) | 166,713 | 235,817 |
| Change in net unrealized appreciation (depreciation) | (997,191) | (131,060) |
| Net increase (decrease) in net assets resulting from operations | (809,581) | 150,601 |
| Distributions to shareholders from net investment income | (39,813) | (41,090) |
| Distributions to shareholders from net realized gain | (240,243) | – |
| Total distributions | (280,056) | (41,090) |
| Share transactions - net increase (decrease) | (186,162) | (743,092) |
| Redemption fees | 78 | 302 |
| Total increase (decrease) in net assets | (1,275,721) | (633,279) |
| Net Assets | | |
| Beginning of period | 4,746,285 | 5,379,564 |
| End of period (including undistributed net investment income of $6,058 and undistributed net investment income of $24,974, respectively) | $3,470,564 | $4,746,285 |
See accompanying notes which are an integral part of the financial statements.
Financial Highlights — Fidelity Leveraged Company Stock Fund
| | Six months ended (Unaudited) | Years ended July 31, | | | | |
| January 31, | 2016 | 2015 | 2014 | 2013 | 2012 | 2011 |
| Selected Per–Share Data | | | | | | |
| Net asset value, beginning of period | $46.90 | $45.82 | $39.44 | $28.22 | $28.85 | $23.50 |
| Income from Investment Operations | | | | | | |
| Net investment income (loss)A | .21 | .41 | .34 | .42B | .16 | –C |
| Net realized and unrealized gain (loss) | (8.33) | 1.01 | 6.31 | 10.92 | (.50) | 5.46 |
| Total from investment operations | (8.12) | 1.42 | 6.65 | 11.34 | (.34) | 5.46 |
| Distributions from net investment income | (.40) | (.34) | (.27) | (.12) | (.29) | (.11) |
| Distributions from net realized gain | (2.46) | – | – | – | – | – |
| Total distributions | (2.86) | (.34) | (.27) | (.12) | (.29) | (.11) |
| Redemption fees added to paid in capitalA,C | – | – | – | – | – | – |
| Net asset value, end of period | $35.92 | $46.90 | $45.82 | $39.44 | $28.22 | $28.85 |
| Total ReturnD,E | (18.08)% | 3.12% | 16.96% | 40.31% | (1.05)% | 23.27% |
| Ratios to Average Net AssetsF,G | | | | | | |
| Expenses before reductions | .80%H | .79% | .79% | .82% | .86% | .85% |
| Expenses net of fee waivers, if any | .80%H | .78% | .79% | .82% | .86% | .85% |
| Expenses net of all reductions | .79%H | .78% | .79% | .82% | .85% | .84% |
| Net investment income (loss) | .99%H | .87% | .81% | 1.25%B | .60% | - %I |
| Supplemental Data | | | | | | |
| Net assets, end of period (in millions) | $2,813 | $3,755 | $4,207 | $4,227 | $3,009 | $3,931 |
| Portfolio turnover rateJ | 6%H | 4% | 10% | 21% | 29% | 18% |
A Calculated based on average shares outstanding during the period.
B Net Investment income per share reflects a large, non-recurring dividend which amounted to $.08 per share. Excluding this non-recurring dividend, the ratio of net investment income (loss) to average net assets would have been 1.03%.
C Amount represents less than $.005 per share.
D Total returns for periods of less than one year are not annualized.
E Total returns would have been lower if certain expenses had not been reduced during the applicable periods shown.
F Fees and expenses of any underlying Fidelity Central Funds are not included in the Fund's expense ratio. The Fund indirectly bears its proportionate share of the expenses of any underlying Fidelity Central Funds.
G Expense ratios reflect operating expenses of the class. Expenses before reductions do not reflect amounts reimbursed by the investment adviser or reductions from brokerage service arrangements or reductions from other expense offset arrangements and do not represent the amount paid by the class during periods when reimbursements or reductions occur. Expenses net of fee waivers reflect expenses after reimbursement by the investment adviser but prior to reductions from brokerage service arrangements or other expense offset arrangements. Expenses net of all reductions represent the net expenses paid by the class.
H Annualized
I Amount represents less than .005%.
J Amount does not include the portfolio activity of any underlying Fidelity Central Funds.
See accompanying notes which are an integral part of the financial statements.
Financial Highlights — Fidelity Leveraged Company Stock Fund Class K
| | Six months ended (Unaudited) | Years ended July 31, | | | | |
| January 31, | 2016 | 2015 | 2014 | 2013 | 2012 | 2011 |
| Selected Per–Share Data | | | | | | |
| Net asset value, beginning of period | $47.00 | $45.91 | $39.52 | $28.26 | $28.86 | $23.52 |
| Income from Investment Operations | | | | | | |
| Net investment income (loss)A | .23 | .46 | .40 | .47B | .20 | .04 |
| Net realized and unrealized gain (loss) | (8.35) | 1.03 | 6.31 | 10.93 | (.49) | 5.45 |
| Total from investment operations | (8.12) | 1.49 | 6.71 | 11.40 | (.29) | 5.49 |
| Distributions from net investment income | (.45) | (.40) | (.32) | (.14) | (.31) | (.15) |
| Distributions from net realized gain | (2.46) | – | – | – | – | – |
| Total distributions | (2.91) | (.40) | (.32) | (.14) | (.31) | (.15) |
| Redemption fees added to paid in capitalA,C | – | – | – | – | – | – |
| Net asset value, end of period | $35.97 | $47.00 | $45.91 | $39.52 | $28.26 | $28.86 |
| Total ReturnD,E | (18.05)% | 3.26% | 17.10% | 40.47% | (.87)% | 23.45% |
| Ratios to Average Net AssetsF,G | | | | | | |
| Expenses before reductions | .68%H | .67% | .67% | .69% | .69% | .69% |
| Expenses net of fee waivers, if any | .68%H | .67% | .67% | .69% | .69% | .69% |
| Expenses net of all reductions | .67%H | .67% | .67% | .68% | .69% | .69% |
| Net investment income (loss) | 1.11%H | .99% | .92% | 1.39%B | .76% | .16% |
| Supplemental Data | | | | | | |
| Net assets, end of period (in millions) | $657 | $991 | $1,173 | $1,053 | $600 | $555 |
| Portfolio turnover rateI | 6%H | 4% | 10% | 21% | 29% | 18% |
A Calculated based on average shares outstanding during the period.
B Net Investment income per share reflects a large, non-recurring dividend which amounted to $.08 per share. Excluding this non-recurring dividend, the ratio of net investment income (loss) to average net assets would have been 1.17%.
C Amount represents less than $.005 per share.
D Total returns for periods of less than one year are not annualized.
E Total returns would have been lower if certain expenses had not been reduced during the applicable periods shown.
F Fees and expenses of any underlying Fidelity Central Funds are not included in the Fund's expense ratio. The Fund indirectly bears its proportionate share of the expenses of any underlying Fidelity Central Funds.
G Expense ratios reflect operating expenses of the class. Expenses before reductions do not reflect amounts reimbursed by the investment adviser or reductions from brokerage service arrangements or reductions from other expense offset arrangements and do not represent the amount paid by the class during periods when reimbursements or reductions occur. Expenses net of fee waivers reflect expenses after reimbursement by the investment adviser but prior to reductions from brokerage service arrangements or other expense offset arrangements. Expenses net of all reductions represent the net expenses paid by the class.
H Annualized
I Amount does not include the portfolio activity of any underlying Fidelity Central Funds.
See accompanying notes which are an integral part of the financial statements.
Notes to Financial Statements (Unaudited)
For the period ended January 31, 2016
(Amounts in thousands except percentages)
1. Organization.
Fidelity Leveraged Company Stock Fund (the Fund) is a fund of Fidelity Securities Fund (the Trust) and is authorized to issue an unlimited number of shares. The Trust is registered under the Investment Company Act of 1940, as amended (the 1940 Act), as an open-end management investment company organized as a Massachusetts business trust. The Fund offers Leveraged Company Stock and Class K shares, each of which has equal rights as to assets and voting privileges. Each class has exclusive voting rights with respect to matters that affect that class.
2. Investments in Fidelity Central Funds.
The Fund invests in Fidelity Central Funds, which are open-end investment companies generally available only to other investment companies and accounts managed by the investment adviser and its affiliates. The Fund's Schedule of Investments lists each of the Fidelity Central Funds held as of period end, if any, as an investment of the Fund, but does not include the underlying holdings of each Fidelity Central Fund. As an Investing Fund, the Fund indirectly bears its proportionate share of the expenses of the underlying Fidelity Central Funds.
The Money Market Central Funds seek preservation of capital and current income and are managed by Fidelity Investments Money Management, Inc. (FIMM), an affiliate of the investment adviser. Annualized expenses of the Money Market Central Funds as of their most recent shareholder report date are less than .005%.
A complete unaudited list of holdings for each Fidelity Central Fund is available upon request or at the Securities and Exchange Commission (the SEC) website at www.sec.gov. In addition, the financial statements of the Fidelity Central Funds are available on the SEC website or upon request.
3. Significant Accounting Policies.
The financial statements have been prepared in conformity with accounting principles generally accepted in the United States of America (GAAP), which require management to make certain estimates and assumptions at the date of the financial statements. Actual results could differ from those estimates. Subsequent events, if any, through the date that the financial statements were issued have been evaluated in the preparation of the financial statements. The following summarizes the significant accounting policies of the Fund:
Investment Valuation. Investments are valued as of 4:00 p.m. Eastern time on the last calendar day of the period. The Board of Trustees (the Board) has delegated the day to day responsibility for the valuation of the Fund's investments to the Fidelity Management & Research Company (FMR) Fair Value Committee (the Committee). In accordance with valuation policies and procedures approved by the Board, the Fund attempts to obtain prices from one or more third party pricing vendors or brokers to value its investments. When current market prices, quotations or currency exchange rates are not readily available or reliable, investments will be fair valued in good faith by the Committee, in accordance with procedures adopted by the Board. Factors used in determining fair value vary by investment type and may include market or investment specific events, changes in interest rates and credit quality. The frequency with which these procedures are used cannot be predicted and they may be utilized to a significant extent. The Committee oversees the Fund's valuation policies and procedures and reports to the Board on the Committee's activities and fair value determinations. The Board monitors the appropriateness of the procedures used in valuing the Fund's investments and ratifies the fair value determinations of the Committee.
The Fund categorizes the inputs to valuation techniques used to value its investments into a disclosure hierarchy consisting of three levels as shown below:
- Level 1 – quoted prices in active markets for identical investments
- Level 2 – other significant observable inputs (including quoted prices for similar investments, interest rates, prepayment speeds, etc.)
- Level 3 – unobservable inputs (including the Fund's own assumptions based on the best information available)
Valuation techniques used to value the Fund's investments by major category are as follows:
Equity securities, including restricted securities, for which market quotations are readily available, are valued at the last reported sale price or official closing price as reported by a third party pricing vendor on the primary market or exchange on which they are traded and are categorized as Level 1 in the hierarchy. In the event there were no sales during the day or closing prices are not available, securities are valued at the last quoted bid price or may be valued using the last available price and are generally categorized as Level 2 in the hierarchy. For foreign equity securities, when market or security specific events arise, comparisons to the valuation of American Depositary Receipts (ADRs), futures contracts, Exchange-Traded Funds (ETFs) and certain indexes as well as quoted prices for similar securities may be used and would be categorized as Level 2 in the hierarchy. Utilizing these techniques may result in transfers between Level 1 and Level 2. For equity securities, including restricted securities, where observable inputs are limited, assumptions about market activity and risk are used and these securities may be categorized as Level 3 in the hierarchy.
Debt securities, including restricted securities, are valued based on evaluated prices received from third party pricing vendors or from brokers who make markets in such securities. Corporate bonds are valued by pricing vendors who utilize matrix pricing which considers yield or price of bonds of comparable quality, coupon, maturity and type or by broker-supplied prices. When independent prices are unavailable or unreliable, debt securities may be valued utilizing pricing methodologies which consider similar factors that would be used by third party pricing vendors. Debt securities are generally categorized as Level 2 in the hierarchy but may be Level 3 depending on the circumstances.
Investments in open-end mutual funds, including the Fidelity Central Funds, are valued at their closing net asset value (NAV) each business day and are categorized as Level 1 in the hierarchy.
Changes in valuation techniques may result in transfers in or out of an assigned level within the disclosure hierarchy. The aggregate value of investments by input level as of January 31, 2016 is included at the end of the Fund's Schedule of Investments.
Investment Transactions and Income. For financial reporting purposes, the Fund's investment holdings and NAV include trades executed through the end of the last business day of the period. The NAV per share for processing shareholder transactions is calculated as of the close of business of the New York Stock Exchange (NYSE), normally 4:00 p.m. Eastern time and includes trades executed through the end of the prior business day. Gains and losses on securities sold are determined on the basis of identified cost and may include proceeds received from litigation. Dividend income is recorded on the ex-dividend date, except for certain dividends from foreign securities where the ex-dividend date may have passed, which are recorded as soon as the Fund is informed of the ex-dividend date. Non-cash dividends included in dividend income, if any, are recorded at the fair market value of the securities received. Income and capital gain distributions from Fidelity Central Funds, if any, are recorded on the ex-dividend date. Distributions received on securities that represent a return of capital or capital gain are recorded as a reduction of cost of investments and/or as a realized gain. Subsequent to ex-dividend date the Fund determines the components of these distributions, based upon receipt of tax filings or other correspondence relating to the underlying investment. Interest income is accrued as earned and includes coupon interest and amortization of premium and accretion of discount on debt securities as applicable.
Class Allocations and Expenses. Investment income, realized and unrealized capital gains and losses, common expenses of the Fund, and certain fund-level expense reductions, if any, are allocated daily on a pro-rata basis to each class based on the relative net assets of each class to the total net assets of the Fund. Each class differs with respect to transfer agent fees incurred. Certain expense reductions may also differ by class. For the reporting period, the allocated portion of income and expenses to each class as a percent of its average net assets may vary due to the timing of recording these transactions in relation to fluctuating net assets of the classes. Expenses directly attributable to a fund are charged to that fund. Expenses attributable to more than one fund are allocated among the respective funds on the basis of relative net assets or other appropriate methods. Expense estimates are accrued in the period to which they relate and adjustments are made when actual amounts are known.
Income Tax Information and Distributions to Shareholders. Each year, the Fund intends to qualify as a regulated investment company under Subchapter M of the Internal Revenue Code, including distributing substantially all of its taxable income and realized gains. As a result, no provision for U.S. Federal income taxes is required. The Fund files a U.S. federal tax return, in addition to state and local tax returns as required. The Fund's federal income tax returns are subject to examination by the Internal Revenue Service (IRS) for a period of three fiscal years after they are filed. State and local tax returns may be subject to examination for an additional fiscal year depending on the jurisdiction.
Distributions are declared and recorded on the ex-dividend date. Income dividends and capital gain distributions are declared separately for each class. Income and capital gain distributions are determined in accordance with income tax regulations, which may differ from GAAP.
Capital accounts within the financial statements are adjusted for permanent book-tax differences. These adjustments have no impact on net assets or the results of operations. Capital accounts are not adjusted for temporary book-tax differences which will reverse in a subsequent period.
Book-tax differences are primarily due to market discount, equity-debt classifications, capital loss carryforwards and losses deferred due to excise tax regulations.
The federal tax cost of investment securities and unrealized appreciation (depreciation) as of period end were as follows:
| Gross unrealized appreciation | $1,253,486 |
| Gross unrealized depreciation | (363,056) |
| Net unrealized appreciation (depreciation) on securities | $890,430 |
| Tax cost | $2,683,759 |
Short-Term Trading (Redemption) Fees. Shares held by investors in the Fund less than 90 days may have been subject to a redemption fee equal to 1.50% of the NAV of shares redeemed. All redemption fees, which reduce the proceeds of the shareholder redemption, are retained by the Fund and accounted for as an addition to paid in capital.
Restricted Securities. The Fund may invest in securities that are subject to legal or contractual restrictions on resale. These securities generally may be resold in transactions exempt from registration or to the public if the securities are registered. Disposal of these securities may involve time-consuming negotiations and expense, and prompt sale at an acceptable price may be difficult. Information regarding restricted securities is included at the end of the Fund's Schedule of Investments.
4. Purchases and Sales of Investments.
Purchases and sales of securities, other than short-term securities, aggregated $125,201 and $504,747, respectively.
5. Fees and Other Transactions with Affiliates.
Management Fee. Fidelity Management & Research Company (the investment adviser) and its affiliates provide the Fund with investment management related services for which the Fund pays a monthly management fee. The management fee is the sum of an individual fund fee rate that is based on an annual rate of .35% of the Fund's average net assets and an annualized group fee rate that averaged .25% during the period. The group fee rate is based upon the average net assets of all the mutual funds advised by the investment adviser, including any mutual funds previously advised by the investment adviser that are currently advised by Fidelity SelectCo, LLC, an affiliate of the investment adviser. The group fee rate decreases as assets under management increase and increases as assets under management decrease. For the reporting period, the total annualized management fee rate was .60% of the Fund's average net assets.
Transfer Agent Fees. Fidelity Investments Institutional Operations Company, Inc., (FIIOC), an affiliate of the investment adviser, is the transfer, dividend disbursing and shareholder servicing agent for each class of the Fund. FIIOC receives account fees and asset-based fees that vary according to the account size and type of account of the shareholders of Leveraged Company Stock, except for Class K. FIIOC receives an asset-based fee of Class K's average net assets. FIIOC pays for typesetting, printing and mailing of shareholder reports, except proxy statements.
For the period, transfer agent fees for each class were as follows:
| | Amount | % of
Class-Level Average
Net Assets(a) |
| Leveraged Company Stock | $2,776 | .17 |
| Class K | 186 | .05 |
| | $ 2,962 | |
(a) Annualized
Accounting and Security Lending Fees. Fidelity Service Company, Inc. (FSC), an affiliate of the investment adviser, maintains the Fund's accounting records. The accounting fee is based on the level of average net assets for each month. Under a separate contract, FSC administers the security lending program. The security lending fee is based on the number and duration of lending transactions.
Brokerage Commissions. The Fund placed a portion of its portfolio transactions with brokerage firms which are affiliates of the investment adviser. Brokerage commissions are included in net realized gain (loss) and change in net unrealized appreciation (depreciation) in the Statement of Operations. The commissions paid to these affiliated firms were $8 for the period.
Interfund Trades. The Fund may purchase from or sell securities to other Fidelity Funds under procedures adopted by the Board. The procedures have been designed to ensure these interfund trades are executed in accordance with Rule 17a-7 of the 1940 Act. Interfund trades are included within the respective purchases and sales amounts shown in the Purchases and Sales of Investments note.
Other. During the period, the investment adviser reimbursed the Fund for certain losses in the amount of $3.
6. Committed Line of Credit.
The Fund participates with other funds managed by the investment adviser or an affiliate in a $4.25 billion credit facility (the "line of credit") to be utilized for temporary or emergency purposes to fund shareholder redemptions or for other short-term liquidity purposes. The Fund has agreed to pay commitment fees on its pro-rata portion of the line of credit, which amounted to $3 and is reflected in Miscellaneous expenses on the Statement of Operations. During the period, the Fund did not borrow on this line of credit.
7. Security Lending.
The Fund lends portfolio securities through a lending agent from time to time in order to earn additional income. For equity securities, a lending agent is used and may loan securities to certain qualified borrowers, including Fidelity Capital Markets (FCM), a broker-dealer affiliated with the Fund. On the settlement date of the loan, the Fund receives collateral (in the form of U.S. Treasury obligations, letters of credit and/or cash) against the loaned securities and maintains collateral in an amount not less than 100% of the market value of the loaned securities during the period of the loan. The market value of the loaned securities is determined at the close of business of the Fund and any additional required collateral is delivered to the Fund on the next business day. The Fund or borrower may terminate the loan at any time, and if the borrower defaults on its obligation to return the securities loaned because of insolvency or other reasons, the Fund may apply collateral received from the borrower against the obligation. The Fund may experience delays and costs in recovering the securities loaned. Any cash collateral received is invested in the Fidelity Securities Lending Cash Central Fund. The value of loaned securities and cash collateral at period end are disclosed on the Fund's Statement of Assets and Liabilities. The value of securities loaned to FCM at period end was $3,777. Security lending income represents the income earned on investing cash collateral, less rebates paid to borrowers and any lending agent fees associated with the loan, plus any premium payments received for lending certain types of securities. Security lending income is presented in the Statement of Operations as a component of income from Fidelity Central Funds. Total security lending income during the period amounted to $914, including $136 from securities loaned to FCM.
8. Expense Reductions.
Commissions paid to certain brokers with whom the investment adviser, or its affiliates, places trades on behalf of the Fund include an amount in addition to trade execution, which may be rebated back to the Fund to offset certain expenses. This amount totaled $26 for the period.
In addition, during the period the investment adviser reimbursed and/or waived a portion of fund-level operating expenses in the amount of $14.
9. Distributions to Shareholders.
Distributions to shareholders of each class were as follows:
| | Six months ended January 31, 2016 | Year ended July 31, 2015 |
| From net investment income | | |
| Leveraged Company Stock | $31,472 | $30,775 |
| Class K | 8,341 | 10,315 |
| Total | $39,813 | $41,090 |
| From net realized gain | | |
| Leveraged Company Stock | $194,476 | $– |
| Class K | 45,767 | – |
| Total | $240,243 | $– |
10. Share Transactions.
Share transactions for each class were as follows and may contain automatic conversions between classes or exchanges between affiliated funds:
| | Shares | Shares | Dollars | Dollars |
| | Six months ended January 31, 2016 | Year ended July 31, 2015 | Six months ended January 31, 2016 | Year ended July 31, 2015 |
| Leveraged Company Stock | | | | |
| Shares sold | 1,760 | 5,334 | $72,641 | $246,873 |
| Reinvestment of distributions | 5,086 | 626 | 212,362 | 29,028 |
| Shares redeemed | (8,587) | (17,699) | (350,740) | (811,035) |
| Net increase (decrease) | (1,741) | (11,739) | $(65,737) | $(535,134) |
| Class K | | | | |
| Shares sold | 1,654 | 5,815 | $64,860 | $269,619 |
| Reinvestment of distributions | 1,294 | 222 | 54,108 | 10,315 |
| Shares redeemed | (5,762) | (10,500) | (239,393) | (487,892) |
| Net increase (decrease) | (2,814) | (4,463) | $(120,425) | $(207,958) |
11. Other.
The Fund's organizational documents provide former and current trustees and officers with a limited indemnification against liabilities arising in connection with the performance of their duties to the Fund. In the normal course of business, the Fund may also enter into contracts that provide general indemnifications. The Fund's maximum exposure under these arrangements is unknown as this would be dependent on future claims that may be made against the Fund. The risk of material loss from such claims is considered remote.
Shareholder Expense Example
As a shareholder of the Fund, you incur two types of costs: (1) transaction costs, including redemption fees and (2) ongoing costs, including management fees and other Fund expenses. This Example is intended to help you understand your ongoing costs (in dollars) of investing in the Fund and to compare these costs with the ongoing costs of investing in other mutual funds.
The Example is based on an investment of $1,000 invested at the beginning of the period and held for the entire period (August 1, 2015 to January 31, 2016).
Actual Expenses
The first line of the accompanying table for each class of the Fund provides information about actual account values and actual expenses. You may use the information in this line, together with the amount you invested, to estimate the expenses that you paid over the period. Simply divide your account value by $1,000.00 (for example, an $8,600 account value divided by $1,000.00 = 8.6), then multiply the result by the number in the first line for a class of the Fund under the heading entitled "Expenses Paid During Period" to estimate the expenses you paid on your account during this period. A small balance maintenance fee of $12.00 that is charged once a year may apply for certain accounts with a value of less than $2,000. This fee is not included in the table below. If it was, the estimate of expenses you paid during the period would be higher, and your ending account value lower, by this amount. In addition, the Fund, as a shareholder in the underlying Fidelity Central Funds, will indirectly bear its pro-rata share of the fees and expenses incurred by the underlying Fidelity Central Funds. These fees and expenses are not included in the Fund's annualized expense ratio used to calculate the expense estimate in the table below.
Hypothetical Example for Comparison Purposes
The second line of the accompanying table for each class of the Fund provides information about hypothetical account values and hypothetical expenses based on a Class' actual expense ratio and an assumed rate of return of 5% per year before expenses, which is not the Class' actual return. The hypothetical account values and expenses may not be used to estimate the actual ending account balance or expenses you paid for the period. You may use this information to compare the ongoing costs of investing in the Fund and other funds. To do so, compare this 5% hypothetical example with the 5% hypothetical examples that appear in the shareholder reports of the other funds. A small balance maintenance fee of $12.00 that is charged once a year may apply for certain accounts with a value of less than $2,000. This fee is not included in the table below. If it was, the estimate of expenses you paid during the period would be higher, and your ending account value lower, by this amount. In addition, the Fund, as a shareholder in the underlying Fidelity Central Funds, will indirectly bear its pro-rata share of the fees and expenses incurred by the underlying Fidelity Central Funds. These fees and expenses are not included in the Fund's annualized expense ratio used to calculate the expense estimate in the table below.
Please note that the expenses shown in the table are meant to highlight your ongoing costs only and do not reflect any transaction costs. Therefore, the second line of the table is useful in comparing ongoing costs only, and will not help you determine the relative total costs of owning different funds. In addition, if these transactional costs were included, your costs would have been higher.
| | Annualized Expense Ratio-A | Beginning
Account Value
August 1, 2015 | Ending
Account Value
January 31, 2016 | Expenses Paid
During Period-B
August 1, 2015
to January 31, 2016 |
| Leveraged Company Stock | .80% | | | |
| Actual | | $1,000.00 | $819.20 | $3.66 |
| Hypothetical-C | | $1,000.00 | $1,021.11 | $4.06 |
| Class K | .68% | | | |
| Actual | | $1,000.00 | $819.50 | $3.11 |
| Hypothetical-C | | $1,000.00 | $1,021.72 | $3.46 |
A Annualized expense ratio reflects expenses net of applicable fee waivers.
B Expenses are equal to each Class' annualized expense ratio, multiplied by the average account value over the period, multiplied by 184/366 (to reflect the one-half year period).
C 5% return per year before expenses
Corporate Headquarters
245 Summer St.
Boston, MA 02210
www.fidelity.com
LSF-SANN-0316
1.753758.116
Fidelity Advisor® Small Cap Growth Fund -
Class I
Semi-Annual Report January 31, 2016 Class I is a class of Fidelity® Small Cap Growth Fund |
|
Contents
To view a fund's proxy voting guidelines and proxy voting record for the 12-month period ended June 30, visit http://www.fidelity.com/proxyvotingresults or visit the Securities and Exchange Commission's (SEC) web site at http://www.sec.gov.
You may also call 1-877-208-0098 to request a free copy of the proxy voting guidelines.
Standard & Poor's, S&P and S&P 500 are registered service marks of The McGraw-Hill Companies, Inc. and have been licensed for use by Fidelity Distributors Corporation.
Other third-party marks appearing herein are the property of their respective owners.
All other marks appearing herein are registered or unregistered trademarks or service marks of FMR LLC or an affiliated company. © 2016 FMR LLC. All rights reserved.
This report and the financial statements contained herein are submitted for the general information of the shareholders of the Fund. This report is not authorized for distribution to prospective investors in the Fund unless preceded or accompanied by an effective prospectus.
A fund files its complete schedule of portfolio holdings with the SEC for the first and third quarters of each fiscal year on Form N-Q. Forms N-Q are available on the SEC’s web site at http://www.sec.gov. A fund's Forms N-Q may be reviewed and copied at the SEC’s Public Reference Room in Washington, DC. Information regarding the operation of the SEC's Public Reference Room may be obtained by calling 1-800-SEC-0330.
For a complete list of a fund's portfolio holdings, view the most recent holdings listing, semiannual report, or annual report on Fidelity's web site at http://www.fidelity.com, http://www.advisor.fidelity.com, or http://www.401k.com, as applicable.
NOT FDIC INSURED •MAY LOSE VALUE •NO BANK GUARANTEE
Neither the Fund nor Fidelity Distributors Corporation is a bank.
Investment Summary (Unaudited)
Top Ten Stocks as of January 31, 2016
| | % of fund's net assets | % of fund's net assets 6 months ago |
| 2U, Inc. | 2.6 | 2.4 |
| Stamps.com, Inc. | 1.8 | 0.8 |
| Global Payments, Inc. | 1.8 | 1.4 |
| NxStage Medical, Inc. | 1.7 | 0.5 |
| Surgical Care Affiliates, Inc. | 1.7 | 0.9 |
| Gartner, Inc. Class A | 1.6 | 1.2 |
| Vail Resorts, Inc. | 1.6 | 1.2 |
| Bright Horizons Family Solutions, Inc. | 1.6 | 0.0 |
| Steris PLC | 1.5 | 0.0 |
| Tyler Technologies, Inc. | 1.3 | 0.0 |
| | 17.2 | |
Top Five Market Sectors as of January 31, 2016
| | % of fund's net assets | % of fund's net assets 6 months ago |
| Information Technology | 23.7 | 24.4 |
| Health Care | 22.7 | 29.2 |
| Consumer Discretionary | 15.7 | 17.3 |
| Industrials | 11.9 | 14.5 |
| Financials | 10.0 | 5.3 |
Asset Allocation (% of fund's net assets)
| As of January 31, 2016 * |
| | Stocks | 92.8% |
| | Other Investments | 2.1% |
| | Short-Term Investments and Net Other Assets (Liabilities) | 5.1% |

* Foreign investments - 5.6%
| As of July 31, 2015* |
| | Stocks | 96.0% |
| | Short-Term Investments and Net Other Assets (Liabilities) | 2.1% |

* Foreign investments - 3.6%
Percentages shown as 0.0% may reflect amounts less than 0.05%.
Investments January 31, 2016 (Unaudited)
Showing Percentage of Net Assets
| Common Stocks - 92.8% | | | |
| | | Shares | Value |
| CONSUMER DISCRETIONARY - 15.7% | | | |
| Auto Components - 0.8% | | | |
| Tenneco, Inc. (a) | | 285,288 | $10,900,854 |
| Visteon Corp. | | 69,100 | 4,621,408 |
| | | | 15,522,262 |
| Distributors - 0.6% | | | |
| Pool Corp. | | 120,000 | 10,140,000 |
| Diversified Consumer Services - 5.9% | | | |
| 2U, Inc. (a)(b)(c) | | 2,370,282 | 47,855,994 |
| Bright Horizons Family Solutions, Inc. (a) | | 402,100 | 28,215,357 |
| Service Corp. International | | 417,400 | 10,096,906 |
| ServiceMaster Global Holdings, Inc. (a) | | 480,000 | 20,260,800 |
| | | | 106,429,057 |
| Hotels, Restaurants & Leisure - 3.9% | | | |
| Dave & Buster's Entertainment, Inc. (a) | | 362,800 | 13,158,756 |
| DineEquity, Inc. | | 90,000 | 7,642,800 |
| Sonic Corp. | | 290,000 | 8,520,200 |
| Vail Resorts, Inc. | | 231,000 | 28,875,000 |
| Wingstop, Inc. (b) | | 520,800 | 12,634,608 |
| | | | 70,831,364 |
| Household Durables - 1.7% | | | |
| NACCO Industries, Inc. Class A | | 2,900 | 138,011 |
| Tempur Sealy International, Inc. (a) | | 210,560 | 12,705,190 |
| Universal Electronics, Inc. (a) | | 344,209 | 17,262,081 |
| | | | 30,105,282 |
| Leisure Products - 1.0% | | | |
| Malibu Boats, Inc. Class A (a) | | 529,100 | 6,915,337 |
| Vista Outdoor, Inc. (a) | | 250,000 | 12,052,500 |
| | | | 18,967,837 |
| Media - 0.8% | | | |
| Gray Television, Inc. (a) | | 66,841 | 878,959 |
| Live Nation Entertainment, Inc. (a) | | 410,200 | 9,311,540 |
| Starz Series A (a) | | 163,945 | 4,660,956 |
| | | | 14,851,455 |
| Specialty Retail - 0.2% | | | |
| Winmark Corp. | | 34,081 | 3,215,883 |
| Textiles, Apparel & Luxury Goods - 0.8% | | | |
| G-III Apparel Group Ltd. (a) | | 271,800 | 13,416,048 |
| Unifi, Inc. (a) | | 44,886 | 1,071,429 |
| | | | 14,487,477 |
|
| TOTAL CONSUMER DISCRETIONARY | | | 284,550,617 |
|
| CONSUMER STAPLES - 2.6% | | | |
| Food & Staples Retailing - 1.3% | | | |
| Casey's General Stores, Inc. | | 190,900 | 23,049,266 |
| Food Products - 1.3% | | | |
| Post Holdings, Inc. (a) | | 180,000 | 10,530,000 |
| TreeHouse Foods, Inc. (a) | | 165,000 | 13,094,400 |
| | | | 23,624,400 |
|
| TOTAL CONSUMER STAPLES | | | 46,673,666 |
|
| ENERGY - 1.8% | | | |
| Energy Equipment & Services - 1.7% | | | |
| Dril-Quip, Inc. (a) | | 83,700 | 4,908,168 |
| Frank's International NV | | 300,000 | 4,389,000 |
| Oil States International, Inc. (a) | | 390,000 | 11,009,700 |
| Superior Drilling Products, Inc. (a)(c) | | 1,133,901 | 2,551,277 |
| Tesco Corp. | | 972,960 | 6,616,128 |
| Xtreme Drilling & Coil Services Corp. (a) | | 1,289,000 | 1,536,605 |
| | | | 31,010,878 |
| Oil, Gas & Consumable Fuels - 0.1% | | | |
| StealthGas, Inc. (a) | | 859,100 | 2,319,570 |
|
| TOTAL ENERGY | | | 33,330,448 |
|
| FINANCIALS - 10.0% | | | |
| Banks - 2.9% | | | |
| Commerce Bancshares, Inc. | | 336,000 | 13,819,680 |
| Eagle Bancorp, Inc. (a) | | 150,000 | 7,086,000 |
| Investors Bancorp, Inc. | | 1,000,000 | 11,690,000 |
| Pacific Premier Bancorp, Inc. (a) | | 1,002,186 | 20,574,879 |
| | | | 53,170,559 |
| Consumer Finance - 0.4% | | | |
| Navient Corp. | | 720,000 | 6,883,200 |
| Diversified Financial Services - 1.5% | | | |
| FactSet Research Systems, Inc. | | 90,000 | 13,563,000 |
| MSCI, Inc. Class A | | 210,000 | 14,456,400 |
| | | | 28,019,400 |
| Insurance - 1.3% | | | |
| First American Financial Corp. | | 388,000 | 13,335,560 |
| ProAssurance Corp. | | 190,000 | 9,522,800 |
| | | | 22,858,360 |
| Real Estate Investment Trusts - 3.0% | | | |
| Coresite Realty Corp. | | 320,000 | 20,524,800 |
| Store Capital Corp. | | 772,300 | 19,145,317 |
| Sun Communities, Inc. | | 220,000 | 14,649,800 |
| | | | 54,319,917 |
| Thrifts & Mortgage Finance - 0.9% | | | |
| Meridian Bancorp, Inc. | | 1,216,834 | 17,096,518 |
|
| TOTAL FINANCIALS | | | 182,347,954 |
|
| HEALTH CARE - 22.7% | | | |
| Biotechnology - 5.3% | | | |
| Alder Biopharmaceuticals, Inc. (a) | | 100,000 | 2,418,000 |
| Amicus Therapeutics, Inc. (a)(b) | | 699,700 | 4,226,188 |
| Anacor Pharmaceuticals, Inc. (a) | | 145,486 | 10,930,363 |
| Blueprint Medicines Corp. (b) | | 250,000 | 3,930,000 |
| Cara Therapeutics, Inc. (a) | | 147,266 | 1,325,394 |
| Cellectis SA sponsored ADR | | 129,100 | 2,886,676 |
| Chimerix, Inc. (a) | | 210,100 | 1,617,770 |
| Coherus BioSciences, Inc. (a)(b) | | 306,150 | 4,059,549 |
| Curis, Inc. (a) | | 998,200 | 1,637,048 |
| DBV Technologies SA sponsored ADR (a) | | 154,188 | 4,007,346 |
| Dyax Corp. rights 12/31/19 | | 380,400 | 1,065,120 |
| Dynavax Technologies Corp. (a)(b) | | 391,625 | 9,434,246 |
| Edge Therapeutics, Inc. (a)(b) | | 181,800 | 2,019,798 |
| Heron Therapeutics, Inc. (a)(b) | | 262,200 | 5,503,578 |
| Insmed, Inc. (a) | | 223,400 | 2,948,880 |
| Intercept Pharmaceuticals, Inc. (a) | | 31,600 | 3,356,868 |
| La Jolla Pharmaceutical Co. (a) | | 152,622 | 2,702,936 |
| Lion Biotechnologies, Inc. (a)(b) | | 410,000 | 2,455,900 |
| Mirati Therapeutics, Inc. (a) | | 177,354 | 3,818,432 |
| Novavax, Inc. (a) | | 1,717,697 | 8,846,140 |
| OncoMed Pharmaceuticals, Inc. (a)(b) | | 80,739 | 746,836 |
| Portola Pharmaceuticals, Inc. (a) | | 180,000 | 5,945,400 |
| ProNai Therapeutics, Inc. (a)(b) | | 193,800 | 1,604,664 |
| TESARO, Inc. (a) | | 100,000 | 3,454,000 |
| Ultragenyx Pharmaceutical, Inc. (a) | | 110,000 | 6,176,500 |
| | | | 97,117,632 |
| Health Care Equipment & Supplies - 7.5% | | | |
| Cantel Medical Corp. | | 71,379 | 4,237,771 |
| CONMED Corp. | | 91,962 | 3,397,076 |
| Hill-Rom Holdings, Inc. | | 330,000 | 16,130,400 |
| Integra LifeSciences Holdings Corp. (a) | | 150,000 | 9,217,500 |
| Nevro Corp. (a) | | 221,200 | 13,667,948 |
| NxStage Medical, Inc. (a) | | 1,670,300 | 31,602,076 |
| Steris PLC | | 400,000 | 27,696,000 |
| Teleflex, Inc. | | 70,000 | 9,498,300 |
| The Spectranetics Corp. (a) | | 13,300 | 160,265 |
| Vascular Solutions, Inc. (a) | | 200,000 | 5,472,000 |
| Wright Medical Group NV (a) | | 772,129 | 15,403,974 |
| | | | 136,483,310 |
| Health Care Providers & Services - 4.8% | | | |
| Aceto Corp. | | 350,000 | 7,997,500 |
| Amedisys, Inc. (a) | | 220,000 | 7,865,000 |
| Civitas Solutions, Inc. (a) | | 116,883 | 2,812,205 |
| HealthEquity, Inc. (a) | | 468,000 | 10,085,400 |
| LHC Group, Inc. (a) | | 100,000 | 3,792,000 |
| Molina Healthcare, Inc. (a) | | 30,000 | 1,647,300 |
| Providence Service Corp. (a) | | 266,229 | 11,820,568 |
| Surgical Care Affiliates, Inc. (a) | | 720,917 | 30,761,528 |
| Teladoc, Inc. (b) | | 345,000 | 5,602,800 |
| VCA, Inc. (a) | | 90,000 | 4,614,300 |
| | | | 86,998,601 |
| Health Care Technology - 1.6% | | | |
| athenahealth, Inc. (a)(b) | | 110,557 | 15,676,983 |
| Nexus AG | | 4,600 | 87,144 |
| Press Ganey Holdings, Inc. (b) | | 230,000 | 6,796,500 |
| Veeva Systems, Inc. Class A (a) | | 55,047 | 1,326,633 |
| Vocera Communications, Inc. (a) | | 297,994 | 4,288,134 |
| | | | 28,175,394 |
| Life Sciences Tools & Services - 1.3% | | | |
| Accelerate Diagnostics, Inc. (a)(b) | | 590,000 | 8,737,900 |
| Bruker Corp. (a) | | 641,500 | 14,324,695 |
| | | | 23,062,595 |
| Pharmaceuticals - 2.2% | | | |
| DepoMed, Inc. (a)(b) | | 580,000 | 8,897,200 |
| Prestige Brands Holdings, Inc. (a) | | 304,175 | 14,198,889 |
| SCYNEXIS, Inc. (a) | | 476,100 | 2,175,777 |
| The Medicines Company (a) | | 200,000 | 6,912,000 |
| TherapeuticsMD, Inc. (a) | | 1,019,345 | 7,288,317 |
| | | | 39,472,183 |
|
| TOTAL HEALTH CARE | | | 411,309,715 |
|
| INDUSTRIALS - 11.9% | | | |
| Aerospace & Defense - 2.4% | | | |
| Aerojet Rocketdyne Holdings, Inc. (a) | | 430,013 | 7,073,714 |
| BWX Technologies, Inc. | | 561,000 | 16,796,340 |
| Huntington Ingalls Industries, Inc. | | 110,000 | 14,066,800 |
| Teledyne Technologies, Inc. (a) | | 60,000 | 4,875,000 |
| | | | 42,811,854 |
| Building Products - 1.8% | | | |
| A.O. Smith Corp. | | 95,000 | 6,635,750 |
| Gibraltar Industries, Inc. (a) | | 484,467 | 10,290,079 |
| Universal Forest Products, Inc. | | 240,000 | 16,533,600 |
| | | | 33,459,429 |
| Commercial Services & Supplies - 2.4% | | | |
| Deluxe Corp. | | 250,000 | 13,975,000 |
| Knoll, Inc. | | 907,500 | 16,652,625 |
| Matthews International Corp. Class A | | 240,018 | 11,979,298 |
| | | | 42,606,923 |
| Construction & Engineering - 0.2% | | | |
| Comfort Systems U.S.A., Inc. | | 138,782 | 3,933,082 |
| Electrical Equipment - 0.8% | | | |
| AZZ, Inc. | | 130,000 | 6,692,400 |
| EnerSys | | 160,000 | 7,748,800 |
| | | | 14,441,200 |
| Machinery - 1.2% | | | |
| Hillenbrand, Inc. | | 298,954 | 8,095,674 |
| Mueller Industries, Inc. | | 209,728 | 5,337,578 |
| Toro Co. | | 120,000 | 8,942,400 |
| | | | 22,375,652 |
| Marine - 0.6% | | | |
| Matson, Inc. | | 290,000 | 11,718,900 |
| Professional Services - 1.9% | | | |
| CBIZ, Inc. (a) | | 1,216,100 | 12,282,610 |
| Exponent, Inc. | | 200,000 | 10,262,000 |
| GP Strategies Corp. (a) | | 200,557 | 4,851,474 |
| On Assignment, Inc. (a) | | 180,000 | 6,957,000 |
| | | | 34,353,084 |
| Road & Rail - 0.6% | | | |
| Swift Transporation Co. (a)(b) | | 650,000 | 10,601,500 |
|
| TOTAL INDUSTRIALS | | | 216,301,624 |
|
| INFORMATION TECHNOLOGY - 23.7% | | | |
| Communications Equipment - 0.4% | | | |
| CommScope Holding Co., Inc. (a) | | 340,000 | 7,622,800 |
| Electronic Equipment & Components - 0.8% | | | |
| ePlus, Inc. (a) | | 150,000 | 14,206,500 |
| Internet Software & Services - 5.5% | | | |
| Cimpress NV (a)(b) | | 15,435 | 1,211,956 |
| Cvent, Inc. (a) | | 485,560 | 12,823,640 |
| Demandware, Inc. (a) | | 199,313 | 8,456,851 |
| GoDaddy, Inc. (a)(b) | | 400,000 | 12,196,000 |
| Gogo, Inc. (a)(b) | | 620,488 | 9,028,100 |
| New Relic, Inc. (a) | | 25,100 | 708,322 |
| Stamps.com, Inc. (a) | | 358,711 | 33,654,266 |
| WebMD Health Corp. (a)(b) | | 425,000 | 21,721,750 |
| | | | 99,800,885 |
| IT Services - 8.1% | | | |
| Broadridge Financial Solutions, Inc. | | 150,100 | 8,039,356 |
| CSG Systems International, Inc. | | 340,000 | 11,879,600 |
| Euronet Worldwide, Inc. (a) | | 215,000 | 17,150,550 |
| Gartner, Inc. Class A (a) | | 330,596 | 29,056,082 |
| Genpact Ltd. (a) | | 430,000 | 10,285,600 |
| Global Payments, Inc. | | 546,000 | 32,186,700 |
| Mattersight Corp. (a)(b)(c) | | 1,854,975 | 10,128,164 |
| Maximus, Inc. | | 189,167 | 10,095,843 |
| Perficient, Inc. (a) | | 449,112 | 8,555,584 |
| Virtusa Corp. (a) | | 200,000 | 8,944,000 |
| | | | 146,321,479 |
| Semiconductors & Semiconductor Equipment - 1.5% | | | |
| Cirrus Logic, Inc. (a)(b) | | 511,432 | 17,756,919 |
| Monolithic Power Systems, Inc. | | 150,000 | 9,385,500 |
| Semtech Corp. (a) | | 41,541 | 834,974 |
| | | | 27,977,393 |
| Software - 7.4% | | | |
| Atlassian Corp. PLC | | 255,300 | 5,302,581 |
| Blackbaud, Inc. | | 380,000 | 23,362,400 |
| Cadence Design Systems, Inc. (a) | | 886,200 | 17,334,072 |
| Callidus Software, Inc. (a) | | 232,512 | 3,587,660 |
| Fleetmatics Group PLC (a) | | 395,000 | 17,146,950 |
| HubSpot, Inc. (a) | | 477,490 | 19,381,319 |
| Paylocity Holding Corp. (a)(b) | | 233,400 | 7,263,408 |
| RealPage, Inc. (a) | | 470,000 | 9,066,300 |
| RingCentral, Inc. (a) | | 320,000 | 6,982,400 |
| Tyler Technologies, Inc. (a) | | 155,000 | 24,344,300 |
| | | | 133,771,390 |
|
| TOTAL INFORMATION TECHNOLOGY | | | 429,700,447 |
|
| MATERIALS - 3.1% | | | |
| Chemicals - 1.5% | | | |
| Axiall Corp. | | 800,000 | 14,344,000 |
| Codexis, Inc. (a) | | 442,129 | 1,790,622 |
| Innospec, Inc. | | 220,000 | 10,967,000 |
| | | | 27,101,622 |
| Containers & Packaging - 1.5% | | | |
| Aptargroup, Inc. | | 101,876 | 7,426,760 |
| Avery Dennison Corp. | | 125,000 | 7,611,250 |
| Graphic Packaging Holding Co. | | 1,050,200 | 11,930,272 |
| | | | 26,968,282 |
| Paper & Forest Products - 0.1% | | | |
| TFS Corp. Ltd. (b) | | 2,443,636 | 2,246,923 |
|
| TOTAL MATERIALS | | | 56,316,827 |
|
| TELECOMMUNICATION SERVICES - 1.3% | | | |
| Diversified Telecommunication Services - 1.3% | | | |
| 8x8, Inc. (a) | | 500,000 | 6,280,000 |
| inContact, Inc. (a) | | 1,214,000 | 10,501,100 |
| Vonage Holdings Corp. (a) | | 1,485,436 | 7,620,287 |
| | | | 24,401,387 |
| TOTAL COMMON STOCKS | | | |
| (Cost $1,714,294,780) | | | 1,684,932,685 |
|
| Money Market Funds - 12.9% | | | |
| Fidelity Cash Central Fund, 0.38% (d) | | 96,060,417 | 96,060,417 |
| Fidelity Securities Lending Cash Central Fund, 0.42% (d)(e) | | 138,061,480 | 138,061,480 |
| TOTAL MONEY MARKET FUNDS | | | |
| (Cost $234,121,897) | | | 234,121,897 |
|
| Equity Funds - 2.1% | | | |
| Small Growth Funds - 2.1% | | | |
| iShares Russell 2000 Growth Index ETF (b) | | | |
| (Cost $39,322,310) | | 315,000 | 39,223,800 |
| TOTAL INVESTMENT PORTFOLIO - 107.8% | | | |
| (Cost $1,987,738,987) | | | 1,958,278,382 |
| NET OTHER ASSETS (LIABILITIES) - (7.8)% | | | (142,440,221) |
| NET ASSETS - 100% | | | $1,815,838,161 |
Security Type Abbreviations
ETF – Exchange Traded Fund
Legend
(a) Non-income producing
(b) Security or a portion of the security is on loan at period end.
(c) Affiliated company
(d) Affiliated fund that is generally available only to investment companies and other accounts managed by Fidelity Investments. The rate quoted is the annualized seven-day yield of the fund at period end. A complete unaudited listing of the fund's holdings as of its most recent quarter end is available upon request. In addition, each Fidelity Central Fund's financial statements are available on the SEC's website or upon request.
(e) Investment made with cash collateral received from securities on loan.
Affiliated Central Funds
Information regarding fiscal year to date income earned by the Fund from investments in Fidelity Central Funds is as follows:
| Fund | Income earned |
| Fidelity Cash Central Fund | $82,098 |
| Fidelity Securities Lending Cash Central Fund | 1,453,834 |
| Total | $1,535,932 |
Other Affiliated Issuers
An affiliated company is a company in which the Fund has ownership of at least 5% of the voting securities. Fiscal year to date transactions with companies which are or were affiliates are as follows:
| Affiliate | Value, beginning of period | Purchases | Sales Proceeds | Dividend Income | Value, end of period |
| 2U, Inc. | $40,893,251 | $31,536,253 | $3,375,776 | $-- | $47,855,994 |
| Mattersight Corp. | 12,150,086 | -- | -- | -- | 10,128,164 |
| Superior Drilling Products, Inc. | 1,928,281 | -- | 37,522 | -- | 2,551,277 |
| Total | $54,971,618 | $31,536,253 | $3,413,298 | $-- | $60,535,435 |
Investment Valuation
The following is a summary of the inputs used, as of January 31, 2016, involving the Fund's assets and liabilities carried at fair value. The inputs or methodology used for valuing securities may not be an indication of the risk associated with investing in those securities. For more information on valuation inputs, and their aggregation into the levels used below, please refer to the Investment Valuation section in the accompanying Notes to Financial Statements.
| | Valuation Inputs at Reporting Date: |
| Description | Total | Level 1 | Level 2 | Level 3 |
| Investments in Securities: | | | | |
| Equities: | | | | |
| Consumer Discretionary | $284,550,617 | $284,550,617 | $-- | $-- |
| Consumer Staples | 46,673,666 | 46,673,666 | -- | -- |
| Energy | 33,330,448 | 33,330,448 | -- | -- |
| Financials | 182,347,954 | 182,347,954 | -- | -- |
| Health Care | 411,309,715 | 410,157,451 | 87,144 | 1,065,120 |
| Industrials | 216,301,624 | 216,301,624 | -- | -- |
| Information Technology | 429,700,447 | 429,700,447 | -- | -- |
| Materials | 56,316,827 | 54,069,904 | 2,246,923 | -- |
| Telecommunication Services | 24,401,387 | 24,401,387 | -- | -- |
| Money Market Funds | 234,121,897 | 234,121,897 | -- | -- |
| Equity Funds | 39,223,800 | 39,223,800 | -- | -- |
| Total Investments in Securities: | $1,958,278,382 | $1,954,879,195 | $2,334,067 | $1,065,120 |
See accompanying notes which are an integral part of the financial statements.
Financial Statements
Statement of Assets and Liabilities
| | | January 31, 2016 (Unaudited) |
| Assets | | |
Investment in securities, at value (including securities loaned of $138,209,768) — See accompanying schedule:
Unaffiliated issuers (cost $1,687,190,375) | $1,663,621,050 | |
| Fidelity Central Funds (cost $234,121,897) | 234,121,897 | |
| Other affiliated issuers (cost $66,426,715) | 60,535,435 | |
| Total Investments (cost $1,987,738,987) | | $1,958,278,382 |
| Cash | | 1,498,090 |
| Foreign currency held at value (cost $36,806) | | 36,608 |
| Receivable for investments sold | | 56,805,431 |
| Receivable for fund shares sold | | 3,869,354 |
| Dividends receivable | | 126,725 |
| Distributions receivable from Fidelity Central Funds | | 452,236 |
| Prepaid expenses | | 2,652 |
| Other receivables | | 38,176 |
| Total assets | | 2,021,107,654 |
| Liabilities | | |
| Payable for investments purchased | $61,818,193 | |
| Payable for fund shares redeemed | 3,519,273 | |
| Accrued management fee | 1,296,120 | |
| Distribution and service plan fees payable | 103,307 | |
| Other affiliated payables | 432,695 | |
| Other payables and accrued expenses | 38,425 | |
| Collateral on securities loaned, at value | 138,061,480 | |
| Total liabilities | | 205,269,493 |
| Net Assets | | $1,815,838,161 |
| Net Assets consist of: | | |
| Paid in capital | | $1,907,475,409 |
| Accumulated net investment loss | | (3,822,741) |
| Accumulated undistributed net realized gain (loss) on investments and foreign currency transactions | | (58,352,721) |
| Net unrealized appreciation (depreciation) on investments and assets and liabilities in foreign currencies | | (29,461,786) |
| Net Assets | | $1,815,838,161 |
| Calculation of Maximum Offering Price | | |
| Class A: | | |
| Net Asset Value and redemption price per share ($146,714,670 ÷ 8,965,749 shares) | | $16.36 |
| Maximum offering price per share (100/94.25 of $16.36) | | $17.36 |
| Class T: | | |
| Net Asset Value and redemption price per share ($47,555,183 ÷ 2,975,761 shares) | | $15.98 |
| Maximum offering price per share (100/96.50 of $15.98) | | $16.56 |
| Class B: | | |
| Net Asset Value and offering price per share ($1,471,270 ÷ 97,417 shares)(a) | | $15.10 |
| Class C: | | |
| Net Asset Value and offering price per share ($60,995,304 ÷ 4,062,692 shares)(a) | | $15.01 |
| Small Cap Growth: | | |
| Net Asset Value, offering price and redemption price per share ($1,430,546,797 ÷ 84,667,789 shares) | | $16.90 |
| Class I: | | |
| Net Asset Value, offering price and redemption price per share ($128,554,937 ÷ 7,592,754 shares) | | $16.93 |
(a) Redemption price per share is equal to net asset value less any applicable contingent deferred sales charge.
See accompanying notes which are an integral part of the financial statements.
Statement of Operations
| | | Six months ended January 31, 2016 (Unaudited) |
| Investment Income | | |
| Dividends | | $5,461,117 |
| Interest | | 15 |
| Income from Fidelity Central Funds (including $1,453,834 from security lending) | | 1,535,932 |
| Total income | | 6,997,064 |
| Expenses | | |
| Management fee | | |
| Basic fee | $6,324,712 | |
| Performance adjustment | 1,195,467 | |
| Transfer agent fees | 2,220,905 | |
| Distribution and service plan fees | 612,381 | |
| Accounting and security lending fees | 293,075 | |
| Custodian fees and expenses | 30,004 | |
| Independent trustees' compensation | 3,850 | |
| Registration fees | 166,949 | |
| Audit | 33,167 | |
| Legal | 3,375 | |
| Miscellaneous | 4,679 | |
| Total expenses before reductions | 10,888,564 | |
| Expense reductions | (68,759) | 10,819,805 |
| Net investment income (loss) | | (3,822,741) |
| Realized and Unrealized Gain (Loss) | | |
| Net realized gain (loss) on: | | |
| Investment securities: | | |
| Unaffiliated issuers | (52,952,176) | |
| Other affiliated issuers | (178,011) | |
| Foreign currency transactions | (11,321) | |
| Total net realized gain (loss) | | (53,141,508) |
Change in net unrealized appreciation (depreciation) on:
Investment securities | (276,851,624) | |
| Assets and liabilities in foreign currencies | 11,758 | |
| Total change in net unrealized appreciation (depreciation) | | (276,839,866) |
| Net gain (loss) | | (329,981,374) |
| Net increase (decrease) in net assets resulting from operations | | $(333,804,115) |
See accompanying notes which are an integral part of the financial statements.
Statement of Changes in Net Assets
| | Six months ended January 31, 2016 (Unaudited) | Year ended July 31, 2015 |
| Increase (Decrease) in Net Assets | | |
| Operations | | |
| Net investment income (loss) | $(3,822,741) | $(5,784,041) |
| Net realized gain (loss) | (53,141,508) | 108,754,619 |
| Change in net unrealized appreciation (depreciation) | (276,839,866) | 166,432,213 |
| Net increase (decrease) in net assets resulting from operations | (333,804,115) | 269,402,791 |
| Distributions to shareholders from net realized gain | (71,394,910) | (103,188,484) |
| Share transactions - net increase (decrease) | 542,860,559 | 214,155,809 |
| Redemption fees | 530,486 | 177,411 |
| Total increase (decrease) in net assets | 138,192,020 | 380,547,527 |
| Net Assets | | |
| Beginning of period | 1,677,646,141 | 1,297,098,614 |
| End of period (including accumulated net investment loss of $3,822,741 and undistributed net investment income of $0, respectively) | $1,815,838,161 | $1,677,646,141 |
See accompanying notes which are an integral part of the financial statements.
Financial Highlights — Fidelity Small Cap Growth Fund Class A
| | Six months ended (Unaudited) | Years ended July 31, | | | | |
| January 31, | 2016 | 2015 | 2014 | 2013 | 2012 | 2011 |
| Selected Per–Share Data | | | | | | |
| Net asset value, beginning of period | $20.55 | $17.99 | $19.66 | $15.87 | $16.42 | $12.66 |
| Income from Investment Operations | | | | | | |
| Net investment income (loss)A | (.06) | (.13) | (.12) | (.04) | (.07)B | (.07)C |
| Net realized and unrealized gain (loss) | (3.36) | 4.23 | 1.69 | 4.87 | (.16) | 3.84 |
| Total from investment operations | (3.42) | 4.10 | 1.57 | 4.83 | (.23) | 3.77 |
| Distributions from net realized gain | (.78) | (1.54) | (3.24) | (1.04) | (.32) | (.01)D |
| Redemption fees added to paid in capitalA | .01 | –E | –E | –E | –E | –E |
| Net asset value, end of period | $16.36 | $20.55 | $17.99 | $19.66 | $15.87 | $16.42 |
| Total ReturnF,G,H | (17.09)% | 24.46% | 8.58% | 32.20% | (1.14)% | 29.78% |
| Ratios to Average Net AssetsI,J | | | | | | |
| Expenses before reductions | 1.39%K | 1.21% | 1.22% | 1.24% | 1.35% | 1.25% |
| Expenses net of fee waivers, if any | 1.39%K | 1.21% | 1.22% | 1.24% | 1.35% | 1.25% |
| Expenses net of all reductions | 1.38%K | 1.20% | 1.22% | 1.22% | 1.34% | 1.23% |
| Net investment income (loss) | (.61)%K | (.67)% | (.62)% | (.26)% | (.49)%B | (.47)%C |
| Supplemental Data | | | | | | |
| Net assets, end of period (000 omitted) | $146,715 | $123,370 | $88,822 | $74,978 | $59,684 | $67,272 |
| Portfolio turnover rateL | 133%K | 156% | 148%M | 142% | 150% | 106% |
A Calculated based on average shares outstanding during the period.
B Net Investment income per share reflects a large, non-recurring dividend which amounted to $.01 per share. Excluding this non-recurring dividend, the ratio of net investment income (loss) to average net assets would have been (.57) %.
C Net Investment income per share reflects a large, non-recurring dividend which amounted to $.02 per share. Excluding this non-recurring dividend, the ratio of net investment income (loss) to average net assets would have been (.61) %.
D The amounts shown reflect certain reclassifications related to book to tax differences that were made in the year shown.
E Amount represents less than $.005 per share.
F Total returns for periods of less than one year are not annualized.
G Total returns would have been lower if certain expenses had not been reduced during the applicable periods shown.
H Total returns do not include the effect of the sales charges.
I Fees and expenses of any underlying Fidelity Central Funds are not included in the Fund's expense ratio. The Fund indirectly bears its proportionate share of the expenses of any underlying Fidelity Central Funds.
J Expense ratios reflect operating expenses of the class. Expenses before reductions do not reflect amounts reimbursed by the investment adviser or reductions from brokerage service arrangements or reductions from other expense offset arrangements and do not represent the amount paid by the class during periods when reimbursements or reductions occur. Expenses net of fee waivers reflect expenses after reimbursement by the investment adviser but prior to reductions from brokerage service arrangements or other expense offset arrangements. Expenses net of all reductions represent the net expenses paid by the class.
K Annualized
L Amount does not include the portfolio activity of any underlying Fidelity Central Funds.
M Portfolio turnover rate excludes securities received or delivered in-kind.
See accompanying notes which are an integral part of the financial statements.
Financial Highlights — Fidelity Small Cap Growth Fund Class T
| | Six months ended (Unaudited) | Years ended July 31, | | | | |
| January 31, | 2016 | 2015 | 2014 | 2013 | 2012 | 2011 |
| Selected Per–Share Data | | | | | | |
| Net asset value, beginning of period | $20.08 | $17.66 | $19.38 | $15.68 | $16.27 | $12.57 |
| Income from Investment Operations | | | | | | |
| Net investment income (loss)A | (.08) | (.17) | (.16) | (.09) | (.11)B | (.11)C |
| Net realized and unrealized gain (loss) | (3.28) | 4.13 | 1.66 | 4.82 | (.16) | 3.81 |
| Total from investment operations | (3.36) | 3.96 | 1.50 | 4.73 | (.27) | 3.70 |
| Distributions from net realized gain | (.75) | (1.54) | (3.22) | (1.03) | (.32) | – |
| Redemption fees added to paid in capitalA | .01 | –D | –D | –D | –D | –D |
| Net asset value, end of period | $15.98 | $20.08 | $17.66 | $19.38 | $15.68 | $16.27 |
| Total ReturnE,F,G | (17.19)% | 24.10% | 8.30% | 31.87% | (1.41)% | 29.44% |
| Ratios to Average Net AssetsH,I | | | | | | |
| Expenses before reductions | 1.67%J | 1.49% | 1.50% | 1.49% | 1.61% | 1.50% |
| Expenses net of fee waivers, if any | 1.67%J | 1.48% | 1.50% | 1.49% | 1.61% | 1.50% |
| Expenses net of all reductions | 1.66%J | 1.47% | 1.49% | 1.48% | 1.60% | 1.49% |
| Net investment income (loss) | (.89)%J | (.95)% | (.90)% | (.52)% | (.74)%B | (.73)%C |
| Supplemental Data | | | | | | |
| Net assets, end of period (000 omitted) | $47,555 | $52,667 | $42,586 | $34,686 | $27,658 | $30,764 |
| Portfolio turnover rateK | 133%J | 156% | 148%L | 142% | 150% | 106% |
A Calculated based on average shares outstanding during the period.
B Net Investment income per share reflects a large, non-recurring dividend which amounted to $.01 per share. Excluding this non-recurring dividend, the ratio of net investment income (loss) to average net assets would have been (.83) %.
C Net Investment income per share reflects a large, non-recurring dividend which amounted to $.02 per share. Excluding this non-recurring dividend, the ratio of net investment income (loss) to average net assets would have been (.86) %.
D Amount represents less than $.005 per share.
E Total returns for periods of less than one year are not annualized.
F Total returns would have been lower if certain expenses had not been reduced during the applicable periods shown.
G Total returns do not include the effect of the sales charges.
H Fees and expenses of any underlying Fidelity Central Funds are not included in the Fund's expense ratio. The Fund indirectly bears its proportionate share of the expenses of any underlying Fidelity Central Funds.
I Expense ratios reflect operating expenses of the class. Expenses before reductions do not reflect amounts reimbursed by the investment adviser or reductions from brokerage service arrangements or reductions from other expense offset arrangements and do not represent the amount paid by the class during periods when reimbursements or reductions occur. Expenses net of fee waivers reflect expenses after reimbursement by the investment adviser but prior to reductions from brokerage service arrangements or other expense offset arrangements. Expenses net of all reductions represent the net expenses paid by the class.
J Annualized
K Amount does not include the portfolio activity of any underlying Fidelity Central Funds.
L Portfolio turnover rate excludes securities received or delivered in-kind.
See accompanying notes which are an integral part of the financial statements.
Financial Highlights — Fidelity Small Cap Growth Fund Class B
| | Six months ended (Unaudited) | Years ended July 31, | | | | |
| January 31, | 2016 | 2015 | 2014 | 2013 | 2012 | 2011 |
| Selected Per–Share Data | | | | | | |
| Net asset value, beginning of period | $18.99 | $16.86 | $18.65 | $15.19 | $15.86 | $12.30 |
| Income from Investment Operations | | | | | | |
| Net investment income (loss)A | (.12) | (.25) | (.25) | (.16) | (.18)B | (.18)C |
| Net realized and unrealized gain (loss) | (3.11) | 3.92 | 1.60 | 4.64 | (.17) | 3.74 |
| Total from investment operations | (3.23) | 3.67 | 1.35 | 4.48 | (.35) | 3.56 |
| Distributions from net realized gain | (.67) | (1.54) | (3.14) | (1.02) | (.32) | – |
| Redemption fees added to paid in capitalA | .01 | –D | –D | –D | –D | –D |
| Net asset value, end of period | $15.10 | $18.99 | $16.86 | $18.65 | $15.19 | $15.86 |
| Total ReturnE,F,G | (17.43)% | 23.48% | 7.73% | 31.25% | (1.96)% | 28.94% |
| Ratios to Average Net AssetsH,I | | | | | | |
| Expenses before reductions | 2.19%J | 2.01% | 2.01% | 1.99% | 2.10% | 2.00% |
| Expenses net of fee waivers, if any | 2.19%J | 2.01% | 2.01% | 1.99% | 2.10% | 2.00% |
| Expenses net of all reductions | 2.18%J | 2.00% | 2.01% | 1.97% | 2.09% | 1.98% |
| Net investment income (loss) | (1.41)%J | (1.47)% | (1.41)% | (1.01)% | (1.23)%B | (1.22)%C |
| Supplemental Data | | | | | | |
| Net assets, end of period (000 omitted) | $1,471 | $2,357 | $2,764 | $3,486 | $4,123 | $5,295 |
| Portfolio turnover rateK | 133%J | 156% | 148%L | 142% | 150% | 106% |
A Calculated based on average shares outstanding during the period.
B Net Investment income per share reflects a large, non-recurring dividend which amounted to $.01 per share. Excluding this non-recurring dividend, the ratio of net investment income (loss) to average net assets would have been (1.32) %.
C Net Investment income per share reflects a large, non-recurring dividend which amounted to $.02 per share. Excluding this non-recurring dividend, the ratio of net investment income (loss) to average net assets would have been (1.36) %.
D Amount represents less than $.005 per share.
E Total returns for periods of less than one year are not annualized.
F Total returns would have been lower if certain expenses had not been reduced during the applicable periods shown.
G Total returns do not include the effect of the contingent deferred sales charge.
H Fees and expenses of any underlying Fidelity Central Funds are not included in the Fund's expense ratio. The Fund indirectly bears its proportionate share of the expenses of any underlying Fidelity Central Funds.
I Expense ratios reflect operating expenses of the class. Expenses before reductions do not reflect amounts reimbursed by the investment adviser or reductions from brokerage service arrangements or reductions from other expense offset arrangements and do not represent the amount paid by the class during periods when reimbursements or reductions occur. Expenses net of fee waivers reflect expenses after reimbursement by the investment adviser but prior to reductions from brokerage service arrangements or other expense offset arrangements. Expenses net of all reductions represent the net expenses paid by the class.
J Annualized
K Amount does not include the portfolio activity of any underlying Fidelity Central Funds.
L Portfolio turnover rate excludes securities received or delivered in-kind.
See accompanying notes which are an integral part of the financial statements.
Financial Highlights — Fidelity Small Cap Growth Fund Class C
| | Six months ended (Unaudited) | Years ended July 31, | | | | |
| January 31, | 2016 | 2015 | 2014 | 2013 | 2012 | 2011 |
| Selected Per–Share Data | | | | | | |
| Net asset value, beginning of period | $18.90 | $16.78 | $18.62 | $15.16 | $15.83 | $12.28 |
| Income from Investment Operations | | | | | | |
| Net investment income (loss)A | (.12) | (.25) | (.25) | (.16) | (.18)B | (.18)C |
| Net realized and unrealized gain (loss) | (3.08) | 3.91 | 1.59 | 4.64 | (.17) | 3.73 |
| Total from investment operations | (3.20) | 3.66 | 1.34 | 4.48 | (.35) | 3.55 |
| Distributions from net realized gain | (.69) | (1.54) | (3.18) | (1.02) | (.32) | – |
| Redemption fees added to paid in capitalA,D | – | – | – | – | – | – |
| Net asset value, end of period | $15.01 | $18.90 | $16.78 | $18.62 | $15.16 | $15.83 |
| Total ReturnE,F,G | (17.45)% | 23.53% | 7.70% | 31.32% | (1.96)% | 28.91% |
| Ratios to Average Net AssetsH,I | | | | | | |
| Expenses before reductions | 2.17%J | 2.00% | 2.01% | 1.99% | 2.10% | 2.00% |
| Expenses net of fee waivers, if any | 2.17%J | 2.00% | 2.00% | 1.99% | 2.10% | 2.00% |
| Expenses net of all reductions | 2.17%J | 1.99% | 2.00% | 1.97% | 2.09% | 1.98% |
| Net investment income (loss) | (1.39)%J | (1.46)% | (1.41)% | (1.01)% | (1.24)%B | (1.22)%C |
| Supplemental Data | | | | | | |
| Net assets, end of period (000 omitted) | $60,995 | $55,671 | $42,215 | $32,756 | $24,683 | $24,914 |
| Portfolio turnover rateK | 133%J | 156% | 148%L | 142% | 150% | 106% |
A Calculated based on average shares outstanding during the period.
B Net Investment income per share reflects a large, non-recurring dividend which amounted to $.01 per share. Excluding this non-recurring dividend, the ratio of net investment income (loss) to average net assets would have been (1.32) %.
C Net Investment income per share reflects a large, non-recurring dividend which amounted to $.02 per share. Excluding this non-recurring dividend, the ratio of net investment income (loss) to average net assets would have been (1.36) %.
D Amount represents less than $.005 per share.
E Total returns for periods of less than one year are not annualized.
F Total returns would have been lower if certain expenses had not been reduced during the applicable periods shown.
G Total returns do not include the effect of the contingent deferred sales charge.
H Fees and expenses of any underlying Fidelity Central Funds are not included in the Fund's expense ratio. The Fund indirectly bears its proportionate share of the expenses of any underlying Fidelity Central Funds.
I Expense ratios reflect operating expenses of the class. Expenses before reductions do not reflect amounts reimbursed by the investment adviser or reductions from brokerage service arrangements or reductions from other expense offset arrangements and do not represent the amount paid by the class during periods when reimbursements or reductions occur. Expenses net of fee waivers reflect expenses after reimbursement by the investment adviser but prior to reductions from brokerage service arrangements or other expense offset arrangements. Expenses net of all reductions represent the net expenses paid by the class.
J Annualized
K Amount does not include the portfolio activity of any underlying Fidelity Central Funds.
L Portfolio turnover rate excludes securities received or delivered in-kind.
See accompanying notes which are an integral part of the financial statements.
Financial Highlights — Fidelity Small Cap Growth Fund
| | Six months ended (Unaudited) | Years ended July 31, | | | | |
| January 31, | 2016 | 2015 | 2014 | 2013 | 2012 | 2011 |
| Selected Per–Share Data | | | | | | |
| Net asset value, beginning of period | $21.20 | $18.45 | $20.07 | $16.14 | $16.65 | $12.81 |
| Income from Investment Operations | | | | | | |
| Net investment income (loss)A | (.03) | (.07) | (.06) | .01 | (.03)B | (.03)C |
| Net realized and unrealized gain (loss) | (3.47) | 4.36 | 1.71 | 4.98 | (.16) | 3.90 |
| Total from investment operations | (3.50) | 4.29 | 1.65 | 4.99 | (.19) | 3.87 |
| Distributions from net realized gain | (.81) | (1.54) | (3.27) | (1.06) | (.32) | (.03)D |
| Redemption fees added to paid in capitalA | .01 | –E | –E | –E | –E | –E |
| Net asset value, end of period | $16.90 | $21.20 | $18.45 | $20.07 | $16.14 | $16.65 |
| Total ReturnF,G | (16.97)% | 24.91% | 8.87% | 32.74% | (.88)% | 30.20% |
| Ratios to Average Net AssetsH,I | | | | | | |
| Expenses before reductions | 1.14%J | .91% | .91% | .90% | 1.03% | .95% |
| Expenses net of fee waivers, if any | 1.13%J | .91% | .90% | .90% | 1.03% | .95% |
| Expenses net of all reductions | 1.13%J | .90% | .90% | .88% | 1.02% | .93% |
| Net investment income (loss) | (.35)%J | (.37)% | (.31)% | .08% | (.16)%B | (.17)%C |
| Supplemental Data | | | | | | |
| Net assets, end of period (000 omitted) | $1,430,547 | $1,345,684 | $1,069,105 | $1,315,659 | $1,166,101 | $1,382,688 |
| Portfolio turnover rateK | 133%J | 156% | 148%L | 142% | 150% | 106% |
A Calculated based on average shares outstanding during the period.
B Net Investment income per share reflects a large, non-recurring dividend which amounted to $.01 per share. Excluding this non-recurring dividend, the ratio of net investment income (loss) to average net assets would have been (.25) %.
C Net Investment income per share reflects a large, non-recurring dividend which amounted to $.02 per share. Excluding this non-recurring dividend, the ratio of net investment income (loss) to average net assets would have been (.31) %.
D The amounts shown reflect certain reclassifications related to book to tax differences that were made in the year shown.
E Amount represents less than $.005 per share.
F Total returns for periods of less than one year are not annualized.
G Total returns would have been lower if certain expenses had not been reduced during the applicable periods shown.
H Fees and expenses of any underlying Fidelity Central Funds are not included in the Fund's expense ratio. The Fund indirectly bears its proportionate share of the expenses of any underlying Fidelity Central Funds.
I Expense ratios reflect operating expenses of the class. Expenses before reductions do not reflect amounts reimbursed by the investment adviser or reductions from brokerage service arrangements or reductions from other expense offset arrangements and do not represent the amount paid by the class during periods when reimbursements or reductions occur. Expenses net of fee waivers reflect expenses after reimbursement by the investment adviser but prior to reductions from brokerage service arrangements or other expense offset arrangements. Expenses net of all reductions represent the net expenses paid by the class.
J Annualized
K Amount does not include the portfolio activity of any underlying Fidelity Central Funds.
L Portfolio turnover rate excludes securities received or delivered in-kind.
See accompanying notes which are an integral part of the financial statements.
Financial Highlights — Fidelity Small Cap Growth Fund Class I
| | Six months ended (Unaudited) | Years ended July 31, | | | | |
| January 31, | 2016 | 2015 | 2014 | 2013 | 2012 | 2011 |
| Selected Per–Share Data | | | | | | |
| Net asset value, beginning of period | $21.24 | $18.49 | $20.10 | $16.17 | $16.68 | $12.83 |
| Income from Investment Operations | | | | | | |
| Net investment income (loss)A | (.03) | (.07) | (.06) | .01 | (.03)B | (.03)C |
| Net realized and unrealized gain (loss) | (3.48) | 4.36 | 1.72 | 4.98 | (.16) | 3.91 |
| Total from investment operations | (3.51) | 4.29 | 1.66 | 4.99 | (.19) | 3.88 |
| Distributions from net realized gain | (.81) | (1.54) | (3.27) | (1.06) | (.32) | (.03)D |
| Redemption fees added to paid in capitalA | .01 | –E | –E | –E | –E | –E |
| Net asset value, end of period | $16.93 | $21.24 | $18.49 | $20.10 | $16.17 | $16.68 |
| Total ReturnF,G | (16.99)% | 24.85% | 8.89% | 32.65% | (.88)% | 30.24% |
| Ratios to Average Net AssetsH,I | | | | | | |
| Expenses before reductions | 1.10%J | .93% | .92% | .92% | 1.06% | .94% |
| Expenses net of fee waivers, if any | 1.10%J | .93% | .92% | .92% | 1.06% | .94% |
| Expenses net of all reductions | 1.09%J | .91% | .92% | .91% | 1.05% | .93% |
| Net investment income (loss) | (.32)%J | (.39)% | (.32)% | .06% | (.19)%B | (.17)%C |
| Supplemental Data | | | | | | |
| Net assets, end of period (000 omitted) | $128,555 | $97,897 | $51,607 | $51,158 | $36,694 | $41,440 |
| Portfolio turnover rateK | 133%J | 156% | 148%L | 142% | 150% | 106% |
A Calculated based on average shares outstanding during the period.
B Net Investment income per share reflects a large, non-recurring dividend which amounted to $.01 per share. Excluding this non-recurring dividend, the ratio of net investment income (loss) to average net assets would have been (.28) %.
C Net Investment income per share reflects a large, non-recurring dividend which amounted to $.02 per share. Excluding this non-recurring dividend, the ratio of net investment income (loss) to average net assets would have been (.30) %.
D The amounts shown reflect certain reclassifications related to book to tax differences that were made in the year shown.
E Amount represents less than $.005 per share.
F Total returns for periods of less than one year are not annualized.
G Total returns would have been lower if certain expenses had not been reduced during the applicable periods shown.
H Fees and expenses of any underlying Fidelity Central Funds are not included in the Fund's expense ratio. The Fund indirectly bears its proportionate share of the expenses of any underlying Fidelity Central Funds.
I Expense ratios reflect operating expenses of the class. Expenses before reductions do not reflect amounts reimbursed by the investment adviser or reductions from brokerage service arrangements or reductions from other expense offset arrangements and do not represent the amount paid by the class during periods when reimbursements or reductions occur. Expenses net of fee waivers reflect expenses after reimbursement by the investment adviser but prior to reductions from brokerage service arrangements or other expense offset arrangements. Expenses net of all reductions represent the net expenses paid by the class.
J Annualized
K Amount does not include the portfolio activity of any underlying Fidelity Central Funds.
L Portfolio turnover rate excludes securities received or delivered in-kind.
See accompanying notes which are an integral part of the financial statements.
Notes to Financial Statements (Unaudited)
For the period ended January 31, 2016
1. Organization.
Fidelity Small Cap Growth Fund (the Fund) is a fund of Fidelity Securities Fund (the Trust) and is authorized to issue an unlimited number of shares. The Trust is registered under the Investment Company Act of 1940, as amended (the 1940 Act), as an open-end management investment company organized as a Massachusetts business trust. The Fund offers Class A, Class T, Class C, Small Cap Growth and Class I shares, each of which, along with Class B shares, has equal rights as to assets and voting privileges. Class B shares are closed to new accounts and additional purchases, except for exchanges and reinvestments. Each class has exclusive voting rights with respect to matters that affect that class. Class B shares will automatically convert to Class A shares after a holding period of seven years from the initial date of purchase.
During the period, the Board of Trustees approved the conversion of all existing Class B shares into Class A shares, effective on or about July 1, 2016, regardless of the length of times shares have been held.
2. Investments in Fidelity Central Funds.
The Fund invests in Fidelity Central Funds, which are open-end investment companies generally available only to other investment companies and accounts managed by the investment adviser and its affiliates. The Fund's Schedule of Investments lists each of the Fidelity Central Funds held as of period end, if any, as an investment of the Fund, but does not include the underlying holdings of each Fidelity Central Fund. As an Investing Fund, the Fund indirectly bears its proportionate share of the expenses of the underlying Fidelity Central Funds.
The Money Market Central Funds seek preservation of capital and current income and are managed by Fidelity Investments Money Management, Inc. (FIMM), an affiliate of the investment adviser. Annualized expenses of the Money Market Central Funds as of their most recent shareholder report date are less than .005%.
A complete unaudited list of holdings for each Fidelity Central Fund is available upon request or at the Securities and Exchange Commission (the SEC) website at www.sec.gov. In addition, the financial statements of the Fidelity Central Funds are available on the SEC website or upon request.
3. Significant Accounting Policies.
The financial statements have been prepared in conformity with accounting principles generally accepted in the United States of America (GAAP), which require management to make certain estimates and assumptions at the date of the financial statements. Actual results could differ from those estimates. Subsequent events, if any, through the date that the financial statements were issued have been evaluated in the preparation of the financial statements. The following summarizes the significant accounting policies of the Fund:
Investment Valuation. Investments are valued as of 4:00 p.m. Eastern time on the last calendar day of the period. The Board of Trustees (the Board) has delegated the day to day responsibility for the valuation of the Fund's investments to the Fidelity Management & Research Company (FMR) Fair Value Committee (the Committee). In accordance with valuation policies and procedures approved by the Board, the Fund attempts to obtain prices from one or more third party pricing vendors or brokers to value its investments. When current market prices, quotations or currency exchange rates are not readily available or reliable, investments will be fair valued in good faith by the Committee, in accordance with procedures adopted by the Board. Factors used in determining fair value vary by investment type and may include market or investment specific events. The frequency with which these procedures are used cannot be predicted and they may be utilized to a significant extent. The Committee oversees the Fund's valuation policies and procedures and reports to the Board on the Committee's activities and fair value determinations. The Board monitors the appropriateness of the procedures used in valuing the Fund's investments and ratifies the fair value determinations of the Committee.
The Fund categorizes the inputs to valuation techniques used to value its investments into a disclosure hierarchy consisting of three levels as shown below:
- Level 1 – quoted prices in active markets for identical investments
- Level 2 – other significant observable inputs (including quoted prices for similar investments, interest rates, prepayment speeds, etc.)
- Level 3 – unobservable inputs (including the Fund's own assumptions based on the best information available)
Valuation techniques used to value the Fund's investments by major category are as follows:
Equity securities, including restricted securities, for which market quotations are readily available, are valued at the last reported sale price or official closing price as reported by a third party pricing vendor on the primary market or exchange on which they are traded and are categorized as Level 1 in the hierarchy. In the event there were no sales during the day or closing prices are not available, securities are valued at the last quoted bid price or may be valued using the last available price and are generally categorized as Level 2 in the hierarchy. For foreign equity securities, when market or security specific events arise, comparisons to the valuation of American Depositary Receipts (ADRs), futures contracts, Exchange-Traded Funds (ETFs) and certain indexes as well as quoted prices for similar securities may be used and would be categorized as Level 2 in the hierarchy. Utilizing these techniques may result in transfers between Level 1 and Level 2. For equity securities, including restricted securities, where observable inputs are limited, assumptions about market activity and risk are used and these securities may be categorized as Level 3 in the hierarchy.
ETFs are valued at their last sale price or official closing price as reported by a third party pricing vendor on the primary market or exchange on which they are traded and are categorized as Level 1 in the hierarchy. In the event there were no sales during the day but the exchange reports a closing bid level, ETFs are valued at the closing bid and would be categorized as Level 1 in the hierarchy. In the event there was no closing bid, ETFs may be valued by another method that the Board believes reflects fair value in accordance with the Board's fair value pricing policies and may be categorized as Level 2 in the hierarchy.
Investments in open-end mutual funds, including the Fidelity Central Funds, are valued at their closing net asset value (NAV) each business day and are categorized as Level 1 in the hierarchy.
Changes in valuation techniques may result in transfers in or out of an assigned level within the disclosure hierarchy. The aggregate value of investments by input level as of January 31, 2016 is included at the end of the Fund's Schedule of Investments.
Foreign Currency. The Fund may use foreign currency contracts to facilitate transactions in foreign-denominated securities. Gains and losses from these transactions may arise from changes in the value of the foreign currency or if the counterparties do not perform under the contracts' terms.
Foreign-denominated assets, including investment securities, and liabilities are translated into U.S. dollars at the exchange rates at period end. Purchases and sales of investment securities, income and dividends received and expenses denominated in foreign currencies are translated into U.S. dollars at the exchange rate in effect on the transaction date.
The effects of exchange rate fluctuations on investments are included with the net realized and unrealized gain (loss) on investment securities. Other foreign currency transactions resulting in realized and unrealized gain (loss) are disclosed separately.
Investment Transactions and Income. For financial reporting purposes, the Fund's investment holdings and NAV include trades executed through the end of the last business day of the period. The NAV per share for processing shareholder transactions is calculated as of the close of business of the New York Stock Exchange (NYSE), normally 4:00 p.m. Eastern time and includes trades executed through the end of the prior business day. Gains and losses on securities sold are determined on the basis of identified cost and may include proceeds received from litigation. Dividend income is recorded on the ex-dividend date, except for certain dividends from foreign securities where the ex-dividend date may have passed, which are recorded as soon as the Fund is informed of the ex-dividend date. Non-cash dividends included in dividend income, if any, are recorded at the fair market value of the securities received. Income and capital gain distributions from Fidelity Central Funds, if any, are recorded on the ex-dividend date. Distributions received on securities that represent a return of capital or capital gain are recorded as a reduction of cost of investments and/or as a realized gain. Subsequent to ex-dividend date the Fund determines the components of these distributions, based upon receipt of tax filings or other correspondence relating to the underlying investment. Interest income is accrued as earned and includes coupon interest and amortization of premium and accretion of discount on debt securities as applicable. Investment income is recorded net of foreign taxes withheld where recovery of such taxes is uncertain.
Class Allocations and Expenses. Investment income, realized and unrealized capital gains and losses, common expenses of the Fund, and certain fund-level expense reductions, if any, are allocated daily on a pro-rata basis to each class based on the relative net assets of each class to the total net assets of the Fund. Each class differs with respect to transfer agent and distribution and service plan fees incurred. Certain expense reductions may also differ by class. For the reporting period, the allocated portion of income and expenses to each class as a percent of its average net assets may vary due to the timing of recording these transactions in relation to fluctuating net assets of the classes. Expenses directly attributable to a fund are charged to that fund. Expenses attributable to more than one fund are allocated among the respective funds on the basis of relative net assets or other appropriate methods. Expense estimates are accrued in the period to which they relate and adjustments are made when actual amounts are known.
Income Tax Information and Distributions to Shareholders. Each year, the Fund intends to qualify as a regulated investment company under Subchapter M of the Internal Revenue Code, including distributing substantially all of its taxable income and realized gains. As a result, no provision for U.S. Federal income taxes is required. The Fund files a U.S. federal tax return, in addition to state and local tax returns as required. The Fund's federal income tax returns are subject to examination by the Internal Revenue Service (IRS) for a period of three fiscal years after they are filed. State and local tax returns may be subject to examination for an additional fiscal year depending on the jurisdiction. Foreign taxes are provided for based on the Fund's understanding of the tax rules and rates that exist in the foreign markets in which it invests.
Distributions are declared and recorded on the ex-dividend date. Income dividends and capital gain distributions are declared separately for each class. Income and capital gain distributions are determined in accordance with income tax regulations, which may differ from GAAP.
Capital accounts within the financial statements are adjusted for permanent book-tax differences. These adjustments have no impact on net assets or the results of operations. Capital accounts are not adjusted for temporary book-tax differences which will reverse in a subsequent period.
Book-tax differences are primarily due to foreign currency transactions, partnerships and losses deferred due to wash sales and excise tax regulations.
The federal tax cost of investment securities and unrealized appreciation (depreciation) as of period end were as follows:
| Gross unrealized appreciation | $140,469,918 |
| Gross unrealized depreciation | (179,315,659) |
| Net unrealized appreciation (depreciation) on securities | $(38,845,741) |
| Tax cost | $1,997,124,123 |
Short-Term Trading (Redemption) Fees. Shares held by investors in the Fund less than 90 days may have been subject to a redemption fee equal to 1.50% of the NAV of shares redeemed. All redemption fees, which reduce the proceeds of the shareholder redemption, are retained by the Fund and accounted for as an addition to paid in capital.
4. Purchases and Sales of Investments.
Purchases and sales of securities, other than short-term securities, aggregated $1,583,055,509 and $1,159,316,197, respectively.
5. Fees and Other Transactions with Affiliates.
Management Fee. Fidelity Management & Research Company (the investment adviser) and its affiliates provide the Fund with investment management related services for which the Fund pays a monthly management fee. The management fee is the sum of an individual fund fee rate that is based on an annual rate of .45% of the Fund's average net assets and an annualized group fee rate that averaged .25% during the period. The group fee rate is based upon the average net assets of all the mutual funds advised by the investment adviser, including any mutual funds previously advised by the investment adviser that are currently advised by Fidelity SelectCo, LLC, an affiliate of the investment adviser. The group fee rate decreases as assets under management increase and increases as assets under management decrease. In addition, the management fee is subject to a performance adjustment (up to a maximum of +/- .20% of the Fund's average net assets over a 36 month performance period). The upward or downward adjustment to the management fee is based on the Small Cap Growth as compared to its benchmark index, the Russell 2000 Growth Index, over the same 36 month performance period. For the reporting period, the total annualized management fee rate, including the performance adjustment, was .83% of the Fund's average net assets. The performance adjustment included in the management fee rate may be higher or lower than the maximum performance adjustment rate due to the difference between the average net assets for the reporting and performance periods.
Distribution and Service Plan Fees. In accordance with Rule 12b-1 of the 1940 Act, the Fund has adopted separate Distribution and Service Plans for each class of shares. Certain classes pay Fidelity Distributors Corporation (FDC), an affiliate of the investment adviser, separate Distribution and Service Fees, each of which is based on an annual percentage of each class' average net assets. In addition, FDC may pay financial intermediaries for selling shares of the Fund and providing shareholder support services. For the period, the Distribution and Service Fee rates, total fees and amounts retained by FDC were as follows:
| | Distribution
Fee | Service
Fee | Total Fees | Retained
by FDC |
| Class A | -% | .25% | $170,431 | $- |
| Class T | .25% | .25% | 126,693 | - |
| Class B | .75% | .25% | 9,477 | 7,108 |
| Class C | .75% | .25% | 305,780 | 89,202 |
| | | | $612,381 | $96,310 |
Sales Load. FDC may receive a front-end sales charge of up to 5.75% for selling Class A shares and 3.50% for selling Class T shares, some of which is paid to financial intermediaries for selling shares of the Fund. Depending on the holding period, FDC may receive contingent deferred sales charges levied on Class A, Class T, Class B, and Class C redemptions. The deferred sales charges range from 5.00% to 1.00% for Class B shares, 1.00% for Class C shares, 1.00% for certain purchases of Class A shares and .25% for certain purchases of Class T shares.
For the period, sales charge amounts retained by FDC were as follows:
| | Retained
by FDC |
| Class A | $75,745 |
| Class T | 9,304 |
| Class B(a) | 178 |
| Class C(a) | 5,760 |
| | $90,987 |
(a) When Class B and Class C shares are initially sold, FDC pays commissions from its own resources to financial intermediaries through which the sales are made.
Transfer Agent Fees. Fidelity Investments Institutional Operations Company, Inc., (FIIOC), an affiliate of the investment adviser, is the transfer, dividend disbursing and shareholder servicing agent for each class of the Fund. FIIOC receives account fees and asset-based fees that vary according to the account size and type of account of the shareholders of the respective classes of the Fund. FIIOC pays for typesetting, printing and mailing of shareholder reports, except proxy statements.
For the period, transfer agent fees for each class were as follows:
| | Amount | % of
Class-Level Average
Net Assets(a) |
| Class A | $168,349 | .25 |
| Class T | 70,180 | .28 |
| Class B | 2,888 | .30 |
| Class C | 86,626 | .28 |
| Small Cap Growth | 1,771,102 | .25 |
| Class I | 121,760 | .21 |
| | $2,220,905 | |
(a) Annualized
Accounting and Security Lending Fees. Fidelity Service Company, Inc. (FSC), an affiliate of the investment adviser, maintains the Fund's accounting records. The accounting fee is based on the level of average net assets for each month. Under a separate contract, FSC administers the security lending program. The security lending fee is based on the number and duration of lending transactions.
Brokerage Commissions. The Fund placed a portion of its portfolio transactions with brokerage firms which are affiliates of the investment adviser. Brokerage commissions are included in net realized gain (loss) and change in net unrealized appreciation (depreciation) in the Statement of Operations. The commissions paid to these affiliated firms were $41,003 for the period.
Interfund Trades. The Fund may purchase from or sell securities to other Fidelity Funds under procedures adopted by the Board. The procedures have been designed to ensure these interfund trades are executed in accordance with Rule 17a-7 of the 1940 Act. Interfund trades are included within the respective purchases and sales amounts shown in the Purchases and Sales of Investments note.
6. Committed Line of Credit.
The Fund participates with other funds managed by the investment adviser or an affiliate in a $4.25 billion credit facility (the "line of credit") to be utilized for temporary or emergency purposes to fund shareholder redemptions or for other short-term liquidity purposes. The Fund has agreed to pay commitment fees on its pro-rata portion of the line of credit, which amounted to $1,182 and is reflected in Miscellaneous expenses on the Statement of Operations. During the period, the Fund did not borrow on this line of credit.
7. Security Lending.
The Fund lends portfolio securities through a lending agent from time to time in order to earn additional income. For equity securities, a lending agent is used and may loan securities to certain qualified borrowers, including Fidelity Capital Markets (FCM), a broker-dealer affiliated with the Fund. On the settlement date of the loan, the Fund receives collateral (in the form of U.S. Treasury obligations, letters of credit and/or cash) against the loaned securities and maintains collateral in an amount not less than 100% of the market value of the loaned securities during the period of the loan. The market value of the loaned securities is determined at the close of business of the Fund and any additional required collateral is delivered to the Fund on the next business day. The Fund or borrower may terminate the loan at any time, and if the borrower defaults on its obligation to return the securities loaned because of insolvency or other reasons, the Fund may apply collateral received from the borrower against the obligation. The Fund may experience delays and costs in recovering the securities loaned. Any cash collateral received is invested in the Fidelity Securities Lending Cash Central Fund. The value of loaned securities and cash collateral at period end are disclosed on the Fund's Statement of Assets and Liabilities. The value of securities loaned to FCM at period end was $9,721,986. Security lending income represents the income earned on investing cash collateral, less rebates paid to borrowers and any lending agent fees associated with the loan, plus any premium payments received for lending certain types of securities. Security lending income is presented in the Statement of Operations as a component of income from Fidelity Central Funds, and includes $135,856 from securities loaned to FCM.
8. Expense Reductions.
Commissions paid to certain brokers with whom the investment adviser, or its affiliates, places trades on behalf of the Fund include an amount in addition to trade execution, which may be rebated back to the Fund to offset certain expenses. This amount totaled $61,599 for the period. In addition, through arrangements with the Fund's custodian, credits realized as a result of certain uninvested cash balances were used to reduce the Fund's expenses. During the period, these credits reduced the Fund's custody expenses by $211.
In addition, during the period the investment adviser reimbursed and/or waived a portion of fund-level operating expenses in the amount of $6,949.
9. Distributions to Shareholders.
Distributions to shareholders of each class were as follows:
| | Six months ended January 31, 2016 | Year ended July 31, 2015 |
| From net realized gain | | |
| Class A | $5,181,395 | $7,463,655 |
| Class T | 2,020,848 | 3,715,268 |
| Class B | 78,117 | 242,938 |
| Class C | 2,268,668 | 3,707,592 |
| Small Cap Growth | 57,632,579 | 83,762,458 |
| Class I | 4,213,303 | 4,296,573 |
| Total | $71,394,910 | $103,188,484 |
10. Share Transactions.
Share transactions for each class were as follows and may contain automatic conversions between classes or exchanges between affiliated funds:
| | Shares | Shares | Dollars | Dollars |
| | Six months ended January 31, 2016 | Year ended July 31, 2015 | Six months ended January 31, 2016 | Year ended July 31, 2015 |
| Class A | | | | |
| Shares sold | 3,788,380 | 2,167,593 | $69,322,533 | $41,925,439 |
| Reinvestment of distributions | 264,882 | 412,446 | 5,002,118 | 7,203,479 |
| Shares redeemed | (1,089,932) | (1,515,208) | (19,532,200) | (27,623,856) |
| Net increase (decrease) | 2,963,330 | 1,064,831 | $54,792,451 | $21,505,062 |
| Class T | | | | |
| Shares sold | 614,464 | 659,898 | $11,042,487 | $12,282,234 |
| Reinvestment of distributions | 107,630 | 211,200 | 1,987,314 | 3,613,802 |
| Shares redeemed | (368,566) | (660,724) | (6,582,314) | (11,765,139) |
| Net increase (decrease) | 353,528 | 210,374 | $6,447,487 | $4,130,897 |
| Class B | | | | |
| Shares sold | 5,563 | 11,802 | $90,672 | $209,809 |
| Reinvestment of distributions | 4,376 | 14,482 | 76,516 | 235,501 |
| Shares redeemed | (36,629) | (66,110) | (623,367) | (1,127,352) |
| Net increase (decrease) | (26,690) | (39,826) | $(456,179) | $(682,042) |
| Class C | | | | |
| Shares sold | 1,483,971 | 992,298 | $25,270,133 | $17,729,436 |
| Reinvestment of distributions | 125,336 | 216,825 | 2,178,654 | 3,508,500 |
| Shares redeemed | (492,824) | (778,826) | (7,982,478) | (13,034,787) |
| Net increase (decrease) | 1,116,483 | 430,297 | $19,466,309 | $8,203,149 |
| Small Cap Growth | | | | |
| Shares sold | 30,093,908 | 23,816,242 | $567,615,388 | $475,203,336 |
| Reinvestment of distributions | 2,848,706 | 4,527,816 | 55,506,569 | 81,276,349 |
| Shares redeemed | (11,760,847) | (22,793,867) | (217,402,735) | (412,013,233) |
| Net increase (decrease) | 21,181,767 | 5,550,191 | $405,719,222 | $144,466,452 |
| Class I | | | | |
| Shares sold | 4,395,489 | 2,387,318 | $82,906,484 | $47,676,724 |
| Reinvestment of distributions | 199,940 | 220,272 | 3,903,639 | 3,963,647 |
| Shares redeemed | (1,612,638) | (789,017) | (29,918,854) | (15,108,080) |
| Net increase (decrease) | 2,982,791 | 1,818,573 | $56,891,269 | $36,532,291 |
11. Other.
The Fund's organizational documents provide former and current trustees and officers with a limited indemnification against liabilities arising in connection with the performance of their duties to the Fund. In the normal course of business, the Fund may also enter into contracts that provide general indemnifications. The Fund's maximum exposure under these arrangements is unknown as this would be dependent on future claims that may be made against the Fund. The risk of material loss from such claims is considered remote.
Shareholder Expense Example
As a shareholder of the Fund, you incur two types of costs: (1) transaction costs, including sales charges (loads) on purchase payments or redemption proceeds, redemption fees and (2) ongoing costs, including management fees, distribution and/or service (12b-1) fees and other Fund expenses. This Example is intended to help you understand your ongoing costs (in dollars) of investing in the Fund and to compare these costs with the ongoing costs of investing in other mutual funds.
The Example is based on an investment of $1,000 invested at the beginning of the period and held for the entire period (August 1, 2015 to January 31, 2016).
Actual Expenses
The first line of the accompanying table for each class of the Fund provides information about actual account values and actual expenses. You may use the information in this line, together with the amount you invested, to estimate the expenses that you paid over the period. Simply divide your account value by $1,000.00 (for example, an $8,600 account value divided by $1,000.00 = 8.6), then multiply the result by the number in the first line for a class of the Fund under the heading entitled "Expenses Paid During Period" to estimate the expenses you paid on your account during this period. A small balance maintenance fee of $12.00 that is charged once a year may apply for certain accounts with a value of less than $2,000. This fee is not included in the table below. If it was, the estimate of expenses you paid during the period would be higher, and your ending account value lower, by this amount. In addition, the Fund, as a shareholder in the underlying Fidelity Central Funds, will indirectly bear its pro-rata share of the fees and expenses incurred by the underlying Fidelity Central Funds. These fees and expenses are not included in the Fund's annualized expense ratio used to calculate the expense estimate in the table below.
Hypothetical Example for Comparison Purposes
The second line of the accompanying table for each class of the Fund provides information about hypothetical account values and hypothetical expenses based on a Class' actual expense ratio and an assumed rate of return of 5% per year before expenses, which is not the Class' actual return. The hypothetical account values and expenses may not be used to estimate the actual ending account balance or expenses you paid for the period. You may use this information to compare the ongoing costs of investing in the Fund and other funds. To do so, compare this 5% hypothetical example with the 5% hypothetical examples that appear in the shareholder reports of the other funds. A small balance maintenance fee of $12.00 that is charged once a year may apply for certain accounts with a value of less than $2,000. This fee is not included in the table below. If it was, the estimate of expenses you paid during the period would be higher, and your ending account value lower, by this amount. In addition, the Fund, as a shareholder in the underlying Fidelity Central Funds, will indirectly bear its pro-rata share of the fees and expenses incurred by the underlying Fidelity Central Funds. These fees and expenses are not included in the Fund's annualized expense ratio used to calculate the expense estimate in the table below.
Please note that the expenses shown in the table are meant to highlight your ongoing costs only and do not reflect any transaction costs. Therefore, the second line of the table is useful in comparing ongoing costs only, and will not help you determine the relative total costs of owning different funds. In addition, if these transactional costs were included, your costs would have been higher.
| | Annualized Expense Ratio-A | Beginning
Account Value
August 1, 2015 | Ending
Account Value
January 31, 2016 | Expenses Paid
During Period-B
August 1, 2015
to January 31, 2016 |
| Class A | 1.39% | | | |
| Actual | | $1,000.00 | $829.10 | $6.39 |
| Hypothetical-C | | $1,000.00 | $1,018.15 | $7.05 |
| Class T | 1.67% | | | |
| Actual | | $1,000.00 | $828.10 | $7.67 |
| Hypothetical-C | | $1,000.00 | $1,016.74 | $8.47 |
| Class B | 2.19% | | | |
| Actual | | $1,000.00 | $825.70 | $10.05 |
| Hypothetical-C | | $1,000.00 | $1,014.13 | $11.09 |
| Class C | 2.17% | | | |
| Actual | | $1,000.00 | $825.50 | $9.96 |
| Hypothetical-C | | $1,000.00 | $1,014.23 | $10.99 |
| Small Cap Growth | 1.13% | | | |
| Actual | | $1,000.00 | $830.30 | $5.20 |
| Hypothetical-C | | $1,000.00 | $1,019.46 | $5.74 |
| Class I | 1.10% | | | |
| Actual | | $1,000.00 | $830.10 | $5.06 |
| Hypothetical-C | | $1,000.00 | $1,019.61 | $5.58 |
A Annualized expense ratio reflects expenses net of applicable fee waivers.
B Expenses are equal to each Class' annualized expense ratio, multiplied by the average account value over the period, multiplied by 184/366 (to reflect the one-half year period).
C 5% return per year before expenses
ASCPI-SANN-0316
1.803725.112
Fidelity Advisor® Small Cap Growth Fund -
Class A, Class T, Class B and Class C
Semi-Annual Report January 31, 2016 Class A, Class T, Class B and Class C are classes of Fidelity® Small Cap Growth Fund |
|
Contents
To view a fund's proxy voting guidelines and proxy voting record for the 12-month period ended June 30, visit http://www.fidelity.com/proxyvotingresults or visit the Securities and Exchange Commission's (SEC) web site at http://www.sec.gov.
You may also call 1-877-208-0098 to request a free copy of the proxy voting guidelines.
Standard & Poor's, S&P and S&P 500 are registered service marks of The McGraw-Hill Companies, Inc. and have been licensed for use by Fidelity Distributors Corporation.
Other third-party marks appearing herein are the property of their respective owners.
All other marks appearing herein are registered or unregistered trademarks or service marks of FMR LLC or an affiliated company. © 2016 FMR LLC. All rights reserved.
This report and the financial statements contained herein are submitted for the general information of the shareholders of the Fund. This report is not authorized for distribution to prospective investors in the Fund unless preceded or accompanied by an effective prospectus.
A fund files its complete schedule of portfolio holdings with the SEC for the first and third quarters of each fiscal year on Form N-Q. Forms N-Q are available on the SEC’s web site at http://www.sec.gov. A fund's Forms N-Q may be reviewed and copied at the SEC’s Public Reference Room in Washington, DC. Information regarding the operation of the SEC's Public Reference Room may be obtained by calling 1-800-SEC-0330.
For a complete list of a fund's portfolio holdings, view the most recent holdings listing, semiannual report, or annual report on Fidelity's web site at http://www.fidelity.com, http://www.advisor.fidelity.com, or http://www.401k.com, as applicable.
NOT FDIC INSURED •MAY LOSE VALUE •NO BANK GUARANTEE
Neither the Fund nor Fidelity Distributors Corporation is a bank.
Investment Summary (Unaudited)
Top Ten Stocks as of January 31, 2016
| | % of fund's net assets | % of fund's net assets 6 months ago |
| 2U, Inc. | 2.6 | 2.4 |
| Stamps.com, Inc. | 1.8 | 0.8 |
| Global Payments, Inc. | 1.8 | 1.4 |
| NxStage Medical, Inc. | 1.7 | 0.5 |
| Surgical Care Affiliates, Inc. | 1.7 | 0.9 |
| Gartner, Inc. Class A | 1.6 | 1.2 |
| Vail Resorts, Inc. | 1.6 | 1.2 |
| Bright Horizons Family Solutions, Inc. | 1.6 | 0.0 |
| Steris PLC | 1.5 | 0.0 |
| Tyler Technologies, Inc. | 1.3 | 0.0 |
| | 17.2 | |
Top Five Market Sectors as of January 31, 2016
| | % of fund's net assets | % of fund's net assets 6 months ago |
| Information Technology | 23.7 | 24.4 |
| Health Care | 22.7 | 29.2 |
| Consumer Discretionary | 15.7 | 17.3 |
| Industrials | 11.9 | 14.5 |
| Financials | 10.0 | 5.3 |
Asset Allocation (% of fund's net assets)
| As of January 31, 2016* |
| | Stocks | 92.8% |
| | Other Investments | 2.1% |
| | Short-Term Investments and Net Other Assets (Liabilities) | 5.1% |

* Foreign investments - 5.6%
| As of July 31, 2015* |
| | Stocks | 96.0% |
| | Short-Term Investments and Net Other Assets (Liabilities) | 2.1% |

* Foreign investments - 3.6%
Percentages shown as 0.0% may reflect amounts less than 0.05%.
Investments January 31, 2016 (Unaudited)
Showing Percentage of Net Assets
| Common Stocks - 92.8% | | | |
| | | Shares | Value |
| CONSUMER DISCRETIONARY - 15.7% | | | |
| Auto Components - 0.8% | | | |
| Tenneco, Inc. (a) | | 285,288 | $10,900,854 |
| Visteon Corp. | | 69,100 | 4,621,408 |
| | | | 15,522,262 |
| Distributors - 0.6% | | | |
| Pool Corp. | | 120,000 | 10,140,000 |
| Diversified Consumer Services - 5.9% | | | |
| 2U, Inc. (a)(b)(c) | | 2,370,282 | 47,855,994 |
| Bright Horizons Family Solutions, Inc. (a) | | 402,100 | 28,215,357 |
| Service Corp. International | | 417,400 | 10,096,906 |
| ServiceMaster Global Holdings, Inc. (a) | | 480,000 | 20,260,800 |
| | | | 106,429,057 |
| Hotels, Restaurants & Leisure - 3.9% | | | |
| Dave & Buster's Entertainment, Inc. (a) | | 362,800 | 13,158,756 |
| DineEquity, Inc. | | 90,000 | 7,642,800 |
| Sonic Corp. | | 290,000 | 8,520,200 |
| Vail Resorts, Inc. | | 231,000 | 28,875,000 |
| Wingstop, Inc. (b) | | 520,800 | 12,634,608 |
| | | | 70,831,364 |
| Household Durables - 1.7% | | | |
| NACCO Industries, Inc. Class A | | 2,900 | 138,011 |
| Tempur Sealy International, Inc. (a) | | 210,560 | 12,705,190 |
| Universal Electronics, Inc. (a) | | 344,209 | 17,262,081 |
| | | | 30,105,282 |
| Leisure Products - 1.0% | | | |
| Malibu Boats, Inc. Class A (a) | | 529,100 | 6,915,337 |
| Vista Outdoor, Inc. (a) | | 250,000 | 12,052,500 |
| | | | 18,967,837 |
| Media - 0.8% | | | |
| Gray Television, Inc. (a) | | 66,841 | 878,959 |
| Live Nation Entertainment, Inc. (a) | | 410,200 | 9,311,540 |
| Starz Series A (a) | | 163,945 | 4,660,956 |
| | | | 14,851,455 |
| Specialty Retail - 0.2% | | | |
| Winmark Corp. | | 34,081 | 3,215,883 |
| Textiles, Apparel & Luxury Goods - 0.8% | | | |
| G-III Apparel Group Ltd. (a) | | 271,800 | 13,416,048 |
| Unifi, Inc. (a) | | 44,886 | 1,071,429 |
| | | | 14,487,477 |
|
| TOTAL CONSUMER DISCRETIONARY | | | 284,550,617 |
|
| CONSUMER STAPLES - 2.6% | | | |
| Food & Staples Retailing - 1.3% | | | |
| Casey's General Stores, Inc. | | 190,900 | 23,049,266 |
| Food Products - 1.3% | | | |
| Post Holdings, Inc. (a) | | 180,000 | 10,530,000 |
| TreeHouse Foods, Inc. (a) | | 165,000 | 13,094,400 |
| | | | 23,624,400 |
|
| TOTAL CONSUMER STAPLES | | | 46,673,666 |
|
| ENERGY - 1.8% | | | |
| Energy Equipment & Services - 1.7% | | | |
| Dril-Quip, Inc. (a) | | 83,700 | 4,908,168 |
| Frank's International NV | | 300,000 | 4,389,000 |
| Oil States International, Inc. (a) | | 390,000 | 11,009,700 |
| Superior Drilling Products, Inc. (a)(c) | | 1,133,901 | 2,551,277 |
| Tesco Corp. | | 972,960 | 6,616,128 |
| Xtreme Drilling & Coil Services Corp. (a) | | 1,289,000 | 1,536,605 |
| | | | 31,010,878 |
| Oil, Gas & Consumable Fuels - 0.1% | | | |
| StealthGas, Inc. (a) | | 859,100 | 2,319,570 |
|
| TOTAL ENERGY | | | 33,330,448 |
|
| FINANCIALS - 10.0% | | | |
| Banks - 2.9% | | | |
| Commerce Bancshares, Inc. | | 336,000 | 13,819,680 |
| Eagle Bancorp, Inc. (a) | | 150,000 | 7,086,000 |
| Investors Bancorp, Inc. | | 1,000,000 | 11,690,000 |
| Pacific Premier Bancorp, Inc. (a) | | 1,002,186 | 20,574,879 |
| | | | 53,170,559 |
| Consumer Finance - 0.4% | | | |
| Navient Corp. | | 720,000 | 6,883,200 |
| Diversified Financial Services - 1.5% | | | |
| FactSet Research Systems, Inc. | | 90,000 | 13,563,000 |
| MSCI, Inc. Class A | | 210,000 | 14,456,400 |
| | | | 28,019,400 |
| Insurance - 1.3% | | | |
| First American Financial Corp. | | 388,000 | 13,335,560 |
| ProAssurance Corp. | | 190,000 | 9,522,800 |
| | | | 22,858,360 |
| Real Estate Investment Trusts - 3.0% | | | |
| Coresite Realty Corp. | | 320,000 | 20,524,800 |
| Store Capital Corp. | | 772,300 | 19,145,317 |
| Sun Communities, Inc. | | 220,000 | 14,649,800 |
| | | | 54,319,917 |
| Thrifts & Mortgage Finance - 0.9% | | | |
| Meridian Bancorp, Inc. | | 1,216,834 | 17,096,518 |
|
| TOTAL FINANCIALS | | | 182,347,954 |
|
| HEALTH CARE - 22.7% | | | |
| Biotechnology - 5.3% | | | |
| Alder Biopharmaceuticals, Inc. (a) | | 100,000 | 2,418,000 |
| Amicus Therapeutics, Inc. (a)(b) | | 699,700 | 4,226,188 |
| Anacor Pharmaceuticals, Inc. (a) | | 145,486 | 10,930,363 |
| Blueprint Medicines Corp. (b) | | 250,000 | 3,930,000 |
| Cara Therapeutics, Inc. (a) | | 147,266 | 1,325,394 |
| Cellectis SA sponsored ADR | | 129,100 | 2,886,676 |
| Chimerix, Inc. (a) | | 210,100 | 1,617,770 |
| Coherus BioSciences, Inc. (a)(b) | | 306,150 | 4,059,549 |
| Curis, Inc. (a) | | 998,200 | 1,637,048 |
| DBV Technologies SA sponsored ADR (a) | | 154,188 | 4,007,346 |
| Dyax Corp. rights 12/31/19 | | 380,400 | 1,065,120 |
| Dynavax Technologies Corp. (a)(b) | | 391,625 | 9,434,246 |
| Edge Therapeutics, Inc. (a)(b) | | 181,800 | 2,019,798 |
| Heron Therapeutics, Inc. (a)(b) | | 262,200 | 5,503,578 |
| Insmed, Inc. (a) | | 223,400 | 2,948,880 |
| Intercept Pharmaceuticals, Inc. (a) | | 31,600 | 3,356,868 |
| La Jolla Pharmaceutical Co. (a) | | 152,622 | 2,702,936 |
| Lion Biotechnologies, Inc. (a)(b) | | 410,000 | 2,455,900 |
| Mirati Therapeutics, Inc. (a) | | 177,354 | 3,818,432 |
| Novavax, Inc. (a) | | 1,717,697 | 8,846,140 |
| OncoMed Pharmaceuticals, Inc. (a)(b) | | 80,739 | 746,836 |
| Portola Pharmaceuticals, Inc. (a) | | 180,000 | 5,945,400 |
| ProNai Therapeutics, Inc. (a)(b) | | 193,800 | 1,604,664 |
| TESARO, Inc. (a) | | 100,000 | 3,454,000 |
| Ultragenyx Pharmaceutical, Inc. (a) | | 110,000 | 6,176,500 |
| | | | 97,117,632 |
| Health Care Equipment & Supplies - 7.5% | | | |
| Cantel Medical Corp. | | 71,379 | 4,237,771 |
| CONMED Corp. | | 91,962 | 3,397,076 |
| Hill-Rom Holdings, Inc. | | 330,000 | 16,130,400 |
| Integra LifeSciences Holdings Corp. (a) | | 150,000 | 9,217,500 |
| Nevro Corp. (a) | | 221,200 | 13,667,948 |
| NxStage Medical, Inc. (a) | | 1,670,300 | 31,602,076 |
| Steris PLC | | 400,000 | 27,696,000 |
| Teleflex, Inc. | | 70,000 | 9,498,300 |
| The Spectranetics Corp. (a) | | 13,300 | 160,265 |
| Vascular Solutions, Inc. (a) | | 200,000 | 5,472,000 |
| Wright Medical Group NV (a) | | 772,129 | 15,403,974 |
| | | | 136,483,310 |
| Health Care Providers & Services - 4.8% | | | |
| Aceto Corp. | | 350,000 | 7,997,500 |
| Amedisys, Inc. (a) | | 220,000 | 7,865,000 |
| Civitas Solutions, Inc. (a) | | 116,883 | 2,812,205 |
| HealthEquity, Inc. (a) | | 468,000 | 10,085,400 |
| LHC Group, Inc. (a) | | 100,000 | 3,792,000 |
| Molina Healthcare, Inc. (a) | | 30,000 | 1,647,300 |
| Providence Service Corp. (a) | | 266,229 | 11,820,568 |
| Surgical Care Affiliates, Inc. (a) | | 720,917 | 30,761,528 |
| Teladoc, Inc. (b) | | 345,000 | 5,602,800 |
| VCA, Inc. (a) | | 90,000 | 4,614,300 |
| | | | 86,998,601 |
| Health Care Technology - 1.6% | | | |
| athenahealth, Inc. (a)(b) | | 110,557 | 15,676,983 |
| Nexus AG | | 4,600 | 87,144 |
| Press Ganey Holdings, Inc. (b) | | 230,000 | 6,796,500 |
| Veeva Systems, Inc. Class A (a) | | 55,047 | 1,326,633 |
| Vocera Communications, Inc. (a) | | 297,994 | 4,288,134 |
| | | | 28,175,394 |
| Life Sciences Tools & Services - 1.3% | | | |
| Accelerate Diagnostics, Inc. (a)(b) | | 590,000 | 8,737,900 |
| Bruker Corp. (a) | | 641,500 | 14,324,695 |
| | | | 23,062,595 |
| Pharmaceuticals - 2.2% | | | |
| DepoMed, Inc. (a)(b) | | 580,000 | 8,897,200 |
| Prestige Brands Holdings, Inc. (a) | | 304,175 | 14,198,889 |
| SCYNEXIS, Inc. (a) | | 476,100 | 2,175,777 |
| The Medicines Company (a) | | 200,000 | 6,912,000 |
| TherapeuticsMD, Inc. (a) | | 1,019,345 | 7,288,317 |
| | | | 39,472,183 |
|
| TOTAL HEALTH CARE | | | 411,309,715 |
|
| INDUSTRIALS - 11.9% | | | |
| Aerospace & Defense - 2.4% | | | |
| Aerojet Rocketdyne Holdings, Inc. (a) | | 430,013 | 7,073,714 |
| BWX Technologies, Inc. | | 561,000 | 16,796,340 |
| Huntington Ingalls Industries, Inc. | | 110,000 | 14,066,800 |
| Teledyne Technologies, Inc. (a) | | 60,000 | 4,875,000 |
| | | | 42,811,854 |
| Building Products - 1.8% | | | |
| A.O. Smith Corp. | | 95,000 | 6,635,750 |
| Gibraltar Industries, Inc. (a) | | 484,467 | 10,290,079 |
| Universal Forest Products, Inc. | | 240,000 | 16,533,600 |
| | | | 33,459,429 |
| Commercial Services & Supplies - 2.4% | | | |
| Deluxe Corp. | | 250,000 | 13,975,000 |
| Knoll, Inc. | | 907,500 | 16,652,625 |
| Matthews International Corp. Class A | | 240,018 | 11,979,298 |
| | | | 42,606,923 |
| Construction & Engineering - 0.2% | | | |
| Comfort Systems U.S.A., Inc. | | 138,782 | 3,933,082 |
| Electrical Equipment - 0.8% | | | |
| AZZ, Inc. | | 130,000 | 6,692,400 |
| EnerSys | | 160,000 | 7,748,800 |
| | | | 14,441,200 |
| Machinery - 1.2% | | | |
| Hillenbrand, Inc. | | 298,954 | 8,095,674 |
| Mueller Industries, Inc. | | 209,728 | 5,337,578 |
| Toro Co. | | 120,000 | 8,942,400 |
| | | | 22,375,652 |
| Marine - 0.6% | | | |
| Matson, Inc. | | 290,000 | 11,718,900 |
| Professional Services - 1.9% | | | |
| CBIZ, Inc. (a) | | 1,216,100 | 12,282,610 |
| Exponent, Inc. | | 200,000 | 10,262,000 |
| GP Strategies Corp. (a) | | 200,557 | 4,851,474 |
| On Assignment, Inc. (a) | | 180,000 | 6,957,000 |
| | | | 34,353,084 |
| Road & Rail - 0.6% | | | |
| Swift Transporation Co. (a)(b) | | 650,000 | 10,601,500 |
|
| TOTAL INDUSTRIALS | | | 216,301,624 |
|
| INFORMATION TECHNOLOGY - 23.7% | | | |
| Communications Equipment - 0.4% | | | |
| CommScope Holding Co., Inc. (a) | | 340,000 | 7,622,800 |
| Electronic Equipment & Components - 0.8% | | | |
| ePlus, Inc. (a) | | 150,000 | 14,206,500 |
| Internet Software & Services - 5.5% | | | |
| Cimpress NV (a)(b) | | 15,435 | 1,211,956 |
| Cvent, Inc. (a) | | 485,560 | 12,823,640 |
| Demandware, Inc. (a) | | 199,313 | 8,456,851 |
| GoDaddy, Inc. (a)(b) | | 400,000 | 12,196,000 |
| Gogo, Inc. (a)(b) | | 620,488 | 9,028,100 |
| New Relic, Inc. (a) | | 25,100 | 708,322 |
| Stamps.com, Inc. (a) | | 358,711 | 33,654,266 |
| WebMD Health Corp. (a)(b) | | 425,000 | 21,721,750 |
| | | | 99,800,885 |
| IT Services - 8.1% | | | |
| Broadridge Financial Solutions, Inc. | | 150,100 | 8,039,356 |
| CSG Systems International, Inc. | | 340,000 | 11,879,600 |
| Euronet Worldwide, Inc. (a) | | 215,000 | 17,150,550 |
| Gartner, Inc. Class A (a) | | 330,596 | 29,056,082 |
| Genpact Ltd. (a) | | 430,000 | 10,285,600 |
| Global Payments, Inc. | | 546,000 | 32,186,700 |
| Mattersight Corp. (a)(b)(c) | | 1,854,975 | 10,128,164 |
| Maximus, Inc. | | 189,167 | 10,095,843 |
| Perficient, Inc. (a) | | 449,112 | 8,555,584 |
| Virtusa Corp. (a) | | 200,000 | 8,944,000 |
| | | | 146,321,479 |
| Semiconductors & Semiconductor Equipment - 1.5% | | | |
| Cirrus Logic, Inc. (a)(b) | | 511,432 | 17,756,919 |
| Monolithic Power Systems, Inc. | | 150,000 | 9,385,500 |
| Semtech Corp. (a) | | 41,541 | 834,974 |
| | | | 27,977,393 |
| Software - 7.4% | | | |
| Atlassian Corp. PLC | | 255,300 | 5,302,581 |
| Blackbaud, Inc. | | 380,000 | 23,362,400 |
| Cadence Design Systems, Inc. (a) | | 886,200 | 17,334,072 |
| Callidus Software, Inc. (a) | | 232,512 | 3,587,660 |
| Fleetmatics Group PLC (a) | | 395,000 | 17,146,950 |
| HubSpot, Inc. (a) | | 477,490 | 19,381,319 |
| Paylocity Holding Corp. (a)(b) | | 233,400 | 7,263,408 |
| RealPage, Inc. (a) | | 470,000 | 9,066,300 |
| RingCentral, Inc. (a) | | 320,000 | 6,982,400 |
| Tyler Technologies, Inc. (a) | | 155,000 | 24,344,300 |
| | | | 133,771,390 |
|
| TOTAL INFORMATION TECHNOLOGY | | | 429,700,447 |
|
| MATERIALS - 3.1% | | | |
| Chemicals - 1.5% | | | |
| Axiall Corp. | | 800,000 | 14,344,000 |
| Codexis, Inc. (a) | | 442,129 | 1,790,622 |
| Innospec, Inc. | | 220,000 | 10,967,000 |
| | | | 27,101,622 |
| Containers & Packaging - 1.5% | | | |
| Aptargroup, Inc. | | 101,876 | 7,426,760 |
| Avery Dennison Corp. | | 125,000 | 7,611,250 |
| Graphic Packaging Holding Co. | | 1,050,200 | 11,930,272 |
| | | | 26,968,282 |
| Paper & Forest Products - 0.1% | | | |
| TFS Corp. Ltd. (b) | | 2,443,636 | 2,246,923 |
|
| TOTAL MATERIALS | | | 56,316,827 |
|
| TELECOMMUNICATION SERVICES - 1.3% | | | |
| Diversified Telecommunication Services - 1.3% | | | |
| 8x8, Inc. (a) | | 500,000 | 6,280,000 |
| inContact, Inc. (a) | | 1,214,000 | 10,501,100 |
| Vonage Holdings Corp. (a) | | 1,485,436 | 7,620,287 |
| | | | 24,401,387 |
| TOTAL COMMON STOCKS | | | |
| (Cost $1,714,294,780) | | | 1,684,932,685 |
|
| Money Market Funds - 12.9% | | | |
| Fidelity Cash Central Fund, 0.38% (d) | | 96,060,417 | 96,060,417 |
| Fidelity Securities Lending Cash Central Fund, 0.42% (d)(e) | | 138,061,480 | 138,061,480 |
| TOTAL MONEY MARKET FUNDS | | | |
| (Cost $234,121,897) | | | 234,121,897 |
|
| Equity Funds - 2.1% | | | |
| Small Growth Funds - 2.1% | | | |
| iShares Russell 2000 Growth Index ETF (b) | | | |
| (Cost $39,322,310) | | 315,000 | 39,223,800 |
| TOTAL INVESTMENT PORTFOLIO - 107.8% | | | |
| (Cost $1,987,738,987) | | | 1,958,278,382 |
| NET OTHER ASSETS (LIABILITIES) - (7.8)% | | | (142,440,221) |
| NET ASSETS - 100% | | | $1,815,838,161 |
Security Type Abbreviations
ETF – Exchange Traded Fund
Legend
(a) Non-income producing
(b) Security or a portion of the security is on loan at period end.
(c) Affiliated company
(d) Affiliated fund that is generally available only to investment companies and other accounts managed by Fidelity Investments. The rate quoted is the annualized seven-day yield of the fund at period end. A complete unaudited listing of the fund's holdings as of its most recent quarter end is available upon request. In addition, each Fidelity Central Fund's financial statements are available on the SEC's website or upon request.
(e) Investment made with cash collateral received from securities on loan.
Affiliated Central Funds
Information regarding fiscal year to date income earned by the Fund from investments in Fidelity Central Funds is as follows:
| Fund | Income earned |
| Fidelity Cash Central Fund | $82,098 |
| Fidelity Securities Lending Cash Central Fund | 1,453,834 |
| Total | $1,535,932 |
Other Affiliated Issuers
An affiliated company is a company in which the Fund has ownership of at least 5% of the voting securities. Fiscal year to date transactions with companies which are or were affiliates are as follows:
| Affiliate | Value, beginning of period | Purchases | Sales Proceeds | Dividend Income | Value, end of period |
| 2U, Inc. | $40,893,251 | $31,536,253 | $3,375,776 | $-- | $47,855,994 |
| Mattersight Corp. | 12,150,086 | -- | -- | -- | 10,128,164 |
| Superior Drilling Products, Inc. | 1,928,281 | -- | 37,522 | -- | 2,551,277 |
| Total | $54,971,618 | $31,536,253 | $3,413,298 | $-- | $60,535,435 |
Investment Valuation
The following is a summary of the inputs used, as of January 31, 2016, involving the Fund's assets and liabilities carried at fair value. The inputs or methodology used for valuing securities may not be an indication of the risk associated with investing in those securities. For more information on valuation inputs, and their aggregation into the levels used below, please refer to the Investment Valuation section in the accompanying Notes to Financial Statements.
| | Valuation Inputs at Reporting Date: |
| Description | Total | Level 1 | Level 2 | Level 3 |
| Investments in Securities: | | | | |
| Equities: | | | | |
| Consumer Discretionary | $284,550,617 | $284,550,617 | $-- | $-- |
| Consumer Staples | 46,673,666 | 46,673,666 | -- | -- |
| Energy | 33,330,448 | 33,330,448 | -- | -- |
| Financials | 182,347,954 | 182,347,954 | -- | -- |
| Health Care | 411,309,715 | 410,157,451 | 87,144 | 1,065,120 |
| Industrials | 216,301,624 | 216,301,624 | -- | -- |
| Information Technology | 429,700,447 | 429,700,447 | -- | -- |
| Materials | 56,316,827 | 54,069,904 | 2,246,923 | -- |
| Telecommunication Services | 24,401,387 | 24,401,387 | -- | -- |
| Money Market Funds | 234,121,897 | 234,121,897 | -- | -- |
| Equity Funds | 39,223,800 | 39,223,800 | -- | -- |
| Total Investments in Securities: | $1,958,278,382 | $1,954,879,195 | $2,334,067 | $1,065,120 |
See accompanying notes which are an integral part of the financial statements.
Financial Statements
Statement of Assets and Liabilities
| | | January 31, 2016 (Unaudited) |
| Assets | | |
Investment in securities, at value (including securities loaned of $138,209,768) — See accompanying schedule:
Unaffiliated issuers (cost $1,687,190,375) | $1,663,621,050 | |
| Fidelity Central Funds (cost $234,121,897) | 234,121,897 | |
| Other affiliated issuers (cost $66,426,715) | 60,535,435 | |
| Total Investments (cost $1,987,738,987) | | $1,958,278,382 |
| Cash | | 1,498,090 |
| Foreign currency held at value (cost $36,806) | | 36,608 |
| Receivable for investments sold | | 56,805,431 |
| Receivable for fund shares sold | | 3,869,354 |
| Dividends receivable | | 126,725 |
| Distributions receivable from Fidelity Central Funds | | 452,236 |
| Prepaid expenses | | 2,652 |
| Other receivables | | 38,176 |
| Total assets | | 2,021,107,654 |
| Liabilities | | |
| Payable for investments purchased | $61,818,193 | |
| Payable for fund shares redeemed | 3,519,273 | |
| Accrued management fee | 1,296,120 | |
| Distribution and service plan fees payable | 103,307 | |
| Other affiliated payables | 432,695 | |
| Other payables and accrued expenses | 38,425 | |
| Collateral on securities loaned, at value | 138,061,480 | |
| Total liabilities | | 205,269,493 |
| Net Assets | | $1,815,838,161 |
| Net Assets consist of: | | |
| Paid in capital | | $1,907,475,409 |
| Accumulated net investment loss | | (3,822,741) |
| Accumulated undistributed net realized gain (loss) on investments and foreign currency transactions | | (58,352,721) |
| Net unrealized appreciation (depreciation) on investments and assets and liabilities in foreign currencies | | (29,461,786) |
| Net Assets | | $1,815,838,161 |
| Calculation of Maximum Offering Price | | |
| Class A: | | |
| Net Asset Value and redemption price per share ($146,714,670 ÷ 8,965,749 shares) | | $16.36 |
| Maximum offering price per share (100/94.25 of $16.36) | | $17.36 |
| Class T: | | |
| Net Asset Value and redemption price per share ($47,555,183 ÷ 2,975,761 shares) | | $15.98 |
| Maximum offering price per share (100/96.50 of $15.98) | | $16.56 |
| Class B: | | |
| Net Asset Value and offering price per share ($1,471,270 ÷ 97,417 shares)(a) | | $15.10 |
| Class C: | | |
| Net Asset Value and offering price per share ($60,995,304 ÷ 4,062,692 shares)(a) | | $15.01 |
| Small Cap Growth: | | |
| Net Asset Value, offering price and redemption price per share ($1,430,546,797 ÷ 84,667,789 shares) | | $16.90 |
| Class I: | | |
| Net Asset Value, offering price and redemption price per share ($128,554,937 ÷ 7,592,754 shares) | | $16.93 |
(a) Redemption price per share is equal to net asset value less any applicable contingent deferred sales charge.
See accompanying notes which are an integral part of the financial statements.
Statement of Operations
| | | Six months ended January 31, 2016 (Unaudited) |
| Investment Income | | |
| Dividends | | $5,461,117 |
| Interest | | 15 |
| Income from Fidelity Central Funds (including $1,453,834 from security lending) | | 1,535,932 |
| Total income | | 6,997,064 |
| Expenses | | |
| Management fee | | |
| Basic fee | $6,324,712 | |
| Performance adjustment | 1,195,467 | |
| Transfer agent fees | 2,220,905 | |
| Distribution and service plan fees | 612,381 | |
| Accounting and security lending fees | 293,075 | |
| Custodian fees and expenses | 30,004 | |
| Independent trustees' compensation | 3,850 | |
| Registration fees | 166,949 | |
| Audit | 33,167 | |
| Legal | 3,375 | |
| Miscellaneous | 4,679 | |
| Total expenses before reductions | 10,888,564 | |
| Expense reductions | (68,759) | 10,819,805 |
| Net investment income (loss) | | (3,822,741) |
| Realized and Unrealized Gain (Loss) | | |
| Net realized gain (loss) on: | | |
| Investment securities: | | |
| Unaffiliated issuers | (52,952,176) | |
| Other affiliated issuers | (178,011) | |
| Foreign currency transactions | (11,321) | |
| Total net realized gain (loss) | | (53,141,508) |
Change in net unrealized appreciation (depreciation) on:
Investment securities | (276,851,624) | |
| Assets and liabilities in foreign currencies | 11,758 | |
| Total change in net unrealized appreciation (depreciation) | | (276,839,866) |
| Net gain (loss) | | (329,981,374) |
| Net increase (decrease) in net assets resulting from operations | | $(333,804,115) |
See accompanying notes which are an integral part of the financial statements.
Statement of Changes in Net Assets
| | Six months ended January 31, 2016 (Unaudited) | Year ended July 31, 2015 |
| Increase (Decrease) in Net Assets | | |
| Operations | | |
| Net investment income (loss) | $(3,822,741) | $(5,784,041) |
| Net realized gain (loss) | (53,141,508) | 108,754,619 |
| Change in net unrealized appreciation (depreciation) | (276,839,866) | 166,432,213 |
| Net increase (decrease) in net assets resulting from operations | (333,804,115) | 269,402,791 |
| Distributions to shareholders from net realized gain | (71,394,910) | (103,188,484) |
| Share transactions - net increase (decrease) | 542,860,559 | 214,155,809 |
| Redemption fees | 530,486 | 177,411 |
| Total increase (decrease) in net assets | 138,192,020 | 380,547,527 |
| Net Assets | | |
| Beginning of period | 1,677,646,141 | 1,297,098,614 |
| End of period (including accumulated net investment loss of $3,822,741 and undistributed net investment income of $0, respectively) | $1,815,838,161 | $1,677,646,141 |
See accompanying notes which are an integral part of the financial statements.
Financial Highlights — Fidelity Small Cap Growth Fund Class A
| | Six months ended (Unaudited) | Years ended July 31, | | | | |
| January 31, | 2016 | 2015 | 2014 | 2013 | 2012 | 2011 |
| Selected Per–Share Data | | | | | | |
| Net asset value, beginning of period | $20.55 | $17.99 | $19.66 | $15.87 | $16.42 | $12.66 |
| Income from Investment Operations | | | | | | |
| Net investment income (loss)A | (.06) | (.13) | (.12) | (.04) | (.07)B | (.07)C |
| Net realized and unrealized gain (loss) | (3.36) | 4.23 | 1.69 | 4.87 | (.16) | 3.84 |
| Total from investment operations | (3.42) | 4.10 | 1.57 | 4.83 | (.23) | 3.77 |
| Distributions from net realized gain | (.78) | (1.54) | (3.24) | (1.04) | (.32) | (.01)D |
| Redemption fees added to paid in capitalA | .01 | –E | –E | –E | –E | –E |
| Net asset value, end of period | $16.36 | $20.55 | $17.99 | $19.66 | $15.87 | $16.42 |
| Total ReturnF,G,H | (17.09)% | 24.46% | 8.58% | 32.20% | (1.14)% | 29.78% |
| Ratios to Average Net AssetsI,J | | | | | | |
| Expenses before reductions | 1.39%K | 1.21% | 1.22% | 1.24% | 1.35% | 1.25% |
| Expenses net of fee waivers, if any | 1.39%K | 1.21% | 1.22% | 1.24% | 1.35% | 1.25% |
| Expenses net of all reductions | 1.38%K | 1.20% | 1.22% | 1.22% | 1.34% | 1.23% |
| Net investment income (loss) | (.61)%K | (.67)% | (.62)% | (.26)% | (.49)%B | (.47)%C |
| Supplemental Data | | | | | | |
| Net assets, end of period (000 omitted) | $146,715 | $123,370 | $88,822 | $74,978 | $59,684 | $67,272 |
| Portfolio turnover rateL | 133%K | 156% | 148%M | 142% | 150% | 106% |
A Calculated based on average shares outstanding during the period.
B Net Investment income per share reflects a large, non-recurring dividend which amounted to $.01 per share. Excluding this non-recurring dividend, the ratio of net investment income (loss) to average net assets would have been (.57) %.
C Net Investment income per share reflects a large, non-recurring dividend which amounted to $.02 per share. Excluding this non-recurring dividend, the ratio of net investment income (loss) to average net assets would have been (.61) %.
D The amounts shown reflect certain reclassifications related to book to tax differences that were made in the year shown.
E Amount represents less than $.005 per share.
F Total returns for periods of less than one year are not annualized.
G Total returns would have been lower if certain expenses had not been reduced during the applicable periods shown.
H Total returns do not include the effect of the sales charges.
I Fees and expenses of any underlying Fidelity Central Funds are not included in the Fund's expense ratio. The Fund indirectly bears its proportionate share of the expenses of any underlying Fidelity Central Funds.
J Expense ratios reflect operating expenses of the class. Expenses before reductions do not reflect amounts reimbursed by the investment adviser or reductions from brokerage service arrangements or reductions from other expense offset arrangements and do not represent the amount paid by the class during periods when reimbursements or reductions occur. Expenses net of fee waivers reflect expenses after reimbursement by the investment adviser but prior to reductions from brokerage service arrangements or other expense offset arrangements. Expenses net of all reductions represent the net expenses paid by the class.
K Annualized
L Amount does not include the portfolio activity of any underlying Fidelity Central Funds.
M Portfolio turnover rate excludes securities received or delivered in-kind.
See accompanying notes which are an integral part of the financial statements.
Financial Highlights — Fidelity Small Cap Growth Fund Class T
| | Six months ended (Unaudited) | Years ended July 31, | | | | |
| January 31, | 2016 | 2015 | 2014 | 2013 | 2012 | 2011 |
| Selected Per–Share Data | | | | | | |
| Net asset value, beginning of period | $20.08 | $17.66 | $19.38 | $15.68 | $16.27 | $12.57 |
| Income from Investment Operations | | | | | | |
| Net investment income (loss)A | (.08) | (.17) | (.16) | (.09) | (.11)B | (.11)C |
| Net realized and unrealized gain (loss) | (3.28) | 4.13 | 1.66 | 4.82 | (.16) | 3.81 |
| Total from investment operations | (3.36) | 3.96 | 1.50 | 4.73 | (.27) | 3.70 |
| Distributions from net realized gain | (.75) | (1.54) | (3.22) | (1.03) | (.32) | – |
| Redemption fees added to paid in capitalA | .01 | –D | –D | –D | –D | –D |
| Net asset value, end of period | $15.98 | $20.08 | $17.66 | $19.38 | $15.68 | $16.27 |
| Total ReturnE,F,G | (17.19)% | 24.10% | 8.30% | 31.87% | (1.41)% | 29.44% |
| Ratios to Average Net AssetsH,I | | | | | | |
| Expenses before reductions | 1.67%J | 1.49% | 1.50% | 1.49% | 1.61% | 1.50% |
| Expenses net of fee waivers, if any | 1.67%J | 1.48% | 1.50% | 1.49% | 1.61% | 1.50% |
| Expenses net of all reductions | 1.66%J | 1.47% | 1.49% | 1.48% | 1.60% | 1.49% |
| Net investment income (loss) | (.89)%J | (.95)% | (.90)% | (.52)% | (.74)%B | (.73)%C |
| Supplemental Data | | | | | | |
| Net assets, end of period (000 omitted) | $47,555 | $52,667 | $42,586 | $34,686 | $27,658 | $30,764 |
| Portfolio turnover rateK | 133%J | 156% | 148%L | 142% | 150% | 106% |
A Calculated based on average shares outstanding during the period.
B Net Investment income per share reflects a large, non-recurring dividend which amounted to $.01 per share. Excluding this non-recurring dividend, the ratio of net investment income (loss) to average net assets would have been (.83) %.
C Net Investment income per share reflects a large, non-recurring dividend which amounted to $.02 per share. Excluding this non-recurring dividend, the ratio of net investment income (loss) to average net assets would have been (.86) %.
D Amount represents less than $.005 per share.
E Total returns for periods of less than one year are not annualized.
F Total returns would have been lower if certain expenses had not been reduced during the applicable periods shown.
G Total returns do not include the effect of the sales charges.
H Fees and expenses of any underlying Fidelity Central Funds are not included in the Fund's expense ratio. The Fund indirectly bears its proportionate share of the expenses of any underlying Fidelity Central Funds.
I Expense ratios reflect operating expenses of the class. Expenses before reductions do not reflect amounts reimbursed by the investment adviser or reductions from brokerage service arrangements or reductions from other expense offset arrangements and do not represent the amount paid by the class during periods when reimbursements or reductions occur. Expenses net of fee waivers reflect expenses after reimbursement by the investment adviser but prior to reductions from brokerage service arrangements or other expense offset arrangements. Expenses net of all reductions represent the net expenses paid by the class.
J Annualized
K Amount does not include the portfolio activity of any underlying Fidelity Central Funds.
L Portfolio turnover rate excludes securities received or delivered in-kind.
See accompanying notes which are an integral part of the financial statements.
Financial Highlights — Fidelity Small Cap Growth Fund Class B
| | Six months ended (Unaudited) | Years ended July 31, | | | | |
| January 31, | 2016 | 2015 | 2014 | 2013 | 2012 | 2011 |
| Selected Per–Share Data | | | | | | |
| Net asset value, beginning of period | $18.99 | $16.86 | $18.65 | $15.19 | $15.86 | $12.30 |
| Income from Investment Operations | | | | | | |
| Net investment income (loss)A | (.12) | (.25) | (.25) | (.16) | (.18)B | (.18)C |
| Net realized and unrealized gain (loss) | (3.11) | 3.92 | 1.60 | 4.64 | (.17) | 3.74 |
| Total from investment operations | (3.23) | 3.67 | 1.35 | 4.48 | (.35) | 3.56 |
| Distributions from net realized gain | (.67) | (1.54) | (3.14) | (1.02) | (.32) | – |
| Redemption fees added to paid in capitalA | .01 | –D | –D | –D | –D | –D |
| Net asset value, end of period | $15.10 | $18.99 | $16.86 | $18.65 | $15.19 | $15.86 |
| Total ReturnE,F,G | (17.43)% | 23.48% | 7.73% | 31.25% | (1.96)% | 28.94% |
| Ratios to Average Net AssetsH,I | | | | | | |
| Expenses before reductions | 2.19%J | 2.01% | 2.01% | 1.99% | 2.10% | 2.00% |
| Expenses net of fee waivers, if any | 2.19%J | 2.01% | 2.01% | 1.99% | 2.10% | 2.00% |
| Expenses net of all reductions | 2.18%J | 2.00% | 2.01% | 1.97% | 2.09% | 1.98% |
| Net investment income (loss) | (1.41)%J | (1.47)% | (1.41)% | (1.01)% | (1.23)%B | (1.22)%C |
| Supplemental Data | | | | | | |
| Net assets, end of period (000 omitted) | $1,471 | $2,357 | $2,764 | $3,486 | $4,123 | $5,295 |
| Portfolio turnover rateK | 133%J | 156% | 148%L | 142% | 150% | 106% |
A Calculated based on average shares outstanding during the period.
B Net Investment income per share reflects a large, non-recurring dividend which amounted to $.01 per share. Excluding this non-recurring dividend, the ratio of net investment income (loss) to average net assets would have been (1.32) %.
C Net Investment income per share reflects a large, non-recurring dividend which amounted to $.02 per share. Excluding this non-recurring dividend, the ratio of net investment income (loss) to average net assets would have been (1.36) %.
D Amount represents less than $.005 per share.
E Total returns for periods of less than one year are not annualized.
F Total returns would have been lower if certain expenses had not been reduced during the applicable periods shown.
G Total returns do not include the effect of the contingent deferred sales charge.
H Fees and expenses of any underlying Fidelity Central Funds are not included in the Fund's expense ratio. The Fund indirectly bears its proportionate share of the expenses of any underlying Fidelity Central Funds.
I Expense ratios reflect operating expenses of the class. Expenses before reductions do not reflect amounts reimbursed by the investment adviser or reductions from brokerage service arrangements or reductions from other expense offset arrangements and do not represent the amount paid by the class during periods when reimbursements or reductions occur. Expenses net of fee waivers reflect expenses after reimbursement by the investment adviser but prior to reductions from brokerage service arrangements or other expense offset arrangements. Expenses net of all reductions represent the net expenses paid by the class.
J Annualized
K Amount does not include the portfolio activity of any underlying Fidelity Central Funds.
L Portfolio turnover rate excludes securities received or delivered in-kind.
See accompanying notes which are an integral part of the financial statements.
Financial Highlights — Fidelity Small Cap Growth Fund Class C
| | Six months ended (Unaudited) | Years ended July 31, | | | | |
| January 31, | 2016 | 2015 | 2014 | 2013 | 2012 | 2011 |
| Selected Per–Share Data | | | | | | |
| Net asset value, beginning of period | $18.90 | $16.78 | $18.62 | $15.16 | $15.83 | $12.28 |
| Income from Investment Operations | | | | | | |
| Net investment income (loss)A | (.12) | (.25) | (.25) | (.16) | (.18)B | (.18)C |
| Net realized and unrealized gain (loss) | (3.08) | 3.91 | 1.59 | 4.64 | (.17) | 3.73 |
| Total from investment operations | (3.20) | 3.66 | 1.34 | 4.48 | (.35) | 3.55 |
| Distributions from net realized gain | (.69) | (1.54) | (3.18) | (1.02) | (.32) | – |
| Redemption fees added to paid in capitalA,D | – | – | – | – | – | – |
| Net asset value, end of period | $15.01 | $18.90 | $16.78 | $18.62 | $15.16 | $15.83 |
| Total ReturnE,F,G | (17.45)% | 23.53% | 7.70% | 31.32% | (1.96)% | 28.91% |
| Ratios to Average Net AssetsH,I | | | | | | |
| Expenses before reductions | 2.17%J | 2.00% | 2.01% | 1.99% | 2.10% | 2.00% |
| Expenses net of fee waivers, if any | 2.17%J | 2.00% | 2.00% | 1.99% | 2.10% | 2.00% |
| Expenses net of all reductions | 2.17%J | 1.99% | 2.00% | 1.97% | 2.09% | 1.98% |
| Net investment income (loss) | (1.39)%J | (1.46)% | (1.41)% | (1.01)% | (1.24)%B | (1.22)%C |
| Supplemental Data | | | | | | |
| Net assets, end of period (000 omitted) | $60,995 | $55,671 | $42,215 | $32,756 | $24,683 | $24,914 |
| Portfolio turnover rateK | 133%J | 156% | 148%L | 142% | 150% | 106% |
A Calculated based on average shares outstanding during the period.
B Net Investment income per share reflects a large, non-recurring dividend which amounted to $.01 per share. Excluding this non-recurring dividend, the ratio of net investment income (loss) to average net assets would have been (1.32) %.
C Net Investment income per share reflects a large, non-recurring dividend which amounted to $.02 per share. Excluding this non-recurring dividend, the ratio of net investment income (loss) to average net assets would have been (1.36) %.
D Amount represents less than $.005 per share.
E Total returns for periods of less than one year are not annualized.
F Total returns would have been lower if certain expenses had not been reduced during the applicable periods shown.
G Total returns do not include the effect of the contingent deferred sales charge.
H Fees and expenses of any underlying Fidelity Central Funds are not included in the Fund's expense ratio. The Fund indirectly bears its proportionate share of the expenses of any underlying Fidelity Central Funds.
I Expense ratios reflect operating expenses of the class. Expenses before reductions do not reflect amounts reimbursed by the investment adviser or reductions from brokerage service arrangements or reductions from other expense offset arrangements and do not represent the amount paid by the class during periods when reimbursements or reductions occur. Expenses net of fee waivers reflect expenses after reimbursement by the investment adviser but prior to reductions from brokerage service arrangements or other expense offset arrangements. Expenses net of all reductions represent the net expenses paid by the class.
J Annualized
K Amount does not include the portfolio activity of any underlying Fidelity Central Funds.
L Portfolio turnover rate excludes securities received or delivered in-kind.
See accompanying notes which are an integral part of the financial statements.
Financial Highlights — Fidelity Small Cap Growth Fund
| | Six months ended (Unaudited) | Years ended July 31, | | | | |
| January 31, | 2016 | 2015 | 2014 | 2013 | 2012 | 2011 |
| Selected Per–Share Data | | | | | | |
| Net asset value, beginning of period | $21.20 | $18.45 | $20.07 | $16.14 | $16.65 | $12.81 |
| Income from Investment Operations | | | | | | |
| Net investment income (loss)A | (.03) | (.07) | (.06) | .01 | (.03)B | (.03)C |
| Net realized and unrealized gain (loss) | (3.47) | 4.36 | 1.71 | 4.98 | (.16) | 3.90 |
| Total from investment operations | (3.50) | 4.29 | 1.65 | 4.99 | (.19) | 3.87 |
| Distributions from net realized gain | (.81) | (1.54) | (3.27) | (1.06) | (.32) | (.03)D |
| Redemption fees added to paid in capitalA | .01 | –E | –E | –E | –E | –E |
| Net asset value, end of period | $16.90 | $21.20 | $18.45 | $20.07 | $16.14 | $16.65 |
| Total ReturnF,G | (16.97)% | 24.91% | 8.87% | 32.74% | (.88)% | 30.20% |
| Ratios to Average Net AssetsH,I | | | | | | |
| Expenses before reductions | 1.14%J | .91% | .91% | .90% | 1.03% | .95% |
| Expenses net of fee waivers, if any | 1.13%J | .91% | .90% | .90% | 1.03% | .95% |
| Expenses net of all reductions | 1.13%J | .90% | .90% | .88% | 1.02% | .93% |
| Net investment income (loss) | (.35)%J | (.37)% | (.31)% | .08% | (.16)%B | (.17)%C |
| Supplemental Data | | | | | | |
| Net assets, end of period (000 omitted) | $1,430,547 | $1,345,684 | $1,069,105 | $1,315,659 | $1,166,101 | $1,382,688 |
| Portfolio turnover rateK | 133%J | 156% | 148%L | 142% | 150% | 106% |
A Calculated based on average shares outstanding during the period.
B Net Investment income per share reflects a large, non-recurring dividend which amounted to $.01 per share. Excluding this non-recurring dividend, the ratio of net investment income (loss) to average net assets would have been (.25) %.
C Net Investment income per share reflects a large, non-recurring dividend which amounted to $.02 per share. Excluding this non-recurring dividend, the ratio of net investment income (loss) to average net assets would have been (.31) %.
D The amounts shown reflect certain reclassifications related to book to tax differences that were made in the year shown.
E Amount represents less than $.005 per share.
F Total returns for periods of less than one year are not annualized.
G Total returns would have been lower if certain expenses had not been reduced during the applicable periods shown.
H Fees and expenses of any underlying Fidelity Central Funds are not included in the Fund's expense ratio. The Fund indirectly bears its proportionate share of the expenses of any underlying Fidelity Central Funds.
I Expense ratios reflect operating expenses of the class. Expenses before reductions do not reflect amounts reimbursed by the investment adviser or reductions from brokerage service arrangements or reductions from other expense offset arrangements and do not represent the amount paid by the class during periods when reimbursements or reductions occur. Expenses net of fee waivers reflect expenses after reimbursement by the investment adviser but prior to reductions from brokerage service arrangements or other expense offset arrangements. Expenses net of all reductions represent the net expenses paid by the class.
J Annualized
K Amount does not include the portfolio activity of any underlying Fidelity Central Funds.
L Portfolio turnover rate excludes securities received or delivered in-kind.
See accompanying notes which are an integral part of the financial statements.
Financial Highlights — Fidelity Small Cap Growth Fund Class I
| | Six months ended (Unaudited) | Years ended July 31, | | | | |
| January 31, | 2016 | 2015 | 2014 | 2013 | 2012 | 2011 |
| Selected Per–Share Data | | | | | | |
| Net asset value, beginning of period | $21.24 | $18.49 | $20.10 | $16.17 | $16.68 | $12.83 |
| Income from Investment Operations | | | | | | |
| Net investment income (loss)A | (.03) | (.07) | (.06) | .01 | (.03)B | (.03)C |
| Net realized and unrealized gain (loss) | (3.48) | 4.36 | 1.72 | 4.98 | (.16) | 3.91 |
| Total from investment operations | (3.51) | 4.29 | 1.66 | 4.99 | (.19) | 3.88 |
| Distributions from net realized gain | (.81) | (1.54) | (3.27) | (1.06) | (.32) | (.03)D |
| Redemption fees added to paid in capitalA | .01 | –E | –E | –E | –E | –E |
| Net asset value, end of period | $16.93 | $21.24 | $18.49 | $20.10 | $16.17 | $16.68 |
| Total ReturnF,G | (16.99)% | 24.85% | 8.89% | 32.65% | (.88)% | 30.24% |
| Ratios to Average Net AssetsH,I | | | | | | |
| Expenses before reductions | 1.10%J | .93% | .92% | .92% | 1.06% | .94% |
| Expenses net of fee waivers, if any | 1.10%J | .93% | .92% | .92% | 1.06% | .94% |
| Expenses net of all reductions | 1.09%J | .91% | .92% | .91% | 1.05% | .93% |
| Net investment income (loss) | (.32)%J | (.39)% | (.32)% | .06% | (.19)%B | (.17)%C |
| Supplemental Data | | | | | | |
| Net assets, end of period (000 omitted) | $128,555 | $97,897 | $51,607 | $51,158 | $36,694 | $41,440 |
| Portfolio turnover rateK | 133%J | 156% | 148%L | 142% | 150% | 106% |
A Calculated based on average shares outstanding during the period.
B Net Investment income per share reflects a large, non-recurring dividend which amounted to $.01 per share. Excluding this non-recurring dividend, the ratio of net investment income (loss) to average net assets would have been (.28) %.
C Net Investment income per share reflects a large, non-recurring dividend which amounted to $.02 per share. Excluding this non-recurring dividend, the ratio of net investment income (loss) to average net assets would have been (.30) %.
D The amounts shown reflect certain reclassifications related to book to tax differences that were made in the year shown.
E Amount represents less than $.005 per share.
F Total returns for periods of less than one year are not annualized.
G Total returns would have been lower if certain expenses had not been reduced during the applicable periods shown.
H Fees and expenses of any underlying Fidelity Central Funds are not included in the Fund's expense ratio. The Fund indirectly bears its proportionate share of the expenses of any underlying Fidelity Central Funds.
I Expense ratios reflect operating expenses of the class. Expenses before reductions do not reflect amounts reimbursed by the investment adviser or reductions from brokerage service arrangements or reductions from other expense offset arrangements and do not represent the amount paid by the class during periods when reimbursements or reductions occur. Expenses net of fee waivers reflect expenses after reimbursement by the investment adviser but prior to reductions from brokerage service arrangements or other expense offset arrangements. Expenses net of all reductions represent the net expenses paid by the class.
J Annualized
K Amount does not include the portfolio activity of any underlying Fidelity Central Funds.
L Portfolio turnover rate excludes securities received or delivered in-kind.
See accompanying notes which are an integral part of the financial statements.
Notes to Financial Statements (Unaudited)
For the period ended January 31, 2016
1. Organization.
Fidelity Small Cap Growth Fund (the Fund) is a fund of Fidelity Securities Fund (the Trust) and is authorized to issue an unlimited number of shares. The Trust is registered under the Investment Company Act of 1940, as amended (the 1940 Act), as an open-end management investment company organized as a Massachusetts business trust. The Fund offers Class A, Class T, Class C, Small Cap Growth and Class I shares, each of which, along with Class B shares, has equal rights as to assets and voting privileges. Class B shares are closed to new accounts and additional purchases, except for exchanges and reinvestments. Each class has exclusive voting rights with respect to matters that affect that class. Class B shares will automatically convert to Class A shares after a holding period of seven years from the initial date of purchase.
During the period, the Board of Trustees approved the conversion of all existing Class B shares into Class A shares, effective on or about July 1, 2016, regardless of the length of times shares have been held.
2. Investments in Fidelity Central Funds.
The Fund invests in Fidelity Central Funds, which are open-end investment companies generally available only to other investment companies and accounts managed by the investment adviser and its affiliates. The Fund's Schedule of Investments lists each of the Fidelity Central Funds held as of period end, if any, as an investment of the Fund, but does not include the underlying holdings of each Fidelity Central Fund. As an Investing Fund, the Fund indirectly bears its proportionate share of the expenses of the underlying Fidelity Central Funds.
The Money Market Central Funds seek preservation of capital and current income and are managed by Fidelity Investments Money Management, Inc. (FIMM), an affiliate of the investment adviser. Annualized expenses of the Money Market Central Funds as of their most recent shareholder report date are less than .005%.
A complete unaudited list of holdings for each Fidelity Central Fund is available upon request or at the Securities and Exchange Commission (the SEC) website at www.sec.gov. In addition, the financial statements of the Fidelity Central Funds are available on the SEC website or upon request.
3. Significant Accounting Policies.
The financial statements have been prepared in conformity with accounting principles generally accepted in the United States of America (GAAP), which require management to make certain estimates and assumptions at the date of the financial statements. Actual results could differ from those estimates. Subsequent events, if any, through the date that the financial statements were issued have been evaluated in the preparation of the financial statements. The following summarizes the significant accounting policies of the Fund:
Investment Valuation. Investments are valued as of 4:00 p.m. Eastern time on the last calendar day of the period. The Board of Trustees (the Board) has delegated the day to day responsibility for the valuation of the Fund's investments to the Fidelity Management & Research Company (FMR) Fair Value Committee (the Committee). In accordance with valuation policies and procedures approved by the Board, the Fund attempts to obtain prices from one or more third party pricing vendors or brokers to value its investments. When current market prices, quotations or currency exchange rates are not readily available or reliable, investments will be fair valued in good faith by the Committee, in accordance with procedures adopted by the Board. Factors used in determining fair value vary by investment type and may include market or investment specific events. The frequency with which these procedures are used cannot be predicted and they may be utilized to a significant extent. The Committee oversees the Fund's valuation policies and procedures and reports to the Board on the Committee's activities and fair value determinations. The Board monitors the appropriateness of the procedures used in valuing the Fund's investments and ratifies the fair value determinations of the Committee.
The Fund categorizes the inputs to valuation techniques used to value its investments into a disclosure hierarchy consisting of three levels as shown below:
- Level 1 – quoted prices in active markets for identical investments
- Level 2 – other significant observable inputs (including quoted prices for similar investments, interest rates, prepayment speeds, etc.)
- Level 3 – unobservable inputs (including the Fund's own assumptions based on the best information available)
Valuation techniques used to value the Fund's investments by major category are as follows:
Equity securities, including restricted securities, for which market quotations are readily available, are valued at the last reported sale price or official closing price as reported by a third party pricing vendor on the primary market or exchange on which they are traded and are categorized as Level 1 in the hierarchy. In the event there were no sales during the day or closing prices are not available, securities are valued at the last quoted bid price or may be valued using the last available price and are generally categorized as Level 2 in the hierarchy. For foreign equity securities, when market or security specific events arise, comparisons to the valuation of American Depositary Receipts (ADRs), futures contracts, Exchange-Traded Funds (ETFs) and certain indexes as well as quoted prices for similar securities may be used and would be categorized as Level 2 in the hierarchy. Utilizing these techniques may result in transfers between Level 1 and Level 2. For equity securities, including restricted securities, where observable inputs are limited, assumptions about market activity and risk are used and these securities may be categorized as Level 3 in the hierarchy.
ETFs are valued at their last sale price or official closing price as reported by a third party pricing vendor on the primary market or exchange on which they are traded and are categorized as Level 1 in the hierarchy. In the event there were no sales during the day but the exchange reports a closing bid level, ETFs are valued at the closing bid and would be categorized as Level 1 in the hierarchy. In the event there was no closing bid, ETFs may be valued by another method that the Board believes reflects fair value in accordance with the Board's fair value pricing policies and may be categorized as Level 2 in the hierarchy.
Investments in open-end mutual funds, including the Fidelity Central Funds, are valued at their closing net asset value (NAV) each business day and are categorized as Level 1 in the hierarchy.
Changes in valuation techniques may result in transfers in or out of an assigned level within the disclosure hierarchy. The aggregate value of investments by input level as of January 31, 2016 is included at the end of the Fund's Schedule of Investments.
Foreign Currency. The Fund may use foreign currency contracts to facilitate transactions in foreign-denominated securities. Gains and losses from these transactions may arise from changes in the value of the foreign currency or if the counterparties do not perform under the contracts' terms.
Foreign-denominated assets, including investment securities, and liabilities are translated into U.S. dollars at the exchange rates at period end. Purchases and sales of investment securities, income and dividends received and expenses denominated in foreign currencies are translated into U.S. dollars at the exchange rate in effect on the transaction date.
The effects of exchange rate fluctuations on investments are included with the net realized and unrealized gain (loss) on investment securities. Other foreign currency transactions resulting in realized and unrealized gain (loss) are disclosed separately.
Investment Transactions and Income. For financial reporting purposes, the Fund's investment holdings and NAV include trades executed through the end of the last business day of the period. The NAV per share for processing shareholder transactions is calculated as of the close of business of the New York Stock Exchange (NYSE), normally 4:00 p.m. Eastern time and includes trades executed through the end of the prior business day. Gains and losses on securities sold are determined on the basis of identified cost and may include proceeds received from litigation. Dividend income is recorded on the ex-dividend date, except for certain dividends from foreign securities where the ex-dividend date may have passed, which are recorded as soon as the Fund is informed of the ex-dividend date. Non-cash dividends included in dividend income, if any, are recorded at the fair market value of the securities received. Income and capital gain distributions from Fidelity Central Funds, if any, are recorded on the ex-dividend date. Distributions received on securities that represent a return of capital or capital gain are recorded as a reduction of cost of investments and/or as a realized gain. Subsequent to ex-dividend date the Fund determines the components of these distributions, based upon receipt of tax filings or other correspondence relating to the underlying investment. Interest income is accrued as earned and includes coupon interest and amortization of premium and accretion of discount on debt securities as applicable. Investment income is recorded net of foreign taxes withheld where recovery of such taxes is uncertain.
Class Allocations and Expenses. Investment income, realized and unrealized capital gains and losses, common expenses of the Fund, and certain fund-level expense reductions, if any, are allocated daily on a pro-rata basis to each class based on the relative net assets of each class to the total net assets of the Fund. Each class differs with respect to transfer agent and distribution and service plan fees incurred. Certain expense reductions may also differ by class. For the reporting period, the allocated portion of income and expenses to each class as a percent of its average net assets may vary due to the timing of recording these transactions in relation to fluctuating net assets of the classes. Expenses directly attributable to a fund are charged to that fund. Expenses attributable to more than one fund are allocated among the respective funds on the basis of relative net assets or other appropriate methods. Expense estimates are accrued in the period to which they relate and adjustments are made when actual amounts are known.
Income Tax Information and Distributions to Shareholders. Each year, the Fund intends to qualify as a regulated investment company under Subchapter M of the Internal Revenue Code, including distributing substantially all of its taxable income and realized gains. As a result, no provision for U.S. Federal income taxes is required. The Fund files a U.S. federal tax return, in addition to state and local tax returns as required. The Fund's federal income tax returns are subject to examination by the Internal Revenue Service (IRS) for a period of three fiscal years after they are filed. State and local tax returns may be subject to examination for an additional fiscal year depending on the jurisdiction. Foreign taxes are provided for based on the Fund's understanding of the tax rules and rates that exist in the foreign markets in which it invests.
Distributions are declared and recorded on the ex-dividend date. Income dividends and capital gain distributions are declared separately for each class. Income and capital gain distributions are determined in accordance with income tax regulations, which may differ from GAAP.
Capital accounts within the financial statements are adjusted for permanent book-tax differences. These adjustments have no impact on net assets or the results of operations. Capital accounts are not adjusted for temporary book-tax differences which will reverse in a subsequent period.
Book-tax differences are primarily due to foreign currency transactions, partnerships and losses deferred due to wash sales and excise tax regulations.
The federal tax cost of investment securities and unrealized appreciation (depreciation) as of period end were as follows:
| Gross unrealized appreciation | $140,469,918 |
| Gross unrealized depreciation | (179,315,659) |
| Net unrealized appreciation (depreciation) on securities | $(38,845,741) |
| Tax cost | $1,997,124,123 |
Short-Term Trading (Redemption) Fees. Shares held by investors in the Fund less than 90 days may have been subject to a redemption fee equal to 1.50% of the NAV of shares redeemed. All redemption fees, which reduce the proceeds of the shareholder redemption, are retained by the Fund and accounted for as an addition to paid in capital.
4. Purchases and Sales of Investments.
Purchases and sales of securities, other than short-term securities, aggregated $1,583,055,509 and $1,159,316,197, respectively.
5. Fees and Other Transactions with Affiliates.
Management Fee. Fidelity Management & Research Company (the investment adviser) and its affiliates provide the Fund with investment management related services for which the Fund pays a monthly management fee. The management fee is the sum of an individual fund fee rate that is based on an annual rate of .45% of the Fund's average net assets and an annualized group fee rate that averaged .25% during the period. The group fee rate is based upon the average net assets of all the mutual funds advised by the investment adviser, including any mutual funds previously advised by the investment adviser that are currently advised by Fidelity SelectCo, LLC, an affiliate of the investment adviser. The group fee rate decreases as assets under management increase and increases as assets under management decrease. In addition, the management fee is subject to a performance adjustment (up to a maximum of +/- .20% of the Fund's average net assets over a 36 month performance period). The upward or downward adjustment to the management fee is based on the Small Cap Growth as compared to its benchmark index, the Russell 2000 Growth Index, over the same 36 month performance period. For the reporting period, the total annualized management fee rate, including the performance adjustment, was .83% of the Fund's average net assets. The performance adjustment included in the management fee rate may be higher or lower than the maximum performance adjustment rate due to the difference between the average net assets for the reporting and performance periods.
Distribution and Service Plan Fees. In accordance with Rule 12b-1 of the 1940 Act, the Fund has adopted separate Distribution and Service Plans for each class of shares. Certain classes pay Fidelity Distributors Corporation (FDC), an affiliate of the investment adviser, separate Distribution and Service Fees, each of which is based on an annual percentage of each class' average net assets. In addition, FDC may pay financial intermediaries for selling shares of the Fund and providing shareholder support services. For the period, the Distribution and Service Fee rates, total fees and amounts retained by FDC were as follows:
| | Distribution
Fee | Service
Fee | Total Fees | Retained
by FDC |
| Class A | -% | .25% | $170,431 | $- |
| Class T | .25% | .25% | 126,693 | - |
| Class B | .75% | .25% | 9,477 | 7,108 |
| Class C | .75% | .25% | 305,780 | 89,202 |
| | | | $612,381 | $96,310 |
Sales Load. FDC may receive a front-end sales charge of up to 5.75% for selling Class A shares and 3.50% for selling Class T shares, some of which is paid to financial intermediaries for selling shares of the Fund. Depending on the holding period, FDC may receive contingent deferred sales charges levied on Class A, Class T, Class B, and Class C redemptions. The deferred sales charges range from 5.00% to 1.00% for Class B shares, 1.00% for Class C shares, 1.00% for certain purchases of Class A shares and .25% for certain purchases of Class T shares.
For the period, sales charge amounts retained by FDC were as follows:
| | Retained
by FDC |
| Class A | $75,745 |
| Class T | 9,304 |
| Class B(a) | 178 |
| Class C(a) | 5,760 |
| | $90,987 |
(a) When Class B and Class C shares are initially sold, FDC pays commissions from its own resources to financial intermediaries through which the sales are made.
Transfer Agent Fees. Fidelity Investments Institutional Operations Company, Inc., (FIIOC), an affiliate of the investment adviser, is the transfer, dividend disbursing and shareholder servicing agent for each class of the Fund. FIIOC receives account fees and asset-based fees that vary according to the account size and type of account of the shareholders of the respective classes of the Fund. FIIOC pays for typesetting, printing and mailing of shareholder reports, except proxy statements.
For the period, transfer agent fees for each class were as follows:
| | Amount | % of
Class-Level Average
Net Assets(a) |
| Class A | $168,349 | .25 |
| Class T | 70,180 | .28 |
| Class B | 2,888 | .30 |
| Class C | 86,626 | .28 |
| Small Cap Growth | 1,771,102 | .25 |
| Class I | 121,760 | .21 |
| | $2,220,905 | |
(a) Annualized
Accounting and Security Lending Fees. Fidelity Service Company, Inc. (FSC), an affiliate of the investment adviser, maintains the Fund's accounting records. The accounting fee is based on the level of average net assets for each month. Under a separate contract, FSC administers the security lending program. The security lending fee is based on the number and duration of lending transactions.
Brokerage Commissions. The Fund placed a portion of its portfolio transactions with brokerage firms which are affiliates of the investment adviser. Brokerage commissions are included in net realized gain (loss) and change in net unrealized appreciation (depreciation) in the Statement of Operations. The commissions paid to these affiliated firms were $41,003 for the period.
Interfund Trades. The Fund may purchase from or sell securities to other Fidelity Funds under procedures adopted by the Board. The procedures have been designed to ensure these interfund trades are executed in accordance with Rule 17a-7 of the 1940 Act. Interfund trades are included within the respective purchases and sales amounts shown in the Purchases and Sales of Investments note.
6. Committed Line of Credit.
The Fund participates with other funds managed by the investment adviser or an affiliate in a $4.25 billion credit facility (the "line of credit") to be utilized for temporary or emergency purposes to fund shareholder redemptions or for other short-term liquidity purposes. The Fund has agreed to pay commitment fees on its pro-rata portion of the line of credit, which amounted to $1,182 and is reflected in Miscellaneous expenses on the Statement of Operations. During the period, the Fund did not borrow on this line of credit.
7. Security Lending.
The Fund lends portfolio securities through a lending agent from time to time in order to earn additional income. For equity securities, a lending agent is used and may loan securities to certain qualified borrowers, including Fidelity Capital Markets (FCM), a broker-dealer affiliated with the Fund. On the settlement date of the loan, the Fund receives collateral (in the form of U.S. Treasury obligations, letters of credit and/or cash) against the loaned securities and maintains collateral in an amount not less than 100% of the market value of the loaned securities during the period of the loan. The market value of the loaned securities is determined at the close of business of the Fund and any additional required collateral is delivered to the Fund on the next business day. The Fund or borrower may terminate the loan at any time, and if the borrower defaults on its obligation to return the securities loaned because of insolvency or other reasons, the Fund may apply collateral received from the borrower against the obligation. The Fund may experience delays and costs in recovering the securities loaned. Any cash collateral received is invested in the Fidelity Securities Lending Cash Central Fund. The value of loaned securities and cash collateral at period end are disclosed on the Fund's Statement of Assets and Liabilities. The value of securities loaned to FCM at period end was $9,721,986. Security lending income represents the income earned on investing cash collateral, less rebates paid to borrowers and any lending agent fees associated with the loan, plus any premium payments received for lending certain types of securities. Security lending income is presented in the Statement of Operations as a component of income from Fidelity Central Funds, and includes $135,856 from securities loaned to FCM.
8. Expense Reductions.
Commissions paid to certain brokers with whom the investment adviser, or its affiliates, places trades on behalf of the Fund include an amount in addition to trade execution, which may be rebated back to the Fund to offset certain expenses. This amount totaled $61,599 for the period. In addition, through arrangements with the Fund's custodian, credits realized as a result of certain uninvested cash balances were used to reduce the Fund's expenses. During the period, these credits reduced the Fund's custody expenses by $211.
In addition, during the period the investment adviser reimbursed and/or waived a portion of fund-level operating expenses in the amount of $6,949.
9. Distributions to Shareholders.
Distributions to shareholders of each class were as follows:
| | Six months ended January 31, 2016 | Year ended July 31, 2015 |
| From net realized gain | | |
| Class A | $5,181,395 | $7,463,655 |
| Class T | 2,020,848 | 3,715,268 |
| Class B | 78,117 | 242,938 |
| Class C | 2,268,668 | 3,707,592 |
| Small Cap Growth | 57,632,579 | 83,762,458 |
| Class I | 4,213,303 | 4,296,573 |
| Total | $71,394,910 | $103,188,484 |
10. Share Transactions.
Share transactions for each class were as follows and may contain automatic conversions between classes or exchanges between affiliated funds:
| | Shares | Shares | Dollars | Dollars |
| | Six months ended January 31, 2016 | Year ended July 31, 2015 | Six months ended January 31, 2016 | Year ended July 31, 2015 |
| Class A | | | | |
| Shares sold | 3,788,380 | 2,167,593 | $69,322,533 | $41,925,439 |
| Reinvestment of distributions | 264,882 | 412,446 | 5,002,118 | 7,203,479 |
| Shares redeemed | (1,089,932) | (1,515,208) | (19,532,200) | (27,623,856) |
| Net increase (decrease) | 2,963,330 | 1,064,831 | $54,792,451 | $21,505,062 |
| Class T | | | | |
| Shares sold | 614,464 | 659,898 | $11,042,487 | $12,282,234 |
| Reinvestment of distributions | 107,630 | 211,200 | 1,987,314 | 3,613,802 |
| Shares redeemed | (368,566) | (660,724) | (6,582,314) | (11,765,139) |
| Net increase (decrease) | 353,528 | 210,374 | $6,447,487 | $4,130,897 |
| Class B | | | | |
| Shares sold | 5,563 | 11,802 | $90,672 | $209,809 |
| Reinvestment of distributions | 4,376 | 14,482 | 76,516 | 235,501 |
| Shares redeemed | (36,629) | (66,110) | (623,367) | (1,127,352) |
| Net increase (decrease) | (26,690) | (39,826) | $(456,179) | $(682,042) |
| Class C | | | | |
| Shares sold | 1,483,971 | 992,298 | $25,270,133 | $17,729,436 |
| Reinvestment of distributions | 125,336 | 216,825 | 2,178,654 | 3,508,500 |
| Shares redeemed | (492,824) | (778,826) | (7,982,478) | (13,034,787) |
| Net increase (decrease) | 1,116,483 | 430,297 | $19,466,309 | $8,203,149 |
| Small Cap Growth | | | | |
| Shares sold | 30,093,908 | 23,816,242 | $567,615,388 | $475,203,336 |
| Reinvestment of distributions | 2,848,706 | 4,527,816 | 55,506,569 | 81,276,349 |
| Shares redeemed | (11,760,847) | (22,793,867) | (217,402,735) | (412,013,233) |
| Net increase (decrease) | 21,181,767 | 5,550,191 | $405,719,222 | $144,466,452 |
| Class I | | | | |
| Shares sold | 4,395,489 | 2,387,318 | $82,906,484 | $47,676,724 |
| Reinvestment of distributions | 199,940 | 220,272 | 3,903,639 | 3,963,647 |
| Shares redeemed | (1,612,638) | (789,017) | (29,918,854) | (15,108,080) |
| Net increase (decrease) | 2,982,791 | 1,818,573 | $56,891,269 | $36,532,291 |
11. Other.
The Fund's organizational documents provide former and current trustees and officers with a limited indemnification against liabilities arising in connection with the performance of their duties to the Fund. In the normal course of business, the Fund may also enter into contracts that provide general indemnifications. The Fund's maximum exposure under these arrangements is unknown as this would be dependent on future claims that may be made against the Fund. The risk of material loss from such claims is considered remote.
Shareholder Expense Example
As a shareholder of the Fund, you incur two types of costs: (1) transaction costs, including sales charges (loads) on purchase payments or redemption proceeds, redemption fees and (2) ongoing costs, including management fees, distribution and/or service (12b-1) fees and other Fund expenses. This Example is intended to help you understand your ongoing costs (in dollars) of investing in the Fund and to compare these costs with the ongoing costs of investing in other mutual funds.
The Example is based on an investment of $1,000 invested at the beginning of the period and held for the entire period (August 1, 2015 to January 31, 2016).
Actual Expenses
The first line of the accompanying table for each class of the Fund provides information about actual account values and actual expenses. You may use the information in this line, together with the amount you invested, to estimate the expenses that you paid over the period. Simply divide your account value by $1,000.00 (for example, an $8,600 account value divided by $1,000.00 = 8.6), then multiply the result by the number in the first line for a class of the Fund under the heading entitled "Expenses Paid During Period" to estimate the expenses you paid on your account during this period. A small balance maintenance fee of $12.00 that is charged once a year may apply for certain accounts with a value of less than $2,000. This fee is not included in the table below. If it was, the estimate of expenses you paid during the period would be higher, and your ending account value lower, by this amount. In addition, the Fund, as a shareholder in the underlying Fidelity Central Funds, will indirectly bear its pro-rata share of the fees and expenses incurred by the underlying Fidelity Central Funds. These fees and expenses are not included in the Fund's annualized expense ratio used to calculate the expense estimate in the table below.
Hypothetical Example for Comparison Purposes
The second line of the accompanying table for each class of the Fund provides information about hypothetical account values and hypothetical expenses based on a Class' actual expense ratio and an assumed rate of return of 5% per year before expenses, which is not the Class' actual return. The hypothetical account values and expenses may not be used to estimate the actual ending account balance or expenses you paid for the period. You may use this information to compare the ongoing costs of investing in the Fund and other funds. To do so, compare this 5% hypothetical example with the 5% hypothetical examples that appear in the shareholder reports of the other funds. A small balance maintenance fee of $12.00 that is charged once a year may apply for certain accounts with a value of less than $2,000. This fee is not included in the table below. If it was, the estimate of expenses you paid during the period would be higher, and your ending account value lower, by this amount. In addition, the Fund, as a shareholder in the underlying Fidelity Central Funds, will indirectly bear its pro-rata share of the fees and expenses incurred by the underlying Fidelity Central Funds. These fees and expenses are not included in the Fund's annualized expense ratio used to calculate the expense estimate in the table below.
Please note that the expenses shown in the table are meant to highlight your ongoing costs only and do not reflect any transaction costs. Therefore, the second line of the table is useful in comparing ongoing costs only, and will not help you determine the relative total costs of owning different funds. In addition, if these transactional costs were included, your costs would have been higher.
| | Annualized Expense Ratio-A | Beginning
Account Value
August 1, 2015 | Ending
Account Value
January 31, 2016 | Expenses Paid
During Period-B
August 1, 2015
to January 31, 2016 |
| Class A | 1.39% | | | |
| Actual | | $1,000.00 | $829.10 | $6.39 |
| Hypothetical-C | | $1,000.00 | $1,018.15 | $7.05 |
| Class T | 1.67% | | | |
| Actual | | $1,000.00 | $828.10 | $7.67 |
| Hypothetical-C | | $1,000.00 | $1,016.74 | $8.47 |
| Class B | 2.19% | | | |
| Actual | | $1,000.00 | $825.70 | $10.05 |
| Hypothetical-C | | $1,000.00 | $1,014.13 | $11.09 |
| Class C | 2.17% | | | |
| Actual | | $1,000.00 | $825.50 | $9.96 |
| Hypothetical-C | | $1,000.00 | $1,014.23 | $10.99 |
| Small Cap Growth | 1.13% | | | |
| Actual | | $1,000.00 | $830.30 | $5.20 |
| Hypothetical-C | | $1,000.00 | $1,019.46 | $5.74 |
| Class I | 1.10% | | | |
| Actual | | $1,000.00 | $830.10 | $5.06 |
| Hypothetical-C | | $1,000.00 | $1,019.61 | $5.58 |
A Annualized expense ratio reflects expenses net of applicable fee waivers.
B Expenses are equal to each Class' annualized expense ratio, multiplied by the average account value over the period, multiplied by 184/366 (to reflect the one-half year period).
C 5% return per year before expenses
ASCP-SANN-0316
1.803717.112
Fidelity® Leveraged Company Stock Fund
Class K
Semi-Annual Report January 31, 2016 |
|
Contents
To view a fund's proxy voting guidelines and proxy voting record for the 12-month period ended June 30, visit http://www.fidelity.com/proxyvotingresults or visit the Securities and Exchange Commission's (SEC) web site at http://www.sec.gov.
You may also call 1-800-835-5092 to request a free copy of the proxy voting guidelines.
Standard & Poor's, S&P and S&P 500 are registered service marks of The McGraw-Hill Companies, Inc. and have been licensed for use by Fidelity Distributors Corporation.
Other third-party marks appearing herein are the property of their respective owners.
All other marks appearing herein are registered or unregistered trademarks or service marks of FMR LLC or an affiliated company. © 2016 FMR LLC. All rights reserved.
This report and the financial statements contained herein are submitted for the general information of the shareholders of the Fund. This report is not authorized for distribution to prospective investors in the Fund unless preceded or accompanied by an effective prospectus.
A fund files its complete schedule of portfolio holdings with the SEC for the first and third quarters of each fiscal year on Form N-Q. Forms N-Q are available on the SEC’s web site at http://www.sec.gov. A fund's Forms N-Q may be reviewed and copied at the SEC’s Public Reference Room in Washington, DC. Information regarding the operation of the SEC's Public Reference Room may be obtained by calling 1-800-SEC-0330.
For a complete list of a fund's portfolio holdings, view the most recent holdings listing, semiannual report, or annual report on Fidelity's web site at http://www.fidelity.com, http://www.advisor.fidelity.com, or http://www.401k.com, as applicable.
NOT FDIC INSURED •MAY LOSE VALUE •NO BANK GUARANTEE
Neither the Fund nor Fidelity Distributors Corporation is a bank.
Investment Summary (Unaudited)
Top Ten Stocks as of January 31, 2016
| | % of fund's net assets | % of fund's net assets 6 months ago |
| LyondellBasell Industries NV Class A | 8.1 | 9.0 |
| Service Corp. International | 6.2 | 6.2 |
| Boston Scientific Corp. | 4.3 | 3.4 |
| Delta Air Lines, Inc. | 3.2 | 2.4 |
| Bank of America Corp. | 3.0 | 2.9 |
| Comcast Corp. Class A | 2.7 | 2.3 |
| General Motors Co. | 2.7 | 2.2 |
| WestRock Co. | 2.6 | 3.1 |
| Tenet Healthcare Corp. | 2.3 | 1.7 |
| Newell Rubbermaid, Inc. | 2.3 | 1.9 |
| | 37.4 | |
Top Five Market Sectors as of January 31, 2016
| | % of fund's net assets | % of fund's net assets 6 months ago |
| Consumer Discretionary | 24.9 | 26.0 |
| Health Care | 14.8 | 14.6 |
| Materials | 13.9 | 14.3 |
| Industrials | 12.4 | 10.2 |
| Financials | 11.6 | 12.1 |
Asset Allocation (% of fund's net assets)
| As of January 31, 2016 * |
| | Stocks | 97.8% |
| | Bonds | 0.2% |
| | Short-Term Investments and Net Other Assets (Liabilities) | 2.0% |

* Foreign investments - 14.8%
| As of July 31, 2015 * |
| | Stocks | 96.9% |
| | Bonds | 0.3% |
| | Short-Term Investments and Net Other Assets (Liabilities) | 2.8% |

* Foreign investments - 16.2%
Investments January 31, 2016 (Unaudited)
Showing Percentage of Net Assets
| Common Stocks - 97.5% | | | |
| | | Shares | Value (000s) |
| CONSUMER DISCRETIONARY - 24.9% | | | |
| Auto Components - 1.7% | | | |
| Delphi Automotive PLC | | 490,700 | $31,866 |
| Tenneco, Inc. (a) | | 674,800 | 25,784 |
| | | | 57,650 |
| Automobiles - 5.2% | | | |
| Ford Motor Co. | | 6,012,933 | 71,794 |
| General Motors Co. | | 3,133,537 | 92,878 |
| General Motors Co.: | | | |
| warrants 7/10/16 (a) | | 482,521 | 9,482 |
| warrants 7/10/19 (a) | | 482,521 | 5,790 |
| | | | 179,944 |
| Diversified Consumer Services - 6.2% | | | |
| Service Corp. International | | 8,875,127 | 214,689 |
| Hotels, Restaurants & Leisure - 1.0% | | | |
| ARAMARK Holdings Corp. | | 987,744 | 31,558 |
| Penn National Gaming, Inc. (a) | | 360,340 | 5,092 |
| Station Holdco LLC unit (a)(b)(c) | | 146,846 | 79 |
| | | | 36,729 |
| Household Durables - 3.2% | | | |
| Hovnanian Enterprises, Inc. Class A (a)(d) | | 1,419,000 | 2,185 |
| Lennar Corp. Class A (d) | | 677,100 | 28,540 |
| Newell Rubbermaid, Inc. | | 2,037,747 | 79,024 |
| | | | 109,749 |
| Media - 6.5% | | | |
| AMC Networks, Inc. Class A (a) | | 446,400 | 32,493 |
| Cinemark Holdings, Inc. | | 1,853,345 | 54,655 |
| Comcast Corp. Class A | | 1,672,234 | 93,160 |
| Gray Television, Inc. (a) | | 2,889,565 | 37,998 |
| Nexstar Broadcasting Group, Inc. Class A | | 178,698 | 8,079 |
| | | | 226,385 |
| Specialty Retail - 1.1% | | | |
| GameStop Corp. Class A (d) | | 620,207 | 16,256 |
| Sally Beauty Holdings, Inc. (a) | | 808,000 | 22,268 |
| | | | 38,524 |
|
| TOTAL CONSUMER DISCRETIONARY | | | 863,670 |
|
| CONSUMER STAPLES - 1.8% | | | |
| Food Products - 1.3% | | | |
| ConAgra Foods, Inc. | | 541,700 | 22,556 |
| Darling International, Inc. (a) | | 2,698,383 | 24,258 |
| | | | 46,814 |
| Personal Products - 0.5% | | | |
| Revlon, Inc. (a) | | 553,261 | 16,448 |
|
| TOTAL CONSUMER STAPLES | | | 63,262 |
|
| ENERGY - 6.0% | | | |
| Energy Equipment & Services - 1.6% | | | |
| Ensco PLC Class A | | 110,000 | 1,076 |
| Halliburton Co. | | 1,126,593 | 35,814 |
| Oil States International, Inc. (a) | | 270,466 | 7,635 |
| SAExploration Holdings, Inc. (a)(e) | | 1,257,304 | 2,100 |
| Schlumberger Ltd. | | 109,400 | 7,906 |
| | | | 54,531 |
| Oil, Gas & Consumable Fuels - 4.4% | | | |
| Continental Resources, Inc. (a)(d) | | 807,474 | 17,046 |
| Hess Corp. | | 825,110 | 35,067 |
| QEP Resources, Inc. | | 901,000 | 11,551 |
| Range Resources Corp. (d) | | 247,200 | 7,307 |
| Valero Energy Corp. | | 1,056,166 | 71,682 |
| Whiting Petroleum Corp. (a) | | 1,439,895 | 10,583 |
| | | | 153,236 |
|
| TOTAL ENERGY | | | 207,767 |
|
| FINANCIALS - 11.3% | | | |
| Banks - 8.4% | | | |
| Bank of America Corp. | | 7,243,199 | 102,419 |
| Barclays PLC sponsored ADR | | 2,083,121 | 22,456 |
| CIT Group, Inc. | | 229,310 | 6,730 |
| Citigroup, Inc. | | 1,169,047 | 49,778 |
| Huntington Bancshares, Inc. | | 4,806,680 | 41,241 |
| Regions Financial Corp. | | 4,496,280 | 36,510 |
| SunTrust Banks, Inc. | | 895,500 | 32,757 |
| | | | 291,891 |
| Capital Markets - 0.1% | | | |
| Motors Liquidation Co. GUC Trust (a) | | 123,112 | 1,988 |
| Consumer Finance - 0.8% | | | |
| American Express Co. | | 542,948 | 29,048 |
| Insurance - 0.5% | | | |
| Lincoln National Corp. | | 435,700 | 17,193 |
| Real Estate Investment Trusts - 1.0% | | | |
| Gaming & Leisure Properties | | 430,875 | 11,237 |
| Host Hotels & Resorts, Inc. | | 1,016,122 | 14,073 |
| Sabra Health Care REIT, Inc. | | 547,507 | 10,052 |
| | | | 35,362 |
| Real Estate Management & Development - 0.4% | | | |
| Realogy Holdings Corp. (a) | | 463,840 | 15,214 |
| Thrifts & Mortgage Finance - 0.1% | | | |
| MGIC Investment Corp. (a) | | 441,300 | 2,921 |
|
| TOTAL FINANCIALS | | | 393,617 |
|
| HEALTH CARE - 14.8% | | | |
| Health Care Equipment & Supplies - 4.3% | | | |
| Boston Scientific Corp. (a) | | 8,457,056 | 148,252 |
| Health Care Providers & Services - 6.2% | | | |
| Community Health Systems, Inc. (a) | | 1,213,027 | 26,056 |
| DaVita HealthCare Partners, Inc. (a) | | 532,952 | 35,772 |
| HCA Holdings, Inc. (a) | | 532,479 | 37,050 |
| Tenet Healthcare Corp. (a) | | 2,965,644 | 80,428 |
| Universal Health Services, Inc. Class B | | 334,505 | 37,679 |
| | | | 216,985 |
| Life Sciences Tools & Services - 0.8% | | | |
| PRA Health Sciences, Inc. (a) | | 651,400 | 28,062 |
| Pharmaceuticals - 3.5% | | | |
| Johnson & Johnson | | 153,000 | 15,979 |
| Merck & Co., Inc. | | 1,390,800 | 70,472 |
| Sanofi SA sponsored ADR | | 819,934 | 34,142 |
| | | | 120,593 |
|
| TOTAL HEALTH CARE | | | 513,892 |
|
| INDUSTRIALS - 12.4% | | | |
| Aerospace & Defense - 2.7% | | | |
| Honeywell International, Inc. | | 426,776 | 44,043 |
| Huntington Ingalls Industries, Inc. | | 210,260 | 26,888 |
| Textron, Inc. | | 602,700 | 20,624 |
| | | | 91,555 |
| Airlines - 4.8% | | | |
| American Airlines Group, Inc. | | 860,580 | 33,554 |
| Delta Air Lines, Inc. | | 2,531,601 | 112,125 |
| Southwest Airlines Co. | | 571,283 | 21,492 |
| | | | 167,171 |
| Building Products - 0.7% | | | |
| Allegion PLC | | 246,500 | 14,928 |
| Armstrong World Industries, Inc. (a) | | 273,500 | 10,579 |
| | | | 25,507 |
| Commercial Services & Supplies - 1.0% | | | |
| Civeo Corp. (a) | | 540,932 | 584 |
| Deluxe Corp. | | 431,413 | 24,116 |
| Tyco International Ltd. | | 328,233 | 11,288 |
| | | | 35,988 |
| Electrical Equipment - 0.6% | | | |
| Emerson Electric Co. | | 163,500 | 7,518 |
| Generac Holdings, Inc. (a)(d) | | 490,557 | 13,942 |
| | | | 21,460 |
| Industrial Conglomerates - 0.9% | | | |
| General Electric Co. | | 1,103,883 | 32,123 |
| Machinery - 1.1% | | | |
| Ingersoll-Rand PLC | | 648,800 | 33,394 |
| Pentair PLC | | 78,757 | 3,711 |
| | | | 37,105 |
| Marine - 0.1% | | | |
| Genco Shipping & Trading Ltd. (a) | | 565,366 | 571 |
| Genco Shipping & Trading Ltd. (a) | | 8,314 | 8 |
| Navios Maritime Holdings, Inc. (d) | | 2,162,794 | 2,107 |
| | | | 2,686 |
| Road & Rail - 0.3% | | | |
| Hertz Global Holdings, Inc. (a) | | 1,200,900 | 10,904 |
| Trading Companies & Distributors - 0.2% | | | |
| United Rentals, Inc. (a) | | 147,000 | 7,043 |
|
| TOTAL INDUSTRIALS | | | 431,542 |
|
| INFORMATION TECHNOLOGY - 9.4% | | | |
| Electronic Equipment & Components - 1.8% | | | |
| Avnet, Inc. | | 594,313 | 23,725 |
| Belden, Inc. | | 510,764 | 21,820 |
| Corning, Inc. | | 726,800 | 13,526 |
| TTM Technologies, Inc. (a) | | 381,564 | 2,225 |
| | | | 61,296 |
| Internet Software & Services - 0.4% | | | |
| VeriSign, Inc. (a)(d) | | 194,300 | 14,689 |
| IT Services - 0.1% | | | |
| Everi Holdings, Inc. (a) | | 1,851,000 | 5,201 |
| Semiconductors & Semiconductor Equipment - 3.8% | | | |
| Intersil Corp. Class A | | 1,460,387 | 18,985 |
| Micron Technology, Inc. (a) | | 2,079,945 | 22,942 |
| NXP Semiconductors NV (a) | | 940,864 | 70,358 |
| ON Semiconductor Corp. (a) | | 2,134,568 | 18,272 |
| | | | 130,557 |
| Software - 2.6% | | | |
| Citrix Systems, Inc. (a) | | 230,899 | 16,269 |
| Microsoft Corp. | | 1,324,668 | 72,976 |
| | | | 89,245 |
| Technology Hardware, Storage & Peripherals - 0.7% | | | |
| NCR Corp. (a) | | 1,117,931 | 23,857 |
|
| TOTAL INFORMATION TECHNOLOGY | | | 324,845 |
|
| MATERIALS - 13.9% | | | |
| Chemicals - 9.1% | | | |
| H.B. Fuller Co. | | 461,829 | 17,189 |
| LyondellBasell Industries NV Class A | | 3,619,555 | 282,220 |
| OMNOVA Solutions, Inc. (a)(e) | | 3,114,962 | 16,354 |
| Phosphate Holdings, Inc. (a) | | 307,500 | 10 |
| | | | 315,773 |
| Containers & Packaging - 3.2% | | | |
| Sealed Air Corp. | | 483,434 | 19,594 |
| WestRock Co. | | 2,590,728 | 91,401 |
| | | | 110,995 |
| Metals & Mining - 0.0% | | | |
| Ormet Corp.(a)(e) | | 1,075,000 | 0 |
| Paper & Forest Products - 1.6% | | | |
| Kapstone Paper & Packaging Corp. | | 989,200 | 14,620 |
| Louisiana-Pacific Corp. (a) | | 1,563,090 | 24,572 |
| Neenah Paper, Inc. | | 266,200 | 16,089 |
| | | | 55,281 |
|
| TOTAL MATERIALS | | | 482,049 |
|
| TELECOMMUNICATION SERVICES - 1.6% | | | |
| Diversified Telecommunication Services - 1.6% | | | |
| Frontier Communications Corp. (d) | | 5,528,256 | 25,154 |
| Intelsat SA (a)(d) | | 1,144,700 | 3,823 |
| Level 3 Communications, Inc. (a) | | 514,400 | 25,108 |
| | | | 54,085 |
| UTILITIES - 1.4% | | | |
| Electric Utilities - 0.4% | | | |
| FirstEnergy Corp. | | 421,304 | 13,928 |
| Independent Power and Renewable Electricity Producers - 1.0% | | | |
| Calpine Corp. (a) | | 2,167,700 | 33,187 |
|
| TOTAL UTILITIES | | | 47,115 |
|
| TOTAL COMMON STOCKS | | | |
| (Cost $2,485,910) | | | 3,381,844 |
|
| Nonconvertible Preferred Stocks - 0.3% | | | |
| FINANCIALS - 0.3% | | | |
| Capital Markets - 0.3% | | | |
| GMAC Capital Trust I Series 2, 8.125% | | | |
| (Cost $10,975) | | 439,013 | 11,173 |
| | | Principal Amount (000s) | Value (000s) |
|
| Nonconvertible Bonds - 0.2% | | | |
| ENERGY - 0.2% | | | |
| Energy Equipment & Services - 0.2% | | | |
| Gulfmark Offshore, Inc. 6.375% 3/15/22 | | 5,786 | 1,794 |
| SAExploration Holdings, Inc. 10% 7/15/19 | | 9,032 | 5,238 |
| | | | 7,032 |
| TOTAL NONCONVERTIBLE BONDS | | | |
| (Cost $11,680) | | | 7,032 |
| | | Shares | Value (000s) |
|
| Money Market Funds - 5.0% | | | |
| Fidelity Cash Central Fund, 0.38% (f) | | 70,796,283 | 70,796 |
| Fidelity Securities Lending Cash Central Fund, 0.42% (f)(g) | | 103,343,912 | 103,344 |
| TOTAL MONEY MARKET FUNDS | | | |
| (Cost $174,140) | | | 174,140 |
| TOTAL INVESTMENT PORTFOLIO - 103.0% | | | |
| (Cost $2,682,705) | | | 3,574,189 |
| NET OTHER ASSETS (LIABILITIES) - (3.0)% | | | (103,625) |
| NET ASSETS - 100% | | | $3,470,564 |
Values shown as $0 may reflect amounts less than $500.
Legend
(a) Non-income producing
(b) Investment is owned by an entity that is treated as a U.S. Corporation for tax purposes in which the Fund holds a percentage ownership.
(c) Restricted securities - Investment in securities not registered under the Securities Act of 1933 (excluding 144A issues). At the end of the period, the value of restricted securities (excluding 144A issues) amounted to $79,000 or 0.0% of net assets.
(d) Security or a portion of the security is on loan at period end.
(e) Affiliated company
(f) Affiliated fund that is generally available only to investment companies and other accounts managed by Fidelity Investments. The rate quoted is the annualized seven-day yield of the fund at period end. A complete unaudited listing of the fund's holdings as of its most recent quarter end is available upon request. In addition, each Fidelity Central Fund's financial statements are available on the SEC's website or upon request.
(g) Investment made with cash collateral received from securities on loan.
Additional information on each restricted holding is as follows:
| Security | Acquisition Date | Acquisition Cost (000s) |
| Station Holdco LLC unit | 10/28/08 - 12/1/08 | $5,990 |
Affiliated Central Funds
Information regarding fiscal year to date income earned by the Fund from investments in Fidelity Central Funds is as follows:
| Fund | Income earned |
| | (Amounts in thousands) |
| Fidelity Cash Central Fund | $117 |
| Fidelity Securities Lending Cash Central Fund | 914 |
| Total | $1,031 |
Other Affiliated Issuers
An affiliated company is a company in which the Fund has ownership of at least 5% of the voting securities. Fiscal year to date transactions with companies which are or were affiliates are as follows:
| Affiliate (Amounts in thousands) | Value, beginning of period | Purchases | Sales Proceeds | Dividend Income | Value, end of period |
| Gray Television, Inc. | $63,611 | $-- | $10,795 | $-- | $-- |
| OMNOVA Solutions, Inc. | 20,154 | -- | -- | -- | 16,354 |
| Ormet Corp. | 5 | -- | -- | -- | -- |
| SAExploration Holdings, Inc. | -- | -- | -- | -- | 2,100 |
| Total | $83,770 | $-- | $10,795 | $-- | $18,454 |
Investment Valuation
The following is a summary of the inputs used, as of January 31, 2016, involving the Fund's assets and liabilities carried at fair value. The inputs or methodology used for valuing securities may not be an indication of the risk associated with investing in those securities. For more information on valuation inputs, and their aggregation into the levels used below, please refer to the Investment Valuation section in the accompanying Notes to Financial Statements.
| | Valuation Inputs at Reporting Date: |
| Description | Total | Level 1 | Level 2 | Level 3 |
| (Amounts in thousands) | | | | |
| Investments in Securities: | | | | |
| Equities: | | | | |
| Consumer Discretionary | $863,670 | $863,591 | $-- | $79 |
| Consumer Staples | 63,262 | 63,262 | -- | -- |
| Energy | 207,767 | 207,767 | -- | -- |
| Financials | 404,790 | 404,790 | -- | -- |
| Health Care | 513,892 | 513,892 | -- | -- |
| Industrials | 431,542 | 431,542 | -- | -- |
| Information Technology | 324,845 | 324,845 | -- | -- |
| Materials | 482,049 | 482,039 | -- | 10 |
| Telecommunication Services | 54,085 | 54,085 | -- | -- |
| Utilities | 47,115 | 47,115 | -- | -- |
| Corporate Bonds | 7,032 | -- | 7,032 | -- |
| Money Market Funds | 174,140 | 174,140 | -- | -- |
| Total Investments in Securities: | $3,574,189 | $3,567,068 | $7,032 | $89 |
Other Information
Distribution of investments by country or territory of incorporation, as a percentage of Total Net Assets, is as follows (Unaudited):
| United States of America | 85.2% |
| Netherlands | 10.1% |
| Ireland | 1.8% |
| France | 1.0% |
| Others (Individually Less Than 1%) | 1.9% |
| | 100.0% |
See accompanying notes which are an integral part of the financial statements.
Financial Statements
Statement of Assets and Liabilities
| Amounts in thousands (except per-share amounts) | | January 31, 2016 (Unaudited) |
| Assets | | |
Investment in securities, at value (including securities loaned of $102,909) — See accompanying schedule:
Unaffiliated issuers (cost $2,479,750) | $3,381,595 | |
| Fidelity Central Funds (cost $174,140) | 174,140 | |
| Other affiliated issuers (cost $28,815) | 18,454 | |
| Total Investments (cost $2,682,705) | | $3,574,189 |
| Receivable for investments sold | | 2,803 |
| Receivable for fund shares sold | | 1,306 |
| Dividends receivable | | 3,243 |
| Interest receivable | | 179 |
| Distributions receivable from Fidelity Central Funds | | 105 |
| Prepaid expenses | | 8 |
| Other receivables | | 23 |
| Total assets | | 3,581,856 |
| Liabilities | | |
| Payable for investments purchased | $1,610 | |
| Payable for fund shares redeemed | 3,986 | |
| Accrued management fee | 1,754 | |
| Other affiliated payables | 561 | |
| Other payables and accrued expenses | 37 | |
| Collateral on securities loaned, at value | 103,344 | |
| Total liabilities | | 111,292 |
| Net Assets | | $3,470,564 |
| Net Assets consist of: | | |
| Paid in capital | | $2,486,221 |
| Undistributed net investment income | | 6,058 |
| Accumulated undistributed net realized gain (loss) on investments | | 86,801 |
| Net unrealized appreciation (depreciation) on investments | | 891,484 |
| Net Assets | | $3,470,564 |
| Leveraged Company Stock: | | |
| Net Asset Value, offering price and redemption price per share ($2,813,418 ÷ 78,326 shares) | | $35.92 |
| Class K: | | |
| Net Asset Value, offering price and redemption price per share ($657,146 ÷ 18,269 shares) | | $35.97 |
See accompanying notes which are an integral part of the financial statements.
Statement of Operations
| Amounts in thousands | | Six months ended January 31, 2016 (Unaudited) |
| Investment Income | | |
| Dividends | | $34,966 |
| Interest | | 789 |
| Income from Fidelity Central Funds | | 1,031 |
| Total income | | 36,786 |
| Expenses | | |
| Management fee | $12,307 | |
| Transfer agent fees | 2,962 | |
| Accounting and security lending fees | 539 | |
| Custodian fees and expenses | 16 | |
| Independent trustees' compensation | 10 | |
| Registration fees | 35 | |
| Audit | 35 | |
| Legal | 14 | |
| Miscellaneous | 11 | |
| Total expenses before reductions | 15,929 | |
| Expense reductions | (40) | 15,889 |
| Net investment income (loss) | | 20,897 |
| Realized and Unrealized Gain (Loss) | | |
| Net realized gain (loss) on: | | |
| Investment securities: | | |
| Unaffiliated issuers | 173,913 | |
| Other affiliated issuers | (7,200) | |
| Total net realized gain (loss) | | 166,713 |
| Change in net unrealized appreciation (depreciation) on investment securities | | (997,191) |
| Net gain (loss) | | (830,478) |
| Net increase (decrease) in net assets resulting from operations | | $(809,581) |
See accompanying notes which are an integral part of the financial statements.
Statement of Changes in Net Assets
| Amounts in thousands | Six months ended January 31, 2016 (Unaudited) | Year ended July 31, 2015 |
| Increase (Decrease) in Net Assets | | |
| Operations | | |
| Net investment income (loss) | $20,897 | $45,844 |
| Net realized gain (loss) | 166,713 | 235,817 |
| Change in net unrealized appreciation (depreciation) | (997,191) | (131,060) |
| Net increase (decrease) in net assets resulting from operations | (809,581) | 150,601 |
| Distributions to shareholders from net investment income | (39,813) | (41,090) |
| Distributions to shareholders from net realized gain | (240,243) | – |
| Total distributions | (280,056) | (41,090) |
| Share transactions - net increase (decrease) | (186,162) | (743,092) |
| Redemption fees | 78 | 302 |
| Total increase (decrease) in net assets | (1,275,721) | (633,279) |
| Net Assets | | |
| Beginning of period | 4,746,285 | 5,379,564 |
| End of period (including undistributed net investment income of $6,058 and undistributed net investment income of $24,974, respectively) | $3,470,564 | $4,746,285 |
See accompanying notes which are an integral part of the financial statements.
Financial Highlights — Fidelity Leveraged Company Stock Fund
| | Six months ended (Unaudited) | Years ended July 31, | | | | |
| January 31, | 2016 | 2015 | 2014 | 2013 | 2012 | 2011 |
| Selected Per–Share Data | | | | | | |
| Net asset value, beginning of period | $46.90 | $45.82 | $39.44 | $28.22 | $28.85 | $23.50 |
| Income from Investment Operations | | | | | | |
| Net investment income (loss)A | .21 | .41 | .34 | .42B | .16 | –C |
| Net realized and unrealized gain (loss) | (8.33) | 1.01 | 6.31 | 10.92 | (.50) | 5.46 |
| Total from investment operations | (8.12) | 1.42 | 6.65 | 11.34 | (.34) | 5.46 |
| Distributions from net investment income | (.40) | (.34) | (.27) | (.12) | (.29) | (.11) |
| Distributions from net realized gain | (2.46) | – | – | – | – | – |
| Total distributions | (2.86) | (.34) | (.27) | (.12) | (.29) | (.11) |
| Redemption fees added to paid in capitalA,C | – | – | – | – | – | – |
| Net asset value, end of period | $35.92 | $46.90 | $45.82 | $39.44 | $28.22 | $28.85 |
| Total ReturnD,E | (18.08)% | 3.12% | 16.96% | 40.31% | (1.05)% | 23.27% |
| Ratios to Average Net AssetsF,G | | | | | | |
| Expenses before reductions | .80%H | .79% | .79% | .82% | .86% | .85% |
| Expenses net of fee waivers, if any | .80%H | .78% | .79% | .82% | .86% | .85% |
| Expenses net of all reductions | .79%H | .78% | .79% | .82% | .85% | .84% |
| Net investment income (loss) | .99%H | .87% | .81% | 1.25%B | .60% | - %I |
| Supplemental Data | | | | | | |
| Net assets, end of period (in millions) | $2,813 | $3,755 | $4,207 | $4,227 | $3,009 | $3,931 |
| Portfolio turnover rateJ | 6%H | 4% | 10% | 21% | 29% | 18% |
A Calculated based on average shares outstanding during the period.
B Net Investment income per share reflects a large, non-recurring dividend which amounted to $.08 per share. Excluding this non-recurring dividend, the ratio of net investment income (loss) to average net assets would have been 1.03%.
C Amount represents less than $.005 per share.
D Total returns for periods of less than one year are not annualized.
E Total returns would have been lower if certain expenses had not been reduced during the applicable periods shown.
F Fees and expenses of any underlying Fidelity Central Funds are not included in the Fund's expense ratio. The Fund indirectly bears its proportionate share of the expenses of any underlying Fidelity Central Funds.
G Expense ratios reflect operating expenses of the class. Expenses before reductions do not reflect amounts reimbursed by the investment adviser or reductions from brokerage service arrangements or reductions from other expense offset arrangements and do not represent the amount paid by the class during periods when reimbursements or reductions occur. Expenses net of fee waivers reflect expenses after reimbursement by the investment adviser but prior to reductions from brokerage service arrangements or other expense offset arrangements. Expenses net of all reductions represent the net expenses paid by the class.
H Annualized
I Amount represents less than .005%.
J Amount does not include the portfolio activity of any underlying Fidelity Central Funds.
See accompanying notes which are an integral part of the financial statements.
Financial Highlights — Fidelity Leveraged Company Stock Fund Class K
| | Six months ended (Unaudited) | Years ended July 31, | | | | |
| January 31, | 2016 | 2015 | 2014 | 2013 | 2012 | 2011 |
| Selected Per–Share Data | | | | | | |
| Net asset value, beginning of period | $47.00 | $45.91 | $39.52 | $28.26 | $28.86 | $23.52 |
| Income from Investment Operations | | | | | | |
| Net investment income (loss)A | .23 | .46 | .40 | .47B | .20 | .04 |
| Net realized and unrealized gain (loss) | (8.35) | 1.03 | 6.31 | 10.93 | (.49) | 5.45 |
| Total from investment operations | (8.12) | 1.49 | 6.71 | 11.40 | (.29) | 5.49 |
| Distributions from net investment income | (.45) | (.40) | (.32) | (.14) | (.31) | (.15) |
| Distributions from net realized gain | (2.46) | – | – | – | – | – |
| Total distributions | (2.91) | (.40) | (.32) | (.14) | (.31) | (.15) |
| Redemption fees added to paid in capitalA,C | – | – | – | – | – | – |
| Net asset value, end of period | $35.97 | $47.00 | $45.91 | $39.52 | $28.26 | $28.86 |
| Total ReturnD,E | (18.05)% | 3.26% | 17.10% | 40.47% | (.87)% | 23.45% |
| Ratios to Average Net AssetsF,G | | | | | | |
| Expenses before reductions | .68%H | .67% | .67% | .69% | .69% | .69% |
| Expenses net of fee waivers, if any | .68%H | .67% | .67% | .69% | .69% | .69% |
| Expenses net of all reductions | .67%H | .67% | .67% | .68% | .69% | .69% |
| Net investment income (loss) | 1.11%H | .99% | .92% | 1.39%B | .76% | .16% |
| Supplemental Data | | | | | | |
| Net assets, end of period (in millions) | $657 | $991 | $1,173 | $1,053 | $600 | $555 |
| Portfolio turnover rateI | 6%H | 4% | 10% | 21% | 29% | 18% |
A Calculated based on average shares outstanding during the period.
B Net Investment income per share reflects a large, non-recurring dividend which amounted to $.08 per share. Excluding this non-recurring dividend, the ratio of net investment income (loss) to average net assets would have been 1.17%.
C Amount represents less than $.005 per share.
D Total returns for periods of less than one year are not annualized.
E Total returns would have been lower if certain expenses had not been reduced during the applicable periods shown.
F Fees and expenses of any underlying Fidelity Central Funds are not included in the Fund's expense ratio. The Fund indirectly bears its proportionate share of the expenses of any underlying Fidelity Central Funds.
G Expense ratios reflect operating expenses of the class. Expenses before reductions do not reflect amounts reimbursed by the investment adviser or reductions from brokerage service arrangements or reductions from other expense offset arrangements and do not represent the amount paid by the class during periods when reimbursements or reductions occur. Expenses net of fee waivers reflect expenses after reimbursement by the investment adviser but prior to reductions from brokerage service arrangements or other expense offset arrangements. Expenses net of all reductions represent the net expenses paid by the class.
H Annualized
I Amount does not include the portfolio activity of any underlying Fidelity Central Funds.
See accompanying notes which are an integral part of the financial statements.
Notes to Financial Statements (Unaudited)
For the period ended January 31, 2016
(Amounts in thousands except percentages)
1. Organization.
Fidelity Leveraged Company Stock Fund (the Fund) is a fund of Fidelity Securities Fund (the Trust) and is authorized to issue an unlimited number of shares. The Trust is registered under the Investment Company Act of 1940, as amended (the 1940 Act), as an open-end management investment company organized as a Massachusetts business trust. The Fund offers Leveraged Company Stock and Class K shares, each of which has equal rights as to assets and voting privileges. Each class has exclusive voting rights with respect to matters that affect that class.
2. Investments in Fidelity Central Funds.
The Fund invests in Fidelity Central Funds, which are open-end investment companies generally available only to other investment companies and accounts managed by the investment adviser and its affiliates. The Fund's Schedule of Investments lists each of the Fidelity Central Funds held as of period end, if any, as an investment of the Fund, but does not include the underlying holdings of each Fidelity Central Fund. As an Investing Fund, the Fund indirectly bears its proportionate share of the expenses of the underlying Fidelity Central Funds.
The Money Market Central Funds seek preservation of capital and current income and are managed by Fidelity Investments Money Management, Inc. (FIMM), an affiliate of the investment adviser. Annualized expenses of the Money Market Central Funds as of their most recent shareholder report date are less than .005%.
A complete unaudited list of holdings for each Fidelity Central Fund is available upon request or at the Securities and Exchange Commission (the SEC) website at www.sec.gov. In addition, the financial statements of the Fidelity Central Funds are available on the SEC website or upon request.
3. Significant Accounting Policies.
The financial statements have been prepared in conformity with accounting principles generally accepted in the United States of America (GAAP), which require management to make certain estimates and assumptions at the date of the financial statements. Actual results could differ from those estimates. Subsequent events, if any, through the date that the financial statements were issued have been evaluated in the preparation of the financial statements. The following summarizes the significant accounting policies of the Fund:
Investment Valuation. Investments are valued as of 4:00 p.m. Eastern time on the last calendar day of the period. The Board of Trustees (the Board) has delegated the day to day responsibility for the valuation of the Fund's investments to the Fidelity Management & Research Company (FMR) Fair Value Committee (the Committee). In accordance with valuation policies and procedures approved by the Board, the Fund attempts to obtain prices from one or more third party pricing vendors or brokers to value its investments. When current market prices, quotations or currency exchange rates are not readily available or reliable, investments will be fair valued in good faith by the Committee, in accordance with procedures adopted by the Board. Factors used in determining fair value vary by investment type and may include market or investment specific events, changes in interest rates and credit quality. The frequency with which these procedures are used cannot be predicted and they may be utilized to a significant extent. The Committee oversees the Fund's valuation policies and procedures and reports to the Board on the Committee's activities and fair value determinations. The Board monitors the appropriateness of the procedures used in valuing the Fund's investments and ratifies the fair value determinations of the Committee.
The Fund categorizes the inputs to valuation techniques used to value its investments into a disclosure hierarchy consisting of three levels as shown below:
- Level 1 – quoted prices in active markets for identical investments
- Level 2 – other significant observable inputs (including quoted prices for similar investments, interest rates, prepayment speeds, etc.)
- Level 3 – unobservable inputs (including the Fund's own assumptions based on the best information available)
Valuation techniques used to value the Fund's investments by major category are as follows:
Equity securities, including restricted securities, for which market quotations are readily available, are valued at the last reported sale price or official closing price as reported by a third party pricing vendor on the primary market or exchange on which they are traded and are categorized as Level 1 in the hierarchy. In the event there were no sales during the day or closing prices are not available, securities are valued at the last quoted bid price or may be valued using the last available price and are generally categorized as Level 2 in the hierarchy. For foreign equity securities, when market or security specific events arise, comparisons to the valuation of American Depositary Receipts (ADRs), futures contracts, Exchange-Traded Funds (ETFs) and certain indexes as well as quoted prices for similar securities may be used and would be categorized as Level 2 in the hierarchy. Utilizing these techniques may result in transfers between Level 1 and Level 2. For equity securities, including restricted securities, where observable inputs are limited, assumptions about market activity and risk are used and these securities may be categorized as Level 3 in the hierarchy.
Debt securities, including restricted securities, are valued based on evaluated prices received from third party pricing vendors or from brokers who make markets in such securities. Corporate bonds are valued by pricing vendors who utilize matrix pricing which considers yield or price of bonds of comparable quality, coupon, maturity and type or by broker-supplied prices. When independent prices are unavailable or unreliable, debt securities may be valued utilizing pricing methodologies which consider similar factors that would be used by third party pricing vendors. Debt securities are generally categorized as Level 2 in the hierarchy but may be Level 3 depending on the circumstances.
Investments in open-end mutual funds, including the Fidelity Central Funds, are valued at their closing net asset value (NAV) each business day and are categorized as Level 1 in the hierarchy.
Changes in valuation techniques may result in transfers in or out of an assigned level within the disclosure hierarchy. The aggregate value of investments by input level as of January 31, 2016 is included at the end of the Fund's Schedule of Investments.
Investment Transactions and Income. For financial reporting purposes, the Fund's investment holdings and NAV include trades executed through the end of the last business day of the period. The NAV per share for processing shareholder transactions is calculated as of the close of business of the New York Stock Exchange (NYSE), normally 4:00 p.m. Eastern time and includes trades executed through the end of the prior business day. Gains and losses on securities sold are determined on the basis of identified cost and may include proceeds received from litigation. Dividend income is recorded on the ex-dividend date, except for certain dividends from foreign securities where the ex-dividend date may have passed, which are recorded as soon as the Fund is informed of the ex-dividend date. Non-cash dividends included in dividend income, if any, are recorded at the fair market value of the securities received. Income and capital gain distributions from Fidelity Central Funds, if any, are recorded on the ex-dividend date. Distributions received on securities that represent a return of capital or capital gain are recorded as a reduction of cost of investments and/or as a realized gain. Subsequent to ex-dividend date the Fund determines the components of these distributions, based upon receipt of tax filings or other correspondence relating to the underlying investment. Interest income is accrued as earned and includes coupon interest and amortization of premium and accretion of discount on debt securities as applicable.
Class Allocations and Expenses. Investment income, realized and unrealized capital gains and losses, common expenses of the Fund, and certain fund-level expense reductions, if any, are allocated daily on a pro-rata basis to each class based on the relative net assets of each class to the total net assets of the Fund. Each class differs with respect to transfer agent fees incurred. Certain expense reductions may also differ by class. For the reporting period, the allocated portion of income and expenses to each class as a percent of its average net assets may vary due to the timing of recording these transactions in relation to fluctuating net assets of the classes. Expenses directly attributable to a fund are charged to that fund. Expenses attributable to more than one fund are allocated among the respective funds on the basis of relative net assets or other appropriate methods. Expense estimates are accrued in the period to which they relate and adjustments are made when actual amounts are known.
Income Tax Information and Distributions to Shareholders. Each year, the Fund intends to qualify as a regulated investment company under Subchapter M of the Internal Revenue Code, including distributing substantially all of its taxable income and realized gains. As a result, no provision for U.S. Federal income taxes is required. The Fund files a U.S. federal tax return, in addition to state and local tax returns as required. The Fund's federal income tax returns are subject to examination by the Internal Revenue Service (IRS) for a period of three fiscal years after they are filed. State and local tax returns may be subject to examination for an additional fiscal year depending on the jurisdiction.
Distributions are declared and recorded on the ex-dividend date. Income dividends and capital gain distributions are declared separately for each class. Income and capital gain distributions are determined in accordance with income tax regulations, which may differ from GAAP.
Capital accounts within the financial statements are adjusted for permanent book-tax differences. These adjustments have no impact on net assets or the results of operations. Capital accounts are not adjusted for temporary book-tax differences which will reverse in a subsequent period.
Book-tax differences are primarily due to market discount, equity-debt classifications, capital loss carryforwards and losses deferred due to excise tax regulations.
The federal tax cost of investment securities and unrealized appreciation (depreciation) as of period end were as follows:
| Gross unrealized appreciation | $1,253,486 |
| Gross unrealized depreciation | (363,056) |
| Net unrealized appreciation (depreciation) on securities | $890,430 |
| Tax cost | $2,683,759 |
Short-Term Trading (Redemption) Fees. Shares held by investors in the Fund less than 90 days may have been subject to a redemption fee equal to 1.50% of the NAV of shares redeemed. All redemption fees, which reduce the proceeds of the shareholder redemption, are retained by the Fund and accounted for as an addition to paid in capital.
Restricted Securities. The Fund may invest in securities that are subject to legal or contractual restrictions on resale. These securities generally may be resold in transactions exempt from registration or to the public if the securities are registered. Disposal of these securities may involve time-consuming negotiations and expense, and prompt sale at an acceptable price may be difficult. Information regarding restricted securities is included at the end of the Fund's Schedule of Investments.
4. Purchases and Sales of Investments.
Purchases and sales of securities, other than short-term securities, aggregated $125,201 and $504,747, respectively.
5. Fees and Other Transactions with Affiliates.
Management Fee. Fidelity Management & Research Company (the investment adviser) and its affiliates provide the Fund with investment management related services for which the Fund pays a monthly management fee. The management fee is the sum of an individual fund fee rate that is based on an annual rate of .35% of the Fund's average net assets and an annualized group fee rate that averaged .25% during the period. The group fee rate is based upon the average net assets of all the mutual funds advised by the investment adviser, including any mutual funds previously advised by the investment adviser that are currently advised by Fidelity SelectCo, LLC, an affiliate of the investment adviser. The group fee rate decreases as assets under management increase and increases as assets under management decrease. For the reporting period, the total annualized management fee rate was .60% of the Fund's average net assets.
Transfer Agent Fees. Fidelity Investments Institutional Operations Company, Inc., (FIIOC), an affiliate of the investment adviser, is the transfer, dividend disbursing and shareholder servicing agent for each class of the Fund. FIIOC receives account fees and asset-based fees that vary according to the account size and type of account of the shareholders of Leveraged Company Stock, except for Class K. FIIOC receives an asset-based fee of Class K's average net assets. FIIOC pays for typesetting, printing and mailing of shareholder reports, except proxy statements.
For the period, transfer agent fees for each class were as follows:
| | Amount | % of
Class-Level Average
Net Assets(a) |
| Leveraged Company Stock | $2,776 | .17 |
| Class K | 186 | .05 |
| | $ 2,962 | |
(a) Annualized
Accounting and Security Lending Fees. Fidelity Service Company, Inc. (FSC), an affiliate of the investment adviser, maintains the Fund's accounting records. The accounting fee is based on the level of average net assets for each month. Under a separate contract, FSC administers the security lending program. The security lending fee is based on the number and duration of lending transactions.
Brokerage Commissions. The Fund placed a portion of its portfolio transactions with brokerage firms which are affiliates of the investment adviser. Brokerage commissions are included in net realized gain (loss) and change in net unrealized appreciation (depreciation) in the Statement of Operations. The commissions paid to these affiliated firms were $8 for the period.
Interfund Trades. The Fund may purchase from or sell securities to other Fidelity Funds under procedures adopted by the Board. The procedures have been designed to ensure these interfund trades are executed in accordance with Rule 17a-7 of the 1940 Act. Interfund trades are included within the respective purchases and sales amounts shown in the Purchases and Sales of Investments note.
Other. During the period, the investment adviser reimbursed the Fund for certain losses in the amount of $3.
6. Committed Line of Credit.
The Fund participates with other funds managed by the investment adviser or an affiliate in a $4.25 billion credit facility (the "line of credit") to be utilized for temporary or emergency purposes to fund shareholder redemptions or for other short-term liquidity purposes. The Fund has agreed to pay commitment fees on its pro-rata portion of the line of credit, which amounted to $3 and is reflected in Miscellaneous expenses on the Statement of Operations. During the period, the Fund did not borrow on this line of credit.
7. Security Lending.
The Fund lends portfolio securities through a lending agent from time to time in order to earn additional income. For equity securities, a lending agent is used and may loan securities to certain qualified borrowers, including Fidelity Capital Markets (FCM), a broker-dealer affiliated with the Fund. On the settlement date of the loan, the Fund receives collateral (in the form of U.S. Treasury obligations, letters of credit and/or cash) against the loaned securities and maintains collateral in an amount not less than 100% of the market value of the loaned securities during the period of the loan. The market value of the loaned securities is determined at the close of business of the Fund and any additional required collateral is delivered to the Fund on the next business day. The Fund or borrower may terminate the loan at any time, and if the borrower defaults on its obligation to return the securities loaned because of insolvency or other reasons, the Fund may apply collateral received from the borrower against the obligation. The Fund may experience delays and costs in recovering the securities loaned. Any cash collateral received is invested in the Fidelity Securities Lending Cash Central Fund. The value of loaned securities and cash collateral at period end are disclosed on the Fund's Statement of Assets and Liabilities. The value of securities loaned to FCM at period end was $3,777. Security lending income represents the income earned on investing cash collateral, less rebates paid to borrowers and any lending agent fees associated with the loan, plus any premium payments received for lending certain types of securities. Security lending income is presented in the Statement of Operations as a component of income from Fidelity Central Funds. Total security lending income during the period amounted to $914, including $136 from securities loaned to FCM.
8. Expense Reductions.
Commissions paid to certain brokers with whom the investment adviser, or its affiliates, places trades on behalf of the Fund include an amount in addition to trade execution, which may be rebated back to the Fund to offset certain expenses. This amount totaled $26 for the period.
In addition, during the period the investment adviser reimbursed and/or waived a portion of fund-level operating expenses in the amount of $14.
9. Distributions to Shareholders.
Distributions to shareholders of each class were as follows:
| | Six months ended January 31, 2016 | Year ended July 31, 2015 |
| From net investment income | | |
| Leveraged Company Stock | $31,472 | $30,775 |
| Class K | 8,341 | 10,315 |
| Total | $39,813 | $41,090 |
| From net realized gain | | |
| Leveraged Company Stock | $194,476 | $– |
| Class K | 45,767 | – |
| Total | $240,243 | $– |
10. Share Transactions.
Share transactions for each class were as follows and may contain automatic conversions between classes or exchanges between affiliated funds:
| | Shares | Shares | Dollars | Dollars |
| | Six months ended January 31, 2016 | Year ended July 31, 2015 | Six months ended January 31, 2016 | Year ended July 31, 2015 |
| Leveraged Company Stock | | | | |
| Shares sold | 1,760 | 5,334 | $72,641 | $246,873 |
| Reinvestment of distributions | 5,086 | 626 | 212,362 | 29,028 |
| Shares redeemed | (8,587) | (17,699) | (350,740) | (811,035) |
| Net increase (decrease) | (1,741) | (11,739) | $(65,737) | $(535,134) |
| Class K | | | | |
| Shares sold | 1,654 | 5,815 | $64,860 | $269,619 |
| Reinvestment of distributions | 1,294 | 222 | 54,108 | 10,315 |
| Shares redeemed | (5,762) | (10,500) | (239,393) | (487,892) |
| Net increase (decrease) | (2,814) | (4,463) | $(120,425) | $(207,958) |
11. Other.
The Fund's organizational documents provide former and current trustees and officers with a limited indemnification against liabilities arising in connection with the performance of their duties to the Fund. In the normal course of business, the Fund may also enter into contracts that provide general indemnifications. The Fund's maximum exposure under these arrangements is unknown as this would be dependent on future claims that may be made against the Fund. The risk of material loss from such claims is considered remote.
Shareholder Expense Example
As a shareholder of the Fund, you incur two types of costs: (1) transaction costs, including redemption fees and (2) ongoing costs, including management fees and other Fund expenses. This Example is intended to help you understand your ongoing costs (in dollars) of investing in the Fund and to compare these costs with the ongoing costs of investing in other mutual funds.
The Example is based on an investment of $1,000 invested at the beginning of the period and held for the entire period (August 1, 2015 to January 31, 2016).
Actual Expenses
The first line of the accompanying table for each class of the Fund provides information about actual account values and actual expenses. You may use the information in this line, together with the amount you invested, to estimate the expenses that you paid over the period. Simply divide your account value by $1,000.00 (for example, an $8,600 account value divided by $1,000.00 = 8.6), then multiply the result by the number in the first line for a class of the Fund under the heading entitled "Expenses Paid During Period" to estimate the expenses you paid on your account during this period. A small balance maintenance fee of $12.00 that is charged once a year may apply for certain accounts with a value of less than $2,000. This fee is not included in the table below. If it was, the estimate of expenses you paid during the period would be higher, and your ending account value lower, by this amount. In addition, the Fund, as a shareholder in the underlying Fidelity Central Funds, will indirectly bear its pro-rata share of the fees and expenses incurred by the underlying Fidelity Central Funds. These fees and expenses are not included in the Fund's annualized expense ratio used to calculate the expense estimate in the table below.
Hypothetical Example for Comparison Purposes
The second line of the accompanying table for each class of the Fund provides information about hypothetical account values and hypothetical expenses based on a Class' actual expense ratio and an assumed rate of return of 5% per year before expenses, which is not the Class' actual return. The hypothetical account values and expenses may not be used to estimate the actual ending account balance or expenses you paid for the period. You may use this information to compare the ongoing costs of investing in the Fund and other funds. To do so, compare this 5% hypothetical example with the 5% hypothetical examples that appear in the shareholder reports of the other funds. A small balance maintenance fee of $12.00 that is charged once a year may apply for certain accounts with a value of less than $2,000. This fee is not included in the table below. If it was, the estimate of expenses you paid during the period would be higher, and your ending account value lower, by this amount. In addition, the Fund, as a shareholder in the underlying Fidelity Central Funds, will indirectly bear its pro-rata share of the fees and expenses incurred by the underlying Fidelity Central Funds. These fees and expenses are not included in the Fund's annualized expense ratio used to calculate the expense estimate in the table below.
Please note that the expenses shown in the table are meant to highlight your ongoing costs only and do not reflect any transaction costs. Therefore, the second line of the table is useful in comparing ongoing costs only, and will not help you determine the relative total costs of owning different funds. In addition, if these transactional costs were included, your costs would have been higher.
| | Annualized Expense Ratio-A | Beginning
Account Value
August 1, 2015 | Ending
Account Value
January 31, 2016 | Expenses Paid
During Period-B
August 1, 2015
to January 31, 2016 |
| Leveraged Company Stock | .80% | | | |
| Actual | | $1,000.00 | $819.20 | $3.66 |
| Hypothetical-C | | $1,000.00 | $1,021.11 | $4.06 |
| Class K | .68% | | | |
| Actual | | $1,000.00 | $819.50 | $3.11 |
| Hypothetical-C | | $1,000.00 | $1,021.72 | $3.46 |
A Annualized expense ratio reflects expenses net of applicable fee waivers.
B Expenses are equal to each Class' annualized expense ratio, multiplied by the average account value over the period, multiplied by 184/366 (to reflect the one-half year period).
C 5% return per year before expenses
Corporate Headquarters
245 Summer St.
Boston, MA 02210
www.fidelity.com
LSF-K-SANN-0316
1.863385.107
Fidelity® Dividend Growth Fund
Semi-Annual Report January 31, 2016 |
|
Contents
To view a fund's proxy voting guidelines and proxy voting record for the 12-month period ended June 30, visit http://www.fidelity.com/proxyvotingresults or visit the Securities and Exchange Commission's (SEC) web site at http://www.sec.gov.
You may also call 1-800-544-8544 to request a free copy of the proxy voting guidelines.
Standard & Poor's, S&P and S&P 500 are registered service marks of The McGraw-Hill Companies, Inc. and have been licensed for use by Fidelity Distributors Corporation.
Other third-party marks appearing herein are the property of their respective owners.
All other marks appearing herein are registered or unregistered trademarks or service marks of FMR LLC or an affiliated company. © 2016 FMR LLC. All rights reserved.
This report and the financial statements contained herein are submitted for the general information of the shareholders of the Fund. This report is not authorized for distribution to prospective investors in the Fund unless preceded or accompanied by an effective prospectus.
A fund files its complete schedule of portfolio holdings with the SEC for the first and third quarters of each fiscal year on Form N-Q. Forms N-Q are available on the SEC’s web site at http://www.sec.gov. A fund's Forms N-Q may be reviewed and copied at the SEC’s Public Reference Room in Washington, DC. Information regarding the operation of the SEC's Public Reference Room may be obtained by calling 1-800-SEC-0330.
For a complete list of a fund's portfolio holdings, view the most recent holdings listing, semiannual report, or annual report on Fidelity's web site at http://www.fidelity.com, http://www.advisor.fidelity.com, or http://www.401k.com, as applicable.
NOT FDIC INSURED •MAY LOSE VALUE •NO BANK GUARANTEE
Neither the Fund nor Fidelity Distributors Corporation is a bank.
Investment Summary (Unaudited)
Top Ten Stocks as of January 31, 2016
| | % of fund's net assets | % of fund's net assets 6 months ago |
| Apple, Inc. | 4.2 | 4.7 |
| Microsoft Corp. | 3.5 | 2.5 |
| Johnson & Johnson | 3.4 | 2.6 |
| General Electric Co. | 2.9 | 2.6 |
| Wells Fargo & Co. | 2.5 | 2.5 |
| JPMorgan Chase & Co. | 2.5 | 2.9 |
| Exxon Mobil Corp. | 2.5 | 2.3 |
| Alphabet, Inc. Class C | 2.4 | 2.5 |
| Medtronic PLC | 2.2 | 2.0 |
| Chevron Corp. | 2.1 | 1.9 |
| | 28.2 | |
Top Five Market Sectors as of January 31, 2016
| | % of fund's net assets | % of fund's net assets 6 months ago |
| Information Technology | 23.0 | 23.3 |
| Financials | 15.7 | 17.3 |
| Consumer Staples | 14.9 | 12.0 |
| Health Care | 13.4 | 15.2 |
| Industrials | 9.6 | 9.6 |
Asset Allocation (% of fund's net assets)
| As of January 31, 2016* |
| | Stocks | 96.7% |
| | Convertible Securities | 0.1% |
| | Short-Term Investments and Net Other Assets (Liabilities) | 3.2% |

* Foreign investments - 15.9%
| As of July 31, 2015 * |
| | Stocks | 97.5% |
| | Convertible Securities | 0.1% |
| | Short-Term Investments and Net Other Assets (Liabilities) | 2.4% |

* Foreign investments - 15.5%
Investments January 31, 2016 (Unaudited)
Showing Percentage of Net Assets
| Common Stocks - 96.7% | | | |
| | | Shares | Value (000s) |
| CONSUMER DISCRETIONARY - 9.0% | | | |
| Diversified Consumer Services - 0.8% | | | |
| H&R Block, Inc. | | 1,609,650 | $54,809 |
| Hotels, Restaurants & Leisure - 1.2% | | | |
| Las Vegas Sands Corp. | | 616,500 | 27,804 |
| Wyndham Worldwide Corp. | | 896,491 | 58,182 |
| | | | 85,986 |
| Leisure Products - 0.2% | | | |
| Vista Outdoor, Inc. (a) | | 260,300 | 12,549 |
| Media - 1.7% | | | |
| Altice NV Class A (a) | | 1,519,500 | 21,914 |
| Comcast Corp. Class A | | 1,858,496 | 103,537 |
| | | | 125,451 |
| Multiline Retail - 2.4% | | | |
| Dillard's, Inc. Class A (b) | | 758,900 | 53,434 |
| Target Corp. | | 1,649,500 | 119,457 |
| | | | 172,891 |
| Specialty Retail - 2.2% | | | |
| AutoZone, Inc. (a) | | 79,200 | 60,777 |
| Foot Locker, Inc. | | 1,343,979 | 90,799 |
| Staples, Inc. | | 884,700 | 7,892 |
| | | | 159,468 |
| Textiles, Apparel & Luxury Goods - 0.5% | | | |
| VF Corp. | | 583,100 | 36,502 |
|
| TOTAL CONSUMER DISCRETIONARY | | | 647,656 |
|
| CONSUMER STAPLES - 14.9% | | | |
| Beverages - 5.3% | | | |
| Constellation Brands, Inc. Class A (sub. vtg.) | | 438,200 | 66,817 |
| Dr. Pepper Snapple Group, Inc. | | 669,608 | 62,836 |
| PepsiCo, Inc. | | 1,307,600 | 129,845 |
| The Coca-Cola Co. | | 2,936,038 | 126,015 |
| | | | 385,513 |
| Food & Staples Retailing - 4.0% | | | |
| CVS Health Corp. | | 1,344,200 | 129,836 |
| Kroger Co. | | 1,150,318 | 44,644 |
| Rami Levi Chain Stores Hashikma Marketing 2006 Ltd. | | 556,301 | 24,017 |
| Walgreens Boots Alliance, Inc. | | 1,143,636 | 91,171 |
| | | | 289,668 |
| Food Products - 0.7% | | | |
| Greencore Group PLC | | 6,474,677 | 35,967 |
| Hilton Food Group PLC | | 1,939,905 | 14,488 |
| | | | 50,455 |
| Household Products - 2.1% | | | |
| Procter & Gamble Co. | | 1,812,600 | 148,071 |
| Personal Products - 0.2% | | | |
| Edgewell Personal Care Co. (a) | | 178,800 | 13,233 |
| Tobacco - 2.6% | | | |
| British American Tobacco PLC (United Kingdom) | | 1,013,603 | 56,482 |
| Imperial Tobacco Group PLC | | 956,063 | 51,767 |
| Reynolds American, Inc. | | 1,638,300 | 81,833 |
| | | | 190,082 |
|
| TOTAL CONSUMER STAPLES | | | 1,077,022 |
|
| ENERGY - 6.4% | | | |
| Energy Equipment & Services - 0.1% | | | |
| Baker Hughes, Inc. | | 265,200 | 11,539 |
| Oil, Gas & Consumable Fuels - 6.3% | | | |
| Chevron Corp. | | 1,722,700 | 148,962 |
| Emerald Oil, Inc. warrants 2/4/16 (a) | | 8,559 | 0 |
| Exxon Mobil Corp. | | 2,274,597 | 177,077 |
| Imperial Oil Ltd. | | 1,899,100 | 58,224 |
| Northern Oil & Gas, Inc. (a) | | 1,037,290 | 3,423 |
| PrairieSky Royalty Ltd. (b) | | 971,100 | 13,822 |
| Suncor Energy, Inc. | | 2,209,100 | 52,322 |
| | | | 453,830 |
|
| TOTAL ENERGY | | | 465,369 |
|
| FINANCIALS - 15.7% | | | |
| Banks - 10.8% | | | |
| Bank of America Corp. | | 8,479,217 | 119,896 |
| Citigroup, Inc. | | 2,158,161 | 91,894 |
| JPMorgan Chase & Co. | | 3,046,535 | 181,269 |
| PacWest Bancorp | | 1,236,200 | 45,381 |
| SunTrust Banks, Inc. | | 1,400,000 | 51,212 |
| U.S. Bancorp | | 2,678,069 | 107,283 |
| Wells Fargo & Co. | | 3,613,193 | 181,491 |
| | | | 778,426 |
| Capital Markets - 0.8% | | | |
| Diamond Hill Investment Group, Inc. | | 77,538 | 13,108 |
| Franklin Resources, Inc. | | 646,900 | 22,422 |
| The Blackstone Group LP | | 765,384 | 20,107 |
| | | | 55,637 |
| Consumer Finance - 0.5% | | | |
| American Express Co. | | 631,200 | 33,769 |
| Imperial Holdings, Inc. warrants 4/11/19 (a) | | 48,012 | 24 |
| | | | 33,793 |
| Diversified Financial Services - 1.5% | | | |
| McGraw Hill Financial, Inc. | | 965,827 | 82,115 |
| MSCI, Inc. Class A | | 428,800 | 29,519 |
| | | | 111,634 |
| Insurance - 1.4% | | | |
| Chubb Ltd. | | 632,000 | 71,460 |
| MetLife, Inc. | | 714,900 | 31,920 |
| | | | 103,380 |
| Real Estate Investment Trusts - 0.7% | | | |
| American Tower Corp. | | 576,800 | 54,415 |
|
| TOTAL FINANCIALS | | | 1,137,285 |
|
| HEALTH CARE - 13.4% | | | |
| Biotechnology - 2.3% | | | |
| AbbVie, Inc. | | 1,558,200 | 85,545 |
| Amgen, Inc. | | 535,810 | 81,834 |
| | | | 167,379 |
| Health Care Equipment & Supplies - 2.6% | | | |
| Medtronic PLC | | 2,113,603 | 160,465 |
| The Cooper Companies, Inc. | | 199,584 | 26,175 |
| | | | 186,640 |
| Health Care Providers & Services - 0.7% | | | |
| McKesson Corp. | | 292,858 | 47,144 |
| Health Care Technology - 0.3% | | | |
| CompuGroup Medical AG | | 552,022 | 22,201 |
| Pharmaceuticals - 7.5% | | | |
| Allergan PLC (a) | | 213,100 | 60,612 |
| Astellas Pharma, Inc. | | 2,833,000 | 39,227 |
| Johnson & Johnson | | 2,356,043 | 246,065 |
| Sanofi SA sponsored ADR | | 1,269,900 | 52,879 |
| Shire PLC | | 457,100 | 25,640 |
| Teva Pharmaceutical Industries Ltd. sponsored ADR | | 1,974,300 | 121,380 |
| | | | 545,803 |
|
| TOTAL HEALTH CARE | | | 969,167 |
|
| INDUSTRIALS - 9.6% | | | |
| Aerospace & Defense - 2.4% | | | |
| BWX Technologies, Inc. | | 2,487,600 | 74,479 |
| General Dynamics Corp. | | 221,200 | 29,590 |
| The Boeing Co. | | 550,100 | 66,084 |
| | | | 170,153 |
| Air Freight & Logistics - 0.4% | | | |
| C.H. Robinson Worldwide, Inc. | | 473,300 | 30,656 |
| Commercial Services & Supplies - 0.1% | | | |
| Deluxe Corp. | | 176,900 | 9,889 |
| Construction & Engineering - 0.1% | | | |
| Astaldi SpA | | 1,098,700 | 5,536 |
| Electrical Equipment - 0.8% | | | |
| AMETEK, Inc. | | 1,020,000 | 47,991 |
| EnerSys | | 176,900 | 8,567 |
| | | | 56,558 |
| Industrial Conglomerates - 5.7% | | | |
| Danaher Corp. | | 1,275,892 | 110,556 |
| General Electric Co. | | 7,077,900 | 205,967 |
| Roper Technologies, Inc. | | 538,544 | 94,606 |
| | | | 411,129 |
| Professional Services - 0.1% | | | |
| CEB, Inc. | | 163,600 | 9,649 |
|
| TOTAL INDUSTRIALS | | | 693,570 |
|
| INFORMATION TECHNOLOGY - 23.0% | | | |
| Communications Equipment - 2.7% | | | |
| Cisco Systems, Inc. | | 4,458,986 | 106,079 |
| Qualcomm, Inc. | | 1,899,283 | 86,113 |
| | | | 192,192 |
| Electronic Equipment & Components - 0.5% | | | |
| TE Connectivity Ltd. | | 584,494 | 33,410 |
| Internet Software & Services - 2.4% | | | |
| Alphabet, Inc. Class C | | 232,406 | 172,666 |
| IT Services - 5.4% | | | |
| Accenture PLC Class A | | 1,201,000 | 126,754 |
| ASAC II LP (a)(c) | | 2,514,134 | 59,897 |
| Fidelity National Information Services, Inc. | | 882,650 | 52,721 |
| IBM Corp. | | 594,300 | 74,163 |
| Leidos Holdings, Inc. | | 541,900 | 24,992 |
| Total System Services, Inc. | | 1,059,500 | 42,550 |
| Xerox Corp. | | 1,145,900 | 11,173 |
| | | | 392,250 |
| Software - 6.0% | | | |
| Activision Blizzard, Inc. | | 1,709,717 | 59,532 |
| Micro Focus International PLC | | 1,907,363 | 37,779 |
| Microsoft Corp. | | 4,547,016 | 250,495 |
| Oracle Corp. | | 2,433,460 | 88,359 |
| | | | 436,165 |
| Technology Hardware, Storage & Peripherals - 6.0% | | | |
| Apple, Inc. | | 3,127,618 | 304,443 |
| EMC Corp. | | 3,230,700 | 80,024 |
| HP, Inc. | | 3,446,600 | 33,466 |
| Western Digital Corp. | | 369,400 | 17,724 |
| | | | 435,657 |
|
| TOTAL INFORMATION TECHNOLOGY | | | 1,662,340 |
|
| MATERIALS - 2.8% | | | |
| Chemicals - 2.4% | | | |
| CF Industries Holdings, Inc. | | 1,004,800 | 30,144 |
| E.I. du Pont de Nemours & Co. | | 1,163,900 | 61,407 |
| LyondellBasell Industries NV Class A | | 799,000 | 62,298 |
| PPG Industries, Inc. | | 223,600 | 21,269 |
| | | | 175,118 |
| Containers & Packaging - 0.4% | | | |
| Ball Corp. | | 360,100 | 24,065 |
|
| TOTAL MATERIALS | | | 199,183 |
|
| TELECOMMUNICATION SERVICES - 1.9% | | | |
| Diversified Telecommunication Services - 1.9% | | | |
| AT&T, Inc. | | 3,831,300 | 138,157 |
| TOTAL COMMON STOCKS | | | |
| (Cost $6,259,314) | | | 6,989,749 |
| | | Principal Amount (000s) | Value (000s) |
|
| Convertible Bonds - 0.1% | | | |
| ENERGY - 0.1% | | | |
| Oil, Gas & Consumable Fuels - 0.1% | | | |
Amyris, Inc. 3% 2/27/17
(Cost $7,356) | | 7,356 | 6,779 |
| | | Shares | Value (000s) |
|
| Money Market Funds - 3.6% | | | |
| Fidelity Cash Central Fund, 0.38% (d) | | 232,465,069 | 232,465 |
| Fidelity Securities Lending Cash Central Fund, 0.42% (d)(e) | | 25,057,121 | 25,057 |
| TOTAL MONEY MARKET FUNDS | | | |
| (Cost $257,522) | | | 257,522 |
| TOTAL INVESTMENT PORTFOLIO - 100.4% | | | |
| (Cost $6,524,192) | | | 7,254,050 |
| NET OTHER ASSETS (LIABILITIES) - (0.4)% | | | (25,635) |
| NET ASSETS - 100% | | | $7,228,415 |
Values shown as $0 may reflect amounts less than $500.
Legend
(a) Non-income producing
(b) Security or a portion of the security is on loan at period end.
(c) Restricted securities - Investment in securities not registered under the Securities Act of 1933 (excluding 144A issues). At the end of the period, the value of restricted securities (excluding 144A issues) amounted to $59,897,000 or 0.8% of net assets.
(d) Affiliated fund that is generally available only to investment companies and other accounts managed by Fidelity Investments. The rate quoted is the annualized seven-day yield of the fund at period end. A complete unaudited listing of the fund's holdings as of its most recent quarter end is available upon request. In addition, each Fidelity Central Fund's financial statements are available on the SEC's website or upon request.
(e) Investment made with cash collateral received from securities on loan.
Additional information on each restricted holding is as follows:
| Security | Acquisition Date | Acquisition Cost (000s) |
| ASAC II LP | 10/10/13 | $25,141 |
Affiliated Central Funds
Information regarding fiscal year to date income earned by the Fund from investments in Fidelity Central Funds is as follows:
| Fund | Income earned |
| | (Amounts in thousands) |
| Fidelity Cash Central Fund | $287 |
| Fidelity Securities Lending Cash Central Fund | 165 |
| Total | $452 |
Investment Valuation
The following is a summary of the inputs used, as of January 31, 2016, involving the Fund's assets and liabilities carried at fair value. The inputs or methodology used for valuing securities may not be an indication of the risk associated with investing in those securities. For more information on valuation inputs, and their aggregation into the levels used below, please refer to the Investment Valuation section in the accompanying Notes to Financial Statements.
| | Valuation Inputs at Reporting Date: |
| Description | Total | Level 1 | Level 2 | Level 3 |
| (Amounts in thousands) | | | | |
| Investments in Securities: | | | | |
| Equities: | | | | |
| Consumer Discretionary | $647,656 | $625,742 | $21,914 | $-- |
| Consumer Staples | 1,077,022 | 918,318 | 158,704 | -- |
| Energy | 465,369 | 465,369 | -- | -- |
| Financials | 1,137,285 | 1,137,261 | 24 | -- |
| Health Care | 969,167 | 882,099 | 87,068 | -- |
| Industrials | 693,570 | 688,034 | 5,536 | -- |
| Information Technology | 1,662,340 | 1,564,664 | 37,779 | 59,897 |
| Materials | 199,183 | 199,183 | -- | -- |
| Telecommunication Services | 138,157 | 138,157 | -- | -- |
| Corporate Bonds | 6,779 | -- | 6,779 | -- |
| Money Market Funds | 257,522 | 257,522 | -- | -- |
| Total Investments in Securities: | $7,254,050 | $6,876,349 | $317,804 | $59,897 |
The following is a summary of transfers between Level 1 and Level 2 for the period ended January 31, 2016. Transfers are assumed to have occurred at the beginning of the period, and are primarily attributable to the valuation techniques used for foreign equity securities, as discussed in the accompanying Notes to Financial Statements:
| Transfers | Total (000s) |
| Level 1 to Level 2 | $196,126 |
| Level 2 to Level 1 | $0 |
Other Information
Distribution of investments by country or territory of incorporation, as a percentage of Total Net Assets, is as follows (Unaudited):
| United States of America | 84.1% |
| Ireland | 5.3% |
| United Kingdom | 2.2% |
| Israel | 2.0% |
| Canada | 1.7% |
| Switzerland | 1.5% |
| Netherlands | 1.2% |
| Others (Individually Less Than 1%) | 2.0% |
| | 100.0% |
See accompanying notes which are an integral part of the financial statements.
Financial Statements
Statement of Assets and Liabilities
| Amounts in thousands (except per-share amounts) | | January 31, 2016 (Unaudited) |
| Assets | | |
Investment in securities, at value (including securities loaned of $24,830) — See accompanying schedule:
Unaffiliated issuers (cost $6,266,670) | $6,996,528 | |
| Fidelity Central Funds (cost $257,522) | 257,522 | |
| Total Investments (cost $6,524,192) | | $7,254,050 |
| Receivable for fund shares sold | | 2,392 |
| Dividends receivable | | 6,837 |
| Interest receivable | | 94 |
| Distributions receivable from Fidelity Central Funds | | 97 |
| Prepaid expenses | | 14 |
| Other receivables | | 493 |
| Total assets | | 7,263,977 |
| Liabilities | | |
| Payable for fund shares redeemed | $6,500 | |
| Accrued management fee | 2,503 | |
| Other affiliated payables | 988 | |
| Other payables and accrued expenses | 514 | |
| Collateral on securities loaned, at value | 25,057 | |
| Total liabilities | | 35,562 |
| Net Assets | | $7,228,415 |
| Net Assets consist of: | | |
| Paid in capital | | $6,546,766 |
| Undistributed net investment income | | 6,417 |
| Accumulated undistributed net realized gain (loss) on investments and foreign currency transactions | | (54,589) |
| Net unrealized appreciation (depreciation) on investments and assets and liabilities in foreign currencies | | 729,821 |
| Net Assets | | $7,228,415 |
| Dividend Growth: | | |
| Net Asset Value, offering price and redemption price per share ($5,613,552 ÷ 195,116 shares) | | $28.77 |
| Class K: | | |
| Net Asset Value, offering price and redemption price per share ($1,614,863 ÷ 56,187 shares) | | $28.74 |
See accompanying notes which are an integral part of the financial statements.
Statement of Operations
| Amounts in thousands | | Six months ended January 31, 2016 (Unaudited) |
| Investment Income | | |
| Dividends | | $81,103 |
| Interest | | 110 |
| Income from Fidelity Central Funds | | 452 |
| Total income | | 81,665 |
| Expenses | | |
| Management fee | | |
| Basic fee | $21,268 | |
| Performance adjustment | (3,696) | |
| Transfer agent fees | 5,419 | |
| Accounting and security lending fees | 602 | |
| Custodian fees and expenses | 68 | |
| Independent trustees' compensation | 18 | |
| Registration fees | 30 | |
| Audit | 48 | |
| Legal | 21 | |
| Miscellaneous | 22 | |
| Total expenses before reductions | 23,800 | |
| Expense reductions | (105) | 23,695 |
| Net investment income (loss) | | 57,970 |
| Realized and Unrealized Gain (Loss) | | |
| Net realized gain (loss) on: | | |
| Investment securities: | | |
| Unaffiliated issuers | (4,132) | |
| Foreign currency transactions | (3) | |
| Total net realized gain (loss) | | (4,135) |
Change in net unrealized appreciation (depreciation) on:
Investment securities | (749,057) | |
| Assets and liabilities in foreign currencies | (17) | |
| Total change in net unrealized appreciation (depreciation) | | (749,074) |
| Net gain (loss) | | (753,209) |
| Net increase (decrease) in net assets resulting from operations | | $(695,239) |
See accompanying notes which are an integral part of the financial statements.
Statement of Changes in Net Assets
| Amounts in thousands | Six months ended January 31, 2016 (Unaudited) | Year ended July 31, 2015 |
| Increase (Decrease) in Net Assets | | |
| Operations | | |
| Net investment income (loss) | $57,970 | $125,774 |
| Net realized gain (loss) | (4,135) | 767,929 |
| Change in net unrealized appreciation (depreciation) | (749,074) | (102,174) |
| Net increase (decrease) in net assets resulting from operations | (695,239) | 791,529 |
| Distributions to shareholders from net investment income | (116,882) | (124,133) |
| Distributions to shareholders from net realized gain | (571,365) | (1,267,766) |
| Total distributions | (688,247) | (1,391,899) |
| Share transactions - net increase (decrease) | 195,516 | 479,167 |
| Total increase (decrease) in net assets | (1,187,970) | (121,203) |
| Net Assets | | |
| Beginning of period | 8,416,385 | 8,537,588 |
| End of period (including undistributed net investment income of $6,417 and undistributed net investment income of $65,329, respectively) | $7,228,415 | $8,416,385 |
See accompanying notes which are an integral part of the financial statements.
Financial Highlights — Fidelity Dividend Growth Fund
| | Six months ended (Unaudited) | Years ended July 31, | | | | |
| January 31, | 2016 | 2015 | 2014 | 2013 | 2012 | 2011 |
| Selected Per–Share Data | | | | | | |
| Net asset value, beginning of period | $34.46 | $37.27 | $35.33 | $28.61 | $28.96 | $23.84 |
| Income from Investment Operations | | | | | | |
| Net investment income (loss)A | .22 | .49 | .56 | .40 | .20 | .12 |
| Net realized and unrealized gain (loss) | (3.09) | 2.71 | 4.98 | 7.12 | (.41) | 5.23 |
| Total from investment operations | (2.87) | 3.20 | 5.54 | 7.52 | (.21) | 5.35 |
| Distributions from net investment income | (.47) | (.51) | (.37) | (.30) | (.12) | (.15) |
| Distributions from net realized gain | (2.36) | (5.49) | (3.23) | (.50) | (.02) | (.08) |
| Total distributions | (2.82)B | (6.01)C | (3.60) | (.80) | (.14) | (.23) |
| Net asset value, end of period | $28.77 | $34.46 | $37.27 | $35.33 | $28.61 | $28.96 |
| Total ReturnD,E | (8.46)% | 9.54% | 17.30% | 26.83% | (.67)% | 22.57% |
| Ratios to Average Net AssetsF,G | | | | | | |
| Expenses before reductions | .64%H | .69% | .56% | .63% | .91% | .93% |
| Expenses net of fee waivers, if any | .64%H | .68% | .56% | .63% | .91% | .93% |
| Expenses net of all reductions | .64%H | .68% | .56% | .62% | .91% | .93% |
| Net investment income (loss) | 1.47%H | 1.43% | 1.58% | 1.26% | .75% | .44% |
| Supplemental Data | | | | | | |
| Net assets, end of period (in millions) | $5,614 | $6,474 | $6,481 | $6,633 | $5,905 | $9,309 |
| Portfolio turnover rateI | 37%H | 64% | 99% | 69% | 63%J | 67% |
A Calculated based on average shares outstanding during the period.
B Total distributions of $2.82 per share is comprised of distributions from net investment income of $.465 and distributions from net realized gain of $2.358 per share.
C Total distributions of $6.01 per share is comprised of distributions from net investment income of $.512 and distributions from net realized gain of $5.493 per share.
D Total returns for periods of less than one year are not annualized.
E Total returns would have been lower if certain expenses had not been reduced during the applicable periods shown.
F Fees and expenses of any underlying Fidelity Central Funds are not included in the Fund's expense ratio. The Fund indirectly bears its proportionate share of the expenses of any underlying Fidelity Central Funds.
G Expense ratios reflect operating expenses of the class. Expenses before reductions do not reflect amounts reimbursed by the investment adviser or reductions from brokerage service arrangements or reductions from other expense offset arrangements and do not represent the amount paid by the class during periods when reimbursements or reductions occur. Expenses net of fee waivers reflect expenses after reimbursement by the investment adviser but prior to reductions from brokerage service arrangements or other expense offset arrangements. Expenses net of all reductions represent the net expenses paid by the class.
H Annualized
I Amount does not include the portfolio activity of any underlying Fidelity Central Funds.
J Portfolio turnover rate excludes securities received or delivered in-kind.
See accompanying notes which are an integral part of the financial statements.
Financial Highlights — Fidelity Dividend Growth Fund Class K
| | Six months ended (Unaudited) | Years ended July 31, | | | | |
| January 31, | 2016 | 2015 | 2014 | 2013 | 2012 | 2011 |
| Selected Per–Share Data | | | | | | |
| Net asset value, beginning of period | $34.45 | $37.27 | $35.34 | $28.62 | $28.98 | $23.86 |
| Income from Investment Operations | | | | | | |
| Net investment income (loss)A | .24 | .53 | .60 | .45 | .25 | .17 |
| Net realized and unrealized gain (loss) | (3.09) | 2.70 | 4.97 | 7.12 | (.43) | 5.22 |
| Total from investment operations | (2.85) | 3.23 | 5.57 | 7.57 | (.18) | 5.39 |
| Distributions from net investment income | (.50) | (.56) | (.42) | (.35) | (.17) | (.20) |
| Distributions from net realized gain | (2.36) | (5.49) | (3.23) | (.50) | (.02) | (.08) |
| Total distributions | (2.86) | (6.05) | (3.64)B | (.85) | (.18)C | (.27)D |
| Net asset value, end of period | $28.74 | $34.45 | $37.27 | $35.34 | $28.62 | $28.98 |
| Total ReturnE,F | (8.41)% | 9.65% | 17.44% | 27.04% | (.52)% | 22.79% |
| Ratios to Average Net AssetsG,H | | | | | | |
| Expenses before reductions | .52%I | .57% | .44% | .48% | .75% | .78% |
| Expenses net of fee waivers, if any | .52%I | .57% | .43% | .48% | .75% | .78% |
| Expenses net of all reductions | .52%I | .57% | .43% | .47% | .75% | .77% |
| Net investment income (loss) | 1.59%I | 1.54% | 1.70% | 1.41% | .91% | .60% |
| Supplemental Data | | | | | | |
| Net assets, end of period (in millions) | $1,615 | $1,942 | $2,057 | $1,639 | $1,221 | $634 |
| Portfolio turnover rateJ | 37%I | 64% | 99% | 69% | 63%K | 67% |
A Calculated based on average shares outstanding during the period.
B Total distributions of $3.64 per share is comprised of distributions from net investment income of $.419 and distributions from net realized gain of $3.225 per share.
C Total distributions of $.18 per share is comprised of distributions from net investment income of $.169 and distributions from net realized gain of $.015 per share.
D Total distributions of $.27 per share is comprised of distributions from net investment income of $.197 and distributions from net realized gain of $.077 per share.
E Total returns for periods of less than one year are not annualized.
F Total returns would have been lower if certain expenses had not been reduced during the applicable periods shown.
G Fees and expenses of any underlying Fidelity Central Funds are not included in the Fund's expense ratio. The Fund indirectly bears its proportionate share of the expenses of any underlying Fidelity Central Funds.
H Expense ratios reflect operating expenses of the class. Expenses before reductions do not reflect amounts reimbursed by the investment adviser or reductions from brokerage service arrangements or reductions from other expense offset arrangements and do not represent the amount paid by the class during periods when reimbursements or reductions occur. Expenses net of fee waivers reflect expenses after reimbursement by the investment adviser but prior to reductions from brokerage service arrangements or other expense offset arrangements. Expenses net of all reductions represent the net expenses paid by the class.
I Annualized
J Amount does not include the portfolio activity of any underlying Fidelity Central Funds.
K Portfolio turnover rate excludes securities received or delivered in-kind.
See accompanying notes which are an integral part of the financial statements.
Notes to Financial Statements (Unaudited)
For the period ended January 31, 2016
(Amounts in thousands except percentages)
1. Organization.
Fidelity Dividend Growth Fund (the Fund) is a fund of Fidelity Securities Fund (the Trust) and is authorized to issue an unlimited number of shares. The Trust is registered under the Investment Company Act of 1940, as amended (the 1940 Act), as an open-end management investment company organized as a Massachusetts business trust. The Fund offers Dividend Growth and Class K shares, each of which has equal rights as to assets and voting privileges. Each class has exclusive voting rights with respect to matters that affect that class.
2. Investments in Fidelity Central Funds.
The Fund invests in Fidelity Central Funds, which are open-end investment companies generally available only to other investment companies and accounts managed by the investment adviser and its affiliates. The Fund's Schedule of Investments lists each of the Fidelity Central Funds held as of period end, if any, as an investment of the Fund, but does not include the underlying holdings of each Fidelity Central Fund. As an Investing Fund, the Fund indirectly bears its proportionate share of the expenses of the underlying Fidelity Central Funds.
The Money Market Central Funds seek preservation of capital and current income and are managed by Fidelity Investments Money Management, Inc. (FIMM), an affiliate of the investment adviser. Annualized expenses of the Money Market Central Funds as of their most recent shareholder report date are less than .005%.
A complete unaudited list of holdings for each Fidelity Central Fund is available upon request or at the Securities and Exchange Commission (the SEC) website at www.sec.gov. In addition, the financial statements of the Fidelity Central Funds are available on the SEC website or upon request.
3. Significant Accounting Policies.
The financial statements have been prepared in conformity with accounting principles generally accepted in the United States of America (GAAP), which require management to make certain estimates and assumptions at the date of the financial statements. Actual results could differ from those estimates. Subsequent events, if any, through the date that the financial statements were issued have been evaluated in the preparation of the financial statements. The following summarizes the significant accounting policies of the Fund:
Investment Valuation. Investments are valued as of 4:00 p.m. Eastern time on the last calendar day of the period. The Board of Trustees (the Board) has delegated the day to day responsibility for the valuation of the Fund's investments to the Fidelity Management & Research Company (FMR) Fair Value Committee (the Committee). In accordance with valuation policies and procedures approved by the Board, the Fund attempts to obtain prices from one or more third party pricing vendors or brokers to value its investments. When current market prices, quotations or currency exchange rates are not readily available or reliable, investments will be fair valued in good faith by the Committee, in accordance with procedures adopted by the Board. Factors used in determining fair value vary by investment type and may include market or investment specific events, changes in interest rates and credit quality. The frequency with which these procedures are used cannot be predicted and they may be utilized to a significant extent. The Committee oversees the Fund's valuation policies and procedures and reports to the Board on the Committee's activities and fair value determinations. The Board monitors the appropriateness of the procedures used in valuing the Fund's investments and ratifies the fair value determinations of the Committee.
The Fund categorizes the inputs to valuation techniques used to value its investments into a disclosure hierarchy consisting of three levels as shown below:
- Level 1 – quoted prices in active markets for identical investments
- Level 2 – other significant observable inputs (including quoted prices for similar investments, interest rates, prepayment speeds, etc.)
- Level 3 – unobservable inputs (including the Fund's own assumptions based on the best information available)
Valuation techniques used to value the Fund's investments by major category are as follows:
Equity securities, including restricted securities, for which market quotations are readily available, are valued at the last reported sale price or official closing price as reported by a third party pricing vendor on the primary market or exchange on which they are traded and are categorized as Level 1 in the hierarchy. In the event there were no sales during the day or closing prices are not available, securities are valued at the last quoted bid price or may be valued using the last available price and are generally categorized as Level 2 in the hierarchy. For foreign equity securities, when market or security specific events arise, comparisons to the valuation of American Depositary Receipts (ADRs), futures contracts, Exchange-Traded Funds (ETFs) and certain indexes as well as quoted prices for similar securities may be used and would be categorized as Level 2 in the hierarchy. Utilizing these techniques may result in transfers between Level 1 and Level 2. For equity securities, including restricted securities, where observable inputs are limited, assumptions about market activity and risk are used and these securities may be categorized as Level 3 in the hierarchy.
Debt securities, including restricted securities, are valued based on evaluated prices received from third party pricing vendors or from brokers who make markets in such securities. Corporate bonds are valued by pricing vendors who utilize matrix pricing which considers yield or price of bonds of comparable quality, coupon, maturity and type or by broker-supplied prices. When independent prices are unavailable or unreliable, debt securities may be valued utilizing pricing methodologies which consider similar factors that would be used by third party pricing vendors. Debt securities are generally categorized as Level 2 in the hierarchy but may be Level 3 depending on the circumstances.
Investments in open-end mutual funds, including the Fidelity Central Funds, are valued at their closing net asset value (NAV) each business day and are categorized as Level 1 in the hierarchy.
Changes in valuation techniques may result in transfers in or out of an assigned level within the disclosure hierarchy. The aggregate value of investments by input level as of January 31, 2016, including information on transfers between Levels 1 and 2 is included at the end of the Fund's Schedule of Investments.
Foreign Currency. The Fund may use foreign currency contracts to facilitate transactions in foreign-denominated securities. Gains and losses from these transactions may arise from changes in the value of the foreign currency or if the counterparties do not perform under the contracts' terms.
Foreign-denominated assets, including investment securities, and liabilities are translated into U.S. dollars at the exchange rates at period end. Purchases and sales of investment securities, income and dividends received and expenses denominated in foreign currencies are translated into U.S. dollars at the exchange rate in effect on the transaction date.
The effects of exchange rate fluctuations on investments are included with the net realized and unrealized gain (loss) on investment securities. Other foreign currency transactions resulting in realized and unrealized gain (loss) are disclosed separately.
Investment Transactions and Income. For financial reporting purposes, the Fund's investment holdings and NAV include trades executed through the end of the last business day of the period. The NAV per share for processing shareholder transactions is calculated as of the close of business of the New York Stock Exchange (NYSE), normally 4:00 p.m. Eastern time and includes trades executed through the end of the prior business day. Gains and losses on securities sold are determined on the basis of identified cost and may include proceeds received from litigation. Dividend income is recorded on the ex-dividend date, except for certain dividends from foreign securities where the ex-dividend date may have passed, which are recorded as soon as the Fund is informed of the ex-dividend date. Non-cash dividends included in dividend income, if any, are recorded at the fair market value of the securities received. Income and capital gain distributions from Fidelity Central Funds, if any, are recorded on the ex-dividend date. Distributions received on securities that represent a return of capital or capital gain are recorded as a reduction of cost of investments and/or as a realized gain. Subsequent to ex-dividend date the Fund determines the components of these distributions, based upon receipt of tax filings or other correspondence relating to the underlying investment. Interest income is accrued as earned and includes coupon interest and amortization of premium and accretion of discount on debt securities as applicable. Investment income is recorded net of foreign taxes withheld where recovery of such taxes is uncertain.
Class Allocations and Expenses. Investment income, realized and unrealized capital gains and losses, common expenses of the Fund, and certain fund-level expense reductions, if any, are allocated daily on a pro-rata basis to each class based on the relative net assets of each class to the total net assets of the Fund. Each class differs with respect to transfer agent fees incurred. Certain expense reductions may also differ by class. For the reporting period, the allocated portion of income and expenses to each class as a percent of its average net assets may vary due to the timing of recording these transactions in relation to fluctuating net assets of the classes. Expenses directly attributable to a fund are charged to that fund. Expenses attributable to more than one fund are allocated among the respective funds on the basis of relative net assets or other appropriate methods. Expense estimates are accrued in the period to which they relate and adjustments are made when actual amounts are known.
Deferred Trustee Compensation. Under a Deferred Compensation Plan (the Plan), independent Trustees may elect to defer receipt of a portion of their annual compensation. Deferred amounts are invested in a cross-section of Fidelity funds, are marked-to-market and remain in the Fund until distributed in accordance with the Plan. The investment of deferred amounts and the offsetting payable to the Trustees are included in the accompanying Statement of Assets and Liabilities.
Income Tax Information and Distributions to Shareholders. Each year, the Fund intends to qualify as a regulated investment company under Subchapter M of the Internal Revenue Code, including distributing substantially all of its taxable income and realized gains. As a result, no provision for U.S. Federal income taxes is required. The Fund files a U.S. federal tax return, in addition to state and local tax returns as required. The Fund's federal income tax returns are subject to examination by the Internal Revenue Service (IRS) for a period of three fiscal years after they are filed. State and local tax returns may be subject to examination for an additional fiscal year depending on the jurisdiction. Foreign taxes are provided for based on the Fund's understanding of the tax rules and rates that exist in the foreign markets in which it invests.
Distributions are declared and recorded on the ex-dividend date. Income dividends and capital gain distributions are declared separately for each class. Income and capital gain distributions are determined in accordance with income tax regulations, which may differ from GAAP.
Capital accounts within the financial statements are adjusted for permanent book-tax differences. These adjustments have no impact on net assets or the results of operations. Capital accounts are not adjusted for temporary book-tax differences which will reverse in a subsequent period.
Book-tax differences are primarily due to futures contracts, foreign currency transactions, partnerships, deferred trustees compensation and losses deferred due to wash sales.
The federal tax cost of investment securities and unrealized appreciation (depreciation) as of period end were as follows:
| Gross unrealized appreciation | $1,230,601 |
| Gross unrealized depreciation | (510,032) |
| Net unrealized appreciation (depreciation) on securities | $720,569 |
| Tax cost | $6,533,481 |
Restricted Securities. The Fund may invest in securities that are subject to legal or contractual restrictions on resale. These securities generally may be resold in transactions exempt from registration or to the public if the securities are registered. Disposal of these securities may involve time-consuming negotiations and expense, and prompt sale at an acceptable price may be difficult. Information regarding restricted securities is included at the end of the Fund's Schedule of Investments.
4. Purchases and Sales of Investments.
Purchases and sales of securities, other than short-term securities, aggregated $1,410,109 and $1,871,807, respectively.
5. Fees and Other Transactions with Affiliates.
Management Fee. Fidelity Management & Research Company (the investment adviser) and its affiliates provide the Fund with investment management related services for which the Fund pays a monthly management fee. The management fee is the sum of an individual fund fee rate that is based on an annual rate of .30% of the Fund's average net assets and an annualized group fee rate that averaged .25% during the period. The group fee rate is based upon the average net assets of all the mutual funds advised by the investment adviser, including any mutual funds previously advised by the investment adviser that are currently advised by Fidelity SelectCo, LLC, an affiliate of the investment adviser. The group fee rate decreases as assets under management increase and increases as assets under management decrease. In addition, the management fee is subject to a performance adjustment (up to a maximum of +/- .20% of the Fund's average net assets over a 36 month performance period). The upward or downward adjustment to the management fee is based on the relative investment performance of Dividend Growth as compared to its benchmark index, the S&P 500 Index, over the same 36 month performance period. For the reporting period, the total annualized management fee rate, including the performance adjustment, was .45% of the Fund's average net assets. The performance adjustment included in the management fee rate may be higher or lower than the maximum performance adjustment rate due to the difference between the average net assets for the reporting and performance periods.
Transfer Agent Fees. Fidelity Investments Institutional Operations Company, Inc., (FIIOC), an affiliate of the investment adviser, is the transfer, dividend disbursing and shareholder servicing agent for each class of the Fund. FIIOC receives account fees and asset-based fees that vary according to the account size and type of account of the shareholders of Dividend Growth, except for Class K. FIIOC receives an asset-based fee of Class K's average net assets. FIIOC pays for typesetting, printing and mailing of shareholder reports, except proxy statements.
For the period, transfer agent fees for each class were as follows:
| | Amount | % of
Class-Level Average
Net Assets(a) |
| Dividend Growth | $5,005 | .17 |
| Class K | 414 | .05 |
| | $5,419 | |
(a) Annualized
Accounting and Security Lending Fees. Fidelity Service Company, Inc. (FSC), an affiliate of the investment adviser, maintains the Fund's accounting records. The accounting fee is based on the level of average net assets for each month. Under a separate contract, FSC administers the security lending program. The security lending fee is based on the number and duration of lending transactions.
Brokerage Commissions. The Fund placed a portion of its portfolio transactions with brokerage firms which are affiliates of the investment adviser. Brokerage commissions are included in net realized gain (loss) and change in net unrealized appreciation (depreciation) in the Statement of Operations. The commissions paid to these affiliated firms were $42 for the period.
Interfund Trades. The Fund may purchase from or sell securities to other Fidelity Funds under procedures adopted by the Board. The procedures have been designed to ensure these interfund trades are executed in accordance with Rule 17a-7 of the 1940 Act. Interfund trades are included within the respective purchases and sales amounts shown in the Purchases and Sales of Investments note.
6. Committed Line of Credit.
The Fund participates with other funds managed by the investment adviser or an affiliate in a $4.25 billion credit facility (the "line of credit") to be utilized for temporary or emergency purposes to fund shareholder redemptions or for other short-term liquidity purposes. The Fund has agreed to pay commitment fees on its pro-rata portion of the line of credit, which amounted to $5 and is reflected in Miscellaneous expenses on the Statement of Operations. During the period, the Fund did not borrow on this line of credit.
7. Security Lending.
The Fund lends portfolio securities through a lending agent from time to time in order to earn additional income. For equity securities, a lending agent is used and may loan securities to certain qualified borrowers, including Fidelity Capital Markets (FCM), a broker-dealer affiliated with the Fund. On the settlement date of the loan, the Fund receives collateral (in the form of U.S. Treasury obligations, letters of credit and/or cash) against the loaned securities and maintains collateral in an amount not less than 100% of the market value of the loaned securities during the period of the loan. The market value of the loaned securities is determined at the close of business of the Fund and any additional required collateral is delivered to the Fund on the next business day. The Fund or borrower may terminate the loan at any time, and if the borrower defaults on its obligation to return the securities loaned because of insolvency or other reasons, the Fund may apply collateral received from the borrower against the obligation. The Fund may experience delays and costs in recovering the securities loaned. Any cash collateral received is invested in the Fidelity Securities Lending Cash Central Fund. The value of loaned securities and cash collateral at period end are disclosed on the Fund's Statement of Assets and Liabilities. Security lending income represents the income earned on investing cash collateral, less rebates paid to borrowers and any lending agent fees associated with the loan, plus any premium payments received for lending certain types of securities. Security lending income is presented in the Statement of Operations as a component of income from Fidelity Central Funds. Total security lending income during the period amounted to $165. During the period, there were no securities loaned to FCM.
8. Expense Reductions.
Commissions paid to certain brokers with whom the investment adviser, or its affiliates, places trades on behalf of the Fund include an amount in addition to trade execution, which may be rebated back to the Fund to offset certain expenses. This amount totaled $76 for the period. In addition, through arrangements with the Fund's custodian, credits realized as a result of certain uninvested cash balances were used to reduce the Fund's expenses. During the period, these credits reduced the Fund's custody expenses by $1.
In addition, during the period the investment adviser reimbursed and/or waived a portion of fund-level operating expenses in the amount of $28.
9. Distributions to Shareholders.
Distributions to shareholders of each class were as follows:
| | Six months ended January 31, 2016 | Year ended July 31, 2015 |
| From net investment income | | |
| Dividend Growth | $88,523 | $92,079 |
| Class K | 28,359 | 32,054 |
| Total | $116,882 | $124,133 |
| From net realized gain | | |
| Dividend Growth | $440,809 | $962,404 |
| Class K | 130,556 | 305,362 |
| Total | $571,365 | $1,267,766 |
10. Share Transactions.
Share transactions for each class were as follows and may contain automatic conversions between classes or exchanges between affiliated funds:
| | Shares | Shares | Dollars | Dollars |
| | Six months ended January 31, 2016 | Year ended July 31, 2015 | Six months ended January 31, 2016 | Year ended July 31, 2015 |
| Dividend Growth | | | | |
| Shares sold | 4,183 | 10,859 | $128,328 | $370,250 |
| Reinvestment of distributions | 17,089 | 30,298 | 505,767 | 1,009,516 |
| Shares redeemed | (14,015) | (27,183) | (428,093) | (929,933) |
| Net increase (decrease) | 7,257 | 13,974 | $206,002 | $449,833 |
| Class K | | | | |
| Shares sold | 3,434 | 9,521 | $104,803 | $325,624 |
| Reinvestment of distributions | 5,375 | 10,135 | 158,915 | 337,416 |
| Shares redeemed | (8,996) | (18,467) | (274,204) | (633,706) |
| Net increase (decrease) | (187) | 1,189 | $(10,486) | $29,334 |
11. Other.
The Fund's organizational documents provide former and current trustees and officers with a limited indemnification against liabilities arising in connection with the performance of their duties to the Fund. In the normal course of business, the Fund may also enter into contracts that provide general indemnifications. The Fund's maximum exposure under these arrangements is unknown as this would be dependent on future claims that may be made against the Fund. The risk of material loss from such claims is considered remote.
Shareholder Expense Example
As a shareholder of the Fund, you incur two types of costs: (1) transaction costs, and (2) ongoing costs, including management fees and other Fund expenses. This Example is intended to help you understand your ongoing costs (in dollars) of investing in the Fund and to compare these costs with the ongoing costs of investing in other mutual funds.
The Example is based on an investment of $1,000 invested at the beginning of the period and held for the entire period (August 1, 2015 to January 31, 2016).
Actual Expenses
The first line of the accompanying table for each class of the Fund provides information about actual account values and actual expenses. You may use the information in this line, together with the amount you invested, to estimate the expenses that you paid over the period. Simply divide your account value by $1,000.00 (for example, an $8,600 account value divided by $1,000.00 = 8.6), then multiply the result by the number in the first line for a class of the Fund under the heading entitled "Expenses Paid During Period" to estimate the expenses you paid on your account during this period. A small balance maintenance fee of $12.00 that is charged once a year may apply for certain accounts with a value of less than $2,000. This fee is not included in the table below. If it was, the estimate of expenses you paid during the period would be higher, and your ending account value lower, by this amount. In addition, the Fund, as a shareholder in the underlying Fidelity Central Funds, will indirectly bear its pro-rata share of the fees and expenses incurred by the underlying Fidelity Central Funds. These fees and expenses are not included in the Fund's annualized expense ratio used to calculate the expense estimate in the table below.
Hypothetical Example for Comparison Purposes
The second line of the accompanying table for each class of the Fund provides information about hypothetical account values and hypothetical expenses based on a Class' actual expense ratio and an assumed rate of return of 5% per year before expenses, which is not the Class' actual return. The hypothetical account values and expenses may not be used to estimate the actual ending account balance or expenses you paid for the period. You may use this information to compare the ongoing costs of investing in the Fund and other funds. To do so, compare this 5% hypothetical example with the 5% hypothetical examples that appear in the shareholder reports of the other funds. A small balance maintenance fee of $12.00 that is charged once a year may apply for certain accounts with a value of less than $2,000. This fee is not included in the table below. If it was, the estimate of expenses you paid during the period would be higher, and your ending account value lower, by this amount. In addition, the Fund, as a shareholder in the underlying Fidelity Central Funds, will indirectly bear its pro-rata share of the fees and expenses incurred by the underlying Fidelity Central Funds. These fees and expenses are not included in the Fund's annualized expense ratio used to calculate the expense estimate in the table below.
Please note that the expenses shown in the table are meant to highlight your ongoing costs only and do not reflect any transaction costs. Therefore, the second line of the table is useful in comparing ongoing costs only, and will not help you determine the relative total costs of owning different funds.
| | Annualized Expense Ratio-A | Beginning
Account Value
August 1, 2015 | Ending
Account Value
January 31, 2016 | Expenses Paid
During Period-B
August 1, 2015
to January 31, 2016 |
| Dividend Growth | .64% | | | |
| Actual | | $1,000.00 | $915.40 | $3.08 |
| Hypothetical-C | | $1,000.00 | $1,021.92 | $3.25 |
| Class K | .52% | | | |
| Actual | | $1,000.00 | $915.90 | $2.50 |
| Hypothetical-C | | $1,000.00 | $1,022.52 | $2.64 |
A Annualized expense ratio reflects expenses net of applicable fee waivers.
B Expenses are equal to each Class' annualized expense ratio, multiplied by the average account value over the period, multiplied by 184/366 (to reflect the one-half year period).
C 5% return per year before expenses
Corporate Headquarters
245 Summer St.
Boston, MA 02210
www.fidelity.com
DGF-SANN-0316
1.470802.119
Fidelity Advisor® Real Estate Income Fund -
Class A, Class T and Class C
Semi-Annual Report January 31, 2016 Class A, Class T and Class C are classes of Fidelity® Real Estate Income Fund |
|
Contents
To view a fund's proxy voting guidelines and proxy voting record for the 12-month period ended June 30, visit http://www.fidelity.com/proxyvotingresults or visit the Securities and Exchange Commission's (SEC) web site at http://www.sec.gov.
You may also call 1-877-208-0098 to request a free copy of the proxy voting guidelines.
Standard & Poor's, S&P and S&P 500 are registered service marks of The McGraw-Hill Companies, Inc. and have been licensed for use by Fidelity Distributors Corporation.
Other third-party marks appearing herein are the property of their respective owners.
All other marks appearing herein are registered or unregistered trademarks or service marks of FMR LLC or an affiliated company. © 2016 FMR LLC. All rights reserved.
This report and the financial statements contained herein are submitted for the general information of the shareholders of the Fund. This report is not authorized for distribution to prospective investors in the Fund unless preceded or accompanied by an effective prospectus.
A fund files its complete schedule of portfolio holdings with the SEC for the first and third quarters of each fiscal year on Form N-Q. Forms N-Q are available on the SEC’s web site at http://www.sec.gov. A fund's Forms N-Q may be reviewed and copied at the SEC’s Public Reference Room in Washington, DC. Information regarding the operation of the SEC's Public Reference Room may be obtained by calling 1-800-SEC-0330.
For a complete list of a fund's portfolio holdings, view the most recent holdings listing, semiannual report, or annual report on Fidelity's web site at http://www.fidelity.com, http://www.advisor.fidelity.com, or http://www.401k.com, as applicable.
NOT FDIC INSURED •MAY LOSE VALUE •NO BANK GUARANTEE
Neither the Fund nor Fidelity Distributors Corporation is a bank.
Investment Summary
Top Five Stocks as of January 31, 2016
| | % of fund's net assets | % of fund's net assets 6 months ago |
| Equity Lifestyle Properties, Inc. | 4.2 | 3.5 |
| Acadia Realty Trust (SBI) | 3.1 | 2.8 |
| MFA Financial, Inc. | 2.8 | 3.0 |
| Ventas, Inc. | 2.0 | 1.5 |
| WP Carey, Inc. | 1.2 | 1.1 |
| | 13.3 | |
Top 5 Bonds as of January 31, 2016
| | % of fund's net assets | % of fund's net assets 6 months ago |
| Realogy Group LLC Tranche B, term loan 3.75% 3/5/20 | 0.9 | 1.0 |
| IAS Operating Partnership LP 5% 3/15/18 | 0.8 | 0.7 |
| RAIT Financial Trust 4% 10/1/33 | 0.7 | 0.8 |
| iStar Financial, Inc. 5.875% 3/15/16 | 0.7 | 0.6 |
| RWT Holdings, Inc. 5.625% 11/15/19 | 0.6 | 0.4 |
| | 3.7 | |
Top Five REIT Sectors as of January 31, 2016
| | % of fund's net assets | % of fund's net assets 6 months ago |
| REITs - Mortgage | 17.7 | 17.9 |
| REITs - Health Care | 6.4 | 7.4 |
| REITs - Shopping Centers | 5.7 | 5.6 |
| REITs - Apartments | 5.3 | 5.0 |
| REITs - Manufactured Homes | 5.2 | 4.5 |
Asset Allocation (% of fund's net assets)
| As of January 31, 2016 * |
| | Common Stocks | 31.0% |
| | Preferred Stocks | 19.2% |
| | Bonds | 29.5% |
| | Convertible Securities | 5.7% |
| | Other Investments | 6.8% |
| | Short-Term Investments and Net Other Assets (Liabilities) | 7.8% |

* Foreign investments - 0.7%
| As of July 31, 2015 * |
| | Common Stocks | 30.0% |
| | Preferred Stocks | 19.5% |
| | Bonds | 31.8% |
| | Convertible Securities | 5.2% |
| | Other Investments | 7.3% |
| | Short-Term Investments and Net Other Assets (Liabilities) | 6.2% |

* Foreign investments - 0.9%
Investments January 31, 2016
Showing Percentage of Net Assets
| Common Stocks - 31.0% | | | |
| | | Shares | Value |
| CONSUMER DISCRETIONARY - 0.1% | | | |
| Household Durables - 0.1% | | | |
| Stanley Martin Communities LLC Class B (a)(b) | | 4,620 | $5,586,643 |
| FINANCIALS - 30.9% | | | |
| Capital Markets - 0.5% | | | |
| Ellington Financial LLC | | 1,140,284 | 18,484,004 |
| Real Estate Investment Trusts - 29.8% | | | |
| Acadia Realty Trust (SBI) (c) | | 3,755,649 | 128,067,631 |
| AG Mortgage Investment Trust, Inc. | | 781,700 | 9,169,341 |
| American Campus Communities, Inc. | | 386,900 | 16,327,180 |
| American Tower Corp. | | 194,100 | 18,311,394 |
| Annaly Capital Management, Inc. | | 1,666,900 | 15,835,550 |
| Anworth Mortgage Asset Corp. | | 1,148,310 | 4,891,801 |
| Apartment Investment & Management Co. Class A | | 985,000 | 38,562,750 |
| Arbor Realty Trust, Inc. (c) | | 3,058,527 | 20,002,767 |
| AvalonBay Communities, Inc. | | 115,200 | 19,755,648 |
| Boardwalk (REIT) | | 136,200 | 4,281,710 |
| Care Capital Properties, Inc. | | 97,603 | 2,922,234 |
| CBL & Associates Properties, Inc. | | 2,629,473 | 28,266,835 |
| Cedar Shopping Centers, Inc. | | 830,510 | 5,863,401 |
| Chimera Investment Corp. | | 213,900 | 2,650,221 |
| Community Healthcare Trust, Inc. | | 254,862 | 4,720,044 |
| CYS Investments, Inc. | | 1,758,539 | 12,116,334 |
| Douglas Emmett, Inc. | | 295,800 | 8,749,764 |
| Dynex Capital, Inc. (d) | | 2,052,086 | 12,312,516 |
| Ellington Residential Mortgage REIT | | 260,000 | 2,979,600 |
| Equity Lifestyle Properties, Inc. | | 2,627,460 | 173,202,143 |
| Extra Space Storage, Inc. | | 323,200 | 29,311,008 |
| First Potomac Realty Trust | | 1,324,144 | 12,963,370 |
| Five Oaks Investment Corp. (d) | | 479,100 | 2,232,606 |
| Great Ajax Corp. | | 500,000 | 5,510,000 |
| Hatteras Financial Corp. | | 746,600 | 9,153,316 |
| Invesco Mortgage Capital, Inc. | | 874,600 | 9,900,472 |
| Lexington Corporate Properties Trust | | 5,135,782 | 37,645,282 |
| MFA Financial, Inc. | | 17,978,622 | 114,164,250 |
| Mid-America Apartment Communities, Inc. | | 507,100 | 47,576,122 |
| Monmouth Real Estate Investment Corp. Class A (d) | | 612,473 | 6,296,222 |
| National Retail Properties, Inc. | | 244,200 | 10,485,948 |
| New Senior Investment Group, Inc. | | 1,942,525 | 17,851,805 |
| Newcastle Investment Corp. | | 1,840,830 | 6,553,355 |
| NorthStar Realty Europe Corp. | | 1,389 | 13,112 |
| NorthStar Realty Finance Corp. | | 1,370,000 | 16,261,900 |
| Potlatch Corp. | | 769,440 | 22,190,650 |
| Sabra Health Care REIT, Inc. | | 915,903 | 16,815,979 |
| Select Income REIT | | 456,800 | 8,633,520 |
| Senior Housing Properties Trust (SBI) | | 2,994,400 | 43,358,912 |
| Simon Property Group, Inc. | | 126,100 | 23,489,908 |
| Store Capital Corp. | | 833,600 | 20,664,944 |
| Terreno Realty Corp. | | 1,728,064 | 38,846,879 |
| The Macerich Co. | | 155,500 | 12,124,335 |
| Two Harbors Investment Corp. | | 2,370,280 | 18,014,128 |
| Ventas, Inc. | | 1,510,786 | 83,576,682 |
| VEREIT, Inc. | | 1,315,034 | 10,138,912 |
| Weyerhaeuser Co. | | 587,700 | 15,050,997 |
| WP Carey, Inc. | | 866,300 | 50,461,975 |
| WP Glimcher, Inc. | | 565,163 | 5,131,680 |
| | | | 1,223,407,133 |
| Real Estate Management & Development - 0.6% | | | |
| Brookfield Asset Management, Inc. Class A | | 414,000 | 12,497,723 |
| Kennedy-Wilson Holdings, Inc. | | 514,721 | 10,438,542 |
| The RMR Group, Inc. (a) | | 1 | 21 |
| | | | 22,936,286 |
|
| TOTAL FINANCIALS | | | 1,264,827,423 |
|
| TOTAL COMMON STOCKS | | | |
| (Cost $1,214,887,378) | | | 1,270,414,066 |
|
| Preferred Stocks - 19.9% | | | |
| Convertible Preferred Stocks - 0.7% | | | |
| FINANCIALS - 0.7% | | | |
| Real Estate Investment Trusts - 0.7% | | | |
| Alexandria Real Estate Equities, Inc. Series D 7.00% | | 236,759 | 6,396,186 |
| Equity Commonwealth 6.50% (a) | | 31,237 | 778,738 |
| Lexington Corporate Properties Trust Series C, 6.50% | | 468,742 | 22,206,652 |
| | | | 29,381,576 |
| Nonconvertible Preferred Stocks - 19.2% | | | |
| FINANCIALS - 19.2% | | | |
| Capital Markets - 0.1% | | | |
| Arlington Asset Investment Corp. 6.625% | | 182,517 | 3,259,754 |
| Real Estate Investment Trusts - 18.9% | | | |
| AG Mortgage Investment Trust, Inc.: | | | |
| 8.00% | | 587,287 | 12,744,128 |
| 8.25% | | 34,859 | 786,419 |
| Alexandria Real Estate Equities, Inc. Series E, 6.45% | | 145,913 | 3,782,065 |
| American Capital Agency Corp.: | | | |
| 8.00% | | 200,000 | 5,040,000 |
| Series B, 7.75% | | 360,200 | 8,500,720 |
| American Capital Mortgage Investment Corp. Series A, 8.125% | | 248,636 | 5,867,810 |
| American Home Mortgage Investment Corp.: | | | |
| Series A, 9.75% (a) | | 120,300 | 1 |
| Series B, 9.25% (a) | | 124,100 | 1 |
| American Homes 4 Rent: | | | |
| Series A, 5.00% | | 579,260 | 14,678,448 |
| Series B, 5.00% | | 373,880 | 9,601,238 |
| Series C, 5.50% | | 900,053 | 22,933,350 |
| Annaly Capital Management, Inc.: | | | |
| Series A, 7.875% | | 134,900 | 3,363,057 |
| Series C, 7.625% | | 325,332 | 7,720,128 |
| Series D, 7.50% | | 621,976 | 14,516,920 |
| Anworth Mortgage Asset Corp. Series A, 8.625% | | 309,630 | 7,616,898 |
| Apollo Commercial Real Estate Finance, Inc. Series A, 8.625% | | 375,101 | 9,272,497 |
| Apollo Residential Mortgage, Inc. Series A, 8.00% | | 284,843 | 6,181,093 |
| Arbor Realty Trust, Inc.: | | | |
| 7.375% (c) | | 430,605 | 9,714,449 |
| Series A, 8.25% (c) | | 189,089 | 4,350,938 |
| Series B, 7.75% (c) | | 240,000 | 5,143,200 |
| Series C, 8.50% (c) | | 100,000 | 2,380,000 |
| Armour Residential REIT, Inc. Series B, 7.875% | | 153,654 | 3,046,959 |
| Ashford Hospitality Trust, Inc.: | | | |
| Series D, 8.45% | | 47,000 | 1,040,110 |
| Series E, 9.00% | | 140,751 | 3,359,726 |
| Bluerock Residental Growth (REIT), Inc. Series A 8.25% (a) | | 120,000 | 3,042,000 |
| Brandywine Realty Trust Series E, 6.90% | | 95,000 | 2,437,700 |
| Campus Crest Communities, Inc. Series A, 8.00% | | 582,117 | 15,647,305 |
| Capstead Mortgage Corp. Series E, 7.50% | | 202,984 | 4,755,915 |
| CBL & Associates Properties, Inc.: | | | |
| Series D, 7.375% | | 289,876 | 7,043,987 |
| Series E, 6.625% | | 222,063 | 4,956,446 |
| Cedar Shopping Centers, Inc. Series B, 7.25% | | 415,750 | 10,393,750 |
| Chesapeake Lodging Trust Series A, 7.75% | | 266,916 | 6,801,020 |
| Colony Financial, Inc.: | | | |
| 7.125% | | 461,815 | 9,097,756 |
| Series A, 8.50% | | 283,920 | 6,856,668 |
| Series B, 7.50% | | 108,867 | 2,309,069 |
| Coresite Realty Corp. Series A, 7.25% | | 369,799 | 9,633,264 |
| Corporate Office Properties Trust Series L, 7.375% | | 167,140 | 4,248,699 |
| CubeSmart Series A, 7.75% | | 40,000 | 1,036,000 |
| CYS Investments, Inc.: | | | |
| Series A, 7.75% | | 117,824 | 2,709,952 |
| Series B, 7.50% | | 496,667 | 11,224,674 |
| DDR Corp.: | | | |
| Series J, 6.50% | | 340,721 | 8,674,757 |
| Series K, 6.25% | | 228,888 | 5,784,000 |
| Digital Realty Trust, Inc.: | | | |
| Series E, 7.00% | | 219,819 | 5,638,357 |
| Series G, 5.875% | | 145,444 | 3,615,738 |
| Series H, 7.375% | | 50,000 | 1,338,500 |
| DuPont Fabros Technology, Inc. Series B, 7.625% | | 381,202 | 9,652,035 |
| Dynex Capital, Inc.: | | | |
| Series A, 8.50% | | 362,932 | 8,220,410 |
| Series B, 7.625% | | 252,120 | 5,420,580 |
| Equity Commonwealth Series E, 7.25% | | 648,952 | 16,554,766 |
| Equity Lifestyle Properties, Inc. Series C, 6.75% | | 950,148 | 24,114,756 |
| Essex Property Trust, Inc. Series H, 7.125% | | 40,000 | 1,012,800 |
| First Potomac Realty Trust 7.75% | | 272,709 | 6,932,263 |
| Five Oaks Investment Corp. Series A, 8.75% | | 142,000 | 2,203,840 |
| General Growth Properties, Inc. Series A, 6.375% | | 166,463 | 4,269,776 |
| Gladstone Commercial Corp. Series C, 7.125% | | 232,238 | 5,887,233 |
| Hatteras Financial Corp. Series A, 7.625% | | 522,361 | 12,191,906 |
| Hersha Hospitality Trust: | | | |
| Series B, 8.00% | | 162,538 | 4,092,707 |
| Series C, 6.875% | | 50,000 | 1,248,500 |
| Hospitality Properties Trust Series D, 7.125% | | 40,800 | 1,059,168 |
| Inland Real Estate Corp.: | | | |
| Series A, 8.125% | | 466,000 | 11,701,260 |
| Series B, 6.95% | | 245,100 | 6,164,265 |
| Invesco Mortgage Capital, Inc.: | | | |
| Series A, 7.75% | | 123,342 | 2,651,853 |
| Series B, 7.75% | | 804,729 | 17,221,201 |
| Investors Real Estate Trust Series B, 7.95% | | 126,572 | 3,264,292 |
| iStar Financial, Inc.: | | | |
| Series D, 8.00% | | 70,367 | 1,455,893 |
| Series E, 7.875% | | 281,296 | 5,766,568 |
| Series F, 7.80% | | 451,476 | 9,210,110 |
| Series G, 7.65% | | 10,497 | 215,189 |
| Kilroy Realty Corp.: | | | |
| Series G, 6.875% | | 46,760 | 1,208,278 |
| Series H, 6.375% | | 143,296 | 3,629,688 |
| LaSalle Hotel Properties: | | | |
| Series H, 7.50% | | 141,308 | 3,560,962 |
| Series I, 6.375% | | 354,698 | 8,406,343 |
| LBA Realty Fund II Series B, 7.625% | | 31,240 | 697,043 |
| MFA Financial, Inc.: | | | |
| 8.00% | | 538,930 | 13,548,700 |
| Series B, 7.50% | | 616,232 | 14,783,406 |
| Monmouth Real Estate Investment Corp.: | | | |
| Series A, 7.625% | | 80,000 | 2,113,600 |
| Series B, 7.875% | | 95,000 | 2,527,000 |
| National Retail Properties, Inc.: | | | |
| 5.70% | | 315,498 | 7,925,310 |
| Series D, 6.625% | | 222,138 | 5,793,359 |
| New York Mortgage Trust, Inc.: | | | |
| 7.875% | | 196,925 | 3,970,008 |
| Series B, 7.75% | | 239,697 | 4,846,673 |
| NorthStar Realty Finance Corp.: | | | |
| Series A 8.75% | | 7,890 | 165,059 |
| Series B, 8.25% | | 373,313 | 7,216,140 |
| Series C, 8.875% | | 329,101 | 6,835,428 |
| Series D, 8.50% | | 238,715 | 4,678,814 |
| Series E, 8.75% | | 402,327 | 8,042,517 |
| Pebblebrook Hotel Trust: | | | |
| Series A, 7.875% | | 412,000 | 10,378,280 |
| Series B, 8.00% | | 185,085 | 4,728,922 |
| Series C, 6.50% | | 204,321 | 5,044,685 |
| Pennsylvania (REIT) 7.375% | | 100,510 | 2,537,878 |
| Prologis, Inc. Series Q, 8.54% | | 94,446 | 5,885,166 |
| PS Business Parks, Inc.: | | | |
| Series S, 6.45% | | 93,809 | 2,424,963 |
| Series T, 6.00% | | 198,899 | 5,061,980 |
| Series U, 5.75% | | 600 | 15,090 |
| Public Storage 6.375% | | 122,000 | 3,307,420 |
| RAIT Financial Trust: | | | |
| 7.125% | | 336,786 | 7,261,106 |
| 7.625% | | 224,590 | 4,166,145 |
| Regency Centers Corp.: | | | |
| Series 6, 6.625% | | 152,661 | 3,982,925 |
| Series 7, 6.00% | | 176,250 | 4,480,275 |
| Resource Capital Corp. 8.625% | | 156,870 | 2,643,260 |
| Retail Properties America, Inc. 7.00% | | 394,411 | 9,919,437 |
| Sabra Health Care REIT, Inc. Series A, 7.125% | | 318,623 | 8,048,417 |
| Saul Centers, Inc. Series C, 6.875% | | 315,478 | 8,139,332 |
| Stag Industrial, Inc.: | | | |
| Series A, 9.00% | | 280,000 | 7,198,800 |
| Series B, 6.625% | | 80,300 | 1,997,864 |
| Summit Hotel Properties, Inc.: | | | |
| Series A, 9.25% | | 138,340 | 3,591,306 |
| Series B, 7.875% | | 190,173 | 4,925,481 |
| Series C, 7.125% | | 153,212 | 3,700,070 |
| Sun Communities, Inc. Series A, 7.125% | | 375,000 | 9,697,500 |
| Sunstone Hotel Investors, Inc. Series D, 8.00% | | 129,723 | 3,275,506 |
| Taubman Centers, Inc. Series K, 6.25% | | 157,322 | 3,995,979 |
| Terreno Realty Corp. Series A, 7.75% | | 213,890 | 5,561,140 |
| UMH Properties, Inc.: | | | |
| 8.00% | | 156,000 | 4,271,280 |
| Series A, 8.25% | | 600,200 | 15,425,140 |
| Urstadt Biddle Properties, Inc.: | | | |
| 6.75% | | 160,000 | 4,100,800 |
| Series F, 7.125% | | 210,000 | 5,386,500 |
| VEREIT, Inc. Series F, 6.70% | | 1,980,249 | 47,922,026 |
| Wells Fargo Real Estate Investment Corp. 6.375% | | 137,600 | 3,657,408 |
| Welltower, Inc. 6.50% | | 81,600 | 2,144,448 |
| WP Glimcher, Inc.: | | | |
| 6.875% | | 256,115 | 6,300,429 |
| 7.50% | | 198,527 | 4,990,969 |
| | | | 775,513,338 |
| Real Estate Management & Development - 0.2% | | | |
| Kennedy-Wilson, Inc. 7.75% | | 321,574 | 8,167,980 |
| TOTAL FINANCIALS | | | 786,941,072 |
| TOTAL PREFERRED STOCKS | | | |
| (Cost $833,504,891) | | | 816,322,648 |
| | | Principal Amount | Value |
|
| Corporate Bonds - 18.1% | | | |
| Convertible Bonds - 5.0% | | | |
| FINANCIALS - 5.0% | | | |
| Consumer Finance - 0.0% | | | |
| Zais Financial Partners LP 8% 11/15/16 (e) | | 2,000,000 | 1,916,250 |
| Diversified Financial Services - 0.6% | | | |
| RWT Holdings, Inc. 5.625% 11/15/19 | | 27,540,000 | 24,613,875 |
| Real Estate Investment Trusts - 3.6% | | | |
| American Realty Capital Properties, Inc. 3.75% 12/15/20 | | 8,160,000 | 7,328,700 |
| Apollo Commercial Real Estate Finance, Inc. 5.5% 3/15/19 | | 5,600,000 | 5,544,000 |
| Blackstone Mortgage Trust, Inc. 5.25% 12/1/18 | | 7,750,000 | 7,648,281 |
| Campus Crest Communities Operating Partnership LP 4.75% 10/15/18 (e) | | 12,900,000 | 12,738,750 |
| Colony Financial, Inc.: | | | |
| 3.875% 1/15/21 | | 11,410,000 | 9,976,619 |
| 5% 4/15/23 | | 19,383,000 | 17,481,043 |
| Colony Starwood Homes 4.5% 10/15/17 | | 1,965,000 | 1,947,806 |
| PennyMac Corp. 5.375% 5/1/20 | | 18,000,000 | 16,560,000 |
| RAIT Financial Trust 4% 10/1/33 | | 39,190,000 | 29,221,044 |
| Redwood Trust, Inc. 4.625% 4/15/18 | | 14,700,000 | 13,560,750 |
| Resource Capital Corp.: | | | |
| 6% 12/1/18 | | 3,490,000 | 3,202,075 |
| 8% 1/15/20 | | 16,490,000 | 15,888,775 |
| Spirit Realty Capital, Inc. 3.75% 5/15/21 | | 2,400,000 | 2,322,000 |
| Starwood Property Trust, Inc. 3.75% 10/15/17 | | 3,230,000 | 3,161,363 |
| | | | 146,581,206 |
| Thrifts & Mortgage Finance - 0.8% | | | |
| IAS Operating Partnership LP 5% 3/15/18 (e) | | 34,810,000 | 32,764,913 |
| TOTAL FINANCIALS | | | 205,876,244 |
| Nonconvertible Bonds - 13.1% | | | |
| CONSUMER DISCRETIONARY - 3.8% | | | |
| Hotels, Restaurants & Leisure - 0.4% | | | |
| FelCor Lodging LP: | | | |
| 5.625% 3/1/23 | | 2,000,000 | 1,997,500 |
| 6% 6/1/25 | | 2,025,000 | 2,045,250 |
| Hilton Worldwide Finance LLC/Hilton Worldwide Finance Corp. 5.625% 10/15/21 | | 4,000,000 | 4,120,000 |
| Times Square Hotel Trust 8.528% 8/1/26 (e) | | 7,697,500 | 9,125,270 |
| | | | 17,288,020 |
| Household Durables - 3.4% | | | |
| Ashton Woods U.S.A. LLC/Ashton Woods Finance Co. 6.875% 2/15/21 (e) | | 12,145,000 | 10,323,250 |
| Brookfield Residential Properties, Inc./Brookfield Residential U.S. Corp. 6.125% 7/1/22 (e) | | 3,660,000 | 3,211,650 |
| Brookfield Residential Properties, Inc.: | | | |
| 6.375% 5/15/25 (e) | | 2,000,000 | 1,685,000 |
| 6.5% 12/15/20 (e) | | 1,615,000 | 1,461,575 |
| Calatlantic Group, Inc.: | | | |
| 5.875% 11/15/24 | | 3,250,000 | 3,371,875 |
| 8.375% 5/15/18 | | 13,458,000 | 14,837,445 |
| D.R. Horton, Inc.: | | | |
| 4.375% 9/15/22 | | 4,175,000 | 4,154,125 |
| 4.75% 5/15/17 | | 2,000,000 | 2,045,000 |
| 5.75% 8/15/23 | | 2,510,000 | 2,641,775 |
| KB Home: | | | |
| 8% 3/15/20 | | 8,465,000 | 8,655,463 |
| 9.1% 9/15/17 | | 4,985,000 | 5,333,950 |
| Lennar Corp.: | | | |
| 4.125% 12/1/18 | | 5,520,000 | 5,575,200 |
| 4.5% 6/15/19 | | 1,830,000 | 1,875,750 |
| 4.5% 11/15/19 | | 2,000,000 | 2,055,000 |
| 6.5% 4/15/16 | | 4,000,000 | 4,025,000 |
| 6.95% 6/1/18 | | 8,925,000 | 9,527,438 |
| Meritage Homes Corp.: | | | |
| 6% 6/1/25 | | 4,000,000 | 3,900,000 |
| 7% 4/1/22 | | 7,525,000 | 7,713,125 |
| 7.15% 4/15/20 | | 7,060,000 | 7,360,050 |
| Ryland Group, Inc.: | | | |
| 6.625% 5/1/20 | | 1,555,000 | 1,675,513 |
| 8.4% 5/15/17 | | 5,420,000 | 5,772,300 |
| Taylor Morrison Communities, Inc./Monarch Communities, Inc. 5.875% 4/15/23 (e) | | 4,100,000 | 3,833,500 |
| TRI Pointe Homes, Inc. 5.875% 6/15/24 | | 3,890,000 | 3,773,300 |
| WCI Communities, Inc. 6.875% 8/15/21 | | 1,845,000 | 1,881,900 |
| William Lyon Homes, Inc.: | | | |
| 7% 8/15/22 | | 4,180,000 | 4,012,800 |
| 7% 8/15/22 (e) | | 1,000,000 | 960,000 |
| 8.5% 11/15/20 | | 15,550,000 | 16,055,375 |
| | | | 137,717,359 |
| Media - 0.0% | | | |
| CBS Outdoor Americas Capital LLC/CBS Outdoor Americas Capital Corp. 5.625% 2/15/24 | | 1,300,000 | 1,329,250 |
| TOTAL CONSUMER DISCRETIONARY | | | 156,334,629 |
| CONSUMER STAPLES - 0.1% | | | |
| Food & Staples Retailing - 0.1% | | | |
| Ahold Lease Series 2001 A1 pass thru trust certificates 7.82% 1/2/20 | | 428,368 | 463,173 |
| C&S Group Enterprises LLC 5.375% 7/15/22 (e) | | 2,505,000 | 2,267,025 |
| | | | 2,730,198 |
| FINANCIALS - 8.6% | | | |
| Diversified Financial Services - 0.3% | | | |
| Icahn Enterprises LP/Icahn Enterprises Finance Corp.: | | | |
| 5.875% 2/1/22 | | 3,680,000 | 3,289,000 |
| 6% 8/1/20 | | 8,000,000 | 7,509,200 |
| | | | 10,798,200 |
| Real Estate Investment Trusts - 5.6% | | | |
| American Campus Communities Operating Partnership LP 4.125% 7/1/24 | | 2,000,000 | 2,024,816 |
| ARC Properties Operating Partnership LP 4.6% 2/6/24 | | 10,165,000 | 9,567,806 |
| CBL & Associates LP 5.25% 12/1/23 | | 1,000,000 | 981,678 |
| Corporate Office Properties LP 3.6% 5/15/23 | | 5,000,000 | 4,647,390 |
| Crown Castle International Corp. 5.25% 1/15/23 | | 4,000,000 | 4,260,000 |
| CTR Partnership LP/CareTrust Capital Corp. 5.875% 6/1/21 | | 4,955,000 | 4,932,703 |
| CubeSmart LP 4.8% 7/15/22 | | 2,000,000 | 2,179,114 |
| DDR Corp.: | | | |
| 7.5% 7/15/18 | | 8,756,000 | 9,807,289 |
| 7.875% 9/1/20 | | 4,637,000 | 5,617,424 |
| 9.625% 3/15/16 | | 3,836,000 | 3,873,708 |
| DuPont Fabros Technology LP 5.875% 9/15/21 | | 1,000,000 | 1,030,000 |
| Equity One, Inc. 6.25% 1/15/17 | | 3,000,000 | 3,114,576 |
| HCP, Inc. 4% 6/1/25 | | 1,000,000 | 982,552 |
| Health Care Property Investors, Inc.: | | | |
| 5.625% 5/1/17 | | 2,980,000 | 3,114,139 |
| 6% 1/30/17 | | 2,383,000 | 2,481,108 |
| Health Care REIT, Inc.: | | | |
| 4% 6/1/25 | | 1,551,000 | 1,545,148 |
| 4.125% 4/1/19 | | 2,000,000 | 2,095,970 |
| 6.2% 6/1/16 | | 2,750,000 | 2,793,799 |
| Healthcare Realty Trust, Inc.: | | | |
| 3.75% 4/15/23 | | 4,022,000 | 4,023,725 |
| 5.75% 1/15/21 | | 3,095,000 | 3,453,308 |
| Highwoods/Forsyth LP: | | | |
| 3.625% 1/15/23 | | 1,607,000 | 1,593,038 |
| 5.85% 3/15/17 | | 2,800,000 | 2,919,081 |
| Hospitality Properties Trust: | | | |
| 5% 8/15/22 | | 3,177,000 | 3,281,596 |
| 5.625% 3/15/17 | | 915,000 | 944,884 |
| HRPT Properties Trust: | | | |
| 6.25% 8/15/16 | | 9,675,000 | 9,688,245 |
| 6.25% 6/15/17 | | 1,055,000 | 1,089,462 |
| 6.65% 1/15/18 | | 4,246,000 | 4,499,270 |
| iStar Financial, Inc.: | | | |
| 3.875% 7/1/16 | | 2,855,000 | 2,840,725 |
| 4% 11/1/17 | | 15,210,000 | 14,335,425 |
| 5% 7/1/19 | | 15,000,000 | 14,100,000 |
| 5.85% 3/15/17 | | 3,587,000 | 3,649,773 |
| 5.875% 3/15/16 | | 27,070,000 | 27,036,163 |
| 7.125% 2/15/18 | | 5,725,000 | 5,682,063 |
| 9% 6/1/17 | | 9,175,000 | 9,381,438 |
| MPT Operating Partnership LP/MPT Finance Corp.: | | | |
| 6.375% 2/15/22 | | 3,610,000 | 3,664,150 |
| 6.875% 5/1/21 | | 2,000,000 | 2,070,000 |
| National Retail Properties, Inc. 3.3% 4/15/23 | | 2,000,000 | 1,949,982 |
| Omega Healthcare Investors, Inc.: | | | |
| 4.5% 4/1/27 | | 2,462,000 | 2,361,866 |
| 4.95% 4/1/24 | | 2,898,000 | 2,942,302 |
| Potlatch Corp. 7.5% 11/1/19 | | 1,000,000 | 1,095,000 |
| Reckson Operating Partnership LP/SL Green Realty Corp./SL Green Operating Partnership LP 7.75% 3/15/20 | | 2,000,000 | 2,357,732 |
| Select Income REIT 4.5% 2/1/25 | | 5,000,000 | 4,623,970 |
| Senior Housing Properties Trust: | | | |
| 3.25% 5/1/19 | | 2,882,000 | 2,905,370 |
| 4.75% 5/1/24 | | 3,988,000 | 3,941,057 |
| 6.75% 4/15/20 | | 13,624,000 | 15,249,098 |
| 6.75% 12/15/21 | | 8,000,000 | 9,099,688 |
| WP Carey, Inc. 4% 2/1/25 | | 5,000,000 | 4,779,490 |
| | | | 230,607,121 |
| Real Estate Management & Development - 2.1% | | | |
| BioMed Realty LP 3.85% 4/15/16 | | 2,000,000 | 2,010,694 |
| CBRE Group, Inc.: | | | |
| 5% 3/15/23 | | 6,020,000 | 6,072,344 |
| 5.25% 3/15/25 | | 3,295,000 | 3,403,906 |
| Forestar U.S.A. Real Estate Group 8.5% 6/1/22 (e) | | 16,365,000 | 15,014,888 |
| Host Hotels & Resorts LP 5.25% 3/15/22 | | 2,000,000 | 2,161,378 |
| Howard Hughes Corp. 6.875% 10/1/21 (e) | | 11,715,000 | 11,715,000 |
| Hunt Companies, Inc. 9.625% 3/1/21 (e) | | 7,460,000 | 6,676,700 |
| Kennedy-Wilson, Inc. 5.875% 4/1/24 | | 9,310,000 | 8,891,050 |
| Mid-America Apartments LP: | | | |
| 3.75% 6/15/24 | | 1,663,000 | 1,660,075 |
| 6.05% 9/1/16 | | 2,500,000 | 2,559,108 |
| Realogy Group LLC/Realogy Co.-Issuer Corp.: | | | |
| 4.5% 4/15/19 (e) | | 4,805,000 | 4,877,075 |
| 5.25% 12/1/21 (e) | | 6,620,000 | 6,744,125 |
| Regency Centers LP 5.875% 6/15/17 | | 300,000 | 316,422 |
| Taylor Morrison Communities, Inc./Monarch Communities, Inc.: | | | |
| 5.25% 4/15/21 (e) | | 7,000,000 | 6,580,000 |
| 5.625% 3/1/24 (e) | | 2,270,000 | 2,062,863 |
| Ventas Realty LP/Ventas Capital Corp. 4% 4/30/19 | | 2,262,000 | 2,373,286 |
| Wells Operating Partnership II LP 5.875% 4/1/18 | | 3,000,000 | 3,209,613 |
| | | | 86,328,527 |
| Thrifts & Mortgage Finance - 0.6% | | | |
| Cantor Commercial Real Estate Co. LP/CCRE Finance Corp. 7.75% 2/15/18 (e) | | 4,755,000 | 4,850,100 |
| Ocwen Financial Corp. 6.625% 5/15/19 | | 23,533,000 | 20,767,873 |
| | | | 25,617,973 |
| TOTAL FINANCIALS | | | 353,351,821 |
| HEALTH CARE - 0.4% | | | |
| Health Care Providers & Services - 0.4% | | | |
| Sabra Health Care LP/Sabra Capital Corp.: | | | |
| 5.375% 6/1/23 | | 2,795,000 | 2,801,988 |
| 5.5% 2/1/21 | | 12,305,000 | 12,551,100 |
| | | | 15,353,088 |
| INDUSTRIALS - 0.1% | | | |
| Industrial Conglomerates - 0.1% | | | |
| Ladder Capital Finance Holdings LLLP/Ladder Capital Finance Corp. 7.375% 10/1/17 | | 3,050,000 | 3,042,375 |
| INFORMATION TECHNOLOGY - 0.1% | | | |
| Internet Software & Services - 0.1% | | | |
| CyrusOne LP/CyrusOne Finance Corp. 6.375% 11/15/22 | | 4,000,000 | 4,060,000 |
|
| TOTAL NONCONVERTIBLE BONDS | | | 534,872,111 |
|
| TOTAL CORPORATE BONDS | | | |
| (Cost $753,065,588) | | | 740,748,355 |
|
| Asset-Backed Securities - 2.2% | | | |
| American Homes 4 Rent: | | | |
| Series 2014-SFR2 Class E, 6.231% 10/17/36 (e) | | 3,000,000 | 2,985,444 |
| Series 2014-SFR3 Class E, 6.418% 12/17/36 (e) | | 9,025,000 | 9,086,254 |
| Series 2015-SFR1: | | | |
| Class E, 5.639% 4/17/52 (e) | | 1,999,310 | 1,901,946 |
| Class F, 5.885% 4/17/52 (e) | | 2,000,000 | 1,827,407 |
| Series 2015-SFR2: | | | |
| Class E, 6.07% 10/17/45 (e) | | 7,327,000 | 7,140,349 |
| Class XS, 0% 10/17/45 (e)(f) | | 4,882,928 | 0 |
| Capital Trust RE CDO Ltd. Series 2005-1A Class D, 1.926% 3/20/50 (e)(g) | | 2,250,000 | 225 |
| CapLease CDO Ltd. Series 2005-1A Class A, 4.926% 1/29/40 (e) | | 759,673 | 767,270 |
| Conseco Finance Securitizations Corp. Series 2002-2 Class M2, 9.163% 3/1/33 | | 500,000 | 414,760 |
| Crest Clarendon Street Ltd./Crest Clarendon Corp. Series 2002-1A Class D, 9% 12/28/35 (e) | | 305,034 | 151,541 |
| Deutsche Financial Capital Securitization LLC Series 1997-I Class M, 7.275% 9/15/27 | | 5,337,922 | 5,552,900 |
| Green Tree Financial Corp.: | | | |
| Series 1996-4 Class M1, 7.75% 6/15/27 | | 1,450,222 | 1,424,947 |
| Series 1997-3 Class M1, 7.53% 3/15/28 | | 6,696,417 | 6,716,635 |
| Invitation Homes Trust: | | | |
| Series 2013-SFR1 Class F, 4.068% 12/17/30 (e)(g) | | 1,750,000 | 1,664,629 |
| Series 2014-SFR1: | | | |
| Class E, 3.6005% 6/17/31 (e)(g) | | 10,000,000 | 9,609,619 |
| Class F, 4.1005% 6/17/31 (e)(g) | | 9,504,000 | 8,987,591 |
| Series 2014-SFR3: | | | |
| Class E, 4.926% 12/17/31 (e)(g) | | 4,336,000 | 4,297,808 |
| Class F, 5.426% 12/17/31 (e)(g) | | 2,215,000 | 2,153,830 |
| Series 2015-SFR2 Class E, 3.5005% 6/17/32 (e)(g) | | 2,450,000 | 2,305,618 |
| Series 2015-SFR3 Class F, 5.1005% 8/17/32 (e)(g) | | 2,000,000 | 1,924,643 |
| Series 2015-SRF1 Class F, 4.6505% 3/17/32 (e)(g) | | 5,500,000 | 5,218,910 |
| Lehman ABS Manufactured Housing Contract Trust Series 2001-B Class M2, 7.17% 4/15/40 | | 940,050 | 631,947 |
| Merit Securities Corp. Series 13 Class M1, 7.8381% 12/28/33 (g) | | 1,923,000 | 2,008,306 |
| Progress Residential Trust: | | | |
| Series 2015-SFR1 Class E, 4.426% 2/17/32 (e)(g) | | 1,500,000 | 1,458,842 |
| Series 2015-SFR3 Class F, 6.643% 11/12/32 (e) | | 2,940,000 | 2,962,736 |
| Starwood Waypoint Residential Trust Series 2014-1 Class F, 4.9005% 1/17/32 (e)(g) | | 4,071,000 | 3,906,008 |
| Taberna Preferred Funding III Ltd. Series 2005-3A Class D, 2.9836% 2/5/36 (e)(g) | | 3,974,526 | 397 |
| Wrightwood Capital Real Estate CDO Ltd. Series 2005-1A: | | | |
| Class A1, 0.6976% 11/21/40 (e)(g) | | 3,699,927 | 3,570,430 |
| Class F, 2.3276% 11/21/40 (e)(g) | | 250,000 | 168,750 |
| TOTAL ASSET-BACKED SECURITIES | | | |
| (Cost $94,358,207) | | | 88,839,742 |
|
| Collateralized Mortgage Obligations - 0.2% | | | |
| Private Sponsor - 0.2% | | | |
| Countrywide Home Loans, Inc.: | | | |
| Series 2002-R2 Class 2B3, 3.6495% 7/25/33 (e)(g) | | 162,845 | 25,079 |
| Series 2003-R3 Class B2, 5.5% 11/25/33 (e) | | 634,005 | 24,646 |
| FREMF Mortgage Trust: | | | |
| Series 2010-K6 Class B, 5.3578% 12/25/46 (e)(g) | | 4,500,000 | 4,927,085 |
| Series 2010-K7 Class B, 5.4407% 4/25/20 (e)(g) | | 3,200,000 | 3,530,337 |
| Merrill Lynch Mortgage Investors Trust Series 1998-C3 Class F, 6% 12/15/30 (e) | | 585,313 | 594,503 |
| RESI Finance LP/RESI Finance DE Corp. floater Series 2003-B Class B9, 12.2431% 6/10/35 (e)(g) | | 99,022 | 103,504 |
| Residential Funding Securities Corp. Series 2002-RM1 Class BI1, 5.5% 12/25/17 (e) | | 9,277 | 8,611 |
| RESIX Finance Ltd. floater: | | | |
| Series 2003-D Class B8, 6.6945% 12/10/35 (e)(g) | | 120,789 | 23,521 |
| Series 2004-A Class B7, 4.4445% 2/10/36 (e)(g) | | 121,307 | 37,787 |
| Series 2004-B Class B7, 4.1945% 2/10/36 (e)(g) | | 151,064 | 49,350 |
|
| TOTAL PRIVATE SPONSOR | | | 9,324,423 |
|
| U.S. Government Agency - 0.0% | | | |
| Fannie Mae REMIC Trust: | | | |
| Series 2001-W3 subordinate REMIC pass thru certificates, Class B3, 7% 9/25/41 (b) | | 83,363 | 24,122 |
| Series 2002-W1 subordinate REMIC pass thru certificates, Class 3B3, 3.172% 2/25/42 (e)(g) | | 67,698 | 48,620 |
| Series 2003-W1 subordinate REMIC pass thru certificates, Class B3, 4.2244% 12/25/42 (b)(g) | | 111,429 | 15,918 |
| Series 2003-W10 subordinate REMIC pass thru certificates, Class 2B3, 3.1384% 6/25/43 (e)(g) | | 104,422 | 68,036 |
| Series 2003-W4 subordinate REMIC pass thru certificates, Class 2B3, 3.0163% 10/25/42 (e)(g) | | 46,599 | 12,307 |
|
| TOTAL U.S. GOVERNMENT AGENCY | | | 169,003 |
|
| TOTAL COLLATERALIZED MORTGAGE OBLIGATIONS | | | |
| (Cost $9,390,336) | | | 9,493,426 |
|
| Commercial Mortgage Securities - 14.0% | | | |
| Americold LLC Trust Series 2010-ARTA Class D, 7.443% 1/14/29 (e) | | 2,000,000 | 2,242,371 |
| Banc of America Commercial Mortgage Trust: | | | |
| Series 2005-1 Class CJ, 5.3381% 11/10/42 (g) | | 878,434 | 877,630 |
| Series 2005-5 Class D, 5.3813% 10/10/45 (g) | | 3,795,800 | 3,794,992 |
| Bank of America Commercial Mortgage Trust Series 2015-UBS7 Class D, 3.167% 9/15/48 | | 1,000,000 | 685,276 |
| Barclays Commercial Mortgage Securities LLC Series 2015-STP Class F, 4.2844% 9/10/28 (e)(g) | | 4,074,000 | 3,519,794 |
| Bear Stearns Commercial Mortgage Securities Trust Series 2006-T22 Class B, 5.62% 4/12/38 (e)(g) | | 2,520,000 | 2,581,207 |
| Bear Stearns Commercial Mortgage Securities Trust, Series 2006-PWR11 Class AJ, 5.5101% 3/11/39 (g) | | 5,700,000 | 5,696,496 |
| BLCP Hotel Trust: | | | |
| floater Series 2014-CLRN Class F, 3.4596% 8/15/29 (e)(g) | | 2,500,000 | 2,324,962 |
| Series 2014-CLMZ Class M, 6.1535% 8/15/29 (e)(g) | | 10,392,875 | 9,795,960 |
| Boca Hotel Portfolio Trust Series 2013-BOCA Class E, 4.1755% 8/15/26 (e)(g) | | 2,500,000 | 2,492,103 |
| Carefree Portfolio Trust floater Series 2014-CARE: | | | |
| Class E, 4.426% 11/15/19 (e)(g) | | 4,905,000 | 4,838,375 |
| Class F, 3.0097% 11/15/19 (e)(g) | | 1,650,000 | 1,573,272 |
| Class MZA, 6.4025% 11/15/19 (e)(g) | | 16,217,000 | 15,994,738 |
| CGBAM Commercial Mortgage Trust: | | | |
| floater Series 2014-HD Class E, 3.3305% 2/15/31 (e)(g) | | 5,769,000 | 5,758,603 |
| Series 2015-SMRT Class F, 3.7859% 4/10/28(e)(g) | | 5,746,000 | 5,264,023 |
| Citigroup Commercial Mortgage Trust: | | | |
| Series 2013-GC15 Class D, 5.1045% 9/10/46 (e)(g) | | 5,254,000 | 4,706,117 |
| Series 2015-SHP2 Class E, 4.681% 7/15/27 (e)(g) | | 2,933,000 | 2,859,071 |
| COMM Mortgage Trust: | | | |
| sequential payer Series 2013-LC6 Class E, 3.5% 1/10/46 (e) | | 7,300,000 | 5,509,079 |
| Series 2012-CR5 Class D, 4.3374% 12/10/45 (e)(g) | | 2,000,000 | 1,900,687 |
| Series 2013-CR10 Class D, 4.7911% 8/10/46 (e)(g) | | 2,000,000 | 1,760,587 |
| Series 2013-CR12 Class D, 5.0842% 10/10/46 (e)(g) | | 4,500,000 | 4,125,294 |
| Series 2013-CR9 Class D, 4.2572% 7/10/45 (e)(g) | | 4,255,000 | 3,722,473 |
| Series 2013-LC6 Class D, 4.2855% 1/10/46 (e)(g) | | 3,870,000 | 3,413,010 |
| Series 2014-UBS2 Class D, 5.0152% 3/10/47 (e)(g) | | 3,713,000 | 3,123,200 |
| Commercial Mortgage Acceptance Corp. Series 1998-C2 Class J, 5.44% 9/15/30 (e) | | 1,552,481 | 1,505,252 |
| Commercial Mortgage Trust pass-thru certificates: | | | |
| Series 2012-CR1: | | | |
| Class C, 5.3634% 5/15/45 (g) | | 1,000,000 | 1,062,188 |
| Class D, 5.3634% 5/15/45 (e)(g) | | 5,550,000 | 5,424,024 |
| Series 2012-CR2: | | | |
| Class D, 4.8548% 8/15/45 (e)(g) | | 4,500,000 | 4,455,666 |
| Class E, 4.8548% 8/15/45 (e)(g) | | 6,000,000 | 5,600,552 |
| Series 2012-LC4: | | | |
| Class C, 5.6447% 12/10/44 (g) | | 2,000,000 | 2,150,816 |
| Class D, 5.6447% 12/10/44 (e)(g) | | 8,000,000 | 7,902,581 |
| Core Industrial Trust Series 2015-TEXW Class F, 3.8487% 2/10/34 (e)(g) | | 6,565,000 | 5,858,272 |
| Credit Suisse First Boston Mortgage Securities Corp.: | | | |
| Series 1998-C1 Class F, 6% 5/17/40 (e) | | 971,589 | 1,006,474 |
| Series 1998-C2 Class F, 6.75% 11/15/30 (e) | | 1,060,301 | 1,070,607 |
| CSMC Trust floater Series 2015-DEAL: | | | |
| Class E, 4.426% 4/15/29 (e)(g) | | 2,000,000 | 1,894,887 |
| Class F, 5.176% 4/15/29 (e)(g) | | 5,053,000 | 4,841,413 |
| DBCCRE Mortgage Trust Series 2014-ARCP Class E, 4.9345% 1/10/34 (e)(g) | | 10,853,000 | 9,929,594 |
| DBUBS Mortgage Trust Series 2011-LC1A: | | | |
| Class E, 5.6634% 11/10/46 (e)(g) | | 12,490,000 | 12,957,365 |
| Class G, 4.652% 11/10/46 (e) | | 9,843,000 | 8,343,811 |
| Extended Stay America Trust Series 2013-ESH7 Class C7, 3.9017% 12/5/31 (e) | | 500,000 | 500,252 |
| Freddie Mac: | | | |
| pass-thru certificates: | | | |
| Series K011 Class X3, 2.5754% 12/25/43 (f)(g) | | 12,206,096 | 1,387,971 |
| Series K012 Class X3, 2.2509% 1/25/41 (f)(g) | | 20,716,172 | 2,141,698 |
| Series K013 Class X3, 2.9064% 1/25/43 (f)(g) | | 14,360,000 | 1,825,452 |
| Series KAIV Class X2, 3.6147% 6/25/46 (f)(g) | | 7,430,000 | 1,241,023 |
| GAHR Commercial Mortgage Trust Series 2015-NRF: | | | |
| Class EFX, 3.3822% 12/15/19 (e)(g) | | 5,607,000 | 5,183,435 |
| Class FFX, 3.3822% 12/15/19 (e)(g) | | 8,032,000 | 7,169,205 |
| GMAC Commercial Mortgage Securities, Inc. Series 1997-C2 Class G, 6.75% 4/15/29 (g) | | 458,948 | 479,694 |
| GP Portfolio Trust Series 2014-GPP Class E, 4.1805% 2/15/27 (e)(g) | | 2,823,000 | 2,768,531 |
| Greenwich Capital Commercial Funding Corp. Series 2006-GG7 Class A4, 7.5684% 7/10/38 (g) | | 3,080,229 | 3,090,530 |
| GS Mortgage Securities Corp. II Series 2010-C1: | | | |
| Class D, 6.0789% 8/10/43 (e)(g) | | 4,000,000 | 4,106,028 |
| Class E, 4% 8/10/43 (e) | | 3,770,000 | 3,352,972 |
| GS Mortgage Securities Trust: | | | |
| Series 2010-C2 Class D, 5.1881% 12/10/43 (e)(g) | | 3,000,000 | 2,964,030 |
| Series 2011-GC5: | | | |
| Class C, 5.3078% 8/10/44 (e)(g) | | 9,000,000 | 9,627,137 |
| Class D, 5.3078% 8/10/44 (e)(g) | | 7,000,000 | 7,029,985 |
| Class E, 5.3078% 8/10/44 (e)(g) | | 4,049,000 | 3,765,560 |
| Class F, 4.5% 8/10/44 (e) | | 4,500,000 | 3,730,154 |
| Series 2012-GC6: | | | |
| Class C, 5.6314% 1/10/45 (e)(g) | | 3,600,000 | 3,808,214 |
| Class D, 5.6314% 1/10/45 (e)(g) | | 2,000,000 | 1,939,969 |
| Class E, 5% 1/10/45 (e)(g) | | 4,516,000 | 3,890,406 |
| Series 2012-GCJ7: | | | |
| Class C, 5.7229% 5/10/45 (g) | | 6,500,000 | 6,861,214 |
| Class D, 5.7229% 5/10/45 (e)(g) | | 5,500,000 | 5,312,630 |
| Class E, 5% 5/10/45 (e) | | 6,920,000 | 5,593,336 |
| Series 2012-GCJ9 Class D, 4.8524% 11/10/45 (e)(g) | | 4,504,000 | 4,107,122 |
| Series 2013-GC16: | | | |
| Class D, 5.3158% 11/10/46 (e)(g) | | 3,750,000 | 3,359,346 |
| Class F, 3.5% 11/10/46 (e) | | 7,303,000 | 5,227,035 |
| Hilton U.S.A. Trust: | | | |
| floater Series 2014-ORL Class E, 3.5805% 7/15/29 (e)(g) | | 7,241,000 | 6,947,886 |
| Series 2013-HLT Class EFX, 4.4533% 11/5/30 (e)(g) | | 5,000,000 | 4,993,814 |
| Invitation Homes Trust floater Series 2013-SFR1 Class E, 3.068% 12/17/30 (e)(g) | | 1,500,000 | 1,427,129 |
| JPMorgan Chase Commercial Mortgage Securities Corp.: | | | |
| Series 2003-C1 Class F, 5.4229% 1/12/37 (e)(g) | | 1,000,000 | 995,279 |
| Series 2009-IWST: | | | |
| Class C, 7.4453% 12/5/27 (e)(g) | | 3,000,000 | 3,498,814 |
| Class D, 7.4453% 12/5/27 (e)(g) | | 9,550,000 | 11,102,727 |
| Series 2010-CNTR: | | | |
| Class D, 6.1838% 8/5/32 (e)(g) | | 4,500,000 | 4,962,768 |
| Class XB, 0.9305% 8/5/32 (e)(f)(g) | | 32,655,000 | 1,072,965 |
| Series 2012-CBX: | | | |
| Class C, 5.2377% 6/15/45 (g) | | 4,530,000 | 4,667,393 |
| Class F, 4% 6/15/45 (e) | | 5,000,000 | 4,035,745 |
| Class G 4% 6/15/45 (e) | | 4,044,000 | 2,816,098 |
| JPMorgan Chase Commercial Mortgage Securities Trust: | | | |
| floater: | | | |
| Series 2014-FBLU Class E, 3.8305% 12/15/28 (e)(g) | | 2,406,000 | 2,370,857 |
| Series 2014-INN: | | | |
| Class E, 4.026% 6/15/29 (e)(g) | | 9,607,000 | 9,439,807 |
| Class F, 4.426% 6/15/29 (e)(g) | | 9,618,000 | 9,417,957 |
| Series 2005-LDP5 Class AJ, 5.4758% 12/15/44 (g) | | 54,979 | 54,945 |
| Series 2011-C4 Class F, 3.873% 7/15/46 (e) | | 1,400,000 | 1,227,673 |
| Series 2013-LC11: | | | |
| Class D, 4.2384% 4/15/46 (g) | | 5,250,000 | 4,543,023 |
| Class F, 3.25% 4/15/46 (e)(g) | | 2,518,000 | 1,647,056 |
| Series 2014-DSTY Class E, 3.8046% 6/10/27 (e)(g) | | 2,525,000 | 2,307,361 |
| Series 2015-UES Class F, 3.621% 9/5/32 (e)(g) | | 3,500,000 | 3,177,674 |
| JPMorgan Commercial Mortgage Finance Corp. Series 1999-C8 Class H, 6% 7/15/31 (e) | | 874,381 | 818,778 |
| LB-UBS Commercial Mortgage Trust: | | | |
| sequential payer Series 2006-C7 Class AM, 5.378% 11/15/38 | | 2,040,000 | 2,080,036 |
| Series 2006-C4: | | | |
| Class A4, 5.8201% 6/15/38 (g) | | 3,520,012 | 3,528,955 |
| Class AJ, 5.8401% 6/15/38 (g) | | 7,005,000 | 7,074,721 |
| Class AM, 5.8401% 6/15/38 (g) | | 6,700,000 | 6,792,603 |
| LSTAR Commercial Mortgage Trust Series 2014-2: | | | |
| Class D, 4.9783% 1/20/41 (e)(g) | | 3,000,000 | 2,737,147 |
| Class E, 4.9783% 1/20/41 (e)(g) | | 4,800,000 | 3,854,782 |
| Mach One Trust LLC Series 2004-1A Class H, 6.0648% 5/28/40 (e)(g) | | 479,012 | 477,815 |
| Merrill Lynch Mortgage Trust Series 2006-C1 Class AM, 5.6664% 5/12/39 (g) | | 1,200,000 | 1,204,301 |
| Mezz Capital Commercial Mortgage Trust Series 2004-C1 Class IO, 8.8661% 1/15/37 (e)(f)(g) | | 348,229 | 21,416 |
| Morgan Stanley BAML Trust: | | | |
| Series 2012-C6 Class D, 4.6573% 11/15/45 (e)(g) | | 2,000,000 | 1,840,773 |
| Series 2013-C12 Class D, 4.7664% 10/15/46 (e)(g) | | 3,250,000 | 2,961,700 |
| Series 2013-C13: | | | |
| Class D, 4.8939% 11/15/46 (e)(g) | | 3,100,000 | 2,834,372 |
| Class E, 4.8939% 11/15/46 (e)(g) | | 3,379,000 | 2,701,398 |
| Series 2013-C7 Class E, 4.2965% 2/15/46 (e)(g) | | 1,000,000 | 845,463 |
| Series 2013-C9 Class D, 4.1611% 5/15/46 (e)(g) | | 5,000,000 | 4,246,427 |
| Morgan Stanley Capital I Trust: | | | |
| sequential payer: | | | |
| Series 2006-HQ10 Class AM, 5.36% 11/12/41 | | 8,200,000 | 8,337,647 |
| Series 2012-C4 Class E, 5.5245% 3/15/45 (e)(g) | | 5,630,000 | 5,500,149 |
| Series 1997-RR Class F, 7.4216% 4/30/39 (e)(g) | | 740,663 | 727,702 |
| Series 1998-CF1 Class G, 7.35% 7/15/32 (e) | | 2,386,972 | 2,389,695 |
| Series 2006-IQ12 Class AMFX, 5.37% 12/15/43 | | 7,500,000 | 7,673,122 |
| Series 2011-C1 Class C, 5.4382% 9/15/47 (e)(g) | | 4,000,000 | 4,283,740 |
| Series 2011-C2: | | | |
| Class D, 5.3028% 6/15/44 (e)(g) | | 4,610,000 | 4,776,664 |
| Class E, 5.3028% 6/15/44 (e)(g) | | 9,600,000 | 9,594,948 |
| Class F, 5.3028% 6/15/44 (e)(g) | | 4,440,000 | 4,128,554 |
| Class XB, 0.4583% 6/15/44 (e)(f)(g) | | 63,708,222 | 1,589,170 |
| Series 2011-C3: | | | |
| Class C, 5.1783% 7/15/49 (e)(g) | | 2,000,000 | 2,117,105 |
| Class D, 5.1783% 7/15/49 (e)(g) | | 7,400,000 | 7,456,765 |
| Class G, 5.1783% 7/15/49 (e)(g) | | 3,283,000 | 2,675,801 |
| Series 2012-C4 Class D, 5.5245% 3/15/45 (e)(g) | | 6,310,000 | 6,364,725 |
| Series 2015-UBS8 Class D, 3.25% 12/15/48 (e) | | 5,013,000 | 3,491,237 |
| Motel 6 Trust Series 2015-MTL6: | | | |
| Class E, 5.2785% 2/5/30 (e) | | 5,778,000 | 5,548,489 |
| Class F, 5% 2/5/30 (e) | | 10,728,000 | 9,870,337 |
| MSJP Commercial Securities Mortgage Trust Series 2015-HAUL Class E, 4.851% 9/5/47 (e)(g) | | 1,500,000 | 1,247,609 |
| Providence Place Group Ltd. Partnership Series 2000-C1 Class A2, 7.75% 7/20/28 (e) | | 4,752,299 | 5,843,427 |
| SCG Trust Series 2013-SRP1 Class D, 3.6742% 11/15/26 (e)(g) | | 1,000,000 | 971,188 |
| TIAA Seasoned Commercial Mortgage Trust sequential payer Series 2007-C4 Class AJ, 5.5102% 8/15/39 (g) | | 884,336 | 887,598 |
| TimberStar Trust I Series 2006-1 Class F, 7.5296% 10/15/36 (e) | | 10,630,000 | 10,722,216 |
| UBS Commercial Mortgage Trust Series 2012-C1 Class D, 5.5344% 5/10/45 (e)(g) | | 3,235,000 | 3,197,398 |
| UBS-Barclays Commercial Mortgage Trust sequential payer Series 2012-C3 Class A1, 0.726% 8/10/49 | | 1,412,215 | 1,402,675 |
| UBS-Citigroup Commercial Mortgage Trust Series 2011-C1 Class B, 5.8878% 1/10/45 (e)(g) | | 3,000,000 | 3,393,280 |
| Vornado DP LLC Series 2010-VNO Class D, 6.3555% 9/13/28 (e) | | 2,540,000 | 2,829,192 |
| Wachovia Bank Commercial Mortgage Trust Series 2004-C11 Class D, 5.1191% 1/15/41 (g) | | 5,177,000 | 5,257,930 |
| Wells Fargo Commercial Mortgage Trust Series 2012-LC5 Class D, 4.7768% 10/15/45 (e)(g) | | 9,999,000 | 9,260,385 |
| WF-RBS Commercial Mortgage Trust: | | | |
| sequential payer Series 2011-C4I Class G, 5% 6/15/44 (e) | | 4,000,000 | 3,066,684 |
| Series 2011-C3: | | | |
| Class C, 5.335% 3/15/44 (e) | | 4,900,000 | 5,159,663 |
| Class D, 5.5722% 3/15/44 (e)(g) | | 1,000,000 | 1,016,292 |
| Class E, 5% 3/15/44 (e) | | 3,000,000 | 2,678,416 |
| Series 2011-C5: | | | |
| Class F, 5.25% 11/15/44 (e)(g) | | 3,000,000 | 2,416,400 |
| Class G, 5.25% 11/15/44 (e)(g) | | 2,000,000 | 1,531,082 |
| Series 2012-C10 Class E, 4.4542% 12/15/45 (e)(g) | | 4,090,000 | 3,088,721 |
| Series 2012-C7: | | | |
| Class D, 4.8377% 6/15/45 (e)(g) | | 2,380,000 | 2,363,987 |
| Class F, 4.5% 6/15/45 (e) | | 2,000,000 | 1,688,720 |
| Series 2013-C11: | | | |
| Class D, 4.1794% 3/15/45 (e)(g) | | 5,830,000 | 5,041,972 |
| Class E, 4.1794% 3/15/45 (e)(g) | | 4,780,000 | 3,844,105 |
| Series 2013-C13 Class D, 4.1386% 5/15/45 (e)(g) | | 4,000,000 | 3,570,867 |
| Series 2013-UBS1 Class D, 4.6299% 3/15/46 (e)(g) | | 1,668,000 | 1,481,765 |
| WFCG Commercial Mortgage Trust floater Series 2015-BXRP: | | | |
| Class F, 4.0508% 11/15/29 (e)(g) | | 5,152,378 | 5,101,792 |
| Class G, 3.3505% 11/15/29 (e)(g) | | 3,391,668 | 3,083,539 |
| TOTAL COMMERCIAL MORTGAGE SECURITIES | | | |
| (Cost $560,702,920) | | | 574,426,162 |
|
| Bank Loan Obligations - 6.8% | | | |
| CONSUMER DISCRETIONARY - 2.8% | | | |
| Hotels, Restaurants & Leisure - 2.1% | | | |
| Caesars Entertainment Resort Properties LLC Tranche B 1LN, term loan 7% 10/11/20 (g) | | 13,170,905 | 11,452,101 |
| Caesars Growth Properties Holdings, LLC Tranche 1LN, term loan 6.25% 5/8/21 (g) | | 10,143,093 | 8,384,991 |
| Cooper Hotel Group 12% 11/6/17 | | 13,156,538 | 13,814,365 |
| ESH Hospitality, Inc. Tranche B, term loan 5% 6/24/19 (g) | | 14,218,748 | 14,254,294 |
| Four Seasons Holdings, Inc.: | | | |
| Tranche 2LN, term loan 6.25% 12/27/20 (g) | | 2,150,000 | 2,115,063 |
| Tranche B 1LN, term loan 3.5% 6/27/20 (g) | | 1,986,701 | 1,956,900 |
| Hilton Worldwide Finance, LLC Tranche B, term loan 3.5% 10/25/20 (g) | | 14,821,555 | 14,787,317 |
| La Quinta Intermediate Holdings LLC Tranche B LN, term loan 3.75% 4/14/21 (g) | | 13,115,812 | 12,574,785 |
| Playa Resorts Holding BV Tranche B, term loan 4% 8/9/19 (g) | | 6,438,522 | 6,213,174 |
| Ryman Hospitality Properties, Inc. Tranche B, term loan 3.5% 1/15/21 (g) | | 2,255,650 | 2,244,372 |
| | | | 87,797,362 |
| Media - 0.2% | | | |
| CBS Outdoor Americas Capital LLC/CBS Outdoor Americas Capital Corp. Tranche B, term loan 3% 1/31/21 (g) | | 7,776,563 | 7,672,046 |
| Multiline Retail - 0.4% | | | |
| JC Penney Corp., Inc. Tranche B, term loan 6% 5/22/18 (g) | | 15,306,656 | 14,943,123 |
| Specialty Retail - 0.1% | | | |
| The Pep Boys - Manny, Moe & Jack Tranche B, term loan 5.5% 10/11/18 (g) | | 6,181,627 | 6,173,900 |
|
| TOTAL CONSUMER DISCRETIONARY | | | 116,586,431 |
|
| CONSUMER STAPLES - 0.4% | | | |
| Food & Staples Retailing - 0.4% | | | |
| Albertson's LLC: | | | |
| Tranche B 2LN, term loan 5.5% 3/21/19 (g) | | 5,084,922 | 5,031,225 |
| Tranche B 3LN, term loan 5.125% 8/25/19 (g) | | 8,166,812 | 7,983,059 |
| Tranche B 5LN, term loan 12/21/22 (h) | | 5,005,000 | 4,886,131 |
| | | | 17,900,415 |
| ENERGY - 0.5% | | | |
| Oil, Gas & Consumable Fuels - 0.5% | | | |
| Moxie Patriot LLC Tranche B, term loan 6.75% 12/19/20 (g) | | 2,000,000 | 1,800,000 |
| Panda Sherman Power, LLC term loan 9% 9/14/18 (g) | | 7,112,245 | 6,223,215 |
| Panda Temple Power, LLC term loan 7.25% 4/3/19 (g) | | 8,580,000 | 7,293,000 |
| TPF II Power, LLC Tranche B, term loan 5.5% 10/2/21 (g) | | 4,190,353 | 4,014,903 |
| | | | 19,331,118 |
| FINANCIALS - 1.8% | | | |
| Real Estate Investment Trusts - 0.3% | | | |
| Starwood Property Trust, Inc. Tranche B, term loan 3.5% 4/17/20 (g) | | 10,767,409 | 10,583,501 |
| Real Estate Management & Development - 1.3% | | | |
| AmeriCold Reality Operating Partnership LP Tranche B, term loan 6.5% 12/1/22 (g) | | 8,345,000 | 8,324,138 |
| CityCenter 8.74% 7/12/16 (g) | | 2,220,904 | 2,220,904 |
| NorthStar Asset Management LP Tranche B 1LN, term loan 4.625% 1/29/23 (g) | | 5,010,000 | 4,834,650 |
| Realogy Corp. Credit-Linked Deposit 4.6795% 10/10/16 (g) | | 418,475 | 412,198 |
| Realogy Group LLC Tranche B, term loan 3.75% 3/5/20 (g) | | 37,814,057 | 37,511,545 |
| | | | 53,303,435 |
| Thrifts & Mortgage Finance - 0.2% | | | |
| Ocwen Loan Servicing, LLC Tranche B, term loan 5.5% 2/15/18 (g) | | 7,680,832 | 7,666,469 |
|
| TOTAL FINANCIALS | | | 71,553,405 |
|
| HEALTH CARE - 0.1% | | | |
| Health Care Providers & Services - 0.1% | | | |
| Community Health Systems, Inc.: | | | |
| Tranche F, term loan 3.6567% 12/31/18 (g) | | 1,985,000 | 1,951,632 |
| Tranche H, term loan 4% 1/27/21 (g) | | 3,104,062 | 2,983,779 |
| | | | 4,935,411 |
| INDUSTRIALS - 0.4% | | | |
| Commercial Services & Supplies - 0.3% | | | |
| Lineage Logistics Holdings, LLC. Tranche B, term loan 4.5% 4/7/21 (g) | | 3,930,000 | 3,507,525 |
| Pilot Travel Centers LLC Tranche B, term loan 3.75% 10/3/21 (g) | | 7,200,000 | 7,198,200 |
| | | | 10,705,725 |
| Construction & Engineering - 0.1% | | | |
| Drumm Investors LLC Tranche B, term loan 6.75% 5/4/18 (g) | | 5,635,081 | 5,547,061 |
|
| TOTAL INDUSTRIALS | | | 16,252,786 |
|
| UTILITIES - 0.8% | | | |
| Electric Utilities - 0.5% | | | |
| Calpine Construction Finance Co. LP Tranche B 2LN, term loan 3.25% 1/31/22 (g) | | 7,269,112 | 6,828,458 |
| Essential Power LLC Tranche B, term loan 4.75% 8/8/19 (g) | | 3,344,688 | 3,252,709 |
| La Frontera Generation, LLC Tranche B, term loan 4.5% 9/30/20 (g) | | 7,910,170 | 7,560,145 |
| Southeast Powergen LLC Tranche B, term loan 4.5% 12/2/21 (g) | | 2,742,300 | 2,701,166 |
| | | | 20,342,478 |
| Independent Power and Renewable Electricity Producers - 0.3% | | | |
| Calpine Corp. Tranche B 4LN, term loan 4% 10/31/20 (g) | | 1,960,000 | 1,900,220 |
| Tempus Public Foundation Generation Holdings LLC Tranche B, term loan 4.75% 12/31/17 (g) | | 11,427,742 | 10,099,267 |
| | | | 11,999,487 |
|
| TOTAL UTILITIES | | | 32,341,965 |
|
| TOTAL BANK LOAN OBLIGATIONS | | | |
| (Cost $288,225,610) | | | 278,901,531 |
|
| Preferred Securities - 0.0% | | | |
| FINANCIALS - 0.0% | | | |
| Diversified Financial Services - 0.0% | | | |
| Crest Dartmouth Street 2003 1 Ltd. Series 2003-1A Class PS, 6/28/38 (e) | | 1,220,000 | 236,558 |
| Thrifts & Mortgage Finance - 0.0% | | | |
| Crest Clarendon Street 2002-1 Ltd. Series 2002-1A Class PS, 12/28/35 (e) | | 500,000 | 250 |
| TOTAL FINANCIALS | | | |
| (Cost $1,297,768) | | | 236,808 |
| | | Shares | Value |
|
| Money Market Funds - 7.7% | | | |
| Fidelity Cash Central Fund, 0.38% (i) | | 315,432,448 | 315,432,448 |
| Fidelity Securities Lending Cash Central Fund, 0.42% (i)(j) | | 836,900 | 836,900 |
| TOTAL MONEY MARKET FUNDS | | | |
| (Cost $316,269,348) | | | 316,269,348 |
| TOTAL INVESTMENT PORTFOLIO - 99.9% | | | |
| (Cost $4,071,702,046) | | | 4,095,652,086 |
| NET OTHER ASSETS (LIABILITIES) - 0.1% | | | 4,270,263 |
| NET ASSETS - 100% | | | $4,099,922,349 |
Percentages shown as 0.0% may reflect amounts less than 0.05%.
Legend
(a) Non-income producing
(b) Restricted securities - Investment in securities not registered under the Securities Act of 1933 (excluding 144A issues). At the end of the period, the value of restricted securities (excluding 144A issues) amounted to $5,626,683 or 0.1% of net assets.
(c) Affiliated company
(d) Security or a portion of the security is on loan at period end.
(e) Security exempt from registration under Rule 144A of the Securities Act of 1933. These securities may be resold in transactions exempt from registration, normally to qualified institutional buyers. At the end of the period, the value of these securities amounted to $710,214,608 or 17.3% of net assets.
(f) Security represents right to receive monthly interest payments on an underlying pool of mortgages or assets. Principal shown is the outstanding par amount of the pool as of the end of the period.
(g) Coupon rates for floating and adjustable rate securities reflect the rates in effect at period end.
(h) The coupon rate will be determined upon settlement of the loan after period end.
(i) Affiliated fund that is generally available only to investment companies and other accounts managed by Fidelity Investments. The rate quoted is the annualized seven-day yield of the fund at period end. A complete unaudited listing of the fund's holdings as of its most recent quarter end is available upon request. In addition, each Fidelity Central Fund's financial statements, which are not covered by the Fund's Report of Independent Registered Public Accounting Firm, are available on the SEC's website or upon request.
(j) Investment made with cash collateral received from securities on loan.
Additional information on each restricted holding is as follows:
| Security | Acquisition Date | Acquisition Cost |
| Fannie Mae REMIC Trust Series 2001-W3 subordinate REMIC pass thru certificates, Class B3, 7% 9/25/41 | 5/21/03 | $72,239 |
| Fannie Mae REMIC Trust Series 2003-W1 subordinate REMIC pass thru certificates, Class B3, 4.2244% 12/25/42 | 3/25/03 | $66,253 |
| Stanley Martin Communities LLC Class B | 8/3/05 - 3/1/07 | $4,244,623 |
Affiliated Central Funds
Information regarding fiscal year to date income earned by the Fund from investments in Fidelity Central Funds is as follows:
| Fund | Income earned |
| Fidelity Cash Central Fund | $276,541 |
| Fidelity Securities Lending Cash Central Fund | 12,966 |
| Total | $289,507 |
Other Affiliated Issuers
An affiliated company is a company in which the Fund has ownership of at least 5% of the voting securities. Fiscal year to date transactions with companies which are or were affiliates are as follows:
| Affiliate | Value, beginning of period | Purchases | Sales Proceeds | Dividend Income | Value, end of period |
| Acadia Realty Trust (SBI) | $119,299,759 | $826,274 | $-- | $1,870,757 | $128,067,631 |
| Arbor Realty Trust, Inc. | 20,991,789 | -- | 75,982 | 920,693 | 20,002,767 |
| Arbor Realty Trust, Inc. 7.375% | 10,597,189 | -- | -- | 396,964 | 9,714,449 |
| Arbor Realty Trust, Inc. Series A, 8.25% | 4,814,206 | -- | -- | 194,998 | 4,350,938 |
| Arbor Realty Trust, Inc. Series B, 7.75% | 5,940,000 | -- | -- | 232,500 | 5,143,200 |
| Arbor Realty Trust, Inc. Series C, 8.50% | 2,578,000 | -- | -- | 106,250 | 2,380,000 |
| Total | $164,220,943 | $826,274 | $75,982 | $3,722,162 | $169,658,985 |
Investment Valuation
The following is a summary of the inputs used, as of January 31, 2016, involving the Fund's assets and liabilities carried at fair value. The inputs or methodology used for valuing securities may not be an indication of the risk associated with investing in those securities. For more information on valuation inputs, and their aggregation into the levels used below, please refer to the Investment Valuation section in the accompanying Notes to Financial Statements.
| | Valuation Inputs at Reporting Date: |
| Description | Total | Level 1 | Level 2 | Level 3 |
| Investments in Securities: | | | | |
| Equities: | | | | |
| Consumer Discretionary | $5,586,643 | $-- | $-- | $5,586,643 |
| Financials | 2,081,150,071 | 2,045,965,022 | 35,185,047 | 2 |
| Corporate Bonds | 740,748,355 | -- | 740,748,355 | -- |
| Asset-Backed Securities | 88,839,742 | -- | 84,316,452 | 4,523,290 |
| Collateralized Mortgage Obligations | 9,493,426 | -- | 9,164,040 | 329,386 |
| Commercial Mortgage Securities | 574,426,162 | -- | 574,404,746 | 21,416 |
| Bank Loan Obligations | 278,901,531 | -- | 262,454,064 | 16,447,467 |
| Preferred Securities | 236,808 | -- | -- | 236,808 |
| Money Market Funds | 316,269,348 | 316,269,348 | -- | -- |
| Total Investments in Securities: | $4,095,652,086 | $2,362,234,370 | $1,706,272,704 | $27,145,012 |
Other Information
The composition of credit quality ratings as a percentage of Total Net Assets is as follows (Unaudited):
| U.S. Government and U.S. Government Agency Obligations | 0.3% |
| AAA,AA,A | 3.2% |
| BBB | 7.7% |
| BB | 10.2% |
| B | 9.9% |
| CCC,CC,C | 0.8% |
| D | 0.0% |
| Not Rated | 9.2% |
| Equities | 50.9% |
| Short-Term Investments and Net Other Assets | 7.8% |
| | 100.0% |
We have used ratings from Moody's Investors Service, Inc. Where Moody's® ratings are not available, we have used S&P® ratings. All ratings are as of the date indicated and do not reflect subsequent changes.
See accompanying notes which are an integral part of the financial statements.
Financial Statements
Statement of Assets and Liabilities
| | | January 31, 2016 |
| Assets | | |
Investment in securities, at value (including securities loaned of $830,672) — See accompanying schedule:
Unaffiliated issuers (cost $3,629,713,380) | $3,609,723,753 | |
| Fidelity Central Funds (cost $316,269,348) | 316,269,348 | |
| Other affiliated issuers (cost $125,719,318) | 169,658,985 | |
| Total Investments (cost $4,071,702,046) | | $4,095,652,086 |
| Cash | | 406,585 |
| Receivable for investments sold | | 10,498,133 |
| Receivable for fund shares sold | | 6,810,879 |
| Dividends receivable | | 2,831,056 |
| Interest receivable | | 16,631,028 |
| Distributions receivable from Fidelity Central Funds | | 90,835 |
| Prepaid expenses | | 7,239 |
| Other receivables | | 6,404 |
| Total assets | | 4,132,934,245 |
| Liabilities | | |
| Payable for investments purchased | $22,893,903 | |
| Payable for fund shares redeemed | 6,090,145 | |
| Accrued management fee | 1,865,778 | |
| Distribution and service plan fees payable | 336,650 | |
| Other affiliated payables | 895,024 | |
| Other payables and accrued expenses | 93,496 | |
| Collateral on securities loaned, at value | 836,900 | |
| Total liabilities | | 33,011,896 |
| Net Assets | | $4,099,922,349 |
| Net Assets consist of: | | |
| Paid in capital | | $4,058,965,412 |
| Undistributed net investment income | | 5,433,035 |
| Accumulated undistributed net realized gain (loss) on investments and foreign currency transactions | | 11,573,767 |
| Net unrealized appreciation (depreciation) on investments and assets and liabilities in foreign currencies | | 23,950,135 |
| Net Assets | | $4,099,922,349 |
| Calculation of Maximum Offering Price | | |
| Class A: | | |
| Net Asset Value and redemption price per share ($502,555,910 ÷ 45,733,048 shares) | | $10.99 |
| Maximum offering price per share (100/96.00 of $10.99) | | $11.45 |
| Class T: | | |
| Net Asset Value and redemption price per share ($55,119,063 ÷ 5,012,997 shares) | | $11.00 |
| Maximum offering price per share (100/96.00 of $11.00) | | $11.46 |
| Class C: | | |
| Net Asset Value and offering price per share ($266,307,883 ÷ 24,437,854 shares)(a) | | $10.90 |
| Real Estate Income: | | |
| Net Asset Value, offering price and redemption price per share ($2,432,269,584 ÷ 220,305,689 shares) | | $11.04 |
| Class I: | | |
| Net Asset Value, offering price and redemption price per share ($843,669,909 ÷ 76,623,780 shares) | | $11.01 |
(a) Redemption price per share is equal to net asset value less any applicable contingent deferred sales charge.
See accompanying notes which are an integral part of the financial statements.
Statement of Operations
| | | Six months ended January 31, 2016 |
| Investment Income | | |
| Dividends (including $3,722,162 earned from other affiliated issuers) | | $57,796,227 |
| Interest | | 54,330,088 |
| Income from Fidelity Central Funds | | 289,507 |
| Total income | | 112,415,822 |
| Expenses | | |
| Management fee | $11,438,256 | |
| Transfer agent fees | 4,677,965 | |
| Distribution and service plan fees | 2,074,923 | |
| Accounting and security lending fees | 666,667 | |
| Custodian fees and expenses | 18,251 | |
| Independent trustees' compensation | 9,217 | |
| Registration fees | 92,142 | |
| Audit | 92,436 | |
| Legal | 8,157 | |
| Miscellaneous | 11,803 | |
| Total expenses before reductions | 19,089,817 | |
| Expense reductions | (38,726) | 19,051,091 |
| Net investment income (loss) | | 93,364,731 |
| Realized and Unrealized Gain (Loss) | | |
| Net realized gain (loss) on: | | |
| Investment securities: | | |
| Unaffiliated issuers | 27,697,024 | |
| Other affiliated issuers | (10,109) | |
| Foreign currency transactions | (103,705) | |
| Total net realized gain (loss) | | 27,583,210 |
Change in net unrealized appreciation (depreciation) on:
Investment securities | (192,848,074) | |
| Assets and liabilities in foreign currencies | 70,075 | |
| Total change in net unrealized appreciation (depreciation) | | (192,777,999) |
| Net gain (loss) | | (165,194,789) |
| Net increase (decrease) in net assets resulting from operations | | $(71,830,058) |
See accompanying notes which are an integral part of the financial statements.
Statement of Changes in Net Assets
| | Six months ended January 31, 2016 | Year ended July 31, 2015 |
| Increase (Decrease) in Net Assets | | |
| Operations | | |
| Net investment income (loss) | $93,364,731 | $200,528,467 |
| Net realized gain (loss) | 27,583,210 | 54,207,307 |
| Change in net unrealized appreciation (depreciation) | (192,777,999) | (52,184,229) |
| Net increase (decrease) in net assets resulting from operations | (71,830,058) | 202,551,545 |
| Distributions to shareholders from net investment income | (122,107,962) | (199,452,326) |
| Distributions to shareholders from net realized gain | (51,815,947) | (75,677,564) |
| Total distributions | (173,923,909) | (275,129,890) |
| Share transactions - net increase (decrease) | 28,537,379 | 215,193,161 |
| Redemption fees | 122,503 | 424,938 |
| Total increase (decrease) in net assets | (217,094,085) | 143,039,754 |
| Net Assets | | |
| Beginning of period | 4,317,016,434 | 4,173,976,680 |
| End of period (including undistributed net investment income of $5,433,035 and undistributed net investment income of $34,176,266, respectively) | $4,099,922,349 | $4,317,016,434 |
See accompanying notes which are an integral part of the financial statements.
Financial Highlights — Fidelity Real Estate Income Fund Class A
| | Six months ended | Years ended July 31, | | | | |
| January 31, | 2016 | 2015 | 2014 | 2013 | 2012 | 2011 |
| Selected Per–Share Data | | | | | | |
| Net asset value, beginning of period | $11.66 | $11.86 | $11.67 | $11.26 | $10.73 | $9.94 |
| Income from Investment Operations | | | | | | |
| Net investment income (loss)A | .25 | .52 | .49 | .54 | .52 | .53 |
| Net realized and unrealized gain (loss) | (.45) | .02 | .44 | .60 | .61 | .76 |
| Total from investment operations | (.20) | .54 | .93 | 1.14 | 1.13 | 1.29 |
| Distributions from net investment income | (.33) | (.52) | (.50) | (.53) | (.51) | (.50) |
| Distributions from net realized gain | (.14) | (.21) | (.24) | (.20) | (.10) | – |
| Total distributions | (.47) | (.74)B | (.74) | (.73) | (.60)C | (.50) |
| Redemption fees added to paid in capitalA,D | – | – | – | – | – | – |
| Net asset value, end of period | $10.99 | $11.66 | $11.86 | $11.67 | $11.26 | $10.73 |
| Total ReturnE,F,G | (1.74)% | 4.65% | 8.49% | 10.45% | 11.24% | 13.27% |
| Ratios to Average Net AssetsH,I | | | | | | |
| Expenses before reductions | 1.03%J | 1.04% | 1.06% | 1.08% | 1.12% | 1.13% |
| Expenses net of fee waivers, if any | 1.03%J | 1.03% | 1.05% | 1.08% | 1.12% | 1.13% |
| Expenses net of all reductions | 1.03%J | 1.03% | 1.05% | 1.07% | 1.11% | 1.12% |
| Net investment income (loss) | 4.36%J | 4.40% | 4.28% | 4.62% | 4.89% | 5.00% |
| Supplemental Data | | | | | | |
| Net assets, end of period (000 omitted) | $502,556 | $495,462 | $442,271 | $378,269 | $137,352 | $60,283 |
| Portfolio turnover rateK | 15%J | 19% | 29% | 26% | 27% | 25% |
A Calculated based on average shares outstanding during the period.
B Total distributions of $.74 per share is comprised of distributions from net investment income of $.523 and distributions from net realized gain of $.212 per share.
C Total distributions of $.60 per share is comprised of distributions from net investment income of $.505 and distributions from net realized gain of $.097 per share.
D Amount represents less than $.005 per share.
E Total returns for periods of less than one year are not annualized.
F Total returns would have been lower if certain expenses had not been reduced during the applicable periods shown.
G Total returns do not include the effect of the sales charges.
H Fees and expenses of any underlying Fidelity Central Funds are not included in the Fund's expense ratio. The Fund indirectly bears its proportionate share of the expenses of any underlying Fidelity Central Funds.
I Expense ratios reflect operating expenses of the class. Expenses before reductions do not reflect amounts reimbursed by the investment adviser or reductions from brokerage service arrangements or reductions from other expense offset arrangements and do not represent the amount paid by the class during periods when reimbursements or reductions occur. Expenses net of fee waivers reflect expenses after reimbursement by the investment adviser but prior to reductions from brokerage service arrangements or other expense offset arrangements. Expenses net of all reductions represent the net expenses paid by the class.
J Annualized
K Amount does not include the portfolio activity of any underlying Fidelity Central Funds.
See accompanying notes which are an integral part of the financial statements.
Financial Highlights — Fidelity Real Estate Income Fund Class T
| | Six months ended | Years ended July 31, | | | | |
| January 31, | 2016 | 2015 | 2014 | 2013 | 2012 | 2011 |
| Selected Per–Share Data | | | | | | |
| Net asset value, beginning of period | $11.66 | $11.86 | $11.67 | $11.26 | $10.72 | $9.94 |
| Income from Investment Operations | | | | | | |
| Net investment income (loss)A | .25 | .51 | .49 | .54 | .52 | .52 |
| Net realized and unrealized gain (loss) | (.44) | .02 | .43 | .60 | .62 | .76 |
| Total from investment operations | (.19) | .53 | .92 | 1.14 | 1.14 | 1.28 |
| Distributions from net investment income | (.32) | (.52) | (.50) | (.53) | (.50) | (.50) |
| Distributions from net realized gain | (.14) | (.21) | (.24) | (.20) | (.10) | – |
| Total distributions | (.47)B | (.73) | (.73)C | (.73) | (.60) | (.50) |
| Redemption fees added to paid in capitalA,D | – | – | – | – | – | – |
| Net asset value, end of period | $11.00 | $11.66 | $11.86 | $11.67 | $11.26 | $10.72 |
| Total ReturnE,F,G | (1.67)% | 4.62% | 8.44% | 10.42% | 11.33% | 13.11% |
| Ratios to Average Net AssetsH,I | | | | | | |
| Expenses before reductions | 1.07%J | 1.06% | 1.08% | 1.08% | 1.11% | 1.16% |
| Expenses net of fee waivers, if any | 1.07%J | 1.06% | 1.08% | 1.08% | 1.11% | 1.16% |
| Expenses net of all reductions | 1.07%J | 1.06% | 1.07% | 1.08% | 1.11% | 1.16% |
| Net investment income (loss) | 4.33%J | 4.37% | 4.26% | 4.61% | 4.90% | 4.96% |
| Supplemental Data | | | | | | |
| Net assets, end of period (000 omitted) | $55,119 | $55,424 | $48,164 | $46,198 | $26,143 | $7,626 |
| Portfolio turnover rateK | 15%J | 19% | 29% | 26% | 27% | 25% |
A Calculated based on average shares outstanding during the period.
B Total distributions of $.47 per share is comprised of distributions from net investment income of $.324 and distributions from net realized gain of $.142 per share.
C Total distributions of $.73 per share is comprised of distributions from net investment income of $.496 and distributions from net realized gain of $.236 per share.
D Amount represents less than $.005 per share.
E Total returns for periods of less than one year are not annualized.
F Total returns would have been lower if certain expenses had not been reduced during the applicable periods shown.
G Total returns do not include the effect of the sales charges.
H Fees and expenses of any underlying Fidelity Central Funds are not included in the Fund's expense ratio. The Fund indirectly bears its proportionate share of the expenses of any underlying Fidelity Central Funds.
I Expense ratios reflect operating expenses of the class. Expenses before reductions do not reflect amounts reimbursed by the investment adviser or reductions from brokerage service arrangements or reductions from other expense offset arrangements and do not represent the amount paid by the class during periods when reimbursements or reductions occur. Expenses net of fee waivers reflect expenses after reimbursement by the investment adviser but prior to reductions from brokerage service arrangements or other expense offset arrangements. Expenses net of all reductions represent the net expenses paid by the class.
J Annualized
K Amount does not include the portfolio activity of any underlying Fidelity Central Funds.
See accompanying notes which are an integral part of the financial statements.
See accompanying notes which are an integral part of the financial statements.
Financial Highlights — Fidelity Real Estate Income Fund Class C
| | Six months ended | Years ended July 31, | | | | |
| January 31, | 2016 | 2015 | 2014 | 2013 | 2012 | 2011 |
| Selected Per–Share Data | | | | | | |
| Net asset value, beginning of period | $11.55 | $11.77 | $11.59 | $11.20 | $10.67 | $9.93 |
| Income from Investment Operations | | | | | | |
| Net investment income (loss)A | .20 | .43 | .40 | .45 | .44 | .45 |
| Net realized and unrealized gain (loss) | (.43) | .01 | .43 | .60 | .62 | .74 |
| Total from investment operations | (.23) | .44 | .83 | 1.05 | 1.06 | 1.19 |
| Distributions from net investment income | (.28) | (.45) | (.42) | (.46) | (.43) | (.45) |
| Distributions from net realized gain | (.14) | (.21) | (.24) | (.20) | (.10) | – |
| Total distributions | (.42) | (.66) | (.65)B | (.66) | (.53) | (.45) |
| Redemption fees added to paid in capitalA,C | – | – | – | – | – | – |
| Net asset value, end of period | $10.90 | $11.55 | $11.77 | $11.59 | $11.20 | $10.67 |
| Total ReturnD,E,F | (2.02)% | 3.82% | 7.66% | 9.66% | 10.49% | 12.25% |
| Ratios to Average Net AssetsG,H | | | | | | |
| Expenses before reductions | 1.79%I | 1.79% | 1.79% | 1.81% | 1.87% | 1.89% |
| Expenses net of fee waivers, if any | 1.79%I | 1.78% | 1.79% | 1.81% | 1.87% | 1.89% |
| Expenses net of all reductions | 1.78%I | 1.78% | 1.79% | 1.81% | 1.87% | 1.89% |
| Net investment income (loss) | 3.61%I | 3.65% | 3.54% | 3.88% | 4.14% | 4.23% |
| Supplemental Data | | | | | | |
| Net assets, end of period (000 omitted) | $266,308 | $291,387 | $246,306 | $204,012 | $52,780 | $21,555 |
| Portfolio turnover rateJ | 15%I | 19% | 29% | 26% | 27% | 25% |
A Calculated based on average shares outstanding during the period.
B Total distributions of $.65 per share is comprised of distributions from net investment income of $.417 and distributions from net realized gain of $.236 per share.
C Amount represents less than $.005 per share.
D Total returns for periods of less than one year are not annualized.
E Total returns would have been lower if certain expenses had not been reduced during the applicable periods shown.
F Total returns do not include the effect of the contingent deferred sales charge.
G Fees and expenses of any underlying Fidelity Central Funds are not included in the Fund's expense ratio. The Fund indirectly bears its proportionate share of the expenses of any underlying Fidelity Central Funds.
H Expense ratios reflect operating expenses of the class. Expenses before reductions do not reflect amounts reimbursed by the investment adviser or reductions from brokerage service arrangements or reductions from other expense offset arrangements and do not represent the amount paid by the class during periods when reimbursements or reductions occur. Expenses net of fee waivers reflect expenses after reimbursement by the investment adviser but prior to reductions from brokerage service arrangements or other expense offset arrangements. Expenses net of all reductions represent the net expenses paid by the class.
I Annualized
J Amount does not include the portfolio activity of any underlying Fidelity Central Funds.
See accompanying notes which are an integral part of the financial statements.
Financial Highlights — Fidelity Real Estate Income Fund
| | Six months ended | Years ended July 31, | | | | |
| January 31, | 2016 | 2015 | 2014 | 2013 | 2012 | 2011 |
| Selected Per–Share Data | | | | | | |
| Net asset value, beginning of period | $11.71 | $11.91 | $11.71 | $11.29 | $10.75 | $9.95 |
| Income from Investment Operations | | | | | | |
| Net investment income (loss)A | .26 | .54 | .52 | .57 | .54 | .55 |
| Net realized and unrealized gain (loss) | (.45) | .02 | .44 | .60 | .62 | .76 |
| Total from investment operations | (.19) | .56 | .96 | 1.17 | 1.16 | 1.31 |
| Distributions from net investment income | (.34) | (.55) | (.53) | (.55) | (.52) | (.51) |
| Distributions from net realized gain | (.14) | (.21) | (.24) | (.20) | (.10) | – |
| Total distributions | (.48) | (.76) | (.76)B | (.75) | (.62) | (.51) |
| Redemption fees added to paid in capitalA,C | – | – | – | – | – | – |
| Net asset value, end of period | $11.04 | $11.71 | $11.91 | $11.71 | $11.29 | $10.75 |
| Total ReturnD,E | (1.61)% | 4.84% | 8.78% | 10.71% | 11.50% | 13.41% |
| Ratios to Average Net AssetsF,G | | | | | | |
| Expenses before reductions | .84%H | .83% | .83% | .84% | .90% | .92% |
| Expenses net of fee waivers, if any | .84%H | .82% | .83% | .84% | .89% | .92% |
| Expenses net of all reductions | .84%H | .82% | .83% | .84% | .89% | .92% |
| Net investment income (loss) | 4.55%H | 4.61% | 4.50% | 4.85% | 5.12% | 5.21% |
| Supplemental Data | | | | | | |
| Net assets, end of period (000 omitted) | $2,432,270 | $2,561,268 | $2,627,382 | $2,884,545 | $2,252,149 | $1,660,063 |
| Portfolio turnover rateI | 15%H | 19% | 29% | 26% | 27% | 25% |
A Calculated based on average shares outstanding during the period.
B Total distributions of $.76 per share is comprised of distributions from net investment income of $.525 and distributions from net realized gain of $.236 per share.
C Amount represents less than $.005 per share.
D Total returns for periods of less than one year are not annualized.
E Total returns would have been lower if certain expenses had not been reduced during the applicable periods shown.
F Fees and expenses of any underlying Fidelity Central Funds are not included in the Fund's expense ratio. The Fund indirectly bears its proportionate share of the expenses of any underlying Fidelity Central Funds.
G Expense ratios reflect operating expenses of the class. Expenses before reductions do not reflect amounts reimbursed by the investment adviser or reductions from brokerage service arrangements or reductions from other expense offset arrangements and do not represent the amount paid by the class during periods when reimbursements or reductions occur. Expenses net of fee waivers reflect expenses after reimbursement by the investment adviser but prior to reductions from brokerage service arrangements or other expense offset arrangements. Expenses net of all reductions represent the net expenses paid by the class.
H Annualized
I Amount does not include the portfolio activity of any underlying Fidelity Central Funds.
See accompanying notes which are an integral part of the financial statements.
Financial Highlights — Fidelity Real Estate Income Fund Class I
| | Six months ended | Years ended July 31, | | | | |
| January 31, | 2016 | 2015 | 2014 | 2013 | 2012 | 2011 |
| Selected Per–Share Data | | | | | | |
| Net asset value, beginning of period | $11.68 | $11.88 | $11.69 | $11.28 | $10.74 | $9.95 |
| Income from Investment Operations | | | | | | |
| Net investment income (loss)A | .26 | .55 | .52 | .57 | .55 | .55 |
| Net realized and unrealized gain (loss) | (.44) | .02 | .44 | .60 | .62 | .76 |
| Total from investment operations | (.18) | .57 | .96 | 1.17 | 1.17 | 1.31 |
| Distributions from net investment income | (.34) | (.55) | (.53) | (.56) | (.53) | (.52) |
| Distributions from net realized gain | (.14) | (.21) | (.24) | (.20) | (.10) | – |
| Total distributions | (.49)B | (.77)C | (.77) | (.76) | (.63) | (.52) |
| Redemption fees added to paid in capitalA,D | – | – | – | – | – | – |
| Net asset value, end of period | $11.01 | $11.68 | $11.88 | $11.69 | $11.28 | $10.74 |
| Total ReturnE,F | (1.58)% | 4.92% | 8.76% | 10.72% | 11.62% | 13.44% |
| Ratios to Average Net AssetsG,H | | | | | | |
| Expenses before reductions | .77%I | .77% | .78% | .80% | .84% | .89% |
| Expenses net of fee waivers, if any | .77%I | .77% | .78% | .80% | .84% | .89% |
| Expenses net of all reductions | .77%I | .77% | .78% | .80% | .84% | .89% |
| Net investment income (loss) | 4.62%I | 4.66% | 4.55% | 4.89% | 5.17% | 5.24% |
| Supplemental Data | | | | | | |
| Net assets, end of period (000 omitted) | $843,670 | $913,475 | $809,854 | $610,045 | $217,435 | $43,282 |
| Portfolio turnover rateJ | 15%I | 19% | 29% | 26% | 27% | 25% |
A Calculated based on average shares outstanding during the period.
B Total distributions of $.49 per share is comprised of distributions from net investment income of $.344 and distributions from net realized gain of $.142 per share.
C Total distributions of $.77 per share is comprised of distributions from net investment income of $.554 and distributions from net realized gain of $.212 per share.
D Amount represents less than $.005 per share.
E Total returns for periods of less than one year are not annualized.
F Total returns would have been lower if certain expenses had not been reduced during the applicable periods shown.
G Fees and expenses of any underlying Fidelity Central Funds are not included in the Fund's expense ratio. The Fund indirectly bears its proportionate share of the expenses of any underlying Fidelity Central Funds.
H Expense ratios reflect operating expenses of the class. Expenses before reductions do not reflect amounts reimbursed by the investment adviser or reductions from brokerage service arrangements or reductions from other expense offset arrangements and do not represent the amount paid by the class during periods when reimbursements or reductions occur. Expenses net of fee waivers reflect expenses after reimbursement by the investment adviser but prior to reductions from brokerage service arrangements or other expense offset arrangements. Expenses net of all reductions represent the net expenses paid by the class.
I Annualized
J Amount does not include the portfolio activity of any underlying Fidelity Central Funds.
See accompanying notes which are an integral part of the financial statements.
Notes to Financial Statements
For the period ended January 31, 2016
1. Organization.
Fidelity Real Estate Income Fund (the Fund) is a fund of Fidelity Securities Fund (the Trust) and is authorized to issue an unlimited number of shares. The Trust is registered under the Investment Company Act of 1940, as amended (the 1940 Act), as an open-end management investment company organized as a Massachusetts business trust. The Fund offers Class A, Class T, Class C, Real Estate Income and Class I shares, each of which has equal rights as to assets and voting privileges. Each class has exclusive voting rights with respect to matters that affect that class.
2. Investments in Fidelity Central Funds.
The Fund invests in Fidelity Central Funds, which are open-end investment companies generally available only to other investment companies and accounts managed by the investment adviser and its affiliates. The Fund's Schedule of Investments lists each of the Fidelity Central Funds held as of period end, if any, as an investment of the Fund, but does not include the underlying holdings of each Fidelity Central Fund. As an Investing Fund, the Fund indirectly bears its proportionate share of the expenses of the underlying Fidelity Central Funds.
The Money Market Central Funds seek preservation of capital and current income and are managed by Fidelity Investments Money Management, Inc. (FIMM), an affiliate of the investment adviser. Annualized expenses of the Money Market Central Funds as of their most recent shareholder report date are less than .005%.
A complete unaudited list of holdings for each Fidelity Central Fund is available upon request or at the Securities and Exchange Commission (the SEC) website at www.sec.gov. In addition, the financial statements of the Fidelity Central Funds, which are not covered by the Fund's Report of Independent Registered Public Accounting Firm, are available on the SEC website or upon request.
3. Significant Accounting Policies.
The financial statements have been prepared in conformity with accounting principles generally accepted in the United States of America (GAAP), which require management to make certain estimates and assumptions at the date of the financial statements. Actual results could differ from those estimates. Subsequent events, if any, through the date that the financial statements were issued have been evaluated in the preparation of the financial statements. The following summarizes the significant accounting policies of the Fund:
Investment Valuation. Investments are valued as of 4:00 p.m. Eastern time on the last calendar day of the period. The Board of Trustees (the Board) has delegated the day to day responsibility for the valuation of the Fund's investments to the Fidelity Management & Research Company (FMR) Fair Value Committee (the Committee). In accordance with valuation policies and procedures approved by the Board, the Fund attempts to obtain prices from one or more third party pricing vendors or brokers to value its investments. When current market prices, quotations or currency exchange rates are not readily available or reliable, investments will be fair valued in good faith by the Committee, in accordance with procedures adopted by the Board. Factors used in determining fair value vary by investment type and may include market or investment specific events, changes in interest rates and credit quality. The frequency with which these procedures are used cannot be predicted and they may be utilized to a significant extent. The Committee oversees the Fund's valuation policies and procedures and reports to the Board on the Committee's activities and fair value determinations. The Board monitors the appropriateness of the procedures used in valuing the Fund's investments and ratifies the fair value determinations of the Committee.
The Fund categorizes the inputs to valuation techniques used to value its investments into a disclosure hierarchy consisting of three levels as shown below:
- Level 1 – quoted prices in active markets for identical investments
- Level 2 – other significant observable inputs (including quoted prices for similar investments, interest rates, prepayment speeds, etc.)
- Level 3 – unobservable inputs (including the Fund's own assumptions based on the best information available)
Valuation techniques used to value the Fund's investments by major category are as follows:
Equity securities, including restricted securities, for which market quotations are readily available, are valued at the last reported sale price or official closing price as reported by a third party pricing vendor on the primary market or exchange on which they are traded and are categorized as Level 1 in the hierarchy. In the event there were no sales during the day or closing prices are not available, securities are valued at the last quoted bid price or may be valued using the last available price and are generally categorized as Level 2 in the hierarchy. For foreign equity securities, when market or security specific events arise, comparisons to the valuation of American Depositary Receipts (ADRs), futures contracts, Exchange-Traded Funds (ETFs) and certain indexes as well as quoted prices for similar securities may be used and would be categorized as Level 2 in the hierarchy. Utilizing these techniques may result in transfers between Level 1 and Level 2. For equity securities, including restricted securities, where observable inputs are limited, assumptions about market activity and risk are used and these securities may be categorized as Level 3 in the hierarchy.
Debt securities, including restricted securities, are valued based on evaluated prices received from third party pricing vendors or from brokers who make markets in such securities. Corporate bonds, bank loan obligations and preferred securities are valued by pricing vendors who utilize matrix pricing which considers yield or price of bonds of comparable quality, coupon, maturity and type or by broker-supplied prices. Asset backed securities, collateralized mortgage obligations and commercial mortgage securities are valued by pricing vendors who utilize matrix pricing which considers prepayment speed assumptions, attributes of the collateral, yield or price of bonds of comparable quality, coupon, maturity and type or by broker-supplied prices. When independent prices are unavailable or unreliable, debt securities may be valued utilizing pricing methodologies which consider similar factors that would be used by third party pricing vendors. Debt securities are generally categorized as Level 2 in the hierarchy but may be Level 3 depending on the circumstances.
Investments in open-end mutual funds, including the Fidelity Central Funds, are valued at their closing net asset value (NAV) each business day and are categorized as Level 1 in the hierarchy.
Changes in valuation techniques may result in transfers in or out of an assigned level within the disclosure hierarchy. The aggregate value of investments by input level as of January 31, 2016, is included at the end of the Fund's Schedule of Investments.
Foreign Currency. The Fund may use foreign currency contracts to facilitate transactions in foreign-denominated securities. Gains and losses from these transactions may arise from changes in the value of the foreign currency or if the counterparties do not perform under the contracts' terms.
Foreign-denominated assets, including investment securities, and liabilities are translated into U.S. dollars at the exchange rates at period end. Purchases and sales of investment securities, income and dividends received and expenses denominated in foreign currencies are translated into U.S. dollars at the exchange rate in effect on the transaction date.
The effects of exchange rate fluctuations on investments are included with the net realized and unrealized gain (loss) on investment securities. Other foreign currency transactions resulting in realized and unrealized gain (loss) are disclosed separately.
Investment Transactions and Income. For financial reporting purposes, the Fund's investment holdings and NAV include trades executed through the end of the last business day of the period. The NAV per share for processing shareholder transactions is calculated as of the close of business of the New York Stock Exchange (NYSE), normally 4:00 p.m. Eastern time and includes trades executed through the end of the prior business day. Gains and losses on securities sold are determined on the basis of identified cost. Dividend income is recorded on the ex-dividend date, except for certain dividends from foreign securities where the ex-dividend date may have passed, which are recorded as soon as the Fund is informed of the ex-dividend date. Non-cash dividends included in dividend income, if any, are recorded at the fair market value of the securities received. Income and capital gain distributions from Fidelity Central Funds, if any, are recorded on the ex-dividend date. Distributions received on securities that represent a return of capital or capital gain are recorded as a reduction of cost of investments and/or as a realized gain. Subsequent to ex-dividend date the Fund determines the components of these distributions, based upon receipt of tax filings or other correspondence relating to the underlying investment. Interest income is accrued as earned and includes coupon interest and amortization of premium and accretion of discount on debt securities as applicable. For certain lower credit quality securitized assets that have contractual cash flows (for example, asset backed securities, collateralized mortgage obligations and commercial mortgage-backed securities), changes in estimated cash flows are periodically evaluated and the estimated yield is adjusted on a prospective basis, resulting in increases or decreases to Interest Income in the accompanying Statement of Operations. Investment income is recorded net of foreign taxes withheld where recovery of such taxes is uncertain. Debt obligations may be placed on non-accrual status and related interest income may be reduced by ceasing current accruals and writing off interest receivables when the collection of all or a portion of interest has become doubtful based on consistently applied procedures. A debt obligation is removed from non-accrual status when the issuer resumes interest payments or when collectability of interest is reasonably assured.
Class Allocations and Expenses. Investment income, realized and unrealized capital gains and losses, common expenses of the Fund, and certain fund-level expense reductions, if any, are allocated daily on a pro-rata basis to each class based on the relative net assets of each class to the total net assets of the Fund. Each class differs with respect to transfer agent and distribution and service plan fees incurred. Certain expense reductions may also differ by class. For the reporting period, the allocated portion of income and expenses to each class as a percent of its average net assets may vary due to the timing of recording these transactions in relation to fluctuating net assets of the classes. Expenses directly attributable to a fund are charged to that fund. Expenses attributable to more than one fund are allocated among the respective funds on the basis of relative net assets or other appropriate methods. Expense estimates are accrued in the period to which they relate and adjustments are made when actual amounts are known.
Income Tax Information and Distributions to Shareholders. Each year, the Fund intends to qualify as a regulated investment company under Subchapter M of the Internal Revenue Code, including distributing substantially all of its taxable income and realized gains. As a result, no provision for U.S. Federal income taxes is required. The Fund files a U.S. federal tax return, in addition to state and local tax returns as required. The Fund's federal income tax returns are subject to examination by the Internal Revenue Service (IRS) for a period of three fiscal years after they are filed. State and local tax returns may be subject to examination for an additional fiscal year depending on the jurisdiction. Foreign taxes are provided for based on the Fund's understanding of the tax rules and rates that exist in the foreign markets in which it invests.
Distributions are declared and recorded on the ex-dividend date. Income dividends and capital gain distributions are declared separately for each class. Income and capital gain distributions are determined in accordance with income tax regulations, which may differ from GAAP.
Capital accounts within the financial statements are adjusted for permanent book-tax differences. These adjustments have no impact on net assets or the results of operations. Capital accounts are not adjusted for temporary book-tax differences which will reverse in a subsequent period.
Book-tax differences are primarily due to foreign currency transactions, passive foreign investment companies (PFIC), market discount, equity-debt classifications, certain conversion ratio adjustments, partnerships and losses deferred due to wash sales.
The federal tax cost of investment securities and unrealized appreciation (depreciation) as of period end were as follows:
| Gross unrealized appreciation | $334,852,544 |
| Gross unrealized depreciation | (312,097,638) |
| Net unrealized appreciation (depreciation) on securities | $22,754,906 |
| Tax cost | $4,072,897,180 |
Short-Term Trading (Redemption) Fees. Shares held by investors in the Fund less than 90 days may have been subject to a redemption fee equal to .75% of the NAV of shares redeemed. All redemption fees, which reduce the proceeds of the shareholder redemption, are retained by the Fund and accounted for as an addition to paid in capital.
Restricted Securities. The Fund may invest in securities that are subject to legal or contractual restrictions on resale. These securities generally may be resold in transactions exempt from registration or to the public if the securities are registered. Disposal of these securities may involve time-consuming negotiations and expense, and prompt sale at an acceptable price may be difficult. Information regarding restricted securities is included at the end of the Fund's Schedule of Investments.
Loans and Other Direct Debt Instruments. The Fund invests in direct debt instruments which are interests in amounts owed to lenders by corporate or other borrowers. These instruments may be in the form of loans, trade claims or other receivables and may include standby financing commitments such as revolving credit facilities that obligate the Fund to supply additional cash to the borrower on demand. Loans may be acquired through assignment or participation. The Fund did not have any unfunded loan commitments, which are contractual obligations for future funding, at period end.
4. Purchases and Sales of Investments.
Purchases and sales of securities, other than short-term securities and U.S. government securities, aggregated $297,303,556 and $387,535,386, respectively.
5. Fees and Other Transactions with Affiliates.
Management Fee. Fidelity Management & Research Company (the investment adviser) and its affiliates provide the Fund with investment management related services for which the Fund pays a monthly management fee. The management fee is the sum of an individual fund fee rate that is based on an annual rate of .30% of the Fund's average net assets and an annualized group fee rate that averaged .25% during the period. The group fee rate is based upon the average net assets of all the mutual funds advised by the investment adviser, including any mutual funds previously advised by the investment adviser that are currently advised by Fidelity SelectCo, LLC, an affiliate of the investment adviser. The group fee rate decreases as assets under management increase and increases as assets under management decrease. For the reporting period, the total annualized management fee rate was .55% of the Fund's average net assets.
Distribution and Service Plan Fees. In accordance with Rule 12b-1 of the 1940 Act, the Fund has adopted separate Distribution and Service Plans for each class of shares. Certain classes pay Fidelity Distributors Corporation (FDC), an affiliate of the investment adviser, separate Distribution and Service Fees, each of which is based on an annual percentage of each class' average net assets. In addition, FDC may pay financial intermediaries for selling shares of the Fund and providing shareholder support services. For the period, the Distribution and Service Fee rates, total fees and amounts retained by FDC were as follows:
| | Distribution
Fee | Service
Fee | Total Fees | Retained
by FDC |
| Class A | -% | .25% | $606,187 | $4,643 |
| Class T | -% | .25% | 69,476 | – |
| Class C | .75% | .25% | 1,399,260 | 254,178 |
| | | | $2,074,923 | $258,821 |
Sales Load. FDC may receive a front-end sales charge of up to 4.00% for selling Class A shares and Class T shares, some of which is paid to financial intermediaries for selling shares of the Fund. Depending on the holding period, FDC may receive contingent deferred sales charges levied on Class A, Class T, and Class C redemptions. The deferred sales charges are 1.00% for Class C shares, 1.00% for certain purchases of Class A shares and .25% for certain purchases of Class T shares.
For the period, sales charge amounts retained by FDC were as follows:
| | Retained
by FDC |
| Class A | $36,180 |
| Class T | 4,664 |
| Class C(a) | 17,718 |
| | $58,562 |
(a) When Class C shares are initially sold, FDC pays commissions from its own resources to financial intermediaries through which the sales are made.
Transfer Agent Fees. Fidelity Investments Institutional Operations Company, Inc., (FIIOC), an affiliate of the investment adviser, is the transfer, dividend disbursing and shareholder servicing agent for each class of the Fund. FIIOC receives account fees and asset-based fees that vary according to the account size and type of account of the shareholders of the respective classes of the Fund. FIIOC pays for typesetting, printing and mailing of shareholder reports, except proxy statements.
For the period, transfer agent fees for each class were as follows:
| | Amount | % of
Class-Level Average
Net Assets(a) |
| Class A | $465,764 | .19 |
| Class T | 62,806 | .23 |
| Class C | 272,734 | .19 |
| Real Estate Income | 3,114,175 | .25 |
| Class I | 762,486 | .18 |
| | $ 4,677,965 | |
(a) Annualized
Accounting and Security Lending Fees. Fidelity Service Company, Inc. (FSC), an affiliate of the investment adviser, maintains the Fund's accounting records. The accounting fee is based on the level of average net assets for each month. Under a separate contract, FSC administers the security lending program. The security lending fee is based on the number and duration of lending transactions.
Brokerage Commissions. The Fund placed a portion of its portfolio transactions with brokerage firms which are affiliates of the investment adviser. Brokerage commissions are included in net realized gain (loss) and change in net unrealized appreciation (depreciation) in the Statement of Operations. The commissions paid to these affiliated firms were $4,734 for the period.
Interfund Trades. The Fund may purchase from or sell securities to other Fidelity Funds under procedures adopted by the Board. The procedures have been designed to ensure these interfund trades are executed in accordance with Rule 17a-7 of the 1940 Act. Interfund trades are included within the respective purchases and sales amounts shown in the Purchases and Sales of Investments note.
6. Committed Line of Credit.
The Fund participates with other funds managed by the investment adviser or an affiliate in a $4.25 billion credit facility (the "line of credit") to be utilized for temporary or emergency purposes to fund shareholder redemptions or for other short-term liquidity purposes. The Fund has agreed to pay commitment fees on its pro-rata portion of the line of credit, which amounted to $2,805 and is reflected in Miscellaneous expenses on the Statement of Operations. During the period, the Fund did not borrow on this line of credit.
7. Security Lending.
The Fund lends portfolio securities through a lending agent from time to time in order to earn additional income. For equity securities, a lending agent is used and may loan securities to certain qualified borrowers, including Fidelity Capital Markets (FCM), a broker-dealer affiliated with the Fund. On the settlement date of the loan, the Fund receives collateral (in the form of U.S. Treasury obligations, letters of credit and/or cash) against the loaned securities and maintains collateral in an amount not less than 100% of the market value of the loaned securities during the period of the loan. The market value of the loaned securities is determined at the close of business of the Fund and any additional required collateral is delivered to the Fund on the next business day. The Fund or borrower may terminate the loan at any time, and if the borrower defaults on its obligation to return the securities loaned because of insolvency or other reasons, the Fund may apply collateral received from the borrower against the obligation. The Fund may experience delays and costs in recovering the securities loaned. Any cash collateral received is invested in the Fidelity Securities Lending Cash Central Fund. The value of loaned securities and cash collateral at period end are disclosed on the Fund's Statement of Assets and Liabilities. Security lending income represents the income earned on investing cash collateral, less rebates paid to borrowers and any lending agent fees associated with the loan, plus any premium payments received for lending certain types of securities. Security lending income is presented in the Statement of Operations as a component of income from Fidelity Central Funds. Total security lending income during the period amounted to $12,966. During the period, there were no securities loaned to FCM.
8. Expense Reductions.
Commissions paid to certain brokers with whom the investment adviser, or its affiliates, places trades on behalf of the Fund include an amount in addition to trade execution, which may be rebated back to the Fund to offset certain expenses. This amount totaled $22,145 for the period. In addition, through arrangements with the Fund's custodian, credits realized as a result of certain uninvested cash balances were used to reduce the Fund's expenses. During the period, these credits reduced the Fund's custody expenses by $1,735.
In addition, during the period the investment adviser reimbursed and/or waived a portion of fund-level operating expenses in the amount of $14,846.
9. Distributions to Shareholders.
Distributions to shareholders of each class were as follows:
| | Six months ended January 31, 2016 | Year ended July 31, 2015 |
| From net investment income | | |
| Class A | $13,783,244 | $21,010,715 |
| Class T | 1,575,598 | 2,305,119 |
| Class C | 6,852,507 | 10,465,476 |
| Real Estate Income | 74,108,924 | 122,206,251 |
| Class I | 25,787,689 | 43,464,765 |
| Total | $122,107,962 | $199,452,326 |
| From net realized gain | | |
| Class A | $6,008,169 | $7,958,848 |
| Class T | 680,042 | 875,220 |
| Class C | 3,527,228 | 4,645,932 |
| Real Estate Income | 30,805,486 | 46,720,433 |
| Class I | 10,795,022 | 15,477,131 |
| Total | $51,815,947 | $75,677,564 |
10. Share Transactions.
Share transactions for each class were as follows and may contain automatic conversions between classes or exchanges between affiliated funds:
| | Shares | Shares | Dollars | Dollars |
| | Six months ended January 31, 2016 | Year ended July 31, 2015 | Six months ended January 31, 2016 | Year ended July 31, 2015 |
| Class A | | | | |
| Shares sold | 8,833,232 | 17,614,783 | $99,136,860 | $207,492,435 |
| Reinvestment of distributions | 1,654,994 | 2,253,682 | 18,423,230 | 26,209,333 |
| Shares redeemed | (7,261,614) | (14,664,043) | (81,991,780) | (171,937,484) |
| Net increase (decrease) | 3,226,612 | 5,204,422 | $35,568,310 | $61,764,284 |
| Class T | | | | |
| Shares sold | 585,301 | 1,551,308 | $6,617,495 | $18,286,948 |
| Reinvestment of distributions | 187,688 | 251,652 | 2,090,146 | 2,927,374 |
| Shares redeemed | (512,341) | (1,110,729) | (5,798,010) | (13,074,996) |
| Net increase (decrease) | 260,648 | 692,231 | $2,909,631 | $8,139,326 |
| Class C | | | | |
| Shares sold | 2,124,908 | 7,875,459 | $23,840,323 | $92,082,413 |
| Reinvestment of distributions | 822,712 | 1,105,279 | 9,089,251 | 12,763,694 |
| Shares redeemed | (3,727,311) | (4,690,719) | (41,694,636) | (54,577,835) |
| Net increase (decrease) | (779,691) | 4,290,019 | $(8,765,062) | $50,268,272 |
| Real Estate Income | | | | |
| Shares sold | 22,973,738 | 51,184,144 | $261,251,386 | $605,520,317 |
| Reinvestment of distributions | 8,268,560 | 12,742,585 | 92,453,420 | 148,826,128 |
| Shares redeemed | (29,628,387) | (65,882,524) | (336,288,502) | (777,479,294) |
| Net increase (decrease) | 1,613,911 | (1,955,795) | $17,416,304 | $(23,132,849) |
| Class I | | | | |
| Shares sold | 16,198,203 | 38,671,974 | $182,574,922 | $455,469,590 |
| Reinvestment of distributions | 2,502,407 | 3,704,065 | 27,905,962 | 43,129,998 |
| Shares redeemed | (20,276,080) | (32,342,580) | (229,072,688) | (380,445,460) |
| Net increase (decrease) | (1,575,470) | 10,033,459 | $(18,591,804) | $118,154,128 |
11. Other.
The Fund's organizational documents provide former and current trustees and officers with a limited indemnification against liabilities arising in connection with the performance of their duties to the Fund. In the normal course of business, the Fund may also enter into contracts that provide general indemnifications. The Fund's maximum exposure under these arrangements is unknown as this would be dependent on future claims that may be made against the Fund. The risk of material loss from such claims is considered remote.
Report of Independent Registered Public Accounting Firm
To the Trustees of Fidelity Securities Fund and the Shareholders of Fidelity Real Estate Income Fund:
We have audited the accompanying statement of assets and liabilities of Fidelity Real Estate Income Fund (the Fund), a fund of Fidelity Securities Fund, including the schedule of investments, as of January 31, 2016, and the related statement of operations for the six months then ended, the statement of changes in net assets for the six months ended January 31, 2016 and for the year ended July 31, 2015, and the financial highlights for the six months ended January 31, 2016 and for each of the five years in the period ended July 31, 2015. These financial statements and financial highlights are the responsibility of the Fund's management. Our responsibility is to express an opinion on these financial statements and financial highlights based on our audits.
We conducted our audits in accordance with the standards of the Public Company Accounting Oversight Board (United States). Those standards require that we plan and perform the audit to obtain reasonable assurance about whether the financial statements and financial highlights are free of material misstatement. The Fund is not required to have, nor were we engaged to perform, an audit of its internal control over financial reporting. Our audits included consideration of internal control over financial reporting as a basis for designing audit procedures that are appropriate in the circumstances, but not for the purpose of expressing an opinion on the effectiveness of the Fund's internal control over financial reporting. Accordingly, we express no such opinion. An audit also includes examining, on a test basis, evidence supporting the amounts and disclosures in the financial statements, assessing the accounting principles used and significant estimates made by management, as well as evaluating the overall financial statement presentation. Our procedures included confirmation of securities owned as of January 31, 2016, by correspondence with the custodians and brokers; when replies were not received from brokers, we performed other auditing procedures. We believe that our audits provide a reasonable basis for our opinion.
In our opinion, such financial statements and financial highlights referred to above present fairly, in all material respects, the financial position of Fidelity Real Estate Income Fund as of January 31, 2016, the results of its operations for the six months then ended, the changes in its net assets for the six months ended January 31, 2016 and for the year ended July 31, 2015, and the financial highlights for the six months ended January 31, 2016 and for each of the five years in the period ended July 31, 2015, in conformity with accounting principles generally accepted in the United States of America.
DELOITTE & TOUCHE LLP
Boston, Massachusetts
March 18, 2016
Shareholder Expense Example
As a shareholder of the Fund, you incur two types of costs: (1) transaction costs, including sales charges (loads) on purchase payments or redemption proceeds, redemption fees and (2) ongoing costs, including management fees, distribution and/or service (12b-1) fees and other Fund expenses. This Example is intended to help you understand your ongoing costs (in dollars) of investing in the Fund and to compare these costs with the ongoing costs of investing in other mutual funds.
The Example is based on an investment of $1,000 invested at the beginning of the period and held for the entire period (August 1, 2015 to January 31, 2016).
Actual Expenses
The first line of the accompanying table for each class of the Fund provides information about actual account values and actual expenses. You may use the information in this line, together with the amount you invested, to estimate the expenses that you paid over the period. Simply divide your account value by $1,000.00 (for example, an $8,600 account value divided by $1,000.00 = 8.6), then multiply the result by the number in the first line for a class of the Fund under the heading entitled "Expenses Paid During Period" to estimate the expenses you paid on your account during this period. A small balance maintenance fee of $12.00 that is charged once a year may apply for certain accounts with a value of less than $2,000. This fee is not included in the table below. If it was, the estimate of expenses you paid during the period would be higher, and your ending account value lower, by this amount. In addition, the Fund, as a shareholder in the underlying Fidelity Central Funds, will indirectly bear its pro-rata share of the fees and expenses incurred by the underlying Fidelity Central Funds. These fees and expenses are not included in the Fund's annualized expense ratio used to calculate the expense estimate in the table below.
Hypothetical Example for Comparison Purposes
The second line of the accompanying table for each class of the Fund provides information about hypothetical account values and hypothetical expenses based on a Class' actual expense ratio and an assumed rate of return of 5% per year before expenses, which is not the Class' actual return. The hypothetical account values and expenses may not be used to estimate the actual ending account balance or expenses you paid for the period. You may use this information to compare the ongoing costs of investing in the Fund and other funds. To do so, compare this 5% hypothetical example with the 5% hypothetical examples that appear in the shareholder reports of the other funds. A small balance maintenance fee of $12.00 that is charged once a year may apply for certain accounts with a value of less than $2,000. This fee is not included in the table below. If it was, the estimate of expenses you paid during the period would be higher, and your ending account value lower, by this amount. In addition, the Fund, as a shareholder in the underlying Fidelity Central Funds, will indirectly bear its pro-rata share of the fees and expenses incurred by the underlying Fidelity Central Funds. These fees and expenses are not included in the Fund's annualized expense ratio used to calculate the expense estimate in the table below.
Please note that the expenses shown in the table are meant to highlight your ongoing costs only and do not reflect any transaction costs. Therefore, the second line of the table is useful in comparing ongoing costs only, and will not help you determine the relative total costs of owning different funds. In addition, if these transactional costs were included, your costs would have been higher.
| | Annualized Expense Ratio-A | Beginning
Account Value
August 1, 2015 | Ending
Account Value
January 31, 2016 | Expenses Paid
During Period-B
August 1, 2015
to January 31, 2016 |
| Class A | 1.03% | | | |
| Actual | | $1,000.00 | $982.60 | $5.13 |
| Hypothetical-C | | $1,000.00 | $1,019.96 | $5.23 |
| Class T | 1.07% | | | |
| Actual | | $1,000.00 | $983.30 | $5.33 |
| Hypothetical-C | | $1,000.00 | $1,019.76 | $5.43 |
| Class C | 1.79% | | | |
| Actual | | $1,000.00 | $979.80 | $8.91 |
| Hypothetical-C | | $1,000.00 | $1,016.14 | $9.07 |
| Real Estate Income | .84% | | | |
| Actual | | $1,000.00 | $983.90 | $4.19 |
| Hypothetical-C | | $1,000.00 | $1,020.91 | $4.27 |
| Class I | .77% | | | |
| Actual | | $1,000.00 | $984.20 | $3.84 |
| Hypothetical-C | | $1,000.00 | $1,021.27 | $3.91 |
A Annualized expense ratio reflects expenses net of applicable fee waivers.
B Expenses are equal to each Class' annualized expense ratio, multiplied by the average account value over the period, multiplied by 184/366 (to reflect the one-half year period).
C 5% return per year before expenses
REIA-SANN-0316
1.907552.105
Fidelity Advisor® Small Cap Value Fund -
Class A, Class T, Class B and Class C
Semi-Annual Report January 31, 2016 Class A, Class T, Class B and Class C are classes of Fidelity® Small Cap Value Fund |
|
Contents
To view a fund's proxy voting guidelines and proxy voting record for the 12-month period ended June 30, visit http://www.fidelity.com/proxyvotingresults or visit the Securities and Exchange Commission's (SEC) web site at http://www.sec.gov.
You may also call 1-877-208-0098 to request a free copy of the proxy voting guidelines.
Standard & Poor's, S&P and S&P 500 are registered service marks of The McGraw-Hill Companies, Inc. and have been licensed for use by Fidelity Distributors Corporation.
Other third-party marks appearing herein are the property of their respective owners.
All other marks appearing herein are registered or unregistered trademarks or service marks of FMR LLC or an affiliated company. © 2016 FMR LLC. All rights reserved.
This report and the financial statements contained herein are submitted for the general information of the shareholders of the Fund. This report is not authorized for distribution to prospective investors in the Fund unless preceded or accompanied by an effective prospectus.
A fund files its complete schedule of portfolio holdings with the SEC for the first and third quarters of each fiscal year on Form N-Q. Forms N-Q are available on the SEC’s web site at http://www.sec.gov. A fund's Forms N-Q may be reviewed and copied at the SEC’s Public Reference Room in Washington, DC. Information regarding the operation of the SEC's Public Reference Room may be obtained by calling 1-800-SEC-0330.
For a complete list of a fund's portfolio holdings, view the most recent holdings listing, semiannual report, or annual report on Fidelity's web site at http://www.fidelity.com, http://www.advisor.fidelity.com, or http://www.401k.com, as applicable.
NOT FDIC INSURED •MAY LOSE VALUE •NO BANK GUARANTEE
Neither the Fund nor Fidelity Distributors Corporation is a bank.
Investment Summary (Unaudited)
Top Ten Stocks as of January 31, 2016
| | % of fund's net assets | % of fund's net assets 6 months ago |
| Store Capital Corp. | 3.5 | 2.6 |
| ProAssurance Corp. | 2.8 | 2.4 |
| Silgan Holdings, Inc. | 2.7 | 2.6 |
| Universal Corp. | 2.7 | 2.4 |
| CVB Financial Corp. | 2.6 | 2.5 |
| First Niagara Financial Group, Inc. | 2.6 | 2.2 |
| World Fuel Services Corp. | 2.5 | 2.2 |
| Aspen Insurance Holdings Ltd. | 2.5 | 2.7 |
| Genesee & Wyoming, Inc. Class A | 2.4 | 0.0 |
| Allied World Assurance Co. Holdings AG | 2.4 | 0.0 |
| | 26.7 | |
Top Five Market Sectors as of January 31, 2016
| | % of fund's net assets | % of fund's net assets 6 months ago |
| Financials | 40.4 | 41.0 |
| Industrials | 13.0 | 13.2 |
| Consumer Discretionary | 12.0 | 9.3 |
| Information Technology | 11.3 | 12.9 |
| Health Care | 6.6 | 6.8 |
Asset Allocation (% of fund's net assets)
| As of January 31, 2016 * |
| | Stocks | 99.4% |
| | Short-Term Investments and Net Other Assets (Liabilities) | 0.6% |

* Foreign investments - 14.2%
| As of July 31, 2015* |
| | Stocks | 99.2% |
| | Short-Term Investments and Net Other Assets (Liabilities) | 0.8% |

* Foreign investments - 11.2%
Percentages shown as 0.0% may reflect amounts less than 0.05%.
Investments January 31, 2016 (Unaudited)
Showing Percentage of Net Assets
| Common Stocks - 99.4% | | | |
| | | Shares | Value |
| CONSUMER DISCRETIONARY - 12.0% | | | |
| Auto Components - 1.7% | | | |
| Standard Motor Products, Inc. (a) | | 1,183,301 | $44,148,960 |
| Hotels, Restaurants & Leisure - 2.4% | | | |
| DineEquity, Inc. | | 750,000 | 63,690,000 |
| Multiline Retail - 2.2% | | | |
| Dillard's, Inc. Class A (b) | | 850,000 | 59,848,500 |
| Specialty Retail - 5.3% | | | |
| Aarons, Inc. Class A | | 2,045,100 | 46,791,888 |
| Genesco, Inc. (c) | | 616,728 | 40,790,390 |
| Hibbett Sports, Inc. (a)(b)(c) | | 1,625,600 | 52,279,296 |
| | | | 139,861,574 |
| Textiles, Apparel & Luxury Goods - 0.4% | | | |
| Vera Bradley, Inc. (c) | | 750,000 | 11,085,000 |
|
| TOTAL CONSUMER DISCRETIONARY | | | 318,634,034 |
|
| CONSUMER STAPLES - 3.4% | | | |
| Food Products - 0.7% | | | |
| Post Holdings, Inc. (c) | | 300,000 | 17,550,000 |
| Tobacco - 2.7% | | | |
| Universal Corp. (a)(b) | | 1,308,239 | 71,599,920 |
|
| TOTAL CONSUMER STAPLES | | | 89,149,920 |
|
| ENERGY - 4.7% | | | |
| Energy Equipment & Services - 2.0% | | | |
| Hornbeck Offshore Services, Inc. (b)(c) | | 1,600,000 | 13,008,000 |
| ShawCor Ltd. Class A | | 1,800,000 | 38,867,871 |
| | | | 51,875,871 |
| Oil, Gas & Consumable Fuels - 2.7% | | | |
| Northern Oil & Gas, Inc. (b)(c) | | 1,958,249 | 6,462,222 |
| World Fuel Services Corp. | | 1,700,000 | 66,215,000 |
| | | | 72,677,222 |
|
| TOTAL ENERGY | | | 124,553,093 |
|
| FINANCIALS - 40.4% | | | |
| Banks - 11.7% | | | |
| Associated Banc-Corp. | | 2,846,535 | 49,956,689 |
| CVB Financial Corp. (b) | | 4,500,010 | 68,895,153 |
| First Citizen Bancshares, Inc. | | 140,370 | 34,539,442 |
| First Citizen Bancshares, Inc. Class A (c) | | 180,954 | 44,525,541 |
| First Niagara Financial Group, Inc. | | 7,000,000 | 68,530,000 |
| UMB Financial Corp. | | 898,691 | 42,148,608 |
| | | | 308,595,433 |
| Capital Markets - 5.3% | | | |
| Federated Investors, Inc. Class B (non-vtg.) | | 2,199,963 | 55,637,064 |
| OM Asset Management Ltd. | | 3,200,001 | 36,192,011 |
| Waddell & Reed Financial, Inc. Class A | | 1,750,000 | 48,020,000 |
| | | | 139,849,075 |
| Insurance - 11.6% | | | |
| Allied World Assurance Co. Holdings AG | | 1,750,000 | 64,032,500 |
| Aspen Insurance Holdings Ltd. | | 1,413,257 | 65,730,583 |
| Endurance Specialty Holdings Ltd. | | 902,400 | 55,885,632 |
| First American Financial Corp. | | 1,421,287 | 48,849,634 |
| ProAssurance Corp. | | 1,468,200 | 73,586,184 |
| | | | 308,084,533 |
| Real Estate Investment Trusts - 7.9% | | | |
| National Retail Properties, Inc. (b) | | 450,000 | 19,323,000 |
| Potlatch Corp. | | 200,630 | 5,786,169 |
| Rouse Properties, Inc. (a)(b) | | 3,000,000 | 52,500,000 |
| Sabra Health Care REIT, Inc. | | 2,042,700 | 37,503,972 |
| Store Capital Corp. | | 3,750,000 | 92,962,501 |
| | | | 208,075,642 |
| Real Estate Management & Development - 2.0% | | | |
| Kennedy Wilson Europe Real Estate PLC | | 3,409,540 | 54,378,646 |
| Thrifts & Mortgage Finance - 1.9% | | | |
| Washington Federal, Inc. | | 2,323,600 | 49,608,860 |
|
| TOTAL FINANCIALS | | | 1,068,592,189 |
|
| HEALTH CARE - 6.6% | | | |
| Health Care Equipment & Supplies - 1.0% | | | |
| Integra LifeSciences Holdings Corp. (c) | | 439,597 | 27,013,236 |
| Health Care Providers & Services - 3.8% | | | |
| Civitas Solutions, Inc. (a)(c) | | 2,451,897 | 58,992,642 |
| Team Health Holdings, Inc. (c) | | 1,000,000 | 40,870,000 |
| | | | 99,862,642 |
| Health Care Technology - 0.7% | | | |
| Cegedim SA (c) | | 670,247 | 20,017,720 |
| Pharmaceuticals - 1.1% | | | |
| Innoviva, Inc. | | 2,831,853 | 28,375,167 |
|
| TOTAL HEALTH CARE | | | 175,268,765 |
|
| INDUSTRIALS - 13.0% | | | |
| Aerospace & Defense - 1.9% | | | |
| Moog, Inc. Class A (c) | | 1,100,000 | 50,963,000 |
| Commercial Services & Supplies - 1.4% | | | |
| Essendant, Inc. | | 1,242,998 | 37,115,920 |
| Electrical Equipment - 2.1% | | | |
| AZZ, Inc. | | 500,000 | 25,740,000 |
| EnerSys | | 600,000 | 29,058,000 |
| | | | 54,798,000 |
| Machinery - 3.7% | | | |
| Hillenbrand, Inc. | | 500,000 | 13,540,000 |
| Mueller Industries, Inc. | | 2,100,000 | 53,445,000 |
| Valmont Industries, Inc. (b) | | 295,000 | 31,444,050 |
| | | | 98,429,050 |
| Road & Rail - 2.4% | | | |
| Genesee & Wyoming, Inc. Class A (c) | | 1,300,000 | 64,454,000 |
| Trading Companies & Distributors - 1.5% | | | |
| WESCO International, Inc. (b)(c) | | 960,033 | 38,766,133 |
|
| TOTAL INDUSTRIALS | | | 344,526,103 |
|
| INFORMATION TECHNOLOGY - 11.3% | | | |
| Electronic Equipment & Components - 5.7% | | | |
| Ingram Micro, Inc. Class A | | 1,800,000 | 50,760,000 |
| SYNNEX Corp. | | 527,200 | 44,258,440 |
| Tech Data Corp. (c) | | 900,000 | 56,160,000 |
| | | | 151,178,440 |
| Internet Software & Services - 3.2% | | | |
| Cimpress NV (b)(c) | | 528,100 | 41,466,412 |
| j2 Global, Inc. | | 574,300 | 41,642,493 |
| | | | 83,108,905 |
| IT Services - 1.7% | | | |
| CACI International, Inc. Class A (c) | | 540,400 | 44,891,028 |
| Software - 0.7% | | | |
| SS&C Technologies Holdings, Inc. | | 300,000 | 19,287,000 |
|
| TOTAL INFORMATION TECHNOLOGY | | | 298,465,373 |
|
| MATERIALS - 3.5% | | | |
| Containers & Packaging - 2.7% | | | |
| Silgan Holdings, Inc. | | 1,370,000 | 72,431,900 |
| Metals & Mining - 0.8% | | | |
| Compass Minerals International, Inc. | | 290,052 | 21,710,392 |
|
| TOTAL MATERIALS | | | 94,142,292 |
|
| UTILITIES - 4.5% | | | |
| Electric Utilities - 4.5% | | | |
| El Paso Electric Co. | | 1,524,121 | 62,382,273 |
| IDACORP, Inc. | | 822,000 | 57,202,980 |
| | | | 119,585,253 |
| TOTAL COMMON STOCKS | | | |
| (Cost $2,511,983,311) | | | 2,632,917,022 |
|
| Money Market Funds - 5.0% | | | |
| Fidelity Cash Central Fund, 0.38% (d) | | 7,686,167 | 7,686,167 |
| Fidelity Securities Lending Cash Central Fund, 0.42% (d)(e) | | 124,346,925 | 124,346,925 |
| TOTAL MONEY MARKET FUNDS | | | |
| (Cost $132,033,092) | | | 132,033,092 |
| TOTAL INVESTMENT PORTFOLIO - 104.4% | | | |
| (Cost $2,644,016,403) | | | 2,764,950,114 |
| NET OTHER ASSETS (LIABILITIES) - (4.4)% | | | (117,765,989) |
| NET ASSETS - 100% | | | $2,647,184,125 |
Legend
(a) Affiliated company
(b) Security or a portion of the security is on loan at period end.
(c) Non-income producing
(d) Affiliated fund that is generally available only to investment companies and other accounts managed by Fidelity Investments. The rate quoted is the annualized seven-day yield of the fund at period end. A complete unaudited listing of the fund's holdings as of its most recent quarter end is available upon request. In addition, each Fidelity Central Fund's financial statements are available on the SEC's website or upon request.
(e) Investment made with cash collateral received from securities on loan.
Affiliated Central Funds
Information regarding fiscal year to date income earned by the Fund from investments in Fidelity Central Funds is as follows:
| Fund | Income earned |
| Fidelity Cash Central Fund | $25,747 |
| Fidelity Securities Lending Cash Central Fund | 917,702 |
| Total | $943,449 |
Other Affiliated Issuers
An affiliated company is a company in which the Fund has ownership of at least 5% of the voting securities. Fiscal year to date transactions with companies which are or were affiliates are as follows:
| Affiliate | Value, beginning of period | Purchases | Sales Proceeds | Dividend Income | Value, end of period |
| Civitas Solutions, Inc. | $66,136,343 | $-- | $13,660,090 | $-- | $58,992,642 |
| Hibbett Sports, Inc. | 11,341,950 | 55,985,079 | 2,178,105 | -- | 52,279,296 |
| Rouse Properties, Inc. | 76,560,000 | -- | 23,770,281 | 438,063 | 52,500,000 |
| Standard Motor Products, Inc. | 43,273,318 | -- | -- | 354,990 | 44,148,960 |
| Universal Corp. | 68,930,035 | 4,859,141 | -- | 1,373,651 | 71,599,920 |
| Total | $266,241,646 | $60,844,220 | $39,608,476 | $2,166,704 | $279,520,818 |
Investment Valuation
The following is a summary of the inputs used, as of January 31, 2016, involving the Fund's assets and liabilities carried at fair value. The inputs or methodology used for valuing securities may not be an indication of the risk associated with investing in those securities. For more information on valuation inputs, and their aggregation into the levels used below, please refer to the Investment Valuation section in the accompanying Notes to Financial Statements.
| | Valuation Inputs at Reporting Date: |
| Description | Total | Level 1 | Level 2 | Level 3 |
| Investments in Securities: | | | | |
| Equities: | | | | |
| Consumer Discretionary | $318,634,034 | $318,634,034 | $-- | $-- |
| Consumer Staples | 89,149,920 | 89,149,920 | -- | -- |
| Energy | 124,553,093 | 124,553,093 | -- | -- |
| Financials | 1,068,592,189 | 1,014,213,543 | 54,378,646 | -- |
| Health Care | 175,268,765 | 155,251,045 | 20,017,720 | -- |
| Industrials | 344,526,103 | 344,526,103 | -- | -- |
| Information Technology | 298,465,373 | 298,465,373 | -- | -- |
| Materials | 94,142,292 | 94,142,292 | -- | -- |
| Utilities | 119,585,253 | 119,585,253 | -- | -- |
| Money Market Funds | 132,033,092 | 132,033,092 | -- | -- |
| Total Investments in Securities: | $2,764,950,114 | $2,690,553,748 | $74,396,366 | $-- |
The following is a summary of transfers between Level 1 and Level 2 for the period ended January 31, 2016. Transfers are assumed to have occurred at the beginning of the period, and are primarily attributable to the valuation techniques used for foreign equity securities, as discussed in the accompanying Notes to Financial Statements:
| Transfers | Total |
| Level 1 to Level 2 | $76,991,539 |
| Level 2 to Level 1 | $0 |
Other Information
Distribution of investments by country or territory of incorporation, as a percentage of Total Net Assets, is as follows (Unaudited):
| United States of America | 85.8% |
| Bermuda | 4.6% |
| Switzerland | 2.4% |
| Bailiwick of Jersey | 2.0% |
| Netherlands | 1.6% |
| Canada | 1.5% |
| United Kingdom | 1.4% |
| Others (Individually Less Than 1%) | 0.7% |
| | 100.0% |
See accompanying notes which are an integral part of the financial statements.
Financial Statements
Statement of Assets and Liabilities
| | | January 31, 2016 (Unaudited) |
| Assets | | |
Investment in securities, at value (including securities loaned of $126,372,798) — See accompanying schedule:
Unaffiliated issuers (cost $2,257,670,042) | $2,353,396,204 | |
| Fidelity Central Funds (cost $132,033,092) | 132,033,092 | |
| Other affiliated issuers (cost $254,313,269) | 279,520,818 | |
| Total Investments (cost $2,644,016,403) | | $2,764,950,114 |
| Receivable for investments sold | | 46,449,057 |
| Receivable for fund shares sold | | 2,104,092 |
| Dividends receivable | | 1,972,351 |
| Distributions receivable from Fidelity Central Funds | | 184,289 |
| Prepaid expenses | | 4,733 |
| Other receivables | | 7,953 |
| Total assets | | 2,815,672,589 |
| Liabilities | | |
| Payable for investments purchased | $36,727,025 | |
| Payable for fund shares redeemed | 4,651,132 | |
| Accrued management fee | 2,025,863 | |
| Distribution and service plan fees payable | 122,582 | |
| Other affiliated payables | 582,300 | |
| Other payables and accrued expenses | 32,637 | |
| Collateral on securities loaned, at value | 124,346,925 | |
| Total liabilities | | 168,488,464 |
| Net Assets | | $2,647,184,125 |
| Net Assets consist of: | | |
| Paid in capital | | $2,404,244,806 |
| Undistributed net investment income | | 1,931,109 |
| Accumulated undistributed net realized gain (loss) on investments and foreign currency transactions | | 120,075,104 |
| Net unrealized appreciation (depreciation) on investments and assets and liabilities in foreign currencies | | 120,933,106 |
| Net Assets | | $2,647,184,125 |
| Calculation of Maximum Offering Price | | |
| Class A: | | |
| Net Asset Value and redemption price per share ($202,645,428 ÷ 12,830,231 shares) | | $15.79 |
| Maximum offering price per share (100/94.25 of $15.79) | | $16.75 |
| Class T: | | |
| Net Asset Value and redemption price per share ($79,395,746 ÷ 5,128,305 shares) | | $15.48 |
| Maximum offering price per share (100/96.50 of $15.48) | | $16.04 |
| Class B: | | |
| Net Asset Value and offering price per share ($2,463,431 ÷ 168,841 shares)(a) | | $14.59 |
| Class C: | | |
| Net Asset Value and offering price per share ($55,258,599 ÷ 3,778,811 shares)(a) | | $14.62 |
| Small Cap Value: | | |
| Net Asset Value, offering price and redemption price per share ($1,973,618,546 ÷ 122,989,122 shares) | | $16.05 |
| Class I: | | |
| Net Asset Value, offering price and redemption price per share ($333,802,375 ÷ 20,796,332 shares) | | $16.05 |
(a) Redemption price per share is equal to net asset value less any applicable contingent deferred sales charge.
See accompanying notes which are an integral part of the financial statements.
Statement of Operations
| | | Six months ended January 31, 2016 (Unaudited) |
| Investment Income | | |
| Dividends (including $2,166,704 earned from other affiliated issuers) | | $25,160,403 |
| Income from Fidelity Central Funds | | 943,449 |
| Total income | | 26,103,852 |
| Expenses | | |
| Management fee | | |
| Basic fee | $9,619,395 | |
| Performance adjustment | 3,197,803 | |
| Transfer agent fees | 3,125,757 | |
| Distribution and service plan fees | 809,143 | |
| Accounting and security lending fees | 416,808 | |
| Custodian fees and expenses | 14,720 | |
| Independent trustees' compensation | 6,108 | |
| Registration fees | 99,766 | |
| Audit | 33,967 | |
| Legal | 5,172 | |
| Miscellaneous | 7,530 | |
| Total expenses before reductions | 17,336,169 | |
| Expense reductions | (18,541) | 17,317,628 |
| Net investment income (loss) | | 8,786,224 |
| Realized and Unrealized Gain (Loss) | | |
| Net realized gain (loss) on: | | |
| Investment securities: | | |
| Unaffiliated issuers | 159,265,356 | |
| Other affiliated issuers | 5,363,625 | |
| Foreign currency transactions | (26,557) | |
| Total net realized gain (loss) | | 164,602,424 |
Change in net unrealized appreciation (depreciation) on:
Investment securities | (400,477,145) | |
| Assets and liabilities in foreign currencies | (606) | |
| Total change in net unrealized appreciation (depreciation) | | (400,477,751) |
| Net gain (loss) | | (235,875,327) |
| Net increase (decrease) in net assets resulting from operations | | $(227,089,103) |
See accompanying notes which are an integral part of the financial statements.
Statement of Changes in Net Assets
| | Six months ended January 31, 2016 (Unaudited) | Year ended July 31, 2015 |
| Increase (Decrease) in Net Assets | | |
| Operations | | |
| Net investment income (loss) | $8,786,224 | $20,225,902 |
| Net realized gain (loss) | 164,602,424 | 285,516,597 |
| Change in net unrealized appreciation (depreciation) | (400,477,751) | 14,012,997 |
| Net increase (decrease) in net assets resulting from operations | (227,089,103) | 319,755,496 |
| Distributions to shareholders from net investment income | (21,953,606) | (9,146,893) |
| Distributions to shareholders from net realized gain | (264,174,606) | (322,480,172) |
| Total distributions | (286,128,212) | (331,627,065) |
| Share transactions - net increase (decrease) | 351,373,003 | (16,898,248) |
| Redemption fees | 94,271 | 149,785 |
| Total increase (decrease) in net assets | (161,750,041) | (28,620,032) |
| Net Assets | | |
| Beginning of period | 2,808,934,166 | 2,837,554,198 |
| End of period (including undistributed net investment income of $1,931,109 and undistributed net investment income of $15,098,491, respectively) | $2,647,184,125 | $2,808,934,166 |
See accompanying notes which are an integral part of the financial statements.
Financial Highlights — Fidelity Small Cap Value Fund Class A
| | Six months ended (Unaudited) | Years ended July 31, | | | | |
| January 31, | 2016 | 2015 | 2014 | 2013 | 2012 | 2011 |
| Selected Per–Share Data | | | | | | |
| Net asset value, beginning of period | $19.14 | $19.29 | $19.96 | $14.86 | $15.48 | $13.45 |
| Income from Investment Operations | | | | | | |
| Net investment income (loss)A | .04 | .10B | .03 | .07 | .01 | .01C |
| Net realized and unrealized gain (loss) | (1.54) | 2.01 | 1.24 | 5.57 | .30 | 2.22 |
| Total from investment operations | (1.50) | 2.11 | 1.27 | 5.64 | .31 | 2.23 |
| Distributions from net investment income | (.11) | (.02) | (.01) | (.07) | (.01) | (.08) |
| Distributions from net realized gain | (1.75) | (2.25) | (1.93) | (.47) | (.93) | (.12) |
| Total distributions | (1.85)D | (2.26)E | (1.94) | (.54) | (.93)F | (.20) |
| Redemption fees added to paid in capitalA,G | – | – | – | – | – | – |
| Net asset value, end of period | $15.79 | $19.14 | $19.29 | $19.96 | $14.86 | $15.48 |
| Total ReturnH,I,J | (8.30)% | 11.86% | 6.83% | 39.09% | 3.24% | 16.72% |
| Ratios to Average Net AssetsK,L | | | | | | |
| Expenses before reductions | 1.44%M | 1.42% | 1.36% | 1.36% | 1.44% | 1.44% |
| Expenses net of fee waivers, if any | 1.44%M | 1.39% | 1.35% | 1.36% | 1.44% | 1.43% |
| Expenses net of all reductions | 1.44%M | 1.39% | 1.34% | 1.36% | 1.44% | 1.43% |
| Net investment income (loss) | .46%M | .52%B | .13% | .41% | .09% | .06%C |
| Supplemental Data | | | | | | |
| Net assets, end of period (000 omitted) | $202,645 | $235,844 | $258,183 | $275,265 | $150,285 | $140,707 |
| Portfolio turnover rateN | 33 %M | 34% | 26%O | 29% | 27% | 22% |
A Calculated based on average shares outstanding during the period.
B Net Investment income per share reflects a large, non-recurring dividend which amounted to $.05 per share. Excluding this non-recurring dividend, the ratio of net investment income (loss) to average net assets would have been .26%.
C Net Investment income per share reflects a large, non-recurring dividend which amounted to $.06 per share. Excluding this non-recurring dividend, the ratio of net investment income (loss) to average net assets would have been (.31) %.
D Total distributions of $1.85 per share is comprised of distributions from net investment income of $.105 and distributions from net realized gain of $1.747 per share.
E Total distributions of $2.26 per share is comprised of distributions from net investment income of $.016 and distributions from net realized gain of $2.248 per share.
F Total distributions of $.93 per share is comprised of distributions from net investment income of $.006 and distributions from net realized gain of $.925 per share.
G Amount represents less than $.005 per share.
H Total returns for periods of less than one year are not annualized.
I Total returns would have been lower if certain expenses had not been reduced during the applicable periods shown.
J Total returns do not include the effect of the sales charges.
K Fees and expenses of any underlying Fidelity Central Funds are not included in the Fund's expense ratio. The Fund indirectly bears its proportionate share of the expenses of any underlying Fidelity Central Funds.
L Expense ratios reflect operating expenses of the class. Expenses before reductions do not reflect amounts reimbursed by the investment adviser or reductions from brokerage service arrangements or reductions from other expense offset arrangements and do not represent the amount paid by the class during periods when reimbursements or reductions occur. Expenses net of fee waivers reflect expenses after reimbursement by the investment adviser but prior to reductions from brokerage service arrangements or other expense offset arrangements. Expenses net of all reductions represent the net expenses paid by the class.
M Annualized
N Amount does not include the portfolio activity of any underlying Fidelity Central Funds.
O Portfolio turnover rate excludes securities received or delivered in-kind.
See accompanying notes which are an integral part of the financial statements.
Financial Highlights — Fidelity Small Cap Value Fund Class T
| | Six months ended (Unaudited) | Years ended July 31, | | | | |
| January 31, | 2016 | 2015 | 2014 | 2013 | 2012 | 2011 |
| Selected Per–Share Data | | | | | | |
| Net asset value, beginning of period | $18.78 | $18.98 | $19.70 | $14.70 | $15.34 | $13.34 |
| Income from Investment Operations | | | | | | |
| Net investment income (loss)A | .02 | .05B | (.02) | .03 | (.02) | (.03)C |
| Net realized and unrealized gain (loss) | (1.51) | 1.98 | 1.23 | 5.50 | .31 | 2.20 |
| Total from investment operations | (1.49) | 2.03 | 1.21 | 5.53 | .29 | 2.17 |
| Distributions from net investment income | (.06) | – | – | (.06) | – | (.05) |
| Distributions from net realized gain | (1.75) | (2.23) | (1.93) | (.47) | (.93) | (.12) |
| Total distributions | (1.81) | (2.23) | (1.93) | (.53) | (.93) | (.17) |
| Redemption fees added to paid in capitalA,D | – | – | – | – | – | – |
| Net asset value, end of period | $15.48 | $18.78 | $18.98 | $19.70 | $14.70 | $15.34 |
| Total ReturnE,F,G | (8.42)% | 11.58% | 6.58% | 38.70% | 3.08% | 16.36% |
| Ratios to Average Net AssetsH,I | | | | | | |
| Expenses before reductions | 1.68%J | 1.67% | 1.61% | 1.60% | 1.67% | 1.70% |
| Expenses net of fee waivers, if any | 1.68%J | 1.64% | 1.59% | 1.60% | 1.67% | 1.69% |
| Expenses net of all reductions | 1.68%J | 1.63% | 1.59% | 1.59% | 1.67% | 1.69% |
| Net investment income (loss) | .21%J | .27%B | (.11)% | .18% | (.14)% | (.19)%C |
| Supplemental Data | | | | | | |
| Net assets, end of period (000 omitted) | $79,396 | $91,716 | $100,975 | $107,444 | $57,514 | $55,845 |
| Portfolio turnover rateK | 33 %J | 34% | 26%L | 29% | 27% | 22% |
A Calculated based on average shares outstanding during the period.
B Net Investment income per share reflects a large, non-recurring dividend which amounted to $.05 per share. Excluding this non-recurring dividend, the ratio of net investment income (loss) to average net assets would have been .01%.
C Net Investment income per share reflects a large, non-recurring dividend which amounted to $.06 per share. Excluding this non-recurring dividend, the ratio of net investment income (loss) to average net assets would have been (.57) %.
D Amount represents less than $.005 per share.
E Total returns for periods of less than one year are not annualized.
F Total returns would have been lower if certain expenses had not been reduced during the applicable periods shown.
G Total returns do not include the effect of the sales charges.
H Fees and expenses of any underlying Fidelity Central Funds are not included in the Fund's expense ratio. The Fund indirectly bears its proportionate share of the expenses of any underlying Fidelity Central Funds.
I Expense ratios reflect operating expenses of the class. Expenses before reductions do not reflect amounts reimbursed by the investment adviser or reductions from brokerage service arrangements or reductions from other expense offset arrangements and do not represent the amount paid by the class during periods when reimbursements or reductions occur. Expenses net of fee waivers reflect expenses after reimbursement by the investment adviser but prior to reductions from brokerage service arrangements or other expense offset arrangements. Expenses net of all reductions represent the net expenses paid by the class.
J Annualized
K Amount does not include the portfolio activity of any underlying Fidelity Central Funds.
L Portfolio turnover rate excludes securities received or delivered in-kind.
See accompanying notes which are an integral part of the financial statements.
Financial Highlights — Fidelity Small Cap Value Fund Class B
| | Six months ended (Unaudited) | Years ended July 31, | | | | |
| January 31, | 2016 | 2015 | 2014 | 2013 | 2012 | 2011 |
| Selected Per–Share Data | | | | | | |
| Net asset value, beginning of period | $17.79 | $18.18 | $19.06 | $14.27 | $15.00 | $13.08 |
| Income from Investment Operations | | | | | | |
| Net investment income (loss)A | (.03) | (.06)B | (.13) | (.06) | (.09) | (.10)C |
| Net realized and unrealized gain (loss) | (1.42) | 1.90 | 1.18 | 5.34 | .29 | 2.15 |
| Total from investment operations | (1.45) | 1.84 | 1.05 | 5.28 | .20 | 2.05 |
| Distributions from net investment income | – | – | – | (.02) | – | (.01) |
| Distributions from net realized gain | (1.75) | (2.23) | (1.93) | (.47) | (.93) | (.12) |
| Total distributions | (1.75) | (2.23) | (1.93) | (.49) | (.93) | (.13) |
| Redemption fees added to paid in capitalA,D | – | – | – | – | – | – |
| Net asset value, end of period | $14.59 | $17.79 | $18.18 | $19.06 | $14.27 | $15.00 |
| Total ReturnE,F,G | (8.68)% | 10.94% | 5.92% | 38.07% | 2.51% | 15.80% |
| Ratios to Average Net AssetsH,I | | | | | | |
| Expenses before reductions | 2.28%J | 2.25% | 2.18% | 2.15% | 2.19% | 2.20% |
| Expenses net of fee waivers, if any | 2.27%J | 2.23% | 2.17% | 2.15% | 2.19% | 2.19% |
| Expenses net of all reductions | 2.27%J | 2.22% | 2.16% | 2.14% | 2.19% | 2.19% |
| Net investment income (loss) | (.38)%J | (.32)%B | (.69)% | (.37)% | (.66)% | (.69)%C |
| Supplemental Data | | | | | | |
| Net assets, end of period (000 omitted) | $2,463 | $3,473 | $4,808 | $7,052 | $6,675 | $8,549 |
| Portfolio turnover rateK | 33 %J | 34% | 26%L | 29% | 27% | 22% |
A Calculated based on average shares outstanding during the period.
B Net Investment income per share reflects a large, non-recurring dividend which amounted to $.05 per share. Excluding this non-recurring dividend, the ratio of net investment income (loss) to average net assets would have been (.58) %.
C Net Investment income per share reflects a large, non-recurring dividend which amounted to $.06 per share. Excluding this non-recurring dividend, the ratio of net investment income (loss) to average net assets would have been (1.07) %.
D Amount represents less than $.005 per share.
E Total returns for periods of less than one year are not annualized.
F Total returns would have been lower if certain expenses had not been reduced during the applicable periods shown.
G Total returns do not include the effect of the contingent deferred sales charge.
H Fees and expenses of any underlying Fidelity Central Funds are not included in the Fund's expense ratio. The Fund indirectly bears its proportionate share of the expenses of any underlying Fidelity Central Funds.
I Expense ratios reflect operating expenses of the class. Expenses before reductions do not reflect amounts reimbursed by the investment adviser or reductions from brokerage service arrangements or reductions from other expense offset arrangements and do not represent the amount paid by the class during periods when reimbursements or reductions occur. Expenses net of fee waivers reflect expenses after reimbursement by the investment adviser but prior to reductions from brokerage service arrangements or other expense offset arrangements. Expenses net of all reductions represent the net expenses paid by the class.
J Annualized
K Amount does not include the portfolio activity of any underlying Fidelity Central Funds.
L Portfolio turnover rate excludes securities received or delivered in-kind.
See accompanying notes which are an integral part of the financial statements.
Financial Highlights — Fidelity Small Cap Value Fund Class C
| | Six months ended (Unaudited) | Years ended July 31, | | | | |
| January 31, | 2016 | 2015 | 2014 | 2013 | 2012 | 2011 |
| Selected Per–Share Data | | | | | | |
| Net asset value, beginning of period | $17.82 | $18.19 | $19.06 | $14.28 | $15.01 | $13.08 |
| Income from Investment Operations | | | | | | |
| Net investment income (loss)A | (.02) | (.04)B | (.12) | (.06) | (.09) | (.10)C |
| Net realized and unrealized gain (loss) | (1.43) | 1.90 | 1.18 | 5.34 | .29 | 2.17 |
| Total from investment operations | (1.45) | 1.86 | 1.06 | 5.28 | .20 | 2.07 |
| Distributions from net investment income | – | – | – | (.03) | – | (.02) |
| Distributions from net realized gain | (1.75) | (2.23) | (1.93) | (.47) | (.93) | (.12) |
| Total distributions | (1.75) | (2.23) | (1.93) | (.50) | (.93) | (.14) |
| Redemption fees added to paid in capitalA,D | – | – | – | – | – | – |
| Net asset value, end of period | $14.62 | $17.82 | $18.19 | $19.06 | $14.28 | $15.01 |
| Total ReturnE,F,G | (8.67)% | 11.05% | 5.97% | 38.00% | 2.52% | 15.91% |
| Ratios to Average Net AssetsH,I | | | | | | |
| Expenses before reductions | 2.20%J | 2.19% | 2.12% | 2.13% | 2.19% | 2.18% |
| Expenses net of fee waivers, if any | 2.20%J | 2.16% | 2.11% | 2.13% | 2.19% | 2.18% |
| Expenses net of all reductions | 2.20%J | 2.15% | 2.10% | 2.12% | 2.19% | 2.18% |
| Net investment income (loss) | (.30)%J | (.25)%B | (.63)% | (.35)% | (.66)% | (.68)%C |
| Supplemental Data | | | | | | |
| Net assets, end of period (000 omitted) | $55,259 | $64,928 | $70,541 | $76,018 | $47,265 | $47,457 |
| Portfolio turnover rateK | 33 %J | 34% | 26%L | 29% | 27% | 22% |
A Calculated based on average shares outstanding during the period.
B Net Investment income per share reflects a large, non-recurring dividend which amounted to $.05 per share. Excluding this non-recurring dividend, the ratio of net investment income (loss) to average net assets would have been (.51) %.
C Net Investment income per share reflects a large, non-recurring dividend which amounted to $.06 per share. Excluding this non-recurring dividend, the ratio of net investment income (loss) to average net assets would have been (1.06) %.
D Amount represents less than $.005 per share.
E Total returns for periods of less than one year are not annualized.
F Total returns would have been lower if certain expenses had not been reduced during the applicable periods shown.
G Total returns do not include the effect of the contingent deferred sales charge.
H Fees and expenses of any underlying Fidelity Central Funds are not included in the Fund's expense ratio. The Fund indirectly bears its proportionate share of the expenses of any underlying Fidelity Central Funds.
I Expense ratios reflect operating expenses of the class. Expenses before reductions do not reflect amounts reimbursed by the investment adviser or reductions from brokerage service arrangements or reductions from other expense offset arrangements and do not represent the amount paid by the class during periods when reimbursements or reductions occur. Expenses net of fee waivers reflect expenses after reimbursement by the investment adviser but prior to reductions from brokerage service arrangements or other expense offset arrangements. Expenses net of all reductions represent the net expenses paid by the class.
J Annualized
K Amount does not include the portfolio activity of any underlying Fidelity Central Funds.
L Portfolio turnover rate excludes securities received or delivered in-kind.
See accompanying notes which are an integral part of the financial statements.
Financial Highlights — Fidelity Small Cap Value Fund
| | Six months ended (Unaudited) | Years ended July 31, | | | | |
| January 31, | 2016 | 2015 | 2014 | 2013 | 2012 | 2011 |
| Selected Per–Share Data | | | | | | |
| Net asset value, beginning of period | $19.45 | $19.57 | $20.22 | $15.05 | $15.62 | $13.56 |
| Income from Investment Operations | | | | | | |
| Net investment income (loss)A | .06 | .15B | .08 | .12 | .06 | .06C |
| Net realized and unrealized gain (loss) | (1.56) | 2.05 | 1.26 | 5.63 | .32 | 2.23 |
| Total from investment operations | (1.50) | 2.20 | 1.34 | 5.75 | .38 | 2.29 |
| Distributions from net investment income | (.15) | (.07) | (.06) | (.11) | (.02) | (.10) |
| Distributions from net realized gain | (1.75) | (2.25) | (1.93) | (.47) | (.93) | (.13) |
| Total distributions | (1.90) | (2.32) | (1.99) | (.58) | (.95) | (.23) |
| Redemption fees added to paid in capitalA,D | – | – | – | – | – | – |
| Net asset value, end of period | $16.05 | $19.45 | $19.57 | $20.22 | $15.05 | $15.62 |
| Total ReturnE,F | (8.18)% | 12.18% | 7.12% | 39.45% | 3.67% | 17.03% |
| Ratios to Average Net AssetsG,H | | | | | | |
| Expenses before reductions | 1.21%I | 1.15% | 1.08% | 1.07% | 1.13% | 1.13% |
| Expenses net of fee waivers, if any | 1.21%I | 1.12% | 1.06% | 1.07% | 1.13% | 1.13% |
| Expenses net of all reductions | 1.21%I | 1.12% | 1.06% | 1.06% | 1.13% | 1.13% |
| Net investment income (loss) | .69%I | .78%B | .41% | .71% | .41% | .37%C |
| Supplemental Data | | | | | | |
| Net assets, end of period (000 omitted) | $1,973,619 | $2,036,157 | $2,060,546 | $2,672,854 | $1,756,962 | $1,899,805 |
| Portfolio turnover rateJ | 33 %I | 34% | 26%K | 29% | 27% | 22% |
A Calculated based on average shares outstanding during the period.
B Net Investment income per share reflects a large, non-recurring dividend which amounted to $.05 per share. Excluding this non-recurring dividend, the ratio of net investment income (loss) to average net assets would have been .53%.
C Net Investment income per share reflects a large, non-recurring dividend which amounted to $.06 per share. Excluding this non-recurring dividend, the ratio of net investment income (loss) to average net assets would have been (.01) %.
D Amount represents less than $.005 per share.
E Total returns for periods of less than one year are not annualized.
F Total returns would have been lower if certain expenses had not been reduced during the applicable periods shown.
G Fees and expenses of any underlying Fidelity Central Funds are not included in the Fund's expense ratio. The Fund indirectly bears its proportionate share of the expenses of any underlying Fidelity Central Funds.
H Expense ratios reflect operating expenses of the class. Expenses before reductions do not reflect amounts reimbursed by the investment adviser or reductions from brokerage service arrangements or reductions from other expense offset arrangements and do not represent the amount paid by the class during periods when reimbursements or reductions occur. Expenses net of fee waivers reflect expenses after reimbursement by the investment adviser but prior to reductions from brokerage service arrangements or other expense offset arrangements. Expenses net of all reductions represent the net expenses paid by the class.
I Annualized
J Amount does not include the portfolio activity of any underlying Fidelity Central Funds.
K Portfolio turnover rate excludes securities received or delivered in-kind.
See accompanying notes which are an integral part of the financial statements.
Financial Highlights — Fidelity Small Cap Value Fund Class I
| | Six months ended (Unaudited) | Years ended July 31, | | | | |
| January 31, | 2016 | 2015 | 2014 | 2013 | 2012 | 2011 |
| Selected Per–Share Data | | | | | | |
| Net asset value, beginning of period | $19.45 | $19.57 | $20.23 | $15.05 | $15.63 | $13.58 |
| Income from Investment Operations | | | | | | |
| Net investment income (loss)A | .06 | .15B | .08 | .12 | .06 | .06C |
| Net realized and unrealized gain (loss) | (1.56) | 2.05 | 1.25 | 5.65 | .31 | 2.23 |
| Total from investment operations | (1.50) | 2.20 | 1.33 | 5.77 | .37 | 2.29 |
| Distributions from net investment income | (.16) | (.07) | (.06) | (.12) | (.02) | (.11) |
| Distributions from net realized gain | (1.75) | (2.25) | (1.93) | (.47) | (.93) | (.13) |
| Total distributions | (1.90)D | (2.32) | (1.99) | (.59) | (.95) | (.24) |
| Redemption fees added to paid in capitalA,E | – | – | – | – | – | – |
| Net asset value, end of period | $16.05 | $19.45 | $19.57 | $20.23 | $15.05 | $15.63 |
| Total ReturnF,G | (8.17)% | 12.17% | 7.08% | 39.54% | 3.59% | 17.02% |
| Ratios to Average Net AssetsH,I | | | | | | |
| Expenses before reductions | 1.17%J | 1.15% | 1.09% | 1.07% | 1.14% | 1.10% |
| Expenses net of fee waivers, if any | 1.17%J | 1.12% | 1.07% | 1.07% | 1.14% | 1.10% |
| Expenses net of all reductions | 1.17%J | 1.12% | 1.07% | 1.06% | 1.14% | 1.10% |
| Net investment income (loss) | .73%J | .79%B | .40% | .70% | .39% | .39%C |
| Supplemental Data | | | | | | |
| Net assets, end of period (000 omitted) | $333,802 | $376,817 | $342,500 | $359,582 | $138,981 | $101,565 |
| Portfolio turnover rateK | 33 %J | 34% | 26%L | 29% | 27% | 22% |
A Calculated based on average shares outstanding during the period.
B Net Investment income per share reflects a large, non-recurring dividend which amounted to $.05 per share. Excluding this non-recurring dividend, the ratio of net investment income (loss) to average net assets would have been .53%.
C Net Investment income per share reflects a large, non-recurring dividend which amounted to $.06 per share. Excluding this non-recurring dividend, the ratio of net investment income (loss) to average net assets would have been .01%.
D Total distributions of $1.90 per share is comprised of distributions from net investment income of $.157 and distributions from net realized gain of $1.747 per share.
E Amount represents less than $.005 per share.
F Total returns for periods of less than one year are not annualized.
G Total returns would have been lower if certain expenses had not been reduced during the applicable periods shown.
H Fees and expenses of any underlying Fidelity Central Funds are not included in the Fund's expense ratio. The Fund indirectly bears its proportionate share of the expenses of any underlying Fidelity Central Funds.
I Expense ratios reflect operating expenses of the class. Expenses before reductions do not reflect amounts reimbursed by the investment adviser or reductions from brokerage service arrangements or reductions from other expense offset arrangements and do not represent the amount paid by the class during periods when reimbursements or reductions occur. Expenses net of fee waivers reflect expenses after reimbursement by the investment adviser but prior to reductions from brokerage service arrangements or other expense offset arrangements. Expenses net of all reductions represent the net expenses paid by the class.
J Annualized
K Amount does not include the portfolio activity of any underlying Fidelity Central Funds.
L Portfolio turnover rate excludes securities received or delivered in-kind.
See accompanying notes which are an integral part of the financial statements.
Notes to Financial Statements (Unaudited)
For the period ended January 31, 2016
1. Organization.
Fidelity Small Cap Value Fund (the Fund) is a fund of Fidelity Securities Fund (the Trust) and is authorized to issue an unlimited number of shares. The Trust is registered under the Investment Company Act of 1940, as amended (the 1940 Act), as an open-end management investment company organized as a Massachusetts business trust. The Fund offers Class A, Class T, Class C, Small Cap Value and Class I shares, each of which, along with Class B shares, has equal rights as to assets and voting privileges. Class B shares are closed to new accounts and additional purchases, except for exchanges and reinvestments. The Fund's other share classes are also closed to new accounts with certain exceptions. Each class has exclusive voting rights with respect to matters that affect that class. Class B shares will automatically convert to Class A shares after a holding period of seven years from the initial date of purchase.
During the period, the Board of Trustees approved the conversion of all existing Class B shares into Class A shares, effective on or about July 1, 2016, regardless of the length of times shares have been held.
2. Investments in Fidelity Central Funds.
The Fund invests in Fidelity Central Funds, which are open-end investment companies generally available only to other investment companies and accounts managed by the investment adviser and its affiliates. The Fund's Schedule of Investments lists each of the Fidelity Central Funds held as of period end, if any, as an investment of the Fund, but does not include the underlying holdings of each Fidelity Central Fund. As an Investing Fund, the Fund indirectly bears its proportionate share of the expenses of the underlying Fidelity Central Funds.
The Money Market Central Funds seek preservation of capital and current income and are managed by Fidelity Investments Money Management, Inc. (FIMM), an affiliate of the investment adviser. Annualized expenses of the Money Market Central Funds as of their most recent shareholder report date are less than .005%.
A complete unaudited list of holdings for each Fidelity Central Fund is available upon request or at the Securities and Exchange Commission (the SEC) website at www.sec.gov. In addition, the financial statements of the Fidelity Central Funds are available on the SEC website or upon request.
3. Significant Accounting Policies.
The financial statements have been prepared in conformity with accounting principles generally accepted in the United States of America (GAAP), which require management to make certain estimates and assumptions at the date of the financial statements. Actual results could differ from those estimates. Subsequent events, if any, through the date that the financial statements were issued have been evaluated in the preparation of the financial statements. The following summarizes the significant accounting policies of the Fund:
Investment Valuation. Investments are valued as of 4:00 p.m. Eastern time on the last calendar day of the period. The Board of Trustees (the Board) has delegated the day to day responsibility for the valuation of the Fund's investments to the Fidelity Management & Research Company (FMR) Fair Value Committee (the Committee). In accordance with valuation policies and procedures approved by the Board, the Fund attempts to obtain prices from one or more third party pricing vendors or brokers to value its investments. When current market prices, quotations or currency exchange rates are not readily available or reliable, investments will be fair valued in good faith by the Committee, in accordance with procedures adopted by the Board. Factors used in determining fair value vary by investment type and may include market or investment specific events. The frequency with which these procedures are used cannot be predicted and they may be utilized to a significant extent. The Committee oversees the Fund's valuation policies and procedures and reports to the Board on the Committee's activities and fair value determinations. The Board monitors the appropriateness of the procedures used in valuing the Fund's investments and ratifies the fair value determinations of the Committee.
The Fund categorizes the inputs to valuation techniques used to value its investments into a disclosure hierarchy consisting of three levels as shown below:
- Level 1 – quoted prices in active markets for identical investments
- Level 2 – other significant observable inputs (including quoted prices for similar investments, interest rates, prepayment speeds, etc.)
- Level 3 – unobservable inputs (including the Fund's own assumptions based on the best information available)
Valuation techniques used to value the Fund's investments by major category are as follows:
Equity securities, including restricted securities, for which market quotations are readily available, are valued at the last reported sale price or official closing price as reported by a third party pricing vendor on the primary market or exchange on which they are traded and are categorized as Level 1 in the hierarchy. In the event there were no sales during the day or closing prices are not available, securities are valued at the last quoted bid price or may be valued using the last available price and are generally categorized as Level 2 in the hierarchy. For foreign equity securities, when market or security specific events arise, comparisons to the valuation of American Depositary Receipts (ADRs), futures contracts, Exchange-Traded Funds (ETFs) and certain indexes as well as quoted prices for similar securities may be used and would be categorized as Level 2 in the hierarchy. Utilizing these techniques may result in transfers between Level 1 and Level 2. For equity securities, including restricted securities, where observable inputs are limited, assumptions about market activity and risk are used and these securities may be categorized as Level 3 in the hierarchy.
Investments in open-end mutual funds, including the Fidelity Central Funds, are valued at their closing net asset value (NAV) each business day and are categorized as Level 1 in the hierarchy.
Changes in valuation techniques may result in transfers in or out of an assigned level within the disclosure hierarchy. The aggregate value of investments by input level as of January 31, 2016, including information on transfers between Levels 1 and 2, is included at the end of the Fund's Schedule of Investments.
Foreign Currency. The Fund may use foreign currency contracts to facilitate transactions in foreign-denominated securities. Gains and losses from these transactions may arise from changes in the value of the foreign currency or if the counterparties do not perform under the contracts' terms.
Foreign-denominated assets, including investment securities, and liabilities are translated into U.S. dollars at the exchange rates at period end. Purchases and sales of investment securities, income and dividends received and expenses denominated in foreign currencies are translated into U.S. dollars at the exchange rate in effect on the transaction date.
The effects of exchange rate fluctuations on investments are included with the net realized and unrealized gain (loss) on investment securities. Other foreign currency transactions resulting in realized and unrealized gain (loss) are disclosed separately.
Investment Transactions and Income. For financial reporting purposes, the Fund's investment holdings and NAV include trades executed through the end of the last business day of the period. The NAV per share for processing shareholder transactions is calculated as of the close of business of the New York Stock Exchange (NYSE), normally 4:00 p.m. Eastern time and includes trades executed through the end of the prior business day. Gains and losses on securities sold are determined on the basis of identified cost. Dividend income is recorded on the ex-dividend date, except for certain dividends from foreign securities where the ex-dividend date may have passed, which are recorded as soon as the Fund is informed of the ex-dividend date. Non-cash dividends included in dividend income, if any, are recorded at the fair market value of the securities received. Income and capital gain distributions from Fidelity Central Funds, if any, are recorded on the ex-dividend date. Distributions received on securities that represent a return of capital or capital gain are recorded as a reduction of cost of investments and/or as a realized gain. Subsequent to ex-dividend date the Fund determines the components of these distributions, based upon receipt of tax filings or other correspondence relating to the underlying investment. Investment income is recorded net of foreign taxes withheld where recovery of such taxes is uncertain.
Class Allocations and Expenses. Investment income, realized and unrealized capital gains and losses, common expenses of the Fund, and certain fund-level expense reductions, if any, are allocated daily on a pro-rata basis to each class based on the relative net assets of each class to the total net assets of the Fund. Each class differs with respect to transfer agent and distribution and service plan fees incurred. Certain expense reductions may also differ by class. For the reporting period, the allocated portion of income and expenses to each class as a percent of its average net assets may vary due to the timing of recording these transactions in relation to fluctuating net assets of the classes. Expenses directly attributable to a fund are charged to that fund. Expenses attributable to more than one fund are allocated among the respective funds on the basis of relative net assets or other appropriate methods. Expense estimates are accrued in the period to which they relate and adjustments are made when actual amounts are known.
Income Tax Information and Distributions to Shareholders. Each year, the Fund intends to qualify as a regulated investment company under Subchapter M of the Internal Revenue Code, including distributing substantially all of its taxable income and realized gains. As a result, no provision for U.S. Federal income taxes is required. The Fund files a U.S. federal tax return, in addition to state and local tax returns as required. The Fund's federal income tax returns are subject to examination by the Internal Revenue Service (IRS) for a period of three fiscal years after they are filed. State and local tax returns may be subject to examination for an additional fiscal year depending on the jurisdiction. Foreign taxes are provided for based on the Fund's understanding of the tax rules and rates that exist in the foreign markets in which it invests.
Distributions are declared and recorded on the ex-dividend date. Income dividends and capital gain distributions are declared separately for each class. Income and capital gain distributions are determined in accordance with income tax regulations, which may differ from GAAP.
Capital accounts within the financial statements are adjusted for permanent book-tax differences. These adjustments have no impact on net assets or the results of operations. Capital accounts are not adjusted for temporary book-tax differences which will reverse in a subsequent period.
Book-tax differences are primarily due to foreign currency transactions, passive foreign investment companies (PFIC) and losses deferred due to wash sales.
The federal tax cost of investment securities and unrealized appreciation (depreciation) as of period end were as follows:
| Gross unrealized appreciation | $387,748,822 |
| Gross unrealized depreciation | (267,041,047) |
| Net unrealized appreciation (depreciation) on securities | $120,707,775 |
| Tax cost | $2,644,242,339 |
Short-Term Trading (Redemption) Fees. Shares held by investors in the Fund less than 90 days may have been subject to a redemption fee equal to 1.50% of the NAV of shares redeemed. All redemption fees, which reduce the proceeds of the shareholder redemption, are retained by the Fund and accounted for as an addition to paid in capital.
4. Purchases and Sales of Investments.
Purchases and sales of securities, other than short-term securities, aggregated $544,684,068 and $458,614,173, respectively.
5. Fees and Other Transactions with Affiliates.
Management Fee. Fidelity Management & Research Company (the investment adviser) and its affiliates provide the Fund with investment management related services for which the Fund pays a monthly management fee. The management fee is the sum of an individual fund fee rate that is based on an annual rate of .45% of the Fund's average net assets and an annualized group fee rate that averaged .25% during the period. The group fee rate is based upon the average net assets of all the mutual funds advised by the investment adviser, including any mutual funds previously advised by the investment adviser that are currently advised by Fidelity SelectCo, LLC, an affiliate of the investment adviser. The group fee rate decreases as assets under management increase and increases as assets under management decrease. In addition, the management fee is subject to a performance adjustment (up to a maximum of +/- .20% of the Fund's average net assets over a 36 month performance period). The upward or downward adjustment to the management fee is based on the relative investment performance of Small Cap Value as compared to its benchmark index, the Russell 2000 Value Index, over the same 36 month performance period. For the reporting period, the total annualized management fee rate, including the performance adjustment, was .93% of the Fund's average net assets. The performance adjustment included in the management fee rate may be higher or lower than the maximum performance adjustment rate due to the difference between the average net assets for the reporting and performance periods.
Distribution and Service Plan Fees. In accordance with Rule 12b-1 of the 1940 Act, the Fund has adopted separate Distribution and Service Plans for each class of shares. Certain classes pay Fidelity Distributors Corporation (FDC), an affiliate of the investment adviser, separate Distribution and Service Fees, each of which is based on an annual percentage of each class' average net assets. In addition, FDC may pay financial intermediaries for selling shares of the Fund and providing shareholder support services. For the period, the Distribution and Service Fee rates, total fees and amounts retained by FDC were as follows:
| | Distribution
Fee | Service
Fee | Total Fees | Retained
by FDC |
| Class A | -% | .25% | $276,222 | $– |
| Class T | .25% | .25% | 215,804 | – |
| Class B | .75% | .25% | 14,877 | 11,158 |
| Class C | .75% | .25% | 302,240 | – |
| | | | $809,143 | $11,158 |
Sales Load. FDC may receive a front-end sales charge of up to 5.75% for selling Class A shares and 3.50% for selling Class T shares, some of which is paid to financial intermediaries for selling shares of the Fund. Depending on the holding period, FDC may receive contingent deferred sales charges levied on Class A, Class T, Class B, and Class C redemptions. The deferred sales charges range from 5.00% to 1.00% for Class B shares, 1.00% for Class C shares, 1.00% for certain purchases of Class A shares and .25% for certain purchases of Class T shares.
For the period, sales charge amounts retained by FDC were as follows:
| | Retained
by FDC |
| Class A | $3,343 |
| Class T | 1,558 |
| Class B(a) | 600 |
| Class C(a) | 175 |
| | $5,676 |
(a) When Class B and Class C shares are initially sold, FDC pays commissions from its own resources to financial intermediaries through which the sales are made.
Transfer Agent Fees. Fidelity Investments Institutional Operations Company, Inc., (FIIOC), an affiliate of the investment adviser, is the transfer, dividend disbursing and shareholder servicing agent for each class of the Fund. FIIOC receives account fees and asset-based fees that vary according to the account size and type of account of the shareholders of the respective classes of the Fund.FIIOC pays for typesetting, printing and mailing of shareholder reports, except proxy statements.
For the period, transfer agent fees for each class were as follows:
| | Amount | % of
Class-Level Average
Net Assets(a) |
| Class A | $240,091 | .22 |
| Class T | 91,163 | .21 |
| Class B | 4,520 | .30 |
| Class C | 69,338 | .23 |
| Small Cap Value | 2,371,533 | .23 |
| Class I | 349,112 | .20 |
| | $3,125,757 | |
(a) Annualized
Accounting and Security Lending Fees. Fidelity Service Company, Inc. (FSC), an affiliate of the investment adviser, maintains the Fund's accounting records. The accounting fee is based on the level of average net assets for each month. Under a separate contract, FSC administers the security lending program. The security lending fee is based on the number and duration of lending transactions.
Brokerage Commissions. The Fund placed a portion of its portfolio transactions with brokerage firms which are affiliates of the investment adviser. Brokerage commissions are included in net realized gain (loss) and change in net unrealized appreciation (depreciation) in the Statement of Operations. The commissions paid to these affiliated firms were $12,094 for the period.
Interfund Trades. The Fund may purchase from or sell securities to other Fidelity Funds under procedures adopted by the Board. The procedures have been designed to ensure these interfund trades are executed in accordance with Rule 17a-7 of the 1940 Act. Interfund trades are included within the respective purchases and sales amounts shown in the Purchases and Sales of Investments note.
6. Committed Line of Credit.
The Fund participates with other funds managed by the investment adviser or an affiliate in a $4.25 billion credit facility (the "line of credit") to be utilized for temporary or emergency purposes to fund shareholder redemptions or for other short-term liquidity purposes. The Fund has agreed to pay commitment fees on its pro-rata portion of the line of credit, which amounted to $1,860 and is reflected in Miscellaneous expenses on the Statement of Operations. During the period, the Fund did not borrow on this line of credit.
7. Security Lending.
The Fund lends portfolio securities through a lending agent from time to time in order to earn additional income. For equity securities, a lending agent is used and may loan securities to certain qualified borrowers, including Fidelity Capital Markets (FCM), a broker-dealer affiliated with the Fund. On the settlement date of the loan, the Fund receives collateral (in the form of U.S. Treasury obligations, letters of credit and/or cash) against the loaned securities and maintains collateral in an amount not less than 100% of the market value of the loaned securities during the period of the loan. The market value of the loaned securities is determined at the close of business of the Fund and any additional required collateral is delivered to the Fund on the next business day. The Fund or borrower may terminate the loan at any time, and if the borrower defaults on its obligation to return the securities loaned because of insolvency or other reasons, the Fund may apply collateral received from the borrower against the obligation. The Fund may experience delays and costs in recovering the securities loaned. Any cash collateral received is the Fidelity Securities Lending Cash Central Fund. The value of loaned securities and cash collateral at period end are disclosed on the Fund's Statement of Assets and Liabilities. The value of securities loaned to FCM at period end was $142,275. Security lending income represents the income earned on investing cash collateral, less rebates paid to borrowers and any lending agent fees associated with the loan, plus any premium payments received for lending certain types of securities. Security lending income is presented in the Statement of Operations as a component of income from Fidelity Central Funds. Total security lending income during the period amounted to $917,702, including $1,535 from securities loaned to FCM.
8. Expense Reductions.
Commissions paid to certain brokers with whom the investment adviser, or its affiliates, places trades on behalf of the Fund include an amount in addition to trade execution, which may be rebated back to the Fund to offset certain expenses. This amount totaled $8,582 for the period. In addition, through arrangements with the Fund's custodian, credits realized as a result of certain uninvested cash balances were used to reduce the Fund's expenses. During the period, these credits reduced the Fund's expense by $110.
In addition, during the period the investment adviser reimbursed and/or waived a portion of fund-level operating expenses in the amount of $9,849.
9. Distributions to Shareholders.
Distributions to shareholders of each class were as follows:
| | Six months ended January 31, 2016 | Year ended July 31, 2015 |
| From net investment income | | |
| Class A | $1,294,370 | $207,059 |
| Class T | 298,011 | – |
| Small Cap Value | 17,252,984 | 7,655,420 |
| Class I | 3,108,241 | 1,284,414 |
| Total | $21,953,606 | $9,146,893 |
| From net realized gain | | |
| Class A | $21,315,531 | $29,002,450 |
| Class T | 8,511,334 | 11,758,984 |
| Class B | 317,311 | 573,044 |
| Class C | 6,297,703 | 8,461,258 |
| Small Cap Value | 193,461,328 | 233,242,234 |
| Class I | 34,271,399 | 39,442,202 |
| Total | $264,174,606 | $322,480,172 |
10. Share Transactions.
Share transactions for each class were as follows and may contain automatic conversions between classes or exchanges between affiliated funds:
| | Shares | Shares | Dollars | Dollars |
| | Six months ended January 31, 2016 | Year ended July 31, 2015 | Six months ended January 31, 2016 | Year ended July 31, 2015 |
| Class A | | | | |
| Shares sold | 975,320 | 1,619,679 | $16,612,607 | $30,035,137 |
| Reinvestment of distributions | 1,320,026 | 1,578,405 | 22,234,691 | 28,466,035 |
| Shares redeemed | (1,786,996) | (4,261,712) | (30,317,795) | (79,564,907) |
| Net increase (decrease) | 508,350 | (1,063,628) | $8,529,503 | $(21,063,735) |
| Class T | | | | |
| Shares sold | 310,224 | 599,331 | $5,203,698 | $10,911,777 |
| Reinvestment of distributions | 527,842 | 655,613 | 8,714,816 | 11,618,861 |
| Shares redeemed | (594,533) | (1,691,524) | (9,865,736) | (30,859,052) |
| Net increase (decrease) | 243,533 | (436,580) | $4,052,778 | $(8,328,414) |
| Class B | | | | |
| Shares sold | 2,263 | 5,056 | $34,845 | $89,676 |
| Reinvestment of distributions | 19,426 | 31,870 | 302,868 | 537,830 |
| Shares redeemed | (48,105) | (106,178) | (758,742) | (1,834,363) |
| Net increase (decrease) | (26,416) | (69,252) | $(421,029) | $(1,206,857) |
| Class C | | | | |
| Shares sold | 125,591 | 167,565 | $1,958,139 | $2,897,201 |
| Reinvestment of distributions | 367,680 | 447,025 | 5,744,375 | 7,553,140 |
| Shares redeemed | (358,789) | (847,704) | (5,654,174) | (14,671,382) |
| Net increase (decrease) | 134,482 | (233,114) | $2,048,340 | $(4,221,041) |
| Small Cap Value | | | | |
| Shares sold | 18,049,566 | 13,163,441 | $309,409,636 | $248,872,334 |
| Reinvestment of distributions | 11,459,014 | 12,098,173 | 196,112,754 | 221,448,638 |
| Shares redeemed | (11,230,058) | (25,848,809) | (192,654,407) | (487,056,437) |
| Net increase (decrease) | 18,278,522 | (587,195) | $312,867,983 | $(16,735,465) |
| Class I | | | | |
| Shares sold | 1,966,371 | 4,194,067 | $33,969,215 | $79,803,869 |
| Reinvestment of distributions | 1,907,860 | 1,996,970 | 32,653,194 | 36,554,847 |
| Shares redeemed | (2,451,782) | (4,316,971) | (42,326,981) | (81,701,452) |
| Net increase (decrease) | 1,422,449 | 1,874,066 | $24,295,428 | $34,657,264 |
11. Other.
The Fund's organizational documents provide former and current trustees and officers with a limited indemnification against liabilities arising in connection with the performance of their duties to the Fund. In the normal course of business, the Fund may also enter into contracts that provide general indemnifications. The Fund's maximum exposure under these arrangements is unknown as this would be dependent on future claims that may be made against the Fund. The risk of material loss from such claims is considered remote.
Shareholder Expense Example
As a shareholder of the Fund, you incur two types of costs: (1) transaction costs, including sales charges (loads) on purchase payments or redemption proceeds, redemption fees and (2) ongoing costs, including management fees, distribution and/or service (12b-1) fees and other Fund expenses. This Example is intended to help you understand your ongoing costs (in dollars) of investing in the Fund and to compare these costs with the ongoing costs of investing in other mutual funds.
The Example is based on an investment of $1,000 invested at the beginning of the period and held for the entire period (August 1, 2015 to January 31, 2016).
Actual Expenses
The first line of the accompanying table for each class of the Fund provides information about actual account values and actual expenses. You may use the information in this line, together with the amount you invested, to estimate the expenses that you paid over the period. Simply divide your account value by $1,000.00 (for example, an $8,600 account value divided by $1,000.00 = 8.6), then multiply the result by the number in the first line for a class of the Fund under the heading entitled "Expenses Paid During Period" to estimate the expenses you paid on your account during this period. A small balance maintenance fee of $12.00 that is charged once a year may apply for certain accounts with a value of less than $2,000. This fee is not included in the table below. If it was, the estimate of expenses you paid during the period would be higher, and your ending account value lower, by this amount. In addition, the Fund, as a shareholder in the underlying Fidelity Central Funds, will indirectly bear its pro-rata share of the fees and expenses incurred by the underlying Fidelity Central Funds. These fees and expenses are not included in the Fund's annualized expense ratio used to calculate the expense estimate in the table below.
Hypothetical Example for Comparison Purposes
The second line of the accompanying table for each class of the Fund provides information about hypothetical account values and hypothetical expenses based on a Class' actual expense ratio and an assumed rate of return of 5% per year before expenses, which is not the Class' actual return. The hypothetical account values and expenses may not be used to estimate the actual ending account balance or expenses you paid for the period. You may use this information to compare the ongoing costs of investing in the Fund and other funds. To do so, compare this 5% hypothetical example with the 5% hypothetical examples that appear in the shareholder reports of the other funds. A small balance maintenance fee of $12.00 that is charged once a year may apply for certain accounts with a value of less than $2,000. This fee is not included in the table below. If it was, the estimate of expenses you paid during the period would be higher, and your ending account value lower, by this amount. In addition, the Fund, as a shareholder in the underlying Fidelity Central Funds, will indirectly bear its pro-rata share of the fees and expenses incurred by the underlying Fidelity Central Funds. These fees and expenses are not included in the Fund's annualized expense ratio used to calculate the expense estimate in the table below.
Please note that the expenses shown in the table are meant to highlight your ongoing costs only and do not reflect any transaction costs. Therefore, the second line of the table is useful in comparing ongoing costs only, and will not help you determine the relative total costs of owning different funds. In addition, if these transactional costs were included, your costs would have been higher.
| | Annualized Expense Ratio-A | Beginning
Account Value
August 1, 2015 | Ending
Account Value
January 31, 2016 | Expenses Paid
During Period-B
August 1, 2015
to January 31, 2016 |
| Class A | 1.44% | | | |
| Actual | | $1,000.00 | $917.00 | $6.94 |
| Hypothetical-C | | $1,000.00 | $1,017.90 | $7.30 |
| Class T | 1.68% | | | |
| Actual | | $1,000.00 | $915.80 | $8.09 |
| Hypothetical-C | | $1,000.00 | $1,016.69 | $8.52 |
| Class B | 2.27% | | | |
| Actual | | $1,000.00 | $913.20 | $10.92 |
| Hypothetical-C | | $1,000.00 | $1,013.72 | $11.49 |
| Class C | 2.20% | | | |
| Actual | | $1,000.00 | $913.30 | $10.58 |
| Hypothetical-C | | $1,000.00 | $1,014.08 | $11.14 |
| Small Cap Value | 1.21% | | | |
| Actual | | $1,000.00 | $918.20 | $5.83 |
| Hypothetical-C | | $1,000.00 | $1,019.05 | $6.14 |
| Class I | 1.17% | | | |
| Actual | | $1,000.00 | $918.30 | $5.64 |
| Hypothetical-C | | $1,000.00 | $1,019.25 | $5.94 |
A Annualized expense ratio reflects expenses net of applicable fee waivers.
B Expenses are equal to each Class' annualized expense ratio, multiplied by the average account value over the period, multiplied by 184/366 (to reflect the one-half year period).
C 5% return per year before expenses
ASCV-SANN-0316
1.803738.112
Fidelity® Series Real Estate Income Fund
Fidelity® Series Real Estate Income Fund
Class F
Semi-Annual Report January 31, 2016 |
|
Contents
To view a fund's proxy voting guidelines and proxy voting record for the 12-month period ended June 30, visit http://www.fidelity.com/proxyvotingresults or visit the Securities and Exchange Commission's (SEC) web site at http://www.sec.gov.
You may also call 1-800-544-8544, or for Class F, call 1-800-835-5092, to request a free copy of the proxy voting guidelines.
Standard & Poor's, S&P and S&P 500 are registered service marks of The McGraw-Hill Companies, Inc. and have been licensed for use by Fidelity Distributors Corporation.
Other third-party marks appearing herein are the property of their respective owners.
All other marks appearing herein are registered or unregistered trademarks or service marks of FMR LLC or an affiliated company. © 2016 FMR LLC. All rights reserved.
This report and the financial statements contained herein are submitted for the general information of the shareholders of the Fund. This report is not authorized for distribution to prospective investors in the Fund unless preceded or accompanied by an effective prospectus.
A fund files its complete schedule of portfolio holdings with the SEC for the first and third quarters of each fiscal year on Form N-Q. Forms N-Q are available on the SEC’s web site at http://www.sec.gov. A fund's Forms N-Q may be reviewed and copied at the SEC’s Public Reference Room in Washington, DC. Information regarding the operation of the SEC's Public Reference Room may be obtained by calling 1-800-SEC-0330.
For a complete list of a fund's portfolio holdings, view the most recent holdings listing, semiannual report, or annual report on Fidelity's web site at http://www.fidelity.com, http://www.advisor.fidelity.com, or http://www.401k.com, as applicable.
NOT FDIC INSURED •MAY LOSE VALUE •NO BANK GUARANTEE
Neither the Fund nor Fidelity Distributors Corporation is a bank.
Investment Summary (Unaudited)
Top Five Stocks as of January 31, 2016
| | % of fund's net assets | % of fund's net assets 6 months ago |
| Equity Lifestyle Properties, Inc. | 2.3 | 2.1 |
| Acadia Realty Trust (SBI) | 1.9 | 1.8 |
| MFA Financial, Inc. | 1.4 | 1.5 |
| Ventas, Inc. | 1.0 | 0.7 |
| Stag Industrial, Inc. Series A, 9.00% | 0.9 | 0.9 |
| | 7.5 | |
Top 5 Bonds as of January 31, 2016
| | % of fund's net assets | % of fund's net assets 6 months ago |
| RWT Holdings, Inc. 5.625% 11/15/19 | 1.2 | 0.7 |
| Blackstone Mortgage Trust, Inc. 5.25% 12/1/18 | 1.0 | 1.0 |
| iStar Financial, Inc. 5.875% 3/15/16 | 0.8 | 0.8 |
| Realogy Group LLC Tranche B, term loan 3.75% 3/5/20 | 0.8 | 0.8 |
| IAS Operating Partnership LP 5% 3/15/18 | 0.8 | 0.7 |
| | 4.6 | |
Top Five REIT Sectors as of January 31, 2016
| | % of fund's net assets | % of fund's net assets 6 months ago |
| REITs - Mortgage | 16.7 | 16.5 |
| REITs - Shopping Centers | 4.9 | 5.0 |
| REITs - Health Care | 4.6 | 4.7 |
| REITs - Office Property | 4.5 | 4.6 |
| REITs - Management/Investment | 4.2 | 4.3 |
Asset Allocation (% of fund's net assets)
| As of January 31, 2016* |
| | Common Stocks | 15.2% |
| | Preferred Stocks | 24.2% |
| | Bonds | 41.0% |
| | Convertible Securities | 7.2% |
| | Other Investments | 6.2% |
| | Short-Term Investments and Net Other Assets (Liabilities) | 6.2% |
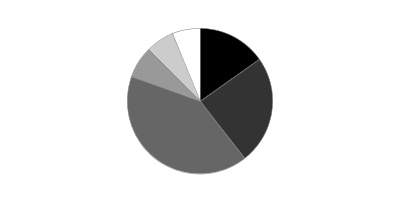
* Foreign investments - 0.3%
| As of July 31, 2015* |
| | Common Stocks | 14.7% |
| | Preferred Stocks | 24.2% |
| | Bonds | 42.4% |
| | Convertible Securities | 6.1% |
| | Other Investments | 6.9% |
| | Short-Term Investments and Net Other Assets (Liabilities) | 5.7% |

* Foreign investments - 0.3%
Investments January 31, 2016 (Unaudited)
Showing Percentage of Net Assets
| Common Stocks - 15.2% | | | |
| | | Shares | Value |
| FINANCIALS - 15.2% | | | |
| Capital Markets - 0.1% | | | |
| Ellington Financial LLC | | 61,200 | $992,052 |
| Real Estate Investment Trusts - 14.9% | | | |
| Acadia Realty Trust (SBI) | | 459,000 | 15,651,900 |
| American Campus Communities, Inc. | | 37,800 | 1,595,160 |
| American Tower Corp. | | 17,800 | 1,679,252 |
| Annaly Capital Management, Inc. | | 155,500 | 1,477,250 |
| Anworth Mortgage Asset Corp. | | 191,300 | 814,938 |
| Apartment Investment & Management Co. Class A | | 94,300 | 3,691,845 |
| Arbor Realty Trust, Inc. | | 223,500 | 1,461,690 |
| AvalonBay Communities, Inc. | | 11,500 | 1,972,135 |
| Care Capital Properties, Inc. | | 8,200 | 245,508 |
| CBL & Associates Properties, Inc. | | 260,500 | 2,800,375 |
| Cedar Shopping Centers, Inc. | | 41,700 | 294,402 |
| Chimera Investment Corp. | | 16,700 | 206,913 |
| Community Healthcare Trust, Inc. | | 24,400 | 451,888 |
| CYS Investments, Inc. | | 166,600 | 1,147,874 |
| Douglas Emmett, Inc. | | 29,400 | 869,652 |
| Dynex Capital, Inc. | | 228,300 | 1,369,800 |
| Equity Lifestyle Properties, Inc. | | 288,100 | 18,991,537 |
| Extra Space Storage, Inc. | | 30,900 | 2,802,321 |
| First Potomac Realty Trust | | 114,600 | 1,121,934 |
| Five Oaks Investment Corp. | | 15,700 | 73,162 |
| Hatteras Financial Corp. | | 64,100 | 785,866 |
| Invesco Mortgage Capital, Inc. | | 85,800 | 971,256 |
| Lexington Corporate Properties Trust | | 496,100 | 3,636,413 |
| MFA Financial, Inc. | | 1,716,300 | 10,898,505 |
| Mid-America Apartment Communities, Inc. | | 50,100 | 4,700,382 |
| Monmouth Real Estate Investment Corp. Class A | | 54,300 | 558,204 |
| National Retail Properties, Inc. | | 25,000 | 1,073,500 |
| New Senior Investment Group, Inc. | | 182,599 | 1,678,085 |
| Newcastle Investment Corp. | | 153,599 | 546,812 |
| NorthStar Realty Europe Corp. | | 104 | 982 |
| NorthStar Realty Finance Corp. | | 138,250 | 1,641,028 |
| Potlatch Corp. | | 70,800 | 2,041,872 |
| Sabra Health Care REIT, Inc. | | 95,800 | 1,758,888 |
| Select Income REIT | | 44,200 | 835,380 |
| Senior Housing Properties Trust (SBI) | | 286,400 | 4,147,072 |
| Simon Property Group, Inc. | | 10,800 | 2,011,824 |
| Store Capital Corp. | | 77,600 | 1,923,704 |
| Terreno Realty Corp. | | 181,061 | 4,070,251 |
| The Macerich Co. | | 13,700 | 1,068,189 |
| Two Harbors Investment Corp. | | 206,200 | 1,567,120 |
| Ventas, Inc. | | 149,900 | 8,292,468 |
| VEREIT, Inc. | | 128,400 | 989,964 |
| Weyerhaeuser Co. | | 58,500 | 1,498,185 |
| WP Carey, Inc. | | 82,400 | 4,799,800 |
| WP Glimcher, Inc. | | 55,950 | 508,026 |
| | | | 120,723,312 |
| Real Estate Management & Development - 0.2% | | | |
| Kennedy-Wilson Holdings, Inc. | | 51,700 | 1,048,476 |
|
| TOTAL FINANCIALS | | | 122,763,840 |
|
| HEALTH CARE - 0.0% | | | |
| Health Care Providers & Services - 0.0% | | | |
| Chartwell Retirement Residence (a)(b) | | 14,700 | 133,789 |
| TOTAL COMMON STOCKS | | | |
| (Cost $106,996,929) | | | 122,897,629 |
|
| Preferred Stocks - 24.9% | | | |
| Convertible Preferred Stocks - 0.7% | | | |
| FINANCIALS - 0.7% | | | |
| Real Estate Investment Trusts - 0.7% | | | |
| Alexandria Real Estate Equities, Inc. Series D 7.00% | | 8,241 | 222,636 |
| FelCor Lodging Trust, Inc. Series A, 1.95% | | 32,700 | 797,226 |
| Lexington Corporate Properties Trust Series C, 6.50% | | 70,019 | 3,317,150 |
| Weyerhaeuser Co. Series A, 6.375% | | 32,000 | 1,460,000 |
| | | | 5,797,012 |
| Nonconvertible Preferred Stocks - 24.2% | | | |
| FINANCIALS - 24.2% | | | |
| Capital Markets - 0.1% | | | |
| Arlington Asset Investment Corp. 6.625% | | 31,528 | 563,090 |
| Real Estate Investment Trusts - 23.9% | | | |
| AG Mortgage Investment Trust, Inc.: | | | |
| 8.00% | | 132,104 | 2,866,657 |
| 8.25% | | 300 | 6,768 |
| Alexandria Real Estate Equities, Inc. Series E, 6.45% | | 24,001 | 622,106 |
| American Capital Agency Corp.: | | | |
| 8.00% | | 120,000 | 3,024,000 |
| Series B, 7.75% | | 16,000 | 377,600 |
| American Capital Mortgage Investment Corp. Series A, 8.125% | | 33,100 | 781,160 |
| American Homes 4 Rent: | | | |
| Series A, 5.00% | | 238,619 | 6,046,605 |
| Series B, 5.00% | | 134,563 | 3,455,578 |
| Series C, 5.50% | | 138,310 | 3,524,139 |
| Annaly Capital Management, Inc.: | | | |
| Series A, 7.875% | | 150,300 | 3,746,979 |
| Series C, 7.625% | | 24,839 | 589,429 |
| Series D, 7.50% | | 83,513 | 1,949,193 |
| Anworth Mortgage Asset Corp. Series A, 8.625% | | 178,800 | 4,398,480 |
| Apollo Commercial Real Estate Finance, Inc. Series A, 8.625% | | 61,725 | 1,525,842 |
| Apollo Residential Mortgage, Inc. Series A, 8.00% | | 50,238 | 1,090,165 |
| Arbor Realty Trust, Inc.: | | | |
| 7.375% | | 20,000 | 451,200 |
| Series A, 8.25% | | 41,922 | 964,625 |
| Series B, 7.75% | | 40,000 | 857,200 |
| Series C, 8.50% | | 15,000 | 357,000 |
| Armour Residential REIT, Inc. Series B, 7.875% | | 25,701 | 509,651 |
| Ashford Hospitality Trust, Inc.: | | | |
| Series D, 8.45% | | 51,709 | 1,144,320 |
| Series E, 9.00% | | 35,948 | 858,079 |
| Bluerock Residental Growth (REIT), Inc. Series A 8.25% (a) | | 40,000 | 1,014,000 |
| Brandywine Realty Trust Series E, 6.90% | | 21,000 | 538,860 |
| Campus Crest Communities, Inc. Series A, 8.00% | | 132,676 | 3,566,331 |
| Capstead Mortgage Corp. Series E, 7.50% | | 37,016 | 867,285 |
| CBL & Associates Properties, Inc.: | | | |
| Series D, 7.375% | | 67,200 | 1,632,960 |
| Series E, 6.625% | | 45,505 | 1,015,672 |
| Cedar Shopping Centers, Inc. Series B, 7.25% | | 113,018 | 2,825,450 |
| Chesapeake Lodging Trust Series A, 7.75% | | 64,034 | 1,631,586 |
| Colony Financial, Inc.: | | | |
| 7.125% | | 103,850 | 2,045,845 |
| Series A, 8.50% | | 77,829 | 1,879,570 |
| Series B, 7.50% | | 4,300 | 91,203 |
| Coresite Realty Corp. Series A, 7.25% | | 42,600 | 1,109,730 |
| Corporate Office Properties Trust Series L, 7.375% | | 136,869 | 3,479,210 |
| CubeSmart Series A, 7.75% | | 40,000 | 1,036,000 |
| CYS Investments, Inc.: | | | |
| Series A, 7.75% | | 10,014 | 230,322 |
| Series B, 7.50% | | 113,333 | 2,561,326 |
| DDR Corp.: | | | |
| Series J, 6.50% | | 70,181 | 1,786,808 |
| Series K, 6.25% | | 25,489 | 644,107 |
| Digital Realty Trust, Inc.: | | | |
| Series E, 7.00% | | 40,181 | 1,030,643 |
| Series F, 6.625% | | 20,000 | 522,800 |
| Series G, 5.875% | | 28,270 | 702,792 |
| Series H, 7.375% | | 10,000 | 267,700 |
| DuPont Fabros Technology, Inc. Series B, 7.625% | | 73,798 | 1,868,565 |
| Dynex Capital, Inc.: | | | |
| Series A, 8.50% | | 96,313 | 2,181,489 |
| Series B, 7.625% | | 47,335 | 1,017,703 |
| Equity Commonwealth Series E, 7.25% | | 200,160 | 5,106,082 |
| Equity Lifestyle Properties, Inc. Series C, 6.75% | | 182,313 | 4,627,104 |
| Essex Property Trust, Inc. Series H, 7.125% | | 8,100 | 205,092 |
| First Potomac Realty Trust 7.75% | | 83,695 | 2,127,527 |
| Five Oaks Investment Corp. Series A, 8.75% | | 48,000 | 744,960 |
| General Growth Properties, Inc. Series A, 6.375% | | 34,690 | 889,799 |
| Gladstone Commercial Corp. Series C, 7.125% | | 67,762 | 1,717,767 |
| Hatteras Financial Corp. Series A, 7.625% | | 89,188 | 2,081,648 |
| Hersha Hospitality Trust Series B, 8.00% | | 18,928 | 476,607 |
| Hospitality Properties Trust Series D, 7.125% | | 40,200 | 1,043,592 |
| Inland Real Estate Corp.: | | | |
| Series A, 8.125% | | 207,500 | 5,210,325 |
| Series B, 6.95% | | 46,000 | 1,156,900 |
| Invesco Mortgage Capital, Inc.: | | | |
| Series A, 7.75% | | 30,151 | 648,247 |
| Series B, 7.75% | | 170,898 | 3,657,217 |
| Investors Real Estate Trust Series B, 7.95% | | 33,428 | 862,108 |
| iStar Financial, Inc.: | | | |
| Series D, 8.00% | | 15,010 | 310,557 |
| Series E, 7.875% | | 43,106 | 883,673 |
| Series F, 7.80% | | 137,664 | 2,808,346 |
| Series G, 7.65% | | 84,000 | 1,722,000 |
| Kilroy Realty Corp.: | | | |
| Series G, 6.875% | | 20,300 | 524,552 |
| Series H, 6.375% | | 31,704 | 803,062 |
| LaSalle Hotel Properties: | | | |
| Series H, 7.50% | | 37,192 | 937,238 |
| Series I, 6.375% | | 47,339 | 1,121,934 |
| LBA Realty Fund II Series B, 7.625% | | 118,900 | 2,652,956 |
| MFA Financial, Inc.: | | | |
| 8.00% | | 108,747 | 2,733,900 |
| Series B, 7.50% | | 188,749 | 4,528,089 |
| Monmouth Real Estate Investment Corp. Series B, 7.875% | | 30,000 | 798,000 |
| National Retail Properties, Inc.: | | | |
| 5.70% | | 46,124 | 1,158,635 |
| Series D, 6.625% | | 46,667 | 1,217,075 |
| New York Mortgage Trust, Inc.: | | | |
| 7.875% | | 101,433 | 2,044,889 |
| Series B, 7.75% | | 70,013 | 1,415,663 |
| NorthStar Realty Finance Corp.: | | | |
| Series A 8.75% | | 1,500 | 31,380 |
| Series B, 8.25% | | 77,484 | 1,497,766 |
| Series C, 8.875% | | 115,595 | 2,400,908 |
| Series D, 8.50% | | 45,035 | 882,686 |
| Series E, 8.75% | | 77,921 | 1,557,641 |
| Pebblebrook Hotel Trust: | | | |
| Series A, 7.875% | | 119,000 | 2,997,610 |
| Series B, 8.00% | | 37,400 | 955,570 |
| Series C, 6.50% | | 71,026 | 1,753,632 |
| Pennsylvania (REIT) 7.375% | | 55,408 | 1,399,052 |
| Prologis, Inc. Series Q, 8.54% | | 15,800 | 984,538 |
| PS Business Parks, Inc.: | | | |
| Series S, 6.45% | | 5,665 | 146,440 |
| Series T, 6.00% | | 26,000 | 661,700 |
| Series U, 5.75% | | 102,483 | 2,577,447 |
| Public Storage 6.375% | | 24,000 | 650,640 |
| RAIT Financial Trust: | | | |
| 7.125% | | 82,863 | 1,786,526 |
| 7.625% | | 46,080 | 854,784 |
| Regency Centers Corp.: | | | |
| Series 6, 6.625% | | 31,239 | 815,026 |
| Series 7, 6.00% | | 32,000 | 813,440 |
| Retail Properties America, Inc. 7.00% | | 83,617 | 2,102,968 |
| Sabra Health Care REIT, Inc. Series A, 7.125% | | 99,665 | 2,517,538 |
| Saul Centers, Inc. Series C, 6.875% | | 69,596 | 1,795,577 |
| Stag Industrial, Inc.: | | | |
| Series A, 9.00% | | 280,000 | 7,198,800 |
| Series B, 6.625% | | 10,000 | 248,800 |
| Summit Hotel Properties, Inc. Series A, 9.25% | | 173,700 | 4,509,252 |
| Sun Communities, Inc. Series A, 7.125% | | 59,000 | 1,525,740 |
| Sunstone Hotel Investors, Inc. Series D, 8.00% | | 32,939 | 831,710 |
| Taubman Centers, Inc. Series K, 6.25% | | 19,561 | 496,849 |
| Terreno Realty Corp. Series A, 7.75% | | 81,048 | 2,107,248 |
| UMH Properties, Inc.: | | | |
| 8.00% | | 120,000 | 3,285,600 |
| Series A, 8.25% | | 97,931 | 2,516,827 |
| Urstadt Biddle Properties, Inc.: | | | |
| 6.75% | | 33,500 | 858,605 |
| Series F, 7.125% | | 30,000 | 769,500 |
| VEREIT, Inc. Series F, 6.70% | | 253,683 | 6,139,129 |
| Wells Fargo Real Estate Investment Corp. 6.375% | | 23,000 | 611,340 |
| Welltower, Inc. 6.50% | | 33,400 | 877,752 |
| WP Glimcher, Inc.: | | | |
| 6.875% | | 3,183 | 78,302 |
| 7.50% | | 53,575 | 1,346,876 |
| | | | 193,495,476 |
| Real Estate Management & Development - 0.2% | | | |
| Kennedy-Wilson, Inc. 7.75% | | 55,054 | 1,398,372 |
| TOTAL FINANCIALS | | | 195,456,938 |
| TOTAL PREFERRED STOCKS | | | |
| (Cost $202,404,892) | | | 201,253,950 |
| | | Principal Amount | Value |
|
| Corporate Bonds - 23.9% | | | |
| Convertible Bonds - 6.5% | | | |
| FINANCIALS - 6.5% | | | |
| Consumer Finance - 0.3% | | | |
| Zais Financial Partners LP 8% 11/15/16 (b) | | 3,000,000 | 2,874,375 |
| Diversified Financial Services - 1.2% | | | |
| RWT Holdings, Inc. 5.625% 11/15/19 | | 10,590,000 | 9,464,813 |
| Real Estate Investment Trusts - 4.2% | | | |
| American Realty Capital Properties, Inc. 3.75% 12/15/20 | | 1,630,000 | 1,463,944 |
| Apollo Commercial Real Estate Finance, Inc. 5.5% 3/15/19 | | 1,180,000 | 1,168,200 |
| Blackstone Mortgage Trust, Inc. 5.25% 12/1/18 | | 8,080,000 | 7,973,950 |
| Campus Crest Communities Operating Partnership LP 4.75% 10/15/18 (b) | | 3,000,000 | 2,962,500 |
| Colony Financial, Inc.: | | | |
| 3.875% 1/15/21 | | 2,090,000 | 1,827,444 |
| 5% 4/15/23 | | 2,095,000 | 1,889,428 |
| Colony Starwood Homes 4.5% 10/15/17 | | 390,000 | 386,588 |
| PennyMac Corp. 5.375% 5/1/20 | | 5,762,000 | 5,301,040 |
| RAIT Financial Trust 4% 10/1/33 | | 7,370,000 | 5,495,256 |
| Redwood Trust, Inc. 4.625% 4/15/18 | | 2,200,000 | 2,029,500 |
| Resource Capital Corp.: | | | |
| 6% 12/1/18 | | 690,000 | 633,075 |
| 8% 1/15/20 | | 2,150,000 | 2,071,611 |
| Spirit Realty Capital, Inc. 3.75% 5/15/21 | | 500,000 | 483,750 |
| Starwood Property Trust, Inc. 3.75% 10/15/17 | | 650,000 | 636,188 |
| | | | 34,322,474 |
| Thrifts & Mortgage Finance - 0.8% | | | |
| IAS Operating Partnership LP 5% 3/15/18 (b) | | 6,700,000 | 6,306,375 |
| TOTAL FINANCIALS | | | 52,968,037 |
| Nonconvertible Bonds - 17.4% | | | |
| CONSUMER DISCRETIONARY - 4.8% | | | |
| Hotels, Restaurants & Leisure - 0.7% | | | |
| FelCor Lodging LP 6% 6/1/25 | | 1,380,000 | 1,393,800 |
| Hilton Worldwide Finance LLC/Hilton Worldwide Finance Corp. 5.625% 10/15/21 | | 1,555,000 | 1,601,650 |
| Times Square Hotel Trust 8.528% 8/1/26 (b) | | 2,398,487 | 2,843,370 |
| | | | 5,838,820 |
| Household Durables - 4.1% | | | |
| Ashton Woods U.S.A. LLC/Ashton Woods Finance Co. 6.875% 2/15/21 (b) | | 2,100,000 | 1,785,000 |
| Brookfield Residential Properties, Inc./Brookfield Residential U.S. Corp. 6.125% 7/1/22 (b) | | 1,060,000 | 930,150 |
| Brookfield Residential Properties, Inc.: | | | |
| 6.375% 5/15/25 (b) | | 2,000,000 | 1,685,000 |
| 6.5% 12/15/20 (b) | | 395,000 | 357,475 |
| Calatlantic Group, Inc.: | | | |
| 5.875% 11/15/24 | | 630,000 | 653,625 |
| 8.375% 5/15/18 | | 3,737,000 | 4,120,043 |
| D.R. Horton, Inc.: | | | |
| 4.375% 9/15/22 | | 825,000 | 820,875 |
| 5.75% 8/15/23 | | 490,000 | 515,725 |
| 6.5% 4/15/16 | | 811,000 | 816,069 |
| KB Home: | | | |
| 8% 3/15/20 | | 2,395,000 | 2,448,888 |
| 9.1% 9/15/17 | | 1,185,000 | 1,267,950 |
| Lennar Corp.: | | | |
| 4.125% 12/1/18 | | 1,220,000 | 1,232,200 |
| 4.5% 6/15/19 | | 400,000 | 410,000 |
| 6.95% 6/1/18 | | 1,075,000 | 1,147,563 |
| Meritage Homes Corp.: | | | |
| 6% 6/1/25 | | 2,085,000 | 2,032,875 |
| 7% 4/1/22 | | 2,005,000 | 2,055,125 |
| 7.15% 4/15/20 | | 1,940,000 | 2,022,450 |
| Ryland Group, Inc.: | | | |
| 6.625% 5/1/20 | | 445,000 | 479,488 |
| 8.4% 5/15/17 | | 1,446,000 | 1,539,990 |
| Taylor Morrison Communities, Inc./Monarch Communities, Inc. 5.875% 4/15/23 (b) | | 760,000 | 710,600 |
| William Lyon Homes, Inc.: | | | |
| 7% 8/15/22 | | 820,000 | 787,200 |
| 7% 8/15/22 (b) | | 425,000 | 408,000 |
| 8.5% 11/15/20 | | 4,320,000 | 4,460,400 |
| | | | 32,686,691 |
| Media - 0.0% | | | |
| CBS Outdoor Americas Capital LLC/CBS Outdoor Americas Capital Corp. 5.625% 2/15/24 | | 240,000 | 245,400 |
| TOTAL CONSUMER DISCRETIONARY | | | 38,770,911 |
| CONSUMER STAPLES - 0.1% | | | |
| Food & Staples Retailing - 0.1% | | | |
| C&S Group Enterprises LLC 5.375% 7/15/22 (b) | | 495,000 | 447,975 |
| FINANCIALS - 11.3% | | | |
| Diversified Financial Services - 0.5% | | | |
| Icahn Enterprises LP/Icahn Enterprises Finance Corp.: | | | |
| 5.875% 2/1/22 | | 820,000 | 732,875 |
| 6% 8/1/20 | | 3,500,000 | 3,285,275 |
| | | | 4,018,150 |
| Real Estate Investment Trusts - 7.9% | | | |
| American Campus Communities Operating Partnership LP 4.125% 7/1/24 | | 1,000,000 | 1,012,408 |
| ARC Properties Operating Partnership LP 4.6% 2/6/24 | | 605,000 | 569,456 |
| CBL & Associates LP 5.25% 12/1/23 | | 2,000,000 | 1,963,356 |
| Crown Castle International Corp. 5.25% 1/15/23 | | 1,500,000 | 1,597,500 |
| CTR Partnership LP/CareTrust Capital Corp. 5.875% 6/1/21 | | 1,590,000 | 1,582,845 |
| CubeSmart LP 4.8% 7/15/22 | | 1,000,000 | 1,089,557 |
| DCT Industrial Operating Partnership LP 4.5% 10/15/23 | | 2,000,000 | 2,045,472 |
| DDR Corp.: | | | |
| 7.5% 7/15/18 | | 2,407,000 | 2,695,996 |
| 9.625% 3/15/16 | | 2,254,000 | 2,276,157 |
| DuPont Fabros Technology LP 5.875% 9/15/21 | | 2,000,000 | 2,060,000 |
| Equity One, Inc. 6.25% 1/15/17 | | 811,000 | 841,974 |
| HCP, Inc. 4% 6/1/25 | | 2,000,000 | 1,965,104 |
| Health Care Property Investors, Inc. 6.3% 9/15/16 | | 3,850,000 | 3,962,016 |
| Health Care REIT, Inc.: | | | |
| 4% 6/1/25 | | 1,010,000 | 1,006,189 |
| 4.125% 4/1/19 | | 1,000,000 | 1,047,985 |
| Healthcare Realty Trust, Inc. 3.75% 4/15/23 | | 801,000 | 801,344 |
| Highwoods/Forsyth LP: | | | |
| 3.625% 1/15/23 | | 393,000 | 389,586 |
| 5.85% 3/15/17 | | 2,593,000 | 2,703,278 |
| Hospitality Properties Trust: | | | |
| 5% 8/15/22 | | 823,000 | 850,096 |
| 5.625% 3/15/17 | | 1,248,000 | 1,288,760 |
| 6.7% 1/15/18 | | 811,000 | 857,863 |
| HRPT Properties Trust 6.25% 8/15/16 | | 4,000,000 | 4,005,476 |
| iStar Financial, Inc.: | | | |
| 3.875% 7/1/16 | | 525,000 | 522,375 |
| 4% 11/1/17 | | 2,540,000 | 2,393,950 |
| 5% 7/1/19 | | 2,500,000 | 2,350,000 |
| 5.85% 3/15/17 | | 825,000 | 839,438 |
| 5.875% 3/15/16 | | 6,800,000 | 6,791,500 |
| 7.125% 2/15/18 | | 1,010,000 | 1,002,425 |
| 9% 6/1/17 | | 2,430,000 | 2,484,675 |
| Lexington Corporate Properties Trust 4.25% 6/15/23 | | 2,500,000 | 2,517,663 |
| MPT Operating Partnership LP/MPT Finance Corp. 6.375% 2/15/22 | | 1,685,000 | 1,710,275 |
| Omega Healthcare Investors, Inc.: | | | |
| 4.5% 4/1/27 | | 455,000 | 436,494 |
| 4.95% 4/1/24 | | 627,000 | 636,585 |
| Potlatch Corp. 7.5% 11/1/19 | | 811,000 | 888,045 |
| Reckson Operating Partnership LP/SL Green Realty Corp./SL Green Operating Partnership LP 7.75% 3/15/20 | | 811,000 | 956,060 |
| Senior Housing Properties Trust: | | | |
| 4.75% 5/1/24 | | 849,000 | 839,006 |
| 6.75% 4/15/20 | | 576,000 | 644,706 |
| 6.75% 12/15/21 | | 2,000,000 | 2,274,922 |
| | | | 63,900,537 |
| Real Estate Management & Development - 2.3% | | | |
| Brandywine Operating Partnership LP 6% 4/1/16 | | 811,000 | 816,798 |
| CBRE Group, Inc.: | | | |
| 5% 3/15/23 | | 1,225,000 | 1,235,651 |
| 5.25% 3/15/25 | | 625,000 | 645,658 |
| Forestar U.S.A. Real Estate Group 8.5% 6/1/22 (b) | | 2,130,000 | 1,954,275 |
| Host Hotels & Resorts LP 6% 10/1/21 | | 485,000 | 549,816 |
| Howard Hughes Corp. 6.875% 10/1/21 (b) | | 3,115,000 | 3,115,000 |
| Hunt Companies, Inc. 9.625% 3/1/21 (b) | | 1,540,000 | 1,378,300 |
| Kennedy-Wilson, Inc. 5.875% 4/1/24 | | 3,360,000 | 3,208,800 |
| Mid-America Apartments LP: | | | |
| 3.75% 6/15/24 | | 337,000 | 336,407 |
| 6.05% 9/1/16 | | 1,216,000 | 1,244,750 |
| Realogy Group LLC/Realogy Co.-Issuer Corp.: | | | |
| 4.5% 4/15/19 (b) | | 1,005,000 | 1,020,075 |
| 5.25% 12/1/21 (b) | | 1,280,000 | 1,304,000 |
| Regency Centers LP 5.875% 6/15/17 | | 364,000 | 383,925 |
| Taylor Morrison Communities, Inc./Monarch Communities, Inc. 5.625% 3/1/24 (b) | | 495,000 | 449,831 |
| Ventas Realty LP/Ventas Capital Corp. 4% 4/30/19 | | 597,000 | 626,371 |
| | | | 18,269,657 |
| Thrifts & Mortgage Finance - 0.6% | | | |
| Cantor Commercial Real Estate Co. LP/CCRE Finance Corp. 7.75% 2/15/18 (b) | | 1,025,000 | 1,045,500 |
| Ocwen Financial Corp. 6.625% 5/15/19 | | 4,740,000 | 4,183,050 |
| | | | 5,228,550 |
| TOTAL FINANCIALS | | | 91,416,894 |
| HEALTH CARE - 1.0% | | | |
| Health Care Providers & Services - 1.0% | | | |
| Sabra Health Care LP/Sabra Capital Corp.: | | | |
| 5.375% 6/1/23 | | 3,500,000 | 3,508,750 |
| 5.5% 2/1/21 | | 4,450,000 | 4,539,000 |
| | | | 8,047,750 |
| INDUSTRIALS - 0.1% | | | |
| Industrial Conglomerates - 0.1% | | | |
| Ladder Capital Finance Holdings LLLP/Ladder Capital Finance Corp. 7.375% 10/1/17 | | 785,000 | 783,038 |
| INFORMATION TECHNOLOGY - 0.1% | | | |
| Internet Software & Services - 0.1% | | | |
| CyrusOne LP/CyrusOne Finance Corp. 6.375% 11/15/22 | | 1,000,000 | 1,015,000 |
|
| TOTAL NONCONVERTIBLE BONDS | | | 140,481,568 |
|
| TOTAL CORPORATE BONDS | | | |
| (Cost $195,562,198) | | | 193,449,605 |
|
| Asset-Backed Securities - 2.3% | | | |
| American Homes 4 Rent: | | | |
| Series 2014-SFR3 Class E, 6.418% 12/17/36 (b) | | 1,740,000 | 1,751,810 |
| Series 2015-SFR1 Class E, 5.639% 4/17/52 (b) | | 1,354,586 | 1,288,620 |
| Series 2015-SFR2: | | | |
| Class E, 6.07% 10/17/45 (b) | | 1,451,000 | 1,414,037 |
| Class XS, 0% 10/17/45 (b)(c) | | 965,195 | 0 |
| Colony American Homes Series 2014-2A Class F, 3.768% 7/17/31 (b)(d) | | 1,090,000 | 1,018,898 |
| Conseco Finance Securitizations Corp.: | | | |
| Series 2002-1 Class M2, 9.546% 12/1/33 | | 1,216,000 | 1,293,429 |
| Series 2002-2 Class M2, 9.163% 3/1/33 | | 2,026,000 | 1,680,607 |
| Deutsche Financial Capital Securitization LLC Series 1997-I Class M, 7.275% 9/15/27 | | 914,189 | 951,007 |
| Invitation Homes Trust: | | | |
| Series 2013-SFR1 Class F, 4.068% 12/17/30 (b)(d) | | 1,750,000 | 1,664,629 |
| Series 2014-SFR1 Class F, 4.1005% 6/17/31 (b)(d) | | 756,000 | 714,922 |
| Series 2014-SFR3: | | | |
| Class E, 4.926% 12/17/31 (b)(d) | | 842,000 | 834,584 |
| Class F, 5.426% 12/17/31 (b)(d) | | 426,000 | 414,235 |
| Series 2015-SFR2 Class E, 3.5005% 6/17/32 (b)(d) | | 450,000 | 423,481 |
| Series 2015-SFR3 Class F, 5.1005% 8/17/32 (b)(d) | | 2,000,000 | 1,924,643 |
| Lehman ABS Manufactured Housing Contract Trust Series 2001-B Class M2, 7.17% 4/15/40 | | 3,162,328 | 2,125,869 |
| Progress Residential Trust Series 2015-SFR3 Class F, 6.643% 11/12/32 (b) | | 588,000 | 592,547 |
| Residential Asset Securities Corp. Series 2003-KS10 Class MI3, 6.41% 12/25/33 | | 212,363 | 186,696 |
| Starwood Waypoint Residential Trust Series 2014-1 Class F, 4.9005% 1/17/32 (b)(d) | | 780,000 | 748,388 |
| TOTAL ASSET-BACKED SECURITIES | | | |
| (Cost $18,503,485) | | | 19,028,402 |
|
| Collateralized Mortgage Obligations - 0.5% | | | |
| Private Sponsor - 0.5% | | | |
| FREMF Mortgage Trust: | | | |
| Series 2010-K6 Class B, 5.3578% 12/25/46 (b)(d) | | 811,000 | 887,970 |
| Series 2010-K7 Class B, 5.4407% 4/25/20 (b)(d) | | 2,605,000 | 2,873,915 |
| Merrill Lynch Mortgage Investors Trust Series 1998-C3 Class F, 6% 12/15/30 (b) | | 66,670 | 67,717 |
| TOTAL PRIVATE SPONSOR | | | |
| (Cost $3,365,084) | | | 3,829,602 |
|
| Commercial Mortgage Securities - 20.8% | | | |
| Aventura Mall Trust Series 2013-AVM Class E, 3.7427% 12/5/32 (b)(d) | | 2,000,000 | 1,962,867 |
| Banc of America Commercial Mortgage Trust Series 2005-1 Class CJ, 5.3381% 11/10/42 (d) | | 288,313 | 288,049 |
| Bank of America Commercial Mortgage Trust Series 2015-UBS7 Class D, 3.167% 9/15/48 | | 500,000 | 342,638 |
| Barclays Commercial Mortgage Securities LLC Series 2015-STP Class F, 4.2844% 9/10/28 (b)(d) | | 800,000 | 691,172 |
| Bear Stearns Commercial Mortgage Securities Trust, Series 2006-PWR11 Class AJ, 5.5101% 3/11/39 (d) | | 2,432,000 | 2,430,505 |
| BLCP Hotel Trust: | | | |
| floater Series 2014-CLRN Class F, 3.4596% 8/15/29 (b)(d) | | 500,000 | 464,992 |
| Series 2014-CLMZ Class M, 6.1535% 8/15/29 (b)(d) | | 2,065,352 | 1,946,728 |
| Boca Hotel Portfolio Trust Series 2013-BOCA Class E, 4.1755% 8/15/26 (b)(d) | | 1,500,000 | 1,495,262 |
| Carefree Portfolio Trust floater Series 2014-CARE: | | | |
| Class E, 4.426% 11/15/19 (b)(d) | | 1,445,000 | 1,425,372 |
| Class MZA, 6.4025% 11/15/19 (b)(d) | | 3,873,000 | 3,819,919 |
| CGBAM Commercial Mortgage Trust Series 2015-SMRT Class F, 3.7859% 4/10/28 (b)(d) | | 1,063,000 | 973,835 |
| Chase Commercial Mortgage Securities Corp. Series 1998-1 Class H, 6.34% 5/18/30 (b) | | 1,621,000 | 1,688,292 |
| Citigroup Commercial Mortgage Trust: | | | |
| Series 2013-GC15 Class D, 5.1045% 9/10/46 (b)(d) | | 2,496,000 | 2,235,719 |
| Series 2015-SHP2 Class E, 4.681% 7/15/27 (b)(d) | | 567,000 | 552,708 |
| COMM Mortgage Trust: | | | |
| sequential payer Series 2013-LC6 Class E, 3.5% 1/10/46 (b) | | 2,000,000 | 1,509,337 |
| Series 2013-CR10 Class D, 4.7911% 8/10/46 (b)(d) | | 1,300,000 | 1,144,381 |
| Series 2013-CR12 Class D, 5.0842% 10/10/46 (b)(d) | | 2,900,000 | 2,658,523 |
| Series 2013-CR9 Class D, 4.2572% 7/10/45 (b)(d) | | 2,397,000 | 2,097,008 |
| Series 2013-LC6 Class D, 4.2855% 1/10/46 (b)(d) | | 1,912,000 | 1,686,221 |
| Series 2014-UBS2 Class D, 5.0152% 3/10/47 (b)(d) | | 537,000 | 451,699 |
| COMM Mortgage Trust pass-thru certificates Series 2005-LP5 Class F, 4.9455% 5/10/43 (b)(d) | | 2,000,000 | 1,998,563 |
| Commercial Mortgage Acceptance Corp. Series 1998-C2 Class J, 5.44% 9/15/30 (b) | | 1,034,987 | 1,003,501 |
| Commercial Mortgage Trust pass-thru certificates: | | | |
| Series 2012-CR1: | | | |
| Class C, 5.3634% 5/15/45 (d) | | 3,000,000 | 3,186,564 |
| Class D, 5.3634% 5/15/45 (b)(d) | | 1,917,000 | 1,873,487 |
| Series 2012-CR2 Class D, 4.8548% 8/15/45 (b)(d) | | 500,000 | 495,074 |
| Series 2012-LC4: | | | |
| Class C, 5.6447% 12/10/44 (d) | | 780,000 | 838,818 |
| Class D, 5.6447% 12/10/44 (b)(d) | | 2,830,000 | 2,795,538 |
| Core Industrial Trust Series 2015-TEXW Class F, 3.8487% 2/10/34 (b)(d) | | 1,212,000 | 1,081,527 |
| Credit Suisse First Boston Mortgage Securities Corp. Series 1998-C2 Class F, 6.75% 11/15/30 (b) | | 286,635 | 289,421 |
| CSMC Trust floater Series 2015-DEAL: | | | |
| Class E, 4.426% 4/15/29 (b)(d) | | 2,000,000 | 1,894,887 |
| Class F, 5.176% 4/15/29 (b)(d) | | 2,947,000 | 2,823,599 |
| DBCCRE Mortgage Trust Series 2014-ARCP Class E, 4.9345% 1/10/34 (b)(d) | | 2,047,000 | 1,872,835 |
| DBUBS Mortgage Trust Series 2011-LC1A: | | | |
| Class E, 5.6634% 11/10/46 (b)(d) | | 2,450,000 | 2,541,677 |
| Class G, 4.652% 11/10/46 (b) | | 2,157,000 | 1,828,467 |
| Extended Stay America Trust Series 2013-ESH7 Class C7, 3.9017% 12/5/31 (b) | | 2,000,000 | 2,001,009 |
| Freddie Mac pass-thru certificates: | | | |
| Series K011 Class X3, 2.5754% 12/25/43 (c)(d) | | 4,947,000 | 562,530 |
| Series K012 Class X3, 2.2509% 1/25/41 (c)(d) | | 2,798,806 | 289,349 |
| Series K013 Class X3, 2.9064% 1/25/43 (c)(d) | | 4,806,000 | 610,942 |
| GAHR Commercial Mortgage Trust Series 2015-NRF: | | | |
| Class EFX, 3.3822% 12/15/19 (b)(d) | | 2,254,000 | 2,083,728 |
| Class FFX, 3.3822% 12/15/19 (b)(d) | | 1,478,000 | 1,319,234 |
| GMAC Commercial Mortgage Securities, Inc. Series 1997-C2 Class G, 6.75% 4/15/29 (d) | | 402,406 | 420,595 |
| GP Portfolio Trust Series 2014-GPP Class E, 4.1805% 2/15/27 (b)(d) | | 1,615,000 | 1,583,839 |
| GS Mortgage Securities Trust: | | | |
| Series 2010-C2 Class D, 5.1881% 12/10/43 (b)(d) | | 2,000,000 | 1,976,020 |
| Series 2011-GC5 Class D, 5.3078% 8/10/44 (b)(d) | | 857,000 | 860,671 |
| Series 2012-GC6: | | | |
| Class C, 5.6314% 1/10/45 (b)(d) | | 2,400,000 | 2,538,810 |
| Class D, 5.6314% 1/10/45 (b)(d) | | 1,786,000 | 1,732,393 |
| Class E, 5% 1/10/45 (b)(d) | | 831,000 | 715,883 |
| Series 2012-GCJ7: | | | |
| Class C, 5.7229% 5/10/45 (d) | | 3,500,000 | 3,694,500 |
| Class D, 5.7229% 5/10/45 (b)(d) | | 2,690,000 | 2,598,359 |
| Class E, 5% 5/10/45 (b) | | 1,760,000 | 1,422,582 |
| Series 2012-GCJ9 Class D, 4.8524% 11/10/45 (b)(d) | | 1,339,000 | 1,221,012 |
| Series 2013-GC16: | | | |
| Class D, 5.3158% 11/10/46 (b)(d) | | 3,250,000 | 2,911,433 |
| Class F, 3.5% 11/10/46 (b) | | 1,428,000 | 1,022,074 |
| Hilton U.S.A. Trust: | | | |
| floater Series 2014-ORL Class E, 3.5805% 7/15/29 (b)(d) | | 639,000 | 613,133 |
| Series 2013-HLT Class EFX, 4.4533% 11/5/30 (b)(d) | | 4,250,000 | 4,244,742 |
| Invitation Homes Trust floater Series 2013-SFR1 Class E, 3.068% 12/17/30 (b)(d) | | 1,500,000 | 1,427,129 |
| JPMorgan Chase Commercial Mortgage Securities Corp.: | | | |
| Series 2003-C1 Class F, 5.4229% 1/12/37 (b)(d) | | 756,000 | 752,431 |
| Series 2009-IWST Class D, 7.4453% 12/5/27 (b)(d) | | 2,779,000 | 3,230,835 |
| Series 2010-CNTR Class D, 6.1838% 8/5/32 (b)(d) | | 1,216,000 | 1,341,050 |
| Series 2012-CBX: | | | |
| Class C, 5.2377% 6/15/45 (d) | | 1,240,000 | 1,277,609 |
| Class G 4% 6/15/45 (b) | | 805,000 | 560,573 |
| JPMorgan Chase Commercial Mortgage Securities Trust: | | | |
| floater: | | | |
| Series 2014-FBLU Class E, 3.8305% 12/15/28 (b)(d) | | 2,076,000 | 2,045,677 |
| Series 2014-INN: | | | |
| Class E, 4.026% 6/15/29 (b)(d) | | 1,059,000 | 1,040,570 |
| Class F, 4.426% 6/15/29 (b)(d) | | 1,255,000 | 1,228,898 |
| Series 2005-LDP2 Class C, 4.911% 7/15/42 (d) | | 4,000,000 | 3,999,809 |
| Series 2011-C4 Class E, 5.4145% 7/15/46 (b)(d) | | 1,390,000 | 1,383,343 |
| Series 2013-LC11: | | | |
| Class D, 4.2384% 4/15/46 (d) | | 500,000 | 432,669 |
| Class F, 3.25% 4/15/46 (b)(d) | | 482,000 | 315,282 |
| Series 2015-UES Class F, 3.621% 9/5/32 (b)(d) | | 1,500,000 | 1,361,860 |
| LB-UBS Commercial Mortgage Trust Series 2006-C4 Class AJ, 5.8401% 6/15/38 (d) | | 2,511,000 | 2,535,992 |
| Mach One Trust LLC Series 2004-1A Class H, 6.0648% 5/28/40 (b)(d) | | 91,080 | 90,852 |
| Morgan Stanley BAML Trust: | | | |
| Series 2012-C6 Class D, 4.6573% 11/15/45 (b)(d) | | 2,000,000 | 1,840,773 |
| Series 2013-C12 Class D, 4.7664% 10/15/46 (b)(d) | | 1,500,000 | 1,366,939 |
| Series 2013-C13: | | | |
| Class D, 4.8939% 11/15/46 (b)(d) | | 2,500,000 | 2,285,784 |
| Class E, 4.8939% 11/15/46 (b)(d) | | 621,000 | 496,469 |
| Series 2013-C7 Class E, 4.2965% 2/15/46 (b)(d) | | 1,490,000 | 1,259,740 |
| Morgan Stanley Capital I Trust: | | | |
| sequential payer: | | | |
| Series 2006-HQ10 Class AM, 5.36% 11/12/41 | | 3,769,000 | 3,832,267 |
| Series 2012-C4 Class E, 5.5245% 3/15/45 (b)(d) | | 2,250,000 | 2,198,106 |
| Series 1997-RR Class F, 7.4216% 4/30/39 (b)(d) | | 159,964 | 157,165 |
| Series 1998-CF1 Class G, 7.35% 7/15/32 (b) | | 1,626,968 | 1,628,824 |
| Series 2006-IQ12 Class AMFX, 5.37% 12/15/43 | | 3,242,000 | 3,316,835 |
| Series 2011-C1 Class C, 5.4382% 9/15/47 (b)(d) | | 2,000,000 | 2,141,870 |
| Series 2011-C2: | | | |
| Class D, 5.3028% 6/15/44 (b)(d) | | 1,532,000 | 1,587,386 |
| Class E, 5.3028% 6/15/44 (b)(d) | | 1,946,000 | 1,944,976 |
| Class F, 5.3028% 6/15/44 (b)(d) | | 1,467,000 | 1,364,097 |
| Class XB, 0.4583% 6/15/44 (b)(c)(d) | | 51,641,000 | 1,288,159 |
| Series 2011-C3: | | | |
| Class C, 5.1783% 7/15/49 (b)(d) | | 2,000,000 | 2,117,105 |
| Class G, 5.1783% 7/15/49 (b)(d) | | 606,000 | 493,919 |
| Series 2012-C4 Class D, 5.5245% 3/15/45 (b)(d) | | 1,640,000 | 1,654,223 |
| Series 2015-UBS8 Class D, 3.25% 12/15/48 (b) | | 987,000 | 687,383 |
| Motel 6 Trust Series 2015-MTL6: | | | |
| Class E, 5.2785% 2/5/30 (b) | | 5,094,000 | 4,891,659 |
| Class F, 5% 2/5/30 (b) | | 1,975,000 | 1,817,106 |
| MSJP Commercial Securities Mortgage Trust Series 2015-HAUL Class E, 4.851% 9/5/47 (b)(d) | | 1,000,000 | 831,739 |
| Providence Place Group Ltd. Partnership Series 2000-C1 Class A2, 7.75% 7/20/28 (b) | | 1,305,298 | 1,604,995 |
| SCG Trust Series 2013-SRP1 Class D, 3.6742% 11/15/26 (b)(d) | | 1,500,000 | 1,456,782 |
| TimberStar Trust I Series 2006-1 Class F, 7.5296% 10/15/36 (b) | | 2,026,000 | 2,043,576 |
| UBS Commercial Mortgage Trust Series 2012-C1 Class D, 5.5344% 5/10/45 (b)(d) | | 645,000 | 637,503 |
| UBS-BAMLL Trust Series 12-WRM Class D, 4.238% 6/10/30 (b)(d) | | 1,460,000 | 1,370,237 |
| WF-RBS Commercial Mortgage Trust: | | | |
| Series 2011-C3: | | | |
| Class C, 5.335% 3/15/44 (b) | | 2,100,000 | 2,211,284 |
| Class D, 5.5722% 3/15/44 (b)(d) | | 1,000,000 | 1,016,292 |
| Series 2011-C5: | | | |
| Class C, 5.6343% 11/15/44 (b)(d) | | 1,250,000 | 1,344,093 |
| Class F, 5.25% 11/15/44 (b)(d) | | 2,000,000 | 1,610,933 |
| Class G, 5.25% 11/15/44 (b)(d) | | 1,000,000 | 765,541 |
| Series 2012-C10 Class E, 4.4542% 12/15/45 (b)(d) | | 910,000 | 687,221 |
| Series 2012-C7 Class D, 4.8377% 6/15/45 (b)(d) | | 620,000 | 615,829 |
| Series 2013-UBS1 Class D, 4.6299% 3/15/46 (b)(d) | | 332,000 | 294,932 |
| WFCG Commercial Mortgage Trust floater Series 2015-BXRP: | | | |
| Class F, 4.0508% 11/15/29 (b)(d) | | 952,061 | 942,714 |
| Class G, 3.3505% 11/15/29 (b)(d) | | 624,263 | 567,549 |
| TOTAL COMMERCIAL MORTGAGE SECURITIES | | | |
| (Cost $162,233,788) | | | 168,208,607 |
|
| Bank Loan Obligations - 6.2% | | | |
| CONSUMER DISCRETIONARY - 2.5% | | | |
| Hotels, Restaurants & Leisure - 1.8% | | | |
| Caesars Entertainment Resort Properties LLC Tranche B 1LN, term loan 7% 10/11/20 (d) | | 3,185,000 | 2,769,358 |
| Caesars Growth Properties Holdings, LLC Tranche 1LN, term loan 6.25% 5/8/21 (d) | | 2,524,118 | 2,086,613 |
| Cooper Hotel Group 12% 11/6/17 | | 2,302,394 | 2,417,514 |
| ESH Hospitality, Inc. Tranche B, term loan 5% 6/24/19 (d) | | 2,091,280 | 2,096,508 |
| Four Seasons Holdings, Inc. Tranche 2LN, term loan 6.25% 12/27/20 (d) | | 405,000 | 398,419 |
| Hilton Worldwide Finance, LLC Tranche B, term loan 3.5% 10/25/20 (d) | | 2,780,455 | 2,774,032 |
| La Quinta Intermediate Holdings LLC Tranche B LN, term loan 3.75% 4/14/21 (d) | | 2,023,274 | 1,939,814 |
| Playa Resorts Holding BV Tranche B, term loan 4% 8/9/19 (d) | | 236,373 | 228,100 |
| | | | 14,710,358 |
| Media - 0.2% | | | |
| CBS Outdoor Americas Capital LLC/CBS Outdoor Americas Capital Corp. Tranche B, term loan 3% 1/31/21 (d) | | 1,598,438 | 1,576,955 |
| Multiline Retail - 0.3% | | | |
| JC Penney Corp., Inc. Tranche B, term loan 6% 5/22/18 (d) | | 2,576,554 | 2,515,361 |
| Specialty Retail - 0.2% | | | |
| The Pep Boys - Manny, Moe & Jack Tranche B, term loan 5.5% 10/11/18 (d) | | 1,319,200 | 1,317,551 |
|
| TOTAL CONSUMER DISCRETIONARY | | | 20,120,225 |
|
| CONSUMER STAPLES - 0.3% | | | |
| Food & Staples Retailing - 0.3% | | | |
| Albertson's LLC: | | | |
| Tranche B 3LN, term loan 5.125% 8/25/19 (d) | | 1,227,188 | 1,199,576 |
| Tranche B 5LN, term loan 12/21/22 (e) | | 995,000 | 971,369 |
| | | | 2,170,945 |
| ENERGY - 0.3% | | | |
| Oil, Gas & Consumable Fuels - 0.3% | | | |
| Moxie Patriot LLC Tranche B, term loan 6.75% 12/19/20 (d) | | 2,000,000 | 1,800,000 |
| TPF II Power, LLC Tranche B, term loan 5.5% 10/2/21 (d) | | 831,185 | 796,383 |
| | | | 2,596,383 |
| FINANCIALS - 1.6% | | | |
| Real Estate Investment Trusts - 0.3% | | | |
| Starwood Property Trust, Inc. Tranche B, term loan 3.5% 4/17/20 (d) | | 2,437,343 | 2,395,714 |
| Real Estate Management & Development - 1.2% | | | |
| AmeriCold Reality Operating Partnership LP Tranche B, term loan 6.5% 12/1/22 (d) | | 1,655,000 | 1,650,863 |
| NorthStar Asset Management LP Tranche B 1LN, term loan 4.625% 1/29/23 (d) | | 990,000 | 955,350 |
| Realogy Corp. Credit-Linked Deposit 4.6795% 10/10/16 (d) | | 75,692 | 74,557 |
| Realogy Group LLC Tranche B, term loan 3.75% 3/5/20 (d) | | 6,824,024 | 6,769,432 |
| | | | 9,450,202 |
| Thrifts & Mortgage Finance - 0.1% | | | |
| Ocwen Loan Servicing, LLC Tranche B, term loan 5.5% 2/15/18 (d) | | 1,321,598 | 1,319,126 |
|
| TOTAL FINANCIALS | | | 13,165,042 |
|
| HEALTH CARE - 0.3% | | | |
| Health Care Providers & Services - 0.3% | | | |
| Community Health Systems, Inc.: | | | |
| Tranche F, term loan 3.6567% 12/31/18 (d) | | 992,500 | 975,816 |
| Tranche H, term loan 4% 1/27/21 (d) | | 1,552,031 | 1,491,890 |
| | | | 2,467,706 |
| INDUSTRIALS - 0.3% | | | |
| Commercial Services & Supplies - 0.1% | | | |
| Pilot Travel Centers LLC Tranche B, term loan 3.75% 10/3/21 (d) | | 1,440,000 | 1,439,640 |
| Construction & Engineering - 0.2% | | | |
| Drumm Investors LLC Tranche B, term loan 6.75% 5/4/18 (d) | | 1,517,565 | 1,493,860 |
|
| TOTAL INDUSTRIALS | | | 2,933,500 |
|
| UTILITIES - 0.9% | | | |
| Electric Utilities - 0.5% | | | |
| Calpine Construction Finance Co. LP Tranche B 2LN, term loan 3.25% 1/31/22 (d) | | 979,959 | 920,553 |
| Essential Power LLC Tranche B, term loan 4.75% 8/8/19 (d) | | 979,260 | 952,330 |
| La Frontera Generation, LLC Tranche B, term loan 4.5% 9/30/20 (d) | | 1,656,957 | 1,583,636 |
| Southeast Powergen LLC Tranche B, term loan 4.5% 12/2/21 (d) | | 529,650 | 521,705 |
| | | | 3,978,224 |
| Independent Power and Renewable Electricity Producers - 0.4% | | | |
| Calpine Corp. Tranche B 4LN, term loan 4% 10/31/20 (d) | | 1,960,000 | 1,900,220 |
| Tempus Public Foundation Generation Holdings LLC Tranche B, term loan 4.75% 12/31/17 (d) | | 1,286,752 | 1,137,167 |
| | | | 3,037,387 |
|
| TOTAL UTILITIES | | | 7,015,611 |
|
| TOTAL BANK LOAN OBLIGATIONS | | | |
| (Cost $51,946,496) | | | 50,469,412 |
| | | Shares | Value |
|
| Money Market Funds - 6.2% | | | |
| Fidelity Cash Central Fund, 0.38% (f) | | | |
| (Cost $50,015,480) | | 50,015,480 | 50,015,480 |
| TOTAL INVESTMENT PORTFOLIO - 100.0% | | | |
| (Cost $791,028,352) | | | 809,152,687 |
| NET OTHER ASSETS (LIABILITIES) - 0.0% | | | 327,647 |
| NET ASSETS - 100% | | | $809,480,334 |
Legend
(a) Non-income producing
(b) Security exempt from registration under Rule 144A of the Securities Act of 1933. These securities may be resold in transactions exempt from registration, normally to qualified institutional buyers. At the end of the period, the value of these securities amounted to $188,480,922 or 23.3% of net assets.
(c) Security represents right to receive monthly interest payments on an underlying pool of mortgages or assets. Principal shown is the outstanding par amount of the pool as of the end of the period.
(d) Coupon rates for floating and adjustable rate securities reflect the rates in effect at period end.
(e) The coupon rate will be determined upon settlement of the loan after period end.
(f) Affiliated fund that is generally available only to investment companies and other accounts managed by Fidelity Investments. The rate quoted is the annualized seven-day yield of the fund at period end. A complete unaudited listing of the fund's holdings as of its most recent quarter end is available upon request. In addition, each Fidelity Central Fund's financial statements are available on the SEC's website or upon request.
Affiliated Central Funds
Information regarding fiscal year to date income earned by the Fund from investments in Fidelity Central Funds is as follows:
| Fund | Income earned |
| Fidelity Cash Central Fund | $46,757 |
Investment Valuation
The following is a summary of the inputs used, as of January 31, 2016, involving the Fund's assets and liabilities carried at fair value. The inputs or methodology used for valuing securities may not be an indication of the risk associated with investing in those securities. For more information on valuation inputs, and their aggregation into the levels used below, please refer to the Investment Valuation section in the accompanying Notes to Financial Statements.
| | Valuation Inputs at Reporting Date: |
| Description | Total | Level 1 | Level 2 | Level 3 |
| Investments in Securities: | | | | |
| Equities: | | | | |
| Financials | $324,017,790 | $315,380,510 | $8,637,280 | $-- |
| Health Care | 133,789 | 133,789 | -- | -- |
| Corporate Bonds | 193,449,605 | -- | 193,449,605 | -- |
| Asset-Backed Securities | 19,028,402 | -- | 16,715,837 | 2,312,565 |
| Collateralized Mortgage Obligations | 3,829,602 | -- | 3,829,602 | -- |
| Commercial Mortgage Securities | 168,208,607 | -- | 168,208,607 | -- |
| Bank Loan Obligations | 50,469,412 | -- | 47,977,341 | 2,492,071 |
| Money Market Funds | 50,015,480 | 50,015,480 | -- | -- |
| Total Investments in Securities: | $809,152,687 | $365,529,779 | $438,818,272 | $4,804,636 |
Other Information
The composition of credit quality ratings as a percentage of Total Net Assets is as follows (Unaudited):
| U.S. Government and U.S. Government Agency Obligations | 0.6% |
| AAA,AA,A | 4.5% |
| BBB | 11.9% |
| BB | 13.4% |
| B | 10.4% |
| CCC,CC,C | 1.2% |
| Not Rated | 11.7% |
| Equities | 40.1% |
| Short-Term Investments and Net Other Assets | 6.2% |
We have used ratings from Moody's Investors Service, Inc. Where Moody's® ratings are not available, we have used S&P® ratings. All ratings are as of the date indicated and do not reflect subsequent changes.
See accompanying notes which are an integral part of the financial statements.
Financial Statements
Statement of Assets and Liabilities
| | | January 31, 2016 (Unaudited) |
| Assets | | |
Investment in securities, at value — See accompanying schedule:
Unaffiliated issuers (cost $741,012,872) | $759,137,207 | |
| Fidelity Central Funds (cost $50,015,480) | 50,015,480 | |
| Total Investments (cost $791,028,352) | | $809,152,687 |
| Cash | | 74,236 |
| Receivable for investments sold | | 247,517 |
| Receivable for fund shares sold | | 639,448 |
| Dividends receivable | | 332,852 |
| Interest receivable | | 4,308,743 |
| Distributions receivable from Fidelity Central Funds | | 14,765 |
| Prepaid expenses | | 1,390 |
| Other receivables | | 732 |
| Total assets | | 814,772,370 |
| Liabilities | | |
| Payable for investments purchased | $4,455,861 | |
| Payable for fund shares redeemed | 336,897 | |
| Accrued management fee | 369,870 | |
| Other affiliated payables | 81,763 | |
| Other payables and accrued expenses | 47,645 | |
| Total liabilities | | 5,292,036 |
| Net Assets | | $809,480,334 |
| Net Assets consist of: | | |
| Paid in capital | | $786,863,770 |
| Undistributed net investment income | | 1,854,332 |
| Accumulated undistributed net realized gain (loss) on investments and foreign currency transactions | | 2,637,894 |
| Net unrealized appreciation (depreciation) on investments and assets and liabilities in foreign currencies | | 18,124,338 |
| Net Assets | | $809,480,334 |
| Series Real Estate Income: | | |
| Net Asset Value, offering price and redemption price per share ($383,410,519 ÷ 36,293,826 shares) | | $10.56 |
| Class F: | | |
| Net Asset Value, offering price and redemption price per share ($426,069,815 ÷ 40,325,526 shares) | | $10.57 |
See accompanying notes which are an integral part of the financial statements.
Statement of Operations
| | | Six months ended January 31, 2016 (Unaudited) |
| Investment Income | | |
| Dividends | | $9,026,959 |
| Interest | | 13,851,044 |
| Income from Fidelity Central Funds | | 46,757 |
| Total income | | 22,924,760 |
| Expenses | | |
| Management fee | $2,259,655 | |
| Transfer agent fees | 317,675 | |
| Accounting fees and expenses | 180,083 | |
| Custodian fees and expenses | 7,369 | |
| Independent trustees' compensation | 1,808 | |
| Audit | 45,550 | |
| Legal | 1,528 | |
| Miscellaneous | 2,344 | |
| Total expenses before reductions | 2,816,012 | |
| Expense reductions | (6,561) | 2,809,451 |
| Net investment income (loss) | | 20,115,309 |
| Realized and Unrealized Gain (Loss) | | |
| Net realized gain (loss) on: | | |
| Investment securities: | | |
| Unaffiliated issuers | 4,258,987 | |
| Foreign currency transactions | (15) | |
| Total net realized gain (loss) | | 4,258,972 |
Change in net unrealized appreciation (depreciation) on:
Investment securities | (32,952,375) | |
| Assets and liabilities in foreign currencies | 8 | |
| Total change in net unrealized appreciation (depreciation) | | (32,952,367) |
| Net gain (loss) | | (28,693,395) |
| Net increase (decrease) in net assets resulting from operations | | $(8,578,086) |
See accompanying notes which are an integral part of the financial statements.
Statement of Changes in Net Assets
| | Six months ended January 31, 2016 (Unaudited) | Year ended July 31, 2015 |
| Increase (Decrease) in Net Assets | | |
| Operations | | |
| Net investment income (loss) | $20,115,309 | $42,892,013 |
| Net realized gain (loss) | 4,258,972 | 10,015,807 |
| Change in net unrealized appreciation (depreciation) | (32,952,367) | (10,965,973) |
| Net increase (decrease) in net assets resulting from operations | (8,578,086) | 41,941,847 |
| Distributions to shareholders from net investment income | (26,163,859) | (45,472,455) |
| Distributions to shareholders from net realized gain | (8,001,126) | (20,829,892) |
| Total distributions | (34,164,985) | (66,302,347) |
| Share transactions - net increase (decrease) | 23,038,804 | 24,549,288 |
| Total increase (decrease) in net assets | (19,704,267) | 188,788 |
| Net Assets | | |
| Beginning of period | 829,184,601 | 828,995,813 |
| End of period (including undistributed net investment income of $1,854,332 and undistributed net investment income of $7,902,882, respectively) | $809,480,334 | $829,184,601 |
See accompanying notes which are an integral part of the financial statements.
Financial Highlights — Fidelity Series Real Estate Income
| | Six months ended (Unaudited) | Years ended July 31, | | | |
| January 31, | 2016 | 2015 | 2014 | 2013 | 2012 A |
| Selected Per–Share Data | | | | | |
| Net asset value, beginning of period | $11.13 | $11.47 | $11.41 | $11.10 | $10.00 |
| Income from Investment Operations | | | | | |
| Net investment income (loss)B | .26 | .56 | .58 | .67 | .47 |
| Net realized and unrealized gain (loss) | (.38) | (.01) | .31 | .46 | .97 |
| Total from investment operations | (.12) | .55 | .89 | 1.13 | 1.44 |
| Distributions from net investment income | (.34) | (.61) | (.59) | (.66) | (.33) |
| Distributions from net realized gain | (.11) | (.29) | (.24) | (.16) | (.01) |
| Total distributions | (.45) | (.89)C | (.83) | (.82) | (.34) |
| Net asset value, end of period | $10.56 | $11.13 | $11.47 | $11.41 | $11.10 |
| Total ReturnD,E | (1.10)% | 5.05% | 8.33% | 10.50% | 14.67% |
| Ratios to Average Net AssetsF,G | | | | | |
| Expenses before reductions | .77%H | .77% | .77% | .79% | .80%H |
| Expenses net of fee waivers, if any | .77%H | .77% | .77% | .79% | .80%H |
| Expenses net of all reductions | .77%H | .77% | .77% | .79% | .80%H |
| Net investment income (loss) | 4.80%H | 5.03% | 5.15% | 5.85% | 5.70%H |
| Supplemental Data | | | | | |
| Net assets, end of period (000 omitted) | $383,411 | $401,861 | $409,084 | $415,192 | $416,151 |
| Portfolio turnover rateI | 16%H | 19% | 33% | 25% | 29%H |
A For the period October 20, 2011 (commencement of operations) to July 31, 2012.
B Calculated based on average shares outstanding during the period.
C Total distributions of $.89 per share is comprised of distributions from net investment income of $.606 and distributions from net realized gain of $.288 per share.
D Total returns for periods of less than one year are not annualized.
E Total returns would have been lower if certain expenses had not been reduced during the applicable periods shown.
F Fees and expenses of any underlying Fidelity Central Funds are not included in the Fund's expense ratio. The Fund indirectly bears its proportionate share of the expenses of any underlying Fidelity Central Funds.
G Expense ratios reflect operating expenses of the class. Expenses before reductions do not reflect amounts reimbursed by the investment adviser or reductions from brokerage service arrangements or reductions from other expense offset arrangements and do not represent the amount paid by the class during periods when reimbursements or reductions occur. Expense ratios before reductions for start-up periods may not be representative of longer-term operating periods. Expenses net of fee waivers reflect expenses after reimbursement by the investment adviser but prior to reductions from brokerage service arrangements or other expense offset arrangements. Expenses net of all reductions represent the net expenses paid by the class.
H Annualized
I Amount does not include the portfolio activity of any underlying Fidelity Central Funds.
See accompanying notes which are an integral part of the financial statements.
Financial Highlights — Fidelity Series Real Estate Income Fund Class F
| | Six months ended (Unaudited) | Years ended July 31, | | | |
| January 31, | 2016 | 2015 | 2014 | 2013 | 2012 A |
| Selected Per–Share Data | | | | | |
| Net asset value, beginning of period | $11.14 | $11.48 | $11.41 | $11.11 | $10.00 |
| Income from Investment Operations | | | | | |
| Net investment income (loss)B | .27 | .58 | .60 | .69 | .48 |
| Net realized and unrealized gain (loss) | (.38) | (.01) | .32 | .45 | .98 |
| Total from investment operations | (.11) | .57 | .92 | 1.14 | 1.46 |
| Distributions from net investment income | (.35) | (.62) | (.60) | (.68) | (.34) |
| Distributions from net realized gain | (.11) | (.29) | (.24) | (.16) | (.01) |
| Total distributions | (.46) | (.91) | (.85)C | (.84) | (.35) |
| Net asset value, end of period | $10.57 | $11.14 | $11.48 | $11.41 | $11.11 |
| Total ReturnD,E | (1.00)% | 5.22% | 8.60% | 10.60% | 14.89% |
| Ratios to Average Net AssetsF,G | | | | | |
| Expenses before reductions | .61%H | .61% | .61% | .61% | .62%H |
| Expenses net of fee waivers, if any | .61%H | .61% | .61% | .61% | .62%H |
| Expenses net of all reductions | .61%H | .61% | .61% | .61% | .62%H |
| Net investment income (loss) | 4.96%H | 5.19% | 5.32% | 6.02% | 5.88%H |
| Supplemental Data | | | | | |
| Net assets, end of period (000 omitted) | $426,070 | $427,323 | $419,911 | $391,490 | $286,854 |
| Portfolio turnover rateI | 16%H | 19% | 33% | 25% | 29%H |
A For the period October 20, 2011 (commencement of operations) to July 31, 2012.
B Calculated based on average shares outstanding during the period.
C Total distributions of $.85 per share is comprised of distributions from net investment income of $.604 and distributions from net realized gain of $.242 per share.
D Total returns for periods of less than one year are not annualized.
E Total returns would have been lower if certain expenses had not been reduced during the applicable periods shown.
F Fees and expenses of any underlying Fidelity Central Funds are not included in the Fund's expense ratio. The Fund indirectly bears its proportionate share of the expenses of any underlying Fidelity Central Funds.
G Expense ratios reflect operating expenses of the class. Expenses before reductions do not reflect amounts reimbursed by the investment adviser or reductions from brokerage service arrangements or reductions from other expense offset arrangements and do not represent the amount paid by the class during periods when reimbursements or reductions occur. Expense ratios before reductions for start-up periods may not be representative of longer-term operating periods. Expenses net of fee waivers reflect expenses after reimbursement by the investment adviser but prior to reductions from brokerage service arrangements or other expense offset arrangements. Expenses net of all reductions represent the net expenses paid by the class.
H Annualized
I Amount does not include the portfolio activity of any underlying Fidelity Central Funds.
See accompanying notes which are an integral part of the financial statements.
Notes to Financial Statements (Unaudited)
For the period ended January 31, 2016
1. Organization.
Fidelity Series Real Estate Income Fund (the Fund) is a fund of Fidelity Securities Fund (the Trust) and is authorized to issue an unlimited number of shares. Shares of the Fund are only available for purchase by mutual funds for which Fidelity Management & Research Company (FMR) or an affiliate serves as an investment manager. The Trust is registered under the Investment Company Act of 1940, as amended (the 1940 Act), as an open-end management investment company organized as a Massachusetts business trust. The Fund offers Series Real Estate Income and Class F shares, each of which has equal rights as to assets and voting privileges. Each class has exclusive voting rights with respect to matters that affect that class.
2. Investments in Fidelity Central Funds.
The Fund invests in Fidelity Central Funds, which are open-end investment companies generally available only to other investment companies and accounts managed by the investment adviser and its affiliates. The Fund's Schedule of Investments lists each of the Fidelity Central Funds held as of period end, if any, as an investment of the Fund, but does not include the underlying holdings of each Fidelity Central Fund. As an Investing Fund, the Fund indirectly bears its proportionate share of the expenses of the underlying Fidelity Central Funds.
The Money Market Central Funds seek preservation of capital and current income and are managed by Fidelity Investments Money Management, Inc. (FIMM), an affiliate of the investment adviser. Annualized expenses of the Money Market Central Funds as of their most recent shareholder report date are less than .005%.
A complete unaudited list of holdings for each Fidelity Central Fund is available upon request or at the Securities and Exchange Commission (the SEC) website at www.sec.gov. In addition, the financial statements of the Fidelity Central Funds are available on the SEC website or upon request.
3. Significant Accounting Policies.
The financial statements have been prepared in conformity with accounting principles generally accepted in the United States of America (GAAP), which require management to make certain estimates and assumptions at the date of the financial statements. Actual results could differ from those estimates. Subsequent events, if any, through the date that the financial statements were issued have been evaluated in the preparation of the financial statements. The following summarizes the significant accounting policies of the Fund:
Investment Valuation. Investments are valued as of 4:00 p.m. Eastern time on the last calendar day of the period. The Board of Trustees (the Board) has delegated the day to day responsibility for the valuation of the Fund's investments to the FMR Fair Value Committee (the Committee). In accordance with valuation policies and procedures approved by the Board, the Fund attempts to obtain prices from one or more third party pricing vendors or brokers to value its investments. When current market prices, quotations or currency exchange rates are not readily available or reliable, investments will be fair valued in good faith by the Committee, in accordance with procedures adopted by the Board. Factors used in determining fair value vary by investment type and may include market or investment specific events, changes in interest rates and credit quality. The frequency with which these procedures are used cannot be predicted and they may be utilized to a significant extent. The Committee oversees the Fund's valuation policies and procedures and reports to the Board on the Committee's activities and fair value determinations. The Board monitors the appropriateness of the procedures used in valuing the Fund's investments and ratifies the fair value determinations of the Committee.
The Fund categorizes the inputs to valuation techniques used to value its investments into a disclosure hierarchy consisting of three levels as shown below:
- Level 1 – quoted prices in active markets for identical investments
- Level 2 – other significant observable inputs (including quoted prices for similar investments, interest rates, prepayment speeds, etc.)
- Level 3 – unobservable inputs (including the Fund's own assumptions based on the best information available)
Valuation techniques used to value the Fund's investments by major category are as follows:
Equity securities, including restricted securities, for which market quotations are readily available, are valued at the last reported sale price or official closing price as reported by a third party pricing vendor on the primary market or exchange on which they are traded and are categorized as Level 1 in the hierarchy. In the event there were no sales during the day or closing prices are not available, securities are valued at the last quoted bid price or may be valued using the last available price and are generally categorized as Level 2 in the hierarchy. For foreign equity securities, when market or security specific events arise, comparisons to the valuation of American Depositary Receipts (ADRs), futures contracts, Exchange-Traded Funds (ETFs) and certain indexes as well as quoted prices for similar securities may be used and would be categorized as Level 2 in the hierarchy. Utilizing these techniques may result in transfers between Level 1 and Level 2. For equity securities, including restricted securities, where observable inputs are limited, assumptions about market activity and risk are used and these securities may be categorized as Level 3 in the hierarchy.
Debt securities, including restricted securities, are valued based on evaluated prices received from third party pricing vendors or from brokers who make markets in such securities. Corporate bonds and bank loan obligations are valued by pricing vendors who utilize matrix pricing which considers yield or price of bonds of comparable quality, coupon, maturity and type or by broker-supplied prices. Asset backed securities, collateralized mortgage obligations and commercial mortgage securities are valued by pricing vendors who utilize matrix pricing which considers prepayment speed assumptions, attributes of the collateral, yield or price of bonds of comparable quality, coupon, maturity and type or by broker-supplied prices. When independent prices are unavailable or unreliable, debt securities may be valued utilizing pricing methodologies which consider similar factors that would be used by third party pricing vendors. Debt securities are generally categorized as Level 2 in the hierarchy but may be Level 3 depending on the circumstances.
Investments in open-end mutual funds, including the Fidelity Central Funds, are valued at their closing net asset value (NAV) each business day and are categorized as Level 1 in the hierarchy.
Changes in valuation techniques may result in transfers in or out of an assigned level within the disclosure hierarchy. The aggregate value of investments by input level as of January 31, 2016 is included at the end of the Fund's Schedule of Investments.
Foreign Currency. The Fund may use foreign currency contracts to facilitate transactions in foreign-denominated securities. Gains and losses from these transactions may arise from changes in the value of the foreign currency or if the counterparties do not perform under the contracts' terms.
Foreign-denominated assets, including investment securities, and liabilities are translated into U.S. dollars at the exchange rates at period end. Purchases and sales of investment securities, income and dividends received and expenses denominated in foreign currencies are translated into U.S. dollars at the exchange rate in effect on the transaction date.
The effects of exchange rate fluctuations on investments are included with the net realized and unrealized gain (loss) on investment securities. Other foreign currency transactions resulting in realized and unrealized gain (loss) are disclosed separately.
Investment Transactions and Income. For financial reporting purposes, the Fund's investment holdings and NAV include trades executed through the end of the last business day of the period. The NAV per share for processing shareholder transactions is calculated as of the close of business of the New York Stock Exchange (NYSE), normally 4:00 p.m. Eastern time and includes trades executed through the end of the prior business day. Gains and losses on securities sold are determined on the basis of identified cost. Dividend income is recorded on the ex-dividend date, except for certain dividends from foreign securities where the ex-dividend date may have passed, which are recorded as soon as the Fund is informed of the ex-dividend date. Non-cash dividends included in dividend income, if any, are recorded at the fair market value of the securities received. Income and capital gain distributions from Fidelity Central Funds, if any, are recorded on the ex-dividend date. Distributions received on securities that represent a return of capital or capital gain are recorded as a reduction of cost of investments and/or as a realized gain. Subsequent to ex-dividend date the Fund determines the components of these distributions, based upon receipt of tax filings or other correspondence relating to the underlying investment. Interest income is accrued as earned and includes coupon interest and amortization of premium and accretion of discount on debt securities as applicable. Investment income is recorded net of foreign taxes withheld where recovery of such taxes is uncertain. Debt obligations may be placed on non-accrual status and related interest income may be reduced by ceasing current accruals and writing off interest receivables when the collection of all or a portion of interest has become doubtful based on consistently applied procedures. A debt obligation is removed from non-accrual status when the issuer resumes interest payments or when collectability of interest is reasonably assured.
Class Allocations and Expenses. Investment income, realized and unrealized capital gains and losses, common expenses of the Fund, and certain fund-level expense reductions, if any, are allocated daily on a pro-rata basis to each class based on the relative net assets of each class to the total net assets of the Fund. Each class differs with respect to transfer agent fees incurred. Certain expense reductions may also differ by class. For the reporting period, the allocated portion of income and expenses to each class as a percent of its average net assets may vary due to the timing of recording these transactions in relation to fluctuating net assets of the classes. Expenses directly attributable to a fund are charged to that fund. Expenses attributable to more than one fund are allocated among the respective funds on the basis of relative net assets or other appropriate methods. Expense estimates are accrued in the period to which they relate and adjustments are made when actual amounts are known.
Income Tax Information and Distributions to Shareholders. Each year, the Fund intends to qualify as a regulated investment company under Subchapter M of the Internal Revenue Code, including distributing substantially all of its taxable income and realized gains. As a result, no provision for U.S. Federal income taxes is required. The Fund files a U.S. federal tax return, in addition to state and local tax returns as required. The Fund's federal income tax returns are subject to examination by the Internal Revenue Service (IRS) for a period of three fiscal years after they are filed. State and local tax returns may be subject to examination for an additional fiscal year depending on the jurisdiction. Foreign taxes are provided for based on the Fund's understanding of the tax rules and rates that exist in the foreign markets in which it invests.
Distributions are declared and recorded on the ex-dividend date. Income dividends and capital gain distributions are declared separately for each class. Income and capital gain distributions are determined in accordance with income tax regulations, which may differ from GAAP.
Capital accounts within the financial statements are adjusted for permanent book-tax differences. These adjustments have no impact on net assets or the results of operations. Capital accounts are not adjusted for temporary book-tax differences which will reverse in a subsequent period.
Book-tax differences are primarily due to foreign currency transactions, passive foreign investment companies (PFIC), equity-debt classifications, certain conversion ratio adjustments, partnerships and losses deferred due to wash sales.
The federal tax cost of investment securities and unrealized appreciation (depreciation) as of period end were as follows:
| Gross unrealized appreciation | $50,533,586 |
| Gross unrealized depreciation | (32,450,608) |
| Net unrealized appreciation (depreciation) on securities | $18,082,978 |
| Tax cost | $791,069,709 |
Restricted Securities. The Fund may invest in securities that are subject to legal or contractual restrictions on resale. These securities generally may be resold in transactions exempt from registration or to the public if the securities are registered. Disposal of these securities may involve time-consuming negotiations and expense, and prompt sale at an acceptable price may be difficult. Information regarding restricted securities is included at the end of the Fund's Schedule of Investments.
Loans and Other Direct Debt Instruments. The Fund invests in direct debt instruments which are interests in amounts owed to lenders by corporate or other borrowers. These instruments may be in the form of loans, trade claims or other receivables and may include standby financing commitments such as revolving credit facilities that obligate the Fund to supply additional cash to the borrower on demand. Loans may be acquired through assignment or participation. The Fund did not have any unfunded loan commitments, which are contractual obligations for future funding, at period end.
4. Purchases and Sales of Investments.
Purchases and sales of securities, other than short-term securities, aggregated $71,006,170 and $63,644,718, respectively.
5. Fees and Other Transactions with Affiliates.
Management Fee. Fidelity Management & Research Company (the investment adviser) and its affiliates provide the Fund with investment management related services for which the Fund pays a monthly management fee. The management fee is the sum of an individual fund fee rate that is based on an annual rate of .30% of the Fund's average net assets and an annualized group fee rate that averaged .25% during the period. The group fee rate is based upon the average net assets of all the mutual funds advised by the investment adviser, including any mutual funds previously advised by the investment adviser that are currently advised by Fidelity SelectCo, LLC, an affiliate of the investment adviser. The group fee rate decreases as assets under management increase and increases as assets under management decrease. For the reporting period, the total annualized management fee rate was .55% of the Fund's average net assets.
Transfer Agent Fees. Fidelity Investments Institutional Operations Company, Inc., (FIIOC), an affiliate of the investment adviser, is the transfer, dividend disbursing and shareholder servicing agent for each class of the Fund. FIIOC receives account fees and asset-based fees that vary according to the account size and type of account of the shareholders of Series Real Estate Income. FIIOC receives no fees for providing transfer agency services to Class F. FIIOC pays for typesetting, printing and mailing of shareholder reports, except proxy statements.
For the period, transfer agent fees for each applicable class were as follows:
| | Amount | % of
Class-Level Average
Net Assets(a) |
| Series Real Estate Income | $317,675 | .16 |
(a) Annualized
Accounting Fees. Fidelity Service Company, Inc. (FSC), an affiliate of the investment adviser, maintains the Fund's accounting records. The fee is based on the level of average net assets for each month.
Brokerage Commissions. The Fund placed a portion of its portfolio transactions with brokerage firms which are affiliates of the investment adviser. Brokerage commissions are included in net realized gain (loss) and change in net unrealized appreciation (depreciation) in the Statement of Operations. The commissions paid to these affiliated firms were $459 for the period.
Interfund Trades. The Fund may purchase from or sell securities to other Fidelity Funds under procedures adopted by the Board. The procedures have been designed to ensure these interfund trades are executed in accordance with Rule 17a-7 of the 1940 Act. Interfund trades are included within the respective purchases and sales amounts shown in the Purchases and Sales of Investments note.
6. Committed Line of Credit.
The Fund participates with other funds managed by the investment adviser or an affiliate in a $4.25 billion credit facility (the "line of credit") to be utilized for temporary or emergency purposes to fund shareholder redemptions or for other short-term liquidity purposes. The Fund has agreed to pay commitment fees on its pro-rata portion of the line of credit, which amounted to $551 and is reflected in Miscellaneous expenses on the Statement of Operations. During the period, the Fund did not borrow on this line of credit.
7. Expense Reductions.
Commissions paid to certain brokers with whom the investment adviser, or its affiliates, places trades on behalf of the Fund include an amount in addition to trade execution, which may be rebated back to the Fund to offset certain expenses. This amount totaled $3,383 for the period. In addition, through arrangements with the Fund's custodian, credits realized as a result of certain uninvested cash balances were used to reduce the Fund's expenses. During the period, these credits reduced the Fund's custody expenses by $222.
In addition, during the period the investment adviser reimbursed and/or waived a portion of fund-level operating expenses in the amount of $2,956.
8. Distributions to Shareholders.
Distributions to shareholders of each class were as follows:
| | Six months ended January 31, 2016 | Year ended July 31, 2015 |
| From net investment income | | |
| Series Real Estate Income | $12,281,092 | $21,727,712 |
| Class F | 13,882,767 | 23,744,743 |
| Total | $26,163,859 | $45,472,455 |
| From net realized gain | | |
| Series Real Estate Income | $3,833,583 | $10,207,221 |
| Class F | 4,167,543 | 10,622,671 |
| Total | $8,001,126 | $20,829,892 |
9. Share Transactions.
Transactions for each class of shares were as follows:
| | Shares | Shares | Dollars | Dollars |
| | Six months ended January 31, 2016 | Year ended July 31, 2015 | Six months ended January 31, 2016 | Year ended July 31, 2015 |
| Series Real Estate Income | | | | |
| Shares sold | 930,880 | 2,035,991 | $10,096,667 | $22,922,397 |
| Reinvestment of distributions | 1,505,515 | 2,871,749 | 16,114,675 | 31,934,933 |
| Shares redeemed | (2,237,466) | (4,463,283) | (24,281,406) | (50,201,779) |
| Net increase (decrease) | 198,929 | 444,457 | $1,929,936 | $4,655,551 |
| Class F | | | | |
| Shares sold | 2,141,684 | 4,231,772 | $23,217,608 | $47,649,383 |
| Reinvestment of distributions | 1,686,551 | 3,090,749 | 18,050,310 | 34,367,414 |
| Shares redeemed | (1,874,474) | (5,535,580) | (20,159,050) | (62,123,060) |
| Net increase (decrease) | 1,953,761 | 1,786,941 | $21,108,868 | $19,893,737 |
10. Other.
The Fund's organizational documents provide former and current trustees and officers with a limited indemnification against liabilities arising in connection with the performance of their duties to the Fund. In the normal course of business, the Fund may also enter into contracts that provide general indemnifications. The Fund's maximum exposure under these arrangements is unknown as this would be dependent on future claims that may be made against the Fund. The risk of material loss from such claims is considered remote.
At the end of the period, mutual funds managed by the investment adviser or its affiliates were the owners of record of all of the outstanding shares of the Fund.
Shareholder Expense Example
As a shareholder of the Fund, you incur two types of costs: (1) transaction costs, and (2) ongoing costs, including management fees and other Fund expenses. This Example is intended to help you understand your ongoing costs (in dollars) of investing in the Fund and to compare these costs with the ongoing costs of investing in other mutual funds.
The Example is based on an investment of $1,000 invested at the beginning of the period and held for the entire period (August 1, 2015 to January 31, 2016).
Actual Expenses
The first line of the accompanying table for each class of the Fund provides information about actual account values and actual expenses. You may use the information in this line, together with the amount you invested, to estimate the expenses that you paid over the period. Simply divide your account value by $1,000.00 (for example, an $8,600 account value divided by $1,000.00 = 8.6), then multiply the result by the number in the first line for a class of the Fund under the heading entitled "Expenses Paid During Period" to estimate the expenses you paid on your account during this period. In addition, the Fund, as a shareholder in the underlying Fidelity Central Funds, will indirectly bear its pro-rata share of the fees and expenses incurred by the underlying Fidelity Central Funds. These fees and expenses are not included in the Fund's annualized expense ratio used to calculate the expense estimate in the table below.
Hypothetical Example for Comparison Purposes
The second line of the accompanying table for each class of the Fund provides information about hypothetical account values and hypothetical expenses based on a Class' actual expense ratio and an assumed rate of return of 5% per year before expenses, which is not the Class' actual return. The hypothetical account values and expenses may not be used to estimate the actual ending account balance or expenses you paid for the period. You may use this information to compare the ongoing costs of investing in the Fund and other funds. To do so, compare this 5% hypothetical example with the 5% hypothetical examples that appear in the shareholder reports of the other funds. In addition, the Fund, as a shareholder in the underlying Fidelity Central Funds, will indirectly bear its pro-rata share of the fees and expenses incurred by the underlying Fidelity Central Funds. These fees and expenses are not included in the Fund's annualized expense ratio used to calculate the expense estimate in the table below.
Please note that the expenses shown in the table are meant to highlight your ongoing costs only and do not reflect any transaction costs. Therefore, the second line of the table is useful in comparing ongoing costs only, and will not help you determine the relative total costs of owning different funds.
| | Annualized Expense Ratio-A | Beginning
Account Value
August 1, 2015 | Ending
Account Value
January 31, 2016 | Expenses Paid
During Period-B
August 1, 2015
to January 31, 2016 |
| Series Real Estate Income | .77% | | | |
| Actual | | $1,000.00 | $989.00 | $3.85 |
| Hypothetical-C | | $1,000.00 | $1,021.27 | $3.91 |
| Class F | .61% | | | |
| Actual | | $1,000.00 | $990.00 | $3.05 |
| Hypothetical-C | | $1,000.00 | $1,022.07 | $3.10 |
A Annualized expense ratio reflects expenses net of applicable fee waivers.
B Expenses are equal to each Class' annualized expense ratio, multiplied by the average account value over the period, multiplied by 184/366 (to reflect the one-half year period).
C 5% return per year before expenses
Corporate Headquarters
245 Summer St.
Boston, MA 02210
www.fidelity.com
SRE-SANN-0316
1.924313.104
Fidelity® OTC Portfolio
Semi-Annual Report January 31, 2016 |
|
Contents
To view a fund's proxy voting guidelines and proxy voting record for the 12-month period ended June 30, visit http://www.fidelity.com/proxyvotingresults or visit the Securities and Exchange Commission's (SEC) web site at http://www.sec.gov.
You may also call 1-800-544-8544 to request a free copy of the proxy voting guidelines.
Standard & Poor's, S&P and S&P 500 are registered service marks of The McGraw-Hill Companies, Inc. and have been licensed for use by Fidelity Distributors Corporation.
Other third-party marks appearing herein are the property of their respective owners.
All other marks appearing herein are registered or unregistered trademarks or service marks of FMR LLC or an affiliated company. © 2016 FMR LLC. All rights reserved.
This report and the financial statements contained herein are submitted for the general information of the shareholders of the Fund. This report is not authorized for distribution to prospective investors in the Fund unless preceded or accompanied by an effective prospectus.
A fund files its complete schedule of portfolio holdings with the SEC for the first and third quarters of each fiscal year on Form N-Q. Forms N-Q are available on the SEC’s web site at http://www.sec.gov. A fund's Forms N-Q may be reviewed and copied at the SEC’s Public Reference Room in Washington, DC. Information regarding the operation of the SEC's Public Reference Room may be obtained by calling 1-800-SEC-0330.
For a complete list of a fund's portfolio holdings, view the most recent holdings listing, semiannual report, or annual report on Fidelity's web site at http://www.fidelity.com, http://www.advisor.fidelity.com, or http://www.401k.com, as applicable.
NOT FDIC INSURED •MAY LOSE VALUE •NO BANK GUARANTEE
Neither the Fund nor Fidelity Distributors Corporation is a bank.
Investment Summary (Unaudited)
Top Ten Stocks as of January 31, 2016
| | % of fund's net assets | % of fund's net assets 6 months ago |
| Apple, Inc. | 5.4 | 9.2 |
| Alphabet, Inc. Class A | 5.3 | 3.9 |
| Amazon.com, Inc. | 4.6 | 5.7 |
| Activision Blizzard, Inc. | 4.4 | 2.7 |
| Facebook, Inc. Class A | 4.2 | 2.8 |
| Alphabet, Inc. Class C | 4.0 | 4.0 |
| Microsoft Corp. | 4.0 | 3.5 |
| Tesla Motors, Inc. | 3.4 | 1.9 |
| NVIDIA Corp. | 3.0 | 1.8 |
| athenahealth, Inc. | 2.8 | 2.4 |
| | 41.1 | |
Top Five Market Sectors as of January 31, 2016
| | % of fund's net assets | % of fund's net assets 6 months ago |
| Information Technology | 50.1 | 47.2 |
| Health Care | 19.8 | 20.9 |
| Consumer Discretionary | 16.6 | 16.6 |
| Consumer Staples | 4.9 | 6.4 |
| Financials | 4.7 | 4.0 |
Asset Allocation (% of fund's net assets)
| As of January 31, 2016* |
| | Stocks | 96.6% |
| | Convertible Securities | 3.3% |
| | Short-Term Investments and Net Other Assets (Liabilities) | 0.1% |

* Foreign investments - 7.8%
| As of July 31, 2015* |
| | Stocks | 97.4% |
| | Convertible Securities | 2.4% |
| | Short-Term Investments and Net Other Assets (Liabilities) | 0.2% |

* Foreign investments - 9.6%
Investments January 31, 2016 (Unaudited)
Showing Percentage of Net Assets
| Common Stocks - 96.6% | | | |
| | | Shares | Value (000s) |
| CONSUMER DISCRETIONARY - 16.2% | | | |
| Automobiles - 3.4% | | | |
| Tesla Motors, Inc. (a)(b) | | 2,148,099 | $410,717 |
| Diversified Consumer Services - 0.2% | | | |
| 2U, Inc. (a)(b) | | 1,118,041 | 22,573 |
| Hotels, Restaurants & Leisure - 1.6% | | | |
| Buffalo Wild Wings, Inc. (a) | | 218,900 | 33,338 |
| Chipotle Mexican Grill, Inc. (a) | | 94,500 | 42,806 |
| Intrawest Resorts Holdings, Inc. (a) | | 726,835 | 6,113 |
| Panera Bread Co. Class A (a) | | 130,300 | 25,278 |
| Starbucks Corp. | | 1,289,420 | 78,358 |
| Vail Resorts, Inc. | | 85,500 | 10,688 |
| | | | 196,581 |
| Internet & Catalog Retail - 7.1% | | | |
| Amazon.com, Inc. (a) | | 928,398 | 544,970 |
| Etsy, Inc. (b) | | 1,870,275 | 14,513 |
| Groupon, Inc. Class A (a)(b)(c) | | 62,409,181 | 169,753 |
| Netflix, Inc. (a) | | 126,200 | 11,590 |
| Wayfair LLC Class A (a)(b) | | 2,482,768 | 112,221 |
| | | | 853,047 |
| Media - 2.3% | | | |
| Altice NV (a) | | 1,015,500 | 14,379 |
| Charter Communications, Inc. Class A (a)(b) | | 1,025,300 | 175,695 |
| Liberty Global PLC: | | | |
| Class A (a) | | 1,860,400 | 64,016 |
| LiLAC Class A (a) | | 23,980 | 844 |
| Twenty-First Century Fox, Inc. Class A | | 837,400 | 22,585 |
| | | | 277,519 |
| Specialty Retail - 0.5% | | | |
| Ross Stores, Inc. | | 1,001,900 | 56,367 |
| Textiles, Apparel & Luxury Goods - 1.1% | | | |
| lululemon athletica, Inc. (a)(b) | | 1,091,146 | 67,727 |
| Ralph Lauren Corp. | | 551,500 | 62,044 |
| | | | 129,771 |
|
| TOTAL CONSUMER DISCRETIONARY | | | 1,946,575 |
|
| CONSUMER STAPLES - 4.8% | | | |
| Beverages - 0.5% | | | |
| Monster Beverage Corp. | | 431,400 | 58,252 |
| Food & Staples Retailing - 3.2% | | | |
| Costco Wholesale Corp. | | 1,566,350 | 236,707 |
| Sprouts Farmers Market LLC (a) | | 501,000 | 11,423 |
| Walgreens Boots Alliance, Inc. | | 1,701,200 | 135,620 |
| | | | 383,750 |
| Food Products - 1.1% | | | |
| Mondelez International, Inc. | | 3,184,400 | 137,248 |
|
| TOTAL CONSUMER STAPLES | | | 579,250 |
|
| ENERGY - 0.4% | | | |
| Energy Equipment & Services - 0.1% | | | |
| Oceaneering International, Inc. | | 319,700 | 10,822 |
| Oil, Gas & Consumable Fuels - 0.3% | | | |
| Anadarko Petroleum Corp. | | 407,800 | 15,941 |
| Diamondback Energy, Inc. | | 111,100 | 8,394 |
| EOG Resources, Inc. | | 194,900 | 13,842 |
| | | | 38,177 |
|
| TOTAL ENERGY | | | 48,999 |
|
| FINANCIALS - 4.4% | | | |
| Banks - 2.9% | | | |
| Bank of America Corp. | | 3,897,600 | 55,112 |
| Citigroup, Inc. | | 1,526,000 | 64,977 |
| Commerce Bancshares, Inc. | | 784,189 | 32,254 |
| Fifth Third Bancorp | | 515,900 | 8,151 |
| Huntington Bancshares, Inc. | | 1,784,000 | 15,307 |
| JPMorgan Chase & Co. | | 811,400 | 48,278 |
| Signature Bank (a) | | 261,300 | 36,410 |
| UMB Financial Corp. | | 531,500 | 24,927 |
| Wells Fargo & Co. | | 1,324,900 | 66,550 |
| | | | 351,966 |
| Capital Markets - 0.4% | | | |
| Carlyle Group LP | | 630,500 | 8,625 |
| Northern Trust Corp. | | 537,600 | 33,374 |
| | | | 41,999 |
| Consumer Finance - 1.1% | | | |
| Capital One Financial Corp. | | 1,407,400 | 92,354 |
| LendingClub Corp. (a)(b) | | 5,370,400 | 39,634 |
| | | | 131,988 |
| Real Estate Management & Development - 0.0% | | | |
| WeWork Companies, Inc. Class A (d) | | 29,911 | 1,501 |
|
| TOTAL FINANCIALS | | | 527,454 |
|
| HEALTH CARE - 19.3% | | | |
| Biotechnology - 15.0% | | | |
| Acceleron Pharma, Inc. (a) | | 262,300 | 8,053 |
| Aduro Biotech, Inc. (e) | | 1,938,567 | 28,070 |
| Alexion Pharmaceuticals, Inc. (a) | | 1,132,389 | 165,250 |
| Alkermes PLC (a) | | 1,053,536 | 33,724 |
| Alnylam Pharmaceuticals, Inc. (a) | | 138,100 | 9,521 |
| Amgen, Inc. | | 875,400 | 133,700 |
| Anacor Pharmaceuticals, Inc. (a) | | 825,300 | 62,005 |
| Array BioPharma, Inc. (a)(b) | | 2,200,963 | 6,801 |
| Avalanche Biotechnologies, Inc. (a) | | 988,352 | 5,930 |
| BioCryst Pharmaceuticals, Inc. (a) | | 2,815,264 | 19,622 |
| Biogen, Inc. (a) | | 798,700 | 218,093 |
| BioMarin Pharmaceutical, Inc. (a) | | 1,773,956 | 131,308 |
| bluebird bio, Inc. (a) | | 164,013 | 6,784 |
| Blueprint Medicines Corp. (b) | | 382,300 | 6,010 |
| Celgene Corp. (a) | | 693,100 | 69,532 |
| Celldex Therapeutics, Inc. (a)(b) | | 1,273,285 | 10,568 |
| Cellectis SA sponsored ADR | | 371,100 | 8,298 |
| Chiasma, Inc. (a)(b) | | 349,820 | 3,603 |
| Chimerix, Inc. (a) | | 54,700 | 421 |
| Coherus BioSciences, Inc. (a)(b) | | 809,715 | 10,737 |
| CytomX Therapeutics, Inc. | | 244,269 | 3,646 |
| CytomX Therapeutics, Inc. (a)(b) | | 517,300 | 8,127 |
| Dicerna Pharmaceuticals, Inc. (a) | | 327,980 | 2,152 |
| Galapagos Genomics NV sponsored ADR (b) | | 554,000 | 27,102 |
| Genocea Biosciences, Inc. (a) | | 845,070 | 2,628 |
| Gilead Sciences, Inc. | | 2,516,599 | 208,878 |
| Heron Therapeutics, Inc. (a)(b) | | 428,983 | 9,004 |
| Intercept Pharmaceuticals, Inc. (a) | | 314,519 | 33,411 |
| Ionis Pharmaceuticals, Inc. (a) | | 148,537 | 5,783 |
| Ironwood Pharmaceuticals, Inc. Class A (a) | | 3,140,542 | 28,987 |
| Juno Therapeutics, Inc. (a)(b) | | 60,124 | 1,658 |
| Karyopharm Therapeutics, Inc. (a)(b) | | 614,200 | 3,820 |
| Lion Biotechnologies, Inc. (a)(b)(c) | | 2,913,500 | 17,452 |
| Medivation, Inc. (a) | | 490,000 | 16,023 |
| Neurocrine Biosciences, Inc. (a) | | 976,100 | 41,533 |
| Novavax, Inc. (a)(b) | | 10,970,600 | 56,499 |
| OvaScience, Inc. (a)(b) | | 981,623 | 5,546 |
| Portola Pharmaceuticals, Inc. (a)(c) | | 2,842,407 | 93,885 |
| ProNai Therapeutics, Inc. (a) | | 193,200 | 1,600 |
| Puma Biotechnology, Inc. (a)(b) | | 743,687 | 31,041 |
| Regeneron Pharmaceuticals, Inc. (a) | | 208,400 | 87,547 |
| Sage Therapeutics, Inc. (a) | | 15,800 | 531 |
| Seattle Genetics, Inc. (a)(b) | | 1,594,486 | 52,586 |
| Spark Therapeutics, Inc. (b) | | 268,480 | 7,563 |
| TESARO, Inc. (a) | | 462,000 | 15,957 |
| Trevena, Inc. (a)(c) | | 3,326,521 | 24,217 |
| Ultragenyx Pharmaceutical, Inc. (a) | | 401,496 | 22,544 |
| uniQure B.V. (a)(b) | | 302,200 | 5,509 |
| Versartis, Inc. (a)(b) | | 459,286 | 5,116 |
| Vertex Pharmaceuticals, Inc. (a) | | 382,600 | 34,721 |
| XOMA Corp. (a)(b) | | 1,194,513 | 1,206 |
| | | | 1,794,302 |
| Health Care Equipment & Supplies - 0.5% | | | |
| IDEXX Laboratories, Inc. (a) | | 393,804 | 27,621 |
| Novadaq Technologies, Inc. (a) | | 2,613,956 | 28,780 |
| | | | 56,401 |
| Health Care Providers & Services - 0.3% | | | |
| Accretive Health, Inc. (a)(b)(c) | | 6,962,302 | 18,241 |
| Diplomat Pharmacy, Inc. (a)(b) | | 574,900 | 15,643 |
| | | | 33,884 |
| Health Care Technology - 3.0% | | | |
| athenahealth, Inc. (a)(b)(c) | | 2,376,613 | 337,004 |
| Castlight Health, Inc. Class B (a)(b) | | 63,800 | 211 |
| Veeva Systems, Inc. Class A (a)(b) | | 939,100 | 22,632 |
| | | | 359,847 |
| Pharmaceuticals - 0.5% | | | |
| Achaogen, Inc. (a)(b) | | 805,700 | 2,917 |
| Flex Pharma, Inc. | | 376,179 | 3,130 |
| GW Pharmaceuticals PLC ADR (a) | | 127,027 | 6,372 |
| Innoviva, Inc. | | 78 | 1 |
| Intra-Cellular Therapies, Inc. (a) | | 324,200 | 12,021 |
| Jazz Pharmaceuticals PLC (a) | | 133,600 | 17,200 |
| Relypsa, Inc. (a)(b) | | 518,000 | 9,759 |
| The Medicines Company (a) | | 297,800 | 10,292 |
| | | | 61,692 |
|
| TOTAL HEALTH CARE | | | 2,306,126 |
|
| INDUSTRIALS - 3.2% | | | |
| Aerospace & Defense - 0.1% | | | |
| Space Exploration Technologies Corp. Class A (d) | | 110,610 | 9,844 |
| Airlines - 0.0% | | | |
| Wheels Up Partners Holdings LLC Series B unit (d)(f) | | 1,760,377 | 5,000 |
| Commercial Services & Supplies - 0.2% | | | |
| Regus PLC | | 887,884 | 3,753 |
| Stericycle, Inc. (a) | | 150,300 | 18,089 |
| | | | 21,842 |
| Electrical Equipment - 2.2% | | | |
| SolarCity Corp. (a)(b)(c) | | 7,218,748 | 257,348 |
| Professional Services - 0.1% | | | |
| TriNet Group, Inc. (a) | | 629,437 | 9,316 |
| Road & Rail - 0.6% | | | |
| J.B. Hunt Transport Services, Inc. | | 1,012,480 | 73,607 |
|
| TOTAL INDUSTRIALS | | | 376,957 |
|
| INFORMATION TECHNOLOGY - 48.2% | | | |
| Communications Equipment - 1.1% | | | |
| Cisco Systems, Inc. | | 98,400 | 2,341 |
| Qualcomm, Inc. | | 2,782,153 | 126,143 |
| | | | 128,484 |
| Electronic Equipment & Components - 0.3% | | | |
| Fitbit, Inc. (b) | | 2,337,056 | 38,795 |
| Internet Software & Services - 16.5% | | | |
| Alphabet, Inc.: | | | |
| Class A | | 829,627 | 631,637 |
| Class C | | 651,869 | 484,306 |
| Criteo SA sponsored ADR (a)(b) | | 5,430,471 | 160,633 |
| Dropbox, Inc. (a)(d) | | 331,524 | 3,992 |
| Facebook, Inc. Class A (a) | | 4,494,938 | 504,377 |
| GoDaddy, Inc. (a) | | 826,100 | 25,188 |
| Marketo, Inc. (a) | | 1,016,778 | 19,329 |
| New Relic, Inc. (a)(b) | | 1,000,196 | 28,226 |
| Opower, Inc. (a) | | 157,056 | 1,335 |
| Rackspace Hosting, Inc. (a) | | 4,996,030 | 100,970 |
| Shopify, Inc. Class A | | 19,200 | 446 |
| Wix.com Ltd. (a)(b) | | 868,336 | 17,731 |
| | | | 1,978,170 |
| IT Services - 1.2% | | | |
| Cognizant Technology Solutions Corp. Class A (a) | | 1,430,000 | 90,533 |
| PayPal Holdings, Inc. (a) | | 1,300,700 | 47,007 |
| Sabre Corp. | | 136,900 | 3,506 |
| Square, Inc. (a)(b) | | 483,500 | 4,240 |
| | | | 145,286 |
| Semiconductors & Semiconductor Equipment - 7.5% | | | |
| Avago Technologies Ltd. | | 683,100 | 91,337 |
| Broadcom Corp. Class A | | 50,600 | 2,766 |
| Cirrus Logic, Inc. (a) | | 676,030 | 23,472 |
| Marvell Technology Group Ltd. | | 5,136,900 | 45,462 |
| Micron Technology, Inc. (a) | | 13,947,700 | 153,843 |
| NVIDIA Corp. | | 12,240,461 | 358,523 |
| NXP Semiconductors NV (a) | | 1,093,600 | 81,779 |
| Qorvo, Inc. (a) | | 1,718,600 | 68,057 |
| SolarEdge Technologies, Inc. (b)(c) | | 2,437,000 | 68,894 |
| | | | 894,133 |
| Software - 14.7% | | | |
| Activision Blizzard, Inc. | | 15,072,239 | 524,815 |
| GameLoft SE (a)(b)(c) | | 7,537,787 | 41,371 |
| HubSpot, Inc. (a) | | 883,980 | 35,881 |
| Interactive Intelligence Group, Inc. (a) | | 211,287 | 5,046 |
| Microsoft Corp. | | 8,669,039 | 477,577 |
| NetSuite, Inc. (a)(b) | | 574,700 | 39,867 |
| Paylocity Holding Corp. (a) | | 345,500 | 10,752 |
| Salesforce.com, Inc. (a) | | 2,162,220 | 147,161 |
| Ubisoft Entertainment SA (a)(c) | | 10,178,905 | 279,592 |
| Workday, Inc. Class A (a) | | 1,206,800 | 76,040 |
| Xero Ltd. (a)(b) | | 628,814 | 6,837 |
| Zendesk, Inc. (a)(c) | | 5,252,784 | 115,614 |
| | | | 1,760,553 |
| Technology Hardware, Storage & Peripherals - 6.9% | | | |
| Apple, Inc. | | 6,658,620 | 648,145 |
| Nimble Storage, Inc. (a) | | 2,124,508 | 13,958 |
| Pure Storage, Inc.: | | | |
| Class A (a)(b) | | 118,400 | 1,540 |
| Class B | | 184,982 | 2,286 |
| Western Digital Corp. | | 3,424,800 | 164,322 |
| | | | 830,251 |
|
| TOTAL INFORMATION TECHNOLOGY | | | 5,775,672 |
|
| TELECOMMUNICATION SERVICES - 0.1% | | | |
| Diversified Telecommunication Services - 0.1% | | | |
| Cogent Communications Group, Inc. | | 252,500 | 8,436 |
| TOTAL COMMON STOCKS | | | |
| (Cost $10,211,607) | | | 11,569,469 |
|
| Convertible Preferred Stocks - 3.3% | | | |
| CONSUMER DISCRETIONARY - 0.4% | | | |
| Diversified Consumer Services - 0.0% | | | |
| Handy Technologies, Inc. Series C (d) | | 415,643 | 2,212 |
| Household Durables - 0.3% | | | |
| Roku, Inc.: | | | |
| Series F, 8.00% (a)(d) | | 16,562,507 | 25,322 |
| Series G, 8.00% (a)(d) | | 3,185,945 | 4,871 |
| Series H (d) | | 1,931,947 | 2,954 |
| | | | 33,147 |
| Internet & Catalog Retail - 0.1% | | | |
| One Kings Lane, Inc. Series E (a)(d) | | 648,635 | 2,990 |
| The Honest Co., Inc. Series D (d) | | 75,268 | 3,444 |
| | | | 6,434 |
| Media - 0.0% | | | |
| Turn, Inc. Series E (a)(d) | | 1,199,041 | 4,137 |
|
| TOTAL CONSUMER DISCRETIONARY | | | 45,930 |
|
| CONSUMER STAPLES - 0.1% | | | |
| Food & Staples Retailing - 0.1% | | | |
| Blue Apron, Inc. Series D (d) | | 866,669 | 12,047 |
| FINANCIALS - 0.3% | | | |
| Real Estate Management & Development - 0.3% | | | |
| Redfin Corp. Series G (a)(d) | | 6,064,833 | 20,257 |
| WeWork Companies, Inc. Series E (d) | | 269,198 | 13,512 |
| | | | 33,769 |
| HEALTH CARE - 0.5% | | | |
| Biotechnology - 0.2% | | | |
| 23andMe, Inc. Series E (d) | | 1,817,170 | 17,172 |
| Editas Medicine, Inc. Series B (d) | | 176,244 | 2,538 |
| Gensight Biologics Series B (d) | | 270,022 | 1,344 |
| Intellia Therapeutics, Inc. Series B (d) | | 402,664 | 2,114 |
| Jounce Therapeutics, Inc. Series B (d) | | 2,212,389 | 3,040 |
| Ovid Therapeutics, Inc. Series B (d) | | 314,408 | 1,170 |
| | | | 27,378 |
| Health Care Providers & Services - 0.3% | | | |
| Mulberry Health, Inc. Series A8 (d) | | 4,342,250 | 29,331 |
|
| TOTAL HEALTH CARE | | | 56,709 |
|
| INDUSTRIALS - 0.1% | | | |
| Aerospace & Defense - 0.1% | | | |
| Space Exploration Technologies Corp. Series G (d) | | 62,037 | 5,521 |
| Professional Services - 0.0% | | | |
| YourPeople, Inc. Series C (d) | | 335,546 | 2,319 |
|
| TOTAL INDUSTRIALS | | | 7,840 |
|
| INFORMATION TECHNOLOGY - 1.9% | | | |
| Internet Software & Services - 1.2% | | | |
| Jet.Com, Inc. Series B1 (d) | | 4,896,249 | 24,422 |
| Pinterest, Inc. Series G, 8.00% (d) | | 27,858 | 1,053 |
| Uber Technologies, Inc.: | | | |
| Series D, 8.00% (a)(d) | | 2,256,164 | 110,038 |
| Series E, 8.00% (a)(d) | | 150,072 | 7,319 |
| | | | 142,832 |
| IT Services - 0.2% | | | |
| AppNexus, Inc. Series E (a)(d) | | 1,416,796 | 22,683 |
| Nutanix, Inc. Series E (a)(d) | | 311,503 | 3,863 |
| | | | 26,546 |
| Software - 0.5% | | | |
| Bracket Computing, Inc. Series C (d) | | 1,877,241 | 14,766 |
| Cloudera, Inc. Series F (a)(d) | | 126,709 | 4,160 |
| Cloudflare, Inc. Series D (a)(d) | | 395,787 | 1,935 |
| Dataminr, Inc. Series D (d) | | 2,219,446 | 17,616 |
| Delphix Corp. Series D (d) | | 427,177 | 2,136 |
| Snapchat, Inc. Series F (d) | | 32,552 | 838 |
| Taboola.Com Ltd. Series E (a)(d) | | 1,918,392 | 15,577 |
| Twilio, Inc. Series E (d) | | 351,811 | 4,531 |
| | | | 61,559 |
|
| TOTAL INFORMATION TECHNOLOGY | | | 230,937 |
|
| TELECOMMUNICATION SERVICES - 0.0% | | | |
| Wireless Telecommunication Services - 0.0% | | | |
| Altiostar Networks, Inc. Series D (d) | | 1,220,504 | 6,896 |
| TOTAL CONVERTIBLE PREFERRED STOCKS | | | |
| (Cost $349,539) | | | 394,128 |
|
| Money Market Funds - 6.3% | | | |
| Fidelity Cash Central Fund, 0.38% (g) | | 53,239,744 | 53,240 |
| Fidelity Securities Lending Cash Central Fund, 0.42% (g)(h) | | 704,512,730 | 704,513 |
| TOTAL MONEY MARKET FUNDS | | | |
| (Cost $757,753) | | | 757,753 |
| TOTAL INVESTMENT PORTFOLIO - 106.2% | | | |
| (Cost $11,318,899) | | | 12,721,350 |
| NET OTHER ASSETS (LIABILITIES) - (6.2)% | | | (737,966) |
| NET ASSETS - 100% | | | $11,983,384 |
Legend
(a) Non-income producing
(b) Security or a portion of the security is on loan at period end.
(c) Affiliated company
(d) Restricted securities - Investment in securities not registered under the Securities Act of 1933 (excluding 144A issues). At the end of the period, the value of restricted securities (excluding 144A issues) amounted to $414,465,000 or 3.5% of net assets.
(e) Security exempt from registration under Rule 144A of the Securities Act of 1933. These securities may be resold in transactions exempt from registration, normally to qualified institutional buyers. At the end of the period, the value of these securities amounted to $28,070,000 or 0.2% of net assets.
(f) Investment is owned by an entity that is treated as a corporation for U.S. tax purposes and is wholly-owned by the Fund.
(g) Affiliated fund that is generally available only to investment companies and other accounts managed by Fidelity Investments. The rate quoted is the annualized seven-day yield of the fund at period end. A complete unaudited listing of the fund's holdings as of its most recent quarter end is available upon request. In addition, each Fidelity Central Fund's financial statements are available on the SEC's website or upon request.
(h) Investment made with cash collateral received from securities on loan.
Additional information on each restricted holding is as follows:
| Security | Acquisition Date | Acquisition Cost (000s) |
| 23andMe, Inc. Series E | 6/18/15 | $19,675 |
| Altiostar Networks, Inc. Series D | 1/7/15 | $15,000 |
| AppNexus, Inc. Series E | 8/1/14 - 9/17/14 | $28,382 |
| Blue Apron, Inc. Series D | 5/18/15 | $11,550 |
| Bracket Computing, Inc. Series C | 9/9/15 | $14,766 |
| Cloudera, Inc. Series F | 2/5/14 | $1,845 |
| Cloudflare, Inc. Series D | 11/5/14 | $2,424 |
| Dataminr, Inc. Series D | 2/18/15 - 3/6/15 | $28,298 |
| Delphix Corp. Series D | 7/10/15 | $3,845 |
| Dropbox, Inc. | 5/2/12 | $3,000 |
| Editas Medicine, Inc. Series B | 8/4/15 | $2,062 |
| Gensight Biologics Series B | 7/2/15 | $2,081 |
| Handy Technologies, Inc. Series C | 10/14/15 | $2,436 |
| Intellia Therapeutics, Inc. Series B | 8/20/15 | $2,114 |
| Jet.Com, Inc. Series B1 | 11/24/15 | $24,422 |
| Jounce Therapeutics, Inc. Series B | 4/17/15 | $5,000 |
| Mulberry Health, Inc. Series A8 | 1/20/16 | $29,331 |
| Nutanix, Inc. Series E | 8/26/14 | $4,173 |
| One Kings Lane, Inc. Series E | 1/29/14 | $10,000 |
| Ovid Therapeutics, Inc. Series B | 8/10/15 | $1,959 |
| Pinterest, Inc. Series G, 8.00% | 2/27/15 | $1,000 |
| Redfin Corp. Series G | 12/16/14 | $20,000 |
| Roku, Inc. Series F, 8.00% | 5/7/13 | $15,000 |
| Roku, Inc. Series G, 8.00% | 10/1/14 | $4,140 |
| Roku, Inc. Series H | 11/9/15 | $2,954 |
| Snapchat, Inc. Series F | 3/25/15 | $1,000 |
| Space Exploration Technologies Corp. Class A | 10/16/15 | $9,844 |
| Space Exploration Technologies Corp. Series G | 1/20/15 | $4,805 |
| Taboola.Com Ltd. Series E | 12/22/14 | $20,000 |
| The Honest Co., Inc. Series D | 8/3/15 | $3,444 |
| Turn, Inc. Series E | 12/30/13 | $10,000 |
| Twilio, Inc. Series E | 4/24/15 | $3,979 |
| Uber Technologies, Inc. Series D, 8.00% | 6/6/14 | $35,000 |
| Uber Technologies, Inc. Series E, 8.00% | 12/5/14 | $5,000 |
| WeWork Companies, Inc. Class A | 6/23/15 | $984 |
| WeWork Companies, Inc. Series E | 6/23/15 | $8,854 |
| Wheels Up Partners Holdings LLC Series B unit | 9/18/15 | $5,000 |
| YourPeople, Inc. Series C | 5/1/15 | $5,000 |
Affiliated Central Funds
Information regarding fiscal year to date income earned by the Fund from investments in Fidelity Central Funds is as follows:
| Fund | Income earned |
| | (Amounts in thousands) |
| Fidelity Cash Central Fund | $21 |
| Fidelity Securities Lending Cash Central Fund | 11,486 |
| Total | $11,507 |
Other Affiliated Issuers
An affiliated company is a company in which the Fund has ownership of at least 5% of the voting securities. Fiscal year to date transactions with companies which are or were affiliates are as follows:
| Affiliate (Amounts in thousands) | Value, beginning of period | Purchases | Sales Proceeds* | Dividend Income | Value, end of period |
| Accretive Health, Inc. | $18,789 | $-- | $703 | $-- | $18,241 |
| athenahealth, Inc. | 327,395 | 8,694 | 3,192 | -- | 337,004 |
| Criteo SA sponsored ADR | 291,470 | -- | 1,762 | -- | -- |
| GameLoft SE | 36,312 | -- | 496 | -- | 41,371 |
| Groupon, Inc. Class A | 317,266 | -- | 12,726 | -- | 169,753 |
| Lion Biotechnologies, Inc. | 25,788 | -- | 747 | -- | 17,452 |
| Portola Pharmaceuticals, Inc. | 140,217 | 4,896 | 4,712 | -- | 93,885 |
| SolarCity Corp. | 89,259 | 207,856 | 11,228 | -- | 257,348 |
| SolarEdge Technologies, Inc. | -- | 63,165 | -- | -- | 68,894 |
| Synchronoss Technologies, Inc. | 127,356 | 3,746 | 110,002 | -- | -- |
| Trevena, Inc. | 19,522 | -- | 310 | -- | 24,217 |
| Ubisoft Entertainment SA | 204,478 | -- | 9,994 | -- | 279,592 |
| Zendesk, Inc. | 106,272 | 3,035 | 989 | -- | 115,614 |
| Total | $1,704,124 | $291,392 | $156,861 | $-- | $1,423,371 |
* Includes the value of securities delivered through in-kind transactions, if applicable.
Investment Valuation
The following is a summary of the inputs used, as of January 31, 2016, involving the Fund's assets and liabilities carried at fair value. The inputs or methodology used for valuing securities may not be an indication of the risk associated with investing in those securities. For more information on valuation inputs, and their aggregation into the levels used below, please refer to the Investment Valuation section in the accompanying Notes to Financial Statements.
| | Valuation Inputs at Reporting Date: |
| Description | Total | Level 1 | Level 2 | Level 3 |
| (Amounts in thousands) | | | | |
| Investments in Securities: | | | | |
| Equities: | | | | |
| Consumer Discretionary | $1,992,505 | $1,932,196 | $-- | $60,309 |
| Consumer Staples | 591,297 | 579,250 | -- | 12,047 |
| Energy | 48,999 | 48,999 | -- | -- |
| Financials | 561,223 | 525,953 | -- | 35,270 |
| Health Care | 2,362,835 | 2,302,480 | 3,646 | 56,709 |
| Industrials | 384,797 | 358,360 | 3,753 | 22,684 |
| Information Technology | 6,006,609 | 5,448,431 | 323,249 | 234,929 |
| Telecommunication Services | 15,332 | 8,436 | -- | 6,896 |
| Money Market Funds | 757,753 | 757,753 | -- | -- |
| Total Investments in Securities: | $12,721,350 | $11,961,858 | $330,648 | $428,844 |
The following is a summary of transfers between Level 1 and Level 2 for the period ended January 31, 2016. Transfers are assumed to have occurred at the beginning of the period, and are primarily attributable to the valuation techniques used for foreign equity securities, as discussed in the accompanying Notes to Financial Statements:
| Transfers | Total (000s) |
| Level 1 to Level 2 | $251,265 |
| Level 2 to Level 1 | $0 |
The following is a reconciliation of Investments in Securities for which Level 3 inputs were used in determining value:
| (Amounts in thousands) | | | | |
| Investments in Securities: | |
| Equities - Information Technology | |
| Beginning Balance | $203,955 |
| Net Realized Gain (Loss) on Investment Securities | -- |
| Net Unrealized Gain (Loss) on Investment Securities | (6,932) |
| Cost of Purchases | 39,188 |
| Proceeds of Sales | (1,282) |
| Amortization/Accretion | -- |
| Transfers into Level 3 | -- |
| Transfers out of Level 3 | -- |
| Ending Balance | $234,929 |
| The change in unrealized gain (loss) for the period attributable to Level 3 securities held at January 31, 2016 | $(4,835) |
| Equities - Other Investments in Securities | |
| Beginning Balance | $133,963 |
| Net Realized Gain (Loss) on Investment Securities | -- |
| Net Unrealized Gain (Loss) on Investment Securities | (10,870) |
| Cost of Purchases | 73,105 |
| Proceeds of Sales | (2,283) |
| Amortization/Accretion | -- |
| Transfers into Level 3 | -- |
| Transfers out of Level 3 | -- |
| Ending Balance | $193,915 |
| The change in unrealized gain (loss) for the period attributable to Level 3 securities held at January 31, 2016 | $(10,870) |
The information used in the above reconciliations represents fiscal year to date activity for any Investments in Securities identified as using Level 3 inputs at either the beginning or the end of the current fiscal period. Transfers in or out of Level 3 represent the beginning value of any Security or Instrument where a change in the pricing level occurred from the beginning to the end of the period. The cost of purchases and the proceeds of sales may include securities received or delivered through corporate actions or exchanges. Realized and unrealized gains (losses) disclosed in the reconciliations are included in Net Gain (Loss) on the Fund's Statement of Operations.
See accompanying notes which are an integral part of the financial statements.
Financial Statements
Statement of Assets and Liabilities
| Amounts in thousands (except per-share amounts) | | January 31, 2016 (Unaudited) |
| Assets | | |
Investment in securities, at value (including securities loaned of $698,617) — See accompanying schedule:
Unaffiliated issuers (cost $9,054,478) | $10,540,226 | |
| Fidelity Central Funds (cost $757,753) | 757,753 | |
| Other affiliated issuers (cost $1,506,668) | 1,423,371 | |
| Total Investments (cost $11,318,899) | | $12,721,350 |
| Receivable for investments sold | | 277,059 |
| Receivable for fund shares sold | | 14,547 |
| Dividends receivable | | 999 |
| Distributions receivable from Fidelity Central Funds | | 2,631 |
| Prepaid expenses | | 22 |
| Other receivables | | 259 |
| Total assets | | 13,016,867 |
| Liabilities | | |
| Payable for investments purchased | $311,570 | |
| Payable for fund shares redeemed | 8,030 | |
| Accrued management fee | 7,505 | |
| Other affiliated payables | 1,568 | |
| Other payables and accrued expenses | 297 | |
| Collateral on securities loaned, at value | 704,513 | |
| Total liabilities | | 1,033,483 |
| Net Assets | | $11,983,384 |
| Net Assets consist of: | | |
| Paid in capital | | $10,560,184 |
| Accumulated net investment loss | | (7,652) |
| Accumulated undistributed net realized gain (loss) on investments and foreign currency transactions | | 28,433 |
| Net unrealized appreciation (depreciation) on investments and assets and liabilities in foreign currencies | | 1,402,419 |
| Net Assets | | $11,983,384 |
| OTC: | | |
| Net Asset Value, offering price and redemption price per share ($8,742,384 ÷ 120,065 shares) | | $72.81 |
| Class K: | | |
| Net Asset Value, offering price and redemption price per share ($3,241,000 ÷ 44,041 shares) | | $73.59 |
See accompanying notes which are an integral part of the financial statements.
Statement of Operations
| Amounts in thousands | | Six months ended January 31, 2016 (Unaudited) |
| Investment Income | | |
| Dividends | | $39,295 |
| Income from Fidelity Central Funds (including $11,486 from security lending) | | 11,507 |
| Total income | | 50,802 |
| Expenses | | |
| Management fee | | |
| Basic fee | $38,705 | |
| Performance adjustment | 10,143 | |
| Transfer agent fees | 8,494 | |
| Accounting and security lending fees | 766 | |
| Custodian fees and expenses | 230 | |
| Independent trustees' compensation | 29 | |
| Registration fees | 113 | |
| Audit | 53 | |
| Legal | 34 | |
| Interest | 14 | |
| Miscellaneous | 38 | |
| Total expenses before reductions | 58,619 | |
| Expense reductions | (300) | 58,319 |
| Net investment income (loss) | | (7,517) |
| Realized and Unrealized Gain (Loss) | | |
| Net realized gain (loss) on: | | |
| Investment securities: | | |
| Unaffiliated issuers | 167,693 | |
| Other affiliated issuers | 21,516 | |
| Foreign currency transactions | (7) | |
| Total net realized gain (loss) | | 189,202 |
Change in net unrealized appreciation (depreciation) on:
Investment securities | (1,746,920) | |
| Assets and liabilities in foreign currencies | (1) | |
| Total change in net unrealized appreciation (depreciation) | | (1,746,921) |
| Net gain (loss) | | (1,557,719) |
| Net increase (decrease) in net assets resulting from operations | | $(1,565,236) |
See accompanying notes which are an integral part of the financial statements.
Statement of Changes in Net Assets
| Amounts in thousands | Six months ended January 31, 2016 (Unaudited) | Year ended July 31, 2015 |
| Increase (Decrease) in Net Assets | | |
| Operations | | |
| Net investment income (loss) | $(7,517) | $(11,952) |
| Net realized gain (loss) | 189,202 | 1,282,162 |
| Change in net unrealized appreciation (depreciation) | (1,746,921) | 1,068,362 |
| Net increase (decrease) in net assets resulting from operations | (1,565,236) | 2,338,572 |
| Distributions to shareholders from net realized gain | (704,905) | (1,408,892) |
| Share transactions - net increase (decrease) | 706,677 | 1,841,344 |
| Total increase (decrease) in net assets | (1,563,464) | 2,771,024 |
| Net Assets | | |
| Beginning of period | 13,546,848 | 10,775,824 |
| End of period (including accumulated net investment loss of $7,652 and accumulated net investment loss of $135, respectively) | $11,983,384 | $13,546,848 |
See accompanying notes which are an integral part of the financial statements.
Financial Highlights — Fidelity OTC Portfolio
| | Six months ended (Unaudited) | Years ended July 31, | | | | |
| | 2016 | 2015 | 2014 | 2013 | 2012 | 2011 |
| Selected Per–Share Data | | | | | | |
| Net asset value, beginning of period | $86.98 | $81.23 | $78.98 | $57.53 | $59.28 | $45.00 |
| Income from Investment Operations | | | | | | |
| Net investment income (loss)A | (.06) | (.11) | (.06) | .36B | (.08)C | (.27) |
| Net realized and unrealized gain (loss) | (9.60) | 16.14 | 12.78 | 21.37 | (1.67) | 14.55 |
| Total from investment operations | (9.66) | 16.03 | 12.72 | 21.73 | (1.75) | 14.28 |
| Distributions from net investment income | – | – | (.05) | (.28) | – | – |
| Distributions from net realized gain | (4.51) | (10.28) | (10.42) | – | – | – |
| Total distributions | (4.51) | (10.28) | (10.47) | (.28) | – | – |
| Net asset value, end of period | $72.81 | $86.98 | $81.23 | $78.98 | $57.53 | $59.28 |
| Total ReturnD,E | (11.46)% | 21.34% | 17.96% | 37.93% | (2.95)% | 31.73% |
| Ratios to Average Net AssetsF,G | | | | | | |
| Expenses before reductions | .94%H | .83% | .77% | .76% | .91% | .94% |
| Expenses net of fee waivers, if any | .94%H | .83% | .77% | .76% | .91% | .94% |
| Expenses net of all reductions | .94%H | .83% | .76% | .74% | .90% | .92% |
| Net investment income (loss) | (.15)%H | (.13)% | (.08)% | .55%B | (.14)%C | (.49)% |
| Supplemental Data | | | | | | |
| Net assets, end of period (in millions) | $8,742 | $9,710 | $7,870 | $6,693 | $5,499 | $6,374 |
| Portfolio turnover rateI | 69%H,J | 66%J | 106% | 116% | 149% | 158% |
A Calculated based on average shares outstanding during the period.
B Net Investment income per share reflects a large, non-recurring dividend which amounted to $.10 per share. Excluding this non-recurring dividend, the ratio of net investment income (loss) to average net assets would have been .40%.
C Net Investment income per share reflects a large, non-recurring dividend which amounted to $.03 per share. Excluding this non-recurring dividend, the ratio of net investment income (loss) to average net assets would have been (.20) %.
D Total returns for periods of less than one year are not annualized.
E Total returns would have been lower if certain expenses had not been reduced during the applicable periods shown.
F Fees and expenses of any underlying Fidelity Central Funds are not included in the Fund's expense ratio. The Fund indirectly bears its proportionate share of the expenses of any underlying Fidelity Central Funds.
G Expense ratios reflect operating expenses of the class. Expenses before reductions do not reflect amounts reimbursed by the investment adviser or reductions from brokerage service arrangements or reductions from other expense offset arrangements and do not represent the amount paid by the class during periods when reimbursements or reductions occur. Expenses net of fee waivers reflect expenses after reimbursement by the investment adviser but prior to reductions from brokerage service arrangements or other expense offset arrangements. Expenses net of all reductions represent the net expenses paid by the class.
H Annualized
I Amount does not include the portfolio activity of any underlying Fidelity Central Funds.
J Portfolio turnover rate excludes securities received or delivered in-kind.
See accompanying notes which are an integral part of the financial statements.
Financial Highlights — Fidelity OTC Portfolio Class K
| | Six months ended (Unaudited) | Years ended July 31, | | | | |
| | 2016 | 2015 | 2014 | 2013 | 2012 | 2011 |
| Selected Per–Share Data | | | | | | |
| Net asset value, beginning of period | $87.87 | $81.96 | $79.60 | $57.94 | $59.61 | $45.19 |
| Income from Investment Operations | | | | | | |
| Net investment income (loss)A | (.01) | (.01) | .04 | .45B | –C,D | (.19) |
| Net realized and unrealized gain (loss) | (9.70) | 16.29 | 12.87 | 21.53 | (1.67) | 14.61 |
| Total from investment operations | (9.71) | 16.28 | 12.91 | 21.98 | (1.67) | 14.42 |
| Distributions from net investment income | – | – | (.10) | (.32) | – | – |
| Distributions from net realized gain | (4.57) | (10.37) | (10.46) | – | – | – |
| Total distributions | (4.57) | (10.37) | (10.55)E | (.32) | – | – |
| Net asset value, end of period | $73.59 | $87.87 | $81.96 | $79.60 | $57.94 | $59.61 |
| Total ReturnF,G | (11.41)% | 21.49% | 18.10% | 38.11% | (2.80)% | 31.91% |
| Ratios to Average Net AssetsH,I | | | | | | |
| Expenses before reductions | .82%J | .72% | .65% | .62% | .77% | .80% |
| Expenses net of fee waivers, if any | .82%J | .72% | .65% | .62% | .77% | .80% |
| Expenses net of all reductions | .82%J | .71% | .64% | .60% | .76% | .78% |
| Net investment income (loss) | (.03)%J | (.02)% | .05% | .69%B | - %C,K | (.35)% |
| Supplemental Data | | | | | | |
| Net assets, end of period (in millions) | $3,241 | $3,836 | $2,906 | $2,260 | $1,644 | $1,363 |
| Portfolio turnover rateL | 69%J,M | 66%M | 106% | 116% | 149% | 158% |
A Calculated based on average shares outstanding during the period.
B Net Investment income per share reflects a large, non-recurring dividend which amounted to $.10 per share. Excluding this non-recurring dividend, the ratio of net investment income (loss) to average net assets would have been .53%.
C Net Investment income per share reflects a large, non-recurring dividend which amounted to $.03 per share. Excluding this non-recurring dividend, the ratio of net investment income (loss) to average net assets would have been (.06) %.
D Amount represents less than $.005 per share.
E Total distributions of $10.55 per share is comprised of distributions from net investment income of $.098 and distributions from net realized gain of $10.456 per share.
F Total returns for periods of less than one year are not annualized.
G Total returns would have been lower if certain expenses had not been reduced during the applicable periods shown.
H Fees and expenses of any underlying Fidelity Central Funds are not included in the Fund's expense ratio. The Fund indirectly bears its proportionate share of the expenses of any underlying Fidelity Central Funds.
I Expense ratios reflect operating expenses of the class. Expenses before reductions do not reflect amounts reimbursed by the investment adviser or reductions from brokerage service arrangements or reductions from other expense offset arrangements and do not represent the amount paid by the class during periods when reimbursements or reductions occur. Expenses net of fee waivers reflect expenses after reimbursement by the investment adviser but prior to reductions from brokerage service arrangements or other expense offset arrangements. Expenses net of all reductions represent the net expenses paid by the class.
J Annualized
K Amount represents less than .005%.
L Amount does not include the portfolio activity of any underlying Fidelity Central Funds.
M Portfolio turnover rate excludes securities received or delivered in-kind.
See accompanying notes which are an integral part of the financial statements.
Notes to Financial Statements (Unaudited)
For the period ended January 31, 2016
(Amounts in thousands except percentages)
1. Organization.
Fidelity OTC Portfolio (the Fund) is a non-diversified fund of Fidelity Securities Fund (the Trust) and is authorized to issue an unlimited number of shares. The Trust is registered under the Investment Company Act of 1940, as amended (the 1940 Act), as an open-end management investment company organized as a Massachusetts business trust. The Fund offers OTC and Class K shares, each of which has equal rights as to assets and voting privileges. Each class has exclusive voting rights with respect to matters that affect that class.
2. Investments in Fidelity Central Funds.
The Fund invests in Fidelity Central Funds, which are open-end investment companies generally available only to other investment companies and accounts managed by the investment adviser and its affiliates. The Fund's Schedule of Investments lists each of the Fidelity Central Funds held as of period end, if any, as an investment of the Fund, but does not include the underlying holdings of each Fidelity Central Fund. As an Investing Fund, the Fund indirectly bears its proportionate share of the expenses of the underlying Fidelity Central Funds.
The Money Market Central Funds seek preservation of capital and current income and are managed by Fidelity Investments Money Management, Inc. (FIMM), an affiliate of the investment adviser. Annualized expenses of the Money Market Central Funds as of their most recent shareholder report date are less than .005%.
A complete unaudited list of holdings for each Fidelity Central Fund is available upon request or at the Securities and Exchange Commission (the SEC) website at www.sec.gov. In addition, the financial statements of the Fidelity Central Funds are available on the SEC website or upon request.
3. Significant Accounting Policies.
The financial statements have been prepared in conformity with accounting principles generally accepted in the United States of America (GAAP), which require management to make certain estimates and assumptions at the date of the financial statements. Actual results could differ from those estimates. Subsequent events, if any, through the date that the financial statements were issued have been evaluated in the preparation of the financial statements. The following summarizes the significant accounting policies of the Fund:
Investment Valuation. Investments are valued as of 4:00 p.m. Eastern time on the last calendar day of the period. The Board of Trustees (the Board) has delegated the day to day responsibility for the valuation of the Fund's investments to the Fidelity Management & Research Company (FMR) Fair Value Committee (the Committee). In accordance with valuation policies and procedures approved by the Board, the Fund attempts to obtain prices from one or more third party pricing vendors or brokers to value its investments. When current market prices, quotations or currency exchange rates are not readily available or reliable, investments will be fair valued in good faith by the Committee, in accordance with procedures adopted by the Board. Factors used in determining fair value vary by investment type and may include market or investment specific events. The frequency with which these procedures are used cannot be predicted and they may be utilized to a significant extent. The Committee oversees the Fund's valuation policies and procedures and reports to the Board on the Committee's activities and fair value determinations. The Board monitors the appropriateness of the procedures used in valuing the Fund's investments and ratifies the fair value determinations of the Committee.
The Fund categorizes the inputs to valuation techniques used to value its investments into a disclosure hierarchy consisting of three levels as shown below:
- Level 1 – quoted prices in active markets for identical investments
- Level 2 – other significant observable inputs (including quoted prices for similar investments, interest rates, prepayment speeds, etc.)
- Level 3 – unobservable inputs (including the Fund's own assumptions based on the best information available)
Valuation techniques used to value the Fund's investments by major category are as follows:
Equity securities, including restricted securities, for which market quotations are readily available, are valued at the last reported sale price or official closing price as reported by a third party pricing vendor on the primary market or exchange on which they are traded and are categorized as Level 1 in the hierarchy. In the event there were no sales during the day or closing prices are not available, securities are valued at the last quoted bid price or may be valued using the last available price and are generally categorized as Level 2 in the hierarchy. For foreign equity securities, when market or security specific events arise, comparisons to the valuation of American Depositary Receipts (ADRs), futures contracts, Exchange-Traded Funds (ETFs) and certain indexes as well as quoted prices for similar securities may be used and would be categorized as Level 2 in the hierarchy. Utilizing these techniques may result in transfers between Level 1 and Level 2. For equity securities, including restricted securities, where observable inputs are limited, assumptions about market activity and risk are used and these securities may be categorized as Level 3 in the hierarchy. Equity securities, including restricted securities, for which observable inputs are not available are valued using alternate valuation approaches, including the market approach and the income approach and are categorized as Level 3 in the hierarchy. The market approach generally consists of using comparable market transactions while the income approach generally consists of using the net present value of estimated future cash flows, adjusted as appropriate for liquidity, credit, market and/or other risk factors.
Investments in open-end mutual funds, including the Fidelity Central Funds, are valued at their closing net asset value (NAV) each business day and are categorized as Level 1 in the hierarchy.
The following provides information on Level 3 securities held by the Fund that were valued at period end based on unobservable inputs. These amounts exclude valuations provided by a broker.
| Asset Type | Fair Value at 01/31/16 (000s) | Valuation Technique(s) | Unobservable Input | Amount or Range/Weighted Average | Impact to Valuation from an Increase in Input(a) |
| Equities | $428,844 | Discount cash flow | Discount rate | 8.0% | Decrease |
| | | | Discount for lack of marketability | 20.0% | Decrease |
| | | | Growth rate | 2.5% - 3.0% / 2.5% | Increase |
| | | | Weighted average cost of capital | 11.5% - 40.0% / 14.7% | Decrease |
| | | Last transaction price | Transaction price | $1.53 - $89.00 / $30.32 | Increase |
| | | Market comparable | EV/Sales multiple | 1.2 – 11.1 / 3.3 | Increase |
| | | | Discount rate | 3.0% - 50.0% / 17.5% | Decrease |
| | | | Discount for lack of marketability | 10.0% - 30.0% / 19.9% | Decrease |
| | | | Premium rate | 10.0% - 86.4% / 26.6% | Increase |
| | | | EV/GP multiple | 4.2 | Increase |
| | | Proposed transactions price | Transaction price | $8.00 - $50.19 / $46.72 | Increase |
| | | | Discount rate | 10.0% | Decrease |
| | | | Index movement | 30.2% | Increase |
| | | Proxy adjustment | Proxy movement | 39.0% - 40.3% / 39.4% | Increase |
| | | Replacement cost | Liquidity preference | $8.34 | Increase |
(a) Represents the expected directional change in the fair value of the Level 3 investments that would result from an increase in the corresponding input. A decrease to the unobservable input would have the opposite effect. Significant changes in these inputs could result in significantly higher or lower fair value measurements.
Changes in valuation techniques may result in transfers in or out of an assigned level within the disclosure hierarchy. The aggregate value of investments by input level as of January 31, 2016, including information on transfers between Levels 1 and 2 , as well as a roll forward of Level 3 investments, is included at the end of the Fund's Schedule of Investments.
Foreign Currency. The Fund may use foreign currency contracts to facilitate transactions in foreign-denominated securities. Gains and losses from these transactions may arise from changes in the value of the foreign currency or if the counterparties do not perform under the contracts' terms.
Foreign-denominated assets, including investment securities, and liabilities are translated into U.S. dollars at the exchange rates at period end. Purchases and sales of investment securities, income and dividends received and expenses denominated in foreign currencies are translated into U.S. dollars at the exchange rate in effect on the transaction date.
The effects of exchange rate fluctuations on investments are included with the net realized and unrealized gain (loss) on investment securities. Other foreign currency transactions resulting in realized and unrealized gain (loss) are disclosed separately.
Investment Transactions and Income. For financial reporting purposes, the Fund's investment holdings and NAV include trades executed through the end of the last business day of the period. The NAV per share for processing shareholder transactions is calculated as of the close of business of the New York Stock Exchange (NYSE), normally 4:00 p.m. Eastern time and includes trades executed through the end of the prior business day. Gains and losses on securities sold are determined on the basis of identified cost and may include proceeds received from litigation. Dividend income is recorded on the ex-dividend date, except for certain dividends from foreign securities where the ex-dividend date may have passed, which are recorded as soon as the Fund is informed of the ex-dividend date. Non-cash dividends included in dividend income, if any, are recorded at the fair market value of the securities received. Income and capital gain distributions from Fidelity Central Funds, if any, are recorded on the ex-dividend date. Distributions received on securities that represent a return of capital or capital gain are recorded as a reduction of cost of investments and/or as a realized gain. Subsequent to ex-dividend date the Fund determines the components of these distributions, based upon receipt of tax filings or other correspondence relating to the underlying investment. Interest income is accrued as earned and includes coupon interest and amortization of premium and accretion of discount on debt securities as applicable. Investment income is recorded net of foreign taxes withheld where recovery of such taxes is uncertain.
Class Allocations and Expenses. Investment income, realized and unrealized capital gains and losses, common expenses of the Fund, and certain fund-level expense reductions, if any, are allocated daily on a pro-rata basis to each class based on the relative net assets of each class to the total net assets of the Fund. Each class differs with respect to transfer agent fees incurred. Certain expense reductions may also differ by class. For the reporting period, the allocated portion of income and expenses to each class as a percent of its average net assets may vary due to the timing of recording these transactions in relation to fluctuating net assets of the classes. Expenses directly attributable to a fund are charged to that fund. Expenses attributable to more than one fund are allocated among the respective funds on the basis of relative net assets or other appropriate methods. Expense estimates are accrued in the period to which they relate and adjustments are made when actual amounts are known.
Deferred Trustee Compensation. Under a Deferred Compensation Plan (the Plan), independent Trustees may elect to defer receipt of a portion of their annual compensation. Deferred amounts are invested in a cross-section of Fidelity funds, are marked-to-market and remain in the Fund until distributed in accordance with the Plan. The investment of deferred amounts and the offsetting payable to the Trustees are included in the accompanying Statement of Assets and Liabilities.
Income Tax Information and Distributions to Shareholders. Each year, the Fund intends to qualify as a regulated investment company under Subchapter M of the Internal Revenue Code, including distributing substantially all of its taxable income and realized gains. As a result, no provision for U.S. Federal income taxes is required. The Fund files a U.S. federal tax return, in addition to state and local tax returns as required. The Fund's federal income tax returns are subject to examination by the Internal Revenue Service (IRS) for a period of three fiscal years after they are filed. State and local tax returns may be subject to examination for an additional fiscal year depending on the jurisdiction. Foreign taxes are provided for based on the Fund's understanding of the tax rules and rates that exist in the foreign markets in which it invests.
Distributions are declared and recorded on the ex-dividend date. Income dividends and capital gain distributions are declared separately for each class. Income and capital gain distributions are determined in accordance with income tax regulations, which may differ from GAAP.
Capital accounts within the financial statements are adjusted for permanent book-tax differences. These adjustments have no impact on net assets or the results of operations. Capital accounts are not adjusted for temporary book-tax differences which will reverse in a subsequent period.
Book-tax differences are primarily due to redemptions in-kind, foreign currency transactions, passive foreign investment companies (PFIC), net operating losses, partnerships, deferred trustees compensation and losses deferred due to wash sales.
The federal tax cost of investment securities and unrealized appreciation (depreciation) as of period end were as follows:
| Gross unrealized appreciation | $3,197,874 |
| Gross unrealized depreciation | (1,846,819) |
| Net unrealized appreciation (depreciation) on securities | $1,351,055 |
| Tax cost | $11,370,295 |
Restricted Securities. The Fund may invest in securities that are subject to legal or contractual restrictions on resale. These securities generally may be resold in transactions exempt from registration or to the public if the securities are registered. Disposal of these securities may involve time-consuming negotiations and expense, and prompt sale at an acceptable price may be difficult. Information regarding restricted securities is included at the end of the Fund's Schedule of Investments.
4. Purchases and Sales of Investments.
Purchases and sales of securities, other than short-term securities and in-kind transactions, aggregated $4,554,570 and $4,443,603, respectively.
Redemptions In-Kind. During the period, 1,292 shares of the Fund held by an unaffiliated entity were redeemed in-kind for cash and investments with a value of $104,098. The net realized gain of $41,724 on investments delivered through the in-kind redemption is included in the accompanying Statement of Operations. The amount of in-kind redemptions is included in share transactions in the accompanying Statement of Changes in Net Assets as well as Note 11: Share Transactions. The Fund recognized no gain or loss for federal income tax purposes.
5. Fees and Other Transactions with Affiliates.
Management Fee. Fidelity Management & Research Company (the investment adviser) and its affiliates provide the Fund with investment management related services for which the Fund pays a monthly management fee. The management fee is the sum of an individual fund fee rate that is based on an annual rate of .35% of the Fund's average net assets and an annualized group fee rate that averaged .25% during the period. The group fee rate is based upon the average net assets of all the mutual funds advised by the investment adviser, including any mutual funds previously advised by the investment adviser that are currently advised by Fidelity SelectCo, LLC, an affiliate of the investment adviser. The group fee rate decreases as assets under management increase and increases as assets under management decrease. In addition, the management fee is subject to a performance adjustment (up to a maximum of +/- .20% of the Fund's average net assets over a 36 month performance period). The upward or downward adjustment to the management fee is based on the relative investment performance of OTC as compared to its benchmark index, the Nasdaq Composite Index, over the same 36 month performance period. For the reporting period, the total annualized management fee rate, including the performance adjustment, was .76% of the Fund's average net assets. The performance adjustment included in the management fee rate may be higher or lower than the maximum performance adjustment rate due to the difference between the average net assets for the reporting and performance periods.
Transfer Agent Fees. Fidelity Investments Institutional Operations Company, Inc., (FIIOC), an affiliate of the investment adviser, is the transfer, dividend disbursing and shareholder servicing agent for each class of the Fund. FIIOC receives account fees and asset-based fees that vary according to the account size and type of account of the shareholders of OTC. FIIOC receives an asset-based fee of Class K's average net assets. FIIOC pays for typesetting, printing and mailing of shareholder reports, except proxy statements.
For the period, transfer agent fees for each class were as follows:
| | Amount | % of
Class-Level Average
Net Assets(a) |
| OTC | $7,639 | .16 |
| Class K | 855 | .05 |
| | $8,494 | |
(a) Annualized
Accounting and Security Lending Fees. Fidelity Service Company, Inc. (FSC), an affiliate of the investment adviser, maintains the Fund's accounting records. The accounting fee is based on the level of average net assets for each month. Under a separate contract, FSC administers the security lending program. The security lending fee is based on the number and duration of lending transactions.
Brokerage Commissions. The Fund placed a portion of its portfolio transactions with brokerage firms which are affiliates of the investment adviser. Brokerage commissions are included in net realized gain (loss) and change in net unrealized appreciation (depreciation) in the Statement of Operations. The commissions paid to these affiliated firms were $93 for the period.
Interfund Lending Program. Pursuant to an Exemptive Order issued by the SEC, the Fund, along with other registered investment companies having management contracts with FMR or other affiliated entities of FMR, may participate in an interfund lending program. This program provides an alternative credit facility allowing the funds to borrow from, or lend money to, other participating affiliated funds. At period end, there were no interfund loans outstanding. The Fund's activity in this program during the period for which loans were outstanding was as follows:
| Borrower or Lender | Average Loan Balance | Weighted Average Interest Rate | Interest Expense |
| Borrower | $19,193 | .52% | $14 |
Interfund Trades. The Fund may purchase from or sell securities to other Fidelity Funds under procedures adopted by the Board. The procedures have been designed to ensure these interfund trades are executed in accordance with Rule 17a-7 of the 1940 Act. Interfund trades are included within the respective purchases and sales amounts shown in the Purchases and Sales of Investments note.
6. Committed Line of Credit.
The Fund participates with other funds managed by the investment adviser or an affiliate in a $4.25 billion credit facility (the "line of credit") to be utilized for temporary or emergency purposes to fund shareholder redemptions or for other short-term liquidity purposes. The Fund has agreed to pay commitment fees on its pro-rata portion of the line of credit, which amounted to $9 and is reflected in Miscellaneous expenses on the Statement of Operations. During the period, the Fund did not borrow on this line of credit.
7. Security Lending.
The Fund lends portfolio securities through a lending agent from time to time in order to earn additional income. For equity securities, a lending agent is used and may loan securities to certain qualified borrowers, including Fidelity Capital Markets (FCM), a broker-dealer affiliated with the Fund. On the settlement date of the loan, the Fund receives collateral (in the form of U.S. Treasury obligations, letters of credit and/or cash) against the loaned securities and maintains collateral in an amount not less than 100% of the market value of the loaned securities during the period of the loan. The market value of the loaned securities is determined at the close of business of the Fund and any additional required collateral is delivered to the Fund on the next business day. The Fund or borrower may terminate the loan at any time, and if the borrower defaults on its obligation to return the securities loaned because of insolvency or other reasons, the Fund may apply collateral received from the borrower against the obligation. The Fund may experience delays and costs in recovering the securities loaned. Any cash collateral received is invested in the Fidelity Securities Lending Cash Central Fund. The value of loaned securities and cash collateral at period end are disclosed on the Fund's Statement of Assets and Liabilities. The value of securities loaned to FCM at period end was $36,876. Security lending income represents the income earned on investing cash collateral, less rebates paid to borrowers and any lending agent fees associated with the loan, plus any premium payments received for lending certain types of securities. Security lending income is presented in the Statement of Operations as a component of income from Fidelity Central Funds and includes $1,352 from securities loaned to FCM.
8. Bank Borrowings.
The Fund is permitted to have bank borrowings for temporary or emergency purposes to fund shareholder redemptions or for other short-term liquidity requirements. The Fund has established borrowing arrangements with certain banks. The interest rate on the borrowings is the bank's base rate, as revised from time to time. The average loan balance during the period for which loans were outstanding amounted to $5,043. The weighted average interest rate was .64%. The interest expense amounted to less than five hundred dollars under the bank borrowing program. At period end, there were no bank borrowings outstanding.
9. Expense Reductions.
Commissions paid to certain brokers with whom the investment adviser, or its affiliates, places trades on behalf of the Fund include an amount in addition to trade execution, which may be rebated back to the Fund to offset certain expenses. This amount totaled $251 for the period.
In addition, during the period the investment adviser reimbursed and/or waived a portion of fund-level operating expenses in the amount of $49.
10. Distributions to Shareholders.
Distributions to shareholders of each class were as follows:
| | Six months ended January 31, 2016 | Year ended July 31, 2015 |
| From net realized gain | | |
| OTC | $505,475 | $1,012,327 |
| Class K | 199,430 | 396,565 |
| Total | $704,905 | $1,408,892 |
11. Share Transactions.
Share transactions for each class were as follows and may contain automatic conversions between classes or exchanges between affiliated funds:
| | Shares | Shares | Dollars | Dollars |
| | Six months ended January 31, 2016 | Year ended July 31, 2015 | Six months ended January 31, 2016 | Year ended July 31, 2015 |
| OTC | | | | |
| Shares sold | 14,519 | 22,946 | $1,162,995 | $1,893,100 |
| Reinvestment of distributions | 6,240 | 12,406 | 491,074 | 985,025 |
| Shares redeemed | (12,328) | (20,601) | (971,846) | (1,665,615) |
| Net increase (decrease) | 8,431 | 14,751 | $682,223 | $1,212,510 |
| Class K | | | | |
| Shares sold | 6,792 | 16,984 | $546,527 | $1,383,593 |
| Reinvestment of distributions | 2,509 | 4,953 | 199,430 | 396,565 |
| Shares redeemed | (8,920)(a) | (13,732)(b) | (721,503)(a) | (1,151,324)(b) |
| Net increase (decrease) | 381 | 8,205 | $24,454 | $628,834 |
(a) Amount includes in-kind redemptions (see Note 4: Redemptions In-Kind).
(b) Amount includes in-kind redemptions.
12. Other.
The Fund's organizational documents provide former and current trustees and officers with a limited indemnification against liabilities arising in connection with the performance of their duties to the Fund. In the normal course of business, the Fund may also enter into contracts that provide general indemnifications. The Fund's maximum exposure under these arrangements is unknown as this would be dependent on future claims that may be made against the Fund. The risk of material loss from such claims is considered remote.
Shareholder Expense Example
As a shareholder of the Fund, you incur two types of costs: (1) transaction costs, and (2) ongoing costs, including management fees and other Fund expenses. This Example is intended to help you understand your ongoing costs (in dollars) of investing in the Fund and to compare these costs with the ongoing costs of investing in other mutual funds.
The Example is based on an investment of $1,000 invested at the beginning of the period and held for the entire period (August 1, 2015 to January 31, 2016).
Actual Expenses
The first line of the accompanying table for each class of the Fund provides information about actual account values and actual expenses. You may use the information in this line, together with the amount you invested, to estimate the expenses that you paid over the period. Simply divide your account value by $1,000.00 (for example, an $8,600 account value divided by $1,000.00 = 8.6), then multiply the result by the number in the first line for a class of the Fund under the heading entitled "Expenses Paid During Period" to estimate the expenses you paid on your account during this period. A small balance maintenance fee of $12.00 that is charged once a year may apply for certain accounts with a value of less than $2,000. This fee is not included in the table below. If it was, the estimate of expenses you paid during the period would be higher, and your ending account value lower, by this amount. In addition, the Fund, as a shareholder in the underlying Fidelity Central Funds, will indirectly bear its pro-rata share of the fees and expenses incurred by the underlying Fidelity Central Funds. These fees and expenses are not included in the Fund's annualized expense ratio used to calculate the expense estimate in the table below.
Hypothetical Example for Comparison Purposes
The second line of the accompanying table for each class of the Fund provides information about hypothetical account values and hypothetical expenses based on a Class' actual expense ratio and an assumed rate of return of 5% per year before expenses, which is not the Class' actual return. The hypothetical account values and expenses may not be used to estimate the actual ending account balance or expenses you paid for the period. You may use this information to compare the ongoing costs of investing in the Fund and other funds. To do so, compare this 5% hypothetical example with the 5% hypothetical examples that appear in the shareholder reports of the other funds. A small balance maintenance fee of $12.00 that is charged once a year may apply for certain accounts with a value of less than $2,000. This fee is not included in the table below. If it was, the estimate of expenses you paid during the period would be higher, and your ending account value lower, by this amount. In addition, the Fund, as a shareholder in the underlying Fidelity Central Funds, will indirectly bear its pro-rata share of the fees and expenses incurred by the underlying Fidelity Central Funds. These fees and expenses are not included in the Fund's annualized expense ratio used to calculate the expense estimate in the table below.
Please note that the expenses shown in the table are meant to highlight your ongoing costs only and do not reflect any transaction costs. Therefore, the second line of the table is useful in comparing ongoing costs only, and will not help you determine the relative total costs of owning different funds.
| | Annualized Expense Ratio-A | Beginning
Account Value
August 1, 2015 | Ending
Account Value
January 31, 2016 | Expenses Paid
During Period-B
August 1, 2015
to January 31, 2016 |
| OTC | .94% | | | |
| Actual | | $1,000.00 | $885.40 | $4.45 |
| Hypothetical-C | | $1,000.00 | $1,020.41 | $4.77 |
| Class K | .82% | | | |
| Actual | | $1,000.00 | $885.90 | $3.89 |
| Hypothetical-C | | $1,000.00 | $1,021.01 | $4.17 |
A Annualized expense ratio reflects expenses net of applicable fee waivers.
B Expenses are equal to each Class' annualized expense ratio, multiplied by the average account value over the period, multiplied by 184/366 (to reflect the one-half year period).
C 5% return per year before expenses
Corporate Headquarters
245 Summer St.
Boston, MA 02210
www.fidelity.com
OTC-SANN-0316
1.700332.118
Fidelity® Blue Chip Growth Fund
Semi-Annual Report January 31, 2016 |
|
Contents
To view a fund's proxy voting guidelines and proxy voting record for the 12-month period ended June 30, visit http://www.fidelity.com/proxyvotingresults or visit the Securities and Exchange Commission's (SEC) web site at http://www.sec.gov.
You may also call 1-800-544-8544 to request a free copy of the proxy voting guidelines.
Standard & Poor's, S&P and S&P 500 are registered service marks of The McGraw-Hill Companies, Inc. and have been licensed for use by Fidelity Distributors Corporation.
Other third-party marks appearing herein are the property of their respective owners.
All other marks appearing herein are registered or unregistered trademarks or service marks of FMR LLC or an affiliated company. © 2016 FMR LLC. All rights reserved.
This report and the financial statements contained herein are submitted for the general information of the shareholders of the Fund. This report is not authorized for distribution to prospective investors in the Fund unless preceded or accompanied by an effective prospectus.
A fund files its complete schedule of portfolio holdings with the SEC for the first and third quarters of each fiscal year on Form N-Q. Forms N-Q are available on the SEC’s web site at http://www.sec.gov. A fund's Forms N-Q may be reviewed and copied at the SEC’s Public Reference Room in Washington, DC. Information regarding the operation of the SEC's Public Reference Room may be obtained by calling 1-800-SEC-0330.
For a complete list of a fund's portfolio holdings, view the most recent holdings listing, semiannual report, or annual report on Fidelity's web site at http://www.fidelity.com, http://www.advisor.fidelity.com, or http://www.401k.com, as applicable.
NOT FDIC INSURED •MAY LOSE VALUE •NO BANK GUARANTEE
Neither the Fund nor Fidelity Distributors Corporation is a bank.
Investment Summary (Unaudited)
Top Ten Stocks as of January 31, 2016
| | % of fund's net assets | % of fund's net assets 6 months ago |
| Alphabet, Inc. Class A | 5.7 | 4.3 |
| Amazon.com, Inc. | 4.9 | 3.9 |
| Facebook, Inc. Class A | 4.1 | 2.9 |
| Apple, Inc. | 4.1 | 6.4 |
| Alphabet, Inc. Class C | 2.4 | 2.0 |
| Home Depot, Inc. | 2.1 | 1.8 |
| The Coca-Cola Co. | 2.0 | 1.0 |
| Visa, Inc. Class A | 2.0 | 1.8 |
| Salesforce.com, Inc. | 1.9 | 1.8 |
| Allergan PLC | 1.8 | 1.8 |
| | 31.0 | |
Top Five Market Sectors as of January 31, 2016
| | % of fund's net assets | % of fund's net assets 6 months ago |
| Information Technology | 37.4 | 34.2 |
| Consumer Discretionary | 26.4 | 24.9 |
| Health Care | 16.1 | 18.0 |
| Consumer Staples | 10.8 | 9.8 |
| Industrials | 4.9 | 5.5 |
Asset Allocation (% of fund's net assets)
| As of January 31, 2016 * |
| | Stocks | 97.6% |
| | Convertible Securities | 2.4% |

* Foreign investments - 12.2%
| As of July 31, 2015 * |
| | Stocks | 98.1% |
| | Convertible Securities | 1.9% |

* Foreign investments - 12.5%
Investments January 31, 2016
Showing Percentage of Net Assets
| Common Stocks - 97.5% | | | |
| | | Shares | Value (000s) |
| CONSUMER DISCRETIONARY - 26.2% | | | |
| Auto Components - 0.2% | | | |
| Delphi Automotive PLC | | 343,451 | $22,304 |
| Magna International, Inc. Class A (sub. vtg.) | | 593,150 | 20,607 |
| | | | 42,911 |
| Automobiles - 1.2% | | | |
| Tesla Motors, Inc. (a)(b) | | 1,166,133 | 222,965 |
| Hotels, Restaurants & Leisure - 5.9% | | | |
| Buffalo Wild Wings, Inc. (a)(b) | | 463,809 | 70,638 |
| Chipotle Mexican Grill, Inc. (a) | | 474,570 | 214,966 |
| Dave & Buster's Entertainment, Inc. (a) | | 1,736,913 | 62,998 |
| Domino's Pizza, Inc. | | 389,471 | 44,372 |
| Fiesta Restaurant Group, Inc. (a) | | 233,800 | 8,510 |
| Hilton Worldwide Holdings, Inc. | | 2,857,776 | 50,897 |
| Jubilant Foodworks Ltd. | | 63,454 | 1,197 |
| McDonald's Corp. | | 2,725,375 | 337,347 |
| MGM Mirage, Inc. (a) | | 531,642 | 10,675 |
| Panera Bread Co. Class A (a) | | 21,700 | 4,210 |
| Royal Caribbean Cruises Ltd. | | 146,600 | 12,015 |
| Starbucks Corp. | | 5,164,647 | 313,856 |
| | | | 1,131,681 |
| Household Durables - 0.9% | | | |
| Jarden Corp. (a) | | 613,766 | 32,560 |
| Newell Rubbermaid, Inc. | | 298,337 | 11,570 |
| Sony Corp. | | 1,790,700 | 41,561 |
| Sony Corp. sponsored ADR | | 995,475 | 23,772 |
| Tempur Sealy International, Inc. (a) | | 147,999 | 8,930 |
| Whirlpool Corp. | | 405,332 | 54,473 |
| | | | 172,866 |
| Internet & Catalog Retail - 7.0% | | | |
| Amazon.com, Inc. (a) | | 1,600,987 | 939,779 |
| Ctrip.com International Ltd. sponsored ADR (a) | | 799,533 | 34,124 |
| Expedia, Inc. | | 698,499 | 70,576 |
| Groupon, Inc. Class A (a)(b) | | 4,483,314 | 12,195 |
| JD.com, Inc. sponsored ADR (a) | | 182,652 | 4,754 |
| Netflix, Inc. (a) | | 1,348,248 | 123,823 |
| Priceline Group, Inc. (a) | | 137,905 | 146,865 |
| The Honest Co., Inc. (a)(c) | | 150,143 | 6,870 |
| | | | 1,338,986 |
| Leisure Products - 0.3% | | | |
| Hasbro, Inc. | | 532,239 | 39,535 |
| Mattel, Inc. | | 301,588 | 8,321 |
| NJOY, Inc. (a)(c) | | 8,088,440 | 1,035 |
| Spin Master Corp. (a) | | 412,100 | 5,880 |
| | | | 54,771 |
| Media - 1.6% | | | |
| Altice NV Class A (a) | | 1,849,008 | 26,666 |
| Charter Communications, Inc. Class A (a) | | 154,935 | 26,550 |
| DreamWorks Animation SKG, Inc. Class A (a)(b) | | 566,929 | 14,536 |
| Lions Gate Entertainment Corp. | | 319,865 | 8,364 |
| Naspers Ltd. Class N | | 198,800 | 25,123 |
| Starz Series A (a) | | 324,159 | 9,216 |
| The Walt Disney Co. | | 1,997,851 | 191,434 |
| | | | 301,889 |
| Multiline Retail - 1.4% | | | |
| B&M European Value Retail S.A. | | 8,179,226 | 32,855 |
| Burlington Stores, Inc. (a) | | 670,971 | 36,051 |
| Dollar Tree, Inc. (a) | | 946,965 | 77,007 |
| Target Corp. | | 1,600,646 | 115,919 |
| | | | 261,832 |
| Specialty Retail - 4.7% | | | |
| AutoZone, Inc. (a) | | 16,577 | 12,721 |
| Home Depot, Inc. | | 3,227,524 | 405,893 |
| Inditex SA | | 561,709 | 18,485 |
| L Brands, Inc. | | 1,148,336 | 110,413 |
| Lowe's Companies, Inc. | | 221,610 | 15,881 |
| O'Reilly Automotive, Inc. (a) | | 31,457 | 8,207 |
| Restoration Hardware Holdings, Inc. (a)(b) | | 1,727,774 | 106,465 |
| Ross Stores, Inc. | | 977,149 | 54,974 |
| Signet Jewelers Ltd. | | 481,524 | 55,857 |
| TJX Companies, Inc. | | 1,505,267 | 107,235 |
| Ulta Salon, Cosmetics & Fragrance, Inc. (a) | | 94,384 | 17,100 |
| | | | 913,231 |
| Textiles, Apparel & Luxury Goods - 3.0% | | | |
| adidas AG | | 997,300 | 102,695 |
| Coach, Inc. | | 164,819 | 6,107 |
| Columbia Sportswear Co. | | 105,804 | 5,838 |
| G-III Apparel Group Ltd. (a) | | 608,239 | 30,023 |
| Kate Spade & Co. (a) | | 1,001,102 | 17,830 |
| lululemon athletica, Inc. (a)(b) | | 1,294,472 | 80,348 |
| NIKE, Inc. Class B | | 2,174,144 | 134,819 |
| Pandora A/S | | 18,275 | 2,445 |
| PVH Corp. | | 792,781 | 58,174 |
| Ralph Lauren Corp. | | 36,950 | 4,157 |
| Regina Miracle International Holdings Ltd. (a) | | 6,171,551 | 10,101 |
| Skechers U.S.A., Inc. Class A (sub. vtg.) (a) | | 1,854,582 | 52,281 |
| Tory Burch LLC unit (c)(d) | | 293,611 | 15,356 |
| Under Armour, Inc. Class A (sub. vtg.) (a) | | 518,665 | 44,310 |
| Vera Bradley, Inc. (a) | | 878,600 | 12,986 |
| VF Corp. | | 150,995 | 9,452 |
| | | | 586,922 |
|
| TOTAL CONSUMER DISCRETIONARY | | | 5,028,054 |
|
| CONSUMER STAPLES - 10.6% | | | |
| Beverages - 4.2% | | | |
| Anheuser-Busch InBev SA NV ADR | | 306,974 | 38,630 |
| Coca-Cola Bottling Co. Consolidated | | 30,858 | 5,428 |
| Constellation Brands, Inc. Class A (sub. vtg.) | | 362,427 | 55,263 |
| Molson Coors Brewing Co. Class B | | 919,655 | 83,210 |
| Monster Beverage Corp. | | 1,130,295 | 152,624 |
| PepsiCo, Inc. | | 801,191 | 79,558 |
| The Coca-Cola Co. | | 9,100,465 | 390,592 |
| United Spirits Ltd. (a) | | 41,658 | 1,535 |
| | | | 806,840 |
| Food & Staples Retailing - 3.0% | | | |
| Costco Wholesale Corp. | | 799,297 | 120,790 |
| CVS Health Corp. | | 1,815,506 | 175,360 |
| Kroger Co. | | 2,888,050 | 112,085 |
| Sprouts Farmers Market LLC (a) | | 1,732,222 | 39,495 |
| Wal-Mart Stores, Inc. | | 172,865 | 11,471 |
| Walgreens Boots Alliance, Inc. | | 750,280 | 59,812 |
| Whole Foods Market, Inc. | | 1,955,118 | 57,305 |
| | | | 576,318 |
| Food Products - 1.3% | | | |
| Amplify Snack Brands, Inc. | | 659,687 | 7,125 |
| Associated British Foods PLC | | 1,086,100 | 48,998 |
| Edita Food Industries SAE GDR (a)(e) | | 129,600 | 2,171 |
| Mondelez International, Inc. | | 2,771,433 | 119,449 |
| Premium Brands Holdings Corp. | | 73,200 | 2,195 |
| The Hain Celestial Group, Inc. (a) | | 944,971 | 34,378 |
| The Kraft Heinz Co. | | 315,571 | 24,633 |
| TreeHouse Foods, Inc. (a) | | 83,900 | 6,658 |
| WhiteWave Foods Co. (a) | | 366,371 | 13,831 |
| | | | 259,438 |
| Household Products - 0.2% | | | |
| Procter & Gamble Co. | | 515,964 | 42,149 |
| Personal Products - 1.2% | | | |
| Estee Lauder Companies, Inc. Class A | | 609,272 | 51,940 |
| Herbalife Ltd. (a) | | 2,128,165 | 98,343 |
| Nu Skin Enterprises, Inc. Class A (b) | | 2,576,924 | 81,560 |
| | | | 231,843 |
| Tobacco - 0.7% | | | |
| Imperial Tobacco Group PLC | | 204,055 | 11,049 |
| Reynolds American, Inc. | | 2,309,361 | 115,353 |
| | | | 126,402 |
|
| TOTAL CONSUMER STAPLES | | | 2,042,990 |
|
| ENERGY - 1.2% | | | |
| Energy Equipment & Services - 0.1% | | | |
| Baker Hughes, Inc. | | 138,500 | 6,026 |
| Schlumberger Ltd. | | 148,900 | 10,761 |
| | | | 16,787 |
| Oil, Gas & Consumable Fuels - 1.1% | | | |
| Anadarko Petroleum Corp. | | 565,132 | 22,091 |
| Cimarex Energy Co. | | 359,750 | 33,457 |
| Continental Resources, Inc. (a)(b) | | 1,215,841 | 25,666 |
| Devon Energy Corp. | | 305,600 | 8,526 |
| Diamondback Energy, Inc. | | 43,100 | 3,256 |
| EOG Resources, Inc. | | 698,058 | 49,576 |
| Hess Corp. | | 211,000 | 8,968 |
| Noble Energy, Inc. | | 66,100 | 2,140 |
| Pioneer Natural Resources Co. | | 390,126 | 48,356 |
| Rice Energy, Inc. (a) | | 194,700 | 2,272 |
| SM Energy Co. (b) | | 1,039,753 | 14,536 |
| Whiting Petroleum Corp. (a) | | 527,800 | 3,879 |
| | | | 222,723 |
|
| TOTAL ENERGY | | | 239,510 |
|
| FINANCIALS - 2.5% | | | |
| Banks - 1.7% | | | |
| Bank of America Corp. | | 5,319,921 | 75,224 |
| Citigroup, Inc. | | 1,831,521 | 77,986 |
| HDFC Bank Ltd. sponsored ADR | | 649,917 | 39,209 |
| JPMorgan Chase & Co. | | 2,346,136 | 139,595 |
| | | | 332,014 |
| Capital Markets - 0.4% | | | |
| BlackRock, Inc. Class A | | 167,664 | 52,690 |
| Charles Schwab Corp. | | 705,841 | 18,020 |
| Fairfax India Holdings Corp. (a) | | 911,500 | 9,206 |
| | | | 79,916 |
| Consumer Finance - 0.0% | | | |
| Synchrony Financial (a) | | 197,900 | 5,624 |
| Diversified Financial Services - 0.1% | | | |
| CME Group, Inc. | | 105,257 | 9,457 |
| Multi Commodity Exchange of India Ltd. (a) | | 4,622 | 59 |
| | | | 9,516 |
| Real Estate Investment Trusts - 0.2% | | | |
| Extra Space Storage, Inc. | | 304,087 | 27,578 |
| Real Estate Management & Development - 0.0% | | | |
| Parsvnath Developers Ltd. (a)(f) | | 21,771,340 | 6,148 |
| Thrifts & Mortgage Finance - 0.1% | | | |
| Housing Development Finance Corp. Ltd. | | 697,722 | 12,214 |
| Indiabulls Housing Finance Ltd. | | 604,148 | 6,337 |
| LIC Housing Finance Ltd. (a) | | 351,944 | 2,494 |
| | | | 21,045 |
|
| TOTAL FINANCIALS | | | 481,841 |
|
| HEALTH CARE - 15.9% | | | |
| Biotechnology - 9.9% | | | |
| AbbVie, Inc. | | 1,860,412 | 102,137 |
| ACADIA Pharmaceuticals, Inc. (a) | | 119,000 | 2,462 |
| Acceleron Pharma, Inc. (a) | | 144,143 | 4,425 |
| Aduro Biotech, Inc. (b) | | 85,684 | 1,241 |
| Agios Pharmaceuticals, Inc. (a)(b) | | 192,578 | 8,131 |
| Aimmune Therapeutics, Inc. (a) | | 399,157 | 5,460 |
| Alexion Pharmaceuticals, Inc. (a) | | 655,869 | 95,711 |
| Alkermes PLC (a) | | 963,547 | 30,843 |
| Alnylam Pharmaceuticals, Inc. (a) | | 679,240 | 46,827 |
| Amgen, Inc. | | 1,850,286 | 282,594 |
| Ascendis Pharma A/S sponsored ADR | | 330,551 | 6,294 |
| Avalanche Biotechnologies, Inc. (a) | | 88,979 | 534 |
| BioCryst Pharmaceuticals, Inc. (a) | | 1,028,402 | 7,168 |
| Biogen, Inc. (a) | | 725,190 | 198,020 |
| BioMarin Pharmaceutical, Inc. (a) | | 259,887 | 19,237 |
| bluebird bio, Inc. (a) | | 244,767 | 10,124 |
| Calithera Biosciences, Inc. (a)(b) | | 262,144 | 1,311 |
| Catabasis Pharmaceuticals, Inc. | | 520,393 | 3,445 |
| Celgene Corp. (a) | | 2,830,872 | 283,993 |
| Cellectis SA sponsored ADR | | 66,709 | 1,492 |
| Chiasma, Inc. (a)(b) | | 298,351 | 3,073 |
| Chiasma, Inc. (e) | | 221,566 | 2,282 |
| Chiasma, Inc. warrants (a) | | 55,391 | 151 |
| Chimerix, Inc. (a) | | 84,785 | 653 |
| Coherus BioSciences, Inc. (a)(b) | | 484,489 | 6,424 |
| CytomX Therapeutics, Inc. | | 378,621 | 5,651 |
| CytomX Therapeutics, Inc. (a) | | 164,776 | 2,589 |
| DBV Technologies SA sponsored ADR (a) | | 107,154 | 2,785 |
| Dicerna Pharmaceuticals, Inc. (a) | | 158,644 | 1,041 |
| Edge Therapeutics, Inc. (a) | | 338,839 | 3,765 |
| Exelixis, Inc. (a)(b) | | 2,801,991 | 12,945 |
| FibroGen, Inc. (a) | | 368,341 | 7,470 |
| Gilead Sciences, Inc. | | 3,767,727 | 312,721 |
| Global Blood Therapeutics, Inc. (a)(b) | | 508,233 | 9,621 |
| Heron Therapeutics, Inc. (a) | | 87,877 | 1,845 |
| Intercept Pharmaceuticals, Inc. (a) | | 142,207 | 15,107 |
| Intrexon Corp. (a)(b) | | 472,617 | 13,772 |
| Ionis Pharmaceuticals, Inc. (a) | | 125,729 | 4,895 |
| Ironwood Pharmaceuticals, Inc. Class A (a) | | 893,167 | 8,244 |
| Juno Therapeutics, Inc. (a)(b) | | 221,037 | 6,096 |
| Kite Pharma, Inc. (a)(b) | | 97,468 | 4,629 |
| Merrimack Pharmaceuticals, Inc. (a)(b) | | 1,569,525 | 9,684 |
| Mirati Therapeutics, Inc. (a) | | 220,034 | 4,737 |
| Momenta Pharmaceuticals, Inc. (a) | | 96,669 | 1,201 |
| Neurocrine Biosciences, Inc. (a) | | 627,247 | 26,689 |
| Novavax, Inc. (a) | | 438,504 | 2,258 |
| Portola Pharmaceuticals, Inc. (a) | | 300,825 | 9,936 |
| ProNai Therapeutics, Inc. (a) | | 292,403 | 2,421 |
| Prothena Corp. PLC (a) | | 103,459 | 4,030 |
| Radius Health, Inc. (a) | | 84,485 | 2,706 |
| Regeneron Pharmaceuticals, Inc. (a) | | 426,508 | 179,172 |
| REGENXBIO, Inc. (a)(b) | | 118,439 | 1,646 |
| Sage Therapeutics, Inc. (a) | | 119,767 | 4,022 |
| Seattle Genetics, Inc. (a) | | 372,893 | 12,298 |
| Seres Therapeutics, Inc. (b) | | 48,933 | 1,318 |
| Spark Therapeutics, Inc. | | 98,965 | 2,788 |
| Trevena, Inc. (a) | | 1,033,895 | 7,527 |
| Ultragenyx Pharmaceutical, Inc. (a) | | 58,720 | 3,297 |
| uniQure B.V. (a)(b) | | 300,878 | 5,485 |
| Versartis, Inc. (a)(b) | | 159,453 | 1,776 |
| Vertex Pharmaceuticals, Inc. (a) | | 1,061,002 | 96,286 |
| Xencor, Inc. (a) | | 110,350 | 1,194 |
| | | | 1,917,679 |
| Health Care Equipment & Supplies - 1.2% | | | |
| Boston Scientific Corp. (a) | | 3,061,638 | 53,671 |
| DexCom, Inc. (a) | | 103,329 | 7,365 |
| Edwards Lifesciences Corp. (a) | | 26,500 | 2,073 |
| Glaukos Corp. (b) | | 75,218 | 1,228 |
| Intuitive Surgical, Inc. (a) | | 146,941 | 79,473 |
| Invuity, Inc. | | 507,111 | 3,895 |
| Medtronic PLC | | 660,925 | 50,177 |
| Nevro Corp. (a) | | 377,795 | 23,344 |
| Novocure Ltd. (a)(b) | | 143,904 | 1,796 |
| Olympus Corp. | | 101,400 | 3,954 |
| | | | 226,976 |
| Health Care Providers & Services - 0.6% | | | |
| Adeptus Health, Inc. Class A (a) | | 506,235 | 23,884 |
| AmSurg Corp. (a) | | 555,956 | 40,690 |
| Apollo Hospitals Enterprise Ltd. (a) | | 936,371 | 20,409 |
| Cardinal Health, Inc. | | 114,049 | 9,280 |
| Dr Lal Pathlabs Ltd. | | 7,779 | 90 |
| Teladoc, Inc. (b) | | 656,907 | 10,668 |
| UnitedHealth Group, Inc. | | 101,362 | 11,673 |
| | | | 116,694 |
| Health Care Technology - 0.1% | | | |
| athenahealth, Inc. (a) | | 75,273 | 10,674 |
| Castlight Health, Inc. Class B (a) | | 508,709 | 1,684 |
| Evolent Health, Inc. | | 241,372 | 2,382 |
| | | | 14,740 |
| Life Sciences Tools & Services - 0.1% | | | |
| Illumina, Inc. (a) | | 93,862 | 14,826 |
| Lonza Group AG | | 37,805 | 5,792 |
| | | | 20,618 |
| Pharmaceuticals - 4.0% | | | |
| Achaogen, Inc. (a) | | 325,957 | 1,180 |
| Allergan PLC (a) | | 1,233,475 | 350,837 |
| Bristol-Myers Squibb Co. | | 2,053,785 | 127,663 |
| Cempra, Inc. (a)(b) | | 132,400 | 2,281 |
| CSPC Pharmaceutical Group Ltd. | | 2,108,000 | 1,783 |
| Dermira, Inc. (a) | | 406,148 | 11,372 |
| Endo Health Solutions, Inc. (a) | | 407,846 | 22,623 |
| GW Pharmaceuticals PLC ADR (a)(b) | | 261,411 | 13,112 |
| Intra-Cellular Therapies, Inc. (a) | | 105,204 | 3,901 |
| Jazz Pharmaceuticals PLC (a) | | 188,344 | 24,247 |
| Johnson & Johnson | | 37,600 | 3,927 |
| Pacira Pharmaceuticals, Inc. (a) | | 114,684 | 6,815 |
| Teva Pharmaceutical Industries Ltd. sponsored ADR | | 1,545,799 | 95,036 |
| The Medicines Company (a) | | 497,424 | 17,191 |
| Valeant Pharmaceuticals International, Inc. (Canada) (a) | | 899,100 | 82,792 |
| | | | 764,760 |
|
| TOTAL HEALTH CARE | | | 3,061,467 |
|
| INDUSTRIALS - 4.8% | | | |
| Aerospace & Defense - 0.8% | | | |
| Honeywell International, Inc. | | 879,698 | 90,785 |
| Lockheed Martin Corp. | | 84,997 | 17,934 |
| Northrop Grumman Corp. | | 33,169 | 6,138 |
| Raytheon Co. | | 136,215 | 17,468 |
| Space Exploration Technologies Corp. Class A (c) | | 160,303 | 14,267 |
| | | | 146,592 |
| Airlines - 1.9% | | | |
| American Airlines Group, Inc. | | 48,000 | 1,872 |
| Azul-Linhas Aereas Brasileiras warrants (a)(c) | | 165,571 | 0 |
| Delta Air Lines, Inc. | | 2,318,749 | 102,697 |
| InterGlobe Aviation Ltd. (a) | | 257,728 | 3,358 |
| JetBlue Airways Corp. (a) | | 646,400 | 13,775 |
| Southwest Airlines Co. | | 3,402,173 | 127,990 |
| Spirit Airlines, Inc. (a) | | 778,342 | 32,535 |
| United Continental Holdings, Inc. (a) | | 1,634,834 | 78,930 |
| Wizz Air Holdings PLC | | 268,021 | 7,257 |
| | | | 368,414 |
| Building Products - 0.1% | | | |
| Caesarstone Sdot-Yam Ltd. (a) | | 208,417 | 7,834 |
| Toto Ltd. | | 232,800 | 7,556 |
| | | | 15,390 |
| Construction & Engineering - 0.2% | | | |
| Dycom Industries, Inc. (a) | | 556,900 | 36,900 |
| Electrical Equipment - 0.7% | | | |
| Acuity Brands, Inc. | | 182,840 | 37,012 |
| SolarCity Corp. (a)(b) | | 2,616,654 | 93,284 |
| | | | 130,296 |
| Industrial Conglomerates - 0.7% | | | |
| Danaher Corp. | | 618,359 | 53,581 |
| General Electric Co. | | 2,939,843 | 85,549 |
| | | | 139,130 |
| Machinery - 0.1% | | | |
| Eicher Motors Ltd. (a) | | 14,288 | 3,502 |
| Rational AG | | 16,438 | 7,372 |
| | | | 10,874 |
| Professional Services - 0.1% | | | |
| Equifax, Inc. | | 42,542 | 4,501 |
| WageWorks, Inc. (a) | | 187,645 | 8,395 |
| | | | 12,896 |
| Road & Rail - 0.0% | | | |
| Swift Transporation Co. (a) | | 253,100 | 4,128 |
| Trading Companies & Distributors - 0.2% | | | |
| HD Supply Holdings, Inc. (a) | | 1,845,147 | 48,472 |
|
| TOTAL INDUSTRIALS | | | 913,092 |
|
| INFORMATION TECHNOLOGY - 35.6% | | | |
| Communications Equipment - 0.5% | | | |
| Palo Alto Networks, Inc. (a) | | 107,028 | 16,000 |
| Qualcomm, Inc. | | 1,942,653 | 88,080 |
| | | | 104,080 |
| Electronic Equipment & Components - 0.2% | | | |
| Fitbit, Inc. (b) | | 2,357,613 | 39,136 |
| Internet Software & Services - 14.7% | | | |
| 58.com, Inc. ADR (a) | | 294,400 | 16,516 |
| Alibaba Group Holding Ltd. sponsored ADR (a) | | 1,946,816 | 130,495 |
| Alphabet, Inc.: | | | |
| Class A | | 1,430,536 | 1,089,134 |
| Class C | | 622,484 | 462,474 |
| Dropbox, Inc. (a)(c) | | 1,003,814 | 12,086 |
| Facebook, Inc. Class A (a) | | 7,023,784 | 788,139 |
| Gogo, Inc. (a)(b) | | 1,808,342 | 26,311 |
| IAC/InterActiveCorp | | 146,900 | 7,630 |
| Info Edge India Ltd. | | 151,831 | 1,786 |
| JUST EAT Ltd. (a) | | 3,725,262 | 19,951 |
| LinkedIn Corp. Class A (a) | | 300,192 | 59,411 |
| New Relic, Inc. (a) | | 173,681 | 4,901 |
| Rackspace Hosting, Inc. (a) | | 4,410,905 | 89,144 |
| Tencent Holdings Ltd. | | 3,115,100 | 58,522 |
| Twitter, Inc. (a)(b) | | 2,593,816 | 43,576 |
| Yahoo!, Inc. (a) | | 386,100 | 11,394 |
| | | | 2,821,470 |
| IT Services - 4.7% | | | |
| Blackhawk Network Holdings, Inc. (a) | | 45,139 | 1,701 |
| Cognizant Technology Solutions Corp. Class A (a) | | 3,518,764 | 222,773 |
| EOH Holdings Ltd. | | 179,900 | 1,526 |
| MasterCard, Inc. Class A | | 2,655,183 | 236,391 |
| PayPal Holdings, Inc. (a) | | 839,913 | 30,354 |
| Sabre Corp. | | 897,777 | 22,992 |
| Total System Services, Inc. | | 163,278 | 6,557 |
| Visa, Inc. Class A | | 5,072,585 | 377,857 |
| | | | 900,151 |
| Semiconductors & Semiconductor Equipment - 4.8% | | | |
| Analog Devices, Inc. | | 2,913,408 | 156,916 |
| Avago Technologies Ltd. | | 2,106,359 | 281,641 |
| Cavium, Inc. (a) | | 943,519 | 54,507 |
| Cirrus Logic, Inc. (a)(b) | | 2,582,827 | 89,676 |
| Monolithic Power Systems, Inc. | | 187,949 | 11,760 |
| NVIDIA Corp. | | 1,487,948 | 43,582 |
| NXP Semiconductors NV (a) | | 3,606,558 | 269,698 |
| Semtech Corp. (a) | | 312,100 | 6,273 |
| SolarEdge Technologies, Inc. (b) | | 600,439 | 16,974 |
| | | | 931,027 |
| Software - 6.4% | | | |
| 1-Page Ltd. (a)(b) | | 3,708,397 | 9,221 |
| Activision Blizzard, Inc. | | 5,264,487 | 183,309 |
| Adobe Systems, Inc. (a) | | 991,602 | 88,381 |
| Appirio, Inc. (c) | | 87,529 | 371 |
| Electronic Arts, Inc. (a) | | 2,636,571 | 170,177 |
| Ellie Mae, Inc. (a)(b) | | 222,697 | 15,551 |
| HubSpot, Inc. (a) | | 52,029 | 2,112 |
| Imperva, Inc. (a) | | 58,021 | 2,992 |
| Microsoft Corp. | | 3,751,601 | 206,676 |
| Mobileye NV (a)(b) | | 1,072,976 | 29,110 |
| Paycom Software, Inc. (a) | | 172,565 | 5,203 |
| Qlik Technologies, Inc. (a) | | 825,071 | 20,660 |
| Red Hat, Inc. (a) | | 433,411 | 30,360 |
| Salesforce.com, Inc. (a) | | 5,288,541 | 359,938 |
| SAP AG sponsored ADR (b) | | 171,000 | 13,646 |
| ServiceNow, Inc. (a) | | 24,800 | 1,543 |
| Tableau Software, Inc. (a) | | 276,324 | 22,172 |
| Workday, Inc. Class A (a) | | 723,454 | 45,585 |
| Zendesk, Inc. (a) | | 602,381 | 13,258 |
| | | | 1,220,265 |
| Technology Hardware, Storage & Peripherals - 4.3% | | | |
| Apple, Inc. | | 8,021,826 | 780,845 |
| SanDisk Corp. | | 289,670 | 20,480 |
| Western Digital Corp. | | 591,196 | 28,366 |
| | | | 829,691 |
|
| TOTAL INFORMATION TECHNOLOGY | | | 6,845,820 |
|
| MATERIALS - 0.6% | | | |
| Chemicals - 0.5% | | | |
| Albemarle Corp. U.S. | | 254,316 | 13,387 |
| CF Industries Holdings, Inc. | | 2,760,957 | 82,829 |
| LyondellBasell Industries NV Class A | | 25,600 | 1,996 |
| Sherwin-Williams Co. | | 7,600 | 1,943 |
| | | | 100,155 |
| Construction Materials - 0.0% | | | |
| Prism Cement Ltd. (a) | | 2,498,232 | 2,811 |
| Containers & Packaging - 0.1% | | | |
| Ball Corp. | | 90,876 | 6,073 |
|
| TOTAL MATERIALS | | | 109,039 |
|
| TELECOMMUNICATION SERVICES - 0.1% | | | |
| Wireless Telecommunication Services - 0.1% | | | |
| Bharti Infratel Ltd. | | 4,892,590 | 26,202 |
| TOTAL COMMON STOCKS | | | |
| (Cost $14,027,259) | | | 18,748,015 |
|
| Preferred Stocks - 2.5% | | | |
| Convertible Preferred Stocks - 2.4% | | | |
| CONSUMER DISCRETIONARY - 0.1% | | | |
| Internet & Catalog Retail - 0.1% | | | |
| The Honest Co., Inc.: | | | |
| Series C (a)(c) | | 350,333 | 16,029 |
| Series D (c) | | 77,448 | 3,544 |
| | | | 19,573 |
| CONSUMER STAPLES - 0.2% | | | |
| Food & Staples Retailing - 0.1% | | | |
| Blue Apron, Inc. Series D (c) | | 780,377 | 10,847 |
| Food Products - 0.1% | | | |
| BLUE BOTTLE Coffee, Inc. Series C (c) | | 632,822 | 9,783 |
| Tobacco - 0.0% | | | |
| PAX Labs, Inc. Series C (c) | | 2,555,833 | 8,409 |
| TOTAL CONSUMER STAPLES | | | 29,039 |
| FINANCIALS - 0.0% | | | |
| Consumer Finance - 0.0% | | | |
| Oportun Finance Corp. Series H (c) | | 3,552,125 | 8,845 |
| HEALTH CARE - 0.2% | | | |
| Biotechnology - 0.1% | | | |
| AC Immune SA Series E (c) | | 603,000 | 4,314 |
| Editas Medicine, Inc. Series B (c) | | 276,353 | 3,979 |
| Gensight Biologics Series B (c) | | 423,803 | 2,110 |
| Immunocore Ltd. Series A (c) | | 11,275 | 1,577 |
| Intellia Therapeutics, Inc. Series B (c) | | 634,094 | 3,329 |
| Pronutria Biosciences, Inc. Series C (c) | | 545,634 | 3,906 |
| | | | 19,215 |
| Health Care Providers & Services - 0.1% | | | |
| Mulberry Health, Inc. Series A8 (c) | | 2,728,716 | 18,432 |
| Pharmaceuticals - 0.0% | | | |
| Corvus Pharmaceuticals, Inc. Series B (c) | | 338,682 | 4,745 |
| TOTAL HEALTH CARE | | | 42,392 |
| INDUSTRIALS - 0.1% | | | |
| Aerospace & Defense - 0.1% | | | |
| Space Exploration Technologies Corp. Series G (c) | | 97,277 | 8,658 |
| Airlines - 0.0% | | | |
| Azul-Linhas Aereas Brasileiras Series B (a)(c) | | 165,571 | 6,209 |
| Professional Services - 0.0% | | | |
| YourPeople, Inc. Series C (c) | | 692,196 | 4,783 |
| TOTAL INDUSTRIALS | | | 19,650 |
| INFORMATION TECHNOLOGY - 1.8% | | | |
| Internet Software & Services - 1.4% | | | |
| Jet.Com, Inc. Series B1 (c) | | 2,928,086 | 14,605 |
| Uber Technologies, Inc.: | | | |
| Series D, 8.00% (a)(c) | | 5,156,948 | 251,516 |
| Series E, 8.00% (a)(c) | | 102,648 | 5,006 |
| | | | 271,127 |
| IT Services - 0.1% | | | |
| AppNexus, Inc. Series E (a)(c) | | 646,522 | 10,351 |
| Nutanix, Inc. Series E (a)(c) | | 482,746 | 5,986 |
| | | | 16,337 |
| Software - 0.3% | | | |
| Appirio, Inc. Series E (c) | | 612,702 | 2,598 |
| Bracket Computing, Inc. Series C (c) | | 1,207,761 | 9,500 |
| Cloudera, Inc. Series F (a)(c) | | 186,078 | 6,109 |
| Cloudflare, Inc. Series D (a)(c) | | 696,025 | 3,404 |
| Dataminr, Inc. Series D (c) | | 277,250 | 2,201 |
| Delphix Corp. Series D (c) | | 675,445 | 3,377 |
| Malwarebytes Corp. Series B (c) | | 1,056,193 | 10,958 |
| Snapchat, Inc. Series F (c) | | 661,195 | 17,026 |
| Taboola.Com Ltd. Series E (a)(c) | | 634,902 | 5,155 |
| | | | 60,328 |
| TOTAL INFORMATION TECHNOLOGY | | | 347,792 |
|
| TOTAL CONVERTIBLE PREFERRED STOCKS | | | 467,291 |
|
| Nonconvertible Preferred Stocks - 0.1% | | | |
| CONSUMER DISCRETIONARY - 0.1% | | | |
| Internet & Catalog Retail - 0.1% | | | |
| China Internet Plus Holdings Ltd. (c) | | 3,163,704 | 12,214 |
| TOTAL PREFERRED STOCKS | | | |
| (Cost $331,652) | | | 479,505 |
|
| Money Market Funds - 2.0% | | | |
| Fidelity Cash Central Fund, 0.38% (g) | | 11,683,561 | 11,684 |
| Fidelity Securities Lending Cash Central Fund, 0.42% (g)(h) | | 374,522,697 | 374,523 |
| TOTAL MONEY MARKET FUNDS | | | |
| (Cost $386,207) | | | 386,207 |
| TOTAL INVESTMENT PORTFOLIO - 102.0% | | | |
| (Cost $14,745,118) | | | 19,613,727 |
| NET OTHER ASSETS (LIABILITIES) - (2.0)% | | | (384,585) |
| NET ASSETS - 100% | | | $19,229,142 |
Values shown as $0 may reflect amounts less than $500.
Legend
(a) Non-income producing
(b) Security or a portion of the security is on loan at period end.
(c) Restricted securities - Investment in securities not registered under the Securities Act of 1933 (excluding 144A issues). At the end of the period, the value of restricted securities (excluding 144A issues) amounted to $529,490,000 or 2.8% of net assets.
(d) Investment is owned by an entity that is treated as a corporation for U.S. tax purposes and is wholly-owned by the Fund.
(e) Security exempt from registration under Rule 144A of the Securities Act of 1933. These securities may be resold in transactions exempt from registration, normally to qualified institutional buyers. At the end of the period, the value of these securities amounted to $4,453,000 or 0.0% of net assets.
(f) Affiliated company
(g) Affiliated fund that is generally available only to investment companies and other accounts managed by Fidelity Investments. The rate quoted is the annualized seven-day yield of the fund at period end. A complete unaudited listing of the fund's holdings as of its most recent quarter end is available upon request. In addition, each Fidelity Central Fund's financial statements, which are not covered by the Fund's Report of Independent Registered Public Accounting Firm, are available on the SEC's website or upon request.
(h) Investment made with cash collateral received from securities on loan.
Additional information on each restricted holding is as follows:
| Security | Acquisition Date | Acquisition Cost (000s) |
| AC Immune SA Series E | 10/19/15 | $5,811 |
| Appirio, Inc. | 2/12/15 | $625 |
| Appirio, Inc. Series E | 2/12/15 | $4,375 |
| AppNexus, Inc. Series E | 8/1/14 | $12,951 |
| Azul-Linhas Aereas Brasileiras Series B | 12/24/13 | $7,023 |
| Azul-Linhas Aereas Brasileiras warrants | 12/24/13 | $0 |
| Blue Apron, Inc. Series D | 5/18/15 | $10,400 |
| BLUE BOTTLE Coffee, Inc. Series C | 5/29/15 | $21,086 |
| Bracket Computing, Inc. Series C | 9/9/15 | $9,500 |
| China Internet Plus Holdings Ltd. | 1/26/15 | $10,000 |
| Cloudera, Inc. Series F | 2/5/14 | $2,709 |
| Cloudflare, Inc. Series D | 11/5/14 - 6/24/15 | $4,349 |
| Corvus Pharmaceuticals, Inc. Series B | 9/16/15 | $4,745 |
| Dataminr, Inc. Series D | 3/6/15 | $3,535 |
| Delphix Corp. Series D | 7/10/15 | $6,079 |
| Dropbox, Inc. | 5/2/12 | $9,084 |
| Editas Medicine, Inc. Series B | 8/4/15 | $3,233 |
| Gensight Biologics Series B | 7/2/15 | $3,266 |
| Immunocore Ltd. Series A | 7/27/15 | $2,122 |
| Intellia Therapeutics, Inc. Series B | 8/20/15 | $3,329 |
| Jet.Com, Inc. Series B1 | 11/24/15 | $14,605 |
| Malwarebytes Corp. Series B | 12/21/15 | $10,958 |
| Mulberry Health, Inc. Series A8 | 1/20/16 | $18,432 |
| NJOY, Inc. | 6/7/13 - 2/14/14 | $16,957 |
| Nutanix, Inc. Series E | 8/26/14 | $6,467 |
| Oportun Finance Corp. Series H | 2/6/15 | $10,114 |
| PAX Labs, Inc. Series C | 5/22/15 | $9,840 |
| Pronutria Biosciences, Inc. Series C | 1/30/15 | $5,500 |
| Snapchat, Inc. Series F | 3/25/15 | $20,312 |
| Space Exploration Technologies Corp. Class A | 10/16/15 | $14,267 |
| Space Exploration Technologies Corp. Series G | 1/20/15 | $7,535 |
| Taboola.Com Ltd. Series E | 12/22/14 | $6,619 |
| The Honest Co., Inc. | 8/21/14 | $4,062 |
| The Honest Co., Inc. Series C | 8/21/14 | $9,479 |
| The Honest Co., Inc. Series D | 8/3/15 | $3,544 |
| Tory Burch LLC unit | 5/14/15 | $20,890 |
| Uber Technologies, Inc. Series D, 8.00% | 6/6/14 | $80,000 |
| Uber Technologies, Inc. Series E, 8.00% | 12/5/14 | $3,420 |
| YourPeople, Inc. Series C | 5/1/15 | $10,314 |
Affiliated Central Funds
Information regarding fiscal year to date income earned by the Fund from investments in Fidelity Central Funds is as follows:
| Fund | Income earned |
| | (Amounts in thousands) |
| Fidelity Cash Central Fund | $33 |
| Fidelity Securities Lending Cash Central Fund | 7,700 |
| Total | $7,733 |
Other Affiliated Issuers
An affiliated company is a company in which the Fund has ownership of at least 5% of the voting securities. Fiscal year to date transactions with companies which are or were affiliates are as follows:
| Affiliate (Amounts in thousands) | Value, beginning of period | Purchases | Sales Proceeds* | Dividend Income | Value, end of period |
| Nu Skin Enterprises, Inc. Class A | $134,517 | $16,005 | $38,070 | $2,678 | $-- |
| Parsvnath Developers Ltd. | 6,516 | -- | -- | -- | 6,148 |
| Total | $141,033 | $16,005 | $38,070 | $2,678 | $6,148 |
* Includes the value of securities delivered through in-kind transactions, if applicable.
Investment Valuation
The following is a summary of the inputs used, as of January 31, 2016, involving the Fund's assets and liabilities carried at fair value. The inputs or methodology used for valuing securities may not be an indication of the risk associated with investing in those securities. For more information on valuation inputs, and their aggregation into the levels used below, please refer to the Investment Valuation section in the accompanying Notes to Financial Statements.
| | Valuation Inputs at Reporting Date: |
| Description | Total | Level 1 | Level 2 | Level 3 |
| (Amounts in thousands) | | | | |
| Investments in Securities: | | | | |
| Equities: | | | | |
| Consumer Discretionary | $5,059,841 | $4,743,665 | $261,128 | $55,048 |
| Consumer Staples | 2,072,029 | 1,981,408 | 61,582 | 29,039 |
| Energy | 239,510 | 239,510 | -- | -- |
| Financials | 490,686 | 454,589 | 27,252 | 8,845 |
| Health Care | 3,103,859 | 3,023,637 | 37,830 | 42,392 |
| Industrials | 932,742 | 869,780 | 29,045 | 33,917 |
| Information Technology | 7,193,612 | 6,742,357 | 91,006 | 360,249 |
| Materials | 109,039 | 106,228 | 2,811 | -- |
| Telecommunication Services | 26,202 | -- | 26,202 | -- |
| Money Market Funds | 386,207 | 386,207 | -- | -- |
| Total Investments in Securities: | $19,613,727 | $18,547,381 | $536,856 | $529,490 |
The following is a summary of transfers between Level 1 and Level 2 for the period ended January 31, 2016. Transfers are assumed to have occurred at the beginning of the period, and are primarily attributable to the valuation techniques used for foreign equity securities, as discussed in the accompanying Notes to Financial Statements:
| Transfers | Total (000s) |
| Level 1 to Level 2 | $290,982 |
| Level 2 to Level 1 | $0 |
The following is a reconciliation of Investments in Securities for which Level 3 inputs were used in determining value:
| (Amounts in thousands) | | | | |
| Investments in Securities: | |
| Equities - Information Technology | |
| Beginning Balance | $298,720 |
| Net Realized Gain (Loss) on Investment Securities | -- |
| Net Unrealized Gain (Loss) on Investment Securities | 26,466 |
| Cost of Purchases | 35,063 |
| Proceeds of Sales | -- |
| Amortization/Accretion | -- |
| Transfers into Level 3 | -- |
| Transfers out of Level 3 | -- |
| Ending Balance | $360,249 |
| The change in unrealized gain (loss) for the period attributable to Level 3 securities held at January 31, 2016 | $26,466 |
| Equities - Other Investments in Securities | |
| Beginning Balance | $161,801 |
| Net Realized Gain (Loss) on Investment Securities | (3,712) |
| Net Unrealized Gain (Loss) on Investment Securities | (24,841) |
| Cost of Purchases | 70,926 |
| Proceeds of Sales | (34,933) |
| Amortization/Accretion | -- |
| Transfers into Level 3 | -- |
| Transfers out of Level 3 | -- |
| Ending Balance | $169,241 |
| The change in unrealized gain (loss) for the period attributable to Level 3 securities held at January 31, 2016 | $(26,661) |
The information used in the above reconciliations represents fiscal year to date activity for any Investments in Securities identified as using Level 3 inputs at either the beginning or the end of the current fiscal period. Transfers in or out of Level 3 represent the beginning value of any Security or Instrument where a change in the pricing level occurred from the beginning to the end of the period. The cost of purchases and the proceeds of sales may include securities received or delivered through corporate actions or exchanges. Realized and unrealized gains (losses) disclosed in the reconciliations are included in Net Gain (Loss) on the Fund's Statement of Operations.
Other Information
Distribution of investments by country or territory of incorporation, as a percentage of Total Net Assets, is as follows (Unaudited):
| United States of America | 87.8% |
| Ireland | 2.5% |
| Cayman Islands | 2.0% |
| Netherlands | 1.6% |
| Singapore | 1.5% |
| Others (Individually Less Than 1%) | 4.6% |
| | 100.0% |
See accompanying notes which are an integral part of the financial statements.
Financial Statements
Statement of Assets and Liabilities
| Amounts in thousands (except per-share amounts) | | January 31, 2016 |
| Assets | | |
Investment in securities, at value (including securities loaned of $373,149) — See accompanying schedule:
Unaffiliated issuers (cost $14,328,060) | $19,221,372 | |
| Fidelity Central Funds (cost $386,207) | 386,207 | |
| Other affiliated issuers (cost $30,851) | 6,148 | |
| Total Investments (cost $14,745,118) | | $19,613,727 |
| Cash | | 643 |
| Foreign currency held at value (cost $1,938) | | 1,940 |
| Receivable for investments sold | | 144,610 |
| Receivable for fund shares sold | | 30,282 |
| Dividends receivable | | 6,247 |
| Distributions receivable from Fidelity Central Funds | | 1,532 |
| Prepaid expenses | | 35 |
| Other receivables | | 887 |
| Total assets | | 19,799,903 |
| Liabilities | | |
| Payable for investments purchased | $162,758 | |
| Payable for fund shares redeemed | 19,598 | |
| Accrued management fee | 10,570 | |
| Other affiliated payables | 2,455 | |
| Other payables and accrued expenses | 857 | |
| Collateral on securities loaned, at value | 374,523 | |
| Total liabilities | | 570,761 |
| Net Assets | | $19,229,142 |
| Net Assets consist of: | | |
| Paid in capital | | $14,378,109 |
| Undistributed net investment income | | 3,899 |
| Accumulated undistributed net realized gain (loss) on investments and foreign currency transactions | | (21,478) |
| Net unrealized appreciation (depreciation) on investments and assets and liabilities in foreign currencies | | 4,868,612 |
| Net Assets | | $19,229,142 |
| Blue Chip Growth: | | |
| Net Asset Value, offering price and redemption price per share ($14,218,071 ÷ 224,760 shares) | | $63.26 |
| Class K: | | |
| Net Asset Value, offering price and redemption price per share ($5,011,071 ÷ 79,093 shares) | | $63.36 |
See accompanying notes which are an integral part of the financial statements.
Statement of Operations
| Amounts in thousands | | Six months ended January 31, 2016 |
| Investment Income | | |
| Dividends (including $2,678 earned from other affiliated issuers) | | $85,017 |
| Income from Fidelity Central Funds (including $7,700 from security lending) | | 7,733 |
| Total income | | 92,750 |
| Expenses | | |
| Management fee | | |
| Basic fee | $55,737 | |
| Performance adjustment | 16,955 | |
| Transfer agent fees | 13,596 | |
| Accounting and security lending fees | 907 | |
| Custodian fees and expenses | 197 | |
| Independent trustees' compensation | 46 | |
| Registration fees | 248 | |
| Audit | 76 | |
| Legal | 38 | |
| Interest | 5 | |
| Miscellaneous | 59 | |
| Total expenses before reductions | 87,864 | |
| Expense reductions | (338) | 87,526 |
| Net investment income (loss) | | 5,224 |
| Realized and Unrealized Gain (Loss) | | |
| Net realized gain (loss) on: | | |
| Investment securities: | | |
| Unaffiliated issuers | 129,515 | |
| Other affiliated issuers | (26,101) | |
| Foreign currency transactions | (304) | |
| Total net realized gain (loss) | | 103,110 |
Change in net unrealized appreciation (depreciation) on:
Investment securities (net of decrease in deferred foreign taxes of $1,459) | (2,563,680) | |
| Total change in net unrealized appreciation (depreciation) | | (2,563,680) |
| Net gain (loss) | | (2,460,570) |
| Net increase (decrease) in net assets resulting from operations | | $(2,455,346) |
See accompanying notes which are an integral part of the financial statements.
Statement of Changes in Net Assets
| Amounts in thousands | Six months ended January 31, 2016 | Year ended July 31, 2015 |
| Increase (Decrease) in Net Assets | | |
| Operations | | |
| Net investment income (loss) | $5,224 | $20,601 |
| Net realized gain (loss) | 103,110 | 1,230,303 |
| Change in net unrealized appreciation (depreciation) | (2,563,680) | 2,175,419 |
| Net increase (decrease) in net assets resulting from operations | (2,455,346) | 3,426,323 |
| Distributions to shareholders from net investment income | (10,672) | (27,789) |
| Distributions to shareholders from net realized gain | (1,033,010) | (1,011,245) |
| Total distributions | (1,043,682) | (1,039,034) |
| Share transactions - net increase (decrease) | 1,483,954 | 2,274,956 |
| Total increase (decrease) in net assets | (2,015,074) | 4,662,245 |
| Net Assets | | |
| Beginning of period | 21,244,216 | 16,581,971 |
| End of period (including undistributed net investment income of $3,899 and undistributed net investment income of $9,347, respectively) | $19,229,142 | $21,244,216 |
See accompanying notes which are an integral part of the financial statements.
Financial Highlights — Fidelity Blue Chip Growth Fund
| | Six months ended | Years ended July 31, | | | | |
| January 31, | 2016 | 2015 | 2014 | 2013 | 2012 | 2011 |
| Selected Per–Share Data | | | | | | |
| Net asset value, beginning of period | $75.25 | $66.72 | $59.65 | $47.38 | $48.17 | $37.63 |
| Income from Investment Operations | | | | | | |
| Net investment income (loss)A | .01 | .05 | .15 | .39 | .10 | (.03) |
| Net realized and unrealized gain (loss) | (8.34) | 12.56 | 11.63 | 12.79 | .75 | 10.61 |
| Total from investment operations | (8.33) | 12.61 | 11.78 | 13.18 | .85 | 10.58 |
| Distributions from net investment income | (.03) | (.09) | (.24) | (.23) | (.04) | –B,C |
| Distributions from net realized gain | (3.63) | (3.99) | (4.47) | (.68) | (1.60) | (.04)B |
| Total distributions | (3.66) | (4.08) | (4.71) | (.91) | (1.64) | (.04) |
| Net asset value, end of period | $63.26 | $75.25 | $66.72 | $59.65 | $47.38 | $48.17 |
| Total ReturnD,E | (11.37)% | 19.72% | 21.07% | 28.25% | 2.27% | 28.12% |
| Ratios to Average Net AssetsF,G | | | | | | |
| Expenses before reductions | .90%H | .89% | .80% | .76% | .90% | .94% |
| Expenses net of fee waivers, if any | .90%H | .89% | .80% | .76% | .90% | .94% |
| Expenses net of all reductions | .89%H | .88% | .80% | .74% | .89% | .92% |
| Net investment income (loss) | .02%H | .07% | .23% | .75% | .21% | (.06)% |
| Supplemental Data | | | | | | |
| Net assets, end of period (in millions) | $14,218 | $15,346 | $11,970 | $12,927 | $10,595 | $12,024 |
| Portfolio turnover rateI | 51%H,J | 51%J | 57%J | 75% | 95% | 132% |
A Calculated based on average shares outstanding during the period.
B The amounts shown reflect certain reclassifications related to book to tax differences that were made in the year shown.
C Amount represents less than $.005 per share.
D Total returns for periods of less than one year are not annualized.
E Total returns would have been lower if certain expenses had not been reduced during the applicable periods shown.
F Fees and expenses of any underlying Fidelity Central Funds are not included in the Fund's expense ratio. The Fund indirectly bears its proportionate share of the expenses of any underlying Fidelity Central Funds.
G Expense ratios reflect operating expenses of the class. Expenses before reductions do not reflect amounts reimbursed by the investment adviser or reductions from brokerage service arrangements or reductions from other expense offset arrangements and do not represent the amount paid by the class during periods when reimbursements or reductions occur. Expenses net of fee waivers reflect expenses after reimbursement by the investment adviser but prior to reductions from brokerage service arrangements or other expense offset arrangements. Expenses net of all reductions represent the net expenses paid by the class.
H Annualized
I Amount does not include the portfolio activity of any underlying Fidelity Central Funds.
J Portfolio turnover rate excludes securities received or delivered in-kind.
See accompanying notes which are an integral part of the financial statements.
Financial Highlights — Fidelity Blue Chip Growth Fund Class K
| | Six months ended | Years ended July 31, | | | | |
| January 31, | 2016 | 2015 | 2014 | 2013 | 2012 | 2011 |
| Selected Per–Share Data | | | | | | |
| Net asset value, beginning of period | $75.36 | $66.82 | $59.74 | $47.46 | $48.21 | $37.66 |
| Income from Investment Operations | | | | | | |
| Net investment income (loss)A | .05 | .13 | .23 | .47 | .17 | .05 |
| Net realized and unrealized gain (loss) | (8.35) | 12.57 | 11.64 | 12.79 | .75 | 10.62 |
| Total from investment operations | (8.30) | 12.70 | 11.87 | 13.26 | .92 | 10.67 |
| Distributions from net investment income | (.07) | (.17) | (.33) | (.30) | (.08) | (.05)B |
| Distributions from net realized gain | (3.63) | (3.99) | (4.47) | (.68) | (1.60) | (.07)B |
| Total distributions | (3.70) | (4.16) | (4.79)C | (.98) | (1.67)D | (.12) |
| Net asset value, end of period | $63.36 | $75.36 | $66.82 | $59.74 | $47.46 | $48.21 |
| Total ReturnE,F | (11.31)% | 19.84% | 21.23% | 28.42% | 2.43% | 28.37% |
| Ratios to Average Net AssetsG,H | | | | | | |
| Expenses before reductions | .78%I | .78% | .68% | .61% | .74% | .77% |
| Expenses net of fee waivers, if any | .78%I | .77% | .68% | .61% | .74% | .77% |
| Expenses net of all reductions | .77%I | .77% | .67% | .60% | .73% | .76% |
| Net investment income (loss) | .14%I | .19% | .36% | .89% | .37% | .11% |
| Supplemental Data | | | | | | |
| Net assets, end of period (in millions) | $5,011 | $5,898 | $4,612 | $3,506 | $2,467 | $1,455 |
| Portfolio turnover rateJ | 51%I,K | 51%K | 57%K | 75% | 95% | 132% |
A Calculated based on average shares outstanding during the period.
B The amounts shown reflect certain reclassifications related to book to tax differences that were made in the year shown.
C Total distributions of $4.79 per share is comprised of distributions from net investment income of $.325 and distributions from net realized gain of $4.466 per share.
D Total distributions of $1.67 per share is comprised of distributions from net investment income of $.076 and distributions from net realized gain of $1.598 per share.
E Total returns for periods of less than one year are not annualized.
F Total returns would have been lower if certain expenses had not been reduced during the applicable periods shown.
G Fees and expenses of any underlying Fidelity Central Funds are not included in the Fund's expense ratio. The Fund indirectly bears its proportionate share of the expenses of any underlying Fidelity Central Funds.
H Expense ratios reflect operating expenses of the class. Expenses before reductions do not reflect amounts reimbursed by the investment adviser or reductions from brokerage service arrangements or reductions from other expense offset arrangements and do not represent the amount paid by the class during periods when reimbursements or reductions occur. Expenses net of fee waivers reflect expenses after reimbursement by the investment adviser but prior to reductions from brokerage service arrangements or other expense offset arrangements. Expenses net of all reductions represent the net expenses paid by the class.
I Annualized
J Amount does not include the portfolio activity of any underlying Fidelity Central Funds.
K Portfolio turnover rate excludes securities received or delivered in-kind.
See accompanying notes which are an integral part of the financial statements.
See accompanying notes which are an integral part of the financial statements.
Notes to Financial Statements
For the period ended January 31, 2016
(Amounts in thousands except percentages)
1. Organization.
Fidelity Blue Chip Growth Fund (the Fund) is a fund of Fidelity Securities Fund (the Trust) and is authorized to issue an unlimited number of shares. The Trust is registered under the Investment Company Act of 1940, as amended (the 1940 Act), as an open-end management investment company organized as a Massachusetts business trust. The Fund offers Blue Chip Growth and Class K shares, each of which has equal rights as to assets and voting privileges. Each class has exclusive voting rights with respect to matters that affect that class.
2. Investments in Fidelity Central Funds.
The Fund invests in Fidelity Central Funds, which are open-end investment companies generally available only to other investment companies and accounts managed by the investment adviser and its affiliates. The Fund's Schedule of Investments lists each of the Fidelity Central Funds held as of period end, if any, as an investment of the Fund, but does not include the underlying holdings of each Fidelity Central Fund. As an Investing Fund, the Fund indirectly bears its proportionate share of the expenses of the underlying Fidelity Central Funds.
The Money Market Central Funds seek preservation of capital and current income and are managed by Fidelity Investments Money Management, Inc. (FIMM), an affiliate of the investment adviser. Annualized expenses of the Money Market Central Funds as of their most recent shareholder report date are less than .005%.
A complete unaudited list of holdings for each Fidelity Central Fund is available upon request or at the Securities and Exchange Commission (the SEC) website at www.sec.gov. In addition, the financial statements of the Fidelity Central Funds, which are not covered by the Fund's Report of Independent Registered Public Accounting Firm, are available on the SEC website or upon request.
3. Significant Accounting Policies.
The financial statements have been prepared in conformity with accounting principles generally accepted in the United States of America (GAAP), which require management to make certain estimates and assumptions at the date of the financial statements. Actual results could differ from those estimates. Subsequent events, if any, through the date that the financial statements were issued have been evaluated in the preparation of the financial statements. The following summarizes the significant accounting policies of the Fund:
Investment Valuation. Investments are valued as of 4:00 p.m. Eastern time on the last calendar day of the period. The Board of Trustees (the Board) has delegated the day to day responsibility for the valuation of the Fund's investments to the Fidelity Management & Research Company (FMR) Fair Value Committee (the Committee). In accordance with valuation policies and procedures approved by the Board, the Fund attempts to obtain prices from one or more third party pricing vendors or brokers to value its investments. When current market prices, quotations or currency exchange rates are not readily available or reliable, investments will be fair valued in good faith by the Committee, in accordance with procedures adopted by the Board. Factors used in determining fair value vary by investment type and may include market or investment specific events. The frequency with which these procedures are used cannot be predicted and they may be utilized to a significant extent. The Committee oversees the Fund's valuation policies and procedures and reports to the Board on the Committee's activities and fair value determinations. The Board monitors the appropriateness of the procedures used in valuing the Fund's investments and ratifies the fair value determinations of the Committee.
The Fund categorizes the inputs to valuation techniques used to value its investments into a disclosure hierarchy consisting of three levels as shown below:
- Level 1 – quoted prices in active markets for identical investments
- Level 2 – other significant observable inputs (including quoted prices for similar investments, interest rates, prepayment speeds, etc.)
- Level 3 – unobservable inputs (including the Fund's own assumptions based on the best information available)
Valuation techniques used to value the Fund's investments by major category are as follows:
Equity securities, including restricted securities, for which market quotations are readily available, are valued at the last reported sale price or official closing price as reported by a third party pricing vendor on the primary market or exchange on which they are traded and are categorized as Level 1 in the hierarchy. In the event there were no sales during the day or closing prices are not available, securities are valued at the last quoted bid price or may be valued using the last available price and are generally categorized as Level 2 in the hierarchy. For foreign equity securities, when market or security specific events arise, comparisons to the valuation of American Depositary Receipts (ADRs), futures contracts, Exchange-Traded Funds (ETFs) and certain indexes as well as quoted prices for similar securities may be used and would be categorized as Level 2 in the hierarchy. Utilizing these techniques may result in transfers between Level 1 and Level 2. For equity securities, including restricted securities, where observable inputs are limited, assumptions about market activity and risk are used and these securities may be categorized as Level 3 in the hierarchy. Equity securities, including restricted securities, for which observable inputs are not available are valued using alternate valuation approaches, including the market approach and the income approach and are categorized as Level 3 in the hierarchy. The market approach generally consists of using comparable market transactions while the income approach generally consists of using the net present value of estimated future cash flows, adjusted as appropriate for liquidity, credit, market and/or other risk factors.
Investments in open-end mutual funds, including the Fidelity Central Funds, are valued at their closing net asset value (NAV) each business day and are categorized as Level 1 in the hierarchy.
The following provides information on Level 3 securities held by the Fund that were valued at period end based on unobservable inputs. These amounts exclude valuations provided by a broker.
| Asset Type | Fair Value at 01/31/16 | Valuation Technique(s) | Unobservable Input | Amount or Range/Weighted Average | Impact to Valuation from an Increase in Input(a) |
| Equities | $ 529,490 | Discount cash flow | Growth rate | 2.5% | Increase |
| | | | Weighted average cost of capital | 11.5% | Decrease |
| | | Last transaction price | Transaction price | $0.00 - $140.00 / $43.20 | Increase |
| | | | Discount rate | 15.0% | Decrease |
| | | | Put premium | 38.0% | Increase |
| | | Market comparable | EV/EBITDA multiple | 8.2 | Increase |
| | | | EV/Sales multiple | 1.2 - 11.1 / 5.1 | Increase |
| | | | Discount rate | 3.0% - 30.0% / 12.8% | Decrease |
| | | | P/E multiple | 12.1 - 12.7 / 12.6 | Increase |
| | | | Discount for lack of marketability | 10.0% - 25.0% / 15.9% | Decrease |
| | | | Premium rate | 1.0% - 86.4% / 40.4% | Increase |
| | | | EV/GP multiple | 4.2 | Increase |
| | | | Probability rate | 90.0% - 100.0% / 95.0% | Increase |
| | | Proposed transaction price | Transaction price | $8.00 | Increase |
| | | | Discount rate | 10.0% | Decrease |
| | | | Index movement | 30.2% | Increase |
| | | Proxy adjustment | Proxy movement | 25.8% - 29.9% / 27.7% | Increase |
(a) Represents the expected directional change in the fair value of the Level 3 investments that would result from an increase in the corresponding input. A decrease to the unobservable input would have the opposite effect. Significant changes in these inputs could result in significantly higher or lower fair value measurements.
Changes in valuation techniques may result in transfers in or out of an assigned level within the disclosure hierarchy. The aggregate value of investments by input level as of January 31, 2016, including information on transfers between Levels 1 and 2, as well as a roll forward of Level 3 investments, is included at the end of the Fund's Schedule of Investments.
Foreign Currency. The Fund may use foreign currency contracts to facilitate transactions in foreign-denominated securities. Gains and losses from these transactions may arise from changes in the value of the foreign currency or if the counterparties do not perform under the contracts' terms.
Foreign-denominated assets, including investment securities, and liabilities are translated into U.S. dollars at the exchange rates at period end. Purchases and sales of investment securities, income and dividends received and expenses denominated in foreign currencies are translated into U.S. dollars at the exchange rate in effect on the transaction date.
The effects of exchange rate fluctuations on investments are included with the net realized and unrealized gain (loss) on investment securities. Other foreign currency transactions resulting in realized and unrealized gain (loss) are disclosed separately.
Investment Transactions and Income. For financial reporting purposes, the Fund's investment holdings and NAV include trades executed through the end of the last business day of the period. The NAV per share for processing shareholder transactions is calculated as of the close of business of the New York Stock Exchange (NYSE), normally 4:00 p.m. Eastern time and includes trades executed through the end of the prior business day. Gains and losses on securities sold are determined on the basis of identified cost and may include proceeds received from litigation. Dividend income is recorded on the ex-dividend date, except for certain dividends from foreign securities where the ex-dividend date may have passed, which are recorded as soon as the Fund is informed of the ex-dividend date. Non-cash dividends included in dividend income, if any, are recorded at the fair market value of the securities received. Income and capital gain distributions from Fidelity Central Funds, if any, are recorded on the ex-dividend date. Distributions received on securities that represent a return of capital or capital gain are recorded as a reduction of cost of investments and/or as a realized gain. Subsequent to ex-dividend date the Fund determines the components of these distributions, based upon receipt of tax filings or other correspondence relating to the underlying investment. Investment income is recorded net of foreign taxes withheld where recovery of such taxes is uncertain.
Class Allocations and Expenses. Investment income, realized and unrealized capital gains and losses, common expenses of the Fund, and certain fund-level expense reductions, if any, are allocated daily on a pro-rata basis to each class based on the relative net assets of each class to the total net assets of the Fund. Each class differs with respect to transfer agent fees incurred. Certain expense reductions may also differ by class. For the reporting period, the allocated portion of income and expenses to each class as a percent of its average net assets may vary due to the timing of recording these transactions in relation to fluctuating net assets of the classes. Expenses directly attributable to a fund are charged to that fund. Expenses attributable to more than one fund are allocated among the respective funds on the basis of relative net assets or other appropriate methods. Expense estimates are accrued in the period to which they relate and adjustments are made when actual amounts are known.
Deferred Trustee Compensation. Under a Deferred Compensation Plan (the Plan), independent Trustees may elect to defer receipt of a portion of their annual compensation. Deferred amounts are invested in a cross-section of Fidelity funds, are marked-to-market and remain in the Fund until distributed in accordance with the Plan. The investment of deferred amounts and the offsetting payable to the Trustees are included in the accompanying Statement of Assets and Liabilities.
Income Tax Information and Distributions to Shareholders. Each year, the Fund intends to qualify as a regulated investment company under Subchapter M of the Internal Revenue Code, including distributing substantially all of its taxable income and realized gains. As a result, no provision for U.S. Federal income taxes is required. The Fund files a U.S. federal tax return, in addition to state and local tax returns as required. The Fund's federal income tax returns are subject to examination by the Internal Revenue Service (IRS) for a period of three fiscal years after they are filed. State and local tax returns may be subject to examination for an additional fiscal year depending on the jurisdiction. Foreign taxes are provided for based on the Fund's understanding of the tax rules and rates that exist in the foreign markets in which it invests.
Distributions are declared and recorded on the ex-dividend date. Income dividends and capital gain distributions are declared separately for each class. Income and capital gain distributions are determined in accordance with income tax regulations, which may differ from GAAP.
Capital accounts within the financial statements are adjusted for permanent book-tax differences. These adjustments have no impact on net assets or the results of operations. Capital accounts are not adjusted for temporary book-tax differences which will reverse in a subsequent period.
Book-tax differences are primarily due to foreign currency transactions, passive foreign investment companies (PFIC), redemptions in kind, partnerships, deferred trustees compensation and losses deferred due to wash sales.
The federal tax cost of investment securities and unrealized appreciation (depreciation) as of period end were as follows:
| Gross unrealized appreciation | $6,078,270 |
| Gross unrealized depreciation | (1,312,022) |
| Net unrealized appreciation (depreciation) on securities | $4,766,248 |
| Tax cost | $14,847,479 |
Restricted Securities. The Fund may invest in securities that are subject to legal or contractual restrictions on resale. These securities generally may be resold in transactions exempt from registration or to the public if the securities are registered. Disposal of these securities may involve time-consuming negotiations and expense, and prompt sale at an acceptable price may be difficult. Information regarding restricted securities is included at the end of the Fund's Schedule of Investments.
4. Purchases and Sales of Investments.
Purchases and sales of securities, other than short-term securities and in-kind transactions, aggregated $5,876,876 and $5,221,442, respectively.
Redemptions In-Kind. During the period, 2,731 shares of the Fund held by unaffiliated entities were redeemed in-kind for cash and investments with a value of $184,152. The net realized gain of $89,282 on investments delivered through the in-kind redemption is included in the accompanying Statement of Operations. The amount of in-kind redemptions is included in share transactions in the accompanying Statement of Changes in Net Assets as well as Note 10: Share Transactions. The Fund recognized no gain or loss for federal income tax purposes.
5. Fees and Other Transactions with Affiliates.
Management Fee. Fidelity Management & Research Company (the investment adviser) and its affiliates provide the Fund with investment management related services for which the Fund pays a monthly management fee. The management fee is the sum of an individual fund fee rate that is based on an annual rate of .30% of the Fund's average net assets and an annualized group fee rate that averaged .25% during the period. The group fee rate is based upon the average net assets of all the mutual funds advised by the investment adviser, including any mutual funds previously advised by the investment adviser that are currently advised by Fidelity SelectCo, LLC, an affiliate of the investment adviser. The group fee rate decreases as assets under management increase and increases as assets under management decrease. In addition, the management fee is subject to a performance adjustment (up to a maximum of +/- .20% of the Fund's average net assets over a 36 month performance period). The upward or downward adjustment to the management fee is based on the relative investment performance of Blue Chip Growth as compared to its benchmark index, the Russell 1000 Growth Index, over the same 36 month performance period. For the reporting period, the total annualized management fee rate, including the performance adjustment, was .72% of the Fund's average net assets. The performance adjustment included in the management fee rate may be higher or lower than the maximum performance adjustment rate due to the difference between the average net assets for the reporting and performance periods.
Transfer Agent Fees. Fidelity Investments Institutional Operations Company, Inc., (FIIOC), an affiliate of the investment adviser, is the transfer, dividend disbursing and shareholder servicing agent for each class of the Fund. FIIOC receives account fees and asset-based fees that vary according to the account size and type of account of the shareholders of Blue Chip Growth, except for Class K. FIIOC receives an asset-based fee of Class K's average net assets. FIIOC pays for typesetting, printing and mailing of shareholder reports, except proxy statements.
For the period, transfer agent fees for each class were as follows:
| | Amount | % of
Class-Level Average
Net Assets(a) |
| Blue Chip Growth | $12,319 | .17 |
| Class K | 1,277 | .05 |
| | $ 13,596 | |
(a) Annualized
Accounting and Security Lending Fees. Fidelity Service Company, Inc. (FSC), an affiliate of the investment adviser, maintains the Fund's accounting records. The accounting fee is based on the level of average net assets for each month. Under a separate contract, FSC administers the security lending program. The security lending fee is based on the number and duration of lending transactions.
Brokerage Commissions. The Fund placed a portion of its portfolio transactions with brokerage firms which are affiliates of the investment adviser. Brokerage commissions are included in net realized gain (loss) and change in net unrealized appreciation (depreciation) in the Statement of Operations. The commissions paid to these affiliated firms were $89 for the period.
Interfund Lending Program. Pursuant to an Exemptive Order issued by the SEC, the Fund, along with other registered investment companies having management contracts with FMR or other affiliated entities of FMR, may participate in an interfund lending program. This program provides an alternative credit facility allowing the funds to borrow from, or lend money to, other participating affiliated funds. At period end, there were no interfund loans outstanding. The Fund's activity in this program during the period for which loans were outstanding was as follows:
| Borrower or Lender | Average Loan Balance | Weighted Average Interest Rate | Interest Expense |
| Borrower | $35,619 | .55% | $5 |
Interfund Trades. The Fund may purchase from or sell securities to other Fidelity Funds under procedures adopted by the Board. The procedures have been designed to ensure these interfund trades are executed in accordance with Rule 17a-7 of the 1940 Act. Interfund trades are included within the respective purchases and sales amounts shown in the Purchases and Sales of Investments note.
6. Committed Line of Credit.
The Fund participates with other funds managed by the investment adviser or an affiliate in a $4.25 billion credit facility (the "line of credit") to be utilized for temporary or emergency purposes to fund shareholder redemptions or for other short-term liquidity purposes. The Fund has agreed to pay commitment fees on its pro-rata portion of the line of credit, which amounted to $14 and is reflected in Miscellaneous expenses on the Statement of Operations. During the period, the Fund did not borrow on this line of credit.
7. Security Lending.
The Fund lends portfolio securities through a lending agent from time to time in order to earn additional income. For equity securities, a lending agent is used and may loan securities to certain qualified borrowers, including Fidelity Capital Markets (FCM), a broker-dealer affiliated with the Fund. On the settlement date of the loan, the Fund receives collateral (in the form of U.S. Treasury obligations, letters of credit and/or cash) against the loaned securities and maintains collateral in an amount not less than 100% of the market value of the loaned securities during the period of the loan. The market value of the loaned securities is determined at the close of business of the Fund and any additional required collateral is delivered to the Fund on the next business day. The Fund or borrower may terminate the loan at any time, and if the borrower defaults on its obligation to return the securities loaned because of insolvency or other reasons, the Fund may apply collateral received from the borrower against the obligation. The Fund may experience delays and costs in recovering the securities loaned. Any cash collateral received is invested in the Fidelity Securities Lending Cash Central Fund. The value of loaned securities and cash collateral at period end are disclosed on the Fund's Statement of Assets and Liabilities. The value of securities loaned to FCM at period end was $24,265. Security lending income represents the income earned on investing cash collateral, less rebates paid to borrowers and any lending agent fees associated with the loan, plus any premium payments received for lending certain types of securities. Security lending income is presented in the Statement of Operations as a component of income from Fidelity Central Funds, and includes $955 from securities loaned to FCM.
8. Expense Reductions.
Commissions paid to certain brokers with whom the investment adviser, or its affiliates, places trades on behalf of the Fund include an amount in addition to trade execution, which may be rebated back to the Fund to offset certain expenses. This amount totaled $262 for the period. In addition, through arrangements with the Fund's custodian, credits realized as a result of certain uninvested cash balances were used to reduce the Fund's expenses. During the period, these credits reduced the Fund's custody expenses by $1.
In addition, during the period the investment adviser reimbursed and/or waived a portion of fund-level operating expenses in the amount of $75.
9. Distributions to Shareholders.
Distributions to shareholders of each class were as follows:
| | Six months ended January 31, 2016 | Year ended July 31, 2015 |
| From net investment income | | |
| Blue Chip Growth | $5,376 | $15,581 |
| Class K | 5,296 | 12,208 |
| Total | $10,672 | $27,789 |
| From net realized gain | | |
| Blue Chip Growth | $753,870 | $722,639 |
| Class K | 279,140 | 288,606 |
| Total | $1,033,010 | $1,011,245 |
10. Share Transactions.
Share transactions for each class were as follows and may contain automatic conversions between classes or exchanges between affiliated funds:
| | Shares | Shares | Dollars | Dollars |
| | Six months ended January 31, 2016 | Year ended July 31, 2015 | Six months ended January 31, 2016 | Year ended July 31, 2015 |
| Blue Chip Growth | | | | |
| Shares sold | 29,784 | 45,258 | $2,028,783 | $3,161,935 |
| Reinvestment of distributions | 10,852 | 10,699 | 732,286 | 715,067 |
| Shares redeemed | (19,806) | (31,433) | (1,336,794) | (2,196,025) |
| Net increase (decrease) | 20,830 | 24,524 | $1,424,275 | $1,680,977 |
| Class K | | | | |
| Shares sold | 9,577 | 26,108 | $652,724 | $1,808,830 |
| Reinvestment of distributions | 4,210 | 4,497 | 284,436 | 300,814 |
| Shares redeemed | (12,959)(a) | (21,373)(b) | (877,481)(a) | (1,515,665)(b) |
| Net increase (decrease) | 828 | 9,232 | $59,679 | $593,979 |
(a) Amount includes in-kind redemptions (See Note 4: Redemptions In-Kind).
(b) Amount includes in-kind redemptions.
11. Other.
The Fund's organizational documents provide former and current trustees and officers with a limited indemnification against liabilities arising in connection with the performance of their duties to the Fund. In the normal course of business, the Fund may also enter into contracts that provide general indemnifications. The Fund's maximum exposure under these arrangements is unknown as this would be dependent on future claims that may be made against the Fund. The risk of material loss from such claims is considered remote.
Report of Independent Registered Public Accounting Firm
To the Trustees of Fidelity Securities Fund and the Shareholders of Fidelity Blue Chip Growth Fund:
We have audited the accompanying statement of assets and liabilities of Fidelity® Blue Chip Growth Fund (the Fund), a fund of Fidelity Securities Fund, including the schedule of investments, as of January 31, 2016, and the related statement of operations for the six months then ended, the statement of changes in net assets for the six months ended January 31, 2016 and for the year ended July 31, 2015, and the financial highlights for the six months ended January 31, 2016 and for each of the five years in the period ended July 31, 2015. These financial statements and financial highlights are the responsibility of the Fund's management. Our responsibility is to express an opinion on these financial statements and financial highlights based on our audits.
We conducted our audits in accordance with the standards of the Public Company Accounting Oversight Board (United States). Those standards require that we plan and perform the audit to obtain reasonable assurance about whether the financial statements and financial highlights are free of material misstatement. The Fund is not required to have, nor were we engaged to perform, an audit of its internal control over financial reporting. Our audits included consideration of internal control over financial reporting as a basis for designing audit procedures that are appropriate in the circumstances, but not for the purpose of expressing an opinion on the effectiveness of the Fund's internal control over financial reporting. Accordingly, we express no such opinion. An audit also includes examining, on a test basis, evidence supporting the amounts and disclosures in the financial statements, assessing the accounting principles used and significant estimates made by management, as well as evaluating the overall financial statement presentation. Our procedures included confirmation of securities owned as of January 31, 2016, by correspondence with the custodians and brokers; when replies were not received from brokers, we performed other auditing procedures. We believe that our audits provide a reasonable basis for our opinion.
In our opinion, such financial statements and financial highlights referred to above present fairly, in all material respects, the financial position of Fidelity® Blue Chip Growth Fund as of January 31, 2016, the results of its operations for the six months then ended, the changes in its net assets for the six months ended January 31, 2016 and for the year ended July 31, 2015, and the financial highlights for the six months ended January 31, 2016 and for each of the five years in the period then ended July 31, 2015, in conformity with accounting principles generally accepted in the United States of America.
DELOITTE & TOUCHE LLP
Boston, Massachusetts
March 17, 2016
Shareholder Expense Example
As a shareholder of the Fund, you incur two types of costs: (1) transaction costs and (2) ongoing costs, including management fees and other Fund expenses. This Example is intended to help you understand your ongoing costs (in dollars) of investing in the Fund and to compare these costs with the ongoing costs of investing in other mutual funds.
The Example is based on an investment of $1,000 invested at the beginning of the period and held for the entire period (August 1, 2015 to January 31, 2016).
Actual Expenses
The first line of the accompanying table for each class of the Fund provides information about actual account values and actual expenses. You may use the information in this line, together with the amount you invested, to estimate the expenses that you paid over the period. Simply divide your account value by $1,000.00 (for example, an $8,600 account value divided by $1,000.00 = 8.6), then multiply the result by the number in the first line for a class of the Fund under the heading entitled "Expenses Paid During Period" to estimate the expenses you paid on your account during this period. A small balance maintenance fee of $12.00 that is charged once a year may apply for certain accounts with a value of less than $2,000. This fee is not included in the table below. If it was, the estimate of expenses you paid during the period would be higher, and your ending account value lower, by this amount. In addition, the Fund, as a shareholder in the underlying Fidelity Central Funds, will indirectly bear its pro-rata share of the fees and expenses incurred by the underlying Fidelity Central Funds. These fees and expenses are not included in the Fund's annualized expense ratio used to calculate the expense estimate in the table below.
Hypothetical Example for Comparison Purposes
The second line of the accompanying table for each class of the Fund provides information about hypothetical account values and hypothetical expenses based on a Class' actual expense ratio and an assumed rate of return of 5% per year before expenses, which is not the Class' actual return. The hypothetical account values and expenses may not be used to estimate the actual ending account balance or expenses you paid for the period. You may use this information to compare the ongoing costs of investing in the Fund and other funds. To do so, compare this 5% hypothetical example with the 5% hypothetical examples that appear in the shareholder reports of the other funds. A small balance maintenance fee of $12.00 that is charged once a year may apply for certain accounts with a value of less than $2,000. This fee is not included in the table below. If it was, the estimate of expenses you paid during the period would be higher, and your ending account value lower, by this amount. In addition, the Fund, as a shareholder in the underlying Fidelity Central Funds, will indirectly bear its pro-rata share of the fees and expenses incurred by the underlying Fidelity Central Funds. These fees and expenses are not included in the Fund's annualized expense ratio used to calculate the expense estimate in the table below.
Please note that the expenses shown in the table are meant to highlight your ongoing costs only and do not reflect any transaction costs. Therefore, the second line of the table is useful in comparing ongoing costs only, and will not help you determine the relative total costs of owning different funds.
| | Annualized Expense Ratio-A | Beginning
Account Value
August 1, 2015 | Ending
Account Value
January 31, 2016 | Expenses Paid
During Period-B
August 1, 2015
to January 31, 2016 |
| Blue Chip Growth | .90% | | | |
| Actual | | $1,000.00 | $886.30 | $4.27 |
| Hypothetical-C | | $1,000.00 | $1,020.61 | $4.57 |
| Class K | .78% | | | |
| Actual | | $1,000.00 | $886.90 | $3.70 |
| Hypothetical-C | | $1,000.00 | $1,021.22 | $3.96 |
A Annualized expense ratio reflects expenses net of applicable fee waivers.
B Expenses are equal to each Class' annualized expense ratio, multiplied by the average account value over the period, multiplied by 184/366 (to reflect the one-half year period).
C 5% return per year before expenses
Corporate Headquarters
245 Summer St.
Boston, MA 02210
www.fidelity.com
BCF-SANN-0316
1.700126.119
Fidelity® Growth & Income Portfolio
Class K
Semi-Annual Report January 31, 2016 |
|
Contents
To view a fund's proxy voting guidelines and proxy voting record for the 12-month period ended June 30, visit http://www.fidelity.com/proxyvotingresults or visit the Securities and Exchange Commission's (SEC) web site at http://www.sec.gov.
You may also call 1-800-835-5092 to request a free copy of the proxy voting guidelines.
Standard & Poor's, S&P and S&P 500 are registered service marks of The McGraw-Hill Companies, Inc. and have been licensed for use by Fidelity Distributors Corporation.
Other third-party marks appearing herein are the property of their respective owners.
All other marks appearing herein are registered or unregistered trademarks or service marks of FMR LLC or an affiliated company. © 2016 FMR LLC. All rights reserved.
This report and the financial statements contained herein are submitted for the general information of the shareholders of the Fund. This report is not authorized for distribution to prospective investors in the Fund unless preceded or accompanied by an effective prospectus.
A fund files its complete schedule of portfolio holdings with the SEC for the first and third quarters of each fiscal year on Form N-Q. Forms N-Q are available on the SEC’s web site at http://www.sec.gov. A fund's Forms N-Q may be reviewed and copied at the SEC’s Public Reference Room in Washington, DC. Information regarding the operation of the SEC's Public Reference Room may be obtained by calling 1-800-SEC-0330.
For a complete list of a fund's portfolio holdings, view the most recent holdings listing, semiannual report, or annual report on Fidelity's web site at http://www.fidelity.com, http://www.advisor.fidelity.com, or http://www.401k.com, as applicable.
NOT FDIC INSURED •MAY LOSE VALUE •NO BANK GUARANTEE
Neither the Fund nor Fidelity Distributors Corporation is a bank.
Investment Summary (Unaudited)
Top Ten Stocks as of January 31, 2016
| | % of fund's net assets | % of fund's net assets 6 months ago |
| JPMorgan Chase & Co. | 4.0 | 4.4 |
| Microsoft Corp.(a) | 3.6 | 2.9 |
| General Electric Co.(a) | 3.5 | 3.3 |
| Apple, Inc. | 2.9 | 3.5 |
| Bank of America Corp. | 2.8 | 2.7 |
| Procter & Gamble Co. | 2.5 | 2.0 |
| Chevron Corp. | 2.3 | 1.8 |
| Johnson & Johnson | 2.3 | 1.8 |
| Citigroup, Inc. | 2.3 | 2.8 |
| Target Corp.(a) | 2.0 | 2.2 |
| | 28.2 | |
(a) Security or a portion of the security is pledged as collateral for call options written.
Top Five Market Sectors as of January 31, 2016
| | % of fund's net assets | % of fund's net assets 6 months ago |
| Information Technology | 21.2 | 21.8 |
| Financials | 21.0 | 22.9 |
| Industrials | 12.8 | 12.7 |
| Health Care | 12.6 | 10.8 |
| Energy | 10.1 | 8.5 |
Asset Allocation (% of fund's net assets)
| As of January 31, 2016*,** |
| | Stocks | 98.8% |
| | Convertible Securities | 1.2% |

* Foreign investments - 12.0%
** Written options - (0.0)%
| As of July 31, 2015*,** |
| | Stocks | 98.8% |
| | Convertible Securities | 1.0% |
| | Other Investments | 0.1% |
| | Short-Term Investments and Net Other Assets (Liabilities) | 0.1% |

* Foreign investments - 11.9%
** Written options - (0.0)%
Percentages shown as 0.0% may reflect amounts less than 0.05%.
Investments January 31, 2016 (Unaudited)
Showing Percentage of Net Assets
| Common Stocks - 98.8% | | | |
| | | Shares | Value (000s) |
| CONSUMER DISCRETIONARY - 9.1% | | | |
| Automobiles - 0.1% | | | |
| General Motors Co. | | 106,900 | $3,169 |
| Harley-Davidson, Inc. | | 95,600 | 3,824 |
| | | | 6,993 |
| Diversified Consumer Services - 0.2% | | | |
| ServiceMaster Global Holdings, Inc. (a) | | 288,900 | 12,194 |
| Hotels, Restaurants & Leisure - 0.9% | | | |
| Cedar Fair LP (depositary unit) | | 6,000 | 325 |
| Dunkin' Brands Group, Inc. | | 187,000 | 7,360 |
| Las Vegas Sands Corp. | | 289,000 | 13,034 |
| Yum! Brands, Inc. | | 453,944 | 32,852 |
| | | | 53,571 |
| Household Durables - 0.1% | | | |
| Tupperware Brands Corp. | | 178,500 | 8,288 |
| Leisure Products - 0.2% | | | |
| Mattel, Inc. | | 201,900 | 5,570 |
| NJOY, Inc. (a)(b) | | 671,365 | 86 |
| Polaris Industries, Inc. | | 69,900 | 5,161 |
| | | | 10,817 |
| Media - 4.5% | | | |
| Comcast Corp. Class A | | 1,821,000 | 101,448 |
| Scripps Networks Interactive, Inc. Class A | | 583,889 | 35,600 |
| Sinclair Broadcast Group, Inc. Class A | | 385,061 | 12,707 |
| Time Warner, Inc. | | 1,075,017 | 75,724 |
| Viacom, Inc. Class B (non-vtg.) | | 792,300 | 36,161 |
| | | | 261,640 |
| Multiline Retail - 2.0% | | | |
| Dillard's, Inc. Class A | | 19,100 | 1,345 |
| Target Corp. (c) | | 1,577,275 | 114,226 |
| | | | 115,571 |
| Specialty Retail - 1.1% | | | |
| Lowe's Companies, Inc. (c) | | 875,979 | 62,773 |
|
| TOTAL CONSUMER DISCRETIONARY | | | 531,847 |
|
| CONSUMER STAPLES - 8.4% | | | |
| Beverages - 2.9% | | | |
| Britvic PLC | | 175,700 | 1,814 |
| Diageo PLC | | 1,118,799 | 30,120 |
| PepsiCo, Inc. | | 301,614 | 29,950 |
| The Coca-Cola Co. | | 2,579,603 | 110,717 |
| | | | 172,601 |
| Food & Staples Retailing - 1.0% | | | |
| CVS Health Corp. | | 410,704 | 39,670 |
| Walgreens Boots Alliance, Inc. | | 249,684 | 19,905 |
| | | | 59,575 |
| Food Products - 0.2% | | | |
| Mead Johnson Nutrition Co. Class A | | 118,700 | 8,605 |
| Household Products - 2.5% | | | |
| Procter & Gamble Co. | | 1,806,815 | 147,599 |
| Personal Products - 0.1% | | | |
| Edgewell Personal Care Co. (a) | | 47,800 | 3,538 |
| Estee Lauder Companies, Inc. Class A | | 7,200 | 614 |
| | | | 4,152 |
| Tobacco - 1.7% | | | |
| British American Tobacco PLC sponsored ADR | | 291,023 | 32,306 |
| Imperial Tobacco Group PLC | | 177,740 | 9,624 |
| Philip Morris International, Inc. | | 673,171 | 60,592 |
| | | | 102,522 |
|
| TOTAL CONSUMER STAPLES | | | 495,054 |
|
| ENERGY - 10.0% | | | |
| Energy Equipment & Services - 1.2% | | | |
| Baker Hughes, Inc. | | 255,800 | 11,130 |
| Helmerich & Payne, Inc. | | 126,400 | 6,421 |
| National Oilwell Varco, Inc. | | 396,800 | 12,912 |
| Oceaneering International, Inc. | | 654,000 | 22,138 |
| Schlumberger Ltd. | | 265,732 | 19,204 |
| | | | 71,805 |
| Oil, Gas & Consumable Fuels - 8.8% | | | |
| Apache Corp. | | 1,177,968 | 50,111 |
| Cabot Oil & Gas Corp. | | 110,700 | 2,297 |
| Cenovus Energy, Inc. | | 1,031,400 | 12,708 |
| Chevron Corp. | | 1,588,696 | 137,375 |
| ConocoPhillips Co. | | 731,800 | 28,599 |
| Energy Transfer Equity LP | | 554,600 | 4,814 |
| EQT Midstream Partners LP | | 91,802 | 6,249 |
| Golar LNG Ltd. | | 559,200 | 10,412 |
| Imperial Oil Ltd. | | 1,448,300 | 44,403 |
| Kinder Morgan, Inc. | | 1,690,100 | 27,802 |
| Legacy Reserves LP | | 1,050,368 | 1,376 |
| MPLX LP | | 496,947 | 15,291 |
| PrairieSky Royalty Ltd. (d) | | 690,973 | 9,835 |
| Suncor Energy, Inc. | | 3,305,750 | 78,296 |
| The Williams Companies, Inc. | | 2,144,272 | 41,384 |
| Williams Partners LP | | 2,064,285 | 45,456 |
| | | | 516,408 |
|
| TOTAL ENERGY | | | 588,213 |
|
| FINANCIALS - 21.0% | | | |
| Banks - 14.1% | | | |
| Bank of America Corp. | | 11,439,956 | 161,761 |
| Citigroup, Inc. | | 3,169,630 | 134,963 |
| Comerica, Inc. | | 601,200 | 20,621 |
| Commerce Bancshares, Inc. | | 180,415 | 7,420 |
| Fifth Third Bancorp | | 471,500 | 7,450 |
| JPMorgan Chase & Co. | | 3,920,192 | 233,248 |
| Lloyds Banking Group PLC | | 2,027,500 | 1,899 |
| M&T Bank Corp. | | 222,300 | 24,493 |
| PNC Financial Services Group, Inc. | | 372,354 | 32,264 |
| Regions Financial Corp. | | 3,778,700 | 30,683 |
| Standard Chartered PLC (United Kingdom) | | 1,791,655 | 12,087 |
| SunTrust Banks, Inc. | | 1,632,066 | 59,701 |
| U.S. Bancorp | | 1,850,773 | 74,142 |
| Wells Fargo & Co. | | 611,141 | 30,698 |
| | | | 831,430 |
| Capital Markets - 5.1% | | | |
| Apollo Global Management LLC Class A | | 482,300 | 6,550 |
| Ashmore Group PLC (d) | | 787,300 | 2,476 |
| Charles Schwab Corp. | | 1,320,743 | 33,719 |
| Franklin Resources, Inc. | | 226,700 | 7,857 |
| Invesco Ltd. | | 524,900 | 15,710 |
| KKR & Co. LP | | 2,392,343 | 32,608 |
| Morgan Stanley | | 1,478,197 | 38,256 |
| Northern Trust Corp. | | 796,264 | 49,432 |
| Oaktree Capital Group LLC Class A | | 258,700 | 11,321 |
| PJT Partners, Inc. (a) | | 954 | 25 |
| State Street Corp. | | 1,508,427 | 84,065 |
| T. Rowe Price Group, Inc. | | 7,300 | 518 |
| The Blackstone Group LP | | 657,500 | 17,273 |
| | | | 299,810 |
| Diversified Financial Services - 0.2% | | | |
| McGraw Hill Financial, Inc. | | 131,200 | 11,155 |
| Insurance - 1.0% | | | |
| Chubb Ltd. | | 39,200 | 4,432 |
| Marsh & McLennan Companies, Inc. | | 369,846 | 19,724 |
| MetLife, Inc. | | 435,140 | 19,429 |
| Principal Financial Group, Inc. | | 371,400 | 14,113 |
| Willis Group Holdings PLC | | 15,400 | 1,763 |
| | | | 59,461 |
| Real Estate Investment Trusts - 0.4% | | | |
| American Tower Corp. | | 84,700 | 7,991 |
| Crown Castle International Corp. | | 84,900 | 7,318 |
| First Potomac Realty Trust | | 57,018 | 558 |
| Sabra Health Care REIT, Inc. | | 223,000 | 4,094 |
| | | | 19,961 |
| Thrifts & Mortgage Finance - 0.2% | | | |
| Radian Group, Inc. | | 1,052,168 | 10,585 |
|
| TOTAL FINANCIALS | | | 1,232,402 |
|
| HEALTH CARE - 11.8% | | | |
| Biotechnology - 1.9% | | | |
| AbbVie, Inc. | | 580,500 | 31,869 |
| Amgen, Inc. (c) | | 266,403 | 40,688 |
| Biogen, Inc. (a) | | 113,800 | 31,074 |
| Celgene Corp. (a) | | 52,600 | 5,277 |
| Intercept Pharmaceuticals, Inc. (a) | | 39,826 | 4,231 |
| | | | 113,139 |
| Health Care Equipment & Supplies - 2.1% | | | |
| Abbott Laboratories | | 673,804 | 25,503 |
| Ansell Ltd. | | 396,877 | 5,704 |
| Medtronic PLC | | 868,230 | 65,916 |
| Zimmer Biomet Holdings, Inc. | | 281,910 | 27,982 |
| | | | 125,105 |
| Health Care Providers & Services - 1.1% | | | |
| McKesson Corp. | | 311,787 | 50,191 |
| Patterson Companies, Inc. | | 296,870 | 12,605 |
| | | | 62,796 |
| Life Sciences Tools & Services - 0.2% | | | |
| Agilent Technologies, Inc. | | 381,200 | 14,352 |
| Pharmaceuticals - 6.5% | | | |
| Astellas Pharma, Inc. | | 453,600 | 6,281 |
| Bristol-Myers Squibb Co. | | 190,900 | 11,866 |
| GlaxoSmithKline PLC sponsored ADR | | 2,375,122 | 98,069 |
| Innoviva, Inc. | | 289,100 | 2,897 |
| Johnson & Johnson | | 1,300,569 | 135,831 |
| Novartis AG sponsored ADR | | 6,744 | 526 |
| Sanofi SA | | 166,837 | 13,874 |
| Shire PLC sponsored ADR (d) | | 121,600 | 20,465 |
| Teva Pharmaceutical Industries Ltd. sponsored ADR | | 1,481,320 | 91,072 |
| | | | 380,881 |
|
| TOTAL HEALTH CARE | | | 696,273 |
|
| INDUSTRIALS - 12.7% | | | |
| Aerospace & Defense - 2.1% | | | |
| Meggitt PLC | | 330,468 | 1,719 |
| Rolls-Royce Group PLC | | 1,095,600 | 8,715 |
| The Boeing Co. | | 590,989 | 70,996 |
| United Technologies Corp. | | 465,282 | 40,801 |
| | | | 122,231 |
| Air Freight & Logistics - 2.1% | | | |
| C.H. Robinson Worldwide, Inc. | | 341,500 | 22,119 |
| PostNL NV (a) | | 4,588,400 | 16,698 |
| United Parcel Service, Inc. Class B | | 892,004 | 83,135 |
| | | | 121,952 |
| Airlines - 0.2% | | | |
| Copa Holdings SA Class A | | 265,854 | 12,522 |
| Building Products - 0.2% | | | |
| Lennox International, Inc. | | 80,700 | 9,669 |
| Commercial Services & Supplies - 0.3% | | | |
| ADT Corp. (d) | | 661,510 | 19,567 |
| Electrical Equipment - 0.9% | | | |
| Eaton Corp. PLC | | 238,000 | 12,021 |
| Emerson Electric Co. | | 560,200 | 25,758 |
| Hubbell, Inc. Class B | | 196,639 | 17,782 |
| | | | 55,561 |
| Industrial Conglomerates - 3.5% | | | |
| General Electric Co. (c) | | 7,176,480 | 208,836 |
| Machinery - 0.7% | | | |
| CLARCOR, Inc. | | 25,400 | 1,190 |
| Cummins, Inc. | | 22,500 | 2,023 |
| Deere & Co. (d) | | 192,900 | 14,855 |
| Donaldson Co., Inc. | | 311,900 | 8,789 |
| IMI PLC | | 206,300 | 2,382 |
| Pentair PLC | | 43,800 | 2,064 |
| Wabtec Corp. | | 46,100 | 2,948 |
| Xylem, Inc. | | 157,600 | 5,666 |
| | | | 39,917 |
| Professional Services - 0.1% | | | |
| Nielsen Holdings PLC | | 110,400 | 5,317 |
| Road & Rail - 2.1% | | | |
| CSX Corp. | | 1,854,620 | 42,693 |
| J.B. Hunt Transport Services, Inc. | | 528,040 | 38,389 |
| Kansas City Southern | | 244,500 | 17,330 |
| Norfolk Southern Corp. | | 210,899 | 14,868 |
| Union Pacific Corp. | | 131,000 | 9,432 |
| | | | 122,712 |
| Trading Companies & Distributors - 0.5% | | | |
| MSC Industrial Direct Co., Inc. Class A | | 67,100 | 4,349 |
| W.W. Grainger, Inc. (d) | | 18,100 | 3,560 |
| Watsco, Inc. | | 190,392 | 22,125 |
| | | | 30,034 |
|
| TOTAL INDUSTRIALS | | | 748,318 |
|
| INFORMATION TECHNOLOGY - 21.0% | | | |
| Communications Equipment - 3.2% | | | |
| Cisco Systems, Inc. (c) | | 3,284,352 | 78,135 |
| Qualcomm, Inc. | | 2,415,446 | 109,516 |
| | | | 187,651 |
| Internet Software & Services - 3.5% | | | |
| Alphabet, Inc.: | | | |
| Class A | | 144,007 | 109,640 |
| Class C | | 123,346 | 91,640 |
| Yahoo!, Inc. (a) | | 245,195 | 7,236 |
| | | | 208,516 |
| IT Services - 5.3% | | | |
| First Data Corp. | | 1,631,010 | 20,716 |
| First Data Corp. Class A (a) | | 80,900 | 1,082 |
| IBM Corp. | | 460,204 | 57,429 |
| MasterCard, Inc. Class A (c) | | 682,700 | 60,781 |
| Paychex, Inc. | | 1,486,052 | 71,122 |
| Unisys Corp. (a) | | 973,600 | 9,561 |
| Visa, Inc. Class A | | 1,191,384 | 88,746 |
| | | | 309,437 |
| Semiconductors & Semiconductor Equipment - 0.5% | | | |
| Marvell Technology Group Ltd. | | 292,300 | 2,587 |
| Maxim Integrated Products, Inc. | | 552,000 | 18,437 |
| Xilinx, Inc. | | 164,300 | 8,259 |
| | | | 29,283 |
| Software - 4.3% | | | |
| Microsoft Corp. (c) | | 3,792,999 | 208,956 |
| Oracle Corp. | | 1,123,353 | 40,789 |
| | | | 249,745 |
| Technology Hardware, Storage & Peripherals - 4.2% | | | |
| Apple, Inc. | | 1,784,494 | 173,703 |
| EMC Corp. | | 2,598,100 | 64,355 |
| HP, Inc. | | 59,800 | 581 |
| Western Digital Corp. | | 208,700 | 10,013 |
| | | | 248,652 |
|
| TOTAL INFORMATION TECHNOLOGY | | | 1,233,284 |
|
| MATERIALS - 3.1% | | | |
| Chemicals - 2.7% | | | |
| CF Industries Holdings, Inc. | | 362,400 | 10,872 |
| E.I. du Pont de Nemours & Co. | | 322,146 | 16,996 |
| LyondellBasell Industries NV Class A | | 186,300 | 14,526 |
| Monsanto Co. | | 749,415 | 67,897 |
| Potash Corp. of Saskatchewan, Inc. | | 1,266,200 | 20,644 |
| Syngenta AG (Switzerland) | | 79,559 | 29,295 |
| | | | 160,230 |
| Containers & Packaging - 0.4% | | | |
| Ball Corp. | | 65,300 | 4,364 |
| International Paper Co. | | 27,400 | 937 |
| Packaging Corp. of America | | 114,400 | 5,815 |
| WestRock Co. | | 357,700 | 12,620 |
| | | | 23,736 |
|
| TOTAL MATERIALS | | | 183,966 |
|
| TELECOMMUNICATION SERVICES - 1.1% | | | |
| Diversified Telecommunication Services - 1.1% | | | |
| Verizon Communications, Inc. (c) | | 1,243,374 | 62,131 |
| UTILITIES - 0.6% | | | |
| Electric Utilities - 0.6% | | | |
| Exelon Corp. | | 1,056,600 | 31,244 |
| PPL Corp. | | 77,500 | 2,717 |
| | | | 33,961 |
| Multi-Utilities - 0.0% | | | |
| Sempra Energy | | 33,600 | 3,184 |
|
| TOTAL UTILITIES | | | 37,145 |
|
| TOTAL COMMON STOCKS | | | |
| (Cost $5,739,188) | | | 5,808,633 |
|
| Preferred Stocks - 0.9% | | | |
| Convertible Preferred Stocks - 0.9% | | | |
| HEALTH CARE - 0.8% | | | |
| Health Care Equipment & Supplies - 0.8% | | | |
| Alere, Inc. 3.00% (a) | | 182,843 | 47,027 |
| INDUSTRIALS - 0.1% | | | |
| Commercial Services & Supplies - 0.1% | | | |
| Stericycle, Inc. 2.25% (a) | | 83,400 | 7,586 |
|
| TOTAL CONVERTIBLE PREFERRED STOCKS | | | 54,613 |
|
| Nonconvertible Preferred Stocks - 0.0% | | | |
| INDUSTRIALS - 0.0% | | | |
| Aerospace & Defense - 0.0% | | | |
| Rolls-Royce Group PLC (C Shares) (a) | | 32,482,080 | 46 |
| TOTAL PREFERRED STOCKS | | | |
| (Cost $53,077) | | | 54,659 |
| | | Principal Amount (000s) | Value (000s) |
|
| Convertible Bonds - 0.3% | | | |
| CONSUMER DISCRETIONARY - 0.0% | | | |
| Automobiles - 0.0% | | | |
| Tesla Motors, Inc. 1.25% 3/1/21 | | 3,470 | 2,789 |
| ENERGY - 0.1% | | | |
| Oil, Gas & Consumable Fuels - 0.1% | | | |
| Amyris, Inc.: | | | |
| 5% 10/15/18 (b) | | 3,094 | 2,655 |
| 9.5% 4/15/19 (e) | | 5,075 | 4,304 |
| Peabody Energy Corp. 4.75% 12/15/41 | | 7,660 | 230 |
| | | | 7,189 |
| INFORMATION TECHNOLOGY - 0.2% | | | |
| Internet Software & Services - 0.2% | | | |
| Twitter, Inc. 0.25% 9/15/19 | | 10,230 | 8,747 |
| TOTAL CONVERTIBLE BONDS | | | |
| (Cost $26,246) | | | 18,725 |
| | | Shares | Value (000s) |
|
| Money Market Funds - 0.9% | | | |
| Fidelity Securities Lending Cash Central Fund, 0.42% (f)(g) | | | |
| (Cost $52,906) | | 52,906,401 | 52,906 |
| TOTAL INVESTMENT PORTFOLIO - 100.9% | | | |
| (Cost $5,871,417) | | | 5,934,923 |
| NET OTHER ASSETS (LIABILITIES) - (0.9)% | | | (53,661) |
| NET ASSETS - 100% | | | $5,881,262 |
| Written Options | | | | |
| | Expiration Date/Exercise Price | Number of Contracts | Premium (000s) | Value (000s) |
| Call Options | | | | |
| Amgen, Inc. | 2/19/16 - $165.00 | 675 | $116 | $(21) |
| Cisco Systems, Inc. | 3/18/16 - $29.00 | 3,868 | 159 | (4) |
| General Electric Co. | 3/18/16 - $33.00 | 11,857 | 250 | (24) |
| Lowe's Companies, Inc. | 4/15/16 - $85.00 | 8,498 | 723 | (72) |
| MasterCard, Inc. Class A | 2/19/16 - $100.00 | 1,733 | 80 | (9) |
| Microsoft Corp. | 3/18/16 - $60.00 | 5,823 | 473 | (131) |
| Target Corp. | 2/19/16 - $77.50 | 2,402 | 180 | (12) |
| Verizon Communications, Inc. | 3/18/16 - $48.00 | 2,296 | 108 | (576) |
| TOTAL WRITTEN OPTIONS | | | $2,089 | $(849) |
Legend
(a) Non-income producing
(b) Restricted securities - Investment in securities not registered under the Securities Act of 1933 (excluding 144A issues). At the end of the period, the value of restricted securities (excluding 144A issues) amounted to $2,741,000 or 0.0% of net assets.
(c) Security or a portion of the security is pledged as collateral for call options written. At period end, the value of securities pledged amounted to $191,288,000.
(d) Security or a portion of the security is on loan at period end.
(e) Security exempt from registration under Rule 144A of the Securities Act of 1933. These securities may be resold in transactions exempt from registration, normally to qualified institutional buyers. At the end of the period, the value of these securities amounted to $4,304,000 or 0.1% of net assets.
(f) Affiliated fund that is generally available only to investment companies and other accounts managed by Fidelity Investments. The rate quoted is the annualized seven-day yield of the fund at period end. A complete unaudited listing of the fund's holdings as of its most recent quarter end is available upon request. In addition, each Fidelity Central Fund's financial statements are available on the SEC's website or upon request.
(g) Investment made with cash collateral received from securities on loan.
Additional information on each restricted holding is as follows:
| Security | Acquisition Date | Acquisition Cost (000s) |
| Amyris, Inc. 5% 10/15/18 | 10/16/13 - 10/15/15 | $3,094 |
| NJOY, Inc. | 2/14/14 | $1,164 |
Affiliated Central Funds
Information regarding fiscal year to date income earned by the Fund from investments in Fidelity Central Funds is as follows:
| Fund | Income earned |
| | (Amounts in thousands) |
| Fidelity Cash Central Fund | $5 |
| Fidelity Securities Lending Cash Central Fund | 283 |
| Total | $288 |
Investment Valuation
The following is a summary of the inputs used, as of January 31, 2016, involving the Fund's assets and liabilities carried at fair value. The inputs or methodology used for valuing securities may not be an indication of the risk associated with investing in those securities. For more information on valuation inputs, and their aggregation into the levels used below, please refer to the Investment Valuation section in the accompanying Notes to Financial Statements.
| | Valuation Inputs at Reporting Date: |
| Description | Total | Level 1 | Level 2 | Level 3 |
| (Amounts in thousands) | | | | |
| Investments in Securities: | | | | |
| Equities: | | | | |
| Consumer Discretionary | $531,847 | $531,761 | $-- | $86 |
| Consumer Staples | 495,054 | 453,496 | 41,558 | -- |
| Energy | 588,213 | 588,213 | -- | -- |
| Financials | 1,232,402 | 1,215,940 | 16,462 | -- |
| Health Care | 743,300 | 717,441 | 25,859 | -- |
| Industrials | 755,950 | 718,850 | 37,100 | -- |
| Information Technology | 1,233,284 | 1,212,568 | 20,716 | -- |
| Materials | 183,966 | 154,671 | 29,295 | -- |
| Telecommunication Services | 62,131 | 62,131 | -- | -- |
| Utilities | 37,145 | 37,145 | -- | -- |
| Corporate Bonds | 18,725 | -- | 18,725 | -- |
| Money Market Funds | 52,906 | 52,906 | -- | -- |
| Total Investments in Securities: | $5,934,923 | $5,745,122 | $189,715 | $86 |
| Derivative Instruments: | | | | |
| Liabilities | | | | |
| Written Options | $(849) | $(849) | $-- | $-- |
| Total Liabilities | $(849) | $(849) | $-- | $-- |
| Total Derivative Instruments: | $(849) | $(849) | $-- | $-- |
The following is a summary of transfers between Level 1 and Level 2 for the period ended January 31, 2016. Transfers are assumed to have occurred at the beginning of the period, and are primarily attributable to the valuation techniques used for foreign equity securities, as discussed in the accompanying Notes to Financial Statements:
| Transfers | Total (000s) |
| Level 1 to Level 2 | $119,518 |
| Level 2 to Level 1 | $0 |
Value of Derivative Instruments
The following table is a summary of the Fund's value of derivative instruments by primary risk exposure as of January 31, 2016. For additional information on derivative instruments, please refer to the Derivative Instruments section in the accompanying Notes to Financial Statements.
| Primary Risk Exposure / Derivative Type | Value (000s) |
| | Asset | Liability |
| Equity Risk | | |
| Written Options(a) | $0 | $(849) |
| Total Equity Risk | $0 | $(849) |
| Total Value of Derivatives | $0 | $(849) |
(a) Gross value is presented in the Statement of Assets and Liabilities in the written options, at value line-item.
Other Information
Distribution of investments by country or territory of incorporation, as a percentage of Total Net Assets, is as follows (Unaudited):
| United States of America | 88.0% |
| United Kingdom | 3.4% |
| Canada | 2.8% |
| Israel | 1.6% |
| Ireland | 1.3% |
| Others (Individually Less Than 1%) | 2.9% |
| | 100.0% |
See accompanying notes which are an integral part of the financial statements.
Financial Statements
Statement of Assets and Liabilities
| Amounts in thousands (except per-share amounts) | | January 31, 2016 (Unaudited) |
| Assets | | |
Investment in securities, at value (including securities loaned of $52,808) — See accompanying schedule:
Unaffiliated issuers (cost $5,818,511) | $5,882,017 | |
| Fidelity Central Funds (cost $52,906) | 52,906 | |
| Total Investments (cost $5,871,417) | | $5,934,923 |
| Receivable for investments sold | | 36,912 |
| Receivable for fund shares sold | | 968 |
| Dividends receivable | | 8,127 |
| Interest receivable | | 256 |
| Distributions receivable from Fidelity Central Funds | | 68 |
| Prepaid expenses | | 13 |
| Other receivables | | 674 |
| Total assets | | 5,981,941 |
| Liabilities | | |
| Payable to custodian bank | $2,084 | |
| Payable for investments purchased | 37,211 | |
| Payable for fund shares redeemed | 3,790 | |
| Accrued management fee | 2,187 | |
| Written options, at value (premium received $2,089) | 849 | |
| Other affiliated payables | 926 | |
| Other payables and accrued expenses | 726 | |
| Collateral on securities loaned, at value | 52,906 | |
| Total liabilities | | 100,679 |
| Net Assets | | $5,881,262 |
| Net Assets consist of: | | |
| Paid in capital | | $8,273,423 |
| Distributions in excess of net investment income | | (8,950) |
| Accumulated undistributed net realized gain (loss) on investments and foreign currency transactions | | (2,447,891) |
| Net unrealized appreciation (depreciation) on investments and assets and liabilities in foreign currencies | | 64,680 |
| Net Assets | | $5,881,262 |
| Growth and Income: | | |
| Net Asset Value, offering price and redemption price per share ($5,139,689 ÷ 190,272 shares) | | $27.01 |
| Class K: | | |
| Net Asset Value, offering price and redemption price per share ($741,573 ÷ 27,477 shares) | | $26.99 |
See accompanying notes which are an integral part of the financial statements.
Statement of Operations
| Amounts in thousands | | Six months ended January 31, 2016 (Unaudited) |
| Investment Income | | |
| Dividends | | $83,521 |
| Interest | | 668 |
| Income from Fidelity Central Funds | | 288 |
| Total income | | 84,477 |
| Expenses | | |
| Management fee | $14,673 | |
| Transfer agent fees | 5,088 | |
| Accounting and security lending fees | 577 | |
| Custodian fees and expenses | 84 | |
| Independent trustees' compensation | 15 | |
| Registration fees | 28 | |
| Audit | 45 | |
| Legal | 24 | |
| Interest | 7 | |
| Miscellaneous | 20 | |
| Total expenses before reductions | 20,561 | |
| Expense reductions | (68) | 20,493 |
| Net investment income (loss) | | 63,984 |
| Realized and Unrealized Gain (Loss) | | |
| Net realized gain (loss) on: | | |
| Investment securities: | | |
| Unaffiliated issuers | 231,502 | |
| Foreign currency transactions | (126) | |
| Written options | 186 | |
| Total net realized gain (loss) | | 231,562 |
Change in net unrealized appreciation (depreciation) on:
Investment securities | (1,115,546) | |
| Assets and liabilities in foreign currencies | (36) | |
| Written options | 1,240 | |
| Total change in net unrealized appreciation (depreciation) | | (1,114,342) |
| Net gain (loss) | | (882,780) |
| Net increase (decrease) in net assets resulting from operations | | $(818,796) |
See accompanying notes which are an integral part of the financial statements.
Statement of Changes in Net Assets
| Amounts in thousands | Six months ended January 31, 2016 (Unaudited) | Year ended July 31, 2015 |
| Increase (Decrease) in Net Assets | | |
| Operations | | |
| Net investment income (loss) | $63,984 | $140,160 |
| Net realized gain (loss) | 231,562 | 743,260 |
| Change in net unrealized appreciation (depreciation) | (1,114,342) | (281,519) |
| Net increase (decrease) in net assets resulting from operations | (818,796) | 601,901 |
| Distributions to shareholders from net investment income | (72,212) | (135,475) |
| Distributions to shareholders from net realized gain | (2,644) | – |
| Total distributions | (74,856) | (135,475) |
| Share transactions - net increase (decrease) | (649,281) | (551,906) |
| Total increase (decrease) in net assets | (1,542,933) | (85,480) |
| Net Assets | | |
| Beginning of period | 7,424,195 | 7,509,675 |
| End of period (including distributions in excess of net investment income of $8,950 and distributions in excess of net investment income of $722, respectively) | $5,881,262 | $7,424,195 |
See accompanying notes which are an integral part of the financial statements.
Financial Highlights — Fidelity Growth & Income Portfolio
| | Six months ended (Unaudited) | Years ended July 31, | | | | |
| January 31, | 2016 | 2015 | 2014 | 2013 | 2012 | 2011 |
| Selected Per–Share Data | | | | | | |
| Net asset value, beginning of period | $30.85 | $29.02 | $25.66 | $20.13 | $18.58 | $15.75 |
| Income from Investment Operations | | | | | | |
| Net investment income (loss)A | .28 | .55 | .51 | .46 | .36 | .20 |
| Net realized and unrealized gain (loss) | (3.79) | 1.82B | 3.35 | 5.54 | 1.55 | 2.82 |
| Total from investment operations | (3.51) | 2.37 | 3.86 | 6.00 | 1.91 | 3.02 |
| Distributions from net investment income | (.32) | (.54) | (.50) | (.44) | (.35) | (.19) |
| Distributions from net realized gain | (.01) | – | (.01) | (.03) | (.01) | – |
| Total distributions | (.33) | (.54) | (.50)C | (.47) | (.36) | (.19) |
| Net asset value, end of period | $27.01 | $30.85 | $29.02 | $25.66 | $20.13 | $18.58 |
| Total ReturnD,E | (11.41)% | 8.23%B | 15.16% | 30.15% | 10.45% | 19.16% |
| Ratios to Average Net AssetsF,G | | | | | | |
| Expenses before reductions | .64%H | .64% | .65% | .68% | .71% | .72% |
| Expenses net of fee waivers, if any | .64%H | .63% | .65% | .68% | .71% | .72% |
| Expenses net of all reductions | .64%H | .63% | .65% | .67% | .71% | .71% |
| Net investment income (loss) | 1.94%H | 1.83% | 1.86% | 2.04% | 1.95% | 1.09% |
| Supplemental Data | | | | | | |
| Net assets, end of period (in millions) | $5,140 | $6,563 | $6,550 | $6,060 | $4,863 | $5,052 |
| Portfolio turnover rateI | 35%H | 35% | 41%J | 49% | 62% | 129% |
A Calculated based on average shares outstanding during the period.
B Net realized and unrealized gain (loss) per share reflects proceeds from litigation which amounted to $.06 per share. Excluding these litigation proceeds, the total return would have been 8.03%.
C Total distributions of $.50 per share is comprised of distributions from net investment income of $.495 and distributions from net realized gain of $.006 per share.
D Total returns for periods of less than one year are not annualized.
E Total returns would have been lower if certain expenses had not been reduced during the applicable periods shown.
F Fees and expenses of any underlying Fidelity Central Funds are not included in the Fund's expense ratio. The Fund indirectly bears its proportionate share of the expenses of any underlying Fidelity Central Funds.
G Expense ratios reflect operating expenses of the class. Expenses before reductions do not reflect amounts reimbursed by the investment adviser or reductions from brokerage service arrangements or reductions from other expense offset arrangements and do not represent the amount paid by the class during periods when reimbursements or reductions occur. Expenses net of fee waivers reflect expenses after reimbursement by the investment adviser but prior to reductions from brokerage service arrangements or other expense offset arrangements. Expenses net of all reductions represent the net expenses paid by the class.
H Annualized
I Amount does not include the portfolio activity of any underlying Fidelity Central Funds.
J Portfolio turnover rate excludes securities received or delivered in-kind.
See accompanying notes which are an integral part of the financial statements.
Financial Highlights — Fidelity Growth & Income Portfolio Class K
| | Six months ended (Unaudited) | Years ended July 31, | | | | |
| January 31, | 2016 | 2015 | 2014 | 2013 | 2012 | 2011 |
| Selected Per–Share Data | | | | | | |
| Net asset value, beginning of period | $30.82 | $29.00 | $25.64 | $20.12 | $18.57 | $15.74 |
| Income from Investment Operations | | | | | | |
| Net investment income (loss)A | .30 | .59 | .54 | .50 | .40 | .23 |
| Net realized and unrealized gain (loss) | (3.78) | 1.81B | 3.36 | 5.52 | 1.54 | 2.82 |
| Total from investment operations | (3.48) | 2.40 | 3.90 | 6.02 | 1.94 | 3.05 |
| Distributions from net investment income | (.34) | (.58) | (.53) | (.47) | (.38) | (.22) |
| Distributions from net realized gain | (.01) | – | (.01) | (.03) | (.01) | – |
| Total distributions | (.35) | (.58) | (.54) | (.50) | (.39) | (.22) |
| Net asset value, end of period | $26.99 | $30.82 | $29.00 | $25.64 | $20.12 | $18.57 |
| Total ReturnC,D | (11.33)% | 8.34%B | 15.32% | 30.28% | 10.66% | 19.40% |
| Ratios to Average Net AssetsE,F | | | | | | |
| Expenses before reductions | .52%G | .52% | .52% | .53% | .54% | .54% |
| Expenses net of fee waivers, if any | .52%G | .52% | .52% | .53% | .54% | .54% |
| Expenses net of all reductions | .52%G | .52% | .52% | .52% | .54% | .53% |
| Net investment income (loss) | 2.06%G | 1.95% | 1.99% | 2.19% | 2.13% | 1.27% |
| Supplemental Data | | | | | | |
| Net assets, end of period (in millions) | $742 | $862 | $960 | $1,016 | $752 | $403 |
| Portfolio turnover rateH | 35%G | 35% | 41%I | 49% | 62% | 129% |
A Calculated based on average shares outstanding during the period.
B Net realized and unrealized gain (loss) per share reflects proceeds from litigation which amounted to $.06 per share. Excluding these litigation proceeds, the total return would have been 8.14%.
C Total returns for periods of less than one year are not annualized.
D Total returns would have been lower if certain expenses had not been reduced during the applicable periods shown.
E Fees and expenses of any underlying Fidelity Central Funds are not included in the Fund's expense ratio. The Fund indirectly bears its proportionate share of the expenses of any underlying Fidelity Central Funds.
F Expense ratios reflect operating expenses of the class. Expenses before reductions do not reflect amounts reimbursed by the investment adviser or reductions from brokerage service arrangements or reductions from other expense offset arrangements and do not represent the amount paid by the class during periods when reimbursements or reductions occur. Expenses net of fee waivers reflect expenses after reimbursement by the investment adviser but prior to reductions from brokerage service arrangements or other expense offset arrangements. Expenses net of all reductions represent the net expenses paid by the class.
G Annualized
H Amount does not include the portfolio activity of any underlying Fidelity Central Funds.
I Portfolio turnover rate excludes securities received or delivered in-kind.
See accompanying notes which are an integral part of the financial statements.
Notes to Financial Statements (Unaudited)
For the period ended January 31, 2016
(Amounts in thousands except percentages)
1. Organization.
Fidelity Growth & Income Portfolio (the Fund) is a fund of Fidelity Securities Fund (the Trust) and is authorized to issue an unlimited number of shares. The Trust is registered under the Investment Company Act of 1940, as amended (the 1940 Act), as an open-end management investment company organized as a Massachusetts business trust. The Fund offers Growth & Income, and Class K shares, each of which has equal rights as to assets and voting privileges. Each class has exclusive voting rights with respect to matters that affect that class.
2. Investments in Fidelity Central Funds.
The Fund invests in Fidelity Central Funds, which are open-end investment companies generally available only to other investment companies and accounts managed by the investment adviser and its affiliates. The Fund's Schedule of Investments lists each of the Fidelity Central Funds held as of period end, if any, as an investment of the Fund, but does not include the underlying holdings of each Fidelity Central Fund. As an Investing Fund, the Fund indirectly bears its proportionate share of the expenses of the underlying Fidelity Central Funds.
The Money Market Central Funds seek preservation of capital and current income and are managed by Fidelity Investments Money Management, Inc. (FIMM), an affiliate of the investment adviser. Annualized expenses of the Money Market Central Funds as of their most recent shareholder report date are less than .005%.
A complete unaudited list of holdings for each Fidelity Central Fund is available upon request or at the Securities and Exchange Commission (the SEC) website at www.sec.gov. In addition, the financial statements of the Fidelity Central Funds are available on the SEC website or upon request.
3. Significant Accounting Policies.
The financial statements have been prepared in conformity with accounting principles generally accepted in the United States of America (GAAP), which require management to make certain estimates and assumptions at the date of the financial statements. Actual results could differ from those estimates. Subsequent events, if any, through the date that the financial statements were issued have been evaluated in the preparation of the financial statements. The following summarizes the significant accounting policies of the Fund:
Investment Valuation. Investments are valued as of 4:00 p.m. Eastern time on the last calendar day of the period. The Board of Trustees (the Board) has delegated the day to day responsibility for the valuation of the Fund's investments to the Fidelity Management & Research Company (FMR) Fair Value Committee (the Committee). In accordance with valuation policies and procedures approved by the Board, the Fund attempts to obtain prices from one or more third party pricing vendors or brokers to value its investments. When current market prices, quotations or currency exchange rates are not readily available or reliable, investments will be fair valued in good faith by the Committee, in accordance with procedures adopted by the Board. Factors used in determining fair value vary by investment type and may include market or investment specific events, changes in interest rates and credit quality. The frequency with which these procedures are used cannot be predicted and they may be utilized to a significant extent. The Committee oversees the Fund's valuation policies and procedures and reports to the Board on the Committee's activities and fair value determinations. The Board monitors the appropriateness of the procedures used in valuing the Fund's investments and ratifies the fair value determinations of the Committee.
The Fund categorizes the inputs to valuation techniques used to value its investments into a disclosure hierarchy consisting of three levels as shown below:
- Level 1 – quoted prices in active markets for identical investments
- Level 2 – other significant observable inputs (including quoted prices for similar investments, interest rates, prepayment speeds, etc.)
- Level 3 – unobservable inputs (including the Fund's own assumptions based on the best information available)
Valuation techniques used to value the Fund's investments by major category are as follows:
Equity securities, including restricted securities, for which market quotations are readily available, are valued at the last reported sale price or official closing price as reported by a third party pricing vendor on the primary market or exchange on which they are traded and are categorized as Level 1 in the hierarchy. In the event there were no sales during the day or closing prices are not available, securities are valued at the last quoted bid price or may be valued using the last available price and are generally categorized as Level 2 in the hierarchy. For foreign equity securities, when market or security specific events arise, comparisons to the valuation of American Depositary Receipts (ADRs), futures contracts, Exchange-Traded Funds (ETFs) and certain indexes as well as quoted prices for similar securities may be used and would be categorized as Level 2 in the hierarchy. Utilizing these techniques may result in transfers between Level 1 and Level 2. For equity securities, including restricted securities, where observable inputs are limited, assumptions about market activity and risk are used and these securities may be categorized as Level 3 in the hierarchy.
Debt securities, including restricted securities, are valued based on evaluated prices received from third party pricing vendors or from brokers who make markets in such securities. Corporate bonds are valued by pricing vendors who utilize matrix pricing which considers yield or price of bonds of comparable quality, coupon, maturity and type or by broker-supplied prices. When independent prices are unavailable or unreliable, debt securities may be valued utilizing pricing methodologies which consider similar factors that would be used by third party pricing vendors. Debt securities are generally categorized as Level 2 in the hierarchy but may be Level 3 depending on the circumstances.
Exchange-traded options are valued using the last sale price or, in the absence of a sale, the last offering price and are categorized as Level 1 in the hierarchy. Investments in open-end mutual funds, including the Fidelity Central Funds, are valued at their closing net asset value (NAV) each business day and are categorized as Level 1 in the hierarchy.
Changes in valuation techniques may result in transfers in or out of an assigned level within the disclosure hierarchy. The aggregate value of investments by input level as of January 31, 2016, including information on transfers between Levels 1 and 2 is included at the end of the Fund's Schedule of Investments.
Foreign Currency. The Fund may use foreign currency contracts to facilitate transactions in foreign-denominated securities. Gains and losses from these transactions may arise from changes in the value of the foreign currency or if the counterparties do not perform under the contracts' terms.
Foreign-denominated assets, including investment securities, and liabilities are translated into U.S. dollars at the exchange rates at period end. Purchases and sales of investment securities, income and dividends received and expenses denominated in foreign currencies are translated into U.S. dollars at the exchange rate in effect on the transaction date.
The effects of exchange rate fluctuations on investments are included with the net realized and unrealized gain (loss) on investment securities. Other foreign currency transactions resulting in realized and unrealized gain (loss) are disclosed separately.
Investment Transactions and Income. For financial reporting purposes, the Fund's investment holdings and NAV include trades executed through the end of the last business day of the period. The NAV per share for processing shareholder transactions is calculated as of the close of business of the New York Stock Exchange (NYSE), normally 4:00 p.m. Eastern time and includes trades executed through the end of the prior business day. Gains and losses on securities sold are determined on the basis of identified cost and may include proceeds received from litigation. Dividend income is recorded on the ex-dividend date, except for certain dividends from foreign securities where the ex-dividend date may have passed, which are recorded as soon as the Fund is informed of the ex-dividend date. Non-cash dividends included in dividend income, if any, are recorded at the fair market value of the securities received. Income and capital gain distributions from Fidelity Central Funds, if any, are recorded on the ex-dividend date. Distributions received on securities that represent a return of capital or capital gain are recorded as a reduction of cost of investments and/or as a realized gain. Subsequent to ex-dividend date the Fund determines the components of these distributions, based upon receipt of tax filings or other correspondence relating to the underlying investment. Interest income is accrued as earned and includes coupon interest and amortization of premium and accretion of discount on debt securities as applicable. Investment income is recorded net of foreign taxes withheld where recovery of such taxes is uncertain.
Class Allocations and Expenses. Investment income, realized and unrealized capital gains and losses, common expenses of the Fund, and certain fund-level expense reductions, if any, are allocated daily on a pro-rata basis to each class based on the relative net assets of each class to the total net assets of the Fund. Each class differs with respect to transfer agent fees incurred. Certain expense reductions may also differ by class. For the reporting period, the allocated portion of income and expenses to each class as a percent of its average net assets may vary due to the timing of recording these transactions in relation to fluctuating net assets of the classes. Expenses directly attributable to a fund are charged to that fund. Expenses attributable to more than one fund are allocated among the respective funds on the basis of relative net assets or other appropriate methods. Expense estimates are accrued in the period to which they relate and adjustments are made when actual amounts are known.
Deferred Trustee Compensation. Under a Deferred Compensation Plan (the Plan), independent Trustees may elect to defer receipt of a portion of their annual compensation. Deferred amounts are invested in a cross-section of Fidelity funds, are marked-to-market and remain in the Fund until distributed in accordance with the Plan. The investment of deferred amounts and the offsetting payable to the Trustees are included in the accompanying Statement of Assets and Liabilities.
Income Tax Information and Distributions to Shareholders. Each year, the Fund intends to qualify as a regulated investment company under Subchapter M of the Internal Revenue Code, including distributing substantially all of its taxable income and realized gains. As a result, no provision for U.S. Federal income taxes is required. The Fund files a U.S. federal tax return, in addition to state and local tax returns as required. The Fund's federal income tax returns are subject to examination by the Internal Revenue Service (IRS) for a period of three fiscal years after they are filed. State and local tax returns may be subject to examination for an additional fiscal year depending on the jurisdiction. Foreign taxes are provided for based on the Fund's understanding of the tax rules and rates that exist in the foreign markets in which it invests.
Distributions are declared and recorded on the ex-dividend date. Income dividends and capital gain distributions are declared separately for each class. Income and capital gain distributions are determined in accordance with income tax regulations, which may differ from GAAP.
Capital accounts within the financial statements are adjusted for permanent book-tax differences. These adjustments have no impact on net assets or the results of operations. Capital accounts are not adjusted for temporary book-tax differences which will reverse in a subsequent period.
Book-tax differences are primarily due to foreign currency transactions, market discount, partnerships, deferred trustees compensation, certain conversion ratio adjustments, capital loss carryforwards and losses deferred due to wash sales.
The federal tax cost of investment securities and unrealized appreciation (depreciation) as of period end were as follows:
| Gross unrealized appreciation | $783,648 |
| Gross unrealized depreciation | (733,263) |
| Net unrealized appreciation (depreciation) on securities | $50,385 |
| Tax cost | $5,884,538 |
Capital loss carryforwards are only available to offset future capital gains of the Fund to the extent provided by regulations and may be limited. Under the Regulated Investment Company Modernization Act of 2010 (the Act), the Fund is permitted to carry forward capital losses incurred in taxable years beginning after December 22, 2010 for an unlimited period and such capital losses are required to be used prior to any losses that expire. The capital loss carryforward information presented below, including any applicable limitation, is estimated as of prior fiscal period end and is subject to adjustment.
| Fiscal year of expiration | |
| 2018 | $(2,680,247) |
Restricted Securities. The Fund may invest in securities that are subject to legal or contractual restrictions on resale. These securities generally may be resold in transactions exempt from registration or to the public if the securities are registered. Disposal of these securities may involve time-consuming negotiations and expense, and prompt sale at an acceptable price may be difficult. Information regarding restricted securities is included at the end of the Fund's Schedule of Investments.
4. Derivative Instruments.
Risk Exposures and the Use of Derivative Instruments. The Fund's investment objective allows the Fund to enter into various types of derivative contracts, including options. Derivatives are investments whose value is primarily derived from underlying assets, indices or reference rates and may be transacted on an exchange or over-the-counter (OTC). Derivatives may involve a future commitment to buy or sell a specified asset based on specified terms, to exchange future cash flows at periodic intervals based on a notional principal amount, or for one party to make one or more payments upon the occurrence of specified events in exchange for periodic payments from the other party.
The Fund used derivatives to increase returns and to manage exposure to certain risks as defined below. The success of any strategy involving derivatives depends on analysis of numerous economic factors, and if the strategies for investment do not work as intended, the Fund may not achieve its objectives.
The Fund's use of derivatives increased or decreased its exposure to the following risk:
| Equity Risk | Equity risk relates to the fluctuations in the value of financial instruments as a result of changes in market prices (other than those arising from interest rate risk or foreign exchange risk), whether caused by factors specific to an individual investment, its issuer, or all factors affecting all instruments traded in a market or market segment.
|
The Fund is also exposed to additional risks from investing in derivatives, such as liquidity risk and counterparty credit risk. Liquidity risk is the risk that the Fund will be unable to close out the derivative in the open market in a timely manner. Counterparty credit risk is the risk that the counterparty will not be able to fulfill its obligation to the Fund. Counterparty credit risk related to exchange-traded options may be mitigated by the protection provided by the exchange on which they trade.
Investing in derivatives may involve greater risks than investing in the underlying assets directly and, to varying degrees, may involve risk of loss in excess of any initial investment and collateral received and amounts recognized in the Statement of Assets and Liabilities. In addition, there may be the risk that the change in value of the derivative contract does not correspond to the change in value of the underlying instrument.
Options. Options give the purchaser the right, but not the obligation, to buy (call) or sell (put) an underlying security or financial instrument at an agreed exercise or strike price between or on certain dates. Options obligate the seller (writer) to buy (put) or sell (call) an underlying instrument at the exercise or strike price or cash settle an underlying derivative instrument if the holder exercises the option on or before the expiration date.
The Fund used exchange-traded written covered call options to manage its exposure to the market. When the Fund writes a covered call option, the Fund holds the underlying instrument which must be delivered to the holder upon the exercise of the option.
Upon entering into a written options contract, the Fund will receive a premium. Premiums received are reflected as a liability on the Statement of Assets and Liabilities. Options are valued daily and any unrealized appreciation (depreciation) is reflected on the Statement of Assets and Liabilities. When a written option is exercised, the premium is added to the proceeds from the sale of the underlying instrument in determining the gain or loss realized on that investment. When an option is closed the Fund will realize a gain or loss depending on whether the proceeds or amount paid for the closing sale transaction are greater or less than the premium received. When an option expires, gains and losses are realized to the extent of premiums received. The net realized gain (loss) on closed and expired written options and the change in net unrealized appreciation (depreciation) on written options are reflected separately on the Statement of Operations.
Writing call options tends to decrease exposure to the underlying instrument and risk of loss is the change in value in excess of the premium received.
Any open options at period end are presented in the Schedule of Investments under the caption "Written Options."
During the period, the Fund recognized net realized gain (loss) of $186 and a change in net unrealized appreciation (depreciation) of $1,240 related to its investment in written options. This amount is included in the Statement of Operations.
The following is a summary of the Fund's written options activity:
| | Number of Contracts | Amount of Premiums |
| Outstanding at beginning of period | – | $– |
| Options Opened | 41 | 2,275 |
| Options Exercised | – | – |
| Options Closed | – | – |
| Options Expired | (4) | (186) |
| Outstanding at end of period | 37 | $2,089 |
5. Purchases and Sales of Investments.
Purchases and sales of securities, other than short-term securities, aggregated $1,141,475 and $1,796,761, respectively.
6. Fees and Other Transactions with Affiliates.
Management Fee. Fidelity Management & Research Company (the investment adviser) and its affiliates provide the Fund with investment management related services for which the Fund pays a monthly management fee. The management fee is the sum of an individual fund fee rate that is based on an annual rate of .20% of the Fund's average net assets and an annualized group fee rate that averaged .25% during the period. The group fee rate is based upon the average net assets of all the mutual funds advised by the investment adviser, including any mutual funds previously advised by the investment adviser that are currently advised by Fidelity SelectCo, LLC, an affiliate of the investment adviser. The group fee rate decreases as assets under management increase and increases as assets under management decrease. For the reporting period, the total annualized management fee rate was .45% of the Fund's average net assets.
Transfer Agent Fees. Fidelity Investments Institutional Operations Company, Inc., (FIIOC), an affiliate of the investment adviser, is the transfer, dividend disbursing and shareholder servicing agent for each class of the Fund. FIIOC receives account fees and asset-based fees that vary according to the account size and type of account of the shareholders of Growth & Income, except for Class K. FIIOC receives an asset-based fee of Class K's average net assets. FIIOC pays for typesetting, printing and mailing of shareholder reports, except proxy statements.
For the period, transfer agent fees for each class were as follows:
| | Amount | % of
Class-Level Average
Net Assets(a) |
| Growth and Income | $4,901 | .17 |
| Class K | 187 | .05 |
| | $5,088 | |
(a) Annualized
Accounting and Security Lending Fees. Fidelity Service Company, Inc. (FSC), an affiliate of the investment adviser, maintains the Fund's accounting records. The accounting fee is based on the level of average net assets for each month. Under a separate contract, FSC administers the security lending program. The security lending fee is based on the number and duration of lending transactions.
Brokerage Commissions. The Fund placed a portion of its portfolio transactions with brokerage firms which are affiliates of the investment adviser. Brokerage commissions are included in net realized gain (loss) and change in net unrealized appreciation (depreciation) in the Statement of Operations. The commissions paid to these affiliated firms were $27 for the period.
Interfund Lending Program. Pursuant to an Exemptive Order issued by the SEC, the Fund, along with other registered investment companies having management contracts with FMR or other affiliated entities of FMR, may participate in an interfund lending program. This program provides an alternative credit facility allowing the funds to borrow from, or lend money to, other participating affiliated funds. At period end, there were no interfund loans outstanding. The Fund's activity in this program during the period for which loans were outstanding was as follows:
| Borrower or Lender | Average Loan Balance | Weighted Average Interest Rate | Interest Expense |
| Borrower | $5,789 | .40% | $5 |
Interfund Trades. The Fund may purchase from or sell securities to other Fidelity Funds under procedures adopted by the Board. The procedures have been designed to ensure these interfund trades are executed in accordance with Rule 17a-7 of the 1940 Act. Interfund trades are included within the respective purchases and sales amounts shown in the Purchases and Sales of Investments note.
Other. During the period, the investment adviser reimbursed the Fund for certain losses in the amount of $71.
7. Committed Line of Credit.
The Fund participates with other funds managed by the investment adviser or an affiliate in a $4.25 billion credit facility (the "line of credit") to be utilized for temporary or emergency purposes to fund shareholder redemptions or for other short-term liquidity purposes. The Fund has agreed to pay commitment fees on its pro-rata portion of the line of credit, which amounted to $5 and is reflected in Miscellaneous expenses on the Statement of Operations. During the period, the Fund did not borrow on this line of credit.
8. Security Lending.
The Fund lends portfolio securities through a lending agent from time to time in order to earn additional income. For equity securities, a lending agent is used and may loan securities to certain qualified borrowers, including Fidelity Capital Markets (FCM), a broker-dealer affiliated with the Fund. On the settlement date of the loan, the Fund receives collateral (in the form of U.S. Treasury obligations, letters of credit and/or cash) against the loaned securities and maintains collateral in an amount not less than 100% of the market value of the loaned securities during the period of the loan. The market value of the loaned securities is determined at the close of business of the Fund and any additional required collateral is delivered to the Fund on the next business day. The Fund or borrower may terminate the loan at any time, and if the borrower defaults on its obligation to return the securities loaned because of insolvency or other reasons, the Fund may apply collateral received from the borrower against the obligation. The Fund may experience delays and costs in recovering the securities loaned. Any cash collateral received is invested in the Fidelity Securities Lending Cash Central Fund. The value of loaned securities and cash collateral at period end are disclosed on the Fund's Statement of Assets and Liabilities. Security lending income represents the income earned on investing cash collateral, less rebates paid to borrowers and any lending agent fees associated with the loan, plus any premium payments received for lending certain types of securities. Security lending income is presented in the Statement of Operations as a component of income from Fidelity Central Funds. Total security lending income during the period amounted to $283. During the period, there were no securities loaned to FCM.
9. Bank Borrowings.
The Fund is permitted to have bank borrowings for temporary or emergency purposes to fund shareholder redemptions or for other short-term liquidity requirements. The Fund has established borrowing arrangements with certain banks. The interest rate on the borrowings is the bank's base rate, as revised from time to time. The average loan balance during the period for which loans were outstanding amounted to $5,281. The weighted average interest rate was .68%. The interest expense amounted to $2 under the bank borrowing program. At period end, there were no bank borrowings outstanding.
10. Expense Reductions.
Commissions paid to certain brokers with whom the investment adviser, or its affiliates, places trades on behalf of the Fund include an amount in addition to trade execution, which may be rebated back to the Fund to offset certain expenses. This amount totaled $45 for the period.
In addition, during the period the investment adviser reimbursed and/or waived a portion of fund-level operating expenses in the amount of $23.
11. Distributions to Shareholders.
Distributions to shareholders of each class were as follows:
| | Six months ended January 31, 2016 | Year ended July 31, 2015 |
| From net investment income | | |
| Growth and Income | $62,788 | $117,218 |
| Class K | 9,424 | 18,257 |
| Total | $72,212 | $135,475 |
| From net realized gain | | |
| Growth and Income | $2,314 | $– |
| Class K | 330 | – |
| Total | $2,644 | $– |
12. Share Transactions.
Share transactions for each class were as follows and may contain automatic conversions between classes or exchanges between affiliated funds:
| | Shares | Shares | Dollars | Dollars |
| | Six months ended January 31, 2016 | Year ended July 31, 2015 | Six months ended January 31, 2016 | Year ended July 31, 2015 |
| Growth and Income | | | | |
| Shares sold | 2,811 | 12,118 | $80,462 | $365,420 |
| Reinvestment of distributions | 2,203 | 3,750 | 62,034 | 111,890 |
| Shares redeemed | (27,486) | (28,824) | (777,051) | (872,624) |
| Net increase (decrease) | (22,472) | (12,956) | $(634,555) | $(395,314) |
| Class K | | | | |
| Shares sold | 2,132 | 4,866 | $60,021 | $146,512 |
| Reinvestment of distributions | 347 | 612 | 9,754 | 18,257 |
| Shares redeemed | (2,955) | (10,609) | (84,501) | (321,361) |
| Net increase (decrease) | (476) | (5,131) | $(14,726) | $(156,592) |
13. Other.
The Fund's organizational documents provide former and current trustees and officers with a limited indemnification against liabilities arising in connection with the performance of their duties to the Fund. In the normal course of business, the Fund may also enter into contracts that provide general indemnifications. The Fund's maximum exposure under these arrangements is unknown as this would be dependent on future claims that may be made against the Fund. The risk of material loss from such claims is considered remote.
Shareholder Expense Example
As a shareholder of the Fund, you incur two types of costs: (1) transaction costs, and (2) ongoing costs, including management fees and other Fund expenses. This Example is intended to help you understand your ongoing costs (in dollars) of investing in the Fund and to compare these costs with the ongoing costs of investing in other mutual funds.
The Example is based on an investment of $1,000 invested at the beginning of the period and held for the entire period (August 1, 2015 to January 31, 2016).
Actual Expenses
The first line of the accompanying table for each class of the Fund provides information about actual account values and actual expenses. You may use the information in this line, together with the amount you invested, to estimate the expenses that you paid over the period. Simply divide your account value by $1,000.00 (for example, an $8,600 account value divided by $1,000.00 = 8.6), then multiply the result by the number in the first line for a class of the Fund under the heading entitled "Expenses Paid During Period" to estimate the expenses you paid on your account during this period. A small balance maintenance fee of $12.00 that is charged once a year may apply for certain accounts with a value of less than $2,000. This fee is not included in the table below. If it was, the estimate of expenses you paid during the period would be higher, and your ending account value lower, by this amount. In addition, the Fund, as a shareholder in the underlying Fidelity Central Funds, will indirectly bear its pro-rata share of the fees and expenses incurred by the underlying Fidelity Central Funds. These fees and expenses are not included in the Fund's annualized expense ratio used to calculate the expense estimate in the table below.
Hypothetical Example for Comparison Purposes
The second line of the accompanying table for each class of the Fund provides information about hypothetical account values and hypothetical expenses based on a Class' actual expense ratio and an assumed rate of return of 5% per year before expenses, which is not the Class' actual return. The hypothetical account values and expenses may not be used to estimate the actual ending account balance or expenses you paid for the period. You may use this information to compare the ongoing costs of investing in the Fund and other funds. To do so, compare this 5% hypothetical example with the 5% hypothetical examples that appear in the shareholder reports of the other funds. A small balance maintenance fee of $12.00 that is charged once a year may apply for certain accounts with a value of less than $2,000. This fee is not included in the table below. If it was, the estimate of expenses you paid during the period would be higher, and your ending account value lower, by this amount. In addition, the Fund, as a shareholder in the underlying Fidelity Central Funds, will indirectly bear its pro-rata share of the fees and expenses incurred by the underlying Fidelity Central Funds. These fees and expenses are not included in the Fund's annualized expense ratio used to calculate the expense estimate in the table below.
Please note that the expenses shown in the table are meant to highlight your ongoing costs only and do not reflect any transaction costs. Therefore, the second line of the table is useful in comparing ongoing costs only, and will not help you determine the relative total costs of owning different funds.
| | Annualized Expense Ratio-A | Beginning
Account Value
August 1, 2015 | Ending
Account Value
January 31, 2016 | Expenses Paid
During Period-B
August 1, 2015
to January 31, 2016 |
| Growth and Income | .64% | | | |
| Actual | | $1,000.00 | $885.90 | $3.03 |
| Hypothetical-C | | $1,000.00 | $1,021.92 | $3.25 |
| Class K | .52% | | | |
| Actual | | $1,000.00 | $886.70 | $2.47 |
| Hypothetical-C | | $1,000.00 | $1,022.52 | $2.64 |
A Annualized expense ratio reflects expenses net of applicable fee waivers.
B Expenses are equal to each Class' annualized expense ratio, multiplied by the average account value over the period, multiplied by 184/366 (to reflect the one-half year period).
C 5% return per year before expenses
Corporate Headquarters
245 Summer St.
Boston, MA 02210
www.fidelity.com
GAI-K-SANN-0316
1.863233.107
Item 2.
Code of Ethics
Not applicable.
Item 3.
Audit Committee Financial Expert
Not applicable.
Item 4.
Principal Accountant Fees and Services
Not applicable.
Item 5.
Audit Committee of Listed Registrants
Not applicable.
Item 6.
Investments
(a)
Not applicable.
(b)
Not applicable
Item 7.
Disclosure of Proxy Voting Policies and Procedures for Closed-End Management Investment Companies
Not applicable.
Item 8.
Portfolio Managers of Closed-End Management Investment Companies
Not applicable.
Item 9.
Purchase of Equity Securities by Closed-End Management Investment Company and Affiliated Purchasers
Not applicable.
Item 10.
Submission of Matters to a Vote of Security Holders
There were no material changes to the procedures by which shareholders may recommend nominees to the Fidelity Securities Fund’s Board of Trustees.
Item 11.
Controls and Procedures
(a)(i) The President and Treasurer and the Chief Financial Officer have concluded that the Fidelity Securities Fund’s (the “Trust”) disclosure controls and procedures (as defined
in Rule 30a-3(c) under the Investment Company Act) provide reasonable assurances that material information relating to the Trust is made known to them by the appropriate persons, based on their evaluation of these controls and procedures as of a date within 90 days of the filing date of this report.
(a)(ii) There was no change in the Trust’s internal control over financial reporting (as defined in Rule 30a-3(d) under the Investment Company Act) that occurred during the second fiscal quarter of the period covered by this report that has materially affected, or is reasonably likely to materially affect, the Trust’s internal control over financial reporting.
Item 12.
Exhibits
| | |
(a) | (1) | Not applicable. |
(a) | (2) | Certification pursuant to Rule 30a-2(a) under the Investment Company Act of 1940 (17 CFR 270.30a-2(a)) is filed and attached hereto as Exhibit 99.CERT. |
(a) | (3) | Not applicable. |
(b) |
| Certification pursuant to Rule 30a-2(b) under the Investment Company Act of 1940 (17 CFR 270.30a-2(b)) is furnished and attached hereto as Exhibit 99.906CERT. |
SIGNATURES
Pursuant to the requirements of the Securities Exchange Act of 1934 and the Investment Company Act of 1940, the registrant has duly caused this report to be signed on its behalf by the undersigned, thereunto duly authorized.
Fidelity Securities Fund
| |
By: | /s/Kenneth B. Robins |
| Kenneth B. Robins |
| President and Treasurer |
|
|
Date: | March 25, 2016 |
Pursuant to the requirements of the Securities Exchange Act of 1934 and the Investment Company Act of 1940, this report has been signed below by the following persons on behalf of the registrant and in the capacities and on the dates indicated.
| |
By: | /s/Kenneth B. Robins |
| Kenneth B. Robins |
| President and Treasurer |
|
|
Date: | March 25, 2016 |
| |
By: | /s/Howard J. Galligan III |
| Howard J. Galligan III |
| Chief Financial Officer |
|
|
Date: | March 25, 2016 |