UNITED STATES
SECURITIES AND EXCHANGE COMMISSION
Washington, D.C. 20549
Form N-CSR
CERTIFIED SHAREHOLDER REPORT OF REGISTERED
MANAGEMENT INVESTMENT COMPANIES
Investment Company Act File Number: 811-04409
Eaton Vance Municipals Trust
(Exact Name of Registrant as Specified in Charter)
One Post Office Square, Boston, Massachusetts 02109
(Address of Principal Executive Offices)
Deidre E. Walsh
One Post Office Square, Boston, Massachusetts 02109
(Name and Address of Agent for Services)
(617) 482-8260
(Registrant’s Telephone Number)
September 30
Date of Fiscal Year End
September 30, 2024
Date of Reporting Period
Item 1. Reports to Stockholders
(a)

Eaton Vance California Municipal Opportunities Fund
Class A EACAX
Annual Shareholder Report September 30, 2024
This annual shareholder report contains important information about the Eaton Vance California Municipal Opportunities Fund for the period of October 1, 2023 to September 30, 2024. You can find additional information about the Fund at www.eatonvance.com/open-end-mutual-fund-documents.php. You can also request this information by contacting us at 1-800-262-1122.
What were the Fund costs for the last year?
(based on a hypothetical $10,000 investment)
| Class Name | Costs of a $10,000 investment | Costs paid as a percentage of a $10,000 investment |
|---|---|---|
| Class A | $79 | 0.75% |
How did the Fund perform last year and what affected its performance?
Key contributors to (↑) and detractors from (↓) performance, relative to the Bloomberg Municipal Bond Index (the Index):
↓ Out-of-Index positions in variable-rate demand notes and floating-rate notes — typically considered defensive investments with virtually zero duration — detracted from returns relative to the Index as interest rates generally declined during the period
↓ Security selections and an underweight position in the health care sector, which outperformed the Index, detracted from performance relative to the Index
↓ Security selections and an underweight position in A-rated bonds hampered performance as lower-rated bonds generally outperformed higher-rated bonds
↑ An overweight position in bonds with 17 years or more remaining to maturity contributed to Index-relative returns as longer-maturity bonds generally outperformed shorter-maturity bonds during the period
↑ Tactical short-term U.S. Treasury futures trades, which were not present at period-end, contributed to performance relative to the Index during the period
↑ Security selections in general obligation bonds contributed to returns relative to the Index during the period
Fund Performance
Comparison of the change in value of a $10,000 investment for the period indicated.
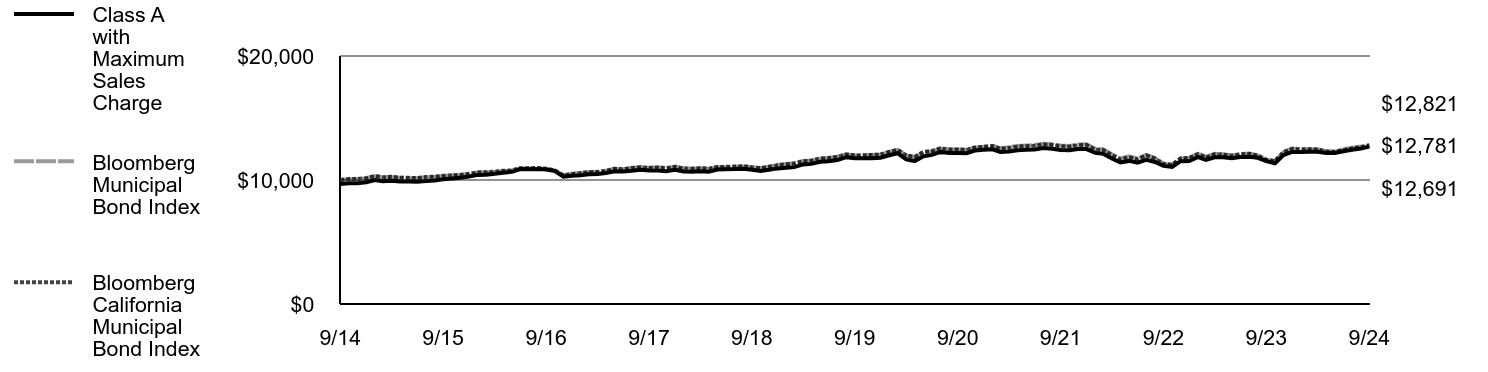
| Class A with Maximum Sales Charge | Bloomberg Municipal Bond Index | Bloomberg California Municipal Bond Index | |
|---|---|---|---|
| 9/14 | $9,675 | $10,000 | $10,000 |
| 10/14 | $9,743 | $10,069 | $10,072 |
| 11/14 | $9,745 | $10,086 | $10,084 |
| 12/14 | $9,822 | $10,137 | $10,140 |
| 1/15 | $9,995 | $10,317 | $10,314 |
| 2/15 | $9,892 | $10,210 | $10,220 |
| 3/15 | $9,932 | $10,240 | $10,252 |
| 4/15 | $9,876 | $10,186 | $10,195 |
| 5/15 | $9,878 | $10,158 | $10,172 |
| 6/15 | $9,850 | $10,148 | $10,163 |
| 7/15 | $9,909 | $10,222 | $10,240 |
| 8/15 | $9,957 | $10,242 | $10,268 |
| 9/15 | $10,054 | $10,316 | $10,339 |
| 10/15 | $10,112 | $10,357 | $10,377 |
| 11/15 | $10,189 | $10,398 | $10,417 |
| 12/15 | $10,277 | $10,472 | $10,496 |
| 1/16 | $10,413 | $10,596 | $10,611 |
| 2/16 | $10,430 | $10,613 | $10,628 |
| 3/16 | $10,495 | $10,647 | $10,664 |
| 4/16 | $10,590 | $10,725 | $10,745 |
| 5/16 | $10,654 | $10,754 | $10,776 |
| 6/16 | $10,887 | $10,925 | $10,946 |
| 7/16 | $10,861 | $10,932 | $10,951 |
| 8/16 | $10,892 | $10,947 | $10,969 |
| 9/16 | $10,842 | $10,892 | $10,902 |
| 10/16 | $10,720 | $10,778 | $10,775 |
| 11/16 | $10,266 | $10,376 | $10,360 |
| 12/16 | $10,348 | $10,497 | $10,482 |
| 1/17 | $10,391 | $10,567 | $10,564 |
| 2/17 | $10,455 | $10,640 | $10,625 |
| 3/17 | $10,489 | $10,663 | $10,646 |
| 4/17 | $10,563 | $10,741 | $10,721 |
| 5/17 | $10,708 | $10,911 | $10,900 |
| 6/17 | $10,679 | $10,872 | $10,863 |
| 7/17 | $10,743 | $10,960 | $10,959 |
| 8/17 | $10,827 | $11,043 | $11,026 |
| 9/17 | $10,776 | $10,987 | $10,975 |
| 10/17 | $10,756 | $11,014 | $11,010 |
| 11/17 | $10,716 | $10,955 | $10,951 |
| 12/17 | $10,821 | $11,069 | $11,071 |
| 1/18 | $10,687 | $10,939 | $10,939 |
| 2/18 | $10,659 | $10,906 | $10,904 |
| 3/18 | $10,713 | $10,947 | $10,953 |
| 4/18 | $10,674 | $10,908 | $10,908 |
| 5/18 | $10,845 | $11,033 | $11,055 |
| 6/18 | $10,868 | $11,042 | $11,059 |
| 7/18 | $10,881 | $11,069 | $11,085 |
| 8/18 | $10,914 | $11,097 | $11,119 |
| 9/18 | $10,832 | $11,025 | $11,034 |
| 10/18 | $10,728 | $10,957 | $10,958 |
| 11/18 | $10,826 | $11,079 | $11,072 |
| 12/18 | $10,936 | $11,211 | $11,194 |
| 1/19 | $10,991 | $11,296 | $11,267 |
| 2/19 | $11,037 | $11,357 | $11,323 |
| 3/19 | $11,255 | $11,536 | $11,509 |
| 4/19 | $11,300 | $11,579 | $11,560 |
| 5/19 | $11,474 | $11,739 | $11,729 |
| 6/19 | $11,518 | $11,782 | $11,769 |
| 7/19 | $11,605 | $11,877 | $11,868 |
| 8/19 | $11,843 | $12,065 | $12,060 |
| 9/19 | $11,755 | $11,968 | $11,970 |
| 10/19 | $11,753 | $11,989 | $11,991 |
| 11/19 | $11,763 | $12,019 | $12,018 |
| 12/19 | $11,802 | $12,056 | $12,053 |
| 1/20 | $11,997 | $12,273 | $12,269 |
| 2/20 | $12,161 | $12,431 | $12,428 |
| 3/20 | $11,665 | $11,980 | $11,994 |
| 4/20 | $11,522 | $11,830 | $11,865 |
| 5/20 | $11,908 | $12,206 | $12,267 |
| 6/20 | $12,028 | $12,307 | $12,338 |
| 7/20 | $12,266 | $12,514 | $12,550 |
| 8/20 | $12,183 | $12,455 | $12,467 |
| 9/20 | $12,175 | $12,458 | $12,463 |
| 10/20 | $12,157 | $12,420 | $12,429 |
| 11/20 | $12,373 | $12,608 | $12,621 |
| 12/20 | $12,430 | $12,685 | $12,673 |
| 1/21 | $12,476 | $12,765 | $12,734 |
| 2/21 | $12,266 | $12,563 | $12,502 |
| 3/21 | $12,298 | $12,640 | $12,589 |
| 4/21 | $12,399 | $12,746 | $12,689 |
| 5/21 | $12,433 | $12,784 | $12,724 |
| 6/21 | $12,467 | $12,819 | $12,757 |
| 7/21 | $12,571 | $12,926 | $12,863 |
| 8/21 | $12,515 | $12,878 | $12,819 |
| 9/21 | $12,426 | $12,785 | $12,725 |
| 10/21 | $12,404 | $12,748 | $12,689 |
| 11/21 | $12,496 | $12,856 | $12,802 |
| 12/21 | $12,494 | $12,877 | $12,827 |
| 1/22 | $12,187 | $12,525 | $12,447 |
| 2/22 | $12,121 | $12,480 | $12,409 |
| 3/22 | $11,736 | $12,075 | $11,996 |
| 4/22 | $11,420 | $11,741 | $11,649 |
| 5/22 | $11,540 | $11,916 | $11,845 |
| 6/22 | $11,400 | $11,720 | $11,662 |
| 7/22 | $11,626 | $12,030 | $11,990 |
| 8/22 | $11,453 | $11,766 | $11,734 |
| 9/22 | $11,140 | $11,315 | $11,300 |
| 10/22 | $11,050 | $11,221 | $11,226 |
| 11/22 | $11,518 | $11,746 | $11,742 |
| 12/22 | $11,524 | $11,779 | $11,780 |
| 1/23 | $11,855 | $12,118 | $12,098 |
| 2/23 | $11,630 | $11,844 | $11,823 |
| 3/23 | $11,836 | $12,106 | $12,081 |
| 4/23 | $11,832 | $12,079 | $12,050 |
| 5/23 | $11,757 | $11,974 | $11,950 |
| 6/23 | $11,847 | $12,094 | $12,068 |
| 7/23 | $11,878 | $12,142 | $12,117 |
| 8/23 | $11,791 | $11,967 | $11,977 |
| 9/23 | $11,516 | $11,616 | $11,633 |
| 10/23 | $11,347 | $11,517 | $11,532 |
| 11/23 | $12,014 | $12,249 | $12,237 |
| 12/23 | $12,264 | $12,533 | $12,513 |
| 1/24 | $12,262 | $12,469 | $12,462 |
| 2/24 | $12,272 | $12,485 | $12,476 |
| 3/24 | $12,282 | $12,485 | $12,461 |
| 4/24 | $12,172 | $12,330 | $12,301 |
| 5/24 | $12,181 | $12,294 | $12,264 |
| 6/24 | $12,325 | $12,482 | $12,436 |
| 7/24 | $12,432 | $12,596 | $12,547 |
| 8/24 | $12,540 | $12,696 | $12,652 |
| 9/24 | $12,691 | $12,821 | $12,781 |
Average Annual Total Returns (%)
| Fund | 1 Year | 5 Years | 10 Years |
|---|---|---|---|
| Class A | 10.16% | 1.53% | 2.74% |
| Class A with 3.25% Maximum Sales Charge | 6.53% | 0.87% | 2.41% |
| Bloomberg Municipal Bond Index | 10.37% | 1.38% | 2.51% |
| Bloomberg California Municipal Bond Index | 9.87% | 1.32% | 2.48% |
Performance does not reflect the deduction of taxes that a shareholder would pay on Fund distributions or redemption of Fund shares. Performance assumes that all dividends and distributions, if any, were reinvested. For more recent performance information, visit www.eatonvance.com/performance.php.
THE FUND'S PAST PERFORMANCE IS NO GUARANTEE OF FUTURE RESULTS.
Key Fund Statistics
| Total Net Assets | $942,281,175 |
| # of Portfolio Holdings | 284 |
| Portfolio Turnover Rate | 173% |
| Total Advisory Fees Paid | $3,457,213 |
What did the Fund invest in?
The following tables reflect what the Fund invested in as of the report date.
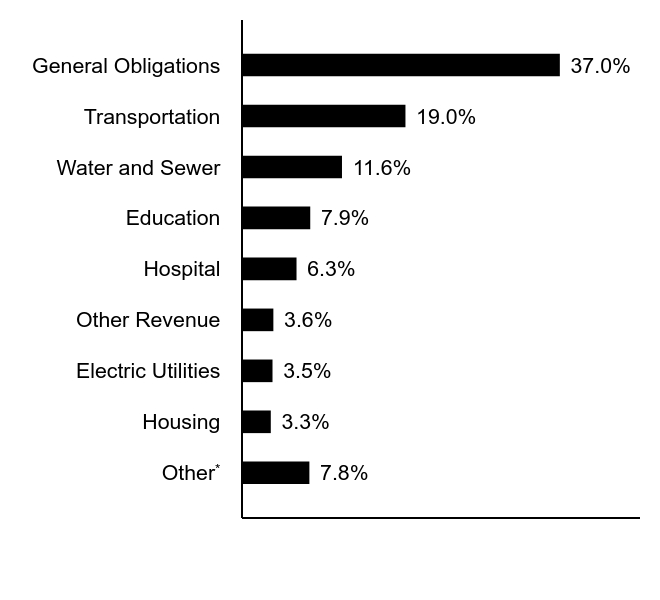
Sector Allocation (% of total investments)
| Value | Value |
|---|---|
OtherFootnote Reference* | 7.8% |
| Housing | 3.3% |
| Electric Utilities | 3.5% |
| Other Revenue | 3.6% |
| Hospital | 6.3% |
| Education | 7.9% |
| Water and Sewer | 11.6% |
| Transportation | 19.0% |
| General Obligations | 37.0% |
| Footnote | Description |
Footnote* | Sectors less than 3% each |
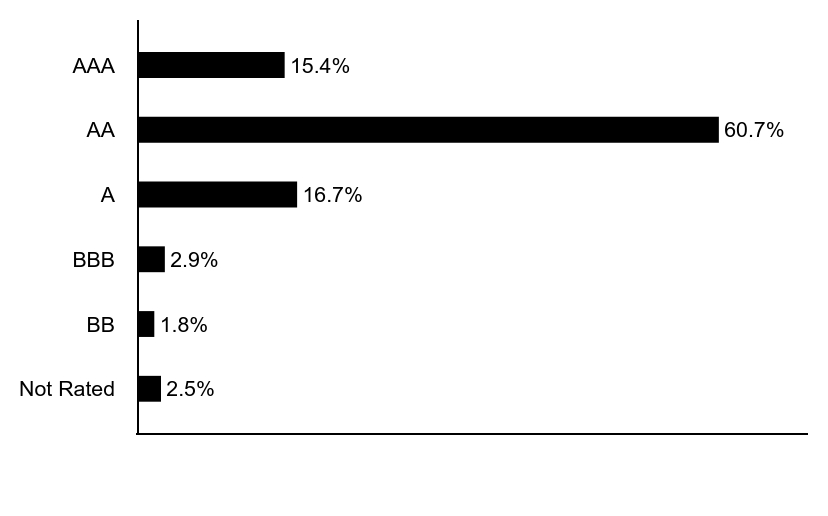
Credit Quality (% of total investments)Footnote Referencea

| Value | Value |
|---|---|
| Not Rated | 2.5% |
| BB | 1.8% |
| BBB | 2.9% |
| A | 16.7% |
| AA | 60.7% |
| AAA | 15.4% |
| Footnote | Description |
Footnotea | Ratings are based on Moody’s Investors Service, Inc. (“Moody’s”), S&P Global Ratings (“S&P”) or Fitch Ratings (“Fitch”). If securities are rated differently by the ratings agencies, the highest rating is applied. Moody's ratings are converted to the S&P and Fitch scale with ratings ranging from AAA, being the highest, to D, being the lowest. Ratings of BBB or higher are considered to be investment-grade quality. Holdings designated as “Not Rated” (if any) are not rated by the national ratings agencies stated above. |
Additional Information

If you wish to view additional information about the Fund, including the prospectus, statement of additional information, financial statements and holdings, please scan the QR code or visit www.eatonvance.com/open-end-mutual-fund-documents.php. For proxy information, please visit www.eatonvance.com/proxyvoting.
Householding
The Funds may deliver a single copy of certain required shareholder documents (including prospectuses, shareholder reports, and proxy materials) to investors with the same last name and the same address. Your participation will continue indefinitely unless you instruct otherwise by calling 1-800-262-1122 or by contacting your financial intermediary. Your instruction will typically be effective within 30 days of receipt.
Not FDIC Insured | May Lose Value | No Bank Guarantee
Annual Shareholder Report September 30, 2024
EACAX-TSR-AR

Eaton Vance California Municipal Opportunities Fund
Class C ECCAX
Annual Shareholder Report September 30, 2024
This annual shareholder report contains important information about the Eaton Vance California Municipal Opportunities Fund for the period of October 1, 2023 to September 30, 2024. You can find additional information about the Fund at www.eatonvance.com/open-end-mutual-fund-documents.php. You can also request this information by contacting us at 1-800-262-1122.
What were the Fund costs for the last year?
(based on a hypothetical $10,000 investment)
| Class Name | Costs of a $10,000 investment | Costs paid as a percentage of a $10,000 investment |
|---|---|---|
| Class C | $157 | 1.50% |
How did the Fund perform last year and what affected its performance?
Key contributors to (↑) and detractors from (↓) performance, relative to the Bloomberg Municipal Bond Index (the Index):
↓ Out-of-Index positions in variable-rate demand notes and floating-rate notes — typically considered defensive investments with virtually zero duration — detracted from returns relative to the Index as interest rates generally declined during the period
↓ Security selections and an underweight position in the health care sector, which outperformed the Index, detracted from performance relative to the Index
↓ Security selections and an underweight position in A-rated bonds hampered performance as lower-rated bonds generally outperformed higher-rated bonds
↑ An overweight position in bonds with 17 years or more remaining to maturity contributed to Index-relative returns as longer-maturity bonds generally outperformed shorter-maturity bonds during the period
↑ Tactical short-term U.S. Treasury futures trades, which were not present at period-end, contributed to performance relative to the Index during the period
↑ Security selections in general obligation bonds contributed to returns relative to the Index during the period
Fund Performance
Comparison of the change in value of a $10,000 investment for the period indicated.
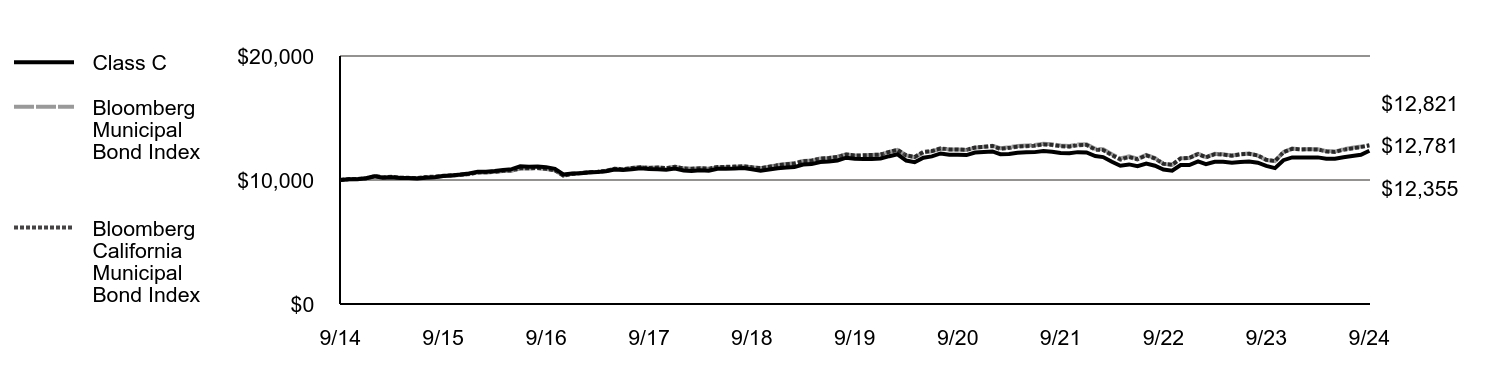
| Class C | Bloomberg Municipal Bond Index | Bloomberg California Municipal Bond Index | |
|---|---|---|---|
| 9/14 | $10,000 | $10,000 | $10,000 |
| 10/14 | $10,067 | $10,069 | $10,072 |
| 11/14 | $10,060 | $10,086 | $10,084 |
| 12/14 | $10,138 | $10,137 | $10,140 |
| 1/15 | $10,301 | $10,317 | $10,314 |
| 2/15 | $10,187 | $10,210 | $10,220 |
| 3/15 | $10,223 | $10,240 | $10,252 |
| 4/15 | $10,163 | $10,186 | $10,195 |
| 5/15 | $10,156 | $10,158 | $10,172 |
| 6/15 | $10,117 | $10,148 | $10,163 |
| 7/15 | $10,184 | $10,222 | $10,240 |
| 8/15 | $10,229 | $10,242 | $10,268 |
| 9/15 | $10,317 | $10,316 | $10,339 |
| 10/15 | $10,371 | $10,357 | $10,377 |
| 11/15 | $10,438 | $10,398 | $10,417 |
| 12/15 | $10,526 | $10,472 | $10,496 |
| 1/16 | $10,656 | $10,596 | $10,611 |
| 2/16 | $10,666 | $10,613 | $10,628 |
| 3/16 | $10,730 | $10,647 | $10,664 |
| 4/16 | $10,815 | $10,725 | $10,745 |
| 5/16 | $10,877 | $10,754 | $10,776 |
| 6/16 | $11,103 | $10,925 | $10,946 |
| 7/16 | $11,065 | $10,932 | $10,951 |
| 8/16 | $11,091 | $10,947 | $10,969 |
| 9/16 | $11,037 | $10,892 | $10,902 |
| 10/16 | $10,906 | $10,778 | $10,775 |
| 11/16 | $10,443 | $10,376 | $10,360 |
| 12/16 | $10,525 | $10,497 | $10,482 |
| 1/17 | $10,552 | $10,567 | $10,564 |
| 2/17 | $10,614 | $10,640 | $10,625 |
| 3/17 | $10,642 | $10,663 | $10,646 |
| 4/17 | $10,704 | $10,741 | $10,721 |
| 5/17 | $10,843 | $10,911 | $10,900 |
| 6/17 | $10,814 | $10,872 | $10,863 |
| 7/17 | $10,864 | $10,960 | $10,959 |
| 8/17 | $10,947 | $11,043 | $11,026 |
| 9/17 | $10,883 | $10,987 | $10,975 |
| 10/17 | $10,864 | $11,014 | $11,010 |
| 11/17 | $10,822 | $10,955 | $10,951 |
| 12/17 | $10,917 | $11,069 | $11,071 |
| 1/18 | $10,774 | $10,939 | $10,939 |
| 2/18 | $10,735 | $10,906 | $10,904 |
| 3/18 | $10,786 | $10,947 | $10,953 |
| 4/18 | $10,746 | $10,908 | $10,908 |
| 5/18 | $10,911 | $11,033 | $11,055 |
| 6/18 | $10,917 | $11,042 | $11,059 |
| 7/18 | $10,922 | $11,069 | $11,085 |
| 8/18 | $10,961 | $11,097 | $11,119 |
| 9/18 | $10,874 | $11,025 | $11,034 |
| 10/18 | $10,752 | $10,957 | $10,958 |
| 11/18 | $10,851 | $11,079 | $11,072 |
| 12/18 | $10,949 | $11,211 | $11,194 |
| 1/19 | $11,000 | $11,296 | $11,267 |
| 2/19 | $11,042 | $11,357 | $11,323 |
| 3/19 | $11,244 | $11,536 | $11,509 |
| 4/19 | $11,284 | $11,579 | $11,560 |
| 5/19 | $11,452 | $11,739 | $11,729 |
| 6/19 | $11,491 | $11,782 | $11,769 |
| 7/19 | $11,575 | $11,877 | $11,868 |
| 8/19 | $11,799 | $12,065 | $12,060 |
| 9/19 | $11,707 | $11,968 | $11,970 |
| 10/19 | $11,696 | $11,989 | $11,991 |
| 11/19 | $11,698 | $12,019 | $12,018 |
| 12/19 | $11,730 | $12,056 | $12,053 |
| 1/20 | $11,920 | $12,273 | $12,269 |
| 2/20 | $12,075 | $12,431 | $12,428 |
| 3/20 | $11,569 | $11,980 | $11,994 |
| 4/20 | $11,430 | $11,830 | $11,865 |
| 5/20 | $11,800 | $12,206 | $12,267 |
| 6/20 | $11,907 | $12,307 | $12,338 |
| 7/20 | $12,141 | $12,514 | $12,550 |
| 8/20 | $12,043 | $12,455 | $12,467 |
| 9/20 | $12,038 | $12,458 | $12,463 |
| 10/20 | $12,010 | $12,420 | $12,429 |
| 11/20 | $12,220 | $12,608 | $12,621 |
| 12/20 | $12,260 | $12,685 | $12,673 |
| 1/21 | $12,301 | $12,765 | $12,734 |
| 2/21 | $12,080 | $12,563 | $12,502 |
| 3/21 | $12,106 | $12,640 | $12,589 |
| 4/21 | $12,193 | $12,746 | $12,689 |
| 5/21 | $12,232 | $12,784 | $12,724 |
| 6/21 | $12,248 | $12,819 | $12,757 |
| 7/21 | $12,337 | $12,926 | $12,863 |
| 8/21 | $12,281 | $12,878 | $12,819 |
| 9/21 | $12,178 | $12,785 | $12,725 |
| 10/21 | $12,158 | $12,748 | $12,689 |
| 11/21 | $12,247 | $12,856 | $12,802 |
| 12/21 | $12,224 | $12,877 | $12,827 |
| 1/22 | $11,927 | $12,525 | $12,447 |
| 2/22 | $11,849 | $12,480 | $12,409 |
| 3/22 | $11,469 | $12,075 | $11,996 |
| 4/22 | $11,151 | $11,741 | $11,649 |
| 5/22 | $11,257 | $11,916 | $11,845 |
| 6/22 | $11,113 | $11,720 | $11,662 |
| 7/22 | $11,330 | $12,030 | $11,990 |
| 8/22 | $11,151 | $11,766 | $11,734 |
| 9/22 | $10,849 | $11,315 | $11,300 |
| 10/22 | $10,746 | $11,221 | $11,226 |
| 11/22 | $11,205 | $11,746 | $11,742 |
| 12/22 | $11,201 | $11,779 | $11,780 |
| 1/23 | $11,504 | $12,118 | $12,098 |
| 2/23 | $11,282 | $11,844 | $11,823 |
| 3/23 | $11,476 | $12,106 | $12,081 |
| 4/23 | $11,462 | $12,079 | $12,050 |
| 5/23 | $11,387 | $11,974 | $11,950 |
| 6/23 | $11,459 | $12,094 | $12,068 |
| 7/23 | $11,494 | $12,142 | $12,117 |
| 8/23 | $11,393 | $11,967 | $11,977 |
| 9/23 | $11,133 | $11,616 | $11,633 |
| 10/23 | $10,960 | $11,517 | $11,532 |
| 11/23 | $11,597 | $12,249 | $12,237 |
| 12/23 | $11,823 | $12,533 | $12,513 |
| 1/24 | $11,822 | $12,469 | $12,462 |
| 2/24 | $11,824 | $12,485 | $12,476 |
| 3/24 | $11,824 | $12,485 | $12,461 |
| 4/24 | $11,711 | $12,330 | $12,301 |
| 5/24 | $11,712 | $12,294 | $12,264 |
| 6/24 | $11,838 | $12,482 | $12,436 |
| 7/24 | $11,927 | $12,596 | $12,547 |
| 8/24 | $12,029 | $12,696 | $12,652 |
| 9/24 | $12,355 | $12,821 | $12,781 |
Average Annual Total Returns (%)
| Fund | 1 Year | 5 Years | 10 Years |
|---|---|---|---|
| Class C | 9.20% | 0.76% | 2.14% |
| Class C with 1% Maximum Deferred Sales Charge | 8.20% | 0.76% | 2.14% |
| Bloomberg Municipal Bond Index | 10.37% | 1.38% | 2.51% |
| Bloomberg California Municipal Bond Index | 9.87% | 1.32% | 2.48% |
Performance does not reflect the deduction of taxes that a shareholder would pay on Fund distributions or redemption of Fund shares. Performance assumes that all dividends and distributions, if any, were reinvested. For more recent performance information, visit www.eatonvance.com/performance.php.
THE FUND'S PAST PERFORMANCE IS NO GUARANTEE OF FUTURE RESULTS.
Key Fund Statistics
| Total Net Assets | $942,281,175 |
| # of Portfolio Holdings | 284 |
| Portfolio Turnover Rate | 173% |
| Total Advisory Fees Paid | $3,457,213 |
What did the Fund invest in?
The following tables reflect what the Fund invested in as of the report date.
Sector Allocation (% of total investments)

| Value | Value |
|---|---|
OtherFootnote Reference* | 7.8% |
| Housing | 3.3% |
| Electric Utilities | 3.5% |
| Other Revenue | 3.6% |
| Hospital | 6.3% |
| Education | 7.9% |
| Water and Sewer | 11.6% |
| Transportation | 19.0% |
| General Obligations | 37.0% |
| Footnote | Description |
Footnote* | Sectors less than 3% each |
Credit Quality (% of total investments)Footnote Referencea

| Value | Value |
|---|---|
| Not Rated | 2.5% |
| BB | 1.8% |
| BBB | 2.9% |
| A | 16.7% |
| AA | 60.7% |
| AAA | 15.4% |
| Footnote | Description |
Footnotea | Ratings are based on Moody’s Investors Service, Inc. (“Moody’s”), S&P Global Ratings (“S&P”) or Fitch Ratings (“Fitch”). If securities are rated differently by the ratings agencies, the highest rating is applied. Moody's ratings are converted to the S&P and Fitch scale with ratings ranging from AAA, being the highest, to D, being the lowest. Ratings of BBB or higher are considered to be investment-grade quality. Holdings designated as “Not Rated” (if any) are not rated by the national ratings agencies stated above. |
Additional Information
If you wish to view additional information about the Fund, including the prospectus, statement of additional information, financial statements and holdings, please scan the QR code or visit www.eatonvance.com/open-end-mutual-fund-documents.php. For proxy information, please visit www.eatonvance.com/proxyvoting.
Householding
The Funds may deliver a single copy of certain required shareholder documents (including prospectuses, shareholder reports, and proxy materials) to investors with the same last name and the same address. Your participation will continue indefinitely unless you instruct otherwise by calling 1-800-262-1122 or by contacting your financial intermediary. Your instruction will typically be effective within 30 days of receipt.
Not FDIC Insured | May Lose Value | No Bank Guarantee
Annual Shareholder Report September 30, 2024
ECCAX-TSR-AR

Eaton Vance California Municipal Opportunities Fund
Class I EICAX
Annual Shareholder Report September 30, 2024
This annual shareholder report contains important information about the Eaton Vance California Municipal Opportunities Fund for the period of October 1, 2023 to September 30, 2024. You can find additional information about the Fund at www.eatonvance.com/open-end-mutual-fund-documents.php. You can also request this information by contacting us at 1-800-262-1122.
What were the Fund costs for the last year?
(based on a hypothetical $10,000 investment)
| Class Name | Costs of a $10,000 investment | Costs paid as a percentage of a $10,000 investment |
|---|---|---|
| Class I | $53 | 0.50% |
How did the Fund perform last year and what affected its performance?
Key contributors to (↑) and detractors from (↓) performance, relative to the Bloomberg Municipal Bond Index (the Index):
↓ Out-of-Index positions in variable-rate demand notes and floating-rate notes — typically considered defensive investments with virtually zero duration — detracted from returns relative to the Index as interest rates generally declined during the period
↓ Security selections and an underweight position in the health care sector, which outperformed the Index, detracted from performance relative to the Index
↓ Security selections and an underweight position in A-rated bonds hampered performance as lower-rated bonds generally outperformed higher-rated bonds
↑ An overweight position in bonds with 17 years or more remaining to maturity contributed to Index-relative returns as longer-maturity bonds generally outperformed shorter-maturity bonds during the period
↑ Tactical short-term U.S. Treasury futures trades, which were not present at period-end, contributed to performance relative to the Index during the period
↑ Security selections in general obligation bonds contributed to returns relative to the Index during the period
Fund Performance
Comparison of the change in value of a $1,000,000 investment for the period indicated.
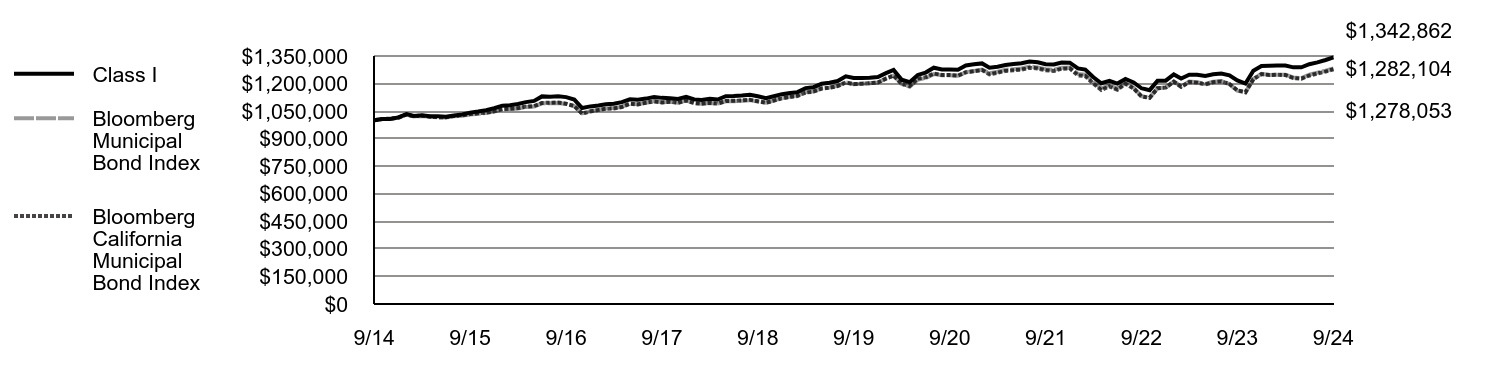
| Class I | Bloomberg Municipal Bond Index | Bloomberg California Municipal Bond Index | |
|---|---|---|---|
| 9/14 | $1,000,000 | $1,000,000 | $1,000,000 |
| 10/14 | $1,007,255 | $1,006,857 | $1,007,201 |
| 11/14 | $1,007,637 | $1,008,598 | $1,008,428 |
| 12/14 | $1,015,843 | $1,013,687 | $1,014,004 |
| 1/15 | $1,033,945 | $1,031,654 | $1,031,413 |
| 2/15 | $1,023,432 | $1,021,012 | $1,022,047 |
| 3/15 | $1,027,812 | $1,023,960 | $1,025,161 |
| 4/15 | $1,022,274 | $1,018,588 | $1,019,499 |
| 5/15 | $1,021,687 | $1,015,774 | $1,017,165 |
| 6/15 | $1,019,030 | $1,014,848 | $1,016,347 |
| 7/15 | $1,026,384 | $1,022,199 | $1,023,967 |
| 8/15 | $1,031,567 | $1,024,207 | $1,026,821 |
| 9/15 | $1,041,803 | $1,031,626 | $1,033,922 |
| 10/15 | $1,047,970 | $1,035,727 | $1,037,703 |
| 11/15 | $1,055,218 | $1,039,845 | $1,041,738 |
| 12/15 | $1,065,492 | $1,047,151 | $1,049,604 |
| 1/16 | $1,079,832 | $1,059,645 | $1,061,123 |
| 2/16 | $1,081,781 | $1,061,312 | $1,062,846 |
| 3/16 | $1,088,808 | $1,064,674 | $1,066,410 |
| 4/16 | $1,098,885 | $1,072,502 | $1,074,461 |
| 5/16 | $1,105,723 | $1,075,403 | $1,077,559 |
| 6/16 | $1,130,147 | $1,092,511 | $1,094,634 |
| 7/16 | $1,127,607 | $1,093,178 | $1,095,109 |
| 8/16 | $1,131,127 | $1,094,653 | $1,096,942 |
| 9/16 | $1,126,090 | $1,089,190 | $1,090,244 |
| 10/16 | $1,112,678 | $1,077,763 | $1,077,539 |
| 11/16 | $1,066,822 | $1,037,568 | $1,035,996 |
| 12/16 | $1,075,590 | $1,049,749 | $1,048,182 |
| 1/17 | $1,080,214 | $1,056,669 | $1,056,392 |
| 2/17 | $1,087,131 | $1,064,007 | $1,062,544 |
| 3/17 | $1,089,765 | $1,066,317 | $1,064,616 |
| 4/17 | $1,098,759 | $1,074,054 | $1,072,081 |
| 5/17 | $1,114,080 | $1,091,100 | $1,089,959 |
| 6/17 | $1,111,297 | $1,087,187 | $1,086,326 |
| 7/17 | $1,118,167 | $1,095,983 | $1,095,887 |
| 8/17 | $1,127,118 | $1,104,323 | $1,102,634 |
| 9/17 | $1,122,088 | $1,098,708 | $1,097,483 |
| 10/17 | $1,120,235 | $1,101,390 | $1,101,048 |
| 11/17 | $1,116,267 | $1,095,493 | $1,095,147 |
| 12/17 | $1,127,472 | $1,106,943 | $1,107,144 |
| 1/18 | $1,113,824 | $1,093,911 | $1,093,900 |
| 2/18 | $1,111,072 | $1,090,642 | $1,090,366 |
| 3/18 | $1,116,974 | $1,094,668 | $1,095,266 |
| 4/18 | $1,113,118 | $1,090,761 | $1,090,835 |
| 5/18 | $1,131,145 | $1,103,252 | $1,105,531 |
| 6/18 | $1,132,725 | $1,104,193 | $1,105,882 |
| 7/18 | $1,135,381 | $1,106,873 | $1,108,498 |
| 8/18 | $1,139,089 | $1,109,715 | $1,111,947 |
| 9/18 | $1,130,725 | $1,102,531 | $1,103,429 |
| 10/18 | $1,120,092 | $1,095,742 | $1,095,840 |
| 11/18 | $1,130,616 | $1,107,870 | $1,107,244 |
| 12/18 | $1,142,260 | $1,121,135 | $1,119,440 |
| 1/19 | $1,148,313 | $1,129,609 | $1,126,745 |
| 2/19 | $1,153,362 | $1,135,658 | $1,132,328 |
| 3/19 | $1,175,195 | $1,153,610 | $1,150,940 |
| 4/19 | $1,180,148 | $1,157,945 | $1,155,960 |
| 5/19 | $1,198,572 | $1,173,909 | $1,172,919 |
| 6/19 | $1,204,626 | $1,178,244 | $1,176,925 |
| 7/19 | $1,213,958 | $1,187,739 | $1,186,758 |
| 8/19 | $1,239,055 | $1,206,474 | $1,205,991 |
| 9/19 | $1,230,122 | $1,196,803 | $1,197,022 |
| 10/19 | $1,230,210 | $1,198,948 | $1,199,129 |
| 11/19 | $1,231,491 | $1,201,946 | $1,201,850 |
| 12/19 | $1,235,774 | $1,205,616 | $1,205,306 |
| 1/20 | $1,256,500 | $1,227,277 | $1,226,897 |
| 2/20 | $1,273,859 | $1,243,103 | $1,242,783 |
| 3/20 | $1,221,059 | $1,198,012 | $1,199,387 |
| 4/20 | $1,207,454 | $1,182,977 | $1,186,549 |
| 5/20 | $1,246,975 | $1,220,609 | $1,226,740 |
| 6/20 | $1,259,696 | $1,230,655 | $1,233,791 |
| 7/20 | $1,286,077 | $1,251,382 | $1,254,988 |
| 8/20 | $1,276,428 | $1,245,511 | $1,246,658 |
| 9/20 | $1,277,103 | $1,245,775 | $1,246,307 |
| 10/20 | $1,275,430 | $1,242,033 | $1,242,879 |
| 11/20 | $1,298,354 | $1,260,776 | $1,262,057 |
| 12/20 | $1,304,636 | $1,268,456 | $1,267,330 |
| 1/21 | $1,309,744 | $1,276,540 | $1,273,370 |
| 2/21 | $1,286,744 | $1,256,257 | $1,250,246 |
| 3/21 | $1,291,574 | $1,264,005 | $1,258,852 |
| 4/21 | $1,301,294 | $1,274,607 | $1,268,876 |
| 5/21 | $1,306,273 | $1,278,410 | $1,272,352 |
| 6/21 | $1,310,159 | $1,281,920 | $1,275,669 |
| 7/21 | $1,320,075 | $1,292,552 | $1,286,286 |
| 8/21 | $1,315,702 | $1,287,808 | $1,281,941 |
| 9/21 | $1,305,481 | $1,278,514 | $1,272,481 |
| 10/21 | $1,303,434 | $1,274,776 | $1,268,884 |
| 11/21 | $1,314,541 | $1,285,628 | $1,280,235 |
| 12/21 | $1,313,401 | $1,287,702 | $1,282,742 |
| 1/22 | $1,282,637 | $1,252,454 | $1,244,707 |
| 2/22 | $1,275,960 | $1,247,967 | $1,240,944 |
| 3/22 | $1,234,484 | $1,207,512 | $1,199,646 |
| 4/22 | $1,201,506 | $1,174,113 | $1,164,863 |
| 5/22 | $1,214,361 | $1,191,554 | $1,184,523 |
| 6/22 | $1,199,885 | $1,172,038 | $1,166,153 |
| 7/22 | $1,225,132 | $1,203,006 | $1,199,040 |
| 8/22 | $1,205,975 | $1,176,640 | $1,173,373 |
| 9/22 | $1,174,510 | $1,131,480 | $1,130,002 |
| 10/22 | $1,164,095 | $1,122,070 | $1,122,638 |
| 11/22 | $1,214,809 | $1,174,553 | $1,174,228 |
| 12/22 | $1,215,699 | $1,177,916 | $1,178,004 |
| 1/23 | $1,249,679 | $1,211,751 | $1,209,811 |
| 2/23 | $1,227,383 | $1,184,351 | $1,182,308 |
| 3/23 | $1,248,122 | $1,210,629 | $1,208,077 |
| 4/23 | $1,247,925 | $1,207,864 | $1,205,032 |
| 5/23 | $1,241,574 | $1,197,397 | $1,194,956 |
| 6/23 | $1,250,090 | $1,209,391 | $1,206,797 |
| 7/23 | $1,254,841 | $1,214,176 | $1,211,677 |
| 8/23 | $1,244,690 | $1,196,696 | $1,197,679 |
| 9/23 | $1,217,135 | $1,161,622 | $1,163,285 |
| 10/23 | $1,199,630 | $1,151,737 | $1,153,209 |
| 11/23 | $1,270,308 | $1,224,851 | $1,223,701 |
| 12/23 | $1,295,700 | $1,253,319 | $1,251,318 |
| 1/24 | $1,296,988 | $1,246,918 | $1,246,229 |
| 2/24 | $1,298,393 | $1,248,519 | $1,247,625 |
| 3/24 | $1,298,437 | $1,248,480 | $1,246,073 |
| 4/24 | $1,288,281 | $1,233,018 | $1,230,144 |
| 5/24 | $1,288,320 | $1,229,401 | $1,226,387 |
| 6/24 | $1,305,066 | $1,248,245 | $1,243,601 |
| 7/24 | $1,315,376 | $1,259,622 | $1,254,672 |
| 8/24 | $1,328,400 | $1,269,557 | $1,265,163 |
| 9/24 | $1,342,862 | $1,282,104 | $1,278,053 |
Average Annual Total Returns (%)
| Fund | 1 Year | 5 Years | 10 Years |
|---|---|---|---|
| Class I | 10.32% | 1.77% | 2.99% |
| Bloomberg Municipal Bond Index | 10.37% | 1.38% | 2.51% |
| Bloomberg California Municipal Bond Index | 9.87% | 1.32% | 2.48% |
Performance does not reflect the deduction of taxes that a shareholder would pay on Fund distributions or redemption of Fund shares. Performance assumes that all dividends and distributions, if any, were reinvested. For more recent performance information, visit www.eatonvance.com/performance.php.
THE FUND'S PAST PERFORMANCE IS NO GUARANTEE OF FUTURE RESULTS.
Key Fund Statistics
| Total Net Assets | $942,281,175 |
| # of Portfolio Holdings | 284 |
| Portfolio Turnover Rate | 173% |
| Total Advisory Fees Paid | $3,457,213 |
What did the Fund invest in?
The following tables reflect what the Fund invested in as of the report date.
Sector Allocation (% of total investments)

| Value | Value |
|---|---|
OtherFootnote Reference* | 7.8% |
| Housing | 3.3% |
| Electric Utilities | 3.5% |
| Other Revenue | 3.6% |
| Hospital | 6.3% |
| Education | 7.9% |
| Water and Sewer | 11.6% |
| Transportation | 19.0% |
| General Obligations | 37.0% |
| Footnote | Description |
Footnote* | Sectors less than 3% each |
Credit Quality (% of total investments)Footnote Referencea
| Value | Value |
|---|---|
| Not Rated | 2.5% |
| BB | 1.8% |
| BBB | 2.9% |
| A | 16.7% |
| AA | 60.7% |
| AAA | 15.4% |
| Footnote | Description |
Footnotea | Ratings are based on Moody’s Investors Service, Inc. (“Moody’s”), S&P Global Ratings (“S&P”) or Fitch Ratings (“Fitch”). If securities are rated differently by the ratings agencies, the highest rating is applied. Moody's ratings are converted to the S&P and Fitch scale with ratings ranging from AAA, being the highest, to D, being the lowest. Ratings of BBB or higher are considered to be investment-grade quality. Holdings designated as “Not Rated” (if any) are not rated by the national ratings agencies stated above. |
Additional Information
If you wish to view additional information about the Fund, including the prospectus, statement of additional information, financial statements and holdings, please scan the QR code or visit www.eatonvance.com/open-end-mutual-fund-documents.php. For proxy information, please visit www.eatonvance.com/proxyvoting.
Householding
The Funds may deliver a single copy of certain required shareholder documents (including prospectuses, shareholder reports, and proxy materials) to investors with the same last name and the same address. Your participation will continue indefinitely unless you instruct otherwise by calling 1-800-262-1122 or by contacting your financial intermediary. Your instruction will typically be effective within 30 days of receipt.
Not FDIC Insured | May Lose Value | No Bank Guarantee
Annual Shareholder Report September 30, 2024
EICAX-TSR-AR

Eaton Vance Massachusetts Municipal Income Fund
Class A ETMAX
Annual Shareholder Report September 30, 2024
This annual shareholder report contains important information about the Eaton Vance Massachusetts Municipal Income Fund for the period of October 1, 2023 to September 30, 2024. You can find additional information about the Fund at www.eatonvance.com/open-end-mutual-fund-documents.php. You can also request this information by contacting us at 1-800-262-1122.
What were the Fund costs for the last year?
(based on a hypothetical $10,000 investment)
| Class Name | Costs of a $10,000 investment | Costs paid as a percentage of a $10,000 investment |
|---|---|---|
| Class A | $85 | 0.81% |
How did the Fund perform last year and what affected its performance?
Key contributors to (↑) and detractors from (↓) performance, relative to the Bloomberg Municipal Bond Index (the Index):
↓ Out-of-Index positions in variable-rate demand notes and floating-rate notes — typically considered defensive investments with virtually zero duration — detracted from returns relative to the Index as interest rates generally declined during the period
↓ Security selections in the health care sector detracted from performance relative to the Index during the period
↓ Security selections in the housing sector detracted from performance relative to the Index during the period
↑ An overweight position in bonds rated BBB and below helped returns as lower-credit-quality bonds generally outperformed higher-credit-quality bonds
↑ An overweight position in bonds with 17 years or more remaining to maturity contributed to Index-relative returns as longer-maturity bonds generally outperformed shorter-maturity bonds during the period
↑ An overweight position in 4% coupon bonds contributed to Index-relative returns as interest rates generally declined during the period
Fund Performance
Comparison of the change in value of a $10,000 investment for the period indicated.
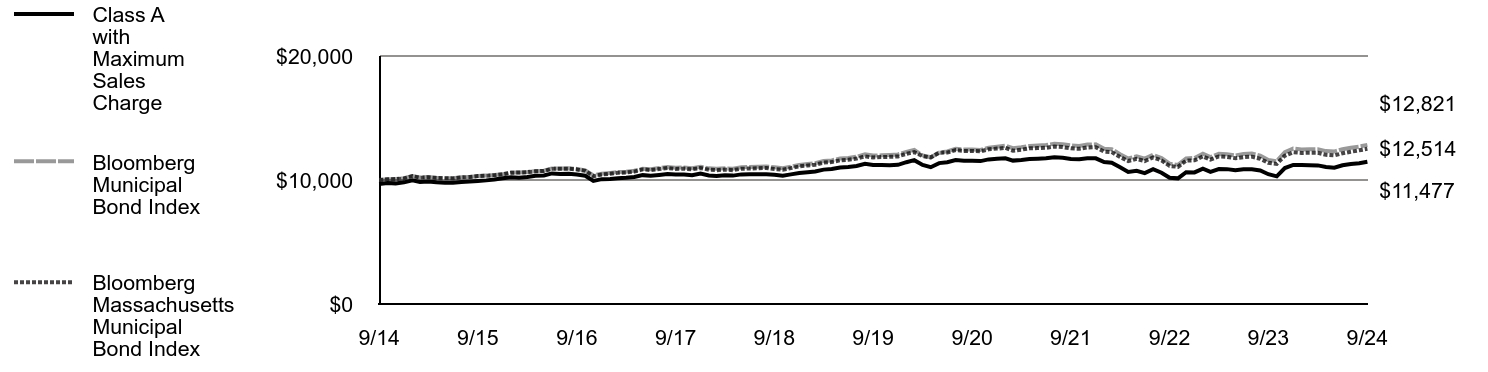
| Class A with Maximum Sales Charge | Bloomberg Municipal Bond Index | Bloomberg Massachusetts Municipal Bond Index | |
|---|---|---|---|
| 9/14 | $9,675 | $10,000 | $10,000 |
| 10/14 | $9,757 | $10,069 | $10,060 |
| 11/14 | $9,728 | $10,086 | $10,073 |
| 12/14 | $9,811 | $10,137 | $10,130 |
| 1/15 | $9,967 | $10,317 | $10,314 |
| 2/15 | $9,845 | $10,210 | $10,186 |
| 3/15 | $9,884 | $10,240 | $10,223 |
| 4/15 | $9,816 | $10,186 | $10,160 |
| 5/15 | $9,779 | $10,158 | $10,143 |
| 6/15 | $9,775 | $10,148 | $10,130 |
| 7/15 | $9,836 | $10,222 | $10,211 |
| 8/15 | $9,875 | $10,242 | $10,241 |
| 9/15 | $9,926 | $10,316 | $10,320 |
| 10/15 | $9,970 | $10,357 | $10,349 |
| 11/15 | $10,043 | $10,398 | $10,390 |
| 12/15 | $10,140 | $10,472 | $10,462 |
| 1/16 | $10,230 | $10,596 | $10,586 |
| 2/16 | $10,180 | $10,613 | $10,601 |
| 3/16 | $10,243 | $10,647 | $10,629 |
| 4/16 | $10,339 | $10,725 | $10,705 |
| 5/16 | $10,366 | $10,754 | $10,727 |
| 6/16 | $10,530 | $10,925 | $10,906 |
| 7/16 | $10,479 | $10,932 | $10,913 |
| 8/16 | $10,506 | $10,947 | $10,913 |
| 9/16 | $10,442 | $10,892 | $10,851 |
| 10/16 | $10,344 | $10,778 | $10,741 |
| 11/16 | $9,927 | $10,376 | $10,304 |
| 12/16 | $10,070 | $10,497 | $10,441 |
| 1/17 | $10,086 | $10,567 | $10,506 |
| 2/17 | $10,138 | $10,640 | $10,580 |
| 3/17 | $10,178 | $10,663 | $10,603 |
| 4/17 | $10,239 | $10,741 | $10,678 |
| 5/17 | $10,392 | $10,911 | $10,854 |
| 6/17 | $10,350 | $10,872 | $10,806 |
| 7/17 | $10,411 | $10,960 | $10,888 |
| 8/17 | $10,484 | $11,043 | $10,973 |
| 9/17 | $10,441 | $10,987 | $10,894 |
| 10/17 | $10,445 | $11,014 | $10,919 |
| 11/17 | $10,393 | $10,955 | $10,862 |
| 12/17 | $10,529 | $11,069 | $10,974 |
| 1/18 | $10,368 | $10,939 | $10,829 |
| 2/18 | $10,325 | $10,906 | $10,793 |
| 3/18 | $10,388 | $10,947 | $10,843 |
| 4/18 | $10,354 | $10,908 | $10,794 |
| 5/18 | $10,452 | $11,033 | $10,914 |
| 6/18 | $10,454 | $11,042 | $10,921 |
| 7/18 | $10,467 | $11,069 | $10,943 |
| 8/18 | $10,470 | $11,097 | $10,974 |
| 9/18 | $10,423 | $11,025 | $10,892 |
| 10/18 | $10,352 | $10,957 | $10,825 |
| 11/18 | $10,452 | $11,079 | $10,960 |
| 12/18 | $10,563 | $11,211 | $11,096 |
| 1/19 | $10,626 | $11,296 | $11,172 |
| 2/19 | $10,689 | $11,357 | $11,233 |
| 3/19 | $10,838 | $11,536 | $11,403 |
| 4/19 | $10,889 | $11,579 | $11,448 |
| 5/19 | $11,013 | $11,739 | $11,593 |
| 6/19 | $11,051 | $11,782 | $11,635 |
| 7/19 | $11,125 | $11,877 | $11,727 |
| 8/19 | $11,310 | $12,065 | $11,910 |
| 9/19 | $11,202 | $11,968 | $11,819 |
| 10/19 | $11,200 | $11,989 | $11,847 |
| 11/19 | $11,199 | $12,019 | $11,870 |
| 12/19 | $11,223 | $12,056 | $11,902 |
| 1/20 | $11,436 | $12,273 | $12,114 |
| 2/20 | $11,601 | $12,431 | $12,251 |
| 3/20 | $11,210 | $11,980 | $11,930 |
| 4/20 | $11,033 | $11,830 | $11,818 |
| 5/20 | $11,361 | $12,206 | $12,207 |
| 6/20 | $11,436 | $12,307 | $12,210 |
| 7/20 | $11,611 | $12,514 | $12,410 |
| 8/20 | $11,557 | $12,455 | $12,340 |
| 9/20 | $11,553 | $12,458 | $12,348 |
| 10/20 | $11,523 | $12,420 | $12,312 |
| 11/20 | $11,661 | $12,608 | $12,479 |
| 12/20 | $11,721 | $12,685 | $12,531 |
| 1/21 | $11,751 | $12,765 | $12,588 |
| 2/21 | $11,563 | $12,563 | $12,367 |
| 3/21 | $11,605 | $12,640 | $12,450 |
| 4/21 | $11,687 | $12,746 | $12,551 |
| 5/21 | $11,718 | $12,784 | $12,571 |
| 6/21 | $11,749 | $12,819 | $12,595 |
| 7/21 | $11,830 | $12,926 | $12,697 |
| 8/21 | $11,795 | $12,878 | $12,654 |
| 9/21 | $11,695 | $12,785 | $12,551 |
| 10/21 | $11,673 | $12,748 | $12,517 |
| 11/21 | $11,757 | $12,856 | $12,627 |
| 12/21 | $11,750 | $12,877 | $12,649 |
| 1/22 | $11,451 | $12,525 | $12,289 |
| 2/22 | $11,391 | $12,480 | $12,250 |
| 3/22 | $11,027 | $12,075 | $11,862 |
| 4/22 | $10,651 | $11,741 | $11,528 |
| 5/22 | $10,736 | $11,916 | $11,706 |
| 6/22 | $10,559 | $11,720 | $11,528 |
| 7/22 | $10,872 | $12,030 | $11,817 |
| 8/22 | $10,590 | $11,766 | $11,578 |
| 9/22 | $10,187 | $11,315 | $11,137 |
| 10/22 | $10,132 | $11,221 | $11,056 |
| 11/22 | $10,625 | $11,746 | $11,564 |
| 12/22 | $10,610 | $11,779 | $11,586 |
| 1/23 | $10,918 | $12,118 | $11,902 |
| 2/23 | $10,662 | $11,844 | $11,637 |
| 3/23 | $10,877 | $12,106 | $11,901 |
| 4/23 | $10,876 | $12,079 | $11,862 |
| 5/23 | $10,781 | $11,974 | $11,755 |
| 6/23 | $10,863 | $12,094 | $11,841 |
| 7/23 | $10,863 | $12,142 | $11,881 |
| 8/23 | $10,768 | $11,967 | $11,712 |
| 9/23 | $10,468 | $11,616 | $11,383 |
| 10/23 | $10,291 | $11,517 | $11,299 |
| 11/23 | $10,966 | $12,249 | $11,961 |
| 12/23 | $11,216 | $12,533 | $12,236 |
| 1/24 | $11,203 | $12,469 | $12,182 |
| 2/24 | $11,191 | $12,485 | $12,193 |
| 3/24 | $11,179 | $12,485 | $12,190 |
| 4/24 | $11,057 | $12,330 | $12,030 |
| 5/24 | $10,990 | $12,294 | $11,981 |
| 6/24 | $11,189 | $12,482 | $12,154 |
| 7/24 | $11,291 | $12,596 | $12,280 |
| 8/24 | $11,351 | $12,696 | $12,392 |
| 9/24 | $11,477 | $12,821 | $12,514 |
Average Annual Total Returns (%)
| Fund | 1 Year | 5 Years | 10 Years |
|---|---|---|---|
| Class A | 9.68% | 0.49% | 1.73% |
| Class A with 3.25% Maximum Sales Charge | 6.07% | (0.16)% | 1.39% |
| Bloomberg Municipal Bond Index | 10.37% | 1.38% | 2.51% |
| Bloomberg Massachusetts Municipal Bond Index | 9.94% | 1.15% | 2.27% |
Performance does not reflect the deduction of taxes that a shareholder would pay on Fund distributions or redemption of Fund shares. Performance assumes that all dividends and distributions, if any, were reinvested. For more recent performance information, visit www.eatonvance.com/performance.php.
THE FUND'S PAST PERFORMANCE IS NO GUARANTEE OF FUTURE RESULTS.
Key Fund Statistics
| Total Net Assets | $166,484,049 |
| # of Portfolio Holdings | 85 |
| Portfolio Turnover Rate | 57% |
| Total Advisory Fees Paid | $571,899 |
What did the Fund invest in?
The following tables reflect what the Fund invested in as of the report date.
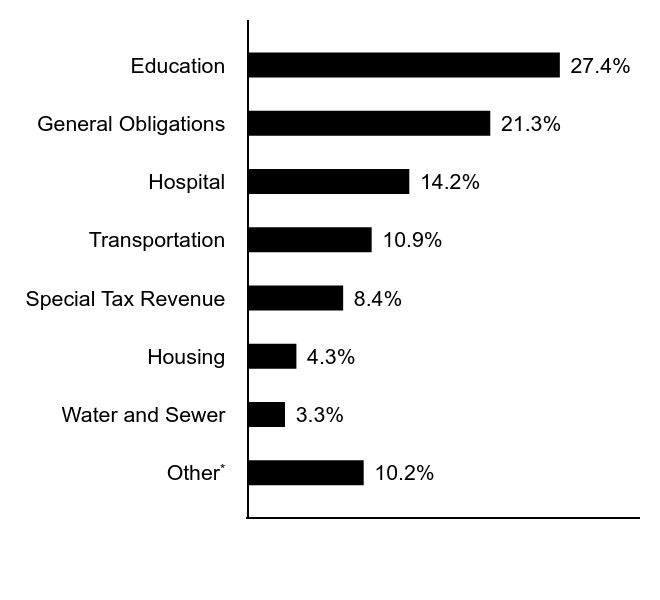
Sector Allocation (% of total investments)

| Value | Value |
|---|---|
OtherFootnote Reference* | 10.2% |
| Water and Sewer | 3.3% |
| Housing | 4.3% |
| Special Tax Revenue | 8.4% |
| Transportation | 10.9% |
| Hospital | 14.2% |
| General Obligations | 21.3% |
| Education | 27.4% |
| Footnote | Description |
Footnote* | Sectors less than 3% each |
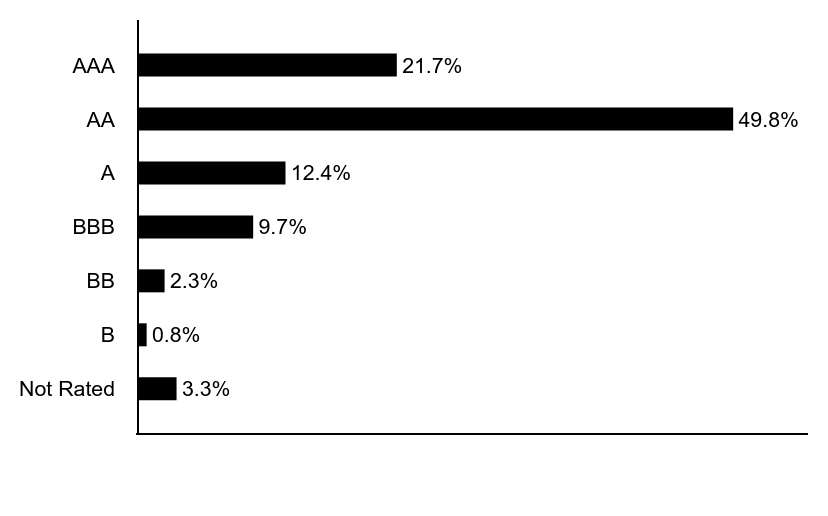
Credit Quality (% of total investments)Footnote Referencea ,Footnote Referenceb

| Value | Value |
|---|---|
| Not Rated | 3.3% |
| B | 0.8% |
| BB | 2.3% |
| BBB | 9.7% |
| A | 12.4% |
| AA | 49.8% |
| AAA | 21.7% |
| Footnote | Description |
Footnotea | Ratings are based on Moody’s Investors Service, Inc. (“Moody’s”), S&P Global Ratings (“S&P”) or Fitch Ratings (“Fitch”). If securities are rated differently by the ratings agencies, the highest rating is applied. Moody's ratings are converted to the S&P and Fitch scale with ratings ranging from AAA, being the highest, to D, being the lowest. Ratings of BBB or higher are considered to be investment-grade quality. Holdings designated as “Not Rated” (if any) are not rated by the national ratings agencies stated above. |
Footnoteb | The chart includes the municipal bonds held by a trust that issues residual interest bonds. |
Additional Information
If you wish to view additional information about the Fund, including the prospectus, statement of additional information, financial statements and holdings, please scan the QR code or visit www.eatonvance.com/open-end-mutual-fund-documents.php. For proxy information, please visit www.eatonvance.com/proxyvoting.
Householding
The Funds may deliver a single copy of certain required shareholder documents (including prospectuses, shareholder reports, and proxy materials) to investors with the same last name and the same address. Your participation will continue indefinitely unless you instruct otherwise by calling 1-800-262-1122 or by contacting your financial intermediary. Your instruction will typically be effective within 30 days of receipt.
Not FDIC Insured | May Lose Value | No Bank Guarantee
Annual Shareholder Report September 30, 2024
ETMAX-TSR-AR

Eaton Vance Massachusetts Municipal Income Fund
Class C ECMMX
Annual Shareholder Report September 30, 2024
This annual shareholder report contains important information about the Eaton Vance Massachusetts Municipal Income Fund for the period of October 1, 2023 to September 30, 2024. You can find additional information about the Fund at www.eatonvance.com/open-end-mutual-fund-documents.php. You can also request this information by contacting us at 1-800-262-1122.
What were the Fund costs for the last year?
(based on a hypothetical $10,000 investment)
| Class Name | Costs of a $10,000 investment | Costs paid as a percentage of a $10,000 investment |
|---|---|---|
| Class C | $163 | 1.56% |
How did the Fund perform last year and what affected its performance?
Key contributors to (↑) and detractors from (↓) performance, relative to the Bloomberg Municipal Bond Index (the Index):
↓ Out-of-Index positions in variable-rate demand notes and floating-rate notes — typically considered defensive investments with virtually zero duration — detracted from returns relative to the Index as interest rates generally declined during the period
↓ Security selections in the health care sector detracted from performance relative to the Index during the period
↓ Security selections in the housing sector detracted from performance relative to the Index during the period
↑ An overweight position in bonds rated BBB and below helped returns as lower-credit-quality bonds generally outperformed higher-credit-quality bonds
↑ An overweight position in bonds with 17 years or more remaining to maturity contributed to Index-relative returns as longer-maturity bonds generally outperformed shorter-maturity bonds during the period
↑ An overweight position in 4% coupon bonds contributed to Index-relative returns as interest rates generally declined during the period
Fund Performance
Comparison of the change in value of a $10,000 investment for the period indicated.
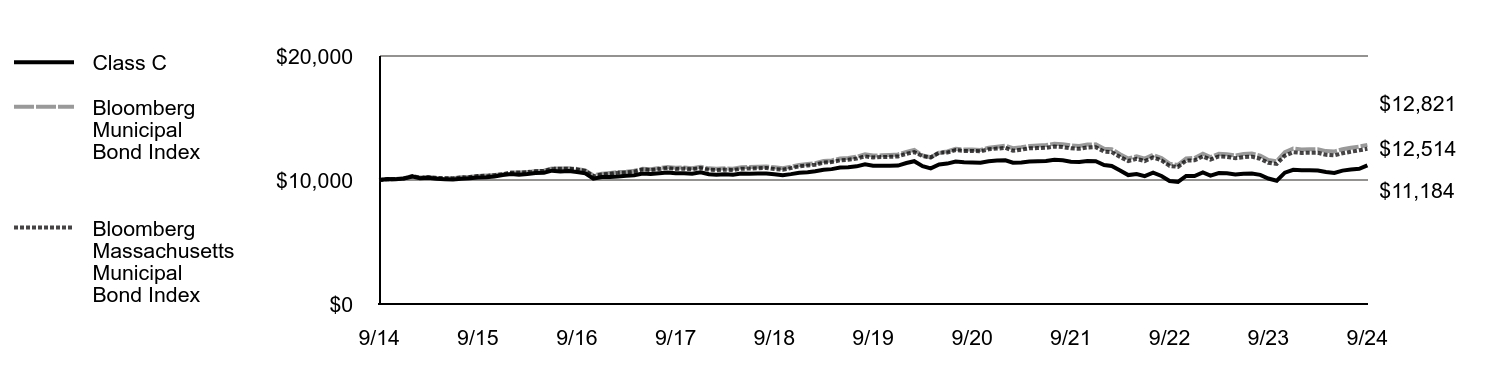
| Class C | Bloomberg Municipal Bond Index | Bloomberg Massachusetts Municipal Bond Index | |
|---|---|---|---|
| 9/14 | $10,000 | $10,000 | $10,000 |
| 10/14 | $10,089 | $10,069 | $10,060 |
| 11/14 | $10,054 | $10,086 | $10,073 |
| 12/14 | $10,121 | $10,137 | $10,130 |
| 1/15 | $10,287 | $10,317 | $10,314 |
| 2/15 | $10,145 | $10,210 | $10,186 |
| 3/15 | $10,178 | $10,240 | $10,223 |
| 4/15 | $10,101 | $10,186 | $10,160 |
| 5/15 | $10,068 | $10,158 | $10,143 |
| 6/15 | $10,047 | $10,148 | $10,130 |
| 7/15 | $10,103 | $10,222 | $10,211 |
| 8/15 | $10,149 | $10,242 | $10,241 |
| 9/15 | $10,195 | $10,316 | $10,320 |
| 10/15 | $10,221 | $10,357 | $10,349 |
| 11/15 | $10,290 | $10,398 | $10,390 |
| 12/15 | $10,395 | $10,472 | $10,462 |
| 1/16 | $10,480 | $10,596 | $10,586 |
| 2/16 | $10,423 | $10,613 | $10,601 |
| 3/16 | $10,481 | $10,647 | $10,629 |
| 4/16 | $10,572 | $10,725 | $10,705 |
| 5/16 | $10,593 | $10,754 | $10,727 |
| 6/16 | $10,754 | $10,925 | $10,906 |
| 7/16 | $10,695 | $10,932 | $10,913 |
| 8/16 | $10,716 | $10,947 | $10,913 |
| 9/16 | $10,644 | $10,892 | $10,851 |
| 10/16 | $10,537 | $10,778 | $10,741 |
| 11/16 | $10,107 | $10,376 | $10,304 |
| 12/16 | $10,246 | $10,497 | $10,441 |
| 1/17 | $10,245 | $10,567 | $10,506 |
| 2/17 | $10,291 | $10,640 | $10,580 |
| 3/17 | $10,336 | $10,663 | $10,603 |
| 4/17 | $10,380 | $10,741 | $10,678 |
| 5/17 | $10,529 | $10,911 | $10,854 |
| 6/17 | $10,480 | $10,872 | $10,806 |
| 7/17 | $10,546 | $10,960 | $10,888 |
| 8/17 | $10,602 | $11,043 | $10,973 |
| 9/17 | $10,552 | $10,987 | $10,894 |
| 10/17 | $10,550 | $11,014 | $10,919 |
| 11/17 | $10,502 | $10,955 | $10,862 |
| 12/17 | $10,621 | $11,069 | $10,974 |
| 1/18 | $10,464 | $10,939 | $10,829 |
| 2/18 | $10,415 | $10,906 | $10,793 |
| 3/18 | $10,472 | $10,947 | $10,843 |
| 4/18 | $10,431 | $10,908 | $10,794 |
| 5/18 | $10,522 | $11,033 | $10,914 |
| 6/18 | $10,506 | $11,042 | $10,921 |
| 7/18 | $10,525 | $11,069 | $10,943 |
| 8/18 | $10,521 | $11,097 | $10,974 |
| 9/18 | $10,468 | $11,025 | $10,892 |
| 10/18 | $10,378 | $10,957 | $10,825 |
| 11/18 | $10,472 | $11,079 | $10,960 |
| 12/18 | $10,589 | $11,211 | $11,096 |
| 1/19 | $10,632 | $11,296 | $11,172 |
| 2/19 | $10,702 | $11,357 | $11,233 |
| 3/19 | $10,831 | $11,536 | $11,403 |
| 4/19 | $10,876 | $11,579 | $11,448 |
| 5/19 | $11,005 | $11,739 | $11,593 |
| 6/19 | $11,024 | $11,782 | $11,635 |
| 7/19 | $11,103 | $11,877 | $11,727 |
| 8/19 | $11,268 | $12,065 | $11,910 |
| 9/19 | $11,153 | $11,968 | $11,819 |
| 10/19 | $11,144 | $11,989 | $11,847 |
| 11/19 | $11,149 | $12,019 | $11,870 |
| 12/19 | $11,166 | $12,056 | $11,902 |
| 1/20 | $11,371 | $12,273 | $12,114 |
| 2/20 | $11,515 | $12,431 | $12,251 |
| 3/20 | $11,120 | $11,980 | $11,930 |
| 4/20 | $10,938 | $11,830 | $11,818 |
| 5/20 | $11,257 | $12,206 | $12,207 |
| 6/20 | $11,325 | $12,307 | $12,210 |
| 7/20 | $11,492 | $12,514 | $12,410 |
| 8/20 | $11,431 | $12,455 | $12,340 |
| 9/20 | $11,421 | $12,458 | $12,348 |
| 10/20 | $11,386 | $12,420 | $12,312 |
| 11/20 | $11,516 | $12,608 | $12,479 |
| 12/20 | $11,569 | $12,685 | $12,531 |
| 1/21 | $11,592 | $12,765 | $12,588 |
| 2/21 | $11,399 | $12,563 | $12,367 |
| 3/21 | $11,421 | $12,640 | $12,450 |
| 4/21 | $11,494 | $12,746 | $12,551 |
| 5/21 | $11,517 | $12,784 | $12,571 |
| 6/21 | $11,541 | $12,819 | $12,595 |
| 7/21 | $11,626 | $12,926 | $12,697 |
| 8/21 | $11,584 | $12,878 | $12,654 |
| 9/21 | $11,466 | $12,785 | $12,551 |
| 10/21 | $11,450 | $12,748 | $12,517 |
| 11/21 | $11,525 | $12,856 | $12,627 |
| 12/21 | $11,511 | $12,877 | $12,649 |
| 1/22 | $11,211 | $12,525 | $12,289 |
| 2/22 | $11,132 | $12,480 | $12,250 |
| 3/22 | $10,769 | $12,075 | $11,862 |
| 4/22 | $10,395 | $11,741 | $11,528 |
| 5/22 | $10,485 | $11,916 | $11,706 |
| 6/22 | $10,306 | $11,720 | $11,528 |
| 7/22 | $10,592 | $12,030 | $11,817 |
| 8/22 | $10,323 | $11,766 | $11,578 |
| 9/22 | $9,924 | $11,315 | $11,137 |
| 10/22 | $9,850 | $11,221 | $11,056 |
| 11/22 | $10,324 | $11,746 | $11,564 |
| 12/22 | $10,316 | $11,779 | $11,586 |
| 1/23 | $10,609 | $12,118 | $11,902 |
| 2/23 | $10,354 | $11,844 | $11,637 |
| 3/23 | $10,556 | $12,106 | $11,901 |
| 4/23 | $10,549 | $12,079 | $11,862 |
| 5/23 | $10,450 | $11,974 | $11,755 |
| 6/23 | $10,510 | $12,094 | $11,841 |
| 7/23 | $10,517 | $12,142 | $11,881 |
| 8/23 | $10,418 | $11,967 | $11,712 |
| 9/23 | $10,121 | $11,616 | $11,383 |
| 10/23 | $9,943 | $11,517 | $11,299 |
| 11/23 | $10,590 | $12,249 | $11,961 |
| 12/23 | $10,824 | $12,533 | $12,236 |
| 1/24 | $10,791 | $12,469 | $12,182 |
| 2/24 | $10,787 | $12,485 | $12,193 |
| 3/24 | $10,769 | $12,485 | $12,190 |
| 4/24 | $10,644 | $12,330 | $12,030 |
| 5/24 | $10,572 | $12,294 | $11,981 |
| 6/24 | $10,758 | $12,482 | $12,154 |
| 7/24 | $10,849 | $12,596 | $12,280 |
| 8/24 | $10,899 | $12,696 | $12,392 |
| 9/24 | $11,184 | $12,821 | $12,514 |
Average Annual Total Returns (%)
| Fund | 1 Year | 5 Years | 10 Years |
|---|---|---|---|
| Class C | 8.86% | (0.24)% | 1.12% |
| Class C with 1% Maximum Deferred Sales Charge | 7.86% | (0.24)% | 1.12% |
| Bloomberg Municipal Bond Index | 10.37% | 1.38% | 2.51% |
| Bloomberg Massachusetts Municipal Bond Index | 9.94% | 1.15% | 2.27% |
Performance does not reflect the deduction of taxes that a shareholder would pay on Fund distributions or redemption of Fund shares. Performance assumes that all dividends and distributions, if any, were reinvested. For more recent performance information, visit www.eatonvance.com/performance.php.
THE FUND'S PAST PERFORMANCE IS NO GUARANTEE OF FUTURE RESULTS.
Key Fund Statistics
| Total Net Assets | $166,484,049 |
| # of Portfolio Holdings | 85 |
| Portfolio Turnover Rate | 57% |
| Total Advisory Fees Paid | $571,899 |
What did the Fund invest in?
The following tables reflect what the Fund invested in as of the report date.
Sector Allocation (% of total investments)
| Value | Value |
|---|---|
OtherFootnote Reference* | 10.2% |
| Water and Sewer | 3.3% |
| Housing | 4.3% |
| Special Tax Revenue | 8.4% |
| Transportation | 10.9% |
| Hospital | 14.2% |
| General Obligations | 21.3% |
| Education | 27.4% |
| Footnote | Description |
Footnote* | Sectors less than 3% each |
Credit Quality (% of total investments)Footnote Referencea ,Footnote Referenceb
| Value | Value |
|---|---|
| Not Rated | 3.3% |
| B | 0.8% |
| BB | 2.3% |
| BBB | 9.7% |
| A | 12.4% |
| AA | 49.8% |
| AAA | 21.7% |
| Footnote | Description |
Footnotea | Ratings are based on Moody’s Investors Service, Inc. (“Moody’s”), S&P Global Ratings (“S&P”) or Fitch Ratings (“Fitch”). If securities are rated differently by the ratings agencies, the highest rating is applied. Moody's ratings are converted to the S&P and Fitch scale with ratings ranging from AAA, being the highest, to D, being the lowest. Ratings of BBB or higher are considered to be investment-grade quality. Holdings designated as “Not Rated” (if any) are not rated by the national ratings agencies stated above. |
Footnoteb | The chart includes the municipal bonds held by a trust that issues residual interest bonds. |
Additional Information
If you wish to view additional information about the Fund, including the prospectus, statement of additional information, financial statements and holdings, please scan the QR code or visit www.eatonvance.com/open-end-mutual-fund-documents.php. For proxy information, please visit www.eatonvance.com/proxyvoting.
Householding
The Funds may deliver a single copy of certain required shareholder documents (including prospectuses, shareholder reports, and proxy materials) to investors with the same last name and the same address. Your participation will continue indefinitely unless you instruct otherwise by calling 1-800-262-1122 or by contacting your financial intermediary. Your instruction will typically be effective within 30 days of receipt.
Not FDIC Insured | May Lose Value | No Bank Guarantee
Annual Shareholder Report September 30, 2024
ECMMX-TSR-AR

Eaton Vance Massachusetts Municipal Income Fund
Class I EIMAX
Annual Shareholder Report September 30, 2024
This annual shareholder report contains important information about the Eaton Vance Massachusetts Municipal Income Fund for the period of October 1, 2023 to September 30, 2024. You can find additional information about the Fund at www.eatonvance.com/open-end-mutual-fund-documents.php. You can also request this information by contacting us at 1-800-262-1122.
What were the Fund costs for the last year?
(based on a hypothetical $10,000 investment)
| Class Name | Costs of a $10,000 investment | Costs paid as a percentage of a $10,000 investment |
|---|---|---|
| Class I | $64 | 0.61% |
How did the Fund perform last year and what affected its performance?
Key contributors to (↑) and detractors from (↓) performance, relative to the Bloomberg Municipal Bond Index (the Index):
↓ Out-of-Index positions in variable-rate demand notes and floating-rate notes — typically considered defensive investments with virtually zero duration — detracted from returns relative to the Index as interest rates generally declined during the period
↓ Security selections in the health care sector detracted from performance relative to the Index during the period
↓ Security selections in the housing sector detracted from performance relative to the Index during the period
↑ An overweight position in bonds rated BBB and below helped returns as lower-credit-quality bonds generally outperformed higher-credit-quality bonds
↑ An overweight position in bonds with 17 years or more remaining to maturity contributed to Index-relative returns as longer-maturity bonds generally outperformed shorter-maturity bonds during the period
↑ An overweight position in 4% coupon bonds contributed to Index-relative returns as interest rates generally declined during the period
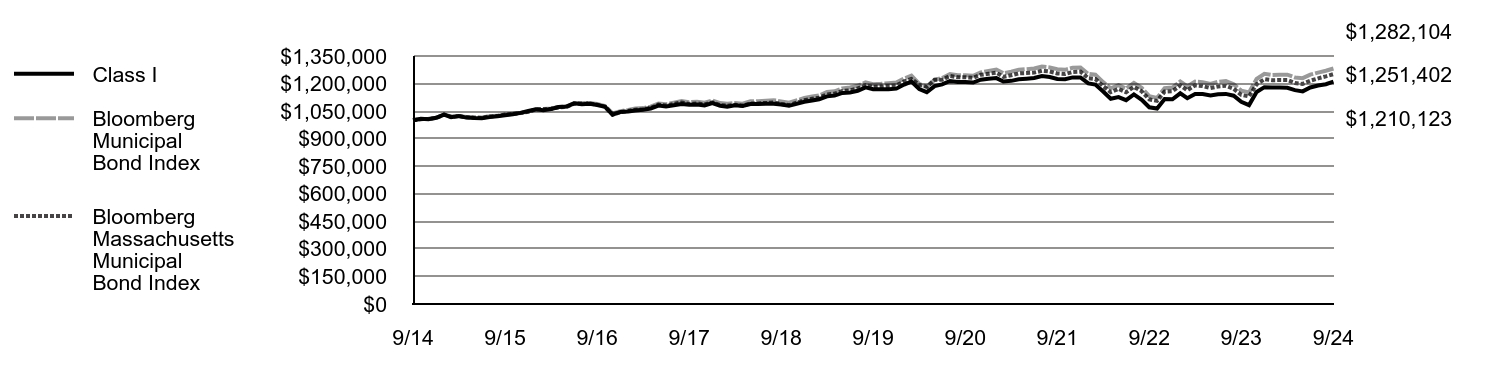
Fund Performance
Comparison of the change in value of a $1,000,000 investment for the period indicated.
| Class I | Bloomberg Municipal Bond Index | Bloomberg Massachusetts Municipal Bond Index | |
|---|---|---|---|
| 9/14 | $1,000,000 | $1,000,000 | $1,000,000 |
| 10/14 | $1,008,636 | $1,006,857 | $1,006,017 |
| 11/14 | $1,005,856 | $1,008,598 | $1,007,316 |
| 12/14 | $1,013,416 | $1,013,687 | $1,012,952 |
| 1/15 | $1,030,893 | $1,031,654 | $1,031,362 |
| 2/15 | $1,017,340 | $1,021,012 | $1,018,557 |
| 3/15 | $1,022,668 | $1,023,960 | $1,022,252 |
| 4/15 | $1,014,604 | $1,018,588 | $1,015,972 |
| 5/15 | $1,012,074 | $1,015,774 | $1,014,267 |
| 6/15 | $1,010,694 | $1,014,848 | $1,012,981 |
| 7/15 | $1,017,230 | $1,022,199 | $1,021,102 |
| 8/15 | $1,022,612 | $1,024,207 | $1,024,066 |
| 9/15 | $1,028,051 | $1,031,626 | $1,032,040 |
| 10/15 | $1,032,712 | $1,035,727 | $1,034,924 |
| 11/15 | $1,040,475 | $1,039,845 | $1,038,956 |
| 12/15 | $1,050,744 | $1,047,151 | $1,046,151 |
| 1/16 | $1,060,111 | $1,059,645 | $1,058,642 |
| 2/16 | $1,055,198 | $1,061,312 | $1,060,105 |
| 3/16 | $1,061,864 | $1,064,674 | $1,062,950 |
| 4/16 | $1,071,941 | $1,072,502 | $1,070,538 |
| 5/16 | $1,074,955 | $1,075,403 | $1,072,719 |
| 6/16 | $1,092,154 | $1,092,511 | $1,090,559 |
| 7/16 | $1,087,064 | $1,093,178 | $1,091,307 |
| 8/16 | $1,090,040 | $1,094,653 | $1,091,254 |
| 9/16 | $1,083,601 | $1,089,190 | $1,085,064 |
| 10/16 | $1,073,560 | $1,077,763 | $1,074,086 |
| 11/16 | $1,030,524 | $1,037,568 | $1,030,438 |
| 12/16 | $1,045,460 | $1,049,749 | $1,044,109 |
| 1/17 | $1,047,385 | $1,056,669 | $1,050,603 |
| 2/17 | $1,052,857 | $1,064,007 | $1,057,957 |
| 3/17 | $1,057,190 | $1,066,317 | $1,060,336 |
| 4/17 | $1,063,703 | $1,074,054 | $1,067,774 |
| 5/17 | $1,079,852 | $1,091,100 | $1,085,405 |
| 6/17 | $1,075,588 | $1,087,187 | $1,080,631 |
| 7/17 | $1,082,120 | $1,095,983 | $1,088,812 |
| 8/17 | $1,088,690 | $1,104,323 | $1,097,273 |
| 9/17 | $1,084,363 | $1,098,708 | $1,089,432 |
| 10/17 | $1,086,262 | $1,101,390 | $1,091,867 |
| 11/17 | $1,080,963 | $1,095,493 | $1,086,203 |
| 12/17 | $1,094,136 | $1,106,943 | $1,097,359 |
| 1/18 | $1,078,753 | $1,093,911 | $1,082,880 |
| 2/18 | $1,074,467 | $1,090,642 | $1,079,327 |
| 3/18 | $1,081,267 | $1,094,668 | $1,084,276 |
| 4/18 | $1,077,891 | $1,090,761 | $1,079,389 |
| 5/18 | $1,088,213 | $1,103,252 | $1,091,415 |
| 6/18 | $1,088,603 | $1,104,193 | $1,092,090 |
| 7/18 | $1,090,243 | $1,106,873 | $1,094,310 |
| 8/18 | $1,090,636 | $1,109,715 | $1,097,357 |
| 9/18 | $1,085,955 | $1,102,531 | $1,089,193 |
| 10/18 | $1,078,776 | $1,095,742 | $1,082,476 |
| 11/18 | $1,089,354 | $1,107,870 | $1,095,966 |
| 12/18 | $1,101,134 | $1,121,135 | $1,109,622 |
| 1/19 | $1,107,840 | $1,129,609 | $1,117,186 |
| 2/19 | $1,114,627 | $1,135,658 | $1,123,261 |
| 3/19 | $1,130,326 | $1,153,610 | $1,140,342 |
| 4/19 | $1,134,566 | $1,157,945 | $1,144,760 |
| 5/19 | $1,148,977 | $1,173,909 | $1,159,275 |
| 6/19 | $1,151,818 | $1,178,244 | $1,163,544 |
| 7/19 | $1,161,002 | $1,187,739 | $1,172,730 |
| 8/19 | $1,179,238 | $1,206,474 | $1,191,023 |
| 9/19 | $1,169,447 | $1,196,803 | $1,181,863 |
| 10/19 | $1,169,435 | $1,198,948 | $1,184,746 |
| 11/19 | $1,169,499 | $1,201,946 | $1,187,025 |
| 12/19 | $1,172,251 | $1,205,616 | $1,190,186 |
| 1/20 | $1,194,692 | $1,227,277 | $1,211,391 |
| 2/20 | $1,210,744 | $1,243,103 | $1,225,069 |
| 3/20 | $1,170,069 | $1,198,012 | $1,193,037 |
| 4/20 | $1,153,074 | $1,182,977 | $1,181,777 |
| 5/20 | $1,186,228 | $1,220,609 | $1,220,708 |
| 6/20 | $1,195,541 | $1,230,655 | $1,220,973 |
| 7/20 | $1,213,997 | $1,251,382 | $1,241,037 |
| 8/20 | $1,208,457 | $1,245,511 | $1,233,983 |
| 9/20 | $1,208,173 | $1,245,775 | $1,234,785 |
| 10/20 | $1,205,211 | $1,242,033 | $1,231,177 |
| 11/20 | $1,221,042 | $1,260,776 | $1,247,879 |
| 12/20 | $1,226,087 | $1,268,456 | $1,253,108 |
| 1/21 | $1,229,529 | $1,276,540 | $1,258,816 |
| 2/21 | $1,211,368 | $1,256,257 | $1,236,696 |
| 3/21 | $1,214,636 | $1,264,005 | $1,244,987 |
| 4/21 | $1,223,389 | $1,274,607 | $1,255,090 |
| 5/21 | $1,226,790 | $1,278,410 | $1,257,056 |
| 6/21 | $1,230,273 | $1,281,920 | $1,259,510 |
| 7/21 | $1,240,389 | $1,292,552 | $1,269,718 |
| 8/21 | $1,235,494 | $1,287,808 | $1,265,448 |
| 9/21 | $1,225,267 | $1,278,514 | $1,255,092 |
| 10/21 | $1,223,207 | $1,274,776 | $1,251,702 |
| 11/21 | $1,233,536 | $1,285,628 | $1,262,728 |
| 12/21 | $1,232,975 | $1,287,702 | $1,264,856 |
| 1/22 | $1,200,523 | $1,252,454 | $1,228,906 |
| 2/22 | $1,194,355 | $1,247,967 | $1,225,035 |
| 3/22 | $1,156,390 | $1,207,512 | $1,186,209 |
| 4/22 | $1,117,131 | $1,174,113 | $1,152,772 |
| 5/22 | $1,126,329 | $1,191,554 | $1,170,645 |
| 6/22 | $1,109,288 | $1,172,038 | $1,152,825 |
| 7/22 | $1,140,967 | $1,203,006 | $1,181,705 |
| 8/22 | $1,111,549 | $1,176,640 | $1,157,815 |
| 9/22 | $1,070,827 | $1,131,480 | $1,113,742 |
| 10/22 | $1,063,768 | $1,122,070 | $1,105,590 |
| 11/22 | $1,115,739 | $1,174,553 | $1,156,368 |
| 12/22 | $1,114,356 | $1,177,916 | $1,158,599 |
| 1/23 | $1,146,869 | $1,211,751 | $1,190,157 |
| 2/23 | $1,120,184 | $1,184,351 | $1,163,667 |
| 3/23 | $1,142,961 | $1,210,629 | $1,190,137 |
| 4/23 | $1,143,081 | $1,207,864 | $1,186,183 |
| 5/23 | $1,134,724 | $1,197,397 | $1,175,501 |
| 6/23 | $1,142,098 | $1,209,391 | $1,184,083 |
| 7/23 | $1,143,748 | $1,214,176 | $1,188,093 |
| 8/23 | $1,133,920 | $1,196,696 | $1,171,218 |
| 9/23 | $1,101,074 | $1,161,622 | $1,138,256 |
| 10/23 | $1,082,615 | $1,151,737 | $1,129,871 |
| 11/23 | $1,153,874 | $1,224,851 | $1,196,102 |
| 12/23 | $1,180,335 | $1,253,319 | $1,223,607 |
| 1/24 | $1,179,202 | $1,246,918 | $1,218,192 |
| 2/24 | $1,178,164 | $1,248,519 | $1,219,266 |
| 3/24 | $1,177,099 | $1,248,480 | $1,219,014 |
| 4/24 | $1,164,371 | $1,233,018 | $1,202,978 |
| 5/24 | $1,157,495 | $1,229,401 | $1,198,090 |
| 6/24 | $1,178,719 | $1,248,245 | $1,215,403 |
| 7/24 | $1,189,657 | $1,259,622 | $1,228,031 |
| 8/24 | $1,196,146 | $1,269,557 | $1,239,172 |
| 9/24 | $1,210,123 | $1,282,104 | $1,251,402 |
Average Annual Total Returns (%)
| Fund | 1 Year | 5 Years | 10 Years |
|---|---|---|---|
| Class I | 9.90% | 0.69% | 1.92% |
| Bloomberg Municipal Bond Index | 10.37% | 1.38% | 2.51% |
| Bloomberg Massachusetts Municipal Bond Index | 9.94% | 1.15% | 2.27% |
Performance does not reflect the deduction of taxes that a shareholder would pay on Fund distributions or redemption of Fund shares. Performance assumes that all dividends and distributions, if any, were reinvested. For more recent performance information, visit www.eatonvance.com/performance.php.
THE FUND'S PAST PERFORMANCE IS NO GUARANTEE OF FUTURE RESULTS.
Key Fund Statistics
| Total Net Assets | $166,484,049 |
| # of Portfolio Holdings | 85 |
| Portfolio Turnover Rate | 57% |
| Total Advisory Fees Paid | $571,899 |
What did the Fund invest in?
The following tables reflect what the Fund invested in as of the report date.
Sector Allocation (% of total investments)

| Value | Value |
|---|---|
OtherFootnote Reference* | 10.2% |
| Water and Sewer | 3.3% |
| Housing | 4.3% |
| Special Tax Revenue | 8.4% |
| Transportation | 10.9% |
| Hospital | 14.2% |
| General Obligations | 21.3% |
| Education | 27.4% |
| Footnote | Description |
Footnote* | Sectors less than 3% each |
Credit Quality (% of total investments)Footnote Referencea ,Footnote Referenceb

| Value | Value |
|---|---|
| Not Rated | 3.3% |
| B | 0.8% |
| BB | 2.3% |
| BBB | 9.7% |
| A | 12.4% |
| AA | 49.8% |
| AAA | 21.7% |
| Footnote | Description |
Footnotea | Ratings are based on Moody’s Investors Service, Inc. (“Moody’s”), S&P Global Ratings (“S&P”) or Fitch Ratings (“Fitch”). If securities are rated differently by the ratings agencies, the highest rating is applied. Moody's ratings are converted to the S&P and Fitch scale with ratings ranging from AAA, being the highest, to D, being the lowest. Ratings of BBB or higher are considered to be investment-grade quality. Holdings designated as “Not Rated” (if any) are not rated by the national ratings agencies stated above. |
Footnoteb | The chart includes the municipal bonds held by a trust that issues residual interest bonds. |
Additional Information
If you wish to view additional information about the Fund, including the prospectus, statement of additional information, financial statements and holdings, please scan the QR code or visit www.eatonvance.com/open-end-mutual-fund-documents.php. For proxy information, please visit www.eatonvance.com/proxyvoting.
Householding
The Funds may deliver a single copy of certain required shareholder documents (including prospectuses, shareholder reports, and proxy materials) to investors with the same last name and the same address. Your participation will continue indefinitely unless you instruct otherwise by calling 1-800-262-1122 or by contacting your financial intermediary. Your instruction will typically be effective within 30 days of receipt.
Not FDIC Insured | May Lose Value | No Bank Guarantee
Annual Shareholder Report September 30, 2024
EIMAX-TSR-AR

Eaton Vance National Municipal Income Fund
Class A EANAX
Annual Shareholder Report September 30, 2024
This annual shareholder report contains important information about the Eaton Vance National Municipal Income Fund for the period of October 1, 2023 to September 30, 2024. You can find additional information about the Fund at www.eatonvance.com/open-end-mutual-fund-documents.php. You can also request this information by contacting us at 1-800-262-1122.
What were the Fund costs for the last year?
(based on a hypothetical $10,000 investment)
| Class Name | Costs of a $10,000 investment | Costs paid as a percentage of a $10,000 investment |
|---|---|---|
| Class A | $75 | 0.71% |
How did the Fund perform last year and what affected its performance?
Key contributors to (↑) and detractors from (↓) performance, relative to the Bloomberg Municipal Bond Index (the Index):
↑ An overweight position in bonds with 17 years or more remaining to maturity helped returns as longer-maturity bonds outperformed shorter-maturity bonds
↑ Security selections and an overweight position in 4% coupon bonds contributed to Index-relative returns as interest rates generally declined during the period
↑ Security selections and an overweight position in the health care sector — the best-performing sector within the Index during the period — contributed to Fund returns relative to the Index
↓ An out-of-Index position in variable-rate demand notes — typically considered defensive investments with virtually zero duration — detracted from returns relative to the Index as interest rates generally declined during the period
↓ An underweight position in bonds with coupon rates below 4% ― excluding zero-coupon bonds ― detracted from Index-relative returns during the period
↓ Security selections in bonds with 22 years or more remaining to maturity detracted from Fund performance relative to the Index during the period
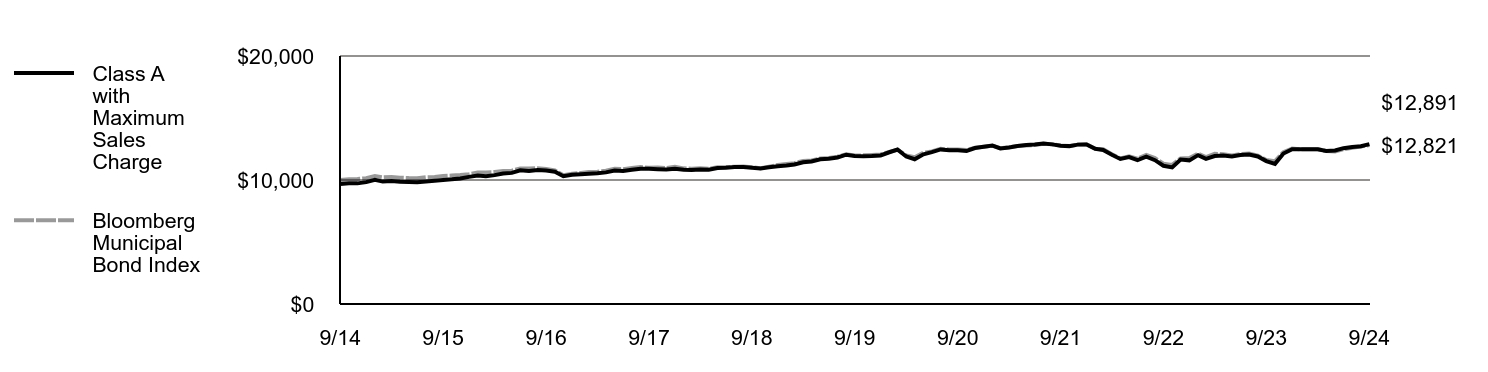
Fund Performance
Comparison of the change in value of a $10,000 investment for the period indicated.
| Class A with Maximum Sales Charge | Bloomberg Municipal Bond Index | |
|---|---|---|
| 9/14 | $9,675 | $10,000 |
| 10/14 | $9,736 | $10,069 |
| 11/14 | $9,728 | $10,086 |
| 12/14 | $9,829 | $10,137 |
| 1/15 | $10,020 | $10,317 |
| 2/15 | $9,873 | $10,210 |
| 3/15 | $9,915 | $10,240 |
| 4/15 | $9,857 | $10,186 |
| 5/15 | $9,839 | $10,158 |
| 6/15 | $9,811 | $10,148 |
| 7/15 | $9,873 | $10,222 |
| 8/15 | $9,936 | $10,242 |
| 9/15 | $9,999 | $10,316 |
| 10/15 | $10,052 | $10,357 |
| 11/15 | $10,126 | $10,398 |
| 12/15 | $10,252 | $10,472 |
| 1/16 | $10,356 | $10,596 |
| 2/16 | $10,297 | $10,613 |
| 3/16 | $10,393 | $10,647 |
| 4/16 | $10,520 | $10,725 |
| 5/16 | $10,573 | $10,754 |
| 6/16 | $10,785 | $10,925 |
| 7/16 | $10,734 | $10,932 |
| 8/16 | $10,798 | $10,947 |
| 9/16 | $10,767 | $10,892 |
| 10/16 | $10,672 | $10,778 |
| 11/16 | $10,310 | $10,376 |
| 12/16 | $10,427 | $10,497 |
| 1/17 | $10,461 | $10,567 |
| 2/17 | $10,505 | $10,640 |
| 3/17 | $10,538 | $10,663 |
| 4/17 | $10,614 | $10,741 |
| 5/17 | $10,766 | $10,911 |
| 6/17 | $10,733 | $10,872 |
| 7/17 | $10,820 | $10,960 |
| 8/17 | $10,907 | $11,043 |
| 9/17 | $10,908 | $10,987 |
| 10/17 | $10,873 | $11,014 |
| 11/17 | $10,839 | $10,955 |
| 12/17 | $10,915 | $11,069 |
| 1/18 | $10,825 | $10,939 |
| 2/18 | $10,813 | $10,906 |
| 3/18 | $10,846 | $10,947 |
| 4/18 | $10,822 | $10,908 |
| 5/18 | $10,968 | $11,033 |
| 6/18 | $10,993 | $11,042 |
| 7/18 | $11,039 | $11,069 |
| 8/18 | $11,049 | $11,097 |
| 9/18 | $10,991 | $11,025 |
| 10/18 | $10,931 | $10,957 |
| 11/18 | $11,020 | $11,079 |
| 12/18 | $11,108 | $11,211 |
| 1/19 | $11,163 | $11,296 |
| 2/19 | $11,254 | $11,357 |
| 3/19 | $11,436 | $11,536 |
| 4/19 | $11,491 | $11,579 |
| 5/19 | $11,672 | $11,739 |
| 6/19 | $11,714 | $11,782 |
| 7/19 | $11,813 | $11,877 |
| 8/19 | $12,042 | $12,065 |
| 9/19 | $11,932 | $11,968 |
| 10/19 | $11,925 | $11,989 |
| 11/19 | $11,943 | $12,019 |
| 12/19 | $11,984 | $12,056 |
| 1/20 | $12,237 | $12,273 |
| 2/20 | $12,456 | $12,431 |
| 3/20 | $11,899 | $11,980 |
| 4/20 | $11,676 | $11,830 |
| 5/20 | $12,074 | $12,206 |
| 6/20 | $12,246 | $12,307 |
| 7/20 | $12,467 | $12,514 |
| 8/20 | $12,399 | $12,455 |
| 9/20 | $12,390 | $12,458 |
| 10/20 | $12,345 | $12,420 |
| 11/20 | $12,578 | $12,608 |
| 12/20 | $12,677 | $12,685 |
| 1/21 | $12,775 | $12,765 |
| 2/21 | $12,544 | $12,563 |
| 3/21 | $12,628 | $12,640 |
| 4/21 | $12,749 | $12,746 |
| 5/21 | $12,819 | $12,784 |
| 6/21 | $12,855 | $12,819 |
| 7/21 | $12,951 | $12,926 |
| 8/21 | $12,874 | $12,878 |
| 9/21 | $12,760 | $12,785 |
| 10/21 | $12,732 | $12,748 |
| 11/21 | $12,853 | $12,856 |
| 12/21 | $12,863 | $12,877 |
| 1/22 | $12,512 | $12,525 |
| 2/22 | $12,424 | $12,480 |
| 3/22 | $12,035 | $12,075 |
| 4/22 | $11,698 | $11,741 |
| 5/22 | $11,851 | $11,916 |
| 6/22 | $11,604 | $11,720 |
| 7/22 | $11,885 | $12,030 |
| 8/22 | $11,599 | $11,766 |
| 9/22 | $11,149 | $11,315 |
| 10/22 | $11,018 | $11,221 |
| 11/22 | $11,652 | $11,746 |
| 12/22 | $11,585 | $11,779 |
| 1/23 | $12,005 | $12,118 |
| 2/23 | $11,707 | $11,844 |
| 3/23 | $11,937 | $12,106 |
| 4/23 | $11,973 | $12,079 |
| 5/23 | $11,892 | $11,974 |
| 6/23 | $12,019 | $12,094 |
| 7/23 | $12,055 | $12,142 |
| 8/23 | $11,895 | $11,967 |
| 9/23 | $11,526 | $11,616 |
| 10/23 | $11,301 | $11,517 |
| 11/23 | $12,133 | $12,249 |
| 12/23 | $12,477 | $12,533 |
| 1/24 | $12,489 | $12,469 |
| 2/24 | $12,488 | $12,485 |
| 3/24 | $12,486 | $12,485 |
| 4/24 | $12,338 | $12,330 |
| 5/24 | $12,377 | $12,294 |
| 6/24 | $12,566 | $12,482 |
| 7/24 | $12,660 | $12,596 |
| 8/24 | $12,726 | $12,696 |
| 9/24 | $12,891 | $12,821 |
Average Annual Total Returns (%)
| Fund | 1 Year | 5 Years | 10 Years |
|---|---|---|---|
| Class A | 11.82% | 1.55% | 2.91% |
| Class A with 3.25% Maximum Sales Charge | 8.24% | 0.89% | 2.57% |
| Bloomberg Municipal Bond Index | 10.37% | 1.38% | 2.51% |
Performance does not reflect the deduction of taxes that a shareholder would pay on Fund distributions or redemption of Fund shares. Performance assumes that all dividends and distributions, if any, were reinvested. For more recent performance information, visit www.eatonvance.com/performance.php.
THE FUND'S PAST PERFORMANCE IS NO GUARANTEE OF FUTURE RESULTS.
Key Fund Statistics
| Total Net Assets | $4,618,197,661 |
| # of Portfolio Holdings | 548 |
| Portfolio Turnover Rate | 82% |
| Total Advisory Fees Paid | $13,359,012 |
What did the Fund invest in?
The following tables reflect what the Fund invested in as of the report date.
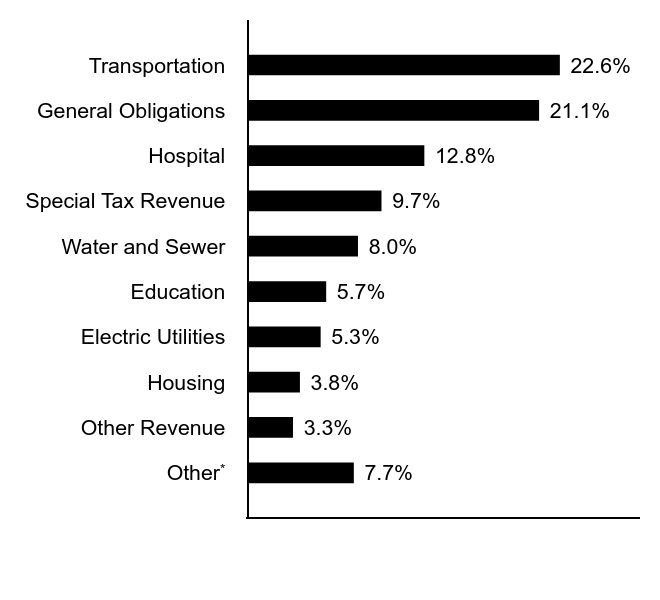
Sector Allocation (% of total investments)
| Value | Value |
|---|---|
OtherFootnote Reference* | 7.7% |
| Other Revenue | 3.3% |
| Housing | 3.8% |
| Electric Utilities | 5.3% |
| Education | 5.7% |
| Water and Sewer | 8.0% |
| Special Tax Revenue | 9.7% |
| Hospital | 12.8% |
| General Obligations | 21.1% |
| Transportation | 22.6% |
| Footnote | Description |
Footnote* | Sectors less than 3% each |
Credit Quality (% of total investments)Footnote Referencea ,Footnote Referenceb
| Value | Value |
|---|---|
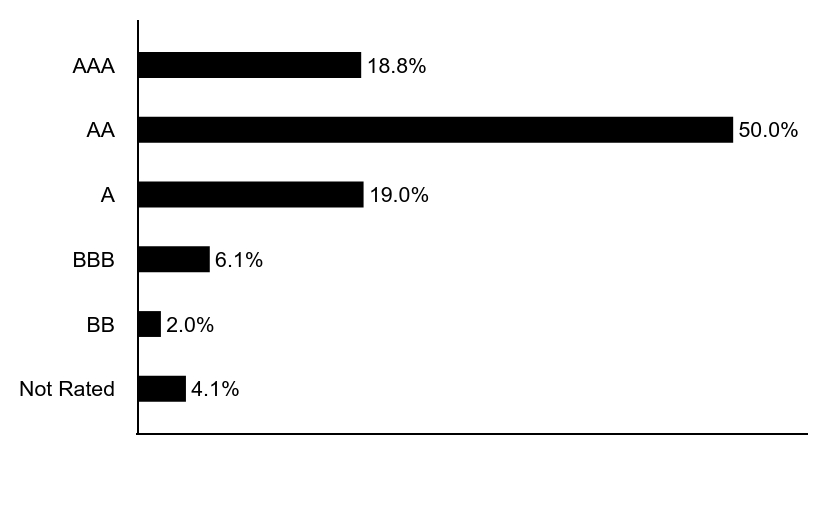
| Not Rated | 4.1% |
| BB | 2.0% |
| BBB | 6.1% |
| A | 19.0% |
| AA | 50.0% |
| AAA | 18.8% |
| Footnote | Description |
Footnotea | Ratings are based on Moody’s Investors Service, Inc. (“Moody’s”), S&P Global Ratings (“S&P”) or Fitch Ratings (“Fitch”). If securities are rated differently by the ratings agencies, the highest rating is applied. Moody's ratings are converted to the S&P and Fitch scale with ratings ranging from AAA, being the highest, to D, being the lowest. Ratings of BBB or higher are considered to be investment-grade quality. Holdings designated as “Not Rated” (if any) are not rated by the national ratings agencies stated above. |
Footnoteb | The chart includes the municipal bonds held by a trust that issues residual interest bonds. |
Additional Information
If you wish to view additional information about the Fund, including the prospectus, statement of additional information, financial statements and holdings, please scan the QR code or visit www.eatonvance.com/open-end-mutual-fund-documents.php. For proxy information, please visit www.eatonvance.com/proxyvoting.
Householding
The Funds may deliver a single copy of certain required shareholder documents (including prospectuses, shareholder reports, and proxy materials) to investors with the same last name and the same address. Your participation will continue indefinitely unless you instruct otherwise by calling 1-800-262-1122 or by contacting your financial intermediary. Your instruction will typically be effective within 30 days of receipt.
Not FDIC Insured | May Lose Value | No Bank Guarantee
Annual Shareholder Report September 30, 2024
EANAX-TSR-AR

Eaton Vance National Municipal Income Fund
Class C ECHMX
Annual Shareholder Report September 30, 2024
This annual shareholder report contains important information about the Eaton Vance National Municipal Income Fund for the period of October 1, 2023 to September 30, 2024. You can find additional information about the Fund at www.eatonvance.com/open-end-mutual-fund-documents.php. You can also request this information by contacting us at 1-800-262-1122.
What were the Fund costs for the last year?
(based on a hypothetical $10,000 investment)
| Class Name | Costs of a $10,000 investment | Costs paid as a percentage of a $10,000 investment |
|---|---|---|
| Class C | $154 | 1.46% |
How did the Fund perform last year and what affected its performance?
Key contributors to (↑) and detractors from (↓) performance, relative to the Bloomberg Municipal Bond Index (the Index):
↑ An overweight position in bonds with 17 years or more remaining to maturity helped returns as longer-maturity bonds outperformed shorter-maturity bonds
↑ Security selections and an overweight position in 4% coupon bonds contributed to Index-relative returns as interest rates generally declined during the period
↑ Security selections and an overweight position in the health care sector — the best-performing sector within the Index during the period — contributed to Fund returns relative to the Index
↓ An out-of-Index position in variable-rate demand notes — typically considered defensive investments with virtually zero duration — detracted from returns relative to the Index as interest rates generally declined during the period
↓ An underweight position in bonds with coupon rates below 4% ― excluding zero-coupon bonds ― detracted from Index-relative returns during the period
↓ Security selections in bonds with 22 years or more remaining to maturity detracted from Fund performance relative to the Index during the period
Fund Performance
Comparison of the change in value of a $10,000 investment for the period indicated.
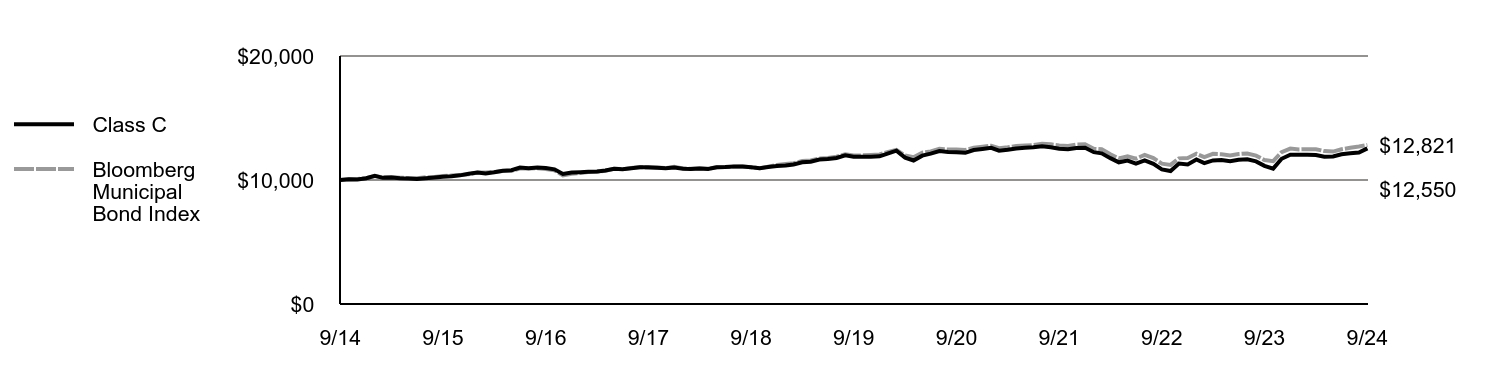
| Class C | Bloomberg Municipal Bond Index | |
|---|---|---|
| 9/14 | $10,000 | $10,000 |
| 10/14 | $10,057 | $10,069 |
| 11/14 | $10,042 | $10,086 |
| 12/14 | $10,140 | $10,137 |
| 1/15 | $10,330 | $10,317 |
| 2/15 | $10,173 | $10,210 |
| 3/15 | $10,210 | $10,240 |
| 4/15 | $10,144 | $10,186 |
| 5/15 | $10,119 | $10,158 |
| 6/15 | $10,073 | $10,148 |
| 7/15 | $10,142 | $10,222 |
| 8/15 | $10,199 | $10,242 |
| 9/15 | $10,258 | $10,316 |
| 10/15 | $10,305 | $10,357 |
| 11/15 | $10,375 | $10,398 |
| 12/15 | $10,497 | $10,472 |
| 1/16 | $10,598 | $10,596 |
| 2/16 | $10,531 | $10,613 |
| 3/16 | $10,622 | $10,647 |
| 4/16 | $10,745 | $10,725 |
| 5/16 | $10,793 | $10,754 |
| 6/16 | $11,003 | $10,925 |
| 7/16 | $10,944 | $10,932 |
| 8/16 | $11,002 | $10,947 |
| 9/16 | $10,963 | $10,892 |
| 10/16 | $10,859 | $10,778 |
| 11/16 | $10,485 | $10,376 |
| 12/16 | $10,598 | $10,497 |
| 1/17 | $10,625 | $10,567 |
| 2/17 | $10,663 | $10,640 |
| 3/17 | $10,690 | $10,663 |
| 4/17 | $10,761 | $10,741 |
| 5/17 | $10,908 | $10,911 |
| 6/17 | $10,868 | $10,872 |
| 7/17 | $10,949 | $10,960 |
| 8/17 | $11,031 | $11,043 |
| 9/17 | $11,024 | $10,987 |
| 10/17 | $10,982 | $11,014 |
| 11/17 | $10,941 | $10,955 |
| 12/17 | $11,010 | $11,069 |
| 1/18 | $10,913 | $10,939 |
| 2/18 | $10,895 | $10,906 |
| 3/18 | $10,920 | $10,947 |
| 4/18 | $10,890 | $10,908 |
| 5/18 | $11,030 | $11,033 |
| 6/18 | $11,048 | $11,042 |
| 7/18 | $11,088 | $11,069 |
| 8/18 | $11,090 | $11,097 |
| 9/18 | $11,025 | $11,025 |
| 10/18 | $10,958 | $10,957 |
| 11/18 | $11,040 | $11,079 |
| 12/18 | $11,122 | $11,211 |
| 1/19 | $11,170 | $11,296 |
| 2/19 | $11,254 | $11,357 |
| 3/19 | $11,430 | $11,536 |
| 4/19 | $11,477 | $11,579 |
| 5/19 | $11,651 | $11,739 |
| 6/19 | $11,685 | $11,782 |
| 7/19 | $11,777 | $11,877 |
| 8/19 | $11,998 | $12,065 |
| 9/19 | $11,881 | $11,968 |
| 10/19 | $11,867 | $11,989 |
| 11/19 | $11,878 | $12,019 |
| 12/19 | $11,911 | $12,056 |
| 1/20 | $12,155 | $12,273 |
| 2/20 | $12,365 | $12,431 |
| 3/20 | $11,805 | $11,980 |
| 4/20 | $11,576 | $11,830 |
| 5/20 | $11,964 | $12,206 |
| 6/20 | $12,127 | $12,307 |
| 7/20 | $12,338 | $12,514 |
| 8/20 | $12,263 | $12,455 |
| 9/20 | $12,247 | $12,458 |
| 10/20 | $12,194 | $12,420 |
| 11/20 | $12,417 | $12,608 |
| 12/20 | $12,507 | $12,685 |
| 1/21 | $12,596 | $12,765 |
| 2/21 | $12,361 | $12,563 |
| 3/21 | $12,435 | $12,640 |
| 4/21 | $12,546 | $12,746 |
| 5/21 | $12,608 | $12,784 |
| 6/21 | $12,635 | $12,819 |
| 7/21 | $12,721 | $12,926 |
| 8/21 | $12,637 | $12,878 |
| 9/21 | $12,518 | $12,785 |
| 10/21 | $12,482 | $12,748 |
| 11/21 | $12,581 | $12,856 |
| 12/21 | $12,595 | $12,877 |
| 1/22 | $12,243 | $12,525 |
| 2/22 | $12,150 | $12,480 |
| 3/22 | $11,762 | $12,075 |
| 4/22 | $11,426 | $11,741 |
| 5/22 | $11,568 | $11,916 |
| 6/22 | $11,321 | $11,720 |
| 7/22 | $11,587 | $12,030 |
| 8/22 | $11,301 | $11,766 |
| 9/22 | $10,856 | $11,315 |
| 10/22 | $10,721 | $11,221 |
| 11/22 | $11,331 | $11,746 |
| 12/22 | $11,259 | $11,779 |
| 1/23 | $11,659 | $12,118 |
| 2/23 | $11,364 | $11,844 |
| 3/23 | $11,579 | $12,106 |
| 4/23 | $11,607 | $12,079 |
| 5/23 | $11,521 | $11,974 |
| 6/23 | $11,637 | $12,094 |
| 7/23 | $11,665 | $12,142 |
| 8/23 | $11,503 | $11,967 |
| 9/23 | $11,139 | $11,616 |
| 10/23 | $10,914 | $11,517 |
| 11/23 | $11,711 | $12,249 |
| 12/23 | $12,035 | $12,533 |
| 1/24 | $12,039 | $12,469 |
| 2/24 | $12,031 | $12,485 |
| 3/24 | $12,022 | $12,485 |
| 4/24 | $11,871 | $12,330 |
| 5/24 | $11,901 | $12,294 |
| 6/24 | $12,076 | $12,482 |
| 7/24 | $12,158 | $12,596 |
| 8/24 | $12,214 | $12,696 |
| 9/24 | $12,550 | $12,821 |
Average Annual Total Returns (%)
| Fund | 1 Year | 5 Years | 10 Years |
|---|---|---|---|
| Class C | 10.99% | 0.80% | 2.30% |
| Class C with 1% Maximum Deferred Sales Charge | 9.99% | 0.80% | 2.30% |
| Bloomberg Municipal Bond Index | 10.37% | 1.38% | 2.51% |
Performance does not reflect the deduction of taxes that a shareholder would pay on Fund distributions or redemption of Fund shares. Performance assumes that all dividends and distributions, if any, were reinvested. For more recent performance information, visit www.eatonvance.com/performance.php.
THE FUND'S PAST PERFORMANCE IS NO GUARANTEE OF FUTURE RESULTS.
Key Fund Statistics
| Total Net Assets | $4,618,197,661 |
| # of Portfolio Holdings | 548 |
| Portfolio Turnover Rate | 82% |
| Total Advisory Fees Paid | $13,359,012 |
What did the Fund invest in?
The following tables reflect what the Fund invested in as of the report date.
Sector Allocation (% of total investments)

| Value | Value |
|---|---|
OtherFootnote Reference* | 7.7% |
| Other Revenue | 3.3% |
| Housing | 3.8% |
| Electric Utilities | 5.3% |
| Education | 5.7% |
| Water and Sewer | 8.0% |
| Special Tax Revenue | 9.7% |
| Hospital | 12.8% |
| General Obligations | 21.1% |
| Transportation | 22.6% |
| Footnote | Description |
Footnote* | Sectors less than 3% each |
Credit Quality (% of total investments)Footnote Referencea ,Footnote Referenceb

| Value | Value |
|---|---|
| Not Rated | 4.1% |
| BB | 2.0% |
| BBB | 6.1% |
| A | 19.0% |
| AA | 50.0% |
| AAA | 18.8% |
| Footnote | Description |
Footnotea | Ratings are based on Moody’s Investors Service, Inc. (“Moody’s”), S&P Global Ratings (“S&P”) or Fitch Ratings (“Fitch”). If securities are rated differently by the ratings agencies, the highest rating is applied. Moody's ratings are converted to the S&P and Fitch scale with ratings ranging from AAA, being the highest, to D, being the lowest. Ratings of BBB or higher are considered to be investment-grade quality. Holdings designated as “Not Rated” (if any) are not rated by the national ratings agencies stated above. |
Footnoteb | The chart includes the municipal bonds held by a trust that issues residual interest bonds. |
Additional Information
If you wish to view additional information about the Fund, including the prospectus, statement of additional information, financial statements and holdings, please scan the QR code or visit www.eatonvance.com/open-end-mutual-fund-documents.php. For proxy information, please visit www.eatonvance.com/proxyvoting.
Householding
The Funds may deliver a single copy of certain required shareholder documents (including prospectuses, shareholder reports, and proxy materials) to investors with the same last name and the same address. Your participation will continue indefinitely unless you instruct otherwise by calling 1-800-262-1122 or by contacting your financial intermediary. Your instruction will typically be effective within 30 days of receipt.
Not FDIC Insured | May Lose Value | No Bank Guarantee
Annual Shareholder Report September 30, 2024
ECHMX-TSR-AR

Eaton Vance National Municipal Income Fund
Class I EIHMX
Annual Shareholder Report September 30, 2024
This annual shareholder report contains important information about the Eaton Vance National Municipal Income Fund for the period of October 1, 2023 to September 30, 2024. You can find additional information about the Fund at www.eatonvance.com/open-end-mutual-fund-documents.php. You can also request this information by contacting us at 1-800-262-1122.
What were the Fund costs for the last year?
(based on a hypothetical $10,000 investment)
| Class Name | Costs of a $10,000 investment | Costs paid as a percentage of a $10,000 investment |
|---|---|---|
| Class I | $49 | 0.46% |
How did the Fund perform last year and what affected its performance?
Key contributors to (↑) and detractors from (↓) performance, relative to the Bloomberg Municipal Bond Index (the Index):
↑ An overweight position in bonds with 17 years or more remaining to maturity helped returns as longer-maturity bonds outperformed shorter-maturity bonds
↑ Security selections and an overweight position in 4% coupon bonds contributed to Index-relative returns as interest rates generally declined during the period
↑ Security selections and an overweight position in the health care sector — the best-performing sector within the Index during the period — contributed to Fund returns relative to the Index
↓ An out-of-Index position in variable-rate demand notes — typically considered defensive investments with virtually zero duration — detracted from returns relative to the Index as interest rates generally declined during the period
↓ An underweight position in bonds with coupon rates below 4% ― excluding zero-coupon bonds ― detracted from Index-relative returns during the period
↓ Security selections in bonds with 22 years or more remaining to maturity detracted from Fund performance relative to the Index during the period
Fund Performance
Comparison of the change in value of a $1,000,000 investment for the period indicated.
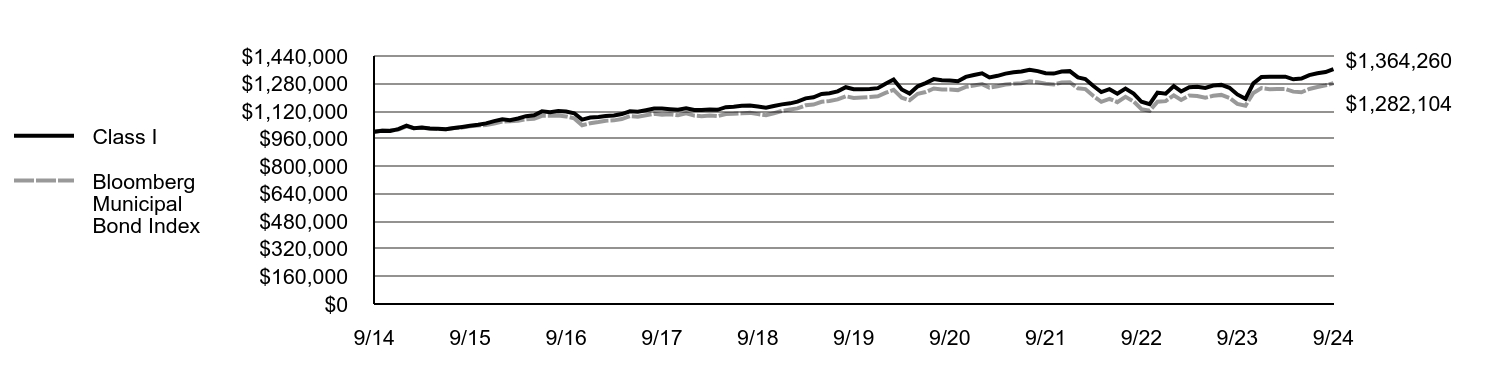
| Class I | Bloomberg Municipal Bond Index | |
|---|---|---|
| 9/14 | $1,000,000 | $1,000,000 |
| 10/14 | $1,005,503 | $1,006,857 |
| 11/14 | $1,004,890 | $1,008,598 |
| 12/14 | $1,015,498 | $1,013,687 |
| 1/15 | $1,035,468 | $1,031,654 |
| 2/15 | $1,020,453 | $1,021,012 |
| 3/15 | $1,025,034 | $1,023,960 |
| 4/15 | $1,019,257 | $1,018,588 |
| 5/15 | $1,017,607 | $1,015,774 |
| 6/15 | $1,014,900 | $1,014,848 |
| 7/15 | $1,021,579 | $1,022,199 |
| 8/15 | $1,028,228 | $1,024,207 |
| 9/15 | $1,034,978 | $1,031,626 |
| 10/15 | $1,040,681 | $1,035,727 |
| 11/15 | $1,048,558 | $1,039,845 |
| 12/15 | $1,061,805 | $1,047,151 |
| 1/16 | $1,072,893 | $1,059,645 |
| 2/16 | $1,066,957 | $1,061,312 |
| 3/16 | $1,077,114 | $1,064,674 |
| 4/16 | $1,090,460 | $1,072,502 |
| 5/16 | $1,096,259 | $1,075,403 |
| 6/16 | $1,118,468 | $1,092,511 |
| 7/16 | $1,113,412 | $1,093,178 |
| 8/16 | $1,120,238 | $1,094,653 |
| 9/16 | $1,117,225 | $1,089,190 |
| 10/16 | $1,107,609 | $1,077,763 |
| 11/16 | $1,070,332 | $1,037,568 |
| 12/16 | $1,082,732 | $1,049,749 |
| 1/17 | $1,086,398 | $1,056,669 |
| 2/17 | $1,091,194 | $1,064,007 |
| 3/17 | $1,094,871 | $1,066,317 |
| 4/17 | $1,102,982 | $1,074,054 |
| 5/17 | $1,118,985 | $1,091,100 |
| 6/17 | $1,115,809 | $1,087,187 |
| 7/17 | $1,125,117 | $1,095,983 |
| 8/17 | $1,134,445 | $1,104,323 |
| 9/17 | $1,134,694 | $1,098,708 |
| 10/17 | $1,131,377 | $1,101,390 |
| 11/17 | $1,128,028 | $1,095,493 |
| 12/17 | $1,136,141 | $1,106,943 |
| 1/18 | $1,127,040 | $1,093,911 |
| 2/18 | $1,126,047 | $1,090,642 |
| 3/18 | $1,129,665 | $1,094,668 |
| 4/18 | $1,127,420 | $1,090,761 |
| 5/18 | $1,142,907 | $1,103,252 |
| 6/18 | $1,145,730 | $1,104,193 |
| 7/18 | $1,150,801 | $1,106,873 |
| 8/18 | $1,151,988 | $1,109,715 |
| 9/18 | $1,146,175 | $1,102,531 |
| 10/18 | $1,140,184 | $1,095,742 |
| 11/18 | $1,149,692 | $1,107,870 |
| 12/18 | $1,159,202 | $1,121,135 |
| 1/19 | $1,165,176 | $1,129,609 |
| 2/19 | $1,174,852 | $1,135,658 |
| 3/19 | $1,194,146 | $1,153,610 |
| 4/19 | $1,200,072 | $1,157,945 |
| 5/19 | $1,219,234 | $1,173,909 |
| 6/19 | $1,223,834 | $1,178,244 |
| 7/19 | $1,234,465 | $1,187,739 |
| 8/19 | $1,258,645 | $1,206,474 |
| 9/19 | $1,247,308 | $1,196,803 |
| 10/19 | $1,246,829 | $1,198,948 |
| 11/19 | $1,248,959 | $1,201,946 |
| 12/19 | $1,253,480 | $1,205,616 |
| 1/20 | $1,280,226 | $1,227,277 |
| 2/20 | $1,303,362 | $1,243,103 |
| 3/20 | $1,245,356 | $1,198,012 |
| 4/20 | $1,222,262 | $1,182,977 |
| 5/20 | $1,264,246 | $1,220,609 |
| 6/20 | $1,282,521 | $1,230,655 |
| 7/20 | $1,305,906 | $1,251,382 |
| 8/20 | $1,299,052 | $1,245,511 |
| 9/20 | $1,298,384 | $1,245,775 |
| 10/20 | $1,293,906 | $1,242,033 |
| 11/20 | $1,318,649 | $1,260,776 |
| 12/20 | $1,329,281 | $1,268,456 |
| 1/21 | $1,339,845 | $1,276,540 |
| 2/21 | $1,315,886 | $1,256,257 |
| 3/21 | $1,324,945 | $1,264,005 |
| 4/21 | $1,337,866 | $1,274,607 |
| 5/21 | $1,345,551 | $1,278,410 |
| 6/21 | $1,349,591 | $1,281,920 |
| 7/21 | $1,359,934 | $1,292,552 |
| 8/21 | $1,352,139 | $1,287,808 |
| 9/21 | $1,340,459 | $1,278,514 |
| 10/21 | $1,337,810 | $1,274,776 |
| 11/21 | $1,349,511 | $1,285,628 |
| 12/21 | $1,352,123 | $1,287,702 |
| 1/22 | $1,315,493 | $1,252,454 |
| 2/22 | $1,306,488 | $1,247,967 |
| 3/22 | $1,265,880 | $1,207,512 |
| 4/22 | $1,230,746 | $1,174,113 |
| 5/22 | $1,247,080 | $1,191,554 |
| 6/22 | $1,221,371 | $1,172,038 |
| 7/22 | $1,251,212 | $1,203,006 |
| 8/22 | $1,221,347 | $1,176,640 |
| 9/22 | $1,174,230 | $1,131,480 |
| 10/22 | $1,160,617 | $1,122,070 |
| 11/22 | $1,227,632 | $1,174,553 |
| 12/22 | $1,220,866 | $1,177,916 |
| 1/23 | $1,265,379 | $1,211,751 |
| 2/23 | $1,234,259 | $1,184,351 |
| 3/23 | $1,258,679 | $1,210,629 |
| 4/23 | $1,261,383 | $1,207,864 |
| 5/23 | $1,254,498 | $1,197,397 |
| 6/23 | $1,268,176 | $1,209,391 |
| 7/23 | $1,272,235 | $1,214,176 |
| 8/23 | $1,255,653 | $1,196,696 |
| 9/23 | $1,216,921 | $1,161,622 |
| 10/23 | $1,192,014 | $1,151,737 |
| 11/23 | $1,281,513 | $1,224,851 |
| 12/23 | $1,318,126 | $1,253,319 |
| 1/24 | $1,319,660 | $1,246,918 |
| 2/24 | $1,319,846 | $1,248,519 |
| 3/24 | $1,319,952 | $1,248,480 |
| 4/24 | $1,304,493 | $1,233,018 |
| 5/24 | $1,308,914 | $1,229,401 |
| 6/24 | $1,329,161 | $1,248,245 |
| 7/24 | $1,339,376 | $1,259,622 |
| 8/24 | $1,346,695 | $1,269,557 |
| 9/24 | $1,364,260 | $1,282,104 |
Average Annual Total Returns (%)
| Fund | 1 Year | 5 Years | 10 Years |
|---|---|---|---|
| Class I | 12.10% | 1.81% | 3.15% |
| Bloomberg Municipal Bond Index | 10.37% | 1.38% | 2.51% |
Performance does not reflect the deduction of taxes that a shareholder would pay on Fund distributions or redemption of Fund shares. Performance assumes that all dividends and distributions, if any, were reinvested. For more recent performance information, visit www.eatonvance.com/performance.php.
THE FUND'S PAST PERFORMANCE IS NO GUARANTEE OF FUTURE RESULTS.
Key Fund Statistics
| Total Net Assets | $4,618,197,661 |
| # of Portfolio Holdings | 548 |
| Portfolio Turnover Rate | 82% |
| Total Advisory Fees Paid | $13,359,012 |
What did the Fund invest in?
The following tables reflect what the Fund invested in as of the report date.
Sector Allocation (% of total investments)

| Value | Value |
|---|---|
OtherFootnote Reference* | 7.7% |
| Other Revenue | 3.3% |
| Housing | 3.8% |
| Electric Utilities | 5.3% |
| Education | 5.7% |
| Water and Sewer | 8.0% |
| Special Tax Revenue | 9.7% |
| Hospital | 12.8% |
| General Obligations | 21.1% |
| Transportation | 22.6% |
| Footnote | Description |
Footnote* | Sectors less than 3% each |
Credit Quality (% of total investments)Footnote Referencea ,Footnote Referenceb

| Value | Value |
|---|---|
| Not Rated | 4.1% |
| BB | 2.0% |
| BBB | 6.1% |
| A | 19.0% |
| AA | 50.0% |
| AAA | 18.8% |
| Footnote | Description |
Footnotea | Ratings are based on Moody’s Investors Service, Inc. (“Moody’s”), S&P Global Ratings (“S&P”) or Fitch Ratings (“Fitch”). If securities are rated differently by the ratings agencies, the highest rating is applied. Moody's ratings are converted to the S&P and Fitch scale with ratings ranging from AAA, being the highest, to D, being the lowest. Ratings of BBB or higher are considered to be investment-grade quality. Holdings designated as “Not Rated” (if any) are not rated by the national ratings agencies stated above. |
Footnoteb | The chart includes the municipal bonds held by a trust that issues residual interest bonds. |
Additional Information
If you wish to view additional information about the Fund, including the prospectus, statement of additional information, financial statements and holdings, please scan the QR code or visit www.eatonvance.com/open-end-mutual-fund-documents.php. For proxy information, please visit www.eatonvance.com/proxyvoting.
Householding
The Funds may deliver a single copy of certain required shareholder documents (including prospectuses, shareholder reports, and proxy materials) to investors with the same last name and the same address. Your participation will continue indefinitely unless you instruct otherwise by calling 1-800-262-1122 or by contacting your financial intermediary. Your instruction will typically be effective within 30 days of receipt.
Not FDIC Insured | May Lose Value | No Bank Guarantee
Annual Shareholder Report September 30, 2024
EIHMX-TSR-AR

Eaton Vance New York Municipal Income Fund
Class A ETNYX
Annual Shareholder Report September 30, 2024
This annual shareholder report contains important information about the Eaton Vance New York Municipal Income Fund for the period of October 1, 2023 to September 30, 2024. You can find additional information about the Fund at www.eatonvance.com/open-end-mutual-fund-documents.php. You can also request this information by contacting us at 1-800-262-1122.
What were the Fund costs for the last year?
(based on a hypothetical $10,000 investment)
| Class Name | Costs of a $10,000 investment | Costs paid as a percentage of a $10,000 investment |
|---|---|---|
| Class A | $95 | 0.89% |
How did the Fund perform last year and what affected its performance?
Key contributors to (↑) and detractors from (↓) performance, relative to the Bloomberg Municipal Bond Index (the Index):
↑ An overweight position in bonds rated BBB and below helped returns as lower-credit-quality bonds generally outperformed higher-credit-quality bonds
↑ An overweight position in bonds with 22 years or more remaining to maturity contributed to returns relative to the Index as longer-maturity bonds outperformed shorter-maturity bonds during the period
↑ Security selections and an overweight position in 4% coupon bonds, which typically have longer durations than higher-coupon bonds, contributed to returns relative to the Index as interest rates declined during the period
↓ An underweight position in the health care sector ― the best-performing sector within the Index during the period ― detracted from Index-relative returns
↓ An out-of-Index position in variable-rate demand notes — typically considered defensive investments with virtually zero duration — detracted from returns relative to the Index as interest rates declined during the period
Fund Performance
Comparison of the change in value of a $10,000 investment for the period indicated.

| Class A with Maximum Sales Charge | Bloomberg Municipal Bond Index | Bloomberg New York Municipal Bond Index | |
|---|---|---|---|
| 9/14 | $9,675 | $10,000 | $10,000 |
| 10/14 | $9,715 | $10,069 | $10,068 |
| 11/14 | $9,706 | $10,086 | $10,079 |
| 12/14 | $9,784 | $10,137 | $10,121 |
| 1/15 | $9,958 | $10,317 | $10,303 |
| 2/15 | $9,853 | $10,210 | $10,191 |
| 3/15 | $9,883 | $10,240 | $10,224 |
| 4/15 | $9,844 | $10,186 | $10,172 |
| 5/15 | $9,815 | $10,158 | $10,163 |
| 6/15 | $9,814 | $10,148 | $10,159 |
| 7/15 | $9,872 | $10,222 | $10,237 |
| 8/15 | $9,901 | $10,242 | $10,264 |
| 9/15 | $9,959 | $10,316 | $10,329 |
| 10/15 | $10,008 | $10,357 | $10,367 |
| 11/15 | $10,057 | $10,398 | $10,405 |
| 12/15 | $10,165 | $10,472 | $10,469 |
| 1/16 | $10,293 | $10,596 | $10,602 |
| 2/16 | $10,270 | $10,613 | $10,617 |
| 3/16 | $10,337 | $10,647 | $10,643 |
| 4/16 | $10,424 | $10,725 | $10,728 |
| 5/16 | $10,471 | $10,754 | $10,755 |
| 6/16 | $10,680 | $10,925 | $10,911 |
| 7/16 | $10,645 | $10,932 | $10,925 |
| 8/16 | $10,671 | $10,947 | $10,937 |
| 9/16 | $10,605 | $10,892 | $10,881 |
| 10/16 | $10,497 | $10,778 | $10,764 |
| 11/16 | $10,074 | $10,376 | $10,384 |
| 12/16 | $10,203 | $10,497 | $10,510 |
| 1/17 | $10,230 | $10,567 | $10,574 |
| 2/17 | $10,291 | $10,640 | $10,640 |
| 3/17 | $10,317 | $10,663 | $10,665 |
| 4/17 | $10,385 | $10,741 | $10,742 |
| 5/17 | $10,557 | $10,911 | $10,915 |
| 6/17 | $10,520 | $10,872 | $10,876 |
| 7/17 | $10,588 | $10,960 | $10,962 |
| 8/17 | $10,656 | $11,043 | $11,034 |
| 9/17 | $10,640 | $10,987 | $10,971 |
| 10/17 | $10,655 | $11,014 | $10,998 |
| 11/17 | $10,596 | $10,955 | $10,935 |
| 12/17 | $10,716 | $11,069 | $11,044 |
| 1/18 | $10,593 | $10,939 | $10,914 |
| 2/18 | $10,544 | $10,906 | $10,880 |
| 3/18 | $10,579 | $10,947 | $10,912 |
| 4/18 | $10,540 | $10,908 | $10,867 |
| 5/18 | $10,640 | $11,033 | $10,989 |
| 6/18 | $10,644 | $11,042 | $10,995 |
| 7/18 | $10,670 | $11,069 | $11,016 |
| 8/18 | $10,673 | $11,097 | $11,037 |
| 9/18 | $10,613 | $11,025 | $10,970 |
| 10/18 | $10,541 | $10,957 | $10,901 |
| 11/18 | $10,643 | $11,079 | $11,029 |
| 12/18 | $10,755 | $11,211 | $11,159 |
| 1/19 | $10,824 | $11,296 | $11,242 |
| 2/19 | $10,905 | $11,357 | $11,303 |
| 3/19 | $11,083 | $11,536 | $11,479 |
| 4/19 | $11,152 | $11,579 | $11,518 |
| 5/19 | $11,308 | $11,739 | $11,677 |
| 6/19 | $11,343 | $11,782 | $11,713 |
| 7/19 | $11,442 | $11,877 | $11,806 |
| 8/19 | $11,652 | $12,065 | $11,975 |
| 9/19 | $11,540 | $11,968 | $11,877 |
| 10/19 | $11,516 | $11,989 | $11,892 |
| 11/19 | $11,527 | $12,019 | $11,921 |
| 12/19 | $11,572 | $12,056 | $11,954 |
| 1/20 | $11,817 | $12,273 | $12,164 |
| 2/20 | $12,042 | $12,431 | $12,311 |
| 3/20 | $11,581 | $11,980 | $11,857 |
| 4/20 | $11,300 | $11,830 | $11,653 |
| 5/20 | $11,705 | $12,206 | $12,029 |
| 6/20 | $11,817 | $12,307 | $12,135 |
| 7/20 | $12,030 | $12,514 | $12,313 |
| 8/20 | $11,937 | $12,455 | $12,221 |
| 9/20 | $11,899 | $12,458 | $12,199 |
| 10/20 | $11,871 | $12,420 | $12,159 |
| 11/20 | $12,116 | $12,608 | $12,394 |
| 12/20 | $12,212 | $12,685 | $12,499 |
| 1/21 | $12,322 | $12,765 | $12,585 |
| 2/21 | $12,070 | $12,563 | $12,372 |
| 3/21 | $12,154 | $12,640 | $12,450 |
| 4/21 | $12,286 | $12,746 | $12,585 |
| 5/21 | $12,348 | $12,784 | $12,643 |
| 6/21 | $12,398 | $12,819 | $12,685 |
| 7/21 | $12,496 | $12,926 | $12,785 |
| 8/21 | $12,417 | $12,878 | $12,719 |
| 9/21 | $12,291 | $12,785 | $12,616 |
| 10/21 | $12,260 | $12,748 | $12,587 |
| 11/21 | $12,371 | $12,856 | $12,707 |
| 12/21 | $12,392 | $12,877 | $12,733 |
| 1/22 | $12,014 | $12,525 | $12,372 |
| 2/22 | $11,925 | $12,480 | $12,326 |
| 3/22 | $11,499 | $12,075 | $11,901 |
| 4/22 | $11,133 | $11,741 | $11,554 |
| 5/22 | $11,308 | $11,916 | $11,786 |
| 6/22 | $11,076 | $11,720 | $11,534 |
| 7/22 | $11,400 | $12,030 | $11,852 |
| 8/22 | $11,107 | $11,766 | $11,557 |
| 9/22 | $10,682 | $11,315 | $11,108 |
| 10/22 | $10,572 | $11,221 | $11,004 |
| 11/22 | $11,158 | $11,746 | $11,569 |
| 12/22 | $11,123 | $11,779 | $11,595 |
| 1/23 | $11,517 | $12,118 | $11,974 |
| 2/23 | $11,227 | $11,844 | $11,686 |
| 3/23 | $11,476 | $12,106 | $11,968 |
| 4/23 | $11,492 | $12,079 | $11,950 |
| 5/23 | $11,409 | $11,974 | $11,843 |
| 6/23 | $11,524 | $12,094 | $11,987 |
| 7/23 | $11,554 | $12,142 | $12,019 |
| 8/23 | $11,372 | $11,967 | $11,827 |
| 9/23 | $10,978 | $11,616 | $11,454 |
| 10/23 | $10,759 | $11,517 | $11,357 |
| 11/23 | $11,683 | $12,249 | $12,144 |
| 12/23 | $12,031 | $12,533 | $12,443 |
| 1/24 | $12,013 | $12,469 | $12,371 |
| 2/24 | $11,983 | $12,485 | $12,371 |
| 3/24 | $11,965 | $12,485 | $12,352 |
| 4/24 | $11,834 | $12,330 | $12,202 |
| 5/24 | $11,842 | $12,294 | $12,168 |
| 6/24 | $12,056 | $12,482 | $12,380 |
| 7/24 | $12,143 | $12,596 | $12,486 |
| 8/24 | $12,217 | $12,696 | $12,574 |
| 9/24 | $12,359 | $12,821 | $12,700 |
Average Annual Total Returns (%)
| Fund | 1 Year | 5 Years | 10 Years |
|---|---|---|---|
| Class A | 12.57% | 1.38% | 2.48% |
| Class A with 3.25% Maximum Sales Charge | 8.96% | 0.71% | 2.14% |
| Bloomberg Municipal Bond Index | 10.37% | 1.38% | 2.51% |
| Bloomberg New York Municipal Bond Index | 10.88% | 1.35% | 2.42% |
Performance does not reflect the deduction of taxes that a shareholder would pay on Fund distributions or redemption of Fund shares. Performance assumes that all dividends and distributions, if any, were reinvested. For more recent performance information, visit www.eatonvance.com/performance.php.
THE FUND'S PAST PERFORMANCE IS NO GUARANTEE OF FUTURE RESULTS.
Key Fund Statistics
| Total Net Assets | $362,823,791 |
| # of Portfolio Holdings | 139 |
| Portfolio Turnover Rate | 67% |
| Total Advisory Fees Paid | $1,420,337 |
What did the Fund invest in?
The following tables reflect what the Fund invested in as of the report date.
Sector Allocation (% of total investments)

| Value | Value |
|---|---|
OtherFootnote Reference* | 10.6% |
| Housing | 3.8% |
| Industrial Development Revenue | 3.9% |
| Hospital | 4.0% |
| Electric Utilities | 6.9% |
| General Obligations | 7.7% |
| Education | 8.0% |
| Water and Sewer | 8.4% |
| Transportation | 18.9% |
| Special Tax Revenue | 27.8% |
| Footnote | Description |
Footnote* | Sectors less than 3% each |
Credit Quality (% of total investments)Footnote Referencea ,Footnote Referenceb

| Value | Value |
|---|---|
| Not Rated | 6.4% |
| B | 1.2% |
| BB | 1.0% |
| BBB | 13.0% |
| A | 6.7% |
| AA | 54.8% |
| AAA | 16.9% |
| Footnote | Description |
Footnotea | Ratings are based on Moody’s Investors Service, Inc. (“Moody’s”), S&P Global Ratings (“S&P”) or Fitch Ratings (“Fitch”). If securities are rated differently by the ratings agencies, the highest rating is applied. Moody's ratings are converted to the S&P and Fitch scale with ratings ranging from AAA, being the highest, to D, being the lowest. Ratings of BBB or higher are considered to be investment-grade quality. Holdings designated as “Not Rated” (if any) are not rated by the national ratings agencies stated above. |
Footnoteb | The chart includes the municipal bonds held by a trust that issues residual interest bonds. |
Additional Information
If you wish to view additional information about the Fund, including the prospectus, statement of additional information, financial statements and holdings, please scan the QR code or visit www.eatonvance.com/open-end-mutual-fund-documents.php. For proxy information, please visit www.eatonvance.com/proxyvoting.
Householding
The Funds may deliver a single copy of certain required shareholder documents (including prospectuses, shareholder reports, and proxy materials) to investors with the same last name and the same address. Your participation will continue indefinitely unless you instruct otherwise by calling 1-800-262-1122 or by contacting your financial intermediary. Your instruction will typically be effective within 30 days of receipt.
Not FDIC Insured | May Lose Value | No Bank Guarantee
Annual Shareholder Report September 30, 2024
ETNYX-TSR-AR

Eaton Vance New York Municipal Income Fund
Class C ECNYX
Annual Shareholder Report September 30, 2024
This annual shareholder report contains important information about the Eaton Vance New York Municipal Income Fund for the period of October 1, 2023 to September 30, 2024. You can find additional information about the Fund at www.eatonvance.com/open-end-mutual-fund-documents.php. You can also request this information by contacting us at 1-800-262-1122.
What were the Fund costs for the last year?
(based on a hypothetical $10,000 investment)
| Class Name | Costs of a $10,000 investment | Costs paid as a percentage of a $10,000 investment |
|---|---|---|
| Class C | $175 | 1.65% |
How did the Fund perform last year and what affected its performance?
Key contributors to (↑) and detractors from (↓) performance, relative to the Bloomberg Municipal Bond Index (the Index):
↑ An overweight position in bonds rated BBB and below helped returns as lower-credit-quality bonds generally outperformed higher-credit-quality bonds
↑ An overweight position in bonds with 22 years or more remaining to maturity contributed to returns relative to the Index as longer-maturity bonds outperformed shorter-maturity bonds during the period
↑ Security selections and an overweight position in 4% coupon bonds, which typically have longer durations than higher-coupon bonds, contributed to returns relative to the Index as interest rates declined during the period
↓ An underweight position in the health care sector ― the best-performing sector within the Index during the period ― detracted from Index-relative returns
↓ An out-of-Index position in variable-rate demand notes — typically considered defensive investments with virtually zero duration — detracted from returns relative to the Index as interest rates declined during the period
Fund Performance
Comparison of the change in value of a $10,000 investment for the period indicated.
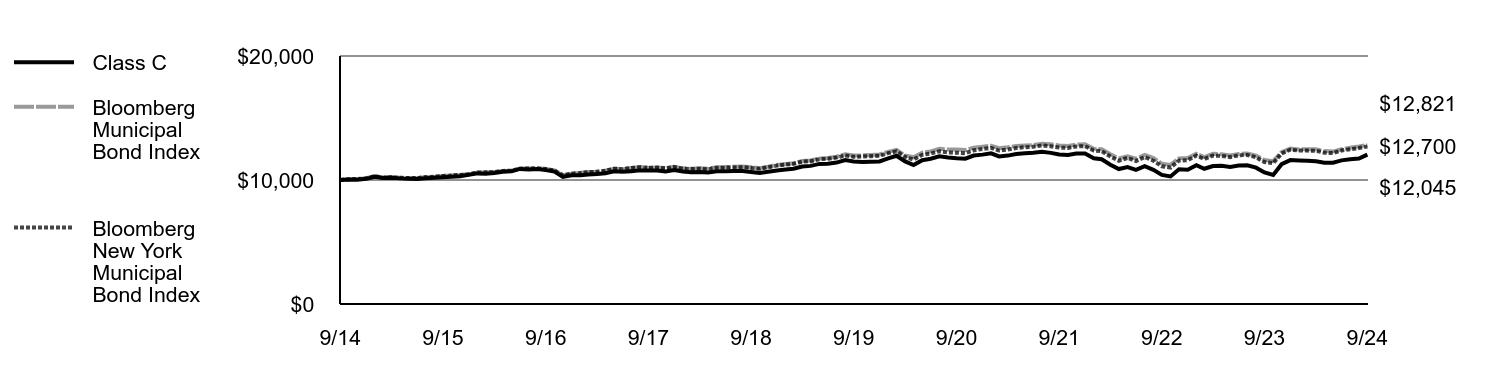
| Class C | Bloomberg Municipal Bond Index | Bloomberg New York Municipal Bond Index | |
|---|---|---|---|
| 9/14 | $10,000 | $10,000 | $10,000 |
| 10/14 | $10,044 | $10,069 | $10,068 |
| 11/14 | $10,030 | $10,086 | $10,079 |
| 12/14 | $10,093 | $10,137 | $10,121 |
| 1/15 | $10,267 | $10,317 | $10,303 |
| 2/15 | $10,162 | $10,210 | $10,191 |
| 3/15 | $10,187 | $10,240 | $10,224 |
| 4/15 | $10,131 | $10,186 | $10,172 |
| 5/15 | $10,104 | $10,158 | $10,163 |
| 6/15 | $10,087 | $10,148 | $10,159 |
| 7/15 | $10,141 | $10,222 | $10,237 |
| 8/15 | $10,173 | $10,242 | $10,264 |
| 9/15 | $10,217 | $10,316 | $10,329 |
| 10/15 | $10,260 | $10,357 | $10,367 |
| 11/15 | $10,305 | $10,398 | $10,405 |
| 12/15 | $10,419 | $10,472 | $10,469 |
| 1/16 | $10,533 | $10,596 | $10,602 |
| 2/16 | $10,503 | $10,613 | $10,617 |
| 3/16 | $10,565 | $10,647 | $10,643 |
| 4/16 | $10,658 | $10,725 | $10,728 |
| 5/16 | $10,699 | $10,754 | $10,755 |
| 6/16 | $10,895 | $10,925 | $10,911 |
| 7/16 | $10,853 | $10,932 | $10,925 |
| 8/16 | $10,883 | $10,947 | $10,937 |
| 9/16 | $10,798 | $10,892 | $10,881 |
| 10/16 | $10,682 | $10,778 | $10,764 |
| 11/16 | $10,255 | $10,376 | $10,384 |
| 12/16 | $10,380 | $10,497 | $10,510 |
| 1/17 | $10,390 | $10,567 | $10,574 |
| 2/17 | $10,446 | $10,640 | $10,640 |
| 3/17 | $10,477 | $10,663 | $10,665 |
| 4/17 | $10,539 | $10,741 | $10,742 |
| 5/17 | $10,696 | $10,911 | $10,915 |
| 6/17 | $10,663 | $10,872 | $10,876 |
| 7/17 | $10,714 | $10,960 | $10,962 |
| 8/17 | $10,776 | $11,043 | $11,034 |
| 9/17 | $10,764 | $10,987 | $10,971 |
| 10/17 | $10,762 | $11,014 | $10,998 |
| 11/17 | $10,696 | $10,955 | $10,935 |
| 12/17 | $10,810 | $11,069 | $11,044 |
| 1/18 | $10,679 | $10,939 | $10,914 |
| 2/18 | $10,623 | $10,906 | $10,880 |
| 3/18 | $10,652 | $10,947 | $10,912 |
| 4/18 | $10,606 | $10,908 | $10,867 |
| 5/18 | $10,711 | $11,033 | $10,989 |
| 6/18 | $10,708 | $11,042 | $10,995 |
| 7/18 | $10,716 | $11,069 | $11,016 |
| 8/18 | $10,724 | $11,097 | $11,037 |
| 9/18 | $10,646 | $11,025 | $10,970 |
| 10/18 | $10,567 | $10,957 | $10,901 |
| 11/18 | $10,663 | $11,079 | $11,029 |
| 12/18 | $10,769 | $11,211 | $11,159 |
| 1/19 | $10,842 | $11,296 | $11,242 |
| 2/19 | $10,905 | $11,357 | $11,303 |
| 3/19 | $11,088 | $11,536 | $11,479 |
| 4/19 | $11,138 | $11,579 | $11,518 |
| 5/19 | $11,298 | $11,739 | $11,677 |
| 6/19 | $11,314 | $11,782 | $11,713 |
| 7/19 | $11,406 | $11,877 | $11,806 |
| 8/19 | $11,608 | $12,065 | $11,975 |
| 9/19 | $11,501 | $11,968 | $11,877 |
| 10/19 | $11,459 | $11,989 | $11,892 |
| 11/19 | $11,474 | $12,019 | $11,921 |
| 12/19 | $11,500 | $12,056 | $11,954 |
| 1/20 | $11,736 | $12,273 | $12,164 |
| 2/20 | $11,952 | $12,431 | $12,311 |
| 3/20 | $11,499 | $11,980 | $11,857 |
| 4/20 | $11,202 | $11,830 | $11,653 |
| 5/20 | $11,596 | $12,206 | $12,029 |
| 6/20 | $11,712 | $12,307 | $12,135 |
| 7/20 | $11,904 | $12,514 | $12,313 |
| 8/20 | $11,816 | $12,455 | $12,221 |
| 9/20 | $11,760 | $12,458 | $12,199 |
| 10/20 | $11,724 | $12,420 | $12,159 |
| 11/20 | $11,971 | $12,608 | $12,394 |
| 12/20 | $12,047 | $12,685 | $12,499 |
| 1/21 | $12,147 | $12,765 | $12,585 |
| 2/21 | $11,903 | $12,563 | $12,372 |
| 3/21 | $11,968 | $12,640 | $12,450 |
| 4/21 | $12,090 | $12,746 | $12,585 |
| 5/21 | $12,154 | $12,784 | $12,643 |
| 6/21 | $12,197 | $12,819 | $12,685 |
| 7/21 | $12,273 | $12,926 | $12,785 |
| 8/21 | $12,187 | $12,878 | $12,719 |
| 9/21 | $12,056 | $12,785 | $12,616 |
| 10/21 | $12,018 | $12,748 | $12,587 |
| 11/21 | $12,132 | $12,856 | $12,707 |
| 12/21 | $12,144 | $12,877 | $12,733 |
| 1/22 | $11,755 | $12,525 | $12,372 |
| 2/22 | $11,673 | $12,480 | $12,326 |
| 3/22 | $11,237 | $12,075 | $11,901 |
| 4/22 | $10,884 | $11,741 | $11,554 |
| 5/22 | $11,049 | $11,916 | $11,786 |
| 6/22 | $10,816 | $11,720 | $11,534 |
| 7/22 | $11,113 | $12,030 | $11,852 |
| 8/22 | $10,821 | $11,766 | $11,557 |
| 9/22 | $10,411 | $11,315 | $11,108 |
| 10/22 | $10,286 | $11,221 | $11,004 |
| 11/22 | $10,861 | $11,746 | $11,569 |
| 12/22 | $10,821 | $11,779 | $11,595 |
| 1/23 | $11,196 | $12,118 | $11,974 |
| 2/23 | $10,908 | $11,844 | $11,686 |
| 3/23 | $11,131 | $12,106 | $11,968 |
| 4/23 | $11,139 | $12,079 | $11,950 |
| 5/23 | $11,052 | $11,974 | $11,843 |
| 6/23 | $11,169 | $12,094 | $11,987 |
| 7/23 | $11,190 | $12,142 | $12,019 |
| 8/23 | $10,995 | $11,967 | $11,827 |
| 9/23 | $10,608 | $11,616 | $11,454 |
| 10/23 | $10,401 | $11,517 | $11,357 |
| 11/23 | $11,275 | $12,249 | $12,144 |
| 12/23 | $11,603 | $12,533 | $12,443 |
| 1/24 | $11,579 | $12,469 | $12,371 |
| 2/24 | $11,543 | $12,485 | $12,371 |
| 3/24 | $11,519 | $12,485 | $12,352 |
| 4/24 | $11,397 | $12,330 | $12,202 |
| 5/24 | $11,398 | $12,294 | $12,168 |
| 6/24 | $11,584 | $12,482 | $12,380 |
| 7/24 | $11,673 | $12,596 | $12,486 |
| 8/24 | $11,737 | $12,696 | $12,574 |
| 9/24 | $12,045 | $12,821 | $12,700 |
Average Annual Total Returns (%)
| Fund | 1 Year | 5 Years | 10 Years |
|---|---|---|---|
| Class C | 11.84% | 0.62% | 1.88% |
| Class C with 1% Maximum Deferred Sales Charge | 10.84% | 0.62% | 1.88% |
| Bloomberg Municipal Bond Index | 10.37% | 1.38% | 2.51% |
| Bloomberg New York Municipal Bond Index | 10.88% | 1.35% | 2.42% |
Performance does not reflect the deduction of taxes that a shareholder would pay on Fund distributions or redemption of Fund shares. Performance assumes that all dividends and distributions, if any, were reinvested. For more recent performance information, visit www.eatonvance.com/performance.php.
THE FUND'S PAST PERFORMANCE IS NO GUARANTEE OF FUTURE RESULTS.
Key Fund Statistics
| Total Net Assets | $362,823,791 |
| # of Portfolio Holdings | 139 |
| Portfolio Turnover Rate | 67% |
| Total Advisory Fees Paid | $1,420,337 |
What did the Fund invest in?
The following tables reflect what the Fund invested in as of the report date.
Sector Allocation (% of total investments)

| Value | Value |
|---|---|
OtherFootnote Reference* | 10.6% |
| Housing | 3.8% |
| Industrial Development Revenue | 3.9% |
| Hospital | 4.0% |
| Electric Utilities | 6.9% |
| General Obligations | 7.7% |
| Education | 8.0% |
| Water and Sewer | 8.4% |
| Transportation | 18.9% |
| Special Tax Revenue | 27.8% |
| Footnote | Description |
Footnote* | Sectors less than 3% each |
Credit Quality (% of total investments)Footnote Referencea ,Footnote Referenceb

| Value | Value |
|---|---|
| Not Rated | 6.4% |
| B | 1.2% |
| BB | 1.0% |
| BBB | 13.0% |
| A | 6.7% |
| AA | 54.8% |
| AAA | 16.9% |
| Footnote | Description |
Footnotea | Ratings are based on Moody’s Investors Service, Inc. (“Moody’s”), S&P Global Ratings (“S&P”) or Fitch Ratings (“Fitch”). If securities are rated differently by the ratings agencies, the highest rating is applied. Moody's ratings are converted to the S&P and Fitch scale with ratings ranging from AAA, being the highest, to D, being the lowest. Ratings of BBB or higher are considered to be investment-grade quality. Holdings designated as “Not Rated” (if any) are not rated by the national ratings agencies stated above. |
Footnoteb | The chart includes the municipal bonds held by a trust that issues residual interest bonds. |
Additional Information
If you wish to view additional information about the Fund, including the prospectus, statement of additional information, financial statements and holdings, please scan the QR code or visit www.eatonvance.com/open-end-mutual-fund-documents.php. For proxy information, please visit www.eatonvance.com/proxyvoting.
Householding
The Funds may deliver a single copy of certain required shareholder documents (including prospectuses, shareholder reports, and proxy materials) to investors with the same last name and the same address. Your participation will continue indefinitely unless you instruct otherwise by calling 1-800-262-1122 or by contacting your financial intermediary. Your instruction will typically be effective within 30 days of receipt.
Not FDIC Insured | May Lose Value | No Bank Guarantee
Annual Shareholder Report September 30, 2024
ECNYX-TSR-AR

Eaton Vance New York Municipal Income Fund
Class I EINYX
Annual Shareholder Report September 30, 2024
This annual shareholder report contains important information about the Eaton Vance New York Municipal Income Fund for the period of October 1, 2023 to September 30, 2024. You can find additional information about the Fund at www.eatonvance.com/open-end-mutual-fund-documents.php. You can also request this information by contacting us at 1-800-262-1122.
What were the Fund costs for the last year?
(based on a hypothetical $10,000 investment)
| Class Name | Costs of a $10,000 investment | Costs paid as a percentage of a $10,000 investment |
|---|---|---|
| Class I | $73 | 0.69% |
How did the Fund perform last year and what affected its performance?
Key contributors to (↑) and detractors from (↓) performance, relative to the Bloomberg Municipal Bond Index (the Index):
↑ An overweight position in bonds rated BBB and below helped returns as lower-credit-quality bonds generally outperformed higher-credit-quality bonds
↑ An overweight position in bonds with 22 years or more remaining to maturity contributed to returns relative to the Index as longer-maturity bonds outperformed shorter-maturity bonds during the period
↑ Security selections and an overweight position in 4% coupon bonds, which typically have longer durations than higher-coupon bonds, contributed to returns relative to the Index as interest rates declined during the period
↓ An underweight position in the health care sector ― the best-performing sector within the Index during the period ― detracted from Index-relative returns
↓ An out-of-Index position in variable-rate demand notes — typically considered defensive investments with virtually zero duration — detracted from returns relative to the Index as interest rates declined during the period
Fund Performance
Comparison of the change in value of a $1,000,000 investment for the period indicated.
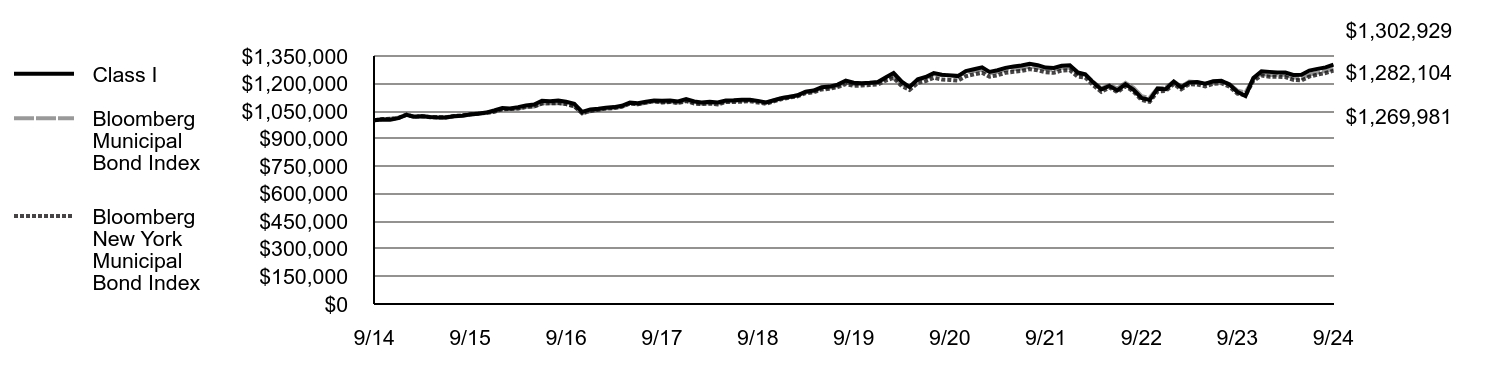
| Class I | Bloomberg Municipal Bond Index | Bloomberg New York Municipal Bond Index | |
|---|---|---|---|
| 9/14 | $1,000,000 | $1,000,000 | $1,000,000 |
| 10/14 | $1,004,261 | $1,006,857 | $1,006,815 |
| 11/14 | $1,003,551 | $1,008,598 | $1,007,893 |
| 12/14 | $1,011,757 | $1,013,687 | $1,012,127 |
| 1/15 | $1,029,936 | $1,031,654 | $1,030,287 |
| 2/15 | $1,019,237 | $1,021,012 | $1,019,086 |
| 3/15 | $1,022,498 | $1,023,960 | $1,022,422 |
| 4/15 | $1,017,649 | $1,018,588 | $1,017,245 |
| 5/15 | $1,015,794 | $1,015,774 | $1,016,278 |
| 6/15 | $1,014,920 | $1,014,848 | $1,015,935 |
| 7/15 | $1,022,118 | $1,022,199 | $1,023,705 |
| 8/15 | $1,025,221 | $1,024,207 | $1,026,358 |
| 9/15 | $1,031,417 | $1,031,626 | $1,032,883 |
| 10/15 | $1,035,624 | $1,035,727 | $1,036,675 |
| 11/15 | $1,041,959 | $1,039,845 | $1,040,494 |
| 12/15 | $1,053,326 | $1,047,151 | $1,046,928 |
| 1/16 | $1,066,725 | $1,059,645 | $1,060,151 |
| 2/16 | $1,064,527 | $1,061,312 | $1,061,749 |
| 3/16 | $1,071,659 | $1,064,674 | $1,064,335 |
| 4/16 | $1,080,859 | $1,072,502 | $1,072,820 |
| 5/16 | $1,085,874 | $1,075,403 | $1,075,456 |
| 6/16 | $1,106,664 | $1,092,511 | $1,091,145 |
| 7/16 | $1,104,323 | $1,093,178 | $1,092,498 |
| 8/16 | $1,107,195 | $1,094,653 | $1,093,687 |
| 9/16 | $1,100,496 | $1,089,190 | $1,088,129 |
| 10/16 | $1,089,522 | $1,077,763 | $1,076,424 |
| 11/16 | $1,045,784 | $1,037,568 | $1,038,431 |
| 12/16 | $1,059,349 | $1,049,749 | $1,050,960 |
| 1/17 | $1,062,329 | $1,056,669 | $1,057,355 |
| 2/17 | $1,068,834 | $1,064,007 | $1,063,996 |
| 3/17 | $1,071,732 | $1,066,317 | $1,066,531 |
| 4/17 | $1,078,958 | $1,074,054 | $1,074,222 |
| 5/17 | $1,096,985 | $1,091,100 | $1,091,487 |
| 6/17 | $1,093,396 | $1,087,187 | $1,087,648 |
| 7/17 | $1,100,637 | $1,095,983 | $1,096,173 |
| 8/17 | $1,107,874 | $1,104,323 | $1,103,424 |
| 9/17 | $1,106,385 | $1,098,708 | $1,097,124 |
| 10/17 | $1,108,163 | $1,101,390 | $1,099,770 |
| 11/17 | $1,102,207 | $1,095,493 | $1,093,516 |
| 12/17 | $1,114,888 | $1,106,943 | $1,104,444 |
| 1/18 | $1,102,207 | $1,093,911 | $1,091,444 |
| 2/18 | $1,097,284 | $1,090,642 | $1,087,997 |
| 3/18 | $1,101,175 | $1,094,668 | $1,091,189 |
| 4/18 | $1,097,272 | $1,090,761 | $1,086,656 |
| 5/18 | $1,107,880 | $1,103,252 | $1,098,928 |
| 6/18 | $1,108,471 | $1,104,193 | $1,099,540 |
| 7/18 | $1,111,324 | $1,106,873 | $1,101,594 |
| 8/18 | $1,111,899 | $1,109,715 | $1,103,724 |
| 9/18 | $1,105,755 | $1,102,531 | $1,097,003 |
| 10/18 | $1,097,327 | $1,095,742 | $1,090,089 |
| 11/18 | $1,109,245 | $1,107,870 | $1,102,872 |
| 12/18 | $1,121,179 | $1,121,135 | $1,115,945 |
| 1/19 | $1,128,548 | $1,129,609 | $1,124,203 |
| 2/19 | $1,136,023 | $1,135,658 | $1,130,316 |
| 3/19 | $1,155,945 | $1,153,610 | $1,147,859 |
| 4/19 | $1,162,119 | $1,157,945 | $1,151,819 |
| 5/19 | $1,179,713 | $1,173,909 | $1,167,699 |
| 6/19 | $1,183,527 | $1,178,244 | $1,171,316 |
| 7/19 | $1,194,097 | $1,187,739 | $1,180,573 |
| 8/19 | $1,216,188 | $1,206,474 | $1,197,510 |
| 9/19 | $1,204,749 | $1,196,803 | $1,187,724 |
| 10/19 | $1,201,309 | $1,198,948 | $1,189,150 |
| 11/19 | $1,203,798 | $1,201,946 | $1,192,131 |
| 12/19 | $1,208,640 | $1,205,616 | $1,195,367 |
| 1/20 | $1,234,490 | $1,227,277 | $1,216,358 |
| 2/20 | $1,256,953 | $1,243,103 | $1,231,106 |
| 3/20 | $1,210,211 | $1,198,012 | $1,185,683 |
| 4/20 | $1,181,032 | $1,182,977 | $1,165,275 |
| 5/20 | $1,223,529 | $1,220,609 | $1,202,853 |
| 6/20 | $1,235,461 | $1,230,655 | $1,213,495 |
| 7/20 | $1,256,714 | $1,251,382 | $1,231,318 |
| 8/20 | $1,248,371 | $1,245,511 | $1,222,067 |
| 9/20 | $1,244,555 | $1,245,775 | $1,219,913 |
| 10/20 | $1,240,635 | $1,242,033 | $1,215,869 |
| 11/20 | $1,267,691 | $1,260,776 | $1,239,442 |
| 12/20 | $1,278,014 | $1,268,456 | $1,249,904 |
| 1/21 | $1,288,433 | $1,276,540 | $1,258,524 |
| 2/21 | $1,263,466 | $1,256,257 | $1,237,232 |
| 3/21 | $1,272,562 | $1,264,005 | $1,245,038 |
| 4/21 | $1,285,357 | $1,274,607 | $1,258,468 |
| 5/21 | $1,293,251 | $1,278,410 | $1,264,306 |
| 6/21 | $1,298,770 | $1,281,920 | $1,268,465 |
| 7/21 | $1,307,948 | $1,292,552 | $1,278,464 |
| 8/21 | $1,299,875 | $1,287,808 | $1,271,851 |
| 9/21 | $1,286,935 | $1,278,514 | $1,261,635 |
| 10/21 | $1,285,122 | $1,274,776 | $1,258,682 |
| 11/21 | $1,297,029 | $1,285,628 | $1,270,680 |
| 12/21 | $1,299,379 | $1,287,702 | $1,273,252 |
| 1/22 | $1,259,951 | $1,252,454 | $1,237,249 |
| 2/22 | $1,250,836 | $1,247,967 | $1,232,583 |
| 3/22 | $1,205,072 | $1,207,512 | $1,190,050 |
| 4/22 | $1,168,129 | $1,174,113 | $1,155,397 |
| 5/22 | $1,186,755 | $1,191,554 | $1,178,599 |
| 6/22 | $1,162,602 | $1,172,038 | $1,153,419 |
| 7/22 | $1,196,772 | $1,203,006 | $1,185,161 |
| 8/22 | $1,166,269 | $1,176,640 | $1,155,670 |
| 9/22 | $1,121,782 | $1,131,480 | $1,110,801 |
| 10/22 | $1,110,442 | $1,122,070 | $1,100,387 |
| 11/22 | $1,172,150 | $1,174,553 | $1,156,876 |
| 12/22 | $1,168,716 | $1,177,916 | $1,159,484 |
| 1/23 | $1,210,333 | $1,211,751 | $1,197,429 |
| 2/23 | $1,179,956 | $1,184,351 | $1,168,585 |
| 3/23 | $1,206,337 | $1,210,629 | $1,196,778 |
| 4/23 | $1,208,207 | $1,207,864 | $1,194,953 |
| 5/23 | $1,199,686 | $1,197,397 | $1,184,323 |
| 6/23 | $1,212,054 | $1,209,391 | $1,198,736 |
| 7/23 | $1,215,325 | $1,214,176 | $1,201,854 |
| 8/23 | $1,195,096 | $1,196,696 | $1,182,678 |
| 9/23 | $1,155,175 | $1,161,622 | $1,145,389 |
| 10/23 | $1,132,324 | $1,151,737 | $1,135,660 |
| 11/23 | $1,229,764 | $1,224,851 | $1,214,380 |
| 12/23 | $1,266,603 | $1,253,319 | $1,244,312 |
| 1/24 | $1,263,599 | $1,246,918 | $1,237,110 |
| 2/24 | $1,260,635 | $1,248,519 | $1,237,082 |
| 3/24 | $1,260,323 | $1,248,480 | $1,235,166 |
| 4/24 | $1,246,671 | $1,233,018 | $1,220,237 |
| 5/24 | $1,247,778 | $1,229,401 | $1,216,799 |
| 6/24 | $1,270,501 | $1,248,245 | $1,237,954 |
| 7/24 | $1,279,927 | $1,259,622 | $1,248,625 |
| 8/24 | $1,287,941 | $1,269,557 | $1,257,437 |
| 9/24 | $1,302,929 | $1,282,104 | $1,269,981 |
Average Annual Total Returns (%)
| Fund | 1 Year | 5 Years | 10 Years |
|---|---|---|---|
| Class I | 12.79% | 1.58% | 2.68% |
| Bloomberg Municipal Bond Index | 10.37% | 1.38% | 2.51% |
| Bloomberg New York Municipal Bond Index | 10.88% | 1.35% | 2.42% |
Performance does not reflect the deduction of taxes that a shareholder would pay on Fund distributions or redemption of Fund shares. Performance assumes that all dividends and distributions, if any, were reinvested. For more recent performance information, visit www.eatonvance.com/performance.php.
THE FUND'S PAST PERFORMANCE IS NO GUARANTEE OF FUTURE RESULTS.
Key Fund Statistics
| Total Net Assets | $362,823,791 |
| # of Portfolio Holdings | 139 |
| Portfolio Turnover Rate | 67% |
| Total Advisory Fees Paid | $1,420,337 |
What did the Fund invest in?
The following tables reflect what the Fund invested in as of the report date.
Sector Allocation (% of total investments)
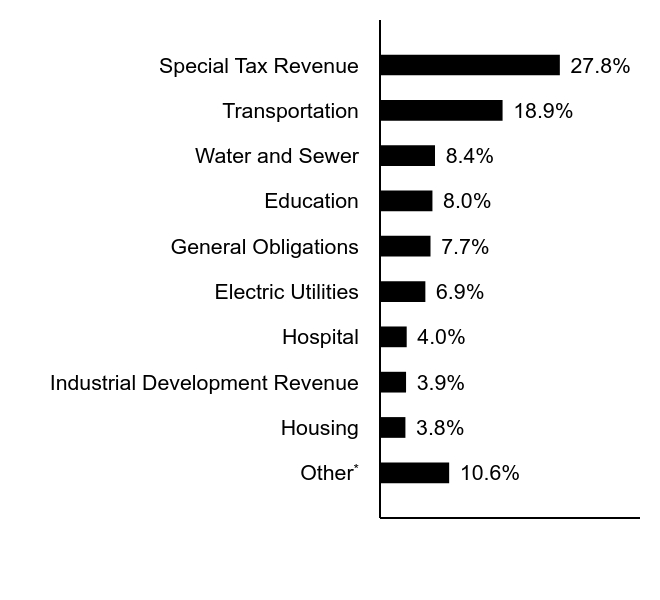
| Value | Value |
|---|---|
OtherFootnote Reference* | 10.6% |
| Housing | 3.8% |
| Industrial Development Revenue | 3.9% |
| Hospital | 4.0% |
| Electric Utilities | 6.9% |
| General Obligations | 7.7% |
| Education | 8.0% |
| Water and Sewer | 8.4% |
| Transportation | 18.9% |
| Special Tax Revenue | 27.8% |
| Footnote | Description |
Footnote* | Sectors less than 3% each |
Credit Quality (% of total investments)Footnote Referencea ,Footnote Referenceb
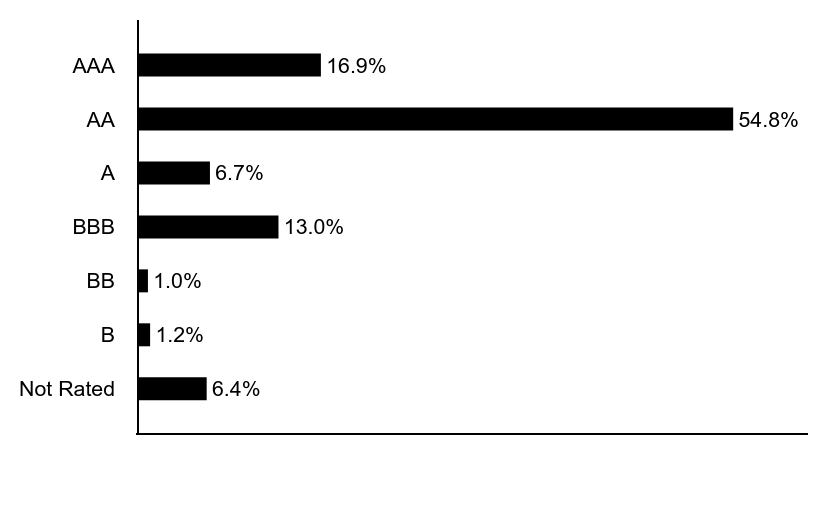
| Value | Value |
|---|---|
| Not Rated | 6.4% |
| B | 1.2% |
| BB | 1.0% |
| BBB | 13.0% |
| A | 6.7% |
| AA | 54.8% |
| AAA | 16.9% |
| Footnote | Description |
Footnotea | Ratings are based on Moody’s Investors Service, Inc. (“Moody’s”), S&P Global Ratings (“S&P”) or Fitch Ratings (“Fitch”). If securities are rated differently by the ratings agencies, the highest rating is applied. Moody's ratings are converted to the S&P and Fitch scale with ratings ranging from AAA, being the highest, to D, being the lowest. Ratings of BBB or higher are considered to be investment-grade quality. Holdings designated as “Not Rated” (if any) are not rated by the national ratings agencies stated above. |
Footnoteb | The chart includes the municipal bonds held by a trust that issues residual interest bonds. |
Additional Information
If you wish to view additional information about the Fund, including the prospectus, statement of additional information, financial statements and holdings, please scan the QR code or visit www.eatonvance.com/open-end-mutual-fund-documents.php. For proxy information, please visit www.eatonvance.com/proxyvoting.
Householding
The Funds may deliver a single copy of certain required shareholder documents (including prospectuses, shareholder reports, and proxy materials) to investors with the same last name and the same address. Your participation will continue indefinitely unless you instruct otherwise by calling 1-800-262-1122 or by contacting your financial intermediary. Your instruction will typically be effective within 30 days of receipt.
Not FDIC Insured | May Lose Value | No Bank Guarantee
Annual Shareholder Report September 30, 2024
EINYX-TSR-AR

Eaton Vance Ohio Municipal Income Fund
Class A ETOHX
Annual Shareholder Report September 30, 2024
This annual shareholder report contains important information about the Eaton Vance Ohio Municipal Income Fund for the period of October 1, 2023 to September 30, 2024. You can find additional information about the Fund at www.eatonvance.com/open-end-mutual-fund-documents.php. You can also request this information by contacting us at 1-800-262-1122.
What were the Fund costs for the last year?
(based on a hypothetical $10,000 investment)
| Class Name | Costs of a $10,000 investment | Costs paid as a percentage of a $10,000 investment |
|---|---|---|
| Class A | $96 | 0.91% |
How did the Fund perform last year and what affected its performance?
Key contributors to (↑) and detractors from (↓) performance, relative to the Bloomberg Municipal Bond Index (the Index):
↓ Security selections and an underweight position in bonds with coupon rates below 4% detracted from Index-relative returns during the period
↓ Security selections and an underweight position in the transportation sector detracted from the Fund’s returns relative to the Index during the period
↓ Security selections in bonds with 22 years or more remaining to maturity detracted from Fund performance relative to the Index during the period
↑ An overweight position in bonds rated BBB and below helped Fund returns as lower-credit-quality bonds generally outperformed higher-credit-quality bonds
↑ Security selections and an overweight position in the health care sector ― the best-performing sector within the Index ― contributed to Index-relative performance during the period
↑ Fund management’s use of leveraged investments, and security selections within those investments, magnified the Fund’s positive return and contributed to performance versus the Index during the period
Fund Performance
Comparison of the change in value of a $10,000 investment for the period indicated.
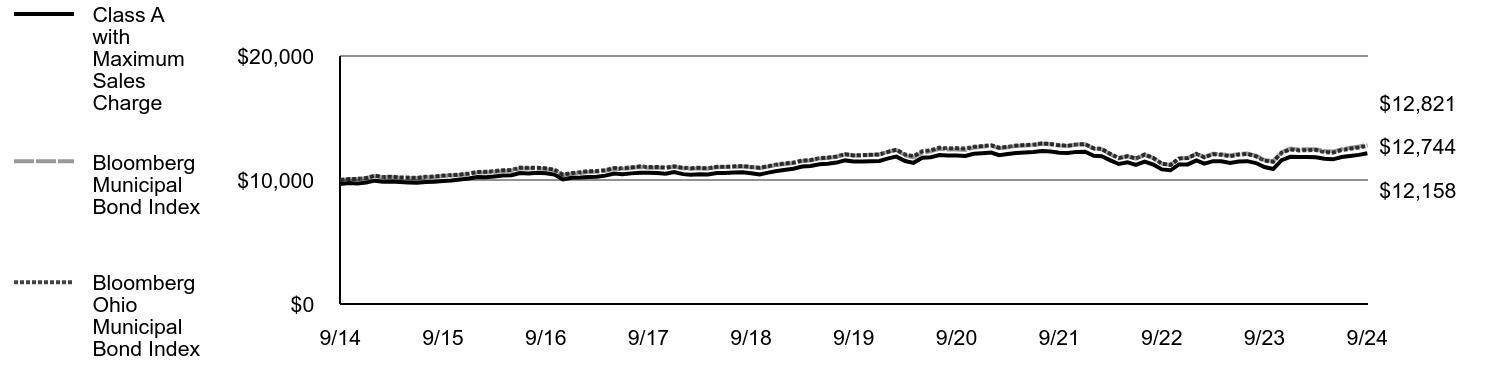
| Class A with Maximum Sales Charge | Bloomberg Municipal Bond Index | Bloomberg Ohio Municipal Bond Index | |
|---|---|---|---|
| 9/14 | $9,675 | $10,000 | $10,000 |
| 10/14 | $9,758 | $10,069 | $10,073 |
| 11/14 | $9,725 | $10,086 | $10,089 |
| 12/14 | $9,787 | $10,137 | $10,152 |
| 1/15 | $9,946 | $10,317 | $10,357 |
| 2/15 | $9,859 | $10,210 | $10,235 |
| 3/15 | $9,878 | $10,240 | $10,271 |
| 4/15 | $9,834 | $10,186 | $10,209 |
| 5/15 | $9,800 | $10,158 | $10,192 |
| 6/15 | $9,777 | $10,148 | $10,179 |
| 7/15 | $9,830 | $10,222 | $10,259 |
| 8/15 | $9,851 | $10,242 | $10,286 |
| 9/15 | $9,915 | $10,316 | $10,358 |
| 10/15 | $9,958 | $10,357 | $10,395 |
| 11/15 | $10,043 | $10,398 | $10,448 |
| 12/15 | $10,128 | $10,472 | $10,531 |
| 1/16 | $10,247 | $10,596 | $10,653 |
| 2/16 | $10,222 | $10,613 | $10,670 |
| 3/16 | $10,286 | $10,647 | $10,714 |
| 4/16 | $10,361 | $10,725 | $10,796 |
| 5/16 | $10,391 | $10,754 | $10,817 |
| 6/16 | $10,567 | $10,925 | $10,998 |
| 7/16 | $10,529 | $10,932 | $10,988 |
| 8/16 | $10,592 | $10,947 | $10,996 |
| 9/16 | $10,542 | $10,892 | $10,944 |
| 10/16 | $10,436 | $10,778 | $10,836 |
| 11/16 | $10,044 | $10,376 | $10,436 |
| 12/16 | $10,176 | $10,497 | $10,563 |
| 1/17 | $10,193 | $10,567 | $10,634 |
| 2/17 | $10,234 | $10,640 | $10,710 |
| 3/17 | $10,264 | $10,663 | $10,731 |
| 4/17 | $10,351 | $10,741 | $10,797 |
| 5/17 | $10,520 | $10,911 | $10,972 |
| 6/17 | $10,469 | $10,872 | $10,946 |
| 7/17 | $10,534 | $10,960 | $11,027 |
| 8/17 | $10,588 | $11,043 | $11,101 |
| 9/17 | $10,584 | $10,987 | $11,039 |
| 10/17 | $10,555 | $11,014 | $11,054 |
| 11/17 | $10,503 | $10,955 | $10,999 |
| 12/17 | $10,637 | $11,069 | $11,113 |
| 1/18 | $10,474 | $10,939 | $10,984 |
| 2/18 | $10,431 | $10,906 | $10,954 |
| 3/18 | $10,470 | $10,947 | $10,992 |
| 4/18 | $10,450 | $10,908 | $10,945 |
| 5/18 | $10,572 | $11,033 | $11,067 |
| 6/18 | $10,564 | $11,042 | $11,073 |
| 7/18 | $10,603 | $11,069 | $11,101 |
| 8/18 | $10,617 | $11,097 | $11,131 |
| 9/18 | $10,536 | $11,025 | $11,057 |
| 10/18 | $10,442 | $10,957 | $10,996 |
| 11/18 | $10,592 | $11,079 | $11,115 |
| 12/18 | $10,730 | $11,211 | $11,259 |
| 1/19 | $10,831 | $11,296 | $11,357 |
| 2/19 | $10,908 | $11,357 | $11,408 |
| 3/19 | $11,084 | $11,536 | $11,574 |
| 4/19 | $11,125 | $11,579 | $11,613 |
| 5/19 | $11,276 | $11,739 | $11,763 |
| 6/19 | $11,316 | $11,782 | $11,812 |
| 7/19 | $11,405 | $11,877 | $11,897 |
| 8/19 | $11,581 | $12,065 | $12,082 |
| 9/19 | $11,497 | $11,968 | $11,983 |
| 10/19 | $11,499 | $11,989 | $12,009 |
| 11/19 | $11,514 | $12,019 | $12,037 |
| 12/19 | $11,541 | $12,056 | $12,069 |
| 1/20 | $11,743 | $12,273 | $12,275 |
| 2/20 | $11,883 | $12,431 | $12,439 |
| 3/20 | $11,531 | $11,980 | $12,056 |
| 4/20 | $11,384 | $11,830 | $11,934 |
| 5/20 | $11,795 | $12,206 | $12,327 |
| 6/20 | $11,836 | $12,307 | $12,400 |
| 7/20 | $12,016 | $12,514 | $12,615 |
| 8/20 | $11,967 | $12,455 | $12,553 |
| 9/20 | $11,969 | $12,458 | $12,577 |
| 10/20 | $11,945 | $12,420 | $12,534 |
| 11/20 | $12,114 | $12,608 | $12,688 |
| 12/20 | $12,166 | $12,685 | $12,748 |
| 1/21 | $12,217 | $12,765 | $12,809 |
| 2/21 | $11,999 | $12,563 | $12,610 |
| 3/21 | $12,090 | $12,640 | $12,675 |
| 4/21 | $12,181 | $12,746 | $12,779 |
| 5/21 | $12,220 | $12,784 | $12,820 |
| 6/21 | $12,259 | $12,819 | $12,845 |
| 7/21 | $12,337 | $12,926 | $12,957 |
| 8/21 | $12,296 | $12,878 | $12,908 |
| 9/21 | $12,203 | $12,785 | $12,808 |
| 10/21 | $12,176 | $12,748 | $12,762 |
| 11/21 | $12,267 | $12,856 | $12,868 |
| 12/21 | $12,280 | $12,877 | $12,894 |
| 1/22 | $11,960 | $12,525 | $12,553 |
| 2/22 | $11,920 | $12,480 | $12,508 |
| 3/22 | $11,586 | $12,075 | $12,105 |
| 4/22 | $11,291 | $11,741 | $11,780 |
| 5/22 | $11,425 | $11,916 | $11,925 |
| 6/22 | $11,223 | $11,720 | $11,737 |
| 7/22 | $11,491 | $12,030 | $12,060 |
| 8/22 | $11,247 | $11,766 | $11,774 |
| 9/22 | $10,853 | $11,315 | $11,322 |
| 10/22 | $10,785 | $11,221 | $11,212 |
| 11/22 | $11,260 | $11,746 | $11,725 |
| 12/22 | $11,259 | $11,779 | $11,773 |
| 1/23 | $11,573 | $12,118 | $12,101 |
| 2/23 | $11,314 | $11,844 | $11,835 |
| 3/23 | $11,519 | $12,106 | $12,076 |
| 4/23 | $11,519 | $12,079 | $12,028 |
| 5/23 | $11,381 | $11,974 | $11,905 |
| 6/23 | $11,492 | $12,094 | $12,045 |
| 7/23 | $11,520 | $12,142 | $12,095 |
| 8/23 | $11,368 | $11,967 | $11,906 |
| 9/23 | $11,050 | $11,616 | $11,564 |
| 10/23 | $10,884 | $11,517 | $11,470 |
| 11/23 | $11,599 | $12,249 | $12,189 |
| 12/23 | $11,867 | $12,533 | $12,466 |
| 1/24 | $11,855 | $12,469 | $12,383 |
| 2/24 | $11,857 | $12,485 | $12,408 |
| 3/24 | $11,831 | $12,485 | $12,417 |
| 4/24 | $11,707 | $12,330 | $12,243 |
| 5/24 | $11,669 | $12,294 | $12,202 |
| 6/24 | $11,858 | $12,482 | $12,406 |
| 7/24 | $11,935 | $12,596 | $12,519 |
| 8/24 | $12,026 | $12,696 | $12,621 |
| 9/24 | $12,158 | $12,821 | $12,744 |
Average Annual Total Returns (%)
| Fund | 1 Year | 5 Years | 10 Years |
|---|---|---|---|
| Class A | 10.05% | 1.13% | 2.31% |
| Class A with 3.25% Maximum Sales Charge | 6.42% | 0.46% | 1.97% |
| Bloomberg Municipal Bond Index | 10.37% | 1.38% | 2.51% |
| Bloomberg Ohio Municipal Bond Index | 10.21% | 1.24% | 2.45% |
Performance does not reflect the deduction of taxes that a shareholder would pay on Fund distributions or redemption of Fund shares. Performance assumes that all dividends and distributions, if any, were reinvested. For more recent performance information, visit www.eatonvance.com/performance.php.
THE FUND'S PAST PERFORMANCE IS NO GUARANTEE OF FUTURE RESULTS.
Key Fund Statistics
| Total Net Assets | $188,658,528 |
| # of Portfolio Holdings | 122 |
| Portfolio Turnover Rate | 40% |
| Total Advisory Fees Paid | $713,889 |
What did the Fund invest in?
The following tables reflect what the Fund invested in as of the report date.
Sector Allocation (% of total investments)
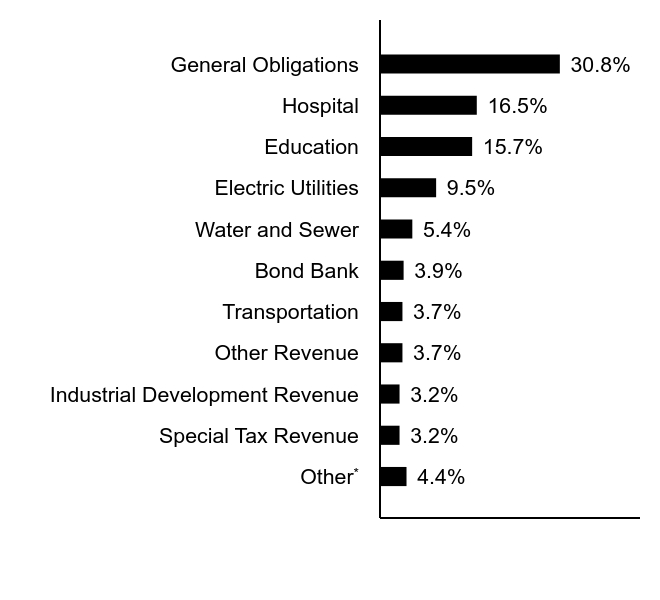
| Value | Value |
|---|---|
OtherFootnote Reference* | 4.4% |
| Special Tax Revenue | 3.2% |
| Industrial Development Revenue | 3.2% |
| Other Revenue | 3.7% |
| Transportation | 3.7% |
| Bond Bank | 3.9% |
| Water and Sewer | 5.4% |
| Electric Utilities | 9.5% |
| Education | 15.7% |
| Hospital | 16.5% |
| General Obligations | 30.8% |
| Footnote | Description |
Footnote* | Sectors less than 3% each |
Credit Quality (% of total investments)Footnote Referencea ,Footnote Referenceb
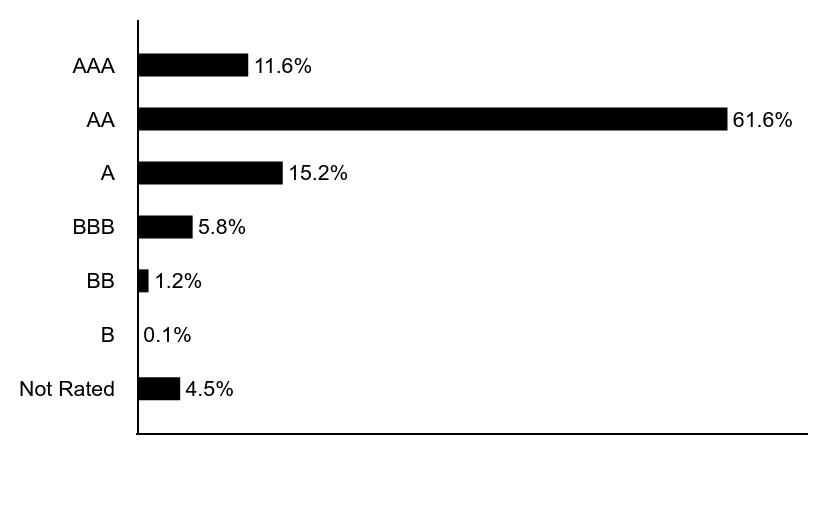
| Value | Value |
|---|---|
| Not Rated | 4.5% |
| B | 0.1% |
| BB | 1.2% |
| BBB | 5.8% |
| A | 15.2% |
| AA | 61.6% |
| AAA | 11.6% |
| Footnote | Description |
Footnotea | Ratings are based on Moody’s Investors Service, Inc. (“Moody’s”), S&P Global Ratings (“S&P”) or Fitch Ratings (“Fitch”). If securities are rated differently by the ratings agencies, the highest rating is applied. Moody's ratings are converted to the S&P and Fitch scale with ratings ranging from AAA, being the highest, to D, being the lowest. Ratings of BBB or higher are considered to be investment-grade quality. Holdings designated as “Not Rated” (if any) are not rated by the national ratings agencies stated above. |
Footnoteb | The chart includes the municipal bonds held by a trust that issues residual interest bonds. |
Additional Information
If you wish to view additional information about the Fund, including the prospectus, statement of additional information, financial statements and holdings, please scan the QR code or visit www.eatonvance.com/open-end-mutual-fund-documents.php. For proxy information, please visit www.eatonvance.com/proxyvoting.
Householding
The Funds may deliver a single copy of certain required shareholder documents (including prospectuses, shareholder reports, and proxy materials) to investors with the same last name and the same address. Your participation will continue indefinitely unless you instruct otherwise by calling 1-800-262-1122 or by contacting your financial intermediary. Your instruction will typically be effective within 30 days of receipt.
Not FDIC Insured | May Lose Value | No Bank Guarantee
Annual Shareholder Report September 30, 2024
ETOHX-TSR-AR

Eaton Vance Ohio Municipal Income Fund
Class C ECOHX
Annual Shareholder Report September 30, 2024
This annual shareholder report contains important information about the Eaton Vance Ohio Municipal Income Fund for the period of October 1, 2023 to September 30, 2024. You can find additional information about the Fund at www.eatonvance.com/open-end-mutual-fund-documents.php. You can also request this information by contacting us at 1-800-262-1122.
What were the Fund costs for the last year?
(based on a hypothetical $10,000 investment)
| Class Name | Costs of a $10,000 investment | Costs paid as a percentage of a $10,000 investment |
|---|---|---|
| Class C | $174 | 1.66% |
How did the Fund perform last year and what affected its performance?
Key contributors to (↑) and detractors from (↓) performance, relative to the Bloomberg Municipal Bond Index (the Index):
↓ Security selections and an underweight position in bonds with coupon rates below 4% detracted from Index-relative returns during the period
↓ Security selections and an underweight position in the transportation sector detracted from the Fund’s returns relative to the Index during the period
↓ Security selections in bonds with 22 years or more remaining to maturity detracted from Fund performance relative to the Index during the period
↑ An overweight position in bonds rated BBB and below helped Fund returns as lower-credit-quality bonds generally outperformed higher-credit-quality bonds
↑ Security selections and an overweight position in the health care sector ― the best-performing sector within the Index ― contributed to Index-relative performance during the period
↑ Fund management’s use of leveraged investments, and security selections within those investments, magnified the Fund’s positive return and contributed to performance versus the Index during the period
Fund Performance
Comparison of the change in value of a $10,000 investment for the period indicated.
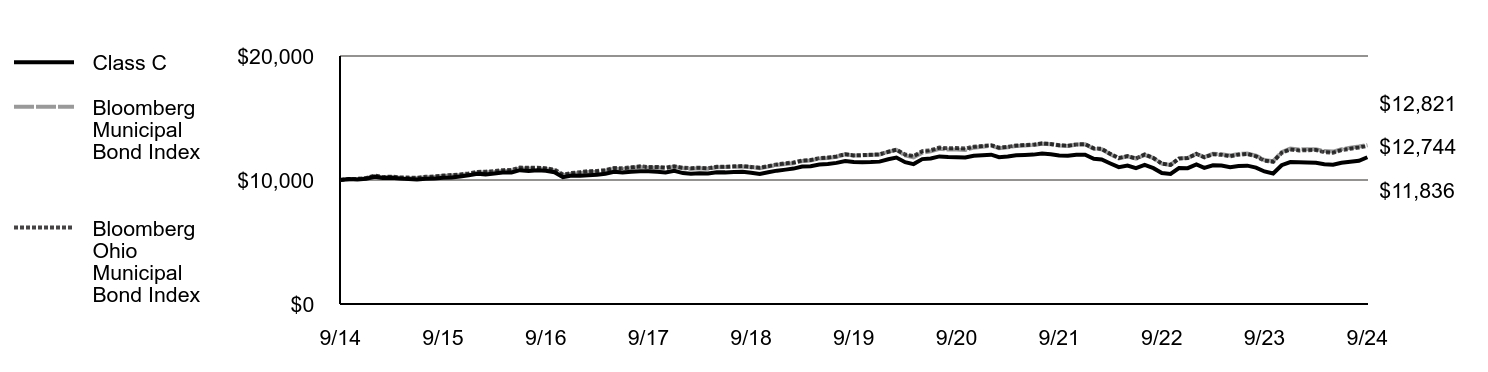
| Class C | Bloomberg Municipal Bond Index | Bloomberg Ohio Municipal Bond Index | |
|---|---|---|---|
| 9/14 | $10,000 | $10,000 | $10,000 |
| 10/14 | $10,080 | $10,069 | $10,073 |
| 11/14 | $10,039 | $10,086 | $10,089 |
| 12/14 | $10,097 | $10,137 | $10,152 |
| 1/15 | $10,254 | $10,317 | $10,357 |
| 2/15 | $10,159 | $10,210 | $10,235 |
| 3/15 | $10,183 | $10,240 | $10,271 |
| 4/15 | $10,120 | $10,186 | $10,209 |
| 5/15 | $10,079 | $10,158 | $10,192 |
| 6/15 | $10,049 | $10,148 | $10,179 |
| 7/15 | $10,097 | $10,222 | $10,259 |
| 8/15 | $10,111 | $10,242 | $10,286 |
| 9/15 | $10,183 | $10,316 | $10,358 |
| 10/15 | $10,209 | $10,357 | $10,395 |
| 11/15 | $10,290 | $10,398 | $10,448 |
| 12/15 | $10,382 | $10,472 | $10,531 |
| 1/16 | $10,497 | $10,596 | $10,653 |
| 2/16 | $10,454 | $10,613 | $10,670 |
| 3/16 | $10,524 | $10,647 | $10,714 |
| 4/16 | $10,595 | $10,725 | $10,796 |
| 5/16 | $10,607 | $10,754 | $10,817 |
| 6/16 | $10,791 | $10,925 | $10,998 |
| 7/16 | $10,734 | $10,932 | $10,988 |
| 8/16 | $10,792 | $10,947 | $10,996 |
| 9/16 | $10,746 | $10,892 | $10,944 |
| 10/16 | $10,630 | $10,778 | $10,836 |
| 11/16 | $10,226 | $10,376 | $10,436 |
| 12/16 | $10,353 | $10,497 | $10,563 |
| 1/17 | $10,352 | $10,567 | $10,634 |
| 2/17 | $10,388 | $10,640 | $10,710 |
| 3/17 | $10,423 | $10,663 | $10,731 |
| 4/17 | $10,505 | $10,741 | $10,797 |
| 5/17 | $10,658 | $10,911 | $10,972 |
| 6/17 | $10,612 | $10,872 | $10,946 |
| 7/17 | $10,659 | $10,960 | $11,027 |
| 8/17 | $10,707 | $11,043 | $11,101 |
| 9/17 | $10,696 | $10,987 | $11,039 |
| 10/17 | $10,660 | $11,014 | $11,054 |
| 11/17 | $10,612 | $10,955 | $10,999 |
| 12/17 | $10,741 | $11,069 | $11,113 |
| 1/18 | $10,558 | $10,939 | $10,984 |
| 2/18 | $10,508 | $10,906 | $10,954 |
| 3/18 | $10,553 | $10,947 | $10,992 |
| 4/18 | $10,526 | $10,908 | $10,945 |
| 5/18 | $10,631 | $11,033 | $11,067 |
| 6/18 | $10,615 | $11,042 | $11,073 |
| 7/18 | $10,648 | $11,069 | $11,101 |
| 8/18 | $10,656 | $11,097 | $11,131 |
| 9/18 | $10,579 | $11,025 | $11,057 |
| 10/18 | $10,479 | $10,957 | $10,996 |
| 11/18 | $10,623 | $11,079 | $11,115 |
| 12/18 | $10,754 | $11,211 | $11,259 |
| 1/19 | $10,836 | $11,296 | $11,357 |
| 2/19 | $10,920 | $11,357 | $11,408 |
| 3/19 | $11,088 | $11,536 | $11,574 |
| 4/19 | $11,110 | $11,579 | $11,613 |
| 5/19 | $11,254 | $11,739 | $11,763 |
| 6/19 | $11,299 | $11,782 | $11,812 |
| 7/19 | $11,381 | $11,877 | $11,897 |
| 8/19 | $11,537 | $12,065 | $12,082 |
| 9/19 | $11,446 | $11,968 | $11,983 |
| 10/19 | $11,441 | $11,989 | $12,009 |
| 11/19 | $11,449 | $12,019 | $12,037 |
| 12/19 | $11,481 | $12,056 | $12,069 |
| 1/20 | $11,674 | $12,273 | $12,275 |
| 2/20 | $11,807 | $12,431 | $12,439 |
| 3/20 | $11,437 | $11,980 | $12,056 |
| 4/20 | $11,284 | $11,830 | $11,934 |
| 5/20 | $11,685 | $12,206 | $12,327 |
| 6/20 | $11,731 | $12,307 | $12,400 |
| 7/20 | $11,902 | $12,514 | $12,615 |
| 8/20 | $11,846 | $12,455 | $12,553 |
| 9/20 | $11,841 | $12,458 | $12,577 |
| 10/20 | $11,809 | $12,420 | $12,534 |
| 11/20 | $11,956 | $12,608 | $12,688 |
| 12/20 | $12,000 | $12,685 | $12,748 |
| 1/21 | $12,043 | $12,765 | $12,809 |
| 2/21 | $11,833 | $12,563 | $12,610 |
| 3/21 | $11,902 | $12,640 | $12,675 |
| 4/21 | $11,998 | $12,746 | $12,779 |
| 5/21 | $12,016 | $12,784 | $12,820 |
| 6/21 | $12,047 | $12,819 | $12,845 |
| 7/21 | $12,128 | $12,926 | $12,957 |
| 8/21 | $12,081 | $12,878 | $12,908 |
| 9/21 | $11,982 | $12,785 | $12,808 |
| 10/21 | $11,947 | $12,748 | $12,762 |
| 11/21 | $12,030 | $12,856 | $12,868 |
| 12/21 | $12,034 | $12,877 | $12,894 |
| 1/22 | $11,713 | $12,525 | $12,553 |
| 2/22 | $11,654 | $12,480 | $12,508 |
| 3/22 | $11,333 | $12,075 | $12,105 |
| 4/22 | $11,038 | $11,741 | $11,780 |
| 5/22 | $11,161 | $11,916 | $11,925 |
| 6/22 | $10,957 | $11,720 | $11,737 |
| 7/22 | $11,212 | $12,030 | $12,060 |
| 8/22 | $10,954 | $11,766 | $11,774 |
| 9/22 | $10,564 | $11,315 | $11,322 |
| 10/22 | $10,490 | $11,221 | $11,212 |
| 11/22 | $10,959 | $11,746 | $11,725 |
| 12/22 | $10,952 | $11,779 | $11,773 |
| 1/23 | $11,249 | $12,118 | $12,101 |
| 2/23 | $10,978 | $11,844 | $11,835 |
| 3/23 | $11,183 | $12,106 | $12,076 |
| 4/23 | $11,163 | $12,079 | $12,028 |
| 5/23 | $11,035 | $11,974 | $11,905 |
| 6/23 | $11,136 | $12,094 | $12,045 |
| 7/23 | $11,156 | $12,142 | $12,095 |
| 8/23 | $11,002 | $11,967 | $11,906 |
| 9/23 | $10,688 | $11,616 | $11,564 |
| 10/23 | $10,521 | $11,517 | $11,470 |
| 11/23 | $11,191 | $12,249 | $12,189 |
| 12/23 | $11,443 | $12,533 | $12,466 |
| 1/24 | $11,424 | $12,469 | $12,383 |
| 2/24 | $11,420 | $12,485 | $12,408 |
| 3/24 | $11,387 | $12,485 | $12,417 |
| 4/24 | $11,274 | $12,330 | $12,243 |
| 5/24 | $11,230 | $12,294 | $12,202 |
| 6/24 | $11,392 | $12,482 | $12,406 |
| 7/24 | $11,472 | $12,596 | $12,519 |
| 8/24 | $11,552 | $12,696 | $12,621 |
| 9/24 | $11,836 | $12,821 | $12,744 |
Average Annual Total Returns (%)
| Fund | 1 Year | 5 Years | 10 Years |
|---|---|---|---|
| Class C | 9.10% | 0.37% | 1.70% |
| Class C with 1% Maximum Deferred Sales Charge | 8.10% | 0.37% | 1.70% |
| Bloomberg Municipal Bond Index | 10.37% | 1.38% | 2.51% |
| Bloomberg Ohio Municipal Bond Index | 10.21% | 1.24% | 2.45% |
Performance does not reflect the deduction of taxes that a shareholder would pay on Fund distributions or redemption of Fund shares. Performance assumes that all dividends and distributions, if any, were reinvested. For more recent performance information, visit www.eatonvance.com/performance.php.
THE FUND'S PAST PERFORMANCE IS NO GUARANTEE OF FUTURE RESULTS.
Key Fund Statistics
| Total Net Assets | $188,658,528 |
| # of Portfolio Holdings | 122 |
| Portfolio Turnover Rate | 40% |
| Total Advisory Fees Paid | $713,889 |
What did the Fund invest in?
The following tables reflect what the Fund invested in as of the report date.
Sector Allocation (% of total investments)

| Value | Value |
|---|---|
OtherFootnote Reference* | 4.4% |
| Special Tax Revenue | 3.2% |
| Industrial Development Revenue | 3.2% |
| Other Revenue | 3.7% |
| Transportation | 3.7% |
| Bond Bank | 3.9% |
| Water and Sewer | 5.4% |
| Electric Utilities | 9.5% |
| Education | 15.7% |
| Hospital | 16.5% |
| General Obligations | 30.8% |
| Footnote | Description |
Footnote* | Sectors less than 3% each |
Credit Quality (% of total investments)Footnote Referencea ,Footnote Referenceb

| Value | Value |
|---|---|
| Not Rated | 4.5% |
| B | 0.1% |
| BB | 1.2% |
| BBB | 5.8% |
| A | 15.2% |
| AA | 61.6% |
| AAA | 11.6% |
| Footnote | Description |
Footnotea | Ratings are based on Moody’s Investors Service, Inc. (“Moody’s”), S&P Global Ratings (“S&P”) or Fitch Ratings (“Fitch”). If securities are rated differently by the ratings agencies, the highest rating is applied. Moody's ratings are converted to the S&P and Fitch scale with ratings ranging from AAA, being the highest, to D, being the lowest. Ratings of BBB or higher are considered to be investment-grade quality. Holdings designated as “Not Rated” (if any) are not rated by the national ratings agencies stated above. |
Footnoteb | The chart includes the municipal bonds held by a trust that issues residual interest bonds. |
Additional Information
If you wish to view additional information about the Fund, including the prospectus, statement of additional information, financial statements and holdings, please scan the QR code or visit www.eatonvance.com/open-end-mutual-fund-documents.php. For proxy information, please visit www.eatonvance.com/proxyvoting.
Householding
The Funds may deliver a single copy of certain required shareholder documents (including prospectuses, shareholder reports, and proxy materials) to investors with the same last name and the same address. Your participation will continue indefinitely unless you instruct otherwise by calling 1-800-262-1122 or by contacting your financial intermediary. Your instruction will typically be effective within 30 days of receipt.
Not FDIC Insured | May Lose Value | No Bank Guarantee
Annual Shareholder Report September 30, 2024
ECOHX-TSR-AR

Eaton Vance Ohio Municipal Income Fund
Class I EIOHX
Annual Shareholder Report September 30, 2024
This annual shareholder report contains important information about the Eaton Vance Ohio Municipal Income Fund for the period of October 1, 2023 to September 30, 2024. You can find additional information about the Fund at www.eatonvance.com/open-end-mutual-fund-documents.php. You can also request this information by contacting us at 1-800-262-1122.
What were the Fund costs for the last year?
(based on a hypothetical $10,000 investment)
| Class Name | Costs of a $10,000 investment | Costs paid as a percentage of a $10,000 investment |
|---|---|---|
| Class I | $75 | 0.71% |
How did the Fund perform last year and what affected its performance?
Key contributors to (↑) and detractors from (↓) performance, relative to the Bloomberg Municipal Bond Index (the Index):
↓ Security selections and an underweight position in bonds with coupon rates below 4% detracted from Index-relative returns during the period
↓ Security selections and an underweight position in the transportation sector detracted from the Fund’s returns relative to the Index during the period
↓ Security selections in bonds with 22 years or more remaining to maturity detracted from Fund performance relative to the Index during the period
↑ An overweight position in bonds rated BBB and below helped Fund returns as lower-credit-quality bonds generally outperformed higher-credit-quality bonds
↑ Security selections and an overweight position in the health care sector ― the best-performing sector within the Index ― contributed to Index-relative performance during the period
↑ Fund management’s use of leveraged investments, and security selections within those investments, magnified the Fund’s positive return and contributed to performance versus the Index during the period
Fund Performance
Comparison of the change in value of a $1,000,000 investment for the period indicated.
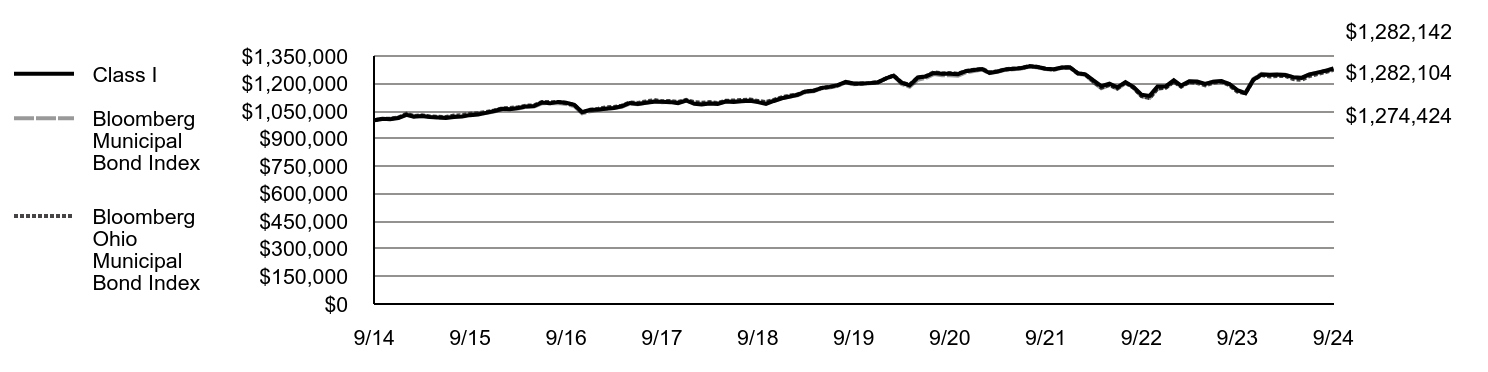
| Class I | Bloomberg Municipal Bond Index | Bloomberg Ohio Municipal Bond Index | |
|---|---|---|---|
| 9/14 | $1,000,000 | $1,000,000 | $1,000,000 |
| 10/14 | $1,008,793 | $1,006,857 | $1,007,339 |
| 11/14 | $1,005,507 | $1,008,598 | $1,008,936 |
| 12/14 | $1,012,115 | $1,013,687 | $1,015,221 |
| 1/15 | $1,029,762 | $1,031,654 | $1,035,744 |
| 2/15 | $1,019,836 | $1,021,012 | $1,023,497 |
| 3/15 | $1,023,155 | $1,023,960 | $1,027,092 |
| 4/15 | $1,017,625 | $1,018,588 | $1,020,941 |
| 5/15 | $1,015,406 | $1,015,774 | $1,019,192 |
| 6/15 | $1,013,169 | $1,014,848 | $1,017,875 |
| 7/15 | $1,017,707 | $1,022,199 | $1,025,920 |
| 8/15 | $1,019,996 | $1,024,207 | $1,028,588 |
| 9/15 | $1,028,002 | $1,031,626 | $1,035,807 |
| 10/15 | $1,031,428 | $1,035,727 | $1,039,471 |
| 11/15 | $1,040,476 | $1,039,845 | $1,044,771 |
| 12/15 | $1,050,606 | $1,047,151 | $1,053,094 |
| 1/16 | $1,063,055 | $1,059,645 | $1,065,332 |
| 2/16 | $1,060,640 | $1,061,312 | $1,066,981 |
| 3/16 | $1,067,460 | $1,064,674 | $1,071,389 |
| 4/16 | $1,075,448 | $1,072,502 | $1,079,556 |
| 5/16 | $1,077,593 | $1,075,403 | $1,081,694 |
| 6/16 | $1,097,144 | $1,092,511 | $1,099,835 |
| 7/16 | $1,092,252 | $1,093,178 | $1,098,783 |
| 8/16 | $1,100,163 | $1,094,653 | $1,099,643 |
| 9/16 | $1,095,182 | $1,089,190 | $1,094,351 |
| 10/16 | $1,084,272 | $1,077,763 | $1,083,640 |
| 11/16 | $1,043,861 | $1,037,568 | $1,043,628 |
| 12/16 | $1,057,668 | $1,049,749 | $1,056,318 |
| 1/17 | $1,058,440 | $1,056,669 | $1,063,359 |
| 2/17 | $1,062,890 | $1,064,007 | $1,070,999 |
| 3/17 | $1,067,337 | $1,066,317 | $1,073,056 |
| 4/17 | $1,076,603 | $1,074,054 | $1,079,712 |
| 5/17 | $1,094,305 | $1,091,100 | $1,097,242 |
| 6/17 | $1,089,209 | $1,087,187 | $1,094,628 |
| 7/17 | $1,094,963 | $1,095,983 | $1,102,730 |
| 8/17 | $1,100,728 | $1,104,323 | $1,110,085 |
| 9/17 | $1,100,433 | $1,098,708 | $1,103,931 |
| 10/17 | $1,098,856 | $1,101,390 | $1,105,389 |
| 11/17 | $1,093,614 | $1,095,493 | $1,099,917 |
| 12/17 | $1,107,746 | $1,106,943 | $1,111,265 |
| 1/18 | $1,089,785 | $1,093,911 | $1,098,398 |
| 2/18 | $1,085,455 | $1,090,642 | $1,095,437 |
| 3/18 | $1,090,963 | $1,094,668 | $1,099,196 |
| 4/18 | $1,089,019 | $1,090,761 | $1,094,492 |
| 5/18 | $1,101,978 | $1,103,252 | $1,106,686 |
| 6/18 | $1,099,986 | $1,104,193 | $1,107,326 |
| 7/18 | $1,104,261 | $1,106,873 | $1,110,102 |
| 8/18 | $1,105,983 | $1,109,715 | $1,113,088 |
| 9/18 | $1,098,936 | $1,102,531 | $1,105,683 |
| 10/18 | $1,089,370 | $1,095,742 | $1,099,577 |
| 11/18 | $1,105,153 | $1,107,870 | $1,111,488 |
| 12/18 | $1,119,728 | $1,121,135 | $1,125,852 |
| 1/19 | $1,129,178 | $1,129,609 | $1,135,681 |
| 2/19 | $1,138,700 | $1,135,658 | $1,140,771 |
| 3/19 | $1,157,200 | $1,153,610 | $1,157,416 |
| 4/19 | $1,160,355 | $1,157,945 | $1,161,273 |
| 5/19 | $1,176,323 | $1,173,909 | $1,176,304 |
| 6/19 | $1,181,976 | $1,178,244 | $1,181,206 |
| 7/19 | $1,191,503 | $1,187,739 | $1,189,734 |
| 8/19 | $1,208,791 | $1,206,474 | $1,208,189 |
| 9/19 | $1,200,178 | $1,196,803 | $1,198,269 |
| 10/19 | $1,200,620 | $1,198,948 | $1,200,850 |
| 11/19 | $1,202,345 | $1,201,946 | $1,203,706 |
| 12/19 | $1,206,678 | $1,205,616 | $1,206,914 |
| 1/20 | $1,227,999 | $1,227,277 | $1,227,465 |
| 2/20 | $1,242,851 | $1,243,103 | $1,243,902 |
| 3/20 | $1,204,949 | $1,198,012 | $1,205,555 |
| 4/20 | $1,189,799 | $1,182,977 | $1,193,369 |
| 5/20 | $1,232,992 | $1,220,609 | $1,232,701 |
| 6/20 | $1,238,746 | $1,230,655 | $1,240,015 |
| 7/20 | $1,257,817 | $1,251,382 | $1,261,511 |
| 8/20 | $1,252,891 | $1,245,511 | $1,255,318 |
| 9/20 | $1,253,369 | $1,245,775 | $1,257,720 |
| 10/20 | $1,251,045 | $1,242,033 | $1,253,439 |
| 11/20 | $1,267,558 | $1,260,776 | $1,268,784 |
| 12/20 | $1,273,236 | $1,268,456 | $1,274,786 |
| 1/21 | $1,278,849 | $1,276,540 | $1,280,863 |
| 2/21 | $1,257,496 | $1,256,257 | $1,261,004 |
| 3/21 | $1,265,900 | $1,264,005 | $1,267,535 |
| 4/21 | $1,277,039 | $1,274,607 | $1,277,876 |
| 5/21 | $1,279,966 | $1,278,410 | $1,281,952 |
| 6/21 | $1,284,272 | $1,281,920 | $1,284,528 |
| 7/21 | $1,294,013 | $1,292,552 | $1,295,722 |
| 8/21 | $1,289,975 | $1,287,808 | $1,290,777 |
| 9/21 | $1,280,430 | $1,278,514 | $1,280,795 |
| 10/21 | $1,277,764 | $1,274,776 | $1,276,194 |
| 11/21 | $1,287,593 | $1,285,628 | $1,286,770 |
| 12/21 | $1,289,118 | $1,287,702 | $1,289,357 |
| 1/22 | $1,255,795 | $1,252,454 | $1,255,313 |
| 2/22 | $1,250,415 | $1,247,967 | $1,250,775 |
| 3/22 | $1,216,950 | $1,207,512 | $1,210,537 |
| 4/22 | $1,186,274 | $1,174,113 | $1,177,954 |
| 5/22 | $1,199,052 | $1,191,554 | $1,192,462 |
| 6/22 | $1,179,471 | $1,172,038 | $1,173,677 |
| 7/22 | $1,207,803 | $1,203,006 | $1,206,014 |
| 8/22 | $1,180,997 | $1,176,640 | $1,177,354 |
| 9/22 | $1,139,861 | $1,131,480 | $1,132,199 |
| 10/22 | $1,132,895 | $1,122,070 | $1,121,167 |
| 11/22 | $1,184,364 | $1,174,553 | $1,172,509 |
| 12/22 | $1,184,508 | $1,177,916 | $1,177,253 |
| 1/23 | $1,217,627 | $1,211,751 | $1,210,091 |
| 2/23 | $1,189,164 | $1,184,351 | $1,183,492 |
| 3/23 | $1,212,369 | $1,210,629 | $1,207,645 |
| 4/23 | $1,211,141 | $1,207,864 | $1,202,812 |
| 5/23 | $1,198,270 | $1,197,397 | $1,190,467 |
| 6/23 | $1,210,150 | $1,209,391 | $1,204,450 |
| 7/23 | $1,213,310 | $1,214,176 | $1,209,500 |
| 8/23 | $1,197,536 | $1,196,696 | $1,190,629 |
| 9/23 | $1,164,271 | $1,161,622 | $1,156,387 |
| 10/23 | $1,147,043 | $1,151,737 | $1,146,974 |
| 11/23 | $1,220,986 | $1,224,851 | $1,218,904 |
| 12/23 | $1,249,397 | $1,253,319 | $1,246,628 |
| 1/24 | $1,248,349 | $1,246,918 | $1,238,276 |
| 2/24 | $1,248,815 | $1,248,519 | $1,240,815 |
| 3/24 | $1,246,236 | $1,248,480 | $1,241,716 |
| 4/24 | $1,234,903 | $1,233,018 | $1,224,339 |
| 5/24 | $1,231,055 | $1,229,401 | $1,220,243 |
| 6/24 | $1,249,727 | $1,248,245 | $1,240,614 |
| 7/24 | $1,259,514 | $1,259,622 | $1,251,894 |
| 8/24 | $1,269,342 | $1,269,557 | $1,262,142 |
| 9/24 | $1,282,142 | $1,282,104 | $1,274,424 |
Average Annual Total Returns (%)
| Fund | 1 Year | 5 Years | 10 Years |
|---|---|---|---|
| Class I | 10.13% | 1.33% | 2.51% |
| Bloomberg Municipal Bond Index | 10.37% | 1.38% | 2.51% |
| Bloomberg Ohio Municipal Bond Index | 10.21% | 1.24% | 2.45% |
Performance does not reflect the deduction of taxes that a shareholder would pay on Fund distributions or redemption of Fund shares. Performance assumes that all dividends and distributions, if any, were reinvested. For more recent performance information, visit www.eatonvance.com/performance.php.
THE FUND'S PAST PERFORMANCE IS NO GUARANTEE OF FUTURE RESULTS.
Key Fund Statistics
| Total Net Assets | $188,658,528 |
| # of Portfolio Holdings | 122 |
| Portfolio Turnover Rate | 40% |
| Total Advisory Fees Paid | $713,889 |
What did the Fund invest in?
The following tables reflect what the Fund invested in as of the report date.
Sector Allocation (% of total investments)

| Value | Value |
|---|---|
OtherFootnote Reference* | 4.4% |
| Special Tax Revenue | 3.2% |
| Industrial Development Revenue | 3.2% |
| Other Revenue | 3.7% |
| Transportation | 3.7% |
| Bond Bank | 3.9% |
| Water and Sewer | 5.4% |
| Electric Utilities | 9.5% |
| Education | 15.7% |
| Hospital | 16.5% |
| General Obligations | 30.8% |
| Footnote | Description |
Footnote* | Sectors less than 3% each |
Credit Quality (% of total investments)Footnote Referencea ,Footnote Referenceb

| Value | Value |
|---|---|
| Not Rated | 4.5% |
| B | 0.1% |
| BB | 1.2% |
| BBB | 5.8% |
| A | 15.2% |
| AA | 61.6% |
| AAA | 11.6% |
| Footnote | Description |
Footnotea | Ratings are based on Moody’s Investors Service, Inc. (“Moody’s”), S&P Global Ratings (“S&P”) or Fitch Ratings (“Fitch”). If securities are rated differently by the ratings agencies, the highest rating is applied. Moody's ratings are converted to the S&P and Fitch scale with ratings ranging from AAA, being the highest, to D, being the lowest. Ratings of BBB or higher are considered to be investment-grade quality. Holdings designated as “Not Rated” (if any) are not rated by the national ratings agencies stated above. |
Footnoteb | The chart includes the municipal bonds held by a trust that issues residual interest bonds. |
Additional Information
If you wish to view additional information about the Fund, including the prospectus, statement of additional information, financial statements and holdings, please scan the QR code or visit www.eatonvance.com/open-end-mutual-fund-documents.php. For proxy information, please visit www.eatonvance.com/proxyvoting.
Householding
The Funds may deliver a single copy of certain required shareholder documents (including prospectuses, shareholder reports, and proxy materials) to investors with the same last name and the same address. Your participation will continue indefinitely unless you instruct otherwise by calling 1-800-262-1122 or by contacting your financial intermediary. Your instruction will typically be effective within 30 days of receipt.
Not FDIC Insured | May Lose Value | No Bank Guarantee
Annual Shareholder Report September 30, 2024
EIOHX-TSR-AR
(b) Not applicable.
Item 2. Code of Ethics
The registrant (sometimes referred to as the “Fund”) has adopted a code of ethics applicable to its Principal Executive Officer, Principal Financial Officer and Principal Accounting Officer. The registrant undertakes to provide a copy of such code of ethics to any person upon request, without charge, by calling 1-800-262-1122. The registrant has not amended the code of ethics as described in Form N-CSR during the period covered by this report. The registrant has not granted any waiver, including an implicit waiver, from a provision of the code of ethics as described in Form N-CSR during the period covered by this report.
Item 3. Audit Committee Financial Expert
The registrant’s Board of Trustees (the “Board”) has designated George J. Gorman and Scott E. Wennerholm, each an independent trustee, as audit committee financial experts. Mr. Gorman is a certified public accountant who is the Principal at George J. Gorman LLC (a consulting firm). Previously, Mr. Gorman served in various capacities at Ernst & Young LLP (a registered public accounting firm), including as Senior Partner. Mr. Gorman also has experience serving as an independent trustee and audit committee financial expert of other mutual fund complexes. Mr. Wennerholm is a private investor. Previously, Mr. Wennerholm served as a Trustee at Wheelock College (postsecondary institution), as a Consultant at GF Parish Group (executive recruiting firm), Chief Operating Officer and Executive Vice President at BNY Mellon Asset Management (investment management firm), Chief Operating Officer and Chief Financial Officer at Natixis Global Asset Management (investment management firm), and Vice President at Fidelity Investments Institutional Services (investment management firm).
Item 4. Principal Accountant Fees and Services
Eaton Vance California Municipal Opportunities Fund, Eaton Vance Massachusetts Municipal Income Fund, Eaton Vance National Municipal Income Fund, Eaton Vance New York Municipal Income Fund and Eaton Vance Ohio Municipal Income Fund (the “Fund(s)”) are series of Eaton Vance Municipals Trust (the “Trust”), a Massachusetts business trust, which, including the Funds, contains a total of 18 series (the “Series”). The Trust is registered under the Investment Company Act of 1940 as an open-end management investment company. This Form N-CSR relates to the Funds’ annual reports.
(a)-(d)
The following tables present the aggregate fees billed to each Fund for each Fund’s fiscal years ended September 30, 2023 and September 30, 2024 by the registrant’s principal accountant, Deloitte & Touche LLP (“D&T”), for professional services rendered for the audit of the Funds’ annual financial statements and fees billed for other services rendered by D&T during those periods.
Eaton Vance California Municipal Opportunities Fund
Fiscal Years Ended | 9/30/23 | 9/30/24 | ||||||
Audit Fees | $ | 59,700 | $ | 79,600 | ||||
Audit-Related Fees(1) | $ | 0 | $ | 0 | ||||
Tax Fees(2) | $ | 0 | $ | 0 | ||||
All Other Fees(3) | $ | 0 | $ | 0 | ||||
|
|
|
| |||||
Total | $ | 59,700 | $ | 79,600 | ||||
|
|
|
| |||||
Eaton Vance Massachusetts Municipal Income Fund
Fiscal Years Ended | 9/30/23 | 9/30/24 | ||||||
Audit Fees | $ | 54,200 | $ | 58,400 | ||||
Audit-Related Fees(1) | $ | 0 | $ | 0 | ||||
Tax Fees(2) | $ | 0 | $ | 0 | ||||
All Other Fees(3) | $ | 0 | $ | 0 | ||||
|
|
|
| |||||
Total | $ | 54,200 | $ | 58,400 | ||||
|
|
|
| |||||
Eaton Vance National Municipal Income Fund
Fiscal Years Ended | 9/30/23 | 9/30/24 | ||||||
Audit Fees | $ | 100,600 | $ | 91,000 | ||||
Audit-Related Fees(1) | $ | 0 | $ | 0 | ||||
Tax Fees(2) | $ | 0 | $ | 0 | ||||
All Other Fees(3) | $ | 0 | $ | 0 | ||||
|
|
|
| |||||
Total | $ | 100,600 | $ | 91,000 | ||||
|
|
|
| |||||
Eaton Vance New York Municipal Income Fund
Fiscal Years Ended | 9/30/23 | 9/30/24 | ||||||
Audit Fees | $ | 54,200 | $ | 58,400 | ||||
Audit-Related Fees(1) | $ | 0 | $ | 0 | ||||
Tax Fees(2) | $ | 0 | $ | 0 | ||||
All Other Fees(3) | $ | 0 | $ | 0 | ||||
|
|
|
| |||||
Total | $ | 54,200 | $ | 58,400 | ||||
|
|
|
| |||||
Eaton Vance Ohio Municipal Income Fund
Fiscal Years Ended | 9/30/23 | 9/30/24 | ||||||
Audit Fees | $ | 46,700 | $ | 58,400 | ||||
Audit-Related Fees(1) | $ | 0 | $ | 0 | ||||
Tax Fees(2) | $ | 0 | $ | 0 | ||||
All Other Fees(3) | $ | 0 | $ | 0 | ||||
|
|
|
| |||||
Total | $ | 46,700 | $ | 58,400 | ||||
|
|
|
| |||||
| (1) | Audit-related fees consist of the aggregate fees billed for assurance and related services that are reasonably related to the performance of the audit of the registrant’s financial statements and are not reported under the category of audit fees. |
| (2) | Tax fees consist of the aggregate fees billed for professional services rendered by the principal accountant relating to tax compliance, tax advice, and tax planning and specifically include fees for tax return preparation and other related tax compliance/planning matters. |
| (3) | All other fees consist of the aggregate fees billed for products and services provided by the principal accountant other than audit, audit-related, and tax services. |
The Series comprising the Trust have varying fiscal year ends (July 31, August 31, and September 30). The following table presents the aggregate audit, audit-related, tax, and other fees billed to all of the Series in the Trust by D&T for the last two fiscal years of each Series.
Fiscal Years Ended | ||||||||||||||||||||||||
| 7/31/23 | 8/31/23 | 9/30/23 | 7/31/24 | 8/31/24 | 9/30/24 | |||||||||||||||||||
Audit Fees | $ | 284,000 | $ | 290,100 | $ | 323,400 | $ | 309,400 | $ | 311,800 | $ | 345,800 | ||||||||||||
Audit-Related Fees(1) | $ | 0 | $ | 0 | $ | 0 | $ | 0 | $ | 0 | $ | 0 | ||||||||||||
Tax Fees(2) | $ | 0 | $ | 0 | $ | 0 | $ | 0 | $ | 0 | $ | 0 | ||||||||||||
All Other Fees(3) | $ | 0 | $ | 0 | $ | 0 | $ | 0 | $ | 0 | $ | 0 | ||||||||||||
|
|
|
|
|
|
|
|
|
|
|
| |||||||||||||
Total | $ | 284,000 | $ | 290,100 | $ | 323,400 | $ | 309,400 | $ | 311,800 | $ | 345,800 | ||||||||||||
|
|
|
|
|
|
|
|
|
|
|
| |||||||||||||
| (1) | Audit-related fees consist of the aggregate fees billed for assurance and related services that are reasonably related to the performance of the audit of the registrant’s financial statements and are not reported under the category of audit fees. |
| (2) | Tax fees consist of the aggregate fees billed for professional services rendered by the principal accountant relating to tax compliance, tax advice, and tax planning and specifically include fees for tax return preparation and other related tax compliance/planning matters. |
| (3) | All other fees consist of the aggregate fees billed for products and services provided by the principal accountant other than audit, audit-related, and tax services. |
(e)(1) The registrant’s audit committee has adopted policies and procedures relating to the pre-approval of services provided by the registrant’s principal accountant (the “Pre-Approval Policies”). The Pre-Approval Policies establish a framework intended to assist the audit committee in the proper discharge of its pre-approval responsibilities. As a general matter, the Pre-Approval Policies (i) specify certain types of audit, audit-related, tax, and other services determined to be pre-approved by the audit committee; and (ii) delineate specific procedures governing the mechanics of the pre-approval process, including the approval and monitoring of audit and non-audit service fees. Unless a service is specifically pre-approved under the Pre-Approval Policies, it must be separately pre-approved by the audit committee.
The Pre-Approval Policies and the types of audit and non-audit services pre-approved therein must be reviewed and ratified by the registrant’s audit committee at least annually. The registrant’s audit committee maintains full responsibility for the appointment, compensation, and oversight of the work of the registrant’s principal accountant.
(e)(2) No services described in paragraphs (b)-(d) above were approved by the registrant’s audit committee pursuant to the “de minimis exception” set forth in Rule 2-01(c)(7)(i)(C) of Regulation S-X.
(f) Not applicable.
(g) The following table presents (i) the aggregate non-audit fees (i.e., fees for audit-related, tax, and other services) billed for services rendered to all of the Series in the Trust by D&T for the last two fiscal years of each Series; and (ii) the aggregate non-audit fees (i.e., fees for audit-related, tax, and other services) billed for services rendered to the Eaton Vance organization by D&T for the last 2 fiscal years of each Series.
Fiscal Years Ended | ||||||||||||||||||||||||
| 7/31/23 | 8/31/23 | 9/30/23 | 7/31/24 | 8/31/24 | 9/30/24 | |||||||||||||||||||
Registrant(1) | $ | 0 | $ | 0 | $ | 0 | $ | 0 | $ | 0 | $ | 0 | ||||||||||||
Eaton Vance(2) | $ | 52,836 | $ | 52,836 | $ | 52,836 | $ | 18,490 | $ | 18,490 | $ | 18,490 | ||||||||||||
| (1) | Includes all of the Series of the Trust. |
| (2) | The investment adviser to the Series, as well as any of its affiliates that provide ongoing services to the Series, are subsidiaries of Morgan Stanley. |
(h) The registrant’s audit committee has considered whether the provision by the registrant’s principal accountant of non-audit services to the registrant’s investment adviser and any entity controlling, controlled by, or under common control with the adviser that provides ongoing services to the registrant that were not pre-approved pursuant to Rule 2-01(c)(7)(ii) of Regulation S-X is compatible with maintaining the principal accountant’s independence.
(i) Not applicable.
(j) Not applicable.
Item 5. Audit Committee of Listed Registrants
Not applicable.
Item 6. Schedule of Investments
(a) Please see schedule of investments contained in the Financial Statements and Financial Highlights included under Item 7 of this Form N-CSR.
(b) Not applicable.
Item 7. Financial Statements and Financial Highlights for Open-End Management Investment Companies
Additional Information

| Corporate Bonds — 0.2% |
| Security | Principal Amount (000's omitted) | Value | |
| Other Revenue — 0.2% | |||
| Morongo Band of Mission Indians, 7.00%, 10/1/39(1) | $ | 2,080 | $ 2,295,509 |
| Total Corporate Bonds (identified cost $2,080,000) | $ 2,295,509 | ||
| Tax-Exempt Mortgage-Backed Securities — 0.6% |
| Security | Principal Amount (000's omitted) | Value | |
| Housing — 0.6% | |||
| California Housing Finance Agency, Municipal Certificates, Series 2021-1, Class A, 3.50%, 11/20/35 | $ | 6,036 | $ 5,909,517 |
| Total Tax-Exempt Mortgage-Backed Securities (identified cost $5,927,302) | $ 5,909,517 | ||
| Tax-Exempt Municipal Obligations — 88.9% |
| Security | Principal Amount (000's omitted) | Value | |
| Education — 7.0% | |||
| California Enterprise Development Authority, (Castilleja School Foundation): | |||
| 5.00%, 6/1/35(2) | $ | 425 | $ 502,503 |
| 5.00%, 6/1/36(2) | 435 | 513,013 | |
| 5.00%, 6/1/37(2) | 520 | 609,955 | |
| 5.00%, 6/1/38(2) | 600 | 700,722 | |
| 5.00%, 6/1/40(2) | 400 | 462,060 | |
| 5.00%, 6/1/41(2) | 600 | 687,108 | |
| 5.00%, 6/1/42(2) | 1,000 | 1,138,030 | |
| 5.00%, 6/1/43(2) | 1,075 | 1,216,234 | |
| 5.00%, 6/1/44(2) | 1,000 | 1,126,020 | |
| 5.00%, 6/1/49(2) | 1,500 | 1,668,105 | |
| California Enterprise Development Authority, (Curtis School Foundation): | |||
| 4.00%, 6/1/49 | 1,000 | 1,002,520 | |
| 4.00%, 6/1/53 | 2,000 | 1,994,540 | |
| 5.00%, 6/1/41 | 500 | 566,515 | |
| California Infrastructure and Economic Development Bank, (The Colburn School), Social Bonds, 4.05%, (SIFMA + 0.90%), 6/1/27 (Put Date), 8/1/72(3) | 5,000 | 5,007,200 | |
| Security | Principal Amount (000's omitted) | Value | |
| Education (continued) | |||
| California Municipal Finance Authority (St. Ignatius College Preparatory): | |||
| 5.00%, 9/1/37 | $ | 1,000 | $ 1,178,600 |
| 5.00%, 9/1/38 | 1,500 | 1,759,140 | |
| 5.00%, 9/1/39 | 1,000 | 1,160,720 | |
| 5.00%, 9/1/40 | 750 | 863,085 | |
| 5.00%, 9/1/41 | 750 | 856,395 | |
| 5.00%, 9/1/42 | 1,250 | 1,417,512 | |
| 5.00%, 9/1/43 | 1,000 | 1,129,120 | |
| 5.00%, 9/1/44 | 500 | 562,565 | |
| 5.00%, 9/1/49 | 3,150 | 3,495,586 | |
| 5.00%, 9/1/54 | 4,000 | 4,399,080 | |
| California School Finance Authority, (Granada Hills Charter Obligated Group): | |||
| 5.00%, 7/1/54(1) | 1,050 | 1,101,156 | |
| 5.00%, 7/1/64(1) | 3,000 | 3,122,850 | |
| California School Finance Authority, (Green Dot Public Schools): | |||
| 5.00%, 8/1/28(1) | 570 | 604,360 | |
| 5.00%, 8/1/38(1) | 2,500 | 2,590,675 | |
| University of California, 4.00%, 5/15/40 | 11,875 | 11,887,825 | |
| University of California Medical Center, 5.00%, 5/15/47 | 11,240 | 12,435,936 | |
| $ 65,759,130 | |||
| Electric Utilities — 3.4% | |||
| Los Angeles Department of Water and Power, CA, Power System Revenue: | |||
| 5.00%, 7/1/42 | $ | 6,525 | $ 6,772,428 |
| 5.00%, 7/1/49 | 9,185 | 9,724,251 | |
| 5.00%, 7/1/52 | 3,340 | 3,676,872 | |
| Southern California Public Power Authority, CA, (Southern Transmission System), 5.25%, 7/1/53 | 9,055 | 10,296,441 | |
| Vernon, CA, Electric System Revenue, 5.00%, 8/1/35 | 1,420 | 1,582,491 | |
| $ 32,052,483 | |||
| General Obligations — 32.7% | |||
| ABC Unified School District, CA, (Election of 2018): | |||
| 4.00%, 8/1/44 | $ | 1,605 | $ 1,656,119 |
| 4.00%, 8/1/46 | 5,820 | 5,931,104 | |
| 4.00%, 8/1/47 | 5,780 | 5,863,752 | |
| Beverly Hills Unified School District, CA, (Election of 2008): | |||
| 0.00%, 8/1/30 | 7,750 | 6,632,140 | |
| 0.00%, 8/1/32 | 6,465 | 5,169,479 | |
| Beverly Hills Unified School District, CA, (Election of 2018), 3.25%, 8/1/42 | 9,960 | 9,705,920 | |
| Security | Principal Amount (000's omitted) | Value | |
| General Obligations (continued) | |||
| California: | |||
| 4.00%, 3/1/37 | $ | 11,500 | $ 12,044,640 |
| 4.55%, 12/1/37 | 1,000 | 1,090,460 | |
| 5.00%, 8/1/39 | 7,000 | 8,214,010 | |
| 5.00%, 11/1/42 | 10,000 | 11,328,700 | |
| Chico Unified School District, CA, 4.00%, 8/1/37 | 2,200 | 2,205,170 | |
| Clovis Unified School District, CA, (Election of 2020), 5.25%, 8/1/39 | 1,860 | 2,092,705 | |
| Culver City Unified School District, CA, (Election of 2024): | |||
| 4.00%, 8/1/44 | 6,640 | 6,639,734 | |
| 4.00%, 8/1/45 | 2,830 | 2,895,345 | |
| 4.00%, 8/1/46 | 3,185 | 3,232,679 | |
| Fairfield-Suisun Unified School District, CA, 0.00%, 2/1/29 | 590 | 530,499 | |
| Folsom Cordova Unified School District School Facilities Improvement District No. 5, CA, (Election of 2014), 4.00%, 10/1/40 | 4,355 | 4,362,055 | |
| Gilroy Unified School District, CA, (Election of 2016), 4.00%, 8/1/41 | 2,000 | 2,006,380 | |
| Hacienda La Puente Unified School District, CA, (Election of 2016): | |||
| 4.00%, 8/1/41 | 1,800 | 1,864,872 | |
| 4.00%, 8/1/42 | 2,000 | 2,059,940 | |
| 4.00%, 8/1/43 | 1,695 | 1,734,934 | |
| Jefferson Union High School District, CA, (Election of 2020), 4.125%, 8/1/46 | 2,000 | 2,044,460 | |
| Kern Community College District, CA, (Election of 2016): | |||
| 5.25%, 8/1/37 | 1,500 | 1,782,555 | |
| 5.25%, 8/1/41 | 1,000 | 1,165,190 | |
| La Canada Unified School District, CA, (Election of 2017): | |||
| 5.25%, 8/1/41 | 1,190 | 1,395,370 | |
| 5.50%, 8/1/43 | 1,780 | 2,101,628 | |
| 5.75%, 8/1/50 | 4,000 | 4,752,800 | |
| Long Beach Unified School District, CA, (Election of 2016), 4.00%, 8/1/39 | 2,095 | 2,113,813 | |
| Los Angeles Unified School District, CA: | |||
| Sustainability Bonds, 5.00%, 7/1/39 | 4,000 | 4,668,480 | |
| Sustainability Bonds, 5.00%, 7/1/40(2) | 3,170 | 3,730,297 | |
| Sustainability Bonds, 5.00%, 7/1/41(2) | 3,000 | 3,504,960 | |
| Los Angeles Unified School District, CA, (Election of 2008), 4.00%, 7/1/40 | 18,000 | 18,021,780 | |
| Mill Valley School District, CA, (Election of 2022): | |||
| 4.00%, 8/1/42(2) | 625 | 648,731 | |
| 4.00%, 8/1/43(2) | 600 | 620,568 | |
| 4.00%, 8/1/44(2) | 1,000 | 1,027,540 | |
| 4.00%, 8/1/45(2) | 1,355 | 1,385,637 | |
| Security | Principal Amount (000's omitted) | Value | |
| General Obligations (continued) | |||
| Mill Valley School District, CA, (Election of 2022): (continued) | |||
| 5.00%, 8/1/38(2) | $ | 250 | $ 291,750 |
| 5.00%, 8/1/39(2) | 500 | 579,600 | |
| 5.00%, 8/1/40(2) | 750 | 863,873 | |
| 5.00%, 8/1/41(2) | 500 | 572,110 | |
| Milpitas Unified School District, CA, (Election of 2018): | |||
| 4.00%, 8/1/39 | 3,780 | 4,074,613 | |
| 4.00%, 8/1/40 | 4,075 | 4,341,912 | |
| 4.00%, 8/1/42 | 2,360 | 2,479,605 | |
| Monterey Peninsula Unified School District, CA, 4.00%, 8/1/45 | 11,000 | 11,001,100 | |
| Morgan Hill Unified School District, CA, (Election of 2012): | |||
| 5.25%, 8/1/40 | 3,860 | 4,485,243 | |
| 5.25%, 8/1/41 | 2,440 | 2,820,860 | |
| 5.25%, 8/1/42 | 2,000 | 2,309,620 | |
| Mount San Antonio Community College District, CA, (Election of 2018): | |||
| 4.00%, 8/1/44 | 2,980 | 3,084,926 | |
| 5.00%, 8/1/42 | 2,890 | 3,339,857 | |
| Mountain View Whisman School District, CA, (Election of 2020): | |||
| 4.00%, 9/1/38 | 1,000 | 1,051,450 | |
| 4.00%, 9/1/39 | 2,200 | 2,304,302 | |
| 4.00%, 9/1/40 | 1,300 | 1,354,665 | |
| 4.00%, 9/1/41 | 1,100 | 1,141,536 | |
| 4.00%, 9/1/42 | 1,250 | 1,291,188 | |
| Pajaro Valley Unified School District, CA, 4.00%, 8/1/45 | 10,000 | 10,128,200 | |
| Palo Alto Unified School District, CA, (Election of 2008), 0.00%, 8/1/33 | 15,995 | 12,499,293 | |
| Palo Alto Unified School District, CA, (Election of 2018), 3.25%, 8/1/42 | 5,255 | 5,112,957 | |
| Puerto Rico: | |||
| 0.00%, 7/1/33 | 638 | 433,615 | |
| 5.625%, 7/1/29 | 3,045 | 3,290,001 | |
| San Bernardino Community College District, CA, (Election of 2018), 4.125%, 8/1/49 | 5,835 | 5,900,352 | |
| San Carlos School District, CA: | |||
| 4.00%, 10/1/43(2) | 3,000 | 3,074,280 | |
| 4.00%, 10/1/44(2) | 3,120 | 3,177,782 | |
| 4.00%, 10/1/45(2) | 1,550 | 1,572,056 | |
| 5.00%, 10/1/39(2) | 275 | 328,369 | |
| 5.00%, 10/1/40(2) | 250 | 295,455 | |
| 5.00%, 10/1/41(2) | 400 | 467,516 | |
| 5.00%, 10/1/42(2) | 500 | 580,335 | |
| Security | Principal Amount (000's omitted) | Value | |
| General Obligations (continued) | |||
| San Carlos School District, CA, (Election of 2012), 4.00%, 10/1/45 | $ | 13,000 | $ 12,999,350 |
| San Carlos School District, CA, (Election of 2024): | |||
| 5.00%, 10/1/41(2) | 250 | 292,198 | |
| 5.00%, 10/1/42(2) | 320 | 371,414 | |
| 5.00%, 10/1/43(2) | 400 | 461,504 | |
| 5.00%, 10/1/44(2) | 500 | 573,440 | |
| San Diego Unified School District, CA, (Election of 2018), Green Bonds, 5.00%, 7/1/39 | 715 | 855,498 | |
| San Diego Unified School District, CA, (Election of 2022): | |||
| Sustainability Bonds, 5.00%, 7/1/41 | 2,500 | 2,929,125 | |
| Sustainability Bonds, 5.00%, 7/1/42 | 2,900 | 3,374,585 | |
| Sustainability Bonds, 5.00%, 7/1/43 | 2,635 | 3,050,724 | |
| San Jose-Evergreen Community College District, CA, (Election of 2016): | |||
| 4.00%, 9/1/41 | 1,600 | 1,682,912 | |
| 4.00%, 9/1/42 | 2,000 | 2,095,420 | |
| San Rafael City Elementary School District, CA, (Election of 2022): | |||
| 4.00%, 8/1/42 | 1,240 | 1,268,632 | |
| 5.00%, 8/1/44 | 500 | 571,055 | |
| 5.00%, 8/1/49 | 2,500 | 2,816,300 | |
| Santa Clarita Community College District, CA, 5.25%, 8/1/45 | 2,420 | 2,750,693 | |
| Santa Monica-Malibu Unified School District, CA, (Election of 2018), 5.00%, 8/1/40 | 7,420 | 8,403,373 | |
| Torrance Unified School District, CA, (Election of 2008), 4.00%, 8/1/39 | 9,000 | 9,096,840 | |
| Washington Unified School District, CA, (Election of 2020): | |||
| 4.00%, 8/1/41 | 1,965 | 2,083,175 | |
| 4.00%, 8/1/43 | 2,400 | 2,507,640 | |
| 4.00%, 8/1/44 | 2,640 | 2,716,824 | |
| 4.25%, 8/1/50 | 2,170 | 2,218,586 | |
| West Valley-Mission Community College District, CA, (Election of 2012), 4.00%, 8/1/40 | 4,420 | 4,427,470 | |
| $308,019,625 | |||
| Hospital — 5.0% | |||
| California Health Facilities Financing Authority, 5.00% to 10/1/25 (Put Date), 10/1/39 | $ | 1,485 | $ 1,500,444 |
| California Health Facilities Financing Authority, (Adventist Health System), 5.25%, 12/1/43 | 1,825 | 2,038,726 | |
| California Health Facilities Financing Authority, (Cedars-Sinai Health System), 5.00%, 8/15/51 | 4,620 | 5,020,092 | |
| California Health Facilities Financing Authority, (Cedars-Sinai Medical Center), 4.00%, 8/15/36 | 8,920 | 9,034,533 | |
| Security | Principal Amount (000's omitted) | Value | |
| Hospital (continued) | |||
| California Health Facilities Financing Authority, (City of Hope): | |||
| 5.00%, 11/15/32 | $ | 735 | $ 735,456 |
| 5.00%, 11/15/35 | 1,050 | 1,050,619 | |
| California Health Facilities Financing Authority, (Providence Health & Services), 5.00%, 10/1/44 | 3,010 | 3,010,030 | |
| California Health Facilities Financing Authority, (Sutter Health), 5.00%, 11/15/46 | 3,000 | 3,076,170 | |
| California Infrastructure and Economic Development Bank, (Adventist Health Energy), 5.00%, 7/1/43 | 1,320 | 1,424,161 | |
| California Municipal Finance Authority, (NorthBay Healthcare Group): | |||
| 5.00%, 11/1/24 | 800 | 800,456 | |
| 5.00%, 11/1/26 | 500 | 509,790 | |
| Series 2017A, 5.00%, 11/1/25 | 800 | 808,976 | |
| California Public Finance Authority, (Henry Mayo Newhall Hospital), 5.00%, 10/15/33 | 425 | 434,762 | |
| California Statewide Communities Development Authority, (John Muir Health): | |||
| 5.00%, 12/1/41 | 2,500 | 2,862,225 | |
| 5.25%, 12/1/54 | 7,000 | 7,846,720 | |
| California Statewide Communities Development Authority, (Methodist Hospital of Southern California), 5.00%, 1/1/38 | 2,000 | 2,121,920 | |
| University of California Medical Center, 5.00%, 5/15/41 | 5,000 | 5,143,600 | |
| $ 47,418,680 | |||
| Housing — 2.5% | |||
| California Housing Finance Agency, Sustainability Bonds, 3.60% to 8/1/26 (Put Date), 8/1/63 | $ | 1,500 | $ 1,512,240 |
| California Housing Finance Agency, (Shoreview Apartments), (FHLMC), 4.10%, 7/1/40 | 5,000 | 5,117,750 | |
| California Municipal Finance Authority (Caritas Corp.): | |||
| Social Bonds, 5.00%, 8/15/49 | 1,000 | 1,083,420 | |
| Social Bonds, 5.00%, 8/15/54 | 1,000 | 1,075,480 | |
| California Municipal Finance Authority, (Gibson Drive Apartments), (FNMA), 4.45%, 12/1/42 | 2,385 | 2,453,950 | |
| California Statewide Communities Development Authority, (FNMA), 4.00%, 10/1/42 | 3,650 | 3,677,047 | |
| CSCDA Community Improvement Authority, CA, (City of Orange Portfolio), Essential Housing Revenue, Social Bonds, 3.00%, 3/1/57(1) | 5,000 | 3,733,950 | |
| CSCDA Community Improvement Authority, CA, (Pasadena Portfolio), Essential Housing Revenue, Social Bonds, 3.00%, 12/1/56(1) | 2,525 | 1,826,484 | |
| Security | Principal Amount (000's omitted) | Value | |
| Housing (continued) | |||
| Independent Cities Finance Authority, CA, (Castle Mobile Estates), 3.00%, 5/15/36 | $ | 1,205 | $ 1,135,496 |
| Independent Cities Finance Authority, CA, (Vista de Santa Barbara Mobilehome Park), 3.00%, 9/15/36 | 1,625 | 1,514,971 | |
| $ 23,130,788 | |||
| Industrial Development Revenue — 1.9% | |||
| California Municipal Finance Authority, (Republic Services, Inc.), (AMT), 4.375% to 9/1/33 (Put Date), 9/1/53 | $ | 2,000 | $ 2,112,900 |
| California Municipal Finance Authority, (Waste Management, Inc.): | |||
| (AMT), 4.125% to 10/1/25 (Put Date), 10/1/41 | 4,500 | 4,526,055 | |
| (AMT), 4.25% to 12/2/24 (Put Date), 12/1/44 | 11,000 | 11,010,450 | |
| $ 17,649,405 | |||
| Insured - Electric Utilities — 0.2% | |||
| Puerto Rico Electric Power Authority, (NPFG), 5.25%, 7/1/32 | $ | 2,100 | $ 2,088,408 |
| $ 2,088,408 | |||
| Insured - General Obligations — 2.5% | |||
| El Rancho Unified School District, CA, (Election of 2016), (BAM), 5.75%, 8/1/48 | $ | 1,500 | $ 1,793,670 |
| Folsom Cordova Unified School District, CA, (AGM), 4.00%, 10/1/39 | 2,900 | 2,928,623 | |
| Holtville Unified School District, CA, (Election of 2018), (AGM), 6.00%, 8/1/52 | 1,000 | 1,162,360 | |
| Lemoore Union Elementary School District, CA, (Election of 2018), (AGM), 5.50%, 8/1/53 | 1,000 | 1,107,150 | |
| Long Beach Unified School District, CA, (Election of 1999), (AGC), 0.00%, 8/1/27 | 3,265 | 3,034,132 | |
| McFarland Unified School District, CA, (Election of 2020), (BAM), 5.25%, 11/1/49 | 2,500 | 2,686,650 | |
| Palo Verde Unified School District, CA, (Election of 2018), (AGM), 5.50%, 8/1/50 | 1,200 | 1,328,736 | |
| Riverbank Unified School District, CA, (Election of 2018), (AGM), 5.50%, 8/1/52 | 1,000 | 1,140,360 | |
| Simi Valley Unified School District, CA, (Election of 2004), (AGM), 0.00%, 8/1/28 | 5,000 | 4,526,350 | |
| Ukiah Unified School District, CA, (Election of 2020), (AGM), 5.50%, 8/1/49 | 2,350 | 2,692,747 | |
| Washington Township Health Care District, CA, (Election of 2020), (AGM), 4.125%, 8/1/42 | 1,000 | 1,039,970 | |
| $ 23,440,748 | |||
| Security | Principal Amount (000's omitted) | Value | |
| Insured - Hospital — 0.6% | |||
| California Health Facilities Financing Authority, (Adventist Health System), (AGM), 4.00%, 3/1/39 | $ | 5,530 | $ 5,571,199 |
| $ 5,571,199 | |||
| Insured - Special Tax Revenue — 0.5% | |||
| Lompoc Redevelopment Agency Successor Agency, CA, (BAM), 5.00%, 9/1/38 | $ | 500 | $ 582,175 |
| RNR School Financing Authority Community Facilities District No. 92-1, CA: | |||
| (BAM), 4.00%, 9/1/40 | 1,000 | 1,045,200 | |
| (BAM), 4.00%, 9/1/42 | 1,000 | 1,026,650 | |
| San Francisco City and County Redevelopment Agency, CA, (Transbay Infrastructure Project), (AGM), 5.00%, 8/1/48 | 2,000 | 2,237,400 | |
| $ 4,891,425 | |||
| Insured - Transportation — 0.1% | |||
| Long Beach, CA, (Long Beach Airport), (AGM), (AMT), 5.25%, 6/1/47 | $ | 1,000 | $ 1,090,080 |
| $ 1,090,080 | |||
| Insured - Water and Sewer — 0.5% | |||
| Mountain House Financing Authority, CA, Utility Systems Revenue, Green Bonds, (BAM), 4.125%, 12/1/48 | $ | 3,545 | $ 3,561,520 |
| St. Helena Financing Authority, CA, (BAM), 4.00%, 10/1/54 | 1,250 | 1,242,737 | |
| $ 4,804,257 | |||
| Lease Revenue/Certificates of Participation — 1.0% | |||
| California State Public Works Board, 4.50%, 9/1/35 | $ | 9,800 | $ 9,807,154 |
| $ 9,807,154 | |||
| Other Revenue — 3.5% | |||
| California Community Choice Financing Authority, Clean Energy Project Revenue: | |||
| Green Bonds, 5.00% to 8/1/29 (Put Date), 12/1/53 | $ | 8,030 | $ 8,596,837 |
| Green Bonds, 5.00% to 12/1/32 (Put Date), 1/1/55 | 7,000 | 7,690,130 | |
| Green Bonds, 5.25% to 4/1/30 (Put Date), 11/1/54 | 10,020 | 10,912,682 | |
| Green Bonds, 5.50% to 11/1/30 (Put Date), 10/1/54 | 4,355 | 4,874,987 | |
| Morongo Band of Mission Indians, CA, 5.00%, 10/1/42(1) | 440 | 452,672 | |
| $ 32,527,308 | |||
| Senior Living/Life Care — 1.1% | |||
| California Health Facilities Financing Authority, (Episcopal Communities and Services): | |||
| 3.85%, 11/15/27 | $ | 1,500 | $ 1,511,025 |
| Security | Principal Amount (000's omitted) | Value | |
| Senior Living/Life Care (continued) | |||
| California Health Facilities Financing Authority, (Episcopal Communities and Services): (continued) | |||
| 5.25%, 11/15/48 | $ | 1,645 | $ 1,774,132 |
| California Municipal Finance Authority, (HumanGood - California Obligated Group), 4.00%, 10/1/38 | 3,790 | 3,773,324 | |
| California Public Finance Authority, (Enso Village): | |||
| Green Bonds, 3.125%, 5/15/29(1) | 2,510 | 2,480,633 | |
| Green Bonds, 5.00%, 11/15/46(1) | 1,000 | 985,460 | |
| $ 10,524,574 | |||
| Special Tax Revenue — 0.4% | |||
| Irvine Community Facilities District No. 2013-3, CA, (Great Park): | |||
| 5.00%, 9/1/35 | $ | 1,150 | $ 1,200,071 |
| 5.00%, 9/1/38 | 1,000 | 1,041,560 | |
| Series 2018, 5.00%, 9/1/32 | 625 | 653,031 | |
| Series 2018, 5.00%, 9/1/34 | 765 | 798,675 | |
| San Luis Obispo Community Facilities District No. 2019-1, CA, (San Luis Ranch): | |||
| 4.00%, 9/1/29 | 185 | 191,951 | |
| 4.00%, 9/1/33 | 125 | 128,859 | |
| $ 4,014,147 | |||
| Transportation — 18.4% | |||
| Bay Area Toll Authority, CA, (San Francisco Bay Area): | |||
| 3.45%, (SIFMA + 0.30%), 4/1/56(3) | $ | 5,000 | $ 4,934,450 |
| 3.60%, (SIFMA + 0.45%), 4/1/56(3) | 800 | 797,760 | |
| Burbank-Glendale-Pasadena Airport Authority, CA, (AMT), 5.25%, 7/1/49 | 2,500 | 2,745,900 | |
| California Infrastructure and Economic Development Bank, (Brightline West Passenger Rail), (AMT), 8.00% to 8/15/25 (Put Date), 1/1/50(1) | 4,170 | 4,294,766 | |
| California Municipal Finance Authority, (LINXS Automated People Mover): | |||
| (AMT), 5.00%, 12/31/37 | 2,570 | 2,664,319 | |
| (AMT), 5.00%, 12/31/43 | 4,220 | 4,325,205 | |
| (AMT), 5.00%, 12/31/47 | 2,200 | 2,242,746 | |
| Los Angeles Department of Airports, CA, (Los Angeles International Airport): | |||
| (AMT), 5.00%, 5/15/38 | 3,215 | 3,330,965 | |
| (AMT), 5.00%, 5/15/41 | 10,635 | 10,692,004 | |
| (AMT), 5.00%, 5/15/44 | 3,700 | 3,844,152 | |
| (AMT), 5.00%, 5/15/45 | 4,670 | 4,689,427 | |
| (AMT), 5.00%, 5/15/48 | 2,520 | 2,608,654 | |
| (AMT), 5.00%, 5/15/49 | 8,900 | 9,163,173 | |
| (AMT), 5.25%, 5/15/48 | 9,395 | 9,782,262 | |
| (AMT), 5.50%, 5/15/47 | 10,000 | 10,999,500 | |
| Security | Principal Amount (000's omitted) | Value | |
| Transportation (continued) | |||
| Los Angeles Harbor Department, CA, (AMT), 5.00%, 8/1/44 | $ | 17,905 | $ 17,969,816 |
| Port of Los Angeles, CA: | |||
| 5.00%, 8/1/36 | 500 | 600,770 | |
| 5.00%, 8/1/38 | 1,000 | 1,188,980 | |
| 5.00%, 8/1/39 | 1,850 | 2,181,224 | |
| 5.00%, 8/1/40 | 1,500 | 1,754,865 | |
| 5.00%, 8/1/41 | 2,000 | 2,318,080 | |
| 5.00%, 8/1/41 | 1,045 | 1,211,197 | |
| 5.00%, 8/1/42 | 740 | 853,834 | |
| 5.00%, 8/1/42 | 1,100 | 1,269,213 | |
| 5.00%, 8/1/43 | 1,810 | 2,076,179 | |
| Green Bonds, 5.00%, 8/1/44 | 1,000 | 1,143,020 | |
| Sacramento County, CA, Airport System Revenue: | |||
| 5.00%, 7/1/39(2) | 2,125 | 2,482,191 | |
| 5.00%, 7/1/41(2) | 2,250 | 2,584,080 | |
| 5.00%, 7/1/42(2) | 3,070 | 3,510,146 | |
| 5.00%, 7/1/54(2) | 2,000 | 2,204,860 | |
| San Diego County Regional Airport Authority, CA, (San Diego International Airport): | |||
| 5.00%, 7/1/47 | 5,770 | 5,977,893 | |
| (AMT), 5.00%, 7/1/39 | 3,000 | 3,309,300 | |
| (AMT), 5.00%, 7/1/42 | 6,850 | 7,447,799 | |
| (AMT), 5.00%, 7/1/43 | 7,240 | 7,841,354 | |
| San Francisco City and County Airport Commission, CA, (San Francisco International Airport): | |||
| (AMT), 5.00%, 5/1/41 | 4,450 | 4,516,794 | |
| (AMT), 5.00%, 5/1/43 | 5,015 | 5,160,285 | |
| (AMT), 5.00%, 5/1/46 | 2,985 | 3,022,701 | |
| (AMT), 5.00%, 5/1/49 | 5,000 | 5,177,700 | |
| (AMT), 5.75%, 5/1/48 | 9,500 | 10,760,555 | |
| $173,678,119 | |||
| Water and Sewer — 7.6% | |||
| Los Angeles Department of Water and Power, CA, Water System Revenue: | |||
| 5.00%, 7/1/41 | $ | 12,325 | $ 13,610,621 |
| 5.00%, 7/1/47 | 5,920 | 6,420,418 | |
| Los Angeles, CA, Wastewater System Revenue, Green Bonds, 5.00%, 6/1/48 | 7,875 | 8,312,141 | |
| Metropolitan Water District of Southern California: | |||
| 5.00%, 4/1/44 | 35 | 40,387 | |
| 5.00%, 4/1/45 | 905 | 1,039,374 | |
| 5.00%, 4/1/46 | 2,880 | 3,292,934 | |
| Rancho California Water District Financing Authority, 4.00%, 8/1/37 | 2,750 | 2,920,280 | |
| Security | Principal Amount (000's omitted) | Value | |
| Water and Sewer (continued) | |||
| San Diego Public Facilities Financing Authority, CA, 5.00%, 5/15/46 | $ | 9,000 | $ 10,272,240 |
| San Francisco City and County Public Utilities Commission, CA, Water Revenue, 4.00%, 11/1/39 | 15,010 | 15,161,301 | |
| San Mateo-Foster City Public Financing Authority, CA, (Clean Water Program), 5.00%, 8/1/49 | 5,555 | 5,954,016 | |
| Santa Clara Valley Water District, CA, 5.00%, 6/1/42 | 3,625 | 4,217,216 | |
| $ 71,240,928 | |||
| Total Tax-Exempt Municipal Obligations (identified cost $811,642,896) | $837,708,458 | ||
| Taxable Municipal Obligations — 12.7% |
| Security | Principal Amount (000's omitted) | Value | |
| Education — 1.2% | |||
| California Municipal Finance Authority, (Albert Einstein Academies), 3.75%, 8/1/31(1) | $ | 2,415 | $ 2,150,702 |
| University of California: | |||
| 3.063%, 7/1/25 | 3,825 | 3,793,865 | |
| 4.85%, 7/1/41(4) | 5,100 | 5,100,000 | |
| $ 11,044,567 | |||
| General Obligations — 2.7% | |||
| California: | |||
| 2.40%, 10/1/25 | $ | 4,640 | $ 4,556,805 |
| 7.50%, 4/1/34(5) | 8,000 | 9,599,600 | |
| Huntington Beach Union High School District, CA, 1.884%, 8/1/29 | 1,775 | 1,619,262 | |
| Los Angeles, CA, 3.00%, 9/1/26 | 2,820 | 2,771,834 | |
| Palmdale School District, CA, 1.67%, 8/1/29 | 500 | 450,430 | |
| Puerto Rico, GO Contingent Value Instrument, 0.00%, 11/1/43 | 788 | 508,204 | |
| San Diego Unified School District, CA, (Election of 2022), Sustainability Bonds, 4.446%, 7/1/25 | 5,000 | 5,001,000 | |
| San Mateo Union High School District, CA, 2.111%, 9/1/34 | 1,220 | 999,070 | |
| $ 25,506,205 | |||
| Hospital — 0.9% | |||
| California Infrastructure and Economic Development Bank, (Adventist Health Energy), 5.929%, 7/1/34 | $ | 2,150 | $ 2,233,162 |
| Security | Principal Amount (000's omitted) | Value | |
| Hospital (continued) | |||
| California Statewide Communities Development Authority, (Loma Linda University Medical Center), 6.00%, 12/1/24 | $ | 6,000 | $ 5,998,200 |
| $ 8,231,362 | |||
| Housing — 0.3% | |||
| Independent Cities Finance Authority, CA, (Sahara Mobile Home Park): | |||
| 3.20%, 6/15/41 | $ | 775 | $ 555,752 |
| 3.20%, 6/15/56 | 3,685 | 2,227,472 | |
| $ 2,783,224 | |||
| Insured - General Obligations — 0.0%(6) | |||
| Mojave Unified School District, CA, (BAM), 2.731%, 8/1/37 | $ | 500 | $ 411,025 |
| $ 411,025 | |||
| Insured - Lease Revenue/Certificates of Participation — 0.8% | |||
| Anaheim, CA, Public Financing Authority, (Public Improvements), (AGM), 1.643%, 7/1/25 | $ | 7,850 | $ 7,685,072 |
| $ 7,685,072 | |||
| Insured - Special Tax Revenue — 0.2% | |||
| Rio Elementary School District Community Facilities District No. 1, CA: | |||
| (BAM), 1.826%, 9/1/28 | $ | 1,000 | $ 911,930 |
| (BAM), 2.307%, 9/1/31 | 1,500 | 1,305,930 | |
| $ 2,217,860 | |||
| Insured - Transportation — 0.8% | |||
| Alameda Corridor Transportation Authority, CA: | |||
| (AGM), (AMBAC), 0.00%, 10/1/26 | $ | 6,700 | $ 6,170,633 |
| (AMBAC), 0.00%, 10/1/27 | 740 | 652,451 | |
| (AMBAC), 0.00%, 10/1/28 | 1,010 | 853,500 | |
| $ 7,676,584 | |||
| Lease Revenue/Certificates of Participation — 0.7% | |||
| California State Public Works Board: | |||
| 4.859%, 4/1/28 | $ | 3,000 | $ 3,070,260 |
| 4.879%, 4/1/29 | 1,500 | 1,543,020 | |
| 4.917%, 4/1/27 | 2,000 | 2,036,560 | |
| $ 6,649,840 | |||
| Security | Principal Amount (000's omitted) | Value | |
| Special Tax Revenue — 1.2% | |||
| Los Angeles County Metropolitan Transportation Authority, CA, Sales Tax Revenue: | |||
| 4.654%, 7/1/28 | $ | 1,640 | $ 1,689,085 |
| 4.726%, 7/1/27 | 2,000 | 2,048,820 | |
| 4.792%, 7/1/26 | 1,250 | 1,268,925 | |
| Riverside Unified School District Financing Authority, CA, 1.463%, 9/1/25 | 800 | 778,960 | |
| San Jose Redevelopment Agency Successor Agency, CA, 3.375%, 8/1/34 | 5,000 | 4,694,950 | |
| Successor Agency to San Diego Redevelopment Agency, CA: | |||
| 3.625%, 9/1/25 | 250 | 248,445 | |
| 3.75%, 9/1/26 | 250 | 248,700 | |
| $ 10,977,885 | |||
| Water and Sewer — 3.9% | |||
| Los Angeles, CA, Wastewater System Revenue, Green Bonds, 3.044%, 6/1/25 | $ | 2,000 | $ 1,983,580 |
| Metropolitan Water District of Southern California: | |||
| (SPA: PNC Bank, N.A.), 4.86%, 7/1/46(4) | 5,500 | 5,500,000 | |
| (SPA: TD Bank, N.A.), 4.85%, 7/1/37(4) | 28,750 | 28,750,000 | |
| $ 36,233,580 | |||
| Total Taxable Municipal Obligations (identified cost $120,255,960) | $119,417,204 | ||
| Trust Units — 0.1% |
| Security | Notional Amount (000's omitted) | Value | |
| Transportation — 0.1% | |||
| HTA TRRB 2005L-745190UR7 Assured Custodial Trust, 5.25%, 7/1/41 | $ | 945 | $ 924,839 |
| Total Trust Units (identified cost $938,606) | $ 924,839 | ||
| Total Investments — 102.5% (identified cost $940,844,764) | $966,255,527 | ||
| Other Assets, Less Liabilities — (2.5)% | $(23,974,352) | ||
| Net Assets — 100.0% | $942,281,175 | ||
| The percentage shown for each investment category in the Portfolio of Investments is based on net assets. | |
| (1) | Security exempt from registration under Rule 144A of the Securities Act of 1933, as amended. These securities may be sold in certain transactions in reliance on an exemption from registration (normally to qualified institutional buyers). At September 30, 2024, the aggregate value of these securities is $25,639,217 or 2.7% of the Fund's net assets. |
| (2) | When-issued security. |
| (3) | Floating rate security. The stated interest rate represents the rate in effect at September 30, 2024. |
| (4) | Variable rate demand obligation that may be tendered at par on any day for payment the lesser of 5 business days or 7 calendar days. The stated interest rate, which generally resets weekly, is determined by the remarketing agent and represents the rate in effect at September 30, 2024. |
| (5) | Build America Bond. Represents taxable municipal obligation issued pursuant to the American Recovery and Reinvestment Act of 2009 or other legislation providing for the issuance of taxable municipal debt on which the issuer receives federal support. |
| (6) | Amount is less than 0.05%. |
| The Fund invests primarily in debt securities issued by California municipalities. The ability of the issuers of the debt securities to meet their obligations may be affected by economic developments in a specific industry or municipality. At September 30, 2024, 6.2% of total investments are backed by bond insurance of various financial institutions and financial guaranty assurance agencies. The aggregate percentage insured by an individual financial institution or financial guaranty assurance agency ranged from 0.2% to 4.0% of total investments. | |
| Abbreviations: | |
| AGC | – Assured Guaranty Corp. |
| AGM | – Assured Guaranty Municipal Corp. |
| AMBAC | – AMBAC Financial Group, Inc. |
| AMT | – Interest earned from these securities may be considered a tax preference item for purposes of the Federal Alternative Minimum Tax. |
| BAM | – Build America Mutual Assurance Co. |
| FHLMC | – Federal Home Loan Mortgage Corp. |
| FNMA | – Federal National Mortgage Association |
| NPFG | – National Public Finance Guarantee Corp. |
| SIFMA | – Securities Industry and Financial Markets Association Municipal Swap Index |
| SPA | – Standby Bond Purchase Agreement |
| Tax-Exempt Municipal Obligations — 98.8% |
| Security | Principal Amount (000's omitted) | Value | |
| Bond Bank — 2.3% | |||
| Massachusetts Water Pollution Abatement Trust, 5.25%, 8/1/34 | $ | 3,105 | $ 3,830,701 |
| $ 3,830,701 | |||
| Education — 23.6% | |||
| Massachusetts Development Finance Agency, (Bentley University), 4.00%, 7/1/40 | $ | 1,300 | $ 1,314,092 |
| Massachusetts Development Finance Agency, (Boston College), 5.00%, 7/1/55 | 1,500 | 1,855,110 | |
| Massachusetts Development Finance Agency, (Boston University): | |||
| 4.00%, 10/1/46 | 2,750 | 2,716,312 | |
| 4.00%, 10/1/46 | 1,500 | 1,501,680 | |
| Massachusetts Development Finance Agency, (Dexter Southfield): | |||
| 5.00%, 5/1/33 | 1,550 | 1,560,989 | |
| 5.00%, 5/1/35 | 1,660 | 1,670,989 | |
| Massachusetts Development Finance Agency, (Middlesex School): | |||
| 4.25%, 7/1/54 | 1,600 | 1,571,152 | |
| 5.00%, 7/1/34 | 2,000 | 2,338,760 | |
| Massachusetts Development Finance Agency, (Northeastern University), 5.00%, 10/1/37 | 1,600 | 1,888,912 | |
| Massachusetts Development Finance Agency, (Phillips Academy): | |||
| 5.00%, 9/1/39 | 575 | 677,086 | |
| 5.00%, 9/1/41 | 1,000 | 1,159,280 | |
| 5.00%, 9/1/43 | 225 | 258,536 | |
| Massachusetts Development Finance Agency, (Springfield College), Green Bonds, 4.00%, 6/1/56 | 4,700 | 3,967,317 | |
| Massachusetts Development Finance Agency, (Suffolk University): | |||
| 5.00%, 7/1/35 | 750 | 781,995 | |
| 5.00%, 7/1/38 | 340 | 351,540 | |
| Massachusetts Development Finance Agency, (Wentworth Institute of Technology), 5.00%, 10/1/36 | 1,575 | 1,604,090 | |
| Massachusetts Development Finance Agency, (Worcester Polytechnic Institute), 4.00%, 9/1/44 | 3,250 | 3,230,630 | |
| Massachusetts Health and Educational Facilities Authority, (Massachusetts Institute of Technology), 5.50%, 7/1/32 | 5,000 | 6,037,400 | |
| University of Massachusetts Building Authority: | |||
| 5.00%, 11/1/46 | 2,000 | 2,243,300 | |
| 5.00%, 11/1/52 | 2,365 | 2,524,425 | |
| $ 39,253,595 | |||
| Security | Principal Amount (000's omitted) | Value | |
| Electric Utilities — 0.6% | |||
| Massachusetts Municipal Wholesale Electric Co., 4.00%, 7/1/51 | $ | 1,000 | $ 990,220 |
| $ 990,220 | |||
| General Obligations — 21.3% | |||
| Andover, MA: | |||
| 4.00%, 12/1/51 | $ | 1,350 | $ 1,356,494 |
| 4.00%, 7/15/52 | 1,805 | 1,810,036 | |
| Ashland, MA, 4.00%, 8/1/41 | 1,905 | 1,950,758 | |
| Boston, MA, 5.00%, 11/1/42 | 1,410 | 1,630,707 | |
| Massachusetts: | |||
| 5.00%, 5/1/48 | 3,000 | 3,299,670 | |
| 5.25%, 10/1/47 | 2,000 | 2,251,360 | |
| Maynard, MA, 4.00%, 4/15/44 | 2,450 | 2,471,928 | |
| Nauset Regional School District, MA, 4.00%, 5/15/48 | 2,500 | 2,490,675 | |
| New Bedford, MA, 4.00%, 9/1/47 | 2,650 | 2,646,184 | |
| Northeast Metropolitan Regional Vocational School District, MA, 4.00%, 4/15/47 | 3,075 | 3,075,031 | |
| Norwood, MA, 4.00%, 9/15/47 | 2,500 | 2,488,975 | |
| Quincy, MA, 5.00%, 7/25/25 | 1,500 | 1,526,940 | |
| Somerset, MA, 4.00%, 4/1/48 | 2,970 | 2,978,702 | |
| Somerville, MA, 4.00%, 6/1/48 | 2,955 | 2,975,389 | |
| Taunton, MA, 4.00%, 3/1/49 | 2,610 | 2,589,903 | |
| $ 35,542,752 | |||
| Hospital — 13.6% | |||
| Massachusetts Development Finance Agency, (Beth Israel Lahey Health, Inc.): | |||
| 5.00%, 7/1/33 | $ | 1,000 | $ 1,030,030 |
| 5.00%, 7/1/34 | 2,500 | 2,916,650 | |
| Massachusetts Development Finance Agency, (Boston Children's Hospital): | |||
| 4.00%, 3/1/54 | 1,070 | 1,047,926 | |
| 5.25%, 3/1/54 | 2,500 | 2,790,175 | |
| Massachusetts Development Finance Agency, (Boston Medical Center): | |||
| Green Bonds, 4.00%, 7/1/47 | 1,875 | 1,809,769 | |
| Green Bonds, 5.00%, 7/1/44 | 2,500 | 2,509,925 | |
| Massachusetts Development Finance Agency, (Lahey Health System Obligated Group), 5.00%, 8/15/40 | 2,000 | 2,023,020 | |
| Massachusetts Development Finance Agency, (Mass General Brigham, Inc.), 5.00%, 7/1/54 | 2,600 | 2,823,600 | |
| Massachusetts Development Finance Agency, (Partners Healthcare System): | |||
| 5.00%, 7/1/35 | 2,000 | 2,061,000 | |
| 5.00%, 7/1/47 | 2,000 | 2,033,920 | |
| Security | Principal Amount (000's omitted) | Value | |
| Hospital (continued) | |||
| Massachusetts Development Finance Agency, (South Shore Hospital), 5.00%, 7/1/41 | $ | 1,295 | $ 1,307,432 |
| Massachusetts Health and Educational Facilities Authority, (Baystate Medical Center), (LOC: TD Bank, N.A.), 3.80%, 7/1/39(1) | 250 | 250,000 | |
| $ 22,603,447 | |||
| Housing — 4.3% | |||
| Massachusetts Development Finance Agency, (Merrimack College Student Housing): | |||
| 4.25%, 7/1/34(2) | $ | 500 | $ 512,525 |
| 5.00%, 7/1/44(2) | 1,000 | 1,051,130 | |
| Massachusetts Housing Finance Agency: | |||
| (FHLMC), (FNMA), (GNMA), Social Bonds, 4.90%, 12/1/48 | 2,000 | 2,064,540 | |
| Sustainability Bonds, 2.65%, 6/1/26 | 1,000 | 993,350 | |
| Sustainability Bonds, 4.00%, 12/1/25 | 2,500 | 2,520,325 | |
| $ 7,141,870 | |||
| Industrial Development Revenue — 0.8% | |||
| National Finance Authority, NH, (Covanta): | |||
| 4.625%, 11/1/42(2) | $ | 670 | $ 648,821 |
| (AMT), 4.875%, 11/1/42(2) | 740 | 735,131 | |
| $ 1,383,952 | |||
| Insured - Education — 3.8% | |||
| Massachusetts Development Finance Agency, (College of the Holy Cross), (AMBAC), 5.25%, 9/1/32(3) | $ | 5,460 | $ 6,398,792 |
| $ 6,398,792 | |||
| Insured - Special Tax Revenue — 3.4% | |||
| Massachusetts, Dedicated Tax Revenue, (NPFG), 5.50%, 1/1/30 | $ | 4,955 | $ 5,646,024 |
| $ 5,646,024 | |||
| Lease Revenue/Certificates of Participation — 0.9% | |||
| National Finance Authority, NH, (Centurion BioSquare, Inc.), 5.88%, 12/15/38 | $ | 1,370 | $ 1,443,185 |
| $ 1,443,185 | |||
| Other Revenue — 1.5% | |||
| Massachusetts Development Finance Agency, (Broad Institute), 4.00%, 4/1/41 | $ | 2,500 | $ 2,503,775 |
| $ 2,503,775 | |||
| Security | Principal Amount (000's omitted) | Value | |
| Senior Living/Life Care — 2.0% | |||
| Massachusetts Development Finance Agency, (Linden Ponds, Inc.): | |||
| 5.00%, 11/15/33(2) | $ | 205 | $ 214,260 |
| 5.00%, 11/15/38(2) | 135 | 140,761 | |
| Massachusetts Development Finance Agency, (Loomis Communities), 4.00%, 1/1/51 | 690 | 645,205 | |
| Massachusetts Development Finance Agency, (NewBridge on the Charles, Inc.), 5.00%, 10/1/57(2) | 2,000 | 2,014,380 | |
| Massachusetts Development Finance Agency, (Salem Community Corp.), 5.00%, 1/1/25 | 365 | 365,135 | |
| $ 3,379,741 | |||
| Special Tax Revenue — 4.5% | |||
| American Samoa Economic Development Authority, 5.00%, 9/1/38(2) | $ | 200 | $ 203,912 |
| Massachusetts Bay Transportation Authority, Sales Tax Revenue: | |||
| 4.00%, 7/1/39 | 2,170 | 2,245,950 | |
| 5.25%, 7/1/31 | 1,240 | 1,449,659 | |
| Massachusetts School Building Authority, 3.375%, 8/15/30 | 1,500 | 1,502,130 | |
| Puerto Rico Sales Tax Financing Corp., 5.00%, 7/1/58 | 2,000 | 2,020,700 | |
| $ 7,422,351 | |||
| Student Loan — 2.0% | |||
| Massachusetts Educational Financing Authority: | |||
| (AMT), 3.625%, 7/1/38 | $ | 1,515 | $ 1,428,781 |
| (AMT), 4.25%, 7/1/32 | 1,800 | 1,826,766 | |
| $ 3,255,547 | |||
| Transportation — 10.9% | |||
| Massachusetts Port Authority: | |||
| (AMT), 4.00%, 7/1/46 | $ | 3,000 | $ 2,875,590 |
| (AMT), 5.00%, 7/1/43 | 2,000 | 2,027,560 | |
| (AMT), 5.00%, 7/1/51 | 4,090 | 4,285,216 | |
| Massachusetts Port Authority, (Bosfuel Project): | |||
| (AMT), 5.00%, 7/1/35 | 1,350 | 1,438,236 | |
| (AMT), 5.00%, 7/1/49 | 2,500 | 2,583,000 | |
| Massachusetts, (Rail Enhancement Program), Sustainability Bonds, 5.00%, 6/1/53 | 4,500 | 4,936,140 | |
| $ 18,145,742 | |||
| Water and Sewer — 3.3% | |||
| Boston Water and Sewer Commission, MA: | |||
| 4.00%, 11/1/27 | $ | 2,000 | $ 2,030,000 |
| 4.00%, 11/1/47 | 2,360 | 2,381,547 | |
| Security | Principal Amount (000's omitted) | Value | |
| Water and Sewer (continued) | |||
| Massachusetts Clean Water Trust, Sustainability Bonds, 5.00%, 2/1/43 | $ | 1,000 | $ 1,132,970 |
| $ 5,544,517 | |||
| Total Tax-Exempt Municipal Obligations (identified cost $159,251,421) | $164,486,211 | ||
| Taxable Municipal Obligations — 1.2% |
| Security | Principal Amount (000's omitted) | Value | |
| Insured - Hospital — 0.6% | |||
| Massachusetts Development Finance Agency, (Wellforce), (AGM), 3.89%, 7/1/25 | $ | 1,000 | $ 992,580 |
| $ 992,580 | |||
| Lease Revenue/Certificates of Participation — 0.1% | |||
| National Finance Authority, NH, (Centurion BioSquare, Inc.), 9.58%, 12/15/38 | $ | 85 | $ 87,356 |
| National Finance Authority, NH, (Centurion Foundation), 11.00%, 12/15/38 | 45 | 46,179 | |
| $ 133,535 | |||
| Special Tax Revenue — 0.5% | |||
| Massachusetts School Building Authority, Social Bonds, 1.753%, 8/15/30 | $ | 1,000 | $ 900,410 |
| $ 900,410 | |||
| Total Taxable Municipal Obligations (identified cost $1,982,850) | $ 2,026,525 | ||
| Total Investments — 100.0% (identified cost $161,234,271) | $166,512,736 | ||
| Other Assets, Less Liabilities — (0.0)%(4) | $ (28,687) | ||
| Net Assets — 100.0% | $166,484,049 | ||
| The percentage shown for each investment category in the Portfolio of Investments is based on net assets. | |
| (1) | Variable rate demand obligation that may be tendered at par on any day for payment the same or next business day. The stated interest rate, which generally resets daily, is determined by the remarketing agent and represents the rate in effect at September 30, 2024. |
| (2) | Security exempt from registration under Rule 144A of the Securities Act of 1933, as amended. These securities may be sold in certain transactions in reliance on an exemption from registration (normally to qualified institutional buyers). At September 30, 2024, the aggregate value of these securities is $5,520,920 or 3.3% of the Fund's net assets. |
| (3) | Security represents the municipal bond held by a trust that issues residual interest bonds (see Note 1H). |
| (4) | Amount is less than (0.05)%. |
| The Fund invests primarily in debt securities issued by Massachusetts municipalities. The ability of the issuers of the debt securities to meet their obligations may be affected by economic developments in a specific industry or municipality. At September 30, 2024, 7.8% of total investments are backed by bond insurance of various financial institutions and financial guaranty assurance agencies. The aggregate percentage insured by an individual financial institution or financial guaranty assurance agency ranged from 0.6% to 3.8% of total investments. | |
| Abbreviations: | |
| AGM | – Assured Guaranty Municipal Corp. |
| AMBAC | – AMBAC Financial Group, Inc. |
| AMT | – Interest earned from these securities may be considered a tax preference item for purposes of the Federal Alternative Minimum Tax. |
| FHLMC | – Federal Home Loan Mortgage Corp. |
| FNMA | – Federal National Mortgage Association |
| GNMA | – Government National Mortgage Association |
| LOC | – Letter of Credit |
| NPFG | – National Public Finance Guarantee Corp. |
| Corporate Bonds — 0.4% |
| Security | Principal Amount (000's omitted) | Value | |
| Hospital — 0.4% | |||
| Montefiore Obligated Group, 4.287%, 9/1/50 | $ | 2,080 | $ 1,570,534 |
| Total Corporate Bonds (identified cost $2,080,000) | $ 1,570,534 | ||
| Tax-Exempt Municipal Obligations — 104.8% |
| Security | Principal Amount (000's omitted) | Value | |
| Bond Bank — 1.2% | |||
| New York State Environmental Facilities Corp., (State Revolving Fund), Green Bonds, 5.00%, 9/15/47(1) | $ | 4,000 | $ 4,410,680 |
| $ 4,410,680 | |||
| Education — 6.4% | |||
| Albany Capital Resource Corp., NY, (KIPP Capital Region Public Charter Schools), 4.75%, 6/1/54 | $ | 1,350 | $ 1,362,595 |
| Build NYC Resource Corp., NY, (New World Preparatory Charter School), 4.00%, 6/15/31(2) | 240 | 234,874 | |
| Dutchess County Local Development Corp., NY, (Culinary Institute of America), 4.00%, 7/1/37 | 250 | 248,583 | |
| Monroe County Industrial Development Corp., NY, (True North Rochester Preparatory Charter School), 5.00%, 6/1/50(2) | 1,640 | 1,670,209 | |
| Monroe County Industrial Development Corp., NY, (University of Rochester): | |||
| 4.00%, 7/1/50 | 3,020 | 2,997,743 | |
| 5.00%, 7/1/53 | 2,265 | 2,488,080 | |
| New York Dormitory Authority, (Barnard College), 4.00%, 7/1/49 | 2,000 | 1,936,180 | |
| New York Dormitory Authority, (Cornell University), 5.50%, 7/1/54 | 2,500 | 2,893,400 | |
| New York Dormitory Authority, (New York University): | |||
| 4.00%, 7/1/39 | 1,260 | 1,297,422 | |
| 4.00%, 7/1/46 | 3,000 | 2,999,580 | |
| New York Dormitory Authority, (Pace University): | |||
| 5.25%, 5/1/41 | 425 | 475,188 | |
| 5.50%, 5/1/49 | 1,500 | 1,666,260 | |
| Troy Capital Resource Corp., NY, (Rensselaer Polytechnic Institute), 5.00%, 9/1/38 | 2,725 | 2,963,764 | |
| $ 23,233,878 | |||
| Security | Principal Amount (000's omitted) | Value | |
| Electric Utilities — 6.4% | |||
| Long Island Power Authority, NY, Electric System Revenue: | |||
| 5.00%, 9/1/41 | $ | 2,500 | $ 2,862,725 |
| 5.00%, 9/1/42 | 3,000 | 3,419,520 | |
| 5.00%, 9/1/49 | 4,000 | 4,421,760 | |
| New York Power Authority: | |||
| Green Bonds, 5.00%, 11/15/37(3) | 2,000 | 2,373,840 | |
| Green Bonds, 5.00%, 11/15/42(3) | 2,500 | 2,879,375 | |
| Utility Debt Securitization Authority, NY: | |||
| 5.00%, 12/15/41 | 3,500 | 4,069,520 | |
| Green Bonds, 5.00%, 9/15/52 | 3,050 | 3,357,288 | |
| $ 23,384,028 | |||
| General Obligations — 7.7% | |||
| Nassau County, NY, 4.00%, 4/1/50 | $ | 1,500 | $ 1,491,945 |
| New York: | |||
| 5.00%, 3/15/38 | 1,250 | 1,467,000 | |
| 5.00%, 3/15/38 | 2,250 | 2,640,600 | |
| 5.00%, 3/15/39 | 2,375 | 2,759,275 | |
| 5.00%, 3/15/40 | 2,125 | 2,453,652 | |
| New York, NY: | |||
| 4.00%, 9/1/46 | 2,000 | 1,995,640 | |
| 4.00%, 4/1/50 | 2,000 | 1,981,660 | |
| 5.25%, 5/1/42 | 1,665 | 1,870,911 | |
| 5.50%, 5/1/44 | 2,500 | 2,834,750 | |
| 5.50%, 5/1/46 | 2,600 | 2,931,656 | |
| (SPA: Barclays Bank PLC), 4.15%, 6/1/44(4) | 2,000 | 2,000,000 | |
| Puerto Rico: | |||
| 5.625%, 7/1/29 | 1,634 | 1,764,951 | |
| 5.75%, 7/1/31 | 1,000 | 1,112,840 | |
| Valley Stream, NY: | |||
| 2.25%, 5/15/27 | 250 | 237,742 | |
| 2.375%, 5/15/28 | 255 | 238,777 | |
| $ 27,781,399 | |||
| Hospital — 3.1% | |||
| Dutchess County Local Development Corp., NY, (Health Quest System, Inc.), 4.00%, 7/1/41 | $ | 4,870 | $ 4,858,068 |
| Jefferson County Civic Facility Development Corp., NY, (Samaritan Medical Center), 4.00%, 11/1/47 | 505 | 383,820 | |
| New York Dormitory Authority, (Northwell Health Obligated Group), 5.00%, 5/1/52 | 2,025 | 2,166,811 | |
| New York Dormitory Authority, (NYU Langone Hospitals Obligated Group): | |||
| 5.00%, 7/1/33(3) | 2,000 | 2,340,420 | |
| Security | Principal Amount (000's omitted) | Value | |
| Hospital (continued) | |||
| New York Dormitory Authority, (NYU Langone Hospitals Obligated Group): (continued) | |||
| 5.00%, 7/1/34(3) | $ | 1,400 | $ 1,657,376 |
| $ 11,406,495 | |||
| Housing — 4.1% | |||
| New York City Housing Development Corp., NY: | |||
| Sustainable Development Bonds, 2.60%, 11/1/46 | $ | 1,000 | $ 756,240 |
| Sustainable Development Bonds, 2.85%, 11/1/39 | 3,930 | 3,366,870 | |
| New York Mortgage Agency: | |||
| 3.65%, 4/1/32 | 115 | 115,414 | |
| Social Bonds, 4.55%, 10/1/49 | 6,000 | 6,075,300 | |
| Social Bonds, 4.875%, 10/1/48 | 2,000 | 2,061,520 | |
| Westchester County Local Development Corp., NY, (Purchase Housing Corp. II), 5.00%, 6/1/42 | 2,500 | 2,535,525 | |
| $ 14,910,869 | |||
| Industrial Development Revenue — 4.2% | |||
| New York State Environmental Facilities Corp., (Casella Waste Systems, Inc.), (AMT), 2.875% to 12/3/29 (Put Date), 12/1/44(2) | $ | 930 | $ 880,682 |
| New York Transportation Development Corp., (Delta Air Lines, Inc. - LaGuardia Airport Terminals C&D Redevelopment): | |||
| (AMT), 5.00%, 1/1/36 | 2,000 | 2,060,180 | |
| (AMT), 5.00%, 10/1/40 | 4,165 | 4,323,978 | |
| (AMT), 6.00%, 4/1/35 | 1,335 | 1,510,753 | |
| New York Transportation Development Corp., (Terminal 4 John F. Kennedy International Airport), (AMT), 3.00%, 8/1/31 | 2,795 | 2,640,436 | |
| Niagara Area Development Corp., NY, (Covanta), (AMT), 4.75%, 11/1/42(2) | 4,000 | 3,890,960 | |
| $ 15,306,989 | |||
| Insured - Education — 2.2% | |||
| New York Dormitory Authority, (CUNY Student Housing), (AMBAC), (BAM), 5.50%, 7/1/35 | $ | 6,600 | $ 7,862,052 |
| $ 7,862,052 | |||
| Insured - Electric Utilities — 1.0% | |||
| New York Power Authority, Green Transmission Revenue: | |||
| (AGM), 5.00%, 11/15/48 | $ | 1,000 | $ 1,115,710 |
| (AGM), 5.25%, 11/15/39 | 1,000 | 1,196,510 | |
| (AGM), 5.25%, 11/15/40 | 1,000 | 1,188,840 | |
| $ 3,501,060 | |||
| Security | Principal Amount (000's omitted) | Value | |
| Insured - Escrowed/Prerefunded — 2.7% | |||
| New York Dormitory Authority, (Memorial Sloan Kettering Cancer Center), (NPFG), Escrowed to Maturity, 0.00%, 7/1/30 | $ | 11,530 | $ 9,714,832 |
| $ 9,714,832 | |||
| Insured - General Obligations — 0.6% | |||
| Nassau County, NY, (AGM), 4.00%, 4/1/47 | $ | 2,140 | $ 2,153,118 |
| $ 2,153,118 | |||
| Insured - Hospital — 0.5% | |||
| Westchester County Local Development Corp., NY, (Westchester Medical Center Obligated Group), (AGM), 5.75%, 11/1/48 | $ | 1,500 | $ 1,717,350 |
| $ 1,717,350 | |||
| Insured - Other Revenue — 0.7% | |||
| New York City Industrial Development Agency, NY, (Yankee Stadium): | |||
| (AGC), 0.00%, 3/1/31 | $ | 1,690 | $ 1,352,051 |
| (AGM), 4.00%, 3/1/32 | 1,130 | 1,192,150 | |
| $ 2,544,201 | |||
| Insured - Transportation — 1.9% | |||
| Metropolitan Transportation Authority, NY, Green Bonds, (BAM), 4.00%, 11/15/48 | $ | 3,250 | $ 3,226,730 |
| New York Transportation Development Corp., (John F. Kennedy International Airport New Terminal One): | |||
| Green Bonds, (AGM), (AMT), 5.00%, 6/30/49 | 2,165 | 2,260,563 | |
| Green Bonds, (AGM), (AMT), 5.00%, 6/30/54 | 1,250 | 1,308,175 | |
| $ 6,795,468 | |||
| Lease Revenue/Certificates of Participation — 2.6% | |||
| Battery Park City Authority, NY: | |||
| (SPA: TD Bank, N.A.), 3.80%, 11/1/38(4) | $ | 2,000 | $ 2,000,000 |
| Sustainability Bonds, 5.00%, 11/1/53 | 3,000 | 3,324,630 | |
| New York City Transitional Finance Authority, NY, (Building Aid), 4.00%, 7/15/45 | 4,000 | 3,991,760 | |
| $ 9,316,390 | |||
| Other Revenue — 2.2% | |||
| Hudson Yards Infrastructure Corp., NY: | |||
| 5.00%, 2/15/42 | $ | 3,855 | $ 3,991,891 |
| Green Bonds, 4.00%, 2/15/41 | 4,000 | 4,126,400 | |
| $ 8,118,291 | |||
| Security | Principal Amount (000's omitted) | Value | |
| Senior Living/Life Care — 1.8% | |||
| Buffalo and Erie County Industrial Land Development Corp., NY, (Orchard Park CCRC, Inc.), 5.00%, 11/15/37 | $ | 4,500 | $ 4,544,730 |
| Suffolk County Economic Development Corp., NY, (Peconic Landing at Southold, Inc.), Series 2020B, 5.00%, 12/1/40 | 2,000 | 2,058,520 | |
| $ 6,603,250 | |||
| Special Tax Revenue — 28.2% | |||
| Metropolitan Transportation Authority, NY: | |||
| Green Bonds, 4.00%, 11/15/51 | $ | 1,000 | $ 986,910 |
| Green Bonds, 5.00%, 11/15/43 | 1,500 | 1,693,950 | |
| Green Bonds, 5.00%, 11/15/49 | 3,000 | 3,308,460 | |
| New York City Transitional Finance Authority, NY, Future Tax Revenue: | |||
| 4.00%, 11/1/40 | 2,000 | 2,036,760 | |
| 4.00%, 2/1/43 | 4,000 | 4,068,120 | |
| 4.00%, 5/1/45 | 1,750 | 1,755,268 | |
| 4.00%, 8/1/48 | 3,500 | 3,496,115 | |
| 4.375%, 5/1/53 | 2,000 | 2,038,520 | |
| 5.00%, 8/1/39 | 4,250 | 4,458,462 | |
| 5.00%, 5/1/40(3) | 2,500 | 2,859,150 | |
| 5.00%, 11/1/46(1) | 5,000 | 5,448,650 | |
| 5.50%, 11/1/45(1) | 5,000 | 5,726,250 | |
| New York Dormitory Authority, Personal Income Tax Revenue: | |||
| 4.00%, 2/15/47 | 2,500 | 2,482,325 | |
| 4.00%, 3/15/47 | 1,395 | 1,378,511 | |
| 4.00%, 3/15/48 | 1,930 | 1,908,075 | |
| 4.00%, 3/15/54 | 1,350 | 1,306,287 | |
| 5.00%, 3/15/49 | 2,855 | 3,061,302 | |
| 5.25%, 3/15/52 | 2,000 | 2,241,700 | |
| New York Dormitory Authority, Sales Tax Revenue: | |||
| 4.00%, 3/15/48 | 2,000 | 1,983,260 | |
| 5.00%, 3/15/45 | 4,000 | 4,186,040 | |
| New York State Thruway Authority, Personal Income Tax Revenue, 4.00%, 3/15/55 | 2,000 | 1,974,440 | |
| New York State Urban Development Corp., Sales Tax Revenue: | |||
| 4.00%, 3/15/39 | 5,000 | 5,158,050 | |
| 4.00%, 3/15/45 | 2,000 | 2,006,740 | |
| 5.00%, 3/15/49 | 4,000 | 4,390,120 | |
| Puerto Rico Sales Tax Financing Corp., 5.00%, 7/1/58 | 6,445 | 6,511,706 | |
| Triborough Bridge and Tunnel Authority, NY, Payroll Mobility Tax: | |||
| 4.00%, 5/15/46 | 1,455 | 1,460,020 | |
| Series 2021A, 5.00%, 5/15/51 | 2,500 | 2,682,875 | |
| Series 2021C, 5.00%, 5/15/51 | 6,000 | 6,467,940 | |
| Security | Principal Amount (000's omitted) | Value | |
| Special Tax Revenue (continued) | |||
| Triborough Bridge and Tunnel Authority, NY, Payroll Mobility Tax: (continued) | |||
| Green Bonds, 5.25%, 5/15/47(1) | $ | 3,000 | $ 3,343,680 |
| Green Bonds, 5.25%, 5/15/47 | 2,500 | 2,786,400 | |
| Triborough Bridge and Tunnel Authority, NY, Sales Tax Revenue: | |||
| 4.00%, 5/15/48 | 2,500 | 2,491,825 | |
| 5.00%, 5/15/49 | 6,000 | 6,621,360 | |
| $102,319,271 | |||
| Transportation — 18.3% | |||
| Metropolitan Transportation Authority, NY: | |||
| (LOC: Barclays Bank PLC), 3.80%, 11/1/32(4) | $ | 2,500 | $ 2,500,000 |
| Green Bonds, 4.00%, 11/15/45 | 2,000 | 1,983,740 | |
| Green Bonds, 4.75%, 11/15/45 | 900 | 933,300 | |
| New York State Thruway Authority: | |||
| 4.00%, 1/1/45 | 3,000 | 2,994,240 | |
| 5.00%, 1/1/49 | 3,250 | 3,594,792 | |
| New York Transportation Development Corp., (John F. Kennedy International Airport New Terminal One): | |||
| Green Bonds, (AMT), 5.50%, 6/30/54 | 2,000 | 2,153,100 | |
| Green Bonds, (AMT), 6.00%, 6/30/54 | 1,925 | 2,104,891 | |
| New York Transportation Development Corp., (LaGuardia Airport Terminal B Redevelopment): | |||
| (AMT), 5.00%, 12/1/39 | 1,500 | 1,595,550 | |
| (AMT), 5.00%, 7/1/41 | 2,150 | 2,150,000 | |
| (AMT), 5.00%, 7/1/46 | 9,100 | 9,100,091 | |
| New York Transportation Development Corp., (Terminal 4 John F. Kennedy International Airport): | |||
| (AMT), 4.00%, 12/1/42 | 1,960 | 1,894,301 | |
| (AMT), 5.00%, 12/1/28 | 2,000 | 2,129,220 | |
| Niagara Frontier Transportation Authority, NY, (Buffalo Niagara International Airport), (AMT), 5.00%, 4/1/26 | 1,210 | 1,210,920 | |
| Port Authority of New York and New Jersey: | |||
| 4.00%, 11/1/41 | 3,250 | 3,297,028 | |
| 4.00%, 11/1/49 | 3,000 | 3,009,420 | |
| 6.125%, 6/1/94 | 2,500 | 2,502,925 | |
| (AMT), 5.00%, 8/1/37 | 2,550 | 2,797,452 | |
| (AMT), 5.00%, 1/15/47 | 2,000 | 2,132,600 | |
| (AMT), 5.50%, 8/1/52 | 2,000 | 2,195,700 | |
| Series 245, 5.00%, 9/1/38(3) | 2,500 | 2,934,125 | |
| Triborough Bridge and Tunnel Authority, NY: | |||
| 3.00%, 11/15/46 | 4,000 | 3,311,920 | |
| 5.00%, 11/15/51 | 7,545 | 8,061,229 | |
| (LOC: TD Bank, N.A.), 3.80%, 1/1/32(4) | 2,000 | 2,000,000 | |
| $ 66,586,544 | |||
| Security | Principal Amount (000's omitted) | Value | |
| Water and Sewer — 9.0% | |||
| New York City Municipal Water Finance Authority, NY, (Water and Sewer System): | |||
| 4.00%, 6/15/51 | $ | 5,260 | $ 5,237,067 |
| 5.00%, 6/15/39 | 4,515 | 4,566,290 | |
| 5.00%, 6/15/43 | 2,500 | 2,811,450 | |
| 5.00%, 6/15/47(1) | 2,000 | 2,192,900 | |
| 5.00%, 6/15/50 | 5,000 | 5,313,300 | |
| 5.25%, 6/15/47 | 4,000 | 4,509,840 | |
| 5.25%, 6/15/52 | 3,025 | 3,340,114 | |
| Suffolk County Water Authority, NY, 3.25%, 6/1/42 | 5,000 | 4,621,400 | |
| $ 32,592,361 | |||
| Total Tax-Exempt Municipal Obligations (identified cost $362,420,203) | $380,258,526 | ||
| Taxable Municipal Obligations — 1.8% |
| Security | Principal Amount (000's omitted) | Value | |
| Hospital — 0.2% | |||
| Jefferson County Civic Facility Development Corp., NY, (Samaritan Medical Center), 4.25%, 11/1/28 | $ | 835 | $ 811,837 |
| $ 811,837 | |||
| Special Tax Revenue — 1.6% | |||
| Metropolitan Transportation Authority, NY, Payroll Mobility Tax Revenue, 5.37%, 12/19/24 | $ | 3,500 | $ 3,503,815 |
| Oneida Indian Nation of New York, 8.00%, 9/1/40(2) | 2,000 | 2,040,800 | |
| $ 5,544,615 | |||
| Total Taxable Municipal Obligations (identified cost $6,295,772) | $ 6,356,452 | ||
| Total Investments — 107.0% (identified cost $370,795,975) | $388,185,512 | ||
| Other Assets, Less Liabilities — (7.0)% | $(25,361,721) | ||
| Net Assets — 100.0% | $362,823,791 | ||
| The percentage shown for each investment category in the Portfolio of Investments is based on net assets. | |
| (1) | Security represents the municipal bond held by a trust that issues residual interest bonds (see Note 1H). |
| (2) | Security exempt from registration under Rule 144A of the Securities Act of 1933, as amended. These securities may be sold in certain transactions in reliance on an exemption from registration (normally to qualified institutional buyers). At September 30, 2024, the aggregate value of these securities is $8,717,525 or 2.4% of the Fund's net assets. |
| (3) | When-issued security. |
| (4) | Variable rate demand obligation that may be tendered at par on any day for payment the same or next business day. The stated interest rate, which generally resets daily, is determined by the remarketing agent and represents the rate in effect at September 30, 2024. |
| The Fund invests primarily in debt securities issued by New York municipalities. The ability of the issuers of the debt securities to meet their obligations may be affected by economic developments in a specific industry or municipality. At September 30, 2024, 8.8% of total investments are backed by bond insurance of various financial institutions and financial guaranty assurance agencies. The aggregate percentage insured by an individual financial institution or financial guaranty assurance agency ranged from 0.3% to 3.1% of total investments. | |
| Abbreviations: | |
| AGC | – Assured Guaranty Corp. |
| AGM | – Assured Guaranty Municipal Corp. |
| AMBAC | – AMBAC Financial Group, Inc. |
| AMT | – Interest earned from these securities may be considered a tax preference item for purposes of the Federal Alternative Minimum Tax. |
| BAM | – Build America Mutual Assurance Co. |
| LOC | – Letter of Credit |
| NPFG | – National Public Finance Guarantee Corp. |
| SPA | – Standby Bond Purchase Agreement |
| Tax-Exempt Municipal Obligations — 102.3% |
| Security | Principal Amount (000's omitted) | Value | |
| Bond Bank — 4.1% | |||
| Ohio Water Development Authority: | |||
| 4.00%, 6/1/36 | $ | 1,500 | $ 1,514,760 |
| 5.00%, 12/1/38 | 1,000 | 1,094,670 | |
| Green Bonds, 5.00%, 12/1/38 | 1,000 | 1,154,600 | |
| Sustainability Bonds, 5.00%, 12/1/40 | 2,000 | 2,273,480 | |
| Rickenbacker Port Authority, OH, (OASBO Expanded Asset Pooled Financing Program), 5.375%, 1/1/32 | 1,455 | 1,638,214 | |
| $ 7,675,724 | |||
| Education — 16.3% | |||
| Dayton-Montgomery County Port Authority, OH, (Dayton Regional STEM Schools, Inc.): | |||
| 5.00%, 12/1/32 | $ | 820 | $ 895,071 |
| 5.00%, 12/1/44 | 1,250 | 1,313,550 | |
| Miami University, OH, 4.00%, 9/1/45 | 2,000 | 2,004,940 | |
| Ohio Higher Educational Facility Commission, (Case Western Reserve University), 5.00%, 12/1/40 | 1,000 | 1,041,360 | |
| Ohio Higher Educational Facility Commission, (Denison University): | |||
| 5.00%, 11/1/48 | 2,250 | 2,469,397 | |
| 5.25%, 11/1/46 | 1,355 | 1,399,566 | |
| Ohio Higher Educational Facility Commission, (Oberlin College), Green Bonds, 5.00%, 10/1/48 | 2,175 | 2,382,038 | |
| Ohio Higher Educational Facility Commission, (The College of Wooster), 5.00%, 9/1/36 | 1,000 | 1,077,840 | |
| Ohio Higher Educational Facility Commission, (University of Dayton): | |||
| 5.00%, 12/1/32 | 550 | 556,847 | |
| 5.00%, 2/1/38 | 1,200 | 1,336,428 | |
| Ohio State University: | |||
| 5.00%, 12/1/29 | 1,060 | 1,195,436 | |
| 5.25%, 12/1/46 | 2,000 | 2,270,020 | |
| Green Bonds, 4.00%, 12/1/43 | 1,725 | 1,755,757 | |
| Ohio University, 5.25%, 12/1/54(1) | 3,000 | 3,360,210 | |
| Port of Greater Cincinnati Development Authority, OH, (St. Xavier High School, Inc.): | |||
| 4.00%, 4/1/33 | 335 | 345,328 | |
| 4.00%, 4/1/34 | 510 | 524,974 | |
| 4.00%, 4/1/35 | 350 | 357,886 | |
| 4.00%, 4/1/36 | 350 | 356,178 | |
| 4.00%, 4/1/37 | 560 | 566,406 | |
| 4.00%, 4/1/38 | 400 | 402,376 | |
| 4.00%, 4/1/39 | 415 | 415,751 | |
| 4.00%, 4/1/40 | 415 | 409,879 | |
| Security | Principal Amount (000's omitted) | Value | |
| Education (continued) | |||
| University of Cincinnati, OH: | |||
| 5.00%, 6/1/47 | $ | 2,000 | $ 2,055,700 |
| 5.25%, 6/1/49 | 2,000 | 2,224,260 | |
| $ 30,717,198 | |||
| Electric Utilities — 2.6% | |||
| American Municipal Power, Inc., OH, (Combined Hydroelectric), 5.00%, 2/15/48 | $ | 1,300 | $ 1,425,320 |
| American Municipal Power, Inc., OH, (Greenup Hydroelectric Facility), 5.00%, 2/15/46 | 1,000 | 1,018,220 | |
| American Municipal Power, Inc., OH, (Meldahl Hydroelectric): | |||
| Green Bonds, 4.00%, 2/15/34 | 2,005 | 2,022,765 | |
| Green Bonds, 5.00%, 2/15/33 | 495 | 506,558 | |
| $ 4,972,863 | |||
| Escrowed/Prerefunded — 0.0%(2) | |||
| Ohio, (Cleveland Clinic Health System), Prerefunded to 1/1/28, 4.00%, 1/1/43 | $ | 20 | $ 20,939 |
| $ 20,939 | |||
| General Obligations — 16.6% | |||
| Butler County, OH, Special Tax Assessment, 5.50%, 12/1/28 | $ | 855 | $ 856,402 |
| Central Ohio Transit Authority, OH, 5.00%, 12/1/48 | 2,000 | 2,198,120 | |
| Cleveland, OH: | |||
| 5.00%, 12/1/44 | 1,000 | 1,097,920 | |
| 5.00%, 12/1/51 | 2,000 | 2,156,560 | |
| Columbus, OH, 5.00%, 4/1/39 | 2,700 | 3,060,666 | |
| Cuyahoga Community College District, OH, 3.50%, 12/1/39 | 1,400 | 1,376,060 | |
| Mayfield Heights, OH, 4.00%, 12/1/48 | 1,250 | 1,233,350 | |
| North Canton City School District, OH, 5.00%, 10/1/49 | 560 | 603,109 | |
| North Olmsted City School District, OH, 5.00%, 10/15/48 | 2,500 | 2,674,375 | |
| North Ridgeville City School District, OH: | |||
| 4.375%, 12/1/50 | 2,750 | 2,757,122 | |
| 5.00%, 12/1/47 | 1,300 | 1,372,683 | |
| Ohio, 4.00%, 6/15/40 | 2,500 | 2,591,600 | |
| Shaker Heights City School District, OH, 5.00%, 12/15/49 | 3,000 | 3,305,190 | |
| Summit County, OH, 5.00%, 12/1/43 | 1,000 | 1,108,540 | |
| Troy City School District, OH, 5.00%, 12/1/54 | 1,000 | 1,092,620 | |
| Upper Arlington City School District, OH, 5.75%, 12/1/40 | 500 | 514,665 | |
| Worthington City School District, OH, 5.50%, 12/1/54 | 3,000 | 3,374,400 | |
| $ 31,373,382 | |||
| Security | Principal Amount (000's omitted) | Value | |
| Hospital — 16.3% | |||
| Akron, Bath and Copley Joint Township Hospital District, OH, (Children's Hospital Medical Center of Akron), 4.00%, 11/15/42 | $ | 1,250 | $ 1,234,887 |
| Akron, Bath and Copley Joint Township Hospital District, OH, (Summa Health Obligated Group), 4.00%, 11/15/37 | 525 | 516,779 | |
| Allen County, OH, (Bon Secours Mercy Health, Inc.), 4.00%, 12/1/40 | 1,000 | 1,008,780 | |
| Allen County, OH, (Mercy Health), 4.00%, 8/1/47(3) | 5,150 | 5,098,706 | |
| Butler County, OH, (UC Health): | |||
| 4.00%, 11/15/37 | 920 | 873,374 | |
| 5.00%, 11/15/28 | 590 | 611,081 | |
| Franklin County, OH, (Nationwide Children's Hospital): | |||
| 5.00%, 11/1/34 | 750 | 780,750 | |
| (SPA: JPMorgan Chase Bank, N.A.), 4.05%, 11/1/42(4) | 1,580 | 1,580,000 | |
| Franklin County, OH, (OhioHealth Corp.), 5.00%, 5/15/40 | 1,200 | 1,210,836 | |
| Franklin County, OH, (Trinity Health Credit Group): | |||
| 3.50% to 11/1/24 (Put Date), 12/1/46 | 1,500 | 1,499,550 | |
| 4.00%, 12/1/44 | 2,445 | 2,442,848 | |
| 5.00%, 12/1/46 | 3,000 | 3,074,160 | |
| Hamilton County, OH, (UC Health), 5.00%, 9/15/45 | 1,125 | 1,135,811 | |
| Miami County, OH, (Kettering Health Network Obligated Group), 5.00%, 8/1/38 | 1,000 | 1,047,570 | |
| Muskingum County, OH, (Genesis HealthCare System Obligated Group), 5.00%, 2/15/33 | 460 | 460,092 | |
| Ohio, (Childrens Hospital Medical Center), 5.25%, 8/15/48 | 1,500 | 1,678,320 | |
| Ohio, (Cleveland Clinic Health System): | |||
| 4.00%, 1/1/36 | 2,055 | 2,081,489 | |
| 4.00%, 1/1/43 | 2,165 | 2,170,586 | |
| 4.00%, 1/1/46 | 2,000 | 2,000,740 | |
| Southeastern Ohio Port Authority, (Memorial Health System Obligated Group), 5.00%, 12/1/24 | 215 | 214,886 | |
| $ 30,721,245 | |||
| Housing — 2.9% | |||
| Ohio Housing Finance Agency: | |||
| 3.00%, 9/1/39 | $ | 375 | $ 331,837 |
| (FHLMC), (FNMA), (GNMA), Social Bonds, 4.35%, 9/1/44 | 2,995 | 3,021,626 | |
| (FHLMC), (FNMA), (GNMA), Social Bonds, 4.80%, 9/1/43 | 960 | 998,640 | |
| (FHLMC), (FNMA), (GNMA), Social Bonds, 5.50%, 3/1/53 | 960 | 1,029,370 | |
| $ 5,381,473 | |||
| Security | Principal Amount (000's omitted) | Value | |
| Industrial Development Revenue — 3.4% | |||
| Cleveland, OH, (Continental Airlines), 5.375%, 9/15/27 | $ | 1,630 | $ 1,630,994 |
| Ohio Air Quality Development Authority, (American Electric Power Co., Inc.), (AMT), 3.75%, 1/1/29 | 1,000 | 1,000,470 | |
| Ohio Air Quality Development Authority, (Pratt Paper, LLC), (AMT), 4.25%, 1/15/38(5) | 1,700 | 1,717,578 | |
| Ohio, (Republic Services, Inc.), 3.50% to 12/2/24 (Put Date), 11/1/35 | 2,000 | 2,000,000 | |
| $ 6,349,042 | |||
| Insured - Electric Utilities — 7.2% | |||
| Cleveland, OH, Public Power System Revenue: | |||
| (AGM), 4.00%, 11/15/36 | $ | 1,000 | $ 1,027,600 |
| (NPFG), 0.00%, 11/15/27 | 2,540 | 2,308,428 | |
| Ohio Municipal Electric Generation Agency: | |||
| (NPFG), 0.00%, 2/15/26 | 3,000 | 2,873,460 | |
| (NPFG), 0.00%, 2/15/27 | 2,500 | 2,324,000 | |
| (NPFG), 0.00%, 2/15/28 | 4,750 | 4,276,615 | |
| Puerto Rico Electric Power Authority, (NPFG), 5.25%, 7/1/34 | 770 | 766,450 | |
| $ 13,576,553 | |||
| Insured - Escrowed/Prerefunded — 0.1% | |||
| Cleveland, OH, Public Power System Revenue, (AGM), Escrowed to Maturity, 5.00%, 11/15/24 | $ | 235 | $ 235,449 |
| $ 235,449 | |||
| Insured - General Obligations — 15.3% | |||
| Cincinnati City School District, OH, (AGM), 5.25%, 12/1/29(3) | $ | 7,500 | $ 8,467,200 |
| Green Local School District, OH, (AGM), 4.625%, 11/1/47 | 1,020 | 1,042,338 | |
| Kettering City School District, OH, (AGM), 5.25%, 12/1/31 | 4,505 | 4,897,025 | |
| Mason City School District, OH, (AGM), 5.25%, 12/1/31 | 3,525 | 3,979,972 | |
| Springboro Community City School District, OH, (AGM), 5.25%, 12/1/30 | 5,000 | 5,617,200 | |
| Westerville City School District, OH, (XLCA), 5.00%, 12/1/27 | 4,590 | 4,881,144 | |
| $ 28,884,879 | |||
| Insured - Hospital — 0.9% | |||
| Lucas County, OH, (ProMedica Healthcare Obligated Group), (AGM), 4.00%, 11/15/45 | $ | 1,725 | $ 1,662,417 |
| $ 1,662,417 | |||
| Security | Principal Amount (000's omitted) | Value | |
| Insured - Special Tax Revenue — 0.5% | |||
| Port of Greater Cincinnati Development Authority, OH, (Duke Energy Convention Center), (AGM), 4.375%, 12/1/58 | $ | 1,000 | $ 1,010,280 |
| $ 1,010,280 | |||
| Insured - Transportation — 1.3% | |||
| Cleveland, OH, Airport System Revenue, (AGM), (AMT), 5.00%, 1/1/43 | $ | 1,000 | $ 1,026,340 |
| Ohio, (Portsmouth Gateway Group, LLC), (AGM), (AMT), 5.00%, 12/31/35 | 1,500 | 1,514,475 | |
| $ 2,540,815 | |||
| Insured - Water and Sewer — 2.0% | |||
| Newark, OH, Water System Revenue, (AGM), 5.00%, 12/1/39 | $ | 3,680 | $ 3,842,435 |
| $ 3,842,435 | |||
| Other Revenue — 3.8% | |||
| Buckeye Tobacco Settlement Financing Authority, OH: | |||
| 4.00%, 6/1/37 | $ | 1,875 | $ 1,896,188 |
| 5.00%, 6/1/55 | 1,995 | 1,880,168 | |
| Cuyahoga County, OH, (Cleveland Orchestra): | |||
| 5.00%, 1/1/33 | 400 | 433,432 | |
| 5.00%, 1/1/34 | 300 | 324,597 | |
| 5.00%, 1/1/35 | 500 | 540,095 | |
| 5.00%, 1/1/41 | 725 | 770,073 | |
| Riversouth Authority, OH, (Lazarus Building Redevelopment), 5.75%, 12/1/27 | 1,330 | 1,330,638 | |
| $ 7,175,191 | |||
| Senior Living/Life Care — 1.6% | |||
| Franklin County, OH, (Ohio Living Communities): | |||
| 4.00%, 7/1/40 | $ | 995 | $ 919,082 |
| 5.25%, 7/1/41 | 1,500 | 1,589,415 | |
| Prerefunded to 7/1/28, 4.00%, 7/1/40 | 5 | 5,405 | |
| Hamilton County, OH, (Life Enriching Communities Project), 5.50%, 1/1/43 | 500 | 533,035 | |
| $ 3,046,937 | |||
| Special Tax Revenue — 1.7% | |||
| Akron, OH, Income Tax Revenue, 4.00%, 12/1/36 | $ | 655 | $ 663,246 |
| American Samoa Economic Development Authority, 5.00%, 9/1/38(5) | 200 | 203,912 | |
| Puerto Rico Sales Tax Financing Corp., 5.00%, 7/1/58 | 2,285 | 2,308,650 | |
| $ 3,175,808 | |||
| Security | Principal Amount (000's omitted) | Value | |
| Transportation — 2.1% | |||
| Ohio Turnpike and Infrastructure Commission, 4.00%, 2/15/46 | $ | 2,000 | $ 2,004,600 |
| Ohio, Major New State Infrastructure Project Revenue: | |||
| 5.00%, 12/15/25 | 750 | 772,208 | |
| 5.00%, 12/15/27 | 750 | 810,607 | |
| 5.00%, 12/15/33 | 350 | 394,083 | |
| $ 3,981,498 | |||
| Water and Sewer — 3.6% | |||
| Cleveland, OH, Water Pollution Control Revenue: | |||
| 5.00%, 11/15/49 | $ | 750 | $ 818,160 |
| Green Bonds, 5.00%, 11/15/41 | 945 | 959,043 | |
| Lancaster, OH, Wastewater System Revenue, 4.00%, 12/1/33 | 1,265 | 1,280,673 | |
| Mahoning County, OH, Sewer System Revenue, 5.00%, 12/1/46 | 1,565 | 1,668,368 | |
| Ohio Water Development Authority, Water Pollution Control Loan Fund, Green Bonds, 4.00%, 12/1/46 | 2,000 | 2,009,300 | |
| $ 6,735,544 | |||
| Total Tax-Exempt Municipal Obligations (identified cost $187,876,341) | $193,079,672 | ||
| Taxable Municipal Obligations — 1.1% |
| Security | Principal Amount (000's omitted) | Value | |
| Special Tax Revenue — 1.1% | |||
| JobsOhio Beverage System, OH, 4.433%, 1/1/33 | $ | 2,000 | $ 2,033,400 |
| Total Taxable Municipal Obligations (identified cost $1,982,860) | $ 2,033,400 | ||
| Trust Units — 0.4% |
| Security | Notional Amount (000's omitted) | Value | |
| Transportation — 0.4% | |||
| HTA TRRB 2005L-745190R75 Assured Custodial Trust, 5.25%, 7/1/41 | $ | 772 | $ 755,932 |
| Total Trust Units (identified cost $777,674) | $ 755,932 | ||
| Total Investments — 103.8% (identified cost $190,636,875) | $195,869,004 | ||
| Other Assets, Less Liabilities — (3.8)% | $ (7,210,476) | ||
| Net Assets — 100.0% | $188,658,528 | ||
| The percentage shown for each investment category in the Portfolio of Investments is based on net assets. | |
| (1) | When-issued security. |
| (2) | Amount is less than 0.05%. |
| (3) | Security represents the municipal bond held by a trust that issues residual interest bonds (see Note 1H). |
| (4) | Variable rate demand obligation that may be tendered at par on any day for payment the same or next business day. The stated interest rate, which generally resets daily, is determined by the remarketing agent and represents the rate in effect at September 30, 2024. |
| (5) | Security exempt from registration under Rule 144A of the Securities Act of 1933, as amended. These securities may be sold in certain transactions in reliance on an exemption from registration (normally to qualified institutional buyers). At September 30, 2024, the aggregate value of these securities is $1,921,490 or 1.0% of the Fund's net assets. |
| The Fund invests primarily in debt securities issued by Ohio municipalities. The ability of the issuers of the debt securities to meet their obligations may be affected by economic developments in a specific industry or municipality. At September 30, 2024, 26.4% of total investments are backed by bond insurance of various financial institutions and financial guaranty assurance agencies. The aggregate percentage insured by an individual financial institution or financial guaranty assurance agency ranged from 2.5% to 17.5% of total investments. | |
| Abbreviations: | |
| AGM | – Assured Guaranty Municipal Corp. |
| AMT | – Interest earned from these securities may be considered a tax preference item for purposes of the Federal Alternative Minimum Tax. |
| FHLMC | – Federal Home Loan Mortgage Corp. |
| FNMA | – Federal National Mortgage Association |
| GNMA | – Government National Mortgage Association |
| NPFG | – National Public Finance Guarantee Corp. |
| SPA | – Standby Bond Purchase Agreement |
| XLCA | – XL Capital Assurance, Inc. |
| September 30, 2024 | ||||
| California Opportunities Fund | Massachusetts Fund | New York Fund | Ohio Fund | |
| Assets | ||||
| Investments: | ||||
| Identified cost | $940,844,764 | $161,234,271 | $370,795,975 | $190,636,875 |
| Unrealized appreciation | 25,410,763 | 5,278,465 | 17,389,537 | 5,232,129 |
| Investments, at value | $966,255,527 | $166,512,736 | $388,185,512 | $195,869,004 |
| Cash | $9,967 | $140,531 | $1,574,447 | $1,785,112 |
| Interest receivable | 9,203,748 | 1,983,746 | 4,260,760 | 2,386,003 |
| Receivable for investments sold | 12,784,313 | 1,958,125 | 190,000 | 1,767,130 |
| Receivable for Fund shares sold | 3,935,331 | 209,178 | 277,756 | 234,403 |
| Trustees' deferred compensation plan | 71,337 | 62,270 | 113,685 | 61,854 |
| Total assets | $992,260,223 | $170,866,586 | $394,602,160 | $202,103,506 |
| Liabilities | ||||
| Payable for floating rate notes issued | $— | $3,662,459 | $15,245,096 | $8,460,967 |
| Payable for line of credit | 1,900,000 | — | — | — |
| Payable for investments purchased | 1,108,552 | — | — | 1,000,000 |
| Payable for when-issued securities | 43,673,986 | — | 14,982,831 | 3,331,740 |
| Payable for Fund shares redeemed | 2,011,807 | 294,888 | 726,485 | 232,715 |
| Distributions payable | 503,457 | 154,681 | 141,920 | 36,045 |
| Payable to affiliates: | ||||
| Investment adviser fee | 311,220 | 50,613 | 119,474 | 57,912 |
| Distribution and service fees | 42,076 | 14,431 | 34,293 | 15,399 |
| Trustees' deferred compensation plan | 71,337 | 62,270 | 113,685 | 61,854 |
| Interest expense and fees payable | — | 12,122 | 191,011 | 89,095 |
| Accrued expenses | 356,613 | 131,073 | 223,574 | 159,251 |
| Total liabilities | $49,979,048 | $4,382,537 | $31,778,369 | $13,444,978 |
| Net Assets | $942,281,175 | $166,484,049 | $362,823,791 | $188,658,528 |
| Sources of Net Assets | ||||
| Paid-in capital | $957,076,377 | $172,115,909 | $380,719,707 | $197,930,171 |
| Accumulated loss | (14,795,202) | (5,631,860) | (17,895,916) | (9,271,643) |
| Net Assets | $942,281,175 | $166,484,049 | $362,823,791 | $188,658,528 |
| Class A Shares | ||||
| Net Assets | $152,008,451 | $79,640,249 | $178,092,642 | $74,900,039 |
| Shares Outstanding | 14,747,929 | 9,834,809 | 18,664,025 | 8,868,767 |
| Net Asset Value and Redemption Price Per Share (net assets ÷ shares of beneficial interest outstanding) | $10.31 | $8.10 | $9.54 | $8.45 |
| Maximum Offering Price Per Share (100 ÷ 96.75 of net asset value per share) | $10.66 | $8.37 | $9.86 | $8.73 |
| Class C Shares | ||||
| Net Assets | $14,168,743 | $1,543,973 | $6,756,115 | $4,049,969 |
| Shares Outstanding | 1,487,687 | 190,704 | 707,687 | 479,846 |
| Net Asset Value and Offering Price Per Share* (net assets ÷ shares of beneficial interest outstanding) | $9.52 | $8.10 | $9.55 | $8.44 |
| September 30, 2024 | ||||
| California Opportunities Fund | Massachusetts Fund | New York Fund | Ohio Fund | |
| Class I Shares | ||||
| Net Assets | $776,103,981 | $85,299,827 | $177,975,034 | $109,708,520 |
| Shares Outstanding | 75,248,890 | 10,531,733 | 18,655,285 | 12,982,710 |
| Net Asset Value, Offering Price and Redemption Price Per Share (net assets ÷ shares of beneficial interest outstanding) | $10.31 | $8.10 | $9.54 | $8.45 |
| On sales of $100,000 or more, the offering price of Class A shares is reduced. | |
| * | Redemption price per share is equal to the net asset value less any applicable contingent deferred sales charge. |
| Year Ended September 30, 2024 | ||||
| California Opportunities Fund | Massachusetts Fund | New York Fund | Ohio Fund | |
| Investment Income | ||||
| Interest income | $35,390,880 | $6,419,175 | $15,505,776 | $7,855,481 |
| Total investment income | $35,390,880 | $6,419,175 | $15,505,776 | $7,855,481 |
| Expenses | ||||
| Investment adviser fee | $3,457,213 | $571,899 | $1,420,337 | $713,889 |
| Distribution and service fees: | ||||
| Class A | 318,251 | 161,333 | 359,448 | 153,842 |
| Class C | 158,424 | 25,479 | 74,473 | 40,926 |
| Trustees’ fees and expenses | 53,190 | 10,235 | 22,824 | 12,461 |
| Custodian fee | 204,139 | 42,196 | 87,191 | 49,538 |
| Transfer and dividend disbursing agent fees | 232,850 | 55,635 | 150,920 | 78,089 |
| Legal and accounting services | 122,100 | 78,256 | 82,560 | 83,558 |
| Printing and postage | 28,713 | 5,861 | 15,167 | 8,498 |
| Registration fees | 3,428 | 15,755 | 7,924 | 12,448 |
| Interest expense and fees | — | 146,263 | 608,881 | 347,169 |
| Miscellaneous | 103,971 | 28,817 | 63,622 | 49,208 |
| Total expenses | $4,682,279 | $1,141,729 | $2,893,347 | $1,549,626 |
| Net investment income | $30,708,601 | $5,277,446 | $12,612,429 | $6,305,855 |
| Realized and Unrealized Gain (Loss) | ||||
| Net realized gain (loss): | ||||
| Investment transactions | $766,243 | $(919,472) | $(6,913,623) | $(2,112,600) |
| Futures contracts | 2,334,123 | — | 146,121 | (17,991) |
| Net realized gain (loss) | $3,100,366 | $(919,472) | $(6,767,502) | $(2,130,591) |
| Change in unrealized appreciation (depreciation): | ||||
| Investments | $44,953,624 | $9,755,851 | $36,041,443 | $14,165,107 |
| Futures contracts | — | — | (533,013) | (141,508) |
| Net change in unrealized appreciation (depreciation) | $44,953,624 | $9,755,851 | $35,508,430 | $14,023,599 |
| Net realized and unrealized gain | $48,053,990 | $8,836,379 | $28,740,928 | $11,893,008 |
| Net increase in net assets from operations | $78,762,591 | $14,113,825 | $41,353,357 | $18,198,863 |
| Year Ended September 30, 2024 | ||||
| California Opportunities Fund | Massachusetts Fund | New York Fund | Ohio Fund | |
| Increase (Decrease) in Net Assets | ||||
| From operations: | ||||
| Net investment income | $30,708,601 | $5,277,446 | $12,612,429 | $6,305,855 |
| Net realized gain (loss) | 3,100,366 | (919,472) | (6,767,502) | (2,130,591) |
| Net change in unrealized appreciation (depreciation) | 44,953,624 | 9,755,851 | 35,508,430 | 14,023,599 |
| Net increase in net assets from operations | $78,762,591 | $14,113,825 | $41,353,357 | $18,198,863 |
| Distributions to shareholders: | ||||
| Class A | $(4,300,985) | $(2,637,587) | $(6,167,283) | $(2,483,187) |
| Class C | (416,910) | (67,151) | (209,586) | (106,559) |
| Class I | (25,405,471) | (2,529,754) | (6,052,909) | (3,743,742) |
| Total distributions to shareholders | $(30,123,366) | $(5,234,492) | $(12,429,778) | $(6,333,488) |
| Transactions in shares of beneficial interest: | ||||
| Class A | $28,297,420 | $(2,382,961) | $(14,331,106) | $(8,729,974) |
| Class C | (3,475,163) | (2,222,282) | (2,911,295) | (787,649) |
| Class I | 160,028,791 | 14,986,052 | 5,924,519 | (3,715,601) |
| Net increase (decrease) in net assets from Fund share transactions | $184,851,048 | $10,380,809 | $(11,317,882) | $(13,233,224) |
| Net increase (decrease) in net assets | $233,490,273 | $19,260,142 | $17,605,697 | $(1,367,849) |
| Net Assets | ||||
| At beginning of year | $708,790,902 | $147,223,907 | $345,218,094 | $190,026,377 |
| At end of year | $942,281,175 | $166,484,049 | $362,823,791 | $188,658,528 |
| Year Ended September 30, 2023 | ||||
| California Opportunities Fund | Massachusetts Fund | New York Fund | Ohio Fund | |
| Increase (Decrease) in Net Assets | ||||
| From operations: | ||||
| Net investment income | $21,266,761 | $4,522,833 | $11,196,832 | $5,876,216 |
| Net realized loss | (9,523,642) | (1,746,218) | (11,066,174) | (1,427,027) |
| Net change in unrealized appreciation (depreciation) | 3,997,134 | 697,654 | 9,616,292 | (879,730) |
| Net increase in net assets from operations | $15,740,253 | $3,474,269 | $9,746,950 | $3,569,459 |
| Distributions to shareholders: | ||||
| Class A | $(3,715,593) | $(2,272,650) | $(5,607,350) | $(2,515,854) |
| Class C | (447,384) | (90,608) | (244,518) | (117,013) |
| Class I | (16,695,418) | (2,135,702) | (5,196,140) | (3,188,149) |
| Total distributions to shareholders | $(20,858,395) | $(4,498,960) | $(11,048,008) | $(5,821,016) |
| Transactions in shares of beneficial interest: | ||||
| Class A | $(1,518,749) | $3,862,898 | $(7,192,578) | $(10,434,074) |
| Class C | (3,026,717) | (889,526) | (3,968,790) | (2,141,255) |
| Class I | 138,348,631 | 6,230,440 | 13,565,124 | 15,265,920 |
| Net increase in net assets from Fund share transactions | $133,803,165 | $9,203,812 | $2,403,756 | $2,690,591 |
| Net increase in net assets | $128,685,023 | $8,179,121 | $1,102,698 | $439,034 |
| Net Assets | ||||
| At beginning of year | $580,105,879 | $139,044,786 | $344,115,396 | $189,587,343 |
| At end of year | $708,790,902 | $147,223,907 | $345,218,094 | $190,026,377 |
| California Opportunities Fund — Class A | |||||
| Year Ended September 30, | |||||
| 2024 | 2023 | 2022 | 2021 | 2020 | |
| Net asset value — Beginning of year | $9.68 | $9.66 | $10.99 | $10.93 | $10.80 |
| Income (Loss) From Operations | |||||
| Net investment income(1) | $0.35 | $0.32 | $0.17 | $0.14 | $0.20 |
| Net realized and unrealized gain (loss) | 0.62 | 0.01(2) | (1.29) | 0.09 | 0.18 |
| Total income (loss) from operations | $0.97 | $0.33 | $(1.12) | $0.23 | $0.38 |
| Less Distributions | |||||
| From net investment income | $(0.34) | $(0.31) | $(0.17) | $(0.14) | $(0.21) |
| From net realized gain | — | — | (0.04) | (0.03) | (0.04) |
| Total distributions | $(0.34) | $(0.31) | $(0.21) | $(0.17) | $(0.25) |
| Net asset value — End of year | $10.31 | $9.68 | $9.66 | $10.99 | $10.93 |
| Total Return(3) | 10.16% | 3.37% | (10.35)% | 2.06% | 3.58% |
| Ratios/Supplemental Data | |||||
| Net assets, end of year (000’s omitted) | $152,008 | $116,041 | $117,491 | $145,636 | $147,662 |
| Ratios (as a percentage of average daily net assets):(4) | |||||
| Expenses excluding interest and fees | 0.75% | 0.75% | 0.71% | 0.69% | 0.71% |
| Interest and fee expense(5) | — | — | — | — | 0.01% |
| Total expenses | 0.75% | 0.75% | 0.71% | 0.69% | 0.72% |
| Net expenses | 0.75% | 0.75% | 0.71% | 0.69% | 0.72% |
| Net investment income | 3.44% | 3.17% | 1.59% | 1.23% | 1.88% |
| Portfolio Turnover | 173% | 171% | 170% | 104% | 184% |
| (1) | Computed using average shares outstanding. |
| (2) | The per share amount is not in accord with the net realized and unrealized gain (loss) for the period because of the timing of Fund share transactions and the amount of the per share realized and unrealized gains and losses at such time. |
| (3) | Returns are historical and are calculated by determining the percentage change in net asset value with all distributions reinvested and do not reflect the effect of sales charges. |
| (4) | Total expenses do not reflect amounts reimbursed and/or waived by the adviser and certain of its affiliates, if applicable. Net expenses are net of all reductions and represent the net expenses paid by the Fund. |
| (5) | Interest and fee expense relates to the liability for floating rate notes issued in conjunction with residual interest bond transactions (see Note 1H). |
| California Opportunities Fund — Class C | |||||
| Year Ended September 30, | |||||
| 2024 | 2023 | 2022 | 2021 | 2020 | |
| Net asset value — Beginning of year | $8.95 | $8.93 | $10.15 | $10.11 | $9.99 |
| Income (Loss) From Operations | |||||
| Net investment income(1) | $0.25 | $0.22 | $0.08 | $0.05 | $0.11 |
| Net realized and unrealized gain (loss) | 0.56 | 0.02(2) | (1.18) | 0.07 | 0.17 |
| Total income (loss) from operations | $0.81 | $0.24 | $(1.10) | $0.12 | $0.28 |
| Less Distributions | |||||
| From net investment income | $(0.24) | $(0.22) | $(0.08) | $(0.05) | $(0.12) |
| From net realized gain | — | — | (0.04) | (0.03) | (0.04) |
| Total distributions | $(0.24) | $(0.22) | $(0.12) | $(0.08) | $(0.16) |
| Net asset value — End of year | $9.52 | $8.95 | $8.93 | $10.15 | $10.11 |
| Total Return(3) | 9.20% | 2.62% | (10.92)% | 1.16% | 2.83% |
| Ratios/Supplemental Data | |||||
| Net assets, end of year (000’s omitted) | $14,169 | $16,663 | $19,575 | $30,823 | $28,977 |
| Ratios (as a percentage of average daily net assets):(4) | |||||
| Expenses excluding interest and fees | 1.50% | 1.50% | 1.46% | 1.44% | 1.46% |
| Interest and fee expense(5) | — | — | — | — | 0.01% |
| Total expenses | 1.50% | 1.50% | 1.46% | 1.44% | 1.47% |
| Net expenses | 1.50% | 1.50% | 1.46% | 1.44% | 1.47% |
| Net investment income | 2.70% | 2.42% | 0.81% | 0.48% | 1.13% |
| Portfolio Turnover | 173% | 171% | 170% | 104% | 184% |
| (1) | Computed using average shares outstanding. |
| (2) | The per share amount is not in accord with the net realized and unrealized gain (loss) for the period because of the timing of Fund share transactions and the amount of the per share realized and unrealized gains and losses at such time. |
| (3) | Returns are historical and are calculated by determining the percentage change in net asset value with all distributions reinvested and do not reflect the effect of sales charges. |
| (4) | Total expenses do not reflect amounts reimbursed and/or waived by the adviser and certain of its affiliates, if applicable. Net expenses are net of all reductions and represent the net expenses paid by the Fund. |
| (5) | Interest and fee expense relates to the liability for floating rate notes issued in conjunction with residual interest bond transactions (see Note 1H). |
| California Opportunities Fund — Class I | |||||
| Year Ended September 30, | |||||
| 2024 | 2023 | 2022 | 2021 | 2020 | |
| Net asset value — Beginning of year | $9.69 | $9.67 | $10.99 | $10.94 | $10.81 |
| Income (Loss) From Operations | |||||
| Net investment income(1) | $0.37 | $0.34 | $0.19 | $0.16 | $0.23 |
| Net realized and unrealized gain (loss) | 0.62 | 0.02(2) | (1.28) | 0.08 | 0.18 |
| Total income (loss) from operations | $0.99 | $0.36 | $(1.09) | $0.24 | $0.41 |
| Less Distributions | |||||
| From net investment income | $(0.37) | $(0.34) | $(0.19) | $(0.16) | $(0.24) |
| From net realized gain | — | — | (0.04) | (0.03) | (0.04) |
| Total distributions | $(0.37) | $(0.34) | $(0.23) | $(0.19) | $(0.28) |
| Net asset value — End of year | $10.31 | $9.69 | $9.67 | $10.99 | $10.94 |
| Total Return(3) | 10.32% | 3.63% | (10.03)% | 2.22% | 3.82% |
| Ratios/Supplemental Data | |||||
| Net assets, end of year (000’s omitted) | $776,104 | $576,087 | $443,039 | $572,453 | $410,090 |
| Ratios (as a percentage of average daily net assets):(4) | |||||
| Expenses excluding interest and fees | 0.50% | 0.50% | 0.46% | 0.44% | 0.46% |
| Interest and fee expense(5) | — | — | — | — | 0.01% |
| Total expenses | 0.50% | 0.50% | 0.46% | 0.44% | 0.47% |
| Net expenses | 0.50% | 0.50% | 0.46% | 0.44% | 0.47% |
| Net investment income | 3.69% | 3.43% | 1.83% | 1.47% | 2.08% |
| Portfolio Turnover | 173% | 171% | 170% | 104% | 184% |
| (1) | Computed using average shares outstanding. |
| (2) | The per share amount is not in accord with the net realized and unrealized gain (loss) for the period because of the timing of Fund share transactions and the amount of the per share realized and unrealized gains and losses at such time. |
| (3) | Returns are historical and are calculated by determining the percentage change in net asset value with all distributions reinvested. |
| (4) | Total expenses do not reflect amounts reimbursed and/or waived by the adviser and certain of its affiliates, if applicable. Net expenses are net of all reductions and represent the net expenses paid by the Fund. |
| (5) | Interest and fee expense relates to the liability for floating rate notes issued in conjunction with residual interest bond transactions (see Note 1H). |
| Massachusetts Fund — Class A | |||||
| Year Ended September 30, | |||||
| 2024 | 2023 | 2022 | 2021 | 2020 | |
| Net asset value — Beginning of year | $7.63 | $7.65 | $8.97 | $9.03 | $8.98 |
| Income (Loss) From Operations | |||||
| Net investment income(1) | $0.26 | $0.24 | $0.18 | $0.17 | $0.21 |
| Net realized and unrealized gain (loss) | 0.47 | (0.02) | (1.32) | (0.06) | 0.07 |
| Total income (loss) from operations | $0.73 | $0.22 | $(1.14) | $0.11 | $0.28 |
| Less Distributions | |||||
| From net investment income | $(0.26) | $(0.24) | $(0.18) | $(0.17) | $(0.23) |
| Total distributions | $(0.26) | $(0.24) | $(0.18) | $(0.17) | $(0.23) |
| Net asset value — End of year | $8.10 | $7.63 | $7.65 | $8.97 | $9.03 |
| Total Return(2) | 9.68% | 2.75% | (12.89)% | 1.23% | 3.13% |
| Ratios/Supplemental Data | |||||
| Net assets, end of year (000’s omitted) | $79,640 | $77,294 | $73,926 | $96,499 | $100,099 |
| Ratios (as a percentage of average daily net assets):(3) | |||||
| Expenses excluding interest and fees | 0.72% | 0.70% | 0.68% | 0.65% | 0.68% |
| Interest and fee expense(4) | 0.09% | 0.09% | 0.02% | 0.01% | 0.03% |
| Total expenses | 0.81% | 0.79% | 0.70% | 0.66% | 0.71% |
| Net expenses | 0.81% | 0.79% | 0.70% | 0.66% | 0.71% |
| Net investment income | 3.30% | 2.99% | 2.09% | 1.83% | 2.30% |
| Portfolio Turnover | 57% | 39% | 46% | 26% | 15% |
| (1) | Computed using average shares outstanding. |
| (2) | Returns are historical and are calculated by determining the percentage change in net asset value with all distributions reinvested and do not reflect the effect of sales charges. |
| (3) | Total expenses do not reflect amounts reimbursed and/or waived by the adviser and certain of its affiliates, if applicable. Net expenses are net of all reductions and represent the net expenses paid by the Fund. |
| (4) | Interest and fee expense relates to the liability for floating rate notes issued in conjunction with residual interest bond transactions (see Note 1H). |
| Massachusetts Fund — Class C | |||||
| Year Ended September 30, | |||||
| 2024 | 2023 | 2022 | 2021 | 2020 | |
| Net asset value — Beginning of year | $7.63 | $7.65 | $8.96 | $9.04 | $8.99 |
| Income (Loss) From Operations | |||||
| Net investment income(1) | $0.20 | $0.18 | $0.11 | $0.10 | $0.14 |
| Net realized and unrealized gain (loss) | 0.47 | (0.02) | (1.31) | (0.07) | 0.07 |
| Total income (loss) from operations | $0.67 | $0.16 | $(1.20) | $0.03 | $0.21 |
| Less Distributions | |||||
| From net investment income | $(0.20) | $(0.18) | $(0.11) | $(0.11) | $(0.16) |
| Total distributions | $(0.20) | $(0.18) | $(0.11) | $(0.11) | $(0.16) |
| Net asset value — End of year | $8.10 | $7.63 | $7.65 | $8.96 | $9.04 |
| Total Return(2) | 8.86% | 1.99% | (13.45)% | 0.39% | 2.40% |
| Ratios/Supplemental Data | |||||
| Net assets, end of year (000’s omitted) | $1,544 | $3,581 | $4,452 | $8,464 | $9,811 |
| Ratios (as a percentage of average daily net assets):(3) | |||||
| Expenses excluding interest and fees | 1.47% | 1.45% | 1.43% | 1.40% | 1.43% |
| Interest and fee expense(4) | 0.09% | 0.09% | 0.02% | 0.01% | 0.03% |
| Total expenses | 1.56% | 1.54% | 1.45% | 1.41% | 1.46% |
| Net expenses | 1.56% | 1.54% | 1.45% | 1.41% | 1.46% |
| Net investment income | 2.54% | 2.24% | 1.31% | 1.08% | 1.56% |
| Portfolio Turnover | 57% | 39% | 46% | 26% | 15% |
| (1) | Computed using average shares outstanding. |
| (2) | Returns are historical and are calculated by determining the percentage change in net asset value with all distributions reinvested and do not reflect the effect of sales charges. |
| (3) | Total expenses do not reflect amounts reimbursed and/or waived by the adviser and certain of its affiliates, if applicable. Net expenses are net of all reductions and represent the net expenses paid by the Fund. |
| (4) | Interest and fee expense relates to the liability for floating rate notes issued in conjunction with residual interest bond transactions (see Note 1H). |
| Massachusetts Fund — Class I | |||||
| Year Ended September 30, | |||||
| 2024 | 2023 | 2022 | 2021 | 2020 | |
| Net asset value — Beginning of year | $7.63 | $7.66 | $8.97 | $9.03 | $8.98 |
| Income (Loss) From Operations | |||||
| Net investment income(1) | $0.28 | $0.25 | $0.19 | $0.18 | $0.22 |
| Net realized and unrealized gain (loss) | 0.47 | (0.03) | (1.31) | (0.05) | 0.07 |
| Total income (loss) from operations | $0.75 | $0.22 | $(1.12) | $0.13 | $0.29 |
| Less Distributions | |||||
| From net investment income | $(0.28) | $(0.25) | $(0.19) | $(0.19) | $(0.24) |
| Total distributions | $(0.28) | $(0.25) | $(0.19) | $(0.19) | $(0.24) |
| Net asset value — End of year | $8.10 | $7.63 | $7.66 | $8.97 | $9.03 |
| Total Return(2) | 9.90% | 2.82% | (12.60)% | 1.42% | 3.31% |
| Ratios/Supplemental Data | |||||
| Net assets, end of year (000’s omitted) | $85,300 | $66,350 | $60,667 | $99,684 | $96,780 |
| Ratios (as a percentage of average daily net assets):(3) | |||||
| Expenses excluding interest and fees | 0.52% | 0.50% | 0.48% | 0.45% | 0.48% |
| Interest and fee expense(4) | 0.09% | 0.09% | 0.02% | 0.01% | 0.03% |
| Total expenses | 0.61% | 0.59% | 0.50% | 0.46% | 0.51% |
| Net expenses | 0.61% | 0.59% | 0.50% | 0.46% | 0.51% |
| Net investment income | 3.50% | 3.19% | 2.27% | 2.03% | 2.48% |
| Portfolio Turnover | 57% | 39% | 46% | 26% | 15% |
| (1) | Computed using average shares outstanding. |
| (2) | Returns are historical and are calculated by determining the percentage change in net asset value with all distributions reinvested. |
| (3) | Total expenses do not reflect amounts reimbursed and/or waived by the adviser and certain of its affiliates, if applicable. Net expenses are net of all reductions and represent the net expenses paid by the Fund. |
| (4) | Interest and fee expense relates to the liability for floating rate notes issued in conjunction with residual interest bond transactions (see Note 1H). |
| New York Fund — Class A | |||||
| Year Ended September 30, | |||||
| 2024 | 2023 | 2022 | 2021 | 2020 | |
| Net asset value — Beginning of year | $8.77 | $8.79 | $10.40 | $10.47 | $10.38 |
| Income (Loss) From Operations | |||||
| Net investment income(1) | $0.32 | $0.28 | $0.19 | $0.16 | $0.22 |
| Net realized and unrealized gain (loss) | 0.77 | (0.03) | (1.53) | 0.18 | 0.10 |
| Total income (loss) from operations | $1.09 | $0.25 | $(1.34) | $0.34 | $0.32 |
| Less Distributions | |||||
| From net investment income | $(0.32) | $(0.27) | $(0.19) | $(0.16) | $(0.23) |
| From net realized gain | — | — | (0.08) | (0.25) | — |
| Total distributions | $(0.32) | $(0.27) | $(0.27) | $(0.41) | $(0.23) |
| Net asset value — End of year | $9.54 | $8.77 | $8.79 | $10.40 | $10.47 |
| Total Return(2) | 12.57% | 2.77% | (13.09)% | 3.30% | 3.11% |
| Ratios/Supplemental Data | |||||
| Net assets, end of year (000’s omitted) | $178,093 | $177,164 | $184,700 | $250,441 | $240,960 |
| Ratios (as a percentage of average daily net assets):(3) | |||||
| Expenses excluding interest and fees | 0.72% | 0.71% | 0.68% | 0.65% | 0.67% |
| Interest and fee expense(4) | 0.17% | 0.13% | 0.00%(5) | — | — |
| Total expenses | 0.89% | 0.84% | 0.68% | 0.65% | 0.67% |
| Net expenses | 0.89% | 0.84% | 0.68% | 0.65% | 0.67% |
| Net investment income | 3.48% | 3.00% | 1.96% | 1.55% | 2.07% |
| Portfolio Turnover | 67% | 54% | 59% | 63% | 125% |
| (1) | Computed using average shares outstanding. |
| (2) | Returns are historical and are calculated by determining the percentage change in net asset value with all distributions reinvested and do not reflect the effect of sales charges. |
| (3) | Total expenses do not reflect amounts reimbursed and/or waived by the adviser and certain of its affiliates, if applicable. Net expenses are net of all reductions and represent the net expenses paid by the Fund. |
| (4) | Interest and fee expense relates to the liability for floating rate notes issued in conjunction with residual interest bond transactions (see Note 1H). |
| (5) | Amount is less than 0.005%. |
| New York Fund — Class C | |||||
| Year Ended September 30, | |||||
| 2024 | 2023 | 2022 | 2021 | 2020 | |
| Net asset value — Beginning of year | $8.77 | $8.80 | $10.40 | $10.47 | $10.39 |
| Income (Loss) From Operations | |||||
| Net investment income(1) | $0.25 | $0.21 | $0.12 | $0.09 | $0.14 |
| Net realized and unrealized gain (loss) | 0.78 | (0.04) | (1.52) | 0.17 | 0.09 |
| Total income (loss) from operations | $1.03 | $0.17 | $(1.40) | $0.26 | $0.23 |
| Less Distributions | |||||
| From net investment income | $(0.25) | $(0.20) | $(0.12) | $(0.08) | $(0.15) |
| From net realized gain | — | — | (0.08) | (0.25) | — |
| Total distributions | $(0.25) | $(0.20) | $(0.20) | $(0.33) | $(0.15) |
| Net asset value — End of year | $9.55 | $8.77 | $8.80 | $10.40 | $10.47 |
| Total Return(2) | 11.84% | 1.89% | (13.65)% | 2.53% | 2.25% |
| Ratios/Supplemental Data | |||||
| Net assets, end of year (000’s omitted) | $6,756 | $8,975 | $12,833 | $22,375 | $31,347 |
| Ratios (as a percentage of average daily net assets):(3) | |||||
| Expenses excluding interest and fees | 1.48% | 1.46% | 1.43% | 1.40% | 1.42% |
| Interest and fee expense(4) | 0.17% | 0.13% | 0.00%(5) | — | — |
| Total expenses | 1.65% | 1.59% | 1.43% | 1.40% | 1.42% |
| Net expenses | 1.65% | 1.59% | 1.43% | 1.40% | 1.42% |
| Net investment income | 2.73% | 2.24% | 1.19% | 0.81% | 1.33% |
| Portfolio Turnover | 67% | 54% | 59% | 63% | 125% |
| (1) | Computed using average shares outstanding. |
| (2) | Returns are historical and are calculated by determining the percentage change in net asset value with all distributions reinvested and do not reflect the effect of sales charges. |
| (3) | Total expenses do not reflect amounts reimbursed and/or waived by the adviser and certain of its affiliates, if applicable. Net expenses are net of all reductions and represent the net expenses paid by the Fund. |
| (4) | Interest and fee expense relates to the liability for floating rate notes issued in conjunction with residual interest bond transactions (see Note 1H). |
| (5) | Amount is less than 0.005%. |
| New York Fund — Class I | |||||
| Year Ended September 30, | |||||
| 2024 | 2023 | 2022 | 2021 | 2020 | |
| Net asset value — Beginning of year | $8.77 | $8.79 | $10.39 | $10.47 | $10.38 |
| Income (Loss) From Operations | |||||
| Net investment income(1) | $0.34 | $0.29 | $0.21 | $0.18 | $0.24 |
| Net realized and unrealized gain (loss) | 0.77 | (0.02) | (1.52) | 0.17 | 0.10 |
| Total income (loss) from operations | $1.11 | $0.27 | $(1.31) | $0.35 | $0.34 |
| Less Distributions | |||||
| From net investment income | $(0.34) | $(0.29) | $(0.21) | $(0.18) | $(0.25) |
| From net realized gain | — | — | (0.08) | (0.25) | — |
| Total distributions | $(0.34) | $(0.29) | $(0.29) | $(0.43) | $(0.25) |
| Net asset value — End of year | $9.54 | $8.77 | $8.79 | $10.39 | $10.47 |
| Total Return(2) | 12.79% | 2.98% | (12.83)% | 3.41% | 3.30% |
| Ratios/Supplemental Data | |||||
| Net assets, end of year (000’s omitted) | $177,975 | $159,079 | $146,582 | $191,239 | $165,573 |
| Ratios (as a percentage of average daily net assets):(3) | |||||
| Expenses excluding interest and fees | 0.52% | 0.51% | 0.48% | 0.45% | 0.47% |
| Interest and fee expense(4) | 0.17% | 0.13% | 0.00%(5) | — | — |
| Total expenses | 0.69% | 0.64% | 0.48% | 0.45% | 0.47% |
| Net expenses | 0.69% | 0.64% | 0.48% | 0.45% | 0.47% |
| Net investment income | 3.68% | 3.20% | 2.16% | 1.74% | 2.27% |
| Portfolio Turnover | 67% | 54% | 59% | 63% | 125% |
| (1) | Computed using average shares outstanding. |
| (2) | Returns are historical and are calculated by determining the percentage change in net asset value with all distributions reinvested. |
| (3) | Total expenses do not reflect amounts reimbursed and/or waived by the adviser and certain of its affiliates, if applicable. Net expenses are net of all reductions and represent the net expenses paid by the Fund. |
| (4) | Interest and fee expense relates to the liability for floating rate notes issued in conjunction with residual interest bond transactions (see Note 1H). |
| (5) | Amount is less than 0.005%. |
| Ohio Fund — Class A | |||||
| Year Ended September 30, | |||||
| 2024 | 2023 | 2022 | 2021 | 2020 | |
| Net asset value — Beginning of year | $7.93 | $8.02 | $9.26 | $9.32 | $9.21 |
| Income (Loss) From Operations | |||||
| Net investment income(1) | $0.27 | $0.24 | $0.23 | $0.24 | $0.26 |
| Net realized and unrealized gain (loss) | 0.52 | (0.09) | (1.24) | (0.06) | 0.11 |
| Total income (loss) from operations | $0.79 | $0.15 | $(1.01) | $0.18 | $0.37 |
| Less Distributions | |||||
| From net investment income | $(0.27) | $(0.24) | $(0.23) | $(0.24) | $(0.26) |
| Total distributions | $(0.27) | $(0.24) | $(0.23) | $(0.24) | $(0.26) |
| Net asset value — End of year | $8.45 | $7.93 | $8.02 | $9.26 | $9.32 |
| Total Return(2) | 10.05% | 1.81% | (11.06)% | 1.95% | 4.11% |
| Ratios/Supplemental Data | |||||
| Net assets, end of year (000’s omitted) | $74,900 | $78,705 | $89,734 | $111,629 | $105,917 |
| Ratios (as a percentage of average daily net assets):(3) | |||||
| Expenses excluding interest and fees | 0.73% | 0.70% | 0.70% | 0.68% | 0.69% |
| Interest and fee expense(4) | 0.18% | 0.16% | 0.05% | 0.03% | 0.07% |
| Total expenses | 0.91% | 0.86% | 0.75% | 0.71% | 0.76% |
| Net expenses | 0.91% | 0.86% | 0.75% | 0.71% | 0.76% |
| Net investment income | 3.21% | 2.95% | 2.66% | 2.60% | 2.84% |
| Portfolio Turnover | 40% | 28% | 17% | 3% | 11% |
| (1) | Computed using average shares outstanding. |
| (2) | Returns are historical and are calculated by determining the percentage change in net asset value with all distributions reinvested and do not reflect the effect of sales charges. |
| (3) | Total expenses do not reflect amounts reimbursed and/or waived by the adviser and certain of its affiliates, if applicable. Net expenses are net of all reductions and represent the net expenses paid by the Fund. |
| (4) | Interest and fee expense relates to the liability for floating rate notes issued in conjunction with residual interest bond transactions (see Note 1H). |
| Ohio Fund — Class C | |||||
| Year Ended September 30, | |||||
| 2024 | 2023 | 2022 | 2021 | 2020 | |
| Net asset value — Beginning of year | $7.93 | $8.01 | $9.26 | $9.32 | $9.20 |
| Income (Loss) From Operations | |||||
| Net investment income(1) | $0.20 | $0.18 | $0.17 | $0.17 | $0.19 |
| Net realized and unrealized gain (loss) | 0.52 | (0.08) | (1.25) | (0.06) | 0.12 |
| Total income (loss) from operations | $0.72 | $0.10 | $(1.08) | $0.11 | $0.31 |
| Less Distributions | |||||
| From net investment income | $(0.21) | $(0.18) | $(0.17) | $(0.17) | $(0.19) |
| Total distributions | $(0.21) | $(0.18) | $(0.17) | $(0.17) | $(0.19) |
| Net asset value — End of year | $8.44 | $7.93 | $8.01 | $9.26 | $9.32 |
| Total Return(2) | 9.10% | 1.17% | (11.84)% | 1.19% | 3.45% |
| Ratios/Supplemental Data | |||||
| Net assets, end of year (000’s omitted) | $4,050 | $4,561 | $6,697 | $11,078 | $10,805 |
| Ratios (as a percentage of average daily net assets):(3) | |||||
| Expenses excluding interest and fees | 1.48% | 1.46% | 1.45% | 1.43% | 1.44% |
| Interest and fee expense(4) | 0.18% | 0.16% | 0.05% | 0.03% | 0.07% |
| Total expenses | 1.66% | 1.62% | 1.50% | 1.46% | 1.51% |
| Net expenses | 1.66% | 1.62% | 1.50% | 1.46% | 1.51% |
| Net investment income | 2.46% | 2.19% | 1.90% | 1.85% | 2.09% |
| Portfolio Turnover | 40% | 28% | 17% | 3% | 11% |
| (1) | Computed using average shares outstanding. |
| (2) | Returns are historical and are calculated by determining the percentage change in net asset value with all distributions reinvested and do not reflect the effect of sales charges. |
| (3) | Total expenses do not reflect amounts reimbursed and/or waived by the adviser and certain of its affiliates, if applicable. Net expenses are net of all reductions and represent the net expenses paid by the Fund. |
| (4) | Interest and fee expense relates to the liability for floating rate notes issued in conjunction with residual interest bond transactions (see Note 1H). |
| Ohio Fund — Class I | |||||
| Year Ended September 30, | |||||
| 2024 | 2023 | 2022 | 2021 | 2020 | |
| Net asset value — Beginning of year | $7.94 | $8.02 | $9.27 | $9.33 | $9.21 |
| Income (Loss) From Operations | |||||
| Net investment income(1) | $0.28 | $0.26 | $0.25 | $0.26 | $0.28 |
| Net realized and unrealized gain (loss) | 0.51 | (0.08) | (1.25) | (0.06) | 0.12 |
| Total income (loss) from operations | $0.79 | $0.18 | $(1.00) | $0.20 | $0.40 |
| Less Distributions | |||||
| From net investment income | $(0.28) | $(0.26) | $(0.25) | $(0.26) | $(0.28) |
| Total distributions | $(0.28) | $(0.26) | $(0.25) | $(0.26) | $(0.28) |
| Net asset value — End of year | $8.45 | $7.94 | $8.02 | $9.27 | $9.33 |
| Total Return(2) | 10.13% | 2.14% | (10.98)% | 2.16% | 4.43% |
| Ratios/Supplemental Data | |||||
| Net assets, end of year (000’s omitted) | $109,709 | $106,759 | $93,156 | $73,812 | $63,267 |
| Ratios (as a percentage of average daily net assets):(3) | |||||
| Expenses excluding interest and fees | 0.53% | 0.50% | 0.50% | 0.48% | 0.49% |
| Interest and fee expense(4) | 0.18% | 0.16% | 0.05% | 0.03% | 0.07% |
| Total expenses | 0.71% | 0.66% | 0.55% | 0.51% | 0.56% |
| Net expenses | 0.71% | 0.66% | 0.55% | 0.51% | 0.56% |
| Net investment income | 3.41% | 3.15% | 2.87% | 2.80% | 3.04% |
| Portfolio Turnover | 40% | 28% | 17% | 3% | 11% |
| (1) | Computed using average shares outstanding. |
| (2) | Returns are historical and are calculated by determining the percentage change in net asset value with all distributions reinvested. |
| (3) | Total expenses do not reflect amounts reimbursed and/or waived by the adviser and certain of its affiliates, if applicable. Net expenses are net of all reductions and represent the net expenses paid by the Fund. |
| (4) | Interest and fee expense relates to the liability for floating rate notes issued in conjunction with residual interest bond transactions (see Note 1H). |
| Massachusetts Fund | New York Fund | Ohio Fund | |
| Floating Rate Notes Outstanding | $3,662,459 | $15,245,096 | $ 8,460,967 |
| Interest Rate or Range of Interest Rates (%) | 3.18 | 3.15 - 3.18 | 3.24 - 3.27 |
| Collateral for Floating Rate Notes Outstanding | $6,398,792 | $21,122,160 | $13,565,906 |
| Massachusetts Fund | New York Fund | Ohio Fund | |
| Average Floating Rate Notes Outstanding | $3,640,000 | $15,200,000 | $ 8,435,000 |
| Average Interest Rate | 4.02% | 4.01% | 4.12% |
| Year Ended September 30, 2024 | ||||
| California Opportunities Fund | Massachusetts Fund | New York Fund | Ohio Fund | |
| Tax-exempt income | $25,063,799 | $5,177,628 | $11,990,413 | $6,202,125 |
| Ordinary income | $5,059,567 | $56,864 | $439,365 | $131,363 |
| Year Ended September 30, 2023 | ||||
| California Opportunities Fund | Massachusetts Fund | New York Fund | Ohio Fund | |
| Tax-exempt income | $17,916,804 | $4,379,717 | $10,802,158 | $5,821,016 |
| Ordinary income | $2,941,591 | $119,243 | $245,850 | $ — |
| California Opportunities Fund | Massachusetts Fund | New York Fund | Ohio Fund | |
| Change in: | ||||
| Paid-in capital | $ — | $ — | $ — | $(3,910) |
| Accumulated loss | $ — | $ — | $ — | $3,910 |
| California Opportunities Fund | Massachusetts Fund | New York Fund | Ohio Fund | |
| Undistributed tax-exempt income | $ 495,060 | $ 154,684 | $ 69,853 | $ — |
| Deferred capital losses | (40,129,315) | (11,084,365) | (35,393,314) | (14,950,272) |
| Net unrealized appreciation | 25,342,510 | 5,452,502 | 17,569,465 | 5,714,674 |
| Distributions payable | (503,457) | (154,681) | (141,920) | (36,045) |
| Accumulated loss | $(14,795,202) | $(5,631,860) | $(17,895,916) | $(9,271,643) |
| California Opportunities Fund | Massachusetts Fund | New York Fund | Ohio Fund | |
| Deferred capital losses: | ||||
| Short-term | $23,571,073 | $3,989,987 | $12,613,131 | $7,294,696 |
| Long-term | $16,558,242 | $7,094,378 | $22,780,183 | $7,655,576 |
| California Opportunities Fund | Massachusetts Fund | New York Fund | Ohio Fund | |
| Aggregate cost | $940,913,017 | $157,397,775 | $355,370,951 | $181,693,363 |
| Gross unrealized appreciation | $28,441,737 | $6,060,088 | $18,794,240 | $6,634,866 |
| Gross unrealized depreciation | (3,099,227) | (607,586) | (1,224,775) | (920,192) |
| Net unrealized appreciation | $25,342,510 | $5,452,502 | $17,569,465 | $5,714,674 |
| Total Daily Net Assets | Annual Asset Rate | Daily Income Rate |
| Up to $500 million | 0.300% | 3.000% |
| $500 million but less than $1 billion | 0.275% | 2.750% |
| $1 billion but less than $1.5 billion | 0.250% | 2.500% |
| $1.5 billion but less than $2 billion | 0.225% | 2.250% |
| $2 billion but less than $3 billion | 0.200% | 2.000% |
| $3 billion and over | 0.175% | 1.750% |
| Total Daily Net Assets | Annual Asset Rate | Daily Income Rate |
| Up to $20 million | 0.100% | 1.000% |
| $20 million but less than $40 million | 0.200% | 2.000% |
| $40 million but less than $500 million | 0.300% | 3.000% |
| $500 million but less than $1 billion | 0.275% | 2.750% |
| $1 billion but less than $1.5 billion | 0.250% | 2.500% |
| $1.5 billion but less than $2 billion | 0.225% | 2.250% |
| $2 billion but less than $3 billion | 0.200% | 2.000% |
| $3 billion and over | 0.175% | 1.750% |
| California Opportunities Fund | Massachusetts Fund | New York Fund | Ohio Fund | |
| Investment Adviser Fee | $3,457,213 | $571,899 | $1,420,337 | $713,889 |
| Effective Annual Rate | 0.41% | 0.37% | 0.40% | 0.37% |
| California Opportunities Fund | Massachusetts Fund | New York Fund | Ohio Fund | |
| EVM's Sub-Transfer Agent Fees | $11,888 | $12,154 | $31,991 | $11,042 |
| EVD's Class A Sales Charges | $10,455 | $4,670 | $6,390 | $6,001 |
| Morgan Stanley affiliated broker-dealers’ Class A Sales Charges | $8,718 | $180 | $1,575 | $182 |
| California Opportunities Fund | Massachusetts Fund | New York Fund | Ohio Fund | |
| Class A Distribution and Service Fees | $318,251 | $161,333 | $359,448 | $153,842 |
| California Opportunities Fund | Massachusetts Fund | New York Fund | Ohio Fund | |
| Class C Distribution Fees | $118,818 | $20,115 | $58,795 | $32,310 |
| California Opportunities Fund | Massachusetts Fund | New York Fund | Ohio Fund | |
| Class C Service Fees | $39,606 | $5,364 | $15,678 | $8,616 |
| California Opportunities Fund | Massachusetts Fund | New York Fund | Ohio Fund | |
| Class A | $260 | $14,097 | $6,518 | $127 |
| Class C | $581 | $ —(1) | $314 | $ —(1) |
| (1) | Amount is less than $100. |
| California Opportunities Fund | Massachusetts Fund | New York Fund | Ohio Fund | |
| Purchases | $1,675,021,818 | $102,182,206 | $249,386,087 | $79,385,300 |
| Sales | $1,473,942,215 | $89,002,480 | $257,744,697 | $90,484,518 |
| California Opportunities Fund | ||||||
| Year Ended September 30, 2024 | Year Ended September 30, 2023 | |||||
| Shares | Amount | Shares | Amount | |||
| Class A | ||||||
| Sales | 5,202,953 | $ 52,722,344 | 3,210,174 | $ 31,996,528 | ||
| Issued to shareholders electing to receive payments of distributions in Fund shares | 349,084 | 3,523,217 | 309,870 | 3,083,987 | ||
| Redemptions | (2,789,525) | (27,948,141) | (3,695,521) | (36,599,264) | ||
| Net increase (decrease) | 2,762,512 | $ 28,297,420 | (175,477) | $ (1,518,749) | ||
| Class C | ||||||
| Sales | 295,656 | $ 2,764,543 | 201,530 | $ 1,866,339 | ||
| Issued to shareholders electing to receive payments of distributions in Fund shares | 43,260 | 402,945 | 47,024 | 432,478 | ||
| Redemptions | (713,777) | (6,642,651) | (578,759) | (5,325,534) | ||
| Net decrease | (374,861) | $ (3,475,163) | (330,205) | $ (3,026,717) | ||
| Class I | ||||||
| Sales | 42,003,134 | $423,104,978 | 40,461,257 | $403,806,256 | ||
| Issued to shareholders electing to receive payments of distributions in Fund shares | 2,050,589 | 20,718,440 | 1,383,987 | 13,777,277 | ||
| Redemptions | (28,267,847) | (283,794,627) | (28,209,870) | (279,234,902) | ||
| Net increase | 15,785,876 | $160,028,791 | 13,635,374 | $138,348,631 | ||
| Massachusetts Fund | ||||||
| Year Ended September 30, 2024 | Year Ended September 30, 2023 | |||||
| Shares | Amount | Shares | Amount | |||
| Class A | ||||||
| Sales | 1,475,715 | $11,682,258 | 1,762,992 | $14,075,617 | ||
| Issued to shareholders electing to receive payments of distributions in Fund shares | 268,535 | 2,137,461 | 236,480 | 1,869,800 | ||
| Redemptions | (2,042,173) | (16,202,680) | (1,524,746) | (12,082,519) | ||
| Net increase (decrease) | (297,923) | $(2,382,961) | 474,726 | $ 3,862,898 | ||
| Massachusetts Fund (continued) | ||||||
| Year Ended September 30, 2024 | Year Ended September 30, 2023 | |||||
| Shares | Amount | Shares | Amount | |||
| Class C | ||||||
| Sales | 33,995 | $ 271,306 | 19,774 | $ 156,020 | ||
| Issued to shareholders electing to receive payments of distributions in Fund shares | 7,982 | 63,397 | 10,292 | 81,356 | ||
| Redemptions | (320,772) | (2,556,985) | (142,299) | (1,126,902) | ||
| Net decrease | (278,795) | $(2,222,282) | (112,233) | $ (889,526) | ||
| Class I | ||||||
| Sales | 5,054,098 | $40,375,494 | 4,263,610 | $33,675,931 | ||
| Issued to shareholders electing to receive payments of distributions in Fund shares | 198,970 | 1,583,141 | 196,992 | 1,558,745 | ||
| Redemptions | (3,417,540) | (26,972,583) | (3,688,754) | (29,004,236) | ||
| Net increase | 1,835,528 | $14,986,052 | 771,848 | $ 6,230,440 | ||
| New York Fund | ||||||
| Year Ended September 30, 2024 | Year Ended September 30, 2023 | |||||
| Shares | Amount | Shares | Amount | |||
| Class A | ||||||
| Sales | 1,748,056 | $16,203,268 | 2,956,765 | $27,189,945 | ||
| Issued to shareholders electing to receive payments of distributions in Fund shares | 576,288 | 5,377,817 | 539,993 | 4,935,256 | ||
| Redemptions | (3,867,688) | (35,912,191) | (4,296,846) | (39,317,779) | ||
| Net decrease | (1,543,344) | $(14,331,106) | (800,088) | $(7,192,578) | ||
| Class C | ||||||
| Sales | 89,650 | $ 838,432 | 136,187 | $ 1,249,195 | ||
| Issued to shareholders electing to receive payments of distributions in Fund shares | 19,993 | 186,462 | 23,669 | 216,342 | ||
| Redemptions | (425,152) | (3,936,189) | (595,567) | (5,434,327) | ||
| Net decrease | (315,509) | $(2,911,295) | (435,711) | $(3,968,790) | ||
| Class I | ||||||
| Sales | 5,568,039 | $51,890,144 | 8,667,264 | $78,887,976 | ||
| Issued to shareholders electing to receive payments of distributions in Fund shares | 565,083 | 5,274,504 | 490,416 | 4,483,152 | ||
| Redemptions | (5,625,999) | (51,240,129) | (7,684,416) | (69,806,004) | ||
| Net increase | 507,123 | $ 5,924,519 | 1,473,264 | $13,565,124 | ||
| Ohio Fund | ||||||
| Year Ended September 30, 2024 | Year Ended September 30, 2023 | |||||
| Shares | Amount | Shares | Amount | |||
| Class A | ||||||
| Sales | 587,517 | $ 4,834,411 | 960,743 | $ 7,945,502 | ||
| Issued to shareholders electing to receive payments of distributions in Fund shares | 268,850 | 2,230,957 | 269,374 | 2,220,088 | ||
| Redemptions | (1,910,930) | (15,795,342) | (2,499,974) | (20,599,664) | ||
| Net decrease | (1,054,563) | $(8,729,974) | (1,269,857) | $(10,434,074) | ||
| Class C | ||||||
| Sales | 60,726 | $ 506,581 | 63,311 | $ 523,333 | ||
| Issued to shareholders electing to receive payments of distributions in Fund shares | 11,952 | 99,080 | 13,162 | 108,413 | ||
| Redemptions | (168,287) | (1,393,310) | (336,880) | (2,773,001) | ||
| Net decrease | (95,609) | $ (787,649) | (260,407) | $(2,141,255) | ||
| Class I | ||||||
| Sales | 3,679,988 | $30,350,482 | 7,075,687 | $58,372,473 | ||
| Issued to shareholders electing to receive payments of distributions in Fund shares | 428,499 | 3,558,723 | 360,288 | 2,972,355 | ||
| Redemptions | (4,578,219) | (37,624,806) | (5,597,265) | (46,078,908) | ||
| Net increase (decrease) | (469,732) | $(3,715,601) | 1,838,710 | $15,265,920 | ||
| California Opportunities Fund | New York Fund | Ohio Fund | |
| Realized Gain (Loss) on Derivatives Recognized in Income | $2,334,123(1) | $146,121(1) | $(17,991)(1) |
| Change in Unrealized Appreciation (Depreciation) on Derivatives Recognized in Income | $ — | $(533,013)(2) | $(141,508)(2) |
| (1) | Statements of Operations location: Net realized gain (loss): Futures contracts. |
| (2) | Statements of Operations location: Change in unrealized appreciation (depreciation): Futures contracts. |
| California Opportunities Fund | New York Fund | Ohio Fund | |
| Average Notional Cost: | |||
| Futures Contracts — Short | $1,264,000 | $2,060,000 | $2,709,000 |
| • | Level 1 – quoted prices in active markets for identical investments |
| • | Level 2 – other significant observable inputs (including quoted prices for similar investments, interest rates, prepayment speeds, credit risk, etc.) |
| • | Level 3 – significant unobservable inputs (including a fund's own assumptions in determining the fair value of investments) |
| California Opportunities Fund | ||||
| Asset Description | Level 1 | Level 2 | Level 3 | Total |
| Corporate Bonds | $ — | $ 2,295,509 | $ — | $ 2,295,509 |
| Tax-Exempt Mortgage-Backed Securities | — | 5,909,517 | — | 5,909,517 |
| Tax-Exempt Municipal Obligations | — | 837,708,458 | — | 837,708,458 |
| Taxable Municipal Obligations | — | 119,417,204 | — | 119,417,204 |
| Trust Units | — | 924,839 | — | 924,839 |
| Total Investments | $ — | $966,255,527 | $ — | $966,255,527 |
| Massachusetts Fund | ||||
| Asset Description | Level 1 | Level 2 | Level 3 | Total |
| Tax-Exempt Municipal Obligations | $ — | $164,486,211 | $ — | $164,486,211 |
| Taxable Municipal Obligations | — | 2,026,525 | — | 2,026,525 |
| Total Investments | $ — | $166,512,736 | $ — | $166,512,736 |
| New York Fund | ||||
| Asset Description | Level 1 | Level 2 | Level 3 | Total |
| Corporate Bonds | $ — | $ 1,570,534 | $ — | $ 1,570,534 |
| Tax-Exempt Municipal Obligations | — | 380,258,526 | — | 380,258,526 |
| Taxable Municipal Obligations | — | 6,356,452 | — | 6,356,452 |
| Total Investments | $ — | $388,185,512 | $ — | $388,185,512 |
| Ohio Fund | ||||
| Asset Description | Level 1 | Level 2 | Level 3 | Total |
| Tax-Exempt Municipal Obligations | $ — | $193,079,672 | $ — | $193,079,672 |
| Taxable Municipal Obligations | — | 2,033,400 | — | 2,033,400 |
| Trust Units | — | 755,932 | — | 755,932 |
| Total Investments | $ — | $195,869,004 | $ — | $195,869,004 |
Boston, Massachusetts
November 20, 2024
| California Municipal Opportunities Fund | 83.20% |
| Massachusetts Municipal Income Fund | 98.91% |
| New York Municipal Income Fund | 96.47% |
| Ohio Municipal Income Fund | 97.93% |
| Performance Relative to: | |||
| Fund | Median of Peer Group | Primary Index | Secondary Index |
| Eaton Vance California Municipal Opportunities Fund | Higher | Lower | Lower |
| Eaton Vance Massachusetts Municipal Income Fund | Consistent | Lower | Lower |
| Eaton Vance New York Municipal Income Fund | Higher | Lower | Lower |
| Eaton Vance Ohio Municipal Income Fund | Lower | Lower | Lower |
Additional Information

| Tax-Exempt Mortgage-Backed Securities — 0.5% |
| Security | Principal Amount (000's omitted) | Value | |
| Housing — 0.5% | |||
| California Housing Finance Agency, Municipal Certificates, Series 2021-1, Class A, 3.50%, 11/20/35 | $ | 999 | $ 977,967 |
| Total Tax-Exempt Mortgage-Backed Securities (identified cost $948,910) | $ 977,967 | ||
| Tax-Exempt Municipal Obligations — 102.1% |
| Security | Principal Amount (000's omitted) | Value | |
| Education — 1.5% | |||
| District of Columbia, (KIPP DC), 4.00%, 7/1/44 | $ | 105 | $ 101,843 |
| Florida Development Finance Corp., (River City Science Academy), 4.00%, 7/1/45 | 25 | 23,301 | |
| Georgia Private Colleges and Universities Authority, (Savannah College of Art and Design): | |||
| 4.00%, 4/1/40 | 1,400 | 1,418,522 | |
| 4.00%, 4/1/44 | 1,500 | 1,490,265 | |
| $ 3,033,931 | |||
| Electric Utilities — 3.0% | |||
| Douglas County Public Utility District No. 1, WA, 3.00%, 9/1/52 | $ | 1,355 | $ 1,085,165 |
| Gainesville, FL, Utilities System Revenue, (SPA: Truist Bank), 4.05%, 10/1/42(1) | 825 | 825,000 | |
| New York Power Authority, Green Bonds, 5.00%, 11/15/34(2) | 2,000 | 2,413,840 | |
| Philadelphia, PA, Gas Works Revenue, 5.25%, 8/1/49 | 750 | 834,120 | |
| South Carolina Public Service Authority, 5.25%, 12/1/54 | 800 | 879,760 | |
| $ 6,037,885 | |||
| Escrowed/Prerefunded — 1.6% | |||
| New Jersey Economic Development Authority, (School Facilities Construction), Prerefunded to 12/15/28, 5.00%, 6/15/37 | $ | 3,000 | $ 3,322,140 |
| $ 3,322,140 | |||
| General Obligations — 21.1% | |||
| Baldwin County, AL, 4.00%, 4/1/54 | $ | 1,400 | $ 1,382,416 |
| Beverly Hills Unified School District, CA, (Election of 2018), 3.25%, 8/1/42 | 1,110 | 1,081,684 | |
| California, 4.00%, 8/1/44 | 2,140 | 2,216,441 | |
| Security | Principal Amount (000's omitted) | Value | |
| General Obligations (continued) | |||
| Chicago Board of Education, IL: | |||
| 5.00%, 12/1/42 | $ | 390 | $ 389,980 |
| 5.00%, 12/1/44 | 2,000 | 2,022,720 | |
| Chicago, IL: | |||
| 5.00%, 1/1/39 | 1,400 | 1,459,976 | |
| 5.00%, 1/1/45 | 1,000 | 1,051,030 | |
| District of Columbia, 5.00%, 8/1/49(2) | 1,500 | 1,669,890 | |
| Falls Church, VA, 3.00%, 7/15/42 | 1,445 | 1,295,168 | |
| Houston, TX, 4.125%, 3/1/51 | 1,510 | 1,510,181 | |
| Hutto Independent School District, TX, (PSF Guaranteed), 5.00%, 8/1/53 | 3,000 | 3,253,110 | |
| Illinois: | |||
| 4.00%, 11/1/40 | 1,000 | 999,360 | |
| 5.00%, 5/1/35 | 2,000 | 2,008,960 | |
| 5.50%, 5/1/39 | 205 | 225,461 | |
| 5.50%, 3/1/42 | 2,300 | 2,568,663 | |
| 5.75%, 5/1/45 | 210 | 230,908 | |
| New York, NY: | |||
| 4.00%, 9/1/46 | 2,000 | 1,995,640 | |
| 4.00%, 4/1/50 | 2,000 | 1,981,660 | |
| Northwest Independent School District, TX, (PSF Guaranteed), 4.00%, 2/15/47 | 3,000 | 3,007,290 | |
| Palo Alto Unified School District, CA, (Election of 2018), 3.25%, 8/1/42 | 945 | 919,457 | |
| Prosper Independent School District, TX, (PSF Guaranteed), 4.00%, 2/15/54 | 2,000 | 1,956,960 | |
| Spring Branch Independent School District, TX, (PSF Guaranteed), 4.50%, 2/1/47 | 8,750 | 9,017,837 | |
| $ 42,244,792 | |||
| Hospital — 9.2% | |||
| Brevard County Health Facilities Authority, FL, (Health First Obligated Group): | |||
| 5.00%, 4/1/47 | $ | 2,500 | $ 2,685,375 |
| 5.00%, 4/1/52 | 2,500 | 2,662,125 | |
| California Statewide Communities Development Authority, (Loma Linda University Medical Center), 5.25%, 12/1/34 | 3,000 | 3,006,840 | |
| Colorado Health Facilities Authority, (CommonSpirit Health), 5.25%, 11/1/52 | 1,000 | 1,093,250 | |
| Delaware Health Facilities Authority, (Beebe Medical Center): | |||
| 5.00%, 6/1/36 | 3,730 | 3,885,466 | |
| 5.00%, 6/1/37 | 1,000 | 1,039,770 | |
| Fairfax County Industrial Development Authority, VA, (Inova Health System), 4.00%, 5/15/48 | 550 | 544,060 | |
| Security | Principal Amount (000's omitted) | Value | |
| Hospital (continued) | |||
| New York Dormitory Authority, (Northwell Health Obligated Group), 5.00%, 5/1/52 | $ | 1,010 | $ 1,080,730 |
| Ohio Higher Educational Facility Commission, (University Hospitals Health System, Inc.), 4.00%, 1/15/39 | 1,110 | 1,116,849 | |
| South Carolina Jobs-Economic Development Authority, (McLeod Health), 4.25%, 11/1/54 | 1,450 | 1,446,651 | |
| $ 18,561,116 | |||
| Housing — 2.9% | |||
| Cuyahoga Metropolitan Housing Authority, OH, Social Bonds, 2.00%, 12/1/31 | $ | 1,250 | $ 1,076,725 |
| Massachusetts Housing Finance Agency, (FHLMC), (FNMA), (GNMA), Social Bonds, 4.95%, 12/1/53 | 2,495 | 2,571,372 | |
| Phoenix Industrial Development Authority, AZ, (Downtown Phoenix Student Housing, LLC - Arizona State University): | |||
| 5.00%, 7/1/37 | 500 | 516,745 | |
| 5.00%, 7/1/42 | 1,250 | 1,280,500 | |
| Texas Student Housing Corp., (University of North Texas), 9.375%, 7/1/06(3) | 285 | 285,000 | |
| $ 5,730,342 | |||
| Industrial Development Revenue — 1.0% | |||
| Mississippi Business Finance Corp., (Chevron USA, Inc.), 3.90%, 11/1/35(1) | $ | 2,000 | $ 2,000,000 |
| $ 2,000,000 | |||
| Insured - Education — 1.0% | |||
| Virginia College Building Authority, (Washington and Lee University), (NPFG), 5.25%, 1/1/31 | $ | 1,750 | $ 1,943,760 |
| $ 1,943,760 | |||
| Insured - Electric Utilities — 1.2% | |||
| Ohio Municipal Electric Generation Agency, (NPFG), 0.00%, 2/15/29 | $ | 2,865 | $ 2,493,782 |
| $ 2,493,782 | |||
| Insured - General Obligations — 3.1% | |||
| Harris County Municipal Utility District No. 55, TX, (AGC), 4.00%, 2/1/37 | $ | 1,300 | $ 1,314,807 |
| McCamey Independent School District, TX, (AGM), 4.00%, 2/15/53 | 3,500 | 3,367,700 | |
| Proviso Township High School District No. 209, IL, (AGM), 4.00%, 12/1/38 | 1,500 | 1,518,105 | |
| $ 6,200,612 | |||
| Security | Principal Amount (000's omitted) | Value | |
| Insured - Lease Revenue/Certificates of Participation — 3.5% | |||
| Anaheim Public Financing Authority, CA, (Anaheim Public Improvements), (AGM), 0.00%, 9/1/31 | $ | 8,680 | $ 7,053,976 |
| $ 7,053,976 | |||
| Insured - Other Revenue — 0.6% | |||
| Hudson Yards Infrastructure Corp., NY, (AGM), 4.00%, 2/15/47 | $ | 1,155 | $ 1,144,120 |
| $ 1,144,120 | |||
| Insured - Special Tax Revenue — 8.0% | |||
| Harris County-Houston Sports Authority, TX, (AGM), (NPFG), 0.00%, 11/15/34 | $ | 10,600 | $ 6,696,444 |
| Massachusetts, Dedicated Tax Revenue: | |||
| (NPFG), 5.50%, 1/1/27 | 6,000 | 6,404,160 | |
| (NPFG), 5.50%, 1/1/30 | 2,565 | 2,922,715 | |
| $ 16,023,319 | |||
| Insured - Transportation — 9.5% | |||
| E-470 Public Highway Authority, CO, (NPFG), 0.00%, 9/1/39 | $ | 7,120 | $ 3,433,691 |
| North Texas Tollway Authority, (AGC), 0.00%, 1/1/35 | 5,000 | 3,547,250 | |
| Pennsylvania Turnpike Commission, (AGM), 6.375%, 12/1/38 | 11,000 | 12,080,200 | |
| $ 19,061,141 | |||
| Lease Revenue/Certificates of Participation — 4.0% | |||
| National Finance Authority, NH, (Centurion BioSquare, Inc.), 5.88%, 12/15/38 | $ | 1,000 | $ 1,053,420 |
| New Jersey Economic Development Authority, (Portal North Bridge), 5.25%, 11/1/47 | 4,000 | 4,412,200 | |
| New Jersey Transportation Trust Fund Authority, (Transportation Program), 5.00%, 6/15/50 | 2,500 | 2,597,150 | |
| $ 8,062,770 | |||
| Other Revenue — 3.1% | |||
| Buckeye Tobacco Settlement Financing Authority, OH, 5.00%, 6/1/55 | $ | 1,600 | $ 1,507,904 |
| California Community Choice Financing Authority, Clean Energy Project Revenue: | |||
| Green Bonds, 5.00% to 8/1/29 (Put Date), 12/1/53 | 750 | 802,943 | |
| Green Bonds, 5.25% to 4/1/30 (Put Date), 11/1/54 | 1,660 | 1,807,889 | |
| Central Falls Detention Facility Corp., RI, 7.25%, 7/15/35(4) | 1,200 | 480,000 | |
| Main Street Natural Gas, Inc., GA, Gas Supply Revenue, 5.00% to 12/1/30 (Put Date), 5/1/54 | 1,500 | 1,603,200 | |
| $ 6,201,936 | |||
| Security | Principal Amount (000's omitted) | Value | |
| Senior Living/Life Care — 3.5% | |||
| California Public Finance Authority, (Enso Village), Green Bonds, 2.375%, 11/15/28(5) | $ | 80 | $ 79,145 |
| Manhattan, KS, (Meadowlark Hills), 4.00%, 6/1/46 | 1,180 | 1,042,011 | |
| National Finance Authority, NH, (The Vista): | |||
| 5.25%, 7/1/39(5) | 265 | 267,128 | |
| 5.625%, 7/1/46(5) | 360 | 363,531 | |
| 5.75%, 7/1/54(5) | 775 | 781,665 | |
| New Hope Cultural Education Facilities Finance Corp., TX, (The Outlook at Windhaven), 6.75%, 10/1/52 | 1,000 | 1,006,740 | |
| Saint Louis County Industrial Development Authority, MO, (St. Andrew's Resources for Seniors Obligated Group), 5.00%, 12/1/35 | 1,700 | 1,706,953 | |
| Washington Housing Finance Commission, (Horizon House), 5.00%, 1/1/30(5) | 1,730 | 1,744,307 | |
| $ 6,991,480 | |||
| Special Tax Revenue — 11.5% | |||
| Dallas Area Rapid Transit, TX, Sales Tax Revenue, 4.00%, 12/1/51 | $ | 2,275 | $ 2,226,156 |
| Detroit Downtown Development Authority, MI, (Catalyst Development), 5.00%, 7/1/48 | 2,500 | 2,665,850 | |
| Metropolitan Pier and Exposition Authority, IL, (McCormick Place Expansion), 4.00%, 6/15/50 | 5,000 | 4,776,700 | |
| New York City Transitional Finance Authority, NY, Future Tax Revenue: | |||
| 4.00%, 5/1/39 | 1,000 | 1,032,380 | |
| 4.00%, 5/1/45 | 1,380 | 1,384,154 | |
| 5.00%, 11/1/46(6) | 2,000 | 2,179,460 | |
| New York State Thruway Authority, Personal Income Tax Revenue, 4.00%, 3/15/44 | 1,000 | 1,006,470 | |
| New York State Urban Development Corp., Personal Income Tax Revenue, Green Bonds, 4.00%, 3/15/50 | 1,635 | 1,613,467 | |
| Puerto Rico Sales Tax Financing Corp.: | |||
| 0.00%, 7/1/51 | 4,500 | 1,109,835 | |
| 5.00%, 7/1/58 | 2,817 | 2,846,156 | |
| Tampa, FL, (Central and Lower Basin Stormwater Improvements), 5.00%, 5/1/46 | 2,000 | 2,164,580 | |
| $ 23,005,208 | |||
| Transportation — 9.2% | |||
| Atlanta, GA, Airport Revenue, Green Bonds, 5.00%, 7/1/48 | $ | 2,000 | $ 2,198,320 |
| Charlotte, NC, (Charlotte Douglas International Airport), 5.00%, 7/1/48(6) | 2,000 | 2,203,040 | |
| Chicago, IL, (O'Hare International Airport), 5.00%, 1/1/48 | 1,010 | 1,107,495 | |
| Security | Principal Amount (000's omitted) | Value | |
| Transportation (continued) | |||
| Denver City and County, CO, Airport System Revenue, 5.25%, 11/15/53 | $ | 2,000 | $ 2,218,220 |
| Metropolitan Transportation Authority, NY, Green Bonds, 4.75%, 11/15/45 | 225 | 233,325 | |
| Minneapolis-St. Paul Metropolitan Airports Commission, MN, 4.00%, 1/1/54 | 2,500 | 2,472,825 | |
| New Jersey Turnpike Authority, 5.25%, 1/1/52 | 1,000 | 1,120,370 | |
| New York Transportation Development Corp., (Terminal 4 John F. Kennedy International Airport), 4.00%, 12/1/42 | 2,400 | 2,391,720 | |
| South Jersey Transportation Authority, NJ, 4.625%, 11/1/47 | 1,500 | 1,546,425 | |
| Texas Transportation Commission, 0.00%, 8/1/40 | 1,000 | 485,300 | |
| Triborough Bridge and Tunnel Authority, NY, 4.00%, 11/15/54 | 2,500 | 2,455,375 | |
| $ 18,432,415 | |||
| Water and Sewer — 3.6% | |||
| Charleston, SC, Waterworks and Sewer System Revenue, 5.00%, 1/1/44(2) | $ | 2,000 | $ 2,291,820 |
| New York City Municipal Water Finance Authority, NY, (Water and Sewer System): | |||
| 4.00%, 6/15/41 | 1,900 | 1,927,987 | |
| 4.00%, 6/15/51 | 2,000 | 1,991,280 | |
| 5.25%, 6/15/52(6) | 1,000 | 1,104,170 | |
| $ 7,315,257 | |||
| Total Tax-Exempt Municipal Obligations (identified cost $195,173,035) | $ 204,859,982 | ||
| Total Investments — 102.6% (identified cost $196,121,945) | $ 205,837,949 | ||
| Other Assets, Less Liabilities — (2.6)% | $ (5,235,756) | ||
| Net Assets — 100.0% | $ 200,602,193 | ||
| The percentage shown for each investment category in the Portfolio of Investments is based on net assets. | |
| (1) | Variable rate demand obligation that may be tendered at par on any day for payment the same or next business day. The stated interest rate, which generally resets daily, is determined by the remarketing agent and represents the rate in effect at September 30, 2024. |
| (2) | When-issued security. |
| (3) | Issuer is in default with respect to interest and/or principal payments or has declared bankruptcy and is non-income producing. |
| (4) | Security is in default and making only partial interest payments. |
| (5) | Security exempt from registration under Rule 144A of the Securities Act of 1933, as amended. These securities may be sold in certain transactions in reliance on an exemption from registration (normally to qualified institutional buyers). At September 30, 2024, the aggregate value of these securities is $3,235,776 or 1.6% of the Fund's net assets. |
| (6) | Security represents the municipal bond held by a trust that issues residual interest bonds (see Note 1H). |
| At September 30, 2024, the concentration of the Fund’s investments in the various states and territories, determined as a percentage of net assets, is as follows: | |
| Texas | 18.8% |
| New York | 12.9% |
| Others, representing less than 10% individually | 70.9% |
| The Fund invests primarily in debt securities issued by municipalities. The ability of the issuers of the debt securities to meet their obligations may be affected by economic developments in a specific industry or municipality. At September 30, 2024, 26.2% of total investments are backed by bond insurance of various financial institutions and financial guaranty assurance agencies. The aggregate percentage insured by an individual financial institution or financial guaranty assurance agency ranged from 2.4% to 15.5% of total investments. |
| Abbreviations: | |
| AGC | – Assured Guaranty Corp. |
| AGM | – Assured Guaranty Municipal Corp. |
| FHLMC | – Federal Home Loan Mortgage Corp. |
| FNMA | – Federal National Mortgage Association |
| GNMA | – Government National Mortgage Association |
| NPFG | – National Public Finance Guarantee Corp. |
| PSF | – Permanent School Fund |
| SPA | – Standby Bond Purchase Agreement |
| Corporate Bonds — 0.9% |
| Security | Principal Amount (000's omitted) | Value | |
| Education — 0.4% | |||
| Grand Canyon University, 4.125%, 10/1/24 | $ | 20,000 | $ 20,000,000 |
| $ 20,000,000 | |||
| Hospital — 0.5% | |||
| Sutter Health, 5.164%, 8/15/33 | $ | 14,000 | $ 14,504,895 |
| UPMC, 1.803%, 4/15/26 | 7,650 | 7,344,830 | |
| $ 21,849,725 | |||
| Total Corporate Bonds (identified cost $40,956,604) | $ 41,849,725 | ||
| Tax-Exempt Municipal Obligations — 100.6% |
| Security | Principal Amount (000's omitted) | Value | |
| Bond Bank — 1.8% | |||
| Delaware Valley Regional Finance Authority, PA, (LOC: TD Bank, N.A.), 3.20%, 11/1/55(1) | $ | 19,500 | $ 19,500,000 |
| New York State Environmental Facilities Corp., (State Revolving Fund), Green Bonds, 5.00%, 9/15/47(2) | 10,000 | 11,026,700 | |
| Ohio Water Development Authority, Water Pollution Control Loan Fund, (SPA: TD Bank, N.A.), 3.80%, 12/1/54(3) | 25,000 | 25,000,000 | |
| Oklahoma Water Resources Board, 4.00%, 10/1/54(4) | 4,000 | 3,963,000 | |
| Rickenbacker Port Authority, OH, (OASBO Expanded Asset Pooled Financing Program), 5.375%, 1/1/32 | 9,265 | 10,431,649 | |
| Texas Water Development Board, 4.00%, 10/15/49 | 12,500 | 12,228,375 | |
| $ 82,149,724 | |||
| Cogeneration — 0.1% | |||
| Northampton County Industrial Development Authority, PA, (Northampton Generating), (AMT), 5.00%, 6/30/27(5) | $ | 14,652 | $ 6,447,019 |
| $ 6,447,019 | |||
| Education — 5.3% | |||
| Clifton Higher Education Finance Corp., TX, (Idea Public Schools), (PSF Guaranteed), 4.00%, 8/15/49 | $ | 3,500 | $ 3,458,175 |
| Florida Development Finance Corp., (River City Science Academy), 4.00%, 7/1/45 | 45 | 41,943 | |
| Massachusetts Development Finance Agency, (Boston University): | |||
| 5.00%, 10/1/46 | 11,855 | 12,285,929 | |
| Security | Principal Amount (000's omitted) | Value | |
| Education (continued) | |||
| Massachusetts Development Finance Agency, (Boston University): (continued) | |||
| (LOC: TD Bank, N.A.), 3.95%, 10/1/42(3) | $ | 6,000 | $ 6,000,000 |
| Metropolitan Government of Nashville and Davidson County Health and Educational Facilities Board, TN, (Vanderbilt University), 5.00%, 10/1/49 | 5,125 | 5,714,067 | |
| Minnesota Higher Education Facilities Authority, (University of St. Thomas), 5.00%, 10/1/49 | 2,750 | 2,966,013 | |
| New York Dormitory Authority, (Cornell University), 5.50%, 7/1/54 | 10,000 | 11,573,600 | |
| New York Dormitory Authority, (New York University), 5.00%, 7/1/49 | 14,360 | 15,272,578 | |
| Ohio State University, 5.25%, 12/1/46 | 14,315 | 16,247,668 | |
| Oregon State University: | |||
| 4.00%, 4/1/44 | 4,500 | 4,573,530 | |
| 5.00%, 4/1/45(4) | 8,000 | 8,671,760 | |
| Pennsylvania Economic Development Financing Authority, (Villanova University), 4.00%, 8/1/54 | 5,860 | 5,769,170 | |
| Pennsylvania State University, 4.00%, 9/1/50 | 5,920 | 5,809,770 | |
| Philadelphia Authority for Industrial Development, PA, (Temple University), 5.00%, 4/1/45 | 5,000 | 5,022,500 | |
| San Antonio Education Facilities Corp., TX, (University of the Incarnate Word), 4.00%, 4/1/54 | 3,500 | 2,891,210 | |
| Texas A&M University, 4.00%, 5/15/49 | 5,000 | 4,884,600 | |
| Texas State University System, 4.00%, 3/15/49 | 4,750 | 4,694,330 | |
| University of Alabama: | |||
| 4.00%, 7/1/43 | 5,000 | 5,056,100 | |
| 4.00%, 7/1/44 | 8,340 | 8,403,467 | |
| 4.00%, 7/1/54 | 13,875 | 13,524,240 | |
| University of California Medical Center, 5.00%, 5/15/47 | 28,170 | 31,167,288 | |
| University of Delaware, (SPA: TD Bank, N.A.), 3.80%, 11/1/37(3) | 10,680 | 10,680,000 | |
| University of Massachusetts Building Authority, 5.00%, 11/1/52 | 20,000 | 21,348,200 | |
| University of Oregon: | |||
| 5.00%, 4/1/48 | 12,470 | 12,980,148 | |
| 5.00%, 4/1/50 | 12,500 | 13,238,875 | |
| University of Texas, 4.00%, 7/1/42 | 3,080 | 3,157,770 | |
| Utah Board of Higher Education, (Dixie State University), 4.00%, 6/1/44 | 6,000 | 6,102,480 | |
| Vermont Educational and Health Buildings Financing Agency, (Middlebury College), 4.00%, 11/1/50 | 5,000 | 5,015,850 | |
| $ 246,551,261 | |||
| Electric Utilities — 5.2% | |||
| Austin, TX, Electric Utility System Revenue, 5.00%, 11/15/48 | $ | 10,000 | $ 10,938,000 |
| Security | Principal Amount (000's omitted) | Value | |
| Electric Utilities (continued) | |||
| Clark County Public Utility District No. 1, WA, Electric System Revenue: | |||
| 5.00%, 1/1/42(4) | $ | 500 | $ 561,840 |
| 5.00%, 1/1/44(4) | 450 | 501,917 | |
| 5.00%, 1/1/45(4) | 750 | 830,820 | |
| Douglas County Public Utility District No. 1, WA, 3.00%, 9/1/52 | 16,020 | 12,829,777 | |
| Fayetteville, NC, Public Works Commission Revenue: | |||
| 4.50%, 3/1/49 | 15,710 | 16,507,125 | |
| 5.00%, 3/1/46 | 5,000 | 5,532,950 | |
| Gainesville, FL, Utilities System Revenue, (SPA: Truist Bank), 4.05%, 10/1/42(3) | 17,965 | 17,965,000 | |
| JEA, FL, Electric System Revenue: | |||
| 5.00%, 10/1/36(4) | 1,750 | 2,041,095 | |
| 5.00%, 10/1/37(4) | 2,310 | 2,668,027 | |
| Long Island Power Authority, NY, Electric System Revenue: | |||
| 5.00%, 9/1/44 | 5,000 | 5,658,250 | |
| 5.00%, 9/1/49 | 12,500 | 13,818,000 | |
| Green Bonds, 5.00%, 9/1/48 | 5,000 | 5,492,750 | |
| Los Angeles Department of Water and Power, CA, Power System Revenue: | |||
| 5.00%, 7/1/40 | 2,150 | 2,515,414 | |
| 5.00%, 7/1/41 | 3,400 | 3,942,640 | |
| 5.00%, 7/1/42 | 2,600 | 2,993,016 | |
| (SPA: JPMorgan Chase Bank, N.A.), 3.10%, 7/1/48(3) | 12,500 | 12,500,000 | |
| New York Power Authority, Green Bonds, 5.00%, 11/15/35(4) | 2,500 | 3,001,325 | |
| Omaha Public Power District, NE: | |||
| 5.00%, 2/1/47 | 20,000 | 21,965,400 | |
| 5.25%, 2/1/48 | 10,000 | 11,228,400 | |
| Orlando Utilities Commission, FL: | |||
| 5.00%, 10/1/39 | 3,000 | 3,474,510 | |
| 5.00%, 10/1/40 | 2,500 | 2,875,100 | |
| Philadelphia, PA, Gas Works Revenue: | |||
| 5.00%, 8/1/42 | 2,000 | 2,234,040 | |
| 5.25%, 8/1/49 | 5,325 | 5,922,252 | |
| Salt River Project Agricultural Improvement and Power District, AZ: | |||
| 5.00%, 1/1/42(4) | 1,750 | 2,018,432 | |
| 5.00%, 1/1/43(4) | 500 | 573,670 | |
| 5.00%, 1/1/44(4) | 750 | 853,898 | |
| San Antonio, TX, Electric and Gas Systems Revenue, 5.25%, 2/1/49 | 11,000 | 12,317,360 | |
| Seattle, WA, Municipal Light and Power Revenue: | |||
| 5.00%, 10/1/46 | 7,585 | 8,500,661 | |
| 5.00%, 10/1/47 | 7,965 | 8,901,923 | |
| Security | Principal Amount (000's omitted) | Value | |
| Electric Utilities (continued) | |||
| Seattle, WA, Municipal Light and Power Revenue: (continued) | |||
| 5.00%, 10/1/54 | $ | 7,155 | $ 7,899,120 |
| South Carolina Public Service Authority: | |||
| 5.00%, 12/1/46 | 12,600 | 12,613,104 | |
| 5.25%, 12/1/54 | 9,010 | 9,908,297 | |
| Utility Debt Securitization Authority, NY, 5.00%, 12/15/40 | 5,000 | 5,853,800 | |
| $ 237,437,913 | |||
| Escrowed/Prerefunded — 0.5% | |||
| Los Angeles Department of Airports, CA, (Los Angeles International Airport), (AMT), Prerefunded to 11/15/31, 5.00%, 5/15/46 | $ | 65 | $ 73,181 |
| New Jersey Economic Development Authority, (School Facilities Construction): | |||
| Prerefunded to 12/15/28, 5.00%, 6/15/34 | 8,460 | 9,368,435 | |
| Prerefunded to 12/15/28, 5.00%, 6/15/35 | 13,300 | 14,728,154 | |
| $ 24,169,770 | |||
| General Obligations — 21.2% | |||
| Alamo Community College District, TX, 4.50%, 8/15/47 | $ | 4,000 | $ 4,123,160 |
| Aldine Independent School District, TX, (PSF Guaranteed), 4.00%, 2/15/54 | 3,425 | 3,368,488 | |
| Azle Independent School District, TX, (PSF Guaranteed): | |||
| 4.00%, 2/15/49 | 5,525 | 5,445,164 | |
| 4.00%, 2/15/54 | 4,985 | 4,852,848 | |
| Banquete Independent School District, TX, (PSF Guaranteed), 4.00%, 8/1/49 | 7,000 | 6,895,980 | |
| Bastrop, TX: | |||
| 4.00%, 8/1/42 | 1,760 | 1,761,654 | |
| 4.00%, 8/1/45 | 5,715 | 5,669,166 | |
| 5.00%, 8/1/41 | 1,675 | 1,863,086 | |
| Beaverton School District No. 48J, OR, 5.00%, 6/15/52 | 15,000 | 16,287,300 | |
| Bethel Park School District, PA, 5.25%, 8/1/42 | 5,185 | 5,891,612 | |
| California: | |||
| 4.00%, 8/1/44 | 9,520 | 9,860,054 | |
| 5.00%, 11/1/42 | 25,000 | 28,321,750 | |
| Charlotte Independent School District, TX, (PSF Guaranteed), 4.00%, 8/1/54 | 2,500 | 2,460,550 | |
| Chicago Board of Education, IL: | |||
| 5.00%, 12/1/30 | 9,000 | 9,287,640 | |
| 5.00%, 12/1/42 | 23,400 | 23,398,830 | |
| 5.00%, 12/1/44 | 20,515 | 20,748,050 | |
| 5.875%, 12/1/47 | 6,500 | 7,190,950 | |
| Security | Principal Amount (000's omitted) | Value | |
| General Obligations (continued) | |||
| Chicago, IL: | |||
| 5.00%, 1/1/44 | $ | 12,350 | $ 12,728,774 |
| 5.25%, 1/1/38 | 6,750 | 7,400,430 | |
| 5.50%, 1/1/39 | 5,000 | 5,525,050 | |
| Cypress-Fairbanks Independent School District, TX, (PSF Guaranteed): | |||
| 5.00%, 2/15/43 | 5,000 | 5,581,900 | |
| 5.00%, 2/15/43(4) | 3,750 | 4,224,938 | |
| 5.00%, 2/15/44 | 5,150 | 5,727,676 | |
| Denton County, TX, 4.00%, 7/15/49 | 10,000 | 9,761,800 | |
| District of Columbia: | |||
| 5.00%, 8/1/41(4) | 3,500 | 4,024,510 | |
| 5.00%, 8/1/42(4) | 4,280 | 4,903,211 | |
| 5.00%, 8/1/43(4) | 5,500 | 6,263,895 | |
| 5.00%, 8/1/49(4) | 5,000 | 5,566,300 | |
| Fayetteville School District No. 1, AR, 4.00%, 2/1/46 | 12,000 | 11,908,920 | |
| Fort Bend Independent School District, TX, (PSF Guaranteed), 4.00%, 8/15/49 | 3,850 | 3,780,354 | |
| Galena Park Independent School District, TX, (PSF Guaranteed): | |||
| 5.00%, 8/15/42(4) | 1,730 | 1,959,381 | |
| 5.00%, 8/15/43(4) | 2,000 | 2,253,680 | |
| 5.00%, 8/15/44(4) | 2,000 | 2,243,960 | |
| Galveston Independent School District, TX, (PSF Guaranteed), 4.00%, 2/1/47 | 13,150 | 13,040,855 | |
| Hacienda La Puente Unified School District, CA, (Election of 2016), 5.00%, 8/1/47 | 8,265 | 9,069,019 | |
| Harris County Flood Control District, TX: | |||
| Sustainability Bonds, 4.00%, 9/15/48 | 10,000 | 9,965,300 | |
| Sustainability Bonds, 4.25%, 10/1/47 | 10,940 | 11,133,419 | |
| Hays Consolidated Independent School District, TX, (PSF Guaranteed), 5.00%, 2/15/48 | 10,855 | 11,784,948 | |
| Houston, TX, 4.125%, 3/1/51(2) | 8,845 | 8,846,061 | |
| Humble Independent School District, TX, (PSF Guaranteed): | |||
| 4.00%, 2/15/54 | 4,400 | 4,305,312 | |
| 5.00%, 2/15/47 | 10,250 | 11,138,265 | |
| Hurst-Euless-Bedford Independent School District, TX, (PSF Guaranteed), 4.00%, 8/15/50 | 14,040 | 13,867,589 | |
| Illinois: | |||
| 4.00%, 7/1/37 | 15,000 | 15,245,700 | |
| 4.00%, 10/1/42(4) | 25,000 | 24,746,750 | |
| 4.25%, 5/1/46 | 12,000 | 12,019,200 | |
| 5.00%, 11/1/24 | 11,295 | 11,309,232 | |
| 5.00%, 2/1/27 | 18,500 | 18,585,470 | |
| 5.00%, 2/1/29 | 15,000 | 15,704,850 | |
| 5.00%, 2/1/39(4) | 5,000 | 5,594,950 | |
| Security | Principal Amount (000's omitted) | Value | |
| General Obligations (continued) | |||
| Illinois: (continued) | |||
| 5.00%, 5/1/39 | $ | 10,000 | $ 10,044,800 |
| 5.50%, 5/1/39 | 870 | 956,835 | |
| 5.50%, 3/1/42 | 11,700 | 13,066,677 | |
| 5.75%, 5/1/45 | 890 | 978,608 | |
| Irion County Independent School District, TX, (PSF Guaranteed), 5.00%, 8/15/49(4) | 6,120 | 6,715,598 | |
| King County, WA, (SPA: TD Bank, N.A.), 3.95%, 1/1/46(3) | 18,610 | 18,610,000 | |
| Klein Independent School District, TX, (PSF Guaranteed), 4.00%, 8/1/48 | 4,875 | 4,862,130 | |
| Lamar Consolidated Independent School District, TX, (PSF Guaranteed), 5.00%, 2/15/49 | 6,800 | 7,494,552 | |
| Los Angeles Unified School District, CA, Sustainability Bonds, 5.00%, 7/1/38(4) | 9,150 | 10,891,336 | |
| Mabank Independent School District, TX, (PSF Guaranteed), 4.00%, 8/15/49 | 7,115 | 7,051,961 | |
| Martin County West Independent School District No. 2448, MN: | |||
| 5.00%, 2/1/37 | 3,670 | 4,272,798 | |
| 5.00%, 2/1/39 | 4,045 | 4,658,505 | |
| 5.00%, 2/1/40 | 4,250 | 4,862,085 | |
| Massachusetts: | |||
| 3.00%, 4/1/49 | 10,000 | 8,272,200 | |
| 5.00%, 5/1/48 | 10,000 | 10,998,900 | |
| 5.00%, 8/1/51 | 15,000 | 16,581,450 | |
| 5.00%, 8/1/53 | 15,000 | 16,499,850 | |
| Melissa Independent School District, TX, (PSF Guaranteed), 4.00%, 2/1/49 | 4,900 | 4,844,973 | |
| Midland Independent School District, TX, (PSF Guaranteed), 5.00%, 2/15/47 | 15,000 | 16,426,800 | |
| Milpitas Unified School District, CA, (Election of 2018), 4.00%, 8/1/41 | 4,390 | 4,636,674 | |
| Montgomery County, MD, 2.00%, 8/1/39 | 4,000 | 3,111,160 | |
| Mountain View Whisman School District, CA, (Election of 2020): | |||
| 4.00%, 9/1/44 | 1,710 | 1,784,163 | |
| 4.00%, 9/1/45 | 3,200 | 3,324,704 | |
| New Orleans, LA, 5.00%, 12/1/47 | 8,590 | 9,416,358 | |
| New York, 5.00%, 3/15/40 | 4,865 | 5,617,421 | |
| New York, NY: | |||
| 4.00%, 9/1/46 | 10,000 | 9,978,200 | |
| 5.00%, 9/1/40 | 5,250 | 6,012,773 | |
| 5.00%, 3/1/50 | 12,350 | 13,209,683 | |
| 5.25%, 5/1/42 | 3,335 | 3,747,439 | |
| 5.25%, 3/1/47 | 10,000 | 11,265,400 | |
| 5.25%, 10/1/47 | 5,000 | 5,550,900 | |
| Security | Principal Amount (000's omitted) | Value | |
| General Obligations (continued) | |||
| New York, NY: (continued) | |||
| (LOC: U.S. Bank, N.A.), 3.90%, 4/1/38(3) | $ | 15,000 | $ 15,000,000 |
| (SPA: Barclays Bank PLC), 4.15%, 6/1/44(3) | 12,000 | 12,000,000 | |
| (SPA: JPMorgan Chase Bank, N.A.), 4.05%, 6/1/44(3) | 15,000 | 15,000,000 | |
| (SPA: JPMorgan Chase Bank, N.A.), 4.05%, 8/1/44(3) | 10,000 | 10,000,000 | |
| Northwest Independent School District, TX, (PSF Guaranteed), 5.00%, 2/15/48 | 20,000 | 21,700,000 | |
| Norwood, MA, 4.00%, 9/15/47 | 11,065 | 11,016,203 | |
| Oregon City School District No. 62, OR, 5.00%, 6/15/49 | 6,500 | 6,809,790 | |
| Pasadena Independent School District, TX, (PSF Guaranteed), 5.00%, 2/15/48 | 5,000 | 5,464,650 | |
| Prosper Independent School District, TX, (PSF Guaranteed), 4.00%, 2/15/54 | 15,000 | 14,677,200 | |
| Puerto Rico: | |||
| 4.00%, 7/1/41 | 7,551 | 7,305,362 | |
| 5.625%, 7/1/29 | 10,762 | 11,627,645 | |
| 5.75%, 7/1/31 | 12,303 | 13,691,115 | |
| Royse City Independent School District, TX, (PSF Guaranteed), 5.00%, 2/15/48(2) | 12,000 | 13,120,440 | |
| San Diego Unified School District, CA, (Election of 2022), Sustainability Bonds, 4.00%, 7/1/53 | 8,500 | 8,544,795 | |
| San Luis Coastal Unified School District, CA, (Election of 2022), 4.00%, 8/1/46 | 11,230 | 11,346,006 | |
| Santa Clarita Community College District, CA, (Election of 2016), 5.25%, 8/1/48 | 10,000 | 11,293,900 | |
| Spring Branch Independent School District, TX, (PSF Guaranteed), 4.50%, 2/1/47 | 8,750 | 9,017,837 | |
| Temple Independent School District, TX, (PSF Guaranteed), 4.25%, 2/1/47 | 13,000 | 13,162,760 | |
| Texas: | |||
| 5.00%, 10/1/43(4) | 3,000 | 3,417,390 | |
| 5.00%, 10/1/44(4) | 2,000 | 2,268,340 | |
| Waco Independent School District, TX, (PSF Guaranteed), 4.125%, 8/15/47 | 6,000 | 6,029,100 | |
| Washington: | |||
| 5.00%, 6/1/40 | 5,350 | 5,672,231 | |
| 5.00%, 6/1/41 | 5,465 | 5,782,298 | |
| 5.00%, 6/1/42 | 5,950 | 6,282,069 | |
| Waxahachie Independent School District, TX, (PSF Guaranteed), 4.00%, 2/15/49 | 6,750 | 6,652,462 | |
| Wisconsin, 4.00%, 5/1/41 | 7,090 | 7,223,150 | |
| Wylie Independent School District, TX, (PSF Guaranteed): | |||
| 4.00%, 2/15/49 | 9,380 | 9,272,974 | |
| 4.25%, 2/15/54 | 5,000 | 5,120,700 | |
| Security | Principal Amount (000's omitted) | Value | |
| General Obligations (continued) | |||
| Ysleta Independent School District, TX, (PSF Guaranteed): | |||
| 4.25%, 8/15/56 | $ | 11,000 | $ 11,059,400 |
| 5.00%, 8/15/56 | 5,000 | 5,371,250 | |
| $ 978,311,981 | |||
| Hospital — 11.8% | |||
| Brevard County Health Facilities Authority, FL, (Health First Obligated Group): | |||
| 5.00%, 4/1/47 | $ | 10,000 | $ 10,741,500 |
| 5.00%, 4/1/52 | 10,000 | 10,648,500 | |
| California Health Facilities Financing Authority, (Adventist Health System), 5.25%, 12/1/44 | 2,750 | 3,056,845 | |
| California Health Facilities Financing Authority, (Cedars-Sinai Health System), 5.00%, 8/15/51 | 13,845 | 15,043,977 | |
| California Infrastructure and Economic Development Bank, (Adventist Health Energy), 5.25%, 7/1/54 | 12,000 | 12,903,600 | |
| Colorado Health Facilities Authority, (AdventHealth Obligated Group): | |||
| 3.00%, 11/15/51 | 10,000 | 7,969,000 | |
| 4.00%, 11/15/50 | 7,350 | 7,209,909 | |
| Colorado Health Facilities Authority, (Intermountain Healthcare): | |||
| 4.00%, 5/15/52 | 11,955 | 11,589,775 | |
| (SPA: TD Bank, N.A.), 3.80%, 5/15/64(3) | 8,000 | 8,000,000 | |
| Connecticut Health and Educational Facilities Authority, (Trinity Health Corp.), 5.00%, 12/1/41 | 5,295 | 5,392,852 | |
| Fairfax County Industrial Development Authority, VA, (Inova Health System): | |||
| 4.00%, 5/15/48 | 2,770 | 2,740,084 | |
| 4.125%, 5/15/54 | 14,175 | 14,076,625 | |
| 5.00%, 5/15/51 | 16,000 | 17,507,680 | |
| Geisinger Authority, PA, (Geisinger Health System): | |||
| 4.00%, 6/1/41 | 8,000 | 7,990,160 | |
| 4.00%, 2/15/47 | 9,105 | 8,966,513 | |
| Greenville Health System, SC, 5.00%, 5/1/39 | 2,500 | 2,501,400 | |
| Harris County Cultural Education Facilities Finance Corp., TX, (Texas Children's Hospital), 4.00%, 10/1/47 | 10,805 | 10,551,191 | |
| Illinois Finance Authority, (Northwestern Memorial HealthCare), 4.00%, 7/15/47 | 12,500 | 12,166,625 | |
| Illinois Finance Authority, (University of Chicago Medical Center), (LOC: TD Bank, N.A.), 3.80%, 8/1/43(3) | 15,000 | 15,000,000 | |
| Indiana Finance Authority, (Franciscan Alliance, Inc.), 5.00%, 11/1/41 | 5,000 | 5,059,950 | |
| Lancaster County Hospital Authority, PA, (Penn State Health), 5.00%, 11/1/46 | 10,500 | 10,994,550 | |
| Security | Principal Amount (000's omitted) | Value | |
| Hospital (continued) | |||
| Lehigh County General Purpose Authority, PA, (Lehigh Valley Health Network), 4.00%, 7/1/49 | $ | 5,000 | $ 4,715,500 |
| Maricopa County Industrial Development Authority, AZ, (Banner Health): | |||
| 4.00%, 1/1/44 | 15,000 | 15,054,150 | |
| Series 2019-E, 4.00%, 1/1/45 | 8,650 | 8,666,694 | |
| Maryland Health and Higher Educational Facilities Authority, (MedStar Health), 5.00%, 8/15/42 | 11,900 | 11,940,460 | |
| Massachusetts Development Finance Agency, (Boston Children's Hospital), 4.00%, 3/1/54 | 7,000 | 6,855,590 | |
| Massachusetts Development Finance Agency, (Mass General Brigham, Inc.), 5.00%, 7/1/54 | 5,000 | 5,430,000 | |
| Massachusetts Development Finance Agency, (Partners HealthCare System), 4.00%, 7/1/41 | 8,500 | 8,519,295 | |
| Michigan Finance Authority, (Beaumont Health Credit Group), 5.00%, 11/1/44 | 11,000 | 11,096,470 | |
| Michigan Finance Authority, (Henry Ford Health System), 4.00%, 11/15/50 | 11,795 | 11,012,638 | |
| Michigan Finance Authority, (Trinity Health Credit Group): | |||
| 4.00%, 12/1/49 | 5,645 | 5,418,466 | |
| 5.00%, 12/1/41 | 5,395 | 5,687,733 | |
| 5.00%, 12/1/45 | 10,000 | 10,142,400 | |
| Minnesota Agricultural and Economic Development Board, (HealthPartners Obligated Group), 4.00%, 1/1/49 | 15,000 | 14,819,550 | |
| Missouri Health and Educational Facilities Authority, (BJC Health System): | |||
| 4.00%, 1/1/45 | 5,975 | 5,974,641 | |
| 5.00%, 1/1/44 | 6,000 | 6,003,420 | |
| Missouri Health and Educational Facilities Authority, (Children's Mercy Hospital), 4.00%, 5/15/48 | 18,120 | 17,434,883 | |
| Missouri Health and Educational Facilities Authority, (CoxHealth): | |||
| 4.00%, 11/15/49 | 10,750 | 10,384,070 | |
| 5.00%, 11/15/38 | 4,340 | 4,343,385 | |
| New York Dormitory Authority, (Northwell Health Obligated Group), 5.00%, 5/1/52 | 8,090 | 8,656,543 | |
| Norfolk Economic Development Authority, VA, (Sentara Healthcare), 4.00%, 11/1/48 | 1,025 | 1,011,593 | |
| North Carolina Medical Care Commission, (Novant Health Obligated Group), 4.00%, 11/1/49 | 1,960 | 1,938,362 | |
| Oregon Facilities Authority, (PeaceHealth), (LOC: TD Bank, N.A.), 3.80%, 8/1/34(3) | 4,000 | 4,000,000 | |
| Pennsylvania Economic Development Financing Authority, (UPMC), 4.00%, 11/15/42 | 3,660 | 3,654,107 | |
| Salem Hospital Facility Authority, OR, (Salem Health), 5.00%, 5/15/44 | 11,620 | 12,190,891 | |
| Security | Principal Amount (000's omitted) | Value | |
| Hospital (continued) | |||
| South Carolina Jobs-Economic Development Authority, (Anmed Health), 4.25%, 2/1/48 | $ | 7,240 | $ 7,328,690 |
| South Carolina Jobs-Economic Development Authority, (Bon Secours Mercy Health, Inc.), 4.00%, 12/1/44 | 5,520 | 5,519,006 | |
| South Carolina Jobs-Economic Development Authority, (McLeod Health), 4.25%, 11/1/54 | 14,060 | 14,027,521 | |
| South Carolina Jobs-Economic Development Authority, (Prisma Health Obligated Group), (LOC: TD Bank, N.A.), 3.80%, 5/1/48(3) | 2,300 | 2,300,000 | |
| South Dakota Health and Educational Facilities Authority, (Sanford Health), 5.00%, 11/1/44 | 10,000 | 10,007,500 | |
| Southcentral Pennsylvania General Authority, (WellSpan Health Obligated Group), 4.00%, 6/1/49 | 5,000 | 4,873,600 | |
| St. Cloud, MN, (CentraCare Health System), 4.00%, 5/1/50(4) | 5,000 | 4,909,800 | |
| Tarrant County Cultural Education Facilities Finance Corp., TX, (Baylor Scott & White Health), 5.00%, 11/15/45 | 8,000 | 8,112,480 | |
| University of Colorado Hospital Authority, (SPA: TD Bank, N.A.), 3.80%, 11/15/39(3) | 13,000 | 13,000,000 | |
| University of Wisconsin Hospitals and Clinics Authority: | |||
| (SPA: JPMorgan Chase Bank, N.A.), 4.00%, 4/1/48(3) | 16,000 | 16,000,000 | |
| Green Bonds, 4.25%, 4/1/52 | 3,000 | 2,987,490 | |
| Utah County, UT, (IHC Health Services, Inc.), 4.00%, 5/15/47 | 8,565 | 8,304,538 | |
| Virginia Commonwealth University Health System Authority, 4.00%, 7/1/54 | 19,950 | 19,445,664 | |
| Washington Health Care Facilities Authority, (Seattle Children's Hospital), 4.00%, 10/1/45 | 5,000 | 4,973,800 | |
| Wisconsin Health and Educational Facilities Authority, (Ascension Senior Credit Group), 4.00%, 11/15/46 | 8,600 | 8,165,356 | |
| Wisconsin Health and Educational Facilities Authority, (Children's Hospital of Wisconsin, Inc.), 4.00%, 8/15/42 | 11,015 | 11,020,618 | |
| Wisconsin Health and Educational Facilities Authority, (Thedacare, Inc.), 5.00%, 12/15/44 | 5,650 | 5,653,277 | |
| Yuma Industrial Development Authority, AZ, (Yuma Regional Medical Center), 5.25%, 8/1/49(4) | 4,000 | 4,444,440 | |
| $ 546,135,357 | |||
| Housing — 3.0% | |||
| California Community Housing Agency, (Summit at Sausalito Apartments), 3.00%, 2/1/57(6) | $ | 3,000 | $ 2,220,600 |
| CSCDA Community Improvement Authority, CA, (City of Orange Portfolio), Essential Housing Revenue, Social Bonds, 3.00%, 3/1/57(6) | 25,275 | 18,875,117 | |
| Delaware Housing Authority, (FHLMC), (FNMA), (GNMA), 4.60%, 7/1/44 | 2,000 | 2,054,300 | |
| Security | Principal Amount (000's omitted) | Value | |
| Housing (continued) | |||
| Georgia Housing and Finance Authority, 3.65%, 6/1/44 | $ | 7,670 | $ 7,361,513 |
| Illinois Housing Development Authority, Social Bonds, (FHLMC), (FNMA), (GNMA), 4.55%, 10/1/44 | 4,000 | 4,073,680 | |
| Indiana Finance Authority, (CHF-Tippecanoe, LLC - Student Housing), 5.00%, 6/1/53 | 2,300 | 2,397,934 | |
| Maryland Economic Development Corp., (Morgan State University), Student Housing Revenue, 5.75%, 7/1/53 | 2,000 | 2,204,120 | |
| Massachusetts Development Finance Agency, (Merrimack College Student Housing), 5.00%, 7/1/54(6) | 1,200 | 1,241,100 | |
| Missouri Housing Development Commission, SFMR: | |||
| (FHLMC), (FNMA), (GNMA), 3.30%, 12/1/47 | 1,281 | 1,192,398 | |
| (FHLMC), (FNMA), (GNMA), 3.40%, 11/1/46 | 2,156 | 2,050,083 | |
| (FHLMC), (FNMA), (GNMA), 4.60%, 11/1/49 | 995 | 1,009,786 | |
| (FHLMC), (FNMA), (GNMA), Series 2024-A, 4.45%, 11/1/44 | 1,245 | 1,262,206 | |
| (FHLMC), (FNMA), (GNMA), Series 2024-E, 4.45%, 11/1/44 | 12,205 | 12,373,673 | |
| Nebraska Investment Finance Authority, Social Bonds, (FHLMC), (FNMA), GNMA), 4.50%, 9/1/44 | 16,830 | 17,140,513 | |
| New Mexico Mortgage Finance Authority, Single Family Mortgage Program, (FHLMC), (FNMA), (GNMA), 4.45%, 9/1/48 | 1,490 | 1,500,177 | |
| New York City Housing Development Corp., NY, Sustainable Development Bonds, 2.60%, 11/1/46 | 1,500 | 1,134,360 | |
| North Carolina Housing Finance Agency: | |||
| (FHLMC), (FNMA), (GNMA), 4.00%, 7/1/39(4) | 1,375 | 1,399,887 | |
| (FHLMC), (FNMA), (GNMA), 4.35%, 1/1/44(4) | 3,200 | 3,235,616 | |
| Social Bonds, (FHLMC), (FNMA), (GNMA), 4.35%, 7/1/43 | 2,725 | 2,760,343 | |
| Pennsylvania Housing Finance Agency, SFMR: | |||
| Social Bonds, 4.75%, 10/1/49 | 11,330 | 11,657,437 | |
| Social Bonds, 5.00%, 10/1/50 | 7,335 | 7,655,173 | |
| Social Bonds, 5.45%, 4/1/51 | 5,000 | 5,325,200 | |
| South Carolina Housing Finance and Development Authority, 4.375%, 7/1/44 | 2,500 | 2,521,450 | |
| Texas Student Housing Corp., (University of Northern Texas), 6.85%, 7/1/31(7) | 10,640 | 10,640,000 | |
| Utah State University, 4.00%, 4/1/48 | 10,875 | 10,716,769 | |
| Virginia Housing Development Authority: | |||
| 5.125%, 11/1/43 | 2,650 | 2,813,902 | |
| 5.25%, 11/1/48 | 2,250 | 2,366,685 | |
| $ 139,184,022 | |||
| Security | Principal Amount (000's omitted) | Value | |
| Industrial Development Revenue — 1.9% | |||
| Montgomery County Industrial Development Authority, PA, (Constellation Energy Generation, LLC), 4.10% to 4/3/28 (Put Date), 4/1/53 | $ | 250 | $ 257,070 |
| New York Transportation Development Corp., (Delta Air Lines, Inc. - LaGuardia Airport Terminals C&D Redevelopment): | |||
| (AMT), 4.375%, 10/1/45 | 25,000 | 24,511,500 | |
| (AMT), 5.00%, 10/1/40 | 41,585 | 43,172,299 | |
| (AMT), 6.00%, 4/1/35 | 7,360 | 8,328,944 | |
| South Carolina Jobs-Economic Development Authority, (International Paper Co.), (AMT), 4.00% to 4/1/26 (Put Date), 4/1/33 | 10,000 | 10,101,600 | |
| Valparaiso, IN, (Pratt Paper IN, LLC), (AMT), 4.875%, 1/1/44(6) | 2,000 | 2,102,460 | |
| $ 88,473,873 | |||
| Insured - Education — 0.2% | |||
| Florida, (Florida State University Athletics Association), (BAM), 4.25%, 10/1/53(2) | $ | 7,725 | $ 7,754,509 |
| $ 7,754,509 | |||
| Insured - Electric Utilities — 0.5% | |||
| Brownsville, TX, Utility System Revenue, (BAM), 5.00%, 9/1/51 | $ | 1,195 | $ 1,255,622 |
| Garland, TX, Electric Utility System Revenue, (AGM), 4.25%, 3/1/48 | 1,750 | 1,766,713 | |
| Greenville, TX, Electric System Revenue: | |||
| (BAM), 5.00%, 2/15/41 | 1,125 | 1,237,770 | |
| (BAM), 5.00%, 2/15/42 | 200 | 219,230 | |
| Lower Colorado River Authority, TX, (LCRA Transmission Services Corp.): | |||
| (AGC), 5.00%, 5/15/49 | 13,000 | 14,225,120 | |
| (AGM), 5.00%, 5/15/49 | 3,500 | 3,795,505 | |
| $ 22,499,960 | |||
| Insured - Escrowed/Prerefunded — 0.8% | |||
| North Texas Tollway Authority, (AGC), Prerefunded to 1/1/25, 6.20%, 1/1/42 | $ | 37,070 | $ 37,330,602 |
| $ 37,330,602 | |||
| Insured - General Obligations — 1.0% | |||
| Clark County School District, NV, (AGM), 4.25%, 6/15/41 | $ | 5,000 | $ 5,212,800 |
| Generation Park Management District, TX: | |||
| (AGC), 3.50%, 9/1/43(4) | 4,075 | 3,760,451 | |
| (AGC), 3.75%, 9/1/47(4) | 4,820 | 4,510,170 | |
| Little Rock School District, AR, (BAM), 4.00%, 2/1/49 | 1,835 | 1,829,385 | |
| Security | Principal Amount (000's omitted) | Value | |
| Insured - General Obligations (continued) | |||
| Lumberton Municipal Utility District, TX, (AGM), 3.00%, 8/15/52 | $ | 5,045 | $ 3,903,014 |
| Nassau County, NY, (AGM), 5.00%, 4/1/49 | 10,335 | 11,067,234 | |
| Sienna Parks and Levee Improvement District of Fort Bend County, TX, (BAM), 3.75%, 9/1/48 | 10,450 | 9,517,024 | |
| Waller Independent School District, TX, (BAM), 4.00%, 2/15/48 | 7,590 | 7,351,067 | |
| $ 47,151,145 | |||
| Insured - Hospital — 0.5% | |||
| Northampton County General Purpose Authority, PA, (St. Luke's University Health Network), (AGM), 5.00%, 8/15/49 | $ | 12,510 | $ 13,879,345 |
| Wisconsin Health and Educational Facilities Authority, (Marshfield Clinic Health System, Inc.), (BAM), 4.50%, 2/15/54 | 3,500 | 3,506,860 | |
| Yuma Industrial Development Authority, AZ, (Yuma Regional Medical Center), (AGC), 4.00%, 8/1/54(4) | 3,900 | 3,813,264 | |
| $ 21,199,469 | |||
| Insured - Housing — 0.0%(8) | |||
| Knox County Health, Educational and Housing Facility Board, TN, (University of Tennessee), (BAM), 5.50%, 7/1/54 | $ | 1,250 | $ 1,379,088 |
| $ 1,379,088 | |||
| Insured - Special Tax Revenue — 1.4% | |||
| Harris County-Houston Sports Authority, TX, (AGM), (NPFG), 0.00%, 11/15/34 | $ | 58,155 | $ 36,738,840 |
| Massachusetts, Dedicated Tax Revenue: | |||
| (NPFG), 5.50%, 1/1/29 | 11,000 | 12,300,200 | |
| (NPFG), 5.50%, 1/1/30 | 3,080 | 3,509,537 | |
| Metropolitan Pier and Exposition Authority, IL, (McCormick Place), (BAM), 4.00%, 12/15/42 | 10,440 | 10,513,289 | |
| St. Clair County Board of Education, AL, (BAM), 4.125%, 2/1/49 | 650 | 650,227 | |
| $ 63,712,093 | |||
| Insured - Transportation — 1.4% | |||
| Burbank-Glendale-Pasadena Airport Authority, CA, (AGM), (AMT), 4.25%, 7/1/43 | $ | 1,465 | $ 1,485,847 |
| E-470 Public Highway Authority, CO, (NPFG), 0.00%, 9/1/37 | 13,335 | 7,137,425 | |
| Houston, TX, Airport System Revenue, (AGM), (AMT), 5.25%, 7/1/53 | 12,000 | 13,021,080 | |
| Security | Principal Amount (000's omitted) | Value | |
| Insured - Transportation (continued) | |||
| Kansas City Industrial Development Authority, MO, (Kansas City International Airport Terminal Modernization), (AGM), (AMT), 5.00%, 3/1/49 | $ | 10,000 | $ 10,335,400 |
| Love Field Airport Modernization Corp., TX, (AGM), (AMT), 4.00%, 11/1/37 | 3,285 | 3,330,990 | |
| Metropolitan Transportation Authority, NY, Green Bonds, (BAM), 4.00%, 11/15/48 | 8,000 | 7,942,720 | |
| New York Transportation Development Corp., (John F. Kennedy International Airport New Terminal One): | |||
| Green Bonds, (AGM), (AMT), 5.00%, 6/30/49 | 8,650 | 9,031,811 | |
| Green Bonds, (AGM), (AMT), 5.00%, 6/30/54 | 10,000 | 10,465,400 | |
| $ 62,750,673 | |||
| Lease Revenue/Certificates of Participation — 2.3% | |||
| Battery Park City Authority, NY, Sustainability Bonds, 5.00%, 11/1/53 | $ | 12,000 | $ 13,298,520 |
| Maryland Stadium Authority, Built to Learn Revenue, 4.00%, 6/1/47 | 4,830 | 4,808,748 | |
| National Finance Authority, NH, (Centurion BioSquare, Inc.), 5.88%, 12/15/38 | 9,185 | 9,675,663 | |
| New Jersey Economic Development Authority, (Portal North Bridge), 5.25%, 11/1/47 | 12,700 | 14,008,735 | |
| New Jersey Transportation Trust Fund Authority, (Transportation Program): | |||
| 4.25%, 6/15/44 | 3,600 | 3,685,428 | |
| 5.00%, 6/15/46 | 6,000 | 6,601,080 | |
| 5.00%, 6/15/50 | 20,500 | 21,296,630 | |
| 2019 Series AA, 5.25%, 6/15/43 | 10,000 | 10,687,500 | |
| 2020 Series AA, 4.00%, 6/15/50 | 15,000 | 14,914,200 | |
| 2022 Series CC, 5.25%, 6/15/43 | 5,750 | 6,471,970 | |
| $ 105,448,474 | |||
| Nursing Home — 0.0%(8) | |||
| Mississippi Business Finance Corp., (Magnolia Healthcare), 7.99%, 7/1/25 | $ | 1,145 | $ 1,147,794 |
| $ 1,147,794 | |||
| Other Revenue — 3.0% | |||
| Black Belt Energy Gas District, AL, 5.25% to 10/1/30 (Put Date), 1/1/54 | $ | 11,250 | $ 12,214,125 |
| Buckeye Tobacco Settlement Financing Authority, OH, 5.00%, 6/1/55 | 37,890 | 35,709,052 | |
| California Community Choice Financing Authority, Clean Energy Project Revenue, Green Bonds, 5.50% to 11/1/30 (Put Date), 10/1/54 | 10,270 | 11,496,238 | |
| Central Falls Detention Facility Corp., RI, 7.25%, 7/15/35(7) | 250 | 100,000 | |
| Security | Principal Amount (000's omitted) | Value | |
| Other Revenue (continued) | |||
| Main Street Natural Gas, Inc., GA, Gas Supply Revenue: | |||
| 5.00% to 12/1/30 (Put Date), 5/1/54 | $ | 11,750 | $ 12,558,400 |
| 5.00% to 6/1/31 (Put Date), 12/1/53 | 12,500 | 13,620,000 | |
| 5.00% to 9/1/30 (Put Date), 9/1/53 | 10,000 | 10,807,700 | |
| Minnesota Municipal Gas Agency, (Liq: Royal Bank of Canada), 4.243%, (67% of SOFR + 1.00%), 12/1/52(9) | 12,500 | 12,536,750 | |
| Patriots Energy Group Financing Agency, SC, Gas Supply Revenue, 5.25% to 8/1/31 (Put Date), 10/1/54 | 10,750 | 11,679,337 | |
| Texas Municipal Gas Acquisition and Supply Corp. I, Gas Supply Revenue, 6.25%, 12/15/26 | 10,000 | 10,343,000 | |
| Texas Municipal Gas Acquisition and Supply Corp. II, Gas Supply Revenue, 4.117%, (66% of 3 mo. SOFR + 0.863%), 9/15/27(9) | 3,075 | 3,076,876 | |
| Tobacco Settlement Financing Corp., NJ, 5.25%, 6/1/46 | 5,270 | 5,475,846 | |
| $ 139,617,324 | |||
| Senior Living/Life Care — 0.7% | |||
| California Public Finance Authority, (Enso Village), Green Bonds, 2.375%, 11/15/28(6) | $ | 560 | $ 554,014 |
| Orange County Health Facilities Authority, FL, (Presbyterian Retirement Communities Obligated Group), 5.00%, 8/1/54 | 4,930 | 5,208,249 | |
| Palm Beach County Health Facilities Authority, FL, (Green Cay Life Plan Village), 11.50%, 7/1/27(6) | 5,570 | 7,040,758 | |
| South Carolina Jobs-Economic Development Authority, (Seafields Kiawah Island Project), 5.25%, 11/15/28 | 10,000 | 10,056,500 | |
| Tarrant County Cultural Education Facilities Finance Corp., TX, (MRC Stevenson Oaks): | |||
| 6.625%, 11/15/41 | 730 | 723,664 | |
| 6.875%, 11/15/55 | 200 | 194,850 | |
| Tarrant County Cultural Education Facilities Finance Corp., TX, (Trinity Terrace), 5.00%, 10/1/49 | 1,800 | 1,928,754 | |
| Wisconsin Health and Educational Facilities Authority, (Three Pillars Senior Living Communities), 4.20%, 8/15/28 | 4,000 | 4,033,960 | |
| $ 29,740,749 | |||
| Special Tax Revenue — 8.8% | |||
| Central Puget Sound Regional Transit Authority, WA, Sales and Motor Vehicle Excise Tax Revenue: | |||
| Green Bonds, 4.00%, 11/1/46 | $ | 11,825 | $ 11,861,185 |
| Green Bonds, 5.00%, 11/1/41 | 13,840 | 14,311,667 | |
| Dallas Area Rapid Transit, TX, Sales Tax Revenue: | |||
| 3.00%, 12/1/47 | 7,825 | 6,478,239 | |
| 4.00%, 12/1/51 | 3,485 | 3,410,177 | |
| Security | Principal Amount (000's omitted) | Value | |
| Special Tax Revenue (continued) | |||
| Hampton Roads Transportation Accountability Commission, VA, 5.00%, 7/1/48 | $ | 10,790 | $ 11,266,271 |
| Massachusetts Bay Transportation Authority, Sales Tax Revenue: | |||
| 4.00%, 7/1/48 | 5,405 | 5,401,162 | |
| 4.00%, 7/1/51 | 12,310 | 12,169,789 | |
| Metropolitan Pier and Exposition Authority, IL, (McCormick Place Expansion): | |||
| 4.00%, 6/15/50 | 12,060 | 11,521,400 | |
| 5.00%, 6/15/50 | 4,465 | 4,649,672 | |
| 5.00%, 6/15/53 | 3,500 | 3,797,570 | |
| Metropolitan Transportation Authority, NY, Green Bonds, 4.00%, 11/15/51 | 5,000 | 4,934,550 | |
| Michigan Trunk Line Fund: | |||
| 4.00%, 11/15/45 | 9,925 | 9,954,378 | |
| 5.00%, 11/15/46 | 18,000 | 20,114,820 | |
| New River Community Development District, FL, (Capital Improvements): | |||
| 5.00%, 5/1/13(10) | 230 | 0 | |
| 5.35%, 5/1/38(10) | 80 | 0 | |
| 5.75%, 5/1/38 | 310 | 312,784 | |
| New York City Transitional Finance Authority, NY, Future Tax Revenue: | |||
| 4.00%, 5/1/45 | 10,000 | 10,030,100 | |
| 4.00%, 8/1/48 | 5,705 | 5,698,668 | |
| 5.00%, 11/1/39 | 9,000 | 10,382,940 | |
| 5.00%, 11/1/40 | 4,500 | 5,146,470 | |
| 5.00%, 5/1/42(4) | 10,000 | 11,304,300 | |
| 5.00%, 11/1/46(2) | 13,000 | 14,166,490 | |
| 5.00%, 5/1/53 | 10,000 | 10,831,300 | |
| (SPA: JPMorgan Chase Bank, N.A.), 4.05%, 8/1/39(3) | 12,000 | 12,000,000 | |
| (SPA: JPMorgan Chase Bank, N.A.), 4.05%, 8/1/42(3) | 10,000 | 10,000,000 | |
| New York Dormitory Authority, Personal Income Tax Revenue: | |||
| 4.00%, 2/15/47 | 15,020 | 14,913,809 | |
| 5.25%, 3/15/52 | 5,000 | 5,604,250 | |
| New York Dormitory Authority, Sales Tax Revenue: | |||
| 4.00%, 3/15/49 | 5,000 | 4,949,050 | |
| 5.00%, 3/15/39 | 10,000 | 10,654,300 | |
| New York State Thruway Authority, Personal Income Tax Revenue, 4.00%, 3/15/44 | 5,000 | 5,032,350 | |
| New York State Urban Development Corp., Personal Income Tax Revenue: | |||
| 5.00%, 3/15/49 | 25,000 | 27,204,000 | |
| Green Bonds, 4.00%, 3/15/50 | 16,825 | 16,603,415 | |
| New York State Urban Development Corp., Sales Tax Revenue, 5.00%, 3/15/49 | 10,000 | 10,975,300 | |
| Security | Principal Amount (000's omitted) | Value | |
| Special Tax Revenue (continued) | |||
| Pasco County, FL, Sales Tax Revenue, 5.00%, 10/1/49 | $ | 9,245 | $ 10,177,173 |
| Pennsylvania Turnpike Commission, Oil Franchise Tax Revenue, 4.00%, 12/1/51 | 5,000 | 4,924,800 | |
| Puerto Rico Sales Tax Financing Corp.: | |||
| 0.00%, 7/1/46 | 19,385 | 6,578,881 | |
| 5.00%, 7/1/58 | 38,291 | 38,687,312 | |
| Southeastern Pennsylvania Transportation Authority, 5.25%, 6/1/47 | 13,000 | 14,420,900 | |
| Southern Hills Plantation I Community Development District, FL: | |||
| Series A1, 5.80%, 5/1/35 | 355 | 341,524 | |
| Series A2, 5.80%, 5/1/35 | 295 | 205,774 | |
| Sterling Hill Community Development District, FL, 6.20%, 5/1/35 | 1,532 | 704,558 | |
| Triborough Bridge and Tunnel Authority, NY, Payroll Mobility Tax: | |||
| Series 2021A, 5.00%, 5/15/51 | 6,500 | 6,975,475 | |
| Green Bonds, 5.25%, 5/15/47 | 8,065 | 8,988,926 | |
| Triborough Bridge and Tunnel Authority, NY, Sales Tax Revenue: | |||
| 4.00%, 5/15/48 | 5,000 | 4,983,650 | |
| 5.00%, 5/15/54 | 5,000 | 5,478,050 | |
| $ 408,147,429 | |||
| Student Loan — 0.0%(8) | |||
| New Jersey Higher Education Student Assistance Authority, Series 2015-1A, (AMT), 4.00%, 12/1/28 | $ | 1,730 | $ 1,728,253 |
| $ 1,728,253 | |||
| Transportation — 21.2% | |||
| Allegheny County Airport Authority, PA, (Pittsburgh International Airport), (AMT), 5.00%, 1/1/51 | $ | 12,775 | $ 13,330,840 |
| Atlanta, GA, Airport Revenue: | |||
| (AMT), 5.25%, 7/1/49 | 5,000 | 5,500,300 | |
| Green Bonds, 5.00%, 7/1/44 | 7,000 | 7,793,170 | |
| Green Bonds, 5.00%, 7/1/49 | 17,000 | 18,809,140 | |
| Green Bonds, (AMT), 5.25%, 7/1/41 | 5,820 | 6,484,178 | |
| Austin, TX, Airport System Revenue, (AMT), 5.00%, 11/15/38 | 6,175 | 6,545,994 | |
| Bay Area Toll Authority, CA, (San Francisco Bay Area), (LOC: Barclays Bank PLC), 3.40%, 4/1/55(3) | 11,465 | 11,465,000 | |
| Burbank-Glendale-Pasadena Airport Authority, CA, (AMT), 5.25%, 7/1/42 | 3,000 | 3,365,340 | |
| Charleston County Airport District, SC, 5.25%, 7/1/54(4) | 4,000 | 4,459,640 | |
| Charlotte, NC, (Charlotte Douglas International Airport), 5.00%, 7/1/48(2) | 4,000 | 4,406,080 | |
| Security | Principal Amount (000's omitted) | Value | |
| Transportation (continued) | |||
| Chicago, IL, (Midway International Airport): | |||
| 5.00%, 1/1/41 | $ | 6,000 | $ 6,077,220 |
| (AMT), 5.00%, 1/1/39 | 4,000 | 4,317,960 | |
| (AMT), 5.00%, 1/1/40 | 4,000 | 4,293,000 | |
| Chicago, IL, (O'Hare International Airport): | |||
| 4.00%, 1/1/44 | 9,500 | 9,429,320 | |
| 5.00%, 1/1/48 | 16,160 | 17,719,925 | |
| (AMT), 5.00%, 1/1/34 | 12,500 | 12,531,625 | |
| (AMT), 5.00%, 1/1/47 | 22,085 | 22,435,489 | |
| (AMT), 5.00%, 1/1/53 | 14,370 | 14,703,959 | |
| (AMT), 5.25%, 1/1/53 | 11,500 | 12,168,035 | |
| Dallas and Fort Worth, TX, (Dallas/Fort Worth International Airport): | |||
| 4.00%, 11/1/45 | 10,000 | 9,975,600 | |
| 4.00%, 11/1/49 | 6,900 | 6,835,278 | |
| Delaware River Port Authority of Pennsylvania and New Jersey, 5.00%, 1/1/40 | 5,000 | 5,020,050 | |
| Denver City and County, CO, Airport System Revenue: | |||
| (AMT), 4.00%, 12/1/43 | 5,000 | 4,874,800 | |
| (AMT), 5.00%, 12/1/35 | 5,000 | 5,264,650 | |
| (AMT), 5.00%, 12/1/38 | 10,000 | 10,456,400 | |
| (AMT), 5.00%, 11/15/42 | 9,575 | 10,255,878 | |
| (AMT), 5.00%, 11/15/53 | 5,835 | 6,172,555 | |
| Harris County, TX, Toll Road Revenue, 5.25%, 8/15/49 | 5,000 | 5,605,150 | |
| Hawaii, Airports System Revenue: | |||
| (AMT), 5.00%, 7/1/43 | 3,900 | 4,017,741 | |
| (AMT), 5.00%, 7/1/45 | 13,705 | 13,773,388 | |
| Illinois Toll Highway Authority, 5.25%, 1/1/43 | 16,835 | 19,104,526 | |
| Indianapolis Local Public Improvement Bond Bank, IN, (Indianapolis Airport Authority), (AMT), 5.25%, 1/1/40 | 5,000 | 5,464,600 | |
| Kansas City Industrial Development Authority, MO, (Kansas City International Airport Terminal Modernization): | |||
| (AMT), 5.00%, 3/1/38 | 13,500 | 14,098,050 | |
| (AMT), 5.00%, 3/1/46 | 6,965 | 7,217,063 | |
| (AMT), 5.00%, 3/1/54 | 4,835 | 4,994,458 | |
| Lee County, FL, Airport Revenue, (AMT), 5.00%, 10/1/46 | 6,775 | 7,102,910 | |
| Los Angeles Department of Airports, CA, (Los Angeles International Airport): | |||
| (AMT), 5.00%, 5/15/46 | 19,935 | 21,254,498 | |
| Green Bonds, (AMT), 5.00%, 5/15/47 | 17,855 | 18,997,363 | |
| Louisiana Public Facilities Authority, (I-10 Calcasieu River Bridge Public-Private Partnership), (AMT), 5.50%, 9/1/59 | 10,625 | 11,654,138 | |
| Massachusetts Port Authority, (AMT), 5.00%, 7/1/43 | 8,000 | 8,110,240 | |
| Security | Principal Amount (000's omitted) | Value | |
| Transportation (continued) | |||
| Massachusetts, (Rail Enhancement and Accelerated Bridge Program), 5.00%, 6/1/47 | $ | 18,000 | $ 18,620,640 |
| Massachusetts, (Rail Enhancement Program), Sustainability Bonds, 5.00%, 6/1/53(2) | 16,500 | 18,099,345 | |
| Metropolitan Nashville Airport Authority, TN, (AMT), 5.00%, 7/1/49 | 10,500 | 10,946,355 | |
| Metropolitan Transportation Authority, NY: | |||
| (LOC: Barclays Bank PLC), 4.15%, 11/15/50(3) | 19,500 | 19,500,000 | |
| Green Bonds, 4.75%, 11/15/45 | 3,050 | 3,162,850 | |
| Metropolitan Washington Airports Authority, D.C., (AMT), 5.00%, 10/1/44 | 15,750 | 16,409,767 | |
| Minneapolis-St. Paul Metropolitan Airports Commission, MN: | |||
| 4.00%, 1/1/54 | 5,000 | 4,945,650 | |
| 5.00%, 1/1/52 | 11,000 | 11,992,200 | |
| New Jersey Turnpike Authority: | |||
| 4.50%, 1/1/48 | 8,000 | 8,324,880 | |
| 5.25%, 1/1/49 | 5,000 | 5,695,250 | |
| New York State Thruway Authority, 4.00%, 1/1/44 | 10,000 | 10,024,300 | |
| New York Transportation Development Corp., (John F. Kennedy International Airport New Terminal One): | |||
| Green Bonds, (AMT), 5.50%, 6/30/54 | 6,750 | 7,266,713 | |
| Green Bonds, (AMT), 6.00%, 6/30/54 | 5,765 | 6,303,739 | |
| New York Transportation Development Corp., (LaGuardia Airport Terminal B Redevelopment), (AMT), 5.00%, 7/1/46 | 35,865 | 35,865,359 | |
| New York Transportation Development Corp., (Terminal 4 John F. Kennedy International Airport), (AMT), 5.00%, 12/1/29 | 10,000 | 10,772,400 | |
| North Texas Tollway Authority: | |||
| 4.125%, 1/1/39 | 10,215 | 10,603,783 | |
| 5.00%, 1/1/48 | 10,000 | 10,167,000 | |
| Oklahoma Turnpike Authority, 5.50%, 1/1/53 | 12,500 | 13,912,500 | |
| Oregon Department of Transportation, 4.00%, 11/15/42 | 9,380 | 9,560,377 | |
| Pennsylvania Economic Development Financing Authority, (PennDOT Major Bridges Package One): | |||
| (AMT), 5.25%, 6/30/53 | 21,630 | 22,888,866 | |
| (AMT), 5.75%, 6/30/48 | 2,030 | 2,265,297 | |
| Pennsylvania Turnpike Commission: | |||
| 4.25%, 12/1/44 | 3,000 | 3,078,720 | |
| 5.00%, 12/1/46 | 5,000 | 5,096,600 | |
| 5.00%, 12/1/48 | 10,000 | 11,072,500 | |
| Philadelphia, PA, Airport Revenue, (AMT), 5.00%, 7/1/47 | 4,595 | 4,683,316 | |
| Phoenix Civic Improvement Corp., AZ, Airport Revenue: | |||
| (AMT), 5.00%, 7/1/42 | 6,250 | 6,408,125 | |
| (AMT), 5.00%, 7/1/49 | 10,400 | 10,745,280 | |
| Security | Principal Amount (000's omitted) | Value | |
| Transportation (continued) | |||
| Port Authority of New York and New Jersey: | |||
| 5.00%, 9/1/36(4) | $ | 9,000 | $ 10,658,070 |
| 5.00%, 9/1/37(4) | 6,000 | 7,082,700 | |
| (AMT), 5.00%, 12/1/44 | 4,500 | 4,876,155 | |
| Series 213, 5.00%, 9/1/38 | 6,130 | 6,646,943 | |
| Series 245, 5.00%, 9/1/38(4) | 2,500 | 2,934,125 | |
| Port of Portland, OR, (Portland International Airport): | |||
| (AMT), 5.00%, 7/1/44 | 8,000 | 8,294,880 | |
| (AMT), 5.00%, 7/1/45 | 12,260 | 12,782,889 | |
| Green Bonds, (AMT), 5.25%, 7/1/43 | 17,000 | 18,791,290 | |
| Port of Seattle, WA: | |||
| (AMT), 5.00%, 5/1/43 | 11,595 | 11,873,280 | |
| (AMT), 5.00%, 4/1/44 | 9,870 | 10,234,302 | |
| (AMT), 5.00%, 8/1/46 | 11,915 | 12,586,291 | |
| Sacramento County, CA, Airport System Revenue: | |||
| 5.00%, 7/1/37(4) | 5,850 | 6,907,739 | |
| 5.25%, 7/1/54(4) | 4,000 | 4,511,520 | |
| Salt Lake City, UT, (Salt Lake City International Airport): | |||
| (AMT), 5.00%, 7/1/42 | 17,330 | 17,745,747 | |
| (AMT), 5.00%, 7/1/43 | 3,165 | 3,260,551 | |
| (AMT), 5.00%, 7/1/46 | 15,975 | 16,819,119 | |
| (AMT), 5.00%, 7/1/47 | 6,500 | 6,624,930 | |
| (AMT), 5.25%, 7/1/48 | 16,260 | 16,854,466 | |
| San Diego County Regional Airport Authority, CA, (San Diego International Airport), (AMT), 5.00%, 7/1/48 | 15,000 | 16,103,700 | |
| San Francisco City and County Airport Commission, CA, (San Francisco International Airport): | |||
| (AMT), 5.00%, 5/1/49 | 5,000 | 5,177,700 | |
| (AMT), 5.50%, 5/1/43 | 7,200 | 8,133,480 | |
| Texas Private Activity Bond Surface Transportation Corp., (North Tarrant Express Project), (AMT), 5.50%, 12/31/58 | 9,940 | 10,934,497 | |
| Triborough Bridge and Tunnel Authority, NY: | |||
| 4.00%, 11/15/54 | 16,500 | 16,205,475 | |
| 5.00%, 11/15/40 | 7,000 | 8,080,520 | |
| 5.00%, 11/15/41 | 5,000 | 5,735,550 | |
| 5.00%, 11/15/42 | 3,000 | 3,420,030 | |
| 5.00%, 11/15/43 | 3,230 | 3,660,171 | |
| (LOC: Barclays Bank PLC), 4.15%, 1/1/32(3) | 10,030 | 10,030,000 | |
| (LOC: TD Bank, N.A.), 3.80%, 1/1/32(3) | 12,500 | 12,500,000 | |
| Virginia Small Business Financing Authority, (95 Express Lanes, LLC): | |||
| (AMT), 4.00%, 1/1/39 | 9,070 | 8,929,778 | |
| (AMT), 4.00%, 1/1/48 | 5,565 | 5,208,506 | |
| $ 978,101,767 | |||
| Security | Principal Amount (000's omitted) | Value | |
| Water and Sewer — 8.0% | |||
| Austin, TX, Water and Wastewater System Revenue: | |||
| 5.00%, 11/15/47 | $ | 4,000 | $ 4,374,880 |
| 5.00%, 11/15/49 | 5,250 | 5,812,380 | |
| Charleston, SC, Waterworks and Sewer System Revenue: | |||
| 5.00%, 1/1/42(4) | 2,500 | 2,888,025 | |
| 5.00%, 1/1/45(4) | 3,000 | 3,423,330 | |
| Series 2022, 5.00%, 1/1/47 | 5,000 | 5,515,850 | |
| Series 2024-A, 5.00%, 1/1/47(4) | 2,500 | 2,833,700 | |
| Corpus Christi, TX, Utility System Revenue, 4.00%, 7/15/48 | 4,530 | 4,429,570 | |
| District of Columbia Water and Sewer Authority, 4.00%, 10/1/51 | 10,935 | 10,845,770 | |
| Dorchester County, SC, Waterworks and Sewer System Revenue, 5.00%, 10/1/54(4) | 7,500 | 8,285,325 | |
| Fort Lauderdale, FL, Water & Sewer Revenue, 5.50%, 9/1/48 | 11,000 | 12,613,810 | |
| Gilbert Water Resources Municipal Property Corp., AZ, Green Bonds, 4.00%, 7/15/47 | 3,000 | 3,012,180 | |
| Greenville County Metropolitan Sewer Subdistrict, SC, 4.00%, 6/1/54 | 2,430 | 2,411,702 | |
| Hampton Roads Sanitation District, VA, 5.00%, 7/1/54 | 11,000 | 12,166,990 | |
| Houston, TX, Combined Utility System Revenue, 5.25%, 11/15/49 | 8,000 | 9,009,840 | |
| JEA, FL, Water and Sewer System Revenue, 5.25%, 10/1/49 | 7,800 | 8,731,164 | |
| Johnston County, NC, Water and Sewer System Revenue: | |||
| 4.00%, 4/1/54 | 1,835 | 1,840,248 | |
| 5.00%, 4/1/49 | 5,000 | 5,554,850 | |
| Kansas City, MO, Sanitary Sewer System Revenue, 4.00%, 1/1/48 | 4,000 | 3,982,800 | |
| Kansas Development Finance Authority, 5.00%, 5/1/38(4) | 15,595 | 18,241,784 | |
| New York City Municipal Water Finance Authority, NY, (Water and Sewer System): | |||
| 4.00%, 6/15/49 | 10,000 | 9,852,200 | |
| 4.00%, 6/15/54(4) | 5,500 | 5,454,790 | |
| 5.00%, 6/15/47(2) | 8,000 | 8,771,600 | |
| 5.00%, 6/15/50 | 5,000 | 5,313,300 | |
| 5.25%, 6/15/47 | 20,000 | 22,549,200 | |
| 5.25%, 6/15/48 | 13,500 | 15,170,220 | |
| 5.25%, 6/15/53(4) | 12,300 | 13,826,184 | |
| (SPA: Barclays Bank PLC), 4.15%, 6/15/50(3) | 11,500 | 11,500,000 | |
| (SPA: Barclays Bank PLC), 4.15%, 6/15/53(3) | 10,000 | 10,000,000 | |
| (SPA: JPMorgan Chase Bank, N.A.), 4.05%, 6/15/43(3) | 10,000 | 10,000,000 | |
| Security | Principal Amount (000's omitted) | Value | |
| Water and Sewer (continued) | |||
| New York City Municipal Water Finance Authority, NY, (Water and Sewer System): (continued) | |||
| (SPA: JPMorgan Chase Bank, N.A.), 4.05%, 6/15/44(3) | $ | 10,000 | $ 10,000,000 |
| Peace River Manasota Regional Water Supply Authority, FL, 4.00%, 10/1/54(4) | 6,000 | 5,903,520 | |
| Philadelphia, PA, Water and Wastewater Revenue, 5.00%, 10/1/43 | 5,000 | 5,279,350 | |
| Phoenix Civic Improvement Corp., AZ, Wastewater System Revenue, 5.25%, 7/1/47 | 17,200 | 19,410,028 | |
| San Mateo-Foster City Public Financing Authority, CA, (Clean Water Program), 5.00%, 8/1/49 | 9,000 | 9,646,470 | |
| Santa Clara Valley Water District, CA, 5.00%, 6/1/43 | 5,385 | 6,233,245 | |
| Sarasota County, FL, Utility System Revenue, 5.25%, 10/1/52 | 15,000 | 16,639,050 | |
| Seattle, WA, Water System Revenue, Green Bonds, 5.00%, 9/1/52 | 8,610 | 9,371,727 | |
| Tacoma, WA, Sewer Revenue, 4.00%, 12/1/48 | 4,315 | 4,320,221 | |
| Tarrant Regional Water District, TX, Water Revenue, 4.00%, 3/1/54 | 10,000 | 9,773,600 | |
| Texas Water Development Board, 4.00%, 10/15/41(4) | 4,000 | 4,116,600 | |
| Tualatin Valley Water District, OR: | |||
| 5.00%, 6/1/48 | 3,400 | 3,781,310 | |
| 5.00%, 6/1/49 | 4,120 | 4,573,035 | |
| Washington Suburban Sanitary District, MD, (SPA: TD Bank, N.A.), 4.15%, 6/1/27(3) | 13,850 | 13,850,000 | |
| Westminster, CO, Water and Wastewater Utility Revenue, 5.00%, 12/1/54 | 7,500 | 8,317,125 | |
| $ 369,626,973 | |||
| Total Tax-Exempt Municipal Obligations (identified cost $4,472,828,289) | $4,646,197,222 | ||
| Taxable Municipal Obligations — 4.1% |
| Security | Principal Amount (000's omitted) | Value | |
| Cogeneration — 0.0%(8) | |||
| Northampton County Industrial Development Authority, PA, (Northampton Generating), 5.00%, 6/30/27(5) | $ | 8,071 | $ 1,452,793 |
| $ 1,452,793 | |||
| Education — 0.0%(8) | |||
| San Antonio Education Facilities Corp., TX, (University of the Incarnate Word), 3.15%, 4/1/37 | $ | 1,750 | $ 1,406,545 |
| $ 1,406,545 | |||
| Security | Principal Amount (000's omitted) | Value | |
| General Obligations — 0.1% | |||
| Puerto Rico, GO Contingent Value Instrument, 0.00%, 11/1/43 | $ | 6,667 | $ 4,300,450 |
| $ 4,300,450 | |||
| Hospital — 0.8% | |||
| California Statewide Communities Development Authority, (Loma Linda University Medical Center), 6.00%, 12/1/24 | $ | 34,250 | $ 34,239,725 |
| $ 34,239,725 | |||
| Housing — 0.9% | |||
| Maine Housing Authority, (SPA: Barclays Bank PLC), 4.86%, 11/15/52(1) | $ | 20,000 | $ 20,000,000 |
| North Dakota Housing Finance Agency, (SPA: TD Bank, N.A.), 4.88%, 1/1/47(1) | 22,420 | 22,420,000 | |
| $ 42,420,000 | |||
| Insured - Transportation — 1.0% | |||
| Alameda Corridor Transportation Authority, CA: | |||
| (AGM), 0.00%, 10/1/43 | $ | 14,295 | $ 4,840,859 |
| (AMBAC), 0.00%, 10/1/26 | 14,395 | 13,239,513 | |
| (AMBAC), 0.00%, 10/1/27 | 22,355 | 19,710,180 | |
| (AMBAC), Escrowed to Maturity, 0.00%, 10/1/26 | 8,105 | 7,519,414 | |
| $ 45,309,966 | |||
| Lease Revenue/Certificates of Participation — 0.0%(8) | |||
| National Finance Authority, NH, (Centurion BioSquare, Inc.), 9.58%, 12/15/38 | $ | 615 | $ 632,042 |
| National Finance Authority, NH, (Centurion Foundation), 11.00%, 12/15/38 | 300 | 307,860 | |
| $ 939,902 | |||
| Other Revenue — 0.5% | |||
| Golden State Tobacco Securitization Corp., CA, 3.714%, 6/1/41 | $ | 28,000 | $ 22,324,680 |
| $ 22,324,680 | |||
| Transportation — 0.4% | |||
| Foothill/Eastern Transportation Corridor Agency, CA, 4.094%, 1/15/49 | $ | 20,856 | $ 18,147,223 |
| $ 18,147,223 | |||
| Security | Principal Amount (000's omitted) | Value | |
| Water and Sewer — 0.4% | |||
| Metropolitan Water District of Southern California, (SPA: TD Bank, N.A.), 4.85%, 7/1/37(1) | $ | 20,000 | $ 20,000,000 |
| $ 20,000,000 | |||
| Total Taxable Municipal Obligations (identified cost $196,290,111) | $ 190,541,284 | ||
| Total Investments — 105.6% (identified cost $4,710,075,004) | $4,878,588,231 | ||
| Other Assets, Less Liabilities — (5.6)% | $ (260,390,570) | ||
| Net Assets — 100.0% | $4,618,197,661 | ||
| The percentage shown for each investment category in the Portfolio of Investments is based on net assets. | |
| (1) | Variable rate demand obligation that may be tendered at par on any day for payment the lesser of 5 business days or 7 calendar days. The stated interest rate, which generally resets weekly, is determined by the remarketing agent and represents the rate in effect at September 30, 2024. |
| (2) | Security represents the municipal bond held by a trust that issues residual interest bonds (see Note 1H). |
| (3) | Variable rate demand obligation that may be tendered at par on any day for payment the same or next business day. The stated interest rate, which generally resets daily, is determined by the remarketing agent and represents the rate in effect at September 30, 2024. |
| (4) | When-issued security. |
| (5) | Represents a payment-in-kind security which may pay interest in additional principal at the issuer’s discretion. |
| (6) | Security exempt from registration under Rule 144A of the Securities Act of 1933, as amended. These securities may be sold in certain transactions in reliance on an exemption from registration (normally to qualified institutional buyers). At September 30, 2024, the aggregate value of these securities is $32,034,049 or 0.7% of the Fund's net assets. |
| (7) | Security is in default and making only partial interest payments. |
| (8) | Amount is less than 0.05%. |
| (9) | Floating rate security. The stated interest rate represents the rate in effect at September 30, 2024. |
| (10) | Issuer is in default with respect to interest and/or principal payments or has declared bankruptcy and is non-income producing. |
| At September 30, 2024, the concentration of the Fund’s investments in the various states and territories, determined as a percentage of net assets, is as follows: | |
| New York | 18.2% |
| Texas | 14.7% |
| California | 10.2% |
| Others, representing less than 10% individually | 61.6% |
| The Fund invests primarily in debt securities issued by municipalities. The ability of the issuers of the debt securities to meet their obligations may be affected by economic developments in a specific industry or municipality. At September 30, 2024, 6.3% of total investments are backed by bond insurance of various financial institutions and financial guaranty assurance agencies. The aggregate percentage insured by an individual financial institution or financial guaranty assurance agency ranged from 0.8% to 2.6% of total investments. |
| Abbreviations: | |
| AGC | – Assured Guaranty Corp. |
| AGM | – Assured Guaranty Municipal Corp. |
| AMBAC | – AMBAC Financial Group, Inc. |
| AMT | – Interest earned from these securities may be considered a tax preference item for purposes of the Federal Alternative Minimum Tax. |
| BAM | – Build America Mutual Assurance Co. |
| FHLMC | – Federal Home Loan Mortgage Corp. |
| FNMA | – Federal National Mortgage Association |
| GNMA | – Government National Mortgage Association |
| Liq | – Liquidity Provider |
| LOC | – Letter of Credit |
| NPFG | – National Public Finance Guarantee Corp. |
| PSF | – Permanent School Fund |
| SFMR | – Single Family Mortgage Revenue |
| SOFR | – Secured Overnight Financing Rate |
| SPA | – Standby Bond Purchase Agreement |
| September 30, 2024 | ||
| AMT-Free Fund | National Fund | |
| Assets | ||
| Investments: | ||
| Identified cost | $196,121,945 | $4,710,075,004 |
| Unrealized appreciation | 9,716,004 | 168,513,227 |
| Investments, at value | $205,837,949 | $4,878,588,231 |
| Cash | $731,733 | $544,582 |
| Interest receivable | 2,186,957 | 51,900,270 |
| Receivable for investments sold | 2,675,304 | 46,724,691 |
| Receivable for Fund shares sold | 239,760 | 7,114,029 |
| Trustees' deferred compensation plan | 112,141 | 424,232 |
| Total assets | $211,783,844 | $4,985,296,035 |
| Liabilities | ||
| Payable for floating rate notes issued | $4,008,780 | $62,007,658 |
| Payable for when-issued securities | 6,339,420 | 277,234,414 |
| Payable for Fund shares redeemed | 302,013 | 22,275,062 |
| Distributions payable | 94,153 | 1,927,473 |
| Payable to affiliates: | ||
| Investment adviser fee | 70,809 | 1,185,516 |
| Distribution and service fees | 23,316 | 280,159 |
| Trustees' deferred compensation plan | 112,141 | 424,232 |
| Interest expense and fees payable | 51,317 | 593,755 |
| Accrued expenses | 179,702 | 1,170,105 |
| Total liabilities | $11,181,651 | $367,098,374 |
| Net Assets | $200,602,193 | $4,618,197,661 |
| Sources of Net Assets | ||
| Paid-in capital | $240,338,415 | $4,883,239,003 |
| Accumulated loss | (39,736,222) | (265,041,342) |
| Net Assets | $200,602,193 | $4,618,197,661 |
| Class A Shares | ||
| Net Assets | $104,232,772 | $1,198,847,496 |
| Shares Outstanding | 12,623,704 | 127,312,944 |
| Net Asset Value and Redemption Price Per Share (net assets ÷ shares of beneficial interest outstanding) | $8.26 | $9.42 |
| Maximum Offering Price Per Share (100 ÷ 96.75 of net asset value per share) | $8.54 | $9.74 |
| Class C Shares | ||
| Net Assets | $2,565,439 | $42,141,232 |
| Shares Outstanding | 312,547 | 4,475,796 |
| Net Asset Value and Offering Price Per Share* (net assets ÷ shares of beneficial interest outstanding) | $8.21 | $9.42 |
| Class I Shares | ||
| Net Assets | $93,803,982 | $3,377,208,933 |
| Shares Outstanding | 10,403,791 | 358,700,784 |
| Net Asset Value, Offering Price and Redemption Price Per Share (net assets ÷ shares of beneficial interest outstanding) | $9.02 | $9.42 |
| On sales of $100,000 or more, the offering price of Class A shares is reduced. | |
| * | Redemption price per share is equal to the net asset value less any applicable contingent deferred sales charge. |
| Year Ended September 30, 2024 | ||
| AMT-Free Fund | National Fund | |
| Investment Income | ||
| Interest income | $9,731,821 | $186,141,322 |
| Total investment income | $9,731,821 | $186,141,322 |
| Expenses | ||
| Investment adviser fee | $921,632 | $13,359,012 |
| Distribution and service fees: | ||
| Class A | 262,706 | 2,933,263 |
| Class C | 30,403 | 443,244 |
| Trustees’ fees and expenses | 14,045 | 108,500 |
| Custodian fee | 59,307 | 716,783 |
| Transfer and dividend disbursing agent fees | 69,933 | 1,566,694 |
| Legal and accounting services | 86,381 | 263,462 |
| Printing and postage | 7,574 | 134,248 |
| Registration fees | 62,282 | 290,530 |
| Interest expense and fees | 192,793 | 2,253,425 |
| Miscellaneous | 66,360 | 278,201 |
| Total expenses | $1,773,416 | $22,347,362 |
| Net investment income | $7,958,405 | $163,793,960 |
| Realized and Unrealized Gain (Loss) | ||
| Net realized gain (loss): | ||
| Investment transactions | $249,913 | $(5,878,476) |
| Futures contracts | — | 1,196,126 |
| Net realized gain (loss) | $249,913 | $(4,682,350) |
| Change in unrealized appreciation (depreciation): | ||
| Investments | $16,717,804 | $292,497,578 |
| Futures contracts | — | (4,363,160) |
| Net change in unrealized appreciation (depreciation) | $16,717,804 | $288,134,418 |
| Net realized and unrealized gain | $16,967,717 | $283,452,068 |
| Net increase in net assets from operations | $24,926,122 | $447,246,028 |
| Year Ended September 30, 2024 | ||
| AMT-Free Fund | National Fund | |
| Increase (Decrease) in Net Assets | ||
| From operations: | ||
| Net investment income | $7,958,405 | $163,793,960 |
| Net realized gain (loss) | 249,913 | (4,682,350) |
| Net change in unrealized appreciation (depreciation) | 16,717,804 | 288,134,418 |
| Net increase in net assets from operations | $24,926,122 | $447,246,028 |
| Distributions to shareholders: | ||
| Class A | $(3,783,054) | $(44,667,007) |
| Class C | (86,620) | (1,354,682) |
| Class I | (4,009,714) | (118,137,744) |
| Total distributions to shareholders | $(7,879,388) | $(164,159,433) |
| Transactions in shares of beneficial interest: | ||
| Class A | $(4,761,576) | $(11,782,201) |
| Class C | (938,223) | (6,744,532) |
| Class I | (31,185,537) | 670,507,014 |
| Net increase (decrease) in net assets from Fund share transactions | $(36,885,336) | $651,980,281 |
| Net increase (decrease) in net assets | $(19,838,602) | $935,066,876 |
| Net Assets | ||
| At beginning of year | $220,440,795 | $3,683,130,785 |
| At end of year | $200,602,193 | $4,618,197,661 |
| Year Ended September 30, 2023 | ||
| AMT-Free Fund | National Fund | |
| Increase (Decrease) in Net Assets | ||
| From operations: | ||
| Net investment income | $8,754,263 | $133,637,938 |
| Net realized loss | (5,868,207) | (49,314,855) |
| Net change in unrealized appreciation (depreciation) | 1,277,150 | 4,443,142 |
| Net increase in net assets from operations | $4,163,206 | $88,766,225 |
| Distributions to shareholders: | ||
| Class A | $(3,899,645) | $(43,200,549) |
| Class C | (114,999) | (1,519,512) |
| Class I | (4,682,937) | (86,466,621) |
| Total distributions to shareholders | $(8,697,581) | $(131,186,682) |
| Transactions in shares of beneficial interest: | ||
| Class A | $(11,277,440) | $(49,788,169) |
| Class C | (1,635,102) | (10,052,301) |
| Class I | (418,520) | 658,700,475 |
| Net increase (decrease) in net assets from Fund share transactions | $(13,331,062) | $598,860,005 |
| Net increase (decrease) in net assets | $(17,865,437) | $556,439,548 |
| Net Assets | ||
| At beginning of year | $238,306,232 | $3,126,691,237 |
| At end of year | $220,440,795 | $3,683,130,785 |
| AMT-Free Fund — Class A | |||||
| Year Ended September 30, | |||||
| 2024 | 2023 | 2022 | 2021 | 2020 | |
| Net asset value — Beginning of year | $7.62 | $7.79 | $9.29 | $9.25 | $9.25 |
| Income (Loss) From Operations | |||||
| Net investment income(1) | $0.29 | $0.28 | $0.23 | $0.24 | $0.28 |
| Net realized and unrealized gain (loss) | 0.64 | (0.17) | (1.50) | 0.05 | 0.01(2) |
| Total income (loss) from operations | $0.93 | $0.11 | $(1.27) | $0.29 | $0.29 |
| Less Distributions | |||||
| From net investment income | $(0.29) | $(0.28) | $(0.23) | $(0.25) | $(0.29) |
| Total distributions | $(0.29) | $(0.28) | $(0.23) | $(0.25) | $(0.29) |
| Net asset value — End of year | $8.26 | $7.62 | $7.79 | $9.29 | $9.25 |
| Total Return(3) | 12.36% | 1.29% | (13.85)% | 3.14% | 3.12% |
| Ratios/Supplemental Data | |||||
| Net assets, end of year (000’s omitted) | $104,233 | $100,835 | $113,933 | $157,981 | $158,729 |
| Ratios (as a percentage of average daily net assets):(4) | |||||
| Expenses excluding interest and fees | 0.86% | 0.83% | 0.79% | 0.76% | 0.78% |
| Interest and fee expense(5) | 0.09% | 0.17% | 0.07% | 0.04% | 0.14% |
| Total expenses | 0.95% | 1.00% | 0.86% | 0.80% | 0.92% |
| Net expenses | 0.95% | 1.00% | 0.86% | 0.80% | 0.92% |
| Net investment income | 3.64% | 3.50% | 2.61% | 2.53% | 2.97% |
| Portfolio Turnover | 74% | 53% | 60% | 32% | 58% |
| (1) | Computed using average shares outstanding. |
| (2) | The per share amount is not in accord with the net realized and unrealized gain (loss) for the period because of the timing of Fund share transactions and the amount of the per share realized and unrealized gains and losses at such time. |
| (3) | Returns are historical and are calculated by determining the percentage change in net asset value with all distributions reinvested and do not reflect the effect of sales charges. |
| (4) | Total expenses do not reflect amounts reimbursed and/or waived by the adviser and certain of its affiliates, if applicable. Net expenses are net of all reductions and represent the net expenses paid by the Fund. |
| (5) | Interest and fee expense relates to the liability for floating rate notes issued in conjunction with residual interest bond transactions (see Note 1H). |
| AMT-Free Fund — Class C | |||||
| Year Ended September 30, | |||||
| 2024 | 2023 | 2022 | 2021 | 2020 | |
| Net asset value — Beginning of year | $7.58 | $7.74 | $9.24 | $9.20 | $9.20 |
| Income (Loss) From Operations | |||||
| Net investment income(1) | $0.23 | $0.22 | $0.16 | $0.17 | $0.21 |
| Net realized and unrealized gain (loss) | 0.63 | (0.16) | (1.49) | 0.05 | 0.01(2) |
| Total income (loss) from operations | $0.86 | $0.06 | $(1.33) | $0.22 | $0.22 |
| Less Distributions | |||||
| From net investment income | $(0.23) | $(0.22) | $(0.17) | $(0.18) | $(0.22) |
| Total distributions | $(0.23) | $(0.22) | $(0.17) | $(0.18) | $(0.22) |
| Net asset value — End of year | $8.21 | $7.58 | $7.74 | $9.24 | $9.20 |
| Total Return(3) | 11.58% | 0.51% | (14.59)% | 2.38% | 2.36% |
| Ratios/Supplemental Data | |||||
| Net assets, end of year (000’s omitted) | $2,565 | $3,258 | $4,906 | $9,017 | $15,094 |
| Ratios (as a percentage of average daily net assets):(4) | |||||
| Expenses excluding interest and fees | 1.61% | 1.58% | 1.54% | 1.51% | 1.53% |
| Interest and fee expense(5) | 0.09% | 0.17% | 0.07% | 0.04% | 0.14% |
| Total expenses | 1.70% | 1.75% | 1.61% | 1.55% | 1.67% |
| Net expenses | 1.70% | 1.75% | 1.61% | 1.55% | 1.67% |
| Net investment income | 2.89% | 2.74% | 1.83% | 1.80% | 2.23% |
| Portfolio Turnover | 74% | 53% | 60% | 32% | 58% |
| (1) | Computed using average shares outstanding. |
| (2) | The per share amount is not in accord with the net realized and unrealized gain (loss) for the period because of the timing of Fund share transactions and the amount of the per share realized and unrealized gains and losses at such time. |
| (3) | Returns are historical and are calculated by determining the percentage change in net asset value with all distributions reinvested and do not reflect the effect of sales charges. |
| (4) | Total expenses do not reflect amounts reimbursed and/or waived by the adviser and certain of its affiliates, if applicable. Net expenses are net of all reductions and represent the net expenses paid by the Fund. |
| (5) | Interest and fee expense relates to the liability for floating rate notes issued in conjunction with residual interest bond transactions (see Note 1H). |
| AMT-Free Fund — Class I | |||||
| Year Ended September 30, | |||||
| 2024 | 2023 | 2022 | 2021 | 2020 | |
| Net asset value — Beginning of year | $8.32 | $8.50 | $10.15 | $10.11 | $10.10 |
| Income (Loss) From Operations | |||||
| Net investment income(1) | $0.34 | $0.33 | $0.27 | $0.28 | $0.33 |
| Net realized and unrealized gain (loss) | 0.70 | (0.18) | (1.64) | 0.06 | 0.02(2) |
| Total income (loss) from operations | $1.04 | $0.15 | $(1.37) | $0.34 | $0.35 |
| Less Distributions | |||||
| From net investment income | $(0.34) | $(0.33) | $(0.28) | $(0.30) | $(0.34) |
| Total distributions | $(0.34) | $(0.33) | $(0.28) | $(0.30) | $(0.34) |
| Net asset value — End of year | $9.02 | $8.32 | $8.50 | $10.15 | $10.11 |
| Total Return(3) | 12.66% | 1.49% | (13.64)% | 3.36% | 3.48% |
| Ratios/Supplemental Data | |||||
| Net assets, end of year (000’s omitted) | $93,804 | $116,348 | $119,467 | $184,002 | $168,113 |
| Ratios (as a percentage of average daily net assets):(4) | |||||
| Expenses excluding interest and fees | 0.61% | 0.58% | 0.54% | 0.51% | 0.53% |
| Interest and fee expense(5) | 0.09% | 0.17% | 0.07% | 0.04% | 0.14% |
| Total expenses | 0.70% | 0.75% | 0.61% | 0.55% | 0.67% |
| Net expenses | 0.70% | 0.75% | 0.61% | 0.55% | 0.67% |
| Net investment income | 3.89% | 3.75% | 2.84% | 2.77% | 3.21% |
| Portfolio Turnover | 74% | 53% | 60% | 32% | 58% |
| (1) | Computed using average shares outstanding. |
| (2) | The per share amount is not in accord with the net realized and unrealized gain (loss) for the period because of the timing of Fund share transactions and the amount of the per share realized and unrealized gains and losses at such time. |
| (3) | Returns are historical and are calculated by determining the percentage change in net asset value with all distributions reinvested. |
| (4) | Total expenses do not reflect amounts reimbursed and/or waived by the adviser and certain of its affiliates, if applicable. Net expenses are net of all reductions and represent the net expenses paid by the Fund. |
| (5) | Interest and fee expense relates to the liability for floating rate notes issued in conjunction with residual interest bond transactions (see Note 1H). |
| National Fund — Class A | |||||
| Year Ended September 30, | |||||
| 2024 | 2023 | 2022 | 2021 | 2020 | |
| Net asset value — Beginning of year | $8.75 | $8.78 | $10.31 | $10.24 | $10.14 |
| Income (Loss) From Operations | |||||
| Net investment income(1) | $0.35 | $0.34 | $0.23 | $0.23 | $0.26 |
| Net realized and unrealized gain (loss) | 0.67 | (0.04) | (1.51) | 0.08 | 0.12 |
| Total income (loss) from operations | $1.02 | $0.30 | $(1.28) | $0.31 | $0.38 |
| Less Distributions | |||||
| From net investment income | $(0.35) | $(0.33) | $(0.25) | $(0.24) | $(0.28) |
| Total distributions | $(0.35) | $(0.33) | $(0.25) | $(0.24) | $(0.28) |
| Net asset value — End of year | $9.42 | $8.75 | $8.78 | $10.31 | $10.24 |
| Total Return(2) | 11.82% | 3.38% | (12.62)% | 2.99% | 3.84% |
| Ratios/Supplemental Data | |||||
| Net assets, end of year (000’s omitted) | $1,198,847 | $1,126,345 | $1,179,909 | $1,558,418 | $1,620,505 |
| Ratios (as a percentage of average daily net assets):(3) | |||||
| Expenses excluding interest and fees | 0.66% | 0.67% | 0.64% | 0.61% | 0.64% |
| Interest and fee expense(4) | 0.05% | 0.08% | 0.03% | 0.02% | 0.05% |
| Total expenses | 0.71% | 0.75% | 0.67% | 0.63% | 0.69% |
| Net expenses | 0.71% | 0.75% | 0.67% | 0.63% | 0.69% |
| Net investment income | 3.80% | 3.73% | 2.30% | 2.15% | 2.61% |
| Portfolio Turnover | 82% | 86% | 151% | 56% | 105% |
| (1) | Computed using average shares outstanding. |
| (2) | Returns are historical and are calculated by determining the percentage change in net asset value with all distributions reinvested and do not reflect the effect of sales charges. |
| (3) | Total expenses do not reflect amounts reimbursed and/or waived by the adviser and certain of its affiliates, if applicable. Net expenses are net of all reductions and represent the net expenses paid by the Fund. |
| (4) | Interest and fee expense relates to the liability for floating rate notes issued in conjunction with residual interest bond transactions (see Note 1H). |
| National Fund — Class C | |||||
| Year Ended September 30, | |||||
| 2024 | 2023 | 2022 | 2021 | 2020 | |
| Net asset value — Beginning of year | $8.75 | $8.78 | $10.31 | $10.24 | $10.14 |
| Income (Loss) From Operations | |||||
| Net investment income(1) | $0.28 | $0.28 | $0.14 | $0.15 | $0.19 |
| Net realized and unrealized gain (loss) | 0.67 | (0.04) | (1.50) | 0.08 | 0.12 |
| Total income (loss) from operations | $0.95 | $0.24 | $(1.36) | $0.23 | $0.31 |
| Less Distributions | |||||
| From net investment income | $(0.28) | $(0.27) | $(0.17) | $(0.16) | $(0.21) |
| Total distributions | $(0.28) | $(0.27) | $(0.17) | $(0.16) | $(0.21) |
| Net asset value — End of year | $9.42 | $8.75 | $8.78 | $10.31 | $10.24 |
| Total Return(2) | 10.99% | 2.60% | (13.28)% | 2.22% | 3.08% |
| Ratios/Supplemental Data | |||||
| Net assets, end of year (000’s omitted) | $42,141 | $45,670 | $55,558 | $94,851 | $131,330 |
| Ratios (as a percentage of average daily net assets):(3) | |||||
| Expenses excluding interest and fees | 1.41% | 1.42% | 1.39% | 1.36% | 1.39% |
| Interest and fee expense(4) | 0.05% | 0.08% | 0.03% | 0.02% | 0.05% |
| Total expenses | 1.46% | 1.50% | 1.42% | 1.38% | 1.44% |
| Net expenses | 1.46% | 1.50% | 1.42% | 1.38% | 1.44% |
| Net investment income | 3.05% | 2.98% | 1.52% | 1.41% | 1.87% |
| Portfolio Turnover | 82% | 86% | 151% | 56% | 105% |
| (1) | Computed using average shares outstanding. |
| (2) | Returns are historical and are calculated by determining the percentage change in net asset value with all distributions reinvested and do not reflect the effect of sales charges. |
| (3) | Total expenses do not reflect amounts reimbursed and/or waived by the adviser and certain of its affiliates, if applicable. Net expenses are net of all reductions and represent the net expenses paid by the Fund. |
| (4) | Interest and fee expense relates to the liability for floating rate notes issued in conjunction with residual interest bond transactions (see Note 1H). |
| National Fund — Class I | |||||
| Year Ended September 30, | |||||
| 2024 | 2023 | 2022 | 2021 | 2020 | |
| Net asset value — Beginning of year | $8.75 | $8.78 | $10.31 | $10.24 | $10.14 |
| Income (Loss) From Operations | |||||
| Net investment income(1) | $0.37 | $0.37 | $0.25 | $0.25 | $0.29 |
| Net realized and unrealized gain (loss) | 0.67 | (0.04) | (1.51) | 0.08 | 0.12 |
| Total income (loss) from operations | $1.04 | $0.33 | $(1.26) | $0.33 | $0.41 |
| Less Distributions | |||||
| From net investment income | $(0.37) | $(0.36) | $(0.27) | $(0.26) | $(0.31) |
| Total distributions | $(0.37) | $(0.36) | $(0.27) | $(0.26) | $(0.31) |
| Net asset value — End of year | $9.42 | $8.75 | $8.78 | $10.31 | $10.24 |
| Total Return(2) | 12.10% | 3.64% | (12.40)% | 3.24% | 4.10% |
| Ratios/Supplemental Data | |||||
| Net assets, end of year (000’s omitted) | $3,377,209 | $2,511,115 | $1,891,224 | $2,347,177 | $1,797,038 |
| Ratios (as a percentage of average daily net assets):(3) | |||||
| Expenses excluding interest and fees | 0.41% | 0.42% | 0.39% | 0.36% | 0.39% |
| Interest and fee expense(4) | 0.05% | 0.08% | 0.03% | 0.02% | 0.05% |
| Total expenses | 0.46% | 0.50% | 0.42% | 0.38% | 0.44% |
| Net expenses | 0.46% | 0.50% | 0.42% | 0.38% | 0.44% |
| Net investment income | 4.04% | 3.98% | 2.55% | 2.39% | 2.85% |
| Portfolio Turnover | 82% | 86% | 151% | 56% | 105% |
| (1) | Computed using average shares outstanding. |
| (2) | Returns are historical and are calculated by determining the percentage change in net asset value with all distributions reinvested. |
| (3) | Total expenses do not reflect amounts reimbursed and/or waived by the adviser and certain of its affiliates, if applicable. Net expenses are net of all reductions and represent the net expenses paid by the Fund. |
| (4) | Interest and fee expense relates to the liability for floating rate notes issued in conjunction with residual interest bond transactions (see Note 1H). |
| AMT-Free Fund | National Fund | |
| Floating Rate Notes Outstanding | $4,008,780 | $62,007,658 |
| Interest Rate or Range of Interest Rates (%) | 3.18 | 3.15 - 3.19 |
| Collateral for Floating Rate Notes Outstanding | $5,486,670 | $86,191,225 |
| AMT-Free Fund | National Fund | |
| Average Floating Rate Notes Outstanding | $4,686,475 | $56,207,500 |
| Average Interest Rate | 4.11% | 4.01% |
| AMT-Free Fund | National Fund | ||||
| Year Ended September 30, | Year Ended September 30, | ||||
| 2024 | 2023 | 2024 | 2023 | ||
| Tax-exempt income | $7,877,590 | $8,697,559 | $148,757,917 | $121,388,863 | |
| Ordinary income | $1,798 | $22 | $15,401,516 | $9,797,819 | |
| AMT-Free Fund | National Fund | |
| Undistributed tax-exempt income | $ 721,295 | $ 2,145,347 |
| Deferred capital losses | (50,167,611) | (426,435,131) |
| Net unrealized appreciation | 9,804,247 | 161,175,915 |
| Distributions payable | (94,153) | (1,927,473) |
| Accumulated loss | $(39,736,222) | $(265,041,342) |
| AMT-Free Fund | National Fund | |
| Deferred capital losses: | ||
| Short-term | $26,016,544 | $298,699,227 |
| Long-term | $24,151,067 | $127,735,904 |
| AMT-Free Fund | National Fund | |
| Aggregate cost | $192,024,922 | $4,655,404,658 |
| Gross unrealized appreciation | $11,025,199 | $183,081,873 |
| Gross unrealized depreciation | (1,220,952) | (21,905,958) |
| Net unrealized appreciation | $9,804,247 | $161,175,915 |
| Total Daily Net Assets | Annual Asset Rate | Daily Income Rate |
| Up to $500 million | 0.300% | 3.000% |
| $500 million but less than $1 billion | 0.275% | 2.750% |
| $1 billion but less than $1.5 billion | 0.250% | 2.500% |
| $1.5 billion but less than $2 billion | 0.225% | 2.250% |
| $2 billion but less than $3 billion | 0.200% | 2.000% |
| $3 billion and over | 0.175% | 1.750% |
| AMT-Free Fund | National Fund | |
| Investment Adviser Fee | $921,632 | $13,359,012 |
| Effective Annual Rate | 0.43% | 0.32% |
| AMT-Free Fund | National Fund | |
| EVM's Sub-Transfer Agent Fees | $10,134 | $170,698 |
| EVD's Class A Sales Charges | $1,389 | $38,037 |
| Morgan Stanley affiliated broker-dealers’ Class A Sales Charges | $ — | $12,641 |
| AMT-Free Fund | National Fund | |
| Class A Distribution and Service Fees | $262,706 | $2,933,263 |
| AMT-Free Fund | National Fund | |
| Class C Distribution Fees | $22,802 | $332,433 |
| AMT-Free Fund | National Fund | |
| Class C Service Fees | $7,601 | $110,811 |
| AMT-Free Fund | National Fund | |
| Class A | $ —(1) | $119 |
| Class C | $ — | $1,798 |
| (1) | Amount is less than $100. |
| AMT-Free Fund | National Fund | |
| Purchases | $160,915,185 | $4,335,764,083 |
| Sales | $195,468,808 | $3,486,689,262 |
| AMT-Free Fund | ||||||
| Year Ended September 30, 2024 | Year Ended September 30, 2023 | |||||
| Shares | Amount | Shares | Amount | |||
| Class A | ||||||
| Sales | 2,215,344 | $17,952,953 | 1,888,917 | $14,993,570 | ||
| Issued to shareholders electing to receive payments of distributions in Fund shares | 385,503 | 3,113,046 | 412,323 | 3,293,503 | ||
| Redemptions | (3,207,834) | (25,827,575) | (3,699,939) | (29,564,513) | ||
| Net decrease | (606,987) | $(4,761,576) | (1,398,699) | $(11,277,440) | ||
| Class C | ||||||
| Sales | 76,495 | $ 615,449 | 132,801 | $ 1,060,779 | ||
| Issued to shareholders electing to receive payments of distributions in Fund shares | 10,293 | 82,633 | 13,573 | 107,806 | ||
| Redemptions | (204,192) | (1,636,305) | (350,028) | (2,803,687) | ||
| Net decrease | (117,404) | $ (938,223) | (203,654) | $(1,635,102) | ||
| Class I | ||||||
| Sales | 2,424,718 | $21,350,679 | 7,686,554 | $67,351,799 | ||
| Issued to shareholders electing to receive payments of distributions in Fund shares | 382,666 | 3,372,035 | 462,122 | 4,032,283 | ||
| Redemptions | (6,384,136) | (55,908,251) | (8,214,826) | (71,802,602) | ||
| Net decrease | (3,576,752) | $(31,185,537) | (66,150) | $ (418,520) | ||
| National Fund | ||||||
| Year Ended September 30, 2024 | Year Ended September 30, 2023 | |||||
| Shares | Amount | Shares | Amount | |||
| Class A | ||||||
| Sales | 18,426,434 | $ 169,942,020 | 17,509,254 | $ 159,744,009 | ||
| Issued to shareholders electing to receive payments of distributions in Fund shares | 4,170,023 | 38,453,338 | 4,046,834 | 36,759,694 | ||
| Redemptions | (24,029,562) | (220,177,559) | (27,121,465) | (246,291,872) | ||
| Net decrease | (1,433,105) | $ (11,782,201) | (5,565,377) | $ (49,788,169) | ||
| Class C | ||||||
| Sales | 1,071,098 | $ 9,868,273 | 1,180,431 | $ 10,743,048 | ||
| Issued to shareholders electing to receive payments of distributions in Fund shares | 133,484 | 1,230,196 | 151,181 | 1,373,270 | ||
| Redemptions | (1,949,577) | (17,843,001) | (2,435,564) | (22,168,619) | ||
| Net decrease | (744,995) | $ (6,744,532) | (1,103,952) | $ (10,052,301) | ||
| Class I | ||||||
| Sales | 166,253,236 | $1,527,366,480 | 195,677,015 | $1,778,704,708 | ||
| Issued to shareholders electing to receive payments of distributions in Fund shares | 10,788,378 | 99,585,315 | 7,485,180 | 67,982,627 | ||
| Redemptions | (105,421,044) | (956,444,781) | (131,390,441) | (1,187,986,860) | ||
| Net increase | 71,620,570 | $ 670,507,014 | 71,771,754 | $ 658,700,475 | ||
| National Fund | |
| Realized Gain (Loss) on Derivatives Recognized in Income | $1,196,126(1) |
| Change in Unrealized Appreciation (Depreciation) on Derivatives Recognized in Income | $(4,363,160)(2) |
| (1) | Statement of Operations location: Net realized gain (loss): Futures contracts. |
| (2) | Statement of Operations location: Change in unrealized appreciation (depreciation): Futures contracts. |
| National Fund | |
| Average Notional Cost: | |
| Futures Contracts — Short | $16,863,000 |
| • | Level 1 – quoted prices in active markets for identical investments |
| • | Level 2 – other significant observable inputs (including quoted prices for similar investments, interest rates, prepayment speeds, credit risk, etc.) |
| • | Level 3 – significant unobservable inputs (including a fund's own assumptions in determining the fair value of investments) |
| AMT-Free Fund | ||||
| Asset Description | Level 1 | Level 2 | Level 3 | Total |
| Tax-Exempt Mortgage-Backed Securities | $ — | $ 977,967 | $ — | $ 977,967 |
| Tax-Exempt Municipal Obligations | — | 204,859,982 | — | 204,859,982 |
| Total Investments | $ — | $ 205,837,949 | $ — | $ 205,837,949 |
| National Fund | ||||
| Asset Description | Level 1 | Level 2 | Level 3 | Total |
| Corporate Bonds | $ — | $ 41,849,725 | $ — | $ 41,849,725 |
| Tax-Exempt Municipal Obligations | — | 4,646,197,222 | — | 4,646,197,222 |
| Taxable Municipal Obligations | — | 190,541,284 | — | 190,541,284 |
| Total Investments | $ — | $4,878,588,231 | $ — | $4,878,588,231 |
Boston, Massachusetts
November 20, 2024
Boston, Massachusetts
November 20, 2024
| AMT-Free Municipal Income Fund | 99.98% |
| National Municipal Income Fund | 90.62% |
| Performance Relative to: | ||
| Fund | Median of Peer Group | Benchmark Index |
| Eaton Vance AMT-Free Municipal Income Fund | Lower | Lower |
| Eaton Vance National Municipal Income Fund | Higher | Lower |
Item 8. Changes in and Disagreements with Accountants for Open-End Management Investment Companies
Not applicable.
Item 9. Proxy Disclosures for Open-End Management Investment Companies
Not applicable.
Item 10. Remuneration Paid to Directors, Officers, and Others of Open-End Management Investment Companies
The information is disclosed as part of the Financial Statements included in Item 7 of this Form N-CSR.
Item 11. Statement Regarding Basis for Approval of Investment Advisory Contract
The information is included in Item 7 of this Form N-CSR.
Item 12. Disclosure of Proxy Voting Policies and Procedures for Closed-End Management Investment Companies
Not applicable.
Item 13. Portfolio Managers of Closed-End Management Investment Companies
Not applicable.
Item 14. Purchases of Equity Securities by Closed-End Management Investment Company and Affiliated Purchasers
Not applicable.
Item 15. Submission of Matters to a Vote of Security Holders
There have been no material changes to the procedures by which shareholders may recommend nominee to the Fund’s Board of Trustees since the Fund last provided disclosure in response to this item.
Item 16. Controls and Procedures
| (a) | It is the conclusion of the registrant’s principal executive officer and principal financial officer that the effectiveness of the registrant’s current disclosure controls and procedures (such disclosure controls and procedures having been evaluated within 90 days of the date of this filing) provide reasonable assurance that the information required to be disclosed by the registrant has been recorded, processed, summarized and reported within the time period specified in the Commission’s rules and forms and that the information required to be disclosed by the registrant has been accumulated and communicated to the registrant’s principal executive officer and principal financial officer in order to allow timely decisions regarding required disclosure. |
| (b) | There have been no changes in the registrant’s internal control over financial reporting during the period covered by this report that has materially affected, or is reasonably likely to materially affect, the registrant’s internal control over financial reporting. |
Item 17. Disclosure of Securities Lending Activities for Closed-End Management Investment Companies
Not applicable.
Item 18. Recovery of Erroneously Awarded Compensation
Not applicable.
Item 19. Exhibits
(a)(1) | Registrant’s Code of Ethics – Not applicable (please see Item 2). | |
(a)(2)(i) | Principal Financial Officer’s Section 302 certification. | |
(a)(2)(ii) | Principal Executive Officer’s Section 302 certification. | |
(b) | Combined Section 906 certification. | |
Signatures
Pursuant to the requirements of the Securities Exchange Act of 1934 and the Investment Company Act of 1940, the registrant has duly caused this report to be signed on its behalf by the undersigned, thereunto duly authorized.
| Eaton Vance Municipals Trust | ||
| By: | /s/ Kenneth A. Topping | |
Kenneth A. Topping Principal Executive Officer | ||
Date: November 25, 2024
Pursuant to the requirements of the Securities Exchange Act of 1934 and the Investment Company Act of 1940, this report has been signed below by the following persons on behalf of the registrant and in the capacities and on the dates indicated.
| By: | /s/ James F. Kirchner | |
| James F. Kirchner | ||
| Principal Financial Officer | ||
| Date: | November 25, 2024 | |
| By: | /s/ Kenneth A. Topping | |
| Kenneth A. Topping | ||
| Principal Executive Officer | ||
| Date: | November 25, 2024 | |