As filed with the SEC on July 1, 2005.
UNITED STATES
SECURITIES AND EXCHANGE COMMISSION
Washington, D.C. 20549
FORM N-CSR
CERTIFIED SHAREHOLDER REPORT OF REGISTERED
MANAGEMENT INVESTMENT COMPANIES
Investment Company Act file number | 811-4556 | ||||||||
| |||||||||
TRANSAMERICA IDEX MUTUAL FUNDS | |||||||||
(Exact name of registrant as specified in charter) | |||||||||
| |||||||||
570 Carillon Parkway, St. Petersburg, Florida |
| 33716 | |||||||
(Address of principal executive offices) |
| (Zip code) | |||||||
| |||||||||
John K. Carter, Esq. P.O. Box 5068, Clearwater, Florida 33758-5068 | |||||||||
(Name and address of agent for service) | |||||||||
| |||||||||
Registrant’s telephone number, including area code: | (727) 299-1800 |
| |||||||
| |||||||||
Date of fiscal year end: | October 31 |
| |||||||
| |||||||||
Date of reporting period: | November 1, 2004 – April 30, 2005 |
| |||||||
Item 1: Report(s) to Shareholders. The Semi-Annual Report is attached.

Semi-Annual Report
April 30, 2005
www.transamericaidex.com
Investor Services 1-888-233-IDEX (4339)
P.O. Box 9012 • Clearwater, FL 33758-9012
Distributor: AFSG Securities Corporation, Member NASD
Dear Fellow Shareholder,
On behalf of Transamerica IDEX Mutual Funds, I would like to thank you for your continued support and confidence in our products as we look forward to continuing to serve you and your financial advisor in the future. We value the trust you have placed in us.
This semi-annual report is provided to you with the intent of presenting a comprehensive review of the investments of each of your funds. The Securities and Exchange Commission requires that annual and semi-annual reports be sent to all shareholders, and we believe it to be an important part of the investment process. In addition to providing a comprehensive review, this report also provides a discussion of accounting policies in addition to matters presented to shareholders that may have required their vote.
We believe it is important to recognize and understand current market conditions in order to provide a context for reading the contents of this report. In review of the past six months, the positive market environment experienced in the last two months of 2004 led by falling oil prices and the conclusion of the U.S. presidential election has transitioned to a more difficult period in the first four months of 2005. This period has been led by volatile oil prices and investor fears of rising inflation, which has muted investment returns, and in many cases, resulted in losses. While economic growth has remained positive, creating investment opportunities, it is important to maintain a diversified portfolio as investment returns have historically been difficult to predict.
In addition to your active involvement in the investment process, we firmly believe that a financial advisor is a key resource to help you build a comprehensive picture of your current and future financial needs. In addition, financial advisors are familiar with the market's history, including long-term returns and volatility of various asset classes.
With your financial advisor, you can develop an investment program that incorporates factors such as your goals, your investment timeline, and your risk tolerance.
Please contact your financial advisor if you have any questions about the contents of this report, and thanks again for the confidence you have placed in us.
Sincerely,
Brian C. Scott
President
Transamerica IDEX Mutual Funds
TA IDEX American Century International
UNDERSTANDING YOUR FUND'S EXPENSES
(unaudited)
SHAREHOLDER EXPENSES
The following Example is intended to help you understand your ongoing costs (in dollars and cents) of investing in a Fund and to compare these costs with the ongoing costs of investing in other funds.
The Example is based on an investment of $1,000 invested at November 1, 2004 and held for the entire period until April 30, 2005.
ACTUAL EXPENSES
The first line in the table below provides information about actual account values and actual expenses. You may use the information in this line, together with the amount you invested, to estimate the expenses that you paid over the period. Simply divide your account value by $1,000 (for example, an $8,600 account value divided by $1,000 = 8.6), then multiply the result by the number in the first line of your Fund under the heading entitled "Expenses Paid During Period" to estimate the expenses you paid on your account during this period.
HYPOTHETICAL EXAMPLE FOR COMPARISON PURPOSES
The second line in the table below provides information about hypothetical account values and hypothetical expenses based on the Fund's actual expense ratio and an assumed rate of return of 5% per year before expenses, which is not the Fund's actual return. The hypothetical account values and expenses may not be used to estimate the actual ending account balance or expenses you paid for the period. You may use this information to compare the ongoing costs of investing in your Fund and other funds. To do so, compare this 5% hypothetical example with the 5% hypothetical examples that appear in the shareholder reports of the other funds.
Please note that the expenses shown in the table are meant to highlight your ongoing costs only and do not reflect any transactional costs, such as sales charges, redemption fees, brokerage commissions paid on purchases and sales of fund shares. Therefore, the second line under the Fund in the table is useful in comparing ongoing costs only, and will not help you determine the relative total costs of owning different funds. In addition, note that the expenses shown in the table are meant to highlight your ongoing costs and do not reflect any transaction costs.
| Beginning Account Value | Ending Account Value | Annualized Expense Ratio | Expenses Paid During Period (a) | ||||||||||||||||
| Class A | |||||||||||||||||||
| Actual | $ | 1,000.00 | $ | 1,071.40 | 1.47 | % | $ | 7.55 | |||||||||||
| Hypothetical (b) | 1,000.00 | 1,017.50 | 1.47 | 7.35 | |||||||||||||||
| Class B | |||||||||||||||||||
| Actual | 1,000.00 | 1,068.00 | 2.35 | 12.05 | |||||||||||||||
| Hypothetical (b) | 1,000.00 | 1,013.14 | 2.35 | 11.73 | |||||||||||||||
| Class C | |||||||||||||||||||
| Actual | 1,000.00 | 1,066.80 | 2.35 | 12.04 | |||||||||||||||
| Hypothetical (b) | 1,000.00 | 1,013.14 | 2.35 | 11.73 | |||||||||||||||
(a) Expenses are calculated using each Fund's annualized expense ratio (as disclosed in the table), multiplied by the average account value for the period, multiplied by number of days in the period (181 days), and divided by the number of days in the year (365 days).
(b) 5% return per year before expenses.
GRAPHICAL PRESENTATION OF SCHEDULE OF INVESTMENTS
By Region
At April 30, 2005
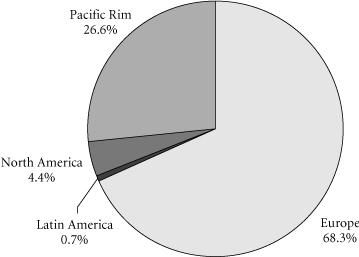
This chart shows the percentage breakdown by region of the Fund's total investment securities.
Transamerica IDEX Mutual Funds
Semi-Annual Report 2005
1
TA IDEX American Century International
SCHEDULE OF INVESTMENTS
At April 30, 2005
(all amounts except share amounts in thousands)
(unaudited)
| Shares | Value | ||||||||||
| CONVERTIBLE PREFERRED STOCKS (0.7%) | |||||||||||
| Switzerland (0.7%) | |||||||||||
| Compagnie Financiere Richemont AG–Class A | 22,100 | $ | 663 | ||||||||
| Total Convertible Preferred Stocks (cost: $570) | 663 | ||||||||||
| COMMON STOCKS (94.5%) | |||||||||||
| Australia (5.1%) | |||||||||||
| Amcor, Ltd. | 174,900 | 889 | |||||||||
| BHP Billiton, Ltd. | 103,324 | 1,309 | |||||||||
| Commonwealth Bank of Australia | 35,480 | 1,011 | |||||||||
| Macquarie Infrastructure Group | 255,670 | 730 | |||||||||
| QBE Insurance Group, Ltd. | 72,100 | 845 | |||||||||
| Austria (0.9%) | |||||||||||
| Erste Bank der Oesterreichischen Sparkassen AG | 18,032 | 878 | |||||||||
| Belgium (1.0%) | |||||||||||
| KBC Groupe | 12,090 | 960 | |||||||||
| Canada (2.0%) | |||||||||||
| EnCana Corp. | 7,291 | 468 | |||||||||
| Shoppers Drug Mart Corp. | 28,026 | 876 | |||||||||
| Thomson Corp. (The) | 17,240 | 572 | |||||||||
| Denmark (0.7%) | |||||||||||
| Novo Nordisk A/S–Class B | 12,540 | 636 | |||||||||
| Finland (0.5%) | |||||||||||
| Stora Enso OYJ–Class R | 37,650 | 501 | |||||||||
| France (13.1%) | |||||||||||
| Accor SA | 8,490 | 390 | |||||||||
| AXA | 36,068 | 904 | |||||||||
| Cie Generale D'Optique Essilor International SA | 8,830 | 633 | |||||||||
| Credit Agricole SA | 6,144 | 160 | |||||||||
| Groupe Danone | 10,520 | 989 | |||||||||
| Lafarge SA | 10,340 | 944 | |||||||||
| Pernod-Ricard | 4,950 | 753 | |||||||||
| Pinault-Printemps-Redoute SA | 4,520 | 447 | |||||||||
| Sanofi-Aventis | 6,070 | 539 | |||||||||
| Schneider Electric SA | 11,810 | 854 | |||||||||
| Societe Generale–Class A | 11,347 | 1,135 | |||||||||
| Total SA | 12,120 | 2,705 | |||||||||
| Vinci SA | 6,653 | 1,003 | |||||||||
| Vivendi Universal SA (a) | 30,830 | 926 | |||||||||
| Germany (6.1%) | |||||||||||
| Adidas-Salomon AG | 2,660 | 415 | |||||||||
| BASF AG | 11,830 | 778 | |||||||||
| Continental AG | 14,320 | 1,059 | |||||||||
| Deutsche Telekom AG | 48,270 | 915 | |||||||||
| E.ON AG | 8,230 | 700 | |||||||||
| Shares | Value | ||||||||||
| Germany (continued) | |||||||||||
| Fresenius Medical Care AG | 9,618 | $ | 776 | ||||||||
| Metro AG | 9,370 | 496 | |||||||||
| Puma AG Rudolf Dassler Sport | 2,927 | 677 | |||||||||
| Greece (1.9%) | |||||||||||
| Alpha Bank A.E. | 5,470 | 177 | |||||||||
| National Bank of Greece SA | 28,770 | 970 | |||||||||
| OPAP SA | 25,864 | 680 | |||||||||
| Hong Kong (0.9%) | |||||||||||
| CLP Holdings, Ltd. | 142,500 | 808 | |||||||||
| Ireland (2.5%) | |||||||||||
| Anglo Irish Bank Corp. PLC | 92,940 | 1,103 | |||||||||
| Bank of Ireland | 61,330 | 933 | |||||||||
| Ryanair Holdings PLC–ADR (a) | 9,230 | 371 | |||||||||
| Italy (1.8%) | |||||||||||
| ENI-Ente Nazionale Idrocarburi SpA | 41,430 | 1,045 | |||||||||
| Saipem SpA | 52,770 | 663 | |||||||||
| Japan (20.0%) | |||||||||||
| Ajinomoto Co., Inc. | 58,000 | 696 | |||||||||
| Astellas Pharma, Inc. | 28,900 | 1,046 | |||||||||
| Bank of Yokohama, Ltd. (The) | 190,000 | 1,086 | |||||||||
| Daikin Industries, Ltd. | 32,600 | 814 | |||||||||
| Denso Corp. | 13,900 | 329 | |||||||||
| East Japan Railway Co. | 170 | 884 | |||||||||
| Eisai Co., Ltd. | 20,800 | 693 | |||||||||
| Fuji Photo Film Co., Ltd. | 27,100 | 894 | |||||||||
| Honda Motor Co., Ltd. | 14,600 | 702 | |||||||||
| Hoya Corp. | 4,864 | 508 | |||||||||
| Kao Corp. | 17,000 | 393 | |||||||||
| KDDI Corp. | 110 | 507 | |||||||||
| Komatsu, Ltd. | 72,000 | 507 | |||||||||
| Matsushita Electric Industrial Co., Ltd. | 66,000 | 965 | |||||||||
| Mitsubishi Tokyo Financial Group, Inc. | 50 | 432 | |||||||||
| Omron Corp. | 37,800 | 826 | |||||||||
| ORIX Corp. | 7,000 | 950 | |||||||||
| Osaka Gas Co., Ltd. | 289,000 | 909 | |||||||||
| Seven-Eleven Japan Co., Ltd. | 15,400 | 434 | |||||||||
| Shin-Etsu Chemical Co., Ltd. | 15,200 | 560 | |||||||||
| Shiseido Co., Ltd. | 14,000 | 178 | |||||||||
| Sumitomo Metal Mining Co., Ltd. | 37,000 | 260 | |||||||||
| Sumitomo Mitsui Financial Group, Inc. | 60 | 387 | |||||||||
| Taisei Corp. | 192,000 | 671 | |||||||||
| Takefuji Corp. | 12,600 | 798 | |||||||||
| Toray Industries, Inc. | 173,000 | 771 | |||||||||
| Toto, Ltd. | 35,000 | 298 | |||||||||
| Toyota Motor Corp. | 15,600 | 566 | |||||||||
| Yamada Denki Co., Ltd. | 18,400 | 879 | |||||||||
The notes to the financial statements are an integral part of this report.
Transamerica IDEX Mutual Funds
Semi-Annual Report 2005
2
TA IDEX American Century International
SCHEDULE OF INVESTMENTS (continued)
At April 30, 2005
(all amounts except share amounts in thousands)
(unaudited)
| Shares | Value | ||||||||||
| Luxembourg (0.3%) | |||||||||||
| Arcelor | 15,140 | $ | 308 | ||||||||
| Mexico (0.6%) | |||||||||||
| America Movil SA de CV–Class L–ADR (b) | 12,267 | 609 | |||||||||
| Netherlands (2.4%) | |||||||||||
| ING Groep NV | 39,634 | 1,096 | |||||||||
| Royal Numico NV (a)(b) | 27,170 | 1,128 | |||||||||
| Norway (1.4%) | |||||||||||
| DnB Nor ASA | 72,450 | 693 | |||||||||
| Telenor ASA | 72,260 | 605 | |||||||||
| Spain (2.3%) | |||||||||||
| Cintra Concesiones de Infraestructuras de Transporte SA (a) | 44,351 | 478 | |||||||||
| Grupo Ferrovial SA | 13,669 | 781 | |||||||||
| Telefonica SA | 53,127 | 906 | |||||||||
| Sweden (0.7%) | |||||||||||
| Volvo AB–Class B (b) | 15,595 | 633 | |||||||||
| Switzerland (6.1%) | |||||||||||
| Nestle SA | 5,140 | 1,358 | |||||||||
| Novartis AG | 45,340 | 2,216 | |||||||||
| Roche Holding AG–Genusschein | 9,137 | 1,110 | |||||||||
| UBS AG | 13,526 | 1,086 | |||||||||
| United Kingdom (23.2%) | |||||||||||
| AstraZeneca PLC | 31,190 | 1,367 | |||||||||
| BAA PLC | 85,130 | 946 | |||||||||
| BG Group PLC | 83,780 | 651 | |||||||||
| BP PLC | 256,211 | 2,615 | |||||||||
| Diageo PLC | 99,230 | 1,473 | |||||||||
| GlaxoSmithKline PLC | 105,010 | 2,657 | |||||||||
| HSBC Holdings PLC | 12,340 | 198 | |||||||||
| Legal & General Group PLC | 310,590 | 622 | |||||||||
| Man Group PLC | 23,570 | 550 | |||||||||
| Next PLC | 30,740 | 872 | |||||||||
| O2 PLC (a) | 64,709 | 145 | |||||||||
| Reckitt Benckiser PLC | 48,353 | 1,573 | |||||||||
| Reed Elsevier PLC | 97,530 | 957 | |||||||||
| Royal Bank of Scotland Group PLC | 45,168 | 1,366 | |||||||||
| Smith & Nephew PLC | 96,615 | 997 | |||||||||
| Tesco PLC | 252,710 | 1,494 | |||||||||
| Unilever PLC | 56,540 | 539 | |||||||||
| Vodafone Group PLC | 900,330 | 2,357 | |||||||||
| Wolseley PLC | 30,830 | 621 | |||||||||
| United States (1.0%) | |||||||||||
| iShares MSCI EAFE Index Fund | 3,000 | 469 | |||||||||
| Synthes, Inc. | 3,870 | 440 | |||||||||
| Total Common Stocks (cost: $84,003) | 89,482 | ||||||||||
| Principal | Value | ||||||||||
| SECURITY LENDING COLLATERAL (2.2%) | |||||||||||
| Debt (1.9%) | |||||||||||
| Bank Notes (0.3%) | |||||||||||
| Bank of America | |||||||||||
| 2.82%, due 05/16/2005 | $ | 65 | $ | 65 | |||||||
| 2.80%, due 06/09/2005 (c) | 16 | 16 | |||||||||
| 2.77%, due 07/18/2005 (c) | 65 | 65 | |||||||||
| Canadian Imperial Bank of Commerce 3.02%, due 11/04/2005 (c) | 65 | 65 | |||||||||
| Credit Suisse First Boston Corp. 2.88%, due 09/09/2005 (c) 3.06%, due 03/10/2006 (c) | 16 16 | 16 16 | |||||||||
| Euro Dollar Overnight (0.3%) | |||||||||||
| Bank of Montreal 2.94%, due 05/04/2005 | 49 | 49 | |||||||||
| BNP Paribas 2.80%, due 05/05/2005 | 67 | 67 | |||||||||
| Den Danske Bank 2.93%, due 05/02/2005 2.80%, due 05/06/2005 | 59 33 | 59 33 | |||||||||
| Dexia Group 2.80%, due 05/05/2005 | 29 | 29 | |||||||||
| Royal Bank of Canada 2.80%, due 05/04/2005 | 67 | 67 | |||||||||
| Svenska Handlesbanken 2.80%, due 05/06/2005 | 11 | 11 | |||||||||
| Euro Dollar Terms (0.8%) | |||||||||||
| Bank of Nova Scotia 2.88%, due 05/11/2005 3.01%, due 05/31/2005 | 33 91 | 33 91 | |||||||||
| Barclays 3.02%, due 06/27/2005 | 58 | 58 | |||||||||
| BNP Paribas 2.93%, due 06/07/2005 | 52 | 52 | |||||||||
| Branch Banker & Trust 2.94%, due 06/06/2005 | 14 | 14 | |||||||||
| Calyon 2.93%, due 06/03/2005 | 54 | 54 | |||||||||
| Citigroup 2.87%, due 06/06/2005 | 68 | 68 | |||||||||
| Credit Suisse First Boston Corp. 2.91%, due 05/16/2005 | 67 | 67 | |||||||||
| HSBC Banking/Holdings PLC 3.01%, due 06/23/2005 | 33 | 33 | |||||||||
| Royal Bank of Scotland 2.94%, due 06/07/2005 2.95%, due 06/10/2005 | 63 35 | 63 35 | |||||||||
The notes to the financial statements are an integral part of this report.
Transamerica IDEX Mutual Funds
Semi-Annual Report 2005
3
TA IDEX American Century International
SCHEDULE OF INVESTMENTS (continued)
At April 30, 2005
(all amounts except share amounts in thousands)
(unaudited)
| Principal | Value | ||||||||||
| Euro Dollar Terms (continued) | |||||||||||
| Societe Generale 2.80%, due 05/03/2005 | $ | 62 | $ | 62 | |||||||
| Toronto Dominion Bank 2.75%, due 05/09/2005 3.01%, due 06/24/2005 | 49 18 | 49 18 | |||||||||
| UBS AG 2.81%, due 05/03/2005 | 33 | 33 | |||||||||
| Promissory Notes (0.2%) | |||||||||||
| Goldman Sachs Group, Inc. 2.99%, due 06/27/2005 3.01%, due 07/27/2005 | 68 114 | 68 114 | |||||||||
| Repurchase Agreements (0.3%) (d) | |||||||||||
| Goldman Sachs Group, Inc. (The) 3.04%, Repurchase Agreement dated 04/29/2005 to be repurchased at $147 on 05/02/2005 | 147 | 147 | |||||||||
| Merrill Lynch & Co., Inc. 3.04%, Repurchase Agreement dated 04/29/2005 to be repurchased at $176 on 05/02/2005 | 176 | 176 | |||||||||
| Shares | Value | ||||||||||
| Investment Companies (0.3%) | |||||||||||
| Money Market Funds (0.3%) | |||||||||||
| American Beacon Funds 1-day yield of 2.84% | 25,873 | $ | 26 | ||||||||
| BGI Institutional Money Market Fund 1-day yield of 2.93% | 153,208 | 153 | |||||||||
| Merrill Lynch Premier Institutional Fund 1-day yield of 2.65% | 34,477 | 34 | |||||||||
| Merrimac Cash Fund, Premium Class 1-day yield of 2.74% (e) | 63,057 | 63 | |||||||||
| Total Security Lending Collateral (cost: $2,069) | 2,069 | ||||||||||
| Total Investment Securities (cost: $86,642) | $ | 92,214 | |||||||||
| SUMMARY: | |||||||||||
| Investments, at value | 97.4 | % | $ | 92,214 | |||||||
| Other Assets and Liabilities | 2.6 | % | 2,455 | ||||||||
| Net assets | 100.0 | % | $ | 94,669 | |||||||
NOTES TO SCHEDULE OF INVESTMENTS:
(a) No dividends were paid during the preceding twelve months.
(b) At April 30, 2005, all or a portion of this security is on loan (see Note 1). The value at April 30, 2005, of all securities on loan is $1,973.
(c) Floating or variable rate note. Rate is listed as of April 30, 2005.
(d) Cash collateral for the Repurchase Agreements, valued at $328 that serve as collateral for securities lending are invested in corporate bonds with interest rates and maturity dates ranging from 0.00%–8.875% and 06/15/2005–03/15/2035, respectively.
(e) Regulated investment company advised by Investors Bank and Trust Co. ("IBT"). IBT is also the accounting, custody and lending agent for the Fund.
DEFINITIONS:
ADR American Depositary Receipt
The notes to the financial statements are an integral part of this report.
Transamerica IDEX Mutual Funds
Semi-Annual Report 2005
4
TA IDEX American Century International
SCHEDULE OF INVESTMENTS (continued)
At April 30, 2005
(all amounts except share amounts in thousands)
(unaudited)
| Percentage of Net Assets | Value | ||||||||||
| INVESTMENTS BY INDUSTRY: | |||||||||||
| Commercial Banks | 13.3 | % | $ | 12,576 | |||||||
| Pharmaceuticals | 10.8 | % | 10,264 | ||||||||
| Telecommunications | 6.4 | % | 6,044 | ||||||||
| Petroleum Refining | 5.6 | % | 5,320 | ||||||||
| Food & Kindred Products | 4.4 | % | 4,171 | ||||||||
| Chemicals & Allied Products | 3.7 | % | 3,482 | ||||||||
| Oil & Gas Extraction | 3.0 | % | 2,827 | ||||||||
| Beer, Wine & Distilled Beverages | 2.4 | % | 2,226 | ||||||||
| Medical Instruments & Supplies | 2.3 | % | 2,213 | ||||||||
| Industrial Machinery & Equipment | 2.3 | % | 2,175 | ||||||||
| Rubber & Misc. Plastic Products | 2.3 | % | 2,151 | ||||||||
| Instruments & Related Products | 2.1 | % | 2,034 | ||||||||
| Life Insurance | 2.1 | % | 2,000 | ||||||||
| Food Stores | 2.0 | % | 1,928 | ||||||||
| Automotive | 2.0 | % | 1,901 | ||||||||
| Construction | 1.9 | % | 1,784 | ||||||||
| Engineering & Management Services | 1.7 | % | 1,617 | ||||||||
| Metal Mining | 1.7 | % | 1,569 | ||||||||
| Electric Services | 1.7 | % | 1,508 | ||||||||
| Insurance | 1.6 | % | 1,467 | ||||||||
| Communications Equipment | 1.0 | % | 965 | ||||||||
| Printing & Publishing | 1.0 | % | 957 | ||||||||
| Business Credit Institutions | 1.0 | % | 950 | ||||||||
| Stone, Clay & Glass Products | 1.0 | % | 944 | ||||||||
| Department Stores | 1.0 | % | 943 | ||||||||
| Radio & Television Broadcasting | 1.0 | % | 926 | ||||||||
| Gas Production & Distribution | 1.0 | % | 909 | ||||||||
| Metal Cans & Shipping Containers | 0.9 | % | 889 | ||||||||
| Railroads | 0.9 | % | 884 | ||||||||
| Radio, Television & Computer Stores | 0.9 | % | 879 | ||||||||
| Drug Stores & Proprietary Stores | 0.9 | % | 876 | ||||||||
| Shoe Stores | 0.9 | % | 872 | ||||||||
| Electronic Components & Accessories | 0.9 | % | 826 | ||||||||
| Personal Credit Institutions | 0.8 | % | 798 | ||||||||
| Textile Mill Products | 0.8 | % | 771 | ||||||||
| Security & Commodity Brokers | 0.8 | % | 730 | ||||||||
| Amusement & Recreation Services | 0.7 | % | 680 | ||||||||
| Retail Trade | 0.7 | % | 663 | ||||||||
| Wholesale Trade Durable Goods | 0.7 | % | 621 | ||||||||
| Computer & Data Processing Services | 0.6 | % | 572 | ||||||||
| Holding & Other Investment Offices | 0.6 | % | 550 | ||||||||
| Wholesale Trade Nondurable Goods | 0.6 | % | 539 | ||||||||
| Paper & Paper Products | 0.5 | % | 501 | ||||||||
| Public Administration | 0.5 | % | 478 | ||||||||
| Investment Companies | 0.5 | % | 469 | ||||||||
| Hotels & Other Lodging Places | 0.4 | % | 390 | ||||||||
| Percentage of Net Assets | Value | ||||||||||
| INVESTMENTS BY INDUSTRY (continued) | |||||||||||
| Air Transportation | 0.4 | % | $ | 371 | |||||||
| Motor Vehicles, Parts & Supplies | 0.3 | % | 329 | ||||||||
| Primary Metal Industries | 0.3 | % | 308 | ||||||||
| Furniture & Fixtures | 0.3 | % | 298 | ||||||||
| Investments, at value | 95.2 | % | 90,145 | ||||||||
| Short-term investments | 2.2 | % | 2,069 | ||||||||
| Other assets and liabilities | 2.6 | % | 2,455 | ||||||||
| Net assets | 100.0 | % | $ | 94,669 | |||||||
The notes to the financial statements are an integral part of this report.
Transamerica IDEX Mutual Funds
Semi-Annual Report 2005
5
TA IDEX American Century International
STATEMENT OF ASSETS AND LIABILITIES
At April 30, 2005
(all amounts except per share amounts in thousands)
(unaudited)
| Assets: | |||||||
| Investment securities, at value (cost: $86,642) (including securities loaned of $1,973) | $ | 92,214 | |||||
| Cash | 3,558 | ||||||
| Receivables: | |||||||
| Investment securities sold | 1,426 | ||||||
| Shares of beneficial interest sold | 39 | ||||||
| Interest | 7 | ||||||
| Dividends | 410 | ||||||
| Dividend reclaims receivable | 234 | ||||||
| Other | 8 | ||||||
| 97,896 | |||||||
| Liabilities: | |||||||
| Investment securities purchased | 810 | ||||||
| Accounts payable and accrued liabilities: | |||||||
| Shares of beneficial interest redeemed | 79 | ||||||
| Management and advisory fees | 98 | ||||||
| Distribution and service fees | 45 | ||||||
| Transfer agent fees | 48 | ||||||
| Foreign cash overdraft (proceeds $12) | 13 | ||||||
| Payable for collateral for securities on loan | 2,069 | ||||||
| Other | 65 | ||||||
| 3,227 | |||||||
| Net Assets | $ | 94,669 | |||||
| Net Assets Consist of: | |||||||
| Shares of beneficial interest, unlimited shares authorized, no par value | $ | 72,465 | |||||
| Accumulated net investment income (loss) | (965 | ) | |||||
| Undistributed net realized gain (loss) from investment securities and foreign currency transactions | 17,588 | ||||||
| Net unrealized appreciation (depreciation) on: Investment securities | 5,570 | ||||||
| Translation of assets and liabilities denominated in foreign currencies | 11 | ||||||
| Net Assets | $ | 94,669 | |||||
| Net Assets by Class: | |||||||
| Class A | $ | 64,025 | |||||
| Class B | 21,343 | ||||||
| Class C | 9,301 | ||||||
| Shares Outstanding: | |||||||
| Class A | 6,823 | ||||||
| Class B | 2,377 | ||||||
| Class C | 1,043 | ||||||
| Net Asset Value Per Share: | |||||||
| Class A | $ | 9.38 | |||||
| Class B | 8.98 | ||||||
| Class C | 8.91 | ||||||
| Maximum Offering Price Per Share (a): | |||||||
| Class A | $ | 9.93 | |||||
(a) Includes the maximum selling commission (represented as a percentage of offering price) which is reduced on certain levels of sales as set forth in the Prospectus. Net asset value per share for Classes B and C shares represents offering price. The redemption price for Classes B and C shares equals net asset value less any applicable contingent deferred sales charge.
STATEMENT OF OPERATIONS
For the period ended April 30, 2005
(all amounts in thousands)
(unaudited)
| Investment Income: | |||||||
| Interest | $ | 33 | |||||
| Dividends | 1,765 | ||||||
| Income from loaned securities–net | 5 | ||||||
| Less withholding taxes on foreign dividends | (91 | ) | |||||
| 1,712 | |||||||
| Expenses: | |||||||
| Management and advisory fees | 897 | ||||||
| Transfer agent fees: | |||||||
| Class A | 30 | ||||||
| Class B | 27 | ||||||
| Class C | 14 | ||||||
| Printing and shareholder reports | 17 | ||||||
| Custody fees | 98 | ||||||
| Administration fees | 18 | ||||||
| Legal fees | 7 | ||||||
| Audit fees | 14 | ||||||
| Trustees fees | 6 | ||||||
| Registration fees: | |||||||
| Class A | 16 | ||||||
| Class B | 4 | ||||||
| Class C | 13 | ||||||
| Other | 2 | ||||||
| Distribution and service fees: | |||||||
| Class A | 291 | ||||||
| Class B | 107 | ||||||
| Class C | 48 | ||||||
| Total expenses | 1,609 | ||||||
| Less: | |||||||
| Reimbursement of class expenses: | |||||||
| Class B | (6 | ) | |||||
| Class C | (17 | ) | |||||
| Net expenses | 1,586 | ||||||
| Net Investment Income (Loss) | 126 | ||||||
| Net Realized Gain (Loss) from: | |||||||
| Investment securities | 38,207 | ||||||
| Foreign currency transactions | (1,034 | ) | |||||
| 37,173 | |||||||
| Net Increase (Decrease) in Unrealized Appreciation (Depreciation) on: | |||||||
| Investment securities | (16,075 | ) | |||||
| Translation of assets and liabilities denominated in foreign currencies | (2 | ) | |||||
| (16,077 | ) | ||||||
| Net Gain (Loss) on Investments and Foreign Currency Transactions | 21,096 | ||||||
| Net Increase (Decrease) in Net Assets Resulting from Operations | $ | 21,222 | |||||
The notes to the financial statements are an integral part of this report.
Transamerica IDEX Mutual Funds
Semi-Annual Report 2005
6
TA IDEX American Century International
STATEMENTS OF CHANGES IN NET ASSETS
For the period or year ended
(all amounts in thousands)
| April 30, 2005 (unaudited) | October 31, 2004 | ||||||||||
| Increase (Decrease) In Net Assets From: | |||||||||||
| Operations: | |||||||||||
| Net investment income (loss) | $ | 126 | $ | (76 | ) | ||||||
| Net realized gain (loss) from investment securities and foreign currency transactions | 37,173 | 16,156 | |||||||||
| Net unrealized appreciation (depreciation) on investment securities and foreign currency translation | (16,077 | ) | 4,506 | ||||||||
| 21,222 | 20,586 | ||||||||||
| Distributions to Shareholders: | |||||||||||
| From net investment income: | |||||||||||
| Class A | (1,265 | ) | (410 | ) | |||||||
| Class B | (4 | ) | (47 | ) | |||||||
| Class C | (51 | ) | (2 | ) | |||||||
| Class C2 | – | (12 | ) | ||||||||
| Class M | – | (7 | ) | ||||||||
| (1,320 | ) | (478 | ) | ||||||||
| Capital Share Transactions: | |||||||||||
| Proceeds from shares sold: | |||||||||||
| Class A | 5,749 | 43,204 | |||||||||
| Class B | 2,431 | 2,535 | |||||||||
| Class C | 1,356 | 920 | |||||||||
| Class C2 | – | 476 | |||||||||
| Class M | – | 358 | |||||||||
| 9,536 | 47,493 | ||||||||||
| Dividends and distributions reinvested: | |||||||||||
| Class A | 1,263 | 409 | |||||||||
| Class B | 4 | 44 | |||||||||
| Class C | 49 | 2 | |||||||||
| Class C2 | – | 11 | |||||||||
| Class M | – | 7 | |||||||||
| 1,316 | 473 | ||||||||||
| Cost of shares redeemed: | |||||||||||
| Class A | (148,592 | ) | (25,540 | ) | |||||||
| Class B | (2,581 | ) | (5,662 | ) | |||||||
| Class C | (1,839 | ) | (842 | ) | |||||||
| Class C2 | – | (1,501 | ) | ||||||||
| Class M | – | (879 | ) | ||||||||
| (153,012 | ) | (34,424 | ) | ||||||||
| Class level exchanges: | |||||||||||
| Class C | – | 8,249 | |||||||||
| Class C2 | – | (5,368 | ) | ||||||||
| Class M | – | (2,881 | ) | ||||||||
| – | – | ||||||||||
| April 30, 2005 (unaudited) | October 31, 2004 | ||||||||||
| Automatic conversions: | |||||||||||
| Class A | $ | 8 | $ | 9 | |||||||
| Class B | (8 | ) | (9 | ) | |||||||
| – | – | ||||||||||
| (142,160 | ) | 13,542 | |||||||||
| Net increase (decrease) in net assets | (122,258 | ) | 33,650 | ||||||||
| Net Assets: | |||||||||||
| Beginning of period | 216,927 | 183,277 | |||||||||
| End of period | $ | 94,669 | $ | 216,927 | |||||||
| Accumulated Net Investment Income (Loss) | $ | (965 | ) | $ | 229 | ||||||
| Share Activity: | |||||||||||
| Shares issued: | |||||||||||
| Class A | 600 | 5,293 | |||||||||
| Class B | 265 | 308 | |||||||||
| Class C | 149 | 112 | |||||||||
| Class C2 | – | 58 | |||||||||
| Class M | – | 43 | |||||||||
| 1,014 | 5,814 | ||||||||||
| Shares issued–reinvested from distributions: | |||||||||||
| Class A | 134 | 47 | |||||||||
| Class B | – | 5 | |||||||||
| Class C | 5 | – | |||||||||
| Class C2 | – | 1 | |||||||||
| Class M | – | 1 | |||||||||
| 139 | 54 | ||||||||||
| Shares redeemed: | |||||||||||
| Class A | (15,199 | ) | (2,998 | ) | |||||||
| Class B | (283 | ) | (698 | ) | |||||||
| Class C | (203 | ) | (103 | ) | |||||||
| Class C2 | – | (183 | ) | ||||||||
| Class M | – | (105 | ) | ||||||||
| (15,685 | ) | (4,087 | ) | ||||||||
| Class level exchanges: | |||||||||||
| Class C | 1,009 | ||||||||||
| Class C2 | (654 | ) | |||||||||
| Class M | (353 | ) | |||||||||
| 2 | |||||||||||
| Automatic conversions: | |||||||||||
| Class A | 1 | 1 | |||||||||
| Class B | (1 | ) | (1 | ) | |||||||
| – | – | ||||||||||
| Net increase (decrease) in shares outstanding: | |||||||||||
| Class A | (14,464 | ) | 2,343 | ||||||||
| Class B | (19 | ) | (386 | ) | |||||||
| Class C | (49 | ) | 1,018 | ||||||||
| Class C2 | – | (778 | ) | ||||||||
| Class M | – | (414 | ) | ||||||||
| (14,532 | ) | 1,783 | |||||||||
The notes to the financial statements are an integral part of this report.
Transamerica IDEX Mutual Funds
Semi-Annual Report 2005
7
TA IDEX American Century International
FINANCIAL HIGHLIGHTS
(unaudited for the period ended April 30, 2005)
| For a share of beneficial interest outstanding throughout each period | |||||||||||||||||||||||||||||||||||||||
| Net Asset | Investment Operations | Distributions | Net Asset | ||||||||||||||||||||||||||||||||||||
| For the Period Ended (d)(g) | Value, Beginning of Period | Net Investment Income (Loss) | Net Realized and Unrealized Gain (Loss) | Total Operations | From Net Investment Income | From Net Realized Gains | Total Distributions | Value, End of Period | |||||||||||||||||||||||||||||||
| Class A | 4/30/2005 | $ | 8.81 | $ | 0.01 | $ | 0.62 | $ | 0.63 | $ | (0.06 | ) | $ | – | $ | (0.06 | ) | $ | 9.38 | ||||||||||||||||||||
| 10/31/2004 | 8.03 | – | 0.80 | 0.80 | (0.02 | ) | – | (0.02 | ) | 8.81 | |||||||||||||||||||||||||||||
| 10/31/2003 | 7.00 | 0.02 | 1.01 | 1.03 | – | – | – | 8.03 | |||||||||||||||||||||||||||||||
| 10/31/2002 | 8.38 | 0.01 | (1.39 | ) | (1.38 | ) | – | – | – | 7.00 | |||||||||||||||||||||||||||||
| 10/31/2001 | 12.76 | 0.05 | (3.05 | ) | (3.00 | ) | – | (1.38 | ) | (1.38 | ) | 8.38 | |||||||||||||||||||||||||||
| 10/31/2000 | 12.85 | 0.05 | 0.35 | 0.40 | – | (0.49 | ) | (0.49 | ) | 12.76 | |||||||||||||||||||||||||||||
| Class B | 4/30/2005 | 8.41 | (0.01 | ) | 0.58 | 0.57 | – | (h) | – | – | 8.98 | ||||||||||||||||||||||||||||
| 10/31/2004 | 7.70 | (0.04 | ) | 0.77 | 0.73 | (0.02 | ) | – | (0.02 | ) | 8.41 | ||||||||||||||||||||||||||||
| 10/31/2003 | 6.76 | (0.03 | ) | 0.97 | 0.94 | – | – | – | 7.70 | ||||||||||||||||||||||||||||||
| 10/31/2002 | 8.15 | (0.04 | ) | (1.35 | ) | (1.39 | ) | – | – | – | 6.76 | ||||||||||||||||||||||||||||
| 10/31/2001 | 12.53 | (0.02 | ) | (2.98 | ) | (3.00 | ) | – | (1.38 | ) | (1.38 | ) | 8.15 | ||||||||||||||||||||||||||
| 10/31/2000 | 12.70 | (0.03 | ) | 0.35 | 0.32 | – | (0.49 | ) | (0.49 | ) | 12.53 | ||||||||||||||||||||||||||||
| Class C | 4/30/2005 | 8.40 | (0.01 | ) | 0.57 | 0.56 | (0.05 | ) | – | (0.05 | ) | 8.91 | |||||||||||||||||||||||||||
| 10/31/2004 | 7.70 | (0.09 | ) | 0.81 | 0.72 | (0.02 | ) | – | (0.02 | ) | 8.40 | ||||||||||||||||||||||||||||
| 10/31/2003 | 6.73 | (0.03 | ) | 1.00 | 0.97 | �� | – | – | – | 7.70 | |||||||||||||||||||||||||||||
| Ratios/Supplemental Data | |||||||||||||||||||||||||||||||
| For the Period | Total | Net Assets, End of Period | Ratio of Expenses to Average Net Assets (a) | Net Investment Income (Loss) to Average | Portfolio Turnover | ||||||||||||||||||||||||||
| Ended (g) | Return (c) | (000's) | Net (e) | Total (f) | Net Assets (a) | Rate (b) | |||||||||||||||||||||||||
| Class A | 4/30/2005 | 7.14 | % | $ | 64,025 | 1.47 | % | 1.47 | % | 0.20 | % | 44 | % | ||||||||||||||||||
| 10/31/2004 | 9.95 | 187,608 | 1.59 | 1.59 | (0.05 | ) | 159 | ||||||||||||||||||||||||
| 10/31/2003 | 14.71 | 152,086 | 1.78 | 2.39 | 0.23 | 220 | |||||||||||||||||||||||||
| 10/31/2002 | (16.49 | ) | 14,921 | 1.87 | 3.68 | 0.22 | 241 | ||||||||||||||||||||||||
| 10/31/2001 | (26.43 | ) | 5,209 | 1.55 | 2.77 | 0.47 | 129 | ||||||||||||||||||||||||
| 10/31/2000 | 2.74 | 6,977 | 1.62 | 3.56 | 0.09 | 108 | |||||||||||||||||||||||||
| Class B | 4/30/2005 | 6.80 | 21,343 | 2.35 | 2.41 | (0.27 | ) | 44 | |||||||||||||||||||||||
| 10/31/2004 | 9.46 | 20,153 | 2.09 | 2.09 | (0.46 | ) | 159 | ||||||||||||||||||||||||
| 10/31/2003 | 13.91 | 21,421 | 2.44 | 3.05 | (0.42 | ) | 220 | ||||||||||||||||||||||||
| 10/31/2002 | (17.09 | ) | 5,328 | 2.52 | 4.33 | (0.43 | ) | 241 | |||||||||||||||||||||||
| 10/31/2001 | (26.96 | ) | 5,003 | 2.20 | 3.42 | (0.18 | ) | 129 | |||||||||||||||||||||||
| 10/31/2000 | 2.09 | 4,407 | 2.27 | 4.21 | (0.56 | ) | 108 | ||||||||||||||||||||||||
| Class C | 4/30/2005 | 6.68 | 9,301 | 2.35 | 2.71 | (0.28 | ) | 44 | |||||||||||||||||||||||
| 10/31/2004 | 9.33 | 9,166 | 2.40 | 2.49 | (1.07 | ) | 159 | ||||||||||||||||||||||||
| 10/31/2003 | 14.41 | 568 | 2.44 | 3.04 | (0.42 | ) | 220 | ||||||||||||||||||||||||
NOTES TO FINANCIAL HIGHLIGHTS
(a) Annualized.
(b) Not annualized for periods of less that one year.
(c) Total Return has been calculated for the applicable period without deduction of a sales load, if any, on an initial purchase. Periods of less than one year are not annualized.
(d) Per share information is calculated based on average number of shares outstanding for the periods ended 10/31/2001, 10/31/2002, 10/31/2003, 10/31/2004 and 04/30/2005.
(e) Ratio of Net Expenses to Average Net Assets is net of fee waivers and reimbursements by the investment adviser, if any (see note 2).
(f) Ratio of Total Expenses to Average Net Assets includes all expenses before fee waivers and reimbursements by the investment adviser.
(g) The inception date for the Fund's offering of share Class C was November 11, 2002.
(h) Distributions from net investment income is less than $0.01 per share.
The notes to the financial statements are an integral part of this report.
Transamerica IDEX Mutual Funds
Semi-Annual Report 2005
8
TA IDEX American Century International
NOTES TO FINANCIAL STATEMENTS
At April 30, 2005
(all amounts in thousands)
(unaudited)
NOTE 1. ORGANIZATION AND SIGNIFICANT ACCOUNTING POLICIES
Transamerica IDEX Mutual Funds is a Delaware statutory trust registered under the Investment Company Act of 1940, as amended (the "1940 Act"), as an open-end management investment company. Prior to March 1, 2005, Transamerica IDEX Mutual Funds was a Massachusetts business trust. TA IDEX American Century International ("the Fund"), part of Transamerica IDEX Mutual Funds, began operations on February 1, 1997.
In the normal course of business, the Fund enters into contracts that contain a variety of representations and warranties, which provide general indemnifications. The Fund's maximum exposure under these arrangements is unknown, as this would involve future claims that may be made against the Fund and/or its affiliates that have not yet occurred. However, based on experience, the Fund expects the risk of loss to be remote.
See the Prospectus and Statement of Additional Information for a description of the Fund's investment objective.
In preparing the Fund's financial statements in accordance with accounting principles generally accepted in the United States of America ("GAAP"), estimates or assumptions (which could differ from actual results) may be used that affect reported amounts and disclosures. The following policies were consistently followed by the Fund, in accordance with GAAP.
Multiple class operations and expenses: The Fund currently offers three classes of shares, each with a public offering price that reflects different sales charges, if any, and expense levels. On June 15, 2004, Class C2 shares merged into Class C. On September 24, 2004, Class M shares merged into Class C. Class B shares will convert to Class A shares eight years after purchase. Income, non-class specific expenses and realized and unrealized gains and losses, are allocated daily to each class, based upon the value of shares outstanding method as permitted under Rule 18f-3 of the 1940 Act. Each class bears its own specific expenses as well as a portion of general, common expenses.
Pricing of shares: The Fund prices its shares on the basis of the net asset value of each class of shares of the Fund, which is determined as of the close of the New York Stock Exchange ("NYSE") (generally 4:00 p.m. Eastern Time) on each day on which the NYSE is open for trading.
Security valuations: Fund investments traded on an exchange are valued at the closing price on the day of valuation on the exchange where the security is principally traded. With respect to securities traded on NASDAQ NMS, such closing price may be the last reported sales price or the NASDAQ Official Closing Price.
Securities traded in the over-the-counter market and listed securities for which no sale was reported on that date are valued at the last quoted bid price.
Debt securities are valued by independent pricing services at the last quoted bid price; however, those that mature in sixty days or less are valued at amortized cost, which approximates market.
Investment company securities are valued at net asset value of the underlying portfolio.
Foreign securities generally are valued based on quotations from the primary market in which they are traded and are translated from the local currency into U.S. dollars using closing exchange rates. Many foreign securities markets are open for trading at times when the U.S. markets are closed for trading, and many foreign securities markets close for trading before the close of the NYSE. The value of foreign securities may be affected significantly on a day that the NYSE is closed and an investor is unable to purchase or redeem shares. If a significant market event impacting the value of a portfolio security (e.g., natural disaster, company announcement, market volatility) occurs subsequent to the close of trading in the security, but prior to the calculation of the Fund's net asset value per share, market quotations for that security may be determined to be unreliable and, accordingly, not "readily av ailable." If market quotations are not readily available, and the impact of such a significant market event materially effects the net asset value per share of the Fund, an affected portfolio security will be valued at fair market value as determined in good faith using guidelines adopted by the Board of Trustees of the Fund, under the supervision of the Fund's Valuation Committee. Factors that may be considered to value foreign securities at fair market value may include, among others: the value of other securities traded on other markets, foreign currency exchange activity and the trading of financial products tied to foreign securities.
Other securities for which quotations are not readily available are valued at fair market value as determined in good faith using guidelines adopted by the Board of Trustees of the Fund, under the supervision of the Fund's Valuation Committee. These guidelines may include: the type of security; any restrictions on its resale; financial or business news of the issuer; similar or related securities that are actively trading; related corporate actions; and other significant events occurring after the close of trading in the security.
Cash: The Fund may leave cash overnight in its cash account with the custodian, Investors Bank & Trust Company ("IBT"). IBT has been contracted on behalf of the Fund to invest the excess cash into a savings account, which at April 30, 2005, was paying an interest rate of 2.02%.
Throughout the period, the Fund may have a cash overdraft balance. A fee is incurred on this overdraft, calculated by multiplying the overdraft by a rate based on the federal funds rate.
Repurchase agreements: The Fund is authorized to enter into repurchase agreements. The Fund, through IBT, receives delivery of the underlying
Transamerica IDEX Mutual Funds
Semi-Annual Report 2005
9
TA IDEX American Century International
NOTES TO FINANCIAL STATEMENTS (continued)
At April 30, 2005
(all amounts in thousands)
(unaudited)
NOTE 1.–(continued)
securities, the value of which at the time of purchase is required to be an amount equal to at least 100% of the resale price. Repurchase agreements involve the risk that the seller will fail to repurchase the security, as agreed. In that case, the Fund will bear the risk of value fluctuations until the security can be sold and may encounter delays and incur costs in liquidating the security. In the event of bankruptcy or insolvency of the seller, delays and costs may be incurred.
Securities lending: The Fund may lend securities to enhance fund earnings from investing cash collateral in making such loans to qualified borrowers (typically broker/dealers). The Fund has engaged its custodian bank, IBT, as a lending agent to administer its securities lending program. IBT earned $3 of program income for its services. When the Fund makes a security loan, it receives cash collateral as protection against the risk that the borrower will default on the loan, and records an asset for the cash invested collateral and a liability for the return of the collateral.
Loans of securities are required to be secured by collateral at least equal to 102% of the value of the securities at inception of the loan, and not less then 100% thereafter. The Fund may invest cash collateral in short-term money market instruments including: U.S. Treasury Bills, U.S. agency obligations, commercial paper, money market mutual funds, repurchase agreements and other highly rated, liquid investments. During the life of securities loans, the collateral and securities loaned remain subject to fluctuation in value. IBT marks to market securities loaned and the collateral each business day. If additional collateral is due (at least $1), IBT collects additional cash collateral from the borrowers. Although securities loaned will be fully collateralized at all times, IBT may experience delays in, or may be prevented from, recovering the collateral on behalf of the Fund. The Fund may recall a loa ned security position at any time from the borrower through IBT. In the event the borrower fails to timely return a recalled security, IBT may indemnify the Fund by purchasing replacement securities for the Fund at its own expense and claiming the collateral to fund such a purchase. IBT absorbs the loss if the collateral value is not sufficient to cover the cost of the replacement securities. If replacement securities are not available, IBT will credit the equivalent cash value to the Fund.
While a security is on loan, the Fund does not have the right to vote that security. However, if time permits, the Fund will attempt to recall a security on loan and vote the proxy.
Income from securities lending is included in the Statement of Operations. The amount of collateral and value of securities on loan are included in the Statement of Assets and Liabilities as well as in the Schedule of Investments.
Security transactions and investment income: Security transactions are recorded on the trade date. Security gains and losses are calculated on the specific identification basis. Dividend income is recorded on the ex-dividend date or, in the case of foreign securities, as soon as the Fund is informed of the ex-dividend date. Interest income, including accretion of discounts and amortization of premiums, is recorded on the accrual basis commencing on the settlement date.
Foreign currency denominated investments: The accounting records of the Fund are maintained in U.S. dollars. Securities and other assets and liabilities denominated in foreign currencies are translated into U.S. dollars at the closing exchange rate each day. The cost of foreign securities is translated at the exchange rate in effect when the investment was acquired. The Fund combines fluctuations from currency exchange rates and fluctuations in value when computing net realized and unrealized gains or losses from investments.
Net foreign currency gains and losses resulting from changes in exchange rates include: 1) foreign currency fluctuations between trade date and settlement date of investment security transactions; 2) gains and losses on forward foreign currency contracts; and 3) the difference between the receivable amounts of interest and dividends recorded in the accounting records in U.S. dollars and the amounts actually received.
Foreign currency denominated assets may involve risks not typically associated with domestic transactions, including unanticipated movements in exchange currency rates, the degree of government supervision and regulation of security markets, and the possibility of political or economic instability.
Foreign capital gains taxes: The Fund may be subject to taxes imposed by countries in which it invests, with respect to its investment in issuers existing or operating in such countries. Such taxes are generally based on income earned or repatriated and capital gains realized on the sale of such investments. The Fund accrues such taxes when the related income or capital gains are earned. Some countries require governmental approval for the repatriation of investment income, capital or the proceeds of sales earned by foreign investors. In addition, if there is deterioration in a country's balance of payments or for other reasons, a country may impose temporary restrictions on foreign capital remittances abroad.
Forward foreign currency contracts: The Fund may enter into forward foreign currency contracts to hedge against exchange rate risk arising from investments in securities denominated in foreign currencies. Contracts are valued at the contractual forward rate and are marked to market daily, with the change in value recorded as an unrealized gain or loss. When the contracts are closed a realized gain or loss is incurred. Risks may arise from changes in market value of the underlying currencies and from the possible inability of counterparties to meet the terms of their contracts.
At April 30, 2005, there were no outstanding forward foreign currency contracts.
Transamerica IDEX Mutual Funds
Semi-Annual Report 2005
10
TA IDEX American Century International
NOTES TO FINANCIAL STATEMENTS (continued)
At April 30, 2005
(all amounts in thousands)
(unaudited)
NOTE 1.–(continued)
Account maintenance fees: If the shareholder account balance falls below $1 by either shareholder action or as a result of market action, a $25 (not in thousands) fee is assessed every year until the balance reaches $1. The fee is assessed by redeeming shares in the shareholder's account.
No fee will be charged under the following conditions:
• accounts opened within the preceding 24 months
• accounts with an active monthly Automatic Investment Plan ($50 (not in thousands) minimum per fund)
• accounts owned by an individual which, when combined by social security number, have a balance of $5 or more
• accounts owned by individuals in the same household (by address) that have a combined balance of $5 or more
• UTMA/UGMA accounts
• Fiduciary accounts
• B-share accounts whose shares have started to convert to A-shares accounts (as long as combined value of both accounts is at least $1)
For the six months ended April 30, 2005, this fee totaled less than $1. These fees are included in Paid in Capital in the Statement of Assets and Liabilities.
Redemption fees: A short-term trading redemption fee may be assessed on any fund shares in a fund account that are sold during the first five (5) NYSE trading days following their purchase date. This redemption fee will equal 2% of the amount redeemed and shares held the longest will be treated as being redeemed first and shares held the shortest as being redeemed last.
For the six months ended April 30, 2005, the Fund received less than a $1 in redemption fees.
Dividend distributions: Distributions to shareholders are recorded on the ex-dividend date and are determined in accordance with Federal income tax regulations which may differ from GAAP.
NOTE 2. RELATED PARTY TRANSACTIONS
Transamerica Fund Advisors, Inc. ("TFAI") is the Fund's investment adviser. Transamerica Fund Services, Inc. ("TFS") is the Fund's administrator and transfer agent. AFSG Securities Corp. ("AFSG") is the Fund's distributor/principal underwriter. AFSG is 100% owned by AUSA Holding Company ("AUSA"). TFAI is a directly owned subsidiary of Western Reserve Life Assurance Co. of Ohio (78%) and AUSA (22%). TFS is a wholly owned subsidiary of WRL (50%) and AUSA (50%). AUSA and WRL are wholly owned indirect subsidiaries of AEGON, NV, a Netherlands corporation.
Effective January 1, 2005 AEGON/Transamerica Fund Advisors, Inc. ("ATFA") was renamed Transamerica Fund Advisors, Inc. ("TFAI"); AEGON/Transamerica Fund Services, Inc. ("ATFS") and AEGON/Transamerica Investor Services, Inc. ("ATIS") merged into one entity and was renamed Transamerica Fund Services, Inc. ("TFS").
The following schedule reflects the percentage of fund assets owned by affiliated mutual funds (i. e.: through the asset allocation funds):
| Net Assets | % of Net Assets | ||||||||||
| TA IDEX Asset Allocation– Growth Portfolio | $ | 25,273 | 26.69 | % | |||||||
| TA IDEX Asset Allocation– Moderate Growth Portfolio | 19,803 | 20.92 | % | ||||||||
| TA IDEX Asset Allocation– Moderate Portfolio | 5,259 | 5.56 | % | ||||||||
| Total | $ | 50,335 | 53.17 | % | |||||||
Investment advisory fee: The Fund pays management fees to TFAI based on average daily net assets ("ANA") at the following breakpoints:
From November 1, 2004 to December 31, 2004:
1.00% of the first $50 million of ANA
0.95% of the next $100 million of ANA
0.90% of the next $350 million of ANA
0.85% of the next $500 million of ANA
0.80% of ANA over $1 billion
From January 1, 2005 on:
0.925% of the first $250 million of ANA
0.90% of the next $250 million of ANA
0.85% of the next $500 million of ANA
0.80% of ANA over $1 billion
Transamerica IDEX Mutual Funds
Semi-Annual Report 2005
11
TA IDEX American Century International
NOTES TO FINANCIAL STATEMENTS (continued)
At April 30, 2005
(all amounts in thousands)
(unaudited)
NOTE 2.–(continued)
TFAI has contractually agreed to waive its advisory fee and will reimburse the Fund to the extent that operating expenses, excluding 12b-1 fees, exceed the following stated annual limit:
From November 1, 2004 to December 31, 2004:
1.40% Expense Limit
From January 1, 2005 on:
1.325% Expense Limit
If total fund expenses fall below the annual expense limitation agreement agreed to by the adviser within the succeeding three years, the Fund may be required to pay that adviser a portion or all of the waived advisory fees.
| Advisory Fee Waived | Available for Recapture Through | ||||||||||
| Fiscal Year 2003 | $ | 473 | 10/31/2006 | ||||||||
If total class expenses fall below the annual expense limitation agreement agreed to by the adviser within the succeeding three years, the Fund may be required to pay that adviser a portion or all of the reimbursed class expenses.
| Reimbursement Fiscal Year 2004 | Available for of Class Expenses | Recapture Through | |||||||||
| Class C | $ | 3 | 10/31/2007 | ||||||||
Distribution and service fees: The Fund has a 12b-1 distribution plan under the 1940 Act pursuant to which an annual fee, based on average daily net assets, is paid to the distributor for various disbursements such as broker-dealer account servicing fees and other promotional expenses of the Fund. The Fund is authorized under the 12b-1 plan to pay fees on each class up to the following limits:
| Class A | 0.35 | % | |||||
| Class B | 1.00 | % | |||||
| Class C | 1.00 | % | |||||
In the case the Fund or a class of shares of the Fund is closed to new investors or investments, the Fund is authorized to pay 12b-1 fees for past sales and distribution efforts and present and past investor services.
Underwriter commissions relate to front-end sales charges imposed for Class A shares and contingent deferred sales charges from Classes B, C and certain A share redemptions. For the six months ended April 30, 2005, the underwriter commissions were as follows:
| Received by Underwriter | $ | 246 | |||||
| Retained by Underwriter | 4 | ||||||
| Contingent Deferred Sales Charge | 50 | ||||||
Administrative services: The Fund has entered into an agreement with TFS for financial and legal fund administration services, which includes such items as compliance, expenses, financial statements and other reporting, distributions, tax returns, prospectus preparation, board of trustees meeting support and other legal matters. As of January 1, 2005 the Fund pays TFS an annual fee of 0.02% of average net assets. Prior to January 1, 2005 the Fund paid TFS an annual fee of 0.015% of average net assets. The Legal fees on the Statement of Operations are for fees paid to external legal counsel.
Transfer agent fees: The Fund pays TFS an annual per-account charge of $20 (not in thousands) for each open account and $1.63 (not in thousands) for each closed account. There is no new account charge. The Transfer agent fees on the Statement of Operations are made up of fees paid to TFS and costs associated with shareholder statements.
The Fund paid TFS $107 for the six months ended April 30, 2005.
Deferred compensation plan: Each eligible Fund Trustee may elect participation in the Deferred Compensation Plan ("the Plan"). Under the Plan, such Trustees may defer payment of a percentage of their total fees earned as a Fund Trustee. These deferred amounts may be invested in any Transamerica IDEX Mutual Fund. At April 30, 2005, the value of invested plan amount was $8. Invested plan amounts and the total liability for deferred compensation to the Trustees under the Plan at April 30, 2005, are included in the accompanying Statement of Assets and Liabilities.
Brokerage commissions: Brokerage commissions incurred on security transactions placed with an affiliate of the sub-adviser for the six months ended April 30, 2005, were $7.
NOTE 3. INVESTMENT TRANSACTIONS
The cost of securities purchased and proceeds from securities sold (excluding short-term securities) for the six months ended April 30, 2005, were as follows:
| Purchases of securities: | |||||||
| Long-Term excluding U.S. Government | $ | 83,289 | |||||
| U.S. Government | – | ||||||
| Proceeds from maturities and sales of securities: | |||||||
| Long-Term excluding U.S. Government | 226,594 | ||||||
| U.S. Government | – | ||||||
Transamerica IDEX Mutual Funds
Semi-Annual Report 2005
12
TA IDEX American Century International
NOTES TO FINANCIAL STATEMENTS (continued)
At April 30, 2005
(all amounts in thousands)
(unaudited)
NOTE 4. FEDERAL INCOME TAX MATTERS
The Fund has not made any provision for federal income or excise taxes due to its policy to distribute all of its taxable income and capital gains to its shareholders and otherwise qualify as a regulated investment company under the Internal Revenue Code. Income and capital gain distributions are determined in accordance with income tax regulations, which may differ from GAAP. These differences are primarily due to differing treatment for items including, but not limited to, wash sales, net operating losses and capital loss carryforwards.
The aggregate cost of investments and composition of unrealized appreciation (depreciation) for federal income tax purposes as of April 30, 2005, are as follows:
| Federal Tax Cost Basis | $ | 86,874 | |||||
| Unrealized Appreciation | $ | 7,305 | |||||
| Unrealized (Depreciation) | (1,965 | ) | |||||
| Net Unrealized Appreciation (Depreciation) | $ | 5,340 | |||||
NOTE 5. REGULATORY PROCEEDINGS
There continues to be significant federal and state regulatory activity relating to financial services companies, particularly mutual fund companies and their investment advisers. As part of an ongoing investigation regarding potential market timing, recordkeeping and trading compliance issues and matters affecting the Fund's investment adviser, TFAI, and certain employees and affiliates of TFAI, the SEC staff has indicated that it is likely to take some action against TFAI and certain of its affiliates at the conclusion of the investigation. The potential timing and the scope of any such action is difficult to predict. Although the impact of any action brought against TFAI and/or its affiliates is difficult to assess at the present time, the Fund currently believes that the likelihood that any such action will have a material adverse impact on it is remote. It is important to note that the Fund is not aware of any allegation of wrongdoing against it and its board at the time this semi-annual report is printed. Although it is not anticipated that these developments will have an adverse impact on the Fund, there can be no assurance at this time. TFAI and its affiliates are actively working with the SEC in regard to this matter; however, the exact resolution cannot be determined at this time. TFAI will take such actions that it deems necessary or appropriate to continue providing management services to the Fund and to bring all matters to an appropriate conclusion.
TFAI and/or its affiliates, and not the Fund, will bear the costs regarding these regulatory matters.
Transamerica IDEX Mutual Funds
Semi-Annual Report 2005
13
TA IDEX American Century International
INVESTMENT ADVISORY AND SUB-ADVISORY AGREEMENTS – REVIEW AND RENEWAL
At a meeting of the Board of Trustees of Transamerica IDEX Mutual Funds ("TA IDEX") held on October 6, 2004, the Board considered and approved the renewal for a one-year period of the Investment Advisory Agreement between TA IDEX American Century International (the "Fund") and Transamerica Fund Advisors, Inc. ("TFAI") as well as the Investment Sub-Advisory Agreement of the Fund between TFAI and American Century Global Investment Management, Inc. (the "Sub-Adviser"). In approving the renewal of these agreements, the Board concluded that the Investment Advisory and Investment Sub-Advisory Agreements enable shareholders of the Fund to obtain high quality services at a cost that is appropriate, reasonable, and in the best interests of shareholders based upon the following determinations, among others:
The nature, extent and quality of the advisory service to be provided. The Board considered the nature and quality of the services provided by TFAI and the Sub-Adviser to the Fund in the past, as well as the services anticipated to be provided in the future. The Board concluded that TFAI and the Sub-Adviser are capable of providing high quality services to the Fund, as indicated by TFAI's management capabilities demonstrated with respect to the Fund and other funds managed by TFAI, TFAI's management oversight process, and the professional qualifications and experience of the SubAdviser's portfolio management team. The Board also concluded that TFAI and the Sub-Adviser would provide the same quality and quantity of investment management and related services as before, that these services are appr opriate in scope and extent in light of the Fund's operations, the competitive landscape of the investment company business and investor needs, and that TFAI's and the Sub-Adviser's obligations will remain the same in all respects.
The investment performance of the Fund. The Board concluded, based on information provided by Lipper Analytics, that the Fund's investment performance was acceptable, although the Board noted that the Fund had underperformed comparable investment companies, as represented by Lipper Analytics. As a consequence, the Board decided to carefully monitor the Fund's investment performance, and requested that Sub-Advisory personnel attend an upcoming meeting to review the Fund's performance with the Board. However, on the basis of the Trustees' assessment of the nature, extent and quality of investment advisory and related services to be provided or procured by TFAI and the Sub-Adviser, the Trustees concluded that TFAI and the Sub-Adviser were capable of generating a level of investment performance that is appropriate in light of the Fund's investment objective, policies and strategies and competitive with many other investment companies.
The cost of advisory services provided and the level of profitability. On the basis of the Board's review of the fees to be charged by TFAI and the Sub-Adviser for investment advisory and related services, TFAI's financial statements, the fees paid by TFAI to the Sub-Adviser, TFAI's estimated net management income resulting from its management of the Fund, the estimated profitability of TFAI's relationships with the Fund and TA IDEX, and the estimated profitability of the Sub-Adviser's relationship with the Fund, the Board concluded that the level of investment advisory fees and the profitability is appropriate in light of the services provided, the management fees and overall expense ratios of comparable investment companies, and the anticipated profitability of the relationship between the Fun d, TFAI and the Sub-Adviser. Further, on the basis of comparative information supplied by Lipper Analytics, the Board determined that the estimated overall expense ratio of the Fund were consistent with industry averages, and that the Fund's advisory fees had been lowered in the recent past, which will likely lower overall expenses for the benefit of shareholders.
The extent to which economies of scale would be realized as the Fund grows and whether fee levels reflect these economies of scale for the benefit of Fund investors. The Trustees concluded that inclusion of asset-based breakpoints in the Fund's advisory fee schedule appropriately benefit investors by realizing economies of scale in the form of a lower advisory fee rate as the level of Fund assets increases. The Board also concluded that the advisory fees appropriately reflect the Fund's current size, the current economic environment for TFAI, and the competitive nature of the investment company market. In addition, the Board noted that it will have the opportunity to periodically re-examine whether the Fund has achieved economies of scale, as well as the appropriateness of advisory fees payable to TFAI and the Sub-Adviser in the future.
Benefits (such as soft dollars) to TFAI or the Sub-Adviser from its relationship with the Fund. The Board concluded that other benefits derived by TFAI or the Sub-Adviser from its relationship with the Fund are reasonable and fair, and are consistent with industry practice and the best interests of the Fund and its shareholders. In this regard, the Board noted that TFAI does not realize "soft dollar" benefits from its relationship with the Fund, and that the Sub-Adviser engaged in "soft dollar" arrangements consistent with applicable law and "best execution" requirements.
Other considerations. The Board also determined that TFAI had made a substantial commitment to the recruitment and retention of high quality personnel, and maintained the financial, compliance and operational resources reasonably necessary to manage the Fund in a professional manner that is consistent with the best interests of the Fund and its shareholders. The Trustees also concluded that TFAI had made a significant entrepreneurial commitment to the management and success of the Fund, reflected by TFAI's expense limitation and fee waiver arrangement with the Fund which, as demonstrated in the past with the Fund, may result in TFAI waiving a substantial amount of advisory fees for the benefit of shareholders.
Transamerica IDEX Mutual Funds
Semi-Annual Report 2005
14
TA IDEX American Century International
SUPPLEMENTAL INFORMATION (unaudited)
RESULTS OF SHAREHOLDER PROXY
At a special meeting of shareholders held on February 25, 2005, the results of the Proposals were as follows:
Transamerica IDEX Mutual Funds
Proposal 1: Election of Trustees to the Board of Trustees of Transamerica IDEX Mutual Funds.
| For | Withheld | ||||||||||
| Peter R. Brown | 872,017,875.249 | 4,468,498.551 | |||||||||
| Daniel Calabria | 871,917,069.786 | 4,569,304.014 | |||||||||
| Janise B. Case | 872,099,393.125 | 4,386,980.675 | |||||||||
| Charles C. Harris | 872,086,722.025 | 4,399,651.775 | |||||||||
| Leo J. Hill | 872,304,465.640 | 4,181,908.160 | |||||||||
| Russell A. Kimball, Jr. | 872,253,556.471 | 4,232,817.329 | |||||||||
| William W. Short, Jr. | 872,139,920.944 | 4,346,452.856 | |||||||||
| John Waechter | 872,261,152.376 | 4,225,221.424 | |||||||||
| Jack E. Zimmerman | 871,929,967.512 | 4,556,406.288 | |||||||||
| Brian C. Scott | 872,218,970.367 | 4,267,403.433 | |||||||||
| Thomas P. O'Neill | 872,111,944.117 | 4,374,429.683 | |||||||||
TA IDEX American Century International
Proposal 2: Approval of an Agreement and Plan of Reorganization pursuant to which Transamerica IDEX Mutual Funds will organize as a Delaware statutory trust.
| For | Against | Abstentions/Broker Non-Votes | |||||||||
| 22,024,150.125 | 51,471.679 | 1,702,502.104 | |||||||||
Proposal 3: Approval of changes to the fundamental investment restrictions of TA IDEX American Century International.
| A. Diversification | For | Against | Abstentions/Broker Non-Votes | ||||||||||||
| 22,040,265.032 | 69,468.893 | 1,668,389.983 | |||||||||||||
| B. Borrowing | For | Against | Abstentions/Broker Non-Votes | ||||||||||||
| 22,036,970.076 | 72,763.849 | 1,668,389.983 | |||||||||||||
| C. Senior Securities | For | Against | Abstentions/Broker Non-Votes | ||||||||||||
| 22,034,446.384 | 75,287.541 | 1,668,389.983 | |||||||||||||
| D. Underwriting Securities | For | Against | Abstentions/Broker Non-Votes | ||||||||||||
| 22,038,027.609 | 71,706.316 | 1,668,389.983 | |||||||||||||
| E. Real Estate | For | Against | Abstentions/Broker Non-Votes | ||||||||||||
| 22,040,743.033 | 68,990.892 | 1,668,389.983 | |||||||||||||
| F. Making Loans | For | Against | Abstentions/Broker Non-Votes | ||||||||||||
| 22,029,145.864 | 80,588.061 | 1,668,389.983 | |||||||||||||
| G. Concentration | For | Against | Abstentions/Broker Non-Votes | ||||||||||||
| 22,038,505.286 | 71,228.639 | 1,668,389.983 | |||||||||||||
| H. Commodities | For | Against | Abstentions/Broker Non-Votes | ||||||||||||
| 22,033,209.394 | 76,524.531 | 1,668,389.983 | |||||||||||||
Transamerica IDEX Mutual Funds
Semi-Annual Report 2005
15
TA IDEX American Century Large Company Value
UNDERSTANDING YOUR FUND'S EXPENSES
(unaudited)
SHAREHOLDER EXPENSES
The following Example is intended to help you understand your ongoing costs (in dollars and cents) of investing in a Fund and to compare these costs with the ongoing costs of investing in other funds.
The Example is based on an investment of $1,000 invested at November 1, 2004 and held for the entire period until April 30, 2005.
ACTUAL EXPENSES
The first line in the table below provides information about actual account values and actual expenses. You may use the information in this line, together with the amount you invested, to estimate the expenses that you paid over the period. Simply divide your account value by $1,000 (for example, an $8,600 account value divided by $1,000 = 8.6), then multiply the result by the number in the first line of your Fund under the heading entitled "Expenses Paid During Period" to estimate the expenses you paid on your account during this period.
HYPOTHETICAL EXAMPLE FOR COMPARISON PURPOSES
The second line in the table below provides information about hypothetical account values and hypothetical expenses based on the Fund's actual expense ratio and an assumed rate of return of 5% per year before expenses, which is not the Fund's actual return. The hypothetical account values and expenses may not be used to estimate the actual ending account balance or expenses you paid for the period. You may use this information to compare the ongoing costs of investing in your Fund and other funds. To do so, compare this 5% hypothetical example with the 5% hypothetical examples that appear in the shareholder reports of the other funds.
Please note that the expenses shown in the table are meant to highlight your ongoing costs only and do not reflect any transactional costs, such as sales charges, redemption fees, brokerage commissions paid on purchases and sales of fund shares. Therefore, the second line under the Fund in the table is useful in comparing ongoing costs only, and will not help you determine the relative total costs of owning different funds. In addition, note that the expenses shown in the table are meant to highlight your ongoing costs and do not reflect any transaction costs.
| Beginning Account Value | Ending Account Value | Annualized Expense Ratio | Expenses Paid During Period (a) | ||||||||||||||||
| Class A | |||||||||||||||||||
| Actual | $ | 1,000.00 | $ | 1,053.20 | 1.25 | % | $ | 6.36 | |||||||||||
| Hypothetical (b) | 1,000.00 | 1,018.60 | 1.25 | 6.26 | |||||||||||||||
| Class B | |||||||||||||||||||
| Actual | 1,000.00 | 1,048.70 | 2.22 | 11.28 | |||||||||||||||
| Hypothetical (b) | 1,000.00 | 1,013.79 | 2.22 | 11.08 | |||||||||||||||
| Class C | |||||||||||||||||||
| Actual | 1,000.00 | 1,047.30 | 2.47 | 12.54 | |||||||||||||||
| Hypothetical (b) | 1,000.00 | 1,012.55 | 2.47 | 12.33 | |||||||||||||||
(a) Expenses are calculated using each Fund's annualized expense ratio (as disclosed in the table), multiplied by the average account value for the period, multiplied by number of days in the period (181 days), and divided by the number of days in the year (365 days).
(b) 5% return per year before expenses.
GRAPHICAL PRESENTATION OF SCHEDULE OF INVESTMENTS
By Sector
At April 30, 2005
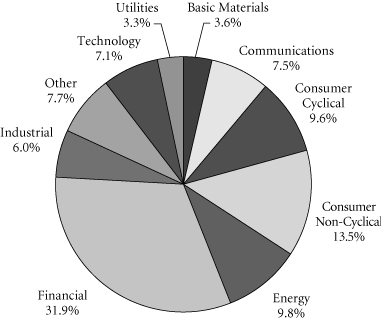
This chart shows the percentage breakdown by sector of the Fund's total investment securities.
Transamerica IDEX Mutual Funds
Semi-Annual Report 2005
1
TA IDEX American Century Large Company Value
SCHEDULE OF INVESTMENTS
At April 30, 2005
(all amounts except share amounts in thousands)
(unaudited)
| Shares | Value | ||||||||||
| COMMON STOCKS (96.1%) | |||||||||||
| Aerospace (0.5%) | |||||||||||
| Northrop Grumman Corp. | 39,500 | $ | 2,166 | ||||||||
| Apparel & Accessory Stores (0.6%) | |||||||||||
| Gap (The), Inc. | 117,100 | 2,500 | |||||||||
| Apparel Products (1.3%) | |||||||||||
| Liz Claiborne, Inc. | 72,700 | 2,576 | |||||||||
| V.F. Corp. | 51,400 | 2,909 | |||||||||
| Automotive (1.8%) | |||||||||||
| General Motors Corp. (a) | 81,400 | 2,172 | |||||||||
| Lear Corp. (a) | 59,400 | 2,013 | |||||||||
| Toyota Motor Corp., ADR | 44,900 | 3,265 | |||||||||
| Automotive Dealers & Service Stations (0.6%) | |||||||||||
| Advance Auto Parts, Inc. (b) | 50,800 | 2,710 | |||||||||
| Beverages (2.4%) | |||||||||||
| Coca-Cola Co. (The) | 95,100 | 4,131 | |||||||||
| Molson Coors Brewing Co.–Class B (a) | 41,500 | 2,563 | |||||||||
| Pepsi Bottling Group, Inc. | 112,600 | 3,228 | |||||||||
| Business Credit Institutions (3.4%) | |||||||||||
| Freddie Mac | 233,900 | 14,390 | |||||||||
| Chemicals & Allied Products (1.2%) | |||||||||||
| PPG Industries, Inc. | 72,800 | 4,918 | |||||||||
| Commercial Banks (17.8%) | |||||||||||
| Bank of America Corp. | 316,800 | 14,269 | |||||||||
| Bank of New York Co., Inc. (The) | 120,800 | 3,375 | |||||||||
| Citigroup, Inc. | 427,800 | 20,090 | |||||||||
| JPMorgan Chase & Co. | 255,000 | 9,050 | |||||||||
| National City Corp. | 65,500 | 2,224 | |||||||||
| PNC Financial Services Group, Inc. | 91,800 | 4,887 | |||||||||
| US Bancorp | 199,700 | 5,572 | |||||||||
| Wachovia Corp. | 127,200 | 6,510 | |||||||||
| Wells Fargo & Co. | 150,900 | 9,045 | |||||||||
| Computer & Data Processing Services (3.2%) | |||||||||||
| Computer Sciences Corp. (b) | 77,400 | 3,365 | |||||||||
| Fiserv, Inc. (a)(b) | 71,300 | 3,016 | |||||||||
| Microsoft Corp. | 278,400 | 7,044 | |||||||||
| Computer & Office Equipment (3.0%) | |||||||||||
| Hewlett-Packard Co. | 384,300 | 7,867 | |||||||||
| International Business Machines Corp. | 59,700 | 4,560 | |||||||||
| Department Stores (1.2%) | |||||||||||
| May Department Stores Co. (The) | 141,400 | 4,960 | |||||||||
| Drug Stores & Proprietary Stores (0.7%) | |||||||||||
| CVS Corp. | 58,500 | 3,017 | |||||||||
| Shares | Value | ||||||||||
| Electric Services (1.2%) | |||||||||||
| PPL Corp. | 90,900 | $ | 4,932 | ||||||||
| Electric, Gas & Sanitary Services (2.2%) | |||||||||||
| Exelon Corp. | 133,400 | 6,603 | |||||||||
| NiSource, Inc. | 116,500 | 2,707 | |||||||||
| Electronic & Other Electric Equipment (1.8%) | |||||||||||
| General Electric Co. | 145,700 | 5,274 | |||||||||
| Whirlpool Corp. (a) | 38,500 | 2,389 | |||||||||
| Electronic Components & Accessories (1.7%) | |||||||||||
| Intel Corp. | 126,600 | 2,978 | |||||||||
| Tyco International, Ltd. | 137,400 | 4,302 | |||||||||
| Environmental Services (0.7%) | |||||||||||
| Waste Management, Inc. | 102,200 | 2,912 | |||||||||
| Fabricated Metal Products (0.7%) | |||||||||||
| Parker Hannifin Corp. | 46,300 | 2,775 | |||||||||
| Finance (0.6%) | |||||||||||
| SPDR Trust Series 1 (a) | 21,700 | 2,513 | |||||||||
| Food & Kindred Products (3.9%) | |||||||||||
| Altria Group, Inc. | 97,600 | 6,343 | |||||||||
| HJ Heinz Co. | 98,200 | 3,619 | |||||||||
| Sara Lee Corp. | 128,900 | 2,757 | |||||||||
| Unilever NV-NY Shares | 59,900 | 3,859 | |||||||||
| Food Stores (0.8%) | |||||||||||
| Kroger Co. (a)(b) | 222,400 | 3,507 | |||||||||
| Health Services (0.7%) | |||||||||||
| HCA, Inc. | 54,500 | 3,043 | |||||||||
| Industrial Machinery & Equipment (2.1%) | |||||||||||
| Deere & Co. | 35,900 | 2,245 | |||||||||
| Dover Corp. | 80,500 | 2,927 | |||||||||
| Ingersoll-Rand Co.–Class A | 48,100 | 3,697 | |||||||||
| Instruments & Related Products (0.5%) | |||||||||||
| Xerox Corp. (b) | 160,600 | 2,128 | |||||||||
| Insurance (5.1%) | |||||||||||
| Allstate Corp. (The) (a) | 114,600 | 6,436 | |||||||||
| American International Group, Inc. | 93,300 | 4,744 | |||||||||
| Cigna Corp. | 31,900 | 2,934 | |||||||||
| Loews Corp. | 69,100 | 4,898 | |||||||||
| MGIC Investment Corp. | 39,600 | 2,336 | |||||||||
| Insurance Agents, Brokers & Service (1.7%) | |||||||||||
| Hartford Financial Services Group, Inc. (The) (a) | 73,200 | 5,298 | |||||||||
| Marsh & McLennan Cos., Inc. | 67,900 | 1,903 | |||||||||
| Life Insurance (0.8%) | |||||||||||
| Torchmark Corp. | 60,700 | 3,243 | |||||||||
The notes to the financial statements are an integral part of this report.
Transamerica IDEX Mutual Funds
Semi-Annual Report 2005
2
TA IDEX American Century Large Company Value
SCHEDULE OF INVESTMENTS (continued)
At April 30, 2005
(all amounts except share amounts in thousands)
(unaudited)
| Shares | Value | ||||||||||
| Lumber & Wood Products (1.4%) | |||||||||||
| Weyerhaeuser Co. | 87,500 | $ | 6,003 | ||||||||
| Medical Instruments & Supplies (1.0%) | |||||||||||
| Baxter International, Inc. | 107,300 | 3,981 | |||||||||
| Motion Pictures (1.6%) | |||||||||||
| Time Warner, Inc. (b) | 409,100 | 6,877 | |||||||||
| Petroleum Refining (10.1%) | |||||||||||
| ChevronTexaco Corp. | 144,300 | 7,504 | |||||||||
| ConocoPhillips | 66,900 | 7,015 | |||||||||
| Exxon Mobil Corp. | 305,000 | 17,394 | |||||||||
| Royal Dutch Petroleum Co.–NY Shares | 182,400 | 10,625 | |||||||||
| Pharmaceuticals (4.5%) | |||||||||||
| Abbott Laboratories | 109,400 | 5,378 | |||||||||
| Bristol-Myers Squibb Co. | 121,100 | 3,149 | |||||||||
| Johnson & Johnson | 76,100 | 5,223 | |||||||||
| Merck & Co., Inc. | 59,600 | 2,020 | |||||||||
| Wyeth | 67,300 | 3,025 | |||||||||
| Primary Metal Industries (1.1%) | |||||||||||
| Alcoa, Inc. | 115,000 | 3,337 | |||||||||
| Nucor Corp. | 25,500 | 1,303 | |||||||||
| Printing & Publishing (1.9%) | |||||||||||
| Gannett Co., Inc. | 65,500 | 5,044 | |||||||||
| RR Donnelley & Sons Co. | 87,700 | 2,886 | |||||||||
| Restaurants (1.3%) | |||||||||||
| McDonald's Corp. | 192,100 | 5,630 | |||||||||
| Rubber & Misc. Plastic Products (1.2%) | |||||||||||
| Newell Rubbermaid, Inc. (a) | 133,100 | 2,892 | |||||||||
| Reebok International, Ltd. (a) | 56,200 | 2,282 | |||||||||
| Savings Institutions (1.4%) | |||||||||||
| Washington Mutual, Inc. | 146,700 | 6,062 | |||||||||
| Security & Commodity Brokers (2.8%) | |||||||||||
| Merrill Lynch & Co., Inc. | 109,100 | 5,884 | |||||||||
| Morgan Stanley | 108,700 | 5,720 | |||||||||
| Telecommunications (5.0%) | |||||||||||
| ALLTEL Corp. (a) | 60,500 | 3,446 | |||||||||
| AT&T Corp. | 55,200 | 1,056 | |||||||||
| BellSouth Corp. | 178,700 | 4,734 | |||||||||
| SBC Communications, Inc. | 232,100 | 5,524 | |||||||||
| Sprint Corp. (FON Group) (a) | 150,100 | 3,341 | |||||||||
| Verizon Communications, Inc. | 75,500 | 2,703 | |||||||||
| Variety Stores (0.6%) | |||||||||||
| Dollar General Corp. | 122,700 | 2,497 | |||||||||
| Total Common Stocks (cost: $398,192) | 404,229 | ||||||||||
| Principal | Value | ||||||||||
| SECURITY LENDING COLLATERAL (7.3%) | |||||||||||
| Debt (6.3%) | |||||||||||
| Bank Notes (0.9%) | |||||||||||
| Bank of America | |||||||||||
| 2.82%, due 05/16/2005 | $ | 966 | $ | 966 | |||||||
| 2.80%, due 06/09/2005 (c) | 242 | 242 | |||||||||
| 2.77%, due 07/18/2005 (c) | 966 | 966 | |||||||||
| Canadian Imperial Bank of Commerce 3.02%, due 11/04/2005 (c) | 966 | 966 | |||||||||
| Credit Suisse First Boston Corp. 2.88%, due 09/09/2005 (c) 3.06%, due 03/10/2006 (c) | 242 242 | 242 242 | |||||||||
| Euro Dollar Overnight (1.1%) | |||||||||||
| Bank of Montreal 2.94%, due 05/04/2005 | 725 | 725 | |||||||||
| BNP Paribas 2.80%, due 05/05/2005 | 1,000 | 1,000 | |||||||||
| Den Danske Bank 2.93%, due 05/02/2005 2.80%, due 05/06/2005 | 870 483 | 870 483 | |||||||||
| Dexia Group 2.80%, due 05/05/2005 | 427 | 427 | |||||||||
| Royal Bank of Canada 2.80%, due 05/04/2005 | 992 | 992 | |||||||||
| Svenska Handlesbanken 2.80%, due 05/06/2005 | 159 | 159 | |||||||||
| Euro Dollar Terms (2.6%) | |||||||||||
| Bank of Nova Scotia 2.88%, due 05/11/2005 3.01%, due 05/31/2005 | 483 1,351 | 483 1,351 | |||||||||
| Barclays 3.02%, due 06/27/2005 | 861 | 861 | |||||||||
| BNP Paribas 2.93%, due 06/07/2005 | 773 | 773 | |||||||||
| Branch Banker & Trust 2.94%, due 06/06/2005 | 207 | 207 | |||||||||
| Calyon 2.93%, due 06/03/2005 | 798 | 798 | |||||||||
| Citigroup 2.87%, due 06/06/2005 | 1,003 | 1,003 | |||||||||
| Credit Suisse First Boston Corp. 2.91%, due 05/16/2005 | 990 | 990 | |||||||||
| HSBC Banking/Holdings PLC 3.01%, due 06/23/2005 | 483 | 483 | |||||||||
| Royal Bank of Scotland 2.94%, due 06/07/2005 2.95%, due 06/10/2005 | 939 521 | 939 521 | |||||||||
The notes to the financial statements are an integral part of this report.
Transamerica IDEX Mutual Funds
Semi-Annual Report 2005
3
TA IDEX American Century Large Company Value
SCHEDULE OF INVESTMENTS (continued)
At April 30, 2005
(all amounts except share amounts in thousands)
(unaudited)
| Principal | Value | ||||||||||
| Euro Dollar Terms (continued) | |||||||||||
| Societe Generale 2.80%, due 05/03/2005 | $ | 924 | $ | 924 | |||||||
| Toronto Dominion Bank 2.75%, due 05/09/2005 3.01%, due 06/24/2005 | 725 268 | 725 268 | |||||||||
| UBS AG 2.81%, due 05/03/2005 | 483 | 483 | |||||||||
| Promissory Notes (0.6%) | |||||||||||
| Goldman Sachs Group, Inc. 2.99%, due 06/27/2005 3.01%, due 07/27/2005 | 1,015 1,691 | 1,015 1,691 | |||||||||
| Repurchase Agreements (1.1%) (d) | |||||||||||
| Goldman Sachs Group, Inc. (The) 3.04%, Repurchase Agreement dated 04/29/2005 to be repurchased at $2,174 on 05/02/2005 | 2,174 | 2,174 | |||||||||
| Merrill Lynch & Co., Inc. 3.04%, Repurchase Agreement dated 04/29/2005 to be repurchased at $2,609 on 05/02/2005 | 2,609 | 2,609 | |||||||||
| Shares | Value | ||||||||||
| Investment Companies (1.0%) | |||||||||||
| Money Market Funds (1.0%) | |||||||||||
| American Beacon Funds 1-day yield of 2.84% | 383,732 | $ | 384 | ||||||||
| BGI Institutional Money Market Fund 1-day yield of 2.93% | 2,272,290 | 2,272 | |||||||||
| Merrill Lynch Premier Institutional Fund 1-day yield of 2.65% | 511,337 | 511 | |||||||||
| Merrimac Cash Fund, Premium Class 1-day yield of 2.74% (e) | 935,228 | 935 | |||||||||
| Total Security Lending Collateral (cost: $30,680) | 30,680 | ||||||||||
| Total Investment Securities (cost: $428,872) | $ | 434,909 | |||||||||
| SUMMARY: | |||||||||||
| Investments, at value | 103.4 | % | $ | 434,909 | |||||||
| Liabilities in excess of other assets | (3.4 | )% | (14,241 | ) | |||||||
| Net assets | 100.0 | % | $ | 420,668 | |||||||
NOTES TO SCHEDULE OF INVESTMENTS:
(a) At April 30, 2005, all or a portion of this security is on loan (see Note 1). The value at April 30, 2005, of all securities on loan is $29,438.
(b) No dividends were paid during the preceding twelve months.
(c) Floating or variable rate note. Rate is listed as of April 30, 2005.
(d) Cash collateral for the Repurchase Agreements, valued at $4,867, that serve as collateral for securities lending are invested in corporate bonds with interest rates and maturity dates ranging from 0.00%–8.875% and 06/15/2005–03/15/2035, respectively.
(e) Regulated investment company advised by Investors Bank and Trust Co. ("IBT"). IBT is also the accounting, custody and lending agent for the Fund.
DEFINITIONS:
ADR American Depositary Receipt
The notes to the financial statements are an integral part of this report.
Transamerica IDEX Mutual Funds
Semi-Annual Report 2005
4
TA IDEX American Century Large Company Value
STATEMENT OF ASSETS AND LIABILITIES
At April 30, 2005
(all amounts except per share amounts in thousands)
(unaudited)
| Assets: | |||||||
| Investment securities, at value (cost: $428,872) (including securities loaned of $29,438) | $ | 434,909 | |||||
| Cash | 16,294 | ||||||
| Receivables: | |||||||
| Shares of beneficial interest sold | 52 | ||||||
| Interest | 34 | ||||||
| Dividends | 873 | ||||||
| Dividend reclaims receivable | 11 | ||||||
| Other | 24 | ||||||
| 452,197 | |||||||
| Liabilities: | |||||||
| Investment securities purchased | 377 | ||||||
| Accounts payable and accrued liabilities: | |||||||
| Shares of beneficial interest redeemed | 10 | ||||||
| Management and advisory fees | 291 | ||||||
| Distribution and service fees | 135 | ||||||
| Transfer agent fees | 24 | ||||||
| Payable for collateral for securities on loan | 30,680 | ||||||
| Other | 12 | ||||||
| 31,529 | |||||||
| Net Assets | $ | 420,668 | |||||
| Net Assets Consist of: | |||||||
| Shares of beneficial interest, unlimited shares authorized, no par value | $ | 410,297 | |||||
| Undistributed net investment income (loss) | 1,687 | ||||||
| Undistributed net realized gain (loss) from investment securities | 2,647 | ||||||
| Net unrealized appreciation (depreciation) on investment securities | 6,037 | ||||||
| Net Assets | $ | 420,668 | |||||
| Net Assets by Class: | |||||||
| Class A | $ | 394,517 | |||||
| Class B | 18,448 | ||||||
| Class C | 7,703 | ||||||
| Shares Outstanding: | |||||||
| Class A | 36,880 | ||||||
| Class B | 1,781 | ||||||
| Class C | 746 | ||||||
| Net Asset Value Per Share: | |||||||
| Class A | $ | 10.70 | |||||
| Class B | 10.36 | ||||||
| Class C | 10.33 | ||||||
| Maximum Offering Price Per Share (a): | |||||||
| Class A | $ | 11.32 | |||||
(a) Includes the maximum selling commission (represented as a percentage of offering price) which is reduced on certain levels of sales as set forth in the Prospectus. Net asset value per share for Classes B and C shares represents offering price. The redemption price for Classes B and C shares equals net asset value less any applicable contingent deferred sales charge.
STATEMENT OF OPERATIONS
For the period ended April 30, 2005
(all amounts in thousands)
(unaudited)
| Investment Income: | |||||||
| Interest | $ | 151 | |||||
| Dividends | 4,881 | ||||||
| Income from loaned securities–net | 18 | ||||||
| Less withholding taxes on foreign dividends | (58 | ) | |||||
| 4,992 | |||||||
| Expenses: | |||||||
| Management and advisory fees | 1,583 | ||||||
| Transfer agent fees: | |||||||
| Class A | 19 | ||||||
| Class B | 24 | ||||||
| Class C | 10 | ||||||
| Printing and shareholder reports | 11 | ||||||
| Custody fees | 24 | ||||||
| Administration fees | 35 | ||||||
| Legal fees | 7 | ||||||
| Audit fees | 5 | ||||||
| Trustees fees | 5 | ||||||
| Registration fees: | |||||||
| Class A | 17 | ||||||
| Class B | 7 | ||||||
| Class C | 14 | ||||||
| Distribution and service fees: | |||||||
| Class A | 616 | ||||||
| Class B | 95 | ||||||
| Class C | 39 | ||||||
| Total expenses | 2,511 | ||||||
| Less: | |||||||
| Reimbursement of class expenses: | |||||||
| Class C | (1 | ) | |||||
| Net expenses | 2,510 | ||||||
| Net Investment Income (Loss) | 2,482 | ||||||
| Net Realized and Unrealized Gain (Loss): | |||||||
| Realized gain (loss) from investment securities | 5,661 | ||||||
| Increase (decrease) in unrealized appreciation (depreciation) on investment securities | 1,249 | ||||||
| Net Gain (Loss) on Investments | 6,910 | ||||||
| Net Increase (Decrease) in Net Assets Resulting from Operations | $ | 9,392 | |||||
The notes to the financial statements are an integral part of this report.
Transamerica IDEX Mutual Funds
Semi-Annual Report 2005
5
TA IDEX American Century Large Company Value
STATEMENTS OF CHANGES IN NET ASSETS
For the period or year ended
(all amounts in thousands)
| April 30, 2005 (unaudited) | October 31, 2004 | ||||||||||
| Increase (Decrease) in Net Assets From: | |||||||||||
| Operations: | |||||||||||
| Net investment income (loss) | $ | 2,482 | $ | 604 | |||||||
| Net realized gain (loss) from investment securities and futures contracts | 5,661 | 4,617 | |||||||||
| Net unrealized appreciation (depreciation) on investment securities and futures contracts | 1,249 | 2,671 | |||||||||
| 9,392 | 7,892 | ||||||||||
| Distributions to Shareholders: | |||||||||||
| From net investment income: | |||||||||||
| Class A | (1,333 | ) | (39 | ) | |||||||
| Class B | – | (27 | ) | ||||||||
| Class C | (1 | ) | (2 | ) | |||||||
| Class C2 | – | (8 | ) | ||||||||
| Class M | – | (3 | ) | ||||||||
| (1,334 | ) | (79 | ) | ||||||||
| Capital Share Transactions: | |||||||||||
| Proceeds from shares sold: | |||||||||||
| Class A | 264,891 | 147,090 | |||||||||
| Class B | 1,332 | 3,766 | |||||||||
| Class C | 715 | 1,077 | |||||||||
| Class C2 | – | 427 | |||||||||
| Class M | – | 269 | |||||||||
| 266,938 | 152,629 | ||||||||||
| Dividends and distributions reinvested: | |||||||||||
| Class A | 1,332 | 38 | |||||||||
| Class B | – | 25 | |||||||||
| Class C | 1 | 1 | |||||||||
| Class C2 | – | 7 | |||||||||
| Class M | – | 3 | |||||||||
| 1,333 | 74 | ||||||||||
| Cost of shares redeemed: | |||||||||||
| Class A | (35,635 | ) | (3,949 | ) | |||||||
| Class B | (2,368 | ) | (4,402 | ) | |||||||
| Class C | (959 | ) | (2,320 | ) | |||||||
| Class C2 | – | (1,018 | ) | ||||||||
| Class M | – | (674 | ) | ||||||||
| (38,962 | ) | (12,363 | ) | ||||||||
| Class level exchanges: | |||||||||||
| Class C | – | 7,377 | |||||||||
| Class C2 | – | (5,388 | ) | ||||||||
| Class M | – | (1,989 | ) | ||||||||
| – | – | ||||||||||
| Automatic conversions: | |||||||||||
| Class A | 47 | 10 | |||||||||
| Class B | (47 | ) | (10 | ) | |||||||
| – | – | ||||||||||
| 229,309 | 140,340 | ||||||||||
| Net increase (decrease) in net assets | 237,367 | 148,153 | |||||||||
| Net Assets: | |||||||||||
| Beginning of period | 183,301 | 35,148 | |||||||||
| End of period | $ | 420,668 | $ | 183,301 | |||||||
| Undistributed Net Investment Income (Loss) | $ | 1,687 | $ | 539 | |||||||
| April 30, 2005 (unaudited) | October 31, 2004 | ||||||||||
| Share Activity: | |||||||||||
| Shares issued: | |||||||||||
| Class A | 24,637 | 14,819 | |||||||||
| Class B | 127 | 396 | |||||||||
| Class C | 69 | 112 | |||||||||
| Class C2 | – | 45 | |||||||||
| Class M | – | 28 | |||||||||
| 24,833 | 15,400 | ||||||||||
| Shares issued–reinvested from distributions: | |||||||||||
| Class A | 123 | 4 | |||||||||
| Class B | – | 3 | |||||||||
| Class C | – | – | |||||||||
| Class C2 | – | 1 | |||||||||
| Class M | – | – | |||||||||
| 123 | 8 | ||||||||||
| Shares redeemed: | |||||||||||
| Class A | (3,294 | ) | (403 | ) | |||||||
| Class B | (226 | ) | (459 | ) | |||||||
| Class C | (92 | ) | (243 | ) | |||||||
| Class C2 | – | (109 | ) | ||||||||
| Class M | – | (71 | ) | ||||||||
| (3,612 | ) | (1,285 | ) | ||||||||
| Class level exchanges: | |||||||||||
| Class C | – | 761 | |||||||||
| Class C2 | – | (557 | ) | ||||||||
| Class M | – | (203 | ) | ||||||||
| – | 1 | ||||||||||
| Automatic conversions: | |||||||||||
| Class A | 4 | 1 | |||||||||
| Class B | (4 | ) | (1 | ) | |||||||
| – | – | ||||||||||
| Net increase (decrease) in shares outstanding: | |||||||||||
| Class A | 21,470 | 14,421 | |||||||||
| Class B | (103 | ) | (61 | ) | |||||||
| Class C | (23 | ) | 630 | ||||||||
| Class C2 | – | (620 | ) | ||||||||
| Class M | – | (246 | ) | ||||||||
| 21,344 | 14,124 | ||||||||||
The notes to the financial statements are an integral part of this report.
Transamerica IDEX Mutual Funds
Semi-Annual Report 2005
6
TA IDEX American Century Large Company Value
FINANCIAL HIGHLIGHTS
(unaudited for the period ended April 30, 2005)
| For a share of beneficial interest outstanding throughout each period | |||||||||||||||||||||||||||||||||||||||
| Net Asset | Investment Operations | Distributions | Net Asset | ||||||||||||||||||||||||||||||||||||
| For the Period Ended (d)(g) | Value, Beginning of Period | Net Investment Income (Loss) | Net Realized and Unrealized Gain (Loss) | Total Operations | From Net Investment Income | From Net Realized Gains | Total Distributions | Value, End of Period | |||||||||||||||||||||||||||||||
| Class A | 4/30/2005 | $ | 10.20 | $ | 0.07 | $ | 0.47 | $ | 0.54 | $ | (0.04 | ) | $ | – | $ | (0.04 | ) | $ | 10.70 | ||||||||||||||||||||
| 10/31/2004 | 9.09 | 0.11 | 1.01 | 1.12 | (0.01 | ) | – | (0.01 | ) | 10.20 | |||||||||||||||||||||||||||||
| 10/31/2003 | 7.55 | 0.04 | 1.50 | 1.54 | – | – | – | 9.09 | |||||||||||||||||||||||||||||||
| 10/31/2002 | 8.79 | 0.01 | (1.25 | ) | (1.24 | ) | – | – | – | 7.55 | |||||||||||||||||||||||||||||
| 10/31/2001 | 10.83 | (0.03 | ) | (2.01 | ) | (2.04 | ) | – | – | – | 8.79 | ||||||||||||||||||||||||||||
| 10/31/2000 | 10.00 | – | 0.83 | 0.83 | – | – | – | 10.83 | |||||||||||||||||||||||||||||||
| Class B | 4/30/2005 | 9.88 | 0.03 | 0.45 | 0.48 | – | – | – | 10.36 | ||||||||||||||||||||||||||||||
| 10/31/2004 | 8.87 | 0.02 | 1.00 | 1.02 | (0.01 | ) | – | (0.01 | ) | 9.88 | |||||||||||||||||||||||||||||
| 10/31/2003 | 7.41 | (0.01 | ) | 1.47 | 1.46 | – | – | – | 8.87 | ||||||||||||||||||||||||||||||
| 10/31/2002 | 8.69 | (0.05 | ) | (1.23 | ) | (1.28 | ) | – | – | – | 7.41 | ||||||||||||||||||||||||||||
| 10/31/2001 | 10.79 | (0.10 | ) | (2.00 | ) | (2.10 | ) | – | – | – | 8.69 | ||||||||||||||||||||||||||||
| 10/31/2000 | 10.00 | (0.04 | ) | 0.83 | 0.79 | – | – | – | 10.79 | ||||||||||||||||||||||||||||||
| Class C | 4/30/2005 | 9.86 | 0.02 | 0.45 | 0.47 | (0.00 | ) (h) | – | (0.00 | ) | 10.33 | ||||||||||||||||||||||||||||
| 10/31/2004 | 8.87 | – | 1.00 | 1.00 | (0.01 | ) | – | (0.01 | ) | 9.86 | |||||||||||||||||||||||||||||
| 10/31/2003 | 7.32 | (0.01 | ) | 1.56 | 1.55 | – | – | – | 8.87 | ||||||||||||||||||||||||||||||
| Ratios/Supplemental Data | |||||||||||||||||||||||||||||||
| For the Period | Total | Net Assets, End of Period | Ratio of Expenses to Average Net Assets (a) | Net Investment Income (Loss) to Average | Portfolio Turnover | ||||||||||||||||||||||||||
| Ended (g) | Return (c) | (000's) | Net (e) | Total (f) | Net Assets (a) | Rate (b) | |||||||||||||||||||||||||
| Class A | 4/30/2005 | 5.32 | % | $ | 394,517 | 1.25 | % | 1.25 | % | 1.37 | % | 17 | % | ||||||||||||||||||
| 10/31/2004 | 12.38 | 157,103 | 1.54 | 1.54 | 1.11 | 61 | |||||||||||||||||||||||||
| 10/31/2003 | 20.40 | 8,988 | 1.85 | 2.56 | 0.53 | 76 | |||||||||||||||||||||||||
| 10/31/2002 | (14.15 | ) | 7,908 | 1.80 | 2.43 | 0.09 | 161 | ||||||||||||||||||||||||
| 10/31/2001 | (18.80 | ) | 5,183 | 1.55 | 2.49 | (0.28 | ) | 113 | |||||||||||||||||||||||
| 10/31/2000 | 8.30 | 2,974 | 1.55 | 6.85 | (0.42 | ) | 111 | ||||||||||||||||||||||||
| Class B | 4/30/2005 | 4.87 | 18,448 | 2.22 | 2.22 | 0.59 | 17 | ||||||||||||||||||||||||
| 10/31/2004 | 11.54 | 18,612 | 2.32 | 2.32 | 0.20 | 61 | |||||||||||||||||||||||||
| 10/31/2003 | 19.70 | 17,245 | 2.50 | 3.21 | (0.12 | ) | 76 | ||||||||||||||||||||||||
| 10/31/2002 | (14.76 | ) | 14,446 | 2.45 | 3.08 | (0.56 | ) | 161 | |||||||||||||||||||||||
| 10/31/2001 | (19.41 | ) | 11,623 | 2.20 | 3.14 | (0.93 | ) | 113 | |||||||||||||||||||||||
| 10/31/2000 | 7.86 | 3,635 | 2.20 | 7.50 | (1.07 | ) | 111 | ||||||||||||||||||||||||
| Class C | 4/30/2005 | 4.73 | 7,703 | 2.47 | 2.50 | 0.34 | 17 | ||||||||||||||||||||||||
| 10/31/2004 | 11.38 | 7,586 | 2.50 | 2.54 | 0.04 | 61 | |||||||||||||||||||||||||
| 10/31/2003 | 21.17 | 1,230 | 2.50 | 3.21 | (0.12 | ) | 76 | ||||||||||||||||||||||||
NOTES TO FINANCIAL HIGHLIGHTS
(a) Annualized.
(b) Not annualized for periods of less than one year.
(c) Total Return has been calculated for the applicable period without deduction of a sales load, if any, on an initial purchase. Periods of less than one year are not annualized.
(d) Per share information is calculated based on average number of shares outstanding for the periods ended 10/31/2001, 10/31/2002, 10/31/2003, 10/31/2004, and 4/30/2005
(e) Ratio of Net Expenses to Average Net Assets is net of fee waivers and reimbursements by the investment adviser, if any (see note 2).
(f) Ratio of Total Expenses to Average Net Assets includes all expenses before fee waivers and reimbursements by the investment adviser.
(g) TA IDEX American Century Large Company Value ("the Fund") commenced operations on March 1, 2000. The inception date for the Fund's offering of share Class C was November 11, 2002.
(h) Distributions from net investment income is less than $0.01 per share.
The notes to the financial statements are an integral part of this report.
Transamerica IDEX Mutual Funds
Semi-Annual Report 2005
7
TA IDEX American Century Large Company Value
NOTES TO FINANCIAL STATEMENTS
At April 30, 2005
(all amounts in thousands)
(unaudited)
NOTE 1. ORGANIZATION AND SIGNIFICANT ACCOUNTING POLICIES
Transamerica IDEX Mutual Funds is a Delaware statutory trust registered under the Investment Company Act of 1940, as amended (the "1940 Act"), as an open-end management investment company. Prior to March 1, 2005, Transamerica IDEX Mutual Funds was a Massachusetts business trust. TA IDEX American Century Large Company Value ("the Fund"), part of Transamerica IDEX Mutual Funds, began operations on March 1, 2000.
In the normal course of business, the Fund enters into contracts that contain a variety of representations and warranties, which provide general indemnifications. The Fund's maximum exposure under these arrangements is unknown, as this would involve future claims that may be made against the Fund and/or its affiliates that have not yet occurred. However, based on experience, the Fund expects the risk of loss to be remote.
See the Prospectus and Statement of Additional Information for a description of the Fund's investment objective.
In preparing the Fund's financial statements in accordance with accounting principles generally accepted in the United States of America ("GAAP"), estimates or assumptions (which could differ from actual results) may be used that affect reported amounts and disclosures. The following policies were consistently followed by the Fund, in accordance with GAAP.
Multiple class operations and expenses: The Fund currently offers three classes of shares, each with a public offering price that reflects different sales charges, if any, and expense levels. On June 15, 2004, Class C2 shares merged into Class C. On September 24, 2004, Class M shares merged into Class C. Class B shares will convert to Class A shares eight years after purchase. Income, non-class specific expenses and realized and unrealized gains and losses, are allocated daily to each class, based upon the value of shares outstanding method as permitted under Rule 18f-3 of the 1940 Act. Each class bears its own specific expenses as well as a portion of general, common expenses.
Pricing of shares: The Fund prices its shares on the basis of the net asset value of each class of shares of the Fund, which is determined as of the close of the New York Stock Exchange ("NYSE") (generally 4:00 p.m. Eastern Time) on each day on which the NYSE is open for trading.
Security valuations: Fund investments traded on an exchange are valued at the closing price on the day of valuation on the exchange where the security is principally traded. With respect to securities traded on NASDAQ NMS, such closing price may be last reported sales price or the NASDAQ Official Closing Price.
Securities traded in the over-the-counter market and listed securities for which no sale was reported on that date are valued at the last quoted bid price.
Debt securities are valued by independent pricing services at the last quoted bid price; however, those that mature in sixty days or less are valued at amortized cost, which approximates market.
Investment company securities are valued at net asset value of the underlying portfolio.
Other securities for which quotations are not readily available are valued at fair market value as determined in good faith using guidelines adopted by the Board of Trustees of the Fund, under the supervision of the Fund's Valuation Committee. These guidelines may include: the type of security; any restrictions on its resale; financial or business news of the issuer; similar or related securities that are actively trading; related corporate actions; and other significant events occurring after the close of trading in the security.
Cash: The Fund may leave cash overnight in its cash account with the custodian, Investors Bank & Trust Company ("IBT"). IBT has been contracted on behalf of the Fund to invest the excess cash into a savings account, which at April 30, 2005, was paying an interest rate of 2.02%.
Throughout the period, the Fund may have a cash overdraft balance. A fee is incurred on this overdraft, calculated by multiplying the overdraft by a rate based on the federal funds rate.
Repurchase agreements: The Fund is authorized to enter into repurchase agreements. The Fund, through IBT, receives delivery of the underlying securities, the value of which at the time of purchase is required to be an amount equal to at least 100% of the resale price. Repurchase agreements involve the risk that the seller will fail to repurchase the security, as agreed. In that case, the Fund will bear the risk of value fluctuations until the security can be sold and may encounter delays and incur costs in liquidating the security. In the event of bankruptcy or insolvency of the seller, delays and costs may be incurred.
Securities lending: The Fund may lend securities to enhance fund earnings from investing cash collateral in making such loans to qualified borrowers (typically broker/dealers). The Fund has engaged its custodian bank, IBT, as a lending agent to administer its securities lending program. IBT earned $9 of program income for its services. When the Fund makes a security loan, it receives cash collateral as protection against the risk that the borrower will default on the loan, and records an asset for the cash invested collateral and a liability for the return of the collateral.
Loans of securities are required to be secured by collateral at least equal to 102% of the value of the securities at inception of the loan, and not less then 100% thereafter. The Fund may invest cash collateral in short-term money market instruments including: U.S. Treasury Bills,
Transamerica IDEX Mutual Funds
Semi-Annual Report 2005
8
TA IDEX American Century Large Company Value
NOTES TO FINANCIAL STATEMENTS (continued)
At April 30, 2005
(all amounts in thousands)
(unaudited)
NOTE 1.–(continued)
U.S. agency obligations, commercial paper, money market mutual funds, repurchase agreements and other highly rated, liquid investments. During the life of securities loans, the collateral and securities loaned remain subject to fluctuation in value. IBT marks to market securities loaned and the collateral each business day. If additional collateral is due (at least $1), IBT collects additional cash collateral from the borrowers. Although securities loaned will be fully collateralized at all times, IBT may experience delays in, or may be prevented from, recovering the collateral on behalf of the Fund. The Fund may recall a loaned security position at any time from the borrower through IBT. In the event the borrower fails to timely return a recalled security, IBT may indemnify the Fund by purchasing replacement securities for the Fund at its own expense and claiming the collateral to fund such a purchase. IBT absorbs the loss if the collateral value is not sufficient to cover the cost of the replacement securities. If replacement securities are not available, IBT will credit the equivalent cash value to the Fund.
While a security is on loan, the Fund does not have the right to vote that security. However, if time permits, the Fund will attempt to recall a security on loan and vote the proxy.
Income from securities lending is included in the Statement of Operations. The amount of collateral and value of securities on loan are included in the Statement of Assets and Liabilities as well as in the Schedule of Investments.
Security transactions and investment income: Security transactions are recorded on the trade date. Security gains and losses are calculated on the specific identification basis. Dividend income is recorded on the ex-dividend date or, in the case of foreign securities, as soon as the Fund is informed of the ex-dividend date. Interest income, including accretion of discounts and amortization of premiums, is recorded on the accrual basis commencing on the settlement date.
Account maintenance fees: If the shareholder account balance falls below $1 by either shareholder action or as a result of market action, a $25 (not in thousands) fee is assessed every year until the balance reaches $1. The fee is assessed by redeeming shares in the shareholder's account.
No fee will be charged under the following conditions:
• accounts opened within the preceding 24 months
• accounts with an active monthly Automatic Investment Plan ($50 (not in thousands) minimum per fund)
• accounts owned by an individual which, when combined by social security number, have a balance of $5 or more
• accounts owned by individuals in the same household (by address) that have a combined balance of $5 or more
• UTMA/UGMA accounts
• Fiduciary accounts
• B-share accounts whose shares have started to convert to A-shares accounts (as long as combined value of both accounts is at least $1)
For the six months ended April 30, 2005, this fee totaled less than $1. These fees are included in Paid in Capital in the Statement of Assets and Liabilities.
Redemption fees: A short-term trading redemption fee may be assessed on any fund shares in a fund account that are sold during the first five (5) NYSE trading days following their purchase date. This redemption fee will equal 2% of the amount redeemed and shares held the longest will be treated as being redeemed first and shares held the shortest as being redeemed last.
For the six months ended April 30, 2005, the Fund received less than $1 in redemption fees.
Dividend distributions: Distributions to shareholders are recorded on the ex-dividend date and are determined in accordance with Federal income tax regulations which may differ from GAAP.
NOTE 2. RELATED PARTY TRANSACTIONS
Transamerica Fund Advisors, Inc. ("TFAI") is the Fund's investment adviser. Transamerica Fund Services, Inc. ("TFS") is the Fund's administrator and transfer agent. AFSG Securities Corp. ("AFSG") is the Fund's distributor/principal underwriter. AFSG is 100% owned by AUSA Holding Company ("AUSA"). TFAI is a directly owned subsidiary of Western Reserve Life Assurance Co. of Ohio (78%) and AUSA (22%). TFS is a wholly owned subsidiary of WRL (50%) and AUSA (50%). AUSA and WRL are wholly owned indirect subsidiaries of AEGON, NV, a Netherlands corporation.
Effective January 1, 2005 AEGON/Transamerica Fund Advisors, Inc. ("ATFA") was renamed Transamerica Fund Advisors, Inc. ("TFAI"); AEGON/Transamerica Fund Services, Inc. ("ATFS") and AEGON/ Transamerica Investor Services, Inc. ("ATIS") merged into one entity and was renamed Transamerica Fund Services, Inc. ("TFS").
Transamerica IDEX Mutual Funds
Semi-Annual Report 2005
9
TA IDEX American Century Large Company Value
NOTES TO FINANCIAL STATEMENTS (continued)
At April 30, 2005
(all amounts in thousands)
(unaudited)
NOTE 2.–(continued)
The following schedule reflects the percentage of fund assets owned by affiliated mutual funds (ie: through the asset allocation funds):
| Net Assets | % of Net Assets | ||||||||||
| TA IDEX Asset Allocation – Conservative Portfolio | $ | 24,970 | 5.94 | % | |||||||
| TA IDEX Asset Allocation – Growth Portfolio | 84,868 | 20.17 | % | ||||||||
| TA IDEX Asset Allocation – Moderate Growth Portfolio | 189,432 | 45.03 | % | ||||||||
| TA IDEX Asset Allocation – Moderate Portfolio | 84,189 | 20.01 | % | ||||||||
| Total | $ | 383,459 | 91.15 | % | |||||||
Investment advisory fee: The Fund pays management fees to TFAI based on average daily net assets ("ANA") at the following breakpoints:
From November 1, 2004 to December 31, 2004
0.90% of the first $100 million of ANA
0.85% of the next $150 million of ANA
0.80% of ANA over $250 million
From January 1, 2005 on:
0.85% of the first $250 million of ANA
0.80% of the next $250million of ANA
0.775% of the next $250 million of ANA
0.70% of ANA over $750 million
TFAI has contractually agreed to waive its advisory fee and will reimburse the Fund to the extent that operating expenses, excluding 12b-1 fees, exceed the following stated annual limit:
From November 1, 2004 to December 31, 2004
1.50% Expense Limit
From January 1, 2005 on:
1.45% Expense Limit
If total fund expenses fall below the annual expense limitation agreement agreed to by the adviser within the succeeding three years, the Fund may be required to pay that adviser a portion or all of the waived advisory fees.
| Advisory Fee Waived | Available for Recapture Through | ||||||||||
| Fiscal Year 2003 | $ | 207 | 10/31/2006 | ||||||||
If total class expenses fall below the annual expense limitation agreement agreed to by the adviser within the succeeding three years, the Fund may be required to pay that adviser a portion or all of the reimbursed class expenses.
| Reimbursement of Class Expenses | Available for Recapture Through | ||||||||||
| Fiscal Year 2004 | |||||||||||
| Class C | 1 | 10/31/2007 | |||||||||
Distribution and service fees: The Fund has a 12b-1 distribution plan under the 1940 Act pursuant to which an annual fee, based on average daily net assets, is paid to the distributor for various disbursements such as broker-dealer account servicing fees and other promotional expenses of the Fund. The Fund is authorized under the 12b-1 plan to pay fees on each class up to the following limits:
| Class A | 0.35 | % | |||||
| Class B | 1.00 | % | |||||
| Class C | 1.00 | % | |||||
In the case the Fund or a class of shares of the Fund is closed to new investors or investments, the Fund is authorized to pay 12b-1 fees for past sales and distribution efforts and present and past investor services.
Underwriter commissions relate to front-end sales charges imposed for Class A shares and contingent deferred sales charges from Classes B, C, and certain A share redemptions. For the six months ended April 30, 2005, the underwriter commissions were as follows:
| Received by Underwriter | $ | 60 | |||||
| Retained by Underwriter | 4 | ||||||
| Contingent Deferred Sales Charge | 22 | ||||||
Administrative services: The Fund has entered into an agreement with TFS for financial and legal fund administration services, which includes such items as compliance, expenses, financial statements and other reporting, distributions, tax returns, prospectus preparation, board of trustees meeting support and other legal matters. As of January 1, 2005 the Fund pays TFS an annual fee of 0.02% of average net assets. Prior to January 1, 2005 the Fund paid TFS an annual fee of 0.015% of average net assets. The Legal fees on the Statement of Operations are for fees paid to external legal counsel.
Transfer agent fees: The Fund pays TFS an annual per-account charge of $20 (not in thousands) for each open account and $1.63 (not in thousands) for each closed account. There is no new account charge. The Transfer agent fees on the Statement of Operations are made up of fees paid to TFS and costs associated with shareholder statements.
The Fund paid TFS $65 for the six months ended April 30, 2005.
Deferred compensation plan: Each eligible Fund Trustee may elect participation in the Deferred Compensation Plan ("the Plan"). Under the Plan, such Trustees may defer payment of a percentage of their total fees earned as a Fund Trustee. These deferred amounts may be invested
Transamerica IDEX Mutual Funds
Semi-Annual Report 2005
10
TA IDEX American Century Large Company Value
NOTES TO FINANCIAL STATEMENTS (continued)
At April 30, 2005
(all amounts in thousands)
(unaudited)
NOTE 2.–(continued)
in any Transamerica IDEX Mutual Fund. At April 30, 2005, the value of invested plan amount was $4. Invested plan amounts and the total liability for deferred compensation to the Trustees under the Plan at April 30, 2005, are included in the accompanying Statement of Assets and Liabilities.
NOTE 3. INVESTMENT TRANSACTIONS
The cost of securities purchased and proceeds from securities sold (excluding short-term securities) for the six months ended April 30, 2005, were as follows:
| Purchases of securities: | |||||||
| Long-Term excluding U.S. Government | $ | 283,226 | |||||
| U.S. Government | – | ||||||
| Proceeds from maturities and sales of securities: | |||||||
| Long-Term excluding U.S. Government | 61,084 | ||||||
| U.S. Government | – | ||||||
NOTE 4. FEDERAL INCOME TAX MATTERS
The Fund has not made any provision for federal income or excise taxes due to its policy to distribute all of its taxable income and capital gains to its shareholders and otherwise qualify as a regulated investment company under the Internal Revenue Code. Income and capital gain distributions are determined in accordance with income tax regulations, which may differ from GAAP. These differences are primarily due to differing treatment for items including, but not limited to, wash sales, net operating losses and capital loss carryforwards.
The capital loss carryforwards are available to offset future realized capital gains through the period listed:
| Capital Loss Carryforward | Available through | ||||||
| $ | 2,425 | October 31, 2011 | |||||
The aggregate cost of investments and composition of unrealized appreciation (depreciation) for federal income tax purposes as of April 30, 2005, are as follows:
| Federal Tax Cost Basis | $ | 429,832 | |||||
| Unrealized Appreciation | $ | 18,500 | |||||
| Unrealized (Depreciation) | (13,423 | ) | |||||
| Net Unrealized Appreciation (Depreciation) | $ | 5,077 | |||||
NOTE 5. REGULATORY PROCEEDINGS
There continues to be significant federal and state regulatory activity relating to financial services companies, particularly mutual fund companies and their investment advisers. As part of an ongoing investigation regarding potential market timing, recordkeeping and trading compliance issues and matters affecting the Fund's investment adviser, TFAI, and certain employees and affiliates of TFAI, the SEC staff has indicated that it is likely to take some action against TFAI and certain of its affiliates at the conclusion of the investigation. The potential timing and the scope of any such action is difficult to predict. Although the impact of any action brought against TFAI and/or its affiliates is difficult to assess at the present time, the Fund currently believes that the likelihood that any such action will have a material adverse impact on it is remote. It is important to note that the Fund is not aware of any allegation of wrongdoing against it and its board at the time this semi-annual report is printed. Although it is not anticipated that these developments will have an adverse impact on the Fund, there can be no assurance at this time. TFAI and its affiliates are actively working with the SEC in regard to this matter; however, the exact resolution cannot be determined at this time. TFAI will take such actions that it deems necessary or appropriate to continue providing management services to the Fund and to bring all matters to an appropriate conclusion.
TFAI and/or its affiliates, and not the Fund, will bear the costs regarding these regulatory matters.
Transamerica IDEX Mutual Funds
Semi-Annual Report 2005
11
TA IDEX American Century Large Company Value
INVESTMENT ADVISORY AND SUB-ADVISORY AGREEMENTS – REVIEW AND RENEWAL
At a meeting of the Board of Trustees of Transamerica IDEX Mutual Funds ("TA IDEX") held on October 6, 2004, the Board considered and approved the renewal for a one-year period of the Investment Advisory Agreement between TA IDEX American Century Large Company Value (the "Fund") and Transamerica Fund Advisors, Inc. ("TFAI") as well as the Investment Sub-Advisory Agreement of the Fund between TFAI and American Century Investment Management, Inc. (the "Sub-Adviser"). In approving the renewal of these agreements, the Board concluded that the Investment Advisory and Investment Sub-Advisory Agreements enable shareholders of the Fund to obtain high quality services at a cost that is appropriate, reasonable, and in the best interests of shareholders based upon the following determinations, among others:
The nature, extent and quality of the advisory service to be provided. The Board considered the nature and quality of the services provided by TFAI and the Sub-Adviser to the Fund in the past, as well as the services anticipated to be provided in the future. The Board concluded that TFAI and the Sub-Adviser are capable of providing high quality services to the Fund, as indicated by TFAI's management capabilities demonstrated with respect to the Fund and other funds managed by TFAI, TFAI's management oversight process, the professional qualifications and experience of the Sub-Adviser's portfolio management team, and the Fund's competitive investment performance. The Board also concluded that TFAI and the Sub-Adviser would provide the same quality and quantity of investment management and related services as before, that these services are appropriate in scope and extent in light of the Fund's operations, the competitive landscape of the investment company business and investor needs, and that TFAI's and the Sub-Adviser's obligations will remain the same in all respects.
The investment performance of the Fund. The Board concluded, based in particular on information provided by Lipper Analytics, that the Fund's investment performance was competitive relative to comparable funds over trailing one-, two- and three-year periods and to the Fund's benchmark index over the past year, but nevertheless decided to monitor the Fund's long-term performance on a regular basis. On the basis of the Trustees' assessment of the nature, extent and quality of investment advisory and related services to be provided or procured by TFAI and the Sub-Adviser, the Trustees concluded that TFAI and the Sub-Adviser were capable of generating a level of investment performance that is appropriate in light of the Fund's investment objective, policies and strategies and competitive with many o ther investment companies.
The cost of advisory services provided and the level of profitability. On the basis of the Board's review of the fees to be charged by TFAI and the Sub-Adviser for investment advisory and related services, TFAI's financial statements, the fees paid by TFAI to the Sub-Adviser, TFAI's estimated net management income resulting from its management of the Fund, the estimated profitability of TFAI's relationships with the Fund and TA IDEX, and the estimated profitability of the Sub-Adviser's relationship with the Fund, the Board concluded that the level of investment advisory fees and the profitability is appropriate in light of the services provided, the management fees and overall expense ratios of comparable investment companies, and the anticipated profitability of the relationship between the Fun d, TFAI and the Sub-Adviser. Further, the Board noted that TFAI lowered the level of advisory fees, which will likely lower overall expenses for the benefit of shareholders.
The extent to which economies of scale would be realized as the Fund grows and whether fee levels reflect these economies of scale for the benefit of Fund investors. The Trustees concluded that inclusion of asset-based breakpoints in the Fund's advisory fee schedule appropriately benefited investors by realizing economies of scale in the form of a lower advisory fee rate as the level of Fund assets increases. The Board also concluded that the advisory fees appropriately reflect the Fund's current size, the current economic environment for TFAI, and the competitive nature of the investment company market. In addition, the Board noted that it will have the opportunity to periodically re-examine whether the Fund has achieved economies of scale, as well as the appropriateness of advisory fees payabl e to TFAI and the Sub-Adviser in the future.
Benefits (such as soft dollars) to TFAI or the Sub-Adviser from its relationship with the Fund. The Board concluded that other benefits derived by TFAI or the Sub-Adviser from its relationship with the Fund are reasonable and fair, and are consistent with industry practice and the best interests of the Fund and its shareholders. In this regard, the Board noted that TFAI does not realize "soft dollar" benefits from its relationship with the Fund, and that the Sub-Adviser engaged in "soft dollar" arrangements consistent with applicable law and "best execution" requirements.
Other considerations. The Board also determined that TFAI had made a substantial commitment to the recruitment and retention of high quality personnel, and maintained the financial, compliance and operational resources reasonably necessary to manage the Fund in a professional manner that is consistent with the best interests of the Fund and its shareholders. The Trustees also concluded that TFAI had made a significant entrepreneurial commitment to the management and success of the Fund, reflected by TFAI's expense limitation and fee waiver arrangement with the Fund which, as demonstrated in the past with the Fund, may result in TFAI waiving a substantial amount of advisory fees for the benefit of shareholders.
Transamerica IDEX Mutual Funds
Semi-Annual Report 2005
12
TA IDEX American Century Large Company Value
SUPPLEMENTAL INFORMATION (unaudited)
RESULTS OF SHAREHOLDER PROXY
At a special meeting of shareholders held on February 25, 2005, the results of the Proposals were as follows:
Transamerica IDEX Mutual Funds
Proposal 1: Election of Trustees to the Board of Trustees of Transamerica IDEX Mutual Funds.
| For | Withheld | ||||||||||
| Peter R. Brown | 872,017,875.249 | 4,468,498.551 | |||||||||
| Daniel Calabria | 871,917,069.786 | 4,569,304.014 | |||||||||
| Janise B. Case | 872,099,393.125 | 4,386,980.675 | |||||||||
| Charles C. Harris | 872,086,722.025 | 4,399,651.775 | |||||||||
| Leo J. Hill | 872,304,465.640 | 4,181,908.160 | |||||||||
| Russell A. Kimball, Jr. | 872,253,556.471 | 4,232,817.329 | |||||||||
| William W. Short, Jr. | 872,139,920.944 | 4,346,452.856 | |||||||||
| John Waechter | 872,261,152.376 | 4,225,221.424 | |||||||||
| Jack E. Zimmerman | 871,929,967.512 | 4,556,406.288 | |||||||||
| Brian C. Scott | 872,218,970.367 | 4,267,403.433 | |||||||||
| Thomas P. O'Neill | 872,111,944.117 | 4,374,429.683 | |||||||||
TA IDEX American Century Large Company Value
Proposal 2: Approval of an Agreement and Plan of Reorganization pursuant to which Transamerica IDEX Mutual Funds will organize as a Delaware statutory trust.
| For | Against | Abstentions/Broker Non-Votes | |||||||||
| 17,791,042.543 | 32,752.872 | 1,164,534.578 | |||||||||
Proposal 3: Approval of changes to the fundamental investment restrictions of TA IDEX American Century Large Company Value.
| A. Diversification | For | Against | Abstentions/Broker Non-Votes | ||||||||||||
| 17,819,865.501 | 39,033.493 | 1,129,430.999 | |||||||||||||
| B. Borrowing | For | Against | Abstentions/Broker Non-Votes | ||||||||||||
| 17,819,865.501 | 39,033.493 | 1,129,430.999 | |||||||||||||
| C. Senior Securities | For | Against | Abstentions/Broker Non-Votes | ||||||||||||
| 17,819,865.501 | 39,033.493 | 1,129,430.999 | |||||||||||||
| D. Underwriting Securities | For | Against | Abstentions/Broker Non-Votes | ||||||||||||
| 17,819,865.501 | 39,033.493 | 1,129,430.999 | |||||||||||||
| E. Real Estate | For | Against | Abstentions/Broker Non-Votes | ||||||||||||
| 17,819,865.501 | 39,033.493 | 1,129,430.999 | |||||||||||||
| F. Making Loans | For | Against | Abstentions/Broker Non-Votes | ||||||||||||
| 17,819,683.732 | 39,215.262 | 1,129,430.999 | |||||||||||||
| G. Concentration | For | Against | Abstentions/Broker Non-Votes | ||||||||||||
| 17,819,865.501 | 39,033.493 | 1,129,430.999 | |||||||||||||
| H. Commodities | For | Against | Abstentions/Broker Non-Votes | ||||||||||||
| 17,819,096.343 | 39,802.651 | 1,129,430.999 | |||||||||||||
Transamerica IDEX Mutual Funds
Semi-Annual Report 2005
13
TA IDEX Asset Allocation–Conservative Portfolio
UNDERSTANDING YOUR FUND'S EXPENSES
(unaudited)
SHAREHOLDER EXPENSES
The following Example is intended to help you understand your ongoing costs (in dollars and cents) of investing in a Fund and to compare these costs with the ongoing costs of investing in other funds.
The Example is based on an investment of $1,000 invested at November 1, 2004 and held for the entire period until April 30, 2005.
ACTUAL EXPENSES
The first line in the table below provides information about actual account values and actual expenses. You may use the information in this line, together with the amount you invested, to estimate the expenses that you paid over the period. Simply divide your account value by $1,000 (for example, an $8,600 account value divided by $1,000 = 8.6), then multiply the result by the number in the first line of your Fund under the heading entitled "Expenses Paid During Period" to estimate the expenses you paid on your account during this period.
HYPOTHETICAL EXAMPLE FOR COMPARISON PURPOSES
The second line in the table below provides information about hypothetical account values and hypothetical expenses based on the Fund's actual expense ratio and an assumed rate of return of 5% per year before expenses, which is not the Fund's actual return. The hypothetical account values and expenses may not be used to estimate the actual ending account balance or expenses you paid for the period. You may use this information to compare the ongoing costs of investing in your Fund and other funds. To do so, compare this 5% hypothetical example with the 5% hypothetical examples that appear in the shareholder reports of the other funds.
Please note that the expenses shown in the table are meant to highlight your ongoing costs only and do not reflect any transactional costs, such as sales charges, redemption fees, brokerage commissions paid on purchases and sales of fund shares. Therefore, the second line under the Fund in the table is useful in comparing ongoing costs only, and will not help you determine the relative total costs of owning different funds. In addition, note that the expenses shown in the table are meant to highlight your ongoing costs and do not reflect any transaction costs.
| Beginning Account Value | Ending Account Value | Annualized Expense Ratio | Expenses Paid During Period (a) | ||||||||||||||||
| Class A | |||||||||||||||||||
| Actual | $ | 1,000.00 | $ | 1,014.10 | 0.26 | % | $ | 1.30 | |||||||||||
| Hypothetical (b) | 1,000.00 | 1,023.51 | 0.26 | 1.30 | |||||||||||||||
| Class B | |||||||||||||||||||
| Actual | 1,000.00 | 1,011.30 | 0.91 | 4.54 | |||||||||||||||
| Hypothetical (b) | 1,000.00 | 1,020.28 | 0.91 | 4.56 | |||||||||||||||
| Class C | |||||||||||||||||||
| Actual | 1,000.00 | 1,010.90 | 0.89 | 4.44 | |||||||||||||||
| Hypothetical (b) | 1,000.00 | 1,020.38 | 0.89 | 4.46 | |||||||||||||||
(a) Expenses are calculated using each Fund's annualized expense ratio (as disclosed in the table), multiplied by the average account value for the period, multiplied by number of days in the period (181 days), and divided by the number of days in the year (365 days).
(b) 5% return per year before expenses.
GRAPHICAL PRESENTATION OF SCHEDULE OF INVESTMENTS
By Asset Type
At April 30, 2005
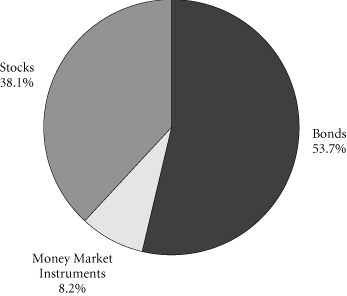
This chart shows the percentage breakdown by asset type of the Fund's total investment securities. Asset type is calculated based on the aggregate portfolio holdings in the underlying funds in which the Fund invests. The security lending collateral in the underlying funds is excluded from this calculation.
Transamerica IDEX Mutual Funds
Semi-Annual Report 2005
1
TA IDEX Asset Allocation–Conservative Portfolio
SCHEDULE OF INVESTMENTS
At April 30, 2005
(all amounts except share amounts in thousands)
(unaudited)
| Shares | Value | ||||||||||
| INVESTMENT COMPANIES (100.0%) (b) | |||||||||||
| Aggressive Equity (10.3%) | |||||||||||
| TA IDEX J.P. Morgan Mid Cap Value (a) | 981,530 | $ | 9,305 | ||||||||
| TA IDEX T. Rowe Price Health Sciences | 1,360,460 | 14,911 | |||||||||
| TA IDEX T. Rowe Price Small Cap (a) | 165,997 | 1,843 | |||||||||
| TA IDEX Transamerica Growth Opportunities (a) | 917,764 | 5,975 | |||||||||
| TA IDEX Transamerica Small/Mid Cap Value | 705,816 | 10,361 | |||||||||
| Capital Preservation (5.1%) | |||||||||||
| TA IDEX Transamerica Money Market | 20,840,249 | 20,840 | |||||||||
| Fixed-Income (54.9%) | |||||||||||
| TA IDEX PIMCO Real Return TIPS | 4,005,936 | 42,142 | |||||||||
| TA IDEX PIMCO Total Return | 2,473,975 | 25,630 | |||||||||
| TA IDEX Short Term Bond | 3,931,306 | 38,802 | |||||||||
| TA IDEX Transamerica Conservative High-Yield Bond | 7,176,790 | 64,878 | |||||||||
| TA IDEX Transamerica Convertible Securities | 3,096,064 | 33,097 | |||||||||
| TA IDEX Transamerica Flexible Income | 2,294,542 | 21,660 | |||||||||
| Growth Equity (15.6%) | |||||||||||
| TA IDEX American Century Large Company Value | 2,333,609 | 24,970 | |||||||||
| TA IDEX Great Companies–TechnologySM (a) | 826,074 | 2,908 | |||||||||
| TA IDEX Janus Growth (a) | 315,570 | 7,084 | |||||||||
| Shares | Value | ||||||||||
| Growth Equity (continued) | |||||||||||
| TA IDEX Salomon All Cap | 751 | $ | 11 | ||||||||
| TA IDEX Salomon Investors Value | 591,341 | 7,883 | |||||||||
| TA IDEX T. Rowe Price Tax-Efficient Growth (a) | 396,771 | 3,960 | |||||||||
| TA IDEX Transamerica Equity | 1,060,185 | 7,973 | |||||||||
| TA IDEX UBS Large Cap Value (a) | 923,069 | 9,452 | |||||||||
| Specialty–Real Estate (2.6%) | |||||||||||
| TA IDEX Clarion Real Estate Securities | 731,807 | 10,831 | |||||||||
| World Equity (11.5%) | |||||||||||
| TA IDEX Evergreen International Small Cap (a) | 786,568 | 8,660 | |||||||||
| TA IDEX Marsico International Growth (a) | 296,773 | 2,944 | |||||||||
| TA IDEX Templeton Great Companies Global (a) | 1,164,129 | 27,392 | |||||||||
| TA IDEX Van Kampen Emerging Markets Debt | 809,003 | 8,090 | |||||||||
| Total Investment Companies (cost: $397,101) | 411,602 | ||||||||||
| Total Investment Securities (cost: $397,101) | $ | 411,602 | |||||||||
| SUMMARY: | |||||||||||
| Investments, at value | 100.0 | % | $ | 411,602 | |||||||
| Other assets in excess of liabilities | 0.0 | % | 193 | ||||||||
| Net assets | 100.0 | % | $ | 411,795 | |||||||
NOTES TO SCHEDULE OF INVESTMENTS:
(a) No dividends were paid during the preceding twelve months.
(b) The Fund invests its assets in Class A shares of the underlying TA IDEX Mutual Funds, which are affiliates of the Fund.
The notes to the financial statements are an integral part of this report.
Transamerica IDEX Mutual Funds
Semi-Annual Report 2005
2
TA IDEX Asset Allocation–Conservative Portfolio
STATEMENT OF ASSETS AND LIABILITIES
At April 30, 2005
(all amounts except per share amounts in thousands)
(unaudited)
| Assets: | |||||||
| Investment in affiliated mutual funds, at value (cost: $397,101) | $ | 411,602 | |||||
| Receivables: | |||||||
| Shares of beneficial interest sold | 1,631 | ||||||
| Dividends | 65 | ||||||
| Other | 12 | ||||||
| 413,310 | |||||||
| Liabilities: | |||||||
| Investment securities purchased | 390 | ||||||
| Accounts payable and accrued liabilities: | |||||||
| Shares of beneficial interest redeemed | 835 | ||||||
| Management and advisory fees | 34 | ||||||
| Distribution and service fees | 159 | ||||||
| Transfer agent fees | 38 | ||||||
| Dividends to shareholders | 3 | ||||||
| Other | 56 | ||||||
| 1,515 | |||||||
| Net Assets | $ | 411,795 | |||||
| Net Assets Consist of: | |||||||
| Shares of beneficial interest, unlimited shares authorized, no par value | $ | 386,532 | |||||
| Accumulated net investment income (loss) | (2,651 | ) | |||||
| Undistributed net realized gain (loss) from investment in affiliated mutual funds | 13,415 | ||||||
| Net unrealized appreciation (depreciation) on investment in affiliated mutual funds | 14,499 | ||||||
| Net Assets | $ | 411,795 | |||||
| Net Assets by Class: | |||||||
| Class A | $ | 112,250 | |||||
| Class B | 105,498 | ||||||
| Class C | 194,047 | ||||||
| Shares Outstanding: | |||||||
| Class A | 10,325 | ||||||
| Class B | 9,717 | ||||||
| Class C | 17,872 | ||||||
| Net Asset Value Per Share: | |||||||
| Class A | $ | 10.87 | |||||
| Class B | 10.86 | ||||||
| Class C | 10.86 | ||||||
| Maximum Offering Price Per Share (a): | |||||||
| Class A | $ | 11.50 | |||||
(a) Includes the maximum selling commission (represented as a percentage of offering price) which is reduced on certain levels of sales as set forth in the Prospectus. Net asset value per share for Classes B and C shares represents offering price. The redemption price for Classes B and C shares equals net asset value less any applicable contingent deferred sales charge.
STATEMENT OF OPERATIONS
For the period ended April 30, 2005
(all amounts in thousands)
(unaudited)
| Investment Income: | |||||||
| Dividends from affiliated mutual funds | $ | 3,967 | |||||
| Expenses: | |||||||
| Management and advisory fees | 201 | ||||||
| Transfer agent fees: | |||||||
| Class A | 52 | ||||||
| Class B | 55 | ||||||
| Class C | 75 | ||||||
| Custody fees | 15 | ||||||
| Administration fees | 37 | ||||||
| Legal fees | 11 | ||||||
| Audit fees | 12 | ||||||
| Trustees fees | 10 | ||||||
| Registration fees: | |||||||
| Class A | 15 | ||||||
| Class B | 8 | ||||||
| Class C | 19 | ||||||
| Other | 1 | ||||||
| Distribution and service fees: | |||||||
| Class B | 345 | ||||||
| Class C | 609 | ||||||
| Total expenses | 1,465 | ||||||
| Net Investment Income (Loss) | 2,502 | ||||||
| Net Realized and Unrealized Gain (Loss): | |||||||
| Realized gain (loss) from investment in affiliated mutual funds | 9,789 | ||||||
| Realized gain distributions from investment in affiliated mutual funds | 3,735 | ||||||
| Increase (decrease) in unrealized appreciation (depreciation) on investment in affiliated mutual funds | (11,678 | ) | |||||
| Net Gain (Loss) on Investment in Affiliated Mutual Funds | 1,846 | ||||||
| Net Increase (Decrease) in Net Assets Resulting from Operations | $ | 4,348 | |||||
The notes to the financial statements are an integral part of this report.
Transamerica IDEX Mutual Funds
Semi-Annual Report 2005
3
TA IDEX Asset Allocation–Conservative Portfolio
STATEMENTS OF CHANGES IN NET ASSETS
For the period or year ended
(all amounts in thousands)
| April 30, 2005 (unaudited) | October 31, 2004 | ||||||||||
| Increase (Decrease) in Net Assets From: | |||||||||||
| Operations: | |||||||||||
| Net investment income (loss) | $ | 2,502 | $ | 3,509 | |||||||
| Net realized gain (loss) from investment in affiliated mutual funds | 13,524 | 16,522 | |||||||||
| Net unrealized appreciation (depreciation) on investment in affiliated mutual funds | (11,678 | ) | 4,037 | ||||||||
| 4,348 | 24,068 | ||||||||||
| Distributions to Shareholders: | |||||||||||
| From net investment income: | |||||||||||
| Class A | (1,656 | ) | (3,504 | ) | |||||||
| Class B | (1,267 | ) | (3,870 | ) | |||||||
| Class C | (2,230 | ) | (5,152 | ) | |||||||
| Class C2 | – | (672 | ) | ||||||||
| Class M | – | (306 | ) | ||||||||
| (5,153 | ) | (13,504 | ) | ||||||||
| From net realized gains: | |||||||||||
| Class A | (1,841 | ) | (137 | ) | |||||||
| Class B | (1,833 | ) | (216 | ) | |||||||
| Class C | (3,177 | ) | (232 | ) | |||||||
| Class C2 | – | (39 | ) | ||||||||
| Class M | – | (18 | ) | ||||||||
| (6,851 | ) | (642 | ) | ||||||||
| Capital Share Transactions: | |||||||||||
| Proceeds from shares sold: | |||||||||||
| Class A | 33,418 | 65,052 | |||||||||
| Class B | 10,878 | 35,549 | |||||||||
| Class C | 36,830 | 106,542 | |||||||||
| Class C2 | – | 5,538 | |||||||||
| Class M | – | 1,592 | |||||||||
| 81,126 | 214,273 | ||||||||||
| Dividends and distributions reinvested: | |||||||||||
| Class A | 2,964 | 3,046 | |||||||||
| Class B | 2,559 | 3,317 | |||||||||
| Class C | 3,757 | 3,961 | |||||||||
| Class C2 | – | 184 | |||||||||
| Class M | – | 288 | |||||||||
| 9,280 | 10,796 | ||||||||||
| Cost of shares redeemed: | |||||||||||
| Class A | (21,851 | ) | (30,060 | ) | |||||||
| Class B | (12,550 | ) | (20,630 | ) | |||||||
| Class C | (25,080 | ) | (40,681 | ) | |||||||
| Class C2 | – | (3,918 | ) | ||||||||
| Class M | – | (2,031 | ) | ||||||||
| (59,481 | ) | (97,320 | ) | ||||||||
| Redemption fees: | |||||||||||
| Class B | 2 | – | |||||||||
| 2 | – | ||||||||||
| Class level exchanges: | |||||||||||
| Class C | – | 25,151 | |||||||||
| Class C2 | – | (17,719 | ) | ||||||||
| Class M | – | (7,432 | ) | ||||||||
| – | – | ||||||||||
| April 30, 2005 (unaudited) | October 31, 2004 | ||||||||||
| Automatic conversions: | |||||||||||
| Class A | $ | 101 | $ | 128 | |||||||
| Class B | (101 | ) | (128 | ) | |||||||
| – | – | ||||||||||
| 30,927 | 127,749 | ||||||||||
| Net increase (decrease) in net assets | 23,271 | 137,671 | |||||||||
| Net Assets: | |||||||||||
| Beginning of period | 388,524 | 250,853 | |||||||||
| End of period | $ | 411,795 | $ | 388,524 | |||||||
| Accumulated Net Investment Income (Loss) | $ | (2,653 | ) | $ | – | ||||||
| Share Activity: | |||||||||||
| Shares issued: | |||||||||||
| Class A | 2,999 | 5,924 | |||||||||
| Class B | 981 | 3,244 | |||||||||
| Class C | 3,313 | 9,685 | |||||||||
| Class C2 | – | 501 | |||||||||
| Class M | – | 146 | |||||||||
| 7,293 | 19,500 | ||||||||||
| Shares issued–reinvested from distributions: | |||||||||||
| Class A | 265 | 283 | |||||||||
| Class B | 229 | 309 | |||||||||
| Class C | 336 | 369 | |||||||||
| Class C2 | – | 17 | |||||||||
| Class M | – | 27 | |||||||||
| 830 | 1,005 | ||||||||||
| Shares redeemed: | |||||||||||
| Class A | (1,965 | ) | (2,753 | ) | |||||||
| Class B | (1,127 | ) | (1,882 | ) | |||||||
| Class C | (2,251 | ) | (3,715 | ) | |||||||
| Class C2 | – | (354 | ) | ||||||||
| Class M | – | (186 | ) | ||||||||
| (5,343 | ) | (8,890 | ) | ||||||||
| Class level exchanges: | |||||||||||
| Class C | – | 2,336 | |||||||||
| Class C2 | – | (1,654 | ) | ||||||||
| Class M | – | (682 | ) | ||||||||
| – | – | ||||||||||
| Automatic conversions: | |||||||||||
| Class A | 9 | 12 | |||||||||
| Class B | (9 | ) | (12 | ) | |||||||
| – | – | ||||||||||
| Net increase (decrease) in shares outstanding: | |||||||||||
| Class A | 1,308 | 3,466 | |||||||||
| Class B | 74 | 1,659 | |||||||||
| Class C | 1,398 | 8,675 | |||||||||
| Class C2 | – | (1,490 | ) | ||||||||
| Class M | – | (695 | ) | ||||||||
| 2,780 | 11,615 | ||||||||||
The notes to the financial statements are an integral part of this report.
Transamerica IDEX Mutual Funds
Semi-Annual Report 2005
4
TA IDEX Asset Allocation–Conservative Portfolio
FINANCIAL HIGHLIGHTS
(unaudited for the period ended April 30, 2005)
| For a share of beneficial interest outstanding throughout each period | |||||||||||||||||||||||||||||||||||||||
| Net Asset | Investment Operations | Distributions | Net Asset | ||||||||||||||||||||||||||||||||||||
| For the Period Ended (d)(g) | Value, Beginning of Period | Net Investment Income (Loss) | Net Realized and Unrealized Gain (Loss) | Total Operations | From Net Investment Income | From Net Realized Gains | Total Distributions | Value, End of Period | |||||||||||||||||||||||||||||||
| Class A | 4/30/2005 | $ | 11.07 | $ | 0.09 | $ | 0.07 | $ | 0.16 | $ | (0.17 | ) | $ | (0.19 | ) | $ | (0.36 | ) | $ | 10.87 | |||||||||||||||||||
| 10/31/2004 | 10.67 | 0.17 | 0.77 | 0.94 | (0.51 | ) | (0.03 | ) | (0.54 | ) | 11.07 | ||||||||||||||||||||||||||||
| 10/31/2003 | 9.22 | 0.18 | 1.47 | 1.65 | (0.20 | ) | – | (0.20 | ) | 10.67 | |||||||||||||||||||||||||||||
| 10/31/2002 | 10.00 | 0.07 | (0.85 | ) | (0.78 | ) | – | – | – | 9.22 | |||||||||||||||||||||||||||||
| Class B | 4/30/2005 | 11.05 | 0.06 | 0.07 | 0.13 | (0.13 | ) | (0.19 | ) | (0.32 | ) | 10.86 | |||||||||||||||||||||||||||
| 10/31/2004 | 10.66 | 0.10 | 0.76 | 0.86 | (0.44 | ) | (0.03 | ) | (0.47 | ) | 11.05 | ||||||||||||||||||||||||||||
| 10/31/2003 | 9.18 | 0.11 | 1.47 | 1.58 | (0.10 | ) | – | (0.10 | ) | 10.66 | |||||||||||||||||||||||||||||
| 10/31/2002 | 10.00 | 0.03 | (0.85 | ) | (0.82 | ) | – | – | – | 9.18 | |||||||||||||||||||||||||||||
| Class C | 4/30/2005 | 11.05 | 0.06 | 0.07 | 0.13 | (0.13 | ) | (0.19 | ) | (0.32 | ) | 10.86 | |||||||||||||||||||||||||||
| 10/31/2004 | 10.66 | 0.10 | 0.76 | 0.86 | (0.44 | ) | (0.03 | ) | (0.47 | ) | 11.05 | ||||||||||||||||||||||||||||
| 10/31/2003 | 9.19 | 0.11 | 1.46 | 1.57 | (0.10 | ) | – | (0.10 | ) | 10.66 | |||||||||||||||||||||||||||||
| Ratios/Supplemental Data | |||||||||||||||||||||||||||||||
| For the Period | Total | Net Assets, End of Period | Ratio of Expenses to Average Net Assets (a) | Net Investment Income (Loss) to Average | Portfolio Turnover | ||||||||||||||||||||||||||
| Ended (g) | Return (c) | (000's) | Net (e) | Total (f) | Net Assets (a) | Rate (b) | |||||||||||||||||||||||||
| Class A | 4/30/2005 | 1.41 | % | $ | 112,250 | 0.26 | % | 0.26 | % | 1.71 | % | 29 | % | ||||||||||||||||||
| 10/31/2004 | 8.97 | 99,811 | 0.29 | 0.28 | 1.55 | 11 | |||||||||||||||||||||||||
| 10/31/2003 | 18.18 | 59,250 | 0.41 | 0.41 | 1.80 | 22 | |||||||||||||||||||||||||
| 10/31/2002 | (7.80 | ) | 9,482 | 0.45 | 1.21 | 1.27 | 8 | ||||||||||||||||||||||||
| Class B | 4/30/2005 | 1.13 | 105,498 | 0.91 | 0.91 | 1.05 | 29 | ||||||||||||||||||||||||
| 10/31/2004 | 8.21 | 106,601 | 0.92 | 0.91 | 0.93 | 11 | |||||||||||||||||||||||||
| 10/31/2003 | 17.38 | 85,134 | 1.06 | 1.06 | 1.15 | 22 | |||||||||||||||||||||||||
| 10/31/2002 | (8.20 | ) | 23,229 | 1.10 | 1.86 | 0.62 | 8 | ||||||||||||||||||||||||
| Class C | 4/30/2005 | 1.09 | 194,047 | 0.89 | 0.89 | 1.08 | 29 | ||||||||||||||||||||||||
| 10/31/2004 | 8.26 | 182,112 | 0.93 | 0.92 | 0.89 | 11 | |||||||||||||||||||||||||
| 10/31/2003 | 17.25 | 83,165 | 1.06 | 1.06 | 1.15 | 22 | |||||||||||||||||||||||||
NOTES TO FINANCIAL HIGHLIGHTS
(a) Annualized.
(b) Not annualized for periods of less than one year.
(c) Total Return has been calculated for the applicable period without deduction of a sales load, if any, on an initial purchase. Periods of less than one year are not annualized.
(d) Per share information is calculated based on average number of shares outstanding.
(e) Ratio of Net Expenses to Average Net Assets is net of fee waivers and reimbursements by the investment adviser, if any, and includes the recapture of previously waived expenses (see note 2).
(f) Ratio of Total Expenses to Average Net Assets includes all expenses before fee waivers, reimbursements by the investment adviser and recapture of previously waived expenses.
(g) TA IDEX Asset Allocation – Conservative Portfolio ("the Fund") commenced operations on March 1, 2002. The inception date for the Fund's offering of share Class C is November 11, 2002.
The notes to the financial statements are an integral part of this report.
Transamerica IDEX Mutual Funds
Semi-Annual Report 2005
5
TA IDEX Asset Allocation–Conservative Portfolio
NOTES TO FINANCIAL STATEMENTS
At April 30, 2005
(all amounts in thousands)
(unaudited)
NOTE 1. ORGANIZATION AND SIGNIFICANT ACCOUNTING POLICIES
Transamerica IDEX Mutual Funds is a Delaware statutory trust registered under the Investment Company Act of 1940, as amended (the "1940 Act"), as an open-end management investment company. Prior to March 1, 2005, Transamerica IDEX Mutual Funds was a Massachusetts business trust. TA IDEX Asset Allocation – Conservative Portfolio ("the Fund"), part of Transamerica IDEX Mutual Funds, began operations on March 1, 2002.
In the normal course of business, the Fund enters into contracts that contain a variety of representations and warranties, which provide general indemnifications. The Fund's maximum exposure under these arrangements is unknown, as this would involve future claims that may be made against the Fund and/or its affiliates that have not yet occurred. However, based on experience, the Fund expects the risk of loss to be remote.
See the Prospectus and Statement of Additional Information for a description of the Fund's investment objective.
In preparing the Fund's financial statements in accordance with accounting principles generally accepted in the United States of America ("GAAP"), estimates or assumptions (which could differ from actual results) may be used that affect reported amounts and disclosures. The following policies were consistently followed by the Fund, in accordance with GAAP.
Multiple class operations and expenses: The Fund currently offers three classes of shares, each with a public offering price that reflects different sales charges, if any, and expense levels. On June 15, 2004, Class C2 shares merged into Class C. On September 24, 2004, Class M shares merged into Class C. Class B shares will convert to Class A shares eight years after purchase. Income, non-class specific expenses and realized and unrealized gains and losses, are allocated daily to each class, based upon the value of shares outstanding method as permitted under Rule 18f-3 of the 1940 Act. Each class bears its own specific expenses as well as a portion of general, common expenses.
Pricing of shares: The Fund prices its shares on the basis of the net asset value of each class of shares of the Fund, which is determined as of the close of the New York Stock Exchange ("NYSE") (generally 4:00 p.m. Eastern Time) on each day on which the NYSE is open for trading.
Security valuations: The Fund's investments are valued at the net asset values of the underlying portfolios of Transamerica IDEX Mutual Funds. The net asset values of the underlying portfolios are determined at the close of the NYSE (generally 4:00 p.m. eastern time) on the valuation date.
Cash: The Fund may leave cash overnight in its cash account with the custodian, Investors Bank & Trust Company ("IBT"). IBT has been contracted on behalf of the Fund to invest the excess cash into a savings account, which at April 30, 2005, was paying an interest rate of 2.02%.
Throughout the period, the Fund may have a cash overdraft balance. A fee is incurred on this overdraft, calculated by multiplying the overdraft by a rate based on the federal funds rate.
Security transactions and investment income: Security transactions are recorded on the trade date. Security gains and losses are calculated on the specific identification basis. Interest income, including accretion of discounts and amortization of premiums, is recorded on the accrual basis commencing on the settlement date. Dividend income is recorded on the ex-dividend date. Dividends and net realized gain (loss) from investment securities for the Fund are from investments in shares of affiliated investment companies.
Account maintenance fees: If the shareholder account balance falls below $1 by either shareholder action or as a result of market action, a $25 (not in thousands) fee is assessed every year until the balance reaches $1. The fee is assessed by redeeming shares in the shareholder's account.
No fee will be charged under the following conditions:
• accounts opened within the preceding 24 months
• accounts with an active monthly Automatic Investment Plan ($50 (not in thousands) minimum per fund)
• accounts owned by an individual which, when combined by social security number, have a balance of $5 or more
• accounts owned by individuals in the same household (by address) that have a combined balance of $5 or more
• UTMA/UGMA accounts
• Fiduciary accounts
• B-share accounts whose shares have started to convert to
A-shares accounts (as long as combined value of both accounts is at least $1)
For the six months ended April 30, 2005, there were no account maintenance fees.
Redemption fees: A short-term trading redemption fee may be assessed on any fund shares in a fund account that are sold during the first five (5) NYSE trading days following their purchase date. This redemption fee will equal 2% of the amount redeemed and shares held the longest will be treated as being redeemed first and shares held the shortest as being redeemed last.
Transamerica IDEX Mutual Funds
Semi-Annual Report 2005
6
TA IDEX Asset Allocation–Conservative Portfolio
NOTES TO FINANCIAL STATEMENTS (continued)
At April 30, 2005
(all amounts in thousands)
(unaudited)
NOTE 1.–(continued)
Dividend distributions: Distributions to shareholders are recorded on the ex-dividend date and are determined in accordance with Federal income tax regulations which may differ from GAAP.
NOTE 2. RELATED PARTY TRANSACTIONS
Transamerica Fund Advisors, Inc. ("TFAI") is the Fund's investment adviser. Transamerica Fund Services, Inc. ("TFS") is the Fund's administrator and transfer agent. AFSG Securities Corp. ("AFSG") is the Fund's distributor/principal underwriter. AFSG is 100% owned by AUSA Holding Company ("AUSA"). TFAI is a directly owned subsidiary of Western Reserve Life Assurance Co. of Ohio (78%) and AUSA (22%). TFS is a wholly owned subsidiary of WRL (50%) and AUSA (50%). AUSA and WRL are wholly owned indirect subsidiaries of AEGON, NV, a Netherlands corporation.
Effective January 1, 2005 AEGON/Transamerica Fund Advisors, Inc. ("ATFA") was renamed Transamerica Fund Advisors, Inc. ("TFAI"); AEGON/Transamerica Fund Services, Inc. ("ATFS") and AEGON/Transamerica Investor Services, Inc. ("ATIS") merged into one entity and was renamed Transamerica Fund Services, Inc. ("TFS").
TFAI has entered into an agreement with Morningstar Associates, LLC to provide investment services to the Fund. TFAI compensates Morningstar Associates, LLC as described in the Prospectus.
Transamerica Investment Management, LLC and Great Companies, LLC are affiliates of the Fund and are sub-advisers to other funds within Transamerica IDEX Mutual Funds.
Investment advisory fees: The Fund pays management fees to TFAI based on average daily net assets ("ANA") at the following rate:
0.10% of ANA
TFAI has contractually agreed to waive its advisory fee and will reimburse the Fund to the extent that operating expenses, excluding 12b-1 fees, exceed the following stated annual limit:
0.45% Expense Limit
If total fund expenses fall below the annual expense limitations agreed to by the adviser within the succeeding three years, the Fund may be required to pay the adviser a portion or all of the waived advisory fees.
There were no amounts available for recapture at April 30, 2005.
Distribution and service fees: The Fund has a 12b-1 distribution plan under the 1940 Act pursuant to which an annual fee, based on average daily net assets, is paid to the distributor for various disbursements such as broker-dealer account servicing fees and other promotional expenses of the Fund. The Fund is authorized under the 12b-1 plan to pay fees on each class up to the following limits:
| Class A | N/A | ||||||
| Class B | 0.65 | % | |||||
| Class C | 0.65 | % | |||||
In addition, the underlying funds' Class A shares in which the Fund invests impose a 0.35% 12b-1 fee. To avoid duplication of the 12b-1 fees, each class of fund shares of the Fund has reduced the 12b-1 fees by the amount of the underlying funds' Class A 12b-1 fees.
In the case the Fund or a class of shares of the Fund is closed to new investors or investments, the Fund is authorized to pay 12b-1 fees for past sales and distribution efforts and present and past investor services.
Underwriter commission relate to front-end sales charges imposed for Class A shares and contingent deferred sales charges from Classes B, C and certain A share redemptions. For the six months ended April 30, 2005, the underwriter commissions were as follows:
| Received by Underwriter | $ | 3,225 | |||||
| Retained by Underwriter | 238 | ||||||
| Contingent Deferred Sales Charge | 269 | ||||||
Administrative services: The Fund has entered into an agreement with TFS for financial and legal fund administration services, which includes such items as compliance, expenses, financial statements and other reporting, distributions, tax returns, prospectus preparation, board of trustees meeting support and other legal matters. As of January 1, 2005 the Fund pays TFS an annual fee of 0.02% of average net assets. Prior to January 1, 2005 the Fund paid TFS an annual fee of 0.015% of average net assets. The Legal fees on the Statement of Operations are for fees paid to external legal counsel.
Transfer agent fees: The Fund pays TFS an annual per-account charge of $20 (not in thousands) for each open account and $1.63 (not in thousands) for each closed account. There is no new account charge. The Transfer agent fees on the Statement of Operations are made up of fees paid to TFS and costs associated with shareholder statements.
The Fund paid TFS $185 for the six months ended April 30, 2005.
Deferred compensation plan: Each eligible Fund Trustee may elect participation in the Deferred Compensation Plan ("the Plan"). Under the Plan, such Trustees may defer payment of a percentage of their total fees earned as a Fund Trustee. These deferred amounts may be invested in any Transamerica IDEX Mutual Fund. At April 30, 2005, the value of invested plan amount was $12. Invested plan amounts and the total liability for deferred compensation to the Trustees under the Plan at
Transamerica IDEX Mutual Funds
Semi-Annual Report 2005
7
TA IDEX Asset Allocation–Conservative Portfolio
NOTES TO FINANCIAL STATEMENTS (continued)
At April 30, 2005
(all amounts in thousands)
(unaudited)
NOTE 2.–(continued)
April 30, 2005, are included in the accompanying Statement of Assets and Liabilities.
NOTE 3. INVESTMENT TRANSACTIONS
The cost of securities purchased and proceeds from securities sold (excluding short-term securities) for the six months ended April 30, 2005, were as follows:
| Purchases of securities: | |||||||
| Long-Term excluding U.S. Government | $ | 142,601 | |||||
| U.S. Government | – | ||||||
| Proceeds from maturities and sales of securities | |||||||
| Long-Term excluding U.S. Government | 117,270 | ||||||
| U.S. Government | – | ||||||
NOTE 4. FEDERAL INCOME TAX MATTERS
The Fund has not made any provision for federal income or excise taxes due to its policy to distribute all of its taxable income and capital gains to its shareholders and otherwise qualify as a regulated investment company under the Internal Revenue Code. Income and capital gain distributions are determined in accordance with income tax regulations, which may differ from GAAP. These differences are primarily due to differing treatment for items including, but not limited to, wash sales, and capital loss carryforwards.
The aggregate cost of investments and composition of unrealized appreciation (depreciation) for federal income tax purposes as of April 30, 2005, are as follows:
| Federal Tax Cost Basis | $ | 397,188 | |||||
| Unrealized Appreciation | $ | 16,248 | |||||
| Unrealized (Depreciation) | (1,834 | ) | |||||
| Net Unrealized Appreciation (Depreciation) | $ | 14,414 | |||||
NOTE 5. REGULATORY PROCEEDINGS
There continues to be significant federal and state regulatory activity relating to financial services companies, particularly mutual fund companies and their investment advisers. As part of an ongoing investigation regarding potential market timing, recordkeeping and trading compliance issues and matters affecting the Fund's investment adviser, TFAI, and certain employees and affiliates of TFAI, the SEC staff has indicated that it is likely to take some action against TFAI and certain of its affiliates at the conclusion of the investigation. The potential timing and the scope of any such action is difficult to predict. Although the impact of any action brought against TFAI and/or its affiliates is difficult to assess at the present time, the Fund currently believes that the likelihood that any such action will have a material adverse impact on it is remote. It is important to note that the Fund is not aware of any allegation of wrongdoing against it and its board at the time this semi-annual report is printed. Although it is not anticipated that these developments will have an adverse impact on the Fund, there can be no assurance at this time. TFAI and its affiliates are actively working with the SEC in regard to this matter; however, the exact resolution cannot be determined at this time. TFAI will take such actions that it deems necessary or appropriate to continue providing management services to the Fund and to bring all matters to an appropriate conclusion.
TFAI and/or its affiliates, and not the Fund, will bear the costs regarding these regulatory matters.
Transamerica IDEX Mutual Funds
Semi-Annual Report 2005
8
TA IDEX Asset Allocation–Conservative Portfolio
INVESTMENT ADVISORY AND ASSET ALLOCATION MANAGEMENT AGREEMENTS – REVIEW AND RENEWAL
At a meeting of the Board of Trustees of Transamerica IDEX Mutual Funds ("TA IDEX") held on October 6, 2004, the Board considered and approved the renewal for a one-year period of the Investment Advisory Agreement between TA IDEX Asset Allocation – Conservative Portfolio (the "Fund") and Transamerica Fund Advisors, Inc. ("TFAI"). Additionally, at a meeting held on March 22, 2005, the Board considered and approved for a two-year period the Asset Allocation Management Agreement of the Fund between TFAI and Morningstar Associates, LLC (the "Portfolio Construction Manager"). In approving these agreements, the Board concluded that the Investment Advisory and Asset Allocation Management Agreement enable shareholders of the Fund to obtain high quality services at a cost that is appropriate, reasonable, and in the best interests of shareholders based upon the following determinations, among other s:
The nature, extent and quality of the advisory service to be provided. The Board considered the nature and quality of the services provided by TFAI and the Portfolio Construction Manager to the Fund in the past, as well as the services anticipated to be provided in the future. The Board concluded that TFAI and the Portfolio Construction Manager are capable of providing high quality services to the Fund, as indicated by TFAI's management capabilities demonstrated with respect to the Fund and other funds managed by TFAI, TFAI's management oversight process, the professional qualifications and experience of the Portfolio Construction Manager's portfolio management team, and the Fund's strong investment performance. The Board also concluded that TFAI and the Portfolio Construction Manager would prov ide the same quality and quantity of investment management and related services as before, that these services are appropriate in scope and extent in light of the Fund's operations, the competitive landscape of the investment company business and investor needs, and that TFAI's and the Portfolio Construction Manager's obligations will remain the same in all respects.
The investment performance of the Fund. The Board concluded, based in particular on information provided by Lipper Analytics, that the Fund's investment performance was competitive or superior relative to comparable funds over trailing one- and two-year periods and to the Fund's benchmark index over the past year. On the basis of the Trustees' assessment of the nature, extent and quality of investment advisory and related services to be provided or procured by TFAI and the Portfolio Construction Manager, the Trustees concluded that TFAI and the Portfolio Construction Manager were capable of generating a level of long-term investment performance that is appropriate in light of the Fund's investment objective, policies and strategies and competitive with many other investment companies.
The cost of advisory services provided and the level of profitability. On the basis of the Board's review of the fees to be charged by TFAI and the Portfolio Construction Manager for investment advisory and related services, TFAI's financial statements, the fees paid by TFAI to the Portfolio Construction Manager, TFAI's estimated net management income resulting from its management of the Fund, the estimated profitability of TFAI's relationships with the Fund and TA IDEX, and the estimated profitability of the Portfolio Construction Manager's relationship with the Fund, the Board concluded that the level of investment advisory fees and the profitability is appropriate in light of the services provided, the management fees and overall expense ratios of comparable investment companies, and the anti cipated profitability of the relationship between the Fund, TFAI and the Portfolio Construction Manager. Further, on the basis of comparative information supplied by Lipper Analytics, the Board determined that the advisory fees and estimated overall expense ratio of the Fund were consistent with industry averages.
The extent to which economies of scale would be realized as the Fund grows and whether fee levels reflect these economies of scale for the benefit of Fund investors. Although the investment advisory fees do not reduce should Fund assets grow meaningfully, the Board concluded that the advisory fees appropriately reflect the Fund's current size, the current economic environment for TFAI, and the competitive nature of the investment company market. In addition, the Board noted that it will have the opportunity to periodically re-examine whether the Fund has achieved economies of scale, as well as the appropriateness of advisory fees payable to TFAI and the Portfolio Construction Manager in light of such economies of scale (including whether it would be appropriate to have advisory fee breakpoints i n the future).
Benefits (such as soft dollars) to TFAI or the Portfolio Construction Manager from its relationship with the Fund. The Board concluded that other benefits derived by TFAI (including any benefits derived from investment advisory fees payable to TFAI with respect to the underlying funds in which the Fund invests) or the Portfolio Construction Manager from its relationship with the Fund are reasonable and fair, and are consistent with industry practice and the best interests of the Fund and its shareholders. In this regard, the Board noted that TFAI or the Portfolio Construction Manager do not realize "soft dollar" benefits from their relationship with the Fund.
Other considerations. The Board also determined that TFAI had made a substantial commitment to the recruitment and retention of high quality personnel, and maintained the financial, compliance and operational resources reasonably necessary to manage the Fund in a professional manner that is consistent with the best interests of the Fund and its shareholders. The Trustees also concluded that TFAI had made a significant entrepreneurial commitment to the management and success of the Fund, reflected by TFAI's expense limitation and fee waiver arrangement with the Fund which, as demonstrated in the past with the Fund, may result in TFAI waiving a substantial amount of advisory fees for the benefit of shareholders. The Board also noted the significant growth in the Fund's assets in the past year.
Transamerica IDEX Mutual Funds
Semi-Annual Report 2005
9
TA IDEX Asset Allocation–Conservative Portfolio
SUPPLEMENTAL INFORMATION (unaudited)
RESULTS OF SHAREHOLDER PROXY
At a special meeting of shareholders held on February 25, 2005, the results of the Proposals were as follows:
Transamerica IDEX Mutual Funds
Proposal 1: Election of Trustees to the Board of Trustees of Transamerica IDEX Mutual Funds.
| For | Withheld | ||||||||||
| Peter R. Brown | 872,017,875.249 | 4,468,498.551 | |||||||||
| Daniel Calabria | 871,917,069.786 | 4,569,304.014 | |||||||||
| Janise B. Case | 872,099,393.125 | 4,386,980.675 | |||||||||
| Charles C. Harris | 872,086,722.025 | 4,399,651.775 | |||||||||
| Leo J. Hill | 872,304,465.640 | 4,181,908.160 | |||||||||
| Russell A. Kimball, Jr. | 872,253,556.471 | 4,232,817.329 | |||||||||
| William W. Short, Jr. | 872,139,920.944 | 4,346,452.856 | |||||||||
| John Waechter | 872,261,152.376 | 4,225,221.424 | |||||||||
| Jack E. Zimmerman | 871,929,967.512 | 4,556,406.288 | |||||||||
| Brian C. Scott | 872,218,970.367 | 4,267,403.433 | |||||||||
| Thomas P. O'Neill | 872,111,944.117 | 4,374,429.683 | |||||||||
TA IDEX Asset Allocation – Conservative Portfolio
Proposal 2: Approval of an Agreement and Plan of Reorganization pursuant to which Transamerica IDEX Mutual Funds will organize as a Delaware statutory trust.
| For | Against | Abstentions/Broker Non-Votes | |||||||||
| 11,940,196.863 | 328,005.560 | 5,516,962.908 | |||||||||
Proposal 3: Approval of changes to the fundamental investment restrictions of TA IDEX Asset Allocation – Conservative Portfolio.
| A. Diversification | For | Against | Abstentions/Broker Non-Votes | ||||||||||||
| 12,462,462.839 | 375,434.443 | 4,947,268.049 | |||||||||||||
| B. Borrowing | For | Against | Abstentions/Broker Non-Votes | ||||||||||||
| 12,411,694.456 | 426,202.826 | 4,947,268.049 | |||||||||||||
| C. Senior Securities | For | Against | Abstentions/Broker Non-Votes | ||||||||||||
| 12,438,896.069 | 399,001.213 | 4,947,268.049 | |||||||||||||
| D. Underwriting Securities | For | Against | Abstentions/Broker Non-Votes | ||||||||||||
| 12,454,147.528 | 383,749.754 | 4,947,268.049 | |||||||||||||
| E. Real Estate | For | Against | Abstentions/Broker Non-Votes | ||||||||||||
| 12,453,890.243 | 384,007.039 | 4,947,268.049 | |||||||||||||
| F. Making Loans | For | Against | Abstentions/Broker Non-Votes | ||||||||||||
| 12,391,415.472 | 446,481.810 | 4,947,268.049 | |||||||||||||
| G. Concentration | For | Against | Abstentions/Broker Non-Votes | ||||||||||||
| 12,456,356.040 | 381,541.242 | 4,947,268.049 | |||||||||||||
| H. Commodities | For | Against | Abstentions/Broker Non-Votes | ||||||||||||
| 12,429,148.728 | 408,748.554 | 4,947,268.049 | |||||||||||||
Transamerica IDEX Mutual Funds
Semi-Annual Report 2005
10
TA IDEX Asset Allocation–Growth Portfolio
UNDERSTANDING YOUR FUND'S EXPENSES
(unaudited)
SHAREHOLDER EXPENSES
The following Example is intended to help you understand your ongoing costs (in dollars and cents) of investing in a Fund and to compare these costs with the ongoing costs of investing in other funds.
The Example is based on an investment of $1,000 invested at November 1, 2004 and held for the entire period until April 30, 2005.
ACTUAL EXPENSES
The first line in the table below provides information about actual account values and actual expenses. You may use the information in this line, together with the amount you invested, to estimate the expenses that you paid over the period. Simply divide your account value by $1,000 (for example, an $8,600 account value divided by $1,000 = 8.6), then multiply the result by the number in the first line of your Fund under the heading entitled "Expenses Paid During Period" to estimate the expenses you paid on your account during this period.
HYPOTHETICAL EXAMPLE FOR COMPARISON PURPOSES
The second line in the table below provides information about hypothetical account values and hypothetical expenses based on the Fund's actual expense ratio and an assumed rate of return of 5% per year before expenses, which is not the Fund's actual return. The hypothetical account values and expenses may not be used to estimate the actual ending account balance or expenses you paid for the period. You may use this information to compare the ongoing costs of investing in your Fund and other funds. To do so, compare this 5% hypothetical example with the 5% hypothetical examples that appear in the shareholder reports of the other funds.
Please note that the expenses shown in the table are meant to highlight your ongoing costs only and do not reflect any transactional costs, such as sales charges, redemption fees, brokerage commissions paid on purchases and sales of fund shares. Therefore, the second line under the Fund in the table is useful in comparing ongoing costs only, and will not help you determine the relative total costs of owning different funds. In addition, note that the expenses shown in the table are meant to highlight your ongoing costs and do not reflect any transaction costs.
| Beginning Account Value | Ending Account Value | Annualized Expense Ratio | Expenses Paid During Period (a) | ||||||||||||||||
| Class A | |||||||||||||||||||
| Actual | $ | 1,000.00 | $ | 1,026.40 | 0.33 | % | $ | 1.66 | |||||||||||
| Hypothetical (b) | 1,000.00 | 1,023.16 | 0.33 | 1.66 | |||||||||||||||
| Class B | |||||||||||||||||||
| Actual | 1,000.00 | 1,021.30 | 0.98 | 4.91 | |||||||||||||||
| Hypothetical (b) | 1,000.00 | 1,019.93 | 0.98 | 4.91 | |||||||||||||||
| Class C | |||||||||||||||||||
| Actual | 1,000.00 | 1,023.80 | 0.92 | 4.62 | |||||||||||||||
| Hypothetical (b) | 1,000.00 | 1,020.23 | 0.92 | 4.61 | |||||||||||||||
(a) Expenses are calculated using each Fund's annualized expense ratio (as disclosed in the table), multiplied by the average account value for the period, multiplied by number of days in the period (181 days), and divided by the number of days in the year (365 days).
(b) 5% return per year before expenses.
GRAPHICAL PRESENTATION OF SCHEDULE OF INVESTMENTS
By Asset Type
At April 30, 2005
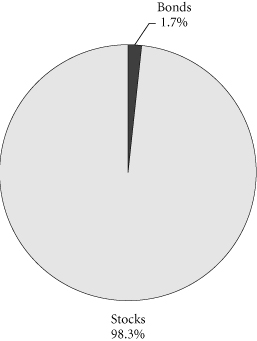
This chart shows the percentage breakdown by asset type of the Fund's total investment securities. Asset type is calculated based on the aggregate portfolio holdings in the underlying funds in which the Fund invests. The security lending collateral in the underlying funds is excluded from this calculation.
Transamerica IDEX Mutual Funds
Semi-Annual Report 2005
1
TA IDEX Asset Allocation–Growth Portfolio
SCHEDULE OF INVESTMENTS
At April 30, 2005
(all amounts except share amounts in thousands)
(unaudited)
| Shares | Value | ||||||||||
| INVESTMENT COMPANIES (99.8%) (b) | |||||||||||
| Aggressive Equity (28.5%) | |||||||||||
| TA IDEX J.P. Morgan Mid Cap Value (a) | 4,543,851 | $ | 43,076 | ||||||||
| TA IDEX T. Rowe Price Health Sciences | 3,670,767 | 40,232 | |||||||||
| TA IDEX Transamerica Growth Opportunities (a) | 7,336,464 | 47,760 | |||||||||
| TA IDEX Transamerica Small/Mid Cap Value | 6,429,037 | 94,378 | |||||||||
| TA IDEX Van Kampen Small Company Growth (a) | 1,574,851 | 15,670 | |||||||||
| Growth Equity (50.7%) | |||||||||||
| TA IDEX American Century Large Company Value | 7,931,584 | 84,868 | |||||||||
| TA IDEX Great Companies–TechnologySM (a) | 3,861,605 | 13,593 | |||||||||
| TA IDEX Janus Growth (a) | 1,695,193 | 38,057 | |||||||||
| TA IDEX Jennison Growth (a) | 3,613,957 | 34,585 | |||||||||
| TA IDEX Mercury Large Cap Value (a) | 13,893,998 | 129,353 | |||||||||
| TA IDEX Salomon All Cap | 2,438,982 | 36,341 | |||||||||
| TA IDEX Salomon Investors Value | 2,702,614 | 36,026 | |||||||||
| TA IDEX Transamerica Equity | 7,588,605 | 57,066 | |||||||||
| Shares | Value | ||||||||||
| Specialty–Real Estate (1.2%) | |||||||||||
| TA IDEX Clarion Real Estate Securities | 699,786 | $ | 10,357 | ||||||||
| World Equity (19.4%) | |||||||||||
| TA IDEX American Century International | 2,694,308 | 25,273 | |||||||||
| TA IDEX Evergreen International Small Cap (a) | 2,521,150 | 27,758 | |||||||||
| TA IDEX Marsico International Growth (a) | 2,796,971 | 27,746 | |||||||||
| TA IDEX Templeton Great Companies Global (a) | 3,067,337 | 72,174 | |||||||||
| TA IDEX Van Kampen Emerging Markets Debt | 1,189,072 | 11,891 | |||||||||
| Total Investment Companies (cost: $817,816) | 846,204 | ||||||||||
| Total Investment Securities (cost: $817,816) | $ | 846,204 | |||||||||
| SUMMARY: | |||||||||||
| Investments, at value | 99.8 | % | $ | 846,204 | |||||||
| Other assets in excess of liabilities | 0.2 | % | 1,340 | ||||||||
| Net assets | 100.0 | % | $ | 847,544 | |||||||
NOTES TO SCHEDULE OF INVESTMENTS:
(a) No dividends were paid during the preceding twelve months.
(b) The Fund invests its assets in Class A shares of the underlying TA IDEX Mutual Funds, which are affiliates of the Fund.
The notes to the financial statements are an integral part of this report.
Transamerica IDEX Mutual Funds
Semi-Annual Report 2005
2
TA IDEX Asset Allocation–Growth Portfolio
STATEMENT OF ASSETS AND LIABILITIES
At April 30, 2005
(all amounts except per share amounts in thousands)
(unaudited)
Assets:
| Investment in affliated mutual funds, at value (cost: $817,816) | $ | 846,204 | |||||
| Receivables: | |||||||
| Shares of beneficial interest sold | 4,389 | ||||||
| Dividends | 21 | ||||||
| Other | 141 | ||||||
| 850,755 | |||||||
| Liabilities: | |||||||
| Investment securities purchased | 358 | ||||||
| Accounts payable and accrued liabilities: | |||||||
| Shares of beneficial interest redeemed | 1,950 | ||||||
| Management and advisory fees | 165 | ||||||
| Distribution and service fees | 331 | ||||||
| Transfer agent fees | 70 | ||||||
| Other | 337 | ||||||
| 3,211 | |||||||
| Net Assets | $ | 847,544 | |||||
| Net Assets Consist of: | |||||||
| Shares of beneficial interest, unlimited shares authorized, no par value | $ | 789,803 | |||||
| Accumulated net investment income (loss) | (3,820 | ) | |||||
| Undistributed net realized gain (loss) from investment in affiliated mutual funds | 33,176 | ||||||
| Net unrealized appreciation (depreciation) on investment in affiliated mutual funds | 28,385 | ||||||
| Net Assets | $ | 847,544 | |||||
| Net Assets by Class: | |||||||
| Class A | $ | 228,498 | |||||
| Class B | 184,496 | ||||||
| Class C | 434,550 | ||||||
| Shares Outstanding: | |||||||
| Class A | 21,061 | ||||||
| Class B | 17,270 | ||||||
| Class C | 40,670 | ||||||
| Net Asset Value Per Share: | |||||||
| Class A | $ | 10.85 | |||||
| Class B | 10.68 | ||||||
| Class C | 10.68 | ||||||
| Maximum Offering Price Per Share (a): | |||||||
| Class A | $ | 11.48 | |||||
(a) Includes the maximum selling commission (represented as a percentage of offering price) which is reduced on certain levels of sales as set forth in the Prospectus. Net asset value per share for Classes B and C shares represents offering price. The redemption price for Classes B and C shares equals net asset value less any applicable contingent deferred sales charge.
STATEMENT OF OPERATIONS
For the period ended April 30, 2005
(all amounts in thousands)
(unaudited)
| Investment Income: | |||||||
| Dividends from affiliated mutual funds | $ | 1,806 | |||||
| Expenses: | |||||||
| Management and advisory fees | 397 | ||||||
| Transfer agent fees: | |||||||
| Class A | 172 | ||||||
| Class B | 152 | ||||||
| Class C | 239 | ||||||
| Printing and shareholder reports | 15 | ||||||
| Custody fees | 19 | ||||||
| Administration fees | 73 | ||||||
| Legal fees | 20 | ||||||
| Audit fees | 12 | ||||||
| Trustees fees | 18 | ||||||
| Registration fees: | |||||||
| Class A | 23 | ||||||
| Class B | 13 | ||||||
| Class C | 22 | ||||||
| Distribution and service fees: | |||||||
| Class B | 579 | ||||||
| Class C | 1,329 | ||||||
| Total expenses | 3,083 | ||||||
| Net Investment Income (Loss) | (1,277 | ) | |||||
| Net Realized and Unrealized Gain (Loss): | |||||||
| Realized gain (loss) from investment in affiliated mutual funds | 27,876 | ||||||
| Realized gain distribution from investment in affiliated mutual funds | 6,110 | ||||||
| Increase (decrease) in unrealized appreciation (depreciation) on investment in affiliated mutual funds | (20,773 | ) | |||||
| Net Gain (Loss) on Investment in Affiliated Mutual Funds | 13,213 | ||||||
| Net Increase (Decrease) in Net Assets Resulting from Operations | $ | 11,936 | |||||
The notes to the financial statements are an integral part of this report.
Transamerica IDEX Mutual Funds
Semi-Annual Report 2005
3
TA IDEX Asset Allocation–Growth Portfolio
STATEMENTS OF CHANGES IN NET ASSETS
For the period or year ended
(all amounts in thousands)
| April 30, 2005 (unaudited) | October 31, 2004 | ||||||||||
| Increase (Decrease) in Net Assets From: | |||||||||||
| Operations: | |||||||||||
| Net investment income (loss) | $ | (1,277 | ) | $ | (3,397 | ) | |||||
| Net realized gain (loss) from investment in affiliated mutual funds | 33,986 | 11,217 | |||||||||
| Net unrealized appreciation (depreciation) on investment in affiliated mutual funds | (20,773 | ) | 23,549 | ||||||||
| 11,936 | 31,369 | ||||||||||
| Distributions to Shareholders: | |||||||||||
| From net investment income: | |||||||||||
| Class A | (2,140 | ) | – | ||||||||
| Class B | (1,002 | ) | – | ||||||||
| Class C | (2,478 | ) | – | ||||||||
| (5,620 | ) | – | |||||||||
| From net realized gains: | |||||||||||
| Class A | (1,161 | ) | – | ||||||||
| Class B | (1,060 | ) | – | ||||||||
| Class C | (2,385 | ) | – | ||||||||
| (4,606 | ) | – | |||||||||
| Capital Share Transactions: | |||||||||||
| Proceeds from shares sold: | |||||||||||
| Class A | 73,574 | 132,291 | |||||||||
| Class B | 32,773 | 84,889 | |||||||||
| Class C | 107,781 | 228,642 | |||||||||
| Class C2 | – | 6,081 | |||||||||
| Class M | – | 2,709 | |||||||||
| 214,128 | 454,612 | ||||||||||
| Dividends and distributions reinvested: | |||||||||||
| Class A | 2,790 | – | |||||||||
| Class B | 1,725 | – | |||||||||
| Class C | 3,362 | – | |||||||||
| 7,877 | – | ||||||||||
| Cost of shares redeemed: | |||||||||||
| Class A | (19,331 | ) | (23,172 | ) | |||||||
| Class B | (11,874 | ) | (14,563 | ) | |||||||
| Class C | (34,179 | ) | (28,450 | ) | |||||||
| Class C2 | – | (3,211 | ) | ||||||||
| Class M | – | (1,183 | ) | ||||||||
| (65,384 | ) | (70,579 | ) | ||||||||
| Redemption fees: | |||||||||||
| Class A | 3 | – | |||||||||
| 3 | – | ||||||||||
| Class level exchanges: | |||||||||||
| Class C | – | 25,301 | |||||||||
| Class C2 | – | (15,616 | ) | ||||||||
| Class M | – | (9,685 | ) | ||||||||
| – | – | ||||||||||
| Automatic conversions: | |||||||||||
| Class A | 87 | 69 | |||||||||
| Class B | (87 | ) | (69 | ) | |||||||
| – | – | ||||||||||
| 156,624 | 384,033 | ||||||||||
| Net increase (decrease) in net assets | 158,334 | 415,402 | |||||||||
| Net Assets: | |||||||||||
| Beginning of period | 689,210 | 273,808 | |||||||||
| End of period | $ | 847,544 | $ | 689,210 | |||||||
| Accumulated Net Investment Income (Loss) | $ | (3,822 | ) | $ | 3,077 | ||||||
| April 30, 2005 (unaudited) | October 31, 2004 | ||||||||||
| Share Activity: | |||||||||||
| Shares issued: | |||||||||||
| Class A | 6,559 | 12,550 | |||||||||
| Class B | 2,962 | 8,165 | |||||||||
| Class C | 9,738 | 22,002 | |||||||||
| Class C2 | – | 585 | |||||||||
| Class M | – | 261 | |||||||||
| 19,259 | 43,563 | ||||||||||
| Shares issued–reinvested from distributions: | |||||||||||
| Class A | 246 | – | |||||||||
| Class B | 154 | – | |||||||||
| Class C | 301 | – | |||||||||
| 701 | – | ||||||||||
| Shares redeemed: | |||||||||||
| Class A | (1,723 | ) | (2,207 | ) | |||||||
| Class B | (1,070 | ) | (1,402 | ) | |||||||
| Class C | (3,092 | ) | (2,738 | ) | |||||||
| Class C2 | – | (305 | ) | ||||||||
| Class M | – | (114 | ) | ||||||||
| (5,885 | ) | (6,766 | ) | ||||||||
| Class level exchanges: | |||||||||||
| Class C | – | 2,417 | |||||||||
| Class C2 | – | (1,487 | ) | ||||||||
| Class M | – | (928 | ) | ||||||||
| – | 2 | ||||||||||
| Automatic conversions: | |||||||||||
| Class A | 8 | 6 | |||||||||
| Class B | (8 | ) | (6 | ) | |||||||
| – | – | ||||||||||
| Net increase (decrease) in shares outstanding: | |||||||||||
| Class A | 5,090 | 10,349 | |||||||||
| Class B | 2,038 | 6,757 | |||||||||
| Class C | 6,947 | 21,681 | |||||||||
| Class C2 | – | (1,207 | ) | ||||||||
| Class M | – | (781 | ) | ||||||||
| 14,075 | 36,799 | ||||||||||
The notes to the financial statements are an integral part of this report.
Transamerica IDEX Mutual Funds
Semi-Annual Report 2005
4
TA IDEX Asset Allocation–Growth Portfolio
FINANCIAL HIGHLIGHTS
(unaudited for the period ended April 30, 2005)
| For a share of beneficial interest outstanding throughout each period | |||||||||||||||||||||||||||||||||||||||
| Net Asset | Investment Operations | Distributions | Net Asset | ||||||||||||||||||||||||||||||||||||
| For the Period Ended (d)(g) | Value, Beginning of Period | Net Investment Income (Loss) | Net Realized and Unrealized Gain (Loss) | Total Operations | From Net Investment Income | From Net Realized Gains | Total Distributions | Value, End of Period | |||||||||||||||||||||||||||||||
| Class A | 4/30/2005 | $ | 10.75 | $ | 0.01 | $ | 0.28 | $ | 0.29 | $ | (0.12 | ) | $ | (0.07 | ) | $ | (0.19 | ) | $ | 10.85 | |||||||||||||||||||
| 10/31/2004 | 9.82 | (0.02 | ) | 0.95 | 0.93 | – | – | – | 10.75 | ||||||||||||||||||||||||||||||
| 10/31/2003 | 7.95 | (0.03 | ) | 1.90 | 1.87 | – | – | – | 9.82 | ||||||||||||||||||||||||||||||
| 10/31/2002 | 10.00 | (0.02 | ) | (2.03 | ) | (2.05 | ) | – | – | – | 7.95 | ||||||||||||||||||||||||||||
| Class B | 4/30/2005 | 10.57 | (0.03 | ) | 0.27 | 0.24 | (0.06 | ) | (0.07 | ) | (0.13 | ) | 10.68 | ||||||||||||||||||||||||||
| 10/31/2004 | 9.71 | (0.09 | ) | 0.95 | 0.86 | – | – | – | 10.57 | ||||||||||||||||||||||||||||||
| 10/31/2003 | 7.91 | (0.08 | ) | 1.88 | 1.80 | – | – | – | 9.71 | ||||||||||||||||||||||||||||||
| 10/31/2002 | 10.00 | (0.06 | ) | (2.03 | ) | (2.09 | ) | – | – | – | 7.91 | ||||||||||||||||||||||||||||
| Class C | 4/30/2005 | 10.57 | (0.03 | ) | 0.28 | 0.25 | (0.07 | ) | (0.07 | ) | (0.14 | ) | 10.68 | ||||||||||||||||||||||||||
| 10/31/2004 | 9.71 | (0.08 | ) | 0.94 | 0.86 | – | – | – | 10.57 | ||||||||||||||||||||||||||||||
| 10/31/2003 | 7.86 | (0.08 | ) | 1.93 | 1.85 | – | – | – | 9.71 | ||||||||||||||||||||||||||||||
| Ratios/Supplemental Data | |||||||||||||||||||||||||||||||
| For the Period | Total | Net Assets, End of Period | Ratio of Expenses to Average Net Assets (a) | Net Investment Income (Loss) to Average | Portfolio Turnover | ||||||||||||||||||||||||||
| Ended (g) | Return (c) | (000's) | Net (e) | Total (f) | Net Assets (a) | Rate (b) | |||||||||||||||||||||||||
| Class A | 4/30/2005 | 2.64 | % | $ | 228,498 | 0.33 | % | 0.33 | % | 0.12 | % | 39 | % | ||||||||||||||||||
| 10/31/2004 | 9.47 | 171,708 | 0.43 | 0.38 | (0.22 | ) | 5 | ||||||||||||||||||||||||
| 10/31/2003 | 23.52 | 55,209 | 0.45 | 0.60 | (0.30 | ) | 25 | ||||||||||||||||||||||||
| 10/31/2002 | (20.50 | ) | 8,368 | 0.45 | 1.65 | (0.44 | ) | 31 | |||||||||||||||||||||||
| Class B | 4/30/2005 | 2.13 | 184,496 | 0.98 | 0.98 | (0.52 | ) | 39 | |||||||||||||||||||||||
| 10/31/2004 | 8.96 | 160,959 | 1.05 | 1.00 | (0.82 | ) | 5 | ||||||||||||||||||||||||
| 10/31/2003 | 22.76 | 82,318 | 1.10 | 1.25 | (0.95 | ) | 25 | ||||||||||||||||||||||||
| 10/31/2002 | (20.90 | ) | 10,452 | 1.10 | 2.30 | (1.09 | ) | 31 | |||||||||||||||||||||||
| Class C | 4/30/2005 | 2.38 | 434,550 | 0.92 | 0.92 | (0.46 | ) | 39 | |||||||||||||||||||||||
| 10/31/2004 | 8.86 | 356,543 | 0.99 | 0.94 | (0.78 | ) | 5 | ||||||||||||||||||||||||
| 10/31/2003 | 23.54 | 116,956 | 1.10 | 1.25 | (0.95 | ) | 25 | ||||||||||||||||||||||||
NOTES TO FINANCIAL HIGHLIGHTS
(a) Annualized.
(b) Not annualized for periods of less than one year.
(c) Total Return has been calculated for the applicable period without deduction of a sales load, if any, on an initial purchase. Periods of less than one year are not annualized.
(d) Per share information is calculated based on the average number of shares outstanding.
(e) Ratio of Net Expenses to Average Net Assets is net of fee waivers and reimbursements by the investment adviser, if any and includes the recapture of previously waived expenses (see note 2).
(f) Ratio of Total Expenses to Average Net Assets includes all expenses before fee waivers, reimbursements by the investment adviser and recapture of previously waived expenses.
(g) TA IDEX Asset Allocation-Growth Portfolio ("the Fund") commenced operations on March 1, 2002. The inception date for the Fund's offering of share Class C was November 11, 2002.
The notes to the financial statements are an integral part of this report.
Transamerica IDEX Mutual Funds
Semi-Annual Report 2005
5
TA IDEX Asset Allocation–Growth Portfolio
NOTES TO FINANCIAL STATEMENTS
At April 30, 2005
(all amounts in thousands)
(unaudited)
NOTE 1. ORGANIZATION AND SIGNIFICANT ACCOUNTING POLICIES
Transamerica IDEX Mutual Funds is a Delaware statutory trust registered under the Investment Company Act of 1940, as amended (the "1940 Act"), as an open-end management investment company. Prior to March 1, 2005, Transamerica IDEX Mutual Funds was a Massachusetts business trust. TA IDEX Asset Allocation–Growth Portfolio ("the Fund"), part of Transamerica IDEX Mutual Funds, began operations on March 1, 2002.
In the normal course of business, the Fund enters into contracts that contain a variety of representations and warranties, which provide general indemnifications. The Fund's maximum exposure under these arrangements is unknown, as this would involve future claims that may be made against the Fund and/or its affiliates that have not yet occurred. However, based on experience, the Fund expects the risk of loss to be remote.
See the Prospectus and Statement of Additional Information for a description of the Fund's investment objective.
In preparing the Fund's financial statements in accordance with accounting principles generally accepted in the United States of America ("GAAP"), estimates or assumptions (which could differ from actual results) may be used that affect reported amounts and disclosures. The following policies were consistently followed by the Fund, in accordance with GAAP.
Multiple class operations and expenses: The Fund currently offers three classes of shares, each with a public offering price that reflects different sales charges, if any, and expense levels. On June 15, 2004, Class C2 shares merged into Class C. On September 24, 2004, Class M shares merged into Class C. Class B shares will convert to Class A shares eight years after purchase. Income, non-class specific expenses and realized and unrealized gains and losses, are allocated daily to each class, based upon the value of shares outstanding method as permitted under Rule 18f-3 of the 1940 Act. Each class bears its own specific expenses as well as a portion of general, common expenses.
Pricing of shares: The Fund prices its shares on the basis of the net asset value of each class of shares of the Fund, which is determined as of the close of the New York Stock Exchange ("NYSE") (generally 4:00 p.m. Eastern Time) on each day on which the NYSE is open for trading.
Security valuations: The Fund's investments are valued at the net asset values of the underlying portfolios of Transamerica IDEX Mutual Funds. The net asset values of the underlying portfolios are determined at the close of the NYSE (generally 4:00 p.m. eastern time) on the valuation date.
Cash: The Fund may leave cash overnight in its cash account with the custodian, Investors Bank & Trust Company ("IBT"). IBT has been contracted on behalf of the Fund to invest the excess cash into a savings account, which at April 30, 2005, was paying an interest rate of 2.02%.
Throughout the period, the Fund may have a cash overdraft balance. A fee is incurred on this overdraft, calculated by multiplying the overdraft by a rate based on the federal funds rate.
Security transactions and investment income: Security transactions are recorded on the trade date. Security gains and losses are calculated on the specific identification basis.Dividend income is recorded on the ex-dividend date. Dividend and net realized gain (loss) from investment securities for the Fund are from investment of affiliated investment companies.
Account maintenance fees: If the shareholder account balance falls below $1 by either shareholder action or as a result of market action, a $25 (not in thousands) fee is assessed every year until the balance reaches $1. The fee is assessed by redeeming shares in the shareholder's account.
No fee will be charged under the following conditions:
• accounts opened within the preceding 24 months
• accounts with an active monthly Automatic Investment Plan ($50 (not in thousands) minimum per fund)
• accounts owned by an individual which, when combined by social security number, have a balance of $5 or more
• accounts owned by individuals in the same household (by address) that have a combined balance of $5 or more
• UTMA/UGMA accounts
• Fiduciary accounts
• B-share accounts whose shares have started to convert to A-shares accounts (as long as combined value of both accounts is at least $1)
For the six months ended April 30, 2005, there were no account maintenance fees.
Redemption fees: A short-term trading redemption fee may be assessed on any fund shares in a fund account that are sold during the first five (5) NYSE trading days following their purchase date. This redemption fee will equal 2% of the amount redeemed and shares held the longest will be treated as being redeemed first and shares held the shortest as being redeemed last.
Dividend distributions: Distributions to shareholders are recorded on the ex-dividend date and are determined in accordance with Federal income tax regulations which may differ from GAAP.
Transamerica IDEX Mutual Funds
Semi-Annual Report 2005
6
TA IDEX Asset Allocation–Growth Portfolio
NOTES TO FINANCIAL STATEMENTS (continued)
At April 30, 2005
(all amounts in thousands)
(unaudited)
NOTE 2. RELATED PARTY TRANSACTIONS
Transamerica Fund Advisors, Inc. ("TFAI") is the Fund's investment adviser. Transamerica Fund Services, Inc. ("TFS") is the Fund's administrator and transfer agent. AFSG Securities Corp. ("AFSG") is the Fund's distributor/principal underwriter. AFSG is 100% owned by AUSA Holding Company ("AUSA"). TFAI is a directly owned subsidiary of Western Reserve Life Assurance Co. of Ohio (78%) and AUSA (22%). TFS is a wholly owned subsidiary of WRL (50%) and AUSA (50%). AUSA and WRL are wholly owned indirect subsidiaries of AEGON, NV, a Netherlands corporation.
Effective January 1, 2005 AEGON/Transamerica Fund Advisors, Inc. ("ATFA") was renamed Transamerica Fund Advisors, Inc. ("TFAI"); AEGON/Transamerica Fund Services, Inc. ("ATFS") and AEGON/Transamerica Investor Services, Inc. ("ATIS") merged into one entity and was renamed Transamerica Fund Services, Inc. ("TFS").
TFAI has entered into an agreement with Morningstar Associates, LLC to provide investment services to the Fund. TFAI compensates Morningstar Associates, LLC as described in the Prospectus.
Transamerica Investment Management, LLC and Great Companies, LLC are affiliates of the Fund and are sub-advisers to other funds within Transamerica IDEX Mutual Funds.
Investment advisory fees: The Fund pays management fees to TFAI based on average daily net assets ("ANA") at the following rate:
0.10% of ANA
TFAI has contractually agreed to waive its advisory fee and will reimburse the Fund to the extent that operating expenses, excluding 12b-1 fees, exceed the following stated annual limit:
0.45% Expense Limit
If total fund expenses fall below the annual expense limitation agreement agreed to by the adviser within the succeeding three years, the Fund may be required to pay that adviser a portion or all of the waived advisory fees.
There are no amounts available for recapture at April 30, 2005.
Distribution and service fees: The Fund has a 12b-1 distribution plan under the 1940 Act pursuant to which an annual fee, based on average daily net assets, is paid to the distributor for various disbursements such as broker-dealer account servicing fees and other promotional expenses of the Fund. The Fund is authorized under the 12b-1 plan to pay fees on each class up to the following limits:
| Class A | N/A | ||||||
| Class B | 0.65 | % | |||||
| Class C | 0.65 | % | |||||
In addition, the underlying funds' Class A shares in which the Fund invests impose a 0.35% 12b-1 fee. To avoid duplication of the 12b-1 fees, each class of fund shares of the Fund has reduced the 12b-1 fees by the amount of the underlying funds' Class A 12b-1 fees.
In the case the Fund or a class of shares of the Fund is closed to new investors or investments, the Fund is authorized to pay 12b-1 fees for past sales and distribution efforts and present and past investor services.
Underwriter commissions relate to front-end sales charges imposed for Class A shares and contingent deferred sales charges from Classes B, C and certain A share redemptions. For the six months ended April 30, 2005, the underwriter commissions were as follows:
| Received by Underwriter | $ | 9,407 | |||||
| Retained by Underwriter | 524 | ||||||
| Contingent Deferred Sales Charge | 389 | ||||||
Administrative services: The Fund has entered into an agreement with TFS for financial and legal fund administration services, which includes such items as compliance, expenses, financial statements and other reporting, distributions, tax returns, prospectus preparation, board of trustees meeting support and other legal matters. As of January 1, 2005 the Fund pays TFS an annual fee of 0.02% of average net assets. Prior to January 1, 2005 the Fund paid TFS an annual fee of 0.015% of average net assets. The Legal fees on the Statement of Operations are for fees paid to external legal counsel.
Transfer agent fees: The Fund pays TFS an annual per-account charge of $20 (not in thousands) for each open account and $1.63 (not in thousands) for each closed account. There is no new account charge. The Transfer agent fees on the Statement of Operations are made up of fees paid to TFS and costs associated with shareholder statements.
The Fund paid TFS $553 for the six months ended April 30, 2005.
Deferred compensation plan: Each eligible Fund Trustee may elect participation in the Deferred Compensation Plan ("the Plan"). Under the Plan, such Trustees may defer payment of a percentage of their total fees earned as a Fund Trustee. These deferred amounts may be invested in any Transamerica IDEX Mutual Fund. At April 30, 2005, the value of invested plan amount was $13. Invested plan amounts and the total liability for deferred compensation to the Trustees under the Plan at April 30, 2005, are included in the accompanying Statement of Assets and Liabilities.
Transamerica IDEX Mutual Funds
Semi-Annual Report 2005
TA IDEX Asset Allocation–Growth Portfolio 7
TA IDEX Asset Allocation–Growth Portfolio
NOTES TO FINANCIAL STATEMENTS (continued)
At April 30, 2005
(all amounts in thousands)
(unaudited)
NOTE 3. INVESTMENT TRANSACTIONS
The cost of securities purchased and proceeds from securities sold (excluding short-term securities) for the six months ended April 30, 2005, were as follows:
| Purchases of securities: | |||||||
| Long-Term excluding U.S. Government | $ | 460,701 | |||||
| U.S. Government | – | ||||||
| Proceeds from maturities and sales of securities | |||||||
| Long-Term excluding U.S. Government | 308,496 | ||||||
| U.S. Government | – | ||||||
NOTE 4. FEDERAL INCOME TAX MATTERS
The Fund has not made any provision for federal income or excise taxes due to its policy to distribute all of its taxable income and capital gains to its shareholders and otherwise qualify as a regulated investment company under the Internal Revenue Code. Income and capital gain distributions are determined in accordance with income tax regulations, which may differ from GAAP. These differences are primarily due to differing treatment for items including, but not limited to, wash sales, net operating losses and capital loss carryforwards.
The aggregate cost of investments and composition of unrealized appreciation (depreciation) for federal income tax purposes as of April 30, 2005, are as follows:
| Federal Tax Cost Basis | $ | 818,736 | |||||
| Unrealized Appreciation | $ | 39,873 | |||||
| Unrealized (Depreciation) | (12,405 | ) | |||||
| Net Unrealized Appreciation (Depreciation) | $ | 27,468 | |||||
NOTE 5. REGULATORY PROCEEDINGS
There continues to be significant federal and state regulatory activity relating to financial services companies, particularly mutual fund companies and their investment advisers. As part of an ongoing investigation regarding potential market timing, recordkeeping and trading compliance issues and matters affecting the Fund's investment adviser, TFAI, and certain employees and affiliates of TFAI, the SEC staff has indicated that it is likely to take some action against TFAI and certain of its affiliates at the conclusion of the investigation. The potential timing and the scope of any such action is difficult to predict. Although the impact of any action brought against TFAI and/or its affiliates is difficult to assess at the present time, the Fund currently believes that the likelihood that any such action will have a material adverse impact on it is remote. It is important to note that the Fu nd is not aware of any allegation of wrongdoing against it and its board at the time this semi-annual report is printed. Although it is not anticipated that these developments will have an adverse impact on the Fund, there can be no assurance at this time. TFAI and its affiliates are actively working with the SEC in regard to this matter; however, the exact resolution cannot be determined at this time. TFAI will take such actions that it deems necessary or appropriate to continue providing management services to the Fund and to bring all matters to an appropriate conclusion.
TFAI and/or its affiliates, and not the Fund, will bear the costs regarding these regulatory matters.
Transamerica IDEX Mutual Funds
Semi-Annual Report 2005
8
TA IDEX Asset Allocation–Growth Portfolio
INVESTMENT ADVISORY AND ASSET ALLOCATION MANAGEMENT AGREEMENTS – REVIEW AND RENEWAL
At a meeting of the Board of Trustees of Transamerica IDEX Mutual Funds ("TA IDEX") held on October 6, 2004, the Board considered and approved the renewal for a one-year period of the Investment Advisory Agreement between TA IDEX Asset Allocation-Growth Portfolio (the "Fund") and Transamerica Fund Advisors, Inc. ("TFAI"). Additionally, at a meeting held on March 22, 2005, the Board considered and approved for a two-year period the Asset Allocation Management Agreement of the Fund between TFAI and Morningstar Associates, LLC (the "Portfolio Construction Manager"). In approving these agreements, the Board concluded that the Investment Advisory Agreement and the Asset Allocation Management Agreement enable shareholders of the Fund to obtain high quality services at a cost that is appropriate, reasonable, and in the best interests of shareholders based upon the following determinations, among othe rs:
The nature, extent and quality of the advisory service to be provided. The Board considered the nature and quality of the services provided by TFAI and the Portfolio Construction Manager to the Fund in the past, as well as the services anticipated to be provided in the future. The Board concluded that TFAI and the Portfolio Construction Manager are capable of providing high quality services to the Fund, as indicated by TFAI's management capabilities demonstrated with respect to the Fund and other funds managed by TFAI, TFAI's management oversight process, and the professional qualifications and experience of the Portfolio Construction Manager's portfolio management team. The Board also concluded that TFAI and the Portfolio Construction Manager would provide the same quality and quantity of inves tment management and related services as before, that these services are appropriate in scope and extent in light of the Fund's operations, the competitive landscape of the investment company business and investor needs, and that TFAI's and the Portfolio Construction Manager's obligations will remain the same in all respects.
The investment performance of the Fund. The Board concluded, based in particular on information provided by Lipper Analytics, that the Fund's investment performance was competitive or superior relative to comparable funds over trailing one- and two-year periods and to the Fund's benchmark index over the past year. On the basis of the Trustees' assessment of the nature, extent and quality of investment advisory and related services to be provided or procured by TFAI and the Portfolio Construction Manager, the Trustees concluded that TFAI and the Portfolio Construction Manager were capable of generating a level of long-term investment performance that is appropriate in light of the Fund's investment objective, policies and strategies and competitive with many other investment companies.
The cost of advisory services provided and the level of profitability. On the basis of the Board's review of the fees to be charged by TFAI and the Portfolio Construction Manager for investment advisory and related services, TFAI's financial statements, the fees paid by TFAI to the Portfolio Construction Manager, TFAI's estimated net management income resulting from its management of the Fund, the estimated profitability of TFAI's relationships with the Fund and TA IDEX, and the estimated profitability of the Portfolio Construction Manager's relationship with the Fund, the Board concluded that the level of investment advisory fees and the profitability is appropriate in light of the services provided, the management fees and overall expense ratios of comparable investment companies, and the anti cipated profitability of the relationship between the Fund, TFAI and the Portfolio Construction Manager. Further, on the basis of comparative information supplied by Lipper Analytics, the Board determined that the advisory fees and estimated overall expense ratio of the Fund were consistent with industry averages.
The extent to which economies of scale would be realized as the Fund grows and whether fee levels reflect these economies of scale for the benefit of Fund investors. Although the investment advisory fees do not reduce should Fund assets grow meaningfully, the Board concluded that the advisory fees appropriately reflect the Fund's current size, the current economic environment for TFAI, and the competitive nature of the investment company market. In addition, the Board noted that it will have the opportunity to periodically re-examine whether the Fund has achieved economies of scale, as well as the appropriateness of advisory fees payable to TFAI and the Portfolio Construction Manager in the future.
Benefits (such as soft dollars) to TFAI or the Portfolio Construction Manager from its relationship with the Fund. The Board concluded that other benefits derived by TFAI (including any benefits derived from investment advisory fees payable to TFAI with respect to the underlying funds in which the Fund invests) or the Portfolio Construction Manager from its relationship with the Fund are reasonable and fair, and are consistent with industry practice and the best interests of the Fund and its shareholders. In this regard, the Board noted that TFAI or the Portfolio Construction Manager do not realize "soft dollar" benefits from their relationship with the Fund.
Other considerations. The Board also determined that TFAI had made a substantial commitment to the recruitment and retention of high quality personnel, and maintained the financial, compliance and operational resources reasonably necessary to manage the Fund in a professional manner that is consistent with the best interests of the Fund and its shareholders. The Trustees also concluded that TFAI had made a significant entrepreneurial commitment to the management and success of the Fund, reflected by TFAI's expense limitation and fee waiver arrangement with the Fund which, as demonstrated in the past with the Fund, may result in TFAI waiving a substantial amount of advisory fees for the benefit of shareholders. The Board also noted the significant growth in the Fund's assets in the past year.
Transamerica IDEX Mutual Funds
Semi-Annual Report 2005
9
TA IDEX Asset Allocation–Growth Portfolio
SUPPLEMENTAL INFORMATION (unaudited)
RESULTS OF SHAREHOLDER PROXY
At a special meeting of shareholders held on February 25, 2005, the results of the Proposals were as follows:
Transamerica IDEX Mutual Funds
Proposal 1: Election of Trustees to the Board of Trustees of Transamerica IDEX Mutual Funds.
| For | Withheld | ||||||||||
| Peter R. Brown | 872,017,875.249 | 4,468,498.551 | |||||||||
| Daniel Calabria | 871,917,069.786 | 4,569,304.014 | |||||||||
| Janise B. Case | 872,099,393.125 | 4,386,980.675 | |||||||||
| Charles C. Harris | 872,086,722.025 | 4,399,651.775 | |||||||||
| Leo J. Hill | 872,304,465.640 | 4,181,908.160 | |||||||||
| Russell A. Kimball, Jr. | 872,253,556.471 | 4,232,817.329 | |||||||||
| William W. Short, Jr. | 872,139,920.944 | 4,346,452.856 | |||||||||
| John Waechter | 872,261,152.376 | 4,225,221.424 | |||||||||
| Jack E. Zimmerman | 871,929,967.512 | 4,556,406.288 | |||||||||
| Brian C. Scott | 872,218,970.367 | 4,267,403.433 | |||||||||
| Thomas P. O'Neill | 872,111,944.117 | 4,374,429.683 | |||||||||
TA IDEX Asset Allocation-Growth Portfolio
Proposal 2: Approval of an Agreement and Plan of Reorganization pursuant to which Transamerica IDEX Mutual Funds will organize as a Delaware statutory trust.
| For | Against | Abstentions/Broker Non-Votes | |||||||||
| 22,244,822.527 | 493,021.605 | 10,334,910.404 | |||||||||
Proposal 3: Approval of changes to the fundamental investment restrictions of TA IDEX Asset Allocation-Growth Portfolio.
| A. Diversification | For | Against | Abstentions/Broker Non-Votes | ||||||||||||
| 22,458,567.436 | 827,500.961 | 9,786,686.139 | |||||||||||||
| B. Borrowing | For | Against | Abstentions/Broker Non-Votes | ||||||||||||
| 22,430,872.771 | 855,195.626 | 9,786,686.139 | |||||||||||||
| C. Senior Securities | For | Against | Abstentions/Broker Non-Votes | ||||||||||||
| 22,453,030.875 | 833,037.522 | 9,786,686.139 | |||||||||||||
| D. Underwriting Securities | For | Against | Abstentions/Broker Non-Votes | ||||||||||||
| 22,439,218.601 | 846,849.796 | 9,786,686.139 | |||||||||||||
| E. Real Estate | For | Against | Abstentions/Broker Non-Votes | ||||||||||||
| 22,452,300.280 | 833,768.117 | 9,786,686.139 | |||||||||||||
| F. Making Loans | For | Against | Abstentions/Broker Non-Votes | ||||||||||||
| 22,414,483.290 | 871,585.107 | 9,786,686.139 | |||||||||||||
| G. Concentration | For | Against | Abstentions/Broker Non-Votes | ||||||||||||
| 22,452,158.252 | 833,910.145 | 9,786,686.139 | |||||||||||||
| H. Commodities | For | Against | Abstentions/Broker Non-Votes | ||||||||||||
| 22,424,284.486 | 861,783.911 | 9,786,686.139 | |||||||||||||
Transamerica IDEX Mutual Funds
Semi-Annual Report 2005
10
TA IDEX Asset Allocation–Moderate Portfolio
UNDERSTANDING YOUR FUND'S EXPENSES
(unaudited)
SHAREHOLDER EXPENSES
The following Example is intended to help you understand your ongoing costs (in dollars and cents) of investing in a Fund and to compare these costs with the ongoing costs of investing in other funds.
The Example is based on an investment of $1,000 invested at November 1, 2004 and held for the entire period until April 30, 2005.
ACTUAL EXPENSES
The first line in the table below provides information about actual account values and actual expenses. You may use the information in this line, together with the amount you invested, to estimate the expenses that you paid over the period. Simply divide your account value by $1,000 (for example, an $8,600 account value divided by $1,000 = 8.6), then multiply the result by the number in the first line of your Fund under the heading entitled "Expenses Paid During Period" to estimate the expenses you paid on your account during this period.
HYPOTHETICAL EXAMPLE FOR COMPARISON PURPOSES
The second line in the table below provides information about hypothetical account values and hypothetical expenses based on the Fund's actual expense ratio and an assumed rate of return of 5% per year before expenses, which is not the Fund's actual return. The hypothetical account values and expenses may not be used to estimate the actual ending account balance or expenses you paid for the period. You may use this information to compare the ongoing costs of investing in your Fund and other funds. To do so, compare this 5% hypothetical example with the 5% hypothetical examples that appear in the shareholder reports of the other funds.
Please note that the expenses shown in the table are meant to highlight your ongoing costs only and do not reflect any transactional costs, such as sales charges, redemption fees, brokerage commissions paid on purchases and sales of fund shares. Therefore, the second line under the Fund in the table is useful in comparing ongoing costs only, and will not help you determine the relative total costs of owning different funds. In addition, note that the expenses shown in the table are meant to highlight your ongoing costs and do not reflect any transaction costs.
| Beginning Account Value | Ending Account Value | Annualized Expense Ratio | Expenses Paid During Period (a) | ||||||||||||||||
| Class A | |||||||||||||||||||
| Actual | $ | 1,000.00 | $ | 1,020.90 | 0.25 | % | $ | 1.25 | |||||||||||
| Hypothetical (b) | 1,000.00 | 1,023.55 | 0.25 | 1.25 | |||||||||||||||
| Class B | |||||||||||||||||||
| Actual | 1,000.00 | 1,017.20 | 0.92 | 4.60 | |||||||||||||||
| Hypothetical (b) | 1,000.00 | 1,020.23 | 0.92 | 4.61 | |||||||||||||||
| Class C | |||||||||||||||||||
| Actual | 1,000.00 | 1,017.70 | 0.88 | 4.40 | |||||||||||||||
| Hypothetical (b) | 1,000.00 | 1,020.43 | 0.88 | 4.41 | |||||||||||||||
(a) Expenses are calculated using each Fund's annualized expense ratio (as disclosed in the table), multiplied by the average account value for the period, multiplied by number of days in the period (181 days), and divided by the number of days in the year (365 days).
(b) 5% return per year before expenses.
GRAPHICAL PRESENTATION OF SCHEDULE OF INVESTMENTS
By Asset Type
At April 30, 2005
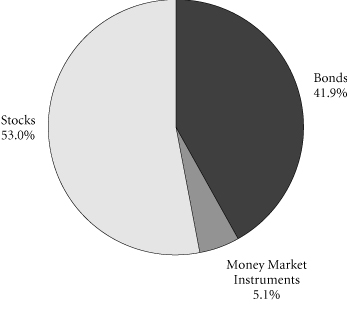
This chart shows the percentage breakdown by asset type of the Fund's total investment securities. Asset type is calculated based on the aggregate portfolio holdings in the underlying funds in which the Fund invests. The security lending collateral in the underlying funds is excluded from this calculation.
Transamerica IDEX Mutual Funds
Semi-Annual Report 2005
1
TA IDEX Asset Allocation–Moderate Portfolio
SCHEDULE OF INVESTMENTS
At April 30, 2005
(all amounts except share amounts in thousands)
(unaudited)
| Shares | Value | ||||||||||
| INVESTMENT COMPANIES (99.8%) (b) | |||||||||||
| Aggressive Equity (16.1%) | |||||||||||
| TA IDEX J.P. Morgan Mid Cap Value (a) | 1,408,132 | $ | 13,349 | ||||||||
| TA IDEX T. Rowe Price Health Sciences | 4,252,015 | 46,602 | |||||||||
| TA IDEX T. Rowe Price Small Cap (a) | 2,022,102 | 22,445 | |||||||||
| TA IDEX Transamerica Growth Opportunities (a) | 5,146,268 | 33,502 | |||||||||
| TA IDEX Transamerica Small/Mid Cap Value | 4,733,562 | 69,489 | |||||||||
| Capital Preservation (2.9%) | |||||||||||
| TA IDEX Transamerica Money Market | 33,116,744 | 33,117 | |||||||||
| Fixed-Income (42.3%) | |||||||||||
| TA IDEX PIMCO Real Return TIPS | 12,107,070 | 127,366 | |||||||||
| TA IDEX PIMCO Total Return | 4,713,241 | 48,829 | |||||||||
| TA IDEX Short Term Bond | 4,900,331 | 48,366 | |||||||||
| TA IDEX Transamerica Conservative High-Yield Bond | 15,089,049 | 136,405 | |||||||||
| TA IDEX Transamerica Convertible Securities | 7,516,852 | 80,355 | |||||||||
| TA IDEX Transamerica Flexible Income | 4,868,243 | 45,956 | |||||||||
| Growth Equity (25.1%) | |||||||||||
| TA IDEX American Century Large Company Value | 7,868,156 | 84,189 | |||||||||
| TA IDEX Great Companies–TechnologySM (a) | 3,019,616 | 10,629 | |||||||||
| TA IDEX Janus Growth (a) | 985,461 | 22,124 | |||||||||
| TA IDEX Marsico Growth (a) | 1,972,239 | 18,874 | |||||||||
| Shares | Value | ||||||||||
| Growth Equity (continued) | |||||||||||
| TA IDEX Salomon All Cap | 1,582,044 | $ | 23,573 | ||||||||
| TA IDEX Salomon Investors Value | 3,535,372 | 47,127 | |||||||||
| TA IDEX Transamerica Equity | 4,072,598 | 30,626 | |||||||||
| TA IDEX UBS Large Cap Value (a) | 5,139,919 | 52,633 | |||||||||
| Specialty–Real Estate (3.9%) | |||||||||||
| TA IDEX Clarion Real Estate Securities | 3,028,360 | 44,820 | |||||||||
| World Equity (9.5%) | |||||||||||
| TA IDEX American Century International | 560,630 | 5,259 | |||||||||
| TA IDEX Evergreen International Small Cap (a) | 1,445,778 | 15,918 | |||||||||
| TA IDEX Marsico International Growth (a) | 2,383,072 | 23,640 | |||||||||
| TA IDEX Templeton Great Companies Global (a) | 2,027,965 | 47,718 | |||||||||
| TA IDEX Van Kampen Emerging Markets Debt | 1,775,673 | 17,757 | |||||||||
| Total Investment Companies (cost: $1,089,534) | 1,150,668 | ||||||||||
| Total Investment Securities (cost: $1,089,534) | $ | 1,150,668 | |||||||||
| SUMMARY: | |||||||||||
| Investments, at value | 99.8 | % | $ | 1,150,668 | |||||||
| Other assets in excess of liabilities | 0.2 | % | 1,957 | ||||||||
| Net assets | 100.0 | % | $ | 1,152,625 | |||||||
NOTES TO SCHEDULE OF INVESTMENTS:
(a) No dividends were paid during the preceding twelve months.
(b) The Fund invests its assets in Class A shares of the underlying TA IDEX Mutual Funds, which are affiliates of the Fund.
The notes to the financial statements are an integral part of this report.
Transamerica IDEX Mutual Funds
Semi-Annual Report 2005
2
TA IDEX Asset Allocation–Moderate Portfolio
STATEMENT OF ASSETS AND LIABILITIES
At April 30, 2005
(all amounts except per share amounts in thousands)
(unaudited)
| Assets: | |||||||
| Investment in affiliated mutual funds, at value (cost: $1,089,534) | $ | 1,150,668 | |||||
| Receivables: | |||||||
| Shares of beneficial interest sold | 6,629 | ||||||
| Dividends | 99 | ||||||
| Other | 30 | ||||||
| 1,157,426 | |||||||
| Liabilities: | |||||||
| Investment securities purchased | 2,187 | ||||||
| Accounts payable and accrued liabilities: | |||||||
| Shares of beneficial interest redeemed | 1,795 | ||||||
| Management and advisory fees | 94 | ||||||
| Distribution and service fees | 465 | ||||||
| Transfer agent fees | 77 | ||||||
| Dividends to shareholders | 1 | ||||||
| Other | 182 | ||||||
| 4,801 | |||||||
| Net Assets | $ | 1,152,625 | |||||
| Net Assets Consist of: | |||||||
| Shares of beneficial interest, unlimited shares authorized, no par value | $ | 1,061,443 | |||||
| Accumulated net investment income (loss) | (3,562 | ) | |||||
| Undistributed net realized gain (loss) from investment in affiliated mutual funds | 33,618 | ||||||
| Net unrealized appreciation (depreciation) on investment in affiliated mutual funds | 61,126 | ||||||
| Net Assets | $ | 1,152,625 | |||||
| Net Assets by Class: | |||||||
| Class A | $ | 280,996 | |||||
| Class B | 276,845 | ||||||
| Class C | 594,784 | ||||||
| Shares Outstanding: | |||||||
| Class A | 25,362 | ||||||
| Class B | 25,080 | ||||||
| Class C | 53,893 | ||||||
| Net Asset Value Per Share: | |||||||
| Class A | $ | 11.08 | |||||
| Class B | 11.04 | ||||||
| Class C | 11.04 | ||||||
| Maximum Offering Price Per Share (a): | |||||||
| Class A | $ | 11.72 | |||||
(a) Includes the maximum selling commission (represented as a percentage of offering price) which is reduced on certain levels of sales as set forth in the Prospectus. Net asset value per share for Classes B and C shares represents offering price. The redemption price for Classes B and C shares equals net asset value less any applicable contingent deferred sales charge.
STATEMENT OF OPERATIONS
For the period ended April 30, 2005
(all amounts in thousands)
(unaudited)
| Investment Income: | |||||||
| Dividends from affiliated mutual funds | $ | 8,907 | |||||
| Expenses: | |||||||
| Management and advisory fees | 550 | ||||||
| Transfer agent fees: | |||||||
| Class A | 129 | ||||||
| Class B | 163 | ||||||
| Class C | 239 | ||||||
| Printing and shareholder reports | 8 | ||||||
| Custody fees | 23 | ||||||
| Administration fees | 102 | ||||||
| Legal fees | 38 | ||||||
| Audit fees | 14 | ||||||
| Trustees fees | 31 | ||||||
| Registration fees: | |||||||
| Class A | 24 | ||||||
| Class B | 15 | ||||||
| Class C | 29 | ||||||
| Distribution and service fees: | |||||||
| Class B | 893 | ||||||
| Class C | 1,845 | ||||||
| Total expenses | 4,103 | ||||||
| Net Investment Income (Loss) | 4,804 | ||||||
| Net Realized and Unrealized Gain (Loss): | |||||||
| Realized gain (loss) from investment in affiliated mutual funds | 23,869 | ||||||
| Realized gain distributions from investment in affiliated mutual funds | 9,918 | ||||||
| Increase (decrease) in unrealized appreciation (depreciation) on investment in affiliated mutual funds | (22,266 | ) | |||||
| Net Gain (Loss) on Investment in Affiliated Mutual Funds | 11,521 | ||||||
| Net Increase (Decrease) in Net Assets Resulting from Operations | $ | 16,325 | |||||
The notes to the financial statements are an integral part of this report.
Transamerica IDEX Mutual Funds
Semi-Annual Report 2005
3
TA IDEX Asset Allocation–Moderate Portfolio
STATEMENTS OF CHANGES IN NET ASSETS
For the period or year ended
(all amounts in thousands)
| April 30, 2005 (unaudited) | October 31, 2004 | ||||||||||
| Increase (Decrease) In Net Assets From: | |||||||||||
| Operations: | |||||||||||
| Net investment income (loss) | $ | 4,804 | $ | 5,358 | |||||||
| Net realized gain (loss) from investment in affiliated mutual funds | 33,787 | 24,191 | |||||||||
| Net unrealized appreciation (depreciation) on investment in affiliated mutual funds | (22,266 | ) | 31,585 | ||||||||
| 16,325 | 61,134 | ||||||||||
| Distributions to Shareholders: | |||||||||||
| From net investment income: | |||||||||||
| Class A | (7,272 | ) | (1,929 | ) | |||||||
| Class B | (6,250 | ) | (1,796 | ) | |||||||
| Class C | (13,126 | ) | (2,222 | ) | |||||||
| Class C2 | – | (412 | ) | ||||||||
| Class M | – | (167 | ) | ||||||||
| (26,648 | ) | (6,526 | ) | ||||||||
| From net realized gains: | |||||||||||
| Class A | (1,417 | ) | – | ||||||||
| Class B | (1,533 | ) | – | ||||||||
| Class C | (3,103 | ) | – | ||||||||
| (6,053 | ) | – | |||||||||
| Capital Share Transactions: | |||||||||||
| Proceeds from shares sold: | |||||||||||
| Class A | 76,890 | 136,942 | |||||||||
| Class B | 33,171 | 93,601 | |||||||||
| Class C | 119,127 | 277,155 | |||||||||
| Class C2 | – | 8,303 | |||||||||
| Class M | – | 3,239 | |||||||||
| 229,188 | 519,240 | ||||||||||
| Dividends and distributions reinvested: | |||||||||||
| Class A | 7,496 | 1,710 | |||||||||
| Class B | 6,500 | 1,484 | |||||||||
| Class C | 11,210 | 1,515 | |||||||||
| Class C2 | – | 324 | |||||||||
| Class M | – | 152 | |||||||||
| 25,206 | 5,185 | ||||||||||
| Cost of shares redeemed: | |||||||||||
| Class A | (31,806 | ) | (34,420 | ) | |||||||
| Class B | (21,019 | ) | (32,173 | ) | |||||||
| Class C | (45,615 | ) | (52,508 | ) | |||||||
| Class C2 | – | (5,376 | ) | ||||||||
| Class M | – | (3,146 | ) | ||||||||
| (98,440 | ) | (127,623 | ) | ||||||||
| Class level exchanges: | |||||||||||
| Class C | – | 67,248 | |||||||||
| Class C2 | – | (49,594 | ) | ||||||||
| Class M | – | (17,654 | ) | ||||||||
| – | – | ||||||||||
| April 30, 2005 (unaudited) | October 31, 2004 | ||||||||||
| Automatic conversions: | |||||||||||
| Class A | $ | 180 | $ | 95 | |||||||
| Class B | (180 | ) | (95 | ) | |||||||
| – | – | ||||||||||
| 155,954 | 396,802 | ||||||||||
| Net increase (decrease) in net assets | 139,578 | 451,410 | |||||||||
| Net Assets: | |||||||||||
| Beginning of period | 1,013,047 | 561,637 | |||||||||
| End of period | $ | 1,152,625 | $ | 1,013,047 | |||||||
| Accumulated Net Investment Income (Loss) | $ | (3,567 | ) | $ | 18,282 | ||||||
| Share Activity: | |||||||||||
| Shares issued: | |||||||||||
| Class A | 6,770 | 12,569 | |||||||||
| Class B | 2,930 | 8,625 | |||||||||
| Class C | 10,516 | 25,497 | |||||||||
| Class C2 | – | 768 | |||||||||
| Class M | – | 299 | |||||||||
| 20,216 | 47,758 | ||||||||||
| Shares issued–reinvested from distributions: | |||||||||||
| Class A | 658 | 162 | |||||||||
| Class B | 571 | 140 | |||||||||
| Class C | 986 | 143 | |||||||||
| Class C2 | – | 31 | |||||||||
| Class M | – | 14 | |||||||||
| 2,215 | 490 | ||||||||||
| Shares redeemed: | |||||||||||
| Class A | (2,806 | ) | (3,153 | ) | |||||||
| Class B | (1,857 | ) | (2,959 | ) | |||||||
| Class C | (4,040 | ) | (4,828 | ) | |||||||
| Class C2 | – | (496 | ) | ||||||||
| Class M | – | (289 | ) | ||||||||
| (8,703 | ) | (11,725 | ) | ||||||||
| Class level exchanges: | |||||||||||
| Class C | – | 6,171 | |||||||||
| Class C2 | – | (4,566 | ) | ||||||||
| Class M | – | (1,603 | ) | ||||||||
| – | 2 | ||||||||||
| Automatic conversions: | |||||||||||
| Class A | 16 | 9 | |||||||||
| Class B | (16 | ) | (9 | ) | |||||||
| – | – | ||||||||||
| Net increase (decrease) in shares outstanding: | |||||||||||
| Class A | 4,638 | 9,587 | |||||||||
| Class B | 1,628 | 5,797 | |||||||||
| Class C | 7,462 | 26,983 | |||||||||
| Class C2 | – | (4,263 | ) | ||||||||
| Class M | – | (1,579 | ) | ||||||||
| 13,728 | 36,525 | ||||||||||
The notes to the financial statements are an integral part of this report.
Transamerica IDEX Mutual Funds
Semi-Annual Report 2005
4
TA IDEX Asset Allocation–Moderate Portfolio
FINANCIAL HIGHLIGHTS
(unaudited for the period ended April 30, 2005)
| For a share of beneficial interest outstanding throughout each period | |||||||||||||||||||||||||||||||||||||||
| Net Asset | Investment Operations | Distributions | Net Asset | ||||||||||||||||||||||||||||||||||||
| For the Period Ended (d)(g) | Value, Beginning of Period | Net Investment Income (Loss) | Net Realized and Unrealized Gain (Loss) | Total Operations | From Net Investment Income | From Net Realized Gains | Total Distributions | Value, End of Period | |||||||||||||||||||||||||||||||
| Class A | 4/30/2005 | $ | 11.23 | $ | 0.08 | $ | 0.16 | $ | 0.24 | $ | (0.33 | ) | $ | (0.06 | ) | $ | (0.39 | ) | $ | 11.08 | |||||||||||||||||||
| 10/31/2004 | 10.42 | 0.12 | 0.84 | 0.96 | (0.15 | ) | – | (0.15 | ) | 11.23 | |||||||||||||||||||||||||||||
| 10/31/2003 | 8.76 | 0.12 | 1.62 | 1.74 | (0.08 | ) | – | (0.08 | ) | 10.42 | |||||||||||||||||||||||||||||
| 10/31/2002 | 10.00 | 0.04 | (1.28 | ) | (1.24 | ) | – | – | – | 8.76 | |||||||||||||||||||||||||||||
| Class B | 4/30/2005 | 11.16 | 0.04 | 0.16 | 0.20 | (0.26 | ) | (0.06 | ) | (0.32 | ) | 11.04 | |||||||||||||||||||||||||||
| 10/31/2004 | 10.37 | 0.05 | 0.83 | 0.88 | (0.09 | ) | – | (0.09 | ) | 11.16 | |||||||||||||||||||||||||||||
| 10/31/2003 | 8.71 | 0.05 | 1.63 | 1.68 | (0.02 | ) | – | (0.02 | ) | 10.37 | |||||||||||||||||||||||||||||
| 10/31/2002 | 10.00 | 0.01 | (1.30 | ) | (1.29 | ) | – | – | – | 8.71 | |||||||||||||||||||||||||||||
| Class C | 4/30/2005 | 11.17 | 0.04 | 0.16 | 0.20 | (0.27 | ) | (0.06 | ) | (0.33 | ) | 11.04 | |||||||||||||||||||||||||||
| 10/31/2004 | 10.37 | 0.05 | 0.84 | 0.89 | (0.09 | ) | – | (0.09 | ) | 11.17 | |||||||||||||||||||||||||||||
| 10/31/2003 | 8.71 | 0.05 | 1.63 | 1.68 | (0.02 | ) | – | (0.02 | ) | 10.37 | |||||||||||||||||||||||||||||
| Ratios/Supplemental Data | |||||||||||||||||||||||||||||||
| For the Period | Total | Net Assets, End of Period | Ratio of Expenses to Average Net Assets (a) | Net Investment Income (Loss) to Average | Portfolio Turnover | ||||||||||||||||||||||||||
| Ended (g) | Return (c) | (000's) | Net (e) | Total (f) | Net Assets (a) | Rate (b) | |||||||||||||||||||||||||
| Class A | 4/30/2005 | 2.09 | % | $ | 280,996 | 0.25 | % | 0.25 | % | 1.36 | % | 19 | % | ||||||||||||||||||
| 10/31/2004 | 9.32 | 232,748 | 0.28 | 0.28 | 1.13 | 1 | |||||||||||||||||||||||||
| 10/31/2003 | 19.98 | 116,102 | 0.37 | 0.37 | 1.22 | 18 | |||||||||||||||||||||||||
| 10/31/2002 | (12.40 | ) | 17,517 | 0.45 | 0.78 | 0.83 | 12 | ||||||||||||||||||||||||
| Class B | 4/30/2005 | 1.72 | 276,845 | 0.92 | 0.92 | 0.69 | 19 | ||||||||||||||||||||||||
| 10/31/2004 | 8.62 | 261,772 | 0.93 | 0.93 | 0.48 | 1 | |||||||||||||||||||||||||
| 10/31/2003 | 19.39 | 183,148 | 1.02 | 1.02 | 0.57 | 18 | |||||||||||||||||||||||||
| 10/31/2002 | (12.90 | ) | 38,969 | 1.10 | 1.43 | 0.18 | 12 | ||||||||||||||||||||||||
| Class C | 4/30/2005 | 1.77 | 594,784 | 0.88 | 0.88 | 0.73 | 19 | ||||||||||||||||||||||||
| 10/31/2004 | 8.67 | 518,527 | 0.89 | 0.89 | 0.50 | 1 | |||||||||||||||||||||||||
| 10/31/2003 | 19.39 | 201,774 | 1.02 | 1.02 | 0.57 | 18 | |||||||||||||||||||||||||
NOTES TO FINANCIAL HIGHLIGHTS
(a) Annualized.
(b) Not annualized for periods of less than one year.
(c) Total Return has been calculated for the applicable period without deduction of a sales load, if any, on an initial purchase. Periods of less than one year are not annualized.
(d) Per share information is calculated based on average number of shares outstanding.
(e) Ratio of Net Expenses to Average Net Assets is net of fee waivers and reimbursements by the investment adviser, if any (see note 2).
(f) Ratio of Total Expenses to Average Net Assets includes all expenses before fee waivers and reimbursements by the investment adviser.
(g) TA IDEX Asset Allocation–Moderate Portfolio ("the Fund") commenced operations on March 1, 2002. The inception date for the Fund's offering of share Class C was November 11, 2002.
The notes to the financial statements are an integral part of this report.
Transamerica IDEX Mutual Funds
Semi-Annual Report 2005
5
TA IDEX Asset Allocation–Moderate Portfolio
NOTES TO FINANCIAL STATEMENTS
At April 30, 2005
(all amounts in thousands)
(unaudited)
NOTE 1. ORGANIZATION AND SIGNIFICANT ACCOUNTING POLICIES
Transamerica IDEX Mutual Funds is a Delaware statutory trust registered under the Investment Company Act of 1940, as amended (the "1940 Act"), as an open-end management investment company. Prior to March 1, 2005, Transamerica IDEX Mutual Funds was a Massachusetts business trust. TA IDEX Asset Allocation–Moderate Portfolio ("the Fund"), part of Transamerica IDEX Mutual Funds, began operations on March 1, 2002.
In the normal course of business, the Fund enters into contracts that contain a variety of representations and warranties, which provide general indemnifications. The Fund's maximum exposure under these arrangements is unknown, as this would involve future claims that may be made against the Fund and/or its affiliates that have not yet occurred. However, based on experience, the Fund expects the risk of loss to be remote.
See the Prospectus and Statement of Additional Information for a description of the Fund's investment objective.
In preparing the Fund's financial statements in accordance with accounting principles generally accepted in the United States of America ("GAAP"), estimates or assumptions (which could differ from actual results) may be used that affect reported amounts and disclosures. The following policies were consistently followed by the Fund, in accordance with GAAP.
Multiple class operations and expenses: The Fund currently offers three classes of shares, each with a public offering price that reflects different sales charges, if any, and expense levels. On June 15, 2004, Class C2 shares merged into Class C. On September 24, 2004, Class M shares merged into Class C. Class B shares will convert to Class A shares eight years after purchase. Income, non-class specific expenses and realized and unrealized gains and losses, are allocated daily to each class, based upon the value of shares outstanding method as permitted under Rule 18f-3 of the 1940 Act. Each class bears its own specific expenses as well as a portion of general, common expenses.
Pricing of shares: The Fund prices its shares on the basis of the net asset value of each class of shares of the Fund, which is determined as of the close of the New York Stock Exchange ("NYSE") (generally 4:00 p.m. Eastern Time) on each day on which the NYSE is open for trading.
Security valuations: The Fund's investments are valued at the net asset values of the underlying portfolios of Transamerica IDEX Mutual Funds. The net asset values of the underlying portfolios are determined at the close of the NYSE (generally 4:00 p.m. eastern time) on the valuation date.
Cash: The Fund may leave cash overnight in its cash account with the custodian, Investors Bank & Trust Company ("IBT"). IBT has been contracted on behalf of the Fund to invest the excess cash into a savings account, which at April 30, 2005, was paying an interest rate of 2.02%.
Throughout the period, the Fund may have a cash overdraft balance. A fee is incurred on this overdraft, calculated by multiplying the overdraft by a rate based on the federal funds rate.
Security transactions and investment income: Security transactions are recorded on the trade date. Security gains and losses are calculated on the specific identification basis. Interest income, including accretion of discounts and amortization of premiums, is recorded on the accrual basis commencing on the settlement date. Dividend income is recorded on the ex-dividend date. Dividends and net realized gain (loss) from investment securities for the Fund are from investments in shares of affiliated investment companies.
Account maintenance fees: If the shareholder account balance falls below $1 by either shareholder action or as a result of market action, a $25 (not in thousands) fee is assessed every year until the balance reaches $1. The fee is assessed by redeeming shares in the shareholder's account.
No fee will be charged under the following conditions:
• accounts opened within the preceding 24 months
• accounts with an active monthly Automatic Investment Plan ($50 (not in thousands) minimum per fund)
• accounts owned by an individual which, when combined by social security number, have a balance of $5 or more
• accounts owned by individuals in the same household (by address) that have a combined balance of $5 or more
• UTMA/UGMA accounts
• Fiduciary accounts
• B-share accounts whose shares have started to convert to A-shares accounts (as long as combined value of both accounts is at least $1)
For the six months ended April 30, 2005, there were no account maintenance fees.
Redemption fees: A short-term trading redemption fee may be assessed on any fund shares in a fund account that are sold during the first five (5) NYSE trading days following their purchase date. This redemption fee will equal 2% of the amount redeemed and shares held the longest will be treated as being redeemed first and shares held the shortest as being redeemed last.
Transamerica IDEX Mutual Funds
Semi-Annual Report 2005
6
TA IDEX Asset Allocation–Moderate Portfolio
NOTES TO FINANCIAL STATEMENTS (continued)
At April 30, 2005
(all amounts in thousands)
(unaudited)
NOTE 1.–(continued)
For the six months ended April 30, 2005, the Fund received $1 in redemption fees.
Dividend distributions: Distributions to shareholders are recorded on the ex-dividend date and are determined in accordance with Federal income tax regulations which may differ from GAAP.
NOTE 2. RELATED PARTY TRANSACTIONS
Transamerica Fund Advisors, Inc. ("TFAI") is the Fund's investment adviser. Transamerica Fund Services, Inc. ("TFS") is the Fund's administrator and transfer agent. AFSG Securities Corp. ("AFSG") is the Fund's distributor/principal underwriter. AFSG is 100% owned by AUSA Holding Company ("AUSA"). TFAI is a directly owned subsidiary of Western Reserve Life Assurance Co. of Ohio (78%) and AUSA (22%). TFS is a wholly owned subsidiary of WRL (50%) and AUSA (50%). AUSA and WRL are wholly owned indirect subsidiaries of AEGON, NV, a Netherlands corporation.
Effective January 1, 2005 AEGON/Transamerica Fund Advisors, Inc. ("ATFA") was renamed Transamerica Fund Advisors, Inc. ("TFAI"); AEGON/Transamerica Fund Services, Inc. ("ATFS") and AEGON/Transamerica Investor Services, Inc. ("ATIS") merged into one entity and was renamed Transamerica Fund Services, Inc. ("TFS").
TFAI has entered into an agreement with Morningstar Associates, LLC to provide investment services to the Fund. TFAI compensates Morningstar Associates, LLC as described in the Prospectus.
Transamerica Investment Management, LLC and Great Companies, LLC are affiliates of the Fund and are sub-advisers to other funds within Transamerica IDEX Mutual Funds.
Investment advisory fee: The Fund pays management fees to TFAI based on average daily net assets ("ANA") at the following rate:
0.10% of ANA
TFAI has contractually agreed to waive its advisory fee and will reimburse the Fund to the extent that operating expenses, excluding 12b-1 fees, exceed the following stated annual limit:
0.45% Expense Limit
If total fund expenses fall below the annual expense limitation agreement agreed to by the adviser within the succeeding three years, the Fund may be required to pay that adviser a portion or all of the waived advisory fees.
There were no amounts available for recapture at April 30, 2005.
Distribution and service fees: The Fund has a 12b-1 distribution plan under the 1940 Act pursuant to which an annual fee, based on average daily net assets, is paid to the distributor for various disbursements such as broker-dealer account servicing fees and other promotional expenses of the Fund. The Fund is authorized under the 12b-1 plan to pay fees on each class up to the following limits:
| Class A | N/A | ||||||
| Class B | 0.65 | % | |||||
| Class C | 0.65 | % | |||||
In addition, the underlying funds' Class A shares in which the Fund invests impose a 0.35% 12b-1 fee. To avoid duplication of the 12b-1 fees, each class of fund shares of the Fund has reduced the 12b-1 fees by the amount of the underlying funds' Class A 12b-1 fees.
In the case the Fund or a class of shares of the Fund is closed to new investors or investments, the Fund is authorized to pay 12b-1 fees for past sales and distribution efforts and present and past investor services.
Underwriter commissions relate to front-end sales charges imposed for Class A shares and contingent deferred sales charges from Classes B, C and certain A share redemptions. For the six months ended April 30, 2005, the underwriter commissions were as follows:
| Received by Underwriter | $ | 9,892 | |||||
| Retained by Underwriter | 570 | ||||||
| Contingent Deferred Sales Charge | 537 | ||||||
Administrative services: The Fund has entered into an agreement with TFS for financial and legal fund administration services, which includes such items as compliance, expenses, financial statements and other reporting, distributions, tax returns, prospectus preparation, board of trustees meeting support and other legal matters. As of January 1, 2005 the Fund pays TFS an annual fee of 0.02% of average net assets. Prior to January 1, 2005 the Fund paid TFS an annual fee of 0.015% of average net assets. The Legal fees on the Statement of Operations are for fees paid to external legal counsel.
Transfer agent fees: The Fund pays TFS an annual per-account charge of $20 (not in thousands) for each open account and $1.63 (not in thousands) for each closed account. There is no new account charge. The Transfer agent fees on the Statement of Operations are made up of fees paid to TFS and costs associated with shareholder statements.
The Fund paid TFS $537 for the six months ended April 30, 2005.
Deferred compensation plan: Each eligible Fund Trustee may elect participation in the Deferred Compensation Plan ("the Plan"). Under the Plan, such Trustees may defer payment of a percentage of their total fees earned as a Fund Trustee. These deferred amounts may be invested in any Transamerica IDEX Mutual Fund. At April 30, 2005, the value of invested plan amount was $31. Invested plan amounts and the total liability for deferred compensation to the Trustees under the Plan at
Transamerica IDEX Mutual Funds
Semi-Annual Report 2005
7
TA IDEX Asset Allocation–Moderate Portfolio
NOTES TO FINANCIAL STATEMENTS (continued)
At April 30, 2005
(all amounts in thousands)
(unaudited)
NOTE 3. INVESTMENT TRANSACTIONS
April 30, 2005, are included in the accompanying Statement of Assets and Liabilities.
The cost of securities purchased and proceeds from securities sold (excluding short-term securities) for the six months ended April 30, 2005, were as follows:
| Purchases of securities: | |||||||
| Long-Term excluding U.S. Government | $ | 353,771 | |||||
| U.S. Government | – | ||||||
| Proceeds from maturities and sales of securities: | |||||||
| Long-Term excluding U.S. Government | 215,158 | ||||||
| U.S. Government | – | ||||||
NOTE 4. FEDERAL INCOME TAX MATTERS
The Fund has not made any provision for federal income or excise taxes due to its policy to distribute all of its taxable income and capital gains to its shareholders and otherwise qualify as a regulated investment company under the Internal Revenue Code. Income and capital gain distributions are determined in accordance with income tax regulations, which may differ from GAAP. These differences are primarily due to differing treatment for items including, but not limited to, wash sales, net operating losses and capital loss carryforwards.
The aggregate cost of investments and composition of unrealized appreciation (depreciation) for federal income tax purposes as of April 30, 2005, are as follows:
| Federal Tax Cost Basis | $ | 1,089,355 | |||||
| Unrealized Appreciation | $ | 65,768 | |||||
| Unrealized (Depreciation) | (4,455 | ) | |||||
| Net Unrealized Appreciation (Depreciation) | $ | 61,313 | |||||
NOTE 5. REGULATORY PROCEEDINGS
There continues to be significant federal and state regulatory activity relating to financial services companies, particularly mutual fund companies and their investment advisers. As part of an ongoing investigation regarding potential market timing, recordkeeping and trading compliance issues and matters affecting the Fund's investment adviser, TFAI, and certain employees and affiliates of TFAI, the SEC staff has indicated that it is likely to take some action against TFAI and certain of its affiliates at the conclusion of the investigation. The potential timing and the scope of any such action is difficult to predict. Although the impact of any action brought against TFAI and/or its affiliates is difficult to assess at the present time, the Fund currently believes that the likelihood that any such action will have a material adverse impact on it is remote. It is important to note that the Fund is not aware of any allegation of wrongdoing against it and its board at the time this semi-annual report is printed. Although it is not anticipated that these developments will have an adverse impact on the Fund, there can be no assurance at this time. TFAI and its affiliates are actively working with the SEC in regard to this matter; however, the exact resolution cannot be determined at this time. TFAI will take such actions that it deems necessary or appropriate to continue providing management services to the Fund and to bring all matters to an appropriate conclusion.
TFAI and/or its affiliates, and not the Fund, will bear the costs regarding these regulatory matters.
Transamerica IDEX Mutual Funds
Semi-Annual Report 2005
8
TA IDEX Asset Allocation–Moderate Portfolio
INVESTMENT ADVISORY AND ASSET ALLOCATION MANAGEMENT AGREEMENTS – REVIEW AND RENEWAL
At a meeting of the Board of Trustees of Transamerica IDEX Mutual Funds ("TA IDEX") held on October 6, 2004, the Board considered and approved the renewal for a one-year period of the Investment Advisory Agreement between TA IDEX Asset Allocation - Moderate Portfolio (the "Fund") and Transamerica Fund Advisors, Inc. ("TFAI"). Additionally, at a meeting held on March 22, 2005, the Board considered and approved for a two-year period the Asset Allocation Management Agreement of the Fund between TFAI and Morningstar Associates, LLC (the "Portfolio Construction Manager"). In approving these agreements, the Board concluded that the Investment Advisory and Asset Allocation Management Agreement enable shareholders of the Fund to obtain high quality services at a cost that is appropriate, reasonable, and in the best interests of shareholders based upon the following determinations, among others:
The nature, extent and quality of the advisory service to be provided. The Board considered the nature and quality of the services provided by TFAI and the Portfolio Construction Manager to the Fund in the past, as well as the services anticipated to be provided in the future. The Board concluded that TFAI and the Portfolio Construction Manager are capable of providing high quality services to the Fund, as indicated by TFAI's management capabilities demonstrated with respect to the Fund and other funds managed by TFAI, TFAI's management oversight process, the professional qualifications and experience of the Portfolio Construction Manager's portfolio management team, and the Fund's strong investment performance. The Board also concluded that TFAI and the Portfolio Construction Manager would prov ide the same quality and quantity of investment management and related services as before, that these services are appropriate in scope and extent in light of the Fund's operations, the competitive landscape of the investment company business and investor needs, and that TFAI's and the Portfolio Construction Manager's obligations will remain the same in all respects.
The investment performance of the Fund. The Board concluded, based in particular on information provided by Lipper Analytics, that the Fund's investment performance was competitive or superior relative to comparable funds over trailing one- and two-year periods and to the Fund's benchmark index over the past year. On the basis of the Trustees' assessment of the nature, extent and quality of investment advisory and related services to be provided or procured by TFAI and the Portfolio Construction Manager, the Trustees concluded that TFAI and the Portfolio Construction Manager were capable of generating a level of long-term investment performance that is appropriate in light of the Fund's investment objective, policies and strategies and competitive with many other investment companies.
The cost of advisory services provided and the level of profitability. On the basis of the Board's review of the fees to be charged by TFAI and the Portfolio Construction Manager for investment advisory and related services, TFAI's financial statements, the fees paid by TFAI to the Portfolio Construction Manager, TFAI's estimated net management income resulting from its management of the Fund, the estimated profitability of TFAI's relationships with the Fund and TA IDEX, and the estimated profitability of the Portfolio Construction Manager's relationship with the Fund, the Board concluded that the level of investment advisory fees and the profitability is appropriate in light of the services provided, the management fees and overall expense ratios of comparable investment companies, and the anti cipated profitability of the relationship between the Fund, TFAI and the Portfolio Construction Manager. Further, on the basis of comparative information supplied by Lipper Analytics, the Board determined that the advisory fees and estimated overall expense ratio of the Fund were consistent with industry averages.
The extent to which economies of scale would be realized as the Fund grows and whether fee levels reflect these economies of scale for the benefit of Fund investors. Although the investment advisory fees do not reduce should Fund assets grow meaningfully, the Board concluded that the advisory fees appropriately reflect the Fund's current size, the current economic environment for TFAI, and the competitive nature of the investment company market. In addition, the Board noted that it will have the opportunity to periodically re-examine whether the Fund has achieved economies of scale, as well as the appropriateness of advisory fees payable to TFAI and the Portfolio Construction Manager in light of such economies of scale (including whether it would be appropriate to have advisory fee breakpoints i n the future).
Benefits (such as soft dollars) to TFAI or the Portfolio Construction Manager from its relationship with the Fund. The Board concluded that other benefits derived by TFAI (including any benefits derived from investment advisory fees payable to TFAI with respect to the underlying funds in which the Fund invests) or the Portfolio Construction Manager from its relationship with the Fund are reasonable and fair, and are consistent with industry practice and the best interests of the Fund and its shareholders. In this regard, the Board noted that TFAI or the Portfolio Construction Manager do not realize "soft dollar" benefits from their relationship with the Fund.
Other considerations. The Board also determined that TFAI had made a substantial commitment to the recruitment and retention of high quality personnel, and maintained the financial, compliance and operational resources reasonably necessary to manage the Fund in a professional manner that is consistent with the best interests of the Fund and its shareholders. The Trustees also concluded that TFAI had made a significant entrepreneurial commitment to the management and success of the Fund, reflected by TFAI's expense limitation and fee waiver arrangement with the Fund which, as demonstrated in the past with the Fund, may result in TFAI waiving a substantial amount of advisory fees for the benefit of shareholders. The Board also noted the significant growth in the Fund's assets in the past year.
Transamerica IDEX Mutual Funds
Semi-Annual Report 2005
9
TA IDEX Asset Allocation–Moderate Portfolio
SUPPLEMENTAL INFORMATION (unaudited)
RESULTS OF SHAREHOLDER PROXY
At a special meeting of shareholders held on February 25, 2005, the results of the Proposals were as follows:
Transamerica IDEX Mutual Funds
Proposal 1: Election of Trustees to the Board of Trustees of Transamerica IDEX Mutual Funds.
| For | Withheld | ||||||||||
| Peter R. Brown | 872,017,875.249 | 4,468,498.551 | |||||||||
| Daniel Calabria | 871,917,069.786 | 4,569,304.014 | |||||||||
| Janise B. Case | 872,099,393.125 | 4,386,980.675 | |||||||||
| Charles C. Harris | 872,086,722.025 | 4,399,651.775 | |||||||||
| Leo J. Hill | 872,304,465.640 | 4,181,908.160 | |||||||||
| Russell A. Kimball, Jr. | 872,253,556.471 | 4,232,817.329 | |||||||||
| William W. Short, Jr. | 872,139,920.944 | 4,346,452.856 | |||||||||
| John Waechter | 872,261,152.376 | 4,225,221.424 | |||||||||
| Jack E. Zimmerman | 871,929,967.512 | 4,556,406.288 | |||||||||
| Brian C. Scott | 872,218,970.367 | 4,267,403.433 | |||||||||
| Thomas P. O'Neill | 872,111,944.117 | 4,374,429.683 | |||||||||
TA IDEX Asset Allocation – Moderate Portfolio
Proposal 2: Approval of an Agreement and Plan of Reorganization pursuant to which Transamerica IDEX Mutual Funds will organize as a Delaware statutory trust.
| For | Against | Abstentions/Broker Non-Votes | |||||||||
| 32,925,327.826 | 687,620.250 | 14,764,030.261 | |||||||||
Proposal 3: Approval of changes to the fundamental investment restrictions of TA IDEX Asset Allocation – Moderate Portfolio.
| A. Diversification | For | Against | Abstentions/Broker Non-Votes | ||||||||||||
| 33,860,919.285 | 809,508.898 | 13,706,550.154 | |||||||||||||
| B. Borrowing | For | Against | Abstentions/Broker Non-Votes | ||||||||||||
| 33,779,516.111 | 890,912.072 | 13,706,550.154 | |||||||||||||
| C. Senior Securities | For | Against | Abstentions/Broker Non-Votes | ||||||||||||
| 33,817,316.753 | 849,524.430 | 13,710,137.154 | |||||||||||||
| D. Underwriting Securities | For | Against | Abstentions/Broker Non-Votes | ||||||||||||
| 33,829,220.410 | 841,207.774 | 13,706,550.153 | |||||||||||||
| E. Real Estate | For | Against | Abstentions/Broker Non-Votes | ||||||||||||
| 33,819,021.085 | 851,407.098 | 13,706,550.154 | |||||||||||||
| F. Making Loans | For | Against | Abstentions/Broker Non-Votes | ||||||||||||
| 33,791,218.673 | 879,209.510 | 13,706,550.154 | |||||||||||||
| G. Concentration | For | Against | Abstentions/Broker Non-Votes | ||||||||||||
| 33,804,341.930 | 866,086.253 | 13,706,550.154 | |||||||||||||
| H. Commodities | For | Against | Abstentions/Broker Non-Votes | ||||||||||||
| 33,782,095.419 | 888,332.764 | 13,706,550.154 | |||||||||||||
Transamerica IDEX Mutual Funds
Semi-Annual Report 2005
10
TA IDEX Asset Allocation–Moderate Growth Portfolio
UNDERSTANDING YOUR FUND'S EXPENSES
(unaudited)
SHAREHOLDER EXPENSES
The following Example is intended to help you understand your ongoing costs (in dollars and cents) of investing in a Fund and to compare these costs with the ongoing costs of investing in other funds.
The Example is based on an investment of $1,000 invested at November 1, 2004 and held for the entire period until April 30, 2005.
ACTUAL EXPENSES
The first line in the table below provides information about actual account values and actual expenses. You may use the information in this line, together with the amount you invested, to estimate the expenses that you paid over the period. Simply divide your account value by $1,000 (for example, an $8,600 account value divided by $1,000 = 8.6), then multiply the result by the number in the first line of your Fund under the heading entitled "Expenses Paid During Period" to estimate the expenses you paid on your account during this period.
HYPOTHETICAL EXAMPLE FOR COMPARISON PURPOSES
The second line in the table below provides information about hypothetical account values and hypothetical expenses based on the Fund's actual expense ratio and an assumed rate of return of 5% per year before expenses, which is not the Fund's actual return. The hypothetical account values and expenses may not be used to estimate the actual ending account balance or expenses you paid for the period. You may use this information to compare the ongoing costs of investing in your Fund and other funds. To do so, compare this 5% hypothetical example with the 5% hypothetical examples that appear in the shareholder reports of the other funds.
Please note that the expenses shown in the table are meant to highlight your ongoing costs only and do not reflect any transactional costs, such as sales charges, redemption fees, brokerage commissions paid on purchases and sales of fund shares. Therefore, the second line under the Fund in the table is useful in comparing ongoing costs only, and will not help you determine the relative total costs of owning different funds. In addition, note that the expenses shown in the table are meant to highlight your ongoing costs and do not reflect any transaction costs.
| Beginning Account Value | Ending Account Value | Annualized Expense Ratio | Expenses Paid During Period (a) | ||||||||||||||||
| Class A | |||||||||||||||||||
| Actual | $ | 1,000.00 | $ | 1,023.90 | 0.27 | % | $ | 1.35 | |||||||||||
| Hypothetical (b) | 1,000.00 | 1,023.46 | 0.27 | % | 1.35 | ||||||||||||||
| Class B | |||||||||||||||||||
| Actual | 1,000.00 | 1,020.30 | 0.94 | % | 4.71 | ||||||||||||||
| Hypothetical (b) | 1,000.00 | 1,020.13 | 0.94 | % | 4.71 | ||||||||||||||
| Class C | |||||||||||||||||||
| Actual | 1,000.00 | 1,021.00 | 0.89 | % | 4.46 | ||||||||||||||
| Hypothetical (b) | 1,000.00 | 1,020.38 | 0.89 | % | 4.46 | ||||||||||||||
(a) Expenses are calculated using each Fund's annualized expense ratio (as disclosed in the table), multiplied by the average account value for the period, multiplied by number of days in the period (181 days), and divided by the number of days in the year (365 days).
(b) 5% return per year before expenses.
GRAPHICAL PRESENTATION OF SCHEDULE OF INVESTMENTS
By Asset Type
At April 30, 2005
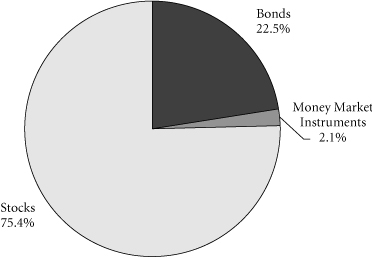
This chart shows the percentage breakdown by asset type of the Fund's total investment securities. Asset type is calculated based on the aggregate portfolio holdings in the underlying funds in which the Fund invests. The security lending collateral in the underlying funds is excluded from this calculation.
Transamerica IDEX Mutual Funds
Semi-Annual Report 2005
1
TA IDEX Asset Allocation–Moderate Growth Portfolio
SCHEDULE OF INVESTMENTS
At April 30, 2005
(all amounts except share amounts in thousands)
(unaudited)
| Shares | Value | ||||||||||
| INVESTMENT COMPANIES (99.9%) (b) | |||||||||||
| Aggressive Equity (21.3%) | |||||||||||
| TA IDEX J.P. Morgan Mid Cap Value (a) | 7,232,837 | $ | 68,567 | ||||||||
| TA IDEX T. Rowe Price Health Sciences | 5,621,778 | 61,615 | |||||||||
| TA IDEX Transamerica Growth Opportunities (a) | 11,903,561 | 77,492 | |||||||||
| TA IDEX Transamerica Small/Mid Cap Value | 8,347,309 | 122,538 | |||||||||
| TA IDEX Van Kampen Small Company Growth (a) | 2,089,862 | 20,794 | |||||||||
| Capital Preservation (1.0%) | |||||||||||
| TA IDEX Transamerica Money Market | 16,252,899 | 16,253 | |||||||||
| Fixed-Income (21.1%) | |||||||||||
| TA IDEX PIMCO Real Return TIPS | 9,531,649 | 100,273 | |||||||||
| TA IDEX PIMCO Total Return | 3,645,155 | 37,764 | |||||||||
| TA IDEX Transamerica Conservative High-Yield Bond | 10,422,230 | 94,217 | |||||||||
| TA IDEX Transamerica Convertible Securities | 7,286,415 | 77,892 | |||||||||
| TA IDEX Transamerica Flexible Income | 4,190,172 | 39,555 | |||||||||
| Growth Equity (39.9%) | |||||||||||
| TA IDEX American Century Large Company Value | 17,703,932 | 189,432 | |||||||||
| TA IDEX Great Companies–TechnologySM (a) | 7,520,031 | 26,471 | |||||||||
| TA IDEX Janus Growth (a) | 2,863,849 | 64,293 | |||||||||
| Shares | Value | ||||||||||
| Growth Equity (continued) | |||||||||||
| TA IDEX Jennison Growth (a) | 22,211 | $ | 213 | ||||||||
| TA IDEX Marsico Growth (a) | 5,337,402 | 51,079 | |||||||||
| TA IDEX Mercury Large Cap Value (a) | 15,498,385 | 144,290 | |||||||||
| TA IDEX Salomon All Cap | 3,202,051 | 47,711 | |||||||||
| TA IDEX Salomon Investors Value | 5,480,101 | 73,050 | |||||||||
| TA IDEX Transamerica Equity | 8,502,875 | 63,942 | |||||||||
| Specialty–Real Estate (2.4%) | |||||||||||
| TA IDEX Clarion Real Estate Securities | 2,703,273 | 40,008 | |||||||||
| World Equity (14.2%) | |||||||||||
| TA IDEX American Century International | 2,111,235 | 19,803 | |||||||||
| TA IDEX Evergreen International Small Cap (a) | 3,756,025 | 41,354 | |||||||||
| TA IDEX Marsico International Growth (a) | 3,557,900 | 35,294 | |||||||||
| TA IDEX Templeton Great Companies Global (a) | 4,259,027 | 100,215 | |||||||||
| TA IDEX Van Kampen Emerging Markets Debt | 3,782,126 | 37,821 | |||||||||
| Total Investment Companies (cost: $1,591,946) | 1,651,936 | ||||||||||
| Total Investment Securities (cost: $1,591,946) | $ | 1,651,936 | |||||||||
| SUMMARY: | |||||||||||
| Investments, at value | 99.9 | % | $ | 1,651,936 | |||||||
| Other assets in excess of liabilities | 0.1 | % | 1,717 | ||||||||
| Net assets | 100.0 | % | $ | 1,653,653 | |||||||
NOTES TO SCHEDULE OF INVESTMENTS:
(a) No dividends were paid during the preceding twelve months.
(b) The Fund invests its assets in Class A shares of the underlying TA IDEX Mutual Funds, which are affiliates of the Fund.
The notes to the financial statements are an integral part of this report.
Transamerica IDEX Mutual Funds
Semi-Annual Report 2005
2
TA IDEX Asset Allocation–Moderate Growth Portfolio
STATEMENT OF ASSETS AND LIABILITIES
At April 30, 2005
(all amounts except per share amounts in thousands)
(unaudited)
| Assets: | |||||||
| Investment in affiliated mutual funds, at value (cost: $1,591,946) | $ | 1,651,936 | |||||
| Receivables: | |||||||
| Shares of beneficial interest sold | 7,467 | ||||||
| Dividends | 76 | ||||||
| Other | 25 | ||||||
| 1,659,504 | |||||||
| Liabilities: | |||||||
| Investment securities purchased | 941 | ||||||
| Accounts payable and accrued liabilities: | |||||||
| Shares of beneficial interest redeemed | 3,708 | ||||||
| Management and advisory fees | 201 | ||||||
| Distribution and service fees | 641 | ||||||
| Transfer agent fees | 119 | ||||||
| Dividends to shareholders | 2 | ||||||
| Other | 239 | ||||||
| 5,851 | |||||||
| Net Assets | $ | 1,653,653 | |||||
| Net Assets Consist of: | |||||||
| Shares of beneficial interest, unlimited shares authorized, no par value | $ | 1,539,890 | |||||
| Accumulated net investment income (loss) | (5,301 | ) | |||||
| Undistributed net realized gain (loss) from investment in affiliated mutual funds | 59,081 | ||||||
| Net unrealized appreciation (depreciation) on investment in affiliated mutual funds | 59,983 | ||||||
| Net Assets | $ | 1,653,653 | |||||
| Net Assets by Class: | |||||||
| Class A | $ | 453,276 | |||||
| Class B | 377,377 | ||||||
| Class C | 823,000 | ||||||
| Shares Outstanding: | |||||||
| Class A | 41,258 | ||||||
| Class B | 34,483 | ||||||
| Class C | 75,193 | ||||||
| Net Asset Value Per Share: | |||||||
| Class A | $ | 10.99 | |||||
| Class B | 10.94 | ||||||
| Class C | 10.95 | ||||||
| Maximum Offering Price Per Share (a): | |||||||
| Class A | $ | 11.63 | |||||
(a) Includes the maximum selling commission (represented as a percentage of offering price) which is reduced on certain levels of sales as set forth in the Prospectus. Net asset value per share for Classes B and C shares represents offering price. The redemption price for Classes B and C shares equals net asset value less any applicable contingent deferred sales charge.
STATEMENT OF OPERATIONS
For the period ended April 30, 2005
(all amounts in thousands)
(unaudited)
| Investment Income: | |||||||
| Dividends from affiliated mutual funds | $ | 8,059 | |||||
| Expenses: | |||||||
| Management and advisory fees | 776 | ||||||
| Transfer agent fees: | |||||||
| Class A | 249 | ||||||
| Class B | 261 | ||||||
| Class C | 390 | ||||||
| Printing and shareholder reports | 9 | ||||||
| Custody fees | 27 | ||||||
| Administration fees | 143 | ||||||
| Legal fees | 31 | ||||||
| Audit fees | 14 | ||||||
| Trustees fees | 29 | ||||||
| Registration fees: | |||||||
| Class A | 36 | ||||||
| Class B | 18 | ||||||
| Class C | 24 | ||||||
| Distribution and service fees: | |||||||
| Class B | 1,188 | ||||||
| Class C | 2,509 | ||||||
| Total expenses | 5,704 | ||||||
| Net Investment Income (Loss) | 2,355 | ||||||
| Net Realized Gain (Loss) from: | |||||||
| Realized gain (loss) from investment in affiliated mutual funds | 47,747 | ||||||
| Realized gain distributions from investment in affiliated mutual funds | 11,410 | ||||||
| Increase (decrease) in unrealized appreciation (depreciation) on investment in affiliated mutual funds | (38,921 | ) | |||||
| Net Gain (Loss) on Investments in Affiliated Mutual Funds | 20,236 | ||||||
| Net Increase (Decrease) in Net Assets Resulting from Operations | $ | 22,591 | |||||
The notes to the financial statements are an integral part of this report.
Transamerica IDEX Mutual Funds
Semi-Annual Report 2005
3
TA IDEX Asset Allocation–Moderate Growth Portfolio
STATEMENTS OF CHANGES IN NET ASSETS
For the period or year ended
(all amounts in thousands)
| April 30, 2005 (unaudited) | October 31, 2004 | ||||||||||
| Increase (Decrease) In Net Assets From: | |||||||||||
| Operations: | |||||||||||
| Net investment income (loss) | $ | 2,355 | $ | (89 | ) | ||||||
| Net realized gain (loss) from investment in affiliated mutual funds | 59,157 | 23,388 | |||||||||
| Net unrealized appreciation (depreciation) on investment in affiliated mutual funds | (38,921 | ) | 43,855 | ||||||||
| 22,591 | 67,154 | ||||||||||
| Distributions to Shareholders: | |||||||||||
| From net investment income: | |||||||||||
| Class A | (7,069 | ) | (1,243 | ) | |||||||
| Class B | (4,399 | ) | (452 | ) | |||||||
| Class C | (9,608 | ) | (639 | ) | |||||||
| Class C2 | – | (66 | ) | ||||||||
| Class M | – | (55 | ) | ||||||||
| (21,076 | ) | (2,455 | ) | ||||||||
| From net realized gains: | |||||||||||
| Class A | (1,708 | ) | – | ||||||||
| Class B | (1,542 | ) | – | ||||||||
| Class C | (3,196 | ) | – | ||||||||
| (6,446 | ) | – | |||||||||
| Capital Share Transactions: | |||||||||||
| Proceeds from shares sold: | |||||||||||
| Class A | 132,900 | 244,152 | |||||||||
| Class B | 61,762 | 153,748 | |||||||||
| Class C | 195,482 | 410,207 | |||||||||
| Class C2 | – | 6,869 | |||||||||
| Class M | – | 4,667 | |||||||||
| 390,144 | 819,643 | ||||||||||
| Dividends and distributions reinvested: | |||||||||||
| Class A | 7,807 | 1,112 | |||||||||
| Class B | 5,035 | 375 | |||||||||
| Class C | 8,955 | 455 | |||||||||
| Class C2 | – | 49 | |||||||||
| Class M | – | 51 | |||||||||
| 21,797 | 2,042 | ||||||||||
| Cost of shares redeemed: | |||||||||||
| Class A | (38,037 | ) | (44,420 | ) | |||||||
| Class B | (22,707 | ) | (29,188 | ) | |||||||
| Class C | (54,564 | ) | (57,323 | ) | |||||||
| Class C2 | – | (3,856 | ) | ||||||||
| Class M | – | (3,241 | ) | ||||||||
| (115,308 | ) | (138,028 | ) | ||||||||
| Redemption fees: | |||||||||||
| Class A | 3 | – | |||||||||
| Class C | 1 | – | |||||||||
| 4 | – | ||||||||||
| Class level exchanges: | |||||||||||
| Class C | – | 55,381 | |||||||||
| Class C2 | – | (34,726 | ) | ||||||||
| Class M | – | (20,655 | ) | ||||||||
| – | – | ||||||||||
| April 30, 2005 (unaudited) | October 31, 2004 | ||||||||||
| Automatic conversions: | |||||||||||
| Class A | $ | 222 | $ | 128 | |||||||
| Class B | (222 | ) | (128 | ) | |||||||
| – | – | ||||||||||
| 296,637 | 683,657 | ||||||||||
| Net increase (decrease) in net assets | 291,706 | 748,356 | |||||||||
| Net Assets: | |||||||||||
| Beginning of period | 1,361,947 | 613,591 | |||||||||
| End of period | $ | 1,653,653 | $ | 1,361,947 | |||||||
| Accumulated Net Investment Income (Loss) | $ | (5,305 | ) | $ | 13,420 | ||||||
| Share Activity: | |||||||||||
| Shares issued: | |||||||||||
| Class A | 11,759 | 22,751 | |||||||||
| Class B | 5,484 | 14,399 | |||||||||
| Class C | 17,324 | 38,386 | |||||||||
| Class C2 | – | 646 | |||||||||
| Class M | – | 439 | |||||||||
| 34,567 | 76,621 | ||||||||||
| Shares issued–reinvested from distributions: | |||||||||||
| Class A | 686 | 107 | |||||||||
| Class B | 443 | 36 | |||||||||
| Class C | 788 | 44 | |||||||||
| Class C2 | – | 5 | |||||||||
| Class M | – | 5 | |||||||||
| 1,917 | 197 | ||||||||||
| Shares redeemed: | |||||||||||
| Class A | (3,377 | ) | (4,149 | ) | |||||||
| Class B | (2,016 | ) | (2,732 | ) | |||||||
| Class C | (4,845 | ) | (5,358 | ) | |||||||
| Class C2 | – | (359 | ) | ||||||||
| Class M | – | (303 | ) | ||||||||
| (10,238 | ) | (12,901 | ) | ||||||||
| Class level exchanges: | |||||||||||
| Class C | – | 5,155 | |||||||||
| Class C2 | – | (3,233 | ) | ||||||||
| Class M | – | (1,920 | ) | ||||||||
| – | 2 | ||||||||||
| Automatic conversions: | |||||||||||
| Class A | 19 | 12 | |||||||||
| Class B | (20 | ) | (12 | ) | |||||||
| (1 | ) | – | |||||||||
| Net increase (decrease) in shares outstanding: | |||||||||||
| Class A | 9,087 | 18,721 | |||||||||
| Class B | 3,891 | 11,691 | |||||||||
| Class C | 13,267 | 38,227 | |||||||||
| Class C2 | – | (2,941 | ) | ||||||||
| Class M | – | (1,779 | ) | ||||||||
| 26,245 | 63,919 | ||||||||||
The notes to the financial statements are an integral part of this report.
Transamerica IDEX Mutual Funds
Semi-Annual Report 2005
4
TA IDEX Asset Allocation–Moderate Growth Portfolio
FINANCIAL HIGHLIGHTS
(unaudited for the period ended April 30, 2005)
| For a share of beneficial interest outstanding throughout each period | |||||||||||||||||||||||||||||||||||||||
| Net Asset | Investment Operations | Distributions | Net Asset | ||||||||||||||||||||||||||||||||||||
| For the Period Ended (d)(g) | Value, Beginning of Period | Net Investment Income (Loss) | Net Realized and Unrealized Gain (Loss) | Total Operations | From Net Investment Income | From Net Realized Gains | Total Distributions | Value, End of Period | |||||||||||||||||||||||||||||||
| Class A | 4/30/2005 | $ | 10.97 | $ | 0.04 | $ | 0.23 | $ | 0.27 | $ | (0.20 | ) | $ | (0.05 | ) | $ | (0.25 | ) | $ | 10.99 | |||||||||||||||||||
| 10/31/2004 | 10.13 | 0.05 | 0.87 | 0.92 | (0.08 | ) | – | (0.08 | ) | 10.97 | |||||||||||||||||||||||||||||
| 10/31/2003 | 8.37 | 0.04 | 1.77 | 1.81 | (0.05 | ) | – | (0.05 | ) | 10.13 | |||||||||||||||||||||||||||||
| 10/31/2002 | 10.00 | 0.02 | (1.65 | ) | (1.63 | ) | – | – | – | 8.37 | |||||||||||||||||||||||||||||
| Class B | 4/30/2005 | 10.90 | 0.01 | 0.22 | 0.23 | (0.14 | ) | (0.05 | ) | (0.19 | ) | 10.94 | |||||||||||||||||||||||||||
| 10/31/2004 | 10.09 | (0.02 | ) | 0.85 | 0.83 | (0.02 | ) | – | (0.02 | ) | 10.90 | ||||||||||||||||||||||||||||
| 10/31/2003 | 8.33 | (0.02 | ) | 1.78 | 1.76 | – | – | – | 10.09 | ||||||||||||||||||||||||||||||
| 10/31/2002 | 10.00 | (0.01 | ) | (1.66 | ) | (1.67 | ) | – | – | – | 8.33 | ||||||||||||||||||||||||||||
| Class C | 4/30/2005 | 10.91 | 0.01 | 0.23 | 0.24 | (0.15 | ) | (0.05 | ) | (0.20 | ) | 10.95 | |||||||||||||||||||||||||||
| 10/31/2004 | 10.09 | (0.02 | ) | 0.86 | 0.84 | (0.02 | ) | – | (0.02 | ) | 10.91 | ||||||||||||||||||||||||||||
| 10/31/2003 | 8.31 | (0.02 | ) | 1.80 | 1.78 | – | – | – | 10.09 | ||||||||||||||||||||||||||||||
| Ratios/Supplemental Data | |||||||||||||||||||||||||||||||
| For the Period | Total | Net Assets, End of Period | Ratio of Expenses to Average Net Assets (a) | Net Investment Income (Loss) to Average | Portfolio Turnover | ||||||||||||||||||||||||||
| Ended (g) | Return (c) | (000's) | Net (e) | Total (f) | Net Assets (a) | Rate (b) | |||||||||||||||||||||||||
| Class A | 4/30/2005 | 2.39 | % | $ | 453,276 | 0.27 | % | 0.27 | % | 0.77 | % | 28 | % | ||||||||||||||||||
| 10/31/2004 | 9.09 | 352,852 | 0.32 | 0.31 | 0.45 | 3 | |||||||||||||||||||||||||
| 10/31/2003 | 21.79 | 136,295 | 0.44 | 0.44 | 0.48 | 15 | |||||||||||||||||||||||||
| 10/31/2002 | (16.30 | ) | 20,681 | 0.45 | 0.90 | 0.41 | 21 | ||||||||||||||||||||||||
| Class B | 4/30/2005 | 2.03 | 377,377 | 0.94 | 0.94 | 0.10 | 28 | ||||||||||||||||||||||||
| 10/31/2004 | 8.25 | 333,533 | 0.97 | 0.96 | (0.19 | ) | 3 | ||||||||||||||||||||||||
| 10/31/2003 | 21.15 | 190,621 | 1.09 | 1.09 | (0.17 | ) | 15 | ||||||||||||||||||||||||
| 10/31/2002 | (16.70 | ) | 33,241 | 1.10 | 1.55 | (0.24 | ) | 21 | |||||||||||||||||||||||
| Class C | 4/30/2005 | 2.10 | 823,000 | 0.89 | 0.89 | 0.15 | 28 | ||||||||||||||||||||||||
| 10/31/2004 | 8.35 | 675,562 | 0.92 | 0.91 | (0.15 | ) | 3 | ||||||||||||||||||||||||
| 10/31/2003 | 21.44 | 239,043 | 1.09 | 1.09 | (0.17 | ) | 15 | ||||||||||||||||||||||||
NOTES TO FINANCIAL HIGHLIGHTS
(a) Annualized.
(b) Not annualized for periods of less than one year.
(c) Total Return has been calculated for the applicable period without deduction of a sales load, if any, on an initial purchase. Periods of less that one year are not annualized.
(d) Per share information is calculated based on average number of shares outstanding.
(e) Ratio of Net Expenses to Average Net Assets is net of fee waivers and reimbursements by the investment adviser, if any and includes the recapture of previously waived expenses (see note 2).
(f) Ratio of Total Expenses to Average Net Assets includes all expenses before fee waivers and reimbursements by the investment adviser and recapture of previously waived expenses.
(g) TA IDEX Asset Allocation–Moderate Growth Portfolio ("the Fund") commenced operations on March 1, 2002. The inception date for the Fund's offering of share Class C was November 11, 2002.
The notes to the financial statements are an integral part of this report.
Transamerica IDEX Mutual Funds
Semi-Annual Report 2005
5
TA IDEX Asset Allocation–Moderate Growth Portfolio
NOTES TO FINANCIAL STATEMENTS
At April 30, 2005
(all amounts in thousands)
(unaudited)
NOTE 1. ORGANIZATION AND SIGNIFICANT ACCOUNTING POLICIES
Transamerica IDEX Mutual Funds is a Delaware statutory trust registered under the Investment Company Act of 1940, as amended (the "1940 Act"), as an open-end management investment company. Prior to March 1, 2005, Transamerica IDEX Mutual Funds was a Massachusetts business trust. TA IDEX Asset Allocation - Moderate Growth Portfolio ("the Fund"), part of Transamerica IDEX Mutual Funds, began operations on March 1, 2002.
In the normal course of business, the Fund enters into contracts that contain a variety of representations and warranties, which provide general indemnifications. The Fund's maximum exposure under these arrangements is unknown, as this would involve future claims that may be made against the Fund and/or its affiliates that have not yet occurred. However, based on experience, the Fund expects the risk of loss to be remote.
See the Prospectus and Statement of Additional Information for a description of the Fund's investment objective.
In preparing the Fund's financial statements in accordance with accounting principles generally accepted in the United States of America ("GAAP"), estimates or assumptions (which could differ from actual results) may be used that affect reported amounts and disclosures. The following policies were consistently followed by the Fund, in accordance with GAAP.
Multiple class operations and expenses: The Fund currently offers three classes of shares, each with a public offering price that reflects different sales charges, if any, and expense levels. On June 15, 2004, Class C2 shares merged into Class C. On September 24, 2004, Class M shares merged into Class C. Class B shares will convert to Class A shares eight years after purchase. Income, non-class specific expenses and realized and unrealized gains and losses, are allocated daily to each class, based upon the value of shares outstanding method as permitted under Rule 18f-3 of the 1940 Act. Each class bears its own specific expenses as well as a portion of general, common expenses.
Pricing of shares: The Fund prices its shares on the basis of the net asset value of each class of shares of the Fund, which is determined as of the close of the New York Stock Exchange ("NYSE") (generally 4:00 p.m. Eastern Time) on each day on which the NYSE is open for trading.
Security valuations: The Fund's investments are valued at the net asset values of the underlying portfolios of Transamerica IDEX Mutual Funds. The net asset values of the underlying portfolios are determined at the close of the NYSE (generally 4:00 p.m. eastern time) on the valuation date.
Cash: The Fund may leave cash overnight in its cash account with the custodian, Investors Bank & Trust Company ("IBT"). IBT has been contracted on behalf of the Fund to invest the excess cash into a savings account, which at April 30, 2005, was paying an interest rate of 2.02%.
Throughout the period, the Fund may have a cash overdraft balance. A fee is incurred on this overdraft, calculated by multiplying the overdraft by a rate based on the federal funds rate.
Security transactions and investment income: Security transactions are recorded on the trade date. Security gains and losses are calculated on the specific identification basis. Interest income, including accretion of discounts and amortization of premiums, is recorded on the accrual basis commencing on the settlement date. Dividend income is recorded on the ex-dividend date. Dividends and net realized gain (loss) from investment securities for the Fund are from investments in shares of affiliated investment companies.
Account maintenance fees: If the shareholder account balance falls below $1 by either shareholder action or as a result of market action, a $25 (not in thousands) fee is assessed every year until the balance reaches $1. The fee is assessed by redeeming shares in the shareholder's account.
No fee will be charged under the following conditions:
• accounts opened within the preceding 24 months
• accounts with an active monthly Automatic Investment Plan ($50 (not in thousands) minimum per fund)
• accounts owned by an individual which, when combined by social security number, have a balance of $5 or more
• accounts owned by individuals in the same household (by address) that have a combined balance of $5 or more
• UTMA/UGMA accounts
• Fiduciary accounts
• B-share accounts whose shares have started to convert to A-shares accounts (as long as combined value of both accounts is at least $1)
For the six months ended April 30, 2005, this fee totaled less than $1. These fees are included in Paid in Capital in the Statement of Assets and Liabilities.
Redemption fees: A short-term trading redemption fee may be assessed on any fund shares in a fund account that are sold during the first five (5) NYSE trading days following their purchase date. This redemption fee will equal 2% of the amount redeemed and shares held the longest will be treated as being redeemed first and shares held the shortest as being redeemed last.
Dividend distributions: Distributions to shareholders are recorded on the ex-dividend date and are determined in accordance with Federal income tax regulations which may differ from GAAP.
Transamerica IDEX Mutual Funds
Semi-Annual Report 2005
6
TA IDEX Asset Allocation–Moderate Growth Portfolio
NOTES TO FINANCIAL STATEMENTS (continued)
At April 30, 2005
(all amounts in thousands)
(unaudited)
NOTE 2. RELATED PARTY TRANSACTIONS
Transamerica Fund Advisors, Inc. ("TFAI") is the Fund's Investment adviser. Transamerica Fund Services, Inc. ("TFS") is the Fund's administrator and transfer agent. AFSG Securities Corp. ("AFSG") is the Fund's distributor/principal underwriter. AFSG is 100% owned by AUSA Holding Company ("AUSA"). TFAI is a directly owned subsidiary of Western Reserve Life Assurance Co. of Ohio (78%) and AUSA (22%). TFS is a wholly owned subsidiary of WRL (50%) and AUSA (50%). AUSA and WRL are wholly owned indirect subsidiaries of AEGON, NV, a Netherlands corporation.
Effective January 1, 2005 AEGON/Transamerica Fund Advisors, Inc. ("ATFA") was renamed Transamerica Fund Advisors, Inc. ("TFAI"); AEGON/Transamerica Fund Services, Inc. ("ATFS") and AEGON/Transamerica Investor Services, Inc. ("ATIS") merged into one entity and was renamed Transamerica Fund Services, Inc. ("TFS").
TFAI has entered into an agreement with Morningstar Associates, LLC to provide investment services to the Fund. TFAI compensates Morningstar Associates, LLC as described in the Prospectus.
Transamerica Investment Management, LLC and Great Companies, LLC are affiliates of the Fund and are sub-advisers to other funds within Transamerica IDEX Mutual Funds.
Investment advisory fee: The Fund pays management fees to TFAI based on average daily net assets ("ANA") at the following rate:
0.10% of ANA
TFAI has contractually agreed to waive its advisory fee and will reimburse the Fund to the extent that operating expenses, excluding 12b-1 fees, exceed the following stated annual limit:
0.45% Expense Limit
If total fund expenses fall below the annual expense limitation agreement agreed to by the adviser within the succeeding three years, the Fund may be required to pay that adviser a portion or all of the waived advisory fees.
There were no amounts available for recapture at April 30, 2005.
Distribution and service fees: The Fund has a 12b-1 distribution plan under the 1940 Act pursuant to which an annual fee, based on average daily net assets, is paid to the distributor for various disbursements such as broker-dealer account servicing fees and other promotional expenses of the Fund. The Fund is authorized under the 12b-1 plan to pay fees on each class up to the following limits:
| Class A | N/A | ||||||
| Class B | 0.65 | % | |||||
| Class C | 0.65 | % | |||||
In addition, the underlying funds' Class A shares in which the Fund invests impose a 0.35% 12b-1 fee. To avoid duplication of the 12b-1 fees, each class of fund shares of the Fund has reduced the 12b-1 fees by the amount of the underlying funds' Class A 12b-1 fees.
In the case the Fund or a class of shares of the Fund is closed to new investors or investments, the Fund is authorized to pay 12b-1 fees for past sales and distribution efforts and present and past investor services.
Underwriter commissions relate to front-end sales charges imposed for Class A shares and contingent deferred sales charges from Classes B, C and certain A share redemptions. For the six months ended April 30, 2005, the underwriter commissions were as follows:
| Received by Underwriter | $ | 18,367 | |||||
| Retained by Underwriter | 1,079 | ||||||
| Contingent Deferred Sales Charge | 694 | ||||||
Administrative services: The Fund has entered into an agreement with TFS for financial and legal fund administration services, which includes such items as compliance, expenses, financial statements and other reporting, distributions, tax returns, prospectus preparation, board of trustees meeting support and other legal matters. As of January 1, 2005 the Fund pays TFS an annual fee of 0.02% of average net assets. Prior to January 1, 2005 the Fund paid TFS an annual fee of 0.015% of average net assets. The Legal fees on the Statement of Operations are for fees paid to external legal counsel.
Transfer agent fees: The Fund pays TFS an annual per-account charge of $20 (not in thousands) for each open account and $1.63 (not in thousands) for each closed account. There is no new account charge. The Transfer agent fees on the Statement of Operations are made up of fees paid to TFS and costs associated with shareholder statements.
The Fund paid TFS $893 for the six months ended April 30, 2005.
Deferred compensation plan: Each eligible Fund Trustee may elect participation in the Deferred Compensation Plan ("the Plan"). Under the Plan, such Trustees may defer payment of a percentage of their total fees earned as a Fund Trustee. These deferred amounts may be invested in any Transamerica IDEX Mutual Fund. At April 30, 2005, the value of invested plan amount was $25. Invested plan amounts and the total liability for deferred compensation to the Trustees under the Plan at April 30, 2005, are included in the accompanying Statement of Assets and Liabilities.
Transamerica IDEX Mutual Funds
Semi-Annual Report 2005
7
TA IDEX Asset Allocation–Moderate Growth Portfolio
NOTES TO FINANCIAL STATEMENTS (continued)
At April 30, 2005
(all amounts in thousands)
(unaudited)
NOTE 3. INVESTMENT TRANSACTIONS
The cost of securities purchased and proceeds from securities sold (excluding short-term securities) for the six months ended April 30, 2005, were as follows:
| Purchases of securities: | |||||||
| Long-Term excluding U.S. Government | $ | 723,677 | |||||
| U.S. Government | – | ||||||
| Proceeds from maturities and sales of securities: | |||||||
| Long-Term excluding U.S. Government | 438,191 | ||||||
| U.S. Government | – | ||||||
NOTE 4. FEDERAL INCOME TAX MATTERS
The Fund has not made any provision for federal income or excise taxes due to its policy to distribute all of its taxable income and capital gains to its shareholders and otherwise qualify as a regulated investment company under the Internal Revenue Code. Income and capital gain distributions are determined in accordance with income tax regulations, which may differ from GAAP. These differences are primarily due to differing treatment for items including, but not limited to, wash sales, net operating losses and capital loss carryforwards.
The aggregate cost of investments and composition of unrealized appreciation (depreciation) for federal income tax purposes as of April 30, 2005, are as follows:
| Federal Tax Cost Basis | $ | 1,592,030 | |||||
| Unrealized Appreciation | $ | 78,380 | |||||
| Unrealized (Depreciation) | (18,474 | ) | |||||
| Net Unrealized Appreciation (Depreciation) | $ | 59,906 | |||||
NOTE 5. REGULATORY PROCEEDINGS
There continues to be significant federal and state regulatory activity relating to financial services companies, particularly mutual fund companies and their investment advisers. As part of an ongoing investigation regarding potential market timing, recordkeeping and trading compliance issues and matters affecting the Fund's investment adviser, TFAI, and certain employees and affiliates of TFAI, the SEC staff has indicated that it is likely to take some action against TFAI and certain of its affiliates at the conclusion of the investigation. The potential timing and the scope of any such action is difficult to predict. Although the impact of any action brought against TFAI and/or its affiliates is difficult to assess at the present time, the Fund currently believes that the likelihood that any such action will have a material adverse impact on it is remote. It is important to note that the Fund is not aware of any allegation of wrongdoing against it and its board at the time this semi-annual report is printed. Although it is not anticipated that these developments will have an adverse impact on the Fund, there can be no assurance at this time. TFAI and its affiliates are actively working with the SEC in regard to this matter; however, the exact resolution cannot be determined at this time. TFAI will take such actions that it deems necessary or appropriate to continue providing management services to the Fund and to bring all matters to an appropriate conclusion.
TFAI and/or its affiliates, and not the Fund, will bear the costs regarding these regulatory matters.
Transamerica IDEX Mutual Funds
Semi-Annual Report 2005
8
TA IDEX Asset Allocation–Moderate Growth Portfolio
INVESTMENT ADVISORY AND ASSET ALLOCATION MANAGEMENT AGREEMENTS – REVIEW AND RENEWAL
At a meeting of the Board of Trustees of Transamerica IDEX Mutual Funds ("TA IDEX") held on October 6, 2004, the Board considered and approved the renewal for a one-year period of the Investment Advisory Agreement between TA IDEX Asset Allocation – Moderate Growth Portfolio (the "Fund") and Transamerica Fund Advisors, Inc. ("TFAI"). Additionally, at a meeting held on March 22, 2005, the Board considered and approved for a two-year period the Asset Allocation Management Agreement of the Fund between TFAI and Morningstar Associates, LLC (the "Portfolio Construction Manager"). In approving these agreements, the Board concluded that the Investment Advisory and Asset Allocation Management Agreement enable shareholders of the Fund to obtain high quality services at a cost that is appropriate, reasonable, and in the best interests of shareholders based upon the following determinations, among ot hers:
The nature, extent and quality of the advisory service to be provided. The Board considered the nature and quality of the services provided by TFAI and the Portfolio Construction Manager to the Fund in the past, as well as the services anticipated to be provided in the future. The Board concluded that TFAI and the Portfolio Construction Manager are capable of providing high quality services to the Fund, as indicated by TFAI's management capabilities demonstrated with respect to the Fund and other funds managed by TFAI, TFAI's management oversight process, and the professional qualifications and experience of the Portfolio Construction Manager's portfolio management team. The Board also concluded that TFAI and the Portfolio Construction Manager would provide the same quality and quantity of inves tment management and related services as before, that these services are appropriate in scope and extent in light of the Fund's operations, the competitive landscape of the investment company business and investor needs, and that TFAI's and the Portfolio Construction Manager's obligations will remain the same in all respects.
The investment performance of the Fund. The Board concluded, based in particular on information provided by Lipper Analytics, that the Fund's investment performance was competitive or superior relative to comparable funds over trailing one- and two-year periods and to the Fund's benchmark index over the past year. On the basis of the Trustees' assessment of the nature, extent and quality of investment advisory and related services to be provided or procured by TFAI and the Portfolio Construction Manager, the Trustees concluded that TFAI and the Portfolio Construction Manager were capable of generating a level of long-term investment performance that is appropriate in light of the Fund's investment objective, policies and strategies and competitive with many other investment companies.
The cost of advisory services provided and the level of profitability. On the basis of the Board's review of the fees to be charged by TFAI and the Portfolio Construction Manager for investment advisory and related services, TFAI's financial statements, the fees paid by TFAI to the Portfolio Construction Manager, TFAI's estimated net management income resulting from its management of the Fund, the estimated profitability of TFAI's relationships with the Fund and TA IDEX, and the estimated profitability of the Portfolio Construction Manager's relationship with the Fund, the Board concluded that the level of investment advisory fees and the profitability is appropriate in light of the services provided, the management fees and overall expense ratios of comparable investment companies, and the anti cipated profitability of the relationship between the Fund, TFAI and the Portfolio Construction Manager. Further, on the basis of comparative information supplied by Lipper Analytics, the Board determined that the advisory fees and estimated overall expense ratio of the Fund were consistent with industry averages.
The extent to which economies of scale would be realized as the Fund grows and whether fee levels reflect these economies of scale for the benefit of Fund investors. Although the investment advisory fees do not reduce should Fund assets grow meaningfully, the Board concluded that the advisory fees appropriately reflect the Fund's current size, the current economic environment for TFAI, and the competitive nature of the investment company market. In addition, the Board noted that it will have the opportunity to periodically re-examine whether the Fund has achieved economies of scale, as well as the appropriateness of advisory fees payable to TFAI and the Portfolio Construction Manager in the future.
Benefits (such as soft dollars) to TFAI or the Portfolio Construction Manager from its relationship with the Fund. The Board concluded that other benefits derived by TFAI (including any benefits derived from investment advisory fees payable to TFAI with respect to the underlying funds in which the Fund invests) or the Portfolio Construction Manager from its relationship with the Fund are reasonable and fair, and are consistent with industry practice and the best interests of the Fund and its shareholders. In this regard, the Board noted that TFAI or the Portfolio Construction Manager do not realize "soft dollar" benefits from their relationship with the Fund.
Other considerations. The Board also determined that TFAI had made a substantial commitment to the recruitment and retention of high quality personnel, and maintained the financial, compliance and operational resources reasonably necessary to manage the Fund in a professional manner that is consistent with the best interests of the Fund and its shareholders. The Trustees also concluded that TFAI had made a significant entrepreneurial commitment to the management and success of the Fund, reflected by TFAI's expense limitation and fee waiver arrangement with the Fund which, as demonstrated in the past with the Fund, may result in TFAI waiving a substantial amount of advisory fees for the benefit of shareholders. The Board also noted the significant growth in the Fund's assets in the past year.
Transamerica IDEX Mutual Funds
Semi-Annual Report 2005
9
TA IDEX Asset Allocation–Moderate Growth Portfolio
SUPPLEMENTAL INFORMATION (unaudited)
RESULTS OF SHAREHOLDER PROXY
At a special meeting of shareholders held on February 25, 2005, the results of the Proposals were as follows:
Transamerica IDEX Mutual Funds
Proposal 1: Election of Trustees to the Board of Trustees of Transamerica IDEX Mutual Funds.
| For | Withheld | ||||||||||
| Peter R. Brown | 872,017,875.249 | 4,468,498.551 | |||||||||
| Daniel Calabria | 871,917,069.786 | 4,569,304.014 | |||||||||
| Janise B. Case | 872,099,393.125 | 4,386,980.675 | |||||||||
| Charles C. Harris | 872,086,722.025 | 4,399,651.775 | |||||||||
| Leo J. Hill | 872,304,465.640 | 4,181,908.160 | |||||||||
| Russell A. Kimball, Jr. | 872,253,556.471 | 4,232,817.329 | |||||||||
| William W. Short, Jr. | 872,139,920.944 | 4,346,452.856 | |||||||||
| John Waechter | 872,261,152.376 | 4,225,221.424 | |||||||||
| Jack E. Zimmerman | 871,929,967.512 | 4,556,406.288 | |||||||||
| Brian C. Scott | 872,218,970.367 | 4,267,403.433 | |||||||||
| Thomas P. O'Neill | 872,111,944.117 | 4,374,429.683 | |||||||||
TA IDEX Asset Allocation – Moderate Growth Portfolio
Proposal 2: Approval of an Agreement and Plan of Reorganization pursuant to which Transamerica IDEX Mutual Funds will organize as a Delaware statutory trust.
| For | Against | Abstentions/Broker Non-Votes | |||||||||
| 44,245,471.409 | 916,159.173 | 20,721,442.730 | |||||||||
Proposal 3: Approval of changes to the fundamental investment restrictions of TA IDEX Asset Allocation – Moderate Growth Portfolio.
| A. Diversification | For | Against | Abstentions/Broker Non-Votes | ||||||||||||
| 45,180,819.052 | 1,235,445.486 | 19,466,808.774 | |||||||||||||
| B. Borrowing | For | Against | Abstentions/Broker Non-Votes | ||||||||||||
| 45,098,856.486 | 1,316,426.052 | 19,467,790.774 | |||||||||||||
| C. Senior Securities | For | Against | Abstentions/Broker Non-Votes | ||||||||||||
| 45,180,265.065 | 1,235,999.473 | 19,466,808.774 | |||||||||||||
| D. Underwriting Securities | For | Against | Abstentions/Broker Non-Votes | ||||||||||||
| 45,138,435.503 | 1,276,847.035 | 19,467,790.774 | |||||||||||||
| E. Real Estate | For | Against | Abstentions/Broker Non-Votes | ||||||||||||
| 45,149,884.368 | 1,266,380.170 | 19,466,808.774 | |||||||||||||
| F. Making Loans | For | Against | Abstentions/Broker Non-Votes | ||||||||||||
| 45,040,985.203 | 1,372,395.335 | 19,469,692.774 | |||||||||||||
| G. Concentration | For | Against | Abstentions/Broker Non-Votes | ||||||||||||
| 45,144,608.714 | 1,269,753.824 | 19,468,710.774 | |||||||||||||
| H. Commodities | For | Against | Abstentions/Broker Non-Votes | ||||||||||||
| 45,067,064.013 | 1,348,218.525 | 19,467,790.774 | |||||||||||||
Transamerica IDEX Mutual Funds
Semi-Annual Report 2005
10
TA IDEX Clarion Real Estate Securities
UNDERSTANDING YOUR FUND'S EXPENSES
(unaudited)
SHAREHOLDER EXPENSES
The following Example is intended to help you understand your ongoing costs (in dollars and cents) of investing in a Fund and to compare these costs with the ongoing costs of investing in other funds.
The Example is based on an investment of $1,000 invested at November 1, 2004 and held for the entire period until April 30, 2005.
ACTUAL EXPENSES
The first line in the table below provides information about actual account values and actual expenses. You may use the information in this line, together with the amount you invested, to estimate the expenses that you paid over the period. Simply divide your account value by $1,000 (for example, an $8,600 account value divided by $1,000 = 8.6), then multiply the result by the number in the first line of your Fund under the heading entitled "Expenses Paid During Period" to estimate the expenses you paid on your account during this period.
HYPOTHETICAL EXAMPLE FOR COMPARISON PURPOSES
The second line in the table below provides information about hypothetical account values and hypothetical expenses based on the Fund's actual expense ratio and an assumed rate of return of 5% per year before expenses, which is not the Fund's actual return. The hypothetical account values and expenses may not be used to estimate the actual ending account balance or expenses you paid for the period. You may use this information to compare the ongoing costs of investing in your Fund and other funds. To do so, compare this 5% hypothetical example with the 5% hypothetical examples that appear in the shareholder reports of the other funds.
Please note that the expenses shown in the table are meant to highlight your ongoing costs only and do not reflect any transactional costs, such as sales charges, redemption fees, brokerage commissions paid on purchases and sales of fund shares. Therefore, the second line under the Fund in the table is useful in comparing ongoing costs only, and will not help you determine the relative total costs of owning different funds. In addition, note that the expenses shown in the table are meant to highlight your ongoing costs and do not reflect any transaction costs.
| Beginning Account Value | Ending Account Value | Annualized Expense Ratio | Expenses Paid During Period (a) | ||||||||||||||||
| Class A | |||||||||||||||||||
| Actual | $ | 1,000.00 | $ | 1,083.40 | 1.25 | % | $ | 6.46 | |||||||||||
| Hypothetical (b) | 1,000.00 | 1,018.60 | 1.25 | 6.26 | |||||||||||||||
| Class B | |||||||||||||||||||
| Actual | 1,000.00 | 1,078.10 | 2.31 | 11.90 | |||||||||||||||
| Hypothetical (b) | 1,000.00 | 1,013.34 | 2.31 | 11.53 | |||||||||||||||
| Class C | |||||||||||||||||||
| Actual | 1,000.00 | 1,077.00 | 2.40 | 12.36 | |||||||||||||||
| Hypothetical (b) | 1,000.00 | 1,012.89 | 2.40 | 11.98 | |||||||||||||||
(a) Expenses are calculated using each Fund's annualized expense ratio (as disclosed in the table), multiplied by the average account value for the period, multiplied by number of days in the period (181 days), and divided by the number of days in the year (365 days).
(b) 5% return per year before expenses.
GRAPHICAL PRESENTATION OF SCHEDULE OF INVESTMENTS
By Real Estate Property Type
At April 30, 2005
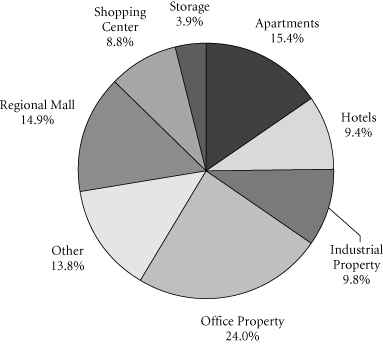
This chart shows the percentage breakdown by real estate property type of the Fund's total investment securities.
Transamerica IDEX Mutual Funds
Semi-Annual Report 2005
1
TA IDEX Clarion Real Estate Securities
SCHEDULE OF INVESTMENTS
At April 30, 2005
(all amounts except share amounts in thousands)
(unaudited)
| Shares | Value | ||||||||||
| COMMON STOCKS (98.3%) | |||||||||||
| Apartments (17.4%) | |||||||||||
| American Campus Communities, Inc. | 57,500 | $ | 1,206 | ||||||||
| Archstone-Smith Trust | 85,900 | 3,090 | |||||||||
| AvalonBay Communities, Inc. (a) | 60,900 | 4,385 | |||||||||
| Camden Property Trust | 77,060 | 3,930 | |||||||||
| Education Realty Trust, Inc. | 43,200 | 691 | |||||||||
| Equity Residential | 54,200 | 1,862 | |||||||||
| Gables Residential Trust (a) | 34,800 | 1,275 | |||||||||
| Post Properties, Inc. | 36,200 | 1,179 | |||||||||
| United Dominion Realty Trust, Inc. (a) | 175,800 | 3,894 | |||||||||
| Hotels (10.8%) | |||||||||||
| Hilton Hotels Corp. | 55,300 | 1,207 | |||||||||
| Host Marriott Corp. | 253,600 | 4,266 | |||||||||
| LaSalle Hotel Properties | 38,400 | 1,167 | |||||||||
| Starwood Hotels & Resorts Worldwide, Inc. | 102,600 | 5,575 | |||||||||
| Strategic Hotel Capital, Inc. | 74,500 | 1,051 | |||||||||
| Industrial Property (11.2%) | |||||||||||
| AMB Property Corp. | 77,800 | 3,033 | |||||||||
| Catellus Development Corp. | 43,303 | 1,199 | |||||||||
| Liberty Property Trust | 87,749 | 3,495 | |||||||||
| Prologis | 154,100 | 6,101 | |||||||||
| Office Property (27.4%) | |||||||||||
| Arden Realty, Inc. | 84,150 | 3,003 | |||||||||
| Boston Properties, Inc. (a) | 88,200 | 5,863 | |||||||||
| CarrAmerica Realty Corp. | 27,600 | 912 | |||||||||
| Corporate Office Properties Trust | 68,900 | 1,812 | |||||||||
| Equity Office Properties Trust | 138,200 | 4,349 | |||||||||
| Maguire Properties, Inc. | 99,600 | 2,540 | |||||||||
| Prentiss Properties Trust (a) | 1,340 | 45 | |||||||||
| Reckson Associates Realty Corp. | 94,900 | 3,061 | |||||||||
| SL Green Realty Corp. | 79,800 | 4,868 | |||||||||
| Trizec Properties, Inc. | 226,000 | 4,518 | |||||||||
| Vornado Realty Trust | 36,400 | 2,783 | |||||||||
| Regional Mall (17.0%) | |||||||||||
| CBL & Associates Properties, Inc. (a) | 16,180 | 1,252 | |||||||||
| General Growth Properties, Inc. | 128,360 | 5,020 | |||||||||
| Macerich Co. (The) | 53,200 | 3,208 | |||||||||
| Mills Corp. (The) (a) | 77,800 | 4,445 | |||||||||
| Simon Property Group, Inc. | 105,600 | 6,977 | |||||||||
| Shopping Center (10.0%) | |||||||||||
| Acadia Realty Trust | 74,500 | 1,196 | |||||||||
| Developers Diversified Realty Corp. | 87,200 | 3,701 | |||||||||
| Federal Realty Investment Trust | 21,300 | 1,140 | |||||||||
| Kite Realty Group Trust | 44,300 | 620 | |||||||||
| Pan Pacific Retail Properties, Inc. | 41,400 | 2,501 | |||||||||
| Regency Centers Corp. (a) | 60,600 | 3,191 | |||||||||
| Shares | Value | ||||||||||
| Storage (4.5%) | |||||||||||
| Extra Space Storage, Inc. (a) | 91,700 | $ | 1,192 | ||||||||
| Public Storage, Inc. | 73,500 | 4,314 | |||||||||
| Total Common Stocks (cost: $103,452) | 121,117 | ||||||||||
| Principal | Value | ||||||||||
| SECURITY LENDING COLLATERAL (15.7%) | |||||||||||
| Debt (13.6%) | |||||||||||
| Bank Notes (1.9%) | |||||||||||
| Bank of America 2.82%, due 05/16/2005 $609 $609 2.80%, due 06/09/2005 (b) 152 152 2.77%, due 07/18/2005 (b) | 609 | 609 | |||||||||
| Canadian Imperial Bank of Commerce 3.02%, due 11/04/2005 (b) | 609 | 609 | |||||||||
| Credit Suisse First Boston Corp. 2.88%, due 09/09/2005 (b) 152 152 3.06%, due 03/10/2006 (b) | 152 | 152 | |||||||||
| Euro Dollar Overnight (2.4%) | |||||||||||
| Bank of Montreal 2.94%, due 05/04/2005 | 456 | 456 | |||||||||
| BNP Paribas 2.80%, due 05/05/2005 | 630 | 630 | |||||||||
| Den Danske Bank 2.93%, due 05/02/2005 548 548 2.80%, due 05/06/2005 | 304 | 304 | |||||||||
| Dexia Group 2.80%, due 05/05/2005 | 269 | 269 | |||||||||
| Royal Bank of Canada 2.80%, due 05/04/2005 | 625 | 625 | |||||||||
| Svenska Handlesbanken 2.80%, due 05/06/2005 | 100 | 100 | |||||||||
| Euro Dollar Terms (5.5%) | |||||||||||
| Bank of Nova Scotia 2.88%, due 05/11/2005 304 304 3.01%, due 05/31/2005 | 851 | 851 | |||||||||
| Barclays 3.02%, due 06/27/2005 | 542 | 542 | |||||||||
| BNP Paribas 2.93%, due 06/07/2005 | 487 | 487 | |||||||||
| Branch Banker & Trust 2.94%, due 06/06/2005 | 130 | 130 | |||||||||
| Calyon 2.93%, due 06/03/2005 | 503 | 503 | |||||||||
| Citigroup 2.87%, due 06/06/2005 | 632 | 632 | |||||||||
| Credit Suisse First Boston Corp. 2.91%, due 05/16/2005 | 623 | 623 | |||||||||
The notes to the financial statements are an integral part of this report.
Transamerica IDEX Mutual Funds
Semi-Annual Report 2005
2
TA IDEX Clarion Real Estate Securities
SCHEDULE OF INVESTMENTS (continued)
At April 30, 2005
(all amounts except share amounts in thousands)
(unaudited)
| Principal | Value | ||||||||||
| Euro Dollar Terms (continued) | |||||||||||
| HSBC Banking/Holdings PLC 3.01%, due 06/23/2005 | $ | 304 | $ | 304 | |||||||
| Royal Bank of Scotland 2.94%, due 06/07/2005 591 591 2.95%, due 06/10/2005 | 328 | 328 | |||||||||
| Societe Generale 2.80%, due 05/03/2005 | 582 | 582 | |||||||||
| Toronto Dominion Bank 2.75%, due 05/09/2005 456 456 3.01%, due 06/24/2005 | 169 | 169 | |||||||||
| UBS AG 2.81%, due 05/03/2005 | 304 | 304 | |||||||||
| Promissory Notes (1.4%) | |||||||||||
| Goldman Sachs Group, Inc. 2.99%, due 06/27/2005 639 639 3.01%, due 07/27/2005 | 1,065 | 1,065 | |||||||||
| Repurchase Agreements (2.4%) (c) | |||||||||||
| Goldman Sachs Group, Inc. (The) 3.04% Repurchase Agreement dated 04/29/2005 to be repurchased at $1,370 on 05/02/2005 | 1,369 | 1,369 | |||||||||
| Merrill Lynch & Co., Inc. 3.04% Repurchase Agreement dated 04/29/2005 to be repurchased at $1,644 on 05/02/2005 | 1,643 | 1,643 | |||||||||
| Shares | Value | ||||||||||
| Investment Companies (2.1%) | |||||||||||
| Money Market Funds (2.1%) | |||||||||||
| American Beacon Funds 1-day yield of 2.84% | 241,659 | $ | 242 | ||||||||
| BGI Institutional Money Market Fund 1-day yield of 2.93% | 1,430,997 | 1,431 | |||||||||
| Merrill Lynch Premier Institutional Fund 1-day yield of 2.65% | 322,020 | 322 | |||||||||
| Merrimac Cash Fund, Premium Class 1-day yield of 2.74% (d) | 588,969 | 589 | |||||||||
| Total Security Lending Collateral (cost: $19,321) | 19,321 | ||||||||||
| Total Investment Securities (cost: $122,773) | $ | 140,438 | |||||||||
| SUMMARY: | |||||||||||
| Investments, at value | 114.0 | % | $ | 140,438 | |||||||
| Liabilities in excess of other assets | (14.0 | )% | (17,235 | ) | |||||||
| Net assets | 100.0 | % | $ | 123,203 | |||||||
NOTES TO SCHEDULE OF INVESTMENTS:
(a) At April 30, 2005, all or a portion of this security is on loan (see Note 1). The value at April 30, 2005, of all securities on loan is $18,750.
(b) Floating or variable rate note. Rate is listed as of April 30, 2005.
(c) Cash collateral for the Repurchase Agreements, valued at $3,065, that serve as collateral for securities lending are invested in corporate bonds with interest rates and maturity dates ranging from 0.00%–8.875% and 06/15/2005–03/15/2035, respectively.
(d) Regulated investment company advised by Investors Bank and Trust Co. ("IBT"). IBT is also the accounting, custody and lending agent for the Fund.
The notes to the financial statements are an integral part of this report.
Transamerica IDEX Mutual Funds
Semi-Annual Report 2005
3
TA IDEX Clarion Real Estate Securities
STATEMENT OF ASSETS AND LIABILITIES
At April 30, 2005
(all amounts except per share amounts in thousands)
(unaudited)
| Assets: | |||||||
| Investment securities, at value (cost: $122,773) (including securities loaned of $18,750) | $ | 140,438 | |||||
| Cash | 1,328 | ||||||
| Receivables: | |||||||
| Investment securities sold | 1,291 | ||||||
| Shares of beneficial interest sold | 9 | ||||||
| Interest | 5 | ||||||
| Dividends | 265 | ||||||
| Other | 3 | ||||||
| 143,339 | |||||||
| Liabilities: | |||||||
| Investment securities purchased | 638 | ||||||
| Accounts payable and accrued liabilities: | |||||||
| Shares of beneficial interest redeemed | 2 | ||||||
| Management and advisory fees | 89 | ||||||
| Distribution and service fees | 40 | ||||||
| Transfer agent fees | 4 | ||||||
| Payable for collateral for securities on loan | 19,321 | ||||||
| Other | 42 | ||||||
| 20,136 | |||||||
| Net Assets | $ | 123,203 | |||||
| Net Assets Consist of: | |||||||
| Shares of beneficial interest, unlimited shares authorized, no par value | $ | 95,952 | |||||
| Undistributed net investment income (loss) | 702 | ||||||
| Undistributed net realized gain (loss) from investment securities | 8,884 | ||||||
| Net unrealized appreciation (depreciation) on investment securities | 17,665 | ||||||
| Net Assets | $ | 123,203 | |||||
| Net Assets by Class: | |||||||
| Class A | $ | 112,076 | |||||
| Class B | 5,386 | ||||||
| Class C | 5,741 | ||||||
| Shares Outstanding: | |||||||
| Class A | 7,571 | ||||||
| Class B | 365 | ||||||
| Class C | 391 | ||||||
| Net Asset Value Per Share: | |||||||
| Class A | $ | 14.80 | |||||
| Class B | 14.78 | ||||||
| Class C | 14.69 | ||||||
| Maximum Offering Price Per Share (a): | |||||||
| Class A | $ | 15.66 | |||||
(a) Includes the maximum selling commission (represented as a percentage of offering price) which is reduced on certain levels of sales as set forth in the Prospectus. Net asset value per share for Classes B and C shares represents offering price. The redemption price for Classes B and C shares equals net asset value less any applicable contingent deferred sales charge.
STATEMENT OF OPERATIONS
For the period ended April 30, 2005
(all amounts in thousands)
(unaudited)
| Investment Income: | |||||||
| Interest | $ | 11 | |||||
| Dividends | 3,025 | ||||||
| Income from loaned securities–net | 7 | ||||||
| 3,043 | |||||||
| Expenses: | |||||||
| Management and advisory fees | 520 | ||||||
| Transfer agent fees: | |||||||
| Class A | 9 | ||||||
| Class B | 6 | ||||||
| Class C | 3 | ||||||
| Custody fees | 11 | ||||||
| Administration fees | 11 | ||||||
| Legal fees | 4 | ||||||
| Audit fees | 6 | ||||||
| Trustees fees | 3 | ||||||
| Registration fees: | |||||||
| Class A | 19 | ||||||
| Class B | 5 | ||||||
| Class C | 21 | ||||||
| Distribution and service fees: | |||||||
| Class A | 209 | ||||||
| Class B | 24 | ||||||
| Class C | 29 | ||||||
| Total expenses | 880 | ||||||
| Less: | |||||||
| Reimbursement of class expenses: | |||||||
| Class C | (9 | ) | |||||
| Net expenses | 871 | ||||||
| Net Investment Income (Loss) | 2,172 | ||||||
| Net Realized and Unrealized Gain (Loss): | |||||||
| Realized gain (loss) from investment securities | 9,091 | ||||||
| Increase (decrease) in unrealized appreciation (depreciation) on investment securities | (1,111 | ) | |||||
| Net Gain (Loss) on Investments | 7,980 | ||||||
| Net Increase (Decrease) in Net Assets Resulting from Operations | $ | 10,152 | |||||
The notes to the financial statements are an integral part of this report.
Transamerica IDEX Mutual Funds
Semi-Annual Report 2005
4
TA IDEX Clarion Real Estate Securities
STATEMENTS OF CHANGES IN NET ASSETS
For the period or year ended
(all amounts in thousands)
| April 30, 2005 (unaudited) | October 31, 2004 | ||||||||||
| Increase (Decrease) In Net Assets From: | |||||||||||
| Operations: | |||||||||||
| Net investment income (loss) | $ | 2,172 | $ | 2,213 | |||||||
| Net realized gain (loss) from investment securities | 9,091 | 7,514 | |||||||||
| Net unrealized appreciation (depreciation) on investment securities | (1,111 | ) | 15,478 | ||||||||
| 10,152 | 25,205 | ||||||||||
| Distributions to Shareholders: | |||||||||||
| From net investment income: | |||||||||||
| Class A | (1,377 | ) | (3,781 | ) | |||||||
| Class B | (42 | ) | (88 | ) | |||||||
| Class C | (51 | ) | (106 | ) | |||||||
| Class C2 | – | (7 | ) | ||||||||
| Class M | – | (13 | ) | ||||||||
| (1,470 | ) | (3,995 | ) | ||||||||
| From net realized gains: | |||||||||||
| Class A | (1,619 | ) | (7,237 | ) | |||||||
| Class B | (57 | ) | (192 | ) | |||||||
| Class C | (75 | ) | (228 | ) | |||||||
| Class C2 | – | (21 | ) | ||||||||
| Class M | – | (28 | ) | ||||||||
| (1,751 | ) | (7,706 | ) | ||||||||
| Capital Share Transactions: | |||||||||||
| Proceeds from shares sold: | |||||||||||
| Class A | 2,318 | 39,247 | |||||||||
| Class B | 1,765 | 2,642 | |||||||||
| Class C | 1,115 | 2,662 | |||||||||
| Class C2 | – | 101 | |||||||||
| Class M | – | 202 | |||||||||
| 5,198 | 44,854 | ||||||||||
| Dividends and distributions reinvested: | |||||||||||
| Class A | 2,991 | 11,008 | |||||||||
| Class B | 86 | 226 | |||||||||
| Class C | 98 | 240 | |||||||||
| Class C2 | – | 27 | |||||||||
| Class M | – | 29 | |||||||||
| 3,175 | 11,530 | ||||||||||
| Cost of shares redeemed: | |||||||||||
| Class A | (25,103 | ) | (1,533 | ) | |||||||
| Class B | (709 | ) | (1,021 | ) | |||||||
| Class C | (1,079 | ) | (714 | ) | |||||||
| Class C2 | – | (91 | ) | ||||||||
| Class M | – | (22 | ) | ||||||||
| (26,891 | ) | (3,381 | ) | ||||||||
| Class level exchanges: | |||||||||||
| Class C | – | 736 | |||||||||
| Class C2 | – | (256 | ) | ||||||||
| Class M | – | (480 | ) | ||||||||
| – | – | ||||||||||
| April 30, 2005 (unaudited) | October 31, 2004 | ||||||||||
| Automatic conversions: | |||||||||||
| Class A | $ | 31 | $ | 4 | |||||||
| Class B | (31 | ) | (4 | ) | |||||||
| – | – | ||||||||||
| (18,518 | ) | 53,003 | |||||||||
| Net increase (decrease) in net assets | (11,587 | ) | 66,507 | ||||||||
| Net Assets: | |||||||||||
| Beginning of period | 134,790 | 68,283 | |||||||||
| End of period | $ | 123,203 | $ | 134,790 | |||||||
| Undistributed Net Investment Income (Loss) | $ | 702 | $ | – | |||||||
| Share Activity: | |||||||||||
| Shares issued: | |||||||||||
| Class A | 159 | 2,967 | |||||||||
| Class B | 121 | 204 | |||||||||
| Class C | 77 | 205 | |||||||||
| Class C2 | – | 8 | |||||||||
| Class M | – | 17 | |||||||||
| 357 | 3,401 | ||||||||||
| Shares issued–reinvested from distributions: | |||||||||||
| Class A | 201 | 887 | |||||||||
| Class B | 6 | 18 | |||||||||
| Class C | 6 | 19 | |||||||||
| Class C2 | – | 2 | |||||||||
| Class M | – | 2 | |||||||||
| 213 | 928 | ||||||||||
| Shares redeemed: | |||||||||||
| Class A | (1,757 | ) | (121 | ) | |||||||
| Class B | (49 | ) | (81 | ) | |||||||
| Class C | (75 | ) | (56 | ) | |||||||
| Class C2 | – | (7 | ) | ||||||||
| Class M | – | (2 | ) | ||||||||
| (1,881 | ) | (267 | ) | ||||||||
| Class level exchanges: | |||||||||||
| Class C | – | 58 | |||||||||
| Class C2 | – | (21 | ) | ||||||||
| Class M | – | (37 | ) | ||||||||
| – | – | ||||||||||
| Automatic conversions: | |||||||||||
| Class A | 2 | – | |||||||||
| Class B | (2 | ) | – | ||||||||
| – | – | ||||||||||
| Net increase (decrease) in shares outstanding: | |||||||||||
| Class A | (1,395 | ) | 3,733 | ||||||||
| Class B | 76 | 141 | |||||||||
| Class C | 8 | 226 | |||||||||
| Class C2 | – | (18 | ) | ||||||||
| Class M | – | (20 | ) | ||||||||
| (1,311 | ) | 4,062 | |||||||||
The notes to the financial statements are an integral part of this report.
Transamerica IDEX Mutual Funds
Semi-Annual Report 2005
5
TA IDEX Clarion Real Estate Securities
FINANCIAL HIGHLIGHTS
(unaudited for the period ended April 30, 2005)
| For a share of beneficial interest outstanding throughout each period | |||||||||||||||||||||||||||||||||||||||
| Net Asset | Investment Operations | Distributions | Net Asset | ||||||||||||||||||||||||||||||||||||
| For the Period Ended (d)(g) | Value, Beginning of Period | Net Investment Income (Loss) | Net Realized and Unrealized Gain (Loss) | Total Operations | From Net Investment Income | From Net Realized Gains | Total Distributions | Value, End of Period | |||||||||||||||||||||||||||||||
| Class A | 4/30/2005 | $ | 13.99 | $ | 0.25 | $ | 0.91 | $ | 1.16 | $ | (0.17 | ) | $ | (0.18 | ) | $ | (0.35 | ) | $ | 14.80 | |||||||||||||||||||
| 10/31/2004 | 12.25 | 0.28 | 3.05 | 3.33 | (0.53 | ) | (1.06 | ) | (1.59 | ) | 13.99 | ||||||||||||||||||||||||||||
| 10/31/2003 | 10.00 | 0.43 | 1.95 | 2.38 | (0.13 | ) | – | (0.13 | ) | 12.25 | |||||||||||||||||||||||||||||
| Class B | 4/30/2005 | 13.99 | 0.17 | 0.92 | 1.09 | (0.12 | ) | (0.18 | ) | (0.30 | ) | 14.78 | |||||||||||||||||||||||||||
| 10/31/2004 | 12.22 | 0.25 | 3.03 | 3.28 | (0.45 | ) | (1.06 | ) | (1.51 | ) | 13.99 | ||||||||||||||||||||||||||||
| 10/31/2003 | 10.00 | 0.38 | 1.95 | 2.33 | (0.11 | ) | – | (0.11 | ) | 12.22 | |||||||||||||||||||||||||||||
| Class C | 4/30/2005 | 13.92 | 0.16 | 0.91 | 1.07 | (0.12 | ) | (0.18 | ) | (0.30 | ) | 14.69 | |||||||||||||||||||||||||||
| 10/31/2004 | 12.22 | 0.17 | 3.04 | 3.21 | (0.45 | ) | (1.06 | ) | (1.51 | ) | 13.92 | ||||||||||||||||||||||||||||
| 10/31/2003 | 10.00 | 0.38 | 1.95 | 2.33 | (0.11 | ) | – | (0.11 | ) | 12.22 | |||||||||||||||||||||||||||||
| Ratios/Supplemental Data | |||||||||||||||||||||||||||||||
| For the Period | Total | Net Assets, End of Period | Ratio of Expenses to Average Net Assets (a) | Net Investment Income (Loss) to Average | Portfolio Turnover | ||||||||||||||||||||||||||
| Ended (g) | Return (c) | (000's) | Net (e) | Total (f) | Net Assets (a) | Rate (b) | |||||||||||||||||||||||||
| Class A | 4/30/2005 | 8.34 | % | $ | 112,076 | 1.25 | % | 1.25 | % | 3.43 | % | 31 | % | ||||||||||||||||||
| 10/31/2004 | 29.30 | 125,423 | 1.30 | 1.30 | 2.16 | 73 | |||||||||||||||||||||||||
| 10/31/2003 | 23.80 | 64,090 | 1.75 | 1.76 | 5.55 | 95 | |||||||||||||||||||||||||
| Class B | 4/30/2005 | 7.81 | 5,386 | 2.31 | 2.31 | 2.35 | 31 | ||||||||||||||||||||||||
| 10/31/2004 | 28.96 | 4,042 | 1.51 | 1.51 | 1.97 | 73 | |||||||||||||||||||||||||
| 10/31/2003 | 23.33 | 1,804 | 2.40 | 2.41 | 4.91 | 95 | |||||||||||||||||||||||||
| Class C | 4/30/2005 | 7.70 | 5,741 | 2.40 | 2.69 | 2.26 | 31 | ||||||||||||||||||||||||
| 10/31/2004 | 28.32 | 5,325 | 2.22 | 2.22 | 1.32 | 73 | |||||||||||||||||||||||||
| 10/31/2003 | 23.33 | 1,913 | 2.40 | 2.41 | 4.91 | 95 | |||||||||||||||||||||||||
NOTES TO FINANCIAL HIGHLIGHTS
(a) Annualized.
(b) Not annualized for periods of less than one year.
(c) Total Return has been calculated for the applicable period without deduction of a sales load, if any, on an initial purchase. Periods of less than one year are not annualized.
(d) Per share information is calculated based on average number of shares outstanding.
(e) Ratio of Net Expenses to Average Net Assets shows the net expense ratio, which is total expenses less reimbursement by the investment adviser, if any (see note 2).
(f) Ratio of Total Expenses to Average Net Assets includes all expenses before fee waivers and reimbursements by the investment adviser or affiliated brokerage and custody earnings credits, if any, for the period ended 10/31/2003.
(g) TA IDEX Clarion Real Estate Securities commenced operations on March 1, 2003.
The notes to the financial statements are an integral part of this report.
Transamerica IDEX Mutual Funds
Semi-Annual Report 2005
6
TA IDEX Clarion Real Estate Securities
NOTES TO FINANCIAL STATEMENTS
At April 30, 2005
(all amounts in thousands)
(unaudited)
NOTE 1. ORGANIZATION AND SIGNIFICANT ACCOUNTING POLICIES
Transamerica IDEX Mutual Funds is a Delaware statutory trust registered under the Investment Company Act of 1940, as amended (the "1940 Act"), as an open-end management investment company. Prior to March 1, 2005, Transamerica IDEX Mutual Funds was a Massachusetts business trust. TA IDEX Clarion Real Estate Securities ("the Fund"), part of Transamerica IDEX Mutual Funds, began operations on March 1, 2003.
In the normal course of business, the Fund enters into contracts that contain a variety of representations and warranties, which provide general indemnifications. The Fund's maximum exposure under these arrangements is unknown, as this would involve future claims that may be made against the Fund and/or its affiliates that have not yet occurred. However, based on experience, the Fund expects the risk of loss to be remote.
See the Prospectus and Statement of Additional Information for a description of the Fund's investment objective.
In preparing the Fund's financial statements in accordance with accounting principles generally accepted in the United States of America ("GAAP"), estimates or assumptions (which could differ from actual results) may be used that affect reported amounts and disclosures. The following policies were consistently followed by the Fund, in accordance with GAAP.
Multiple class operations and expenses: The Fund currently offers three classes of shares, each with a public offering price that reflects different sales charges, if any, and expense levels. On June 15, 2004, Class C2 shares merged into Class C. On September 24, 2004, Class M shares merged into Class C. Class B shares will convert to Class A shares eight years after purchase. Income, non-class specific expenses and realized and unrealized gains and losses, are allocated daily to each class, based upon the value of shares outstanding method as permitted under Rule 18f-3 of the 1940 Act. Each class bears its own specific expenses as well as a portion of general, common expenses.
Pricing of shares: The Fund prices its shares on the basis of the net asset value of each class of shares of the Fund, which is determined as of the close of the New York Stock Exchange ("NYSE") (generally 4:00 p.m. Eastern Time) on each day on which the NYSE is open for trading.
Security valuations: Fund investments traded on an exchange are valued at the closing price on the day of valuation on the exchange where the security is principally traded. With respect to securities traded on NASDAQ NMS, such closing price may be last reported sales price or the NASDAQ Official Closing Price.
Securities traded in the over-the-counter market and listed securities for which no sale was reported on that date are valued at the last quoted bid price.
Debt securities are valued by independent pricing services at the last quoted bid price; however, those that mature in sixty days or less are valued at amortized cost, which approximates market.
Investment company securities are valued at net asset value of the underlying portfolio.
Other securities for which quotations are not readily available are valued at fair market value as determined in good faith using guidelines adopted by the Board of Trustees of the Fund, under the supervision of the Fund's Valuation Committee. These guidelines may include: the type of security; any restrictions on its resale; financial or business news of the issuer; similar or related securities that are actively trading; related corporate actions; and other significant events occurring after the close of trading in the security.
Cash: The Fund may leave cash overnight in its cash account with the custodian, Investors Bank & Trust Company ("IBT"). IBT has been contracted on behalf of the Fund to invest the excess cash into a savings account, which at April 30, 2005, was paying an interest rate of 2.02%.
Throughout the period, the Fund may have a cash overdraft balance. A fee is incurred on this overdraft, calculated by multiplying the overdraft by a rate based on the federal funds rate.
Repurchase agreements: The Fund is authorized to enter into repurchase agreements. The Fund, through IBT, receives delivery of the underlying securities, the value of which at the time of purchase is required to be an amount equal to at least 100% of the resale price. Repurchase agreements involve the risk that the seller will fail to repurchase the security, as agreed. In that case, the Fund will bear the risk of value fluctuations until the security can be sold and may encounter delays and incur costs in liquidating the security. In the event of bankruptcy or insolvency of the seller, delays and costs may be incurred.
Commission recapture: The sub-adviser, to the extent consistent with the best execution and usual commission rate policies and practices, may place security transactions of the Fund with broker/dealers with which Transamerica IDEX Mutual Funds has established a Commission Recapture Program. A Commission Recapture Program is any arrangement under which a broker/dealer applies a portion of the commissions received by such broker/dealer on the security transactions to the Fund. In no event will commissions paid by the Fund be used to pay expenses that would otherwise be borne by any other funds within Transamerica IDEX Mutual Funds, or by any other party.
Recaptured commissions during the six months ended April 30, 2005, of $37 are included in net realized gains in the Statement of Operations.
Transamerica IDEX Mutual Funds
Semi-Annual Report 2005
7
TA IDEX Clarion Real Estate Securities
NOTES TO FINANCIAL STATEMENTS (continued)
At April 30, 2005
(all amounts in thousands)
(unaudited)
NOTE 1.–(continued)
Securities lending: The Fund may lend securities to enhance fund earnings from investing cash collateral in making such loans to qualified borrowers (typically broker/dealers). The Fund has engaged its custodian bank, IBT, as a lending agent to administer its securities lending program. IBT earned $4 of program income for its services. When the Fund makes a security loan, it receives cash collateral as protection against the risk that the borrower will default on the loan, and records an asset for the cash invested collateral and a liability for the return of the collateral.
Loans of securities are required to be secured by collateral at least equal to 102% of the value of the securities at inception of the loan, and not less then 100% thereafter. The Fund may invest cash collateral in short-term money market instruments including: U.S. Treasury Bills, U.S. agency obligations, commercial paper, money market mutual funds, repurchase agreements and other highly rated, liquid investments. During the life of securities loans, the collateral and securities loaned remain subject to fluctuation in value. IBT marks to market securities loaned and the collateral each business day. If additional collateral is due (at least $1), IBT collects additional cash collateral from the borrowers. Although securities loaned will be fully collateralized at all times, IBT may experience delays in, or may be prevented from, recovering the collateral on behalf of the Fund. The Fund may recall a loa ned security position at any time from the borrower through IBT. In the event the borrower fails to timely return a recalled security, IBT may indemnify the Fund by purchasing replacement securities for the Fund at its own expense and claiming the collateral to fund such a purchase. IBT absorbs the loss if the collateral value is not sufficient to cover the cost of the replacement securities. If replacement securities are not available, IBT will credit the equivalent cash value to the Fund.
While a security is on loan, the Fund does not have the right to vote that security. However, if time permits, the Fund will attempt to recall a security on loan and vote the proxy.
Income from securities lending is included in the Statement of Operations. The amount of collateral and value of securities on loan are included in the Statement of Assets and Liabilities as well as in the Schedule of Investments.
Real Estate Investment Trusts ("REITs"): There are certain additional risks involved in investing in REITs. These include, but are not limited to, economic conditions, changes in zoning laws, real estate values, property taxes and interest rates. Since the Fund invests primarily in
real estate securities, the value of its share may fluctuate more widely than the value of shares of a fund that invests in a broad range of industries.
Dividend income is recorded at management's estimate of the income included in distributions from the REIT investments. Distributions received in excess of the estimated amount are recorded as a reduction of the cost investments. The actual amounts of income, return of capital and capital gains are only determined by each REIT after the fiscal year end and may differ from the estimated amounts.
Security transactions and investment income: Security transactions are recorded on the trade date. Security gains and losses are calculated on the specific identification basis. Dividend income is recorded on the ex-dividend date or, in the case of foreign securities, as soon as the Fund is informed of the ex-dividend date. Interest income, including accretion of discounts and amortization of premiums, is recorded on the accrual basis commencing on the settlement date.
Account maintenance fees: If the shareholder account balance falls below $1 by either shareholder action or as a result of market action, a $25 (not in thousands) fee is assessed every year until the balance reaches $1. The fee is assessed by redeeming shares in the shareholder's account.
No fee will be charged under the following conditions:
• accounts opened within the preceding 24 months
• accounts with an active monthly Automatic Investment Plan ($50 (not in thousands) minimum per fund)
• accounts owned by an individual which, when combined by social security number, have a balance of $5 or more
• accounts owned by individuals in the same household (by address) that have a combined balance of $5 or more
• UTMA/UGMA accounts
• Fiduciary accounts
• B-share accounts whose shares have started to convert to A-shares accounts (as long as combined value of both accounts is at least $1)
For the six months ended April 30, 2005, there were no account maintenance fees.
Redemption fees: A short-term trading redemption fee may be assessed on any fund shares in a fund account that are sold during the first five (5) NYSE trading days following their purchase date. This redemption fee will equal 2% of the amount redeemed and shares held the longest will be treated as being redeemed first and shares held the shortest as being redeemed last.
Transamerica IDEX Mutual Funds
Semi-Annual Report 2005
8
TA IDEX Clarion Real Estate Securities
NOTES TO FINANCIAL STATEMENTS (continued)
At April 30, 2005
(all amounts in thousands)
(unaudited)
NOTE 1.–(continued)
For the six months ended April 30, 2005, the Fund received less than $1 in redemption fees.
Dividend distributions: Distributions to shareholders are recorded on the ex-dividend date and are determined in accordance with Federal income tax regulations which may differ from GAAP.
NOTE 2. RELATED PARTY TRANSACTIONS
Transamerica Fund Advisors, Inc. ("TFAI") is the Fund's investment adviser. Transamerica Fund Services, Inc. ("TFS") is the Fund's administrator and transfer agent. AFSG Securities Corp. ("AFSG") is the Fund's distributor/principal underwriter. AFSG is 100% owned by AUSA Holding Company ("AUSA"). TFAI is a directly owned subsidiary of Western Reserve Life Assurance Co. of Ohio (78%) and AUSA (22%). TFS is a wholly owned subsidiary of WRL (50%) and AUSA (50%). AUSA and WRL are wholly owned indirect subsidiaries of AEGON, NV, a Netherlands corporation.
Effective January 1, 2005 AEGON/Transamerica Fund Advisors, Inc. ("ATFA") was renamed Transamerica Fund Advisors, Inc. ("TFAI"); AEGON/Transamerica Fund Services, Inc. ("ATFS") and AEGON/Transamerica Investor Services, Inc. ("ATIS") merged into one entity and was renamed Transamerica Fund Services, Inc. ("TFS").
The following schedule reflects the percentage of fund assets owned by affiliated mutual funds (i.e., through the asset allocation funds):
| Net Assets | % of Net Assets | ||||||||||
| TA IDEX Asset Allocation– Conservative Portfolio | $ | 10,831 | 8.79 | % | |||||||
| TA IDEX Asset Allocation– Growth Portfolio | 10,357 | 8.41 | % | ||||||||
| TA IDEX Asset Allocation– Moderate Growth Portfolio | 40,008 | 32.47 | % | ||||||||
| TA IDEX Asset Allocation– Moderate Portfolio | 44,820 | 36.38 | % | ||||||||
| Total | $ | 106,016 | 86.05 | % | |||||||
Investment advisory fee: The Fund pays management fees to TFAI based on average daily net assets ("ANA") at the following breakpoints:
0.80% of the first $250 million of ANA
0.775% of the next $250 million of ANA
0.70% of the next $500 million of ANA
0.65% of ANA over $1 billion
TFAI has contractually agreed to waive its advisory fee and will reimburse the Fund to the extent that operating expenses, excluding 12b-1 fees, exceed the following stated annual limit:
1.40% Expense Limit
If total fund expenses fall below the annual expense limitation agreement agreed to by the adviser within the succeeding three years, the Fund may be required to pay that adviser a portion or all of the waived advisory fees.
There were no amounts available for recapture at April 30, 2005.
Distribution and service fees: The Fund has a 12b-1 distribution plan under the 1940 Act pursuant to which an annual fee, based on average daily net assets, is paid to the distributor for various disbursements such as broker-dealer account servicing fees and other promotional expenses of the Fund. The Fund is authorized under the 12b-1 plan to pay fees on each class up to the following limits:
| Class A | 0.35 | % | |||||
| Class B | 1.00 | % | |||||
| Class C | 1.00 | % | |||||
In the case the Fund or a class of shares of the Fund is closed to new investors or investments, the Fund is authorized to pay 12b-1 fees for past sales and distribution efforts and present and past investor services.
Underwriter commissions relate to front-end sales charges imposed for Class A shares and contingent deferred sales charges from Classes B, C and certain A share redemptions. For the six months ended April 30, 2005, the underwriter commissions were as follows:
| Received by Underwriter | $ | 104 | |||||
| Retained by Underwriter | 8 | ||||||
| Contingent Deferred Sales Charge | 13 | ||||||
Administrative services: The Fund has entered into an agreement with TFS for financial and legal fund administration services, which includes such items as compliance, expenses, financial statements and other reporting, distributions, tax returns, prospectus preparation, board of trustees meeting support and other legal matters. As of January 1, 2005 the Fund pays TFS an annual fee of 0.02% of average net assets. Prior to January 1, 2005 the Fund paid TFS an annual fee of 0.015% of average net assets. The Legal fees on the Statement of Operations are for fees paid to external legal counsel.
Transfer agent fees: The Fund pays TFS an annual per-account charge of $20 (not in thousands) for each open account and $1.63 (not in thousands) for each closed account. There is no new account charge. The Transfer agent fees on the Statement of Operations are made up of fees paid to TFS and costs associated with shareholder statements.
The Fund paid TFS $21 for the six months ended April 30, 2005.
Transamerica IDEX Mutual Funds
Semi-Annual Report 2005
9
TA IDEX Clarion Real Estate Securities
NOTES TO FINANCIAL STATEMENTS (continued)
At April 30, 2005
(all amounts in thousands)
(unaudited)
NOTE 2.–(continued)
Deferred compensation plan: Each eligible Fund Trustee may elect participation in the Deferred Compensation Plan ("the Plan"). Under the Plan, such Trustees may defer payment of a percentage of their total fees earned as a Fund Trustee. These deferred amounts may be invested in any Transamerica IDEX Mutual Fund. At April 30, 2005, the value of invested plan amount was $3. Invested plan amounts and the total liability for deferred compensation to the Trustees under the Plan at April 30, 2005, are included in the accompanying Statement of Assets and Liabilities.
NOTE 3. INVESTMENT TRANSACTIONS
The cost of securities purchased and proceeds from securities sold (excluding short-term securities) for the six months ended April 30, 2005, were as follows:
| Purchases of securities: | |||||||
| Long-Term excluding U.S. Government | $ | 40,031 | |||||
| U.S. Government | – | ||||||
| Proceeds from maturities and sales of securities: | |||||||
| Long-Term excluding U.S. Government | 61,309 | ||||||
| U.S. Government | – | ||||||
NOTE 4. FEDERAL INCOME TAX MATTERS
The Fund has not made any provision for federal income or excise taxes due to its policy to distribute all of its taxable income and capital gains to its shareholders and otherwise qualify as a regulated investment company under the Internal Revenue Code. Income and capital gain distributions are determined in accordance with income tax regulations, which may differ from GAAP. These differences are primarily due to differing treatment for items including, but not limited to, wash sales, net operating losses and capital loss carryforwards.
The aggregate cost of investments and composition of unrealized appreciation (depreciation) for federal income tax purposes as of April 30, 2005, are as follows:
| Federal Tax Cost Basis | $ | 123,351 | |||||
| Unrealized Appreciation | $ | 17,228 | |||||
| Unrealized (Depreciation) | (141 | ) | |||||
| Net Unrealized Appreciation (Depreciation) | $ | 17,087 | |||||
NOTE 5. REGULATORY PROCEEDINGS
There continues to be significant federal and state regulatory activity relating to financial services companies, particularly mutual fund companies and their investment advisers. As part of an ongoing investigation regarding potential market timing, recordkeeping and trading compliance issues and matters affecting the Fund's investment adviser, TFAI, and certain employees and affiliates of TFAI, the SEC staff has indicated that it is likely to take some action against TFAI and certain of its affiliates at the conclusion of the investigation. The potential timing and the scope of any such action is difficult to predict. Although the impact of any action brought against TFAI and/or its affiliates is difficult to assess at the present time, the Fund currently believes that the likelihood that any such action will have a material adverse impact on it is remote. It is important to note that the Fund is not aware of any allegation of wrongdoing against it and its board at the time this semi-annual report is printed. Although it is not anticipated that these developments will have an adverse impact on the Fund, there can be no assurance at this time. TFAI and its affiliates are actively working with the SEC in regard to this matter; however, the exact resolution cannot be determined at this time. TFAI will take such actions that it deems necessary or appropriate to continue providing management services to the Fund and to bring all matters to an appropriate conclusion.
TFAI and/or its affiliates, and not the Fund, will bear the costs regarding these regulatory matters.
Transamerica IDEX Mutual Funds
Semi-Annual Report 2005
10
TA IDEX Clarion Real Estate Securities
INVESTMENT ADVISORY AND SUB-ADVISORY AGREEMENTS – REVIEW AND RENEWAL
At a meeting of the Board of Trustees of Transamerica IDEX Mutual Funds ("TA IDEX") held on October 6, 2004, the Board considered and approved the renewal for a one-year period of the Investment Advisory Agreement between TA IDEX Clarion Real Estate Securities (the "Fund") and Transamerica Fund Advisors, Inc. ("TFAI") as well as the Investment Sub-Advisory Agreement of the Fund between TFAI and ING Clarion Real Estate Securities L.P. (the "Sub-Adviser"). In approving the renewal of these agreements, the Board concluded that the Investment Advisory and Investment Sub-Advisory Agreements enable shareholders of the Fund to obtain high quality services at a cost that is appropriate, reasonable, and in the best interests of shareholders based upon the following determinations, among others:
The nature, extent and quality of the advisory service to be provided. The Board considered the nature and quality of the services provided by TFAI and the Sub-Adviser to the Fund in the past, as well as the services anticipated to be provided in the future. The Board concluded that TFAI and the Sub-Adviser are capable of providing high quality services to the Fund, as indicated by TFAI's management capabilities demonstrated with respect to the Fund and other funds managed by TFAI, TFAI's management oversight process, and the professional qualifications and experience of the Sub-Adviser's portfolio management team. The Board also concluded that TFAI and the Sub-Adviser would provide the same quality and quantity of investment management and related services as before, that these services are app ropriate in scope and extent in light of the Fund's operations, the competitive landscape of the investment company business and investor needs, and that TFAI's and the Sub-Adviser's obligations will remain the same in all respects.
The investment performance of the Fund. The Board concluded, based in particular on information provided by Lipper Analytics, that the Fund's investment performance was competitive relative to comparable funds over a trailing one-year period and to the Fund's benchmark index over the past year period. On the basis of the Trustees' assessment of the nature, extent and quality of investment advisory and related services to be provided or procured by TFAI and the Sub-Adviser, the Trustees concluded that TFAI and the Sub-Adviser were capable of generating a level of long-term investment performance that is appropriate in light of the Fund's investment objective, policies and strategies and competitive with many other investment companies.
The cost of advisory services provided and the level of profitability. On the basis of the Board's review of the fees to be charged by TFAI and the Sub-Adviser for investment advisory and related services, TFAI's financial statements, the fees paid by TFAI to the Sub-Adviser, TFAI's estimated net management income resulting from its management of the Fund, the estimated profitability of TFAI's relationships with the Fund and TA IDEX, and the estimated profitability of the Sub-Adviser's relationship with the Fund, the Board concluded that the level of investment advisory fees and the profitability is appropriate in light of the services provided, the management fees and overall expense ratios of comparable investment companies, and the anticipated profitability of the relationship between the Fun d, TFAI and the Sub-Adviser. Further, on the basis of comparative information supplied by Lipper Analytics, the Board determined that the advisory fees and estimated overall expense ratio of the Fund were consistent with industry averages.
The extent to which economies of scale would be realized as the Fund grows and whether fee levels reflect these economies of scale for the benefit of Fund investors. The Trustees concluded that the recent inclusion of asset-based breakpoints in the Fund's advisory fee schedule appropriately benefited investors by realizing economies of scale in the form of a lower advisory fee rate as the level of Fund assets increases. The Board also concluded that the advisory fees appropriately reflect the Fund's current size, the current economic environment for TFAI, and the competitive nature of the investment company market. In addition, the Board noted that it will have the opportunity to periodically re-examine whether the Fund has achieved economies of scale, as well as the appropriateness of advisory fees payable to TFAI and the Sub-Adviser in the future.
Benefits (such as soft dollars) to TFAI or the Sub-Adviser from its relationship with the Fund. The Board concluded that other benefits derived by TFAI or the Sub-Adviser from its relationship with the Fund are reasonable and fair, and are consistent with industry practice and the best interests of the Fund and its shareholders. In this regard, the Board noted that TFAI does not realize "soft dollar" benefits from its relationship with the Fund, and that the Sub-Adviser is participating in a brokerage program pursuant to which a portion of brokerage commissions paid by the Fund is recaptured for the benefit of the Fund and its shareholders, thus limiting the amount of "soft-dollar" arrangements the Sub-Adviser may engage in with respect to the Fund's portfolio brokerage transactions.
Other considerations. The Board also determined that TFAI had made a substantial commitment to the recruitment and retention of high quality personnel, and maintained the financial, compliance and operational resources reasonably necessary to manage the Fund in a professional manner that is consistent with the best interests of the Fund and its shareholders. The Trustees also concluded that TFAI had made a significant entrepreneurial commitment to the management and success of the Fund, reflected by TFAI's expense limitation and fee waiver arrangement with the Fund which, as demonstrated in the past with the Fund, may result in TFAI waiving a substantial amount of advisory fees for the benefit of shareholders.
Transamerica IDEX Mutual Funds
Semi-Annual Report 2005
11
TA IDEX Clarion Real Estate Securities
SUPPLEMENTAL INFORMATION (unaudited)
RESULTS OF SHAREHOLDER PROXY
At a special meeting of shareholders held on February 25, 2005, the results of the Proposals were as follows:
Transamerica IDEX Mutual Funds
Proposal 1: Election of Trustees to the Board of Trustees of Transamerica IDEX Mutual Funds.
| For | Withheld | ||||||||||
| Peter R. Brown | 872,017,875.249 | 4,468,498.551 | |||||||||
| Daniel Calabria | 871,917,069.786 | 4,569,304.014 | |||||||||
| Janise B. Case | 872,099,393.125 | 4,386,980.675 | |||||||||
| Charles C. Harris | 872,086,722.025 | 4,399,651.775 | |||||||||
| Leo J. Hill | 872,304,465.640 | 4,181,908.160 | |||||||||
| Russell A. Kimball, Jr. | 872,253,556.471 | 4,232,817.329 | |||||||||
| William W. Short, Jr. | 872,139,920.944 | 4,346,452.856 | |||||||||
| John Waechter | 872,261,152.376 | 4,225,221.424 | |||||||||
| Jack E. Zimmerman | 871,929,967.512 | 4,556,406.288 | |||||||||
| Brian C. Scott | 872,218,970.367 | 4,267,403.433 | |||||||||
| Thomas P. O'Neill | 872,111,944.117 | 4,374,429.683 | |||||||||
TA IDEX Clarion Real Estate Securities
Proposal 2: Approval of an Agreement and Plan of Reorganization pursuant to which Transamerica IDEX Mutual Funds will organize as a Delaware statutory trust.
| For | Against | Abstentions/Broker Non-Votes | |||||||||
| 9,022,827.779 | 9,837.087 | 406,771.789 | |||||||||
Proposal 3: Approval of changes to the fundamental investment restrictions of TA IDEX Clarion Real Estate Securities.
| A. Diversification | For | Against | Abstentions/Broker Non-Votes | ||||||||||||
| 9,034,117.122 | 6,559.533 | 398,760.000 | |||||||||||||
| B. Borrowing | For | Against | Abstentions/Broker Non-Votes | ||||||||||||
| 9,034,117.122 | 6,559.533 | 398,760.000 | |||||||||||||
| C. Senior Securities | For | Against | Abstentions/Broker Non-Votes | ||||||||||||
| 9,034,117.122 | 6,559.533 | 398,760.000 | |||||||||||||
| D. Underwriting Securities | For | Against | Abstentions/Broker Non-Votes | ||||||||||||
| 9,034,117.122 | 6,559.533 | 398,760.000 | |||||||||||||
| E. Real Estate | For | Against | Abstentions/Broker Non-Votes | ||||||||||||
| 9,034,117.122 | 6,559.533 | 398,760.000 | |||||||||||||
| F. Making Loans | For | Against | Abstentions/Broker Non-Votes | ||||||||||||
| 9,034,117.122 | 6,559.533 | 398,760.000 | |||||||||||||
| G. Concentration | For | Against | Abstentions/Broker Non-Votes | ||||||||||||
| 9,034,117.122 | 6,559.533 | 398,760.000 | |||||||||||||
| H. Commodities | For | Against | Abstentions/Broker Non-Votes | ||||||||||||
| 9,033,799.104 | 6,877.551 | 398,760.000 | |||||||||||||
Transamerica IDEX Mutual Funds
Semi-Annual Report 2005
12
TA IDEX Evergreen International Small Cap
GRAPHICAL PRESENTATION OF SCHEDULE OF INVESTMENTS
By Region
At April 30, 2005
(unaudited)
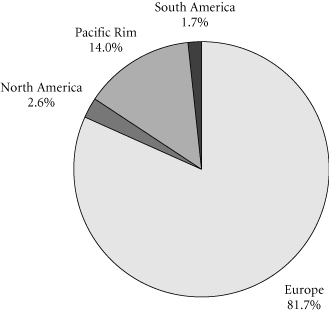
This chart shows the percentage breakdown by region of the Fund's total investment securities.
Transamerica IDEX Mutual Funds
Semi-Annual Report 2005
1
TA IDEX Evergreen International Small Cap
SCHEDULE OF INVESTMENTS
At April 30, 2005
(all amounts except share amounts in thousands)
(unaudited)
| Shares | Value | ||||||||||
| PREFERRED STOCKS ( 0.3%) | |||||||||||
| Germany (0.3%) | |||||||||||
| ProSieben SAT.1 Media AG | 39,765 | $ | 686 | ||||||||
| Total Preferred Stocks (cost: $726) | 686 | ||||||||||
| COMMON STOCKS ( 89.8%) | |||||||||||
| Australia (0.4%) | |||||||||||
| QBE Insurance Group, Ltd. | 82,919 | 972 | |||||||||
| Austria (0.0%) | |||||||||||
| Raiffeisen International Bank Holding AG (a) | 88 | 5 | |||||||||
| Belgium (3.9%) | |||||||||||
| AGFA-Gevaert NV | 160,376 | 5,254 | |||||||||
| Colruyt SA | 12,598 | 1,909 | |||||||||
| Mobistar SA (a) | 30,223 | 2,584 | |||||||||
| Brazil (1.6%) | |||||||||||
| Cia Energetica de Minas Gerais, ADR | 55,306 | 1,531 | |||||||||
| Empresa Brasileira de Aeronautica SA, ADR | 43,977 | 1,268 | |||||||||
| Tim Participacoes SA, ADR | 75,514 | 1,133 | |||||||||
| Canada (2.3%) | |||||||||||
| Brascan Corp.–Class A | 20,000 | 725 | |||||||||
| Gabriel Resources, Ltd. (a) | 62,160 | 74 | |||||||||
| Gabriel Resources, Ltd. Warrants, Expires TBD (a) | 23,380 | 5 | |||||||||
| RONA, Inc. (a) | 257,300 | 4,958 | |||||||||
| France (12.1%) | |||||||||||
| Altran Technologies SA (a) | 545,844 | 4,472 | |||||||||
| Bull SA (a) | 8,052,891 | 6,694 | |||||||||
| Eurofins Scientific (a) | 45,485 | 1,245 | |||||||||
| Flo Groupe (a) | 95,713 | 772 | |||||||||
| Galeries Lafayette | 12,247 | 3,731 | |||||||||
| Lafuma | 29,017 | 2,496 | |||||||||
| Michelin (C.G.D.E.)–Class B | 13,758 | 837 | |||||||||
| Neopost SA | 71,028 | 5,974 | |||||||||
| PagesJaunes SA | 80,643 | 1,930 | |||||||||
| Scor SA (a) | 661,034 | 1,306 | |||||||||
| UBISOFT Entertainment (a) | 25,260 | 1,015 | |||||||||
| Germany (8.7%) | |||||||||||
| Adidas-Salomon AG | 40,662 | 6,339 | |||||||||
| Continental AG | 76,664 | 5,671 | |||||||||
| Deutz AG (a) | 389,694 | 1,792 | |||||||||
| Leoni AG | 7,549 | 587 | |||||||||
| Linde AG | 20,343 | 1,351 | |||||||||
| Man AG | 63,626 | 2,688 | |||||||||
| Puma AG Rudolf Dassler Sport | 5,947 | 1,375 | |||||||||
| SGL Carbon AG (a) | 187,918 | 2,125 | |||||||||
| Shares | Value | ||||||||||
| Hong Kong (0.5%) | |||||||||||
| Techtronic Industries Co. | 582,000 | $ | 1,294 | ||||||||
| Ireland (1.2%) | |||||||||||
| Anglo Irish Bank Corp. PLC | 267,870 | 3,093 | |||||||||
| Italy (2.4%) | |||||||||||
| Arnoldo Mondadori Editore SpA | 68,505 | 713 | |||||||||
| Davide Campari-Milano SpA | 29,803 | 2,121 | |||||||||
| Geox SpA (a) | 278,726 | 2,445 | |||||||||
| Gruppo Coin SpA (a) | 216,573 | 671 | |||||||||
| Japan (11.3%) | |||||||||||
| Advan Co., Ltd. | 40,500 | 558 | |||||||||
| Arrk Corp. | 24,900 | 973 | |||||||||
| Bank of Yokohama, Ltd. (The) | 297,000 | 1,697 | |||||||||
| Chiba Bank, Ltd. (The) | 302,000 | 1,857 | |||||||||
| Diamond Lease Co., Ltd. | 31,300 | 1,145 | |||||||||
| Hino Motors, Ltd. | 447,000 | 2,681 | |||||||||
| Isetan Co., Ltd. | 99,100 | 1,180 | |||||||||
| Ito En, Ltd. | 27,900 | 1,367 | |||||||||
| Jupiter Telecommunications Co. (a) | 98 | 78 | |||||||||
| Nidec Corp. | 15,200 | 1,784 | |||||||||
| Nissin Co., Ltd. | 1,022,020 | 2,301 | |||||||||
| Pigeon Corp. | 63,900 | 978 | |||||||||
| Ryohin Keikaku Co., Ltd. | 46,700 | 2,351 | |||||||||
| THK Co., Ltd. | 54,400 | 1,018 | |||||||||
| Tokuyama Corp. | 338,000 | 2,577 | |||||||||
| United Arrows, Ltd. | 108,900 | 2,880 | |||||||||
| Yamada Denki Co., Ltd. | 60,600 | 2,895 | |||||||||
| Netherlands (12.6%) | |||||||||||
| Buhrmann NV | 658,588 | 5,878 | |||||||||
| Grolsch NV | 19,052 | 567 | |||||||||
| Hagemeyer NV (a) | 214,482 | 486 | |||||||||
| Heijmans NV | 103,882 | 4,087 | |||||||||
| Kendrion NV (a) | 363,965 | 641 | |||||||||
| Koninklijke BAM NBM NV | 101,287 | 5,621 | |||||||||
| Koninklijke Wessanen NV | 349,541 | 4,836 | |||||||||
| United Services Group NV | 217,754 | 6,675 | |||||||||
| Univar NV | 37,195 | 1,176 | |||||||||
| Vedior NV | 108,291 | 1,672 | |||||||||
| New Zealand (0.4%) | |||||||||||
| NGC Holdings, Ltd. | 461,633 | 1,132 | |||||||||
| Spain (8.0%) | |||||||||||
| AC Aguas de Barcelona (a) | 174 | 4 | |||||||||
| Cia de Distribucion Integral Logista SA | 91,016 | 4,584 | |||||||||
| Cintra Concesiones de Infraestructuras de Transporte SA (a) | 246,701 | 2,659 | |||||||||
The notes to the financial statements are an integral part of this report.
Transamerica IDEX Mutual Funds
Semi-Annual Report 2005
2
TA IDEX Evergreen International Small Cap
SCHEDULE OF INVESTMENTS (continued)
At April 30, 2005
(all amounts except share amounts in thousands)
(unaudited)
| Shares | Value | ||||||||||
| Spain (continued) | |||||||||||
| Fadesa SA (a) | 33,306 | $ | 757 | ||||||||
| Fomento de Construcciones y Contratas SA | 17,008 | 922 | |||||||||
| Gestevision Telecinco SA (a) | 59,225 | 1,360 | |||||||||
| Miquel y Costas | 35,885 | 1,615 | |||||||||
| Promotora de Informaciones SA | 198,046 | 3,791 | |||||||||
| Sociedad General de Aguas de Barcelona SA–Class B | 46,332 | 951 | |||||||||
| Sogecable SA (a) | 89,842 | 3,369 | |||||||||
| Switzerland (1.4%) | |||||||||||
| Lindt & Spruengli AG | 1,519 | 2,282 | |||||||||
| Logitech International SA (a) | 23,450 | 1,350 | |||||||||
| United Kingdom (23.0%) | |||||||||||
| Aberdeen Asset Management PLC | 245,403 | 560 | |||||||||
| Alliance Unichem PLC | 36,825 | 563 | |||||||||
| Ashtead Group PLC (a) | 3,617,182 | 6,053 | |||||||||
| AWG PLC | 148,075 | 2,473 | |||||||||
| BAE Systems PLC | 631,521 | 3,098 | |||||||||
| Body Shop International PLC | 466,505 | 1,738 | |||||||||
| Burberry Group PLC | 165,880 | 1,145 | |||||||||
| Carphone Warehouse Group PLC | 335,706 | 953 | |||||||||
| Charter PLC (a) | 1,101,838 | 5,267 | |||||||||
| Daily Mail and General Trust NV–Class A | 41,278 | 528 | |||||||||
| Electronics Boutique PLC | 1,591,619 | 2,407 | |||||||||
| Enterprise Inns PLC | 157,936 | 2,206 | |||||||||
| Hilton Group PLC | 186,408 | 978 | |||||||||
| ICAP PLC | 199,166 | 1,003 | |||||||||
| ITV PLC | 1,655,313 | 3,850 | |||||||||
| Lastminute.com PLC (a) | 464,058 | 951 | |||||||||
| Laura Ashley Holdings PLC (a) | 3,422,210 | 654 | |||||||||
| Luminar PLC | 191,771 | 1,780 | |||||||||
| Man Group PLC | 30,086 | 702 | |||||||||
| Next PLC | 19,731 | 560 | |||||||||
| Pace Micro Technology PLC (a) | 121,714 | 76 | |||||||||
| Paladin Resources PLC | 358,439 | 1,250 | |||||||||
| Photo-Me International PLC | 3,301,056 | 6,006 | |||||||||
| Premier Oil PLC (a) | 65,806 | 690 | |||||||||
| Regent Inns PLC (a) | 649,732 | 999 | |||||||||
| Schroders PLC | 219,953 | 2,852 | |||||||||
| SHL Group PLC | 276,837 | 690 | |||||||||
| SSL International PLC | 264,869 | 1,393 | |||||||||
| Surfcontrol PLC (a) | 84,763 | 827 | |||||||||
| Tullow Oil PLC | 337,434 | 1,037 | |||||||||
| Umbro (a) | 715,913 | 1,504 | |||||||||
| United Utilities PLC | 233,845 | 2,846 | |||||||||
| Total Common Stocks (cost: $224,574) | 225,529 | ||||||||||
| Total Investment Securities (cost: $225,300) | $ | 226,215 | |||||||||
| SUMMARY: | |||||||||||
| Investments, at value | 90.1 | % | $ | 226,215 | |||||||
| Other Assets and Liabilities | 9.9 | % | 24,783 | ||||||||
| Net assets | 100.0 | % | $ | 250,998 | |||||||
| Percentage of Net Assets | Value | ||||||||||
| INVESTMENTS BY INDUSTRY: | |||||||||||
| Business Services | 9.5 | % | $ | 23,901 | |||||||
| Engineering & Management Services | 6.2 | % | 15,531 | ||||||||
| Rubber & Misc. Plastic Products | 5.7 | % | 14,223 | ||||||||
| Computer & Office Equipment | 5.3 | % | 13,203 | ||||||||
| Instruments & Related Products | 4.5 | % | 11,260 | ||||||||
| Computer & Data Processing Services | 3.8 | % | 9,487 | ||||||||
| Industrial Machinery & Equipment | 3.4 | % | 8,576 | ||||||||
| Chemicals & Allied Products | 3.0 | % | 7,418 | ||||||||
| Food & Kindred Products | 2.8 | % | 7,118 | ||||||||
| Wholesale Trade Durable Goods | 2.7 | % | 6,804 | ||||||||
| Commercial Banks | 2.7 | % | 6,652 | ||||||||
| Manufacturing Industries | 2.5 | % | 6,301 | ||||||||
| Electric, Gas & Sanitary Services | 2.5 | % | 6,270 | ||||||||
| Radio & Television Broadcasting | 2.3 | % | 5,896 | ||||||||
| Restaurants | 2.3 | % | 5,757 | ||||||||
| Department Stores | 2.2 | % | 5,582 | ||||||||
| Radio, Television & Computer Stores | 2.1 | % | 5,302 | ||||||||
| Printing & Publishing | 2.0 | % | 5,032 | ||||||||
| Lumber & Other Building Materials | 2.0 | % | 4,958 | ||||||||
| Telecommunications | 1.9 | % | 4,670 | ||||||||
| Aerospace | 1.7 | % | 4,367 | ||||||||
| Shoe Stores | 1.6 | % | 4,093 | ||||||||
| Security & Commodity Brokers | 1.5 | % | 3,855 | ||||||||
| Communication | 1.4 | % | 3,447 | ||||||||
| Oil & Gas Extraction | 1.2 | % | 2,977 | ||||||||
| Beer, Wine & Distilled Beverages | 1.1 | % | 2,688 | ||||||||
| Automotive | 1.1 | % | 2,681 | ||||||||
| Public Administration | 1.0 | % | 2,659 | ||||||||
| Leather & Leather Products | 1.0 | % | 2,445 | ||||||||
| Misc. General Merchandise Stores | 0.9 | % | 2,351 | ||||||||
| Insurance | 0.9 | % | 2,277 | ||||||||
| Holding & Other Investment Offices | 0.8 | % | 2,046 | ||||||||
| Food Stores | 0.8 | % | 1,909 | ||||||||
| Paper & Paper Products | 0.6 | % | 1,615 | ||||||||
| Electric Services | 0.6 | % | 1,531 | ||||||||
| Medical Instruments & Supplies | 0.6 | % | 1,393 | ||||||||
| Beverages | 0.5 | % | 1,367 | ||||||||
| Health Services | 0.5 | % | 1,245 | ||||||||
| Apparel Products | 0.5 | % | 1,145 | ||||||||
| Personal Credit Institutions | 0.5 | % | 1,145 | ||||||||
| Gas Production & Distribution | 0.4 | % | 1,132 | ||||||||
| Amusement & Recreation Services | 0.4 | % | 978 | ||||||||
| Construction | 0.4 | % | 922 | ||||||||
| Real Estate | 0.3 | % | 757 | ||||||||
| Electronic Components & Accessories | 0.2 | % | 587 | ||||||||
| Pharmaceuticals | 0.2 | % | 563 | ||||||||
The notes to the financial statements are an integral part of this report.
Transamerica IDEX Mutual Funds
Semi-Annual Report 2005
3
TA IDEX Evergreen International Small Cap
SCHEDULE OF INVESTMENTS (continued)
At April 30, 2005
(all amounts except share amounts in thousands)
(unaudited)
| Percentage of Net Assets | Value | ||||||||||
| INVESTMENTS BY INDUSTRY (continued) | |||||||||||
| Electronic & Other Electric Equipment | 0.0 | % | $ | 76 | |||||||
| Metal Mining | 0.0 | % | 23 | ||||||||
| Investments, at value | 90.1 | % | 226,215 | ||||||||
| Other assets and liabilities | 9.9 | % | 24,783 | ||||||||
| Net assets | 100.0 | % | $ | 250,998 | |||||||
NOTES TO SCHEDULE OF INVESTMENTS:
(a) No dividends were paid during the preceding twelve months.
DEFINITIONS:
ADR American Depositary Receipt
TBD To Be Determined
The notes to the financial statements are an integral part of this report.
Transamerica IDEX Mutual Funds
Semi-Annual Report 2005
4
TA IDEX Evergreen International Small Cap
STATEMENT OF ASSETS AND LIABILITIES
At April 30, 2005
(all amounts except per share amounts in thousands)
(unaudited)
| Assets: | |||||||
| Investment securities, at value (cost: $225,300) | $ | 226,215 | |||||
| Cash | 30,410 | ||||||
| Foreign cash (cost: $1,202) | 1,199 | ||||||
| Receivables: | |||||||
| Investment securities sold | 2 | ||||||
| Shares of beneficial interest sold | 749 | ||||||
| Interest | 26 | ||||||
| Dividends | 621 | ||||||
| Dividend reclaims receivable | 75 | ||||||
| 259,297 | |||||||
| Liabilities: | |||||||
| Investment securities purchased | 8,055 | ||||||
| Accounts payable and accrued liabilities: | |||||||
| Management and advisory fees | 197 | ||||||
| Distribution and service fees | 26 | ||||||
| Other | 21 | ||||||
| 8,299 | |||||||
| Net Assets | $ | 250,998 | |||||
| Net Assets Consist of: | |||||||
| Shares of beneficial interest, unlimited shares authorized, no par value | $ | 249,303 | |||||
| Undistributed net investment income (loss) | 405 | ||||||
| Undistributed net realized gain (loss) from investment securities and foreign currency transactions | 360 | ||||||
| Net unrealized appreciation (depreciation) on: | |||||||
| Investment securities | 915 | ||||||
| Translation of assets and liabilities denominated in foreign currencies | 15 | ||||||
| Net Assets | $ | 250,998 | |||||
| Net Assets by Class: | |||||||
| Class A | $ | 93,731 | |||||
| Class I | 157,267 | ||||||
| Shares Outstanding: | |||||||
| Class A | 8,512 | ||||||
| Class I | 14,277 | ||||||
| Net Asset Value and Offering Price Per Share: | |||||||
| Class A | $ | 11.01 | |||||
| Class I | 11.02 | ||||||
STATEMENT OF OPERATIONS
For the period ended April 30, 2005 (a)
(all amounts in thousands)
(unaudited)
| Investment Income: | |||||||
| Interest | $ | 90 | |||||
| Dividends | 1,234 | ||||||
| Less withholding taxes on foreign dividends | (117 | ) | |||||
| 1,207 | |||||||
| Expenses: | |||||||
| Management and advisory fees | 688 | ||||||
| Printing and shareholder reports | 3 | ||||||
| Custody fees | 76 | ||||||
| Administration fees | 12 | ||||||
| Legal fees | 2 | ||||||
| Audit fees | 8 | ||||||
| Trustees fees | 2 | ||||||
| Other | 1 | ||||||
| Distribution and service fees: | |||||||
| Class A | 37 | ||||||
| Total expenses | 829 | ||||||
| Less: | |||||||
| Reimbursement of class expenses: | |||||||
| Class A | (27 | ) | |||||
| Net expenses | 802 | ||||||
| Net Investment Income (Loss) | 405 | ||||||
| Net Realized Gain (Loss) from: | |||||||
| Investment securities | 324 | ||||||
| Foreign currency transactions | 36 | ||||||
| 360 | |||||||
| Net Increase (Decrease) in Unrealized Appreciation (Depreciation) on: | |||||||
| Investment securities | 915 | ||||||
| Translation of assets and liabilities denominated in foreign currencies | 15 | ||||||
| 930 | |||||||
| Net Gain (Loss) on Investments and Foreign Currency Transactions | 1,290 | ||||||
| Net Increase (Decrease) in Net Assets Resulting from Operations | $ | 1,695 | |||||
(a) TA IDEX Evergreen International Small Cap ("the Fund") commenced operations on November 8, 2004. The inception date for the Fund's offering of share Class A was March 1, 2005.
The notes to the financial statements are an integral part of this report.
Transamerica IDEX Mutual Funds
Semi-Annual Report 2005
5
TA IDEX Evergreen International Small Cap
STATEMENT OF CHANGES IN NET ASSETS
For the period ended
(all amounts in thousands)
| April 30, 2005 (a) (unaudited) | |||||||
| Increase (Decrease) in Net Assets From: | |||||||
| Operations: | |||||||
| Net investment income (loss) | $ | 405 | |||||
| Net realized gain (loss) from investment securities and foreign currency transactions | 360 | ||||||
| Net unrealized appreciation (depreciation) on investment securities and foreign currency translation | 930 | ||||||
| 1,695 | |||||||
| Capital Share Transactions: | |||||||
| Proceeds from shares sold: | |||||||
| Class A | 98,420 | ||||||
| Class I | 150,883 | ||||||
| 249,303 | |||||||
| Net increase (decrease) in net assets | 250,998 | ||||||
| Net Assets: | |||||||
| Beginning of period | – | ||||||
| End of period | $ | 250,998 | |||||
| Undistributed Net Investment Income (Loss) | $ | 405 | |||||
| Share Activity: | |||||||
| Shares issued: | |||||||
| Class A | 8,512 | ||||||
| Class I | 14,277 | ||||||
| 22,789 | |||||||
| Net increase (decrease) in shares outstanding: | |||||||
| Class A | 8,512 | ||||||
| Class I | 14,277 | ||||||
| 22,789 | |||||||
(a) TA IDEX Evergreen International Small Cap ("the Fund") commenced operations on November 8, 2004. The inception date for the Fund's offering of share Class A was March 1, 2005.
The notes to the financial statements are an integral part of this report.
Transamerica IDEX Mutual Funds
Semi-Annual Report 2005
6
TA IDEX Evergreen International Small Cap
FINANCIAL HIGHLIGHTS
(unaudited)
| For a share of beneficial interest outstanding throughout the period | |||||||||||||||||||||||||||||||||||||||
| Net Asset | Investment Operations | Distributions | Net Asset | ||||||||||||||||||||||||||||||||||||
| For the Period Ended (d)(g) | Value, Beginning of Period | Net Investment Income (Loss) | Net Realized and Unrealized Gain (Loss) | Total Operations | From Net Investment Income | From Net Realized Gains | Total Distributions | Value, End of Period | |||||||||||||||||||||||||||||||
| Class A | 4/30/2005 | $ | 11.50 | $ | 0.04 | $ | (0.53 | ) | $ | (0.49 | ) | $ | – | $ | – | $ | – | $ | 11.01 | ||||||||||||||||||||
| Class I | 4/30/2005 | 10.00 | 0.02 | 1.00 | 1.02 | – | – | – | 11.02 | ||||||||||||||||||||||||||||||
| Ratios/Supplemental Data | |||||||||||||||||||||||||||||||
| For the Period | Total | Net Assets, End of Period | Ratio of Expenses to Average Net Assets (a) | Net Investment Income (Loss) to Average | Portfolio Turnover | ||||||||||||||||||||||||||
| Ended (g) | Return (c) | (000's) | Net (e) | Total (f) | Net Assets (a) | Rate (b) | |||||||||||||||||||||||||
| Class A | 4/30/2005 | (4.26 | )% | $ | 93,731 | 1.32 | % | 1.58 | % | 2.05 | % | 19 | % | ||||||||||||||||||
| Class I | 4/30/2005 | 10.20 | 157,267 | 1.23 | 1.23 | 0.35 | 19 | ||||||||||||||||||||||||
NOTES TO FINANCIAL HIGHLIGHTS
(a) Annualized.
(b) Not annualized for periods of less than one year.
(c) Total Return has been calculated for the applicable period without deduction of a sales load, if any, on an initial purchase. Periods of less than one year are not annualized.
(d) Per share information is calculated based on average number of shares outstanding.
(e) Ratio of Net Expenses to Average Net Assets is net of fee waivers and reimbursements by the investment adviser, if any (see note 2).
(f) Ratio of Total Expenses to Average Net Assets includes all expenses before fee waivers and reimbursements by the investment adviser.
(g) TA IDEX Evergreen International Small Cap ("the Fund") commenced operations on November 8, 2004. The inception date for the Fund's offering of share Class A was March 1, 2005.
The notes to the financial statements are an integral part of this report.
Transamerica IDEX Mutual Funds
Semi-Annual Report 2005
7
TA IDEX Evergreen International Small Cap
NOTES TO FINANCIAL STATEMENTS
At April 30, 2005
(all amounts in thousands)
(unaudited)
NOTE 1. ORGANIZATION AND SIGNIFICANT ACCOUNTING POLICIES
Transamerica IDEX Mutual Funds is a Delaware statutory trust registered under the Investment Company Act of 1940, as amended (the "1940 Act"), as an open-end management investment company. Prior to March 1, 2005, Transamerica IDEX Mutual Funds was a Massachusetts business trust. TA IDEX Evergreen International Small Cap ("the Fund"), part of Transamerica IDEX Mutual Funds, began operations on November 8, 2004.
In the normal course of business, the Fund enters into contracts that contain a variety of representations and warranties, which provide general indemnifications. The Fund's maximum exposure under these arrangements is unknown, as this would involve future claims that may be made against the Fund and/or its affiliates that have not yet occurred. However, based on experience, the Fund expects the risk of loss to be remote.
See the Prospectus and Statement of Additional Information for a description of the Fund's investment objective.
In preparing the Fund's financial statements in accordance with accounting principles generally accepted in the United States of America ("GAAP"), estimates or assumptions (which could differ from actual results) may be used that affect reported amounts and disclosures. The following policies were consistently followed by the Fund, in accordance with GAAP.
Multiple class operations and expenses: The Fund currently offers two classes of shares, Class A and Class I, each with a public offering price that reflects different sales charges, if any, and expense levels. The initial sales charge currently is waived as this Fund is available for investment only by certain strategic asset allocation funds. Income, non-class specific expenses and realized and unrealized gains and losses, are allocated daily to each class, based upon the value of shares outstanding method as permitted under Rule 18f-3 of the 1940 Act. Each class bears its own specific expenses as well as a portion of general, common expenses.
Pricing of shares: The Fund prices its shares on the basis of the net asset value of each class of shares of the Fund, which is determined as of the close of the New York Stock Exchange ("NYSE") (generally 4:00 p.m. Eastern Time) on each day on which the NYSE is open for trading.
Security valuations: Fund investments traded on an exchange are valued at the closing price on the day of valuation on the exchange where the security is principally traded. With respect to securities traded on NASDAQ NMS, such closing price may be last reported sales price or the NASDAQ Official Closing Price.
Securities traded in the over-the-counter market and listed securities for which no sale was reported on that date are valued at the last quoted bid price.
Foreign securities generally are valued based on quotations from the primary market in which they are traded and are translated from the local currency into U.S. dollars using closing exchange rates. Many foreign securities markets are open for trading at times when the U.S. markets are closed for trading, and many foreign securities markets close for trading before the close of the NYSE. The value of foreign securities may be affected significantly on a day that the NYSE is closed and an investor is unable to purchase or redeem shares. If a significant market event impacting the value of a portfolio security (e.g., natural disaster, company announcement, market volatility) occurs subsequent to the close of trading in the security, but prior to the calculation of the Fund's net asset value per share, market quotations for that security may be determined to be unreliable and, accordingly, not "readily av ailable." If market quotations are not readily available, and the impact of such a significant market event materially effects the net asset value per share of the Fund, an affected portfolio security will be valued at fair market value as determined in good faith using guidelines adopted by the Board of Trustees of the Fund, under the supervision of the Fund's Valuation Committee. Factors that may be considered to value foreign securities at fair market value may include, among others: the value of other securities traded on other markets, foreign currency exchange activity and the trading of financial products tied to foreign securities.
Other securities for which quotations are not readily available are valued at fair market value as determined in good faith using guidelines adopted by the Board of Trustees of the Fund, under the supervision of the Fund's Valuation Committee. These guidelines may include: the type of security; any restrictions on its resale; financial or business news of the issuer; similar or related securities that are actively trading; related corporate actions; and other significant events occurring after the close of trading in the security.
Cash: The Fund may leave cash overnight in its cash account with the custodian, Investors Bank & Trust Company ("IBT"). IBT has been contracted on behalf of the Fund to invest the excess cash into a savings account, which at April 30, 2005, was paying an interest rate of 2.02%.
Throughout the period, from inception through April 30, 2005 the Fund may have a cash overdraft balance. A fee is incurred on this overdraft, calculated by multiplying the overdraft by a rate based on the federal funds rate.
Security transactions and investment income: Security transactions are recorded on the trade date. Security gains and losses are calculated on the specific identification basis. Dividend income is recorded on the ex-dividend date or, in the case of foreign securities, as soon as the Fund is informed of the ex-dividend date. Interest income, including accretion of discounts and amortization of premiums, is recorded on the accrual basis commencing on the settlement date.
Transamerica IDEX Mutual Funds
Semi-Annual Report 2005
8
TA IDEX Evergreen International Small Cap
NOTES TO FINANCIAL STATEMENTS (continued)
At April 30, 2005
(all amounts in thousands)
(unaudited)
NOTE 1.–(continued)
Foreign currency denominated investments: The accounting records of the Fund are maintained in U.S. dollars. Securities and other assets and liabilities denominated in foreign currencies are translated into U.S. dollars at the closing exchange rate each day. The cost of foreign securities is translated at the exchange rate in effect when the investment was acquired. The Fund combines fluctuations from currency exchange rates and fluctuations in value when computing net realized and unrealized gains or losses from investments.
Net foreign currency gains and losses resulting from changes in exchange rates include: 1) foreign currency fluctuations between trade date and settlement date of investment security transactions; 2) gains and losses on forward foreign currency contracts; and 3) the difference between the receivable amounts of interest and dividends recorded in the accounting records in U.S. dollars and the amounts actually received.
Foreign currency denominated assets may involve risks not typically associated with domestic transactions, including unanticipated movements in exchange currency rates, the degree of government supervision and regulation of security markets, and the possibility of political or economic instability.
Foreign capital gains taxes: The Fund may be subject to taxes imposed by countries in which it invests, with respect to its investment in issuers existing or operating in such countries. Such taxes are generally based on income earned or repatriated and capital gains realized on the sale of such investments. The Fund accrues such taxes when the related income or capital gains are earned. Some countries require governmental approval for the repatriation of investment income, capital or the proceeds of sales earned by foreign investors. In addition, if there is deterioration in a country's balance of payments or for other reasons, a country may impose temporary restrictions on foreign capital remittances abroad.
Forward foreign currency contracts: The Fund may enter into forward foreign currency contracts to hedge against exchange rate risk arising from investments in securities denominated in foreign currencies. Contracts are valued at the contractual forward rate and are marked to market daily, with the change in value recorded as an unrealized gain or loss. When the contracts are closed a realized gain or loss is incurred. Risks may arise from changes in market value of the underlying currencies and from the possible inability of counterparties to meet the terms of their contracts.
There are no open forward foreign currency contracts at April 30, 2005.
Redemption fees: A short-term trading redemption fee may be assessed on any fund shares in a fund account that are sold during the first five (5) NYSE trading days following their purchase date. This redemption fee will equal 2% of the amount redeemed and shares held the longest will be treated as being redeemed first and shares held the shortest as being redeemed last.
For the period from inception to April 30, 2005, the Fund received no redemption fees.
Dividend distributions: Distributions to shareholders are recorded on the ex-dividend date and are determined in accordance with Federal income tax regulations which may differ from GAAP.
NOTE 2. RELATED PARTY TRANSACTIONS
Transamerica Fund Advisors, Inc. ("TFAI") is the Fund's investment adviser. Transamerica Fund Services, Inc. ("TFS") is the Fund's administrator and transfer agent. AFSG Securities Corp. ("AFSG") is the Fund's distributor/principal underwriter. AFSG is 100% owned by AUSA Holding Company ("AUSA"). TFAI is a directly owned subsidiary of Western Reserve Life Assurance Co. of Ohio (78%) and AUSA (22%). TFS is a wholly owned subsidiary of WRL (50%) and AUSA (50%). AUSA and WRL are wholly owned indirect subsidiaries of AEGON, NV, a Netherlands corporation.
Effective January 1, 2005 AEGON/Transamerica Fund Advisors, Inc. ("ATFA") was renamed Transamerica Fund Advisors, Inc. ("TFAI"); AEGON/Transamerica Fund Services, Inc. ("ATFS") and AEGON/Transamerica Investor Services, Inc. ("ATIS") merged into one entity and was renamed Transamerica Fund Services, Inc. ("TFS").
The following schedule reflects the percentage of fund assets owned by affiliated mutual funds (i.e., through the Transamerica IDEX Mutual Funds and AEGON/Transamerica Series Trust (f/k/a AEGON/Transamerica Series Fund, Inc.) asset allocation funds):
| Net Assets | % of Net Assets | ||||||||||
| TA IDEX Asset Allocation – Conservative Portfolio | $ | 8,660 | 3.45 | % | |||||||
| TA IDEX Asset Allocation – Growth Portfolio | 27,758 | 11.06 | % | ||||||||
| TA IDEX Asset Allocation – Moderate Growth Portfolio | 41,354 | 16.48 | % | ||||||||
| TA IDEX Asset Allocation – Moderate Portfolio | 15,918 | 6.34 | % | ||||||||
| Asset Allocation – Conservative Portfolio | 7,899 | 3.15 | % | ||||||||
| Asset Allocation – Growth Portfolio | 43,437 | 17.31 | % | ||||||||
| Asset Allocation – Moderate Growth Portfolio | 35,190 | 14.02 | % | ||||||||
| Asset Allocation – Moderate Portfolio | 70,575 | 28.11 | % | ||||||||
| Total | $ | 250,791 | 99.92 | % | |||||||
Transamerica IDEX Mutual Funds
Semi-Annual Report 2005
9
TA IDEX Evergreen International Small Cap
NOTES TO FINANCIAL STATEMENTS (continued)
At April 30, 2005
(all amounts in thousands)
(unaudited)
NOTE 2.–(continued)
Investment advisory fee: The Fund pays management fees to TFAI based on average daily net assets ("ANA") at the following breakpoints:
1.07% of the first $250 million of ANA
1.00% of ANA over $250 million
TFAI has contractually agreed to waive its advisory fee and will reimburse the Fund to the extent that operating expenses exceed the following stated annual limit:
1.32% Expense Limit
If total fund expenses fall below the annual expense limitation agreement agreed to by the adviser within the succeeding three years, the Fund may be required to pay that adviser a portion or all of the waived advisory fees.
There are no amounts available for recapture at April 30, 2005.
Distribution and service fees: The Fund has a 12b-1 distribution plan under the 1940 Act pursuant to which an annual fee, based on average daily net assets, is paid to the distributor for various disbursements such as broker-dealer account servicing fees and other promotional expenses of the Fund. The Fund is authorized under the 12b-1 plan to pay fees on each class up to the following limits:
| Class A | 0.35 | % | |||||
| Class I | N/A | ||||||
In the case the Fund or a class of shares of the Fund is closed to new investors or investments, the Fund is authorized to pay 12b-1 fees for past sales and distribution efforts and present and past investor services.
Administrative services: The Fund has entered into an agreement with TFS for financial and legal fund administration services, which includes such items as compliance, expenses, financial statements and other reporting, distributions, tax returns, prospectus preparation, board of trustees meeting support and other legal matters. As of January 1, 2005 the Fund pays TFS an annual fee of 0.02% of average net assets. Prior to January 1, 2005 the Fund paid TFS an annual fee of 0.015% of average net assets. The Legal fees on the Statement of Operations are for fees paid to external legal counsel.
Transfer agent fees: The Fund pays TFS an annual per-account charge of $20 (not in thousands) for each open account and $1.63 (not in thousands) for each closed account. There is no new account charge.
The Transfer agent fees on the Statement of Operations are made up of fees paid to TFS and costs associated with shareholder statements.
The Fund paid TFS less than $1 for the period from inception through April 30, 2005.
NOTE 3. INVESTMENT TRANSACTIONS
The cost of securities purchased and proceeds from securities sold (excluding short-term securities) for the period from inception through April 30, 2005, were as follows:
| Purchases of securities: | |||||||
| Long-Term excluding U.S. Government | $ | 248,269 | |||||
| U.S. Government | – | ||||||
| Proceeds from maturities and sales of securities: | |||||||
| Long-Term excluding U.S. Government | 23,292 | ||||||
| U.S. Government | – | ||||||
NOTE 4. FEDERAL INCOME TAX MATTERS
The Fund has not made any provision for federal income or excise taxes due to its policy to distribute all of its taxable income and capital gains to its shareholders and otherwise qualify as a regulated investment company under the Internal Revenue Code. Income and capital gain distributions are determined in accordance with income tax regulations, which may differ from GAAP. These differences are primarily due to differing treatment for items including, but not limited to, wash sales and net operating losses.
The aggregate cost of investments and composition of unrealized appreciation (depreciation) for federal income tax purposes as of April 30, 2005, are as follows:
| Federal Tax Cost Basis | $ | 225,397 | |||||
| Unrealized Appreciation | $ | 7,926 | |||||
| Unrealized (Depreciation) | (7,108 | ) | |||||
| Net Unrealized Appreciation (Depreciation) | $ | 818 | |||||
NOTE 5. REGULATORY PROCEEDINGS
There continues to be significant federal and state regulatory activity relating to financial services companies, particularly mutual fund companies and their investment advisers. As part of an ongoing investigation regarding potential market timing, recordkeeping and trading compliance issues and matters affecting the Fund's investment adviser, TFAI, and certain employees and affiliates of TFAI, the SEC staff has indicated that it is likely to take some action against TFAI and certain of its affiliates at the conclusion of the investigation. The potential timing and the scope of any such action is difficult to predict. Although the impact of any action brought against TFAI and/or its affiliates is difficult to assess at the present time, the Fund currently believes that the likelihood that any such action will have a material adverse impact on it is remote. It is important to note that the Fund is not
Transamerica IDEX Mutual Funds
Semi-Annual Report 2005
10
TA IDEX Evergreen International Small Cap
NOTES TO FINANCIAL STATEMENTS (continued)
At April 30, 2005
(all amounts in thousands)
(unaudited)
NOTE 5.–(continued)
aware of any allegation of wrongdoing against it and its board at the time this semi-annual report is printed. Although it is not anticipated that these developments will have an adverse impact on the Fund, there can be no assurance at this time. TFAI and its affiliates are actively working with the SEC in regard to this matter; however, the exact resolution cannot be determined at this time. TFAI will take such actions that it deems necessary or appropriate to continue providing management services to the Fund and to bring all matters to an appropriate conclusion.
TFAI and/or its affiliates, and not the Fund, will bear the costs regarding these regulatory matters.
Transamerica IDEX Mutual Funds
Semi-Annual Report 2005
11
TA IDEX Evergreen International Small Cap
A discussion regarding the basis of Transamerica IDEX Mutual Fund's Board of Trustees' approval of the fund's advisory arrangements will be available in the fund's annual report for the fiscal year ending October 31, 2005.
Transamerica IDEX Mutual Funds
Semi-Annual Report 2005
12
TA IDEX Evergreen International Small Cap
SUPPLEMENTAL INFORMATION (unaudited)
RESULTS OF SHAREHOLDER PROXY
At a special meeting of shareholders held on February 25, 2005, the results of the Proposals were as follows:
Transamerica IDEX Mutual Funds
Proposal 1: Election of Trustees to the Board of Trustees of Transamerica IDEX Mutual Funds.
| For | Withheld | ||||||||||
| Peter R. Brown | 872,017,875.249 | 4,468,498.551 | |||||||||
| Daniel Calabria | 871,917,069.786 | 4,569,304.014 | |||||||||
| Janise B. Case | 872,099,393.125 | 4,386,980.675 | |||||||||
| Charles C. Harris | 872,086,722.025 | 4,399,651.775 | |||||||||
| Leo J. Hill | 872,304,465.640 | 4,181,908.160 | |||||||||
| Russell A. Kimball, Jr. | 872,253,556.471 | 4,232,817.329 | |||||||||
| William W. Short, Jr. | 872,139,920.944 | 4,346,452.856 | |||||||||
| John Waechter | 872,261,152.376 | 4,225,221.424 | |||||||||
| Jack E. Zimmerman | 871,929,967.512 | 4,556,406.288 | |||||||||
| Brian C. Scott | 872,218,970.367 | 4,267,403.433 | |||||||||
| Thomas P. O'Neill | 872,111,944.117 | 4,374,429.683 | |||||||||
TA IDEX Evergreen International Small Cap
Proposal 2: Approval of an Agreement and Plan of Reorganization pursuant to which Transamerica IDEX Mutual Funds will organize as a Delaware statutory trust.
| For | Against | Abstentions/Broker Non-Votes | |||||||||
| 2,298,926.010 | 0 | 0 | |||||||||
Proposal 3: Approval of changes to the fundamental investment restrictions of TA IDEX Evergreen International Small Cap.
| A. Diversification | For | Against | Abstentions/Broker Non-Votes | ||||||||||||
| 2,298,926.010 | 0 | 0 | |||||||||||||
| B. Borrowing | For | Against | Abstentions/Broker Non-Votes | ||||||||||||
| 2,298,926.010 | 0 | 0 | |||||||||||||
| C. Senior Securities | For | Against | Abstentions/Broker Non-Votes | ||||||||||||
| 2,298,926.010 | 0 | 0 | |||||||||||||
| D. Underwriting Securities | For | Against | Abstentions/Broker-Non-Votes | ||||||||||||
| 2,298,926.010 | 0 | 0 | |||||||||||||
| E. Real Estate | For | Against | Abstentions/Broker Non-Votes | ||||||||||||
| 2,298,926.010 | 0 | 0 | |||||||||||||
| F. Making Loans | For | Against | Abstentions/Broker Non-Votes | ||||||||||||
| 2,298,926.010 | 0 | 0 | |||||||||||||
| G. Concentration | For | Against | Abstentions/Broker Non-Votes | ||||||||||||
| 2,298,926.010 | 0 | 0 | |||||||||||||
| H. Commodities | For | Against | Abstentions/Broker Non-Votes | ||||||||||||
| 2,298,926.010 | 0 | 0 | |||||||||||||
Transamerica IDEX Mutual Funds
Semi-Annual Report 2005
13
TA IDEX Federated Tax Exempt
UNDERSTANDING YOUR FUND'S EXPENSES
(unaudited)
SHAREHOLDER EXPENSES
The following Example is intended to help you understand your ongoing costs (in dollars and cents) of investing in a Fund and to compare these costs with the ongoing costs of investing in other funds.
The Example is based on an investment of $1,000 invested at November 1, 2004 and held for the entire period until April 30, 2005.
ACTUAL EXPENSES
The first line in the table below provides information about actual account values and actual expenses. You may use the information in this line, together with the amount you invested, to estimate the expenses that you paid over the period. Simply divide your account value by $1,000 (for example, an $8,600 account value divided by $1,000 = 8.6), then multiply the result by the number in the first line of your Fund under the heading entitled "Expenses Paid During Period" to estimate the expenses you paid on your account during this period.
HYPOTHETICAL EXAMPLE FOR COMPARISON PURPOSES
The second line in the table below provides information about hypothetical account values and hypothetical expenses based on the Fund's actual expense ratio and an assumed rate of return of 5% per year before expenses, which is not the Fund's actual return. The hypothetical account values and expenses may not be used to estimate the actual ending account balance or expenses you paid for the period. You may use this information to compare the ongoing costs of investing in your Fund and other funds. To do so, compare this 5% hypothetical example with the 5% hypothetical examples that appear in the shareholder reports of the other funds.
Please note that the expenses shown in the table are meant to highlight your ongoing costs only and do not reflect any transactional costs, such as sales charges, redemption fees, brokerage commissions paid on purchases and sales of fund shares. Therefore, the second line under the Fund in the table is useful in comparing ongoing costs only, and will not help you determine the relative total costs of owning different funds. In addition, note that the expenses shown in the table are meant to highlight your ongoing costs and do not reflect any transaction costs.
| Beginning Account Value | Ending Account Value | Annualized Expense Ratio | Expenses Paid During Period (a) | ||||||||||||||||
| Class A | |||||||||||||||||||
| Actual | $ | 1,000.00 | $ | 1,011.20 | 1.24 | % | $ | 6.18 | |||||||||||
| Hypothetical (b) | 1,000.00 | 1,018.30 | 1.24 | 6.21 | |||||||||||||||
| Class B | |||||||||||||||||||
| Actual | 1,000.00 | 1,007.80 | 1.93 | 9.61 | |||||||||||||||
| Hypothetical (b) | 1,000.00 | 1,014.93 | 1.93 | 9.64 | |||||||||||||||
| Class C | |||||||||||||||||||
| Actual | 1,000.00 | 1,007.90 | 2.00 | 9.96 | |||||||||||||||
| Hypothetical (b) | 1,000.00 | 1,014.88 | 2.00 | 9.99 | |||||||||||||||
| Class M | |||||||||||||||||||
| Actual | 1,000.00 | 1,009.80 | 1.60 | 7.97 | |||||||||||||||
| Hypothetical (b) | 1,000.00 | 1,016.86 | 1.60 | 8.00 | |||||||||||||||
(a) Expenses are calculated using each Fund's annualized expense ratio (as disclosed in the table), multiplied by the average account value for the period, multiplied by number of days in the period (181 days), and divided by the number of days in the year (365 days).
(b) 5% return per year before expenses.
GRAPHICAL PRESENTATION OF SCHEDULE OF INVESTMENTS
By Municipal Bond Type
At April 30, 2005
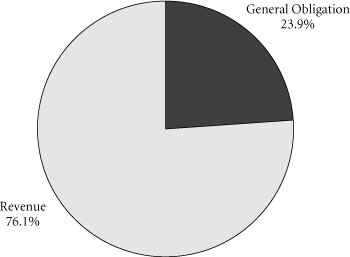
This chart shows the percentage breakdown by municipal bond type of the Fund's total investment securities.
Transamerica IDEX Mutual Funds
Semi-Annual Report 2005
1
TA IDEX Federated Tax Exempt
SCHEDULE OF INVESTMENTS
At April 30, 2005
(all amounts except share amounts in thousands)
(unaudited)
| Principal | Value | ||||||||||
| LONG-TERM MUNICIPAL BONDS ( 97.4%) | |||||||||||
| Alabama (1.9%) | |||||||||||
| Alabama Water Pollution Control Authority, Revenue Bonds, 5.50%, due 08/15/2023 | $ | 500 | $ | 547 | |||||||
| California (6.2%) | |||||||||||
| California Health Facilities Financing Authority, (Catholic Healthcare West), Revenue Bonds, Series I, (a) 4.95%, due 07/01/2026 | 145 | 152 | |||||||||
| California State, 5.00%, due 03/01/2024 | 500 | 527 | |||||||||
| California State, General Obligation Bonds, 5.25%, due 02/01/2014 | 500 | 552 | |||||||||
| Torrance, CA, (Torrance Memorial Medical Center), Revenue Bonds, Series A, 6.00%, due 06/01/2022 | 500 | 556 | |||||||||
| Colorado (2.0%) | |||||||||||
| Colorado Department of Transportation, Revenue Bonds, Series A, 5.50%, due 06/15/2015 | 500 | 565 | |||||||||
| District of Columbia (2.0%) | |||||||||||
| District of Columbia Water & Sewer Authority, Revenue Bonds, 5.50%, due 10/01/2017 | 500 | 579 | |||||||||
| Illinois (9.2%) | |||||||||||
| Illinois Educational Facilities Authority, (Loyola University), Revenue Bonds, Series A, 5.00%, due 07/01/2026 | 500 | 515 | |||||||||
| Illinois State Partnership, Department of Central Management, Public Improvements, General Obligations Bonds, 5.65%, due 07/01/2017 | 1,000 | 1,049 | |||||||||
| McHenry County, IL, Community Unit School District No. 200, Prerefunded, Series A, 5.85%, due 01/01/2016 | 770 | 828 | |||||||||
| McHenry County, IL, Community Unit School District No. 200, Unrefunded, Series A, 5.85%, due 01/01/2016 | 230 | 245 | |||||||||
| Indiana (6.7%) | |||||||||||
| Indiana Health Facility Financing Authority, (Community Foundation Northwest, IN), Revenue Bonds, 6.25%, due 03/01/2025 | 300 | 325 | |||||||||
| Indiana State Development Finance Authority, (USX Corp./Marathon Oil Co.), Revenue Bonds, 5.25%, due 12/01/2022 | 500 | 549 | |||||||||
| Principal | Value | ||||||||||
| Indiana (continued) | |||||||||||
| Indianapolis, IN, (Distribution System), Revenue Bonds, Series A, 5.25%, due 08/15/2012 | $ | 1,000 | $ | 1,062 | |||||||
| Louisiana (1.9%) | |||||||||||
| Sabine River Authority, (International Paper Co.), Water Facilities, Revenue Bonds, 6.20%, due 02/01/2025 | 500 | 547 | |||||||||
| Massachusetts (1.9%) | |||||||||||
| Massachusetts State Development Finance Agency, (Massachusetts College of Pharmacy & Allied Health Services), Revenue Bonds, 6.38%, due 07/01/2023 | 500 | 557 | |||||||||
| Michigan (3.9%) | |||||||||||
| Cornell Township, MI, Economic Development Corp., (MeadWestvaco/Mead Corp.), Revenue Bonds, 5.88%, due 05/01/2018 | 500 | 549 | |||||||||
| Michigan Municipal Bond Authority, Revenue Bonds, 5.50%, due 10/01/2022 (b) | 500 | 561 | |||||||||
| Minnesota (1.9%) | |||||||||||
| Minneapolis & St. Paul, MN, Housing & Redevelopment Authority, (Group Health Plan, Inc.), Revenue Bonds, 6.00%, due 12/01/2019 | 500 | 549 | |||||||||
| Mississippi (2.1%) | |||||||||||
| Lowndes County, MS, Solid Waste Disposal & Pollution Control, (Weyerhaeuser Co.), Revenue Bonds, 6.70%, due 04/01/2022 | 500 | 604 | |||||||||
| Nevada (3.3%) | |||||||||||
| Clark County, NV, Industrial Development, (Southwest Gas Corp.), Revenue Bonds, (a) 5.45%, due 03/01/2038 | 400 | 425 | |||||||||
| Clark County, NV, School District, General Obligations Bonds, Series F, 5.00%, due 06/15/2006 | 500 | 512 | |||||||||
| New Hampshire (0.3%) | |||||||||||
| New Hampshire State Housing Finance Authority, Single Family Mortgage, Revenue Bonds, Series C, 6.13%, due 01/01/2020 | 85 | 85 | |||||||||
The notes to the financial statements are an integral part of this report.
Transamerica IDEX Mutual Funds
Semi-Annual Report 2005
2
TA IDEX Federated Tax Exempt
SCHEDULE OF INVESTMENTS (continued)
At April 30, 2005
(all amounts except share amounts in thousands)
(unaudited)
| Principal | Value | ||||||||||
| New Jersey (0.7%) | |||||||||||
| New Jersey Economic Development Authority, (Winchester Gardens/Marcus L Ward Home), Revenue Bonds, Series A, 5.80%, due 11/01/2031 | $ | 200 | $ | 206 | |||||||
| New Mexico (0.6%) | |||||||||||
| New Mexico Mortgage Finance Authority, Revenue Bonds, 6.05%, due 09/01/2021 | 165 | 173 | |||||||||
| New York (13.3%) | |||||||||||
| Hempstead Town, NY, Industrial Development Agency, (Hofstra University), Revenue Bonds, 4.63%, due 07/01/2021 | 500 | 510 | |||||||||
| New York City, NY, City Industrial Development Agency, (New York University), Revenue Bonds, 5.38%, due 07/01/2017 | 250 | 275 | |||||||||
| New York State Mortgage Agency, Revenue Bonds, Series 95, 5.50%, due 10/01/2017 | 500 | 528 | |||||||||
| New York, NY, City Transitional Finance Authority, Revenue Bonds, 5.50%, due 02/15/2019 | 360 | 403 | |||||||||
| New York, NY, City Transitional Finance Authority, Revenue Bonds, 5.50%, due 02/15/2019 | 640 | 703 | |||||||||
| New York, NY, General Obligation Bonds, Series G, 5.00%, due 12/01/2025 | 500 | 523 | |||||||||
| United Nations Development Corp., Revenue Bonds, Series A, 5.25%, due 07/01/2024 | 250 | 260 | |||||||||
| Warwick Valley Central School District, NY, General Obligations Bonds, 5.50%, due 01/15/2017 | 570 | 627 | |||||||||
| North Carolina (4.2%) | |||||||||||
| North Carolina Eastern Municipal Power Agency, Revenue Bonds, Series A, 5.50%, due 01/01/2012 | 500 | 547 | |||||||||
| North Carolina Medical Care Commission, (Arc of North Carolina), 5.50%, due 10/01/2024 | 240 | 242 | |||||||||
| North Carolina State Housing Finance Agency, Revenue Bonds, 5.25%, due 01/01/2022 | 420 | 434 | |||||||||
| Principal | Value | ||||||||||
| North Dakota (0.9%) | |||||||||||
| North Dakota State Housing Finance Agency, Revenue Bonds, Series C, 6.00%, due 07/01/2020 | $ | 245 | $ | 247 | |||||||
| Ohio (4.9%) | |||||||||||
| Cleveland, OH, Municipal School District, 5.25%, due 12/01/2024 | 300 | 325 | |||||||||
| Ohio State Air Quality Development Authority, (Cleveland Electric Illumination), Revenue Bonds, 6.00%, due 12/01/2013 | 500 | 531 | |||||||||
| Ohio State, General Obligations Bonds, Series A, 5.38%, due 09/15/2017 | 500 | 550 | |||||||||
| Pennsylvania (6.9%) | |||||||||||
| Pennsylvania State Higher Educational Facilities Authority, (LaSalle University), Revenue Bonds, 5.25%, due 05/01/2023 | 350 | 362 | |||||||||
| Pennsylvania State Higher Educational Facilities Authority, (UPMC Health System), Revenue Bonds, 6.00%, due 01/15/2022 | 500 | 553 | |||||||||
| Pennsylvania State University, Revenue Bonds, 5.00%, due 09/01/2029 | 500 | 527 | |||||||||
| Sayre, PA, Health Care Facilities Authority, (Guthrie Healthcare System), Revenue Bonds, 5.75%, due 12/01/2021 | 500 | 536 | |||||||||
| Rhode Island (5.7%) | |||||||||||
| Providence, RI, Public Building Authority, Revenue Bonds, Series A, 5.70%, due 12/15/2015 | 500 | 563 | |||||||||
| Rhode Island Clean Water Finance Agency, (Triton Ocean LLC), Revenue Bonds, 5.80%, due 09/01/2022 | 1,000 | 1,070 | |||||||||
| South Dakota (1.8%) | |||||||||||
| South Dakota Housing Development Authority, Revenue Bonds, Series C, 5.35%, due 05/01/2022 | 500 | 526 | |||||||||
| Tennessee (1.8%) | |||||||||||
| Tennessee Housing Development Agency, Revenue Bonds, 5.38%, due 01/01/2018 | 495 | 522 | |||||||||
The notes to the financial statements are an integral part of this report.
Transamerica IDEX Mutual Funds
Semi-Annual Report 2005
3
TA IDEX Federated Tax Exempt
SCHEDULE OF INVESTMENTS (continued)
At April 30, 2005
(all amounts except share amounts in thousands)
(unaudited)
| Principal | Value | ||||||||||
| Texas (5.3%) | |||||||||||
| Kingsbridge, TX, Municipal Utility District, General Obligations Bonds, 5.38%, due 03/01/2015 | $ | 500 | $ | 521 | |||||||
| Port Houston Authority, Harris County, General Obligation Bonds, Series A, 5.50%, due 10/01/2024 | 500 | 546 | |||||||||
| Sabine River Authority, (TXU Energy Co. LLC), Revenue Bonds, Series A, (a) 5.80%, due 07/01/2022 | 165 | 177 | |||||||||
| Sabine River, TX, Authority, (TXU Energy Co. LLC), 6.15%, due 08/01/2022 | 250 | 275 | |||||||||
| Washington (3.9%) | |||||||||||
| Energy Northwest, WA, Electric, (Bonneville Power Administration), Revenue Bonds, Series A, 5.75%, due 07/01/2018 | 500 | 562 | |||||||||
| University of Washington, Student Facilities Improvements, Revenue Bonds, 5.88%, due 06/01/2016 | 500 | 561 | |||||||||
| Principal | Value | ||||||||||
| Wyoming (4.1%) | |||||||||||
| Wyoming State Farm Loan Board, Capital Facilities, Revenue Bonds, 5.75%, due 10/01/2020 | $ | 1,000 | $ | 1,172 | |||||||
| Total Long-Term Municipal Bonds (cost: $26,123) | 27,997 | ||||||||||
| SHORT-TERM MUNICIPAL BONDS ( 1.7%) | |||||||||||
| Indiana Health Facility Financing Authority, (Clarian Health Partners), Revenue Bonds (a) 3.00%, due 03/01/2030 | 500 | 500 | |||||||||
| Total Short-Term Municipal Bonds (cost: $500) | 500 | ||||||||||
| Total Investment Securities (cost: $26,623) | $ | 28,497 | |||||||||
| SUMMARY: | |||||||||||
| Investments, at value | 99.1 | % | 28,497 | ||||||||
| Other assets and liabilities | 0.9 | % | 272 | ||||||||
| Net assets | 100.0 | % | 28,769 | ||||||||
| SHORT FUTURES CONTRACTS: | |||||||||||
| Contracts | Settlement Date | Amount | Net Unrealized Appreciation (Depreciation) | ||||||||||||||||
| 10-Year U.S. Treasury Note | (15 | ) | 06/30/2005 | $ | (1,671 | ) | $ | (24 | ) | ||||||||||
| $ | (1,671 | ) | $ | (24 | ) | ||||||||||||||
NOTES TO SCHEDULE OF INVESTMENTS:
(a) Floating or variable rate note. Rate is listed as of April 30, 2005.
(b) At April 30, 2005, all or a portion of this security is segregated with the custodian to cover margin requirements for open futures contracts. The value of all securities segregated at April 30, 2005 is $112.
The notes to the financial statements are an integral part of this report.
Transamerica IDEX Mutual Funds
Semi-Annual Report 2005
4
TA IDEX Federated Tax Exempt
STATEMENT OF ASSETS AND LIABILITIES
At April 30, 2005
(all amounts except per share amounts in thousands)
(unaudited)
| Assets: | |||||||
| Investment securities, at value (cost: $26,623) | $ | 28,497 | |||||
| Cash | 30 | ||||||
| Receivables: | |||||||
| Interest | 396 | ||||||
| Variation margin | 4 | ||||||
| Other | 15 | ||||||
| 28,942 | |||||||
| Liabilities: | |||||||
| Accounts payable and accrued liabilities: | |||||||
| Shares of beneficial interest redeemed | 100 | ||||||
| Management and advisory fees | 24 | ||||||
| Transfer agent fees | 11 | ||||||
| Distribution and service fees | 14 | ||||||
| Other | 24 | ||||||
| 173 | |||||||
| Net Assets | $ | 28,769 | |||||
| Net Assets Consist of: | |||||||
| Shares of beneficial interest, unlimited shares authorized, no par value | $ | 27,335 | |||||
| Undistributed net investment income (loss) | 16 | ||||||
| Accumulated net realized gain (loss) from investment securities and futures contracts | (433 | ) | |||||
| Net unrealized appreciation (depreciation) on: | |||||||
| Investment securities | 1,875 | ||||||
| Futures contracts | (24 | ) | |||||
| Net Assets | $ | 28,769 | |||||
| Net Assets by Class: | |||||||
| Class A | $ | 16,533 | |||||
| Class B | 6,670 | ||||||
| Class C | 4,267 | ||||||
| Class M | 1,299 | ||||||
| Shares Outstanding: | |||||||
| Class A | 1,400 | ||||||
| Class B | 565 | ||||||
| Class C | 361 | ||||||
| Class M | 110 | ||||||
| Net Asset Value Per Share: | |||||||
| Class A | $ | 11.81 | |||||
| Class B | 11.80 | ||||||
| Class C | 11.81 | ||||||
| Class M | 11.81 | ||||||
| Maximum Offering Price Per Share (a): | |||||||
| Class A | $ | 12.40 | |||||
| Class M | 11.93 | ||||||
(a) Includes the maximum selling commission (represented as a percentage of offering price) which is reduced on certain levels of sales as set forth in the Prospectus. Net asset value per share for Classes B and C shares represents offering price. The redemption price for Classes B, C and M shares equals net asset value less any applicable contingent deferred sales charge.
STATEMENT OF OPERATIONS
For the period ended April 30, 2005
(all amounts in thousands)
(unaudited)
| Investment Income: | |||||||
| Interest | $ | 745 | |||||
| Expenses: | |||||||
| Management and advisory fees | 90 | ||||||
| Transfer agent fees: | |||||||
| Class A | 4 | ||||||
| Class B | 1 | ||||||
| Class C | 1 | ||||||
| Class M | 1 | ||||||
| Printing and shareholder reports | 3 | ||||||
| Custody fees | 5 | ||||||
| Administration fees | 3 | ||||||
| Legal fees | 1 | ||||||
| Audit fees | 13 | ||||||
| Trustees fees | 1 | ||||||
| Registration fees: | |||||||
| Class A | 7 | ||||||
| Class B | 4 | ||||||
| Class C | 13 | ||||||
| Class M | 5 | ||||||
| Distribution and service fees: | |||||||
| Class A | 29 | ||||||
| Class B | 36 | ||||||
| Class C | 23 | ||||||
| Class M | 4 | ||||||
| Total expenses | 244 | ||||||
| Less: | |||||||
| Reimbursement of class expenses: | |||||||
| Class C | (9 | ) | |||||
| Class M | (4 | ) | |||||
| Net expenses | 231 | ||||||
| Net Investment Income (Loss) | 514 | ||||||
| Net Realized Gain (Loss): | |||||||
| Realized gain (loss) from investment securities | 154 | ||||||
| Net Increase (Decrease) in Unrealized Appreciation (Depreciation) on: | |||||||
| Investment securities | (342 | ) | |||||
| Futures contracts | (24 | ) | |||||
| (366 | ) | ||||||
| Net Gain (Loss) on Investments and Futures Contracts | (212 | ) | |||||
| Net Increase (Decrease) in Net Assets Resulting from Operations | $ | 302 | |||||
The notes to the financial statements are an integral part of this report.
Transamerica IDEX Mutual Funds
Semi-Annual Report 2005
5
TA IDEX Federated Tax Exempt
STATEMENTS OF CHANGES IN NET ASSETS
For the period or year ended
(all amounts in thousands)
| April 30, 2005 (unaudited) | October 31, 2004 | ||||||||||
| Increase (Decrease) In Net Assets From: | |||||||||||
| Operations: | |||||||||||
| Net investment income (loss) | $ | 514 | $ | 1,137 | |||||||
| Net realized gain (loss) from investment securities and futures contracts | 154 | 327 | |||||||||
| Net unrealized appreciation (depreciation) on investment securities and futures contracts | (366 | ) | 211 | ||||||||
| 302 | 1,675 | ||||||||||
| Distributions to Shareholders: | |||||||||||
| From net investment income: | |||||||||||
| Class A | (311 | ) | (692 | ) | |||||||
| Class B | (108 | ) | (266 | ) | |||||||
| Class C | (68 | ) | (95 | ) | |||||||
| Class C2 | – | (81 | ) | ||||||||
| Class M | (23 | ) | (56 | ) | |||||||
| (510 | ) | (1,190 | ) | ||||||||
| Capital Share Transactions: | |||||||||||
| Proceeds from shares sold: | |||||||||||
| Class A | 269 | 1,066 | |||||||||
| Class B | 441 | 825 | |||||||||
| Class C | 219 | 1,802 | |||||||||
| Class C2 | – | 634 | |||||||||
| Class M | 2 | 9 | |||||||||
| 931 | 4,336 | ||||||||||
| Dividends and distributions reinvested: | |||||||||||
| Class A | 240 | 526 | |||||||||
| Class B | 70 | 168 | |||||||||
| Class C | 36 | 60 | |||||||||
| Class C2 | – | 31 | |||||||||
| Class M | 21 | 48 | |||||||||
| 367 | 833 | ||||||||||
| Cost of shares redeemed: | |||||||||||
| Class A | (1,103 | ) | (3,582 | ) | |||||||
| Class B | (1,388 | ) | (3,427 | ) | |||||||
| Class C | (881 | ) | (1,927 | ) | |||||||
| Class C2 | – | (1,523 | ) | ||||||||
| Class M | (96 | ) | (565 | ) | |||||||
| (3,468 | ) | (11,024 | ) | ||||||||
| Class level exchanges: | |||||||||||
| Class C | – | 3,266 | |||||||||
| Class C2 | – | (3,266 | ) | ||||||||
| – | – | ||||||||||
| (2,170 | ) | (5,855 | ) | ||||||||
| Net increase (decrease) in net assets | (2,378 | ) | (5,370 | ) | |||||||
| Net Assets: | |||||||||||
| Beginning of period | 31,147 | 36,517 | |||||||||
| End of period | $ | 28,769 | $ | 31,147 | |||||||
| Undistributed Net Investment Income (Loss) | $ | 16 | $ | 12 | |||||||
| April 30, 2005 (unaudited) | October 31, 2004 | ||||||||||
| Share Activity: | |||||||||||
| Shares issued: | |||||||||||
| Class A | 23 | 90 | |||||||||
| Class B | 37 | 70 | |||||||||
| Class C | 19 | 151 | |||||||||
| Class C2 | – | 53 | |||||||||
| Class M | – | 1 | |||||||||
| 79 | 365 | ||||||||||
| Shares issued–reinvested from distributions: | |||||||||||
| Class A | 20 | 45 | |||||||||
| Class B | 6 | 14 | |||||||||
| Class C | 3 | 5 | |||||||||
| Class C2 | – | 3 | |||||||||
| Class M | 2 | 4 | |||||||||
| 31 | 71 | ||||||||||
| Shares redeemed: | |||||||||||
| Class A | (93 | ) | (304 | ) | |||||||
| Class B | (117 | ) | (291 | ) | |||||||
| Class C | (75 | ) | (165 | ) | |||||||
| Class C2 | – | (130 | ) | ||||||||
| Class M | (8 | ) | (49 | ) | |||||||
| (293 | ) | (939 | ) | ||||||||
| Class level exchanges: | |||||||||||
| Class C | – | 284 | |||||||||
| Class C2 | – | (284 | ) | ||||||||
| – | – | ||||||||||
| Net increase (decrease) in shares outstanding: | |||||||||||
| Class A | (50 | ) | (169 | ) | |||||||
| Class B | (74 | ) | (207 | ) | |||||||
| Class C | (53 | ) | 275 | ||||||||
| Class C2 | – | (358 | ) | ||||||||
| Class M | (6 | ) | (44 | ) | |||||||
| (183 | ) | (503 | ) | ||||||||
The notes to the financial statements are an integral part of this report.
Transamerica IDEX Mutual Funds
Semi-Annual Report 2005
6
TA IDEX Federated Tax Exempt
FINANCIAL HIGHLIGHTS
(unaudited for the period ended April 30, 2005)
| For a share of beneficial interest outstanding throughout each period | |||||||||||||||||||||||||||||||||||||||
| Net Asset | Investment Operations | Distributions | Net Asset | ||||||||||||||||||||||||||||||||||||
| For the Period Ended (d)(g) | Value, Beginning of Period | Net Investment Income (Loss) | Net Realized and Unrealized Gain (Loss) | Total Operations | From Net Investment Income | From Net Realized Gains | Total Distributions | Value, End of Period | |||||||||||||||||||||||||||||||
| Class A | 4/30/2005 | $ | 11.90 | $ | 0.22 | $ | (0.09 | ) | $ | 0.13 | $ | (0.22 | ) | $ | – | $ | (0.22 | ) | $ | 11.81 | |||||||||||||||||||
| 10/31/2004 | 11.70 | 0.43 | 0.22 | 0.65 | (0.45 | ) | – | (0.45 | ) | 11.90 | |||||||||||||||||||||||||||||
| 10/31/2003 | 11.51 | 0.41 | 0.19 | 0.60 | (0.41 | ) | – | (0.41 | ) | 11.70 | |||||||||||||||||||||||||||||
| 10/31/2002 | 11.44 | 0.38 | 0.14 | 0.52 | (0.45 | ) | – | (0.45 | ) | 11.51 | |||||||||||||||||||||||||||||
| 10/31/2001 | 10.91 | 0.40 | 0.56 | 0.96 | (0.43 | ) | – | (0.43 | ) | 11.44 | |||||||||||||||||||||||||||||
| 10/31/2000 | 10.60 | 0.44 | 0.42 | 0.86 | (0.44 | ) | (0.11 | ) | (0.55 | ) | 10.91 | ||||||||||||||||||||||||||||
| Class B | 4/30/2005 | 11.89 | 0.18 | (0.09 | ) | 0.09 | (0.18 | ) | – | (0.18 | ) | 11.80 | |||||||||||||||||||||||||||
| 10/31/2004 | 11.69 | 0.35 | 0.22 | 0.57 | (0.37 | ) | – | (0.37 | ) | 11.89 | |||||||||||||||||||||||||||||
| 10/31/2003 | 11.51 | 0.34 | 0.17 | 0.51 | (0.33 | ) | – | (0.33 | ) | 11.69 | |||||||||||||||||||||||||||||
| 10/31/2002 | 11.44 | 0.30 | 0.11 | 0.41 | (0.34 | ) | – | (0.34 | ) | 11.51 | |||||||||||||||||||||||||||||
| 10/31/2001 | 10.90 | 0.34 | 0.56 | 0.90 | (0.36 | ) | – | (0.36 | ) | 11.44 | |||||||||||||||||||||||||||||
| 10/31/2000 | 10.59 | 0.37 | 0.42 | 0.79 | (0.37 | ) | (0.11 | ) | (0.48 | ) | 10.90 | ||||||||||||||||||||||||||||
| Class C | 4/30/2005 | 11.89 | 0.17 | (0.08 | ) | 0.09 | (0.17 | ) | – | (0.17 | ) | 11.81 | |||||||||||||||||||||||||||
| 10/31/2004 | 11.69 | 0.35 | 0.22 | 0.57 | (0.37 | ) | – | (0.37 | ) | 11.89 | |||||||||||||||||||||||||||||
| 10/31/2003 | 11.59 | 0.33 | 0.10 | 0.43 | (0.33 | ) | – | (0.33 | ) | 11.69 | |||||||||||||||||||||||||||||
| Class M | 4/30/2005 | 11.89 | 0.20 | (0.08 | ) | 0.12 | (0.20 | ) | – | (0.20 | ) | 11.81 | |||||||||||||||||||||||||||
| 10/31/2004 | 11.70 | 0.40 | 0.21 | 0.61 | (0.42 | ) | – | (0.42 | ) | 11.89 | |||||||||||||||||||||||||||||
| 10/31/2003 | 11.51 | 0.38 | 0.19 | 0.57 | (0.38 | ) | – | (0.38 | ) | 11.70 | |||||||||||||||||||||||||||||
| 10/31/2002 | 11.44 | 0.36 | 0.09 | 0.45 | (0.38 | ) | – | (0.38 | ) | 11.51 | |||||||||||||||||||||||||||||
| 10/31/2001 | 10.91 | 0.40 | 0.53 | 0.93 | (0.40 | ) | – | (0.40 | ) | 11.44 | |||||||||||||||||||||||||||||
| 10/31/2000 | 10.59 | 0.42 | 0.42 | 0.84 | (0.41 | ) | (0.11 | ) | (0.52 | ) | 10.91 | ||||||||||||||||||||||||||||
| Ratios/Supplemental Data | |||||||||||||||||||||||||||||||
| For the Period | Total | Net Assets, End of Period | Ratio of Expenses to Average Net Assets (a) | Net Investment Income (Loss) to Average | Portfolio Turnover | ||||||||||||||||||||||||||
| Ended (g) | Return (c) | (000's) | Net (e) | Total (f) | Net Assets (a) | Rate (b) | |||||||||||||||||||||||||
| Class A | 4/30/2005 | 1.12 | % | $ | 16,528 | 1.24 | % | 1.24 | % | 3.73 | % | 12 | % | ||||||||||||||||||
| 10/31/2004 | 5.61 | 17,244 | 1.35 | 1.38 | 3.63 | 16 | |||||||||||||||||||||||||
| 10/31/2003 | 5.26 | 18,948 | 1.35 | 1.52 | 3.53 | 22 | |||||||||||||||||||||||||
| 10/31/2002 | 4.26 | 20,469 | 1.35 | 1.46 | 3.63 | 55 | |||||||||||||||||||||||||
| 10/31/2001 | 8.99 | 23,190 | 1.35 | 1.48 | 3.80 | 35 | |||||||||||||||||||||||||
| 10/31/2000 | 8.38 | 16,999 | 1.35 | 1.68 | 4.14 | 67 | |||||||||||||||||||||||||
| Class B | 4/30/2005 | 0.78 | 6,667 | 1.93 | 1.93 | 3.04 | 12 | ||||||||||||||||||||||||
| 10/31/2004 | 4.93 | 7,597 | 2.00 | 2.03 | 2.98 | 16 | |||||||||||||||||||||||||
| 10/31/2003 | 4.48 | 9,897 | 2.00 | 2.17 | 2.88 | 22 | |||||||||||||||||||||||||
| 10/31/2002 | 3.63 | 12,019 | 2.00 | 2.11 | 2.98 | 55 | |||||||||||||||||||||||||
| 10/31/2001 | 8.32 | 6,276 | 2.00 | 2.13 | 3.15 | 35 | |||||||||||||||||||||||||
| 10/31/2000 | 7.72 | 1,728 | 2.00 | 2.33 | 3.49 | 67 | |||||||||||||||||||||||||
| Class C | 4/30/2005 | 0.79 | 4,267 | 2.00 | 2.38 | 2.97 | 12 | ||||||||||||||||||||||||
| 10/31/2004 | 4.95 | 4,924 | 2.00 | 2.33 | 2.99 | 16 | |||||||||||||||||||||||||
| 10/31/2003 | 3.76 | 1,621 | 2.00 | 2.17 | 2.88 | 22 | |||||||||||||||||||||||||
| Class M | 4/30/2005 | 0.98 | 1,299 | 1.60 | 2.17 | 3.38 | 12 | ||||||||||||||||||||||||
| 10/31/2004 | 5.31 | 1,382 | 1.60 | 2.10 | 3.38 | 16 | |||||||||||||||||||||||||
| 10/31/2003 | 5.00 | 1,869 | 1.60 | 1.77 | 3.28 | 22 | |||||||||||||||||||||||||
| 10/31/2002 | 4.02 | 2,878 | 1.60 | 1.71 | 3.38 | 55 | |||||||||||||||||||||||||
| 10/31/2001 | 8.73 | 2,413 | 1.60 | 1.73 | 3.55 | 35 | |||||||||||||||||||||||||
| 10/31/2000 | 8.13 | 2,014 | 1.60 | 1.93 | 3.89 | 67 | |||||||||||||||||||||||||
The notes to the financial statements are an integral part of this report.
Transamerica IDEX Mutual Funds
Semi-Annual Report 2005
7
TA IDEX Federated Tax Exempt
FINANCIAL HIGHLIGHTS (continued)
NOTES TO FINANCIAL HIGHLIGHTS
(a) Annualized.
(b) Not annualized for periods of less than one year.
(c) Total Return has been calculated for the applicable period without deduction of a sales load, if any, on an initial purchase. Periods of less than one year are not annualized.
(d) Per share information is calculated based on average number of shares outstanding for the periods ended 10/31/2001, 10/31/2002, 10/31/2003, 10/31/2004 and 04/30/2005.
(e) Ratio of Net Expenses to Average Net Assets is net of fee waivers, reimbursements by the investment adviser, and includes the recapture of previously waived expenses, if any (see note 2).
(f) Ratio of Total Expenses to Average Net Assets includes all expenses before fee waivers and reimbursements by the investment adviser and recapture of previously waived expenses.
(g) The inception date for the Fund's offering of share Class C was November 11, 2002.
The notes to the financial statements are an integral part of this report.
Transamerica IDEX Mutual Funds
Semi-Annual Report 2005
8
TA IDEX Federated Tax Exempt
NOTES TO FINANCIAL STATEMENTS
At April 30, 2005
(all amounts in thousands)
(unaudited)
NOTE 1. ORGANIZATION AND SIGNIFICANT ACCOUNTING POLICIES
Transamerica IDEX Mutual Funds is a Delaware statutory trust registered under the Investment Company Act of 1940, as amended (the "1940 Act"), as an open-end management investment company. Prior to March 1, 2005, Transamerica IDEX Mutual Funds was a Massachusetts business trust. TA IDEX Federated Tax Exempt ("the Fund"), part of the Transamerica IDEX Mutual Funds, began operations on April 1, 1985.
In the normal course of business, the Fund enters into contracts that contain a variety of representations and warranties, which provide general indemnifications. The Fund's maximum exposure under these arrangements is unknown, as this would involve future claims that may be made against the Fund and/or its affiliates that have not yet occurred. However, based on experience, the Fund expects the risk of loss to be remote.
See the Prospectus and Statement of Additional Information for a description of the Fund's investment objective.
In preparing the Fund's financial statements in accordance with accounting principles generally accepted in the United States of America ("GAAP"), estimates or assumptions (which could differ from actual results) may be used that affect reported amounts and disclosures. The following policies were consistently followed by the Fund, in accordance with GAAP.
Multiple class operations and expenses: The Fund currently offers four classes of shares, each with a public offering price that reflects different sales charges, if any, and expense levels. On June 15, 2004, Class C2 shares merged into class C. Class B shares will convert to Class A shares eight years after purchase. Income, non-class specific expenses and realized and unrealized gains and losses, are allocated daily to each class, based upon the value of shares outstanding method permitted under Rule 18f-3 of the 1940 Act. Each class bears its own specific expenses as well as a portion of general, common expenses.
Pricing of shares: The Fund prices its shares on the basis of the net asset value of each class of shares of the Fund, which is determined as of the close of the New York Stock Exchange ("NYSE") (generally 4:00 p.m. Eastern Time) on each day on which the NYSE is open for trading.
Security valuations: Fund investments traded on an exchange are valued at the closing price on the day of valuation on the exchange where the security is principally traded. With respect to securities traded on NASDAQ NMS, such closing price may be the last reported sales price or the NASDAQ Official Closing Price.
Securities traded in the over-the-counter market and listed securities for which no sale was reported on that date are valued at the last quoted bid price.
Debt securities are valued by independent pricing services at the last quoted bid price; however, those that mature in sixty days or less are valued at amortized cost, which approximates market.
Other securities for which quotations are not readily available are valued at fair market value as determined in good faith using guidelines adopted by the Board of Trustees of the Fund, under the supervision of the Fund's Valuation Committee. These guidelines may include: the type of security; any restrictions on its resale; financial or business news of the issuer; similar or related securities that are actively trading; related corporate actions; and other significant events occurring after the close of trading in the security.
Cash: The Fund may leave cash overnight in its cash account with the custodian, Investors Bank & Trust Company ("IBT"). IBT has been contracted on behalf of the Fund to invest the excess cash into a savings account, which at April 30, 2005, was paying an interest rate of 2.02%.
Throughout the period, the Fund may have a cash overdraft balance. A fee is incurred on this overdraft, calculated by multiplying the overdraft by a rate based on the federal funds rate.
Security transactions and investment income: Security transactions are recorded on the trade date. Security gains and losses are calculated on the specific identification basis. Interest income, including accretion of discounts and amortization of premiums, is recorded on the accrual basis commencing on the settlement date.
Futures contracts: The Fund may enter into futures contracts to manage exposure to market, interest rate or currency fluctuations. Futures contracts are valued at the settlement price established each day by the board of trade or exchange on which they are traded. The primary risks associated with futures contracts are imperfect correlation between the change in market value of the securities held and the prices of futures contracts; the possibility of an illiquid market and inability of the counterparty to meet the contract terms.
The underlying face amounts of open futures contracts at April 30, 2005, are listed in the Schedule of Investments. The variation margin receivable or payable, as applicable, is included in the accompanying Statements of Assets and Liabilities. Variation margin represents the additional payment due or excess deposit made in order to maintain the equity account at the required margin level.
Account maintenance fees: If the shareholder account balance falls below $1 by either shareholder action or as a result of market action, a $25 (not in thousands) fee is assessed every year until the balance reaches $1. The fee is assessed by redeeming shares in the shareholder's account.
Transamerica IDEX Mutual Funds
Semi-Annual Report 2005
9
TA IDEX Federated Tax Exempt
NOTES TO FINANCIAL STATEMENTS (continued)
At April 30, 2005
(all amounts in thousands)
(unaudited)
NOTE 1.–(continued)
No fee will be charged under the following conditions:
• accounts opened within the preceding 24 months
• accounts with an active monthly Automatic Investment Plan ($50 (not in thousands) minimum per fund)
• accounts owned by an individual which, when combined by social security number, have a balance of $5 or more
• accounts owned by individuals in the same household (by address) that have a combined balance of $5 or more
• UTMA/UGMA accounts
• Fiduciary accounts
• B-share accounts whose shares have started to convert to A-shares accounts (as long as combined value of both accounts is at least $1)
For the six months ended April 30, 2005, This fee totaled less than $1. These fees are included in Paid in Capital in the Statement of Assets and Liabilities.
Redemption fees: A short-term trading redemption fee may be assessed on any fund shares in a fund account that are sold during the first five (5) NYSE trading days following their purchase date. This redemption fee will equal 2% of the amount redeemed and shares held the longest will be treated as being redeemed first and shares held the shortest as being redeemed last.
For the six months ended April 30, 2005, the Fund received less than $1 in redemption fees.
Dividend distributions: Distributions to shareholders are recorded on the ex-dividend date and are determined in accordance with Federal income tax regulations which may differ from GAAP.
NOTE 2. RELATED PARTY TRANSACTIONS
Transamerica Fund Advisors, Inc. ("TFAI") is the Fund's investment adviser. Transamerica Fund Services, Inc. ("TFS") is the Fund's administrator and transfer agent. AFSG Securities Corp. ("AFSG") is the Fund's distributor/principal underwriter. AFSG is 100% owned by AUSA Holding Company ("AUSA"). TFAI is a directly owned subsidiary of Western Reserve Life Assurance Co. of Ohio (78%) and AUSA (22%). TFS is a wholly owned subsidiary of WRL (50%) and AUSA (50%).
AUSA and WRL are wholly owned indirect subsidiaries of AEGON, NV, a Netherlands corporation.
Effective January 1, 2005 AEGON/Transamerica Fund Advisors, Inc. ("ATFA") was renamed Transamerica Fund Advisors, Inc. ("TFAI"); AEGON/Transamerica Fund Services, Inc. ("ATFS") and AEGON/Transamerica Investor Services, Inc. ("ATIS") merged into one entity and was renamed Transamerica Fund Services, Inc. ("TFS").
Investment advisory fee: The Fund pays management fees to TFAI based on average daily net assets ("ANA") at the following rate:
0.60% of ANA
TFAI has contractually agreed to waive its advisory fee and will reimburse the Fund to the extent that operating expenses, excluding 12b-1 fees, exceed the following stated annual limit:
1.00% Expense Limit
Distribution and service fees: The Fund has a 12b-1 distribution plan under the 1940 Act pursuant to which an annual fee, based on average daily net assets, is paid to the distributor for various disbursements such as broker-dealer account servicing fees and other promotional expenses of the Fund. The Fund is authorized under the 12b-1 plan to pay fees on each class up to the following limits:
| Class A | 0.35 | % | |||||
| Class B | 1.00 | % | |||||
| Class C | 1.00 | % | |||||
| Class M | 0.60 | % | |||||
In the case the Fund or a class of shares of the Fund is closed to new investors or investments, the Fund is authorized to pay 12b-1 fees for past sales and distribution efforts and present and past investor services.
Underwriter commissions relate to front-end sales charges imposed for Class A and M shares and contingent deferred sales charges from Classes B, C, M and certain A share redemptions. For the six months ended April 30, 2005, the underwriter commissions were as follows:
| Received by Underwriter | $ | 18 | |||||
| Retained by Underwriter | 2 | ||||||
| Contingent Deferred Sales Charge | 19 | ||||||
Administrative services: The Fund has entered into an agreement with TFS for financial and legal fund administration services, which includes such items as compliance, expenses, financial statements and other reporting, distributions, tax returns, prospectus preparation, board of trustees meeting support and other legal matters. As of January 1, 2005 the Fund pays TFS an annual fee of 0.02% of average net assets. Prior to January 1, 2005 the Fund paid TFS an annual fee of 0.015% of average net assets. The Legal fees on the Statement of Operations are for fees paid to external legal counsel.
Transamerica IDEX Mutual Funds
Semi-Annual Report 2005
10
TA IDEX Federated Tax Exempt
NOTES TO FINANCIAL STATEMENTS (continued)
At April 30, 2005
(all amounts in thousands)
(unaudited)
NOTE 2.–(continued)
Transfer agent fees: The Fund pays TFS an annual per-account charge of $20 (not in thousands) for each open account and $1.63 (not in thousands) for each closed account. There is no new account charge. The Transfer agent fees on the Statement of Operations are made up of fees paid to TFS and costs associated with shareholder statements.
The Fund paid TFS $15 for the six months ended April 30, 2005.
Deferred compensation plan: Each eligible Fund Trustee may elect participation in the Deferred Compensation Plan ("the Plan"). Under the Plan, such Trustees may defer payment of a percentage of their total fees earned as a Fund Trustee. These deferred amounts may be invested in any Transamerica IDEX Mutual Fund. At April 30, 2005, the value of invested plan amount was $5. Invested plan amounts and the total liability for deferred compensation to the Trustees under the Plan at April 30, 2005, are included in the accompanying Statement of Assets and Liabilities.
NOTE 3. INVESTMENT TRANSACTIONS
The cost of securities purchased and proceeds from securities sold (excluding short-term securities) for the six months ended April 30, 2005, were as follows:
| Purchases of securities: | |||||||
| Long-Term excluding U.S. Government | $ | 3,648 | |||||
| U.S. Government | – | ||||||
| Proceeds from maturities and sales of securities: | |||||||
| Long-Term excluding U.S. Government | 5,846 | ||||||
| U.S. Government | – | ||||||
NOTE 4. FEDERAL INCOME TAX MATTERS
The Fund has not made any provision for federal income or excise taxes due to its policy to distribute all of its taxable income and capital gains to its shareholders and otherwise qualify as a regulated investment company under the Internal Revenue Code. Income and capital gain distributions are determined in accordance with income tax regulations, which may differ from GAAP. These differences are primarily due to differing treatment for items including, but not limited to, wash sales, net operating losses and capital loss carryforwards.
The capital loss carryforward is available to offset future realized capital gains through the period listed:
| Capital Loss Carryforward | Available through | ||||||
| $ | 587 | October 31, 2008 | |||||
The aggregate cost of investments and composition of unrealized appreciation (depreciation) for federal income tax purposes as of April 30, 2005, are as follows:
| Federal Tax Cost Basis | $ | 26,623 | |||||
| Unrealized Appreciation | $ | 1,885 | |||||
| Unrealized (Depreciation) | (11 | ) | |||||
| Net Unrealized Appreciation (Depreciation) | $ | 1,874 | |||||
NOTE 5. REGULATORY PROCEEDINGS
There continues to be significant federal and state regulatory activity relating to financial services companies, particularly mutual fund companies and their investment advisers. As part of an ongoing investigation regarding potential market timing, recordkeeping and trading compliance issues and matters affecting the Fund's investment adviser, TFAI, and certain employees and affiliates of TFAI, the SEC staff has indicated that it is likely to take some action against TFAI and certain of its affiliates at the conclusion of the investigation. The potential timing and the scope of any such action is difficult to predict. Although the impact of any action brought against TFAI and/or its affiliates is difficult to assess at the present time, the Fund currently believes that the likelihood that any such action will have a material adverse impact on it is remote. It is important to note that the Fund is not aware of any allegation of wrongdoing against it and its board at the time this semi-annual report is printed. Although it is not anticipated that these developments will have an adverse impact on the Fund, there can be no assurance at this time. TFAI and its affiliates are actively working with the SEC in regard to this matter; however, the exact resolution cannot be determined at this time. TFAI will take such actions that it deems necessary or appropriate to continue providing management services to the Fund and to bring all matters to an appropriate conclusion.
TFAI and/or its affiliates, and not the Fund, will bear the costs regarding these regulatory matters.
Transamerica IDEX Mutual Funds
Semi-Annual Report 2005
11
TA IDEX Federated Tax Exempt
INVESTMENT ADVISORY AND SUB-ADVISORY AGREEMENTS – REVIEW AND RENEWAL
At a meeting of the Board of Trustees of Transamerica IDEX Mutual Funds ("TA IDEX") held on October 6, 2004, the Board considered and approved the renewal for a one-year period of the Investment Advisory Agreement between TA IDEX Federated Tax Exempt (the "Fund") and Transamerica Fund Advisors, Inc. ("TFAI") as well as the Investment Sub-Advisory Agreement of the Fund between TFAI and Federated Investment Management Company (the "Sub-Adviser"). In approving the renewal of these agreements, the Board concluded that the Investment Advisory and Investment Sub-Advisory Agreements enable shareholders of the Fund to obtain high quality services at a cost that is appropriate, reasonable, and in the best interests of shareholders based upon the following determinations, among others:
The nature, extent and quality of the advisory service to be provided. The Board considered the nature and quality of the services provided by TFAI and the Sub-Adviser to the Fund in the past, as well as the services anticipated to be provided in the future. The Board concluded that TFAI and the Sub-Adviser are capable of providing high quality services to the Fund, as indicated by TFAI's management capabilities demonstrated with respect to the Fund and other funds managed by TFAI, TFAI's management oversight process, the professional qualifications and experience of the Sub-Adviser's portfolio management team, and the Fund's strong investment performance. The Board also concluded that TFAI and the Sub-Adviser would provide the same quality and quantity of investment management and related servi ces as before, that these services are appropriate in scope and extent in light of the Fund's operations, the competitive landscape of the investment company business and investor needs, and that TFAI's and the Sub-Adviser's obligations will remain the same in all respects.
The investment performance of the Fund. The Board concluded, based in particular on information provided by Lipper Analytics, that the Fund's investment performance was competitive or superior relative to comparable funds over trailing one-, two-, three-, five- and ten-year periods and to the Fund's benchmark index over one-, five- and ten-year periods. On the basis of the Trustees' assessment of the nature, extent and quality of investment advisory and related services to be provided or procured by TFAI and the Sub-Adviser, the Trustees concluded that TFAI and the Sub-Adviser were capable of generating a level of long-term investment performance that is appropriate in light of the Fund's investment objective, policies and strategies and competitive with many other investment companies.
The cost of advisory services provided and the level of profitability. Overall, on the basis of the Board's review of the fees to be charged by TFAI and the Sub-Adviser for investment advisory and related services, TFAI's financial statements, the fees paid by TFAI to the Sub-Adviser, TFAI's estimated net management income resulting from its management of the Fund, the estimated profitability of TFAI's relationships with the Fund and TA IDEX, TFAI's limitation and fee waiver arrangement for the Fund, and the estimated profitability of the Sub-Adviser's relationship with the Fund, the Board concluded that the level of investment advisory fees and the profitability is appropriate in light of the entirety of the services provided and the anticipated profitability of the relationship between the Fun d, TFAI and the Sub-Adviser.
The extent to which economies of scale would be realized as the Fund grows and whether fee levels reflect these economies of scale for the benefit of Fund investors. The Board concluded that the advisory fees appropriately reflect the Fund's current size, the current economic environment for TFAI, and the competitive nature of the investment company market. While the investment advisory fees do not reduce should Fund assets grow meaningfully, the Board determined that the investment advisory fees already reflect potential future economies of scale to some extent by virtue of their competitive levels determined with reference to industry standards as reported by Lipper Analytics and the estimated profitability at current or foreseeable asset levels. In addition, the Board noted that it will have the opportunity to periodically re-examine whether the Fund has achieved economies of scale, as well as the appropriateness of advisory fees payable to TFAI and the Sub-Adviser in light of such economies of scale (including whether it would be appropriate to have advisory fee breakpoints in the future).
Benefits (such as soft dollars) to TFAI or the Sub-Adviser from its relationship with the Fund. The Board concluded that other benefits derived by TFAI or the Sub-Adviser from its relationship with the Fund are reasonable and fair, and are consistent with industry practice and the best interests of the Fund and its shareholders. In this regard, the Board noted that neither TFAI nor the Sub-Adviser realizes "soft dollar" benefits from its relationship with the Fund.
Other considerations. The Board also determined that TFAI had made a substantial commitment to the recruitment and retention of high quality personnel, and maintained the financial, compliance and operational resources reasonably necessary to manage the Fund in a professional manner that is consistent with the best interests of the Fund and its shareholders. The Trustees also concluded that TFAI had made a significant entrepreneurial commitment to the management and success of the Fund, reflected by TFAI's expense limitation and fee waiver arrangement with the Fund which, as demonstrated in the past with the Fund, may result in TFAI waiving a substantial amount of advisory fees for the benefit of shareholders.
Transamerica IDEX Mutual Funds
Semi-Annual Report 2005
12
TA IDEX Federated Tax Exempt
SUPPLEMENTAL INFORMATION (unaudited)
RESULTS OF SHAREHOLDER PROXY
At a special meeting of shareholders held on February 25, 2005, the results of the Proposals were as follows:
Transamerica IDEX Mutual Funds
Proposal 1: Election of Trustees to the Board of Trustees of Transamerica IDEX Mutual Funds.
| For | Withheld | ||||||||||
| Peter R. Brown | 872,017,875.249 | 4,468,498.551 | |||||||||
| Daniel Calabria | 871,917,069.786 | 4,569,304.014 | |||||||||
| Janise B. Case | 872,099,393.125 | 4,386,980.675 | |||||||||
| Charles C. Harris | 872,086,722.025 | 4,399,651.775 | |||||||||
| Leo J. Hill | 872,304,465.640 | 4,181,908.160 | |||||||||
| Russell A. Kimball, Jr. | 872,253,556.471 | 4,232,817.329 | |||||||||
| William W. Short, Jr. | 872,139,920.944 | 4,346,452.856 | |||||||||
| John Waechter | 872,261,152.376 | 4,225,221.424 | |||||||||
| Jack E. Zimmerman | 871,929,967.512 | 4,556,406.288 | |||||||||
| Brian C. Scott | 872,218,970.367 | 4,267,403.433 | |||||||||
| Thomas P. O'Neill | 872,111,944.117 | 4,374,429.683 | |||||||||
TA IDEX Federated Tax Exempt
Proposal 2: Approval of an Agreement and Plan of Reorganization pursuant to which Transamerica IDEX Mutual Funds will organize as a Delaware statutory trust.
| For | Against | Abstentions/Broker Non-Votes | |||||||||
| 1,037,954.302 | 46,302.112 | 383,993.375 | |||||||||
Proposal 3: Approval of changes to the fundamental investment restrictions of TA IDEX Federated Tax Exempt.
| A. Diversification | For | Against | Abstentions/Broker Non-Votes | ||||||||||||
| 1,065,642.908 | 34,203.881 | 368,403.000 | |||||||||||||
| B. Borrowing | For | Against | Abstentions/Broker Non-Votes | ||||||||||||
| 1,059,650.790 | 40,195.999 | 368,403.000 | |||||||||||||
| C. Senior Securities | For | Against | Abstentions/Broker Non-Votes | ||||||||||||
| 1,059,650.790 | 40,195.999 | 368,403.000 | |||||||||||||
| D. Underwriting Securities | For | Against | Abstentions/Broker Non-Votes | ||||||||||||
| 1,065,642.908 | 34,203.881 | 368,403.000 | |||||||||||||
| E. Real Estate | For | Against | Abstentions/Broker Non-Votes | ||||||||||||
| 1,063,426.140 | 36,420.649 | 368,403.000 | |||||||||||||
| F. Making Loans | For | Against | Abstentions/Broker Non-Votes | ||||||||||||
| 1,063,426.140 | 36,420.649 | 368,403.000 | |||||||||||||
| G. Concentration | For | Against | Abstentions/Broker Non-Votes | ||||||||||||
| 1,065,642.908 | 34,203.881 | 368,403.000 | |||||||||||||
| H. Commodities | For | Against | Abstentions/Broker Non-Votes | ||||||||||||
| 1,058,183.821 | 41,662.968 | 368,403.000 | |||||||||||||
| J. Investments in Investment Companies | For | Against | Abstentions/Broker-Non-Votes | ||||||||||||
| 1,065,642.908 | 34,203.881 | 368,403.000 | |||||||||||||
| K. Margin Activities and Short Selling | For | Against | Abstentions/Broker-Non-Votes | ||||||||||||
| 1,052,191.703 | 47,655.086 | 368,403.000 | |||||||||||||
Transamerica IDEX Mutual Funds
Semi-Annual Report 2005
13
TA IDEX Great Companies–AmericaSM
UNDERSTANDING YOUR FUND'S EXPENSES
(unaudited)
SHAREHOLDER EXPENSES
The following Example is intended to help you understand your ongoing costs (in dollars and cents) of investing in a Fund and to compare these costs with the ongoing costs of investing in other funds.
The Example is based on an investment of $1,000 invested at November 1, 2004 and held for the entire period until April 30, 2005.
ACTUAL EXPENSES
The first line in the table below provides information about actual account values and actual expenses. You may use the information in this line, together with the amount you invested, to estimate the expenses that you paid over the period. Simply divide your account value by $1,000 (for example, an $8,600 account value divided by $1,000 = 8.6), then multiply the result by the number in the first line of your Fund under the heading entitled "Expenses Paid During Period" to estimate the expenses you paid on your account during this period.
HYPOTHETICAL EXAMPLE FOR COMPARISON PURPOSES
The second line in the table below provides information about hypothetical account values and hypothetical expenses based on the Fund's actual expense ratio and an assumed rate of return of 5% per year before expenses, which is not the Fund's actual return. The hypothetical account values and expenses may not be used to estimate the actual ending account balance or expenses you paid for the period. You may use this information to compare the ongoing costs of investing in your Fund and other funds. To do so, compare this 5% hypothetical example with the 5% hypothetical examples that appear in the shareholder reports of the other funds.
Please note that the expenses shown in the table are meant to highlight your ongoing costs only and do not reflect any transactional costs, such as sales charges, redemption fees, brokerage commissions paid on purchases and sales of fund shares. Therefore, the second line under the Fund in the table is useful in comparing ongoing costs only, and will not help you determine the relative total costs of owning different funds. In addition, note that the expenses shown in the table are meant to highlight your ongoing costs and do not reflect any transaction costs.
| Beginning Account Value | Ending Account Value | Annualized Expense Ratio | Expenses Paid During Period (a) | ||||||||||||||||
| Class A | |||||||||||||||||||
| Actual | $ | 1,000.00 | $ | 1,037.10 | 1.53 | % | $ | 7.73 | |||||||||||
| Hypothetical (b) | 1,000.00 | 1,017.21 | 1.53 | 7.65 | |||||||||||||||
| Class B | |||||||||||||||||||
| Actual | 1,000.00 | 1,033.70 | 2.15 | 10.84 | |||||||||||||||
| Hypothetical (b) | 1,000.00 | 1,014.13 | 2.15 | 10.74 | |||||||||||||||
| Class C | |||||||||||||||||||
| Actual | 1,000.00 | 1,034.90 | 2.18 | 11.00 | |||||||||||||||
| Hypothetical (b) | 1,000.00 | 1,013.98 | 2.18 | 10.89 | |||||||||||||||
(a) Expenses are calculated using each Fund's annualized expense ratio (as disclosed in the table), multiplied by the average account value for the period, multiplied by number of days in the period (181 days), and divided by the number of days in the year (365 days).
(b) 5% return per year before expenses.
GRAPHICAL PRESENTATION OF SCHEDULE OF INVESTMENTS
By Sector
At April 30, 2005
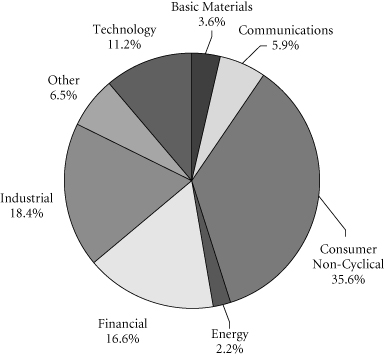
This chart shows the percentage breakdown by sector of the Fund's total investment securities.
Transamerica IDEX Mutual Funds
Semi-Annual Report 2005
1
TA IDEX Great Companies–AmericaSM
SCHEDULE OF INVESTMENTS
At April 30, 2005
(all amounts except share amounts in thousands)
(unaudited)
| Shares | Value | ||||||||||
| COMMON STOCKS (95.8%) | |||||||||||
| Aerospace (4.8%) | |||||||||||
| United Technologies Corp. | 50,702 | $ | 5,157 | ||||||||
| Beverages (5.4%) | |||||||||||
| PepsiCo, Inc. | 105,000 | 5,842 | |||||||||
| Business Services (12.8%) | |||||||||||
| First Data Corp. | 190,900 | 7,260 | |||||||||
| Omnicom Group, Inc. (a) | 78,200 | 6,483 | |||||||||
| Chemicals & Allied Products (11.1%) | |||||||||||
| Colgate-Palmolive Co. | 90,000 | 4,481 | |||||||||
| Ecolab, Inc. (a) | 122,000 | 3,991 | |||||||||
| Procter & Gamble Co. (a) | 65,000 | 3,520 | |||||||||
| Commercial Banks (4.9%) | |||||||||||
| Citigroup, Inc. | 112,100 | 5,264 | |||||||||
| Electronic & Other Electric Equipment (7.4%) | |||||||||||
| General Electric Co. | 219,900 | 7,960 | |||||||||
| Electronic Components & Accessories (4.8%) | |||||||||||
| Texas Instruments, Inc. | 204,901 | 5,114 | |||||||||
| Fabricated Metal Products (2.7%) | |||||||||||
| Fortune Brands, Inc. | 35,000 | 2,960 | |||||||||
| Instruments & Related Products (1.9%) | |||||||||||
| Danaher Corp. | 40,410 | 2,046 | |||||||||
| Insurance (2.0%) | |||||||||||
| American International Group, Inc. | 42,610 | 2,167 | |||||||||
| Medical Instruments & Supplies (9.7%) | |||||||||||
| Medtronic, Inc. | 137,800 | 7,262 | |||||||||
| Zimmer Holdings, Inc. (b) | 39,190 | 3,191 | |||||||||
| Oil & Gas Extraction (0.7%) | |||||||||||
| Apache Corp. | 13,000 | 732 | |||||||||
| Paper & Allied Products (4.8%) | |||||||||||
| 3M Co. | 67,100 | 5,131 | |||||||||
| Petroleum Refining (1.5%) | |||||||||||
| ConocoPhillips | 8,000 | 839 | |||||||||
| Exxon Mobil Corp. | 14,000 | 799 | |||||||||
| Pharmaceuticals (11.2%) | |||||||||||
| Abbott Laboratories | 109,200 | 5,368 | |||||||||
| Johnson & Johnson | 71,100 | 4,880 | |||||||||
| Wyeth | 39,100 | 1,757 | |||||||||
| Security & Commodity Brokers (10.1%) | |||||||||||
| American Express Co. | 103,000 | 5,428 | |||||||||
| Goldman Sachs Group, Inc. (The) | 50,400 | 5,382 | |||||||||
| Total Common Stocks (cost: $95,549) | 103,014 | ||||||||||
| Principal | Value | ||||||||||
| SECURITY LENDING COLLATERAL (6.6%) | |||||||||||
| Debt (5.7%) | |||||||||||
| Bank Notes (0.8%) | |||||||||||
| Bank of America | |||||||||||
| 2.82%, due 05/16/2005 | $ | 225 | $ | 225 | |||||||
| 2.80%, due 06/09/2005 (c) | 56 | 56 | |||||||||
| 2.77%, due 07/18/2005 (c) | 225 | 225 | |||||||||
| Canadian Imperial Bank of Commerce 3.02%, due 11/04/2005 (c) | 225 | 225 | |||||||||
| Credit Suisse First Boston Corp. 2.88%, due 09/09/2005 (c) 3.06%, due 03/10/2006 (c) | 56 56 | 56 56 | |||||||||
| Euro Dollar Overnight (1.0%) | |||||||||||
| Bank of Montreal 2.94%, due 05/04/2005 | 169 | 169 | |||||||||
| BNP Paribas 2.80%, due 05/05/2005 | 233 | 233 | |||||||||
| Den Danske Bank 2.93%, due 05/02/2005 2.80%, due 05/06/2005 | 202 113 | 202 113 | |||||||||
| Dexia Group 2.80%, due 05/05/2005 | 99 | 99 | |||||||||
| Royal Bank of Canada 2.80%, due 05/04/2005 | 231 | 231 | |||||||||
| Svenska Handlesbanken 2.80%, due 05/06/2005 | 37 | 37 | |||||||||
| Euro Dollar Terms (2.3%) | |||||||||||
| Bank of Nova Scotia 2.88%, due 05/11/2005 3.01%, due 05/31/2005 | 113 315 | 113 315 | |||||||||
| Barclays 3.02%, due 06/27/2005 | 200 | 200 | |||||||||
| BNP Paribas 2.93%, due 06/07/2005 | 180 | 180 | |||||||||
| Branch Banker & Trust 2.94%, due 06/06/2005 | 48 | 48 | |||||||||
| Calyon 2.93%, due 06/03/2005 | 186 | 186 | |||||||||
| Citigroup 2.87%, due 06/06/2005 | 234 | 234 | |||||||||
| Credit Suisse First Boston Corp. 2.91%, due 05/16/2005 | 230 | 230 | |||||||||
| HSBC Banking/Holdings PLC 3.01%, due 06/23/2005 | 112 | 112 | |||||||||
| Royal Bank of Scotland 2.94%, due 06/07/2005 2.95%, due 06/10/2005 | 219 121 | 219 121 | |||||||||
The notes to the financial statements are an integral part of this report.
Transamerica IDEX Mutual Funds
Semi-Annual Report 2005
2
TA IDEX Great Companies–AmericaSM
SCHEDULE OF INVESTMENTS (continued)
At April 30, 2005
(all amounts except share amounts in thousands)
(unaudited)
| Principal | Value | ||||||||||
| Euro Dollar Terms (continued) | |||||||||||
| Societe Generale 2.80%, due 05/03/2005 | $ | 215 | $ | 215 | |||||||
| Toronto Dominion Bank 2.75%, due 05/09/2005 3.01%, due 06/24/2005 | 169 62 | 169 62 | |||||||||
| UBS AG 2.81%, due 05/03/2005 | 112 | 112 | |||||||||
| Promissory Notes (0.6%) | |||||||||||
| Goldman Sachs Group, Inc. 2.99%, due 06/27/2005 3.01%, due 07/27/2005 | 236 394 | 236 394 | |||||||||
| Repurchase Agreements (1.0%) (d) | |||||||||||
| Goldman Sachs Group, Inc. (The) 3.04% Repurchase Agreement dated 04/29/2005 to be repurchased at $506 on 05/02/2005 | 506 | 506 | |||||||||
| Merrill Lynch & Co, Inc. 3.04% Repurchase Agreement dated 04/29/2005 to be repurchased at $607 on 05/02/2005 | 607 | 607 | |||||||||
| Shares | Value | ||||||||||
| Investment Companies (0.9%) | |||||||||||
| Money Market Funds (0.9%) | |||||||||||
| American Beacon Funds 1-day yield of 2.84% | 89,312 | $ | 89 | ||||||||
| BGI Institutional Money Market Fund 1-day yield of 2.93% | 528,867 | 529 | |||||||||
| Merrill Lynch Premier Institutional Fund 1-day yield of 2.65% | 119,012 | 119 | |||||||||
| Merrimac Cash Fund, Premium Class 1-day yield of 2.74% (e) | 217,671 | 218 | |||||||||
| Total Security Lending Collateral (cost: $7,141) | 7,141 | ||||||||||
| Total Investment Securities (cost: $102,690) | $ | 110,155 | |||||||||
| SUMMARY: | |||||||||||
| Investments, at value | 102.4 | % | $ | 110,155 | |||||||
| Liabilities in excess of other assets | (2.4 | )% | (2,634 | ) | |||||||
| Net assets | 100.0 | % | $ | 107,521 | |||||||
NOTES TO SCHEDULE OF INVESTMENTS:
(a) At April 30, 2005, all or a portion of this security is on loan (see Note 1). The value at April 30, 2005, of all securities on loan is $6,914.
(b) No dividends were paid during the preceding twelve months.
(c) Floating or variable rate note. Rate is listed as of April 30, 2005.
(d) Cash collateral for the Repurchase Agreements, valued at $1,133, that serve as collateral for securities lending are invested in corporate bonds with interest rates and maturity dates ranging from 0.00%–8.875% and 06/15/2005–03/15/2035, respectively.
(e) Regulated investment company advised by Investors Bank and Trust Co. ("IBT"). IBT is also the accounting, custody and lending agent for the Fund.
The notes to the financial statements are an integral part of this report.
Transamerica IDEX Mutual Funds
Semi-Annual Report 2005
3
TA IDEX Great Companies–AmericaSM
STATEMENT OF ASSETS AND LIABILITIES
At April 30, 2005
(all amounts except per share amounts in thousands)
(unaudited)
| Assets: | |||||||
| Investment securities, at value (cost: $102,690) (including securities loaned of $6,914) | $ | 110,155 | |||||
| Cash | 4,844 | ||||||
| Receivables: | |||||||
| Shares of beneficial interest sold | 28 | ||||||
| Interest | 5 | ||||||
| Dividends | 170 | ||||||
| Other | 56 | ||||||
| 115,258 | |||||||
| Liabilities: | |||||||
| Accounts payable and accrued liabilities: | |||||||
| Shares of beneficial interest redeemed | 326 | ||||||
| Management and advisory fees | 113 | ||||||
| Distribution and service fees | 69 | ||||||
| Transfer agent fees | 61 | ||||||
| Payable for collateral for securities on loan | 7,141 | ||||||
| Other | 27 | ||||||
| 7,737 | |||||||
| Net Assets | $ | 107,521 | |||||
| Net Assets Consist of: | |||||||
| Shares of beneficial interest, unlimited shares authorized, no par value | $ | 117,922 | |||||
| Accumulated net investment income (loss) | (264 | ) | |||||
| Accumulated net realized gain (loss) from investment securities | (17,601 | ) | |||||
| Net unrealized appreciation (depreciation) on investment securities | 7,464 | ||||||
| Net Assets | $ | 107,521 | |||||
| Net Assets by Class: | |||||||
| Class A | $ | 37,704 | |||||
| Class B | 46,797 | ||||||
| Class C | 23,020 | ||||||
| Shares Outstanding: | |||||||
| Class A | 4,107 | ||||||
| Class B | 5,264 | ||||||
| Class C | 2,591 | ||||||
| Net Asset Value Per Share: | |||||||
| Class A | $ | 9.18 | |||||
| Class B | 8.89 | ||||||
| Class C | 8.89 | ||||||
| Maximum Offering Price Per Share (a): | |||||||
| Class A | $ | 9.71 | |||||
(a) Includes the maximum selling commission (represented as a percentage of offering price) which is reduced on certain levels of sales as set forth in the Prospectus. Net asset value per share for Classes B and C shares represents offering price. The redemption price for Classes B and C shares equals net asset value less any applicable contingent deferred sales charge.
STATEMENT OF OPERATIONS
For the period ended April 30, 2005
(all amounts in thousands)
(unaudited)
| Investment Income: | |||||||
| Interest | $ | 17 | |||||
| Dividends | 867 | ||||||
| Income from loaned securities–net | 3 | ||||||
| 887 | |||||||
| Expenses: | |||||||
| Management and advisory fees | 463 | ||||||
| Transfer agent fees: | |||||||
| Class A | 51 | ||||||
| Class B | 64 | ||||||
| Class C | 31 | ||||||
| Printing and shareholder reports | 33 | ||||||
| Custody fees | 7 | ||||||
| Administration fees | 11 | ||||||
| Legal fees | 3 | ||||||
| Audit fees | 6 | ||||||
| Trustees fees | 3 | ||||||
| Registration fees: | |||||||
| Class A | 9 | ||||||
| Class B | 3 | ||||||
| Class C | 12 | ||||||
| Distribution and service fees: | |||||||
| Class A | 72 | ||||||
| Class B | 259 | ||||||
| Class C | 127 | ||||||
| Total expenses | 1,154 | ||||||
| Less: | |||||||
| Reimbursement of class expenses: | |||||||
| Class C | (5 | ) | |||||
| Net expenses | 1,149 | ||||||
| Net Investment Income (Loss) | (262 | ) | |||||
| Net Realized and Unrealized Gain (Loss): | |||||||
| Realized gain (loss) from investment securities | 5,200 | ||||||
| Increase (decrease) in unrealized appreciation (depreciation) on investment securities | (315 | ) | |||||
| Net Gain (Loss) on Investments | 4,885 | ||||||
| Net Increase (Decrease) in Net Assets Resulting from Operations | $ | 4,623 | |||||
The notes to the financial statements are an integral part of this report.
Transamerica IDEX Mutual Funds
Semi-Annual Report 2005
4
TA IDEX Great Companies–AmericaSM
STATEMENTS OF CHANGES IN NET ASSETS
For the period or year ended
(all amounts in thousands)
| April 30, 2005 (unaudited) | October 31, 2004 | ||||||||||
| Increase (Decrease) In Net Assets From: | |||||||||||
| Operations: | |||||||||||
| Net investment income (loss) | $ | (262 | ) | $ | (564 | ) | |||||
| Net realized gain (loss) from investment securities | 5,200 | 1,147 | |||||||||
| Net unrealized appreciation (depreciation) on investment securities | (315 | ) | 439 | ||||||||
| 4,623 | 1,022 | ||||||||||
| Capital Share Transactions: | |||||||||||
| Proceeds from shares sold: | |||||||||||
| Class A | 2,040 | 10,563 | |||||||||
| Class B | 927 | 4,872 | |||||||||
| Class C | 2,424 | 4,740 | |||||||||
| Class C2 | – | 652 | |||||||||
| Class M | – | 718 | |||||||||
| 5,391 | 21,545 | ||||||||||
| Cost of shares redeemed: | |||||||||||
| Class A | (10,120 | ) | (16,054 | ) | |||||||
| Class B | (10,561 | ) | (12,938 | ) | |||||||
| Class C | (7,028 | ) | (3,961 | ) | |||||||
| Class C2 | – | (3,142 | ) | ||||||||
| Class M | – | (2,627 | ) | ||||||||
| (27,709 | ) | (38,722 | ) | ||||||||
| Class level exchanges: | |||||||||||
| Class C | – | 22,151 | |||||||||
| Class C2 | – | (15,042 | ) | ||||||||
| Class M | – | (7,109 | ) | ||||||||
| – | – | ||||||||||
| Automatic conversions: | |||||||||||
| Class A | 8 | 20 | |||||||||
| Class B | (8 | ) | (20 | ) | |||||||
| – | – | ||||||||||
| (22,318 | ) | (17,177 | ) | ||||||||
| Net increase (decrease) in net assets | (17,695 | ) | (16,155 | ) | |||||||
| Net Assets: | |||||||||||
| Beginning of period | 125,216 | 141,371 | |||||||||
| End of period | $ | 107,521 | $ | 125,216 | |||||||
| Accumulated Net Investment Income (Loss) | $ | (264 | ) | $ | (2 | ) | |||||
| April 30, 2005 (unaudited) | October 31, 2004 | ||||||||||
| Share Activity: | |||||||||||
| Shares issued: | |||||||||||
| Class A | 220 | 1,161 | |||||||||
| Class B | 103 | 547 | |||||||||
| Class C | 266 | 534 | |||||||||
| Class C2 | – | 73 | |||||||||
| Class M | – | 81 | |||||||||
| 589 | 2,396 | ||||||||||
| Shares redeemed: | |||||||||||
| Class A | (1,091 | ) | (1,775 | ) | |||||||
| Class B | (1,173 | ) | (1,466 | ) | |||||||
| Class C | (782 | ) | (452 | ) | |||||||
| Class C2 | – | (349 | ) | ||||||||
| Class M | – | (294 | ) | ||||||||
| (3,046 | ) | (4,336 | ) | ||||||||
| Class level exchanges: | |||||||||||
| Class C | – | 2,503 | |||||||||
| Class C2 | – | (1,676 | ) | ||||||||
| Class M | – | (823 | ) | ||||||||
| – | 4 | ||||||||||
| Automatic conversions: | |||||||||||
| Class A | 1 | 2 | |||||||||
| Class B | (1 | ) | (2 | ) | |||||||
| – | – | ||||||||||
| Net increase (decrease) in shares outstanding: | |||||||||||
| Class A | (870 | ) | (612 | ) | |||||||
| Class B | (1,071 | ) | (921 | ) | |||||||
| Class C | (516 | ) | 2,585 | ||||||||
| Class C2 | – | (1,952 | ) | ||||||||
| Class M | – | (1,036 | ) | ||||||||
| (2,457 | ) | (1,936 | ) | ||||||||
The notes to the financial statements are an integral part of this report.
Transamerica IDEX Mutual Funds
Semi-Annual Report 2005
5
TA IDEX Great Companies–AmericaSM
FINANCIAL HIGHLIGHTS
(unaudited for the period ended April 30, 2005)
| For a share of beneficial interest outstanding throughout each period | |||||||||||||||||||||||||||||||||||||||
| Net Asset | Investment Operations | Distributions | Net Asset | ||||||||||||||||||||||||||||||||||||
| For the Period Ended (d)(g) | Value, Beginning of Period | Net Investment Income (Loss) | Net Realized and Unrealized Gain (Loss) | Total Operations | From Net Investment Income | From Net Realized Gains | Total Distributions | Value, End of Period | |||||||||||||||||||||||||||||||
| Class A | 4/30/2005 | $ | 8.85 | $ | – | $ | 0.33 | $ | 0.33 | $ | – | $ | – | $ | – | $ | 9.18 | ||||||||||||||||||||||
| 10/31/2004 | 8.77 | – | 0.08 | 0.08 | – | – | – | 8.85 | |||||||||||||||||||||||||||||||
| 10/31/2003 | 7.65 | – | 1.12 | 1.12 | – | – | – | 8.77 | |||||||||||||||||||||||||||||||
| 10/31/2002 | 8.96 | (0.01 | ) | (1.30 | ) | (1.31 | ) | – | – | – | 7.65 | ||||||||||||||||||||||||||||
| 10/31/2001 | 10.58 | (0.02 | ) | (1.60 | ) | (1.62 | ) | – | – | – | 8.96 | ||||||||||||||||||||||||||||
| 10/31/2000 | 10.00 | – | 0.58 | 0.58 | – | – | – | 10.58 | |||||||||||||||||||||||||||||||
| Class B | 4/30/2005 | 8.60 | (0.03 | ) | 0.32 | 0.29 | – | – | – | 8.89 | |||||||||||||||||||||||||||||
| 10/31/2004 | 8.57 | (0.06 | ) | 0.09 | 0.03 | – | – | – | 8.60 | ||||||||||||||||||||||||||||||
| 10/31/2003 | 7.52 | (0.05 | ) | 1.10 | 1.05 | – | – | – | 8.57 | ||||||||||||||||||||||||||||||
| 10/31/2002 | 8.87 | (0.08 | ) | (1.27 | ) | (1.35 | ) | – | – | – | 7.52 | ||||||||||||||||||||||||||||
| 10/31/2001 | 10.56 | (0.08 | ) | (1.61 | ) | (1.69 | ) | – | – | – | 8.87 | ||||||||||||||||||||||||||||
| 10/31/2000 | 10.00 | (0.02 | ) | 0.58 | 0.56 | – | – | – | 10.56 | ||||||||||||||||||||||||||||||
| Class C | 4/30/2005 | 8.59 | (0.03 | ) | 0.33 | 0.30 | – | – | – | 8.89 | |||||||||||||||||||||||||||||
| 10/31/2004 | 8.57 | (0.06 | ) | 0.08 | 0.02 | – | – | – | 8.59 | ||||||||||||||||||||||||||||||
| 10/31/2003 | 7.51 | (0.05 | ) | 1.11 | 1.06 | – | – | – | 8.57 | ||||||||||||||||||||||||||||||
| Ratios/Supplemental Data | |||||||||||||||||||||||||||||||
For the Period | Total | Net Assets, End of Period | Ratio of Expenses to Average Net Assets (a) | Net Investment Income (Loss) to Average | Portfolio Turnover | ||||||||||||||||||||||||||
| Ended (g) | Return (c) | (000's) | Net (e) | Total (f) | Net Assets (a) | Rate (b) | |||||||||||||||||||||||||
| Class A | 4/30/2005 | 3.71 | % | $ | 37,704 | 1.53 | % | 1.53 | % | (0.03 | )% | 25 | % | ||||||||||||||||||
| 10/31/2004 | 0.93 | 44,056 | 1.55 | 1.55 | 0.00 | 23 | |||||||||||||||||||||||||
| 10/31/2003 | 14.64 | 49,040 | 1.55 | 1.66 | 0.05 | 54 | |||||||||||||||||||||||||
| 10/31/2002 | (14.59 | ) | 55,508 | 1.55 | 1.66 | (0.16 | ) | 28 | |||||||||||||||||||||||
| 10/31/2001 | (15.35 | ) | 38,345 | 1.55 | 1.78 | (0.18 | ) | 65 | |||||||||||||||||||||||
| 10/31/2000 | 5.81 | 13,377 | 1.55 | 3.38 | (0.08 | ) | 2 | ||||||||||||||||||||||||
| Class B | 4/30/2005 | 3.37 | 46,797 | 2.15 | 2.15 | (0.65 | ) | 25 | |||||||||||||||||||||||
| 10/31/2004 | 0.35 | 54,460 | 2.17 | 2.17 | (0.62 | ) | 23 | ||||||||||||||||||||||||
| 10/31/2003 | 13.96 | 62,205 | 2.20 | 2.31 | (0.60 | ) | 54 | ||||||||||||||||||||||||
| 10/31/2002 | (15.26 | ) | 53,256 | 2.20 | 2.31 | (0.81 | ) | 28 | |||||||||||||||||||||||
| 10/31/2001 | (15.98 | ) | 40,769 | 2.20 | 2.43 | (0.83 | ) | 65 | |||||||||||||||||||||||
| 10/31/2000 | 5.62 | 7,839 | 2.20 | 4.03 | (0.73 | ) | 2 | ||||||||||||||||||||||||
| Class C | 4/30/2005 | 3.49 | 23,020 | 2.18 | 2.22 | (0.69 | ) | 25 | |||||||||||||||||||||||
| 10/31/2004 | 0.23 | 26,700 | 2.20 | 2.26 | (0.64 | ) | 23 | ||||||||||||||||||||||||
| 10/31/2003 | 14.11 | 4,474 | 2.20 | 2.31 | (0.60 | ) | 54 | ||||||||||||||||||||||||
NOTES TO FINANCIAL HIGHLIGHTS
(a) Annualized.
(b) Not annualized for the periods of less than one year.
(c) Total Return has been calculated for the applicable period without deduction of a sales load, if any, on an initial purchase. Periods of less than one year are not annualized.
(d) Per share information is calculated based on average number of shares outstanding for the periods ended 10/31/2001, 10/31/2002, 10/31/2003, 10/31/2004 and 4/30/2005.
(e) Ratio of Net Expenses to Average Net Assets is net of fee waivers and reimbursements by the investment adviser, if any (see note 2).
(f) Ratio of Total Expenses to Average Net Assets includes all expenses before fee waivers and reimbursements by the investment adviser.
(g) TA IDEX Great Companies–AmericaSM ("the Fund") commenced operations on July 14, 2000. The inception date for the Fund's offering of share Class C was November 11, 2002.
The notes to the financial statements are an integral part of this report.
Transamerica IDEX Mutual Funds
Semi-Annual Report 2005
6
TA IDEX Great Companies–AmericaSM
NOTES TO FINANCIAL STATEMENTS
At April 30, 2005
(all amounts in thousands)
(unaudited)
NOTE 1. ORGANIZATION AND SIGNIFICANT ACCOUNTING POLICIES
Transamerica IDEX Mutual Funds is a Delaware statutory trust registered under the Investment Company Act of 1940, as amended (the "1940 Act"), as an open-end management investment company. Prior to March 1, 2005, Transamerica IDEX Mutual Funds was a Massachusetts business trust. TA IDEX Great Companies–AmericaSM ("the Fund"), part of Transamerica IDEX Mutual Funds, began operations on July 14, 2000. The Fund is "non-diversified" under the 1940 Act.
In the normal course of business, the Fund enters into contracts that contain a variety of representations and warranties, which provide general indemnifications. The Fund's maximum exposure under these arrangements is unknown, as this would involve future claims that may be made against the Fund and/or its affiliates that have not yet occurred. However, based on experience, the Fund expects the risk of loss to be remote.
See the Prospectus and Statement of Additional Information for a description of the Fund's investment objective.
In preparing the Fund's financial statements in accordance with accounting principles generally accepted in the United States of America ("GAAP"), estimates or assumptions (which could differ from actual results) may be used that affect reported amounts and disclosures. The following policies were consistently followed by the Fund, in accordance with GAAP.
Multiple class operations and expenses: The Fund currently offers three classes of shares, each with a public offering price that reflects different sales charges, if any, and expense levels. On June 15, 2004, Class C2 shares merged into Class C. On September 24, 2004, Class M shares merged into Class C. Class B shares will convert to Class A shares eight years after purchase. Income, non-class specific expenses and realized and unrealized gains and losses, are allocated daily to each class, based upon the value of shares outstanding method as permitted under Rule 18f-3 of the 1940 Act. Each class bears its own specific expenses as well as a portion of general, common expenses.
Pricing of shares: The Fund prices its shares on the basis of the net asset value of each class of shares of the Fund, which is determined as of the close of the New York Stock Exchange ("NYSE") (generally 4:00 p.m. Eastern Time) on each day on which the NYSE is open for trading.
Security valuations: Fund investments traded on an exchange are valued at the closing price on the day of valuation on the exchange where the security is principally traded. With respect to securities traded on NASDAQ NMS, such closing price may be the last reported sales price or the NASDAQ Official Closing Price.
Securities traded in the over-the-counter market and listed securities for which no sale was reported on that date are valued at the last quoted bid price.
Debt securities are valued by independent pricing services at the last quoted bid price; however, those that mature in sixty days or less are valued at amortized cost, which approximates market.
Investment company securities are valued at net asset value of the underlying portfolio.
Other securities for which quotations are not readily available are valued at fair market value as determined in good faith using guidelines adopted by the Board of Trustees of the Fund, under the supervision of the Fund's Valuation Committee. These guidelines may include: the type of security; any restrictions on its resale; financial or business news of the issuer; similar or related securities that are actively trading; related corporate actions; and other significant events occurring after the close of trading in the security.
Cash: The Fund may leave cash overnight in its cash account with the custodian, Investors Bank & Trust Company ("IBT"). IBT has been contracted on behalf of the Fund to invest the excess cash into a savings account, which at April 30, 2005, was paying an interest rate of 2.02%.
Throughout the period, the Fund may have a cash overdraft balance. A fee is incurred on this overdraft, calculated by multiplying the overdraft by a rate based on the federal funds rate.
Repurchase agreements: The Fund is authorized to enter into repurchase agreements. The Fund, through IBT, receives delivery of the underlying securities, the value of which at the time of purchase is required to be an amount equal to at least 100% of the resale price. Repurchase agreements involve the risk that the seller will fail to repurchase the security, as agreed. In that case, the Fund will bear the risk of value fluctuations until the security can be sold and may encounter delays and incur costs in liquidating the security. In the event of bankruptcy or insolvency of the seller, delays and costs may be incurred.
Commission recapture: The sub-adviser, to the extent consistent with the best execution and usual commission rate policies and practices, may place security transactions of the Fund with broker/dealers with which Transamerica IDEX Mutual Funds has established a Commission Recapture Program. A Commission Recapture Program is any arrangement under which a broker/dealer applies a portion of the commissions received by such broker/dealer on the security transactions to the Fund. In no event will commissions paid by the Fund be used to pay expenses that would otherwise be borne by any other funds within Transamerica IDEX Mutual Funds, or by any other party.
Recaptured commissions during the six months ended April 30, 2005, of $8 are included in net realized gains in the Statement of Operations
Transamerica IDEX Mutual Funds
Semi-Annual Report 2005
7
TA IDEX Great Companies–AmericaSM
NOTES TO FINANCIAL STATEMENTS (continued)
At April 30, 2005
(all amounts in thousands)
(unaudited)
NOTE 1.–(continued)
Securities lending: The Fund may lend securities to enhance fund earnings from investing cash collateral in making such loans to qualified borrowers (typically broker/dealers). The Fund has engaged its custodian bank, IBT, as a lending agent to administer its securities lending program. IBT earned $1 of program income for its services. When the Fund makes a security loan, it receives cash collateral as protection against the risk that the borrower will default on the loan, and records an asset for the cash invested collateral and a liability for the return of the collateral.
Loans of securities are required to be secured by collateral at least equal to 102% of the value of the securities at inception of the loan, and not less then 100% thereafter. The Fund may invest cash collateral in short-term money market instruments including: U.S. Treasury Bills, U.S. agency obligations, commercial paper, money market mutual funds, repurchase agreements and other highly rated, liquid investments. During the life of securities loans, the collateral and securities loaned remain subject to fluctuation in value. IBT marks to market securities loaned and the collateral each business day. If additional collateral is due (at least $1), IBT collects additional cash collateral from the borrowers. Although securities loaned will be fully collateralized at all times, IBT may experience delays in, or may be prevented from, recovering the collateral on behalf of the Fund. The Fund may recall a loa ned security position at any time from the borrower through IBT. In the event the borrower fails to timely return a recalled security, IBT may indemnify the Fund by purchasing replacement securities for the Fund at its own expense and claiming the collateral to fund such a purchase. IBT absorbs the loss if the collateral value is not sufficient to cover the cost of the replacement securities. If replacement securities are not available, IBT will credit the equivalent cash value to the Fund.
While a security is on loan, the Fund does not have the right to vote that security. However, if time permits, the Fund will attempt to recall a security on loan and vote the proxy.
Income from securities lending is included in the Statement of Operations. The amount of collateral and value of securities on loan are included in the Statement of Assets and Liabilities as well as in the Schedule of Investments.
Security transactions and investment income: Security transactions are recorded on the trade date. Security gains and losses are calculated on the specific identification basis. Dividend income is recorded on the ex-dividend date or, in the case of foreign securities, as soon as the Fund is informed of the ex-dividend date. Interest income, including accretion of discounts and amortization of premiums, is recorded on the accrual basis commencing on the settlement date.
Account maintenance fees: If the shareholder account balance falls below $1 by either shareholder action or as a result of market action, a $25 (not in thousands) fee is assessed every year until the balance reaches $1. The fee is assessed by redeeming shares in the shareholder's account.
No fee will be charged under the following conditions:
• accounts opened within the preceding 24 months
• accounts with an active monthly Automatic Investment Plan ($50 (not in thousands) minimum per fund)
• accounts owned by an individual which, when combined by social security number, have a balance of $5 or more
• accounts owned by individuals in the same household (by address) that have a combined balance of $5 or more
• UTMA/UGMA accounts
• Fiduciary accounts
• B-share accounts whose shares have started to convert to A-shares accounts (as long as combined value of both accounts is at least $1)
For the six months ended April 30, 2005, this fee totaled $3. These fees are included in Paid in Capital in the Statement of Assets and Liabilities.
Redemption fees: A short-term trading redemption fee may be assessed on any fund shares in a fund account that are sold during the first five (5) NYSE trading days following their purchase date. This redemption fee will equal 2% of the amount redeemed and shares held the longest will be treated as being redeemed first and shares held the shortest as being redeemed last.
For the six months ended April 30, 2005, the Fund received less than $1 in redemption fees.
Dividend distributions: Distributions to shareholders are recorded on the ex-dividend date and are determined in accordance with Federal income tax regulations which may differ from GAAP.
NOTE 2. RELATED PARTY TRANSACTIONS
Transamerica Fund Advisors, Inc. ("TFAI") is the Fund's investment adviser. Transamerica Fund Services, Inc. ("TFS") is the Fund's administrator and transfer agent. AFSG Securities Corp. ("AFSG") is the Fund's distributor/principal underwriter. AFSG is 100% owned by AUSA Holding Company ("AUSA"). TFAI is a directly owned subsidiary of Western Reserve Life Assurance Co. of Ohio (78%) and AUSA (22%). TFS is a wholly owned subsidiary of WRL (50%) and AUSA (50%). AUSA and WRL are wholly owned indirect subsidiaries of AEGON, NV, a Netherlands corporation.
Transamerica IDEX Mutual Funds
Semi-Annual Report 2005
8
TA IDEX Great Companies–AmericaSM
NOTES TO FINANCIAL STATEMENTS (continued)
At April 30, 2005
(all amounts in thousands)
(unaudited)
NOTE 2.–(continued)
Effective January 1, 2005 AEGON/Transamerica Fund Advisors, Inc. ("ATFA") was renamed Transamerica Fund Advisors, Inc. ("TFAI"); AEGON/Transamerica Fund Services, Inc. ("ATFS") and AEGON/Transamerica Investor Services, Inc. ("ATIS") merged into one entity and was renamed Transamerica Fund Services, Inc. ("TFS").
Great Companies, LLC is both an affiliate of the Fund and a sub-adviser to the Fund.
Investment advisory fee: The Fund pays management fees to TFAI based on average daily net assets ("ANA") at the following breakpoints:
From November 1, 2004 to December 31, 2004:
0.80% of the first $500 million of ANA
0.70% of ANA over $500 million
From January 1, 2005 on:
0.775% of the first $250 million of ANA
0.75% of the next $250 million of ANA
0.70% of the next $500 million of ANA
0.65% of ANA over 1 billion
TFAI has contractually agreed to waive its advisory fee and will reimburse the Fund to the extent that operating expenses, excluding 12b-1 fees, exceed the following stated annual limit:
From November 1, 2004 to December 31, 2004:
1.20% Expense Limit
From January 1, 2005 on:
1.175% Expense Limit
If total fund expenses fall below the annual expense limitation agreement agreed to by the adviser within the succeeding three years, the Fund may be required to pay that adviser a portion or all of the waived advisory fees.
| Advisory Fee Waived | Available for Recapture Through | ||||||||||
| Fiscal Year 2003 | $ | 148 | 10/31/2006 | ||||||||
| Fiscal Year2002 | 146 | 10/31/2005 | |||||||||
If total class expenses fall below the annual expense limitation agreement agreed to by the adviser within the succeeding three years, the Fund may be required to pay that adviser a portion or all of the reimbursed expenses.
| Reimbursement of Class Expenses | Available for Recapture Through | ||||||||||
| Fiscal Year 2004: | |||||||||||
| Class A | $ | 2 | 10/31/2007 | ||||||||
| Class C | 7 | 10/31/2007 | |||||||||
Distribution and service fees: The Fund has a 12b-1 distribution plan under the 1940 Act pursuant to which an annual fee, based on average daily net assets, is paid to the distributor for various disbursements such as broker-dealer account servicing fees and other promotional expenses of the Fund. The Fund is authorized under the 12b-1 plan to pay fees on each class up to the following limits:
| Class A | 0.35 | % | |||||
| Class B | 1.00 | % | |||||
| Class C | 1.00 | % | |||||
In the case the Fund or a class of shares of the Fund is closed to new investors or investments, the Fund is authorized to pay 12b-1 fees for past sales and distribution efforts and present and past investor services.
Underwriter commissions relate to front-end sales charges imposed for Class A shares and contingent deferred sales charges from Classes B, C, and certain A share redemptions. For the six months ended April 30, 2005, the underwriter commissions were as follows:
| Received by Underwriter | $ | 120 | |||||
| Retained by Underwriter | 5 | ||||||
| Contingent Deferred Sales Charge | 122 | ||||||
Administrative services: The Fund has entered into an agreement with TFS for financial and legal fund administration services, which includes such items as compliance, expenses, financial statements and other reporting, distributions, tax returns, prospectus preparation, board of trustees meeting support and other legal matters. As of January 1, 2005 the Fund pays TFS an annual fee of 0.02% of average net assets. Prior to January 1, 2005 the Fund paid TFS an annual fee of 0.015% of average net assets. The Legal fees on the Statement of Operations are for fees paid to external legal counsel.
Transfer agent fees: The Fund pays TFS an annual per-account charge of $20 (not in thousands) for each open account and $1.63 (not in thousands) for each closed account. There is no new account charge. The Transfer agent fees on the Statement of Operations are made up of fees paid to TFS and costs associated with shareholder statements.
The Fund paid TFS $171 for the six months ended April 30, 2005.
Deferred compensation plan: Each eligible Fund Trustee may elect participation in the Deferred Compensation Plan ("the Plan"). Under the Plan, such Trustees may defer payment of a percentage of their total fees earned as a Fund Trustee. These deferred amounts may be invested in any Transamerica IDEX Mutual Fund. At April 30, 2005, the value of invested plan amount was $8. Invested plan amounts and the total liability for deferred compensation to the Trustees under the Plan at April 30, 2005, are included in the accompanying Statement of Assets and Liabilities.
Transamerica IDEX Mutual Funds
Semi-Annual Report 2005
9
TA IDEX Great Companies–AmericaSM
NOTES TO FINANCIAL STATEMENTS (continued)
At April 30, 2005
(all amounts in thousands)
(unaudited)
NOTE 3. INVESTMENT TRANSACTIONS
The cost of securities purchased and proceeds from securities sold (excluding short-term securities) for the six months ended April 30, 2005, were as follows:
| Purchases of securities: | |||||||
| Long-Term excluding U.S. Government | $ | 29,182 | |||||
| U.S. Government | – | ||||||
| Proceeds from maturities and sales of securities: | |||||||
| Long-Term excluding U.S. Government | 54,031 | ||||||
| U.S. Government | – | ||||||
NOTE 4. FEDERAL INCOME TAX MATTERS
The Fund has not made any provision for federal income or excise taxes due to its policy to distribute all of its taxable income and capital gains to its shareholders and otherwise qualify as a regulated investment company under the Internal Revenue Code. Income and capital gain distributions are determined in accordance with income tax regulations, which may differ from GAAP. These differences are primarily due to differing treatment for items including, but not limited to, wash sales, net operating losses and capital loss carryforwards.
The capital loss carryforwards are available to offset future realized capital gains through the periods listed:
| Capital Loss Carryforward | Available through | ||||||
| $ | 3,191 | October 31, 2009 | |||||
| 6,883 | October 31, 2010 | ||||||
| 10,217 | October 31, 2011 | ||||||
The aggregate cost of investments and composition of unrealized appreciation (depreciation) for federal income tax purposes as of April 30, 2005, are as follows:
| Federal Tax Cost Basis | $ | 104,594 | |||||
| Unrealized Appreciation | $ | 7,283 | |||||
| Unrealized (Depreciation) | (1,722 | ) | |||||
| Net Unrealized Appreciation (Depreciation) | $ | 5,561 | |||||
NOTE 5. REGULATORY PROCEEDINGS
There continues to be significant federal and state regulatory activity relating to financial services companies, particularly mutual fund companies and their investment advisers. As part of an ongoing investigation regarding potential market timing, recordkeeping and trading compliance issues and matters affecting the Fund's investment adviser, TFAI, and certain employees and affiliates of TFAI, the SEC staff has indicated that it is likely to take some action against TFAI and certain of its affiliates at the conclusion of the investigation. The potential timing and the scope of any such action is difficult to predict. Although the impact of any action brought against TFAI and/or its affiliates is difficult to assess at the present time, the Fund currently believes that the likelihood that any such action will have a material adverse impact on it is remote. It is important to note that the Fund is not aware of any allegation of wrongdoing against it and its board at the time this semi-annual report is printed. Although it is not anticipated that these developments will have an adverse impact on the Fund, there can be no assurance at this time. TFAI and its affiliates are actively working with the SEC in regard to this matter; however, the exact resolution cannot be determined at this time. TFAI will take such actions that it deems necessary or appropriate to continue providing management services to the Fund and to bring all matters to an appropriate conclusion.
TFAI and/or its affiliates, and not the Fund, will bear the costs regarding these regulatory matters.
Transamerica IDEX Mutual Funds
Semi-Annual Report 2005
10
TA IDEX Great Companies–AmericaSM
INVESTMENT ADVISORY AND SUB-ADVISORY AGREEMENTS – REVIEW AND RENEWAL
At a meeting of the Board of Trustees of Transamerica IDEX Mutual Funds ("TA IDEX") held on October 6, 2004, the Board considered and approved the renewal for a one-year period of the Investment Advisory Agreement between TA IDEX Great Companies–America (the "Fund") and Transamerica Fund Advisors, Inc. ("TFAI") as well as the Investment Sub-Advisory Agreement of the Fund between TFAI and Great Companies, LLC (the "Sub-Adviser"). In approving the renewal of these agreements, the Board concluded that the Investment Advisory and Investment Sub-Advisory Agreements enable shareholders of the Fund to obtain high quality services at a cost that is appropriate, reasonable, and in the best interests of shareholders based upon the following determinations, among others:
The nature, extent and quality of the advisory service to be provided. The Board considered the nature and quality of the services provided by TFAI and the Sub-Adviser to the Fund in the past, as well as the services anticipated to be provided in the future. The Board concluded that TFAI and the Sub-Adviser are capable of providing high quality services to the Fund, as indicated by TFAI's management capabilities demonstrated with respect to the Fund and other funds managed by TFAI, TFAI's management oversight process, and the professional qualifications and experience of the Sub-Adviser's portfolio management team. The Board also concluded that TFAI and the Sub-Adviser would provide the same quality and quantity of investment management and related services as before, that these services are app ropriate in scope and extent in light of the Fund's operations, the competitive landscape of the investment company business and investor needs, and that TFAI's and the Sub-Adviser's obligations will remain the same in all respects.
The investment performance of the Fund. The Board concluded, based in particular on information provided by Lipper Analytics, that the Fund's longer-term investment performance was competitive relative to comparable funds, although its recent performance has lagged. On the basis of the Trustees' assessment of the nature, extent and quality of investment advisory and related services to be provided or procured by TFAI and the Sub-Adviser, including steps to be taken to improve recent performance, the Trustees concluded that TFAI and the Sub-Adviser were capable of generating a level of long-term investment performance that is appropriate in light of the Fund's investment objective, policies and strategies and competitive with many other investment companies.
The cost of advisory services provided and the level of profitability. On the basis of comparative information, the Board concluded that the advisory fees were lower than industry averages, although overall expense of the Fund were relatively higher than certain industry averages. The Board also noted that the Fund's long-term performance is relatively strong and that, as assets increase, expenses are likely to decrease. Overall, on the basis of the Board's review of the fees to be charged by TFAI and the Sub-Adviser for investment advisory and related services, TFAI's financial statements, the fees paid by TFAI to the Sub-Adviser, TFAI's estimated net management income resulting from its management of the Fund, the estimated profitability of TFAI's relationships with the Fund and TA IDEX, TFAI' s limitation and fee waiver arrangement for the Fund, and the estimated profitability of the Sub-Adviser's relationship with the Fund, the Board concluded that the level of investment advisory fees and the profitability is appropriate in light of the entirety of the services provided and the anticipated profitability of the relationship between the Fund, TFAI and the Sub-Adviser.
The extent to which economies of scale would be realized as the Fund grows and whether fee levels reflect these economies of scale for the benefit of Fund investors. The Trustees concluded that inclusion of asset-based breakpoints in the Fund's advisory fee schedule appropriately benefited investors by realizing economies of scale in the form of a lower advisory fee rate as the level of Fund assets increases. The Board also concluded that the advisory fees appropriately reflect the Fund's current size, the current economic environment for TFAI, and the competitive nature of the investment company market. In addition, the Board noted that it will have the opportunity to periodically re-examine whether the Fund has achieved economies of scale, as well as the appropriateness of advisory fees payabl e to TFAI and the Sub-Adviser in the future.
Benefits (such as soft dollars) to TFAI or the Sub-Adviser from its relationship with the Fund. The Board concluded that other benefits derived by TFAI or the Sub-Adviser from its relationship with the Fund are reasonable and fair, and are consistent with industry practice and the best interests of the Fund and its shareholders. In this regard, the Board noted that TFAI does not realize "soft dollar" benefits from its relationship with the Fund, and that the Sub-Adviser is participating in a brokerage program pursuant to which a portion of brokerage commissions paid by the Fund is recaptured for the benefit of the Fund and its shareholders, thus limiting the amount of "soft-dollar" arrangements the Sub-Adviser may engage in with respect to the Fund's portfolio brokerage transactions.
Other considerations. The Board also determined that TFAI had made a substantial commitment to the recruitment and retention of high quality personnel, and maintained the financial, compliance and operational resources reasonably necessary to manage the Fund in a professional manner that is consistent with the best interests of the Fund and its shareholders. The Trustees also concluded that TFAI had made a significant entrepreneurial commitment to the management and success of the Fund, reflected by TFAI's expense limitation and fee waiver arrangement with the Fund which, as demonstrated in the past with the Fund, may result in TFAI waiving a substantial amount of advisory fees for the benefit of shareholders.
Transamerica IDEX Mutual Funds
Semi-Annual Report 2005
11
TA IDEX Great Companies��AmericaSM
SUPPLEMENTAL INFORMATION (unaudited)
RESULTS OF SHAREHOLDER PROXY
At a special meeting of shareholders held on February 25, 2005, the results of the Proposals were as follows:
Transamerica IDEX Mutual Funds
Proposal 1: Election of Trustees to the Board of Trustees of Transamerica IDEX Mutual Funds.
| For | Withheld | ||||||||||
| Peter R. Brown | 872,017,875.249 | 4,468,498.551 | |||||||||
| Daniel Calabria | 871,917,069.786 | 4,569,304.014 | |||||||||
| Janise B. Case | 872,099,393.125 | 4,386,980.675 | |||||||||
| Charles C. Harris | 872,086,722.025 | 4,399,651.775 | |||||||||
| Leo J. Hill | 872,304,465.640 | 4,181,908.160 | |||||||||
| Russell A. Kimball, Jr. | 872,253,556.471 | 4,232,817.329 | |||||||||
| William W. Short, Jr. | 872,139,920.944 | 4,346,452.856 | |||||||||
| John Waechter | 872,261,152.376 | 4,225,221.424 | |||||||||
| Jack E. Zimmerman | 871,929,967.512 | 4,556,406.288 | |||||||||
| Brian C. Scott | 872,218,970.367 | 4,267,403.433 | |||||||||
| Thomas P. O'Neill | 872,111,944.117 | 4,374,429.683 | |||||||||
TA IDEX Great Companies–AmericaSM
Proposal 2: Approval of an Agreement and Plan of Reorganization pursuant to which Transamerica IDEX Mutual Funds will organize as a Delaware statutory trust.
| For | Against | Abstentions/Broker Non-Votes | |||||||||
| 5,429,197.973 | 143,286.953 | 2,406,460.447 | |||||||||
Proposal 3: Approval of changes to the fundamental investment restrictions of TA IDEX Great Companies–AmericaSM.
| A. Diversification | For | Against | Abstentions/Broker Non-Votes | ||||||||||||
| 5,505,033.759 | 263,975.614 | 2,209,936.000 | |||||||||||||
| B. Borrowing | For | Against | Abstentions/Broker Non-Votes | ||||||||||||
| 5,459,333.941 | 309,675.432 | 2,209,936.000 | |||||||||||||
| C. Senior Securities | For | Against | Abstentions/Broker Non-Votes | ||||||||||||
| 5,469,236.780 | 299,772.593 | 2,209,936.000 | |||||||||||||
| D. Underwriting Securities | For | Against | Abstentions/Broker Non-Votes | ||||||||||||
| 5,468,021.190 | 300,988.183 | 2,209,936.000 | |||||||||||||
| E. Real Estate | For | Against | Abstentions/Broker Non-Votes | ||||||||||||
| 5,469,649.780 | 299,359.593 | 2,209,936.000 | |||||||||||||
| F. Making Loans | For | Against | Abstentions/Broker Non-Votes | ||||||||||||
| 5,491,581.275 | 277,428.098 | 2,209,936.000 | |||||||||||||
| G. Concentration | For | Against | Abstentions/Broker Non-Votes | ||||||||||||
| 5,498,910.481 | 270,098.892 | 2,209,936.000 | |||||||||||||
| H. Commodities | For | Against | Abstentions/Broker Non-Votes | ||||||||||||
| 5,490,381.456 | 278,627.917 | 2,209,936.000 | |||||||||||||
Transamerica IDEX Mutual Funds
Semi-Annual Report 2005
12
TA IDEX Great Companies–TechnologySM
UNDERSTANDING YOUR FUND'S EXPENSES
(unaudited)
SHAREHOLDER EXPENSES
The following Example is intended to help you understand your ongoing costs (in dollars and cents) of investing in a Fund and to compare these costs with the ongoing costs of investing in other funds.
The Example is based on an investment of $1,000 invested at November 1, 2004 and held for the entire period until April 30, 2005.
ACTUAL EXPENSES
The first line in the table below provides information about actual account values and actual expenses. You may use the information in this line, together with the amount you invested, to estimate the expenses that you paid over the period. Simply divide your account value by $1,000 (for example, an $8,600 account value divided by $1,000 = 8.6), then multiply the result by the number in the first line of your Fund under the heading entitled "Expenses Paid During Period" to estimate the expenses you paid on your account during this period.
HYPOTHETICAL EXAMPLE FOR COMPARISON PURPOSES
The second line in the table below provides information about hypothetical account values and hypothetical expenses based on the Fund's actual expense ratio and an assumed rate of return of 5% per year before expenses, which is not the Fund's actual return. The hypothetical account values and expenses may not be used to estimate the actual ending account balance or expenses you paid for the period. You may use this information to compare the ongoing costs of investing in your Fund and other funds. To do so, compare this 5% hypothetical example with the 5% hypothetical examples that appear in the shareholder reports of the other funds.
Please note that the expenses shown in the table are meant to highlight your ongoing costs only and do not reflect any transactional costs, such as sales charges, redemption fees, brokerage commissions paid on purchases and sales of fund shares. Therefore, the second line under the Fund in the table is useful in comparing ongoing costs only, and will not help you determine the relative total costs of owning different funds. In addition, note that the expenses shown in the table are meant to highlight your ongoing costs and do not reflect any transaction costs.
| Beginning Account Value | Ending Account Value | Annualized Expense Ratio | Expenses Paid During Period (a) | ||||||||||||||||
| Class A | |||||||||||||||||||
| Actual | $ | 1,000.00 | $ | 926.30 | 1.29 | % | $ | 6.16 | |||||||||||
| Hypothetical (b) | 1,000.00 | 1,018.40 | 1.29 | 6.46 | |||||||||||||||
| Class B | |||||||||||||||||||
| Actual | 1,000.00 | 918.50 | 2.20 | 10.47 | |||||||||||||||
| Hypothetical (b) | 1,000.00 | 1,013.88 | 2.20 | 10.99 | |||||||||||||||
| Class C | |||||||||||||||||||
| Actual | 1,000.00 | 921.00 | 2.20 | 10.48 | |||||||||||||||
| Hypothetical (b) | 1,000.00 | 1,013.88 | 2.20 | 10.99 | |||||||||||||||
(a) Expenses are calculated using each Fund's annualized expense ratio (as disclosed in the table), multiplied by the average account value for the period, multiplied by number of days in the period (181 days), and divided by the number of days in the year (365 days).
(b) 5% return per year before expenses.
GRAPHICAL PRESENTATION OF SCHEDULE OF INVESTMENTS
By Industry
At April 30, 2005
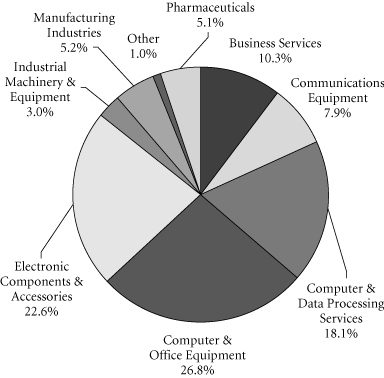
This chart shows the percentage breakdown by industry of the Fund's total investment securities.
Transamerica IDEX Mutual Funds
Semi-Annual Report 2005
1
TA IDEX Great Companies–TechnologySM
SCHEDULE OF INVESTMENTS
At April 30, 2005
(all amounts except share amounts in thousands)
(unaudited)
| Shares | Value | ||||||||||
| COMMON STOCKS (92.9%) | |||||||||||
| Business Services (9.6%) | |||||||||||
| eBay, Inc. (a) | 65,000 | $ | 2,062 | ||||||||
| First Data Corp. | 123,683 | 4,704 | |||||||||
| Communications Equipment (7.4%) | |||||||||||
| QUALCOMM, Inc. | 148,250 | 5,172 | |||||||||
| Computer & Data Processing Services (17.0%) | |||||||||||
| Electronic Arts, Inc. (a) | 55,000 | 2,936 | |||||||||
| Microsoft Corp. | 261,700 | 6,621 | |||||||||
| Yahoo!, Inc. (a)(b) | 68,420 | 2,361 | |||||||||
| Computer & Office Equipment (25.2%) | |||||||||||
| Cisco Systems, Inc. (a) | 291,760 | 5,042 | |||||||||
| Dell, Inc. (a) | 128,300 | 4,469 | |||||||||
| Diebold, Inc. | 60,670 | 2,935 | |||||||||
| EMC Corp. (a) | 397,800 | 5,219 | |||||||||
| Electronic Components & Accessories (21.2%) | |||||||||||
| Analog Devices, Inc. (b) | 95,200 | 3,247 | |||||||||
| Intel Corp. | 109,524 | 2,576 | |||||||||
| Linear Technology Corp. | 89,400 | 3,195 | |||||||||
| Texas Instruments, Inc. | 112,800 | 2,816 | |||||||||
| Xilinx, Inc. | 113,400 | 3,055 | |||||||||
| Entertainment (4.9%) | |||||||||||
| International Game Technology | 126,900 | 3,412 | |||||||||
| Industrial Machinery & Equipment (2.8%) | |||||||||||
| Applied Materials, Inc. (a) | 131,300 | 1,952 | |||||||||
| Pharmaceuticals (4.8%) | |||||||||||
| Amgen, Inc. (a)(b) | 57,800 | 3,365 | |||||||||
| Total Common Stocks (cost: $68,180) | 65,139 | ||||||||||
| Principal | Value | ||||||||||
| SECURITY LENDING COLLATERAL (1.0%) | |||||||||||
| Debt (0.9%) | |||||||||||
| Bank Notes (0.1%) | |||||||||||
| Bank of America 2.82%, due 05/16/2005 | $ | 21 | $ | 21 | |||||||
| 2.77%, due 07/18/2005 (c) 2.80%, due 06/09/2005 (c) | 5 21 | 5 21 | |||||||||
| Canadian Imperial Bank of Commerce 3.02%, due 11/04/2005 (c) | 21 | 21 | |||||||||
| Credit Suisse First Boston Corp. 2.88%, due 09/09/2005 (c) 3.06%, due 03/10/2006 (c) | 5 5 | 5 5 | |||||||||
| Principal | Value | ||||||||||
| Euro Dollar Overnight (0.2%) | |||||||||||
| Bank of Montreal 2.94%, due 05/04/2005 | $ | 16 | $ | 16 | |||||||
| BNP Paribas 2.80%, due 05/05/2005 | 22 | 22 | |||||||||
| Den Danske Bank 2.93%, due 05/02/2005 2.80%, due 05/06/2005 | 19 11 | 19 11 | |||||||||
| Dexia Group 2.80%, due 05/05/2005 | 9 | 9 | |||||||||
| Royal Bank of Canada 2.80%, due 05/04/2005 | 22 | 22 | |||||||||
| Svenska Handlesbanken 2.80%, due 05/06/2005 | 4 | 4 | |||||||||
| Euro Dollar Terms (0.3%) | |||||||||||
| Bank of Nova Scotia 2.88%, due 05/11/2005 3.01%, due 05/31/2005 | 11 30 | 11 30 | |||||||||
| Barclays 3.02%, due 06/27/2005 | 19 | 19 | |||||||||
| BNP Paribas 2.93%, due 06/07/2005 | 17 | 17 | |||||||||
| Branch Banker & Trust 2.94%, due 06/06/2005 | 5 | 5 | |||||||||
| Calyon 2.93%, due 06/03/2005 | 18 | 18 | |||||||||
| Citigroup 2.87%, due 06/06/2005 | 22 | 22 | |||||||||
| Credit Suisse First Boston Corp. 2.91%, due 05/16/2005 | 22 | 22 | |||||||||
| HSBC Banking/Holdings PLC 3.01%, due 06/23/2005 | 11 | 11 | |||||||||
| Royal Bank of Scotland 2.94%, due 06/07/2005 2.95%, due 06/10/2005 | 21 12 | 21 12 | |||||||||
| Societe Generale 2.80%, due 05/03/2005 | 21 | 21 | |||||||||
| Toronto Dominion Bank 2.75%, due 05/09/2005 3.01%, due 06/24/2005 | 16 6 | 16 6 | |||||||||
| UBS AG 2.81%, due 05/03/2005 | 11 | 11 | |||||||||
| Promissory Notes (0.1%) | |||||||||||
| Goldman Sachs Group, Inc. 2.99%, due 06/27/2005 3.01%, due 07/27/2005 | 23 39 | 23 39 | |||||||||
The notes to the financial statements are an integral part of this report.
Transamerica IDEX Mutual Funds
Semi-Annual Report 2005
2
TA IDEX Great Companies–TechnologySM
SCHEDULE OF INVESTMENTS (continued)
At April 30, 2005
(all amounts except share amounts in thousands)
(unaudited)
| Principal | Value | ||||||||||
| Repurchase Agreements (0.2%) (d) | |||||||||||
| Goldman Sachs Group, Inc. 3.04% Repurchase Agreement dated 04/29/2005 to be repurchased at $48 on 05/02/2005 | $ | 48 | $ | 48 | |||||||
| Merrill Lynch & Co., Inc. 3.04% Repurchase Agreement dated 04/29/2005 to be repurchased at $58 on 05/02/2005 | 58 | 58 | |||||||||
| Shares | Value | ||||||||||
| Investment Companies (0.1%) | |||||||||||
| Money Market Funds (0.1%) | |||||||||||
| American Beacon Funds 1-day yield of 2.84% | 8,525 | $ | 9 | ||||||||
| BGI Institutional Money Market Fund 1-day yield of 2.93% | 50,479 | 50 | |||||||||
| Merrill Lynch Premier Institutional Fund 1-day yield of 2.65% | 11,359 | 11 | |||||||||
| Merrimac Cash Fund, Premium Class 1-day yield of 2.74% (e) | 20,776 | 21 | |||||||||
| Total Security Lending Collateral (cost: $682) | 682 | ||||||||||
| Total Investment Securities (cost: $68,862) | $ | 65,821 | |||||||||
| SUMMARY: | |||||||||||
| Investments, at value | 93.9 | % | $ | 65,821 | |||||||
| Other assets in excess of liabilities | 6.1 | % | 4,277 | ||||||||
| Net assets | 100.0 | % | $ | 70,098 | |||||||
NOTES TO SCHEDULE OF INVESTMENTS:
(a) No dividends were paid during the preceding twelve months.
(b) At April 30, 2005, all or a portion of this security is on loan (see Note 1). The value at April 30, 2005, of all securities on loan is $652.
(c) Floating or variable rate note. Rate is listed as of April 30, 2005.
(d) Cash collateral for the Repurchase Agreements, valued at $108, that serve as collateral for securities lending are invested in corporate bonds with interest rates and maturity dates ranging from 0.00%–8.875% and 06/15/2005–03/15/2035, respectively.
(e) Regulated investment company advised by Investors Bank and Trust Co. ("IBT"). IBT is also the accounting, custody and lending agent for the Fund.
The notes to the financial statements are an integral part of this report.
Transamerica IDEX Mutual Funds
Semi-Annual Report 2005
3
TA IDEX Great Companies–TechnologySM
STATEMENT OF ASSETS AND LIABILITIES
At April 30, 2005
(all amounts except per share amounts in thousands)
(unaudited)
| Assets: | |||||||
| Investment securities, at value (cost: $68,862) (including securities loaned of $652) | $ | 65,821 | |||||
| Cash | 5,054 | ||||||
| Receivables: | |||||||
| Shares of beneficial interest sold | 8 | ||||||
| Interest | 11 | ||||||
| Dividends | 12 | ||||||
| Other | 4 | ||||||
| 70,910 | |||||||
| Liabilities: | |||||||
| Accounts payable and accrued liabilities: | |||||||
| Shares of beneficial interest redeemed | 24 | ||||||
| Management and advisory fees | 55 | ||||||
| Distribution and service fees | 25 | ||||||
| Transfer Agent fees | 20 | ||||||
| Payable for collateral for securities on loan | 682 | ||||||
| Other | 6 | ||||||
| 812 | |||||||
| Net Assets | $ | 70,098 | |||||
| Net Assets Consist of: | |||||||
| Shares of beneficial interest, unlimited shares authorized, no par value | $ | 73,696 | |||||
| Undistributed net investment income (loss) | 709 | ||||||
| Accumulated net realized gain (loss) from investment securities | (1,265 | ) | |||||
| Net unrealized appreciation (depreciation) on investment securities | (3,042 | ) | |||||
| Net Assets | $ | 70,098 | |||||
| Net Assets by Class: | |||||||
| Class A | $ | 61,362 | |||||
| Class B | 5,661 | ||||||
| Class C | 3,075 | ||||||
| Shares Outstanding: | |||||||
| Class A | 17,443 | ||||||
| Class B | 1,675 | ||||||
| Class C | 911 | ||||||
| Net Asset Value Per Share: | |||||||
| Class A | $ | 3.52 | |||||
| Class B | 3.38 | ||||||
| Class C | 3.37 | ||||||
| Maximum Offering Price Per Share (a): | |||||||
| Class A | $ | 3.72 | |||||
(a) Includes the maximum selling commission (represented as a percentage of offering price) which is reduced on certain levels of sales as set forth in the Prospectus. Net asset value per share for Classes B and C shares represents offering price. The redemption price for Classes B and C shares equals net asset value less any applicable contingent deferred sales charge.
STATEMENT OF OPERATIONS
For the period ended April 30, 2005
(all amounts in thousands)
(unaudited)
| Investment Income: | |||||||
| Interest | $ | 50 | |||||
| Dividends | 1,378 | ||||||
| 1,428 | |||||||
| Expenses: | |||||||
| Management and advisory fees | 416 | ||||||
| Transfer agent fees: | |||||||
| Class A | 18 | ||||||
| Class B | 13 | ||||||
| Class C | 7 | ||||||
| Printing and shareholder reports | 5 | ||||||
| Custody fees | 8 | ||||||
| Administration fees | 9 | ||||||
| Legal fees | 4 | ||||||
| Audit fees | 5 | ||||||
| Trustees fees | 3 | ||||||
| Registration fees: | |||||||
| Class A | 17 | ||||||
| Class B | 4 | ||||||
| Class C | 12 | ||||||
| Other | 1 | ||||||
| Distribution and service fees: | |||||||
| Class A | 164 | ||||||
| Class B | 33 | ||||||
| Class C | 19 | ||||||
| Total expenses | 738 | ||||||
| Less: | |||||||
| Reimbursement of class expenses: | |||||||
| Class B | (6 | ) | |||||
| Class C | (13 | ) | |||||
| Net expenses | 719 | ||||||
| Net Investment Income (Loss) | 709 | ||||||
| Net Realized and Unrealized Gain (Loss) | |||||||
| Realized gain (loss) from investment securities | 7,951 | ||||||
| Increase (decrease) in unrealized appreciation (depreciation) on investment securities | (14,373 | ) | |||||
| Net Gain (Loss) on Investments | (6,422 | ) | |||||
| Net Increase (Decrease) in Net Assets Resulting from Operations | $ | (5,713 | ) | ||||
The notes to the financial statements are an integral part of this report.
Transamerica IDEX Mutual Funds
Semi-Annual Report 2005
4
TA IDEX Great Companies–TechnologySM
STATEMENTS OF CHANGES IN NET ASSETS
For the period or year ended
(all amounts in thousands)
| April 30, 2005 (unaudited) | October 31, 2004 | ||||||||||
| Increase (Decrease) In Net Assets From: | |||||||||||
| Operations: | |||||||||||
| Net investment income (loss) | $ | 709 | $ | (1,410 | ) | ||||||
| Net realized gain (loss) from investment securities | 7,951 | 7,229 | |||||||||
| Net unrealized appreciation (depreciation) on investment securities | (14,373 | ) | (596 | ) | |||||||
| (5,713 | ) | 5,223 | |||||||||
| Capital Share Transactions: | |||||||||||
| Proceeds from shares sold: | |||||||||||
| Class A | 586 | 43,251 | |||||||||
| Class B | 263 | 1,211 | |||||||||
| Class C | 251 | 1,072 | |||||||||
| Class C2 | – | 217 | |||||||||
| Class M | – | 169 | |||||||||
| 1,100 | 45,920 | ||||||||||
| Cost of shares redeemed: | |||||||||||
| Class A | (54,274 | ) | (6,253 | ) | |||||||
| Class B | (967 | ) | (2,528 | ) | |||||||
| Class C | (996 | ) | (1,125 | ) | |||||||
| Class C2 | – | (485 | ) | ||||||||
| Class M | – | (584 | ) | ||||||||
| (56,237 | ) | (10,975 | ) | ||||||||
| Class level exchanges: | |||||||||||
| Class C | – | 3,369 | |||||||||
| Class C2 | – | (2,246 | ) | ||||||||
| Class M | – | (1,123 | ) | ||||||||
| – | – | ||||||||||
| Automatic conversions: | |||||||||||
| Class A | 2 | 5 | |||||||||
| Class B | (2 | ) | (5 | ) | |||||||
| – | – | ||||||||||
| (55,137 | ) | 34,945 | |||||||||
| Net increase (decrease) in net assets | (60,850 | ) | 40,168 | ||||||||
| Net Assets: | |||||||||||
| Beginning of period | 130,948 | 90,780 | |||||||||
| End of period | $ | 70,098 | $ | 130,948 | |||||||
| Undistributed Net Investment Income (Loss) | $ | 709 | $ | – | |||||||
| April 30, 2005 (unaudited) | October 31, 2004 | ||||||||||
| Share Activity: | |||||||||||
| Shares issued: | |||||||||||
| Class A | 152 | 11,526 | |||||||||
| Class B | 71 | 335 | |||||||||
| Class C | 68 | 299 | |||||||||
| Class C2 | – | 60 | |||||||||
| Class M | – | 47 | |||||||||
| 291 | 12,267 | ||||||||||
| Shares redeemed: | |||||||||||
| Class A | (14,249 | ) | (1,667 | ) | |||||||
| Class B | (266 | ) | (705 | ) | |||||||
| Class C | (272 | ) | (316 | ) | |||||||
| Class C2 | – | (133 | ) | ||||||||
| Class M | – | (161 | ) | ||||||||
| (14,787 | ) | (2,982 | ) | ||||||||
| Class level exchanges: | |||||||||||
| Class C | – | 921 | |||||||||
| Class C2 | – | (602 | ) | ||||||||
| Class M | – | (318 | ) | ||||||||
| – | 1 | ||||||||||
| Automatic conversions: | |||||||||||
| Class A | 1 | 1 | |||||||||
| Class B | (1 | ) | (1 | ) | |||||||
| – | – | ||||||||||
| Net increase (decrease) in shares outstanding: | |||||||||||
| Class A | (14,096 | ) | 9,860 | ||||||||
| Class B | (196 | ) | (371 | ) | |||||||
| Class C | (204 | ) | 904 | ||||||||
| Class C2 | – | (675 | ) | ||||||||
| Class M | – | (432 | ) | ||||||||
| (14,496 | ) | 9,286 | |||||||||
The notes to the financial statements are an integral part of this report.
Transamerica IDEX Mutual Funds
Semi-Annual Report 2005
5
TA IDEX Great Companies–TechnologySM
FINANCIAL HIGHLIGHTS
(unaudited for the period ended April 30, 2005)
| For a share of beneficial interest outstanding throughout each period | |||||||||||||||||||||||||||||||||||||||
| Net Asset | Investment Operations | Distributions | Net Asset | ||||||||||||||||||||||||||||||||||||
| For the Period Ended (d)(g) | Value, Beginning of Period | Net Investment Income (Loss) | Net Realized and Unrealized Gain (Loss) | Total Operations | From Net Investment Income | From Net Realized Gains | Total Distributions | Value, End of Period | |||||||||||||||||||||||||||||||
| Class A | 4/30/2005 | $ | 3.80 | $ | 0.03 | $ | (0.31 | ) | $ | (0.28 | ) | $ | – | $ | – | $ | – | $ | 3.52 | ||||||||||||||||||||
| 10/31/2004 | 3.61 | (0.04 | ) | 0.23 | 0.19 | – | – | – | 3.80 | ||||||||||||||||||||||||||||||
| 10/31/2003 | 2.56 | (0.04 | ) | 1.09 | 1.05 | – | – | – | 3.61 | ||||||||||||||||||||||||||||||
| 10/31/2002 | 3.63 | (0.05 | ) | (1.02 | ) | (1.07 | ) | – | – | – | 2.56 | ||||||||||||||||||||||||||||
| 10/31/2001 | 7.93 | (0.06 | ) | (4.24 | ) | (4.30 | ) | – | – | – | 3.63 | ||||||||||||||||||||||||||||
| 10/31/2000 | 10.00 | – | (2.07 | ) | (2.07 | ) | – | – | – | 7.93 | |||||||||||||||||||||||||||||
| Class B | 4/30/2005 | 3.68 | – | (0.30 | ) | (0.30 | ) | – | – | – | 3.38 | ||||||||||||||||||||||||||||
| 10/31/2004 | 3.51 | (0.06 | ) | 0.23 | 0.17 | – | – | – | 3.68 | ||||||||||||||||||||||||||||||
| 10/31/2003 | 2.50 | (0.06 | ) | 1.07 | 1.01 | – | – | – | 3.51 | ||||||||||||||||||||||||||||||
| 10/31/2002 | 3.58 | (0.08 | ) | (1.00 | ) | (1.08 | ) | – | – | – | 2.50 | ||||||||||||||||||||||||||||
| 10/31/2001 | 7.91 | (0.10 | ) | (4.23 | ) | (4.33 | ) | – | – | – | 3.58 | ||||||||||||||||||||||||||||
| 10/31/2000 | 10.00 | (0.02 | ) | (2.07 | ) | (2.09 | ) | – | – | – | 7.91 | ||||||||||||||||||||||||||||
| Class C | 4/30/2005 | 3.67 | – | (0.30 | ) | (0.30 | ) | – | – | – | 3.37 | ||||||||||||||||||||||||||||
| 10/31/2004 | 3.51 | (0.07 | ) | 0.23 | 0.16 | – | – | – | 3.67 | ||||||||||||||||||||||||||||||
| 10/31/2003 | 2.45 | (0.06 | ) | 1.12 | 1.06 | – | – | – | 3.51 | ||||||||||||||||||||||||||||||
| Ratios/Supplemental Data | |||||||||||||||||||||||||||||||
| For the Period | Total | Net Assets, End of Period | Ratio of Expenses to Average Net Assets (a) | Net Investment Income (Loss) to Average | Portfolio Turnover | ||||||||||||||||||||||||||
| Ended (g) | Return (c) | (000's) | Net (e) | Total (f) | Net Assets (a) | Rate (b) | |||||||||||||||||||||||||
| Class A | 4/30/2005 | (7.37 | )% | $ | 61,362 | 1.29 | % | 1.29 | % | 1.49 | % | 23 | % | ||||||||||||||||||
| 10/31/2004 | 5.26 | 119,985 | 1.36 | 1.36 | (1.12 | ) | 41 | ||||||||||||||||||||||||
| 10/31/2003 | 41.02 | 78,289 | 1.55 | 1.90 | (1.23 | ) | 24 | ||||||||||||||||||||||||
| 10/31/2002 | (29.45 | ) | 6,445 | 1.55 | 2.61 | (1.40 | ) | 64 | |||||||||||||||||||||||
| 10/31/2001 | (54.26 | ) | 7,106 | 1.55 | 2.68 | (1.04 | ) | 58 | |||||||||||||||||||||||
| 10/31/2000 | (20.66 | ) | 6,322 | 1.55 | 5.55 | (0.64 | ) | 11 | |||||||||||||||||||||||
| Class B | 4/30/2005 | (8.15 | ) | 5,661 | 2.20 | 2.39 | 0.16 | 23 | |||||||||||||||||||||||
| 10/31/2004 | 4.84 | 6,874 | 1.91 | 1.91 | (1.68 | ) | 41 | ||||||||||||||||||||||||
| 10/31/2003 | 40.40 | 7,864 | 2.20 | 2.55 | (1.88 | ) | 24 | ||||||||||||||||||||||||
| 10/31/2002 | (30.12 | ) | 4,348 | 2.20 | 3.26 | (2.05 | ) | 64 | |||||||||||||||||||||||
| 10/31/2001 | (54.80 | ) | 5,938 | 2.20 | 3.33 | (1.69 | ) | 58 | |||||||||||||||||||||||
| 10/31/2000 | (20.86 | ) | 3,295 | 2.20 | 6.20 | (1.29 | ) | 11 | |||||||||||||||||||||||
| Class C | 4/30/2005 | (7.90 | ) | 3,075 | 2.20 | 2.87 | 0.23 | 23 | |||||||||||||||||||||||
| 10/31/2004 | 4.56 | 4,089 | 2.20 | 2.60 | (1.94 | ) | 41 | ||||||||||||||||||||||||
| 10/31/2003 | 43.27 | 739 | 2.20 | 2.55 | (1.88 | ) | 24 | ||||||||||||||||||||||||
NOTES TO FINANCIAL HIGHLIGHTS
(a) Annualized.
(b) Not annualized for periods of less than one year.
(c) Total Return has been calculated for the applicable periods without deduction of a sales load, if any, on an initial purchase. Periods of less than one year are not annualized.
(d) Per share information is calculated based on average number of shares outstanding for the years ended 10/31/2001, 10/31/2002, 10/31/2003, 10/31/2004, and the period ended 4/30/2005.
(e) Ratio of Net Expenses to Average Net Assets is net of fee waivers and reimbursements by the investment adviser, if any (see note 2).
(f) Ratio of Total Expenses to Average Net Assets includes all expenses before fee waivers, reimbursements.
(g) TA IDEX Great Companies–Technology ("the Fund") commenced operations on July 14, 2000. The inception date for the Fund's offering of share Class C was November 11, 2002.
The notes to the financial statements are an integral part of this report.
Transamerica IDEX Mutual Funds
Semi-Annual Report 2005
6
TA IDEX Great Companies–TechnologySM
NOTES TO FINANCIAL STATEMENTS
At April 30, 2005
(all amounts in thousands)
(unaudited)
NOTE 1. ORGANIZATION AND SIGNIFICANT ACCOUNTING POLICIES
Transamerica IDEX Mutual Funds is a Delaware statutory trust registered under the Investment Company Act of 1940, as amended (the "1940 Act"), as an open-end management investment company. Prior to March 1, 2005, Transamerica IDEX Mutual Funds was a Massachusetts business trust. TA IDEX Great Companies–TechnologySM ("the Fund"), part of Transamerica IDEX Mutual Funds, began operations on July 14, 2000.
The Fund is "non-diversified" under the 1940 Act.
In the normal course of business, the Fund enters into contracts that contain a variety of representations and warranties, which provide general indemnifications. The Fund's maximum exposure under these arrangements is unknown, as this would involve future claims that may be made against the Fund and/or its affiliates that have not yet occurred. However, based on experience, the Fund expects the risk of loss to be remote.
See the Prospectus and Statement of Additional Information for a description of the Fund's investment objective.
In preparing the Fund's financial statements in accordance with accounting principles generally accepted in the United States of America ("GAAP"), estimates or assumptions (which could differ from actual results) may be used that affect reported amounts and disclosures. The following policies were consistently followed by the Fund, in accordance with GAAP.
Multiple class operations and expenses: The Fund currently offers three classes of shares, each with a public offering price that reflects different sales charges, if any, and expense levels. On June 15, 2004, Class C2 shares merged into Class C. On September 24, 2004, Class M shares merged into Class C. Class B shares will convert to Class A shares eight years after purchase. Income, non-class specific expenses and realized and unrealized gains and losses, are allocated daily to each class, based upon the value of shares outstanding method as permitted under Rule 18f-3 of the 1940 Act. Each class bears its own specific expenses as well as a portion of general, common expenses.
Pricing of shares: The Fund prices its shares on the basis of the net asset value of each class of shares of the Fund, which is determined as of the close of the New York Stock Exchange ("NYSE") (generally 4:00 p.m. Eastern Time) on each day on which the NYSE is open for trading.
Security valuations: Fund investments traded on an exchange are valued at the closing price on the day of valuation on the exchange where the security is principally traded. With respect to securities traded on NASDAQ NMS, such closing price may be the last reported sales price or the NASDAQ Official Closing Price.
Securities traded in the over-the-counter market and listed securities for which no sale was reported on that date are valued at the last quoted bid price.
Debt securities are valued by independent pricing services at the last quoted bid price; however, those that mature in sixty days or less are valued at amortized cost, which approximates market.
Investment company securities are valued at net asset value of the underlying portfolio.
Other securities for which quotations are not readily available are valued at fair market value as determined in good faith using guidelines adopted by the Board of Trustees of the Fund, under the supervision of the Fund's Valuation Committee. These guidelines may include: the type of security; any restrictions on its resale; financial or business news of the issuer; similar or related securities that are actively trading; related corporate actions; and other significant events occurring after the close of trading in the security.
Cash: The Fund may leave cash overnight in its cash account with the custodian, Investors Bank & Trust Company ("IBT"). IBT has been contracted on behalf of the Fund to invest the excess cash into a savings account, which at April 30, 2005, was paying an interest rate of 2.02%.
Throughout the period, the Fund may have a cash overdraft balance. A fee is incurred on this overdraft, calculated by multiplying the overdraft by a rate based on the federal funds rate.
Repurchase agreements: The Fund is authorized to enter into repurchase agreements. The Fund, through IBT, receives delivery of the underlying securities, the value of which at the time of purchase is required to be an amount equal to at least 100% of the resale price. Repurchase agreements involve the risk that the seller will fail to repurchase the security, as agreed. In that case, the Fund will bear the risk of value fluctuations until the security can be sold and may encounter delays and incur costs in liquidating the security. In the event of bankruptcy or insolvency of the seller, delays and costs may be incurred.
Commission recapture: The sub-adviser, to the extent consistent with the best execution and usual commission rate policies and practices, may place security transactions of the Fund with broker/dealers with which Transamerica IDEX Mutual Funds has established a Commission Recapture Program. A Commission Recapture Program is any arrangement under which a broker/dealer applies a portion of the commissions received by such broker/dealer on the security transactions to the Fund. In no event will commissions paid by the Fund be used to pay expenses that would otherwise be borne by any other funds within Transamerica IDEX Mutual Funds, or by any other party.
Recaptured commissions during the six months ended April 30, 2005, of $15 are included in net realized gains in the Statement of Operations.
Transamerica IDEX Mutual Funds
Semi-Annual Report 2005
7
TA IDEX Great Companies–TechnologySM
NOTES TO FINANCIAL STATEMENTS (continued)
At April 30, 2005
(all amounts in thousands)
(unaudited)
NOTE 1.–(continued)
Securities lending: The Fund may lend securities to enhance fund earnings from investing cash collateral in making such loans to qualified borrowers (typically broker/dealers). The Fund has engaged its custodian bank, IBT, as a lending agent to administer its securities lending program. IBT earned less than $1 of program income for its services. When the Fund makes a security loan, it receives cash collateral as protection against the risk that the borrower will default on the loan, and records an asset for the cash invested collateral and a liability for the return of the collateral.
Loans of securities are required to be secured by collateral at least equal to 102% of the value of the securities at inception of the loan, and not less then 100% thereafter. The Fund may invest cash collateral in short-term money market instruments including: U.S. Treasury Bills, U.S. agency obligations, commercial paper, money market mutual funds, repurchase agreements and other highly rated, liquid investments. During the life of securities loans, the collateral and securities loaned remain subject to fluctuation in value. IBT marks to market securities loaned and the collateral each business day. If additional collateral is due (at least $1), IBT collects additional cash collateral from the borrowers. Although securities loaned will be fully collateralized at all times, IBT may experience delays in, or may be prevented from, recovering the collateral on behalf of the Fund. The Fund may recall a loa ned security position at any time from the borrower through IBT. In the event the borrower fails to timely return a recalled security, IBT may indemnify the Fund by purchasing replacement securities for the Fund at its own expense and claiming the collateral to fund such a purchase. IBT absorbs the loss if the collateral value is not sufficient to cover the cost of the replacement securities. If replacement securities are not available, IBT will credit the equivalent cash value to the Fund.
While a security is on loan, the Fund does not have the right to vote that security. However, if time permits, the Fund will attempt to recall a security on loan and vote the proxy.
Income from securities lending is included in the Statement of Operations. The amount of collateral and value of securities on loan are included in the Statement of Assets and Liabilities as well as in the Schedule of Investments.
Security transactions and investment income: Security transactions are recorded on the trade date. Security gains and losses are calculated on the specific identification basis. Dividend income is recorded on the ex-dividend date or, in the case of foreign securities, as soon as the Fund is informed of the ex-dividend date. Interest income, including accretion of discounts and amortization of premiums, is recorded on the accrual basis commencing on the settlement date.
Account maintenance fees: If the shareholder account balance falls below $1 by either shareholder action or as a result of market action, a $25 (not in thousands) fee is assessed every year until the balance reaches $1. The fee is assessed by redeeming shares in the shareholder's account.
No fee will be charged under the following conditions:
• accounts opened within the preceding 24 months
• accounts with an active monthly Automatic Investment Plan ($50 (not in thousands) minimum per fund)
• accounts owned by an individual which, when combined by social security number, have a balance of $5 or more
• accounts owned by individuals in the same household (by address) that have a combined balance of $5 or more
• UTMA/UGMA accounts
• Fiduciary accounts
• B-share accounts whose shares have started to convert to A-shares accounts (as long as combined value of both accounts is at least $1)
For the six months ended April 30, 2005, this fee totaled less than $1. These fees are included in Paid in Capital in the Statement of Assets and Liabilities.
Redemption fees: A short-term trading redemption fee may be assessed on any fund shares in a fund account that are sold during the first five (5) NYSE trading days following their purchase date. This redemption fee will equal 2% of the amount redeemed and shares held the longest will be treated as being redeemed first and shares held the shortest as being redeemed last.
For the six months ended April 30, 2005, the Fund received less than $1 in redemption fees.
Dividend distributions: Distributions to shareholders are recorded on the ex-dividend date and are determined in accordance with Federal income tax regulations which may differ from GAAP.
NOTE 2. RELATED PARTY TRANSACTIONS
Transamerica Fund Advisors, Inc. ("TFAI") is the Fund's investment adviser. Transamerica Fund Services, Inc. ("TFS") is the Fund's administrator and transfer agent. AFSG Securities Corp. ("AFSG") is the Fund's distributor/principal underwriter. AFSG is 100% owned by AUSA Holding Company ("AUSA"). TFAI is a directly owned sub
Transamerica IDEX Mutual Funds
Semi-Annual Report 2005
8
TA IDEX Great Companies–TechnologySM
NOTES TO FINANCIAL STATEMENTS (continued)
At April 30, 2005
(all amounts in thousands)
(unaudited)
NOTE 2.–(continued)
sidiary of Western Reserve Life Assurance Co. of Ohio (78%) and AUSA (22%). TFS is a wholly owned subsidiary of WRL (50%) and AUSA (50%). AUSA and WRL are wholly owned indirect subsidiaries of AEGON, NV, a Netherlands corporation.
Effective January 1, 2005 AEGON/Transamerica Fund Advisors, Inc. ("ATFA") was renamed Transamerica Fund Advisors, Inc. ("TFAI"); AEGON/Transamerica Fund Services, Inc. ("ATFS") and AEGON/Transamerica Investor Services, Inc. ("ATIS") merged into one entity and was renamed Transamerica Fund Services, Inc. ("TFS").
Great Companies, LLC is both an affiliate of the Fund and a sub-adviser to the Fund.
The following schedule reflects the percentage of fund assets owned by affiliated mutual funds (i.e., through the asset allocation funds):
| Net Assets | % of Net Assets | ||||||||||
| TA IDEX Asset Allocation– Conservative Portfolio | $ | 2,908 | 4.15 | % | |||||||
| TA IDEX Asset Allocation– Growth Portfolio | 13,593 | 19.39 | % | ||||||||
| TA IDEX Asset Allocation– Moderate Growth Portfolio | 26,471 | 37.76 | % | ||||||||
| TA IDEX Asset Allocation– Moderate Portfolio | 10,629 | 15.16 | % | ||||||||
| Total | $ | 53,601 | 76.46 | % | |||||||
Investment advisory fees: The Fund pays management fees to TFAI based on average daily net assets ("ANA") at the following breakpoints:
0.80% of the first $500 million of ANA
0.70% of ANA over $500 million
TFAI has contractually agreed to waive its advisory fee and will reimburse the Fund to the extent that operating expenses, excluding 12b-1 fees, exceed the following stated annual limit:
1.20% Expense Limit
If total fund expenses fall below the annual expense limitation agreement agreed to by the adviser within the succeeding three years, the Fund may be required to pay that adviser a portion or all of the waived advisory fees.
| Advisory Fee Waived | Available for Recapture Through | ||||||||||
| Fiscal Year 2003 | $ | 138 | 10/31/2006 | ||||||||
| Fiscal Year 2002 | 193 | 10/31/2005 | |||||||||
If total class expenses fall below the annual expense limitation agreement agreed to by the adviser within the succeeding three years, the Fund may be required to pay that adviser a portion or all of the reimbursed class expenses.
| Reimbursement of Class Expenses | Available for Recapture Through | ||||||||||
| Fiscal Year 2004–Class C | $ | 7 | 10/31/2007 | ||||||||
Distribution and service fees: The Fund has a 12b-1 distribution plan under the 1940 Act pursuant to which an annual fee, based on average daily net assets, is paid to the distributor for various disbursements such as broker-dealer account servicing fees and other promotional expenses of the Fund. The Fund is authorized under the 12b-1 plan to pay fees on each class up to the following limits:
| Class A | 0.35 | % | |||||
| Class B | 1.00 | % | |||||
| Class C | 1.00 | % | |||||
In the case the Fund or a class of shares of the Fund is closed to new investors or investments, the Fund is authorized to pay 12b-1 fees for past sales and distribution efforts and present and past investor services.
Underwriter commissions relate to front-end sales charges imposed for Class A shares and contingent deferred sales charges from Classes B, C, and certain A share redemptions. For the six months ended April 30, 2005, the underwriter commissions were as follows:
| Received by Underwriter | $ | 29 | |||||
| Retained by Underwriter | 2 | ||||||
| Contingent Deferred Sales Charge | 8 | ||||||
Administrative services: The Fund has entered into an agreement with TFS for financial and legal fund administration services, which includes such items as compliance, expenses, financial statements and other reporting, distributions, tax returns, prospectus preparation, board of trustees meeting support and other legal matters. As of January 1, 2005 the Fund pays TFS an annual fee of 0.02% of average net assets. Prior to January 1, 2005 the Fund paid TFS an annual fee of 0.015% of average net assets. The Legal fees on the Statement of Operations are for fees paid to external legal counsel.
Transfer agent fees: The Fund pays TFS an annual per-account charge of $20 (not in thousands) for each open account and $1.63 (not in thousands) for each closed account. There is no new account charge. The Transfer agent fees on the Statement of Operations are made up of fees paid to TFS and costs associated with shareholder statements.
The Fund paid TFS $51 for the six months ended April 30, 2005.
Transamerica IDEX Mutual Funds
Semi-Annual Report 2005
9
TA IDEX Great Companies–TechnologySM
NOTES TO FINANCIAL STATEMENTS (continued)
At April 30, 2005
(all amounts in thousands)
(unaudited)
NOTE 2.–(continued)
Deferred compensation plan: Each eligible Fund Trustee may elect participation in the Deferred Compensation Plan ("the Plan"). Under the Plan, such Trustees may defer payment of a percentage of their total fees earned as a Fund Trustee. These deferred amounts may be invested in any Transamerica IDEX Mutual Fund. At April 30, 2005, the value of invested plan amount was $4. Invested plan amounts and the total liability for deferred compensation to the Trustees under the Plan at April 30, 2005, are included in the accompanying Statement of Assets and Liabilities.
NOTE 3. INVESTMENT TRANSACTIONS
The cost of securities purchased and proceeds from securities sold (excluding short-term securities) for the six months ended April 30, 2005, were as follows:
| Purchases of securities: | |||||||
| Long-Term excluding U.S. Government | $ | 22,056 | |||||
| U.S. Government | – | ||||||
| Proceeds from maturities and sales of securities: | |||||||
| Long-Term excluding U.S. Government | 70,913 | ||||||
| U.S. Government | – | ||||||
NOTE 4. FEDERAL INCOME TAX MATTERS
The Fund has not made any provision for federal income or excise taxes due to its policy to distribute all of its taxable income and capital gains to its shareholders and otherwise qualify as a regulated investment company under the Internal Revenue Code. Income and capital gain distributions are determined in accordance with income tax regulations, which may differ from GAAP. These differences are primarily due to differing treatment for items including, but not limited to, wash sales, net operating losses and capital loss carryforwards.
The capital loss carryforwards are available to offset future realized capital gains through the periods listed:
| Capital Loss Carryforward | Available through | ||||||
| $ | 6,163 | October 31, 2010 | |||||
| 1,294 | October 31, 2011 | ||||||
The aggregate cost of investments and composition of unrealized appreciation (depreciation) for federal income tax purposes as of April 30, 2005, are as follows:
| Federal Tax Cost Basis | $ | 69,056 | |||||
| Unrealized Appreciation | $ | 1,495 | |||||
| Unrealized (Depreciation) | (4,730 | ) | |||||
| Net Unrealized Appreciation (Depreciation) | $ | (3,235 | ) | ||||
NOTE 5. REGULATORY PROCEEDINGS
There continues to be significant federal and state regulatory activity relating to financial services companies, particularly mutual fund companies and their investment advisers. As part of an ongoing investigation regarding potential market timing, recordkeeping and trading compliance issues and matters affecting the Fund's investment adviser, TFAI, and certain employees and affiliates of TFAI, the SEC staff has indicated that it is likely to take some action against TFAI and certain of its affiliates at the conclusion of the investigation. The potential timing and the scope of any such action is difficult to predict. Although the impact of any action brought against TFAI and/or its affiliates is difficult to assess at the present time, the Fund currently believes that the likelihood that any such action will have a material adverse impact on it is remote. It is important to note that the Fund is not aware of any allegation of wrongdoing against it and its board at the time this semi-annual report is printed. Although it is not anticipated that these developments will have an adverse impact on the Fund, there can be no assurance at this time. TFAI and its affiliates are actively working with the SEC in regard to this matter; however, the exact resolution cannot be determined at this time. TFAI will take such actions that it deems necessary or appropriate to continue providing management services to the Fund and to bring all matters to an appropriate conclusion.
TFAI and/or its affiliates, and not the Fund, will bear the costs regarding these regulatory matters.
Transamerica IDEX Mutual Funds
Semi-Annual Report 2005
10
TA IDEX Great Companies–TechnologySM
INVESTMENT ADVISORY AND SUB-ADVISORY AGREEMENTS – REVIEW AND RENEWAL
At a meeting of the Board of Trustees of Transamerica IDEX Mutual Funds ("TA IDEX") held on October 6, 2004, the Board considered and approved the renewal for a one-year period of the Investment Advisory Agreement between TA IDEX Great Companies-Technology (the "Fund") and Transamerica Fund Advisors, Inc. ("TFAI") as well as the Investment Sub-Advisory Agreement of the Fund between TFAI and Great Companies, LLC (the "Sub-Adviser"). In approving the renewal of these agreements, the Board concluded that the Investment Advisory and Investment Sub-Advisory Agreements enable shareholders of the Fund to obtain high quality services at a cost that is appropriate, reasonable, and in the best interests of shareholders based upon the following determinations, among others:
The nature, extent and quality of the advisory service to be provided. The Board considered the nature and quality of the services provided by TFAI and the Sub-Adviser to the Fund in the past, as well as the services anticipated to be provided in the future. The Board concluded that TFAI and the Sub-Adviser are capable of providing high quality services to the Fund, as indicated by TFAI's management capabilities demonstrated with respect to the Fund and other funds managed by TFAI, TFAI's management oversight process, the professional qualifications and experience of the Sub-Adviser's portfolio management team, and the Fund's strong investment performance. The Board also concluded that TFAI and the Sub-Adviser would provide the same quality and quantity of investment management and related servi ces as before, that these services are appropriate in scope and extent in light of the Fund's operations, the competitive landscape of the investment company business and investor needs, and that TFAI's and the Sub-Adviser's obligations will remain the same in all respects.
The investment performance of the Fund. The Board concluded, based in particular on information provided by Lipper Analytics, that the Fund's investment performance was competitive or superior relative to comparable funds over trailing one-, two- and three-year periods and to the Fund's benchmark index over a one-year period. On the basis of the Trustees' assessment of the nature, extent and quality of investment advisory and related services to be provided or procured by TFAI and the Sub-Adviser, the Trustees concluded that TFAI and the Sub-Adviser were capable of generating a level of long-term investment performance that is appropriate in light of the Fund's investment objective, policies and strategies and competitive with many other investment companies.
The cost of advisory services provided and the level of profitability. On the basis of the Board's review of the fees to be charged by TFAI and the Sub-Adviser for investment advisory and related services, TFAI's financial statements, the fees paid by TFAI to the Sub-Adviser, TFAI's estimated net management income resulting from its management of the Fund, the estimated profitability of TFAI's relationships with the Fund and TA IDEX, and the estimated profitability of the Sub-Adviser's relationship with the Fund, the Board concluded that the level of investment advisory fees and the profitability is appropriate in light of the services provided, the management fees and overall expense ratios of comparable investment companies, and the anticipated profitability of the relationship between the Fun d, TFAI and the Sub-Adviser. Further, on the basis of comparative information supplied by Lipper Analytics, the Board determined that the advisory fees and estimated overall expense ratio of the Fund were consistent with, or lower than, industry averages.
The extent to which economies of scale would be realized as the Fund grows and whether fee levels reflect these economies of scale for the benefit of Fund investors. The Trustees concluded that inclusion of new asset-based breakpoints in the Fund's advisory fee schedule appropriately benefited investors by realizing economies of scale in the form of a lower advisory fee rate as the level of Fund assets increases. The Board also concluded that the advisory fees appropriately reflect the Fund's current size, the current economic environment for TFAI, and the competitive nature of the investment company market. In addition, the Board noted that it will have the opportunity to periodically re-examine whether the Fund has achieved economies of scale, as well as the appropriateness of advisory fees pa yable to TFAI and the Sub-Adviser in the future.
Benefits (such as soft dollars) to TFAI or the Sub-Adviser from its relationship with the Fund. The Board concluded that other benefits derived by TFAI or the Sub-Adviser from its relationship with the Fund are reasonable and fair, and are consistent with industry practice and the best interests of the Fund and its shareholders. In this regard, the Board noted that TFAI does not realize "soft dollar" benefits from its relationship with the Fund, and that the Sub-Adviser is participating in a brokerage program pursuant to which a portion of brokerage commissions paid by the Fund is recaptured for the benefit of the Fund and its shareholders, thus limiting the amount of "soft-dollar" arrangements the Sub-Adviser may engage in with respect to the Fund's portfolio brokerage transactions.
Other considerations. The Board also determined that TFAI had made a substantial commitment to the recruitment and retention of high quality personnel, and maintained the financial, compliance and operational resources reasonably necessary to manage the Fund in a professional manner that is consistent with the best interests of the Fund and its shareholders. The Trustees also concluded that TFAI had made a significant entrepreneurial commitment to the management and success of the Fund, reflected by TFAI's expense limitation and fee waiver arrangement with the Fund which, as demonstrated in the past with the Fund, may result in TFAI waiving a substantial amount of advisory fees for the benefit of shareholders.
Transamerica IDEX Mutual Funds
Semi-Annual Report 2005
11
TA IDEX Great Companies–TechnologySM
SUPPLEMENTAL INFORMATION (unaudited)
RESULTS OF SHAREHOLDER PROXY
At a special meeting of shareholders held on February 25, 2005, the results of the Proposals were as follows:
Transamerica IDEX Mutual Funds
Proposal 1: Election of Trustees to the Board of Trustees of Transamerica IDEX Mutual Funds.
| For | Withheld | ||||||||||
| Peter R. Brown | 872,017,875.249 | 4,468,498.551 | |||||||||
| Daniel Calabria | 871,917,069.786 | 4,569,304.014 | |||||||||
| Janise B. Case | 872,099,393.125 | 4,386,980.675 | |||||||||
| Charles C. Harris | 872,086,722.025 | 4,399,651.775 | |||||||||
| Leo J. Hill | 872,304,465.640 | 4,181,908.160 | |||||||||
| Russell A. Kimball, Jr. | 872,253,556.471 | 4,232,817.329 | |||||||||
| William W. Short, Jr. | 872,139,920.944 | 4,346,452.856 | |||||||||
| John Waechter | 872,261,152.376 | 4,225,221.424 | |||||||||
| Jack E. Zimmerman | 871,929,967.512 | 4,556,406.288 | |||||||||
| Brian C. Scott | 872,218,970.367 | 4,267,403.433 | |||||||||
| Thomas P. O'Neill | 872,111,944.117 | 4,374,429.683 | |||||||||
TA IDEX Great Companies-TechnologySM
Proposal 2: Approval of an Agreement and Plan of Reorganization pursuant to which Transamerica IDEX Mutual Funds will organize as a Delaware statutory trust.
| For | Against | Abstentions/Broker Non-Votes | |||||||||
| 31,627,114.838 | 49,158.003 | 1,533,048.498 | |||||||||
Proposal 3: Approval of changes to the fundamental investment restrictions of TA IDEX Great Companies-TechnologySM.
| A. Diversification | For | Against | Abstentions/Broker Non-Votes | ||||||||||||
| 31,641,142.610 | 98,162.729 | 1,470,016.000 | |||||||||||||
| B. Borrowing | For | Against | Abstentions/Broker Non-Votes | ||||||||||||
| 31,641,142.610 | 98,162.729 | 1,470,016.000 | |||||||||||||
| C. Senior Securities | For | Against | Abstentions/Broker Non-Votes | ||||||||||||
| 31,641,142.610 | 98,162.729 | 1,470,016.000 | |||||||||||||
| D. Underwriting Securities | For | Against | Abstentions/Broker Non-Votes | ||||||||||||
| 31,638,434.165 | 100,871.174 | 1,470,016.000 | |||||||||||||
| E. Real Estate | For | Against | Abstentions/Broker Non-Votes | ||||||||||||
| 31,639,750.610 | 99,554.729 | 1,470,016.000 | |||||||||||||
| F. Making Loans | For | Against | Abstentions/Broker Non-Votes | ||||||||||||
| 31,622,275.859 | 117,029.480 | 1,470,016.000 | |||||||||||||
| G. Concentration | For | Against | Abstentions/Broker Non-Votes | ||||||||||||
| 31,639,826.165 | 99,479.174 | 1,470,016.000 | |||||||||||||
| H. Commodities | For | Against | Abstentions/Broker Non-Votes | ||||||||||||
| 31,639,750.610 | 99,554.729 | 1,470,016.000 | |||||||||||||
Transamerica IDEX Mutual Funds
Semi-Annual Report 2005
12
TA IDEX Janus Growth
UNDERSTANDING YOUR FUND'S EXPENSES
(unaudited)
SHAREHOLDER EXPENSES
The following Example is intended to help you understand your ongoing costs (in dollars and cents) of investing in a Fund and to compare these costs with the ongoing costs of investing in other funds.
The Example is based on an investment of $1,000 invested at November 1, 2004 and held for the entire period until April 30, 2005.
ACTUAL EXPENSES
The first line in the table below provides information about actual account values and actual expenses. You may use the information in this line, together with the amount you invested, to estimate the expenses that you paid over the period. Simply divide your account value by $1,000 (for example, an $8,600 account value divided by $1,000 = 8.6), then multiply the result by the number in the first line of your Fund under the heading entitled "Expenses Paid During Period" to estimate the expenses you paid on your account during this period.
HYPOTHETICAL EXAMPLE FOR COMPARISON PURPOSES
The second line in the table below provides information about hypothetical account values and hypothetical expenses based on the Fund's actual expense ratio and an assumed rate of return of 5% per year before expenses, which is not the Fund's actual return. The hypothetical account values and expenses may not be used to estimate the actual ending account balance or expenses you paid for the period. You may use this information to compare the ongoing costs of investing in your Fund and other funds. To do so, compare this 5% hypothetical example with the 5% hypothetical examples that appear in the shareholder reports of the other funds.
Please note that the expenses shown in the table are meant to highlight your ongoing costs only and do not reflect any transactional costs, such as sales charges, redemption fees, brokerage commissions paid on purchases and sales of fund shares. Therefore, the second line under the Fund in the table is useful in comparing ongoing costs only, and will not help you determine the relative total costs of owning different funds. In addition, note that the expenses shown in the table are meant to highlight your ongoing costs and do not reflect any transaction costs.
| Beginning Account Value | Ending Account Value | Annualized Expense Ratio | Expenses Paid During Period (a) | ||||||||||||||||
| Class A | |||||||||||||||||||
| Actual | $ | 1,000.00 | $ | 1,041.30 | 1.43 | % | $ | 7.24 | |||||||||||
| Hypothetical (b) | 1,000.00 | 1,017.70 | 1.43 | 7.15 | |||||||||||||||
| Class B | |||||||||||||||||||
| Actual | 1,000.00 | 1,036.90 | 2.25 | 11.36 | |||||||||||||||
| Hypothetical (b) | 1,000.00 | 1,013.64 | 2.25 | 11.23 | |||||||||||||||
| Class C | |||||||||||||||||||
| Actual | 1,000.00 | 1,035.40 | 2.37 | 11.96 | |||||||||||||||
| Hypothetical (b) | 1,000.00 | 1,013.04 | 2.37 | 11.83 | |||||||||||||||
| Class T | |||||||||||||||||||
| Actual | 1,000.00 | 1,042.90 | 1.04 | 5.27 | |||||||||||||||
| Hypothetical (b) | 1,000.00 | 1,019.64 | 1.04 | 5.21 | |||||||||||||||
(a) Expenses are calculated using each Fund's annualized expense ratio (as disclosed in the table), multiplied by the average account value for the period, multiplied by number of days in the period (181 days), and divided by the number of days in the year (365 days).
(b) 5% return per year before expenses.
GRAPHICAL PRESENTATION OF SCHEDULE OF INVESTMENTS
By Sector
At April 30, 2005
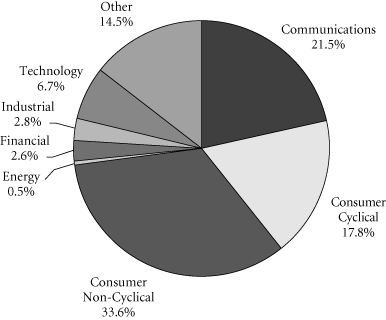
This chart shows the percentage breakdown by sector of the Fund's total investment securities.
Transamerica IDEX Mutual Funds
Semi-Annual Report 2005
1
TA IDEX Janus Growth
SCHEDULE OF INVESTMENTS
At April 30, 2005
(all amounts except share amounts in thousands)
(unaudited)
| Shares | Value | ||||||||||
| COMMON STOCKS (89.7%) | |||||||||||
| Air Transportation (0.3%) | |||||||||||
| FedEx Corp. | 42,860 | $ | 3,641 | ||||||||
| Amusement & Recreation Services (2.1%) | |||||||||||
| Harrah's Entertainment, Inc. (a) | 332,845 | 21,841 | |||||||||
| Apparel & Accessory Stores (1.2%) | |||||||||||
| Kohl's Corp. (b) | 264,580 | 12,594 | |||||||||
| Business Services (3.9%) | |||||||||||
| Clear Channel Communications, Inc. | 1,140,730 | 36,435 | |||||||||
| eBay, Inc. (b) | 155,965 | 4,949 | |||||||||
| Chemicals & Allied Products (1.7%) | |||||||||||
| Procter & Gamble Co. | 332,230 | 17,990 | |||||||||
| Commercial Banks (1.4%) | |||||||||||
| Citigroup, Inc. | 318,400 | 14,952 | |||||||||
| Communication (4.5%) | |||||||||||
| Liberty Media Corp.–Class A | 3,847,411 | 38,628 | |||||||||
| XM Satellite Radio Holdings, Inc.–Class A (a)(b) | 328,215 | 9,105 | |||||||||
| Communications Equipment (2.3%) | |||||||||||
| Research In Motion, Ltd. (b) | 380,405 | 24,502 | |||||||||
| Computer & Data Processing Services (11.7%) | |||||||||||
| Amdocs, Ltd. (b) | 501,395 | 13,392 | |||||||||
| Check Point Software Technologies, Ltd. (b) | 554,500 | 11,617 | |||||||||
| Checkfree Corp. (a)(b) | 341,735 | 12,535 | |||||||||
| NAVTEQ Corp. (b) | 332,400 | 12,106 | |||||||||
| Yahoo!, Inc. (b) | 2,149,240 | 74,170 | |||||||||
| Computer & Office Equipment (1.0%) | |||||||||||
| Cisco Systems, Inc. (b) | 621,467 | 10,739 | |||||||||
| Construction (1.2%) | |||||||||||
| Pulte Homes, Inc. (a) | 178,525 | 12,756 | |||||||||
| Electronic & Other Electric Equipment (3.6%) | |||||||||||
| General Electric Co. | 748,680 | 27,102 | |||||||||
| Harman International Industries, Inc. | 139,130 | 10,933 | |||||||||
| Electronic Components & Accessories (3.6%) | |||||||||||
| Intel Corp. | 943,790 | 22,198 | |||||||||
| Maxim Integrated Products, Inc. | 414,875 | 15,516 | |||||||||
| Food Stores (1.0%) | |||||||||||
| Safeway, Inc. (a)(b) | 517,635 | 11,021 | |||||||||
| Furniture & Fixtures (3.1%) | |||||||||||
| Kinetic Concepts, Inc. (b) | 537,040 | 33,001 | |||||||||
| Hotels & Other Lodging Places (4.8%) | |||||||||||
| Four Seasons Hotels, Inc. (a) | 86,975 | 5,520 | |||||||||
| Marriott International, Inc.–Class A | 384,120 | 24,104 | |||||||||
| Starwood Hotels & Resorts Worldwide, Inc. | 390,475 | 21,218 | |||||||||
| Shares | Value | ||||||||||
| Instruments & Related Products (1.9%) | |||||||||||
| Alcon, Inc. (b) | 210,710 | $ | 20,439 | ||||||||
| Insurance (8.3%) | |||||||||||
| Aetna, Inc. | 322,750 | 23,680 | |||||||||
| UnitedHealth Group, Inc. | 683,775 | 64,624 | |||||||||
| Lumber & Other Building Materials (1.5%) | |||||||||||
| Lowe's Cos., Inc. (a) | 302,515 | 15,764 | |||||||||
| Medical Instruments & Supplies (9.0%) | |||||||||||
| Biomet, Inc. | 391,935 | 15,164 | |||||||||
| Medtronic, Inc. | 1,256,510 | 66,218 | |||||||||
| Varian Medical Systems, Inc. (a)(b) | 434,275 | 14,652 | |||||||||
| Oil & Gas Extraction (0.5%) | |||||||||||
| GlobalSantaFe Corp. | 149,665 | 5,029 | |||||||||
| Personal Credit Institutions (1.3%) | |||||||||||
| SLM Corp. | 294,480 | 14,029 | |||||||||
| Pharmaceuticals (10.3%) | |||||||||||
| Celgene Corp. (a)(b) | 959,700 | 36,382 | |||||||||
| Genentech, Inc. (b) | 385,000 | 27,312 | |||||||||
| Roche Holding AG-Genusschein | 377,529 | 45,874 | |||||||||
| Radio & Television Broadcasting (1.4%) | |||||||||||
| IAC/InterActive Corp. (a)(b) | 672,865 | 14,628 | |||||||||
| Retail Trade (2.4%) | |||||||||||
| Staples, Inc. | 1,342,627 | 25,604 | |||||||||
| Telecommunications (1.2%) | |||||||||||
| Nextel Partners, Inc.–Class A (a)(b) | 552,945 | 13,005 | |||||||||
| Water Transportation (4.5%) | |||||||||||
| Carnival Corp. | 350,540 | 17,134 | |||||||||
| Royal Caribbean Cruises, Ltd. (a) | 730,160 | 30,681 | |||||||||
| Total Common Stocks (cost: $768,146) | 952,784 | ||||||||||
| Principal | Value | ||||||||||
| SECURITY LENDING COLLATERAL (15.3%) | |||||||||||
| Debt (13.3%) | |||||||||||
| Bank Notes (1.8%) | |||||||||||
| Bank of America | |||||||||||
| 2.82%, due 05/16/2005 | $ | 5,121 | $ | 5,121 | |||||||
| 2.80%, due 06/09/2005 (c) | 1,280 | 1,280 | |||||||||
| 2.77%, due 07/18/2005 (c) | 5,121 | 5,121 | |||||||||
| Canadian Imperial Bank of Commerce 3.02%, due 11/04/2005 (c) | 5,121 | 5,121 | |||||||||
| Credit Suisse First Boston Corp. 2.88%, due 09/09/2005 (c) 3.06%, due 03/10/2006 (c) | 1,280 1,280 | 1,280 1,280 | |||||||||
The notes to the financial statements are an integral part of this report.
Transamerica IDEX Mutual Funds
Semi-Annual Report 2005
2
TA IDEX Janus Growth
SCHEDULE OF INVESTMENTS (continued)
At April 30, 2005
(all amounts except share amounts in thousands)
(unaudited)
| Principal | Value | ||||||||||
| Euro Dollar Overnight (2.3%) | |||||||||||
| Bank of Montreal 2.94%, due 05/04/2005 | $ | 3,841 | $ | 3,841 | |||||||
| BNP Paribas 2.80%, due 05/05/2005 | 5,300 | 5,300 | |||||||||
| Den Danske Bank 2.93%, due 05/02/2005 2.80%, due 05/06/2005 | 4,609 2,560 | 4,609 2,560 | |||||||||
| Dexia Group 2.80%, due 05/05/2005 | 2,261 | 2,261 | |||||||||
| Royal Bank of Canada 2.80%, due 05/04/2005 | 5,255 | 5,255 | |||||||||
| Svenska Handlesbanken 2.80%, due 05/06/2005 | 845 | 845 | |||||||||
| Euro Dollar Terms (5.4%) | |||||||||||
| Bank of Nova Scotia 2.88%, due 05/11/2005 3.01%, due 05/31/2005 | 2,560 7,160 | 2,560 7,160 | |||||||||
| Barclays 3.02%, due 06/27/2005 | 4,564 | 4,564 | |||||||||
| BNP Paribas 2.93%, due 06/07/2005 | 4,098 | 4,098 | |||||||||
| Branch Banker & Trust 2.94%, due 06/06/2005 | 1,095 | 1,095 | |||||||||
| Calyon 2.93%, due 06/03/2005 | 4,230 | 4,230 | |||||||||
| Citigroup 2.87%, due 06/06/2005 | 5,317 | 5,317 | |||||||||
| Credit Suisse First Boston Corp. 2.91%, due 05/16/2005 | 5,244 | 5,244 | |||||||||
| HSBC Banking/Holdings PLC 3.01%, due 06/23/2005 | 2,561 | 2,561 | |||||||||
| Royal Bank of Scotland 2.94%, due 06/07/2005 2.95%, due 06/10/2005 | 4,974 2,763 | 4,974 2,763 | |||||||||
| Societe Generale 2.80%, due 05/03/2005 | 4,898 | 4,898 | |||||||||
| Toronto Dominion Bank 2.75%, due 05/09/2005 | 3,841 | 3,841 | |||||||||
| 3.01%, due 06/24/2005 | 1,422 | 1,422 | |||||||||
| UBS AG 2.81%, due 05/03/2005 | 2,561 | 2,561 | |||||||||
| Principal | Value | ||||||||||
| Promissory Notes (1.4%) | |||||||||||
| Goldman Sachs Group, Inc. | |||||||||||
| 2.99%, due 06/27/2005 | $ | 5,377 | $ | 5,377 | |||||||
| 3.01%, due 07/27/2005 | 8,962 | 8,962 | |||||||||
| Repurchase Agreements (2.4%) (d) | |||||||||||
| Goldman Sachs Group, Inc. (The) 3.04%, Repurchase Agreement dated 04/29/2005 to be repurchased at $11,526 on 05/02/2005 | 11,522 | 11,522 | |||||||||
| Merrill Lynch & Co., Inc. 3.04%, Repurchase Agreement dated 04/29/2005 to be repurchased at $13,831 on 05/02/2005 | 13,827 | 13,827 | |||||||||
| Shares | Value | ||||||||||
| Investment Companies (2.0%) | |||||||||||
| Money Market Funds (2.0%) | |||||||||||
| American Beacon Funds 1-day yield of 2.84% | 2,033,595 | $ | 2,034 | ||||||||
| BGI Institutional Money Market Fund 1-day yield of 2.93% | 12,042,055 | 12,042 | |||||||||
| Merrill Lynch Premier Institutional Fund 1-day yield of 2.65% | 2,709,843 | 2,710 | |||||||||
| Merrimac Cash Fund, Premium Class 1-day yield of 2.74% (e) | 4,956,265 | 4,956 | |||||||||
| Total Security Lending Collateral (cost: $162,592) | 162,592 | ||||||||||
| Total Investment Securities (cost: $930,738) | $ | 1,115,376 | |||||||||
| SUMMARY: | |||||||||||
| Investments, at value | 105.0 | % | $ | 1,115,376 | |||||||
| Liabilities in excess of other assets | (5.0 | )% | (52,442 | ) | |||||||
| Net assets | 100.0 | % | $ | 1,062,934 | |||||||
| FORWARD FOREIGN CURRENCY CONTRACTS: | |||||||||||
| Currency | Bought (Sold) | Settlement Date | Amount in U.S. Dollars Bought (Sold) | Net Unrealized Appreciation (Depreciation) | |||||||||||||||
| Swiss Franc | (26,700 | ) | 07/15/2005 | $ | (22,576 | ) | $ | 30 | |||||||||||
| $ | (22,576 | ) | $ | 30 | |||||||||||||||
NOTES TO SCHEDULE OF INVESTMENTS:
(a) At April 30, 2005, all or a portion of this security is on loan (see Note 1). The value at April 30, 2005, of all securities on loan is $157,560.
(b) No dividends were paid during the preceding twelve months.
(c) Floating or variable rate note. Rate is listed as of April 30, 2005.
(d) Cash collateral for the Repurchase Agreements, valued at $25,790, that serve as collateral for securities lending are invested in corporate bonds with interest rates and maturity dates ranging from 0.00%–8.875% and 06/15/2005–03/15/2035, respectively.
(e) Regulated investment company advised by Investors Bank and Trust Co. ("IBT"). IBT is also the accounting, custody and lending agent for the Fund.
The notes to the financial statements are an integral part of this report.
Transamerica IDEX Mutual Funds
Semi-Annual Report 2005
3
TA IDEX Janus Growth
STATEMENT OF ASSETS AND LIABILITIES
At April 30, 2005
(all amounts except per share amounts in thousands)
(unaudited)
| Assets: | |||||||
| Investment securities, at value (cost: $930,738) (including securities loaned of $157,560) | $ | 1,115,376 | |||||
| Cash | 95,153 | ||||||
| Receivables: | |||||||
| Investment securities sold | 17,816 | ||||||
| Shares of beneficial interest sold | 204 | ||||||
| Interest | 137 | ||||||
| Dividends | 351 | ||||||
| Dividend reclaims receivable | 190 | ||||||
| Unrealized appreciation on forward currency contracts | 30 | ||||||
| Other | 331 | ||||||
| 1,229,588 | |||||||
| Liabilities: | |||||||
| Investment securities purchased | 1,421 | ||||||
| Accounts payable and accrued liabilities: | |||||||
| Shares of beneficial interest redeemed | 1,110 | ||||||
| Management and advisory fees | 977 | ||||||
| Distribution and service fees | 381 | ||||||
| Payable for collateral for securities on loan | 162,592 | ||||||
| Other | 173 | ||||||
| 166,654 | |||||||
| Net Assets | $ | 1,062,934 | |||||
| Net Assets Consist of: | |||||||
| Shares of beneficial interest, unlimited shares authorized, no par value | $ | 1,702,365 | |||||
| Accumulated net investment income (loss) | (4,291 | ) | |||||
| Accumulated net realized gain (loss) from investment securities and foreign currency transactions | (819,728 | ) | |||||
| Net unrealized appreciation (depreciation) on: | |||||||
| Investment securities | 184,554 | ||||||
| Translation of assets and liabilities denominated in foreign currencies | 34 | ||||||
| Net Assets | $ | 1,062,934 | |||||
| Net Assets by Class: | |||||||
| Class A | $ | 582,128 | |||||
| Class B | 185,542 | ||||||
| Class C | 65,251 | ||||||
| Class T | 230,013 | ||||||
| Shares Outstanding: | |||||||
| Class A | 25,930 | ||||||
| Class B | 8,929 | ||||||
| Class C | 3,144 | ||||||
| Class T | 9,849 | ||||||
| Net Asset Value Per Share: | |||||||
| Class A | $ | 22.45 | |||||
| Class B | 20.78 | ||||||
| Class C | 20.76 | ||||||
| Class T | 23.35 | ||||||
| Maximum Offering Price Per Share (a): | |||||||
| Class A | $ | 23.76 | |||||
| Class T | 25.52 | ||||||
(a) Includes the maximum selling commission (represented as a percentage of offering price) which is reduced on certain levels of sales as set forth in the Prospectus. Net asset value per share for Classes B and C shares represents offering price. The redemption price for Classes B and C shares equals net asset value less any applicable contingent deferred sales charge.
STATEMENT OF OPERATIONS
For the period ended April 30, 2005
(all amounts in thousands)
(unaudited)
| Investment Income: | |||||||
| Interest | $ | 683 | |||||
| Dividends | 4,173 | ||||||
| Income from loaned securities–net | 39 | ||||||
| Less withholding taxes on foreign dividends | (106 | ) | |||||
| 4,789 | |||||||
| Expenses: | |||||||
| Management and advisory fees | 4,523 | ||||||
| Transfer agent fees: | |||||||
| Class A | 543 | ||||||
| Class B | 358 | ||||||
| Class C | 162 | ||||||
| Class T | 168 | ||||||
| Printing and shareholder reports | 299 | ||||||
| Custody fees | 65 | ||||||
| Administration fees | 103 | ||||||
| Legal fees | 25 | ||||||
| Audit fees | 8 | ||||||
| Trustees fees | 23 | ||||||
| Registration fees: | |||||||
| Class A | 13 | ||||||
| Class B | 4 | ||||||
| Class C | 11 | ||||||
| Class T | 9 | ||||||
| Distribution and service fees: | |||||||
| Class A | 1,068 | ||||||
| Class B | 1,007 | ||||||
| Class C | 353 | ||||||
| Total expenses | 8,742 | ||||||
| Less: | |||||||
| Reimbursement of class expenses: | |||||||
| Class C | (6 | ) | |||||
| Net expenses | 8,736 | ||||||
| Net Investment Income (Loss) | (3,947 | ) | |||||
| Net Realized Gain (Loss) from: | |||||||
| Investment securities | 57,141 | ||||||
| Foreign currency transactions | (1 | ) | |||||
| 57,140 | |||||||
| Net Increase (Decrease) in Unrealized Appreciation (Depreciation) on: | |||||||
| Investment securities | (7,458 | ) | |||||
| Translation of assets and liabilities denominated in foreign currencies | 29 | ||||||
| (7,429 | ) | ||||||
| Net Gain (Loss) on Investments and Foreign Currency Transactions | 49,711 | ||||||
| Net Increase (Decrease) in Net Assets Resulting from Operations | $ | 45,764 | |||||
The notes to the financial statements are an integral part of this report.
Transamerica IDEX Mutual Funds
Semi-Annual Report 2005
4
TA IDEX Janus Growth
STATEMENTS OF CHANGES IN NET ASSETS
For the period or year ended
(all amounts in thousands)
| April 30, 2005 (unaudited) | October 31, 2004 | ||||||||||
| Increase (Decrease) In Net Assets From: | |||||||||||
| Operations: | |||||||||||
| Net investment income (loss) | $ | (3,947 | ) | $ | (13,666 | ) | |||||
| Net realized gain (loss) from investment securities and foreign currency transactions | 57,140 | 106,544 | |||||||||
| Net unrealized appreciation (depreciation) on investment securities and foreign currency translation | (7,429 | ) | 16,812 | ||||||||
| 45,764 | 109,690 | ||||||||||
| Capital Share Transactions: | |||||||||||
| Proceeds from shares sold: | |||||||||||
| Class A | 56,600 | 67,910 | |||||||||
| Class B | 4,078 | 10,284 | |||||||||
| Class C | 2,984 | 1,430 | |||||||||
| Class C2 | – | 1,299 | |||||||||
| Class M | – | 1,439 | |||||||||
| Class T | 1,582 | 16,270 | |||||||||
| 65,244 | 98,632 | ||||||||||
| Cost of shares redeemed: | |||||||||||
| Class A | (72,869 | ) | (131,454 | ) | |||||||
| Class B | (28,994 | ) | (57,915 | ) | |||||||
| Class C | (11,708 | ) | (5,449 | ) | |||||||
| Class C2 | – | (7,522 | ) | ||||||||
| Class M | – | (17,120 | ) | ||||||||
| Class T | (28,799 | ) | (218,736 | ) | |||||||
| (142,370 | ) | (438,196 | ) | ||||||||
| Class level exchanges: | |||||||||||
| Class C | – | 73,690 | |||||||||
| Class C2 | – | (27,543 | ) | ||||||||
| Class M | – | (46,147 | ) | ||||||||
| – | – | ||||||||||
| Automatic conversions: | |||||||||||
| Class A | 1,031 | 1,347 | |||||||||
| Class B | (1,031 | ) | (1,347 | ) | |||||||
| – | – | ||||||||||
| (77,126 | ) | (339,564 | ) | ||||||||
| Net increase (decrease) in net assets | (31,362 | ) | (229,874 | ) | |||||||
| Net Assets: | |||||||||||
| Beginning of period | 1,094,296 | 1,324,170 | |||||||||
| End of period | $ | 1,062,934 | $ | 1,094,296 | |||||||
| Accumulated Net Investment Income (Loss) | $ | (4,291 | ) | $ | (344 | ) | |||||
| April 30, 2005 (unaudited) | October 31, 2004 | ||||||||||
| Share Activity: | |||||||||||
| Shares issued: | |||||||||||
| Class A | 2,467 | 3,230 | |||||||||
| Class B | 191 | 524 | |||||||||
| Class C | 141 | 73 | |||||||||
| Class C2 | – | 66 | |||||||||
| Class M | – | 73 | |||||||||
| Class T | 67 | 750 | |||||||||
| 2,866 | 4,716 | ||||||||||
| Shares redeemed: | |||||||||||
| Class A | (3,188 | ) | (6,266 | ) | |||||||
| Class B | (1,364 | ) | (2,972 | ) | |||||||
| Class C | (552 | ) | (278 | ) | |||||||
| Class C2 | – | (385 | ) | ||||||||
| Class M | – | (867 | ) | ||||||||
| Class T | (1,209 | ) | (10,137 | ) | |||||||
| (6,313 | ) | (20,905 | ) | ||||||||
| Class level exchanges: | |||||||||||
| Class C | – | 3,720 | |||||||||
| Class C2 | – | (1,363 | ) | ||||||||
| Class M | – | (2,331 | ) | ||||||||
| – | 26 | ||||||||||
| Automatic conversions: | |||||||||||
| Class A | 45 | 63 | |||||||||
| Class B | (48 | ) | (68 | ) | |||||||
| (3 | ) | (5 | ) | ||||||||
| Net increase (decrease) in shares outstanding: | |||||||||||
| Class A | (676 | ) | (2,973 | ) | |||||||
| Class B | (1,221 | ) | (2,516 | ) | |||||||
| Class C | (411 | ) | 3,515 | ||||||||
| Class C2 | – | (1,682 | ) | ||||||||
| Class M | – | (3,125 | ) | ||||||||
| Class T | (1,142 | ) | (9,387 | ) | |||||||
| (3,450 | ) | (16,168 | ) | ||||||||
The notes to the financial statements are an integral part of this report.
Transamerica IDEX Mutual Funds
Semi-Annual Report 2005
5
TA IDEX Janus Growth
FINANCIAL HIGHLIGHTS
(unaudited for the period ended April 30, 2005)
| For a share of beneficial interest outstanding throughout each period | |||||||||||||||||||||||||||||||||||||||
| Net Asset | Investment Operations | Distributions | Net Asset | ||||||||||||||||||||||||||||||||||||
| For the Period Ended (d)(g) | Value, Beginning of Period | Net Investment Income (Loss) | Net Realized and Unrealized Gain (Loss) | Total Operations | From Net Investment Income | From Net Realized Gains | Total Distributions | Value, End of Period | |||||||||||||||||||||||||||||||
| Class A | 4/30/2005 | $ | 21.56 | $ | (0.07 | ) | $ | 0.96 | $ | 0.89 | $ | – | $ | – | $ | – | $ | 22.45 | |||||||||||||||||||||
| 10/31/2004 | 19.73 | (0.21 | ) | 2.04 | 1.83 | – | – | – | 21.56 | ||||||||||||||||||||||||||||||
| 10/31/2003 | 15.87 | (0.21 | ) | 4.07 | 3.86 | – | – | – | 19.73 | ||||||||||||||||||||||||||||||
| 10/31/2002 | 19.64 | (0.22 | ) | (3.55 | ) | (3.77 | ) | – | – | – | 15.87 | ||||||||||||||||||||||||||||
| 10/31/2001 | 43.81 | (0.24 | ) | (20.80 | ) | (21.04 | ) | – | (3.13 | ) | (3.13 | ) | 19.64 | ||||||||||||||||||||||||||
| 10/31/2000 | 46.72 | 0.03 | 5.35 | 5.38 | – | (8.29 | ) | (8.29 | ) | 43.81 | |||||||||||||||||||||||||||||
| Class B | 4/30/2005 | 20.04 | (0.15 | ) | 0.89 | 0.74 | – | – | – | 20.78 | |||||||||||||||||||||||||||||
| 10/31/2004 | 18.45 | (0.32 | ) | 1.91 | 1.59 | – | – | – | 20.04 | ||||||||||||||||||||||||||||||
| 10/31/2003 | 14.93 | (0.31 | ) | 3.83 | 3.52 | – | – | – | 18.45 | ||||||||||||||||||||||||||||||
| 10/31/2002 | 18.63 | (0.34 | ) | (3.36 | ) | (3.70 | ) | – | – | – | 14.93 | ||||||||||||||||||||||||||||
| 10/31/2001 | 42.08 | (0.41 | ) | (19.91 | ) | (20.32 | ) | – | (3.13 | ) | (3.13 | ) | 18.63 | ||||||||||||||||||||||||||
| 10/31/2000 | 45.38 | (0.36 | ) | 5.35 | 4.99 | – | (8.29 | ) | (8.29 | ) | 42.08 | ||||||||||||||||||||||||||||
| Class C | 4/30/2005 | 20.03 | (0.16 | ) | 0.89 | 0.73 | – | – | – | 20.76 | |||||||||||||||||||||||||||||
| 10/31/2004 | 18.45 | (0.30 | ) | 1.88 | 1.58 | – | – | – | 20.03 | ||||||||||||||||||||||||||||||
| 10/31/2003 | 14.74 | (0.32 | ) | 4.03 | 3.71 | – | – | – | 18.45 | ||||||||||||||||||||||||||||||
| Class T | 4/30/2005 | 22.39 | (0.02 | ) | 0.98 | 0.96 | – | – | – | 23.35 | |||||||||||||||||||||||||||||
| 10/31/2004 | 20.45 | (0.16 | ) | 2.10 | 1.94 | – | – | – | 22.39 | ||||||||||||||||||||||||||||||
| 10/31/2003 | 16.40 | (0.16 | ) | 4.21 | 4.05 | – | – | – | 20.45 | ||||||||||||||||||||||||||||||
| 10/31/2002 | 20.20 | (0.16 | ) | (3.64 | ) | (3.80 | ) | – | – | – | 16.40 | ||||||||||||||||||||||||||||
| 10/31/2001 | 44.76 | (0.14 | ) | (21.29 | ) | (21.43 | ) | – | (3.13 | ) | (3.13 | ) | 20.20 | ||||||||||||||||||||||||||
| 10/31/2000 | 47.45 | 0.25 | 5.35 | 5.60 | – | (8.29 | ) | (8.29 | ) | 44.76 | |||||||||||||||||||||||||||||
| Ratios/Supplemental Data | |||||||||||||||||||||||||||||||
| For the Period | Total | Net Assets, End of Period | Ratio of Expenses to Average Net Assets (a) | Net Investment Income (Loss) to Average | Portfolio Turnover | ||||||||||||||||||||||||||
| Ended (g) | Return (c) | (000's) | Net (e) | Total (f) | Net Assets (a) | Rate (b) | |||||||||||||||||||||||||
| Class A | 4/30/2005 | 4.13 | % | $ | 582,128 | 1.43 | % | 1.43 | % | (0.58 | )% | 31 | % | ||||||||||||||||||
| 10/31/2004 | 9.28 | 573,640 | 1.60 | 1.60 | (1.01 | ) | 41 | ||||||||||||||||||||||||
| 10/31/2003 | 24.32 | 583,674 | 1.70 | 1.72 | (1.22 | ) | 62 | ||||||||||||||||||||||||
| 10/31/2002 | (19.21 | ) | 505,704 | 1.66 | 1.69 | (1.10 | ) | 62 | |||||||||||||||||||||||
| 10/31/2001 | (51.31 | ) | 770,590 | 1.49 | 1.49 | (0.83 | ) | 64 | |||||||||||||||||||||||
| 10/31/2000 | 10.82 | 1,727,573 | 1.39 | 1.42 | (0.61 | ) | 41 | ||||||||||||||||||||||||
| Class B | 4/30/2005 | 3.69 | 185,542 | 2.25 | 2.25 | (1.40 | ) | 31 | |||||||||||||||||||||||
| 10/31/2004 | 8.62 | 203,408 | 2.22 | 2.22 | (1.59 | ) | 41 | ||||||||||||||||||||||||
| 10/31/2003 | 23.58 | 233,731 | 2.35 | 2.37 | (1.87 | ) | 62 | ||||||||||||||||||||||||
| 10/31/2002 | (19.86 | ) | 224,348 | 2.31 | 2.35 | (1.75 | ) | 62 | |||||||||||||||||||||||
| 10/31/2001 | (51.74 | ) | 354,949 | 2.14 | 2.14 | (1.48 | ) | 64 | |||||||||||||||||||||||
| 10/31/2000 | 10.11 | 775,252 | 2.04 | 2.07 | (1.26 | ) | 41 | ||||||||||||||||||||||||
| Class C | 4/30/2005 | 3.54 | 65,251 | 2.37 | 2.39 | (1.52 | ) | 31 | |||||||||||||||||||||||
| 10/31/2004 | 8.62 | 71,196 | 2.08 | 2.08 | (1.44 | ) | 41 | ||||||||||||||||||||||||
| 10/31/2003 | 25.17 | 735 | 2.35 | 2.37 | (1.88 | ) | 62 | ||||||||||||||||||||||||
| Class T | 4/30/2005 | 4.29 | 230,013 | 1.04 | 1.04 | (0.19 | ) | 31 | |||||||||||||||||||||||
| 10/31/2004 | 9.49 | 246,052 | 1.38 | 1.38 | (0.75 | ) | 41 | ||||||||||||||||||||||||
| 10/31/2003 | 24.70 | 416,719 | 1.35 | 1.37 | (0.87 | ) | 62 | ||||||||||||||||||||||||
| 10/31/2002 | (18.82 | ) | 368,301 | 1.31 | 1.34 | (0.75 | ) | 62 | |||||||||||||||||||||||
| 10/31/2001 | (51.07 | ) | 546,317 | 1.14 | 1.14 | (0.48 | ) | 64 | |||||||||||||||||||||||
| 10/31/2000 | 11.20 | 1,232,295 | 1.04 | 1.07 | (0.26 | ) | 41 | ||||||||||||||||||||||||
The notes to the financial statements are an integral part of this report.
Transamerica IDEX Mutual Funds
Semi-Annual Report 2005
6
TA IDEX Janus Growth
FINANCIAL HIGHLIGHTS (continued)
NOTES TO FINANCIAL HIGHLIGHTS
(unaudited)
(a) Annualized.
(b) Not annualized for periods of less than one year.
(c) Total Return has been calculated for the applicable period without deduction of a sales load, if any, on an initial purchase. Periods of less than one year are not annualized.
(d) Per share information is calculated based on average number of shares outstanding for the periods ended 10/31/2001, 10/31/2002, 10/31/2003, 10/31/2004 and 04/30/2005.
(e) Ratio of Net Expenses to Average Net Assets is net of fee waivers and reimbursements by the investment adviser, if any (see note 2).
(f) Ratio of Total Expenses to Average Net Assets includes all expenses before fee waivers and reimbursements by the investment adviser.
(g) The inception date for the Fund's offering of share Class C was November 11, 2002.
The notes to the financial statements are an integral part of this report.
Transamerica IDEX Mutual Funds
Semi-Annual Report 2005
7
TA IDEX Janus Growth
NOTES TO FINANCIAL STATEMENTS
At April 30, 2005
(all amounts in thousands)
(unaudited)
NOTE 1. ORGANIZATION AND SIGNIFICANT ACCOUNTING POLICIES
Transamerica IDEX Mutual Funds is a Delaware statutory trust registered under the Investment Company Act of 1940, as amended (the "1940 Act"), as an open-end management investment company. Prior to March 1, 2005, Transamerica IDEX Mutual Funds was a Massachusetts business trust. TA IDEX Janus Growth ("the Fund"), part of Transamerica IDEX Mutual Funds, began operations on May 8, 1986.
In the normal course of business, the Fund enters into contracts that contain a variety of representations and warranties, which provide general indemnifications. The Fund's maximum exposure under these arrangements is unknown, as this would involve future claims that may be made against the Fund and/or its affiliates that have not yet occurred. However, based on experience, the Fund expects the risk of loss to be remote.
See the Prospectus and Statement of Additional Information for a description of the Fund's investment objective.
In preparing the Fund's financial statements in accordance with accounting principles generally accepted in the United States of America ("GAAP"), estimates or assumptions (which could differ from actual results) may be used that affect reported amounts and disclosures. The following policies were consistently followed by the Fund, in accordance with GAAP.
Multiple class operations and expenses: The Fund currently offers four classes of shares, each with a public offering price that reflects different sales charges, if any, and expense levels. Class T shares are not available to new investors. On June 15, 2004, Class C2 shares merged into Class C. On September 24, 2004, Class M shares merged into Class C. Class B shares will convert to Class A shares eight years after purchase. Income, non-class specific expenses and realized and unrealized gains and losses, are allocated daily to each class, based upon the value of shares outstanding method as permitted under Rule 18f-3 of the 1940 Act. Each class bears its own specific expenses as well as a portion of general, common expenses.
Pricing of shares: The Fund prices its shares on the basis of the net asset value of each class of shares of the Fund, which is determined as of the close of the New York Stock Exchange ("NYSE") (generally 4:00 p.m. Eastern Time) on each day on which the NYSE is open for trading.
Security valuations: Fund investments traded on an exchange are valued at the closing price on the day of valuation on the exchange where the security is principally traded. With respect to securities traded on NASDAQ NMS, such closing price may be last reported sales price or the NASDAQ Official Closing Price.
Securities traded in the over-the-counter market and listed securities for which no sale was reported on that date are valued at the last quoted bid price.
Debt securities are valued by independent pricing services at the last quoted bid price; however, those that mature in sixty days or less are valued at amortized cost, which approximates market.
Investment company securities are valued at net asset value of the underlying portfolio.
Foreign securities generally are valued based on quotations from the primary market in which they are traded and are translated from the local currency into U.S. dollars using closing exchange rates. Many foreign securities markets are open for trading at times when the U.S. markets are closed for trading, and many foreign securities markets close for trading before the close of the NYSE. The value of foreign securities may be affected significantly on a day that the NYSE is closed and an investor is unable to purchase or redeem shares. If a significant market event impacting the value of a portfolio security (e.g., natural disaster, company announcement, market volatility) occurs subsequent to the close of trading in the security, but prior to the calculation of the Fund's net asset value per share, market quotations for that security may be determined to be unreliable and, accordingly, not "readily av ailable." If market quotations are not readily available, and the impact of such a significant market event materially effects the net asset value per share of the Fund, an affected portfolio security will be valued at fair market value as determined in good faith using guidelines adopted by the Board of Trustees of the Fund, under the supervision of the Fund's Valuation Committee. Factors that may be considered to value foreign securities at fair market value may include, among others: the value of other securities traded on other markets, foreign currency exchange activity and the trading of financial products tied to foreign securities.
Other securities for which quotations are not readily available are valued at fair market value as determined in good faith using guidelines adopted by the Board of Trustees of the Fund, under the supervision of the Fund's Valuation Committee. These guidelines may include: the type of security; any restrictions on its resale; financial or business news of the issuer; similar or related securities that are actively trading; related corporate actions; and other significant events occurring after the close of trading in the security.
Cash: The Fund may leave cash overnight in its cash account with the custodian, Investors Bank & Trust Company ("IBT"). IBT has been contracted on behalf of the Fund to invest the excess cash into a savings account, which at April 30, 2005, was paying an interest rate of 2.02%.
Throughout the period, the Fund may have a cash overdraft balance. A fee is incurred on this overdraft, calculated by multiplying the overdraft by a rate based on the federal funds rate.
Transamerica IDEX Mutual Funds
Semi-Annual Report 2005
8
TA IDEX Janus Growth
NOTES TO FINANCIAL STATEMENTS (continued)
At April 30, 2005
(all amounts in thousands)
(unaudited)
NOTE 1.–(continued)
Repurchase agreements: The Fund is authorized to enter into repurchase agreements. The Fund, through IBT, receives delivery of the underlying securities, the value of which at the time of purchase is required to be an amount equal to at least 100% of the resale price. Repurchase agreements involve the risk that the seller will fail to repurchase the security, as agreed. In that case, the Fund will bear the risk of value fluctuations until the security can be sold and may encounter delays and incur costs in liquidating the security. In the event of bankruptcy or insolvency of the seller, delays and costs may be incurred.
Commission recapture: The sub-adviser, to the extent consistent with the best execution and usual commission rate policies and practices, may place security transactions of the Fund with broker/dealers with which Transamerica IDEX Mutual Funds has established a Commission Recapture Program. A Commission Recapture Program is any arrangement under which a broker/dealer applies a portion of the commissions received by such broker/dealer on the security transactions to the Fund. In no event will commissions paid by the Fund be used to pay expenses that would otherwise be borne by any other funds within Transamerica IDEX Mutual Funds, or by any other party.
Recaptured commissions during the six months ended April 30, 2005, of $112 are included in net realized gains in the Statement of Operations.
Securities lending: The Fund may lend securities to enhance fund earnings from investing cash collateral in making such loans to qualified borrowers (typically broker/dealers). The Fund has engaged its custodian bank, IBT, as a lending agent to administer its securities lending program. IBT earned $28 of program income for its services. When the Fund makes a security loan, it received cash collateral as protection against the risk that the borrower will default on the loan, and records an asset for the cash invested collateral and a liability for the return of the collateral.
Loans of securities are required to be secured by collateral at least equal to 102% of the value of the securities at inception of the loan, and not less then 100% thereafter. The Fund may invest cash collateral in short-term money market instruments including: U.S. Treasury Bills, U.S. agency obligations, commercial paper, money market mutual funds, repurchase agreements and other highly rated, liquid investments. During the life of securities loans, the collateral and securities loaned remain subject to fluctuation in value. IBT marks to market securities loaned and the collateral each business day. If additional collateral is due (at least $1), IBT collects additional cash collateral from the borrowers. Although securities loaned will be fully collateralized at all times, IBT may experience delays in, or may be prevented from, recovering the collateral on behalf of the Fund. The Fund may recall a loaned security position at any time from the borrower through IBT. In the event the borrower fails to timely return a recalled security, IBT may indemnify the Fund by purchasing replacement securities for the Fund at its own expense and claiming the collateral to fund such a purchase. IBT absorbs the loss if the collateral value is not sufficient to cover the cost of the replacement securities. If replacement securities are not available, IBT will credit the equivalent cash value to the Fund.
While a security is on loan, the Fund does not have the right to vote that security. However, if time permits, the Fund will attempt to recall a security on loan and vote the proxy.
Income from securities lending is included in the Statement of Operations. The amount of collateral and value of securities on loan are included in the Statement of Assets and Liabilities as well as in the Schedule of Investments.
Security transactions and investment income: Security transactions are recorded on the trade date. Security gains and losses are calculated on the specific identification basis. Dividend income is recorded on the ex-dividend date or, in the case of foreign securities, as soon as the Fund is informed of the ex-dividend date. Interest income, including accretion of discounts and amortization of premiums, is recorded on the accrual basis commencing on the settlement date.
Foreign currency denominated investments: The accounting records of the Fund are maintained in U.S. dollars. Securities and other assets and liabilities denominated in foreign currencies are translated into U.S. dollars at the closing exchange rate each day. The cost of foreign securities is translated at the exchange rate in effect when the investment was acquired. The Fund combines fluctuations from currency exchange rates and fluctuations in value when computing net realized and unrealized gains or losses from investments.
Net foreign currency gains and losses resulting from changes in exchange rates include: 1) foreign currency fluctuations between trade date and settlement date of investment security transactions; 2) gains and losses on forward foreign currency contracts; and 3) the difference between the receivable amounts of interest and dividends recorded in the accounting records in U.S. dollars and the amounts actually received.
Foreign currency denominated assets may involve risks not typically associated with domestic transactions, including unanticipated movements in exchange currency rates, the degree of government supervision and regulation of security markets, and the possibility of political or economic instability.
Foreign capital gains taxes: The Fund may be subject to taxes imposed by countries in which it invests, with respect to its investment in issuers existing or operating in such countries. Such taxes are generally based on income earned or repatriated and capital gains realized on the sale of such investments. The Fund accrues such taxes when the related
Transamerica IDEX Mutual Funds
Semi-Annual Report 2005
9
TA IDEX Janus Growth
NOTES TO FINANCIAL STATEMENTS (continued)
At April 30, 2005
(all amounts in thousands)
(unaudited)
NOTE 1.–(continued)
income or capital gains are earned. Some countries require governmental approval for the repatriation of investment income, capital or the proceeds of sales earned by foreign investors. In addition, if there is deterioration in a country's balance of payments or for other reasons, a country may impose temporary restrictions on foreign capital remittances abroad.
Forward foreign currency contracts: The Fund may enter into forward foreign currency contracts to hedge against exchange rate risk arising from investments in securities denominated in foreign currencies. Contracts are valued at the contractual forward rate and are marked to market daily, with the change in value recorded as an unrealized gain or loss. When the contracts are closed a realized gain or loss is incurred. Risks may arise from changes in market value of the underlying currencies and from the possible inability of counterparties to meet the terms of their contracts.
Open forward currency contracts at April 30, 2005, are listed in the Schedule of Investments.
Account maintenance fees: If the shareholder account balance falls below $1 by either shareholder action or as a result of market action, a $25 (not in thousands) fee is assessed every year until the balance reaches $1. The fee is assessed by redeeming shares in the shareholder's account.
No fee will be charged under the following conditions:
• accounts opened within the preceding 24 months
• accounts with an active monthly Automatic Investment Plan ($50 (not in thousands) minimum per fund)
• accounts owned by an individual which, when combined by social security number, have a balance of $5 or more
• accounts owned by individuals in the same household (by address) that have a combined balance of $5 or more
• UTMA/UGMA accounts
• Fiduciary accounts
• B-share accounts whose shares have started to convert to A-shares accounts (as long as combined value of both accounts is at least $1)
For the six months ended April 30, 2005, this fee totaled $41. These fees are included in Paid in Capital in the Statement of Assets and Liabilities.Redemption fees: A short-term trading redemption fee may be assessed on any fund shares in a fund account that are sold during the first five (5) NYSE trading days following their purchase date. This redemption fee will equal 2% of the amount redeemed and shares held the longest will be treated as being redeemed first and shares held the shortest as being redeemed last.
For the six months ended April 30, 2005, the Fund received less than $1 in redemption fees.
Dividend distributions: Distributions to shareholders are recorded on the ex-dividend date and are determined in accordance with Federal income tax regulations which may differ from GAAP.
NOTE 2. RELATED PARTY TRANSACTIONS
Transamerica Fund Advisors, Inc. ("TFAI") is the Fund's investment adviser. Transamerica Fund Services, Inc. ("TFS") is the Fund's administrator and transfer agent. AFSG Securities Corp. ("AFSG") is the Fund's distributor/principal underwriter. AFSG is 100% owned by AUSA Holding Company ("AUSA"). TFAI is a directly owned subsidiary of Western Reserve Life Assurance Co. of Ohio (78%) and AUSA (22%). TFS is a wholly owned subsidiary of WRL (50%) and AUSA (50%). AUSA and WRL are wholly owned indirect subsidiaries of AEGON, NV, a Netherlands corporation.
Effective January 1, 2005 AEGON/Transamerica Fund Advisors, Inc. ("ATFA") was renamed Transamerica Fund Advisors, Inc. ("TFAI"); AEGON/Transamerica Fund Services, Inc. ("ATFS") and AEGON/Transamerica Investor Services, Inc. ("ATIS") merged into one entity and was renamed Transamerica Fund Services, Inc. ("TFS").
The following schedule reflects the percentage of fund assets owned by affiliated mutual funds (i.e., through the asset allocation funds):
| Net Assets | % of Net Assets | ||||||||||
| TA IDEX Asset Allocation– Conservative Portfolio | $ | 7,084 | 0.67 | % | |||||||
| TA IDEX Asset Allocation– Growth Portfolio | 38,057 | 3.58 | % | ||||||||
| TA IDEX Asset Allocation– Moderate Growth Portfolio | 64,293 | 6.05 | % | ||||||||
| TA IDEX Asset Allocation– Moderate Portfolio | 22,124 | 2.08 | % | ||||||||
| Total | $ | 131,558 | 12.38 | % | |||||||
Investment advisory fee: The Fund pays management fees to TFA based on average daily net assets ("ANA") at the following breakpoints:
From November 1, 2004 to December 31, 2004
1.00% of the first $250 million of ANA
0.90 of the next $500 million of ANA
0.80% of the next $750 million of ANA
0.70% of ANA over $1.5 billion
Transamerica IDEX Mutual Funds
Semi-Annual Report 2005
10
TA IDEX Janus Growth
NOTES TO FINANCIAL STATEMENTS (continued)
At April 30, 2005
(all amounts in thousands)
(unaudited)
NOTE 2.–(continued)
From January 1, 2005 on:
0.80% of the first $250 million of ANA
0.77% of the next $500 million of ANA
0.75% of the next $750 million of ANA
0.70% of the next $1.5 billion of ANA
0.675% of ANA over $3 billion
TFAI has contractually agreed to waive its advisory fee and will reimburse the Fund to the extent that operating expenses, excluding 12b-1 fees, exceed the following stated annual limit:
From November 1, 2004 to December 31, 2004
1.50% Expense Limit
From January 1, 2005 on:
1.30% Expense Limit
The sub-adviser, Janus Capital Management, LLC, has agreed to a pricing discount based on the aggregate assets that they manage in the AEGON/Transamerica Series Fund, Inc. and Transamerica IDEX Mutual Funds. There were no amounts received for the six months ended April 30, 2005.
Distribution and service fees: The Fund has a 12b-1 distribution plan under the 1940 Act pursuant to which an annual fee, based on average daily net assets, is paid to the distributor for various disbursements such as broker-dealer account servicing fees and other promotional expenses of the Fund, excluding Class T. The 12b-1 fee for the Fund is comprised of a 0.25% service fee and the remaining amount is an asset-based sales charge/distribution fee. The Fund is authorized under the 12b-1 plan to pay fees on each class up to the following limits:
| Class A | 0.35 | % | |||||
| Class B | 1.00 | % | |||||
| Class C | 1.00 | % | |||||
| Class T | N/A | ||||||
In the case the Fund or a class of shares of the Fund is closed to new investors or investments, the Fund is authorized to pay 12b-1 fees for past sales and distribution efforts and present and past investor services.
Underwriter commissions relate to front-end sales charges imposed for Class A and T shares and contingent deferred sales charges from Classes B, C, and certain A share redemptions. For the six months ended April 30, 2005, the underwriter commissions were as follows:
| Received by Underwriter | $ | 641 | |||||
| Retained by Underwriter | 49 | ||||||
| Contingent Deferred Sales Charge | 212 | ||||||
Administrative services: The Fund has entered into an agreement with TFS for financial and legal fund administration services, which includes such items as compliance, expenses, financial statements and other reporting, distributions, tax returns, prospectus preparation, board of trustees meeting support and other legal matters. As of January 1, 2005 the Fund pays TFS an annual fee of 0.02% of average net assets. Prior to January 1, 2005 the Fund paid TFS an annual fee of 0.015% of average net assets. The Legal fees on the Statement of Operations are for fees paid to external legal counsel.
Transfer agent fees: The Fund pays TFS an annual per-account charge of $20 (not in thousands) for each open account and $1.63 (not in thousands) for each closed account. There is no new account charge. The Transfer agent fees on the Statement of Operations are made up of fees paid to TFS and costs associated with shareholder statements.
The Fund paid TFS $1,663 for the six months ended April 30, 2005.
Deferred compensation plan: Each eligible Fund Trustee may elect participation in the Deferred Compensation Plan ("the Plan"). Under the Plan, such Trustees may defer payment of a percentage of their total fees earned as a Fund Trustee. These deferred amounts may be invested in any Transamerica IDEX Mutual Fund. At April 30, 2005, the value of invested plan amount was $331. Invested plan amounts and the total liability for deferred compensation to the Trustees under the Plan at April 30, 2005, are included in the accompanying Statement of Assets and Liabilities.
NOTE 3. INVESTMENT TRANSACTIONS
The cost of securities purchased and proceeds from securities sold (excluding short-term securities) for the six months ended April 30, 2005, were as follows:
| Purchases of securities: | |||||||
| Long-Term excluding U.S. Government | $ | 318,440 | |||||
| U.S. Government | – | ||||||
| Proceeds from maturities and sales of securities: | |||||||
| Long-Term excluding U.S. Government | 386,744 | ||||||
| U.S. Government | – | ||||||
NOTE 4. FEDERAL INCOME TAX MATTERS
The Fund has not made any provision for federal income or excise taxes due to its policy to distribute all of its taxable income and capital gains to its shareholders and otherwise qualify as a regulated investment company under the Internal Revenue Code. Income and capital gain distributions are determined in accordance with income tax regulations,
Transamerica IDEX Mutual Funds
Semi-Annual Report 2005
11
TA IDEX Janus Growth
NOTES TO FINANCIAL STATEMENTS (continued)
At April 30, 2005
(all amounts in thousands)
(unaudited)
NOTE 4.–(continued)
which may differ from GAAP. These differences are primarily due to differing treatment for items including, but not limited to, wash sales, foreign currency transactions, net operating losses and capital loss carryforwards.
The capital loss carryforwards are available to offset future realized capital gains through the period listed:
| Capital Loss Carryforward | Available through | ||||||
| $ | 527,580 | October 31, 2009 | |||||
| 259,422 | October 31, 2010 | ||||||
| 86,859 | October 31, 2011 | ||||||
The aggregate cost of investments and composition of unrealized appreciation (depreciation) for federal income tax purposes as of April 30, 2005, are as follows:
| Federal Tax Cost Basis | $ | 933,745 | |||||
| Unrealized Appreciation | $ | 212,714 | |||||
| Unrealized (Depreciation) | (31,083 | ) | |||||
| Net Unrealized Appreciation (Depreciation) | $ | 181,631 | |||||
NOTE 5. REGULATORY PROCEEDINGS
There continues to be significant federal and state regulatory activity relating to financial services companies, particularly mutual fund companies and their investment advisers. As part of an ongoing investigation regarding potential market timing, recordkeeping and trading compliance issues and matters affecting the Fund's investment adviser, TFAI, and certain employees and affiliates of TFAI, the SEC staff has indicated that it is likely to take some action against TFAI and certain of its affiliates at the conclusion of the investigation. The potential timing and the scope of any such action is difficult to predict. Although the impact of any action brought against TFAI and/or its affiliates is difficult to assess at the present time, the Fund currently believes that the likelihood that any such action will have a material adverse impact on it is remote. It is important to note that the Fund is not aware of any allegation of wrongdoing against it and its board at the time this semi-annual report is printed. Although it is not anticipated that these developments will have an adverse impact on the Fund, there can be no assurance at this time. TFAI and its affiliates are actively working with the SEC in regard to this matter; however, the exact resolution cannot be determined at this time. TFAI will take such actions that it deems necessary or appropriate to continue providing management services to the Fund and to bring all matters to an appropriate conclusion.
TFAI and/or its affiliates, and not the Fund, will bear the costs regarding these regulatory matters.
Transamerica IDEX Mutual Funds
Semi-Annual Report 2005
12
TA IDEX Janus Growth
INVESTMENT ADVISORY AND SUB-ADVISORY AGREEMENTS – REVIEW AND RENEWAL
At a meeting of the Board of Trustees of Transamerica IDEX Mutual Funds ("TA IDEX") held on October 6, 2004, the Board considered and approved the renewal for a one-year period of the Investment Advisory Agreement between TA IDEX Janus Growth (the "Fund") and Transamerica Fund Advisors, Inc. ("TFAI") as well as the Investment Sub-Advisory Agreement of the Fund between TFAI and Janus Capital Management LLC (the "Sub-Adviser"). In approving the renewal of these agreements, the Board concluded that the Investment Advisory and Investment Sub-Advisory Agreements enable shareholders of the Fund to obtain high quality services at a cost that is appropriate, reasonable, and in the best interests of shareholders based upon the following determinations, among others:
The nature, extent and quality of the advisory service to be provided. The Board considered the nature and quality of the services provided by TFAI and the Sub-Adviser to the Fund in the past, as well as the services anticipated to be provided in the future. The Board concluded that TFAI and the Sub-Adviser are capable of providing high quality services to the Fund, as indicated by TFAI's management capabilities demonstrated with respect to the Fund and other funds managed by TFAI, TFAI's management oversight process, the professional qualifications and experience of the Sub-Adviser's portfolio management team, and the Fund's strong investment performance. The Board also concluded that TFAI and the Sub-Adviser would provide the same quality and quantity of investment management and related servi ces as before, that these services are appropriate in scope and extent in light of the Fund's operations, the competitive landscape of the investment company business and investor needs, and that TFAI's and the Sub-Adviser's obligations will remain the same in all respects.
The investment performance of the Fund. The Board concluded, based in particular on information provided by Lipper Analytics, that the Fund's investment performance was competitive or superior relative to comparable funds over trailing one-, two-, three-, five- and ten-year periods and to the Fund's benchmark index over one-, five- and ten-year periods. On the basis of the Trustees' assessment of the nature, extent and quality of investment advisory and related services to be provided or procured by TFAI and the Sub-Adviser, the Trustees concluded that TFAI and the Sub-Adviser were capable of generating a level of long-term investment performance that is appropriate in light of the Fund's investment objective, policies and strategies and competitive with many other investment companies.
The cost of advisory services provided and the level of profitability. On the basis of the Board's review of the fees to be charged by TFAI and the Sub-Adviser for investment advisory and related services, TFAI's financial statements, the fees paid by TFAI to the Sub-Adviser, TFAI's estimated net management income resulting from its management of the Fund, the estimated profitability of TFAI's relationships with the Fund and TA IDEX, and the estimated profitability of the Sub-Adviser's relationship with the Fund, the Board concluded that the level of investment advisory fees and the profitability is appropriate in light of the services provided, the Fund's performance, and the anticipated profitability of the relationship between the Fund, TFAI and the Sub-Adviser.
The extent to which economies of scale would be realized as the Fund grows and whether fee levels reflect these economies of scale for the benefit of Fund investors. The Trustees concluded that inclusion of asset-based breakpoints in the Fund's advisory fee schedule appropriately benefited investors by realizing economies of scale in the form of a lower advisory fee rate as the level of Fund assets increases. The Board also concluded that the advisory fees appropriately reflect the Fund's current size, the current economic environment for TFAI, and the competitive nature of the investment company market. In addition, the Board noted that it will have the opportunity to periodically re-examine whether the Fund has achieved economies of scale, as well as the appropriateness of advisory fees payabl e to TFAI and the Sub-Adviser in the future.
Benefits (such as soft dollars) to TFAI or the Sub-Adviser from its relationship with the Fund. The Board concluded that other benefits derived by TFAI or the Sub-Adviser from its relationship with the Fund are reasonable and fair, and are consistent with industry practice and the best interests of the Fund and its shareholders. In this regard, the Board noted that TFAI does not realize "soft dollar" benefits from its relationship with the Fund, and that the Sub-Adviser is participating in a brokerage program pursuant to which a portion of brokerage commissions paid by the Fund is recaptured for the benefit of the Fund and its shareholders, thus limiting the amount of "soft-dollar" arrangements the Sub-Adviser may engage in with respect to the Fund's portfolio brokerage transactions.
Other considerations. The Board also determined that TFAI had made a substantial commitment to the recruitment and retention of high quality personnel, and maintained the financial, compliance and operational resources reasonably necessary to manage the Fund in a professional manner that is consistent with the best interests of the Fund and its shareholders. The Trustees also concluded that TFAI had made a significant entrepreneurial commitment to the management and success of the Fund, reflected by TFAI's expense limitation and fee waiver arrangement with the Fund which, as demonstrated in the past with the Fund, may result in TFAI waiving a substantial amount of advisory fees for the benefit of shareholders.
Transamerica IDEX Mutual Funds
Semi-Annual Report 2005
13
TA IDEX Janus Growth
SUPPLEMENTAL INFORMATION (unaudited)
RESULTS OF SHAREHOLDER PROXY
At a special meeting of shareholders held on February 25, 2005, the results of the Proposals were as follows:
Transamerica IDEX Mutual Funds
Proposal 1: Election of Trustees to the Board of Trustees of Transamerica IDEX Mutual Funds.
| For | Withheld | ||||||||||
| Peter R. Brown | 872,017,875.249 | 4,468,498.551 | |||||||||
| Daniel Calabria | 871,917,069.786 | 4,569,304.014 | |||||||||
| Janise B. Case | 872,099,393.125 | 4,386,980.675 | |||||||||
| Charles C. Harris | 872,086,722.025 | 4,399,651.775 | |||||||||
| Leo J. Hill | 872,304,465.640 | 4,181,908.160 | |||||||||
| Russell A. Kimball, Jr. | 872,253,556.471 | 4,232,817.329 | |||||||||
| William W. Short, Jr. | 872,139,920.944 | 4,346,452.856 | |||||||||
| John Waechter | 872,261,152.376 | 4,225,221.424 | |||||||||
| Jack E. Zimmerman | 871,929,967.512 | 4,556,406.288 | |||||||||
| Brian C. Scott | 872,218,970.367 | 4,267,403.433 | |||||||||
| Thomas P. O'Neill | 872,111,944.117 | 4,374,429.683 | |||||||||
TA IDEX Janus Growth
Proposal 2: Approval of an Agreement and Plan of Reorganization pursuant to which Transamerica IDEX Mutual Funds will organize as a Delaware statutory trust.
| For | Against | Abstentions/Broker Non-Votes | |||||||||
| 27,662,937.277 | 481,918.886 | 9,488,715.878 | |||||||||
Proposal 3: Approval of changes to the fundamental investment restrictions of TA IDEX Janus Growth.
| A. Diversification | For | Against | Abstentions/Broker Non-Votes | ||||||||||||
| 28,064,892.689 | 523,489.144 | 9,045,190.208 | |||||||||||||
| B. Borrowing | For | Against | Abstentions/Broker Non-Votes | ||||||||||||
| 27,999,797.895 | 588,166.938 | 9,045,607.208 | |||||||||||||
| C. Senior Securities | For | Against | Abstentions/Broker Non-Votes | ||||||||||||
| 28,044,283.174 | 544,356.659 | 9,044,932.208 | |||||||||||||
| D. Underwriting Securities | For | Against | Abstentions/Broker Non-Votes | ||||||||||||
| 28,048,799.419 | 539,423.414 | 9,045,349.208 | |||||||||||||
| E. Real Estate | For | Against | Abstentions/Broker Non-Votes | ||||||||||||
| 28,038,530.543 | 549,692.290 | 9,045,349.208 | |||||||||||||
| F. Making Loans | For | Against | Abstentions/Broker Non-Votes | ||||||||||||
| 27,992,259.146 | 595,963.687 | 9,045,349.208 | |||||||||||||
| G. Concentration | For | Against | Abstentions/Broker Non-Votes | ||||||||||||
| 28,031,494.183 | 556,728.650 | 9,045,349.208 | |||||||||||||
| H. Commodities | For | Against | Abstentions/Broker Non-Votes | ||||||||||||
| 28,011,949.273 | 576,690.560 | 9,044,932.208 | |||||||||||||
Transamerica IDEX Mutual Funds
Semi-Annual Report 2005
14
TA IDEX Jennison Growth
UNDERSTANDING YOUR FUND'S EXPENSES
(unaudited)
SHAREHOLDER EXPENSES
The following Example is intended to help you understand your ongoing costs (in dollars and cents) of investing in a Fund and to compare these costs with the ongoing costs of investing in other funds.
The Example is based on an investment of $1,000 invested at November 1, 2004 and held for the entire period until April 30, 2005.
ACTUAL EXPENSES
The first line in the table below provides information about actual account values and actual expenses. You may use the information in this line, together with the amount you invested, to estimate the expenses that you paid over the period. Simply divide your account value by $1,000 (for example, an $8,600 account value divided by $1,000 = 8.6), then multiply the result by the number in the first line of your Fund under the heading entitled "Expenses Paid During Period" to estimate the expenses you paid on your account during this period.
HYPOTHETICAL EXAMPLE FOR COMPARISON PURPOSES
The second line in the table below provides information about hypothetical account values and hypothetical expenses based on the Fund's actual expense ratio and an assumed rate of return of 5% per year before expenses, which is not the Fund's actual return. The hypothetical account values and expenses may not be used to estimate the actual ending account balance or expenses you paid for the period. You may use this information to compare the ongoing costs of investing in your Fund and other funds. To do so, compare this 5% hypothetical example with the 5% hypothetical examples that appear in the shareholder reports of the other funds.
Please note that the expenses shown in the table are meant to highlight your ongoing costs only and do not reflect any transactional costs, such as sales charges, redemption fees, brokerage commissions paid on purchases and sales of fund shares. Therefore, the second line under the Fund in the table is useful in comparing ongoing costs only, and will not help you determine the relative total costs of owning different funds. In addition, note that the expenses shown in the table are meant to highlight your ongoing costs and do not reflect any transaction costs.
| Beginning Account Value | Ending Account Value | Annualized Expense Ratio | Expenses Paid During Period (a) | ||||||||||||||||
| Class A | |||||||||||||||||||
| Actual | $ | 1,000.00 | $ | 1,005.30 | 1.38 | % | $ | 6.86 | |||||||||||
| Hypothetical (b) | 1,000.00 | 1,017.95 | 1.38 | 6.90 | |||||||||||||||
| Class B | |||||||||||||||||||
| Actual | 1,000.00 | 1,001.10 | 2.17 | 10.77 | |||||||||||||||
| Hypothetical (b) | 1,000.00 | 1,014.03 | 2.17 | 10.84 | |||||||||||||||
| Class C | |||||||||||||||||||
| Actual | 1,000.00 | 1,000.00 | 2.40 | 11.90 | |||||||||||||||
| Hypothetical (b) | 1,000.00 | 1,012.89 | 2.40 | 11.98 | |||||||||||||||
(a) Expenses are calculated using each Fund's annualized expense ratio (as disclosed in the table), multiplied by the average account value for the period, multiplied by number of days in the period (181 days), and divided by the number of days in the year (365 days).
(b) 5% return per year before expenses.
GRAPHICAL PRESENTATION OF SCHEDULE OF INVESTMENTS
By Sector
At April 30, 2005
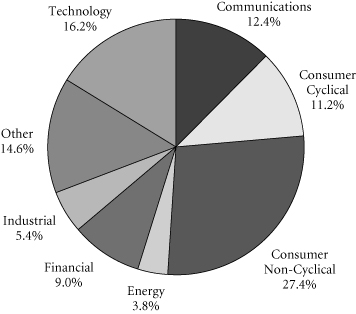
This chart shows the percentage breakdown by sector of the Fund's total investment securities.
Transamerica IDEX Mutual Funds
Semi-Annual Report 2005
1
TA IDEX Jennison Growth
SCHEDULE OF INVESTMENTS
At April 30, 2005
(all amounts except share amounts in thousands)
(unaudited)
| Shares | Value | ||||||||||
| COMMON STOCKS (99.4%) | |||||||||||
| Apparel & Accessory Stores (2.1%) | |||||||||||
| Chico's FAS, Inc. (a)(b) | 75,500 | $ | 1,935 | ||||||||
| Beverages (1.5%) | |||||||||||
| PepsiCo, Inc. | 24,700 | 1,374 | |||||||||
| Business Services (1.8%) | |||||||||||
| eBay, Inc. (a) | 52,200 | 1,656 | |||||||||
| Chemicals & Allied Products (2.6%) | |||||||||||
| Lauder (Estee) Cos., Inc. (The)–Class A | 23,600 | 906 | |||||||||
| Procter & Gamble Co. (b) | 26,300 | 1,424 | |||||||||
| Commercial Banks (1.6%) | |||||||||||
| JPMorgan Chase & Co. | 41,200 | 1,462 | |||||||||
| Communications Equipment (3.2%) | |||||||||||
| QUALCOMM, Inc. | 62,200 | 2,170 | |||||||||
| Research In Motion, Ltd. (a) | 10,800 | 696 | |||||||||
| Computer & Data Processing Services (15.0%) | |||||||||||
| Adobe Systems, Inc. | 24,200 | 1,439 | |||||||||
| Electronic Arts, Inc. (a)(b) | 34,200 | 1,826 | |||||||||
| Google, Inc.–Class A (a)(b) | 16,800 | 3,696 | |||||||||
| Mercury Interactive Corp. (a) | 22,200 | 918 | |||||||||
| Microsoft Corp. | 55,100 | 1,394 | |||||||||
| NAVTEQ Corp. (a) | 13,700 | 499 | |||||||||
| SAP AG, ADR | 20,300 | 800 | |||||||||
| Yahoo!, Inc. (a)(b) | 87,900 | 3,033 | |||||||||
| Computer & Office Equipment (5.5%) | |||||||||||
| Apple Computer, Inc. (a) | 45,200 | 1,630 | |||||||||
| Cisco Systems, Inc. (a) | 75,700 | 1,308 | |||||||||
| Dell, Inc. (a) | 50,700 | 1,766 | |||||||||
| International Business Machines Corp. | 3,400 | 260 | |||||||||
| Cosmetics/Personal Care (1.0%) | |||||||||||
| Gillette Co. (The) | 18,300 | 945 | |||||||||
| Department Stores (1.3%) | |||||||||||
| Federated Department Stores, Inc. | 20,700 | 1,190 | |||||||||
| Electronic & Other Electric Equipment (4.6%) | |||||||||||
| General Electric Co. | 94,500 | 3,421 | |||||||||
| Harman International Industries, Inc. | 9,200 | 723 | |||||||||
| Electronic Components & Accessories (5.3%) | |||||||||||
| Intel Corp. | 89,000 | 2,093 | |||||||||
| Marvell Technology Group, Ltd. (a)(b) | 38,600 | 1,292 | |||||||||
| Maxim Integrated Products, Inc. (b) | 33,800 | 1,264 | |||||||||
| Texas Instruments, Inc. | 5,200 | 130 | |||||||||
| Food & Kindred Products (1.0%) | |||||||||||
| Cadbury Schweppes PLC, ADR | 23,100 | 939 | |||||||||
| Shares | Value | ||||||||||
| Food Stores (2.2%) | |||||||||||
| Whole Foods Market, Inc. (b) | 19,700 | $ | 1,964 | ||||||||
| Furniture & Home Furnishings Stores (1.5%) | |||||||||||
| Bed Bath & Beyond, Inc. (a) | 18,500 | 688 | |||||||||
| Williams-Sonoma, Inc. (a) | 21,300 | 713 | |||||||||
| Health Services (1.4%) | |||||||||||
| Caremark Rx, Inc. (a) | 32,400 | 1,298 | |||||||||
| Industrial Machinery & Equipment (1.2%) | |||||||||||
| Applied Materials, Inc. (a) | 73,500 | 1,093 | |||||||||
| Instruments & Related Products (2.5%) | |||||||||||
| Agilent Technologies, Inc. (a) | 46,500 | 965 | |||||||||
| Alcon, Inc. (a) | 13,800 | 1,339 | |||||||||
| Insurance (4.9%) | |||||||||||
| Cigna Corp. | 10,100 | 929 | |||||||||
| UnitedHealth Group, Inc. | 20,100 | 1,900 | |||||||||
| WellPoint, Inc. (a) | 12,400 | 1,584 | |||||||||
| Leather & Leather Products (1.1%) | |||||||||||
| Coach, Inc. (a) | 38,200 | 1,024 | |||||||||
| Lumber & Other Building Materials (1.0%) | |||||||||||
| Lowe's Cos., Inc. | 18,300 | 954 | |||||||||
| Medical Instruments & Supplies (1.1%) | |||||||||||
| St. Jude Medical, Inc. (a) | 25,700 | 1,003 | |||||||||
| Oil & Gas Extraction (3.2%) | |||||||||||
| Schlumberger, Ltd. (b) | 30,100 | 2,059 | |||||||||
| Total SA, ADR (b) | 7,900 | 876 | |||||||||
| Petroleum Refining (1.2%) | |||||||||||
| Suncor Energy, Inc. | 28,500 | 1,051 | |||||||||
| Pharmaceuticals (15.8%) | |||||||||||
| Allergan, Inc. | 9,000 | 634 | |||||||||
| Amgen, Inc. (a) | 29,000 | 1,688 | |||||||||
| Genentech, Inc. (a) | 40,900 | 2,901 | |||||||||
| Gilead Sciences, Inc. (a) | 27,000 | 1,002 | |||||||||
| Lilly (Eli) & Co. | 29,600 | 1,731 | |||||||||
| Novartis AG, ADR | 36,700 | 1,788 | |||||||||
| Pfizer, Inc. | 58,700 | 1,595 | |||||||||
| Roche Holding AG, ADR | 37,738 | 2,276 | |||||||||
| Sanofi-Aventis, ADR (b) | 16,700 | 741 | |||||||||
| Restaurants (1.6%) | |||||||||||
| Starbucks Corp. (a) | 29,900 | 1,481 | |||||||||
| Retail Trade (0.8%) | |||||||||||
| Petsmart, Inc. | 29,000 | 773 | |||||||||
The notes to the financial statements are an integral part of this report.
Transamerica IDEX Mutual Funds
Semi-Annual Report 2005
2
TA IDEX Jennison Growth
SCHEDULE OF INVESTMENTS (continued)
At April 30, 2005
(all amounts except share amounts in thousands)
(unaudited)
| Shares | Value | ||||||||||
| Security & Commodity Brokers (7.9%) | |||||||||||
| American Express Co. | 58,600 | $ | 3,088 | ||||||||
| Charles Schwab Corp. (The) (b) | 129,600 | 1,341 | |||||||||
| Goldman Sachs Group, Inc. (The) | 12,600 | 1,346 | |||||||||
| Merrill Lynch & Co., Inc. | 25,600 | 1,381 | |||||||||
| Telecommunications (1.4%) | |||||||||||
| Nextel Communications, Inc.–Class A (a) | 46,200 | 1,293 | |||||||||
| Trucking & Warehousing (1.5%) | |||||||||||
| United Parcel Service, Inc.–Class B | 19,000 | 1,355 | |||||||||
| Variety Stores (2.6%) | |||||||||||
| Target Corp. | 50,100 | 2,325 | |||||||||
| Total Common Stocks (cost: $87,625) | 90,368 | ||||||||||
| Principal | Value | ||||||||||
| SECURITY LENDING COLLATERAL (17.0%) | |||||||||||
| Debt (14.7%) | |||||||||||
| Bank Notes (2.0%) | |||||||||||
| Bank of America | |||||||||||
| 2.82%, due 05/16/2005 | $ | 488 | $ | 488 | |||||||
| 2.80%, due 06/09/2005 (c) | 122 | 122 | |||||||||
| 2.77%, due 07/18/2005 (c) | 488 | 488 | |||||||||
| Canadian Imperial Bank of Commerce 3.02%, due 11/04/2005 (c) | 488 | 488 | |||||||||
| Credit Suisse First Boston Corp. 2.88%, due 09/09/2005 (c) 3.06%, due 03/10/2006 (c) | 122 122 | 122 122 | |||||||||
| Euro Dollar Overnight (2.6%) | |||||||||||
| Bank of Montreal 2.94%, due 05/04/2005 | 366 | 366 | |||||||||
| BNP Paribas 2.80%, due 05/05/2005 | 505 | 505 | |||||||||
| Den Danske Bank 2.93%, due 05/02/2005 2.80%, due 05/06/2005 | 439 244 | 439 244 | |||||||||
| Dexia Group 2.80%, due 05/05/2005 | 215 | 215 | |||||||||
| Royal Bank of Canada 2.80%, due 05/04/2005 | 500 | 500 | |||||||||
| Svenska Handlesbanken 2.80%, due 05/06/2005 | 80 | 80 | |||||||||
| Euro Dollar Terms (6.0%) | |||||||||||
| Bank of Nova Scotia 2.88%, due 05/11/2005 3.01%, due 05/31/2005 | 244 682 | 244 682 | |||||||||
| Barclays 3.02%, due 06/27/2005 | 435 | 435 | |||||||||
| Principal | Value | ||||||||||
| Euro Dollar Terms (continued) | |||||||||||
| BNP Paribas | |||||||||||
| 2.93%, due 06/07/2005 | $ | 390 | $ | 390 | |||||||
| Branch Banker & Trust 2.94%, due 06/06/2005 | 104 | 104 | |||||||||
| Calyon 2.93%, due 06/03/2005 | 403 | 403 | |||||||||
| Citigroup 2.87%, due 06/06/2005 | 506 | 506 | |||||||||
| Credit Suisse First Boston Corp. 2.91%, due 05/16/2005 | 499 | 499 | |||||||||
| HSBC Banking/Holdings PLC 3.01%, due 06/23/2005 | 244 | 244 | |||||||||
| Royal Bank of Scotland 2.94%, due 06/07/2005 2.95%, due 06/10/2005 | 474 263 | 474 263 | |||||||||
| Societe Generale 2.80%, due 05/03/2005 | 466 | 466 | |||||||||
| Toronto Dominion Bank 2.75%, due 05/09/2005 3.01%, due 06/24/2005 | 366 135 | 366 135 | |||||||||
| UBS AG 2.81%, due 05/03/2005 | 244 | 244 | |||||||||
| Promissory Notes (1.5%) | |||||||||||
| Goldman Sachs Group, Inc. 2.99%, due 06/27/2005 3.01%, due 07/27/2005 | 512 853 | 512 853 | |||||||||
| Repurchase Agreements (2.6%) (d) | |||||||||||
| Goldman Sachs Group, Inc. 3.04% Repurchase Agreement dated 04/29/2005 to be repurchased at $1,098 on 05/02/2005 | 1,097 | 1,097 | |||||||||
| Merrill Lynch & Co., Inc. 3.04% Repurchase Agreement dated 04/29/2005 to be repurchased at $1,317 on 05/02/2005 | 1,317 | 1,317 | |||||||||
| Shares | Value | ||||||||||
| Investment Companies (2.3%) | |||||||||||
| Money Market Funds (2.3%) | |||||||||||
| American Beacon Funds 1-day yield of 2.84% | 193,669 | $ | 194 | ||||||||
| BGI Institutional Money Market Fund | |||||||||||
| 1-day yield of 2.93% | 1,146,823 | 1,147 | |||||||||
| Merrill Lynch Premier Institutional Fund | |||||||||||
| 1-day yield of 2.65% | 258,071 | 258 | |||||||||
The notes to the financial statements are an integral part of this report.
Transamerica IDEX Mutual Funds
Semi-Annual Report 2005
3
TA IDEX Jennison Growth
SCHEDULE OF INVESTMENTS (continued)
At April 30, 2005
(all amounts except share amounts in thousands)
(unaudited)
| Shares | Value | ||||||||||
| Money Market Funds (continued) | |||||||||||
| Merrimac Cash Fund, Premium Class 1-day yield of 2.74% (e) | 472,009 | $ | 472 | ||||||||
| Total Security Lending Collateral (cost: $15,484) | 15,484 | ||||||||||
| Total Investment Securities (cost: $103,109) | $ | 105,852 | |||||||||
| SUMMARY: | |||||||||||
| Investments, at value | 116.4 | % | $ | 105,852 | |||||||
| Liabilities in excess of other assets | (16.4 | )% | (14,877 | ) | |||||||
| Net assets | 100.0 | % | $ | 90,975 | |||||||
NOTES TO SCHEDULE OF INVESTMENTS:
(a) No dividends were paid during the preceding twelve months.
(b) At April 30, 2005, all or a portion of this security is on loan (see Note 1). The value at April 30, 2005, of all securities on loan is $14,976.
(c) Floating or variable rate note. Rate is listed as of April 30, 2005.
(d) Cash collateral for the Repurchase Agreements, valued at $2,456, that serve as collateral for securities lending are invested in corporate bonds with interest rates and maturity dates ranging from 0.00%–8.875% and 06/15/2005–03/15/2035, respectively.
(e) Regulated investment company advised by Investors Bank and Trust Co. ("IBT"). IBT is also the accounting, custody and lending agent for the Fund.
DEFINITIONS:
ADR American Depositary Receipt
The notes to the financial statements are an integral part of this report.
Transamerica IDEX Mutual Funds
Semi-Annual Report 2005
TA IDEX Jennison Growth 4
TA IDEX Jennison Growth
STATEMENT OF ASSETS AND LIABILITIES
At April 30, 2005
(all amounts except per share amounts in thousands)
(unaudited)
| Assets: | |||||||
| Investment securities, at value (cost: $103,109) | |||||||
| (including securities loaned of $14,976) | $ | 105,852 | |||||
| Cash | 722 | ||||||
| Receivables: | |||||||
| Investment securities sold | 279 | ||||||
| Shares of beneficial interest sold | 6 | ||||||
| Interest | 4 | ||||||
| Dividends | 52 | ||||||
| Other | 44 | ||||||
| 106,959 | |||||||
| Liabilities: | |||||||
| Investment securities purchased | 224 | ||||||
| Accounts payable and accrued liabilities: | |||||||
| Shares of beneficial interest redeemed | 92 | ||||||
| Management and advisory fees | 67 | ||||||
| Distribution and service fees | 49 | ||||||
| Transfer agent fees | 44 | ||||||
| Payable for collateral for securities on loan | 15,484 | ||||||
| Other | 24 | ||||||
| 15,984 | |||||||
| Net Assets | $ | 90,975 | |||||
| Net Assets Consist of: | |||||||
| Shares of beneficial interest, unlimited shares authorized, no par value | $ | 89,079 | |||||
| Accumulated net investment income (loss) | (139 | ) | |||||
| Accumulated net realized gain (loss) from investment securities | (708 | ) | |||||
| Net unrealized appreciation (depreciation) on investment securities | 2,743 | ||||||
| Net Assets | $ | 90,975 | |||||
| Net Assets by Class: | |||||||
| Class A | $ | 49,210 | |||||
| Class B | 31,329 | ||||||
| Class C | 10,436 | ||||||
| Shares Outstanding: | |||||||
| Class A | 5,141 | ||||||
| Class B | 3,467 | ||||||
| Class C | 1,153 | ||||||
| Net Asset Value Per Share: | |||||||
| Class A | $ | 9.57 | |||||
| Class B | 9.04 | ||||||
| Class C | 9.05 | ||||||
| Maximum Offering Price Per Share (a): | |||||||
| Class A | $ | 10.13 | |||||
(a) Includes the maximum selling commission (represented as a percentage of offering price) which is reduced on certain levels of sales as set forth in the Prospectus. Net asset value per share for Classes B and C shares represents offering price. The redemption price for Classes B and C shares equals net asset value less any applicable contingent deferred sales charge.
STATEMENT OF OPERATIONS
For the period ended April 30, 2005
(all amounts in thousands)
(unaudited)
| Investment Income: | |||||||
| Interest | $ | 23 | |||||
| Dividends | 802 | ||||||
| Income from loaned securities–net | 11 | ||||||
| Less withholding taxes on foreign dividends | (15 | ) | |||||
| 821 | |||||||
| Expenses: | |||||||
| Management and advisory fees | 442 | ||||||
| Transfer agent fees: | |||||||
| Class A | 26 | ||||||
| Class B | 38 | ||||||
| Class C | 22 | ||||||
| Printing and shareholder reports | 22 | ||||||
| Custody fees | 11 | ||||||
| Administration fees | 10 | ||||||
| Legal fees | 3 | ||||||
| Audit fees | 5 | ||||||
| Trustees fees | 2 | ||||||
| Registration fees: | |||||||
| Class A | 15 | ||||||
| Class B | 8 | ||||||
| Class C | 11 | ||||||
| Distribution and service fees: | |||||||
| Class A | 110 | ||||||
| Class B | 170 | ||||||
| Class C | 68 | ||||||
| Total expenses | 963 | ||||||
| Net Investment Income (Loss) | (142 | ) | |||||
| Net Realized and Unrealized Gain (Loss): | |||||||
| Realized gain (loss) from investment securities | 1,632 | ||||||
| Increase (decrease) in unrealized appreciation (depreciation) on investment securities | (913 | ) | |||||
| Net Gain (Loss) on Investments | 719 | ||||||
| Net Increase (Decrease) in Net Assets Resulting from Operations | $ | 577 | |||||
The notes to the financial statements are an integral part of this report.
Transamerica IDEX Mutual Funds
Semi-Annual Report 2005
TA IDEX Jennison Growth 5
TA IDEX Jennison Growth
STATEMENTS OF CHANGES IN NET ASSETS
For the period or year ended
(all amounts in thousands)
| April 30, 2005 (unaudited) | October 31, 2004 | ||||||||||
| Increase (Decrease) In Net Assets From: | |||||||||||
| Operations: | |||||||||||
| Net investment income (loss) | $ | (142 | ) | $ | (973 | ) | |||||
| Net realized gain (loss) from investment securities | 1,632 | 11,967 | |||||||||
| Net unrealized appreciation (depreciation) on investment securities | (913 | ) | (2,428 | ) | |||||||
| 577 | 8,566 | ||||||||||
| Capital Share Transactions: | |||||||||||
| Proceeds from shares sold: | |||||||||||
| Class A | 14,686 | 43,811 | |||||||||
| Class B | 574 | 2,025 | |||||||||
| Class C | 2,163 | 2,846 | |||||||||
| Class C2 | – | 369 | |||||||||
| Class M | – | 1,047 | |||||||||
| 17,423 | 50,098 | ||||||||||
| Cost of shares redeemed: | |||||||||||
| Class A | (23,644 | ) | (8,121 | ) | |||||||
| Class B | (3,990 | ) | (8,690 | ) | |||||||
| Class C | (5,535 | ) | (3,250 | ) | |||||||
| Class C2 | – | (1,667 | ) | ||||||||
| Class M | – | (2,836 | ) | ||||||||
| (33,169 | ) | (24,564 | ) | ||||||||
| Class level exchanges: | |||||||||||
| Class C | – | 13,383 | |||||||||
| Class C2 | – | (7,197 | ) | ||||||||
| Class M | – | (6,186 | ) | ||||||||
| – | – | ||||||||||
| Automatic conversions: | |||||||||||
| Class A | 65 | 31 | |||||||||
| Class B | (65 | ) | (31 | ) | |||||||
| – | – | ||||||||||
| (15,746 | ) | 25,534 | |||||||||
| Net increase (decrease) in net assets | (15,169 | ) | 34,100 | ||||||||
| Net Assets: | |||||||||||
| Beginning of period | 106,144 | 72,044 | |||||||||
| End of period | $ | 90,975 | $ | 106,144 | |||||||
| Accumulated Net Investment Income (Loss) | $ | (139 | ) | $ | 3 | ||||||
| April 30, 2005 (unaudited) | October 31, 2004 | ||||||||||
| Share Activity: | |||||||||||
| Shares issued: | |||||||||||
| Class A | 1,483 | 4,731 | |||||||||
| Class B | 62 | 228 | |||||||||
| Class C | 232 | 319 | |||||||||
| Class C2 | – | 42 | |||||||||
| Class M | – | 116 | |||||||||
| 1,777 | 5,436 | ||||||||||
| Shares redeemed: | |||||||||||
| Class A | (2,418 | ) | (872 | ) | |||||||
| Class B | (429 | ) | (990 | ) | |||||||
| Class C | (594 | ) | (373 | ) | |||||||
| Class C2 | – | (191 | ) | ||||||||
| Class M | – | (322 | ) | ||||||||
| (3,441 | ) | (2,748 | ) | ||||||||
| Class level exchanges: | |||||||||||
| Class C | – | 1,494 | |||||||||
| Class C2 | – | (791 | ) | ||||||||
| Class M | – | (703 | ) | ||||||||
| – | – | ||||||||||
| Automatic conversions: | |||||||||||
| Class A | 7 | 3 | |||||||||
| Class B | (7 | ) | (4 | ) | |||||||
| – | (1 | ) | |||||||||
| Net increase (decrease) in shares outstanding: | |||||||||||
| Class A | (928 | ) | 3,862 | ||||||||
| Class B | (374 | ) | (766 | ) | |||||||
| Class C | (362 | ) | 1,440 | ||||||||
| Class C2 | – | (940 | ) | ||||||||
| Class M | – | (909 | ) | ||||||||
| (1,664 | ) | 2,687 | |||||||||
The notes to the financial statements are an integral part of this report.
Transamerica IDEX Mutual Funds
Semi-Annual Report 2005
TA IDEX Jennison Growth 6
TA IDEX Jennison Growth
FINANCIAL HIGHLIGHTS
(unaudited for the period ended April 30, 2005)
| For a share of beneficial interest outstanding throughout each period | |||||||||||||||||||||||||||||||||||||||
| Net Asset | Investment Operations | Distributions | Net Asset | ||||||||||||||||||||||||||||||||||||
| For the Period Ended (d)(g) | Value, Beginning of Period | Net Investment Income (Loss) | Net Realized and Unrealized Gain (Loss) | Total Operations | From Net Investment Income | From Net Realized Gains | Total Distributions | Value, End of Period | |||||||||||||||||||||||||||||||
| Class A | 4/30/2005 | $ | 9.52 | $ | – | $ | 0.05 | $ | 0.05 | $ | – | $ | – | $ | – | $ | 9.57 | ||||||||||||||||||||||
| 10/31/2004 | 8.54 | (0.07 | ) | 1.05 | 0.98 | – | – | – | 9.52 | ||||||||||||||||||||||||||||||
| 10/31/2003 | 6.88 | (0.04 | ) | 1.70 | 1.66 | – | – | – | 8.54 | ||||||||||||||||||||||||||||||
| 10/31/2002 | 8.04 | (0.05 | ) | (1.11 | ) | (1.16 | ) | – | – | – | 6.88 | ||||||||||||||||||||||||||||
| 10/31/2001 | 10.26 | (0.01 | ) | (1.17 | ) | (1.18 | ) | – | (1.04 | ) | (1.04 | ) | 8.04 | ||||||||||||||||||||||||||
| 10/31/2000 | 12.14 | (0.13 | ) | (1.54 | ) | (1.67 | ) | – | (0.21 | ) | (0.21 | ) | 10.26 | ||||||||||||||||||||||||||
| Class B | 4/30/2005 | 9.03 | (0.03 | ) | 0.04 | 0.01 | – | – | – | 9.04 | |||||||||||||||||||||||||||||
| 10/31/2004 | 8.14 | (0.12 | ) | 1.01 | 0.89 | – | – | – | 9.03 | ||||||||||||||||||||||||||||||
| 10/31/2003 | 6.60 | (0.08 | ) | 1.62 | 1.54 | – | – | – | 8.14 | ||||||||||||||||||||||||||||||
| 10/31/2002 | 7.77 | (0.10 | ) | (1.07 | ) | (1.17 | ) | – | – | – | 6.60 | ||||||||||||||||||||||||||||
| 10/31/2001 | 10.01 | (0.05 | ) | (1.15 | ) | (1.20 | ) | – | (1.04 | ) | (1.04 | ) | 7.77 | ||||||||||||||||||||||||||
| 10/31/2000 | 11.93 | (0.17 | ) | (1.54 | ) | (1.71 | ) | – | (0.21 | ) | (0.21 | ) | 10.01 | ||||||||||||||||||||||||||
| Class C | 4/30/2005 | 9.05 | (0.04 | ) | 0.04 | – | – | – | – | 9.05 | |||||||||||||||||||||||||||||
| 10/31/2004 | 8.14 | (0.15 | ) | 1.06 | 0.91 | – | – | – | 9.05 | ||||||||||||||||||||||||||||||
| 10/31/2003 | 6.60 | (0.09 | ) | 1.63 | 1.54 | – | – | – | 8.14 | ||||||||||||||||||||||||||||||
| Ratios/Supplemental Data | |||||||||||||||||||||||||||||||
| For the Period | Total | Net Assets, End of Period | Ratio of Expenses to Average Net Assets (a) | Net Investment Income (Loss) to Average | Portfolio Turnover | ||||||||||||||||||||||||||
| Ended (g) | Return (c) | (000's) | Net (e) | Total (f) | Net Assets (a) | Rate (b) | |||||||||||||||||||||||||
| Class A | 4/30/2005 | 0.53 | % | $ | 49,210 | 1.38 | % | 1.38 | % | 0.10 | % | 52 | % | ||||||||||||||||||
| 10/31/2004 | 11.48 | 57,760 | 1.59 | 1.59 | (0.79 | ) | 147 | ||||||||||||||||||||||||
| 10/31/2003 | 24.13 | 18,833 | 1.75 | 1.90 | (0.54 | ) | 100 | ||||||||||||||||||||||||
| 10/31/2002 | (14.47 | ) | 21,836 | 1.75 | 1.82 | (0.52 | ) | 98 | |||||||||||||||||||||||
| 10/31/2001 | (11.08 | ) | 17,670 | 1.55 | 2.44 | (0.11 | ) | 158 | |||||||||||||||||||||||
| 10/31/2000 | (14.06 | ) | 4,147 | 1.55 | 2.66 | (0.87 | ) | 244 | |||||||||||||||||||||||
| Class B | 4/30/2005 | 0.11 | 31,329 | 2.17 | 2.17 | (0.68 | ) | 52 | |||||||||||||||||||||||
| 10/31/2004 | 10.93 | 34,667 | 2.24 | 2.24 | (1.37 | ) | 147 | ||||||||||||||||||||||||
| 10/31/2003 | 23.33 | 37,500 | 2.40 | 2.55 | (1.19 | ) | 100 | ||||||||||||||||||||||||
| 10/31/2002 | (15.10 | ) | 37,363 | 2.40 | 2.47 | (1.17 | ) | 98 | |||||||||||||||||||||||
| 10/31/2001 | (11.54 | ) | 31,922 | 2.20 | 3.09 | (0.76 | ) | 158 | |||||||||||||||||||||||
| 10/31/2000 | (14.70 | ) | 3,483 | 2.20 | 3.31 | (1.52 | ) | 244 | |||||||||||||||||||||||
| Class C | 4/30/2005 | 0.00 | 10,436 | 2.40 | 2.40 | (0.84 | ) | 52 | |||||||||||||||||||||||
| 10/31/2004 | 11.18 | 13,717 | 2.39 | 2.39 | (1.68 | ) | 147 | ||||||||||||||||||||||||
| 10/31/2003 | 23.33 | 607 | 2.40 | 2.55 | (1.19 | ) | 100 | ||||||||||||||||||||||||
NOTES TO FINANCIAL HIGHLIGHTS
(a) Annualized.
(b) Not annualized for periods of less than one year.
(c) Total Return has been calculated for the applicable period without deduction of a sales load, if any, on an initial purchase. Periods of less than one year are not annualized.
(d) Per share information is calculated based on the average number of shares outstanding for the periods ended 10/31/2001, 10/31/2002, 10/31/2003, 10/31/2004 and 4/30/2005.
(e) Ratio of Net Expenses to Average Net Assets is net of fee waivers and reimbursements by the investment adviser, if any (see note 2).
(f) Ratio of Total Expenses to Average Net Assets includes all expenses before fee waivers and reimbursements by the investment adviser.
(g) The inception date for the Fund's offering of share Class C was November 11, 2002.
The notes to the financial statements are an integral part of this report.
Transamerica IDEX Mutual Funds
Semi-Annual Report 2005
7
TA IDEX Jennison Growth
NOTES TO FINANCIAL STATEMENTS
At April 30, 2005
(all amounts in thousands)
(unaudited)
NOTE 1. ORGANIZATION AND SIGNIFICANT ACCOUNTING POLICIES
Transamerica IDEX Mutual Funds is a Delaware statutory trust registered under the Investment Company Act of 1940, as amended (the "1940 Act"), as an open-end management investment company. Prior to March 1, 2005, Transamerica IDEX Mutual Funds was a Massachusetts business trust. TA IDEX Jennison Growth ("the Fund"), part of Transamerica IDEX Mutual Funds, began operations on February 1, 1996.
In the normal course of business, the Fund enters into contracts that contain a variety of representations and warranties, which provide general indemnifications. The Fund's maximum exposure under these arrangements is unknown, as this would involve future claims that may be made against the Fund and/or its affiliates that have not yet occurred. However, based on experience, the Fund expects the risk of loss to be remote.
See the Prospectus and Statement of Additional Information for a description of the Fund's investment objective.
In preparing the Fund's financial statements in accordance with accounting principles generally accepted in the United States of America ("GAAP"), estimates or assumptions (which could differ from actual results) may be used that affect reported amounts and disclosures. The following policies were consistently followed by the Fund, in accordance with GAAP.
Multiple class operations and expenses: The Fund currently offers three classes of shares, each with a public offering price that reflects different sales charges, if any, and expense levels. On June 15, 2004, Class C2 shares merged into Class C. On September 24, 2004, Class M shares merged into Class C. Class B shares will convert to Class A shares eight years after purchase. Income, non-class specific expenses and realized and unrealized gains and losses, are allocated daily to each class, based upon the value of shares outstanding method as permitted under Rule 18f-3 of the 1940 Act. Each class bears its own specific expenses as well as a portion of general, common expenses.
Pricing of shares: The Fund prices its shares on the basis of the net asset value of each class of shares of the Fund, which is determined as of the close of the New York Stock Exchange ("NYSE") (generally 4:00 p.m. Eastern Time) on each day on which the NYSE is open for trading.
Security valuations: Fund investments traded on an exchange are valued at the closing price on the day of valuation on the exchange where the security is principally traded. With respect to securities traded on NASDAQ NMS, such closing price may be last reported sales price or the NASDAQ Official Closing Price.
Securities traded in the over-the-counter market and listed securities for which no sale was reported on that date are valued at the last quoted bid price.
Debt securities are valued by independent pricing services at the last quoted bid price; however, those that mature in sixty days or less are valued at amortized cost, which approximates market.
Investment company securities are valued at net asset value of the underlying portfolio.
Other securities for which quotations are not readily available are valued at fair market value as determined in good faith using guidelines adopted by the Board of Trustees of the Fund, under the supervision of the Fund's Valuation Committee. These guidelines may include: the type of security; any restrictions on its resale; financial or business news of the issuer; similar or related securities that are actively trading; related corporate actions; and other significant events occurring after the close of trading in the security.
Cash: The Fund may leave cash overnight in its cash account with the custodian, Investors Bank & Trust Company ("IBT"). IBT has been contracted on behalf of the Fund to invest the excess cash into a savings account, which at April 30, 2005, was paying an interest rate of 2.02%.
Throughout the period, the Fund may have a cash overdraft balance. A fee is incurred on this overdraft, calculated by multiplying the overdraft by a rate based on the federal funds rate.
Repurchase agreements: The Fund is authorized to enter into repurchase agreements. The Fund, through IBT, receives delivery of the underlying securities, the value of which at the time of purchase is required to be an amount equal to at least 100% of the resale price. Repurchase agreements involve the risk that the seller will fail to repurchase the security, as agreed. In that case, the Fund will bear the risk of value fluctuations until the security can be sold and may encounter delays and incur costs in liquidating the security. In the event of bankruptcy or insolvency of the seller, delays and costs may be incurred.
Commission recapture: The sub-adviser, to the extent consistent with the best execution and usual commission rate policies and practices, may place security transactions of the Fund with broker/dealers with which Transamerica IDEX Mutual Funds has established a Commission Recapture Program. A Commission Recapture Program is any arrangement under which a broker/dealer applies a portion of the commissions received by such broker/dealer on the security transactions to the Fund. In no event will commissions paid by the Fund be used to pay expenses that would otherwise be borne by any other funds within Transamerica IDEX Mutual Funds, or by any other party.
Recaptured commissions during the six months ended April 30, 2005, of $21 are included in net realized gains in the Statement of Operations.
Transamerica IDEX Mutual Funds
Semi-Annual Report 2005
8
TA IDEX Jennison Growth
NOTES TO FINANCIAL STATEMENTS (continued)
At April 30, 2005
(all amounts in thousands)
(unaudited)
NOTE 1.–(continued)
Securities lending: The Fund may lend securities to enhance fund earnings from investing cash collateral in making such loans to qualified borrowers (typically broker/dealers). The Fund has engaged its custodian bank, IBT, as a lending agent to administer its securities lending program. IBT earned $5 of program income for its services. When the Fund makes a security loan, it receives cash collateral as protection against the risk that the borrower will default on the loan, and records an asset for the cash invested collateral and a liability for the return of the collateral.
Loans of securities are required to be secured by collateral at least equal to 102% of the value of the securities at inception of the loan, and not less then 100% thereafter. The Fund may invest cash collateral in short-term money market instruments including: U.S. Treasury Bills, U.S. agency obligations, commercial paper, money market mutual funds, repurchase agreements and other highly rated, liquid investments. During the life of securities loans, the collateral and securities loaned remain subject to fluctuation in value. IBT marks to market securities loaned and the collateral each business day. If additional collateral is due (at least $1), IBT collects additional cash collateral from the borrowers. Although securities loaned will be fully collateralized at all times, IBT may experience delays in, or may be prevented from, recovering the collateral on behalf of the Fund. The Fund may recall a loa ned security position at any time from the borrower through IBT. In the event the borrower fails to timely return a recalled security, IBT may indemnify the Fund by purchasing replacement securities for the Fund at its own expense and claiming the collateral to fund such a purchase. IBT absorbs the loss if the collateral value is not sufficient to cover the cost of the replacement securities. If replacement securities are not available, IBT will credit the equivalent cash value to the Fund.
While a security is on loan, the Fund does not have the right to vote that security. However, if time permits, the Fund will attempt to recall a security on loan and vote the proxy.
Income from securities lending is included in the Statement of Operations. The amount of collateral and value of securities on loan are included in the Statement of Assets and Liabilities as well as in the Schedule of Investments.
Security transactions and investment income: Security transactions are recorded on the trade date. Security gains and losses are calculated on the specific identification basis. Dividend income is recorded on the ex-dividend date or, in the case of foreign securities, as soon as the Fund is informed of the ex-dividend date. Interest income, including accretion of discounts and amortization of premiums, is recorded on the accrual basis commencing on the settlement date.
Account maintenance fees: If the shareholder account balance falls below $1 by either shareholder action or as a result of market action, a $25 (not in thousands) fee is assessed every year until the balance reaches $1. The fee is assessed by redeeming shares in the shareholder's account.
No fee will be charged under the following conditions:
• accounts opened within the preceding 24 months
• accounts with an active monthly Automatic Investment Plan ($50 (not in thousands) minimum per fund)
• accounts owned by an individual which, when combined by social security number, have a balance of $5 or more
• accounts owned by individuals in the same household (by address) that have a combined balance of $5 or more
• UTMA/UGMA accounts
• Fiduciary accounts
• B-share accounts whose shares have started to convert to A-shares accounts (as long as combined value of both accounts is at least $1)
For the six months ended April 30, 2005, this fee totaled $1. These fees are included in Paid in Capital in the Statement of Assets and Liabilities.
Redemption fees: A short-term trading redemption fee may be assessed on any fund shares in a fund account that are sold during the first five (5) NYSE trading days following their purchase date. This redemption fee will equal 2% of the amount redeemed and shares held the longest will be treated as being redeemed first and shares held the shortest as being redeemed last.
For the six months ended April 30, 2005, the Fund received less than $1 in redemption fees.
Dividend distributions: Distributions to shareholders are recorded on the ex-dividend date and are determined in accordance with Federal income tax regulations which may differ from GAAP.
NOTE 2. RELATED PARTY TRANSACTIONS
Transamerica Fund Advisors, Inc. ("TFAI") is the Fund's investment adviser. Transamerica Fund Services, Inc. ("TFS") is the Fund's administrator and transfer agent. AFSG Securities Corp. ("AFSG") is the Fund's distributor/principal underwriter. AFSG is 100% owned by AUSA Holding Company ("AUSA"). TFAI is a directly owned subsidiary of Western Reserve Life Assurance Co. of Ohio (78%) and AUSA (22%).
Transamerica IDEX Mutual Funds
Semi-Annual Report 2005
TA IDEX Jennison Growth 9
TA IDEX Jennison Growth
NOTES TO FINANCIAL STATEMENTS (continued)
At April 30, 2005
(all amounts in thousands)
(unaudited)
NOTE 2.–(continued)
TFS is a wholly owned subsidiary of WRL (50%) and AUSA (50%). AUSA and WRL are wholly owned indirect subsidiaries of AEGON, NV, a Netherlands corporation.
Effective January 1, 2005 AEGON/Transamerica Fund Advisors, Inc. ("ATFA") was renamed Transamerica Fund Advisors, Inc. ("TFAI"); AEGON/Transamerica Fund Services, Inc. ("ATFS") and AEGON/Transamerica Investor Services, Inc. ("ATIS") merged into one entity and was renamed Transamerica Fund Services, Inc. ("TFS").
The following schedule reflects the percentage of fund assets owned by affiliated mutual funds (i.e., through the asset allocation funds):
| Net Assets | % of Net Assets | ||||||||||
| TA IDEX Asset Allocation– Growth Portfolio | $ | 34,585 | 38.02 | % | |||||||
| TA IDEX Asset Allocation– Moderate Growth Portfolio | 213 | 0.23 | % | ||||||||
| Total | $ | 34,798 | 38.25 | % | |||||||
Investment advisory fee: The Fund pays management fees to TFAI based on average daily net assets ("ANA") at the following breakpoints:
0.80% of the first $500 million of ANA
0.70% of ANA over $500 million
TFAI has contractually agreed to waive its advisory fee and will reimburse the Fund to the extent that operating expenses, excluding 12b-1 fees, exceed the following stated annual limit:
1.40% Expense Limit
Distribution and service fees: The Fund has a 12b-1 distribution plan under the 1940 Act pursuant to which an annual fee, based on average daily net assets, is paid to the distributor for various disbursements such as broker-dealer account servicing fees and other promotional expenses of the Fund. The Fund is authorized under the 12b-1 plan to pay fees on each class up to the following limits:
| Class A | 0.35 | % | |||||
| Class B | 1.00 | % | |||||
| Class C | 1.00 | % | |||||
In the case the Fund or a class of shares of the Fund is closed to new investors or investments, the Fund is authorized to pay 12b-1 fees for past sales and distribution efforts and present and past investor services.
Underwriter commissions relate to front-end sales charges imposed for Class A shares and contingent deferred sales charges from Classes B, C, and certain A share redemptions. For the six months ended April 30, 2005, the underwriter commissions were as follows:
| Received by Underwriter | $ | 55 | |||||
| Retained by Underwriter | 2 | ||||||
| Contingent Deferred Sales Charge | 46 | ||||||
Administrative services: The Fund has entered into an agreement with TFS for financial and legal fund administration services, which includes such items as compliance, expenses, financial statements and other reporting, distributions, tax returns, prospectus preparation, board of trustees meeting support and other legal matters. As of January 1, 2005 the Fund pays TFS an annual fee of 0.02% of average net assets. Prior to January 1, 2005 the Fund paid TFS an annual fee of 0.015% of average net assets. The Legal fees on the Statement of Operations are for fees paid to external legal counsel.
Transfer agent fees: The Fund pays TFS an annual per-account charge of $20 (not in thousands) for each open account and $1.63 (not in thousands) for each closed account. There is no new account charge. The Transfer agent fees on the Statement of Operations are made up of fees paid to TFS and costs associated with shareholder statements.
The Fund Paid TFS $104 for the six months ended April 30, 2005.
Deferred compensation plan: Each eligible Fund Trustee may elect participation in the Deferred Compensation Plan ("the Plan"). Under the Plan, such Trustees may defer payment of a percentage of their total fees earned as a Fund Trustee. These deferred amounts may be invested in any Transamerica IDEX Mutual Fund. At April 30, 2005, the value of invested plan amount was $6. Invested plan amounts and the total liability for deferred compensation to the Trustees under the Plan at April 30, 2005, are included in the accompanying Statement of Assets and Liabilities.
NOTE 3. INVESTMENT TRANSACTIONS
The cost of securities purchased and proceeds from securities sold (excluding short-term securities) for the six months ended April 30, 2005, were as follows:
| Purchases of securities: | |||||||
| Long-Term excluding U.S. Government | $ | 55,487 | |||||
| U.S. Government | – | ||||||
| Proceeds from maturities and sales of securities: | |||||||
| Long-Term excluding U.S. Government | 68,973 | ||||||
| U.S. Government | – | ||||||
NOTE 4. FEDERAL INCOME TAX MATTERS
The Fund has not made any provision for federal income or excise taxes due to its policy to distribute all of its taxable income and capital gains to its shareholders and otherwise qualify as a regulated investment company under the Internal Revenue Code. Income and capital gain distributions are determined in accordance with income tax regulations,
Transamerica IDEX Mutual Funds
Semi-Annual Report 2005
TA IDEX Jennison Growth 10
TA IDEX Jennison Growth
NOTES TO FINANCIAL STATEMENTS (continued)
At April 30, 2005
(all amounts in thousands)
(unaudited)
NOTE 4.–(continued)
which may differ from GAAP. These differences are primarily due to differing treatment for items including, but not limited to, wash sales, net operating losses and capital loss carryforwards.
The capital loss carryforwards are available to offset future realized capital gains through the periods listed:
| Capital Loss Carryforward | Available through | ||||||
| $ | 1,911 | October 31, 2011 | |||||
The aggregate cost of investments and composition of unrealized appreciation (depreciation) for federal income tax purposes as of April 30, 2005, are as follows:
| Federal Tax Cost Basis | $ | 103,608 | |||||
| Unrealized Appreciation | $ | 6,142 | |||||
| Unrealized (Depreciation) | (3,898 | ) | |||||
| Net Unrealized Appreciation (Depreciation) | $ | 2,244 | |||||
NOTE 5. REGULATORY PROCEEDINGS
There continues to be significant federal and state regulatory activity relating to financial services companies, particularly mutual fund companies and their investment advisers. As part of an ongoing investigation regarding potential market timing, recordkeeping and trading compliance issues and matters affecting the Fund's investment adviser, TFAI, and certain employees and affiliates of TFAI, the SEC staff has indicated that it is likely to take some action against TFAI and certain of its affiliates at the conclusion of the investigation. The potential timing and the scope of any such action is difficult to predict. Although the impact of any action brought against TFAI and/or its affiliates is difficult to assess at the present time, the Fund currently believes that the likelihood that any such action will have a material adverse impact on it is remote. It is important to note that the Fund is not aware of any allegation of wrongdoing against it and its board at the time this semi-annual report is printed. Although it is not anticipated that these developments will have an adverse impact on the Fund, there can be no assurance at this time. TFAI and its affiliates are actively working with the SEC in regard to this matter; however, the exact resolution cannot be determined at this time. TFAI will take such actions that it deems necessary or appropriate to continue providing management services to the Fund and to bring all matters to an appropriate conclusion.
TFAI and/or its affiliates, and not the Fund, will bear the costs regarding these regulatory matters.
Transamerica IDEX Mutual Funds
Semi-Annual Report 2005
TA IDEX Jennison Growth 11
TA IDEX Jennison Growth
INVESTMENT ADVISORY AND SUB-ADVISORY AGREEMENTS – REVIEW AND RENEWAL
At a meeting of the Board of Trustees of Transamerica IDEX Mutual Funds ("TA IDEX") held on October 6, 2004, the Board considered and approved the renewal for a one-year period of the Investment Advisory Agreement between TA IDEX Jennison Growth (the "Fund") and Transamerica Fund Advisors, Inc. ("TFAI") as well as the Investment Sub-Advisory Agreement of the Fund between TFAI and Jennison Associates LLC (the "Sub-Adviser"). In approving the renewal of these agreements, the Board concluded that the Investment Advisory and Investment Sub-Advisory Agreements enable shareholders of the Fund to obtain high quality services at a cost that is appropriate, reasonable, and in the best interests of shareholders based upon the following determinations, among others:
The nature, extent and quality of the advisory service to be provided. The Board considered the nature and quality of the services provided by TFAI and the Sub-Adviser to the Fund in the past, as well as the services anticipated to be provided in the future. The Board concluded that TFAI and the Sub-Adviser are capable of providing high quality services to the Fund, as indicated by TFAI's management capabilities demonstrated with respect to the Fund and other funds managed by TFAI, TFAI's management oversight process, and the professional qualifications and experience of the Sub-Adviser's portfolio management team. The Board also concluded that TFAI and the Sub-Adviser would provide the same quality and quantity of investment management and related services as before, that these services are app ropriate in scope and extent in light of the Fund's operations, the competitive landscape of the investment company business and investor needs, and that TFAI's and the Sub-Adviser's obligations will remain the same in all respects.
The investment performance of the Fund. The Board concluded, based in particular on information provided by Lipper Analytics, that the Fund's investment performance was competitive relative to comparable funds over trailing one-, two-, three- and five-year periods and to the Fund's benchmark index over one- and five-year periods. On the basis of the Trustees' assessment of the nature, extent and quality of investment advisory and related services to be provided or procured by TFAI and the Sub-Adviser, the Trustees concluded that TFAI and the Sub-Adviser were capable of generating a level of investment performance that is appropriate in light of the Fund's investment objective, policies and strategies and competitive with many other investment companies.
The cost of advisory services provided and the level of profitability. On the basis of the Board's review of the fees to be charged by TFAI and the Sub-Adviser for investment advisory and related services, TFAI's financial statements, the fees paid by TFAI to the Sub-Adviser, TFAI's estimated net management income resulting from its management of the Fund, the estimated profitability of TFAI's relationships with the Fund and TA IDEX, and the estimated profitability of the Sub-Adviser's relationship with the Fund, the Board concluded that the level of investment advisory fees and the profitability is appropriate in light of the services provided, the management fees and overall expense ratios of comparable investment companies, and the anticipated profitability of the relationship between the Fun d, TFAI and the Sub-Adviser. Further, on the basis of comparative information supplied by Lipper Analytics, the Board determined that the advisory fees and estimated overall expense ratio of the Fund were consistent with industry averages.
The extent to which economies of scale would be realized as the Fund grows and whether fee levels reflect these economies of scale for the benefit of Fund investors. The Trustees concluded that inclusion of asset-based breakpoints in the Fund's advisory fee schedule appropriately benefited investors by realizing economies of scale in the form of a lower advisory fee rate as the level of Fund assets increases. The Board also concluded that the advisory fees appropriately reflect the Fund's current size, the current economic environment for TFAI, and the competitive nature of the investment company market. In addition, the Board noted that it will have the opportunity to periodically re-examine whether the Fund has achieved economies of scale, as well as the appropriateness of advisory fees payabl e to TFAI and the Sub-Adviser in the future.
Benefits (such as soft dollars) to TFAI or the Sub-Adviser from its relationship with the Fund. The Board concluded that other benefits derived by TFAI or the Sub-Adviser from its relationship with the Fund are reasonable and fair, and are consistent with industry practice and the best interests of the Fund and its shareholders. In this regard, the Board noted that TFAI does not realize "soft dollar" benefits from its relationship with the Fund, and that the Sub-Adviser is participating in a brokerage program pursuant to which a portion of brokerage commissions paid by the Fund is recaptured for the benefit of the Fund and its shareholders, thus limiting the amount of "soft-dollar" arrangements the Sub-Adviser may engage in with respect to the Fund's portfolio brokerage transactions.
Other considerations. The Board also determined that TFAI had made a substantial commitment to the recruitment and retention of high quality personnel, and maintained the financial, compliance and operational resources reasonably necessary to manage the Fund in a professional manner that is consistent with the best interests of the Fund and its shareholders. The Trustees also concluded that TFAI had made a significant entrepreneurial commitment to the management and success of the Fund, reflected by TFAI's expense limitation and fee waiver arrangement with the Fund which, as demonstrated in the past with the Fund, may result in TFAI waiving a substantial amount of advisory fees for the benefit of shareholders.
Transamerica IDEX Mutual Funds
Semi-Annual Report 2005
12
TA IDEX Jennison Growth
SUPPLEMENTAL INFORMATION (unaudited)
RESULTS OF SHAREHOLDER PROXY
At a special meeting of shareholders held on February 25, 2005, the results of the Proposals were as follows:
Transamerica IDEX Mutual Funds
Proposal 1: Election of Trustees to the Board of Trustees of Transamerica IDEX Mutual Funds.
| For | Withheld | ||||||||||
| Peter R. Brown | 872,017,875.249 | 4,468,498.551 | |||||||||
| Daniel Calabria | 871,917,069.786 | 4,569,304.014 | |||||||||
| Janise B. Case | 872,099,393.125 | 4,386,980.675 | |||||||||
| Charles C. Harris | 872,086,722.025 | 4,399,651.775 | |||||||||
| Leo J. Hill | 872,304,465.640 | 4,181,908.160 | |||||||||
| Russell A. Kimball, Jr. | 872,253,556.471 | 4,232,817.329 | |||||||||
| William W. Short, Jr. | 872,139,920.944 | 4,346,452.856 | |||||||||
| John Waechter | 872,261,152.376 | 4,225,221.424 | |||||||||
| Jack E. Zimmerman | 871,929,967.512 | 4,556,406.288 | |||||||||
| Brian C. Scott | 872,218,970.367 | 4,267,403.433 | |||||||||
| Thomas P. O'Neill | 872,111,944.117 | 4,374,429.683 | |||||||||
TA IDEX Jennison Growth
Proposal 2: Approval of an Agreement and Plan of Reorganization pursuant to which Transamerica IDEX Mutual Funds will organize as a Delaware statutory trust.
| For | Against | Abstentions/Broker Non-Votes | |||||||||
| 7,755,518.190 | 43,078.308 | 3,063,084.518 | |||||||||
Proposal 3: Approval of changes to the fundamental investment restrictions of TA IDEX Jennison Growth.
| A. Diversification | For | Against | Abstentions/Broker Non-Votes | ||||||||||||
| 7,763,759.362 | 56,008.015 | 3,041,913.639 | |||||||||||||
| B. Borrowing | For | Against | Abstentions/Broker Non-Votes | ||||||||||||
| 7,762,087.992 | 57,679.385 | 3,041,913.639 | |||||||||||||
| C. Senior Securities | For | Against | Abstentions/Broker Non-Votes | ||||||||||||
| 7,761,753.100 | 58,014.277 | 3,041,913.639 | |||||||||||||
| D. Underwriting Securities | For | Against | Abstentions/Broker Non-Votes | ||||||||||||
| 7,763,759.362 | 56,008.015 | 3,041,913.639 | |||||||||||||
| E. Real Estate | For | Against | Abstentions/Broker Non-Votes | ||||||||||||
| 7,767,188.362 | 56,008.015 | 3,038,484.639 | |||||||||||||
| F. Making Loans | For | Against | Abstentions/Broker Non-Votes | ||||||||||||
| 7,762,473.362 | 60,723.015 | 3,038,484.639 | |||||||||||||
| G. Concentration | For | Against | Abstentions/Broker Non-Votes | ||||||||||||
| 7,767,188.362 | 56,008.015 | 3,038,484.639 | |||||||||||||
| H. Commodities | For | Against | Abstentions/Broker Non-Votes | ||||||||||||
| 7,764,117.113 | 59,079.264 | 3,038,484.639 | |||||||||||||
Transamerica IDEX Mutual Funds
Semi-Annual Report 2005
13
TA IDEX J.P. Morgan Mid Cap Value
GRAPHICAL PRESENTATION OF SCHEDULE OF INVESTMENTS
By Sector
At April 30, 2005
(unaudited)

This chart shows the percentage breakdown by sector of the Fund's total investment securities.
Transamerica IDEX Mutual Funds
Semi-Annual Report 2005
1
TA IDEX J.P. Morgan Mid Cap Value
SCHEDULE OF INVESTMENTS
At April 30, 2005
(all amounts except share amounts in thousands)
(unaudited)
| Shares | Value | ||||||||||
| COMMON STOCKS (95.9%) | |||||||||||
| Apparel Products (4.1%) | |||||||||||
| Columbia Sportswear Co. (a) | 40,000 | $ | 1,720 | ||||||||
| V.F. Corp. | 66,800 | 3,780 | |||||||||
| Automotive (1.5%) | |||||||||||
| Genuine Parts Co. | 19,900 | 854 | |||||||||
| Harsco Corp. | 22,900 | 1,229 | |||||||||
| Automotive Dealers & Service Stations (3.5%) | |||||||||||
| AutoNation, Inc. (a) | 62,000 | 1,133 | |||||||||
| AutoZone, Inc. (a) | 42,600 | 3,536 | |||||||||
| Beverages (0.9%) | |||||||||||
| Brown-Forman Corp.–Class B | 20,700 | 1,149 | |||||||||
| Chemicals & Allied Products (5.3%) | |||||||||||
| Albemarle Corp. | 46,400 | 1,699 | |||||||||
| Clorox Co. | 13,200 | 836 | |||||||||
| International Flavors & Fragrances, Inc. | 40,800 | 1,546 | |||||||||
| Lauder (Estee) Cos., Inc. (The)–Class A | 18,600 | 714 | |||||||||
| PPG Industries, Inc. | 19,900 | 1,344 | |||||||||
| Sherwin-Williams Co. (The) | 21,200 | 945 | |||||||||
| Commercial Banks (7.2%) | |||||||||||
| Cullen/Frost Bankers, Inc. | 14,700 | 637 | |||||||||
| M&T Bank Corp. | 28,800 | 2,979 | |||||||||
| North Fork Bancorp, Inc. | 102,000 | 2,871 | |||||||||
| Northern Trust Corp. | 29,500 | 1,328 | |||||||||
| TCF Financial Corp. | 34,000 | 860 | |||||||||
| Wilmington Trust Corp. | 30,500 | 1,078 | |||||||||
| Computer & Data Processing Services (3.1%) | |||||||||||
| Affiliated Computer Services, Inc.–Class A (a) | 26,100 | 1,244 | |||||||||
| Computer Associates International, Inc. | 36,000 | 968 | |||||||||
| IMS Health, Inc. | 44,300 | 1,062 | |||||||||
| Interactive Data Corp. (a) | 45,100 | 904 | |||||||||
| Computer & Office Equipment (0.7%) | |||||||||||
| Lexmark International, Inc. (a) | 13,400 | 931 | |||||||||
| Department Stores (1.9%) | |||||||||||
| May Department Stores Co. (The) | 18,500 | 649 | |||||||||
| TJX Cos., Inc. | 85,800 | 1,943 | |||||||||
| Electric Services (4.0%) | |||||||||||
| DPL, Inc. | 29,000 | 738 | |||||||||
| Energy East Corp. | 39,100 | 1,017 | |||||||||
| PPL Corp. | 20,700 | 1,123 | |||||||||
| SCANA Corp. | 34,100 | 1,324 | |||||||||
| Westar Energy, Inc. | 51,400 | 1,177 | |||||||||
| Electrical Goods (1.3%) | |||||||||||
| Carlisle Cos., Inc. | 24,800 | 1,781 | |||||||||
| Shares | Value | ||||||||||
| Electronic & Other Electric Equipment (1.6%) | |||||||||||
| Ametek, Inc. | 23,000 | $ | 871 | ||||||||
| Cooper Industries, Ltd.–Class A | 19,200 | 1,222 | |||||||||
| Environmental Services (0.8%) | |||||||||||
| Republic Services, Inc. | 29,300 | 1,014 | |||||||||
| Fabricated Metal Products (2.7%) | |||||||||||
| Crane Co. | 43,200 | 1,106 | |||||||||
| Fortune Brands, Inc. | 18,400 | 1,556 | |||||||||
| Parker Hannifin Corp. | 16,100 | 965 | |||||||||
| Food & Kindred Products (1.4%) | |||||||||||
| Hormel Foods Corp. | 44,200 | 1,376 | |||||||||
| Smucker (J.M.) Co. (The) | 11,000 | 546 | |||||||||
| Furniture & Home Furnishings Stores (0.5%) | |||||||||||
| Tuesday Morning Corp. (a) | 28,200 | 741 | |||||||||
| Gas Production & Distribution (4.9%) | |||||||||||
| AGL Resources, Inc. | 27,800 | 962 | |||||||||
| Energen Corp. | 16,500 | 1,022 | |||||||||
| Kinder Morgan, Inc. | 39,900 | 3,051 | |||||||||
| Questar Corp. | 16,100 | 940 | |||||||||
| UGI Corp. | 12,300 | 618 | |||||||||
| Health Services (4.6%) | |||||||||||
| Coventry Health Care, Inc. (a) | 37,300 | 2,552 | |||||||||
| Manor Care, Inc. | 31,400 | 1,047 | |||||||||
| Omnicare, Inc. | 25,700 | 891 | |||||||||
| Quest Diagnostics, Inc. | 8,300 | 878 | |||||||||
| Renal Care Group, Inc. (a) | 22,200 | 847 | |||||||||
| Holding & Other Investment Offices (1.3%) | |||||||||||
| PS Business Parks, Inc. | 14,000 | 565 | |||||||||
| Rayonier, Inc. | 23,400 | 1,176 | |||||||||
| Industrial Machinery & Equipment (0.7%) | |||||||||||
| American Standard Cos., Inc. | 22,400 | 1,002 | |||||||||
| Insurance (10.1%) | |||||||||||
| Assurant, Inc. | 104,700 | 3,465 | |||||||||
| Cincinnati Financial Corp. | 26,355 | 1,061 | |||||||||
| IPC Holdings, Ltd. | 46,100 | 1,735 | |||||||||
| MGIC Investment Corp. | 22,500 | 1,328 | |||||||||
| Old Republic International Corp. | 105,200 | 2,483 | |||||||||
| PartnerRe, Ltd. | 18,300 | 1,067 | |||||||||
| Principal Financial Group | 26,800 | 1,047 | |||||||||
| SAFECO Corp. | 25,900 | 1,364 | |||||||||
| Insurance Agents, Brokers & Service (0.5%) | |||||||||||
| Willis Group Holdings, Ltd. | 21,100 | 706 | |||||||||
| Metal Cans & Shipping Containers (0.9%) | |||||||||||
| Ball Corp. | 29,700 | 1,173 | |||||||||
The notes to the financial statements are an integral part of this report.
Transamerica IDEX Mutual Funds
Semi-Annual Report 2005
2
TA IDEX J.P. Morgan Mid Cap Value
SCHEDULE OF INVESTMENTS (continued)
At April 30, 2005
(all amounts except share amounts in thousands)
(unaudited)
| Shares | Value | ||||||||||
| Mining (1.8%) | |||||||||||
| Florida Rock Industries, Inc. | 8,900 | $ | 517 | ||||||||
| Vulcan Materials Co. | 35,700 | 1,894 | |||||||||
| Motor Vehicles, Parts & Supplies (0.7%) | |||||||||||
| BorgWarner, Inc. | 21,200 | 969 | |||||||||
| Oil & Gas Extraction (3.9%) | |||||||||||
| Burlington Resources, Inc. | 45,000 | 2,187 | |||||||||
| Devon Energy Corp. | 54,500 | 2,462 | |||||||||
| Pioneer Natural Resources Company | 14,400 | 586 | |||||||||
| Paper & Allied Products (1.6%) | |||||||||||
| MeadWestvaco Corp. | 22,200 | 654 | |||||||||
| Pactiv Corp. (a) | 69,800 | 1,497 | |||||||||
| Petroleum Refining (2.4%) | |||||||||||
| Ashland, Inc. | 17,600 | 1,183 | |||||||||
| Marathon Oil Corp. | 21,200 | 987 | |||||||||
| Premcor, Inc. | 15,300 | 1,012 | |||||||||
| Pharmaceuticals (0.8%) | |||||||||||
| Sigma-Aldrich Corp. | 18,200 | 1,063 | |||||||||
| Printing & Publishing (4.6%) | |||||||||||
| Dex Media, Inc. | 58,600 | 1,283 | |||||||||
| Gannett Co., Inc. | 31,500 | 2,426 | |||||||||
| Knight-Ridder, Inc. | 11,700 | 757 | |||||||||
| Scripps (E.W.) Co. (The) | 34,200 | 1,742 | |||||||||
| Real Estate (1.2%) | |||||||||||
| Brookfield Properties Co. | 46,100 | 1,170 | |||||||||
| Forest City Enterprises, Inc.–Class A | 8,000 | 505 | |||||||||
| Restaurants (1.9%) | |||||||||||
| Applebees International, Inc. | 31,200 | 773 | |||||||||
| Outback Steakhouse, Inc. | 44,500 | 1,798 | |||||||||
| Shares | Value | ||||||||||
| Retail Trade (0.8%) | |||||||||||
| Tiffany & Co. | 38,000 | $ | 1,146 | ||||||||
| Savings Institutions (3.4%) | |||||||||||
| Golden West Financial Corp. | 51,700 | 3,222 | |||||||||
| Webster Financial Corp. | 30,400 | 1,382 | |||||||||
| Security & Commodity Brokers (1.5%) | |||||||||||
| Legg Mason, Inc. | 16,600 | 1,176 | |||||||||
| T. Rowe Price Group, Inc. | 14,700 | 811 | |||||||||
| Telecommunications (4.6%) | |||||||||||
| ALLTEL Corp. | 45,100 | 2,569 | |||||||||
| CenturyTel, Inc. | 76,500 | 2,348 | |||||||||
| Telephone & Data Systems, Inc. | 16,800 | 1,297 | |||||||||
| Textile Mill Products (0.6%) | |||||||||||
| Mohawk Industries, Inc. (a) | 10,500 | 817 | |||||||||
| Variety Stores (1.4%) | |||||||||||
| Family Dollar Stores, Inc. | 70,400 | 1,899 | |||||||||
| Wholesale Trade Nondurable Goods (1.2%) | |||||||||||
| Dean Foods Co. (a) | 47,400 | 1,629 | |||||||||
| Total Common Stocks (cost: $133,958) | 129,237 | ||||||||||
| Total Investment Securities (cost: $133,958) | $ | 129,237 | |||||||||
| SUMMARY: | |||||||||||
| Investments, at value | 95.9 | % | $ | 129,237 | |||||||
| Other assets in excess of liabilities | 4.1 | % | 5,526 | ||||||||
| Net assets | 100.0 | % | $ | 134,763 | |||||||
NOTES TO SCHEDULE OF INVESTMENTS:
(a) No dividends were paid during the preceding twelve months.
The notes to the financial statements are an integral part of this report.
Transamerica IDEX Mutual Funds
Semi-Annual Report 2005
3
TA IDEX J.P. Morgan Mid Cap Value
STATEMENT OF ASSETS AND LIABILITIES
At April 30, 2005
(all amounts except per share amounts in thousands)
(unaudited)
| Assets: | |||||||
| Investment securities, at value (cost: $133,958) | $ | 129,237 | |||||
| Cash | 8,522 | ||||||
| Receivables: | |||||||
| Investment securities sold | 1,632 | ||||||
| Shares of beneficial interest sold | 388 | ||||||
| Interest | 10 | ||||||
| Dividends | 94 | ||||||
| 139,883 | |||||||
| Liabilities: | |||||||
| Investment securities purchased | 5,005 | ||||||
| Accounts payable and accrued liabilities: | |||||||
| Management and advisory fees | 63 | ||||||
| Distribution and service fees | 38 | ||||||
| Other | 14 | ||||||
| 5,120 | |||||||
| Net Assets | $ | 134,763 | |||||
| Net Assets Consist of: | |||||||
| Shares of beneficial interest, unlimited shares authorized, no par value | $ | 139,394 | |||||
| Undistributed net investment income (loss) | 16 | ||||||
| Undistributed net realized gain (loss) from investment securities | 74 | ||||||
| Net unrealized appreciation (depreciation) on investment securities | (4,721 | ) | |||||
| Net Assets | $ | 134,763 | |||||
| Shares Outstanding: | 14,216 | ||||||
| Net Asset Value and Offering Price Per Share: | $ | 9.48 | |||||
STATEMENT OF OPERATIONS
For the period ended April 30, 2005 (a)
(all amounts in thousands)
(unaudited)
| Investment Income: | |||||||
| Interest | $ | 32 | |||||
| Dividends | 151 | ||||||
| 183 | |||||||
| Expenses: | |||||||
| Management and advisory fees | 133 | ||||||
| Transfer agent fees | 1 | ||||||
| Printing and shareholder reports | 1 | ||||||
| Custody fees | 19 | ||||||
| Administration fees | 3 | ||||||
| Legal fees | 1 | ||||||
| Audit fees | 2 | ||||||
| Trustees fees | 1 | ||||||
| Distribution and service fees | 55 | ||||||
| Total expenses | 216 | ||||||
| Less: | |||||||
| Advisory fee waiver | (49 | ) | |||||
| Net expenses | 167 | ||||||
| Net Investment Income (Loss) | 16 | ||||||
| Net Realized and Unrealized Gain (Loss) | |||||||
| Realized Gain (Loss) from investment securities | 74 | ||||||
| Increase (decrease) in unrealized appreciation (depreciation) on investment securities | (4,721 | ) | |||||
| Net Gain (Loss) on Investments | (4,647 | ) | |||||
| Net Increase (Decrease) in Net Assets Resulting from Operations | $ | (4,631 | ) | ||||
(a) Commenced operations on March 1, 2005.
The notes to the financial statements are an integral part of this report.
Transamerica IDEX Mutual Funds
Semi-Annual Report 2005
4
TA IDEX J.P. Morgan Mid Cap Value
STATEMENT OF CHANGES IN NET ASSETS
For the period ended
(all amounts in thousands)
| April 30, 2005 (a) (unaudited) | |||||||||||
| Increase (Decrease) In Net Assets From: | |||||||||||
| Operations: | |||||||||||
| Net investment income (loss) | $ | 16 | |||||||||
| Net realized gain (loss) from investment securities | 74 | ||||||||||
| Net unrealized appreciation (depreciation) on investment securities | (4,721 | ) | |||||||||
| (4,631 | ) | ||||||||||
| Capital Share Transactions: | |||||||||||
| Proceeds from shares sold | 139,394 | ||||||||||
| Net increase (decrease) in net assets | 134,763 | ||||||||||
| Net Assets: | |||||||||||
| Beginning of period | – | ||||||||||
| End of period | $ | 134,763 | |||||||||
| Undistributed Net Investment Income (Loss) | $ | 16 | |||||||||
| Share Activity: | |||||||||||
| Shares issued | 14,216 | ||||||||||
| 14,216 | |||||||||||
| Net increase (decrease) in shares outstanding | 14,216 | ||||||||||
| 14,216 | |||||||||||
(a) Commenced operations on March 1, 2005.
The notes to the financial statements are an integral part of this report.
Transamerica IDEX Mutual Funds
Semi-Annual Report 2005
5
TA IDEX J.P. Morgan Mid Cap Value
FINANCIAL HIGHLIGHTS
(unaudited for the period ended April 30, 2005)
| For a share of beneficial interest outstanding throughout the period | |||||||||||||||||||||||||||||||||||
| Net Asset | Investment Operations | Distributions | Net Asset | ||||||||||||||||||||||||||||||||
| For the Period Ended (d)(g) | Value, Beginning of Period | Net Investment Income (Loss) | Net Realized and Unrealized Gain (Loss) | Total Operations | From Net Investment Income | From Net Realized Gains | Total Distributions | Value, End of Period | |||||||||||||||||||||||||||
| 4/30/2005 | $ | 10.00 | $ | 0.00 | $ | (0.52 | ) | $ | (0.52 | ) | $ | – | $ | – | $ | – | $ | 9.48 | |||||||||||||||||
| Ratios/Supplemental Data | |||||||||||||||||||||||||||
| For the Period | Total | Net Assets, End of PeriodRatio of Expenses to Average Net Assets (a) | Net Investment Income (Loss) to Average | Portfolio Turnover | |||||||||||||||||||||||
| Ended (g) | Return (c) | (000's) | Net (e) | Total (f) | Net Assets (a) | Rate (b) | |||||||||||||||||||||
| 4/30/2005 | (5.20 | )% | $ | 134,763 | 1.05 | % | 1.37 | % | 0.10 | % | 6 | % | |||||||||||||||
NOTES TO FINANCIAL HIGHLIGHTS
(a) Annualized.
(b) Not annualized for periods of less than one year.
(c) Total Return has been calculated for the applicable period without deduction of a sales load, if any, on an initial purchase. Periods of less than one year are not annualized.
(d) Per share information is calculated based on average number of shares outstanding.
(e) Ratio of Net Expenses to Average Net Assets is net of fee waivers and reimbursements by the investment adviser, if any (see note 2).
(f) Ratio of Total Expenses to Average Net Assets includes all expenses before fee waivers and reimbursements by the investment adviser.
(g) TA IDEX J.P. Morgan Mid Cap Value ("the Fund") commenced operations on March 1, 2005.
The notes to the financial statements are an integral part of this report.
Transamerica IDEX Mutual Funds
Semi-Annual Report 2005
6
TA IDEX J.P. Morgan Mid Cap Value
NOTES TO FINANCIAL STATEMENTS
At April 30, 2005
(all amounts in thousands)
(unaudited)
NOTE 1. ORGANIZATION AND SIGNIFICANT ACCOUNTING POLICIES
Transamerica IDEX Mutual Funds is a Delaware statutory trust registered under the Investment Company Act of 1940, as amended (the "1940 Act"), as an open-end management investment company. Prior to March 1, 2005, Transamerica IDEX Mutual Funds was a Massachusetts business trust. TA IDEX J.P. Morgan Mid Cap Value ("the Fund"), part of Transamerica IDEX Mutual Funds, began operations on March 1, 2005.
In the normal course of business, the Fund enters into contracts that contain a variety of representations and warranties, which provide general indemnifications. The Fund's maximum exposure under these arrangements is unknown, as this would involve future claims that may be made against the Fund and/or its affiliates that have not yet occurred. However, based on experience, the Fund expects the risk of loss to be remote.
See the Prospectus and Statement of Additional Information for a description of the Fund's investment objective.
In preparing the Fund's financial statements in accordance with accounting principles generally accepted in the United States of America ("GAAP"), estimates or assumptions (which could differ from actual results) may be used that affect reported amounts and disclosures. The following policies were consistently followed by the Fund, in accordance with GAAP.
Pricing of shares: The Fund prices its shares on the basis of the net asset value of each class of shares of the Fund, which is determined as of the close of the New York Stock Exchange ("NYSE") (generally 4:00 p.m. Eastern Time) on each day on which the NYSE is open for trading.
Security valuations: Fund investments traded on an exchange are valued at the closing price on the day of valuation on the exchange where the security is principally traded. With respect to securities traded on NASDAQ NMS, such closing price may be last reported sales price or the NASDAQ Official Closing Price.
Securities traded in the over-the-counter market and listed securities for which no sale was reported on that date are valued at the last quoted bid price.
Other securities for which quotations are not readily available are valued at fair market value as determined in good faith using guidelines adopted by the Board of Trustees of the Fund, under the supervision of the Fund's Valuation Committee. These guidelines may include: the type of security; any restrictions on its resale; financial or business news of the issuer; similar or related securities that are actively trading; related corporate actions; and other significant events occurring after the close of trading in the security.
Cash: The Fund may leave cash overnight in its cash account with the custodian, Investors Bank & Trust Company ("IBT"). IBT has been contracted on behalf of the Fund to invest the excess cash into a savings account, which at April 30, 2005, was paying an interest rate of 2.02%.
Throughout the period from inception through April 30, 2005, the Fund may have a cash overdraft balance. A fee is incurred on this overdraft, calculated by multiplying the overdraft by a rate based on the federal funds rate.
Security transactions and investment income: Security transactions are recorded on the trade date. Security gains and losses are calculated on the specific identification basis. Dividend income is recorded on the ex-dividend date or, in the case of foreign securities, as soon as the Fund is informed of the ex-dividend date. Interest income, including accretion of discounts and amortization of premiums, is recorded on the accrual basis commencing on the settlement date.
Redemption fees: A short-term trading redemption fee may be assessed on any fund shares in a fund account that are sold during the first five (5) NYSE trading days following their purchase date. This redemption fee will equal 2% of the amount redeemed and shares held the longest will be treated as being redeemed first and shares held the shortest as being redeemed last.
For the period from inception through April 30, 2005, the Fund received no redemption fees.
Dividend distributions: Distributions to shareholders are recorded on the ex-dividend date and are determined in accordance with Federal income tax regulations which may differ from GAAP.
NOTE 2. RELATED PARTY TRANSACTIONS
Transamerica Fund Advisors, Inc. ("TFAI") is the Fund's investment adviser. Transamerica Fund Services, Inc. ("TFS") is the Fund's administrator and transfer agent. AFSG Securities Corp. ("AFSG") is the Fund's distributor/principal underwriter. AFSG is 100% owned by AUSA Holding Company ("AUSA"). TFAI is a directly owned subsidiary of Western Reserve Life Assurance Co. of Ohio (78%) and AUSA (22%). TFS is a wholly owned subsidiary of WRL (50%) and AUSA (50%). AUSA and WRL are wholly owned indirect subsidiaries of AEGON, NV, a Netherlands corporation.
Effective January 1, 2005 AEGON/Transamerica Fund Advisors, Inc. ("ATFA") was renamed Transamerica Fund Advisors, Inc. ("TFAI"); AEGON/Transamerica Fund Services, Inc. ("ATFS") and AEGON/Transamerica Investor Services, Inc. ("ATIS") merged into one entity and was renamed Transamerica Fund Services, Inc. ("TFS").
Transamerica IDEX Mutual Funds
Semi-Annual Report 2005
7
TA IDEX J.P. Morgan Mid Cap Value
NOTES TO FINANCIAL STATEMENTS (continued)
At April 30, 2005
(all amounts in thousands)
(unaudited)
NOTE 2.–(continued)
The following schedule reflects the percentage of fund assets owned by affiliated mutual funds (i.e., through the asset allocation funds):
| Net Assets | % of Net Assets | ||||||||||
| TA IDEX Asset Allocation– Conservative Portfolio | $ | 9,305 | 6.90 | % | |||||||
| TA IDEX Asset Allocation– Growth Portfolio | 43,076 | 31.96 | % | ||||||||
| TA IDEX Asset Allocation– Moderate Growth Portfolio | 68,567 | 50.88 | % | ||||||||
| TA IDEX Asset Allocation– Moderate Portfolio | 13,349 | 9.91 | % | ||||||||
| Total | $ | 134,297 | 99.65 | % | |||||||
Investment advisory fee: The Fund pays management fees to TFAI based on average daily net assets ("ANA") at the following breakpoints:
0.85% of the first $100 million of ANA
0.80% of ANA over $100 million
TFAI has contractually agreed to waive its advisory fee and will reimburse the Fund to the extent that operating expenses exceed the following stated annual limit:
1.05% Expense Limit
If total fund expenses fall below the annual expense limitation agreement agreed to by the adviser within the succeeding three years, the Fund may be required to pay that adviser a portion or all of the waived advisory fees.
There were no amounts available for recapture at April 30, 2005.
Distribution and service fees: The Fund has a 12b-1 distribution plan under the 1940 Act pursuant to which an annual fee, based on average daily net assets, is paid to the distributor for various disbursements such as broker-dealer account servicing fees and other promotional expenses of the Fund. The Fund is authorized under the 12b-1 plan to pay fees on each class up to the following limits:
| Class A | 0.35 | % | |||||
In the case the Fund or a class of shares of the Fund is closed to new investors or investments, the Fund is authorized to pay 12b-1 fees for past sales and distribution efforts and present and past investor services.
Administrative services: The Fund has entered into an agreement with TFS for financial and legal fund administration services, which includes such items as compliance, expenses, financial statements and other reporting, distributions, tax returns, prospectus preparation, board of trustees meeting support and other legal matters. The Fund pays TFS an annual fee of 0.02% of average net assets. The Legal fees on the Statement of Operations are for fees paid to external legal counsel.
Transfer agent fees: The Fund pays TFS an annual per-account charge of $20 (not in thousands) for each open account and $1.63 (not in thousands) for each closed account. There is no new account charge. The Transfer agent fees on the Statement of Operations are made up of fees paid to TFS and costs associated with shareholder statements.
The Fund paid TFS $1 for the period from inception through April 30, 2005.
NOTE 3. INVESTMENT TRANSACTIONS
The cost of securities purchased and proceeds from securities sold (excluding short-term securities) for the period from inception through April 30, 2005, were as follows:
| Purchases of securities: | |||||||
| Long-Term excluding U.S. Government | $ | 139,769 | |||||
| U.S. Government | – | ||||||
| Proceeds from maturities and sales of securities: | |||||||
| Long-Term excluding U.S. Government | 5,885 | ||||||
| U.S. Government | – | ||||||
NOTE 4. FEDERAL INCOME TAX MATTERS
The Fund has not made any provision for federal income or excise taxes due to its policy to distribute all of its taxable income and capital gains to its shareholders and otherwise qualify as a regulated investment company under the Internal Revenue Code. Income and capital gain distributions are determined in accordance with income tax regulations, which may differ from GAAP. These differences are primarily due to differing treatment for items including, but not limited to, wash sales, net operating losses and capital loss carryforwards.
The aggregate cost of investments and composition of unrealized appreciation (depreciation) for federal income tax purposes as of April 30, 2005, are as follows:
| Federal Tax Cost Basis | $ | 134,026 | |||||
| Unrealized Appreciation | $ | 1,073 | |||||
| Unrealized (Depreciation) | (5,862 | ) | |||||
| Net Unrealized Appreciation (Depreciation) | $ | (4,789 | ) | ||||
Transamerica IDEX Mutual Funds
Semi-Annual Report 2005
8
TA IDEX J.P. Morgan Mid Cap Value
NOTES TO FINANCIAL STATEMENTS (continued)
At April 30, 2005
(all amounts in thousands)
(unaudited)
NOTE 5. REGULATORY PROCEEDINGS
There continues to be significant federal and state regulatory activity relating to financial services companies, particularly mutual fund companies and their investment advisers. As part of an ongoing investigation regarding potential market timing, recordkeeping and trading compliance issues and matters affecting the Fund's investment adviser, TFAI, and certain employees and affiliates of TFAI, the SEC staff has indicated that it is likely to take some action against TFAI and certain of its affiliates at the conclusion of the investigation. The potential timing and the scope of any such action is difficult to predict. Although the impact of any action brought against TFAI and/or its affiliates is difficult to assess at the present time, the Fund currently believes that the likelihood that any such action will have a material adverse impact on it is remote. It is important to note that the Fund is not aware of any allegation of wrongdoing against it and its board at the time this semi-annual report is printed. Although it is not anticipated that these developments will have an adverse impact on the Fund, there can be no assurance at this time. TFAI and its affiliates are actively working with the SEC in regard to this matter; however, the exact resolution cannot be determined at this time. TFAI will take such actions that it deems necessary or appropriate to continue providing management services to the Fund and to bring all matters to an appropriate conclusion.
TFAI and/or its affiliates, and not the Fund, will bear the costs regarding these regulatory matters.
Transamerica IDEX Mutual Funds
Semi-Annual Report 2005
9
TA IDEX J.P. Morgan Mid Cap Value
A discussion regarding the basis of Transamerica IDEX Mutual Fund's Board of Trustees' approval of the fund's advisory arrangements will be available in the fund's annual report for the fiscal year ending October 31, 2005.
Transamerica IDEX Mutual Funds
Semi-Annual Report 2005
10
TA IDEX Marsico Growth
UNDERSTANDING YOUR FUND'S EXPENSES
(unaudited)
SHAREHOLDER EXPENSES
The following Example is intended to help you understand your ongoing costs (in dollars and cents) of investing in a Fund and to compare these costs with the ongoing costs of investing in other funds.
The Example is based on an investment of $1,000 invested at November 1, 2004 and held for the entire period until April 30, 2005.
ACTUAL EXPENSES
The first line in the table below provides information about actual account values and actual expenses. You may use the information in this line, together with the amount you invested, to estimate the expenses that you paid over the period. Simply divide your account value by $1,000 (for example, an $8,600 account value divided by $1,000 = 8.6), then multiply the result by the number in the first line of your Fund under the heading entitled "Expenses Paid During Period" to estimate the expenses you paid on your account during this period.
HYPOTHETICAL EXAMPLE FOR COMPARISON PURPOSES
The second line in the table below provides information about hypothetical account values and hypothetical expenses based on the Fund's actual expense ratio and an assumed rate of return of 5% per year before expenses, which is not the Fund's actual return. The hypothetical account values and expenses may not be used to estimate the actual ending account balance or expenses you paid for the period. You may use this information to compare the ongoing costs of investing in your Fund and other funds. To do so, compare this 5% hypothetical example with the 5% hypothetical examples that appear in the shareholder reports of the other funds.
Please note that the expenses shown in the table are meant to highlight your ongoing costs only and do not reflect any transactional costs, such as sales charges, redemption fees, brokerage commissions paid on purchases and sales of fund shares. Therefore, the second line under the Fund in the table is useful in comparing ongoing costs only, and will not help you determine the relative total costs of owning different funds. In addition, note that the expenses shown in the table are meant to highlight your ongoing costs and do not reflect any transaction costs.
| Beginning Account Value | Ending Account Value | Annualized Expense Ratio | Expenses Paid During Period (a) | ||||||||||||||||
| Class A | |||||||||||||||||||
| Actual | $ | 1,000.00 | $ | 1,045.90 | 1.38 | % | $ | 7.00 | |||||||||||
| Hypothetical (b) | 1,000.00 | 1,017.95 | 1.38 | 6.90 | |||||||||||||||
| Class B | |||||||||||||||||||
| Actual | 1,000.00 | 1,040.90 | 2.27 | 11.49 | |||||||||||||||
| Hypothetical (b) | 1,000.00 | 1,013.54 | 2.27 | 11.33 | |||||||||||||||
| Class C | |||||||||||||||||||
| Actual | 1,000.00 | 1,040.60 | 2.37 | 11.99 | |||||||||||||||
| Hypothetical (b) | 1,000.00 | 1,013.04 | 2.37 | 11.83 | |||||||||||||||
(a) Expenses are calculated using each Fund's annualized expense ratio (as disclosed in the table), multiplied by the average account value for the period, multiplied by number of days in the period (181 days), and divided by the number of days in the year (365 days).
(b) 5% return per year before expenses.
GRAPHICAL PRESENTATION OF SCHEDULE OF INVESTMENTS
By Sector
At April 30, 2005
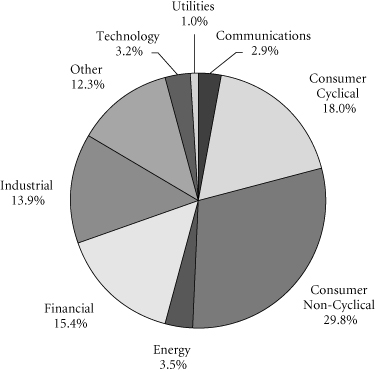
This chart shows the percentage breakdown by sector of the Fund's total investment securities.
Transamerica IDEX Mutual Funds
Semi-Annual Report 2005
1
TA IDEX Marsico Growth
SCHEDULE OF INVESTMENTS
At April 30, 2005
(all amounts except share amounts in thousands)
(unaudited)
| Shares | Value | ||||||||||
| COMMON STOCKS (95.3%) | |||||||||||
| Aerospace (5.0%) | |||||||||||
| General Dynamics Corp. | 16,036 | $ | 1,685 | ||||||||
| Lockheed Martin Corp. | 28,339 | 1,727 | |||||||||
| United Technologies Corp. | 22,063 | 2,244 | |||||||||
| Air Transportation (3.1%) | |||||||||||
| FedEx Corp. | 41,915 | 3,561 | |||||||||
| Beverages (0.5%) | |||||||||||
| PepsiCo, Inc. | 9,870 | 549 | |||||||||
| Chemicals & Allied Products (3.7%) | |||||||||||
| Procter & Gamble Co. (a) | 76,729 | 4,155 | |||||||||
| Commercial Banks (4.8%) | |||||||||||
| Citigroup, Inc. | 40,693 | 1,911 | |||||||||
| UBS AG (Foreign Registered) | 35,791 | 2,874 | |||||||||
| UCBH Holdings, Inc. | 38,128 | 600 | |||||||||
| Communications Equipment (2.7%) | |||||||||||
| QUALCOMM, Inc. | 85,949 | 2,999 | |||||||||
| Computer & Data Processing Services (2.5%) | |||||||||||
| Electronic Arts, Inc. (a)(b) | 38,272 | 2,043 | |||||||||
| Google, Inc.–Class A (a)(b) | 2,564 | 564 | |||||||||
| Pixar, Inc. (b) | 4,485 | 205 | |||||||||
| Computer & Office Equipment (1.5%) | |||||||||||
| Dell, Inc. (b) | 48,244 | 1,680 | |||||||||
| Construction (1.7%) | |||||||||||
| KB Home | 23,242 | 1,325 | |||||||||
| MDC Holdings, Inc. | 9,079 | 594 | |||||||||
| Drug Stores & Proprietary Stores (1.7%) | |||||||||||
| CVS Corp. | 15,734 | 812 | |||||||||
| Walgreen Co. (a) | 26,219 | 1,129 | |||||||||
| Electric Services (1.1%) | |||||||||||
| TXU Corp. | 14,569 | 1,250 | |||||||||
| Electronic & Other Electric Equipment (5.0%) | |||||||||||
| General Electric Co. | 145,757 | 5,276 | |||||||||
| Harman International Industries, Inc. | 5,285 | 415 | |||||||||
| Health Services (1.1%) | |||||||||||
| Quest Diagnostics, Inc. | 11,660 | 1,234 | |||||||||
| Hotels & Other Lodging Places (3.0%) | |||||||||||
| MGM Mirage, Inc. (b) | 18,704 | 1,306 | |||||||||
| Wynn Resorts, Ltd. (a)(b) | 40,300 | 2,133 | |||||||||
| Industrial Machinery & Equipment (2.3%) | |||||||||||
| Caterpillar, Inc. | 28,961 | 2,550 | |||||||||
| Insurance (7.9%) | |||||||||||
| Aetna, Inc. | 5,098 | 374 | |||||||||
| Shares | Value | ||||||||||
| Insurance (continued) | |||||||||||
| PacifiCare Health Systems, Inc. (b) | 7,482 | $ | 447 | ||||||||
| UnitedHealth Group, Inc. | 79,683 | 7,531 | |||||||||
| WellPoint, Inc. (b) | 4,468 | 571 | |||||||||
| Lumber & Other Building Materials (2.7%) | |||||||||||
| Lowe's Cos., Inc. (a) | 58,948 | 3,072 | |||||||||
| Medical Instruments & Supplies (6.2%) | |||||||||||
| Medtronic, Inc. | 26,580 | 1,401 | |||||||||
| St. Jude Medical, Inc. (b) | 41,760 | 1,630 | |||||||||
| Zimmer Holdings, Inc. (b) | 48,421 | 3,942 | |||||||||
| Mortgage Bankers & Brokers (3.2%) | |||||||||||
| Countrywide Financial Corp. | 101,299 | 3,666 | |||||||||
| Oil & Gas Extraction (1.2%) | |||||||||||
| Schlumberger, Ltd. | 19,012 | 1,301 | |||||||||
| Personal Credit Institutions (3.9%) | |||||||||||
| SLM Corp. | 93,570 | 4,458 | |||||||||
| Petroleum Refining (2.7%) | |||||||||||
| Exxon Mobil Corp. | 52,972 | 3,021 | |||||||||
| Pharmaceuticals (13.2%) | |||||||||||
| Genentech, Inc. (b) | 109,435 | 7,763 | |||||||||
| Johnson & Johnson | 50,024 | 3,433 | |||||||||
| Pfizer, Inc. | 76,736 | 2,085 | |||||||||
| Sanofi-Aventis, ADR (a) | 37,037 | 1,643 | |||||||||
| Real Estate (1.0%) | |||||||||||
| St. Joe Co. (The) | 15,962 | 1,111 | |||||||||
| Residential Building Construction (1.8%) | |||||||||||
| Lennar Corp.–Class A | 24,130 | 1,242 | |||||||||
| Toll Brothers, Inc. (a)(b) | 11,219 | 850 | |||||||||
| Restaurants (3.3%) | |||||||||||
| Starbucks Corp. (b) | 33,938 | 1,681 | |||||||||
| Yum! Brands, Inc. | 44,889 | 2,108 | |||||||||
| Rubber & Misc. Plastic Products (2.5%) | |||||||||||
| NIKE, Inc.–Class B | 37,081 | 2,848 | |||||||||
| Security & Commodity Brokers (3.8%) | |||||||||||
| Chicago Mercantile Exchange | 9,054 | 1,770 | |||||||||
| Goldman Sachs Group, Inc. (The) | 23,817 | 2,543 | |||||||||
| Variety Stores (0.8%) | |||||||||||
| Target Corp. | 20,191 | 937 | |||||||||
| Water Transportation (1.4%) | |||||||||||
| Royal Caribbean Cruises, Ltd. (a) | 38,889 | 1,634 | |||||||||
| Total Common Stocks (cost: $95,112) | 107,883 | ||||||||||
The notes to the financial statements are an integral part of this report.
Transamerica IDEX Mutual Funds
Semi-Annual Report 2005
2
TA IDEX Marsico Growth
SCHEDULE OF INVESTMENTS (continued)
At April 30, 2005
(all amounts except share amounts in thousands)
(unaudited)
| Principal | Value | ||||||||||
| SECURITY LENDING COLLATERAL (13.3%) | |||||||||||
| Debt (11.5%) | |||||||||||
| Bank Notes (1.5%) | |||||||||||
| Bank of America | |||||||||||
| 2.82%, due 05/16/2005 | $ | 475 | $ | 475 | |||||||
| 2.80%, due 06/09/2005 (c) | 119 | 119 | |||||||||
| 2.77%, due 07/18/2005 (c) | 475 | 475 | |||||||||
| Canadian Imperial Bank of Commerce 3.02%, due 11/04/2005 (c) | 475 | 475 | |||||||||
| Credit Suisse First Boston Corp. 2.88%, due 09/09/2005 (c) 119 119 3.06%, due 03/10/2006 (c) | 119 | 119 | |||||||||
| Euro Dollar Overnight (2.0%) | |||||||||||
| Bank of Montreal 2.94%, due 05/04/2005 | 356 | 356 | |||||||||
| BNP Paribas 2.80%, due 05/05/2005 | 492 | 492 | |||||||||
| Den Danske Bank 2.93%, due 05/02/2005 2.80%, due 05/06/2005 | 428 238 | 428 238 | |||||||||
| Dexia Group 2.80%, due 05/05/2005 | 210 | 210 | |||||||||
| Royal Bank of Canada 2.80%, due 05/04/2005 | 488 | 488 | |||||||||
| Svenska Handlesbanken 2.80%, due 05/06/2005 | 78 | 78 | |||||||||
| Euro Dollar Terms (4.7%) | |||||||||||
| Bank of Nova Scotia 2.88%, due 05/11/2005 3.01%, due 05/31/2005 | 238 665 | 238 665 | |||||||||
| Barclays 3.02%, due 06/27/2005 | 424 | 424 | |||||||||
| BNP Paribas 2.93%, due 06/07/2005 | 380 | 380 | |||||||||
| Branch Banker & Trust 2.94%, due 06/06/2005 | 102 | 102 | |||||||||
| Calyon 2.93%, due 06/03/2005 | 393 | 393 | |||||||||
| Citigroup 2.87%, due 06/06/2005 | 493 | 493 | |||||||||
| Credit Suisse First Boston Corp. 2.91%, due 05/16/2005 | 487 | 487 | |||||||||
| HSBC Banking/Holdings PLC 3.01%, due 06/23/2005 | 238 | 238 | |||||||||
| Principal | Value | ||||||||||
| Euro Dollar Terms (continued) | |||||||||||
| Royal Bank of Scotland | |||||||||||
| 2.94%, due 06/07/2005 | $ | 462 | $ | 462 | |||||||
| 2.95%, due 06/10/2005 | 256 | 256 | |||||||||
| Societe Generale 2.80%, due 05/03/2005 | 455 | 455 | |||||||||
| Toronto Dominion Bank 2.75%, due 05/09/2005 3.01%, due 06/24/2005 | 356 132 | 356 132 | |||||||||
| UBS AG 2.81%, due 05/03/2005 | 238 | 238 | |||||||||
| Promissory Notes (1.2%) | |||||||||||
| Goldman Sachs Group, Inc. 2.99%, due 06/27/2005 3.01%, due 07/27/2005 | 499 832 | 499 832 | |||||||||
| Repurchase Agreements (2.1%) (d) | |||||||||||
| Goldman Sachs Group, Inc. (The) 3.04% Repurchase Agreement dated 04/29/2005 to be repurchased at $1,070 on 05/02/2005 | 1,070 | 1,070 | |||||||||
| Merrill Lynch & Co. Inc. 3.04% Repurchase Agreement dated 04/29/2005 to be repurchased at $1,284 on 05/02/2005 | 1,284 | 1,284 | |||||||||
| Shares | Value | ||||||||||
| Investment Companies (1.8%) | |||||||||||
| Money Market Funds (1.8%) | |||||||||||
| American Beacon Funds 1-day yield of 2.84% | 188,790 | $ | 189 | ||||||||
| BGI Institutional Money Market Fund 1-day yield of 2.93% | 1,117,926 | 1,118 | |||||||||
| Merrill Lynch Premier Institutional Fund 1-day yield of 2.65% | 251,569 | 251 | |||||||||
| Merrimac Cash Fund, Premium Class 1-day yield of 2.74% (e) | 460,115 | 460 | |||||||||
| Total Security Lending Collateral (cost: $15,094) | 15,094 | ||||||||||
| Total Investment Securities (cost: $110,206) | $ | 122,977 | |||||||||
| SUMMARY: | |||||||||||
| Investments, at value | 108.6 | % | $ | 122,977 | |||||||
| Liabilities in excess of other assets | (8.6 | )% | (9,782 | ) | |||||||
| Net assets | 100.0 | % | $ | 113,195 | |||||||
NOTES TO SCHEDULE OF INVESTMENTS:
(a) At April 30, 2005, all or a portion of this security is on loan (see Note 1). The value at April 30, 2005, of all securities on loan is $14,639.
(b) No dividends were paid during the preceding twelve months.
(c) Floating or variable rate note. Rate is listed as of April 30, 2005.
(d) Cash collateral for the Repurchase Agreements, valued at $2,394, that serve as collateral for securities lending are invested in corporate bonds with interest rates and maturity dates ranging from 0.00%–8.875% and 06/15/2005–03/15/2035, respectively.
(e) Regulated investment company advised by Investors Bank and Trust Co. ("IBT"). IBT is also the accounting, custody and lending agent for the Fund.
DEFINITIONS:
ADR American Depositary Receipt
The notes to the financial statements are an integral part of this report.
Transamerica IDEX Mutual Funds
Semi-Annual Report 2005
3
TA IDEX Marsico Growth
STATEMENT OF ASSETS AND LIABILITIES
At April 30, 2005
(all amounts except per share amounts in thousands)
(unaudited)
| Assets: | |||||||
| Investment securities, at value (cost: $110,206) (including securities loaned of $14,639) | $ | 122,977 | |||||
| Cash | 4,222 | ||||||
| Receivables: | |||||||
| Investment securities sold | 1,190 | ||||||
| Shares of beneficial interest sold | 93 | ||||||
| Interest | 10 | ||||||
| Dividends | 74 | ||||||
| Dividend reclaims receivable | 18 | ||||||
| Other | 3 | ||||||
| 128,587 | |||||||
| Liabilities: | |||||||
| Accounts payable and accrued liabilities: | |||||||
| Shares of beneficial interest redeemed | 94 | ||||||
| Management and advisory fees | 106 | ||||||
| Distribution and service fees | 49 | ||||||
| Transfer agent fees | 18 | ||||||
| Payable for collateral for securities on loan | 15,094 | ||||||
| Other | 31 | ||||||
| 15,392 | |||||||
| Net Assets | $ | 113,195 | |||||
| Net Assets Consist of: | |||||||
| Shares of beneficial interest, unlimited shares authorized, no par value | $ | 113,862 | |||||
| Accumulated net investment income (loss) | (266 | ) | |||||
| Accumulated net realized gain (loss) from investment securities | (13,172 | ) | |||||
| Net unrealized appreciation (depreciation) on investment securities | 12,771 | ||||||
| Net Assets | $ | 113,195 | |||||
| Net Assets by Class: | |||||||
| Class A | $ | 82,728 | |||||
| Class B | 19,856 | ||||||
| Class C | 10,611 | ||||||
| Shares Outstanding: | |||||||
| Class A | 8,644 | ||||||
| Class B | 2,167 | ||||||
| Class C | 1,161 | ||||||
| Net Asset Value Per Share: | |||||||
| Class A | $ | 9.57 | |||||
| Class B | 9.16 | ||||||
| Class C | 9.14 | ||||||
| Maximum Offering Price Per Share (a): | |||||||
| Class A | $ | 10.13 | |||||
(a) Includes the maximum selling commission (represented as a percentage of offering price) which is reduced on certain levels of sales as set forth in the Prospectus. Net asset value per share for Classes B and C shares represents offering price. The redemption price for Classes B and C shares equals net asset value less any applicable contingent deferred sales charge.
STATEMENT OF OPERATIONS
For the period ended April 30, 2005
(all amounts in thousands)
(unaudited)
| Investment Income: | |||||||
| Interest | $ | 67 | |||||
| Dividends | 536 | ||||||
| Income from loaned securities–net | 3 | ||||||
| Less withholding taxes on foreign dividends | (14 | ) | |||||
| 592 | |||||||
| Expenses: | |||||||
| Management and advisory fees | 413 | ||||||
| Transfer agent fees: | |||||||
| Class A | 21 | ||||||
| Class B | 27 | ||||||
| Class C | 12 | ||||||
| Printing and shareholder reports | 7 | ||||||
| Custody fees | 11 | ||||||
| Administration fees | 10 | ||||||
| Legal fees | 2 | ||||||
| Audit fees | 5 | ||||||
| Trustees fees | 2 | ||||||
| Registration fees: | |||||||
| Class A | 17 | ||||||
| Class B | 9 | ||||||
| Class C | 12 | ||||||
| Other | 1 | ||||||
| Distribution and service fees: | |||||||
| Class A | 126 | ||||||
| Class B | 103 | ||||||
| Class C | 52 | ||||||
| Total expenses before recapture of waived expenses | 830 | ||||||
| Recapture expenses | 27 | ||||||
| Net expenses | 857 | ||||||
| Net Investment Income (Loss) | (265 | ) | |||||
| Net Realized and Unrealized Gain (Loss) | |||||||
| Realized gain (loss) from investment securities | 1,015 | ||||||
| Increase (decrease) in unrealized appreciation (depreciation) on investment securities | 1,208 | ||||||
| Net Gain (Loss) on Investments | 2,223 | ||||||
| Net Increase (Decrease) in Net Assets Resulting from Operations | $ | 1,958 | |||||
The notes to the financial statements are an integral part of this report.
Transamerica IDEX Mutual Funds
Semi-Annual Report 2005
4
TA IDEX Marsico Growth
STATEMENTS OF CHANGES IN NET ASSETS
For the period or year ended
(all amounts in thousands)
| April 30, 2005 (unaudited) | October 31, 2004 | ||||||||||
| Increase (Decrease) In Net Assets From: | |||||||||||
| Operations: | |||||||||||
| Net investment income (loss) | $ | (265 | ) | $ | (567 | ) | |||||
| Net realized gain (loss) from investment securities | 1,015 | 869 | |||||||||
| Net unrealized appreciation (depreciation) on investment securities | 1,208 | 781 | |||||||||
| 1,958 | 1,083 | ||||||||||
| Capital Share Transactions: | |||||||||||
| Proceeds from shares sold: | |||||||||||
| Class A | 47,146 | 5,879 | |||||||||
| Class B | 2,309 | 5,383 | |||||||||
| Class C | 2,262 | 3,088 | |||||||||
| Class C2 | – | 318 | |||||||||
| Class M | – | 464 | |||||||||
| 51,717 | 15,132 | ||||||||||
| Cost of shares redeemed: | |||||||||||
| Class A | (2,425 | ) | (3,608 | ) | |||||||
| Class B | (3,033 | ) | (5,546 | ) | |||||||
| Class C | (1,379 | ) | (531 | ) | |||||||
| Class C2 | – | (564 | ) | ||||||||
| Class M | – | (911 | ) | ||||||||
| (6,837 | ) | (11,160 | ) | ||||||||
| Class level exchanges: | |||||||||||
| Class C | – | 5,573 | |||||||||
| Class C2 | – | (2,070 | ) | ||||||||
| Class M | – | (3,503 | ) | ||||||||
| – | – | ||||||||||
| Automatic conversions: | |||||||||||
| Class A | 32 | 17 | |||||||||
| Class B | (32 | ) | (17 | ) | |||||||
| – | – | ||||||||||
| 44,880 | 3,972 | ||||||||||
| Net increase (decrease) in net assets | 46,838 | 5,055 | |||||||||
| Net Assets: | |||||||||||
| Beginning of period | 66,357 | 61,302 | |||||||||
| End of period | $ | 113,195 | $ | 66,357 | |||||||
| Accumulated Net Investment Income (Loss) | $ | (266 | ) | $ | (1 | ) | |||||
| April 30, 2005 (unaudited) | October 31, 2004 | ||||||||||
| Share Activity: | |||||||||||
| Shares issued: | |||||||||||
| Class A | 4,825 | 649 | |||||||||
| Class B | 246 | 615 | |||||||||
| Class C | 241 | 352 | |||||||||
| Class C2 | – | 36 | |||||||||
| Class M | – | 53 | |||||||||
| 5,312 | 1,705 | ||||||||||
| Shares redeemed: | |||||||||||
| Class A | (246 | ) | (399 | ) | |||||||
| Class B | (325 | ) | (637 | ) | |||||||
| Class C | (148 | ) | (61 | ) | |||||||
| Class C2 | – | (63 | ) | ||||||||
| Class M | – | (104 | ) | ||||||||
| (719 | ) | (1,264 | ) | ||||||||
| Class level exchanges: | |||||||||||
| Class C | – | 639 | |||||||||
| Class C2 | – | (237 | ) | ||||||||
| Class M | – | (399 | ) | ||||||||
| – | 3 | ||||||||||
| Automatic conversions: | |||||||||||
| Class A | 3 | 2 | |||||||||
| Class B | (3 | ) | (2 | ) | |||||||
| – | – | ||||||||||
| Net increase (decrease) in shares outstanding: | |||||||||||
| Class A | 4,582 | 252 | |||||||||
| Class B | (82 | ) | (24 | ) | |||||||
| Class C | 93 | 930 | |||||||||
| Class C2 | – | (264 | ) | ||||||||
| Class M | – | (450 | ) | ||||||||
| 4,593 | 444 | ||||||||||
The notes to the financial statements are an integral part of this report.
Transamerica IDEX Mutual Funds
Semi-Annual Report 2005
5
TA IDEX Marsico Growth
FINANCIAL HIGHLIGHTS
(unaudited for the period ended April 30, 2005)
| For a share of beneficial interest outstanding throughout each period | |||||||||||||||||||||||||||||||||||||||
| Net Asset | Investment Operations | Distributions | Net Asset | ||||||||||||||||||||||||||||||||||||
| For the Period Ended (d)(g) | Value, Beginning of Period | Net Investment Income (Loss) | Net Realized and Unrealized Gain (Loss) | Total Operations | From Net Investment Income | From Net Realized Gains | Total Distributions | Value, End of Period | |||||||||||||||||||||||||||||||
| Class A | 4/30/2005 | $ | 9.15 | $ | (0.01 | ) | $ | 0.43 | $ | 0.42 | $ | – | $ | – | $ | – | $ | 9.57 | |||||||||||||||||||||
| 10/31/2004 | 8.97 | (0.05 | ) | 0.23 | 0.18 | – | – | – | 9.15 | ||||||||||||||||||||||||||||||
| 10/31/2003 | 7.56 | (0.08 | ) | 1.49 | 1.41 | – | – | – | 8.97 | ||||||||||||||||||||||||||||||
| 10/31/2002 | 9.10 | (0.06 | ) | (1.48 | ) | (1.54 | ) | – | – | – | 7.56 | ||||||||||||||||||||||||||||
| 10/31/2001 | 12.54 | (0.05 | ) | (3.25 | ) | (3.30 | ) | – | (0.14 | ) | (0.14 | ) | 9.10 | ||||||||||||||||||||||||||
| 10/31/2000 | 11.40 | 0.02 | 1.15 | 1.17 | – | (0.03 | ) | (0.03 | ) | 12.54 | |||||||||||||||||||||||||||||
| Class B | 4/30/2005 | 8.80 | (0.05 | ) | 0.41 | 0.36 | – | – | – | 9.16 | |||||||||||||||||||||||||||||
| 10/31/2004 | 8.68 | (0.10 | ) | 0.22 | 0.12 | – | – | – | 8.80 | ||||||||||||||||||||||||||||||
| 10/31/2003 | 7.36 | (0.12 | ) | 1.44 | 1.32 | – | – | – | 8.68 | ||||||||||||||||||||||||||||||
| 10/31/2002 | 8.92 | (0.11 | ) | (1.45 | ) | (1.56 | ) | – | – | – | 7.36 | ||||||||||||||||||||||||||||
| 10/31/2001 | 12.41 | (0.11 | ) | (3.24 | ) | (3.35 | ) | – | (0.14 | ) | (0.14 | ) | 8.92 | ||||||||||||||||||||||||||
| 10/31/2000 | 11.35 | (0.06 | ) | 1.15 | 1.09 | – | (0.03 | ) | (0.03 | ) | 12.41 | ||||||||||||||||||||||||||||
| Class C | 4/30/2005 | 8.78 | (0.06 | ) | 0.42 | 0.36 | – | – | – | 9.14 | |||||||||||||||||||||||||||||
| 10/31/2004 | 8.68 | (0.12 | ) | 0.22 | 0.10 | – | – | – | 8.78 | ||||||||||||||||||||||||||||||
| 10/31/2003 | 7.18 | (0.12 | ) | 1.62 | 1.50 | – | – | – | 8.68 | ||||||||||||||||||||||||||||||
| Ratios/Supplemental Data | |||||||||||||||||||||||||||||||
| For the Period | Total | Net Assets, End of Period | Ratio of Expenses to Average Net Assets (a) | Net Investment Income (Loss) to Average | Portfolio Turnover | ||||||||||||||||||||||||||
| Ended (g) | Return (c) | (000's) | Net (e) | Total (f) | Net Assets (a) | Rate (b) | |||||||||||||||||||||||||
| Class A | 4/30/2005 | 4.59 | % | $ | 82,728 | 1.38 | % | 1.33 | % | (0.23 | )% | 32 | % | ||||||||||||||||||
| 10/31/2004 | 2.01 | 37,186 | 1.52 | 1.52 | (0.58 | ) | 85 | ||||||||||||||||||||||||
| 10/31/2003 | 18.65 | 34,167 | 1.75 | 1.80 | (0.97 | ) | 129 | ||||||||||||||||||||||||
| 10/31/2002 | (16.88 | ) | 5,752 | 1.73 | 2.05 | (0.56 | ) | 34 | |||||||||||||||||||||||
| 10/31/2001 | (26.63 | ) | 7,361 | 1.55 | 2.03 | (0.43 | ) | 15 | |||||||||||||||||||||||
| 10/31/2000 | 10.29 | 6,587 | 1.55 | 2.53 | (0.47 | ) | 25 | ||||||||||||||||||||||||
| Class B | 4/30/2005 | 4.09 | 19,856 | 2.27 | 2.22 | (1.12 | ) | 32 | |||||||||||||||||||||||
| 10/31/2004 | 1.38 | 19,792 | 2.13 | 2.13 | (1.19 | ) | 85 | ||||||||||||||||||||||||
| 10/31/2003 | 17.93 | 19,723 | 2.40 | 2.45 | (1.62 | ) | 129 | ||||||||||||||||||||||||
| 10/31/2002 | (17.52 | ) | 14,130 | 2.38 | 2.70 | (1.21 | ) | 34 | |||||||||||||||||||||||
| 10/31/2001 | (27.25 | ) | 15,081 | 2.20 | 2.68 | (1.08 | ) | 15 | |||||||||||||||||||||||
| 10/31/2000 | 9.54 | 7,908 | 2.20 | 3.18 | (1.12 | ) | 25 | ||||||||||||||||||||||||
| Class C | 4/30/2005 | 4.06 | 10,611 | 2.37 | 2.32 | (1.22 | ) | 32 | |||||||||||||||||||||||
| 10/31/2004 | 1.27 | 9,379 | 2.40 | 2.40 | (1.38 | ) | 85 | ||||||||||||||||||||||||
| 10/31/2003 | 20.89 | 1,200 | 2.40 | 2.46 | (1.62 | ) | 129 | ||||||||||||||||||||||||
NOTES TO FINANCIAL HIGHLIGHTS
(a) Annualized.
(b Not annualized for periods of less than one year.
(c) Total Return has been calculated for the applicable period without deduction of a sales load, if any, on an initial purchase. Periods of less than one year are not annualized.
(d) Per share information is calculated based on average number of shares outstanding for the years ended 10/31/2001, 10/31/2002, 10/31/2003, 10/31/2004 and the period ended 4/30/2005.
(e) Ratio of Net Expenses to Average Net Assets is net of fee waivers and reimbursements by the investment adviser, if any and includes the recapture of previously waived expenses (see note 2).
(f) Ratio of Total Expenses to Average Net Assets includes all expenses before fee waivers, reimbursements by the investment adviser and recapture of previously waived expenses.
(g) TA IDEX Marsico Growth ("the Fund") commenced operations on March 1, 1999. The inception date for the Fund's offering of share Class C was November 11, 2002.
The notes to the financial statements are an integral part of this report.
Transamerica IDEX Mutual Funds
Semi-Annual Report 2005
6
TA IDEX Marsico Growth
NOTES TO FINANCIAL STATEMENTS
At April 30, 2005
(all amounts in thousands)
(unaudited)
NOTE 1. ORGANIZATION AND SIGNIFICANT ACCOUNTING POLICIES
Transamerica IDEX Mutual Funds is a Delaware statutory trust registered under the Investment Company Act of 1940, as amended (the "1940 Act"), as an open-end management investment company. Prior to March 1, 2005, Transamerica IDEX Mutual Funds was a Massachusetts business trust. TA IDEX Marisco Growth ("the Fund"), part of Transamerica IDEX Mutual Funds, began operations on March 1, 1999.
In the normal course of business, the Fund enters into contracts that contain a variety of representations and warranties, which provide general indemnifications. The Fund's maximum exposure under these arrangements is unknown, as this would involve future claims that may be made against the Fund and/or its affiliates that have not yet occurred. However, based on experience, the Fund expects the risk of loss to be remote.
See the Prospectus and Statement of Additional Information for a description of the Fund's investment objective.
In preparing the Fund's financial statements in accordance with accounting principles generally accepted in the United States of America ("GAAP"), estimates or assumptions (which could differ from actual results) may be used that affect reported amounts and disclosures. The following policies were consistently followed by the Fund, in accordance with GAAP.
Multiple class operations and expenses: The Fund currently offers three classes of shares, each with a public offering price that reflects different sales charges, if any, and expense levels. On June 15, 2004, Class C2 shares merged into Class C. On September 24, 2004, Class M shares merged into Class C. Class B shares will convert to Class A shares eight years after purchase. Income, non-class specific expenses and realized and unrealized gains and losses, are allocated daily to each class, based upon the value of shares outstanding method as permitted under Rule 18f-3 of the 1940 Act. Each class bears its own specific expenses as well as a portion of general, common expenses.
Pricing of shares: The Fund prices its shares on the basis of the net asset value of each class of shares of the Fund, which is determined as of the close of the New York Stock Exchange ("NYSE") (generally 4:00 p.m. Eastern Time) on each day on which the NYSE is open for trading.
Security valuations: Fund investments traded on an exchange are valued at the closing price on the day of valuation on the exchange where the security is principally traded. With respect to securities traded on NASDAQ NMS, such closing price may be last reported sales price or the NASDAQ Official Closing Price.
Securities traded in the over-the-counter market and listed securities for which no sale was reported on that date are valued at the last quoted bid price.
Debt securities are valued by independent pricing services at the last quoted bid price; however, those that mature in sixty days or less are valued at amortized cost, which approximates market.
Investment company securities are valued at net asset value of the underlying portfolio.
Other securities for which quotations are not readily available are valued at fair market value as determined in good faith using guidelines adopted by the Board of Trustees of the Fund, under the supervision of the Fund's Valuation Committee. These guidelines may include: the type of security; any restrictions on its resale; financial or business news of the issuer; similar or related securities that are actively trading; related corporate actions; and other significant events occurring after the close of trading in the security.
Cash: The Fund may leave cash overnight in its cash account with the custodian, Investors Bank & Trust Company ("IBT"). IBT has been contracted on behalf of the Fund to invest the excess cash into a savings account, which at April 30, 2005, was paying an interest rate of 2.02%.
Throughout the period, the Fund may have a cash overdraft balance. A fee is incurred on this overdraft, calculated by multiplying the overdraft by a rate based on the federal funds rate.
Repurchase agreements: The Fund is authorized to enter into repurchase agreements. The Fund, through IBT, receives delivery of the underlying securities, the value of which at the time of purchase is required to be an amount equal to at least 100% of the resale price. Repurchase agreements involve the risk that the seller will fail to repurchase the security, as agreed. In that case, the Fund will bear the risk of value fluctuations until the security can be sold and may encounter delays and incur costs in liquidating the security. In the event of bankruptcy or insolvency of the seller, delays and costs may be incurred.
Commission recapture: The sub-adviser, to the extent consistent with the best execution and usual commission rate policies and practices, may place security transactions of the Fund with broker/dealers with which Transamerica IDEX Mutual Funds has established a Commission Recapture Program. A Commission Recapture Program is any arrangement under which a broker/dealer applies a portion of the commissions received by such broker/dealer on the security transactions to the Fund. In no event will commissions paid by the Fund be used to pay expenses that would otherwise be borne by any other funds within Transamerica IDEX Mutual Funds, or by any other party.
Recaptured commissions during the six months ended April 30, 2005, of $18 are included in net realized gains in the Statement of Operations.
Transamerica IDEX Mutual Funds
Semi-Annual Report 2005
7
TA IDEX Marsico Growth
NOTES TO FINANCIAL STATEMENTS (continued)
At April 30, 2005
(all amounts in thousands)
(unaudited)
NOTE 1.–(continued)
Securities lending: The Fund may lend securities to enhance fund earnings from investing cash collateral in making such loans to qualified borrowers (typically broker/dealers). The Fund has engaged its custodian bank, IBT, as a lending agent to administer its securities lending program. IBT earned $2 of program income for its services. When the Fund makes a security loan, it receives cash collateral as protection against the risk that the borrower will default on the loan, and records an asset for the cash invested collateral and a liability for the return of the collateral.
Loans of securities are required to be secured by collateral at least equal to 102% of the value of the securities at inception of the loan, and not less then 100% thereafter. The Fund may invest cash collateral in short-term money market instruments including: U.S. Treasury Bills, U.S. agency obligations, commercial paper, money market mutual funds, repurchase agreements and other highly rated, liquid investments. During the life of securities loans, the collateral and securities loaned remain subject to fluctuation in value. IBT marks to market securities loaned and the collateral each business day. If additional collateral is due (at least $1), IBT collects additional cash collateral from the borrowers. Although securities loaned will be fully collateralized at all times, IBT may experience delays in, or may be prevented from, recovering the collateral on behalf of the Fund. The Fund may recall a loaned security position at any time from the borrower through IBT. In the event the borrower fails to timely return a recalled security, IBT may indemnify the Fund by purchasing replacement securities for the Fund at its own expense and claiming the collateral to fund such a purchase. IBT absorbs the loss if the collateral value is not sufficient to cover the cost of the replacement securities. If replacement securities are not available, IBT will credit the equivalent cash value to the Fund.
While a security is on loan, the Fund does not have the right to vote that security. However, if time permits, the Fund will attempt to recall a security on loan and vote the proxy.
Income from securities lending is included in the Statement of Operations. The amount of collateral and value of securities on loan are included in the Statement of Assets and Liabilities as well as in the Schedule of Investments.
Security transactions and investment income: Security transactions are recorded on the trade date. Security gains and losses are calculated on the specific identification basis. Dividend income is recorded on the ex-dividend date or, in the case of foreign securities, as soon as the Fund is informed of the ex-dividend date. Interest income, including accretion of discounts and amortization of premiums, is recorded on the accrual basis commencing on the settlement date.
Account maintenance fees: If the shareholder account balance falls below $1 by either shareholder action or as a result of market action, a $25 (not in thousands) fee is assessed every year until the balance reaches $1. The fee is assessed by redeeming shares in the shareholder's account.
No fee will be charged under the following conditions:
• accounts opened within the preceding 24 months
• accounts with an active monthly Automatic Investment Plan ($50 (not in thousands) minimum per fund)
• accounts owned by an individual which, when combined by social security number, have a balance of $5 or more
• accounts owned by individuals in the same household (by address) that have a combined balance of $5 or more
• UTMA/UGMA accounts
• Fiduciary accounts
• B-share accounts whose shares have started to convert to A-shares accounts (as long as combined value of both accounts is at least $1)
For the six months ended April 30, 2005, this fee totaled less than $1. These fees are included in Paid in Capital in the Statement of Assets and Liabilities.
Redemption fees: A short-term trading redemption fee may be assessed on any fund shares in a fund account that are sold during the first five (5) NYSE trading days following their purchase date. This redemption fee will equal 2% of the amount redeemed and shares held the longest will be treated as being redeemed first and shares held the shortest as being redeemed last.
For the six months ended April 30, 2005, the Fund received less than $1 in redemption fees.
Dividend distributions: Distributions to shareholders are recorded on the ex-dividend date and are determined in accordance with Federal income tax regulations which may differ from GAAP.
NOTE 2. RELATED PARTY TRANSACTIONS
Transamerica Fund Advisors, Inc. ("TFAI") is the Fund's investment adviser. Transamerica Fund Services, Inc. ("TFS") is the Fund's administrator and transfer agent. AFSG Securities Corp. ("AFSG") is the Fund's distributor/principal underwriter. AFSG is 100% owned by AUSA Holding Company ("AUSA"). TFAI is a directly owned
Transamerica IDEX Mutual Funds
Semi-Annual Report 2005
8
TA IDEX Marsico Growth
NOTES TO FINANCIAL STATEMENTS (continued)
At April 30, 2005
(all amounts in thousands)
(unaudited)
NOTE 2.–(continued)
subsidiary of Western Reserve Life Assurance Co. of Ohio (78%) and AUSA (22%). TFS is a wholly owned subsidiary of WRL (50%) and AUSA (50%). AUSA and WRL are wholly owned indirect subsidiaries of AEGON, NV, a Netherlands corporation.
Effective January 1, 2005 AEGON/Transamerica Fund Advisors, Inc. ("ATFA") was renamed Transamerica Fund Advisors, Inc. ("TFAI"); AEGON/Transamerica Fund Services, Inc. ("ATFS") and AEGON/Transamerica Investor Services, Inc. ("ATIS") merged into one entity and was renamed Transamerica Fund Services, Inc. ("TFS").
The following schedule reflects the percentage of fund assets owned by affiliated mutual funds (i.e.: through the asset allocation funds):
| Net Assets | % of Net Assets | ||||||||||
| TA IDEX Asset Allocation– Moderate Growth Portfolio | $ | 51,079 | 45.13 | % | |||||||
| TA IDEX Asset Allocation– Moderate Portfolio | 18,874 | 16.67 | % | ||||||||
| Total | $ | 69,953 | 61.80 | % | |||||||
Investment advisory fee: The Fund pays management fees to TFAI based on average daily net assets ("ANA") at the following breakpoints:
0.80% of the first $500 million of ANA
0.70% of ANA over $500 million
TFAI has contractually agreed to waive its advisory fee and will reimburse the Fund to the extent that operating expenses, excluding 12b-1 fees, exceed the following stated annual limit:
1.40% Expense Limit
If total fund expenses fall below the annual expense limitation agreement agreed to by the adviser within the succeeding three years, the Fund may be required to pay that adviser a portion or all of the waived advisory fees.
| Advisory Fee Waived | Available for Recapture Through | ||||||||||
| Fiscal Year 2003 | $ | 27 | 10/31/2006 | ||||||||
Distribution and service fees: The Fund has a 12b-1 distribution plan under the 1940 Act pursuant to which an annual fee, based on average daily net assets, is paid to the distributor for various disbursements such as broker-dealer account servicing fees and other promotional expenses of the Fund. The Fund is authorized under the 12b-1 plan to pay fees on each class up to the following limits:
| Class A | 0.35 | % | |||||
| Class B | 1.00 | % | |||||
| Class C | 1.00 | % | |||||
In the case the Fund or a class of shares of the Fund is closed to new investors or investments, the Fund is authorized to pay 12b-1 fees for past sales and distribution efforts and present and past investor services.
Underwriter commissions relate to front-end sales charges imposed for Class A shares and contingent deferred sales charges from Classes B, C, and certain A share redemptions. For the six months ended April 30, 2005, the underwriter commissions were as follows:
| Received by Underwriter | $ | 124 | |||||
| Retained by Underwriter | 6 | ||||||
| Contingent Deferred Sales Charge | 32 | ||||||
Administrative services: The Fund has entered into an agreement with TFS for financial and legal fund administration services, which includes such items as compliance, expenses, financial statements and other reporting, distributions, tax returns, prospectus preparation, board of trustees meeting support and other legal matters. As of January 1, 2005 the Fund pays TFS an annual fee of 0.02% of average net assets. Prior to January 1, 2005 the Fund paid TFS an annual fee of 0.015% of average net assets. The Legal fees on the Statement of Operations are for fees paid to external legal counsel.
Transfer agent fees: The Fund pays TFS an annual per-account charge of $20 (not in thousands) for each open account and $1.63 (not in thousands) for each closed account. There is no new account charge. The Transfer agent fees on the Statement of Operations are made up of fees paid to TFS and costs associated with shareholder statements.
The Fund paid TFS $68 for the six months ended April 30, 2005.
Deferred compensation plan: Each eligible Fund Trustee may elect participation in the Deferred Compensation Plan ("the Plan"). Under the Plan, such Trustees may defer payment of a percentage of their total fees earned as a Fund Trustee. These deferred amounts may be invested in any Transamerica IDEX Mutual Fund. At April 30, 2005, the value of invested plan amount was $3. Invested plan amounts and the total liability for deferred compensation to the Trustees under the Plan at April 30, 2005, are included in the accompanying Statement of Assets and Liabilities.
Transamerica IDEX Mutual Funds
Semi-Annual Report 2005
9
TA IDEX Marsico Growth
NOTES TO FINANCIAL STATEMENTS (continued)
At April 30, 2005
(all amounts in thousands)
(unaudited)
NOTE 3. INVESTMENT TRANSACTIONS
The cost of securities purchased and proceeds from securities sold (excluding short-term securities) for the six months ended April 30, 2005, were as follows:
| Purchases of securities: | |||||||
| Long-Term excluding U.S. Government | $ | 72,086 | |||||
| U.S. Government | – | ||||||
| Proceeds from maturities and sales of securities: | |||||||
| Long-Term excluding U.S. Government | 29,762 | ||||||
| U.S. Government | – | ||||||
NOTE 4. FEDERAL INCOME TAX MATTERS
The Fund has not made any provision for federal income or excise taxes due to its policy to distribute all of its taxable income and capital gains to its shareholders and otherwise qualify as a regulated investment company under the Internal Revenue Code. Income and capital gain distributions are determined in accordance with income tax regulations, which may differ from GAAP. These differences are primarily due to differing treatment for items including, but not limited to, wash sales, net operating losses and capital loss carryforwards.
The capital loss carryforwards are available to offset future realized capital gains through the periods listed:
| Capital Loss Carryforward | Available through | ||||||
| $ | 974 | October 31, 2009 | |||||
| 4,581 | October 31, 2010 | ||||||
| 8,550 | October 31, 2011 | ||||||
The aggregate cost of investments and composition of unrealized appreciation (depreciation) for federal income tax purposes as of April 30, 2005, are as follows:
| Federal Tax Cost Basis | $ | 110,239 | |||||
| Unrealized Appreciation | $ | 14,897 | |||||
| Unrealized (Depreciation) | (2,159 | ) | |||||
| Net Unrealized Appreciation (Depreciation) | $ | 12,738 | |||||
NOTE 5. REGULATORY PROCEEDINGS
There continues to be significant federal and state regulatory activity relating to financial services companies, particularly mutual fund companies and their investment advisers. As part of an ongoing investigation regarding potential market timing, recordkeeping and trading compliance issues and matters affecting the Fund's investment adviser, TFAI, and certain employees and affiliates of TFAI, the SEC staff has indicated that it is likely to take some action against TFAI and certain of its affiliates at the conclusion of the investigation. The potential timing and the scope of any such action is difficult to predict. Although the impact of any action brought against TFAI and/or its affiliates is difficult to assess at the present time, the Fund currently believes that the likelihood that any such action will have a material adverse impact on it is remote. It is important to note that the Fund is not aware of any allegation of wrongdoing against it and its board at the time this semi-annual report is printed. Although it is not anticipated that these developments will have an adverse impact on the Fund, there can be no assurance at this time. TFAI and its affiliates are actively working with the SEC in regard to this matter; however, the exact resolution cannot be determined at this time. TFAI will take such actions that it deems necessary or appropriate to continue providing management services to the Fund and to bring all matters to an appropriate conclusion.
TFAI and/or its affiliates, and not the Fund, will bear the costs regarding these regulatory matters.
Transamerica IDEX Mutual Funds
Semi-Annual Report 2005
10
TA IDEX Marsico Growth
INVESTMENT ADVISORY AND SUB-ADVISORY AGREEMENTS – REVIEW AND RENEWAL
At a meeting of the Board of Trustees of Transamerica IDEX Mutual Funds ("TA IDEX") held on October 6, 2004, the Board considered and approved the renewal for a one-year period of the Investment Advisory Agreement between TA IDEX Marsico Growth (the "Fund") and Transamerica Fund Advisors, Inc. ("TFAI") as well as the Investment Sub-Advisory Agreement of the Fund between TFAI and Banc of America Capital Management, LLC (the "Sub-Adviser"). In approving the renewal of these agreements, the Board concluded that the Investment Advisory and Investment Sub-Advisory Agreements enable shareholders of the Fund to obtain high quality services at a cost that is appropriate, reasonable, and in the best interests of shareholders based upon the following determinations, among others:
The nature, extent and quality of the advisory service to be provided. The Board considered the nature and quality of the services provided by TFAI and the Sub-Adviser to the Fund in the past, as well as the services anticipated to be provided in the future. The Board concluded that TFAI and the Sub-Adviser are capable of providing high quality services to the Fund, as indicated by TFAI's management capabilities demonstrated with respect to the Fund and other funds managed by TFAI, TFAI's management oversight process, and the professional qualifications and experience of the Sub-Adviser's portfolio management team. The Board also concluded that TFAI and the Sub-Adviser would provide the same quality and quantity of investment management and related services as before, that these services are app ropriate in scope and extent in light of the Fund's operations, the competitive landscape of the investment company business and investor needs, and that TFAI's and the Sub-Adviser's obligations will remain the same in all respects.
The investment performance of the Fund. The Board concluded, based in particular on information provided by Lipper Analytics, that the Fund's investment performance was competitive relative to comparable funds over trailing one-, two-, three- and five-year periods and to the Fund's benchmark index over one- and five-year periods. On the basis of the Trustees' assessment of the nature, extent and quality of investment advisory and related services to be provided or procured by TFAI and the Sub-Adviser, the Trustees concluded that TFAI and the Sub-Adviser were capable of generating a level of long-term investment performance that is appropriate in light of the Fund's investment objective, policies and strategies and competitive with many other investment companies.
The cost of advisory services provided and the level of profitability. On the basis of the Board's review of the fees to be charged by TFAI and the Sub-Adviser for investment advisory and related services, TFAI's financial statements, the fees paid by TFAI to the Sub-Adviser, TFAI's estimated net management income resulting from its management of the Fund, the estimated profitability of TFAI's relationships with the Fund and TA IDEX, and the estimated profitability of the Sub-Adviser's relationship with the Fund, the Board concluded that the level of investment advisory fees and the profitability is appropriate in light of the services provided, the management fees and overall expense ratios of comparable investment companies, and the anticipated profitability of the relationship between the Fun d, TFAI and the Sub-Adviser. Further, on the basis of comparative information supplied by Lipper Analytics, the Board determined that the advisory fees and estimated overall expense ratio of the Fund were consistent with industry averages.
The extent to which economies of scale would be realized as the Fund grows and whether fee levels reflect these economies of scale for the benefit of Fund investors. The Trustees concluded that inclusion of asset-based breakpoints in the Fund's advisory fee schedule appropriately benefited investors by realizing economies of scale in the form of a lower advisory fee rate as the level of Fund assets increases. The Board also concluded that the advisory fees appropriately reflect the Fund's current size, the current economic environment for TFAI, and the competitive nature of the investment company market. In addition, the Board noted that it will have the opportunity to periodically re-examine whether the Fund has achieved economies of scale, as well as the appropriateness of advisory fees payabl e to TFAI and the Sub-Adviser in the future.
Benefits (such as soft dollars) to TFAI or the Sub-Adviser from its relationship with the Fund. The Board concluded that other benefits derived by TFAI or the Sub-Adviser from its relationship with the Fund are reasonable and fair, and are consistent with industry practice and the best interests of the Fund and its shareholders. In this regard, the Board noted that TFAI does not realize "soft dollar" benefits from its relationship with the Fund, and that the Sub-Adviser is participating in a brokerage program pursuant to which a portion of brokerage commissions paid by the Fund is recaptured for the benefit of the Fund and its shareholders, thus limiting the amount of "soft-dollar" arrangements the Sub-Adviser may engage in with respect to the Fund's portfolio brokerage transactions.
Other considerations. The Board also determined that TFAI had made a substantial commitment to the recruitment and retention of high quality personnel, and maintained the financial, compliance and operational resources reasonably necessary to manage the Fund in a professional manner that is consistent with the best interests of the Fund and its shareholders. The Trustees also concluded that TFAI had made a significant entrepreneurial commitment to the management and success of the Fund, reflected by TFAI's expense limitation and fee waiver arrangement with the Fund which, as demonstrated in the past with the Fund, may result in TFAI waiving a substantial amount of advisory fees for the benefit of shareholders.
Transamerica IDEX Mutual Funds
Semi-Annual Report 2005
11
TA IDEX Marsico Growth
SUPPLEMENTAL INFORMATION (unaudited)
RESULTS OF SHAREHOLDER PROXY
At a special meeting of shareholders held on February 25, 2005, the results of the Proposals were as follows:
Transamerica IDEX Mutual Funds
Proposal 1: Election of Trustees to the Board of Trustees of Transamerica IDEX Mutual Funds.
| For | Withheld | ||||||||||
| Peter R. Brown | 872,017,875.249 | 4,468,498.551 | |||||||||
| Daniel Calabria | 871,917,069.786 | 4,569,304.014 | |||||||||
| Janise B. Case | 872,099,393.125 | 4,386,980.675 | |||||||||
| Charles C. Harris | 872,086,722.025 | 4,399,651.775 | |||||||||
| Leo J. Hill | 872,304,465.640 | 4,181,908.160 | |||||||||
| Russell A. Kimball, Jr. | 872,253,556.471 | 4,232,817.329 | |||||||||
| William W. Short, Jr. | 872,139,920.944 | 4,346,452.856 | |||||||||
| John Waechter | 872,261,152.376 | 4,225,221.424 | |||||||||
| Jack E. Zimmerman | 871,929,967.512 | 4,556,406.288 | |||||||||
| Brian C. Scott | 872,218,970.367 | 4,267,403.433 | |||||||||
| Thomas P. O'Neill | 872,111,944.117 | 4,374,429.683 | |||||||||
TA IDEX Marsico Growth
Proposal 2: Approval of an Agreement and Plan of Reorganization pursuant to which Transamerica IDEX Mutual Funds will organize as a Delaware statutory trust.
| For | Against | Abstentions/Broker Non-Votes | |||||||||
| 4,581,056.723 | 51,681.740 | 1,902,699.432 | |||||||||
Proposal 3: Approval of changes to the fundamental investment restrictions of TA IDEX Marsico Growth.
| A. Diversification | For | Against | Abstentions/Broker Non-Votes | ||||||||||||
| 4,588,227.186 | 65,627.709 | 1,881,583.000 | |||||||||||||
| B. Borrowing | For | Against | Abstentions/Broker Non-Votes | ||||||||||||
| 4,586,704.726 | 67,150.169 | 1,881,583.000 | |||||||||||||
| C. Senior Securities | For | Against | Abstentions/Broker Non-Votes | ||||||||||||
| 4,586,870.186 | 66,984.709 | 1,881,583.000 | |||||||||||||
| D. Underwriting Securities | For | Against | Abstentions/Broker Non-Votes | ||||||||||||
| 4,587,635.080 | 66,219.815 | 1,881,583.000 | |||||||||||||
| E. Real Estate | For | Against | Abstentions/Broker Non-Votes | ||||||||||||
| 4,587,501.418 | 66,353.477 | 1,881,583.000 | |||||||||||||
| F. Making Loans | For | Against | Abstentions/Broker Non-Votes | ||||||||||||
| 4,584,531.080 | 69,323.815 | 1,881,583.000 | |||||||||||||
| G. Concentration | For | Against | Abstentions/Broker Non-Votes | ||||||||||||
| 4,589,421.418 | 64,433.477 | 1,881,583.000 | |||||||||||||
| H. Commodities | For | Against | Abstentions/Broker Non-Votes | ||||||||||||
| 4,585,809.030 | 68,045.865 | 1,881,583.000 | |||||||||||||
Transamerica IDEX Mutual Funds
Semi-Annual Report 2005
12
TA IDEX Marsico International Growth
GRAPHICAL PRESENTATION OF SCHEDULE OF INVESTMENTS
By Region
At April 30, 2005
(unaudited)
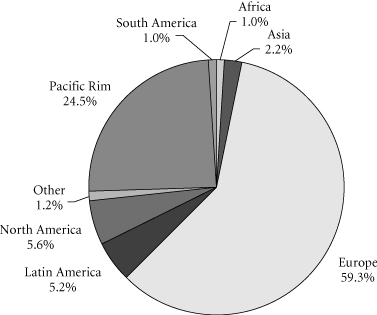
This chart shows the percentage breakdown by region of the Fund's total investment securities.
Transamerica IDEX Mutual Funds
Semi-Annual Report 2005
1
TA IDEX Marsico International Growth
SCHEDULE OF INVESTMENTS
At April 30, 2005
(all amounts except share amounts in thousands)
(unaudited)
| Shares | Value | ||||||||||
| PREFERRED STOCKS (2.1%) | |||||||||||
| Germany (2.1%) | |||||||||||
| Fresenius AG Preferred | 58,432 | $ | 6,828 | ||||||||
| Total Preferred Stocks (cost: $6,444) | 6,828 | ||||||||||
| COMMON STOCKS (92.6%) | |||||||||||
| Austria (2.2%) | |||||||||||
| Erste Bank der Oesterreichischen Sparkassen AG | 120,582 | 5,871 | |||||||||
| Erste Bank der Oesterreichischen Sparkassen AG (Foreign Registered) | 13,960 | 676 | |||||||||
| Raiffeisen International Bank Holding AG (a) | 13,701 | 708 | |||||||||
| Bahama Islands (1.1%) | |||||||||||
| Kerzner International, Ltd. (a) | 67,908 | 3,741 | |||||||||
| Brazil (0.9%) | |||||||||||
| Petroleo Brasileiro SA, ADR | 71,250 | 2,988 | |||||||||
| Canada (4.1%) | |||||||||||
| Canadian National Railway Co. | 110,608 | 6,328 | |||||||||
| Shoppers Drug Mart Corp. | 121,726 | 3,803 | |||||||||
| Talisman Energy, Inc. | 106,059 | 3,210 | |||||||||
| France (14.9%) | |||||||||||
| JC Decaux SA (a) | 177,496 | 4,708 | |||||||||
| Renault SA | 35,498 | 2,986 | |||||||||
| Sanofi-Aventis | 146,703 | 13,037 | |||||||||
| Thomson Multimedia SA | 291,737 | 7,228 | |||||||||
| Total SA | 33,746 | 7,531 | |||||||||
| Vinci SA | 86,564 | 13,056 | |||||||||
| Germany (1.5%) | |||||||||||
| Bayerische Hypo-und Vereinsbank AG (a) | 204,861 | 4,891 | |||||||||
| Hong Kong (4.0%) | |||||||||||
| CNOOC, Ltd., ADR | 59,271 | 3,190 | |||||||||
| Hang Lung Properties, Ltd. | 2,050,825 | 3,153 | |||||||||
| Shangri-La Asia, Ltd. | 4,318,000 | 6,576 | |||||||||
| India (2.1%) | |||||||||||
| ICICI Bank, Ltd., Sponsored ADR | 189,538 | 3,427 | |||||||||
| Reliance Industries, Ltd., GDR–144A | 142,458 | 3,454 | |||||||||
| Ireland (1.9%) | |||||||||||
| Anglo Irish Bank Corp. PLC | 538,960 | 6,224 | |||||||||
| Italy (1.3%) | |||||||||||
| Banca Intesa SpA | 891,250 | 4,271 | |||||||||
| Japan (16.2%) | |||||||||||
| Astellas Pharma, Inc. | 302,300 | 10,941 | |||||||||
| Canon, Inc. | 58,000 | 3,015 | |||||||||
| Fanuc, Ltd. | 50,026 | 2,943 | |||||||||
| Keyence Corp. | 14,400 | 3,175 | |||||||||
| Shares | Value | ||||||||||
| Japan (continued) | |||||||||||
| Millea Holdings, Inc. | 270 | $ | 3,678 | ||||||||
| Mitsubishi Tokyo Financial Group, Inc. | 554 | 4,786 | |||||||||
| Promise Co., Ltd. | 116,100 | 7,489 | |||||||||
| Sony Corp. | 80,000 | 2,952 | |||||||||
| Sumitomo Realty & Development Co., Ltd. | 295,000 | 3,355 | |||||||||
| Trend Micro, Inc. | 84,000 | 3,034 | |||||||||
| Yamada Denki Co., Ltd. | 149,200 | 7,127 | |||||||||
| Mexico (4.9%) | |||||||||||
| America Movil SA de CV–Class L, ADR | 126,336 | 6,273 | |||||||||
| Cemex SA de CV, Sponsored ADR | 85,505 | 3,078 | |||||||||
| Grupo Televisa SA, Sponsored ADR | 116,197 | 6,528 | |||||||||
| Singapore (2.1%) | |||||||||||
| Capitaland, Ltd. (a) | 4,408,000 | 6,885 | |||||||||
| South Africa (1.0%) | |||||||||||
| Sasol, Ltd. | 135,102 | 3,174 | |||||||||
| South Korea (1.0%) | |||||||||||
| Samsung Electronics Co., Ltd., GDR–144A | 14,021 | 3,162 | |||||||||
| Sweden (2.7%) | |||||||||||
| ForeningsSparbanken AB | 273,143 | 6,437 | |||||||||
| Telefonaktiebolaget LM Ericsson, ADR (a) | 79,091 | 2,329 | |||||||||
| Switzerland (13.7%) | |||||||||||
| Lonza Group AG | 109,036 | 6,590 | |||||||||
| Roche Holding AG–Genusschein | 127,599 | 15,505 | |||||||||
| Swiss Life Holding (a) | 64,287 | 8,904 | |||||||||
| UBS AG | 169,712 | 13,629 | |||||||||
| United Kingdom (15.8%) | |||||||||||
| ARM Holdings PLC | 1,855,475 | 3,390 | |||||||||
| British Energy Group PLC (a) | 660,362 | 3,961 | |||||||||
| Diageo PLC | 438,152 | 6,503 | |||||||||
| EMI Group PLC | 1,032,070 | 4,717 | |||||||||
| Enterprise Inns PLC | 937,243 | 13,092 | |||||||||
| Intercontinental Hotels Group PLC | 813,325 | 9,715 | |||||||||
| Reckitt Benckiser PLC | 302,837 | 9,852 | |||||||||
| United States (1.2%) | |||||||||||
| Wynn Resorts, Ltd. (a) | 71,212 | 3,770 | |||||||||
| Total Common Stocks (cost: $308,495) | 301,046 | ||||||||||
| Total Investment Securities (cost: $314,939) | $ | 307,874 | |||||||||
| SUMMARY: | |||||||||||
| Investments, at value | 94.7 | % | $ | 307,874 | |||||||
| Other Assets and Liabilities | 5.3 | % | 17,127 | ||||||||
| Net assets | 100.0 | % | $ | 325,001 | |||||||
The notes to the financial statements are an integral part of this report.
Transamerica IDEX Mutual Funds
Semi-Annual Report 2005
2
TA IDEX Marsico International Growth
SCHEDULE OF INVESTMENTS (continued)
At April 30, 2005
(all amounts except share amounts in thousands)
(unaudited)
| Percentage of Net Assets | Value | ||||||||||
| INVESTMENTS BY INDUSTRY: | |||||||||||
| Commercial Banks | 15.7 | % | $ | 50,920 | |||||||
| Pharmaceuticals | 14.3 | % | 46,311 | ||||||||
| Hotels & Other Lodging Places | 7.3 | % | 23,802 | ||||||||
| Chemicals & Allied Products | 6.1 | % | 19,896 | ||||||||
| Electronic & Other Electric Equipment | 4.1 | % | 13,342 | ||||||||
| Restaurants | 4.0 | % | 13,092 | ||||||||
| Construction | 4.0 | % | 13,056 | ||||||||
| Oil & Gas Extraction | 3.9 | % | 12,562 | ||||||||
| Real Estate | 3.2 | % | 10,240 | ||||||||
| Life Insurance | 2.7 | % | 8,904 | ||||||||
| Petroleum Refining | 2.3 | % | 7,531 | ||||||||
| Personal Credit Institutions | 2.3 | % | 7,489 | ||||||||
| Radio, Television & Computer Stores | 2.2 | % | 7,127 | ||||||||
| Radio & Television Broadcasting | 2.0 | % | 6,528 | ||||||||
| Beer, Wine & Distilled Beverages | 2.0 | % | 6,503 | ||||||||
| Electronic Components & Accessories | 2.0 | % | 6,333 | ||||||||
| Railroads | 2.0 | % | 6,328 | ||||||||
| Telecommunications | 1.9 | % | 6,273 | ||||||||
| Amusement & Recreation Services | 1.5 | % | 4,717 | ||||||||
| Business Services | 1.4 | % | 4,708 | ||||||||
| Electric Services | 1.2 | % | 3,961 | ||||||||
| Drug Stores & Proprietary Stores | 1.2 | % | 3,803 | ||||||||
| Insurance | 1.1 | % | 3,678 | ||||||||
| Instruments & Related Products | 1.0 | % | 3,175 | ||||||||
| Residential Building Construction | 1.0 | % | 3,153 | ||||||||
| Stone, Clay & Glass Products | 0.9 | % | 3,078 | ||||||||
| Computer & Data Processing Services | 0.9 | % | 3,034 | ||||||||
| Computer & Office Equipment | 0.9 | % | 3,015 | ||||||||
| Automotive | 0.9 | % | 2,986 | ||||||||
| Communications Equipment | 0.7 | % | 2,329 | ||||||||
| Investments, at value | 94.7 | % | 307,874 | ||||||||
| Other Assets and Liabilities | 5.3 | % | 17,127 | ||||||||
| Net Assets | 100.0 | % | $ | 325,001 | |||||||
| NOTES TO SCHEDULE OF INVESTMENTS: | |||
(a) No dividends were paid during the preceding twelve months.
DEFINITIONS:
144A 144A Securities are registered pursuant to Rule 144A of the Securities Act of 1933. These securities are deemed to be liquid for purposes of compliance limitations on holdings of illiquid securities and may be resold as transactions exempt from registration, normally to qualified institutional buyers. At April 30, 2005, these securities aggregated $6,616 or 2.0% of the net assets of the Fund.
ADR American Depositary Receipt
GDR Global Depositary Receipt
The notes to the financial statements are an integral part of this report.
Transamerica IDEX Mutual Funds
Semi-Annual Report 2005
3
TA IDEX Marsico International Growth
STATEMENT OF ASSETS AND LIABILITIES
At April 30, 2005
(all amounts except per share amounts in thousands)
(unaudited)
| Assets: | |||||||
| Investment securities, at value (cost: $314,939) | $ | 307,874 | |||||
| Cash | 27,286 | ||||||
| Foreign cash (cost: $1,235) | 1,230 | ||||||
| Receivables: | |||||||
| Investment securities sold | 2,169 | ||||||
| Shares of beneficial interest sold | 632 | ||||||
| Interest | 34 | ||||||
| Dividends | 460 | ||||||
| Dividend reclaims receivable | 113 | ||||||
| 339,798 | |||||||
| Liabilities: | |||||||
| Investment securities purchased | 14,479 | ||||||
| Accounts payable and accrued liabilities: | |||||||
| Management and advisory fees | 263 | ||||||
| Distribution and service fees | 24 | ||||||
| Other | 31 | ||||||
| 14,797 | |||||||
| Net Assets | $ | 325,001 | |||||
| Net Assets Consist of: | |||||||
| Shares of beneficial interest, unlimited shares authorized, no par value | $ | 335,427 | |||||
| Undistributed net investment income (loss) | 595 | ||||||
| Accumulated net realized gain (loss) from investment securities and foreign currency transactions | (3,961 | ) | |||||
| Net unrealized appreciation (depreciation) on: | |||||||
| Investment securities | (7,065 | ) | |||||
| Translation of assets and liabilities denominated in foreign currencies | 5 | ||||||
| Net Assets | $ | 325,001 | |||||
| Net Assets by Class: | |||||||
| Class A | $ | 89,688 | |||||
| Class I | 235,313 | ||||||
| Shares Outstanding: | |||||||
| Class A | 9,037 | ||||||
| Class I | 23,721 | ||||||
| Net Asset Value and Offering Price Per Share: | |||||||
| Class A | $ | 9.92 | |||||
| Class I | 9.92 | ||||||
STATEMENT OF OPERATIONS
For the period ended April 30, 2005 (a)
(all amounts in thousands)
(unaudited)
| Investment Income: | |||||||
| Interest | $ | 143 | |||||
| Dividends | 2,355 | ||||||
| Less withholding taxes on foreign dividends | (166 | ) | |||||
| 2,332 | |||||||
| Expenses: | |||||||
| Management and advisory fees | 1,029 | ||||||
| Printing and shareholder reports | 3 | ||||||
| Custody fees | 90 | ||||||
| Administration fees | 19 | ||||||
| Legal fees | 3 | ||||||
| Audit fees | 8 | ||||||
| Trustees fees | 2 | ||||||
| Distribution and service fees: | |||||||
| Class A | 35 | ||||||
| Total expenses | 1,189 | ||||||
| Less: | |||||||
| Reimbursement of class expenses: | |||||||
| Class A | (25 | ) | |||||
| Net expenses | 1,164 | ||||||
| Net Investment Income (Loss) | 1,168 | ||||||
| Net Realized Gain (Loss) from: | |||||||
| Investment securities | (3,971 | ) | |||||
| Foreign currency transactions | 10 | ||||||
| (3,961 | ) | ||||||
| Net Increase (Decrease) in Unrealized Appreciation (Depreciation) on: | |||||||
| Investment securities | (7,065 | ) | |||||
| Translation of assets and liabilities denominated in foreign currencies | 5 | ||||||
| (7,060 | ) | ||||||
| Net Gain (Loss) on Investments and Foreign Currency Transactions | (11,021 | ) | |||||
| Net Increase (Decrease) in Net Assets Resulting from Operations | $ | (9,853 | ) | ||||
(a) TA IDEX Marsico International Growth ("the Fund") commenced operations on November 8, 2004. The inception date for the Fund's offering of share Class A was March 01, 2005.
The notes to the financial statements are an integral part of this report.
Transamerica IDEX Mutual Funds
Semi-Annual Report 2005
4
TA IDEX Marsico International Growth
STATEMENT OF CHANGES IN NET ASSETS
For the period ended
(all amounts in thousands)
| April 30, 2005 (a) (unaudited) | |||||||
| Increase (Decrease) In Net Assets From: | |||||||
| Operations: | |||||||
| Net investment income (loss) | $ | 1,168 | |||||
| Net realized gain (loss) from investment securities and foreign currency transactions | (3,961 | ) | |||||
| Net unrealized appreciation (depreciation) on investment securities and foreign currency translations | (7,060 | ) | |||||
| (9,853 | ) | ||||||
| Distributions to Shareholders: | |||||||
| From net investment income: | |||||||
| Class I | (573 | ) | |||||
| (573 | ) | ||||||
| Capital Share Transactions: | |||||||
| Proceeds from shares sold: | |||||||
| Class A | 93,831 | ||||||
| Class I | 241,023 | ||||||
| 334,854 | |||||||
| Dividends and distributions reinvested: | |||||||
| Class I | 573 | ||||||
| 573 | |||||||
| 335,427 | |||||||
| Net increase (decrease) in net assets | 325,001 | ||||||
| Net Assets: | |||||||
| Beginning of period | – | ||||||
| End of period | $ | 325,001 | |||||
| Undistributed Net Investment Income (Loss) | $ | 595 | |||||
| Share Activity: | |||||||
| Shares issued: | |||||||
| Class A | 9,037 | ||||||
| Class I | 23,665 | ||||||
| 32,702 | |||||||
| Shares issued–reinvested from distributions: | |||||||
| Class I | 56 | ||||||
| 56 | |||||||
| Net increase (decrease) in shares outstanding: | |||||||
| Class A | 9,037 | ||||||
| Class I | 23,721 | ||||||
| 32,758 | |||||||
(a) TA IDEX Marsico International Growth ("the Fund") commenced operations on November 8, 2004. The inception date for the Fund's offering of share Class A was March 01, 2005.
The notes to the financial statements are an integral part of this report.
Transamerica IDEX Mutual Funds
Semi-Annual Report 2005
5
TA IDEX Marsico International Growth
FINANCIAL HIGHLIGHTS
(unaudited)
| For a share of beneficial interest outstanding throughout the period | |||||||||||||||||||||||||||||||||||||||
| Net Asset | Investment Operations | Distributions | Net Asset | ||||||||||||||||||||||||||||||||||||
| For the Period Ended (d)(g) | Value, Beginning of Period | Net Investment Income (Loss) | Net Realized and Unrealized Gain (Loss) | Total Operations | From Net Investment Income | From Net Realized Gains | Total Distributions | Value, End of Period | |||||||||||||||||||||||||||||||
| Class A | 4/30/2005 | $ | 10.51 | $ | 0.04 | $ | (0.63 | ) | $ | (0.59 | ) | $ | – | $ | – | $ | – | $ | 9.92 | ||||||||||||||||||||
| Class I | 4/30/2005 | 10.00 | 0.05 | (0.09 | ) | (0.04 | ) | (0.04 | ) | – | (0.04 | ) | 9.92 | ||||||||||||||||||||||||||
| Ratios/Supplemental Data | |||||||||||||||||||||||||||||||
| For the Period | Total | Net Assets, End of Period | Ratio of Expenses to Average Net Assets (a) | Net Investment Income (Loss) to Average | Portfolio Turnover | ||||||||||||||||||||||||||
| Ended (g) | Return (c) | (000's) | Net (e) | Total (f) | Net Assets (a) | Rate (b) | |||||||||||||||||||||||||
| Class A | 4/30/2005 | (5.61 | )% | $ | 89,688 | 1.31 | % | 1.58 | % | 2.12 | % | 101 | % | ||||||||||||||||||
| Class I | 4/30/2005 | (0.45 | ) | 235,313 | 1.18 | 1.18 | 1.10 | 101 | |||||||||||||||||||||||
NOTES TO FINANCIAL HIGHLIGHTS
(a) Annualized.
(b) Not annualized for periods of less than one year.
(c) Total Return has been calculated for the applicable period without deduction of a sales load, if any, on an initial purchase. Periods of less than one year are not annualized.
(d) Per share information is calculated based on average number of shares outstanding.
(e) Ratio of Net Expenses to Average Net Assets is net of fee waivers and reimbursements by the investment adviser, if any (see note 2).
(f) Ratio of Total Expenses to Average Net Assets includes all expenses before fee waivers and reimbursements by the investment adviser.
(g) TA IDEX Marsico International Growth ("the Fund") commenced operations on November 8, 2004. The inception date for the Fund's offering of share Class A was March 01, 2005.
The notes to the financial statements are an integral part of this report.
Transamerica IDEX Mutual Funds
Semi-Annual Report 2005
6
TA IDEX Marsico International Growth
NOTES TO FINANCIAL STATEMENTS
At April 30, 2005
(all amounts in thousands)
(unaudited)
NOTE 1. ORGANIZATION AND SIGNIFICANT ACCOUNTING POLICIES
Transamerica IDEX Mutual Funds is a Delaware statutory trust registered under the Investment Company Act of 1940, as amended (the "1940 Act"), as an open-end management investment company. Prior to March 1, 2005, Transamerica IDEX Mutual Funds was a Massachusetts business trust. TA IDEX Marsico International Growth ("the Fund"), part of Transamerica IDEX Mutual Funds, began operations on November 8, 2004.
In the normal course of business, the Fund enters into contracts that contain a variety of representations and warranties, which provide general indemnifications. The Fund's maximum exposure under these arrangements is unknown, as this would involve future claims that may be made against the Fund and/or its affiliates that have not yet occurred. However, based on experience, the Fund expects the risk of loss to be remote.
See the Prospectus and Statement of Additional Information for a description of the Fund's investment objective.
In preparing the Fund's financial statements in accordance with accounting principles generally accepted in the United States of America ("GAAP"), estimates or assumptions (which could differ from actual results) may be used that affect reported amounts and disclosures. The following policies were consistently followed by the Fund, in accordance with GAAP.
Multiple class operations and expenses: The Fund currently offers two classes of shares, Class A and Class I, each with a public offering price that reflects different sales charges, if any, and expense levels. The initial sales charge currently is waived as this Fund is available for investment only by certain strategic asset allocation funds. Income, non-class specific expenses and realized and unrealized gains and losses, are allocated daily to each class, based upon the value of shares outstanding method as permitted under Rule 18f-3 of the 1940 Act. Each class bears its own specific expenses as well as a portion of general, common expenses.
Pricing of shares: The Fund prices its shares on the basis of the net asset value of each class of shares of the Fund, which is determined as of the close of the New York Stock Exchange ("NYSE") (generally 4:00 p.m. Eastern Time) on each day on which the NYSE is open for trading.
Security valuations: Fund investments traded on an exchange are valued at the closing price on the day of valuation on the exchange where the security is principally traded. With respect to securities traded on NASDAQ NMS, such closing price may be last reported sales price or the NASDAQ Official Closing Price.
Securities traded in the over-the-counter market and listed securities for which no sale was reported on that date are valued at the last quoted bid price.
Foreign securities generally are valued based on quotations from the primary market in which they are traded and are translated from the local currency into U.S. dollars using closing exchange rates. Many foreign securities markets are open for trading at times when the
U.S. markets are closed for trading, and many foreign securities markets close for trading before the close of the NYSE. The value of foreign securities may be affected significantly on a day that the NYSE is closed and an investor is unable to purchase or redeem shares. If a significant market event impacting the value of a portfolio security (e.g., natural disaster, company announcement, market volatility) occurs subsequent to the close of trading in the security, but prior to the calculation of the Fund's net asset value per share, market quotations for that security may be determined to be unreliable and, accordingly, not "readil y available." If market quotations are not readily available, and the impact of such a significant market event materially effects the net asset value per share of the Fund, an affected portfolio security will be valued at fair market value as determined in good faith using guidelines adopted by the Board of Trustees of the Fund, under the supervision of the Fund's Valuation Committee. Factors that may be considered to value foreign securities at fair market value may include, among others: the value of other securities traded on other markets, foreign currency exchange activity and the trading of financial products tied to foreign securities.
Other securities for which quotations are not readily available are valued at fair market value as determined in good faith using guidelines adopted by the Board of Trustees of the Fund, under the supervision of the Fund's Valuation Committee. These guidelines may include: the type of security; any restrictions on its resale; financial or business news of the issuer; similar or related securities that are actively trading; related corporate actions; and other significant events occurring after the close of trading in the security.
Cash: The Fund may leave cash overnight in its cash account with the custodian, Investors Bank & Trust Company ("IBT"). IBT has been contracted on behalf of the Fund to invest the excess cash into a savings account, which at April 30, 2005, was paying an interest rate of 2.02%.
Throughout the period from inception through, the Fund may have a cash overdraft balance. A fee is incurred on this overdraft, calculated by multiplying the overdraft by a rate based on the federal funds rate.
Security transactions and investment income: Security transactions are recorded on the trade date. Security gains and losses are calculated on the specific identification basis. Dividend income is recorded on the ex-dividend date or, in the case of foreign securities, as soon as the Fund is informed of the ex-dividend date. Interest income, including accretion of discounts and amortization of premiums, is recorded on the accrual basis commencing on the settlement date.
Transamerica IDEX Mutual Funds
Semi-Annual Report 2005
7
TA IDEX Marsico International Growth
NOTES TO FINANCIAL STATEMENTS (continued)
At April 30, 2005
(all amounts in thousands)
(unaudited)
NOTE 1.–(continued)
Foreign currency denominated investments: The accounting records of the Fund are maintained in U.S. dollars. Securities and other assets and liabilities denominated in foreign currencies are translated into
U.S. dollars at the closing exchange rate each day. The cost of foreign securities is translated at the exchange rate in effect when the investment was acquired. The Fund combines fluctuations from currency exchange rates and fluctuations in value when computing net realized and unrealized gains or losses from investments.
Net foreign currency gains and losses resulting from changes in exchange rates include: 1) foreign currency fluctuations between trade date and settlement date of investment security transactions; 2) gains and losses on forward foreign currency contracts; and 3) the difference between the receivable amounts of interest and dividends recorded in the accounting records in U.S. dollars and the amounts actually received.
Foreign currency denominated assets may involve risks not typically associated with domestic transactions, including unanticipated movements in exchange currency rates, the degree of government supervision and regulation of security markets, and the possibility of political or economic instability.
Foreign capital gains taxes: The Fund may be subject to taxes imposed by countries in which it invests, with respect to its investment in issuers existing or operating in such countries. Such taxes are generally based on income earned or repatriated and capital gains realized on the sale of such investments. The Fund accrues such taxes when the related income or capital gains are earned. Some countries require governmental approval for the repatriation of investment income, capital or the proceeds of sales earned by foreign investors. In addition, if there is deterioration in a country's balance of payments or for other reasons, a country may impose temporary restrictions on foreign capital remittances abroad.
The Fund's investments in India are subject to a 30% governmental short-term capital gains tax. The Indian government has elected to waive the long-term capital gains tax of 10% on equity securities held for longer than one year. This waiver of tax is effective through March of 2007. Such taxes are due upon sale of individual securities. The Fund accrues for taxes on the capital gains throughout the holding period of the underlying securities.
Forward foreign currency contracts: The Fund may enter into forward foreign currency contracts to hedge against exchange rate risk arising from investments in securities denominated in foreign currencies. Contracts are valued at the contractual forward rate and are marked to market daily, with the change in value recorded as an unrealized gain or loss. When the contracts are closed a realized gain or loss is incurred. Risks may arise from changes in market value of the underlying currencies and from the possible inability of counterparties to meet the terms of their contracts.
There were no open forward foreign currency contracts at April 30, 2005.
Redemption fees: A short-term trading redemption fee may be assessed on any fund shares in a fund account that are sold during the first five (5) NYSE trading days following their purchase date. This redemption fee will equal 2% of the amount redeemed and shares held the longest will be treated as being redeemed first and shares held the shortest as being redeemed last.
For the period from inception through April 30, 2005, the fund received no redemption fees.
Dividend distributions: Distributions to shareholders are recorded on the ex-dividend date and are determined in accordance with Federal income tax regulations which may differ from GAAP.
NOTE 2. RELATED PARTY TRANSACTIONS
Transamerica Fund Advisors, Inc. ("TFAI") is the Fund's investment adviser. Transamerica Fund Services, Inc. ("TFS") is the Fund's administrator and transfer agent. AFSG Securities Corp. ("AFSG") is the Fund's distributor/principal underwriter. AFSG is 100% owned by AUSA Holding Company ("AUSA"). TFAI is a directly owned subsidiary of Western Reserve Life Assurance Co. of Ohio (78%) and AUSA (22%). TFS is a wholly owned subsidiary of WRL (50%) and AUSA (50%). AUSA and WRL are wholly owned indirect subsidiaries of AEGON NV, a Netherlands corporation.
Effective January 1, 2005 AEGON/Transamerica Fund Advisors, Inc. ("ATFA") was renamed Transamerica Fund Advisors, Inc. ("TFAI"); AEGON/Transamerica Fund Services, Inc. ("ATFS") and AEGON/Transamerica Investor Services, Inc. ("ATIS") merged into one entity and was renamed Transamerica Fund Services, Inc. ("TFS").
The following schedule reflects the percentage of fund assets owned by affiliated mutual funds (i.e., through the Transamerica IDEX Mutual Funds and AEGON/Transamerica Series Trust (f/k/a AEGON/Transamerica Series Fund, Inc.) the asset allocation funds):
| Net Assets | % of Net Assets | ||||||||||
| TA IDEX Asset Allocation– Conservative Portfolio | $ | 2,944 | 0.91 | % | |||||||
| TA IDEX Asset Allocation– Growth Portfolio | 27,746 | 8.44 | % | ||||||||
| TA IDEX Asset Allocation– Moderate Growth Portfolio | 35,294 | 10.86 | % | ||||||||
| TA IDEX Asset Allocation– Moderate Portfolio | 23,640 | 7.27 | % | ||||||||
| Asset Allocation–Conservative Portfolio | 11,867 | 3.65 | % | ||||||||
| Asset Allocation–Growth Portfolio | 64,828 | 19.95 | % | ||||||||
| Asset Allocation–Moderate Growth Portfolio | 109,296 | 33.63 | % | ||||||||
| Asset Allocation–Moderate Portfolio | 49,111 | 15.11 | % | ||||||||
| Total | $ | 324,726 | 99.82 | % | |||||||
Transamerica IDEX Mutual Funds
Semi-Annual Report 2005
8
TA IDEX Marsico International Growth
NOTES TO FINANCIAL STATEMENTS (continued)
At April 30, 2005
(all amounts in thousands)
(unaudited)
NOTE 2.–(continued)
Investment advisory fee: The Fund pays management fees to TFAI based on average daily net assets ("ANA") at the following breakpoints:
1.06% of the first $300 million of ANA
1.01% of the next $100 million of ANA
0.96% of the next $600 million of ANA
0.91% of ANA over $1 billion
TFAI has contractually agreed to waive its advisory fee and will reimburse the Fund to the extent that operating expenses exceed the following stated annual limit:
1.31% Expense Limit
If total fund expenses fall below the annual expense limitation agreement agreed to by the adviser within the succeeding three years, the Fund may be required to pay that adviser a portion or all of the waived advisory fees.
There were no amounts available for recapture at April 30, 2005.
Distribution and service fees: The Fund has a 12b-1 distribution plan under the 1940 Act pursuant to which an annual fee, based on average daily net assets, is paid to the distributor for various disbursements such as broker-dealer account servicing fees and other promotional expenses of the Fund. The Fund is authorized under the 12b-1 plan to pay fees on each class up to the following limits:
| Class A | 0.35 | % | |||||
| Class I | N/A | ||||||
In the case the Fund or a class of shares of the Fund is closed to new investors or investments, the Fund is authorized to pay 12b-1 fees for past sales and distribution efforts and present and past investor services.
Administrative services: The Fund has entered into an agreement with TFS for financial and legal fund administration services, which includes such items as compliance, expenses, financial statements and other reporting, distributions, tax returns, prospectus preparation, board of trustees meeting support and other legal matters. As of January 1, 2005 the Fund pays TFS an annual fee of 0.02% of average net assets. Prior to January 1, 2005 the Fund paid TFS an annual fee of 0.015% of average net assets. The Legal fees on the Statement of Operations are for fees paid to external legal counsel.
Transfer agent fees: The Fund pays TFS an annual per-account charge of $20 (not in thousands) for each open account and $1.63 (not in thousands) for each closed account. There is no new account charge. The Transfer agent fees on the Statement of Operations are made up of fees paid to TFS and costs associated with shareholder statements.
The Fund paid TFS less than $1 for the period from inception through April 30, 2005.
NOTE 3. INVESTMENT TRANSACTIONS
The cost of securities purchased and proceeds from securities sold (excluding short-term securities) for the period from inception through April 30, 2005, were as follows:
| Purchases of securities: | |||||||
| Long-Term excluding U.S. Government | $ | 501,905 | |||||
| U.S. Government | – | ||||||
| Proceeds from maturities and sales of securities: | |||||||
| Long-Term excluding U.S. Government | 182,995 | ||||||
| U.S. Government | – | ||||||
NOTE 4. FEDERAL INCOME TAX MATTERS
The Fund has not made any provision for federal income or excise taxes due to its policy to distribute all of its taxable income and capital gains to its shareholders and otherwise qualify as a regulated investment company under the Internal Revenue Code. Income and capital gain distributions are determined in accordance with income tax regulations, which may differ from GAAP. These differences are primarily due to differing treatment for items including, but not limited to, wash sales, net operating losses and capital loss carryforwards.
The aggregate cost of investments and composition of unrealized appreciation (depreciation) for federal income tax purposes as of April 30, 2005, are as follows:
| Federal Tax Cost Basis | $ | 316,487 | |||||
| Unrealized Appreciation | $ | 4,616 | |||||
| Unrealized (Depreciation) | (13,229 | ) | |||||
| Net Unrealized Appreciation (Depreciation) | $ | (8,613 | ) | ||||
NOTE 5. REGULATORY PROCEEDINGS
There continues to be significant federal and state regulatory activity relating to financial services companies, particularly mutual fund companies and their investment advisers. As part of an ongoing investigation regarding potential market timing, recordkeeping and trading compliance issues and matters affecting the Fund's investment adviser, TFAI, and certain employees and affiliates of TFAI, the SEC staff has indicated that it is likely to take some action against TFAI and certain of its affiliates at the conclusion of the investigation. The potential timing and the scope of any such action is difficult to predict. Although the impact of any action brought against TFAI and/or its affiliates is difficult to assess at the present time, the Fund currently believes that the likelihood that any such action will have a material adverse impact on it is remote. It is important to note that the Fund is not aware of any allegation of wrongdoing against it and its board at the time this semi-annual report is printed. Although it is not anticipated that these developments will have an adverse impact on the Fund, there can be no assurance at this time. TFAI and its affiliates are actively working with the SEC in regard to this matter; however, the exact resolution cannot be determined at this time. TFAI will take such actions that it deems necessary or appropriate to continue providing management services to the Fund and to bring all matters to an appropriate conclusion.
TFAI and/or its affiliates, and not the Fund, will bear the costs regarding these regulatory matters.
Transamerica IDEX Mutual Funds
Semi-Annual Report 2005
9
TA IDEX Marsico International Growth
A discussion regarding the basis of Transamerica IDEX Mutual Fund's Board of Trustees' approval of the fund's advisory arrangements will be available in the fund's annual report for the fiscal year ending October 31, 2005.
Transamerica IDEX Mutual Funds
Semi-Annual Report 2005
10
TA IDEX Marsico International Growth
SUPPLEMENTAL INFORMATION (unaudited)
RESULTS OF SHAREHOLDER PROXY
At a special meeting of shareholders held on February 25, 2005, the results of the Proposals were as follows:
Transamerica IDEX Mutual Funds
Proposal 1: Election of Trustees to the Board of Trustees of Transamerica IDEX Mutual Funds.
| For | Withheld | ||||||||||
| Peter R. Brown | 872,017,875.249 | 4,468,498.551 | |||||||||
| Daniel Calabria | 871,917,069.786 | 4,569,304.014 | |||||||||
| Janise B. Case | 872,099,393.125 | 4,386,980.675 | |||||||||
| Charles C. Harris | 872,086,722.025 | 4,399,651.775 | |||||||||
| Leo J. Hill | 872,304,465.640 | 4,181,908.160 | |||||||||
| Russell A. Kimball, Jr. | 872,253,556.471 | 4,232,817.329 | |||||||||
| William W. Short, Jr. | 872,139,920.944 | 4,346,452.856 | |||||||||
| John Waechter | 872,261,152.376 | 4,225,221.424 | |||||||||
| Jack E. Zimmerman | 871,929,967.512 | 4,556,406.288 | |||||||||
| Brian C. Scott | 872,218,970.367 | 4,267,403.433 | |||||||||
| Thomas P. O'Neill | 872,111,944.117 | 4,374,429.683 | |||||||||
TA IDEX Marsico International Growth
Proposal 2: Approval of an Agreement and Plan of Reorganization pursuant to which Transamerica IDEX Mutual Funds will organize as a Delaware statutory trust.
| For | Against | Abstentions/Broker Non-Votes | |||||||||
| 4,019,710.021 | 0 | 0 | |||||||||
Proposal 3: Approval of changes to the fundamental investment restrictions of TA IDEX Marsico International Growth.
| A. Diversification | For | Against | Abstentions/Broker Non-Votes | ||||||||||||
| 4,019,710.021 | 0 | 0 | |||||||||||||
| B. Borrowing | For | Against | Abstentions/Broker Non-Votes | ||||||||||||
| 4,019,710.021 | 0 | 0 | |||||||||||||
| C. Senior Securities | For | Against | Abstentions/Broker Non-Votes | ||||||||||||
| 4,019,710.021 | 0 | 0 | |||||||||||||
| D. Underwriting Securities | For | Against | Abstentions/Broker Non-Votes | ||||||||||||
| 4,019,710.021 | 0 | 0 | |||||||||||||
| E. Real Estate | For | Against | Abstentions/Broker Non-Votes | ||||||||||||
| 4,019,710.021 | 0 | 0 | |||||||||||||
| F. Making Loans | For | Against | Abstentions/Broker Non-Votes | ||||||||||||
| 4,019,710.021 | 0 | 0 | |||||||||||||
| G. Concentration | For | Against | Abstentions/Broker Non-Votes | ||||||||||||
| 4,019,710.021 | 0 | 0 | |||||||||||||
| H. Commodities | For | Against | Abstentions/Broker Non-Votes | ||||||||||||
| 4,019,710.021 | 0 | 0 | |||||||||||||
Transamerica IDEX Mutual Funds
Semi-Annual Report 2005
11
TA IDEX Mercury Large Cap Value
GRAPHICAL PRESENTATION OF SCHEDULE OF INVESTMENTS
By Sector
At April 30, 2005
(unaudited)
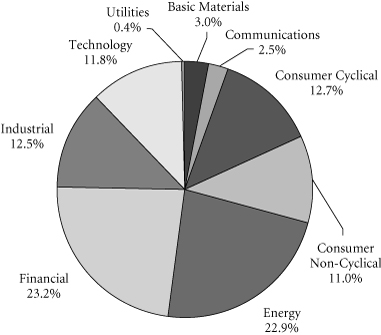
This chart shows the percentage breakdown by sector of the Fund's total investment securities.
Transamerica IDEX Mutual Funds
Semi-Annual Report 2005
1
TA IDEX Mercury Large Cap Value
SCHEDULE OF INVESTMENTS
At April 30, 2005
(all amounts except share amounts in thousands)
(unaudited)
| Shares | Value | ||||||||||
| COMMON STOCKS (98.3%) | |||||||||||
| Aerospace (2.2%) | |||||||||||
| Goodrich Corp. | 71,000 | $ | 2,861 | ||||||||
| Lockheed Martin Corp. | 50,000 | 3,047 | |||||||||
| Amusement & Recreation Services (0.3%) | |||||||||||
| Disney (Walt) Co. (The) | 28,000 | 739 | |||||||||
| Apparel & Accessory Stores (1.9%) | |||||||||||
| American Eagle Outfitters | 104,000 | 2,727 | |||||||||
| Nordstrom, Inc. | 50,000 | 2,541 | |||||||||
| Automotive (0.2%) | |||||||||||
| Ford Motor Co. | 66,000 | 601 | |||||||||
| Automotive Dealers & Service Stations (1.0%) | |||||||||||
| AutoNation, Inc. (a) | 143,000 | 2,613 | |||||||||
| Business Services (1.9%) | |||||||||||
| Equifax, Inc. | 81,000 | 2,726 | |||||||||
| Omnicom Group, Inc. | 30,000 | 2,487 | |||||||||
| Chemicals & Allied Products (1.2%) | |||||||||||
| Monsanto Co. | 58,000 | 3,400 | |||||||||
| Commercial Banks (4.8%) | |||||||||||
| Bank of America Corp. | 60,000 | 2,702 | |||||||||
| Citigroup, Inc. | 194,000 | 9,110 | |||||||||
| M&T Bank Corp. | 14,000 | 1,448 | |||||||||
| Communications Equipment (0.2%) | |||||||||||
| L-3 Communications Holdings, Inc. | 7,000 | 497 | |||||||||
| Computer & Data Processing Services (6.7%) | |||||||||||
| Activision, Inc. (a) | 29,333 | 424 | |||||||||
| Checkfree Corp. (a) | 39,000 | 1,431 | |||||||||
| Compuware Corp. (a) | 446,000 | 2,654 | |||||||||
| Fair Isaac Corp. | 76,000 | 2,499 | |||||||||
| McAfee, Inc. (a) | 47,000 | 983 | |||||||||
| Oracle Corp. (a) | 245,000 | 2,832 | |||||||||
| Sabre Holdings Corp. | 129,000 | 2,523 | |||||||||
| Siebel Systems, Inc. (a) | 100,000 | 900 | |||||||||
| Sun Microsystems, Inc. (a) | 854,000 | 3,100 | |||||||||
| Sybase, Inc. (a) | 53,000 | 1,003 | |||||||||
| Computer & Office Equipment (4.8%) | |||||||||||
| Apple Computer, Inc. (a) | 91,000 | 3,281 | |||||||||
| EMC Corp. (a) | 225,000 | 2,952 | |||||||||
| Hewlett-Packard Co. | 259,000 | 5,302 | |||||||||
| Storage Technology Corp. (a) | 57,000 | 1,585 | |||||||||
| Construction (0.9%) | |||||||||||
| MDC Holdings, Inc. | 36,000 | 2,354 | |||||||||
| Shares | Value | ||||||||||
| Department Stores (2.5%) | |||||||||||
| Dillard's, Inc.–Class A | 30,000 | $ | 698 | ||||||||
| Federated Department Stores, Inc. | 52,000 | 2,990 | |||||||||
| JC Penney Co., Inc. | 69,000 | 3,271 | |||||||||
| Electric Services (0.4%) | |||||||||||
| Northeast Utilities | 62,000 | 1,135 | |||||||||
| Electrical Goods (1.0%) | |||||||||||
| Avnet, Inc. (a) | 139,000 | 2,626 | |||||||||
| Electronic & Other Electric Equipment (4.4%) | |||||||||||
| Energizer Holdings, Inc. (a) | 45,000 | 2,564 | |||||||||
| General Electric Co. | 265,000 | 9,593 | |||||||||
| Electronic Components & Accessories (0.9%) | |||||||||||
| QLogic Corp. (a) | 76,000 | 2,526 | |||||||||
| Food & Kindred Products (2.1%) | |||||||||||
| Altria Group, Inc. | 9,000 | 585 | |||||||||
| Archer-Daniels-Midland Co. | 24,000 | 432 | |||||||||
| PepsiAmericas, Inc. | 117,000 | 2,889 | |||||||||
| Smithfield Foods, Inc. (a) | 61,000 | 1,846 | |||||||||
| Health Services (1.7%) | |||||||||||
| HCA, Inc. | 62,000 | 3,462 | |||||||||
| Manor Care, Inc. | 34,000 | 1,134 | |||||||||
| Hotels & Other Lodging Places (1.4%) | |||||||||||
| MGM Mirage, Inc. (a) | 37,000 | 2,583 | |||||||||
| Starwood Hotels & Resorts Worldwide, Inc. | 22,000 | 1,195 | |||||||||
| Industrial Machinery & Equipment (0.2%) | |||||||||||
| Timken Co. | 17,000 | 422 | |||||||||
| Instruments & Related Products (2.1%) | |||||||||||
| Eastman Kodak Co. | 111,000 | 2,775 | |||||||||
| Rockwell Automation, Inc. | 8,000 | 370 | |||||||||
| Xerox Corp. (a) | 207,000 | 2,743 | |||||||||
| Insurance (9.4%) | |||||||||||
| Aetna, Inc. | 48,000 | 3,522 | |||||||||
| Allstate Corp. (The) | 81,000 | 4,549 | |||||||||
| American Financial Group, Inc. | 53,000 | 1,648 | |||||||||
| Chubb Corp. | 43,000 | 3,517 | |||||||||
| Cigna Corp. | 37,000 | 3,403 | |||||||||
| Cincinnati Financial Corp. | 28,350 | 1,141 | |||||||||
| PacifiCare Health Systems, Inc. (a) | 46,000 | 2,749 | |||||||||
| Principal Financial Group | 57,000 | 2,228 | |||||||||
| Progressive Corp. (The) | 9,000 | 821 | |||||||||
| SAFECO Corp. | 42,000 | 2,212 | |||||||||
| Iron & Steel Foundries (0.3%) | |||||||||||
| Precision Castparts Corp. | 13,000 | 958 | |||||||||
The notes to the financial statements are an integral part of this report.
Transamerica IDEX Mutual Funds
Semi-Annual Report 2005
2
TA IDEX Mercury Large Cap Value
SCHEDULE OF INVESTMENTS (continued)
At April 30, 2005
(all amounts except share amounts in thousands)
(unaudited)
| Shares | Value | ||||||||||
| Life Insurance (3.9%) | |||||||||||
| Lincoln National Corp. | 64,000 | $ | 2,878 | ||||||||
| Metlife, Inc. | 85,000 | 3,306 | |||||||||
| Nationwide Financial Services–Class A | 14,000 | 496 | |||||||||
| Prudential Financial, Inc. | 68,000 | 3,886 | |||||||||
| Metal Mining (0.9%) | |||||||||||
| Phelps Dodge Corp. | 29,000 | 2,490 | |||||||||
| Oil & Gas Extraction (7.9%) | |||||||||||
| Anadarko Petroleum Corp. | 38,000 | 2,776 | |||||||||
| Apache Corp. | 56,000 | 3,152 | |||||||||
| Burlington Resources, Inc. | 69,000 | 3,354 | |||||||||
| Devon Energy Corp. | 80,000 | 3,614 | |||||||||
| Noble Energy, Inc. | 29,000 | 1,859 | |||||||||
| Occidental Petroleum Corp. | 57,000 | 3,933 | |||||||||
| Unocal Corp. | 57,000 | 3,109 | |||||||||
| Petroleum Refining (14.5%) | |||||||||||
| Amerada Hess Corp. | 30,000 | 2,809 | |||||||||
| ChevronTexaco Corp. | 113,000 | 5,876 | |||||||||
| ConocoPhillips | 56,000 | 5,872 | |||||||||
| Exxon Mobil Corp. | 329,000 | 18,763 | |||||||||
| Marathon Oil Corp. | 3,000 | 140 | |||||||||
| Sunoco, Inc. | 30,000 | 2,978 | |||||||||
| Valero Energy Corp. | 50,000 | 3,426 | |||||||||
| Pharmaceuticals (2.5%) | |||||||||||
| AmerisourceBergen Corp. | 45,000 | 2,758 | |||||||||
| Invitrogen Corp. (a) | 27,000 | 1,978 | |||||||||
| McKesson Corp. | 55,000 | 2,035 | |||||||||
| Primary Metal Industries (2.1%) | |||||||||||
| Nucor Corp. | 57,000 | 2,913 | |||||||||
| United States Steel Corp. | 65,000 | 2,779 | |||||||||
| Railroads (0.9%) | |||||||||||
| CSX Corp. | 50,000 | 2,007 | |||||||||
| Norfolk Southern Corp. | 16,000 | 502 | |||||||||
| Shares | Value | ||||||||||
| Residential Building Construction (1.9%) | |||||||||||
| Lennar Corp.–Class A | 55,000 | $ | 2,831 | ||||||||
| Ryland Group, Inc. | 41,000 | 2,517 | |||||||||
| Retail Trade (0.7%) | |||||||||||
| Toys R US, Inc. (a) | 77,000 | 1,952 | |||||||||
| Rubber & Misc. Plastic Products (0.2%) | |||||||||||
| Reebok International, Ltd. | 11,000 | 447 | |||||||||
| Savings Institutions (0.2%) | |||||||||||
| Astoria Financial Corp. | 16,000 | 424 | |||||||||
| Security & Commodity Brokers (6.9%) | |||||||||||
| AG Edwards, Inc. | 72,000 | 2,859 | |||||||||
| Bear Stearns Cos. Inc. (The) | 32,000 | 3,029 | |||||||||
| Goldman Sachs Group, Inc. (The) | 40,000 | 4,272 | |||||||||
| Lehman Brothers Holdings, Inc. | 42,000 | 3,852 | |||||||||
| Morgan Stanley | 92,000 | 4,841 | |||||||||
| Stone, Clay & Glass Products (1.0%) | |||||||||||
| Owens-IIlinois, Inc. (a) | 112,000 | 2,746 | |||||||||
| Telecommunications (0.4%) | |||||||||||
| Qwest Communications International (a) | 328,000 | 1,122 | |||||||||
| Toys, Games & Hobbies (0.4%) | |||||||||||
| Mattel, Inc. | 61,000 | 1,101 | |||||||||
| Trucking & Warehousing (1.0%) | |||||||||||
| Yellow Roadway Corp. (a) | 56,000 | 2,744 | |||||||||
| Wholesale Trade Durable Goods (0.4%) | |||||||||||
| Tech Data Corp. (a) | 32,000 | 1,169 | |||||||||
| Total Common Stocks (cost: $281,900) | 269,504 | ||||||||||
| Total Investment Securities (cost: $281,900) | $ | 269,504 | |||||||||
| SUMMARY: | |||||||||||
| Investments, at value | 98.3 | % | $ | 269,504 | |||||||
| Other assets in excess of liabilities | 1.7 | % | 4,645 | ||||||||
| Net assets | 100.0 | % | $ | 274,149 | |||||||
NOTES TO SCHEDULE OF INVESTMENTS:
(a) No dividends were paid during the preceding twelve months.
The notes to the financial statements are an integral part of this report.
Transamerica IDEX Mutual Funds
Semi-Annual Report 2005
3
TA IDEX Mercury Large Cap Value
STATEMENT OF ASSETS AND LIABILITIES
At April 30, 2005
(all amounts except per share amounts in thousands)
(unaudited)
| Assets: | |||||||
| Investment securities, at value (cost: $281,900) | $ | 269,504 | |||||
| Cash | 4,193 | ||||||
| Receivables: | |||||||
| Shares of beneficial interest sold | 425 | ||||||
| Interest | 9 | ||||||
| Dividends | 219 | ||||||
| 274,350 | |||||||
| Liabilities: | |||||||
| Accounts payable and accrued liabilities: | |||||||
| Management and advisory fees | 109 | ||||||
| Distribution and service fees | 77 | ||||||
| Other | 15 | ||||||
| 201 | |||||||
| Net Assets | $ | 274,149 | |||||
| Net Assets Consist of: | |||||||
| Shares of beneficial interest, unlimited shares authorized, no par value | $ | 286,455 | |||||
| Undistributed net investment income (loss) | 12 | ||||||
| Undistributed net realized gain (loss) from investment securities | 78 | ||||||
| Net unrealized appreciation (depreciation) on investment securities | (12,396 | ) | |||||
| Net Assets | $ | 274,149 | |||||
| Shares Outstanding | 29,442 | ||||||
| Net Asset Value and Offering Price Per Share | $ | 9.31 | |||||
STATEMENT OF OPERATIONS
For the period ended April 30, 2005 (a)
(all amounts in thousands)
(unaudited)
| Investment Income: | |||||||
| Interest | $ | 52 | |||||
| Dividends | 276 | ||||||
| 328 | |||||||
| Expenses: | |||||||
| Management and advisory fees | 251 | ||||||
| Printing and shareholder reports | 1 | ||||||
| Custody fees | 19 | ||||||
| Administration fees | 6 | ||||||
| Audit fees | 2 | ||||||
| Trustees fees | 1 | ||||||
| Other | 1 | ||||||
| Distribution and service fees | 110 | ||||||
| Total expenses | 391 | ||||||
| Less: | |||||||
| Advisory fee waiver | (75 | ) | |||||
| Net expenses | 316 | ||||||
| Net Investment Income (Loss) | 12 | ||||||
| Net Realized and Unrealized Gain (Loss) | |||||||
| Realized gain (loss) from investment securities | 78 | ||||||
| Increase (decrease) in unrealized appreciation (depreciation) on investment securities | (12,396 | ) | |||||
| Net Gain (Loss) on Investments | (12,318 | ) | |||||
| Net Increase (Decrease) in Net Assets Resulting from Operations | $ | (12,306 | ) | ||||
(a) Commenced operations on March 1, 2005.
The notes to the financial statements are an integral part of this report.
Transamerica IDEX Mutual Funds
Semi-Annual Report 2005
4
TA IDEX Mercury Large Cap Value
STATEMENT OF CHANGES IN NET ASSETS
For the period ended
(all amounts in thousands)
| April 30, 2005 (a) (unaudited) | |||||||
| Increase (Decrease) In Net Assets From: | |||||||
| Operations: | |||||||
| Net investment income (loss) | $ | 12 | |||||
| Net realized gain (loss) from investment securities | 78 | ||||||
| Net unrealized appreciation (depreciation) on investment securities | (12,396 | ) | |||||
| (12,306 | ) | ||||||
| Capital Share Transactions: | |||||||
| Proceeds from shares sold | 286,455 | ||||||
| Net increase (decrease) in net assets | 274,149 | ||||||
| Net Assets: | |||||||
| Beginning of period | – | ||||||
| End of period | $ | 274,149 | |||||
| Undistributed Net Investment Income (Loss) | $ | 12 | |||||
| Share Activity: | |||||||
| Shares issued | 29,442 | ||||||
| Net increase (decrease) in shares outstanding | 29,442 | ||||||
(a) Commenced operations on March 1, 2005.
The notes to the financial statements are an integral part of this report.
Transamerica IDEX Mutual Funds
Semi-Annual Report 2005
5
TA IDEX Mercury Large Cap Value
FINANCIAL HIGHLIGHTS
(unaudited)
| For a share of beneficial interest outstanding throughout the period | |||||||||||||||||||||||||||||||||||
| Net Asset | Investment Operations | Distributions | Net Asset | ||||||||||||||||||||||||||||||||
| For the Period Ended (d)(g) | Value, Beginning of Period | Net Investment Income (Loss) | Net Realized and Unrealized Gain (Loss) | Total Operations | From Net Investment Income | From Net Realized Gains | Total Distributions | Value, End of Period | |||||||||||||||||||||||||||
| 4/30/2005 | $ | 10.00 | $ | – | $ | (0.69 | ) | $ | (0.69 | ) | $ | – | $ | – | $ | – | $ | 9.31 | |||||||||||||||||
| Ratios/Supplemental Data | |||||||||||||||||||||||||||||||
| For the Period | Total | Net Assets, End of Period | Ratio of Expenses to Average Net Assets (a) | Net Investment Income (Loss) to Average | Portfolio Turnover | ||||||||||||||||||||||||||
| Ended (g) | Return (c) | (000's) | Net (e) | Total (f) | Net Assets (a) | Rate (b) | |||||||||||||||||||||||||
| 4/30/2005 | (6.90 | )% | $ | 274,149 | 1.00 | % | 1.25 | % | 0.04 | % | 4 | % | |||||||||||||||||||
NOTES TO FINANCIAL HIGHLIGHTS
(a) Annualized.
(b) Not Annualized for periods of less than one year.
(c) Total Return has been calculated for the applicable period without deduction of a sales load, if any, on an initial purchase. Periods of less than one year are not annualized.
(d) Per share information is based on average number of shares outstanding.
(e) Ratio of Net Expenses to Average Net Assets is net of fee waivers and reimbursements by the investment adviser, if any (see note 2).
(f) Ratio of Total Expenses to Average Net Assets includes all expenses before fee waivers and reimbursements by the investment adviser.
(g) TA IDEX Mercury Large Cap Value ("the Fund") commenced operations on March 1, 2005.
The notes to the financial statements are an integral part of this report.
Transamerica IDEX Mutual Funds
Semi-Annual Report 2005
6
TA IDEX Mercury Large Cap Value
NOTES TO FINANCIAL STATEMENTS
At April 30, 2005
(all amounts in thousands)
(unaudited)
NOTE 1. ORGANIZATION AND SIGNIFICANT ACCOUNTING POLICIES
Transamerica IDEX Mutual Funds is a Delaware statutory trust registered under the Investment Company Act of 1940, as amended (the "1940 Act"), as an open-end management investment company. Prior to March 1, 2005, Transamerica IDEX Mutual Funds was a Massachusetts business trust. TA IDEX Mercury Large Cap Value ("the Fund"), part of Transamerica IDEX Mutual Funds, began operations on March 1, 2005.
In the normal course of business, the Fund enters into contracts that contain a variety of representations and warranties, which provide general indemnifications. The Fund's maximum exposure under these arrangements is unknown, as this would involve future claims that may be made against the Fund and/or its affiliates that have not yet occurred. However, based on experience, the Fund expects the risk of loss to be remote.
See the Prospectus and Statement of Additional Information for a description of the Fund's investment objective.
In preparing the Fund's financial statements in accordance with accounting principles generally accepted in the United States of America ("GAAP"), estimates or assumptions (which could differ from actual results) may be used that affect reported amounts and disclosures. The following policies were consistently followed by the Fund, in accordance with GAAP.
The initial sales charge currently is waived as this fund is available for investment only by certain strategic asset allocation funds.
Pricing of shares: The Fund prices its shares on the basis of the net asset value of shares of the Fund, which is determined as of the close of the New York Stock Exchange ("NYSE") (generally 4:00 p.m. Eastern Time) on each day on which the NYSE is open for trading.
Security valuations: Fund investments traded on an exchange are valued at the closing price on the day of valuation on the exchange where the security is principally traded. With respect to securities traded on NASDAQ NMS, such closing price may be the last reported sales price or the NASDAQ Official Closing Price.
Securities traded in the over-the-counter market and listed securities for which no sale was reported on that date are valued at the last quoted bid price.
Other securities for which quotations are not readily available are valued at fair market value as determined in good faith using guidelines adopted by the Board of Trustees of the Fund, under the supervision of the Fund's Valuation Committee. These guidelines may include: the type of security; any restrictions on its resale; financial or business news of the issuer; similar or related securities that are actively trading; related corporate actions; and other significant events occurring after the close of trading in the security.
Cash: The Fund may leave cash overnight in its cash account with the custodian, Investors Bank & Trust Company ("IBT"). IBT has been contracted on behalf of the Fund to invest the excess cash into a savings account, which at April 30, 2005, was paying an interest rate of 2.02%.
Throughout the period from inception through April 30, 2005, the Fund may have a cash overdraft balance. A fee is incurred on this overdraft, calculated by multiplying the overdraft by a rate based on the Federal Funds rate.
Security transactions and investment income: Security transactions are recorded on the trade date. Security gains and losses are calculated on the specific identification basis. Dividend income is recorded on the ex-dividend date or, in the case of foreign securities, as soon as the Fund is informed of the ex-dividend date. Interest income, including accretion of discounts and amortization of premiums, is recorded on the accrual basis commencing on the settlement date.
Redemption fees: A short-term trading redemption fee may be assessed on any fund shares in a fund account that are sold during the first five (5) NYSE trading days following their purchase date. This redemption fee will equal 2% of the amount redeemed and shares held the longest will be treated as being redeemed first and shares held the shortest as being redeemed last.
For the period from inception through April 30, 2005, the Fund received no redemption fees.
Dividend distributions: Distributions to shareholders are recorded on the ex-dividend date and are determined in accordance with Federal income tax regulations which may differ from GAAP.
NOTE 2. RELATED PARTY TRANSACTIONS
Transamerica Fund Advisors, Inc. ("TFAI") is the Fund's investment adviser. Transamerica Fund Services, Inc. ("TFS") is the Fund's administrator and transfer agent. AFSG Securities Corp. ("AFSG") is the Fund's distributor/principal underwriter. AFSG is 100% owned by AUSA Holding Company ("AUSA"). TFAI is a directly owned subsidiary of Western Reserve Life Assurance Co. of Ohio (78%) and AUSA (22%). TFS is a wholly owned subsidiary of WRL (50%) and AUSA (50%). AUSA and WRL are wholly owned indirect subsidiaries of AEGON, NV, a Netherlands corporation.
Effective January 1, 2005 AEGON/Transamerica Fund Advisors, Inc. ("ATFA") was renamed Transamerica Fund Advisors, Inc. ("TFAI"); AEGON/Transamerica Fund Services, Inc. ("ATFS") and AEGON/Transamerica Investor Services, Inc. ("ATIS") merged into one entity and was renamed Transamerica Fund Services, Inc. ("TFS").
Transamerica IDEX Mutual Funds
Semi-Annual Report 2005
7
TA IDEX Mercury Large Cap Value
NOTES TO FINANCIAL STATEMENTS (continued)
At April 30, 2005
(all amounts in thousands)
(unaudited)
NOTE 2.–(continued)
The following schedule represents the percentage of fund assets owned by affiliated mutual funds (i.e. through the asset allocation funds):
| Net Assets | % of Net Assets | ||||||||||
| TA IDEX Asset Allocation–Growth Portfolio | $ | 129,353 | 47.18 | % | |||||||
| TA IDEX Asset Allocation–Moderate Growth Portfolio | 144,290 | 52.64 | % | ||||||||
| Total | $ | 273,643 | 99.82 | % | |||||||
Investment advisory fee: The Fund pays management fees to TFAI based on average daily net assets ("ANA") at the following breakpoints:
0.80% of the first $250 million of ANA
0.775% of the next $500 million of ANA
0.75% of ANA over $750 million
TFAI has contractually agreed to waive its advisory fee and will reimburse the Fund to the extent that operating expenses exceed the following stated annual limit:
1.00% Expense Limit
If total fund expenses fall below the annual expense limitation agreement agreed to by the adviser within the succeeding three years, the Fund may be required to pay that adviser a portion or all of the waived advisory fees.
There are no amounts available for recapture at April 30, 2005.
Distribution and service fees: The Fund has a 12b-1 distribution plan under the 1940 Act pursuant to which an annual fee, based on average daily net assets, is paid to the distributor for various disbursements such as broker-dealer account servicing fees and other promotional expenses of the Fund. The Fund is authorized under the 12b-1 plan to pay fees on each class up to the following limits:
| Class A | 0.35 | % | |||||
In the case the Fund or a class of shares of the Fund is closed to new investors or investments, the Fund is authorized to pay 12b-1 fees for past sales and distribution efforts and present and past investor services.
Administrative Services: The Fund has entered into an agreement with TFS for financial and legal fund administration services, which includes such items as compliance, expenses, financial statements and other reporting, distributions, tax returns, prospectus preparation, board of trustees meeting support and other legal matters. The Fund pays TFS an annual fee of 0.02% of average net assets. The Legal fees on the statement on the Statement of Operations are for fees paid to external legal counsel.
Transfer agent fees: The Fund pays TFS an annual per-account charge of $20 (not in thousands) for each open account and $1.63 (not in thousands) for each closed account. There is no new account charge. The Transfer agent fees on the Statement of Operations are made up of fees paid to TFS and costs associated with shareholder statements.
The Fund paid TFS less than $1 for the period from inception through April 30, 2005.
NOTE 3. INVESTMENT TRANSACTIONS
The cost of securities purchased and proceeds from securities sold (excluding short-term securities) for the period from inception through April 30, 2005, were as follows:
| Purchases of securities: | |||||||
| Long-Term excluding U.S. Government | $ | 289,168 | |||||
| U.S. Government | – | ||||||
| Proceeds from maturities and sales of securities: | |||||||
| Long-Term excluding U.S. Government | 7,346 | ||||||
| U.S. Government | – | ||||||
NOTE 4. FEDERAL INCOME TAX MATTERS
The Fund has not made any provision for federal income or excise taxes due to its policy to distribute all of its taxable income and capital gains to its shareholders and otherwise qualify as a regulated investment company under the Internal Revenue Code. Income and capital gain distributions are determined in accordance with income tax regulations, which may differ from GAAP. These differences are primarily due to differing treatment for items including, but not limited to, wash sales and net operating losses.
The aggregate cost of investments and composition of unrealized appreciation (depreciation) for federal income tax purposes as of April 30, 2005, are as follows:
| Federal Tax Cost Basis | $ | 281,900 | |||||
| Unrealized Appreciation | $ | 2,431 | |||||
| Unrealized (Depreciation) | (14,827 | ) | |||||
| Net Unrealized Appreciation (Depreciation) | $ | (12,396 | ) | ||||
Transamerica IDEX Mutual Funds
Semi-Annual Report 2005
8
TA IDEX Mercury Large Cap Value
NOTES TO FINANCIAL STATEMENTS (continued)
At April 30, 2005
(all amounts in thousands)
(unaudited)
NOTE 5. REGULATORY PROCEEDINGS
There continues to be significant federal and state regulatory activity relating to financial services companies, particularly mutual fund companies and their investment advisers. As part of an ongoing investigation regarding potential market timing, recordkeeping and trading compliance issues and matters affecting the Fund's investment adviser, TFAI, and certain employees and affiliates of TFAI, the SEC staff has indicated that it is likely to take some action against TFAI and certain of its affiliates at the conclusion of the investigation. The potential timing and the scope of any such action is difficult to predict. Although the impact of any action brought against TFAI and/or its affiliates is difficult to assess at the present time, the Fund currently believes that the likelihood that any such action will have a material adverse impact on it is remote. It is important to note that the Fund is not aware of any allegation of wrongdoing against it and its board at the time this semi-annual report is printed. Although it is not anticipated that these developments will have an adverse impact on the Fund, there can be no assurance at this time. TFAI and its affiliates are actively working with the SEC in regard to this matter; however, the exact resolution cannot be determined at this time. TFAI will take such actions that it deems necessary or appropriate to continue providing management services to the Fund and to bring all matters to an appropriate conclusion.
TFAI and/or its affiliates, and not the Fund, will bear the costs regarding these regulatory matters.
Transamerica IDEX Mutual Funds
Semi-Annual Report 2005
9
TA IDEX Mercury Large Cap Value
A discussion regarding the basis of Transamerica IDEX Mutual Fund's Board of Trustees' approval of the fund's advisory arrangements will be available in the fund's annual report for the fiscal year ending October 31, 2005.
Transamerica IDEX Mutual Funds
Semi-Annual Report 2005
10
TA IDEX PIMCO Real Return TIPS
UNDERSTANDING YOUR FUND'S EXPENSES
(unaudited)
SHAREHOLDER EXPENSES
The following Example is intended to help you understand your ongoing costs (in dollars and cents) of investing in a Fund and to compare these costs with the ongoing costs of investing in other funds.
The Example is based on an investment of $1,000 invested at November 1, 2004 and held for the entire period until April 30, 2005.
ACTUAL EXPENSES
The first line in the table below provides information about actual account values and actual expenses. You may use the information in this line, together with the amount you invested, to estimate the expenses that you paid over the period. Simply divide your account value by $1,000 (for example, an $8,600 account value divided by $1,000 = 8.6), then multiply the result by the number in the first line of your Fund under the heading entitled "Expenses Paid During Period" to estimate the expenses you paid on your account during this period.
HYPOTHETICAL EXAMPLE FOR COMPARISON PURPOSES
The second line in the table below provides information about hypothetical account values and hypothetical expenses based on the Fund's actual expense ratio and an assumed rate of return of 5% per year before expenses, which is not the Fund's actual return. The hypothetical account values and expenses may not be used to estimate the actual ending account balance or expenses you paid for the period. You may use this information to compare the ongoing costs of investing in your Fund and other funds. To do so, compare this 5% hypothetical example with the 5% hypothetical examples that appear in the shareholder reports of the other funds.
Please note that the expenses shown in the table are meant to highlight your ongoing costs only and do not reflect any transactional costs, such as sales charges, redemption fees, brokerage commissions paid on purchases and sales of fund shares. Therefore, the second line under the Fund in the table is useful in comparing ongoing costs only, and will not help you determine the relative total costs of owning different funds. In addition, note that the expenses shown in the table are meant to highlight your ongoing costs and do not reflect any transaction costs.
| Beginning Account Value | Ending Account Value | Annualized Expense Ratio | Expenses Paid During Period (a) | ||||||||||||||||
| Class A | |||||||||||||||||||
| Actual | $ | 1,000.00 | $ | 1,027.40 | 1.10 | % | $ | 5.53 | |||||||||||
| Hypothetical (b) | 1,000.00 | 1,019.34 | 1.10 | 5.51 | |||||||||||||||
| Class B | |||||||||||||||||||
| Actual | 1,000.00 | 1,021.90 | 1.98 | 9.93 | |||||||||||||||
| Hypothetical (b) | 1,000.00 | 1,014.98 | 1.98 | 9.89 | |||||||||||||||
| Class C | |||||||||||||||||||
| Actual | 1,000.00 | 1,021.10 | 2.30 | 11.53 | |||||||||||||||
| Hypothetical (b) | 1,000.00 | 1,013.39 | 2.30 | 11.48 | |||||||||||||||
| Class I | |||||||||||||||||||
| Actual | 1,000.00 | 1,034.20 | 0.71 | 3.42 | |||||||||||||||
| Hypothetical (b) | 1,000.00 | 1,020.33 | 0.71 | 3.40 | |||||||||||||||
(a) Expenses are calculated using each Fund's annualized expense ratio (as disclosed in the table), multiplied by the average account value for the period, multiplied by number of days in the period (181 days), and divided by the number of days in the year (365 days).
(b) 5% return per year before expenses.
GRAPHICAL PRESENTATION OF SCHEDULE OF INVESTMENTS
By Bond Type
At April 30, 2005
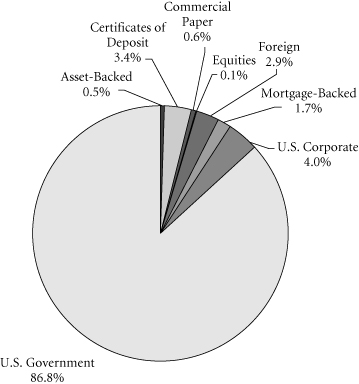
This chart shows the percentage breakdown by bond type of the Fund's total investment securities.
Transamerica IDEX Mutual Funds
Semi-Annual Report 2005
1
TA IDEX PIMCO Real Return TIPS
SCHEDULE OF INVESTMENTS
At April 30, 2005
(all amounts except share amounts in thousands)
(unaudited)
| Principal | Value | ||||||||||
| U.S. GOVERNMENT OBLIGATIONS (99.3%) | |||||||||||
| U.S. Treasury Inflation Indexed Bond 3.38%, due 01/15/2007 | $ | 27,349 | $ | 28,702 | |||||||
| 3.63%, due 01/15/2008 | 2,255 | 2,425 | |||||||||
| 3.88%, due 01/15/2009 | 48,166 | 53,229 | |||||||||
| 0.88%, due 04/15/2010 | 14,067 | 13,876 | |||||||||
| 3.50%, due 01/15/2011 | 32,607 | 36,683 | |||||||||
| 3.38%, due 01/15/2012 | 490 | 555 | |||||||||
| 3.00%, due 07/15/2012 | 45,319 | 50,409 | |||||||||
| 1.88%, due 07/15/2013 | 64,304 | 66,284 | |||||||||
| 2.00%, due 01/15/2014 | 58,730 | 60,976 | |||||||||
| 1.63%, due 01/15/2015 | 9,840 | 9,867 | |||||||||
| 2.38%, due 01/15/2025 | 32,548 | 35,550 | |||||||||
| 3.63%, due 04/15/2028 | 34,140 | 45,612 | |||||||||
| 3.88%, due 04/15/2029 | 52,296 | 73,093 | |||||||||
| 3.38%, due 04/15/2032 | 1,080 | 1,460 | |||||||||
| U.S. Treasury Inflation Indexed Note 2.00%, due 07/15/2014 | 72,522 | 75,262 | |||||||||
| U.S. Treasury Bond 6.63%, due 02/15/2027 | 900 | 1,147 | |||||||||
| Total U.S. Government Obligations (cost: $547,088) | 555,130 | ||||||||||
| U.S. GOVERNMENT AGENCY OBLIGATIONS (6.2%) | |||||||||||
| FNMA 2.83%, due 09/07/2006 (a) 22,600 22,589 2.93%, due 09/21/2006 (a) | 10,500 | 10,490 | |||||||||
| FNMA, Series 2003-63, Class FA 3.17%, due 08/25/2034 (a) | 1,804 | 1,801 | |||||||||
| Total U.S. Government Agency Obligations (cost $34,872) | 34,880 | ||||||||||
| FOREIGN GOVERNMENT OBLIGATIONS (3.5%) | |||||||||||
| Canada Government 3.00%, due 12/01/2036 | CAD | 410 | 406 | ||||||||
| French Republic 5.75%, due 10/25/2032 | EUR | 1,100 | 1,843 | ||||||||
| Kingdom of Spain 5.75%, due 07/30/2032 | EUR | 3,600 | 6,020 | ||||||||
| Republic of Brazil 8.00%, due 04/15/2014 | $ | 528 | 524 | ||||||||
| Republic of Germany 6.25%, due 01/04/2030 | EUR | 3,700 | 6,514 | ||||||||
| Russian Federation 5.00%, due 03/31/2030 (b) | $ | 4,200 | 4,465 | ||||||||
| Total Foreign Government Obligations (cost: $19,601) | 19,772 | ||||||||||
| Principal | Value | ||||||||||
| MORTGAGE-BACKED SECURITIES (1.8%) | |||||||||||
| Ameriquest Mortgage Securities, Inc., Series 2003-1, Class AII 3.43%, due 02/25/2033 (a) | $ | 100 | $ | 101 | |||||||
| Bank of America Mortgage Securities, Series 2004-1, Class 5A1 6.50%, due 09/25/2033 | 209 | 213 | |||||||||
| Countrywide Home Loan Mortgage Pass Through Trust, Series 2005-3, Class 1A2 3.31%, due 04/25/2035 (a) | 4,581 | 4,594 | |||||||||
| Greenpoint Mortgage Funding Trust, Series 2005-AR1, Class A2 3.22%, due 06/25/2045 (a) | 2,700 | 2,706 | |||||||||
| GSAMP Trust, Series 2004-SEA2, Class A2A 3.31%, due 03/25/2034 (a) | 476 | 476 | |||||||||
| Residential Asset Mortgage Product, Inc., Series 2004-RS9, Class AII1 3.18%, due 09/25/2013 (a) | 1,598 | 1,598 | |||||||||
| Truman Capital Mortgage Loan Trust, Series 2004-1, Class A1-144A 3.36%, due 01/25/2034 (a) | 169 | 169 | |||||||||
| Wells Fargo Home Equity Trust, Series 2004-2, Class AIII1 3.18%, due 06/25/2019 (a) | 113 | 113 | |||||||||
| Total Mortgage-Backed Securities (cost: $9,952) | 9,970 | ||||||||||
| ASSET-BACKED SECURITIES (0.6%) | |||||||||||
| Small Business Administration, Series 2004-P10, Class A 4.50%, due 02/01/2014 | 1,165 | 1,154 | |||||||||
| Equity One ABS, Inc., Series 2004-1, Class AV2 3.32%, due 04/25/2034 (a) | 750 | 753 | |||||||||
| Redwood Capital, Ltd., Series 2003-3-144A 6.95%, due 01/09/2006 (a) | 300 | 300 | |||||||||
| Redwood Capital, Ltd., Series 2003-4-144A 5.40%, due 01/09/2006 (a) | 300 | 300 | |||||||||
| Sequoia Mortgage Trust, Series 5, Class A 3.33%, due 10/19/2026 (a) | 751 | 752 | |||||||||
| Total Asset-Backed Securities (cost: $3,269) | 3,259 | ||||||||||
The notes to the financial statements are an integral part of this report.
Transamerica IDEX Mutual Funds
Semi-Annual Report 2005
2
TA IDEX PIMCO Real Return TIPS
SCHEDULE OF INVESTMENTS (continued)
At April 30, 2005
(all amounts except share amounts in thousands)
(unaudited)
| Principal | Value | ||||||||||
| CORPORATE DEBT SECURITIES (4.9%) | |||||||||||
| Automotive (0.5%) | |||||||||||
| DaimlerChrysler North America Holding Corp. 3.20%, due 03/07/2007 (a) | $ | 2,800 | $ | 2,772 | |||||||
| Business Credit Institutions (0.4%) | |||||||||||
| General Electric Capital Corp. 2.98%, due 03/04/2008 (a) | 2,300 | 2,300 | |||||||||
| Insurance (0.0%) | |||||||||||
| Residential Reinsurance, Ltd.-144A 7.35%, due 06/08/2006 (a) | 300 | 298 | |||||||||
| Personal Credit Institutions (3.3%) | |||||||||||
| Ford Motor Credit Co. 3.57%, due 07/07/2005 (a) | 3,000 | 2,981 | |||||||||
| 6.88%, due 02/01/2006 | 1,000 | 1,012 | |||||||||
| 3.75%, due 11/16/2006 (a) | 1,700 | 1,669 | |||||||||
| 4.00%, due 03/21/2007 (a) | 8,000 | 7,785 | |||||||||
| General Motors Acceptance Corp. 3.70%, due 05/18/2006 (a) | 1,500 | 1,470 | |||||||||
| Toyota Motor Credit Corp. 2.91%, due 09/18/2006 (a) | 3,500 | 3,499 | |||||||||
| Revenue-Miscellaneous (0.1%) | |||||||||||
| New Hampshire Municipal Bond Bank 5.00%, due 08/15/2013 | 500 | 552 | |||||||||
| Revenue-Tobacco (0.1%) | |||||||||||
| Tobacco Settlement Financing Corp., RI 6.00%, due 06/01/2023 | 600 | 605 | |||||||||
| Security & Commodity Brokers (0.4%) | |||||||||||
| Goldman Sachs Group, Inc., Series E 2.90%, due 08/01/2006 (a) | 2,100 | 2,099 | |||||||||
| Telecommunications (0.1%) | |||||||||||
| Verizon Wireless Capital LLC-144A 2.93%, due 05/23/2005 (a) | 300 | 300 | |||||||||
| Total Corporate Debt Securities (cost: $27,636) | 27,342 | ||||||||||
| Shares | Value | ||||||||||
| PREFERRED STOCKS (0.2%) | |||||||||||
| Business Credit Institutions (0.2%) | |||||||||||
| Fannie Mae (a) | 14,800 | 822 | |||||||||
| Total Preferred Stocks (cost: $740) | 822 | ||||||||||
| Principal | Value | ||||||||||
| SHORT-TERM U.S. GOVERNMENT OBLIGATIONS (0.1%) | |||||||||||
| U.S. Treasury Bill 2.65%, due 06/16/2005 (c)(d) | $ | 40 | 40 | ||||||||
| Principal | Value | ||||||||||
| 2.68%, due 06/16/2005 (c)(d) | $ | 30 | $ | 30 | |||||||
| 2.74%, due 06/16/2005 (c)(d) | 500 | 497 | |||||||||
| Total Short-Term U.S. Government Obligations (cost: $567) | 567 | ||||||||||
| COMMERCIAL PAPER (0.7%) | |||||||||||
| Personal Credit Institutions (0.4%) | |||||||||||
| General Electric Capital Corp. 3.09%, due 07/25/2005 | 2,200 | 2,183 | |||||||||
| Security & Commodity Brokers (0.3%) | |||||||||||
| IXIS Commercial Paper-144A 3.08%, due 07/19/2005 | 1,900 | 1,886 | |||||||||
| Total Commercial Paper (cost: $4,069) | 4,069 | ||||||||||
| CERTIFICATES OF DEPOSIT (4.1%) | |||||||||||
| Citibank NA 2.68%, due 05/04/2005 | 100 | 100 | |||||||||
| 2.90%, due 06/10/2005 | 7,700 | 7,700 | |||||||||
| HSBC Bank USA 2.75%, due 06/27/2005 | 2,800 | 2,800 | |||||||||
| Bank of America Corp. 2.72%, due 05/16/2005 | 200 | 200 | |||||||||
| 2.91%, due 06/08/2005 | 12,300 | 12,300 | |||||||||
| Total Certificates Of Deposit (cost: $23,100) | 23,100 | ||||||||||
| Contracts (e) | Value | ||||||||||
| PURCHASED OPTIONS (0.0%) | |||||||||||
| Put Options (0.0%) | |||||||||||
| 90 Day Eurodollar Futures Put Strike $94.00 Expires 06/13/2005 | 111 | 1 | |||||||||
| 90 Day Eurodollar Futures Put Strike $94.25 Expires 06/13/2005 | 63 | – | (f) | ||||||||
| Euro-BOBL Put Strike $107.00 Expires 05/25/2005 | 75 | 1 | |||||||||
| U.S. Treasury Inflation Index Put Strike $89.00 Expires 05/25/2005 | 35,000,000 | 8 | |||||||||
| Total Purchased Options (cost: $11) | 10 | ||||||||||
| Total Investment Securities (cost: $670,905) | $ | 678,921 | |||||||||
| WRITTEN OPTIONS (0.0%) | |||||||||||
| Covered Call Options (0.0%) | |||||||||||
| U.S. 10 Year Treasury Note Futures Call Strike $113.00 Expires 05/20/2005 | 88 | (11 | ) | ||||||||
The notes to the financial statements are an integral part of this report.
Transamerica IDEX Mutual Funds
Semi-Annual Report 2005
3
TA IDEX PIMCO Real Return TIPS
SCHEDULE OF INVESTMENTS (continued)
At April 30, 2005
(all amounts except share amounts in thousands)
(unaudited)
| Contracts (e) | Value | ||||||||||
| U.S. 10 Year Treasury Note Futures | $ | 187 | $ | (64 | ) | ||||||
| Call Strike $112.00 | |||||||||||
| Expires 05/20/2005 | |||||||||||
| Put Options (0.0%) | |||||||||||
| U.S. 10 Year Treasury Note Futures Put Strike $107.00 Expires 05/20/2005 | 267 | (4 | ) | ||||||||
| U.S. 10 Year Treasury Note Futures Put Strike $109.00 Expires 05/20/2005 | 8 | (1 | ) | ||||||||
| Total Written Options (premiums: -$123) | (80 | ) | |||||||||
| SUMMARY: | |||||||||||
| Investments, at value | 121.4 | % | $ | 678,921 | |||||||
| Written Options | 0.0 | % | (80 | ) | |||||||
| Liabilities in excess of other assets | (21.4 | )% | $ | (119,731 | ) | ||||||
| Net assets | 100.0 | % | $ | 559,110 | |||||||
| SWAP AGREEMENTS: | |||||||||||
| Expiration Date | Notional Amount | Net Unrealized Appreciation (Depreciation) | |||||||||||||
| Receive a floating rate based on 3-month United States Dollar – LIBOR (London Interbank Offered Rate) and pay a fixed rate equal to 6.00%. Counterparty: UBS AG | 12/18/13 | $ | 2,700 | $ | (189 | ) | |||||||||
| Receive a floating rate based on 3-month United States Dollar – LIBOR (London Interbank Offered Rate) and pay a fixed rate equal to 4.00%. Counterparty: Bank of America, N.A. | 6/15/15 | 3,100 | (1 | ) | |||||||||||
| Receive a floating rate based on 3-month United States Dollar – LIBOR (London Interbank Offered Rate) and pay a fixed rate equal to 5.00%. Counterparty: Bank of America, N.A. | 6/15/15 | 16,800 | (113 | ) | |||||||||||
| Receive a floating rate based on 3-month United States Dollar-LIBOR (London Interbank Offered Rate) and pay a fixed rate equal to 5.00%. Counterparty: Goldman Sachs Capital Markets, LP | 6/15/15 | 19,400 | (83 | ) | |||||||||||
| Receive a floating rate based on 3-month United States Dollar – LIBOR (London Interbank Offered Rate) and pay a fixed rate equal to 5.00%. Counterparty: JP Morgan | 6/15/15 | 8,400 | (81 | ) | |||||||||||
The notes to the financial statements are an integral part of this report.
| Expiration Date | Notional Amount | Net Unrealized Appreciation (Depreciation) | |||||||||||||
| Receive a floating rate based on 3-month United States Dollar – LIBOR (London Interbank Offered Rate) and pay a fixed rate equal to 5.00%. Counterparty: Lehman Brothers Special Financing Inc. | 6/15/15 | $ | 10,400 | $ | 85 | ||||||||||
| Receive a floating rate based on 3-month United States Dollar – LIBOR (London Interbank Offered Rate) and pay a fixed rate equal to 5.00%. Counterparty: Morgan Stanley | 6/15/15 | 32,600 | 209 | ||||||||||||
| Receive a fixed rate equal to 4.00% and pay a floating rate based on 6-month EUIBOR (Euro Interbank Offered Rate). Counterparty: Citibank N.A. | 6/17/10 | 8,000 | 524 | ||||||||||||
| Receive a fixed rate equal to 4.00% and pay a floating rate based on 6-month EUIBOR (Euro Interbank Offered Rate). Counterparty: Barclays Bank PLC | 6/17/10 | 5,700 | 396 | ||||||||||||
| Receive a fixed rate equal to 0.70% and the Fund will pay to the counterparty at par in the event of default of Russian Federation, 5.00%, due 03/31/2030. Counterparty: Morgan Stanley | 5/24/05 | 5,500 | 1 | ||||||||||||
| Total Swap Agreements (premium $2,319) | $ | 112,600 | $ | 748 | |||||||||||
| FORWARD FOREIGN CURRENCY CONTRACTS: | |||||||||||||||
| Currency | Bought (Sold) | Settlement Date | Amount in U.S. Dollars Bought (Sold) | Net Unrealized Appreciation (Depreciation) | |||||||||||||||
| Canadian Dollar | (487 | ) | 6/9/2005 | $ | (394 | ) | $ | 5 | |||||||||||
| Euro Dollar | (313 | ) | 5/18/2005 | (404 | ) | 0 | |||||||||||||
| Euro Dollar | (11,286 | ) | 5/25/2005 | (14,782 | ) | 199 | |||||||||||||
| $ | (15,580 | ) | $ | 204 | |||||||||||||||
| FUTURES CONTRACTS: | |||||||||||||||||||
| Contracts | Settlement Date | Amount | Net Unrealized Appreciation (Depreciation) | ||||||||||||||||
| 10-Year U.S. Treasury Note | 90 | 06/30/2005 | $ | 10,028 | $ | 191 | |||||||||||||
| 90-Day Euro Dollar | 174 | 06/13/2005 | 42,010 | (268) | |||||||||||||||
| Euro-BUND | 33 | 06/10/2005 | 5,144 | 122 | |||||||||||||||
| U.S. Long Bond | 50 | 06/30/2005 | 5,742 | 163 | |||||||||||||||
| $ | 62,924 | $ | 208 | ||||||||||||||||
Transamerica IDEX Mutual Funds
Semi-Annual Report 2005
4
TA IDEX PIMCO Real Return TIPS
SCHEDULE OF INVESTMENTS (continued)
At April 30, 2005
(all amounts in thousands)
(unaudited)
NOTES TO SCHEDULE OF INVESTMENTS:
(a) Floating or variable rate note. Rate is listed as of April 30, 2005.
(b) Securities are stepbonds. Russian Federation has a coupon rate of 5.00% until 03/31/2007, thereafter the coupon rate will become 7.50%.
(c) At April 30, 2005, all or a portion of this security is segregated with the custodian to cover margin requirements for open option contracts. The value of all securities segregated at April 30, 2005, is $259.
(d) At April 30, 2005, all or a portion of this security is segregated with the custodian to cover margin requirements for open futures contracts. The value of all securities segregated at April 30, 2005 is $309.
(e) Contract amounts are not in thousands.
(f) Value is less than $1.
DEFINITIONS:
ABS Asset Backed Security
BOBL German Federal Debt Obligations (Bundes OBLigationen)
CAD Canadian Dollar
EUR Euro
144A 144A Securities are registered pursuant to Rule 144A of the Securities Act of 1933. These securities are deemed to be liquid for purposes of compliance limitations on holdings of illiquid securities and may be resold as transactions exempt from registration, normally to qualified institutional buyers. At April 30, 2005, these securities aggregated $3,253 or 0.6% of the net assets of the Fund.
The notes to the financial statements are an integral part of this report.
Transamerica IDEX Mutual Funds
Semi-Annual Report 2005
5
TA IDEX PIMCO Real Return TIPS
STATEMENT OF ASSETS AND LIABILITIES
At April 30, 2005
(all amounts except per share amounts in thousands)
(unaudited)
| Assets: | |||||||
| Investment securities, at value (cost: $670,905) | $ | 678,921 | |||||
| Cash | 6,123 | ||||||
| Foreign cash (cost: $175) | 172 | ||||||
| Receivables: | |||||||
| Shares of beneficial interest sold | 333 | ||||||
| Interest | 4,106 | ||||||
| Receivable from premiums on written options | 1 | ||||||
| Unrealized appreciation on forward currency contracts | 204 | ||||||
| Other | 72 | ||||||
| 689,932 | |||||||
| Liabilities: | |||||||
| Investment securities purchased | 128,650 | ||||||
| Accounts payable and accrued liabilities: | |||||||
| Shares of beneficial interest redeemed | 43 | ||||||
| Management and advisory fees | 311 | ||||||
| Distribution and service fees | 92 | ||||||
| Transfer agent fees | 9 | ||||||
| Variation margin | 36 | ||||||
| Written options (premiums $123) | 80 | ||||||
| Swap agreements at value (premium $2,319) | 1,571 | ||||||
| Other | 30 | ||||||
| 130,822 | |||||||
| Net Assets | $ | 559,110 | |||||
| Net Assets Consist of: | |||||||
| Shares of beneficial interest, unlimited shares authorized, no par value | $ | 549,300 | |||||
| Undistributed net investment income (loss) | 1,085 | ||||||
| Accumulated net realized gain (loss) from investment securities, futures contracts, foreign currency transactions, written options and swaps | (488 | ) | |||||
| Net unrealized appreciation (depreciation) on: | |||||||
| Investment securities | 8,014 | ||||||
| Futures contracts | 208 | ||||||
| Written option contracts | 43 | ||||||
| Swap agreements | 748 | ||||||
| Translation of assets and liabilites denominated in foreign currencies | 200 | ||||||
| Net Assets | $ | 559,110 | |||||
| Net Assets by Class: | |||||||
| Class A | $ | 275,963 | |||||
| Class B | 9,274 | ||||||
| Class C | 8,102 | ||||||
| Class I | 265,771 | ||||||
| Shares Outstanding: | |||||||
| Class A | 26,233 | ||||||
| Class B | 887 | ||||||
| Class C | 779 | ||||||
| Class I | 25,212 | ||||||
| Net Asset Value Per Share: | |||||||
| Class A | $ | 10.52 | |||||
| Class B | 10.45 | ||||||
| Class C | 10.41 | ||||||
| Class I | 10.54 | ||||||
| Maximum Offering Price Per Share (a): | |||||||
| Class A | $ | 11.04 | |||||
(a) Includes the maximum selling commission (represented as a percentage of offering price) which is reduced on certain levels of sales as set forth in the Prospectus. Net asset value per share for Classes B, C and I shares represents offering price. The redemption price for Classes B and C shares equals net asset value less any applicable contingent deferred sales charge.
STATEMENT OF OPERATIONS
For the period ended April 30, 2005
(all amounts in thousands)
(unaudited)
| Investment Income: | |||||||
| Interest | $ | 8,058 | |||||
| Dividends | 13 | ||||||
| 8,071 | |||||||
| Expenses: | |||||||
| Management and advisory fees | 1,869 | ||||||
| Transfer agent fees: | |||||||
| Class A | 4 | ||||||
| Class B | 4 | ||||||
| Class C | 3 | ||||||
| Class I | 2 | ||||||
| Custody fees | 48 | ||||||
| Administration fees | 51 | ||||||
| Legal fees | 13 | ||||||
| Audit fees | 13 | ||||||
| Trustees fees | 10 | ||||||
| Registration fees: | |||||||
| Class A | 21 | ||||||
| Class B | 6 | ||||||
| Class C | 19 | ||||||
| Distribution and service fees: | |||||||
| Class A | 560 | ||||||
| Class B | 41 | ||||||
| Class C | 36 | ||||||
| Total expenses | 2,700 | ||||||
| Less: | |||||||
| Reimbursement of class expenses: | |||||||
| Class C | (2 | ) | |||||
| Net expenses | 2,698 | ||||||
| Net Investment Income (Loss) | 5,373 | ||||||
| Net Realized Gain (Loss) from: | |||||||
| Investment securities | 1,978 | ||||||
| Futures contracts | 511 | ||||||
| Written option contracts | 130 | ||||||
| Swap agreements | (1,649 | ) | |||||
| Foreign currency transactions | (93 | ) | |||||
| 877 | |||||||
| Net Increase (Decrease) in Unrealized Appreciation (Depreciation) on: | |||||||
| Investment securities | 5,947 | ||||||
| Futures contracts | 3 | ||||||
| Written option contracts | 8 | ||||||
| Swap agreements | 2,405 | ||||||
| Translation of assets and liabilities denominated in foreign currencies | 196 | ||||||
| 8,559 | |||||||
| Net Gain (Loss) on Investments, Futures Contracts, Written Options, Swaps and Foreign Currency Transactions | 9,436 | ||||||
| Net Increase (Decrease) in Net Assets Resulting from Operations | $ | 14,809 | |||||
The notes to the financial statements are an integral part of this report.
Transamerica IDEX Mutual Funds
Semi-Annual Report 2005
6
TA IDEX PIMCO Real Return TIPS
STATEMENTS OF CHANGES IN NET ASSETS
For the period or year ended
(all amounts in thousands)
| April 30, 2005 (unaudited) | October 31, 2004 | ||||||||||
| Increase (Decrease) in Net Assets From: | |||||||||||
| Operations: | |||||||||||
| Net investment income (loss) | $ | 5,373 | $ | 400 | |||||||
| Net realized gain (loss) from investment securities, futures contracts, foreign currency transactions, written options and swaps | 877 | 16,577 | |||||||||
| Net unrealized appreciation (depreciation) on investment securities, futures contracts, written options, swaps and foreign currency translation | 8,559 | 605 | |||||||||
| 14,809 | 17,582 | ||||||||||
| Distributions to Shareholders: | |||||||||||
| From net investment income: | |||||||||||
| Class A | (2,173 | ) | (392 | ) | |||||||
| Class B | (22 | ) | (6 | ) | |||||||
| Class C | (20 | ) | (6 | ) | |||||||
| Class I | (2,204 | ) | – | ||||||||
| (4,419 | ) | (404 | ) | ||||||||
| From net realized gains: | |||||||||||
| Class A | (5,455 | ) | (8,780 | ) | |||||||
| Class B | (127 | ) | (216 | ) | |||||||
| Class C | (109 | ) | (183 | ) | |||||||
| Class C2 | – | (12 | ) | ||||||||
| Class M | – | (20 | ) | ||||||||
| Class I | (3,816 | ) | – | ||||||||
| (9,507 | ) | (9,211 | ) | ||||||||
| Capital Share Transactions: | |||||||||||
| Proceeds from shares sold: | |||||||||||
| Class A | 13,711 | 281,364 | |||||||||
| Class B | 3,441 | 5,292 | |||||||||
| Class C | 2,927 | 4,790 | |||||||||
| Class C2 | – | 59 | |||||||||
| Class M | – | 345 | |||||||||
| Class I | 258,919 | – | |||||||||
| 278,998 | 291,850 | ||||||||||
| Dividends and distributions reinvested: | |||||||||||
| Class A | 7,605 | 9,143 | |||||||||
| Class B | 113 | 169 | |||||||||
| Class C | 81 | 123 | |||||||||
| Class C2 | – | 11 | |||||||||
| Class M | – | 20 | |||||||||
| Class I | 6,020 | – | |||||||||
| 13,819 | 9,466 | ||||||||||
| Cost of shares redeemed: | |||||||||||
| Class A | (75,622 | ) | (4,390 | ) | |||||||
| Class B | (1,814 | ) | (1,311 | ) | |||||||
| Class C | (1,533 | ) | (2,691 | ) | |||||||
| Class C2 | – | (99 | ) | ||||||||
| Class M | – | (59 | ) | ||||||||
| (78,969 | ) | (8,550 | ) | ||||||||
| Class level exchanges: | |||||||||||
| Class C | – | 1,062 | |||||||||
| Class C2 | – | (302 | ) | ||||||||
| Class M | – | (760 | ) | ||||||||
| – | – | ||||||||||
| 213,848 | 292,766 | ||||||||||
| Net increase (decrease) in net assets | 214,731 | 300,733 | |||||||||
| April 30, 2005 (unaudited) | October 31, 2004 | ||||||||||
| Net Assets: | |||||||||||
| Beginning of period | 344,379 | 43,646 | |||||||||
| End of period | $ | 559,110 | $ | 344,379 | |||||||
| Undistributed Net Investment Income (Loss) | $ | 1,085 | $ | 131 | |||||||
| Share Activity: | |||||||||||
| Shares issued: | |||||||||||
| Class A | 1,310 | 27,408 | |||||||||
| Class B | 331 | 514 | |||||||||
| Class C | 284 | 470 | |||||||||
| Class C2 | – | 6 | |||||||||
| Class M | – | 35 | |||||||||
| Class I | 24,638 | – | |||||||||
| 26,563 | 28,433 | ||||||||||
| Shares issued-reinvested from distributions: | |||||||||||
| Class A | 726 | 908 | |||||||||
| Class B | 10 | 17 | |||||||||
| Class C | 8 | 12 | |||||||||
| Class C2 | – | 1 | |||||||||
| Class M | – | 2 | |||||||||
| Class I | 574 | – | |||||||||
| 1,318 | 940 | ||||||||||
| Shares redeemed: | |||||||||||
| Class A | (7,307 | ) | (428 | ) | |||||||
| Class B | (174 | ) | (128 | ) | |||||||
| Class C | (148 | ) | (263 | ) | |||||||
| Class C2 | – | (10 | ) | ||||||||
| Class M | – | (6 | ) | ||||||||
| (7,629 | ) | (835 | ) | ||||||||
| Class level exchanges: | |||||||||||
| Class C | – | 104 | |||||||||
| Class C2 | – | (30 | ) | ||||||||
| Class M | – | (74 | ) | ||||||||
| – | – | ||||||||||
| Net increase (decrease) in shares outstanding: | |||||||||||
| Class A | (5,271 | ) | 27,888 | ||||||||
| Class B | 167 | 403 | |||||||||
| Class C | 144 | 323 | |||||||||
| Class C2 | – | (33 | ) | ||||||||
| Class M | – | (43 | ) | ||||||||
| Class I | 25,212 | – | |||||||||
| 20,252 | 28,538 | ||||||||||
The notes to the financial statements are an integral part of this report.
Transamerica IDEX Mutual Funds
Semi-Annual Report 2005
7
TA IDEX PIMCO Real Return TIPS
FINANCIAL HIGHLIGHTS
(unaudited for the period ended April 30, 2005)
| For a share of beneficial interest outstanding throughout each period | |||||||||||||||||||||||||||||||||||||||
| Net Asset | Investment Operations | Distributions | Net Asset | ||||||||||||||||||||||||||||||||||||
| For the Period Ended (d)(g) | Value, Beginning of Period | Net Investment Income (Loss) | Net Realized and Unrealized Gain (Loss) | Total Operations | From Net Investment Income | From Net Realized Gains | Total Distributions | Value, End of Period | |||||||||||||||||||||||||||||||
| Class A | 4/30/2005 | $ | 10.48 | $ | 0.09 | $ | 0.19 | $ | 0.28 | $ | (0.07 | ) | $ | (0.17 | ) | $ | (0.24 | ) | $ | 10.52 | |||||||||||||||||||
| 10/31/2004 | 10.10 | 0.02 | 0.76 | 0.78 | (0.02 | ) | (0.38 | ) | (0.40 | ) | 10.48 | ||||||||||||||||||||||||||||
| 10/31/2003 | 10.00 | 0.14 | 0.07 | 0.21 | (0.11 | ) | – | (0.11 | ) | 10.10 | |||||||||||||||||||||||||||||
| Class B | 4/30/2005 | 10.42 | 0.05 | 0.18 | 0.23 | (0.03 | ) | (0.17 | ) | (0.20 | ) | 10.45 | |||||||||||||||||||||||||||
| 10/31/2004 | 10.08 | (0.02 | ) | 0.75 | 0.73 | (0.01 | ) | (0.38 | ) | (0.39 | ) | 10.42 | |||||||||||||||||||||||||||
| 10/31/2003 | 10.00 | 0.09 | 0.08 | 0.17 | (0.09 | ) | – | (0.09 | ) | 10.08 | |||||||||||||||||||||||||||||
| Class C | 4/30/2005 | 10.39 | 0.04 | 0.18 | 0.22 | (0.03 | ) | (0.17 | ) | (0.20 | ) | 10.41 | |||||||||||||||||||||||||||
| 10/31/2004 | 10.08 | (0.06 | ) | 0.76 | 0.70 | (0.01 | ) | (0.38 | ) | (0.39 | ) | 10.39 | |||||||||||||||||||||||||||
| 10/31/2003 | 10.00 | 0.09 | 0.08 | 0.17 | (0.09 | ) | – | (0.09 | ) | 10.08 | |||||||||||||||||||||||||||||
| Class I | 4/30/2005 | 10.45 | 0.12 | 0.23 | 0.35 | (0.09 | ) | (0.17 | ) | (0.26 | ) | 10.54 | |||||||||||||||||||||||||||
| Ratios/Supplemental Data | |||||||||||||||||||||||||||||||
| For the Period | Total | Net Assets, End of Period | Ratio of Expenses to Average Net Assets (a) | Net Investment Income (Loss) to Average | Portfolio Turnover | ||||||||||||||||||||||||||
| Ended (g) | Return (c) | (000's) | Net (e) | Total (f) | Net Assets (a) | Rate (b) | |||||||||||||||||||||||||
| Class A | 4/30/2005 | 2.74 | % | $ | 275,963 | 1.10 | % | 1.10 | % | 1.72 | % | 561 | % | ||||||||||||||||||
| 10/31/2004 | 7.94 | 330,282 | 1.15 | 1.15 | 0.20 | 1,438 | |||||||||||||||||||||||||
| 10/31/2003 | 2.09 | 36,531 | 1.65 | 2.03 | 2.07 | 480 | |||||||||||||||||||||||||
| Class B | 4/30/2005 | 2.19 | 9,274 | 1.98 | 1.98 | 0.99 | 561 | ||||||||||||||||||||||||
| 10/31/2004 | 7.51 | 7,496 | 1.51 | 1.51 | (0.20 | ) | 1,438 | ||||||||||||||||||||||||
| 10/31/2003 | 1.72 | 3,194 | 2.30 | 2.68 | 1.42 | 480 | |||||||||||||||||||||||||
| Class C | 4/30/2005 | 2.11 | 8,102 | 2.30 | 2.35 | 0.70 | 561 | ||||||||||||||||||||||||
| 10/31/2004 | 7.20 | 6,601 | 1.87 | 1.87 | (0.52 | ) | 1,438 | ||||||||||||||||||||||||
| 10/31/2003 | 1.72 | 3,148 | 2.30 | 2.68 | 1.42 | 480 | |||||||||||||||||||||||||
| Class I | 4/30/2005 | 3.42 | 265,771 | 0.71 | 0.71 | 2.35 | 561 | ||||||||||||||||||||||||
NOTES TO FINANCIAL HIGHLIGHTS
(a) Annualized.
(b) Not annualized for periods of less than one year.
(c) Total Return has been calculated for the applicable period without deduction of a sales load, if any, on an initial purchase. Periods of less than one year are not annualized.
(d) Per share information is calculated based on average number of shares outstanding,
(e) Ratio of Net Expenses to Average Net Assets is net of fee waivers and reimbursements by the investment adviser, if any (see note 2).
(f) Ratio of Total Expenses to Average Net Assets includes all expenses before fee waivers and reimbursements by the investment adviser.
(g) TA IDEX PIMCO Real Return TIPS ("The Fund") commenced operations on March 1, 2003. The inception date of the Fund's offering of share Class I was November 8, 2004.
The notes to the financial statements are an integral part of this report.
Transamerica IDEX Mutual Funds
Semi-Annual Report 2005
8
TA IDEX PIMCO Real Return TIPS
NOTES TO FINANCIAL STATEMENTS
At April 30, 2005
(all amounts in thousands)
(unaudited)
NOTE 1. ORGANIZATION AND SIGNIFICANT ACCOUNTING POLICIES
Transamerica IDEX Mutual Funds is a Delaware statutory trust registered under the Investment Company Act of 1940, as amended (the "1940 Act"), as an open-end management investment company. Prior to March 1, 2005, Transamerica IDEX Mutual Funds was a Massachusetts business trust. TA IDEX PIMCO Real Return TIPS ("the Fund"), part of Transamerica IDEX Mutual Funds, began operations on March 1, 2003.
The Fund is "non-diversified" under the 1940 Act.
In the normal course of business, the Fund enters into contracts that contain a variety of representations and warranties, which provide general indemnifications. The Fund's maximum exposure under these arrangements is unknown, as this would involve future claims that may be made against the Fund and/or its affiliates that have not yet occurred. However, based on experience, the Fund expects the risk of loss to be remote.
See the Prospectus and Statement of Additional Information for a description of the Fund's investment objective.
In preparing the Fund's financial statements in accordance with accounting principles generally accepted in the United States of America ("GAAP"), estimates or assumptions (which could differ from actual results) may be used that affect reported amounts and disclosures. The following policies were consistently followed by the Fund, in accordance with GAAP.
Multiple class operations and expenses: The fund currently offers four classes of shares, each with a public offering price that reflects different sales charges, if any, and expense levels. On June 15, 2004, Class C2 shares merged into Class C. On September 24, 2004, Class M shares merged into Class C. Class B shares will convert to Class A shares eight years after purchase. Income, non-class specific expenses and realized and unrealized gains and losses, are allocated daily to each class, based upon the value of shares outstanding method as permitted under Rule 18f-3 of the 1940 Act. Each class bears its own specific expenses as well as a portion of general common expenses.
Pricing of shares: The Fund prices its shares on the basis of the net asset value of each class of shares of the Fund, which is determined as of the close of the New York Stock Exchange ("NYSE") (generally 4:00 p.m. Eastern Time) on each day on which the NYSE is open for trading.
Security valuations: Fund investments traded on an exchange are valued at the closing price on the day of valuation on the exchange where the security is principally traded. With respect to securities
traded on NASDAQ NMS, such closing price may be the last reported sales price or the NASDAQ Official Closing Price.
Securities traded in the over-the-counter market and listed securities for which no sale was reported on that date are valued at the last quoted bid price.
Debt securities are valued by independent pricing services at the last quoted bid price; however, those that mature in sixty days or less are valued at amortized cost, which approximates market.
Foreign securities generally are valued based on quotations from the primary market in which they are traded and are translated from the local currency into U.S. dollars using closing exchange rates. Many foreign securities markets are open for trading at times when the U.S. markets are closed for trading, and many foreign securities markets close for trading before the close of the NYSE. The value of foreign securities may be affected significantly on a day that the NYSE is closed and an investor is unable to purchase or redeem shares. If a significant market event impacting the value of a portfolio security (e.g., natural disaster, company announcement, market volatility) occurs subsequent to the close of trading in the security, but prior to the calculation of the Fund's net asset value per share, market quotations for that security may be determined to be unreliable and, accordingly, not "readily av ailable." If market quotations are not readily available, and the impact of such a significant market event materially effects the net asset value per share of the Fund, an affected portfolio security will be valued at fair market value as determined in good faith using guidelines adopted by the Board of Trustees of the Fund, under the supervision of the Fund's Valuation Committee. Factors that may be considered to value foreign securities at fair market value may include, among others: the value of other securities traded on other markets, foreign currency exchange activity and the trading of financial products tied to foreign securities.
Other securities for which quotations are not readily available are valued at fair market value as determined in good faith using guidelines adopted by the Board of Trustees of the Fund, under the supervision of the Fund's Valuation Committee. These guidelines may include: the type of security; any restrictions on its resale; financial or business news of the issuer; similar or related securities that are actively trading; related corporate actions; and other significant events occurring after the close of trading in the security.
Cash: The Fund may leave cash overnight in its cash account with the custodian, Investors Bank & Trust Company ("IBT"). IBT has been contracted on behalf of the Fund to invest the excess cash into a savings account, which at April 30, 2005, was paying an interest rate of 2.02%.
Throughout the period, the Fund may have a cash overdraft balance. A fee is incurred on this overdraft, calculated by multiplying the overdraft by a rate based on the federal funds rate.
Security transactions and investment income: Security transactions are recorded on the trade date. Security gains and losses are calculated
Transamerica IDEX Mutual Funds
Semi-Annual Report 2005
9
TA IDEX PIMCO Real Return TIPS
NOTES TO FINANCIAL STATEMENTS (continued)
At April 30, 2005
(all amounts in thousands)
(unaudited)
NOTE 1.–(continued)
on the specific identification basis. Interest income, including accretion of discounts and amortization of premiums, is recorded on the accrual basis commencing on the settlement date.
Foreign currency denominated investments: The accounting records of the Fund are maintained in U.S. dollars. Securities and other assets and liabilities denominated in foreign currencies are translated into U.S. dollars at the closing exchange rate each day. The cost of foreign securities is translated at the exchange rate in effect when the investment was acquired. The Fund combines fluctuations from currency exchange rates and fluctuations in value when computing net realized and unrealized gains or losses from investments.
Net foreign currency gains and losses resulting from changes in exchange rates include: 1) foreign currency fluctuations between trade date and settlement date of investment security transactions; 2) gains and losses on forward foreign currency contracts; and 3) the difference between the receivable amounts of interest and dividends recorded in the accounting records in U.S. dollars and the amounts actually received.
Foreign currency denominated assets may involve risks not typically associated with domestic transactions, including unanticipated movements in exchange currency rates, the degree of government supervision and regulation of security markets, and the possibility of political or economic instability.
Foreign capital gains taxes: The Fund may be subject to taxes imposed by countries in which it invests, with respect to its investment in issuers existing or operating in such countries. Such taxes are generally based on income earned or repatriated and capital gains realized on the sale of such investments. The Fund accrues such taxes when the related income or capital gains are earned. Some countries require governmental approval for the repatriation of investment income, capital or the proceeds of sales earned by foreign investors. In addition, if there is deterioration in a country's balance of payments or for other reasons, a country may impose temporary restrictions on foreign capital remittances abroad.
Forward foreign currency contracts: The Fund may enter into forward foreign currency contracts to hedge against exchange rate risk arising from investments in securities denominated in foreign currencies. Contracts are valued at the contractual forward rate and are marked to market daily, with the change in value recorded as an unrealized gain or loss. When the contracts are closed a realized gain or loss is incurred. Risks may arise from changes in market value of the underlying currencies and from the possible inability of counterparties to meet the terms of their contracts.
Open forward foreign currency contracts at April 30, 2005, are listed in the Schedule of Investments.
Swap agreements: The Fund may invest in swap agreements. A swap is an agreement to exchange the return generated by one instrument for the return generated by another instrument. The Fund may enter into interest rate and credit default swap agreements to manage its exposure to interest rates and credit risk. Interest rate swap agreements involve commitments to pay interest in exchange for a market-linked return, both based on notional amounts. To the extent the total return of the security or index underlying the transaction exceeds or falls short of the offsetting interest rate obligation, the Fund will receive a payment from or make a payment to the counterparty. In a credit default swap, one party makes a stream of payments to another party in exchange for the right to receive a specified ret urn in the event of a default by a third party, typically corporate issues or sovereign issues of an emerging country, on its obligation. The Fund may use credit default swaps to provide a measure of protection against defaults of sovereign issuers (i.e., to reduce risk where the Fund owns or has exposure to the sovereign issuer) or to take an active long or short position with respect to the likelihood of a particular issuer's default.
Swaps are marked to market daily based upon quotations from market makers and vendors and the change in value, if any, is recorded as unrealized gain or loss in the Statement of Operations. Payments received or made at the beginning of the measurement period are reflected as such on the Statement of Assets and Liabilities. A liquidation payment received or made at the termination of the swap is recorded as realized gain or loss in the Statement of Operations. Net periodic payments are included as part of realized gain or loss on the Statement of Operations.
Entering into these agreements involves, to varying degrees, elements of credit, market and documentation risk in excess of the amounts recognized on the Statement of Assets and Liabilities. Such risks involve the possibility that there will be no liquid market for these agreements, that the counterparty to the agreements may default on its obligation to perform or disagree as to the meaning of contractual terms in the agreements, and that there may be unfavorable changes in interest rates.
Open swap agreements at April 30, 2005, are listed in the Schedule of Investments.
Futures, options and swaptions contracts: The Fund may enter into futures and/or options contracts to manage exposure to market, interest rate or currency fluctuations. Futures contracts are valued at the settlement price established each day by the board of trade or exchange on which they are traded. Option contracts are valued at the average of the bid and ask ("Mean Quote") established each day at the close of the board of trade or exchange on which they are traded. The primary risks associated with futures contracts and options are imperfect correlation between the change in value of the securities held and the prices of futures contracts and options; the possibility of an illiquid market and inability of the counterparty to meet the contract terms. When the Fund writes a covered call or put option, an amount equal to the premium received by the Fund is included in the Fund's Statement of
Transamerica IDEX Mutual Funds
Semi-Annual Report 2005
10
TA IDEX PIMCO Real Return TIPS
NOTES TO FINANCIAL STATEMENTS (continued)
At April 30, 2005
(all amounts in thousands)
(unaudited)
NOTE 1.–(continued)
Assets and Liabilities as an asset and as an equivalent liability. The amount of the liability is subsequently marked-to-market to reflect the current value of the option written.
The Fund is authorized to write swaption contracts to manage exposure to fluctuations in interest rates and to enhance fund yield. Swaption contracts written by the Fund represents an option that gives the purchaser the right, but not the obligation, to enter into a previously agreed upon swap contract on a future date. If a written call option is exercised, the writer will enter a swap and is obligated to pay the fixed rate and receive a fixed rate in exchange. Swaptions are marked-to-market daily based upon quotations from market makers.
When the Fund writes a swaption, the premium received is recorded as a liability and is subsequently adjusted to the current value of the swaption. Changes in the value of the swaption are reported as Unrealized gains or losses in written options in the Statement of Assets and Liabilities. Gain or loss is recognized when the swaption contract expires or is closed. Premiums received from writing swaptions that expire or are exercised are treated by the Fund as realized gains from written options. The difference between the premium and the amount paid on affecting a closing purchase transaction is also treated as a realized gain, or if the premium is less than the amount paid for the closing purchase, as a realized loss.
Entering into a swaption contract involves, to varying degrees, the elements of credit, market and interest rate risk in excess of the amounts reported in the Statement of Assets and Liabilities, associated with both option contracts and swap contracts. To reduce credit risk from potential counterparty default, the Fund enters into swaption contracts with counterparties whose creditworthiness has been approved by the Board of Trustees. The Fund bears the market risk arising from any changes in index values or interest rates.
The underlying face amount of open futures, option, and swaption contracts at April 30, 2005, are listed in the Schedule of Investments. The variation margin receivable or payable, as applicable, is included in the accompanying Statement of Assets and Liabilities. Variation margin represents the additional payment due or excess deposits made in order to maintain the equity account at the required margin level.
Transactions in written options were as follows:
| Premium | Contracts* | ||||||||||
| Beginning Balance October 31, 2004 | $ | 24 | 100 | ||||||||
| Sales | 188 | 698 | |||||||||
| Expirations | (89 | ) | (248 | ) | |||||||
| Balance at April 30, 2005 | $ | 123 | 550 | ||||||||
* Contracts not in thousands
Transactions in written swaptions were as follows:
| Premium | Notional Amount | ||||||||||
| Beginning Balance October 31, 2004 | $ | 41 | 4,800 | ||||||||
| Expirations | (41 | ) | (4,800 | ) | |||||||
| Balance at April 30, 2005 | $ | – | – | ||||||||
Account maintenance fees: If the shareholder account balance falls below $1 by either shareholder action or as a result of market action, a $25 (not in thousands) fee is assessed every year until the balance reaches $1. The fee is assessed by redeeming shares in the shareholder's account.
No fee will be charged under the following conditions:
• accounts opened within the preceding 24 months
• accounts with an active monthly Automatic Investment Plan ($50 (not in thousands) minimum per fund)
• accounts owned by an individual which, when combined by social security number, have a balance of $5 or more
• accounts owned by individuals in the same household (by address) that have a combined balance of $5 or more
• UTMA/UGMA accounts
• Fiduciary accounts
• B-share accounts whose shares have started to convert to A-shares accounts (as long as combined value of both accounts is at least $1)
For the six months ended April 30, 2005, there were no account maintenance fees.
Redemption fees: A short-term trading redemption fee may be assessed on any fund shares in a fund account that are sold during the first five (5) NYSE trading days following their purchase date. This redemption fee will equal 2% of the amount redeemed and shares held the longest will be treated as being redeemed first and shares held the shortest as being redeemed last.
Transamerica IDEX Mutual Funds
Semi-Annual Report 2005
11
TA IDEX PIMCO Real Return TIPS
NOTES TO FINANCIAL STATEMENTS (continued)
At April 30, 2005
(all amounts in thousands)
(unaudited)
NOTE 1.–(continued)
For the six months ended April 30, 2005, the Fund received less than $1 in redemption fees.
Dividend distributions: Distributions to shareholders are recorded on the ex-dividend date and are determined in accordance with Federal income tax regulations which may differ from GAAP.
NOTE 2. RELATED PARTY TRANSACTIONS
Transamerica Fund Advisors, Inc. ("TFAI") is the Fund's investment adviser. Transamerica Fund Services, Inc. ("TFS") is the Fund's administrator and transfer agent. AFSG Securities Corp. ("AFSG") is the Fund's distributor/principal underwriter. AFSG is 100% owned by AUSA Holding Company ("AUSA"). TFAI is a directly owned subsidiary of Western Reserve Life Assurance Co. of Ohio (78%) and AUSA (22%). TFS is a wholly owned subsidiary of WRL (50%) and AUSA (50%). AUSA and WRL are wholly owned indirect subsidiaries of AEGON, NV, a Netherlands corporation.
Effective January 1, 2005 AEGON/Transamerica Fund Advisors, Inc. ("ATFA") was renamed Transamerica Fund Advisors, Inc. ("TFAI"); AEGON/Transamerica Fund Services, Inc. ("ATFS") and AEGON/Transamerica Investor Services, Inc. ("ATIS") merged into one entity and was renamed Transamerica Fund Services, Inc. ("TFS").
The following schedule represents the percentage of fund assets owned by affiliated mutual funds (i.e. through the Transamerica IDEX Mutual Funds and AEGON/Transamerica Series Trust (f/k/a AEGON/Transamerica Series Fund, Inc.) asset allocation funds):
| Net Assets | % of Net Assets | ||||||||||
| TA IDEX Asset Allocation–Conservative Portfolio | $ | 42,142 | 7.54 | % | |||||||
| TA IDEX Asset Allocation–Moderate Growth Portfolio | 100,273 | 17.93 | % | ||||||||
| TA IDEX Asset Allocation–Moderate Portfolio | 127,366 | 22.78 | % | ||||||||
| Asset Allocation–Conservative Portfolio | 59,133 | 10.58 | % | ||||||||
| Asset Allocation–Moderate Growth Portfolio | 86,614 | 15.49 | % | ||||||||
| Asset Allocation–Moderate Portfolio | 119,725 | 21.41 | % | ||||||||
| Total | $ | 535,253 | 95.73 | % | |||||||
Investment advisory fees: The Fund pays management fees to TFAI based on average daily net assets ("ANA") at the following breakpoints:
From November 1, 2004 to December 31, 2004:
0.70% of ANA
From January 1, 2005 on:
0.70% of the first $250 million of ANA
0.65% of the next $500 million of ANA
0.60% of ANA over $750 million
TFAI has contractually agreed to waive its advisory fee and will reimburse the Fund to the extent that operating expenses, excluding 12b-1 fees, exceed the following stated annual limit for Classes A, B and C:
1.30% Expense Limit
1.00% Expense Limit–Class I
If total fund expenses fall below the annual expense limitation agreement agreed to by the adviser within the succeeding three years, the Fund may be required to pay that adviser a portion or all of the waived advisory fees.
There are no amounts available for recapture at April 30, 2005.
Distribution and service fees: The Fund has a 12b-1 distribution plan under the 1940 Act pursuant to which an annual fee, based on average daily net assets, is paid to the distributor for various disbursements such as broker-dealer account servicing fees and other promotional expenses of the Fund. The Fund is authorized under the 12b-1 plan to pay fees on each class up to the following limits:
| Class A | 0.35 | % | |||||
| Class B | 1.00 | % | |||||
| Class C | 1.00 | % | |||||
| Class I | N/A | ||||||
In the case the Fund or a class of shares of the Fund is closed to new investors or investments, the Fund is authorized to pay 12b-1 fees for past sales and distribution efforts and present and past investor services.
Underwriter commissions relate to front-end sales charges imposed for Class A shares and contingent deferred sales charges from Classes B, C, and certain A share redemptions. For the six months ended April 30, 2005, the underwriter commissions were as follows:
| Received by Underwriter | $ | 154 | |||||
| Retained by Underwriter | 10 | ||||||
| Contingent Deferred Sales Charge | 15 | ||||||
Administrative services: The Fund has entered into an agreement with TFS for financial and legal fund administration services, which includes such items as compliance, expenses, financial statements and other reporting, distributions, tax returns, prospectus preparation, board of trustees meeting support and other legal matters. As of January 1, 2005
Transamerica IDEX Mutual Funds
Semi-Annual Report 2005
12
TA IDEX PIMCO Real Return TIPS
NOTES TO FINANCIAL STATEMENTS (continued)
At April 30, 2005
(all amounts in thousands)
(unaudited)
NOTE 2.–(continued)
the Fund pays TFS an annual fee of 0.02% of average net assets. Prior to January 1, 2005 the Fund paid TFS an annual fee of 0.015% of average net assets. The Legal fees on the Statement of Operations are for fees paid to external legal counsel.
Transfer agent fees: The Fund pays TFS an annual per-account charge of $20 (not in thousands) for each open account and $1.63 (not in thousands) for each closed account. There is no new account charge. The Transfer agent fees on the Statement of Operations are made up of fees paid to TFS and costs associated with shareholder statements.
The Fund paid TFS $15 for the six months ended April 30, 2005.
Deferred compensation plan: Each eligible Fund Trustee may elect participation in the Deferred Compensation Plan ("the Plan"). Under the Plan, such Trustees may defer payment of a percentage of their total fees earned as a Fund Trustee. These deferred amounts may be invested in any Transamerica IDEX Mutual Fund. At April 30, 2005, the value of invested plan amount was $7. Invested plan amounts and the total liability for deferred compensation to the Trustees under the Plan at April 30, 2005, are included in the accompanying Statement of Assets and Liabilities.
NOTE 3. INVESTMENT TRANSACTIONS
The cost of securities purchased and proceeds from securities sold (excluding short-term securities) for the six months ended April 30, 2005, were as follows:
| Purchases of securities: | |||||||
| Long-Term excluding U.S. Government | $ | 30,000 | |||||
| U.S. Government | 3,651,123 | ||||||
| Proceeds from maturities and sales of securities | |||||||
| Long-Term excluding U.S. Government | 11,133 | ||||||
| U.S. Government | 3,421,422 | ||||||
NOTE 4. FEDERAL INCOME TAX MATTERS
The Fund has not made any provision for federal income or excise taxes due to its policy to distribute all of its taxable income and capital gains to its shareholders and otherwise qualify as a regulated investment company under the Internal Revenue Code. Income and capital gain distributions are determined in accordance with income tax regulations, which may differ from GAAP. These differences are primarily due to differing treatment for items including, but not limited to, wash sales, net operating losses and capital loss carryforwards.
The aggregate cost of investments and composition of unrealized appreciation (depreciation) for federal income tax purposes as of April 30, 2005, are as follows:
| Federal Tax Cost Basis | $ | 669,787 | |||||
| Unrealized Appreciation | $ | 9,687 | |||||
| Unrealized (Depreciation) | (553 | ) | |||||
| Net Unrealized Appreciation (Depreciation) | $ | 9,134 | |||||
NOTE 5. REGULATORY PROCEEDINGS
There continues to be significant federal and state regulatory activity relating to financial services companies, particularly mutual fund companies and their investment advisers. As part of an ongoing investigation regarding potential market timing, recordkeeping and trading compliance issues and matters affecting the Fund's investment adviser, TFAI, and certain employees and affiliates of TFAI, the SEC staff has indicated that it is likely to take some action against TFAI and certain of its affiliates at the conclusion of the investigation. The potential timing and the scope of any such action is difficult to predict. Although the impact of any action brought against TFAI and/or its affiliates is difficult to assess at the present time, the Fund currently believes that the likelihood that any such action will have a material adverse impact on it is remote. It is important to note that the Fund is not aware of any allegation of wrongdoing against it and its board at the time this semi-annual report is printed. Although it is not anticipated that these developments will have an adverse impact on the Fund, there can be no assurance at this time. TFAI and its affiliates are actively working with the SEC in regard to this matter; however, the exact resolution cannot be determined at this time. TFAI will take such actions that it deems necessary or appropriate to continue providing management services to the Fund and to bring all matters to an appropriate conclusion.
TFAI and/or its affiliates, and not the Fund, will bear the costs regarding these regulatory matters.
Transamerica IDEX Mutual Funds
Semi-Annual Report 2005
13
TA IDEX PIMCO Real Return TIPS
INVESTMENT ADVISORY AND SUB-ADVISORY AGREEMENTS – REVIEW AND RENEWAL
At a meeting of the Board of Trustees of Transamerica IDEX Mutual Funds ("TA IDEX") held on October 6, 2004, the Board considered and approved the renewal for a one-year period of the Investment Advisory Agreement between TA IDEX PIMCO Real Return TIPS (the "Fund") and Transamerica Fund Advisors, Inc. ("TFAI") as well as the Investment Sub-Advisory Agreement of the Fund between TFAI and Pacific Investment Management LLC (the "Sub-Adviser"). In approving the renewal of these agreements, the Board concluded that the Investment Advisory and Investment Sub-Advisory Agreements enable shareholders of the Fund to obtain high quality services at a cost that is appropriate, reasonable, and in the best interests of shareholders based upon the following determinations, among others:
The nature, extent and quality of the advisory service to be provided. The Board considered the nature and quality of the services provided by TFAI and the Sub-Adviser to the Fund in the past, as well as the services anticipated to be provided in the future. The Board concluded that TFAI and the Sub-Adviser are capable of providing high quality services to the Fund, as indicated by TFAI's management capabilities demonstrated with respect to the Fund and other funds managed by TFAI, TFAI's management oversight process, the professional qualifications and experience of the Sub-Adviser's portfolio management team, and the Fund's strong investment performance. The Board also concluded that TFAI and the Sub-Adviser would provide the same quality and quantity of investment management and related servi ces as before, that these services are appropriate in scope and extent in light of the Fund's operations, the competitive landscape of the investment company business and investor needs, and that TFAI's and the Sub-Adviser's obligations will remain the same in all respects.
The investment performance of the Fund. The Board concluded, based in particular on information provided by Lipper Analytics, that the Fund's investment performance was competitive or superior relative to comparable funds and to the Fund's benchmark index. On the basis of the Trustees' assessment of the nature, extent and quality of investment advisory and related services to be provided or procured by TFAI and the Sub-Adviser, the Trustees concluded that TFAI and the Sub-Adviser were capable of generating a level of long-term investment performance that is appropriate in light of the Fund's investment objective, policies and strategies and competitive with many other investment companies.
The cost of advisory services provided and the level of profitability. On the basis of the Board's review of the fees to be charged by TFAI and the Sub-Adviser for investment advisory and related services, TFAI's financial statements, the fees paid by TFAI to the Sub-Adviser, TFAI's estimated net management income resulting from its management of the Fund, the estimated profitability of TFAI's relationships with the Fund and TA IDEX, and the estimated profitability of the Sub-Adviser's relationship with the Fund, the Board concluded that the level of investment advisory fees and the profitability is appropriate in light of the services provided, the performance of the Fund, the management fees of comparable investment companies, and the anticipated profitability of the relationship between the F und, TFAI and the Sub-Adviser.
The extent to which economies of scale would be realized as the Fund grows and whether fee levels reflect these economies of scale for the benefit of Fund investors. The Trustees concluded that inclusion of asset-based breakpoints in the Fund's advisory fee schedule would appropriately benefit investors by realizing economies of scale in the form of a lower advisory fee rate and lower level of Fund operating expenses as the level of Fund assets increases. Accordingly, the Board and TFAI agreed to implement advisory fee breakpoints as a means to eventually lower the level of the Fund's operating expense. The Board also concluded that the advisory fees appropriately reflect the Fund's current size, the current economic environment for TFAI, and the competitive nature of the investment company mark et. In addition, the Board noted that it will have the opportunity to periodically re-examine whether the Fund has achieved economies of scale, as well as the appropriateness of advisory fees payable to TFAI and the Sub-Adviser in the future.
Benefits (such as soft dollars) to TFAI or the Sub-Adviser from its relationship with the Fund. The Board concluded that other benefits derived by TFAI or the Sub-Adviser from its relationship with the Fund are reasonable and fair, and are consistent with industry practice and the best interests of the Fund and its shareholders. In this regard, the Board noted that neither TFAI nor the Sub-Adviser realizes "soft dollar" benefits from its relationship with the Fund.
Other considerations. The Board also determined that TFAI had made a substantial commitment to the recruitment and retention of high quality personnel, and maintained the financial, compliance and operational resources reasonably necessary to manage the Fund in a professional manner that is consistent with the best interests of the Fund and its shareholders. The Trustees also concluded that TFAI had made a significant entrepreneurial commitment to the management and success of the Fund, reflected by TFAI's expense limitation and fee waiver arrangement with the Fund which, as demonstrated in the past with the Fund, may result in TFAI waiving a substantial amount of advisory fees for the benefit of shareholders.
Transamerica IDEX Mutual Funds
Semi-Annual Report 2005
TA IDEX PIMCO Real Return TIPS 14
TA IDEX PIMCO Real Return TIPS
SUPPLEMENTAL INFORMATION (unaudited)
RESULTS OF SHAREHOLDER PROXY
At a special meeting of shareholders held on February 25, 2005, the results of the Proposals were as follows:
Transamerica IDEX Mutual Funds
Proposal 1: Election of Trustees to the Board of Trustees of Transamerica IDEX Mutual Funds.
| For | Withheld | ||||||||||
| Peter R. Brown | 872,017,875.249 | 4,468,498.551 | |||||||||
| Daniel Calabria | 871,917,069.786 | 4,569,304.014 | |||||||||
| Janise B. Case | 872,099,393.125 | 4,386,980.675 | |||||||||
| Charles C. Harris | 872,086,722.025 | 4,399,651.775 | |||||||||
| Leo J. Hill | 872,304,465.640 | 4,181,908.160 | |||||||||
| Russell A. Kimball, Jr. | 872,253,556.471 | 4,232,817.329 | |||||||||
| William W. Short, Jr. | 872,139,920.944 | 4,346,452.856 | |||||||||
| John Waechter | 872,261,152.376 | 4,225,221.424 | |||||||||
| Jack E. Zimmerman | 871,929,967.512 | 4,556,406.288 | |||||||||
| Brian C. Scott | 872,218,970.367 | 4,267,403.433 | |||||||||
| Thomas P. O'Neill | 872,111,944.117 | 4,374,429.683 | |||||||||
TA IDEX PIMCO Real Return TIPS
Proposal 2: Approval of an Agreement and Plan of Reorganization pursuant to which Transamerica IDEX Mutual Funds will organize as a Delaware statutory trust.
| For | Against | Abstentions/Broker Non-Votes | |||||||||
| 37,320,187.526 | 15,545.572 | 855,530.196 | |||||||||
Proposal 3: Approval of changes to the fundamental investment restrictions of TA IDEX PIMCO Real Returns TIPS.
| A. Diversification | For | Against | Abstentions/Broker Non-Votes | ||||||||||||
| 37,336,818.668 | 12,528.626 | 841,916.000 | |||||||||||||
| B. Borrowing | For | Against | Abstentions/Broker Non-Votes | ||||||||||||
| 37,335,896.668 | 13,450.626 | 841,916.000 | |||||||||||||
| C. Senior Securities | For | Against | Abstentions/Broker Non-Votes | ||||||||||||
| 37,336,818.668 | 12,528.626 | 841,916.000 | |||||||||||||
| D. Underwriting Securities | For | Against | Abstentions/Broker Non-Votes | ||||||||||||
| 37,336,818.668 | 12,528.626 | 841,916.000 | |||||||||||||
| E. Real Estate | For | Against | Abstentions/Broker Non-Votes | ||||||||||||
| 37,336,818.668 | 12,528.626 | 841,916.000 | |||||||||||||
| F. Making Loans | For | Against | Abstentions/Broker Non-Votes | ||||||||||||
| 37,335,004.668 | 14,342.626 | 841,916.000 | |||||||||||||
| G. Concentration | For | Against | Abstentions/Broker Non-Votes | ||||||||||||
| 37,335,896.668 | 13,450.626 | 841,916.000 | |||||||||||||
| H. Commodities | For | Against | Abstentions/Broker Non-Votes | ||||||||||||
| 37,335,896.668 | 13,450.626 | 841,916.000 | |||||||||||||
Transamerica IDEX Mutual Funds
Semi-Annual Report 2005
TA IDEX PIMCO Real Return TIPS 15
TA IDEX PIMCO Total Return
UNDERSTANDING YOUR FUND'S EXPENSES
(unaudited)
SHAREHOLDER EXPENSES
The following Example is intended to help you understand your ongoing costs (in dollars and cents) of investing in a Fund and to compare these costs with the ongoing costs of investing in other funds.
The Example is based on an investment of $1,000 invested at November 1, 2004 and held for the entire period until April 30, 2005.
ACTUAL EXPENSES
The first line in the table below provides information about actual account values and actual expenses. You may use the information in this line, together with the amount you invested, to estimate the expenses that you paid over the period. Simply divide your account value by $1,000 (for example, an $8,600 account value divided by $1,000 = 8.6), then multiply the result by the number in the first line of your Fund under the heading entitled "Expenses Paid During Period" to estimate the expenses you paid on your account during this period.
HYPOTHETICAL EXAMPLE FOR COMPARISON PURPOSES
The second line in the table below provides information about hypothetical account values and hypothetical expenses based on the Fund's actual expense ratio and an assumed rate of return of 5% per year before expenses, which is not the Fund's actual return. The hypothetical account values and expenses may not be used to estimate the actual ending account balance or expenses you paid for the period. You may use this information to compare the ongoing costs of investing in your Fund and other funds. To do so, compare this 5% hypothetical example with the 5% hypothetical examples that appear in the shareholder reports of the other funds.
Please note that the expenses shown in the table are meant to highlight your ongoing costs only and do not reflect any transactional costs, such as sales charges, redemption fees, brokerage commissions paid on purchases and sales of fund shares. Therefore, the second line under the Fund in the table is useful in comparing ongoing costs only, and will not help you determine the relative total costs of owning different funds. In addition, note that the expenses shown in the table are meant to highlight your ongoing costs and do not reflect any transaction costs.
| Beginning Account Value | Ending Account Value | Annualized Expense Ratio | Expenses Paid During Period (a) | ||||||||||||||||
| Class A | |||||||||||||||||||
| Actual | $ | 1,000.00 | $ | 1,010.00 | 1.21 | % | $ | 6.03 | |||||||||||
| Hypothetical (b) | 1,000.00 | 1,018.79 | 1.21 | 6.06 | |||||||||||||||
| Class B | |||||||||||||||||||
| Actual | 1,000.00 | 1,006.60 | 1.94 | 9.65 | |||||||||||||||
| Hypothetical (b) | 1,000.00 | 1,015.17 | 1.94 | 9.69 | |||||||||||||||
| Class C | |||||||||||||||||||
| Actual | 1,000.00 | 1,005.30 | 2.15 | 10.69 | |||||||||||||||
| Hypothetical (b) | 1,000.00 | 1,014.13 | 2.15 | 10.74 | |||||||||||||||
(a) Expenses are calculated using each Fund's annualized expense ratio (as disclosed in the table), multiplied by the average account value for the period, multiplied by number of days in the period (181 days), and divided by the number of days in the year (365 days).
(b) 5% return per year before expenses.
GRAPHICAL PRESENTATION OF SCHEDULE OF INVESTMENTS
By Bond Sector
At April 30, 2005
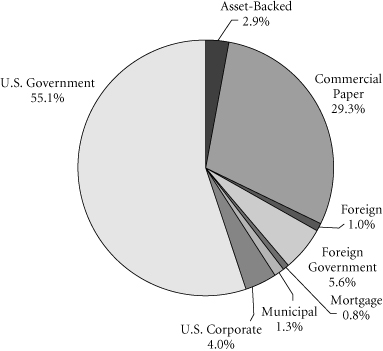
This chart shows the percentage breakdown by bond sector of the Fund's total investment securities.
Transamerica IDEX Mutual Funds
Semi-Annual Report 2005
1
TA IDEX PIMCO Total Return
SCHEDULE OF INVESTMENTS
At April 30, 2005
(all amounts except share amounts in thousands)
(unaudited)
| Principal | Value | ||||||||||
| U.S. GOVERNMENT OBLIGATIONS (15.8%) | |||||||||||
| U.S. Treasury Bond 7.50%, due 11/15/2016 | $ | 4,600 | $ | 5,909 | |||||||
| 6.00%, due 02/15/2026 | 530 | 627 | |||||||||
| U.S. Treasury Inflation Indexed Bond 3.63%, due 01/15/2008 1.88%, due 07/15/2013 2.38%, due 01/15/2025 3.88%, due 04/15/2029 | 1,305 157 366 397 | 1,404 161 400 554 | |||||||||
| U.S. Treasury Inflation Indexed Note 2.00%, due 07/15/2014 | 1,322 | 1,372 | |||||||||
| U.S. Treasury Note 4.88%, due 02/15/2012 | 13,925 | 14,630 | |||||||||
| Total U.S. Government Obligations (cost: $24,674) | 25,057 | ||||||||||
| U.S. GOVERNMENT AGENCY OBLIGATIONS (36.9%) | |||||||||||
| Fannie Mae 5.50%, due 07/01/2016 5.50%, due 12/01/2016 5.50%, due 01/01/2017 5.50%, due 02/01/2017 5.50%, due 05/01/2017 5.00%, due 11/01/2017 5.00%, due 02/01/2018 5.50%, due 02/01/2018 5.00%, due 03/01/2018 5.00%, due 05/01/2018 5.00%, due 06/01/2018 5.00%, due 08/01/2018 5.00%, due 05/01/2019 5.00%, due 09/01/2019 5.00%, due 12/01/2019 4.14%, due 01/01/2028 (a) 5.50%, due 11/01/2032 5.50%, due 01/01/2033 5.16%, due 04/01/2033 (a) 5.50%, due 07/01/2033 5.50%, due 08/01/2033 5.50%, due 01/01/2034 5.00%, due 05/01/2034 5.50%, due 01/01/2035 5.50%, due 02/01/2035 5.50%, due 03/01/2035 5.50%, due 04/01/2035 | 351 118 137 135 156 903 281 392 851 655 648 239 364 300 486 152 2,966 921 58 255 306 432 2,495 1,693 1,786 1,267 206 | 360 121 140 138 160 911 284 401 858 660 653 241 367 302 490 156 3,001 931 59 258 309 437 2,473 1,711 1,804 1,280 208 | |||||||||
| Principal | Value | ||||||||||
| Fannie Mae–May TBA | |||||||||||
| 5.00%, due 05/01/2019 | $ | 1,000 | $ | 1,007 | |||||||
| 5.00%, due 05/01/2035 | 500 | 495 | |||||||||
| 5.50%, due 05/01/2035 | 25,300 | 25,537 | |||||||||
| Fannie Mae–June TBA 5.00%, due 06/01/2035 | 7,500 | 7,406 | |||||||||
| Fannie Mae, Series 2003-88 TB 3.00%, due 08/25/2009 | 100 | 100 | |||||||||
| Freddie Mac 6.00%, due 12/15/2007 6.50%, due 04/15/2029 6.50%, due 02/15/2030 6.50%, due 07/25/2043 | 8 23 23 70 | 8 24 23 73 | |||||||||
| Freddie Mac, Series 2572, Class HA 5.00%, due 06/15/2013 | 160 | 161 | |||||||||
| Ginnie Mae 6.50%, due 07/15/2023 6.50%, due 02/15/2028 6.50%, due 06/15/2029 6.50%, due 01/15/2030 5.50%, due 03/15/2032 5.50%, due 12/15/2032 5.50%, due 12/15/2033 5.50%, due 02/15/2034 | 8 285 360 13 90 227 448 1,788 | 9 299 377 13 92 231 457 1,820 | |||||||||
| Ginnie Mae–May TBA 5.50%, due 05/01/2035 | 1,500 | 1,525 | |||||||||
| Ginnie Mae–Series 2020-40 6.50%, due 06/20/2032 | 48 | 51 | |||||||||
| Total U.S. Government Agency Obligations (cost: $58,217) | 58,421 | ||||||||||
| FOREIGN GOVERNMENT OBLIGATIONS (6.7%) | |||||||||||
| French Republic 4.00%, due 04/25/2055 | 500 | 646 | |||||||||
| French T-Bill Zero Coupon, due 07/28/2005 | 500 | 645 | |||||||||
| Hong Kong Government–144A 5.13%, due 08/01/2014 | 400 | 408 | |||||||||
| Italian Republic 3.75%, due 10/10/2006 | 45,000 | 431 | |||||||||
| Kingdom of Spain 3.10%, due 09/20/2006 5.75%, due 07/30/2032 4.20%, due 01/31/2037 | 30,000 1,580 300 | 298 2,642 401 | |||||||||
| Malaysia Government 7.50%, due 07/15/2011 | 10 | 12 | |||||||||
The notes to the financial statements are an integral part of this report.
Transamerica IDEX Mutual Funds
Semi-Annual Report 2005
2
TA IDEX PIMCO Total Return
SCHEDULE OF INVESTMENTS (continued)
At April 30, 2005
(all amounts except share amounts in thousands)
(unaudited)
| Principal | Value | ||||||||||
| Republic of Brazil | |||||||||||
| 3.06%, due 04/15/2006 (a) | $ | 144 | $ | 144 | |||||||
| 11.50%, due 03/12/2008 122 | 138 | ||||||||||
| 4.31%, due 04/15/2009 (a) 259 | 254 | ||||||||||
| 8.84%, due 06/29/2009 (a) 350 | 400 | ||||||||||
| 11.00%, due 01/11/2012 200 | 232 | �� | |||||||||
| 4.31%, due 04/15/2012 (a) 264 | 247 | ||||||||||
| 8.00%, due 04/15/2014 264 | 262 | ||||||||||
| 11.00%, due 08/17/2040 150 | 170 | ||||||||||
| Republic of Panama 8.25%, due 04/22/2008 | 390 | 422 | |||||||||
| Republic of Peru 9.13%, due 02/21/2012 5.00%, due 03/07/2017 (a) | 170 149 | 195 138 | |||||||||
| Republic of South Africa 5.25%, due 05/16/2013 6.50%, due 06/02/2014 | 90 200 | 124 216 | |||||||||
| Russian Federation, Reg S 8.25%, due 03/31/2010 5.00%, due 03/31/2030 (b) | 750 1,009 | 820 1,073 | |||||||||
| United Mexican States 3.84%, due 01/13/2009 (a) 9.88%, due 02/01/2010 6.38%, due 01/16/2013 | 65 75 75 | 66 90 78 | |||||||||
| Total Foreign Government Obligations (cost: $10,191) | 10,552 | ||||||||||
| MORTGAGE-BACKED SECURITIES (1.0%) | |||||||||||
| Bank of America Mortgage Securities, Series 2002-K, Class 2A1 5.60%, due 10/20/2032 (a) | 87 | 88 | |||||||||
| Bear Stearns Adjustable Rate Mortgage Trust, Series 2002-5, Class VIA 5.93%, due 06/25/2032 (a) | 14 | 14 | |||||||||
| Bear Stearns Adjustable Rate Mortgage Trust, Series 2003-8, Class 1A1 4.43%, due 01/25/2034 (a) | 324 | 322 | |||||||||
| Bear Stearns Adjustable Rate Mortgage Trust, Series 2003-8, Class 2A1 4.88%, due 01/25/2034 (a) | 104 | 103 | |||||||||
| Bear Stearns Adjustable Rate Mortgage Trust, Series 2003-8, Class 4A1 4.73%, due 01/25/2034 (a) | 157 | 154 | |||||||||
| Carrington Mortgage Loan Trust, Series 2004-NC1, Class A2A 3.13%, due 05/25/2034 (a) | 24 | 24 | |||||||||
| Principal | Value | ||||||||||
| CDC Mortgage Capital Trust, Series 2002-BE2, Class A 3.31%, due 01/25/2033 (a) | $ | 5 | $ | 5 | |||||||
| Centex Home Equity, Series 2004-A, Class AV2 3.30%, due 01/25/2034 (a) | 85 | 85 | |||||||||
| Countrywide Alternative Loan Trust, Series 2003-J11, Class 4A1 6.00%, due 10/25/2032 | 25 | 25 | |||||||||
| Countrywide Home Loan Mortgage Pass Through Trust, Series 2004-7, Class 1A2 3.29%, due 05/25/2034 (a) | 39 | 39 | |||||||||
| Credit Suisse First Boston Mortgage Securities Corp., Series 2002, Class P-3–144A 1.90%, due 08/25/2033 | 267 | 268 | |||||||||
| Credit Suisse First Boston Mortgage Securities Corp., Series 2002-P1, Class A1 1.53%, due 03/28/2032 | 10 | 10 | |||||||||
| Credit Suisse First Boston Mortgage Securities Corp., Series 2002-P2A, Class A2 2.14%, due 03/25/2032 | 98 | 97 | |||||||||
| Home Equity Asset Trust, Series 2002-1, Class A4 3.32%, due 11/25/2032 (a) | 15 | 15 | |||||||||
| KBC Bank Fund Trust III Preferred–144A 9.86%, due 11/29/2049 (d) | 15 | 18 | |||||||||
| Merrill Lynch Mortgage Investors, Inc., Series 2002-AFC1, Class AV1 3.22%, due 04/25/2031 (a) | 1 | 1 | |||||||||
| Residential Funding Mortgage Securities I, Series 2003-S9, Class A1 6.50%, due 03/25/2032 | 24 | 24 | |||||||||
| Structured Asset Mortgage Investments, Inc., Series 2002-AR3, Class A-1 3.18%, due 09/19/2032 (a) | 182 | 182 | |||||||||
| Structured Asset Securities Corp., Series 2002-9, Class A2 3.32%, due 10/25/2027 (a) | 40 | 40 | |||||||||
| Structured Asset Securities Corp., Series 2002-HF1, Class A 3.31%, due 01/25/2033 (a) | 6 | 5 | |||||||||
| Structured Asset Securities Trust, Series 2002-BC4, Class A 3.31%, due 07/25/2032 (a) | 12 | 12 | |||||||||
| Total Mortgage-Backed Securities (cost: $1,545) | 1,531 | ||||||||||
The notes to the financial statements are an integral part of this report.
Transamerica IDEX Mutual Funds
Semi-Annual Report 2005
3
TA IDEX PIMCO Total Return
SCHEDULE OF INVESTMENTS (continued)
At April 30, 2005
(all amounts except share amounts in thousands)
(unaudited)
| Principal | Value | ||||||||||
| ASSET-BACKED SECURITIES (3.5%) | |||||||||||
| Bank One Issuance Trust, Series 2002-2, Class A 4.16%, due 01/15/2008 | $ | 125 | $ | 125 | |||||||
| Bear Stearns Asset Backed Securities, Inc., Series 2002-2, Class A1 3.35%, due 10/25/2032 (a) | 43 | 43 | |||||||||
| Countrywide Home Loan Mortgage Pass Trust, Series 2002-30, Class M 3.90%, due 10/19/2032 (a) | 138 | 137 | |||||||||
| Credit-Based Asset Servicing and Securitization, Series 2002-CB6, Class 2A1 3.52%, due 01/25/2033 (a) | 4 | 4 | |||||||||
| Credit-Based Asset Servicing and Securitization, Series 2004-CB5, Class AV1 3.15%, due 09/25/2021 (a) | 75 | 75 | |||||||||
| First Horizon Asset Securities, Inc., Series 2000-H, Class IA 7.00%, due 09/25/2030 | 3 | 3 | |||||||||
| Morgan Stanley ABS Capital I, Series 2003-HE2, Class A2 3.36%, due 08/25/2033 (a) | 100 | 100 | |||||||||
| Park Place Securities, Inc., Series 2004-MCW1, Class A3 3.05%, due 10/25/2034 (a) | 55 | 55 | |||||||||
| Protective Life US Funding Trust–144A 3.19%, due 09/26/2005 (a) | 280 | 280 | |||||||||
| Quest Trust, Series 2004-X2, Class A–144A 3.58%, due 06/25/2034 (a) | 119 | 119 | |||||||||
| Rabobank Capital Funding II–144A 5.26%, due 12/31/2049 (e) | 210 | 211 | |||||||||
| Rabobank Capital Funding Trust–144A 5.25%, due 12/31/2049 (f) | 280 | 280 | |||||||||
| RACERS Series 1997-R-8-3-144A 3.09%, due 08/15/2007 (a) | 300 | 288 | |||||||||
| Ras Laffan Liquefied Natural Gas Co., Ltd.–144A 3.44%, due 09/15/2009 | 83 | 81 | |||||||||
| Sequoia Mortgage Trust, Series 10, Class 2A1 3.37%, due 10/20/2027 (a) | 316 | 317 | |||||||||
| Small Business Administration Participation, Series 2003-201 5.13%, due 09/01/2023 | 92 | 94 | |||||||||
| Small Business Administration, Series 2004-20C 4.34%, due 03/01/2024 | 566 | 550 | |||||||||
| Principal | Value | ||||||||||
| Small Business Administration, Series 2004-P10, Class A 4.50%, due 02/01/2014 | $ | 291 | $ | 289 | |||||||
| Washington Mutual, Series 2000-3, Class A 3.52%, due 12/25/2040 (a) | 148 | 147 | |||||||||
| Washington Mutual, Series 2002-AR10, Class A6 4.82%, due 10/25/2032 (a) | 28 | 27 | |||||||||
| Washington Mutual, Series 2002-AR2, Class A 3.57%, due 02/27/2034 (a) | 53 | 53 | |||||||||
| Washington Mutual, Series 2003-R1, Class A1 3.29%, due 12/25/2027 (a) | 2,202 | 2,198 | |||||||||
| Total Asset-Backed Securities (cost: $5,512) | 5,476 | ||||||||||
| CORPORATE DEBT SECURITIES (7.6%) | |||||||||||
| Air Transportation (0.4%) | |||||||||||
| Continental Airlines, Inc. 7.06%, due 09/15/2009 | 200 | 203 | |||||||||
| UAL Corp. 6.20%, due 09/01/2008 6.60%, due 09/01/2013 | 290 126 | 268 119 | |||||||||
| Automotive (0.8%) | |||||||||||
| DaimlerChrysler North America Holding Corp. 3.20%, due 03/07/2007 (a) 6.50%, due 11/15/2013 | 800 160 | 792 163 | |||||||||
| General Motors Corp. 8.38%, due 07/15/2033 | 325 | 247 | |||||||||
| Commercial Banks (0.3%) | |||||||||||
| Export-Import Bank of China–144A 5.25%, due 07/29/2014 | 250 | 254 | |||||||||
| HSBC Capital Funding LP–144A 10.18%, due 12/31/2049 (g) | 150 | 234 | |||||||||
| Communication (0.2%) | |||||||||||
| Continental Cablevision, Inc. 8.30%, due 05/15/2006 | 100 | 104 | |||||||||
| CSC Holdings, Inc. 7.63%, due 04/01/2011 | 150 | 152 | |||||||||
| Electric Services (0.4%) | |||||||||||
| Florida Power Corp. 4.80%, due 03/01/2013 | 450 | 449 | |||||||||
| PSEG Power LLC 6.95%, due 06/01/2012 | 210 | 234 | |||||||||
The notes to the financial statements are an integral part of this report.
Transamerica IDEX Mutual Funds
Semi-Annual Report 2005
4
TA IDEX PIMCO Total Return
SCHEDULE OF INVESTMENTS (continued)
At April 30, 2005
(all amounts except share amounts in thousands)
(unaudited)
| Principal | Value | ||||||||||
| Electric, Gas & Sanitary Services (0.2%) | |||||||||||
| Niagara Mohawk Power Corp. 7.75%, due 10/01/2008 | $ | 250 | $ | 277 | |||||||
| Pacific Gas & Electric Co. 3.82%, due 04/03/2006 (a) | 45 | 45 | |||||||||
| Environmental Services (0.0%) | |||||||||||
| Waste Management, Inc. 6.38%, due 11/15/2012 | 75 | 83 | |||||||||
| Food & Kindred Products (0.2%) | |||||||||||
| HJ Heinz Co.–144A 6.19%, due 12/01/2020 (a) | 300 | 304 | |||||||||
| Gas Production & Distribution (0.4%) | |||||||||||
| El Paso Energy Corp. 7.75%, due 01/15/2032 | 125 | 115 | |||||||||
| Sonat, Inc. 7.63%, due 07/15/2011 | 370 | 359 | |||||||||
| Southern Natural Gas Co. 8.00%, due 03/01/2032 | 100 | 111 | |||||||||
| General Obligation-City (0.2%) | |||||||||||
| Chicago, IL, Board of Education 5.00%, due 12/01/2012 | 255 | 281 | |||||||||
| Hotels & Other Lodging Places (0.4%) | |||||||||||
| Harrah's Operating Co., Inc. 7.50%, due 01/15/2009 | 10 | 11 | |||||||||
| Park Place Entertainment Corp. 7.50%, due 09/01/2009 | 350 | 382 | |||||||||
| Starwood Hotels & Resorts Worldwide, Inc. 7.88%, due 05/01/2012 | 200 | 219 | |||||||||
| Motion Pictures (0.1%) | |||||||||||
| Time Warner, Inc. 8.11%, due 08/15/2006 6.88%, due 05/01/2012 | 200 20 | 209 22 | |||||||||
| Municipal Obligations (0.0%) | |||||||||||
| Fairfax County, VA 5.25%, due 04/01/2013 | 45 | 57 | |||||||||
| Oil & Gas Extraction (0.4%) | |||||||||||
| Gaz Capital for Gazprom, Reg S 8.63%, due 04/28/2034 | 500 | 573 | |||||||||
| Paper & Allied Products (0.0%) | |||||||||||
| Bowater Canada Finance Corp. 7.95%, due 11/15/2011 | 10 | 10 | |||||||||
| Personal Credit Institutions (1.2%) | |||||||||||
| Ford Motor Credit Co. 6.88%, due 02/01/2006 | 700 | 708 | |||||||||
| Principal | Value | ||||||||||
| Personal Credit Institutions (continued) | |||||||||||
| General Motors Acceptance Corp. | |||||||||||
| 4.39%, due 10/20/2005 (a) | $ | 1,220 | $ | 1,217 | |||||||
| 6.75%, due 01/15/2006 | 50 | 50 | |||||||||
| Railroads (0.0%) | |||||||||||
| Burlington Northern Santa Fe Corp. | |||||||||||
| 6.38%, due 12/15/2005 | 40 | 41 | |||||||||
| Revenue-Education (0.1%) | |||||||||||
| Michigan State Building Authority | |||||||||||
| 5.25%, due 10/15/2013 | 180 | 203 | |||||||||
| Revenue-Tobacco (0.9%) | |||||||||||
| Golden State Tobacco Securitization Corp. 6.75%, due 06/01/2039 | 80 | 85 | |||||||||
| 7.90%, due 06/01/2042 | 35 | 40 | |||||||||
| Tobacco Settlement Authority 5.60%, due 06/01/2035 | 100 | 95 | |||||||||
| Tobacco Settlement Financing Corp. 6.00%, due 06/01/2037 5.88%, due 05/15/2039 6.38%, due 06/01/2032 | 730 40 420 | 730 40 433 | |||||||||
| Revenue-Utilities (0.4%) | |||||||||||
| New York, NY, City Municipal Water Finance Authority 5.00%, due 06/15/2035 | 90 | 94 | |||||||||
| San Antonio, Texas, Texas Water Utility Improvements, Revenue Bonds, Series A 5.00%, due 05/15/2032 | 450 | 465 | |||||||||
| Telecommunications (1.0%) | |||||||||||
| Cingular Wireless LLC 6.50%, due 12/15/2011 | 180 | 196 | |||||||||
| Deutsche Telekom International Finance BV 7.75%, due 06/15/2005 (h) 8.13%, due 05/29/2012 | 205 124 | 206 205 | |||||||||
| France Telecom SA 6.75%, due 03/14/2008 (i) | 307 | 441 | |||||||||
| SBC Communications, Inc. 4.13%, due 09/15/2009 | 575 | 566 | |||||||||
| Total Corporate Debt Securities (cost: $11,499) | 12,092 | ||||||||||
| SHORT-TERM U.S. GOVERNMENT OBLIGATIONS (13.4%) | |||||||||||
| Fannie Mae 2.74%, due 05/02/2005 2.73%, due 06/01/2005 2.66%, due 06/13/2005 2.68%, due 06/13/2005 2.95%, due 06/22/2005 | 1,300 1,900 2,200 300 4,200 | 1,300 1,895 2,192 299 4,182 | |||||||||
The notes to the financial statements are an integral part of this report.
Transamerica IDEX Mutual Funds
Semi-Annual Report 2005
5
TA IDEX PIMCO Total Return
SCHEDULE OF INVESTMENTS (continued)
At April 30, 2005
(all amounts except share amounts in thousands)
(unaudited)
| Principal | Value | ||||||||||
| 2.88%, due 06/27/2005 | $ | 2,100 | $ | 2,090 | |||||||
| 2.96%, due 06/29/2005 | 400 | 398 | |||||||||
| Federal Home Loan Bank 3.03%, due 08/08/2005 | 700 | 694 | |||||||||
| Freddie Mac 2.97%, due 06/28/2005 | 300 | 298 | |||||||||
| 2.92%, due 06/30/2005 | 1,100 | 1,094 | |||||||||
| 3.02%, due 08/09/2005 3.00%, due 08/08/2005 | 3,000 3,100 | 2,975 3,075 | |||||||||
| U.S. Treasury Bill 2.68%, due 06/02/2005 (j)(k) | 30 | 30 | |||||||||
| 2.71%, due 06/02/2005 2.74%, due 06/16/2005 (j)(k) 2.75%, due 06/16/2005 2.69%, due 06/02/2005 | 80 470 15 50 | 80 469 15 50 | |||||||||
| Total Short-Term U.S. Government Obligations (cost: $21,136) | 21,136 | ||||||||||
| COMMERCIAL PAPER (35.1%) | |||||||||||
| Commercial Banks (28.0%) | |||||||||||
| ANZ (Delaware), Inc. 2.84%, due 06/03/2005 | 500 | 499 | |||||||||
| ANZ National International, Ltd.–144A 2.72%, due 05/23/2005 2.83%, due 05/31/2005 2.90%, due 06/08/2005 | 600 800 1,900 | 599 798 1,894 | |||||||||
| Barclays U.S. Funding Corp. 2.67%, due 05/02/2005 2.97%, due 05/25/2005 | 200 1,400 | 200 1,397 | |||||||||
| Danske Corp. 2.79%, due 06/20/2005 2.98%, due 06/30/2005 3.01%, due 07/07/2005 3.02%, due 07/15/2005 | 1,500 800 400 300 | 1,494 796 398 298 | |||||||||
| Dexia Delaware LLC 3.00%, due 07/05/2005 | 400 | 398 | |||||||||
| DNB NOR Bank ASA 2.78%, due 06/15/2005 2.98%, due 07/14/2005 | 2,400 1,600 | 2,392 1,590 | |||||||||
| Governor & Co. (The) of The Bank of Ireland 2.56%, due 05/05/2005 | 4,200 | 4,199 | |||||||||
| HBOS Treasury Services 2.71%, due 05/11/2005 2.87%, due 05/17/2005 2.83%, due 05/31/2005 2.95%, due 06/16/2005 | 500 100 2,100 1,400 | 500 100 2,095 1,395 | |||||||||
| Principal | Value | ||||||||||
| Commercial Banks (continued) | |||||||||||
| ING (US) Funding LLC | |||||||||||
| 2.96%, due 06/21/2005 | $ | 4,200 | $ | 4,183 | |||||||
| 2.98%, due 06/30/2005 | 400 | 398 | |||||||||
| 3.04%, due 07/19/2005 | 100 | 99 | |||||||||
| KFW International Finance–144A 2.85%, due 05/16/2005 | 1,400 | 1,398 | |||||||||
| Skandinaviska Enskilda Banken AB–144A 2.68%, due 05/03/2005 2.88%, due 06/09/2005 2.85%, due 06/24/2005 | 500 500 3,600 | 500 498 3,585 | |||||||||
| Svenska Handelsbanken, Inc. 3.05%, due 07/20/2005 | 3,700 | 3,676 | |||||||||
| Swedbank 3.01%, due 07/01/2005 | 600 | 597 | |||||||||
| UBS Finance Delaware LLC 2.83%, due 05/09/2005 2.73%, due 06/02/2005 2.84%, due 06/22/2005 3.02%, due 07/22/2005 | 100 300 2,700 1,600 | 100 299 2,689 1,589 | |||||||||
| Westpac Capital Corp. 3.01%, due 07/08/2005 | 3,600 | 3,580 | |||||||||
| Holding & Other Investment Offices (2.5%) | |||||||||||
| Rabobank USA Finance Corp. 2.95%, due 06/21/2005 | 3,900 | 3,883 | |||||||||
| Mortgage Bankers & Brokers (1.2%) | |||||||||||
| Spintab AB 2.75%, due 06/03/2005 3.18%, due 09/01/2005 | 400 1,600 | 399 1,582 | |||||||||
| Personal Credit Institutions (0.8%) | |||||||||||
| General Electric Capital Corp. 2.97%, due 06/20/2005 3.04%, due 07/11/2005 | 200 1,000 | 199 994 | |||||||||
| Security & Commodity Brokers (2.6%) | |||||||||||
| IXIS–144A 2.89%, due 06/21/2005 | 4,200 | 4,183 | |||||||||
| Total Commercial Paper (cost: $21,136) | 55,473 | ||||||||||
| PURCHASED OPTIONS (0.0%) | |||||||||||
| Put Options (0.0%) | |||||||||||
| 90-Day Euro Dollar Futures | 94 | 1 | |||||||||
| Put Strike $93.75 | |||||||||||
| Expires 12/19/2005 | |||||||||||
| Total Purchased Options (cost: $1) | 1 | ||||||||||
| Total Investment Securities (cost: $188,248) | $ | 189,739 | |||||||||
The notes to the financial statements are an integral part of this report.
Transamerica IDEX Mutual Funds
Semi-Annual Report 2005
6
TA IDEX PIMCO Total Return
SCHEDULE OF INVESTMENTS (continued)
At April 30, 2005
(all amounts except share amounts in thousands)
(unaudited)
| Contracts (l) | Value | ||||||||||
| WRITTEN OPTIONS (-0.1%) | |||||||||||
| Covered Call Options (-0.1%) | |||||||||||
| U.S. 10 Year Treasury Note Futures | 71 | $ | (9 | ) | |||||||
| Call Strike $113.00 | |||||||||||
| Expires 05/20/2005 | |||||||||||
| U.S. 10 Year Treasury Note Futures Call Strike $115.00 Expires 05/20/2005 | 59 | (1 | ) | ||||||||
| U.S. 10 Year Treasury Note Futures Call Strike $111.00 Expires 05/20/2005 | 50 | (41 | ) | ||||||||
| U.S. 10 Year Treasury Note Futures Call Strike $112.00 Expires 08/26/2005 | 45 | (49 | ) | ||||||||
| Put Options (-0.0%) | |||||||||||
| U.S. 10 Year Treasury Note Futures Put Strike $108.00 Expires 05/20/2005 | 71 | (2 | ) | ||||||||
| U.S. 10 Year Treasury Note Futures Put Strike $109.00 Expires 05/20/2005 | 59 | (4 | ) | ||||||||
| U.S. 10 Year Treasury Note Futures Put Strike $105.00 Expires 05/20/2005 | 50 | (1 | ) | ||||||||
| U.S. 10 Year Treasury Note Futures Put Strike $107.00 Expires 08/26/2005 | 45 | (9 | ) | ||||||||
| U.S. Treasury Bond Futures Put Strike $108.00 Expires 05/20/2005 | 11 | – | (c) | ||||||||
| Total Written Options (premium: -$135) | (116 | ) | |||||||||
| SUMMARY: | |||||||||||
| Investments, at value | 120.0 | % | $ | 189,739 | |||||||
| Written options | (0.1 | )% | (116 | ) | |||||||
| Liabilities in excess of other assets | (19.9 | )% | (31,480 | ) | |||||||
| Net assets | 100.0 | % | $ | 158,143 | |||||||
| SWAP AGREEMENTS: | |||||||||||||||
| Expiration Date | Notional Amount | Net Unrealized Appreciation (Depreciation) | |||||||||||||
| Receive a fixed rate equal to 6.00% and pay a floating rate based on 6-month EURIBOR (Euro Interbank Offered Rate). Counterparty: Lehman Brothers Special Financing Inc. | 06/18/2014 | $ | 1,000 | $ | 122 | ||||||||||
| Receive a floating rate based on 6-month Great British Pound – LIBOR (London Interbank Offered Rate) and pay a fixed rate equal to 5.00%. Counterparty: UBS AG | 06/18/2014 | 500 | (20 | ) | |||||||||||
| Receive a fixed rate equal to 0.70% and the Fund will pay to the counterparty at par in the event of default of Russian Federation, 5.00%, due 03/31/2030. Counterparty: Morgan Stanley | 05/24/2005 | 1,590 | – | (c) | |||||||||||
| Receive a fixed rate equal to 0.61% and the Fund will pay to the counterparty at par in the event of default of Russian Federation, 5.00%, due 03/31/2030. Counterparty: Goldman Sachs International | 03/20/2007 | 425 | (1 | ) | |||||||||||
| Receive a fixed rate equal to 0.70% and the Fund will pay to the counterparty at par in the event of default of Russian Federation, 5.00%, due 03/31/2030. Counterparty: Goldman Sachs International | 03/20/2007 | 175 | – | (c) | |||||||||||
| Receive a fixed rate equal to 0.625% and the Fund will pay to the counterparty at par in the event of default of Mexican Government International Bond, 11.50%, due 05/15/2026. Counterparty: Morgan Stanley | 05/20/2005 | 180 | – | (c) | |||||||||||
| Receive a fixed rate equal to 0.65% and the Fund will pay to the counterparty at par in the event of default of United Mexican States, 7.50%, due 04/08/2033. Counterparty: Barclays PLC | 05/20/2005 | 60 | – | (c) | |||||||||||
The notes to the financial statements are an integral part of this report.
Transamerica IDEX Mutual Funds
Semi-Annual Report 2005
7
TA IDEX PIMCO Total Return
SCHEDULE OF INVESTMENTS (continued)
At April 30, 2005
(all amounts except share amounts in thousands)
(unaudited)
| Expiration Date | Notional Amount | Net Unrealized Appreciation (Depreciation) | |||||||||||||
| Receive a floating rate based on 3-month United States Dollar – LIBOR (London Interbank Offered Rate) and pay a fixed rate equal to 5.00%. Counterparty: Morgan Stanley | 06/15/2005 | $ | 2,000 | $ | (6 | ) | |||||||||
| Receive a floating rate based on 3-month United States Dollar – LIBOR (London Interbank Offered Rate) and pay a fixed rate equal to 5.00%. Counterparty: Goldman Sachs Capital Markets, LP | 06/15/2005 | 1,000 | (6 | ) | |||||||||||
| Receive a floating rate based on 6-month Great British Pound – LIBOR (London Interbank Offered Rate) and pay a fixed rate equal to 5.00%. Counterparty: Barclays PLC | 06/18/2034 | 200 | (10 | ) | |||||||||||
| Receive a floating rate based on 6-month Japanese Yen – LIBOR (London Interbank Offered Rate) and pay a fixed rate equal to 2.00%. Counterparty: Morgan Stanley | 06/15/2012 | 130,000 | (70 | ) | |||||||||||
| Receive a fixed rate equal to 3.20% and the Fund will pay to the counterparty at par in the event of default of General Motors Acceptance Corp, 6.875%, due 8/28/2012 Counterparty: Lehman Brothers Special Financing Inc. | 06/20/2007 | 300 | (8 | ) | |||||||||||
| Receive a fixed rate equal to 2.80% and the Fund will pay to the counterparty at par in the event of default of General Motors Acceptance Corp, 6.875%, due 8/28/2012 Counterparty: JP Morgan | 06/20/2006 | 800 | (7 | ) | |||||||||||
| Total Swap Agreements (premium -$66) | $ | (6 | ) | ||||||||||||
| REVERSE REPURCHASE AGREEMENT: | |||||||||||||||
| $ | 280 | Lehman Brothers, 0.20%, dated 4/7/05, | |||||||||
| to be repurchased on demand by Lehman | |||||||||||
| Brothers at face value plus accrued interest. | $ | 280 | |||||||||
| Face Value | Description | Market Value | |||||||||
| FUTURES CONTRACTS: | |||||||||||
| Contracts | Settlement Date | Amount | Net Unrealized Appreciation (Depreciation) | ||||||||||||||||
| 10 Year U.S. Treasury Note | 13 | 06/30/2005 | $ | 1,448 | $ | 38 | |||||||||||||
| 2 Year U.S. Treasury Note | 108 | 06/30/2005 | 22,432 | 25 | |||||||||||||||
| 5 Year U.S. Treasury Note | 37 | 06/30/2005 | 4,013 | (1 | ) | ||||||||||||||
| 90-Day Euro Dollar | 47 | 06/13/2005 | 11,348 | (57 | ) | ||||||||||||||
| 90-Day Euro Dollar | 173 | 09/19/2005 | 41,630 | (317 | ) | ||||||||||||||
| 90-Day Euro Dollar | 81 | 12/19/2005 | 19,453 | (43 | ) | ||||||||||||||
| Japanese 10 Year Bond | 1 | 06/20/2005 | 1,339 | 31 | |||||||||||||||
| U.S. Long Bond | 55 | 06/30/2005 | 6,316 | 192 | |||||||||||||||
| $ | 107,979 | $ | (132 | ) | |||||||||||||||
| FORWARD FOREIGN CURRENCY CONTRACTS: | |||||||||||||||||||
| Currency | Bought (Sold) | Settlement Date | Amount in U.S. Dollars Bought (Sold) | Net Unrealized Appreciation (Depreciation) | |||||||||||||||
| Euro | 406 | 05/18/2005 | $ | 529 | $ | (4 | ) | ||||||||||||
| Euro | (1,213 | ) | 05/18/2005 | (1,568 | ) | 1 | |||||||||||||
| Euro | (2,728 | ) | 05/25/2005 | (3,573 | ) | 49 | |||||||||||||
| Euro | (498 | ) | 05/25/2005 | (643 | ) | (1 | ) | ||||||||||||
| $ | (5,255 | ) | $ | 45 | |||||||||||||||
The notes to the financial statements are an integral part of this report.
Transamerica IDEX Mutual Funds
Semi-Annual Report 2005
8
TA IDEX PIMCO Total Return
SCHEDULE OF INVESTMENTS (continued)
At April 30, 2005
(all amounts except share amounts in thousands)
(unaudited)
NOTES TO SCHEDULE OF INVESTMENTS:
(a) Floating or variable rate note. Rate is listed as of April 30, 2005.
(b) Securities are stepbonds. Russian Federation has a coupon rate of 5.00% until 03/31/2007, thereafter the coupon rate will become 7.50%.
(c) Value is less than $1.
(d) Securities are stepbonds. KBC Bank Fund Trust III Preferred-144A has a coupon rate of 9.86% until 11/02/2009, thereafter the coupon rate will become the 3 Month LIBOR (London Interbank Offer Rate) + 405 BP.
(e) Rabobank Capital Funding II–144A has a fixed coupon rate 5.26% until 12/31/2013, thereafter the coupon rate will reset quarterly at the 3-month US$LIBOR + 162.75BP, if not called.
(f) Rabobank Capital Funding Trust–144A has a fixed coupon rate 5.25% until 12/31/2016, thereafter the coupon rate will reset quarterly at the 3-month US$LIBOR + 159BP, if not called.
(g) HSBC Capital Funding LP–144A has a fixed coupon rate 10.18% until 06/30/2030, thereafter the coupon rate will reset quarterly at the 3-month US$LIBOR + 498BP, if not called.
(h) Securities are stepbonds. Deutche Telekom International Finance BV coupon steps up by 50 BP for each rating downgrade by Standard and Poor's or Moody's for each notch below BBB+/Baa1. Coupon steps down by 50 BP for each rating upgrade.
(i) Securities are stepbonds. France Telecom SA coupon steps up or down by 25 BP for each rating upgrade or downgrade by Standard and Poor's or Moody's for each notch below A-/A3.
(j) At April 30, 2005, all or a portion of this security is segregated with the custodian to cover margin requirements for open option contracts. The value of all securities segregated at April 30, 2005, is $229.
(k) At April 30, 2005, all or a portion of this security is segregated with the custodian to cover open future contracts. The value of all securities segregated at April 30, 2005, is $414.
(l) Contract amounts are not in thousands.
DEFINITIONS:
144A 144A Securities are registered pursuant to Rule 144A of the Securities Act of 1933. These securities are deemed to be liquid for purposes of compliance limitations on holdings of illiquid securities and may be resold as transactions exempt from registration, normally to qualified institutional buyers. At April 30, 2005, these securities aggregated $16,200 or 10.2% of the net assets of the Fund.
TBA Mortgage-backed securities traded under delay delivery commitments. Income on TBA's are not earned until settlement date.
The notes to the financial statements are an integral part of this report.
Transamerica IDEX Mutual Funds
Semi-Annual Report 2005
9
TA IDEX PIMCO Total Return
STATEMENT OF ASSETS AND LIABILITIES
At April 30, 2005
(all amounts except per share amounts in thousands)
(unaudited)
| Assets: | |||||||
| Investment securities, at value (cost: $188,248) | $ | 189,739 | |||||
| Cash | 2,778 | ||||||
| Foreign cash (cost: $1,604) | 1,604 | ||||||
| Receivables: | |||||||
| Investment securities sold | 7,510 | ||||||
| Shares of beneficial interest sold | 187 | ||||||
| Interest | 836 | ||||||
| Unrealized appreciation on forward currency contracts | 50 | ||||||
| Other | 37 | ||||||
| 202,741 | |||||||
| Liabilities: | |||||||
| Investment securities purchased | 43,690 | ||||||
| Accounts payable and accrued liabilities: | |||||||
| Shares of beneficial interest redeemed | 144 | ||||||
| Management and advisory fees | 90 | ||||||
| Transfer agent fees | 23 | ||||||
| Distribution and service fees | 64 | ||||||
| Variation margin | 85 | ||||||
| Unrealized depreciation on forward currency contracts | 5 | ||||||
| Written options (premiums $135) | 116 | ||||||
| Swap agreements at value (premium $66) | 72 | ||||||
| Payable for reverse repurchase agreement | 280 | ||||||
| Other | 29 | ||||||
| 44,598 | |||||||
| Net Assets | $ | 158,143 | |||||
| Net Assets Consist of: | |||||||
| Shares of beneficial interest, unlimited shares authorized, no par value | $ | 156,298 | |||||
| Undistributed net investment income (loss) | 122 | ||||||
| Undistributed net realized gain (loss) from investment securities, futures contracts, foreign currency transactions, written options and swaps | 307 | ||||||
| Net unrealized appreciation (depreciation) on: | |||||||
| Investment securities | 1,489 | ||||||
| Futures contracts | (132 | ) | |||||
| Written option contracts | 19 | ||||||
| Swap agreements | (6 | ) | |||||
| Translation of assets and liabilites denominated in foreign currencies | 46 | ||||||
| Net Assets | $ | 158,143 | |||||
| Net Assets by Class: | |||||||
| Class A | $ | 122,308 | |||||
| Class B | 24,932 | ||||||
| Class C | 10,903 | ||||||
| Shares Outstanding: | |||||||
| Class A | 11,800 | ||||||
| Class B | 2,403 | ||||||
| Class C | 1,054 | ||||||
| Net Asset Value Per Share: | |||||||
| Class A | $ | 10.37 | |||||
| Class B | 10.37 | ||||||
| Class C | 10.34 | ||||||
| Maximum Offering Price Per Share (a): | |||||||
| Class A | $ | 10.89 | |||||
(a) Includes the maximum selling commission (represented as a percentage of offering price) which is reduced on certain levels of sales as set forth in the Prospectus. Net asset value per share for Classes B and C shares represents offering price. The redemption price for Classes B and C shares equals net asset value less any applicable contingent deferred sales charge.
STATEMENT OF OPERATIONS
For the period ended April 30, 2005
(all amounts in thousands)
(unaudited)
| Investment Income: | |||||||
| Interest | $ | 2,454 | |||||
| Income from loaned securities–net | 2 | ||||||
| 2,456 | |||||||
| Expenses: | |||||||
| Management and advisory fees | 534 | ||||||
| Transfer agent fees: | |||||||
| Class A | 10 | ||||||
| Class B | 12 | ||||||
| Class C | 8 | ||||||
| Printing and shareholder reports | 11 | ||||||
| Custody fees | 42 | ||||||
| Administration fees | 14 | ||||||
| Legal fees | 3 | ||||||
| Audit fees | 12 | ||||||
| Trustees fees | 3 | ||||||
| Registration fees: | |||||||
| Class A | 18 | ||||||
| Class B | 4 | ||||||
| Class C | 12 | ||||||
| Distribution and service fees: | |||||||
| Class A | 201 | ||||||
| Class B | 131 | ||||||
| Class C | 58 | ||||||
| Total expenses | 1,073 | ||||||
| Net Investment Income (Loss) | 1,383 | ||||||
| Net Realized Gain (Loss) from: | |||||||
| Investment securities | 168 | ||||||
| Futures contracts | (124 | ) | |||||
| Written option contracts | 138 | ||||||
| Swap agreements | 175 | ||||||
| Foreign currency transactions | 142 | ||||||
| 499 | |||||||
| Net Increase (Decrease) in Unrealized Appreciation (Depreciation) on: | |||||||
| Investment securities | 317 | ||||||
| Futures contracts | (498 | ) | |||||
| Written option contracts | (29 | ) | |||||
| Swap agreements | (189 | ) | |||||
| Translation of assets and liabilities denominated in foreign currencies | 47 | ||||||
| (352 | ) | ||||||
| Net Gain (Loss) on Investments, Futures Contracts, Foreign Currency Transactions, Written Options and Swaps | 147 | ||||||
| Net Increase (Decrease) in Net Assets Resulting from Operations | $ | 1,530 | |||||
The notes to the financial statements are an integral part of this report.
Transamerica IDEX Mutual Funds
Semi-Annual Report 2005
10
TA IDEX PIMCO Total Return
STATEMENTS OF CHANGES IN NET ASSETS
For the period or year ended
(all amounts in thousands)
| April 30, 2005 (unaudited) | October 31, 2004 | ||||||||||
| Increase (Decrease) In Net Assets From: | |||||||||||
| Operations: | |||||||||||
| Net investment income (loss) | $ | 1,383 | $ | 1,081 | |||||||
| Net realized gain (loss) from investment securities, futures contracts, foreign currency transactions, written options and swaps | 499 | 4,124 | |||||||||
| Net unrealized appreciation (depreciation) on investment securities, futures contracts, foreign currency translations, written options and swaps | (352 | ) | 64 | ||||||||
| 1,530 | 5,269 | ||||||||||
| Distributions to Shareholders: | |||||||||||
| From net investment income: | |||||||||||
| Class A | (1,061 | ) | (924 | ) | |||||||
| Class B | (137 | ) | (223 | ) | |||||||
| Class C | (63 | ) | (49 | ) | |||||||
| Class C2 | – | (45 | ) | ||||||||
| Class M | – | (18 | ) | ||||||||
| (1,261 | ) | (1,259 | ) | ||||||||
| From net realized gains: | |||||||||||
| Class A | (1,399 | ) | (2,206 | ) | |||||||
| Class B | (336 | ) | (1,143 | ) | |||||||
| Class C | (150 | ) | (180 | ) | |||||||
| Class C2 | – | (313 | ) | ||||||||
| Class M | – | (93 | ) | ||||||||
| (1,885 | ) | (3,935 | ) | ||||||||
| Capital Share Transactions: | |||||||||||
| Proceeds from shares sold: | |||||||||||
| Class A | 16,587 | 53,387 | |||||||||
| Class B | 1,412 | 6,093 | |||||||||
| Class C | 742 | 1,432 | |||||||||
| Class C2 | – | 431 | |||||||||
| Class M | – | 57 | |||||||||
| 18,741 | 61,400 | ||||||||||
| Dividends and distributions reinvested: | |||||||||||
| Class A | 2,438 | 3,077 | |||||||||
| Class B | 352 | 1,079 | |||||||||
| Class C | 185 | 181 | |||||||||
| Class C2 | – | 313 | |||||||||
| Class M | – | 107 | |||||||||
| 2,975 | 4,757 | ||||||||||
| Cost of shares redeemed: | |||||||||||
| Class A | (1,933 | ) | (6,832 | ) | |||||||
| Class B | (4,737 | ) | (13,382 | ) | |||||||
| Class C | (2,722 | ) | (3,016 | ) | |||||||
| Class C2 | – | (3,748 | ) | ||||||||
| Class M | – | (1,377 | ) | ||||||||
| (9,392 | ) | (28,355 | ) | ||||||||
| April 30, 2005 (unaudited) | October 31, 2004 | ||||||||||
| Class level exchanges: | |||||||||||
| Class C | $ | – | $ | 8,804 | |||||||
| Class C2 | – | (6,831 | ) | ||||||||
| Class M | – | (1,973 | ) | ||||||||
| – | – | ||||||||||
| 12,324 | 37,802 | ||||||||||
| Net increase (decrease) in net assets | 10,708 | 37,877 | |||||||||
| Net Assets: | |||||||||||
| Beginning of period | 147,435 | 109,558 | |||||||||
| End of period | $ | 158,143 | $ | 147,435 | |||||||
| Undistributed Net Investment Income (Loss) | $ | 122 | $ | – | |||||||
| Share Activity: | |||||||||||
| Shares issued: | |||||||||||
| Class A | 1,597 | 5,141 | |||||||||
| Class B | 136 | 586 | |||||||||
| Class C | 71 | 138 | |||||||||
| Class C2 | – | 41 | |||||||||
| Class M | – | 5 | |||||||||
| 1,804 | 5,911 | ||||||||||
| Shares issued–reinvested from distributions: | |||||||||||
| Class A | 236 | 299 | |||||||||
| Class B | 34 | 105 | |||||||||
| Class C | 18 | 17 | |||||||||
| Class C2 | – | 31 | |||||||||
| Class M | – | 11 | |||||||||
| 288 | 463 | ||||||||||
| Shares redeemed: | |||||||||||
| Class A | (186 | ) | (655 | ) | |||||||
| Class B | (457 | ) | (1,287 | ) | |||||||
| Class C | (263 | ) | (291 | ) | |||||||
| Class C2 | – | (357 | ) | ||||||||
| Class M | – | (133 | ) | ||||||||
| (906 | ) | (2,723 | ) | ||||||||
| Class level exchanges: | |||||||||||
| Class C | – | 866 | |||||||||
| Class C2 | – | (677 | ) | ||||||||
| Class M | – | (189 | ) | ||||||||
| – | – | ||||||||||
| Net increase (decrease) in shares outstanding: | |||||||||||
| Class A | 1,647 | 4,785 | |||||||||
| Class B | (287 | ) | (596 | ) | |||||||
| Class C | (174 | ) | 730 | ||||||||
| Class C2 | – | (962 | ) | ||||||||
| Class M | – | (306 | ) | ||||||||
| 1,186 | 3,651 | ||||||||||
The notes to the financial statements are an integral part of this report.
Transamerica IDEX Mutual Funds
Semi-Annual Report 2005
11
TA IDEX PIMCO Total Return
FINANCIAL HIGHLIGHTS
(unaudited for the period ended April 30, 2005)
| For a share of beneficial interest outstanding throughout each period | |||||||||||||||||||||||||||||||||||||||
| Net Asset | Investment Operations | Distributions | Net Asset | ||||||||||||||||||||||||||||||||||||
| For the Period Ended (d)(g) | Value, Beginning of Period | Net Investment Income (Loss) | Net Realized and Unrealized Gain (Loss) | Total Operations | From Net Investment Income | From Net Realized Gains | Total Distributions | Value, End of Period | |||||||||||||||||||||||||||||||
| Class A | 4/30/2005 | $ | 10.48 | $ | 0.10 | $ | 0.01 | $ | 0.11 | $ | (0.09 | ) | $ | (0.13 | ) | $ | (0.22 | ) | $ | 10.37 | |||||||||||||||||||
| 10/31/2004 | 10.52 | 0.12 | 0.36 | 0.48 | (0.14 | ) | (0.38 | ) | (0.52 | ) | 10.48 | ||||||||||||||||||||||||||||
| 10/31/2003 | 10.32 | 0.20 | 0.39 | 0.59 | (0.25 | ) | (0.14 | ) | (0.39 | ) | 10.52 | ||||||||||||||||||||||||||||
| 10/31/2002 | 10.00 | 0.13 | 0.28 | 0.41 | (0.09 | ) | – | (0.09 | ) | 10.32 | |||||||||||||||||||||||||||||
| Class B | 4/30/2005 | 10.48 | 0.06 | 0.01 | 0.07 | (0.05 | ) | (0.13 | ) | (0.18 | ) | 10.37 | |||||||||||||||||||||||||||
| 10/31/2004 | 10.51 | 0.07 | 0.36 | 0.43 | (0.08 | ) | (0.38 | ) | (0.46 | ) | 10.48 | ||||||||||||||||||||||||||||
| 10/31/2003 | 10.32 | 0.13 | 0.38 | 0.51 | (0.18 | ) | (0.14 | ) | (0.32 | ) | 10.51 | ||||||||||||||||||||||||||||
| 10/31/2002 | 10.00 | 0.09 | 0.29 | 0.38 | (0.06 | ) | – | (0.06 | ) | 10.32 | |||||||||||||||||||||||||||||
| Class C | 4/30/2005 | 10.47 | 0.05 | 0.01 | 0.06 | (0.06 | ) | (0.13 | ) | (0.19 | ) | 10.34 | |||||||||||||||||||||||||||
| 10/31/2004 | 10.51 | 0.04 | 0.38 | 0.42 | (0.08 | ) | (0.38 | ) | (0.46 | ) | 10.47 | ||||||||||||||||||||||||||||
| 10/31/2003 | 10.38 | 0.13 | 0.32 | 0.45 | (0.18 | ) | (0.14 | ) | (0.32 | ) | 10.51 | ||||||||||||||||||||||||||||
| Ratios/Supplemental Data | |||||||||||||||||||||||||||||||
| For the Period | Total | Net Assets, End of Period | Ratio of Expenses to Average Net Assets (a) | Net Investment Income (Loss) to Average | Portfolio Turnover | ||||||||||||||||||||||||||
| Ended (g) | Return (c) | (000's) | Net (e) | Total (f) | Net Assets (a) | Rate (b) | |||||||||||||||||||||||||
| Class A | 4/30/2005 | 1.00 | % | $ | 122,308 | 1.21 | % | 1.21 | % | 2.01 | % | 203 | % | ||||||||||||||||||
| 10/31/2004 | 4.78 | 106,366 | 1.34 | 1.34 | 1.19 | 385 | |||||||||||||||||||||||||
| 10/31/2003 | 5.88 | 56,452 | 1.43 | 1.43 | 1.91 | 326 | |||||||||||||||||||||||||
| 10/31/2002 | 4.13 | 40,767 | 1.65 | 1.81 | 2.28 | 240 | |||||||||||||||||||||||||
| Class B | 4/30/2005 | 0.66 | 24,932 | 1.94 | 1.94 | 1.26 | 203 | ||||||||||||||||||||||||
| 10/31/2004 | 4.30 | 28,219 | 1.92 | 1.92 | 0.64 | 385 | |||||||||||||||||||||||||
| 10/31/2003 | 5.08 | 34,547 | 2.08 | 2.08 | 1.26 | 326 | |||||||||||||||||||||||||
| 10/31/2002 | 3.80 | 30,909 | 2.30 | 2.46 | 1.63 | 240 | |||||||||||||||||||||||||
| Class C | 4/30/2005 | 0.53 | 10,903 | 2.15 | 2.15 | 1.05 | 203 | ||||||||||||||||||||||||
| 10/31/2004 | 4.10 | 12,850 | 2.09 | 2.09 | 0.41 | 385 | |||||||||||||||||||||||||
| 10/31/2003 | 4.47 | 5,231 | 2.08 | 2.08 | 1.25 | 326 | |||||||||||||||||||||||||
NOTES TO FINANCIAL HIGHLIGHTS
(a) Annualized.
(b) Not annualized for periods of less than one year.
(c) Total Return has been calculated for the applicable period without deduction of a sales load, if any, on an initial purchase. Periods of less than one year are not annualized.
(d) Per share information is calculated based on average number of shares outstanding.
(e) Ratio of Net Expenses to Average Net Assets is net of fee waivers and reimbursements by the investment adviser, if any (see note 2).
(f) Ratio of Total Expenses to Average Net Assets includes all expenses before fee waivers and reimbursements by the investment adviser.
(g) TA IDEX PIMCO Total Return ("the Fund") commenced operations on March 1, 2002. The inception date for the Fund's offering of share Class C was November 11, 2002.
The notes to the financial statements are an integral part of this report.
Transamerica IDEX Mutual Funds
Semi-Annual Report 2005
12
TA IDEX PIMCO Total Return
NOTES TO FINANCIAL STATEMENTS
At April 30, 2005
(all amounts in thousands)
(unaudited)
NOTE 1. ORGANIZATION AND SIGNIFICANT ACCOUNTING POLICIES
Transamerica IDEX Mutual Funds is a Delaware statutory trust registered under the Investment Company Act of 1940, as amended (the "1940 Act"), as an open-end management investment company. Prior to March 1, 2005, Transamerica IDEX Mutual Funds was a Massachusetts business trust. TA IDEX PIMCO Total Return ("the Fund"), part of Transamerica IDEX Mutual Funds, began operations on March 1, 2002.
In the normal course of business, the Fund enters into contracts that contain a variety of representations and warranties, which provide general indemnifications. The Fund's maximum exposure under these arrangements is unknown, as this would involve future claims that may be made against the Fund and/or its affiliates that have not yet occurred. However, based on experience, the Fund expects the risk of loss to be remote.
See the Prospectus and Statement of Additional Information for a description of the Fund's investment objective.
In preparing the Fund's financial statements in accordance with accounting principles generally accepted in the United States of America ("GAAP"), estimates or assumptions (which could differ from actual results) may be used that affect reported amounts and disclosures. The following policies were consistently followed by the Fund, in accordance with GAAP.
Multiple class operations and expenses: The Fund currently offers three classes of shares, each with a public offering price that reflects different sales charges, if any, and expense levels. On June 15, 2004, Class C2 shares merged into Class C. On September 24, 2004, Class M shares merged into Class C. Class B shares will convert to Class A shares eight years after purchase. Income, non-class specific expenses and realized and unrealized gains and losses, are allocated daily to each class, based upon the value of shares outstanding method as permitted under Rule 18f-3 of the 1940 Act. Each class bears its own specific expenses as well as a portion of general, common expenses.
Pricing of shares: The Fund prices its shares on the basis of the net asset value of each class of shares of the Fund, which is determined as of the close of the New York Stock Exchange ("NYSE") (generally 4:00 p.m. Eastern Time) on each day on which the NYSE is open for trading.
Security valuations: Fund investments traded on an exchange are valued at the closing price on the day of valuation on the exchange where the security is principally traded. With respect to securities traded on NASDAQ NMS, such closing price may be the last reported sales price or the NASDAQ Official Closing Price.
Securities traded in the over-the-counter market and listed securities for which no sale was reported on that date are valued at the last quoted bid price.
Debt securities are valued by independent pricing services at the last quoted bid price; however, those that mature in sixty days or less are valued at amortized cost, which approximates market.
Foreign securities generally are valued based on quotations from the primary market in which they are traded and are translated from the local currency into U.S. dollars using closing exchange rates. Many foreign securities markets are open for trading at times when the U.S. markets are closed for trading, and many foreign securities markets close for trading before the close of the NYSE. The value of foreign securities may be affected significantly on a day that the NYSE is closed and an investor is unable to purchase or redeem shares. If a significant market event impacting the value of a portfolio security (e.g., natural disaster, company announcement, market volatility) occurs subsequent to the close of trading in the security, but prior to the calculation of the Fund's net asset value per share, market quotations for that security may be determined to be unreliable and, accordingly, not "readily av ailable." If market quotations are not readily available, and the impact of such a significant market event materially effects the net asset value per share of the Fund, an affected portfolio security will be valued at fair market value as determined in good faith using guidelines adopted by the Board of Trustees of the Fund, under the supervision of the Fund's Valuation Committee. Factors that may be considered to value foreign securities at fair market value may include, among others: the value of other securities traded on other markets, foreign currency exchange activity and the trading of financial products tied to foreign securities.
Other securities for which quotations are not readily available are valued at fair market value as determined in good faith using guidelines adopted by the Board of Trustees of the Fund, under the supervision of the Fund's Valuation Committee. These guidelines may include: the type of security; any restrictions on its resale; financial or business news of the issuer; similar or related securities that are actively trading; related corporate actions; and other significant events occurring after the close of trading in the security.
Cash: The Fund may leave cash overnight in its cash account with the custodian, Investors Bank & Trust Company ("IBT"). IBT has been contracted on behalf of the Fund to invest the excess cash into a savings account, which at April 30, 2005, was paying an interest rate of 2.02%.
Throughout the period, the Fund may have a cash overdraft balance. A fee is incurred on this overdraft, calculated by multiplying the overdraft by a rate based on the federal funds rate.
TBA purchase commitments: The Fund may enter into "TBA" (to be announced) purchase commitments to purchase securities for a fixed price at a future date, typically not to exceed 45 days. TBA purchase commitments are considered securities in themselves, and involve a risk of loss if the value of the security to be purchased declines prior to settlement date, in addition to the risk of decline in the value of the Fund's other assets. Unsettled TBA purchase commitments are valued
Transamerica IDEX Mutual Funds
Semi-Annual Report 2005
13
TA IDEX PIMCO Total Return
NOTES TO FINANCIAL STATEMENTS (continued)
At April 30, 2005
(all amounts in thousands)
(unaudited)
NOTE 1.–(continued)
at the current value of the underlying securities, according to the procedures described under Security Valuations. TBA purchase commitments are included in the Schedule of Investments.
Repurchase agreements: The Fund is authorized to enter into repurchase agreements. The Fund, through IBT, receives delivery of the underlying securities, the value of which at the time of purchase is required to be an amount equal to at least 100% of the resale price. Repurchase agreements involve the risk that the seller will fail to repurchase the security, as agreed. In that case, the Fund will bear the risk of value fluctuations until the security can be sold and may encounter delays and incur costs in liquidating the security. In the event of bankruptcy or insolvency of the seller, delays and costs may be incurred.
Reverse repurchase agreements: The Fund may enter into reverse repurchase agreements with certain banks and broker/dealers whereby the Fund sells portfolio assets concurrent with an agreement by the Fund to repurchase the same assets at a later date at a fixed price. In connection with these agreements, the Fund establishes segregated accounts with its custodian in which the Fund maintains cash, U.S. Government securities or other liquid high grade debt obligations in the name of the counterparty equal in value to its obligations in respect of reverse repurchase agreements. Reverse repurchase agreements involve the risk that the market value of the securities the Fund sold may decline below the price at which it is obligated to repurchase them under the agreement. The market value of the securit ies the Fund has sold is determined daily and any additional required collateral is allocated to or sent by the Fund on the next business day. As of April 30, 2005, the Fund had entered into reverse repurchase agreements having a market value plus accrued interest of $280,039, collateralized by securities with a market value of $280,039. Open reverse repurchase agreements held by the Fund as of April 30, 2005 are listed in the Schedule of Investments. A summary of reverse repurchase agreements held during the six months ended April 30, 2005 follows:
| Average balance outstanding | $ | 280,000 | |||||
| Average interest rate | 0.2 | % | |||||
| Maximum balance outstanding | $ | 280,000 | |||||
| Average shares outstanding | 14,871,534 | ||||||
| Average balance per share outstanding | $ | 0.02 | |||||
Average balance outstanding was calculated based on daily balances outstanding during the period that the Fund had entered into reverse repurchase agreements.
Securities lending: The Fund may lend securities to enhance fund earnings from investing cash collateral in making such loans to qualified borrowers (typically broker/dealers). The Fund has engaged its custodian bank, IBT, as a lending agent to administer its securities lending program. IBT earned less than $1 of program income for its services. When the Fund makes a security loan, it receives cash collateral as protection against the risk that the borrower will default on the loan, and records an asset for the cash invested collateral and a liability for the return of the collateral.
Loans of securities are required to be secured by collateral at least equal to 102% of the value of the securities at inception of the loan, and not less then 100% thereafter. The Fund may invest cash collateral in short-term money market instruments including: U.S. Treasury Bills, U.S. agency obligations, commercial paper, money market mutual funds, repurchase agreements and other highly rated, liquid investments. During the life of securities loans, the collateral and securities loaned remain subject to fluctuation in value. IBT marks to market securities loaned and the collateral each business day. If additional collateral is due (at least $1), IBT collects additional cash collateral from the borrowers. Although securities loaned will be fully collateralized at all times, IBT may experience delays in, or may be prevented from, recovering the collateral on behalf of the Fund. The Fund may recall a loa ned security position at any time from the borrower through IBT. In the event the borrower fails to timely return a recalled security, IBT may indemnify the Fund by purchasing replacement securities for the Fund at its own expense and claiming the collateral to fund such a purchase. IBT absorbs the loss if the collateral value is not sufficient to cover the cost of the replacement securities. If replacement securities are not available, IBT will credit the equivalent cash value to the Fund.
While a security is on loan, the Fund does not have the right to vote that security. However, if time permits, the Fund will attempt to recall a security on loan and vote the proxy.
Income from securities lending is included in the Statement of Operations. There were no securities on loan at April 30, 2005.
Security transactions and investment income: Security transactions are recorded on the trade date. Security gains and losses are calculated on the specific identification basis. Interest income, including accretion of discounts and amortization of premiums, is recorded on the accrual basis commencing on the settlement date.
Foreign currency denominated investments: The accounting records of the Fund are maintained in U.S. dollars. Securities and other assets and liabilities denominated in foreign currencies are translated into U.S. dollars at the closing exchange rate each day. The cost of foreign securities is translated at the exchange rate in effect when the investment was acquired. The Fund combines fluctuations from currency exchange rates and fluctuations in value when computing net realized and unrealized gains or losses from investments.
Net foreign currency gains and losses resulting from changes in exchange rates include: 1) foreign currency fluctuations between trade date and settlement date of investment security transactions; 2) gains and losses on forward foreign currency contracts; and 3) the difference between the receivable amounts of interest and dividends recorded in the accounting records in U.S. dollars and the amounts actually received.
Transamerica IDEX Mutual Funds
Semi-Annual Report 2005
14
TA IDEX PIMCO Total Return
NOTES TO FINANCIAL STATEMENTS (continued)
At April 30, 2005
(all amounts in thousands)
(unaudited)
NOTE 1.–(continued)
Foreign currency denominated assets may involve risks not typically associated with domestic transactions, including unanticipated movements in exchange currency rates, the degree of government supervision and regulation of security markets, and the possibility of political or economic instability.
Foreign capital gains taxes: The Fund may be subject to taxes imposed by countries in which it invests, with respect to its investment in issuers existing or operating in such countries. Such taxes are generally based on income earned or repatriated and capital gains realized on the sale of such investments. The Fund accrues such taxes when the related income or capital gains are earned. Some countries require governmental approval for the repatriation of investment income, capital or the proceeds of sales earned by foreign investors. In addition, if there is deterioration in a country's balance of payments or for other reasons, a country may impose temporary restrictions on foreign capital remittances abroad.
Forward foreign currency contracts: The Fund may enter into forward foreign currency contracts to hedge against exchange rate risk arising from investments in securities denominated in foreign currencies. Contracts are valued at the contractual forward rate and are marked to market daily, with the change in value recorded as an unrealized gain or loss. When the contracts are closed a realized gain or loss is incurred. Risks may arise from changes in market value of the underlying currencies and from the possible inability of counterparties to meet the terms of their contracts.
Open forward foreign currency contracts at April 30, 2005, are listed in the Schedule of Investments.
Swap agreements: The Fund may invest in swap agreements. A swap is an agreement to exchange the return generated by one instrument for the return generated by another instrument. The Fund may enter into interest rate and credit default swap agreements to manage its exposure to interest rates and credit risk. Interest rate swap agreements involve commitments to pay interest in exchange for a market-linked return, both based on notional amounts. To the extent the total return of the security or index underlying the transaction exceeds or falls short of the offsetting interest rate obligation, the Fund will receive a payment from or make a payment to the counterparty. In a credit default swap, one party makes a stream of payments to another party in exchange for the right to receive a specified ret urn in the event of a default by a third party, typically corporate issues or sovereign issues of an emerging country, on its obligation. The Fund may use credit default swaps to provide a measure of protection against defaults of sovereign issuers (i.e., to reduce risk where the Fund owns or has exposure to the sovereign issuer) or to take an active long or short position with respect to the likelihood of a particular issuer's default.
Swaps are marked to market daily based upon quotations from market makers and vendors and the change in value, if any, is recorded as unrealized gain or loss in the Statement of Operations. Payments received or made at the beginning of the measurement period are reflected as such on the Statement of Assets and Liabilities. A liquidation payment received or made at the termination of the swap is recorded as realized gain or loss in the Statement of Operations. Net periodic payments are included as part of realized gain or loss on the Statement of Operations.
Entering into these agreements involves, to varying degrees, elements of credit, market and documentation risk in excess of the amounts recognized on the Statement of Assets and Liabilities. Such risks involve the possibility that there will be no liquid market for these agreements, that the counterparty to the agreements may default on its obligation to perform or disagree as to the meaning of contractual terms in the agreements, and that there may be unfavorable changes in interest rates.
Open swaps agreements at April 30, 2005, are listed in the Schedule of Investments.
Futures, options and swaptions contracts: The Fund may enter into futures and/or options contracts to manage exposure to market, interest rate or currency fluctuations. Futures contracts are valued at the settlement price established each day by the board of trade or exchange on which they are traded. Option contracts are valued at the average of the bid and ask ("Mean Quote") established each day at the close of the board of trade or exchange on which they are traded. The primary risks associated with futures contracts and options are imperfect correlation between the change in value of the securities held and the prices of futures contracts and options; the possibility of an illiquid market and inability of the counterparty to meet the contract terms. When the Fund writes a covered call or put option, an amount equal to the premium received by the Fund is included in the Fund's Statement of Assets and Liabilities as an asset and as an equivalent liability. The amount of the liability is subsequently marked-to-market to reflect the current value of the option written.
The Fund is authorized to write swaption contracts to manage exposure to fluctuations in interest rates and to enhance fund yield. Swaption contracts written by the Fund represents an option that gives the purchaser the right, but not the obligation, to enter into a previously agreed upon swap contract on a future date. If a written call option is exercised, the writer will enter a swap and is obligated to pay the fixed rate and receive a fixed rate in exchange. Swaptions are marked-to-market daily based upon quotations from market makers.
When the Fund writes a swaption, the premium received is recorded as a liability and is subsequently adjusted to the current value of the swaption. Changes in the value of the swaption are reported as Unrealized gains or losses in written options in the Statement of Assets and Liabilities. Gain or loss is recognized when the swaption contract expires or is closed. Premiums received from writing swaptions that expire or are exercised are treated by the Fund as realized gains from written options. The difference between the premium and the amount paid on affecting a closing purchase transaction is also treated as a realized gain, or if the premium is less than the amount paid for the closing purchase, as a realized loss.
Transamerica IDEX Mutual Funds
Semi-Annual Report 2005
15
TA IDEX PIMCO Total Return
NOTES TO FINANCIAL STATEMENTS (continued)
At April 30, 2005
(all amounts in thousands)
(unaudited)
NOTE 1.–(continued)
Entering into a swaption contract involves, to varying degrees, the elements of credit, market and interest rate risk in excess of the amounts reported in the Statement of Assets and Liabilities, associated with both option contracts and swap contracts. To reduce credit risk from potential counterparty default, the Fund enters into swaption contracts with counterparties whose creditworthiness has been approved by the Board of Trustees. The Fund bears the market risk arising from any changes in index values or interest rates.
The underlying face amounts of open futures, option, and swaption contracts at April 30, 2005, are listed in the Schedule of Investments. The variation margin receivable or payable, as applicable, is included in the Statement of Assets and Liabilities. Variation margin represents the additional payment due or excess deposits made in order to maintain the equity account at the required margin level.
Transactions in options were as follows:
| Premium | Contracts* | ||||||||||
| Beginning Balance October 31, 2004 | $ | 11 | 23 | ||||||||
| Sales | 170 | 537 | |||||||||
| Expirations | (47 | ) | (99 | ) | |||||||
| Balance at April 30, 2005 | $ | 134 | 461 | ||||||||
* Contracts not in thousands
Transactions in swaptions were as follows:
| Premium | Notional Amount | ||||||||||
| Beginning Balance October 31, 2004 | $ | 55 | 3,700 | ||||||||
| Sales | 35 | 7,000 | |||||||||
| Expirations | (90 | ) | (10,700 | ) | |||||||
| Balance at April 30, 2005 | $ | – | – | ||||||||
Account maintenance fees: If the shareholder account balance falls below $1 by either shareholder action or as a result of market action, a $25 (not in thousands) fee is assessed every year until the balance reaches $1. The fee is assessed by redeeming shares in the shareholder's account.
No fee will be charged under the following conditions:
• accounts opened within the preceding 24 months
• accounts with an active monthly Automatic Investment Plan ($50 (not in thousands) minimum per fund)
• accounts owned by an individual which, when combined by social security number, have a balance of $5 or more
• accounts owned by individuals in the same household (by address) that have a combined balance of $5 or more
• UTMA/UGMA accounts
• Fiduciary accounts
• B-share accounts whose shares have started to convert to A-shares accounts (as long as combined value of both accounts is at least $1)
For the six months ended April 30, 2005, there were no account maintenance fees.
Redemption fees: A short-term trading redemption fee may be assessed on any fund shares in a fund account that are sold during the first five (5) NYSE trading days following their purchase date. This redemption fee will equal 2% of the amount redeemed and shares held the longest will be treated as being redeemed first and shares held the shortest as being redeemed last.
For the six months ended April 30, 2005, the Fund received less than $1 in redemption fees.
Dividend distributions: Distributions to shareholders are recorded on the ex-dividend date and are determined in accordance with Federal income tax regulations which may differ from GAAP.
NOTE 2. RELATED PARTY TRANSACTIONS
Transamerica Fund Advisors, Inc. ("TFAI") is the Fund's investment adviser. Transamerica Fund Services, Inc. ("TFS") is the Fund's administrator and transfer agent. AFSG Securities Corp. ("AFSG") is the Fund's distributor/principal underwriter. AFSG is 100% owned by AUSA Holding Company ("AUSA"). TFAI is a directly owned subsidiary of Western Reserve Life Assurance Co. of Ohio (78%) and AUSA (22%). TFS is a wholly owned subsidiary of WRL (50%) and AUSA (50%). AUSA and WRL are wholly owned indirect subsidiaries of AEGON, NV, a Netherlands corporation.
Effective January 1, 2005 AEGON/Transamerica Fund Advisors, Inc. ("ATFA") was renamed Transamerica Fund Advisors, Inc. ("TFAI"); AEGON/Transamerica Fund Services, Inc. ("ATFS") and AEGON/Transamerica Investor Services, Inc. ("ATIS") merged into one entity and was renamed Transamerica Fund Services, Inc. ("TFS").
Transamerica IDEX Mutual Funds
Semi-Annual Report 2005
16
TA IDEX PIMCO Total Return
NOTES TO FINANCIAL STATEMENTS (continued)
At April 30, 2005
(all amounts in thousands)
(unaudited)
NOTE 2.–(continued)
The following schedule represents the percentage of fund assets owned by affiliated mutual funds (i.e. through the asset allocation funds):
| Net Assets | % of Net Assets | ||||||||||
| TA IDEX Asset Allocation– Conservative Portfolio | $ | 25,630 | 16.21 | % | |||||||
| TA IDEX Asset Allocation– Moderate Growth Portfolio | 37,764 | 23.88 | % | ||||||||
| TA IDEX Asset Allocation– Moderate Portfolio | 48,829 | 30.87 | % | ||||||||
| Total | $ | 112,223 | 70.96 | % | |||||||
Investment advisory fee: The Fund pays management fees to TFAI based on average daily net assets ("ANA") at the following rate:
| From November 1, 2004 through December 31, 2004: | |||
0.70% of ANA
| From January 1, 2005 on: | |||
0.70% of the first $250 million of ANA
0.65% of the next $500 million of ANA
0.60% of ANA over $750 million
TFAI has contractually agreed to waive its advisory fee and will reimburse the Fund to the extent that operating expenses, excluding 12b-1 fees, exceed the following stated annual limit:
1.30% Expense Limit
If total fund expenses fall below the annual expense limitation agreement agreed to by the adviser within the succeeding three years, the Fund may be required to pay that adviser a portion or all of the waived advisory fees.
There were no amounts available for recapture at April 30, 2005.
Distribution and service fees: The Fund has a 12b-1 distribution plan under the 1940 Act pursuant to which an annual fee, based on average daily net assets, is paid to the distributor for various disbursements such as broker-dealer account servicing fees and other promotional expenses of the Fund. The Fund is authorized under the 12b-1 plan to pay fees on each class up to the following limits:
| Class A | 0.35 | % | |||||
| Class B | 1.00 | % | |||||
| Class C | 1.00 | % | |||||
In the case the Fund or a class of shares of the Fund is closed to new investors or investments, the Fund is authorized to pay 12b-1 fees for past sales and distribution efforts and present and past investor services.
Underwriter commissions relate to front-end sales charges imposed for Class A shares and contingent deferred sales charges from Classes B, C, and certain A share redemptions. For the six months ended April 30, 2005, the underwriter commissions were as follows:
| Received by Underwriter | $ | 54 | |||||
| Retained by Underwriter | 3 | ||||||
| Contingent Deferred Sales Charge | 46 | ||||||
Administrative services: The Fund has entered into an agreement with TFS for financial and legal fund administration services, which includes such items as compliance, expenses, financial statements and other reporting, distributions, tax returns, prospectus preparation, board of trustees meeting support and other legal matters. As of January 1, 2005 the Fund pays TFS an annual fee of 0.02% of average net assets. Prior to January 1, 2005 the Fund paid TFS an annual fee of 0.015% of average net assets. The Legal fees on the Statement of Operations are for fees paid to external legal counsel.
Transfer agent fees: The Fund pays TFS an annual per-account charge of $20 (not in thousands) for each open account and $1.63 (not in thousands) for each closed account. There is no new account charge. The Transfer agent fees on the Statement of Operations are made up of fees paid to TFS and costs associated with shareholder statements.
The Fund paid TFS $44 for the six months ended April 30, 2005.
Deferred compensation plan: Each eligible Fund Trustee may elect participation in the Deferred Compensation Plan ("the Plan"). Under the Plan, such Trustees may defer payment of a percentage of their total fees earned as a Fund Trustee. These deferred amounts may be invested in any Transamerica IDEX Mutual Fund. At April 30, 2005, the value of invested plan amount was $5. Invested plan amounts and the total liability for deferred compensation to the Trustees under the Plan at April 30, 2005, are included in the accompanying Statement of Assets and Liabilities.
NOTE 3. INVESTMENT TRANSACTIONS
The cost of securities purchased and proceeds from securities sold (excluding short-term securities) for the six months ended April 30, 2005, were as follows:
| Purchases of securities: | |||||||
| Long-Term excluding U.S. Government | $ | 19,819 | |||||
| U.S. Government | 200,430 | ||||||
| Proceeds from maturities and sales of securities: | |||||||
| Long-Term excluding U.S. Government | 20,936 | ||||||
| U.S. Government | 159,255 | ||||||
Transamerica IDEX Mutual Funds
Semi-Annual Report 2005
17
TA IDEX PIMCO Total Return
NOTES TO FINANCIAL STATEMENTS (continued)
At April 30, 2005
(all amounts in thousands)
(unaudited)
NOTE 4. FEDERAL INCOME TAX MATTERS
The Fund has not made any provision for federal income or excise taxes due to its policy to distribute all of its taxable income and capital gains to its shareholders and otherwise qualify as a regulated investment company under the Internal Revenue Code. Income and capital gain distributions are determined in accordance with income tax regulations, which may differ from GAAP. These differences are primarily due to differing treatment for items including, but not limited to, wash sales, net operating losses and foreign currency transactions.
The aggregate cost of investments and composition of unrealized appreciation (depreciation) for federal income tax purposes as of April 30, 2005, are as follows:
| Federal Tax Cost Basis | $ | 188,343 | |||||
| Unrealized Appreciation | $ | 1,682 | |||||
| Unrealized (Depreciation) | (286 | ) | |||||
| Net Unrealized Appreciation (Depreciation) | $ | 1,396 | |||||
NOTE 5. REGULATORY PROCEEDINGS
There continues to be significant federal and state regulatory activity relating to financial services companies, particularly mutual fund companies and their investment advisers. As part of an ongoing investigation regarding potential market timing, recordkeeping and trading compliance issues and matters affecting the Fund's investment adviser, TFAI, and certain employees and affiliates of TFAI, the SEC staff has indicated that it is likely to take some action against TFAI and certain of its affiliates at the conclusion of the investigation. The potential timing and the scope of any such action is difficult to predict. Although the impact of any action brought against TFAI and/or its affiliates is difficult to assess at the present time, the Fund currently believes that the likelihood that any such action will have a material adverse impact on it is remote. It is important to note that the Fund is not aware of any allegation of wrongdoing against it and its board at the time this semi-annual report is printed. Although it is not anticipated that these developments will have an adverse impact on the Fund, there can be no assurance at this time. TFAI and its affiliates are actively working with the SEC in regard to this matter; however, the exact resolution cannot be determined at this time. TFAI will take such actions that it deems necessary or appropriate to continue providing management services to the Fund and to bring all matters to an appropriate conclusion.
TFAI and/or its affiliates, and not the Fund, will bear the costs regarding these regulatory matters.
Transamerica IDEX Mutual Funds
Semi-Annual Report 2005
18
TA IDEX PIMCO Total Return
INVESTMENT ADVISORY AND SUB-ADVISORY AGREEMENTS – REVIEW AND RENEWAL
At a meeting of the Board of Trustees of Transamerica IDEX Mutual Funds ("TA IDEX") held on October 6, 2004, the Board considered and approved the renewal for a one-year period of the Investment Advisory Agreement between TA IDEX PIMCO Total Return (the "Fund") and Transamerica Fund Advisors, Inc. ("TFAI") as well as the Investment Sub-Advisory Agreement of the Fund between TFAI and Pacific Investment Management LLC (the "Sub-Adviser"). In approving the renewal of these agreements, the Board concluded that the Investment Advisory and Investment Sub-Advisory Agreements enable shareholders of the Fund to obtain high quality services at a cost that is appropriate, reasonable, and in the best interests of shareholders based upon the following determinations, among others:
The nature, extent and quality of the advisory service to be provided. The Board considered the nature and quality of the services provided by TFAI and the Sub-Adviser to the Fund in the past, as well as the services anticipated to be provided in the future. The Board concluded that TFAI and the Sub-Adviser are capable of providing high quality services to the Fund, as indicated by TFAI's management capabilities demonstrated with respect to the Fund and other funds managed by TFAI, TFAI's management oversight process, and the professional qualifications and experience of the SubAdviser's portfolio management team. The Board also concluded that TFAI and the Sub-Adviser would provide the same quality and quantity of investment management and related services as before, that these services are appr opriate in scope and extent in light of the Fund's operations, the competitive landscape of the investment company business and investor needs, and that TFAI's and the Sub-Adviser's obligations will remain the same in all respects.
The investment performance of the Fund. The Board concluded, based in particular on information provided by Lipper Analytics, that the Fund's investment performance was competitive relative to comparable funds over trailing one- and two-year periods and to the Fund's benchmark index over the past year. On the basis of the Trustees' assessment of the nature, extent and quality of investment advisory and related services to be provided or procured by TFAI and the Sub-Adviser, the Trustees concluded that TFAI and the Sub-Adviser were capable of generating a level of long-term investment performance that is appropriate in light of the Fund's investment objective, policies and strategies and competitive with many other investment companies.
The cost of advisory services provided and the level of profitability. On the basis of the Board's review of the fees to be charged by TFAI and the Sub-Adviser for investment advisory and related services, TFAI's financial statements, the fees paid by TFAI to the Sub-Adviser, TFAI's estimated net management income resulting from its management of the Fund, the estimated profitability of TFAI's relationships with the Fund and TA IDEX, and the estimated profitability of the Sub-Adviser's relationship with the Fund, the Board concluded that the level of investment advisory fees and the profitability is appropriate in light of the services provided, the performance of the Fund, the management fees of comparable investment companies, and the anticipated profitability of the relationship between the F und, TFAI and the Sub-Adviser.
The extent to which economies of scale would be realized as the Fund grows and whether fee levels reflect these economies of scale for the benefit of Fund investors. The Trustees concluded that inclusion of asset-based breakpoints in the Fund's advisory fee schedule would appropriately benefited investors by realizing economies of scale in the form of a lower advisory fee rate and lower level of Fund operating expenses as the level of Fund assets increases. Accordingly, the Board and TFAI agreed to implement advisory fee breakpoints as a means to eventually lower the level of the Fund's operating expense. The Board also concluded that the advisory fees appropriately reflect the Fund's current size, the current economic environment for TFAI, and the competitive nature of the investment company ma rket. In addition, the Board noted that it will have the opportunity to periodically re-examine whether the Fund has achieved economies of scale, as well as the appropriateness of advisory fees payable to TFAI and the Sub-Adviser in the future.
Benefits (such as soft dollars) to TFAI or the Sub-Adviser from its relationship with the Fund. The Board concluded that other benefits derived by TFAI or the Sub-Adviser from its relationship with the Fund are reasonable and fair, and are consistent with industry practice and the best interests of the Fund and its shareholders. In this regard, the Board noted that neither TFAI nor the Sub-Adviser realizes "soft dollar" benefits from its relationship with the Fund.
Other considerations. The Board also determined that TFAI had made a substantial commitment to the recruitment and retention of high quality personnel, and maintained the financial, compliance and operational resources reasonably necessary to manage the Fund in a professional manner that is consistent with the best interests of the Fund and its shareholders. The Trustees also concluded that TFAI had made a significant entrepreneurial commitment to the management and success of the Fund, reflected by TFAI's expense limitation and fee waiver arrangement with the Fund which, as demonstrated in the past with the Fund, may result in TFAI waiving a substantial amount of advisory fees for the benefit of shareholders.
Transamerica IDEX Mutual Funds
Semi-Annual Report 2005
19
TA IDEX PIMCO Total Return
SUPPLEMENTAL INFORMATION (unaudited)
RESULTS OF SHAREHOLDER PROXY
At a special meeting of shareholders held on February 25, 2005, the results of the Proposals were as follows:
Transamerica IDEX Mutual Funds
Proposal 1: Election of Trustees to the Board of Trustees of Transamerica IDEX Mutual Funds.
| For | Withheld | ||||||||||
| Peter R. Brown | 872,017,875.249 | 4,468,498.551 | |||||||||
| Daniel Calabria | 871,917,069.786 | 4,569,304.014 | |||||||||
| Janise B. Case | 872,099,393.125 | 4,386,980.675 | |||||||||
| Charles C. Harris | 872,086,722.025 | 4,399,651.775 | |||||||||
| Leo J. Hill | 872,304,465.640 | 4,181,908.160 | |||||||||
| Russell A. Kimball, Jr. | 872,253,556.471 | 4,232,817.329 | |||||||||
| William W. Short, Jr. | 872,139,920.944 | 4,346,452.856 | |||||||||
| John Waechter | 872,261,152.376 | 4,225,221.424 | |||||||||
| Jack E. Zimmerman | 871,929,967.512 | 4,556,406.288 | |||||||||
| Brian C. Scott | 872,218,970.367 | 4,267,403.433 | |||||||||
| Thomas P. O'Neill | 872,111,944.117 | 4,374,429.683 | |||||||||
TA IDEX PIMCO Total Return
Proposal 2: Approval of an Agreement and Plan of Reorganization pursuant to which Transamerica IDEX Mutual Funds will organize as a Delaware statutory trust.
| For | Against | Abstentions/Broker Non-Votes | |||||||||
| 11,111,550.975 | 25,793.351 | 2,755,172.348 | |||||||||
Proposal 3: Approval of changes to the fundamental investment restrictions of TA IDEX PIMCO Total Return.
| A. Diversification | For | Against | Abstentions/Broker Non-Votes | ||||||||||||
| 11,185,990.898 | 42,426.776 | 2,664,099.000 | |||||||||||||
| B. Borrowing | For | Against | Abstentions/Broker Non-Votes | ||||||||||||
| 11,177,213.011 | 51,204.663 | 2,664,099.000 | |||||||||||||
| C. Senior Securities | For | Against | Abstentions/Broker Non-Votes | ||||||||||||
| 11,186,795.114 | 41,622.560 | 2,664,099.000 | |||||||||||||
| D. Underwriting Securities | For | Against | Abstentions/Broker Non-Votes | ||||||||||||
| 11,186,795.114 | 41,622.560 | 2,664,099.000 | |||||||||||||
| E. Real Estate | For | Against | Abstentions/Broker Non-Votes | ||||||||||||
| 11,186,795.114 | 41,622.560 | 2,664,099.000 | |||||||||||||
| F. Making Loans | For | Against | Abstentions/Broker Non-Votes | ||||||||||||
| 11,178,025.148 | 50,392.526 | 2,664,099.000 | |||||||||||||
| G. Concentration | For | Against | Abstentions/Broker Non-Votes | ||||||||||||
| 11,181,865.114 | 46,552.560 | 2,664,099.000 | |||||||||||||
| H. Commodities | For | Against | Abstentions/Broker Non-Votes | ||||||||||||
| 11,183,189.795 | 45,227.879 | 2,664,099.000 | |||||||||||||
Transamerica IDEX Mutual Funds
Semi-Annual Report 2005
20
TA IDEX Protected Principal Stock
UNDERSTANDING YOUR FUND'S EXPENSES
(unaudited)
SHAREHOLDER EXPENSES
The following Example is intended to help you understand your ongoing costs (in dollars and cents) of investing in a Fund and to compare these costs with the ongoing costs of investing in other funds.
The Example is based on an investment of $1,000 invested at November 1, 2004 and held for the entire period until April 30, 2005.
ACTUAL EXPENSES
The first line in the table below provides information about actual account values and actual expenses. You may use the information in this line, together with the amount you invested, to estimate the expenses that you paid over the period. Simply divide your account value by $1,000 (for example, an $8,600 account value divided by $1,000 = 8.6), then multiply the result by the number in the first line of your Fund under the heading entitled "Expenses Paid During Period" to estimate the expenses you paid on your account during this period.
HYPOTHETICAL EXAMPLE FOR COMPARISON PURPOSES
The second line in the table below provides information about hypothetical account values and hypothetical expenses based on the Fund's actual expense ratio and an assumed rate of return of 5% per year before expenses, which is not the Fund's actual return. The hypothetical account values and expenses may not be used to estimate the actual ending account balance or expenses you paid for the period. You may use this information to compare the ongoing costs of investing in your Fund and other funds. To do so, compare this 5% hypothetical example with the 5% hypothetical examples that appear in the shareholder reports of the other funds.
Please note that the expenses shown in the table are meant to highlight your ongoing costs only and do not reflect any transactional costs, such as sales charges, redemption fees, brokerage commissions paid on purchases and sales of fund shares. Therefore, the second line under the Fund in the table is useful in comparing ongoing costs only, and will not help you determine the relative total costs of owning different funds. In addition, note that the expenses shown in the table are meant to highlight your ongoing costs and do not reflect any transaction costs.
| Beginning Account Value | Ending Account Value | Annualized Expense Ratio | Expenses Paid During Period (a) | ||||||||||||||||
| Class A | |||||||||||||||||||
| Actual | $ | 1,000.00 | $ | 1,016.00 | 2.13 | % | $ | 10.65 | |||||||||||
| Hypothetical (b) | 1,000.00 | 1,014.23 | 2.13 | 10.64 | |||||||||||||||
| Class B | |||||||||||||||||||
| Actual | 1,000.00 | 1,014.20 | 2.49 | 12.44 | |||||||||||||||
| Hypothetical (b) | 1,000.00 | 1,012.45 | 2.49 | 12.42 | |||||||||||||||
| Class C | |||||||||||||||||||
| Actual | 1,000.00 | 1,013.20 | 2.73 | 13.63 | |||||||||||||||
| Hypothetical (b) | 1,000.00 | 1,011.26 | 2.73 | 13.61 | |||||||||||||||
| Class M | |||||||||||||||||||
| Actual | 1,000.00 | 1,012.30 | 2.80 | 13.97 | |||||||||||||||
| Hypothetical (b) | 1,000.00 | 1,010.91 | 2.80 | 13.96 | |||||||||||||||
(a) Expenses are calculated using each Fund's annualized expense ratio (as disclosed in the table), multiplied by the average account value for the period, multiplied by number of days in the period (181 days), and divided by the number of days in the year (365 days).
(b) 5% return per year before expenses.
GRAPHICAL PRESENTATION OF SCHEDULE OF INVESTMENTS
By Sector
At April 30, 2005
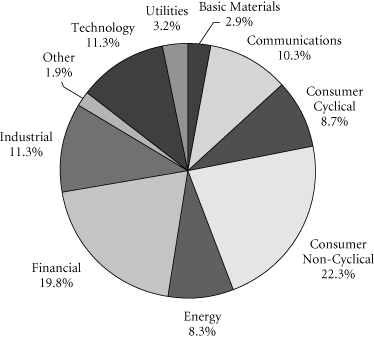
This chart shows the percentage breakdown by sector of the Fund's total investment securities.
Transamerica IDEX Mutual Funds
Semi-Annual Report 2005
1
TA IDEX Protected Principal Stock
SCHEDULE OF INVESTMENTS
At April 30, 2005
(all amounts except share amounts in thousands)
(unaudited)
| Shares | Value | ||||||||||
| COMMON STOCKS (97.2%) (a) | |||||||||||
| Aerospace (1.6%) | |||||||||||
| Boeing Co. (The) | 3,900 | $ | 232 | ||||||||
| General Dynamics Corp. | 900 | 95 | |||||||||
| Goodrich Corp. | 500 | 20 | |||||||||
| Lockheed Martin Corp. | 1,800 | 110 | |||||||||
| Northrop Grumman Corp. | 1,570 | 86 | |||||||||
| Textron, Inc. | 600 | 45 | |||||||||
| United Technologies Corp. | 2,500 | 254 | |||||||||
| Air Transportation (0.3%) | |||||||||||
| Delta Airlines, Inc. (b) | 600 | 2 | |||||||||
| FedEx Corp. | 1,400 | 119 | |||||||||
| Southwest Airlines Co. | 3,600 | 54 | |||||||||
| Amusement & Recreation Services (0.6%) | |||||||||||
| Disney (Walt) Co. (The) | 9,800 | 259 | |||||||||
| Harrah's Entertainment, Inc. | 500 | 33 | |||||||||
| Apparel & Accessory Stores (0.4%) | |||||||||||
| Gap (The), Inc. | 3,600 | 77 | |||||||||
| Kohl's Corp. (b) | 1,500 | 71 | |||||||||
| Ltd. Brands | 1,700 | 37 | |||||||||
| Nordstrom, Inc. | 500 | 25 | |||||||||
| Apparel Products (0.2%) | |||||||||||
| Cintas Corp. | 600 | 23 | |||||||||
| Jones Apparel Group, Inc. | 500 | 15 | |||||||||
| Liz Claiborne, Inc. | 500 | 18 | |||||||||
| V.F. Corp. | 500 | 28 | |||||||||
| Auto Repair, Services & Parking (0.0%) | |||||||||||
| Ryder System, Inc. | 300 | 11 | |||||||||
| Automotive (0.7%) | |||||||||||
| Dana Corp. | 700 | 8 | |||||||||
| Delphi Corp. | 2,700 | 9 | |||||||||
| Ford Motor Co. | 8,700 | 79 | |||||||||
| General Motors Corp. | 2,700 | 72 | |||||||||
| Genuine Parts Co. | 800 | 34 | |||||||||
| Harley-Davidson, Inc. | 1,300 | 61 | |||||||||
| ITT Industries, Inc. | 400 | 36 | |||||||||
| Navistar International Corp. (b) | 300 | 9 | |||||||||
| PACCAR, Inc. | 800 | 54 | |||||||||
| Automotive Dealers & Service Stations (0.1%) | |||||||||||
| AutoNation, Inc. (b) | 1,050 | 19 | |||||||||
| AutoZone, Inc. (b) | 300 | 25 | |||||||||
| Beverages (2.3%) | |||||||||||
| Anheuser-Busch Cos., Inc. | 3,600 | 169 | |||||||||
| Brown-Forman Corp.–Class B | 400 | 22 | |||||||||
| Coca-Cola Co. (The) | 10,800 | 469 | |||||||||
| Shares | Value | ||||||||||
| Beverages (continued) | |||||||||||
| Coca-Cola Enterprises, Inc. | 1,600 | $ | 32 | ||||||||
| Molson Coors Brewing Co.–Class B | 400 | 25 | |||||||||
| Pepsi Bottling Group, Inc. | 900 | 26 | |||||||||
| PepsiCo, Inc. | 8,000 | 445 | |||||||||
| Business Credit Institutions (0.9%) | |||||||||||
| CIT Group, Inc. | 900 | 36 | |||||||||
| Fannie Mae | 4,600 | 248 | |||||||||
| Freddie Mac | 3,300 | 203 | |||||||||
| Business Services (1.3%) | |||||||||||
| Cendant Corp. | 5,000 | 100 | |||||||||
| Clear Channel Communications, Inc. | 2,600 | 83 | |||||||||
| Convergys Corp. (b) | 600 | 8 | |||||||||
| eBay, Inc. (b) | 5,600 | 178 | |||||||||
| Equifax, Inc. | 600 | 20 | |||||||||
| First Data Corp. | 3,795 | 144 | |||||||||
| Interpublic Group of Cos., Inc. (b) | 1,800 | 23 | |||||||||
| Monster Worldwide, Inc. (b) | 500 | 12 | |||||||||
| Moody's Corp. | 600 | 49 | |||||||||
| Omnicom Group, Inc. | 800 | 66 | |||||||||
| Robert Half International, Inc. | 700 | 17 | |||||||||
| Chemicals & Allied Products (3.4%) | |||||||||||
| Air Products & Chemicals, Inc. | 1,000 | 59 | |||||||||
| Alberto Culver Co.–Class B | 400 | 18 | |||||||||
| Avon Products, Inc. | 2,300 | 92 | |||||||||
| Clorox Co. | 700 | 44 | |||||||||
| Colgate-Palmolive Co. | 2,500 | 124 | |||||||||
| Dow Chemical Co. (The) | 4,500 | 207 | |||||||||
| du Pont (E.I.) de Nemours & Co. | 4,700 | 221 | |||||||||
| Eastman Chemical Co. | 400 | 22 | |||||||||
| Ecolab, Inc. | 1,000 | 33 | |||||||||
| Great Lakes Chemical Corp. | 200 | 6 | |||||||||
| International Flavors & Fragrances, Inc. | 400 | 15 | |||||||||
| Monsanto Co. | 1,271 | 75 | |||||||||
| PPG Industries, Inc. | 800 | 54 | |||||||||
| Praxair, Inc. | 1,500 | 70 | |||||||||
| Procter & Gamble Co. | 11,900 | 644 | |||||||||
| Rohm & Haas Co. | 900 | 39 | |||||||||
| Sherwin-Williams Co. (The) | 500 | 22 | |||||||||
| Commercial Banks (10.0%) | |||||||||||
| AmSouth Bancorp | 1,600 | 42 | |||||||||
| Bank of America Corp. | 19,318 | 870 | |||||||||
| Bank of New York Co., Inc. (The) | 3,600 | 101 | |||||||||
| BB&T Corp. | 2,600 | 102 | |||||||||
| Citigroup, Inc. | 24,900 | 1,169 | |||||||||
| Comerica, Inc. | 800 | 46 | |||||||||
| Compass Bancshares, Inc. | 500 | 22 | |||||||||
The notes to the financial statements are an integral part of this report.
Transamerica IDEX Mutual Funds
Semi-Annual Report 2005
2
TA IDEX Protected Principal Stock
SCHEDULE OF INVESTMENTS (continued)
At April 30, 2005
(all amounts except share amounts in thousands)
(unaudited)
| Shares | Value | ||||||||||
| Commercial Banks (continued) | |||||||||||
| Fifth Third Bancorp | 2,600 | $ | 113 | ||||||||
| First Horizon National Corp. | 500 | 21 | |||||||||
| Huntington Bancshares, Inc. | 1,100 | 26 | |||||||||
| JPMorgan Chase & Co. | 16,948 | 601 | |||||||||
| KeyCorp | 1,800 | 60 | |||||||||
| M&T Bank Corp. | 500 | 52 | |||||||||
| Marshall & IIsley Corp. | 900 | 38 | |||||||||
| MBNA Corp. | 6,100 | 120 | |||||||||
| Mellon Financial Corp. | 1,800 | 50 | |||||||||
| National City Corp. | 2,900 | 98 | |||||||||
| North Fork Bancorp, Inc. | 2,300 | 65 | |||||||||
| Northern Trust Corp. | 900 | 41 | |||||||||
| PNC Financial Services Group, Inc. | 1,300 | 69 | |||||||||
| Providian Financial Corp. (b) | 1,400 | 23 | |||||||||
| Regions Financial Corp. | 2,281 | 76 | |||||||||
| State Street Corp. | 1,600 | 74 | |||||||||
| SunTrust Banks, Inc. | 1,600 | 117 | |||||||||
| Synovus Financial Corp. | 1,500 | 42 | |||||||||
| US Bancorp | 8,800 | 246 | |||||||||
| Wachovia Corp. | 7,502 | 384 | |||||||||
| Wells Fargo & Co. | 8,000 | 480 | |||||||||
| Zions Bancorp | 400 | 28 | |||||||||
| Communication (1.2%) | |||||||||||
| Comcast Corp.–Class A (b) | 10,519 | 338 | |||||||||
| Viacom, Inc.–Class B | 8,100 | 280 | |||||||||
| Communications Equipment (1.6%) | |||||||||||
| ADC Telecommunications, Inc. (b) | 3,800 | 9 | |||||||||
| Andrew Corp. (b) | 700 | 9 | |||||||||
| Avaya, Inc. (b) | 2,300 | 20 | |||||||||
| CIENA Corp. (b) | 2,800 | 6 | |||||||||
| Comverse Technology, Inc. (b) | 900 | 21 | |||||||||
| Corning, Inc. (b) | 6,700 | 92 | |||||||||
| L-3 Communications Holdings, Inc. | 500 | 35 | |||||||||
| Lucent Technologies, Inc. (b) | 21,100 | 51 | |||||||||
| Motorola, Inc. | 11,500 | 176 | |||||||||
| Network Appliance, Inc. (b) | 1,700 | 45 | |||||||||
| QUALCOMM, Inc. | 7,800 | 272 | |||||||||
| Rockwell Collins, Inc. | 800 | 37 | |||||||||
| Scientific-Atlanta, Inc. | 700 | 21 | |||||||||
| Tellabs, Inc. (b) | 2,200 | 17 | |||||||||
| Computer & Data Processing Services (5.0%) | |||||||||||
| Adobe Systems, Inc. | 1,100 | 65 | |||||||||
| Affiliated Computer Services, Inc.–Class A (b) | 550 | 26 | |||||||||
| Autodesk, Inc. | 1,100 | 35 | |||||||||
| Automatic Data Processing, Inc. | 2,800 | 122 | |||||||||
| BMC Software, Inc. (b) | 1,000 | 16 | |||||||||
| Shares | Value | ||||||||||
| Computer & Data Processing Services (continued) | |||||||||||
| Citrix Systems, Inc. (b) | 700 | $ | 16 | ||||||||
| Computer Associates International, Inc. | 2,700 | 73 | |||||||||
| Computer Sciences Corp. (b) | 800 | 35 | |||||||||
| Compuware Corp. (b) | 1,700 | 10 | |||||||||
| Electronic Arts, Inc. (b) | 1,400 | 75 | |||||||||
| Electronic Data Systems Corp. | 2,500 | 48 | |||||||||
| Fiserv, Inc. (b) | 800 | 34 | |||||||||
| IMS Health, Inc. | 1,000 | 24 | |||||||||
| Intuit, Inc. (b) | 800 | 32 | |||||||||
| Mercury Interactive Corp. (b) | 400 | 17 | |||||||||
| Microsoft Corp. | 48,100 | 1,217 | |||||||||
| NCR Corp. (b) | 800 | 26 | |||||||||
| Novell, Inc. (b) | 1,700 | 10 | |||||||||
| Oracle Corp. (b) | 21,400 | 247 | |||||||||
| Parametric Technology Corp. (b) | 1,200 | 6 | |||||||||
| Sabre Holdings Corp. | 600 | 12 | |||||||||
| Siebel Systems, Inc. (b) | 2,500 | 23 | |||||||||
| Sun Microsystems, Inc. (b) | 16,100 | 58 | |||||||||
| SunGard Data Systems, Inc. (b) | 1,100 | 37 | |||||||||
| Symantec Corp. (b) | 3,400 | 64 | |||||||||
| Unisys Corp. (b) | 1,600 | 10 | |||||||||
| VERITAS Software Corp. (b) | 1,800 | 37 | |||||||||
| Yahoo!, Inc. (b) | 6,300 | 217 | |||||||||
| Computer & Office Equipment (4.3%) | |||||||||||
| Apple Computer, Inc. (b) | 3,800 | 137 | |||||||||
| Cisco Systems, Inc. (b) | 30,600 | 529 | |||||||||
| Dell, Inc. (b) | 11,600 | 404 | |||||||||
| EMC Corp. (b) | 11,400 | 150 | |||||||||
| Gateway, Inc. (b) | 1,400 | 5 | |||||||||
| Hewlett-Packard Co. | 13,600 | 278 | |||||||||
| International Business Machines Corp. | 7,700 | 588 | |||||||||
| Jabil Circuit, Inc. (b) | 800 | 22 | |||||||||
| Lexmark International, Inc. (b) | 500 | 35 | |||||||||
| Pitney Bowes, Inc. | 1,000 | 45 | |||||||||
| Symbol Technologies, Inc. | 1,100 | 15 | |||||||||
| Construction (0.2%) | |||||||||||
| Centex Corp. | 500 | 29 | |||||||||
| Fluor Corp. | 400 | 21 | |||||||||
| KB Home | 400 | 23 | |||||||||
| Pulte Homes, Inc. | 500 | 36 | |||||||||
| Cosmetics/Personal Care (0.5%) | |||||||||||
| Gillette Co. (The) | 4,700 | 243 | |||||||||
| Department Stores (0.4%) | |||||||||||
| Dillard's, Inc.–Class A | 400 | 9 | |||||||||
| Federated Department Stores, Inc. | 800 | 46 | |||||||||
| JC Penney Co., Inc. | 1,300 | 62 | |||||||||
| May Department Stores Co. (The) | 1,400 | 49 | |||||||||
| TJX Cos., Inc. | 2,300 | 52 | |||||||||
The notes to the financial statements are an integral part of this report.
Transamerica IDEX Mutual Funds
Semi-Annual Report 2005
3
TA IDEX Protected Principal Stock
SCHEDULE OF INVESTMENTS (continued)
At April 30, 2005
(all amounts except share amounts in thousands)
(unaudited)
| Shares | Value | ||||||||||
| Diversified (0.3%) | |||||||||||
| Honeywell International, Inc. | 4,000 | $ | 143 | ||||||||
| Drug Stores & Proprietary Stores (0.6%) | |||||||||||
| CVS Corp. | 1,800 | 93 | |||||||||
| Walgreen Co. | 4,800 | 207 | |||||||||
| Educational Services (0.1%) | |||||||||||
| Apollo Group, Inc.–Class A (b) | 700 | 50 | |||||||||
| Electric Services (2.2%) | |||||||||||
| AES Corp. (The) (b) | 3,100 | 50 | |||||||||
| Allegheny Energy, Inc. (b) | 600 | 15 | |||||||||
| American Electric Power Co., Inc. | 1,700 | 60 | |||||||||
| Calpine Corp. (b) | 2,600 | 5 | |||||||||
| CenterPoint Energy, Inc. | 1,300 | 15 | |||||||||
| CMS Energy Corp. (b) | 900 | 12 | |||||||||
| Consolidated Edison, Inc. | 1,100 | 48 | |||||||||
| Constellation Energy Group, Inc. | 800 | 42 | |||||||||
| Dominion Resources, Inc. | 1,600 | 121 | |||||||||
| DTE Energy Co. | 800 | 37 | |||||||||
| Duke Energy Corp. | 4,400 | 128 | |||||||||
| Edison International | 1,500 | 54 | |||||||||
| FirstEnergy Corp. | 1,500 | 65 | |||||||||
| FPL Group, Inc. | 1,700 | 69 | |||||||||
| Pinnacle West Capital Corp. | 400 | 17 | |||||||||
| PPL Corp. | 800 | 43 | |||||||||
| Progress Energy, Inc. | 1,100 | 46 | |||||||||
| Sempra Energy | 1,100 | 44 | |||||||||
| Southern Co. (The) | 3,500 | 115 | |||||||||
| TECO Energy, Inc. | 900 | 15 | |||||||||
| TXU Corp. | 1,100 | 94 | |||||||||
| Xcel Energy, Inc. | 1,800 | 31 | |||||||||
| Electric, Gas & Sanitary Services (0.9%) | |||||||||||
| Ameren Corp. | 900 | 47 | |||||||||
| Cinergy Corp. | 800 | 32 | |||||||||
| Entergy Corp. | 1,000 | 73 | |||||||||
| Exelon Corp. | 3,200 | 158 | |||||||||
| NiSource, Inc. | 1,300 | 30 | |||||||||
| PG&E Corp. | 1,600 | 56 | |||||||||
| Public Service Enterprise Group, Inc. | 1,100 | 64 | |||||||||
| Electronic & Other Electric Equipment (3.8%) | |||||||||||
| Cooper Industries, Ltd.–Class A | 400 | 25 | |||||||||
| Emerson Electric Co. | 1,800 | 113 | |||||||||
| General Electric Co. | 50,500 | 1,828 | |||||||||
| Maytag Corp. | 400 | 4 | |||||||||
| Whirlpool Corp. | 300 | 19 | |||||||||
| Electronic Components & Accessories (3.3%) | |||||||||||
| Advanced Micro Devices, Inc. (b) | 1,800 | 26 | |||||||||
| Altera Corp. (b) | 1,700 | 35 | |||||||||
| Shares | Value | ||||||||||
| Electronic Components & Accessories (continued) | |||||||||||
| American Power Conversion Corp. | 800 | $ | 19 | ||||||||
| Analog Devices, Inc. | 1,700 | 58 | |||||||||
| Applied Micro Circuits Corp. (b) | 1,400 | 4 | |||||||||
| Broadcom Corp.–Class A (b) | 1,400 | 42 | |||||||||
| Freescale Semiconductor, Inc.–Class B (b) | 1,758 | 33 | |||||||||
| Intel Corp. | 29,500 | 694 | |||||||||
| JDS Uniphase Corp. (b) | 6,900 | 10 | |||||||||
| Linear Technology Corp. | 1,400 | 50 | |||||||||
| LSI Logic Corp. (b) | 1,700 | 9 | |||||||||
| Maxim Integrated Products, Inc. | 1,500 | 56 | |||||||||
| Micron Technology, Inc. (b) | 3,000 | 29 | |||||||||
| Molex, Inc. | 700 | 18 | |||||||||
| National Semiconductor Corp. | 1,600 | 31 | |||||||||
| Novellus Systems, Inc. | 600 | 14 | |||||||||
| NVIDIA Corp. (b) | 700 | 15 | |||||||||
| PMC-Sierra, Inc. (b) | 800 | 6 | |||||||||
| QLogic Corp. (b) | 400 | 13 | |||||||||
| Sanmina-SCI Corp. (b) | 2,500 | 10 | |||||||||
| Solectron Corp. (b) | 4,600 | 15 | |||||||||
| Texas Instruments, Inc. | 8,200 | 205 | |||||||||
| Tyco International, Ltd. | 9,600 | 301 | |||||||||
| Xilinx, Inc. | 1,600 | 43 | |||||||||
| Entertainment (0.1%) | |||||||||||
| International Game Technology | 1,600 | 43 | |||||||||
| Environmental Services (0.2%) | |||||||||||
| Allied Waste Industries, Inc. (b) | 1,300 | 10 | |||||||||
| Waste Management, Inc. | 2,700 | 77 | |||||||||
| Fabricated Metal Products (0.2%) | |||||||||||
| Fortune Brands, Inc. | 600 | 51 | |||||||||
| Parker Hannifin Corp. | 500 | 30 | |||||||||
| Finance (1.2%) | |||||||||||
| SPDR Trust Series 1 | 5,465 | 633 | |||||||||
| Food & Kindred Products (2.4%) | |||||||||||
| Altria Group, Inc. | 9,900 | 643 | |||||||||
| Archer-Daniels-Midland Co. | 3,100 | 56 | |||||||||
| Campbell Soup Co. | 1,500 | 45 | |||||||||
| ConAgra Foods, Inc. | 2,500 | 67 | |||||||||
| General Mills, Inc. | 1,600 | 79 | |||||||||
| Hercules, Inc. (b) | 500 | 7 | |||||||||
| Hershey Co. (The) | 1,000 | 64 | |||||||||
| HJ Heinz Co. | 1,600 | 59 | |||||||||
| Kellogg Co. | 1,600 | 72 | |||||||||
| McCormick & Co., Inc. | 600 | 21 | |||||||||
| Sara Lee Corp. | 3,700 | 79 | |||||||||
| WM Wrigley Jr. Co. | 900 | 62 | |||||||||
The notes to the financial statements are an integral part of this report.
Transamerica IDEX Mutual Funds
Semi-Annual Report 2005
4
TA IDEX Protected Principal Stock
SCHEDULE OF INVESTMENTS (continued)
At April 30, 2005
(all amounts except share amounts in thousands)
(unaudited)
| Shares | Value | ||||||||||
| Food Stores (0.3%) | |||||||||||
| Albertson's, Inc. | 1,600 | $ | 32 | ||||||||
| Kroger Co. (b) | 3,500 | 55 | |||||||||
| Safeway, Inc. (b) | 2,200 | 47 | |||||||||
| Furniture & Fixtures (0.3%) | |||||||||||
| Johnson Controls, Inc. | 900 | 49 | |||||||||
| Leggett & Platt, Inc. | 800 | 22 | |||||||||
| Masco Corp. | 2,200 | 69 | |||||||||
| Furniture & Home Furnishings Stores (0.1%) | |||||||||||
| Bed Bath & Beyond, Inc. (b) | 1,400 | 52 | |||||||||
| Gas Production & Distribution (0.3%) | |||||||||||
| Dynegy, Inc.–Class A (b) | 1,500 | 5 | |||||||||
| El Paso Corp. | 3,100 | 31 | |||||||||
| KeySpan Corp. | 700 | 27 | |||||||||
| Kinder Morgan, Inc. | 500 | 38 | |||||||||
| Nicor, Inc. | 200 | 7 | |||||||||
| Peoples Energy Corp. | 200 | 8 | |||||||||
| Williams Cos., Inc. (The) | 2,700 | 46 | |||||||||
| Health Services (0.7%) | |||||||||||
| Caremark Rx, Inc. (b) | 2,200 | 88 | |||||||||
| Express Scripts, Inc. (b) | 350 | 31 | |||||||||
| HCA, Inc. | 1,800 | 101 | |||||||||
| Health Management Associates, Inc.–Class A | 1,100 | 27 | |||||||||
| Laboratory Corp. of America Holdings (b) | 600 | 30 | |||||||||
| Manor Care, Inc. | 400 | 13 | |||||||||
| Quest Diagnostics, Inc. | 500 | 53 | |||||||||
| Tenet Healthcare Corp. (b) | 2,300 | 28 | |||||||||
| Holding & Other Investment Offices (0.2%) | |||||||||||
| Apartment Investment & Management Co.–Class A | 440 | 17 | |||||||||
| Archstone-Smith Trust REIT | 900 | 32 | |||||||||
| Equity Residential | 1,300 | 45 | |||||||||
| Plum Creek Timber Co., Inc. | 800 | 28 | |||||||||
| Hotels & Other Lodging Places (0.3%) | |||||||||||
| Hilton Hotels Corp. | 1,700 | 37 | |||||||||
| Marriott International, Inc.–Class A | 900 | 56 | |||||||||
| Starwood Hotels & Resorts Worldwide, Inc. | 1,000 | 54 | |||||||||
| Industrial Machinery & Equipment (1.5%) | |||||||||||
| American Standard Cos., Inc. | 800 | 36 | |||||||||
| Applied Materials, Inc. (b) | 7,900 | 117 | |||||||||
| Baker Hughes, Inc. | 1,600 | 71 | |||||||||
| Black & Decker Corp. | 400 | 33 | |||||||||
| Caterpillar, Inc. | 1,600 | 141 | |||||||||
| Cummins, Inc. | 200 | 14 | |||||||||
| Deere & Co. | 1,100 | 69 | |||||||||
| Shares | Value | ||||||||||
| Industrial Machinery & Equipment (continued) | |||||||||||
| Dover Corp. | 900 | $ | 33 | ||||||||
| Eaton Corp. | 700 | 41 | |||||||||
| Illinois Tool Works, Inc. | 1,300 | 109 | |||||||||
| Ingersoll-Rand Co.–Class A | 800 | 62 | |||||||||
| National Oilwell Varco, Inc. (b) | 700 | 28 | |||||||||
| Pall Corp. | 500 | 13 | |||||||||
| Stanley Works (The) | 400 | 17 | |||||||||
| Instruments & Related Products (1.0%) | |||||||||||
| Agilent Technologies, Inc. (b) | 1,800 | 37 | |||||||||
| Applera Corp.–Applied Biosystems Group | 900 | 19 | |||||||||
| Bausch & Lomb, Inc. | 300 | 23 | |||||||||
| Danaher Corp. | 1,300 | 66 | |||||||||
| Eastman Kodak Co. | 1,300 | 33 | |||||||||
| Fisher Scientific International (b) | 500 | 30 | |||||||||
| KLA-Tencor Corp. | 900 | 35 | |||||||||
| Millipore Corp. (b) | 200 | 10 | |||||||||
| PerkinElmer, Inc. | 500 | 9 | |||||||||
| Raytheon Co. | 2,200 | 83 | |||||||||
| Rockwell Automation, Inc. | 800 | 37 | |||||||||
| Snap-On, Inc. | 300 | 10 | |||||||||
| Tektronix, Inc. | 400 | 9 | |||||||||
| Teradyne, Inc. (b) | 900 | 10 | |||||||||
| Thermo Electron Corp. (b) | 700 | 18 | |||||||||
| Waters Corp. (b) | 500 | 20 | |||||||||
| Xerox Corp. (b) | 4,500 | 60 | |||||||||
| Insurance (4.2%) | |||||||||||
| ACE, Ltd. | 1,300 | 56 | |||||||||
| Aetna, Inc. | 1,400 | 103 | |||||||||
| AFLAC, Inc. | 2,400 | 98 | |||||||||
| Allstate Corp. (The) | 3,300 | 185 | |||||||||
| AMBAC Financial Group, Inc. | 500 | 33 | |||||||||
| American International Group, Inc. | 12,300 | 625 | |||||||||
| Chubb Corp. | 900 | 74 | |||||||||
| Cigna Corp. | 600 | 55 | |||||||||
| Cincinnati Financial Corp. | 682 | 27 | |||||||||
| Loews Corp. | 700 | 50 | |||||||||
| MBIA, Inc. | 600 | 31 | |||||||||
| MGIC Investment Corp. | 500 | 30 | |||||||||
| Principal Financial Group | 1,400 | 55 | |||||||||
| Progressive Corp. (The) | 900 | 82 | |||||||||
| SAFECO Corp. | 500 | 26 | |||||||||
| St. Paul Travelers Cos., Inc. (The) | 3,247 | 116 | |||||||||
| UnitedHealth Group, Inc. | 3,100 | 293 | |||||||||
| UnumProvident Corp. | 1,400 | 23 | |||||||||
| WellPoint, Inc. (b) | 1,400 | 179 | |||||||||
| XL Capital, Ltd.–Class A | 600 | 42 | |||||||||
The notes to the financial statements are an integral part of this report.
Transamerica IDEX Mutual Funds
Semi-Annual Report 2005
5
TA IDEX Protected Principal Stock
SCHEDULE OF INVESTMENTS (continued)
At April 30, 2005
(all amounts except share amounts in thousands)
(unaudited)
| Shares | Value | ||||||||||
| Insurance Agents, Brokers & Service (0.4%) | |||||||||||
| AON Corp. | 1,500 | $ | 31 | ||||||||
| Hartford Financial Services Group, Inc. (The) | 1,400 | 101 | |||||||||
| Humana, Inc. (b) | 700 | 24 | |||||||||
| Marsh & McLennan Cos., Inc. | 2,500 | 70 | |||||||||
| Leather & Leather Products (0.1%) | |||||||||||
| Coach, Inc. (b) | 1,800 | 48 | |||||||||
| Life Insurance (0.7%) | |||||||||||
| Jefferson Pilot Corp. | 600 | 30 | |||||||||
| Lincoln National Corp. | 800 | 36 | |||||||||
| Metlife, Inc. | 3,500 | 136 | |||||||||
| Prudential Financial, Inc. | 2,500 | 143 | |||||||||
| Torchmark Corp. | 500 | 27 | |||||||||
| Lumber & Other Building Materials (1.1%) | |||||||||||
| Home Depot, Inc. (The) | 10,500 | 371 | |||||||||
| Lowe's Cos., Inc. | 3,600 | 188 | |||||||||
| Lumber & Wood Products (0.2%) | |||||||||||
| Georgia-Pacific Corp. | 1,200 | 41 | |||||||||
| Louisiana-Pacific Corp. | 500 | 12 | |||||||||
| Weyerhaeuser Co. | 1,100 | 75 | |||||||||
| Management Services (0.1%) | |||||||||||
| Paychex, Inc. | 1,600 | 49 | |||||||||
| Medical Instruments & Supplies (2.0%) | |||||||||||
| Bard, (C.R.) Inc. | 500 | 36 | |||||||||
| Baxter International, Inc. | 3,000 | 111 | |||||||||
| Becton Dickinson & Co. | 1,200 | 70 | |||||||||
| Biomet, Inc. | 1,200 | 46 | |||||||||
| Boston Scientific Corp. (b) | 3,700 | 109 | |||||||||
| Guidant Corp. | 1,500 | 111 | |||||||||
| Medtronic, Inc. | 5,700 | 300 | |||||||||
| St. Jude Medical, Inc. (b) | 1,600 | 62 | |||||||||
| Stryker Corp. | 1,700 | 83 | |||||||||
| Zimmer Holdings, Inc. (b) | 1,100 | 90 | |||||||||
| Metal Cans & Shipping Containers (0.0%) | |||||||||||
| Ball Corp. | 500 | 20 | |||||||||
| Metal Mining (0.3%) | |||||||||||
| Freeport-McMoRan Copper & Gold, Inc.–Class B | 800 | 28 | |||||||||
| Newmont Mining Corp. | 2,100 | 80 | |||||||||
| Phelps Dodge Corp. | 500 | 43 | |||||||||
| Mining (0.0%) | |||||||||||
| Vulcan Materials Co. | 500 | 27 | |||||||||
| Mortgage Bankers & Brokers (0.2%) | |||||||||||
| Countrywide Financial Corp. | 2,800 | 101 | |||||||||
| Shares | Value | ||||||||||
| Motion Pictures (1.1%) | |||||||||||
| News Corp., Inc.–Class A | 12,000 | $ | 183 | ||||||||
| Time Warner, Inc. (b) | 21,900 | 368 | |||||||||
| Motor Vehicles, Parts & Supplies (0.0%) | |||||||||||
| Visteon Corp. | 600 | 2 | |||||||||
| Office Property (0.1%) | |||||||||||
| Equity Office Properties Trust | 1,800 | 57 | |||||||||
| Oil & Gas Extraction (2.3%) | |||||||||||
| Anadarko Petroleum Corp. | 1,100 | 80 | |||||||||
| Apache Corp. | 1,510 | 85 | |||||||||
| BJ Services Co. | 700 | 34 | |||||||||
| Burlington Resources, Inc. | 1,700 | 83 | |||||||||
| Devon Energy Corp. | 2,300 | 104 | |||||||||
| EOG Resources, Inc. | 1,100 | 52 | |||||||||
| Halliburton Co. | 2,400 | 100 | |||||||||
| Kerr-McGee Corp. | 700 | 54 | |||||||||
| Nabors Industries, Ltd. (b) | 600 | 32 | |||||||||
| Noble Corp. | 600 | 31 | |||||||||
| Occidental Petroleum Corp. | 1,800 | 124 | |||||||||
| Rowan Cos., Inc. | 500 | 13 | |||||||||
| Schlumberger, Ltd. | 2,800 | 192 | |||||||||
| Transocean, Inc. (b) | 1,500 | 70 | |||||||||
| Unocal Corp. | 1,300 | 71 | |||||||||
| XTO Energy, Inc. | 1,533 | 46 | |||||||||
| Paper & Allied Products (1.2%) | |||||||||||
| 3M Co. | 3,600 | 275 | |||||||||
| Avery Dennison Corp. | 500 | 26 | |||||||||
| Bemis Co. | 500 | 14 | |||||||||
| International Paper Co. | 2,400 | 82 | |||||||||
| Kimberly-Clark Corp. | 2,300 | 144 | |||||||||
| MeadWestvaco Corp. | 900 | 27 | |||||||||
| OfficeMax, Inc. | 400 | 13 | |||||||||
| Pactiv Corp. (b) | 600 | 13 | |||||||||
| Temple-Inland, Inc. | 600 | 20 | |||||||||
| Personal Credit Institutions (0.3%) | |||||||||||
| Capital One Financial Corp. | 1,100 | 78 | |||||||||
| SLM Corp. | 1,800 | 86 | |||||||||
| Personal Services (0.1%) | |||||||||||
| H&R Block, Inc. | 700 | 35 | |||||||||
| Petroleum Refining (5.5%) | |||||||||||
| Amerada Hess Corp. | 400 | 37 | |||||||||
| Ashland, Inc. | 300 | 20 | |||||||||
| ChevronTexaco Corp. | 10,000 | 520 | |||||||||
| ConocoPhillips | 3,304 | 346 | |||||||||
| Exxon Mobil Corp. | 30,300 | 1,728 | |||||||||
| Marathon Oil Corp. | 1,600 | 75 | |||||||||
The notes to the financial statements are an integral part of this report.
Transamerica IDEX Mutual Funds
Semi-Annual Report 2005
6
TA IDEX Protected Principal Stock
SCHEDULE OF INVESTMENTS (continued)
At April 30, 2005
(all amounts except share amounts in thousands)
(unaudited)
| Shares | Value | ||||||||||
| Petroleum Refining (continued) | |||||||||||
| Sunoco, Inc. | 300 | $ | 30 | ||||||||
| Valero Energy Corp. | 1,200 | 82 | |||||||||
| Pharmaceuticals (9.1%) | |||||||||||
| Abbott Laboratories | 7,400 | 364 | |||||||||
| Allergan, Inc. | 600 | 42 | |||||||||
| AmerisourceBergen Corp. | 500 | 31 | |||||||||
| Amgen, Inc. (b) | 5,972 | 348 | |||||||||
| Biogen Idec, Inc. (b) | 1,600 | 58 | |||||||||
| Bristol-Myers Squibb Co. | 9,300 | 242 | |||||||||
| Cardinal Health, Inc. | 2,100 | 117 | |||||||||
| Chiron Corp. (b) | 600 | 21 | |||||||||
| Forest Laboratories, Inc. (b) | 1,600 | 57 | |||||||||
| Genzyme Corp. (b) | 1,200 | 70 | |||||||||
| Gilead Sciences, Inc. (b) | 2,100 | 78 | |||||||||
| Hospira, Inc. (b) | 720 | 24 | |||||||||
| Johnson & Johnson | 14,200 | 975 | |||||||||
| King Pharmaceuticals, Inc. (b) | 1,100 | 9 | |||||||||
| Lilly (Eli) & Co. | 5,300 | 310 | |||||||||
| McKesson Corp. | 1,400 | 52 | |||||||||
| Medco Health Solutions, Inc. (b) | 1,253 | 64 | |||||||||
| MedImmune, Inc. (b) | 1,100 | 28 | |||||||||
| Merck & Co., Inc. | 10,500 | 356 | |||||||||
| Mylan Laboratories | 1,200 | 20 | |||||||||
| Pfizer, Inc. | 35,540 | 966 | |||||||||
| Schering-Plough Corp. | 7,000 | 146 | |||||||||
| Sigma-Aldrich Corp. | 300 | 18 | |||||||||
| Watson Pharmaceuticals, Inc. (b) | 500 | 15 | |||||||||
| Wyeth | 6,300 | 283 | |||||||||
| Primary Metal Industries (0.4%) | |||||||||||
| Alcoa, Inc. | 4,100 | 119 | |||||||||
| Allegheny Technologies, Inc. | 400 | 9 | |||||||||
| Engelhard Corp. | 500 | 15 | |||||||||
| Nucor Corp. | 700 | 36 | |||||||||
| United States Steel Corp. | 500 | 21 | |||||||||
| Printing & Publishing (0.6%) | |||||||||||
| Dow Jones & Co., Inc. | 400 | 13 | |||||||||
| Gannett Co., Inc. | 1,100 | 85 | |||||||||
| Knight-Ridder, Inc. | 400 | 26 | |||||||||
| McGraw-Hill Cos., Inc. (The) | 900 | 78 | |||||||||
| Meredith Corp. | 200 | 9 | |||||||||
| New York Times Co.–Class A | 600 | 20 | |||||||||
| RR Donnelley & Sons Co. | 1,000 | 33 | |||||||||
| Tribune Co. | 1,400 | 54 | |||||||||
| Radio & Television Broadcasting (0.1%) | |||||||||||
| Univision Communications, Inc.–Class A (b) | 1,400 | 37 | |||||||||
| Shares | Value | ||||||||||
| Radio, Television & Computer Stores (0.2%) | |||||||||||
| Best Buy Co., Inc. | 1,400 | $ | 70 | ||||||||
| Circuit City Stores, Inc. | 800 | 13 | |||||||||
| RadioShack Corp. | 700 | 17 | |||||||||
| Railroads (0.5%) | |||||||||||
| Burlington Northern Santa Fe Corp. | 1,600 | 77 | |||||||||
| CSX Corp. | 1,000 | 40 | |||||||||
| Norfolk Southern Corp. | 1,800 | 57 | |||||||||
| Union Pacific Corp. | 1,200 | 77 | |||||||||
| Regional Mall (0.1%) | |||||||||||
| Simon Property Group, Inc. | 1,000 | 66 | |||||||||
| Restaurants (0.7%) | |||||||||||
| Darden Restaurants, Inc. | 600 | 18 | |||||||||
| McDonald's Corp. | 6,000 | 176 | |||||||||
| Starbucks Corp. (b) | 1,800 | 89 | |||||||||
| Wendy's International, Inc. | 500 | 21 | |||||||||
| Yum! Brands, Inc. | 1,400 | 66 | |||||||||
| Retail Trade (0.3%) | |||||||||||
| Office Depot, Inc. (b) | 1,500 | 29 | |||||||||
| Staples, Inc. | 3,550 | 68 | |||||||||
| Tiffany & Co. | 600 | 18 | |||||||||
| Toys R US, Inc. (b) | 1,000 | 25 | |||||||||
| Rubber & Misc. Plastic Products (0.3%) | |||||||||||
| Cooper Tire & Rubber Co. | 300 | 5 | |||||||||
| Goodyear Tire & Rubber Co. (The) (b) | 800 | 10 | |||||||||
| Newell Rubbermaid, Inc. | 1,300 | 28 | |||||||||
| NIKE, Inc.–Class B | 1,000 | 77 | |||||||||
| Reebok International, Ltd. | 300 | 12 | |||||||||
| Sealed Air Corp. (b) | 400 | 19 | |||||||||
| Savings Institutions (0.5%) | |||||||||||
| Golden West Financial Corp. | 1,300 | 81 | |||||||||
| Sovereign Bancorp, Inc. | 1,700 | 35 | |||||||||
| Washington Mutual, Inc. | 4,100 | 169 | |||||||||
| Security & Commodity Brokers (2.7%) | |||||||||||
| American Express Co. | 5,500 | 290 | |||||||||
| Bear Stearns Cos. Inc. (The) | 500 | 47 | |||||||||
| Charles Schwab Corp. (The) | 5,300 | 55 | |||||||||
| E*TRADE Financial Corp. (b) | 1,650 | 18 | |||||||||
| Federated Investors, Inc.–Class B | 450 | 13 | |||||||||
| Franklin Resources, Inc. | 900 | 62 | |||||||||
| Goldman Sachs Group, Inc. (The) | 2,200 | 235 | |||||||||
| Janus Capital Group, Inc. | 1,100 | 14 | |||||||||
| Lehman Brothers Holdings, Inc. | 1,300 | 119 | |||||||||
| Merrill Lynch & Co., Inc. | 4,400 | 237 | |||||||||
| Morgan Stanley | 5,100 | 268 | |||||||||
| T. Rowe Price Group, Inc. | 500 | 28 | |||||||||
The notes to the financial statements are an integral part of this report.
Transamerica IDEX Mutual Funds
Semi-Annual Report 2005
7
TA IDEX Protected Principal Stock
SCHEDULE OF INVESTMENTS (continued)
At April 30, 2005
(all amounts except share amounts in thousands)
(unaudited)
| Shares | Value | ||||||||||
| Telecommunications (3.1%) | |||||||||||
| ALLTEL Corp. | 1,400 | $ | 80 | ||||||||
| AT&T Corp. | 3,800 | 73 | |||||||||
| BellSouth Corp. | 8,600 | 228 | |||||||||
| CenturyTel, Inc. | 600 | 18 | |||||||||
| Citizens Communications Co. | 1,600 | 20 | |||||||||
| Nextel Communications, Inc.–Class A (b) | 5,200 | 146 | |||||||||
| Qwest Communications International (b) | 8,100 | 28 | |||||||||
| SBC Communications, Inc. | 15,800 | 376 | |||||||||
| Sprint Corp. (FON Group) | 7,050 | 157 | |||||||||
| Verizon Communications, Inc. | 13,100 | 469 | |||||||||
| Tobacco Products (0.1%) | |||||||||||
| Reynolds American, Inc. | 500 | 39 | |||||||||
| UST, Inc. | 700 | 32 | |||||||||
| Toys, Games & Hobbies (0.1%) | |||||||||||
| Hasbro, Inc. | 700 | 13 | |||||||||
| Mattel, Inc. | 1,800 | 33 | |||||||||
| Transportation Equipment (0.0%) | |||||||||||
| Brunswick Corp. | 500 | 21 | |||||||||
| Trucking & Warehousing (0.7%) | |||||||||||
| United Parcel Service, Inc.–Class B | 5,200 | 371 | |||||||||
| Variety Stores (2.2%) | |||||||||||
| Big Lots, Inc. (b) | 500 | 5 | |||||||||
| Costco Wholesale Corp. | 2,300 | 93 | |||||||||
| Dollar General Corp. | 1,400 | 29 | |||||||||
| Family Dollar Stores, Inc. | 700 | 19 | |||||||||
| Sears Holdings Corp. (b) | 283 | 38 | |||||||||
| Target Corp. | 4,200 | 195 | |||||||||
| Wal-Mart Stores, Inc. | 16,100 | 759 | |||||||||
| Warehouse (0.1%) | |||||||||||
| Prologis | 850 | 34 | |||||||||
| Water Transportation (0.3%) | |||||||||||
| Carnival Corp. | 2,700 | 132 | |||||||||
| Wholesale Trade Durable Goods (0.0%) | |||||||||||
| Grainger (W.W.), Inc. | 400 | 22 | |||||||||
| Wholesale Trade Nondurable Goods (0.2%) | |||||||||||
| SUPERVALU, Inc. | 600 | 19 | |||||||||
| SYSCO Corp. | 3,100 | 107 | |||||||||
| Total Common Stocks (cost: $41,371) | 50,306 | ||||||||||
| Contracts (c) | Value | ||||||||||
| PURCHASED OPTIONS (0.6%) | |||||||||||
| Put Options (0.6%) | |||||||||||
| S & P 500 Index | 60 | $ | 16 | ||||||||
| Put Strike $1,100.00 | |||||||||||
| Expires 05/21/2005 | |||||||||||
| S & P 500 Index Put Strike $1,100.00 Expires 06/18/2005 | 166 | 129 | |||||||||
| S & P 500 Index Put Strike $1,075.00 Expires 06/18/2005 | 82 | 41 | |||||||||
| S & P 500 Index Put Strike $1,125.00 Expires 06/18/2005 | 123 | 153 | |||||||||
| Total Purchased Options (cost: $269) | 339 | ||||||||||
| Total Investment Securities (cost: $41,640) | $ | 50,645 | |||||||||
| WRITTEN OPTIONS (-0.9%) | |||||||||||
| Covered Call Options (-0.9%) | |||||||||||
| S & P 500 Index Call Strike $1,225.00 Expires 06/18/2005 | 34 | (7 | ) | ||||||||
| S & P 500 Index Call Strike $1,150.00 Expires 05/21/2005 | 47 | (91 | ) | ||||||||
| S & P 500 Index Call Strike $1,175.00 Expires 05/21/2005 | 96 | (65 | ) | ||||||||
| S & P 500 Index Call Strike $1,200.00 Expires 05/21/2005 | 49 | (7 | ) | ||||||||
| S & P 500 Index Call Strike $1,200.00 Expires 06/18/2005 | 104 | (65 | ) | ||||||||
| S & P 500 Index Call Strike $1,150.00 Expires 06/18/2005 | 49 | (138 | ) | ||||||||
| S & P 500 Index Call Strike $1,175.00 Expires 06/18/2005 | 52 | (77 | ) | ||||||||
| Total Written Options (premiums: -$924) | (450 | ) | |||||||||
| SUMMARY: | |||||||||||
| Investments, at value | 97.8 | % | $ | 50,645 | |||||||
| Written options | (0.9 | %) | (450 | ) | |||||||
| Other assets in excess of liabilities | 3.1 | % | 1,613 | ||||||||
| Net assets | 100.0 | % | $ | 51,808 | |||||||
The notes to the financial statements are an integral part of this report.
NOTES TO SCHEDULE OF INVESTMENTS:
(a) Substantially all of the Fund's common stocks are memo pledged as collateral by the custodian for the listed short index option contracts written by the Fund (see Note 1).
(b) No dividends were paid during the preceding twelve months.
(c) Contract amounts are not in thousands.
DEFINITIONS:
REIT Real Estate Investment Trust
Transamerica IDEX Mutual Funds
Semi-Annual Report 2005
8
TA IDEX Protected Principal Stock
STATEMENT OF ASSETS AND LIABILITIES
At April 30, 2005
(all amounts except per share amounts in thousands)
(unaudited)
| Assets: | |||||||
| Investment securities, at value (cost: $41,640) | $ | 50,645 | |||||
| Cash | 1,734 | ||||||
| Receivables: | |||||||
| Interest | 2 | ||||||
| Dividends | 70 | ||||||
| Other | 4 | ||||||
| 52,455 | |||||||
| Liabilities: | |||||||
| Accounts payable and accrued liabilities: | |||||||
| Shares of beneficial interest redeemed | 108 | ||||||
| Management and advisory fees | 29 | ||||||
| Distribution and service fees | 39 | ||||||
| Transfer agent fees | 14 | ||||||
| Written options (premiums $924) | 450 | ||||||
| Other | 7 | ||||||
| 647 | |||||||
| Net Assets | $ | 51,808 | |||||
| Net Assets Consist of: | |||||||
| Shares of beneficial interest, unlimited shares authorized, no par value | $ | 45,865 | |||||
| Undistributed net investment income (loss) | 8 | ||||||
| Accumulated net realized gain (loss) from investment securities and written option contracts | (3,544 | ) | |||||
| Net unrealized appreciation (depreciation) on: Investment securities | 9,005 | ||||||
| Written option contracts | 474 | ||||||
| Net Assets | $ | 51,808 | |||||
| Net Assets by Class: | |||||||
| Class A | $ | 7,453 | |||||
| Class B | 36,694 | ||||||
| Class C | 5,717 | ||||||
| Class M | 1,944 | ||||||
| Shares Outstanding: | |||||||
| Class A | 689 | ||||||
| Class B | 3,412 | ||||||
| Class C | 533 | ||||||
| Class M | 181 | ||||||
| Net Asset Value Per Share: | |||||||
| Class A | $ | 10.81 | |||||
| Class B | 10.75 | ||||||
| Class C | 10.72 | ||||||
| Class M | 10.72 | ||||||
| Maximum Offering Price Per Share (a): | |||||||
| Class A | $ | 11.44 | |||||
| Class M | 10.83 | ||||||
(a) Includes the maximum selling commission (represented as a percentage of offering price) which is reduced on certain levels of sales as set forth in the Prospectus. Net asset value per share for Classes B and C shares represents offering price. The redemption price for Classes B and M shares equals net asset value less any applicable contingent deferred sales charge.
STATEMENT OF OPERATIONS
For the period ended April 30, 2005
(all amounts in thousands)
(unaudited)
| Investment Income: | |||||||
| Interest | $ | 11 | |||||
| Dividends | 674 | ||||||
| 685 | |||||||
| Expenses: | |||||||
| Management and advisory fees | 355 | ||||||
| Transfer agent fees: | |||||||
| Class A | 1 | ||||||
| Class B | 5 | ||||||
| Class C | 1 | ||||||
| Custody fees | 13 | ||||||
| Administration fees | 5 | ||||||
| Audit fees | 14 | ||||||
| Trustees fees | 1 | ||||||
| Registration fees: | |||||||
| Class A | 9 | ||||||
| Class C | 7 | ||||||
| Class M | 4 | ||||||
| Other | 16 | ||||||
| Distribution and service fees: | |||||||
| Class A | 13 | ||||||
| Class B | 194 | ||||||
| Class C | 30 | ||||||
| Class M | 9 | ||||||
| Total expenses | 677 | ||||||
| Net Investment Income (Loss) | 8 | ||||||
| Net Realized Gain (Loss) from: | |||||||
| Investment securities | 976 | ||||||
| Written option contracts | (563 | ) | |||||
| 413 | |||||||
| Net Increase (Decrease) in Unrealized Appreciation (Depreciation) on: | |||||||
| Investment securities | (41 | ) | |||||
| Written option contracts | 472 | ||||||
| 431 | |||||||
| Net Gain (Loss) on Investments and Written Option Contracts | 844 | ||||||
| Net Increase (Decrease) in Net Assets Resulting from Operations | $ | 852 | |||||
The notes to the financial statements are an integral part of this report.
Transamerica IDEX Mutual Funds
Semi-Annual Report 2005
9
TA IDEX Protected Principal Stock
STATEMENTS OF CHANGES IN NET ASSETS
For the period or year ended
(all amounts in thousands)
| April 30, 2005 (unaudited) | October 31, 2004 | ||||||||||
| Increase (Decrease) In Net Assets From: | |||||||||||
| Operations: | |||||||||||
| Net investment income (loss) | $ | 8 | $ | (572 | ) | ||||||
| Net realized gain (loss) from investment securities and written option contracts | 413 | 477 | |||||||||
| Net unrealized appreciation (depreciation) on investment securities and written option contracts | 431 | 2,835 | |||||||||
| 852 | 2,740 | ||||||||||
| Capital Share Transactions: | |||||||||||
| Proceeds from shares sold: | |||||||||||
| Class A | – | 5 | |||||||||
| Class B | – | 2 | |||||||||
| Class C | – | 2 | |||||||||
| – | 9 | ||||||||||
| Cost of shares redeemed: | |||||||||||
| Class A | (684 | ) | (1,733 | ) | |||||||
| Class B | (4,663 | ) | (7,872 | ) | |||||||
| Class C | (793 | ) | (907 | ) | |||||||
| Class M | (405 | ) | (1,382 | ) | |||||||
| (6,545 | ) | (11,894 | ) | ||||||||
| (6,545 | ) | (11,885 | ) | ||||||||
| Net increase (decrease) in net assets | (5,693 | ) | (9,145 | ) | |||||||
| Net Assets: | |||||||||||
| Beginning of period | 57,501 | 66,646 | |||||||||
| End of period | $ | 51,808 | $ | 57,501 | |||||||
| Undistributed Net Investment Income (Loss) | $ | 8 | $ | – | |||||||
| Share Activity: | |||||||||||
| Shares redeemed: | |||||||||||
| Class A | (63 | ) | (167 | ) | |||||||
| Class B | (432 | ) | (760 | ) | |||||||
| Class C | (74 | ) | (87 | ) | |||||||
| Class M | (38 | ) | (133 | ) | |||||||
| (607 | ) | (1,147 | ) | ||||||||
| Net increase (decrease) in shares outstanding: | |||||||||||
| Class A | (63 | ) | (167 | ) | |||||||
| Class B | (432 | ) | (760 | ) | |||||||
| Class C | (74 | ) | (87 | ) | |||||||
| Class M | (38 | ) | (133 | ) | |||||||
| (607 | ) | (1,147 | ) | ||||||||
The notes to the financial statements are an integral part of this report.
Transamerica IDEX Mutual Funds
Semi-Annual Report 2005
10
TA IDEX Protected Principal Stock
FINANCIAL HIGHLIGHTS
(unaudited for the period ended April 30, 2005)
| For a share of beneficial interest outstanding throughout each period | |||||||||||||||||||||||||||||||||||||||
| Net Asset | Investment Operations | Distributions | Net Asset | ||||||||||||||||||||||||||||||||||||
| For the Period Ended (d)(g) | Value, Beginning of Period | Net Investment Income (Loss) | Net Realized and Unrealized Gain (Loss) | Total Operations | From Net Investment Income | From Net Realized Gains | Total Distributions | Value, End of Period | |||||||||||||||||||||||||||||||
| Class A | 4/30/2005 | $ | 10.64 | $ | 0.02 | $ | 0.15 | $ | 0.17 | $ | – | $ | – | $ | – | $ | 10.81 | ||||||||||||||||||||||
| 10/31/2004 | 10.15 | (0.05 | ) | 0.54 | 0.49 | – | – | – | 10.64 | ||||||||||||||||||||||||||||||
| 10/31/2003 | 10.01 | (0.04 | ) | 0.92 | 0.88 | – | (0.74 | ) | (0.74 | ) | 10.15 | ||||||||||||||||||||||||||||
| 10/31/2002 | 10.00 | (0.02 | ) | 0.03 | 0.01 | – | – | – | 10.01 | ||||||||||||||||||||||||||||||
| Class B | 4/30/2005 | 10.60 | 0.00 | 0.15 | 0.15 | – | – | – | 10.75 | ||||||||||||||||||||||||||||||
| 10/31/2004 | 10.15 | (0.10 | ) | 0.55 | 0.45 | – | – | – | 10.60 | ||||||||||||||||||||||||||||||
| 10/31/2003 | 10.01 | (0.11 | ) | 0.99 | 0.88 | – | (0.74 | ) | (0.74 | ) | 10.15 | ||||||||||||||||||||||||||||
| 10/31/2002 | 10.00 | (0.04 | ) | 0.05 | 0.01 | – | – | – | 10.01 | ||||||||||||||||||||||||||||||
| Class C | 4/30/2005 | 10.58 | (0.01 | ) | 0.15 | 0.14 | – | – | – | 10.72 | |||||||||||||||||||||||||||||
| 10/31/2004 | 10.15 | (0.12 | ) | 0.55 | 0.43 | – | – | – | 10.58 | ||||||||||||||||||||||||||||||
| 10/31/2003 | 10.01 | (0.11 | ) | 0.99 | 0.88 | – | (0.74 | ) | (0.74 | ) | 10.15 | ||||||||||||||||||||||||||||
| 10/31/2002 | 10.00 | (0.04 | ) | 0.05 | 0.01 | – | – | – | 10.01 | ||||||||||||||||||||||||||||||
| Class M | 4/30/2005 | 10.59 | (0.01 | ) | 0.14 | 0.13 | – | – | – | 10.72 | |||||||||||||||||||||||||||||
| 10/31/2004 | 10.14 | (0.10 | ) | 0.55 | 0.45 | – | – | – | 10.59 | ||||||||||||||||||||||||||||||
| 10/31/2003 | 10.01 | (0.10 | ) | 0.97 | 0.87 | – | (0.74 | ) | (0.74 | ) | 10.14 | ||||||||||||||||||||||||||||
| 10/31/2002 | 10.00 | (0.04 | ) | 0.05 | 0.01 | – | – | – | 10.01 | ||||||||||||||||||||||||||||||
| Ratios/Supplemental Data | |||||||||||||||||||||||||||||||
| For the Period | Total | Net Assets, End of Period | Ratio of Expenses to Average Net Assets (a) | Net Investment Income (Loss) to Average | Portfolio Turnover | ||||||||||||||||||||||||||
| Ended (g) | Return (c) | (000's) | Net (e) | Total (f) | Net Assets (a) | Rate (b) | |||||||||||||||||||||||||
| Class A | 4/30/2005 | 1.60 | % | $ | 7,453 | 2.13 | % | 2.13 | % | 0.36 | % | 2 | % | ||||||||||||||||||
| 10/31/2004 | 4.82 | 8,006 | 2.22 | 2.16 | (0.53 | ) | 1 | ||||||||||||||||||||||||
| 10/31/2003 | 9.44 | 9,320 | 2.25 | 2.25 | (0.46 | ) | 3 | ||||||||||||||||||||||||
| 10/31/2002 | 0.10 | 10,381 | 2.25 | 2.62 | (0.70 | ) | 14 | ||||||||||||||||||||||||
| Class B | 4/30/2005 | 1.42 | 36,694 | 2.49 | 2.49 | 0.01 | 2 | ||||||||||||||||||||||||
| 10/31/2004 | 4.43 | 40,756 | 2.69 | 2.63 | (0.97 | ) | 1 | ||||||||||||||||||||||||
| 10/31/2003 | 9.44 | 46,709 | 2.90 | 2.90 | (1.11 | ) | 3 | ||||||||||||||||||||||||
| 10/31/2002 | 0.10 | 47,170 | 2.90 | 3.28 | (1.35 | ) | 14 | ||||||||||||||||||||||||
| Class C | 4/30/2005 | 1.32 | 5,717 | 2.73 | 2.73 | (0.22 | ) | 2 | |||||||||||||||||||||||
| 10/31/2004 | 4.24 | 6,423 | 2.82 | 2.76 | (1.12 | ) | 1 | ||||||||||||||||||||||||
| 10/31/2003 | 9.44 | 7,041 | 2.90 | 2.90 | (1.11 | ) | 3 | ||||||||||||||||||||||||
| 10/31/2002 | 0.10 | 6,969 | 2.90 | 3.28 | (1.35 | ) | 14 | ||||||||||||||||||||||||
| Class M | 4/30/2005 | 1.23 | 1,944 | 2.80 | 2.80 | (0.26 | ) | 2 | |||||||||||||||||||||||
| 10/31/2004 | 4.44 | 2,316 | 2.80 | 2.73 | (1.01 | ) | 1 | ||||||||||||||||||||||||
| 10/31/2003 | 9.33 | 3,576 | 2.80 | 2.80 | (1.01 | ) | 3 | ||||||||||||||||||||||||
| 10/31/2002 | 0.10 | 4,076 | 2.80 | 3.18 | (1.25 | ) | 14 | ||||||||||||||||||||||||
(a) Annualized.
(b) Not annualized for periods of less than one year.
(c) Total Return has been calculated for the applicable period without deduction of a sales load, if any, on an initial purchase. Periods of less than one year are not annualized.
(d) Per share information is calculated based on average number of shares outstanding.
(e) Ratio of Net Expenses to Average Net Assets is net of fee waivers and reimbursements by the investment adviser, if any and includes the recapture of previously waived expenses (see note 2).
(f) Ratio of Total Expenses to Average Net Assets includes all expenses before fee waivers, reimbursements and recapture of previously waived expenses by the investment adviser.
(g) TA IDEX Protected Principal Stock commenced operations on July 1, 2002.
The notes to the financial statements are an integral part of this report.
Transamerica IDEX Mutual Funds
Semi-Annual Report 2005
11
TA IDEX Protected Principal Stock
NOTES TO FINANCIAL STATEMENTS
At April 30, 2005
(all amounts in thousands)
(unaudited)
NOTE 1. ORGANIZATION AND SIGNIFICANT ACCOUNTING POLICIES
Transamerica IDEX Mutual Funds is a Delaware statutory trust registered under the Investment Company Act of 1940, as amended (the "1940 Act"), as an open-end management investment company. Prior to March 1, 2005, Transamerica IDEX Mutual Funds was a Massachusetts business trust. TA IDEX Protected Principal Stock ("the Fund"), part of Transamerica IDEX Mutual Funds, began operations on July 1, 2002.
In the normal course of business, the Fund enters into contracts that contain a variety of representations and warranties, which provide general indemnifications. The Fund's maximum exposure under these arrangements is unknown, as this would involve future claims that may be made against the Fund and/or its affiliates that have not yet occurred. However, based on experience, the Fund expects the risk of loss to be remote.
See the Prospectus and Statement of Additional Information for a description of the Fund's investment objective.
In preparing the Fund's financial statements in accordance with accounting principles generally accepted in the United States of America ("GAAP"), estimates or assumptions (which could differ from actual results) may be used that affect reported amounts and disclosures. The following policies were consistently followed by the Fund, in accordance with GAAP.
Multiple class operations and expenses: The Fund currently offers four classes of shares, each with a public offering price that reflects different sales charges, if any, and expense levels. On June 15, 2004, Class C2 shares converted to Class C. Class B shares will convert to Class A shares eight years after purchase. Currently all share classes are closed to new investors. Income, non-class specific expenses and realized and unrealized gains and losses, are allocated daily to each class, based upon the value of shares outstanding method as permitted under Rule 18f-3 of the 1940 Act. Each class bears its own specific expenses as well as a portion of general, common expenses.
Pricing of shares: The Fund prices its shares on the basis of the net asset value of each class of shares of the Fund, which is determined as of the close of the New York Stock Exchange ("NYSE") (generally 4:00 p.m. Eastern Time) on each day on which the NYSE is open for trading.
Security valuations: Fund investments traded on an exchange are valued at the closing price on the day of valuation on the exchange where the security is principally traded. With respect to securities traded on NASDAQ NMS, such closing price may be the last reported sales price or the NASDAQ Official Closing Price.
Securities traded in the over-the-counter market and listed securities for which no sale was reported on that date are valued at the last quoted bid price.
Other securities for which quotations are not readily available are valued at fair market value as determined in good faith using guidelines adopted by the Board of Trustees of the Fund, under the supervision of the Fund's Valuation Committee. These guidelines may include: the type of security; any restrictions on its resale; financial or business news of the issuer; similar or related securities that are actively trading; related corporate actions; and other significant events occurring after the close of trading in the security.
Cash: The Fund may leave cash overnight in its cash account with the custodian, Investors Bank & Trust Company ("IBT"). IBT has been contracted on behalf of the Fund to invest the excess cash into a savings account, which at April 30, 2005, was paying an interest rate of 2.02%.
Throughout the period, the Fund may have a cash overdraft balance. A fee is incurred on this overdraft, calculated by multiplying the overdraft by a rate based on the federal funds rate.
Real Estate Investment Trusts ("REITs"): There are certain additional risks involved in investing in REITs. These include, but are not limited to, economic conditions, changes in zoning laws, real estate values, property taxes and interest rates.
Dividend income is recorded at management's estimate of the income included in distributions from the REIT investments. Distributions received in excess of the estimated amount are recorded as a reduction of the cost investments. The actual amounts of income, return of capital and capital gains are only determined by each REIT after the fiscal year end and may differ from the estimated amounts.
Security transactions and investment income: Security transactions are recorded on the trade date. Security gains and losses are calculated on the specific identification basis. Dividend income is recorded on the ex-dividend date or, in the case of foreign securities, as soon as the Fund is informed of the ex-dividend date. Interest income, including accretion of discounts and amortization of premiums, is recorded on the accrual basis commencing on the settlement date.
Option contracts: The Fund may enter into options contracts to manage exposure to market fluctuations. Options are valued at the average of the bid and ask ("Mean Quote") established each day at the close of the board of trade or exchange on which they are traded. The primary risks associated with options are imperfect correlation between the change in value of the securities held and the prices of the options contracts; the possibility of an illiquid market and inability of the counterparty to meet the contracts terms. When the Fund writes a covered call or put option, an amount equal to the premium received by the Fund is included in the Fund's Statement of Assets and Liabilities as an asset and as an equivalent liability. The amount is subsequently marked-to-market to reflect the current value of the option written.
Transamerica IDEX Mutual Funds
Semi-Annual Report 2005
12
TA IDEX Protected Principal Stock
NOTES TO FINANCIAL STATEMENTS (continued)
At April 30, 2005
(all amounts in thousands)
(unaudited)
NOTE 1.–(continued)
The underlying face amounts of open contracts at April 30, 2005, are listed in the Schedule of Investments.
Substantially all of the Fund's common stocks are memo pledged as collateral by the custodian for the listed short index option contracts written by the Fund. The custodian uses escrow receipt depository of the Option Clearing Corporation ("OCC") to effect pledging while maintaining custody of the stock positions, rather than delivering them to the broker-dealers. The OCC guarantees the obligations of the contracts that they clear are fulfilled.
Transactions in written call and put options were as follows:
| Premium | Contracts* | ||||||||||
| Beginning Balance October 31, 2004 | $ | 849 | 501 | ||||||||
| Sales | 4,446 | 1,589 | |||||||||
| Closing Buys | (4,033 | ) | (1,551 | ) | |||||||
| Expirations | (338 | ) | (108 | ) | |||||||
| Balance at April 30, 2005 | $ | 924 | 431 | ||||||||
* Contracts not in thousands
Account maintenance fees: If the shareholder account balance falls below $1 by either shareholder action or as a result of market action, a $25 (not in thousands) fee is assessed every year until the balance reaches $1. The fee is assessed by redeeming shares in the shareholder's account.
No fee will be charged under the following conditions:
• accounts opened within the preceding 24 months
• accounts with an active monthly Automatic Investment Plan ($50 (not in thousands) minimum per fund)
• accounts owned by an individual which, when combined by social security number, have a balance of $5 or more
• accounts owned by individuals in the same household (by address) that have a combined balance of $5 or more
• UTMA/UGMA accounts
• Fiduciary accounts
• B-share accounts whose shares have started to convert to
A-shares accounts (as long as combined value of both accounts is at least $1)
For the six months ended April 30, 2005, there were no account maintenance fee.
Redemption fees: A short-term trading redemption fee may be assessed on any fund shares in a fund account that are sold during the first five (5) NYSE trading days following their purchase date. This redemption fee will equal 2% of the amount redeemed and shares held the longest will be treated as being redeemed first and shares held the shortest as being redeemed last.
For the six months ended April 30, 2005, the Fund received no redemption fees.
Dividend distributions: Distributions to shareholders are recorded on the ex-dividend date and are determined in accordance with Federal income tax regulations which may differ from GAAP.
NOTE 2. RELATED PARTY TRANSACTIONS
Transamerica Fund Advisors, Inc. ("TFAI") is the Fund's investment adviser. Transamerica Fund Services, Inc. ("TFS") is the Fund's administrator and transfer agent. AFSG Securities Corp. ("AFSG") is the Fund's distributor/principal underwriter. AFSG is 100% owned by AUSA Holding Company ("AUSA"). TFAI is a directly owned subsidiary of Western Reserve Life Assurance Co. of Ohio (78%) and AUSA (22%). TFS is a wholly owned subsidiary of WRL (50%) and AUSA (50%). AUSA and WRL are wholly owned indirect subsidiaries of AEGON, NV, a Netherlands corporation.
Effective January 1, 2005 AEGON/Transamerica Fund Advisors, Inc. ("ATFA") was renamed Transamerica Fund Advisors, Inc. ("TFAI"); AEGON/Transamerica Fund Services, Inc. ("ATFS") and AEGON/Transamerica Investor Services, Inc. ("ATIS") merged into one entity and was renamed Transamerica Fund Services, Inc. ("TFS").
TA IDEX Protected Principal Stock Guarantee: The Fund's investment adviser, TFAI, guarantees shareholders a Guaranteed Amount five years after the end of the Offering Period. The Guaranteed amount will be no less than the value of that shareholder's account on the Investment Date, less extraordinary charges, provided that shareholders have reinvested all dividends and distributions in additional shares and have redeemed no shares ("Guarantee"). Please see the Prospectus and Statement of Additional Information for further information on the Guarantee.
Investment advisory fee: The Fund pays management fees to TFAI based on average daily net assets ("ANA") at the following breakpoints:
1.30% of the first $100 million of ANA
1.25% of ANA over $100 million
TFAI has contractually agreed to waive its advisory fee and will reimburse the Fund to the extent that operating expenses, excluding 12b-1 fees, exceed the following stated annual limit:
1.90% Expense Limit
Transamerica IDEX Mutual Funds
Semi-Annual Report 2005
13
TA IDEX Protected Principal Stock
NOTES TO FINANCIAL STATEMENTS (continued)
At April 30, 2005
(all amounts in thousands)
(unaudited)
NOTE 2.–(continued)
If total fund expenses fall below the annual expense limitation agreement agreed to by the adviser within the succeeding three years, the Fund may be required to pay that adviser a portion or all of the waived advisory fees.
| Advisory Fee Waived | Available for Recapture Through | ||||||||||
| Fiscal Year 2003 | $ | 9 | 10/31/2006 | ||||||||
| Fiscal Year 2002 | 43 | 10/31/2005 | |||||||||
Distribution and service fees: The Fund has a 12b-1 distribution plan under the 1940 Act pursuant to which an annual fee, based on average daily net assets, is paid to the distributor for various disbursements such as broker-dealer account servicing fees and other promotional expenses of the Fund. The Fund is authorized under the 12b-1 plan to pay fees on each class up to the following limits:
| Class A | 0.35 | % | |||||
| Class B | 1.00 | % | |||||
| Class C | 1.00 | % | |||||
| Class M | 0.90 | % | |||||
In the case the Fund or a class of shares of the Fund is closed to new investors or investments, the Fund is authorized to pay 12b-1 fees for past sales and distribution efforts and present and past investor services.
Underwriter commissions relate to front-end sales charges imposed for Class A and M shares and contingent deferred sales charges from Classes B, M, and certain A share redemptions. For the six months ended April 30, 2005, the underwriter commissions were as follows:
| Received by Underwriter | $ | – | |||||
| Retained by Underwriter | – | ||||||
| Contingent Deferred Sales Charge | 124 | ||||||
Administrative services: The Fund has entered into an agreement with TFS for financial and legal fund administration services, which includes such items as compliance, expenses, financial statements and other reporting, distributions, tax returns, prospectus preparation, board of trustees meeting support and other legal matters. As of January 1, 2005 the Fund pays TFS an annual fee of 0.02% of average net assets. Prior to January 1, 2005 the Fund paid TFS an annual fee of 0.015% of average net assets. The Legal fees on the Statement of Operations are for fees paid to external legal counsel.
Transfer agent fees: The Fund pays TFS an annual per-account charge of $20 (not in thousands) for each open account and $1.63 (not in thousands) for each closed account. There is no new account charge. The Transfer agent fees on the Statement of Operations are made up of fees paid to TFS and costs associated with shareholder statements.
The Fund paid TFS $21 for the six months ended April 30, 2005.
Deferred compensation plan: Each eligible Fund Trustee may elect participation in the Deferred Compensation Plan ("the Plan"). Under the Plan, such Trustees may defer payment of a percentage of their total fees earned as a Fund Trustee. These deferred amounts may be invested in any Transamerica IDEX Mutual Fund. At April 30, 2005, the value of invested plan amount was $3. Invested plan amounts and the total liability for deferred compensation to the Trustees under the Plan at April 30, 2005, are included in the accompanying Statement of Assets and Liabilities.
NOTE 3. INVESTMENT TRANSACTIONS
The cost of securities purchased and proceeds from securities sold (excluding short-term securities) for the six months ended April 30, 2005, were as follows:
| Purchases of securities: | |||||||
| Long-Term excluding U.S. Government | $ | 1,219 | |||||
| U.S. Government | – | ||||||
| Proceeds from maturities and sales of securities: | |||||||
| Long-Term excluding U.S. Government | 8,989 | ||||||
| U.S. Government | – | ||||||
NOTE 4. FEDERAL INCOME TAX MATTERS
The Fund has not made any provision for federal income or excise taxes due to its policy to distribute all of its taxable income and capital gains to its shareholders and otherwise qualify as a regulated investment company under the Internal Revenue Code. Income and capital gain distributions are determined in accordance with income tax regulations, which may differ from GAAP. These differences are primarily due to differing treatment for items including, but not limited to, wash sales, net operating losses and capital loss carryforwards.
The capital loss carryforward is available to offset future realized capital gains through the periods listed:
| Capital Loss Carryforward | Available through | ||||||
| $ | 4,061 | October 31, 2011 | |||||
The aggregate cost of investments and composition of unrealized appreciation (depreciation) for federal income tax purposes as of April 30, 2005, are as follows:
| Federal Tax Cost Basis | $ | 41,637 | |||||
| Unrealized Appreciation | $ | 9,008 | |||||
| Unrealized (Depreciation) | – | ||||||
| Net Unrealized Appreciation (Depreciation) | $ | 9,008 | |||||
NOTE 5. REGULATORY PROCEEDINGS
There continues to be significant federal and state regulatory activity relating to financial services companies, particularly mutual fund companies and their investment advisers. As part of an ongoing investigation regarding potential market timing, recordkeeping and trading compliance issues and matters affecting the Fund's investment adviser,
Transamerica IDEX Mutual Funds
Semi-Annual Report 2005
14
TA IDEX Protected Principal Stock
NOTES TO FINANCIAL STATEMENTS (continued)
At April 30, 2005
(all amounts in thousands)
(unaudited)
NOTE 5.–(continued)
TFAI, and certain employees and affiliates of TFAI, the SEC staff has indicated that it is likely to take some action against TFAI and certain of its affiliates at the conclusion of the investigation. The potential timing and the scope of any such action is difficult to predict. Although the impact of any action brought against TFAI and/or its affiliates is difficult to assess at the present time, the Fund currently believes that the likelihood that any such action will have a material adverse impact on it is remote. It is important to note that the Fund is not aware of any allegation of wrongdoing against it and its board at the time this semi-annual report is printed. Although it is not anticipated that these developments will have an adverse impact on the Fund, there can be no assurance at this time. TFAI and its affiliates are actively working with the SEC in regard to this matter; however, the exac t resolution cannot be determined at this time. TFAI will take such actions that it deems necessary or appropriate to continue providing management services to the Fund and to bring all matters to an appropriate conclusion.
TFAI and/or its affiliates, and not the Fund, will bear the costs regarding these regulatory matters.
Transamerica IDEX Mutual Funds
Semi-Annual Report 2005
15
TA IDEX Protected Principal Stock
INVESTMENT ADVISORY AND SUB-ADVISORY AGREEMENTS – REVIEW AND RENEWAL
At a meeting of the Board of Trustees of Transamerica IDEX Mutual Funds ("TA IDEX") held on October 6, 2004, the Board considered and approved the renewal for a one-year period of the Investment Advisory Agreement between TA IDEX Protected Principal Stock (the "Fund") and Transamerica Fund Advisors, Inc. ("TFAI") as well as the Investment Sub-Advisory Agreement of the Fund between TFAI and Gateway Investment Advisers, LP (the "Sub-Adviser"). In approving the renewal of these agreements, the Board concluded that the Investment Advisory and Investment Sub-Advisory Agreements enable shareholders of the Fund to obtain high quality services at a cost that is appropriate, reasonable, and in the best interests of shareholders based upon the following determinations, among others:
The nature, extent and quality of the advisory service to be provided. The Board considered the nature and quality of the services provided by TFAI and the Sub-Adviser to the Fund in the past, as well as the services anticipated to be provided in the future. The Board concluded that TFAI and the Sub-Adviser are capable of providing high quality services to the Fund, as indicated by TFAI's management capabilities demonstrated with respect to the Fund and other funds managed by TFAI, the level and nature of services provided by TFAI, TFAI's management oversight process, and the professional qualifications and experience of the Sub-Adviser's portfolio management team, and the unique management style employed with respect to a protected principal fund. The Board also concluded that TFAI and the Sub- Adviser would provide the same quality and quantity of investment management and related services as before, that these services are appropriate in scope and extent in light of the Fund's operations, the competitive landscape of the investment company business and investor needs, and that TFAI's and the Sub-Adviser's obligations will remain the same in all respects.
The investment performance of the Fund. The Board noted the low investment performance of the Fund over the past year relative to the Fund's benchmark index. However, the Board considered the unique nature of the Fund, which is structured with a guarantee feature and the effect of the Fund's structure on its performance, and concluded that the Fund's performance was acceptable in light of its mandate.
The cost of advisory services provided and the level of profitability. On the basis of the Board's review of the fees to be charged by TFAI and the Sub-Adviser for investment advisory and related services, TFAI's financial statements, the fees paid by TFAI to the Sub-Adviser, TFAI's estimated net management income resulting from its management of the Fund, the estimated profitability of TFAI's relationships with the Fund and TA IDEX, and the estimated profitability of the Sub-Adviser's relationship with the Fund, the Board concluded that the level of investment advisory fees and the profitability is appropriate in light of the services provided, the unique guarantee feature of the Fund, and the anticipated profitability of the relationship between the Fund, TFAI and the Sub-Adviser.
The extent to which economies of scale would be realized as the Fund grows and whether fee levels reflect these economies of scale for the benefit of Fund investors. The Board noted that the Fund is closed to new investments due, in part, to the Fund's guarantee feature. Consequently, the Board concluded that there is limited opportunity for the Fund to realize economies of scale and increase its assets through issuance of shares to new investors, and concluded that the advisory fees appropriately reflect the Fund's current size, the current economic environment for TFAI, and the competitive nature of the investment company market. Under the circumstances, the Board determined that it was appropriate that the Fund's investment advisory fees do not reduce should Fund assets grow meaningfully. The Board also noted that it will have the opportunity to periodically re-examine whether the Fund has achieved economies of scale by virtue of asset growth due to investment performance, as well as the appropriateness of advisory fees payable to TFAI and the Sub-Adviser, in the future.
Benefits (such as soft dollars) to TFAI or the Sub-Adviser from its relationship with the Fund. The Board concluded that other benefits derived by TFAI or the Sub-Adviser from its relationship with the Fund are reasonable and fair, and are consistent with industry practice and the best interests of the Fund and its shareholders. In this regard, the Board noted that TFAI does not realize "soft dollar" benefits from its relationship with the Fund, and that the Sub-Adviser engaged in "soft dollar" arrangements consistent with applicable law and "best execution" requirements.
Other considerations. The Board also determined that TFAI had made a substantial commitment to the recruitment and retention of high quality personnel, and maintained the financial, compliance and operational resources reasonably necessary to manage the Fund in a professional manner that is consistent with the best interests of the Fund and its shareholders. The Trustees also concluded that TFAI had made a significant entrepreneurial commitment to the management and success of the Fund, reflected by TFAI's expense limitation and fee waiver arrangement with the Fund which, as demonstrated in the past with the Fund, may result in TFAI waiving a substantial amount of advisory fees for the benefit of shareholders.
Transamerica IDEX Mutual Funds
Semi-Annual Report 2005
16
TA IDEX Protected Principal Stock
SUPPLEMENTAL INFORMATION (unaudited)
RESULTS OF SHAREHOLDER PROXY
At a special meeting of shareholders held on February 25, 2005, the results of the Proposals were as follows:
Transamerica IDEX Mutual Funds
Proposal 1: Election of Trustees to the Board of Trustees of Transamerica IDEX Mutual Funds.
| For | Withheld | ||||||||||
| Peter R. Brown | 872,017,875.249 | 4,468,498.551 | |||||||||
| Daniel Calabria | 871,917,069.786 | 4,569,304.014 | |||||||||
| Janise B. Case | 872,099,393.125 | 4,386,980.675 | |||||||||
| Charles C. Harris | 872,086,722.025 | 4,399,651.775 | |||||||||
| Leo J. Hill | 872,304,465.640 | 4,181,908.160 | |||||||||
| Russell A. Kimball, Jr. | 872,253,556.471 | 4,232,817.329 | |||||||||
| William W. Short, Jr. | 872,139,920.944 | 4,346,452.856 | |||||||||
| John Waechter | 872,261,152.376 | 4,225,221.424 | |||||||||
| Jack E. Zimmerman | 871,929,967.512 | 4,556,406.288 | |||||||||
| Brian C. Scott | 872,218,970.367 | 4,267,403.433 | |||||||||
| Thomas P. O'Neill | 872,111,944.117 | 4,374,429.683 | |||||||||
TA IDEX Protected Principal Stock
Proposal 2: Approval of an Agreement and Plan of Reorganization pursuant to which Transamerica IDEX Mutual Funds will organize as a Delaware statutory trust.
| For | Against | Abstentions/Broker Non-Votes | |||||||||
| 1,948,454.551 | 74,645.058 | 848,975.577 | |||||||||
Proposal 3: Approval of changes to the fundamental investment restrictions of TA IDEX Protected Principal Stock.
| A. Diversification | For | Against | Abstentions/Broker Non-Votes | ||||||||||||
| 1,973,094.974 | 122,234.212 | 776,746.000 | |||||||||||||
| B. Borrowing | For | Against | Abstentions/Broker Non-Votes | ||||||||||||
| 1,964,939.050 | 130,390.136 | 776,746.000 | |||||||||||||
| C. Senior Securities | For | Against | Abstentions/Broker Non-Votes | ||||||||||||
| 1,973,525.747 | 121,803.439 | 776,746.000 | |||||||||||||
| D. Underwriting Securities | For | Against | Abstentions/Broker Non-Votes | ||||||||||||
| 1,974,713.966 | 120,615.220 | 776,746.000 | |||||||||||||
| E. Real Estate | For | Against | Abstentions/Broker Non-Votes | ||||||||||||
| 1,972,506.039 | 122,823.147 | 776,746.000 | |||||||||||||
| F. Making Loans | For | Against | Abstentions/Broker Non-Votes | ||||||||||||
| 1,952,148.747 | 143,684.439 | 776,242.000 | |||||||||||||
| G. Concentration | For | Against | Abstentions/Broker Non-Votes | ||||||||||||
| 1,956,538.143 | 138,791.043 | 776,746.000 | |||||||||||||
| H. Commodities | For | Against | Abstentions/Broker Non-Votes | ||||||||||||
| 1,936,984.966 | 158,344.220 | 776,746.000 | |||||||||||||
| Short Selling | K. Margin Activities and For | Against | Abstentions/Broker-Non-Votes | ||||||||||||
| 1,950,815.758 | 145,017.428 | 776,242.000 | |||||||||||||
Transamerica IDEX Mutual Funds
Semi-Annual Report 2005
17
TA IDEX Salomon All Cap
UNDERSTANDING YOUR FUND'S EXPENSES
(unaudited)
SHAREHOLDER EXPENSES
The following Example is intended to help you understand your ongoing costs (in dollars and cents) of investing in a Fund and to compare these costs with the ongoing costs of investing in other funds.
The Example is based on an investment of $1,000 invested at November 1, 2004 and held for the entire period until April 30, 2005.
ACTUAL EXPENSES
The first line in the table below provides information about actual account values and actual expenses. You may use the information in this line, together with the amount you invested, to estimate the expenses that you paid over the period. Simply divide your account value by $1,000 (for example, an $8,600 account value divided by $1,000 = 8.6), then multiply the result by the number in the first line of your Fund under the heading entitled "Expenses Paid During Period" to estimate the expenses you paid on your account during this period.
HYPOTHETICAL EXAMPLE FOR COMPARISON PURPOSES
The second line in the table below provides information about hypothetical account values and hypothetical expenses based on the Fund's actual expense ratio and an assumed rate of return of 5% per year before expenses, which is not the Fund's actual return. The hypothetical account values and expenses may not be used to estimate the actual ending account balance or expenses you paid for the period. You may use this information to compare the ongoing costs of investing in your Fund and other funds. To do so, compare this 5% hypothetical example with the 5% hypothetical examples that appear in the shareholder reports of the other funds.
Please note that the expenses shown in the table are meant to highlight your ongoing costs only and do not reflect any transactional costs, such as sales charges, redemption fees, brokerage commissions paid on purchases and sales of fund shares. Therefore, the second line under the Fund in the table is useful in comparing ongoing costs only, and will not help you determine the relative total costs of owning different funds. In addition, note that the expenses shown in the table are meant to highlight your ongoing costs and do not reflect any transaction costs.
| Beginning Account Value | Ending Account Value | Annualized Expense Ratio | Expenses Paid During Period (a) | ||||||||||||||||
| Class A | |||||||||||||||||||
| Actual | $ | 1,000.00 | $ | 1,006.80 | 1.27 | % | $ | 6.32 | |||||||||||
| Hypothetical (b) | 1,000.00 | 1,018.50 | 1.27 | 6.36 | |||||||||||||||
| Class B | |||||||||||||||||||
| Actual | 1,000.00 | 1,002.70 | 2.07 | 10.27 | |||||||||||||||
| Hypothetical (b) | 1,000.00 | 1,014.53 | 2.07 | 10.34 | |||||||||||||||
| Class C | |||||||||||||||||||
| Actual | 1,000.00 | 1,002.50 | 2.11 | 10.48 | |||||||||||||||
| Hypothetical (b) | 1,000.00 | 1,014.33 | 2.11 | 10.54 | |||||||||||||||
(a) Expenses are calculated using each Fund's annualized expense ratio (as disclosed in the table), multiplied by the average account value for the period, multiplied by number of days in the period (181 days), and divided by the number of days in the year (365 days).
(b) 5% return per year before expenses.
GRAPHICAL PRESENTATION OF SCHEDULE OF INVESTMENTS
By Sector
At April 30, 2005
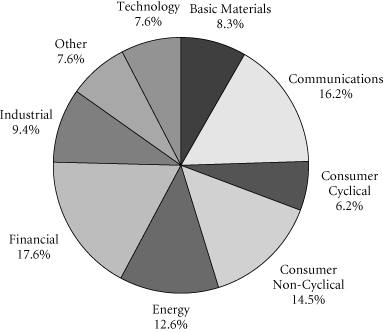
This chart shows the percentage breakdown by sector of the Fund's total investment securities.
Transamerica IDEX Mutual Funds
Semi-Annual Report 2005
1
TA IDEX Salomon All Cap
SCHEDULE OF INVESTMENTS
At April 30, 2005
(all amounts except share amounts in thousands)
(unaudited)
| Shares | Value | ||||||||||
| COMMON STOCKS (92.3%) | |||||||||||
| Aerospace (1.0%) | |||||||||||
| Boeing Co. (The) | 59,600 | $ | 3,547 | ||||||||
| Air Transportation (1.5%) | |||||||||||
| Southwest Airlines Co. | 354,400 | 5,274 | |||||||||
| Amusement & Recreation Services (1.2%) | |||||||||||
| Disney (Walt) Co. (The) | 159,900 | 4,221 | |||||||||
| Business Services (1.0%) | |||||||||||
| Clear Channel Communications, Inc. | 54,400 | 1,738 | |||||||||
| Interpublic Group of Cos., Inc. (a)(b) | 153,800 | 1,978 | |||||||||
| Chemicals & Allied Products (2.4%) | |||||||||||
| Dow Chemical Co. (The) | 101,200 | 4,648 | |||||||||
| du Pont (E.I.) de Nemours & Co. | 84,400 | 3,976 | |||||||||
| Commercial Banks (6.5%) | |||||||||||
| Bank of New York Co., Inc. (The) | 154,700 | 4,322 | |||||||||
| JPMorgan Chase & Co. | 192,900 | 6,846 | |||||||||
| MBNA Corp. | 129,900 | 2,566 | |||||||||
| Mitsubishi Tokyo Financial Group, Inc. | 690 | 5,961 | |||||||||
| State Street Corp. | 76,700 | 3,546 | |||||||||
| Communication (2.5%) | |||||||||||
| Comcast Corp.–Special Class A (a) | 164,200 | 5,210 | |||||||||
| Viacom, Inc.–Class B | 110,100 | 3,812 | |||||||||
| Communications Equipment (3.1%) | |||||||||||
| Lucent Technologies, Inc. (a) | 1,320,200 | 3,208 | |||||||||
| Motorola, Inc. | 266,500 | 4,088 | |||||||||
| Nokia Corp., ADR | 241,000 | 3,851 | |||||||||
| Computer & Data Processing Services (4.5%) | |||||||||||
| Electronics for Imaging (a)(b) | 169,000 | 2,775 | |||||||||
| Micromuse, Inc. (a) | 466,600 | 2,412 | |||||||||
| Microsoft Corp. | 290,500 | 7,350 | |||||||||
| RealNetworks, Inc. (a) | 586,700 | 3,614 | |||||||||
| Computer & Office Equipment (0.8%) | |||||||||||
| Cisco Systems, Inc. (a) | 175,900 | 3,040 | |||||||||
| Diversified (0.9%) | |||||||||||
| Honeywell International, Inc. | 86,900 | 3,108 | |||||||||
| Electronic & Other Electric Equipment (1.4%) | |||||||||||
| Samsung Electronics Co., Ltd., GDR–144A | 22,400 | 5,051 | |||||||||
| Electronic Components & Accessories (4.1%) | |||||||||||
| Maxwell Technologies, Inc. (a) | 90,200 | 697 | |||||||||
| Novellus Systems, Inc. | 75,000 | 1,757 | |||||||||
| Solectron Corp. (a) | 960,500 | 3,170 | |||||||||
| Taiwan Semiconductor Manufacturing Co., Ltd., ADR | 508,245 | 4,376 | |||||||||
| Texas Instruments, Inc. | 158,000 | 3,944 | |||||||||
| Tyco International, Ltd. | 28,100 | 880 | |||||||||
| Shares | Value | ||||||||||
| Food & Kindred Products (1.0%) | |||||||||||
| Unilever PLC, Sponsored ADR (b) | 96,300 | $ | 3,694 | ||||||||
| Food Stores (1.3%) | |||||||||||
| Safeway, Inc. (a)(b) | 214,200 | 4,560 | |||||||||
| Gas Production & Distribution (1.5%) | |||||||||||
| Dynegy, Inc.–Class A (a) | 53,100 | 178 | |||||||||
| Williams Cos., Inc. (The) | 298,400 | 5,079 | |||||||||
| Health Services (0.9%) | |||||||||||
| Enzo Biochemical, Inc. (a)(b) | 248,899 | 3,390 | |||||||||
| Holding & Other Investment Offices (0.6%) | |||||||||||
| Digital Realty Trust, Inc. REIT | 142,800 | 2,038 | |||||||||
| Industrial Machinery & Equipment (4.3%) | |||||||||||
| Applied Materials, Inc. (a)(b) | 254,500 | 3,784 | |||||||||
| Baker Hughes, Inc. | 64,400 | 2,841 | |||||||||
| Caterpillar, Inc. | 59,800 | 5,265 | |||||||||
| Deere & Co. | 54,300 | 3,396 | |||||||||
| Instruments & Related Products (2.5%) | |||||||||||
| Agilent Technologies, Inc. (a) | 153,500 | 3,185 | |||||||||
| Raytheon Co. | 157,300 | 5,916 | |||||||||
| Insurance (6.3%) | |||||||||||
| AMBAC Financial Group, Inc. | 54,300 | 3,630 | |||||||||
| American International Group, Inc. | 70,800 | 3,600 | |||||||||
| Chubb Corp. | 58,580 | 4,791 | |||||||||
| MGIC Investment Corp. (b) | 61,600 | 3,634 | |||||||||
| PMI Group, Inc. (The) | 196,200 | 6,898 | |||||||||
| Insurance Agents, Brokers & Service (1.0%) | |||||||||||
| Hartford Financial Services Group, Inc. (The) | 48,300 | 3,495 | |||||||||
| Lumber & Other Building Materials (1.1%) | |||||||||||
| Home Depot, Inc. (The) | 111,100 | 3,930 | |||||||||
| Lumber & Wood Products (1.4%) | |||||||||||
| Weyerhaeuser Co. | 71,700 | 4,919 | |||||||||
| Medical Instruments & Supplies (0.3%) | |||||||||||
| Boston Scientific Corp. (a) | 33,000 | 976 | |||||||||
| Metal Mining (0.9%) | |||||||||||
| Newmont Mining Corp. (b) | 83,200 | 3,159 | |||||||||
| Mining (0.1%) | |||||||||||
| WGI Heavy Minerals, Inc. (a) | 104,300 | 249 | |||||||||
| Motion Pictures (3.2%) | |||||||||||
| News Corp., Inc.–Class A | 124,800 | 1,907 | |||||||||
| News Corp., Inc.–Class B (b) | 290,000 | 4,617 | |||||||||
| Time Warner, Inc. (a) | 303,300 | 5,099 | |||||||||
| Motor Vehicles, Parts & Supplies (0.6%) | |||||||||||
| BorgWarner, Inc. | 51,100 | 2,336 | |||||||||
The notes to the financial statements are an integral part of this report.
Transamerica IDEX Mutual Funds
Semi-Annual Report 2005
2
TA IDEX Salomon All Cap
SCHEDULE OF INVESTMENTS (continued)
At April 30, 2005
(all amounts except share amounts in thousands)
(unaudited)
| Shares | Value | ||||||||||
| Oil & Gas Extraction (5.0%) | |||||||||||
| Anadarko Petroleum Corp. | 63,900 | $ | 4,667 | ||||||||
| Canadian Natural Resources, Ltd. | 54,100 | 2,680 | |||||||||
| GlobalSantaFe Corp. | 88,400 | 2,970 | |||||||||
| Halliburton Co. | 101,900 | 4,238 | |||||||||
| Schlumberger, Ltd. | 51,500 | 3,523 | |||||||||
| Petroleum Refining (5.3%) | |||||||||||
| BP PLC, ADR | 28,600 | 1,742 | |||||||||
| ChevronTexaco Corp. | 62,400 | 3,245 | |||||||||
| ConocoPhillips | 18,400 | 1,929 | |||||||||
| Exxon Mobil Corp. | 63,000 | 3,593 | |||||||||
| Murphy Oil Corp. | 93,900 | 8,366 | |||||||||
| Pharmaceuticals (11.0%) | |||||||||||
| Abbott Laboratories | 120,300 | 5,914 | |||||||||
| Amgen, Inc. (a) | 50,800 | 2,957 | |||||||||
| Aphton Corp. (a)(b) | 553,200 | 498 | |||||||||
| GlaxoSmithKline PLC, ADR | 99,700 | 5,040 | |||||||||
| Johnson & Johnson | 101,700 | 6,980 | |||||||||
| Lilly (Eli) & Co. | 30,800 | 1,801 | |||||||||
| Novartis AG, ADR | 121,100 | 5,901 | |||||||||
| Pfizer, Inc. | 187,400 | 5,092 | |||||||||
| Wyeth | 117,700 | 5,289 | |||||||||
| Primary Metal Industries (3.5%) | |||||||||||
| Alcoa, Inc. | 152,900 | 4,437 | |||||||||
| Allegheny Technologies, Inc. | 39,100 | 876 | |||||||||
| Engelhard Corp. | 130,500 | 3,997 | |||||||||
| RTI International Metals, Inc. (a) | 153,700 | 3,457 | |||||||||
| Radio & Television Broadcasting (1.0%) | |||||||||||
| IAC/InterActive Corp. (a)(b) | 71,900 | 1,563 | |||||||||
| Pearson PLC | 155,100 | 1,890 | |||||||||
| Security & Commodity Brokers (3.2%) | |||||||||||
| American Express Co. | 88,400 | 4,659 | |||||||||
| Merrill Lynch & Co., Inc. | 72,700 | 3,921 | |||||||||
| Morgan Stanley | 58,800 | 3,094 | |||||||||
| Telecommunications (2.3%) | |||||||||||
| SBC Communications, Inc. | 155,900 | 3,710 | |||||||||
| Vodafone Group PLC, ADR | 177,800 | 4,648 | |||||||||
| Toys, Games & Hobbies (2.0%) | |||||||||||
| Hasbro, Inc. | 194,500 | 3,680 | |||||||||
| Mattel, Inc. | 186,800 | 3,372 | |||||||||
| Transportation Equipment (0.0%) | |||||||||||
| Fleetwood Enterprises, Inc. (a)(b) | 11,900 | 91 | |||||||||
| Variety Stores (1.0%) | |||||||||||
| Costco Wholesale Corp. | 88,400 | 3,587 | |||||||||
| Wholesale Trade Durable Goods (0.1%) | |||||||||||
| IKON Office Solutions, Inc. | 33,200 | 287 | |||||||||
| Total Common Stocks (cost: $318,768) | 331,226 | ||||||||||
| Principal | Value | ||||||||||
| SECURITY LENDING COLLATERAL (7.6%) | |||||||||||
| Debt (6.6%) | |||||||||||
| Bank Notes (0.9%) | |||||||||||
| Bank of America | |||||||||||
| 2.82%, due 05/16/2005 | $ | 858 | $ | 858 | |||||||
| 2.80%, due 06/09/2005 (c) | 214 | 214 | |||||||||
| 2.77%, due 07/18/2005 (c) | 858 | 858 | |||||||||
| Canadian Imperial Bank of Commerce 3.02%, due 11/04/2005 (c) | 858 | 858 | |||||||||
| Credit Suisse First Boston Corp. 2.88%, due 09/09/2005 (c) 3.06%, due 03/10/2006 (c) | 214 214 | 214 214 | |||||||||
| Euro Dollar Overnight (1.1%) | |||||||||||
| Bank of Montreal 2.94%, due 05/04/2005 | 644 | 644 | |||||||||
| BNP Paribas 2.80%, due 05/05/2005 | 888 | 888 | |||||||||
| Den Danske Bank 2.93%, due 05/02/2005 2.80%, due 05/06/2005 | 772 429 | 772 429 | |||||||||
| Dexia Group 2.80%, due 05/05/2005 | 379 | 379 | |||||||||
| Royal Bank of Canada 2.80%, due 05/04/2005 | 880 | 880 | |||||||||
| Svenska Handlesbanken 2.80%, due 05/06/2005 | 141 | 141 | |||||||||
| Euro Dollar Terms (2.7%) | |||||||||||
| Bank of Nova Scotia 2.88%, due 05/11/2005 3.01%, due 05/31/2005 | 429 1,200 | 429 1,200 | |||||||||
| Barclays 3.02%, due 06/27/2005 | 765 | 765 | |||||||||
| BNP Paribas 2.93%, due 06/07/2005 | 687 | 687 | |||||||||
| Branch Banker & Trust 2.94%, due 06/06/2005 | 183 | 183 | |||||||||
| Calyon 2.93%, due 06/03/2005 | 709 | 709 | |||||||||
| Citigroup 2.87%, due 06/06/2005 | 891 | 891 | |||||||||
| Credit Suisse First Boston Corp. 2.91%, due 05/16/2005 | 879 | 879 | |||||||||
| HSBC Banking/Holdings PLC 3.01%, due 06/23/2005 | 429 | 429 | |||||||||
| Royal Bank of Scotland 2.94%, due 06/07/2005 2.95%, due 06/10/2005 | 833 463 | 833 463 | |||||||||
| Societe Generale 2.80%, due 05/03/2005 | 821 | 821 | |||||||||
The notes to the financial statements are an integral part of this report.
Transamerica IDEX Mutual Funds
Semi-Annual Report 2005
3
TA IDEX Salomon All Cap
SCHEDULE OF INVESTMENTS (continued)
At April 30, 2005
(all amounts except share amounts in thousands)
(unaudited)
| Principal | Value | ||||||||||
| Euro Dollar Terms (continued) | |||||||||||
| Toronto Dominion Bank | |||||||||||
| 2.75%, due 05/09/2005 | $ | 644 | $ | 644 | |||||||
| 3.01%, due 06/24/2005 | 238 | 238 | |||||||||
| UBS AG 2.81%, due 05/03/2005 | 429 | 429 | |||||||||
| Promissory Notes (0.7%) | |||||||||||
| Goldman Sachs Group, Inc. 2.99%, due 06/27/2005 3.01%, due 07/27/2005 | 901 1,502 | 901 1,502 | |||||||||
| Repurchase Agreements (1.2%) (d) | |||||||||||
| Goldman Sachs Group, Inc. 3.04% Repurchase Agreement dated 04/29/2005 to be repurchased at $1,931 on 05/02/2005 | 1,931 | 1,931 | |||||||||
| Merrill Lynch & Co., Inc. 3.04% Repurchase Agreement dated 04/29/2005 to be repurchased at $2,317 on 05/02/2005 | 2,317 | 2,317 | |||||||||
| Shares | Value | ||||||||||
| Investment Companies (1.0%) | |||||||||||
| Money Market Funds (1.0%) | |||||||||||
| American Beacon Funds 1-day yield of 2.84% | 340,741 | $ | 341 | ||||||||
| BGI Institutional Money Market Fund 1-day yield of 2.93% | 2,017,719 | 2,018 | |||||||||
| Merrill Lynch Premier Institutional Fund 1-day yield of 2.65% | 454,051 | 454 | |||||||||
| Merrimac Cash Fund, Premium Class 1-day yield of 2.74% (e) | 830,452 | 830 | |||||||||
| Total Security Lending Collateral (cost: $27,243) | 27,243 | ||||||||||
| Total Investment Securities (cost: $346,011) | $ | 358,469 | |||||||||
| SUMMARY: | |||||||||||
| Investments, at value | 99.9 | % | $ | 358,469 | |||||||
| Other assets in excess of liabilities | 0.1 | % | 257 | ||||||||
| Net assets | 100.0 | % | $ | 358,726 | |||||||
NOTES TO SCHEDULE OF INVESTMENTS:
(a) No dividends were paid during the preceding twelve months.
(b) At April 30, 2005, all or a portion of this security is on loan (see Note 1). The value at April 30, 2005, of all securities on loan is $25,069.
(c) Floating or variable rate note. Rate is listed as of April 30, 2005.
(d) Cash collateral for the Repurchase Agreements, valued at $4,321, that serve as collateral for securities lending are invested in corporate bonds with interest rates and maturity dates ranging from 0.00%–8.875% and 06/15/2005–03/15/2035, respectively.
(e) Regulated investment company advised by Investors Bank and Trust Co. ("IBT"). IBT is also the accounting, custody and lending agent for the Fund.
DEFINITIONS:
144A 144A Securities are registered pursuant to Rule 144A of the Securities Act of 1933. These securities are deemed to be liquid for purposes of compliance limitations on holdings of illiquid securities and may be resold as transactions exempt from registration, normally to qualified institutional buyers. At April 30, 2005, these securities aggregated $5,051 or 1.4% of the net assets of the Fund.
ADR American Depositary Receipt
GDR Global Depositary Receipt
REIT Real Estate Investment Trust
The notes to the financial statements are an integral part of this report.
Transamerica IDEX Mutual Funds
Semi-Annual Report 2005
4
TA IDEX Salomon All Cap
STATEMENT OF ASSETS AND LIABILITIES
At April 30, 2005
(all amounts except per share amounts in thousands)
(unaudited)
| Assets: | |||||||
| Investment securities, at value (cost: $346,011) (including securities loaned of $25,069) | $ | 358,469 | |||||
| Cash | 26,982 | ||||||
| Receivables: | |||||||
| Investment securities sold | 1,465 | ||||||
| Shares of beneficial interest sold | 74 | ||||||
| Interest | 49 | ||||||
| Dividends | 457 | ||||||
| Dividend reclaims receivable | 14 | ||||||
| Other | 147 | ||||||
| 387,657 | |||||||
| Liabilities: | |||||||
| Investment securities purchased | 493 | ||||||
| Accounts payable and accrued liabilities: | |||||||
| Shares of beneficial interest redeemed | 501 | ||||||
| Management and advisory fees | 285 | ||||||
| Distribution and service fees | 210 | ||||||
| Transfer agent fees | 144 | ||||||
| Payable for collateral for securities on loan | 27,243 | ||||||
| Other | 55 | ||||||
| 28,931 | |||||||
| Net Assets | $ | 358,726 | |||||
| Net Assets Consist of: | |||||||
| Shares of beneficial interest, unlimited shares authorized, no par value | $ | 349,801 | |||||
| Undistributed net investment income (loss) | 512 | ||||||
| Accumulated net realized gain (loss) from investment securities and foreign currency transactions | (4,038 | ) | |||||
| Net unrealized appreciation (depreciation) on investment securities | 12,451 | ||||||
| Net Assets | $ | 358,726 | |||||
| Net Assets by Class: | |||||||
| Class A | $ | 169,741 | |||||
| Class B | 133,917 | ||||||
| Class C | 55,068 | ||||||
| Shares Outstanding: | |||||||
| Class A | 11,390 | ||||||
| Class B | 9,357 | ||||||
| Class C | 3,850 | ||||||
| Net Asset Value Per Share: | |||||||
| Class A | $ | 14.90 | |||||
| Class B | 14.31 | ||||||
| Class C | 14.30 | ||||||
| Maximum Offering Price Per Share (a): | |||||||
| Class A | $ | 15.77 | |||||
(a) Includes the maximum selling commission (represented as a percentage of offering price) which is reduced on certain levels of sales as set forth in the Prospectus. Net asset value per share for Classes B and C shares represents offering price. The redemption price for Classes B and C shares equals net asset value less any applicable contingent deferred sales charge.
STATEMENT OF OPERATIONS
For the period ended April 30, 2005
(all amounts in thousands)
(unaudited)
| Investment Income: | |||||||
| Interest | $ | 269 | |||||
| Dividends | 4,725 | ||||||
| Income from loaned securities–net | 45 | ||||||
| Less withholding taxes on foreign dividends | (33 | ) | |||||
| 5,006 | |||||||
| Expenses: | |||||||
| Management and advisory fees | 2,217 | ||||||
| Transfer agent fees: | |||||||
| Class A | 101 | ||||||
| Class B | 157 | ||||||
| Class C | 71 | ||||||
| Printing and shareholder reports | 59 | ||||||
| Custody fees | 42 | ||||||
| Administration fees | 51 | ||||||
| Legal fees | 18 | ||||||
| Audit fees | 7 | ||||||
| Trustees fees | 17 | ||||||
| Registration fees: | |||||||
| Class A | 29 | ||||||
| Class B | 10 | ||||||
| Class C | 11 | ||||||
| Distribution and service fees: | |||||||
| Class A | 625 | ||||||
| Class B | 740 | ||||||
| Class C | 314 | ||||||
| Total expenses | 4,469 | ||||||
| Net Investment Income (Loss) | 537 | ||||||
| Net Realized Gain (Loss) from: | |||||||
| Investment securities | 45,909 | ||||||
| Foreign currency transactions | (23 | ) | |||||
| 45,886 | |||||||
| Increase (decrease) in unrealized appreciation (depreciation) on investment securities | (30,535 | ) | |||||
| Net Gain (Loss) on Investments and Foreign Currency Transactions | 15,351 | ||||||
| Net Increase (Decrease) in Net Assets Resulting from Operations | $ | 15,888 | |||||
The notes to the financial statements are an integral part of this report.
Transamerica IDEX Mutual Funds
Semi-Annual Report 2005
5
TA IDEX Salomon All Cap
STATEMENTS OF CHANGES IN NET ASSETS
For the period or year ended
(all amounts in thousands)
| April 30, 2005 (unaudited) | October 31, 2004 | ||||||||||
| Increase (Decrease) In Net Assets From: | |||||||||||
| Operations: | |||||||||||
| Net investment income (loss) | $ | 537 | $ | (2,597 | ) | ||||||
| Net realized gain (loss) from investment securities and foreign currency transactions | 45,886 | 25,144 | |||||||||
| Net unrealized appreciation (depreciation) on investment securities | (30,535 | ) | 6,182 | ||||||||
| 15,888 | 28,729 | ||||||||||
| Distributions to Shareholders: | |||||||||||
| From net investment income: | |||||||||||
| Class A | (19 | ) | – | ||||||||
| (19 | ) | – | |||||||||
| Capital Share Transactions: | |||||||||||
| Proceeds from shares sold: | |||||||||||
| Class A | 2,960 | 172,341 | |||||||||
| Class B | 4,054 | 20,598 | |||||||||
| Class C | 1,682 | 8,093 | |||||||||
| Class C2 | – | 2,046 | |||||||||
| Class M | – | 2,231 | |||||||||
| 8,696 | 205,309 | ||||||||||
| Dividends and distributions reinvested: | |||||||||||
| Class A | 19 | – | |||||||||
| 19 | – | ||||||||||
| Cost of shares redeemed: | |||||||||||
| Class A | (285,580 | ) | (22,683 | ) | |||||||
| Class B | (21,977 | ) | (36,255 | ) | |||||||
| Class C | (12,568 | ) | (7,530 | ) | |||||||
| Class C2 | – | (7,820 | ) | ||||||||
| Class M | – | (9,325 | ) | ||||||||
| (320,125 | ) | (83,613 | ) | ||||||||
| Class level exchanges: | |||||||||||
| Class C | – | 62,362 | |||||||||
| Class C2 | – | (30,201 | ) | ||||||||
| Class M | – | (32,161 | ) | ||||||||
| – | – | ||||||||||
| Automatic conversions: | |||||||||||
| Class A | 88 | 98 | |||||||||
| Class B | (88 | ) | (98 | ) | |||||||
| – | – | ||||||||||
| (311,410 | ) | 121,696 | |||||||||
| Net increase (decrease) in net assets | (295,541 | ) | 150,425 | ||||||||
| April 30, 2005 (unaudited) | October 31, 2004 | ||||||||||
| Net Assets: | |||||||||||
| Beginning of period | $ | 654,267 | $ | 503,842 | |||||||
| End of period | $ | 358,726 | $ | 654,267 | |||||||
| Undistributed Net Investment Income (Loss) | $ | 512 | $ | (6 | ) | ||||||
| Share Activity: | |||||||||||
| Shares issued: | |||||||||||
| Class A | 191 | 11,625 | |||||||||
| Class B | 272 | 1,436 | |||||||||
| Class C | 113 | 567 | |||||||||
| Class C2 | – | 143 | |||||||||
| Class M | – | 154 | |||||||||
| 576 | 13,925 | ||||||||||
| Shares issued–reinvested from distributions: | |||||||||||
| Class A | 1 | – | |||||||||
| 1 | – | ||||||||||
| Shares redeemed: | |||||||||||
| Class A | (18,398 | ) | (1,535 | ) | |||||||
| Class B | (1,477 | ) | (2,548 | ) | |||||||
| Class C | (847 | ) | (536 | ) | |||||||
| Class C2 | – | (542 | ) | ||||||||
| Class M | – | (650 | ) | ||||||||
| (20,722 | ) | (5,811 | ) | ||||||||
| Class level exchanges: | |||||||||||
| Class C | – | 4,365 | |||||||||
| Class C2 | – | (2,082 | ) | ||||||||
| Class M | – | (2,271 | ) | ||||||||
| – | 12 | ||||||||||
| Automatic conversions: | |||||||||||
| Class A | 6 | 6 | |||||||||
| Class B | (6 | ) | (6 | ) | |||||||
| – | – | ||||||||||
| Net increase (decrease) in shares outstanding: | |||||||||||
| Class A | (18,200 | ) | 10,096 | ||||||||
| Class B | (1,211 | ) | (1,118 | ) | |||||||
| Class C | (734 | ) | 4,396 | ||||||||
| Class C2 | – | (2,481 | ) | ||||||||
| Class M | – | (2,767 | ) | ||||||||
| (20,145 | ) | 8,126 | |||||||||
The notes to the financial statements are an integral part of this report.
Transamerica IDEX Mutual Funds
Semi-Annual Report 2005
6
TA IDEX Salomon All Cap
FINANCIAL HIGHLIGHTS
(unaudited for period ended April 30, 2005)
| For a share of beneficial interest outstanding throughout each period | |||||||||||||||||||||||||||||||||||||||
| Net Asset | Investment Operations | Distributions | Net Asset | ||||||||||||||||||||||||||||||||||||
| For the Period Ended (d)(g) | Value, Beginning of Period | Net Investment Income (Loss) | Net Realized and Unrealized Gain (Loss) | Total Operations | From Net Investment Income | From Net Realized Gains | Total Distributions | Value, End of Period | |||||||||||||||||||||||||||||||
| Class A | 4/30/2005 | $ | 14.80 | $ | 0.04 | $ | 0.06 | $ | 0.10 | $ | – | (h) | $ | – | $ | – | $ | 14.90 | |||||||||||||||||||||
| 10/31/2004 | 13.95 | (0.03 | ) | 0.88 | 0.85 | – | – | – | 14.80 | ||||||||||||||||||||||||||||||
| 10/31/2003 | 10.34 | (0.04 | ) | 3.65 | 3.61 | – | – | – | 13.95 | ||||||||||||||||||||||||||||||
| 10/31/2002 | 13.63 | – | (3.15 | ) | (3.15 | ) | – | (0.14 | ) | (0.14 | ) | 10.34 | |||||||||||||||||||||||||||
| 10/31/2001 | 15.51 | 0.12 | (1.58 | ) | (1.46 | ) | – | (0.42 | ) | (0.42 | ) | 13.63 | |||||||||||||||||||||||||||
| 10/31/2000 | 11.70 | 0.08 | 3.92 | 4.00 | – | (0.19 | ) | (0.19 | ) | 15.51 | |||||||||||||||||||||||||||||
| Class B | 4/30/2005 | 14.27 | (0.03 | ) | 0.07 | 0.04 | – | – | – | 14.31 | |||||||||||||||||||||||||||||
| 10/31/2004 | 13.53 | (0.11 | ) | 0.85 | 0.74 | – | – | – | 14.27 | ||||||||||||||||||||||||||||||
| 10/31/2003 | 10.08 | (0.12 | ) | 3.57 | 3.45 | – | – | – | 13.53 | ||||||||||||||||||||||||||||||
| 10/31/2002 | 13.41 | (0.10 | ) | (3.09 | ) | (3.19 | ) | – | (0.14 | ) | (0.14 | ) | 10.08 | ||||||||||||||||||||||||||
| 10/31/2001 | 15.36 | 0.02 | (1.55 | ) | (1.53 | ) | – | (0.42 | ) | (0.42 | ) | 13.41 | |||||||||||||||||||||||||||
| 10/31/2000 | 11.66 | (0.03 | ) | 3.92 | 3.89 | – | (0.19 | ) | (0.19 | ) | 15.36 | ||||||||||||||||||||||||||||
| Class C | 4/30/2005 | 14.26 | (0.03 | ) | 0.07 | 0.04 | – | – | – | 14.30 | |||||||||||||||||||||||||||||
| 10/31/2004 | 13.53 | (0.12 | ) | 0.85 | 0.73 | – | – | – | 14.26 | ||||||||||||||||||||||||||||||
| 10/31/2003 | 10.26 | (0.12 | ) | 3.39 | 3.27 | – | – | – | 13.53 | ||||||||||||||||||||||||||||||
| Ratios/Supplemental Data | |||||||||||||||||||||||||||||||
| For the Period | Total | Net Assets, End of Period | Ratio of Expenses to Average Net Assets (a) | Net Investment Income (Loss) to Average | Portfolio Turnover | ||||||||||||||||||||||||||
| Ended (g) | Return (c) | (000's) | Net (e) | Total (f) | Net Assets (a) | Rate (b) | |||||||||||||||||||||||||
| Class A | 4/30/2005 | 0.68 | % | $ | 169,741 | 1.27 | % | 1.27 | % | 0.51 | % | 15 | % | ||||||||||||||||||
| 10/31/2004 | 6.09 | 438,047 | 1.33 | 1.33 | (0.17 | ) | 25 | ||||||||||||||||||||||||
| 10/31/2003 | 34.91 | 271,958 | 1.55 | 1.64 | (0.36 | ) | 30 | ||||||||||||||||||||||||
| 10/31/2002 | (23.44 | ) | 57,528 | 1.55 | 1.65 | (0.03 | ) | 162 | |||||||||||||||||||||||
| 10/31/2001 | (9.49 | ) | 77,791 | 1.58 | 1.68 | 0.75 | 82 | ||||||||||||||||||||||||
| 10/31/2000 | 34.50 | 25,575 | 1.55 | 2.41 | 0.45 | 91 | |||||||||||||||||||||||||
| Class B | 4/30/2005 | 0.27 | 133,917 | 2.07 | 2.07 | (0.35 | ) | 15 | |||||||||||||||||||||||
| 10/31/2004 | 5.48 | 150,829 | 1.97 | 1.97 | (0.80 | ) | 25 | ||||||||||||||||||||||||
| 10/31/2003 | 34.23 | 158,147 | 2.20 | 2.29 | (1.01 | ) | 30 | ||||||||||||||||||||||||
| 10/31/2002 | (24.11 | ) | 130,709 | 2.20 | 2.30 | (0.68 | ) | 162 | |||||||||||||||||||||||
| 10/31/2001 | (10.09 | ) | 167,214 | 2.23 | 2.33 | 0.10 | 82 | ||||||||||||||||||||||||
| 10/31/2000 | 33.72 | 38,203 | 2.20 | 3.06 | (0.20 | ) | �� | 91 | |||||||||||||||||||||||
| Class C | 4/30/2005 | 0.25 | 55,068 | 2.11 | 2.11 | (0.38 | ) | 15 | |||||||||||||||||||||||
| 10/31/2004 | 5.43 | 65,391 | 1.99 | 1.99 | (0.83 | ) | 25 | ||||||||||||||||||||||||
| 10/31/2003 | 31.87 | 2,547 | 2.20 | 2.29 | (1.01 | ) | 30 | ||||||||||||||||||||||||
NOTES TO FINANCIAL HIGHLIGHTS
(unaudited)
(a) Annualized.
(b) Not annualized for periods of less than one year.
(c) Total Return has been calculated for the applicable period without deduction of a sales load, if any, on an initial purchase. Periods of less than one year are not annualized.
(d) Per share information is calculated based on average number of shares outstanding for the years ended 10/31/2001, 10/31/2002, 10/31/2003, 10/31/2004, and for the six months ended April 30, 2005.
(e) Ratio of Net Expenses to Average Net Assets is net of fee waivers and reimbursements by the investment adviser, if any (see note 2).
(f) Ratio of Total Expenses to Average Net Assets includes all expenses before fee waivers and reimbursements by the investment adviser.
(g) TA IDEX Salomon All Cap ("the Fund") commenced operations on March 1, 1999. The inception date for the Fund's offering of share Class C was November 11, 2002.
(h) Distributions from net investment income were less than $0.01 per share.
The notes to the financial statements are an integral part of this report.
Transamerica IDEX Mutual Funds
Semi-Annual Report 2005
7
TA IDEX Salomon All Cap
NOTES TO FINANCIAL STATEMENTS
At April 30, 2005
(all amounts in thousands)
(unaudited)
NOTE 1. ORGANIZATION AND SIGNIFICANT ACCOUNTING POLICIES
Transamerica IDEX Mutual Funds is a Delaware statutory trust registered under the Investment Company Act of 1940, as amended (the "1940 Act"), as an open-end management investment company. Prior to March 1, 2005, Transamerica IDEX Mutual Funds was a Massachusetts business trust. TA IDEX Salomon All Cap ("the Fund"), part of Transamerica IDEX Mutual Funds, began operations on March 1, 1999.
The Fund is "non-diversified" under the 1940 act.
In the normal course of business, the Fund enters into contracts that contain a variety of representations and warranties, which provide general indemnifications. The Fund's maximum exposure under these arrangements is unknown, as this would involve future claims that may be made against the Fund and/or its affiliates that have not yet occurred. However, based on experience, the Fund expects the risk of loss to be remote.
See the Prospectus and Statement of Additional Information for a description of the Fund's investment objective.
In preparing the Fund's financial statements in accordance with accounting principles generally accepted in the United States of America ("GAAP"), estimates or assumptions (which could differ from actual results) may be used that affect reported amounts and disclosures. The following policies were consistently followed by the Fund, in accordance with GAAP.
Multiple class operations and expenses: The Fund currently offers three classes of shares, each with a public offering price that reflects different sales charges, if any, and expense levels. On June 15, 2004, Class C2 shares merged into Class C. On September 24, 2004, Class M shares merged into Class C. Class B shares will convert to Class A shares eight years after purchase. Income, non-class specific expenses and realized and unrealized gains and losses, are allocated daily to each class, based upon the value of shares outstanding method as permitted under Rule 18f-3 of the 1940 Act. Each class bears its own specific expenses as well as a portion of general, common expenses.
Pricing of shares: The Fund prices its shares on the basis of the net asset value of each class of shares of the Fund, which is determined as of the close of the New York Stock Exchange ("NYSE") (generally 4:00 p.m. Eastern Time) on each day on which the NYSE is open for trading.
Security valuations: Fund investments traded on an exchange are valued at the closing price on the day of valuation on the exchange where the security is principally traded. With respect to securities traded on NASDAQ NMS, such closing price may be last reported sales price or the NASDAQ Official Closing Price.
Securities traded in the over-the-counter market and listed securities for which no sale was reported on that date are valued at the last quoted bid price.
Debt securities are valued by independent pricing services at the last quoted bid price; however, those that mature in sixty days or less are valued at amortized cost, which approximates market.
Investment company securities are valued at net asset value of the underlying portfolio.
Foreign securities generally are valued based on quotations from the primary market in which they are traded and are translated from the local currency into U.S. dollars using closing exchange rates. Many foreign securities markets are open for trading at times when the U.S. markets are closed for trading, and many foreign securities markets close for trading before the close of the NYSE. The value of foreign securities may be affected significantly on a day that the NYSE is closed and an investor is unable to purchase or redeem shares. If a significant market event impacting the value of a portfolio security (e.g., natural disaster, company announcement, market volatility) occurs subsequent to the close of trading in the security, but prior to the calculation of the Fund's net asset value per share, market quotations for that security may be determined to be unreliable and, accordingly, not "readily av ailable." If market quotations are not readily available, and the impact of such a significant market event materially effects the net asset value per share of the Fund, an affected portfolio security will be valued at fair market value as determined in good faith using guidelines adopted by the Board of Trustees of the Fund, under the supervision of the Fund's Valuation Committee. Factors that may be considered to value foreign securities at fair market value may include, among others: the value of other securities traded on other markets, foreign currency exchange activity and the trading of financial products tied to foreign securities.
Other securities for which quotations are not readily available are valued at fair market value as determined in good faith using guidelines adopted by the Board of Trustees of the Fund, under the supervision of the Fund's Valuation Committee. These guidelines may include: the type of security; any restrictions on its resale; financial or business news of the issuer; similar or related securities that are actively trading; related corporate actions; and other significant events occurring after the close of trading in the security.
Cash: The Fund may leave cash overnight in its cash account with the custodian, Investors Bank & Trust Company ("IBT"). IBT has been contracted on behalf of the Fund to invest the excess cash into a savings account, which at April 30, 2005, was paying an interest rate of 2.02%.
Throughout the period, the Fund may have a cash overdraft balance. A fee is incurred on this overdraft, calculated by multiplying the overdraft by a rate based on the federal funds rate.
Transamerica IDEX Mutual Funds
Semi-Annual Report 2005
8
TA IDEX Salomon All Cap
NOTES TO FINANCIAL STATEMENTS (continued)
At April 30, 2005
(all amounts in thousands)
(unaudited)
NOTE 1.–(continued)
Repurchase agreements: The Fund is authorized to enter into repurchase agreements. The Fund, through IBT, receives delivery of the underlying securities, the value of which at the time of purchase is required to be an amount equal to at least 100% of the resale price. Repurchase agreements involve the risk that the seller will fail to repurchase the security, as agreed. In that case, the Fund will bear the risk of value fluctuations until the security can be sold and may encounter delays and incur costs in liquidating the security. In the event of bankruptcy or insolvency of the seller, delays and costs may be incurred.
Commission recapture: The sub-adviser, to the extent consistent with the best execution and usual commission rate policies and practices, may place security transactions of the Fund with broker/dealers with which Transamerica IDEX Mutual Funds has established a Commission Recapture Program. A Commission Recapture Program is any arrangement under which a broker/dealer applies a portion of the commissions received by such broker/dealer on the security transactions to the Fund. In no event will commissions paid by the Fund be used to pay expenses that would otherwise be borne by any other funds within Transamerica IDEX Mutual Funds, or by any other party.
Recaptured commissions during the six months ended April 30, 2005, of $99 are included in net realized gains on the Statement of Operations.
Securities lending: The Fund may lend securities to enhance fund earnings from investing cash collateral in making such loans to qualified borrowers (typically broker/dealers). The Fund has engaged its custodian bank, IBT, as a lending agent to administer its securities lending program. IBT earned $21 of program income for its services. When the Fund makes a security loan, it receives cash collateral as protection against the risk that the borrower will default on the loan, and records an asset for the cash invested collateral and a liability for the return of the collateral.
Loans of securities are required to be secured by collateral at least equal to 102% of the value of the securities at inception of the loan, and not less then 100% thereafter. The Fund may invest cash collateral in short-term money market instruments including: U.S. Treasury Bills, U.S. agency obligations, commercial paper, money market mutual funds, repurchase agreements and other highly rated, liquid investments. During the life of securities loans, the collateral and securities loaned remain subject to fluctuation in value. IBT marks to market securities loaned and the collateral each business day. If additional collateral is due (at least $1), IBT collects additional cash collateral from the borrowers. Although securities loaned will be fully collateralized at all times, IBT may experience delays in, or may be prevented from, recovering the collateral on behalf of the Fund. The Fund may recall a loa ned security position at any time from the borrower through IBT. In the event the borrower fails to timely return a recalled security, IBT may indemnify the Fund by purchasing replacement securities for the Fund at its own expense and claiming the collateral to fund such a purchase. IBT absorbs the loss if the collateral value is not sufficient to cover the cost of the replacement securities. If replacement securities are not available, IBT will credit the equivalent cash value to the Fund.
While a security is on loan, the Fund does not have the right to vote that security. However, if time permits, the Fund will attempt to recall a security on loan and vote the proxy.
Income from securities lending is included in the Statement of Operations. The amount of collateral and value of securities on loan are included in the Statement of Assets and Liabilities as well as in the Schedule of Investments.
Real Estate Investment Trusts ("REITs"): There are certain additional risks involved in investing in REITs. These include, but are not limited to, economic conditions, changes in zoning laws, real estate values, property taxes and interest rates.
Dividend income is recorded at management's estimate of the income included in distributions from the REIT investments. Distributions received in excess of the estimated amount are recorded as a reduction of the cost investments. The actual amounts of income, return of capital and capital gains are only determined by each REIT after the fiscal year end and may differ from the estimated amounts.
Security transactions and investment income: Security transactions are recorded on the trade date. Security gains and losses are calculated on the specific identification basis. Dividend income is recorded on the ex-dividend date or, in the case of foreign securities, as soon as the Fund is informed of the ex-dividend date. Interest income, including accretion of discounts and amortization of premiums, is recorded on the accrual basis commencing on the settlement date.
Foreign currency denominated investments: The accounting records of the Fund are maintained in U.S. dollars. Securities and other assets and liabilities denominated in foreign currencies are translated into U.S. dollars at the closing exchange rate each day. The cost of foreign securities is translated at the exchange rate in effect when the investment was acquired. The Fund combines fluctuations from currency exchange rates and fluctuations in value when computing net realized and unrealized gains or losses from investments.
Net foreign currency gains and losses resulting from changes in exchange rates include: 1) foreign currency fluctuations between trade date and settlement date of investment security transactions; 2) gains and losses on forward foreign currency contracts; and 3) the difference between the receivable amounts of interest and dividends recorded in the accounting records in U.S. dollars and the amounts actually received.
Foreign currency denominated assets may involve risks not typically associated with domestic transactions, including unanticipated movements in exchange currency rates, the degree of government supervision and regulation of security markets, and the possibility of political or economic instability.
Transamerica IDEX Mutual Funds
Semi-Annual Report 2005
9
TA IDEX Salomon All Cap
NOTES TO FINANCIAL STATEMENTS (continued)
At April 30, 2005
(all amounts in thousands)
(unaudited)
NOTE 1.–(continued)
Foreign capital gains taxes: The Fund may be subject to taxes imposed by countries in which it invests, with respect to its investment in issuers existing or operating in such countries. Such taxes are generally based on income earned or repatriated and capital gains realized on the sale of such investments. The Fund accrues such taxes when the related income or capital gains are earned. Some countries require governmental approval for the repatriation of investment income, capital or the proceeds of sales earned by foreign investors. In addition, if there is deterioration in a country's balance of payments or for other reasons, a country may impose temporary restrictions on foreign capital remittances abroad.
Account maintenance fees: If the shareholder account balance falls below $1 by either shareholder action or as a result of market action, a $25 (not in thousands) fee is assessed every year until the balance reaches $1. The fee is assessed by redeeming shares in the shareholder's account.
No fee will be charged under the following conditions:
• accounts opened within the preceding 24 months
• accounts with an active monthly Automatic Investment Plan ($50 (not in thousands) minimum per fund)
• accounts owned by an individual which, when combined by social security number, have a balance of $5 or more
• accounts owned by individuals in the same household (by address) that have a combined balance of $5 or more
• UTMA/UGMA accounts
• Fiduciary accounts
• B-share accounts whose shares have started to convert to A-shares accounts (as long as combined value of both accounts is at least $1)
For the six months ended April 30, 2005, this fee totaled $7. These fees are included in Paid in Capital in the Statement of Assets and Liabilities.
Redemption fees: A short-term trading redemption fee may be assessed on any fund shares in a fund account that are sold during the first five (5) NYSE trading days following their purchase date. This redemption fee will equal 2% of the amount redeemed and shares held the longest will be treated as being redeemed first and shares held the shortest as being redeemed last.
For the six months ended April 30, 2005, the Fund received less than $1 in redemption fees.
Dividend distributions: Distributions to shareholders are recorded on the ex-dividend date and are determined in accordance with Federal income tax regulations which may differ from GAAP.
NOTE 2. RELATED PARTY TRANSACTIONS
Transamerica Fund Advisors, Inc. ("TFAI") is the Fund's investment adviser. Transamerica Fund Services, Inc. ("TFS") is the Fund's administrator and transfer agent. AFSG Securities Corp. ("AFSG") is the Fund's distributor/principal underwriter. AFSG is 100% owned by AUSA Holding Company ("AUSA"). TFAI is a directly owned subsidiary of Western Reserve Life Assurance Co. of Ohio (78%) and AUSA (22%). TFS is a wholly owned subsidiary of WRL (50%) and AUSA (50%). AUSA and WRL are wholly owned indirect subsidiaries of AEGON, NV, a Netherlands corporation.
Effective January 1, 2005 AEGON/Transamerica Fund Advisors, Inc. ("ATFA") was renamed Transamerica Fund Advisors, Inc. ("TFAI"); AEGON/Transamerica Fund Services, Inc. ("ATFS") and AEGON/Transamerica Investor Services, Inc. ("ATIS") merged into one entity and was renamed Transamerica Fund Services, Inc. ("TFS").
The following schedule represents the percentage of fund assets owned by affiliated mutual funds (i.e. through the asset allocation funds):
| Net Assets | % of Net Assets | ||||||||||
| TA IDEX Asset Allocation– Conservative Portfolio | $ | 11 | 0.01 | % | |||||||
| TA IDEX Asset Allocation– Growth Portfolio | 36,341 | 10.13 | % | ||||||||
| TA IDEX Asset Allocation– Moderate Growth Portfolio | 47,711 | 6.57 | % | ||||||||
| TA IDEX Asset Allocation– Moderate Portfolio | 23,573 | 13.30 | % | ||||||||
| Total | $ | 107,636 | 30.01 | % | |||||||
Investment advisory fee: The Fund pays management fees to TFAI based on average daily net assets ("ANA") at the following breakpoints:
0.80% of the first $500 million of ANA
0.70% of ANA over $500 million
TFAI has contractually agreed to waive its advisory fee and will reimburse the Fund to the extent that operating expenses, excluding 12b-1 fees, exceed the following stated annual limit:
1.20% Expense Limit
Transamerica IDEX Mutual Funds
Semi-Annual Report 2005
10
TA IDEX Salomon All Cap
NOTES TO FINANCIAL STATEMENTS (continued)
At April 30, 2005
(all amounts in thousands)
(unaudited)
NOTE 2.–(continued)
Distribution and service fees: The Fund has a 12b-1 distribution plan under the 1940 Act pursuant to which an annual fee, based on average daily net assets, is paid to the distributor for various disbursements such as broker-dealer account servicing fees and other promotional expenses of the Fund. The Fund is authorized under the 12b-1 plan to pay fees on each class up to the following limits:
| Class A | 0.35 | % | |||||
| Class B | 1.00 | % | |||||
| Class C | 1.00 | % | |||||
In the case the Fund or a class of shares of the Fund is closed to new investors or investments, the Fund is authorized to pay 12b-1 fees for past sales and distribution efforts and present and past investor services.
Underwriter commissions relate to front-end sales charges imposed for Class A shares and contingent deferred sales charges from Classes B, C, and certain A share redemptions. For the six months ended April 30, 2005, the underwriter commissions were as follows:
| Received by Underwriter | $ | 329 | |||||
| Retained by Underwriter | 15 | ||||||
| Contingent Deferred Sales Charge | 204 | ||||||
Administrative services: The Fund has entered into an agreement with TFS for financial and legal fund administration services, which includes such items as compliance, expenses, financial statements and other reporting, distributions, tax returns, prospectus preparation, board of trustees meeting support and other legal matters. As of January 1, 2005 the Fund pays TFS an annual fee of 0.02% of average net assets. Prior to January 1, 2005 the Fund paid TFS an annual fee of 0.015% of average net assets. The Legal fees on the Statement of Operations are for fees paid to external legal counsel.
Transfer agent fees: The Fund pays TFS an annual per-account charge of $20 (not in thousands) for each open account and $1.63 (not in thousands) for each closed account. There is no new account charge. The Transfer agent fees on the Statement of Operations are made up of fees paid to TFS and costs associated with shareholder statements.
The Fund paid TFS $402 for the six months ended April 30, 2005.
Deferred compensation plan: Each eligible Fund Trustee may elect participation in the Deferred Compensation Plan ("the Plan"). Under the Plan, such Trustees may defer payment of a percentage of their total fees earned as a Fund Trustee. These deferred amounts may be invested in any Transamerica IDEX Mutual Fund. At April 30, 2005, the value of invested plan amount was $27. Invested plan amounts and the total liability for deferred compensation to the Trustees under the Plan at April 30, 2005, are included in the accompanying Statement of Assets and Liabilities.
Brokerage commissions: Brokerage commissions incurred on security transactions placed with an affiliate of the sub-adviser for the six months ended April 30, 2005, were $15.
NOTE 3. INVESTMENT TRANSACTIONS
The cost of securities purchased and proceeds from securities sold (excluding short-term securities) for the six months ended April 30, 2005, were as follows:
| Purchases of securities: | |||||||
| Long-Term excluding U.S. Government | $ | 76,374 | |||||
| U.S. Government | – | ||||||
| Proceeds from maturities and sales of securities: | |||||||
| Long-Term excluding U.S. Government | 383,686 | ||||||
| U.S. Government | – | ||||||
NOTE 4. FEDERAL INCOME TAX MATTERS
The Fund has not made any provision for federal income or excise taxes due to its policy to distribute all of its taxable income and capital gains to its shareholders and otherwise qualify as a regulated investment company under the Internal Revenue Code. Income and capital gain distributions are determined in accordance with income tax regulations, which may differ from GAAP. These differences are primarily due to differing treatment for items including, but not limited to, wash sales, net operating losses and capital loss carryforwards.
The capital loss carryforwards are available to offset future realized capital gains through the periods listed:
| Capital Loss Carryforward | Available through | ||||||
| $ | 35,550 | October 31, 2010 | |||||
| 14,057 | October 31, 2011 | ||||||
The aggregate cost of investments and composition of unrealized appreciation (depreciation) for federal income tax purposes as of April 30, 2005, are as follows:
| Federal Tax Cost Basis | $ | 346,205 | |||||
| Unrealized Appreciation | $ | 33,079 | |||||
| Unrealized (Depreciation) | (20,815 | ) | |||||
| Net Unrealized Appreciation (Depreciation) | $ | 12,264 | |||||
Transamerica IDEX Mutual Funds
Semi-Annual Report 2005
11
TA IDEX Salomon All Cap
NOTES TO FINANCIAL STATEMENTS (continued)
At April 30, 2005
(all amounts in thousands)
(unaudited)
NOTE 5. REGULATORY PROCEEDINGS
There continues to be significant federal and state regulatory activity relating to financial services companies, particularly mutual fund companies and their investment advisers. As part of an ongoing investigation regarding potential market timing, recordkeeping and trading compliance issues and matters affecting the Fund's investment adviser, TFAI, and certain employees and affiliates of TFAI likely to take some action against TFAI and certain of its affiliates at the conclusion of the investigation. The potential timing and the scope of any such action is difficult to predict. Although the impact of any action brought against TFAI and/or its affiliates is difficult to assess at the present time, the Fund currently believes that the likelihood that any such action will have a material adverse impact on it is remote. It is important to note that the Fund is not aware of any allegation of wrongdoing ag ainst it and its board at the time this semi-annual report is printed. Although it is not anticipated that these developments will have an adverse impact on the Fund, there can be no assurance at this time. TFAI and its affiliates are actively working with the SEC in regard to this matter; however, the exact resolution cannot be determined at this time. TFAI will take such actions that it deems necessary or appropriate to continue providing management services to the Fund and to bring all matters to an appropriate conclusion.
TFAI and/or its affiliates, and not the Fund, will bear the costs regarding these regulatory matters.
Transamerica IDEX Mutual Funds
Semi-Annual Report 2005
12
TA IDEX Salomon All Cap
INVESTMENT ADVISORY AND SUB-ADVISORY AGREEMENTS – REVIEW AND RENEWAL
At a meeting of the Board of Trustees of Transamerica IDEX Mutual Funds ("TA IDEX") held on October 6, 2004, the Board considered and approved the renewal for a one-year period of the Investment Advisory Agreement between TA IDEX Salomon All Cap (the "Fund") and Transamerica Fund Advisors, Inc. ("TFAI") as well as the Investment Sub-Advisory Agreement of the Fund between TFAI and Salomon Brothers Asset Management, Inc. (the "Sub-Adviser"). In approving the renewal of these agreements, the Board concluded that the Investment Advisory and Investment Sub-Advisory Agreements enable shareholders of the Fund to obtain high quality services at a cost that is appropriate, reasonable, and in the best interests of shareholders based upon the following determinations, among others:
The nature, extent and quality of the advisory service to be provided. The Board considered the nature and quality of the services provided by TFAI and the Sub-Adviser to the Fund in the past, as well as the services anticipated to be provided in the future. The Board concluded that TFAI and the Sub-Adviser are capable of providing high quality services to the Fund, as indicated by TFAI's management capabilities demonstrated with respect to the Fund and other funds managed by TFAI, TFAI's management oversight process, the professional qualifications and experience of the Sub-Adviser's portfolio management team, and the Fund's strong investment performance. The Board also concluded that TFAI and the Sub-Adviser would provide the same quality and quantity of investment management and related servi ces as before, that these services are appropriate in scope and extent in light of the Fund's operations, the competitive landscape of the investment company business and investor needs, and that TFAI's and the Sub-Adviser's obligations will remain the same in all respects.
The investment performance of the Fund. The Board concluded, based in particular on information provided by Lipper Analytics, that the Fund's investment performance was competitive or superior relative to comparable funds over trailing one-, two-, three-, and five-year periods and to the Fund's benchmark index over one- and five-year periods. On the basis of the Trustees' assessment of the nature, extent and quality of investment advisory and related services to be provided or procured by TFAI and the Sub-Adviser, the Trustees concluded that TFAI and the Sub-Adviser were capable of generating a level of long-term investment performance that is appropriate in light of the Fund's investment objective, policies and strategies and competitive with many other investment companies.
The cost of advisory services provided and the level of profitability. On the basis of the Board's review of the fees to be charged by TFAI and the Sub-Adviser for investment advisory and related services, TFAI's financial statements, the fees paid by TFAI to the Sub-Adviser, TFAI's estimated net management income resulting from its management of the Fund, the estimated profitability of TFAI's relationships with the Fund and TA IDEX, and the estimated profitability of the Sub-Adviser's relationship with the Fund, the Board concluded that the level of investment advisory fees and the profitability is appropriate in light of the services provided, the management fees and overall expense ratios of comparable investment companies, and the anticipated profitability of the relationship between the Fun d, TFAI and the Sub-Adviser. Further, on the basis of comparative information supplied by Lipper Analytics, the Board determined that the advisory fees of the Fund were consistent with industry averages, although the Board decided to monitor the Fund's expense ratio periodically in light of the Fund's higher-than-average level of operating expenses.
The extent to which economies of scale would be realized as the Fund grows and whether fee levels reflect these economies of scale for the benefit of Fund investors. The Trustees concluded that inclusion of asset-based breakpoints in the Fund's advisory fee schedule appropriately benefited investors by realizing economies of scale in the form of a lower advisory fee rate as the level of Fund assets increases. The Board also concluded that the advisory fees appropriately reflect the Fund's current size, the current economic environment for TFAI, and the competitive nature of the investment company market. In addition, the Board noted that it will have the opportunity to periodically re-examine whether the Fund has achieved economies of scale, as well as the appropriateness of advisory fees payabl e to TFAI and the Sub-Adviser in the future.
Benefits (such as soft dollars) to TFAI or the Sub-Adviser from its relationship with the Fund. The Board concluded that other benefits derived by TFAI or the Sub-Adviser from its relationship with the Fund are reasonable and fair, and are consistent with industry practice and the best interests of the Fund and its shareholders. In this regard, the Board noted that TFAI does not realize "soft dollar" benefits from its relationship with the Fund, and that the Sub-Adviser is participating in a brokerage program pursuant to which a certain portion of brokerage commissions paid by the Fund is recaptured for the benefit of the Fund and its shareholders, thus limiting the amount of "soft-dollar" arrangements the Sub-Adviser may engage in with respect to the Fund's portfolio brokerage transactions.
Other considerations. The Board also determined that TFAI had made a substantial commitment to the recruitment and retention of high quality personnel, and maintained the financial, compliance and operational resources reasonably necessary to manage the Fund in a professional manner that is consistent with the best interests of the Fund and its shareholders. The Trustees also concluded that TFAI had made a significant entrepreneurial commitment to the management and success of the Fund, reflected by TFAI's expense limitation and fee waiver arrangement with the Fund which, as demonstrated in the past with the Fund, may result in TFAI waiving a substantial amount of advisory fees for the benefit of shareholders.
Transamerica IDEX Mutual Funds
Semi-Annual Report 2005
13
TA IDEX Salomon All Cap
SUPPLEMENTAL INFORMATION (unaudited)
RESULTS OF SHAREHOLDER PROXY
At a special meeting of shareholders held on February 25, 2005, the results of the Proposals were as follows:
Transamerica IDEX Mutual Funds
Proposal 1: Election of Trustees to the Board of Trustees of Transamerica IDEX Mutual Funds.
| For | Withheld | ||||||||||
| Peter R. Brown | 872,017,875.249 | 4,468,498.551 | |||||||||
| Daniel Calabria | 871,917,069.786 | 4,569,304.014 | |||||||||
| Janise B. Case | 872,099,393.125 | 4,386,980.675 | |||||||||
| Charles C. Harris | 872,086,722.025 | 4,399,651.775 | |||||||||
| Leo J. Hill | 872,304,465.640 | 4,181,908.160 | |||||||||
| Russell A. Kimball, Jr. | 872,253,556.471 | 4,232,817.329 | |||||||||
| William W. Short, Jr. | 872,139,920.944 | 4,346,452.856 | |||||||||
| John Waechter | 872,261,152.376 | 4,225,221.424 | |||||||||
| Jack E. Zimmerman | 871,929,967.512 | 4,556,406.288 | |||||||||
| Brian C. Scott | 872,218,970.367 | 4,267,403.433 | |||||||||
| Thomas P. O'Neill | 872,111,944.117 | 4,374,429.683 | |||||||||
TA IDEX Salomon All Cap
Proposal 2: Approval of an Agreement and Plan of Reorganization pursuant to which Transamerica IDEX Mutual Funds will organize as a Delaware statutory trust.
| For | Against | Abstentions/Broker Non-Votes | |||||||||
| 31,982,458.431 | 180,265.144 | 9,471,292.554 | |||||||||
Proposal 3: Approval of changes to the fundamental investment restrictions of TA IDEX Salomon All Cap.
| A. Diversification | For | Against | Abstentions/Broker Non-Votes | ||||||||||||
| 32,163,056.133 | 204,547.235 | 9,266,412.761 | |||||||||||||
| B. Borrowing | For | Against | Abstentions/Broker Non-Votes | ||||||||||||
| 32,148,109.047 | 219,494.321 | 9,266,412.761 | |||||||||||||
| C. Senior Securities | For | Against | Abstentions/Broker Non-Votes | ||||||||||||
| 32,160,366.019 | 207,237.349 | 9,266,412.761 | |||||||||||||
| D. Underwriting Securities | For | Against | Abstentions/Broker Non-Votes | ||||||||||||
| 32,160,783.400 | 206,819.968 | 9,266,412.761 | |||||||||||||
| E. Real Estate | For | Against | Abstentions/Broker Non-Votes | ||||||||||||
| 32,158,879.979 | 208,723.389 | 9,266,412.761 | |||||||||||||
| F. Making Loans | For | Against | Abstentions/Broker Non-Votes | ||||||||||||
| 32,146,308.604 | 221,294.764 | 9,266,412.761 | |||||||||||||
| G. Concentration | For | Against | Abstentions/Broker Non-Votes | ||||||||||||
| 32,157,703.075 | 209,900.293 | 9,266,412.761 | |||||||||||||
| H. Commodities | For | Against | Abstentions/Broker Non-Votes | ||||||||||||
| 32,145,584.472 | 221,905.896 | 9,266,525.761 | |||||||||||||
Transamerica IDEX Mutual Funds
Semi-Annual Report 2005
14
TA IDEX Salomon Investors Value
UNDERSTANDING YOUR FUND'S EXPENSES
(unaudited)
SHAREHOLDER EXPENSES
The following Example is intended to help you understand your ongoing costs (in dollars and cents) of investing in a Fund and to compare these costs with the ongoing costs of investing in other funds.
The Example is based on an investment of $1,000 invested at November 1, 2004 and held for the entire period until April 30, 2005.
ACTUAL EXPENSES
The first line in the table below provides information about actual account values and actual expenses. You may use the information in this line, together with the amount you invested, to estimate the expenses that you paid over the period. Simply divide your account value by $1,000 (for example, an $8,600 account value divided by $1,000 = 8.6), then multiply the result by the number in the first line of your Fund under the heading entitled "Expenses Paid During Period" to estimate the expenses you paid on your account during this period.
HYPOTHETICAL EXAMPLE FOR COMPARISON PURPOSES
The second line in the table below provides information about hypothetical account values and hypothetical expenses based on the Fund's actual expense ratio and an assumed rate of return of 5% per year before expenses, which is not the Fund's actual return. The hypothetical account values and expenses may not be used to estimate the actual ending account balance or expenses you paid for the period. You may use this information to compare the ongoing costs of investing in your Fund and other funds. To do so, compare this 5% hypothetical example with the 5% hypothetical examples that appear in the shareholder reports of the other funds.
Please note that the expenses shown in the table are meant to highlight your ongoing costs only and do not reflect any transactional costs, such as sales charges, redemption fees, brokerage commissions paid on purchases and sales of fund shares. Therefore, the second line under the Fund in the table is useful in comparing ongoing costs only, and will not help you determine the relative total costs of owning different funds. In addition, note that the expenses shown in the table are meant to highlight your ongoing costs and do not reflect any transaction costs.
| Beginning Account Value | Ending Account Value | Annualized Expense Ratio | Expenses Paid During Period (a) | ||||||||||||||||
| Class A | |||||||||||||||||||
| Actual | $ | 1,000.00 | $ | 1,023.40 | 1.22 | % | $ | 6.12 | |||||||||||
| Hypothetical (b) | 1,000.00 | 1,018.74 | 1.22 | 6.11 | |||||||||||||||
| Class B | |||||||||||||||||||
| Actual | 1,000.00 | 1,019.30 | 2.12 | 10.61 | |||||||||||||||
| Hypothetical (b) | 1,000.00 | 1,014.28 | 2.12 | 10.59 | |||||||||||||||
| Class C | |||||||||||||||||||
| Actual | 1,000.00 | 1,018.40 | 2.20 | 11.01 | |||||||||||||||
| Hypothetical (b) | 1,000.00 | 1,013.88 | 2.20 | 10.99 | |||||||||||||||
(a) Expenses are calculated using each Fund's annualized expense ratio (as disclosed in the table), multiplied by the average account value for the period, multiplied by number of days in the period (181 days), and divided by the number of days in the year (365 days).
(b) 5% return per year before expenses.
GRAPHICAL PRESENTATION OF SCHEDULE OF INVESTMENTS
By Sector
At April 30, 2005
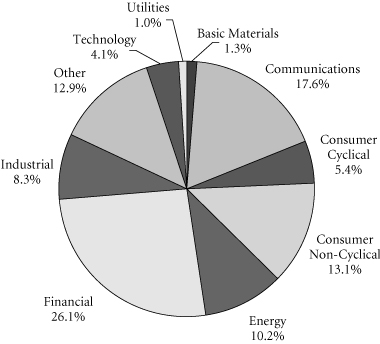
This chart shows the percentage breakdown by sector of the Fund's total investment securities.
Transamerica IDEX Mutual Funds
Semi-Annual Report 2005
1
TA IDEX Salomon Investors Value
SCHEDULE OF INVESTMENTS
At April 30, 2005
(all amounts except share amounts in thousands)
(unaudited)
| Shares | Value | ||||||||||
| COMMON STOCKS (98.1%) | |||||||||||
| Aerospace (5.1%) | |||||||||||
| Boeing Co. (The) | 63,300 | $ | 3,768 | ||||||||
| Lockheed Martin Corp. | 59,600 | 3,633 | |||||||||
| United Technologies Corp. | 27,600 | 2,807 | |||||||||
| Business Credit Institutions (1.5%) | |||||||||||
| Freddie Mac | 50,300 | 3,094 | |||||||||
| Chemicals & Allied Products (1.2%) | |||||||||||
| Air Products & Chemicals, Inc. | 40,500 | 2,379 | |||||||||
| Commercial Banks (11.5%) | |||||||||||
| Bank of America Corp. | 161,200 | 7,260 | |||||||||
| Bank of New York Co., Inc. (The) | 49,400 | 1,380 | |||||||||
| Comerica, Inc. | 37,800 | 2,164 | |||||||||
| JPMorgan Chase & Co. | 71,600 | 2,541 | |||||||||
| MBNA Corp. | 48,200 | 952 | |||||||||
| US Bancorp | 98,100 | 2,737 | |||||||||
| Wachovia Corp. | 62,700 | 3,209 | |||||||||
| Wells Fargo & Co. | 46,400 | 2,781 | |||||||||
| Communication (5.0%) | |||||||||||
| Comcast Corp.–Class A (a) | 109,500 | 3,516 | |||||||||
| Liberty Media Corp.–Class A | 278,100 | 2,792 | |||||||||
| Liberty Media International, Inc.–Class A (a) | 13,960 | 579 | |||||||||
| Viacom, Inc.–Class B | 89,300 | 3,092 | |||||||||
| Communications Equipment (4.6%) | |||||||||||
| Comverse Technology, Inc. (a) | 76,500 | 1,743 | |||||||||
| Nokia Corp., ADR | 244,500 | 3,907 | |||||||||
| Nortel Networks Corp. (a)(b) | 1,018,100 | 2,535 | |||||||||
| SES GLOBAL | 74,100 | 1,020 | |||||||||
| Computer & Data Processing Services (2.0%) | |||||||||||
| Microsoft Corp. | 158,800 | 4,018 | |||||||||
| Computer & Office Equipment (2.6%) | |||||||||||
| Hewlett-Packard Co. | 47,100 | 964 | |||||||||
| International Business Machines Corp. | 26,000 | 1,986 | |||||||||
| Lexmark International, Inc. (a) | 33,500 | 2,327 | |||||||||
| Department Stores (1.4%) | |||||||||||
| JC Penney Co., Inc. (b) | 57,400 | 2,721 | |||||||||
| Diversified (1.8%) | |||||||||||
| Honeywell International, Inc. | 100,900 | 3,608 | |||||||||
| Electric Services (1.1%) | |||||||||||
| Sempra Energy (b) | 54,800 | 2,213 | |||||||||
| Electronic Components & Accessories (0.5%) | |||||||||||
| Solectron Corp. (a) | 320,500 | 1,058 | |||||||||
| Environmental Services (0.9%) | |||||||||||
| Waste Management, Inc. | 62,600 | 1,784 | |||||||||
| Shares | Value | ||||||||||
| Food & Kindred Products (4.9%) | |||||||||||
| Altria Group, Inc. | 110,300 | $ | 7,168 | ||||||||
| Sara Lee Corp. | 128,500 | 2,749 | |||||||||
| Food Stores (1.9%) | |||||||||||
| Kroger Co. (a) | 238,200 | 3,756 | |||||||||
| Gas Production & Distribution (1.3%) | |||||||||||
| El Paso Corp. | 257,600 | 2,573 | |||||||||
| Holding & Other Investment Offices (1.3%) | |||||||||||
| Equity Residential | 77,600 | 2,666 | |||||||||
| Instruments & Related Products (1.1%) | |||||||||||
| Raytheon Co. | 58,900 | 2,215 | |||||||||
| Insurance (5.5%) | |||||||||||
| Aetna, Inc. | 10,300 | 756 | |||||||||
| American International Group, Inc. | 75,500 | 3,839 | |||||||||
| Chubb Corp. (b) | 27,100 | 2,216 | |||||||||
| Loews Corp. | 37,800 | 2,679 | |||||||||
| St. Paul Travelers Cos., Inc. (The) | 44,700 | 1,600 | |||||||||
| Motion Pictures (3.4%) | |||||||||||
| News Corp., Inc.–Class B (b) | 245,100 | 3,902 | |||||||||
| Time Warner, Inc. (a) | 171,500 | 2,883 | |||||||||
| Office Property (1.4%) | |||||||||||
| Equity Office Properties Trust | 91,400 | 2,876 | |||||||||
| Oil & Gas Extraction (6.7%) | |||||||||||
| ENSCO International, Inc. | 97,000 | 3,162 | |||||||||
| EOG Resources, Inc. | 16,500 | 785 | |||||||||
| GlobalSantaFe Corp. | 55,800 | 1,875 | |||||||||
| Nabors Industries, Ltd. (a) | 27,600 | 1,487 | |||||||||
| Noble Corp. | 24,500 | 1,247 | |||||||||
| Total SA, ADR (b) | 44,600 | 4,947 | |||||||||
| Paper & Allied Products (2.6%) | |||||||||||
| Avery Dennison Corp. | 40,800 | 2,136 | |||||||||
| International Paper Co. | 17,100 | 586 | |||||||||
| Kimberly-Clark Corp. | 39,200 | 2,448 | |||||||||
| Personal Credit Institutions (2.0%) | |||||||||||
| Capital One Financial Corp. | 56,200 | 3,984 | |||||||||
| Petroleum Refining (3.5%) | |||||||||||
| BP PLC, ADR | 34,300 | 2,089 | |||||||||
| Marathon Oil Corp. | 61,400 | 2,859 | |||||||||
| Royal Dutch Petroleum Co.–NY Shares | 36,200 | 2,109 | |||||||||
| Pharmaceuticals (5.2%) | |||||||||||
| Johnson & Johnson | 38,500 | 2,642 | |||||||||
| Novartis AG, ADR | 44,500 | 2,169 | |||||||||
| Pfizer, Inc. | 92,900 | 2,524 | |||||||||
| Sanofi-Aventis, ADR (b) | 72,500 | 3,217 | |||||||||
The notes to the financial statements are an integral part of this report.
Transamerica IDEX Mutual Funds
Semi-Annual Report 2005
2
TA IDEX Salomon Investors Value
SCHEDULE OF INVESTMENTS (continued)
At April 30, 2005
(all amounts except share amounts in thousands)
(unaudited)
| Shares | Value | ||||||||||
| Restaurants (1.7%) | |||||||||||
| McDonald's Corp. | 114,300 | $ | 3,350 | ||||||||
| Rubber & Misc. Plastic Products (1.0%) | |||||||||||
| Newell Rubbermaid, Inc. (b) | 92,300 | 2,006 | |||||||||
| Savings Institutions (1.0%) | |||||||||||
| Washington Mutual, Inc. | 48,900 | 2,021 | |||||||||
| Security & Commodity Brokers (5.5%) | |||||||||||
| American Express Co. | 54,900 | 2,893 | |||||||||
| Goldman Sachs Group, Inc. (The) | 25,400 | 2,712 | |||||||||
| Merrill Lynch & Co., Inc. | 72,800 | 3,926 | |||||||||
| Morgan Stanley | 27,600 | 1,452 | |||||||||
| Telecommunications (6.9%) | |||||||||||
| ALLTEL Corp. (b) | 47,800 | 2,723 | |||||||||
| AT&T Corp. | 53,000 | 1,014 | |||||||||
| Nextel Communications, Inc.–Class A (a) | 144,600 | 4,047 | |||||||||
| SBC Communications, Inc. (b) | 128,900 | 3,068 | |||||||||
| Sprint Corp. (FON Group) (b) | 47,500 | 1,057 | |||||||||
| Verizon Communications, Inc. (b) | 55,600 | 1,991 | |||||||||
| Toys, Games & Hobbies (0.2%) | |||||||||||
| Mattel, Inc. | 21,700 | 392 | |||||||||
| Variety Stores (1.8%) | |||||||||||
| Target Corp. | 36,300 | 1,684 | |||||||||
| Wal-Mart Stores, Inc. | 42,400 | 1,999 | |||||||||
| Total Common Stocks (cost: $193,831) | 197,047 | ||||||||||
| Principal | Value | ||||||||||
| SECURITY LENDING COLLATERAL (14.6%) | |||||||||||
| Debt (12.6%) | |||||||||||
| Bank Notes (1.7%) | |||||||||||
| Bank of America | |||||||||||
| 2.82%, due 05/16/2005 | $ | 923 | $ | 923 | |||||||
| 2.80%, due 06/09/2005 (c) | 231 | 231 | |||||||||
| 2.77%, due 07/18/2005 (c) | 923 | 923 | |||||||||
| Canadian Imperial Bank of Commerce 3.02%, due 11/04/2005 (c) | 923 | 923 | |||||||||
| Credit Suisse First Boston Corp. 2.88%, due 09/09/2005 (c) 3.06%, due 03/10/2006 (c) | 231 231 | 231 231 | |||||||||
| Euro Dollar Overnight (2.2%) | |||||||||||
| Bank of Montreal 2.94%, due 05/04/2005 | 692 | 692 | |||||||||
| BNP Paribas 2.80%, due 05/05/2005 | 955 | 955 | |||||||||
| Principal | Value | ||||||||||
| Euro Dollar Overnight (continued) | |||||||||||
| Den Danske Bank 2.93%, due 05/02/2005 | $ | 831 | $ | 831 | |||||||
| 2.80%, due 05/06/2005 | 462 | 462 | |||||||||
| Dexia Group 2.80%, due 05/05/2005 | 408 | 408 | |||||||||
| Royal Bank of Canada 2.80%, due 05/04/2005 | 947 | 947 | |||||||||
| Svenska Handlesbanken 2.80%, due 05/06/2005 | 152 | 152 | |||||||||
| Euro Dollar Terms (5.1%) | |||||||||||
| Bank of Nova Scotia 2.88%, due 05/11/2005 3.01%, due 05/31/2005 | 461 1,290 | 461 1,290 | |||||||||
| Barclays 3.02%, due 06/27/2005 | 822 | 822 | |||||||||
| BNP Paribas 2.93%, due 06/07/2005 | 739 | 739 | |||||||||
| Branch Banker & Trust 2.94%, due 06/06/2005 | 197 | 197 | |||||||||
| Calyon 2.93%, due 06/03/2005 | 762 | 762 | |||||||||
| Citigroup 2.87%, due 06/06/2005 | 958 | 958 | |||||||||
| Credit Suisse First Boston Corp. 2.91%, due 05/16/2005 | 945 | 945 | |||||||||
| HSBC Banking/Holdings PLC 3.01%, due 06/23/2005 | 461 | 461 | |||||||||
| Royal Bank of Scotland 2.94%, due 06/07/2005 2.95%, due 06/10/2005 | 896 498 | 896 498 | |||||||||
| Societe Generale 2.80%, due 05/03/2005 | 883 | 883 | |||||||||
| Toronto Dominion Bank 2.75%, due 05/09/2005 3.01%, due 06/24/2005 | 692 256 | 692 256 | |||||||||
| UBS AG 2.81%, due 05/03/2005 | 461 | 461 | |||||||||
| Promissory Notes (1.3%) | |||||||||||
| Goldman Sachs Group, Inc. 2.99%, due 06/27/2005 3.01%, due 07/27/2005 | 969 1,615 | 969 1,615 | |||||||||
| Repurchase Agreements (2.3%) (d) | |||||||||||
| Goldman Sachs Group, Inc. 3.04%, Repurchase Agreement dated 04/29/2005 to be repurchased at $2,077 on 05/02/2005 | 2,076 | 2,076 | |||||||||
The notes to the financial statements are an integral part of this report.
Transamerica IDEX Mutual Funds
Semi-Annual Report 2005
3
TA IDEX Salomon Investors Value
SCHEDULE OF INVESTMENTS (continued)
At April 30, 2005
(all amounts except share amounts in thousands)
(unaudited)
| Principal | Value | ||||||||||
| Repurchase Agreements (continued) | |||||||||||
| Merrill Lynch & Co., Inc. 3.04%, Repurchase Agreement dated 04/29/2005 to be repurchased at $2,492 on 05/02/2005 | $ | 2,492 | $ | 2,492 | |||||||
| Shares | Value | ||||||||||
| Investment Companies (2.0%) | |||||||||||
| Money Market Funds (2.0%) | |||||||||||
| American Beacon Funds 1-day yield of 2.84% | 366,468 | 367 | |||||||||
| BGI Institutional Money Market Fund 1-day yield of 2.93% | 2,170,062 | 2,170 | |||||||||
| Merrill Lynch Premier Institutional Fund 1-day yield of 2.65% | 488,333 | 488 | |||||||||
| Merrimac Cash Fund, Premium Class 1-day yield of 2.74% (e) | 893,153 | 893 | |||||||||
| Total Security Lending Collateral (cost: $29,300) | 29,300 | ||||||||||
| Total Investment Securities (cost: $223,131) | $ | 226,347 | |||||||||
| SUMMARY: | |||||||||||
| Investments, at value | 112.7 | % | $ | 226,347 | |||||||
| Liabilities in excess of other assets | (12.7 | )% | (25,514 | ) | |||||||
| Net assets | 100.0 | % | $ | 200,833 | |||||||
The notes to the financial statements are an integral part of this report.
Transamerica IDEX Mutual Funds
NOTES TO SCHEDULE OF INVESTMENTS:
(a) No dividends were paid during the preceding twelve months.
(b) At April 30, 2005, all or a portion of this security is on loan (see Note 1). The value at April 30, 2005, of all securities on loan is $28,210.
(c) Floating or variable rate note. Rate is listed as of April 30, 2005.
(d) Cash collateral for the Repurchase Agreements, valued at $4,648, that serve as collateral for securities lending are invested in corporate bonds with interest rates and maturity dates ranging from 0.00%–8.875% and 06/15/2005–03/15/2035, respectively.
(e) Regulated investment company advised by Investors Bank and Trust Co. ("IBT"). IBT is also the accounting, custody and lending agent for the Fund.
DEFINITIONS:
ADR American Depositary Receipt
Semi-Annual Report 2005
4
TA IDEX Salomon Investors Value
STATEMENT OF ASSETS AND LIABILITIES
At April 30, 2005
(all amounts except per share amounts in thousands)
(unaudited)
| Assets: | |||||||
| Investment securities, at value (cost: $223,131) (including securities loaned of $28,210) | $ | 226,347 | |||||
| Cash | 4,005 | ||||||
| Receivables: | |||||||
| Investment securities sold | 176 | ||||||
| Shares of beneficial interest sold | 2 | ||||||
| Interest | 10 | ||||||
| Dividends | 290 | ||||||
| Dividend reclaims receivable | 19 | ||||||
| Other | 30 | ||||||
| 230,879 | |||||||
| Liabilities: | |||||||
| Investment securities purchased | 378 | ||||||
| Accounts payable and accrued liabilities: | |||||||
| Shares of beneficial interest redeemed | 124 | ||||||
| Management and advisory fees | 148 | ||||||
| Distribution and service fees | 72 | ||||||
| Transfer agent fees | 24 | ||||||
| Payable for collateral for securities on loan | 29,300 | ||||||
| 30,046 | |||||||
| Net Assets | $ | 200,833 | |||||
| Net Assets Consist of: | |||||||
| Shares of beneficial interest, unlimited shares authorized, no par value | $ | 157,799 | |||||
| Undistributed net investment income (loss) | 779 | ||||||
| Undistributed net realized gain (loss) from investment securities and foreign currency transactions | 39,043 | ||||||
| Net unrealized appreciation (depreciation) on: Investment securities | 3,213 | ||||||
| Translation of assets and liabilites denominated in foreign currencies | (1 | ) | |||||
| Net Assets | $ | 200,833 | |||||
| Net Assets by Class: | |||||||
| Class A | $ | 176,495 | |||||
| Class B | 18,728 | ||||||
| Class C | 5,610 | ||||||
| Shares Outstanding: | |||||||
| Class A | 13,238 | ||||||
| Class B | 1,480 | ||||||
| Class C | 445 | ||||||
| Net Asset Value Per Share: | |||||||
| Class A | $ | 13.33 | |||||
| Class B | 12.65 | ||||||
| Class C | 12.61 | ||||||
| Maximum Offering Price Per Share (a): | |||||||
| Class A | $ | 14.11 | |||||
(a) Includes the maximum selling commission (represented as a percentage of offering price) which is reduced on certain levels of sales as set forth in the Prospectus. Net asset value per share for Classes B and C shares represents offering price. The redemption price for Classes B and C shares equals net asset value less any applicable contingent deferred sales charge.
STATEMENT OF OPERATIONS
For the period ended April 30, 2005
(all amounts in thousands)
(unaudited)
| Investment Income: | |||||||
| Interest | $ | 113 | |||||
| Dividends | 5,190 | ||||||
| Income from loaned securities–net | 9 | ||||||
| Less withholding taxes on foreign dividends | (68 | ) | |||||
| 5,244 | |||||||
| Expenses: | |||||||
| Management and advisory fees | 1,555 | ||||||
| Transfer agent fees: | |||||||
| Class A | 21 | ||||||
| Class B | 21 | ||||||
| Class C | 9 | ||||||
| Custody fees | 26 | ||||||
| Administration fees | 35 | ||||||
| Legal fees | 12 | ||||||
| Audit fees | 6 | ||||||
| Trustees fees | 11 | ||||||
| Registration fees: | |||||||
| Class A | 28 | ||||||
| Class B | 9 | ||||||
| Class C | 11 | ||||||
| Distribution and service fees: | |||||||
| Class A | 636 | ||||||
| Class B | 103 | ||||||
| Class C | 30 | ||||||
| Total expenses | 2,513 | ||||||
| Less: | |||||||
| Reimbursement of class expenses: | |||||||
| Class C | (8 | ) | |||||
| Net expenses | 2,505 | ||||||
| Net Investment Income (Loss) | 2,739 | ||||||
| Net Realized Gain (Loss) from: | |||||||
| Investment securities | 39,817 | ||||||
| Foreign currency transactions | 1 | ||||||
| 39,818 | |||||||
| Net Increase (Decrease) in Unrealized Appreciation (Depreciation) on: | |||||||
| Investment securities | (23,407 | ) | |||||
| Translation of assets and liabilities denominated in foreign currencies | (1 | ) | |||||
| (23,408 | ) | ||||||
| Net Gain (Loss) on Investments and Foreign Currency Transactions | 16,410 | ||||||
| Net Increase (Decrease) in Net Assets Resulting from Operations | $ | 19,149 | |||||
The notes to the financial statements are an integral part of this report.
Transamerica IDEX Mutual Funds
Semi-Annual Report 2005
5
TA IDEX Salomon Investors Value
STATEMENTS OF CHANGES IN NET ASSETS
For the period or year ended
(all amounts in thousands)
| April 30, 2005 (unaudited) | October 31, 2004 | ||||||||||
| Increase (Decrease) In Net Assets From: | |||||||||||
| Operations: | |||||||||||
| Net investment income (loss) | $ | 2,739 | $ | 2,595 | |||||||
| Net realized gain (loss) from investment securities and foreign currency transactions | 39,818 | 17,527 | |||||||||
| Net unrealized appreciation (depreciation) on investment securities and foreign currency translations | (23,408 | ) | 5,314 | ||||||||
| 19,149 | 25,436 | ||||||||||
| Distributions to Shareholders: | |||||||||||
| From net investment income: | |||||||||||
| Class A | (2,600 | ) | (2,368 | ) | |||||||
| Class B | (57 | ) | (158 | ) | |||||||
| Class C | (24 | ) | (10 | ) | |||||||
| Class C2 | – | (21 | ) | ||||||||
| Class M | – | (17 | ) | ||||||||
| (2,681 | ) | (2,574 | ) | ||||||||
| From net realized gains: | |||||||||||
| Class A | (6,313 | ) | (8,881 | ) | |||||||
| Class B | (331 | ) | (495 | ) | |||||||
| Class C | (97 | ) | (37 | ) | |||||||
| Class C2 | – | (61 | ) | ||||||||
| Class M | – | (50 | ) | ||||||||
| (6,741 | ) | (9,524 | ) | ||||||||
| Capital Share Transactions: | |||||||||||
| Proceeds from shares sold: | |||||||||||
| Class A | 842 | 154,680 | |||||||||
| Class B | 893 | 3,454 | |||||||||
| Class C | 378 | 1,228 | |||||||||
| Class C2 | – | 287 | |||||||||
| Class M | – | 254 | |||||||||
| 2,113 | 159,903 | ||||||||||
| Dividends and distributions reinvested: | |||||||||||
| Class A | 8,905 | 11,237 | |||||||||
| Class B | 370 | 624 | |||||||||
| Class C | 112 | 43 | |||||||||
| Class C2 | – | 73 | |||||||||
| Class M | – | 65 | |||||||||
| 9,387 | 12,042 | ||||||||||
| Cost of shares redeemed: | |||||||||||
| Class A | (248,869 | ) | (6,237 | ) | |||||||
| Class B | (2,559 | ) | (4,752 | ) | |||||||
| Class C | (865 | ) | (814 | ) | |||||||
| Class C2 | – | (584 | ) | ||||||||
| Class M | – | (626 | ) | ||||||||
| (252,293 | ) | (13,013 | ) | ||||||||
| Class level exchanges: | |||||||||||
| Class C | – | 4,670 | |||||||||
| Class C2 | – | (2,688 | ) | ||||||||
| Class M | – | (1,982 | ) | ||||||||
| – | – | ||||||||||
| April 30, 2005 (unaudited) | October 31, 2004 | ||||||||||
| Automatic conversions: | |||||||||||
| Class A | $ | 518 | $ | 48 | |||||||
| Class B | (518 | ) | (48 | ) | |||||||
| – | – | ||||||||||
| (240,793 | ) | 158,932 | |||||||||
| Net increase (decrease) in net assets | (231,066 | ) | 172,270 | ||||||||
| Net Assets: | |||||||||||
| Beginning of period | 431,899 | 259,629 | |||||||||
| End of period | $ | 200,833 | $ | 431,899 | |||||||
| Undistributed Net Investment Income (Loss) | $ | 779 | $ | 721 | |||||||
| Share Activity: | |||||||||||
| Shares issued: | |||||||||||
| Class A | 60 | 11,405 | |||||||||
| Class B | 68 | 270 | |||||||||
| Class C | 29 | 97 | |||||||||
| Class C2 | – | 22 | |||||||||
| Class M | – | 19 | |||||||||
| 157 | 11,813 | ||||||||||
| Shares issued–reinvested from distributions: | |||||||||||
| Class A | 639 | 858 | |||||||||
| Class B | 28 | 50 | |||||||||
| Class C | 8 | 3 | |||||||||
| Class C2 | – | 6 | |||||||||
| Class M | – | 5 | |||||||||
| 675 | 922 | ||||||||||
| Shares redeemed: | |||||||||||
| Class A | (17,982 | ) | (467 | ) | |||||||
| Class B | (195 | ) | (375 | ) | |||||||
| Class C | (66 | ) | (65 | ) | |||||||
| Class C2 | – | (45 | ) | ||||||||
| Class M | – | (48 | ) | ||||||||
| (18,243 | ) | (1,000 | ) | ||||||||
| Class level exchanges: | |||||||||||
| Class C | – | 373 | |||||||||
| Class C2 | – | (214 | ) | ||||||||
| Class M | – | (157 | ) | ||||||||
| – | 2 | ||||||||||
| Automatic conversions: | |||||||||||
| Class A | 37 | 4 | |||||||||
| Class B | (39 | ) | (4 | ) | |||||||
| (2 | ) | – | |||||||||
| Net increase (decrease) in shares outstanding: | |||||||||||
| Class A | (17,246 | ) | 11,800 | ||||||||
| Class B | (138 | ) | (59 | ) | |||||||
| Class C | (29 | ) | 408 | ||||||||
| Class C2 | – | (231 | ) | ||||||||
| Class M | – | (181 | ) | ||||||||
| (17,413 | ) | 11,737 | |||||||||
The notes to the financial statements are an integral part of this report.
Transamerica IDEX Mutual Funds
Semi-Annual Report 2005
6
TA IDEX Salomon Investors Value
FINANCIAL HIGHLIGHTS
(unaudited for the period ended April 30, 2005)
| For a share of beneficial interest outstanding throughout each period | |||||||||||||||||||||||||||||||||||||||
| Net Asset | Investment Operations | Distributions | Net Asset | ||||||||||||||||||||||||||||||||||||
| For the Period Ended (d)(g) | Value, Beginning of Period | Net Investment Income (Loss) | Net Realized and Unrealized Gain (Loss) | Total Operations | From Net Investment Income | From Net Realized Gains | Total Distributions | Value, End of Period | |||||||||||||||||||||||||||||||
| Class A | 4/30/2005 | $ | 13.30 | $ | 0.10 | $ | 0.23 | $ | 0.33 | $ | (0.09 | ) | $ | (0.21 | ) | $ | (0.30 | ) | $ | 13.33 | |||||||||||||||||||
| 10/31/2004 | 12.51 | 0.10 | 1.09 | 1.19 | (0.10 | ) | (0.30 | ) | (0.40 | ) | 13.30 | ||||||||||||||||||||||||||||
| 10/31/2003 | 10.21 | 0.08 | 2.31 | 2.39 | (0.02 | ) | (0.07 | ) | (0.09 | ) | 12.51 | ||||||||||||||||||||||||||||
| 10/31/2002 | 12.55 | 0.04 | (2.10 | ) | (2.06 | ) | – | (0.28 | ) | (0.28 | ) | 10.21 | |||||||||||||||||||||||||||
| 10/31/2001 | 12.91 | 0.07 | (0.42 | ) | (0.35 | ) | – | (0.01 | ) | (0.01 | ) | 12.55 | |||||||||||||||||||||||||||
| 10/31/2000 | 11.28 | 0.09 | 1.54 | 1.63 | – | – | – | 12.91 | |||||||||||||||||||||||||||||||
| Class B | 4/30/2005 | 12.65 | 0.03 | 0.22 | 0.25 | (0.04 | ) | (0.21 | ) | (0.25 | ) | 12.65 | |||||||||||||||||||||||||||
| 10/31/2004 | 11.99 | 0.01 | 1.05 | 1.06 | (0.10 | ) | (0.30 | ) | (0.40 | ) | 12.65 | ||||||||||||||||||||||||||||
| 10/31/2003 | 9.84 | 0.01 | 2.23 | 2.24 | (0.02 | ) | (0.07 | ) | (0.09 | ) | 11.99 | ||||||||||||||||||||||||||||
| 10/31/2002 | 12.19 | (0.01 | ) | (2.06 | ) | (2.07 | ) | – | (0.28 | ) | (0.28 | ) | 9.84 | ||||||||||||||||||||||||||
| 10/31/2001 | 12.61 | (0.02 | ) | (0.39 | ) | (0.41 | ) | – | (0.01 | ) | (0.01 | ) | 12.19 | ||||||||||||||||||||||||||
| 10/31/2000 | 11.09 | (0.02 | ) | 1.54 | 1.52 | – | – | – | 12.61 | ||||||||||||||||||||||||||||||
| Class C | 4/30/2005 | 12.62 | 0.03 | 0.22 | 0.25 | (0.05 | ) | (0.21 | ) | (0.26 | ) | 12.61 | |||||||||||||||||||||||||||
| 10/31/2004 | 11.99 | (0.05 | ) | 1.08 | 1.03 | (0.10 | ) | (0.30 | ) | (0.40 | ) | 12.62 | |||||||||||||||||||||||||||
| 10/31/2003 | 9.77 | 0.01 | 2.30 | 2.31 | (0.02 | ) | (0.07 | ) | (0.09 | ) | 11.99 | ||||||||||||||||||||||||||||
| Ratios/Supplemental Data | |||||||||||||||||||||||||||||||
| For the Period | Total | Net Assets, End of Period | Ratio of Expenses to Average Net Assets (a) | Net Investment Income (Loss) to Average | Portfolio Turnover | ||||||||||||||||||||||||||
| Ended (g) | Return (c) | (000's) | Net (e) | Total (f) | Net Assets (a) | Rate (b) | |||||||||||||||||||||||||
| Class A | 4/30/2005 | 2.34 | % | $ | 176,495 | 1.22 | % | 1.22 | % | 1.47 | % | 26 | % | ||||||||||||||||||
| 10/31/2004 | 9.52 | 405,455 | 1.25 | 1.25 | 0.72 | 33 | |||||||||||||||||||||||||
| 10/31/2003 | 23.57 | 233,779 | 1.42 | 1.42 | 0.71 | 32 | |||||||||||||||||||||||||
| 10/31/2002 | (16.90 | ) | 46,960 | 1.55 | 1.91 | 0.56 | 101 | ||||||||||||||||||||||||
| 10/31/2001 | (2.68 | ) | 12,176 | 1.55 | 1.93 | 0.48 | 29 | ||||||||||||||||||||||||
| 10/31/2000 | 14.38 | 8,431 | 1.55 | 2.20 | 0.40 | 50 | |||||||||||||||||||||||||
| Class B | 4/30/2005 | 1.93 | 18,728 | 2.12 | 2.12 | 0.48 | 26 | ||||||||||||||||||||||||
| 10/31/2004 | 8.82 | 20,463 | 1.86 | 1.86 | 0.11 | 33 | |||||||||||||||||||||||||
| 10/31/2003 | 22.93 | 20,102 | 2.07 | 2.07 | 0.06 | 32 | |||||||||||||||||||||||||
| 10/31/2002 | (17.47 | ) | 16,980 | 2.20 | 2.56 | (0.09 | ) | 101 | |||||||||||||||||||||||
| 10/31/2001 | (3.31 | ) | 20,034 | 2.20 | 2.58 | (0.17 | ) | 29 | |||||||||||||||||||||||
| 10/31/2000 | 13.72 | 10,448 | 2.20 | 2.85 | (0.25 | ) | 50 | ||||||||||||||||||||||||
| Class C | 4/30/2005 | 1.84 | 5,610 | 2.20 | 2.48 | 0.40 | 26 | ||||||||||||||||||||||||
| 10/31/2004 | 8.62 | 5,981 | 2.20 | 2.30 | (0.37 | ) | 33 | ||||||||||||||||||||||||
| 10/31/2003 | 23.81 | 797 | 2.07 | 2.07 | 0.05 | 32 | |||||||||||||||||||||||||
NOTES TO FINANCIAL HIGHLIGHTS
(a) Annualized.
(b) Not annualized for periods of less than one year.
(c) Total Return has been calculated for the applicable period without deduction of a sales load, if any, on an initial purchase. Periods of less than one year are not annualized.
(d) Per share information is calculated based on average number of shares outstanding for the periods ended 10/31/2001, 10/31/2002, 10/31/2003, 10/31/2004 and 04/30/2005.
(e) Ratio of Net Expenses to Average Net Assets is net of fee waivers and reimbursements by the investment adviser, if any (see note 2).
(f) Ratio of Total Expenses to Average Net Assets includes all expenses before fee waivers and reimbursements by the investment adviser.
(g) The inception date for the Fund's offering of share Class C was November 11, 2002.
The notes to the financial statements are an integral part of this report.
Transamerica IDEX Mutual Funds
Semi-Annual Report 2005
7
TA IDEX Salomon Investors Value
NOTES TO FINANCIAL STATEMENTS
At April 30, 2005
(all amounts in thousands)
(unaudited)
NOTE 1. ORGANIZATION AND SIGNIFICANT ACCOUNTING POLICIES
Transamerica IDEX Mutual Funds is a Delaware statutory trust registered under the Investment Company Act of 1940, as amended (the "1940 Act"), as an open-end management investment company. Prior to March 1, 2005, Transamerica IDEX Mutual Funds was a Massachusetts business trust. TA IDEX Salomon Investors Value ("the Fund"), part of Transamerica IDEX Mutual Funds, began operations on February 1, 1997.
In the normal course of business, the Fund enters into contracts that contain a variety of representations and warranties, which provide general indemnifications. The Fund's maximum exposure under these arrangements is unknown, as this would involve future claims that may be made against the Fund and/or its affiliates that have not yet occurred. However, based on experience, the Fund expects the risk of loss to be remote.
See the Prospectus and Statement of Additional Information for a description of the Fund's investment objective.
In preparing the Fund's financial statements in accordance with accounting principles generally accepted in the United States of America ("GAAP"), estimates or assumptions (which could differ from actual results) may be used that affect reported amounts and disclosures. The following policies were consistently followed by the Fund, in accordance with GAAP.
Multiple class operations and expenses: The Fund currently offers three classes of shares, each with a public offering price that reflects different sales charges, if any, and expense levels. On June 15, 2004, Class C2 shares merged into Class C. On September 24, 2004,
Class M shares merged into Class C. Class B shares will convert to Class A shares eight years after purchase. Income, non-class specific expenses and realized and unrealized gains and losses, are allocated daily to each class, based upon the value of shares outstanding method as permitted under Rule 18f-3 of the 1940 Act. Each class bears its own specific expenses as well as a portion of general, common expenses.
Pricing of shares: The Fund prices its shares on the basis of the net asset value of each class of shares of the Fund, which is determined as of the close of the New York Stock Exchange ("NYSE") (generally 4:00 p.m. Eastern Time) on each day on which the NYSE is open for trading.
Security valuations: Fund investments traded on an exchange are valued at the closing price on the day of valuation on the exchange where the security is principally traded. With respect to securities traded on NASDAQ NMS, such closing price may be the last reported sales price or the NASDAQ Official Closing Price.
Securities traded in the over-the-counter market and listed securities for which no sale was reported on that date are valued at the last quoted bid price.
Debt securities are valued by independent pricing services at the last quoted bid price; however, those that mature in sixty days or less are valued at amortized cost, which approximates market.
Investment company securities are valued at net asset value of the underlying portfolio.
Other securities for which quotations are not readily available are valued at fair market value as determined in good faith using guidelines adopted by the Board of Trustees of the Fund, under the supervision of the Fund's Valuation Committee. These guidelines may include: the type of security; any restrictions on its resale; financial or business news of the issuer; similar or related securities that are actively trading; related corporate actions; and other significant events occurring after the close of trading in the security.
Cash: The Fund may leave cash overnight in its cash account with the custodian, Investors Bank & Trust Company ("IBT"). IBT has been contracted on behalf of the Fund to invest the excess cash into a savings account, which at April 30, 2005, was paying an interest rate of 2.02%.
Throughout the period, the Fund may have a cash overdraft balance. A fee is incurred on this overdraft, calculated by multiplying the overdraft by a rate based on the federal funds rate.
Repurchase agreements: The Fund is authorized to enter into repurchase agreements. The Fund, through IBT, receives delivery of the underlying securities, the value of which at the time of purchase is required to be an amount equal to at least 100% of the resale price. Repurchase agreements involve the risk that the seller will fail to repurchase the security, as agreed. In that case, the Fund will bear the risk of value fluctuations until the security can be sold and may encounter delays and incur costs in liquidating the security. In the event of bankruptcy or insolvency of the seller, delays and costs may be incurred.
Securities lending: The Fund may lend securities to enhance fund earnings from investing cash collateral in making such loans to qualified borrowers (typically broker/dealers). The Fund has engaged its custodian bank, IBT, as a lending agent to administer its securities lending program. IBT earned less than $6 of program income for its services. When the Fund makes a security loan, it receives cash collateral as protection against the risk that the borrower will default on the loan, and records an asset for the cash invested collateral and a liability for the return of the collateral.
Loans of securities are required to be secured by collateral at least equal to 102% of the value of the securities at inception of the loan, and not less then 100% thereafter. The Fund may invest cash collateral in short-term money market instruments including: U.S. Treasury Bills, U.S. agency obligations, commercial paper, money market mutual
Transamerica IDEX Mutual Funds
Semi-Annual Report 2005
8
TA IDEX Salomon Investors Value
NOTES TO FINANCIAL STATEMENTS (continued)
At April 30, 2005
(all amounts in thousands)
(unaudited)
NOTE 1.–(continued)
funds, repurchase agreements and other highly rated, liquid investments. During the life of securities loans, the collateral and securities loaned remain subject to fluctuation in value. IBT marks to market securities loaned and the collateral each business day. If additional collateral is due (at least $1), IBT collects additional cash collateral from the borrowers. Although securities loaned will be fully collateralized at all times, IBT may experience delays in, or may be prevented from, recovering the collateral on behalf of the Fund. The Fund may recall a loaned security position at any time from the borrower through IBT. In the event the borrower fails to timely return a recalled security, IBT may indemnify the Fund by purchasing replacement securities for the Fund at its own expense and claiming the collateral to fund such a purchase. IBT absorbs the loss if the collateral value is not sufficient to cover the cost of the replacement securities. If replacement securities are not available, IBT will credit the equivalent cash value to the Fund.
While a security is on loan, the Fund does not have the right to vote that security. However, if time permits, the Fund will attempt to recall a security on loan and vote the proxy.
Income from securities lending is included in the Statement of Operations. The amount of collateral and value of securities on loan are included in the Statement of Assets and Liabilities as well as in the Schedule of Investments.
Security transactions and investment income: Security transactions are recorded on the trade date. Security gains and losses are calculated on the specific identification basis. Dividend income is recorded on the ex-dividend date or, in the case of foreign securities, as soon as the Fund is informed of the ex-dividend date. Interest income, including accretion of discounts and amortization of premiums, is recorded on the accrual basis commencing on the settlement date.
Account maintenance fees: If the shareholder account balance falls below $1 by either shareholder action or as a result of market action, a $25 (not in thousands) fee is assessed every year until the balance reaches $1. The fee is assessed by redeeming shares in the shareholder's account.
No fee will be charged under the following conditions:
• accounts opened within the preceding 24 months
• accounts with an active monthly Automatic Investment Plan ($50 (not in thousands) minimum per fund)
• accounts owned by an individual which, when combined by social security number, have a balance of $5 or more
• accounts owned by individuals in the same household (by address) that have a combined balance of $5 or more
• UTMA/UGMA accounts
• Fiduciary accounts
• B-share accounts whose shares have started to convert to
A-shares accounts (as long as combined value of both accounts is at least $1)
For the six months ended April 30, 2005, this fee totaled $1. These fees are included in Paid in Capital in the Statement of Assets and Liabilities.
Redemption fees: A short-term trading redemption fee may be assessed on any fund shares in a fund account that are sold during the first five (5) NYSE trading days following their purchase date. This redemption fee will equal 2% of the amount redeemed and shares held the longest will be treated as being redeemed first and shares held the shortest as being redeemed last.
For the six months ended April 30, 2005, the Fund received less than $1 in redemption fees.
Dividend distributions: Distributions to shareholders are recorded on the ex-dividend date and are determined in accordance with Federal income tax regulations which may differ from GAAP.
NOTE 2. RELATED PARTY TRANSACTIONS
Transamerica Fund Advisors, Inc. ("TFAI") is the Fund's investment adviser. Transamerica Fund Services, Inc. ("TFS") is the Fund's administrator and transfer agent. AFSG Securities Corp. ("AFSG") is the Fund's distributor/principal underwriter. AFSG is 100% owned by AUSA Holding Company ("AUSA"). TFAI is a directly owned subsidiary of Western Reserve Life Assurance Co. of Ohio (78%) and AUSA (22%). TFS is a wholly owned subsidiary of WRL (50%) and AUSA (50%). AUSA and WRL are wholly owned indirect subsidiaries of AEGON NV, a Netherlands corporation.
Effective January 1, 2005 AEGON/Transamerica Fund Advisors, Inc. ("ATFA") was renamed Transamerica Fund Advisors, Inc. ("TFAI"); AEGON/Transamerica Fund Services, Inc. ("ATFS") and AEGON/Transamerica Investor Services, Inc. ("ATIS") merged into one entity and was renamed Transamerica Fund Services, Inc. ("TFS").
The following schedule represents the percentage of fund assets owned by affiliated mutual funds (i.e. through the asset allocation funds):
| Net Assets | % of Net Assets | ||||||||||
| TA IDEX Asset Allocation–Conservative Portfolio | $ | 7,883 | 3.92 | % | |||||||
| TA IDEX Asset Allocation–Growth Portfolio | 36,026 | 17.94 | % | ||||||||
| TA IDEX Asset Allocation–Moderate Growth Portfolio | 73,050 | 36.37 | % | ||||||||
| TA IDEX Asset Allocation–Moderate Portfolio | 47,127 | 23.47 | % | ||||||||
| Total | $ | 164,086 | 81.70 | % | |||||||
Transamerica IDEX Mutual Funds
Semi-Annual Report 2005
9
TA IDEX Salomon Investors Value
NOTES TO FINANCIAL STATEMENTS (continued)
At April 30, 2005
(all amounts in thousands)
(unaudited)
NOTE 2.–(continued)
Investment advisory fee: The Fund pays management fees to TFAI based on average daily net assets ("ANA") at the following breakpoints:
0.80% of the first $500 million of ANA
0.70% of ANA over $500 million
TFAI has contractually agreed to waive its advisory fee and will reimburse the Fund to the extent that operating expenses, excluding 12b-1 fees, exceed the following stated annual limit:
1.20% Expense Limit
If total fund expenses fall below the annual expense limitation agreement agreed to by the adviser within the succeeding three years, the Fund may be required to pay that adviser a portion or all of the waived advisory fees.
There are no amounts available for recapture at April 30, 2005.
Distribution and service fees: The Fund has a 12b-1 distribution plan under the 1940 Act pursuant to which an annual fee, based on average daily net assets, is paid to the distributor for various disbursements such as broker-dealer account servicing fees and other promotional expenses of the Fund. The Fund is authorized under the 12b-1 plan to pay fees on each class up to the following limits:
| Class A | 0.35 | % | |||||
| Class B | 1.00 | % | |||||
| Class C | 1.00 | % | |||||
In the case the Fund or a class of shares of the Fund is closed to new investors or investments, the Fund is authorized to pay 12b-1 fees for past sales and distribution efforts and present and past investor services.
Underwriter commissions relate to front-end sales charges imposed for Class A shares and contingent deferred sales charges from Classes B, C, and certain A share redemptions. For the six months ended April 30, 2005, the underwriter commissions were as follows:
| Received by Underwriter | $ | 48 | |||||
| Retained by Underwriter | 3 | ||||||
| Contingent Deferred Sales Charge | 17 | ||||||
Administrative services: The Fund has entered into an agreement with TFS for financial and legal fund administration services, which includes such items as compliance, expenses, financial statements and other reporting, distributions, tax returns, prospectus preparation, board of trustees meeting support and other legal matters. As of January 1, 2005 the Fund pays TFS an annual fee of 0.02% of average net assets. Prior to January 1, 2005 the Fund paid TFS an annual fee of 0.015% of average net assets. The Legal fees on the Statement of Operations are for fees paid to external legal counsel.
Transfer agent fees: The Fund pays TFS an annual per-account charge of $20 (not in thousands) for each open account and $1.63 (not in thousands) for each closed account. There is no new account charge. The Transfer agent fees on the Statement of Operations are made up of fees paid to TFS and costs associated with shareholder statements.
The Fund paid TFS $64 for the six months ended April 30, 2005.
Deferred compensation plan: Each eligible Fund Trustee may elect participation in the Deferred Compensation Plan ("the Plan"). Under the Plan, such Trustees may defer payment of a percentage of their total fees earned as a Fund Trustee. These deferred amounts may be invested in any Transamerica IDEX Mutual Fund. At April 30, 2005, the value of invested plan amount was $11. Invested plan amounts and the total liability for deferred compensation to the Trustees under the Plan at April 30, 2005, are included in the accompanying Statement of Assets and Liabilities.
Brokerage commissions: Brokerage commissions incurred on security transactions placed with an affiliate of the sub-adviser for the six months ended April 30, 2005, were $10.
NOTE 3. INVESTMENT TRANSACTIONS
The cost of securities purchased and proceeds from securities sold (excluding short-term securities) for the six months ended April 30, 2005, were as follows:
| Purchases of securities: | |||||||
| Long-Term excluding U.S. Government | $ | 93,490 | |||||
| U.S. Government | – | ||||||
| Proceeds from maturities and sales of securities: | |||||||
| Long-Term excluding U.S. Government | 336,764 | ||||||
| U.S. Government | – | ||||||
NOTE 4. FEDERAL INCOME TAX MATTERS
The Fund has not made any provision for federal income or excise taxes due to its policy to distribute all of its taxable income and capital gains to its shareholders and otherwise qualify as a regulated investment company under the Internal Revenue Code. Income and capital gain distributions are determined in accordance with income tax regulations, which may differ from GAAP. These differences are primarily due to differing treatment for items including, but not limited to, wash sales, net operating losses and capital loss carryforwards.
The aggregate cost of investments and composition of unrealized appreciation (depreciation) for federal income tax purposes as of April 30, 2005, are as follows:
| Federal Tax Cost Basis | $ | 224,105 | |||||
| Unrealized Appreciation | $ | 10,725 | |||||
| Unrealized (Depreciation) | (8,483 | ) | |||||
| Net Unrealized Appreciation (Depreciation) | $ | 2,242 | |||||
Transamerica IDEX Mutual Funds
Semi-Annual Report 2005
10
TA IDEX Salomon Investors Value
NOTES TO FINANCIAL STATEMENTS (continued)
At April 30, 2005
(all amounts in thousands)
(unaudited)
NOTE 5. REGULATORY PROCEEDINGS
There continues to be significant federal and state regulatory activity relating to financial services companies, particularly mutual fund companies and their investment advisers. As part of an ongoing investigation regarding potential market timing, recordkeeping and trading compliance issues and matters affecting the Fund's investment adviser, TFAI, and certain employees and affiliates of TFAI, the SEC staff has indicated that it is likely to take some action against TFAI and certain of its affiliates at the conclusion of the investigation. The potential timing and the scope of any such action is difficult to predict. Although the impact of any action brought against TFAI and/or its affiliates is difficult to assess at the present time, the Fund currently believes that the likelihood that any such action will have a material adverse impact on it is remote. It is important to note that the Fund is not aware of any allegation of wrongdoing against it and its board at the time this semi-annual report is printed. Although it is not anticipated that these developments will have an adverse impact on the Fund, there can be no assurance at this time. TFAI and its affiliates are actively working with the SEC in regard to this matter; however, the exact resolution cannot be determined at this time. TFAI will take such actions that it deems necessary or appropriate to continue providing management services to the Fund and to bring all matters to an appropriate conclusion.
TFAI and/or its affiliates, and not the Fund, will bear the costs regarding these regulatory matters.
Transamerica IDEX Mutual Funds
Semi-Annual Report 2005
11
TA IDEX Salomon Investors Value
INVESTMENT ADVISORY AND SUB-ADVISORY AGREEMENTS – REVIEW AND RENEWAL
At a meeting of the Board of Trustees of Transamerica IDEX Mutual Funds ("TA IDEX") held on October 6, 2004, the Board considered and approved the renewal for a one-year period of the Investment Advisory Agreement between TA IDEX Salomon Investors Value (the "Fund") and Transamerica Fund Advisors, Inc. ("TFAI") as well as the Investment Sub-Advisory Agreement of the Fund between TFAI and Salomon Brothers Asset Management, Inc. (the "Sub-Adviser"). In approving the renewal of these agreements, the Board concluded that the Investment Advisory and Investment Sub-Advisory Agreements enable shareholders of the Fund to obtain high quality services at a cost that is appropriate, reasonable, and in the best interests of shareholders based upon the following determinations, among others:
The nature, extent and quality of the advisory service to be provided. The Board considered the nature and quality of the services provided by TFAI and the Sub-Adviser to the Fund in the past, as well as the services anticipated to be provided in the future. The Board concluded that TFAI and the Sub-Adviser are capable of providing high quality services to the Fund, as indicated by TFAI's management capabilities demonstrated with respect to the Fund and other funds managed by TFAI, TFAI's management oversight process, and the professional qualifications and experience of the Sub-Adviser's portfolio management team. The Board also concluded that TFAI and the Sub-Adviser would provide the same quality and quantity of investment management and related services as before, that these services are app ropriate in scope and extent in light of the Fund's operations, the competitive landscape of the investment company business and investor needs, and that TFAI's and the Sub-Adviser's obligations will remain the same in all respects.
The investment performance of the Fund. The Board concluded, based in particular on information provided by Lipper Analytics, that the Fund's long-term investment performance was competitive relative to comparable funds although its performance had lagged over the past year. The Board noted that the Sub-Adviser was appointed to manage the Fund in 2002 and, consequently, that some of the Fund's long-term performance was attributable to another sub-adviser. Thus, the Board decided to monitor the Fund's performance periodically for improvements. Nevertheless, on the basis of the Trustees' assessment of the nature, extent and quality of investment advisory and related services to be provided or procured by TFAI and the Sub-Adviser, including steps to be taken to improve recent performance, the Trust ees concluded that TFAI and the Sub-Adviser were capable of generating a level of long-term investment performance that is appropriate in light of the Fund's investment objective, policies and strategies and competitive with many other investment companies.
The cost of advisory services provided and the level of profitability. On the basis of the Board's review of the fees to be charged by TFAI and the Sub-Adviser for investment advisory and related services, TFAI's financial statements, the fees paid by TFAI to the Sub-Adviser, TFAI's estimated net management income resulting from its management of the Fund, the estimated profitability of TFAI's relationships with the Fund and TA IDEX, and the estimated profitability of the Sub-Adviser's relationship with the Fund, the Board concluded that the level of investment advisory fees and the profitability is appropriate in light of the services provided, the management fees and overall expense ratios of comparable investment companies, and the anticipated profitability of the relationship between the Fun d, TFAI and the Sub-Adviser. Further, on the basis of comparative information supplied by Lipper Analytics, the Board determined that the advisory fees and estimated overall expense ratio of the Fund were consistent with industry averages.
The extent to which economies of scale would be realized as the Fund grows and whether fee levels reflect these economies of scale for the benefit of Fund investors. The Trustees concluded that inclusion of asset-based breakpoints in the Fund's advisory fee schedule appropriately benefited investors by realizing economies of scale in the form of a lower advisory fee rate as the level of Fund assets increases. The Board also concluded that the advisory fees appropriately reflect the Fund's current size, the current economic environment for TFAI, and the competitive nature of the investment company market. In addition, the Board noted that it will have the opportunity to periodically re-examine whether the Fund has achieved economies of scale, as well as the appropriateness of advisory fees payabl e to TFAI and the Sub-Adviser in the future.
Benefits (such as soft dollars) to TFAI or the Sub-Adviser from its relationship with the Fund. The Board concluded that other benefits derived by TFAI or the Sub-Adviser from its relationship with the Fund are reasonable and fair, and are consistent with industry practice and the best interests of the Fund and its shareholders. In this regard, the Board noted that TFAI does not realize "soft dollar" benefits from its relationship with the Fund, and that the Sub-Adviser engaged in "soft dollar" arrangements consistent with applicable law and "best execution" requirements.
Other considerations. The Board also determined that TFAI had made a substantial commitment to the recruitment and retention of high quality personnel, and maintained the financial, compliance and operational resources reasonably necessary to manage the Fund in a professional manner that is consistent with the best interests of the Fund and its shareholders. The Trustees also concluded that TFAI had made a significant entrepreneurial commitment to the management and success of the Fund, reflected by TFAI's expense limitation and fee waiver arrangement with the Fund which, as demonstrated in the past with the Fund, may result in TFAI waiving a substantial amount of advisory fees for the benefit of shareholders.
Transamerica IDEX Mutual Funds
Semi-Annual Report 2005
12
TA IDEX Salomon Investors Value
SUPPLEMENTAL INFORMATION (unaudited)
RESULTS OF SHAREHOLDER PROXY
At a special meeting of shareholders held on February 25, 2005, the results of the Proposals were as follows:
Transamerica IDEX Mutual Funds
Proposal 1: Election of Trustees to the Board of Trustees of Transamerica IDEX Mutual Funds.
| For | Withheld | ||||||||||
| Peter R. Brown | 872,017,875.249 | 4,468,498.551 | |||||||||
| Daniel Calabria | 871,917,069.786 | 4,569,304.014 | |||||||||
| Janise B. Case | 872,099,393.125 | 4,386,980.675 | |||||||||
| Charles C. Harris | 872,086,722.025 | 4,399,651.775 | |||||||||
| Leo J. Hill | 872,304,465.640 | 4,181,908.160 | |||||||||
| Russell A. Kimball, Jr. | 872,253,556.471 | 4,232,817.329 | |||||||||
| William W. Short, Jr. | 872,139,920.944 | 4,346,452.856 | |||||||||
| John Waechter | 872,261,152.376 | 4,225,221.424 | |||||||||
| Jack E. Zimmerman | 871,929,967.512 | 4,556,406.288 | |||||||||
| Brian C. Scott | 872,218,970.367 | 4,267,403.433 | |||||||||
| Thomas P. O'Neill | 872,111,944.117 | 4,374,429.683 | |||||||||
TA IDEX Salomon Investors Value
Proposal 2: Approval of an Agreement and Plan of Reorganization pursuant to which Transamerica IDEX Mutual Funds will organize as a Delaware statutory trust.
| For | Against | Abstentions/Broker Non-Votes | |||||||||
| 30,893,899.469 | 23,114.099 | 1,041,226.751 | |||||||||
Proposal 3: Approval of changes to the fundamental investment restrictions of TA IDEX Salomon Investors Value.
| A. Diversification | For | Against | Abstentions/Broker Non-Votes | ||||||||||||
| 30,912,760.789 | 28,991.530 | 1,016,488.000 | |||||||||||||
| B. Borrowing | For | Against | Abstentions/Broker Non-Votes | ||||||||||||
| 30,907,423.884 | 34,328.435 | 1,016,488.000 | |||||||||||||
| C. Senior Securities | For | Against | Abstentions/Broker Non-Votes | ||||||||||||
| 30,912,760.789 | 28,991.530 | 1,016,488.000 | |||||||||||||
| D. Underwriting Securities | For | Against | Abstentions/Broker Non-Votes | ||||||||||||
| 30,912,081.207 | 29,671.112 | 1,016,488.000 | |||||||||||||
| E. Real Estate | For | Against | Abstentions/Broker Non-Votes | ||||||||||||
| 30,912,760.789 | 28,991.530 | 1,016,488.000 | |||||||||||||
| F. Making Loans | For | Against | Abstentions/Broker Non-Votes | ||||||||||||
| 30,908,198.795 | 33,553.524 | 1,016,488.000 | |||||||||||||
| G. Concentration | For | Against | Abstentions/Broker Non-Votes | ||||||||||||
| 30,909,607.258 | 32,145.061 | 1,016,488.000 | |||||||||||||
| H. Commodities | For | Against | Abstentions/Broker Non-Votes | ||||||||||||
| 30,910,493.207 | 31,259.112 | 1,016,488.000 | |||||||||||||
Transamerica IDEX Mutual Funds
Semi-Annual Report 2005
13
TA IDEX T. Rowe Price Health Sciences
UNDERSTANDING YOUR FUND'S EXPENSES
(unaudited)
SHAREHOLDER EXPENSES
The following Example is intended to help you understand your ongoing costs (in dollars and cents) of investing in a Fund and to compare these costs with the ongoing costs of investing in other funds.
The Example is based on an investment of $1,000 invested at November 1, 2004 and held for the entire period until April 30, 2005.
ACTUAL EXPENSES
The first line in the table below provides information about actual account values and actual expenses. You may use the information in this line, together with the amount you invested, to estimate the expenses that you paid over the period. Simply divide your account value by $1,000 (for example, an $8,600 account value divided by $1,000 = 8.6), then multiply the result by the number in the first line of your Fund under the heading entitled "Expenses Paid During Period" to estimate the expenses you paid on your account during this period.
HYPOTHETICAL EXAMPLE FOR COMPARISON PURPOSES
The second line in the table below provides information about hypothetical account values and hypothetical expenses based on the Fund's actual expense ratio and an assumed rate of return of 5% per year before expenses, which is not the Fund's actual return. The hypothetical account values and expenses may not be used to estimate the actual ending account balance or expenses you paid for the period. You may use this information to compare the ongoing costs of investing in your Fund and other funds. To do so, compare this 5% hypothetical example with the 5% hypothetical examples that appear in the shareholder reports of the other funds.
Please note that the expenses shown in the table are meant to highlight your ongoing costs only and do not reflect any transactional costs, such as sales charges, redemption fees, brokerage commissions paid on purchases and sales of fund shares. Therefore, the second line under the Fund in the table is useful in comparing ongoing costs only, and will not help you determine the relative total costs of owning different funds. In addition, note that the expenses shown in the table are meant to highlight your ongoing costs and do not reflect any transaction costs.
| Beginning Account Value | Ending Account Value | Annualized Expense Ratio | Expenses Paid During Period (a) | ||||||||||||||||
| Class A | |||||||||||||||||||
| Actual | $ | 1,000.00 | $ | 1,019.30 | 1.42 | % | $ | 7.11 | |||||||||||
| Hypothetical (b) | 1,000.00 | 1,017.75 | 1.42 | 7.10 | |||||||||||||||
| Class B | |||||||||||||||||||
| Actual | 1,000.00 | 1,013.90 | 2.51 | 12.53 | |||||||||||||||
| Hypothetical (b) | 1,000.00 | 1,012.35 | 2.51 | 12.52 | |||||||||||||||
| Class C | |||||||||||||||||||
| Actual | 1,000.00 | 1,014.50 | 2.60 | 12.99 | |||||||||||||||
| Hypothetical (b) | 1,000.00 | 1,011.90 | 2.60 | 12.97 | |||||||||||||||
| Class I | |||||||||||||||||||
| Actual | 1,000.00 | 985.70 | 1.05 | 4.94 | |||||||||||||||
| Hypothetical (b) | 1,000.00 | 1,018.72 | 1.05 | 5.02 | |||||||||||||||
(a) Expenses are calculated using each Fund's annualized expense ratio (as disclosed in the table), multiplied by the average account value for the period, multiplied by number of days in the period (181 days) and divided by the number of days in the year (365 days).
(b) 5% return per year before expenses.
GRAPHICAL PRESENTATION OF SCHEDULE OF INVESTMENTS
By Industry
At April 30, 2005
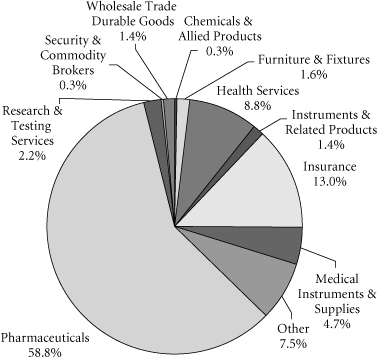
This chart shows the percentage breakdown by industry of the Fund's total investment securities.
Transamerica IDEX Mutual Funds
Semi-Annual Report 2005
1
TA IDEX T. Rowe Price Health Sciences
SCHEDULE OF INVESTMENTS
At April 30, 2005
(all amounts except share amounts in thousands)
(unaudited)
| Shares | Value | ||||||||||
| CONVERTIBLE PREFERRED STOCKS (0.3%) | |||||||||||
| Pharmaceuticals (0.0%) | |||||||||||
| NeoRx Corp. | 3 | $ | 4 | ||||||||
| Security & Commodity Brokers (0.3%) | |||||||||||
| Morgan Stanley–144A (a) | 26,000 | 788 | |||||||||
| Total Convertible Preferred Stocks (cost: $1,146) | 792 | ||||||||||
| COMMON STOCKS (93.6%) | |||||||||||
| Chemicals & Allied Products (0.4%) | |||||||||||
| Solvay SA | 9,500 | 1,084 | |||||||||
| Furniture & Fixtures (1.6%) | |||||||||||
| Kinetic Concepts, Inc. (a)(b) | 68,900 | 4,234 | |||||||||
| Select Comfort Corp. (a) | 37,500 | 829 | |||||||||
| Health Services (9.0%) | |||||||||||
| Caremark Rx, Inc. (a) | 12,289 | 492 | |||||||||
| Community Health Systems, Inc. (a) | 140,700 | 5,129 | |||||||||
| Coventry Health Care, Inc. (a) | 32,000 | 2,190 | |||||||||
| CryoLife, Inc. (a) | 113,600 | 683 | |||||||||
| DaVita, Inc. (a)(b) | 74,200 | 2,990 | |||||||||
| Edwards Lifesciences Corp. (a) | 51,200 | 2,255 | |||||||||
| HCA, Inc. | 18,000 | 1,005 | |||||||||
| Healthsouth Corp. (a) | 150,100 | 758 | |||||||||
| Human Genome Sciences, Inc. (a) | 122,300 | 1,265 | |||||||||
| LabOne, Inc. (a) | 30,300 | 1,063 | |||||||||
| LCA-Vision, Inc. | 36,800 | 1,442 | |||||||||
| Manor Care, Inc. | 2,700 | 90 | |||||||||
| NeighborCare, Inc. (a) | 50,400 | 1,447 | |||||||||
| Nektar Therapeutics (a) | 53,500 | 763 | |||||||||
| Omnicare, Inc. | 12,140 | 421 | |||||||||
| Sunrise Senior Living, Inc. (a) | 55,800 | 2,859 | |||||||||
| Symbion, Inc. (a) | 64,431 | 1,371 | |||||||||
| Triad Hospitals, Inc. (a) | 30,800 | 1,578 | |||||||||
| Instruments & Related Products (1.4%) | |||||||||||
| Alcon, Inc. (a) | 29,600 | 2,871 | |||||||||
| Bausch & Lomb, Inc. | 20,600 | 1,545 | |||||||||
| Insurance (13.2%) | |||||||||||
| UnitedHealth Group, Inc. | 194,200 | 18,354 | |||||||||
| WellChoice, Inc. (a) | 38,200 | 2,147 | |||||||||
| WellPoint, Inc. (a)(b) | 158,500 | 20,248 | |||||||||
| Medical Instruments & Supplies (4.8%) | |||||||||||
| Aspect Medical Systems, Inc. (a) | 23,600 | 591 | |||||||||
| Bard, (C.R.) Inc. | 5,900 | 420 | |||||||||
| Baxter International, Inc. | 11,600 | 430 | |||||||||
| Biomet, Inc. | 24,600 | 952 | |||||||||
| Boston Scientific Corp. (a) | 12,500 | 370 | |||||||||
| Conmed Corp. (a) | 17,400 | 517 | |||||||||
| Shares | Value | ||||||||||
| Medical Instruments & Supplies (continued) | |||||||||||
| Endologix, Inc. (a) | 89,200 | $ | 452 | ||||||||
| Fischer Imaging Corp. (a) | 45,380 | 229 | |||||||||
| Integra LifeSciences Holdings Corp. (a) | 11,900 | 422 | |||||||||
| Kyphon, Inc. (a) | 24,200 | 633 | |||||||||
| Medtronic, Inc. | 36,670 | 1,933 | |||||||||
| Resmed, Inc. (a) | 24,600 | 1,528 | |||||||||
| Respironics, Inc. (a) | 5,100 | 322 | |||||||||
| St. Jude Medical, Inc. (a)(b) | 48,800 | 1,905 | |||||||||
| Stryker Corp. | 53,400 | 2,593 | |||||||||
| Zimmer Holdings, Inc. (a) | 18,400 | 1,498 | |||||||||
| Pharmaceuticals (59.6%) | |||||||||||
| Abgenix, Inc. (a) | 165,200 | 1,151 | |||||||||
| Able Laboratories, Inc. (a) | 42,200 | 1,006 | |||||||||
| Alexion Pharmaceuticals, Inc. (a) | 83,880 | 1,740 | |||||||||
| Alkermes, Inc. (a) | 289,460 | 3,256 | |||||||||
| American Pharmaceutical Partners, Inc. (a) | 5,900 | 308 | |||||||||
| AmerisourceBergen Corp. (b) | 18,200 | 1,115 | |||||||||
| Amgen, Inc. (a) | 181,620 | 10,572 | |||||||||
| Amylin Pharmaceuticals, Inc. (a)(b) | 63,680 | 1,083 | |||||||||
| Andrx Corp. (a) | 85,200 | 1,696 | |||||||||
| Array Biopharma, Inc. (a) | 23,600 | 147 | |||||||||
| Astellas Pharma, Inc. | 72,000 | 2,606 | |||||||||
| AtheroGenics, Inc. (a) | 67,300 | 723 | |||||||||
| BioCryst Pharmaceuticals, Inc. (a) | 142,700 | 569 | |||||||||
| Biogen Idec, Inc. (a)(b) | 73,500 | 2,664 | |||||||||
| BioSphere Medical, Inc. (a) | 112,400 | 455 | |||||||||
| Cardinal Health, Inc. | 30,900 | 1,717 | |||||||||
| Celgene Corp. (a) | 118,200 | 4,481 | |||||||||
| Cephalon, Inc. (a)(b) | 207,140 | 9,093 | |||||||||
| Chiron Corp. (a)(b) | 7,000 | 239 | |||||||||
| Cubist Pharmaceuticals, Inc. (a) | 248,100 | 2,245 | |||||||||
| CV Therapeutics, Inc. (a)(b) | 86,600 | 1,716 | |||||||||
| Cytokinetics, Inc. (a) | 17,700 | 87 | |||||||||
| Dade Behring Holdings, Inc. (a) | 42,300 | 2,609 | |||||||||
| Discovery Laboratories, Inc. (a) | 29,100 | 165 | |||||||||
| Dynavax Technologies Corp. (a) | 11,700 | 47 | |||||||||
| Elan Corp. PLC, ADR (a) | 265,800 | 1,465 | |||||||||
| Encysive Pharmaceuticals, Inc. (a) | 177,900 | 1,736 | |||||||||
| Eyetech Pharmaceuticals, Inc. (a)(b) | 117,400 | 2,699 | |||||||||
| Favrille, Inc. (a) | 23,600 | 91 | |||||||||
| Forest Laboratories, Inc. (a) | 12,600 | 450 | |||||||||
| Genentech, Inc. (a)(b) | 177,640 | 12,602 | |||||||||
| Genzyme Corp. (a) | 3,700 | 217 | |||||||||
| Gilead Sciences, Inc. (a)(b) | 416,771 | 15,462 | |||||||||
| GlaxoSmithKline PLC | 20,100 | 509 | |||||||||
| ICOS Corp. (a) | 25,200 | 569 | |||||||||
The notes to the financial statements are an integral part of this report.
Transamerica IDEX Mutual Funds
Semi-Annual Report 2005
2
TA IDEX T. Rowe Price Health Sciences
SCHEDULE OF INVESTMENTS (continued)
At April 30, 2005
(all amounts except share amounts in thousands)
(unaudited)
| Shares | Value | ||||||||||
| Pharmaceuticals (continued) | |||||||||||
| Idenix Pharmaceuticals, Inc. (a) | 80,600 | $ | 1,524 | ||||||||
| ImClone Systems, Inc. (a)(b) | 188,190 | 5,994 | |||||||||
| Immucor, Inc. (a)(b) | 67,400 | 2,011 | |||||||||
| Indevus Pharmaceuticals, Inc. (a) | 77,300 | 189 | |||||||||
| Inspire Pharmaceuticals, Inc. (a) | 42,600 | 301 | |||||||||
| Invitrogen Corp. (a) | 60,900 | 4,462 | |||||||||
| IVAX Corp. (a)(b) | 127,925 | 2,418 | |||||||||
| Johnson & Johnson | 48,600 | 3,335 | |||||||||
| Keryx Biopharmaceuticals, Inc. (a) | 8,000 | 116 | |||||||||
| Keryx Biopharmaceuticals, Inc., Foreign shares (a) | 51,800 | 751 | |||||||||
| Lilly (Eli) & Co. (b) | 62,700 | 3,666 | |||||||||
| Martek Biosciences Corp. (a)(b) | 49,300 | 1,887 | |||||||||
| Medicines Co. (a)(b) | 191,250 | 4,083 | |||||||||
| Medicis Pharmaceutical Corp.–Class A | 19,000 | 534 | |||||||||
| MedImmune, Inc. (a) | 73,120 | 1,855 | |||||||||
| MGI PHARMA, Inc. (a) | 148,200 | 3,268 | |||||||||
| Myogen, Inc. (a) | 62,400 | 405 | |||||||||
| Myogen, Inc. Warrants (a)(e) | 2,900 | – | (c) | ||||||||
| Myriad Genetics, Inc. (a) | 40,100 | 648 | |||||||||
| NeoRx Corp. (a)(e) | 4,600 | 3 | |||||||||
| NeoRx Corp. Warrants, Expires 12/8/2008 (a)(e) | 1,200 | – | (c) | ||||||||
| Neurocrine Biosciences, Inc. (a) | 115,060 | 4,022 | |||||||||
| Novartis AG, ADR | 19,600 | 955 | |||||||||
| Noven Pharmaceuticals, Inc. (a) | 46,000 | 765 | |||||||||
| NPS Pharmaceuticals, Inc. (a) | 132,400 | 1,609 | |||||||||
| Onyx Pharmaceuticals, Inc. (a)(b) | 48,000 | 1,483 | |||||||||
| OraSure Technologies, Inc. (a) | 59,500 | 474 | |||||||||
| OSI Pharmaceuticals, Inc. (a)(b) | 83,830 | 3,968 | |||||||||
| Penwest Pharmaceuticals Co. (a) | 25,100 | 321 | |||||||||
| Pfizer, Inc. (b) | 138,280 | 3,757 | |||||||||
| Pharmion Corp. (a) | 23,500 | 543 | |||||||||
| Protein Design Labs, Inc. (a) | 153,000 | 2,736 | |||||||||
| Rigel Pharmaceuticals, Inc. (a) | 49,900 | 856 | |||||||||
| Roche Holding AG–Genusschein | 26,000 | 3,159 | |||||||||
| Salix Pharmaceuticals, Ltd. (a) | 11,650 | 167 | |||||||||
| Sanofi-Aventis | 24,400 | 2,168 | |||||||||
| Schering-Plough Corp. | 86,380 | 1,803 | |||||||||
| Schwarz Pharma AG | 27,500 | 1,237 | |||||||||
| Sepracor, Inc. (a)(b) | 160,900 | 9,641 | |||||||||
| Serologicals Corp. (a) | 36,500 | 786 | |||||||||
| Shire Pharmaceuticals PLC, ADR (b) | 43,600 | 1,355 | |||||||||
| Taro Pharmaceuticals Industries (a) | 14,000 | 407 | |||||||||
| Teva Pharmaceutical Industries, Ltd., ADR | 73,980 | 2,311 | |||||||||
| Theravance, Inc. (a) | 71,100 | 1,258 | |||||||||
| Transkaryotic Therapies, Inc. (a) | 18,800 | 637 | |||||||||
| Shares | Value | ||||||||||
| Pharmaceuticals (continued) | |||||||||||
| Trimeris, Inc. (a) | 165,720 | $ | 1,649 | ||||||||
| UCB SA | 6,200 | 302 | |||||||||
| United Therapeutics Corp. (a)(b) | 11,700 | 561 | |||||||||
| Valeant Pharmaceuticals International (b) | 43,500 | 903 | |||||||||
| Vertex Pharmaceuticals, Inc. (a)(b) | 149,300 | 1,424 | |||||||||
| Vicuron Pharmaceuticals, Inc. (a) | 35,900 | 587 | |||||||||
| Vion Pharmaceuticals, Inc. (a) | 222,700 | 599 | |||||||||
| ViroLogic, Inc. (a) | 17,300 | 42 | |||||||||
| Viropharma, Inc. (a) | 83,733 | 141 | |||||||||
| Wyeth (b) | 165,700 | 7,447 | |||||||||
| Research & Testing Services (2.2%) | |||||||||||
| Affymetrix, Inc. (a) | 6,300 | 290 | |||||||||
| DeCODE Genetics, Inc. (a) | 138,400 | 747 | |||||||||
| Exelixis, Inc. (a) | 185,580 | 1,271 | |||||||||
| Gen-Probe, Inc. (a)(b) | 54,800 | 2,750 | |||||||||
| Incyte Corp. (a) | 94,600 | 619 | |||||||||
| Kosan Biosciences, Inc. (a) | 46,500 | 250 | |||||||||
| Regeneration Technologies, Inc. (a) | 105,700 | 971 | |||||||||
| Wholesale Trade Durable Goods (1.4%) | |||||||||||
| Patterson Cos., Inc. (a) | 32,900 | 1,663 | |||||||||
| Symyx Technologies, Inc. (a) | 114,200 | 2,783 | |||||||||
| Total Common Stocks (cost: $289,933) | 290,065 | ||||||||||
| Principal | Value | ||||||||||
| SHORT-TERM U.S. GOVERNMENT OBLIGATIONS (7.6%) | |||||||||||
| U.S. Treasury Bill | |||||||||||
| 2.69%, due 07/07/2005 (b) | $ | 2,273 | $ | 2,262 | |||||||
| 2.77%, due 07/07/2005 (b) | 20,045 | 19,940 | |||||||||
| 2.79%, due 07/07/2005 (b) | 500 | 497 | |||||||||
| 2.81%, due 07/07/2005 (b) | 300 | 299 | |||||||||
| 2.82%, due 07/07/2005 (b) | 700 | 696 | |||||||||
| Total Short-Term U.S. Government Obligations (cost: $23,694) | 23,694 | ||||||||||
| Contracts (d) | Value | ||||||||||
| PURCHASED OPTIONS (0.0%) | |||||||||||
| Call Options (0.0%) | |||||||||||
| Vertex Pharmaceuticals, Inc. | 193 | $ | 9 | ||||||||
| Call Strike $10.00 | |||||||||||
| Expires 05/21/2005 | |||||||||||
| Total Purchased Options (cost: $10) | 9 | ||||||||||
| Total Investment Securities (cost: $314,783) | $ | 314,560 | |||||||||
| WRITTEN OPTIONS (-1.4%) | |||||||||||
| Covered Call Options (-0.5%) | |||||||||||
| AmerisourceBergen Corp. Call Strike $60.00 Expires 05/21/2005 | 173 | (38 | ) | ||||||||
The notes to the financial statements are an integral part of this report.
Transamerica IDEX Mutual Funds
Semi-Annual Report 2005
3
TA IDEX T. Rowe Price Health Sciences
SCHEDULE OF INVESTMENTS (continued)
At April 30, 2005
(all amounts except share amounts in thousands)
(unaudited)
| Contracts (d) | Value | ||||||||||
| Covered Call Options (continued) | |||||||||||
| Amylin Pharmaceuticals, Inc. | 92 | $ | (2 | ) | |||||||
| Call Strike $20.00 | |||||||||||
| Expires 05/21/2005 | |||||||||||
| Amylin Pharmaceuticals, Inc. Call Strike $25.00 Expires 01/21/2006 | 90 | (11 | ) | ||||||||
| Amylin Pharmaceuticals, Inc. Call Strike $22.50 Expires 01/21/2006 | 42 | (7 | ) | ||||||||
| Biogen Idec, Inc. Call Strike $40.00 Expires 07/16/2005 | 114 | (13 | ) | ||||||||
| Biogen Idec, Inc. Call Strike $45.00 Expires 07/16/2005 | 121 | (5 | ) | ||||||||
| Cephalon, Inc. Call Strike $45.30 Expires 06/18/2005 | 37 | (7 | ) | ||||||||
| Chiron Corp. Call Strike $45.00 Expires 10/22/2005 | 70 | (2 | ) | ||||||||
| CV Therapeutics, Inc. Call Strike $20.00 Expires 06/18/2005 | 62 | (9 | ) | ||||||||
| CV Therapeutics, Inc. Call Strike $30.00 Expires 07/16/2005 | 100 | (3 | ) | ||||||||
| CV Therapeutics, Inc. Call Strike $22.50 Expires 10/22/2005 | 52 | (10 | ) | ||||||||
| DaVita, Inc. Call Strike $45.00 Expires 07/16/2005 | 119 | (6 | ) | ||||||||
| Eyetech Pharmaceuticals, Inc. Call Strike $40.00 Expires 09/17/2005 | 228 | (24 | ) | ||||||||
| Genentech, Inc. Call Strike $60.00 Expires 06/18/2005 | 185 | (220 | ) | ||||||||
| Genentech, Inc. Call Strike $65.00 Expires 06/18/2005 | 37 | (29 | ) | ||||||||
| Genentech, Inc. Call Strike $70.00 Expires 09/17/2005 | 401 | (295 | ) | ||||||||
| Gen-Probe, Inc. Call Strike $60.00 Expires 08/20/2005 | 142 | (15 | ) | ||||||||
| Contracts (d) | Value | ||||||||||
| Covered Call Options (continued) | |||||||||||
| Gilead Sciences, Inc. | 357 | $ | (54 | ) | |||||||
| Call Strike $40.00 | |||||||||||
| Expires 08/20/2005 | |||||||||||
| ImClone Systems, Inc. Call Strike $50.00 Expires 08/20/2005 | 282 | (13 | ) | ||||||||
| ImClone Systems, Inc. Call Strike $40.00 Expires 11/19/2005 | 73 | (17 | ) | ||||||||
| ImClone Systems, Inc. Call Strike $45.00 Expires 01/21/2006 | 92 | (17 | ) | ||||||||
| ImClone Systems, Inc. Call Strike $50.00 Expires 01/21/2006 | 227 | (27 | ) | ||||||||
| Immucor, Inc. Call Strike $35.00 Expires 09/17/2005 | 94 | (13 | ) | ||||||||
| IVAX Corp. Call Strike $17.50 Expires 06/18/2005 | 47 | (9 | ) | ||||||||
| Kinetic Concepts, Inc. Call Strike $65.00 Expires 06/18/2005 | 56 | (8 | ) | ||||||||
| Kinetic Concepts, Inc. Call Strike $70.00 Expires 09/17/2005 | 22 | (4 | ) | ||||||||
| Lilly (Eli) & Co. Call Strike $60.00 Expires 07/16/2005 | 25 | (4 | ) | ||||||||
| Martek Biosciences Corp. Call Strike $50.00 Expires 06/18/2005 | 54 | (3 | ) | ||||||||
| Medicines Co. Call Strike $25.00 Expires 07/16/2005 | 181 | (8 | ) | ||||||||
| Onyx Pharmaceuticals, Inc. Call Strike $45.00 Expires 08/20/2005 | 86 | (7 | ) | ||||||||
| OSI Pharmaceuticals, Inc. Call Strike $45.00 Expires 07/16/2005 | 122 | (74 | ) | ||||||||
| OSI Pharmaceuticals, Inc. Call Strike $50.00 Expires 07/16/2005 | 122 | (47 | ) | ||||||||
| OSI Pharmaceuticals, Inc. Call Strike $55.00 Expires 07/16/2005 | 53 | (13 | ) | ||||||||
The notes to the financial statements are an integral part of this report.
Transamerica IDEX Mutual Funds
Semi-Annual Report 2005
4
TA IDEX T. Rowe Price Health Sciences
SCHEDULE OF INVESTMENTS (continued)
At April 30, 2005
(all amounts except share amounts in thousands)
(unaudited)
| Contracts (d) | Value | ||||||||||
| Covered Call Options (continued) | |||||||||||
| Pfizer, Inc. | 163 | $ | (17 | ) | |||||||
| Call Strike $30.00 | |||||||||||
| Expires 01/21/2006 | |||||||||||
| Sepracor, Inc. Call Strike $70.00 Expires 07/16/2005 | 48 | (6 | ) | ||||||||
| Sepracor, Inc. Call Strike $75.00 Expires 07/16/2005 | 237 | (14 | ) | ||||||||
| Shire Pharmaceuticals Call Strike $37.50 Expires 10/22/2005 | 96 | (5 | ) | ||||||||
| St. Jude Medical, Inc. Call Strike $40.00 Expires 07/16/2005 | 35 | (5 | ) | ||||||||
| United Therapeutics Corp. Call Strike $50.00 Expires 05/21/2005 | 46 | (6 | ) | ||||||||
| Valeant Pharmaceuticals International Call Strike $25.00 Expires 09/17/2005 | 142 | (6 | ) | ||||||||
| WellPoint, Inc. Call Strike $90.00 Expires 06/18/2005 | 24 | (91 | ) | ||||||||
| Wyeth Call Strike $40.00 Expires 07/16/2005 | 92 | (49 | ) | ||||||||
| Wyeth Call Strike $45.00 Expires 07/16/2005 | 270 | (45 | ) | ||||||||
| Wyeth Call Strike $45.00 Expires 01/21/2006 | 365 | (135 | ) | ||||||||
| Wyeth Call Strike $50.00 Expires 01/21/2006 | 118 | (19 | ) | ||||||||
| Put Options (-0.9%) | |||||||||||
| Abbott Laboratories Put Strike $55.00 Expires 01/21/2006 | 62 | (41 | ) | ||||||||
| Alexion Pharmaceuticals, Inc. Put Strike $22.50 Expires 05/21/2005 | 30 | (6 | ) | ||||||||
| Allergan, Inc. Put Strike $80.00 Expires 07/16/2005 | 19 | (19 | ) | ||||||||
| Allergan, Inc. Put Strike $80.00 Expires 01/21/2006 | 33 | (36 | ) | ||||||||
| Contracts (d) | Value | ||||||||||
| Put Options (continued) | |||||||||||
| Amgen, Inc. | 144 | $ | (43 | ) | |||||||
| Put Strike $60.00 | |||||||||||
| Expires 07/16/2005 | |||||||||||
| AstraZeneca Put Strike $45.00 Expires 10/22/2005 | 37 | (12 | ) | ||||||||
| Bausch & Lomb, Inc. Put Strike $65.00 Expires 01/21/2006 | 48 | (9 | ) | ||||||||
| Bausch & Lomb, Inc. Put Strike $70.00 Expires 01/21/2006 | 28 | (9 | ) | ||||||||
| Bausch & Lomb, Inc. Put Strike $75.00 Expires 01/21/2006 | 60 | (30 | ) | ||||||||
| Bausch & Lomb, Inc. Put Strike $80.00 Expires 01/21/2006 | 48 | (36 | ) | ||||||||
| Baxter International, Inc. Put Strike $35.00 Expires 01/21/2006 | 56 | (11 | ) | ||||||||
| Baxter International, Inc. Put Strike $40.00 Expires 01/21/2006 | 29 | (12 | ) | ||||||||
| Biogen Idec, Inc. Put Strike $45.00 Expires 07/16/2005 | 55 | (50 | ) | ||||||||
| Biomet, Inc. Put Strike $45.00 Expires 07/16/2005 | 39 | (26 | ) | ||||||||
| Boston Scientific Corp. Put Strike $40.00 Expires 01/21/2006 | 90 | (94 | ) | ||||||||
| Celgene Corp. Put Strike $35.00 Expires 01/21/2006 | 63 | (25 | ) | ||||||||
| Community Health Systems, Inc. Put Strike $35.00 Expires 09/17/2005 | 94 | (11 | ) | ||||||||
| Coventry Health Care, Inc. Put Strike $50.00 Expires 01/21/2006 | 50 | (7 | ) | ||||||||
| Coventry Health Care, Inc. Put Strike $60.00 Expires 01/21/2006 | 42 | (15 | ) | ||||||||
| Coventry Health Care, Inc. Put Strike $65.00 Expires 01/21/2006 | 59 | (31 | ) | ||||||||
The notes to the financial statements are an integral part of this report.
Transamerica IDEX Mutual Funds
Semi-Annual Report 2005
5
TA IDEX T. Rowe Price Health Sciences
SCHEDULE OF INVESTMENTS (continued)
At April 30, 2005
(all amounts except share amounts in thousands)
(unaudited)
| Contracts (d) | Value | ||||||||||
| Put Options (continued) | |||||||||||
| DaVita, Inc. | 86 | $ | (83 | ) | |||||||
| Put Strike $50.00 | |||||||||||
| Expires 07/16/2005 | |||||||||||
| DaVita, Inc. Put Strike $50.00 Expires 01/21/2006 | 75 | (73 | ) | ||||||||
| Edwards Lifesciences Corp. Put Strike $50.00 Expires 08/20/2005 | 64 | (39 | ) | ||||||||
| Elan Corp. Put Strike $25.00 Expires 01/21/2006 | 45 | (88 | ) | ||||||||
| Elan Corp. Put Strike $30.00 Expires 01/21/2006 | 91 | (223 | ) | ||||||||
| Encysive Pharmaceuticals, Inc. Put Strike $15.00 Expires 10/22/2005 | 60 | (32 | ) | ||||||||
| Eyetech Pharmaceuticals, Inc. Put Strike $45.00 Expires 06/18/2005 | 111 | (245 | ) | ||||||||
| Eyetech Pharmaceuticals, Inc. Put Strike $45.00 Expires 09/17/2005 | 24 | (54 | ) | ||||||||
| Genentech, Inc. Put Strike $60.00 Expires 06/18/2005 | 27 | (2 | ) | ||||||||
| Genentech, Inc. Put Strike $70.00 Expires 06/18/2005 | 62 | (20 | ) | ||||||||
| Genentech, Inc. Put Strike $75.00 Expires 06/18/2005 | 62 | (38 | ) | ||||||||
| Genentech, Inc. Put Strike $70.00 Expires 09/17/2005 | 83 | (47 | ) | ||||||||
| Genentech, Inc. Put Strike $75.00 Expires 09/17/2005 | 24 | (20 | ) | ||||||||
| Genentech, Inc. Put Strike $65.00 Expires 01/21/2006 | 268 | (142 | ) | ||||||||
| Genentech, Inc. Put Strike $50.00 Expires 01/21/2006 | 48 | (8 | ) | ||||||||
| Gen-Probe, Inc. Put Strike $50.00 Expires 08/20/2005 | 40 | (15 | ) | ||||||||
| Contracts (d) | Value | ||||||||||
| Put Options (continued) | |||||||||||
| Gilead Sciences, Inc. | 124 | $ | (99 | ) | |||||||
| Put Strike $45.00 | |||||||||||
| Expires 08/20/2005 | |||||||||||
| Gilead Sciences, Inc. Put Strike $45.00 Expires 01/21/2006 | 83 | (73 | ) | ||||||||
| HCA, Inc. Put Strike $50.00 Expires 01/21/2006 | 93 | (21 | ) | ||||||||
| HCA, Inc. Put Strike $55.00 Expires 01/21/2006 | 90 | (36 | ) | ||||||||
| Henry Schein, Inc. Put Strike $30.00 Expires 01/21/2006 | 16 | (1 | ) | ||||||||
| ICOS Corp. Put Strike $30.00 Expires 01/21/2006 | 49 | (38 | ) | ||||||||
| Immucor, Inc. Put Strike $35.00 Expires 09/17/2005 | 33 | (21 | ) | ||||||||
| Invitrogen Corp. Put Strike $75.00 Expires 01/21/2006 | 60 | (42 | ) | ||||||||
| Kinetic Concepts, Inc. Put Strike $65.00 Expires 06/18/2005 | 65 | (31 | ) | ||||||||
| Kinetic Concepts, Inc. Put Strike $65.00 Expires 09/17/2005 | 24 | (15 | ) | ||||||||
| LCA-Vision, Inc. Put Strike $35.00 Expires 09/17/2005 | 22 | (5 | ) | ||||||||
| Martek Biosciences Corp. Put Strike $60.00 Expires 06/18/2005 | 39 | (84 | ) | ||||||||
| Martek Biosciences Corp. Put Strike $30.00 Expires 12/17/2005 | 52 | (13 | ) | ||||||||
| Medtronic, Inc. Put Strike $55.00 Expires 01/21/2006 | 33 | (15 | ) | ||||||||
| Merck & Co., Inc. Put Strike $30.00 Expires 01/21/2006 | 50 | (7 | ) | ||||||||
| MGI PHARMA, Inc. Put Strike $22.50 Expires 01/21/2006 | 35 | (11 | ) | ||||||||
The notes to the financial statements are an integral part of this report.
Transamerica IDEX Mutual Funds
Semi-Annual Report 2005
6
TA IDEX T. Rowe Price Health Sciences
SCHEDULE OF INVESTMENTS (continued)
At April 30, 2005
(all amounts except share amounts in thousands)
(unaudited)
| Contracts (d) | Value | ||||||||||
| Put Options (continued) | |||||||||||
| Neurocrine Biosciences, Inc. | 67 | $ | (69 | ) | |||||||
| Put Strike $45.00 | |||||||||||
| Expires 08/20/2005 | |||||||||||
| OSI Pharmaceuticals, Inc. Put Strike $50.00 Expires 07/16/2005 | 78 | (49 | ) | ||||||||
| Patterson Cos., Inc. Put Strike $45.00 Expires 07/16/2005 | 28 | (1 | ) | ||||||||
| Pharmion Corp. Put Strike $80.00 Expires 01/21/2006 | 31 | (20 | ) | ||||||||
| Resmed, Inc. Put Strike $65.00 Expires 10/22/2005 | 87 | (46 | ) | ||||||||
| Respironics, Inc. Put Strike $65.00 Expires 10/22/2005 | 95 | (45 | ) | ||||||||
| Sepracor, Inc. Put Strike $60.00 Expires 07/16/2005 | 84 | (36 | ) | ||||||||
| Sepracor, Inc. Put Strike $55.00 Expires 01/21/2006 | 80 | (46 | ) | ||||||||
| Sepracor, Inc. Put Strike $60.00 Expires 01/21/2006 | 101 | (77 | ) | ||||||||
| Sepracor, Inc. Put Strike $65.00 Expires 01/21/2006 | 75 | (76 | ) | ||||||||
| Sepracor, Inc. Put Strike $70.00 Expires 01/21/2006 | 19 | (25 | ) | ||||||||
| Shire Pharmaceuticals Put Strike $40.00 Expires 07/16/2005 | 53 | (48 | ) | ||||||||
| Contracts (d) | Value | ||||||||||
| Put Options (continued) | |||||||||||
| Shire Pharmaceuticals | 123 | $ | (111 | ) | |||||||
| Put Strike $40.00 | |||||||||||
| Expires 01/21/2006 | |||||||||||
| St. Jude Medical, Inc. Put Strike $40.00 Expires 07/16/2005 | 50 | (10 | ) | ||||||||
| St. Jude Medical, Inc. Put Strike $40.00 Expires 01/21/2006 | 37 | (13 | ) | ||||||||
| Stryker Corp. Put Strike $50.00 Expires 01/21/2006 | 48 | (22 | ) | ||||||||
| Sunrise Senior Living, Inc. Put Strike $45.00 Expires 07/16/2005 | 35 | (1 | ) | ||||||||
| Triad Hospitals, Inc. Put Strike $40.00 Expires 01/21/2006 | 28 | (3 | ) | ||||||||
| Triad Hospitals, Inc. Put Strike $50.00 Expires 01/21/2006 | 18 | (6 | ) | ||||||||
| Wellchoice, Inc. Put Strike $65.00 Expires 10/22/2005 | 12 | (11 | ) | ||||||||
| WellPoint, Inc. Put Strike $105.00 Expires 06/18/2005 | 28 | (1 | ) | ||||||||
| Total Written Options (premiums: -$4,395) | (4,292 | ) | |||||||||
| SUMMARY: | |||||||||||
| Investments, at value | 101.5 | % | $ | 314,560 | |||||||
| Written options | (1.4 | )% | (4,292 | ) | |||||||
| Liabilities in excess of other assets | (0.1 | )% | (196 | ) | |||||||
| Net assets | 100.0 | % | $ | 310,072 | |||||||
The notes to the financial statements are an integral part of this report.
NOTES TO SCHEDULE OF INVESTMENTS:
(a) No dividends were paid during the preceding twelve months.
(b) At April 30, 2005, all or a portion of this security is segregated with the custodian to cover margin requirements for open option contracts. The value of all securities segregated at April 30, 2005 is $50,146.
(c) Value is less than $1.
(d) Contract amounts are not in thousands.
(e) Securities valued as determined in good faith in accordance with procedures established by the Fund's Board of Trustees.
DEFINITIONS:
144A 144A Securities are registered pursuant to Rule 144A of the Securities Act of 1933. These securities are deemed to be liquid for purposes of compliance limitations on holdings of illiquid securities and may be resold as transactions exempt from registration, normally to qualified institutional buyers. At April 30, 2005, these securities aggregated $788 or 0.3% of the net assets of the Fund.
ADR American Depositary Receipt
Transamerica IDEX Mutual Funds
Semi-Annual Report 2005
7
TA IDEX T. Rowe Price Health Sciences
STATEMENT OF ASSETS AND LIABILITIES
At April 30, 2005
(all amounts except per share amounts in thousands)
(unaudited)
| Assets: | |||||||
| Investment securities, at value (cost: $314,783) | $ | 314,560 | |||||
| Receivables: | |||||||
| Investment securities sold | 2,140 | ||||||
| Shares of beneficial interest sold | 16 | ||||||
| Dividends | 17 | ||||||
| Dividend reclaims receivable | 1 | ||||||
| Other | 3 | ||||||
| 316,737 | |||||||
| Liabilities: | |||||||
| Investment securities purchased | 764 | ||||||
| Accounts payable and accrued liabilities: | |||||||
| Shares of beneficial interest redeemed | 37 | ||||||
| Management and advisory fees | 252 | ||||||
| Distribution and service fees | 53 | ||||||
| Transfer agent fees | 7 | ||||||
| Due to custodian | 1,249 | ||||||
| Written options (premiums $4,395) | 4,292 | ||||||
| Other | 11 | ||||||
| 6,665 | |||||||
| Net Assets | $ | 310,072 | |||||
| Net Assets Consist of: | |||||||
| Shares of beneficial interest, unlimited shares authorized, no par value | $ | 307,738 | |||||
| Accumulated net investment income (loss) | (1,374 | ) | |||||
| Undistributed net realized gain (loss) from investment securities and written option contracts | 3,828 | ||||||
| Net unrealized appreciation (depreciation) on: | |||||||
| Investment securities | (223 | ) | |||||
| Written option contracts | 103 | ||||||
| Net Assets | $ | 310,072 | |||||
| Net Assets by Class: | |||||||
| Class A | $ | 166,850 | |||||
| Class B | 4,337 | ||||||
| Class C | 2,301 | ||||||
| Class I | 136,584 | ||||||
| Shares Outstanding: | |||||||
| Class A | 15,218 | ||||||
| Class B | 404 | ||||||
| Class C | 215 | ||||||
| Class I | 12,403 | ||||||
| Net Asset Value Per Share: | |||||||
| Class A | $ | 10.96 | |||||
| Class B | 10.72 | ||||||
| Class C | 10.69 | ||||||
| Class I | 11.01 | ||||||
| Maximum Offering Price Per Share (a): | |||||||
| Class A | $ | 11.60 | |||||
(a) Includes the maximum selling commission (represented as a percentage of offering price) which is reduced on certain levels of sales as set forth in the Prospectus. Net asset value per share for Classes B, C and I shares represents offering price. The redemption price for Classes B and C shares equals net asset value less any applicable contingent deferred sales charge.
STATEMENT OF OPERATIONS
For the period ended April 30, 2005
(all amounts in thousands)
(unaudited)
| Investment Income: | |||||||
| Interest | $ | 191 | |||||
| Dividends | 322 | ||||||
| Less withholding taxes on foreign dividends | (5 | ) | |||||
| 508 | |||||||
| Expenses: | |||||||
| Management and advisory fees | 1,426 | ||||||
| Transfer agent fees: | |||||||
| Class A | 7 | ||||||
| Class B | 7 | ||||||
| Class C | 3 | ||||||
| Class I | 2 | ||||||
| Custody fees | 44 | ||||||
| Administration fees | 27 | ||||||
| Legal fees | 7 | ||||||
| Audit fees | 5 | ||||||
| Trustees fees | 5 | ||||||
| Registration fees: | |||||||
| Class A | 11 | ||||||
| Class B | 4 | ||||||
| Class C | 12 | ||||||
| Other | 1 | ||||||
| Distribution and service fees: | |||||||
| Class A | 294 | ||||||
| Class B | 23 | ||||||
| Class C | 12 | ||||||
| Total expenses | 1,890 | ||||||
| Less: | |||||||
| Reimbursement of class expenses: | |||||||
| Class C | (8 | ) | |||||
| Net expenses | 1,882 | ||||||
| Net Investment Income (Loss) | (1,374 | ) | |||||
| Net Realized Gain (Loss) from: | |||||||
| Investment securities | 3,089 | ||||||
| Written option contracts | 1,474 | ||||||
| Foreign currency transactions | (38 | ) | |||||
| 4,525 | |||||||
| Net Increase (Decrease) in Unrealized Appreciation (Depreciation) on: | |||||||
| Investment securities | (2,562 | ) | |||||
| Written option contracts | (323 | ) | |||||
| (2,885 | ) | ||||||
| Net Gain (Loss) on Investments, Written Option Contracts and Foreign Currency Transactions | 1,640 | ||||||
| Net Increase (Decrease) in Net Assets Resulting from Operations | $ | 266 | |||||
The notes to the financial statements are an integral part of this report.
Transamerica IDEX Mutual Funds
Semi-Annual Report 2005
8
TA IDEX T. Rowe Price Health Sciences
STATEMENTS OF CHANGES IN NET ASSETS
For the period or year ended
(all amounts in thousands)
| April 30, 2005 (unaudited) | October 31, 2004 | ||||||||||
| Increase (Decrease) In Net Assets From: | |||||||||||
| Operations: | |||||||||||
| Net investment income (loss) | $ | (1,374 | ) | $ | (1,415 | ) | |||||
| Net realized gain (loss) from investment securities, foreign currency transactions and written option contracts | 4,525 | 6,889 | |||||||||
| Net unrealized appreciation (depreciation) on investment securities and written option contracts | (2,885 | ) | (746 | ) | |||||||
| 266 | 4,728 | ||||||||||
| Distributions to Shareholders: | |||||||||||
| From net realized gains: | |||||||||||
| Class A | (1,404 | ) | (3,559 | ) | |||||||
| Class B | (39 | ) | (143 | ) | |||||||
| Class C | (19 | ) | (23 | ) | |||||||
| Class C2 | – | (30 | ) | ||||||||
| Class M | – | (15 | ) | ||||||||
| Class I | (1,010 | ) | – | ||||||||
| (2,472 | ) | (3,770 | ) | ||||||||
| Capital Share Transactions: | |||||||||||
| Proceeds from shares sold: | |||||||||||
| Class A | 10,542 | 93,348 | |||||||||
| Class B | 498 | 2,436 | |||||||||
| Class C | 467 | 849 | |||||||||
| Class C2 | – | 326 | |||||||||
| Class M | – | 146 | |||||||||
| Class I | 139,195 | – | |||||||||
| 150,702 | 97,105 | ||||||||||
| Dividends and distributions reinvested: | |||||||||||
| Class A | 1,404 | 3,555 | |||||||||
| Class B | 38 | 140 | |||||||||
| Class C | 14 | 14 | |||||||||
| Class C2 | – | 23 | |||||||||
| Class M | – | 15 | |||||||||
| Class I | 1,010 | – | |||||||||
| 2,466 | 3,747 | ||||||||||
| Cost of shares redeemed: | |||||||||||
| Class A | (1,455 | ) | (1,910 | ) | |||||||
| Class B | (808 | ) | (1,004 | ) | |||||||
| Class C | (255 | ) | (320 | ) | |||||||
| Class C2 | – | (413 | ) | ||||||||
| Class M | – | (64 | ) | ||||||||
| (2,518 | ) | (3,711 | ) | ||||||||
| Class level exchanges: | |||||||||||
| Class C | – | 1,419 | |||||||||
| Class C2 | – | (942 | ) | ||||||||
| Class M | – | (477 | ) | ||||||||
| – | – | ||||||||||
| April 30, 2005 (unaudited) | October 31, 2004 | ||||||||||
| Automatic conversions: | |||||||||||
| Class A | $ | 5 | $ | 6 | |||||||
| Class B | (5 | ) | (6 | ) | |||||||
| – | – | ||||||||||
| 150,650 | 97,141 | ||||||||||
| Net increase (decrease) in net assets | 148,444 | 98,099 | |||||||||
| Net Assets: | |||||||||||
| Beginning of period | 161,628 | 63,529 | |||||||||
| End of period | $ | 310,072 | $ | 161,628 | |||||||
| Accumulated Net Investment Income (Loss) | $ | (1,374 | ) | $ | – | ||||||
| Share Activity: | |||||||||||
| Shares issued: | |||||||||||
| Class A | 927 | 8,337 | |||||||||
| Class B | 44 | 218 | |||||||||
| Class C | 41 | 77 | |||||||||
| Class C2 | – | 30 | |||||||||
| Class M | – | 13 | |||||||||
| Class I | 12,317 | – | |||||||||
| 13,329 | 8,675 | ||||||||||
| Shares issued–reinvested from distributions: | |||||||||||
| Class A | 120 | 308 | |||||||||
| Class B | 3 | 13 | |||||||||
| Class C | 1 | 1 | |||||||||
| Class C2 | – | 2 | |||||||||
| Class M | – | 1 | |||||||||
| Class I | 86 | – | |||||||||
| 210 | 325 | ||||||||||
| Shares redeemed: | |||||||||||
| Class A | (130 | ) | (175 | ) | |||||||
| Class B | (74 | ) | (93 | ) | |||||||
| Class C | (23 | ) | (30 | ) | |||||||
| Class C2 | – | (38 | ) | ||||||||
| Class M | – | (6 | ) | ||||||||
| (227 | ) | (342 | ) | ||||||||
| Class level exchanges: | |||||||||||
| Class C | – | 128 | |||||||||
| Class C2 | – | (84 | ) | ||||||||
| Class M | – | (44 | ) | ||||||||
| – | – | ||||||||||
| Automatic conversions: | |||||||||||
| Class A | – | 1 | |||||||||
| Class B | – | (1 | ) | ||||||||
| – | – | ||||||||||
| Net increase (decrease) in shares outstanding: | |||||||||||
| Class A | 917 | 8,471 | |||||||||
| Class B | (27 | ) | 137 | ||||||||
| Class C | 19 | 176 | |||||||||
| Class C2 | – | (90 | ) | ||||||||
| Class M | – | (36 | ) | ||||||||
| Class I | 12,403 | – | |||||||||
| 13,312 | 8,658 | ||||||||||
The notes to the financial statements are an integral part of this report.
Transamerica IDEX Mutual Funds
Semi-Annual Report 2005
9
TA IDEX T. Rowe Price Health Sciences
FINANCIAL HIGHLIGHTS
(unaudited for the period ended April 30, 2005)
| For a share of beneficial interest outstanding throughout each period | |||||||||||||||||||||||||||||||||||||||
| Net Asset | Investment Operations | Distributions | Net Asset | ||||||||||||||||||||||||||||||||||||
| For the Period Ended (d)(g) | Value, Beginning of Period | Net Investment Income (Loss) | Net Realized and Unrealized Gain (Loss) | Total Operations | From Net Investment Income | From Net Realized Gains | Total Distributions | Value, End of Period | |||||||||||||||||||||||||||||||
| Class A | 4/30/2005 | $ | 10.84 | $ | (0.06 | ) | $ | 0.28 | $ | 0.22 | $ | – | $ | (0.10 | ) | $ | (0.10 | ) | $ | 10.96 | |||||||||||||||||||
| 10/31/2004 | 10.14 | (0.13 | ) | 1.18 | 1.05 | – | (0.35 | ) | (0.35 | ) | 10.84 | ||||||||||||||||||||||||||||
| 10/31/2003 | 8.28 | (0.16 | ) | 2.02 | 1.86 | – | – | – | 10.14 | ||||||||||||||||||||||||||||||
| 10/31/2002 | 10.00 | (0.08 | ) | (1.64 | ) | (1.72 | ) | – | – | – | 8.28 | ||||||||||||||||||||||||||||
| Class B | 4/30/2005 | 10.66 | (0.12 | ) | 0.28 | 0.16 | – | (0.10 | ) | (0.10 | ) | 10.72 | |||||||||||||||||||||||||||
| 10/31/2004 | 10.03 | (0.17 | ) | 1.15 | 0.98 | – | (0.35 | ) | (0.35 | ) | 10.66 | ||||||||||||||||||||||||||||
| 10/31/2003 | 8.24 | (0.21 | ) | 2.00 | 1.79 | – | – | – | 10.03 | ||||||||||||||||||||||||||||||
| 10/31/2002 | 10.00 | (0.11 | ) | (1.65 | ) | (1.76 | ) | – | – | – | 8.24 | ||||||||||||||||||||||||||||
| Class C | 4/30/2005 | 10.63 | (0.12 | ) | 0.28 | 0.16 | – | (0.10 | ) | (0.10 | ) | 10.69 | |||||||||||||||||||||||||||
| 10/31/2004 | 10.03 | (0.24 | ) | 1.19 | 0.95 | – | (0.35 | ) | (0.35 | ) | 10.63 | ||||||||||||||||||||||||||||
| 10/31/2003 | 8.10 | (0.22 | ) | 2.15 | 1.93 | – | – | – | 10.03 | ||||||||||||||||||||||||||||||
| Class I | 4/30/2005 | 11.26 | (0.04 | ) | (0.11 | ) | (0.15 | ) | – | (0.10 | ) | (0.10 | ) | 11.01 | |||||||||||||||||||||||||
| Ratios/Supplemental Data | |||||||||||||||||||||||||||||||
| For the Period | Total | Net Assets, End of Period | Ratio of Expenses to Average Net Assets (a) | Net Investment Income (Loss) to Average | Portfolio Turnover | ||||||||||||||||||||||||||
| Ended (g) | Return (c) | (000's) | Net (e) | Total (f) | Net Assets (a) | Rate (b) | |||||||||||||||||||||||||
| Class A | 4/30/2005 | 1.93 | % | $ | 166,845 | 1.42 | % | 1.42 | % | (1.06 | )% | 26 | % | ||||||||||||||||||
| 10/31/2004 | 10.19 | 154,957 | 1.53 | 1.53 | (1.15 | ) | 35 | ||||||||||||||||||||||||
| 10/31/2003 | 22.46 | 59,115 | 1.95 | 2.19 | (1.61 | ) | 30 | ||||||||||||||||||||||||
| 10/31/2002 | (17.20 | ) | 3,804 | 1.95 | 8.76 | (1.51 | ) | 43 | |||||||||||||||||||||||
| Class B | 4/30/2005 | 1.39 | 4,337 | 2.51 | 2.51 | (2.14 | ) | 26 | |||||||||||||||||||||||
| 10/31/2004 | 9.59 | 4,590 | 2.09 | 2.09 | (1.58 | ) | 35 | ||||||||||||||||||||||||
| 10/31/2003 | 21.72 | 2,952 | 2.60 | 2.84 | (2.26 | ) | 30 | ||||||||||||||||||||||||
| 10/31/2002 | (17.60 | ) | 758 | 2.60 | 9.41 | (2.16 | ) | 43 | |||||||||||||||||||||||
| Class C | 4/30/2005 | 1.45 | 2,301 | 2.60 | 3.31 | (2.23 | ) | 26 | |||||||||||||||||||||||
| 10/31/2004 | 9.28 | 2,081 | 2.60 | 3.41 | (1.61 | ) | 35 | ||||||||||||||||||||||||
| 10/31/2003 | 23.83 | 201 | 2.60 | 2.84 | (2.26 | ) | 30 | ||||||||||||||||||||||||
| Class I | 4/30/2005 | (1.43 | ) | 136,581 | 1.05 | 1.05 | (0.72 | ) | 26 | ||||||||||||||||||||||
NOTES TO FINANCIAL HIGHLIGHTS
(a) Annualized.
(b) Not annualized for periods of less than one year.
(c) Total Return has been calculated for the applicable period without deduction of a sales load, if any, on an initial purchase. Periods of less than one year are not annualized.
(d) Per share information is calculated based on average shares outstanding.
(e) Ratio of Net Expenses to Average Net Assets is net of fee waivers and reimbursements by the investment adviser and includes the recapture of previously waived expenses, if any ( see note 2).
(f) Ratio of Total Expenses to Average Net Assets includes all expenses before fee waivers, reimbursements and recapture of previously waived expenses by the investment adviser.
(g) TA IDEX T. Rowe Price Health Sciences ("the Fund") commenced operations on March 1, 2002. The inception date for the Fund's offering of share classes are as follows:
Class C – November 11, 2002
Class I – November 8, 2004
The notes to the financial statements are an integral part of this report.
Transamerica IDEX Mutual Funds
Semi-Annual Report 2005
10
TA IDEX T. Rowe Price Health Sciences
NOTES TO FINANCIAL STATEMENTS
At April 30, 2005
(all amounts in thousands)
(unaudited)
NOTE 1. ORGANIZATION AND SIGNIFICANT ACCOUNTING POLICIES
Transamerica IDEX Mutual Funds is a Delaware statutory trust registered under the Investment Company Act of 1940, as amended (the "1940 Act"), as an open-end management investment company. Prior to March 1, 2005, Transamerica IDEX Mutual Funds was a Massachusetts business trust. TA IDEX T. Rowe Price Health Sciences ("the Fund"), part of Transamerica IDEX Mutual Funds, began operations on March 1, 2002. The Fund is "non diversified" under the 1940 Act.
In the normal course of business, the Fund enters into contracts that contain a variety of representations and warranties, which provide general indemnifications. The Fund's maximum exposure under these arrangements is unknown, as this would involve future claims that may be made against the Fund and/or its affiliates that have not yet occurred. However, based on experience, the Fund expects the risk of loss to be remote.
See the Prospectus and Statement of Additional Information for a description of the Fund's investment objective.
In preparing the Fund's financial statements in accordance with accounting principles generally accepted in the United States of America ("GAAP"), estimates or assumptions (which could differ from actual results) may be used that affect reported amounts and disclosures. The following policies were consistently followed by the Fund, in accordance with GAAP.
Multiple class operations and expenses: The fund currently offers four classes of shares, each with a public offering price that reflects different sales charges, if any, and expense levels. On June 15, 2004, Class C2 shares merged into Class C. On September 24, 2004, Class M shares merged into Class C. Class B shares will convert to Class A shares eight years after purchase. Income , non-class specific expenses and realized and unrealized gains and losses, are allocated daily to each class, based upon the value of shares outstanding method as permitted under Rule 18f-3 of the 1940 Act. Each class bears its own specific expenses as well as a portion of general common expenses.
Pricing of shares: The Fund prices its shares on the basis of the net asset value of each class of shares of the Fund, which is determined as of the close of the New York Stock Exchange ("NYSE") (generally 4:00 p.m. Eastern Time) on each day on which the NYSE is open for trading.
Security valuations: Fund investments traded on an exchange are valued at the closing price on the day of valuation on the exchange where the security is principally traded. With respect to securities traded on NASDAQ NMS, such closing price may be the last reported sales price or the NASDAQ Official Closing Price.
Securities traded in the over-the-counter market and listed securities for which no sale was reported on that date are valued at the last quoted bid price.
Debt securities are valued by independent pricing services at the last quoted bid price; however, those that mature in sixty days or less are valued at amortized cost, which approximates market.
Foreign securities generally are valued based on quotations from the primary market in which they are traded and are translated from the local currency into U.S. dollars using closing exchange rates. Many foreign securities markets are open for trading at times when the U.S. markets are closed for trading, and many foreign securities markets close for trading before the close of the NYSE. The value of foreign securities may be affected significantly on a day that the NYSE is closed and an investor is unable to purchase or redeem shares. If a significant market event impacting the value of a portfolio security (e.g., natural disaster, company announcement, market volatility) occurs subsequent to the close of trading in the security, but prior to the calculation of the Fund's net asset value per share, market quotations for that security may be determined to be unreliable and, accordingly, not "readi ly available." If market quotations are not readily available, and the impact of such a significant market event materially effects the net asset value per share of the Fund, an affected portfolio security will be valued at fair market value as determined in good faith using guidelines adopted by the Board of Trustees of the Fund, under the supervision of the Fund's Valuation Committee. Factors that may be considered to value foreign securities at fair market value may include, among others: the value of other securities traded on other markets, foreign currency exchange activity and the trading of financial products tied to foreign securities.
Other securities for which quotations are not readily available are valued at fair market value as determined in good faith using guidelines adopted by the Board of Trustees of the Fund, under the supervision of the Fund's Valuation Committee. These guidelines may include: the type of security; any restrictions on its resale; financial or business news of the issuer; similar or related securities that are actively trading; related corporate actions; and other significant events occurring after the close of trading in the security.
The Fund values its investment securities at fair value based upon procedures approved by the Board of Trustees on days when significant events occur after the close of the principal exchange on which the securities are traded, and as a result, are expected to materially effect the value of investments.
Cash: The Fund may leave cash overnight in its cash account with the custodian, Investors Bank & Trust Company ("IBT"). IBT has been contracted on behalf of the Fund to invest the excess cash into a savings account, which at April 30, 2005, was paying an interest rate of 2.02%.
Throughout the period, the Fund may have a cash overdraft balance. A fee is incurred on this overdraft, calculated by multiplying the overdraft by a rate based on the federal funds rate.
Transamerica IDEX Mutual Funds
Semi-Annual Report 2005
11
TA IDEX T. Rowe Price Health Sciences
NOTES TO FINANCIAL STATEMENTS (continued)
At April 30, 2005
(all amounts in thousands)
(unaudited)
NOTE 1.–(continued)
Commission recapture: The sub-adviser, to the extent consistent with the best execution and usual commission rate policies and practices, may place security transactions of the Fund with broker/dealers with which Transamerica IDEX Mutual Funds has established a Commission Recapture Program. A Commission Recapture Program is any arrangement under which a broker/dealer applies a portion of the commissions received by such broker/dealer on the security transactions to the Fund. In no event will commissions paid by the Fund be used to pay expenses that would otherwise be borne by any other funds within Transamerica IDEX Mutual Funds, or by any other party.
Recaptured commissions during the six months ended April 30, 2005, of $9 are included in net realized gains in the Statement of Operations.
Security transactions and investment income: Security transactions are recorded on the trade date. Security gains and losses are calculated on the specific identification basis. Dividend income is recorded on the ex-dividend date or, in the case of foreign securities, as soon as the Fund is informed of the ex-dividend date. Interest income, including accretion of discounts and amortization of premiums, is recorded on the accrual basis commencing on the settlement date.
Foreign currency denominated investments: The accounting records of the Fund are maintained in U.S. dollars. Securities and other assets and liabilities denominated in foreign currencies are translated into U.S. dollars at the closing exchange rate each day. The cost of foreign securities is translated at the exchange rate in effect when the investment was acquired. The Fund combines fluctuations from currency exchange rates and fluctuations in value when computing net realized and unrealized gains or losses from investments.
Net foreign currency gains and losses resulting from changes in exchange rates include: 1) foreign currency fluctuations between trade date and settlement date of investment security transactions; 2) gains and losses on forward foreign currency contracts; and 3) the difference between the receivable amounts of interest and dividends recorded in the accounting records in U.S. dollars and the amounts actually received.
Foreign currency denominated assets may involve risks not typically associated with domestic transactions, including unanticipated movements in exchange currency rates, the degree of government supervision and regulation of security markets, and the possibility of political or economic instability.
Foreign capital gains taxes: The Fund may be subject to taxes imposed by countries in which it invests, with respect to its investment in issuers existing or operating in such countries. Such taxes are generally based on income earned or repatriated and capital gains realized on the sale of such investments. The Fund accrues such taxes when the related income or capital gains are earned. Some countries require governmental approval for the repatriation of investment income, capital or the proceeds of sales earned by foreign investors. In addition, if there is deterioration in a country's balance of payments or for other reasons, a country may impose temporary restrictions on foreign capital remittan ces abroad.
Forward foreign currency contracts: The Fund may enter into forward foreign currency contracts to hedge against exchange rate risk arising from investments in securities denominated in foreign currencies. Contracts are valued at the contractual forward rate and are marked to market daily, with the change in value recorded as an unrealized gain or loss. When the contracts are closed a realized gain or loss is incurred. Risks may arise from changes in market value of the underlying currencies and from the possible inability of counterparties to meet the terms of their contracts.
There were no open forward foreign currency contracts at April 30, 2005
Option contracts: The Fund may enter into options contracts to manage exposure to market fluctuations. Options are valued at the average of the bid and ask ("Mean Quote") established each day at the close of the board of trade or exchange on which they are traded. The primary risks associated with options are imperfect correlation between the change in value of the securities held and the prices of the options contracts; the possibility of an illiquid market and inability of the counterparty to meet the contracts terms. When the Fund writes a covered call or put option, an amount equal to the premium received by the Fund is included in the Fund's Statement of Assets and Liabilities as an asset and as an equivalent liability. The amount is subsequently marked-to-market to reflect the current valu e of the option written.
The underlying face amounts of open option contracts at April 30, 2005, are listed in the Schedule of Investments.
Transactions in written call and put options were as follows:
| Premium | Contracts* | ||||||||||
| Beginning Balance October 31, 2004 | $ | 2,326 | 5,569 | ||||||||
| Sales | 7,816 | 21,739 | |||||||||
| Closing Buys | (5,137 | ) | (16,393 | ) | |||||||
| Expirations | (28 | ) | (180 | ) | |||||||
| Exercised | (582 | ) | (840 | ) | |||||||
| Balance at April 30, 2005 | $ | 4,395 | 9,895 | ||||||||
* Contracts not in thousands
Account maintenance fees: If the shareholder account balance falls below $1 by either shareholder action or as a result of market action, a $25 (not in thousands) fee is assessed every year until the balance reaches $1. The fee is assessed by redeeming shares in the shareholder's account.
Transamerica IDEX Mutual Funds
Semi-Annual Report 2005
12
TA IDEX T. Rowe Price Health Sciences
NOTES TO FINANCIAL STATEMENTS (continued)
At April 30, 2005
(all amounts in thousands)
(unaudited)
NOTE 1.–(continued)
No fee will be charged under the following conditions:
• accounts opened within the preceding 24 months
• accounts with an active monthly Automatic Investment Plan ($50 (not in thousands) minimum per fund)
• accounts owned by an individual which, when combined by social security number, have a balance of $5 or more
• accounts owned by individuals in the same household (by address) that have a combined balance of $5 or more
• UTMA/UGMA accounts
• Fiduciary accounts
• B-share accounts whose shares have started to convert to A-shares accounts (as long as combined value of both accounts is at least $1)
For the six months ended April 30, 2005, there were no fees.
Redemption fees: A short-term trading redemption fee may be assessed on any fund shares in a fund account that are sold during the first five (5) NYSE trading days following their purchase date. This redemption fee will equal 2% of the amount redeemed and shares held the longest will be treated as being redeemed first and shares held the shortest as being redeemed last.
For the six months ended April 30, 2005, the Fund received less than $1 in redemption fees.
Dividend distributions: Distributions to shareholders are recorded on the ex-dividend date and are determined in accordance with Federal income tax regulations which may differ from GAAP.
NOTE 2. RELATED PARTY TRANSACTIONS
Transamerica Fund Advisors, Inc. ("TFAI") is the Fund's investment adviser. Transamerica Fund Services, Inc. ("TFS") is the Fund's administrator and transfer agent. AFSG Securities Corp. ("AFSG") is the Fund's distributor/principal underwriter. AFSG is 100% owned by AUSA Holding Company ("AUSA"). TFAI is a directly owned subsidiary of Western Reserve Life Assurance Co. of Ohio (78%) and AUSA (22%). TFS is a wholly owned subsidiary of WRL (50%) and AUSA (50%). AUSA and WRL are wholly owned indirect subsidiaries of AEGON, NV, a Netherlands corporation.
Effective January 1, 2005 AEGON/Transamerica Fund Advisors, Inc. ("ATFA") was renamed Transamerica Fund Advisors, Inc. ("TFAI"); AEGON/Transamerica Fund Services, Inc. ("ATFS") and AEGON/Transamerica Investor Services, Inc. ("ATIS") merged into one entity and was renamed Transamerica Fund Services, Inc. ("TFS").
The following schedule reflects the percentage of fund assets owned by affiliated mutual funds (i.e., through the Transamerica IDEX Mutual Funds and AEGON/Transamerica Series Trust (f/k/a) AEGON/Transamerica Series Fund, Inc.) asset allocation funds):
| Net Assets | % of Net Assets | ||||||||||
| TA IDEX Asset Allocation– Conservative Portfolio | $ | 14,911 | 4.81 | % | |||||||
| TA IDEX Asset Allocation– Growth Portfolio | 40,232 | 12.98 | % | ||||||||
| TA IDEX Asset Allocation– Moderate Growth Portfolio | 61,615 | 19.87 | % | ||||||||
| TA IDEX Asset Allocation– Moderate Portfolio | 46,602 | 15.03 | % | ||||||||
| Asset Allocation–Conservative Portfolio | 6,250 | 2.02 | % | ||||||||
| Asset Allocation–Growth Portfolio | 33,053 | 10.66 | % | ||||||||
| Asset Allocation–Moderate Growth Portfolio | 62,705 | 20.22 | % | ||||||||
| Asset Allocation–Moderate Portfolio | 34,545 | 11.14 | % | ||||||||
| Total | $ | 299,913 | 96.73 | % | |||||||
Investment advisory fee: The Fund pays management fees to TFAI based on average daily net assets ("ANA") at the following breakpoints:
1.00% of the first $500 million of ANA
0.95% of ANA over $500 million
TFAI has contractually agreed to waive its advisory fee and will reimburse the Fund to the extent that operating expenses, excluding 12b-1 fees, exceed the following stated annual limit for Class A, B and C:
1.60% Expense Limit
1.30% Expense Limit–Class I
If total fund expenses fall below the annual expense limitation agreement agreed to by the adviser within the succeeding three years, the Fund may be required to pay that adviser a portion or all of the waived advisory fees.
If total class expenses fall below the annual expense limitation agreement agreed to by the adviser within the succeeding three years, the Fund may be required to pay that adviser a portion or all of the reimbursed class expenses.
| Reimbusement of Class Expenses | Available for Recapture Through | ||||||||||
| Fiscal Year 2004–Class C | $ | 8 | 10/31/2007 | ||||||||
Transamerica IDEX Mutual Funds
Semi-Annual Report 2005
13
TA IDEX T. Rowe Price Health Sciences
NOTES TO FINANCIAL STATEMENTS (continued)
At April 30, 2005
(all amounts in thousands)
(unaudited)
NOTE 2.–(continued)
The sub-adviser, T. Rowe Price, has agreed to a pricing discount based on the aggregate assets that they manage in the Transamerica IDEX Mutual Funds. The amount of the discount received by the Fund at April 30, 2005 was $11.
Distribution and service fees: The Fund has a 12b-1 distribution plan under the 1940 Act pursuant to which an annual fee, based on average daily net assets, is paid to the distributor for various disbursements such as broker-dealer account servicing fees and other promotional expenses of the Fund. The Fund is authorized under the 12b-1 plan to pay fees on each class up to the following limits:
| Class A | 0.35 | % | |||||
| Class B | 1.00 | % | |||||
| Class C 1.00% Class I | N/A | ||||||
In the case the Fund or a class of shares of the Fund is closed to new investors or investments, the Fund is authorized to pay 12b-1 fees for past sales and distribution efforts and present and past investor services.
Underwriter commissions relate to front-end sales charges imposed for Class A shares and contingent deferred sales charges from Classes B, C, and certain A share redemptions. For the six months ended April 30, 2005, the underwriter commissions were as follows:
| Received by Underwriter | $ | 35 | |||||
| Retained by Underwriter | 2 | ||||||
| Contingent Deferred Sales Charge | 9 | ||||||
Administrative services: The Fund has entered into an agreement with TFS for financial and legal fund administration services, which includes such items as compliance, expenses, financial statements and other reporting, distributions, tax returns, prospectus preparation, board of trustees meeting support and other legal matters. As of January 1, 2005 the Fund pays TFS an annual fee of 0.02% of average net assets. Prior to January 1, 2005 the Fund paid TFS an annual fee of 0.015% of average net assets. The Legal fees on the Statement of Operations are for fees paid to external legal counsel.
Transfer agent fees: The Fund pays TFS an annual per-account charge of $20 (not in thousands) for each open account and $1.63 (not in thousands) for each closed account. There is no new account charge. The Transfer agent fees on the Statement of Operations are made up of fees paid to TFS and costs associated with shareholder statements.
The Fund paid TFS $43 for the six months ended April 30, 2005.
Deferred compensation plan: Each eligible Fund Trustee may elect participation in the Deferred Compensation Plan ("the Plan"). Under the Plan, such Trustees may defer payment of a percentage of their total fees earned as a Fund Trustee. These deferred amounts may be invested in any Transamerica IDEX Mutual Fund. At April 30, 2005, the value of invested plan amount was $4. Invested plan amounts and the total liability for deferred compensation to the Trustees under the Plan at April 30, 2005, are included in the accompanying Statement of Assets and Liabilities.
NOTE 3. INVESTMENT TRANSACTIONS
The cost of securities purchased and proceeds from securities sold (excluding short-term securities) for the six months ended April 30, 2005, were as follows:
| Purchases of securities: | |||||||
| Long-Term excluding U.S. Government | $ | 210,572 | |||||
| U.S. Government | – | ||||||
| Proceeds from maturities and sales of securities: | |||||||
| Long-Term excluding U.S. Government | 70,115 | ||||||
| U.S. Government | – | ||||||
NOTE 4. FEDERAL INCOME TAX MATTERS
The Fund has not made any provision for federal income or excise taxes due to its policy to distribute all of its taxable income and capital gains to its shareholders and otherwise qualify as a regulated investment company under the Internal Revenue Code. Income and capital gain distributions are determined in accordance with income tax regulations, which may differ from GAAP. These differences are primarily due to differing treatment for items including, but not limited to, wash sales, foreign currency transactions and net operating losses and straddles.
The aggregate cost of investments and composition of unrealized appreciation (depreciation) for federal income tax purposes as of April 30, 2005, are as follows:
| Federal Tax Cost Basis | $ | 316,737 | |||||
| Unrealized Appreciation | $ | 27,442 | |||||
| Unrealized (Depreciation) | (29,619 | ) | |||||
| Net Unrealized Appreciation (Depreciation) | $ | (2,177 | ) | ||||
NOTE 5. REGULATORY PROCEEDINGS
There continues to be significant federal and state regulatory activity relating to financial services companies, particularly mutual fund companies and their investment advisers. As part of an ongoing investigation regarding potential market timing, recordkeeping and trading compliance issues and matters affecting the Fund's investment adviser, TFAI, and certain employees and affiliates of TFAI, the SEC staff has indicated that it is likely to take some action against TFAI and certain of its affiliates at the conclusion of the investigation. The potential timing and the scope of any such action is difficult to predict.
Transamerica IDEX Mutual Funds
Semi-Annual Report 2005
14
TA IDEX T. Rowe Price Health Sciences
NOTES TO FINANCIAL STATEMENTS (continued)
At April 30, 2005
(all amounts in thousands)
(unaudited)
NOTE 5.–(continued)
Although the impact of any action brought against TFAI and/or its affiliates is difficult to assess at the present time, the Fund currently believes that the likelihood that any such action will have a material adverse impact on it is remote. It is important to note that the Fund is not aware of any allegation of wrongdoing against it and its board at the time this semi-annual report is printed. Although it is not anticipated that these developments will have an adverse impact on the Fund, there can be no assurance at this time. TFAI and its affiliates are actively working with the SEC in regard to this matter; however, the exact resolution cannot be determined at this time. TFAI will take such actions that it deems necessary or appropriate to continue providing management services to the Fund and to bring all matters to an appropriate conclusion.
TFAI and/or its affiliates, and not the Fund, will bear the costs regarding these regulatory matters.
Transamerica IDEX Mutual Funds
Semi-Annual Report 2005
15
TA IDEX T. Rowe Price Health Sciences
INVESTMENT ADVISORY AND SUB-ADVISORY AGREEMENTS – REVIEW AND RENEWAL
At a meeting of the Board of Trustees of Transamerica IDEX Mutual Funds ("TA IDEX") held on October 6, 2004, the Board considered and approved the renewal for a one-year period of the Investment Advisory Agreement between TA IDEX T. Rowe Price Health Sciences (the "Fund") and Transamerica Fund Advisors, Inc. ("TFAI") as well as the Investment Sub-Advisory Agreement of the Fund between TFAI and T. Rowe Price Associates, Inc. (the "Sub-Adviser"). In approving the renewal of these agreements, the Board concluded that the Investment Advisory and Investment Sub-Advisory Agreements enable shareholders of the Fund to obtain high quality services at a cost that is appropriate, reasonable, and in the best interests of shareholders based upon the following determinations, among others:
The nature, extent and quality of the advisory service to be provided. The Board considered the nature and quality of the services provided by TFAI and the Sub-Adviser to the Fund in the past, as well as the services anticipated to be provided in the future. The Board concluded that TFAI and the Sub-Adviser are capable of providing high quality services to the Fund, as indicated by TFAI's management capabilities demonstrated with respect to the Fund and other funds managed by TFAI, TFAI's management oversight process, the professional qualifications and experience of the Sub-Adviser's portfolio management team, and the Fund's strong investment performance. The Board also concluded that TFAI and the Sub-Adviser would provide the same quality and quantity of investment management and related servi ces as before, that these services are appropriate in scope and extent in light of the Fund's operations, the competitive landscape of the investment company business and investor needs, and that TFAI's and the Sub-Adviser's obligations will remain the same in all respects.
The investment performance of the Fund. The Board concluded, based in particular on information provided by Lipper Analytics, that the Fund's investment performance was competitive or superior relative to comparable funds over trailing one- and two-year periods and to the Fund's benchmark index over the past year. On the basis of the Trustees' assessment of the nature, extent and quality of investment advisory and related services to be provided or procured by TFAI and the Sub-Adviser, the Trustees concluded that TFAI and the Sub-Adviser were capable of generating a level of long-term investment performance that is appropriate in light of the Fund's investment objective, policies and strategies and competitive with many other investment companies.
The cost of advisory services provided and the level of profitability. On the basis of the Board's review of the fees to be charged by TFAI and the Sub-Adviser for investment advisory and related services, TFAI's financial statements, the fees paid by TFAI to the Sub-Adviser, TFAI's estimated net management income resulting from its management of the Fund, the estimated profitability of TFAI's relationships with the Fund and TA IDEX, and the estimated profitability of the Sub-Adviser's relationship with the Fund, the Board concluded that the level of investment advisory fees and the profitability is appropriate in light of the services provided, the management fees and overall expense ratios of comparable investment companies, and the anticipated profitability of the relationship between the Fun d, TFAI and the Sub-Adviser. Further, on the basis of comparative information supplied by Lipper Analytics, the Board determined that the advisory fees and estimated overall expense ratio of the Fund were consistent with industry averages.
The extent to which economies of scale would be realized as the Fund grows and whether fee levels reflect these economies of scale for the benefit of Fund investors. The Trustees concluded that inclusion of asset-based breakpoints in the Fund's advisory fee schedule appropriately benefited investors by realizing economies of scale in the form of a lower advisory fee rate as the level of Fund assets increases. The Board also concluded that the advisory fees appropriately reflect the Fund's current size, the current economic environment for TFAI, and the competitive nature of the investment company market. In addition, the Board noted that it will have the opportunity to periodically re-examine whether the Fund has achieved economies of scale, as well as the appropriateness of advisory fees payabl e to TFAI and the Sub-Adviser in the future.
Benefits (such as soft dollars) to TFAI or the Sub-Adviser from its relationship with the Fund. The Board concluded that other benefits derived by TFAI or the Sub-Adviser from its relationship with the Fund are reasonable and fair, and are consistent with industry practice and the best interests of the Fund and its shareholders. In this regard, the Board noted that TFAI does not realize "soft dollar" benefits from its relationship with the Fund, and that the Sub-Adviser is participating in a brokerage program pursuant to which a portion of brokerage commissions paid by the Fund is recaptured for the benefit of the Fund and its shareholders, thus limiting the amount of "soft-dollar" arrangements the Sub-Adviser may engage in with respect to the Fund's portfolio brokerage transactions.
Other considerations. The Board also determined that TFAI had made a substantial commitment to the recruitment and retention of high quality personnel, and maintained the financial, compliance and operational resources reasonably necessary to manage the Fund in a professional manner that is consistent with the best interests of the Fund and its shareholders. The Trustees also concluded that TFAI had made a significant entrepreneurial commitment to the management and success of the Fund, reflected by TFAI's expense limitation and fee waiver arrangement with the Fund which, as demonstrated in the past with the Fund, may result in TFAI waiving a substantial amount of advisory fees for the benefit of shareholders.
Transamerica IDEX Mutual Funds
Semi-Annual Report 2005
16
TA IDEX T. Rowe Price Health Sciences
SUPPLEMENTAL INFORMATION (unaudited)
RESULTS OF SHAREHOLDER PROXY
At a special meeting of shareholders held on February 25, 2005, the results of the Proposals were as follows:
Transamerica IDEX Mutual Funds
Proposal 1: Election of Trustees to the Board of Trustees of Transamerica IDEX Mutual Funds.
| For | Withheld | ||||||||||
| Peter R. Brown | 872,017,875.249 | 4,468,498.551 | |||||||||
| Daniel Calabria | 871,917,069.786 | 4,569,304.014 | |||||||||
| Janise B. Case | 872,099,393.125 | 4,386,980.675 | |||||||||
| Charles C. Harris | 872,086,722.025 | 4,399,651.775 | |||||||||
| Leo J. Hill | 872,304,465.640 | 4,181,908.160 | |||||||||
| Russell A. Kimball, Jr. | 872,253,556.471 | 4,232,817.329 | |||||||||
| William W. Short, Jr. | 872,139,920.944 | 4,346,452.856 | |||||||||
| John Waechter | 872,261,152.376 | 4,225,221.424 | |||||||||
| Jack E. Zimmerman | 871,929,967.512 | 4,556,406.288 | |||||||||
| Brian C. Scott | 872,218,970.367 | 4,267,403.433 | |||||||||
| Thomas P. O'Neill | 872,111,944.117 | 4,374,429.683 | |||||||||
TA IDEX T. Rowe Price Health Sciences
Proposal 2: Approval of an Agreement and Plan of Reorganization pursuant to which Transamerica IDEX Mutual Funds will organize as a Delaware statutory trust.
| For | Against | Abstentions/Broker Non-Votes | |||||||||
| 17,380,960.253 | 6,551.351 | 251,587.538 | |||||||||
Proposal 3: Approval of changes to the fundamental investment restrictions of TA IDEX T. Rowe Price Health Sciences.
| A. Diversification | For | Against | Abstentions/Broker Non-Votes | ||||||||||||
| 17,388,158.209 | 7,440.933 | 243,500.000 | |||||||||||||
| B. Borrowing | For | Against | Abstentions/Broker Non-Votes | ||||||||||||
| 17,387,700.209 | 7,898.933 | 243,500.000 | |||||||||||||
| C. Senior Securities | For | Against | Abstentions/Broker Non-Votes | ||||||||||||
| 17,388,158.209 | 7,440.933 | 243,500.000 | |||||||||||||
| D. Underwriting Securities | For | Against | Abstentions/Broker Non-Votes | ||||||||||||
| 17,388,158.209 | 7,440.933 | 243,500.000 | |||||||||||||
| E. Real Estate | For | Against | Abstentions/Broker Non-Votes | ||||||||||||
| 17,388,158.209 | 7,440.933 | 243,500.000 | |||||||||||||
| F. Making Loans | For | Against | Abstentions/Broker Non-Votes | ||||||||||||
| 17,388,045.734 | 7,553.408 | 243,500.000 | |||||||||||||
| G. Concentration | For | Against | Abstentions/Broker Non-Votes | ||||||||||||
| 17,388,158.209 | 7,440.933 | 243,500.000 | |||||||||||||
| H. Commodities | For | Against | Abstentions/Broker Non-Votes | ||||||||||||
| 17,387,778.856 | 7,820.286 | 243,500.000 | |||||||||||||
Transamerica IDEX Mutual Funds
Semi-Annual Report 2005
17
TA IDEX T. Rowe Price Small Cap
UNDERSTANDING YOUR FUND'S EXPENSES
(unaudited)
SHAREHOLDER EXPENSES
The following Example is intended to help you understand your ongoing costs (in dollars and cents) of investing in a Fund and to compare these costs with the ongoing costs of investing in other funds.
The Example is based on an investment of $1,000 invested at November 1, 2004 and held for the entire period until April 30, 2005.
ACTUAL EXPENSES
The first line in the table below provides information about actual account values and actual expenses. You may use the information in this line, together with the amount you invested, to estimate the expenses that you paid over the period. Simply divide your account value by $1,000 (for example, an $8,600 account value divided by $1,000 = 8.6), then multiply the result by the number in the first line of your Fund under the heading entitled "Expenses Paid During Period" to estimate the expenses you paid on your account during this period.
HYPOTHETICAL EXAMPLE FOR COMPARISON PURPOSES
The second line in the table below provides information about hypothetical account values and hypothetical expenses based on the Fund's actual expense ratio and an assumed rate of return of 5% per year before expenses, which is not the Fund's actual return. The hypothetical account values and expenses may not be used to estimate the actual ending account balance or expenses you paid for the period. You may use this information to compare the ongoing costs of investing in your Fund and other funds. To do so, compare this 5% hypothetical example with the 5% hypothetical examples that appear in the shareholder reports of the other funds.
Please note that the expenses shown in the table are meant to highlight your ongoing costs only and do not reflect any transactional costs, such as sales charges, redemption fees, brokerage commissions paid on purchases and sales of fund shares. Therefore, the second line under the Fund in the table is useful in comparing ongoing costs only, and will not help you determine the relative total costs of owning different funds. In addition, note that the expenses shown in the table are meant to highlight your ongoing costs and do not reflect any transaction costs.
| Beginning Account Value | Ending Account Value | Annualized Expense Ratio | Expenses Paid During Period (a) | ||||||||||||||||
| Class A | |||||||||||||||||||
| Actual | $ | 1,000.00 | $ | 1,024.00 | 1.41 | % | $ | 7.08 | |||||||||||
| Hypothetical (b) | 1,000.00 | 1,017.80 | 1.41 | 7.05 | |||||||||||||||
| Class B | |||||||||||||||||||
| Actual | 1,000.00 | 1,019.10 | 2.36 | 11.81 | |||||||||||||||
| Hypothetical (b) | 1,000.00 | 1,013.09 | 2.36 | 11.78 | |||||||||||||||
| Class C | |||||||||||||||||||
| Actual | 1,000.00 | 1,019.60 | 2.36 | 11.82 | |||||||||||||||
| Hypothetical (b) | 1,000.00 | 1,013.09 | 2.36 | 11.78 | |||||||||||||||
(a) Expenses are calculated using each Fund's annualized expense ratio (as disclosed in the table), multiplied by the average account value for the period, multiplied by number of days in the period (181 days), and divided by the number of days in the year (365 days).
(b) 5% return per year before expenses.
GRAPHICAL PRESENTATION OF SCHEDULE OF INVESTMENTS
By Sector
At April 30, 2005
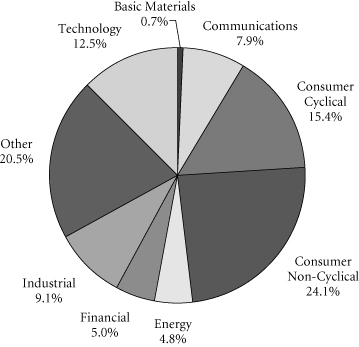
This chart shows the percentage breakdown by sector of the Fund's total investment securities.
Transamerica IDEX Mutual Funds
Semi-Annual Report 2005
1
TA IDEX T. Rowe Price Small Cap
SCHEDULE OF INVESTMENTS
At April 30, 2005
(all amounts except share amounts in thousands)
(unaudited)
| Shares | Value | ||||||||||
| COMMON STOCKS (99.7%) | |||||||||||
| Air Transportation (1.5%) | |||||||||||
| Airtran Holdings, Inc. (a)(b) | 9,500 | $ | 79 | ||||||||
| Frontier Airlines, Inc. (a) | 19,500 | 189 | |||||||||
| JetBlue Airways Corp.(a)(b) | 1,500 | 30 | |||||||||
| Skywest, Inc. | 24,000 | 434 | |||||||||
| Amusement & Recreation Services (1.3%) | |||||||||||
| Alliance Gaming Corp. (a)(b) | 6,800 | 78 | |||||||||
| International Speedway Corp.–Class A | 1,000 | 53 | |||||||||
| Station Casinos, Inc. | 7,900 | 510 | |||||||||
| Apparel & Accessory Stores (2.5%) | |||||||||||
| Christopher & Banks Corp. | 14,000 | 219 | |||||||||
| HOT Topic, Inc. (a)(b) | 11,700 | 234 | |||||||||
| Pacific Sunwear of California, Inc. (a) | 12,550 | 284 | |||||||||
| Ross Stores, Inc. | 7,000 | 187 | |||||||||
| Talbots, Inc. (b) | 2,700 | 69 | |||||||||
| Urban Outfitters, Inc. (a) | 6,000 | 266 | |||||||||
| Apparel Products (0.3%) | |||||||||||
| Gymboree Corp. (a) | 6,700 | 77 | |||||||||
| Quiksilver, Inc. (a) | 3,400 | 94 | |||||||||
| Auto Repair, Services & Parking (0.5%) | |||||||||||
| Dollar Thrifty Automotive Group (a) | 6,800 | 230 | |||||||||
| Automotive (1.0%) | |||||||||||
| Group 1 Automotive, Inc. (a) | 3,700 | 93 | |||||||||
| Oshkosh Truck Corp. | 5,400 | 406 | |||||||||
| Automotive Dealers & Service Stations (0.8%) | |||||||||||
| O'Reilly Automotive, Inc. (a)(b) | 7,400 | 380 | |||||||||
| Sonic Automotive, Inc. | 1,600 | 31 | |||||||||
| Beverages (0.1%) | |||||||||||
| Boston Beer Co., Inc.–Class A (a) | 2,700 | 54 | |||||||||
| Business Services (3.8%) | |||||||||||
| ChoicePoint, Inc. (a) | 7,600 | 300 | |||||||||
| Computer Programs & Systems, Inc. | 17,500 | 553 | |||||||||
| Forrester Research, Inc. (a) | 3,200 | 48 | |||||||||
| Getty Images, Inc. (a)(b) | 3,500 | 250 | |||||||||
| Iron Mountain, Inc. (a)(b) | 9,125 | 271 | |||||||||
| Jupitermedia Corp. (a) | 18,900 | 240 | |||||||||
| MoneyGram International, Inc. | 4,800 | 93 | |||||||||
| Rent-A-Center, Inc. (a) | 2,750 | 66 | |||||||||
| SupportSoft, Inc. (a) | 12,800 | 61 | |||||||||
| Commercial Banks (2.5%) | |||||||||||
| Boston Private Financial Holdings, Inc. | 9,200 | 206 | |||||||||
| CapitalSource, Inc. (a)(b) | 1,100 | 23 | |||||||||
| East-West Bancorp, Inc. | 5,500 | 177 | |||||||||
| Shares | Value | ||||||||||
| Commercial Banks (continued) | |||||||||||
| Investors Financial Services Corp. (c) | 7,800 | $ | 327 | ||||||||
| Silicon Valley Bancshares (a)(b) | 3,600 | 171 | |||||||||
| Southwest Bancorp of Texas, Inc. | 7,000 | 116 | |||||||||
| UCBH Holdings, Inc. | 14,400 | 226 | |||||||||
| Communication (0.6%) | |||||||||||
| Global Payments, Inc. (b) | 3,980 | 258 | |||||||||
| Insight Communications Co., Inc. (a) | 2,900 | 32 | |||||||||
| Communications Equipment (1.3%) | |||||||||||
| Inter-Tel, Inc. | 11,500 | 219 | |||||||||
| Plantronics, Inc. | 9,400 | 296 | |||||||||
| Polycom, Inc. (a) | 6,506 | 99 | |||||||||
| Powerwave Technologies, Inc. (a)(b) | 6,800 | 49 | |||||||||
| Computer & Data Processing Services (10.7%) | |||||||||||
| Activision, Inc. (a) | 18,600 | 269 | |||||||||
| Actuate Corp. (a) | 18,000 | 34 | |||||||||
| Agile Software Corp. (a) | 24,400 | 160 | |||||||||
| Altiris, Inc. (a) | 5,200 | 85 | |||||||||
| Avocent Corp. (a) | 1,200 | 30 | |||||||||
| Borland Software Corp. (a) | 13,700 | 80 | |||||||||
| CACI International, Inc.–Class A (a) | 4,800 | 298 | |||||||||
| CNET Networks, Inc. (a)(b) | 13,300 | 132 | |||||||||
| Cognex Corp. | 5,400 | 118 | |||||||||
| Cognizant Technology Solutions Corp. (a) | 5,400 | 227 | |||||||||
| Digital Insight Corp. (a) | 12,700 | 255 | |||||||||
| Earthlink, Inc. (a) | 3,100 | 28 | |||||||||
| F5 Networks, Inc. (a) | 4,900 | 210 | |||||||||
| Factset Research Systems, Inc. (b) | 3,750 | 104 | |||||||||
| Fair Isaac Corp. | 9,905 | 326 | |||||||||
| Filenet Corp. (a) | 2,300 | 61 | |||||||||
| Hyperion Solutions Corp. (a) | 8,100 | 329 | |||||||||
| Informatica Corp. (a) | 14,800 | 114 | |||||||||
| Inforte Corp. | 38,400 | 121 | |||||||||
| Infospace, Inc. (a) | 1,000 | 31 | |||||||||
| Jack Henry & Associates, Inc. | 6,400 | 110 | |||||||||
| Macromedia, Inc. (a) | 5,100 | 202 | |||||||||
| MatrixOne, Inc. (a) | 32,700 | 140 | |||||||||
| Mercury Interactive Corp. (a) | 500 | 21 | |||||||||
| MTC Technologies, Inc. (a) | 10,700 | 324 | |||||||||
| National Instruments Corp. (b) | 1,500 | 32 | |||||||||
| NetIQ Corp. (a) | 5,000 | 54 | |||||||||
| Open Solutions, Inc. (a) | 1,100 | 21 | |||||||||
| Open Text Corp. (a)(b) | 11,300 | 168 | |||||||||
| Packeteer, Inc. (a) | 11,800 | 138 | |||||||||
| Quest Software, Inc. (a) | 4,300 | 51 | |||||||||
| Radiant Systems, Inc. (a) | 6,450 | 55 | |||||||||
The notes to the financial statements are an integral part of this report.
Transamerica IDEX Mutual Funds
Semi-Annual Report 2005
2
TA IDEX T. Rowe Price Small Cap
SCHEDULE OF INVESTMENTS (continued)
At April 30, 2005
(all amounts except share amounts in thousands)
(unaudited)
| Shares | Value | ||||||||||
| Computer & Data Processing Services (continued) | |||||||||||
| Red Hat, Inc. (a)(b) | 7,700 | $ | 83 | ||||||||
| RightNow Technologies, Inc. (a)(b) | 10,000 | 89 | |||||||||
| RSA Security, Inc. (a) | 6,100 | 66 | |||||||||
| Serena Software, Inc. (a) | 8,700 | 166 | |||||||||
| SkillSoft PLC, ADR (a) | 600 | 2 | |||||||||
| SRA International, Inc.–Class A (a) | 6,400 | 418 | |||||||||
| Websense, Inc. (a) | 2,900 | 154 | |||||||||
| Computer & Office Equipment (1.6%) | |||||||||||
| Maxtor Corp. (a) | 28,300 | 137 | |||||||||
| Sandisk Corp. (a) | 6,800 | 161 | |||||||||
| ScanSource, Inc. (a) | 1,700 | 79 | |||||||||
| Zebra Technologies Corp.–Class A (a) | 8,400 | 401 | |||||||||
| Construction (0.6%) | |||||||||||
| Insituform Technologies, Inc.–Class A (a) | 4,600 | 69 | |||||||||
| MDC Holdings, Inc. | 3,664 | 240 | |||||||||
| Drug Stores & Proprietary Stores (0.1%) | |||||||||||
| Drugstore.Com, Inc. (a)(b) | 21,100 | 50 | |||||||||
| Educational Services (1.9%) | |||||||||||
| Apollo Group, Inc.–Class A (a)(b) | 1,873 | 135 | |||||||||
| Corinthian Colleges, Inc. (a)(b) | 5,500 | 78 | |||||||||
| DeVry, Inc. (a)(b) | 4,000 | 91 | |||||||||
| Education Management Corp. (a) | 12,300 | 344 | |||||||||
| ITT Educational Services, Inc. (a)(b) | 6,800 | 313 | |||||||||
| Electrical Goods (0.3%) | |||||||||||
| Hughes Supply, Inc. | 6,400 | 167 | |||||||||
| Electronic & Other Electric Equipment (1.1%) | |||||||||||
| Aeroflex, Inc. (a) | 32,100 | 255 | |||||||||
| Digital Theater Systems, Inc. (a) | 9,400 | 159 | |||||||||
| Harman International Industries, Inc. | 1,200 | 94 | |||||||||
| SBS Technologies, Inc. (a) | 3,500 | 33 | |||||||||
| Electronic Components & Accessories (6.2%) | |||||||||||
| Advanced Energy Industries, Inc. (a) | 30,800 | 326 | |||||||||
| AMIS Holdings, Inc. (a) | 6,100 | 69 | |||||||||
| ATMI, Inc. (a) | 5,100 | 117 | |||||||||
| Cymer, Inc. (a)(b) | 10,600 | 263 | |||||||||
| Dolby Laboratories, Inc.–Class A (a) | 4,000 | 82 | |||||||||
| Exar Corp. (a) | 7,600 | 96 | |||||||||
| Integrated Circuit Systems, Inc. (a) | 7,600 | 139 | |||||||||
| Integrated Silicon Solutions, Inc. (a)(b) | 16,100 | 104 | |||||||||
| Intersil Corp.–Class A | 11,596 | 202 | |||||||||
| Lattice Semiconductor Corp. (a) | 7,800 | 36 | |||||||||
| Mercury Computer Systems, Inc. (a) | 7,400 | 195 | |||||||||
| Micrel, Inc. (a) | 5,200 | 49 | |||||||||
| Microchip Technology, Inc. | 1,775 | 51 | |||||||||
| Shares | Value | ||||||||||
| Electronic Components & Accessories (continued) | |||||||||||
| Omnivision Technologies, Inc. (a)(b) | 15,500 | $ | 217 | ||||||||
| Pericom Semiconductor Corp. (a) | 8,400 | 70 | |||||||||
| Plexus Corp. (a) | 1,800 | 22 | |||||||||
| Semtech Corp. (a) | 9,000 | 152 | |||||||||
| Silicon Storage Technology, Inc. (a) | 14,500 | 38 | |||||||||
| Skyworks Solutions, Inc. (a) | 6,900 | 36 | |||||||||
| Tessera Technologies, Inc. (a) | 1,500 | 40 | |||||||||
| Trident Microsystems, Inc. (a) | 2,600 | 44 | |||||||||
| Triquint Semiconductor, Inc. (a) | 6,226 | 18 | |||||||||
| TTM Technologies, Inc. (a) | 25,000 | 225 | |||||||||
| Varian Semiconductor Equipment Associates, Inc. (a) | 6,800 | 254 | |||||||||
| Virage Logic Corp. (a) | 5,800 | 53 | |||||||||
| Zoran Corp. (a) | 14,897 | 158 | |||||||||
| Environmental Services (1.0%) | |||||||||||
| Stericycle, Inc. (a) | 5,700 | 277 | |||||||||
| Waste Connections, Inc. (a) | 6,900 | 243 | |||||||||
| Fabricated Metal Products (0.2%) | |||||||||||
| Simpson Manufacturing Co., Inc. | 4,000 | 108 | |||||||||
| Food & Kindred Products (0.1%) | |||||||||||
| Peet's Coffee & Tea, Inc. (a)(b) | 2,800 | 71 | |||||||||
| Food Stores (0.2%) | |||||||||||
| Whole Foods Market, Inc. | 1,000 | 100 | |||||||||
| Furniture & Home Furnishings Stores (0.3%) | |||||||||||
| Williams-Sonoma, Inc. (a) | 4,800 | 161 | |||||||||
| Health Services (6.0%) | |||||||||||
| Amedisys, Inc. (a) | 2,400 | 72 | |||||||||
| Amsurg Corp. (a) | 1,700 | 44 | |||||||||
| Community Health Systems, Inc. (a) | 4,200 | 153 | |||||||||
| Coventry Health Care, Inc. (a) | 6,700 | 458 | |||||||||
| DaVita, Inc. (a) | 9,100 | 367 | |||||||||
| Gentiva Health Services, Inc. (a) | 12,200 | 239 | |||||||||
| Human Genome Sciences, Inc. (a) | 2,800 | 29 | |||||||||
| LCA-Vision, Inc. | 2,000 | 78 | |||||||||
| LifePoint Hospitals, Inc. (a) | 4,000 | 178 | |||||||||
| Manor Care, Inc. | 4,400 | 147 | |||||||||
| Matria Healthcare, Inc. (a)(b) | 3,950 | 109 | |||||||||
| Omnicare, Inc. | 9,200 | 319 | |||||||||
| Renal Care Group, Inc. (a) | 4,100 | 156 | |||||||||
| Symbion, Inc. (a)(b) | 9,000 | 192 | |||||||||
| Triad Hospitals, Inc. (a)(b) | 2,800 | 143 | |||||||||
| United Surgical Partners International, Inc. (a) | 6,100 | 270 | |||||||||
| Holding & Other Investment Offices (0.7%) | |||||||||||
| Affiliated Managers Group (a)(b) | 4,400 | 275 | |||||||||
| First Marblehead Corp. (The) (a)(b) | 2,200 | 85 | |||||||||
The notes to the financial statements are an integral part of this report.
Transamerica IDEX Mutual Funds
Semi-Annual Report 2005
3
TA IDEX T. Rowe Price Small Cap
SCHEDULE OF INVESTMENTS (continued)
At April 30, 2005
(all amounts except share amounts in thousands)
(unaudited)
| Shares | Value | ||||||||||
| Hotels & Other Lodging Places (0.3%) | |||||||||||
| Great Wolf Resorts, Inc. (a) | 7,100 | $ | 151 | ||||||||
| Industrial Machinery & Equipment (2.7%) | |||||||||||
| Actuant Corp.–Class A (a) | 3,700 | 158 | |||||||||
| Axcelis Technologies, Inc. (a) | 17,200 | 107 | |||||||||
| Brooks Automation, Inc. (a) | 5,000 | 64 | |||||||||
| Engineered Support Systems, Inc. (b) | 12,975 | 458 | |||||||||
| Entegris, Inc. (a) | 10,100 | 87 | |||||||||
| FMC Technologies, Inc. (a) | 3,200 | 97 | |||||||||
| National Oilwell Varco, Inc. (a) | 5,359 | 213 | |||||||||
| Oil States International, Inc. (a) | 8,300 | 169 | |||||||||
| Instruments & Related Products (3.3%) | |||||||||||
| Anaren, Inc. (a) | 5,600 | 54 | |||||||||
| August Technology Corp. (a) | 2,100 | 25 | |||||||||
| Cohu, Inc. | 4,600 | 82 | |||||||||
| Cyberoptics Corp. (a) | 28,200 | 349 | |||||||||
| Dionex Corp. (a) | 1,650 | 71 | |||||||||
| Flir Systems, Inc. (a)(b) | 11,700 | 311 | |||||||||
| Fossil, Inc. (a) | 11,730 | 273 | |||||||||
| Herley Industries, Inc. (a) | 3,400 | 62 | |||||||||
| II-VI, Inc. (a) | 5,500 | 78 | |||||||||
| Mine Safety Appliances Co. | 2,700 | 96 | |||||||||
| Orbotech, Ltd. (a) | 4,800 | 98 | |||||||||
| Pinnacle Systems, Inc. (a) | 5,700 | 28 | |||||||||
| Rudolph Technologies, Inc. (a)(b) | 2,300 | 30 | |||||||||
| Varian, Inc. (a) | 2,500 | 83 | |||||||||
| Insurance (2.1%) | |||||||||||
| Max Reinsurance Capital, Ltd. | 7,300 | 160 | |||||||||
| RenaissanceRe Holdings, Ltd. | 4,000 | 179 | |||||||||
| Stancorp Financial Group, Inc. | 2,800 | 214 | |||||||||
| Triad Guaranty, Inc. (a) | 3,700 | 186 | |||||||||
| WellChoice, Inc. (a) | 5,500 | 309 | |||||||||
| Insurance Agents, Brokers & Service (0.3%) | |||||||||||
| Brown & Brown, Inc. | 3,200 | 140 | |||||||||
| Leather & Leather Products (0.3%) | |||||||||||
| Timberland Co.–Class A (a)(b) | 2,100 | 145 | |||||||||
| Management Services (1.9%) | |||||||||||
| Corporate Executive Board Co. | 9,000 | 592 | |||||||||
| Resources Connection, Inc. (a)(b) | 18,400 | 352 | |||||||||
| Manufacturing Industries (0.4%) | |||||||||||
| Daktronics, Inc. (a) | 4,400 | 90 | |||||||||
| RC2 Corp. (a) | 900 | 31 | |||||||||
| Shuffle Master, Inc. (a)(b) | 3,400 | 86 | |||||||||
| Shares | Value | ||||||||||
| Medical Instruments & Supplies (6.0%) | |||||||||||
| Advanced Neuromodulation Systems, Inc. (a)(b) | 4,900 | $ | 148 | ||||||||
| Aspect Medical Systems, Inc. (a) | 6,600 | 165 | |||||||||
| Coherent, Inc. (a) | 3,900 | �� | 125 | ||||||||
| DENTSPLY International, Inc. | 4,750 | 260 | |||||||||
| ICU Medical, Inc. (a)(b) | 6,800 | 241 | |||||||||
| Inamed Corp. (a) | 4,950 | 301 | |||||||||
| Integra LifeSciences Holdings Corp. (a)(b) | 3,700 | 131 | |||||||||
| Kyphon, Inc. (a)(b) | 3,000 | 78 | |||||||||
| Mentor Corp. | 4,400 | 161 | |||||||||
| Merit Medical Systems, Inc. (a) | 4,000 | 51 | |||||||||
| Respironics, Inc. (a) | 6,400 | 404 | |||||||||
| Steris Corp. (a) | 15,900 | 376 | |||||||||
| Techne Corp. (a)(b) | 5,400 | 226 | |||||||||
| Thoratec Corp. (a)(b) | 16,200 | 210 | |||||||||
| Wright Medical Group, Inc. (a) | 3,000 | 74 | |||||||||
| Motion Pictures (1.4%) | |||||||||||
| Avid Technology, Inc. (a)(b) | 9,100 | 451 | |||||||||
| Macrovision Corp. (a) | 11,100 | 227 | |||||||||
| Oil & Gas Extraction (4.7%) | |||||||||||
| Atwood Oceanics, Inc. (a) | 1,700 | 97 | |||||||||
| Bill Barrett Corp. (a) | 3,000 | 80 | |||||||||
| Cabot Oil & Gas Corp. | 7,200 | 212 | |||||||||
| CAL Dive International, Inc. (a) | 8,900 | 396 | |||||||||
| Comstock Resources, Inc. (a) | 14,900 | 377 | |||||||||
| Forest Oil Corp. (a)(b) | 2,400 | 92 | |||||||||
| Global Industries, Ltd. (a) | 7,400 | 71 | |||||||||
| Grey Wolf, Inc. (a)(b) | 18,000 | 108 | |||||||||
| Helmerich & Payne, Inc. | 1,900 | 73 | |||||||||
| Patterson-UTI Energy, Inc. | 9,400 | 225 | |||||||||
| Spinnaker Exploration Co. (a) | 5,400 | 173 | |||||||||
| Stone Energy Corp. (a) | 3,800 | 171 | |||||||||
| Unit Corp. (a) | 6,100 | 234 | |||||||||
| Personal Services (0.1%) | |||||||||||
| Jackson Hewitt Tax Service, Inc. | 3,600 | 66 | |||||||||
| Pharmaceuticals (6.2%) | |||||||||||
| Abgenix, Inc. (a)(b) | 7,500 | 52 | |||||||||
| Alkermes, Inc. (a)(b) | 4,800 | 54 | |||||||||
| Andrx Corp. (a) | 8,200 | 163 | |||||||||
| Bradley Pharmaceuticals, Inc. (a) | 3,200 | 29 | |||||||||
| Celgene Corp. (a)(b) | 3,200 | 121 | |||||||||
| Cephalon, Inc. (a)(b) | 2,924 | 128 | |||||||||
| Charles River Laboratories International, Inc. (a)(b) | 6,100 | 289 | |||||||||
| D&K Healthcare Resources, Inc. | 6,900 | 53 | |||||||||
| Digene Corp. (a) | 12,300 | 234 | |||||||||
The notes to the financial statements are an integral part of this report.
Transamerica IDEX Mutual Funds
Semi-Annual Report 2005
4
TA IDEX T. Rowe Price Small Cap
SCHEDULE OF INVESTMENTS (continued)
At April 30, 2005
(all amounts except share amounts in thousands)
(unaudited)
| Shares | Value | ||||||||||
| Pharmaceuticals (continued) | |||||||||||
| Henry Schein, Inc. (a) | 2,000 | $ | 75 | ||||||||
| ICOS Corp. (a)(b) | 2,100 | 47 | |||||||||
| Idexx Laboratories, Inc. (a)(b) | 1,500 | 85 | |||||||||
| Invitrogen Corp. (a) | 4,100 | 300 | |||||||||
| Martek Biosciences Corp. (a)(b) | 5,600 | 214 | |||||||||
| Medicis Pharmaceutical Corp.–Class A (b) | 9,600 | 270 | |||||||||
| Neurocrine Biosciences, Inc. (a) | 4,800 | 168 | |||||||||
| Noven Pharmaceuticals, Inc. (a) | 11,900 | 198 | |||||||||
| Par Pharmaceutical Cos., Inc. (a)(b) | 1,700 | 51 | |||||||||
| Priority Healthcare Corp.–Class B (a) | 3,400 | 77 | |||||||||
| Protein Design Labs, Inc. (a) | 18,600 | 333 | |||||||||
| Taro Pharmaceuticals Industries (a)(b) | 4,400 | 128 | |||||||||
| Vertex Pharmaceuticals, Inc. (a)(b) | 2,294 | 22 | |||||||||
| Primary Metal Industries (0.6%) | |||||||||||
| Lone Star Technologies, Inc. (a) | 700 | 27 | |||||||||
| Maverick Tube Corp. (a) | 5,300 | 154 | |||||||||
| Steel Dynamics, Inc. | 4,100 | 111 | |||||||||
| Printing & Publishing (0.5%) | |||||||||||
| Scholastic Corp. (a) | 4,800 | 167 | |||||||||
| Valassis Communications, Inc. (a) | 2,000 | 70 | |||||||||
| Radio & Television Broadcasting (1.5%) | |||||||||||
| COX Radio, Inc.–Class A (a) | 6,100 | 96 | |||||||||
| Emmis Communications Corp.–Class A (a) | 9,600 | 148 | |||||||||
| Entercom Communications Corp. (a)(b) | 3,900 | 126 | |||||||||
| Radio One, Inc.–Class D (a) | 14,900 | 195 | |||||||||
| Regent Communications, Inc. (a) | 13,200 | 70 | |||||||||
| Spanish Broadcasting System, Inc.–Class A (a) | 10,400 | 87 | |||||||||
| Radio, Television & Computer Stores (0.4%) | |||||||||||
| GameStop Corp.–Class A (a)(b) | 7,100 | 175 | |||||||||
| Research & Testing Services (1.8%) | |||||||||||
| Advisory Board Co. (The) (a) | 14,200 | 578 | |||||||||
| Incyte Corp. (a) | 3,300 | 22 | |||||||||
| Pharmaceutical Product Development, Inc. (a) | 6,100 | 277 | |||||||||
| Residential Building Construction (0.7%) | |||||||||||
| Toll Brothers, Inc. (a)(b) | 4,300 | 326 | |||||||||
| Restaurants (2.8%) | |||||||||||
| BJ's Restaurants, Inc. (a) | 3,400 | 60 | |||||||||
| CEC Entertainment, Inc. (a)(b) | 7,050 | 255 | |||||||||
| Cheesecake Factory (The) (a)(b) | 6,000 | 184 | |||||||||
| PF Chang's China Bistro, Inc. (a)(b) | 6,300 | 350 | |||||||||
| Rare Hospitality International, Inc. (a) | 10,300 | 287 | |||||||||
| Sonic Corp. (a) | 7,475 | 239 | |||||||||
| Shares | Value | ||||||||||
| Retail Trade (2.7%) | |||||||||||
| AC Moore Arts & Crafts, Inc. (a)(b) | 12,000 | $ | 312 | ||||||||
| Coldwater Creek, Inc. (a) | 6,000 | 100 | |||||||||
| Dollar Tree Stores, Inc. (a)(b) | 3,300 | 81 | |||||||||
| Hibbett Sporting Goods, Inc. (a) | 3,400 | 92 | |||||||||
| Marvel Enterprises, Inc. (a)(b) | 12,450 | 244 | |||||||||
| Michaels Stores, Inc. | 9,100 | 302 | |||||||||
| Petsmart, Inc. | 8,300 | 221 | |||||||||
| Savings Institutions (0.2%) | |||||||||||
| IndyMac Bancorp, Inc. | 2,000 | 77 | |||||||||
| Security & Commodity Brokers (1.1%) | |||||||||||
| Eaton Vance Corp. | 7,000 | 164 | |||||||||
| Greenhill & Co., Inc. | 1,200 | 38 | |||||||||
| Legg Mason, Inc. (b) | 1,900 | 135 | |||||||||
| Raymond James Financial, Inc. | 6,900 | 186 | |||||||||
| Waddell & Reed Financial, Inc.–Class A | 2,550 | 44 | |||||||||
| Social Services (0.8%) | |||||||||||
| Bright Horizons Family Solutions, Inc. (a)(b) | 11,200 | 380 | |||||||||
| Stone, Clay & Glass Products (0.5%) | |||||||||||
| Gentex Corp. (b) | 8,200 | 266 | |||||||||
| Telecommunications (2.2%) | |||||||||||
| Adtran, Inc. | 10,200 | 211 | |||||||||
| Alamosa Holdings, Inc. (a)(b) | 2,000 | 26 | |||||||||
| Nextel Partners, Inc.–Class A (a)(b) | 25,700 | 604 | |||||||||
| NII Holdings, Inc.–Class B (a)(b) | 2,700 | 135 | |||||||||
| Novatel Wireless, Inc. (a)(b) | 1,700 | 15 | |||||||||
| Ubiquitel, Inc. (a) | 6,700 | 48 | |||||||||
| Wireless Facilities, Inc. (a) | 12,900 | 68 | |||||||||
| Transportation & Public Utilities (0.9%) | |||||||||||
| UTI Worldwide, Inc. | 6,700 | 430 | |||||||||
| Transportation Equipment (0.2%) | |||||||||||
| Thor Industries, Inc. | 3,300 | 89 | |||||||||
| Trucking & Warehousing (1.0%) | |||||||||||
| Forward Air Corp. | 5,250 | 126 | |||||||||
| Old Dominion Freight Line, Inc. (a) | 6,800 | 191 | |||||||||
| US Xpress Enterprises, Inc.–Class A (a) | 3,400 | 38 | |||||||||
| Werner Enterprises, Inc. | 7,300 | 136 | |||||||||
| Variety Stores (0.4%) | |||||||||||
| Family Dollar Stores, Inc. | 1,300 | 35 | |||||||||
| Fred's, Inc. (b) | 11,750 | 170 | |||||||||
| Wholesale Trade Durable Goods (2.9%) | |||||||||||
| Conceptus, Inc. (a)(b) | 1,500 | 9 | |||||||||
| Cytyc Corp. (a) | 8,800 | 188 | |||||||||
| Insight Enterprises, Inc. (a) | 12,900 | 233 | |||||||||
The notes to the financial statements are an integral part of this report.
Transamerica IDEX Mutual Funds
Semi-Annual Report 2005
5
TA IDEX T. Rowe Price Small Cap
SCHEDULE OF INVESTMENTS (continued)
At April 30, 2005
(all amounts except share amounts in thousands)
(unaudited)
| Shares | Value | ||||||||||
| Wholesale Trade Durable Goods (continued) | |||||||||||
| Patterson Cos., Inc. (a)(b) | 5,500 | $ | 278 | ||||||||
| Reliance Steel & Aluminum Co. | 2,700 | 102 | |||||||||
| SCP Pool Corp. | 9,930 | 324 | |||||||||
| Symyx Technologies, Inc. (a) | 9,600 | 234 | |||||||||
| West Marine, Inc. (a)(b) | 3,400 | 56 | |||||||||
| Wholesale Trade Nondurable Goods (1.6%) | |||||||||||
| Performance Food Group Co. (a) | 3,000 | 81 | |||||||||
| SunOpta, Inc. (a)(b) | 54,200 | 250 | |||||||||
| Tractor Supply Co. (a) | 4,200 | 169 | |||||||||
| United Natural Foods, Inc. (a) | 10,900 | 292 | |||||||||
| Total Common Stocks (cost: $47,241) | 49,427 | ||||||||||
| Principal | Value | ||||||||||
| SECURITY LENDING COLLATERAL (25.7%) | |||||||||||
| Debt (22.3%) | |||||||||||
| Bank Notes (3.0%) | |||||||||||
| Bank of America | |||||||||||
| 2.82%, due 05/16/2005 | $ | 402 | $ | 402 | |||||||
| 2.80%, due 06/09/2005 (d) | 101 | 101 | |||||||||
| 2.77%, due 07/18/2005 (d) | 402 | 402 | |||||||||
| Canadian Imperial Bank of Commerce 3.02%, due 11/04/2005 (d) | 402 | 402 | |||||||||
| Credit Suisse First Boston Corp. 2.88%, due 09/09/2005 (d) 3.06%, due 03/10/2006 (d) | 101 101 | 101 101 | |||||||||
| Euro Dollar Overnight (3.9%) | |||||||||||
| Bank of Montreal 2.94%, due 05/04/2005 | 301 | 301 | |||||||||
| BNP Paribas 2.80%, due 05/05/2005 | 416 | 416 | |||||||||
| Den Danske Bank 2.93%, due 05/02/2005 2.80%, due 05/06/2005 | 362 201 | 362 201 | |||||||||
| Dexia Group 2.80%, due 05/05/2005 | 177 | 177 | |||||||||
| Royal Bank of Canada 2.80%, due 05/04/2005 | 412 | 412 | |||||||||
| Svenska Handlesbanken 2.80%, due 05/06/2005 | 66 | 66 | |||||||||
| Euro Dollar Terms (9.1%) | |||||||||||
| Bank of Nova Scotia 2.88%, due 05/11/2005 3.01%, due 05/31/2005 | 201 562 | 201 562 | |||||||||
| Barclays 3.02%, due 06/27/2005 | 358 | 358 | |||||||||
| Principal | Value | ||||||||||
| Euro Dollar Terms (continued) | |||||||||||
| BNP Paribas 2.93%, due 06/07/2005 | $ | 322 | $ | 322 | |||||||
| Branch Banker & Trust 2.94%, due 06/06/2005 | 86 | 86 | |||||||||
| Calyon 2.93%, due 06/03/2005 | 332 | 332 | |||||||||
| Citigroup 2.87%, due 06/06/2005 | 417 | 417 | |||||||||
| Credit Suisse First Boston Corp. 2.91%, due 05/16/2005 | 412 | 412 | |||||||||
| HSBC Banking/Holdings PLC 3.01%, due 06/23/2005 | 201 | 201 | |||||||||
| Royal Bank of Scotland 2.94%, due 06/07/2005 2.95%, due 06/10/2005 | 390 217 | 390 217 | |||||||||
| Societe Generale 2.80%, due 05/03/2005 | 384 | 384 | |||||||||
| Toronto Dominion Bank 2.75%, due 05/09/2005 3.01%, due 06/24/2005 | 301 112 | 301 112 | |||||||||
| UBS AG 2.81%, due 05/03/2005 | 201 | 201 | |||||||||
| Promissory Notes (2.3%) | |||||||||||
| Goldman Sachs Group, Inc. 2.99%, due 06/27/2005 3.01%, due 07/27/2005 | 422 703 | 422 703 | |||||||||
| Repurchase Agreements (4.0%) (e) | |||||||||||
| Goldman Sachs Group, Inc. 3.04% Repurchase Agreement dated 4/29/2005 to be repurchased at $905 on 05/02/2005 | 904 | 904 | |||||||||
| Merrill Lynch & Co., Inc. 3.04% Repurchase Agreement dated 4/29/2005 to be repurchased at $1,085 on 05/02/2005 | 1,085 | 1,085 | |||||||||
| Shares | Value | ||||||||||
| Investment Companies (3.4%) | |||||||||||
| Money Market Funds (3.4%) | |||||||||||
| American Beacon Funds 1-day yield of 2.84% | 159,602 | $ | 160 | ||||||||
| BGI Institutional Money Market Fund 1-day yield of 2.93% | 945,096 | 945 | |||||||||
| Merrill Lynch Premier Institutional Fund 1-day yield of 2.65% | 212,676 | 213 | |||||||||
The notes to the financial statements are an integral part of this report.
Transamerica IDEX Mutual Funds
Semi-Annual Report 2005
6
TA IDEX T. Rowe Price Small Cap
SCHEDULE OF INVESTMENTS (continued)
At April 30, 2005
(all amounts except share amounts in thousands)
(unaudited)
| Shares | Value | ||||||||||
| Money Market Funds (continued) | |||||||||||
| Merrimac Cash Fund, Premium Class 1-day yield of 2.74% (f) | 388,982 | $ | 389 | ||||||||
| Total Security Lending Collateral (cost: $12,761) | 12,761 | ||||||||||
| Total Investment Securities (cost: $60,002) | $ | 62,188 | |||||||||
| SUMMARY: | |||||||||||
| Investments, at value | 125.4 | % | $ | 62,188 | |||||||
| Liabilities in excess of other assets | (25.4 | )% | (12,597 | ) | |||||||
| Net assets | 100.0 | % | $ | 49,591 | |||||||
NOTES TO SCHEDULE OF INVESTMENTS:
(a) No dividends were paid during the preceding twelve months.
(b) At April 30, 2005, all or a portion of this security is on loan (see Note 1). The value at April 30, 2005, of all securities on loan is $12,246.
(c) Investors Bank and Trust Co., a wholly-owned subsidiary of Investors Financial Services Corp., serves as the accounting, custody and lending agent for the Fund.
(d) Floating or variable rate note. Rate is listed as of April 30, 2005.
(e) Cash collateral for the Repurchase Agreements, valued at $2,024, that serve as collateral for securities lending are invested in corporate bonds with interest rates and maturity dates ranging from 0.00%–8.875% and 06/15/2005–03/15/2035, respectively.
(f) Regulated investment company advised by Investors Bank and Trust Co. ("IBT"). IBT is also the accounting, custody and lending agent for the Fund.
DEFINITIONS:
ADR American Depositary Receipt
The notes to the financial statements are an integral part of this report.
Transamerica IDEX Mutual Funds
Semi-Annual Report 2005
7
TA IDEX T. Rowe Price Small Cap
STATEMENT OF ASSETS AND LIABILITIES
At April 30, 2005
(all amounts except per share amounts in thousands)
(unaudited)
| Assets: | |||||||
| Investment securities, at value (cost: $60,002) (including securities loaned of $12,246) | $ | 62,188 | |||||
| Cash | 314 | ||||||
| Receivables: | |||||||
| Investment securities sold | 56 | ||||||
| Shares of beneficial interest sold | 11 | ||||||
| Interest | 5 | ||||||
| Dividends | 5 | ||||||
| Other | 4 | ||||||
| 62,583 | |||||||
| Liabilities: | |||||||
| Investment securities purchased | 86 | ||||||
| Accounts payable and accrued liabilities: | |||||||
| Shares of beneficial interest redeemed | 33 | ||||||
| Management and advisory fees | 48 | ||||||
| Distribution and service fees | 23 | ||||||
| Transfer agent fees | 22 | ||||||
| Payable for collateral for securities on loan | 12,761 | ||||||
| Other | 19 | ||||||
| 12,992 | |||||||
| Net Assets | $ | 49,591 | |||||
| Net Assets Consist of: | |||||||
| Shares of beneficial interest, unlimited shares authorized, no par value | $ | 33,417 | |||||
| Accumulated net investment income (loss) | (361 | ) | |||||
| Undistributed net realized gain (loss) from investment securities and futures contracts | 14,349 | ||||||
| Net unrealized appreciation (depreciation) on investment securities | 2,186 | ||||||
| Net Assets | $ | 49,591 | |||||
| Net Assets by Class: | |||||||
| Class A | $ | 33,863 | |||||
| Class B | 10,946 | ||||||
| Class C | 4,782 | ||||||
| Shares Outstanding: | |||||||
| Class A | 3,051 | ||||||
| Class B | 1,029 | ||||||
| Class C | 450 | ||||||
| Net Asset Value Per Share: | |||||||
| Class A | $ | 11.10 | |||||
| Class B | 10.64 | ||||||
| Class C | 10.62 | ||||||
| Maximum Offering Price Per Share (a): | |||||||
| Class A | $ | 11.75 | |||||
(a) Includes the maximum selling commission (represented as a percentage of offering price) which is reduced on certain levels of sales as set forth in the Prospectus. Net asset value per share for Classes B and C shares represents offering price. The redemption price for Classes B and C shares equals net asset value less any applicable contingent deferred sales charge.
STATEMENT OF OPERATIONS
For the period ended April 30, 2005
(all amounts in thousands)
(unaudited)
| Investment Income: | |||||||
| Interest | $ | 5 | |||||
| Dividends | 181 | ||||||
| Income from loaned securities–net | 10 | ||||||
| 196 | |||||||
| Expenses: | |||||||
| Management and advisory fees | 249 | ||||||
| Transfer agent fees: | |||||||
| Class A | 21 | ||||||
| Class B | 22 | ||||||
| Class C | 10 | ||||||
| Printing and shareholder reports | 8 | ||||||
| Custody fees | 15 | ||||||
| Administration fees | 6 | ||||||
| Legal fees | 3 | ||||||
| Audit fees | 6 | ||||||
| Trustees fees | 3 | ||||||
| Registration fees: | |||||||
| Class A | 29 | ||||||
| Class B | 9 | ||||||
| Class C | 11 | ||||||
| Other | 1 | ||||||
| Distribution and service fees: | |||||||
| Class A | 88 | ||||||
| Class B | 59 | ||||||
| Class C | 26 | ||||||
| Total expenses | 566 | ||||||
| Less: | |||||||
| Class expense reimbursement: | |||||||
| Class B | (2 | ) | |||||
| Class C | (8 | ) | |||||
| Net expenses | 556 | ||||||
| Net Investment Income (Loss) | (360 | ) | |||||
| Net Realized Gain (Loss) from: | |||||||
| Investment securities | 15,248 | ||||||
| Futures contracts | 453 | ||||||
| 15,701 | |||||||
| Increase (decrease) in unrealized appreciation (depreciation) on investment securities | (7,921 | ) | |||||
| Net Gain (Loss) on Investments and Futures Contracts | 7,780 | ||||||
| Net Increase (Decrease) in Net Assets Resulting from Operations | $ | 7,420 | |||||
The notes to the financial statements are an integral part of this report.
Transamerica IDEX Mutual Funds
Semi-Annual Report 2005
8
TA IDEX T. Rowe Price Small Cap
STATEMENTS OF CHANGES IN NET ASSETS
For the period or year ended
(all amounts in thousands)
| April 30, 2005 (unaudited) | October 31, 2004 | ||||||||||
| Increase (Decrease) In Net Assets From: | |||||||||||
| Operations: | |||||||||||
| Net investment income (loss) | $ | (360 | ) | $ | (1,650 | ) | |||||
| Net realized gain (loss) from investment securities and futures contracts | 15,701 | 6,447 | |||||||||
| Net unrealized appreciation (depreciation) on investment securities | (7,921 | ) | (3,896 | ) | |||||||
| 7,420 | 901 | ||||||||||
| Capital Share Transactions: | |||||||||||
| Proceeds from shares sold: | |||||||||||
| Class A | 1,344 | 46,740 | |||||||||
| Class B | 605 | 2,565 | |||||||||
| Class C | 752 | 1,843 | |||||||||
| Class C2 | – | 432 | |||||||||
| Class M | – | 129 | |||||||||
| 2,701 | 51,709 | ||||||||||
| Cost of shares redeemed: | |||||||||||
| Class A | (104,348 | ) | (12,651 | ) | |||||||
| Class B | (1,696 | ) | (3,171 | ) | |||||||
| Class C | (1,032 | ) | (1,440 | ) | |||||||
| Class C2 | – | (584 | ) | ||||||||
| Class M | – | (879 | ) | ||||||||
| (107,076 | ) | (18,725 | ) | ||||||||
| Class level exchanges: | |||||||||||
| Class C | – | 4,045 | |||||||||
| Class C2 | – | (2,406 | ) | ||||||||
| Class M | – | (1,639 | ) | ||||||||
| – | – | ||||||||||
| Automatic conversions: | |||||||||||
| Class A | 19 | – | |||||||||
| Class B | (19 | ) | – | ||||||||
| – | – | ||||||||||
| (104,375 | ) | 32,984 | |||||||||
| Net increase (decrease) in net assets | (96,955 | ) | 33,885 | ||||||||
| Net Assets: | |||||||||||
| Beginning of period | 146,546 | 112,661 | |||||||||
| End of period | $ | 49,591 | $ | 146,546 | |||||||
| Accumulated Net Investment Income (Loss) | $ | (361 | ) | $ | (1 | ) | |||||
| April 30, 2005 (unaudited) | October 31, 2004 | ||||||||||
| Share Activity: | |||||||||||
| Shares issued: | |||||||||||
| Class A | 116 | 4,181 | |||||||||
| Class B | 54 | 240 | |||||||||
| Class C | 67 | 173 | |||||||||
| Class C2 | – | 40 | |||||||||
| Class M | – | 13 | |||||||||
| 237 | 4,647 | ||||||||||
| Shares redeemed: | |||||||||||
| Class A | (9,045 | ) | (1,157 | ) | |||||||
| Class B | (151 | ) | (301 | ) | |||||||
| Class C | (93 | ) | (139 | ) | |||||||
| Class C2 | – | (53 | ) | ||||||||
| Class M | – | (83 | ) | ||||||||
| (9,289 | ) | (1,733 | ) | ||||||||
| Class level exchanges: | |||||||||||
| Class C | – | 381 | |||||||||
| Class C2 | – | (222 | ) | ||||||||
| Class M | – | (159 | ) | ||||||||
| – | – | ||||||||||
| Automatic conversions: | |||||||||||
| Class A | 2 | – | |||||||||
| Class B | (2 | ) | – | ||||||||
| – | – | ||||||||||
| Net increase (decrease) in shares outstanding: | |||||||||||
| Class A | (8,927 | ) | 3,024 | ||||||||
| Class B | (99 | ) | (61 | ) | |||||||
| Class C | (26 | ) | 415 | ||||||||
| Class C2 | – | (235 | ) | ||||||||
| Class M | – | (229 | ) | ||||||||
| (9,052 | ) | 2,914 | |||||||||
The notes to the financial statements are an integral part of this report.
Transamerica IDEX Mutual Funds
Semi-Annual Report 2005
9
TA IDEX T. Rowe Price Small Cap
FINANCIAL HIGHLIGHTS
(unaudited for the period ended April 30, 2005)
| For a share of beneficial interest outstanding throughout each period | |||||||||||||||||||||||||||||||||||||||
| Net Asset | Investment Operations | Distributions | Net Asset | ||||||||||||||||||||||||||||||||||||
| For the Period Ended (d)(g) | Value, Beginning of Period | Net Investment Income (Loss) | Net Realized and Unrealized Gain (Loss) | Total Operations | From Net Investment Income | From Net Realized Gains | Total Distributions | Value, End of Period | |||||||||||||||||||||||||||||||
| Class A | 4/30/2005 | $ | 10.84 | $ | (0.05 | ) | $ | 0.31 | $ | 0.26 | $ | – | $ | – | $ | – | $ | 11.10 | |||||||||||||||||||||
| 10/31/2004 | 10.61 | (0.12 | ) | 0.35 | 0.23 | – | – | – | 10.84 | ||||||||||||||||||||||||||||||
| 10/31/2003 | 7.83 | (0.15 | ) | 2.93 | 2.78 | – | – | – | 10.61 | ||||||||||||||||||||||||||||||
| 10/31/2002 | 9.46 | (0.16 | ) | (1.47 | ) | (1.63 | ) | – | – | – | 7.83 | ||||||||||||||||||||||||||||
| 10/31/2001 | 13.17 | (0.14 | ) | (3.56 | ) | (3.70 | ) | – | (0.01 | ) | (0.01 | ) | 9.46 | ||||||||||||||||||||||||||
| 10/31/2000 | 11.01 | (0.07 | ) | 2.51 | 2.44 | – | (0.28 | ) | (0.28 | ) | 13.17 | ||||||||||||||||||||||||||||
| Class B | 4/30/2005 | 10.44 | (0.10 | ) | 0.30 | 0.20 | – | – | – | 10.64 | |||||||||||||||||||||||||||||
| 10/31/2004 | 10.28 | (0.18 | ) | 0.34 | 0.16 | – | – | – | 10.44 | ||||||||||||||||||||||||||||||
| 10/31/2003 | 7.63 | (0.19 | ) | 2.84 | 2.65 | – | – | – | 10.28 | ||||||||||||||||||||||||||||||
| 10/31/2002 | 9.29 | (0.22 | ) | (1.44 | ) | (1.66 | ) | – | – | – | 7.63 | ||||||||||||||||||||||||||||
| 10/31/2001 | 13.05 | (0.21 | ) | (3.54 | ) | (3.75 | ) | – | (0.01 | ) | (0.01 | ) | 9.29 | ||||||||||||||||||||||||||
| 10/31/2000 | 10.97 | (0.15 | ) | 2.51 | 2.36 | – | (0.28 | ) | (0.28 | ) | 13.05 | ||||||||||||||||||||||||||||
| Class C | 4/30/2005 | 10.42 | (0.10 | ) | 0.30 | 0.20 | – | – | – | 10.62 | |||||||||||||||||||||||||||||
| 10/31/2004 | 10.28 | (0.22 | ) | 0.36 | 0.14 | – | – | – | 10.42 | ||||||||||||||||||||||||||||||
| 10/31/2003 | 7.52 | (0.20 | ) | 2.96 | 2.76 | – | – | – | 10.28 | ||||||||||||||||||||||||||||||
| Ratios/Supplemental Data | |||||||||||||||||||||||||||||||
| For the Period | Total | Net Assets, End of Period | Ratio of Expenses to Average Net Assets (a) | Net Investment Income (Loss) to Average | Portfolio Turnover | ||||||||||||||||||||||||||
| Ended (g) | Return (c) | (000's) | Net (e) | Total (f) | Net Assets (a) | Rate (b) | |||||||||||||||||||||||||
| Class A | 4/30/2005 | 2.40 | % | $ | 33,863 | 1.41 | % | 1.41 | % | (0.83 | )% | 10 | % | ||||||||||||||||||
| 10/31/2004 | 2.17 | 129,809 | 1.36 | 1.36 | (1.08 | ) | 29 | ||||||||||||||||||||||||
| 10/31/2003 | 35.50 | 95,018 | 1.75 | 1.93 | (1.55 | ) | 25 | ||||||||||||||||||||||||
| 10/31/2002 | (17.22 | ) | 6,487 | 1.74 | 2.67 | (1.52 | ) | 55 | |||||||||||||||||||||||
| 10/31/2001 | (28.11 | ) | 7,067 | 1.55 | 2.56 | (1.30 | ) | 49 | |||||||||||||||||||||||
| 10/31/2000 | 22.31 | 8,262 | 1.55 | 2.83 | (1.14 | ) | 53 | ||||||||||||||||||||||||
| Class B | 4/30/2005 | 1.91 | 10,946 | 2.36 | 2.40 | (1.80 | ) | 10 | |||||||||||||||||||||||
| 10/31/2004 | 1.56 | 11,776 | 1.94 | 1.94 | (1.67 | ) | 29 | ||||||||||||||||||||||||
| 10/31/2003 | 34.73 | 12,227 | 2.40 | 2.58 | (2.20 | ) | 25 | ||||||||||||||||||||||||
| 10/31/2002 | (17.85 | ) | 8,860 | 2.39 | 3.32 | (2.17 | ) | 55 | |||||||||||||||||||||||
| 10/31/2001 | (28.73 | ) | 9,496 | 2.20 | 3.21 | (1.95 | ) | 49 | |||||||||||||||||||||||
| 10/31/2000 | 21.63 | 8,119 | 2.20 | 3.48 | (1.79 | ) | 53 | ||||||||||||||||||||||||
| Class C | 4/30/2005 | 1.96 | 4,782 | 2.36 | 2.68 | (1.80 | ) | 10 | |||||||||||||||||||||||
| 10/31/2004 | 1.32 | 4,961 | 2.40 | 2.40 | (2.13 | ) | 29 | ||||||||||||||||||||||||
| 10/31/2003 | 36.70 | 628 | 2.40 | 2.58 | (2.20 | ) | 25 | ||||||||||||||||||||||||
NOTES TO FINANCIAL HIGHLIGHTS
(a) Annualized.
(b) Not annualized for periods of less than one year.
(c) Total Return has been calculated for the applicable period without deduction of a sales load, if any, on an initial purchase. Periods of less than one year are not annualized.
(d) Per share information is calculated based on average number of shares outstanding for the periods ended 10/31/2001, 10/31/2002, 10/31/2003, 10/31/2004 and 4/30/2005.
(e) Ratio of Net Expenses to Average Net Assets is net of fee waivers and reimbursements by the investment adviser, if any (see note 2).
(f) Ratio of Total Expenses to Average Net Assets includes all expenses before fee waivers and reimbursements by the investment adviser.
(g) TA IDEX T. Rowe Price Small Cap ("the Fund") commenced operations on March 1, 1999. The inception date for the Fund's offering of share Class C was November 11, 2002.
The notes to the financial statements are an integral part of this report.
Transamerica IDEX Mutual Funds
Semi-Annual Report 2005
10
TA IDEX T. Rowe Price Small Cap
NOTES TO FINANCIAL STATEMENTS
At April 30, 2005
(all amounts in thousands)
(unaudited)
NOTE 1. ORGANIZATION AND SIGNIFICANT ACCOUNTING POLICIES
Transamerica IDEX Mutual Funds is a Delaware statutory trust registered under the Investment Company Act of 1940, as amended (the "1940 Act"), as an open-end management investment company. Prior to March 1, 2005, Transamerica IDEX Mutual Funds was a Massachusetts business trust. TA IDEX T. Rowe Price Small Cap ("the Fund"), part of Transamerica IDEX Mutual Funds, began operations on March 1, 1999.
In the normal course of business, the Fund enters into contracts that contain a variety of representations and warranties, which provide general indemnifications. The Fund's maximum exposure under these arrangements is unknown, as this would involve future claims that may be made against the Fund and/or its affiliates that have not yet occurred. However, based on experience, the Fund expects the risk of loss to be remote.
See the Prospectus and Statement of Additional Information for a description of the Fund's investment objective.
In preparing the Fund's financial statements in accordance with accounting principles generally accepted in the United States of America ("GAAP"), estimates or assumptions (which could differ from actual results) may be used that affect reported amounts and disclosures. The following policies were consistently followed by the Fund, in accordance with GAAP.
Multiple class operations and expenses: The Fund currently offers three classes of shares, each with a public offering price that reflects different sales charges, if any, and expense levels. On June 15, 2004, Class C2 shares merged into Class C. On September 24, 2004, Class M shares merged into Class C. Class B shares will convert to Class A shares eight years after purchase. Income, non-class specific expenses and realized and unrealized gains and losses, are allocated daily to each class, based upon the value of shares outstanding method as permitted under Rule 18f-3 of the 1940 Act. Each class bears its own specific expenses as well as a portion of general, common expenses.
Pricing of shares: The Fund prices its shares on the basis of the net asset value of each class of shares of the Fund, which is determined as of the close of the New York Stock Exchange ("NYSE") (generally 4:00 p.m. Eastern Time) on each day on which the NYSE is open for trading.
Security valuations: Fund investments traded on an exchange are valued at the closing price on the day of valuation on the exchange where the security is principally traded. With respect to securities traded on NASDAQ NMS, such closing price may be last reported sales price or the NASDAQ Official Closing Price.
Securities traded in the over-the-counter market and listed securities for which no sale was reported on that date are valued at the last quoted bid price.
Debt securities are valued by independent pricing services at the last quoted bid price; however, those that mature in sixty days or less are valued at amortized cost, which approximates market.
Investment company securities are valued at net asset value of the underlying portfolio.
Other securities for which quotations are not readily available are valued at fair market value as determined in good faith using guidelines adopted by the Board of Trustees of the Fund, under the supervision of the Fund's Valuation Committee. These guidelines may include: the type of security; any restrictions on its resale; financial or business news of the issuer; similar or related securities that are actively trading; related corporate actions; and other significant events occurring after the close of trading in the security.
Cash: The Fund may leave cash overnight in its cash account with the custodian, Investors Bank & Trust Company ("IBT"). IBT has been contracted on behalf of the Fund to invest the excess cash into a savings account, which at April 30, 2005, was paying an interest rate of 2.02%.
Throughout the period, the Fund may have a cash overdraft balance. A fee is incurred on this overdraft, calculated by multiplying the overdraft by a rate based on the federal funds rate.
Repurchase agreements: The Fund is authorized to enter into repurchase agreements. The Fund, through IBT, receives delivery of the underlying securities, the value of which at the time of purchase is required to be an amount equal to at least 100% of the resale price. Repurchase agreements involve the risk that the seller will fail to repurchase the security, as agreed. In that case, the Fund will bear the risk of value fluctuations until the security can be sold and may encounter delays and incur costs in liquidating the security. In the event of bankruptcy or insolvency of the seller, delays and costs may be incurred.
Commission recapture: The sub-adviser, to the extent consistent with the best execution and usual commission rate policies and practices, may place security transactions of the Fund with broker/dealers with which Transamerica IDEX Mutual Funds has established a Commission Recapture Program. A Commission Recapture Program is any arrangement under which a broker/dealer applies a portion of the commissions received by such broker/dealer on the security transactions to the Fund. In no event will commissions paid by the Fund be used to pay expenses that would otherwise be borne by any other funds within Transamerica IDEX Mutual Funds, or by any other party.
Recaptured commissions during the six months ended April 30, 2005, of less than $1 are included in net realized gains in the Statement of Operations.
Transamerica IDEX Mutual Funds
Semi-Annual Report 2005
11
TA IDEX T. Rowe Price Small Cap
NOTES TO FINANCIAL STATEMENTS (continued)
At April 30, 2005
(all amounts in thousands)
(unaudited)
NOTE 1.–(continued)
Securities lending: The Fund may lend securities to enhance fund earnings from investing cash collateral in making such loans to qualified borrowers (typically broker/dealers). The Fund has engaged its custodian bank, IBT, as a lending agent to administer its securities lending program. IBT earned $5 of program income for its services. When the Fund makes a security loan, it receives cash collateral as protection against the risk that the borrower will default on the loan, and records an asset for the cash invested collateral and a liability for the return of the collateral.
Loans of securities are required to be secured by collateral at least equal to 102% of the value of the securities at inception of the loan, and not less then 100% thereafter. The Fund may invest cash collateral in short-term money market instruments including: U.S. Treasury Bills, U.S. agency obligations, commercial paper, money market mutual funds, repurchase agreements and other highly rated, liquid investments. During the life of securities loans, the collateral and securities loaned remain subject to fluctuation in value. IBT marks to market securities loaned and the collateral each business day. If additional collateral is due (at least $1), IBT collects additional cash collateral from the borrowers. Although securities loaned will be fully collateralized at all times, IBT may experience delays in, or may be prevented from, recovering the collateral on behalf of the Fund. The Fund may recall a loa ned security position at any time from the borrower through IBT. In the event the borrower fails to timely return a recalled security, IBT may indemnify the Fund by purchasing replacement securities for the Fund at its own expense and claiming the collateral to fund such a purchase. IBT absorbs the loss if the collateral value is not sufficient to cover the cost of the replacement securities. If replacement securities are not available, IBT will credit the equivalent cash value to the Fund.
While a security is on loan, the Fund does not have the right to vote that security. However, if time permits, the Fund will attempt to recall a security on loan and vote the proxy.
Income from securities lending is included in the Statement of Operations. The amount of collateral and value of securities on loan are included in the Statement of Assets and Liabilities as well as in the Schedule of Investments.
Security transactions and investment income: Security transactions are recorded on the trade date. Security gains and losses are calculated on the specific identification basis. Dividend income is recorded on the ex-dividend date or, in the case of foreign securities, as soon as the Fund is informed of the ex-dividend date. Interest income, including accretion of discounts and amortization of premiums, is recorded on the accrual basis commencing on the settlement date.
Futures contracts: The Fund may enter into futures contracts to manage exposure to market, interest rate or currency fluctuations. Futures contracts are valued at the settlement price established each day by the board of trade or exchange on which they are traded. The primary risks associated with futures contracts are imperfect correlation between the change in market value of the securities held and the prices of futures contracts; the possibility of an illiquid market and inability of the counterparty to meet the contract terms.
At April 30, 2005, there were no open futures contracts.
Account maintenance fees: If the shareholder account balance falls below $1 by either shareholder action or as a result of market action, a $25 (not in thousands) fee is assessed every year until the balance reaches $1. The fee is assessed by redeeming shares in the shareholder's account.
No fee will be charged under the following conditions:
• accounts opened within the preceding 24 months
• accounts with an active monthly Automatic Investment Plan ($50 (not in thousands) minimum per fund)
• accounts owned by an individual which, when combined by social security number, have a balance of $5 or more
• accounts owned by individuals in the same household (by address) that have a combined balance of $5 or more
• UTMA/UGMA accounts
• Fiduciary accounts
• B-share accounts whose shares have started to convert to A-shares accounts (as long as combined value of both accounts is at least $1)
For the six months ended April 30, 2005, this fee totaled $2. These fees are included in Paid in Capital in the Statement of Assets and Liabilities.
Redemption fees: A short-term trading redemption fee may be assessed on any fund shares in a fund account that are sold during the first five (5) NYSE trading days following their purchase date. This redemption fee will equal 2% of the amount redeemed and shares held the longest will be treated as being redeemed first and shares held the shortest as being redeemed last.
For the six months ended April 30, 2005, the Fund received less than $1 in redemption fees.
Dividend distributions: Distributions to shareholders are recorded on the ex-dividend date and are determined in accordance with Federal income tax regulations which may differ from GAAP.
Transamerica IDEX Mutual Funds
Semi-Annual Report 2005
12
TA IDEX T. Rowe Price Small Cap
NOTES TO FINANCIAL STATEMENTS (continued)
At April 30, 2005
(all amounts in thousands)
(unaudited)
NOTE 2. RELATED PARTY TRANSACTIONS
Transamerica Fund Advisors, Inc. ("TFAI") is the Fund's investment adviser. Transamerica Fund Services, Inc. ("TFS") is the Fund's administrator and transfer agent. AFSG Securities Corp. ("AFSG") is the Fund's distributor/principal underwriter. AFSG is 100% owned by AUSA Holding Company ("AUSA"). TFAI is a directly owned subsidiary of Western Reserve Life Assurance Co. of Ohio (78%) and AUSA (22%). TFS is a wholly owned subsidiary of WRL (50%) and AUSA (50%). AUSA and WRL are wholly owned indirect subsidiaries of AEGON, NV, a Netherlands corporation.
Effective January 1, 2005 AEGON/Transamerica Fund Advisors, Inc. ("ATFA") was renamed Transamerica Fund Advisors, Inc. ("TFAI"); AEGON/Transamerica Fund Services, Inc. ("ATFS") and AEGON/Transamerica Investor Services, Inc. ("ATIS") merged into one entity and was renamed Transamerica Fund Services, Inc. ("TFS").
The following schedule reflects the percentage of fund assets owned by affiliated mutual funds (i.e., through the asset allocation funds):
| Net Assets | % of Net Assets | ||||||||||
| TA IDEX Asset Allocation– Conservative Portfolio | $ | 1,843 | 3.72 | % | |||||||
| TA IDEX Asset Allocation– Moderate Portfolio | 22,445 | 45.26 | % | ||||||||
| Total | $ | 24,288 | 48.98 | % | |||||||
Investment advisory fee: The Fund pays management fees to TFAI based on average daily net assets ("ANA") at the following breakpoints:
From November 1, 2004 to December 31, 2004:
0.80% of the first $500 million of ANA
0.70% of ANA over $500 million
From January 1, 2005 on:
0.75% of the first $500 million of ANA
0.70% of ANA over $500 million
TFAI has contractually agreed to waive its advisory fee and will reimburse the Fund to the extent that operating expenses, excluding 12b-1 fees, exceed the following stated annual limit:
From November 1, 2004 to December 31, 2004:
1.40% Expense Limit
From January 1, 2005 on:
1.35% Expense Limit
The sub-adviser, T. Rowe Price, has agreed to a pricing discount based on the aggregate assets that they manage in the Transamerica IDEX Mutual Funds. The amount of the discount received by the Fund at April 30, 2005 was $3.
Distribution and service fees: The Fund has a 12b-1 distribution plan under the 1940 Act pursuant to which an annual fee, based on average daily net assets, is paid to the distributor for various disbursements such as broker-dealer account servicing fees and other promotional expenses of the Fund. The Fund is authorized under the 12b-1 plan to pay fees on each class up to the following limits:
| Class A | 0.35 | % | |||||
| Class B | 1.00 | % | |||||
| Class C | 1.00 | % | |||||
In the case the Fund or a class of shares of the Fund is closed to new investors or investments, the Fund is authorized to pay 12b-1 fees for past sales and distribution efforts and present and past investor services.
Underwriter commissions relate to front-end sales charges imposed for Class A shares and contingent deferred sales charges from Classes B, C, and certain A share redemptions. For the six months ended April 30, 2005, the underwriter commissions were as follows:
| Received by Underwriter | $ | 72 | |||||
| Retained by Underwriter | 3 | ||||||
| Contingent Deferred Sales Charge | 13 | ||||||
Administrative services: The Fund has entered into an agreement with TFS for financial and legal fund administration services, which includes such items as compliance, expenses, financial statements and other reporting, distributions, tax returns, prospectus preparation, board of trustees meeting support and other legal matters. As of January 1, 2005 the Fund pays TFS an annual fee of 0.02% of average net assets. Prior to January 1, 2005 the Fund paid TFS an annual fee of 0.015% of average net assets. The Legal fees on the Statement of Operations are for fees paid to external legal counsel.
Transfer agent fees: The Fund pays TFS an annual per-account charge of $20 (not in thousands) for each open account and $1.63 (not in thousands) for each closed account. There is no new account charge. The Transfer agent fees on the Statement of Operations are made up of fees paid to TFS and costs associated with shareholder statements.
The Fund paid TFS $66 for the six months ended April 30, 2005.
Deferred compensation plan: Each eligible Fund Trustee may elect participation in the Deferred Compensation Plan ("the Plan"). Under the Plan, such Trustees may defer payment of a percentage of their total fees earned as a Fund Trustee. These deferred amounts may be invested
Transamerica IDEX Mutual Funds
Semi-Annual Report 2005
13
TA IDEX T. Rowe Price Small Cap
NOTES TO FINANCIAL STATEMENTS (continued)
At April 30, 2005
(all amounts in thousands)
(unaudited)
NOTE 2.–(continued)
in any Transamerica IDEX Mutual Fund. At April 30, 2005, the value of invested plan amount was $4. Invested plan amounts and the total liability for deferred compensation to the Trustees under the Plan at April 30, 2005, are included in the accompanying Statement of Assets and Liabilities.
NOTE 3. INVESTMENT TRANSACTIONS
The cost of securities purchased and proceeds from securities sold (excluding short-term securities) for the six months ended April 30, 2005, were as follows:
| Purchases of securities: | |||||||
| Long-Term excluding U.S. Government | $ | 6,682 | |||||
| U.S. Government | – | ||||||
| Proceeds from maturities and sales of securities: | |||||||
| Long-Term excluding U.S. Government | 109,298 | ||||||
| U.S. Government | – | ||||||
NOTE 4. FEDERAL INCOME TAX MATTERS
The Fund has not made any provision for federal income or excise taxes due to its policy to distribute all of its taxable income and capital gains to its shareholders and otherwise qualify as a regulated investment company under the Internal Revenue Code. Income and capital gain distributions are determined in accordance with income tax regulations, which may differ from GAAP. These differences are primarily due to differing treatment for items including, but not limited to, wash sales, net operating losses and capital loss carryforwards.
The capital loss carryforwards are available to offset future realized capital gains through the period listed:
| Capital Loss Carryforward | Available through | ||||||
| $ | 818 | October 31, 2011 | |||||
The aggregate cost of investments and composition of unrealized appreciation (depreciation) for federal income tax purposes as of April 30, 2005, are as follows:
| Federal Tax Cost Basis | $ | 60,349 | |||||
| Unrealized Appreciation | $ | 6,439 | |||||
| Unrealized (Depreciation) | (4,600 | ) | |||||
| Net Unrealized Appreciation (Depreciation) | $ | 1,839 | |||||
NOTE 5. REGULATORY PROCEEDINGS
There continues to be significant federal and state regulatory activity relating to financial services companies, particularly mutual fund companies and their investment advisers. As part of an ongoing investigation regarding potential market timing, recordkeeping and trading compliance issues and matters affecting the Fund's investment adviser, TFAI, and certain employees and affiliates of TFAI, the SEC staff has indicated that it is likely to take some action against TFAI and certain of its affiliates at the conclusion of the investigation. The potential timing and the scope of any such action is difficult to predict. Although the impact of any action brought against TFAI and/or its affiliates is difficult to assess at the present time, the Fund currently believes that the likelihood that any such action will have a material adverse impact on it is remote. It is important to note that the Fund is not aware of any allegation of wrongdoing against it and its board at the time this semi-annual report is printed. Although it is not anticipated that these developments will have an adverse impact on the Fund, there can be no assurance at this time. TFAI and its affiliates are actively working with the SEC in regard to this matter; however, the exact resolution cannot be determined at this time. TFAI will take such actions that it deems necessary or appropriate to continue providing management services to the Fund and to bring all matters to an appropriate conclusion.
TFAI and/or its affiliates, and not the Fund, will bear the costs regarding these regulatory matters.
Transamerica IDEX Mutual Funds
Semi-Annual Report 2005
14
TA IDEX T. Rowe Price Small Cap
INVESTMENT ADVISORY AND SUB-ADVISORY AGREEMENTS – REVIEW AND RENEWAL
At a meeting of the Board of Trustees of Transamerica IDEX Mutual Funds ("TA IDEX") held on October 6, 2004, the Board considered and approved the renewal for a one-year period of the Investment Advisory Agreement between TA IDEX T. Rowe Price Small Cap (the "Fund") and Transamerica Fund Advisors, Inc. ("TFAI") as well as the Investment Sub-Advisory Agreement of the Fund between TFAI and T. Rowe Price Associates, Inc. (the "Sub-Adviser"). In approving the renewal of these agreements, the Board concluded that the Investment Advisory and Investment Sub-Advisory Agreements enable shareholders of the Fund to obtain high quality services at a cost that is appropriate, reasonable, and in the best interests of shareholders based upon the following determinations, among others:
The nature, extent and quality of the advisory service to be provided. The Board considered the nature and quality of the services provided by TFAI and the Sub-Adviser to the Fund in the past, as well as the services anticipated to be provided in the future. The Board concluded that TFAI and the Sub-Adviser are capable of providing high quality services to the Fund, as indicated by TFAI's management capabilities demonstrated with respect to the Fund and other funds managed by TFAI, TFAI's management oversight process, and the professional qualifications and experience of the Sub-Adviser's portfolio management team. The Board also concluded that TFAI and the Sub-Adviser would provide the same quality and quantity of investment management and related services as before, that these services are app ropriate in scope and extent in light of the Fund's operations, the competitive landscape of the investment company business and investor needs, and that TFAI's and the Sub-Adviser's obligations will remain the same in all respects.
The investment performance of the Fund. The Board concluded, based in particular on information provided by Lipper Analytics, that the Fund's investment performance was competitive relative to comparable funds over trailing two- and three-year periods although it had lagged in the past year. However, on the basis of the Trustees' assessment of the nature, extent and quality of investment advisory and related services to be provided or procured by TFAI and the Sub-Adviser, including steps to be taken to improve recent performance, the Trustees concluded that TFAI and the Sub-Adviser were capable of generating a level of long-term investment performance that is appropriate in light of the Fund's investment objective, policies and strategies and competitive with many other investment companies.
The cost of advisory services provided and the level of profitability. On the basis of comparative information, the Board concluded that the advisory fees were lower than industry averages, although the estimated overall expenses of the Fund were relatively higher than certain industry averages. The Board also noted that the advisory fees have breakpoints and that fees and expenses may decrease as the level of Fund assets increase. Overall, on the basis of the Board's review of the fees to be charged by TFAI and the Sub-Adviser for investment advisory and related services, TFAI's financial statements, the fees paid by TFAI to the Sub-Adviser, TFAI's estimated net management income resulting from its management of the Fund, the estimated profitability of TFAI's relationships with the Fund and TA IDEX, TFAI's limitation and fee waiver arrangement for the Fund, and the estimated profitability of the Sub-Adviser's relationship with the Fund, the Board concluded that the level of investment advisory fees and the profitability is appropriate in light of the entirety of the services provided and the anticipated profitability of the relationship between the Fund, TFAI and the Sub-Adviser.
The extent to which economies of scale would be realized as the Fund grows and whether fee levels reflect these economies of scale for the benefit of Fund investors. The Trustees concluded that inclusion of asset-based breakpoints in the Fund's advisory fee schedule appropriately benefit investors by realizing economies of scale in the form of a lower advisory fee rate as the level of Fund assets increases. The Board also concluded that the advisory fees appropriately reflect the Fund's current size, the current economic environment for TFAI, and the competitive nature of the investment company market. In addition, the Board noted that it will have the opportunity to periodically re-examine whether the Fund has achieved economies of scale, as well as the appropriateness of advisory fees payable to TFAI and the Sub-Adviser in the future.
Benefits (such as soft dollars) to TFAI or the Sub-Adviser from its relationship with the Fund. The Board concluded that other benefits derived by TFAI or the Sub-Adviser from its relationship with the Fund are reasonable and fair, and are consistent with industry practice and the best interests of the Fund and its shareholders. In this regard, the Board noted that TFAI does not realize "soft dollar" benefits from its relationship with the Fund, and that the Sub-Adviser is participating in a brokerage program pursuant to which a portion of brokerage commissions paid by the Fund is recaptured for the benefit of the Fund and its shareholders, thus limiting the amount of "soft-dollar" arrangements the Sub-Adviser may engage in with respect to the Fund's portfolio brokerage transactions.
Other considerations. The Board also determined that TFAI had made a substantial commitment to the recruitment and retention of high quality personnel, and maintained the financial, compliance and operational resources reasonably necessary to manage the Fund in a professional manner that is consistent with the best interests of the Fund and its shareholders. The Trustees also concluded that TFAI had made a significant entrepreneurial commitment to the management and success of the Fund, reflected by TFAI's expense limitation and fee waiver arrangement with the Fund which, as demonstrated in the past with the Fund, may result in TFAI waiving a substantial amount of advisory fees for the benefit of shareholders.
Transamerica IDEX Mutual Funds
Semi-Annual Report 2005
15
TA IDEX T. Rowe Price Small Cap
SUPPLEMENTAL INFORMATION (unaudited)
RESULTS OF SHAREHOLDER PROXY
At a special meeting of shareholders held on February 25, 2005, the results of the Proposals were as follows:
Transamerica IDEX Mutual Funds
Proposal 1: Election of Trustees to the Board of Trustees of Transamerica IDEX Mutual Funds.
| For | Withheld | ||||||||||
| Peter R. Brown | 872,017,875.249 | 4,468,498.551 | |||||||||
| Daniel Calabria | 871,917,069.786 | 4,569,304.014 | |||||||||
| Janise B. Case | 872,099,393.125 | 4,386,980.675 | |||||||||
| Charles C. Harris | 872,086,722.025 | 4,399,651.775 | |||||||||
| Leo J. Hill | 872,304,465.640 | 4,181,908.160 | |||||||||
| Russell A. Kimball, Jr. | 872,253,556.471 | 4,232,817.329 | |||||||||
| William W. Short, Jr. | 872,139,920.944 | 4,346,452.856 | |||||||||
| John Waechter | 872,261,152.376 | 4,225,221.424 | |||||||||
| Jack E. Zimmerman | 871,929,967.512 | 4,556,406.288 | |||||||||
| Brian C. Scott | 872,218,970.367 | 4,267,403.433 | |||||||||
| Thomas P. O'Neill | 872,111,944.117 | 4,374,429.683 | |||||||||
TA IDEX T. Rowe Price Small Cap
Proposal 2: Approval of an Agreement and Plan of Reorganization pursuant to which Transamerica IDEX Mutual Funds will organize as a Delaware statutory trust.
| For | Against | Abstentions/Broker Non-Votes | |||||||||
| 12,268,148.089 | 18,115.668 | 701,646.098 | |||||||||
Proposal 3: Approval of changes to the fundamental investment restrictions of TA IDEX T. Rowe Price Small Cap.
| A. Diversification | For | Against | Abstentions/Broker Non-Votes | ||||||||||||
| 12,288,338.264 | 11,628.591 | 687,943.000 | |||||||||||||
| B. Borrowing | For | Against | Abstentions/Broker Non-Votes | ||||||||||||
| 12,286,056.304 | 13,910.551 | 687,943.000 | |||||||||||||
| C. Senior Securities | For | Against | Abstentions/Broker Non-Votes | ||||||||||||
| 12,287,690.420 | 12,276.435 | 687,943.000 | |||||||||||||
| D. Underwriting Securities | For | Against | Abstentions/Broker Non-Votes | ||||||||||||
| 12,287,389.403 | 12,577.452 | 687,943.000 | |||||||||||||
| E. Real Estate | For | Against | Abstentions/Broker Non-Votes | ||||||||||||
| 12,287,976.686 | 11,990.169 | 687,943.000 | |||||||||||||
| F. Making Loans | For | Against | Abstentions/Broker Non-Votes | ||||||||||||
| 12,284,151.036 | 15,815.819 | 687,943.000 | |||||||||||||
| G. Concentration | For | Against | Abstentions/Broker Non-Votes | ||||||||||||
| 12,286,860.737 | 13,106.118 | 687,943.000 | |||||||||||||
| H. Commodities | For | Against | Abstentions/Broker Non-Votes | ||||||||||||
| 12,285,448.001 | 14,518.854 | 687,943.000 | |||||||||||||
Transamerica IDEX Mutual Funds
Semi-Annual Report 2005
16
TA IDEX T. Rowe Price Tax-Efficient Growth
UNDERSTANDING YOUR FUND'S EXPENSES
(unaudited)
SHAREHOLDER EXPENSES
The following Example is intended to help you understand your ongoing costs (in dollars and cents) of investing in a Fund and to compare these costs with the ongoing costs of investing in other funds.
The Example is based on an investment of $1,000 invested at November 1, 2004 and held for the entire period until April 30, 2005.
ACTUAL EXPENSES
The first line in the table below provides information about actual account values and actual expenses. You may use the information in this line, together with the amount you invested, to estimate the expenses that you paid over the period. Simply divide your account value by $1,000 (for example, an $8,600 account value divided by $1,000 = 8.6), then multiply the result by the number in the first line of your Fund under the heading entitled "Expenses Paid During Period" to estimate the expenses you paid on your account during this period.
HYPOTHETICAL EXAMPLE FOR COMPARISON PURPOSES
The second line in the table below provides information about hypothetical account values and hypothetical expenses based on the Fund's actual expense ratio and an assumed rate of return of 5% per year before expenses, which is not the Fund's actual return. The hypothetical account values and expenses may not be used to estimate the actual ending account balance or expenses you paid for the period. You may use this information to compare the ongoing costs of investing in your Fund and other funds. To do so, compare this 5% hypothetical example with the 5% hypothetical examples that appear in the shareholder reports of the other funds.
Please note that the expenses shown in the table are meant to highlight your ongoing costs only and do not reflect any transactional costs, such as sales charges, redemption fees, brokerage commissions paid on purchases and sales of fund shares. Therefore, the second line under the Fund in the table is useful in comparing ongoing costs only, and will not help you determine the relative total costs of owning different funds. In addition, note that the expenses shown in the table are meant to highlight your ongoing costs and do not reflect any transaction costs.
| Beginning Account Value | Ending Account Value | Annualized Expense Ratio | Expenses Paid During Period (a) | ||||||||||||||||
| Class A | |||||||||||||||||||
| Actual | $ | 1,000.00 | $ | 1,004.90 | 1.70 | % | $ | 8.45 | |||||||||||
| Hypothetical (b) | 1,000.00 | 1,016.36 | 1.70 | 8.50 | |||||||||||||||
| Class B | |||||||||||||||||||
| Actual | 1,000.00 | 1,001.10 | 2.34 | 11.61 | |||||||||||||||
| Hypothetical (b) | 1,000.00 | 1,013.19 | 2.34 | 11.68 | |||||||||||||||
| Class C | |||||||||||||||||||
| Actual | 1,000.00 | 1,001.40 | 2.35 | 11.66 | |||||||||||||||
| Hypothetical (b) | 1,000.00 | 1,013.14 | 2.35 | 11.73 | |||||||||||||||
(a) Expenses are calculated using each Fund's annualized expense ratio (as disclosed in the table), multiplied by the average account value for the period, multiplied by number of days in the period (181 days), and divided by the number of days in the year (365 days).
(b) 5% return per year before expenses.
GRAPHICAL PRESENTATION OF SCHEDULE OF INVESTMENTS
By Sector
At April 30, 2005
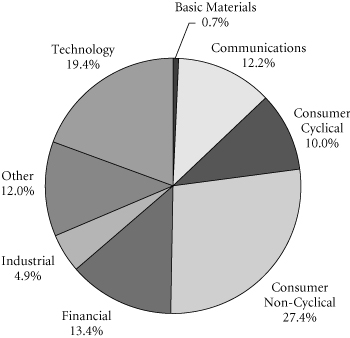
This chart shows the percentage breakdown by sector of the Fund's total investment securities.
Transamerica IDEX Mutual Funds
Semi-Annual Report 2005
1
TA IDEX T. Rowe Price Tax-Efficient Growth
SCHEDULE OF INVESTMENTS
At April 30, 2005
(all amounts except share amounts in thousands)
(unaudited)
| Shares | Value | ||||||||||
| COMMON STOCKS (99.9%) | |||||||||||
| Aerospace (0.6%) | |||||||||||
| Boeing Co. (The) | 2,600 | $ | 155 | ||||||||
| Amusement & Recreation Services (1.7%) | |||||||||||
| Disney (Walt) Co. (The) | 8,900 | 235 | |||||||||
| Station Casinos, Inc. | 2,900 | 187 | |||||||||
| Apparel Products (0.6%) | |||||||||||
| Cintas Corp. (a) | 3,600 | 139 | |||||||||
| Automotive (0.6%) | |||||||||||
| Harley-Davidson, Inc. | 3,000 | 141 | |||||||||
| Beverages (3.0%) | |||||||||||
| Anheuser-Busch Cos., Inc. | 1,900 | 89 | |||||||||
| Coca-Cola Co. (The) | 6,800 | 295 | |||||||||
| PepsiCo, Inc. | 6,670 | 371 | |||||||||
| Business Credit Institutions (1.2%) | |||||||||||
| Fannie Mae | 2,500 | 135 | |||||||||
| Freddie Mac | 2,600 | 160 | |||||||||
| Business Services (7.4%) | |||||||||||
| ChoicePoint, Inc. (b) | 1,900 | 75 | |||||||||
| Clear Channel Communications, Inc. | 6,400 | 204 | |||||||||
| eBay, Inc. (b) | 10,800 | 343 | |||||||||
| Equifax, Inc. | 1,700 | 57 | |||||||||
| First Data Corp. | 4,900 | 186 | |||||||||
| Monster Worldwide, Inc. (b) | 4,300 | 99 | |||||||||
| Moody's Corp. (a) | 3,800 | 312 | |||||||||
| Omnicom Group, Inc. (a) | 2,800 | 232 | |||||||||
| Robert Half International, Inc. (a) | 6,200 | 154 | |||||||||
| WPP Group PLC, ADR | 3,300 | 179 | |||||||||
| Chemicals & Allied Products (3.8%) | |||||||||||
| Avon Products, Inc. | 4,200 | 168 | |||||||||
| Colgate-Palmolive Co. | 2,700 | 134 | |||||||||
| Ecolab, Inc. | 3,600 | 118 | |||||||||
| Monsanto Co. | 1,000 | 59 | |||||||||
| Procter & Gamble Co. (a) | 7,200 | 390 | |||||||||
| Valspar Corp. | 2,000 | 83 | |||||||||
| Commercial Banks (8.7%) | |||||||||||
| Bank of New York Co., Inc. (The) | 7,600 | 212 | |||||||||
| Citigroup, Inc. | 14,459 | 679 | |||||||||
| Mellon Financial Corp. | 4,000 | 111 | |||||||||
| Northern Trust Corp. | 9,100 | 410 | |||||||||
| State Street Corp. (a) | 9,800 | 453 | |||||||||
| Wells Fargo & Co. | 5,200 | 312 | |||||||||
| Communication (1.3%) | |||||||||||
| Certegy, Inc. | 3,900 | 142 | |||||||||
| Viacom, Inc.–Class B | 5,500 | 190 | |||||||||
| Shares | Value | ||||||||||
| Communications Equipment (0.3%) | |||||||||||
| Nokia Corp., ADR | 5,000 | $ | 80 | ||||||||
| Computer & Data Processing Services (7.1%) | |||||||||||
| Adobe Systems, Inc. | 800 | 48 | |||||||||
| Automatic Data Processing, Inc. | 4,200 | 182 | |||||||||
| Computer Associates International, Inc. | 3,905 | 105 | |||||||||
| Electronic Arts, Inc. (a)(b) | 500 | 27 | |||||||||
| Intuit, Inc. (b) | 2,400 | 97 | |||||||||
| Microsoft Corp. | 25,800 | 653 | |||||||||
| Oracle Corp. (b) | 21,000 | 243 | |||||||||
| SAP AG, ADR | 4,000 | 158 | |||||||||
| Yahoo!, Inc. (a)(b) | 7,800 | 269 | |||||||||
| Computer & Office Equipment (4.9%) | |||||||||||
| Cisco Systems, Inc. (b) | 31,300 | 541 | |||||||||
| Dell, Inc. (b) | 16,900 | 589 | |||||||||
| EMC Corp. (b) | 7,700 | 101 | |||||||||
| Cosmetics/Personal Care (0.8%) | |||||||||||
| Gillette Co. (The) | 3,600 | 186 | |||||||||
| Drug Stores & Proprietary Stores (1.3%) | |||||||||||
| CVS Corp. | 2,400 | 124 | |||||||||
| Walgreen Co. | 4,900 | 211 | |||||||||
| Educational Services (0.7%) | |||||||||||
| Apollo Group, Inc.–Class A (b) | 2,350 | 169 | |||||||||
| Electronic & Other Electric Equipment (3.5%) | |||||||||||
| General Electric Co. | 24,350 | 881 | |||||||||
| Electronic Components & Accessories (11.6%) | |||||||||||
| Altera Corp. (a)(b) | 14,700 | 305 | |||||||||
| Analog Devices, Inc. (a) | 7,400 | 252 | |||||||||
| Broadcom Corp.–Class A (b) | 3,500 | 105 | |||||||||
| Intel Corp. | 23,200 | 546 | |||||||||
| Linear Technology Corp. | 11,600 | 415 | |||||||||
| Maxim Integrated Products, Inc. (a) | 10,800 | 404 | |||||||||
| Microchip Technology, Inc. | 6,300 | 179 | |||||||||
| Molex, Inc.–Class A | 3,500 | 80 | |||||||||
| Texas Instruments, Inc. | 10,000 | 250 | |||||||||
| Xilinx, Inc. | 13,400 | 361 | |||||||||
| Entertainment (0.5%) | |||||||||||
| International Game Technology | 4,300 | 116 | |||||||||
| Food & Kindred Products (0.9%) | |||||||||||
| General Mills, Inc. | 2,300 | 114 | |||||||||
| WM Wrigley Jr. Co. | 1,700 | 117 | |||||||||
| Furniture & Home Furnishings Stores (1.0%) | |||||||||||
| Bed Bath & Beyond, Inc. (b) | 3,300 | 123 | |||||||||
| Williams-Sonoma, Inc. (b) | 3,600 | 121 | |||||||||
The notes to the financial statements are an integral part of this report.
Transamerica IDEX Mutual Funds
Semi-Annual Report 2005
TA IDEX T. Rowe Price Tax-Efficient Growth 2
TA IDEX T. Rowe Price Tax-Efficient Growth
SCHEDULE OF INVESTMENTS (continued)
At April 30, 2005
(all amounts except share amounts in thousands)
(unaudited)
| Shares | Value | ||||||||||
| Hotels & Other Lodging Places (0.6%) | |||||||||||
| Marriott International, Inc.–Class A | 2,500 | $ | 157 | ||||||||
| Industrial Machinery & Equipment (1.0%) | |||||||||||
| Applied Materials, Inc. (b) | 9,100 | 135 | |||||||||
| Illinois Tool Works, Inc. | 1,200 | 101 | |||||||||
| Insurance (7.0%) | |||||||||||
| AMBAC Financial Group, Inc. | 1,700 | 114 | |||||||||
| American International Group, Inc. | 6,663 | 339 | |||||||||
| UnitedHealth Group, Inc. | 6,100 | 576 | |||||||||
| WellPoint, Inc. (b) | 5,700 | 728 | |||||||||
| Insurance Agents, Brokers & Service (0.3%) | |||||||||||
| Marsh & McLennan Cos., Inc. | 2,800 | 78 | |||||||||
| Lumber & Other Building Materials (1.7%) | |||||||||||
| Home Depot, Inc. (The) | 12,100 | 428 | |||||||||
| Management Services (0.6%) | |||||||||||
| Paychex, Inc. | 5,200 | 159 | |||||||||
| Medical Instruments & Supplies (3.8%) | |||||||||||
| Baxter International, Inc. | 2,800 | 104 | |||||||||
| Guidant Corp. | 1,700 | 126 | |||||||||
| Medtronic, Inc. | 10,700 | 564 | |||||||||
| Stryker Corp. | 3,400 | 165 | |||||||||
| Motion Pictures (0.9%) | |||||||||||
| Time Warner, Inc. (b) | 13,900 | 234 | |||||||||
| Paper & Allied Products (0.7%) | |||||||||||
| 3M Co. | 600 | 46 | |||||||||
| Kimberly-Clark Corp. | 1,900 | 119 | |||||||||
| Personal Credit Institutions (0.6%) | |||||||||||
| SLM Corp. | 3,200 | 152 | |||||||||
| Pharmaceuticals (9.1%) | |||||||||||
| Abbott Laboratories | 4,900 | 241 | |||||||||
| Amgen, Inc. (b) | 3,900 | 227 | |||||||||
| AstraZeneca PLC, ADR | 1,900 | 83 | |||||||||
| GlaxoSmithKline PLC, ADR | 2,600 | 131 | |||||||||
| Johnson & Johnson | 8,400 | 576 | |||||||||
| Lilly (Eli) & Co. | 2,900 | 170 | |||||||||
| Medco Health Solutions, Inc. (b) | 1,109 | 56 | |||||||||
| Merck & Co., Inc. | 2,300 | 78 | |||||||||
| Pfizer, Inc. | 18,985 | 516 | |||||||||
| Wyeth | 4,100 | 184 | |||||||||
| Printing & Publishing (1.2%) | |||||||||||
| McGraw-Hill Cos., Inc. (The) | 3,400 | 296 | |||||||||
| Radio & Television Broadcasting (0.8%) | |||||||||||
| IAC/InterActive Corp. (a)(b) | 3,700 | 80 | |||||||||
| Univision Communications, Inc.–Class A (a)(b) | 4,100 | 108 | |||||||||
| Shares | Value | ||||||||||
| Restaurants (0.5%) | |||||||||||
| Starbucks Corp. (b) | 2,500 | $ | 124 | ||||||||
| Retail Trade (1.5%) | |||||||||||
| Amazon.com, Inc. (b) | 7,400 | 239 | |||||||||
| Tiffany & Co. | 4,100 | 124 | |||||||||
| Rubber & Misc. Plastic Products (0.4%) | |||||||||||
| NIKE, Inc.–Class B | 1,300 | 100 | |||||||||
| Security & Commodity Brokers (2.6%) | |||||||||||
| American Express Co. | 4,000 | 211 | |||||||||
| Charles Schwab Corp. (The) (a) | 14,600 | 151 | |||||||||
| Franklin Resources, Inc. | 4,200 | 288 | |||||||||
| Telecommunications (0.5%) | |||||||||||
| Vodafone Group PLC, ADR | 5,000 | 131 | |||||||||
| Transportation & Public Utilities (0.6%) | |||||||||||
| Expeditors International of Washington, Inc. (a) | 2,800 | 137 | |||||||||
| Variety Stores (2.8%) | |||||||||||
| Dollar General Corp. | 9,600 | 195 | |||||||||
| Family Dollar Stores, Inc. | 3,900 | 105 | |||||||||
| Wal-Mart Stores, Inc. | 8,700 | 410 | |||||||||
| Water Transportation (0.2%) | |||||||||||
| Carnival Corp. | 900 | 44 | |||||||||
| Wholesale Trade Nondurable Goods (1.0%) | |||||||||||
| SYSCO Corp. | 7,300 | 253 | |||||||||
| Total Common Stocks (cost: $18,635) | 24,944 | ||||||||||
| Principal | Value | ||||||||||
| SECURITY LENDING COLLATERAL (13.6%) | |||||||||||
| Debt (11.8%) | |||||||||||
| Bank Notes (1.6%) | |||||||||||
| Bank of America | |||||||||||
| 2.82%, due 05/16/2005 | $ | 107 | $ | 107 | |||||||
| 2.80%, due 06/09/2005 (c) | 27 | 27 | |||||||||
| 2.77%, due 07/18/2005 (c) | 107 | 107 | |||||||||
| Canadian Imperial Bank of Commerce 3.02%, due 11/04/2005 (c) | 107 | 107 | |||||||||
| Credit Suisse First Boston Corp. 2.88%, due 09/09/2005 (c) 3.06%, due 03/10/2006 (c) | 27 27 | 27 27 | |||||||||
| Euro Dollar Overnight (2.1%) | |||||||||||
| Bank of Montreal 2.94%, due 05/04/2005 | 80 | 80 | |||||||||
| BNP Paribas 2.80%, due 05/05/2005 | 111 | 111 | |||||||||
| Den Danske Bank 2.93%, due 05/02/2005 2.80%, due 05/06/2005 | 96 54 | 96 54 | |||||||||
The notes to the financial statements are an integral part of this report.
Transamerica IDEX Mutual Funds
Semi-Annual Report 2005
TA IDEX T. Rowe Price Tax-Efficient Growth 3
TA IDEX T. Rowe Price Tax-Efficient Growth
SCHEDULE OF INVESTMENTS (continued)
At April 30, 2005
(all amounts except share amounts in thousands)
(unaudited)
| Principal | Value | ||||||||||
| Euro Dollar Overnight (continued) | |||||||||||
| Dexia Group 2.80%, due 05/05/2005 | $ | 47 | $ | 47 | |||||||
| Royal Bank of Canada 2.80%, due 05/04/2005 | 110 | 110 | |||||||||
| Svenska Handlesbanken 2.80%, due 05/06/2005 | 18 | 18 | |||||||||
| Euro Dollar Terms (4.8%) | |||||||||||
| Bank of Nova Scotia 2.88%, due 05/11/2005 3.01%, due 05/31/2005 | 54 150 | 54 150 | |||||||||
| Barclays 3.02%, due 06/27/2005 | 96 | 96 | |||||||||
| BNP Paribas 2.93%, due 06/07/2005 | 86 | 86 | |||||||||
| Branch Banker & Trust 2.94%, due 06/06/2005 | 23 | 23 | |||||||||
| Calyon 2.93%, due 06/03/2005 | 89 | 89 | |||||||||
| Citigroup 2.87%, due 06/06/2005 | 111 | 111 | |||||||||
| Credit Suisse First Boston Corp. 2.91%, due 05/16/2005 | 110 | 110 | |||||||||
| HSBC Banking/Holdings PLC 3.01%, due 06/23/2005 | 54 | 54 | |||||||||
| Royal Bank of Scotland 2.94%, due 06/07/2005 2.95%, due 06/10/2005 | 104 58 | 104 58 | |||||||||
| Societe Generale 2.80%, due 05/03/2005 | 103 | 103 | |||||||||
| Toronto Dominion Bank 2.75%, due 05/09/2005 3.01%, due 06/24/2005 | 80 30 | 80 30 | |||||||||
| UBS AG 2.81%, due 05/03/2005 | 54 | 54 | |||||||||
| Principal | Value | ||||||||||
| Promissory Notes (1.2%) | |||||||||||
| Goldman Sachs Group, Inc. | |||||||||||
| 2.99%, due 06/27/2005 | $ | 113 | $ | 113 | |||||||
| 3.01%, due 07/27/2005 | 188 | 188 | |||||||||
| Repurchase Agreements (2.1%) (d) | |||||||||||
| Goldman Sachs Group, Inc. 3.04% Repurchase Agreement dated 04/29/2005 to be repurchased at $242 on 05/02/2005 | 241 | 241 | |||||||||
| Merrill Lynch & Co. Inc. 3.04% Repurchase Agreement dated 04/29/2005 to be repurchased at $290 on 05/02/2005 | 290 | 290 | |||||||||
| Shares | Value | ||||||||||
| Investment Companies (1.8%) | |||||||||||
| Money Market Funds (1.8%) | |||||||||||
| American Beacon Funds 1-day yield of 2.84% | 42,623 | $ | 43 | ||||||||
| BGI Institutional Money Market Fund 1-day yield of 2.93% | 252,394 | 252 | |||||||||
| Merrill Lynch Premier Institutional Fund 1-day yield of 2.65% | 56,797 | 57 | |||||||||
| Merrimac Cash Fund, Premium Class 1-day yield of 2.74% (e) | 103,880 | 104 | |||||||||
| Total Security Lending Collateral (cost: $3,408) | 3,408 | ||||||||||
| Total Investment Securities (cost: $22,043) | $ | 28,352 | |||||||||
| SUMMARY: | |||||||||||
| Investments, at value | 113.5 | % | $ | 28,352 | |||||||
| Liabilities in excess of other assets | (13.5 | )% | (3,369 | ) | |||||||
| Net assets | 100.0 | % | $ | 24,983 | |||||||
NOTES TO SCHEDULE OF INVESTMENTS:
(a) At April 30, 2005, all or a portion of this security is on loan (see Note 1). The value at April 30, 2005, of all securities on loan is $3,283.
(b) No dividends were paid during the preceding twelve months.
(c) Floating or variable rate note. Rate is listed as of April 30, 2005.
(d) Cash collateral for the Repurchase Agreements, valued at $541, that serve as collateral for securities lending are invested in corporate bonds with interest rates and maturity dates ranging from 0.00%–8.875% and 06/15/2005–03/15/2035, respectively.
(e) Regulated investment company advised by Investors Bank and Trust Co. ("IBT"). IBT is also the accounting, custody and lending agent for the Fund.
DEFINITIONS:
ADR American Depositary Receipt
The notes to the financial statements are an integral part of this report.
Transamerica IDEX Mutual Funds
Semi-Annual Report 2005
4
TA IDEX T. Rowe Price Tax-Efficient Growth
STATEMENT OF ASSETS AND LIABILITIES
At April 30, 2005
(all amounts except share amounts in thousands)
(unaudited)
| Assets: | |||||||
| Investment securities, at value (cost: $22,043) (including securities loaned of $3,283) | $ | 28,352 | |||||
| Cash | 110 | ||||||
| Receivables: | |||||||
| Shares of beneficial interest sold | 2 | ||||||
| Interest | 1 | ||||||
| Dividends | 21 | ||||||
| Other | 2 | ||||||
| 28,488 | |||||||
| Liabilities: | |||||||
| Accounts payable and accrued liabilities: | |||||||
| Shares of beneficial interest redeemed | 15 | ||||||
| Management and advisory fees | 37 | ||||||
| Distribution and service fees | 15 | ||||||
| Transfer agent fees | 16 | ||||||
| Payable for collateral for securities on loan | 3,408 | ||||||
| Other | 14 | ||||||
| 3,505 | |||||||
| Net Assets | $ | 24,983 | |||||
| Net Assets Consist of: | |||||||
| Shares of beneficial interest, unlimited shares authorized, no par value | $ | 23,399 | |||||
| Accumulated net investment income (loss) | (7 | ) | |||||
| Accumulated net realized gain (loss) from investment securities | (4,718 | ) | |||||
| Net unrealized appreciation (depreciation) on investment securities | 6,309 | ||||||
| Net Assets | $ | 24,983 | |||||
| Net Assets by Class: | |||||||
| Class A | $ | 10,438 | |||||
| Class B | 11,187 | ||||||
| Class C | 3,358 | ||||||
| Shares Outstanding: | |||||||
| Class A | 1,046 | ||||||
| Class B | 1,154 | ||||||
| Class C | 347 | ||||||
| Net Asset Value Per Share: | |||||||
| Class A | $ | 9.98 | |||||
| Class B | 9.69 | ||||||
| Class C | 9.69 | ||||||
| Maximum Offering Price Per Share (a): | |||||||
| Class A | $ | 10.56 | |||||
(a) Includes the maximum selling commission (represented as a percentage of offering price) which is reduced on certain levels of sales as set forth in the Prospectus. Net asset value per share for Classes B and C shares represents offering price. The redemption price for Classes B and C shares equals net asset value less any applicable contingent deferred sales charge.
STATEMENT OF OPERATIONS
For the period ended April 30, 2005
(all amounts in thousands)
(unaudited)
| Investment Income: | |||||||
| Dividends | $ | 280 | |||||
| Income from loaned securities–net | 1 | ||||||
| 281 | |||||||
| Expenses: | |||||||
| Management and advisory fees | 101 | ||||||
| Transfer agent fees: | |||||||
| Class A | 11 | ||||||
| Class B | 15 | ||||||
| Class C | 7 | ||||||
| Printing and shareholder reports | 9 | ||||||
| Custody fees | 6 | ||||||
| Administration fees | 3 | ||||||
| Legal fees | 1 | ||||||
| Audit fees | 13 | ||||||
| Registration fees: | |||||||
| Class A | 14 | ||||||
| Class B | 9 | ||||||
| Class C | 12 | ||||||
| Distribution and service fees: | |||||||
| Class A | 20 | ||||||
| Class B | 62 | ||||||
| Class C | 20 | ||||||
| Total expenses | 303 | ||||||
| Less: | |||||||
| Reimbursement of class expenses: | |||||||
| Class A | (4 | ) | |||||
| Class C | (12 | ) | |||||
| Net expenses | 287 | ||||||
| Net Investment Income (Loss) | (6 | ) | |||||
| Net Realized and Unrealized Gain (Loss) | |||||||
| Realized gain (loss) from investment securities | 1,120 | ||||||
| Increase (decrease) in unrealized appreciation (depreciation) on investment securities | (894 | ) | |||||
| Net Gain (Loss) on Investments | 226 | ||||||
| Net Increase (Decrease) in Net Assets Resulting from Operations | $ | 220 | |||||
The notes to the financial statements are an integral part of this report.
Transamerica IDEX Mutual Funds
Semi-Annual Report 2005
5
TA IDEX T. Rowe Price Tax-Efficient Growth
STATEMENTS OF CHANGES IN NET ASSETS
For the period or year ended
(all amounts in thousands)
| April 30, 2005 (unaudited) | October 31, 2004 | ||||||||||
| Increase (Decrease) In Net Assets From: | |||||||||||
| Operations: | |||||||||||
| Net investment income (loss) | $ | (6 | ) | $ | (300 | ) | |||||
| Net realized gain (loss) from investment securities | 1,120 | 211 | |||||||||
| Net unrealized appreciation (depreciation) on investment securities | (894 | ) | 303 | ||||||||
| 220 | 214 | ||||||||||
| Capital Share Transactions: | |||||||||||
| Proceeds from shares sold: | |||||||||||
| Class A | 425 | 1,616 | |||||||||
| Class B | 278 | 2,611 | |||||||||
| Class C | 137 | 217 | |||||||||
| Class C2 | – | 386 | |||||||||
| Class M | – | 146 | |||||||||
| 840 | 4,976 | ||||||||||
| Cost of shares redeemed: | |||||||||||
| Class A | (1,357 | ) | (3,590 | ) | |||||||
| Class B | (2,214 | ) | (3,729 | ) | |||||||
| Class C | (1,095 | ) | (691 | ) | |||||||
| Class C2 | – | (653 | ) | ||||||||
| Class M | – | (526 | ) | ||||||||
| (4,666 | ) | (9,189 | ) | ||||||||
| Class level exchanges: | |||||||||||
| Class C | – | 4,376 | |||||||||
| Class C2 | – | (3,084 | ) | ||||||||
| Class M | – | (1,292 | ) | ||||||||
| – | – | ||||||||||
| Automatic conversions: | |||||||||||
| Class A | 1 | 49 | |||||||||
| Class B | (1 | ) | (49 | ) | |||||||
| – | – | ||||||||||
| (3,826 | ) | (4,213 | ) | ||||||||
| Net increase (decrease) in net assets | (3,606 | ) | (3,999 | ) | |||||||
| Net Assets: | |||||||||||
| Beginning of period | 28,589 | 32,588 | |||||||||
| End of period | $ | 24,983 | $ | 28,589 | |||||||
| Accumulated Net Investment Income (Loss) | $ | (7 | ) | $ | (1 | ) | |||||
| April 30, 2005 (unaudited) | October 31, 2004 | ||||||||||
| Share Activity: | |||||||||||
| Shares issued: | |||||||||||
| Class A | 41 | 159 | |||||||||
| Class B | 27 | 261 | |||||||||
| Class C | 14 | 22 | |||||||||
| Class C2 | – | 39 | |||||||||
| Class M | – | 14 | |||||||||
| 82 | 495 | ||||||||||
| Shares redeemed: | |||||||||||
| Class A | (131 | ) | (353 | ) | |||||||
| Class B | (220 | ) | (377 | ) | |||||||
| Class C | (108 | ) | (71 | ) | |||||||
| Class C2 | – | (66 | ) | ||||||||
| Class M | – | (52 | ) | ||||||||
| (459 | ) | (919 | ) | ||||||||
| Class level exchanges: | |||||||||||
| Class C | – | 441 | |||||||||
| Class C2 | – | (305 | ) | ||||||||
| Class M | – | (135 | ) | ||||||||
| – | 1 | ||||||||||
| Automatic conversions: | |||||||||||
| Class A | – | 5 | |||||||||
| Class B | – | (5 | ) | ||||||||
| – | – | ||||||||||
| Net increase (decrease) in shares outstanding: | |||||||||||
| Class A | (90 | ) | (189 | ) | |||||||
| Class B | (193 | ) | (121 | ) | |||||||
| Class C | (94 | ) | 392 | ||||||||
| Class C2 | – | (332 | ) | ||||||||
| Class M | – | (173 | ) | ||||||||
| (377 | ) | (423 | ) | ||||||||
The notes to the financial statements are an integral part of this report.
Transamerica IDEX Mutual Funds
Semi-Annual Report 2005
6
TA IDEX T. Rowe Price Tax-Efficient Growth
FINANCIAL HIGHLIGHTS
(unaudited for the period ended April 30, 2005)
| For a share of beneficial interest outstanding throughout each period | |||||||||||||||||||||||||||||||||||||||
| Net Asset | Investment Operations | Distributions | Net Asset | ||||||||||||||||||||||||||||||||||||
| For the Period Ended (d)(g) | Value, Beginning of Period | Net Investment Income (Loss) | Net Realized and Unrealized Gain (Loss) | Total Operations | From Net Investment Income | From Net Realized Gains | Total Distributions | Value, End of Period | |||||||||||||||||||||||||||||||
| Class A | 4/30/2005 | $ | 9.93 | $ | 0.02 | $ | 0.03 | $ | 0.05 | $ | – | $ | – | $ | – | $ | 9.98 | ||||||||||||||||||||||
| 10/31/2004 | 9.85 | (0.06 | ) | 0.14 | 0.08 | – | – | – | 9.93 | ||||||||||||||||||||||||||||||
| 10/31/2003 | 8.09 | (0.05 | ) | 1.81 | 1.76 | – | – | – | 9.85 | ||||||||||||||||||||||||||||||
| 10/31/2002 | 9.54 | (0.02 | ) | (1.43 | ) | (1.45 | ) | – | – | – | 8.09 | ||||||||||||||||||||||||||||
| 10/31/2001 | 10.64 | 0.05 | (1.13 | ) | (1.08 | ) | (0.02 | ) | – | (0.02 | ) | 9.54 | |||||||||||||||||||||||||||
| 10/31/2000 | 10.20 | 0.08 | 0.44 | 0.52 | (0.08 | ) | – | (0.08 | ) | 10.64 | |||||||||||||||||||||||||||||
| Class B | 4/30/2005 | 9.68 | (0.01 | ) | 0.02 | 0.01 | – | – | – | 9.69 | |||||||||||||||||||||||||||||
| 10/31/2004 | 9.66 | (0.12 | ) | 0.14 | 0.02 | – | – | – | 9.68 | ||||||||||||||||||||||||||||||
| 10/31/2003 | 7.99 | (0.10 | ) | 1.77 | 1.67 | – | – | – | 9.66 | ||||||||||||||||||||||||||||||
| 10/31/2002 | 9.49 | (0.09 | ) | (1.41 | ) | (1.50 | ) | – | – | – | 7.99 | ||||||||||||||||||||||||||||
| 10/31/2001 | 10.63 | (0.02 | ) | (1.12 | ) | (1.14 | ) | – | – | – | 9.49 | ||||||||||||||||||||||||||||
| 10/31/2000 | 10.19 | 0.02 | 0.44 | 0.46 | (0.02 | ) | – | (0.02 | ) | 10.63 | |||||||||||||||||||||||||||||
| Class C | 4/30/2005 | 9.68 | (0.01 | ) | 0.02 | 0.01 | – | – | – | 9.69 | |||||||||||||||||||||||||||||
| 10/31/2004 | 9.66 | (0.12 | ) | 0.14 | 0.02 | – | – | – | 9.68 | ||||||||||||||||||||||||||||||
| 10/31/2003 | 7.91 | (0.11 | ) | 1.86 | 1.75 | – | – | – | 9.66 | ||||||||||||||||||||||||||||||
| Ratios/Supplemental Data | |||||||||||||||||||||||||||||||
| For the Period | Total | Net Assets, End of Period | Ratio of Expenses to Average Net Assets (a) | Net Investment Income (Loss) to Average | Portfolio Turnover | ||||||||||||||||||||||||||
| Ended (g) | Return (c) | (000's) | Net (e) | Total (f) | Net Assets (a) | Rate (b) | |||||||||||||||||||||||||
| Class A | 4/30/2005 | 0.49 | % | $ | 10,438 | 1.70 | % | 1.77 | % | 0.32 | % | 4 | % | ||||||||||||||||||
| 10/31/2004 | 0.83 | 11,281 | 1.70 | 1.78 | (0.56 | ) | 5 | ||||||||||||||||||||||||
| 10/31/2003 | 21.76 | 13,057 | 1.70 | 1.85 | (0.56 | ) | 50 | ||||||||||||||||||||||||
| 10/31/2002 | (15.20 | ) | 21,389 | 1.68 | 1.95 | (0.27 | ) | 76 | |||||||||||||||||||||||
| 10/31/2001 | (10.14 | ) | 8,552 | 1.55 | 2.07 | 0.47 | 30 | ||||||||||||||||||||||||
| 10/31/2000 | 5.14 | 5,452 | 1.55 | 2.68 | 0.66 | 58 | |||||||||||||||||||||||||
| Class B | 4/30/2005 | 0.11 | 11,187 | 2.34 | 2.34 | (0.30 | ) | 4 | |||||||||||||||||||||||
| 10/31/2004 | 0.20 | 13,038 | 2.31 | 2.31 | (1.18 | ) | 5 | ||||||||||||||||||||||||
| 10/31/2003 | 21.05 | 14,181 | 2.35 | 2.50 | (1.21 | ) | 50 | ||||||||||||||||||||||||
| 10/31/2002 | (15.84 | ) | 11,897 | 2.33 | 2.60 | (0.92 | ) | 76 | |||||||||||||||||||||||
| 10/31/2001 | (10.75 | ) | 15,500 | 2.20 | 2.72 | (0.18 | ) | 30 | |||||||||||||||||||||||
| 10/31/2000 | 4.49 | 7,597 | 2.20 | 3.33 | 0.01 | 58 | |||||||||||||||||||||||||
| Class C | 4/30/2005 | 0.14 | 3,358 | 2.35 | 2.93 | (0.28 | ) | 4 | |||||||||||||||||||||||
| 10/31/2004 | 0.07 | 4,270 | 2.35 | 3.00 | (1.21 | ) | 5 | ||||||||||||||||||||||||
| 10/31/2003 | 22.12 | 473 | 2.35 | 2.50 | (1.21 | ) | 50 | ||||||||||||||||||||||||
NOTES TO FINANCIAL HIGHLIGHTS
(a) Annualized.
(b) Not annualized for periods of less than one year.
(c) Total Return has been calculated for the applicable period without deduction of a sales load, if any, on an initial purchase. Periods of less that one year are not annualized.
(d) Per share information is calculated based on average number of shares outstanding for the years ended 10/31/2001, 10/31/2002, 10/31/2003, 10/31/2004, and period ended 4/30/2005.
(e) Ratio of Net Expenses to Average Net Assets is net of fee waivers and reimbursements by the investment adviser, if any (see note 2).
(f) Ratio of Total Expenses to Average Net Assets includes all expenses before fee waivers and reimbursements by the investment adviser.
(g) TA IDEX T. Rowe Price Tax-Efficient Growth ("the Fund") commenced operations on March 1, 1999. The inception date for the Fund's offering of share Class C was November 11, 2002.
The notes to the financial statements are an integral part of this report.
Transamerica IDEX Mutual Funds
Semi-Annual Report 2005
7
TA IDEX T. Rowe Price Tax-Efficient Growth
NOTES TO FINANCIAL STATEMENTS
At April 30, 2005
(all amounts in thousands)
(unaudited)
NOTE 1. ORGANIZATION AND SIGNIFICANT ACCOUNTING POLICIES
Transamerica IDEX Mutual Funds is a Delaware statutory trust registered under the Investment Company Act of 1940, as amended (the "1940 Act"), as an open-end management investment company. Prior to March 1, 2005, Transamerica IDEX Mutual Funds was a Massachusetts business trust. TA IDEX T. Rowe Price Tax-Efficient Growth ("the Fund"), part of Transamerica IDEX Mutual Funds, began operations on March 1, 1999.
In the normal course of business, the Fund enters into contracts that contain a variety of representations and warranties, which provide general indemnifications. The Fund's maximum exposure under these arrangements is unknown, as this would involve future claims that maybe made against the Fund and/or its affiliates that have not yet occurred. However, based on experience, the Fund expects the risk of loss to be remote.
See the Prospectus and Statement of Additional Information for a description of the Fund's investment objective.
In preparing the Fund's financial statements in accordance with accounting principles generally accepted in the United States of America ("GAAP"), estimates or assumptions (which could differ from actual results) may be used that affect reported amounts and disclosures. The following policies were consistently followed by the Fund, in accordance with GAAP.
Multiple class operations and expenses: The Fund currently offers three classes of shares, each with a public offering price that reflects different sales charges, if any, and expense levels. On June 15, 2004, Class C2 shares merged into Class C. On September 24, 2004, Class M shares merged into Class C. Class B shares will convert to Class A shares eight years after purchase. Income, non-class specific expenses and realized and unrealized gains and losses, are allocated daily to each class, based upon the value of shares outstanding method as permitted under Rule 18f-3 of the 1940 Act. Each class bears its own specific expenses as well as a portion of general, common expenses.
Pricing of shares: The Fund prices its shares on the basis of the net asset value of each class of shares of the Fund, which is determined as of the close of the New York Stock Exchange ("NYSE") (generally 4:00 p.m. Eastern Time) on each day on which the NYSE is open for trading.
Security valuations: Fund investments traded on an exchange are valued at the closing price on the day of valuation on the exchange where the security is principally traded. With respect to securities traded on NASDAQ NMS, such closing price may be last reported sales price or the NASDAQ Official Closing Price.
Securities traded in the over-the-counter market and listed securities for which no sale was reported on that date are valued at the last quoted bid price.
Debt securities are valued by independent pricing services at the last quoted bid price; however, those that mature in sixty days or less are valued at amortized cost, which approximates market.
Investment company securities are valued at net asset value of the underlying portfolio.
Other securities for which quotations are not readily available are valued at fair market value as determined in good faith using guidelines adopted by the Board of Trustees of the Fund, under the supervision of the Fund's Valuation Committee. These guidelines may include: the type of security; any restrictions on its resale; financial or business news of the issuer; similar or related securities that are actively trading; related corporate actions; and other significant events occurring after the close of trading in the security.
Cash: The Fund may leave cash overnight in its cash account with the custodian, Investors Bank & Trust Company ("IBT"). IBT has been contracted on behalf of the Fund to invest the excess cash into a savings account, which at April 30, 2005, was paying an interest rate of 2.02%.
Throughout the period, the Fund may have a cash overdraft balance. A fee is incurred on this overdraft, calculated by multiplying the overdraft by a rate based on the federal funds rate.
Repurchase agreements: The Fund is authorized to enter into repurchase agreements. The Fund, through IBT, receives delivery of the underlying securities, the value of which at the time of purchase is required to be an amount equal to at least 100% of the resale price. Repurchase agreements involve the risk that the seller will fail to repurchase the security, as agreed. In that case, the Fund will bear the risk of value fluctuations until the security can be sold and may encounter delays and incur costs in liquidating the security. In the event of bankruptcy or insolvency of the seller, delays and costs may be incurred.
Securities lending: The Fund may lend securities to enhance fund earnings from investing cash collateral in making such loans to qualified borrowers (typically broker/dealers). The Fund has engaged its custodian bank, IBT, as a lending agent to administer its securities lending program. IBT earned less than $1 of program income for its services. When the Fund makes a security loan, it receives cash collateral as protection against the risk that the borrower will default on the loan, and records an asset for the cash invested collateral and a liability for the return of the collateral.
Loans of securities are required to be secured by collateral at least equal to 102% of the value of the securities at inception of the loan, and not less then 100% thereafter. The Fund may invest cash collateral in short-term money market instruments including: U.S. Treasury Bills, U.S. agency obligations, commercial paper, money market mutual funds,
Transamerica IDEX Mutual Funds
Semi-Annual Report 2005
8
TA IDEX T. Rowe Price Tax-Efficient Growth
NOTES TO FINANCIAL STATEMENTS (continued)
At April 30, 2005
(all amounts in thousands)
(unaudited)
NOTE 1.–(continued)
repurchase agreements and other highly rated, liquid investments. During the life of securities loans, the collateral and securities loaned remain subject to fluctuation in value. IBT marks to market securities loaned and the collateral each business day. If additional collateral is due (at least $1), IBT collects additional cash collateral from the borrowers. Although securities loaned will be fully collateralized at all times, IBT may experience delays in, or may be prevented from, recovering the collateral on behalf of the Fund. The Fund may recall a loaned security position at any time from the borrower through IBT. In the event the borrower fails to timely return a recalled security, IBT may indemnify the Fund by purchasing replacement securities for the Fund at its own expense and claiming the collateral to fund such a purchase. IBT absorbs the loss if the collateral value is not sufficient to cov er the cost of the replacement securities. If replacement securities are not available, IBT will credit the equivalent cash value to the Fund.
While a security is on loan, the Fund does not have the right to vote that security. However, if time permits, the Fund will attempt to recall a security on loan and vote the proxy.
Income from securities lending is included in the Statement of Operations. The amount of collateral and value of securities on loan are included in the Statement of Assets and Liabilities as well as in the Schedule of Investments.
Security transactions and investment income: Security transactions are recorded on the trade date. Security gains and losses are calculated on the specific identification basis. Dividend income is recorded on the ex-dividend date or, in the case of foreign securities, as soon as the Fund is informed of the ex-dividend date. Interest income, including accretion of discounts and amortization of premiums, is recorded on the accrual basis commencing on the settlement date.
Account maintenance fees: If the shareholder account balance falls below $1 by either shareholder action or as a result of market action, a $25 (not in thousands) fee is assessed every year until the balance reaches $1. The fee is assessed by redeeming shares in the shareholder's account.
No fee will be charged under the following conditions:
• accounts opened within the preceding 24 months
• accounts with an active monthly Automatic Investment Plan ($50 (not in thousands) minimum per fund)
• accounts owned by an individual which, when combined by social security number, have a balance of $5 or more
• accounts owned by individuals in the same household (by address) that have a combined balance of $5 or more
• UTMA/UGMA accounts
• Fiduciary accounts
• B-share accounts whose shares have started to convert to A-shares accounts (as long as combined value of both accounts is at least $1)
For the six months ended April 30, 2005, this fee totaled less than $1. These fees are included in Paid in Capital in the Statement of Assets and Liabilities.
Redemption fees: A short-term trading redemption fee may be assessed on any fund shares in a fund account that are sold during the first five (5) NYSE trading days following their purchase date. This redemption fee will equal 2% of the amount redeemed and shares held the longest will be treated as being redeemed first and shares held the shortest as being redeemed last.
For the six months ended April 30, 2005, the Fund received less than $1 in redemption fees.
Dividend distributions: Distributions to shareholders are recorded on the ex-dividend date and are determined in accordance with Federal income tax regulations which may differ from GAAP.
NOTE 2. RELATED PARTY TRANSACTIONS
Transamerica Fund Advisors, Inc. ("TFAI") is the Fund's investment adviser. Transamerica Fund Services, Inc. ("TFS") is the Fund's administrator and transfer agent. AFSG Securities Corp. ("AFSG") is the Fund's distributor/principal underwriter. AFSG is 100% owned by AUSA Holding Company ("AUSA"). TFAI is a directly owned subsidiary of Western Reserve Life Assurance Co. of Ohio (78%) and AUSA (22%). TFS is a wholly owned subsidiary of WRL (50%) and AUSA (50%). AUSA and WRL are wholly owned indirect subsidiaries of AEGON, NV, a Netherlands corporation.
Effective January 1, 2005 AEGON/Transamerica Fund Advisors, Inc. ("ATFA") was renamed Transamerica Fund Advisors, Inc. ("TFAI"); AEGON/Transamerica Fund Services, Inc. ("ATFS") and AEGON/Transamerica Investor Services, Inc. ("ATIS") merged into one entity and was renamed Transamerica Fund Services, Inc. ("TFS").
The following schedule reflects the percentage of fund assets owned by affiliated mutual funds (i.e., through the asset allocation funds):
| Net Assets | % of Net Assets | ||||||||||
| TA IDEX Asset Allocation– Conservative Portfolio | $ | 3,960 | 15.85 | % | |||||||
| Total | $ | 3,960 | 15.85 | % | |||||||
Transamerica IDEX Mutual Funds
Semi-Annual Report 2005
9
TA IDEX T. Rowe Price Tax-Efficient Growth
NOTES TO FINANCIAL STATEMENTS (continued)
At April 30, 2005
(all amounts in thousands)
(unaudited)
NOTE 2.–(continued)
Investment advisory fees: The Fund pays management fees to TFAI based on average daily net assets ("ANA") at the following breakpoints:
0.75% of the first $500 million of ANA
0.65% of ANA over $500 million
TFAI has contractually agreed to waive its advisory fee and will reimburse the Fund to the extent that operating expenses, excluding 12b-1 fees, exceed the following stated annual limit:
1.35% Expense Limit
The sub-adviser, T. Rowe Price, has agreed to a pricing discount based on the aggregate assets that they manage in the Transamerica IDEX Mutual Funds. The amount of the discount received by the Fund for the six months ended April 30, 2005 was $1.
Distribution and service fees: The Fund has a 12b-1 distribution plan under the 1940 Act pursuant to which an annual fee, based on average daily net assets, is paid to the distributor for various disbursements such as broker-dealer account servicing fees and other promotional expenses of the Fund. The Fund is authorized under the 12b-1 plan to pay fees on each class up to the following limits:
| Class A | 0.35 | % | |||||
| Class B | 1.00 | % | |||||
| Class C | 1.00 | % | |||||
In the case the Fund or a class of shares of the Fund is closed to new investors or investments, the Fund is authorized to pay 12b-1 fees for past sales and distribution efforts and present and past investor services.
Underwriter commissions relate to front-end sales charges imposed for Class A shares and contingent deferred sales charges from Classes B, C, and certain A share redemptions. For the six months ended April 30, 2005, the underwriter commissions were as follows:
| Received by Underwriter | $ | 28 | |||||
| Retained by Underwriter | 2 | ||||||
| Contingent Deferred Sales Charge | 15 | ||||||
Administrative services: The Fund has entered into an agreement with TFS for financial and legal fund administration services, which includes such items as compliance, expenses, financial statements and other reporting, distributions, tax returns, prospectus preparation, board of trustees meeting support and other legal matters. As of January 1, 2005 the Fund pays TFS an annual fee of 0.02% of average net assets. Prior to January 1, 2005 the Fund paid TFS an annual fee of 0.015% of average net assets. The Legal fees on the Statement of Operations are for fees paid to external legal counsel.
Transfer agent fees: The Fund pays TFS an annual per-account charge of $20 (not in thousands) for each open account and $1.63 (not in thousands) for each closed account. There is no new account charge. The Transfer agent fees on the Statement of Operations are made up of fees paid to TFS and costs associated with shareholder statements.
The Fund paid TFS $43 for the six months ended April 30, 2005.
Deferred compensation plan: Each eligible Fund Trustee may elect participation in the Deferred Compensation Plan ("the Plan"). Under the Plan, such Trustees may defer payment of a percentage of their total fees earned as a Fund Trustee. These deferred amounts may be invested in any Transamerica IDEX Mutual Fund. At April 30, 2005, the value of invested plan amount was $2. Invested plan amounts and the total liability for deferred compensation to the Trustees under the Plan at April 30, 2005, are included in the accompanying Statement of Assets and Liabilities.
NOTE 3. INVESTMENT TRANSACTIONS
The cost of securities purchased and proceeds from securities sold (excluding short-term securities) for the six months ended April 30, 2005, were as follows:
| Purchases of securities: | |||||||
| Long-Term excluding U.S. Government | $ | 1,049 | |||||
| U.S. Government | – | ||||||
| Proceeds from maturities and sales of securities: | |||||||
| Long-Term excluding U.S. Government | 5,635 | ||||||
| U.S. Government | – | ||||||
NOTE 4. FEDERAL INCOME TAX MATTERS
The Fund has not made any provision for federal income or excise taxes due to its policy to distribute all of its taxable income and capital gains to its shareholders and otherwise qualify as a regulated investment company under the Internal Revenue Code. Income and capital gain distributions are determined in accordance with income tax regulations, which may differ from GAAP. These differences are primarily due to differing treatment for items including, but not limited to, wash sales, net operating losses and capital loss carryforwards.
The capital loss carryforwards are available to offset future realized capital gains through the periods listed:
| Capital Loss Carryforward | Available through | ||||||
| $ | 251 | October 31, 2008 | |||||
| 219 | October 31, 2009 | ||||||
| 1,972 | October 31, 2010 | ||||||
| 3,180 | October 31, 2011 | ||||||
Transamerica IDEX Mutual Funds
Semi-Annual Report 2005
10
TA IDEX T. Rowe Price Tax-Efficient Growth
NOTES TO FINANCIAL STATEMENTS (continued)
At April 30, 2005
(all amounts in thousands)
(unaudited)
NOTE 4.–(continued)
The aggregate cost of investments and composition of unrealized appreciation (depreciation) for federal income tax purposes as of April 30, 2005, are as follows:
| Federal Tax Cost Basis | $ | 22,218 | |||||
| Unrealized Appreciation | $ | 6,378 | |||||
| Unrealized (Depreciation) | (244 | ) | |||||
| Net Unrealized Appreciation (Depreciation) | $ | 6,134 | |||||
NOTE 5. REGULATORY PROCEEDINGS
There continues to be significant federal and state regulatory activity relating to financial services companies, particularly mutual fund companies and their investment advisers. As part of an ongoing
investigation regarding potential market timing, recordkeeping and trading compliance issues and matters affecting the Fund's investment adviser, TFAI, and certain employees and affiliates of TFAI, the SEC staff has indicated that it is likely to take some action against TFAI and certain of its affiliates at the conclusion of the investigation. The potential timing and the scope of any such action is difficult to predict. Although the impact of any action brought against TFAI and/or its affiliates is difficult to assess at the present time, the Fund currently believes that the likelihood that any such action will have a material adverse impact on it is remote. It is important to note that the Fund is not aware of any allegation of wrongdoing against it and its board at the time this semi-annual report is printed. Although it is not anticipated that these developments will have an adverse impact on the Fund, there can be no assurance at this time. TFAI and its affiliates are actively working with the SEC in regard to this matter; however, the exact resolution cannot be determined at this time. TFAI will take such actions that it deems necessary or appropriate to continue providing management services to the Fund and to bring all matters to an appropriate conclusion.
TFAI and/or its affiliates, and not the Fund, will bear the costs regarding these regulatory matters.
Transamerica IDEX Mutual Funds
Semi-Annual Report 2005
11
TA IDEX T. Rowe Price Tax-Efficient Growth
INVESTMENT ADVISORY AND SUB-ADVISORY AGREEMENTS – REVIEW AND RENEWAL
At a meeting of the Board of Trustees of Transamerica IDEX Mutual Funds ("TA IDEX") held on October 6, 2004, the Board considered and approved the renewal for a one-year period of the Investment Advisory Agreement between TA IDEX T. Rowe Price Tax-Efficient Growth (the "Fund") and Transamerica Fund Advisors, Inc. ("TFAI") as well as the Investment Sub-Advisory Agreement of the Fund between TFAI and T. Rowe Price Associates, Inc. (the "Sub-Adviser"). In approving the renewal of these agreements, the Board concluded that the Investment Advisory and Investment Sub-Advisory Agreements enable shareholders of the Fund to obtain high quality services at a cost that is appropriate, reasonable, and in the best interests of shareholders based upon the following determinations, among others:
The nature, extent and quality of the advisory service to be provided. The Board considered the nature and quality of the services provided by TFAI and the Sub-Adviser to the Fund in the past, as well as the services anticipated to be provided in the future. The Board concluded that TFAI and the Sub-Adviser are capable of providing high quality services to the Fund, as indicated by TFAI's management capabilities demonstrated with respect to the Fund and other funds managed by TFAI, TFAI's management oversight process, and the professional qualifications and experience of the Sub-Adviser's portfolio management team. The Board also concluded that TFAI and the Sub-Adviser would provide the same quality and quantity of investment management and related services as before, that these services are app ropriate in scope and extent in light of the Fund's operations, the competitive landscape of the investment company business and investor needs, and that TFAI's and the Sub-Adviser's obligations will remain the same in all respects.
The investment performance of the Fund. The Board concluded, based in particular on information provided by Lipper Analytics, that the Fund's long-term investment performance was competitive or superior relative to comparable funds over trailing two-, three- and five-year periods and to the Fund's benchmark index over a five-year period, although the Fund's investment performance over the past year had lagged. However, on the basis of the Trustees' assessment of the nature, extent and quality of investment advisory and related services to be provided or procured by TFAI and the Sub-Adviser, including steps to be taken to improve recent performance, the Trustees concluded that TFAI and the Sub-Adviser were capable of generating a level of long-term investment performance that is appropriate in li ght of the Fund's investment objective, policies and strategies and competitive with many other investment companies.
The cost of advisory services provided and the level of profitability. On the basis of the Board's review of the fees to be charged by TFAI and the Sub-Adviser for investment advisory and related services, TFAI's financial statements, the fees paid by TFAI to the Sub-Adviser, TFAI's estimated net management income resulting from its management of the Fund, the estimated profitability of TFAI's relationships with the Fund and TA IDEX, and the estimated profitability of the Sub-Adviser's relationship with the Fund, the Board concluded that the level of investment advisory fees and the profitability is appropriate in light of the services provided, the management fees and overall expense ratios of comparable investment companies, and the anticipated profitability of the relationship between the Fun d, TFAI and the Sub-Adviser. Further, on the basis of comparative information supplied by Lipper Analytics, the Board determined that the advisory fees and estimated overall expense ratio of the Fund were consistent with industry averages.
The extent to which economies of scale would be realized as the Fund grows and whether fee levels reflect these economies of scale for the benefit of Fund investors. The Trustees concluded that inclusion of asset-based breakpoints in the Fund's advisory fee schedule appropriately benefited investors by realizing economies of scale in the form of a lower advisory fee rate as the level of Fund assets increases. The Board also concluded that the advisory fees appropriately reflect the Fund's current size, the current economic environment for TFAI, and the competitive nature of the investment company market. In addition, the Board noted that it will have the opportunity to periodically re-examine whether the Fund has achieved economies of scale, as well as the appropriateness of advisory fees payabl e to TFAI and the Sub-Adviser in the future.
Benefits (such as soft dollars) to TFAI or the Sub-Adviser from its relationship with the Fund. The Board concluded that other benefits derived by TFAI or the Sub-Adviser from its relationship with the Fund are reasonable and fair, and are consistent with industry practice and the best interests of the Fund and its shareholders. In this regard, the Board noted that TFAI does not realize "soft dollar" benefits from its relationship with the Fund, and that the Sub-Adviser engaged in "soft dollar" arrangements consistent with applicable law and "best execution" requirements.
Other considerations. The Board also determined that TFAI had made a substantial commitment to the recruitment and retention of high quality personnel, and maintained the financial, compliance and operational resources reasonably necessary to manage the Fund in a professional manner that is consistent with the best interests of the Fund and its shareholders. The Trustees also concluded that TFAI had made a significant entrepreneurial commitment to the management and success of the Fund, reflected by TFAI's expense limitation and fee waiver arrangement with the Fund which, as demonstrated in the past with the Fund, may result in TFAI waiving a substantial amount of advisory fees for the benefit of shareholders.
Transamerica IDEX Mutual Funds
Semi-Annual Report 2005
12
TA IDEX T. Rowe Price Tax-Efficient Growth
SUPPLEMENTAL INFORMATION (unaudited)
RESULTS OF SHAREHOLDER PROXY
At a special meeting of shareholders held on February 25, 2005, the results of the Proposals were as follows:
Transamerica IDEX Mutual Funds
Proposal 1: Election of Trustees to the Board of Trustees of Transamerica IDEX Mutual Funds.
| For | Withheld | ||||||||||
| Peter R. Brown | 872,017,875.249 | 4,468,498.551 | |||||||||
| Daniel Calabria | 871,917,069.786 | 4,569,304.014 | |||||||||
| Janise B. Case | 872,099,393.125 | 4,386,980.675 | |||||||||
| Charles C. Harris | 872,086,722.025 | 4,399,651.775 | |||||||||
| Leo J. Hill | 872,304,465.640 | 4,181,908.160 | |||||||||
| Russell A. Kimball, Jr. | 872,253,556.471 | 4,232,817.329 | |||||||||
| William W. Short, Jr. | 872,139,920.944 | 4,346,452.856 | |||||||||
| John Waechter | 872,261,152.376 | 4,225,221.424 | |||||||||
| Jack E. Zimmerman | 871,929,967.512 | 4,556,406.288 | |||||||||
| Brian C. Scott | 872,218,970.367 | 4,267,403.433 | |||||||||
| Thomas P. O'Neill | 872,111,944.117 | 4,374,429.683 | |||||||||
TA IDEX T. Rowe Price Tax-Efficient Growth
Proposal 2: Approval of an Agreement and Plan of Reorganization pursuant to which Transamerica IDEX Mutual Funds will organize as a Delaware statutory trust.
| For | Against | Abstentions/Broker Non-Votes | |||||||||
| 1,538,265.987 | 11,574.015 | 852,574.814 | |||||||||
Proposal 3: Approval of changes to the fundamental investment restrictions of TA IDEX T. Rowe Price Tax-Efficient Growth.
| A. Diversification | For | Against | Abstentions/Broker Non-Votes | ||||||||||||
| 1,557,509.519 | 18,724.297 | 826,181.000 | |||||||||||||
| B. Borrowing | For | Against | Abstentions/Broker Non-Votes | ||||||||||||
| 1,556,062.888 | 20,170.928 | 826,181.000 | |||||||||||||
| C. Senior Securities | For | Against | Abstentions/Broker Non-Votes | ||||||||||||
| 1,557,509.519 | 18,724.297 | 826,181.000 | |||||||||||||
| D. Underwriting Securities | For | Against | Abstentions/Broker Non-Votes | ||||||||||||
| 1,557,412.888 | 18,820.928 | 826,181.000 | |||||||||||||
| E. Real Estate | For | Against | Abstentions/Broker Non-Votes | ||||||||||||
| 1,557,509.519 | 18,724.297 | 826,181.000 | |||||||||||||
| F. Making Loans | For | Against | Abstentions/Broker Non-Votes | ||||||||||||
| 1,557,509.519 | 18,724.297 | 826,181.000 | |||||||||||||
| G. Concentration | For | Against | Abstentions/Broker Non-Votes | ||||||||||||
| 1,556,551.888 | 19,681.928 | 826,181.000 | |||||||||||||
| H. Commodities | For | Against | Abstentions/Broker Non-Votes | ||||||||||||
| 1,557,387.867 | 18,845.949 | 826,181.000 | |||||||||||||
Transamerica IDEX Mutual Funds
Semi-Annual Report 2005
13
TA IDEX Templeton Great Companies Global
UNDERSTANDING YOUR FUND'S EXPENSES
(unaudited)
SHAREHOLDER EXPENSES
The following Example is intended to help you understand your ongoing costs (in dollars and cents) of investing in a Fund and to compare these costs with the ongoing costs of investing in other funds.
The Example is based on an investment of $1,000 invested at November 1, 2004 and held for the entire period until April 30, 2005.
ACTUAL EXPENSES
The first line in the table below provides information about actual account values and actual expenses. You may use the information in this line, together with the amount you invested, to estimate the expenses that you paid over the period. Simply divide your account value by $1,000 (for example, an $8,600 account value divided by $1,000 = 8.6), then multiply the result by the number in the first line of your Fund under the heading entitled "Expenses Paid During Period" to estimate the expenses you paid on your account during this period.
HYPOTHETICAL EXAMPLE FOR COMPARISON PURPOSES
The second line in the table below provides information about hypothetical account values and hypothetical expenses based on the Fund's actual expense ratio and an assumed rate of return of 5% per year before expenses, which is not the Fund's actual return. The hypothetical account values and expenses may not be used to estimate the actual ending account balance or expenses you paid for the period. You may use this information to compare the ongoing costs of investing in your Fund and other funds. To do so, compare this 5% hypothetical example with the 5% hypothetical examples that appear in the shareholder reports of the other funds.
Please note that the expenses shown in the table are meant to highlight your ongoing costs only and do not reflect any transactional costs, such as sales charges, redemption fees, brokerage commissions paid on purchases and sales of fund shares. Therefore, the second line under the Fund in the table is useful in comparing ongoing costs only, and will not help you determine the relative total costs of owning different funds. In addition, note that the expenses shown in the table are meant to highlight your ongoing costs and do not reflect any transaction costs.
| Beginning Account Value | Ending Account Value | Annualized Expense Ratio | Expenses Paid During Period (a) | ||||||||||||||||
| Class A | |||||||||||||||||||
| Actual | $ | 1,000.00 | $ | 1,042.60 | 1.38 | % | $ | 6.99 | |||||||||||
| Hypothetical (b) | 1,000.00 | 1,017.95 | 1.38 | 6.90 | |||||||||||||||
| Class B | |||||||||||||||||||
| Actual | 1,000.00 | 1,038.30 | 2.19 | 11.07 | |||||||||||||||
| Hypothetical (b) | 1,000.00 | 1,013.93 | 2.19 | 10.94 | |||||||||||||||
| Class C | |||||||||||||||||||
| Actual | 1,000.00 | 1,037.90 | 2.20 | 11.12 | |||||||||||||||
| Hypothetical (b) | 1,000.00 | 1,013.88 | 2.20 | 10.99 | |||||||||||||||
(a) Expenses are calculated using each Fund's annualized expense ratio (as disclosed in the table), multiplied by the average account value for the period, multiplied by number of days in the period (181 days), and divided by the number of days in the year (365 days).
(b) 5% return per year before expenses.
GRAPHICAL PRESENTATION OF SCHEDULE OF INVESTMENTS
By Region
At April 30, 2005
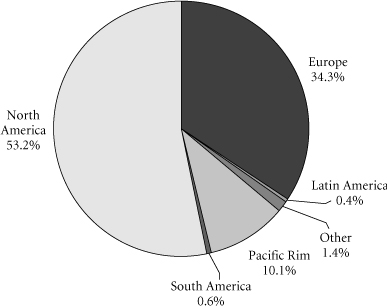
This chart shows the percentage breakdown by region of the Fund's total investment securities.
Transamerica IDEX Mutual Funds
Semi-Annual Report 2005
1
TA IDEX Templeton Great Companies Global
SCHEDULE OF INVESTMENTS
At April 30, 2005
(all amounts except share amounts in thousands)
(unaudited)
| Shares | Value | ||||||||||
| COMMON STOCKS (96.8%) | |||||||||||
| Australia (1.6%) | |||||||||||
| Alumina, Ltd. | 418,920 | $ | 1,897 | ||||||||
| AMP, Ltd. | 504,431 | 2,665 | |||||||||
| BHP Billiton, Ltd. | 80,350 | 1,018 | |||||||||
| National Australia Bank, Ltd. | 135,570 | 3,105 | |||||||||
| Brazil (0.6%) | |||||||||||
| Cia Vale do Rio Doce, ADR | 12,500 | 290 | |||||||||
| Cia Vale do Rio Doce, ADR (a) | 60,840 | 1,640 | |||||||||
| Empresa Brasileira de Aeronautica SA, ADR | 40,910 | 1,180 | |||||||||
| Canada (0.9%) | |||||||||||
| Alcan, Inc. | 60,070 | 1,954 | |||||||||
| BCE, Inc. (a) | 121,510 | 2,923 | |||||||||
| Cayman Islands (0.9%) | |||||||||||
| ACE, Ltd. | 58,730 | 2,523 | |||||||||
| XL Capital, Ltd.–Class A (a) | 34,340 | 2,414 | |||||||||
| Denmark (1.3%) | |||||||||||
| ISS A/S | 50,700 | 4,067 | |||||||||
| Vestas Wind Systems A/S (a)(b) | 208,816 | 2,650 | |||||||||
| Finland (1.0%) | |||||||||||
| Stora Enso OYJ–Class R | 149,230 | 1,985 | |||||||||
| UPM-Kymmene OYJ | 169,220 | 3,381 | |||||||||
| France (3.4%) | |||||||||||
| Accor SA | 52,500 | 2,411 | |||||||||
| AXA | 116,200 | 2,913 | |||||||||
| Michelin (C.G.D.E.)–Class B | 40,857 | 2,487 | |||||||||
| Sanofi-Aventis | 41,719 | 3,707 | |||||||||
| Suez SA, ADR (a)(b) | 95,150 | 2,610 | |||||||||
| Total SA | 11,223 | 2,505 | |||||||||
| Valeo SA | 31,470 | 1,382 | |||||||||
| Germany (2.6%) | |||||||||||
| BASF AG, ADR | 40,250 | 2,612 | |||||||||
| Bayer AG, ADR | 40,090 | 1,293 | |||||||||
| Deutsche Post AG | 189,960 | 4,472 | |||||||||
| E.ON AG, ADR | 131,310 | 3,716 | |||||||||
| Volkswagen AG, ADR | 196,630 | 1,637 | |||||||||
| Hong Kong (0.9%) | |||||||||||
| Cheung Kong Holdings, Ltd. | 280,000 | 2,647 | |||||||||
| Hutchison Whampoa, Ltd. | 206,000 | 1,840 | |||||||||
| Israel (0.5%) | |||||||||||
| Check Point Software Technologies, Ltd. (b) | 122,020 | 2,556 | |||||||||
| Italy (1.1%) | |||||||||||
| ENI SpA, ADR (a) | 30,390 | 3,813 | |||||||||
| Riunione Adriatica di Sicurta SpA | 100,190 | 2,188 | |||||||||
| Shares | Value | ||||||||||
| Japan (4.2%) | |||||||||||
| East Japan Railway Co. | 432 | $ | 2,247 | ||||||||
| Hitachi, Ltd. | 504,000 | 2,956 | |||||||||
| KDDI Corp. | 396 | 1,824 | |||||||||
| Nintendo Co., Ltd. | 31,200 | 3,538 | |||||||||
| Nippon Telegraph & Telephone Corp. | 533 | 2,232 | |||||||||
| Nomura Holdings, Inc. | 117,000 | 1,488 | |||||||||
| Sompo Japan Insurance, Inc. | 259,000 | 2,509 | |||||||||
| Sony Corp., ADR | 72,000 | 2,643 | |||||||||
| Takeda Pharmaceutical Co., Ltd. | 57,000 | 2,773 | |||||||||
| Mexico (0.5%) | |||||||||||
| Telefonos de Mexico SA de CV–Class L, ADR | 71,890 | 2,437 | |||||||||
| Netherlands (2.5%) | |||||||||||
| Akzo Nobel NV, ADR | 73,910 | 3,033 | |||||||||
| IHC Caland NV | 3,690 | 241 | |||||||||
| ING Groep NV | 91,490 | 2,530 | |||||||||
| ING Groep NV, ADR | 26,300 | 721 | |||||||||
| Koninklijke Philips Electronics NV | 110,830 | 2,759 | |||||||||
| Reed Elsevier NV | 258,320 | 3,732 | |||||||||
| Norway (0.6%) | |||||||||||
| Telenor ASA | 397,510 | 3,331 | |||||||||
| Portugal (0.6%) | |||||||||||
| Portugal Telecom SGPS SA (b) | 281,960 | 3,115 | |||||||||
| Singapore (0.6%) | |||||||||||
| DBS Group Holdings, Ltd. | 295,600 | 2,588 | |||||||||
| DBS Group Holdings, Ltd., ADR | 13,610 | 476 | |||||||||
| South Korea (2.7%) | |||||||||||
| Kookmin Bank, ADR (a) | 51,850 | 2,217 | |||||||||
| Korea Electric Power Corp., ADR (a) | 148,580 | 2,199 | |||||||||
| KT Corp., ADR | 107,955 | 2,180 | |||||||||
| Samsung Electronics Co., Ltd., GDR–144A | 23,130 | 5,216 | |||||||||
| SK Telecom Co., Ltd., ADR (a) | 121,900 | 2,372 | |||||||||
| Spain (2.2%) | |||||||||||
| Banco Santander Central Hispano SA | 283,790 | 3,317 | |||||||||
| Iberdrola SA | 53,440 | 1,397 | |||||||||
| Repsol YPF SA | 152,030 | 3,869 | |||||||||
| Telefonica SA | 161,540 | 2,756 | |||||||||
| Sweden (3.3%) | |||||||||||
| Atlas Copco AB–Class A | 78,770 | 3,592 | |||||||||
| Electrolux AB–Class B | 89,570 | 1,820 | |||||||||
| Nordic Baltic Holding, FDR | 334,230 | 3,180 | |||||||||
| Securitas AB–Class B | 246,260 | 3,967 | |||||||||
| Svenska Cellulosa AB–Class B | 62,590 | 2,189 | |||||||||
| Volvo AB–Class B (a) | 59,810 | 2,429 | |||||||||
The notes to the financial statements are an integral part of this report.
Transamerica IDEX Mutual Funds
Semi-Annual Report 2005
2
TA IDEX Templeton Great Companies Global
SCHEDULE OF INVESTMENTS (continued)
At April 30, 2005
(all amounts except share amounts in thousands)
(unaudited)
| Shares | Value | ||||||||||
| Switzerland (2.9%) | |||||||||||
| Lonza Group AG | 52,120 | $ | 3,150 | ||||||||
| Nestle SA, ADR | 46,510 | 3,057 | |||||||||
| Novartis AG, ADR | 64,230 | 3,130 | |||||||||
| Swiss Reinsurance | 46,000 | 3,068 | |||||||||
| UBS AG (a) | 26,130 | 2,098 | |||||||||
| UBS AG (Foreign Registered) | 7,560 | 607 | |||||||||
| Taiwan (0.5%) | |||||||||||
| Chunghwa Telecom Co., Ltd., ADR | 120,570 | 2,444 | |||||||||
| United Kingdom (11.2%) | |||||||||||
| Alliance Unichem PLC | 256,600 | 3,924 | |||||||||
| BAE Systems PLC | 675,000 | 3,312 | |||||||||
| Boots Group PLC | 207,950 | 2,394 | |||||||||
| BP PLC, ADR | 58,450 | 3,560 | |||||||||
| British Airways PLC (b) | 273,070 | 1,251 | |||||||||
| British Sky Broadcasting PLC | 299,630 | 3,114 | |||||||||
| Cadbury Schweppes PLC | 328,480 | 3,308 | |||||||||
| Compass Group PLC | 813,970 | 3,651 | |||||||||
| GlaxoSmithKline PLC | 156,359 | 3,956 | |||||||||
| HSBC Holdings PLC | 108,699 | 1,741 | |||||||||
| HSBC Holdings PLC, ADR (a) | 10,800 | 864 | |||||||||
| National Grid Transco PLC | 268,733 | 2,647 | |||||||||
| Pearson PLC | 196,520 | 2,394 | |||||||||
| Rentokil Initial PLC | 836,620 | 2,511 | |||||||||
| Rolls-Royce Group PLC (b) | 503,400 | 2,292 | |||||||||
| Royal Bank of Scotland Group PLC | 82,880 | 2,506 | |||||||||
| Shell Transport & Trading Co. PLC | 397,520 | 3,576 | |||||||||
| Smiths Group PLC | 227,110 | 3,735 | |||||||||
| Standard Chartered PLC | 137,890 | 2,491 | |||||||||
| Unilever PLC | 254,540 | 2,425 | |||||||||
| Vodafone Group PLC | 1,234,981 | 3,233 | |||||||||
| United States (50.2%) | |||||||||||
| 3M Co. | 137,200 | 10,492 | |||||||||
| Abbott Laboratories | 96,500 | 4,744 | |||||||||
| Advanced Neuromodulation Systems, Inc. (a)(b) | 89,600 | 2,698 | |||||||||
| AFLAC, Inc. | 211,400 | 8,593 | |||||||||
| American Express Co. | 173,100 | 9,122 | |||||||||
| American International Group, Inc. | 105,910 | 5,385 | |||||||||
| Amgen, Inc. (b) | 131,080 | 7,630 | |||||||||
| Apache Corp. | 35,000 | 1,970 | |||||||||
| Citigroup, Inc. | 230,000 | 10,801 | |||||||||
| Colgate-Palmolive Co. | 78,400 | 3,903 | |||||||||
| ConocoPhillips | 20,000 | 2,097 | |||||||||
| Danaher Corp. | 89,810 | 4,547 | |||||||||
| Dell, Inc. (b) | 146,100 | 5,089 | |||||||||
| Donaldson Co., Inc. | 176,100 | 5,239 | |||||||||
| Shares | Value | ||||||||||
| United States (continued) | |||||||||||
| eBay, Inc. (b) | 209,800 | $ | 6,657 | ||||||||
| Ecolab, Inc. | 96,200 | 3,147 | |||||||||
| EMC Corp. (b) | 326,000 | 4,277 | |||||||||
| Emerson Electric Co. | 149,400 | 9,363 | |||||||||
| Exxon Mobil Corp. | 35,000 | 1,996 | |||||||||
| First Data Corp. | 151,700 | 5,769 | |||||||||
| Fortune Brands, Inc. | 60,000 | 5,075 | |||||||||
| Genentech, Inc. (b) | 63,600 | 4,512 | |||||||||
| General Electric Co. | 396,900 | 14,368 | |||||||||
| Genzyme Corp. (a)(b) | 141,900 | 8,317 | |||||||||
| Goldman Sachs Group, Inc. (The) | 98,500 | 10,519 | |||||||||
| IMS Health, Inc. | 338,900 | 8,127 | |||||||||
| International Game Technology | 284,500 | 7,650 | |||||||||
| Johnson & Johnson | 88,000 | 6,039 | |||||||||
| Linear Technology Corp. | 175,900 | 6,287 | |||||||||
| Medtronic, Inc. | 219,300 | 11,557 | |||||||||
| Microsoft Corp. | 367,975 | 9,310 | |||||||||
| Moody's Corp. (a) | 27,300 | 2,242 | |||||||||
| Omnicom Group, Inc. (a) | 99,100 | 8,215 | |||||||||
| PepsiCo, Inc. | 219,700 | 12,224 | |||||||||
| Procter & Gamble Co. | 123,700 | 6,698 | |||||||||
| QUALCOMM, Inc. | 166,400 | 5,806 | |||||||||
| United Technologies Corp. | 73,100 | 7,436 | |||||||||
| Xilinx, Inc. | 206,900 | 5,574 | |||||||||
| Yahoo!, Inc. (b) | 113,820 | 3,928 | |||||||||
| Zimmer Holdings, Inc. (b) | 75,190 | 6,122 | |||||||||
| Total Common Stocks (cost: $492,111) | 508,318 | ||||||||||
| Principal | Value | ||||||||||
| SECURITY LENDING COLLATERAL (6.9%) | |||||||||||
| Debt (6.0%) | |||||||||||
| Bank Notes (0.8%) | |||||||||||
| Bank of America | |||||||||||
| 2.82%, due 05/16/2005 | $ | 1,145 | $ | 1,145 | |||||||
| 2.80%, due 06/09/2005 (c) | 286 | 286 | |||||||||
| 2.77%, due 07/18/2005 (c) | 1,145 | 1,145 | |||||||||
| Canadian Imperial Bank of Commerce 3.02%, due 11/04/2005 (c) | 1,145 | 1,145 | |||||||||
| Credit Suisse First Boston Corp. 2.88%, due 09/09/2005 (c) 3.06%, due 03/10/2006 (c) | 286 286 | 286 286 | |||||||||
| Euro Dollar Overnight (1.1%) | |||||||||||
| Bank of Montreal 2.94%, due 05/04/2005 | 859 | 859 | |||||||||
| BNP Paribas 2.80%, due 05/05/2005 | 1,185 | 1,185 | |||||||||
The notes to the financial statements are an integral part of this report.
Transamerica IDEX Mutual Funds
Semi-Annual Report 2005
3
TA IDEX Templeton Great Companies Global
SCHEDULE OF INVESTMENTS (continued)
At April 30, 2005
(all amounts except share amounts in thousands)
(unaudited)
| Principal | Value | ||||||||||
| Euro Dollar Overnight (continued) | |||||||||||
| Den Danske Bank 2.93%, due 05/02/2005 | $ | 1,031 | $ | 1,031 | |||||||
| 2.80%, due 05/06/2005 | 573 | 573 | |||||||||
| Dexia Group 2.80%, due 05/05/2005 | 506 | 506 | |||||||||
| Royal Bank of Canada 2.80%, due 05/04/2005 | 1,175 | 1,175 | |||||||||
| Svenska Handlesbanken 2.80%, due 05/06/2005 | 189 | 189 | |||||||||
| Euro Dollar Terms (2.4%) | |||||||||||
| Bank of Nova Scotia 2.88%, due 05/11/2005 3.01%, due 05/31/2005 | 573 1,602 | 573 1,602 | |||||||||
| Barclays 3.02%, due 06/27/2005 | 1,021 | 1,021 | |||||||||
| BNP Paribas 2.93%, due 06/07/2005 | 917 | 917 | |||||||||
| Branch Banker & Trust 2.94%, due 06/06/2005 | 245 | 245 | |||||||||
| Calyon 2.93%, due 06/03/2005 | 946 | 946 | |||||||||
| Citigroup 2.87%, due 06/06/2005 | 1,189 | 1,189 | |||||||||
| Credit Suisse First Boston Corp. 2.91%, due 05/16/2005 | 1,173 | 1,173 | |||||||||
| HSBC Banking/Holdings PLC 3.01%, due 06/23/2005 | 573 | 573 | |||||||||
| Royal Bank of Scotland 2.94%, due 06/07/2005 2.95%, due 06/10/2005 | 1,113 618 | 1,113 618 | |||||||||
| Societe Generale 2.80%, due 05/03/2005 | 1,095 | 1,095 | |||||||||
| Toronto Dominion Bank 2.75%, due 05/09/2005 3.01%, due 06/24/2005 | 859 318 | 859 318 | |||||||||
| Principal | Value | ||||||||||
| Euro Dollar Terms (continued) | |||||||||||
| UBS AG 2.81%, due 05/03/2005 | $ | 573 | $ | 573 | |||||||
| Promissory Notes (0.6%) | |||||||||||
| Goldman Sachs Group, Inc. 2.99%, due 06/27/2005 3.01%, due 07/27/2005 | 1,203 2,004 | 1,203 2,004 | |||||||||
| Repurchase Agreements (1.1%) (d) | |||||||||||
| Goldman Sachs Group, Inc. (The) 3.04% Repurchase Agreement dated 04/29/2005 to be repurchased at $2,578 on 05/02/2005 | 2,577 | 2,577 | |||||||||
| Merrill Lynch & Co., Inc. 3.04% Repurchase Agreement dated 04/29/2005 to be repurchased at $3,093 on 05/02/2005 | 3,093 | 3,093 | |||||||||
| Shares | Value | ||||||||||
| Investment Companies (0.9%) | |||||||||||
| Money Market Funds (0.9%) | |||||||||||
| American Beacon Funds 1-day yield of 2.84% | 454,842 | $ | 455 | ||||||||
| BGI Institutional Money Market Fund 1-day yield of 2.93% | 2,693,375 | 2,693 | |||||||||
| Merrill Lynch Premier Institutional Fund 1-day yield of 2.65% | 606,095 | 606 | |||||||||
| Merrimac Cash Fund, Premium Class 1-day yield of 2.74% (e) | 1,108,538 | 1,109 | |||||||||
| Total Security Lending Collateral (cost: $36,366) | 36,366 | ||||||||||
| Total Investment Securities (cost: $528,477) | $ | 544,684 | |||||||||
| SUMMARY: | |||||||||||
| Investments, at value | 103.7 | % | $ | 544,684 | |||||||
| Liabilities in excess of other assets | (3.7 | )% | (19,303 | ) | |||||||
| Net assets | 100.0 | % | $ | 525,381 | |||||||
The notes to the financial statements are an integral part of this report.
NOTES TO SCHEDULE OF INVESTMENTS:
(a) At April 30, 2005, all or a portion of this security is on loan (see Note 1). The value at April 30, 2005, of all securities on loan is $34,980.
(b) No dividends were paid during the preceding twelve months.
(c) Floating or variable rate note. Rate is listed as of April 30, 2005.
(d) Cash collateral for the Repurchase Agreements, valued at $5,768, that serve as collateral for securities lending are invested in corporate bonds with interest rates and maturity dates ranging from 0.00%–8.875% and 06/15/2005–03/15/2035, respectively.
(e) Regulated investment company advised by Investors Bank and Trust Co. ("IBT"). IBT is also the accounting, custody and lending agent for the Fund.
DEFINITIONS:
144A 144A Securities are registered pursuant to Rule 144A of the Securities Act of 1933. These securities are deemed to be liquid for purposes of compliance limitations on holdings of illiquid securities and may be resold as transactions exempt from registration, normally to qualified institutional buyers. At April 30, 2005, these securities aggregated $5,216 or 1.0% of the net assets of the Fund.
ADR American Depositary Receipt
FDR Finnish Depositary Receipt
GDR Global Depositary Receipt
Transamerica IDEX Mutual Funds
Semi-Annual Report 2005
4
TA IDEX Templeton Great Companies Global
SCHEDULE OF INVESTMENTS (continued)
At April 30, 2005
(all amounts except share amounts in thousands)
(unaudited)
| Percentage of Net Assets | Value | ||||||||||
| INVESTMENTS BY INDUSTRY: | |||||||||||
| Pharmaceuticals | 9.3 | % | $ | 48,732 | |||||||
| Business Services | 7.1 | % | 37,163 | ||||||||
| Commercial Banks | 6.9 | % | 35,991 | ||||||||
| Electronic & Other Electric Equipment | 6.3 | % | 33,417 | ||||||||
| Insurance | 5.0 | % | 26,680 | ||||||||
| Telecommunications | 4.9 | % | 25,732 | ||||||||
| Computer & Data Processing Services | 4.5 | % | 23,921 | ||||||||
| Chemicals & Allied Products | 4.5 | % | 23,836 | ||||||||
| Security & Commodity Brokers | 4.0 | % | 21,129 | ||||||||
| Medical Instruments & Supplies | 3.9 | % | 20,377 | ||||||||
| Electronic Components & Accessories | 2.8 | % | 14,620 | ||||||||
| Aerospace | 2.7 | % | 14,220 | ||||||||
| Paper & Allied Products | 2.6 | % | 13,873 | ||||||||
| Oil & Gas Extraction | 2.5 | % | 13,228 | ||||||||
| Computer & Office Equipment | 2.3 | % | 12,322 | ||||||||
| Beverages | 2.3 | % | 12,224 | ||||||||
| Communications Equipment | 2.2 | % | 11,564 | ||||||||
| Petroleum Refining | 1.9 | % | 10,158 | ||||||||
| Electric Services | 1.9 | % | 9,959 | ||||||||
| Industrial Machinery & Equipment | 1.7 | % | 8,831 | ||||||||
| Life Insurance | 1.7 | % | 8,829 | ||||||||
| Entertainment | 1.5 | % | 7,650 | ||||||||
| Food & Kindred Products | 1.2 | % | 6,365 | ||||||||
| Fabricated Metal Products | 1.0 | % | 5,075 | ||||||||
| Metal Mining | 0.9 | % | 4,845 | ||||||||
| Instruments & Related Products | 0.9 | % | 4,547 | ||||||||
| Transportation & Public Utilities | 0.9 | % | 4,472 | ||||||||
| Paper & Paper Products | 0.8 | % | 4,174 | ||||||||
| Automotive | 0.8 | % | 4,066 | ||||||||
| Printing & Publishing | 0.7 | % | 3,732 | ||||||||
| Restaurants | 0.7 | % | 3,651 | ||||||||
| Manufacturing Industries | 0.6 | % | 3,538 | ||||||||
| Communication | 0.6 | % | 3,114 | ||||||||
| Specialty–Real Estate | 0.5 | % | 2,647 | ||||||||
| Electric, Gas & Sanitary Services | 0.5 | % | 2,610 | ||||||||
| Rubber & Misc. Plastic Products | 0.5 | % | 2,487 | ||||||||
| Wholesale Trade Nondurable Goods | 0.5 | % | 2,425 | ||||||||
| Hotels & Other Lodging Places | 0.5 | % | 2,411 | ||||||||
| Radio & Television Broadcasting | 0.5 | % | 2,394 | ||||||||
| Drug Stores & Proprietary Stores | 0.5 | % | 2,394 | ||||||||
| Railroads | 0.4 | % | 2,247 | ||||||||
| Primary Metal Industries | 0.4 | % | 1,954 | ||||||||
| Holding & Other Investment Offices | 0.4 | % | 1,840 | ||||||||
| Motor Vehicles, Parts & Supplies | 0.3 | % | 1,382 | ||||||||
| Air Transportation | 0.2 | % | 1,251 | ||||||||
| Water Transportation | 0.0 | % | 241 | ||||||||
| Investments, at value | 96.8 | % | 508,318 | ||||||||
| Short-Term investments | 6.9 | % | 36,366 | ||||||||
| Liabilities in excess of other assets | (3.7 | )% | (19,303 | ) | |||||||
| Net assets | 100.0 | % | $ | 525,381 | |||||||
The notes to the financial statements are an integral part of this report.
Transamerica IDEX Mutual Funds
Semi-Annual Report 2005
5
TA IDEX Templeton Great Companies Global
STATEMENT OF ASSETS AND LIABILITIES
At April 30, 2005
(all amounts except per share amounts in thousands)
(unaudited)
| Assets: | |||||||
| Investment securities, at value (cost: $528,477) (including securities loaned of $34,980) | $ | 544,684 | |||||
| Cash | 16,068 | ||||||
| Receivables: | |||||||
| Investment securities sold | 182 | ||||||
| Shares of beneficial interest sold | 20 | ||||||
| Interest | 37 | ||||||
| Dividends | 1,400 | ||||||
| Dividend reclaims receivable | 615 | ||||||
| Other | 612 | ||||||
| 563,618 | |||||||
| Liabilities: | |||||||
| Accounts payable and accrued liabilities: | |||||||
| Shares of beneficial interest redeemed | 633 | ||||||
| Management and advisory fees | 533 | ||||||
| Distribution and service fees | 233 | ||||||
| Transfer agent fees | 267 | ||||||
| Payable for collateral for securities on loan | 36,366 | ||||||
| Other | 205 | ||||||
| 38,237 | |||||||
| Net Assets | $ | 525,381 | |||||
| Net Assets Consist of: | |||||||
| Shares of beneficial interest, unlimited shares authorized, no par value | $ | 897,482 | |||||
| Undistributed net investment income (loss) | 1,769 | ||||||
| Accumulated net realized gain (loss) from investment securities and foreign currency transactions | (390,167 | ) | |||||
| Net unrealized appreciation (depreciation) on: | |||||||
| Investment securities | 16,181 | ||||||
| Translation of assets and liabilites denominated in foreign currencies | 116 | ||||||
| Net Assets | $ | 525,381 | |||||
| Net Assets by Class: | |||||||
| Class A | $ | 380,958 | |||||
| Class B | 102,938 | ||||||
| Class C | 41,485 | ||||||
| Shares Outstanding: | |||||||
| Class A | 16,190 | ||||||
| Class B | 4,672 | ||||||
| Class C | 1,885 | ||||||
| Net Asset Value Per Share: | |||||||
| Class A | $ | 23.53 | |||||
| Class B | 22.04 | ||||||
| Class C | 22.01 | ||||||
| Maximum Offering Price Per Share (a): | |||||||
| Class A | $ | 24.90 | |||||
(a) Includes the maximum selling commission (represented as a percentage of offering price) which is reduced on certain levels of sales as set forth in the Prospectus. Net asset value per share for Classes B and C shares represents offering price. The redemption price for Classes B and C shares equals net asset value less any applicable contingent deferred sales charge.
STATEMENT OF OPERATIONS
For the period ended April 30, 2005
(all amounts in thousands)
(unaudited)
| Investment Income: | |||||||
| Interest | $ | 136 | |||||
| Dividends | 6,165 | ||||||
| Income from loaned securities–net | 34 | ||||||
| Less withholding taxes on foreign dividends | (390 | ) | |||||
| 5,945 | |||||||
| Expenses: | |||||||
| Management and advisory fees | 1,880 | ||||||
| Transfer agent fees: | |||||||
| Class A | 179 | ||||||
| Class B | 172 | ||||||
| Class C | 98 | ||||||
| Printing and shareholder reports | 167 | ||||||
| Custody fees | 38 | ||||||
| Administration fees | 44 | ||||||
| Legal fees | 8 | ||||||
| Audit fees | 3 | ||||||
| Trustees fees | 7 | ||||||
| Registration fees: | |||||||
| Class A | 1 | ||||||
| Class C | 10 | ||||||
| Distribution and service fees: | |||||||
| Class A | 549 | ||||||
| Class B | 573 | ||||||
| Class C | 232 | ||||||
| Total expenses | 3,962 | ||||||
| Less: | |||||||
| Reimbursement of class expenses: | |||||||
| Class C | (40 | ) | |||||
| Net expenses | 3,922 | ||||||
| Net Investment Income (Loss) | 2,023 | ||||||
| Net Realized Gain (Loss) from: | |||||||
| Investment securities | 3,946 | ||||||
| Foreign currency transactions | (246 | ) | |||||
| 3,700 | |||||||
| Net Increase (Decrease) in Unrealized Appreciation (Depreciation) on: | |||||||
| Investment securities | 7,851 | ||||||
| Translation of assets and liabilities denominated in foreign currencies | (100 | ) | |||||
| 7,751 | |||||||
| Net Gain (Loss) on Investments and Foreign Currency Transactions | 11,451 | ||||||
| Net Increase (Decrease) in Net Assets Resulting from Operations | $ | 13,474 | |||||
The notes to the financial statements are an integral part of this report.
Transamerica IDEX Mutual Funds
Semi-Annual Report 2005
6
TA IDEX Templeton Great Companies Global
STATEMENTS OF CHANGES IN NET ASSETS
For the period or year ended
(all amounts in thousands)
| April 30, 2005 (unaudited) | October 31, 2004 | ||||||||||
| Increase (Decrease) In Net Assets From: | |||||||||||
| Operations: | |||||||||||
| Net investment income (loss) | $ | 2,023 | $ | (2,434 | ) | ||||||
| Net realized gain (loss) from investment securities and foreign currency transactions | 3,700 | 54,690 | |||||||||
| Net unrealized appreciation (depreciation) on investment securities and foreign currency translation | 7,751 | (30,035 | ) | ||||||||
| 13,474 | 22,221 | ||||||||||
| Capital Share Transactions: | |||||||||||
| Proceeds from shares sold: | |||||||||||
| Class A | 173,032 | 9,922 | |||||||||
| Class B | 1,704 | 3,635 | |||||||||
| Class C | 640 | 505 | |||||||||
| Class C2 | – | 833 | |||||||||
| Class M | – | 771 | |||||||||
| 175,376 | 15,666 | ||||||||||
| Proceeds from fund acquisition: | |||||||||||
| Class A | – | 85,329 | |||||||||
| Class B | – | 4,841 | |||||||||
| Class C | – | 436 | |||||||||
| Class C2 | – | 1,244 | |||||||||
| Class M | – | 838 | |||||||||
| – | 92,688 | ||||||||||
| Cost of shares redeemed: | |||||||||||
| Class A | (26,288 | ) | (70,094 | ) | |||||||
| Class B | (19,919 | ) | (50,478 | ) | |||||||
| Class C | (9,566 | ) | (2,995 | ) | |||||||
| Class C2 | – | (6,874 | ) | ||||||||
| Class M | – | (20,371 | ) | ||||||||
| (55,773 | ) | (150,812 | ) | ||||||||
| Class level exchanges: | |||||||||||
| Class C | – | 49,193 | |||||||||
| Class C2 | – | (14,403 | ) | ||||||||
| Class M | – | (34,790 | ) | ||||||||
| – | – | ||||||||||
| Automatic conversions: | |||||||||||
| Class A | 1,146 | 1,159 | |||||||||
| Class B | (1,146 | ) | (1,159 | ) | |||||||
| – | – | ||||||||||
| 119,603 | (42,458 | ) | |||||||||
| Net increase (decrease) in net assets | 133,077 | (20,237 | ) | ||||||||
| Net Assets: | |||||||||||
| Beginning of period | 392,304 | 412,541 | |||||||||
| End of period | $ | 525,381 | $ | 392,304 | |||||||
| Undistributed Net Investment Income (Loss) | $ | 1,769 | $ | (254 | ) | ||||||
| April 30, 2005 (unaudited) | October 31, 2004 | ||||||||||
| Share Activity: | |||||||||||
| Shares issued: | |||||||||||
| Class A | 7,201 | 438 | |||||||||
| Class B | 75 | 169 | |||||||||
| Class C | 29 | 24 | |||||||||
| Class C2 | – | 38 | |||||||||
| Class M | – | 36 | |||||||||
| 7,305 | 705 | ||||||||||
| Shares issued on fund acquisition: | |||||||||||
| Class A | – | 3,817 | |||||||||
| Class B | – | 230 | |||||||||
| Class C | – | 21 | |||||||||
| Class C2 | – | 59 | |||||||||
| Class M | – | 39 | |||||||||
| – | 4,166 | ||||||||||
| Shares redeemed: | |||||||||||
| Class A | (1,095 | ) | (3,098 | ) | |||||||
| Class B | (884 | ) | (2,370 | ) | |||||||
| Class C | (425 | ) | (144 | ) | |||||||
| Class C2 | – | (321 | ) | ||||||||
| Class M | – | (950 | ) | ||||||||
| (2,404 | ) | (6,883 | ) | ||||||||
| Class level exchanges: | |||||||||||
| Class C | – | 2,372 | |||||||||
| Class C2 | – | (689 | ) | ||||||||
| Class M | – | (1,675 | ) | ||||||||
| – | 8 | ||||||||||
| Automatic conversions: | |||||||||||
| Class A | 47 | 51 | |||||||||
| Class B | (50 | ) | (54 | ) | |||||||
| (3 | ) | (3 | ) | ||||||||
| Net increase (decrease) in shares outstanding: | |||||||||||
| Class A | 6,153 | 1,208 | |||||||||
| Class B | (859 | ) | (2,025 | ) | |||||||
| Class C | (396 | ) | 2,273 | ||||||||
| Class C2 | – | (913 | ) | ||||||||
| Class M | – | (2,550 | ) | ||||||||
| 4,898 | (2,007 | ) | |||||||||
The notes to the financial statements are an integral part of this report.
Transamerica IDEX Mutual Funds
Semi-Annual Report 2005
7
TA IDEX Templeton Great Companies Global
FINANCIAL HIGHLIGHTS
(unaudited for the period ended April 30, 2005)
| For a share of beneficial interest outstanding throughout each period | |||||||||||||||||||||||||||||||||||||||
| Net Asset | Investment Operations | Distributions | Net Asset | ||||||||||||||||||||||||||||||||||||
| For the Period Ended (d)(g) | Value, Beginning of Period | Net Investment Income (Loss) | Net Realized and Unrealized Gain (Loss) | Total Operations | From Net Investment Income | From Net Realized Gains | Total Distributions | Value, End of Period | |||||||||||||||||||||||||||||||
| Class A | 4/30/2005 | $ | 22.57 | $ | 0.14 | $ | 0.82 | $ | 0.96 | $ | – | $ | – | $ | – | $ | 23.53 | ||||||||||||||||||||||
| 10/31/2004 | 21.41 | (0.07 | ) | 1.23 | 1.16 | – | – | – | 22.57 | ||||||||||||||||||||||||||||||
| 10/31/2003 | 19.06 | (0.05 | ) | 2.40 | 2.35 | – | – | – | 21.41 | ||||||||||||||||||||||||||||||
| 10/31/2002 | 23.67 | (0.08 | ) | (4.53 | ) | (4.61 | ) | – | – | – | 19.06 | ||||||||||||||||||||||||||||
| 10/31/2001 | 40.20 | (0.07 | ) | (13.99 | ) | (14.06 | ) | – | (2.47 | ) | (2.47 | ) | 23.67 | ||||||||||||||||||||||||||
| 10/31/2000 | 33.80 | – | 7.53 | 7.53 | – | (1.13 | ) | (1.13 | ) | 40.20 | |||||||||||||||||||||||||||||
| Class B | 4/30/2005 | 21.23 | 0.03 | 0.78 | 0.81 | – | – | – | 22.04 | ||||||||||||||||||||||||||||||
| 10/31/2004 | 20.25 | (0.20 | ) | 1.18 | 0.98 | – | – | – | 21.23 | ||||||||||||||||||||||||||||||
| 10/31/2003 | 18.14 | (0.17 | ) | 2.28 | 2.11 | – | – | – | 20.25 | ||||||||||||||||||||||||||||||
| 10/31/2002 | 22.71 | (0.22 | ) | (4.35 | ) | (4.57 | ) | – | – | – | 18.14 | ||||||||||||||||||||||||||||
| 10/31/2001 | 38.97 | (0.27 | ) | (13.52 | ) | (13.79 | ) | – | (2.47 | ) | (2.47 | ) | 22.71 | ||||||||||||||||||||||||||
| 10/31/2000 | 32.98 | (0.41 | ) | 7.53 | 7.12 | – | (1.13 | ) | (1.13 | ) | 38.97 | ||||||||||||||||||||||||||||
| Class C | 4/30/2005 | 21.21 | 0.03 | 0.77 | 0.80 | – | – | – | 22.01 | ||||||||||||||||||||||||||||||
| 10/31/2004 | 20.25 | (0.15 | ) | 1.11 | 0.96 | – | – | – | 21.21 | ||||||||||||||||||||||||||||||
| 10/31/2003 | 18.00 | (0.17 | ) | 2.42 | 2.25 | – | – | – | 20.25 | ||||||||||||||||||||||||||||||
| Ratios/Supplemental Data | |||||||||||||||||||||||||||||||
| For the Period | Total | Net Assets, End of Period | Ratio of Expenses to Average Net Assets (a) | Net Investment Income (Loss) to Average | Portfolio Turnover | ||||||||||||||||||||||||||
| Ended (g) | Return (c) | (000's) | Net (e) | Total (f) | Net Assets (a) | Rate (b) | |||||||||||||||||||||||||
| Class A | 4/30/2005 | 4.26 | % | $ | 380,958 | 1.38 | % | 1.38 | % | 1.16 | % | 22 | % | ||||||||||||||||||
| 10/31/2004 | 5.41 | 226,517 | 1.85 | 1.85 | (0.31 | ) | 140 | ||||||||||||||||||||||||
| 10/31/2003 | 12.33 | 189,046 | 2.07 | 2.07 | (0.26 | ) | 103 | ||||||||||||||||||||||||
| 10/31/2002 | (19.46 | ) | 225,722 | 1.88 | 1.88 | (0.34 | ) | 72 | |||||||||||||||||||||||
| 10/31/2001 | (37.08 | ) | 374,626 | 1.63 | 1.63 | (0.24 | ) | 79 | |||||||||||||||||||||||
| 10/31/2000 | 22.26 | 749,671 | 1.64 | 1.64 | (0.56 | ) | 53 | ||||||||||||||||||||||||
| Class B | 4/30/2005 | 3.83 | 102,938 | 2.19 | 2.19 | 0.25 | 22 | ||||||||||||||||||||||||
| 10/31/2004 | 4.83 | 117,409 | 2.49 | 2.49 | (0.93 | ) | 140 | ||||||||||||||||||||||||
| 10/31/2003 | 11.57 | 153,046 | 2.72 | 2.72 | (0.91 | ) | 103 | ||||||||||||||||||||||||
| 10/31/2002 | (20.09 | ) | 193,259 | 2.53 | 2.53 | (0.99 | ) | 72 | |||||||||||||||||||||||
| 10/31/2001 | (37.58 | ) | 320,693 | 2.28 | 2.28 | (0.89 | ) | 79 | |||||||||||||||||||||||
| 10/31/2000 | 21.62 | 614,789 | 2.29 | 2.29 | (1.21 | ) | 53 | ||||||||||||||||||||||||
| Class C | 4/30/2005 | 3.79 | 41,486 | 2.20 | 2.37 | 0.24 | 22 | ||||||||||||||||||||||||
| 10/31/2004 | 4.74 | 48,378 | 2.18 | 2.18 | (0.72 | ) | 140 | ||||||||||||||||||||||||
| 10/31/2003 | 12.50 | 163 | 2.72 | 2.72 | (0.92 | ) | 103 | ||||||||||||||||||||||||
NOTES TO FINANCIAL HIGHLIGHTS
(a) Annualized.
(b) Not annualized for periods of less than one year.
(c) Total Return has been calculated for the applicable period without deduction of a sales load, if any, on an initial purchase. Periods of less than one year are not annualized.
(d) Per share information is calculated based on average number of shares outstanding for the periods ended 10/31/2001, 10/31/2002, 10/31/2003, 10/31/2004 and 4/30/2005.
(e) Ratio of Net Expenses to Average Net Assets is net of fee waivers and reimbursements by the investment adviser, if any (see note 2).
(f) Ratio of Total Expenses to Average Net Assets includes all expenses before fee waivers and reimbursements by the investment adviser.
(g) The inception date for the Fund's offering of share Class C was November 11, 2002.
The notes to the financial statements are an integral part of this report.
Transamerica IDEX Mutual Funds
Semi-Annual Report 2005
8
TA IDEX Templeton Great Companies Global
NOTES TO FINANCIAL STATEMENTS
At April 30, 2005
(all amounts in thousands)
(unaudited)
NOTE 1. ORGANIZATION AND SIGNIFICANT ACCOUNTING POLICIES
Transamerica IDEX Mutual Funds is a Delaware statutory trust registered under the Investment Company Act of 1940, as amended (the "1940 Act"), as an open-end management investment company. Prior to March 1, 2005, Transamerica IDEX Mutual Funds was a Massachusetts business trust. TA IDEX Templeton Great Companies Global ("the Fund"), part of Transamerica IDEX Mutual Funds, began operations on October 1, 1992.
In the normal course of business, the Fund enters into contracts that contain a variety of representations and warranties, which provide general indemnifications. The Fund's maximum exposure under these arrangements is unknown, as this would involve future claims that may be made against the Fund and/or its affiliates that have not yet occurred. However, based on experience, the Fund expects the risk of loss to be remote.
See the Prospectus and Statement of Additional Information for a description of the Fund's investment objective.
In preparing the Fund's financial statements in accordance with accounting principles generally accepted in the United States of America ("GAAP"), estimates or assumptions (which could differ from actual results) may be used that affect reported amounts and disclosures. The following policies were consistently followed by the Fund, in accordance with GAAP.
On May 28, 2004, the Fund acquired all of the net assets of TA IDEX Templeton Great Companies Global pursuant to a plan of reorganization. TA IDEX Janus Global is the accounting survivor. At the same time, the Fund changed sub-advisers from Janus Capital Management, LLC to Templeton Investment Counsel, LLC and Great Companies, LLC and was renamed from TA IDEX Janus Global to TA IDEX Templeton Great Companies Global.
The acquisition was accomplished by a tax free exchange of 4,196 shares of the Fund for 12,556 shares of TA IDEX Templeton Great Companies Global outstanding on May 27, 2004. TA IDEX Great Companies Global's net assets at that date, $92,688, including $3,609 unrealized appreciation, were combined with those of the Fund. The aggregate net assets of TA IDEX Janus Global immediately before the acquisition was $341,594. The combined net assets of the Fund immediately after the acquisition was $434,282. Proceeds in connection with the acquisition were as follows:
| Shares | Amount | ||||||||||
| Proceeds in connection with the acquisition | |||||||||||
| Class A | 3,817 | $ | 85,329 | ||||||||
| Class B | 230 | 4,841 | |||||||||
| Class C | 21 | 436 | |||||||||
| Class C2 | 59 | 1,244 | |||||||||
| Class M | 39 | 838 | |||||||||
| $ | 92,688 | ||||||||||
Multiple class operations and expenses: The Fund currently offers three classes of shares, each with a public offering price that reflects different sales charges, if any, and expense levels. On June 15, 2004, Class C2 shares merged into Class C. On September 24, 2004, Class M shares merged into Class C. Class B shares will convert to Class A shares eight years after purchase. Income, non-class specific expenses and realized and unrealized gains and losses, are allocated daily to each class, based upon the value of shares outstanding method as permitted under Rule 18f-3 of the 1940 Act. Each class bears its own specific expenses as well as a portion of general, common expenses.
Pricing of shares: The Fund prices its shares on the basis of the net asset value of each class of shares of the Fund, which is determined as of the close of the New York Stock Exchange ("NYSE") (generally 4:00 p.m. Eastern Time) on each day on which the NYSE is open for trading.
Security valuations: Fund investments traded on an exchange are valued at the closing price on the day of valuation on the exchange where the security is principally traded. With respect to securities traded on NASDAQ NMS, such closing price may be the last reported sales price or the NASDAQ Official Closing Price.
Securities traded in the over-the-counter market and listed securities for which no sale was reported on that date are valued at the last quoted bid price.
Debt securities are valued by independent pricing services at the last quoted bid price; however, those that mature in sixty days or less are valued at amortized cost, which approximates market.
Investment company securities are valued at net asset value of the underlying portfolio.
Transamerica IDEX Mutual Funds
Semi-Annual Report 2005
9
TA IDEX Templeton Great Companies Global
NOTES TO FINANCIAL STATEMENTS (continued)
At April 30, 2005
(all amounts in thousands)
(unaudited)
NOTE 1.–(continued)
Foreign securities generally are valued based on quotations from the primary market in which they are traded and are translated from the local currency into U.S. dollars using closing exchange rates. Many foreign securities markets are open for trading at times when the U.S. markets are closed for trading, and many foreign securities markets close for trading before the close of the NYSE. The value of foreign securities may be affected significantly on a day that the NYSE is closed and an investor is unable to purchase or redeem shares. If a significant market event impacting the value of a portfolio security (e.g., natural disaster, company announcement, market volatility) occurs subsequent to the close of trading in the security, but prior to the calculation of the Fund's net asset value per share, market quotations for that security may be determined to be unreliable and, accordingly, not "readily av ailable." If market quotations are not readily available, and the impact of such a significant market event materially effects the net asset value per share of the Fund, an affected portfolio security will be valued at fair market value as determined in good faith using guidelines adopted by the Board of Trustees of the Fund, under the supervision of the Fund's Valuation Committee. Factors that may be considered to value foreign securities at fair market value may include, among others: the value of other securities traded on other markets, foreign currency exchange activity and the trading of financial products tied to foreign securities.
Other securities for which quotations are not readily available are valued at fair market value as determined in good faith using guidelines adopted by the Board of Trustees of the Fund, under the supervision of the Fund's Valuation Committee. These guidelines may include: the type of security; any restrictions on its resale; financial or business news of the issuer; similar or related securities that are actively trading; related corporate actions; and other significant events occurring after the close of trading in the security.
Cash: The Fund may leave cash overnight in its cash account with the custodian, Investors Bank & Trust Company ("IBT"). IBT has been contracted on behalf of the Fund to invest the excess cash into a savings account, which at April 30, 2005, was paying an interest rate of 2.02%.
Throughout the period, the Fund may have a cash overdraft balance. A fee is incurred on this overdraft, calculated by multiplying the overdraft by a rate based on the federal funds rate.
Repurchase agreements: The Fund is authorized to enter into repurchase agreements. The Fund, through IBT, receives delivery of the underlying securities, the value of which at the time of purchase is required to be an amount equal to at least 100% of the resale price.
Repurchase agreements involve the risk that the seller will fail to repurchase the security, as agreed. In that case, the Fund will bear the risk of value fluctuations until the security can be sold and may encounter delays and incur costs in liquidating the security. In the event of bankruptcy or insolvency of the seller, delays and costs may be incurred.
Commission recapture: The sub-adviser, to the extent consistent with the best execution and usual commission rate policies and practices, may place security transactions of the Fund with broker/dealers with which Transamerica IDEX Mutual Funds has established a Commission Recapture Program. A Commission Recapture Program is any arrangement under which a broker/dealer applies a portion of the commissions received by such broker/dealer on the security transactions to the Fund. In no event will commissions paid by the Fund be used to pay expenses that would otherwise be borne by any other funds within Transamerica IDEX Mutual Funds, or by any other party.
Recaptured commissions during the six months ended April 30, 2005, of $45 are included in net realized gains in the Statement of Operations.
Securities lending: The Fund may lend securities to enhance fund earnings from investing cash collateral in making such loans to qualified borrowers (typically broker/dealers). The Fund has engaged its custodian bank, IBT, as a lending agent to administer its securities lending program. IBT earned $16 of program income for its services. When the Fund makes a security loan, it receives cash collateral as protection against the risk that the borrower will default on the loan, and records an asset for the cash invested collateral and a liability for the return of the collateral.
Loans of securities are required to be secured by collateral at least equal to 102% of the value of the securities at inception of the loan, and not less then 100% thereafter. The Fund may invest cash collateral in short-term money market instruments including: U.S. Treasury Bills, U.S. agency obligations, commercial paper, money market mutual funds, repurchase agreements and other highly rated, liquid investments. During the life of securities loans, the collateral and securities loaned remain subject to fluctuation in value. IBT marks to market securities loaned and the collateral each business day. If additional collateral is due (at least $1), IBT collects additional cash collateral from the borrowers. Although securities loaned will be fully collateralized at all times, IBT may experience delays in, or may be prevented from, recovering the collateral on behalf of the Fund. The Fund may recall a loa ned security position at any time from the borrower through IBT. In the event the borrower fails to timely return a recalled security, IBT may indemnify the Fund by purchasing replacement securities for the Fund at its own expense and claiming the collateral to fund such a purchase. IBT absorbs the loss if the collateral value is not sufficient to cover the cost of the replacement securities. If replacement securities are not available, IBT will credit the equivalent cash value to the Fund.
Transamerica IDEX Mutual Funds
Semi-Annual Report 2005
10
TA IDEX Templeton Great Companies Global
NOTES TO FINANCIAL STATEMENTS (continued)
At April 30, 2005
(all amounts in thousands)
(unaudited)
NOTE 1.–(continued)
While a security is on loan, the Fund does not have the right to vote that security. However, if time permits, the Fund will attempt to recall a security on loan and vote the proxy.
Income from securities lending is included in the Statement of Operations. The amount of collateral and value of securities on loan are included in the Statement of Assets and Liabilities as well as in the Schedule of Investments.
Security transactions and investment income: Security transactions are recorded on the trade date. Security gains and losses are calculated on the specific identification basis. Dividend income is recorded on the ex-dividend date or, in the case of foreign securities, as soon as the Fund is informed of the ex-dividend date. Interest income, including accretion of discounts and amortization of premiums, is recorded on the accrual basis commencing on the settlement date.
Foreign currency denominated investments: The accounting records of the Fund are maintained in U.S. dollars. Securities and other assets and liabilities denominated in foreign currencies are translated into U.S. dollars at the closing exchange rate each day. The cost of foreign securities is translated at the exchange rate in effect when the investment was acquired. The Fund combines fluctuations from currency exchange rates and fluctuations in value when computing net realized and unrealized gains or losses from investments.
Net foreign currency gains and losses resulting from changes in exchange rates include: 1) foreign currency fluctuations between trade date and settlement date of investment security transactions; 2) gains and losses on forward foreign currency contracts; and 3) the difference between the receivable amounts of interest and dividends recorded in the accounting records in U.S. dollars and the amounts actually received.
Foreign currency denominated assets may involve risks not typically associated with domestic transactions, including unanticipated movements in exchange currency rates, the degree of government supervision and regulation of security markets, and the possibility of political or economic instability.
Foreign capital gains taxes: The Fund may be subject to taxes imposed by countries in which it invests, with respect to its investment in issuers existing or operating in such countries. Such taxes are generally based on income earned or repatriated and capital gains realized on the sale of such investments. The Fund accrues such taxes when the related income or capital gains are earned. Some countries require governmental approval for the repatriation of investment income, capital or the proceeds of sales earned by foreign investors. In addition, if there is deterioration in a country's balance of payments or for other reasons, a country may impose temporary restrictions on foreign capital rem ittances abroad.
Forward foreign currency contracts: The Fund may enter into forward foreign currency contracts to hedge against exchange rate risk arising from investments in securities denominated in foreign currencies. Contracts are valued at the contractual forward rate and are marked to market daily, with the change in value recorded as an unrealized gain or loss. When the contracts are closed a realized gain or loss is incurred. Risks may arise from changes in market value of the underlying currencies and from the possible inability of counterparties to meet the terms of their contracts.
At April 30, 2005, there were no outstanding forward foreign currency contracts.
Account maintenance fees: If the shareholder account balance falls below $1 by either shareholder action or as a result of market action, a $25 (not in thousands) fee is assessed every year until the balance reaches $1. The fee is assessed by redeeming shares in the shareholder's account.
No fee will be charged under the following conditions:
• accounts opened within the preceding 24 months
• accounts with an active monthly Automatic Investment Plan ($50 (not in thousands) minimum per fund)
• accounts owned by an individual which, when combined by social security number, have a balance of $5 or more
• accounts owned by individuals in the same household (by address) that have a combined balance of $5 or more
• UTMA/UGMA accounts
• Fiduciary accounts
• B-share accounts whose shares have started to convert to A-shares accounts (as long as combined value of both accounts is at least $1)
For the six months ended April 30, 2005, this fee totaled $16. These fees are included in Paid in Capital in the Statement of Assets and Liabilities.
Redemption fees: A short-term trading redemption fee may be assessed on any fund shares in a fund account that are sold during the first five (5) New York Stock Exchange trading days following their purchase date. This redemption fee will equal 2% of the amount redeemed and shares held the longest will be treated as being redeemed first and shares held the shortest as being redeemed last.
Transamerica IDEX Mutual Funds
Semi-Annual Report 2005
11
TA IDEX Templeton Great Companies Global
NOTES TO FINANCIAL STATEMENTS (continued)
At April 30, 2005
(all amounts in thousands)
(unaudited)
NOTE 1.–(continued)
Dividend distributions: Distributions to shareholders are recorded on the ex-dividend date and are determined in accordance with Federal income tax regulations which may differ from GAAP.
NOTE 2. RELATED PARTY TRANSACTIONS
Transamerica Fund Advisors, Inc. ("TFAI") is the Fund's investment adviser. Transamerica Fund Services, Inc. ("TFS") is the Fund's administrator and transfer agent. AFSG Securities Corp. ("AFSG") is the Fund's distributor/principal underwriter. AFSG is 100% owned by AUSA Holding Company ("AUSA"). TFAI is a directly owned subsidiary of Western Reserve Life Assurance Co. of Ohio (78%) and AUSA (22%). TFS is a wholly owned subsidiary of WRL (50%) and AUSA (50%). AUSA and WRL are wholly owned indirect subsidiaries of AEGON, NV, a Netherlands corporation.
Effective January 1, 2005 AEGON/Transamerica Fund Advisors, Inc. ("ATFA") was renamed Transamerica Fund Advisors, Inc. ("TFAI"); AEGON/Transamerica Fund Services, Inc. ("ATFS") and AEGON/Transamerica Investor Services, Inc. ("ATIS") merged into one entity and was renamed Transamerica Fund Services, Inc. ("TFS").
The following schedule represents the percentage of fund assets owned by affiliated mutual funds (i.e. through the asset allocation funds):
| Net Assets | % of Net Assets | ||||||||||
| TA IDEX Asset Allocation – Conservatiave Portfolio | $ | 27,392 | 5.22 | % | |||||||
| TA IDEX Asset Allocation – Growth Portfolio | 72,174 | 13.74 | % | ||||||||
| TA IDEX Asset Allocation – Moderate Growth Portfolio | 100,215 | 19.07 | % | ||||||||
| TA IDEX Asset Allocation – Moderate Portfolio | 47,718 | 9.08 | % | ||||||||
| Total | $ | 247,499 | 47.11 | % | |||||||
Investment advisory fee: The Fund pays management fees to TFAI based on average daily net assets ("ANA") at the following breakpoints:
0.80% of the first $500 million of ANA
0.70% of ANA over $500 million
TFAI has contractually agreed to waive its advisory fee and will reimburse the Fund to the extent that operating expenses, excluding 12b-1 fees, exceed the following stated annual limit:
1.20% Expense Limit
If total fund expenses fall below the annual expense limitation agreement agreed to by the adviser within the succeeding three years, the Fund may be required to pay that adviser a portion or all of the waived advisory fees.
There are no amounts available for recapture at April 30, 2005.
Great Companies, LLC is both an affiliate of the Fund and a sub-adviser to the Fund.
Distribution and service fees: The Fund has a 12b-1 distribution plan under the 1940 Act pursuant to which an annual fee, based on average daily net assets, is paid to the distributor for various disbursements such as broker-dealer account servicing fees and other promotional expenses of the Fund. The Fund is authorized under the 12b-1 plan to pay fees on each class up to the following limits:
| Class A | 0.35 | % | |||||
| Class B | 1.00 | % | |||||
| Class C | 1.00 | % | |||||
In the case the Fund or a class of shares of the Fund is closed to new investors or investments, the Fund is authorized to pay 12b-1 fees for past sales and distribution efforts and present and past investor services.
Underwriter commissions relate to front-end sales charges imposed for Class A shares and contingent deferred sales charges from Classes B, C, and certain A share redemptions. For the six months ended April 30, 2005, the underwriter commissions were as follows:
| Received by Underwriter | $ | 162 | |||||
| Retained by Underwriter | 10 | ||||||
| Contingent Deferred Sales Charge | 103 | ||||||
Administrative services: The Fund has entered into an agreement with TFS for financial and legal fund administration services, which includes such items as compliance, expenses, financial statements and other reporting, distributions, tax returns, prospectus preparation, board of trustees meeting support and other legal matters. As of January 1, 2005 the Fund pays TFS an annual fee of 0.02% of average net assets. Prior to January 1, 2005 the Fund paid TFS an annual fee of 0.015% of average net assets. The Legal fees on the Statement of Operations are for fees paid to external legal counsel.
Transfer agent fees: The Fund pays TFS an annual per-account charge of $20 (not in thousands) for each open account and $1.63 (not in thousands) for each closed account. There is no new account charge. The Transfer agent fees on the Statement of Operations are made up of fees paid to TFS and costs associated with shareholder statements.
Transamerica IDEX Mutual Funds
Semi-Annual Report 2005
12
TA IDEX Templeton Great Companies Global
NOTES TO FINANCIAL STATEMENTS (continued)
At April 30, 2005
(all amounts in thousands)
(unaudited)
NOTE 2.–(continued)
The Fund paid TFS $586 for the six months ended April 30, 2005.
Deferred compensation plan: Each eligible Fund Trustee may elect participation in the Deferred Compensation Plan ("the Plan"). Under the Plan, such Trustees may defer payment of a percentage of their total fees earned as a Fund Trustee. These deferred amounts may be invested in any Transamerica IDEX Mutual Fund. At April 30, 2005, the value of invested plan amount was $103. Invested plan amounts and the total liability for deferred compensation to the Trustees under the Plan at April 30, 2005, are included in the accompanying Statement of Assets and Liabilities.
NOTE 3. INVESTMENT TRANSACTIONS
The cost of securities purchased and proceeds from securities sold (excluding short-term securities) for the six months ended April 30, 2005, were as follows:
| Purchases of securities: | |||||||
| Long-Term excluding U.S. Government | $ | 210,723 | |||||
| U.S. Government | – | ||||||
| Proceeds from maturities and sales of securities: | |||||||
| Long-Term excluding U.S. Government | 99,324 | ||||||
| U.S. Government | – | ||||||
NOTE 4. FEDERAL INCOME TAX MATTERS
The Fund has not made any provision for federal income or excise taxes due to its policy to distribute all of its taxable income and capital gains to its shareholders and otherwise qualify as a regulated investment company under the Internal Revenue Code. Income and capital gain distributions are determined in accordance with income tax regulations, which may differ from GAAP. These differences are primarily due to differing treatment for items including, but not limited to, wash sales, net operating losses and capital loss carryforwards.
The capital loss carryforwards are available to offset future realized capital gains through the periods listed:
| Capital Loss Carryforward | Available through | ||||||
| $ | 130,090 | October 31, 2009 | |||||
| 205,203 | October 31, 2010 | ||||||
| 57,944 | October 31, 2011 | ||||||
The aggregate cost of investments and composition of unrealized appreciation (depreciation) for federal income tax purposes as of April 30, 2005, are as follows:
| Federal Tax Cost Basis | $ | 529,115 | |||||
| Unrealized Appreciation | $ | 31,950 | |||||
| Unrealized (Depreciation) | (16,381 | ) | |||||
| Net Unrealized Appreciation (Depreciation) | $ | 15,569 | |||||
NOTE 5. REGULATORY PROCEEDINGS
There continues to be significant federal and state regulatory activity relating to financial services companies, particularly mutual fund companies and their investment advisers. As part of an ongoing investigation regarding potential market timing, recordkeeping and trading compliance issues and matters affecting the Fund's investment adviser, TFAI, and certain employees and affiliates of TFAI, the SEC staff has indicated that it is likely to take some action against TFAI and certain of its affiliates at the conclusion of the investigation. The potential timing and the scope of any such action is difficult to predict. Although the impact of any action brought against TFAI and/or its affiliates is difficult to assess at the present time, the Fund currently believes that the likelihood that any such action will have a material adverse impact on it is remote. It is important to note that the Fund is not aware of any allegation of wrongdoing against it and its board at the time this semi-annual report is printed. Although it is not anticipated that these developments will have an adverse impact on the Fund, there can be no assurance at this time. TFAI and its affiliates are actively working with the SEC in regard to this matter; however, the exact resolution cannot be determined at this time. TFAI will take such actions that it deems necessary or appropriate to continue providing management services to the Fund and to bring all matters to an appropriate conclusion.
TFAI and/or its affiliates, and not the Fund, will bear the costs regarding these regulatory matters.
Transamerica IDEX Mutual Funds
Semi-Annual Report 2005
13
TA IDEX Templeton Great Companies Global
INVESTMENT ADVISORY AGREEMENT – REVIEW AND RENEWAL
At a meeting of the Board of Trustees of Transamerica IDEX Mutual Funds ("TA IDEX") held on October 6, 2004, the Board considered and approved the renewal for a one-year period of the Investment Advisory Agreement between TA IDEX Templeton Great Companies Global (the "Fund") and Transamerica Fund Advisors, Inc. ("TFAI"). In approving the renewal of this agreement, the Board concluded that the Investment Advisory Agreement enables shareholders of the Fund to obtain high quality services at a cost that is appropriate, reasonable, and in the best interests of shareholders based upon the following determinations, among others:
The nature, extent and quality of the advisory service to be provided. The Board considered the nature and quality of the services provided by TFAI in the past, as well as the services anticipated to be provided in the future. The Board concluded that TFAI is capable of providing high quality services to the Fund, as indicated by TFAI's management capabilities demonstrated with respect to the Fund and other funds managed by TFAI, and TFAI's management oversight process. The Board also concluded that TFAI would provide the same quality and quantity of investment management and related services as before, that these services are appropriate in scope and extent in light of the Fund's operations, the competitive landscape of the investment company business and investor needs, and that TFAI's obligat ions will remain the same in all respects.
The investment performance of the Fund. The Board reviewed the Fund's investment performance since the Fund's sub-advisers, Great Companies, LLC and Templeton Investment Counsel, LLC (the "Sub-Advisers") were appointed to manage the Fund pursuant to a vote of the Fund's shareholders on May 21, 2004. The Trustees concluded that the performance of the new Sub-Advisers was acceptable, although they would closely monitor the Fund's future investment performance in light of the Fund's investment objective, policies and strategies and the Fund's historical below-average performance relative to certain comparable investment companies to verify that the Fund achieves an acceptable level of performance following the change of Sub-Adviser.
The cost of advisory services provided and the level of profitability. On the basis of the Board's review of the fees to be charged by TFAI and the Sub-Advisers for investment advisory and related services, TFAI's financial statements, the fees paid by TFAI to the Sub-Adviser, TFAI's estimated net management income resulting from its management of the Fund, and the estimated profitability of TFAI's relationships with the Fund and TA IDEX, the Board concluded that the level of investment advisory fees and the profitability is appropriate in light of the services provided, the management fees and overall expense ratios of comparable investment companies, and the anticipated profitability of the relationship between the Fund and TFAI.
The extent to which economies of scale would be realized as the Fund grows and whether fee levels reflect these economies of scale for the benefit of Fund investors. The Trustees concluded that inclusion of asset-based breakpoints in the Fund's advisory fee schedule appropriately benefit investors by realizing economies of scale in the form of a lower advisory fee rate as the level of Fund assets increases. The Board also concluded that the advisory fees appropriately reflect the Fund's current size, the current economic environment for TFAI, and the competitive nature of the investment company market. In addition, the Board noted that it will have the opportunity to periodically re-examine whether the Fund has achieved economies of scale, as well as the appropriateness of advisory fees payable to TFAI in the future.
Benefits (such as soft dollars) to TFAI or the Sub-Adviser from its relationship with the Fund. The Board concluded that other benefits derived by TFAI or the Sub-Adviser from its relationship with the Fund are reasonable and fair, and are consistent with industry practice and the best interests of the Fund and its shareholders. In this regard, the Board noted that TFAI does not realize "soft dollar" benefits from its relationship with the Fund, and that the Sub-Adviser is participating in a brokerage program pursuant to which a portion of brokerage commissions paid by the Fund is recaptured for the benefit of the Fund and its shareholders, thus limiting the amount of "soft-dollar" arrangements the Sub-Adviser may engage in with respect to the Fund's portfolio brokerage transactions.
Other considerations. The Board also determined that TFAI had made a substantial commitment to the recruitment and retention of high quality personnel, and maintained the financial, compliance and operational resources reasonably necessary to manage the Fund in a professional manner that is consistent with the best interests of the Fund and its shareholders. The Trustees also concluded that TFAI had made a significant entrepreneurial commitment to the management and success of the Fund, reflected by TFAI's expense limitation and fee waiver arrangement with the Fund which, as demonstrated in the past with the Fund, may result in TFAI waiving a substantial amount of advisory fees for the benefit of shareholders.
Transamerica IDEX Mutual Funds
Semi-Annual Report 2005
14
TA IDEX Templeton Great Companies Global
SUPPLEMENTAL INFORMATION (unaudited)
RESULTS OF SHAREHOLDER PROXY
At a special meeting of shareholders held on February 25, 2005, the results of the Proposals were as follows:
Transamerica IDEX Mutual Funds
Proposal 1: Election of Trustees to the Board of Trustees of Transamerica IDEX Mutual Funds.
| For | Withheld | ||||||||||
| Peter R. Brown | 872,017,875.249 | 4,468,498.551 | |||||||||
| Daniel Calabria | 871,917,069.786 | 4,569,304.014 | |||||||||
| Janise B. Case | 872,099,393.125 | 4,386,980.675 | |||||||||
| Charles C. Harris | 872,086,722.025 | 4,399,651.775 | |||||||||
| Leo J. Hill | 872,304,465.640 | 4,181,908.160 | |||||||||
| Russell A. Kimball, Jr. | 872,253,556.471 | 4,232,817.329 | |||||||||
| William W. Short, Jr. | 872,139,920.944 | 4,346,452.856 | |||||||||
| John Waechter | 872,261,152.376 | 4,225,221.424 | |||||||||
| Jack E. Zimmerman | 871,929,967.512 | 4,556,406.288 | |||||||||
| Brian C. Scott | 872,218,970.367 | 4,267,403.433 | |||||||||
| Thomas P. O'Neill | 872,111,944.117 | 4,374,429.683 | |||||||||
TA IDEX Templeton Great Companies Global
Proposal 2: Approval of an Agreement and Plan of Reorganization pursuant to which Transamerica IDEX Mutual Funds will organize as a Delaware statutory trust.
| For | Against | Abstentions/Broker Non-Votes | |||||||||
| 9,871,343.481 | 147,479.983 | 4,580,688.510 | |||||||||
Proposal 3: Approval of changes to the fundamental investment restrictions of TA IDEX Templeton Great Companies Global.
| A. Diversification | For | Against | Abstentions/Broker Non-Votes | ||||||||||||
| 10,007,679.287 | 180,811.073 | 4,411,021.614 | |||||||||||||
| B. Borrowing | For | Against | Abstentions/Broker Non-Votes | ||||||||||||
| 9,993,135.953 | 195,354.407 | 4,411,021.614 | |||||||||||||
| C. Senior Securities | For | Against | Abstentions/Broker Non-Votes | ||||||||||||
| 10,005,843.479 | 182,646.881 | 4,411,021.614 | |||||||||||||
| D. Underwriting Securities | For | Against | Abstentions/Broker Non-Votes | ||||||||||||
| 10,006,133.279 | 182,357.081 | 4,411,021.614 | |||||||||||||
| E. Real Estate | For | Against | Abstentions/Broker Non-Votes | ||||||||||||
| 10,007,542.600 | 180,947.760 | 4,411,021.614 | |||||||||||||
| F. Making Loans | For | Against | Abstentions/Broker Non-Votes | ||||||||||||
| 9,992,882.754 | 195,607.606 | 4,411,021.614 | |||||||||||||
| G. Concentration | For | Against | Abstentions/Broker Non-Votes | ||||||||||||
| 10,004,742.185 | 183,748.175 | 4,411,021.614 | |||||||||||||
| H. Commodities | For | Against | Abstentions/Broker Non-Votes | ||||||||||||
| 9,995,977.762 | 192,512.598 | 4,411,021.614 | |||||||||||||
Transamerica IDEX Mutual Funds
Semi-Annual Report 2005
15
TA IDEX Transamerica Balanced
UNDERSTANDING YOUR FUND'S EXPENSES
(unaudited)
SHAREHOLDER EXPENSES
The following Example is intended to help you understand your ongoing costs (in dollars and cents) of investing in a Fund and to compare these costs with the ongoing costs of investing in other funds.
The Example is based on an investment of $1,000 invested at November 1, 2004 and held for the entire period until April 30, 2005.
ACTUAL EXPENSES
The first line in the table below provides information about actual account values and actual expenses. You may use the information in this line, together with the amount you invested, to estimate the expenses that you paid over the period. Simply divide your account value by $1,000 (for example, an $8,600 account value divided by $1,000 = 8.6), then multiply the result by the number in the first line of your Fund under the heading entitled "Expenses Paid During Period" to estimate the expenses you paid on your account during this period.
HYPOTHETICAL EXAMPLE FOR COMPARISON PURPOSES
The second line in the table below provides information about hypothetical account values and hypothetical expenses based on the Fund's actual expense ratio and an assumed rate of return of 5% per year before expenses, which is not the Fund's actual return. The hypothetical account values and expenses may not be used to estimate the actual ending account balance or expenses you paid for the period. You may use this information to compare the ongoing costs of investing in your Fund and other funds. To do so, compare this 5% hypothetical example with the 5% hypothetical examples that appear in the shareholder reports of the other funds.
Please note that the expenses shown in the table are meant to highlight your ongoing costs only and do not reflect any transactional costs, such as sales charges, redemption fees, brokerage commissions paid on purchases and sales of fund shares. Therefore, the second line under the Fund in the table is useful in comparing ongoing costs only, and will not help you determine the relative total costs of owning different funds. In addition, note that the expenses shown in the table are meant to highlight your ongoing costs and do not reflect any transaction costs.
| Beginning Account Value | Ending Account Value | Annualized Expense Ratio | Expenses Paid During Period (a) | ||||||||||||||||
| Class A | |||||||||||||||||||
| Actual | $ | 1,000.00 | $ | 1,022.30 | 1.38 | % | $ | 6.92 | |||||||||||
| Hypothetical (b) | 1,000.00 | 1,017.95 | 1.38 | 6.90 | |||||||||||||||
| Class B | |||||||||||||||||||
| Actual | 1,000.00 | 1,018.80 | 2.04 | 10.21 | |||||||||||||||
| Hypothetical (b) | 1,000.00 | 1,014.68 | 2.04 | 10.19 | |||||||||||||||
| Class C | |||||||||||||||||||
| Actual | 1,000.00 | 1,018.50 | 2.11 | 10.56 | |||||||||||||||
| Hypothetical (b) | 1,000.00 | 1,014.33 | 2.11 | 10.54 | |||||||||||||||
(a) Expenses are calculated using each Fund's annualized expense ratio (as disclosed in the table), multiplied by the average account value for the period, multiplied by number of days in the period (181 days), and divided by the number of days in the year (365 days).
(b) 5% return per year before expenses.
GRAPHICAL PRESENTATION OF SCHEDULE OF INVESTMENTS
By Asset Type
At April 30, 2005

This chart shows the percentage breakdown by asset type of the Fund's total investment securities.
Transamerica IDEX Mutual Funds
Semi-Annual Report 2005
1
TA IDEX Transamerica Balanced
SCHEDULE OF INVESTMENTS
At April 30, 2005
(all amounts except share amounts in thousands)
(unaudited)
| Principal | Value | ||||||||||
| U.S. GOVERNMENT OBLIGATIONS (6.6%) | |||||||||||
| U.S. Treasury Bond | |||||||||||
| 6.25%, due 08/15/2023 (a) | $ | 1,566 | $ | 1,882 | |||||||
| 5.38%, due 02/15/2031 (a) | 1,546 | 1,746 | |||||||||
| U.S. Treasury Note 3.50%, due 11/15/2009 3.50%, due 02/15/2010 (a) 4.75%, due 05/15/2014 4.25%, due 08/15/2014 (a) 4.00%, due 02/15/2015 (a) | 1,540 7,250 2,725 2,000 300 | 1,517 7,129 2,841 2,009 295 | |||||||||
| Total U.S. Government Obligations (cost: $17,235) | 17,419 | ||||||||||
| U.S. GOVERNMENT AGENCY OBLIGATIONS (1.6%) | |||||||||||
| Fannie Mae 6.00%, due 08/01/2034 6.00%, due 09/01/2034 | 2,212 1,933 | 2,272 1,986 | |||||||||
| Total U.S. Government Agency Obligations (cost: $4,293) | 4,258 | ||||||||||
| CORPORATE DEBT SECURITIES (19.5%) | |||||||||||
| Aerospace (0.6%) | |||||||||||
| Honeywell International, Inc. 5.13%, due 11/01/2006 6.13%, due 11/01/2011 | 910 660 | 925 716 | |||||||||
| Amusement & Recreation Services (0.9%) | |||||||||||
| Harrah's Operating Co., Inc. 5.50%, due 07/01/2010 | 1,750 | 1,789 | |||||||||
| Mandalay Resort Group 6.50%, due 07/31/2009 | 585 | 591 | |||||||||
| Beverages (1.0%) | |||||||||||
| Coca-Cola Enterprises, Inc. 5.38%, due 08/15/2006 | 950 | 966 | |||||||||
| Diageo Capital PLC 3.50%, due 11/19/2007 | 1,750 | 1,722 | |||||||||
| Business Services (0.4%) | |||||||||||
| Clear Channel Communications, Inc. 6.00%, due 11/01/2006 4.63%, due 01/15/2008 | 555 545 | 564 538 | |||||||||
| Chemicals & Allied Products (0.2%) | |||||||||||
| Lubrizol Corp. 5.50%, due 10/01/2014 | 500 | 508 | |||||||||
| Commercial Banks (0.9%) | |||||||||||
| BAC Capital Trust VI 5.63%, due 03/08/2035 | 972 | 962 | |||||||||
| US Bank NA 3.75%, due 02/06/2009 | 1,400 | 1,372 | |||||||||
| Principal | Value | ||||||||||
| Communication (0.1%) | |||||||||||
| Echostar DBS Corp. 5.75%, due 10/01/2008 | $ | 255 | $ | 251 | |||||||
| Communications Equipment (0.6%) | |||||||||||
| Motorola, Inc. 4.61%, due 11/16/2007 | 1,750 | 1,762 | |||||||||
| Computer & Office Equipment (0.3%) | |||||||||||
| Hewlett-Packard Co. 3.63%, due 03/15/2008 | 765 | 755 | |||||||||
| Electric Services (0.4%) | |||||||||||
| Duke Capital LLC 5.67%, due 08/15/2014 | 1,000 | 1,028 | |||||||||
| Food & Kindred Products (0.1%) | |||||||||||
| Dean Foods Co. 6.75%, due 06/15/2005 | 230 | 230 | |||||||||
| Furniture & Fixtures (0.6%) | |||||||||||
| Lear Corp. 7.96%, due 05/15/2005 | 1,550 | 1,552 | |||||||||
| Holding & Other Investment Offices (0.3%) | |||||||||||
| iStar Financial, Inc. 4.88%, due 01/15/2009 | 875 | 867 | |||||||||
| Hotels & Other Lodging Places (1.0%) | |||||||||||
| John Q. Hammons Hotels, Inc., Series B 8.88%, due 05/15/2012 | 315 | 335 | |||||||||
| Starwood Hotels & Resorts Worldwide, Inc. 7.38%, due 05/01/2007 | 1,900 | 1,966 | |||||||||
| Wynn Las Vegas LLC/Wynn Las Vegas Capital Corp.–144A 6.63%, due 12/01/2014 | 500 | 468 | |||||||||
| Lumber & Wood Products (0.3%) | |||||||||||
| Weyerhaeuser Co. 7.38%, due 03/15/2032 | 750 | 816 | |||||||||
| Metal Mining (0.4%) | |||||||||||
| Phelps Dodge Corp. 9.50%, due 06/01/2031 | 688 | 1,045 | |||||||||
| Mortgage Bankers & Brokers (0.7%) | |||||||||||
| Countrywide Home Loans, Inc. 5.50%, due 08/01/2006 | 1,800 | 1,832 | |||||||||
| Mortgage-Backed (0.3%) | |||||||||||
| Countrywide Home Loans, Inc., Series L 2.88%, due 02/15/2007 | 865 | 845 | |||||||||
| Motion Pictures (0.5%) | |||||||||||
| Time Warner, Inc. 9.13%, due 01/15/2013 | 1,120 | 1,406 | |||||||||
The notes to the financial statements are an integral part of this report.
Transamerica IDEX Mutual Funds
Semi-Annual Report 2005
2
TA IDEX Transamerica Balanced
SCHEDULE OF INVESTMENTS (continued)
At April 30, 2005
(all amounts except share amounts in thousands)
(unaudited)
| Principal | Value | ||||||||||
| Oil & Gas Extraction (1.6%) | |||||||||||
| Chesapeake Energy Corp. 7.00%, due 08/15/2014 | $ | 500 | $ | 513 | |||||||
| Husky Oil, Ltd. 8.90%, due 08/15/2028 (b) | 870 | 971 | |||||||||
| Kerr-McGee Corp. 6.95%, due 07/01/2024 | 500 | 459 | |||||||||
| Nexen, Inc. 5.88%, due 03/10/2035 | 2,325 | 2,241 | |||||||||
| Paper & Allied Products (0.3%) | |||||||||||
| International Paper Co. 6.75%, due 09/01/2011 | 773 | 843 | |||||||||
| Personal Credit Institutions (1.5%) | |||||||||||
| Capital One Bank 5.00%, due 06/15/2009 | 875 | 885 | |||||||||
| General Electric Capital Corp. 2.85%, due 01/30/2006 5.35%, due 03/30/2006 | 940 1,570 | 935 1,592 | |||||||||
| General Motors Acceptance Corp. 4.38%, due 12/10/2007 | 575 | 530 | |||||||||
| Petroleum Refining (1.1%) | |||||||||||
| Amerada Hess Corp. 7.13%, due 03/15/2033 | 1,300 | 1,462 | |||||||||
| Enterprise Products Operating, LP, Series B 5.60%, due 10/15/2014 | 500 | 503 | |||||||||
| Valero Energy Corp. 7.50%, due 04/15/2032 | 750 | 886 | |||||||||
| Primary Metal Industries (0.7%) | |||||||||||
| Alcoa, Inc. 4.25%, due 08/15/2007 | 1,825 | 1,827 | |||||||||
| Printing & Publishing (1.0%) | |||||||||||
| News America Holdings, Inc. 7.75%, due 12/01/2045 | 1,085 | 1,296 | |||||||||
| Viacom, Inc. 7.75%, due 06/01/2005 | 1,520 | 1,525 | |||||||||
| Restaurants (0.2%) | |||||||||||
| Landry's Restaurants, Inc.–144A 7.50%, due 12/15/2014 | 500 | 465 | |||||||||
| Security & Commodity Brokers (0.9%) | |||||||||||
| E*Trade Financial Corp. 8.00%, due 06/15/2011 | 500 | 513 | |||||||||
| Merrill Lynch & Co., Inc., Series B 6.13%, due 05/16/2006 | 1,900 | 1,942 | |||||||||
| Principal | Value | ||||||||||
| Telecommunications (2.4%) | |||||||||||
| SBC Communications, Inc. 5.75%, due 05/02/2006 | $ | 1,900 | $ | 1,934 | |||||||
| Sprint Capital Corp. 4.78%, due 08/17/2006 | 1,780 | 1,792 | |||||||||
| Telefonica SA 7.35%, due 09/15/2005 | 1,750 | 1,774 | |||||||||
| Verizon Global Funding Corp. 4.00%, due 01/15/2008 | 955 | 949 | |||||||||
| Variety Stores (0.2%) | |||||||||||
| Target Corp. 5.50%, due 04/01/2007 | 435 | 446 | |||||||||
| Total Corporate Debt Securities (cost: $52,130) | 52,094 | ||||||||||
| Shares | Value | ||||||||||
| COMMON STOCKS (71.4%) | |||||||||||
| Automotive (4.3%) | |||||||||||
| Harley-Davidson, Inc. | 100,000 | $ | 4,702 | ||||||||
| PACCAR, Inc. | 100,000 | 6,790 | |||||||||
| Chemicals & Allied Products (0.7%) | |||||||||||
| Ecolab, Inc. (a) | 60,000 | 1,963 | |||||||||
| Commercial Banks (1.8%) | |||||||||||
| JPMorgan Chase & Co. | 134,435 | 4,771 | |||||||||
| Communication (1.3%) | |||||||||||
| XM Satellite Radio Holdings, Inc.–Class A (a)(c) | 125,000 | 3,467 | |||||||||
| Communications Equipment (2.6%) | |||||||||||
| QUALCOMM, Inc. | 200,000 | 6,978 | |||||||||
| Computer & Data Processing Services (3.4%) | |||||||||||
| Microsoft Corp. | 153,465 | 3,883 | |||||||||
| Yahoo!, Inc. (c) | 146,100 | 5,042 | |||||||||
| Computer & Office Equipment (2.4%) | |||||||||||
| Diebold, Inc. (a) | 100,000 | 4,837 | |||||||||
| Sandisk Corp. (c) | 60,000 | 1,422 | |||||||||
| Cosmetics/Personal Care (1.9%) | |||||||||||
| Gillette Co. (The) | 100,000 | 5,164 | |||||||||
| Electronic & Other Electric Equipment (3.7%) | |||||||||||
| General Electric Co. | 270,045 | 9,776 | |||||||||
| Engineering & Management Services (2.4%) | |||||||||||
| Jacobs Engineering Group, Inc. (a)(c) | 130,000 | 6,332 | |||||||||
| Hotels & Other Lodging Places (6.6%) | |||||||||||
| Marriott International, Inc.–Class A | 280,060 | 17,574 | |||||||||
| Industrial Machinery & Equipment (11.1%) | |||||||||||
| American Standard Cos., Inc. (a) | 114,600 | 5,124 | |||||||||
The notes to the financial statements are an integral part of this report.
Transamerica IDEX Mutual Funds
Semi-Annual Report 2005
3
TA IDEX Transamerica Balanced
SCHEDULE OF INVESTMENTS (continued)
At April 30, 2005
(all amounts except share amounts in thousands)
(unaudited)
| Shares | Value | ||||||||||
| Industrial Machinery & Equipment (continued) | |||||||||||
| Caterpillar, Inc. | 100,000 | $ | 8,805 | ||||||||
| Donaldson Co., Inc. | 120,000 | 3,570 | |||||||||
| Graco, Inc. | 100,000 | 3,377 | |||||||||
| Illinois Tool Works, Inc. (a) | 50,000 | 4,191 | |||||||||
| Kennametal, Inc. | 100,000 | 4,530 | |||||||||
| Insurance (2.4%) | |||||||||||
| WellPoint, Inc. (c) | 50,000 | 6,387 | |||||||||
| Medical Instruments & Supplies (1.5%) | |||||||||||
| Zimmer Holdings, Inc. (c) | 50,000 | 4,071 | |||||||||
| Motor Vehicles, Parts & Supplies (1.4%) | |||||||||||
| BorgWarner, Inc. | 80,000 | 3,658 | |||||||||
| Oil & Gas Extraction (3.8%) | |||||||||||
| Anadarko Petroleum Corp. | 70,000 | 5,113 | |||||||||
| Apache Corp. (a) | 90,000 | 5,066 | |||||||||
| Paper & Allied Products (1.9%) | |||||||||||
| 3M Co. | 67,620 | 5,171 | |||||||||
| Pharmaceuticals (5.0%) | |||||||||||
| Amgen, Inc. (a)(c) | 70,495 | 4,104 | |||||||||
| Roche Holding AG–Genusschein | 75,698 | 9,198 | |||||||||
| Primary Metal Industries (1.6%) | |||||||||||
| Hubbell, Inc.–Class B | 100,000 | 4,345 | |||||||||
| Printing & Publishing (4.1%) | |||||||||||
| McGraw-Hill Cos., Inc. (The) | 125,000 | 10,885 | |||||||||
| Telecommunications (1.3%) | |||||||||||
| Verizon Communications, Inc. | 100,000 | 3,580 | |||||||||
| Transportation & Public Utilities (0.9%) | |||||||||||
| Expeditors International of Washington, Inc. (a) | 50,000 | 2,455 | |||||||||
| Trucking & Warehousing (2.0%) | |||||||||||
| United Parcel Service, Inc.–Class B | 75,000 | 5,348 | |||||||||
| Wholesale Trade Durable Goods (3.3%) | |||||||||||
| Grainger (W.W.), Inc. | 160,000 | 8,846 | |||||||||
| Total Common Stocks (cost: $168,415) | 190,525 | ||||||||||
| Principal | Value | ||||||||||
| SECURITY LENDING COLLATERAL (7.1%) | |||||||||||
| Debt (6.2%) | |||||||||||
| Bank Notes (0.9%) | |||||||||||
| Bank of America | |||||||||||
| 2.82%, due 05/16/2005 | $ | 598 | $ | 598 | |||||||
| 2.80%, due 06/09/2005 (d) | 149 | 149 | |||||||||
| 2.77%, due 07/18/2005 (d) | 598 | 598 | |||||||||
| Principal | Value | ||||||||||
| Bank Notes (continued) | |||||||||||
| Canadian Imperial Bank of Commerce 3.02%, due 11/04/2005 (d) | $ | 598 | $ | 598 | |||||||
| Credit Suisse First Boston Corp. 2.88%, due 09/09/2005 (d) 3.06%, due 03/10/2006 (d) | 149 149 | 149 149 | |||||||||
| Euro Dollar Overnight (1.1%) | |||||||||||
| Bank of Montreal 2.94%, due 05/04/2005 | 448 | 448 | |||||||||
| BNP Paribas 2.80%, due 05/05/2005 | 618 | 618 | |||||||||
| Den Danske Bank 2.93%, due 05/02/2005 538 538 2.80%, due 05/06/2005 | 299 | 299 | |||||||||
| Dexia Group 2.80%, due 05/05/2005 | 264 | 264 | |||||||||
| Royal Bank of Canada 2.80%, due 05/04/2005 | 613 | 613 | |||||||||
| Svenska Handlesbanken 2.80%, due 05/06/2005 | 99 | 99 | |||||||||
| Euro Dollar Terms (2.5%) | |||||||||||
| Bank of Nova Scotia 2.88%, due 05/11/2005 3.01%, due 05/31/2005 | 299 836 | 299 836 | |||||||||
| Barclays 3.02%, due 06/27/2005 | 533 | 533 | |||||||||
| BNP Paribas 2.93%, due 06/07/2005 | 478 | 478 | |||||||||
| Branch Banker & Trust 2.94%, due 06/06/2005 | 128 | 128 | |||||||||
| Calyon 2.93%, due 06/03/2005 | 494 | 494 | |||||||||
| Citigroup 2.87%, due 06/06/2005 | 620 | 620 | |||||||||
| Credit Suisse First Boston Corp. 2.91%, due 05/16/2005 | 612 | 612 | |||||||||
| HSBC Banking/Holdings PLC 3.01%, due 06/23/2005 | 299 | 299 | |||||||||
| Royal Bank of Scotland 2.94%, due 06/07/2005 580 580 2.95%, due 06/10/2005 | 322 | 322 | |||||||||
| Societe Generale 2.80%, due 05/03/2005 | 572 | 572 | |||||||||
| Toronto Dominion Bank 2.75%, due 05/09/2005 448 448 3.01%, due 06/24/2005 | 166 | 166 | |||||||||
| UBS AG 2.81%, due 05/03/2005 | 299 | 299 | |||||||||
The notes to the financial statements are an integral part of this report.
Transamerica IDEX Mutual Funds
Semi-Annual Report 2005
4
TA IDEX Transamerica Balanced
SCHEDULE OF INVESTMENTS (continued)
At April 30, 2005
(all amounts except share amounts in thousands)
(unaudited)
| Principal | Value | ||||||||||
| Promissory Notes (0.6%) | |||||||||||
| Goldman Sachs Group, Inc. | |||||||||||
| 2.99%, due 06/27/2005 | $ | 627 | $ | 627 | |||||||
| 3.01%, due 07/27/2005 | 1,047 | 1,047 | |||||||||
| Repurchase Agreements (1.1%) (e) | |||||||||||
| Goldman Sachs Group, Inc. 3.04% Repurchase Agreement dated 04/29/2005 to be repurchased at $1,345 on 05/02/2005 | 1,345 | 1,345 | |||||||||
| Merrill Lynch & Co., Inc. 3.04%, Repurchase Agreement dated 04/29/2005 to be repurchased at $1,613 on 05/02/2005 | 1,613 | 1,613 | |||||||||
| Shares | Value | ||||||||||
| Investment Companies (0.9%) | |||||||||||
| Money Market Funds (0.9%) | |||||||||||
| American Beacon Funds 1-day yield of 2.84% | 237,310 | $ | 237 | ||||||||
| BGI Institutional Money Market Fund 1-day yield of 2.93% | 1,405,248 | 1,405 | |||||||||
| Merrill Lynch Premier Institutional Fund 1-day yield of 2.65% | 316,225 | 316 | |||||||||
| Merrimac Cash Fund, Premium Class 1-day yield of 2.74% (f) | 578,371 | 578 | |||||||||
| Total Security Lending Collateral (cost: $18,974) | 18,974 | ||||||||||
| Total Investment Securities (cost: $261,047) | $ | 283,270 | |||||||||
| SUMMARY: | |||||||||||
| Investments, at value | 106.2 | % | $ | 283,270 | |||||||
| Liabilities in excess of other assets | (6.2 | )% | (16,532 | ) | |||||||
| Net assets | 100.0 | % | $ | 266,738 | |||||||
NOTES TO SCHEDULE OF INVESTMENTS:
(a) At April 30, 2005, all or a portion of this security is on loan (see Note 1). The value at April 30, 2005, of all securities on loan is $18,515.
(b) Husky Oil, Ltd. has a fixed coupon rate of 8.90% until 8/15/2008, thereafter the coupon rate will reset quarterly at the 3-month US$ LIBOR + 550BP, if not called.
(c) No dividends were paid during the preceding twelve months.
(d) Floating or variable rate note. Rate is listed as of April 30, 2005.
(e) Cash collateral for the Repurchase Agreements, valued at $3,010, that serve as collateral for securities lending are invested in corporate bonds with interest rates and maturity dates ranging from 0.00%–8.875% and 06/15/2005–03/15/2035, respectively.
(f) Regulated investment company advised by Investors Bank and Trust Co. ("IBT"). IBT is also the accounting, custody and lending agent for the Fund.
DEFINITIONS:
144A 144A Securities are registered pursuant to Rule 144A of the Securities Act of 1933. These securities are deemed to be liquid for purposes of compliance limitations on holdings of illiquid securities and may be resold as transactions exempt from registration, normally to qualified institutional buyers. At April 30, 2005, these securities aggregated $933 or 0.3% of the net assets of the Fund.
The notes to the financial statements are an integral part of this report.
Transamerica IDEX Mutual Funds
Semi-Annual Report 2005
5
TA IDEX Transamerica Balanced
STATEMENT OF ASSETS AND LIABILITIES
At April 30, 2005
(all amounts except share amounts in thousands)
(unaudited)
| Assets: | |||||||
| Investment securities, at value (cost: $261,047) (including securities loaned of $18,515) | $ | 283,270 | |||||
| Receivables: | |||||||
| Investment securities sold | 3,347 | ||||||
| Shares of beneficial interest sold | 64 | ||||||
| Interest | 1,088 | ||||||
| Dividends | 175 | ||||||
| Dividend reclaims receivable | 51 | ||||||
| Other | 205 | ||||||
| 288,200 | |||||||
| Liabilities: | |||||||
| Investment securities purchased | 891 | ||||||
| Accounts payable and accrued liabilities: | |||||||
| Shares of beneficial interest redeemed | 775 | ||||||
| Management and advisory fees | 179 | ||||||
| Distribution and service fees | 189 | ||||||
| Transfer agent fees | 86 | ||||||
| Due to custodian | 298 | ||||||
| Payable for collateral for securities on loan | 18,974 | ||||||
| Other | 70 | ||||||
| 21,462 | |||||||
| Net Assets | $ | 266,738 | |||||
| Net Assets Consist of: | |||||||
| Shares of beneficial interest, unlimited shares authorized, no par value | $ | 284,841 | |||||
| Undistributed net investment income (loss) | 220 | ||||||
| Accumulated net realized gain (loss) from investment securities and foreign currency transactions | (40,539 | ) | |||||
| Net unrealized appreciation (depreciation) on: Investment securities | 22,214 | ||||||
| Translation of assets and liabilities denominated in foreign currencies | 2 | ||||||
| Net Assets | $ | 266,738 | |||||
| Net Assets by Class: | |||||||
| Class A | $ | 65,737 | |||||
| Class B | 153,434 | ||||||
| Class C | 47,567 | ||||||
| Shares Outstanding: | |||||||
| Class A | 3,492 | ||||||
| Class B | 8,166 | ||||||
| Class C | 2,539 | ||||||
| Net Asset Value Per Share: | |||||||
| Class A | $ | 18.82 | |||||
| Class B | 18.79 | ||||||
| Class C | 18.73 | ||||||
| Maximum Offering Price Per Share (a): | |||||||
| Class A | $ | 19.92 | |||||
(a) Includes the maximum selling commission (represented as a percentage of offering price) which is reduced on certain levels of sales as set forth in the Prospectus. Net asset value per share for Classes B and C shares represents offering price. The redemption price for Classes B and C shares equals net asset value less any applicable contingent deferred sales charge.
STATEMENT OF OPERATIONS
For the period ended April 30, 2005
(all amounts in thousands)
(unaudited)
| Investment Income: | |||||||
| Interest | $ | 1,730 | |||||
| Dividends | 2,016 | ||||||
| Income from loaned securities–net | 31 | ||||||
| Less withholding taxes on foreign dividends | (29 | ) | |||||
| 3,748 | |||||||
| Expenses: | |||||||
| Management and advisory fees | 1,168 | ||||||
| Transfer agent fees: | |||||||
| Class A | 42 | ||||||
| Class B | 121 | ||||||
| Class C | 45 | ||||||
| Printing and shareholder reports | 86 | ||||||
| Custody fees | 14 | ||||||
| Administration fees | 27 | ||||||
| Legal fees | 6 | ||||||
| Audit fees | 3 | ||||||
| Trustees fees | 5 | ||||||
| Registration fees: | |||||||
| Class A | 1 | ||||||
| Class C | 10 | ||||||
| Distribution and service fees: | |||||||
| Class A | 125 | ||||||
| Class B | 836 | ||||||
| Class C | 260 | ||||||
| Total expenses | 2,749 | ||||||
| Net Investment Income (Loss) | 999 | ||||||
| Net Realized Gain (Loss) from: | |||||||
| Investment securities | 3,745 | ||||||
| Foreign currency transactions | 36 | ||||||
| 3,781 | |||||||
| Net Increase (Decrease) in Unrealized Appreciation (Depreciation) on: | |||||||
| Investment securities | 2,112 | ||||||
| Translation of assets and liabilities denominated in foreign currencies | (36 | ) | |||||
| 2,076 | |||||||
| Net Gain (Loss) on Investments and Foreign Currency Transactions | 5,857 | ||||||
| Net Increase (Decrease) in Net Assets Resulting from Operations | $ | 6,856 | |||||
The notes to the financial statements are an integral part of this report.
Transamerica IDEX Mutual Funds
Semi-Annual Report 2005
6
TA IDEX Transamerica Balanced
STATEMENTS OF CHANGES IN NET ASSETS
For the period or year ended
(all amounts in thousands)
| April 30, 2005 (unaudited) | October 31, 2004 | ||||||||||
| Increase (Decrease) In Net Assets From: | |||||||||||
| Operations: | |||||||||||
| Net investment income (loss) | $ | 999 | $ | 1,052 | |||||||
| Net realized gain (loss) from investment securities and foreign currency transactions | 3,781 | 33,174 | |||||||||
| Net unrealized appreciation (depreciation) on investment securities and foreign currency translation | 2,076 | (13,114 | ) | ||||||||
| 6,856 | 21,112 | ||||||||||
| Distributions to Shareholders: | |||||||||||
| From net investment income: | |||||||||||
| Class A | (482 | ) | (579 | ) | |||||||
| Class B | (254 | ) | (399 | ) | |||||||
| Class C | (174 | ) | (10 | ) | |||||||
| Class C2 | – | (53 | ) | ||||||||
| Class M | – | (98 | ) | ||||||||
| (910 | ) | (1,139 | ) | ||||||||
| Capital Share Transactions: | |||||||||||
| Proceeds from shares sold: | |||||||||||
| Class A | 3,183 | 9,645 | |||||||||
| Class B | 3,171 | 7,041 | |||||||||
| Class C | 1,696 | 1,114 | |||||||||
| Class C2 | – | 769 | |||||||||
| Class M | – | 480 | |||||||||
| 8,050 | 19,049 | ||||||||||
| Proceeds from fund acquisition: | |||||||||||
| Class A | – | 6,534 | |||||||||
| Class B | – | 17,187 | |||||||||
| Class C | – | 879 | |||||||||
| Class C2 | – | 2,271 | |||||||||
| Class M | – | 1,338 | |||||||||
| – | 28,209 | ||||||||||
| Dividends and distributions reinvested: | |||||||||||
| Class A | 464 | 558 | |||||||||
| Class B | 234 | 368 | |||||||||
| Class C | 159 | 9 | |||||||||
| Class C2 | – | 47 | |||||||||
| Class M | – | 90 | |||||||||
| 857 | 1,072 | ||||||||||
| Cost of shares redeemed: | |||||||||||
| Class A | (12,387 | ) | (38,320 | ) | |||||||
| Class B | (24,032 | ) | (64,412 | ) | |||||||
| Class C | (9,313 | ) | (6,563 | ) | |||||||
| Class C2 | – | (9,893 | ) | ||||||||
| Class M | – | (13,324 | ) | ||||||||
| (45,732 | ) | (132,512 | ) | ||||||||
| Class level exchanges: | |||||||||||
| Class C | – | 52,877 | |||||||||
| Class C2 | – | (23,753 | ) | ||||||||
| Class M | – | (29,124 | ) | ||||||||
| – | – | ||||||||||
| Automatic conversions: | |||||||||||
| Class A | 113 | 134 | |||||||||
| Class B | (113 | ) | (134 | ) | |||||||
| – | – | ||||||||||
| (36,825 | ) | (84,182 | ) | ||||||||
| Net increase (decrease) in net assets | (30,879 | ) | (64,209 | ) | |||||||
| April 30, 2005 (unaudited) | October 31, 2004 | ||||||||||
| Net Assets: | |||||||||||
| Beginning of period | $ | 297,617 | $ | 361,826 | |||||||
| End of period | $ | 266,738 | $ | 297,617 | |||||||
| Undistributed Net Investment Income (Loss) | $ | 216 | $ | 131 | |||||||
| Share Activity: | |||||||||||
| Shares issued: | |||||||||||
| Class A | 164 | 540 | |||||||||
| Class B | 164 | 393 | |||||||||
| Class C | 88 | 62 | |||||||||
| Class C2 | – | 43 | |||||||||
| Class M | – | 27 | |||||||||
| 416 | 1,065 | ||||||||||
| Shares issued on fund acquisition: | |||||||||||
| Class A | – | 362 | |||||||||
| Class B | – | 956 | |||||||||
| Class C | – | 49 | |||||||||
| Class C2 | – | 126 | |||||||||
| Class M | – | 74 | |||||||||
| – | 1,567 | ||||||||||
| Shares issued–reinvested from distributions: | |||||||||||
| Class A | 24 | 31 | |||||||||
| Class B | 12 | 21 | |||||||||
| Class C | 8 | 1 | |||||||||
| Class C2 | – | 3 | |||||||||
| Class M | – | 5 | |||||||||
| 44 | 61 | ||||||||||
| Shares redeemed: | |||||||||||
| Class A | (640 | ) | (2,128 | ) | |||||||
| Class B | (1,243 | ) | (3,597 | ) | |||||||
| Class C | (483 | ) | (365 | ) | |||||||
| Class C2 | – | (553 | ) | ||||||||
| Class M | – | (745 | ) | ||||||||
| (2,366 | ) | (7,388 | ) | ||||||||
| Class level exchanges: | |||||||||||
| Class C | – | 2,929 | |||||||||
| Class C2 | – | (1,321 | ) | ||||||||
| Class M | – | (1,608 | ) | ||||||||
| – | – | ||||||||||
| Automatic conversions: | |||||||||||
| Class A | 6 | 7 | |||||||||
| Class B | (6 | ) | (7 | ) | |||||||
| – | – | ||||||||||
| Net increase (decrease) in shares outstanding: | |||||||||||
| Class A | (446 | ) | (1,188 | ) | |||||||
| Class B | (1,073 | ) | (2,234 | ) | |||||||
| Class C | (387 | ) | 2,676 | ||||||||
| Class C2 | – | (1,702 | ) | ||||||||
| Class M | – | (2,247 | ) | ||||||||
| (1,906 | ) | (4,695 | ) | ||||||||
The notes to the financial statements are an integral part of this report.
Transamerica IDEX Mutual Funds
Semi-Annual Report 2005
7
TA IDEX Transamerica Balanced
FINANCIAL HIGHLIGHTS
(unaudited for the period ended April 30, 2005)
| For a share of beneficial interest outstanding throughout each period | |||||||||||||||||||||||||||||||||||||||
| Net Asset | Investment Operations | Distributions | Net Asset | ||||||||||||||||||||||||||||||||||||
| For the Period Ended (d)(g) | Value, Beginning of Period | Net Investment Income (Loss) | Net Realized and Unrealized Gain (Loss) | Total Operations | From Net Investment Income | From Net Realized Gains | Total Distributions | Value, End of Period | |||||||||||||||||||||||||||||||
| Class A | 4/30/2005 | $ | 18.53 | $ | 0.12 | $ | 0.30 | $ | 0.42 | $ | (0.13 | ) | $ | – | $ | (0.13 | ) | $ | 18.82 | ||||||||||||||||||||
| 10/31/2004 | 17.43 | 0.14 | 1.08 | 1.22 | (0.12 | ) | – | (0.12 | ) | 18.53 | |||||||||||||||||||||||||||||
| 10/31/2003 | 16.23 | 0.19 | 1.21 | 1.40 | (0.20 | ) | – | (0.20 | ) | 17.43 | |||||||||||||||||||||||||||||
| 10/31/2002 | 17.31 | 0.29 | (1.09 | ) | (0.80 | ) | (0.28 | ) | – | (0.28 | ) | 16.23 | |||||||||||||||||||||||||||
| 10/31/2001 | 19.75 | 0.37 | (2.18 | ) | (1.81 | ) | (0.35 | ) | (0.28 | ) | (0.63 | ) | 17.31 | ||||||||||||||||||||||||||
| 10/31/2000 | 18.96 | 0.25 | 1.03 | 1.28 | (0.24 | ) | (0.25 | ) | (0.49 | ) | 19.75 | ||||||||||||||||||||||||||||
| Class B | 4/30/2005 | 18.47 | 0.05 | 0.30 | 0.35 | (0.03 | ) | – | (0.03 | ) | 18.79 | ||||||||||||||||||||||||||||
| 10/31/2004 | 17.39 | 0.04 | 1.08 | 1.12 | (0.04 | ) | – | (0.04 | ) | 18.47 | |||||||||||||||||||||||||||||
| 10/31/2003 | 16.22 | 0.08 | 1.18 | 1.26 | (0.09 | ) | – | (0.09 | ) | 17.39 | |||||||||||||||||||||||||||||
| 10/31/2002 | 17.30 | 0.18 | (1.09 | ) | (0.91 | ) | (0.17 | ) | – | (0.17 | ) | 16.22 | |||||||||||||||||||||||||||
| 10/31/2001 | 19.73 | 0.25 | (2.17 | ) | (1.92 | ) | (0.23 | ) | (0.28 | ) | (0.51 | ) | 17.30 | ||||||||||||||||||||||||||
| 10/31/2000 | 18.95 | 0.21 | 1.03 | 1.24 | (0.21 | ) | (0.25 | ) | (0.46 | ) | 19.73 | ||||||||||||||||||||||||||||
| Class C | 4/30/2005 | 18.45 | 0.04 | 0.30 | 0.34 | (0.06 | ) | – | (0.06 | ) | 18.73 | ||||||||||||||||||||||||||||
| 10/31/2004 | 17.39 | (0.01 | ) | 1.11 | 1.10 | (0.04 | ) | – | (0.04 | ) | 18.45 | ||||||||||||||||||||||||||||
| 10/31/2003 | 16.22 | 0.08 | 1.18 | 1.26 | (0.09 | ) | – | (0.09 | ) | 17.39 | |||||||||||||||||||||||||||||
| Ratios/Supplemental Data | |||||||||||||||||||||||||||||||
| For the Period | Total | Net Assets, End of Period | Ratio of Expenses to Average Net Assets (a) | Net Investment Income (Loss) to Average | Portfolio Turnover | ||||||||||||||||||||||||||
| Ended (g) | Return (c) | (000's) | Net (e) | Total (f) | Net Assets (a) | Rate (b) | |||||||||||||||||||||||||
| Class A | 4/30/2005 | 2.23 | % | $ | 65,737 | 1.38 | % | 1.38 | % | 1.20 | % | 9 | % | ||||||||||||||||||
| 10/31/2004 | 7.03 | 72,997 | 1.70 | 1.70 | 0.76 | 107 | |||||||||||||||||||||||||
| 10/31/2003 | 8.71 | 89,335 | 1.73 | 1.73 | 1.13 | 69 | |||||||||||||||||||||||||
| 10/31/2002 | (4.72 | ) | 100,923 | 1.68 | 1.70 | 1.70 | 87 | ||||||||||||||||||||||||
| 10/31/2001 | (9.35 | ) | 126,369 | 1.64 | 1.66 | 1.96 | 114 | ||||||||||||||||||||||||
| 10/31/2000 | 7.23 | 133,445 | 1.67 | 1.69 | 1.73 | 71 | |||||||||||||||||||||||||
| Class B | 4/30/2005 | 1.88 | 153,434 | 2.04 | 2.04 | 0.54 | 9 | ||||||||||||||||||||||||
| 10/31/2004 | 6.44 | 170,630 | 2.26 | 2.26 | 0.19 | 107 | |||||||||||||||||||||||||
| 10/31/2003 | 7.84 | 199,472 | 2.37 | 2.37 | 0.48 | 69 | |||||||||||||||||||||||||
| 10/31/2002 | (5.31 | ) | 214,019 | 2.33 | 2.35 | 1.05 | 87 | ||||||||||||||||||||||||
| 10/31/2001 | (9.93 | ) | 243,387 | 2.29 | 2.31 | 1.31 | 114 | ||||||||||||||||||||||||
| 10/31/2000 | 6.58 | 229,160 | 2.32 | 2.34 | 1.08 | 71 | |||||||||||||||||||||||||
| Class C | 4/30/2005 | 1.85 | 47,567 | 2.11 | 2.11 | 0.47 | 9 | ||||||||||||||||||||||||
| 10/31/2004 | 6.33 | 53,990 | 2.28 | 2.28 | (0.08 | ) | 107 | ||||||||||||||||||||||||
| 10/31/2003 | 7.84 | 4,354 | 2.38 | 2.39 | 0.48 | 69 | |||||||||||||||||||||||||
NOTES TO FINANCIAL HIGHLIGHTS
(a) Annualized.
(b) Not annualized for periods of less than one year.
(c) Total Return has been calculated for the applicable period without deduction of a sales load, if any, on an initial purchase. Periods of less that one year are not annualized.
(d) Per share information is calculated based on average number of shares outstanding for the years ended 10/31/2001, 10/31/2002, 10/31/2003, 10/31/2004, and the period ended 4/30/2005.
(e) Ratio of Net Expenses to Average Net Assets is net of fee waivers and reimbursements by the investment adviser, if any (see note 2).
(f) Ratio of Total Expenses to Average Net Assets includes all expenses before fee waivers and reimbursements by the investment adviser.
(g) The inception date for the Fund's offering of share Class C was November 11, 2002.
The notes to the financial statements are an integral part of this report.
Transamerica IDEX Mutual Funds
Semi-Annual Report 2005
8
TA IDEX Transamerica Balanced
NOTES TO FINANCIAL STATEMENTS
At April 30, 2005
(all amounts in thousands)
(unaudited)
NOTE 1. ORGANIZATION AND SIGNIFICANT ACCOUNTING POLICIES
Transamerica IDEX Mutual Funds is a Delaware statutory trust registered under the Investment Company Act of 1940, as amended (the "1940 Act"), as an open-end management investment company. Prior to March 1, 2005, Transamerica IDEX Mutual Funds was a Massachusetts business trust. TA IDEX Transamerica Balanced ("the Fund"), part of Transamerica IDEX Mutual Funds, began operations on December 2, 1994.
On May 28, 2004, the Fund acquired all of the net assets of TA IDEX Janus Growth & Income pursuant to a plan of reorganization. TA IDEX Transamerica Balanced is the accounting survior. At the same time, the Fund changed sub-advisers from Janus Capital Management, LLC to Transamerica Investment Management, LLC and was renamed from TA IDEX Janus Balanced to TA IDEX Transamerica Balanced.
The acquisition was accomplished by a tax free exchange of 1,567 shares of the Fund for 3,232 shares of TA IDEX Janus Growth & Income outstanding on May 27, 2004. TA IDEX Janus Growth & Income's net assets at that date, $28,209, including $4,682 unrealized appreciation, were combined with those of the Fund. The aggregate net assets of TA IDEX Transamerica Balanced immediately before the acquisition was $302,562, the combined net assets of the Fund immediately after the acquisition was $330,771. Proceeds in connection with the acquisition were as follows:
| Shares | Amount | ||||||||||
| Proceeds in connection with the acquisition | |||||||||||
| Class A | 362 | $ | 6,534 | ||||||||
| Class B | 956 | 17,187 | |||||||||
| Class C | 49 | 879 | |||||||||
| Class C2 | 126 | 2,271 | |||||||||
| Class M | 74 | 1,338 | |||||||||
| $ | 28,209 | ||||||||||
In the normal course of business, the Fund enters into contracts that contain a variety of representations and warranties, which provide general indemnifications. The Fund's maximum exposure under these arrangements is unknown, as this would involve future claims that may be made against the Fund and/or its affiliates that have not yet occurred. However, based on experience, the Fund expects the risk of loss to be remote.
See the Prospectus and Statement of Additional Information for a description of the Fund's investment objective.
In preparing the Fund's financial statements in accordance with accounting principles generally accepted in the United States of America ("GAAP"), estimates or assumptions (which could differ from actual results) may be used that affect reported amounts and disclosures. The following policies were consistently followed by the Fund, in accordance with GAAP.
Multiple class operations and expenses: The Fund currently offers three classes of shares, each with a public offering price that reflects different sales charges, if any, and expense levels. On June 15, 2004, Class C2 shares merged into Class C. On September 24, 2004, Class M shares merged into Class C. Class B shares will convert to Class A shares eight years after purchase. Income, non-class specific expenses and realized and unrealized gains and losses, are allocated daily to each class, based upon the value of shares outstanding method as permitted under Rule 18f-3 of the 1940 Act. Each class bears its own specific expenses as well as a portion of general, common expenses.
Pricing of shares: The Fund prices its shares on the basis of the net asset value of each class of shares of the Fund, which is determined as of the close of the New York Stock Exchange ("NYSE") (generally 4:00 p.m. Eastern Time) on each day on which the NYSE is open for trading.
Security valuations: Fund investments traded on an exchange are valued at the closing price on the day of valuation on the exchange where the security is principally traded. With respect to securities traded on NASDAQ NMS, such closing price may be the last reported sales price or the NASDAQ Official Closing Price.
Securities traded in the over-the-counter market and listed securities for which no sale was reported on that date are valued at the last quoted bid price.
Debt securities are valued by independent pricing services at the last quoted bid price; however, those that mature in sixty days or less are valued at amortized cost, which approximates market.
Investment company securities are valued at net asset value of the underlying portfolio.
Foreign securities generally are valued based on quotations from the primary market in which they are traded and are translated from the local currency into U.S. dollars using closing exchange rates. Many foreign securities markets are open for trading at times when the U.S. markets are closed for trading, and many foreign securities markets close for trading before the close of the NYSE. The value of foreign securities may be affected significantly on a day that the NYSE is closed and an investor is unable to purchase or redeem shares. If a significant market event impacting the value of a portfolio security (e.g., natural disaster, company announcement, market volatility) occurs subsequent to the close of trading in the security, but prior to the calculation of the Fund's net asset value per share, market quotations for that security may be determined to be unreliable and, accordingly, not "readily av ailable." If market quotations are not readily available, and the impact of such a significant market event materially effects the net asset value per share of the Fund, an affected portfolio security will be valued at fair market value as determined in good faith using guidelines adopted by the Board of Trustees of the Fund, under the supervision of the Fund's Valuation Committee. Factors that may be considered to value foreign
Transamerica IDEX Mutual Funds
Semi-Annual Report 2005
9
TA IDEX Transamerica Balanced
NOTES TO FINANCIAL STATEMENTS (continued)
At April 30, 2005
(all amounts in thousands)
(unaudited)
NOTE 1.–(continued)
securities at fair market value may include, among others: the value of other securities traded on other markets, foreign currency exchange activity and the trading of financial products tied to foreign securities.
Other securities for which quotations are not readily available are valued at fair market value as determined in good faith using guidelines adopted by the Board of Trustees of the Fund, under the supervision of the Fund's Valuation Committee. These guidelines may include: the type of security; any restrictions on its resale; financial or business news of the issuer; similar or related securities that are actively trading; related corporate actions; and other significant events occurring after the close of trading in the security.
Cash: The Fund may leave cash overnight in its cash account with the custodian, Investors Bank & Trust Company ("IBT"). IBT has been contracted on behalf of the Fund to invest the excess cash into a savings account, which at April 30, 2005, was paying an interest rate of 2.02%.
Throughout the period, the Fund may have a cash overdraft balance. A fee is incurred on this overdraft, calculated by multiplying the overdraft by a rate based on the federal funds rate.
Repurchase agreements: The Fund is authorized to enter into repurchase agreements. The Fund, through IBT, receives delivery of the underlying securities, the value of which at the time of purchase is required to be an amount equal to at least 100% of the resale price. Repurchase agreements involve the risk that the seller will fail to repurchase the security, as agreed. In that case, the Fund will bear the risk of value fluctuations until the security can be sold and may encounter delays and incur costs in liquidating the security. In the event of bankruptcy or insolvency of the seller, delays and costs may be incurred.
Commission recapture: The sub-adviser, to the extent consistent with the best execution and usual commission rate policies and practices, may place security transactions of the Fund with broker/dealers with which Transamerica IDEX Mutual Funds has established a Commission Recapture Program. A Commission Recapture Program is any arrangement under which a broker/dealer applies a portion of the commissions received by such broker/dealer on the security transactions to the Fund. In no event will commissions paid by the Fund be used to pay expenses that would otherwise be borne by any other funds within Transamerica IDEX Mutual Funds, or by any other party.
Recaptured commissions during the six months ended April 30, 2005, of $2 are included in net realized gains in the Statement of Operations.
Securities lending: The Fund may lend securities to enhance fund earnings from investing cash collateral in making such loans to qualified borrowers (typically broker/dealers). The Fund has engaged its custodian bank, IBT, as a lending agent to administer its securities lending program. IBT earned $14 of program income for its services. When the Fund makes a security loan, it receives cash collateral as protection against the risk that the borrower will default on the loan, and records an asset for the cash invested collateral and a liability for the return of the collateral.
Loans of securities are required to be secured by collateral at least equal to 102% of the value of the securities at inception of the loan, and not less then 100% thereafter. The Fund may invest cash collateral in short-term money market instruments including: U.S. Treasury Bills, U.S. agency obligations, commercial paper, money market mutual funds, repurchase agreements and other highly rated, liquid investments. During the life of securities loans, the collateral and securities loaned remain subject to fluctuation in value. IBT marks to market securities loaned and the collateral each business day. If additional collateral is due (at least $1), IBT collects additional cash collateral from the borrowers. Although securities loaned will be fully collateralized at all times, IBT may experience delays in, or may be prevented from, recovering the collateral on behalf of the Fund. The Fund may recall a loa ned security position at any time from the borrower through IBT. In the event the borrower fails to timely return a recalled security, IBT may indemnify the Fund by purchasing replacement securities for the Fund at its own expense and claiming the collateral to fund such a purchase. IBT absorbs the loss if the collateral value is not sufficient to cover the cost of the replacement securities. If replacement securities are not available, IBT will credit the equivalent cash value to the Fund.
While a security is on loan, the Fund does not have the right to vote that security. However, if time permits, the Fund will attempt to recall a security on loan and vote the proxy.
Income from securities lending is included in the Statement of Operations. The amount of collateral and value of securities on loan are included in the Statement of Assets and Liabilities as well as in the Schedule of Investments.
Security transactions and investment income: Security transactions are recorded on the trade date. Security gains and losses are calculated on the specific identification basis. Dividend income is recorded on the ex-dividend date or, in the case of foreign securities, as soon as the Fund is informed of the ex-dividend date. Interest income, including accretion of discounts and amortization of premiums, is recorded on the accrual basis commencing on the settlement date.
Foreign currency denominated investments: The accounting records of the Fund are maintained in U.S. dollars. Securities and other assets and liabilities denominated in foreign currencies are translated into U.S. dollars at the closing exchange rate each day. The cost of foreign securities is translated at the exchange rate in effect when the investment was acquired. The Fund combines fluctuations from currency exchange rates and fluctuations in value when computing net realized and unrealized gains or losses from investments.
Net foreign currency gains and losses resulting from changes in exchange rates include: 1) foreign currency fluctuations between trade date and settlement date of investment security transactions; 2) gains and
Transamerica IDEX Mutual Funds
Semi-Annual Report 2005
10
TA IDEX Transamerica Balanced
NOTES TO FINANCIAL STATEMENTS (continued)
At April 30, 2005
(all amounts in thousands)
(unaudited)
NOTE 1.–(continued)
losses on forward foreign currency contracts; and 3) the difference between the receivable amounts of interest and dividends recorded in the accounting records in U.S. dollars and the amounts actually received.
Foreign currency denominated assets may involve risks not typically associated with domestic transactions, including unanticipated movements in exchange currency rates, the degree of government supervision and regulation of security markets, and the possibility of political or economic instability.
Foreign capital gains taxes: The Fund may be subject to taxes imposed by countries in which it invests, with respect to its investment in issuers existing or operating in such countries. Such taxes are generally based on income earned or repatriated and capital gains realized on the sale of such investments. The Fund accrues such taxes when the related income or capital gains are earned. Some countries require governmental approval for the repatriation of investment income, capital or the proceeds of sales earned by foreign investors. In addition, if there is deterioration in a country's balance of payments or for other reasons, a country may impose temporary restrictions on foreign capital remittances abroad.
Forward foreign currency contracts: The Fund may enter into forward foreign currency contracts to hedge against exchange rate risk arising from investments in securities denominated in foreign currencies. Contracts are valued at the contractual forward rate and are marked to market daily, with the change in value recorded as an unrealized gain or loss. When the contracts are closed a realized gain or loss is incurred. Risks may arise from changes in market value of the underlying currencies and from the possible inability of counterparties to meet the terms of their contracts.
There were no open forward foreign currency contracts at April 30, 2005.
Account maintenance fees: If the shareholder account balance falls below $1 by either shareholder action or as a result of market action, a $25 (not in thousands) fee is assessed every year until the balance reaches $1. The fee is assessed by redeeming shares in the shareholder's account.
No fee will be charged under the following conditions:
• accounts opened within the preceding 24 months
• accounts with an active monthly Automatic Investment Plan ($50 (not in thousands) minimum per fund)
• accounts owned by an individual which, when combined by social security number, have a balance of $5 or more
• accounts owned by individuals in the same household (by address) that have a combined balance of $5 or more
• UTMA/UGMA accounts
• Fiduciary accounts
• B-share accounts whose shares have started to convert to A-shares accounts (as long as combined value of both accounts is at least $1)
For the six months ended April 30, 2005, this fee totaled $9. These fees are included in Paid in Capital in the Statement of Assets and Liabilities.
Redemption fees: A short-term trading redemption fee may be assessed on any fund shares in a fund account that are sold during the first five (5) NYSE trading days following their purchase date. This redemption fee will equal 2% of the amount redeemed and shares held the longest will be treated as being redeemed first and shares held the shortest as being redeemed last.
For the six months ended April 30, 2005, the Fund received less than $1 in redemption fees.
Dividend distributions: Distributions to shareholders are recorded on the ex-dividend date and are determined in accordance with Federal income tax regulations which may differ from GAAP.
NOTE 2. RELATED PARTY TRANSACTIONS
Transamerica Fund Advisors, Inc. ("TFAI") is the Fund's investment adviser. Transamerica Fund Services, Inc. ("TFS") is the Fund's administrator and transfer agent. AFSG Securities Corp. ("AFSG") is the Fund's distributor/principal underwriter. AFSG is 100% owned by AUSA Holding Company ("AUSA"). TFAI is a directly owned subsidiary of Western Reserve Life Assurance Co. of Ohio (78%) and AUSA (22%). TFS is a wholly owned subsidiary of WRL (50%) and AUSA (50%). AUSA and WRL are wholly owned indirect subsidiaries of AEGON, NV, a Netherlands corporation.
Effective January 1, 2005 AEGON/Transamerica Fund Advisors, Inc. ("ATFA") was renamed Transamerica Fund Advisors, Inc. ("TFAI"); AEGON/Transamerica Fund Services, Inc. ("ATFS") and AEGON/Transamerica Investor Services, Inc. ("ATIS") merged into one entity and was renamed Transamerica Fund Services, Inc. ("TFS").
Transamerica IDEX Mutual Funds
Semi-Annual Report 2005
11
TA IDEX Transamerica Balanced
NOTES TO FINANCIAL STATEMENTS (continued)
At April 30, 2005
(all amounts in thousands)
(unaudited)
NOTE 2.–(continued)
Transamerica Investment Management, LLC is both an affiliate of the Fund and a sub-adviser to the Fund.
Investment advisory fees: The Fund pays management fees to TFAI based on average daily net assets ("ANA") at the following breakpoints:
From November 1, 2004 to December 31, 2004:
0.85% of the first $250 million of ANA
0.80% of the next $250 million of ANA
0.75% of the next $1 billion of ANA
0.65% of ANA over $1.5 billion
From January 1, 2005 on:
0.80% of the first $250 million of ANA
0.75% of the next $250 million of ANA
0.70% of the next $1 billion of ANA
0.625% of ANA over $1.5 billion
TFAI has contractually agreed to waive its advisory fee and will reimburse the Fund to the extent that operating expenses, excluding 12b-1 fees, exceed the following stated annual limit:
From November 1, 2004 to December 31, 2004:
1.50% Expense Limit
From January 1, 2005 on:
1.45% Expense Limit
If total fund expenses fall below the annual expense limitation agreement agreed to by the adviser within the succeeding three years, the Fund may be required to pay that adviser a portion or all of the waived advisory fees.
There are no amounts available for recapture at April 30, 2005.
Distribution and service fees: The Fund has a 12b-1 distribution plan under the 1940 Act pursuant to which an annual fee, based on average daily net assets, is paid to the distributor for various disbursements such as broker-dealer account servicing fees and other promotional expenses of the Fund. The Fund is authorized under the 12b-1 plan to pay fees on each class up to the following limits:
| Class A | 0.35 | % | |||||
| Class B | 1.00 | % | |||||
| Class C | 1.00 | % | |||||
In the case the Fund or a class of shares of the Fund is closed to new investors or investments, the Fund is authorized to pay 12b-1 fees for past sales and distribution efforts and present and past investor services.
Underwriter commissions relate to front-end sales charges imposed for Class A shares and contingent deferred sales charges from Classes B, C, and certain A share redemptions. For the six months ended April 30, 2005, the underwriter commissions were as follows:
| Received by Underwriter | $ | 237 | |||||
| Retained by Underwriter | 12 | ||||||
| Contingent Deferred Sales Charge | 188 | ||||||
Administrative services: The Fund has entered into an agreement with TFS for financial and legal fund administration services, which includes such items as compliance, expenses, financial statements and other reporting, distributions, tax returns, prospectus preparation, board of trustees meeting support and other legal matters. As of January 1, 2005 the Fund pays TFS an annual fee of 0.02% of average net assets. Prior to January 1, 2005 the Fund paid TFS an annual fee of 0.015% of average net assets. The Legal fees on the Statement of Operations are for fees paid to external legal counsel.
Transfer agent fees: The Fund pays TFS an annual per-account charge of $20 (not in thousands) for each open account and $1.63 (not in thousands) for each closed account. There is no new account charge. The Transfer agent fees on the Statement of Operations are made up of fees paid to TFS and costs associated with shareholder statements.
The Fund paid TFS $281 for the six months ended April 30, 2005.
Deferred compensation plan: Each eligible Fund Trustee may elect participation in the Deferred Compensation Plan ("the Plan"). Under the Plan, such Trustees may defer payment of a percentage of their total fees earned as a Fund Trustee. These deferred amounts may be invested in any Transamerica IDEX Mutual Fund. At April 30, 2005, the value of invested plan amount was $36. Invested plan amounts and the total liability for deferred compensation to the Trustees under the Plan at April 30, 2005, are included in the accompanying Statement of Assets and Liabilities.
NOTE 3. INVESTMENT TRANSACTIONS
The cost of securities purchased and proceeds from securities sold (excluding short-term securities) for the six months ended April 30, 2005, were as follows:
| Purchases of securities: | |||||||
| Long-Term excluding U.S. Government | $ | 14,845 | |||||
| U.S. Government | 11,565 | ||||||
| Proceeds from maturities and sales of securities: | |||||||
| Long-Term excluding U.S. Government | 52,096 | ||||||
| U.S. Government | 13,784 | ||||||
NOTE 4. FEDERAL INCOME TAX MATTERS
The Fund has not made any provision for federal income or excise taxes due to its policy to distribute all of its taxable income and capital gains to its shareholders and otherwise qualify as a regulated investment company under the Internal Revenue Code. Income and capital gain distributions are determined in accordance with income tax regulations, which may differ from GAAP. These differences are primarily
Transamerica IDEX Mutual Funds
Semi-Annual Report 2005
12
TA IDEX Transamerica Balanced
NOTES TO FINANCIAL STATEMENTS (continued)
At April 30, 2005
(all amounts in thousands)
(unaudited)
NOTE 4.–(continued)
due to differing treatment for items including, but not limited to, wash sales, net operating losses and capital loss carryforwards.
The capital loss carryforwards are available to offset future realized capital gains through the periods listed:
| Capital Loss Carryforward | Available through | ||||||
| $ | 2,279 | October 31, 2009 | |||||
| 32,287 | October 31, 2010 | ||||||
| 9,071 | October 31, 2011 | ||||||
The aggregate cost of investments and composition of unrealized appreciation (depreciation) for federal income tax purposes as of April 30, 2005, are as follows:
| Federal Tax Cost Basis | $ | 261,660 | |||||
| Unrealized Appreciation | $ | 25,720 | |||||
| Unrealized (Depreciation) | (4,110 | ) | |||||
| Net Unrealized Appreciation (Depreciation) | $ | 21,610 | |||||
NOTE 5. REGULATORY PROCEEDINGS
There continues to be significant federal and state regulatory activity relating to financial services companies, particularly mutual fund companies and their investment advisers. As part of an ongoing investigation regarding potential market timing, recordkeeping and trading compliance issues and matters affecting the Fund's investment adviser, TFAI, and certain employees and affiliates of TFAI, the SEC staff has indicated that it is likely to take some action against TFAI and certain of its affiliates at the conclusion of the investigation. The potential timing and the scope of any such action is difficult to predict. Although the impact of any action brought against TFAI and/or its affiliates is difficult to assess at the present time, the Fund currently believes that the likelihood that any such action will have a material adverse impact on it is remote. It is important to note that the Fund is not aware of any allegation of wrongdoing against it and its board at the time this semi-annual report is printed. Although it is not anticipated that these developments will have an adverse impact on the Fund, there can be no assurance at this time. TFAI and its affiliates are actively working with the SEC in regard to this matter; however, the exact resolution cannot be determined at this time. TFAI will take such actions that it deems necessary or appropriate to continue providing management services to the Fund and to bring all matters to an appropriate conclusion.
TFAI and/or its affiliates, and not the Fund, will bear the costs regarding these regulatory matters.
Transamerica IDEX Mutual Funds
Semi-Annual Report 2005
13
TA IDEX Transamerica Balanced
INVESTMENT ADVISORY AGREEMENT – REVIEW AND RENEWAL
At a meeting of the Board of Trustees of Transamerica IDEX Mutual Funds ("TA IDEX") held on October 6, 2004, the Board considered and approved the renewal for a one-year period of the Investment Advisory Agreement between TA IDEX Transamerica Balanced (the "Fund") and Transamerica Fund Advisors, Inc. ("TFAI"). In approving the renewal of this agreement, the Board concluded that the Investment Advisory Agreement enables shareholders of the Fund to obtain high quality services at a cost that is appropriate, reasonable, and in the best interests of shareholders based upon the following determinations, among others:
The nature, extent and quality of the advisory service to be provided. The Board considered the nature and quality of the services provided by TFAI in the past, as well as the services anticipated to be provided in the future. The Board concluded that TFAI is capable of providing high quality services to the Fund, as indicated by TFAI's management capabilities demonstrated with respect to the Fund and other funds managed by TFAI, and TFAI's management oversight process. The Board also concluded that TFAI would provide the same quality and quantity of investment management and related services as before, that these services are appropriate in scope and extent in light of the Fund's operations, the competitive landscape of the investment company business and investor needs, and that TFAI's obligat ions will remain the same in all respects.
The investment performance of the Fund. The Board reviewed the Fund's investment performance since the Fund's sub-adviser, Transamerica Investment Management, LLC (the "Sub-Adviser") was appointed to manage the Fund pursuant to a vote of the Fund's shareholders on May 21, 2004. The Trustees concluded that the performance of the new Sub-Adviser was acceptable, although they would closely monitor the Fund's investment performance in light of the Fund's investment objective, policies and strategies and the Fund's historical below-average performance relative to certain comparable investment companies to verify that the Fund achieves an acceptable level of performance following the change of Sub-Adviser.
The cost of advisory services provided and the level of profitability. On the basis of the Board's review of the fees to be charged by TFAI and the Sub-Adviser for investment advisory and related services, TFAI's financial statements, the fees paid by TFAI to the Sub-Adviser, TFAI's estimated net management income resulting from its management of the Fund, the estimated profitability of TFAI's relationships with the Fund and TA IDEX, and the recent reorganization of the Fund and the Fund's portfolio, the Board concluded that the level of investment advisory fees and the profitability is appropriate in light of the services provided, the management fees and overall expense ratios of comparable investment companies, and the anticipated profitability of the relationship between the Fund and TFAI. I n this regard, the Board noted that the Fund was recently reorganized, a new sub-adviser was appointed to manage the Fund's portfolio, and that such reorganization of the Fund and its portfolio may have increased the Fund's overall expense ratio on a short term basis.
The extent to which economies of scale would be realized as the Fund grows and whether fee levels reflect these economies of scale for the benefit of Fund investors. The Trustees concluded that inclusion of asset-based breakpoints in the Fund's advisory fee schedule appropriately benefit investors by realizing economies of scale in the form of a lower advisory fee rate as the level of Fund assets increases. The Board also concluded that the advisory fees appropriately reflect the Fund's current size, the current economic environment for TFAI, and the competitive nature of the investment company market. In addition, the Board noted that it will have the opportunity to periodically re-examine whether the Fund has achieved economies of scale, as well as the appropriateness of advisory fees payable to TFAI in the future.
Benefits (such as soft dollars) to TFAI or the Sub-Adviser from its relationship with the Fund. The Board concluded that other benefits derived by TFAI or the Sub-Adviser from its relationship with the Fund are reasonable and fair, and are consistent with industry practice and the best interests of the Fund and its shareholders. In this regard, the Board noted that TFAI does not realize "soft dollar" benefits from its relationship with the Fund, and that the Sub-Adviser is participating in a brokerage program pursuant to which a portion of brokerage commissions paid by the Fund is recaptured for the benefit of the Fund and its shareholders, thus limiting the amount of "soft-dollar" arrangements the Sub-Adviser may engage in with respect to the Fund's portfolio brokerage transactions.
Other considerations. The Board also determined that TFAI had made a substantial commitment to the recruitment and retention of high quality personnel, and maintained the financial, compliance and operational resources reasonably necessary to manage the Fund in a professional manner that is consistent with the best interests of the Fund and its shareholders. The Trustees also concluded that TFAI had made a significant entrepreneurial commitment to the management and success of the Fund, reflected by TFAI's expense limitation and fee waiver arrangement with the Fund which, as demonstrated in the past with the Fund, may result in TFAI waiving a substantial amount of advisory fees for the benefit of shareholders.
Transamerica IDEX Mutual Funds
Semi-Annual Report 2005
14
TA IDEX Transamerica Balanced
SUPPLEMENTAL INFORMATION (unaudited)
RESULTS OF SHAREHOLDER PROXY
At a special meeting of shareholders held on February 25, 2005, the results of the Proposals were as follows:
Transamerica IDEX Mutual Funds
Proposal 1: Election of Trustees to the Board of Trustees of Transamerica IDEX Mutual Funds.
| For | Withheld | ||||||||||
| Peter R. Brown | 872,017,875.249 | 4,468,498.551 | |||||||||
| Daniel Calabria | 871,917,069.786 | 4,569,304.014 | |||||||||
| Janise B. Case | 872,099,393.125 | 4,386,980.675 | |||||||||
| Charles C. Harris | 872,086,722.025 | 4,399,651.775 | |||||||||
| Leo J. Hill | 872,304,465.640 | 4,181,908.160 | |||||||||
| Russell A. Kimball, Jr. | 872,253,556.471 | 4,232,817.329 | |||||||||
| William W. Short, Jr. | 872,139,920.944 | 4,346,452.856 | |||||||||
| John Waechter | 872,261,152.376 | 4,225,221.424 | |||||||||
| Jack E. Zimmerman | 871,929,967.512 | 4,556,406.288 | |||||||||
| Brian C. Scott | 872,218,970.367 | 4,267,403.433 | |||||||||
| Thomas P. O'Neill | 872,111,944.117 | 4,374,429.683 | |||||||||
TA IDEX Transamerica Balanced
Proposal 2: Approval of an Agreement and Plan of Reorganization pursuant to which Transamerica IDEX Mutual Funds will organize as a Delaware statutory trust.
| For | Against | Abstentions/Broker Non-Votes | |||||||||
| 6,714,216.979 | 163,374.901 | 2,956,654.095 | |||||||||
Proposal 3: Approval of changes to the fundamental investment restrictions of TA IDEX Transamerica Balanced.
| A. Diversification | For | Against | Abstentions/Broker Non-Votes | ||||||||||||
| 6,911,920.157 | 202,943.440 | 2,719,382.378 | |||||||||||||
| B. Borrowing | For | Against | Abstentions/Broker Non-Votes | ||||||||||||
| 6,894,964.875 | 219,898.722 | 2,719,382.378 | |||||||||||||
| C. Senior Securities | For | Against | Abstentions/Broker Non-Votes | ||||||||||||
| 6,912,489.462 | 202,374.135 | 2,719,382.378 | |||||||||||||
| D. Underwriting Securities | For | Against | Abstentions/Broker Non-Votes | ||||||||||||
| 6,912,565.537 | 202,515.060 | 2,719,165.378 | |||||||||||||
| E. Real Estate | For | Against | Abstentions/Broker Non-Votes | ||||||||||||
| 6,910,358.993 | 204,721.604 | 2,719,165.378 | |||||||||||||
| F. Making Loans | For | Against | Abstentions/Broker Non-Votes | ||||||||||||
| 6,892,622.971 | 222,457.626 | 2,719,165.378 | |||||||||||||
| G. Concentration | For | Against | Abstentions/Broker Non-Votes | ||||||||||||
| 6,908,128.871 | 206,951.726 | 2,719,165.378 | |||||||||||||
| H. Commodities | For | Against | Abstentions/Broker Non-Votes | ||||||||||||
| 6,906,343.128 | 208,737.469 | 2,719,165.378 | |||||||||||||
Transamerica IDEX Mutual Funds
Semi-Annual Report 2005
15
TA IDEX Transamerica Conservative High-Yield Bond
UNDERSTANDING YOUR FUND'S EXPENSES
(unaudited)
SHAREHOLDER EXPENSES
The following Example is intended to help you understand your ongoing costs (in dollars and cents) of investing in a Fund and to compare these costs with the ongoing costs of investing in other funds.
The Example is based on an investment of $1,000 invested at November 1, 2004 and held for the entire period until April 30, 2005.
ACTUAL EXPENSES
The first line in the table below provides information about actual account values and actual expenses. You may use the information in this line, together with the amount you invested, to estimate the expenses that you paid over the period. Simply divide your account value by $1,000 (for example, an $8,600 account value divided by $1,000 = 8.6), then multiply the result by the number in the first line of your Fund under the heading entitled "Expenses Paid During Period" to estimate the expenses you paid on your account during this period.
HYPOTHETICAL EXAMPLE FOR COMPARISON PURPOSES
The second line in the table below provides information about hypothetical account values and hypothetical expenses based on the Fund's actual expense ratio and an assumed rate of return of 5% per year before expenses, which is not the Fund's actual return. The hypothetical account values and expenses may not be used to estimate the actual ending account balance or expenses you paid for the period. You may use this information to compare the ongoing costs of investing in your Fund and other funds. To do so, compare this 5% hypothetical example with the 5% hypothetical examples that appear in the shareholder reports of the other funds.
Please note that the expenses shown in the table are meant to highlight your ongoing costs only and do not reflect any transactional costs, such as sales charges, redemption fees, brokerage commissions paid on purchases and sales of fund shares. Therefore, the second line under the Fund in the table is useful in comparing ongoing costs only, and will not help you determine the relative total costs of owning different funds. In addition, note that the expenses shown in the table are meant to highlight your ongoing costs and do not reflect any transaction costs.
| Beginning Account Value | Ending Account Value | Annualized Expense Ratio | Expenses Paid During Period (a) | ||||||||||||||||
| Class A | |||||||||||||||||||
| Actual | $ | 1,000.00 | $ | 991.80 | 1.03 | % | $ | 5.09 | |||||||||||
| Hypothetical (b) | 1,000.00 | 1,019.69 | 1.03 | 5.16 | |||||||||||||||
| Class B | |||||||||||||||||||
| Actual | 1,000.00 | 987.10 | 1.78 | 8.77 | |||||||||||||||
| Hypothetical (b) | 1,000.00 | 1,015.97 | 1.78 | 8.90 | |||||||||||||||
| Class C | |||||||||||||||||||
| Actual | 1,000.00 | 988.10 | 1.87 | 9.22 | |||||||||||||||
| Hypothetical (b) | 1,000.00 | 1,015.52 | 1.87 | 9.35 | |||||||||||||||
| Class I | |||||||||||||||||||
| Actual | 1,000.00 | 992.50 | 0.66 | 3.12 | |||||||||||||||
| Hypothetical (b) | 1,000.00 | 1,020.57 | 0.66 | 3.16 | |||||||||||||||
(a) Expenses are calculated using each Fund's annualized expense ratio (as disclosed in the table), multiplied by the average account value for the period, multiplied by number of days in the period (181 days), and divided by the number of days in the year (365 days).
(b) 5% return per year before expenses.
GRAPHICAL PRESENTATION OF SCHEDULE OF INVESTMENTS
By Bond Credit Quality (Moody Ratings)
At April 30, 2005
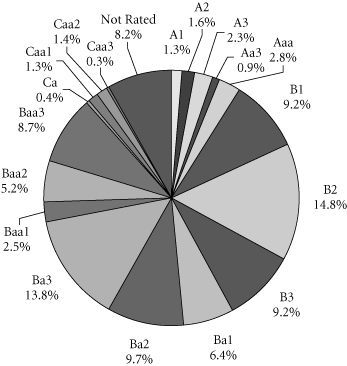
This chart shows the percentage breakdown by Bond Credit Quality of the Fund's total investment securities.
Transamerica IDEX Mutual Funds
Semi-Annual Report 2005
1
TA IDEX Transamerica Conservative High-Yield Bond
GRAPHICAL PRESENTATION OF SCHEDULE OF INVESTMENTS
(continued)
| Credit Rating | Description | ||||||
| Aaa | Prime grade obligations. Exceptional financial security and ability to meet senior financial obligations. | ||||||
| Aa3 | High grade obligations. Strong capacity to pay interest and repay principal. | ||||||
| A1 | Upper medium grade obligations. Interest payments and principal are considered adequate, but elements may be present which suggest a susceptibility to impairment some time in the future. | ||||||
| A2 | Upper medium grade obligations. Interest payments and principal are considered adequate, but elements may be present which suggest a susceptibility to impairment some time in the future. | ||||||
| A3 | Upper medium grade obligations. Interest payments and principal are considered adequate, but elements may be present which suggest a susceptibility to impairment some time in the future. | ||||||
| Baa1 | Medium grade obligations. Interest payments and principal security are adequate for the present but certain protective elements may be lacking or may be characteristically unreliable over great length of time. | ||||||
| Baa2 | Medium grade obligations. Interest payments and principal security appear adequate for the present but certain protective elements may be lacking or may be characteristically unreliable over great length of time. | ||||||
| Baa3 | Medium grade obligations. Interest payments and principal security are not as adequate for the present but certain protective elements may be lacking or may be characteristically unreliable over great length of time. | ||||||
| Ba1 | Moderate vulnerability in the near-term but faces major ongoing uncertainties in the event of adverse business, financial and economic conditions. | ||||||
| Ba2 | Vulnerable in the near-term but faces major ongoing uncertainties in the event of adverse business, financial and economic conditions. | ||||||
| Ba3 | More vulnerable in the near-term but faces major ongoing uncertainties in the event of adverse business, financial and economic conditions. | ||||||
| B1 | Moderate vulnerability to adverse business, financial and economic conditions but currently has the capacity to meet financial commitments. | ||||||
| B2 | More vulnerable to adverse business, financial and economic conditions but currently has the capacity to meet financial commitments. | ||||||
| B3 | Assurance of interest and principal payments or of maintenance of other terms of the contract over any long period of time may be small. | ||||||
| Ca | Speculative in a high degree. Such issues are often in default or have other marked shortcomings. | ||||||
| Caa1 | Highly vulnerable may be in default on their policyholder obligations or there may be present elements of danger with respect to payment of policyholder obligations and claims. | ||||||
| Caa2 | Extremely vulnerable may be in default on their policyholder obligations or there may be present elements of danger with respect to payment of policyholder obligations and claims. | ||||||
| Caa3 | Speculative, may be in default on their policyholder obligations or have other marked shortcomings. | ||||||
Transamerica IDEX Mutual Funds
Semi-Annual Report 2005
2
TA IDEX Transamerica Conservative High-Yield Bond
SCHEDULE OF INVESTMENTS
At April 30, 2005
(all amounts except share amounts in thousands)
(unaudited)
| Principal | Value | ||||||||||
| U.S. GOVERNMENT OBLIGATIONS (2.2%) | |||||||||||
| U.S. Treasury Bond 7.50%, due 11/15/2016 (a) | $ | 1,000 | $ | 1,285 | |||||||
| 7.88%, due 02/15/2021 | 1,000 | 1,373 | |||||||||
| 5.25%, due 11/15/2028 | 1,000 | 1,091 | |||||||||
| 5.38%, due 02/15/2031 (a) | 5,000 | 5,647 | |||||||||
| Total U.S. Government Obligations (cost: $9,127) | 9,396 | ||||||||||
| FOREIGN GOVERNMENT OBLIGATIONS (0.2%) | |||||||||||
| Republic of Colombia 9.75%, due 04/23/2009 | 1,000 | 1,102 | |||||||||
| Total Foreign Government Obligations (cost: $945) | 1,102 | ||||||||||
| CORPORATE DEBT SECURITIES (93.5%) | |||||||||||
| Aerospace (0.2%) | |||||||||||
| Textron, Inc. 4.50%, due 08/01/2010 | 1,000 | 997 | |||||||||
| Agriculture (0.8%) | |||||||||||
| Dole Food Co., Inc. 8.63%, due 05/01/2009 | 3,055 | 3,215 | |||||||||
| Air Transportation (0.7%) | |||||||||||
| American Airlines, Inc., Series 2003-1, Class G 3.86%, due 07/09/2010 | 894 | 872 | |||||||||
| Delta Air Lines, Inc., Series 2003-1, Class G 3.91%, due 01/25/2008 (b) | 2,123 | 2,125 | |||||||||
| Piedmont Aviation, Inc., Series K 10.10%, due 05/13/2007 (c)(i) | 1,048 | – | (d) | ||||||||
| Amusement & Recreation Services (4.6%) | |||||||||||
| Argosy Gaming Co. 9.00%, due 09/01/2011 | 2,500 | 2,731 | |||||||||
| Harrah's Operating Co., Inc. 5.50%, due 07/01/2010 | 3,000 | 3,067 | |||||||||
| International Speedway Corp. 4.20%, due 04/15/2009 | 2,000 | 1,968 | |||||||||
| Isle of Capri Casinos, Inc. 7.00%, due 03/01/2014 | 3,000 | 2,910 | |||||||||
| MGM Mirage 6.75%, due 09/01/2012 5.88%, due 02/27/2014 | 1,000 2,500 | 1,000 2,341 | |||||||||
| Mohegan Tribal Gaming Authority 6.38%, due 07/15/2009 | 1,000 | 997 | |||||||||
| Mohegan Tribal Gaming Authority–144A 6.13%, due 02/15/2013 | 2,000 | 1,970 | |||||||||
| Speedway Motorsports, Inc. 6.75%, due 06/01/2013 | 1,000 | 1,006 | |||||||||
| Station Casinos, Inc. 6.88%, due 03/01/2016 | 2,000 | 2,020 | |||||||||
| Principal | Value | ||||||||||
| Automotive (3.1%) | |||||||||||
| DaimlerChrysler North America Holding Corp. 4.05%, due 06/04/2008 | $ | 1,000 | $ | 963 | |||||||
| Ford Motor Co. 7.45%, due 07/16/2031 (a) | 2,000 | 1,643 | |||||||||
| General Motors Acceptance Corp. 6.75%, due 12/01/2014 (a) | 1,000 | 838 | |||||||||
| General Motors Corp. 7.13%, due 07/15/2013 (a) | 2,000 | 1,588 | |||||||||
| Meritor Automotive, Inc. 6.80%, due 02/15/2009 | 3,000 | 2,767 | |||||||||
| Navistar International Corp. 7.50%, due 06/15/2011 (a) | 1,000 | 945 | |||||||||
| Navistar International Corp.–144A 6.25%, due 03/01/2012 | 2,000 | 1,760 | |||||||||
| Tenneco Automotive, Inc. 10.25%, due 07/15/2013 | 2,500 | 2,731 | |||||||||
| Beverages (0.2%) | |||||||||||
| Cadbury Schweppes US Finance LLC–144A 3.88%, due 10/01/2008 | 1,000 | 980 | |||||||||
| Business Credit Institutions (0.6%) | |||||||||||
| Ford Motor Credit Co. 6.50%, due 01/25/2007 5.80%, due 01/12/2009 | 500 1,000 | 500 930 | |||||||||
| HVB Funding Trust III–144A 9.00%, due 10/22/2031 | 1,000 | 1,303 | |||||||||
| Business Services (3.0%) | |||||||||||
| Clear Channel Communications, Inc. 4.63%, due 01/15/2008 7.65%, due 09/15/2010 | 1,000 1,000 | 988 1,080 | |||||||||
| Quintiles Transnational Corp. 10.00%, due 10/01/2013 | 1,000 | 1,080 | |||||||||
| R.H. Donnelley Corp.–144A 6.88%, due 01/15/2013 | 2,500 | 2,481 | |||||||||
| R.H. Donnelley Finance Corp I–144A 10.88%, due 12/15/2012 | 2,000 | 2,285 | |||||||||
| United Rentals North America, Inc. 6.50%, due 02/15/2012 | 1,000 | 952 | |||||||||
| Universal Compression, Inc. 7.25%, due 05/15/2010 | 2,000 | 2,030 | |||||||||
| Universal Hospital Services, Inc. 10.13%, due 11/01/2011 | 2,000 | 2,025 | |||||||||
| Chemicals & Allied Products (4.0%) | |||||||||||
| Airgas, Inc. 6.25%, due 07/15/2014 | 1,500 | 1,462 | |||||||||
The notes to the financial statements are an integral part of this report.
Transamerica IDEX Mutual Funds
Semi-Annual Report 2005
3
TA IDEX Transamerica Conservative High-Yield Bond
SCHEDULE OF INVESTMENTS (continued)
At April 30, 2005
(all amounts except share amounts in thousands)
(unaudited)
| Principal | Value | ||||||||||
| Chemicals & Allied Products (continued) | |||||||||||
| Eastman Chemical Co. 3.25%, due 06/15/2008 | $ | 1,000 | $ | 964 | |||||||
| Equistar Chemicals, LP/Equistar Funding Corp. 10.13%, due 09/01/2008 10.63%, due 05/01/2011 | 1,000 2,000 | 1,100 2,230 | |||||||||
| Huntsman International LLC 9.88%, due 03/01/2009 11.63%, due 10/15/2010 | 1,000 965 | 1,075 1,115 | |||||||||
| Huntsman International LLC–144A 7.38%, due 01/01/2015 (a) | 2,000 | 1,995 | |||||||||
| Lyondell Chemical Co. 10.50%, due 06/01/2013 | 1,000 | 1,152 | |||||||||
| Monsanto Co. 4.00%, due 05/15/2008 | 2,000 | 1,992 | |||||||||
| Nalco Co. 8.88%, due 11/15/2013 | 2,000 | 2,050 | |||||||||
| NOVA Chemicals Corp. 6.50%, due 01/15/2012 | 1,000 | 1,011 | |||||||||
| Scotts Co. (The) 6.63%, due 11/15/2013 | 1,000 | 1,010 | |||||||||
| Commercial Banks (0.9%) | |||||||||||
| Mizuho Financial Group Cayman, Ltd.–144A 5.79%, due 04/15/2014 | 1,000 | 1,035 | |||||||||
| Popular North America, Inc. 6.13%, due 10/15/2006 | 1,000 | 1,027 | |||||||||
| Wachovia Corp. 3.63%, due 02/17/2009 | 2,000 | 1,954 | |||||||||
| Communication (4.2%) | |||||||||||
| Adelphia Communications Corp. 10.25%, due 11/01/2006 (a)(c) | 1,000 | 855 | |||||||||
| Cablevision Systems Corp.–144A 8.00%, due 04/15/2012 (a) | 1,000 | 986 | |||||||||
| Charter Communications Holdings, Inc. 8.63%, due 04/01/2009 9.92%, due 04/01/2011 | 1,500 1,000 | 1,084 705 | |||||||||
| Comcast Cable Communications 6.75%, due 01/30/2011 | 1,000 | 1,098 | |||||||||
| CSC Holdings, Inc.–144A 6.75%, due 04/15/2012 | 2,000 | 1,935 | |||||||||
| Intelsat Bermuda, Ltd.–144A 8.63%, due 01/15/2015 | 8,000 | 8,120 | |||||||||
| Liberty Media Corp. 7.88%, due 07/15/2009 | 1,000 | 1,089 | |||||||||
| News America Holdings, Inc. 6.63%, due 01/09/2008 | 1,000 | 1,053 | |||||||||
| Principal | Value | ||||||||||
| Communication (continued) | |||||||||||
| PanAmSat Corp. 9.00%, due 08/15/2014 | $ | 1,300 | $ | 1,352 | |||||||
| Communications Equipment (0.9%) | |||||||||||
| L-3 Communications Corp. 7.63%, due 06/15/2012 6.13%, due 07/15/2013 6.13%, due 01/15/2014 | 1,000 2,000 1,000 | 1,057 1,975 982 | |||||||||
| Computer & Office Equipment (1.0%) | |||||||||||
| Seagate Technology Holdings Corp. 8.00%, due 05/15/2009 | 1,000 | 1,050 | |||||||||
| Solectron Corp. 9.63%, due 02/15/2009 (a) | 3,000 | 3,270 | |||||||||
| Construction (2.4%) | |||||||||||
| Beazer Homes USA, Inc. 6.50%, due 11/15/2013 | 2,000 | 1,940 | |||||||||
| Centex Corp. 5.80%, due 09/15/2009 | 750 | 776 | |||||||||
| DR Horton, Inc. 5.88%, due 07/01/2013 6.13%, due 01/15/2014 5.25%, due 02/15/2015 | 3,000 1,000 1,000 | 2,998 1,008 932 | |||||||||
| KB Home 5.75%, due 02/01/2014 | 1,000 | 971 | |||||||||
| Standard-Pacific Corp. 6.25%, due 04/01/2014 | 2,000 | 1,910 | |||||||||
| Department Stores (0.0%) | |||||||||||
| Saks, Inc. 8.25%, due 11/15/2008 | – | – | (d) | ||||||||
| 7.00%, due 12/01/2013 | 56 | 51 | |||||||||
| Drug Stores & Proprietary Stores (0.9%) | |||||||||||
| Jean Coutu Group, Inc. 8.50%, due 08/01/2014 (a) | 2,000 | 1,885 | |||||||||
| Medco Health Solutions, Inc. 7.25%, due 08/15/2013 | 1,000 | 1,112 | |||||||||
| Rite Aid Corp. 9.50%, due 02/15/2011 | 1,000 | 1,015 | |||||||||
| Electric Services (8.6%) | |||||||||||
| AES Corp. (The)–144A 8.75%, due 05/15/2013 | 2,000 | 2,165 | |||||||||
| CenterPoint Energy Resources Corp., Series B 7.88%, due 04/01/2013 | 2,000 | 2,356 | |||||||||
| Cleveland Electric Illuminating Co., (The) 5.65%, due 12/15/2013 | 1,000 | 1,031 | |||||||||
| CMS Energy Corp. 7.50%, due 01/15/2009 | 2,000 | 2,050 | |||||||||
The notes to the financial statements are an integral part of this report.
Transamerica IDEX Mutual Funds
Semi-Annual Report 2005
4
TA IDEX Transamerica Conservative High-Yield Bond
SCHEDULE OF INVESTMENTS (continued)
At April 30, 2005
(all amounts except share amounts in thousands)
(unaudited)
| Principal | Value | ||||||||||
| Electric Services (continued) | |||||||||||
| Dynegy Holdings, Inc.–144A 10.13%, due 07/15/2013 | $ | 3,000 | $ | 3,090 | |||||||
| Elwood Energy LLC 8.16%, due 07/05/2026 | 1,754 | 1,977 | |||||||||
| Nevada Power Co., Series A 8.25%, due 06/01/2011 | 4,000 | 4,420 | |||||||||
| NRG Energy, Inc.–144A 8.00%, due 12/15/2013 | 2,337 | 2,360 | |||||||||
| PSEG Energy Holdings LLC 7.75%, due 04/16/2007 | 3,000 | 3,075 | |||||||||
| Reliant Energy, Inc. 6.75%, due 12/15/2014 | 2,000 | 1,770 | |||||||||
| Texas Genco LLC/Texas Genco Financing Corp.–144A 6.88%, due 12/15/2014 | 5,000 | 4,900 | |||||||||
| Texas New Mexico Power Co. 6.13%, due 06/01/2008 | 3,000 | 3,074 | |||||||||
| TXU Corp.–144A 5.55%, due 11/15/2014 | 4,000 | 3,856 | |||||||||
| Virginia Electric and Power Co. 4.10%, due 12/15/2008 | 1,000 | 988 | |||||||||
| Electric, Gas & Sanitary Services (1.8%) | |||||||||||
| NiSource Finance Corp. 7.88%, due 11/15/2010 | 1,000 | 1,155 | |||||||||
| Northern States Power Co. 4.75%, due 08/01/2010 | 4,000 | 4,048 | |||||||||
| Pacific Gas & Electric Co. 3.82%, due 04/03/2006 (b) 3.60%, due 03/01/2009 | 443 2,000 | 444 1,945 | |||||||||
| Electronic & Other Electric Equipment (0.8%) | |||||||||||
| Celestica Inc. 7.88%, due 07/01/2011 | 1,450 | 1,443 | |||||||||
| Rayovac Corp. 8.50%, due 10/01/2013 | 2,000 | 2,055 | |||||||||
| Electronic Components & Accessories (1.9%) | |||||||||||
| Amkor Technology, Inc. 9.25%, due 02/15/2008 (a) | 1,000 | 887 | |||||||||
| Flextronics International, Ltd. 6.50%, due 05/15/2013 | 1,000 | 955 | |||||||||
| Tyco International Group SA 6.38%, due 02/15/2006 6.00%, due 11/15/2013 | 2,000 4,000 | 2,038 4,272 | |||||||||
| Environmental Services (0.4%) | |||||||||||
| Allied Waste North America, Inc. 6.50%, due 11/15/2010 (a) 7.88%, due 04/15/2013 | 1,000 1,000 | 940 972 | |||||||||
| Principal | Value | ||||||||||
| Food & Kindred Products (1.6%) | |||||||||||
| Bunge Ltd Finance Corp. 4.38%, due 12/15/2008 | $ | 2,000 | $ | 1,994 | |||||||
| Del Monte Corp. 8.63%, due 12/15/2012 | 3,000 | 3,210 | |||||||||
| General Mills, Inc. 6.00%, due 02/15/2012 | 804 | 865 | |||||||||
| Kraft Foods, Inc. 4.00%, due 10/01/2008 | 1,000 | 987 | |||||||||
| Food Stores (0.9%) | |||||||||||
| Safeway, Inc. 7.25%, due 02/01/2031 | 2,000 | 2,207 | |||||||||
| Stater Brothers Holdings, Inc. 8.13%, due 06/15/2012 | 2,000 | 1,860 | |||||||||
| Gas Production & Distribution (1.2%) | |||||||||||
| Dynegy-Roseton/Danskammer, Series 2001, Class B 7.67%, due 11/08/2016 | 2,000 | 1,780 | |||||||||
| Northern Border Partners-LP, Series A 8.88%, due 06/15/2010 | 1,000 | 1,181 | |||||||||
| Northwest Pipeline Corp. 8.13%, due 03/01/2010 | 2,000 | 2,152 | |||||||||
| Health Services (3.8%) | |||||||||||
| Community Health Systems, Inc. 6.50%, due 12/15/2012 | 1,000 | 980 | |||||||||
| Coventry Health Care, Inc. 5.88%, due 01/15/2012 6.13%, due 01/15/2015 | 1,750 2,250 | 1,741 2,239 | |||||||||
| Extendicare Health Services, Inc. 6.88%, due 05/01/2014 | 3,000 | 2,872 | |||||||||
| HCA, Inc. 5.75%, due 03/15/2014 6.38%, due 01/15/2015 | 2,000 3,000 | 1,930 3,011 | |||||||||
| Manor Care, Inc. 6.25%, due 05/01/2013 | 2,000 | 2,140 | |||||||||
| NeighborCare, Inc. 6.88%, due 11/15/2013 | 1,500 | 1,567 | |||||||||
| Holding & Other Investment Offices (2.3%) | |||||||||||
| Developers Diversified Realty Corp. REIT 3.88%, due 01/30/2009 | 3,000 | 2,900 | |||||||||
| General Growth Properties, Inc. 4.94%, due 11/01/2007 | 1,991 | 2,001 | |||||||||
| iStar Financial, Inc. 4.88%, due 01/15/2009 | 1,000 | 991 | |||||||||
| iStar Financial, Inc., Series B 5.70%, due 03/01/2014 | 1,500 | 1,490 | |||||||||
The notes to the financial statements are an integral part of this report.
Transamerica IDEX Mutual Funds
Semi-Annual Report 2005
5
TA IDEX Transamerica Conservative High-Yield Bond
SCHEDULE OF INVESTMENTS (continued)
At April 30, 2005
(all amounts except share amounts in thousands)
(unaudited)
| Principal | Value | ||||||||||
| Holding & Other Investment Offices (continued) | |||||||||||
| Simon Property Group, LP REIT 3.75%, due 01/30/2009 | $ | 1,000 | $ | 966 | |||||||
| Ventas Realty, LP/Ventas Capital Corp. REIT 6.63%, due 10/15/2014 | 1,500 | 1,474 | |||||||||
| Hotels & Other Lodging Places (3.5%) | |||||||||||
| Hilton Hotels Corp. 7.63%, due 12/01/2012 | 2,000 | 2,297 | |||||||||
| John Q. Hammons Hotels, Inc., Series B 8.88%, due 05/15/2012 | 1,500 | 1,597 | |||||||||
| Kerzner International, Ltd. 8.88%, due 08/15/2011 | 4,000 | 4,280 | |||||||||
| Mandalay Resort Group 6.38%, due 12/15/2011 | 1,000 | 1,009 | |||||||||
| Station Casinos, Inc. 6.00%, due 04/01/2012 6.50%, due 02/01/2014 | 1,000 2,000 | 993 1,995 | |||||||||
| Wynn Las Vegas LLC/Wynn Las Vegas Capital Corp.–144A 6.63%, due 12/01/2014 | 3,000 | 2,805 | |||||||||
| Industrial Machinery & Equipment (1.3%) | |||||||||||
| Case New Holland, Inc.–144A 6.00%, due 06/01/2009 | 1,000 | 923 | |||||||||
| Dresser-Rand Group–144A 7.38%, due 11/01/2014 | 3,000 | 2,925 | |||||||||
| Grant Prideco, Inc. 9.63%, due 12/01/2007 | 500 | 546 | |||||||||
| Terex Corp. 7.38%, due 01/15/2014 | 1,000 | 1,005 | |||||||||
| Lumber & Other Building Materials (0.5%) | |||||||||||
| Builders Firstsource, Inc.–144A 7.02%, due 02/15/2012 (b) | 2,000 | 1,940 | |||||||||
| Lumber & Wood Products (0.3%) | |||||||||||
| Georgia-Pacific Corp. 8.88%, due 02/01/2010 | 1,000 | 1,110 | |||||||||
| Management Services (0.2%) | |||||||||||
| Corrections Corp. of America 7.50%, due 05/01/2011 | 1,000 | 1,031 | |||||||||
| Medical Instruments & Supplies (0.4%) | |||||||||||
| Bard (C.R.), Inc. 6.70%, due 12/01/2026 | 1,500 | 1,693 | |||||||||
| Metal Cans & Shipping Containers (1.0%) | |||||||||||
| Ball Corp. 7.75%, due 08/01/2006 6.88%, due 12/15/2012 | 1,000 2,000 | 1,028 2,055 | |||||||||
| Principal | Value | ||||||||||
| Metal Cans & Shipping Containers (continued) | |||||||||||
| Crown European Holdings SA 10.88%, due 03/01/2013 | $ | 1,000 | $ | 1,143 | |||||||
| Metal Mining (0.2%) | |||||||||||
| Rio Tinto Finance USA, Ltd. 2.63%, due 09/30/2008 | 1,000 | 948 | |||||||||
| Mining (0.9%) | |||||||||||
| Massey Energy Co. 6.63%, due 11/15/2010 | 3,000 | 3,000 | |||||||||
| Peabody Energy Corp. 6.88%, due 03/15/2013 | 1,000 | 1,035 | |||||||||
| Mortgage Bankers & Brokers (0.7%) | |||||||||||
| Crystal US Holdings LLC/Crystal US Sub 3 Corp.–144A 0.00%, due 10/01/2014 (e) | 1,300 | 871 | |||||||||
| Mantis Reef, Ltd.–144A 4.69%, due 11/14/2008 | 2,000 | 1,995 | |||||||||
| Motion Pictures (0.9%) | |||||||||||
| Time Warner Entertainment Co., LP 10.15%, due 05/01/2012 | 1,000 | 1,290 | |||||||||
| Time Warner, Inc. 7.75%, due 06/15/2005 7.48%, due 01/15/2008 | 1,000 1,500 | 1,005 1,619 | |||||||||
| Motor Vehicles, Parts & Supplies (0.7%) | |||||||||||
| Dura Operating Corp., Series B 8.63%, due 04/15/2012 (a) | 1,750 | 1,488 | |||||||||
| TRW Automotive, Inc. 11.00%, due 02/15/2013 (a) | 1,300 | 1,398 | |||||||||
| Oil & Gas Extraction (4.4%) | |||||||||||
| Chesapeake Energy Corp. 8.13%, due 04/01/2011 7.50%, due 09/15/2013 | 71 1,000 | 75 1,055 | |||||||||
| Chesapeake Energy Corp.–144A 6.38%, due 06/15/2015 | 3,000 | 2,940 | |||||||||
| Forest Oil Corp. 8.00%, due 12/15/2011 7.75%, due 05/01/2014 | 500 1,000 | 543 1,045 | |||||||||
| Kerr-McGee Corp. 7.00%, due 11/01/2011 | 1,370 | 1,343 | |||||||||
| Key Energy Services, Inc. 6.38%, due 05/01/2013 | 1,000 | 970 | |||||||||
| Louisiana Land & Exploration 7.63%, due 04/15/2013 | 2,000 | 2,308 | |||||||||
| Newfield Exploration Co. 6.63%, due 09/01/2014 | 1,500 | 1,485 | |||||||||
The notes to the financial statements are an integral part of this report.
Transamerica IDEX Mutual Funds
Semi-Annual Report 2005
6
TA IDEX Transamerica Conservative High-Yield Bond
SCHEDULE OF INVESTMENTS (continued)
At April 30, 2005
(all amounts except share amounts in thousands)
(unaudited)
| Principal | Value | ||||||||||
| Oil & Gas Extraction (continued) | |||||||||||
| Petroleum Geo-Services ASA 10.00%, due 11/05/2010 | $ | 2,500 | $ | 2,788 | |||||||
| Pride International, Inc. 7.38%, due 07/15/2014 | 2,000 | 2,100 | |||||||||
| XTO Energy, Inc. 6.25%, due 04/15/2013 | 2,000 | 2,170 | |||||||||
| Paper & Allied Products (0.9%) | |||||||||||
| Cascades, Inc. 7.25%, due 02/15/2013 | 2,000 | 1,970 | |||||||||
| Graphic Packaging International Corp. 8.50%, due 08/15/2011 | 2,000 | 1,990 | |||||||||
| Paper & Paper Products (0.9%) | |||||||||||
| Boise Cascade LLC–144A 7.13%, due 10/15/2014 | 2,000 | 1,900 | |||||||||
| MDP Acquisitions PLC 9.63%, due 10/01/2012 | 2,000 | 1,980 | |||||||||
| Paperboard Containers & Boxes (0.7%) | |||||||||||
| Jefferson Smurfit Corp. 7.50%, due 06/01/2013 | 2,000 | 1,870 | |||||||||
| Jefferson Smurfit-Stone Container Corp. 8.25%, due 10/01/2012 | 1,000 | 980 | |||||||||
| Personal Credit Institutions (2.1%) | |||||||||||
| Capital One Financial Corp. 6.25%, due 11/15/2013 | 3,000 | 3,200 | |||||||||
| Erac USA Finance Co.–144A 7.95%, due 12/15/2009 | 1,000 | 1,141 | |||||||||
| Household Finance Corp. 4.13%, due 11/16/2009 | 5,000 | 4,907 | |||||||||
| Personal Services (0.5%) | |||||||||||
| Service Corp. International 7.70%, due 04/15/2009 | 2,000 | 2,075 | |||||||||
| Petroleum Refining (1.1%) | |||||||||||
| Giant Industries, Inc. 8.00%, due 05/15/2014 (a) | 1,500 | 1,508 | |||||||||
| Premcor Refining Group (The), Inc. 6.75%, due 02/01/2011 6.13%, due 05/01/2011 | 2,000 1,000 | 2,120 1,033 | |||||||||
| Pharmaceuticals (1.0%) | |||||||||||
| Elan Finance PLC/Elan Finance Corp.–144A 7.75%, due 11/15/2011 | 3,000 | 2,325 | |||||||||
| Leiner Health Products, Inc. 11.00%, due 06/01/2012 | 2,000 | 2,110 | |||||||||
| Principal | Value | ||||||||||
| Primary Metal Industries (1.4%) | |||||||||||
| International Steel Group, Inc. 6.50%, due 04/15/2014 | $ | 1,000 | $ | 993 | |||||||
| Novelis, Inc.–144A 7.25%, due 02/15/2015 | 3,500 | 3,386 | |||||||||
| U.S. Steel Corp. 9.75%, due 05/15/2010 | 1,682 | 1,850 | |||||||||
| Printing & Publishing (2.9%) | |||||||||||
| American Color Graphics, Inc. 10.00%, due 06/15/2010 | 2,000 | 1,280 | |||||||||
| Dex Media East LLC/Dex Media East Finance Co. 9.88%, due 11/15/2009 | 1,000 | 1,095 | |||||||||
| Dex Media West LLC/Dex Media Finance Co., Series B 8.50%, due 08/15/2010 | 2,000 | 2,145 | |||||||||
| Dex Media, Inc. 8.00%, due 11/15/2013 | 1,000 | 1,030 | |||||||||
| Houghton Mifflin Co. 9.88%, due 02/01/2013 (a) | 2,000 | 2,020 | |||||||||
| Jostens IH Corp. 7.63%, due 10/01/2012 | 1,000 | 1,000 | |||||||||
| Primedia, Inc. 8.88%, due 05/15/2011 | 2,000 | 2,070 | |||||||||
| Quebecor World Capital Corp. 4.88%, due 11/15/2008 | 2,000 | 1,983 | |||||||||
| Radio & Television Broadcasting (1.6%) | |||||||||||
| British Sky Broadcasting Group PLC 6.88%, due 02/23/2009 | 1,000 | 1,077 | |||||||||
| CanWest Media, Inc. 10.63%, due 05/15/2011 | 1,000 | 1,085 | |||||||||
| CanWest Media, Inc., Series B 7.63%, due 04/15/2013 | 1,000 | 1,048 | |||||||||
| Corus Entertainment, Inc. 8.75%, due 03/01/2012 | 2,005 | 2,125 | |||||||||
| Videotron Ltee 6.88%, due 01/15/2014 | 1,500 | 1,478 | |||||||||
| Railroads (0.9%) | |||||||||||
| Progress Rail Services Corp./Progress Metal Reclamation Co.–144A 7.75%, due 04/01/2012 | 4,000 | 3,980 | |||||||||
| Restaurants (0.3%) | |||||||||||
| Yum! Brands, Inc. 7.70%, due 07/01/2012 | 1,000 | 1,172 | |||||||||
The notes to the financial statements are an integral part of this report.
Transamerica IDEX Mutual Funds
Semi-Annual Report 2005
7
TA IDEX Transamerica Conservative High-Yield Bond
SCHEDULE OF INVESTMENTS (continued)
At April 30, 2005
(all amounts except share amounts in thousands)
(unaudited)
| Principal | Value | ||||||||||
| Rubber & Misc. Plastic Products (0.9%) | |||||||||||
| Jarden Corp. 5.09%, due 01/03/2011 | $ | 1,995 | $ | 2,002 | |||||||
| Sealed Air Corp.–144A 5.38%, due 04/15/2008 | 2,000 | 2,038 | |||||||||
| Savings Institutions (0.5%) | |||||||||||
| Washington Mutual, Inc. 4.00%, due 01/15/2009 | 2,000 | 1,964 | |||||||||
| Security & Commodity Brokers (0.5%) | |||||||||||
| Goldman Sachs Group, Inc. 5.15%, due 01/15/2014 | 1,000 | 1,006 | |||||||||
| Morgan Stanley 4.75%, due 04/01/2014 | 1,000 | 967 | |||||||||
| Stone, Clay & Glass Products (1.6%) | |||||||||||
| Anchor Glass Container Corp., Series B 11.00%, due 02/15/2013 | 1,000 | 810 | |||||||||
| Owens-Brockway 7.75%, due 05/15/2011 | 1,000 | 1,055 | |||||||||
| Owens-Brockway Glass Container 8.75%, due 11/15/2012 | 1,000 | 1,090 | |||||||||
| Owens-Brockway Glass Container–144A 6.75%, due 12/01/2014 | 2,000 | 1,950 | |||||||||
| Owens-Illinois, Inc. 7.35%, due 05/15/2008 | 2,000 | 2,055 | |||||||||
| Telecommunications (7.1%) | |||||||||||
| AT&T Corp. 9.05%, due 11/15/2011 | 3,000 | 3,424 | |||||||||
| BellSouth Corp. 5.20%, due 09/15/2014 | 2,000 | 2,026 | |||||||||
| Citizens Communications Co. 6.25%, due 01/15/2013 | 2,000 | 1,865 | |||||||||
| Hawaiian Telcom Communications, Inc.–144A 9.75%, due 05/01/2013 | 4,500 | 4,472 | |||||||||
| MCI, Inc. 5.91%, due 05/01/2007 | 4,000 | 4,060 | |||||||||
| Nextel Communications, Inc. 5.95%, due 03/15/2014 | 7,000 | 7,088 | |||||||||
| Qwest Capital Funding, Inc. 7.00%, due 08/03/2009 (a) 7.90%, due 08/15/2010 (a) | 2,000 2,000 | 1,805 1,840 | |||||||||
| Rogers Wireless Communications, Inc. 8.00%, due 12/15/2012 (a) 6.38%, due 03/01/2014 | 1,500 2,500 | 1,538 2,394 | |||||||||
| Tobacco Products (0.6%) | |||||||||||
| Philip Morris Cos., Inc. 7.20%, due 02/01/2007 | 2,256 | 2,360 | |||||||||
| Principal | Value | ||||||||||
| Transportation Equipment (1.0%) | |||||||||||
| Trinity Industries, Inc. 6.50%, due 03/15/2014 | $ | 2,500 | $ | 2,400 | |||||||
| Westinghouse Air Brake Co. 6.88%, due 07/31/2013 | 2,000 | 2,010 | |||||||||
| Trucking & Warehousing (0.4%) | |||||||||||
| Iron Mountain, Inc. 6.63%, due 01/01/2016 | 2,000 | 1,780 | |||||||||
| Water Transportation (0.8%) | |||||||||||
| Royal Caribbean Cruises, Ltd. 7.00%, due 10/15/2007 8.75%, due 02/02/2011 | 1,000 2,000 | 1,033 2,240 | |||||||||
| Total Corporate Debt Securities (cost: $402,104) | 403,317 | ||||||||||
| Shares | Value | ||||||||||
| PREFERRED STOCKS (0.5%) | |||||||||||
| Holding & Other Investment Offices (0.5%) | |||||||||||
| Duke Realty Corp. REIT | 40,000 | $ | 2,084 | ||||||||
| Total Preferred Stocks (cost: $2,008) | 2,084 | ||||||||||
| COMMON STOCKS (0.0%) | |||||||||||
| Air Transportation (0.0%) | |||||||||||
| US Airways Group, Inc.–Class A (a)(f) | 1,024 | 1 | |||||||||
| Printing & Publishing (0.0%) | |||||||||||
| Golden Books Family Entertainment, Inc. (f) | 63,750 | – | (d) | ||||||||
| Total Common Stocks (cost: $168) | 1 | ||||||||||
| Principal | Value | ||||||||||
| SECURITY LENDING COLLATERAL (7.5%) | |||||||||||
| Debt (6.5%) | |||||||||||
| Bank Notes (0.9%) | |||||||||||
| Bank of America | |||||||||||
| 2.82%, due 05/16/2005 | $ | 1,014 | $ | 1,014 | |||||||
| 2.80%, due 06/09/2005 (b) | 253 | 253 | |||||||||
| 2.77%, due 07/18/2005 (b) | 1,014 | 1,014 | |||||||||
| Canadian Imperial Bank of Commerce 3.02%, due 11/04/2005 (b) | 1,014 | 1,014 | |||||||||
| Credit Suisse First Boston Corp. 2.88%, due 09/09/2005 (b) 3.06%, due 03/10/2006 (b) | 253 253 | 253 253 | |||||||||
| Euro Dollar Overnight (1.1%) | |||||||||||
| Bank of Montreal 2.94%, due 05/04/2005 | 760 | 760 | |||||||||
| BNP Paribas 2.80%, due 05/05/2005 | 1,049 | 1,049 | |||||||||
| Den Danske Bank 2.93%, due 05/02/2005 2.80%, due 05/06/2005 | 912 507 | 912 507 | |||||||||
The notes to the financial statements are an integral part of this report.
Transamerica IDEX Mutual Funds
Semi-Annual Report 2005
8
TA IDEX Transamerica Conservative High-Yield Bond
SCHEDULE OF INVESTMENTS (continued)
At April 30, 2005
(all amounts except share amounts in thousands)
(unaudited)
| Principal | Value | ||||||||||
| Euro Dollar Overnight (continued) | |||||||||||
| Dexia Group 2.80%, due 05/05/2005 | $ | 448 | $ | 448 | |||||||
| Royal Bank of Canada 2.80%, due 05/04/2005 | 1,040 | 1,040 | |||||||||
| Svenska Handlesbanken 2.80%, due 05/06/2005 | 167 | 167 | |||||||||
| Euro Dollar Terms (2.6%) | |||||||||||
| Bank of Nova Scotia 2.88%, due 05/11/2005 3.01%, due 05/31/2005 | 507 1,417 | 507 1,417 | |||||||||
| Barclays 3.02%, due 06/27/2005 | 903 | 903 | |||||||||
| BNP Paribas 2.93%, due 06/07/2005 | 811 | 811 | |||||||||
| Branch Banker & Trust 2.94%, due 06/06/2005 | 217 | 217 | |||||||||
| Calyon 2.93%, due 06/03/2005 | 837 | 837 | |||||||||
| Citigroup 2.87%, due 06/06/2005 | 1,052 | 1,052 | |||||||||
| Credit Suisse First Boston Corp. 2.91%, due 05/16/2005 | 1,038 | 1,038 | |||||||||
| HSBC Banking/Holdings PLC 3.01%, due 06/23/2005 | 507 | 507 | |||||||||
| Royal Bank of Scotland 2.94%, due 06/07/2005 2.95%, due 06/10/2005 | 985 547 | 985 547 | |||||||||
| Societe Generale 2.80%, due 05/03/2005 | 969 | 969 | |||||||||
| Toronto Dominion Bank 2.75%, due 05/09/2005 3.01%, due 06/24/2005 | 760 281 | 760 281 | |||||||||
| UBS AG 2.81%, due 05/03/2005 | 507 | 507 | |||||||||
| Principal | Value | ||||||||||
| Promissory Notes (0.7%) | |||||||||||
| Goldman Sachs Group, Inc. | |||||||||||
| 2.99%, due 06/27/2005 | $ | 1,064 | $ | 1,064 | |||||||
| 3.01%, due 07/27/2005 | 1,774 | 1,774 | |||||||||
| Repurchase Agreements (1.2%) (g) | |||||||||||
| Goldman Sachs Group, Inc. 3.04% Repurchase Agreement dated 04/29/2005 to be repurchased at $2,281 on 05/02/2005 | 2,281 | 2,281 | |||||||||
| Merrill Lynch & Co., Inc. 3.04% Repurchase Agreement dated 04/29/2005 to be repurchased at $2,737 on 05/02/2005 | 2,737 | 2,737 | |||||||||
| Shares | Value | ||||||||||
| Investment Companies (1.0%) | |||||||||||
| Money Market Funds (1.0%) | |||||||||||
| American Beacon Funds 1-day yield of 2.84% | 402,502 | $ | 403 | ||||||||
| BGI Institutional Money Market Fund 1-day yield of 2.93% | 2,383,443 | 2,383 | |||||||||
| Merrill Lynch Premier Institutional Fund 1-day yield of 2.65% | 536,350 | 536 | |||||||||
| Merrimac Cash Fund, Premium Class 1-day yield of 2.74% (h) | 980,976 | 981 | |||||||||
| Total Security Lending Collateral (cost: $32,181) | 32,181 | ||||||||||
| Total Investment Securities (cost: $446,533) | $ | 448,081 | |||||||||
| SUMMARY: | |||||||||||
| Investments, at value | 103.9 | % | $ | 448,081 | |||||||
| Liabilities in excess of other assets | (3.9 | )% | (16,763 | ) | |||||||
| Net assets | 100.0 | % | $ | 431,318 | |||||||
NOTES TO SCHEDULE OF INVESTMENTS:
(a) At April 30, 2005, all or a portion of this security is on loan (see Note 1). The value at April 30, 2005, of all securities on loan is $31,435.
(b) Floating or variable rate note. Rate is listed as of April 30, 2005.
(c) Securities are currently in default on interest payments.
(d) Value is less than $1.
(e) Securities are stepbonds. Crystal US Holdings LLC/Crystal US Sub 3 Corp.–144A has a coupon rate of 0.00% until 4/01/2010, thereafter a coupon rate 10.00%.
(f) No dividends were paid during the preceding twelve months.
(g) Cash collateral for the Repurchase Agreements, valued at $5,105, that serve as collateral for securities lending are invested in corporate bonds with interest rates and maturity dates ranging from 0.00%–8.875% and 06/15/2005–03/15/2035, respectively.
(h) Regulated investment company advised by Investors Bank and Trust Co. ("IBT"). IBT is also the accounting, custody and lending agent for the Fund.
(i) Securities valued as determined in good faith in accordance with procedures established by the Fund's Board of Trustees.
DEFINITIONS:
144A 144A Securities are registered pursuant to Rule 144A of the Securities Act of 1933. These securities are deemed to be liquid for purposes of compliance limitations on holdings of illiquid securities and may be resold as transactions exempt from registration, normally to qualified institutional buyers. At April 30, 2005, these securities aggregated $76,812 or 17.8% of the net assets of the Fund.
REIT Real Estate Investment Trust
The notes to the financial statements are an integral part of this report.
Transamerica IDEX Mutual Funds
Semi-Annual Report 2005
9
TA IDEX Transamerica Conservative High-Yield Bond
STATEMENT OF ASSETS AND LIABILITIES
At April 30, 2005
(all amounts except per share amounts in thousands)
(unaudited)
| Assets: | |||||||
| Investment securities, at value (cost: $446,533) (including securities loaned of $31,435) | $ | 448,081 | |||||
| Cash | 12,065 | ||||||
| Receivables: | |||||||
| Shares of beneficial interest sold | 47 | ||||||
| Interest | 8,327 | ||||||
| Other | 23 | ||||||
| 468,543 | |||||||
| Liabilities: | |||||||
| Investment securities purchased | 4,500 | ||||||
| Accounts payable and accrued liabilities: | |||||||
| Shares of beneficial interest redeemed | 146 | ||||||
| Management and advisory fees | 213 | ||||||
| Transfer agent fees | 35 | ||||||
| Distribution and service fees | 147 | ||||||
| Payable for collateral for securities on loan | 32,181 | ||||||
| Other | 3 | ||||||
| 37,225 | |||||||
| Net Assets | $ | 431,318 | |||||
| Net Assets Consist of: | |||||||
| Shares of beneficial interest, unlimited shares authorized, no par value | $ | 438,927 | |||||
| Undistributed net investment income (loss) | 646 | ||||||
| Accumulated net realized gain (loss) from investment securities | (9,796 | ) | |||||
| Net unrealized appreciation (depreciation) on investment securities | 1,541 | ||||||
| Net Assets | $ | 431,318 | |||||
| Net Assets by Class: | |||||||
| Class A | $ | 330,520 | |||||
| Class B | 41,493 | ||||||
| Class C | 19,670 | ||||||
| Class I | 39,635 | ||||||
| Shares Outstanding: | |||||||
| Class A | 36,558 | ||||||
| Class B | 4,592 | ||||||
| Class C | 2,179 | ||||||
| Class I | 4,359 | ||||||
| Net Asset Value Per Share: | |||||||
| Class A | $ | 9.04 | |||||
| Class B | 9.03 | ||||||
| Class C | 9.03 | ||||||
| Class I | 9.09 | ||||||
| Maximum Offering Price Per Share (a): | |||||||
| Class A | $ | 9.49 | |||||
(a) Includes the maximum selling commission (represented as a percentage of offering price) which is reduced on certain levels of sales as set forth in the Prospectus. Net asset value per share for Classes B, C and I shares represents offering price. The redemption price for Classes B and C shares equals net asset value less any applicable contingent deferred sales charge.
STATEMENT OF OPERATIONS
For the period ended April 30, 2005
(all amounts in thousands)
(unaudited)
| Investment Income: | |||||||
| Interest | $ | 13,343 | |||||
| Dividends | 80 | ||||||
| Income from loaned securities–net | 36 | ||||||
| 13,459 | |||||||
| Expenses: | |||||||
| Management and advisory fees | 1,240 | ||||||
| Transfer agent fees: | |||||||
| Class A | 31 | ||||||
| Class B | 25 | ||||||
| Class C | 15 | ||||||
| Class I | 2 | ||||||
| Printing and shareholder reports | 4 | ||||||
| Custody fees | 30 | ||||||
| Administration fees | 38 | ||||||
| Legal fees | 10 | ||||||
| Audit fees | 14 | ||||||
| Trustees fees | 10 | ||||||
| Registration fees: | |||||||
| Class A | 16 | ||||||
| Class B | 5 | ||||||
| Class C | 10 | ||||||
| Distribution and service fees: | |||||||
| Class A | 568 | ||||||
| Class B | 232 | ||||||
| Class C | 114 | ||||||
| Total expenses | 2,364 | ||||||
| Net Investment Income (Loss) | 11,095 | ||||||
| Net Realized and Unrealized Gain (Loss): | |||||||
| Realized gain (loss) from investment securities | 2,910 | ||||||
| Increase (decrease) in unrealized appreciation (depreciation) on investment securities | (18,258 | ) | |||||
| Net Gain (Loss) on Investments | (15,348 | ) | |||||
| Net Increase (Decrease) in Net Assets Resulting from Operations | $ | (4,253 | ) | ||||
The notes to the financial statements are an integral part of this report.
Transamerica IDEX Mutual Funds
Semi-Annual Report 2005
10
TA IDEX Transamerica Conservative High-Yield Bond
STATEMENTS OF CHANGES IN NET ASSETS
For the period or year ended
(all amounts in thousands)
| April 30, 2005 (unaudited) | October 31, 2004 | ||||||||||
| Increase (Decrease) In Net Assets From: | |||||||||||
| Operations: | |||||||||||
| Net investment income (loss) | $ | 11,095 | $ | 19,795 | |||||||
| Net realized gain (loss) from investment securities | 2,910 | 1,691 | |||||||||
| Net unrealized appreciation (depreciation) on investment securities | (18,258 | ) | 8,022 | ||||||||
| (4,253 | ) | 29,508 | |||||||||
| Distributions to Shareholders: | |||||||||||
| From net investment income: | |||||||||||
| Class A | (9,007 | ) | (15,855 | ) | |||||||
| Class B | (1,126 | ) | (2,484 | ) | |||||||
| Class C | (550 | ) | (692 | ) | |||||||
| Class C2 | – | (457 | ) | ||||||||
| Class M | – | (230 | ) | ||||||||
| Class I | (610 | ) | – | ||||||||
| (11,293 | ) | (19,718 | ) | ||||||||
| Capital Share Transactions: | |||||||||||
| Proceeds from shares sold: | |||||||||||
| Class A | 29,449 | 123,099 | |||||||||
| Class B | 1,742 | 11,418 | |||||||||
| Class C | 1,707 | 6,907 | |||||||||
| Class C2 | – | 3,491 | |||||||||
| Class M | – | 1,288 | |||||||||
| Class I | 40,302 | – | |||||||||
| 73,200 | 146,203 | ||||||||||
| Dividends and distributions reinvested: | |||||||||||
| Class A | 8,787 | 15,278 | |||||||||
| Class B | 637 | 1,364 | |||||||||
| Class C | 308 | 328 | |||||||||
| Class C2 | – | 139 | |||||||||
| Class M | – | 167 | |||||||||
| Class I | 610 | – | |||||||||
| 10,342 | 17,276 | ||||||||||
| Cost of shares redeemed: | |||||||||||
| Class A | (5,016 | ) | (30,327 | ) | |||||||
| Class B | (8,720 | ) | (16,380 | ) | |||||||
| Class C | (6,966 | ) | (6,611 | ) | |||||||
| Class C2 | – | (10,227 | ) | ||||||||
| Class M | – | (2,569 | ) | ||||||||
| (20,702 | ) | (66,114 | ) | ||||||||
| Class level exchanges: | |||||||||||
| Class C | – | 15,462 | |||||||||
| Class C2 | – | (10,695 | ) | ||||||||
| Class M | – | (4,767 | ) | ||||||||
| – | – | ||||||||||
| 62,840 | 97,365 | ||||||||||
| Net increase (decrease) in net assets | 47,294 | 107,155 | |||||||||
| Net Assets: | |||||||||||
| Beginning of period | 384,024 | 276,869 | |||||||||
| End of period | $ | 431,318 | $ | 384,024 | |||||||
| Undistributed Net Investment Income (Loss) | $ | 643 | $ | 844 | |||||||
| April 30, 2005 (unaudited) | October 31, 2004 | ||||||||||
| Share Activity: | |||||||||||
| Shares issued: | |||||||||||
| Class A | 3,149 | 13,311 | |||||||||
| Class B | 187 | 1,243 | |||||||||
| Class C | 183 | 756 | |||||||||
| Class C2 | – | 377 | |||||||||
| Class M | – | 141 | |||||||||
| Class I | 4,293 | – | |||||||||
| 7,812 | 15,828 | ||||||||||
| Shares issued–reinvested from distributions: | |||||||||||
| Class A | 946 | 1,673 | |||||||||
| Class B | 68 | 149 | |||||||||
| Class C | 34 | 36 | |||||||||
| Class C2 | – | 15 | |||||||||
| Class M | – | 18 | |||||||||
| Class I | 66 | – | |||||||||
| 1,114 | 1,891 | ||||||||||
| Shares redeemed: | |||||||||||
| Class A | (540 | ) | (3,306 | ) | |||||||
| Class B | (940 | ) | (1,790 | ) | |||||||
| Class C | (748 | ) | (722 | ) | |||||||
| Class C2 | – | (1,118 | ) | ||||||||
| Class M | – | (280 | ) | ||||||||
| (2,228 | ) | (7,216 | ) | ||||||||
| Class level exchanges: | |||||||||||
| Class C | – | 1,714 | |||||||||
| Class C2 | – | (1,199 | ) | ||||||||
| Class M | – | (515 | ) | ||||||||
| – | – | ||||||||||
| Net increase (decrease) in shares outstanding: | |||||||||||
| Class A | 3,555 | 11,678 | |||||||||
| Class B | (685 | ) | (398 | ) | |||||||
| Class C | (531 | ) | 1,784 | ||||||||
| Class C2 | – | (1,925 | ) | ||||||||
| Class M | – | (636 | ) | ||||||||
| Class I | 4,359 | – | |||||||||
| 6,698 | 10,503 | ||||||||||
The notes to the financial statements are an integral part of this report.
Transamerica IDEX Mutual Funds
Semi-Annual Report 2005
11
TA IDEX Transamerica Conservative High-Yield Bond
FINANCIAL HIGHLIGHTS
(unaudited for the period ended April 30, 2005)
| For a share of beneficial interest outstanding throughout each period | |||||||||||||||||||||||||||||||||||||||
| Net Asset | Investment Operations | Distributions | Net Asset | ||||||||||||||||||||||||||||||||||||
| For the Period Ended (d)(g) | Value, Beginning of Period | Net Investment Income (Loss) | Net Realized and Unrealized Gain (Loss) | Total Operations | From Net Investment Income | From Net Realized Gains | Total Distributions | Value, End of Period | |||||||||||||||||||||||||||||||
| Class A | 4/30/2005 | $ | 9.37 | $ | 0.25 | $ | (0.32 | ) | $ | (0.07 | ) | $ | (0.26 | ) | $ | – | $ | (0.26 | ) | $ | 9.04 | ||||||||||||||||||
| 10/31/2004 | 9.08 | 0.52 | 0.29 | 0.81 | (0.52 | ) | – | (0.52 | ) | 9.37 | |||||||||||||||||||||||||||||
| 10/31/2003 | 7.93 | 0.57 | 1.16 | 1.73 | (0.58 | ) | – | (0.58 | ) | 9.08 | |||||||||||||||||||||||||||||
| 10/31/2002 | 9.26 | 0.57 | (1.31 | ) | (0.74 | ) | (0.59 | ) | – | (0.59 | ) | 7.93 | |||||||||||||||||||||||||||
| 10/31/2001 | 9.24 | 0.72 | 0.01 | 0.73 | (0.71 | ) | – | (0.71 | ) | 9.26 | |||||||||||||||||||||||||||||
| 10/31/2000 | 9.67 | 0.69 | (0.37 | ) | 0.32 | (0.69 | ) | (0.06 | ) | (0.75 | ) | 9.24 | |||||||||||||||||||||||||||
| Class B | 4/30/2005 | 9.37 | 0.22 | (0.34 | ) | (0.12 | ) | (0.22 | ) | – | (0.22 | ) | 9.03 | ||||||||||||||||||||||||||
| 10/31/2004 | 9.08 | 0.46 | 0.29 | 0.75 | (0.46 | ) | – | (0.46 | ) | 9.37 | |||||||||||||||||||||||||||||
| 10/31/2003 | 7.93 | 0.51 | 1.17 | 1.68 | (0.53 | ) | – | (0.53 | ) | 9.08 | |||||||||||||||||||||||||||||
| 10/31/2002 | 9.26 | 0.52 | (1.32 | ) | (0.80 | ) | (0.53 | ) | – | (0.53 | ) | 7.93 | |||||||||||||||||||||||||||
| 10/31/2001 | 9.24 | 0.57 | 0.10 | 0.67 | (0.65 | ) | – | (0.65 | ) | 9.26 | |||||||||||||||||||||||||||||
| 10/31/2000 | 9.67 | 0.63 | (0.37 | ) | 0.26 | (0.63 | ) | (0.06 | ) | (0.69 | ) | 9.24 | |||||||||||||||||||||||||||
| Class C | 4/30/2005 | 9.36 | 0.21 | (0.32 | ) | (0.11 | ) | (0.22 | ) | – | (0.22 | ) | 9.03 | ||||||||||||||||||||||||||
| 10/31/2004 | 9.08 | 0.46 | 0.28 | 0.74 | (0.46 | ) | – | (0.46 | ) | 9.36 | |||||||||||||||||||||||||||||
| 10/31/2003 | 8.08 | 0.51 | 1.02 | 1.53 | (0.53 | ) | – | (0.53 | ) | 9.08 | |||||||||||||||||||||||||||||
| Class I | 4/30/2005 | 9.39 | 0.26 | (0.33 | ) | (0.07 | ) | (0.23 | ) | – | (0.23 | ) | 9.09 | ||||||||||||||||||||||||||
| Ratios/Supplemental Data | |||||||||||||||||||||||||||||||
| For the Period | Total | Net Assets, End of Period | Ratio of Expenses to Average Net Assets (a) | Net Investment Income (Loss) to Average | Portfolio Turnover | ||||||||||||||||||||||||||
| Ended (g) | Return (c) | (000's) | Net (e) | Total (f) | Net Assets (a) | Rate (b) | |||||||||||||||||||||||||
| Class A | 4/30/2005 | (0.82 | )% | $ | 330,520 | 1.03 | % | 1.03 | % | 5.46 | % | 22 | % | ||||||||||||||||||
| 10/31/2004 | 9.23 | 309,223 | 1.08 | 1.08 | 5.67 | 49 | |||||||||||||||||||||||||
| 10/31/2003 | 22.74 | 193,708 | 1.22 | 1.22 | 6.57 | 46 | |||||||||||||||||||||||||
| 10/31/2002 | (8.48 | ) | 60,332 | 1.35 | 1.35 | 6.61 | 64 | ||||||||||||||||||||||||
| 10/31/2001 | 8.12 | 50,755 | 1.41 | 1.41 | 7.35 | 16 | |||||||||||||||||||||||||
| 10/31/2000 | 3.37 | 49,259 | 1.36 | 1.36 | 7.34 | 11 | |||||||||||||||||||||||||
| Class B | 4/30/2005 | (1.29 | ) | 41,493 | 1.78 | 1.78 | 4.70 | 22 | |||||||||||||||||||||||
| 10/31/2004 | 8.52 | 49,422 | 1.72 | 1.72 | 5.05 | 49 | |||||||||||||||||||||||||
| 10/31/2003 | 21.94 | 51,511 | 1.87 | 1.87 | 5.92 | 46 | |||||||||||||||||||||||||
| 10/31/2002 | (9.03 | ) | 31,336 | 2.00 | 2.00 | 5.96 | 64 | ||||||||||||||||||||||||
| 10/31/2001 | 7.45 | 35,471 | 2.06 | 2.06 | 6.70 | 16 | |||||||||||||||||||||||||
| 10/31/2000 | 2.74 | 13,808 | 2.01 | 2.01 | 6.69 | 11 | |||||||||||||||||||||||||
| Class C | 4/30/2005 | (1.19 | ) | 19,670 | 1.87 | 1.87 | 4.60 | 22 | |||||||||||||||||||||||
| 10/31/2004 | 8.41 | 25,379 | 1.78 | 1.78 | 4.95 | 49 | |||||||||||||||||||||||||
| 10/31/2003 | 19.52 | 8,403 | 1.87 | 1.87 | 5.92 | 46 | |||||||||||||||||||||||||
| Class I | 4/30/2005 | (0.75 | ) | 39,635 | 0.66 | 0.66 | 5.89 | 22 | |||||||||||||||||||||||
The notes to the financial statements are an integral part of this report.
Transamerica IDEX Mutual Funds
Semi-Annual Report 2005
12
TA IDEX Transamerica Conservative High-Yield Bond
FINANCIAL HIGHLIGHTS (continued)
NOTES TO FINANCIAL HIGHLIGHTS
(a) Annualized.
(b) Not annualized for periods of less than one year.
(c) Total Return has been calculated for the applicable period without deduction of a sales load, if any, on an initial purchase. Periods of less than one year are not annualized.
(d) Per share information is calculated based on average number of shares outstanding for the period ended 10/31/2001, 10/31/2002, 10/31/2003, 10/31/2004 and 4/30/2005.
(e) Ratio of Net Expenses to Average Net Assets is net of fee waivers and reimbursements by the investment adviser, if any (see note 2).
(f) Ratio of Total Expenses to Average Net Assets includes all expenses before fee waivers and reimbursements by the investment adviser.
(g) The inception date for the Fund's offering of share classes are as follows:
Class C – November 11, 2002
Class I – November 8, 2004
The notes to the financial statements are an integral part of this report.
Transamerica IDEX Mutual Funds
Semi-Annual Report 2005
13
TA IDEX Transamerica Conservative High-Yield Bond
NOTES TO FINANCIAL STATEMENTS
At April 30, 2005
(all amounts in thousands)
(unaudited)
NOTE 1. ORGANIZATION AND SIGNIFICANT ACCOUNTING POLICIES
Transamerica IDEX Mutual Funds is a Delaware statutory trust registered under the Investment Company Act of 1940, as amended (the "1940 Act"), as an open-end management investment company. Prior to March 1, 2005, Transamerica IDEX Mutual Funds was a Massachusetts business trust. TA IDEX Transamerica Conservative High-Yield Bond ("the Fund"), part of Transamerica IDEX Mutual Funds, began operations on June 14, 1985.
In the normal course of business, the Fund enters into contracts that contain a variety of representations and warranties, which provide general indemnifications. The Fund's maximum exposure under these arrangements is unknown, as this would involve future claims that may be made against the Fund and/or its affiliates that have not yet occurred. However, based on experience, the Fund expects the risk of loss to be remote.
See the Prospectus and Statement of Additional Information for a description of the Fund's investment objective.
In preparing the Fund's financial statements in accordance with accounting principles generally accepted in the United States of America ("GAAP"), estimates or assumptions (which could differ from actual results) may be used that affect reported amounts and disclosures. The following policies were consistently followed by the Fund, in accordance with GAAP.
Multiple class operations and expenses: The Fund currently offers four classes of shares, each with a public offering price that reflects different sales charges, if any, and expense levels. On June 15, 2004, Class C2 shares merged into Class C. On September 24, 2004, Class M shares merged into Class C. Class B shares will convert to Class A shares eight years after purchase. Income, non-class specific expenses and realized and unrealized gains and losses, are allocated daily to each class, based upon the value of shares outstanding method as permitted under Rule 18f-3 of the 1940 Act. Each class bears its own specific expenses as well as a portion of general common expenses.
Pricing of shares: The Fund prices its shares on the basis of the net asset value of each class of shares of the Fund, which is determined as of the close of the New York Stock Exchange ("NYSE") (generally 4:00 p.m. Eastern Time) on each day on which the NYSE is open for trading.
Security valuations: Fund investments traded on an exchange are valued at the closing price on the day of valuation on the exchange where the security is principally traded. With respect to securities traded on NASDAQ NMS, such closing price may be the last reported sales price or the NASDAQ Official Closing Price.
Securities traded in the over-the-counter market and listed securities for which no sale was reported on that date are valued at the last quoted bid price.
Debt securities are valued by independent pricing services at the last quoted bid price; however, those that mature in sixty days or less are valued at amortized cost, which approximates market.
Investment company securities are valued at net asset value of the underlying portfolio.
Other securities for which quotations are not readily available are valued at fair market value as determined in good faith using guidelines adopted by the Board of Trustees of the Fund, under the supervision of the Fund's Valuation Committee. These guidelines may include: the type of security; any restrictions on its resale; financial or business news of the issuer; similar or related securities that are actively trading; related corporate actions; and other significant events occurring after the close of trading in the security.
The Fund values its investment securities at fair value based upon procedures approved by the Board of Trustees on days when significant events occur after the close of the principal exchange on which the securities are traded, and as a result, are expected to materially effect the value of investments.
Cash: The Fund may leave cash overnight in its cash account with the custodian, Investors Bank & Trust Company ("IBT"). IBT has been contracted on behalf of the Fund to invest the excess cash into a savings account, which at April 30, 2005, was paying an interest rate of 2.02%.
Throughout the period, the Fund may have a cash overdraft balance. A fee is incurred on this overdraft, calculated by multiplying the overdraft by a rate based on the federal funds rate.
Repurchase agreements: The Fund is authorized to enter into repurchase agreements. The Fund, through IBT, receives delivery of the underlying securities, the value of which at the time of purchase is required to be an amount equal to at least 100% of the resale price. Repurchase agreements involve the risk that the seller will fail to repurchase the security, as agreed. In that case, the Fund will bear the risk of value fluctuations until the security can be sold and may encounter delays and incur costs in liquidating the security. In the event of bankruptcy or insolvency of the seller, delays and costs may be incurred.
Securities lending: The Fund may lend securities to enhance fund earnings from investing cash collateral in making such loans to qualified borrowers (typically broker/dealers). The Fund has engaged its custodian bank, IBT, as a lending agent to administer its securities lending program. IBT earned $19 of program income for its services. When the Fund makes a security loan, it receives cash collateral as protection against the risk that the borrower will default on the loan, and records an asset for the cash invested collateral and a liability for the return of the collateral.
Transamerica IDEX Mutual Funds
Semi-Annual Report 2005
14
TA IDEX Transamerica Conservative High-Yield Bond
NOTES TO FINANCIAL STATEMENTS (continued)
At April 30, 2005
(all amounts in thousands)
(unaudited)
NOTE 1.–(continued)
Loans of securities are required to be secured by collateral at least equal to 102% of the value of the securities at inception of the loan, and not less then 100% thereafter. The Fund may invest cash collateral in short-term money market instruments including: U.S. Treasury Bills, U.S. agency obligations, commercial paper, money market mutual funds, repurchase agreements and other highly rated, liquid investments. During the life of securities loans, the collateral and securities loaned remain subject to fluctuation in value. IBT marks to market securities loaned and the collateral each business day. If additional collateral is due (at least $1), IBT collects additional cash collateral from the borrowers. Although securities loaned will be fully collateralized at all times, IBT may experience delays in, or may be prevented from, recovering the collateral on behalf of the Fund. The Fund may recall a loa ned security position at any time from the borrower through IBT. In the event the borrower fails to timely return a recalled security, IBT may indemnify the Fund by purchasing replacement securities for the Fund at its own expense and claiming the collateral to fund such a purchase. IBT absorbs the loss if the collateral value is not sufficient to cover the cost of the replacement securities. If replacement securities are not available, IBT will credit the equivalent cash value to the Fund.
While a security is on loan, the Fund does not have the right to vote that security. However, if time permits, the Fund will attempt to recall a security on loan and vote the proxy.
Income from securities lending is included in the Statement of Operations. The amount of collateral and value of securities on loan are included in the Statement of Assets and Liabilities as well as in the Schedule of Investments.
Real Estate Investment Trusts ("REITs"): There are certain additional risks involved in investing in REITs. These include, but are not limited to, economic conditions, changes in zoning laws, real estate values, property taxes and interest rates.
Dividend income is recorded at management's estimate of the income included in distributions from the REIT investments. Distributions received in excess of the estimated amount are recorded as a reduction of the cost investments. The actual amounts of income, return of capital and capital gains are only determined by each REIT after the fiscal year end and may differ from the estimated amounts.
Security transactions and investment income: Security transactions are recorded on the trade date. Security gains and losses are calculated on the specific identification basis. Dividend income is recorded on the ex-dividend date or, in the case of foreign securities, as soon as the
Fund is informed of the ex-dividend date. Interest income, including accretion of discounts and amortization of premiums, is recorded on the accrual basis commencing on the settlement date.
Account maintenance fees: If the shareholder account balance falls below $1 by either shareholder action or as a result of market action, a $25 (not in thousands) fee is assessed every year until the balance reaches $1. The fee is assessed by redeeming shares in the shareholder's account.
No fee will be charged under the following conditions:
• accounts opened within the preceding 24 months
• accounts with an active monthly Automatic Investment Plan ($50 (not in thousands) minimum per fund)
• accounts owned by an individual which, when combined by social security number, have a balance of $5 or more
• accounts owned by individuals in the same household (by address) that have a combined balance of $5 or more
• UTMA/UGMA accounts
• Fiduciary accounts
• B-share accounts whose shares have started to convert to A-shares accounts (as long as combined value of both accounts is at least $1)
For the six months ended April 30, 2005, this fee totaled $2. These fees are included in Paid in Capital in the Statement of Assets and Liabilities.
Redemption fees: A short-term trading redemption fee may be assessed on any fund shares in a fund account that are sold during the first five (5) NYSE trading days following their purchase date. This redemption fee will equal 2% of the amount redeemed and shares held the longest will be treated as being redeemed first and shares held the shortest as being redeemed last.
For the six months ended April 30, 2005, the Fund received less than $1 in redemption fees.
Dividend distributions: Distributions to shareholders are recorded on the ex-dividend date and are determined in accordance with Federal income tax regulations which may differ from GAAP.
NOTE 2. RELATED PARTY TRANSACTIONS
Transamerica Fund Advisors, Inc. ("TFAI") is the Fund's investment adviser. Transamerica Fund Services, Inc. ("TFS") is the Fund's administrator and transfer agent. AFSG Securities Corp. ("AFSG") is the Fund's distributor/principal underwriter. AFSG is 100% owned by
Transamerica IDEX Mutual Funds
Semi-Annual Report 2005
15
TA IDEX Transamerica Conservative High-Yield Bond
NOTES TO FINANCIAL STATEMENTS (continued)
At April 30, 2005
(all amounts in thousands)
(unaudited)
NOTE 2.–(continued)
AUSA Holding Company ("AUSA"). TFAI is a directly owned subsidiary of Western Reserve Life Assurance Co. of Ohio (78%) and AUSA (22%). TFS is a wholly owned subsidiary of WRL (50%) and AUSA (50%). AUSA and WRL are wholly owned indirect subsidiaries of AEGON, NV, a Netherlands corporation.
Effective January 1, 2005 AEGON/Transamerica Fund Advisors, Inc. ("ATFA") was renamed Transamerica Fund Advisors, Inc. ("TFAI"); AEGON/Transamerica Fund Services, Inc. ("ATFS") and AEGON/Transamerica Investor Services, Inc. ("ATIS") merged into one entity and was renamed Transamerica Fund Services, Inc. ("TFS").
AEGON USA Investment Management, Inc. is both the sub-adviser to the Fund and an affiliate of the Fund.
The following schedule represents the percentage of fund assets owned by affiliated mutual funds (i.e. through the Transamerica IDEX Mutual Funds and AEGON/Transamerica Series Trust (f/k/a AEGON/Transamerica Series Fund, Inc.) asset allocation funds):
| Net Assets | % of Net Assets | ||||||||||
| TA IDEX Asset Allocation– Conservative Portfolio | $ | 64,878 | 15.04 | % | |||||||
| TA IDEX Asset Allocation– Moderate Growth Portfolio | 94,217 | 21.84 | % | ||||||||
| TA IDEX Asset Allocation– Moderate Portfolio | 136,405 | 31.63 | % | ||||||||
| Asset Allocation–Moderate Growth Portfolio | 25,432 | 5.90 | % | ||||||||
| Asset Allocation–Moderate Portfolio | 14,187 | 3.29 | % | ||||||||
| Total | $ | 335,119 | 77.70 | % | |||||||
Investment advisory fee: The Fund pays management fees to TFAI based on average daily net assets ("ANA") at the following breakpoints:
From November 1, 2004 to December 31, 2004:
0.60% of ANA
From January 1, 2005 on:
0.60% of the first $400 million of ANA
0.575% of the next $350 million of ANA
0.55% of ANA over $750 million
TFAI has contractually agreed to waive its advisory fee and will reimburse the Fund to the extent that operating expenses, excluding 12b-1 fees, exceed the following stated annual limit for Class A, B and C:
1.25% Expense Limit
0.80% Expense Limit–Class I
Distribution and service fees: The Fund has a 12b-1 distribution plan under the 1940 Act pursuant to which an annual fee, based on average daily net assets, is paid to the distributor for various disbursements such as broker-dealer account servicing fees and other promotional expenses of the Fund. The Fund is authorized under the 12b-1 plan to pay fees on each class up to the following limits:
| Class A | 0.35 | % | |||||
| Class B | 1.00 | % | |||||
| Class C | 1.00 | % | |||||
| Class I | N/A | ||||||
In the case the Fund or a class of shares of the Fund is closed to new investors or investments, the Fund is authorized to pay 12b-1 fees for past sales and distribution efforts and present and past investor services.
Underwriter commissions relate to front-end sales charges imposed for Class A shares and contingent deferred sales charges from Classes B, C, and certain A share redemptions. For the six months ended April 30, 2005, the underwriter commissions were as follows:
| Received by Underwriter | $ | 126 | |||||
| Retained by Underwriter | 12 | ||||||
| Contingent Deferred Sales Charge | 140 | ||||||
Administrative services: The Fund has entered into an agreement with TFS for financial and legal fund administration services, which includes such items as compliance, expenses, financial statements and other reporting, distributions, tax returns, prospectus preparation, board of trustees meeting support and other legal matters. As of January 1, 2005 the Fund pays TFS an annual fee of 0.02% of average net assets. Prior to January 1, 2005 the Fund paid TFS an annual fee of 0.015% of average net assets. The Legal fees on the Statement of Operations are for fees paid to external legal counsel.
Transfer agent fees: The Fund pays TFS an annual per-account charge of $20 (not in thousands) for each open account and $1.63 (not in thousands) for each closed account. There is no new account charge. The Transfer agent fees on the Statement of Operations are made up of fees paid to TFS and costs associated with shareholder statements.
The Fund paid TFS $89 for the six months ended April 30, 2005.
Deferred compensation plan: Each eligible Fund Trustee may elect participation in the Deferred Compensation Plan ("the Plan"). Under the Plan, such Trustees may defer payment of a percentage of their total fees earned as a Fund Trustee. These deferred amounts may be invested in any Transamerica IDEX Mutual Fund. At April 30, 2005, the value of invested plan amount was $23. Invested plan amounts and the total liability for deferred compensation to the Trustees under the Plan at April 30, 2005, are included in the accompanying Statement of Assets and Liabilities.
Transamerica IDEX Mutual Funds
Semi-Annual Report 2005
16
TA IDEX Transamerica Conservative High-Yield Bond
NOTES TO FINANCIAL STATEMENTS (continued)
At April 30, 2005
(all amounts in thousands)
(unaudited)
NOTE 3. INVESTMENT TRANSACTIONS
The cost of securities purchased and proceeds from securities sold (excluding short-term securities) for the six months ended April 30, 2005, were as follows:
| Purchases of securities: | |||||||
| Long-Term excluding U.S. Government | $ | 141,714 | |||||
| U.S. Government | 5,471 | ||||||
| Proceeds from maturities and sales of securities: | |||||||
| Long-Term excluding U.S. Government | 86,365 | ||||||
| U.S. Government | – | ||||||
NOTE 4. FEDERAL INCOME TAX MATTERS
The Fund has not made any provision for federal income or excise taxes due to its policy to distribute all of its taxable income and capital gains to its shareholders and otherwise qualify as a regulated investment company under the Internal Revenue Code. Income and capital gain distributions are determined in accordance with income tax regulations, which may differ from GAAP. These differences are primarily due to differing treatment for items including, but not limited to, wash sales, net operating losses and capital loss carryforwards.
The capital loss carryforwards are available to offset future realized capital gains through the periods listed:
| Capital Loss Carryforward | Available through | ||||||
| $ | 354 | October 31, 2008 | |||||
| 1,519 | October 31, 2009 | ||||||
| 5,464 | October 31, 2010 | ||||||
| 5,283 | October 31, 2011 | ||||||
The aggregate cost of investments and composition of unrealized appreciation (depreciation) for federal income tax purposes as of April 30, 2005, are as follows:
| Federal Tax Cost Basis | $ | 446,620 | |||||
| Unrealized Appreciation | $ | 10,652 | |||||
| Unrealized (Depreciation) | (9,191 | ) | |||||
| Net Unrealized Appreciation (Depreciation) | $ | 1,461 | |||||
NOTE 5. REGULATORY PROCEEDINGS
There continues to be significant federal and state regulatory activity relating to financial services companies, particularly mutual fund companies and their investment advisers. As part of an ongoing investigation regarding potential market timing, recordkeeping and trading compliance issues and matters affecting the Fund's investment adviser, TFAI, and certain employees and affiliates of TFAI, the SEC staff
has indicated that it is likely to take some action against TFAI and certain of its affiliates at the conclusion of the investigation. The potential timing and the scope of any such action is difficult to predict. Although the impact of any action brought against TFAI and/or its affiliates is difficult to assess at the present time, the Fund currently believes that the likelihood that any such action will have a material adverse impact on it is remote. It is important to note that the Fund is not aware of any allegation of wrongdoing against it and its board at the time this semi-annual report is printed. Although it is not anticipated that these developments will have an adverse impact on the Fund, there can be no assurance at this time. TFAI and its affiliates are actively working with the SEC in regard to this matter; however, the exact resolution cannot be determined at this time. TFAI will take suc h actions that it deems necessary or appropriate to continue providing management services to the Fund and to bring all matters to an appropriate conclusion.
TFAI and/or its affiliates, and not the Fund, will bear the costs regarding these regulatory matters.
Transamerica IDEX Mutual Funds
Semi-Annual Report 2005
17
TA IDEX Transamerica Conservative High-Yield Bond
INVESTMENT ADVISORY AND SUB-ADVISORY AGREEMENTS – REVIEW AND RENEWAL
At a meeting of the Board of Trustees of Transamerica IDEX Mutual Funds ("TA IDEX") held on October 6, 2004, the Board considered and approved the renewal for a one-year period of the Investment Advisory Agreement between TA IDEX Transamerica Conservative High-Yield Bond (the "Fund") and Transamerica Fund Advisors, Inc. ("TFAI") as well as the Investment Sub-Advisory Agreement of the Fund between TFAI and AEGON USA Investment Management, LLC (the "Sub-Adviser"). In approving the renewal of these agreements, the Board concluded that the Investment Advisory and Investment Sub-Advisory Agreements enable shareholders of the Fund to obtain high quality services at a cost that is appropriate, reasonable, and in the best interests of shareholders based upon the following determinations, among others:
The nature, extent and quality of the advisory service to be provided. The Board considered the nature and quality of the services provided by TFAI and the Sub-Adviser to the Fund in the past, as well as the services anticipated to be provided in the future. The Board concluded that TFAI and the Sub-Adviser are capable of providing high quality services to the Fund, as indicated by TFAI's management capabilities demonstrated with respect to the Fund and other funds managed by TFAI, TFAI's management oversight process, and the professional qualifications and experience of the SubAdviser's portfolio management team. The Board also concluded that TFAI and the Sub-Adviser would provide the same quality and quantity of investment management and related services as before, that these services are appr opriate in scope and extent in light of the Fund's operations, the competitive landscape of the investment company business and investor needs, and that TFAI's and the Sub-Adviser's obligations will remain the same in all respects.
The investment performance of the Fund. The Board concluded, based on information provided by Lipper Analytics, that the Fund's investment performance was acceptable, although the Board noted that the Fund had underperformed comparable investment companies as represented by Lipper Analytics. As a consequence, the Board decided to carefully monitor the Fund's investment performance, and requested that Sub-Advisory personnel attend an upcoming meeting to review the Fund's performance with the Board. However, on the basis of the Trustees' assessment of the nature, extent and quality of investment advisory and related services to be provided or procured by TFAI and the Sub-Adviser, the Trustees concluded that TFAI and the Sub-Adviser were capable of generating a level of investment performance that is appropriate in light of the Fund's investment objective, policies and strategies and competitive with many other investment companies.
The cost of advisory services provided and the level of profitability. On the basis of the Board's review of the fees to be charged by TFAI and the Sub-Adviser for investment advisory and related services, TFAI's financial statements, the fees paid by TFAI to the Sub-Adviser, TFAI's estimated net management income resulting from its management of the Fund, the estimated profitability of TFAI's relationships with the Fund and TA IDEX, and the estimated profitability of the Sub-Adviser's relationship with the Fund, the Board concluded that the level of investment advisory fees and the profitability is appropriate in light of the services provided, the management fees and overall expense ratios of comparable investment companies, and the anticipated profitability of the relationship between the Fun d, TFAI and the Sub-Adviser. Further, on the basis of comparative information supplied by Lipper Analytics, the Board determined that the advisory fees and estimated overall expense ratio of the Fund were consistent with or lower than industry averages.
The extent to which economies of scale would be realized as the Fund grows and whether fee levels reflect these economies of scale for the benefit of Fund investors. The Trustees concluded that inclusion of asset-based breakpoints in the Fund's advisory fee schedule appropriately benefit investors by realizing economies of scale in the form of a lower advisory fee rate as the level of Fund assets increases. The Board also concluded that the advisory fees appropriately reflect the Fund's current size, the current economic environment for TFAI, and the competitive nature of the investment company market. In addition, the Board noted that it will have the opportunity to periodically re-examine whether the Fund has achieved economies of scale, as well as the appropriateness of advisory fees payable to TFAI and the Sub-Adviser in the future.
Benefits (such as soft dollars) to TFAI or the Sub-Adviser from its relationship with the Fund. The Board concluded that other benefits derived by TFAI or the Sub-Adviser from its relationship with the Fund are reasonable and fair, and are consistent with industry practice and the best interests of the Fund and its shareholders. In this regard, the Board noted that neither TFAI nor the Sub-Adviser realizes "soft dollar" benefits from its relationship with the Fund.
Other considerations. The Board also determined that TFAI had made a substantial commitment to the recruitment and retention of high quality personnel, and maintained the financial, compliance and operational resources reasonably necessary to manage the Fund in a professional manner that is consistent with the best interests of the Fund and its shareholders. The Trustees also concluded that TFAI had made a significant entrepreneurial commitment to the management and success of the Fund, reflected by TFAI's expense limitation and fee waiver arrangement with the Fund which, as demonstrated in the past with the Fund, may result in TFAI waiving a substantial amount of advisory fees for the benefit of shareholders.
Transamerica IDEX Mutual Funds
Semi-Annual Report 2005
18
TA IDEX Transamerica Conservative High-Yield Bond
SUPPLEMENTAL INFORMATION (unaudited)
RESULTS OF SHAREHOLDER PROXY
At a special meeting of shareholders held on February 25, 2005, the results of the Proposals were as follows:
Transamerica IDEX Mutual Funds
Proposal 1: Election of Trustees to the Board of Trustees of Transamerica IDEX Mutual Funds.
| For | Withheld | ||||||||||
| Peter R. Brown | 872,017,875.249 | 4,468,498.551 | |||||||||
| Daniel Calabria | 871,917,069.786 | 4,569,304.014 | |||||||||
| Janise B. Case | 872,099,393.125 | 4,386,980.675 | |||||||||
| Charles C. Harris | 872,086,722.025 | 4,399,651.775 | |||||||||
| Leo J. Hill | 872,304,465.640 | 4,181,908.160 | |||||||||
| Russell A. Kimball, Jr. | 872,253,556.471 | 4,232,817.329 | |||||||||
| William W. Short, Jr. | 872,139,920.944 | 4,346,452.856 | |||||||||
| John Waechter | 872,261,152.376 | 4,225,221.424 | |||||||||
| Jack E. Zimmerman | 871,929,967.512 | 4,556,406.288 | |||||||||
| Brian C. Scott | 872,218,970.367 | 4,267,403.433 | |||||||||
| Thomas P. O'Neill | 872,111,944.117 | 4,374,429.683 | |||||||||
TA IDEX Transamerica Conservative High-Yield Bond
Proposal 2: Approval of an Agreement and Plan of Reorganization pursuant to which Transamerica IDEX Mutual Funds will organize as a Delaware statutory trust.
| For | Against | Abstentions/Broker Non-Votes | |||||||||
| 33,794,977.816 | 88,955.949 | 4,960,512.003 | |||||||||
Transamerica IDEX Mutual Funds
Semi-Annual Report 2005
19
TA IDEX Transamerica Conservative High-Yield Bond
Proposal 3: Approval of changes to the fundamental investment restrictions of TA IDEX Transamerica Conservative High-Yield Bond.
| A. Diversification | For | Against | Abstentions/Broker Non-Votes | ||||||||||||
| 33,899,482.053 | 126,813.715 | 4,818,150.000 | |||||||||||||
| B. Borrowing | For | Against | Abstentions/Broker Non-Votes | ||||||||||||
| 33,882,111.294 | 144,184.474 | 4,818,150.000 | |||||||||||||
| C. Senior Securities | For | Against | Abstentions/Broker Non-Votes | ||||||||||||
| 33,898,276.053 | 128,019.715 | 4,818,150.000 | |||||||||||||
| D. Underwriting Securities | For | Against | Abstentions/Broker Non-Votes | ||||||||||||
| 33,899,482.053 | 126,813.715 | 4,818,150.000 | |||||||||||||
| E. Real Estate | For | Against | Abstentions/Broker Non-Votes | ||||||||||||
| 33,898,686.180 | 127,609.588 | 4,818,150.000 | |||||||||||||
| F. Making Loans | For | Against | Abstentions/Broker Non-Votes | ||||||||||||
| 33,896,482.699 | 129,813.069 | 4,818,150.000 | |||||||||||||
| G. Concentration | For | Against | Abstentions/Broker Non-Votes | ||||||||||||
| 33,899,482.053 | 126,813.715 | 4,818,150.000 | |||||||||||||
| H. Commodities | For | Against | Abstentions/Broker Non-Votes | ||||||||||||
| 33,886,233.734 | 140,062.034 | 4,818,150.000 | |||||||||||||
| I. Pledging, Mortgaging and Hypothecating | For | Against | Abstentions/Broker-Non-Votes | ||||||||||||
| 33,894,792.891 | 131,502.877 | 4,818,150.000 | |||||||||||||
| J. Investments in Investment Companies | For | Against | Abstentions/Broker-Non-Votes | ||||||||||||
| 33,892,531.880 | 133,763.888 | 4,818,150.000 | |||||||||||||
| K. Margin Activities and Short Selling | For | Against | Abstentions/Broker-Non-Votes | ||||||||||||
| 33,879,244.729 | 147,051.039 | 4,818,150.000 | |||||||||||||
| L. Investments – Trustee/Officer Invested | For | Against | Abstentions/Broker-Non-Votes | ||||||||||||
| 33,897,913.874 | 128,381.894 | 4,818,150.000 | |||||||||||||
| M. Investments in Mineral Leases | For | Against | Abstentions/Broker-Non-Votes | ||||||||||||
| 33,888,616.564 | 137,679.204 | 4,818,150.000 | |||||||||||||
| N. Investments in Bank Deposits | For | Against | Abstentions/Broker-Non-Votes | ||||||||||||
| 33,896,408.170 | 129,887.598 | 4,818,150.000 | |||||||||||||
Transamerica IDEX Mutual Funds
Semi-Annual Report 2005
20
TA IDEX Transamerica Convertible Securities
UNDERSTANDING YOUR FUND'S EXPENSES
(unaudited)
SHAREHOLDER EXPENSES
The following Example is intended to help you understand your ongoing costs (in dollars and cents) of investing in a Fund and to compare these costs with the ongoing costs of investing in other funds.
The Example is based on an investment of $1,000 invested at November 1, 2004 and held for the entire period until April 30, 2005.
ACTUAL EXPENSES
The first line in the table below provides information about actual account values and actual expenses. You may use the information in this line, together with the amount you invested, to estimate the expenses that you paid over the period. Simply divide your account value by $1,000 (for example, an $8,600 account value divided by $1,000 = 8.6), then multiply the result by the number in the first line of your Fund under the heading entitled "Expenses Paid During Period" to estimate the expenses you paid on your account during this period.
HYPOTHETICAL EXAMPLE FOR COMPARISON PURPOSES
The second line in the table below provides information about hypothetical account values and hypothetical expenses based on the Fund's actual expense ratio and an assumed rate of return of 5% per year before expenses, which is not the Fund's actual return. The hypothetical account values and expenses may not be used to estimate the actual ending account balance or expenses you paid for the period. You may use this information to compare the ongoing costs of investing in your Fund and other funds. To do so, compare this 5% hypothetical example with the 5% hypothetical examples that appear in the shareholder reports of the other funds.
Please note that the expenses shown in the table are meant to highlight your ongoing costs only and do not reflect any transactional costs, such as sales charges, redemption fees, brokerage commissions paid on purchases and sales of fund shares. Therefore, the second line under the Fund in the table is useful in comparing ongoing costs only, and will not help you determine the relative total costs of owning different funds. In addition, note that the expenses shown in the table are meant to highlight your ongoing costs and do not reflect any transaction costs.
| Beginning Account Value | Ending Account Value | Annualized Expense Ratio | Expenses Paid During Period (a) | ||||||||||||||||
| Class A | |||||||||||||||||||
| Actual | $ | 1,000.00 | $ | 999.10 | 1.16 | % | $ | 5.75 | |||||||||||
| Hypothetical (b) | 1,000.00 | 1,019.04 | 1.16 | 5.81 | |||||||||||||||
| Class B | |||||||||||||||||||
| Actual | 1,000.00 | 993.50 | 2.05 | 10.13 | |||||||||||||||
| Hypothetical (b) | 1,000.00 | 1,014.63 | 2.05 | 10.24 | |||||||||||||||
| Class C | |||||||||||||||||||
| Actual | 1,000.00 | 993.30 | 2.30 | 11.37 | |||||||||||||||
| Hypothetical (b) | 1,000.00 | 1,013.39 | 2.30 | 11.48 | |||||||||||||||
(a) Expenses are calculated using each Fund's annualized expense ratio (as disclosed in the table), multiplied by the average account value for the period, multiplied by number of days in the period (181 days), and divided by the number of days in the year (365 days).
(b) 5% return per year before expenses.
GRAPHICAL PRESENTATION OF SCHEDULE OF INVESTMENTS
By Sector
At April 30, 2005

This chart shows the percentage breakdown by sector of the Fund's total investment securities.
Transamerica IDEX Mutual Funds
Semi-Annual Report 2005
1
TA IDEX Transamerica Convertible Securities
SCHEDULE OF INVESTMENTS
At April 30, 2005
(all amounts except share amounts in thousands)
(unaudited)
| Principal | Value | ||||||||||
| CONVERTIBLE BONDS (86.5%) | |||||||||||
| Business Services (1.9%) | |||||||||||
| Danaher Corp. Zero Coupon, due 01/22/2021 (a) | $ | 5,500 | $ | 4,139 | |||||||
| Chemicals & Allied Products (1.5%) | |||||||||||
| RPM International, Inc. 1.39%, due 05/13/2033 (b) | 6,000 | 3,105 | |||||||||
| Commercial Banks (7.2%) | |||||||||||
| Bank of America Corp. 0.25%, due 04/30/2014 | 4,000 | 5,295 | |||||||||
| Euronet Worldwide, Inc.–144A 1.63%, due 12/15/2024 | 4,000 | 4,245 | |||||||||
| Wells Fargo & Co. 0.25%, due 04/29/2014 | 5,000 | 5,803 | |||||||||
| Communication (3.4%) | |||||||||||
| American Tower Corp. 3.00%, due 08/15/2012 (a) | 3,750 | 3,839 | |||||||||
| XM Satellite Radio, Inc.–144A 1.75%, due 12/01/2009 (a) | 4,000 | 3,380 | |||||||||
| Computer & Data Processing Services (8.1%) | |||||||||||
| Openwave Systems, Inc. 2.75%, due 09/09/2008 | 4,500 | 4,376 | |||||||||
| Overstock.com, Inc. 3.75%, due 12/01/2011 | 4,300 | 3,531 | |||||||||
| RealNetworks, Inc. Zero Coupon, due 07/01/2010 | 4,800 | 4,674 | |||||||||
| Terremark Worldwide, Inc. 9.00%, due 06/15/2009 | 5,000 | 4,600 | |||||||||
| Computer & Office Equipment (1.7%) | |||||||||||
| Scientific Games Corp.–144A 0.75%, due 12/01/2024 | 4,000 | 3,680 | |||||||||
| Electronic Components & Accessories (2.6%) | |||||||||||
| Cypress Semiconductor Corp. 1.25%, due 06/15/2008 (a) | 2,650 | 2,726 | |||||||||
| Pixelworks, Inc. 1.75%, due 05/15/2024 | 4,000 | 2,850 | |||||||||
| Entertainment (1.5%) | |||||||||||
| International Game Technology Zero Coupon, due 01/29/2033 | 4,900 | 3,136 | |||||||||
| Hotels & Other Lodging Places (5.3%) | |||||||||||
| Host Marriott, LP–144A 3.25%, due 04/15/2024 | 2,000 | 2,155 | |||||||||
| Kerzner International, Ltd. 2.38%, due 04/15/2024 | 4,100 | 4,402 | |||||||||
| Starwood Hotels & Resorts Worldwide, Inc. 3.50%, due 05/16/2023 (a) | 4,000 | 4,630 | |||||||||
| Manufacturing Industries (6.4%) | |||||||||||
| K2, Inc. 5.00%, due 06/15/2010 | 3,425 | 4,200 | |||||||||
| Principal | Value | ||||||||||
| Manufacturing Industries (continued) | |||||||||||
| Shuffle Master, Inc. 1.25%, due 04/15/2024 | $ | 4,850 | $ | 5,080 | |||||||
| Tyco International Group SA, Series B, 3.13%, due 01/15/2023 | 3,000 | 4,403 | |||||||||
| Mortgage Bankers & Brokers (2.6%) | |||||||||||
| MSFT Exchangeable Trust–144A Zero Coupon, due 02/25/2031 | 2,750 | 2,970 | |||||||||
| Virgin River Casino Corp.–144A Zero Coupon, due 01/15/2013 (c) | 4,000 | 2,560 | |||||||||
| Motion Pictures (4.5%) | |||||||||||
| Liberty Media Corp. 3.25%, due 03/15/2031 (a) | 4,550 | 3,663 | |||||||||
| Lions Gate Entertainment Corp. 4.88%, due 12/15/2010 2.94%, due 10/15/2024 | 1,000 3,750 | 1,885 3,947 | |||||||||
| Oil & Gas Extraction (4.6%) | |||||||||||
| Halliburton Co. 3.13%, due 07/15/2023 | 4,750 | 5,938 | |||||||||
| Quicksilver Resources, Inc.–144A 1.88%, due 11/01/2024 | 3,000 | 3,904 | |||||||||
| Personal Credit Institutions (2.8%) | |||||||||||
| American Express Co. 1.85%, due 12/01/2033 (a)(d) | 5,800 | 5,952 | |||||||||
| Pharmaceuticals (3.3%) | |||||||||||
| Abgenix, Inc.–144A 1.75%, due 12/15/2011 | 1,100 | 880 | |||||||||
| Medarex, Inc.–144A 2.25%, due 05/15/2011 | 5,085 | 4,176 | |||||||||
| Teva Pharmaceutical Finance II LLC, Series B 0.25%, due 02/01/2024 | 1,900 | 1,907 | |||||||||
| Primary Metal Industries (1.6%) | |||||||||||
| Inco, Ltd. Zero Coupon, due 03/29/2021 | 3,500 | 3,325 | |||||||||
| Radio, Television & Computer Stores (2.0%) | |||||||||||
| Guitar Center, Inc. 4.00%, due 07/15/2013 | 2,800 | 4,151 | |||||||||
| Research & Testing Services (1.1%) | |||||||||||
| Amylin Pharmaceuticals, Inc. 2.25%, due 06/30/2008 (a) | 1,100 | 994 | |||||||||
| deCODE genetics, Inc. 3.50%, due 04/15/2011 | 1,650 | 1,310 | |||||||||
| Residential Building Construction (0.4%) | |||||||||||
| Walter Industries, Inc. 3.75%, due 05/01/2024 (a) | 460 | 941 | |||||||||
The notes to the financial statements are an integral part of this report.
Transamerica IDEX Mutual Funds
Semi-Annual Report 2005
2
TA IDEX Transamerica Convertible Securities
SCHEDULE OF INVESTMENTS (continued)
At April 30, 2005
(all amounts except share amounts in thousands)
(unaudited)
| Principal | Value | ||||||||||
| Retail Trade (1.4%) | |||||||||||
| Dick's Sporting Goods, Inc. 1.61%, due 02/18/2024 (a)(e) | $ | 4,400 | $ | 2,893 | |||||||
| Security & Commodity Brokers (10.6%) | |||||||||||
| Blackrock, Inc.–144A 2.63%, due 02/15/2035 | 4,750 | 4,679 | |||||||||
| Morgan Stanley Group, Inc.–144A 0.25%, due 07/30/2014 | 5,300 | 5,177 | |||||||||
| SG Structured Products, Inc. 0.25%, due 02/13/2012 | 6,500 | 5,739 | |||||||||
| Svensk Exportkredit AB 0.25%, due 01/31/2015 | 7,000 | 7,000 | |||||||||
| Telecommunications (7.7%) | |||||||||||
| Millicom International Cellular Exchangeable Note Trust–144A 10.75%, due 11/20/2008 | 3,650 | 4,989 | |||||||||
| Nextel Partners, Inc. 1.50%, due 11/15/2008 | 4,000 | 7,455 | |||||||||
| NII Holdings, Inc. 2.88%, due 02/01/2034 (a) | 3,500 | 3,911 | |||||||||
| Water Transportation (4.3%) | |||||||||||
| Carnival Corp. 1.13%, due 04/29/2033 (f) | 5,000 | 3,663 | |||||||||
| OMI Corp. 2.88%, due 12/01/2024 (a) | 850 | 778 | |||||||||
| Royal Caribbean Cruises, Ltd. Zero Coupon, due 02/02/2021 Zero Coupon, due 05/18/2021 | 4,000 4,000 | 2,000 2,660 | |||||||||
| Total Convertible Bonds (cost: $183,902) | 183,696 | ||||||||||
| Shares | Value | ||||||||||
| CONVERTIBLE PREFERRED STOCKS (10.9%) | |||||||||||
| Chemicals & Allied Products (3.1%) | |||||||||||
| Celanese Corp. | 155,000 | $ | 3,507 | ||||||||
| Huntsman Corp. | 32,000 | 1,495 | |||||||||
| Terra Industries, Inc.–144A (g) | 1,950 | 1,627 | |||||||||
| Electric Services (1.8%) | |||||||||||
| Aquila, Inc. | 120,000 | 3,825 | |||||||||
| Gas Production & Distribution (0.7%) | |||||||||||
| Southern Union Co. (a) | 27,660 | 1,387 | |||||||||
| Insurance (2.4%) | |||||||||||
| Fortis Insurance NV–144A | 5,000 | 5,073 | |||||||||
| Metal Mining (1.0%) | |||||||||||
| Freeport-McMoRan Copper & Gold, Inc. (a) | 2,500 | 2,228 | |||||||||
| Oil & Gas Extraction (1.9%) | |||||||||||
| Chesapeake Energy Corp. | 20,000 | 2,595 | |||||||||
| Chesapeake Energy Corp. | 1,150 | 1,480 | |||||||||
| Total Convertible Preferred Stocks (cost: $23,683) | 23,217 | ||||||||||
| Principal | Value | ||||||||||
| SECURITY LENDING COLLATERAL (11.5%) | |||||||||||
| Debt (10.0%) | |||||||||||
| Bank Notes (1.4%) | |||||||||||
| Bank of America | |||||||||||
| 2.82%, due 05/16/2005 | $ | 771 | $ | 771 | |||||||
| 2.80%, due 06/09/2005 (h) | 193 | 193 | |||||||||
| 2.77%, due 07/18/2005 (h) | 771 | 771 | |||||||||
| Canadian Imperial Bank of Commerce 3.02%, due 11/04/2005 (h) | 771 | 771 | |||||||||
| Credit Suisse First Boston Corp. 2.88%, due 09/09/2005 (h) 3.06%, due 03/10/2006 (h) | 193 193 | 193 193 | |||||||||
| Euro Dollar Overnight (1.7%) | |||||||||||
| Bank of Montreal 2.94%, due 05/04/2005 | 578 | 578 | |||||||||
| BNP Paribas 2.80%, due 05/05/2005 | 798 | 798 | |||||||||
| Den Danske Bank 2.93%, due 05/02/2005 2.80%, due 05/06/2005 | 694 386 | 694 386 | |||||||||
| Dexia Group 2.80%, due 05/05/2005 | 340 | 340 | |||||||||
| Royal Bank of Canada 2.80%, due 05/04/2005 | 791 | 791 | |||||||||
| Svenska Handlesbanken 2.80%, due 05/06/2005 | 127 | 127 | |||||||||
| Euro Dollar Terms (4.1%) | |||||||||||
| Bank of Nova Scotia 2.88%, due 05/11/2005 3.01%, due 05/31/2005 | 386 1,078 | 386 1,078 | |||||||||
| Barclays 3.02%, due 06/27/2005 | 687 | 687 | |||||||||
| BNP Paribas 2.93%, due 06/07/2005 | 617 | 617 | |||||||||
| Branch Banker & Trust 2.94%, due 06/06/2005 | 165 | 165 | |||||||||
| Calyon 2.93%, due 06/03/2005 | 637 | 637 | |||||||||
| Citigroup 2.87%, due 06/06/2005 | 800 | 800 | |||||||||
| Credit Suisse First Boston Corp. 2.91%, due 05/16/2005 | 790 | 790 | |||||||||
| HSBC Banking/Holdings PLC 3.01%, due 06/23/2005 | 386 | 386 | |||||||||
| Royal Bank of Scotland 2.94%, due 06/07/2005 2.95%, due 06/10/2005 | 749 416 | 749 416 | |||||||||
The notes to the financial statements are an integral part of this report.
Transamerica IDEX Mutual Funds
Semi-Annual Report 2005
3
TA IDEX Transamerica Convertible Securities
SCHEDULE OF INVESTMENTS (continued)
At April 30, 2005
(all amounts except share amounts in thousands)
(unaudited)
| Principal | Value | ||||||||||
| Euro Dollar Terms (continued) | |||||||||||
| Societe Generale | |||||||||||
| 2.80%, due 05/03/2005 | $ | 737 | $ | 737 | |||||||
| Toronto Dominion Bank 2.75%, due 05/09/2005 3.01%, due 06/24/2005 | 578 214 | 578 214 | |||||||||
| UBS AG 2.81%, due 05/03/2005 | 386 | 386 | |||||||||
| Promissory Notes (1.0%) | |||||||||||
| Goldman Sachs Group, Inc. 2.99%, due 06/27/2005 3.01%, due 07/27/2005 | 810 1,349 | 810 1,349 | |||||||||
| Repurchase Agreements (1.8%) (i) | |||||||||||
| Goldman Sachs Group, Inc. (The) 3.04%, Repurchase Agreement dated 04/29/2005 to be repurchased at $1,735 on 05/02/2005 | 1,735 | 1,735 | |||||||||
| Merrill Lynch & Co., Inc. 3.04%, Repurchase Agreement dated 04/29/2005 to be repurchased at $2,083 on 05/02/2005 | 2,082 | 2,082 | |||||||||
| Shares | Value | ||||||||||
| Investment Companies (1.5%) | |||||||||||
| Money Market Funds (1.5%) | |||||||||||
| American Beacon Funds 1-day yield of 2.84% | 306,194 | $ | 306 | ||||||||
| BGI Institutional Money Market Fund 1-day yield of 2.93% | 1,813,145 | 1,813 | |||||||||
| Merrill Lynch Premier Institutional Fund 1-day yield of 2.65% | 408,015 | 408 | |||||||||
| Merrimac Cash Fund, Premium Class 1-day yield of 2.74% (j) | 746,254 | 746 | |||||||||
| Total Security Lending Collateral (cost: $24,481) | 24,481 | ||||||||||
| Total Investment Securities (cost: $232,066) | $ | 231,394 | |||||||||
| SUMMARY: | |||||||||||
| Investments, at value | 108.9 | % | $ | 231,394 | |||||||
| Liabilities in excess of other assets | (8.9 | )% | (18,924 | ) | |||||||
| Net assets | 100.0 | % | $ | 212,470 | |||||||
NOTES TO SCHEDULE OF INVESTMENTS:
(a) At April 30, 2005, all or a portion of this security is on loan (see Note 1). The value at April 30, 2005, of all securities on loan is $23,927.
(b) Securities are stepbonds. RPM International, Inc. has a coupon rate of 1.39% until 05/13/2008, thereafter the coupon rate will be 0.00%.
(c) Securities are stepbonds. Virgin River Casino Corp. has a coupon rate of 0.00% until 01/15/2009, thereafter the coupon rate will be 12.75%.
(d) Securities are stepbonds. American Express Co. has a coupon rate of 1.85% until 12/01/2006, thereafter the coupon rate will be 0.00%.
(e) Securities are stepbonds. Dick's Sporting Goods, Inc. has a coupon rate of 1.61% until 02/18/2009, thereafter the coupon rate will be 0.00%.
(f) Securities are stepbonds. Carnival Corp. has a coupon rate of 1.13% until 04/29/2008, thereafter the coupon rate will be 0.00%.
(g) No dividends were paid during the preceding twelve months.
(h) Floating or variable rate note. Rate is listed as of April 30, 2005.
(i) Cash collateral for the Repurchase Agreements, valued at $3,883, that serve as collateral for securities lending are invested in corporate bonds with interest rates and maturity dates ranging from 0.00%–8.875% and 06/15/2005–03/15/2035, respectively.
(j) Regulated investment company advised by Investors Bank and Trust Co. ("IBT"). IBT is also the accounting, custody and lending agent for the Fund.
DEFINITIONS:
144A 144A Securities are registered pursuant to Rule 144A of the Securities Act of 1933. These securities are deemed to be liquid for purposes of compliance limitations on holdings of illiquid securities and may be resold as transactions exempt from registration, normally to qualified institutional buyers. At April 30, 2005, these securities aggregated $49,495 or 23.3% of the net assets of the Fund.
The notes to the financial statements are an integral part of this report.
Transamerica IDEX Mutual Funds
Semi-Annual Report 2005
4
TA IDEX Transamerica Convertible Securities
STATEMENT OF ASSETS AND LIABILITIES
At April 30, 2005
(all amounts except per share amounts in thousands)
(unaudited)
| Assets: | |||||||
| Investment securities, at value (cost: $232,066) (including securities loaned of $23,927) | $ | 231,394 | |||||
| Cash | 4,495 | ||||||
| Receivables: | |||||||
| Shares of beneficial interest sold | 11 | ||||||
| Interest | 1,220 | ||||||
| Dividends | 107 | ||||||
| Other | 6 | ||||||
| 237,233 | |||||||
| Liabilities: | |||||||
| Accounts payable and accrued liabilities: | |||||||
| Shares of beneficial interest redeemed | 41 | ||||||
| Management and advisory fees | 139 | ||||||
| Distribution and service fees | 69 | ||||||
| Transfer agent fees | 4 | ||||||
| Payable for collateral for securities on loan | 24,481 | ||||||
| Other | 29 | ||||||
| 24,763 | |||||||
| Net Assets | $ | 212,470 | |||||
| Net Assets Consist of: | |||||||
| Shares of beneficial interest, unlimited shares authorized, no par value | $ | 209,844 | |||||
| Undistributed net investment income (loss) | 255 | ||||||
| Undistributed net realized gain (loss) from investment securities | 3,043 | ||||||
| Net unrealized appreciation (depreciation) on investment securities | (672 | ) | |||||
| Net Assets | $ | 212,470 | |||||
| Net Assets by Class: | |||||||
| Class A | $ | 201,382 | |||||
| Class B | 6,354 | ||||||
| Class C | 4,734 | ||||||
| Shares Outstanding: | |||||||
| Class A | 18,841 | ||||||
| Class B | 595 | ||||||
| Class C | 445 | ||||||
| Net Asset Value Per Share: | |||||||
| Class A | $ | 10.69 | |||||
| Class B | 10.67 | ||||||
| Class C | 10.63 | ||||||
| Maximum Offering Price Per Share (a): | |||||||
| Class A | $ | 11.22 | |||||
(a) Includes the maximum selling commission (represented as a percentage of offering price) which is reduced on certain levels of sales as set forth in the Prospectus. Net asset value per share for Classes B and C shares represents offering price. The redemption price for Classes B and C shares equals net asset value less any applicable contingent deferred sales charge.
STATEMENT OF OPERATIONS
For the period ended April 30, 2005
(all amounts in thousands)
(unaudited)
| Investment Income: | |||||||
| Interest | $ | 2,229 | |||||
| Dividends | 625 | ||||||
| Income from loaned securities–net | 77 | ||||||
| 2,931 | |||||||
| Expenses: | |||||||
| Management and advisory fees | 817 | ||||||
| Transfer agent fees: | |||||||
| Class A | 4 | ||||||
| Class B | 5 | ||||||
| Class C | 2 | ||||||
| Custody fees | 16 | ||||||
| Administration fees | 20 | ||||||
| Legal fees | 6 | ||||||
| Audit fees | 6 | ||||||
| Trustees fees | 6 | ||||||
| Registration fees: | |||||||
| Class A | 14 | ||||||
| Class B | 4 | ||||||
| Class C | 11 | ||||||
| Other | 1 | ||||||
| Distribution and service fees: | |||||||
| Class A | 365 | ||||||
| Class B | 33 | ||||||
| Class C | 26 | ||||||
| Total expenses | 1,336 | ||||||
| Net Investment Income (Loss) | 1,595 | ||||||
| Net Realized and Unrealized Gain (Loss): | |||||||
| Realized gain (loss) from investment securities | 3,079 | ||||||
| Increase (decrease) in unrealized appreciation (depreciation) on investment securities | (6,001 | ) | |||||
| Net Gain (Loss) on Investments | (2,922 | ) | |||||
| Net Increase (Decrease) in Net Assets Resulting from Operations | $ | (1,327 | ) | ||||
The notes to the financial statements are an integral part of this report.
Transamerica IDEX Mutual Funds
Semi-Annual Report 2005
5
TA IDEX Transamerica Convertible Securities
STATEMENTS OF CHANGES IN NET ASSETS
For the period or year ended
(all amounts in thousands)
| April 30, 2005 (unaudited) | October 31, 2004 | ||||||||||
| Increase (Decrease) In Net Assets From: | |||||||||||
| Operations: | |||||||||||
| Net investment income (loss) | $ | 1,595 | $ | 3,504 | |||||||
| Net realized gain (loss) from investment securities | 3,079 | 16,278 | |||||||||
| Net unrealized appreciation (depreciation) on investment securities | (6,001 | ) | (6,610 | ) | |||||||
| (1,327 | ) | 13,172 | |||||||||
| Distributions to Shareholders: | |||||||||||
| From net investment income: | |||||||||||
| Class A | (1,406 | ) | (3,482 | ) | |||||||
| Class B | (20 | ) | (85 | ) | |||||||
| Class C | (18 | ) | (70 | ) | |||||||
| Class C2 | – | (11 | ) | ||||||||
| Class M | – | (6 | ) | ||||||||
| (1,444 | ) | (3,654 | ) | ||||||||
| From net realized gains: | |||||||||||
| Class A | (4,356 | ) | (13,842 | ) | |||||||
| Class B | (142 | ) | (501 | ) | |||||||
| Class C | (113 | ) | (412 | ) | |||||||
| Class C2 | – | (92 | ) | ||||||||
| Class M | – | (37 | ) | ||||||||
| (4,611 | ) | (14,884 | ) | ||||||||
| Capital Share Transactions: | |||||||||||
| Proceeds from shares sold: | |||||||||||
| Class A | 27,870 | 1,441 | |||||||||
| Class B | 651 | 1,806 | |||||||||
| Class C | 338 | 915 | |||||||||
| Class C2 | – | 572 | |||||||||
| Class M | – | 174 | |||||||||
| 28,859 | 4,908 | ||||||||||
| Dividends and distributions reinvested: | |||||||||||
| Class A | 5,738 | 17,303 | |||||||||
| Class B | 121 | 422 | |||||||||
| Class C | 107 | 362 | |||||||||
| Class C2 | – | 62 | |||||||||
| Class M | – | 43 | |||||||||
| 5,966 | 18,192 | ||||||||||
| Cost of shares redeemed: | |||||||||||
| Class A | (13,239 | ) | (1,053 | ) | |||||||
| Class B | (603 | ) | (2,085 | ) | |||||||
| Class C | (763 | ) | (2,547 | ) | |||||||
| Class C2 | – | (632 | ) | ||||||||
| Class M | – | (208 | ) | ||||||||
| (14,605 | ) | (6,525 | ) | ||||||||
| Class level exchanges: | |||||||||||
| Class C | – | 1,631 | |||||||||
| Class C2 | – | (1,164 | ) | ||||||||
| Class M | – | (467 | ) | ||||||||
| – | – | ||||||||||
| April 30, 2005 (unaudited) | October 31, 2004 | ||||||||||
| Automatic conversions: | |||||||||||
| Class A | $ | – | $ | 61 | |||||||
| Class B | – | (61 | ) | ||||||||
| – | – | ||||||||||
| 20,220 | 16,575 | ||||||||||
| Net increase (decrease) in net assets | 12,838 | 11,209 | |||||||||
| Net Assets: | |||||||||||
| Beginning of period | 199,632 | 188,423 | |||||||||
| End of period | $ | 212,470 | $ | 199,632 | |||||||
| Undistributed Net Investment Income (Loss) | $ | 255 | $ | 104 | |||||||
| Share Activity: | |||||||||||
| Shares issued: | |||||||||||
| Class A | 2,427 | 125 | |||||||||
| Class B | 58 | 158 | |||||||||
| Class C | 29 | 82 | |||||||||
| Class C2 | – | 49 | |||||||||
| Class M | – | 15 | |||||||||
| 2,514 | 429 | ||||||||||
| Shares issued–reinvested from distributions: | |||||||||||
| Class A | 496 | 1,576 | |||||||||
| Class B | 10 | 38 | |||||||||
| Class C | 9 | 33 | |||||||||
| Class C2 | – | 6 | |||||||||
| Class M | – | 4 | |||||||||
| 515 | 1,657 | ||||||||||
| Shares redeemed: | |||||||||||
| Class A | (1,170 | ) | (93 | ) | |||||||
| Class B | (53 | ) | (184 | ) | |||||||
| Class C | (68 | ) | (236 | ) | |||||||
| Class C2 | – | (55 | ) | ||||||||
| Class M | – | (18 | ) | ||||||||
| (1,291 | ) | (586 | ) | ||||||||
| Class level exchanges: | |||||||||||
| Class C | – | 150 | |||||||||
| Class C2 | – | (107 | ) | ||||||||
| Class M | – | (43 | ) | ||||||||
| – | – | ||||||||||
| Automatic conversions: | |||||||||||
| Class A | – | 7 | |||||||||
| Class B | – | (7 | ) | ||||||||
| – | – | ||||||||||
| Net increase (decrease) in shares outstanding: | |||||||||||
| Class A | 1,753 | 1,615 | |||||||||
| Class B | 15 | 5 | |||||||||
| Class C | (30 | ) | 29 | ||||||||
| Class C2 | – | (107 | ) | ||||||||
| Class M | – | (42 | ) | ||||||||
| 1,738 | 1,500 | ||||||||||
The notes to the financial statements are an integral part of this report.
Transamerica IDEX Mutual Funds
Semi-Annual Report 2005
6
TA IDEX Transamerica Convertible Securities
FINANCIAL HIGHLIGHTS
(unaudited for the period ended April 30, 2005)
| For a share of beneficial interest outstanding throughout each period | |||||||||||||||||||||||||||||||||||||||
| Net Asset | Investment Operations | Distributions | Net Asset | ||||||||||||||||||||||||||||||||||||
| For the Period Ended (d)(g) | Value, Beginning of Period | Net Investment Income (Loss) | Net Realized and Unrealized Gain (Loss) | Total Operations | From Net Investment Income | From Net Realized Gains | Total Distributions | Value, End of Period | |||||||||||||||||||||||||||||||
| Class A | 4/30/2005 | $ | 11.00 | $ | 0.08 | $ | (0.07 | ) | $ | 0.01 | $ | (0.07 | ) | $ | (0.25 | ) | $ | (0.32 | ) | $ | 10.69 | ||||||||||||||||||
| 10/31/2004 | 11.32 | 0.21 | 0.56 | 0.77 | (0.22 | ) | (0.87 | ) | (1.09 | ) | 11.00 | ||||||||||||||||||||||||||||
| 10/31/2003 | 9.39 | 0.24 | 1.92 | 2.16 | (0.23 | ) | – | (0.23 | ) | 11.32 | |||||||||||||||||||||||||||||
| 10/31/2002 | 10.00 | 0.14 | (0.67 | ) | (0.53 | ) | (0.08 | ) | – | (0.08 | ) | 9.39 | |||||||||||||||||||||||||||
| Class B | 4/30/2005 | 11.00 | 0.03 | (0.08 | ) | (0.05 | ) | (0.03 | ) | (0.25 | ) | (0.28 | ) | 10.67 | |||||||||||||||||||||||||
| 10/31/2004 | 11.31 | 0.14 | 0.57 | 0.71 | (0.15 | ) | (0.87 | ) | (1.02 | ) | 11.00 | ||||||||||||||||||||||||||||
| 10/31/2003 | 9.38 | 0.17 | 1.93 | 2.10 | (0.17 | ) | – | (0.17 | ) | 11.31 | |||||||||||||||||||||||||||||
| 10/31/2002 | 10.00 | 0.11 | (0.68 | ) | (0.57 | ) | (0.05 | ) | – | (0.05 | ) | 9.38 | |||||||||||||||||||||||||||
| Class C | 4/30/2005 | 10.97 | 0.02 | (0.07 | ) | (0.05 | ) | (0.04 | ) | (0.25 | ) | (0.29 | ) | 10.63 | |||||||||||||||||||||||||
| 10/31/2004 | 11.31 | 0.11 | 0.57 | 0.68 | (0.15 | ) | (0.87 | ) | (1.02 | ) | 10.97 | ||||||||||||||||||||||||||||
| 10/31/2003 | 9.36 | 0.17 | 1.95 | 2.12 | (0.17 | ) | – | (0.17 | ) | 11.31 | |||||||||||||||||||||||||||||
| Ratios/Supplemental Data | |||||||||||||||||||||||||||||||
| For the Period | Total | Net Assets, End of Period | Ratio of Expenses to Average Net Assets (a) | Net Investment Income (Loss) to Average | Portfolio Turnover | ||||||||||||||||||||||||||
| Ended (g) | Return (c) | (000's) | Net (e) | Total (f) | Net Assets (a) | Rate (b) | |||||||||||||||||||||||||
| Class A | 4/30/2005 | (0.09 | )% | $ | 201,382 | 1.16 | % | 1.16 | % | 1.50 | % | 39 | % | ||||||||||||||||||
| 10/31/2004 | 7.06 | 188,049 | 1.20 | 1.20 | 1.83 | 157 | |||||||||||||||||||||||||
| 10/31/2003 | 23.49 | 175,175 | 1.33 | 1.33 | 2.27 | 119 | |||||||||||||||||||||||||
| 10/31/2002 | (5.42 | ) | 10,205 | 1.73 | 3.85 | 2.59 | 170 | ||||||||||||||||||||||||
| Class B | 4/30/2005 | (0.65 | ) | 6,354 | 2.05 | 2.05 | 0.61 | 39 | |||||||||||||||||||||||
| 10/31/2004 | 6.52 | 6,379 | 1.79 | 1.79 | 1.24 | 157 | |||||||||||||||||||||||||
| 10/31/2003 | 22.58 | 6,508 | 1.98 | 1.98 | 1.62 | 119 | |||||||||||||||||||||||||
| 10/31/2002 | (5.68 | ) | 1,138 | 2.38 | 4.50 | 1.94 | 170 | ||||||||||||||||||||||||
| Class C | 4/30/2005 | (0.67 | ) | 4,734 | 2.30 | 2.30 | 0.36 | 39 | |||||||||||||||||||||||
| 10/31/2004 | 6.33 | 5,204 | 2.05 | 2.05 | 0.98 | 157 | |||||||||||||||||||||||||
| 10/31/2003 | 22.84 | 5,048 | 1.98 | 1.98 | 1.62 | 119 | |||||||||||||||||||||||||
NOTES TO FINANCIAL HIGHLIGHTS
(a) Annualized.
(b) Not annualized for periods of less than one year.
(c) Total Return has been calculated for the applicable period without deduction of a sales load, if any, on an initial purchase. Periods of less than one year are not annualized.
(d) Per share information is calculated based on average number of shares outstanding.
(e) Ratio of Net Expenses to Average Net Assets is net of fee waivers and reimbursements by the investment adviser, if any (see note 2).
(f) Ratio of Total Expenses to Average Net Assets includes all expenses before fee waivers and reimbursements by the investment adviser.
(g) TA IDEX Transamerica Convertible Securities ("the Fund") commenced operations on March 1, 2002. The inception date for the Fund's offering of share Class C was November 11, 2002.
The notes to the financial statements are an integral part of this report.
Transamerica IDEX Mutual Funds
Semi-Annual Report 2005
7
TA IDEX Transamerica Convertible Securities
NOTES TO FINANCIAL STATEMENTS
At April 30, 2005
(all amounts in thousands)
(unaudited)
NOTE 1. ORGANIZATION AND SIGNIFICANT ACCOUNTING POLICIES
Transamerica IDEX Mutual Funds is a Delaware statutory trust registered under the Investment Company Act of 1940, as amended (the "1940 Act"), as an open-end management investment company. Prior to March 1, 2005, Transamerica IDEX Mutual Funds was a Massachusetts business trust. TA IDEX Transamerica Convertible Securities ("the Fund"), part of Transamerica IDEX Mutual Funds, began operations on March 1, 2002.
In the normal course of business, the Fund enters into contracts that contain a variety of representations and warranties, which provide general indemnifications. The Fund's maximum exposure under these arrangements is unknown, as this would involve future claims that may be made against the Fund and/or its affiliates that have not yet occurred. However, based on experience, the Fund expects the risk of loss to be remote.
See the Prospectus and Statement of Additional Information for a description of the Fund's investment objective.
In preparing the Fund's financial statements in accordance with accounting principles generally accepted in the United States of America ("GAAP"), estimates or assumptions (which could differ from actual results) may be used that affect reported amounts and disclosures. The following policies were consistently followed by the Fund, in accordance with GAAP.
Multiple class operations and expenses: The Fund currently offers three classes of shares, each with a public offering price that reflects different sales charges, if any, and expense levels. On June 15, 2004, Class C2 shares merged into Class C. On September 24, 2004, Class M shares merged into Class C. Class B shares will convert to Class A shares eight years after purchase. Income, non-class specific expenses and realized and unrealized gains and losses, are allocated daily to each class, based upon the value of shares outstanding method as permitted under Rule 18f-3 of the 1940 Act. Each class bears its own specific expenses as well as a portion of general, common expenses.
Pricing of shares: The Fund prices its shares on the basis of the net asset value of each class of shares of the Fund, which is determined as of the close of the New York Stock Exchange ("NYSE") (generally 4:00 p.m. Eastern Time) on each day on which the NYSE is open for trading.
Security valuations: Fund investments traded on an exchange are valued at the closing price on the day of valuation on the exchange where the security is principally traded. With respect to securities traded on NASDAQ NMS, such closing price may be last reported sales price or the NASDAQ Official Closing Price.
Securities traded in the over-the-counter market and listed securities for which no sale was reported on that date are valued at the last quoted bid price.
Debt securities are valued by independent pricing services at the last quoted bid price; however, those that mature in sixty days or less are valued at amortized cost, which approximates market.
Investment company securities are valued at net asset value of the underlying portfolio.
Other securities for which quotations are not readily available are valued at fair market value as determined in good faith using guidelines adopted by the Board of Trustees of the Fund, under the supervision of the Fund's Valuation Committee. These guidelines may include: the type of security; any restrictions on its resale; financial or business news of the issuer; similar or related securities that are actively trading; related corporate actions; and other significant events occurring after the close of trading in the security.
Cash: The Fund may leave cash overnight in its cash account with the custodian, Investors Bank & Trust Company ("IBT"). IBT has been contracted on behalf of the Fund to invest the excess cash into a savings account, which at April 30, 2005, was paying an interest rate of 2.02%.
Throughout the period, the Fund may have a cash overdraft balance. A fee is incurred on this overdraft, calculated by multiplying the overdraft by a rate based on the federal funds rate.
Repurchase agreements: The Fund is authorized to enter into repurchase agreements. The Fund, through IBT, receives delivery of the underlying securities, the value of which at the time of purchase is required to be an amount equal to at least 100% of the resale price. Repurchase agreements involve the risk that the seller will fail to repurchase the security, as agreed. In that case, the Fund will bear the risk of value fluctuations until the security can be sold and may encounter delays and incur costs in liquidating the security. In the event of bankruptcy or insolvency of the seller, delays and costs may be incurred.
Securities lending: The Fund may lend securities to enhance fund earnings from investing cash collateral in making such loans to qualified borrowers (typically broker/dealers). The Fund has engaged its custodian bank, IBT, as a lending agent to administer its securities lending program. IBT earned $35 of program income for its services. When the Fund makes a security loan, it receives cash collateral as protection against the risk that the borrower will default on the loan, and records an asset for the cash invested collateral and a liability for the return of the collateral.
Loans of securities are required to be secured by collateral at least equal to 102% of the value of the securities at inception of the loan, and not less then 100% thereafter. The Fund may invest cash collateral in short-term money market instruments including: U.S. Treasury Bills, U.S. agency obligations, commercial paper, money market mutual funds, repurchase agreements and other highly rated, liquid investments. During the life of securities loans, the collateral and
Transamerica IDEX Mutual Funds
Semi-Annual Report 2005
8
TA IDEX Transamerica Convertible Securities
NOTES TO FINANCIAL STATEMENTS (continued)
At April 30, 2005
(all amounts in thousands)
(unaudited)
NOTE 1.–(continued)
securities loaned remain subject to fluctuation in value. IBT marks to market securities loaned and the collateral each business day. If additional collateral is due (at least $1), IBT collects additional cash collateral from the borrowers. Although securities loaned will be fully collateralized at all times, IBT may experience delays in, or may be prevented from, recovering the collateral on behalf of the Fund. The Fund may recall a loaned security position at any time from the borrower through IBT. In the event the borrower fails to timely return a recalled security, IBT may indemnify the Fund by purchasing replacement securities for the Fund at its own expense and claiming the collateral to fund such a purchase. IBT absorbs the loss if the collateral value is not sufficient to cover the cost of the replacement securities. If replacement securities are not available, IBT will credit the equivalent cas h value to the Fund.
While a security is on loan, the Fund does not have the right to vote that security. However, if time permits, the Fund will attempt to recall a security on loan and vote the proxy.
Income from securities lending is included in the Statement of Operations. The amount of collateral and value of securities on loan are included in the Statement of Assets and Liabilities as well as in the Schedule of Investments.
Security transactions and investment income: Security transactions are recorded on the trade date. Security gains and losses are calculated on the specific identification basis. Dividend income is recorded on the ex-dividend date or, in the case of foreign securities, as soon as the Fund is informed of the ex-dividend date. Interest income, including accretion of discounts and amortization of premiums, is recorded on the accrual basis commencing on the settlement date.
Account maintenance fees: If the shareholder account balance falls below $1 by either shareholder action or as a result of market action, a $25 (not in thousands) fee is assessed every year until the balance reaches $1. The fee is assessed by redeeming shares in the shareholder's account.
No fee will be charged under the following conditions:
• accounts opened within the preceding 24 months
• accounts with an active monthly Automatic Investment Plan ($50 (not in thousands) minimum per fund)
• accounts owned by an individual which, when combined by social security number, have a balance of $5 or more
• accounts owned by individuals in the same household (by address) that have a combined balance of $5 or more
• UTMA/UGMA accounts
• Fiduciary accounts
• B-share accounts whose shares have started to convert to A-shares accounts (as long as combined value of both accounts is at least $1)
For the six months ended April 30, 2005, there were no account maintenance fees.
Redemption fees: A short-term trading redemption fee may be assessed on any fund shares in a fund account that are sold during the first five (5) NYSE trading days following their purchase date. This redemption fee will equal 2% of the amount redeemed and shares held the longest will be treated as being redeemed first and shares held the shortest as being redeemed last.
For the six months ended April 30, 2005, the Fund received no redemption fees.
Dividend distributions: Distributions to shareholders are recorded on the ex-dividend date and are determined in accordance with Federal income tax regulations which may differ from GAAP.
NOTE 2. RELATED PARTY TRANSACTIONS
Transamerica Fund Advisors, Inc. ("TFAI") is the Fund's investment adviser. Transamerica Fund Services, Inc. ("TFS") is the Fund's administrator and transfer agent. AFSG Securities Corp. ("AFSG") is the Fund's distributor/principal underwriter. AFSG is 100% owned by AUSA Holding Company ("AUSA"). TFAI is a directly owned subsidiary of Western Reserve Life Assurance Co. of Ohio (78%) and AUSA (22%). TFS is a wholly owned subsidiary of WRL (50%) and AUSA (50%). AUSA and WRL are wholly owned indirect subsidiaries of AEGON, NV, a Netherlands corporation.
Effective January 1, 2005 AEGON/Transamerica Fund Advisors, Inc. ("ATFA") was renamed Transamerica Fund Advisors, Inc. ("TFAI"); AEGON/Transamerica Fund Services, Inc. ("ATFS") and AEGON/Transamerica Investor Services, Inc. ("ATIS") merged into one entity and was renamed Transamerica Fund Services, Inc. ("TFS").
Transamerica Investment Management, LLC is both an affiliate of the Fund and a sub-adviser to the Fund.
The following schedule represents the percentage of fund assets owned by affiliated mutual funds (i.e. through the asset allocation funds):
| Net Assets | % of Net Assets | ||||||||||
| TA IDEX Asset Allocation–Conservative Portfolio | $ | 33,097 | 15.58 | % | |||||||
| TA IDEX Asset Allocation–Moderate Growth Portfolio | 77,892 | 36.66 | % | ||||||||
| TA IDEX Asset Allocation–Moderate Portfolio | 80,355 | 37.82 | % | ||||||||
| Total | $ | 191,344 | 90.06 | % | |||||||
Transamerica IDEX Mutual Funds
Semi-Annual Report 2005
9
TA IDEX Transamerica Convertible Securities
NOTES TO FINANCIAL STATEMENTS (continued)
At April 30, 2005
(all amounts in thousands)
(unaudited)
NOTE 2.–(continued)
Investment advisory fee: The Fund pays management fees to TFAI based on average daily net assets ("ANA") at the following rate:
From November 1, 2004 to December 31, 2004
0.75% of ANA
From January 1, 2005 on:
0.75% of the first $250 million of ANA
0.70% of ANA over $250 million
TFAI has contractually agreed to waive its advisory fee and will reimburse the Fund to the extent that operating expenses, excluding 12b-1 fees, exceed the following stated annual limit:
1.35% Expense Limit
If total fund expenses fall below the annual expense limitation agreement agreed to by the adviser within the succeeding three years, the Fund may be required to pay that adviser a portion or all of the waived advisory fees.
There are no amounts available for recapture at April 30, 2005.
Distribution and service fees: The Fund has a 12b-1 distribution plan under the 1940 Act pursuant to which an annual fee, based on average daily net assets, is paid to the distributor for various disbursements such as broker-dealer account servicing fees and other promotional expenses of the Fund. The Fund is authorized under the 12b-1 plan to pay fees on each class up to the following limits:
| Class A | 0.35 | % | |||||
| Class B | 1.00 | % | |||||
| Class C | 1.00 | % | |||||
In the case the Fund or a class of shares of the Fund is closed to new investors or investments, the Fund is authorized to pay 12b-1 fees for past sales and distribution efforts and present and past investor services.
Underwriter commissions relate to front-end sales charges imposed for Class A shares and contingent deferred sales charges from Classes B, C, and certain A share redemptions. For the six months ended April 30, 2005, the underwriter commissions were as follows:
| Received by Underwriter | $ | 57 | |||||
| Retained by Underwriter | 1 | ||||||
| Contingent Deferred Sales Charge | 10 | ||||||
Administrative services: The Fund has entered into an agreement with TFS for financial and legal fund administration services, which includes such items as compliance, expenses, financial statements and other reporting, distributions, tax returns, prospectus preparation, board of trustees meeting support and other legal matters. As of January 1, 2005 the Fund pays TFS an annual fee of 0.02% of average net assets. Prior to January 1, 2005 the Fund paid TFS an annual fee of 0.015% of average net assets. The Legal fees on the Statement of Operations are for fees paid to external legal counsel.
Transfer agent fees: The Fund pays TFS an annual per-account charge of $20 (not in thousands) for each open account and $1.63 (not in thousands) for each closed account. There is no new account charge. The Transfer agent fees on the Statement of Operations are made up of fees paid to TFS and costs associated with shareholder statements.
The Fund paid TFS $14 for the six months ended April 30, 2005.
Deferred compensation plan: Each eligible Fund Trustee may elect participation in the Deferred Compensation Plan ("the Plan"). Under the Plan, such Trustees may defer payment of a percentage of their total fees earned as a Fund Trustee. These deferred amounts may be invested in any Transamerica IDEX Mutual Fund. At April 30, 2005, the value of invested plan amount was $6. Invested plan amounts and the total liability for deferred compensation to the Trustees under the Plan at April 30, 2005, are included in the accompanying Statement of Assets and Liabilities.
NOTE 3. INVESTMENT TRANSACTIONS
The cost of securities purchased and proceeds from securities sold (excluding short-term securities) for the six months ended April 30, 2005, were as follows:
| Purchases of securities: | |||||||
| Long-Term excluding U.S. Government | $ | 94,866 | |||||
| U.S. Government | – | ||||||
| Proceeds from maturities and sales of securities: | |||||||
| Long-Term excluding U.S. Government | 82,930 | ||||||
| U.S. Government | – | ||||||
NOTE 4. FEDERAL INCOME TAX MATTERS
The Fund has not made any provision for federal income or excise taxes due to its policy to distribute all of its taxable income and capital gains to its shareholders and otherwise qualify as a regulated investment company under the Internal Revenue Code. Income and capital gain distributions are determined in accordance with income tax regulations, which may differ from GAAP. These differences are primarily due to differing treatment for items including, but not limited to, wash sales, net operating losses and capital loss carryforwards.
Transamerica IDEX Mutual Funds
Semi-Annual Report 2005
10
TA IDEX Transamerica Convertible Securities
NOTES TO FINANCIAL STATEMENTS (continued)
At April 30, 2005
(all amounts in thousands)
(unaudited)
NOTE 4.–(continued)
The aggregate cost of investments and composition of unrealized appreciation (depreciation) for federal income tax purposes as of April 30, 2005, are as follows:
| Federal Tax Cost Basis | $ | 232,101 | |||||
| Unrealized Appreciation | $ | 10,764 | |||||
| Unrealized (Depreciation) | (11,471 | ) | |||||
| Net Unrealized Appreciation (Depreciation) | $ | (707 | ) | ||||
NOTE 5. REGULATORY PROCEEDINGS
There continues to be significant federal and state regulatory activity relating to financial services companies, particularly mutual fund companies and their investment advisers. As part of an ongoing investigation regarding potential market timing, recordkeeping and trading compliance issues and matters affecting the Fund's investment adviser, TFAI, and certain employees and affiliates of TFAI, the SEC staff has indicated that it is likely to take some action against TFAI and certain of its affiliates at the conclusion of the investigation. The potential timing and the scope of any such action is difficult to predict. Although the impact of any action brought against TFAI and/or its affiliates is difficult to assess at the present time, the Fund currently believes that the likelihood that any such action will have a material adverse impact on it is remote. It is important to note that the Fund is not aware of any allegation of wrongdoing against it and its board at the time this semi-annual report is printed. Although it is not anticipated that these developments will have an adverse impact on the Fund, there can be no assurance at this time. TFAI and its affiliates are actively working with the SEC in regard to this matter; however, the exact resolution cannot be determined at this time. TFAI will take such actions that it deems necessary or appropriate to continue providing management services to the Fund and to bring all matters to an appropriate conclusion.
TFAI and/or its affiliates, and not the Fund, will bear the costs regarding these regulatory matters.
Transamerica IDEX Mutual Funds
Semi-Annual Report 2005
11
TA IDEX Transamerica Convertible Securities
INVESTMENT ADVISORY AND SUB-ADVISORY AGREEMENTS – REVIEW AND RENEWAL
At a meeting of the Board of Trustees of Transamerica IDEX Mutual Funds ("TA IDEX") held on October 6, 2004, the Board considered and approved the renewal for a one-year period of the Investment Advisory Agreement between TA IDEX Transamerica Convertible Securities (the "Fund") and Transamerica Fund Advisors, Inc. ("TFAI") as well as the Investment Sub-Advisory Agreement of the Fund between TFAI and Transamerica Investment Management, LLC (the "Sub-Adviser"). In approving the renewal of these agreements, the Board concluded that the Investment Advisory and Investment Sub-Advisory Agreements enable shareholders of the Fund to obtain high quality services at a cost that is appropriate, reasonable, and in the best interests of shareholders based upon the following determinations, among others:
The nature, extent and quality of the advisory service to be provided. The Board considered the nature and quality of the services provided by TFAI and the Sub-Adviser to the Fund in the past, as well as the services anticipated to be provided in the future. The Board concluded that TFAI and the Sub-Adviser are capable of providing high quality services to the Fund, as indicated by TFAI's management capabilities demonstrated with respect to the Fund and other funds managed by TFAI, TFAI's management oversight process, and the professional qualifications and experience of the Sub-Adviser's portfolio management team. The Board also concluded that TFAI and the Sub-Adviser would provide the same quality and quantity of investment management and related services as before, that these services are app ropriate in scope and extent in light of the Fund's operations, the competitive landscape of the investment company business and investor needs, and that TFAI's and the Sub-Adviser's obligations will remain the same in all respects.
The investment performance of the Fund. The Board concluded, based in particular on information provided by Lipper Analytics, that the Fund's investment performance was competitive relative to comparable funds over trailing one- and two-year periods and to the Fund's benchmark index over the past year. On the basis of the Trustees' assessment of the nature, extent and quality of investment advisory and related services to be provided or procured by TFAI and the Sub-Adviser, the Trustees concluded that TFAI and the Sub-Adviser were capable of generating a level of long-term investment performance that is appropriate in light of the Fund's investment objective, policies and strategies and competitive with many other investment companies.
The cost of advisory services provided and the level of profitability. On the basis of the Board's review of the fees to be charged by TFAI and the Sub-Adviser for investment advisory and related services, TFAI's financial statements, the fees paid by TFAI to the Sub-Adviser, TFAI's estimated net management income resulting from its management of the Fund, the estimated profitability of TFAI's relationships with the Fund and TA IDEX, and the estimated profitability of the Sub-Adviser's relationship with the Fund, the Board concluded that the level of investment advisory fees and the profitability is appropriate in light of the services provided, the management fees and overall expense ratios of comparable investment companies, and the anticipated profitability of the relationship between the Fun d, TFAI and the Sub-Adviser. Further, on the basis of comparative information supplied by Lipper Analytics, the Board determined that the advisory fees and estimated overall expense ratio of the Fund were consistent with industry averages.
The extent to which economies of scale would be realized as the Fund grows and whether fee levels reflect these economies of scale for the benefit of Fund investors. The Trustees concluded that inclusion of an asset-based breakpoint in the Fund's advisory fee schedule appropriately benefit investors by realizing economies of scale in the form of a lower advisory fee rate as the level of Fund assets increases. The Board also concluded that the advisory fees appropriately reflect the Fund's current size, the current economic environment for TFAI, and the competitive nature of the investment company market. In addition, the Board noted that it will have the opportunity to periodically re-examine whether the Fund has achieved economies of scale, as well as the appropriateness of advisory fees payabl e to TFAI and the Sub-Adviser in the future.
Benefits (such as soft dollars) to TFAI or the Sub-Adviser from its relationship with the Fund. The Board concluded that other benefits derived by TFAI or the Sub-Adviser from its relationship with the Fund are reasonable and fair, and are consistent with industry practice and the best interests of the Fund and its shareholders. In this regard, the Board noted that TFAI does not realize "soft dollar" benefits from its relationship with the Fund, and that the Sub-Adviser engaged in "soft-dollar" arrangements consistent with applicable law and "best execution" requirements.
Other considerations. The Board also determined that TFAI had made a substantial commitment to the recruitment and retention of high quality personnel, and maintained the financial, compliance and operational resources reasonably necessary to manage the Fund in a professional manner that is consistent with the best interests of the Fund and its shareholders. The Trustees also concluded that TFAI had made a significant entrepreneurial commitment to the management and success of the Fund, reflected by TFAI's expense limitation and fee waiver arrangement with the Fund which, as demonstrated in the past with the Fund, may result in TFAI waiving a substantial amount of advisory fees for the benefit of shareholders.
Transamerica IDEX Mutual Funds
Semi-Annual Report 2005
12
TA IDEX Transamerica Convertible Securities
SUPPLEMENTAL INFORMATION (unaudited)
RESULTS OF SHAREHOLDER PROXY
At a special meeting of shareholders held on February 25, 2005, the results of the Proposals were as follows:
Transamerica IDEX Mutual Funds
Proposal 1: Election of Trustees to the Board of Trustees of Transamerica IDEX Mutual Funds.
| For | Withheld | ||||||||||
| Peter R. Brown | 872,017,875.249 | 4,468,498.551 | |||||||||
| Daniel Calabria | 871,917,069.786 | 4,569,304.014 | |||||||||
| Janise B. Case | 872,099,393.125 | 4,386,980.675 | |||||||||
| Charles C. Harris | 872,086,722.025 | 4,399,651.775 | |||||||||
| Leo J. Hill | 872,304,465.640 | 4,181,908.160 | |||||||||
| Russell A. Kimball, Jr. | 872,253,556.471 | 4,232,817.329 | |||||||||
| William W. Short, Jr. | 872,139,920.944 | 4,346,452.856 | |||||||||
| John Waechter | 872,261,152.376 | 4,225,221.424 | |||||||||
| Jack E. Zimmerman | 871,929,967.512 | 4,556,406.288 | |||||||||
| Brian C. Scott | 872,218,970.367 | 4,267,403.433 | |||||||||
| Thomas P. O'Neill | 872,111,944.117 | 4,374,429.683 | |||||||||
TA IDEX Transamerica Convertible Securities
Proposal 2: Approval of an Agreement and Plan of Reorganization pursuant to which Transamerica IDEX Mutual Funds will organize as a Delaware statutory trust.
| For | Against | Abstentions/Broker Non-Votes | |||||||||
| 17,118,820.904 | 11,885.440 | 830,550.716 | |||||||||
Proposal 3: Approval of changes to the fundamental investment restrictions of TA IDEX Transamerica Convertible Securities.
| A. Diversification | For | Against | Abstentions/Broker Non-Votes | ||||||||||||
| 17,134,162.103 | 7,553.957 | 819,541.000 | |||||||||||||
| B. Borrowing | For | Against | Abstentions/Broker Non-Votes | ||||||||||||
| 17,134,162.103 | 7,553.957 | 819,541.000 | |||||||||||||
| C. Senior Securities | For | Against | Abstentions/Broker Non-Votes | ||||||||||||
| 17,134,162.103 | 7,553.957 | 819,541.000 | |||||||||||||
| D. Underwriting Securities | For | Against | Abstentions/Broker Non-Votes | ||||||||||||
| 17,134,162.103 | 7,553.957 | 819,541.000 | |||||||||||||
| E. Real Estate | For | Against | Abstentions/Broker Non-Votes | ||||||||||||
| 17,134,162.103 | 7,553.957 | 819,541.000 | |||||||||||||
| F. Making Loans | For | Against | Abstentions/Broker Non-Votes | ||||||||||||
| 17,134,162.103 | 7,553.957 | 819,541.000 | |||||||||||||
| G. Concentration | For | Against | Abstentions/Broker Non-Votes | ||||||||||||
| 17,134,162.103 | 7,553.957 | 819,541.000 | |||||||||||||
| H. Commodities | For | Against | Abstentions/Broker Non-Votes | ||||||||||||
| 17,134,162.103 | 7,553.957 | 819,541.000 | |||||||||||||
Transamerica IDEX Mutual Funds
Semi-Annual Report 2005
13
TA IDEX Transamerica Equity
UNDERSTANDING YOUR FUND'S EXPENSES
(unaudited)
SHAREHOLDER EXPENSES
The following Example is intended to help you understand your ongoing costs (in dollars and cents) of investing in a Fund and to compare these costs with the ongoing costs of investing in other funds.
The Example is based on an investment of $1,000 invested at November 1, 2004 and held for the entire period until April 30, 2005.
ACTUAL EXPENSES
The first line in the table below provides information about actual account values and actual expenses. You may use the information in this line, together with the amount you invested, to estimate the expenses that you paid over the period. Simply divide your account value by $1,000 (for example, an $8,600 account value divided by $1,000 = 8.6), then multiply the result by the number in the first line of your Fund under the heading entitled "Expenses Paid During Period" to estimate the expenses you paid on your account during this period.
HYPOTHETICAL EXAMPLE FOR COMPARISON PURPOSES
The second line in the table below provides information about hypothetical account values and hypothetical expenses based on the Fund's actual expense ratio and an assumed rate of return of 5% per year before expenses, which is not the Fund's actual return. The hypothetical account values and expenses may not be used to estimate the actual ending account balance or expenses you paid for the period. You may use this information to compare the ongoing costs of investing in your Fund and other funds. To do so, compare this 5% hypothetical example with the 5% hypothetical examples that appear in the shareholder reports of the other funds.
Please note that the expenses shown in the table are meant to highlight your ongoing costs only and do not reflect any transactional costs, such as sales charges, redemption fees, brokerage commissions paid on purchases and sales of fund shares. Therefore, the second line under the Fund in the table is useful in comparing ongoing costs only, and will not help you determine the relative total costs of owning different funds. In addition, note that the expenses shown in the table are meant to highlight your ongoing costs and do not reflect any transaction costs.
| Beginning Account Value | Ending Account Value | Annualized Expense Ratio | Expenses Paid During Period (a) | ||||||||||||||||
| Class A | |||||||||||||||||||
| Actual | $ | 1,000.00 | $ | 1,027.20 | 1.38 | % | $ | 6.94 | |||||||||||
| Hypothetical (b) | 1,000.00 | 1,017.95 | 1.38 | 6.90 | |||||||||||||||
| Class B | |||||||||||||||||||
| Actual | 1,000.00 | 1,022.20 | 2.18 | 10.93 | |||||||||||||||
| Hypothetical (b) | 1,000.00 | 1,013.98 | 2.18 | 10.89 | |||||||||||||||
| Class C | |||||||||||||||||||
| Actual | 1,000.00 | 1,021.10 | 2.18 | 10.92 | |||||||||||||||
| Hypothetical (b) | 1,000.00 | 1,013.98 | 2.18 | 10.89 | |||||||||||||||
(a) Expenses are calculated using each Fund's annualized expense ratio (as disclosed in the table), multiplied by the average account value for the period, multiplied by number of days in the period (181 days), and divided by the number of days in the year (365 days).
(b) 5% return per year before expenses.
GRAPHICAL PRESENTATION OF SCHEDULE OF INVESTMENTS
By Sector
At April 30, 2005
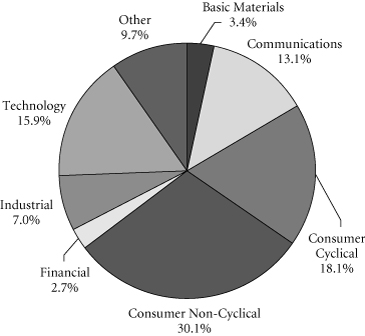
This chart shows the percentage breakdown by sector of the Fund's total investment securities.
Transamerica IDEX Mutual Funds
Semi-Annual Report 2005
1
TA IDEX Transamerica Equity
SCHEDULE OF INVESTMENTS
At April 30, 2005
(all amounts except share amounts in thousands)
(unaudited)
| Shares | Value | ||||||||||
| COMMON STOCKS (99.8%) | |||||||||||
| Business Services (10.4%) | |||||||||||
| eBay, Inc. (a) | 210,000 | $ | 6,663 | ||||||||
| First Data Corp. | 350,000 | 13,310 | |||||||||
| Moody's Corp. (b) | 125,000 | 10,267 | |||||||||
| Chemicals & Allied Products (3.8%) | |||||||||||
| Praxair, Inc. | 235,000 | 11,005 | |||||||||
| Communication (6.6%) | |||||||||||
| Liberty Media International, Inc.–Class A (a) | 260,000 | 10,782 | |||||||||
| XM Satellite Radio Holdings, Inc.–Class A (a)(b) | 310,000 | 8,599 | |||||||||
| Communications Equipment (5.6%) | |||||||||||
| QUALCOMM, Inc. | 465,000 | 16,224 | |||||||||
| Computer & Data Processing Services (7.7%) | |||||||||||
| Intuit, Inc. (a)(b) | 225,000 | 9,068 | |||||||||
| Microsoft Corp. | 525,000 | 13,283 | |||||||||
| Computer & Office Equipment (5.3%) | |||||||||||
| Lexmark International, Inc. (a) | 110,000 | 7,640 | |||||||||
| Sandisk Corp. (a) | 335,000 | 7,940 | |||||||||
| Cosmetics/Personal Care (3.8%) | |||||||||||
| Gillette Co. (The) | 215,000 | 11,103 | |||||||||
| Drug Stores & Proprietary Stores (4.0%) | |||||||||||
| Walgreen Co. | 270,000 | 11,626 | |||||||||
| Entertainment (3.2%) | |||||||||||
| International Game Technology | 350,000 | 9,412 | |||||||||
| Hotels & Other Lodging Places (5.7%) | |||||||||||
| Marriott International, Inc.–Class A | 135,000 | 8,471 | |||||||||
| MGM Mirage, Inc. (a) | 115,000 | 8,028 | |||||||||
| Insurance (5.7%) | |||||||||||
| WellPoint, Inc. (a) | 130,000 | 16,608 | |||||||||
| Management Services (3.4%) | |||||||||||
| Paychex, Inc. | 320,000 | 9,792 | |||||||||
| Medical Instruments & Supplies (4.0%) | |||||||||||
| Zimmer Holdings, Inc. (a) | 145,000 | 11,806 | |||||||||
| Personal Services (3.0%) | |||||||||||
| Weight Watchers International, Inc. (a)(b) | 210,000 | 8,768 | |||||||||
| Pharmaceuticals (9.8%) | |||||||||||
| Allergan, Inc. | 165,000 | 11,614 | |||||||||
| Genentech, Inc. (a) | 240,000 | 17,026 | |||||||||
| Retail Trade (3.7%) | |||||||||||
| Staples, Inc. | 570,000 | 10,870 | |||||||||
| Shares | Value | ||||||||||
| Security & Commodity Brokers (3.0%) | |||||||||||
| Chicago Mercantile Exchange | 45,000 | $ | 8,798 | ||||||||
| Transportation & Public Utilities (3.2%) | |||||||||||
| Expeditors International of Washington, Inc. (b) | 190,000 | 9,331 | |||||||||
| Trucking & Warehousing (4.5%) | |||||||||||
| United Parcel Service, Inc.–Class B | 185,000 | 13,192 | |||||||||
| Variety Stores (3.4%) | |||||||||||
| Wal-Mart Stores, Inc. | 210,000 | 9,899 | |||||||||
| Total Common Stocks (cost: $264,672) | 291,125 | ||||||||||
| Principal | Value | ||||||||||
| SECURITY LENDING COLLATERAL (10.8%) | |||||||||||
| Debt (9.3%) | |||||||||||
| Bank Notes (1.3%) | |||||||||||
| Bank of America | |||||||||||
| 2.82%, due 05/16/2005 | $ | 987 | $ | 987 | |||||||
| 2.80%, due 06/09/2005 (c) | 247 | 247 | |||||||||
| 2.77%, due 07/18/2005 (c) | 987 | 987 | |||||||||
| Canadian Imperial Bank of Commerce 3.02%, due 11/04/2005 (c) | 987 | 987 | |||||||||
| Credit Suisse First Boston Corp. 2.88%, due 09/09/2005 (c) 3.06%, due 03/10/2006 (c) | 247 247 | 247 247 | |||||||||
| Euro Dollar Overnight (1.6%) | |||||||||||
| Bank of Montreal 2.94%, due 05/04/2005 | 740 | 740 | |||||||||
| BNP Paribas 2.80%, due 05/05/2005 | 1,021 | 1,021 | |||||||||
| Den Danske Bank 2.93%, due 05/02/2005 2.80%, due 05/06/2005 | 888 493 | 888 493 | |||||||||
| Dexia Group 2.80%, due 05/05/2005 | 435 | 435 | |||||||||
| Royal Bank of Canada 2.80%, due 05/04/2005 | 1,012 | 1,012 | |||||||||
| Svenska Handlesbanken 2.80%, due 05/06/2005 | 163 | 163 | |||||||||
| Euro Dollar Terms (3.8%) | |||||||||||
| Bank of Nova Scotia 2.88%, due 05/11/2005 3.01%, due 05/31/2005 | 493 1,379 | 493 1,379 | |||||||||
| Barclays 3.02%, due 06/27/2005 | 879 | 879 | |||||||||
| BNP Paribas 2.93%, due 06/07/2005 | 790 | 790 | |||||||||
The notes to the financial statements are an integral part of this report.
Transamerica IDEX Mutual Funds
Semi-Annual Report 2005
2
TA IDEX Transamerica Equity
SCHEDULE OF INVESTMENTS (continued)
At April 30, 2005
(all amounts except share amounts in thousands)
(unaudited)
| Principal | Value | ||||||||||
| Euro Dollar Terms (continued) | |||||||||||
| Branch Banker & Trust 2.94%, due 06/06/2005 | $ | 211 | $ | 211 | |||||||
| Calyon 2.93%, due 06/03/2005 | 815 | 815 | |||||||||
| Citigroup 2.87%, due 06/06/2005 | 1,024 | 1,024 | |||||||||
| Credit Suisse First Boston Corp. 2.91%, due 05/16/2005 | 1,010 | 1,010 | |||||||||
| HSBC Banking/Holdings PLC 3.01%, due 06/23/2005 | 493 | 493 | |||||||||
| Royal Bank of Scotland 2.94%, due 06/07/2005 2.95%, due 06/10/2005 | 958 532 | 958 532 | |||||||||
| Societe Generale 2.80%, due 05/03/2005 | 944 | 944 | |||||||||
| Toronto Dominion Bank 2.75%, due 05/09/2005 3.01%, due 06/24/2005 | 740 274 | 740 274 | |||||||||
| UBS AG 2.81%, due 05/03/2005 | 493 | 493 | |||||||||
| Promissory Notes (0.9%) | |||||||||||
| Goldman Sachs Group, Inc. 2.99%, due 06/27/2005 3.01%, due 07/27/2005 | 1,036 1,726 | 1,036 1,726 | |||||||||
| Principal | Value | ||||||||||
| Repurchase Agreements (1.7%) (d) | |||||||||||
| Goldman Sachs Group, Inc. (The) 3.04% Repurchase Agreement dated 04/29/2005 to be repurchased at $2,221 on 05/02/2005 | $ | 2,220 | $ | 2,220 | |||||||
| Merrill Lynch & Co., Inc. 3.04% Repurchase Agreement dated 04/29/2005 to be repurchased at $2,664 on 05/02/2005 | 2,664 | 2,664 | |||||||||
| Shares | Value | ||||||||||
| Investment Companies (1.5%) | |||||||||||
| Money Market Funds (1.5%) | |||||||||||
| American Beacon Funds 1-day yield of 2.84% | 391,784 | $ | 392 | ||||||||
| BGI Institutional Money Market Fund 1-day yield of 2.93% | 2,319,974 | 2,320 | |||||||||
| Merrill Lynch Premier Institutional Fund 1-day yield of 2.65% | 522,067 | 522 | |||||||||
| Merrimac Cash Fund, Premium Class 1-day yield of 2.74% (e) | 954,854 | 955 | |||||||||
| Total Security Lending Collateral (cost: $31,324) | 31,324 | ||||||||||
| Total Investment Securities (cost: $295,996) | $ | 322,449 | |||||||||
| SUMMARY: | |||||||||||
| Investments, at value | 110.6 | % | $ | 322,449 | |||||||
| Liabilities in excess of other assets | (10.6 | )% | (30,807 | ) | |||||||
| Net assets | 100.0 | % | $ | 291,642 | |||||||
NOTES TO SCHEDULE OF INVESTMENTS:
(a) No dividends were paid during the preceding twelve months.
(b) At April 30, 2005, all or a portion of this security is on loan (see Note 1). The value at April 30, 2005, of all securities on loan is $30,456.
(c) Floating or variable rate note. Rate is listed as of April 30, 2005.
(d) Cash collateral for the Repurchase Agreements, valued at $4,969, that serve as collateral for securities lending are invested in corporate bonds with interest rates and maturity dates ranging from 0.00%–8.875% and 06/15/2005–03/15/2035, respectively.
(e) Regulated investment company advised by Investors Bank and Trust Co. ("IBT"). IBT is also the accounting, custody and lending agent for the Fund.
The notes to the financial statements are an integral part of this report.
Transamerica IDEX Mutual Funds
Semi-Annual Report 2005
3
TA IDEX Transamerica Equity
STATEMENT OF ASSETS AND LIABILITIES
At April 30, 2005
(all amounts except per share amounts in thousands)
(unaudited)
| Assets: | |||||||
| Investment securities, at value (cost: $295,996) (including securities loaned of $30,456) | $ | 322,449 | |||||
| Cash | 1,217 | ||||||
| Receivables: | |||||||
| Shares of beneficial interest sold | 24 | ||||||
| Interest | 9 | ||||||
| Dividends | 77 | ||||||
| Other | 24 | ||||||
| 323,800 | |||||||
| Liabilities: | |||||||
| Accounts payable and accrued liabilities: | |||||||
| Shares of beneficial interest redeemed | 194 | ||||||
| Management and advisory fees | 157 | ||||||
| Distribution and service fees | 121 | ||||||
| Transfer agent fees | 138 | ||||||
| Dividends to shareholders | 1 | ||||||
| Payable for collateral for securities on loan | 31,324 | ||||||
| Other | 223 | ||||||
| 32,158 | |||||||
| Net Assets | $ | 291,642 | |||||
| Net Assets Consist of: | |||||||
| Shares of beneficial interest, unlimited shares authorized, no par value | $ | 387,433 | |||||
| Accumulated net investment income (loss) | (13 | ) | |||||
| Accumulated net realized gain (loss) from investment securities | (122,224 | ) | |||||
| Net unrealized appreciation (depreciation) on investment securities | 26,446 | ||||||
| Net Assets | $ | 291,642 | |||||
| Net Assets by Class: | |||||||
| Class A | $ | 223,827 | |||||
| Class B | 45,812 | ||||||
| Class C | 22,003 | ||||||
| Shares Outstanding: | |||||||
| Class A | 29,778 | ||||||
| Class B | 6,339 | ||||||
| Class C | 3,042 | ||||||
| Net Asset Value Per Share: | |||||||
| Class A | $ | 7.52 | |||||
| Class B | 7.23 | ||||||
| Class C | 7.23 | ||||||
| Maximum Offering Price Per Share (a): | |||||||
| Class A | $ | 7.96 | |||||
(a) Includes the maximum selling commission (represented as a percentage of offering price) which is reduced on certain levels of sales as set forth in the Prospectus. Net asset value per share for Classes B and C shares represents offering price. The redemption price for Classes B and C shares equals net asset value less any applicable contingent deferred sales charge.
STATEMENT OF OPERATIONS
For the period ended April 30, 2005
(all amounts in thousands)
(unaudited)
| Investment Income: | |||||||
| Interest | $ | 41 | |||||
| Dividends | 2,229 | ||||||
| Income from loaned securities–net | 15 | ||||||
| 2,285 | |||||||
| Expenses: | |||||||
| Management and advisory fees | 1,086 | ||||||
| Transfer agent fees: | |||||||
| Class A | 172 | ||||||
| Class B | 148 | ||||||
| Class C | 51 | ||||||
| Printing and shareholder reports | 113 | ||||||
| Custody fees | 17 | ||||||
| Administration fees | 27 | ||||||
| Legal fees | 7 | ||||||
| Trustees fees | 5 | ||||||
| Registration fees: | |||||||
| Class A | 6 | ||||||
| Class C | 11 | ||||||
| Distribution and service fees: | |||||||
| Class A | 381 | ||||||
| Class B | 243 | ||||||
| Class C | 113 | ||||||
| Total expenses | 2,380 | ||||||
| Less: | |||||||
| Reimbursement of class expenses: | |||||||
| Class B | (74 | ) | |||||
| Class C | (27 | ) | |||||
| Net expenses | 2,279 | ||||||
| Net Investment Income (Loss) | 6 | ||||||
| Net Realized and Unrealized Gain (Loss) | |||||||
| Realized gain (loss) from investment securities | 2,736 | ||||||
| Increase (decrease) in unrealized appreciation (depreciation) on investment securities | 2,070 | ||||||
| Net Gain (Loss) on Investments | 4,806 | ||||||
| Net Increase (Decrease) in Net Assets Resulting from Operations | $ | 4,812 | |||||
The notes to the financial statements are an integral part of this report.
Transamerica IDEX Mutual Funds
Semi-Annual Report 2005
4
TA IDEX Transamerica Equity
STATEMENTS OF CHANGES IN NET ASSETS
For the period or year ended
(all amounts in thousands)
| April 30, 2005 (unaudited) | October 31, 2004 | ||||||||||
| Increase (Decrease) In Net Assets From: | |||||||||||
| Operations: | |||||||||||
| Net investment income (loss) | $ | 6 | $ | (1,454 | ) | ||||||
| Net realized gain (loss) from investment securities | 2,736 | 13,061 | |||||||||
| Net unrealized appreciation (depreciation) on investment securities | 2,070 | (5,046 | ) | ||||||||
| 4,812 | 6,561 | ||||||||||
| Distributions to Shareholders: | |||||||||||
| From net realized gains: | |||||||||||
| Class A | (3,512 | ) | – | ||||||||
| Class B | (861 | ) | – | ||||||||
| Class C | (391 | ) | – | ||||||||
| (4,764 | ) | – | |||||||||
| Capital Share Transactions: | |||||||||||
| Proceeds from shares sold: | |||||||||||
| Class A | 53,708 | 60,100 | |||||||||
| Class B | 2,533 | 3,345 | |||||||||
| Class C | 2,516 | 4,567 | |||||||||
| Class C2 | – | 281 | |||||||||
| Class M | – | 197 | |||||||||
| 58,757 | 68,490 | ||||||||||
| Proceeds from fund acquisition: | |||||||||||
| Class A | – | 62,968 | |||||||||
| Class B | – | 45,759 | |||||||||
| Class C | – | 899 | |||||||||
| Class C2 | – | 6,690 | |||||||||
| Class M | – | 8,963 | |||||||||
| – | 125,279 | ||||||||||
| Dividends and distributions reinvested: | |||||||||||
| Class A | 3,494 | – | |||||||||
| Class B | 840 | – | |||||||||
| Class C | 363 | – | |||||||||
| 4,697 | – | ||||||||||
| Cost of shares redeemed: | |||||||||||
| Class A | (10,127 | ) | (9,235 | ) | |||||||
| Class B | (5,533 | ) | (5,696 | ) | |||||||
| Class C | (2,787 | ) | (1,786 | ) | |||||||
| Class C2 | – | (302 | ) | ||||||||
| Class M | – | (741 | ) | ||||||||
| (18,447 | ) | (17,760 | ) | ||||||||
| Class level exchanges: | |||||||||||
| Class C | – | 16,496 | |||||||||
| Class C2 | – | (7,469 | ) | ||||||||
| Class M | – | (9,027 | ) | ||||||||
| – | – | ||||||||||
| Automatic conversions: | |||||||||||
| Class A | 276 | 327 | |||||||||
| Class B | (276 | ) | (327 | ) | |||||||
| – | – | ||||||||||
| 45,007 | 176,009 | ||||||||||
| Net increase (decrease) in net assets | 45,055 | 182,570 | |||||||||
| April 30, 2005 (unaudited) | October 31, 2004 | ||||||||||
| Net Assets: | |||||||||||
| Beginning of period | $ | 246,587 | $ | 64,017 | |||||||
| End of period | $ | 291,642 | $ | 246,587 | |||||||
| Accumulated Net Investment Income (Loss) | $ | (13 | ) | $ | (19 | ) | |||||
| Share Activity: | |||||||||||
| Shares issued: | |||||||||||
| Class A | 6,838 | 8,273 | |||||||||
| Class B | 337 | 475 | |||||||||
| Class C | 334 | 650 | |||||||||
| Class C2 | – | 40 | |||||||||
| Class M | – | 28 | |||||||||
| 7,509 | 9,466 | ||||||||||
| Shares issued on fund acquisition: | |||||||||||
| Class A | – | 8,474 | |||||||||
| Class B | – | 6,356 | |||||||||
| Class C | – | 125 | |||||||||
| Class C2 | – | 929 | |||||||||
| Class M | – | 1,238 | |||||||||
| – | 17,122 | ||||||||||
| Shares issued–reinvested from distributions: | |||||||||||
| Class A | 433 | – | |||||||||
| Class B | 108 | – | |||||||||
| Class C | 47 | – | |||||||||
| 588 | – | ||||||||||
| Shares redeemed: | |||||||||||
| Class A | (1,298 | ) | (1,268 | ) | |||||||
| Class B | (737 | ) | (809 | ) | |||||||
| Class C | (370 | ) | (254 | ) | |||||||
| Class C2 | – | (43 | ) | ||||||||
| Class M | – | (105 | ) | ||||||||
| (2,405 | ) | (2,479 | ) | ||||||||
| Class level exchanges: | |||||||||||
| Class C | – | 2,295 | |||||||||
| Class C2 | – | (1,035 | ) | ||||||||
| Class M | – | (1,254 | ) | ||||||||
| – | 6 | ||||||||||
| Automatic conversions: | |||||||||||
| Class A | 36 | 34 | |||||||||
| Class B | (36 | ) | (46 | ) | |||||||
| – | (12 | ) | |||||||||
| Net increase (decrease) in shares outstanding: | |||||||||||
| Class A | 6,009 | 15,513 | |||||||||
| Class B | (328 | ) | 5,976 | ||||||||
| Class C | 11 | 2,816 | |||||||||
| Class C2 | – | (109 | ) | ||||||||
| Class M | – | (93 | ) | ||||||||
| 5,692 | 24,103 | ||||||||||
The notes to the financial statements are an integral part of this report.
Transamerica IDEX Mutual Funds
Semi-Annual Report 2005
5
TA IDEX Transamerica Equity
FINANCIAL HIGHLIGHTS
(unaudited for the period ended April 30, 2005)
| For a share of beneficial interest outstanding throughout each period | |||||||||||||||||||||||||||||||||||||||
| Net Asset | Investment Operations | Distributions | Net Asset | ||||||||||||||||||||||||||||||||||||
| For the Period Ended (d)(g) | Value, Beginning of Period | Net Investment Income (Loss) | Net Realized and Unrealized Gain (Loss) | Total Operations | From Net Investment Income | From Net Realized Gains | Total Distributions | Value, End of Period | |||||||||||||||||||||||||||||||
| Class A | 4/30/2005 | $ | 7.44 | $ | 0.01 | $ | 0.20 | $ | 0.21 | $ | – | $ | (0.13 | ) | $ | (0.13 | ) | $ | 7.52 | ||||||||||||||||||||
| 10/31/2004 | 6.86 | (0.07 | ) | 0.65 | 0.58 | – | – | – | 7.44 | ||||||||||||||||||||||||||||||
| 10/31/2003 | 5.52 | (0.05 | ) | 1.39 | 1.34 | – | – | – | 6.86 | ||||||||||||||||||||||||||||||
| 10/31/2002 | 6.38 | (0.07 | ) | (0.79 | ) | (0.86 | ) | – | – | – | 5.52 | ||||||||||||||||||||||||||||
| 10/31/2001 | 10.16 | (0.10 | ) | (3.68 | ) | (3.78 | ) | – | – | – | 6.38 | ||||||||||||||||||||||||||||
| 10/31/2000 | 10.00 | (0.02 | ) | 0.18 | 0.16 | – | – | – | 10.16 | ||||||||||||||||||||||||||||||
| Class B | 4/30/2005 | 7.19 | (0.02 | ) | 0.19 | 0.17 | – | (0.13 | ) | (0.13 | ) | 7.23 | |||||||||||||||||||||||||||
| 10/31/2004 | 6.68 | (0.11 | ) | 0.62 | 0.51 | – | – | – | 7.19 | ||||||||||||||||||||||||||||||
| 10/31/2003 | 5.40 | (0.09 | ) | 1.37 | 1.28 | – | – | – | 6.68 | ||||||||||||||||||||||||||||||
| 10/31/2002 | 6.29 | (0.12 | ) | (0.77 | ) | (0.89 | ) | – | – | – | 5.40 | ||||||||||||||||||||||||||||
| 10/31/2001 | 10.12 | (0.16 | ) | (3.67 | ) | (3.83 | ) | – | – | – | 6.29 | ||||||||||||||||||||||||||||
| 10/31/2000 | 10.00 | (0.06 | ) | 0.18 | 0.12 | – | – | – | 10.12 | ||||||||||||||||||||||||||||||
| Class C | 4/30/2005 | 7.20 | (0.02 | ) | 0.18 | 0.16 | – | (0.13 | ) | (0.13 | ) | 7.23 | |||||||||||||||||||||||||||
| 10/31/2004 | 6.68 | (0.11 | ) | 0.63 | 0.52 | – | – | – | 7.20 | ||||||||||||||||||||||||||||||
| 10/31/2003 | 5.30 | (0.09 | ) | 1.47 | 1.38 | – | – | – | 6.68 | ||||||||||||||||||||||||||||||
| Ratios/Supplemental Data | |||||||||||||||||||||||||||||||
| For the Period | Total | Net Assets, End of Period | Ratio of Expenses to Average Net Assets (a) | Net Investment Income (Loss) to Average | Portfolio Turnover | ||||||||||||||||||||||||||
| Ended (g) | Return (c) | (000's) | Net (e) | Total (f) | Net Assets (a) | Rate (b) | |||||||||||||||||||||||||
| Class A | 4/30/2005 | 2.72 | % | $ | 223,827 | 1.38 | % | 1.38 | % | 0.17 | % | 12 | % | ||||||||||||||||||
| 10/31/2004 | 8.45 | 176,851 | 1.50 | 1.50 | (0.90 | ) | 97 | ||||||||||||||||||||||||
| 10/31/2003 | 24.28 | 56,618 | 1.56 | 1.56 | (0.87 | ) | 55 | ||||||||||||||||||||||||
| 10/31/2002 | (13.50 | ) | 25,127 | 1.74 | 2.32 | (1.19 | ) | 19 | |||||||||||||||||||||||
| 10/31/2001 | (37.20 | ) | 2,750 | 1.55 | 2.75 | (1.15 | ) | 42 | |||||||||||||||||||||||
| 10/31/2000 | 1.60 | 3,053 | 1.55 | 6.10 | (1.18 | ) | 13 | ||||||||||||||||||||||||
| Class B | 4/30/2005 | 2.22 | 45,812 | 2.18 | 2.49 | (0.50 | ) | 12 | |||||||||||||||||||||||
| 10/31/2004 | 7.68 | 47,928 | 2.20 | 2.72 | (1.62 | ) | 97 | ||||||||||||||||||||||||
| 10/31/2003 | 23.70 | 4,613 | 2.21 | 2.21 | (1.52 | ) | 55 | ||||||||||||||||||||||||
| 10/31/2002 | (14.22 | ) | 2,732 | 2.39 | 2.98 | (1.84 | ) | 19 | |||||||||||||||||||||||
| 10/31/2001 | (37.78 | ) | 3,070 | 2.20 | 3.40 | (1.80 | ) | 42 | |||||||||||||||||||||||
| 10/31/2000 | 1.17 | 2,840 | 2.20 | 6.75 | (1.83 | ) | 13 | ||||||||||||||||||||||||
| Class C | 4/30/2005 | 2.11 | 22,003 | 2.18 | 2.41 | (0.52 | ) | 12 | |||||||||||||||||||||||
| 10/31/2004 | 7.78 | 21,808 | 2.20 | 2.55 | (1.63 | ) | 97 | ||||||||||||||||||||||||
| 10/31/2003 | 26.04 | 1,435 | 2.21 | 2.21 | (1.52 | ) | 55 | ||||||||||||||||||||||||
NOTES TO FINANCIAL HIGHLIGHTS
(a) Annualized.
(b) Not annualized for periods of less than one year.
(c) Total Return has been calculated for the applicable period without deduction of a sales load, if any, on an initial purchase. Periods of less than one year are not annualized.
(d) Per share information is calculated based on average number of shares outstanding for the years ended 10/31/2001, 10/31/2002, 10/31/2003, 10/31/2004 and the period ended 4/30/2005
(e) Ratio of Net Expenses to Average Net Assets is net of fee waivers and reimbursements by the investment adviser, if any (see note 2).
(f) Ratio of Total Expenses to Average Net Assets includes all expenses before fee waivers and reimbursements by the investment adviser.
(g) TA IDEX Transamerica Equity ("the Fund") commenced operations on March 1, 2000. The inception date for the Fund's offering of share Class C was November 11, 2002.
The notes to the financial statements are an integral part of this report.
Transamerica IDEX Mutual Funds
Semi-Annual Report 2005
6
TA IDEX Transamerica Equity
NOTES TO FINANCIAL STATEMENTS
At April 30, 2005
(all amounts in thousands)
(unaudited)
NOTE 1. ORGANIZATION AND SIGNIFICANT ACCOUNTING POLICIES
Transamerica IDEX Mutual Funds is a Delaware statutory trust registered under the Investment Company Act of 1940, as amended (the "1940 Act"), as an open-end management investment company. Prior to March 1, 2005, Transamerica IDEX Mutual Funds was a Massachusetts business trust. TA IDEX Transamerica Equity ("the Fund"), part of Transamerica IDEX Mutual Funds, began operations on March 1, 2000.
On May 28, 2004, the Fund acquired all of the net assets of TA IDEX Alger Aggressive Growth pursuant to a plan of reorganization. TA IDEX Transamerica Equity is the accounting survivor. The acquisition was accomplished by a tax free exchange of 17,122 shares of the Fund for 6,508 shares of TA IDEX Alger Aggressive Growth outstanding on May 27, 2004. TA IDEX Alger Aggressive Growth's net assets at that date, $125,279, including $17,570 unrealized appreciation, were combined with those of the Fund. The aggregate net assets of TA IDEX Transamerica Equity immediately before the acquisition was $86,465, the combined net assets of the Fund immediately after the acquisition was $211,744. Proceeds in connection with the acquisition were as follows:
| Shares | Amount | ||||||||||
| Proceeds in connection with the acquisition | |||||||||||
| Class A | 8,474 | $ | 62,968 | ||||||||
| Class B | 6,356 | 45,759 | |||||||||
| Class C | 125 | 899 | |||||||||
| Class C2 | 929 | 6,690 | |||||||||
| Class M | 1,238 | 8,963 | |||||||||
| $ | 125,279 | ||||||||||
In the normal course of business, the Fund enters into contracts that contain a variety of representations and warranties, which provide general indemnifications. The Fund's maximum exposure under these arrangements is unknown, as this would involve future claims that may be made against the Fund and/or its affiliates that have not yet occurred. However, based on experience, the Fund expects the risk of loss to be remote.
See the Prospectus and Statement of Additional Information for a description of the Fund's investment objective.
In preparing the Fund's financial statements in accordance with accounting principles generally accepted in the United States of America ("GAAP"), estimates or assumptions (which could differ from actual results) may be used that affect reported amounts and disclosures. The following policies were consistently followed by the Fund, in accordance with GAAP.
Multiple class operations and expenses: The Fund currently offers three classes of shares, each with a public offering price that reflects different sales charges, if any, and expense levels. On June 15, 2004, Class C2 shares merged into Class C. On September 24, 2004, Class M shares merged into Class C. Class B shares will convert to Class A shares eight years after purchase. Income, non-class specific expenses and realized and unrealized gains and losses, are allocated daily to each class, based upon the value of shares outstanding method as permitted under Rule 18f-3 of the 1940 Act. Each class bears its own specific expenses as well as a portion of general, common expenses.
Pricing of shares: The Fund prices its shares on the basis of the net asset value of each class of shares of the Fund, which is determined as of the close of the New York Stock Exchange ("NYSE") (generally 4:00 p.m. Eastern Time) on each day on which the NYSE is open for trading.
Security valuations: Fund investments traded on an exchange are valued at the closing price on the day of valuation on the exchange where the security is principally traded. With respect to securities traded on NASDAQ NMS, such closing price may be the last reported sales price or the NASDAQ Official Closing Price.
Securities traded in the over-the-counter market and listed securities for which no sale was reported on that date are valued at the last quoted bid price.
Debt securities are valued by independent pricing services at the last quoted bid price; however, those that mature in sixty days or less are valued at amortized cost, which approximates market.
Investment company securities are valued at net asset value of the underlying portfolio.
Other securities for which quotations are not readily available are valued at fair market value as determined in good faith using guidelines adopted by the Board of Trustees of the Fund, under the supervision of the Fund's Valuation Committee. These guidelines may include: the type of security; any restrictions on its resale; financial or business news of the issuer; similar or related securities that are actively trading; related corporate actions; and other significant events occurring after the close of trading in the security.
Cash: The Fund may leave cash overnight in its cash account with the custodian, Investors Bank & Trust Company ("IBT"). IBT has been contracted on behalf of the Fund to invest the excess cash into a savings account, which at April 30, 2005, was paying an interest rate of 2.02%.
Throughout the period, the Fund may have a cash overdraft balance. A fee is incurred on this overdraft, calculated by multiplying the overdraft by a rate based on the federal funds rate.
Repurchase agreements: The Fund is authorized to enter into repurchase agreements. The Fund, through IBT, receives delivery of the underlying securities, the value of which at the time of purchase is required to be an amount equal to at least 100% of the resale price. Repurchase agreements
Transamerica IDEX Mutual Funds
Semi-Annual Report 2005
7
TA IDEX Transamerica Equity
NOTES TO FINANCIAL STATEMENTS (continued)
At April 30, 2005
(all amounts in thousands)
(unaudited)
NOTE 1.–(continued)
involve the risk that the seller will fail to repurchase the security, as agreed. In that case, the Fund will bear the risk of value fluctuations until the security can be sold and may encounter delays and incur costs in liquidating the security. In the event of bankruptcy or insolvency of the seller, delays and costs may be incurred.
Commission recapture: The sub-adviser, to the extent consistent with the best execution and usual commission rate policies and practices, may place security transactions of the Fund with broker/dealers with which Transamerica IDEX Mutual Funds has established a Commission Recapture Program. A Commission Recapture Program is any arrangement under which a broker/dealer applies a portion of the commissions received by such broker/dealer on the security transactions to the Fund. In no event will commissions paid by the Fund be used to pay expenses that would otherwise be borne by any other funds within Transamerica IDEX Mutual Funds, or by any other party.
Recaptured commissions during the six months ended April 30, 2005, of $19 are included in net realized gains in the Statement of Operations.
Securities lending: The Fund may lend securities to enhance fund earnings from investing cash collateral in making such loans to qualified borrowers (typically broker/dealers). The Fund has engaged its custodian bank, IBT, as a lending agent to administer its securities lending program. IBT earned $7 of program income for its services. When the Fund makes a security loan, it receives cash collateral as protection against the risk that the borrower will default on the loan, and records an asset for the cash invested collateral and a liability for the return of the collateral.
Loans of securities are required to be secured by collateral at least equal to 102% of the value of the securities at inception of the loan, and not less then 100% thereafter. The Fund may invest cash collateral in short-term money market instruments including: U.S. Treasury Bills, U.S. agency obligations, commercial paper, money market mutual funds, repurchase agreements and other highly rated, liquid investments. During the life of securities loans, the collateral and securities loaned remain subject to fluctuation in value. IBT marks to market securities loaned and the collateral each business day. If additional collateral is due (at least $1), IBT collects additional cash collateral from the borrowers. Although securities loaned will be fully collateralized at all times, IBT may experience delays in, or may be prevented from, recovering the collateral on behalf of the Fund. The Fund may recall a loa ned security position at any time from the borrower through IBT. In the event the borrower fails to timely return a recalled security, IBT may indemnify the Fund by purchasing replacement securities for the Fund at its own expense and claiming the collateral to fund such a purchase. IBT absorbs the loss if the collateral value is not sufficient to cover the cost of the replacement securities. If replacement securities are not available, IBT will credit the equivalent cash value to the Fund.
While a security is on loan, the Fund does not have the right to vote that security. However, if time permits, the Fund will attempt to recall a security on loan and vote the proxy.
Income from securities lending is included in the Statement of Operations. The amount of collateral and value of securities on loan are included in the Statement of Assets and Liabilities as well as in the Schedule of Investments.
Security transactions and investment income: Security transactions are recorded on the trade date. Security gains and losses are calculated on the specific identification basis. Dividend income is recorded on the ex-dividend date or, in the case of foreign securities, as soon as the Fund is informed of the ex-dividend date. Interest income, including accretion of discounts and amortization of premiums, is recorded on the accrual basis commencing on the settlement date.
Account maintenance fees: If the shareholder account balance falls below $1 by either shareholder action or as a result of market action, a $25 (not in thousands) fee is assessed every year until the balance reaches $1. The fee is assessed by redeeming shares in the shareholder's account.
No fee will be charged under the following conditions:
• accounts opened within the preceding 24 months
• accounts with an active monthly Automatic Investment Plan ($50 (not in thousands) minimum per fund)
• accounts owned by an individual which, when combined by social security number, have a balance of $5 or more
• accounts owned by individuals in the same household (by address) that have a combined balance of $5 or more
• UTMA/UGMA accounts
• Fiduciary accounts
• B-share accounts whose shares have started to convert to
A-shares accounts (as long as combined value of both accounts is at least $1)
For the six months ended April 30, 2005, this fee totaled $17. These fees are included in Paid in Capital in the Statement of Assets and Liabilities.
Redemption fees: A short-term trading redemption fee may be assessed on any fund shares in a fund account that are sold during the first five (5) NYSE trading days following their purchase date. This redemption fee will equal 2% of the amount redeemed and shares held
Transamerica IDEX Mutual Funds
Semi-Annual Report 2005
8
TA IDEX Transamerica Equity
NOTES TO FINANCIAL STATEMENTS (continued)
At April 30, 2005
(all amounts in thousands)
(unaudited)
NOTE 1.–(continued)
the longest will be treated as being redeemed first and shares held the shortest as being redeemed last.
For the six months ended April 30, 2005, the Fund received less than $1 in redemption fees.
Dividend distributions: Distributions to shareholders are recorded on the ex-dividend date and are determined in accordance with Federal income tax regulations which may differ from GAAP.
NOTE 2. RELATED PARTY TRANSACTIONS
Transamerica Fund Advisors, Inc. ("TFAI") is the Fund's investment adviser. Transamerica Fund Services, Inc. ("TFS") is the Fund's administrator and transfer agent. AFSG Securities Corp. ("AFSG") is the Fund's distributor/principal underwriter. AFSG is 100% owned by AUSA Holding Company ("AUSA"). TFAI is a directly owned subsidiary of Western Reserve Life Assurance Co. of Ohio (78%) and AUSA (22%). TFS is a wholly owned subsidiary of WRL (50%) and AUSA (50%). AUSA and WRL are wholly owned indirect subsidiaries of AEGON, NV, a Netherlands corporation.
Effective January 1, 2005 AEGON/Transamerica Fund Advisors, Inc. ("ATFA") was renamed Transamerica Fund Advisors, Inc. ("TFAI"); AEGON/Transamerica Fund Services, Inc. ("ATFS") and AEGON/Transamerica Investor Services, Inc. ("ATIS") merged into one entity and was renamed Transamerica Fund Services, Inc. ("TFS").
Transamerica Investment Management, LLC is both an affiliate of the Fund and a sub-adviser to the Fund.
The following schedule represents the percentage of fund assets owned by affiliated mutual funds (i.e. through the asset allocation funds):
| Net Assets | % of Net Assets | ||||||||||
| TA IDEX Asset Allocation– Conservative Portfolio | $ | 7,973 | 2.73 | % | |||||||
| TA IDEX Asset Allocation– Growth Portfolio | 57,066 | 19.57 | % | ||||||||
| TA IDEX Asset Allocation– Moderate Growth Portfolio | 63,942 | 21.92 | % | ||||||||
| TA IDEX Asset Allocation– Moderate Portfolio | 30,626 | 10.50 | % | ||||||||
| Total | $ | 159,607 | 54.72% | ||||||||
Investment advisory fees: The Fund pays management fees to TFAI based on average daily net assets ("ANA") at the following breakpoints:
From November 1, 2004 to December 31, 2004:
0.775% of the first $500 million of ANA
0.70% of ANA over $500 million
From January 1, 2005 on:
0.75% of the first $500 million of ANA
0.70% of ANA over $500 million
TFAI has contractually agreed to waive its advisory fee and will reimburse the Fund to the extent that operating expenses, excluding 12b-1 fees, exceed the following stated annual limit:
From November 1, 2004 to December 31, 2004:
1.20% Expense Limit
From January 1, 2005 on:
1.175% Expense Limit
Distribution and service fees: The Fund has a 12b-1 distribution plan under the 1940 Act pursuant to which an annual fee, based on average daily net assets, is paid to the distributor for various disbursements such as broker-dealer account servicing fees and other promotional expenses of the Fund. The Fund is authorized under the 12b-1 plan to pay fees on each class up to the following limits:
| Class A | 0.35 | % | |||||
| Class B | 1.00 | % | |||||
| Class C | 1.00 | % | |||||
In the case the Fund or a class of shares of the Fund is closed to new investors or investments, the Fund is authorized to pay 12b-1 fees for past sales and distribution efforts and present and past investor services.
Underwriter commissions relate to front-end sales charges imposed for Class A shares and contingent deferred sales charges from Classes B, C, and certain A share redemptions. For the six months ended April 30, 2005, the underwriter commissions were as follows:
| Received by Underwriter | $ | 248 | |||||
| Retained by Underwriter | 11 | ||||||
| Contingent Deferred Sales Charge | 44 | ||||||
Administrative services: The Fund has entered into an agreement with TFS for financial and legal fund administration services, which includes such items as compliance, expenses, financial statements and other reporting, distributions, tax returns, prospectus preparation, board of trustees meeting support and other legal matters. As of January 1, 2005 the Fund pays TFS an annual fee of 0.02% of average net assets. Prior to January 1, 2005 the Fund paid TFS an annual fee of 0.015% of average net assets. The Legal fees on the Statement of Operations are for fees paid to external legal counsel.
Transamerica IDEX Mutual Funds
Semi-Annual Report 2005
9
TA IDEX Transamerica Equity
NOTES TO FINANCIAL STATEMENTS (continued)
At April 30, 2005
(all amounts in thousands)
(unaudited)
NOTE 2.–(continued)
Transfer agent fees: The Fund pays TFS an annual per-account charge of $20 (not in thousands) for each open account and $1.63 (not in thousands) for each closed account. There is no new account charge. The Transfer agent fees on the Statement of Operations are made up of fees paid to TFS and costs associated with shareholder statements.
The Fund paid TFS $400 for the six months ended April 30, 2005.
Deferred compensation plan: Each eligible Fund Trustee may elect participation in the Deferred Compensation Plan ("the Plan"). Under the Plan, such Trustees may defer payment of a percentage of their total fees earned as a Fund Trustee. These deferred amounts may be invested in any Transamerica IDEX Mutual Fund. At April 30, 2005, the value of invested plan amount was $24. Invested plan amounts and the total liability for deferred compensation to the Trustees under the Plan at April 30, 2005, are included in the accompanying Statement of Assets and Liabilities.
NOTE 3. INVESTMENT TRANSACTIONS
The cost of securities purchased and proceeds from securities sold (excluding short-term securities) for the six months ended April 30, 2005, were as follows:
| Purchases of securities: | |||||||
| Long-Term excluding U.S. Government | $ | 69,597 | |||||
| U.S. Government | – | ||||||
| Proceeds from maturities and sales of securities: | |||||||
| Long-Term excluding U.S. Government | 34,002 | ||||||
| U.S. Government | – | ||||||
NOTE 4. FEDERAL INCOME TAX MATTERS
The Fund has not made any provision for federal income or excise taxes due to its policy to distribute all of its taxable income and capital gains to its shareholders and otherwise qualify as a regulated investment company under the Internal Revenue Code. Income and capital gain distributions are determined in accordance with income tax regulations, which may differ from GAAP. These differences are primarily due to differing treatment for items including, but not limited to, wash sales, net operating losses and capital loss carryforwards.
The capital loss carryforwards are available to offset future realized capital gains through the periods listed:
| Capital Loss Carryforward | Available through | ||||||
| $ | 74,003 | October 31, 2008 | |||||
| 48,961 | October 31, 2009 | ||||||
| 1,153 | October 31, 2010 | ||||||
| 92 | October 31, 2011 | ||||||
The aggregate cost of investments and composition of unrealized appreciation (depreciation) for federal income tax purposes as of April 30, 2005, are as follows:
| Federal Tax Cost Basis | $ | 296,472 | |||||
| Unrealized Appreciation | $ | 36,125 | |||||
| Unrealized (Depreciation) | (10,148 | ) | |||||
| Net Unrealized Appreciation (Depreciation) | $ | 25,977 | |||||
NOTE 5. REGULATORY PROCEEDINGS
There continues to be significant federal and state regulatory activity relating to financial services companies, particularly mutual fund companies and their investment advisers. As part of an ongoing investigation regarding potential market timing, recordkeeping and trading compliance issues and matters affecting the Fund's investment adviser, TFAI, and certain employees and affiliates of TFAI, the SEC staff has indicated that it is likely to take some action against TFAI and certain of its affiliates at the conclusion of the investigation. The potential timing and the scope of any such action is difficult to predict. Although the impact of any action brought against TFAI and/or its affiliates is difficult to assess at the present time, the Fund currently believes that the likelihood that any such action will have a material adverse impact on it is remote. It is important to note that the Fund is not aware of any allegation of wrongdoing against it and its board at the time this semi-annual report is printed. Although it is not anticipated that these developments will have an adverse impact on the Fund, there can be no assurance at this time. TFAI and its affiliates are actively working with the SEC in regard to this matter; however, the exact resolution cannot be determined at this time. TFAI will take such actions that it deems necessary or appropriate to continue providing management services to the Fund and to bring all matters to an appropriate conclusion.
TFAI and/or its affiliates, and not the Fund, will bear the costs regarding these regulatory matters.
Transamerica IDEX Mutual Funds
Semi-Annual Report 2005
10
TA IDEX Transamerica Equity
INVESTMENT ADVISORY AND SUB-ADVISORY AGREEMENTS – REVIEW AND RENEWAL
At a meeting of the Board of Trustees of Transamerica IDEX Mutual Funds ("TA IDEX") held on October 6, 2004, the Board considered and approved the renewal for a one-year period of the Investment Advisory Agreement between TA IDEX Transamerica Equity (the "Fund") and Transamerica Fund Advisors, Inc. ("TFAI") as well as the Investment Sub-Advisory Agreement of the Fund between TFAI and Transamerica Investment Management, LLC (the "Sub-Adviser"). In approving the renewal of these agreements, the Board concluded that the Investment Advisory and Investment SubAdvisory Agreements enable shareholders of the Fund to obtain high quality services at a cost that is appropriate, reasonable, and in the best interests of shareholders based upon the following determinations, among others:
The nature, extent and quality of the advisory service to be provided. The Board considered the nature and quality of the services provided by TFAI and the Sub-Adviser to the Fund in the past, as well as the services anticipated to be provided in the future. The Board concluded that TFAI and the Sub-Adviser are capable of providing high quality services to the Fund, as indicated by TFAI's management capabilities demonstrated with respect to the Fund and other funds managed by TFAI, TFAI's management oversight process, the professional qualifications and experience of the Sub-Adviser's portfolio management team, and the Fund's competitive investment performance. The Board also concluded that TFAI and the Sub-Adviser would provide the same quality and quantity of investment management and related services as before, that these services are appropriate in scope and extent in light of the Fund's operations, the competitive landscape of the investment company business and investor needs, and that TFAI's and the SubAdviser's obligations will remain the same in all respects.
The investment performance of the Fund. The Board concluded, based in particular on information provided by Lipper Analytics, that the Fund's investment performance was competitive relative to comparable funds over trailing one-, two- and three-year periods and to the Fund's benchmark index over the past year. On the basis of the Trustees' assessment of the nature, extent and quality of investment advisory and related services to be provided or procured by TFAI and the Sub-Adviser, the Trustees concluded that TFAI and the Sub-Adviser were capable of consistently generating a level of long-term investment performance that is appropriate in light of the Fund's investment objective, policies and strategies and competitive with many other investment companies.
The cost of advisory services provided and the level of profitability. On the basis of the Board's review of the fees to be charged by TFAI and the Sub-Adviser for investment advisory and related services, TFAI's financial statements, the fees paid by TFAI to the Sub-Adviser, TFAI's estimated net management income resulting from its management of the Fund, the estimated profitability of TFAI's relationships with the Fund and TA IDEX, and the estimated profitability of the Sub-Adviser's relationship with the Fund, the Board concluded that the level of investment advisory fees and the profitability is appropriate in light of the services provided, the management fees and overall expense ratios of comparable investment companies, and the anticipated profitability of the relationship between the Fun d, TFAI and the Sub-Adviser. Further, on the basis of comparative information supplied by Lipper Analytics, the Board determined that the advisory fees and estimated overall expense ratio of the Fund were consistent with industry averages, and that the Fund's advisory fees had been lowered in the recent past, which will likely lower overall expenses for the benefit of shareholders.
The extent to which economies of scale would be realized as the Fund grows and whether fee levels reflect these economies of scale for the benefit of Fund investors. The Trustees concluded that inclusion of asset-based breakpoints in the Fund's advisory fee schedule appropriately benefited investors by realizing economies of scale in the form of a lower advisory fee rate as the level of Fund assets increases. The Board also concluded that the advisory fees appropriately reflect the Fund's current size, the current economic environment for TFAI, and the competitive nature of the investment company market. In addition, the Board noted that it will have the opportunity to periodically re-examine whether the Fund has achieved economies of scale, as well as the appropriateness of advisory fees payabl e to TFAI and the Sub-Adviser in the future.
Benefits (such as soft dollars) to TFAI or the Sub-Adviser from its relationship with the Fund. The Board concluded that other benefits derived by TFAI or the Sub-Adviser from its relationship with the Fund are reasonable and fair, and are consistent with industry practice and the best interests of the Fund and its shareholders. In this regard, the Board noted that TFAI does not realize "soft dollar" benefits from its relationship with the Fund, and that the Sub-Adviser is participating in a brokerage program pursuant to which a portion of brokerage transactions paid by the Fund is recaptured for the benefit of the Fund and its shareholders, thus limiting the amount of "soft-dollar" arrangements the Sub-Adviser may engage in with respect to the Fund's portfolio brokerage transactions.
Other considerations. The Board also determined that TFAI had made a substantial commitment to the recruitment and retention of high quality personnel, and maintained the financial, compliance and operational resources reasonably necessary to manage the Fund in a professional manner that is consistent with the best interests of the Fund and its shareholders. The Trustees also concluded that TFAI had made a significant entrepreneurial commitment to the management and success of the Fund, reflected by TFAI's expense limitation and fee waiver arrangement with the Fund which, as demonstrated in the past with the Fund, may result in TFAI waiving a substantial amount of advisory fees for the benefit of shareholders.
Transamerica IDEX Mutual Funds
Semi-Annual Report 2005
11
TA IDEX Transamerica Equity
SUPPLEMENTAL INFORMATION (unaudited)
RESULTS OF SHAREHOLDER PROXY
At a special meeting of shareholders held on February 25, 2005, the results of the Proposals were as follows:
Transamerica IDEX Mutual Funds
Proposal 1: Election of Trustees to the Board of Trustees of Transamerica IDEX Mutual Funds.
| For | Withheld | ||||||||||
| Peter R. Brown | 872,017,875.249 | 4,468,498.551 | |||||||||
| Daniel Calabria | 871,917,069.786 | 4,569,304.014 | |||||||||
| Janise B. Case | 872,099,393.125 | 4,386,980.675 | |||||||||
| Charles C. Harris | 872,086,722.025 | 4,399,651.775 | |||||||||
| Leo J. Hill | 872,304,465.640 | 4,181,908.160 | |||||||||
| Russell A. Kimball, Jr. | 872,253,556.471 | 4,232,817.329 | |||||||||
| William W. Short, Jr. | 872,139,920.944 | 4,346,452.856 | |||||||||
| John Waechter | 872,261,152.376 | 4,225,221.424 | |||||||||
| Jack E. Zimmerman | 871,929,967.512 | 4,556,406.288 | |||||||||
| Brian C. Scott | 872,218,970.367 | 4,267,403.433 | |||||||||
| Thomas P. O'Neill | 872,111,944.117 | 4,374,429.683 | |||||||||
TA IDEX Transamerica Equity
Proposal 2: Approval of an Agreement and Plan of Reorganization pursuant to which Transamerica IDEX Mutual Funds will organize as a Delaware statutory trust.
| For | Against | Abstentions/Broker Non-Votes | |||||||||
| 25,266,525.685 | 154,206.111 | 3,801,473.640 | |||||||||
Proposal 3: Approval of changes to the fundamental investment restrictions of TA IDEX Transamerica Equity.
| A. Diversification | For | Against | Abstentions/Broker Non-Votes | ||||||||||||
| 25,415,764.730 | 159,020.706 | 3,647.420.000 | |||||||||||||
| B. Borrowing | For | Against | Abstentions/Broker Non-Votes | ||||||||||||
| 25,404,164.283 | 170,621.153 | 3,647.420.000 | |||||||||||||
| C. Senior Securities | For | Against | Abstentions/Broker Non-Votes | ||||||||||||
| 25,415,764.730 | 159,020.706 | 3,647.420.000 | |||||||||||||
| D. Underwriting Securities | For | Against | Abstentions/Broker Non-Votes | ||||||||||||
| 25,418,693.833 | 156,091.603 | 3,647.420.000 | |||||||||||||
| E. Real Estate | For | Against | Abstentions/Broker Non-Votes | ||||||||||||
| 25,413,835.411 | 160,950.025 | 3,647.420.000 | |||||||||||||
| F. Making Loans | For | Against | Abstentions/Broker Non-Votes | ||||||||||||
| 25,391,632.060 | 183,153.376 | 3,647.420.000 | |||||||||||||
| G. Concentration | For | Against | Abstentions/Broker Non-Votes | ||||||||||||
| 25,415,371.872 | 159,413.564 | 3,647.420.000 | |||||||||||||
| H. Commodities | For | Against | Abstentions/Broker Non-Votes | ||||||||||||
| 25,405,719.046 | 169,066.390 | 3,647.420.000 | |||||||||||||
| K. Margin Activities and Short Selling | For | Against | Abstentions/Broker-Non-Votes | ||||||||||||
| 25,399,405.749 | 175,379.687 | 3,647.420.000 | |||||||||||||
Transamerica IDEX Mutual Funds
Semi-Annual Report 2005
12
TA IDEX Transamerica Flexible Income
UNDERSTANDING YOUR FUND'S EXPENSES
(unaudited)
SHAREHOLDER EXPENSES
The following Example is intended to help you understand your ongoing costs (in dollars and cents) of investing in a Fund and to compare these costs with the ongoing costs of investing in other funds.
The Example is based on an investment of $1,000 invested at November 1, 2004 and held for the entire period until
April 30, 2005.
ACTUAL EXPENSES
The first line in the table below provides information about actual account values and actual expenses. You may use the information in this line, together with the amount you invested, to estimate the expenses that you paid over the period. Simply divide your account value by $1,000 (for example, an $8,600 account value divided by $1,000 = 8.6), then multiply the result by the number in the first line of your Fund under the heading entitled "Expenses Paid During Period" to estimate the expenses you paid on your account during this period.
HYPOTHETICAL EXAMPLE FOR COMPARISON PURPOSES
The second line in the table below provides information about hypothetical account values and hypothetical expenses based on the Fund's actual expense ratio and an assumed rate of return of 5% per year before expenses, which is not the Fund's actual return. The hypothetical account values and expenses may not be used to estimate the actual ending account balance or expenses you paid for the period. You may use this information to compare the ongoing costs of investing in your Fund and other funds. To do so, compare this 5% hypothetical example with the 5% hypothetical examples that appear in the shareholder reports of the other funds.
Please note that the expenses shown in the table are meant to highlight your ongoing costs only and do not reflect any transactional costs, such as sales charges, redemption fees, brokerage commissions paid on purchases and sales of fund shares. Therefore, the second line under the Fund in the table is useful in comparing ongoing costs only, and will not help you determine the relative total costs of owning different funds. In addition, note that the expenses shown in the table are meant to highlight your ongoing costs and do not reflect any transaction costs.
| Beginning Account Value | Ending Account Value | Annualized Expense Ratio | Expenses Paid During Period (a) | ||||||||||||||||
| Class A | |||||||||||||||||||
| Actual | $ | 1,000.00 | $ | 995.00 | 1.25 | % | $ | 6.18 | |||||||||||
| Hypothetical (b) | 1,000.00 | 1,018.60 | 1.25 | 6.26 | |||||||||||||||
| Class B | |||||||||||||||||||
| Actual | 1,000.00 | 992.20 | 1.95 | 9.63 | |||||||||||||||
| Hypothetical (b) | 1,000.00 | 1,015.12 | 1.95 | 9.74 | |||||||||||||||
| Class C | |||||||||||||||||||
| Actual | 1,000.00 | 991.20 | 2.12 | 10.47 | |||||||||||||||
| Hypothetical (b) | 1,000.00 | 1,014.28 | 2.12 | 10.59 | |||||||||||||||
| Class I | |||||||||||||||||||
| Actual | 1,000.00 | 996.60 | 0.85 | 4.02 | |||||||||||||||
| Hypothetical (b) | 1,000.00 | 1,019.67 | 0.85 | 4.07 | |||||||||||||||
(a) Expenses are calculated using each Fund's annualized expense ratio (as disclosed in the table), multiplied by the average account value for the period, multiplied by number of days in the period (181 days), and divided by the number of days in the year (365 days).
(b) 5% return per year before expenses.
GRAPHICAL PRESENTATION OF SCHEDULE OF INVESTMENTS
By Asset Type
At April 30, 2005
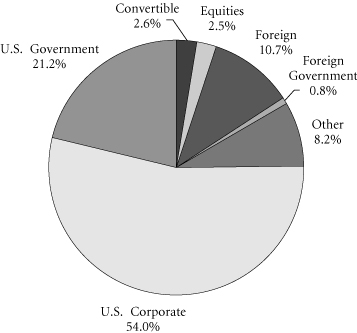
This chart shows the percentage breakdown by asset type of the Fund's total investment securities.
Transamerica IDEX Mutual Funds
Semi-Annual Report 2005
1
TA IDEX Transamerica Flexible Income
SCHEDULE OF INVESTMENTS
At April 30, 2005
(all amounts except share amounts in thousands)
(unaudited)
| Principal | Value | ||||||||||
| U.S. GOVERNMENT OBLIGATIONS (18.2%) | |||||||||||
| U.S. Treasury Bond 5.38%, due 02/15/2031 (a) | $ | 10,000 | $ | 11,294 | |||||||
| U.S. Treasury Note 2.50%, due 10/31/2006 | 12,800 | 12,606 | |||||||||
| 3.38%, due 10/15/2009 | 17,400 | 17,051 | |||||||||
| 3.50%, due 02/15/2010 | 5,000 | 4,917 | |||||||||
| 4.00%, due 02/15/2015 (a) | 5,000 | 4,919 | |||||||||
| Total U.S. Government Obligations (cost: $50,619) | 50,787 | ||||||||||
| FOREIGN GOVERNMENT OBLIGATIONS (0.4%) | |||||||||||
| Ainsworth Lumber Co., Ltd., Senior Note (b) 6.84%, due 10/01/2010 | 1,000 | 1,015 | |||||||||
| Total Foreign Government Obligations (cost: $1,010) | 1,015 | ||||||||||
| MORTGAGE-BACKED SECURITIES (0.4%) | |||||||||||
| Gazprom International SA–144A 7.20%, due 02/01/2020 | 1,000 | 1,040 | |||||||||
| Total Mortgage-Backed Securities (cost: $1,000) | 1,040 | ||||||||||
| CORPORATE DEBT SECURITIES (64.4%) | |||||||||||
| Aerospace (1.0%) | |||||||||||
| Bombardier, Inc.–144A 6.75%, due 05/01/2012 (a) | 3,000 | 2,700 | |||||||||
| Agriculture (0.8%) | |||||||||||
| Dole Food Co., Inc. 8.63%, due 05/01/2009 | 1,200 | 1,263 | |||||||||
| Michael Foods, Inc. 8.00%, due 11/15/2013 | 1,000 | 1,025 | |||||||||
| Amusement & Recreation Services (1.8%) | |||||||||||
| Boyd Gaming Corp. 6.75%, due 04/15/2014 | 2,500 | 2,462 | |||||||||
| Speedway Motorsports, Inc. 6.75%, due 06/01/2013 | 500 | 503 | |||||||||
| Station Casinos, Inc. 6.88%, due 03/01/2016 | 2,000 | 2,020 | |||||||||
| Beverages (1.4%) | |||||||||||
| Cia Brasileira de Bebidas 8.75%, due 09/15/2013 | 750 | 859 | |||||||||
| PepsiAmericas, Inc. 3.88%, due 09/12/2007 | 3,000 | 2,981 | |||||||||
| Business Credit Institutions (1.5%) | |||||||||||
| ChevronTexaco Capital Co. 3.50%, due 09/17/2007 | 1,035 | 1,023 | |||||||||
| Ford Motor Credit Co. 7.00%, due 10/01/2013 (a) | 2,500 | 2,250 | |||||||||
| Principal | Value | ||||||||||
| Business Credit Institutions (continued) | |||||||||||
| Pemex Finance, Ltd. 9.03%, due 02/15/2011 | $ | 850 | $ | 967 | |||||||
| Chemicals & Allied Products (0.9%) | |||||||||||
| Lubrizol Corp. 5.50%, due 10/01/2014 | 2,500 | 2,542 | |||||||||
| Commercial Banks (3.1%) | |||||||||||
| Citizens Banking Corp. 5.75%, due 02/01/2013 | 75 | 78 | |||||||||
| Compass Bank, Subordinated Note 5.50%, due 04/01/2020 | 3,000 | 3,087 | |||||||||
| Royal Bank of Scotland Group PLC 7.65%, due 08/29/2049 (b) | 2,000 | 2,481 | |||||||||
| US Bank NA 3.75%, due 02/06/2009 | 3,000 | 2,941 | |||||||||
| Communication (0.4%) | |||||||||||
| Echostar DBS Corp. 6.38%, due 10/01/2011 | 1,000 | 987 | |||||||||
| Communications Equipment (0.5%) | |||||||||||
| Motorola, Inc. 4.61%, due 11/16/2007 | 1,250 | 1,259 | |||||||||
| Department Stores (1.9%) | |||||||||||
| JC Penney Co., Inc. 6.88%, due 10/15/2015 | 2,000 | 2,065 | |||||||||
| May Department Stores Co. (The) 8.50%, due 06/01/2019 | 2,500 | 3,128 | |||||||||
| Electric Services (4.3%) | |||||||||||
| AES Gener SA 7.50%, due 03/25/2014 | 2,000 | 1,969 | |||||||||
| DPL, Inc. 8.25%, due 03/01/2007 | 2,000 | 2,120 | |||||||||
| Duke Energy Corp. 4.20%, due 10/01/2008 | 3,000 | 2,985 | |||||||||
| FPL Group Capital, Inc. 4.09%, due 02/16/2007 | 2,000 | 1,997 | |||||||||
| Reliant Energy, Inc. 6.75%, due 12/15/2014 | 1,000 | 885 | |||||||||
| Southwestern Public Service Co., Series B 5.13%, due 11/01/2006 | 500 | 508 | |||||||||
| Texas Utilities Corp. 6.38%, due 06/15/2006 | 1,625 | 1,662 | |||||||||
| Electric, Gas & Sanitary Services (0.0%) | |||||||||||
| Public Service Co. of Colorado, Series A 6.88%, due 07/15/2009 | 100 | 109 | |||||||||
The notes to the financial statements are an integral part of this report.
Transamerica IDEX Mutual Funds
Semi-Annual Report 2005
2
TA IDEX Transamerica Flexible Income
SCHEDULE OF INVESTMENTS (continued)
At April 30, 2005
(all amounts except share amounts in thousands)
(unaudited)
| Principal | Value | ||||||||||
| Finance (0.4%) | |||||||||||
| American Real Estate Partners, LP 8.13%, due 06/01/2012 | $ | 1,000 | $ | 1,010 | |||||||
| Food & Kindred Products (1.8%) | |||||||||||
| Burns Philp Capital Property, Ltd./Burns Philp Capital US, Inc. 9.75%, due 07/15/2012 | 2,000 | 2,180 | |||||||||
| ConAgra Foods, Inc. 9.75%, due 03/01/2021 | 1,900 | 2,762 | |||||||||
| Food Stores (0.7%) | |||||||||||
| Stater Brothers Holdings, Inc. 8.13%, due 06/15/2012 | 2,000 | 1,860 | |||||||||
| Furniture & Fixtures (1.5%) | |||||||||||
| Lear Corp. 7.96%, due 05/15/2005 | 4,067 | 4,072 | |||||||||
| Gas Production & Distribution (0.9%) | |||||||||||
| Dynegy Holdings, Inc.–144A 9.88%, due 07/15/2010 | 1,000 | 1,010 | |||||||||
| Pacific Energy Partners, LP / Pacific Energy Finance Corp. 7.13%, due 06/15/2014 | 1,500 | 1,564 | |||||||||
| Holding & Other Investment Offices (2.6%) | |||||||||||
| EOP Operating, LP 8.38%, due 03/15/2006 | 2,150 | 2,232 | |||||||||
| Hutchison Whampoa International, Ltd.–144A 5.45%, due 11/24/2010 | 475 | 486 | |||||||||
| Noble Group, Ltd., Senior Note–144A 6.63%, due 03/17/2015 | 2,000 | 1,783 | |||||||||
| Raytheon Co. 3.50%, due 05/15/2006 | 5,500 | 2,827 | |||||||||
| Hotels & Other Lodging Places (4.4%) | |||||||||||
| Circus Circus Enterprises, Inc. 7.63%, due 07/15/2013 | 2,000 | 2,065 | |||||||||
| Host Marriott, LP 7.13%, due 11/01/2013 | 2,000 | 2,025 | |||||||||
| Intrawest Corp. 7.50%, due 10/15/2013 | 2,000 | 1,990 | |||||||||
| Starwood Hotels & Resorts, Inc. 6.75%, due 11/15/2005 | 4,335 | 4,346 | |||||||||
| Wynn Las Vegas LLC/Wynn Las Vegas Capital Corp.–144A 6.63%, due 12/01/2014 | 2,000 | 1,870 | |||||||||
| Industrial Machinery & Equipment (0.7%) | |||||||||||
| Case New Holland, Inc.–144A 9.25%, due 08/01/2011 | 2,000 | 2,040 | |||||||||
| Principal | Value | ||||||||||
| Insurance (1.5%) | |||||||||||
| First American Capital Trust I 8.50%, due 04/15/2012 | $ | 125 | $ | 141 | |||||||
| TGT Pipeline LLC–144A 5.50%, due 02/01/2017 | 2,800 | 2,858 | |||||||||
| Wellpoint Health Networks, Inc. 6.38%, due 06/15/2006 | 1,185 | 1,215 | |||||||||
| Lumber & Wood Products (0.6%) | |||||||||||
| Weyerhaeuser Co. 7.38%, due 03/15/2032 | 1,500 | 1,631 | |||||||||
| Manufacturing Industries (0.2%) | |||||||||||
| Bombardier Recreational Products, Inc. 8.38%, due 12/15/2013 | 500 | 522 | |||||||||
| Metal Mining (1.2%) | |||||||||||
| Barrick Gold Finance, Inc. 7.50%, due 05/01/2007 | 2,000 | 2,122 | |||||||||
| Phelps Dodge Corp. 9.50%, due 06/01/2031 | 847 | 1,286 | |||||||||
| Mortgage Bankers & Brokers (2.1%) | |||||||||||
| Countrywide Home Loans, Inc. 5.50%, due 08/01/2006 | 2,500 | 2,544 | |||||||||
| Crystal US Holdings 3 LLC/Crystal US Sub 3 Corp., Senior Subordinated Note 9.63%, due 06/15/2014 | 1,300 | 1,433 | |||||||||
| Innophos Investments Holdings, Inc.–144A 10.77%, due 02/15/2015 (b) | 1,000 | 965 | |||||||||
| Virgin River Casino Corp.–144A 9.00%, due 01/15/2012 | 1,000 | 1,035 | |||||||||
| Motion Pictures (1.3%) | |||||||||||
| Time Warner, Inc. 7.63%, due 04/15/2031 | 3,000 | 3,656 | |||||||||
| Oil & Gas Extraction (3.7%) | |||||||||||
| Chesapeake Energy Corp. 6.88%, due 01/15/2016 | 2,000 | 1,990 | |||||||||
| Chesapeake Energy Corp.–144A 6.38%, due 06/15/2015 | 1,000 | 980 | |||||||||
| El Paso CGP Co. 7.63%, due 09/01/2008 | 2,000 | 1,985 | |||||||||
| Evergreen Resources, Inc. 5.88%, due 03/15/2012 | 2,900 | 2,901 | |||||||||
| Husky Oil, Ltd. 8.90%, due 08/15/2028 (c) | 1,420 | 1,584 | |||||||||
| Nexen, Inc. 5.88%, due 03/10/2035 | 810 | 781 | |||||||||
The notes to the financial statements are an integral part of this report.
Transamerica IDEX Mutual Funds
Semi-Annual Report 2005
3
TA IDEX Transamerica Flexible Income
SCHEDULE OF INVESTMENTS (continued)
At April 30, 2005
(all amounts except share amounts in thousands)
(unaudited)
| Principal | Value | ||||||||||
| Paper & Allied Products (0.7%) | |||||||||||
| Domtar, Inc. 7.88%, due 10/15/2011 | $ | 1,875 | $ | 2,016 | |||||||
| Personal Credit Institutions (0.4%) | |||||||||||
| Capital One Bank Corp. 8.25%, due 06/15/2005 | 1,246 | 1,253 | |||||||||
| Petroleum Refining (3.4%) | |||||||||||
| Amerada Hess Corp. 7.13%, due 03/15/2033 | 3,000 | 3,374 | |||||||||
| Enterprise Products Operating, LP, Series B 5.60%, due 10/15/2014 | 1,500 | 1,509 | |||||||||
| Premcor Refining Group (The), Inc. 9.25%, due 02/01/2010 | 2,500 | 2,756 | |||||||||
| Valero Energy Corp. 7.50%, due 04/15/2032 | 1,500 | 1,772 | |||||||||
| Primary Metal Industries (2.5%) | |||||||||||
| Alcoa, Inc. 4.25%, due 08/15/2007 | 2,750 | 2,754 | |||||||||
| Noranda, Inc. 6.00%, due 10/15/2015 | 2,000 | 2,026 | |||||||||
| Novelis, Inc.–144A 7.25%, due 02/15/2015 | 1,000 | 967 | |||||||||
| Phelps Dodge Corp. 8.75%, due 06/01/2011 | 1,000 | 1,201 | |||||||||
| Printing & Publishing (2.2%) | |||||||||||
| News America Holdings, Inc. 7.75%, due 12/01/2045 | 2,700 | 3,225 | |||||||||
| Viacom, Inc. 7.75%, due 06/01/2005 | 3,000 | 3,009 | |||||||||
| Radio & Television Broadcasting (2.0%) | |||||||||||
| Chancellor Media Corp. 8.00%, due 11/01/2008 | 3,275 | 3,538 | |||||||||
| Grupo Televisa SA, Senior Note–144A 6.63%, due 03/18/2025 | 2,000 | 1,960 | |||||||||
| Residential Building Construction (0.8%) | |||||||||||
| Ryland Group, Inc. 9.75%, due 09/01/2010 | 2,000 | 2,137 | |||||||||
| Restaurants (1.8%) | |||||||||||
| Brinker International, Inc. 5.75%, due 06/01/2014 | 3,000 | 3,151 | |||||||||
| Landry's Restaurants, Inc.–144A 7.50%, due 12/15/2014 | 2,000 | 1,860 | |||||||||
| Yum! Brands, Inc. 7.70%, due 07/01/2012 | 85 | 100 | |||||||||
| Principal | Value | ||||||||||
| Savings Institutions (0.7%) | |||||||||||
| Washington Mutual Bank NA 5.13%, due 01/15/2015 | $ | 2,000 | $ | 1,991 | |||||||
| Security & Commodity Brokers (1.6%) | |||||||||||
| American Real Estate Partners, LP/American Real Estate Finance Corp.–144A 7.13%, due 02/15/2013 | 1,000 | 967 | |||||||||
| E*Trade Financial Corp. 8.00%, due 06/15/2011 | 1,500 | 1,537 | |||||||||
| Goldman Sachs Group, Inc. 6.35%, due 02/15/2034 | 1,975 | 2,068 | |||||||||
| Stone, Clay & Glass Products (0.3%) | |||||||||||
| Owens-Brockway Glass Container–144A 6.75%, due 12/01/2014 | 1,000 | 975 | |||||||||
| Telecommunications (4.2%) | |||||||||||
| America Movil SA de CV 5.50%, due 03/01/2014 | 3,000 | 2,924 | |||||||||
| Cincinnati Bell, Inc. 8.38%, due 01/15/2014 (a) | 725 | 691 | |||||||||
| MCI, Inc. 5.91%, due 05/01/2007 | 1,500 | 1,523 | |||||||||
| Mountain States Telephone & Telegraph 7.38%, due 05/01/2030 | 1,000 | 860 | |||||||||
| Northwestern Bell Telephone 7.75%, due 05/01/2030 | 1,235 | 1,093 | |||||||||
| Qwest Corp.–144A 7.88%, due 09/01/2011 | 1,000 | 1,015 | |||||||||
| Rogers Wireless Communications, Inc. 6.14%, due 12/15/2010 (b) | 1,000 | 1,028 | |||||||||
| Sprint Capital Corp. 7.13%, due 01/30/2006 | 2,500 | 2,554 | |||||||||
| Transportation & Public Utilities (0.4%) | |||||||||||
| Plains All American Pipeline Co. 5.63%, due 12/15/2013 | 1,100 | 1,137 | |||||||||
| Water Transportation (0.8%) | |||||||||||
| Royal Caribbean Cruises, Ltd. 8.75%, due 02/02/2011 | 2,000 | 2,240 | |||||||||
| Wholesale Trade Nondurable Goods (1.4%) | |||||||||||
| Domino's, Inc. 8.25%, due 07/01/2011 | 1,750 | 1,829 | |||||||||
| Unilever Capital Corp. 6.88%, due 11/01/2005 | 2,000 | 2,033 | |||||||||
| Total Corporate Debt Securities (cost: $183,863) | 179,680 | ||||||||||
The notes to the financial statements are an integral part of this report.
Transamerica IDEX Mutual Funds
Semi-Annual Report 2005
4
TA IDEX Transamerica Flexible Income
SCHEDULE OF INVESTMENTS (continued)
At April 30, 2005
(all amounts except share amounts in thousands)
(unaudited)
| Principal | Value | ||||||||||
| CONVERTIBLE BONDS (2.5%) | |||||||||||
| Aerospace (0.3%) | |||||||||||
| Armor Holdings, Inc. 2.00%, due 11/01/2024 (d) | $ | 1,000 | $ | 902 | |||||||
| Communications Equipment (0.3%) | |||||||||||
| Inmarsat Finance PLC 0.00%, due 11/15/2012 (e) | 1,000 | 740 | |||||||||
| Computer & Data Processing Services (0.3%) | |||||||||||
| Overstock.com, Inc. 3.75%, due 12/01/2011 (a) | 1,000 | 821 | |||||||||
| Computer & Office Equipment (0.3%) | |||||||||||
| Scientific Games Corp.–144A 0.75%, due 12/01/2024 | 1,000 | 920 | |||||||||
| Electronic Components & Accessories (0.5%) | |||||||||||
| Pixelworks, Inc. 1.75%, due 05/15/2024 | 2,000 | 1,425 | |||||||||
| Entertainment (0.5%) | |||||||||||
| International Game Technology Zero Coupon, due 01/29/2033 | 2,000 | 1,280 | |||||||||
| Retail Trade (0.3%) | |||||||||||
| Dick's Sporting Goods, Inc.–144A 1.61%, due 02/18/2024 (f) | 1,500 | 986 | |||||||||
| Total Convertible Bonds (cost: $8,494) | 7,074 | ||||||||||
| Shares | Value | ||||||||||
| CONVERTIBLE PREFERRED STOCKS (0.1%) | |||||||||||
| Business Credit Institutions (0.1%) | |||||||||||
| Sovereign Capital Trust II (g) | 9,500 | $ | 422 | ||||||||
| Total Convertible Preferred Stocks (cost: $475) | 422 | ||||||||||
| PREFERRED STOCKS (2.3%) | |||||||||||
| Holding & Other Investment Offices (1.0%) | |||||||||||
| Host Marriott Corp. REIT | 100,000 | 2,710 | |||||||||
| Saul Centers, Inc. | 1,850 | 47 | |||||||||
| Telecommunications (1.3%) | |||||||||||
| Centaur Funding Corp.–144A (g) | 2,750 | 3,711 | |||||||||
| Total Preferred Stocks (cost: $6,411) | 6,468 | ||||||||||
| COMMON STOCKS (0.0%) | |||||||||||
| Telecommunications (0.0%) | |||||||||||
| Versatel Telecom International NV Warrants, Expires 5/15/2008 (g) | 75 | – | (h) | ||||||||
| Total Common Stocks (cost: $1) | – | ||||||||||
| Principal | Value | ||||||||||
| SHORT-TERM U.S. GOVERNMENT OBLIGATIONS (2.9%) | |||||||||||
| U.S. Treasury Bill | |||||||||||
| 2.74%, due 06/30/2005 | $ | 8,000 | $ | 7,963 | |||||||
| Total Short-Term U.S. Government Obligations (cost: $7,963) | 7,963 | ||||||||||
| SECURITY LENDING COLLATERAL (8.2%) | |||||||||||
| Debt (7.1%) | |||||||||||
| Bank Notes (1.0%) | |||||||||||
| Bank of America 2.82%, due 05/16/2005 722 722 2.80%, due 06/09/2005 (b) 181 181 2.77%, due 07/18/2005 (b) | 723 | 723 | |||||||||
| Canadian Imperial Bank of Commerce 3.02%, due 11/04/2005 (b) | 723 | 723 | |||||||||
| Credit Suisse First Boston Corp. 2.88%, due 09/09/2005 (b) 181 181 3.06%, due 03/10/2006 (b) | 181 | 181 | |||||||||
| Euro Dollar Overnight (1.2%) | |||||||||||
| Bank of Montreal 2.94%, due 05/04/2005 | 542 | 542 | |||||||||
| BNP Paribas 2.80%, due 05/05/2005 | 748 | 748 | |||||||||
| Den Danske Bank 2.93%, due 05/02/2005 650 650 2.80%, due 05/06/2005 | 361 | 361 | |||||||||
| Dexia Group 2.80%, due 05/05/2005 | 319 | 319 | |||||||||
| Royal Bank of Canada 2.80%, due 05/04/2005 | 741 | 741 | |||||||||
| Svenska Handlesbanken 2.80%, due 05/06/2005 | 119 | 119 | |||||||||
| Euro Dollar Terms (2.9%) | |||||||||||
| Bank of Nova Scotia 2.88%, due 05/11/2005 361 361 3.01%, due 05/31/2005 | 1,010 | 1,010 | |||||||||
| Barclays 3.02%, due 06/27/2005 | 644 | 644 | |||||||||
| BNP Paribas 2.93%, due 06/07/2005 | 578 | 578 | |||||||||
| Branch Banker & Trust 2.94%, due 06/06/2005 | 154 | 154 | |||||||||
| Calyon 2.93%, due 06/03/2005 | 597 | 597 | |||||||||
| Citigroup 2.87%, due 06/06/2005 | 750 | 750 | |||||||||
| Credit Suisse First Boston Corp. 2.91%, due 05/16/2005 | 740 | 740 | |||||||||
The notes to the financial statements are an integral part of this report.
Transamerica IDEX Mutual Funds
Semi-Annual Report 2005
5
TA IDEX Transamerica Flexible Income
SCHEDULE OF INVESTMENTS (continued)
At April 30, 2005
(all amounts except share amounts in thousands)
(unaudited)
| Principal | Value | ||||||
| Shares | Value | ||||||||||
| Investment Companies (1.1%) | |||||||||||
| Money Market Funds (1.1%) | |||||||||||
| American Beacon Funds 1-day yield of 2.84% | 286,921 | $ | 287 | ||||||||
| BGI Institutional Money Market Fund 1-day yield of 2.93% | 1,699,020 | 1,699 | |||||||||
| Merrill Lynch Premier Institutional Fund 1-day yield of 2.65% | 382,333 | 382 | |||||||||
| Merrimac Cash Fund, Premium Class 1-day yield of 2.74% (j) | 699,282 | 699 | |||||||||
| Total Security Lending Collateral (cost: $22,940) | 22,940 | ||||||||||
| Total Investment Securities (cost: $282,776) | $ | 277,389 | |||||||||
| SUMMARY: | |||||||||||
| Investments, at value | 99.4 | % | $ | 277,389 | |||||||
| Other assets in excess of liabilities | 0.6 | % | 1,560 | ||||||||
| Net assets | 100.0 | % | $ | 278,949 | |||||||
| Euro Dollar Terms (continued) | |||||||||||
| HSBC Banking/Holdings PLC 3.01%, due 06/23/2005 | $ | 361 | $ | 361 | |||||||
| Royal Bank of Scotland 2.94%, due 06/07/2005 702 702 2.95%, due 06/10/2005 | 390 | 390 | |||||||||
| Societe Generale 2.80%, due 05/03/2005 | 691 | 691 | |||||||||
| Toronto Dominion Bank 2.75%, due 05/09/2005 542 542 3.01%, due 06/24/2005 | 201 | 201 | |||||||||
| UBS AG 2.81%, due 05/03/2005 | 361 | 361 | |||||||||
| Promissory Notes (0.7%) | |||||||||||
| Goldman Sachs Group, Inc. 2.99%, due 06/27/2005 759 759 3.01%, due 07/27/2005 | 1,264 | 1,264 | |||||||||
| Repurchase Agreements (1.3%) (i) | |||||||||||
| Goldman Sachs Group, Inc. (The) 3.04%, Repurchase Agreement dated 04/29/2005 to be repurchased at $1,626 on 05/02/2005 | 1,626 | 1,626 | |||||||||
| Merrill Lynch & Co., Inc. 3.04%, Repurchase Agreement dated 04/29/2005 to be repurchased at $1,951 on 05/02/2005 | 1,951 | 1,951 | |||||||||
NOTES TO SCHEDULE OF INVESTMENTS:
(a) At April 30, 2005, all or a portion of this security is on loan (see Note 1). The value at April 30, 2005, of all securities on loan is $22,458.
(b) Floating or variable rate note. Rate is listed as of April 30, 2005.
(c) Husky Oil, Ltd. has a fixed coupon rate of 8.90% until 8/15/2008, thereafter the coupon rate will reset quarterly at the 3-month US$ LIBOR + 550BP, if not called.
(d) Securities are stepbonds. Armor Holding, Inc. has a coupon rate of 2.00% until 11/01/2011, thereafter the coupon rate will be 0.00%.
(e) Securities are stepbonds. Inmarsat Finance PLC has a coupon rate of 0.00% until 11/15/2008, thereafter the coupon rate will be 10.38%.
(f) Securities are stepbonds. Dick's Sporting Goods, Inc.–144A has a coupon rate of 1.61% until 02/18/2009, thereafter the coupon rate will be 0.00%.
(g) No dividends were paid during the preceding twelve months.
(h) Value is less than $1.
(i) Cash collateral for the Repurchase Agreements, valued at $3,639, that serve as collateral for securities lending are invested in corporate bonds with interest rates and maturity dates ranging from 0.00%–8.875% and 06/15/2005–03/15/2035, respectively.
(j) Regulated investment company advised by Investors Bank and Trust Co. ("IBT"). IBT is also the accounting, custody and lending agent for the Fund.
DEFINITIONS:
144A 144A Securities are registered pursuant to Rule 144A of the Securities Act of 1933. These securities are deemed to be liquid for purposes of compliance limitations on holdings of illiquid securities and may be resold as transactions exempt from registration, normally to qualified institutional buyers. At April 30, 2005, these securities aggregated $30,128 or 10.8% of the net assets of the Fund.
REIT Real Estate Investment Trust
The notes to the financial statements are an integral part of this report.
Transamerica IDEX Mutual Funds
Semi-Annual Report 2005
6
TA IDEX Transamerica Flexible Income
STATEMENT OF ASSETS AND LIABILITIES
At April 30, 2005
(all amounts except per share amounts in thousands)
(unaudited)
| Assets: | |||||||
| Investment securities, at value (cost: $282,776) (including securities loaned of $22,458) | $ | 277,389 | |||||
| Cash | 19,881 | ||||||
| Receivables: | |||||||
| Investment securities sold | 3,739 | ||||||
| Shares of beneficial interest sold | 604 | ||||||
| Interest | 3,719 | ||||||
| Other | 81 | ||||||
| 305,413 | |||||||
| Liabilities: | |||||||
| Investment securities purchased | 3,060 | ||||||
| Accounts payable and accrued liabilities: | |||||||
| Shares of beneficial interest redeemed | 130 | ||||||
| Management and advisory fees | 165 | ||||||
| Transfer agent fees | 46 | ||||||
| Distribution and service fees | 82 | ||||||
| Payable for collateral for securities on loan | 22,940 | ||||||
| Other | 41 | ||||||
| 26,464 | |||||||
| Net Assets | $ | 278,949 | |||||
| Net Assets Consist of: | |||||||
| Shares of beneficial interest, unlimited shares authorized, no par value | $ | 283,609 | |||||
| Undistributed net investment income (loss) | 417 | ||||||
| Undistributed net realized gain (loss) from investment securities | 314 | ||||||
| Net unrealized appreciation (depreciation) on investment securities | (5,391 | ) | |||||
| Net Assets | $ | 278,949 | |||||
| Net Assets by Class: | |||||||
| Class A | $ | 131,561 | |||||
| Class B | 38,204 | ||||||
| Class C | 15,431 | ||||||
| Class I | 93,753 | ||||||
| Shares Outstanding: | |||||||
| Class A | 13,931 | ||||||
| Class B | 4,044 | ||||||
| Class C | 1,637 | ||||||
| Class I | 9,886 | ||||||
| Net Asset Value Per Share: | |||||||
| Class A | $ | 9.44 | |||||
| Class B | 9.45 | ||||||
| Class C | 9.43 | ||||||
| Class I | 9.48 | ||||||
| Maximum Offering Price Per Share (a): | |||||||
| Class A | $ | 9.91 | |||||
(a) Includes the maximum selling commission (represented as a percentage of offering price) which is reduced on certain levels of sales as set forth in the Prospectus. Net asset value per share for Classes B, C and I shares represents offering price. The redemption price for Classes B and C shares equals net asset value less any applicable contingent deferred sales charge.
STATEMENT OF OPERATIONS
For the period ended April 30, 2005
(all amounts in thousands)
(unaudited)
| Investment Income: | |||||||
| Interest | $ | 6,176 | |||||
| Dividends | 193 | ||||||
| Income from loaned securities–net | 44 | ||||||
| 6,413 | |||||||
| Expenses: | |||||||
| Management and advisory fees | 902 | ||||||
| Transfer agent fees: | |||||||
| Class A | 21 | ||||||
| Class B | 21 | ||||||
| Class C | 15 | ||||||
| Class I | 1 | ||||||
| Printing and shareholder reports | 24 | ||||||
| Custody fees | 11 | ||||||
| Administration fees | 21 | ||||||
| Legal fees | 4 | ||||||
| Audit fees | 6 | ||||||
| Trustees fees | 3 | ||||||
| Registration fees: | |||||||
| Class A | 8 | ||||||
| Class B | 3 | ||||||
| Class C | 10 | ||||||
| Distribution and service fees: | |||||||
| Class A | 193 | ||||||
| Class B | 209 | ||||||
| Class C | 87 | ||||||
| Total expenses | 1,539 | ||||||
| Net Investment Income (Loss) | 4,874 | ||||||
| Net Realized and Unrealized Gain (Loss): | |||||||
| Realized gain (loss) from investment securities | 314 | ||||||
| Increase (decrease) in unrealized appreciation (depreciation) on investment securities | (6,818 | ) | |||||
| Net Gain (Loss) on Investments | (6,504 | ) | |||||
| Net Increase (Decrease) in Net Assets Resulting from Operations | $ | (1,630 | ) | ||||
The notes to the financial statements are an integral part of this report.
Transamerica IDEX Mutual Funds
Semi-Annual Report 2005
7
TA IDEX Transamerica Flexible Income
STATEMENTS OF CHANGES IN NET ASSETS
For the period or year ended
(all amounts in thousands)
| April 30, 2005 (unaudited) | October 31, 2004 | ||||||||||
| Increase (Decrease) In Net Assets From: | |||||||||||
| Operations: | |||||||||||
| Net investment income (loss) | $ | 4,874 | $ | 6,454 | |||||||
| Net realized gain (loss) from investment securities | 314 | 6,618 | |||||||||
| Net unrealized appreciation (depreciation) on investment securities | (6,818 | ) | (4,963 | ) | |||||||
| (1,630 | ) | 8,109 | |||||||||
| Distributions to Shareholders: | |||||||||||
| From net investment income: | |||||||||||
| Class A | (2,215 | ) | (3,599 | ) | |||||||
| Class B | (685 | ) | (1,963 | ) | |||||||
| Class C | (287 | ) | (364 | ) | |||||||
| Class C2 | – | (212 | ) | ||||||||
| Class M | – | (348 | ) | ||||||||
| Class I | (1,265 | ) | – | ||||||||
| (4,452 | ) | (6,486 | ) | ||||||||
| From net realized gains: | |||||||||||
| Class A | – | (5,266 | ) | ||||||||
| Class B | – | (3,484 | ) | ||||||||
| Class C | – | (374 | ) | ||||||||
| Class C2 | – | (586 | ) | ||||||||
| Class M | – | (655 | ) | ||||||||
| – | (10,365 | ) | |||||||||
| Capital Share Transactions: | |||||||||||
| Proceeds from shares sold: | |||||||||||
| Class A | 56,179 | 7,550 | |||||||||
| Class B | 911 | 4,072 | |||||||||
| Class C | 802 | 1,036 | |||||||||
| Class C2 | – | 679 | |||||||||
| Class M | – | 218 | |||||||||
| Class I | 94,231 | – | |||||||||
| 152,123 | 13,555 | ||||||||||
| Dividends and distributions reinvested: | |||||||||||
| Class A | 2,151 | 8,515 | |||||||||
| Class B | 547 | 4,363 | |||||||||
| Class C | 233 | 537 | |||||||||
| Class C2 | – | 629 | |||||||||
| Class M | – | 931 | |||||||||
| Class I | 1,265 | – | |||||||||
| 4,196 | 14,975 | ||||||||||
| Cost of shares redeemed: | |||||||||||
| Class A | (4,040 | ) | (19,408 | ) | |||||||
| Class B | (7,603 | ) | (29,607 | ) | |||||||
| Class C | (4,859 | ) | (6,101 | ) | |||||||
| Class C2 | – | (7,240 | ) | ||||||||
| Class M | – | (4,561 | ) | ||||||||
| Class I | – | – | |||||||||
| (16,502 | ) | (66,917 | ) | ||||||||
| April 30, 2005 (unaudited) | October 31, 2004 | ||||||||||
| Class level exchanges: | |||||||||||
| Class C | $ | – | $ | 15,979 | |||||||
| Class C2 | – | (7,462 | ) | ||||||||
| Class M | – | (8,517 | ) | ||||||||
| – | – | ||||||||||
| 139,817 | (38,387 | ) | |||||||||
| Net increase (decrease) in net assets | 133,735 | (47,129 | ) | ||||||||
| Net Assets: | |||||||||||
| Beginning of period | 145,214 | 192,343 | |||||||||
| End of period | $ | 278,949 | $ | 145,214 | |||||||
| Undistributed Net Investment Income (Loss) | $ | 417 | $ | (5 | ) | ||||||
| Share Activity: | |||||||||||
| Shares issued: | |||||||||||
| Class A | 5,842 | 761 | |||||||||
| Class B | 94 | 411 | |||||||||
| Class C | 83 | 107 | |||||||||
| Class C2 | – | 68 | |||||||||
| Class M | – | 22 | |||||||||
| Class I | 9,754 | – | |||||||||
| 15,773 | 1,369 | ||||||||||
| Shares issued–reinvested from distributions: | |||||||||||
| Class A | 224 | 889 | |||||||||
| Class B | 57 | 455 | |||||||||
| Class C | 24 | 56 | |||||||||
| Class C2 | – | 65 | |||||||||
| Class M | – | 98 | |||||||||
| Class I | 132 | – | |||||||||
| 437 | 1,563 | ||||||||||
| Shares redeemed: | |||||||||||
| Class A | (421 | ) | (1,972 | ) | |||||||
| Class B | (791 | ) | (2,995 | ) | |||||||
| Class C | (506 | ) | (622 | ) | |||||||
| Class C2 | – | (718 | ) | ||||||||
| Class M | – | (464 | ) | ||||||||
| (1,718 | ) | (6,771 | ) | ||||||||
| Class level exchanges: | |||||||||||
| Class C | – | 1,693 | |||||||||
| Class C2 | – | (806 | ) | ||||||||
| Class M | – | (887 | ) | ||||||||
| – | – | ||||||||||
| Net increase (decrease) in shares outstanding: | |||||||||||
| Class A | 5,645 | (322 | ) | ||||||||
| Class B | (640 | ) | (2,129 | ) | |||||||
| Class C | (399 | ) | 1,234 | ||||||||
| Class C2 | – | (1,391 | ) | ||||||||
| Class M | – | (1,231 | ) | ||||||||
| Class I | 9,886 | – | |||||||||
| 14,492 | (3,839 | ) | |||||||||
The notes to the financial statements are an integral part of this report.
Transamerica IDEX Mutual Funds
Semi-Annual Report 2005
8
TA IDEX Transamerica Flexible Income
FINANCIAL HIGHLIGHTS
(unaudited for the period ended April 30, 2005)
| For a share of beneficial interest outstanding throughout each period | |||||||||||||||||||||||||||||||||||||||
| Net Asset | Investment Operations | Distributions | Net Asset | ||||||||||||||||||||||||||||||||||||
| For the Period Ended (d)(g) | Value, Beginning of Period | Net Investment Income (Loss) | Net Realized and Unrealized Gain (Loss) | Total Operations | From Net Investment Income | From Net Realized Gains | Total Distributions | Value, End of Period | |||||||||||||||||||||||||||||||
| Class A | 4/30/2005 | $ | 9.68 | $ | 0.21 | $ | (0.26 | ) | $ | (0.05 | ) | $ | (0.19 | ) | $ | – | $ | (0.19 | ) | $ | 9.44 | ||||||||||||||||||
| 10/31/2004 | 10.21 | 0.41 | 0.11 | 0.52 | (0.42 | ) | (0.63 | ) | (1.05 | ) | 9.68 | ||||||||||||||||||||||||||||
| 10/31/2003 | 9.94 | 0.36 | 0.27 | 0.63 | (0.36 | ) | – | (0.36 | ) | 10.21 | |||||||||||||||||||||||||||||
| 10/31/2002 | 9.99 | 0.40 | 0.02 | 0.42 | (0.41 | ) | (0.06 | ) | (0.47 | ) | 9.94 | ||||||||||||||||||||||||||||
| 10/31/2001 | 9.26 | 0.47 | 0.71 | 1.18 | (0.45 | ) | – | (0.45 | ) | 9.99 | |||||||||||||||||||||||||||||
| 10/31/2000 | 9.46 | 0.57 | (0.19 | ) | 0.38 | (0.58 | ) | – | (0.58 | ) | 9.26 | ||||||||||||||||||||||||||||
| Class B | 4/30/2005 | 9.68 | 0.17 | (0.24 | ) | (0.07 | ) | (0.16 | ) | – | (0.16 | ) | 9.45 | ||||||||||||||||||||||||||
| 10/31/2004 | 10.20 | 0.35 | 0.12 | 0.47 | (0.36 | ) | (0.63 | ) | (0.99 | ) | 9.68 | ||||||||||||||||||||||||||||
| 10/31/2003 | 9.94 | 0.30 | 0.25 | 0.55 | (0.29 | ) | – | (0.29 | ) | 10.20 | |||||||||||||||||||||||||||||
| 10/31/2002 | 9.99 | 0.34 | 0.02 | 0.36 | (0.35 | ) | (0.06 | ) | (0.41 | ) | 9.94 | ||||||||||||||||||||||||||||
| 10/31/2001 | 9.26 | 0.37 | 0.74 | 1.11 | (0.38 | ) | – | (0.38 | ) | 9.99 | |||||||||||||||||||||||||||||
| 10/31/2000 | 9.46 | 0.51 | (0.19 | ) | 0.32 | (0.52 | ) | – | (0.52 | ) | 9.26 | ||||||||||||||||||||||||||||
| Class C | 4/30/2005 | 9.67 | 0.16 | (0.24 | ) | (0.08 | ) | (0.16 | ) | – | (0.16 | ) | 9.43 | ||||||||||||||||||||||||||
| 10/31/2004 | 10.20 | 0.36 | 0.10 | 0.46 | (0.36 | ) | (0.63 | ) | (0.99 | ) | 9.67 | ||||||||||||||||||||||||||||
| 10/31/2003 | 9.98 | 0.29 | 0.22 | 0.51 | (0.29 | ) | – | (0.29 | ) | 10.20 | |||||||||||||||||||||||||||||
| Class I | 4/30/2005 | 9.68 | 0.21 | (0.24 | ) | (0.03 | ) | (0.17 | ) | – | (0.17 | ) | 9.48 | ||||||||||||||||||||||||||
| Ratios/Supplemental Data | |||||||||||||||||||||||||||||||
| For the Period | Total | Net Assets, End of Period | Ratio of Expenses to Average Net Assets (a) | Net Investment Income (Loss) to Average | Portfolio Turnover | ||||||||||||||||||||||||||
| Ended (g) | Return (c) | (000's) | Net (e) | Total (f) | Net Assets (a) | Rate (b) | |||||||||||||||||||||||||
| Class A | 4/30/2005 | (0.50 | )% | $ | 131,561 | 1.25 | % | 1.25 | % | 4.31 | % | 16 | % | ||||||||||||||||||
| 10/31/2004 | 5.72 | 80,201 | 1.43 | 1.43 | 4.25 | 169 | |||||||||||||||||||||||||
| 10/31/2003 | 6.39 | 87,898 | 1.49 | 1.50 | 3.56 | 164 | |||||||||||||||||||||||||
| 10/31/2002 | 4.45 | 61,815 | 1.62 | 1.65 | 4.23 | 245 | |||||||||||||||||||||||||
| 10/31/2001 | 13.14 | 29,600 | 1.68 | 1.70 | 4.84 | 315 | |||||||||||||||||||||||||
| 10/31/2000 | 4.10 | 16,530 | 1.84 | 1.87 | 6.17 | 166 | |||||||||||||||||||||||||
| Class B | 4/30/2005 | (0.78 | ) | 38,204 | 1.95 | 1.95 | 3.61 | 16 | |||||||||||||||||||||||
| 10/31/2004 | 5.13 | 45,338 | 2.03 | 2.03 | 3.61 | 169 | |||||||||||||||||||||||||
| 10/31/2003 | 5.59 | 69,502 | 2.14 | 2.15 | 2.91 | 164 | |||||||||||||||||||||||||
| 10/31/2002 | 3.83 | 67,220 | 2.27 | 2.30 | 3.58 | 245 | |||||||||||||||||||||||||
| 10/31/2001 | 12.28 | 40,435 | 2.33 | 2.35 | 4.19 | 315 | |||||||||||||||||||||||||
| 10/31/2000 | 3.46 | 14,008 | 2.49 | 2.51 | 5.52 | 166 | |||||||||||||||||||||||||
| Class C | 4/30/2005 | (0.88 | ) | 15,431 | 2.12 | 2.12 | 3.44 | 16 | |||||||||||||||||||||||
| 10/31/2004 | 5.02 | 19,675 | 2.10 | 2.10 | 3.74 | 169 | |||||||||||||||||||||||||
| 10/31/2003 | 5.16 | 8,178 | 2.14 | 2.15 | 2.91 | 164 | |||||||||||||||||||||||||
| Class I | 4/30/2005 | (0.34 | ) | 93,753 | 0.85 | 0.85 | 4.71 | 16 | |||||||||||||||||||||||
NOTES TO FINANCIAL HIGHLIGHTS
(a) Annualized.
(b) Not annualized for periods of less than one year.
(c) Total Return has been calculated for the applicable period without deduction of a sales load, if any, on an initial purchase. Periods of less than one year are not annualized.
(d) Per share information is calculated based on average number of shares outstanding for the years ended 10/31/2001, 10/31/2002, 10/31/2003, 10/31/2004 and the period ended 4/30/2005.
(e) Ratio of Net Expenses to Average Net Assets is net of fee waivers and reimbursements by the investment adviser, if any (see note 2).
(f) Ratio of Total Expenses to Average Net Assets includes all expenses before waivers and reimbursements by the investment adviser.
(g) The inception date for the Fund's offering of share classes are as follows:
Class C – November 11, 2002
Class I – November 8, 2004
The notes to the financial statements are an integral part of this report.
Transamerica IDEX Mutual Funds
Semi-Annual Report 2005
9
TA IDEX Transamerica Flexible Income
NOTES TO FINANCIAL STATEMENTS
At April 30, 2005
(all amounts in thousands)
(unaudited)
NOTE 1. ORGANIZATION AND SIGNIFICANT ACCOUNTING POLICIES
Transamerica IDEX Mutual Funds is a Delaware statutory trust registered under the Investment Company Act of 1940, as amended (the "1940 Act"), as an open-end management investment company. Prior to March 1, 2005, Transamerica IDEX Mutual Funds was a Massachusetts business trust. TA IDEX Transamerica Flexible Income ("the Fund"), part of Transamerica IDEX Mutual Funds, began operations on June 29, 1987.
In the normal course of business, the Fund enters into contracts that contain a variety of representations and warranties, which provide general indemnifications. The Fund's maximum exposure under these arrangements is unknown, as this would involve future claims that may be made against the Fund and/or its affiliates that have not yet occurred. However, based on experience, the Fund expects the risk of loss to be remote.
See the Prospectus and Statement of Additional Information for a description of the Fund's investment objective.
In preparing the Fund's financial statements in accordance with accounting principles generally accepted in the United States of America ("GAAP"), estimates or assumptions (which could differ from actual results) may be used that affect reported amounts and disclosures. The following policies were consistently followed by the Fund, in accordance with GAAP.
Multiple class operations and expenses: The Fund currently offers four classes of shares, each with a public offering price that reflects different sales charges, if any, and expense levels. On June 15, 2004, Class C2 shares merged into Class C. On September 24, 2004, Class M shares merged into Class C. Class B shares will convert to Class A shares eight years after purchase. Income, non-class specific expenses and realized and unrealized gains and losses, are allocated daily to each class, based upon the value of shares outstanding method as permitted under Rule 18f-3 of the 1940 Act. Each class bears its own specific expenses as well as a portion of general, common expenses.
Pricing of shares: The Fund prices its shares on the basis of the net asset value of each class of shares of the Fund, which is determined as of the close of the New York Stock Exchange ("NYSE") (generally 4:00 p.m. Eastern Time) on each day on which the NYSE is open for trading.
Security valuations: Fund investments traded on an exchange are valued at the closing price on the day of valuation on the exchange where the security is principally traded. With respect to securities traded on NASDAQ NMS, such closing price may be the last reported sales price or the NASDAQ Official Closing Price.
Securities traded in the over-the-counter market and listed securities for which no sale was reported on that date are valued at the last quoted bid price.
Debt securities are valued by independent pricing services at the last quoted bid price; however, those that mature in sixty days or less are valued at amortized cost, which approximates market.
Investment company securities are valued at net asset value of the underlying portfolio.
Foreign securities generally are valued based on quotations from the primary market in which they are traded and are translated from the local currency into U.S. dollars using closing exchange rates. Many foreign securities markets are open for trading at times when the U.S. markets are closed for trading, and many foreign securities markets close for trading before the close of the NYSE. The value of foreign securities may be affected significantly on a day that the NYSE is closed and an investor is unable to purchase or redeem shares. If a significant market event impacting the value of a portfolio security (e.g., natural disaster, company announcement, market volatility) occurs subsequent to the close of trading in the security, but prior to the calculation of the Fund's net asset value per share, market quotations for that security may be determined to be unreliable and, accordingly, not "readily av ailable." If market quotations are not readily available, and the impact of such a significant market event materially effects the net asset value per share of the Fund, an affected portfolio security will be valued at fair market value as determined in good faith using guidelines adopted by the Board of Trustees of the Fund, under the supervision of the Fund's Valuation Committee. Factors that may be considered to value foreign securities at fair market value may include, among others: the value of other securities traded on other markets, foreign currency exchange activity and the trading of financial products tied to foreign securities.
Other securities for which quotations are not readily available are valued at fair market value as determined in good faith using guidelines adopted by the Board of Trustees of the Fund, under the supervision of the Fund's Valuation Committee. These guidelines may include: the type of security; any restrictions on its resale; financial or business news of the issuer; similar or related securities that are actively trading; related corporate actions; and other significant events occurring after the close of trading in the security.
Cash: The Fund may leave cash overnight in its cash account with the custodian, Investors Bank & Trust Company ("IBT"). IBT has been contracted on behalf of the Fund to invest the excess cash into a savings account, which at April 30, 2005, was paying an interest rate of 2.02%.
Throughout the period, the Fund may have a cash overdraft balance. A fee is incurred on this overdraft, calculated by multiplying the overdraft by a rate based on the federal funds rate.
Repurchase agreements: The Fund is authorized to enter into repurchase agreements. The Fund, through IBT, receives delivery of the
Transamerica IDEX Mutual Funds
Semi-Annual Report 2005
10
TA IDEX Transamerica Flexible Income
NOTES TO FINANCIAL STATEMENTS (continued)
At April 30, 2005
(all amounts in thousands)
(unaudited)
NOTE 1.–(continued)
underlying securities, the value of which at the time of purchase is required to be an amount equal to at least 100% of the resale price. Repurchase agreements involve the risk that the seller will fail to repurchase the security, as agreed. In that case, the Fund will bear the risk of value fluctuations until the security can be sold and may encounter delays and incur costs in liquidating the security. In the event of bankruptcy or insolvency of the seller, delays and costs may be incurred.
Securities lending: The Fund may lend securities to enhance fund earnings from investing cash collateral in making such loans to qualified borrowers (typically broker/dealers). The Fund has engaged its custodian bank, IBT, as a lending agent to administer its securities lending program. IBT earned $19 of program income for its services. When the Fund makes a security loan, it receives cash collateral as protection against the risk that the borrower will default on the loan, and records an asset for the cash invested collateral and a liability for the return of the collateral.
Loans of securities are required to be secured by collateral at least equal to 102% of the value of the securities at inception of the loan, and not less then 100% thereafter. The Fund may invest cash collateral in short-term money market instruments including: U.S. Treasury Bills, U.S. agency obligations, commercial paper, money market mutual funds, repurchase agreements and other highly rated, liquid investments. During the life of securities loans, the collateral and securities loaned remain subject to fluctuation in value. IBT marks to market securities loaned and the collateral each business day. If additional collateral is due (at least $1), IBT collects additional cash collateral from the borrowers. Although securities loaned will be fully collateralized at all times, IBT may experience delays in, or may be prevented from, recovering the collateral on behalf of the Fund. The Fund may recall a loa ned security position at any time from the borrower through IBT. In the event the borrower fails to timely return a recalled security, IBT may indemnify the Fund by purchasing replacement securities for the Fund at its own expense and claiming the collateral to fund such a purchase. IBT absorbs the loss if the collateral value is not sufficient to cover the cost of the replacement securities. If replacement securities are not available, IBT will credit the equivalent cash value to the Fund.
While a security is on loan, the Fund does not have the right to vote that security. However, if time permits, the Fund will attempt to recall a security on loan and vote the proxy.
Income from securities lending is included in the Statement of Operations. The amount of collateral and value of securities on loan are included in the Statement of Assets and Liabilities as well as in the Schedule of Investments.
Real Estate Investment Trusts ("REITs"): There are certain additional risks involved in investing in REITs. These include, but are not limited to, economic conditions, changes in zoning laws, real estate values, property taxes and interest rates.
Dividend income is recorded at management's estimate of the income included in distributions from the REIT investments. Distributions received in excess of the estimated amount are recorded as a reduction of the cost investments. The actual amounts of income, return of capital and capital gains are only determined by each REIT after the fiscal year end and may differ from the estimated amounts.
Security transactions and investment income: Security transactions are recorded on the trade date. Security gains and losses are calculated on the specific identification basis. Dividend income is recorded on the ex-dividend date or, in the case of foreign securities, as soon as the Fund is informed of the ex-dividend date. Interest income, including accretion of discounts and amortization of premiums, is recorded on the accrual basis commencing on the settlement date.
Foreign currency denominated investments: The accounting records of the Fund are maintained in U.S. dollars. Securities and other assets and liabilities denominated in foreign currencies are translated into U.S. dollars at the closing exchange rate each day. The cost of foreign securities is translated at the exchange rate in effect when the investment was acquired. The Fund combines fluctuations from currency exchange rates and fluctuations in value when computing net realized and unrealized gains or losses from investments.
Net foreign currency gains and losses resulting from changes in exchange rates include: 1) foreign currency fluctuations between trade date and settlement date of investment security transactions; 2) gains and losses on forward foreign currency contracts; and 3) the difference between the receivable amounts of interest and dividends recorded in the accounting records in U.S. dollars and the amounts actually received.
Foreign currency denominated assets may involve risks not typically associated with domestic transactions, including unanticipated movements in exchange currency rates, the degree of government supervision and regulation of security markets, and the possibility of political or economic instability.
Foreign capital gains taxes: The Fund may be subject to taxes imposed by countries in which it invests, with respect to its investment in issuers existing or operating in such countries. Such taxes are generally based on income earned or repatriated and capital gains realized on the sale of such investments. The Fund accrues such taxes when the related income or capital gains are earned. Some countries require governmental approval for the repatriation of investment income, capital or the proceeds of sales earned by foreign investors. In addition, if there is deterioration in a country's balance of payments or for other reasons, a country may impose temporary restrictions on foreign capital remittances abroad.
Forward foreign currency contracts: The Fund may enter into forward foreign currency contracts to hedge against exchange rate risk arising from
Transamerica IDEX Mutual Funds
Semi-Annual Report 2005
11
TA IDEX Transamerica Flexible Income
NOTES TO FINANCIAL STATEMENTS (continued)
At April 30, 2005
(all amounts in thousands)
(unaudited)
NOTE 1.–(continued)
investments in securities denominated in foreign currencies. Contracts are valued at the contractual forward rate and are marked to market daily, with the change in value recorded as an unrealized gain or loss. When the contracts are closed a realized gain or loss is incurred. Risks may arise from changes in market value of the underlying currencies and from the possible inability of counterparties to meet the terms of their contracts.
There were no open forward foreign currency contracts at April 30, 2005.
Futures contracts: The Fund may enter into futures contracts to manage exposure to market, interest rate or currency fluctuations. Futures contracts are valued at the settlement price established each day by the board of trade or exchange on which they are traded. The primary risks associated with futures contracts are imperfect correlation between the change in market value of the securities held and the prices of futures contracts; the possibility of an illiquid market and inability of the counterparty to meet the contract terms.
There were no open futures contracts at April 30, 2005.
Account maintenance fees: If the shareholder account balance falls below $1 by either shareholder action or as a result of market action, a $25 (not in thousands) fee is assessed every year until the balance reaches $1. The fee is assessed by redeeming shares in the shareholder's account.
No fee will be charged under the following conditions:
• accounts opened within the preceding 24 months
• accounts with an active monthly Automatic Investment Plan ($50 (not in thousands) minimum per fund)
• accounts owned by an individual which, when combined by social security number, have a balance of $5 or more
• accounts owned by individuals in the same household (by address) that have a combined balance of $5 or more
• UTMA/UGMA accounts
• Fiduciary accounts
• B-share accounts whose shares have started to convert to A-shares accounts (as long as combined value of both accounts is at least $1)
For the six months ended April 30, 2005, this fee totaled less than $1. These fees are included in Paid in Capital in the Statement of Assets and Liabilities.
Redemption fees: A short-term trading redemption fee may be assessed on any fund shares in a fund account that are sold during the first five (5) NYSE trading days following their purchase date. This redemption fee will equal 2% of the amount redeemed and shares held the longest will be treated as being redeemed first and shares held the shortest as being redeemed last.
For the six months ended April 30, 2005, the Fund received less than $1 in redemption fees.
Dividend distributions: Distributions to shareholders are recorded on the ex-dividend date and are determined in accordance with Federal income tax regulations which may differ from GAAP.
NOTE 2. RELATED PARTY TRANSACTIONS
Transamerica Fund Advisors, Inc. ("TFAI") is the Fund's investment adviser. Transamerica Fund Services, Inc. ("TFS") is the Fund's administrator and transfer agent. AFSG Securities Corp. ("AFSG") is the Fund's distributor/principal underwriter. AFSG is 100% owned by AUSA Holding Company ("AUSA"). TFAI is a directly owned subsidiary of Western Reserve Life Assurance Co. of Ohio (78%) and AUSA (22%). TFS is a wholly owned subsidiary of WRL (50%) and AUSA (50%). AUSA and WRL are wholly owned indirect subsidiaries of AEGON, NV, a Netherlands corporation.
Effective January 1, 2005 AEGON/Transamerica Fund Advisors, Inc. ("ATFA") was renamed Transamerica Fund Advisors, Inc. ("TFAI"); AEGON/Transamerica Fund Services, Inc. ("ATFS") and AEGON/Transamerica Investor Services, Inc. ("ATIS") merged into one entity and was renamed Transamerica Fund Services, Inc. ("TFS").
Transamerica Investment Management, LLC is both an affiliate of the Fund and a sub-adviser to the Fund.
The following schedule reflects the percentage of fund assets owned by affiliated mutual funds (i.e., through the Transamerica IDEX Mutual Funds and AEGON/Transamerica Series Trust (f/k/a/ AEGON/Transamerica Series Fund, Inc.) assets allocation funds):
| Net Assets | % of Net Assets | ||||||||||
| TA IDEX Asset Allocation– Conservative Portfolio | $ | 21,660 | 7.76 | % | |||||||
| TA IDEX Asset Allocation– Moderate Growth Portfolio | 39,555 | 14.18 | % | ||||||||
| TA IDEX Asset Allocation– Moderate Portfolio | 45,956 | 16.47 | % | ||||||||
| Asset Allocation–Conservative Portfolio | 47,936 | 17.18 | % | ||||||||
| Asset Allocation– Moderate Growth Portfolio | 28,982 | 10.39 | % | ||||||||
| Asset Allocation–Moderate Portfolio | 16,548 | 5.93 | % | ||||||||
| Total | $ | 200,637 | 71.91 | % | |||||||
Transamerica IDEX Mutual Funds
Semi-Annual Report 2005
12
TA IDEX Transamerica Flexible Income
NOTES TO FINANCIAL STATEMENTS (continued)
At April 30, 2005
(all amounts in thousands)
(unaudited)
NOTE 2.–(continued)
Investment advisory fees: The Fund pays management fees to TFAI based on average daily net assets ("ANA") at the following breakpoints:
0.80% of the first $100 million of ANA
0.775% of the next $150 million of ANA
0.675% of ANA over $250 million
TFAI has contractually agreed to waive its advisory fee and will reimburse the Fund to the extent that operating expenses, excluding 12b-1 fees, exceed the following stated annual limit:
1.50% Expense Limit
If total fund expenses fall below the annual expense limitation agreement agreed to by the adviser within the succeeding three years, the Fund may be required to pay that adviser a portion or all of the waived advisory fees.
There are no amounts available for recapture at April 30, 2005.
Distribution and service fees: The Fund has a 12b-1 distribution plan under the 1940 Act pursuant to which an annual fee, based on average daily net assets, is paid to the distributor for various disbursements such as broker-dealer account servicing fees and other promotional expenses of the Fund. The Fund is authorized under the 12b-1 plan to pay fees on each class up to the following limits:
| Class A | 0.35 | % | |||||
| Class B | 1.00 | % | |||||
| Class C | 1.00 | % | |||||
| Class I | n/a | ||||||
In the case the Fund or a class of shares of the Fund is closed to new investors or investments, the Fund is authorized to pay 12b-1 fees for past sales and distribution efforts and present and past investor services.
Underwriter commissions relate to front-end sales charges imposed for Class A shares and contingent deferred sales charges from Classes B, C, and certain A share redemptions. For the six months ended April 30, 2005, the underwriter commissions were as follows:
| Received by Underwriter | $ | 74 | |||||
| Retained by Underwriter | 5 | ||||||
| Contingent Deferred Sales Charge | 68 | ||||||
Administrative services: The Fund has entered into an agreement with TFS for financial and legal fund administration services, which includes such items as compliance, expenses, financial statements and other reporting, distributions, tax returns, prospectus preparation, board of trustees meeting support and other legal matters. As of January 1, 2005 the Fund pays TFS an annual fee of 0.02% of average net assets. Prior to January 1, 2005 the Fund paid TFS an annual fee of 0.015% of average net assets. The Legal fees on the Statement of Operations are for fees paid to external legal counsel.
Transfer agent fees: The Fund pays TFS an annual per-account charge of $20 (not in thousands) for each open account and $1.63 (not in thousands) for each closed account. There is no new account charge. The Transfer agent fees on the Statement of Operations are made up of fees paid to TFS and costs associated with shareholder statements.
The Fund paid TFS $85 for the six months ended April 30, 2005.
Deferred compensation plan: Each eligible Fund Trustee may elect participation in the Deferred Compensation Plan ("the Plan"). Under the Plan, such Trustees may defer payment of a percentage of their total fees earned as a Fund Trustee. These deferred amounts may be invested in any Transamerica IDEX Mutual Fund. At April 30, 2005, the value of invested plan amount was $13. Invested plan amounts and the total liability for deferred compensation to the Trustees under the Plan at April 30, 2005, are included in the accompanying Statement of Assets and Liabilities.
NOTE 3. INVESTMENT TRANSACTIONS
The cost of securities purchased and proceeds from securities sold (excluding short-term securities) for the six months ended April 30, 2005, were as follows:
| Purchases of securities: | |||||||
| Long-Term excluding U.S. Government | $ | 84,570 | |||||
| U.S. Government | 58,006 | ||||||
| Proceeds from maturities and sales of securities: | |||||||
| Long-Term excluding U.S. Government | 24,705 | ||||||
| U.S. Government | 8,290 | ||||||
NOTE 4. FEDERAL INCOME TAX MATTERS
The Fund has not made any provision for federal income or excise taxes due to its policy to distribute all of its taxable income and capital gains to its shareholders and otherwise qualify as a regulated investment company under the Internal Revenue Code. Income and capital gain distributions are determined in accordance with income tax regulations, which may differ from GAAP. These differences are primarily due to differing treatment for items including, but not limited to, wash sales, foreign currency transactions and capital loss carryforwards.
Transamerica IDEX Mutual Funds
Semi-Annual Report 2005
13
TA IDEX Transamerica Flexible Income
NOTES TO FINANCIAL STATEMENTS (continued)
At April 30, 2005
(all amounts in thousands)
(unaudited)
NOTE 4.–(continued)
The aggregate cost of investments and composition of unrealized appreciation (depreciation) for federal income tax purposes as of April 30, 2005, are as follows:
| Federal Tax Cost Basis | $ | 282,787 | |||||
| Unrealized Appreciation | $ | 1,964 | |||||
| Unrealized (Depreciation) | (7,362 | ) | |||||
| Net Unrealized Appreciation (Depreciation) | $ | (5,398 | ) | ||||
NOTE 5. REGULATORY PROCEEDINGS
There continues to be significant federal and state regulatory activity relating to financial services companies, particularly mutual fund companies and their investment advisers. As part of an ongoing investigation regarding potential market timing, recordkeeping and trading compliance issues and matters affecting the Fund's investment adviser, TFAI, and certain employees and affiliates of TFAI, the SEC staff has indicated that it is likely to take some action against TFAI and certain of its affiliates at the conclusion of the investigation. The potential timing and the scope of any such action is difficult to predict. Although the impact of any action brought against TFAI and/or its affiliates is difficult to assess at the present time, the Fund currently believes that the likelihood that any such action will have a material adverse impact on it is remote. It is important to note that the Fund is not aware of any allegation of wrongdoing against it and its board at the time this semi-annual report is printed. Although it is not anticipated that these developments will have an adverse impact on the Fund, there can be no assurance at this time. TFAI and its affiliates are actively working with the SEC in regard to this matter; however, the exact resolution cannot be determined at this time. TFAI will take such actions that it deems necessary or appropriate to continue providing management services to the Fund and to bring all matters to an appropriate conclusion.
TFAI and/or its affiliates, and not the Fund, will bear the costs regarding these regulatory matters.
Transamerica IDEX Mutual Funds
Semi-Annual Report 2005
14
TA IDEX Transamerica Flexible Income
INVESTMENT ADVISORY AGREEMENT - REVIEW AND RENEWAL
At a meeting of the Board of Trustees of Transamerica IDEX Mutual Funds ("TA IDEX") held on October 6, 2004, the Board considered and approved the renewal for a one-year period of the Investment Advisory Agreement between TA IDEX Transamerica Flexible Income (the "Fund") and Transamerica Fund Advisors, Inc. ("TFAI"). In approving the renewal of this agreement, the Board concluded that the Investment Advisory Agreement enables shareholders of the Fund to obtain high quality services at a cost that is appropriate, reasonable, and in the best interests of shareholders based upon the following determinations, among others:
The nature, extent and quality of the advisory service to be provided. The Board considered the nature and quality of the services provided by TFAI in the past, as well as the services anticipated to be provided in the future. The Board concluded that TFAI is capable of providing high quality services to the Fund, as indicated by TFAI's management capabilities demonstrated with respect to the Fund and other funds managed by TFAI, and TFAI's management oversight process. The Board also concluded that TFAI would provide the same quality and quantity of investment management and related services as before, that these services are appropriate in scope and extent in light of the Fund's operations, the competitive landscape of the investment company business and investor needs, and that TFAI's obligat ions will remain the same in all respects.
The investment performance of the Fund. The Board reviewed the Fund's investment performance since the Fund's sub-adviser, Transamerica Investment Management, LLC (the "Sub-Adviser") was appointed to manage the Fund pursuant to a vote of the Fund's shareholders on February 25, 2004. The Trustees concluded that the performance of the new Sub-Adviser was acceptable, although they would closely monitor the Fund's investment performance in light of the Fund's investment objective, policies and strategies and the Fund's historical below-average performance relative to certain comparable investment companies to verify that the Fund achieves an acceptable level of performance following the change of Sub-Adviser.
The cost of advisory services provided and the level of profitability. On the basis of the Board's review of the fees to be charged by TFAI and the Sub-Adviser for investment advisory and related services, TFAI's financial statements, the fees paid by TFAI to the Sub-Adviser, TFAI's estimated net management income resulting from its management of the Fund, the estimated profitability of TFAI's relationships with the Fund and TA IDEX, and the recent reorganization of the Fund and the Fund's portfolio, the Board concluded that the level of investment advisory fees and the profitability is appropriate in light of the services provided, the management fees and overall expense ratios of comparable investment companies, and the anticipated profitability of the relationship between the Fund and TFAI. I n this regard, the Board noted that the Fund was recently reorganized, a new sub-adviser was appointed to manage the Fund's portfolio, and that such reorganization of the Fund and its portfolio may have increased the Fund's overall expense ratio on a short term basis.
The extent to which economies of scale would be realized as the Fund grows and whether fee levels reflect these economies of scale for the benefit of Fund investors. The Trustees concluded that inclusion of asset-based breakpoints in the Fund's advisory fee schedule appropriately benefit investors by realizing economies of scale in the form of a lower advisory fee rate as the level of Fund assets increases. The Board also concluded that the advisory fees appropriately reflect the Fund's current size, the current economic environment for TFAI, and the competitive nature of the investment company market. In addition, the Board noted that it will have the opportunity to periodically re-examine whether the Fund has achieved economies of scale, as well as the appropriateness of advisory fees payable to TFAI in the future.
Benefits (such as soft dollars) to TFAI from its relationship with the Fund. The Board concluded that other benefits derived by TFAI from its relationship with the Fund are reasonable and fair, and are consistent with industry practice and the best interests of the Fund and its shareholders. In this regard, the Board noted that TFAI does not realize "soft dollar" benefits from its relationship with the Fund.
Other considerations. The Board also determined that TFAI had made a substantial commitment to the recruitment and retention of high quality personnel, and maintained the financial, compliance and operational resources reasonably necessary to manage the Fund in a professional manner that is consistent with the best interests of the Fund and its shareholders. The Trustees also concluded that TFAI had made a significant entrepreneurial commitment to the management and success of the Fund, reflected by TFAI's expense limitation and fee waiver arrangement with the Fund which, as demonstrated in the past with the Fund, may result in TFAI waiving a substantial amount of advisory fees for the benefit of shareholders.
Transamerica IDEX Mutual Funds
Semi-Annual Report 2005
15
TA IDEX Transamerica Flexible Income
SUPPLEMENTAL INFORMATION (unaudited)
RESULTS OF SHAREHOLDER PROXY
At a special meeting of shareholders held on February 25, 2005, the results of the Proposals were as follows:
Transamerica IDEX Mutual Funds
Proposal 1: Election of Trustees to the Board of Trustees of Transamerica IDEX Mutual Funds.
| For | Withheld | ||||||||||
| Peter R. Brown | 872,017,875.249 | 4,468,498.551 | |||||||||
| Daniel Calabria | 871,917,069.786 | 4,569,304.014 | |||||||||
| Janise B. Case | 872,099,393.125 | 4,386,980.675 | |||||||||
| Charles C. Harris | 872,086,722.025 | 4,399,651.775 | |||||||||
| Leo J. Hill | 872,304,465.640 | 4,181,908.160 | |||||||||
| Russell A. Kimball, Jr. | 872,253,556.471 | 4,232,817.329 | |||||||||
| William W. Short, Jr. | 872,139,920.944 | 4,346,452.856 | |||||||||
| John Waechter | 872,261,152.376 | 4,225,221.424 | |||||||||
| Jack E. Zimmerman | 871,929,967.512 | 4,556,406.288 | |||||||||
| Brian C. Scott | 872,218,970.367 | 4,267,403.433 | |||||||||
| Thomas P. O'Neill | 872,111,944.117 | 4,374,429.683 | |||||||||
TA IDEX Transamerica Flexible Income
Proposal 2: Approval of an Agreement and Plan of Reorganization pursuant to which Transamerica IDEX Mutual Funds will organize as a Delaware statutory trust.
| For | Against | Abstentions/Broker Non-Votes | |||||||||
| 10,484,614.246 | 64,789.250 | 4,255,809.074 | |||||||||
Proposal 3: Approval of changes to the fundamental investment restrictions of TA IDEX Transamerica Flexible Income.
| A. Diversification | For | Against | Abstentions/Broker Non-Votes | ||||||||||||
| 10,620,616.300 | 74,337.270 | 4,110,259.000 | |||||||||||||
| B. Borrowing | For | Against | Abstentions/Broker Non-Votes | ||||||||||||
| 10,612,061.324 | 86,378.246 | 4,106,773.000 | |||||||||||||
| C. Senior Securities | For | Against | Abstentions/Broker Non-Votes | ||||||||||||
| 10,623,564.011 | 74,875.559 | 4,106,773.000 | |||||||||||||
| D. Underwriting Securities | For | Against | Abstentions/Broker Non-Votes | ||||||||||||
| 10,625,069.802 | 73,369.768 | 4,106,773.000 | |||||||||||||
| E. Real Estate | For | Against | Abstentions/Broker Non-Votes | ||||||||||||
| 10,619,304.172 | 75,649.398 | 4,110,259.000 | |||||||||||||
| F. Making Loans | For | Against | Abstentions/Broker Non-Votes | ||||||||||||
| 10,620,290.543 | 74,663.027 | 4,110,259.000 | |||||||||||||
| G. Concentration | For | Against | Abstentions/Broker Non-Votes | ||||||||||||
| 10,618,531.426 | 76,422.144 | 4,110,259.000 | |||||||||||||
| H. Commodities | For | Against | Abstentions/Broker Non-Votes | ||||||||||||
| 10,609,265.441 | 85,688.129 | 4,110,259.000 | |||||||||||||
Transamerica IDEX Mutual Funds
Semi-Annual Report 2005
16
TA IDEX Transamerica Growth Opportunities
UNDERSTANDING YOUR FUND'S EXPENSES
(unaudited)
SHAREHOLDER EXPENSES
The following Example is intended to help you understand your ongoing costs (in dollars and cents) of investing in a Fund and to compare these costs with the ongoing costs of investing in other funds.
The Example is based on an investment of $1,000 invested at November 1, 2004 and held for the entire period until April 30, 2005.
ACTUAL EXPENSES
The first line in the table below provides information about actual account values and actual expenses. You may use the information in this line, together with the amount you invested, to estimate the expenses that you paid over the period. Simply divide your account value by $1,000 (for example, an $8,600 account value divided by $1,000 = 8.6), then multiply the result by the number in the first line of your Fund under the heading entitled "Expenses Paid During Period" to estimate the expenses you paid on your account during this period.
HYPOTHETICAL EXAMPLE FOR COMPARISON PURPOSES
The second line in the table below provides information about hypothetical account values and hypothetical expenses based on the Fund's actual expense ratio and an assumed rate of return of 5% per year before expenses, which is not the Fund's actual return. The hypothetical account values and expenses may not be used to estimate the actual ending account balance or expenses you paid for the period. You may use this information to compare the ongoing costs of investing in your Fund and other funds. To do so, compare this 5% hypothetical example with the 5% hypothetical examples that appear in the shareholder reports of the other funds.
Please note that the expenses shown in the table are meant to highlight your ongoing costs only and do not reflect any transactional costs, such as sales charges, redemption fees, brokerage commissions paid on purchases and sales of fund shares. Therefore, the second line under the Fund in the table is useful in comparing ongoing costs only, and will not help you determine the relative total costs of owning different funds. In addition, note that the expenses shown in the table are meant to highlight your ongoing costs and do not reflect any transaction costs.
| Beginning Account Value | Ending Account Value | Annualized Expense Ratio | Expenses Paid During Period (a) | ||||||||||||||||
| Class A | |||||||||||||||||||
| Actual | $ | 1,000.00 | $ | 984.90 | 1.41 | % | $ | 6.94 | |||||||||||
| Hypothetical (b) | 1,000.00 | 1,017.80 | 1.41 | 7.05 | |||||||||||||||
| Class B | |||||||||||||||||||
| Actual | 1,000.00 | 979.60 | 2.27 | 11.14 | |||||||||||||||
| Hypothetical (b) | 1,000.00 | 1,013.54 | 2.27 | 11.33 | |||||||||||||||
| Class B | |||||||||||||||||||
| Actual | 1,000.00 | 979.60 | 2.37 | 11.63 | |||||||||||||||
| Hypothetical (b) | 1,000.00 | 1,013.04 | 2.37 | 11.83 | |||||||||||||||
(a) Expenses are calculated using each Fund's annualized expense ratio (as disclosed in the table), multiplied by the average account value for the period, multiplied by number of days in the period (181 days), and divided by the number of days in the year (365 days).
(b) 5% return per year before expenses.
GRAPHICAL PRESENTATION OF SCHEDULE OF INVESTMENTS
By Sector
At April 30, 2005

This chart shows the percentage breakdown by sector of the Fund's total investment securities.
Transamerica IDEX Mutual Funds
Semi-Annual Report 2005
1
TA IDEX Transamerica Growth Opportunities
SCHEDULE OF INVESTMENTS
At April 30, 2005
(all amounts except share amounts in thousands)
(unaudited)
| Shares | Value | ||||||||||
| COMMON STOCKS (98.4%) | |||||||||||
| Apparel & Accessory Stores (0.1%) | |||||||||||
| Ross Stores, Inc. | 9,600 | $ | 256 | ||||||||
| Automotive Dealers & Service Stations (0.3%) | |||||||||||
| O'Reilly Automotive, Inc. (a)(b) | 17,500 | 898 | |||||||||
| Communication (4.1%) | |||||||||||
| Global Payments, Inc. (b) | 197,000 | 12,758 | |||||||||
| Computer & Data Processing Services (19.5%) | |||||||||||
| GTECH Holdings Corp. | 780,000 | 19,087 | |||||||||
| McAfee, Inc. (a)(b) | 290,000 | 6,064 | |||||||||
| NAVTEQ Corp. (a) | 170,000 | 6,191 | |||||||||
| RealNetworks, Inc. (a)(b) | 3,243,950 | 19,983 | |||||||||
| SkillSoft PLC, ADR (a) | 2,554,800 | 9,964 | |||||||||
| Computer & Office Equipment (4.8%) | |||||||||||
| CDW Corp. (b) | 13,900 | 760 | |||||||||
| Sandisk Corp. (a) | 550,000 | 13,035 | |||||||||
| Symbol Technologies, Inc. | 11,300 | 151 | |||||||||
| Zebra Technologies Corp.–Class A (a) | 25,425 | 1,214 | |||||||||
| Electronic & Other Electric Equipment (2.8%) | |||||||||||
| Gemstar–TV Guide International, Inc. (a) | 2,320,000 | 8,932 | |||||||||
| Environmental Services (0.2%) | |||||||||||
| Stericycle, Inc. (a) | 15,300 | 745 | |||||||||
| Furniture & Home Furnishings Stores (4.4%) | |||||||||||
| Tuesday Morning Corp. (a)(b) | 530,000 | 13,918 | |||||||||
| Health Services (0.2%) | |||||||||||
| Lincare Holdings, Inc. (a) | 10,900 | 465 | |||||||||
| Industrial Machinery & Equipment (3.0%) | |||||||||||
| Graco, Inc. | 275,000 | 9,287 | |||||||||
| Management Services (5.2%) | |||||||||||
| ServiceMaster Co. (The) | 1,275,000 | 16,358 | |||||||||
| Medical Instruments & Supplies (6.3%) | |||||||||||
| DENTSPLY International, Inc. | 15,200 | 831 | |||||||||
| Integra LifeSciences Holdings Corp. (a) | 5,500 | 195 | |||||||||
| Resmed, Inc. (a)(b) | 15,500 | 963 | |||||||||
| Techne Corp. (a)(b) | 400,000 | 16,712 | |||||||||
| Varian Medical Systems, Inc. (a) | 31,000 | 1,046 | |||||||||
| Paperboard Containers & Boxes (4.4%) | |||||||||||
| Packaging Corp. of America (b) | 612,400 | 13,712 | |||||||||
| Personal Credit Institutions (4.4%) | |||||||||||
| Financial Federal Corp. (b) | 392,100 | 13,841 | |||||||||
| Personal Services (8.6%) | |||||||||||
| Jackson Hewitt Tax Service, Inc. | 580,000 | 10,684 | |||||||||
| Weight Watchers International, Inc. (a)(b) | 395,000 | 16,491 | |||||||||
| Shares | Value | ||||||||||
| Pharmaceuticals (0.3%) | |||||||||||
| Henry Schein, Inc. (a) | 23,000 | $ | 863 | ||||||||
| Restaurants (5.7%) | |||||||||||
| IHOP Corp. | 440,000 | 17,996 | |||||||||
| Retail Trade (2.8%) | |||||||||||
| Blue Nile, Inc. (a)(b) | 350,000 | 8,809 | |||||||||
| Security & Commodity Brokers (5.1%) | |||||||||||
| BlackRock, Inc.–Class A | 215,000 | 16,116 | |||||||||
| Stone, Clay & Glass Products (5.4%) | |||||||||||
| Gentex Corp. (b) | 525,000 | 17,041 | |||||||||
| Transportation & Public Utilities (10.8%) | |||||||||||
| CH Robinson Worldwide, Inc. | 340,000 | 17,544 | |||||||||
| Expeditors International of Washington, Inc. | 335,000 | 16,452 | |||||||||
| Total Common Stocks (cost: $269,910) | 309,362 | ||||||||||
| Principal | Value | ||||||||||
| SECURITY LENDING COLLATERAL (22.7%) | |||||||||||
| Debt (19.7%) | |||||||||||
| Bank Notes (2.7%) | |||||||||||
| Bank of America | |||||||||||
| 2.82%, due 05/16/2005 | $ | 2,246 | $ | 2,246 | |||||||
| 2.80%, due 06/09/2005 (c) | 562 | 562 | |||||||||
| 2.77%, due 07/18/2005 (c) | 2,246 | 2,246 | |||||||||
| Canadian Imperial Bank of Commerce 3.02%, due 11/04/2005 (c) | 2,246 | 2,246 | |||||||||
| Credit Suisse First Boston Corp. 2.88%, due 09/09/2005 (c) 3.06%, due 03/10/2006 (c) | 561 561 | 561 561 | |||||||||
| Euro Dollar Overnight (3.5%) | |||||||||||
| Bank of Montreal 2.94%, due 05/04/2005 | 1,684 | 1,684 | |||||||||
| BNP Paribas 2.80%, due 05/05/2005 | 2,325 | 2,325 | |||||||||
| Den Danske Bank 2.93%, due 05/02/2005 2.80%, due 05/06/2005 | 2,021 1,123 | 2,021 1,123 | |||||||||
| Dexia Group 2.80%, due 05/05/2005 | 992 | 992 | |||||||||
| Royal Bank of Canada 2.80%, due 05/04/2005 | 2,305 | 2,305 | |||||||||
| Svenska Handlesbanken 2.80%, due 05/06/2005 | 370 | 370 | |||||||||
| Euro Dollar Terms (8.0%) | |||||||||||
| Bank of Nova Scotia 2.88%, due 05/11/2005 3.01%, due 05/31/2005 | 1,123 3,140 | 1,123 3,140 | |||||||||
The notes to the financial statements are an integral part of this report.
Transamerica IDEX Mutual Funds
Semi-Annual Report 2005
2
TA IDEX Transamerica Growth Opportunities
SCHEDULE OF INVESTMENTS (continued)
At April 30, 2005
(all amounts except share amounts in thousands)
(unaudited)
| Principal | Value | ||||||||||
| Euro Dollar Terms (continued) | |||||||||||
| Barclays 3.02%, due 06/27/2005 | $ | 2,001 | $ | 2,001 | |||||||
| BNP Paribas 2.93%, due 06/07/2005 | 1,797 | 1,797 | |||||||||
| Branch Banker & Trust 2.94%, due 06/06/2005 | 480 | 480 | |||||||||
| Calyon 2.93%, due 06/03/2005 | 1,855 | 1,855 | |||||||||
| Citigroup 2.87%, due 06/06/2005 | 2,332 | 2,332 | |||||||||
| Credit Suisse First Boston Corp. 2.91%, due 05/16/2005 | 2,300 | 2,300 | |||||||||
| HSBC Banking/Holdings PLC 3.01%, due 06/23/2005 | 1,123 | 1,123 | |||||||||
| Royal Bank of Scotland 2.94%, due 06/07/2005 2.95%, due 06/10/2005 | 2,182 1,212 | 2,182 1,212 | |||||||||
| Societe Generale 2.80%, due 05/03/2005 | 2,148 | 2,148 | |||||||||
| Toronto Dominion Bank 2.75%, due 05/09/2005 3.01%, due 06/24/2005 | 1,684 624 | 1,684 624 | |||||||||
| UBS AG 2.81%, due 05/03/2005 | 1,123 | 1,123 | |||||||||
| Promissory Notes (2.0%) | |||||||||||
| Goldman Sachs Group, Inc. 2.99%, due 06/27/2005 3.01%, due 07/27/2005 | 2,358 3,930 | 2,358 3,930 | |||||||||
| Principal | Value | ||||||||||
| Repurchase Agreements (3.5%) (d) | |||||||||||
| Goldman Sachs Group, Inc. | |||||||||||
| 3.04% Repurchase Agreement dated | |||||||||||
| 04/29/2005 to be repurchased at $5,054 | |||||||||||
| on 05/02/2005 | $ | 5,053 | $ | 5,053 | |||||||
| Merrill Lynch & Co. Inc. 3.04% Repurchase Agreement dated 04/29/2005 to be repurchased at $6,065 on 05/02/2005 | 6,064 | 6,064 | |||||||||
| Shares | Value | ||||||||||
| Investment Companies (3.0%) | |||||||||||
| Money Market Funds (3.0%) | |||||||||||
| American Beacon Funds 1-day yield of 2.84% | 891,855 | $ | 892 | ||||||||
| BGI Institutional Money Market Fund 1-day yield of 2.93% | 5,281,172 | 5,281 | |||||||||
| Merrill Lynch Premier Institutional Fund 1-day yield of 2.65% | 1,188,431 | 1,188 | |||||||||
| Merrimac Cash Fund, Premium Class 1-day yield of 2.74% (e) | 2,173,623 | 2,174 | |||||||||
| Total Security Lending Collateral (cost: $71,306) | 71,306 | ||||||||||
| Total Investment Securities (cost: $341,216) | $ | 380,668 | |||||||||
| SUMMARY: | |||||||||||
| Investments, at value | 121.1 | % | $ | 380,668 | |||||||
| Liabilities in excess of other assets | (21.1 | )% | (66,206 | ) | |||||||
| Net assets | 100.0 | % | $ | 314,462 | |||||||
NOTES TO SCHEDULE OF INVESTMENTS:
(a) No dividends were paid during the preceding twelve months.
(b) At April 30, 2005, all or a portion of this security is on loan (see Note 1). The value at April 30, 2005, of all securities on loan is $68,666.
(c) Floating or variable rate note. Rate is listed as of April 30, 2005.
(d) Cash collateral for the Repurchase Agreements, valued at $11,311, that serve as collateral for securities lending are invested in corporate bonds with interest rates and maturity dates ranging from 0.00%–8.875% and 06/15/2005–03/15/2035, respectively.
(e) Regulated investment company advised by Investors Bank and Trust Co. ("IBT"). IBT is also the accounting, custody and lending agent for the Fund.
DEFINITIONS:
ADR American Depositary Receipt
The notes to the financial statements are an integral part of this report.
Transamerica IDEX Mutual Funds
Semi-Annual Report 2005
3
TA IDEX Transamerica Growth Opportunities
STATEMENT OF ASSETS AND LIABILITIES
At April 30, 2005
(all amounts except per share amounts in thousands)
(unaudited)
| Assets: | |||||||
| Investment securities, at value (cost: $341,216) (including securities loaned of $68,666) | $ | 380,668 | |||||
| Cash | 5,726 | ||||||
| Receivables: | |||||||
| Investment securities sold | 117 | ||||||
| Shares of beneficial interest sold | 28 | ||||||
| Interest | 50 | ||||||
| Dividends | 251 | ||||||
| Other | 15 | ||||||
| 386,855 | |||||||
| Liabilities: | |||||||
| Accounts payable and accrued liabilities: | |||||||
| Shares of beneficial interest redeemed | 267 | ||||||
| Management and advisory fees | 344 | ||||||
| Distribution and service fees | 145 | ||||||
| Transfer agent fees | 230 | ||||||
| Payable for collateral for securities on loan | 71,306 | ||||||
| Other | 101 | ||||||
| 72,393 | |||||||
| Net Assets | $ | 314,462 | |||||
| Net Assets Consist of: | |||||||
| Shares of beneficial interest, unlimited shares authorized, no par value | 596,279 | ||||||
| Accumulated net investment income (loss) | (1,205 | ) | |||||
| Accumulated net realized gain (loss) from investment securities | (320,060 | ) | |||||
| Net unrealized appreciation (depreciation) on investment securities | 39,448 | ||||||
| Net Assets | $ | 314,462 | |||||
| Net Assets by Class: | |||||||
| Class A | $ | 219,836 | |||||
| Class B | 69,768 | ||||||
| Class C | 24,858 | ||||||
| Shares Outstanding: | |||||||
| Class A | 33,790 | ||||||
| Class B | 11,184 | ||||||
| Class C | 3,981 | ||||||
| Net Asset Value Per Share: | |||||||
| Class A | $ | 6.51 | |||||
| Class B | 6.24 | ||||||
| Class C | 6.24 | ||||||
| Maximum Offering Price Per Share (a): | |||||||
| Class A | $ | 6.89 | |||||
(a) Includes the maximum selling commission (represented as a percentage of offering price) which is reduced on certain levels of sales as set forth in the Prospectus. Net asset value per share for Classes B and C shares represents offering price. The redemption price for Classes B and C shares equals net asset value less any applicable contingent deferred sales charge.
STATEMENT OF OPERATIONS
For the period ended April 30, 2005
(all amounts in thousands)
(unaudited)
| Investment Income: | |||||||
| Interest | $ | 56 | |||||
| Dividends | 1,567 | ||||||
| Income from loaned securities–net | 51 | ||||||
| 1,674 | |||||||
| Expenses: | |||||||
| Management and advisory fees | 1,363 | ||||||
| Transfer agent fees: | |||||||
| Class A | 197 | ||||||
| Class B | 112 | ||||||
| Class C | 70 | ||||||
| Printing and shareholder reports | 107 | ||||||
| Custody fees | 19 | ||||||
| Administration fees | 31 | ||||||
| Legal fees | 9 | ||||||
| Trustees fees | 8 | ||||||
| Registration fees: | |||||||
| Class A | 8 | ||||||
| Class C | 8 | ||||||
| Distribution and service fees: | |||||||
| Class A | 411 | ||||||
| Class B | 387 | ||||||
| Class C | 138 | ||||||
| Total expenses | 2,868 | ||||||
| Reimbursement of class expenses: | |||||||
| Class C | (7 | ) | |||||
| Net expenses | 2,861 | ||||||
| Net Investment Income (Loss) | (1,187 | ) | |||||
| Net Realized and Unrealized Gain (Loss): | |||||||
| Realized gain (loss) from investment in securities | 5,927 | ||||||
| Increase (decrease) in unrealized appreciation (depreciation) on investment in securities | (9,788 | ) | |||||
| Net Gain (Loss) on Investment Securities | (3,861 | ) | |||||
| Net Increase (Decrease) in Net Assets Resulting from Operations | $ | (5,048 | ) | ||||
The notes to the financial statements are an integral part of this report.
Transamerica IDEX Mutual Funds
Semi-Annual Report 2005
4
TA IDEX Transamerica Growth Opportunities
STATEMENTS OF CHANGES IN NET ASSETS
For the period or year ended
(all amounts in thousands)
| April 30, 2005 (unaudited) | October 31, 2004 | ||||||||||
| Increase (Decrease) In Net Assets From: | |||||||||||
| Operations: | |||||||||||
| Net investment income (loss) | $ | (1,187 | ) | $ | (2,185 | ) | |||||
| Net realized gain (loss) from investment securities | 5,927 | 27,965 | |||||||||
| Net unrealized appreciation (depreciation) on investment securities | (9,788 | ) | (220 | ) | |||||||
| (5,048 | ) | 25,560 | |||||||||
| Capital Share Transactions: | |||||||||||
| Proceeds from shares sold: | |||||||||||
| Class A | 3,409 | 70,124 | |||||||||
| Class B | 3,071 | 5,768 | |||||||||
| Class C | 1,669 | 2,253 | |||||||||
| Class C2 | – | 800 | |||||||||
| Class M | – | 482 | |||||||||
| 8,149 | 79,427 | ||||||||||
| Proceeds from fund acquisition: | |||||||||||
| Class A | – | 18,269 | |||||||||
| Class B | – | 28,710 | |||||||||
| Class C | – | 783 | |||||||||
| Class C2 | – | 5,594 | |||||||||
| Class M | – | 3,540 | |||||||||
| – | 56,896 | ||||||||||
| Cost of shares redeemed: | |||||||||||
| Class A | (11,019 | ) | (23,471 | ) | |||||||
| Class B | (9,743 | ) | (14,231 | ) | |||||||
| Class C | (4,482 | ) | (2,369 | ) | |||||||
| Class C2 | – | (2,125 | ) | ||||||||
| Class M | – | (2,585 | ) | ||||||||
| (25,244 | ) | (44,781 | ) | ||||||||
| Class level exchanges: | |||||||||||
| Class C | – | 26,644 | |||||||||
| Class C2 | – | (14,565 | ) | ||||||||
| Class M | – | (12,079 | ) | ||||||||
| – | – | ||||||||||
| Automatic conversions: | |||||||||||
| Class A | 208 | 268 | |||||||||
| Class B | (208 | ) | (268 | ) | |||||||
| – | – | ||||||||||
| (17,095 | ) | 91,542 | |||||||||
| Net increase (decrease) in net assets | (22,143 | ) | 117,102 | ||||||||
| Net Assets: | |||||||||||
| Beginning of period | 336,605 | 219,503 | |||||||||
| End of period | $ | 314,462 | $ | 336,605 | |||||||
| Undistributed Net Investment Income (Loss) | $ | (1,207 | ) | $ | (18 | ) | |||||
| April 30, 2005 (unaudited) | October 31, 2004 | ||||||||||
| Share Activity: | |||||||||||
| Shares issued: | |||||||||||
| Class A | 497 | 10,916 | |||||||||
| Class B | 464 | 921 | |||||||||
| Class C | 251 | 363 | |||||||||
| Class C2 | – | 129 | |||||||||
| Class M | – | 77 | |||||||||
| 1,212 | 12,406 | ||||||||||
| Shares issued on fund acquisition: | |||||||||||
| Class A | – | 2,818 | |||||||||
| Class B | – | 4,571 | |||||||||
| Class C | – | 125 | |||||||||
| Class C2 | – | 891 | |||||||||
| Class M | – | 561 | |||||||||
| – | 8,966 | ||||||||||
| Shares redeemed: | |||||||||||
| Class A | (1,608 | ) | (3,649 | ) | |||||||
| Class B | (1,477 | ) | (2,289 | ) | |||||||
| Class C | (676 | ) | (377 | ) | |||||||
| Class C2 | – | (343 | ) | ||||||||
| Class M | – | (415 | ) | ||||||||
| (3,761 | ) | (7,073 | ) | ||||||||
| Class level exchanges: | |||||||||||
| Class C | – | 4,213 | |||||||||
| Class C2 | – | (2,335 | ) | ||||||||
| Class M | – | (1,874 | ) | ||||||||
| – | 4 | ||||||||||
| Automatic conversions: | |||||||||||
| Class A | 30 | 33 | |||||||||
| Class B | (31 | ) | (43 | ) | |||||||
| (1 | ) | (10 | ) | ||||||||
| Net increase (decrease) in shares outstanding: | |||||||||||
| Class A | (1,081 | ) | 10,118 | ||||||||
| Class B | (1,044 | ) | 3,160 | ||||||||
| Class C | (425 | ) | 4,324 | ||||||||
| Class C2 | – | (1,658 | ) | ||||||||
| Class M | – | (1,651 | ) | ||||||||
| (2,550 | ) | 14,293 | |||||||||
The notes to the financial statements are an integral part of this report.
Transamerica IDEX Mutual Funds
Semi-Annual Report 2005
5
TA IDEX Transamerica Growth Opportunities
FINANCIAL HIGHLIGHTS
(unaudited for the period ended April 30, 2005)
| For a share of beneficial interest outstanding throughout each period | |||||||||||||||||||||||||||||||||||||||
| Net Asset | Investment Operations | Distributions | Net Asset | ||||||||||||||||||||||||||||||||||||
| For the Period Ended (d)(g) | Value, Beginning of Period | Net Investment Income (Loss) | Net Realized and Unrealized Gain (Loss) | Total Operations | From Net Investment Income | From Net Realized Gains | Total Distributions | Value, End of Period | |||||||||||||||||||||||||||||||
| Class A | 4/30/2005 | $ | 6.61 | $ | (0.01 | ) | $ | (0.09 | ) | $ | (0.10 | ) | $ | – | $ | – | $ | – | $ | 6.51 | |||||||||||||||||||
| 10/31/2004 | 5.95 | (0.03 | ) | 0.69 | 0.66 | – | – | – | 6.61 | ||||||||||||||||||||||||||||||
| 10/31/2003 | 4.81 | (0.06 | ) | 1.20 | 1.14 | – | – | – | 5.95 | ||||||||||||||||||||||||||||||
| 10/31/2002 | 4.81 | (0.06 | ) | 0.06 | – | – | – | – | 4.81 | ||||||||||||||||||||||||||||||
| 10/31/2001 | 8.70 | (0.07 | ) | (3.82 | ) | (3.89 | ) | – | – | – | 4.81 | ||||||||||||||||||||||||||||
| 10/31/2000 | 10.00 | (0.02 | ) | (1.28 | ) | (1.30 | ) | – | – | – | 8.70 | ||||||||||||||||||||||||||||
| Class B | 4/30/2005 | 6.37 | (0.04 | ) | (0.09 | ) | (0.13 | ) | – | – | – | 6.24 | |||||||||||||||||||||||||||
| 10/31/2004 | 5.79 | (0.09 | ) | 0.67 | 0.58 | – | – | – | 6.37 | ||||||||||||||||||||||||||||||
| 10/31/2003 | 4.70 | (0.09 | ) | 1.18 | 1.09 | – | – | – | 5.79 | ||||||||||||||||||||||||||||||
| 10/31/2002 | 4.73 | (0.11 | ) | 0.08 | (0.03 | ) | – | – | – | 4.70 | |||||||||||||||||||||||||||||
| 10/31/2001 | 8.66 | (0.10 | ) | (3.83 | ) | (3.93 | ) | – | – | – | 4.73 | ||||||||||||||||||||||||||||
| 10/31/2000 | 10.00 | (0.06 | ) | (1.28 | ) | (1.34 | ) | – | – | – | 8.66 | ||||||||||||||||||||||||||||
| Class C | 4/30/2005 | 6.38 | (0.05 | ) | (0.09 | ) | (0.14 | ) | – | – | – | 6.24 | |||||||||||||||||||||||||||
| 10/31/2004 | 5.79 | (0.10 | ) | 0.69 | 0.59 | – | – | – | 6.38 | ||||||||||||||||||||||||||||||
| 10/31/2003 | 4.62 | (0.09 | ) | 1.26 | 1.17 | – | – | – | 5.79 | ||||||||||||||||||||||||||||||
| Ratios/Supplemental Data | |||||||||||||||||||||||||||||||
| For the Period | Total | Net Assets, End of Period | Ratio of Expenses to Average Net Assets (a) | Net Investment Income (Loss) to Average | Portfolio Turnover | ||||||||||||||||||||||||||
| Ended (g) | Return (c) | (000's) | Net (e) | Total (f) | Net Assets (a) | Rate (b) | |||||||||||||||||||||||||
| Class A | 4/30/2005 | (1.51 | )% | $ | 219,836 | 1.41 | % | 1.41 | % | (0.42 | )% | 7 | % | ||||||||||||||||||
| 10/31/2004 | 11.09 | 230,633 | 1.43 | 1.43 | (0.47 | ) | 43 | ||||||||||||||||||||||||
| 10/31/2003 | 23.70 | 147,340 | 1.75 | 2.21 | (1.11 | ) | 97 | ||||||||||||||||||||||||
| 10/31/2002 | 0.05 | 12,687 | 1.74 | 2.53 | (1.35 | ) | 32 | ||||||||||||||||||||||||
| 10/31/2001 | (44.76 | ) | 3,807 | 1.55 | 2.83 | (1.11 | ) | 59 | |||||||||||||||||||||||
| 10/31/2000 | (12.96 | ) | 3,726 | 1.55 | 4.54 | (1.23 | ) | 19 | |||||||||||||||||||||||
| Class B | 4/30/2005 | (2.04 | ) | 69,768 | 2.27 | 2.27 | (1.29 | ) | 7 | ||||||||||||||||||||||
| 10/31/2004 | 10.02 | 77,869 | 2.40 | 2.64 | (1.44 | ) | 43 | ||||||||||||||||||||||||
| 10/31/2003 | 23.19 | 52,492 | 2.41 | 2.87 | (1.76 | ) | 97 | ||||||||||||||||||||||||
| 10/31/2002 | (0.70 | ) | 5,897 | 2.39 | 3.18 | (2.00 | ) | 32 | |||||||||||||||||||||||
| 10/31/2001 | (45.35 | ) | 4,513 | 2.20 | 3.48 | (1.76 | ) | 59 | |||||||||||||||||||||||
| 10/31/2000 | (13.39 | ) | 4,366 | 2.20 | 5.19 | (1.88 | ) | 19 | |||||||||||||||||||||||
| Class C | 4/30/2005 | (2.04 | ) | 24,858 | 2.37 | 2.42 | (1.39 | ) | 7 | ||||||||||||||||||||||
| 10/31/2004 | 10.19 | 28,103 | 2.40 | 2.65 | (1.58 | ) | 43 | ||||||||||||||||||||||||
| 10/31/2003 | 25.32 | 483 | 2.42 | 2.89 | (1.78 | ) | 97 | ||||||||||||||||||||||||
NOTES TO FINANCIAL HIGHLIGHTS
(a) Annualized.
(b) Not annualized for periods of less than one year.
(c) Total Return has been calculated for the applicable period without deduction of a sales load, if any, on an initial purchase. Periods of less than one year are not annualized.
(d) Per share information is calculated based on average number of shares outstanding for the periods ended 10/31/2001, 10/31/2002, 10/31/2003, 10/31/2004, and 4/30/2005.
(e) Ratio of Net Expenses to Average Net Assets is net of fee waivers and reimbursements by the investment adviser, if any, and includes the recapture of waived expenses. (see note 2).
(f) Ratio of Total Expenses to Average Net Assets includes all expenses before fee waivers and reimbursements by the investment adviser and recapture of previously waived expense.
(g) TA IDEX Transamerica Growth Opportunities ("the Fund") commenced operations on March 1, 2000. The inception date for the Fund's offering of share Class C was November 11, 2002.
The notes to the financial statements are an integral part of this report.
Transamerica IDEX Mutual Funds
Semi-Annual Report 2005
6
TA IDEX Transamerica Growth Opportunities
NOTES TO FINANCIAL STATEMENTS
At April 30, 2005
(all amounts in thousands)
(unaudited)
NOTE 1. ORGANIZATION AND SIGNIFICANT ACCOUNTING POLICIES
Transamerica IDEX Mutual Funds is a Delaware statutory trust registered under the Investment Company Act of 1940, as amended (the "1940 Act"), as an open-end management investment company. Prior to March 1, 2005, Transamerica IDEX Mutual Funds was a Massachusetts business trust. TA IDEX Transamerica Growth Opportunities ("the Fund"), part of Transamerica IDEX Mutual Funds, began operations on March 1, 2000.
On May 28, 2004, the Fund acquired all of the net assets of TA IDEX PBHG Mid Cap Growth pursuant to a plan of reorganization. TA IDEX Transamerica Growth Opportunities is the accounting survivor. The acquisition was accomplished by a tax free exchange of 8,966 shares of the Fund for 6,421 shares of TA IDEX PBHG Mid Cap Growth outstanding on May 27, 2004. TA IDEX PBHG Mid Cap Growth's net assets at that date, $56,896, including $10,809 unrealized appreciation, were combined with those of the Fund. The aggregate net assets of TA IDEX Transamerica Growth Opportunities immediately before the acquisition was $275,349, the combined net assets of the Fund immediately after the acquisition was $332,245. Proceeds in connection with the acquisition were as follows:
| Shares | Amount | ||||||||||
| Proceeds in connection with the acquisition | |||||||||||
| Class A | 2,818 | $ | 18,269 | ||||||||
| Class B | 4,571 | 28,710 | |||||||||
| Class C | 125 | 783 | |||||||||
| Class C2 | 891 | 5,594 | |||||||||
| Class M | 561 | 3,540 | |||||||||
| $ | 56,896 | ||||||||||
In the normal course of business, the Fund enters into contracts that contain a variety of representations and warranties, which provide general indemnifications. The Fund's maximum exposure under these arrangements is unknown, as this would involve future claims that may be made against the Fund and/or its affiliates that have not yet occurred. However, based on experience, the Fund expects the risk of loss to be remote.
See the Prospectus and Statement of Additional Information for a description of the Fund's investment objective.
In preparing the Fund's financial statements in accordance with accounting principles generally accepted in the United States of America ("GAAP"), estimates or assumptions (which could differ from actual results) may be used that affect reported amounts and disclosures. The following policies were consistently followed by the Fund, in accordance with GAAP.
Multiple class operations and expenses: The Fund currently offers three classes of shares, each with a public offering price that reflects different sales charges, if any, and expense levels. On June 15, 2004, Class C2 shares merged into Class C. On September 24, 2004, Class M shares merged into Class C. Class B shares will convert to Class A shares eight years after purchase. Income, non-class specific expenses and realized and unrealized gains and losses, are allocated daily to each class, based upon the value of shares outstanding method as permitted under Rule 18f-3 of the 1940 Act. Each class bears its own specific expenses as well as a portion of general, common expenses.
Pricing of shares: The Fund prices its shares on the basis of the net asset value of each class of shares of the Fund, which is determined as of the close of the New York Stock Exchange ("NYSE") (generally 4:00 p.m. Eastern Time) on each day on which the NYSE is open for trading.
Security valuations: Fund investments traded on an exchange are valued at the closing price on the day of valuation on the exchange where the security is principally traded. With respect to securities traded on NASDAQ NMS, such closing price may be the last reported sales price or the NASDAQ Official Closing Price.
Securities traded in the over-the-counter market and listed securities for which no sale was reported on that date are valued at the last quoted bid price.
Debt securities are valued by independent pricing services at the last quoted bid price; however, those that mature in sixty days or less are valued at amortized cost, which approximates market.
Investment company securities are valued at net asset value of the underlying portfolio.
Other securities for which quotations are not readily available are valued at fair market value as determined in good faith using guidelines adopted by the Board of Trustees of the Fund, under the supervision of the Fund's Valuation Committee. These guidelines may include: the type of security; any restrictions on its resale; financial or business news of the issuer; similar or related securities that are actively trading; related corporate actions; and other significant events occurring after the close of trading in the security.
Cash: The Fund may leave cash overnight in its cash account with the custodian, Investors Bank & Trust Company ("IBT"). IBT has been contracted on behalf of the Fund to invest the excess cash into a savings account, which at April 30, 2005, was paying an interest rate of 2.02%.
Throughout the period, the Fund may have a cash overdraft balance. A fee is incurred on this overdraft, calculated by multiplying the overdraft by a rate based on the federal funds rate.
Repurchase agreements: The Fund is authorized to enter into repurchase agreements. The Fund, through IBT, receives delivery of the underlying securities, the value of which at the time of purchase is
Transamerica IDEX Mutual Funds
Semi-Annual Report 2005
7
TA IDEX Transamerica Growth Opportunities
NOTES TO FINANCIAL STATEMENTS (continued)
At April 30, 2005
(all amounts in thousands)
(unaudited)
NOTE 1.–(continued)
required to be an amount equal to at least 100% of the resale price. Repurchase agreements involve the risk that the seller will fail to repurchase the security, as agreed. In that case, the Fund will bear the risk of value fluctuations until the security can be sold and may encounter delays and incur costs in liquidating the security. In the event of bankruptcy or insolvency of the seller, delays and costs may be incurred.
Commission recapture: The sub-adviser, to the extent consistent with the best execution and usual commission rate policies and practices, may place security transactions of the Fund with broker/dealers with which Transamerica IDEX Mutual Funds has established a Commission Recapture Program. A Commission Recapture Program is any arrangement under which a broker/dealer applies a portion of the commissions received by such broker/dealer on the security transactions to the Fund. In no event will commissions paid by the Fund be used to pay expenses that would otherwise be borne by any other funds within Transamerica IDEX Mutual Funds, or by any other party.
Recaptured commissions during the six months ended April 30, 2005, of $10 are included in net realized gains in the Statement of Operations.
Securities lending: The Fund may lend securities to enhance fund earnings from investing cash collateral in making such loans to qualified borrowers (typically broker/dealers). The Fund has engaged its custodian bank, IBT, as a lending agent to administer its securities lending program. IBT earned $26 of program income for its services. When the Fund makes a security loan, it receives cash collateral as protection against the risk that the borrower will default on the loan, and records an asset for the cash invested collateral and a liability for the return of the collateral.
Loans of securities are required to be secured by collateral at least equal to 102% of the value of the securities at inception of the loan, and not less then 100% thereafter. The Fund may invest cash collateral in short-term money market instruments including: U.S. Treasury Bills, U.S. agency obligations, commercial paper, money market mutual funds, repurchase agreements and other highly rated, liquid investments. During the life of securities loans, the collateral and securities loaned remain subject to fluctuation in value. IBT marks to market securities loaned and the collateral each business day. If additional collateral is due (at least $1), IBT collects additional cash collateral from the borrowers. Although securities loaned will be fully collateralized at all times, IBT may experience delays in, or may be prevented from, recovering the collateral on behalf of the Fund. The Fund may recall a loa ned security position at any time from the borrower through IBT. In the event the borrower fails to timely return a recalled security, IBT may indemnify the Fund by purchasing replacement securities for the Fund at its own expense and claiming the collateral to fund such a purchase. IBT absorbs the loss if the collateral value is not sufficient to cover the cost of the replacement securities. If replacement securities are not available, IBT will credit the equivalent cash value to the Fund.
While a security is on loan, the Fund does not have the right to vote that security. However, if time permits, the Fund will attempt to recall a security on loan and vote the proxy.
Income from securities lending is included in the Statement of Operations. The amount of collateral and value of securities on loan are included in the Statement of Assets and Liabilities as well as in the Schedule of Investments.
Security transactions and investment income: Security transactions are recorded on the trade date. Security gains and losses are calculated on the specific identification basis. Dividend income is recorded on the ex-dividend date or, in the case of foreign securities, as soon as the Fund is informed of the ex-dividend date. Interest income, including accretion of discounts and amortization of premiums, is recorded on the accrual basis commencing on the settlement date.
Account maintenance fees: If the shareholder account balance falls below $1 by either shareholder action or as a result of market action, a $25 (not in thousands) fee is assessed every year until the balance reaches $1. The fee is assessed by redeeming shares in the shareholder's account.
No fee will be charged under the following conditions:
• accounts opened within the preceding 24 months
• accounts with an active monthly Automatic Investment Plan ($50 (not in thousands) minimum per fund)
• accounts owned by an individual which, when combined by social security number, have a balance of $5 or more
• accounts owned by individuals in the same household (by address) that have a combined balance of $5 or more
• UTMA/UGMA accounts
• Fiduciary accounts
• B-share accounts whose shares have started to convert to A-shares accounts (as long as combined value of both accounts is at least $1)
For the six months ended April 30, 2005, this fee totaled $9. These fees are included in Paid in Capital in the Statement of Assets and Liabilities.
Transamerica IDEX Mutual Funds
Semi-Annual Report 2005
8
TA IDEX Transamerica Growth Opportunities
NOTES TO FINANCIAL STATEMENTS (continued)
At April 30, 2005
(all amounts in thousands)
(unaudited)
NOTE 1.–(continued)
Redemption fees: A short-term trading redemption fee may be assessed on any fund shares in a fund account that are sold during the first five (5) NYSE trading days following their purchase date. This redemption fee will equal 2% of the amount redeemed and shares held the longest will be treated as being redeemed first and shares held the shortest as being redeemed last.
For the six months ended April 30, 2005, the Fund received less than $1 in redemption fees.
Dividend distributions: Distributions to shareholders are recorded on the ex-dividend date and are determined in accordance with Federal income tax regulations which may differ from GAAP.
NOTE 2. RELATED PARTY TRANSACTIONS
Transamerica Fund Advisors, Inc. ("TFAI") is the Fund's investment adviser. Transamerica Fund Services, Inc. ("TFS") is the Fund's administrator and transfer agent. AFSG Securities Corp. ("AFSG") is the Fund's distributor/principal underwriter. AFSG is 100% owned by AUSA Holding Company ("AUSA"). TFAI is a directly owned subsidiary of Western Reserve Life Assurance Co. of Ohio (78%) and AUSA (22%). TFS is a wholly owned subsidiary of WRL (50%) and AUSA (50%). AUSA and WRL are wholly owned indirect subsidiaries of AEGON, NV, a Netherlands corporation.
Effective January 1, 2005 AEGON/Transamerica Fund Advisors, Inc. ("ATFA") was renamed Transamerica Fund Advisors, Inc. ("TFAI"); AEGON/Transamerica Fund Services, Inc. ("ATFS") and AEGON/Transamerica Investor Services, Inc. ("ATIS") merged into one entity and was renamed Transamerica Fund Services, Inc. ("TFS").
Transamerica Investment Management, LLC is both an affiliate of the Fund and a sub-adviser to the Fund.
The following schedule reflects the percentage of fund assets owned by affiliated mutual funds (i.e., through the asset allocation funds):
| Net Assets | % of Net Assets | ||||||||||
| TA IDEX Asset Allocation – Conservative Portfolio | $ | 5,975 | 1.90 | % | |||||||
| TA IDEX Asset Allocation – Growth Portfolio | 47,760 | 15.19 | % | ||||||||
| TA IDEX Asset Allocation – Moderate Growth Portfolio | 77,492 | 24.64 | % | ||||||||
| TA IDEX Asset Allocation – Moderate Portfolio | 33,502 | 10.65 | % | ||||||||
| Total | $ | 164,729 | 52.38 | % | |||||||
Investment advisory fee: The Fund pays management fees to TFAI based on average daily net assets ("ANA") at the following breakpoints:
0.80% of the first $250 million of ANA
0.75% of the next $250 million
0.70% over $500 million
TFAI has contractually agreed to waive its advisory fee and will reimburse the Fund to the extent that operating expenses, excluding 12b-1 fees, exceed the following stated annual limit:
1.40% Expense Limit
Distribution and service fees: The Fund has a 12b-1 distribution plan under the 1940 Act pursuant to which an annual fee, based on average daily net assets, is paid to the distributor for various disbursements such as broker-dealer account servicing fees and other promotional expenses of the Fund. The Fund is authorized under the 12b-1 plan to pay fees on each class up to the following limits:
| Class A | 0.35 | % | |||||
| Class B | 1.00 | % | |||||
| Class C | 1.00 | % | |||||
In the case the Fund or a class of shares of the Fund is closed to new investors or investments, the Fund is authorized to pay 12b-1 fees for past sales and distribution efforts and present and past investor services.
Underwriter commissions relate to front-end sales charges imposed for Class A shares and contingent deferred sales charges from Classes B, C, and certain A share redemptions. For the six months ended April 30, 2005, the underwriter commissions were as follows:
| Received by Underwriter | $ | 245 | |||||
| Retained by Underwriter | 11 | ||||||
| Contingent Deferred Sales Charge | 81 | ||||||
Administrative services: The Fund has entered into an agreement with TFS for financial and legal fund administration services, which includes such items as compliance, expenses, financial statements and other reporting, distributions, tax returns, prospectus preparation, board of trustees meeting support and other legal matters. As of January 1, 2005 the Fund pays TFS an annual fee of 0.02% of average net assets. Prior to January 1, 2005 the Fund paid TFS an annual fee of 0.015% of average net assets. The Legal fees on the Statement of Operations are for fees paid to external legal counsel.
Transfer agent fees: The Fund pays TFS an annual per-account charge of $20 (not in thousands) for each open account and $1.63 (not in thousands) for each closed account. There is no new account charge. The Transfer agent fees on the Statement of Operations are made up of fees paid to TFS and costs associated with shareholder statements.
The Fund paid TFS $558 for the six months ended April 30, 2005.
Transamerica IDEX Mutual Funds
Semi-Annual Report 2005
9
TA IDEX Transamerica Growth Opportunities
NOTES TO FINANCIAL STATEMENTS (continued)
At April 30, 2005
(all amounts in thousands)
(unaudited)
NOTE 2.–(continued)
Deferred compensation plan: Each eligible Fund Trustee may elect participation in the Deferred Compensation Plan ("the Plan"). Under the Plan, such Trustees may defer payment of a percentage of their total fees earned as a Fund Trustee. These deferred amounts may be invested in any Transamerica IDEX Mutual Fund. At April 30, 2005, the value of invested plan amount was $15. Invested plan amounts and the total liability for deferred compensation to the Trustees under the Plan at April 30, 2005, are included in the accompanying Statement of Assets and Liabilities.
NOTE 3. INVESTMENT TRANSACTIONS
The cost of securities purchased and proceeds from securities sold (excluding short-term securities) for the six months ended April 30, 2005, were as follows:
| Purchases of securities: | |||||||
| Long-Term excluding U.S. Government | $ | 24,479 | |||||
| U.S. Government | – | ||||||
| Proceeds from maturities and sales of securities: | |||||||
| Long-Term excluding U.S. Government | 46,710 | ||||||
| U.S. Government | – | ||||||
NOTE 4. FEDERAL INCOME TAX MATTERS
The Fund has not made any provision for federal income or excise taxes due to its policy to distribute all of its taxable income and capital gains to its shareholders and otherwise qualify as a regulated investment company under the Internal Revenue Code. Income and capital gain distributions are determined in accordance with income tax regulations, which may differ from GAAP. These differences are primarily due to differing treatment for items including, but not limited to, wash sales, net operating losses and capital loss carryforwards.
The capital loss carryforwards are available to offset future realized capital gains through the periods listed:
| Capital Loss Carryforward | Available through | ||||||
| $ | 205,155 | October 31, 2008 | |||||
| 108,685 | October 31, 2009 | ||||||
| 4,618 | October 31, 2010 | ||||||
| 7,437 | October 31, 2011 | ||||||
The aggregate cost of investments and composition of unrealized appreciation (depreciation) for federal income tax purposes as of April 30, 2005, are as follows:
| Federal Tax Cost Basis | $ | 341,307 | |||||
| Unrealized Appreciation | $ | 50,367 | |||||
| Unrealized (Depreciation) | (11,006 | ) | |||||
| Net Unrealized Appreciation (Depreciation) | $ | 39,361 | |||||
NOTE 5. REGULATORY PROCEEDING
There continues to be significant federal and state regulatory activity relating to financial services companies, particularly mutual fund companies and their investment advisers. As part of an ongoing investigation regarding potential market timing, recordkeeping and trading compliance issues and matters affecting the Fund's investment adviser, TFAI, and certain employees and affiliates of TFAI, the SEC staff has indicated that it is likely to take some action against TFAI and certain of its affiliates at the conclusion of the investigation. The potential timing and the scope of any such action is difficult to predict. Although the impact of any action brought against TFAI and/or its affiliates is difficult to assess at the present time, the Fund currently believes that the likelihood that any such action will have a material adverse impact on it is remote. It is important to note that the Fund is not aware of any allegation of wrongdoing against it and its board at the time this semi-annual report is printed. Although it is not anticipated that these developments will have an adverse impact on the Fund, there can be no assurance at this time. TFAI and its affiliates are actively working with the SEC in regard to this matter; however, the exact resolution cannot be determined at this time. TFAI will take such actions that it deems necessary or appropriate to continue providing management services to the Fund and to bring all matters to an appropriate conclusion.
TFAI and/or its affiliates, and not the Fund, will bear the costs regarding these regulatory matters.
Transamerica IDEX Mutual Funds
Semi-Annual Report 2005
10
TA IDEX Transamerica Growth Opportunities
INVESTMENT ADVISORY AND SUB-ADVISORY AGREEMENTS – REVIEW AND RENEWAL
At a meeting of the Board of Trustees of Transamerica IDEX Mutual Funds ("TA IDEX") held on October 6, 2004, the Board considered and approved the renewal for a one-year period of the Investment Advisory Agreement between TA IDEX Transamerica Growth Opportunities (the "Fund") and Transamerica Fund Advisors, Inc. ("TFAI") as well as the Investment Sub-Advisory Agreement of the Fund between TFAI and Transamerica Investment Management, LLC (the "Sub-Adviser"). In approving the renewal of these agreements, the Board concluded that the Investment Advisory and Investment Sub-Advisory Agreements enable shareholders of the Fund to obtain high quality services at a cost that is appropriate, reasonable, and in the best interests of shareholders based upon the following determinations, among others:
The nature, extent and quality of the advisory service to be provided. The Board considered the nature and quality of the services provided by TFAI and the Sub-Adviser to the Fund in the past, as well as the services anticipated to be provided in the future. The Board concluded that TFAI and the Sub-Adviser are capable of providing high quality services to the Fund, as indicated by TFAI's management capabilities demonstrated with respect to the Fund and other funds managed by TFAI, TFAI's management oversight process, the professional qualifications and experience of the Sub-Adviser's portfolio management team, and the Fund's strong investment performance. The Board also concluded that TFAI and the Sub-Adviser would provide the same quality and quantity of investment management and related servi ces as before, that these services are appropriate in scope and extent in light of the Fund's operations, the competitive landscape of the investment company business and investor needs, and that TFAI's and the Sub-Adviser's obligations will remain the same in all respects.
The investment performance of the Fund. The Board concluded, based in particular on information provided by Lipper Analytics, that the Fund's investment performance was competitive or superior relative to comparable funds over trailing one-, two- and three-year periods. On the basis of the Trustees' assessment of the nature, extent and quality of investment advisory and related services to be provided or procured by TFAI and the Sub-Adviser, the Trustees concluded that TFAI and the Sub-Adviser were capable of generating a level of long-term investment performance that is appropriate in light of the Fund's investment objective, policies and strategies and competitive with many other investment companies.
The cost of advisory services provided and the level of profitability. On the basis of the Board's review of the fees to be charged by TFAI and the Sub-Adviser for investment advisory and related services, TFAI's financial statements, the fees paid by TFAI to the Sub-Adviser, TFAI's estimated net management income resulting from its management of the Fund, the estimated profitability of TFAI's relationships with the Fund and TA IDEX, and the estimated profitability of the Sub-Adviser's relationship with the Fund, the Board concluded that the level of investment advisory fees and the profitability is appropriate in light of the services provided, the management fees and overall expense ratios of comparable investment companies, and the anticipated profitability of the relationship between the Fun d, TFAI and the Sub-Adviser. Further, on the basis of comparative information supplied by Lipper Analytics, the Board determined that the advisory fees and estimated overall expense ratio of the Fund were consistent with industry averages, and that the Fund's advisory fees were lowered, which will likely lower overall expenses for the benefit of shareholders.
The extent to which economies of scale would be realized as the Fund grows and whether fee levels reflect these economies of scale for the benefit of Fund investors. The Trustees concluded that inclusion of asset-based breakpoints in the Fund's advisory fee schedule appropriately benefited investors by realizing economies of scale in the form of a lower advisory fee rate as the level of Fund assets increases. The Board also concluded that the advisory fees appropriately reflect the Fund's current size, the current economic environment for TFAI, and the competitive nature of the investment company market. In addition, the Board noted that it will have the opportunity to periodically re-examine whether the Fund has achieved economies of scale, as well as the appropriateness of advisory fees payabl e to TFAI and the Sub-Adviser in the future.
Benefits (such as soft dollars) to TFAI or the Sub-Adviser from its relationship with the Fund. The Board concluded that other benefits derived by TFAI or the Sub-Adviser from its relationship with the Fund are reasonable and fair, and are consistent with industry practice and the best interests of the Fund and its shareholders. In this regard, the Board noted that TFAI does not realize "soft dollar" benefits from its relationship with the Fund, and that the Sub-Adviser is participating in a brokerage program pursuant to which a portion of brokerage commissions paid by the Fund is recaptured for the benefit of the Fund and its shareholders, thus limiting the amount of "soft-dollar" arrangements the Sub-Adviser may engage in with respect to the Fund's portfolio brokerage transactions.
Other considerations. The Board also determined that TFAI had made a substantial commitment to the recruitment and retention of high quality personnel, and maintained the financial, compliance and operational resources reasonably necessary to manage the Fund in a professional manner that is consistent with the best interests of the Fund and its shareholders. The Trustees also concluded that TFAI had made a significant entrepreneurial commitment to the management and success of the Fund, reflected by TFAI's expense limitation and fee waiver arrangement with the Fund which, as demonstrated in the past with the Fund, may result in TFAI waiving a substantial amount of advisory fees for the benefit of shareholders.
Transamerica IDEX Mutual Funds
Semi-Annual Report 2005
11
TA IDEX Transamerica Growth Opportunities
SUPPLEMENTAL INFORMATION (unaudited)
RESULTS OF SHAREHOLDER PROXY
At a special meeting of shareholders held on February 25, 2005, the results of the Proposals were as follows:
Transamerica IDEX Mutual Funds
Proposal 1: Election of Trustees to the Board of Trustees of Transamerica IDEX Mutual Funds.
| For | Withheld | ||||||||||
| Peter R. Brown | 872,017,875.249 | 4,468,498.551 | |||||||||
| Daniel Calabria | 871,917,069.786 | 4,569,304.014 | |||||||||
| Janise B. Case | 872,099,393.125 | 4,386,980.675 | |||||||||
| Charles C. Harris | 872,086,722.025 | 4,399,651.775 | |||||||||
| Leo J. Hill | 872,304,465.640 | 4,181,908.160 | |||||||||
| Russell A. Kimball, Jr. | 872,253,556.471 | 4,232,817.329 | |||||||||
| William W. Short, Jr. | 872,139,920.944 | 4,346,452.856 | |||||||||
| John Waechter | 872,261,152.376 | 4,225,221.424 | |||||||||
| Jack E. Zimmerman | 871,929,967.512 | 4,556,406.288 | |||||||||
| Brian C. Scott | 872,218,970.367 | 4,267,403.433 | |||||||||
| Thomas P. O'Neill | 872,111,944.117 | 4,374,429.683 | |||||||||
TA IDEX Transamerica Growth Opportunities
Proposal 2: Approval of an Agreement and Plan of Reorganization pursuant to which Transamerica IDEX Mutual Funds will organize as a Delaware statutory trust.
| For | Against | Abstentions/Broker Non-Votes | |||||||||
| 37,878,865.515 | 234,310.559 | 7,308,465.364 | |||||||||
Proposal 3: Approval of changes to the fundamental investment restrictions of TA IDEX Transamerica Growth Opportunities.
| A. Diversification | For | Against | Abstentions/Broker Non-Votes | ||||||||||||
| 38,101,374.479 | 247,773.416 | 7,072,493.543 | |||||||||||||
| B. Borrowing | For | Against | Abstentions/Broker Non-Votes | ||||||||||||
| 38,079,587.966 | 269,569.929 | 7,072,493.543 | |||||||||||||
| C. Senior Securities | For | Against | Abstentions/Broker Non-Votes | ||||||||||||
| 38,083,538.608 | 264,380.287 | 7,073,722.543 | |||||||||||||
| D. Underwriting Securities | For | Against | Abstentions/Broker Non-Votes | ||||||||||||
| 38,097,724.439 | 249,899.456 | 7,074,017.543 | |||||||||||||
| E. Real Estate | For | Against | Abstentions/Broker Non-Votes | ||||||||||||
| 38,099,641.949 | 248,276.946 | 7,073,722.543 | |||||||||||||
| F. Making Loans | For | Against | Abstentions/Broker Non-Votes | ||||||||||||
| 38,083,846.036 | 264,072.859 | 7,073,722.543 | |||||||||||||
| G. Concentration | For | Against | Abstentions/Broker Non-Votes | ||||||||||||
| 38,080,189.510 | 267,729.385 | 7,073,722.543 | |||||||||||||
| H. Commodities | For | Against | Abstentions/Broker Non-Votes | ||||||||||||
| 38,054,955.585 | 292,668.310 | 7,074,017.543 | |||||||||||||
| K. Margin Activities and Short Selling | For | Against | Abstentions/Broker-Non-Votes | ||||||||||||
| 38,041,750.707 | 306,168.188 | 7,073,722.543 | |||||||||||||
Transamerica IDEX Mutual Funds
Semi-Annual Report 2005
12
TA IDEX Transamerica Money Market
UNDERSTANDING YOUR FUND'S EXPENSES
(unaudited)
SHAREHOLDER EXPENSES
The following Example is intended to help you understand your ongoing costs (in dollars and cents) of investing in a Fund and to compare these costs with the ongoing costs of investing in other funds.
The Example is based on an investment of $1,000 invested at November 1, 2004 and held for the entire period until April 30, 2005.
ACTUAL EXPENSES
The first line in the table below provides information about actual account values and actual expenses. You may use the information in this line, together with the amount you invested, to estimate the expenses that you paid over the period. Simply divide your account value by $1,000 (for example, an $8,600 account value divided by $1,000 = 8.6), then multiply the result by the number in the first line of your Fund under the heading entitled "Expenses Paid During Period" to estimate the expenses you paid on your account during this period.
HYPOTHETICAL EXAMPLE FOR COMPARISON PURPOSES
The second line in the table below provides information about hypothetical account values and hypothetical expenses based on the Fund's actual expense ratio and an assumed rate of return of 5% per year before expenses, which is not the Fund's actual return. The hypothetical account values and expenses may not be used to estimate the actual ending account balance or expenses you paid for the period. You may use this information to compare the ongoing costs of investing in your Fund and other funds. To do so, compare this 5% hypothetical example with the 5% hypothetical examples that appear in the shareholder reports of the other funds.
Please note that the expenses shown in the table are meant to highlight your ongoing costs only and do not reflect any transactional costs, such as sales charges, redemption fees, brokerage commissions paid on purchases and sales of fund shares. Therefore, the second line under the Fund in the table is useful in comparing ongoing costs only, and will not help you determine the relative total costs of owning different funds. In addition, note that the expenses shown in the table are meant to highlight your ongoing costs and do not reflect any transaction costs.
| Beginning Account Value | Ending Account Value | Annualized Expense Ratio | Expenses Paid During Period (a) | ||||||||||||||||
| Class A | |||||||||||||||||||
| Actual | $ | 1,000.00 | $ | 1,007.80 | 0.83 | % | $ | 4.13 | |||||||||||
| Hypothetical (b) | 1,000.00 | 1,020.68 | 0.83 | 4.16 | |||||||||||||||
| Class B | |||||||||||||||||||
| Actual | 1,000.00 | 1,004.50 | 1.17 | 5.81 | |||||||||||||||
| Hypothetical (b) | 1,000.00 | 1,018.99 | 1.17 | 5.86 | |||||||||||||||
| Class C | |||||||||||||||||||
| Actual | 1,000.00 | 1,006.20 | 1.06 | 5.27 | |||||||||||||||
| Hypothetical (b) | 1,000.00 | 1,019.54 | 1.06 | 5.31 | |||||||||||||||
(a) Expenses are calculated using each Fund's annualized expense ratio (as disclosed in the table), multiplied by the average account value for the period, multiplied by number of days in the period (181 days), and divided by the number of days in the year (365 days).
(b) 5% return per year before expenses.
GRAPHICAL PRESENTATION OF SCHEDULE OF INVESTMENTS
By Maturity Distribution
at April 30, 2005
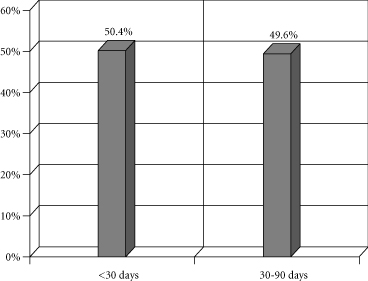
This chart shows the percentage breakdown by maturity date of the Fund's total investment securities.
Transamerica IDEX Mutual Funds
Semi-Annual Report 2005
1
TA IDEX Transamerica Money Market
SCHEDULE OF INVESTMENTS
At April 30, 2005
(all amounts except share amounts in thousands)
(unaudited)
| Principal | Value | ||||||||||
| COMMERCIAL PAPER (85.0%) | |||||||||||
| Asset-Backed (9.7%) | |||||||||||
| CAFCO LLC–144A 2.83%, due 05/11/2005 | $ | 2,000 | $ | 1,998 | |||||||
| 2.84%, due 05/13/2005 | 2,050 | 2,048 | |||||||||
| Ciesco LLC 2.75%, due 05/09/2005 | 2,800 | 2,798 | |||||||||
| Ciesco LLC–144A 3.02%, due 07/08/2005 | 2,700 | 2,684 | |||||||||
| Delaware Funding Corp.–144A 2.79%, due 05/05/2005 | 2,700 | 2,699 | |||||||||
| 2.81%, due 05/06/2005 | 5,000 | 4,999 | |||||||||
| 2.83%, due 05/09/2005 | 2,000 | 1,999 | |||||||||
| Beverages (4.7%) | |||||||||||
| Anheuser-Busch Cos., Inc.–144A 2.72%, due 05/10/2005 | 2,750 | 2,748 | |||||||||
| Coca-Cola Co. (The) 2.73%, due 05/17/2005 | 1,650 | 1,648 | |||||||||
| 2.98%, due 07/01/2005 | 5,000 | 4,975 | |||||||||
| Business Credit Institutions (10.2%) | |||||||||||
| Old Line Funding Corp.–144A 2.82%, due 05/09/2005 | 1,000 | 999 | |||||||||
| 2.95%, due 06/02/2005 | 3,400 | 3,392 | |||||||||
| 2.97%, due 06/03/2005 | 2,935 | 2,927 | |||||||||
| 3.00%, due 06/07/2005 | 2,500 | 2,492 | |||||||||
| Paccar Financial Corp. 2.65%, due 05/04/2005 | 4,100 | 4,099 | |||||||||
| 3.09%, due 07/27/2005 | 2,600 | 2,580 | |||||||||
| Sheffield Receivables Corp.–144A 2.95%, due 05/25/2005 | 3,700 | 3,693 | |||||||||
| Chemicals & Allied Products (0.5%) | |||||||||||
| Dupont EI de Nemours Co. 2.91%, due 06/13/2005 | 1,000 | 996 | |||||||||
| Commercial Banks (25.1%) | |||||||||||
| Bank of America Corp. 2.92%, due 06/03/2005 | 4,000 | 3,990 | |||||||||
| Barclays U.S. Funding Corp. 2.72%, due 05/03/2005 | 1,800 | 1,800 | |||||||||
| 3.01%, due 07/05/2005 | 4,500 | 4,476 | |||||||||
| Nestle Capital Corp.–144A 2.98%, due 07/01/2005 | 5,200 | 5,174 | |||||||||
| 3.00%, due 07/01/2005 | 4,700 | 4,677 | |||||||||
| Ranger Funding Co. LLC–144A 3.02%, due 05/31/2005 | 1,241 | 1,238 | |||||||||
| 2.94%, due 06/15/2005 | 2,050 | 2,042 | |||||||||
| 3.05%, due 07/15/2005 | 2,600 | 2,583 | |||||||||
| Principal | Value | ||||||||||
| Commercial Banks (continued) | |||||||||||
| State Street Corp. 2.79%, due 05/05/2005 | $ | 3,200 | $ | 3,199 | |||||||
| 2.88%, due 05/18/2005 | 700 | 699 | |||||||||
| 2.90%, due 05/19/2005 | 4,100 | 4,095 | |||||||||
| 3.01%, due 06/16/2005 | 1,500 | 1,494 | |||||||||
| UBS Finance Delaware LLC 2.67%, due 05/06/2005 | 700 | 700 | |||||||||
| 2.68%, due 05/06/2005 | 2,900 | 2,899 | |||||||||
| 2.90%, due 05/25/2005 | 1,300 | 1,297 | |||||||||
| 2.83%, due 06/02/2005 | 900 | 898 | |||||||||
| 2.93%, due 06/15/2005 | 3,050 | 3,039 | |||||||||
| 3.04%, due 07/14/2005 | 500 | 497 | |||||||||
| Wells Fargo & Co. 2.87%, due 05/17/2005 | 1,300 | 1,298 | |||||||||
| 2.93%, due 06/20/2005 | 3,700 | 3,685 | |||||||||
| Insurance (2.6%) | |||||||||||
| Metlife Funding, Inc. 2.70%, due 05/20/2005 | 2,700 | 2,696 | |||||||||
| 2.71%, due 05/20/2005 | 2,400 | 2,396 | |||||||||
| Oil & Gas Extraction (4.0%) | |||||||||||
| Total Fina Elf Capital–144A 2.88%, due 05/18/2005 | 5,250 | 5,243 | |||||||||
| 2.90%, due 05/20/2005 | 2,700 | 2,697 | |||||||||
| Personal Credit Institutions (14.8%) | |||||||||||
| American Honda Finance Corp. 2.70%, due 05/04/2005 | 4,300 | 4,299 | |||||||||
| 2.90%, due 05/23/2005 | 2,000 | 1,996 | |||||||||
| 2.92%, due 06/07/2005 | 1,800 | 1,795 | |||||||||
| 3.01%, due 07/11/2005 | 1,700 | 1,690 | |||||||||
| General Electric Capital Corp. 2.68%, due 05/09/2005 | 1,100 | 1,099 | |||||||||
| 2.94%, due 06/06/2005 | 1,000 | 997 | |||||||||
| 2.98%, due 06/17/2005 | 2,300 | 2,291 | |||||||||
| 3.01%, due 07/07/2005 | 5,450 | 5,420 | |||||||||
| Toyota Motor Credit Corp. 2.78%, due 05/11/2005 | 2,000 | 1,998 | |||||||||
| 2.91%, due 06/01/2005 | 5,900 | 5,886 | |||||||||
| 3.03%, due 06/29/2005 | 2,000 | 1,990 | |||||||||
| Pharmaceuticals (4.9%) | |||||||||||
| Pfizer, Inc.–144A 2.74%, due 05/06/2005 | 1,900 | 1,899 | |||||||||
| 2.87%, due 05/24/2005 | 6,600 | 6,588 | |||||||||
| 2.82%, due 05/31/2005 | 1,200 | 1,197 | |||||||||
| Public Administration (0.6%) | |||||||||||
| Quebec Province 2.80%, due 05/06/2005 | 1,300 | 1,299 | |||||||||
The notes to the financial statements are an integral part of this report.
Transamerica IDEX Mutual Funds
Semi-Annual Report 2005
2
TA IDEX Transamerica Money Market
SCHEDULE OF INVESTMENTS (continued)
At April 30, 2005
(all amounts except share amounts in thousands)
(unaudited)
| Principal | Value | ||||||||||
| Security & Commodity Brokers (2.9%) | |||||||||||
| Goldman Sachs Group, Inc. 2.78%, due 05/12/2005 | $ | 3,050 | $ | 3,047 | |||||||
| 2.83%, due 05/26/2005 | 2,700 | 2,695 | |||||||||
| Wholesale Trade Durable Goods (5.0%) | |||||||||||
| Procter & Gamble Co.–144A 2.69%, due 05/16/2005 | 1,300 | 1,298 | |||||||||
| 2.77%, due 05/25/2005 | 2,150 | 2,146 | |||||||||
| 2.81%, due 05/25/2005 | 1,400 | 1,397 | |||||||||
| 3.03%, due 07/19/2005 | 2,100 | 2,086 | |||||||||
| 3.06%, due 07/25/2005 | 900 | 893 | |||||||||
| 3.07%, due 07/25/2005 | 2,050 | 2,035 | |||||||||
| Total Commercial Paper (cost: $168,627) | 168,627 | ||||||||||
| SHORT-TERM OBLIGATIONS (3.7%) | |||||||||||
| Security & Commodity Brokers (3.7%) | |||||||||||
| Merrill Lynch & Co., Inc.–Series B 3.30%, due 06/14/2005 (a) | 7,300 | 7,303 | |||||||||
| Total Short-Term Obligations (cost: $7,303) | 7,303 | ||||||||||
| CERTIFICATES OF DEPOSIT (11.3%) | |||||||||||
| Canadian Imperial Bank of Commerce 2.70%, due 05/02/2005 | 2,800 | 2,800 | |||||||||
| 2.55%, due 05/04/2005 | 1,000 | 1,000 | |||||||||
| 2.60%, due 05/10/2005 | 2,700 | 2,700 | |||||||||
| 2.89%, due 05/19/2005 | 2,300 | 2,300 | |||||||||
| 2.76%, due 05/23/2005 | 1,000 | 1,000 | |||||||||
| Principal | Value | ||||||||||
| Toronto Dominion Bank, Ltd. 2.75%, due 05/09/2005 | $ | 600 | $ | 600 | |||||||
| 2.87%, due 06/13/2005 | 2,100 | 2,100 | |||||||||
| 3.00%, due 06/29/2005 | 1,100 | 1,100 | |||||||||
| 2.76%, due 07/05/2005 | 1,500 | 1,500 | |||||||||
| 3.02%, due 07/06/2005 | 4,400 | 4,400 | |||||||||
| Wells Fargo Bank NA 2.80%, due 05/05/2005 | 1,000 | 1,000 | |||||||||
| 3.02%, due 06/30/2005 | 1,900 | 1,900 | |||||||||
| Total Certificates of Deposit (cost: $22,400) | 22,400 | ||||||||||
| Total Investment Securities (cost: $198,330) | $ | 198,330 | |||||||||
| SUMMARY: | |||||||||||
| Investments, at value | 100.0 | % | $ | 198,330 | |||||||
| Liabilities in excess of other assets | (0.0 | )% | (83 | ) | |||||||
| Net assets | 100.0 | % | $ | 198,247 | |||||||
NOTES TO SCHEDULE OF INVESTMENTS:
(a) Floating or variable rate note. Rate is listed as of April 30, 2005.
DEFINITIONS:
144A 144A Securities are registered pursuant to Rule 144A of the Securities Act of 1933. These securities are deemed to be liquid for purposes of compliance limitations on holdings of illiquid securities and may be resold as transactions exempt from registration, normally to qualified institutional buyers. At April 30, 2005, these securities aggregated $75,871 or 38.2% of the net assets of the Fund.
The notes to the financial statements are an integral part of this report.
Transamerica IDEX Mutual Funds
Semi-Annual Report 2005
3
TA IDEX Transamerica Money Market
STATEMENT OF ASSETS AND LIABILITIES
At April 30, 2005
(all amounts except per share amounts in thousands)
(unaudited)
| Assets: | |||||||
| Investment securities, at value (cost: $198,330) | $ | 198,330 | |||||
| Cash | 58 | ||||||
| Receivables: | |||||||
| Shares of beneficial interest sold | 494 | ||||||
| Interest | 120 | ||||||
| Other | 120 | ||||||
| 199,122 | |||||||
| Liabilities: | |||||||
| Accounts payable and accrued liabilities: | |||||||
| Shares of beneficial interest redeemed | 513 | ||||||
| Management and advisory fees | 32 | ||||||
| Distribution and service fees | 82 | ||||||
| Transfer agent fees | 72 | ||||||
| Dividends to shareholders | 148 | ||||||
| Other | 28 | ||||||
| 875 | |||||||
| Net Assets | $ | 198,247 | |||||
| Net Assets Consist of: | |||||||
| Shares of beneficial interest, unlimited shares authorized, no par value | $ | 198,156 | |||||
| Undistributed net investment income (loss) | 91 | ||||||
| Net Assets | $ | 198,247 | |||||
| Net Assets by Class: | |||||||
| Class A | $ | 148,263 | |||||
| Class B | 33,034 | ||||||
| Class C | 16,950 | ||||||
| Shares Outstanding: | |||||||
| Class A | 148,263 | ||||||
| Class B | 33,034 | ||||||
| Class C | 16,946 | ||||||
| Net Asset Value Per Share: | |||||||
| Class A | $ | 1.00 | |||||
| Class B | 1.00 | ||||||
| Class C | 1.00 | ||||||
STATEMENT OF OPERATIONS
For the period ended April 30, 2005
(all amounts in thousands)
(unaudited)
| Investment Income: | |||||||
| Interest | $ | 2,389 | |||||
| Expenses: | |||||||
| Management and advisory fees | 398 | ||||||
| Transfer agent fees: | |||||||
| Class A | 148 | ||||||
| Class B | 44 | ||||||
| Class C | 23 | ||||||
| Printing and shareholder reports | 37 | ||||||
| Custody fees | 11 | ||||||
| Administration fees | 18 | ||||||
| Legal fees | 4 | ||||||
| Audit fees | 6 | ||||||
| Trustees fees | 3 | ||||||
| Registration fees: | |||||||
| Class A | 17 | ||||||
| Class B | 7 | ||||||
| Class C | 12 | ||||||
| Distribution and service fees: | |||||||
| Class A | 261 | ||||||
| Class B | 168 | ||||||
| Class C | 84 | ||||||
| Total expenses | 1,241 | ||||||
| Less: | |||||||
| Reimbursement of class expenses: | |||||||
| Class A | (164 | ) | |||||
| Class B | (103 | ) | |||||
| Class C | (70 | ) | |||||
| Net expenses | 904 | ||||||
| Net Investment Income (Loss) | 1,485 | ||||||
| Net Increase (Decrease) in Net Assets Resulting from Operations | $ | 1,485 | |||||
The notes to the financial statements are an integral part of this report.
Transamerica IDEX Mutual Funds
Semi-Annual Report 2005
4
TA IDEX Transamerica Money Market
STATEMENTS OF CHANGES IN NET ASSETS
For the period or year ended
(all amounts in thousands)
| April 30, 2005 (unaudited) | October 31, 2004 | ||||||||||
| Increase (Decrease) In Net Assets From: | |||||||||||
| Operations: | |||||||||||
| Net investment income (loss) | $ | 1,485 | $ | 710 | |||||||
| 1,485 | 710 | ||||||||||
| Distributions to Shareholders: | |||||||||||
| From net investment income: | |||||||||||
| Class A | (1,168 | ) | (601 | ) | |||||||
| Class B | (206 | ) | (56 | ) | |||||||
| Class C | (111 | ) | (40 | ) | |||||||
| Class C2 | – | (9 | ) | ||||||||
| Class M | – | (4 | ) | ||||||||
| (1,485 | ) | (710 | ) | ||||||||
| Capital Share Transactions: | |||||||||||
| Proceeds from shares sold: | |||||||||||
| Class A | 60,922 | 179,283 | |||||||||
| Class B | 9,247 | 25,310 | |||||||||
| Class C | 9,191 | 23,364 | |||||||||
| Class C2 | – | 7,547 | |||||||||
| Class M | – | 2,473 | |||||||||
| 79,360 | 237,977 | ||||||||||
| Dividends and distributions reinvested: | |||||||||||
| Class A | 1,095 | 545 | |||||||||
| Class B | 124 | 54 | |||||||||
| Class C | 90 | 11 | |||||||||
| Class C2 | – | 8 | |||||||||
| Class M | – | 4 | |||||||||
| 1,309 | 622 | ||||||||||
| Cost of shares redeemed: | |||||||||||
| Class A | (99,090 | ) | (104,345 | ) | |||||||
| Class B | (16,515 | ) | (39,451 | ) | |||||||
| Class C | (14,608 | ) | (17,946 | ) | |||||||
| Class C2 | – | (10,452 | ) | ||||||||
| Class M | – | (3,810 | ) | ||||||||
| (130,213 | ) | (176,004 | ) | ||||||||
| Class level exchanges: | |||||||||||
| Class C | – | 13,306 | |||||||||
| Class C2 | – | (9,777 | ) | ||||||||
| Class M | – | (3,529 | ) | ||||||||
| – | – | ||||||||||
| Automatic conversions: | |||||||||||
| Class A | 25 | 34 | |||||||||
| Class B | (25 | ) | (34 | ) | |||||||
| – | – | ||||||||||
| (49,544 | ) | 62,595 | |||||||||
| Net increase (decrease) in net assets | (49,544 | ) | 62,595 | ||||||||
| April 30, 2005 (unaudited) | October 31, 2004 | ||||||||||
| Net Assets: | |||||||||||
| Beginning of period | $ | 247,791 | $ | 185,196 | |||||||
| End of period | $ | 198,247 | $ | 247,791 | |||||||
| Undistributed Net Investment Income (Loss) | $ | 91 | $ | 91 | |||||||
| Share Activity: | |||||||||||
| Shares issued: | |||||||||||
| Class A | 60,922 | 179,282 | |||||||||
| Class B | 9,247 | 25,311 | |||||||||
| Class C | 9,191 | 23,364 | |||||||||
| Class C2 | – | 7,548 | |||||||||
| Class M | – | 2,473 | |||||||||
| 79,360 | 237,978 | ||||||||||
| Shares issued–reinvested from distributions: | |||||||||||
| Class A | 1,095 | 545 | |||||||||
| Class B | 124 | 54 | |||||||||
| Class C | 90 | 11 | |||||||||
| Class C2 | – | 8 | |||||||||
| Class M | – | 4 | |||||||||
| 1,309 | 622 | ||||||||||
| Shares redeemed: | |||||||||||
| Class A | (99,090 | ) | (104,345 | ) | |||||||
| Class B | (16,515 | ) | (39,451 | ) | |||||||
| Class C | (14,612 | ) | (17,946 | ) | |||||||
| Class C2 | – | (10,452 | ) | ||||||||
| Class M | – | (3,810 | ) | ||||||||
| (130,217 | ) | (176,004 | ) | ||||||||
| Class level exchanges: | |||||||||||
| Class C | – | 13,302 | |||||||||
| Class C2 | – | (9,777 | ) | ||||||||
| Class M | – | (3,525 | ) | ||||||||
| – | – | ||||||||||
| Automatic conversions: | |||||||||||
| Class A | 25 | 34 | |||||||||
| Class B | (25 | ) | (34 | ) | |||||||
| – | – | ||||||||||
| Net increase (decrease) in shares outstanding: | |||||||||||
| Class A | (37,048 | ) | 75,516 | ||||||||
| Class B | (7,169 | ) | (14,120 | ) | |||||||
| Class C | (5,331 | ) | 18,731 | ||||||||
| Class C2 | – | (12,673 | ) | ||||||||
| Class M | – | (4,858 | ) | ||||||||
| (49,548 | ) | 62,596 | |||||||||
The notes to the financial statements are an integral part of this report.
Transamerica IDEX Mutual Funds
Semi-Annual Report 2005
5
TA IDEX Transamerica Money Market
FINANCIAL HIGHLIGHTS
(unaudited for the period ended April 30, 2005)
| For a share of beneficial interest outstanding throughout each period | |||||||||||||||||||||||||||||||||||||||
| Net Asset | Investment Operations | Distributions | Net Asset | ||||||||||||||||||||||||||||||||||||
| For the Period Ended (c)(f) | Value, Beginning of Period | Net Investment Income (Loss) | Net Realized and Unrealized Gain (Loss) | Total Operations | From Net Investment Income | From Net Realized Gains | Total Distributions | Value, End of Period | |||||||||||||||||||||||||||||||
| Class A | 4/30/2005 | $ | 1.00 | $ | 0.008 | $ | – | $ | 0.008 | $ | (0.008 | ) | $ | – | $ | (0.008 | ) | $ | 1.00 | ||||||||||||||||||||
| 10/31/2004 | 1.00 | 0.004 | – | 0.004 | (0.004 | ) | – | (0.004 | ) | 1.00 | |||||||||||||||||||||||||||||
| 10/31/2003 | 1.00 | 0.004 | – | 0.004 | (0.004 | ) | – | (0.004 | ) | 1.00 | |||||||||||||||||||||||||||||
| 10/31/2002 | 1.00 | 0.008 | – | 0.008 | (0.008 | ) | – | (0.008 | ) | 1.00 | |||||||||||||||||||||||||||||
| Class B | 4/30/2005 | 1.00 | 0.006 | – | 0.006 | (0.006 | ) | – | (0.006 | ) | 1.00 | ||||||||||||||||||||||||||||
| 10/31/2004 | 1.00 | 0.001 | – | 0.001 | (0.001 | ) | – | (0.001 | ) | 1.00 | |||||||||||||||||||||||||||||
| 10/31/2003 | 1.00 | 0.001 | – | 0.001 | (0.001 | ) | – | (0.001 | ) | 1.00 | |||||||||||||||||||||||||||||
| 10/31/2002 | 1.00 | – | – | – | – | – | – | 1.00 | |||||||||||||||||||||||||||||||
| Class C | 4/30/2005 | 1.00 | 0.007 | – | 0.007 | (0.007 | ) | – | (0.007 | ) | 1.00 | ||||||||||||||||||||||||||||
| 10/31/2004 | 1.00 | 0.001 | – | 0.001 | (0.001 | ) | – | (0.001 | ) | 1.00 | |||||||||||||||||||||||||||||
| 10/31/2003 | 1.00 | 0.002 | – | 0.002 | (0.002 | ) | – | (0.002 | ) | 1.00 | |||||||||||||||||||||||||||||
| Ratios/Supplemental Data | |||||||||||||||||||||||||||
| For the Period | Total | Net Assets, End of Period | Ratio of Expenses to Average Net Assets (a) | Net Investment Income (Loss) to Average | |||||||||||||||||||||||
| Ended (f) | Return (b) | (000's) | Net (d) | Total (e) | Net Assets (a) | ||||||||||||||||||||||
| Class A | 4/30/2005 | 0.78 | % | $ | 148,263 | 0.83 | % | 1.05 | % | 1.57 | % | ||||||||||||||||
| 10/31/2004 | 0.42 | 185,311 | 0.83 | 1.19 | 0.45 | ||||||||||||||||||||||
| 10/31/2003 | 0.39 | 109,794 | 0.83 | 1.22 | 0.42 | ||||||||||||||||||||||
| 10/31/2002 | 0.56 | 131,949 | 0.83 | 1.36 | 0.93 | ||||||||||||||||||||||
| Class B | 4/30/2005 | 0.45 | 33,034 | 1.17 | 1.79 | 1.23 | |||||||||||||||||||||
| 10/31/2004 | 0.14 | 40,203 | 1.10 | 1.81 | (g) | 0.13 | |||||||||||||||||||||
| 10/31/2003 | 0.12 | 54,324 | 1.16 | 1.87 | (g) | 0.08 | |||||||||||||||||||||
| 10/31/2002 | 0.28 | 81,683 | 1.48 | 2.01 | 0.28 | ||||||||||||||||||||||
| Class C | 4/30/2005 | 0.62 | 16,950 | 1.06 | 1.90 | 1.33 | |||||||||||||||||||||
| 10/31/2004 | 0.14 | 22,277 | 0.98 | 1.96 | (g) | 0.43 | |||||||||||||||||||||
| 10/31/2003 | 0.12 | 3,542 | 1.04 | 1.87 | (g) | 0.21 | |||||||||||||||||||||
NOTES TO FINANCIAL HIGHLIGHTS
(a) Annualized.
(b) Total Return has been calculated for the applicable period without deduction of a sales load, if any, on an initial purchase. Periods of less than one year are not annualized.
(c) Per share information is calculated based on average number of shares outstanding.
(d) Ratio of Net Expenses to Average Net Assets is net of fee waivers and reimbursements by the investment adviser, if any (see note 2).
(e) Ratio of Total Expenses to Average Net Assets includes all expenses before fee waivers and reimbursements by the investment adviser.
(f) TA IDEX Transamerica Money Market ("the Fund") commenced operations on March 1, 2002. The inception date for the Fund's offering of share Class C was November 11, 2002.
(g) The Fund has restated its financial statements in order to properly present waived distribution and service fees on a gross basis. The effect of this restatement was to increase the ratios of total expenses to average net assets by 0.38% and 0.32% for Class B, and 0.23% and 0.44% for Class C, for the years ended October 31, 2004 and October 31, 2003, respectively. The Fund's net asset value per share, ratios of net expenses to average net assets, and net investment income ratios were not affected by this restatement during any period.
The notes to the financial statements are an integral part of this report.
Transamerica IDEX Mutual Funds
Semi-Annual Report 2005
6
TA IDEX Transamerica Money Market
NOTES TO FINANCIAL STATEMENTS
At April 30, 2005
(all amounts in thousands)
(unaudited)
NOTE 1. ORGANIZATION AND SIGNIFICANT ACCOUNTING POLICIES
Transamerica IDEX Mutual Funds is a Delaware statutory trust registered under the Investment Company Act of 1940, as amended (the "1940 Act"), as an open-end management investment company. Prior to March 1, 2005, Transamerica IDEX Mutual Funds was a Massachusetts business trust. TA IDEX Transamerica Money Market ("the Fund"), part of Transamerica IDEX Mutual Funds, began operations on March 1,2002.
In the normal course of business, the Fund enters into contracts that contain a variety of representations and warranties, which provide general indemnifications. The Fund's maximum exposure under these arrangements is unknown, as this would involve future claims that may be made against the Fund and/or its affiliates that have not yet occurred. However, based on experience, the Fund expects the risk of loss to be remote.
See the Prospectus and Statement of Additional Information for a description of the Fund's investment objective.
In preparing the Fund's financial statements in accordance with accounting principles generally accepted in the United States of America ("GAAP"), estimates or assumptions (which could differ from actual results) may be used that affect reported amounts and disclosures. The following policies were consistently followed by the Fund, in accordance with GAAP.
Multiple class operations and expenses: The Fund currently offers three classes of shares, each with a public offering price that reflects different sales charges, if any, and expense levels. On June 15, 2004, Class C2 shares merged into Class C. On September 24, 2004, Class M shares merged into Class C. Class B shares will convert to Class A shares eight years after purchase. Income, non-class specific expenses and realized and unrealized gains and losses, are allocated daily to each class, based upon the value of shares outstanding method as permitted under Rule 18f-3 of the 1940 Act. Each class bears its own specific expenses as well as a portion of general, common expenses.
Pricing of shares: The Fund prices its shares on the basis of the net asset value of each class of shares of the Fund, which is determined as of the close of the New York Stock Exchange ("NYSE") (generally 4:00 p.m. Eastern Time) on each day on which the NYSE is open for trading.
Security valuations: As permitted under Rule 2a-7 of the 1940 Act, the securities held by the Fund are valued on the basis of amortized cost, which approximates market value.
Other securities for which quotations are not readily available are valued at fair market value as determined in good faith using guidelines adopted by the Board of Trustees of the Fund, under the supervision of the Fund's Valuation Committee. These guidelines may include: the type of security; any restrictions on its resale; financial or business news of the issuer; similar or related securities that are actively trading; related corporate actions; and other significant events occurring after the close of trading in the security.
Cash: The Fund may leave cash overnight in its cash account with the custodian, Investors Bank & Trust Company ("IBT"). IBT has been contracted on behalf of the Fund to invest the excess cash into a savings account, which at April 30, 2005, was paying an interest rate of 2.02%.
Throughout the period, the Fund may have a cash overdraft balance. A fee is incurred on this overdraft, calculated by multiplying the overdraft by a rate based on the federal funds rate.
Security transactions and investment income: Security transactions are recorded on the trade date. Security gains and losses are calculated on the specific identification basis. Interest income, including accretion of discounts and amortization of premiums, is recorded on the accrual basis commencing on the settlement date.
Account maintenance fees: If the shareholder account balance falls below $1 by either shareholder action or as a result of market action, a $25 (not in thousands) fee is assessed every year until the balance reaches $1. The fee is assessed by redeeming shares in the shareholder's account.
No fee will be charged under the following conditions:
• accounts opened within the preceding 24 months
• accounts with an active monthly Automatic Investment Plan ($50 (not in thousands) minimum per fund)
• accounts owned by an individual which, when combined by social security number, have a balance of $5 or more
• accounts owned by individuals in the same household (by address) that have a combined balance of $5 or more
• UTMA/UGMA accounts
• Fiduciary accounts
• B-share accounts whose shares have started to convert to A-shares accounts (as long as combined value of both accounts is at least $1)
For the six months ended April 30, 2005, this fee totaled less than $1. These fees are included in Paid in Capital in the Statement of Assets and Liabilities.
Dividend distributions: Distributions to shareholders are recorded on the ex-dividend date and are determined in accordance with Federal income tax regulations which may differ from GAAP.
Transamerica IDEX Mutual Funds
Semi-Annual Report 2005
7
TA IDEX Transamerica Money Market
NOTES TO FINANCIAL STATEMENTS (continued)
At April 30, 2005
(all amounts in thousands)
(unaudited)
NOTE 2. RELATED PARTY TRANSACTIONS
Transamerica Fund Advisors, Inc. ("TFAI") is the Fund's investment adviser. Transamerica Fund Services, Inc. ("TFS") is the Fund's administrator and transfer agent. AFSG Securities Corp. ("AFSG") is the Fund's distributor/principal underwriter. AFSG is 100% owned by AUSA Holding Company ("AUSA"). TFAI is a directly owned subsidiary of Western Reserve Life Assurance Co. of Ohio (78%) and AUSA (22%). TFS is a wholly owned subsidiary of WRL (50%) and AUSA (50%). AUSA and WRL are wholly owned indirect subsidiaries of AEGON, NV, a Netherlands corporation.
Effective January 1, 2005 AEGON/Transamerica Fund Advisors, Inc. ("ATFA") was renamed Transamerica Fund Advisors, Inc. ("TFAI"); AEGON/Transamerica Fund Services, Inc. ("ATFS") and AEGON/Transamerica Investor Services, Inc. ("ATIS") merged into one entity and was renamed Transamerica Fund Services, Inc. ("TFS").
Transamerica Investment Management, LLC is both an affiliate of the Fund and a sub-adviser to the Fund.
The following schedule reflects the percentage of fund assets owned by affiliated mutual funds (i.e., through the asset allocation funds)
| Net Assets | % of Net Assets | ||||||||||
| TA IDEX Asset Allocation– Conservative Portfolio | $ | 20,840 | 10.51 | % | |||||||
| TA IDEX Asset Allocation– Moderate Growth Portfolio | 16,253 | 8.20 | % | ||||||||
| TA IDEX Asset Allocation– Moderate Portfolio | 33,117 | 16.71 | % | ||||||||
| Total | $ | 70,210 | 35.42 | % | |||||||
Investment advisory fee: The Fund pays management fees to TFAI based on average daily net assets ("ANA") at the following rate:
0.40% of ANA
TFAI has contractually agreed to waive its advisory fee and will reimburse the Fund to the extent that operating expenses, excluding 12b-1 fees, exceed the following stated annual limit:
0.48% Expense Limit
If total fund expenses fall below the annual expense limitation agreement agreed to by the adviser within the succeeding three years, the Fund may be required to pay that adviser a portion or all of the waived advisory fees.
| Advisory Fee Waived | Available for Recapture Through | ||||||||||
| Fiscal Year 2003 | $ | 869 | 10/31/2006 | ||||||||
| Fiscal Year 2002 | 543 | 10/31/2005 | |||||||||
If total class expenses fall below the annual expense limitation agreement agreed to by the adviser within the succeeding three years. The Fund may be required to pay that advisor a portion or all of the reimbursed class expenses.
| Reimbursement of Class Expenses | Available for Recapture Through | ||||||||||
| Fiscal Year 2004–Class A | $ | 477 | 10/31/2007 | ||||||||
| Fiscal Year 2004–Class B | 145 | 10/31/2007 | |||||||||
| Fiscal Year 2004–Class C | 71 | 10/31/2007 | |||||||||
Distribution and service fees: The Fund has a 12b-1 distribution plan under the 1940 Act pursuant to which an annual fee, based on average daily net assets, is paid to the distributor for various disbursements such as broker-dealer account servicing fees and other promotional expenses of the Fund. The Fund is authorized under the 12b-1 plan to pay fees on each class up to the following limits:
| Class A | 0.35 | % | |||||
| Class B | 1.00 | % | |||||
| Class C | 1.00 | % | |||||
In the case the Fund or a class of shares of the Fund is closed to new investors or investments, the Fund is authorized to pay 12b-1 fees for past sales and distribution efforts and present and past investor services.
The Fund has waived a portion of the 12b-1 fees for all classes except Class A. The amount waived for the six months ended April 30, 2005 was $86. These waivers are not subject to the expense recapture agreement. The waivers reduced the ratio of net expenses to average net assets by 0.31% for Class B and 0.42% for Class C.
Underwriter commissions relate to front-end sales charges imposed for Class A shares and contingent deferred sales charges from Classes B, C and certain A share redemptions. For the six months ended April 30, 2005, the underwriter commissions were as follows:
| Received by Underwriter | $ | 126 | |||||
| Retained by Underwriter | – | ||||||
| Contingent Deferred Sales Charge | 159 | ||||||
Administrative services: The Fund has entered into an agreement with TFS for financial and legal fund administration services, which includes such items as compliance, expenses, financial statements and other reporting, distributions, tax returns, prospectus preparation, board of trustees meeting support and other legal matters. As of January 1, 2005 the Fund pays TFS an annual fee of 0.02% of average net assets. Prior to January 1, 2005 the Fund paid TFS an annual fee of 0.015% of average net assets. The Legal fees on the Statement of Operations are for fees paid to external legal counsel.
Transamerica IDEX Mutual Funds
Semi-Annual Report 2005
8
TA IDEX Transamerica Money Market
NOTES TO FINANCIAL STATEMENTS (continued)
At April 30, 2005
(all amounts in thousands)
(unaudited)
NOTE 2.–(continued)
Transfer agent fees: The Fund pays TFS an annual per-account charge of $20 (not in thousands) for each open account and $1.63 (not in thousands) for each closed account. There is no new account charge. The Transfer agent fees on the Statement of Operations are made up of fees paid to TFS and costs associated with shareholder statements.
The Fund paid TFS $183 for the six months ended April 30, 2005.
Deferred compensation plan: Each eligible Fund Trustee may elect participation in the Deferred Compensation Plan ("the Plan"). Under the Plan, such Trustees may defer payment of a percentage of their total fees earned as a Fund Trustee. These deferred amounts may be invested in any Transamerica IDEX Mutual Fund. At April 30, 2005, the value of invested plan amount was $11. Invested plan amounts and the total liability for deferred compensation to the Trustees under the Plan at April 30, 2005, are included in the accompanying Statement of Assets and Liabilities.
NOTE 3. FEDERAL INCOME TAX MATTERS
The Fund has not made any provision for federal income or excise taxes due to its policy to distribute all of its taxable income and capital gains to its shareholders and otherwise qualify as a regulated investment company under the Internal Revenue Code. Income and capital gain distributions are determined in accordance with income tax regulations, which may differ from GAAP. These differences are primarily due to differing treatment for items including, but not limited to, excise taxes, distributions and service fee expenses.
The aggregate cost of investments and composition of unrealized appreciation (depreciation) for federal income tax purposes as of April 30, 2005, are as follows:
| Federal Tax Cost Basis | $ | 198,330 | |||||
| Unrealized Appreciation | $ | – | |||||
| Unrealized (Depreciation) | – | ||||||
| Net Unrealized Appreciation (Depreciation) | $ | – | |||||
NOTE 4. REGULATORY PROCEEDINGS
There continues to be significant federal and state regulatory activity relating to financial services companies, particularly mutual fund companies and their investment advisers. As part of an ongoing investigation regarding potential market timing, recordkeeping and trading compliance issues and matters affecting the Fund's investment adviser, TFAI, and certain employees and affiliates of TFAI, the SEC staff has indicated that it is likely to take some action against TFAI and certain of its affiliates at the conclusion of the investigation. The potential timing and the scope of any such action is difficult to predict. Although the impact of any action brought against TFAI and/or its affiliates is difficult to assess at the present time, the Fund currently believes that the likelihood that any such action will have a material adverse impact on it is remote. It is important to note that the Fund is not aware of any allegation of wrongdoing against it and its board at the time this semi-annual report is printed. Although it is not anticipated that these developments will have an adverse impact on the Fund, there can be no assurance at this time. TFAI and its affiliates are actively working with the SEC in regard to this matter; however, the exact resolution cannot be determined at this time. TFAI will take such actions that it deems necessary or appropriate to continue providing management services to the Fund and to bring all matters to an appropriate conclusion.
TFAI and/or its affiliates, and not the Fund, will bear the costs regarding these regulatory matters.
Transamerica IDEX Mutual Funds
Semi-Annual Report 2005
9
TA IDEX Transamerica Money Market
INVESTMENT ADVISORY AND SUB-ADVISORY AGREEMENTS – REVIEW AND RENEWAL
At a meeting of the Board of Trustees of Transamerica IDEX Mutual Funds ("TA IDEX") held on October 6, 2004, the Board considered and approved the renewal for a one-year period of the Investment Advisory Agreement between TA IDEX Transamerica Money Market (the "Fund") and Transamerica Fund Advisors, Inc. ("TFAI") as well as the Investment Sub-Advisory Agreement of the Fund between TFAI and Transamerica Investment Management, LLC (the "Sub-Adviser"). In approving the renewal of these agreements, the Board concluded that the Investment Advisory and Investment Sub-Advisory Agreements enable shareholders of the Fund to obtain high quality services at a cost that is appropriate, reasonable, and in the best interests of shareholders based upon the following determinations, among others:
The nature, extent and quality of the advisory service to be provided. The Board considered the nature and quality of the services provided by TFAI and the Sub-Adviser to the Fund in the past, as well as the services anticipated to be provided in the future. The Board concluded that TFAI and the Sub-Adviser are capable of providing high quality services to the Fund, as indicated by TFAI's management capabilities demonstrated with respect to the Fund and other funds managed by TFAI, TFAI's management oversight process, and the professional qualifications and experience of the Sub-Adviser's portfolio management team. The Board also concluded that TFAI and the Sub-Adviser would provide the same quality and quantity of investment management and related services as before, that these services are app ropriate in scope and extent in light of the Fund's operations, the competitive landscape of the investment company business and investor needs, and that TFAI's and the Sub-Adviser's obligations will remain the same in all respects.
The investment performance of the Fund. The Board concluded, based in particular on information provided by Lipper Analytics, that the Fund's investment performance was competitive relative to comparable funds over trailing one- and two-year periods and to the Fund's benchmark index over the past year. On the basis of the Trustees' assessment of the nature, extent and quality of investment advisory and related services to be provided or procured by TFAI and the Sub-Adviser, the Trustees concluded that TFAI and the Sub-Adviser were capable of generating a level of long-term investment performance that is appropriate in light of the Fund's investment objective, policies and strategies and competitive with many other investment companies.
The cost of advisory services provided and the level of profitability. On the basis of the Board's review of the fees to be charged by TFAI and the Sub-Adviser for investment advisory and related services, TFAI's financial statements, the fees paid by TFAI to the Sub-Adviser, TFAI's estimated net management income resulting from its management of the Fund, the estimated profitability of TFAI's relationships with the Fund and TA IDEX, and the estimated profitability of the Sub-Adviser's relationship with the Fund, the Board concluded that the level of investment advisory fees and the profitability is appropriate in light of the services provided, the management fees and overall expense ratios of comparable investment companies, and the anticipated profitability of the relationship between the Fun d, TFAI and the Sub-Adviser. Further, on the basis of comparative information supplied by Lipper Analytics, the Board determined that the advisory fees and estimated overall expense ratio of the Fund were consistent with industry averages.
The extent to which economies of scale would be realized as the Fund grows and whether fee levels reflect these economies of scale for the benefit of Fund investors. The Board concluded that the advisory fees appropriately reflect the Fund's current size, the current economic environment for TFAI, and the competitive nature of the investment company market. While the investment advisory fees do not reduce should Fund assets grow meaningfully, the Board determined that the investment advisory fees already reflect potential future economies of scale to some extent by virtue of their competitive levels determined with reference to industry standards as reported by Lipper Analytics and the estimated profitability at current or foreseeable asset levels. In addition, the Board noted that it will have the opportunity to periodically re-examine whether the Fund has achieved economies of scale, as well as the appropriateness of advisory fees payable to TFAI and the Sub-Adviser in the future.
Benefits (such as soft dollars) to TFAI or the Sub-Adviser from its relationship with the Fund. The Board concluded that other benefits derived by TFAI or the Sub-Adviser from its relationship with the Fund are reasonable and fair, and are consistent with industry practice and the best interests of the Fund and its shareholders. In this regard, the Board noted that neither TFAI nor the Sub-Adviser realizes "soft dollar" benefits from its relationship with the Fund.
Other considerations. The Board also determined that TFAI had made a substantial commitment to the recruitment and retention of high quality personnel, and maintained the financial, compliance and operational resources reasonably necessary to manage the Fund in a professional manner that is consistent with the best interests of the Fund and its shareholders. The Trustees also concluded that TFAI and its affiliates had made a significant entrepreneurial commitment to the management and success of the Fund, reflected by expense limitation and fee waiver arrangements with the Fund which, as demonstrated in the past with the Fund, may result in TFAI and its affiliates waiving a substantial amount of fees for the benefit of shareholders.
Transamerica IDEX Mutual Funds
Semi-Annual Report 2005
10
TA IDEX Transamerica Money Market
SUPPLEMENTAL INFORMATION (unaudited)
RESULTS OF SHAREHOLDER PROXY
At a special meeting of shareholders held on February 25, 2005, the results of the Proposals were as follows:
Transamerica IDEX Mutual Funds
Proposal 1: Election of Trustees to the Board of Trustees of Transamerica IDEX Mutual Funds.
| For | Withheld | ||||||||||
| Peter R. Brown | 872,017,875.249 | 4,468,498.551 | |||||||||
| Daniel Calabria | 871,917,069.786 | 4,569,304.014 | |||||||||
| Janise B. Case | 872,099,393.125 | 4,386,980.675 | |||||||||
| Charles C. Harris | 872,086,722.025 | 4,399,651.775 | |||||||||
| Leo J. Hill | 872,304,465.640 | 4,181,908.160 | |||||||||
| Russell A. Kimball, Jr. | 872,253,556.471 | 4,232,817.329 | |||||||||
| William W. Short, Jr. | 872,139,920.944 | 4,346,452.856 | |||||||||
| John Waechter | 872,261,152.376 | 4,225,221.424 | |||||||||
| Jack E. Zimmerman | 871,929,967.512 | 4,556,406.288 | |||||||||
| Brian C. Scott | 872,218,970.367 | 4,267,403.433 | |||||||||
| Thomas P. O'Neill | 872,111,944.117 | 4,374,429.683 | |||||||||
TA IDEX Transamerica Money Market
Proposal 2: Approval of an Agreement and Plan of Reorganization pursuant to which Transamerica IDEX Mutual Funds will organize as a Delaware statutory trust.
| For | Against | Abstentions/Broker Non-Votes | |||||||||
| 161,001,266.001 | 1,101,042.319 | 22,905,580.288 | |||||||||
Proposal 3: Approval of changes to the fundamental investment restrictions of TA IDEX Transamerica Money Market.
| A. Diversification | For | Against | Abstentions/Broker Non-Votes | ||||||||||||
| 161,861,997.719 | 1,277,074.889 | 21,868,816.000 | |||||||||||||
| B. Borrowing | For | Against | Abstentions/Broker Non-Votes | ||||||||||||
| 161,793,498.059 | 1,345,574.549 | 21,868,816.000 | |||||||||||||
| C. Senior Securities | For | Against | Abstentions/Broker Non-Votes | ||||||||||||
| 161,862,047.719 | 1,277,024.889 | 21,868,816.000 | |||||||||||||
| D. Underwriting Securities | For | Against | Abstentions/Broker Non-Votes | ||||||||||||
| 161,817,353.239 | 1,321,719.369 | 21,868,816.000 | |||||||||||||
| E. Real Estate | For | Against | Abstentions/Broker Non-Votes | ||||||||||||
| 161,852,472.029 | 1,286,600.579 | 21,868,816.000 | |||||||||||||
| F. Making Loans | For | Against | Abstentions/Broker Non-Votes | ||||||||||||
| 161,730,135.519 | 1,408,937.089 | 21,868,816.000 | |||||||||||||
| G. Concentration | For | Against | Abstentions/Broker Non-Votes | ||||||||||||
| 161,785,207.409 | 1,353,865.199 | 21,868,816.000 | |||||||||||||
| H. Commodities | For | Against | Abstentions/Broker Non-Votes | ||||||||||||
| 161,768,816.119 | 1,370,256.489 | 21,868,816.000 | |||||||||||||
Transamerica IDEX Mutual Funds
Semi-Annual Report 2005
11
TA IDEX Transamerica Short-Term Bond
GRAPHICAL PRESENTATION OF SCHEDULE OF INVESTMENTS
By Bond Credit Quality (Moody Ratings)
At April 30, 2005
(unaudited)
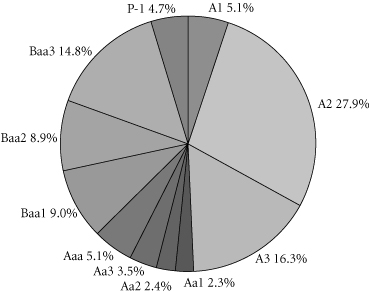
This chart shows the percentage breakdown by Bond Credit Quality of the Fund's total investment securities.
Aaa Prime grade obligations. Exceptional financial security and ability to meet senior financial obligations.
Aa1 High grade obligations. Strong capacity to pay interest and repay principal.
Aa2 High grade obligations. Strong capacity to pay interest and repay principal.
Aa3 High grade obligations. Strong capacity to pay interest and repay principal.
A1 Upper medium grade obligations. Interest payments and principal are considered adequate, but elements may be present which suggest a susceptibility to impairment some time in the future.
A2 Upper medium grade obligations. Interest payments and principal are considered adequate, but elements may be present which suggest a susceptibility to impairment some time in the future.
A3 Upper medium grade obligations. Interest payments and principal are considered adequate, but elements may be present which suggest a susceptibility to impairment some time in the future.
Baa1 Medium grade obligations. Interest payments and principal security are adequate for the present but certain protective elements may be lacking or may be characteristically unreliable over great length of time.
Baa2 Medium grade obligations. Interest payments and principal security appear adequate for the present but certain protective elements may be lacking or may be characteristically unreliable over great length of time.
Baa3 Medium grade obligations. Interest payments and principal security are not as adequate for the present but certain protective elements may be lacking or may be characteristically unreliable over great length of time.
P-1 High grade short term obligations. superior ability to repay short-term debt obligations
Transamerica IDEX Mutual Funds
Semi-Annual Report 2005
1
TA IDEX Transamerica Short-Term Bond
SCHEDULE OF INVESTMENTS
At April 30, 2005
(all amounts except share amounts in thousands)
(unaudited)
| Principal | Value | ||||||||||
| U.S. GOVERNMENT OBLIGATIONS (0.6%) | |||||||||||
| U.S. Treasury Note 2.50%, due 10/31/2006 | $ | 150 | $ | 148 | |||||||
| 3.38%, due 02/28/2007 | 1,355 | 1,349 | |||||||||
| Total U.S. Government Obligations (cost: $1,492) | 1,497 | ||||||||||
| CORPORATE DEBT SECURITIES (90.7%) | |||||||||||
| Aerospace (4.7%) | |||||||||||
| Honeywell International, Inc. 6.88%, due 10/03/2005 | 5,050 | 5,116 | |||||||||
| Textron Financial Corp. 5.88%, due 06/01/2007 | 5,200 | 5,383 | |||||||||
| Amusement & Recreation Services (2.1%) | |||||||||||
| Harrah's Operating Co., Inc. 5.50%, due 07/01/2010 | 4,500 | 4,601 | |||||||||
| Automotive (1.3%) | |||||||||||
| DaimlerChrysler North America Holding Corp. 4.75%, due 01/15/2008 | 2,950 | 2,910 | |||||||||
| Beverages (6.8%) | |||||||||||
| Bottling Group LLC 2.45%, due 10/16/2006 | 3,965 | 3,881 | |||||||||
| Coca-Cola Enterprises, Inc. 5.38%, due 08/15/2006 | 5,000 | 5,083 | |||||||||
| Diageo Capital PLC 3.50%, due 11/19/2007 | 6,400 | 6,296 | |||||||||
| Business Credit Institutions (1.5%) | |||||||||||
| CIT Group, Inc. 2.88%, due 09/29/2006 | 3,500 | 3,444 | |||||||||
| Commercial Banks (1.2%) | |||||||||||
| Bank One Corp. 6.88%, due 08/01/2006 | 2,500 | 2,590 | |||||||||
| Communications Equipment (2.2%) | |||||||||||
| Motorola, Inc. 4.61%, due 11/16/2007 | 5,000 | 5,035 | |||||||||
| Department Stores (2.4%) | |||||||||||
| Meyer (Fred) Stores, Inc. 7.45%, due 03/01/2008 | 5,100 | 5,478 | |||||||||
| Electric Services (8.7%) | |||||||||||
| Dominion Resources, Inc. 3.66%, due 11/15/2006 | 4,140 | 4,115 | |||||||||
| Duke Energy Corp. 4.20%, due 10/01/2008 | 5,000 | 4,975 | |||||||||
| FPL Group Capital, Inc. 4.09%, due 02/16/2007 | 5,040 | 5,032 | |||||||||
| Principal | Value | ||||||||||
| TXU Electric Delivery Co. 5.00%, due 09/01/2007 | 5,400 | 5,460 | |||||||||
| Electric Gas & Sanitary Services (2.3%) | |||||||||||
| Nisource Finance Corp. 7.63%, due 11/15/2005 | $ | 5,000 | $ | 5,102 | |||||||
| Gas Production & Distribution (2.2%) | |||||||||||
| Atmos Energy Corp. 4.00%, due 10/15/2009 | 5,000 | 4,872 | |||||||||
| Holding & Other Investment Offices (3.7%) | |||||||||||
| Berkshire Hathaway Finance Corp. 3.40%, due 07/02/2007 | 4,000 | 3,945 | |||||||||
| iStar Financial, Inc. 4.88%, due 01/15/2009 | 4,500 | 4,461 | |||||||||
| Industrial Machinery & Equipment (3.1%) | |||||||||||
| Caterpillar Financial Services Corp., Series F 2.65%, due 01/30/2006 | 2,000 | 1,985 | |||||||||
| John Deere Capital Corp. 3.90%, due 01/15/2008 | 5,142 | 5,089 | |||||||||
| Insurance (4.9%) | |||||||||||
| International Lease Finance Corp. 5.63%, due 06/01/2007 | 5,790 | 5,946 | |||||||||
| St. Paul Travelers Cos. (The), Inc. 5.75%, due 03/15/2007 | 2,500 | 2,564 | |||||||||
| Wellpoint Health Networks, Inc. 6.38%, due 06/15/2006 | 2,500 | 2,562 | |||||||||
| Insurance Agents, Brokers & Service (2.9%) | |||||||||||
| Metlife, Inc. 3.91%, due 05/15/2005 | 6,500 | 6,502 | |||||||||
| Metal Mining (2.4%) | |||||||||||
| Barrick Gold Finance, Inc. 7.50%, due 05/01/2007 | 5,000 | 5,304 | |||||||||
| Mortgage Bankers & Brokers (2.2%) | |||||||||||
| Countrywide Home Loans, Inc. 5.50%, due 08/01/2006 | 2,500 | 2,544 | |||||||||
| Erac USA Finance Co.–144A 8.25%, due 05/01/2005 | 2,500 | 2,500 | |||||||||
| Personal Credit Institutions (7.3%) | |||||||||||
| Capital One Bank Corp. 6.88%, due 02/01/2006 | 6,500 | 6,645 | |||||||||
| Ford Motor Credit Co. 6.50%, due 01/25/2007 | 2,500 | 2,500 | |||||||||
| General Electric Capital Corp. 5.00%, due 06/15/2007 | 5,500 | 5,596 | |||||||||
| General Motors Acceptance Corp. 6.75%, due 01/15/2006 | 1,675 | 1,687 | |||||||||
The notes to the financial statements are an integral part of this report.
Transamerica IDEX Mutual Funds
Semi-Annual Report 2005
2
TA IDEX Transamerica Short-Term Bond
SCHEDULE OF INVESTMENTS (continued)
At April 30, 2005
(all amounts except share amounts in thousands)
(unaudited)
| Principal | Value | ||||||||||
| Petroleum Refining (2.2%) | |||||||||||
| BP Capital Markets PLC 2.75%, due 12/29/2006 | 5,100 | 5,014 | |||||||||
| Primary Metal Industries (2.3%) | |||||||||||
| Alcoa, Inc. 4.25%, due 08/15/2007 | $ | 5,200 | $ | 5,207 | |||||||
| Printing & Publishing (4.6%) | |||||||||||
| Gannett Co., Inc. 5.50%, due 04/01/2007 | 5,000 | 5,128 | |||||||||
| Viacom, Inc. 5.63%, due 05/01/2007 | 5,000 | 5,106 | |||||||||
| Radio & Television Broadcasting (1.9%) | |||||||||||
| Chancellor Media Corp. 8.00%, due 11/01/2008 | 4,000 | 4,322 | |||||||||
| Security & Commodity Brokers (2.2%) | |||||||||||
| Merrill Lynch & Co., Inc. 2.94%, due 01/30/2006 | 2,500 | 2,489 | |||||||||
| Morgan Stanley 3.63%, due 04/01/2008 | 2,500 | 2,450 | |||||||||
| Telecommunications (8.7%) | |||||||||||
| Alltel Corp. 4.66%, due 05/17/2007 | 5,400 | 5,446 | |||||||||
| SBC Communications, Inc. 5.75%, due 05/02/2006 | 5,400 | 5,497 | |||||||||
| Sprint Capital Corp. 4.78%, due 08/17/2006 | 3,500 | 3,524 | |||||||||
| Telefonica SA 7.35%, due 09/15/2005 | 5,000 | 5,069 | |||||||||
| Principal | Value | ||||||||||
| Variety Stores (4.7%) | |||||||||||
| Target Corp. 5.50%, due 04/01/2007 | $ | 5,160 | $ | 5,290 | |||||||
| Wal-Mart Stores, Inc. 5.45%, due 08/01/2006 | 5,100 | 5,199 | |||||||||
| Wholesale Trade Nondurable Goods (2.2%) | |||||||||||
| Unilever Capital Corp. 6.88%, due 11/01/2005 | 4,900 | 4,980 | |||||||||
| Total Corporate Debt Securities (cost: $205,172) | 203,924 | ||||||||||
| COMMERCIAL PAPER (4.5%) | |||||||||||
| Personal Credit Institutions (2.2%) | |||||||||||
| American Honda Finance Corp. 3.04%, due 07/07/2005 | 5,000 | 4,972 | |||||||||
| Pharmaceuticals (2.3%) | |||||||||||
| Pfizer, Inc.–144A 2.90%, due 05/31/2005 | 5,100 | 5,075 | |||||||||
| Total Commercial Paper (cost: $10,046) | 10,047 | ||||||||||
| Total Investment Securities (cost: $216,711) | $ | 215,468 | |||||||||
| SUMMARY: | |||||||||||
| Investments, at value | 95.8 | % | $ | 215,468 | |||||||
| Other assets in excess of liabilities | 4.2 | % | 9,410 | ||||||||
| Net assets | 100.0 | % | $ | 224,878 | |||||||
DEFINITIONS:
144A 144A Securities are registered pursuant to Rule 144A of the Securities Act of 1933. These securities are deemed to be liquid for purposes of compliance limitations on holdings of illiquid securities and may be resold as transactions exempt from registration, normally to qualified institutional buyers. At April 30, 2005, these securities aggregated $7,575 or 3.4% of the net assets of the Fund.
The notes to the financial statements are an integral part of this report.
Transamerica IDEX Mutual Funds
Semi-Annual Report 2005
3
TA IDEX Transamerica Short-Term Bond
STATEMENT OF ASSETS AND LIABILITIES
At April 30, 2005
(all amounts except per share amounts in thousands)
(unaudited)
| Assets: | |||||||
| Investment securities, at value (cost: $216,711) | $ | 215,468 | |||||
| Cash | 6,918 | ||||||
| Receivables: | |||||||
| Shares of beneficial interest sold | 805 | ||||||
| Interest | 3,023 | ||||||
| 226,214 | |||||||
| Liabilities: | |||||||
| Investment securities purchased | 988 | ||||||
| Accounts payable and accrued liabilities: | |||||||
| Management and advisory fees | 97 | ||||||
| Distribution and service fees | 24 | ||||||
| Dividends to shareholders | 221 | ||||||
| Other | 6 | ||||||
| 1,336 | |||||||
| Net Assets | $ | 224,878 | |||||
| Net Assets Consist of: | |||||||
| Shares of beneficial interest, unlimited shares authorized, no par value | $ | 226,332 | |||||
| Undistributed net investment income (loss) | – | ||||||
| Accumulated net realized gain (loss) from investment securities | (211 | ) | |||||
| Net unrealized appreciation (depreciation) on investment securities | (1,243 | ) | |||||
| Net Assets | $ | 224,878 | |||||
| Net Assets by Class: | |||||||
| Class A | $ | 87,157 | |||||
| Class I | 137,721 | ||||||
| Shares Outstanding: | |||||||
| Class A | 8,834 | ||||||
| Class I | 13,958 | ||||||
| Net Asset Value Per Share: | |||||||
| Class A | $ | 9.87 | |||||
| Class I | 9.87 | ||||||
STATEMENT OF OPERATIONS
For the period ended April 30, 2005 (a)
(all amounts in thousands)
(unaudited)
| Investment Income: | |||||||
| Interest | $ | 2,133 | |||||
| Expenses: | |||||||
| Management and advisory fees | 415 | ||||||
| Printing and shareholder reports | 3 | ||||||
| Custody fees | 10 | ||||||
| Administration fees | 12 | ||||||
| Legal fees | 2 | ||||||
| Audit fees | 6 | ||||||
| Trustees fees | 2 | ||||||
| Distribution and service fees: | |||||||
| Class A | 36 | ||||||
| Total expenses | 486 | ||||||
| Less: | |||||||
| Reimbursement of class expenses: | |||||||
| Class A | (21 | ) | |||||
| Net expenses | 465 | ||||||
| Net Investment Income (Loss) | 1,668 | ||||||
| Net Realized and Unrealized Gain (Loss): | |||||||
| Realized gain (loss) from investment securities | (211 | ) | |||||
| Increase (decrease) in unrealized appreciation (depreciation) on investment securities | (1,243 | ) | |||||
| Net Gain (Loss) on Investments | (1,454 | ) | |||||
| Net Increase (Decrease) in Net Assets Resulting from Operations | $ | 214 | |||||
(a) TA IDEX Transamerica Short-Term Bond ("the Fund") commenced operations on November 8, 2004. The inception date for the Fund's offering of share Class A was March 1, 2005.
The notes to the financial statements are an integral part of this report.
Transamerica IDEX Mutual Funds
Semi-Annual Report 2005
4
TA IDEX Transamerica Short-Term Bond
STATEMENTS OF CHANGES IN NET ASSETS
For the period ended
(all amounts in thousands)
| April 30, 2005 (a) (unaudited) | |||||||
| Increase (Decrease) In Net Assets From: | |||||||
| Operations: | |||||||
| Net investment income (loss) | $ | 1,668 | |||||
| Net realized gain (loss) from investment securities | (211 | ) | |||||
| Net unrealized appreciation (depreciation) on investment securities | (1,243 | ) | |||||
| 214 | |||||||
| Distributions to Shareholders: | |||||||
| From net investment income: | |||||||
| Class A | (294 | ) | |||||
| Class I | (1,374 | ) | |||||
| (1,668 | ) | ||||||
| Capital Share Transactions: | |||||||
| Proceeds from shares sold: | |||||||
| Class A | 86,991 | ||||||
| Class I | 137,895 | ||||||
| 224,886 | |||||||
| Dividends and distributions reinvested: | |||||||
| Class A | 211 | ||||||
| Class I | 1,235 | ||||||
| 1,446 | |||||||
| 226,332 | |||||||
| Net increase (decrease) in net assets | 224,878 | ||||||
| Net Assets: | |||||||
| Beginning of period | – | ||||||
| End of period | $ | 224,878 | |||||
| Undistributed Net Investment Income (Loss) | $ | – | |||||
| Share Activity: | |||||||
| Shares issued: | |||||||
| Class A | 8,813 | ||||||
| Class I | 13,834 | ||||||
| 22,647 | |||||||
| Shares issued–reinvested from distributions: | |||||||
| Class A | 21 | ||||||
| Class I | 124 | ||||||
| 145 | |||||||
| Net increase (decrease) in shares outstanding: | |||||||
| Class A | 8,834 | ||||||
| Class I | 13,958 | ||||||
| 22,792 | |||||||
(a) TA IDEX Transamerica Short-Term Bond ("the Fund") commenced operations on November 8, 2004. The inception date for the Fund's offering of share Class A was March 1, 2005.
The notes to the financial statements are an integral part of this report.
Transamerica IDEX Mutual Funds
Semi-Annual Report 2005
5
TA IDEX Transamerica Short-Term Bond
FINANCIAL HIGHLIGHTS
(unaudited)
| For a share of beneficial interest outstanding throughout each period | |||||||||||||||||||||||||||||||||||||||
| Net Asset | Investment Operations | Distributions | Net Asset | ||||||||||||||||||||||||||||||||||||
| For the Period Ended (d)(g) | Value, Beginning of Period | Net Investment Income (Loss) | Net Realized and Unrealized Gain (Loss) | Total Operations | From Net Investment Income | From Net Realized Gains | Total Distributions | Value, End of Period | |||||||||||||||||||||||||||||||
| Class A | 4/30/2005 | $ | 9.90 | $ | 0.05 | $ | (0.03 | ) | $ | 0.02 | $ | (0.05 | ) | $ | – | $ | (0.05 | ) | $ | 9.87 | |||||||||||||||||||
| Class I | 4/30/2005 | 10.00 | 0.12 | (0.13 | ) | (0.01 | ) | (0.12 | ) | – | (0.12 | ) | 9.87 | ||||||||||||||||||||||||||
| Ratios/Supplemental Data | |||||||||||||||||||||||||||||||
| For the Period | Total | Net Assets, End of Period | Ratio of Expenses to Average Net Assets (a) | Net Investment Income (Loss) to Average | Portfolio Turnover | ||||||||||||||||||||||||||
| Ended (g) | Return (c) | (000's) | Net (e) | Total (f) | Net Assets (a) | Rate (b) | |||||||||||||||||||||||||
| Class A | 4/30/2005 | 0.16 | % | $ | 87,157 | 0.85 | % | 1.06 | % | 2.89 | % | 171 | % | ||||||||||||||||||
| Class I | 4/30/2005 | (0.14 | ) | 137,721 | 0.71 | 0.71 | 2.56 | 171 | |||||||||||||||||||||||
NOTES TO FINANCIAL HIGHLIGHTS
(a) Annualized.
(b) Not annualized for periods of less than one year.
(c) Total return has been calculated for the applicable period without decuction of a sales load, if any, on an initial purchase. Periods of less than one year are not annualized.
(d) Per share information is calculated based on average number of shares outstanding.
(e) Ratio of Net Expenses to Average Net Assets is net of fee waivers and reimbursements by the investment adviser, if any (see note 2).
(f) Ratio of Total Expenses to Average Net Assets includes all expenses before fee waivers and reimbursements by the investment adviser.
(g) TA IDEX Transamerica Short-Term Bond ("the Fund") commenced operations on November 8, 2004. The inception date for the Fund's offering of share Class A was March 1, 2005.
The notes to the financial statements are an integral part of this report.
Transamerica IDEX Mutual Funds
Semi-Annual Report 2005
6
TA IDEX Transamerica Short-Term Bond
NOTES TO FINANCIAL STATEMENTS
At April 30, 2005
(all amounts in thousands)
(unaudited)
NOTE 1. ORGANIZATION AND SIGNIFICANT ACCOUNTING POLICIES
Transamerica IDEX Mutual Funds is a Delaware statutory trust registered under the Investment Company Act of 1940, as amended (the "1940 Act"), as an open-end management investment company. Prior to March 1, 2005, Transamerica IDEX Mutual Funds was a Massachusetts business trust. TA IDEX Transamerica Short-Term Bond ("the Fund"), part of Transamerica IDEX Mutual Funds, began operations on November 8, 2004.
In the normal course of business, the Fund enters into contracts that contain a variety of representations and warranties, which provide general indemnifications. The Fund's maximum exposure under these arrangements is unknown, as this would involve future claims that may be made against the Fund and/or its affiliates that have not yet occurred. However, based on experience, the Fund expects the risk of loss to be remote.
See the Prospectus and Statement of Additional Information for a description of the Fund's investment objective.
In preparing the Fund's financial statements in accordance with accounting principles generally accepted in the United States of America ("GAAP"), estimates or assumptions (which could differ from actual results) may be used that affect reported amounts and disclosures. The following policies were consistently followed by the Fund, in accordance with GAAP.
Multiple class operations and expenses: The Fund currently offers two classes of shares, Class A and Class I, each with a public offering price that reflects different sales charges, if any, and expense levels. The initial sales charge currently is waived as this Fund is available for investment only by certain strategic asset allocation funds. Income, non-class specific expenses and realized and unrealized gains and losses, are allocated daily to each class, based upon the value of shares outstanding method as permitted under Rule 18f-3 of the 1940 Act. Each class bears its own specific expenses as well as a portion of general, common expenses.
Pricing of shares: The Fund prices its shares on the basis of the net asset value of each class of shares of the Fund, which is determined as of the close of the New York Stock Exchange ("NYSE") (generally 4:00 p.m. Eastern Time) on each day on which the NYSE is open for trading.
Security valuations: Fund investments traded on an exchange are valued at the closing price on the day of valuation on the exchange where the security is principally traded. With respect to securities traded on NASDAQ NMS, such closing price may be last reported sales price or the NASDAQ Official Closing Price.
Securities traded in the over-the-counter market and listed securities for which no sale was reported on that date are valued at the last quoted bid price.
Debt securities are valued by independent pricing services at the last quoted bid price; however, those that mature in sixty days or less are valued at amortized cost, which approximates market.
Other securities for which quotations are not readily available are valued at fair market value as determined in good faith using guidelines adopted by the Board of Trustees of the Fund, under the supervision of the Fund's Valuation Committee. These guidelines may include: the type of security; any restrictions on its resale; financial or business news of the issuer; similar or related securities that are actively trading; related corporate actions; and other significant events occurring after the close of trading in the security.
Cash: The Fund may leave cash overnight in its cash account with the custodian, Investors Bank & Trust Company ("IBT"). IBT has been contracted on behalf of the Fund to invest the excess cash into a savings account, which at April 30, 2005, was paying an interest rate of 2.02%.
Throughout the period from inception through April 30, 2005, the Fund may have a cash overdraft balance. A fee is incurred on this overdraft, calculated by multiplying the overdraft by a rate based on the federal funds rate.
Security transactions and investment income: Security transactions are recorded on the trade date. Security gains and losses are calculated on the specific identification basis. Interest income, including accretion of discounts and amortization of premiums, is recorded on the accrual basis commencing on the settlement date.
Redemption fees: A short-term trading redemption fee may be assessed on any fund shares in a fund account that are sold during the first five (5) NYSE trading days following their purchase date. This redemption fee will equal 2% of the amount redeemed and shares held the longest will be treated as being redeemed first and shares held the shortest as being redeemed last.
For the period from inception through April 30, 2005, the Fund received no redemption fees.
Dividend distributions: Distributions to shareholders are recorded on the ex-dividend date and are determined in accordance with Federal income tax regulations which may differ from GAAP.
NOTE 2. RELATED PARTY TRANSACTIONS
Transamerica Fund Advisors, Inc. ("TFAI") is the Fund's investment adviser. Transamerica Fund Services, Inc. ("TFS") is the Fund's administrator and transfer agent. AFSG Securities Corp. ("AFSG") is the Fund's distributor/principal underwriter. AFSG is 100% owned by AUSA Holding Company ("AUSA"). TFAI is a directly owned
Transamerica IDEX Mutual Funds
Semi-Annual Report 2005
7
TA IDEX Transamerica Short-Term Bond
NOTES TO FINANCIAL STATEMENTS (continued)
At April 30, 2005
(all amounts in thousands)
(unaudited)
NOTE 2.–(continued)
subsidiary of Western Reserve Life Assurance Co. of Ohio (78%) and AUSA (22%). TFS is a wholly owned subsidiary of WRL (50%) and AUSA (50%). AUSA and WRL are wholly owned indirect subsidiaries of AEGON, NV, a Netherlands corporation.
Effective January 1, 2005 AEGON/Transamerica Fund Advisors, Inc. ("ATFA") was renamed Transamerica Fund Advisors, Inc. ("TFAI"); AEGON/Transamerica Fund Services, Inc. ("ATFS") and AEGON/Transamerica Investor Services, Inc. ("ATIS") merged into one entity and was renamed Transamerica Fund Services, Inc. ("TFS").
Transamerica Investment Management, LLC is both an affiliate of the Fund and a sub-adviser to the Fund.
The following schedule represents the percentage of fund assets owned by affiliated mutual funds (i.e. through the Transamerica IDEX Muttual Funds and AEGON/Transamerica Series Trust (f/k/a AEGON/Transamerica Series Fund, Inc.) asset allocation funds):
| Net Assets | % of Net Assets | ||||||||||
| TA IDEX Asset Allocation– Conservative Portfolio | $ | 38,802 | 17.25 | % | |||||||
| TA IDEX Asset Allocation– Moderate Portfolio | 48,366 | 21.51 | % | ||||||||
| Asset Allocation–Conservative Portfolio | 58,777 | 26.14 | % | ||||||||
| Asset Allocation–Moderate Portfolio | 78,829 | 35.05 | % | ||||||||
| Total | $ | 224,774 | 99.95 | % | |||||||
Investment advisory fee: The Fund pays management fees to TFAI based on average daily net assets ("ANA") at the following break points:
0.65% of the first $250 million of ANA
0.60% of the next $250 million of ANA
0.575% of the next $500 million of ANA
0.55% of ANA over $1 billion
TFAI has contractually agreed to waive its advisory fee and will reimburse the Fund to the extent that operating expenses exceed the following stated annual limit:
0.85% Expense Limit
If total fund expenses fall below the annual expense limitation agreement agreed to by the adviser within the succeeding three years, the Fund may be required to pay that adviser a portion or all of the waived advisory fees.
There were no amounts available for recapture at April 30, 2005.
Distribution and service fees: The Fund has a 12b-1 distribution plan under the 1940 Act pursuant to which an annual fee, based on average daily net assets, is paid to the distributor for various disbursements such as broker-dealer account servicing fees and other promotional expenses of the Fund. The Fund is authorized under the 12b-1 plan to pay fees on each class up to the following limits:
| Class A | 0.35 | % | |||||
| Class I | N/A | ||||||
In the case the Fund or a class of shares of the Fund is closed to new investors or investments, the Fund is authorized to pay 12b-1 fees for past sales and distribution efforts and present and past investor services.
Administrative services: The Fund has entered into an agreement with TFS for financial and legal fund administration services, which includes such items as compliance, expenses, financial statements and other reporting, distributions, tax returns, prospectus preparation, board of trustees meeting support and other legal matters. As of January 1, 2005 the Fund pays TFS an annual fee of 0.02% of average net assets. Prior to January 1, 2005 the Fund paid TFS an annual fee of 0.015% of average net assets. The Legal fees on the Statement of Operations are for fees paid to external legal counsel.
Transfer agent fees: The Fund pays TFS an annual per-account charge of $20 (not in thousands) for each open account and $1.63 (not in thousands) for each closed account. There is no new account charge. The Transfer agent fees on the Statement of Operations are made up of fees paid to TFS and costs associated with shareholder statements.
The Fund paid TFS $2 for the period from inception through April 30, 2005.
NOTE 3. INVESTMENT TRANSACTIONS
The cost of securities purchased and proceeds from securities sold (excluding short-term securities) for the period from inception through April 30, 2005, were as follows:
| Purchases of securities: | |||||||
| Long-Term excluding U.S. Government | $ | 183,618 | |||||
| U.S. Government | 159,175 | ||||||
| Proceeds from maturities and sales of securities: | |||||||
| Long-Term excluding U.S. Government | 11,220 | ||||||
| U.S. Government | 157,571 | ||||||
Transamerica IDEX Mutual Funds
Semi-Annual Report 2005
8
TA IDEX Transamerica Short-Term Bond
NOTES TO FINANCIAL STATEMENTS (continued)
At April 30, 2005
(all amounts in thousands)
(unaudited)
NOTE 4. FEDERAL INCOME TAX MATTERS
The Fund has not made any provision for federal income or excise taxes due to its policy to distribute all of its taxable income and capital gains to its shareholders and otherwise qualify as a regulated investment company under the Internal Revenue Code. Income and capital gain distributions are determined in accordance with income tax regulations, which may differ from GAAP. These differences are primarily due to differing treatment for items including, but not limited to, foreign currency transactions.
The aggregate cost of investments and composition of unrealized appreciation (depreciation) for federal income tax purposes as of April 30, 2005, are as follows:
| Federal Tax Cost Basis | $ | 216,714 | |||||
| Unrealized Appreciation | $ | 106 | |||||
| Unrealized (Depreciation) | (1,352 | ) | |||||
| Net Unrealized Appreciation (Depreciation) | $ | (1,246 | ) | ||||
NOTE 5. REGULATORY PROCEEDINGS
There continues to be significant federal and state regulatory activity relating to financial services companies, particularly mutual fund companies and their investment advisers. As part of an ongoing investigation regarding potential market timing, recordkeeping and trading compliance issues and matters affecting the Fund's investment adviser, TFAI, and certain employees and affiliates of TFAI, the SEC staff has indicated that it is likely to take some action against TFAI and certain of its affiliates at the conclusion of the investigation. The potential timing and the scope of any such action is difficult to predict. Although the impact of any action brought against TFAI and/or its affiliates is difficult to assess at the present time, the Fund currently believes that the likelihood that any such action will have a material adverse impact on it is remote. It is important to note that the Fund is not aware of any allegation of wrongdoing against it and its board at the time this semi-annual report is printed. Although it is not anticipated that these developments will have an adverse impact on the Fund, there can be no assurance at this time. TFAI and its affiliates are actively working with the SEC in regard to this matter; however, the exact resolution cannot be determined at this time. TFAI will take such actions that it deems necessary or appropriate to continue providing management services to the Fund and to bring all matters to an appropriate conclusion.
TFAI and/or its affiliates, and not the Fund, will bear the costs regarding these regulatory matters.
Transamerica IDEX Mutual Funds
Semi-Annual Report 2005
9
TA IDEX Transamerica Short-Term Bond
A discussion regarding the basis of Transamerica IDEX Mutual Fund's Board of Trustees' approval of the fund's advisory arrangements will be available in the fund's annual report for the fiscal year ending October 31, 2005.
Transamerica IDEX Mutual Funds
Semi-Annual Report 2005
10
TA IDEX Transamerica Short-Term Bond
SUPPLEMENTAL INFORMATION (unaudited)
RESULTS OF SHAREHOLDER PROXY
At a special meeting of shareholders held on February 25, 2005, the results of the Proposals were as follows:
Transamerica IDEX Mutual Funds
Proposal 1: Election of Trustees to the Board of Trustees of Transamerica IDEX Mutual Funds.
| For | Withheld | ||||||||||
| Peter R. Brown | 872,017,875.249 | 4,468,498.551 | |||||||||
| Daniel Calabria | 871,917,069.786 | 4,569,304.014 | |||||||||
| Janise B. Case | 872,099,393.125 | 4,386,980.675 | |||||||||
| Charles C. Harris | 872,086,722.025 | 4,399,651.775 | |||||||||
| Leo J. Hill | 872,304,465.640 | 4,181,908.160 | |||||||||
| Russell A. Kimball, Jr. | 872,253,556.471 | 4,232,817.329 | |||||||||
| William W. Short, Jr. | 872,139,920.944 | 4,346,452.856 | |||||||||
| John Waechter | 872,261,152.376 | 4,225,221.424 | |||||||||
| Jack E. Zimmerman | 871,929,967.512 | 4,556,406.288 | |||||||||
| Brian C. Scott | 872,218,970.367 | 4,267,403.433 | |||||||||
| Thomas P. O'Neill | 872,111,944.117 | 4,374,429.683 | |||||||||
TA IDEX Transamerica Short-Term Bond
Proposal 2: Approval of an Agreement and Plan of Reorganization pursuant to which Transamerica IDEX Mutual Funds will organize as a Delaware statutory trust.
| For | Against | Abstentions/Broker Non-Votes | |||||||||
| 2,896,277.669 | 0 | 0 | |||||||||
Proposal 3: Approval of changes to the fundamental investment restrictions of TA IDEX Transamerica Short-Term Bond.
| A. Diversification | For | Against | Abstentions/Broker Non-Votes | ||||||||||||
| 2,896,277.669 | 0 | 0 | |||||||||||||
| B. Borrowing | For | Against | Abstentions/Broker Non-Votes | ||||||||||||
| 2,896,277.669 | 0 | 0 | |||||||||||||
| C. Senior Securities | For | Against | Abstentions/Broker Non-Votes | ||||||||||||
| 2,896,277.669 | 0 | 0 | |||||||||||||
| D. Underwriting Securities | For | Against | Abstentions/Broker Non-Votes | ||||||||||||
| 2,896,277.669 | 0 | 0 | |||||||||||||
| E. Real Estate | For | Against | Abstentions/Broker Non-Votes | ||||||||||||
| 2,896,277.669 | 0 | 0 | |||||||||||||
| F. Making Loans | For | Against | Abstentions/Broker Non-Votes | ||||||||||||
| 2,896,277.669 | 0 | 0 | |||||||||||||
| G. Concentration | For | Against | Abstentions/Broker Non-Votes | ||||||||||||
| 2,896,277.669 | 0 | 0 | |||||||||||||
| H. Commodities | For | Against | Abstentions/Broker Non-Votes | ||||||||||||
| 2,896,277.669 | 0 | 0 | |||||||||||||
Transamerica IDEX Mutual Funds
Semi-Annual Report 2005
11
TA IDEX Transamerica Small/Mid Cap Value
UNDERSTANDING YOUR FUND'S EXPENSES
(unaudited)
SHAREHOLDER EXPENSES
The following Example is intended to help you understand your ongoing costs (in dollars and cents) of investing in a Fund and to compare these costs with the ongoing costs of investing in other funds.
The Example is based on an investment of $1,000 invested at November 1, 2004 and held for the entire period until April 30, 2005.
ACTUAL EXPENSES
The first line in the table below provides information about actual account values and actual expenses. You may use the information in this line, together with the amount you invested, to estimate the expenses that you paid over the period. Simply divide your account value by $1,000 (for example, an $8,600 account value divided by $1,000 = 8.6), then multiply the result by the number in the first line of your Fund under the heading entitled "Expenses Paid During Period" to estimate the expenses you paid on your account during this period.
HYPOTHETICAL EXAMPLE FOR COMPARISON PURPOSES
The second line in the table below provides information about hypothetical account values and hypothetical expenses based on the Fund's actual expense ratio and an assumed rate of return of 5% per year before expenses, which is not the Fund's actual return. The hypothetical account values and expenses may not be used to estimate the actual ending account balance or expenses you paid for the period. You may use this information to compare the ongoing costs of investing in your Fund and other funds. To do so, compare this 5% hypothetical example with the 5% hypothetical examples that appear in the shareholder reports of the other funds.
Please note that the expenses shown in the table are meant to highlight your ongoing costs only and do not reflect any transactional costs, such as sales charges, redemption fees, brokerage commissions paid on purchases and sales of fund shares. Therefore, the second line under the Fund in the table is useful in comparing ongoing costs only, and will not help you determine the relative total costs of owning different funds. In addition, note that the expenses shown in the table are meant to highlight your ongoing costs and do not reflect any transaction costs.
| Beginning Account Value | Ending Account Value | Annualized Expense Ratio | Expenses Paid During Period (a) | ||||||||||||||||
| Class A | |||||||||||||||||||
| Actual | $ | 1,000.00 | $ | 1,056.60 | 1.23 | % | $ | 6.27 | |||||||||||
| Hypothetical (b) | 1,000.00 | 1,018.70 | 1.23 | 6.16 | |||||||||||||||
| Class B | |||||||||||||||||||
| Actual | 1,000.00 | 1,052.40 | 2.06 | 10.48 | |||||||||||||||
| Hypothetical (b) | 1,000.00 | 1,014.58 | 2.06 | 10.29 | |||||||||||||||
| Class C | |||||||||||||||||||
| Actual | 1,000.00 | 1,051.40 | 2.23 | 11.34 | |||||||||||||||
| Hypothetical (b) | 1,000.00 | 1,013.74 | 2.23 | 11.13 | |||||||||||||||
(a) Expenses are calculated using each Fund's annualized expense ratio (as disclosed in the table), multiplied by the average account value for the period, multiplied by number of days in the period (181 days), and divided by the number of days in the year (365 days).
(b) 5% return per year before expenses.
GRAPHICAL PRESENTATION OF SCHEDULE OF INVESTMENTS
By Sector
At April 30, 2005
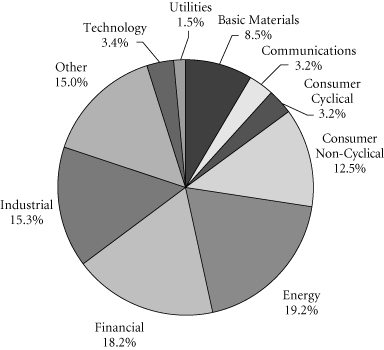
This chart shows the percentage breakdown by sector of the Fund's total investment securities.
Transamerica IDEX Mutual Funds
Semi-Annual Report 2005
1
TA IDEX Transamerica Small/Mid Cap Value
SCHEDULE OF INVESTMENTS
At April 30, 2005
(all amounts except share amounts in thousands)
(unaudited)
| Shares | Value | ||||||||||
| COMMON STOCKS (98.2%) | |||||||||||
| Apparel Products (0.3%) | |||||||||||
| True Religion Apparel, Inc. (a) | 88,040 | $ | 1,308 | ||||||||
| Automotive (2.5%) | |||||||||||
| Gencorp, Inc. (b) | 355,900 | 6,766 | |||||||||
| National R.V. Holdings, Inc. (a) | 302,500 | 2,892 | |||||||||
| Chemicals & Allied Products (9.4%) | |||||||||||
| Crompton Corp. (b) | 418,300 | 5,877 | |||||||||
| Georgia Gulf Corp. | 160,000 | 5,906 | |||||||||
| Olin Corp. (b) | 504,900 | 8,957 | |||||||||
| PolyOne Corp. (a) | 1,265,500 | 9,770 | |||||||||
| Terra Nitrogen Co., L.P. (b) | 280,900 | 6,421 | |||||||||
| Commercial Banks (4.6%) | |||||||||||
| Corus Bankshares, Inc. | 120,000 | 5,860 | |||||||||
| Gold Banc Corp., Inc. | 57,800 | 799 | |||||||||
| North Fork Bancorp, Inc. | 307,710 | 8,662 | |||||||||
| Provident Bankshares Corp. | 95,500 | 2,796 | |||||||||
| Computer & Data Processing Services (2.2%) | |||||||||||
| ActivCard Corp. (a) | 290,100 | 1,517 | |||||||||
| Fair Isaac Corp. | 215,000 | 7,069 | |||||||||
| SoftBrands, Inc. (a) | 2,576 | 5 | |||||||||
| Computer & Office Equipment (3.1%) | |||||||||||
| Hypercom Corp. (a) | 829,700 | 4,115 | |||||||||
| Storage Technology Corp. (a) | 295,000 | 8,201 | |||||||||
| Construction (2.2%) | |||||||||||
| Chemed Corp. | 120,000 | 8,501 | |||||||||
| Electric, Gas & Sanitary Services (0.7%) | |||||||||||
| ALLETE, Inc. | 66,666 | 2,778 | |||||||||
| Electronic & Other Electric Equipment (5.2%) | |||||||||||
| Acuity Brands, Inc. | 310,000 | 7,412 | |||||||||
| Genlyte Group, Inc. (a) | 135,000 | 10,711 | |||||||||
| Maytag Corp. (b) | 220,000 | 2,132 | |||||||||
| Electronic Components & Accessories (0.9%) | |||||||||||
| OSI Systems, Inc. (a)(b) | 240,000 | 3,408 | |||||||||
| Environmental Services (1.3%) | |||||||||||
| Republic Services, Inc. | 150,000 | 5,190 | |||||||||
| Fabricated Metal Products (1.1%) | |||||||||||
| Gulf Island Fabrication, Inc. | 200,000 | 4,208 | |||||||||
| Gas Production & Distribution (1.0%) | |||||||||||
| KeySpan Corp. | 100,000 | 3,793 | |||||||||
| Health Services (2.0%) | |||||||||||
| LifePoint Hospitals, Inc. (a) | 175,000 | 7,779 | |||||||||
| Shares | Value | ||||||||||
| Holding & Other Investment Offices (5.1%) | |||||||||||
| Annaly Mortgage Management, Inc. REIT (b) | 350,000 | $ | 6,692 | ||||||||
| Education Realty Trust, Inc. REIT | 225,000 | 3,600 | |||||||||
| Omega Healthcare Investors, Inc. REIT | 875,000 | 9,818 | |||||||||
| Hotels (2.7%) | |||||||||||
| Host Marriott Corp. (b) | 620,000 | 10,428 | |||||||||
| Industrial Machinery & Equipment (0.5%) | |||||||||||
| EnPro Industries, Inc. (a) | 75,400 | 1,896 | |||||||||
| Instruments & Related Products (0.9%) | |||||||||||
| Analogic Corp. | 83,900 | 3,500 | |||||||||
| Insurance (7.0%) | |||||||||||
| AMBAC Financial Group, Inc. | 120,000 | 8,022 | |||||||||
| HCC Insurance Holdings, Inc. | 255,000 | 9,070 | |||||||||
| PartnerRe, Ltd. | 140,000 | 8,159 | |||||||||
| Triad Guaranty, Inc. (a)(b) | 40,000 | 2,012 | |||||||||
| Management Services (2.6%) | |||||||||||
| First Consulting Group, Inc. (a) | 253,600 | 1,364 | |||||||||
| FTI Consulting, Inc. (a)(b) | 400,000 | 8,832 | |||||||||
| Medical Instruments & Supplies (2.7%) | |||||||||||
| Orthofix International NV (a) | 225,000 | 10,575 | |||||||||
| Metal Mining (0.5%) | |||||||||||
| Western Silver Corp. (a)(b) | 238,100 | 1,988 | |||||||||
| Oil & Gas Extraction (18.8%) | |||||||||||
| Chesapeake Energy Corp. | 600,000 | 11,544 | |||||||||
| Edge Petroleum Corp. (a) | 500,000 | 7,008 | |||||||||
| GlobalSantaFe Corp. | 275,000 | 9,240 | |||||||||
| Harvest Natural Resources, Inc. (a) | 241,200 | 2,603 | |||||||||
| Newpark Resources, Inc. (a) | 404,300 | 2,430 | |||||||||
| Parker Drilling Co. (a) | 600,000 | 3,204 | |||||||||
| Patterson-UTI Energy, Inc. | 385,000 | 9,228 | |||||||||
| Pioneer Drilling Co. (a) | 612,500 | 8,079 | |||||||||
| Pride International, Inc. (a) | 324,991 | 7,247 | |||||||||
| Superior Energy Services, Inc. (a) | 870,000 | 12,946 | |||||||||
| Paper & Allied Products (0.5%) | |||||||||||
| Graphic Packaging Corp. (a) | 581,700 | 1,885 | |||||||||
| Petroleum Refining (2.3%) | |||||||||||
| Murphy Oil Corp. | 100,000 | 8,909 | |||||||||
| Pharmaceuticals (2.8%) | |||||||||||
| ARIAD Pharmaceuticals, Inc. (a) | 975,500 | 5,990 | |||||||||
| Chattem, Inc. (a)(b) | 73,000 | 3,003 | |||||||||
| NeoPharm, Inc. (a)(b) | 134,300 | 1,121 | |||||||||
| Theragenics Corp. (a) | 244,600 | 859 | |||||||||
| Primary Metal Industries (2.2%) | |||||||||||
| Aleris International, Inc. (a) | 394,827 | 8,473 | |||||||||
The notes to the financial statements are an integral part of this report.
Transamerica IDEX Mutual Funds
Semi-Annual Report 2005
2
TA IDEX Transamerica Small/Mid Cap Value
SCHEDULE OF INVESTMENTS (continued)
At April 30, 2005
(all amounts except share amounts in thousands)
(unaudited)
| Shares | Value | ||||||||||
| Retail Trade (2.0%) | |||||||||||
| Sports Authority, Inc. (The) (a)(b) | 300,000 | $ | 7,980 | ||||||||
| Savings Institutions (1.6%) | |||||||||||
| Brookline Bancorp, Inc. (b) | 160,000 | 2,400 | |||||||||
| Partners Trust Financial Group, Inc. | 400,000 | 4,064 | |||||||||
| Telecommunications (2.3%) | |||||||||||
| Citizens Communications Co. (b) | 700,000 | 8,925 | |||||||||
| Trucking & Warehousing (3.5%) | |||||||||||
| Overnite Corp. | 210,000 | 6,296 | |||||||||
| Yellow Roadway Corp. (a)(b) | 150,000 | 7,350 | |||||||||
| Water Transportation (0.9%) | |||||||||||
| DryShips, Inc. (a) | 220,000 | 3,491 | |||||||||
| Wholesale Trade Durable Goods (0.7%) | |||||||||||
| AM Castle & Co. (a) | 219,900 | 2,628 | |||||||||
| Wholesale Trade Nondurable Goods (2.1%) | |||||||||||
| Dean Foods Co. (a) | 240,000 | 8,246 | |||||||||
| Total Common Stocks (cost: $344,087) | 383,938 | ||||||||||
| Principal | Value | ||||||||||
| SECURITY LENDING COLLATERAL (17.3%) | |||||||||||
| Debt (15.0%) | |||||||||||
| Bank Notes (2.1%) | |||||||||||
| Bank of America | |||||||||||
| 2.82%, due 05/16/2005 | $ | 2,137 | $ | 2,137 | |||||||
| 2.80%, due 06/09/2005 (c) | 534 | 534 | |||||||||
| 2.77%, due 07/18/2005 (c) | 2,137 | 2,137 | |||||||||
| Canadian Imperial Bank of Commerce 3.02%, due 11/04/2005 (c) | 2,137 | 2,137 | |||||||||
| Credit Suisse First Boston Corp. 2.88%, due 09/09/2005 (c) 3.06%, due 03/10/2006 (c) | 534 534 | 534 534 | |||||||||
| Euro Dollar Overnight (2.6%) | |||||||||||
| Bank of Montreal 2.94%, due 05/04/2005 | 1,603 | 1,603 | |||||||||
| BNP Paribas 2.80%, due 05/05/2005 | 2,212 | 2,212 | |||||||||
| Den Danske Bank 2.93%, due 05/02/2005 2.80%, due 05/06/2005 | 1,923 1,068 | 1,923 1,068 | |||||||||
| Dexia Group 2.80%, due 05/05/2005 | 943 | 943 | |||||||||
| Royal Bank of Canada 2.80%, due 05/04/2005 | 2,193 | 2,193 | |||||||||
| Svenska Handlesbanken 2.80%, due 05/06/2005 | 352 | 352 | |||||||||
| Principal | Value | ||||||||||
| Euro Dollar Terms (6.1%) | |||||||||||
| Bank of Nova Scotia | |||||||||||
| 2.88%, due 05/11/2005 | $ | 1,068 | $ | 1,068 | |||||||
| 3.01%, due 05/31/2005 | 2,988 | 2,988 | |||||||||
| Barclays 3.02%, due 06/27/2005 | 1,904 | 1,904 | |||||||||
| BNP Paribas 2.93%, due 06/07/2005 | 1,710 | 1,710 | |||||||||
| Branch Banker & Trust 2.94%, due 06/06/2005 | 457 | 457 | |||||||||
| Calyon 2.93%, due 06/03/2005 | 1,765 | 1,765 | |||||||||
| Citigroup 2.87%, due 06/06/2005 | 2,218 | 2,218 | |||||||||
| Credit Suisse First Boston Corp. 2.91%, due 05/16/2005 | 2,188 | 2,188 | |||||||||
| HSBC Banking/Holdings PLC 3.01%, due 06/23/2005 | 1,068 | 1,068 | |||||||||
| Royal Bank of Scotland 2.94%, due 06/07/2005 2.95%, due 06/10/2005 | 2,076 1,153 | 2,076 1,153 | |||||||||
| Societe Generale 2.80%, due 05/03/2005 | 2,044 | 2,044 | |||||||||
| Toronto Dominion Bank 2.75%, due 05/09/2005 3.01%, due 06/24/2005 | 1,603 593 | 1,603 593 | |||||||||
| UBS AG 2.81%, due 05/03/2005 | 1,068 | 1,068 | |||||||||
| Promissory Notes (1.5%) | �� | ||||||||||
| Goldman Sachs Group, Inc. 2.99%, due 06/27/2005 3.01%, due 07/27/2005 | 2,244 3,738 | 2,244 3,738 | |||||||||
| Repurchase Agreements (2.7%) (d) | |||||||||||
| Goldman Sachs Group, Inc. (The) 3.04% Repurchase Agreement dated 04/29/2005 to be repurchased at $4,809 on 05/02/2005 | 4,808 | 4,808 | |||||||||
| Merrill Lynch & Co., Inc. 3.04% Repurchase Agreement dated 04/29/2005 to be repurchased at $5,771 on 05/02/2005 | 5,769 | 5,769 | |||||||||
| Shares | Value | ||||||||||
| Investment Companies (2.3%) | |||||||||||
| Money Market Funds (2.3%) | |||||||||||
| American Beacon Funds 1-day yield of 2.84% | 848,524 | $ | 849 | ||||||||
| BGI Institutional Money Market Fund 1-day yield of 2.93% | 5,024,585 | 5,025 | |||||||||
The notes to the financial statements are an integral part of this report.
Transamerica IDEX Mutual Funds
Semi-Annual Report 2005
3
TA IDEX Transamerica Small/Mid Cap Value
SCHEDULE OF INVESTMENTS (continued)
At April 30, 2005
(all amounts except share amounts in thousands)
(unaudited)
| Shares | Value | ||||||||||
| Money Market Funds (continued) | |||||||||||
| Merrill Lynch Premier Institutional Fund 1-day yield of 2.65% | 1,130,691 | $ | 1,131 | ||||||||
| Merrimac Cash Fund, Premium Class 1-day yield of 2.74% (e) | 2,068,017 | 2,068 | |||||||||
| Total Security Lending Collateral (cost: $67,842) | 67,842 | ||||||||||
| Total Investment Securities (cost: $411,929) | $ | 451,780 | |||||||||
| SUMMARY: | |||||||||||
| Investments, at value | 115.5 | % | $ | 451,780 | |||||||
| Liabilities in excess of other assets | (15.5 | )% | (60,761 | ) | |||||||
| Net assets | 100.0 | % | $ | 391,019 | |||||||
NOTES TO SCHEDULE OF INVESTMENTS:
(a) No dividends were paid during the preceding twelve months.
(b) At April 30, 2005, all or a portion of this security is on loan (see Note 1). The value at April 30, 2005, of all securities on loan is $64,805.
(c) Floating or variable rate note. Rate is listed as of April 30, 2005.
(d) Cash collateral for the Repurchase Agreements, valued at $10,761, that serve as collateral for securities lending are invested in corporate bonds with interest rates and maturity dates ranging from 0.00%–8.875% and 06/15/2005–03/15/2035, respectively.
(e) Regulated investment company advised by Investors Bank and Trust Co. ("IBT"). IBT is also the accounting, custody and lending agent for the Fund.
DEFINITIONS:
REIT Real Estate Investment Trust
The notes to the financial statements are an integral part of this report.
Transamerica IDEX Mutual Funds
Semi-Annual Report 2005
4
TA IDEX Transamerica Small/Mid Cap Value
STATEMENT OF ASSETS AND LIABILITIES
At April 30, 2005
(all amounts except per share amounts in thousands)
(unaudited)
| Assets: | |||||||
| Investment securities, at value (cost: $411,929) (including securities loaned of $64,805) | $ | 451,780 | |||||
| Cash | 7,544 | ||||||
| Receivables: | |||||||
| Investment securities sold | 905 | ||||||
| Shares of beneficial interest sold | 85 | ||||||
| Interest | 122 | ||||||
| Dividends | 419 | ||||||
| Other | 73 | ||||||
| 460,928 | |||||||
| Liabilities: | |||||||
| Investment securities purchased | 1,289 | ||||||
| Accounts payable and accrued liabilities: | |||||||
| Shares of beneficial interest redeemed | 279 | ||||||
| Management and advisory fees | 268 | ||||||
| Distribution and service fees | 152 | ||||||
| Transfer agent fees | 42 | ||||||
| Payable for collateral for securities on loan | 67,842 | ||||||
| Other | 37 | ||||||
| 69,909 | |||||||
| Net Assets | $ | 391,019 | |||||
| Net Assets Consist of: | |||||||
| Shares of beneficial interest, unlimited shares authorized, no par value | $ | 336,939 | |||||
| Accumulated net investment income (loss) | (39 | ) | |||||
| Undistributed net realized gain (loss) from investment securities | 14,272 | ||||||
| Net unrealized appreciation (depreciation) on investment securities | 39,847 | ||||||
| Net Assets | $ | 391,019 | |||||
| Net Assets by Class: | |||||||
| Class A | $ | 328,292 | |||||
| Class B | 43,669 | ||||||
| Class C | 19,058 | ||||||
| Shares Outstanding: | |||||||
| Class A | 22,361 | ||||||
| Class B | 3,054 | ||||||
| Class C | 1,336 | ||||||
| Net Asset Value Per Share: | |||||||
| Class A | $ | 14.68 | |||||
| Class B | 14.30 | ||||||
| Class C | 14.27 | ||||||
| Maximum Offering Price Per Share (a): | |||||||
| Class A | $ | 15.53 | |||||
(a) Includes the maximum selling commission (represented as a percentage of offering price) which is reduced on certain levels of sales as set forth in the Prospectus. Net asset value per share for Classes B and C shares represents offering price. The redemption price for Classes B and C shares equals net asset value less any applicable contingent deferred sales charge.
STATEMENT OF OPERATIONS
For the period ended April 30, 2005
(all amounts in thousands)
(unaudited)
| Investment Income: | |||||||
| Interest | $ | 40 | |||||
| Dividends | 2,990 | ||||||
| Income from loaned securities–net | 357 | ||||||
| 3,387 | |||||||
| Expenses: | |||||||
| Management and advisory fees | 1,679 | ||||||
| Transfer agent fees: | |||||||
| Class A | 39 | ||||||
| Class B | 41 | ||||||
| Class C | 26 | ||||||
| Printing and shareholder reports | 10 | ||||||
| Custody fees | 23 | ||||||
| Administration fees | 38 | ||||||
| Legal fees | 11 | ||||||
| Audit fees | 6 | ||||||
| Trustees fees | 10 | ||||||
| Registration fees: | |||||||
| Class A | 18 | ||||||
| Class B | 8 | ||||||
| Class C | 14 | ||||||
| Distribution and service fees: | |||||||
| Class A | 620 | ||||||
| Class B | 227 | ||||||
| Class C | 102 | ||||||
| Total expenses | 2,872 | ||||||
| Net Investment Income (Loss) | 515 | ||||||
| Net Realized and Unrealized Gain (Loss): | |||||||
| Realized gain (loss) from investment securities | 15,144 | ||||||
| Increase (decrease) in unrealized appreciation (depreciation) on investment securities | 8,158 | ||||||
| Net Gain (Loss) on Investments | 23,302 | ||||||
| Net Increase (Decrease) in Net Assets Resulting from Operations | $ | 23,817 | |||||
The notes to the financial statements are an integral part of this report.
Transamerica IDEX Mutual Funds
Semi-Annual Report 2005
5
TA IDEX Transamerica Small/Mid Cap Value
STATEMENTS OF CHANGES IN NET ASSETS
For the period or year ended
(all amounts in thousands)
| April 30, 2005 (unaudited) | October 31, 2004 | ||||||||||
| Increase (Decrease) In Net Assets From: | |||||||||||
| Operations: | |||||||||||
| Net investment income (loss) | $ | 515 | $ | 521 | |||||||
| Net realized gain (loss) from investment securities | 15,144 | 41,838 | |||||||||
| Net unrealized appreciation (depreciation) on investment securities | 8,158 | 10,477 | |||||||||
| 23,817 | 52,836 | ||||||||||
| Distributions to Shareholders: | |||||||||||
| From net investment income: | |||||||||||
| Class A | (1,062 | ) | – | ||||||||
| Class C | (12 | ) | – | ||||||||
| (1,074 | ) | – | |||||||||
| From net realized gains: | |||||||||||
| Class A | (9,811 | ) | (24,403 | ) | |||||||
| Class B | (1,261 | ) | (3,352 | ) | |||||||
| Class C | (591 | ) | (378 | ) | |||||||
| Class C2 | – | (926 | ) | ||||||||
| Class M | – | (487 | ) | ||||||||
| (11,663 | ) | (29,546 | ) | ||||||||
| Capital Share Transactions: | |||||||||||
| Proceeds from shares sold: | |||||||||||
| Class A | 6,152 | 159,364 | |||||||||
| Class B | 7,050 | 10,062 | |||||||||
| Class C | 2,826 | 5,433 | |||||||||
| Class C2 | – | 915 | |||||||||
| Class M | – | 1,302 | |||||||||
| 16,028 | 177,076 | ||||||||||
| Dividends and distributions reinvested: | |||||||||||
| Class A | 10,826 | 24,237 | |||||||||
| Class B | 1,149 | 3,058 | |||||||||
| Class C | 542 | 343 | |||||||||
| Class C2 | – | 809 | |||||||||
| Class M | – | 475 | |||||||||
| 12,517 | 28,922 | ||||||||||
| Cost of shares redeemed: | |||||||||||
| Class A | (33,332 | ) | (16,086 | ) | |||||||
| Class B | (5,728 | ) | (9,142 | ) | |||||||
| Class C | (4,464 | ) | (4,965 | ) | |||||||
| Class C2 | – | (6,554 | ) | ||||||||
| Class M | – | (2,191 | ) | ||||||||
| (43,524 | ) | (38,938 | ) | ||||||||
| Class level exchanges: | |||||||||||
| Class C | – | 16,014 | |||||||||
| Class C2 | – | (10,526 | ) | ||||||||
| Class M | – | (5,488 | ) | ||||||||
| – | – | ||||||||||
| April 30, 2005 (unaudited) | October 31, 2004 | ||||||||||
| Automatic conversions: | |||||||||||
| Class A | $ | 114 | $ | 60 | |||||||
| Class B | (114 | ) | (60 | ) | |||||||
| – | – | ||||||||||
| (14,979 | ) | 167,060 | |||||||||
| Net increase (decrease) in net assets | (3,899 | ) | 190,350 | ||||||||
| Net Assets: | |||||||||||
| Beginning of period | 394,918 | 204,568 | |||||||||
| End of period | $ | 391,019 | $ | 394,918 | |||||||
| Accumulated Net Investment Income (Loss) | $ | (41 | ) | $ | 520 | ||||||
| Share Activity: | |||||||||||
| Shares issued: | |||||||||||
| Class A | 399 | 11,172 | |||||||||
| Class B | 471 | 729 | |||||||||
| Class C | 189 | 396 | |||||||||
| Class C2 | – | 66 | |||||||||
| Class M | – | 95 | |||||||||
| 1,059 | 12,458 | ||||||||||
| Shares issued–reinvested from distributions: | |||||||||||
| Class A | 706 | 1,787 | |||||||||
| Class B | 76 | 230 | |||||||||
| Class C | 36 | 26 | |||||||||
| Class C2 | – | 61 | |||||||||
| Class M | – | 36 | |||||||||
| 818 | 2,140 | ||||||||||
| Shares redeemed: | |||||||||||
| Class A | (2,125 | ) | (1,144 | ) | |||||||
| Class B | (383 | ) | (666 | ) | |||||||
| Class C | (298 | ) | (367 | ) | |||||||
| Class C2 | – | (459 | ) | ||||||||
| Class M | – | (160 | ) | ||||||||
| (2,806 | ) | (2,796 | ) | ||||||||
| Class level exchanges: | |||||||||||
| Class C | – | 1,197 | |||||||||
| Class C2 | – | (799 | ) | ||||||||
| Class M | – | (396 | ) | ||||||||
| – | 2 | ||||||||||
| Automatic conversions: | |||||||||||
| Class A | 7 | 4 | |||||||||
| Class B | (7 | ) | (4 | ) | |||||||
| – | – | ||||||||||
| Net increase (decrease) in shares outstanding: | |||||||||||
| Class A | (1,013 | ) | 11,819 | ||||||||
| Class B | 157 | 289 | |||||||||
| Class C | (73 | ) | 1,252 | ||||||||
| Class C2 | – | (1,131 | ) | ||||||||
| Class M | – | (425 | ) | ||||||||
| (929 | ) | 11,804 | |||||||||
The notes to the financial statements are an integral part of this report.
Transamerica IDEX Mutual Funds
Semi-Annual Report 2005
6
TA IDEX Transamerica Small/Mid Cap Value
FINANCIAL HIGHLIGHTS
(unaudited for the period ended April 30, 2005)
| For a share of beneficial interest outstanding throughout each period | |||||||||||||||||||||||||||||||||||||||
| Net Asset | Investment Operations | Distributions | Net Asset | ||||||||||||||||||||||||||||||||||||
| For the Period Ended (d)(g) | Value, Beginning of Period | Net Investment Income (Loss) | Net Realized and Unrealized Gain (Loss) | Total Operations | From Net Investment Income | From Net Realized Gains | Total Distributions | Value, End of Period | |||||||||||||||||||||||||||||||
| Class A | 4/30/2005 | $ | 14.32 | $ | 0.03 | $ | 0.80 | $ | 0.83 | $ | (0.05 | ) | $ | (0.42 | ) | $ | (0.47 | ) | $ | 14.68 | |||||||||||||||||||
| 10/31/2004 | 12.94 | 0.04 | 2.56 | 2.60 | – | (1.22 | ) | (1.22 | ) | 14.32 | |||||||||||||||||||||||||||||
| 10/31/2003 | 9.09 | (0.11 | ) | 3.96 | 3.85 | – | – | – | 12.94 | ||||||||||||||||||||||||||||||
| 10/31/2002 | 10.12 | (0.07 | ) | (0.96 | ) | (1.03 | ) | – | – | – | 9.09 | ||||||||||||||||||||||||||||
| 10/31/2001 | 10.00 | (0.02 | ) | 0.14 | 0.12 | – | – | – | 10.12 | ||||||||||||||||||||||||||||||
| Class B | 4/30/2005 | 13.97 | (0.03 | ) | 0.78 | 0.75 | – | (h) | (0.42 | ) | (0.42 | ) | 14.30 | ||||||||||||||||||||||||||
| 10/31/2004 | 12.73 | (0.06 | ) | 2.52 | 2.46 | – | (1.22 | ) | (1.22 | ) | 13.97 | ||||||||||||||||||||||||||||
| 10/31/2003 | 8.98 | (0.17 | ) | 3.92 | 3.75 | – | – | – | 12.73 | ||||||||||||||||||||||||||||||
| 10/31/2002 | 10.08 | (0.19 | ) | (0.91 | ) | (1.10 | ) | – | – | – | 8.98 | ||||||||||||||||||||||||||||
| 10/31/2001 | 10.00 | (0.05 | ) | 0.13 | 0.08 | – | – | – | 10.08 | ||||||||||||||||||||||||||||||
| Class C | 4/30/2005 | 13.96 | (0.05 | ) | 0.79 | 0.74 | (0.01 | ) | (0.42 | ) | (0.43 | ) | 14.27 | ||||||||||||||||||||||||||
| 10/31/2004 | 12.73 | (0.01 | ) | 2.46 | 2.45 | – | (1.22 | ) | (1.22 | ) | 13.96 | ||||||||||||||||||||||||||||
| 10/31/2003 | 9.01 | (0.18 | ) | 3.90 | 3.72 | – | – | – | 12.73 | ||||||||||||||||||||||||||||||
| Ratios/Supplemental Data | |||||||||||||||||||||||||||||||
| For the Period | Total | Net Assets, End of Period | Ratio of Expenses to Average Net Assets (a) | Net Investment Income (Loss) to Average | Portfolio Turnover | ||||||||||||||||||||||||||
| Ended (g) | Return (c) | (000's) | Net (e) | Total (f) | Net Assets (a) | Rate (b) | |||||||||||||||||||||||||
| Class A | 4/30/2005 | 5.66 | % | $ | 328,292 | 1.23 | % | 1.23 | % | 0.38 | % | 25 | % | ||||||||||||||||||
| 10/31/2004 | 20.61 | 334,763 | 1.32 | 1.32 | 0.31 | 81 | |||||||||||||||||||||||||
| 10/31/2003 | 42.35 | 149,557 | 1.73 | 1.73 | (1.04 | ) | 55 | ||||||||||||||||||||||||
| 10/31/2002 | (10.18 | ) | 45,500 | 1.85 | 1.98 | (0.88 | ) | 22 | |||||||||||||||||||||||
| 10/31/2001 | 1.20 | 6,536 | 1.85 | 3.56 | (0.32 | ) | 8 | ||||||||||||||||||||||||
| Class B | 4/30/2005 | 5.24 | 43,669 | 2.06 | 2.06 | (0.45 | ) | 25 | |||||||||||||||||||||||
| 10/31/2004 | 19.85 | 40,477 | 1.97 | 1.97 | (0.43 | ) | 81 | ||||||||||||||||||||||||
| 10/31/2003 | 41.76 | 33,196 | 2.38 | 2.38 | (1.69 | ) | 55 | ||||||||||||||||||||||||
| 10/31/2002 | (10.91 | ) | 24,391 | 2.50 | 2.63 | (1.53 | ) | 22 | |||||||||||||||||||||||
| 10/31/2001 | 0.80 | 7,604 | 2.50 | 4.21 | (0.97 | ) | 8 | ||||||||||||||||||||||||
| Class C | 4/30/2005 | 5.14 | 19,058 | 2.23 | 2.23 | (0.62 | ) | 25 | |||||||||||||||||||||||
| 10/31/2004 | 19.78 | 19,678 | 2.07 | 2.07 | (0.02 | ) | 81 | ||||||||||||||||||||||||
| 10/31/2003 | 41.29 | 1,995 | 2.38 | 2.38 | (1.69 | ) | 55 | ||||||||||||||||||||||||
NOTES TO FINANCIAL HIGHLIGHTS
(a) Annualized.
(b) Not annualized for periods of less than one year.
(c) Total Return has been calculated for the applicable period without deduction of a sales load, if any, on an initial purchase. Periods of less than one year are not annualized.
(d) Per share information is calculated based on average number of shares outstanding.
(e) Ratio of Net Expenses to Average Net Assets is net of fee waivers and reimbursements by the investment adiviser, if any (see note 2).
(f) Ratio of Total Expenses to Average Net Assets includes all expenses before fee waivers and reimbursements by the investment adviser.
(g) TA IDEX Transamerica Small/Mid Cap Value ("the Fund") commenced operations on April 2, 2001. The inception date for the Fund's offering of share Class C was November 11, 2002.
(h) Distributions from net investment calculates to less than $0.01 per share.
The notes to the financial statements are an integral part of this report.
Transamerica IDEX Mutual Funds
Semi-Annual Report 2005
7
TA IDEX Transamerica Small/Mid Cap Value
NOTES TO FINANCIAL STATEMENTS
At April 30, 2005
(all amounts in thousands)
(unaudited)
NOTE 1. ORGANIZATION AND SIGNIFICANT ACCOUNTING POLICIES
Transamerica IDEX Mutual Funds is a Delaware statutory trust registered under the Investment Company Act of 1940, as amended (the "1940 Act"), as an open-end management investment company. Prior to March 1, 2005, Transamerica IDEX Mutual Funds was a Massachusetts business trust. TA IDEX Transamerica Small/Mid Cap Value ("the Fund"), part of Transamerica IDEX Mutual Funds, began operations on April 2, 2001.
In the normal course of business, the Fund enters into contracts that contain a variety of representations and warranties, which provide general indemnifications. The Fund's maximum exposure under these arrangements is unknown, as this would involve future claims that may be made against the Fund and/or its affiliates that have not yet occurred. However, based on experience, the Fund expects the risk of loss to be remote.
See the Prospectus and Statement of Additional Information for a description of the Fund's investment objective.
In preparing the Fund's financial statements in accordance with accounting principles generally accepted in the United States of America ("GAAP"), estimates or assumptions (which could differ from actual results) may be used that affect reported amounts and disclosures. The following policies were consistently followed by the Fund, in accordance with GAAP.
Multiple class operations and expenses: The Fund currently offers three classes of shares, each with a public offering price that reflects different sales charges, if any, and expense levels. On June 15, 2004, Class C2 shares merged into Class C. On September 24, 2004, Class M shares merged into Class C. Class B shares will convert to Class A shares eight years after purchase. Income, non-class specific expenses and realized and unrealized gains and losses, are allocated daily to each class, based upon the value of shares outstanding method as permitted under Rule 18f-3 of the 1940 Act. Each class bears its own specific expenses as well as a portion of general, common expenses.
Pricing of shares: The Fund prices its shares on the basis of the net asset value of each class of shares of the Fund, which is determined as of the close of the New York Stock Exchange ("NYSE") (generally 4:00 p.m. Eastern Time) on each day on which the NYSE is open for trading.
Security valuations: Fund investments traded on an exchange are valued at the closing price on the day of valuation on the exchange where the security is principally traded. With respect to securities traded on NASDAQ NMS, such closing price may be last reported sales price or the NASDAQ Official Closing Price.
Securities traded in the over-the-counter market and listed securities for which no sale was reported on that date are valued at the last quoted bid price.
Debt securities are valued by independent pricing services at the last quoted bid price; however, those that mature in sixty days or less are valued at amortized cost, which approximates market.
Investment company securities are valued at net asset value of the underlying portfolio.
Other securities for which quotations are not readily available are valued at fair market value as determined in good faith using guidelines adopted by the Board of Trustees of the Fund, under the supervision of the Fund's Valuation Committee. These guidelines may include: the type of security; any restrictions on its resale; financial or business news of the issuer; similar or related securities that are actively trading; related corporate actions; and other significant events occurring after the close of trading in the security.
Cash: The Fund may leave cash overnight in its cash account with the custodian, Investors Bank & Trust Company ("IBT"). IBT has been contracted on behalf of the Fund to invest the excess cash into a savings account, which at April 30, 2005, was paying an interest rate of 2.02%.
Throughout the period, the Fund may have a cash overdraft balance. A fee is incurred on this overdraft, calculated by multiplying the overdraft by a rate based on the federal funds rate.
Repurchase agreements: The Fund is authorized to enter into repurchase agreements. The Fund, through IBT, receives delivery of the underlying securities, the value of which at the time of purchase is required to be an amount equal to at least 100% of the resale price. Repurchase agreements involve the risk that the seller will fail to repurchase the security, as agreed. In that case, the Fund will bear the risk of value fluctuations until the security can be sold and may encounter delays and incur costs in liquidating the security. In the event of bankruptcy or insolvency of the seller, delays and costs may be incurred.
Commission recapture: The sub-adviser, to the extent consistent with the best execution and usual commission rate policies and practices, may place security transactions of the Fund with broker/dealers with which Transamerica IDEX Mutual Funds has established a Commission Recapture Program. A Commission Recapture Program is any arrangement under which a broker/dealer applies a portion of the commissions received by such broker/dealer on the security transactions to the Fund. In no event will commissions paid by the Fund be used to pay expenses that would otherwise be borne by any other funds within Transamerica IDEX Mutual Funds, or by any other party.
Recaptured commissions during the six months ended April 30, 2005, of $100 are included in net realized gains in the Statement of Operations.
Transamerica IDEX Mutual Funds
Semi-Annual Report 2005
8
TA IDEX Transamerica Small/Mid Cap Value
NOTES TO FINANCIAL STATEMENTS (continued)
At April 30, 2005
(all amounts in thousands)
(unaudited)
NOTE 1.–(continued)
Securities lending: The Fund may lend securities to enhance fund earnings from investing cash collateral in making such loans to qualified borrowers (typically broker/dealers). The Fund has engaged its custodian bank, IBT, as a lending agent to administer its securities lending program. IBT earned $154 of program income for its services. When the Fund makes a security loan, it receives cash collateral as protection against the risk that the borrower will default on the loan, and records an asset for the cash invested collateral and a liability for the return of the collateral.
Loans of securities are required to be secured by collateral at least equal to 102% of the value of the securities at inception of the loan, and not less then 100% thereafter. The Fund may invest cash collateral in short-term money market instruments including: U.S. Treasury Bills, U.S. agency obligations, commercial paper, money market mutual funds, repurchase agreements and other highly rated, liquid investments. During the life of securities loans, the collateral and securities loaned remain subject to fluctuation in value. IBT marks to market securities loaned and the collateral each business day. If additional collateral is due (at least $1), IBT collects additional cash collateral from the borrowers. Although securities loaned will be fully collateralized at all times, IBT may experience delays in, or may be prevented from, recovering the collateral on behalf of the Fund. The Fund may recall a loa ned security position at any time from the borrower through IBT. In the event the borrower fails to timely return a recalled security, IBT may indemnify the Fund by purchasing replacement securities for the Fund at its own expense and claiming the collateral to fund such a purchase. IBT absorbs the loss if the collateral value is not sufficient to cover the cost of the replacement securities. If replacement securities are not available, IBT will credit the equivalent cash value to the Fund.
While a security is on loan, the Fund does not have the right to vote that security. However, if time permits, the Fund will attempt to recall a security on loan and vote the proxy.
Income from securities lending is included in the Statement of Operations. The amount of collateral and value of securities on loan are included in the Statement of Assets and Liabilities as well as in the Schedule of Investments.
Real Estate Investment Trusts ("REITs"): There are certain additional risks involved in investing in REITs. These include, but are not limited to, economic conditions, changes in zoning laws, real estate values, property taxes and interest rates.
Dividend income is recorded at management's estimate of the income included in distributions from the REIT investments. Distributions received in excess of the estimated amount are recorded as a reduction of the cost investments. The actual amounts of income, return of capital and capital gains are only determined by each REIT after the fiscal year end and may differ from the estimated amounts.
Security transactions and investment income: Security transactions are recorded on the trade date. Security gains and losses are calculated on the specific identification basis. Dividend income is recorded on the ex-dividend date or, in the case of foreign securities, as soon as the Fund is informed of the ex-dividend date. Interest income, including accretion of discounts and amortization of premiums, is recorded on the accrual basis commencing on the settlement date.
Account maintenance fees: If the shareholder account balance falls below $1 by either shareholder action or as a result of market action, a $25 (not in thousands) fee is assessed every year until the balance reaches $1. The fee is assessed by redeeming shares in the shareholder's account.
No fee will be charged under the following conditions:
• accounts opened within the preceding 24 months
• accounts with an active monthly Automatic Investment Plan ($50 (not in thousands) minimum per fund)
• accounts owned by an individual which, when combined by social security number, have a balance of $5 or more
• accounts owned by individuals in the same household (by address) that have a combined balance of $5 or more
• UTMA/UGMA accounts
• Fiduciary accounts
• B-share accounts whose shares have started to convert to A-shares accounts (as long as combined value of both accounts is at least $1)
For the six months ended April 30, 2005, this fee totaled less than $1. These fees are included in Paid in Capital in the Statement of Assets and Liabilities.
Redemption fees: A short-term trading redemption fee may be assessed on any fund shares in a fund account that are sold during the first five (5) NYSE trading days following their purchase date. This redemption fee will equal 2% of the amount redeemed and shares held the longest will be treated as being redeemed first and shares held the shortest as being redeemed last.
For six months ended April 30, 2005 , the Fund received less than $1 in redemption fees.
Dividend distributions: Distributions to shareholders are recorded on the ex-dividend date and are determined in accordance with Federal income tax regulations which may differ from GAAP.
Transamerica IDEX Mutual Funds
Semi-Annual Report 2005
9
TA IDEX Transamerica Small/Mid Cap Value
NOTES TO FINANCIAL STATEMENTS (continued)
At April 30, 2005
(all amounts in thousands)
(unaudited)
NOTE 2. RELATED PARTY TRANSACTIONS
Transamerica Fund Advisors, Inc. ("TFAI") is the Fund's investment adviser. Transamerica Fund Services, Inc. ("TFS") is the Fund's administrator and transfer agent. AFSG Securities Corp. ("AFSG") is the Fund's distributor/principal underwriter. AFSG is 100% owned by AUSA Holding Company ("AUSA"). TFAI is a directly owned subsidiary of Western Reserve Life Assurance Co. of Ohio (78%) and AUSA (22%). TFS is a wholly owned subsidiary of WRL (50%) and AUSA (50%). AUSA and WRL are wholly owned indirect subsidiaries of AEGON, NV, a Netherlands corporation.
Effective January 1, 2005 AEGON/Transamerica Fund Advisors, Inc. ("ATFA") was renamed Transamerica Fund Advisors, Inc. ("TFAI"); AEGON/Transamerica Fund Services, Inc. ("ATFS") and AEGON/Transamerica Investor Services, Inc. ("ATIS") merged into one entity and was renamed Transamerica Fund Services, Inc. ("TFS").
Transamerica Investment Management, LLC is both an affiliate of the Fund and a sub-adviser to the Fund.
The following schedule reflects the percentage of fund assets owned by affiliated mutual funds (i.e., through the asset allocation funds):
| Net Assets | % of Net Assets | ||||||||||
| TA IDEX Asset Allocation– Conservative Portfolio | $ | 10,361 | 2.65 | % | |||||||
| TA IDEX Asset Allocation– Growth Portfolio | 94,378 | 24.14 | % | ||||||||
| TA IDEX Asset Allocation– Moderate Growth Portfolio | 122,538 | 31.34 | % | ||||||||
| TA IDEX Asset Allocation– Moderate Portfolio | 69,489 | 17.77 | % | ||||||||
| Total | $ | 296,766 | 75.90 | % | |||||||
Investment advisory fee: The Fund pays management fees to TFAI based on average daily net assets ("ANA") at the following breakpoints:
0.80% of the first $500 million of ANA
0.75% of ANA over $500 million
TFAI has contractually agreed to waive its advisory fee and will reimburse the Fund to the extent that operating expenses, excluding 12b-1 fees, exceed the following stated annual limit:
1.40% Expense Limit
If total fund expenses fall below the annual expense limitation agreement agreed to by the adviser within the succeeding three years, the Fund may be required to pay that adviser a portion or all of the waived advisory fees.
There are no amounts available for recapture at April 30, 2005.
Distribution and service fees: The Fund has a 12b-1 distribution plan under the 1940 Act pursuant to which an annual fee, based on average daily net assets, is paid to the distributor for various disbursements such as broker-dealer account servicing fees and other promotional expenses of the Fund. The Fund is authorized under the 12b-1 plan to pay fees on each class up to the following limits:
| Class A | 0.35 | % | |||||
| Class B | 1.00 | % | |||||
| Class C | 1.00 | % | |||||
In the case the Fund or a class of shares of the Fund is closed to new investors or investments, the Fund is authorized to pay 12b-1 fees for past sales and distribution efforts and present and past investor services.
Underwriter commissions relate to front-end sales charges imposed for Class A shares and contingent deferred sales charges from Classes B, C, and certain A share redemptions. For the six months ended April 30, 2005, the underwriter commissions were as follows:
| Received by Underwriter | $ | 276 | |||||
| Retained by Underwriter | 15 | ||||||
| Contingent Deferred Sales Charge | 76 | ||||||
Administrative services: The Fund has entered into an agreement with TFS for financial and legal fund administration services, which includes such items as compliance, expenses, financial statements and other reporting, distributions, tax returns, prospectus preparation, board of trustees meeting support and other legal matters. As of January 1, 2005 the Fund pays TFS an annual fee of 0.02% of average net assets. Prior to January 1, 2005 the Fund paid TFS an annual fee of 0.015% of average net assets. The Legal fees on the Statement of Operations are for fees paid to external legal counsel.
Transfer agent fees: The Fund pays TFS an annual per-account charge of $20 (not in thousands) for each open account and $1.63 (not in thousands) for each closed account. There is no new account charge. The Transfer agent fees on the Statement of Operations are made up of fees paid to TFS and costs associated with shareholder statements.
The Fund paid TFS $124 for the six months ended April 30, 2005.
Deferred compensation plan: Each eligible Fund Trustee may elect participation in the Deferred Compensation Plan ("the Plan"). Under the Plan, such Trustees may defer payment of a percentage of their total fees earned as a Fund Trustee. These deferred amounts may be invested in any Transamerica IDEX Mutual Fund. At April 30, 2005, the value of invested plan amount was $11. Invested plan amounts and the total
Transamerica IDEX Mutual Funds
Semi-Annual Report 2005
10
TA IDEX Transamerica Small/Mid Cap Value
NOTES TO FINANCIAL STATEMENTS (continued)
At April 30, 2005
(all amounts in thousands)
(unaudited)
NOTE 2.–(continued)
liability for deferred compensation to the Trustees under the Plan at April 30, 2005, are included in the accompanying Statement of Assets and Liabilities.
NOTE 3. INVESTMENT TRANSACTIONS
The cost of securities purchased and proceeds from securities sold (excluding short-term securities) for the six months ended April 30, 2005, were as follows:
| Purchases of securities: | |||||||
| Long-Term excluding U.S. Government | $ | 104,340 | |||||
| U.S. Government | – | ||||||
| Proceeds from maturities and sales of securities: | |||||||
| Long-Term excluding U.S. Government | 126,334 | ||||||
| U.S. Government | – | ||||||
NOTE 4. FEDERAL INCOME TAX MATTERS
The Fund has not made any provision for federal income or excise taxes due to its policy to distribute all of its taxable income and capital gains to its shareholders and otherwise qualify as a regulated investment company under the Internal Revenue Code. Income and capital gain distributions are determined in accordance with income tax regulations, which may differ from GAAP. These differences are primarily due to differing treatment for items including, but not limited to, wash sales, net operating losses and capital loss carryforwards.
The aggregate cost of investments and composition of unrealized appreciation (depreciation) for federal income tax purposes as of April 30, 2005, are as follows:
| Federal Tax Cost Basis | $ | 412,533 | |||||
| Unrealized Appreciation | $ | 58,200 | |||||
| Unrealized (Depreciation) | (18,953 | ) | |||||
| Net Unrealized Appreciation (Depreciation) | $ | 39,247 | |||||
NOTE 5. REGULATORY PROCEEDINGS
There continues to be significant federal and state regulatory activity relating to financial services companies, particularly mutual fund companies and their investment advisers. As part of an ongoing investigation regarding potential market timing, recordkeeping and trading compliance issues and matters affecting the Fund's investment adviser, TFAI, and certain employees and affiliates of TFAI, the SEC staff has indicated that it is likely to take some action against TFAI and certain of its affiliates at the conclusion of the investigation. The potential timing and the scope of any such action is difficult to predict. Although the impact of any action brought against TFAI and/or its affiliates is difficult to assess at the present time, the Fund currently believes that the likelihood that any such action will have a material adverse impact on it is remote. It is important to note that the Fund is not aware of any allegation of wrongdoing against it and its board at the time this semi-annual report is printed. Although it is not anticipated that these developments will have an adverse impact on the Fund, there can be no assurance at this time. TFAI and its affiliates are actively working with the SEC in regard to this matter; however, the exact resolution cannot be determined at this time. TFAI will take such actions that it deems necessary or appropriate to continue providing management services to the Fund and to bring all matters to an appropriate conclusion.
TFAI and/or its affiliates, and not the Fund, will bear the costs regarding these regulatory matters.
Transamerica IDEX Mutual Funds
Semi-Annual Report 2005
11
TA IDEX Transamerica Small/Mid Cap Value
INVESTMENT ADVISORY AGREEMENT – REVIEW AND RENEWAL
At a meeting of the Board of Trustees of Transamerica IDEX Mutual Funds ("TA IDEX") held on October 6, 2004, the Board considered and approved the renewal for a one-year period of the Investment Advisory Agreement between TA IDEX Transamerica Small Mid/Cap Value (the "Fund") and Transamerica Fund Advisors, Inc. ("TFAI"). In approving the renewal of this agreement, the Board concluded that the Investment Advisory Agreement enables shareholders of the Fund to obtain high quality services at a cost that is appropriate, reasonable, and in the best interests of shareholders based upon the following determinations, among others:
The nature, extent and quality of the advisory service to be provided. The Board considered the nature and quality of the services provided by TFAI in the past, as well as the services anticipated to be provided in the future. The Board concluded that TFAI is capable of providing high quality services to the Fund, as indicated by TFAI's management capabilities demonstrated with respect to the Fund and other funds managed by TFAI, TFAI's management oversight process, and the Fund's strong investment performance. The Board also concluded that TFAI would provide the same quality and quantity of investment management and related services as before, that these services are appropriate in scope and extent in light of the Fund's operations, the competitive landscape of the investment company business a nd investor needs, and that TFAI's obligations will remain the same in all respects.
The investment performance of the Fund. The Board concluded, based in particular on information provided by Lipper Analytics, that the Fund's investment performance was competitive or superior relative to comparable funds over trailing one-, two-, and three-periods and to the Fund's benchmark index over the past year. The Board also reviewed the Fund's investment performance since the Fund's sub-adviser, Transamerica Investment Management, LLC (the "Sub-Adviser"), was appointed to manage the Fund pursuant to a vote of the Fund's shareholders on February 25, 2004. On the basis of the Trustees' assessment of the nature, extent and quality of investment advisory and related services to be provided or procured by TFAI and the Sub-Adviser, the Trustees concluded that TFAI was capable of generati ng a level of long-term investment performance that is appropriate in light of the Fund's investment objective, policies and strategies and competitive with many other investment companies.
The cost of advisory services provided and the level of profitability. On the basis of the Board's review of the fees to be charged by TFAI and the Sub-Adviser for investment advisory and related services, TFAI's financial statements, the fees paid by TFAI to the Sub-Adviser, TFAI's estimated net management income resulting from its management of the Fund, and the estimated profitability of TFAI's relationships with the Fund and TA IDEX, the Board concluded that the level of investment advisory fees and the profitability is appropriate in light of the services provided, the management fees and overall expense ratios of comparable investment companies, and the anticipated profitability of the relationship between the Fund and TFAI.
The extent to which economies of scale would be realized as the Fund grows and whether fee levels reflect these economies of scale for the benefit of Fund investors. The Trustees concluded that inclusion of asset-based breakpoints in the Fund's advisory fee schedule appropriately benefit investors by realizing economies of scale in the form of a lower advisory fee rate as the level of Fund assets increases. The Board also concluded that the advisory fees appropriately reflect the Fund's current size, the current economic environment for TFAI, and the competitive nature of the investment company market. In addition, the Board noted that it will have the opportunity to periodically re-examine whether the Fund has achieved economies of scale, as well as the appropriateness of advisory fees payable to TFAI in the future.
Benefits (such as soft dollars) to TFAI or the Sub-Adviser from its relationship with the Fund. The Board concluded that other benefits derived by TFAI or the Sub-Adviser from its relationship with the Fund are reasonable and fair, and are consistent with industry practice and the best interests of the Fund and its shareholders. In this regard, the Board noted that TFAI does not realize "soft dollar" benefits from its relationship with the Fund, and that the Sub-Adviser is participating in a brokerage program pursuant to which a portion of brokerage commissions paid by the Fund is recaptured for the benefit of the Fund and its shareholders, thus limiting the amount of "soft-dollar" arrangements the Sub-Adviser may engage in with respect to the Fund's portfolio brokerage transactions.
Other considerations. The Board also determined that TFAI had made a substantial commitment to the recruitment and retention of high quality personnel, and maintained the financial, compliance and operational resources reasonably necessary to manage the Fund in a professional manner that is consistent with the best interests of the Fund and its shareholders. The Trustees also concluded that TFAI had made a significant entrepreneurial commitment to the management and success of the Fund, reflected by TFAI's expense limitation and fee waiver arrangement with the Fund which, as demonstrated in the past with the Fund, may result in TFAI waiving a substantial amount of advisory fees for the benefit of shareholders.
Transamerica IDEX Mutual Funds
Semi-Annual Report 2005
12
TA IDEX Transamerica Small/Mid Cap Value
SUPPLEMENTAL INFORMATION (unaudited)
RESULTS OF SHAREHOLDER PROXY
At a special meeting of shareholders held on February 25, 2005, the results of the Proposals were as follows:
Transamerica IDEX Mutual Funds
Proposal 1: Election of Trustees to the Board of Trustees of Transamerica IDEX Mutual Funds.
| For | Withheld | ||||||||||
| Peter R. Brown | 872,017,875.249 | 4,468,498.551 | |||||||||
| Daniel Calabria | 871,917,069.786 | 4,569,304.014 | |||||||||
| Janise B. Case | 872,099,393.125 | 4,386,980.675 | |||||||||
| Charles C. Harris | 872,086,722.025 | 4,399,651.775 | |||||||||
| Leo J. Hill | 872,304,465.640 | 4,181,908.160 | |||||||||
| Russell A. Kimball, Jr. | 872,253,556.471 | 4,232,817.329 | |||||||||
| William W. Short, Jr. | 872,139,920.944 | 4,346,452.856 | |||||||||
| John Waechter | 872,261,152.376 | 4,225,221.424 | |||||||||
| Jack E. Zimmerman | 871,929,967.512 | 4,556,406.288 | |||||||||
| Brian C. Scott | 872,218,970.367 | 4,267,403.433 | |||||||||
| Thomas P. O'Neill | 872,111,944.117 | 4,374,429.683 | |||||||||
TA IDEX Transamerica Small/Mid Cap Value
Proposal 2: Approval of an Agreement and Plan of Reorganization pursuant to which Transamerica IDEX Mutual Funds will organize as a Delaware statutory trust.
| For | Against | Abstentions/Broker Non-Votes | |||||||||
| 23,660,706.795 | 52,650.721 | 2,797,259.190 | |||||||||
Proposal 3: Approval of changes to the fundamental investment restrictions of TA IDEX Transamerica Small/Mid Cap Value.
| A. Diversification | For | Against | Abstentions/Broker Non-Votes | ||||||||||||
| 23,716,995.600 | 61,771.106 | 2,731,850.000 | |||||||||||||
| B. Borrowing | For | Against | Abstentions/Broker Non-Votes | ||||||||||||
| 23,707,296.835 | 71,469.871 | 2,731,850.000 | |||||||||||||
| C. Senior Securities | For | Against | Abstentions/Broker Non-Votes | ||||||||||||
| 23,715,896.921 | 62,869.785 | 2,731,850.000 | |||||||||||||
| D. Underwriting Securities | For | Against | Abstentions/Broker Non-Votes | ||||||||||||
| 23,713,860.958 | 64,905.748 | 2,731,850.000 | |||||||||||||
| E. Real Estate | For | Against | Abstentions/Broker Non-Votes | ||||||||||||
| 23,716,813.805 | 61,952.901 | 2,731,850.000 | |||||||||||||
| F. Making Loans | For | Against | Abstentions/Broker Non-Votes | ||||||||||||
| 23,711,555.876 | 67,210.830 | 2,731,850.000 | |||||||||||||
| G. Concentration | For | Against | Abstentions/Broker Non-Votes | ||||||||||||
| 23,712,940.600 | 65,826.106 | 2,731,850.000 | |||||||||||||
| H. Commodities | For | Against | Abstentions/Broker Non-Votes | ||||||||||||
| 23,708,181.977 | 70,584.729 | 2,731,850.000 | |||||||||||||
Transamerica IDEX Mutual Funds
Semi-Annual Report 2005
13
TA IDEX Transamerica Value Balanced
UNDERSTANDING YOUR FUND'S EXPENSES
(unaudited)
SHAREHOLDER EXPENSES
The following Example is intended to help you understand your ongoing costs (in dollars and cents) of investing in a Fund and to compare these costs with the ongoing costs of investing in other funds.
The Example is based on an investment of $1,000 invested at November 1, 2004 and held for the entire period until April 30, 2005.
ACTUAL EXPENSES
The first line in the table below provides information about actual account values and actual expenses. You may use the information in this line, together with the amount you invested, to estimate the expenses that you paid over the period. Simply divide your account value by $1,000 (for example, an $8,600 account value divided by $1,000 = 8.6), then multiply the result by the number in the first line of your Fund under the heading entitled "Expenses Paid During Period" to estimate the expenses you paid on your account during this period.
HYPOTHETICAL EXAMPLE FOR COMPARISON PURPOSES
The second line in the table below provides information about hypothetical account values and hypothetical expenses based on the Fund's actual expense ratio and an assumed rate of return of 5% per year before expenses, which is not the Fund's actual return. The hypothetical account values and expenses may not be used to estimate the actual ending account balance or expenses you paid for the period. You may use this information to compare the ongoing costs of investing in your Fund and other funds. To do so, compare this 5% hypothetical example with the 5% hypothetical examples that appear in the shareholder reports of the other funds.
Please note that the expenses shown in the table are meant to highlight your ongoing costs only and do not reflect any transactional costs, such as sales charges, redemption fees, brokerage commissions paid on purchases and sales of fund shares. Therefore, the second line under the Fund in the table is useful in comparing ongoing costs only, and will not help you determine the relative total costs of owning different funds. In addition, note that the expenses shown in the table are meant to highlight your ongoing costs and do not reflect any transaction costs.
| Beginning Account Value | Ending Account Value | Annualized Expense Ratio | Expenses Paid During Period (a) | ||||||||||||||||
| Class A | |||||||||||||||||||
| Actual | $ | 1,000.00 | $ | 1,034.70 | 1.45 | % | $ | 7.32 | |||||||||||
| Hypothetical (b) | 1,000.00 | 1,017.60 | 1.45 | 7.25 | |||||||||||||||
| Class B | |||||||||||||||||||
| Actual | 1,000.00 | 1,032.60 | 2.10 | 10.58 | |||||||||||||||
| Hypothetical (b) | 1,000.00 | 1,014.38 | 2.10 | 10.49 | |||||||||||||||
| Class C | |||||||||||||||||||
| Actual | 1,000.00 | 1,032.60 | 2.20 | 11.09 | |||||||||||||||
| Hypothetical (b) | 1,000.00 | 1,013.88 | 2.20 | 10.99 | |||||||||||||||
(a) Expenses are calculated using each Fund's annualized expense ratio (as disclosed in the table), multiplied by the average account value for the period, multiplied by number of days in the period (181 days), and divided by the number of days in the year (365 days).
(b) 5% return per year before expenses.
GRAPHICAL PRESENTATION OF SCHEDULE OF INVESTMENTS
By Asset Type
At April 30, 2005
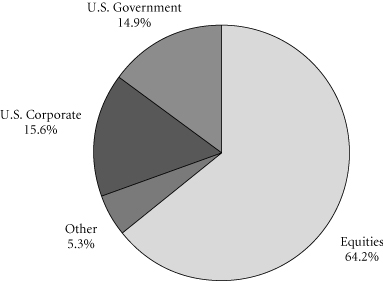
This chart shows the percentage breakdown by asset type of the Fund's total investment securities.
Transamerica IDEX Mutual Funds
Semi-Annual Report 2005
1
TA IDEX Transamerica Value Balanced
SCHEDULE OF INVESTMENTS
At April 30, 2005
(all amounts except share amounts in thousands)
(unaudited)
| Principal | Value | ||||||||||
| U.S. GOVERNMENT OBLIGATIONS (2.0%) (b) | |||||||||||
| U.S. Treasury Bond 5.38%, due 02/15/2031 (a) | $ | 938 | $ | 1,060 | |||||||
| U.S. Treasury Note 4.25%, due 11/15/2014 115 115 4.00%, due 02/15/2015 (a) | 300 | 295 | |||||||||
| Total U.S. Government Obligations (cost: $1,366) | 1,470 | ||||||||||
| U.S. GOVERNMENT AGENCY OBLIGATIONS (13.6%) | |||||||||||
| Fannie Mae–Conventional Pool | |||||||||||
| 5.00%, due 05/01/2018 | 161 | 162 | |||||||||
| 5.00%, due 04/01/2019 | 171 | 172 | |||||||||
| 5.50%, due 07/01/2019 | 156 | 160 | |||||||||
| 5.50%, due 07/01/2019 | 808 | 828 | |||||||||
| 6.00%, due 05/01/2032 | 340 | 349 | |||||||||
| 6.00%, due 04/01/2033 | 417 | 429 | |||||||||
| 6.00%, due 10/01/2033 | 222 | 228 | |||||||||
| 6.00%, due 01/01/2034 | 249 | 256 | |||||||||
| 6.00%, due 01/01/2034 | 303 | 311 | |||||||||
| 6.00%, due 02/01/2034 | 1,064 | 1,093 | |||||||||
| 6.00%, due 06/01/2034 | 413 | 424 | |||||||||
| 6.00%, due 08/01/2034 | 745 | 766 | |||||||||
| 6.00%, due 10/01/2034 | 265 | 272 | |||||||||
| Freddie Mac–Gold Pool 5.00%, due 04/01/2018 5.50%, due 09/01/2018 5.50%, due 11/01/2018 5.50%, due 12/01/2018 7.00%, due 10/01/2028 6.50%, due 04/01/2029 6.00%, due 03/01/2033 6.00%, due 11/01/2033 6.00%, due 11/01/2033 6.00%, due 12/01/2033 | 292 103 186 708 111 113 707 271 725 844 | 295 106 191 726 117 117 726 278 745 867 | |||||||||
| Ginnie Mae–FHA/VA Pool 6.50%, due 10/15/2027 6.00%, due 06/15/2034 | 122 333 | 128 343 | |||||||||
| Total U.S. Government Agency Obligations (cost: $10,112) | 10,089 | ||||||||||
| CORPORATE DEBT SECURITIES (16.2%) | |||||||||||
| Agriculture (0.1%) | |||||||||||
| Dole Food Co., Inc. 8.63%, due 05/01/2009 | 100 | 105 | |||||||||
| Amusement & Recreation Services (1.0%) | |||||||||||
| Harrah's Operating Co., Inc. 5.50%, due 07/01/2010 | 700 | 716 | |||||||||
| Principal | Value | ||||||||||
| Beverages (0.2%) | |||||||||||
| Cia Brasileira de Bebidas 8.75%, due 09/15/2013 | $ | 150 | $ | 172 | |||||||
| Business Credit Institutions (0.4%) | |||||||||||
| eircom Funding 8.25%, due 08/15/2013 | 50 | 54 | |||||||||
| Textron Financial Corp. 2.69%, due 10/03/2006 | 250 | 245 | |||||||||
| Chemicals & Allied Products (0.1%) | |||||||||||
| Nalco Co. 7.75%, due 11/15/2011 | 50 | 51 | |||||||||
| Commercial Banks (0.8%) | |||||||||||
| Abbey National PLC 7.35%, due 06/15/2049 (c) | 250 | 261 | |||||||||
| BAC Capital Trust VI 5.63%, due 03/08/2035 | 351 | 347 | |||||||||
| Communication (0.1%) | |||||||||||
| Echostar DBS Corp. 5.75%, due 10/01/2008 | 75 | 74 | |||||||||
| Communications Equipment (0.7%) | |||||||||||
| Motorola, Inc. 4.61%, due 11/16/2007 | 500 | 503 | |||||||||
| Electric Services (0.3%) | |||||||||||
| DPL, Inc. 8.25%, due 03/01/2007 | 212 | 225 | |||||||||
| Food Stores (0.5%) | |||||||||||
| Stater Brothers Holdings, Inc. 8.13%, due 06/15/2012 | 375 | 349 | |||||||||
| Holding & Other Investment Offices (0.9%) | |||||||||||
| Hutchison Whampoa International, Ltd.–144A 6.25%, due 01/24/2014 | 275 | 290 | |||||||||
| iStar Financial, Inc. 4.88%, due 01/15/2009 | 375 | 372 | |||||||||
| Hotels & Other Lodging Places (1.1%) | |||||||||||
| Mirage Resorts, Inc. 7.25%, due 08/01/2017 | 150 | 153 | |||||||||
| Park Place Entertainment Corp. 7.00%, due 04/15/2013 | 75 | 81 | |||||||||
| Starwood Hotels & Resorts Worldwide, Inc. 7.38%, due 05/01/2007 | 600 | 621 | |||||||||
| Insurance (1.0%) | |||||||||||
| International Lease Finance Corp. 5.63%, due 06/01/2007 | 700 | 719 | |||||||||
The notes to the financial statements are an integral part of this report.
Transamerica IDEX Mutual Funds
Semi-Annual Report 2005
2
TA IDEX Transamerica Value Balanced
SCHEDULE OF INVESTMENTS (continued)
At April 30, 2005
(all amounts except share amounts in thousands)
(unaudited)
| Principal | Value | ||||||||||
| Metal Mining (0.5%) | |||||||||||
| Phelps Dodge Corp. 9.50%, due 06/01/2031 | $ | 262 | $ | 398 | |||||||
| Mortgage Bankers & Brokers (0.9%) | |||||||||||
| Countrywide Home Loans, Inc. 5.50%, due 08/01/2006 | 700 | 712 | |||||||||
| Motion Pictures (0.2%) | |||||||||||
| Time Warner, Inc. 9.13%, due 01/15/2013 | 125 | 157 | |||||||||
| Oil & Gas Extraction (1.6%) | |||||||||||
| Chesapeake Energy Corp. 7.00%, due 08/15/2014 | 200 | 205 | |||||||||
| Husky Oil, Ltd. 8.90%, due 08/15/2028 (d) | 305 | 340 | |||||||||
| Kerr-McGee Corp. 6.95%, due 07/01/2024 | 173 | 159 | |||||||||
| Nexen, Inc. 5.88%, due 03/10/2035 | 533 | 514 | |||||||||
| Personal Credit Institutions (0.7%) | |||||||||||
| Capital One Bank 5.00%, due 06/15/2009 | 375 | 379 | |||||||||
| General Motors Acceptance Corp. 6.75%, due 01/15/2006 | 125 | 126 | |||||||||
| Petroleum Refining (0.7%) | |||||||||||
| Amerada Hess Corp. 7.13%, due 03/15/2033 | 450 | 506 | |||||||||
| Primary Metal Industries (0.2%) | |||||||||||
| Noranda, Inc. 6.00%, due 10/15/2015 | 125 | 127 | |||||||||
| Printing & Publishing (0.8%) | |||||||||||
| Gannett Co., Inc. 5.50%, due 04/01/2007 | 500 | 513 | |||||||||
| News America Holdings, Inc. 7.75%, due 12/01/2045 | 65 | 78 | |||||||||
| Restaurants (0.2%) | |||||||||||
| Landry's Restaurants, Inc.–144A 7.50%, due 12/15/2014 | 150 | 139 | |||||||||
| Security & Commodity Brokers (1.3%) | |||||||||||
| BNP U.S. Funding LLC–144A 7.74%, due 12/29/2049 (e) | 250 | 269 | |||||||||
| Credit Suisse First Boston (London), Inc.–144A 7.90%, due 05/01/2049 (f) | 125 | 133 | |||||||||
| E*Trade Financial Corp. 8.00%, due 06/15/2011 | 150 | 154 | |||||||||
| Merrill Lynch & Co., Inc., Series B 6.13%, due 05/16/2006 | 400 | 409 | |||||||||
| Principal | Value | ||||||||||
| Telecommunications (1.4%) | |||||||||||
| Cincinnati Bell, Inc. 8.38%, due 01/15/2014 (a) | $ | 50 | $ | 48 | |||||||
| SBC Communications, Inc. 5.75%, due 05/02/2006 | 700 | 712 | |||||||||
| Sprint Capital Corp. 4.78%, due 08/17/2006 | 250 | 252 | |||||||||
| Transportation & Public Utilities (0.2%) | |||||||||||
| Magellan Midstream Partners, LP 6.45%, due 06/01/2014 | 135 | 146 | |||||||||
| Water Transportation (0.3%) | |||||||||||
| Royal Caribbean Cruises, Ltd. 8.75%, due 02/02/2011 | 235 | 263 | |||||||||
| Total Corporate Debt Securities (cost: $12,115) | 12,077 | ||||||||||
| Shares | Value | ||||||||||
| COMMON STOCKS (66.7%) | |||||||||||
| Amusement & Recreation Services (1.9%) | |||||||||||
| Disney (Walt) Co. (The) | 52,200 | $ | 1,378 | ||||||||
| Business Credit Institutions (0.3%) | |||||||||||
| Fannie Mae | 4,500 | 243 | |||||||||
| Chemicals & Allied Products (2.2%) | |||||||||||
| Colgate-Palmolive Co. | 7,000 | 349 | |||||||||
| du Pont (E.I.) de Nemours & Co. | 12,000 | 565 | |||||||||
| Praxair, Inc. | 16,000 | 749 | |||||||||
| Commercial Banks (7.5%) | |||||||||||
| Bank of America Corp. | 31,256 | 1,408 | |||||||||
| Citigroup, Inc. | 32,540 | 1,528 | |||||||||
| PNC Financial Services Group, Inc. | 17,000 | 905 | |||||||||
| Wachovia Corp. | 24,140 | 1,236 | |||||||||
| Wells Fargo & Co. | 8,100 | 486 | |||||||||
| Computer & Data Processing Services (5.4%) | |||||||||||
| Microsoft Corp. | 150,000 | 3,795 | |||||||||
| Sun Microsystems, Inc. (g) | 51,000 | 185 | |||||||||
| Electric Services (0.3%) | |||||||||||
| Dominion Resources, Inc. (a) | 3,000 | 226 | |||||||||
| Electronic & Other Electric Equipment (1.3%) | |||||||||||
| Cooper Industries, Ltd.–Class A | 11,000 | 700 | |||||||||
| General Electric Co. | 8,000 | 290 | |||||||||
| Electronic Components & Accessories (0.9%) | |||||||||||
| Intel Corp. | 11,000 | 259 | |||||||||
| Texas Instruments, Inc. | 17,000 | 424 | |||||||||
| Food & Kindred Products (6.5%) | |||||||||||
| Altria Group, Inc. | 50,000 | 3,250 | |||||||||
| HJ Heinz Co. | 29,000 | 1,069 | |||||||||
| Sara Lee Corp. | 24,300 | 520 | |||||||||
The notes to the financial statements are an integral part of this report.
Transamerica IDEX Mutual Funds
Semi-Annual Report 2005
3
TA IDEX Transamerica Value Balanced
SCHEDULE OF INVESTMENTS (continued)
At April 30, 2005
(all amounts except share amounts in thousands)
(unaudited)
| Shares | Value | ||||||||||
| Holding & Other Investment Offices (2.8%) | |||||||||||
| Plum Creek Timber Co., Inc. | 23,000 | $ | 794 | ||||||||
| Rayonier, Inc. | 26,000 | 1,307 | |||||||||
| Insurance (0.9%) | |||||||||||
| American International Group, Inc. | 13,275 | 675 | |||||||||
| Life Insurance (1.1%) | |||||||||||
| Genworth Financial, Inc.–Class A | 29,000 | 811 | |||||||||
| Lumber & Wood Products (0.6%) | |||||||||||
| Louisiana-Pacific Corp. (a) | 17,000 | 418 | |||||||||
| Motion Pictures (4.1%) | |||||||||||
| Time Warner, Inc. (g) | 183,000 | 3,076 | |||||||||
| Oil & Gas Extraction (3.5%) | |||||||||||
| Anadarko Petroleum Corp. | 7,000 | 511 | |||||||||
| EOG Resources, Inc. | 16,000 | 761 | |||||||||
| Schlumberger, Ltd. (a) | 19,300 | 1,320 | |||||||||
| Paper & Allied Products (1.0%) | |||||||||||
| Kimberly-Clark Corp. | 12,000 | 749 | |||||||||
| Petroleum Refining (4.6%) | |||||||||||
| BP PLC, ADR | 25,050 | 1,526 | |||||||||
| Exxon Mobil Corp. | 14,000 | 798 | |||||||||
| Marathon Oil Corp. | 13,750 | 640 | |||||||||
| Murphy Oil Corp. | 5,000 | 445 | |||||||||
| Pharmaceuticals (8.6%) | |||||||||||
| Bristol-Myers Squibb Co. | 85,000 | 2,210 | |||||||||
| Merck & Co., Inc. | 79,500 | 2,695 | |||||||||
| Schering-Plough Corp. | 72,580 | 1,515 | |||||||||
| Primary Metal Industries (0.6%) | |||||||||||
| Hubbell, Inc.–Class B | 10,700 | 465 | |||||||||
| Railroads (1.2%) | |||||||||||
| Union Pacific Corp. | 14,000 | 895 | |||||||||
| Savings Institutions (2.8%) | |||||||||||
| Washington Mutual, Inc. | 49,890 | 2,061 | |||||||||
| Security & Commodity Brokers (4.4%) | |||||||||||
| Alliance Capital Management Holding, LP | 23,700 | 1,065 | |||||||||
| Jefferies Group, Inc. | 20,000 | 724 | |||||||||
| Raymond James Financial, Inc. | 40,000 | 1,079 | |||||||||
| T. Rowe Price Group, Inc. | 8,000 | 441 | |||||||||
| Telecommunications (3.2%) | |||||||||||
| Sprint Corp. (FON Group) (a) | 98,000 | 2,181 | |||||||||
| Verizon Communications, Inc. (a) | 5,000 | 179 | |||||||||
| Tobacco Products (1.0%) | |||||||||||
| Loews Corp.–Carolina Group | 23,000 | 725 | |||||||||
| Total Common Stocks (cost: $44,519) | 49,631 | ||||||||||
| Principal | Value | ||||||||||
| SECURITY LENDING COLLATERAL (5.1%) | |||||||||||
| Debt (4.4%) | |||||||||||
| Bank Notes (0.6%) | |||||||||||
| Bank of America | |||||||||||
| 2.82%, due 05/16/2005 | $ | 120 | $ | 120 | |||||||
| 2.80%, due 06/09/2005 (h) | 30 | 30 | |||||||||
| 2.77%, due 07/18/2005 (h) | 120 | 120 | |||||||||
| Canadian Imperial Bank of Commerce 3.02%, due 11/04/2005 (h) | 120 | 120 | |||||||||
| Credit Suisse First Boston Corp. 2.88%, due 09/09/2005 (h) 3.06%, due 03/10/2006 (h) | 30 30 | 30 30 | |||||||||
| Euro Dollar Overnight (0.8%) | |||||||||||
| Bank of Montreal 2.94%, due 05/04/2005 | 90 | 90 | |||||||||
| BNP Paribas 2.80%, due 05/05/2005 | 124 | 124 | |||||||||
| Den Danske Bank 2.93%, due 05/02/2005 2.80%, due 05/06/2005 | 108 60 | 108 60 | |||||||||
| Dexia Group 2.80%, due 05/05/2005 | 53 | 53 | |||||||||
| Royal Bank of Canada 2.80%, due 05/04/2005 | 123 | 123 | |||||||||
| Svenska Handlesbanken 2.80%, due 05/06/2005 | 20 | 20 | |||||||||
| Euro Dollar Terms (1.8%) | |||||||||||
| Bank of Nova Scotia 2.88%, due 05/11/2005 3.01%, due 05/31/2005 | 60 168 | 60 168 | |||||||||
| Barclays 3.02%, due 06/27/2005 | 107 | 107 | |||||||||
| BNP Paribas 2.93%, due 06/07/2005 | 96 | 96 | |||||||||
| Branch Banker & Trust 2.94%, due 06/06/2005 | 26 | 26 | |||||||||
| Calyon 2.93%, due 06/03/2005 | 99 | 99 | |||||||||
| Citigroup 2.87%, due 06/06/2005 | 124 | 124 | |||||||||
| Credit Suisse First Boston Corp. 2.91%, due 05/16/2005 | 123 | 123 | |||||||||
| HSBC Banking/Holdings PLC 3.01%, due 06/23/2005 | 60 | 60 | |||||||||
| Royal Bank of Scotland 2.94%, due 06/07/2005 2.95%, due 06/10/2005 | 116 65 | 116 65 | |||||||||
The notes to the financial statements are an integral part of this report.
Transamerica IDEX Mutual Funds
Semi-Annual Report 2005
4
TA IDEX Transamerica Value Balanced
SCHEDULE OF INVESTMENTS (continued)
At April 30, 2005
(all amounts except share amounts in thousands)
(unaudited)
| Principal | Value | ||||||||||
| Euro Dollar Terms (continued) | |||||||||||
| Societe Generale 2.80%, due 05/03/2005 | $ | 115 | $ | 115 | |||||||
| Toronto Dominion Bank 2.75%, due 05/09/2005 3.01%, due 06/24/2005 | 90 33 | 90 33 | |||||||||
| UBS AG 2.81%, due 05/03/2005 | 60 | 60 | |||||||||
| Promissory Notes (0.4%) | |||||||||||
| Goldman Sachs Group, Inc. 2.99%, due 06/27/2005 3.01%, due 07/27/2005 | 126 210 | 126 210 | |||||||||
| Repurchase Agreements (0.8%) (i) | |||||||||||
| Goldman Sachs Group, Inc. (The) 3.04%, Repurchase Agreement dated 04/29/2005 to be repurchased at $270 on 05/02/2005 | 270 | 270 | |||||||||
| Merrill Lynch & Co., Inc. 3.04%, Repurchase Agreement dated 04/29/2005 to be repurchased at $324 on 05/02/2005 | 324 | 324 | |||||||||
| Shares | Value | ||||||||||
| Investment Companies (0.7%) | |||||||||||
| Money Market Funds (0.7%) | |||||||||||
| American Beacon Funds 1-day yield of 2.84% | 47,644 | $ | 48 | ||||||||
| BGI Institutional Money Market Fund 1-day yield of 2.93% | 282,126 | 282 | |||||||||
| Merrill Lynch Premier Institutional Fund 1-day yield of 2.65% | 63,487 | 63 | |||||||||
| Merrimac Cash Fund, Premium Class 1-day yield of 2.74% (j) | 116,117 | 116 | |||||||||
| Total Security Lending Collateral (cost: $3,809) | 3,809 | ||||||||||
| Total Investment Securities (cost: $71,921) | $ | 77,076 | |||||||||
| Contracts (k) | Value | ||||||||||
| WRITTEN OPTIONS (–0.4%) | |||||||||||
| Covered Call Options (–0.1%) | |||||||||||
| American International Group, Inc. | 130 | $ | (21 | ) | |||||||
| Call Strike $60.00 | |||||||||||
| Expires 11/19/2005 | |||||||||||
| Louisiana-Pacific Corp. Call Strike $30.00 Expires 05/21/2005 | 70 | – | (l) | ||||||||
| Louisiana-Pacific Corp. Call Strike $30.00 Expires 08/20/2005 | 80 | (3 | ) | ||||||||
| Contracts (k) | Value | ||||||||||
| Covered Call Options (continued) | |||||||||||
| Raymond James Financial, Inc. | 100 | $ | (8 | ) | |||||||
| Call Strike $30.00 | |||||||||||
| Expires 11/19/2005 | |||||||||||
| Schering-Plough Corp. Call Strike $22.50 Expires 01/21/2006 | 175 | (24 | ) | ||||||||
| Sprint Corp. (FON Group) Call Strike $27.50 Expires 08/20/2005 | 200 | (3 | ) | ||||||||
| Put Options (–0.3%) | |||||||||||
| Altria Group, Inc. Put Strike $40.00 Expires 01/21/2006 | 100 | (6 | ) | ||||||||
| Bristol-Myers Squibb Co. Put Strike $22.50 Expires 09/17/2005 | 80 | (3 | ) | ||||||||
| Bristol-Myers Squibb Co. Put Strike $20.00 Expires 01/21/2006 | 150 | (6 | ) | ||||||||
| Colgate-Palmolive Co. Put Strike $45.00 Expires 01/21/2006 | 80 | (14 | ) | ||||||||
| Duke Energy Put Strike $15.00 Expires 01/21/2006 | 20 | – | (l) | ||||||||
| General Electric Co. Put Strike $35.00 Expires 09/17/2005 | 165 | (17 | ) | ||||||||
| Genworth Financial, Inc. Put Strike $25.00 Expires 06/18/2005 | 300 | (3 | ) | ||||||||
| GlobalSantaFe Corp. Put Strike $30.00 Expires 07/16/2005 | 175 | (11 | ) | ||||||||
| GlobalSantaFe Corp. Put Strike $27.50 Expires 07/16/2005 | 100 | (2 | ) | ||||||||
| GlobalSantaFe Corp. Put Strike $32.50 Expires 07/16/2005 | 170 | (24 | ) | ||||||||
| HJ Heinz Co. Put Strike $35.00 Expires 01/21/2006 | 90 | (12 | ) | ||||||||
| Merck & Co., Inc. Put Strike $40.00 Expires 01/21/2006 | 100 | (70 | ) | ||||||||
The notes to the financial statements are an integral part of this report.
Transamerica IDEX Mutual Funds
Semi-Annual Report 2005
5
TA IDEX Transamerica Value Balanced
SCHEDULE OF INVESTMENTS (continued)
At April 30, 2005
(all amounts except share amounts in thousands)
(unaudited)
| Contracts (k) | Value | ||||||||||
| Put Options (continued) | |||||||||||
| PNC Financial Services Group, Inc. | 130 | $ | (12 | ) | |||||||
| Put Strike $47.50 | |||||||||||
| Expires 11/19/2005 | |||||||||||
| Sara Lee Corp. Put Strike $22.50 Expires 07/16/2005 | 80 | (11 | ) | ||||||||
| Sara Lee Corp. Put Strike $20.00 Expires 01/21/2006 | 80 | (6 | ) | ||||||||
| Schering-Plough Corp. Put Strike $15.00 Expires 01/21/2006 | 100 | (3 | ) | ||||||||
| Sun Microsystems, Inc. Put Strike $4.00 Expires 07/16/2005 | 270 | (15 | ) | ||||||||
| Contracts (k) | Value | ||||||||||
| Put Options (continued) | |||||||||||
| Union Pacific Corp. | 25 | $ | (2 | ) | |||||||
| Put Strike $55.00 | |||||||||||
| Expires 08/20/2005 | |||||||||||
| Washington Mutual, Inc. Put Strike $30.00 Expires 01/21/2006 | 220 | (8 | ) | ||||||||
| Total Written Options (premiums: –$397) | (284 | ) | |||||||||
| SUMMARY: | |||||||||||
| Investments, at value | 103.6 | % | $ | 77,076 | |||||||
| Written options | (0.4 | )% | (284 | ) | |||||||
| Liabilities in excess of other assets | (3.2 | )% | (2,396 | ) | |||||||
| Net assets | 100.0 | % | $ | 74,396 | |||||||
NOTES TO SCHEDULE OF INVESTMENTS:
(a) At April 30, 2005, all or a portion of this security is on loan (see Note 1). The value at April 30, 2005, of all securities on loan is $3,697.
(b) Substantially all of the Fund's securities (excluding securities lending) are memo pledged as collateral by the custodian for the listed short index option contracts written by the Fund (see Note 1).
(c) Abbey National PLC has a fixed coupon rate 7.35% until 10/15/2006, thereafter the coupon rate will reset every 5 years at the 5-year current month treasury + 178BP, if not called.
(d) Husky Oil, Ltd. has a fixed coupon rate of 8.90% until 8/15/2008, thereafter the coupon rate will reset quarterly at the 3-month US$ LIBOR + 550BP, if not called.
(e) BNP U.S. Funding LLC –144A has a fixed coupon rate 7.74% until 12/05/2007, thereafter the coupon rate will reset quarterly at the 1-week US$ LIBOR + 280BP, if not called.
(f) Credit Suisse First Boston (London), Inc.,–144A has a fixed coupon rate 7.90% until 05/01/2007, thereafter the coupon rate will reset every 5 years at the 5-year current month treasury + 200BP, if not called.
(g) No dividends were paid during the preceding twelve months.
(h) Floating or variable rate note. Rate is listed as of April 30, 2005.
(i) Cash collateral for the Repurchase Agreements, valued at $604, that serve as collateral for securities lending are invested in corporate bonds with interest rates and maturity dates ranging from 0.00%–8.875% and 06/15/2005–03/15/2035, respectively.
(j) Regulated investment company advised by Investors Bank and Trust Co. ("IBT"). IBT is also the accounting, custody and lending agent for the Fund.
(k) Contract amounts are not in thousands.
(l) Value is less than $1.
DEFINITIONS:
144A 144A Securities are registered pursuant to Rule 144A of the Securities Act of 1933. These securities are deemed to be liquid for purposes of compliance limitations on holdings of illiquid securities and may be resold as transactions exempt from registration, normally to qualified institutional buyers. At April 30, 2005, these securities aggregated $831 or 1.1% of the net assets of the Fund.
ADR American Depositary Receipt
The notes to the financial statements are an integral part of this report.
Transamerica IDEX Mutual Funds
Semi-Annual Report 2005
6
TA IDEX Transamerica Value Balanced
STATEMENT OF ASSETS AND LIABILITIES
At April 30, 2005
(all amounts except per share amounts in thousands)
(unaudited)
| Assets: | |||||||
| Investment securities, at value (cost: $71,921) (including securities loaned of $3,697) | $ | 77,076 | |||||
| Cash | 1,290 | ||||||
| Receivables: | |||||||
| Investment securities sold | 105 | ||||||
| Shares of beneficial interest sold | 10 | ||||||
| Interest | 282 | ||||||
| Dividends | 68 | ||||||
| Other | 14 | ||||||
| 78,845 | |||||||
| Liabilities: | |||||||
| Investment securities purchased | 107 | ||||||
| Accounts payable and accrued liabilities: | |||||||
| Shares of beneficial interest redeemed | 55 | ||||||
| Management and advisory fees | 70 | ||||||
| Distribution and service fees | 43 | ||||||
| Transfer agent fees | 41 | ||||||
| Payable for collateral for securities on loan | 3,809 | ||||||
| Written options (premiums $397) | 284 | ||||||
| Other | 40 | ||||||
| 4,449 | |||||||
| Net Assets | $ | 74,396 | |||||
| Net Assets Consist of: | |||||||
| Shares of beneficial interest, unlimited shares authorized, no par value | $ | 72,274 | |||||
| Undistributed net investment income (loss) | 73 | ||||||
| Accumulated net realized gain (loss) from investment securities and written option contracts | (3,215 | ) | |||||
| Net unrealized appreciation (depreciation) on: Investment securities | 5,151 | ||||||
| Written option contracts | 113 | ||||||
| Net Assets | $ | 74,396 | |||||
| Net Assets by Class: | |||||||
| Class A | $ | 34,613 | |||||
| Class B | 26,670 | ||||||
| Class C | 13,113 | ||||||
| Shares Outstanding: | |||||||
| Class A | 2,990 | ||||||
| Class B | 2,311 | ||||||
| Class C | 1,137 | ||||||
| Net Asset Value Per Share: | |||||||
| Class A | $ | 11.57 | |||||
| Class B | 11.54 | ||||||
| Class C | 11.54 | ||||||
| Maximum Offering Price Per Share (a): | |||||||
| Class A | $ | 12.24 | |||||
(a) Includes the maximum selling commission (represented as a percentage of offering price) which is reduced on certain levels of sales as set forth in the Prospectus. Net asset value per share for Classes B and C shares represents offering price. The redemption price for Classes B and C shares equals net asset value less any applicable contingent deferred sales charge.
STATEMENT OF OPERATIONS
For the period ended April 30, 2005
(all amounts in thousands)
(unaudited)
| Investment Income: | |||||||
| Interest | $ | 688 | |||||
| Dividends | 923 | ||||||
| Income from loaned securities–net | 4 | ||||||
| 1,615 | |||||||
| Expenses: | |||||||
| Management and advisory fees | 288 | ||||||
| Transfer agent fees: | |||||||
| Class A | 42 | ||||||
| Class B | 34 | ||||||
| Class C | 17 | ||||||
| Printing and shareholder reports | 28 | ||||||
| Custody fees | 14 | ||||||
| Administration fees | 7 | ||||||
| Legal fees | 2 | ||||||
| Audit fees | 2 | ||||||
| Trustees fees | 2 | ||||||
| Registration fees: | |||||||
| Class C | 9 | ||||||
| Distribution and service fees: | |||||||
| Class A | 64 | ||||||
| Class B | 141 | ||||||
| Class C | 69 | ||||||
| Total expenses | 719 | ||||||
| Reimbursement of class expenses: | |||||||
| Class C | (5 | ) | |||||
| Net expenses | 714 | ||||||
| Net Investment Income (Loss) | 901 | ||||||
| Net Realized Gain (Loss) from: | |||||||
| Investment securities | 522 | ||||||
| Written option contracts | 535 | ||||||
| 1,057 | |||||||
| Net Increase (Decrease) in Unrealized Appreciation (Depreciation) on: | |||||||
| Investment securities | 811 | ||||||
| Written option contracts | 51 | ||||||
| 862 | |||||||
| Net Gain (Loss) on Investments and Written Option Contracts | 1,919 | ||||||
| Net Increase (Decrease) in Net Assets Resulting from Operations | $ | 2,820 | |||||
The notes to the financial statements are an integral part of this report.
Transamerica IDEX Mutual Funds
Semi-Annual Report 2005
7
TA IDEX Transamerica Value Balanced
STATEMENTS OF CHANGES IN NET ASSETS
For the period or year ended
(all amounts in thousands)
| April 30, 2005 (unaudited) | October 31, 2004 | ||||||||||
| Increase (Decrease) In Net Assets From: | |||||||||||
| Operations: | |||||||||||
| Net investment income (loss) | $ | 901 | $ | 626 | |||||||
| Net realized gain (loss) from investment securities and written options | 1,057 | 6,043 | |||||||||
| Net unrealized appreciation (depreciation) on investment securities and written options | 862 | (3,025 | ) | ||||||||
| 2,820 | 3,644 | ||||||||||
| Distributions to Shareholders: | |||||||||||
| From net investment income: | |||||||||||
| Class A | (441 | ) | (371 | ) | |||||||
| Class B | (249 | ) | (186 | ) | |||||||
| Class C | (126 | ) | (38 | ) | |||||||
| Class C2 | – | (17 | ) | ||||||||
| Class M | – | (45 | ) | ||||||||
| (816 | ) | (657 | ) | ||||||||
| From net realized gains: | |||||||||||
| Class A | (2,499 | ) | – | ||||||||
| Class B | (1,957 | ) | – | ||||||||
| Class C | (975 | ) | – | ||||||||
| (5,431 | ) | – | |||||||||
| Capital Share Transactions: | |||||||||||
| Proceeds from shares sold: | |||||||||||
| Class A | 1,551 | 5,521 | |||||||||
| Class B | 1,106 | 3,631 | |||||||||
| Class C | 471 | 1,973 | |||||||||
| Class C2 | – | 471 | |||||||||
| Class M | – | 328 | |||||||||
| 3,128 | 11,924 | ||||||||||
| Proceeds from fund acquisition: | |||||||||||
| Class A | – | 28,033 | |||||||||
| Class B | – | 16,163 | |||||||||
| Class C | – | 384 | |||||||||
| Class C2 | – | 2,604 | |||||||||
| Class M | – | 3,202 | |||||||||
| – | 50,386 | ||||||||||
| Dividends and distributions reinvested: | |||||||||||
| Class A | 2,881 | 359 | |||||||||
| Class B | 2,123 | 180 | |||||||||
| Class C | 1,060 | 36 | |||||||||
| Class C2 | – | 16 | |||||||||
| Class M | – | 43 | |||||||||
| 6,064 | 634 | ||||||||||
| Cost of shares redeemed: | |||||||||||
| Class A | (6,182 | ) | (10,214 | ) | |||||||
| Class B | (4,197 | ) | (4,870 | ) | |||||||
| Class C | (2,077 | ) | (1,054 | ) | |||||||
| Class C2 | – | (803 | ) | ||||||||
| Class M | – | (921 | ) | ||||||||
| (12,456 | ) | (17,862 | ) | ||||||||
| Class level exchanges: | |||||||||||
| Class C | – | 12,159 | |||||||||
| Class C2 | – | (6,063 | ) | ||||||||
| Class M | – | (6,096 | ) | ||||||||
| – | – | ||||||||||
| April 30, 2005 (unaudited) | October 31, 2004 | ||||||||||
| Automatic conversions: | |||||||||||
| Class A | $ | 559 | $ | 572 | |||||||
| Class B | (559 | ) | (572 | ) | |||||||
| – | – | ||||||||||
| (3,264 | ) | 45,082 | |||||||||
| Net increase (decrease) in net assets | (6,691 | ) | 48,069 | ||||||||
| Net Assets: | |||||||||||
| Beginning of period | 81,087 | 33,018 | |||||||||
| End of period | $ | 74,396 | $ | 81,087 | |||||||
| Undistributed Net Investment Income (Loss) | $ | 73 | $ | (12 | ) | ||||||
| Share Activity: | |||||||||||
| Shares issued: | |||||||||||
| Class A | 130 | 467 | |||||||||
| Class B | 94 | 309 | |||||||||
| Class C | 40 | 166 | |||||||||
| Class C2 | – | 40 | |||||||||
| Class M | – | 26 | |||||||||
| 264 | 1,008 | ||||||||||
| Shares issued on fund acquisition: | |||||||||||
| Class A | – | 2,371 | |||||||||
| Class B | – | 1,372 | |||||||||
| Class C | – | 33 | |||||||||
| Class C2 | – | 221 | |||||||||
| Class M | – | 271 | |||||||||
| – | 4,268 | ||||||||||
| Shares issued–reinvested from distributions: | |||||||||||
| Class A | 244 | 30 | |||||||||
| Class B | 180 | 15 | |||||||||
| Class C | 90 | 3 | |||||||||
| Class C2 | – | 1 | |||||||||
| Class M | – | 4 | |||||||||
| 514 | 53 | ||||||||||
| Shares redeemed: | |||||||||||
| Class A | (519 | ) | (858 | ) | |||||||
| Class B | (352 | ) | (411 | ) | |||||||
| Class C | (176 | ) | (89 | ) | |||||||
| Class C2 | – | (67 | ) | ||||||||
| Class M | – | (77 | ) | ||||||||
| (1,047 | ) | (1,502 | ) | ||||||||
| Class level exchanges: | |||||||||||
| Class C | – | 1,024 | |||||||||
| Class C2 | – | (513 | ) | ||||||||
| Class M | – | (509 | ) | ||||||||
| – | 2 | ||||||||||
| Automatic conversions: | |||||||||||
| Class A | 47 | 48 | |||||||||
| Class B | (47 | ) | (48 | ) | |||||||
| – | – | ||||||||||
| Net increase (decrease) in shares outstanding: | |||||||||||
| Class A | (98 | ) | 2,058 | ||||||||
| Class B | (125 | ) | 1,237 | ||||||||
| Class C | (46 | ) | 1,137 | ||||||||
| Class C2 | – | (318 | ) | ||||||||
| Class M | – | �� | (285 | ) | |||||||
| (269 | ) | 3,829 | |||||||||
The notes to the financial statements are an integral part of this report.
Transamerica IDEX Mutual Funds
Semi-Annual Report 2005
8
TA IDEX Transamerica Value Balanced
FINANCIAL HIGHLIGHTS
(unaudited for the period ended April 30, 2005)
| For a share of beneficial interest outstanding throughout each period | |||||||||||||||||||||||||||||||||||||||
| Net Asset | Investment Operations | Distributions | Net Asset | ||||||||||||||||||||||||||||||||||||
| For the Period Ended (d)(g) | Value, Beginning of Period | Net Investment Income (Loss) | Net Realized and Unrealized Gain (Loss) | Total Operations | From Net Investment Income | From Net Realized Gains | Total Distributions | Value, End of Period | |||||||||||||||||||||||||||||||
| Class A | 4/30/2005 | $ | 12.11 | $ | 0.16 | $ | 0.29 | $ | 0.45 | $ | (0.15 | ) | $ | (0.84 | ) | $ | (0.99 | ) | $ | 11.57 | |||||||||||||||||||
| 10/31/2004 | 11.49 | 0.18 | 0.61 | 0.79 | (0.17 | ) | – | (0.17 | ) | 12.11 | |||||||||||||||||||||||||||||
| 10/31/2003 | 9.69 | 0.18 | 1.83 | 2.01 | (0.21 | ) | – | (0.21 | ) | 11.49 | |||||||||||||||||||||||||||||
| 10/31/2002 | 11.67 | 0.18 | (1.65 | ) | (1.47 | ) | (0.16 | ) | (0.35 | ) | (0.51 | ) | 9.69 | ||||||||||||||||||||||||||
| 10/31/2001 | 12.75 | 0.26 | (0.51 | ) | (0.25 | ) | (0.26 | ) | (0.57 | ) | (0.83 | ) | 11.67 | ||||||||||||||||||||||||||
| 10/31/2000 | 11.79 | 0.30 | 1.01 | 1.31 | (0.35 | ) | – | (0.35 | ) | 12.75 | |||||||||||||||||||||||||||||
| Class B | 4/30/2005 | 12.07 | 0.12 | 0.30 | 0.42 | (0.11 | ) | (0.84 | ) | (0.95 | ) | 11.54 | |||||||||||||||||||||||||||
| 10/31/2004 | 11.46 | 0.10 | 0.61 | 0.71 | (0.10 | ) | – | (0.10 | ) | 12.07 | |||||||||||||||||||||||||||||
| 10/31/2003 | 9.69 | 0.11 | 1.80 | 1.91 | (0.14 | ) | – | (0.14 | ) | 11.46 | |||||||||||||||||||||||||||||
| 10/31/2002 | 11.66 | 0.11 | (1.65 | ) | (1.54 | ) | (0.08 | ) | (0.35 | ) | (0.43 | ) | 9.69 | ||||||||||||||||||||||||||
| 10/31/2001 | 12.74 | 0.18 | (0.50 | ) | (0.32 | ) | (0.19 | ) | (0.57 | ) | (0.76 | ) | 11.66 | ||||||||||||||||||||||||||
| 10/31/2000 | 11.78 | 0.23 | 1.01 | 1.24 | (0.28 | ) | – | (0.28 | ) | 12.74 | |||||||||||||||||||||||||||||
| Class C | 4/30/2005 | 12.07 | 0.11 | 0.31 | 0.42 | (0.11 | ) | (0.84 | ) | (0.95 | ) | 11.54 | |||||||||||||||||||||||||||
| 10/31/2004 | 11.46 | 0.11 | 0.60 | 0.71 | (0.10 | ) | – | (0.10 | ) | 12.07 | |||||||||||||||||||||||||||||
| 10/31/2003 | 9.71 | 0.12 | 1.77 | 1.89 | (0.14 | ) | – | (0.14 | ) | 11.46 | |||||||||||||||||||||||||||||
| Ratios/Supplemental Data | |||||||||||||||||||||||||||||||
| For the Period | Total | Net Assets, End of Period | Ratio of Expenses to Average Net Assets (a) | Net Investment Income (Loss) to Average | Portfolio Turnover | ||||||||||||||||||||||||||
| Ended (g) | Return (c) | (000's) | Net (e) | Total (f) | Net Assets (a) | Rate (b) | |||||||||||||||||||||||||
| Class A | 4/30/2005 | 3.47 | % | $ | 34,613 | 1.45 | % | 1.45 | % | 2.66 | % | 28 | % | ||||||||||||||||||
| 10/31/2004 | 6.99 | 37,393 | 1.55 | 1.63 | 1.50 | 122 | |||||||||||||||||||||||||
| 10/31/2003 | 21.04 | 11,832 | 1.55 | 2.20 | 1.75 | 50 | |||||||||||||||||||||||||
| 10/31/2002 | (13.20 | ) | 11,020 | 1.55 | 1.89 | 1.56 | 82 | ||||||||||||||||||||||||
| 10/31/2001 | (2.13 | ) | 13,880 | 1.55 | 1.95 | 2.04 | 50 | ||||||||||||||||||||||||
| 10/31/2000 | 11.43 | 9,850 | 1.55 | 2.02 | 2.50 | 28 | |||||||||||||||||||||||||
| Class B | 4/30/2005 | 3.26 | 26,670 | 2.10 | 2.10 | 2.01 | 28 | ||||||||||||||||||||||||
| 10/31/2004 | 6.23 | 29,409 | 2.20 | 2.30 | 0.81 | 122 | |||||||||||||||||||||||||
| 10/31/2003 | 19.98 | 13,744 | 2.20 | 2.85 | 1.10 | 50 | |||||||||||||||||||||||||
| 10/31/2002 | (13.72 | ) | 12,038 | 2.20 | 2.54 | 0.91 | 82 | ||||||||||||||||||||||||
| 10/31/2001 | (2.74 | ) | 16,180 | 2.20 | 2.60 | 1.39 | 50 | ||||||||||||||||||||||||
| 10/31/2000 | 10.76 | 9,193 | 2.20 | 2.67 | 1.85 | 28 | |||||||||||||||||||||||||
| Class C | 4/30/2005 | 3.26 | 13,113 | 2.20 | 2.26 | 1.92 | 28 | ||||||||||||||||||||||||
| 10/31/2004 | 6.31 | 14,285 | 2.20 | 2.39 | 0.78 | 122 | |||||||||||||||||||||||||
| 10/31/2003 | 19.73 | 530 | 2.20 | 2.86 | 1.10 | 50 | |||||||||||||||||||||||||
NOTES TO FINANCIAL HIGHLIGHTS
(a) Annualized.
(b) Not annualized for periods of less than one year.
(c) Total Return has been calculated for the applicable period without deduction of a sales load, if any, on an initial purchase. Periods of less that one year are not annualized.
(d) Per share information is calculated based on average number of shares outstanding for the periods ended 10/31/2001, 10/31/2002, 10/31/2003, 10/31/2004 and 04/30/2005.
(e) Ratio of Net Expenses to Average Net Assets is net of fee waivers and reimbursements by the investment adviser, if any, and include the recapture of previously waived expenses (see note 2).
(f) Ratio of Total Expenses to Average Net Assets includes all expenses before fee waivers, reimbursements by the investment adviser and recapture of previously waived expenses.
(g) The inception date for the Fund's offering of share Class C was November 11, 2002.
The notes to the financial statements are an integral part of this report.
Transamerica IDEX Mutual Funds
Semi-Annual Report 2005
9
TA IDEX Transamerica Value Balanced
NOTES TO FINANCIAL STATEMENTS
At April 30, 2005
(all amounts in thousands)
(unaudited)
NOTE 1. ORGANIZATION AND SIGNIFICANT ACCOUNTING POLICIES
Transamerica IDEX Mutual Funds is a Delaware statutory trust registered under the Investment Company Act of 1940, as amended (the "1940 Act"), as an open-end management investment company. Prior to March 1, 2005, Transamerica IDEX Mutual Funds was a Massachusetts business trust. TA IDEX Transamerica Value Balanced ("the Fund"), part of Transamerica IDEX Mutual Funds, began operations on October 1, 1995.
On May 28, 2004, the Fund acquired all of the net assets of TA IDEX LKCM Strategic Total Return pursuant to a plan of reorganization. TA IDEX Transamerica Value Balanced is the accounting survivor. The acquisition was accomplished by a tax free exchange of 4,268 shares of the Fund for 2,942 shares of TA IDEX LKCM Strategic Total Return outstanding on May 27, 2004. TA IDEX LKCM Strategic Total Return's net assets at that date, $50,386, including $6,071 unrealized depreciation, were combined with those of the Fund. The aggregate net asset of the TA IDEX Transamerica Value Balanced immediately before the acquisition was $37,187. The combined net assets of the Fund immediately after the acquisition was $87,573. Proceeds in connection with the acquisition were as follows:
| Shares | Amount | ||||||||||
| Proceeds in connection with the acquisition | |||||||||||
| Class A | 2,371 | $ | 28,033 | ||||||||
| Class B | 1,372 | 16,163 | |||||||||
| Class C | 33 | 384 | |||||||||
| Class C2 | 221 | 2,604 | |||||||||
| Class M | 271 | 3,202 | |||||||||
| $ | 50,386 | ||||||||||
In the normal course of business, the Fund enters into contracts that contain a variety of representations and warranties, which provide general indemnifications. The Fund's maximum exposure under these arrangements is unknown, as this would involve future claims that may be made against the Fund and/or its affiliates that have not yet occurred. However, based on experience, the Fund expects the risk of loss to be remote.
See the Prospectus and Statement of Additional Information for a description of the Fund's investment objective.
In preparing the Fund's financial statements in accordance with accounting principles generally accepted in the United States of America ("GAAP"), estimates or assumptions (which could differ from actual results) may be used that affect reported amounts and disclosures. The following policies were consistently followed by the Fund, in accordance with GAAP.
Multiple class operations and expenses: The Fund currently offers three classes of shares, each with a public offering price that reflects different sales charges, if any, and expense levels. On June 15, 2004, Class C2 shares merged into Class C. On September 24, 2004, Class M shares merged into Class C. Class B shares will convert to Class A shares eight years after purchase. Income, non-class specific expenses and realized and unrealized gains and losses, are allocated daily to each class, based upon the value of shares outstanding method as permitted under Rule 18f-3 of the 1940 Act. Each class bears its own specific expenses as well as a portion of general, common expenses.
Pricing of shares: The Fund prices its shares on the basis of the net asset value of each class of shares of the Fund, which is determined as of the close of the New York Stock Exchange ("NYSE") (generally 4:00 p.m. Eastern Time) on each day on which the NYSE is open for trading.
Security valuations: Fund investments traded on an exchange are valued at the closing price on the day of valuation on the exchange where the security is principally traded. With respect to securities traded on NASDAQ NMS, such closing price may be the last reported sales price or the NASDAQ Official Closing Price.
Securities traded in the over-the-counter market and listed securities for which no sale was reported on that date are valued at the last quoted bid price.
Debt securities are valued by independent pricing services at the last quoted bid price; however, those that mature in sixty days or less are valued at amortized cost, which approximates market.
Investment company securities are valued at net asset value of the underlying portfolio.
Other securities for which quotations are not readily available are valued at fair market value as determined in good faith using guidelines adopted by the Board of Trustees of the Fund, under the supervision of the Fund's Valuation Committee. These guidelines may include: the type of security; any restrictions on its resale; financial or business news of the issuer; similar or related securities that are actively trading; related corporate actions; and other significant events occurring after the close of trading in the security.
Cash: The Fund may leave cash overnight in its cash account with the custodian, Investors Bank & Trust Company ("IBT"). IBT has been contracted on behalf of the Fund to invest the excess cash into a savings account, which at April 30, 2005, was paying an interest rate of 2.02%.
Throughout the period, the Fund may have a cash overdraft balance. A fee is incurred on this overdraft, calculated by multiplying the overdraft by a rate based on the federal funds rate.
Repurchase agreements: The Fund is authorized to enter into repurchase agreements. The Fund, through IBT, receives delivery of the underlying securities, the value of which at the time of purchase is required to be an amount equal to at least 100% of the resale price.
Transamerica IDEX Mutual Funds
Semi-Annual Report 2005
10
TA IDEX Transamerica Value Balanced
NOTES TO FINANCIAL STATEMENTS (continued)
At April 30, 2005
(all amounts in thousands)
(unaudited)
NOTE 1.–(continued)
Repurchase agreements involve the risk that the seller will fail to repurchase the security, as agreed. In that case, the Fund will bear the risk of value fluctuations until the security can be sold and may encounter delays and incur costs in liquidating the security. In the event of bankruptcy or insolvency of the seller, delays and costs may be incurred.
Commission recapture: The sub-adviser, to the extent consistent with the best execution and usual commission rate policies and practices, may place security transactions of the Fund with broker/dealers with which Transamerica IDEX Mutual Funds has established a Commission Recapture Program. A Commission Recapture Program is any arrangement under which a broker/dealer applies a portion of the commissions received by such broker/dealer on the security transactions to the Fund. In no event will commissions paid by the Fund be used to pay expenses that would otherwise be borne by any other funds within Transamerica IDEX Mutual Funds, or by any other party.
Recaptured commissions during the six months ended April 30, 2005, of $8 are included in net realized gains in the Statement of Operations.
Securities lending: The Fund may lend securities to enhance fund earnings from investing cash collateral in making such loans to qualified borrowers (typically broker/dealers). The Fund has engaged its custodian bank, IBT, as a lending agent to administer its securities lending program. IBT earned $2 of program income for its services. When the Fund makes a security loan, it receives cash collateral as protection against the risk that the borrower will default on the loan, and records an asset for the cash invested collateral and a liability for the return of the collateral.
Loans of securities are required to be secured by collateral at least equal to 102% of the value of the securities at inception of the loan, and not less then 100% thereafter. The Fund may invest cash collateral in short-term money market instruments including: U.S. Treasury Bills, U.S. agency obligations, commercial paper, money market mutual funds, repurchase agreements and other highly rated, liquid investments. During the life of securities loans, the collateral and securities loaned remain subject to fluctuation in value. IBT marks to market securities loaned and the collateral each business day. If additional collateral is due (at least $1), IBT collects additional cash collateral from the borrowers. Although securities loaned will be fully collateralized at all times, IBT may experience delays in, or may be prevented from, recovering the collateral on behalf of the Fund. The Fund may recall a loa ned security position at any time from the borrower through IBT. In the event the borrower fails to timely return a recalled security, IBT may indemnify the Fund by purchasing replacement securities for the Fund at its own expense and claiming the collateral to fund such a purchase. IBT absorbs the loss if the collateral value is not sufficient to cover the cost of the replacement securities. If replacement securities are not available, IBT will credit the equivalent cash value to the Fund.
While a security is on loan, the Fund does not have the right to vote that security. However, if time permits, the Fund will attempt to recall a security on loan and vote the proxy.
Income from securities lending is included in the Statement of Operations. The amount of collateral and value of securities on loan are included in the Statement of Assets and Liabilities as well as in the Schedule of Investments.
Security transactions and investment income: Security transactions are recorded on the trade date. Security gains and losses are calculated on the specific identification basis. Dividend income is recorded on the ex-dividend date or, in the case of foreign securities, as soon as the Fund is informed of the ex-dividend date. Interest income, including accretion of discounts and amortization of premiums, is recorded on the accrual basis commencing on the settlement date.
Option contracts: The Fund may enter into options contracts to manage exposure to market fluctuations. Options are valued at the average of the bid and ask ("Mean Quote") established each day at the close of the board of trade or exchange on which they are traded. The primary risks associated with options are imperfect correlation between the change in value of the securities held and the prices of the options contracts; the possibility of an illiquid market and inability of the counterparty to meet the contracts terms. When the Fund writes a covered call or put option, an amount equal to the premium received by the Fund is included in the Fund's Statement of Assets and Liabilities as an asset and as an equivalent liability. The amount is subsequently marked-to-market to reflect the current valu e of the option written.
The underlying face amounts of open option contracts at April 30, 2005, are listed in the Schedule of Investments.
Transactions in written call and put options were as follows:
| Premium | Contracts* | ||||||||||
| Beginning Balance October 31, 2004 | $ | 837 | 6,025 | ||||||||
| Sales | 346 | 3,200 | |||||||||
| Closing Buys | (53 | ) | (555 | ) | |||||||
| Expirations | (535 | ) | (3,855 | ) | |||||||
| Exercised | (198 | ) | (1,625 | ) | |||||||
| Balance at April 30, 2005 | $ | 397 | 3,190 | ||||||||
* Contracts not in thousands
Account maintenance fees: If the shareholder account balance falls below $1 by either shareholder action or as a result of market action, a $25 (not in thousands) fee is assessed every year until the balance reaches $1. The fee is assessed by redeeming shares in the shareholder's account.
Transamerica IDEX Mutual Funds
Semi-Annual Report 2005
11
TA IDEX Transamerica Value Balanced
NOTES TO FINANCIAL STATEMENTS (continued)
At April 30, 2005
(all amounts in thousands)
(unaudited)
NOTE 1.–(continued)
No fee will be charged under the following conditions:
• accounts opened within the preceding 24 months
• accounts with an active monthly Automatic Investment Plan ($50 (not in thousands) minimum per fund)
• accounts owned by an individual which, when combined by social security number, have a balance of $5 or more
• accounts owned by individuals in the same household (by address) that have a combined balance of $5 or more
• UTMA/UGMA accounts
• Fiduciary accounts
• B-share accounts whose shares have started to convert to A-shares accounts (as long as combined value of both accounts is at least $1)
For the six months ended April 30, 2005, this fee totaled $5. These fees are included in Paid in Capital in the Statement of Assets and Liabilities.
Redemption fees: A short-term trading redemption fee may be assessed on any fund shares in a fund account that are sold during the first five (5) NYSE trading days following their purchase date. This redemption fee will equal 2% of the amount redeemed and shares held the longest will be treated as being redeemed first and shares held the shortest as being redeemed last.
For the six months ended April 30, 2005, the Fund received less than $1 in redemption fees.
Dividend distributions: Distributions to shareholders are recorded on the ex-dividend date and are determined in accordance with Federal income tax regulations which may differ from GAAP.
NOTE 2. RELATED PARTY TRANSACTIONS
Transamerica Fund Advisors, Inc. ("TFAI") is the Fund's investment adviser. Transamerica Fund Services, Inc. ("TFS") is the Fund's administrator and transfer agent. AFSG Securities Corp. ("AFSG") is the Fund's distributor/principal underwriter. AFSG is 100% owned by AUSA Holding Company ("AUSA"). TFAI is a directly owned subsidiary of Western Reserve Life Assurance Co. of Ohio (78%) and AUSA (22%). TFS is a wholly owned subsidiary of WRL (50%) and AUSA (50%). AUSA and WRL are wholly owned indirect subsidiaries of AEGON, NV, a Netherlands corporation.
Effective January 1, 2005 AEGON/Transamerica Fund Advisors, Inc. ("ATFA") was renamed Transamerica Fund Advisors, Inc. ("TFAI"); AEGON/Transamerica Fund Services, Inc. ("ATFS") and AEGON/Transamerica Investor Services, Inc. ("ATIS") merged into one entity and was renamed Transamerica Fund Services, Inc. ("TFS").
Transamerica Investment Management, LLC is both an affiliate of the Fund and a sub-adviser to the Fund.
Investment advisory fee: The Fund pays management fees to TFAI based on average daily net assets ("ANA") at the following breakpoints:
0.75% of the first $500 million of ANA
0.65% of the next $500 million of ANA
0.60% of ANA over $1 billion
TFAI has contractually agreed to waive its advisory fee and will reimburse the Fund to the extent that operating expenses, excluding 12b-1 fees, exceed the following stated annual limit:
1.20% Expense Limit
Distribution and service fees: The Fund has a 12b-1 distribution plan under the 1940 Act pursuant to which an annual fee, based on average daily net assets, is paid to the distributor for various disbursements such as broker-dealer account servicing fees and other promotional expenses of the Fund. The Fund is authorized under the 12b-1 plan to pay fees on each class up to the following limits:
| Class A | 0.35 | % | |||||
| Class B | 1.00 | % | |||||
| Class C | 1.00 | % | |||||
In the case the Fund or a class of shares of the Fund is closed to new investors or investments, the Fund is authorized to pay 12b-1 fees for past sales and distribution efforts and present and past investor services.
Underwriter commissions relate to front-end sales charges imposed for Class A shares and contingent deferred sales charges from Classes B, C, and certain A share redemptions. For the six months ended April 30, 2005, the underwriter commissions were as follows:
| Received by Underwriter | $ | 76 | |||||
| Retained by Underwriter | 6 | ||||||
| Contingent Deferred Sales Charge | 30 | ||||||
Administrative services: The Fund has entered into an agreement with TFS for financial and legal fund administration services, which includes such items as compliance, expenses, financial statements and other reporting, distributions, tax returns, prospectus preparation, board of trustees meeting support and other legal matters. As of January 1, 2005 the Fund pays TFS an annual fee of 0.02% of average net assets. Prior to January 1, 2005 the Fund paid TFS an annual fee of 0.015% of average net assets. The Legal fees on the Statement of Operations are for fees paid to external legal counsel.
Transamerica IDEX Mutual Funds
Semi-Annual Report 2005
12
TA IDEX Transamerica Value Balanced
NOTES TO FINANCIAL STATEMENTS (continued)
At April 30, 2005
(all amounts in thousands)
(unaudited)
NOTE 2.–(continued)
Transfer agent fees: The Fund pays TFS an annual per-account charge of $20 (not in thousands) for each open account and $1.63 (not in thousands) for each closed account. There is no new account charge. The Transfer agent fees on the Statement of Operations are made up of fees paid to TFS and costs associated with shareholder statements.
The Fund paid TFS $114 for the six months ended April 30, 2005.
Deferred compensation plan: Each eligible Fund Trustee may elect participation in the Deferred Compensation Plan ("the Plan"). Under the Plan, such Trustees may defer payment of a percentage of their total fees earned as a Fund Trustee. These deferred amounts may be invested in any Transamerica IDEX Mutual Fund. At April 30, 2005, the value of invested plan amount was $14. Invested plan amounts and the total liability for deferred compensation to the Trustees under the Plan at April 30, 2005, are included in the accompanying Statement of Assets and Liabilities.
NOTE 3. INVESTMENT TRANSACTIONS
The cost of securities purchased and proceeds from securities sold (excluding short-term securities) for the six months ended April 30, 2005, were as follows:
| Purchases of securities: | |||||||
| Long-Term excluding U.S. Government | $ | 16,615 | |||||
| U.S. Government | 4,869 | ||||||
| Proceeds from maturities and sales of securities: | |||||||
| Long-Term excluding U.S. Government | 20,562 | ||||||
| U.S. Government | 6,933 | ||||||
NOTE 4. FEDERAL INCOME TAX MATTERS
The Fund has not made any provision for federal income or excise taxes due to its policy to distribute all of its taxable income and capital gains to its shareholders and otherwise qualify as a regulated investment company under the Internal Revenue Code. Income and capital gain distributions are determined in accordance with income tax regulations, which may differ from GAAP. These differences are primarily due to differing treatment for items including, but not limited to, wash sales and capital loss carryforwards.
The aggregate cost of investments and composition of unrealized appreciation (depreciation) for federal income tax purposes as of April 30, 2005, are as follows:
| Federal Tax Cost Basis | $ | 72,147 | |||||
| Unrealized Appreciation | $ | 6,227 | |||||
| Unrealized (Depreciation) | (1,298 | ) | |||||
| Net Unrealized Appreciation (Depreciation) | $ | 4,929 | |||||
NOTE 5. REGULATORY PROCEEDINGS
There continues to be significant federal and state regulatory activity relating to financial services companies, particularly mutual fund companies and their investment advisers. As part of an ongoing investigation regarding potential market timing, recordkeeping and trading compliance issues and matters affecting the Fund's investment adviser, TFAI, and certain employees and affiliates of TFAI, the SEC staff has indicated that it is likely to take some action against TFAI and certain of its affiliates at the conclusion of the investigation. The potential timing and the scope of any such action is difficult to predict. Although the impact of any action brought against TFAI and/or its affiliates is difficult to assess at the present time, the Fund currently believes that the likelihood that any such action will have a material adverse impact on it is remote. It is important to note that the Fund is not aware of any allegation of wrongdoing against it and its board at the time this semi-annual report is printed. Although it is not anticipated that these developments will have an adverse impact on the Fund, there can be no assurance at this time. TFAI and its affiliates are actively working with the SEC in regard to this matter; however, the exact resolution cannot be determined at this time. TFAI will take such actions that it deems necessary or appropriate to continue providing management services to the Fund and to bring all matters to an appropriate conclusion.
TFAI and/or its affiliates, and not the Fund, will bear the costs regarding these regulatory matters.
Transamerica IDEX Mutual Funds
Semi-Annual Report 2005
13
TA IDEX Transamerica Value Balanced
INVESTMENT ADVISORY AND SUB-ADVISORY AGREEMENTS – REVIEW AND RENEWAL
At a meeting of the Board of Trustees of Transamerica IDEX Mutual Funds ("TA IDEX") held on October 6, 2004, the Board considered and approved the renewal for a one-year period of the Investment Advisory Agreement between TA IDEX Transamerica Value Balance (the "Fund") and Transamerica Fund Advisors, Inc. ("TFAI") as well as the Investment Sub-Advisory Agreement of the Fund between TFAI and Transamerica Investment Management, LLC (the "Sub-Adviser"). In approving the renewal of these agreements, the Board concluded that the Investment Advisory and Investment Sub-Advisory Agreements enable shareholders of the Fund to obtain high quality services at a cost that is appropriate, reasonable, and in the best interests of shareholders based upon the following determinations, among others:
The nature, extent and quality of the advisory service to be provided. The Board considered the nature and quality of the services provided by TFAI and the Sub-Adviser to the Fund in the past, as well as the services anticipated to be provided in the future. The Board concluded that TFAI and the Sub-Adviser are capable of providing high quality services to the Fund, as indicated by TFAI's management capabilities demonstrated with respect to the Fund and other funds managed by TFAI, TFAI's management oversight process, and the professional qualifications and experience of the Sub-Adviser's portfolio management team. The Board also concluded that TFAI and the Sub-Adviser would provide the same quality and quantity of investment management and related services as before, that these services are app ropriate in scope and extent in light of the Fund's operations, the competitive landscape of the investment company business and investor needs, and that TFAI's and the Sub-Adviser's obligations will remain the same in all respects.
The investment performance of the Fund. The Board, based in particular on information provided by Lipper Analytics, concluded that the Fund's long-term investment performance was competitive relative to comparable funds over trailing two- and five-year periods and to the Fund's benchmark index over a five-year period. While the Board noted that the Fund's recent investment performance had lagged and decided to monitor the Fund's performance going forward, on the basis of the Trustees' assessment of the nature, extent and quality of investment advisory and related services to be provided or procured by TFAI and the Sub-Adviser, the Trustees concluded that TFAI and the Sub-Adviser were capable of generating a level of long-term investment performance that is appropriate in light of the Fund's inve stment objective, policies and strategies and competitive with other investment companies.
The cost of advisory services provided and the level of profitability. Overall, on the basis of the Board's review of the fees to be charged by TFAI and the Sub-Adviser for investment advisory and related services, TFAI's financial statements, the fees paid by TFAI to the Sub-Adviser, TFAI's estimated net management income resulting from its management of the Fund, the estimated profitability of TFAI's relationships with the Fund and TA IDEX, TFAI's limitation and fee waiver arrangement for the Fund, and the estimated profitability of the Sub-Adviser's relationship with the Fund, the Board concluded that the level of investment advisory fees and the profitability is appropriate in light of the entirety of the services provided and the anticipated profitability of the relationship between the Fun d, TFAI and the Sub-Adviser. On the basis of comparative information supplied by Lipper Analytics, the Board concluded that the level of advisory fees is appropriate, but estimated that overall expense of the Fund were relatively higher than certain industry averages and undertook to monitor Fund expenses closely.
The extent to which economies of scale would be realized as the Fund grows and whether fee levels reflect these economies of scale for the benefit of Fund investors. The Trustees concluded that inclusion of asset-based breakpoints in the Fund's advisory fee schedule appropriately benefited investors by realizing economies of scale in the form of a lower advisory fee rate as the level of Fund assets increases. The Board also concluded that the advisory fees appropriately reflect the Fund's current size, the current economic environment for TFAI, and the competitive nature of the investment company market. In addition, the Board noted that it will have the opportunity to periodically re-examine whether the Fund has achieved economies of scale, as well as the appropriateness of advisory fees payabl e to TFAI and the Sub-Adviser in the future.
Benefits (such as soft dollars) to TFAI or the Sub-Adviser from its relationship with the Fund. The Board concluded that other benefits derived by TFAI or the Sub-Adviser from its relationship with the Fund are reasonable and fair, and are consistent with industry practice and the best interests of the Fund and its shareholders. In this regard, the Board noted that TFAI does not realize "soft dollar" benefits from its relationship with the Fund, and that the Sub-Adviser is participating in a brokerage program pursuant to which a portion of brokerage commissions paid by the Fund is recaptured for the benefit of the Fund and its shareholders, thus limiting the amount of "soft-dollar" arrangements the Sub-Adviser may engage in with respect to the Fund's portfolio brokerage transactions.
Other considerations. The Board also determined that TFAI had made a substantial commitment to the recruitment and retention of high quality personnel, and maintained the financial, compliance and operational resources reasonably necessary to manage the Fund in a professional manner that is consistent with the best interests of the Fund and its shareholders. The Trustees also concluded that TFAI had made a significant entrepreneurial commitment to the management and success of the Fund, reflected by TFAI's expense limitation and fee waiver arrangement with the Fund which, as demonstrated in the past with the Fund, may result in TFAI waiving a substantial amount of advisory fees for the benefit of shareholders.
Transamerica IDEX Mutual Funds
Semi-Annual Report 2005
14
TA IDEX Transamerica Value Balanced
SUPPLEMENTAL INFORMATION (unaudited)
RESULTS OF SHAREHOLDER PROXY
At a special meeting of shareholders held on February 25, 2005, the results of the Proposals were as follows:
Transamerica IDEX Mutual Funds
Proposal 1: Election of Trustees to the Board of Trustees of Transamerica IDEX Mutual Funds.
| For | Withheld | ||||||||||
| Peter R. Brown | 872,017,875.249 | 4,468,498.551 | |||||||||
| Daniel Calabria | 871,917,069.786 | 4,569,304.014 | |||||||||
| Janise B. Case | 872,099,393.125 | 4,386,980.675 | |||||||||
| Charles C. Harris | 872,086,722.025 | 4,399,651.775 | |||||||||
| Leo J. Hill | 872,304,465.640 | 4,181,908.160 | |||||||||
| Russell A. Kimball, Jr. | 872,253,556.471 | 4,232,817.329 | |||||||||
| William W. Short, Jr. | 872,139,920.944 | 4,346,452.856 | |||||||||
| John Waechter | 872,261,152.376 | 4,225,221.424 | |||||||||
| Jack E. Zimmerman | 871,929,967.512 | 4,556,406.288 | |||||||||
| Brian C. Scott | 872,218,970.367 | 4,267,403.433 | |||||||||
| Thomas P. O'Neill | 872,111,944.117 | 4,374,429.683 | |||||||||
TA IDEX Transamerica Value Balanced
Proposal 2: Approval of an Agreement and Plan of Reorganization pursuant to which Transamerica IDEX Mutual Funds will organize as a Delaware statutory trust.
| For | Against | Abstentions/Broker Non-Votes | |||||||||
| 3,538,387.847 | 46,336.145 | 1,077,395.281 | |||||||||
Proposal 3: Approval of changes to the fundamental investment restrictions of TA IDEX Transamerica Value Balanced.
| A. Diversification | For | Against | Abstentions/Broker Non-Votes | ||||||||||||
| 3,587,878.942 | 54,200.331 | 1,020,040.000 | |||||||||||||
| B. Borrowing | For | Against | Abstentions/Broker Non-Votes | ||||||||||||
| 3,584,908.196 | 57,171.077 | 1,020,040.000 | |||||||||||||
| C. Senior Securities | For | Against | Abstentions/Broker Non-Votes | ||||||||||||
| 3,583,742.380 | 58,336.893 | 1,020,040.000 | |||||||||||||
| D. Underwriting Securities | For | Against | Abstentions/Broker Non-Votes | ||||||||||||
| 3,589,529.396 | 52,549.877 | 1,020,040.000 | |||||||||||||
| E. Real Estate | For | Against | Abstentions/Broker Non-Votes | ||||||||||||
| 3,589,529.396 | 52,549.877 | 1,020,040.000 | |||||||||||||
| F. Making Loans | For | Against | Abstentions/Broker Non-Votes | ||||||||||||
| 3,585,610.041 | 56,469.232 | 1,020,040.000 | |||||||||||||
| G. Concentration | For | Against | Abstentions/Broker Non-Votes | ||||||||||||
| 3,588,855.164 | 53,224.109 | 1,020,040.000 | |||||||||||||
| H. Commodities | For | Against | Abstentions/Broker Non-Votes | ||||||||||||
| 3,575,325.168 | 66,754.105 | 1,020,040.000 | |||||||||||||
Transamerica IDEX Mutual Funds
Semi-Annual Report 2005
15
TA IDEX UBS Large Cap Value
GRAPHIC PRESENTATION OF SCHEDULE OF INVESTMENTS
By Sector
At April 30, 2005
(unaudited)
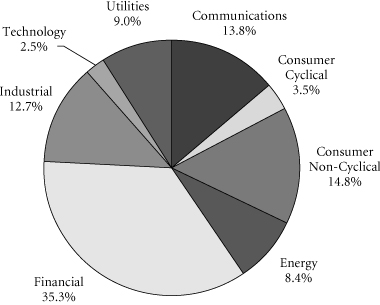
This chart shows the percentage breakdown by sector of the Fund's total investment securities.
Transamerica IDEX Mutual Funds
Semi-Annual Report 2005
1
TA IDEX UBS Large Cap Value
SCHEDULE OF INVESTMENTS
At April 30, 2005
(all amounts except share amounts in thousands)
(unaudited)
| Shares | Value | ||||||||||
| COMMON STOCKS (97.6%) | |||||||||||
| Aerospace (3.2%) | |||||||||||
| Lockheed Martin Corp. | 47,800 | $ | 2,913 | ||||||||
| Northrop Grumman Corp. | 34,100 | 1,870 | |||||||||
| Business Credit Institutions (2.8%) | |||||||||||
| Freddie Mac | 67,300 | 4,140 | |||||||||
| Business Services (1.3%) | |||||||||||
| Omnicom Group, Inc. | 23,600 | 1,956 | |||||||||
| Commercial Banks (21.9%) | |||||||||||
| Bank of America Corp. | 62,000 | 2,792 | |||||||||
| Citigroup, Inc. | 151,300 | 7,105 | |||||||||
| Fifth Third Bancorp | 50,600 | 2,201 | |||||||||
| JPMorgan Chase & Co. | 193,500 | 6,867 | |||||||||
| Mellon Financial Corp. | 112,400 | 3,112 | |||||||||
| Northern Trust Corp. | 40,300 | 1,815 | |||||||||
| PNC Financial Services Group, Inc. | 50,700 | 2,699 | |||||||||
| Wells Fargo & Co. | 101,300 | 6,072 | |||||||||
| Communication (2.1%) | |||||||||||
| Viacom, Inc.–Class B | 88,800 | 3,074 | |||||||||
| Computer & Data Processing Services (1.3%) | |||||||||||
| Microsoft Corp. | 78,200 | 1,978 | |||||||||
| Computer & Office Equipment (1.1%) | |||||||||||
| Hewlett-Packard Co. | 83,000 | 1,699 | |||||||||
| Electric Services (6.1%) | |||||||||||
| American Electric Power Co., Inc. | 83,900 | 2,955 | |||||||||
| FirstEnergy Corp. | 73,400 | 3,194 | |||||||||
| Pepco Holdings, Inc. | 66,800 | 1,448 | |||||||||
| Sempra Energy | 36,000 | 1,454 | |||||||||
| Electric, Gas & Sanitary Services (2.8%) | |||||||||||
| Exelon Corp. | 67,800 | 3,356 | |||||||||
| NiSource, Inc. | 32,500 | 755 | |||||||||
| Food Stores (2.7%) | |||||||||||
| Albertson's, Inc. | 110,700 | 2,191 | |||||||||
| Kroger Co. (a) | 113,100 | 1,784 | |||||||||
| Furniture & Fixtures (3.1%) | |||||||||||
| Johnson Controls, Inc. | 33,300 | 1,827 | |||||||||
| Masco Corp. | 87,500 | 2,755 | |||||||||
| Industrial Machinery & Equipment (2.4%) | |||||||||||
| Baker Hughes, Inc. | 5,100 | 225 | |||||||||
| Illinois Tool Works, Inc. | 40,100 | 3,361 | |||||||||
| Insurance (6.5%) | |||||||||||
| AFLAC, Inc. | 41,100 | 1,671 | |||||||||
| Allstate Corp. (The) | 46,700 | 2,623 | |||||||||
| Shares | Value | ||||||||||
| Insurance (continued) | |||||||||||
| American International Group, Inc. | 26,900 | $ | 1,368 | ||||||||
| UnitedHealth Group, Inc. | 42,400 | 4,007 | |||||||||
| Insurance Agents, Brokers & Service (1.7%) | |||||||||||
| Hartford Financial Services Group, Inc. (The) | 34,900 | 2,526 | |||||||||
| Lumber & Construction Materials (2.0%) | |||||||||||
| Martin Marietta Materials, Inc. | 55,500 | 3,052 | |||||||||
| Motion Pictures (2.2%) | |||||||||||
| Time Warner, Inc. (a) | 194,600 | 3,271 | |||||||||
| Paper & Allied Products (1.1%) | |||||||||||
| Kimberly-Clark Corp. | 26,100 | 1,630 | |||||||||
| Petroleum Refining (8.0%) | |||||||||||
| Exxon Mobil Corp. | 116,300 | 6,633 | |||||||||
| Marathon Oil Corp. | 113,900 | 5,304 | |||||||||
| Pharmaceuticals (7.9%) | |||||||||||
| Bristol-Myers Squibb Co. | 63,100 | 1,641 | |||||||||
| Cephalon, Inc. (a) | 29,100 | 1,278 | |||||||||
| Johnson & Johnson | 47,700 | 3,274 | |||||||||
| Medco Health Solutions, Inc. (a) | 42,900 | 2,187 | |||||||||
| Wyeth | 77,700 | 3,492 | |||||||||
| Printing & Publishing (0.8%) | |||||||||||
| Tribune Co. | 33,000 | 1,274 | |||||||||
| Radio & Television Broadcasting (2.0%) | |||||||||||
| IAC/InterActive Corp. (a) | 73,900 | 1,607 | |||||||||
| Univision Communications, Inc.–Class A (a) | 51,200 | 1,346 | |||||||||
| Railroads (3.0%) | |||||||||||
| Burlington Northern Santa Fe Corp. | 48,600 | 2,345 | |||||||||
| CSX Corp. | 53,900 | 2,163 | |||||||||
| Retail Trade (0.6%) | |||||||||||
| Office Depot, Inc. (a) | 46,600 | 912 | |||||||||
| Security & Commodity Brokers (4.4%) | |||||||||||
| Morgan Stanley | 125,300 | 6,593 | |||||||||
| Telecommunications (5.0%) | |||||||||||
| Nextel Communications, Inc.–Class A (a) | 163,600 | 4,579 | |||||||||
| SBC Communications, Inc. | 122,600 | 2,918 | |||||||||
| Variety Stores (1.6%) | |||||||||||
| Costco Wholesale Corp. | 58,800 | 2,386 | |||||||||
| Total Common Stocks (cost: $146,101) | 145,678 | ||||||||||
| Total Investment Securities (cost: $146,101) | $ | 145,678 | |||||||||
| SUMMARY: | |||||||||||
| Investments, at value | 97.6 | % | $ | 145,678 | |||||||
| Other assets in excess of liabilities | 2.4 | % | 3,616 | ||||||||
| Net assets | 100.0 | % | $ | 149,294 | |||||||
NOTES TO SCHEDULE OF INVESTMENTS:
(a) No dividends were paid during the preceding twelve months.
The notes to the financial statements are an integral part of this report.
Transamerica IDEX Mutual Funds
Semi-Annual Report 2005
2
TA IDEX UBS Large Cap Value
STATEMENT OF ASSETS AND LIABILITIES
At April 30, 2005
(all amounts except per share amounts in thousands)
(unaudited)
| Assets: | |||||||
| Investment securities, at value (cost: $146,101) | $ | 145,678 | |||||
| Cash | 3,200 | ||||||
| Receivables: | |||||||
| Investment securities sold | 420 | ||||||
| Shares of beneficial interest sold | 493 | ||||||
| Interest | 6 | ||||||
| Dividends | 284 | ||||||
| 150,081 | |||||||
| Liabilities: | |||||||
| Investment securities purchased | 676 | ||||||
| Accounts payable and accrued liabilities: | |||||||
| Management and advisory fees | 89 | ||||||
| Distribution and service fees | 17 | ||||||
| Other | 5 | ||||||
| 787 | |||||||
| Net Assets | $ | 149,294 | |||||
| Net Assets Consist of: | |||||||
| Shares of beneficial interest, unlimited shares authorized, no par value | $ | 148,853 | |||||
| Undistributed net investment income (loss) | 426 | ||||||
| Undistributed net realized gain (loss) from investment securities | 438 | ||||||
| Net unrealized appreciation (depreciation) on investment securities | (423 | ) | |||||
| Net Assets | $ | 149,294 | |||||
| Net Assets by Class: | |||||||
| Class A | $ | 62,124 | |||||
| Class I | 87,170 | ||||||
| Shares Outstanding: | |||||||
| Class A | 6,065 | ||||||
| Class I | 8,509 | ||||||
| Net Asset Value and Offering Price Per Share: | |||||||
| Class A | $ | 10.24 | |||||
| Class I | 10.24 | ||||||
STATEMENT OF OPERATIONS
For the period ended April 30, 2005 (a)
(all amounts in thousands)
(unaudited)
| Investment Income: | |||||||
| Interest | $ | 35 | |||||
| Dividends | 877 | ||||||
| 912 | |||||||
| Expenses: | |||||||
| Management and advisory fees | 373 | ||||||
| Printing and shareholder reports | 2 | ||||||
| Custody fees | 11 | ||||||
| Administration fees | 8 | ||||||
| Legal fees | 2 | ||||||
| Audit fees | 6 | ||||||
| Trustees fees | 1 | ||||||
| Other | 2 | ||||||
| Distribution and service fees: | |||||||
| Class A | 25 | ||||||
| Total expenses | 430 | ||||||
| Less: | |||||||
| Reimbursement of class expenses: Class A | (16 | ) | |||||
| Net expenses | 414 | ||||||
| Net Investment Income (Loss) | 498 | ||||||
| Net Realized and Unrealized Gain (Loss): | |||||||
| Realized Gain (Loss) from investment securities | 438 | ||||||
| Increase (decrease) in unrealized appreciation (depreciation) on investment securities | (423 | ) | |||||
| Net Gain (Loss) on Investments | 15 | ||||||
| Net Increase (Decrease) in Net Assets Resulting from Operations | $ | 513 | |||||
(a) TA IDEX UBS Large Cap Value ("the Fund") commenced operations on November 8, 2004. The inception date for the Fund's offering of share Class A was March 1, 2005.
The notes to the financial statements are an integral part of this report.
Transamerica IDEX Mutual Funds
Semi-Annual Report 2005
3
TA IDEX UBS Large Cap Value
STATEMENT OF CHANGES IN NET ASSETS
For the period ended
(all amounts in thousands)
| April 30, 2005 (a) (unaudited) | |||||||||||
| Increase (Decrease) in Net Assets From: | |||||||||||
| Operations: | |||||||||||
| Net investment income (loss) | $ | 498 | |||||||||
| Net realized gain (loss) from investment securities | 438 | ||||||||||
| Net unrealized appreciation (depreciation) on investment securities | (423 | ) | |||||||||
| 513 | |||||||||||
| Distributions to Shareholders: | |||||||||||
| From net investment income: | |||||||||||
| Class I | (72 | ) | |||||||||
| (72 | ) | ||||||||||
| Capital Share Transactions: | |||||||||||
| Proceeds from shares sold: | |||||||||||
| Class A | 62,868 | ||||||||||
| Class I | 85,913 | ||||||||||
| 148,781 | |||||||||||
| Dividends and distributions reinvested: | |||||||||||
| Class I | 72 | ||||||||||
| 72 | |||||||||||
| 148,853 | |||||||||||
| Net increase (decrease) in net assets | 149,294 | ||||||||||
| Net Assets: | |||||||||||
| Beginning of period | – | ||||||||||
| End of period | $ | 149,294 | |||||||||
| Undistributed Net Investment Income (Loss) | $ | 426 | |||||||||
| Share Activity: | |||||||||||
| Shares issued: | |||||||||||
| Class A | 6,065 | ||||||||||
| Class I | 8,502 | ||||||||||
| 14,567 | |||||||||||
| Shares issued–reinvested from distributions: | |||||||||||
| Class I | 7 | ||||||||||
| 7 | |||||||||||
| Net increase (decrease) in shares outstanding: | |||||||||||
| Class A | 6,065 | ||||||||||
| Class I | 8,509 | ||||||||||
| 14,574 | |||||||||||
(a) TA IDEX UBS Large Cap Value ("the Fund") commenced operations on November 8, 2004. The inception date for the Fund's offering of share Class A was March 1, 2005.
The notes to the financial statements are an integral part of this report.
Transamerica IDEX Mutual Funds
Semi-Annual Report 2005
4
TA IDEX UBS Large Cap Value
FINANCIAL HIGHLIGHTS
(unaudited for the period ended April 30, 2005)
| For a share of beneficial interest outstanding throughout the period | |||||||||||||||||||||||||||||||||||||||
| Net Asset | Investment Operations | Distributions | Net Asset | ||||||||||||||||||||||||||||||||||||
| For the Period Ended (d)(g) | Value, Beginning of Period | Net Investment Income (Loss) | Net Realized and Unrealized Gain (Loss) | Total Operations | From Net Investment Income | From Net Realized Gains | Total Distributions | Value, End of Period | |||||||||||||||||||||||||||||||
| Class A | 4/30/2005 | $ | 10.43 | $ | 0.02 | $ | (0.21 | ) | $ | (0.19 | ) | $ | – | $ | – | $ | – | $ | 10.24 | ||||||||||||||||||||
| Class I | 4/30/2005 | 10.00 | 0.06 | 0.19 | 0.25 | (0.01 | ) | – | (0.01 | ) | 10.24 | ||||||||||||||||||||||||||||
| Ratios/Supplemental Data | |||||||||||||||||||||||||||||||
| For the Period | Total | Net Assets, End of Period | Ratio of Expenses to Average Net Assets (a) | Net Investment Income (Loss) to Average | Portfolio Turnover | ||||||||||||||||||||||||||
| Ended (g) | Return (c) | (000's) | Net (e) | Total (f) | Net Assets (a) | Rate (b) | |||||||||||||||||||||||||
| Class A | 4/30/2005 | (1.82 | )% | $ | 62,124 | 1.05 | % | 1.28 | % | 1.09 | % | 26 | % | ||||||||||||||||||
| Class I | 4/30/2005 | 2.49 | 87,170 | 0.92 | 0.92 | 1.14 | 26 | ||||||||||||||||||||||||
NOTES TO FINANCIAL HIGHLIGHTS
(a) Annualized.
(b) Not annualized for periods of less than one year.
(c) Total Return has been calculated for the applicable period without deduction of a sales load, if any, on a initial purchase. Periods of less than one year are not annualized
(d) Per share information is caluclated based on average number of shares outstanding.
(e) Ratio of Net Expenses to Average Net Assets is net of fee waivers and reimbursements by the investment adviser, if any (see note 2).
(f) Ratio of Total Expenses to Average Net Assets includes all expenses before fee waivers and reimbursements by the investment adviser.
(g) TA IDEX UBS Large Cap Value ("the Fund") commenced operations on November 8, 2004. The inception dates for the Fund's offering of share Class A was March 1, 2005.
The notes to the financial statements are an integral part of this report.
Transamerica IDEX Mutual Funds
Semi-Annual Report 2005
5
TA IDEX UBS Large Cap Value
NOTES TO FINANCIAL STATEMENTS
At April 30, 2005
(all amounts in thousands)
(unaudited)
NOTE 1. ORGANIZATION AND SIGNIFICANT ACCOUNTING POLICIES
Transamerica IDEX Mutual Funds is a Delaware statutory trust registered under the Investment Company Act of 1940, as amended (the "1940 Act"), as an open-end management investment company. Prior to March 1, 2005, Transamerica IDEX Mutual Funds was a Massachusetts business trust. TA IDEX UBS Large Cap Value ("the Fund"), part of Transamerica IDEX Mutual Funds, began operations on November 8, 2004.
In the normal course of business, the Fund enters into contracts that contain a variety of representations and warranties, which provide general indemnifications. The Fund's maximum exposure under these arrangements is unknown, as this would involve future claims that may be made against the Fund and/or its affiliates that have not yet occurred. However, based on experience, the Fund expects the risk of loss to be remote.
See the Prospectus and Statement of Additional Information for a description of the Fund's investment objective.
In preparing the Fund's financial statements in accordance with accounting principles generally accepted in the United States of America ("GAAP"), estimates or assumptions (which could differ from actual results) may be used that affect reported amounts and disclosures. The following policies were consistently followed by the Fund, in accordance with GAAP.
Multiple class operations and expenses: The Fund currently offers two classes of shares, Class A and Class I, each with a public offering price that reflects different sales charges, if any, and expense levels. The initial sales charge currently is waived as this Fund is available for investment only by certain strategic asset allocation funds. Income, non-class specific expenses and realized and unrealized gains and losses, are allocated daily to each class, based upon the value of shares outstanding method as permitted under Rule 18f-3 of the 1940 Act. Each class bears its own specific expenses as well as a portion of general, common expenses.
Pricing of shares: The Fund prices its shares on the basis of the net asset value of each class of shares of the Fund, which is determined as of the close of the New York Stock Exchange ("NYSE") (generally 4:00 p.m. Eastern Time) on each day on which the NYSE is open for trading.
Security valuations: Fund investments traded on an exchange are valued at the closing price on the day of valuation on the exchange where the security is principally traded. With respect to securities traded on NASDAQ NMS, such closing price may be last reported sales price or the NASDAQ Official Closing Price.
Securities traded in the over-the-counter market and listed securities for which no sale was reported on that date are valued at the last quoted bid price.
Other securities for which quotations are not readily available are valued at fair market value as determined in good faith using guidelines adopted by the Board of Trustees of the Fund, under the supervision of the Fund's Valuation Committee. These guidelines may include: the type of security; any restrictions on its resale; financial or business news of the issuer; similar or related securities that are actively trading; related corporate actions; and other significant events occurring after the close of trading in the security.
Cash: The Fund may leave cash overnight in its cash account with the custodian, Investors Bank & Trust Company ("IBT"). IBT has been contracted on behalf of the Fund to invest the excess cash into a savings account, which at April 30, 2005, was paying an interest rate of 2.02%.
Throughout the period from inception through April 30, 2005, the Fund may have a cash overdraft balance. A fee is incurred on this overdraft, calculated by multiplying the overdraft by a rate based on the federal funds rate.
Commission recapture: The sub-adviser, to the extent consistent with the best execution and usual commission rate policies and practices, may place security transactions of the Fund with broker/dealers with which Transamerica IDEX Mutual Funds has established a Commission Recapture Program. A Commission Recapture Program is any arrangement under which a broker/dealer applies a portion of the commissions received by such broker/dealer on the security transactions to the Fund. In no event will commissions paid by the Fund be used to pay expenses that would otherwise be borne by any other funds within Transamerica IDEX Mutual Funds, or by any other party.
Recaptured commissions during the period from inception through April 30, 2005, of $37 are included in net realized gains in the Statement of Operations.
Security transactions and investment income: Security transactions are recorded on the trade date. Security gains and losses are calculated on the specific identification basis. Dividend income is recorded on the ex-dividend date or, in the case of foreign securities, as soon as the Fund is informed of the ex-dividend date. Interest income, including accretion of discounts and amortization of premiums, is recorded on the accrual basis commencing on the settlement date.
Redemption fees: A short-term trading redemption fee may be assessed on any fund shares in a fund account that are sold during the first five (5) NYSE trading days following their purchase date. This redemption fee will equal 2% of the amount redeemed and shares held the longest will be treated as being redeemed first and shares held the shortest as being redeemed last.
For the period from inception through April 30, 2005, the Fund received no redemption fees.
Dividend distributions: Distributions to shareholders are recorded on the ex-dividend date and are determined in accordance with Federal income tax regulations which may differ from GAAP.
Transamerica IDEX Mutual Funds
Semi-Annual Report 2005
6
TA IDEX UBS Large Cap Value
NOTES TO FINANCIAL STATEMENTS (continued)
At April 30, 2005
(all amounts in thousands)
(unaudited)
NOTE 2. RELATED PARTY TRANSACTIONS
Transamerica Fund Advisors, Inc. ("TFAI") is the Fund's investment adviser. Transamerica Fund Services, Inc. ("TFS") is the Fund's administrator and transfer agent. AFSG Securities Corp. ("AFSG") is the Fund's distributor/principal underwriter. AFSG is 100% owned by AUSA Holding Company ("AUSA"). TFAI is a directly owned subsidiary of Western Reserve Life Assurance Co. of Ohio (78%) and AUSA (22%). TFS is a wholly owned subsidiary of WRL (50%) and AUSA (50%). AUSA and WRL are wholly owned indirect subsidiaries of AEGON, NV, a Netherlands corporation.
Effective January 1, 2005 AEGON/Transamerica Fund Advisors, Inc. ("ATFA") was renamed Transamerica Fund Advisors, Inc. ("TFAI"); AEGON/Transamerica Fund Services, Inc. ("ATFS") and AEGON/Transamerica Investor Services, Inc. ("ATIS") merged into one entity and was renamed Transamerica Fund Services, Inc. ("TFS").
The following schedule reflects the percentage of fund assets owned by affiliated mutual funds (ie: through the Transamerica IDEX Mutual Funds and AEGON/Transamerica Series Trust (f/k/a AEGON/Transamerica Series Fund, Inc.) asset allocation funds):
| Net Assets | % of Net Assets | ||||||||||
| TA IDEX Asset Allocation – Conservative Portfolio | $ | 9,452 | 6.33 | % | |||||||
| TA IDEX Asset Allocation – Moderate Portfolio | 52,633 | 35.25 | % | ||||||||
| Asset Allocation – Conservative Portfolio | 22,890 | 15.33 | % | ||||||||
| Asset Allocation – Growth Portfolio | 64,228 | 43.02 | % | ||||||||
| Total | $ | 149,203 | 99.93 | % | |||||||
Investment advisory fee: The Fund pays management fees to TFAI based on average daily net assets ("ANA") at the following breakpoints:
0.85% of the first $200 million of ANA
0.80% of the next $550 million of ANA
0.75% of the next $250 million of ANA
0.70% of ANA over $1 billion
TFAI has contractually agreed to waive its advisory fee and will reimburse the Fund to the extent that operating expenses exceed the following stated annual limit:
1.05% Expense Limit
If total fund expenses fall below the annual expense limitation agreement agreed to by the adviser within the succeeding three years, the Fund may be required to pay that adviser a portion or all of the waived advisory fees.
There are no amounts available for recapture at April 30, 2005.
Distribution and service fees: The Fund has a 12b-1 distribution plan under the 1940 Act pursuant to which an annual fee, based on average daily net assets, is paid to the distributor for various disbursements such as broker-dealer account servicing fees and other promotional expenses of the Fund. The Fund is authorized under the 12b-1 plan to pay fees on each class up to the following limits:
| Class A | 0.35 | % | |||||
| Class I | N/A | ||||||
In the case the Fund or a class of shares of the Fund is closed to new investors or investments, the Fund is authorized to pay 12b-1 fees for past sales and distribution efforts and present and past investor services.
Administrative services: The Fund has entered into an agreement with TFS for financial and legal fund administration services, which includes such items as compliance, expenses, financial statements and other reporting, distributions, tax returns, prospectus preparation, board of trustees meeting support and other legal matters. As of January 1, 2005 the Fund pays TFS an annual fee of 0.02% of average net assets. Prior to January 1, 2005 the Fund paid TFS an annual fee of 0.015% of average net assets. The Legal fees on the Statement of Operations are for fees paid to external legal counsel.
Transfer agent fees: The Fund pays TFS an annual per-account charge of $20 (not in thousands) for each open account and $1.63 (not in thousands) for each closed account. There is no new account charge. The Transfer agent fees on the Statement of Operations are made up of fees paid to TFS and costs associated with shareholder statements.
The Fund paid TFS less than $1 for the period from inception through April 30, 2005.
Brokerage commissions: Brokerage commissions incurred on security transactions placed with an affiliate of the sub-adviser for the period from inception through April 30, 2005, were $10.
NOTE 3. INVESTMENT TRANSACTIONS
The cost of securities purchased and proceeds from securities sold (excluding short-term securities) for the period from inception through April 30, 2005, were as follows:
| Purchases of securities: | |||||||
| Long-Term excluding U.S. Government | $ | 168,226 | |||||
| U.S. Government | – | ||||||
| Proceeds from maturities and sales of securities: | |||||||
| Long-Term excluding U.S. Government | 22,526 | ||||||
| U.S. Government | – | ||||||
Transamerica IDEX Mutual Funds
Semi-Annual Report 2005
7
TA IDEX UBS Large Cap Value
NOTES TO FINANCIAL STATEMENTS (continued)
At April 30, 2005
(all amounts in thousands)
(unaudited)
NOTE 4. FEDERAL INCOME TAX MATTERS
The Fund has not made any provision for federal income or excise taxes due to its policy to distribute all of its taxable income and capital gains to its shareholders and otherwise qualify as a regulated investment company under the Internal Revenue Code. Income and capital gain distributions are determined in accordance with income tax regulations, which may differ from GAAP. These differences are primarily due to differing treatment for items including, but not limited to, wash sales, net operating losses and capital loss carryforwards.
The aggregate cost of investments and composition of unrealized appreciation (depreciation) for federal income tax purposes as of April 30, 2005, are as follows:
| Federal Tax Cost Basis | $ | 146,101 | |||||
| Unrealized Appreciation | $ | 3,678 | |||||
| Unrealized (Depreciation) | (4,101 | ) | |||||
| Net Unrealized Appreciation (Depreciation) | $ | (423 | ) | ||||
NOTE 5. REGULATORY PROCEEDINGS
There continues to be significant federal and state regulatory activity relating to financial services companies, particularly mutual fund companies and their investment advisers. As part of an ongoing investigation regarding potential market timing, recordkeeping and trading compliance issues and matters affecting the Fund's investment adviser, TFAI, and certain employees and affiliates of TFAI, the SEC staff has indicated that it is likely to take some action against TFAI and certain of its affiliates at the conclusion of the investigation. The potential timing and the scope of any such action is difficult to predict. Although the impact of any action brought against TFAI and/or its affiliates is difficult to assess at the present time, the Fund currently believes that the likelihood that any such action will have a material adverse impact on it is remote. It is important to note that the Fund is not aware of any allegation of wrongdoing against it and its board at the time this semi-annual report is printed. Although it is not anticipated that these developments will have an adverse impact on the Fund, there can be no assurance at this time. TFAI and its affiliates are actively working with the SEC in regard to this matter; however, the exact resolution cannot be determined at this time. TFAI will take such actions that it deems necessary or appropriate to continue providing management services to the Fund and to bring all matters to an appropriate conclusion.
TFAI and/or its affiliates, and not the Fund, will bear the costs regarding these regulatory matters.
Transamerica IDEX Mutual Funds
Semi-Annual Report 2005
8
TA IDEX UBS Large Cap Value
A discussion regarding the basis of Transamerica IDEX Mutual Fund's Board of Trustees' approval of the fund's advisory arrangements will be available in the fund's annual report for the fiscal year ending October 31, 2005.
Transamerica IDEX Mutual Funds
Semi-Annual Report 2005
9
TA IDEX UBS Large Cap Value
SUPPLEMENTAL INFORMATION (unaudited)
RESULTS OF SHAREHOLDER PROXY
At a special meeting of shareholders held on February 25, 2005, the results of the Proposals were as follows:
Transamerica IDEX Mutual Funds
Proposal 1: Election of Trustees to the Board of Trustees of Transamerica IDEX Mutual Funds.
| For | Withheld | ||||||||||
| Peter R. Brown | 872,017,875.249 | 4,468,498.551 | |||||||||
| Daniel Calabria | 871,917,069.786 | 4,569,304.014 | |||||||||
| Janise B. Case | 872,099,393.125 | 4,386,980.675 | |||||||||
| Charles C. Harris | 872,086,722.025 | 4,399,651.775 | |||||||||
| Leo J. Hill | 872,304,465.640 | 4,181,908.160 | |||||||||
| Russell A. Kimball, Jr. | 872,253,556.471 | 4,232,817.329 | |||||||||
| William W. Short, Jr. | 872,139,920.944 | 4,346,452.856 | |||||||||
| John Waechter | 872,261,152.376 | 4,225,221.424 | |||||||||
| Jack E. Zimmerman | 871,929,967.512 | 4,556,406.288 | |||||||||
| Brian C. Scott | 872,218,970.367 | 4,267,403.433 | |||||||||
| Thomas P. O'Neill | 872,111,944.117 | 4,374,429.683 | |||||||||
TA IDEX UBS Large Cap Value
Proposal 2: Approval of an Agreement and Plan of Reorganization pursuant to which Transamerica IDEX Mutual Funds will organize as a Delaware statutory trust.
| For | Against | Abstentions/Broker Non-Votes | |||||||||
| 1,977,954.901 | 0 | 0 | |||||||||
Proposal 3: Approval of changes to the fundamental investment restrictions of TA IDEX UBS Large Cap Value.
| A. Diversification | For | Against | Abstentions/Broker Non-Votes | ||||||||||||
| 1,977,954.901 | 0 | 0 | |||||||||||||
| B. Borrowing | For | Against | Abstentions/Broker Non-Votes | ||||||||||||
| 1,977,954.901 | 0 | 0 | |||||||||||||
| C. Senior Securities | For | Against | Abstentions/Broker Non-Votes | ||||||||||||
| 1,977,954.901 | 0 | 0 | |||||||||||||
| D. Underwriting Securities | For | Against | Abstentions/Broker Non-Votes | ||||||||||||
| 1,977,954.901 | 0 | 0 | |||||||||||||
| E. Real Estate | For | Against | Abstentions/Broker Non-Votes | ||||||||||||
| 1,977,954.901 | 0 | 0 | |||||||||||||
| F. Making Loans | For | Against | Abstentions/Broker Non-Votes | ||||||||||||
| 1,977,954.901 | 0 | 0 | |||||||||||||
| G. Concentration | For | Against | Abstentions/Broker Non-Votes | ||||||||||||
| 1,977,954.901 | 0 | 0 | |||||||||||||
| H. Commodities | For | Against | Abstentions/Broker Non-Votes | ||||||||||||
| 1,977,954.901 | 0 | 0 | |||||||||||||
Transamerica IDEX Mutual Funds
Semi-Annual Report 2005
10
TA IDEX Van Kampen Emerging Markets Debt
GRAPHICAL PRESENTATION OF SCHEDULE OF INVESTMENTS
By Region
At April 30, 2005
(unaudited)
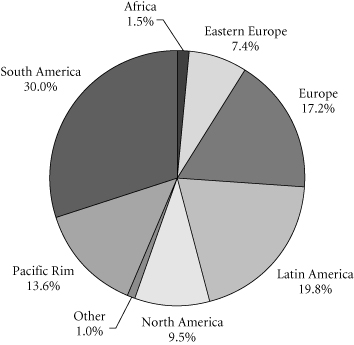
This chart shows the percentage breakdown by region of the Fund's total investment securities.
Transamerica IDEX Mutual Funds
Semi-Annual Report 2005
1
TA IDEX Van Kampen Emerging Markets Debt
SCHEDULE OF INVESTMENTS
At April 30, 2005
(all amounts except share amounts in thousands)
(unaudited)
| Principal | Value | ||||||||||
| FOREIGN GOVERNMENT OBLIGATIONS (80.5%) | |||||||||||
| Argentine Republic 11.75%, due 04/07/2009 (a) | $ | 4,000 | $ | 1,160 | |||||||
| 11.75%, due 06/15/2015 (a) | 1,650 | 470 | |||||||||
| 82.33%, due 04/10/2049 (a) | 1,100 | 319 | |||||||||
| Malaysia Government 8.75%, due 06/01/2009 | 7,350 | 8,493 | |||||||||
| 7.50%, due 07/15/2011 | 2,200 | 2,524 | |||||||||
| Republic of Brazil 14.50%, due 10/15/2009 | 4,350 | 5,546 | |||||||||
| 8.00%, due 04/15/2014 | 6,861 | 6,809 | |||||||||
| 10.50%, due 07/14/2014 | 2,600 | 2,918 | |||||||||
| 8.88%, due 10/14/2019 | 650 | 640 | |||||||||
| 4.25%, due 04/15/2024 (b) | 2,400 | 2,196 | |||||||||
| 6.00%, due 04/15/2024 (b) | 450 | 414 | |||||||||
| 8.88%, due 04/15/2024 | 1,800 | 1,759 | |||||||||
| 11.00%, due 08/17/2040 | 660 | 748 | |||||||||
| Republic of Bulgaria 8.25%, due 01/15/2015 | 2,100 | 2,599 | |||||||||
| Republic of Colombia 9.75%, due 04/09/2011 | 1,630 | 1,808 | |||||||||
| 11.75%, due 02/25/2020 | 980 | 1,191 | |||||||||
| 10.38%, due 01/28/2033 | 420 | 453 | |||||||||
| Republic of Ecuador 8.00%, due 08/15/2030 (c) | 3,350 | 2,680 | |||||||||
| Republic of Nigeria 6.25%, due 11/15/2020 | 2,250 | 2,137 | |||||||||
| Republic of Panama 9.63%, due 02/08/2011 | 1,380 | 1,618 | |||||||||
| 10.75%, due 05/15/2020 | 780 | 1,014 | |||||||||
| 8.88%, due 09/30/2027 | 2,050 | 2,296 | |||||||||
| 9.38%, due 04/01/2029 | 700 | 826 | |||||||||
| Republic of Peru 9.88%, due 02/06/2015 | 2,000 | 2,347 | |||||||||
| 8.38%, due 05/03/2016 | 950 | 1,016 | |||||||||
| Republic of the Philippines 8.88%, due 03/17/2015 | 4,650 | 4,696 | |||||||||
| 10.63%, due 03/16/2025 | 450 | 485 | |||||||||
| 9.50%, due 02/02/2030 | 2,730 | 2,675 | |||||||||
| Republic of Turkey 11.50%, due 01/23/2012 | 1,800 | 2,183 | |||||||||
| 11.00%, due 01/14/2013 | 3,000 | 3,593 | |||||||||
| Republic of Venezuela 10.75%, due 09/19/2013 | 2,850 | 3,185 | |||||||||
| 8.50%, due 10/08/2014 | 1,350 | 1,330 | |||||||||
| 9.25%, due 09/15/2027 | 1,130 | 1,114 | |||||||||
| 9.38%, due 01/13/2034 | 1,300 | 1,286 | |||||||||
| Principal | Value | ||||||||||
| Russian Federation 8.25%, due 03/31/2010 | $ | 2,400 | $ | 2,625 | |||||||
| 11.00%, due 07/24/2018 | 4,300 | 6,140 | |||||||||
| 12.75%, due 06/24/2028 | 4,520 | 7,724 | |||||||||
| 5.00%, due 03/31/2030 (d) | 3,190 | 3,392 | |||||||||
| State of Qatar 9.75%, due 06/15/2030 | 400 | 594 | |||||||||
| Ukraine Government 6.37%, due 08/05/2009 (b) | 1,800 | 1,933 | |||||||||
| United Mexican States 10.38%, due 02/17/2009 | 2,600 | 3,076 | |||||||||
| 8.38%, due 01/14/2011 | 5,900 | 6,753 | |||||||||
| 8.13%, due 12/30/2019 | 3,360 | 3,935 | |||||||||
| 11.50%, due 05/15/2026 | 3,150 | 4,820 | |||||||||
| 8.30%, due 08/15/2031 | 2,810 | 3,291 | |||||||||
| Total Foreign Government Obligations (cost: $119,816) | 118,811 | ||||||||||
| CORPORATE DEBT SECURITIES (13.9%) | |||||||||||
| Commercial Banks (0.5%) | |||||||||||
| Banque Centrale de Tunisie 7.38%, due 04/25/2012 | 600 | 679 | |||||||||
| Mortgage Bankers & Brokers (2.8%) | |||||||||||
| Aries Vermoegensverwaltungs 9.60%, due 10/25/2014 | 3,250 | 4,129 | |||||||||
| Oil & Gas Extraction (7.7%) | |||||||||||
| Empresa Nacional de Petroleo 6.75%, due 11/15/2012 | 2,150 | 2,359 | |||||||||
| Pemex Project Funding Master Trust 4.31%, due 06/15/2010 (b) | 1,950 | 2,015 | |||||||||
| 9.13%, due 10/13/2010 | 2,750 | 3,190 | |||||||||
| Pemex Project Funding Master Trust-144A 9.50%, due 09/15/2027 | 3,070 | 3,813 | |||||||||
| Security & Commodity Brokers (2.9%) | |||||||||||
| Citigroup Global Markets Holdings, Inc.-144A 0.00%, due 04/13/2006 | 1,600 | 1,843 | |||||||||
| 0.00%, due 05/25/2006 | 2,500 | 2,434 | |||||||||
| Total Corporate Debt Securities (cost: $20,237) | 20,462 | ||||||||||
| Total Investment Securities (cost: $140,053) | $ | 139,273 | |||||||||
| SUMMARY: | |||||||||||
| Investments, at value | 94.4 | % | $ | 139,273 | |||||||
| Other assets in excess of liabilities | 5.6 | % | 8,319 | ||||||||
| Net assets | 100.0 | % | $ | 147,592 | |||||||
The notes to the financial statements are an integral part of this report.
Transamerica IDEX Mutual Funds
Semi-Annual Report 2005
2
TA IDEX Van Kampen Emerging Markets Debt
SCHEDULE OF INVESTMENTS
At April 30, 2005
(all amounts except share amounts in thousands)
(unaudited)
| FUTURES CONTRACTS (e): | |||||||||||||||||||
| Contracts | Settlement Date | Amount | Net Unrealized Appreciation (Depreciation) | ||||||||||||||||
| US 2 Year Note (CBT) | 135 | 06/30/2005 | $ | 28,040 | $ | (52 | ) | ||||||||||||
NOTES TO SCHEDULE OF INVESTMENTS:
(a) Securities are currently in default on interest payments.
(b) Floating or variable rate note. Rate is listed as of April 30, 2005.
(c) Securities are stepbonds. Republic of Ecuador has a coupon rate of 8.00% until 08/15/2005 and a coupon rate of 9.00% from 8/15/2005 until 8/15/2006; thereafter the coupon rate will become 10.00%.
(d) Securities are stepbonds. Russian Federation has a coupon rate of 5.00% until 03/31/2007, thereafter the coupon rate will become 7.50%.
(e) At April 30, 2005, the Fund has cash in the amount of $70, segregated with the custodian to cover margin requirements for open futures contracts.
DEFINITIONS:
144A 144A Securities are registered pursuant to Rule 144A of the Securities Act of 1933. These securities are deemed to be liquid for purposes of compliance limitations on holdings of illiquid securities and may be resold as transactions exempt from registration, normally to qualified institutional buyers. At April 30, 2005, these securities aggregated $8,090 or 5.5% of the net assets of the Fund.
The notes to the financial statements are an integral part of this report.
Transamerica IDEX Mutual Funds
Semi-Annual Report 2005
3
TA IDEX Van Kampen Emerging Markets Debt
STATEMENT OF ASSETS AND LIABILITIES
At April 30, 2005
(all amounts except per share amounts in thousands)
(unaudited)
| Assets: | |||||||
| Investment securities, at value (cost: $140,053) | $ | 139,273 | |||||
| Cash | 7,934 | ||||||
| Receivables: | |||||||
| Shares of beneficial interest sold | 436 | ||||||
| Interest | 2,296 | ||||||
| Variation margin | 34 | ||||||
| 149,973 | |||||||
| Liabilities: | |||||||
| Investment securities purchased | 1,999 | ||||||
| Accounts payable and accrued liabilities: | |||||||
| Management and advisory fees | 95 | ||||||
| Distribution and service fees | 20 | ||||||
| Dividends to shareholders | 260 | ||||||
| Other | 7 | ||||||
| 2,381 | |||||||
| Net Assets | $ | 147,592 | |||||
| Net Assets Consist of: | |||||||
| Shares of beneficial interest, unlimited shares authorized, no par value | $ | 148,567 | |||||
| Accumulated net investment income (loss) | (23 | ) | |||||
| Accumulated net realized gain (loss) from investment securities and futures contracts | (120 | ) | |||||
| Net unrealized appreciation (depreciation) on: | |||||||
| Investment securities | (780 | ) | |||||
| Futures contracts | (52 | ) | |||||
| Net Assets | $ | 147,592 | |||||
| Net Assets by Class: | |||||||
| Class A | $ | 75,576 | |||||
| Class I | 72,016 | ||||||
| Shares Outstanding: | |||||||
| Class A | 7,558 | ||||||
| Class I | 7,199 | ||||||
| Net Asset Value and Offering Price Per Share: | |||||||
| Class A | $ | 10.00 | |||||
| Class I | 10.00 | ||||||
STATEMENT OF OPERATIONS
For the period ended April 30, 2005 (a)
(all amounts in thousands)
(unaudited)
| Investment Income: | |||||||
| Interest | $ | 1,968 | |||||
| Expenses: | |||||||
| Management and advisory fees | 297 | ||||||
| Printing and shareholder reports | 4 | ||||||
| Custody fees | 20 | ||||||
| Administration fees | 6 | ||||||
| Legal fees | 1 | ||||||
| Audit fees | 8 | ||||||
| Trustees fees | 1 | ||||||
| Distribution and service fees: | |||||||
| Class A | 28 | ||||||
| Total expenses | 365 | ||||||
| Less: | |||||||
| Class expense reimbursement: | |||||||
| Class A | (20 | ) | |||||
| Net expenses | 345 | ||||||
| Net Investment Income (Loss) | 1,623 | ||||||
| Net Realized Gain (Loss) from: | |||||||
| Investment securities | (121 | ) | |||||
| Futures contracts | 1 | ||||||
| (120 | ) | ||||||
| Net Increase (Decrease) in Unrealized Appreciation (Depreciation) on: | |||||||
| Investment securities | (780 | ) | |||||
| Futures contracts | (52 | ) | |||||
| (832 | ) | ||||||
| Net Gain (Loss) on Investments and Futures Contracts | (952 | ) | |||||
| Net Increase (Decrease) in Net Assets Resulting from Operations | $ | 671 | |||||
(a) TA IDEX Van Kampen Emerging Markets Debt ("the Fund") commenced operations on November 8, 2004. The inception date for the Fund's offering of share Class A was March 1, 2005.
The notes to the financial statements are an integral part of this report.
Transamerica IDEX Mutual Funds
Semi-Annual Report 2005
4
TA IDEX Van Kampen Emerging Markets Debt
STATEMENT OF CHANGES IN NET ASSETS
For the period ended
(all amounts in thousands)
| April 30, 2005 (a) (unaudited) | |||||||
| Increase (Decrease) in Net Assets From: | |||||||
| Operations: | |||||||
| Net investment income (loss) | $ | 1,623 | |||||
| Net realized gain (loss) from investment securities and futures contracts | (120 | ) | |||||
| Net unrealized appreciation (depreciation) on investment securities and futures contracts | (832 | ) | |||||
| 671 | |||||||
| Distributions to Shareholders: | |||||||
| From net investment income: | |||||||
| Class A | (430 | ) | |||||
| Class I | (1,216 | ) | |||||
| (1,646 | ) | ||||||
| Capital Share Transactions: | |||||||
| Proceeds from shares sold: | |||||||
| Class A | 75,727 | ||||||
| Class I | 71,454 | ||||||
| 147,181 | |||||||
| Dividends and distributions reinvested: | |||||||
| Class A | 299 | ||||||
| Class I | 1,087 | ||||||
| 1,386 | |||||||
| 148,567 | |||||||
| Net increase (decrease) in net assets | 147,592 | ||||||
| Net Assets: | |||||||
| Beginning of period | – | ||||||
| End of period | $ | 147,592 | |||||
| Accumulated Net Investment Income (Loss) | $ | (23 | ) | ||||
| Share Activity: | |||||||
| Shares issued: | |||||||
| Class A | 7,528 | ||||||
| Class I | 7,091 | ||||||
| 14,619 | |||||||
| Shares issued–reinvested from distributions: | |||||||
| Class A | 30 | ||||||
| Class I | 108 | ||||||
| 138 | |||||||
| Net increase (decrease) in shares outstanding: | |||||||
| Class A | 7,558 | ||||||
| Class I | 7,199 | ||||||
| 14,757 | |||||||
(a) TA IDEX Van Kampen Emerging Markets Debt ("the Fund") commenced operations on November 8, 2004. The inception date for the Fund's offering of share Class A was March 1, 2005.
The notes to the financial statements are an integral part of this report.
Transamerica IDEX Mutual Funds
Semi-Annual Report 2005
5
TA IDEX Van Kampen Emerging Markets Debt
FINANCIAL HIGHLIGHTS
(unaudited)
| For a share of beneficial interest outstanding throughout the period | |||||||||||||||||||||||||||||||||||||||
| Net Asset | Investment Operations | Distributions | Net Asset | ||||||||||||||||||||||||||||||||||||
| For the Period Ended (d)(g) | Value, Beginning of Period | Net Investment Income (Loss) | Net Realized and Unrealized Gain (Loss) | Total Operations | From Net Investment Income | From Net Realized Gains | Total Distributions | Value, End of Period | |||||||||||||||||||||||||||||||
| Class A | 4/30/2005 | $ | 10.26 | $ | 0.09 | $ | (0.26 | ) | $ | (0.17 | ) | $ | (0.09 | ) | $ | – | $ | (0.09 | ) | $ | 10.00 | ||||||||||||||||||
| Class I | 4/30/2005 | 10.00 | 0.25 | (0.01 | ) | 0.24 | (0.24 | ) | – | (0.24 | ) | 10.00 | |||||||||||||||||||||||||||
| Ratios/Supplemental Data | |||||||||||||||||||||||||||||||
| For the Period | Total | Net Assets, End of Period | Ratio of Expenses to Average Net Assets (a) | Net Investment Income (Loss) to Average | Portfolio Turnover | ||||||||||||||||||||||||||
| Ended (g) | Return (c) | (000's) | Net (e) | Total (f) | Net Assets (a) | Rate (b) | |||||||||||||||||||||||||
| Class A | 4/30/2005 | (1.66 | )% | $ | 75,576 | 1.15 | % | 1.41 | % | 5.30 | % | 41 | % | ||||||||||||||||||
| Class I | 4/30/2005 | 2.39 | 72,016 | 1.08 | 1.08 | 5.15 | 41 | ||||||||||||||||||||||||
NOTES TO FINANCIAL HIGHLIGHTS
(a) Annualized.
(b) Not annualized for periods of less than one year.
(c) Total Return has been calculated for the applicable period without deduction of a sales load, if any, on an initial purchase. Periods of less than one year are not annualized.
(d) Per share information is calculated based on average number of shares outstanding.
(e) Ratio of Net Expenses to Average Net Assets is net of fee waivers and reimbursements by the investment adviser, if any (see note 2).
(f) Ratio of Total Expenses to Average Net Assets includes all expenses before fee waivers and reimbursments by the investment adviser.
(g) TA IDEX Van Kampen Emerging Markets Debt ("the Fund") commenced operations on November 8, 2004. The inception date for the Fund's offering of share Class A was March 1, 2005.
The notes to the financial statements are an integral part of this report.
Transamerica IDEX Mutual Funds
Semi-Annual Report 2005
6
TA IDEX Van Kampen Emerging Markets Debt
NOTES TO FINANCIAL STATEMENTS
At April 30, 2005
(all amounts in thousands)
(unaudited)
NOTE 1. ORGANIZATION AND SIGNIFICANT ACCOUNTING POLICIES
Transamerica IDEX Mutual Funds is a Delaware statutory trust registered under the Investment Company Act of 1940, as amended (the "1940 Act"), as an open-end management investment company. Prior to March 1, 2005, Transamerica IDEX Mutual Funds was a Massachusetts business trust. TA IDEX Van Kampen Emerging Markets Debt ("the Fund"), part of Transamerica IDEX Mutual Funds, began operations on November 8, 2004.
In the normal course of business, the Fund enters into contracts that contain a variety of representations and warranties, which provide general indemnifications. The Fund's maximum exposure under these arrangements is unknown, as this would involve future claims that may be made against the Fund and/or its affiliates that have not yet occurred. However, based on experience, the Fund expects the risk of loss to be remote.
See the Prospectus and Statement of Additional Information for a description of the Fund's investment objective.
In preparing the Fund's financial statements in accordance with accounting principles generally accepted in the United States of America ("GAAP"), estimates or assumptions (which could differ from actual results) may be used that affect reported amounts and disclosures. The following policies were consistently followed by the Fund, in accordance with GAAP.
Multiple class operations and expenses: The Fund currently offers two classes of shares, Class A and Class I, each with a public offering price that reflects different sales charges, if any, and expense levels. The initial sales charge currently is waived as this Fund is available for investment only by certain strategic asset allocation funds. Income, non-class specific expenses and realized and unrealized gains and losses, are allocated daily to each class, based upon the value of shares outstanding method as permitted under Rule 18f-3 of the 1940 Act. Each class bears its own specific expenses as well as a portion of general, common expenses.
Pricing of shares: The Fund prices its shares on the basis of the net asset value of each class of shares of the Fund, which is determined as of the close of the New York Stock Exchange ("NYSE") (generally 4:00 p.m. Eastern Time) on each day on which the NYSE is open for trading.
Security valuations: Fund investments traded on an exchange are valued at the closing price on the day of valuation on the exchange where the security is principally traded. With respect to securities traded on NASDAQ NMS, such closing price may be last reported sales price or the NASDAQ Official Closing Price.
Securities traded in the over-the-counter market and listed securities for which no sale was reported on that date are valued at the last quoted bid price.
Debt securities are valued by independent pricing services at the last quoted bid price; however, those that mature in sixty days or less are valued at amortized cost, which approximates market.
Foreign securities generally are valued based on quotations from the primary market in which they are traded and are translated from the local currency into U.S. dollars using closing exchange rates. Many foreign securities markets are open for trading at times when the U.S. markets are closed for trading, and many foreign securities markets close for trading before the close of the NYSE. The value of foreign securities may be affected significantly on a day that the NYSE is closed and an investor is unable to purchase or redeem shares. If a significant market event impacting the value of a portfolio security (e.g., natural disaster, company announcement, market volatility) occurs subsequent to the close of trading in the security, but prior to the calculation of the Fund's net asset value per share, market quotations for that security may be determined to be unreliable and, accordingly, not "readily av ailable." If market quotations are not readily available, and the impact of such a significant market event materially effects the net asset value per share of the Fund, an affected portfolio security will be valued at fair market value as determined in good faith using guidelines adopted by the Board of Trustees of the Fund, under the supervision of the Fund's Valuation Committee. Factors that may be considered to value foreign securities at fair market value may include, among others: the value of other securities traded on other markets, foreign currency exchange activity and the trading of financial products tied to foreign securities.
Other securities for which quotations are not readily available are valued at fair market value as determined in good faith using guidelines adopted by the Board of Trustees of the Fund, under the supervision of the Fund's Valuation Committee. These guidelines may include: the type of security; any restrictions on its resale; financial or business news of the issuer; similar or related securities that are actively trading; related corporate actions; and other significant events occurring after the close of trading in the security.
Cash: The Fund may leave cash overnight in its cash account with the custodian, Investors Bank & Trust Company ("IBT"). IBT has been contracted on behalf of the Fund to invest the excess cash into a savings account, which at April 30, 2005, was paying an interest rate of 2.02%.
Throughout the period from inception through April 30, 2005, the Fund may have a cash overdraft balance. A fee is incurred on this overdraft, calculated by multiplying the overdraft by a rate based on the federal funds rate.
Transamerica IDEX Mutual Funds
Semi-Annual Report 2005
7
TA IDEX Van Kampen Emerging Markets Debt
NOTES TO FINANCIAL STATEMENTS (continued)
At April 30, 2005
(all amounts in thousands)
(unaudited)
NOTE 1.–(continued)
Security transactions and investment income: Security transactions are recorded on the trade date. Security gains and losses are calculated on the specific identification basis. Interest income, including accretion of discounts and amortization of premiums, is recorded on the accrual basis commencing on the settlement date.
Foreign currency denominated investments: The accounting records of the Fund are maintained in U.S. dollars. Securities and other assets and liabilities denominated in foreign currencies are translated into U.S. dollars at the closing exchange rate each day. The cost of foreign securities is translated at the exchange rate in effect when the investment was acquired. The Fund combines fluctuations from currency exchange rates and fluctuations in value when computing net realized and unrealized gains or losses from investments.
Net foreign currency gains and losses resulting from changes in exchange rates include: 1) foreign currency fluctuations between trade date and settlement date of investment security transactions; 2) gains and losses on forward foreign currency contracts; and 3) the difference between the receivable amounts of interest and dividends recorded in the accounting records in U.S. dollars and the amounts actually received.
Foreign currency denominated assets may involve risks not typically associated with domestic transactions, including unanticipated movements in exchange currency rates, the degree of government supervision and regulation of security markets, and the possibility of political or economic instability.
Foreign capital gains taxes: The Fund may be subject to taxes imposed by countries in which it invests, with respect to its investment in issuers existing or operating in such countries. Such taxes are generally based on income earned or repatriated and capital gains realized on the sale of such investments. The Fund accrues such taxes when the related income or capital gains are earned. Some countries require governmental approval for the repatriation of investment income, capital or the proceeds of sales earned by foreign investors. In addition, if there is deterioration in a country's balance of payments or for other reasons, a country may impose temporary restrictions on foreign capital remittances abroad.
Forward foreign currency contracts: The Fund may enter into forward foreign currency contracts to hedge against exchange rate risk arising from investments in securities denominated in foreign currencies. Contracts are valued at the contractual forward rate and are marked to market daily, with the change in value recorded as an unrealized gain or loss. When the contracts are closed a realized gain or loss is incurred. Risks may arise from changes in market value of the underlying currencies and from the possible inability of counterparties to meet the terms of their contracts.
At April 30, 2005, there were no open forward foreign currency contracts.
Futures contracts: The Fund may enter into futures contracts to manage exposure to market, interest rate or currency fluctuations. Futures contracts are valued at the settlement price established each day by the board of trade or exchange on which they are traded. The primary risks associated with futures contracts are imperfect correlation between the change in market value of the securities held and the prices of futures contracts; the possibility of an illiquid market and inability of the counterparty to meet the contract terms.
Open futures contracts at April 30, 2005, are listed in the Schedule of Investments.
Redemption fees: A short-term trading redemption fee may be assessed on any fund shares in a fund account that are sold during the first five (5) NYSE trading days following their purchase date. This redemption fee will equal 2% of the amount redeemed and shares held the longest will be treated as being redeemed first and shares held the shortest as being redeemed last.
For the period from inception through April 30, 2005, the Fund received no redemption fees.
Dividend distributions: Distributions to shareholders are recorded on the ex-dividend date and are determined in accordance with Federal income tax regulations which may differ from GAAP.
NOTE 2. RELATED PARTY TRANSACTIONS
Transamerica Fund Advisors, Inc. ("TFAI") is the Fund's investment adviser. Transamerica Fund Services, Inc. ("TFS") is the Fund's administrator and transfer agent. AFSG Securities Corp. ("AFSG") is the Fund's distributor/principal underwriter. AFSG is 100% owned by AUSA Holding Company ("AUSA"). TFAI is a directly owned subsidiary of Western Reserve Life Assurance Co. of Ohio (78%) and AUSA (22%). TFS is a wholly owned subsidiary of WRL (50%) and AUSA (50%). AUSA and WRL are wholly owned indirect subsidiaries of AEGON, NV, a Netherlands corporation.
Effective January 1, 2005 AEGON/Transamerica Fund Advisors, Inc. ("ATFA") was renamed Transamerica Fund Advisors, Inc. ("TFAI"); AEGON/Transamerica Fund Services, Inc. ("ATFS") and AEGON/Transamerica Investor Services, Inc. ("ATIS") merged into one entity and was renamed Transamerica Fund Services, Inc. ("TFS").
Transamerica IDEX Mutual Funds
Semi-Annual Report 2005
8
TA IDEX Van Kampen Emerging Markets Debt
NOTES TO FINANCIAL STATEMENTS (continued)
At April 30, 2005
(all amounts in thousands)
(unaudited)
NOTE 2.–(continued)
The following schedule reflects the percentage of fund assets owned by affiliated mutual funds (i.e., through the Transamerica IDEX Mutual Funds and AEGON/Transamerica Series Trust (f/k/a AEGON/Transamerica Series Fund, Inc.) asset allocation funds):
| Net Assets | % of Net Assets | ||||||||||
| TA IDEX Asset Allocation–Conservative Portfolio | $ | 8,090 | 5.48 | % | |||||||
| TA IDEX Asset Allocation–Growth Portfolio | 11,891 | 8.06 | % | ||||||||
| TA IDEX Asset Allocation–Moderate Growth Portfolio | 37,821 | 25.63 | % | ||||||||
| TA IDEX Asset Allocation–Moderate Portfolio | 17,757 | 12.03 | % | ||||||||
| Asset Allocation–Conservative Portfolio | 1,374 | 0.93 | % | ||||||||
| Asset Allocation–Growth Portfolio | 20,477 | 13.87 | % | ||||||||
| Asset Allocation–Moderate Growth Portfolio | 42,834 | 29.02 | % | ||||||||
| Asset Allocation–Moderate Portfolio | 7.299 | 4.95 | % | ||||||||
| Total | $ | 147,543 | 99.97 | % | |||||||
Investment advisory fee: The Fund pays management fees to TFAI based on average daily net assets ("ANA") at the following breakpoints:
0.95% of the first $250 million of ANA
0.90% of the next $250 million of ANA
0.80% of ANA over $500 million
TFAI has contractually agreed to waive its advisory fee and will reimburse the Fund to the extent that operating expenses exceed the following stated annual limit:
1.15% Expense Limit
If total fund expenses fall below the annual expense limitation agreement agreed to by the adviser within the succeeding three years, the Fund may be required to pay that adviser a portion or all of the waived advisory fees.
There are no amounts available for recapture at April 30, 2005.
Distribution and service fees: The Fund has a 12b-1 distribution plan under the 1940 Act pursuant to which an annual fee, based on average daily net assets, is paid to the distributor for various disbursements such as broker-dealer account servicing fees and other promotional expenses of the Fund. The Fund is authorized under the 12b-1 plan to pay fees on each class up to the following limits:
| Class A | 0.35 | % | |||||
| Class I | N/A | ||||||
In the case the Fund or a class of shares of the Fund is closed to new investors or investments, the Fund is authorized to pay 12b-1 fees for past sales and distribution efforts and present and past investor services.
Administrative services: The Fund has entered into an agreement with TFS for financial and legal fund administration services, which includes such items as compliance, expenses, financial statements and other reporting, distributions, tax returns, prospectus preparation, board of trustees meeting support and other legal matters. As of January 1, 2005 the Fund pays TFS an annual fee of 0.02% of average net assets. Prior to January 1, 2005 the Fund paid TFS an annual fee of 0.015% of average net assets. The Legal fees on the Statement of Operations are for fees paid to external legal counsel.
Transfer agent fees: The Fund pays TFS an annual per-account charge of $20 (not in thousands) for each open account and $1.63 (not in thousands) for each closed account. There is no new account charge. The Transfer agent fees on the Statement of Operations are made up of fees paid to TFS and costs associated with shareholder statements.
The Fund paid TFS $2 for the period from inception through
April 30, 2005.
NOTE 3. INVESTMENT TRANSACTIONS
The cost of securities purchased and proceeds from securities sold (excluding short-term securities) for the period from inception through April 30, 2005, were as follows:
| Purchases of securities: | |||||||
| Long-Term excluding U.S. Government | $ | 164,907 | |||||
| U.S. Government | – | ||||||
| Proceeds from maturities and sales of securities | |||||||
| Long-Term excluding U.S. Government | 24,539 | ||||||
| U.S. Government | – | ||||||
NOTE 4. FEDERAL INCOME TAX MATTERS
The Fund has not made any provision for federal income or excise taxes due to its policy to distribute all of its taxable income and capital gains to its shareholders and otherwise qualify as a regulated investment company under the Internal Revenue Code. Income and capital gain distributions are determined in accordance with income tax regulations, which may differ from GAAP. These differences are primarily due to differing treatment for items including, but not limited to, wash sales, net operating losses and capital loss carryforwards.
Transamerica IDEX Mutual Funds
Semi-Annual Report 2005
9
TA IDEX Van Kampen Emerging Markets Debt
NOTES TO FINANCIAL STATEMENTS (continued)
At April 30, 2005
(all amounts in thousands)
(unaudited)
NOTE 4.–(continued)
The aggregate cost of investments and composition of unrealized appreciation (depreciation) for federal income tax purposes as of April 30, 2005, are as follows:
| Federal Tax Cost Basis | $ | 140,227 | |||||
| Unrealized Appreciation | $ | 873 | |||||
| Unrealized (Depreciation) | (1,827 | ) | |||||
| Net Unrealized Appreciation (Depreciation) | $ | (954 | ) | ||||
NOTE 5. REGULATORY PROCEEDINGS
There continues to be significant federal and state regulatory activity relating to financial services companies, particularly mutual fund companies and their investment advisers. As part of an ongoing investigation regarding potential market timing, recordkeeping and trading compliance issues and matters affecting the Fund's investment adviser, TFAI, and certain employees and affiliates of TFAI, the SEC staff has indicated that it is likely to take some action against TFAI and certain of its affiliates at the conclusion of the investigation. The potential timing and the scope of any such action is difficult to predict. Although the impact of any action brought against TFAI and/or its affiliates is difficult to assess at the present time, the Fund currently believes that the likelihood that any such action will have a material adverse impact on it is remote. It is important to note that the Fund is not aware of any allegation of wrongdoing against it and its board at the time this semi-annual report is printed. Although it is not anticipated that these developments will have an adverse impact on the Fund, there can be no assurance at this time. TFAI and its affiliates are actively working with the SEC in regard to this matter; however, the exact resolution cannot be determined at this time. TFAI will take such actions that it deems necessary or appropriate to continue providing management services to the Fund and to bring all matters to an appropriate conclusion.
TFAI and/or its affiliates, and not the Fund, will bear the costs regarding these regulatory matters.
Transamerica IDEX Mutual Funds
Semi-Annual Report 2005
10
TA IDEX Van Kampen Emerging Markets Debt
A discussion regarding the basis of Transamerica IDEX Mutual Fund's Board of Trustees' approval of the fund's advisory arrangements will be available in the fund's annual report for the fiscal year ending October 31, 2005.
Transamerica IDEX Mutual Funds
Semi-Annual Report 2005
11
TA IDEX Van Kampen Emerging Markets Debt
SUPPLEMENTAL INFORMATION (unaudited)
RESULTS OF SHAREHOLDER PROXY
At a special meeting of shareholders held on February 25, 2005, the results of the Proposals were as follows:
Transamerica IDEX Mutual Funds
Proposal 1: Election of Trustees to the Board of Trustees of Transamerica IDEX Mutual Funds.
| For | Withheld | ||||||||||
| Peter R. Brown | 872,017,875.249 | 4,468,498.551 | |||||||||
| Daniel Calabria | 871,917,069.786 | 4,569,304.014 | |||||||||
| Janise B. Case | 872,099,393.125 | 4,386,980.675 | |||||||||
| Charles C. Harris | 872,086,722.025 | 4,399,651.775 | |||||||||
| Leo J. Hill | 872,304,465.640 | 4,181,908.160 | |||||||||
| Russell A. Kimball, Jr. | 872,253,556.471 | 4,232,817.329 | |||||||||
| William W. Short, Jr. | 872,139,920.944 | 4,346,452.856 | |||||||||
| John Waechter | 872,261,152.376 | 4,225,221.424 | |||||||||
| Jack E. Zimmerman | 871,929,967.512 | 4,556,406.288 | |||||||||
| Brian C. Scott | 872,218,970.367 | 4,267,403.433 | |||||||||
| Thomas P. O'Neill | 872,111,944.117 | 4,374,429.683 | |||||||||
TA IDEX Van Kampen Emerging Markets Debt
Proposal 2: Approval of an Agreement and Plan of Reorganization pursuant to which Transamerica IDEX Mutual Funds will organize as a Delaware statutory trust.
| For | Against | Abstentions/Broker Non-Votes | |||||||||
| 985,655.451 | 0 | 0 | |||||||||
Proposal 3: Approval of changes to the fundamental investment restrictions of TA IDEX Van Kampen Emerging Markets Debt.
| A. Diversification | For | Against | Abstentions/Broker Non-Votes | ||||||||||||
| 985,655.451 | 0 | 0 | |||||||||||||
| B. Borrowing | For | Against | Abstentions/Broker Non-Votes | ||||||||||||
| 985,655.451 | 0 | 0 | |||||||||||||
| C. Senior Securities | For | Against | Abstentions/Broker Non-Votes | ||||||||||||
| 985,655.451 | 0 | 0 | |||||||||||||
| D. Underwriting Securities | For | Against | Abstentions/Broker Non-Votes | ||||||||||||
| 985,655.451 | 0 | 0 | |||||||||||||
| E. Real Estate | For | Against | Abstentions/Broker Non-Votes | ||||||||||||
| 985,655.451 | 0 | 0 | |||||||||||||
| F. Making Loans | For | Against | Abstentions/Broker Non-Votes | ||||||||||||
| 985,655.451 | 0 | 0 | |||||||||||||
| G. Concentration | For | Against | Abstentions/Broker Non-Votes | ||||||||||||
| 985,655.451 | 0 | 0 | |||||||||||||
| H. Commodities | For | Against | Abstentions/Broker Non-Votes | ||||||||||||
| 985,655.451 | 0 | 0 | |||||||||||||
Transamerica IDEX Mutual Funds
Semi-Annual Report 2005
12
TA IDEX Van Kampen Small Company Growth
GRAPHIC PRESENTATION OF SCHEDULE OF INVESTMENTS
By Sector
At April 30, 2005
(unaudited)
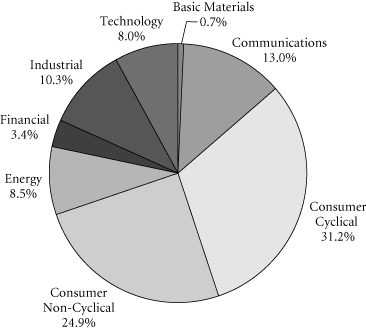
This chart shows the percentage breakdown by sector of the Fund's total investment securities.
Transamerica IDEX Mutual Funds
Semi-Annual Report 2005
1
TA IDEX Van Kampen Small Company Growth
SCHEDULE OF INVESTMENTS
At April 30, 2005
(all amounts except share amounts in thousands)
(unaudited)
| Shares | Value | ||||||||||
| COMMON STOCKS (95.6%) | |||||||||||
| Agriculture (2.9%) | |||||||||||
| VCA Antech, Inc. (a) | 86,200 | $ | 2,007 | ||||||||
| Amusement & Recreation Services (6.7%) | |||||||||||
| Gaylord Entertainment Co. (a) | 26,475 | 1,059 | |||||||||
| Lakes Entertainment, Inc. (a) | 28,800 | 424 | |||||||||
| Penn National Gaming, Inc. (a) | 58,600 | 1,846 | |||||||||
| WMS Industries, Inc. (a) | 53,600 | 1,361 | |||||||||
| Apparel & Accessory Stores (1.3%) | |||||||||||
| Carter's, Inc. (a) | 23,925 | 902 | |||||||||
| Business Services (2.7%) | |||||||||||
| 51job, Inc., ADR (a) | 10,500 | 179 | |||||||||
| Akamai Technologies, Inc. (a) | 51,650 | 610 | |||||||||
| Macquarie Infrastructure Co. Trust (a) | 14,600 | 398 | |||||||||
| Netease.com, ADR (a) | 7,675 | 379 | |||||||||
| Valueclick, Inc. (a) | 33,525 | 347 | |||||||||
| Chemicals & Allied Products (0.5%) | |||||||||||
| Nuco2, Inc. (a) | 14,000 | 344 | |||||||||
| Communication (0.4%) | |||||||||||
| Lodgenet Entertainment Corp. (a) | 19,100 | 311 | |||||||||
| Communications Equipment (2.9%) | |||||||||||
| Plantronics, Inc. | 9,475 | 298 | |||||||||
| Spectrasite, Inc. (a) | 30,550 | 1,715 | |||||||||
| Computer & Data Processing Services (10.1%) | |||||||||||
| Activision, Inc. (a) | 1 | – | (b) | ||||||||
| Arbitron, Inc. | 8,950 | 379 | |||||||||
| CNET Networks, Inc. (a) | 56,150 | 557 | |||||||||
| Eclipsys Corp. (a) | 26,300 | 355 | |||||||||
| Filenet Corp. (a) | 14,450 | 383 | |||||||||
| Hyperion Solutions Corp. (a) | 8,275 | 337 | |||||||||
| Interactive Data Corp. (a) | 25,550 | 512 | |||||||||
| NetFlix, Inc. (a) | 35,500 | 410 | |||||||||
| PlanetOut, Inc. (a) | 22,125 | 145 | |||||||||
| RSA Security, Inc. (a) | 40,250 | 432 | |||||||||
| Salesforce.com, Inc. (a) | 46,600 | 675 | |||||||||
| Shanda Interactive Entertainment, Ltd., ADR (a) | 22,925 | 737 | |||||||||
| Sina Corp. (a) | 11,375 | 312 | |||||||||
| SkillSoft PLC, ADR (a) | 74,400 | 290 | |||||||||
| THQ, Inc. (a) | 19,700 | 497 | |||||||||
| Verint Systems, Inc. (a) | 9,875 | 314 | |||||||||
| Websense, Inc. (a) | 13,625 | 723 | |||||||||
| Computer & Office Equipment (1.8%) | |||||||||||
| Micros Systems, Inc. (a) | 16,700 | 662 | |||||||||
| ProQuest Co. (a) | 12,575 | 408 | |||||||||
| TransAct Technologies, Inc. (a) | 18,950 | 165 | |||||||||
| Shares | Value | ||||||||||
| Construction (0.7%) | |||||||||||
| Chicago Bridge & Iron Co. NV | 21,600 | $ | 483 | ||||||||
| Educational Services (3.5%) | |||||||||||
| Strayer Education, Inc. | 15,575 | 1,671 | |||||||||
| Universal Technical Institute, Inc. (a) | 21,675 | 757 | |||||||||
| Electronic Components & Accessories (1.4%) | |||||||||||
| Microsemi Corp. (a) | 16,150 | 273 | |||||||||
| Tessera Technologies, Inc. (a) | 27,000 | 717 | |||||||||
| Engineering & Management Services (0.6%) | |||||||||||
| Washington Group International, Inc. (a) | 9,400 | 389 | |||||||||
| Environmental Services (1.6%) | |||||||||||
| Stericycle, Inc. (a) | 23,450 | 1,141 | |||||||||
| Food & Kindred Products (0.6%) | |||||||||||
| Peet's Coffee & Tea, Inc. (a) | 15,200 | 385 | |||||||||
| Furniture & Home Furnishings Stores (1.4%) | |||||||||||
| Tuesday Morning Corp. (a) | 35,925 | 943 | |||||||||
| Gas Production & Distribution (2.3%) | |||||||||||
| Southwestern Energy Co. (a) | 27,025 | 1,588 | |||||||||
| Hotels & Other Lodging Places (3.5%) | |||||||||||
| Great Wolf Resorts, Inc. (a) | 50,301 | 1,068 | |||||||||
| Kerzner International, Ltd. (a) | 25,550 | 1,408 | |||||||||
| Industrial Machinery & Equipment (1.1%) | |||||||||||
| Actuant Corp.–Class A (a) | 12,675 | 540 | |||||||||
| Middleby Corp. | 5,025 | 221 | |||||||||
| Instruments & Related Products (2.0%) | |||||||||||
| Cuno, Inc. (a) | 10,575 | 536 | |||||||||
| Dionex Corp. (a) | 6,575 | 282 | |||||||||
| Flir Systems, Inc. (a) | 22,150 | 589 | |||||||||
| Insurance (0.8%) | |||||||||||
| Markel Corp. (a) | 1,660 | 570 | |||||||||
| Lumber & Construction Materials (0.5%) | |||||||||||
| Beacon Roofing Supply, Inc. (a) | 17,100 | 380 | |||||||||
| Management Services (1.6%) | |||||||||||
| Corporate Executive Board Co. | 16,775 | 1,103 | |||||||||
| Manufacturing Industries (1.8%) | |||||||||||
| Shuffle Master, Inc. (a) | 36,850 | 928 | |||||||||
| Yankee Candle Co., Inc. (a) | 11,600 | 322 | |||||||||
| Medical Instruments & Supplies (3.2%) | |||||||||||
| American Medical Systems Holdings, Inc. (a) | 37,150 | 649 | |||||||||
| Animas Corp. (a) | 20,700 | 388 | |||||||||
| Sybron Dental Specialties, Inc. (a) | 21,150 | 788 | |||||||||
| Techne Corp. (a) | 10,000 | 418 | |||||||||
The notes to the financial statements are an integral part of this report.
Transamerica IDEX Mutual Funds
Semi-Annual Report 2005
2
TA IDEX Van Kampen Small Company Growth
SCHEDULE OF INVESTMENTS (continued)
At April 30, 2005
(all amounts except share amounts in thousands)
(unaudited)
| Shares | Value | ||||||||||
| Mining (1.2%) | |||||||||||
| Florida Rock Industries, Inc. | 14,075 | $ | 817 | ||||||||
| Motion Pictures (1.7%) | |||||||||||
| Avid Technology, Inc. (a) | 13,600 | 673 | |||||||||
| Lions Gate Entertainment Corp. (a) | 52,900 | 511 | |||||||||
| Oil & Gas Extraction (5.8%) | |||||||||||
| Bill Barrett Corp. (a) | 11,700 | 312 | |||||||||
| Delta Petroleum Corp. (a) | 26,175 | 293 | |||||||||
| Denbury Resources, Inc. (a) | 10,550 | 335 | |||||||||
| Gasco Energy, Inc. (a) | 97,150 | 345 | |||||||||
| Petrohawk Energy Corp. (a) | 36,800 | 319 | |||||||||
| Quicksilver Resources, Inc. (a) | 41,850 | 2,148 | |||||||||
| Range Resources Corp. | 13,400 | 303 | |||||||||
| Paper & Paper Products (0.7%) | |||||||||||
| Neenah Paper, Inc. | 16,375 | 493 | |||||||||
| Personal Services (0.4%) | |||||||||||
| Coinstar, Inc. (a) | 17,900 | 307 | |||||||||
| Pharmaceuticals (4.9%) | |||||||||||
| Dade Behring Holdings, Inc. (a) | 36,325 | 2,240 | |||||||||
| Flamel Technologies, Sponsored ADR (a) | 19,785 | 317 | |||||||||
| Idexx Laboratories, Inc. (a) | 7,975 | 452 | |||||||||
| Noven Pharmaceuticals, Inc. (a) | 23,200 | 386 | |||||||||
| Radio & Television Broadcasting (0.5%) | |||||||||||
| Radio One, Inc.–Class D (a) | 27,125 | 354 | |||||||||
| Radio, Television & Computer Stores (1.9%) | |||||||||||
| Guitar Center, Inc. (a) | 26,475 | 1,307 | |||||||||
| Real Estate (0.5%) | |||||||||||
| Desarrolladora Homex SA de CV, ADR (a) | 15,200 | 337 | |||||||||
| Research & Testing Services (3.4%) | |||||||||||
| Advisory Board Co. (The) (a) | 39,700 | 1,616 | |||||||||
| Gen-Probe, Inc. (a) | 15,775 | 792 | |||||||||
| Residential Building Construction (1.2%) | |||||||||||
| Brookfield Homes Corp. | 11,700 | 502 | |||||||||
| Meritage Homes Corp. (a) | 5,400 | 342 | |||||||||
| Restaurants (6.0%) | |||||||||||
| AFC Enterprises (a) | 40,150 | 1,084 | |||||||||
| Shares | Value | ||||||||||
| Restaurants (continued) | |||||||||||
| BJ's Restaurants, Inc. (a) | 25,500 | $ | 450 | ||||||||
| IHOP Corp. | 13,000 | 532 | |||||||||
| PF Chang's China Bistro, Inc. (a) | 20,175 | 1,120 | |||||||||
| Sonic Corp. (a) | 21,250 | 681 | |||||||||
| Steak N Shake Co., (The) (a) | 19,775 | 358 | |||||||||
| Retail Trade (1.7%) | |||||||||||
| Blue Nile, Inc. (a) | 13,775 | 347 | |||||||||
| Build-A-Bear Workshop, Inc. (a) | 18,500 | 496 | |||||||||
| Overstock.com, Inc. (a) | 8,775 | 310 | |||||||||
| Security & Commodity Brokers (2.4%) | |||||||||||
| Calamos Asset Management, Inc.–Class A | 33,050 | 770 | |||||||||
| Greenhill & Co., Inc. | 29,190 | 919 | |||||||||
| Social Services (0.8%) | |||||||||||
| Bright Horizons Family Solutions, Inc. (a) | 17,250 | 585 | |||||||||
| Stone, Clay & Glass Products (0.5%) | |||||||||||
| Eagle Materials, Inc. | 4,825 | 353 | |||||||||
| Telecommunications (0.3%) | |||||||||||
| IDT Corp.–Class B (a) | 17,350 | 244 | |||||||||
| Trucking & Warehousing (1.8%) | |||||||||||
| Landstar System, Inc. (a) | 30,850 | 946 | |||||||||
| Universal Truckload Services, Inc. (a) | 19,100 | 304 | |||||||||
| Water Transportation (0.4%) | |||||||||||
| Arlington Tankers, Ltd. | 12,075 | 264 | |||||||||
| Wholesale Trade Durable Goods (2.3%) | |||||||||||
| Neoforma, Inc. (a) | 1,950 | 11 | |||||||||
| SCP Pool Corp. | 49,400 | 1,609 | |||||||||
| Wholesale Trade Nondurable Goods (1.3%) | |||||||||||
| Tractor Supply Co. (a) | 22,100 | 889 | |||||||||
| Total Common Stocks (cost: $69,033) | 66,783 | ||||||||||
| Total Investment Securities (cost: $69,033) | $ | 66,783 | |||||||||
| SUMMARY: | |||||||||||
| Investments, at value | 95.6 | % | $ | 66,783 | |||||||
| Other assets in excess of liabilities | 4.4 | % | 3,089 | ||||||||
| Net assets | 100.0 | % | $ | 69,872 | |||||||
NOTES TO SCHEDULE OF INVESTMENTS:
(a) No dividends were paid during the preceding twelve months.
(b) Value is less than $1.
DEFINITIONS:
ADR American Depositary Receipt
The notes to the financial statements are an integral part of this report.
Transamerica IDEX Mutual Funds
Semi-Annual Report 2005
3
TA IDEX Van Kampen Small Company Growth
STATEMENT OF ASSETS AND LIABILITIES
At April 30, 2005
(all amounts except per share amounts in thousands)
(unaudited)
| Assets: | |||||||
| Investment securities, at value (cost: $69,033) | $ | 66,783 | |||||
| Cash | 5,320 | ||||||
| Receivables: | |||||||
| Investment securities sold | 18 | ||||||
| Shares of beneficial interest sold | 130 | ||||||
| Interest | 6 | ||||||
| Dividends | 3 | ||||||
| 72,260 | |||||||
| Liabilities: | |||||||
| Investment securities purchased | 2,325 | ||||||
| Accounts payable and accrued liabilities: | |||||||
| Management and advisory fees | 50 | ||||||
| Distribution and service fees | 10 | ||||||
| Other | 3 | ||||||
| 2,388 | |||||||
| Net Assets | $ | 69,872 | |||||
| Net Assets Consist of: | |||||||
| Shares of beneficial interest, unlimited shares authorized, no par value | $ | 72,493 | |||||
| Accumulated net investment income (loss) | (170 | ) | |||||
| Accumulated net realized gain (loss) from investment securities | (201 | ) | |||||
| Net unrealized appreciation (depreciation) on investment securities | (2,250 | ) | |||||
| Net Assets | $ | 69,872 | |||||
| Net Assets by Class: | |||||||
| Class A | $ | 36,498 | |||||
| Class I | 33,374 | ||||||
| Shares Outstanding: | |||||||
| Class A | 3,667 | ||||||
| Class I | 3,352 | ||||||
| Net Asset Value and Offering Price Per Share: | |||||||
| Class A | $ | 9.95 | |||||
| Class I | 9.96 | ||||||
STATEMENT OF OPERATIONS
For the period ended April 30, 2005 (a)
(all amounts in thousands) (unaudited)
| Investment Income: | |||||||
| Interest | $ | 19 | |||||
| Dividends | 24 | ||||||
| 43 | |||||||
| Expenses: | |||||||
| Management and advisory fees | 184 | ||||||
| Printing and shareholder reports | 3 | ||||||
| Custody fees | 12 | ||||||
| Administration fees | 4 | ||||||
| Legal fees | 1 | ||||||
| Audit fees | 4 | ||||||
| Trustees fees | 1 | ||||||
| Distribution and service fees: | |||||||
| Class A | 14 | ||||||
| Total expenses | 223 | ||||||
| Less: | |||||||
| Reimbursement of class expenses: | |||||||
| Class A | (10 | ) | |||||
| Net expenses | 213 | ||||||
| Net Investment Income (Loss) | (170 | ) | |||||
| Net Realized and Unrealized Gain (Loss): | |||||||
| Realized Gain (Loss) from investment securities | (201 | ) | |||||
| Increase (decrease) in unrealized appreciation (depreciation) on investment securities | (2,250 | ) | |||||
| Net Gain (Loss) on Investments | (2,451 | ) | |||||
| Net Increase (Decrease) in Net Assets Resulting from Operations | $ | (2,621 | ) | ||||
(a) TA IDEX Van Kampen Small Company Growth ("the Fund") commenced operations on November 8, 2005. The inception date for the Fund's offering of share class A was March 1, 2005.
The notes to the financial statements are an integral part of this report.
Transamerica IDEX Mutual Funds
Semi-Annual Report 2005
4
TA IDEX Van Kampen Small Company Growth
STATEMENT OF CHANGES IN NET ASSETS
For the period ended
(all amounts in thousands)
| April 30, 2005 (a) (unaudited) | |||||||
| Increase (Decrease) in Net Assets From: | |||||||
| Operations: | |||||||
| Net investment income (loss) | $ | (170 | ) | ||||
| Net realized gain (loss) from investment securities | (201 | ) | |||||
| Net unrealized appreciation (depreciation) on investment securities | (2,250 | ) | |||||
| (2,621 | ) | ||||||
| Capital Share Transactions: | |||||||
| Proceeds from shares sold: | |||||||
| Class A | 38,492 | ||||||
| Class I | 34,001 | ||||||
| 72,493 | |||||||
| Net increase (decrease) in net assets | 69,872 | ||||||
| Net Assets: | |||||||
| Beginning of period | – | ||||||
| End of period | $ | 69,872 | |||||
| Accumulated Net Investment Income (Loss) | $ | (170 | ) | ||||
| Share Activity: | |||||||
| Shares issued: | |||||||
| Class A | 3,667 | ||||||
| Class I | 3,352 | ||||||
| 7,019 | |||||||
| Net increase (decrease) in shares outstanding: | |||||||
| Class A | 3,667 | ||||||
| Class I | 3,352 | ||||||
| 7,019 | |||||||
(a) TA IDEX Van Kampen Small Company Growth ("the Fund") commenced operations on November 8, 2005. The inception date for the Fund's offering of share class A was March 1, 2005.
The notes to the financial statements are an integral part of this report.
Transamerica IDEX Mutual Funds
Semi-Annual Report 2005
5
TA IDEX Van Kampen Small Company Growth
FINANCIAL HIGHLIGHTS
(unaudited)
| For a share of beneficial interest outstanding throughout the period | |||||||||||||||||||||||||||||||||||||||
| Net Asset | Investment Operations | Distributions | Net Asset | ||||||||||||||||||||||||||||||||||||
| For the Period Ended (d)(g) | Value, Beginning of Period | Net Investment Income (Loss) | Net Realized and Unrealized Gain (Loss) | Total Operations | From Net Investment Income | From Net Realized Gains | Total Distributions | Value, End of Period | |||||||||||||||||||||||||||||||
| Class A | 4/30/2005 | $ | 10.73 | $ | 0.02 | $ | (0.80 | ) | $ | (0.78 | ) | $ | – | $ | – | $ | – | $ | 9.95 | ||||||||||||||||||||
| Class I | 4/30/2005 | 10.00 | 0.04 | (0.08 | ) | (0.04 | ) | – | – | – | 9.96 | ||||||||||||||||||||||||||||
| Ratios/Supplemental Data | |||||||||||||||||||||||||||||||
| For the Period | Total | Net Assets, End of Period | Ratio of Expenses to Average Net Assets (a) | Net Investment Income (Loss) to Average | Portfolio Turnover | ||||||||||||||||||||||||||
| Ended (g) | Return (c) | (000's) | Net (e) | Total (f) | Net Assets (a) | Rate (b) | |||||||||||||||||||||||||
| Class A | 4/30/2005 | (7.27 | )% | $ | 36,498 | 1.15 | % | 1.41 | % | 0.95 | % | 29 | % | ||||||||||||||||||
| Class I | 4/30/2005 | (0.40 | ) | 33,374 | 1.09 | 1.09 | 0.86 | 29 | |||||||||||||||||||||||
NOTES TO FINANCIAL HIGHLIGHTS
(a) Annualized.
(b) Not annualized for periods of less than one year.
(c) Total Return has been calculated for the applicable period without deduction of a sales load, if any, on an initial purchase. Periods of less than one year are not annualized.
(d) Per share information is calculated based on average number of shares outstanding.
(e) Ratio of Net Expenses to Average Net Assets is net of fee waivers and reimbursements by the investment adviser, if any (see note 2).
(f) Ratio of Total Expenses to Average Net Assets includes all expenses before fee waivers and reimbursements by the investment adviser.
(g) TA IDEX Van Kampen Small Company Growth ("the Fund") commenced operations on November 8, 2004. The inception date for the Fund's offering of share Class A was March 1, 2005.
The notes to the financial statements are an integral part of this report.
Transamerica IDEX Mutual Funds
Semi-Annual Report 2005
6
TA IDEX Van Kampen Small Company Growth
NOTES TO FINANCIAL STATEMENTS
At April 30, 2005
(all amounts in thousands)
(unaudited)
NOTE 1. ORGANIZATION AND SIGNIFICANT ACCOUNTING POLICIES
Transamerica IDEX Mutual Funds is a Delaware statutory trust registered under the Investment Company Act of 1940, as amended (the "1940 Act"), as an open-end management investment company. Prior to March 1, 2005, Transamerica IDEX Mutual Funds was a Massachusetts business trust. TA IDEX Van Kampen Small Company Growth ("the Fund"), part of Transamerica IDEX Mutual Funds, began operations on November 8, 2004.
In the normal course of business, the Fund enters into contracts that contain a variety of representations and warranties, which provide general indemnifications. The Fund's maximum exposure under these arrangements is unknown, as this would involve future claims that may be made against the Fund and/or its affiliates that have not yet occurred. However, based on experience, the Fund expects the risk of loss to be remote.
See the Prospectus and Statement of Additional Information for a description of the Fund's investment objective.
In preparing the Fund's financial statements in accordance with accounting principles generally accepted in the United States of America ("GAAP"), estimates or assumptions (which could differ from actual results) may be used that affect reported amounts and disclosures. The following policies were consistently followed by the Fund, in accordance with GAAP.
Multiple class operations and expenses: The Fund currently offers two classes of shares, Class A and Class I, each with a public offering price that reflects different sales charges, if any, and expense levels. The initial sales charge currently is waived as this Fund is available for investment only by certain strategic asset allocation funds. Income, non-class specific expenses and realized and unrealized gains and losses, are allocated daily to each class, based upon the value of shares outstanding method as permitted under Rule 18f-3 of the 1940 Act. Each class bears its own specific expenses as well as a portion of general, common expenses.
Pricing of shares: The Fund prices its shares on the basis of the net asset value of each class of shares of the Fund, which is determined as of the close of the New York Stock Exchange ("NYSE") (generally 4:00 p.m. Eastern Time) on each day on which the NYSE is open for trading.
Security valuations: Fund investments traded on an exchange are valued at the closing price on the day of valuation on the exchange where the security is principally traded. With respect to securities traded on NASDAQ NMS, such closing price may be last reported sales price or the NASDAQ Official Closing Price.
Securities traded in the over-the-counter market and listed securities for which no sale was reported on that date are valued at the last quoted bid price.
Other securities for which quotations are not readily available are valued at fair market value as determined in good faith using guidelines adopted by the Board of Trustees of the Fund, under the supervision of the Fund's Valuation Committee. These guidelines may include: the type of security; any restrictions on its resale; financial or business news of the issuer; similar or related securities that are actively trading; related corporate actions; and other significant events occurring after the close of trading in the security.
Cash: The Fund may leave cash overnight in its cash account with the custodian, Investors Bank & Trust Company ("IBT"). IBT has been contracted on behalf of the Fund to invest the excess cash into a savings account, which at April 30, 2005, was paying an interest rate of 2.02%.
Throughout the period from inception through April 30, 2005, the Fund may have a cash overdraft balance. A fee is incurred on this overdraft, calculated by multiplying the overdraft by a rate based on the federal funds rate.
Commission recapture: The sub-adviser, to the extent consistent with the best execution and usual commission rate policies and practices, may place security transactions of the Fund with broker/dealers with which Transamerica IDEX Mutual Funds has established a Commission Recapture Program. A Commission Recapture Program is any arrangement under which a broker/dealer applies a portion of the commissions received by such broker/dealer on the security transactions to the Fund. In no event will commissions paid by the Fund be used to pay expenses that would otherwise be borne by any other funds within Transamerica IDEX Mutual Funds, or by any other party.
Recaptured commissions during the period from inception through April 30, 2005, of $8 are included in net realized gains in the Statement of Operations.
Security transactions and investment income: Security transactions are recorded on the trade date. Security gains and losses are calculated on the specific identification basis. Dividend income is recorded on the ex-dividend date or, in the case of foreign securities, as soon as the Fund is informed of the ex-dividend date. Interest income, including accretion of discounts and amortization of premiums, is recorded on the accrual basis commencing on the settlement date.
Redemption fees: A short-term trading redemption fee may be assessed on any fund shares in a fund account that are sold during the first five (5) NYSE trading days following their purchase date. This redemption fee will equal 2% of the amount redeemed and shares held the longest will be treated as being redeemed first and shares held the shortest as being redeemed last.
Transamerica IDEX Mutual Funds
Semi-Annual Report 2005
7
TA IDEX Van Kampen Small Company Growth
NOTES TO FINANCIAL STATEMENTS (continued)
At April 30, 2005
(all amounts in thousands)
(unaudited)
NOTE 1.–(continued)
For the period from inception through April 30, 2005, the Fund received no redemption fees.
Dividend distributions: Distributions to shareholders are recorded on the ex-dividend date and are determined in accordance with Federal income tax regulations which may differ from GAAP.
NOTE 2. RELATED PARTY TRANSACTIONS
Transamerica Fund Advisors, Inc. ("TFAI") is the Fund's investment adviser. Transamerica Fund Services, Inc. ("TFS") is the Fund's administrator and transfer agent. AFSG Securities Corp. ("AFSG") is the Fund's distributor/principal underwriter. AFSG is 100% owned by AUSA Holding Company ("AUSA"). TFAI is a directly owned subsidiary of Western Reserve Life Assurance Co. of Ohio (78%) and AUSA (22%). TFS is a wholly owned subsidiary of WRL (50%) and AUSA (50%). AUSA and WRL are wholly owned indirect subsidiaries of AEGON, NV, a Netherlands corporation.
Effective January 1, 2005 AEGON/Transamerica Fund Advisors, Inc. ("ATFA") was renamed Transamerica Fund Advisors, Inc. ("TFAI"); AEGON/Transamerica Fund Services, Inc. ("ATFS") and AEGON/Transamerica Investor Services, Inc. ("ATIS") merged into one entity and was renamed Transamerica Fund Services, Inc. ("TFS").
The following schedule reflects the percentage of fund assets owned by affiliated mutual funds (i.e., through the Transamerica IDEX Mutual Funds and AEGON/Transamerica Series Trust (f/k/a AEGON/Transamerica Series Fund, Inc.) asset allocation funds):
| Net Assets | % of Net Assets | ||||||||||
| TA IDEX Asset Allocation – Growth Portfolio | $ | 15,670 | 22.43 | % | |||||||
| TA IDEX Asset Allocation – Moderate Growth Portfolio | 20,794 | 29.76 | % | ||||||||
| Asset Allocation – Growth Portfolio | 19,638 | 28.11 | % | ||||||||
| Asset Allocation – Moderate Growth Portfolio | 13,746 | 19.67 | % | ||||||||
| Total | $ | 69,848 | 99.97 | % | |||||||
Investment advisory fee: The Fund pays management fees to TFAI based on average daily net assets ("ANA") at the following breakpoints:
0.95% of the first $500 million of ANA
0.85% of ANA over $500 million
TFAI has contractually agreed to waive its advisory fee and will reimburse the Fund to the extent that operating expenses exceed the following stated annual limit:
1.15% Expense Limit
If total fund expenses fall below the annual expense limitation agreement agreed to by the adviser within the succeeding three years, the Fund may be required to pay that adviser a portion or all of the waived advisory fees.
There were no amounts available for recapture at April 30, 2005.
Distribution and service fees: The Fund has a 12b-1 distribution plan under the 1940 Act pursuant to which an annual fee, based on average daily net assets, is paid to the distributor for various disbursements such as broker-dealer account servicing fees and other promotional expenses of the Fund. The Fund is authorized under the 12b-1 plan to pay fees on each class up to the following limits:
| Class A | 0.35 | % | |||||
| Class I | N/A | ||||||
In the case the Fund or a class of shares of the Fund is closed to new investors or investments, the Fund is authorized to pay 12b-1 fees for past sales and distribution efforts and present and past investor services.
Administrative services: The Fund has entered into an agreement with TFS for financial and legal fund administration services, which includes such items as compliance, expenses, financial statements and other reporting, distributions, tax returns, prospectus preparation, board of trustees meeting support and other legal matters. As of January 1, 2005 the Fund pays TFS an annual fee of 0.02% of average net assets. Prior to January 1, 2005 the Fund paid TFS an annual fee of 0.015% of average net assets. The Legal fees on the Statement of Operations are for fees paid to external legal counsel.
Transfer agent fees: The Fund pays TFS an annual per-account charge of $20 (not in thousands) for each open account and $1.63 (not in thousands) for each closed account. There is no new account charge. The Transfer agent fees on the Statement of Operations are made up of fees paid to TFS and costs associated with shareholder statements.
The Fund paid TFS $2 for the period from inception through April 30, 2005.
Transamerica IDEX Mutual Funds
Semi-Annual Report 2005
8
TA IDEX Van Kampen Small Company Growth
NOTES TO FINANCIAL STATEMENTS (continued)
At April 30, 2005
(all amounts in thousands)
(unaudited)
NOTE 3. INVESTMENT TRANSACTIONS
The cost of securities purchased and proceeds from securities sold (excluding short-term securities) for the period from inception through April 30, 2005, were as follows:
| Purchases of securities: | |||||||
| Long-Term excluding U.S. Government | $ | 80,561 | |||||
| U.S. Government | – | ||||||
| Proceeds from maturities and sales of securities: | |||||||
| Long-Term excluding U.S. Government | 11,319 | ||||||
| U.S. Government | – | ||||||
NOTE 4. FEDERAL INCOME TAX MATTERS
The Fund has not made any provision for federal income or excise taxes due to its policy to distribute all of its taxable income and capital gains to its shareholders and otherwise qualify as a regulated investment company under the Internal Revenue Code. Income and capital gain distributions are determined in accordance with income tax regulations, which may differ from GAAP. These differences are primarily due to differing treatment for items including, but not limited to, wash sales, net operating losses and capital loss carryforwards.
The aggregate cost of investments and composition of unrealized appreciation (depreciation) for federal income tax purposes as of April 30, 2005, are as follows:
| Federal Tax Cost Basis | $ | 69,036 | |||||
| Unrealized Appreciation | $ | 2,132 | |||||
| Unrealized (Depreciation) | (4,385 | ) | |||||
| Net Unrealized Appreciation (Depreciation) | $ | (2,253 | ) | ||||
NOTE 5. REGULATORY PROCEEDINGS
There continues to be significant federal and state regulatory activity relating to financial services companies, particularly mutual fund companies and their investment advisers. As part of an ongoing investigation regarding potential market timing, recordkeeping and trading compliance issues and matters affecting the Fund's investment adviser, TFAI, and certain employees and affiliates of TFAI, the SEC staff has indicated that it is likely to take some action against TFAI and certain of its affiliates at the conclusion of the investigation. The potential timing and the scope of any such action is difficult to predict. Although the impact of any action brought against TFAI and/or its affiliates is difficult to assess at the present time, the Fund currently believes that the likelihood that any such action will have a material adverse impact on it is remote. It is important to note that the Fund is not aware of any allegation of wrongdoing against it and its board at the time this semi-annual report is printed. Although it is not anticipated that these developments will have an adverse impact on the Fund, there can be no assurance at this time. TFAI and its affiliates are actively working with the SEC in regard to this matter; however, the exact resolution cannot be determined at this time. TFAI will take such actions that it deems necessary or appropriate to continue providing management services to the Fund and to bring all matters to an appropriate conclusion.
TFAI and/or its affiliates, and not the Fund, will bear the costs regarding these regulatory matters.
Transamerica IDEX Mutual Funds
Semi-Annual Report 2005
9
TA IDEX Van Kampen Small Company Growth
A discussion regarding the basis of Transamerica IDEX Mutual Fund's Board of Trustees' approval of the fund's advisory arrangements will be available in the fund's annual report for the fiscal year ending October 31, 2005.
Transamerica IDEX Mutual Funds
Semi-Annual Report 2005
10
TA IDEX Van Kampen Small Company Growth
SUPPLEMENTAL INFORMATION (unaudited)
RESULTS OF SHAREHOLDER PROXY
At a special meeting of shareholders held on February 25, 2005, the results of the Proposals were as follows:
Transamerica IDEX Mutual Funds
Proposal 1: Election of Trustees to the Board of Trustees of Transamerica IDEX Mutual Funds.
| For | Withheld | ||||||||||
| Peter R. Brown | 872,017,875.249 | 4,468,498.551 | |||||||||
| Daniel Calabria | 871,917,069.786 | 4,569,304.014 | |||||||||
| Janise B. Case | 872,099,393.125 | 4,386,980.675 | |||||||||
| Charles C. Harris | 872,086,722.025 | 4,399,651.775 | |||||||||
| Leo J. Hill | 872,304,465.640 | 4,181,908.160 | |||||||||
| Russell A. Kimball, Jr. | 872,253,556.471 | 4,232,817.329 | |||||||||
| William W. Short, Jr. | 872,139,920.944 | 4,346,452.856 | |||||||||
| John Waechter | 872,261,152.376 | 4,225,221.424 | |||||||||
| Jack E. Zimmerman | 871,929,967.512 | 4,556,406.288 | |||||||||
| Brian C. Scott | 872,218,970.367 | 4,267,403.433 | |||||||||
| Thomas P. O'Neill | 872,111,944.117 | 4,374,429.683 | |||||||||
TA IDEX Van Kampen Small Company Growth
Proposal 2: Approval of an Agreement and Plan of Reorganization pursuant to which Transamerica IDEX Mutual Funds will organize as a Delaware statutory trust.
| For | Against | Abstentions/Broker Non-Votes | |||||||||
| 850,100.000 | 0 | 0 | |||||||||
Proposal 3: Approval of changes to the fundamental investment restrictions of TA IDEX Van Kampen Small Company Growth.
| A. Diversification | For | Against | Abstentions/Broker Non-Votes | ||||||||||||
| 850,100.000 | 0 | 0 | |||||||||||||
| B. Borrowing | For | Against | Abstentions/Broker Non-Votes | ||||||||||||
| 850,100.000 | 0 | 0 | |||||||||||||
| C. Senior Securities | For | Against | Abstentions/Broker Non-Votes | ||||||||||||
| 850,100.000 | 0 | 0 | |||||||||||||
| D. Underwriting Securities | For | Against | Abstentions/Broker Non-Votes | ||||||||||||
| 850,100.000 | 0 | 0 | |||||||||||||
| E. Real Estate | For | Against | Abstentions/Broker Non-Votes | ||||||||||||
| 850,100.000 | 0 | 0 | |||||||||||||
| F. Making Loans | For | Against | Abstentions/Broker Non-Votes | ||||||||||||
| 850,100.000 | 0 | 0 | |||||||||||||
| G. Concentration | For | Against | Abstentions/Broker Non-Votes | ||||||||||||
| 850,100.000 | 0 | 0 | |||||||||||||
| H. Commodities | For | Against | Abstentions/Broker Non-Votes | ||||||||||||
| 850,100.000 | 0 | 0 | |||||||||||||
Transamerica IDEX Mutual Funds
Semi-Annual Report 2005
11
PROXY VOTING POLICIES AND PROCEDURES AND QUARTERLY PORTFOLIO HOLDINGS
A description of the Transamerica IDEX Mutual Funds' proxy voting policies and procedures is available in the Statement of Additional Information of the Funds, available without charge upon request by calling 1-888-233-4339 (toll free) or on the Securities and Exchange Commission website (http://www.sec.gov).
In addition, the Funds are required to file Form N-PX, with their complete proxy voting records for the 12 months ended June 30th, no later than August 31st of each year. The first filing of Form N-PX was made on or before August 31, 2004, for the 12 month-period ending June 30, 2004. Once filed, the Form will be available without charge: (1) from the Funds, upon request by calling 1-888-233-4339; and (2) on the SEC's website at www.sec.gov.
The Funds file their complete schedule of portfolio holdings with the Securities and Exchange Commission for the first and third quarter of each fiscal year on Form N-Q which is available on the Commission's website at www.sec.gov. The Funds' Form N-Q may be reviewed and copied at the Commission's Public Reference Room in Washington, D.C. Information on the operation of the Public Reference Room may be obtained by calling 1-800-SEC-0330.
P.O. Box 9012
Clearwater, FL 33758-9012

www.transamericaidex.com
Investor Services 1-888-233-IDEX (4339)
P.O. Box 9012 • Clearwater, FL 33758-9012
Distributor: AFSG Securities Corporation, Member NASD
Item 2: Code of Ethics.
Not applicable for semi-annual reports.
Item 3: Audit Committee Financial Expert.
Not applicable for semi-annual reports.
Item 4: Principal Accountant Fees and Services.
Not applicable for semi-annual reports.
Item 5: Audit Committee of Listed Registrants.
Not applicable for semi-annual reports.
Item 6: Schedule of Investments.
The schedule of investments is included in the Semi-Annual report to shareholders filed under Item 1 of this Form N-CSR.
Item 7: Disclosure of Proxy Voting Policies and Procedures for Closed-End Management Investment Companies.
Not applicable.
Item 8: Portfolio Managers of Closed-End Management Investment Companies
Not applicable.
Item 9: Purchases of Equity Securities by Closed-End Management Investment Company and Affiliated Purchasers.
Not Applicable.
Item 10: Submission of Matters to a Vote of Security Holders
There has been no material change to the procedures by which shareholders may recommend nominees to the registrant’s Board of Trustees: currently the registrant does not have a policy with regard to the consideration of trustee candidates recommended by shareholders.
11: Controls and Procedures.
(a) Based on their evaluation of registrant’s disclosure controls and procedures (as defined in rule 30a-3(c) under the Investment Company Act of 1940, as of April 30, 2005, registrant’s principal executive officer and principal financial officer found registrant’s disclosure controls and procedures to be appropriately designed to ensure that information required to be disclosed by registrant in the reports that it files on Form N-CSR (a) is accumulated and communicated to registrant’s management, including its principal executive officer and principal financial officer, to allow timely decisions regarding required disclosure, and (b) is recorded, processed, summarized and reported, within the time periods specified in the rules and forms adopted by the U.S. Securities and Exchange Commission.
(b) There have been no significant changes in registrant’s internal controls over financial reporting that occurred during the registrant’s last fiscal half year that has materially affected, or is reasonable likely to materially affect, the registrant’s internal control over financial reporting.
Item 12: Exhibits.
(a) (1) Not Applicable
(2) Separate certifications for registrant’s principal executive officer and principal financial officer, as required by
Rule 30a-2(a) under the 1940 Act, are attached.
(3) Not Applicable
(b) A certification for registrant’s principal executive officer and principal financial officer, as required by Rule 30a-2(b) under the 1940 Act, is attached. This certification is being furnished to the Securities and Exchange Commission solely pursuant to 18 U.S.C. Section 1350 and is not being filed as part of the Form N-CSR with the Securities and Exchange Commission.
SIGNATURES
Pursuant to the requirements of the Securities Exchange Act of 1934 and the Investment Company Act of 1940, the registrant has duly caused this report to be signed on its behalf by the undersigned, thereunto duly authorized.
| Transamerica IDEX Mutual Funds |
| ||
| (Registrant) | |||
|
| |||
| By: | /s/ Brian C. Scott |
| |
|
| President and Chief Executive Officer | ||
|
| Date: June 28, 2005 | ||
Pursuant to the requirements of the Securities Exchange Act of 1934 and the Investment Company Act of 1940, this report has been signed below by the following persons on behalf of the registrant and in the capacities and on the dates indicated.
By: | /s/ Brian C. Scott |
| |
| President and Chief Executive Officer | ||
Date: | June 28, 2005 | ||
|
| ||
|
| ||
By: | /s/ Glenn E. Brightman |
| |
| Vice President and Interim Principal Financial Officer | ||
Date: | June 28, 2005 | ||
EXHIBIT INDEX
Exhibit No. |
| Description of Exhibit |
|
|
|
12(a)(2) |
| a. Section 302 N-CSR Certification of Principal Executive Officer |
|
| b. Section 302 N-CSR Certification of Principal Financial Officer |
12(b) |
| Section 906 N-CSR Certification of Principal Executive Officer and Principal Financial Officer |