UNITED STATES
SECURITIES AND EXCHANGE COMMISSION
WASHINGTON, D.C. 20549
FORM 10-K
(Mark One)
☒ ANNUAL REPORT PURSUANT TO SECTION 13 OR 15(d) OF THE
SECURITIES EXCHANGE ACT OF 1934
FOR THE FISCAL YEAR ENDED December 31, 2024
OR
☐ TRANSITION REPORT PURSUANT TO SECTION 13 OR 15(d) OF THE
SECURITIES EXCHANGE ACT OF 1934
FOR THE TRANSITION PERIOD FROM TO
| | | | | | | | |
Commission
File Number | | Name of Registrant, Address, and Telephone Number | | State or other
jurisdiction of
Incorporation | | I.R.S. Employer
Identification
Number |
001-09120 |
| Public Service Enterprise Group Incorporated | | New Jersey | | 22-2625848 |
| | 80 Park Plaza | | | | |
| | Newark, | New Jersey | 07102 | | | | |
| | 973 | 430-7000 | | | | |
| | | | | | | | |
001-00973 |
| Public Service Electric and Gas Company | | New Jersey | | 22-1212800 |
| | 80 Park Plaza | | | | |
| | Newark, | New Jersey | 07102 | | | | |
| | 973 | 430-7000 | | | | |
Securities registered pursuant to Section 12(b) of the Act:
| | | | |
Title of Each Class | | Trading Symbol(s) | | Name of Each Exchange
On Which Registered |
Public Service Enterprise Group Incorporated | | | | |
Common Stock without par value | | PEG | | New York Stock Exchange |
Public Service Electric and Gas Company | | | | |
8.00% First and Refunding Mortgage Bonds, due 2037 | | PEG37D | | New York Stock Exchange |
5.00% First and Refunding Mortgage Bonds, due 2037 | | PEG37J | | New York Stock Exchange |
Securities registered pursuant to Section 12(g) of the Act: None
Indicate by check mark whether each registrant is a well-known seasoned issuer, as defined in Rule 405 of the Securities Act.
| | | | |
Public Service Enterprise Group Incorporated | ☒ | Yes | ☐ | No |
Public Service Electric and Gas Company | ☒ | Yes | ☐ | No |
Indicate by check mark if each of the registrants is not required to file reports pursuant to Section 13 or 15(d) of the Securities Exchange Act of 1934. ☐ Yes ☒ No
Indicate by check mark whether each of the registrants (1) has filed all reports required to be filed by Section 13 or 15(d) of the Securities Exchange Act of 1934 during the preceding 12 months (or for such shorter period that the registrants were required to file such reports) and (2) has been subject to such filing requirements for the past 90 days. ☒ Yes ☐ No
(Cover continued on next page)
(Cover continued from previous page)
Indicate by check mark whether the registrants have submitted electronically every Interactive Data File required to be submitted pursuant to Rule 405 of Regulation S-T (§232.405 of this chapter) during the preceding 12 months (or for such shorter period that the registrants were required to submit such files). ☒ Yes ☐ No
Indicate by check mark whether each registrant is a large accelerated filer, an accelerated filer, a non-accelerated filer, a smaller reporting company, or an emerging growth company. See the definitions of “large accelerated filer,” “accelerated filer,” “smaller reporting company,” and “emerging growth company” in Rule 12b-2 of the Exchange Act.
| | | | | | | | | | |
Public Service Enterprise Group Incorporated | Large Accelerated Filer | ☒ | Accelerated Filer | ☐ | Non-accelerated Filer | ☐ | Smaller reporting company | ☐ | Emerging growth company | ☐ |
| | | | | | | | | | |
Public Service Electric and Gas Company | Large Accelerated Filer | ☐ | Accelerated Filer | ☐ | Non-accelerated Filer | ☒ | Smaller reporting company | ☐ | Emerging growth company | ☐ |
If any of the registrants is an emerging growth company, indicate by check mark if such registrant has elected not to use the extended transition period for complying with any new or revised financial accounting standards provided pursuant to Section 13(a) of the Exchange Act. ☐
Indicate by check mark whether each of the registrants has filed a report on and attestation to its management’s assessment of the effectiveness of its internal control over financial reporting under Section 404(b) of the Sarbanes-Oxley Act (15 U.S.C. 726(b)) by the registered public accounting firm that prepared and issued its audit report.
| | |
Public Service Enterprise Group Incorporated | ☒ |
| | |
Public Service Electric and Gas Company | ☐ |
If securities are registered pursuant to Section 12(b) of the Act, indicate by check mark whether the financial statements of the registrants included in the filing reflect the correction of an error to previously issued financial statements. ☐
Indicate by check mark whether any of those error corrections are restatements that required a recovery analysis of incentive-based compensation received by any of the registrants’ executive officers during the relevant recovery period pursuant to §240.10D-1(b). ☐
Indicate by check mark whether any of the registrants is a shell company (as defined in Rule 12b-2 of the Exchange Act).
☐ Yes ☒ No
The aggregate market value of the Common Stock of Public Service Enterprise Group Incorporated held by non-affiliates as of June 30, 2024 was $36,632,552,572 based upon the New York Stock Exchange Composite Transaction closing price.
The number of shares outstanding of Public Service Enterprise Group Incorporated’s sole class of Common Stock as of February 21, 2025 was 498,561,467.
As of February 21, 2025, Public Service Electric and Gas Company had issued and outstanding 132,450,344 shares of Common Stock, without nominal or par value, all of which were held, beneficially and of record, by Public Service Enterprise Group Incorporated.
Public Service Electric and Gas Company is a wholly owned subsidiary of Public Service Enterprise Group Incorporated and meets the conditions set forth in General Instruction I(1)(a) and (b) of Form 10-K. Public Service Electric and Gas Company is filing its Annual Report on Form 10-K with the reduced disclosure format authorized by General Instruction I.
DOCUMENTS INCORPORATED BY REFERENCE
| | |
Part of Form 10-K of
Public Service
Enterprise Group Incorporated | | Documents Incorporated by Reference |
III | | Portions of the definitive Proxy Statement for the 2025 Annual Meeting of Stockholders of Public Service Enterprise Group Incorporated, which definitive Proxy Statement is expected to be filed with the Securities and Exchange Commission on or about March 13, 2025, as specified herein. |
TABLE OF CONTENTS
TABLE OF CONTENTS (continued)
FORWARD-LOOKING STATEMENTS
Certain of the matters discussed in this report about our and our subsidiaries’ future performance, including, without limitation, future revenues, earnings, strategies, prospects, consequences and all other statements that are not purely historical constitute “forward-looking statements” within the meaning of the Private Securities Litigation Reform Act of 1995. Such forward-looking statements are subject to risks and uncertainties, which could cause actual results to differ materially from those anticipated. Such statements are based on management’s beliefs as well as assumptions made by and information currently available to management. When used herein, the words “anticipate,” “intend,” “estimate,” “believe,” “expect,” “plan,” “should,” “hypothetical,” “potential,” “forecast,” “project,” variations of such words and similar expressions are intended to identify forward-looking statements. Factors that may cause actual results to differ are often presented with the forward-looking statements themselves. Other factors that could cause actual results to differ materially from those contemplated in any forward-looking statements made by us herein are discussed in Item 1A. Risk Factors, Item 7. Management’s Discussion and Analysis of Financial Condition and Results of Operations (MD&A), Item 8. Financial Statements and Supplementary Data—Note 13. Commitments and Contingent Liabilities, and other filings we make with the United States Securities and Exchange Commission (SEC), including our subsequent reports on Form 10-Q and Form 8-K. These factors include, but are not limited to:
•any inability to successfully develop, obtain regulatory approval for, or construct transmission and distribution, and our nuclear generation projects;
•the physical, financial and transition risks related to climate change, including risks relating to potentially increased legislative and regulatory burdens, changing customer preferences and lawsuits;
•any equipment failures, accidents, critical operating technology or business system failures, natural disasters, severe weather events, acts of war, terrorism or other acts of violence, sabotage, physical attacks or security breaches, cyberattacks or other incidents that may impact our ability to provide safe and reliable service to our customers;
•any inability to recover the carrying amount of our long-lived assets;
•disruptions or cost increases in our supply chain, including labor shortages;
•any inability to maintain sufficient liquidity or access sufficient capital on commercially reasonable terms;
•the impact of cybersecurity attacks or intrusions or other disruptions to our information technology, operational or other systems;
•an increasing demand for power and load growth, potentially compounded by a shift away from natural gas toward increased electrification;
•failure to attract and retain a qualified workforce;
•increases in the costs of equipment, materials, fuel, services and labor;
•the impact of our covenants in our debt instruments and credit agreements on our business;
•adverse performance of our defined benefit plan trust funds and Nuclear Decommissioning Trust Fund and increases in funding requirements;
•any inability to enter into or extend certain significant contracts;
•development, adoption and use of Artificial Intelligence by us and our third-party vendors;
•fluctuations in, or third-party default risk in wholesale power and natural gas markets, including the potential impacts on the economic viability of our generation units;
•our ability to obtain adequate nuclear fuel supply;
•changes in technology related to energy generation, distribution and consumption and changes in customer usage patterns;
•third-party credit risk relating to our sale of nuclear generation output and purchase of nuclear fuel;
•any inability to meet our commitments under forward sale obligations and Regional Transmission Organization rules;
•the impact of changes in state and federal legislation and regulations on our business, including PSE&G’s ability to recover costs and earn returns on authorized investments;
•PSE&G’s proposed investment projects or programs may not be fully approved by regulators and its capital investment may be lower than planned;
•our ability to receive sufficient financial support for our New Jersey nuclear plants from the markets, production tax credit and/or zero emission certificates program;
•adverse changes in and non-compliance with energy industry laws, policies, regulations and standards, including market structures and transmission planning and transmission returns;
•risks associated with our ownership and operation of nuclear facilities, and third-party operation of co-owned nuclear facilities, including increased nuclear fuel storage costs, regulatory risks, such as compliance with the Atomic Energy Act and trade control, environmental and other regulations, as well as operational, financial, environmental and health and safety risks;
•changes in federal, state and local environmental laws and regulations and enforcement;
•delays in receipt of, or an inability to receive, necessary licenses and permits and siting approvals; and
•changes in tax laws and regulations.
All of the forward-looking statements made in this report are qualified by these cautionary statements and we cannot assure you that the results or developments anticipated by management will be realized or even if realized, will have the expected consequences to, or effects on, us or our business, prospects, financial condition, results of operations or cash flows. Readers are cautioned not to place undue reliance on these forward-looking statements in making any investment decision. Forward-looking statements made in this report apply only as of the date of this report. While we may elect to update forward-looking statements from time to time, we specifically disclaim any obligation to do so, even in light of new information or future events, unless otherwise required by applicable securities laws.
The forward-looking statements contained in this report are intended to qualify for the safe harbor provisions of Section 27A of the Securities Act of 1933, as amended, and Section 21E of the Securities Exchange Act of 1934, as amended.
From time to time, PSEG and PSE&G release important information via postings on their corporate Investor Relations website at https://investor.pseg.com. Investors and other interested parties are encouraged to visit the Investor Relations website to review new postings. You can sign up for automatic email alerts regarding new postings at the bottom of the webpage at https://investor.pseg.com or by navigating to the Email Alerts webpage at https://investor.pseg.com/resources/email-alerts/default.aspx. The information on https://investor.pseg.com and https://investor.pseg.com/resources/email-alerts/default.aspx is not incorporated herein and is not part of this Form 10-K.
FILING FORMAT
This combined Annual Report on Form 10-K is separately filed by Public Service Enterprise Group Incorporated (PSEG) and Public Service Electric and Gas Company (PSE&G). Information relating to any individual company is filed by such company on its own behalf. PSE&G is only responsible for information about itself and its subsidiaries.
Discussions throughout the document refer to PSEG and its direct operating subsidiaries. Depending on the context of each section, references to “we,” “us,” and “our” relate to PSEG or to the specific company or companies being discussed.
WHERE TO FIND MORE INFORMATION
We file annual, quarterly and current reports, proxy statements and other information with the SEC. You may obtain our filed documents from commercial document retrieval services, the SEC’s internet website at www.sec.gov or our website at https://investor.pseg.com. Information on our website should not be deemed incorporated into or as a part of this report. Our Common Stock is listed on the New York Stock Exchange under the trading symbol PEG. You can obtain information about us at the offices of the New York Stock Exchange, Inc., 11 Wall Street, New York, New York 10005.
PART I
ITEM 1. BUSINESS
We were incorporated under the laws of the State of New Jersey in 1985 and our principal executive offices are located at 80 Park Plaza, Newark, New Jersey 07102. We are a public utility holding company that, acting through our wholly owned subsidiaries, is a predominantly regulated electric and gas utility and a nuclear generation business.
As a holding company, our profitability depends on our subsidiaries’ operating results. We principally conduct our business through two direct wholly owned subsidiaries, PSE&G and PSEG Power LLC (PSEG Power), described below, each of which also has its principal executive offices at 80 Park Plaza, Newark, New Jersey 07102. Over the past several years, we have simplified our business mix and focused our capital allocation towards PSE&G, resulting in the majority of earnings being contributed by PSE&G and providing us more predictability of earnings.
•PSE&G—A New Jersey corporation, incorporated in 1924, which is a franchised public utility in New Jersey. It is also the provider of last resort for gas and electric commodity service for end users in its service territory. PSE&G earns revenues from its regulated rate tariffs under which it provides electric transmission and electric and natural gas distribution to residential, commercial and industrial (C&I) customers in its service territory. It also offers appliance services and repairs to customers throughout its service territory and invests in regulated solar generation projects and regulated energy efficiency (EE) and related programs in New Jersey.
•PSEG Power—A Delaware limited liability company formed in 1999 as a result of the deregulation and restructuring of the electric power industry in New Jersey. PSEG Power earns revenues from its nuclear generation and marketing of power and natural gas to hedge business risks and the value of its portfolio of nuclear power plants, other contractual arrangements and gas storage facilities.
In February 2022, we completed the sale of our 6,750 megawatt (MW) fossil generation portfolio which represented an important milestone in our strategy.
Our other direct wholly owned subsidiaries are: PSEG Long Island LLC (PSEG LI), which operates the Long Island Power Authority’s (LIPA) electric transmission and distribution (T&D) system under a contractual agreement; PSEG Energy Holdings L.L.C. (Energy Holdings), which primarily holds our legacy lease investments and competitively bid, FERC regulated transmission; and PSEG Services Corporation (Services), which provides us and our operating subsidiaries with certain management, administrative and general services at cost.
OPERATIONS AND STRATEGY
PSE&G
Our regulated T&D public utility, PSE&G, distributes electric energy and natural gas to customers within a designated service territory running diagonally across New Jersey where approximately 6.8 million people, or about 74% of New Jersey’s population resides.

Products and Services
Our utility operations primarily earn margins through:
•Transmission—the movement of electricity at high voltage from generating plants to substations and transformers, where it is then reduced to a lower voltage for distribution to homes, businesses and industrial customers. Our revenues for these services are based upon tariffs approved by the Federal Energy Regulatory Commission (FERC).
•Distribution—the delivery of electricity and gas to the retail customer’s home, business or industrial facility. Our revenues for these services are based upon tariffs approved by the New Jersey Board of Public Utilities (BPU).
The commodity portion of our utility business’ electric and gas sales is managed by basic generation service (BGS) and basic gas supply service (BGSS) suppliers. Pricing for those services is set by the BPU as a pass-through, resulting in no margin for our utility operations.
In addition, we continue to invest in and pursue opportunities in regulated clean energy programs, including EE, electric vehicle (EV) make-ready charging infrastructure and other potential investments.
We also earn margins through competitive services, such as appliance repair, in our service territory.
How PSE&G Operates
We are a transmission owner in PJM Interconnection, L.L.C. (PJM) which is an Independent System Operator (ISO) and Regional Transmission Organization (RTO) that operates the electric transmission system in the Mid-Atlantic Region,
including New Jersey and the surrounding states. We provide distribution service to 2.4 million electric customers and 1.9 million gas customers in a service area that covers approximately 2,600 square miles running diagonally across New Jersey. We serve the most densely populated, commercialized and industrialized territory in New Jersey, including its six largest cities and approximately 300 suburban and rural communities.
Transmission
We use formula rates for our transmission cost of service and investments. Formula rates provide a method of rate recovery where the transmission owner annually determines its revenue requirements through a fixed formula that provides for a recovery of our operating costs and a return of and on our capital investments in the system, net of accumulated depreciation and deferred tax liabilities (also known as rate base) using an approved return on equity (ROE) in developing the weighted average cost of capital. Under this formula, rates are put into effect in January of each year based upon our internal forecast of annual expenses and capital expenditures. Rates are subsequently trued up to reflect actual annual expenses and capital expenditures. Our transmission revenues are not impacted by sales volumes. Our current approved transmission rates provide for a base ROE of 9.90% and a 50 basis point adder for our membership in PJM as an RTO. See Item 7. MD&A—Executive Overview of 2024 and Future Outlook for additional information.
Distribution
PSE&G distributes electricity and natural gas to end users in our respective franchised service territories. Our distribution rates are subject to periodic rate cases approved by the BPU. In October 2024, the BPU issued an Order approving the settlement of PSE&G’s electric and gas distribution base rate case with new rates effective October 15, 2024. The Order provides for a $17.8 billion rate base, a 9.6% return on equity for PSE&G’s distribution business and a 55% equity component of its capitalization structure. For additional information, see Item 8. Note 6. Regulatory Assets and Liabilities.
The BPU has also approved a series of PSE&G infrastructure, EE, EV and renewable energy investment programs with cost recovery through various clause mechanisms. For a discussion of proposed and approved programs, see Investment Clause Programs as follows and Item 7. MD&A—Executive Overview of 2024 and Future Outlook.
Our load requirements are split among commercial, residential and industrial customers, as shown in the following table for 2024:
| | | | | | | | | | |
| | | | | | | | |
| | | % of 2024 Sales | | |
| Customer Type | | Electric | | | Gas | | |
| Commercial | | | 57 | % | | | 38 | % | |
| Residential | | | 34 | % | | | 58 | % | |
| Industrial | | | 9 | % | | | 4 | % | |
| Total | | | 100 | % | | | 100 | % | |
| | | | | | | | |
Our customer base has modestly increased since 2020, with electric and gas loads changing as illustrated in the following table:
| | | | | | | | | | |
| | | | | | | | | | |
| Electric and Gas Distribution Statistics | |
| | | Number of
Customers as of December 31, 2024 | | Historical Annual
Customer Growth
2020-2024 | | Electric Sales and
Firm Gas Sales for the Year Ended December 31, 2024 (A) | | Historical Annual
Load Decline
2020-2024 | |
| Electric | | 2.4 Million | | 0.9% | | 40,651 Gigawatt hours | | — | |
| Gas | | 1.9 Million | | 0.7% | | 2,371 Million Therms | | (1.7)% | |
| | | | | | | | | | |
(A)Excludes sales from Gas rate classes that do not impact margin, specifically Contract, Non-Firm Transportation, Cogeneration Interruptible and Interruptible Services.
As part of the BPU's approval of the Clean Energy Future-Energy Efficiency (CEF-EE) filing in 2021, we implemented the Conservation Incentive Program (CIP) that trues up PSE&G’s distribution margin to a rate case-approved baseline per customer for the majority of our customers. As a result, electric gas sales volumes and demands are no longer a driver of our margin and over 90% of our Electric and Gas Distribution margin will only vary based upon the number of customers. While load has modestly decreased in the past due to a decline in larger industrial customers, greater EE and other factors, a significant increase in load is anticipated due to the increasing adoption of EVs, the expansion of data centers and other large users in our area, ongoing growth in the number of customers, other sources of electrification and other factors, which will collectively drive the need for increased system investment.
Investment Clause Programs
The following table lists our major approved investment clause programs that are in progress:
| | | | | | | | | | | |
| | | | | | | | | | | |
| Program | | Investment | | Approval
Date | | Term of
Investment | | | Year Started | |
| CEF-EE | | $1 billion | | 2020 | | 5 years | (A) | | 2020 | |
| CEF-EE Extension | | $280 million | | 2023 | | 9 months | | | 2023 | |
| CEF-EE Extension II | | $300 million | | 2024 | | 6 months | | | 2024 | |
| CEF-EE II | | $2.9 billion | | 2024 | | 6 years | | | 2025 | |
| CEF-EV | | $166 million | | 2021 | | ~6 years | | | 2021 | |
| Energy Strong II Program | | $842 million | | 2019 | | 4 years | (B) | | 2019 | |
| Gas System Modernization Program II (GSMP II) Extension | | $902 million | | 2023 | | 2 years | (C) | | 2024 | |
| Infrastructure Advancement Program (IAP) | | $511 million | | 2022 | | 4 years | | | 2022 | |
| | | | | | | | | | | |
(A)Rolling three-year program with over 80% of spending within 5 years, with limited spending thereafter.
(B)The program has a small amount of trailing costs expected to be spent in year 5.
(C)The program has a small amount of trailing costs expected to be spent in year 3.
To date, we launched three of the four components of our CEF:
•EE—designed to achieve EE targets required under New Jersey’s Clean Energy Act through a suite of ten programs for residential, C&I programs, including low-income, multi-family, small business and local government.
•Energy Cloud (EC)—driven by the implementation of “smart meters,” and new software and product solutions to improve our processes and better manage the electric grid.
•EV—primarily relating to preparatory work to deliver infrastructure to the charging point for three programs: residential smart charging; Level-2 mixed use charging; and direct current (dc) fast charging.
Our CEF-Energy Storage (ES) program, which was filed with the BPU in October 2018, is being held in abeyance.
GSMP II Extension—designed to replace at least 400 miles of cast iron and unprotected steel mains and services in our gas system.
Energy Strong II Program—structured to harden, modernize and improve the resiliency of our electric and gas distribution systems.
IAP—designed to improve the reliability of the “last mile” of our electric distribution system and address aging substations and gas metering and regulation stations.
See Item 7. MD&A—Executive Overview of 2024 and Future Outlook for additional information.
Solar Generation
We have also undertaken solar initiatives at PSE&G, which primarily invest in utility-owned solar photovoltaic (PV) grid-connected solar systems installed on PSE&G property and third-party sites with our economics driven by our net investment in solar, with a contemporaneous return on that rate base.
Supply
We make no margin on the default supply of electricity and gas since the actual costs are passed through to our customers.
All electric and gas customers in New Jersey have the ability to choose their electric energy and/or gas supplier. Pursuant to BPU requirements, we serve as the supplier of last resort for two types of electric and gas customers within our service territory that are not served by another supplier. The first type provides default supply service for smaller C&I customers and residential customers at seasonally-adjusted fixed prices for a three-year term (BGS-Residential Small Commercial Pricing (RSCP)). These rates change annually on June 1 and are based on the average price obtained at auctions in the current year and two prior years. The second type provides default supply for larger customers, with energy priced at hourly PJM real-time market prices for a contract term of 12 months (BGS-Commercial Industrial Energy Pricing).
We procure the supply to meet our BGS obligations through auctions authorized by the BPU for New Jersey’s total BGS requirement. These auctions take place annually in February. Once approved by the BPU, electricity prices for BGS service are set. Approximately one-third of PSE&G’s total BGS-RSCP eligible load is auctioned each year for a three-year term. For information on current prices, see Item 8. Note 13. Commitments and Contingent Liabilities.
PSE&G procures the supply requirements of its default service BGSS gas customers through a full-requirements contract with PSEG Power. The BPU has approved a mechanism designed to recover all gas commodity costs related to BGSS for residential customers. BGSS filings are made annually by June 1 of each year, with a targeted effective date of provisional rates by October 1. PSE&G’s revenues are matched with its costs using deferral accounting, with the goal of achieving a zero cumulative balance by September 30 of each year. In addition, we have the ability to put in place two self-implementing BGSS increases on December 1 and February 1 of up to 5% and also may reduce the BGSS rate at any time and/or provide bill credits. Any difference between rates charged under the BGSS contract and rates charged to our residential customers is deferred and collected or refunded through adjustments in future rates. C&I customers that do not select third-party suppliers are also supplied under the BGSS arrangement. These customers are charged a market-based price largely determined by prices for commodity futures contracts.
PSEG Power & Other
PSEG Power & Other is predominantly comprised of its nuclear generation assets, its natural gas supply operations, the Operating Services Agreement (OSA) of PSEG LI with LIPA, and other legacy investments. PSEG Power is a public utility within the meaning of the Federal Power Act (FPA) and the payments it receives and how it operates are subject to FERC regulation.
PSEG Power
Products and Services
As a nuclear generation owner and operator, our revenue has been derived primarily from energy, capacity and ancillary services sold to PJM in the spot markets. These products and services may also be transacted through exchange markets or bilaterally.
In August 2022, the Inflation Reduction Act (IRA) was signed into law expanding incentives that promote carbon-free generation. The enacted legislation established the production tax credit (PTC) for electricity generation using nuclear energy, which began January 1, 2024 and is available through 2032. PSEG Power’s nuclear plants are expected to benefit from the PTC. The expected PTC rate is up to $15 per megawatt hour (MWh) subject to adjustment based upon a facility’s gross receipts and meeting prevailing wage rules. The PTC rate and the gross receipts threshold are subject to annual inflation adjustments. Until additional guidance is issued by the U.S. Treasury, the final realized value of the PTC is subject to adjustment, which may be material.
PSEG Power also sells wholesale natural gas, primarily through a full-requirements BGSS contract with PSE&G to meet the needs of PSE&G’s default service customers. In 2022, the BPU approved an extension of the long-term BGSS contract to March 31, 2027, and thereafter the contract remains in effect unless terminated by either party with a two-year notice.
PSEG Power supplies PSE&G’s peak daily gas requirements through its balanced portfolio of firm gas transportation capacity, storage contracts, contract peaking supply, and liquefied natural gas and propane. Based upon the availability of natural gas beyond PSE&G’s actual daily needs, PSEG Power sells gas to other customers and shares these proceeds with PSE&G’s customers.
How PSEG Power’s Nuclear Generation Operates
As of December 31, 2024, PSEG Power had 3,758 MW of nuclear generation capacity. All of our nuclear generation capacity is located in New Jersey and Pennsylvania.
Generation Dispatch
Our nuclear generation is considered to be base load. Base load units run the most and typically are called to operate whenever they are available. Variable operating costs are low due to the combination of highly efficient operations and the use of relatively lower-cost fuels. Performance is generally measured by the unit’s “capacity factor,” or the ratio of the actual output to the theoretical maximum output.
In PJM, owners of power plants specify prices at which they are prepared to generate and sell energy based on the marginal cost of generating energy from each individual unit. Typically, the bid price of the last unit dispatched by PJM establishes the energy market-clearing price.
This method of determining supply and pricing creates a situation where natural gas prices often have a major influence on the price that generators will receive for their output, especially in periods of relatively strong or weak demand. Therefore, changes in the price of natural gas will often translate into changes in the wholesale price of electricity and will continue to have a strong influence on the price of electricity in the markets in which we operate.
Market wholesale prices may vary by location resulting from congestion or other factors and do not necessarily reflect our contract prices. Forward prices are volatile and there can be no assurance that current forward prices will remain in effect or that we will be able to contract output at these forward prices. The PTC is expected to mitigate our downside exposure to this volatility and provide support for the nuclear units.
Nuclear Fuel Supply
We have long-term contracts for nuclear fuel. These contracts provide for:
•purchase of uranium (concentrates and uranium hexafluoride),
•conversion of uranium concentrates to uranium hexafluoride,
•enrichment of uranium hexafluoride, and
•fabrication of nuclear fuel assemblies.
We expect to be able to meet the nuclear fuel supply demands of our operations. However, there are limited suppliers for certain aspects of this supply chain and the ability to maintain an adequate fuel supply could be affected by several factors not within our control, including changes in prices and demand, tariffs, curtailments by suppliers, severe weather, environmental regulations, war and hostilities, and other factors. For additional information and a discussion of risks, see Item 1A. Risk Factors, Item 7. MD&A—Executive Overview of 2024 and Future Outlook and Item 8. Note 13. Commitments and Contingent Liabilities.
Markets and Market Pricing
All of PSEG Power’s nuclear generation assets are located within the PJM RTO.
Our nuclear generating units’ performance, market prices and the PTC, have a considerable effect on our profitability. The PTC is designed to increase with inflation, and therefore, future inflation levels will impact the financial support of the nuclear units. In addition, market revenues in excess of the PTC threshold would provide incremental benefit.
PSEG Power’s Salem 1, Salem 2 and Hope Creek nuclear plants have also been awarded zero emission certificates (ZECs) by the BPU through May 2025. These nuclear plants are expected to receive ZEC revenue from the electric distribution companies (EDCs) in New Jersey, which is equivalent to approximately $10/MWh. ZEC revenue recorded is reduced by the
estimated production tax credits (PTCs) generated from PSEG Power’s Salem 1, Salem 2, and Hope Creek nuclear plants. ZEC revenue will be adjusted based upon the actual amount of the PTCs when guidance is issued on how to calculate gross receipts and that adjustment could be material.
In addition to energy sales, we earn revenue from capacity payments for our generating assets. These payments are compensation for committing our generating units to PJM for dispatch at its discretion. Capacity payments reflect the value to PJM of assurance that there will be sufficient generating capacity available at all times to meet system reliability and energy requirements.
In PJM the market design for capacity payments provides for a forward-looking, capacity pricing mechanism through the Reliability Pricing Model (RPM). For additional information regarding auction delays, complaints against PJM regarding RPM, PJM and FERC actions related to the capacity market construct and resulting market uncertainty, see Regulatory Issues—Federal Regulation.
The prices to be received by generating units in PJM for capacity have been set through RPM base residual and incremental auctions and depend upon the zone in which the generating unit is located. The average capacity prices that PSEG expects to receive from the base residual and incremental auctions which have been completed are disclosed in Item 8. Note 2. Revenues.
In addition, the PJM capacity market imposes performance obligations and non-performance penalties on resources during times of system stress. These rules provide an opportunity for bonus payments or require the payment of penalties depending on whether a unit is available during a performance interval.
Hedging Strategy
The PTC is intended to provide sufficient and stable support for nuclear units and was effective January 2024. To mitigate volatility in our results, we seek to contract in advance to hedge the price exposure for a significant portion of our anticipated electric output, capacity and fuel needs. The expected PTC rate is up to $15/MWh subject to adjustment based upon a facility’s gross receipts. While the PTC eligibility period began in January 2024, the U.S. Treasury has yet to issue guidance regarding the definition of gross receipts. We continue to analyze the impact of the IRA on our nuclear units, including potential future guidance from the U.S. Treasury, potential impacts on hedging strategies and overall financial support.
We historically have sold a portion of our anticipated generation over a multi-year forward horizon, normally over a period of two to three years. Beginning in 2024, our hedging strategy has incorporated an estimated range of risk reduction impacts from the PTCs on our nuclear generation portfolio while retaining the ability to benefit when market pricing exceeds the phase out threshold. As of December 31, 2024, we expect that our hedged position for 2025 in conjunction with the PTC and market price variability will result in the realized value of our nuclear generation output being at, or above, the PTC phase out. Our strategy will continue to evolve given PTC guidance uncertainty, and potential incremental changes upon final U.S. Treasury guidance.
Generally, we seek to hedge the financial risks of our generation through sales at PJM West or other nodes corresponding to our generation portfolio. Our hedge transactions in PJM generally reflect energy sales at the liquid PJM Western Hub or other basis locations when available and other transactions that seek to secure price certainty for our energy output. Our hedging practices help to manage some of the volatility of the nuclear generation business when forward prices are greater than the PTC threshold. While this limits our exposure to decreasing prices, our ability to realize benefits from rising market prices is also limited.
Our fuel strategy is to maintain certain levels of uranium in inventory and to make periodic purchases to support such levels. Our nuclear fuel commitments cover approximately 100% of our estimated uranium, enrichment and fabrication requirements through 2027 and a significant portion through 2028.
LIPA Operations Services Agreement (OSA)
PSEG LI has been operating LIPA’s electric T&D system in Long Island, New York since 2014 under a 12-year OSA with LIPA that expires on December 31, 2025. Under the OSA, PSEG LI acts as LIPA’s agent in performing many of its obligations and in return (a) is prefunded for pass-through operating expenditures, (b) receives a fixed management fee and (c) is eligible to receive an incentive fee contingent on meeting established performance metrics. PSEG is participating in a process to continue as operations service provider for LIPA’s electrical transmission and distribution system, with resolution expected in the first half of 2025. It is uncertain whether the OSA will be renewed.
Competitively Bid, FERC Regulated Transmission Projects
PSEG continues to evaluate investment opportunities in regulated transmission beyond PSE&G. In December 2023, PJM awarded us an approximately $424 million project to construct a 500 kV transmission line to address increasing load and reliability issues in Maryland and northern Virginia as part of its 2022 Window 3 competitive solicitation. PJM directed that the project be placed in service in 2027.
PSEG will continue to evaluate opportunities to participate in transmission solicitation processes and may decide to submit bids for these opportunities, some of which could be material investments. For additional information, see Item 7. MD&A— Executive Overview of 2024 and Future Outlook.
Energy Holdings
Energy Holdings maintains our portfolio of legacy lease investments. See Item 8. Note 8. Long-Term Investments and Note 9. Financing Receivables for additional information.
Energy Holdings also owns 50% of Garden State Offshore Energy LLC (GSOE) which holds rights to an offshore wind lease area just south of New Jersey. We are evaluating our options for the potential sale of our interest in GSOE.
COMPETITIVE ENVIRONMENT
PSE&G
Our T&D business is not affected when customers choose alternate electric or gas suppliers since we earn our return on our net investment in rate base to provide T&D service, not by supplying the commodity. Based on our transmission formula rate and the CIP program for electric and gas distribution, we are also minimally impacted by changes in customers’ usage. Our growth is driven by (i) our investment program to deliver energy more reliably by investing to meet anticipated demand growth and modernizing our electric transmission and electric and gas distribution system and (ii) investing in programs that meet State targets to help deliver cleaner energy, including our EE programs to help customers use less energy and investment programs to build EV infrastructure and solar generation. There may also be opportunities to expand into related clean energy areas, such as renewable natural gas, hydrogen, energy storage, additional solar and renewables, and broader EE investments, though utility participation in these areas is subject to regulatory approval and market design, which continues to evolve. That growth can be affected by customer cost pressures which could result from higher commodity costs, higher supply costs to support subsidized renewable generation, higher operating costs, higher tax rates, macro-economic conditions including inflation, and other factors. Further rate regulated recovery methods, such as net metered generation and/or changes in customer usage behavior could lead to a reduction in billed customer usage to recover our costs, resulting in higher rates overall. Conversely, an increase in EV adoption and other factors could lead to an increase in system usage, require incremental investments to meet higher peak demands and result in a larger customer usage base. There could also be a shift toward greater electrification and less gas usage in the coming decades. While current costs and relative emission savings would limit any substantial change in the near term, technological advances for heat pumps, actions by certain jurisdictions in our service territory and other factors could drive these potential changes, which could result in a slowing in the growth of our gas distribution and an increase in the growth of our electric T&D business. Our CIP reduces the impact on our distribution revenues from changes in sales volumes and demand for most customers. The CIP, which is calculated annually, provides for a true-up of our current period revenue as compared to revenue thresholds established in our most recent
distribution base rate proceeding. Recovery under the CIP is subject to certain limitations, including an actual versus allowed ROE test and ceilings on customer rate increases.
Changes previously ordered by FERC and implemented by PJM and other ISOs to eliminate contractual provisions that previously provided us a “right of first refusal” to construct new transmission projects in our service territory could result in third-party construction of transmission lines in our area in the future and also allow us to seek opportunities to build in other service territories. While there has been minimal impact so far, these rules continue to evolve so both the extent of the risk within our service territory and the opportunities for our transmission business elsewhere remain difficult to assess.
PSEG Power
Various market participants compete with us and one another in transacting in the wholesale energy markets and entering into bilateral contracts. Our competitors include but are not limited to merchant generators, utility generators, energy marketers, retailers, private equity firms, and other financial entities.
Anticipated demand growth and the pace of that relative to retirements of existing firm generation and new additions of intermittent and firm generation capacity, as well as subsidized generation capacity, or technological advances could impact forward market prices in the future.
PJM has a capacity market that has been approved by FERC. FERC regulates this market and must approve market design rule changes proposed by PJM. For information regarding recent actions by FERC relating to capacity market design, see the discussion in Regulatory Issues—Federal Regulation.
Environmental issues could also impact our competitiveness, including requirements regarding capital investments at our nuclear stations, such as cooling towers, and could lead to a material adverse effect, while other actions to further regulate carbon dioxide emissions could better position our nuclear plants.
HUMAN CAPITAL MANAGEMENT
Our human capital management strategy is integrated with our overall business strategy. Our Values and strong culture of inclusion support our goal to attract, develop and retain a high performing diverse workforce - one with the skill sets to succeed in a rapidly evolving environment.
We believe in treating people with dignity and respect, protecting each of our fundamental human rights, and striving to maintain the high standards of ethical conduct on which our business and reputation have been built.
The Organization and Compensation Committee of the PSEG Board of Directors is responsible for the oversight of PSEG’s human capital management strategy and risks. It is updated regularly on matters related to culture, executive compensation, and leadership succession and development. Safety metrics, such as Occupational Safety and Health Administration (OSHA) recordable incidence rate, OSHA days away from work rate, and serious injury incidence rate, are regularly monitored and reported to our Board.
Sixty percent of our workforce is represented by six unions under various collective bargaining agreements that cover wages, benefits and other terms and conditions of employment. Our current agreements with all six unions remain in place until 2027 and support strategic objectives and business goals.
The following chart presents our total employee population indicating percentages of employees that are represented by a labor organization:
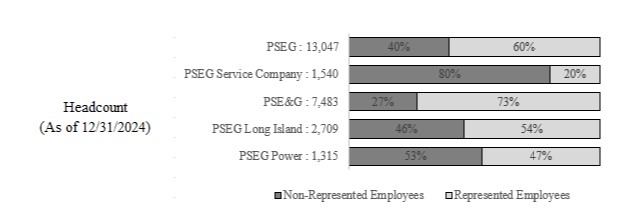
As of December 31, 2024, women constituted approximately 27% of our non-represented employees and 19% of our total workforce. People who are racially/ethnically diverse constituted approximately 34% of our non-represented employees and 30% of our total workforce.
Safety and Security
The safety and security of our employees and the public are integrated into our culture and business operations. We demonstrate this by providing support to employees so that everyone is empowered and encouraged to question, stop and correct any unsafe act or condition and provide feedback on safety and security matters. We take measures to provide employees with proper knowledge, training and protective equipment to maintain their personal health and safety and to mitigate workplace risks.
Employee Experience & Engagement
We provide our dedicated workforce the tools, the resources and an inclusive workplace culture to deliver safe and reliable energy to our customers. Under our Inclusion for All program, we embrace a broad definition of diversity as reflected in our Values where we look to embrace each other’s differences. Our efforts are supported by our Employee Business Resource Groups and Local Inclusion Teams within our business units and field locations. We seek to offer opportunities that are relevant and accessible to all employees, including community outreach, volunteerism, mentorship, recognition and professional development.
To determine if we are being responsive to the needs of our employees, we routinely assess the impact of our work by soliciting employee feedback through focus groups, listening sessions, pulse surveys and a biennial employee engagement survey.
Talent Management
Our recruitment strategy is focused on hiring a workforce to meet our business objectives, including critical skilled trade roles. We have a comprehensive workforce planning strategy to support our hiring needs. It includes hiring ahead of attrition for skilled trade roles, community outreach, workforce development and strategic sourcing with key external partners like trade schools, colleges, county workforce development boards, and other non-profit partners.
We value the growth and development of all our employees and offer a variety of opportunities to enhance their skills and abilities. We hold talent reviews and succession discussions regularly for leadership and critical positions to support workforce planning. We use tailored development opportunities and other tools to build a strong internal pipeline that is ready to take the next step in their careers. We continue to focus on upskilling our skilled trade roles to adapt to evolving technologies and digital advancements.
Total Rewards Program
We support the well-being of our employees through a comprehensive total rewards program. We provide competitive compensation to our workforce and a benefit program that is designed to support emotional and physical health as well as financial wellness and wellbeing.
REGULATORY ISSUES
In the ordinary course of our business, we are subject to regulation by, and are party to various claims and regulatory proceedings with FERC, the BPU, the Commodity Futures Trading Commission (CFTC) and various state and federal environmental regulators, among others. For information regarding material matters, other than those discussed below, see Item 8. Note 13. Commitments and Contingent Liabilities. In addition, information regarding PSE&G’s specific filings pending before the BPU is discussed in Item 8. Note 6. Regulatory Assets and Liabilities.
Federal Regulation
FERC is an independent federal agency that regulates the transmission of electric energy and natural gas in interstate commerce and the sale of electric energy and natural gas at wholesale pursuant to the FPA and the Natural Gas Act. PSE&G and certain operating subsidiaries of PSEG Power are public utilities as defined by the FPA. FERC has extensive oversight
over such public utilities. FERC approval is usually required when a public utility seeks to: sell or acquire an asset that is regulated by FERC (such as a transmission line or a generating station); collect costs from customers associated with a new transmission facility; charge a rate for wholesale sales under a contract or tariff; or engage in certain mergers and internal corporate reorganizations.
FERC also regulates RTOs/ISOs, such as PJM, and their regional transmission planning processes as well as their energy and capacity markets.
Transmission Regulation
FERC has exclusive jurisdiction to establish the rates and terms and conditions of service for interstate transmission. We currently have FERC-approved formula rates in effect to recover the costs of our transmission facilities. Under this formula, rates are put into effect in January of each year based upon our internal forecast of annual expenses and capital expenditures. Rates are subsequently trued up to reflect actual annual expenses and capital expenditures.
Transmission Rate Proceedings and ROE—From time to time, various matters are pending before FERC relating to, among other things, transmission planning and transmission rates and returns, including incentives. Depending on their outcome, any of these matters could materially impact our results of operations and financial condition.
In a rulemaking proceeding issued in 2021, FERC proposed to eliminate the existing 50 basis point adder for RTO membership, which is currently available to PSE&G and other transmission owners in RTOs. Elimination of the RTO adder for RTO membership would reduce PSE&G’s annual Net Income and annual cash inflows by approximately $40 million.
Transmission Planning Proceedings—Through rulemaking proceedings, FERC continues to determine whether changes are needed to current transmission and interconnection planning rules to facilitate the integration of renewable resources onto the grid. FERC is also examining whether there is sufficient oversight over transmission costs to protect customers. Among other issues, FERC is considering whether transmission competitive solicitations are working as intended, whether interconnection queue rules for new generation should dramatically change and whether some type of transmission monitor construct to oversee costs should be imposed.
On the interconnection front, in July 2023, FERC issued a Final Rule, which parties have challenged on rehearing, that will require RTOs to implement rules to speed up the processing of interconnection queue requests. This rule may also result in penalties being imposed on generators, RTOs and transmission owners that fail to meet certain process deadlines. In December 2024, PJM submitted proposed revisions to the PJM Tariff to provide for a reliability based expansion of the interconnection queue window so that a limited number of additional generating resources (50 projects) needed to address PJM’s reliability challenges can be added to this interconnection cycle. FERC accepted this proposal in February 2025, which will allow PJM to accelerate the interconnection of new, "shovel-ready" generation capacity resources and may facilitate PSEG's plan to implement power uprates for both Salem Unit 1 and Unit 2.
In May 2024, FERC issued a Final Rule on transmission planning and cost allocation. As a result of this rule, RTOs like PJM will be required to engage in 20-year transmission planning, applying certain scenarios to the planning process. FERC also reinstated the Right of First Refusal for a discrete category of transmission projects. On rehearing, FERC expanded the states' role in the process for determining how transmission costs will be allocated to various sets of customers. PJM is currently in the process of developing a plan to implement the rule.
In December 2024, a coalition of industrial customers and state ratepayer advocates filed a complaint at FERC against various named public utilities and RTOs/ISOs, including PJM. The complaint alleges that local planning has produced inefficient planning and projects that are not cost-effective, and therefore requests that FERC require the application of regional planning requirements, including relevant competitive solicitation processes, to all transmission facilities over 100kV. The complaint also requests that FERC require RTOs/ISOs to appoint an “Independent System Planner” to oversee transmission planning. While PSEG is not a named party in the complaint, our local planning authority and rights may be impacted by the resolution of this proceeding. We cannot predict the outcome of this proceeding.
Regulation of Wholesale Sales—Generation/Market Issues/Market Power
Under FERC regulations, public utilities that wish to sell power at market rates must receive FERC authorization (market-based rate (MBR) authority) to sell power in interstate commerce before making power sales. They can sell power at cost-based rates or apply to FERC for authority to make MBR sales. For a requesting company to receive MBR authority, FERC
must first determine that the requesting company lacks market power in the relevant markets and/or that market power in the relevant markets is sufficiently mitigated. Certain PSEG companies are public utilities and currently have MBR authority. These companies, which include PSEG Energy Resources & Trading LLC, PSEG Nuclear LLC and PSE&G must file at FERC every three years to update their market power analyses. At the end of 2022, PSEG filed such a market power update at FERC, which remains pending.
In October 2024, FERC issued a Final Rule that eliminates compensation for reactive power in circumstances when the generator is operating within the normal power factor range specified in its interconnection agreement. PSEG Power currently receives reactive power compensation, and we have sought rehearing of this Final Rule. In January 2025, PJM made a compliance filing at FERC seeking approval to delay implementation of the rule, and the resulting prospective loss of reactive power compensation for generators like PSEG Power within the PJM footprint, until June 1, 2026. The loss of reactive power compensation is not expected to have a material impact on PSEG's results of operations.
In addition, there are several ongoing proceedings at FERC that may impact future co-located customer arrangements, such as data centers, involving the supply of power from nuclear units, including whether certain data center customers, depending on their configuration, will pay transmission service charges. FERC is also broadly examining issues concerning whether and to what extent there are potential reliability, cost and customer impacts raised by the location of large customers at generating facilities. In February 2025, FERC issued a show cause order directing PJM and PJM transmission owners to explain within 30 days why the PJM tariff is just and reasonable or, alternatively, what revisions might be necessary, to address perceived gaps in the PJM tariff with respect to co-located load arrangements. We cannot predict the outcome of these proceedings.
Energy Clearing Prices
Energy clearing prices in the markets in which we operate are generally based on bids submitted by generating units. Under FERC-approved market rules, bids are subject to price caps and mitigation rules applicable to certain generation units. FERC rules also govern the overall design of these markets. At present, all units, including those owned by PSEG, within a delivery zone receive a clearing price based on the bid of the marginal unit (i.e., the last unit that must be dispatched to serve the needs of load) which can vary by location.
Capacity Market Issues
PJM operates a capacity market called the Reliability Pricing Model (RPM), the rules for which are approved by FERC. RPM incorporates a forward auction for installed capacity. Under the RPM, generators located in constrained areas within PJM are paid more for their capacity as an incentive to ensure adequate supply where generation capacity is most needed. The mechanics of the RPM in PJM continue to evolve and be refined in stakeholder proceedings and FERC proceedings in which we are active.
Over the past several months, there have been significant activities related to PJM’s capacity market. PJM has delayed capacity auctions for the next three delivery years (2027/28, 2028/29 and 2029/30). Three complaints were filed against PJM alleging that PJM’s capacity market rules have resulted in unjust and unreasonable capacity prices, and seeking to produce short-term increases in supply in the market and a short-term decrease in clearing prices. PJM has also made filings to change its rules to address concerns raised in the complaints, including tariff revisions filed in February 2025 with FERC proposing a collar of $175 per MW-day floor and $325 per MW-day ceiling on capacity prices for the next two delivery years. These ongoing proceedings, as well as potential future proceedings, may affect the future design of the capacity market. We cannot predict the outcome of these proceedings or their impact on our business, results of operations and cash flows.
Compliance
Reliability Standards—PSEG is required to comply with the North American Electric Reliability Corporation (NERC) Reliability Standards, promulgated by NERC and approved by FERC, which are designed to ensure the security and reliability of the United States electric transmission and generation system (the “electric grid”). As a result, PSEG is subject to requirements governing the planning and operation of the electric grid, and requirements governing the physical and cyber security of PSEG assets that are used to protect and operate the electric grid. Due to the increasing sophistication of physical and cyber security threats to the security and reliability of the electric grid, it is anticipated that FERC and NERC will continue to promulgate new Reliability Standards, and modify existing Reliability Standards, to meet these challenges.
CFTC
In accordance with the Dodd-Frank Wall Street Reform and Consumer Protection Act, the SEC and the CFTC continue to implement a regulatory framework for swaps and security-based swaps. The rules are intended to reduce risk, increase transparency and promote market integrity within the financial system by providing for the registration and comprehensive regulation of swap dealers and by imposing recordkeeping, data reporting, margin and clearing requirements with respect to swaps. We are currently subject to recordkeeping and data reporting requirements applicable to commercial end users. The CFTC finalized new rules establishing federal position limits for trading in certain commodities, such as natural gas. Entities such as PSEG began complying with the rules on January 1, 2022.
Nuclear
Nuclear Regulatory Commission (NRC)
Our operation of nuclear generating facilities is subject to comprehensive regulation by the NRC, a federal agency established to regulate nuclear activities to ensure the protection of public health and safety, as well as the environment. Such regulation involves testing, evaluation and modification of all aspects of plant operation in light of NRC safety, security, cybersecurity, and environmental requirements. Continuous demonstration to the NRC that plant operations meet requirements is necessary.
The NRC has the ultimate authority to determine whether any U.S. nuclear generating unit may operate. The NRC conducts ongoing reviews of nuclear industry operations experience and may issue or revise regulatory requirements. We are unable to predict the final outcome of these reviews or the cost of any actions we would need to take to comply with any new regulations, including possible modifications to the Salem, Hope Creek and Peach Bottom facilities, but such costs could be material.
The current operating licenses of our nuclear facilities expire in the years shown in the following table:
| | | | |
| | | | |
| Unit | | Year | |
| Salem Unit 1 | | 2036 | |
| Salem Unit 2 | | 2040 | |
| Hope Creek | | 2046 | |
| Peach Bottom Unit 2 (A) | | 2033 | |
| Peach Bottom Unit 3 (A) | | 2034 | |
| | | | |
(A)Depreciation Expense and the Asset Retirement Obligation assume these units will operate through 2053 and 2054, respectively, given our expectation that previously approved operating license expiration dates will be restored by the NRC. See Item 8. Note 11. Asset Retirement Obligations (AROs) for additional information.
In 2024, PSEG submitted a letter to the NRC regarding a potential timeline to seek a second license renewal for our Salem and Hope Creek units. This second license renewal would extend the operating licenses through 2056 and 2060 for Salem Units 1 and 2, respectively, and 2066 for Hope Creek.
State Regulation
Our principal state regulator is the BPU, which oversees electric and natural gas distribution companies in New Jersey. We are also subject to various other states’ regulations due to our operations in those states.
Our New Jersey utility operations are subject to comprehensive regulation by the BPU including, among other matters, regulation of retail electric and gas distribution rates and service, the issuance and sale of certain types of securities and compliance matters.
In addition to base rates, we recover certain costs or earn on certain investments pursuant to mechanisms known as adjustment clauses. These clauses permit the flow-through of costs to, or the recovery of investments from, customers related to specific programs, outside the context of base rate proceedings. Recovery of these costs or investments is subject to BPU approval for which we make periodic filings. Delays in the pass-through of costs or recovery of investments under these
mechanisms could result in significant changes in PSE&G’s cash flow. PSE&G’s participation in solar, EV and EE programs is also regulated by the BPU, as the terms and conditions of these programs are approved by the BPU. BPU regulation can also have a direct or indirect impact on our power generation business as it relates to energy supply agreements and energy policy in New Jersey.
New Jersey Energy Master Plan (EMP) and Future of Gas Stakeholder Proceeding—In January 2020, the State of New Jersey released its EMP. While the EMP does not have the force of law and does not impose any obligations on utilities, it outlines current expectations regarding New Jersey’s role in the use, management, and development of energy. The EMP recognizes the goals of New Jersey’s Clean Energy Act of 2018 (the Clean Energy Act) to achieve, by 2026, annual reductions of electric and gas consumption of at least 2% and 0.75%, respectively, of the average of the prior three years of retail sales. The annual reductions were subsequently adjusted to 2.15% for electric and 1.10% for gas by 2027 in the BPU’s EE framework approved in June 2020. The EMP outlines several strategies, including statewide EE programs; expansion of renewable generation (solar and offshore wind), energy storage and other carbon-free technologies; preservation of existing nuclear generation; electrification of the transportation sector; and reduced reliance on natural gas. The BPU began proceedings to update the State’s EMP via public input hearings in May and June 2024.
In February 2023, the governor of New Jersey issued three Executive Orders (EOs), one of which directed the BPU to convene a stakeholder process on the future of gas to develop a plan to meet the State’s current EMP goal to reduce emissions by 50% versus 2006 levels by 2030. In March 2023, the BPU opened a stakeholder proceeding to implement such EO that commenced in August 2023 with a two-day technical conference. We cannot predict the impact on our business or results of operations from these stakeholder proceedings, or any laws, rules, or regulations promulgated as a result thereof.
Stakeholder Proceeding on Gas Competition, BGSS—In February 2023, the BPU announced that it would open a new docket to conduct a stakeholder proceeding regarding gas supply issues previously raised by competitive gas suppliers, including third-party suppliers’ participation in New Jersey gas distribution companies’ annual BGSS filings, and other aspects of the existing BGSS construct. There has been no public activity in this matter since May 2023.
Gas Capacity Review—In September 2019, the BPU formally opened a stakeholder proceeding to explore gas capacity procurement service to all New Jersey natural gas customers and in June 2022 accepted a consultant’s finding that, through 2030, New Jersey’s firm gas capacity can meet firm demand under normal design day conditions. The BPU noted that its consultant’s analysis supported the argument against the need for additional interstate pipeline capacity and also supports the BPU’s aggressive policy approach to reduce New Jersey’s overall reliance on fossil fuels and achieve the New Jersey governor’s goal of 100% clean energy by 2050.
Regional Energy Access (REA) Expansion Project — In September 2024, the United States Circuit Court for the District of Columbia Circuit vacated FERC approval of the REA Expansion Project, which involves a natural gas pipeline running through New Jersey and several other states, and in which PSEG Energy Resources & Trade, LLC, the provider of gas supplies to satisfy PSE&G’s BGSS customers, is a customer. The court found that FERC failed to properly consider the environmental consequences of the project, and the alleged lack of market demand for additional natural gas capacity in New Jersey. In January 2025, FERC responded to the Circuit Court’s concerns and reinstated its approval of the project. PSEG is continuing to monitor this proceeding.
Energy Efficiency, Triennial Review—In May 2024, the BPU approved an approximate $300 million extension of our CEF-EE program covering a commitment period from July 2024 through December 2024. In October 2024, the BPU approved our CEF-EE II filing authorizing a total spend of approximately $2.9 billion for energy efficiency projects committed between January 1, 2025 through June 30, 2027, and completed over an expected six-year period. The Order approved a program investment budget of approximately $1.9 billion, net of administrative expenses, and approximately $1 billion to continue our customer on-bill repayment program. This EE filing is a significant increase from our prior filings, driven by an increase in the savings targets required under the BPU Energy Efficiency Framework and higher costs to achieve those targeted savings. The filing also includes demand response programs and building decarbonization programs.
BGS Process—In June 2024, New Jersey’s EDCs, including PSE&G, filed their annual joint proposal for the conduct of the February 2025 BGS auction covering energy years 2026 through 2028. PSE&G’s company-specific addendum to the joint filing includes a proposal for an optional, two-year pilot program for time-of-use rates for residential customers.
EV Activity—Consistent with the policy set forth in New Jersey’s EMP, the BPU has supported electrification of the transportation sector. EDCs in New Jersey, including PSE&G, are making investments, approved by the BPU for recovery in rates, initially focused on light duty vehicles, such as preparatory work to deliver infrastructure to the EV charging point. In October 2024, the BPU released an Order that provided program guidance and minimum filing requirements for electric utility operated medium- and heavy-duty charging incentive programs. The Order caps PSE&G’s program investment at $30 million and requires electric utilities to submit program filings by February 27, 2025.
Grid Modernization—In June 2022, following a stakeholder proceeding, the BPU Staff issued a report containing findings and recommendations to update the BPU’s interconnection regulations and processes. In furtherance of the recommendations, in June 2024 the BPU amended its interconnection rules to speed up the interconnection of renewable resources to the distribution grid. Separately, in July 2024, BPU Staff convened a working group to develop recommendations for integrated distribution planning for distributed energy resources. We cannot predict the impact on our business or results of operations from this Grid Modernization plan or any laws, rules or regulations promulgated as a result thereof, particularly as they may relate to PSE&G’s electric distribution assets.
Cybersecurity Regulation
Federal—NERC Critical Infrastructure Protection standards establish cybersecurity and physical security protections for critical systems and facilities. These standards are also designed to promote coordination, threat sharing and interaction between utilities and various government agencies regarding potential cyber and physical threats against the nation’s electric grid. The Critical Infrastructure Protection standards are designed to protect Bulk Electric System (BES) Cyber Systems that would impact the reliable operation of the BES. PSE&G is obligated to comply with the NERC Critical Infrastructure Protection standards.
NERC Critical Infrastructure Protection standards do not apply to nuclear facilities which are instead governed by the NRC for purposes of physical and cyber security. NRC has a number of risk-informed, performance-based security programs in place to effectively protect U.S. commercial nuclear facilities. NRC has existing requirements, effective processes, and the expertise to regulate and inspect cybersecurity to ensure the federal requirements are met. NERC continues to examine revising criteria for low-impact cyber systems, which could result in expanding the Critical Infrastructure Protection standards to a larger set of applicable cyber assets.
NRC requires operating nuclear power plant licensee and license applicants to ensure that digital computer and communication systems associated with a nuclear power plant’s safety, security, and emergency preparedness functions are protected from cyberattacks. As a result, computer systems at operating power plants that monitor and control safety systems and help the reactor operate are isolated from external communications. Security systems that provide safeguards of the facility are also isolated from external communications, including the Internet.
NRC’s Office of Nuclear Security and Incident Response established the Cyber Security Branch (CSB) to strengthen internal governance of the agency’s regulatory activities. The CSB plans, coordinates, and manages agency activities related to cybersecurity for NRC applicants and licensees, such as security programs’ development and policy enhancements to prevent malevolent cyber acts against NRC-licensed facilities. The CSB’s cybersecurity-related responsibilities include developing rules and guidance, reviewing licensing actions, developing policy enhancements, and overseeing NRC-licensed facilities.
NRC regularly monitors the threats associated with cybersecurity, including potential threats against NRC-licensed facilities. Within the CSB there is a cyber assessment team that assesses real-world cyber events at NRC-licensed facilities. The team evaluates whether an identified threat could impact licensed facilities and makes recommendations for NRC actions and communications to the licensees. Furthermore, the NRC has established liaison relationships with the intelligence and law enforcement communities to include the National Counterterrorism Center, the U.S. Department of Homeland Security’s (DHS) Computer Emergency Response Team, and the Federal Bureau of Investigation.
The Transportation Security Administration, an agency of the U.S.DHS, has issued multiple security directives since May 2021 designed to mitigate cybersecurity threats to natural gas pipelines.
State—The BPU requires utilities, including PSE&G, to, among other things, implement a cybersecurity program that defines and implements organizational accountabilities and responsibilities for cyber risk management activities, and
establishes policies, plans, processes and procedures for identifying and mitigating cyber risk to critical systems. Additional requirements of this order include, but are not limited to (i) annually inventorying critical utility systems; (ii) annually assessing risks to critical utility systems; (iii) implementing controls to mitigate cyber risks to critical utility systems; (iv) monitoring log files of critical utility systems; (v) reporting cyber incidents to the BPU; and (vi) establishing a cybersecurity incident response plan and conducting biennial exercises to test the plan. In addition, New York’s Stop Hacks and Improve Electronic Data Security (SHIELD) Act, which became effective in March 2020, requires businesses that own or license computerized data that includes New York State residents’ private information to implement reasonable safeguards to protect that information.
ENVIRONMENTAL MATTERS
We are subject to federal, state and local laws and regulations with regard to environmental matters. Our associated obligations change as legislatures and regulators pass new laws and regulations and amend existing ones. Therefore, it is difficult to project future costs of compliance and their impact on competition. Capital costs of complying with known pollution control requirements are included in our estimate of construction expenditures in Item 7. MD&A—Capital Requirements. The costs of compliance associated with any new requirements that may be imposed by future regulations are not known but may be material.
For additional information related to environmental matters, including proceedings not discussed below, as well as anticipated expenditures for installation of compliance technology, hazardous substance liabilities and fuel and waste disposal costs, see Item 1A. Risk Factors and Item 8. Note 13. Commitments and Contingent Liabilities.
Air Pollution Control
Our facilities are subject to federal, state and local regulation that requires controls of emissions from sources of air pollution and imposes recordkeeping, reporting and permit requirements.
Water Pollution Control
The Federal Water Pollution Control Act prohibits the discharge of pollutants from point sources to water, except pursuant to a duly issued permit. These permits must generally be renewed every five years. Applicable regulations also impose obligations on facility operators like PSEG Power to install certain technology to treat their discharges to ensure discharges meet certain water quality requirements.
The Environmental Protection Agency’s (EPA) Clean Water Act (CWA) Section 316(b) rule establishes requirements for the regulation of cooling water intakes at existing power plants, such as Salem.
Hazardous Substance Liability
PSEG’s operations involve substances and byproducts classified by environmental regulations as hazardous. These regulations impose handling, storage and disposal requirements for hazardous materials. They also impose liability for damages to the environment, including cash penalties.
Site Remediation—Federal and state environmental laws and regulations require the cleanup of discharged hazardous substances. They authorize the EPA, the New Jersey Department of Environmental Protection (NJDEP) and private parties to commence lawsuits to compel clean-ups or seek reimbursement for such remediation. The clean-ups can be more complicated and costly when the hazardous substances are in or under a body of water. Clean-up obligations may be imposed regardless of the absence of fault, contractual agreements between parties, or the legality of activities at the time of discharge.
In May 2024, the EPA finalized revisions to the coal combustion residuals rule (CCR Rule) which established new requirements for the investigation and, if necessary, the cleanup of certain types of coal ash placed at certain fossil generation station sites, including certain sites owned or formerly owned by PSEG Power. We are in the process of investigating each of the sites that we currently own that are subject to the CCR Rule, as well as sites that we formerly owned that are subject to the CCR Rule where we retained certain environmental obligations to investigate and, if necessary, remediate. PSEG is currently unable to estimate the impact of the CCR Rule, but it could have a material impact on our business, results of operations and cash flows.
Pursuant to the 2022 “Dirty Dirt” legislation, the NJDEP is proposing new requirements for the transportation, handling and disposal of soil and other waste materials generated by utility companies, including PSE&G. NJDEP has not yet finalized the requirements and, therefore, PSE&G is unable to quantify the increased costs of complying with these potential new requirements.
Natural Resource Damages—Federal and state environmental laws and regulations authorize damage assessments against persons who have caused an injury to natural resources through the discharge of a hazardous substance. The NJDEP requires persons conducting remediation to address such injuries through restoration or damage assessments.
Wildlife and Habitat Protection
Federal and state environmental laws and regulations govern activities that may harm certain wildlife or habitats. These laws and regulations impose permit requirements, prohibit certain activities, and impose penalties for violations.
In December 2024, the U.S. Fish and Wildlife Service proposed to designate the monarch butterfly as a “threatened” species under the federal Endangered Species Act. PSEG is unable to determine the impact of this development.
Fuel and Waste Disposal
Nuclear Fuel Disposal—The federal government has entered into contracts with the operators of nuclear power plants for transportation and ultimate disposal of spent nuclear fuel. Under the Nuclear Waste Policy Act of 1982 (NWPA), nuclear plant owners are required to contribute to a Nuclear Waste Fund to pay for this service. Since May 2014, the nuclear waste fee rate has been zero. No assurances can be given that this fee will not be increased in the future. The NWPA allows spent nuclear fuel generated in any reactor to be stored in reactor facility storage pools or in Independent Spent Fuel Storage Installations located at reactors or away from reactor sites.
We have on-site storage facilities that are expected to satisfy the storage needs of Salem 1, Salem 2, Hope Creek, Peach Bottom 2 and Peach Bottom 3 through the end of their operating licenses.
Low-Level Radioactive Waste—As a by-product of their operations, nuclear generation units produce low-level radioactive waste. Such waste includes paper, plastics, protective clothing, water purification materials and other materials. These waste materials are accumulated on site and disposed of at licensed permanent disposal facilities. New Jersey, Connecticut and South Carolina have reached an agreement that gives New Jersey nuclear generators continued access to a waste disposal facility which is owned by South Carolina. We believe that this agreement will provide for adequate low-level radioactive waste disposal for Salem and Hope Creek through the end of their current licenses including full decommissioning, although no assurances can be given. Additionally, there are on-site storage facilities for Salem, Hope Creek and Peach Bottom, which we believe have the capacity for at least five years of temporary storage for each facility.
INFORMATION ABOUT OUR EXECUTIVE OFFICERS (PSEG)
| | | | | | | |
| | | | | | | |
Name | | Age as of December 31, 2024 | | Office | | Effective Date First Elected to Present Position |
| | | | | | | |
Ralph A. LaRossa | | 61 | | Chair of the Board (COB), President and Chief Executive Officer (CEO) - PSEG | | January 2023 to present |
| | | | President and CEO -PSEG | | September 2022 to present |
| | | | Chief Operating Officer (COO) - PSEG | | January 2020 to August 2022 |
| | | | COB and CEO - PSE&G | | September 2022 to present |
| | | | COB, President and CEO - PSEG Power | | May 2023 to present |
| | | | COB and CEO - PSEG Power | | September 2022 to May 2023 |
| | | | COB and CEO - Energy Holdings | | September 2022 to present |
| | | | COB, CEO and President - Services | | September 2022 to present |
| | | | President and COO - PSEG Power | | October 2017 to August 2022 |
| | | | President and COO - PSE&G | | October 2006 to October 2017 |
| | | | COB - PSEG Long Island LLC | | December 2020 to August 2022 |
| | | | | | | |
| | | | | | | |
Daniel J. Cregg | | 61 | | Executive Vice President (EVP) and Chief Financial Officer (CFO) - PSEG | | October 2015 to present |
| | | | EVP and CFO - PSE&G | | October 2015 to present |
| | | | EVP and CFO - PSEG Power | | October 2015 to present |
| | | | | | | |
| | | | | | | |
Kim C. Hanemann | | 61 | | President and COO - PSE&G | | June 2021 to present |
| | | | Senior Vice President (SVP) and COO - PSE&G | | January 2020 to June 2021 |
| | | | SVP - Electric Transmission and Distribution - PSE&G | | September 2018 to January 2020 |
| | | | | | | |
| | | | | | | |
Tamara L. Linde | | 60 | | EVP and Chief Legal Officer - PSEG | | September 2024 to present |
| | | | EVP and General Counsel - PSEG | | July 2014 to September 2024 |
| | | | EVP and General Counsel - PSE&G | | July 2014 to September 2024 |
| | | | EVP and General Counsel - PSEG Power | | July 2014 to September 2024 |
| | | | | | | |
| | | | | | | |
Charles V. McFeaters | | 65 | | President and Chief Nuclear Officer - PSEG Nuclear LLC | | May 2023 to present |
| | | | SVP - Nuclear Operations - PSEG Nuclear LLC | | November 2020 to May 2023 |
| | | | Vice President (VP) - Salem Generating Station - PSEG Nuclear LLC | | October 2016 to November 2020 |
| | | | | | | |
| | | | | | | |
Grace Park | | 49 | | EVP and General Counsel - PSEG | | September 2024 to present |
| | | | EVP and General Counsel - PSE&G | | September 2024 to present |
| | | | EVP and General Counsel - PSEG Power | | September 2024 to present |
| | | | VP - Deputy General Counsel and Chief Litigation Counsel - Services | | July 2020 to September 2024 |
| | | | | | |
Sheila J. Rostiac | | 54 | | SVP - Human Resources, Chief Human Resources and Chief Diversity Officer - Services | | January 2020 to present |
| | | | SVP - Human Resources and Chief Human Resources Officer - Services | | September 2019 to January 2020 |
| | | | | | | |
| | | | | | | |
Richard T. Thigpen | | 64 | | SVP - Corporate Citizenship - Services | | July 2018 to present |
| | | | | | | |
| | | | | | | |
Rose M. Chernick | | 61 | | VP and Controller - PSEG | | March 2019 to present |
| | | | | VP and Controller - PSE&G | | March 2019 to present |
| | | | | VP and Controller - PSEG Power | | March 2019 to present |
| | | | | | | |
ITEM 1A. RISK FACTORS
The following factors should be considered when reviewing our business. These factors could have a material adverse impact on our business, prospects, financial position, results of operations or cash flows and could cause results to differ materially from those expressed elsewhere in this report.
GENERAL OPERATIONAL AND FINANCIAL RISKS
Inability to successfully develop, obtain regulatory approval for, or construct T&D, and our nuclear generation projects could adversely impact our businesses.
Our business plan calls for extensive investment in capital improvements and additions, including the construction of T&D facilities, modernizing and expanding existing infrastructure pursuant to investment programs that provide for current recovery in rates, addressing needs of new customers and increasing demand on the system, and our CEF programs, particularly our energy efficiency program which provides incentives for customers to install high-efficiency equipment at their premises and transmission capital investments outside of our utility service territory, as well as uprates and other potential investments at our nuclear facilities. Currently, we have several significant capital investments underway or being contemplated.
The successful construction and development of these projects will depend, in part, on our ability to:
•obtain necessary governmental and regulatory approvals;
•obtain environmental permits and approvals;
•obtain governmental and community support for such projects to avoid delays in the receipt of permits and approvals from regulatory authorities;
•obtain customer support for investments made at their premises;
•obtain property/land rights in property-constrained areas and for greenfield locations, and at a reasonable cost;
•complete such projects within budgets and on commercially reasonable terms and conditions;
•complete supporting information technology (IT), cybersecurity and physical security upgrades;
•obtain any necessary debt financing on acceptable terms and/or necessary governmental financial incentives;
•ensure that contracting parties, including suppliers, perform under their contracts in a timely and cost-effective manner; and
•timely recovery of these investments through rates.
Failure to obtain regulatory or other approvals, delays, cost escalations or otherwise unsuccessful construction and development could materially affect our financial position, results of operations and cash flows.
Macroeconomic considerations, including inflationary levels, gas and electric supply prices that are passed through to customers and other pressures could factor into our regulators’ assessment in approving the size, duration and timing of cost recovery of certain of these programs. Further, certain negative public and political views by certain stakeholders on natural gas and other types of energy infrastructure could result in diminishing support for those investments.
In addition, the successful operation of new facilities or transmission or distribution projects is subject to risks relating to supply interruptions; labor availability, work stoppages and labor disputes; weather interferences; unforeseen engineering and environmental problems, including those related to climate change; opposition from local communities, and the other risks described herein.
Any of these risks could cause the amounts of our investments and/or our return on these investments to be lower than expected, which could adversely impact our financial condition and results of operations through lower investment opportunities and/or lower returns.
We are subject to physical, financial and transition risks related to climate change, including potentially increased legislative and regulatory burdens and changing customer preferences, and we may be subject to lawsuits, all of which could impact our businesses and results of operations.
Climate change may increasingly drive change to existing or additional legislation and regulation that may impact our business and shape our customers’ energy preference and sustainability goals. While the CIP protects PSE&G’s margin variances against changes in customer usage of gas and electricity, customer demand for natural gas could decrease as a result of changing customer preferences favoring electrification and advanced technologies that offer energy efficient options. Electric demand could also be impacted by electrification, including greater adoption of EVs, installation of distributed energy resources, such as behind the meter solar, installation of more energy efficient equipment, flexible load and/or energy storage, and other advances in technology. Further, climate change may adversely impact the economy and reduced economic and consumer activity in our service areas could lower demand for electricity and gas we deliver. Any one or all of these factors could impact the need to invest in our electric and gas T&D systems and, therefore, our company growth rate.
Severe weather or acts of nature, including hurricanes, winter storms, earthquakes, floods, wildfires and other natural disasters can stress systems, disrupt operation of our facilities and cause service outages, and property damage that require incurring additional expenses. In addition, the effects of climate change will have increased the physical risks to our facilities and operations resulting from such climate hazards as more severe weather events (extreme wind, rainfall and flooding), such as experienced from Superstorm Sandy and Tropical Storms Isaias and Ida, sea level rise, and extreme heat and drought.
These and other physical changes could result in changes in customer demand, increased costs associated with repairing and maintaining generation facilities and T&D systems, resulting in increased maintenance and capital costs (and potential increased financing needs), increased regulatory oversight, and lower customer satisfaction. Where recovery of costs to restore service and repair damaged equipment and facilities is available, any determination by the regulator not to permit timely and full recovery of the costs incurred could have a material adverse effect on our businesses, financial condition, results of operations and prospects.
To the extent financial markets view climate change and greenhouse gas (GHG) emissions as a financial risk, our ability to access capital markets could be negatively affected or cause us to receive less than favorable terms and conditions.
Climate change-related political action and state and federal policy goals, including but not limited to those related to energy efficient targets, solar targets, energy storage targets, encouragement of electrification through EV adoption, policies to restrict the use of natural gas in new or existing homes and businesses, or encourage electrification of end use equipment currently fueled by natural gas, and the associated legislative and regulatory responses, may create financial risk as our operations may be subject to additional regulation at either the state or federal level in the future. Increased regulation of GHG emissions could impose significant additional costs on our electric and natural gas operations, our suppliers and ultimately, our customers. Developing and implementing plans for compliance with GHG emissions reduction, clean/renewable energy requirements, or for achieving voluntary climate commitments can lead to additional capital and Operation and Maintenance (O&M) expenditures and could significantly affect the economic position of existing operations and proposed projects. If our regulators do not allow us to recover all or a part of the cost of capital investment or the O&M costs incurred to comply with increasingly rigorous regulatory mandates, it could have a material adverse effect on our results of operations, financial condition or cash flows. On the other hand, in the event that the political, policy, regulatory or legislative support for clean energy projects declines, the benefits or feasibility of certain investments we could potentially make may be reduced.
We may be subject to climate change lawsuits that may seek injunctive relief, monetary compensation, penalties, and punitive damages, including but not limited to, for liabilities for damages related to mitigate harm caused by climate change. An adverse outcome could require substantial capital expenditures and possibly require payment of substantial penalties or damages. Defense costs associated with such litigation can also be significant and could affect results of operations, financial condition or cash flows if such costs are not recovered through regulated rates.
Further, our business is subject to policy, regulatory, technology and economic uncertainties and contingencies, including regulatory approvals required for our various investments, many of which are beyond our control and may affect planned
investments and our ability to meet our targets of net zero GHG emissions by 2030 for Scopes 1 and 2 emissions, or other GHG emissions reduction or climate-related goals that we may set from time to time, in a cost-effective manner or at all.
We may be adversely affected by asset and equipment failures, accidents, critical operating technology or business system failures, natural disasters, severe weather events, acts of war or terrorism or other acts of violence, sabotage, physical attacks or security breaches, cyberattacks, or other incidents, including pandemics, that impact our ability to provide safe and reliable service to our customers and remain competitive and could result in substantial financial losses.
The success of our businesses is dependent on our ability to continue providing safe and reliable service to our customers while minimizing service disruptions. We are exposed to the risk of asset and equipment failures, gas explosions, accidents, natural disasters, severe weather events, acts of war or terrorism or other acts of violence, including active shooter situations, sabotage, physical attacks or security breaches, cyberattacks or other incidents, which could result in damage to or destruction of our substations or other facilities or infrastructure, or damage to persons or property and to electric and gas supply interruptions. Further, a major failure of availability or performance of a critical operating technology or business system, and inadequate preparation or execution of business continuity or disaster recovery plans for the loss of one or several critical systems, could result in extended disruption to operations or business processes, damage to systems and/or loss of data. We have historically benefited from access to mutual aid, a voluntary and reciprocal arrangement with other utilities that provides access to a trained and flexible labor force which has helped to reduce outage restoration times during extreme weather events. There is no guarantee that we will have continued access to mutual aid as the frequency of severe weather events rises.
We are also exposed to the risk of pandemics, which could result in service disruptions and delays or otherwise impair our ability to timely provide service to our customers, complete our investment projects or obtain timely recovery of our costs.
These events could result in increased political, economic, financial and insurance market instability, a lack of available insurance or the availability of insurance on commercially reasonable terms, and volatility in power and fuel markets, which could materially adversely affect our business and results of operations, including our ability to access capital on terms and conditions acceptable to us.
Any of the issues described above, if experienced at our facilities or otherwise in our business, or by others in our industry, could adversely impact our revenues; increase costs to repair and maintain our systems; subject us to potential litigation and/or damage claims, fines or penalties; and increase the level of oversight of our utility and generation operations and infrastructure through investigations or through the imposition of additional regulatory or legislative requirements. Such actions could adversely affect our costs, competitiveness, future investments and customer rates, which could be material to our financial position, results of operations and cash flow. For our T&D business, the cost of storm restoration efforts may not be fully recoverable through the regulatory process. In addition, the inability to restore power to our customers on a timely basis could result in negative publicity and materially damage our reputation.
Any inability to recover the carrying amount of our long-lived assets could result in future impairment charges which could have a material adverse impact on our financial condition and results of operations.
Long-lived assets represent approximately 73% and 80% of the total assets of PSEG and PSE&G, respectively, as of December 31, 2024. Management evaluates long-lived assets for impairment whenever events or changes in circumstances, such as significant adverse changes in regulation, including a disallowance of certain costs, a potential sale or disposition of an asset significantly before the end of its useful life, business climate or market conditions, including prolonged periods of adverse commodity and capacity prices, could potentially indicate an asset’s or group of assets’ carrying amount may not be recoverable. Significant reductions in our expected revenues or cash flows for an extended period of time resulting from such events could result in future asset impairment charges, which could have a material adverse impact on our financial condition and results of operations.
Disruptions or cost increases in our supply chain, including labor shortages, could materially impact our business.
The supply chain of goods and services could be impacted by several factors, including sanctions, tariffs, manufacturing labor shortages, domestic and international shipping constraints, increases in demand, and shortages of raw materials and
specialty components. This could cause price increases in some areas and delivery delays of certain goods, which could increase our costs and impact our operations.
Inability to maintain sufficient liquidity in the amounts and at the times needed or access sufficient capital at reasonable rates or on commercially reasonable terms could adversely impact our business.
Funding for our investments in capital improvement and additions, scheduled payments of principal and interest on our existing indebtedness and the extension and refinancing of such indebtedness has been provided primarily by internally-generated cash flow and external debt financings. We have significant capital requirements and depend on our ability to generate cash in the future from our operations and continued access to capital and bank markets to efficiently fund our cash flow needs. Our ability to generate cash flow is dependent upon, among other things, industry conditions and general economic, financial, competitive, legislative, regulatory and other factors. The ability to arrange financing and to refinance existing debt and the costs of such financing or refinancing depend on numerous factors including, among other things:
•general economic and capital market conditions, including but not limited to, prevailing interest rates;
•the availability of credit from banks and other financial institutions;
•tax, regulatory and securities law developments;
•for PSE&G, our ability to obtain necessary regulatory approvals for the incurrence of additional indebtedness;
•investor confidence in us, our regulatory environment and our industry;
•our current level of indebtedness and compliance with covenants in our debt agreements;
•the success of current projects and the quality of new projects;
•the predictability of our cash flows;
•our current and future capital structure;
•our financial performance and the continued reliable operation of our business; and
•maintenance of our investment grade credit ratings.
Market disruptions, such as economic downturns experienced in the U.S. and abroad, the bankruptcy of an unrelated energy company or a systemically important financial institution, changes in market prices for electricity and gas, and actual or threatened acts of war or terrorist attacks, may increase our cost of borrowing or adversely affect our ability to access capital. As a result, no assurance can be given that we will be successful in obtaining financing for projects and investments, extending or refinancing maturing debt or meeting our other cash flow needs on acceptable terms or at all, which could materially adversely impact our financial position, results of operations and future growth.
During periods of rising energy prices, hedged positions could be out-of-the-money, increasing PSEG Power’s collateral requirements. In addition, if PSEG Power were to lose its investment grade credit rating from S&P or Moody’s, it would be required under certain agreements to provide a significant amount of additional collateral in the form of letters of credit or cash, which would have a material adverse effect on our liquidity and cash flows.
Cybersecurity attacks, data breaches, or intrusions or other disruptions to our IT, operational or other systems could adversely impact our businesses.
Cybersecurity threats to the energy market infrastructure are increasing in sophistication, magnitude and frequency, particularly with the regularity of virtual operations. Because of the inherent vulnerability of infrastructure and technology and operational systems to disability or failure due to hacking, viruses, malicious or destructive code, phishing and other social engineering attacks, denial of service attacks, ransomware, acts of war or terrorism, or other cybersecurity incidents, we face increased risk of cyberattack. We rely on information and operational technology systems and network infrastructure to operate our generation and T&D systems. We also store sensitive data, intellectual property and proprietary or personally identifiable information regarding our business, infrastructure, employees, shareholders, customers and vendors on our IT systems and conduct power marketing and hedging activities. In addition, the operation of our business is dependent upon the IT systems of Nth parties (i.e., our third parties and other business relationships, including fourth parties, etc.), including our
vendors, regulators, RTOs and ISOs, among others. Our and Nth-party operational and IT systems and products may be vulnerable to cybersecurity attacks involving fraud, malice or oversight on the part of our employees, other insiders or Nth parties, whether domestic or foreign sources. Further, new types of cyberattacks, whether directed at our own infrastructure and technology and operational systems or that of third parties, may be generated or enhanced through the use of Artificial Intelligence (AI) and/or cloud-based infrastructure. A successful cybersecurity attack may result in unauthorized use of our systems to cause disruptions at an Nth party. Cybersecurity risks to our operations include:
•disruption of the operation of our assets, the fuel supply chain, the power grid and gas T&D,
•theft of confidential company, employee, shareholder, vendor or customer information, and critical energy infrastructure information, which may cause us to be in breach of certain covenants and contractual, legal or regulatory obligations and pose risk to our system and our customers,
•general business system and process interruption or compromise, including preventing us from servicing our customers, working remotely, collecting revenues or the ability to record, process and/or report financial information correctly, and
•breaches of vendors’ infrastructures where our confidential information is stored.
We and our Nth-party vendors have been and will continue to be subject to cybersecurity attacks, including but not limited to ransomware, denial of service, business email compromises, and malware attacks. To date, there has been no material impact or reasonably likely material impact on our business strategy, results of operations or financial condition from these attacks or other cybersecurity incidents, including as a result of prior cybersecurity incidents. However, we may be unable to prevent all such attacks in the future from having such a material impact as such attacks continue to increase in sophistication and frequency. If a significant cybersecurity event or breach occurs within our company or with one of our material vendors, we could be exposed to significant loss of revenue, material repair costs to intellectual and physical property, significant fines and penalties if determined that we were in non-compliance with existing laws and regulations, significant litigation costs, increased costs to finance our businesses, negative publicity, damage to our reputation and loss of confidence from our customers, regulators, investors, vendors and employees. The misappropriation, corruption or loss of personally identifiable information and other confidential data from us or one of our vendors could lead to significant breach notification expenses, mitigation expenses such as credit monitoring, and legal and regulatory fines and penalties. Moreover, new or updated security laws or regulations, including laws and regulations that respond to evolving application of AI, or unforeseen threat sources could require changes in current measures taken by us and our business operations, which could result in increased costs and adversely affect our financial statements. Similarly, a significant cybersecurity event or breach experienced by a competitor, regulatory authority, RTO, ISO, or vendor could also materially impact our business and results of operations via enhanced legal and regulatory requirements. The amount and scope of insurance we maintain against losses that result from cybersecurity incidents may not be sufficient to cover losses or adequately compensate for resulting business disruptions. To address the risks to our information and operational technology systems, we maintain a cybersecurity program that includes policies and controls, cybersecurity insurance, cybersecurity governance and compliance, awareness training, table-top exercises, logging and monitoring, and testing. These preventative actions minimize the likelihood and potential impact of cybersecurity breaches. For a discussion of state and federal cybersecurity regulatory requirements and information regarding our cybersecurity program, see Item 1C. Cybersecurity. Further, we are subject to changing data protection laws in the U.S. and abroad. Legal requirements and regulatory scrutiny for the collection, storage, handling, use, disclosure, transfer, and security of personal data continue to evolve and expand, which may present material obligations and risks to our business, including expanded compliance burdens, restrictions on transfer of personal data, costs, and enforcement risks.
An increasing demand for power and load growth, potentially compounded by a shift away from natural gas toward increased electrification could cause reliability issues and higher costs for customers, which could lead to potential pressure on fair and timely recovery of our investments and proposed programs.
Substantial investments in generation, transmission and distribution will be required to meet current projections of increasing customer demand. Higher projected demand is driven by a number of factors, including data centers, reshoring manufacturing, port electrification, EV adoption, other electrification and a shift away from natural gas. Sustained distribution grid modernization will also be required to accommodate increased EE, EV infrastructure, increased penetration of distributed energy resources on the electric system, such as on-site solar generation and also potential deployment of
energy storage, fuel cells, and DR technologies. Higher electric demand could significantly increase the prices of energy and capacity, as well as raise resource adequacy and reliability concerns within PJM, particularly if that increased demand outpaces the addition of firm generation capacity and in transmission constrained zones. This resource adequacy challenge presents reliability concerns, as well as potential for increasing energy and capacity prices that could place pressure on customer bills, could attract political and regulatory scrutiny and increase regulatory uncertainty for utility investment initiatives and programs.
Failure to attract and retain a qualified workforce could have an adverse effect on our business.
Certain events such as an aging workforce looking to retire without an opportunity to transfer knowledge to a successor, inadequate workforce plans and replacements, lack of skill set to meet current and evolving business needs, a culture that does not foster inclusion leading to turnover, acts of violence in the workplace, inadequate training and a workforce that is not engaged may lead to operating challenges, safety concerns and increased costs. The challenges include loss of knowledge and a lengthy time period associated with skill development, increased turnover, costs for contractors to replace employees, poor productivity, and a lack of innovation. Specialized knowledge and experience are required of employees across PSEG and its affiliates. There is competition for these skilled employees. Failure to hire and adequately train and retain employees, including the transfer of significant historical knowledge and expertise to new employees, may adversely affect our results of operations, financial position and cash flows.
Inflation, including increases in the costs of equipment and materials, fuel, services and labor could adversely affect our operating results.
Higher costs from suppliers of equipment and materials, fuel and services and labor and health care costs to attract and retain our workforce, as well as policy matters such as tax rates, tariffs and other policies impacting costs, could lead to increased costs, which could reduce our earnings. Also, seeking recovery of higher costs in future distribution base rate cases could pressure customer rates, resulting in a potentially adverse outcome of such proceedings, or in other proceedings, including the proposal of certain investment programs or other proceedings that impact customer rates.
Covenants in our debt instruments and credit agreements may adversely affect our business.
PSEG’s and PSE&G’s debt instruments contain events of default customary for financings of their type, including cross accelerations to other debt of that entity. PSEG’s, PSE&G’s and PSEG Power’s bank credit agreements contain events of default customary for financings of their type, including cross defaults and accelerations and, in the case of PSEG’s and PSEG Power’s bank credit agreements, certain change of control events. PSEG’s, PSE&G’s and PSEG Power’s bank credit agreements, contain certain limitations on the incurrence of liens and PSEG Power’s bank credit agreements also contain limitations on the incurrence of certain subsidiary debt. PSEG Power's term loan agreements contain a change-of-control clause, which includes under certain circumstances, PSEG Power ceasing to be a wholly owned subsidiary of PSEG. Our ability to comply with these and future covenants may be affected by events beyond our control. If we fail to comply with the covenants and are unable to obtain a waiver or amendment, or a default exists and is continuing under such debt, the lenders or the holders or trustee of such debt, as applicable, could give notice and declare outstanding borrowings and other obligations under such debt immediately due and payable. We may not be able to obtain waivers, amendments or alternative financing, or if obtainable, it could be on terms that are not acceptable to us. Any of these events could adversely impact our financial condition, results of operations and cash flows.
Financial market performance directly affects the asset values of our defined benefit plan trust funds and Nuclear Decommissioning Trust (NDT) Fund. Market performance and other factors could decrease the value of trust assets and could result in the need for significant additional funding.
The performance of the financial markets will affect the value of the assets that are held in trust to satisfy our future obligations under our defined benefit plans and to decommission our nuclear generating plants. A decline in the market value of the defined benefit plan trust funds could increase our pension plan funding requirements and result in increased pension costs in future years. The market value of our defined benefit plan trusts could be negatively impacted by adverse financial market conditions that reduce the return on trust assets, decreased interest rates used to measure the required minimum funding levels, and future government regulation. Additional funding requirements for our defined benefit plans could be
caused by changes in required or voluntary contributions, an increase in the number of employees becoming eligible to retire and changes in life expectancy assumptions. A decline in the market value of our NDT Fund could increase PSEG Power’s funding requirements to decommission its nuclear plants. An increase in projected costs could also lead to additional funding requirements for our decommissioning trust. Failure to manage adequately our investments in our defined benefit plan trusts and NDT Fund could result in the need for us to make significant cash contributions in the future to maintain our funding at sufficient levels, which would negatively impact our results of operations, cash flows and financial position.
If we are unable to enter into or extend certain significant contracts, this may negatively affect our financial condition and operating results
We are party to, and are also exploring opportunities to enter into, several contracts from which we currently or may in the future derive significant revenues.
PSEG Power sells wholesale natural gas, primarily through a full-requirements BGSS contract with PSE&G to meet the needs of PSE&G’s default gas supply service customers. In 2022, the BPU approved an extension of the long-term BGSS contract to March 31, 2027, and thereafter the contract remains in effect unless terminated by either party with a two-year notice. PSEG LI has an OSA with LIPA to operate LIPA’s electric T&D system in Long Island. The OSA continues through 2025 and LIPA is currently conducting a process for provision of these services after 2025. It is uncertain whether these contracts will be extended or renewed, which may negatively affect our financial condition and operating results.
In addition, we are exploring opportunities for the potential sale of power from our nuclear facilities pursuant to long-term agreements with large power users, such as data centers. It is uncertain whether we will be successful in entering into any of such contracts, including without limitation in connection with various ongoing regulatory proceedings.
Artificial Intelligence is an emerging area of technology that has the potential to impact various aspects of our business operations and customer interactions.
AI, including Generative AI and Post-Quantum Cryptography, has the potential to change the way we operate by creating efficiencies and improving processes and customer experiences. The development, adoption, and use for generative AI technologies are still in their early stages and ineffective or inadequate AI development or deployment practices by PSEG or Nth-party vendors could result in unintended consequences. We contract third-party vendors that use AI in products and/or services they provide and we may not have full control or visibility over the quality, performance, security or compliance of the products and services that incorporate AI-related technology. AI algorithms that we or our Nth-party vendors use may be flawed or may be based on data sets that are biased or insufficient. These limitations or failures could result in reputational damage, unauthorized disclosure of data, and legal liabilities. Developing, testing, and deploying resource-intensive AI systems may require additional investment and increase our costs. In addition, the evolving nature of AI may cause new laws and regulations to be enacted which may require significant resources to modify and maintain business practices to comply with the new laws and regulations, the nature of which cannot be determined at this time. Further, inaccurate results generated as a result of our employees’, contractors’ or vendors’ use of generative AI technologies could lead to operational interruptions or reputational harm.
RISKS RELATED TO OUR GENERATION BUSINESS
Fluctuations in the wholesale power and natural gas markets could negatively affect our financial condition, results of operations and cash flows.
In the competitive markets where we operate, participants are not guaranteed any specific rate of return on their capital investments and natural gas prices have a major impact on the price that generators receive for their output. The natural gas market and energy markets have been, and may continue to be, volatile due to higher domestic demand, increased natural gas exports and impacts from the global liquefied natural gas market, weather and other factors. Lower natural gas prices often result in lower electricity prices, which could reduce our margins where our nuclear generation costs may not have declined similarly.
Changes in prevailing market prices below the PTC threshold could have a material adverse effect on our financial condition and results of operations. Factors that may cause market price fluctuations include:
•changes in demand on the system, which could be impacted by new large customers, including data centers, electrification and other factors;
•increases and decreases in generation capacity, including the addition of new supplies of power as a result of the development of new power plants, expansion of existing power plants, continuing retirement of existing generation units, inability of new generating units to be placed online, the retention of power plants that were expected to be retired or recently retired units being returned to service, the extent to which those generating units are firm or intermittent, or additional transmission capacity;
•severe weather conditions;
•power supply disruptions, including power plant outages and transmission disruptions;
•climate change, and weather conditions, particularly unusually mild summers or warm winters in our market areas;
•economic and political conditions that could negatively impact the demand for power or PTCs on our nuclear generation units;
•changes in the supply of, and demand for, energy commodities;
•development of new fuels or new technologies for the production or storage of power;
•incurring penalties due to generation performance failure when called on by PJM during emergency situations;
•federal and state regulations and actions of PJM and changing PJM market rules, including capacity market auction delays and/or rule changes that could materially impact prices; and
•federal and state power, market and environmental regulation and legislation, including financial incentives for new renewable energy generation capacity that could lead to oversupply and price suppression.
Our generation business currently involves the establishment of forward sale positions in the wholesale energy markets on long-term and short-term bases. If the realized value of our generation falls outside of the PTC thresholds, to the extent that we have contracted obligations in excess of energy we have produced, an increase in market prices could reduce profitability. If the strategy we utilize to hedge our exposure to these various risks or if our internal policies and procedures designed to monitor the exposure to these various risks are not effective, we could incur material losses. Our market positions can also be adversely affected by the level of volatility in the energy markets that, in turn, depends on various factors, including weather in various geographical areas, short-term supply and demand imbalances, and pricing differentials at various geographic locations. These risks cannot be predicted with certainty.
In addition, the volatility and potential for higher natural gas or energy prices may have a material impact on collateral requirements related to the forward value of our open futures contracts. Higher collateral requirements reduce available short-term liquidity and increase working capital costs and may affect our ability to hedge generation output and fuel.
We may be unable to obtain an adequate nuclear fuel supply in the future.
We obtain substantially all of our nuclear fuel supply from third parties pursuant to arrangements that vary in term, pricing structure, firmness and delivery flexibility. Our fuel supply arrangements must be coordinated with storage services and other contracts to ensure that the nuclear fuel is delivered to our power plants at the times, in the quantities and otherwise in a manner that meets the needs of our generation portfolio and our customers. We must also comply with laws and regulations governing the transportation of such fuels.
We are exposed to increases in the price of nuclear fuel, and significant changes in the price of nuclear fuel could affect our cash flow, future results and impact our liquidity needs. In addition, we face risks with regard to the delivery to, and the use of nuclear fuel by, our power plants including the following:
•creditworthiness of third-party suppliers, defaults by third-party suppliers on supply obligations and our ability to replace supplies currently under contract may delay or prevent timely delivery;
•market liquidity for physical supplies of such fuels or availability of related services (e.g., fabrication) may be insufficient or available only at prices that are not acceptable to us;
•variation in the quality of such fuels may adversely affect our power plant operations;
•domestic and foreign legislative or regulatory actions or requirements may impact the availability of and/or increase the cost of such fuels; and
•the loss of critical infrastructure, acts of war or terrorist attacks (including cybersecurity breaches) or catastrophic events such as fires, earthquakes, explosions, floods, severe storms or other similar occurrences could impede the delivery of such fuels.
The nuclear units we operate have a diversified portfolio of contracts and inventory that provide a substantial portion of our fuel raw material needs over the next several years. However, each of the nuclear units we operate has contracted with a single fuel fabrication services provider, and transitioning to an alternative provider could take an extended period of time. This could have a material adverse impact on our business, the financial results of specific plants and on our results of operations.
Although our fuel contract portfolio provides a degree of hedging against these market risks, such hedging may not be effective and future increases in our fuel costs could materially and adversely affect our financial condition and results of operations.
The introduction or expansion of technologies related to energy generation, distribution and consumption and changes in customer usage patterns could adversely impact us.
Federal and state incentives for the development and operation of renewable sources of power have facilitated the penetration of competing technologies, such as wind, solar, and commercial-sized power storage. Additionally, the development of demand side management (DSM) and EE programs can impact demand requirements for electricity and natural gas markets. The development of competing on-site power generation could also result in a reduction in anticipated growth which could negatively impact our financial condition, results of operations and cash flows.
Advances in distributed generation technologies, such as fuel cells, micro turbines, micro grids, windmills and net-metered solar installations, coupled with subsidies, may reduce the cost of alternative methods of delivering electricity to customers to a level that is competitive with that of most central station electric production. Large customers, such as universities and hospitals, continue to explore potential micro grid installation. Certain states are also considering mandating the use of power storage resources to replace uneconomic or retiring generation facilities. Such developments could (i) affect the price of energy, (ii) reduce energy deliveries as customer-owned generation becomes more cost-effective, (iii) require further improvements to our distribution systems to address changing load demands, and (iv) make portions of our transmission and/or distribution facilities obsolete prior to the end of their useful lives. These technologies could also result in further declines in commodity prices or demand for delivered energy. Further, a material shift away from natural gas due to customer preference or regulatory developments and initiatives could reduce the number of gas customers.
Some or all of these factors could result in a lack of growth or decline in customer demand for electricity or natural gas or of customers, and may cause us to fail to fully realize anticipated benefits from significant capital investments and expenditures, which could have a material adverse effect on our financial position, results of operations and cash flows. These factors could also materially affect our results of operations, cash flows or financial positions through, among other things, reduced operating revenues, increased O&M expenses, and increased capital expenditures, as well as potential asset impairment charges or accelerated depreciation and decommissioning expenses over shortened remaining asset useful lives.
We are subject to third-party credit risk relating to our sale of nuclear generation output.
We sell generation output through the execution of bilateral contracts. These contracts are subject to credit risk, which relates to the ability of our counterparties to meet their contractual obligations to us. Any failure of these counterparties to perform could have a material adverse impact on our results of operations, cash flows and financial position. In the spot markets, we are exposed to the risks of the default sharing mechanisms that exist in those markets, some of which attempt to spread the risk across all participants. Therefore, a default by a third party could increase our costs, which could negatively impact our results of operations and cash flows.
There may be periods when PSEG Power generation may not operate and/or may not be able to meet its commitments under forward sale obligations and PJM rules at a reasonable cost or at all.
A portion of PSEG Power’s nuclear generation output has been sold forward under fixed price financial power sales contracts. Forward financial sales offset physical sales in the PJM RTO spot market. Our forward sales of energy and capacity assume sustained, acceptable levels of operating performance. Operations at any of our plants could degrade to the point where the plant has to shut down or operate at less than full capacity. Some issues that could impact the operation of our facilities are:
•breakdown or failure of equipment, IT, processes or management effectiveness;
•disruptions in the transmission of electricity;
•labor disputes or work stoppages;
•fuel supply interruptions;
•limitations which may be imposed by environmental or other regulatory requirements; and
•operator error, acts of war or terrorist attacks (including physical or cybersecurity breaches) or catastrophic events such as fires, earthquakes, explosions, floods, severe weather or other similar occurrences.
Identifying and correcting any of these issues may require significant time and expense. Depending on the materiality of the issue, we may choose to close a plant rather than incur the expense of restarting it or returning it to full capacity.
Because the obligations under most of these forward sale agreements are not contingent on a unit being available to generate power, PSEG Power’s results of operations and cash flows are at risk even in the event of a plant outage, or a reduction in the available capacity of the unit. To the extent that PSEG Power does not meet its expected nuclear generation output, PSEG Power would be required to pay the difference between the market price and the contract price on its financial contracts without receiving the physical spot energy revenue or be required to purchase energy at higher prices to cover its shortfall. In addition, as capacity performance resources in PJM, PSEG’s nuclear units have been and will in the future be required to pay penalties if a forced outage at a plant occurs during a declared emergency event within PJM and that plant’s expected performance exceeds its actual performance during such event. The amount of such payments could be substantial and could have a material adverse effect on our financial condition, results of operations and cash flows.
In addition, changing market design rules, including capacity performance rules and timing of capacity market auctions, and/or failure to follow existing rules – by PJM or market participants – creates regulatory uncertainty and reliability risk.
REGULATORY, LEGISLATIVE AND LEGAL RISKS
PSE&G’s revenues, earnings and results of operations are dependent upon state laws and regulations that affect distribution and related activities.
PSE&G is subject to regulation by the BPU. Such regulation affects almost every aspect of its businesses, including its retail rates. Failure to comply with these regulations could have a material adverse impact on PSE&G’s ability to operate its business and could result in fines, penalties or sanctions. The retail rates for electric and gas distribution services are established in a distribution base rate proceeding and remain in effect until a new distribution base rate proceeding is filed and concluded. PSE&G's base rates were most recently approved in October 2024. In addition, our utility has received approval for several clause recovery mechanisms, some of which provide for recovery of costs and earn returns on authorized investments. These clause mechanisms require periodic financial reviews to update rates charged to customers which are independent of base rate proceedings and are subject to prudency reviews by the BPU. Inability to obtain fair or timely recovery of all our costs pursuant to the distribution base rate case and/or these clause recovery mechanisms, including a return of, or on, our investments in rates, could have a material adverse impact on our results of operations and cash flows. In addition, if legislative and regulatory structures were to evolve in such a way that PSE&G’s exclusive rights to serve its regulated customers were eroded, its future earnings could be negatively impacted.
PSE&G also is pursuing a number of opportunities to expand its products and services to customers. BPU approval is required for any new endeavor, and is not guaranteed. Rejection or delay of such filings could have an adverse impact on our future growth, or our standing stakeholders.
The BPU also conducts periodic combined management/competitive service audits of New Jersey utilities related to affiliate standard requirements, competitive services, cross-subsidization, cost allocation and other issues. A finding by the BPU of non-compliance with these requirements could potentially impact our business, results of operations and cash flows. For information regarding PSE&G’s most recent affiliate and management audit, see Item 8. Note 13. Commitments and Contingent Liabilities.
In addition, PSE&G procures the supply requirements of its default service BGSS gas customers through a full-requirements contract with PSEG Power. Government officials, legislators and advocacy groups are aware of the affiliation between PSE&G and PSEG Power. In periods of rising utility rates, those officials and advocacy groups may question or challenge costs and transactions incurred by PSE&G with PSEG Power, irrespective of any previous regulatory processes or approvals underlying those transactions. The occurrence of such challenges may subject PSEG Power to a level of scrutiny not faced by other unaffiliated competitors in those markets and could even adversely affect retail rates received by PSE&G.
PSE&G’s proposed investment projects or programs may not be fully approved by regulators and actual capital investment by PSE&G may be lower than planned, which would cause lower than anticipated rate base.
PSE&G is a regulated public utility that operates and invests in an electric T&D system and a gas distribution system as well as certain regulated clean energy investments, including solar and EE within New Jersey. PSE&G invests in capital projects to maintain and improve its existing T&D system and to address various public policy goals and meet customer expectations. Transmission projects are subject to the rules governing PJM's FERC-approved transmission expansion planning process as well as other FERC rules, while distribution and clean energy projects are subject to approval by the BPU. The costs of PSE&G’s transmission projects are subject to prudency challenge at FERC and PSE&G’s rates themselves may also be challenged at FERC. FERC has also proposed elimination of certain transmission rate incentives, including the incentive that PSE&G receives for being a transmission owner member of PJM and accepting the related risk of RTO membership.
We cannot be certain that any proposed project or program will be approved as requested or at all. If the projects or programs that PSE&G may file from time to time are only approved in part, or not at all, or if the approval fails to allow for the timely recovery of all of PSE&G’s costs, including a return of, or on, its investment, PSE&G will have a lower than anticipated rate base, thus causing its future earnings to be lower than anticipated. Further, the BPU could take positions to exclude or limit utility participation in certain areas, such as renewable generation, EE, EV infrastructure, or energy storage programs, renewable natural gas or hydrogen projects, which would limit our relationship with customers and narrow our future growth prospects. In addition, PSE&G’s Clean Energy Future – Energy Efficiency II Program provides nearly $1 billion of funding to continue the on-bill repayment program, which allows customers to repay their cost of equipment upgrades over time directly through their PSE&G bill. While the deployment of this capital in the form of on-bill repayment is subject to customers meeting acceptable credit standard and bad debt expense is a recoverable cost in this program, any such recovery is subject to prudency review and approval by the BPU.
We are subject to comprehensive federal regulation that affects, or may affect, our businesses.
We are subject to regulation by federal authorities. Such regulation affects almost every aspect of our businesses, including management and operations; the terms and rates of transmission services; investment strategies; the financing of our operations and the payment of dividends. Failure to comply with these regulations could have a material adverse impact on our ability to operate our business and could result in fines, penalties or sanctions.
Recovery of wholesale transmission rates—PSE&G’s wholesale transmission rates are regulated by FERC and our project costs are recovered through a FERC-approved formula rate. The revenue requirements are reset each year through this formula. Our formula rate and its components can be challenged at FERC in the future.
In April 2021, FERC issued a supplemental notice of proposed rulemaking to eliminate the incentive for RTO membership for transmitting utilities that have already received the incentive for three or more years. PSE&G began receiving a 50 basis
point adder for RTO membership in 2008. Elimination of the adder for RTO membership would reduce PSE&G’s annual Net Income and annual cash inflows by approximately $40 million.
Transmission Planning—FERC Order 1000 generally opened transmission development to competition from independent developers, allowing such developers to compete with incumbent utilities for the construction and operation of transmission facilities in its service territory. While Order 1000 retains limited carve-outs for certain projects that will continue to default to incumbents for construction responsibility, increased competition for transmission projects could decrease the value of new investments that would be subject to recovery by PSE&G under its rate base, which could have a material adverse impact on our financial condition and results of operations. FERC has considered, and may in the future consider, whether to modify - either limit or expand - Order 1000’s competition rules. FERC is also examining whether additional oversight is needed to control transmission costs.
A significant input into PJM’s transmission planning process is its regional load forecast, which is adjusted on an annual basis. In January 2025, PJM adjusted its load forecast in the PSEG zone and across PJM to reflect increased expectations of large customer growth. Developing an accurate load forecast that reflects customer demand of the state – and other states in PJM – is critical to ensure that transmission is planned and built where it is needed to maintain reliability and that sufficient generation is procured in the capacity market.
NERC Compliance—NERC, at the direction of FERC, has implemented mandatory NERC Operations and Planning and Critical Infrastructure Protection standards to ensure the reliability of the North American Bulk Electric System, which includes electric transmission and generation systems, and to prevent major system blackouts. NERC Critical Infrastructure Protection standards establish cybersecurity and physical security protections for critical systems and facilities. We have been, and will continue to be, periodically audited by NERC for compliance with both Operations and Planning and Critical Infrastructure Protection standards and are subject to penalties for non-compliance with applicable NERC standards. Failure to comply with applicable NERC standards could result in penalties or increased costs to bring such facilities into compliance. Such penalties and costs could materially adversely impact our business, results of operations and cash flows. Adverse audit findings and/or penalties for non-compliance could also pose reputational risk to us.
MBR Authority and Other Regulatory Approvals—Under FERC regulations, public utilities that sell power at market rates must receive MBR authority before making power sales, and the majority of our businesses operate with such authority. Failure to maintain MBR authorization, or the effects of any severe mitigation measures that would be required if market power was evaluated differently in the future, could have a material adverse effect on our business, financial condition and results of operations. In December 2022, all of PSEG’s operating companies with MBR authority filed at FERC for acceptance of the companies’ updated triennial market power analysis. This filing remains pending at FERC.
Oversight by the CFTC relating to derivative transactions—The CFTC has regulatory oversight of the swap and futures markets and options, including energy trading, and licensed futures professionals such as brokers, clearing members and large traders. Changes to regulations or adoption of additional regulations by the CFTC, including any regulations relating to futures and other derivatives or margin for derivatives and increased investigations by the CFTC, could negatively impact PSEG Power’s ability to hedge its portfolio in an efficient, cost-effective manner by, among other things, potentially decreasing liquidity in the forward commodity and derivatives markets or limiting PSEG Power’s ability to utilize non-cash collateral for derivatives transactions.
We may also be required to obtain various other regulatory approvals to, among other things, buy or sell assets, engage in transactions between our public utility and our other subsidiaries, and, in some cases, enter into financing arrangements, issue securities and allow our subsidiaries to pay dividends. Failure to obtain these approvals on a timely basis could materially adversely affect our results of operations and cash flows.
The markets, PTC and/or ZEC program may not provide sufficient financial support for our New Jersey nuclear plants which could result in the retirement of all of these nuclear plants.
As further described in Item 7. MD&A—Executive Overview of 2024 and Future Outlook, PSEG Power’s Salem 1, Salem 2 and Hope Creek nuclear plants have been awarded ZECs by the BPU through May 2025.
In August 2022, the IRA was signed into law expanding incentives promoting carbon-free generation. The enacted legislation established a PTC for electricity generation using nuclear energy which begins January 1, 2024 and continues through 2032. The expected PTC rate is up to $15/MWh subject to adjustment based upon a facility’s gross receipts. The PTC rate and the gross receipts threshold are subject to annual inflation adjustments. The U.S. Treasury has not yet defined gross receipts. The ZEC payment will be adjusted by the BPU to offset environmental or fuel diversity payments that a selected nuclear plant may receive from another source. We continue to estimate the PTC while we await additional guidance from the U.S. Treasury. The U.S. Treasury may issue guidance related to the PTC and/or the Federal government could amend the IRA, either of which could have an adverse impact on our financial condition, results of operations and cash flows.
If the markets, PTC and/or the ZEC program do not provide sufficient financial support, or, in the case of the Salem nuclear plants, decisions by the EPA and state environmental regulators regarding the implementation of Section 316(b) of the CWA and related state regulations, or other factors, PSEG Power may take all necessary steps to cease to operate all of these plants and will incur associated costs and accounting charges in the event that the financial condition of the plants is materially adversely impacted in the future. Ceasing operations of these plants would result in a material adverse impact on PSEG’s results of operations.
We may be adversely affected by changes in energy regulatory policies, including energy and capacity market design rules and developments affecting transmission.
The energy industry continues to be regulated and the rules to which our businesses are subject are always at risk of being changed. Our business has been impacted by established rules that create locational capacity markets in PJM. Under these rules, generators located in constrained areas are paid more for their capacity so there is an incentive to locate in those areas where generation capacity is most needed. PJM’s capacity market design rules continue to evolve and change, including in response to projections of higher demand, efforts to integrate public policy initiatives into the wholesale markets, lack of sufficient generation capacity and extreme weather events. These changes have led to capacity market auction delays. For a discussion of recent changes in energy regulatory policies that may affect our business and results of operations, see Item 1. Business—Regulatory Issues—Federal Regulation.
Further, some of the market-based mechanisms in which we participate are at times the subject of review or discussion by some of the participants in the New Jersey and federal arenas. We can provide no assurance that these mechanisms will continue to exist in their current form, nor otherwise be modified.
Our ownership and operation of nuclear power plants involve regulatory risks as well as financial, environmental and health and safety risks.
We are exposed to risks related to the continued successful operation of our nuclear facilities and issues that may adversely affect the nuclear generation industry. In addition to the risk of retirement discussed below, risks associated with the operation of nuclear facilities include:
Storage and Disposal of Spent Nuclear Fuel—Federal law requires the United States Department of Energy (DOE) to provide for the permanent storage of spent nuclear fuel. The DOE has not yet begun accepting spent nuclear fuel. Until a federal site is available, we use on-site storage for spent nuclear fuel, which is reimbursed by the DOE. However, future capital expenditures may be required to increase spent fuel storage capacity at our nuclear facilities. Once a federal site is available, the DOE may impose fees to support a permanent repository. Further, the on-site storage for spent nuclear fuel may significantly increase our nuclear unit decommissioning costs.
Regulatory and Legal Risk—We may be required to substantially increase capital expenditures or operating or decommissioning costs at our nuclear facilities if there is a change in the Atomic Energy Act or the applicable regulations, trade controls or the environmental rules and regulations applicable to nuclear facilities; a modification, suspension or revocation of licenses issued by the NRC; the imposition of civil penalties for failure to comply with the Atomic Energy Act, related regulations, trade controls or the terms and conditions of the licenses for nuclear generating facilities; or the shutdown of one of our nuclear facilities. Any such event could have a material adverse effect on our financial condition or results of operations.
Operational Risk—Operations and equipment reliability at any of our nuclear facilities, whether operated by us or our co-owner, could degrade to the point where an affected unit needs to be shut down or operated at less than full capacity. If this were to happen, identifying and correcting the causes could require significant time and expense and a significant outage could result in reduced earnings as we would have less electric output to sell and would be required to deliver on our forward sale commitments.
In addition, if a unit cannot be operated through the end of its current estimated useful life, our results of operations could be adversely affected by increased depreciation rates, impairment charges and accelerated future decommissioning costs.
Nuclear Incident or Accident Risk—Accidents and other unforeseen problems have occurred at nuclear stations, both in the U.S. and elsewhere. The consequences of an accident can be severe and may include loss of life, significant property damage and/or a change in the regulatory climate. We have nuclear units at two sites. It is possible that an accident or other incident at a nuclear generating unit could adversely affect our ability to continue to operate unaffected units located at the same site, which would further affect our financial condition, results of operations and cash flows. An accident or incident at a nuclear unit not owned by us could lead to increased regulation, which could affect our ability to continue to economically operate our units. Any resulting financial impact from a nuclear accident may exceed our resources, including insurance coverages. Further, as a licensed nuclear operator subject to the Price-Anderson Act and a member of a nuclear industry mutual insurance company, PSEG Power is subject to potential retroactive assessments as a result of an industry nuclear incident or retrospective premiums due to adverse industry loss experience and such assessments may be material.
In the event of non-compliance with applicable legislation, regulation and licenses, the NRC may increase oversight, impose fines, and/or shut down a unit, depending on its assessment of the severity of the non-compliance. If a serious nuclear incident were to occur, our business, reputation, financial condition and results of operations could be materially adversely affected. In each case, the amount and types of insurance available to cover losses that might arise in connection with the operation of our nuclear fleet are limited and may be insufficient to cover any costs we may incur.
Decommissioning—NRC regulations require that licensees of nuclear generating facilities demonstrate reasonable assurance that funds will be available to decommission a nuclear facility at the end of its useful life. PSEG Nuclear has established an NDT Fund to satisfy these obligations. However, forecasting trust fund investment earnings and costs to decommission nuclear generating stations requires significant judgment, and actual results could differ significantly from current estimates. If we determine that it is necessary to retire one of our nuclear generating stations before the end of its useful life, there is a higher risk that it will no longer meet the NRC minimum funding requirements due to the earlier commencement of decommissioning activities and a shorter time period over which the NDT investments could appreciate in value. A shortfall could require PSEG to post parental guarantees or make additional cash contributions to ensure that the NDT Fund continues to satisfy the NRC minimum funding requirements. As a result, our financial position or cash flows could be significantly adversely affected.
Third-Party Operation of Peach Bottom Plants—While we have a 50% ownership interest in the Peach Bottom nuclear generation plants, these plants are operated by a third party and, therefore, we have limited control over the operational and other risks associated with these plants.
We are subject to numerous federal, state and local environmental laws and regulations that may significantly limit or affect our businesses, adversely impact our business plans or expose us to significant environmental fines and liabilities.
We are subject to extensive federal, state and local environmental laws and regulations regarding air quality, water quality, site remediation, land use, waste disposal, climate change impact, natural resource damages and other matters. These laws and regulations affect how we conduct our operations and make capital expenditures. Over the past several years, there have been various changes to make existing environmental laws and regulations stricter and this trend may continue. Changes in these laws, or violations of laws, could result in significant increases in our compliance costs, capital expenditures to bring facilities into compliance, operating costs for remediation and clean-up actions, civil penalties or damages from actions brought by third parties for alleged health or property damages. Any such increase in our costs could have a material impact on our financial condition, results of operations and cash flows and could require further economic review to determine whether to continue operations or decommission an affected facility. We may also be unable to successfully recover certain
of these cost increases through our existing regulatory rate structures, in the case of PSE&G, or our contracts with our customers, in the case of PSEG Power.
Actions by state and federal government agencies could also result in reduced reliance on natural gas and could potentially result in stranding natural gas assets owned and operated by PSE&G, which could materially adversely affect our business, financial condition and results of operations.
PSE&G recovers certain remediation and legal costs associated with its manufactured gas plant sites through Remediation Adjustment Charge (RAC) filings with the BPU. Continued future recoveries through the RAC are not guaranteed. Any failure to make future recoveries could materially impact our financial condition.
In addition, PSEG Power retained ownership of certain liabilities excluded from the sale of its fossil generation portfolio. These primarily relate to obligations under environmental regulations, including remediation obligations under the New Jersey Industrial Site Recovery Act and the Connecticut Transfer Act. It will require multiple years and comprehensive environmental sampling to understand the extent of and to carry out the required remediation. At this stage of the remediation process, the full remediation costs are not estimable, but given the number and operating history of the facilities in the portfolio, the full remediation costs will likely be material in the aggregate. The costs could potentially include costs for, among other things, excavating soil, implementation of institutional controls, and the construction, operation and maintenance of engineering controls.
Environmental laws and regulations have generally become more stringent over time, and this trend is likely to continue. For further discussion of environmental laws and regulations impacting our business, results of operations and financial condition, including the impact of federal and state laws and regulations relating to remediation of environmental contamination, see Item 8. Note 13. Commitments and Contingent Liabilities.
We may not receive necessary licenses, permits and siting approvals in a timely manner or at all, which could adversely impact our business and results of operations.
We must periodically apply for licenses and permits from various regulatory authorities, including environmental regulatory authorities, and siting/permitting approvals for our transmission investments, and abide by their respective orders. Delay in obtaining, or failure to obtain and maintain, any permits or approvals, including environmental permits or approvals, or delay in or failure to satisfy any applicable regulatory requirements, could:
•prevent construction of new facilities,
•limit or prevent continued operation of existing facilities,
•limit or prevent the sale of energy from these facilities, or
•result in significant additional costs,
each of which could materially affect our business, financial condition, results of operations and cash flows. In addition, the process of obtaining licenses and permits from regulatory authorities may be delayed or defeated by concerted community opposition and such delay or defeat could have a material effect on our business.
Changes in tax laws and regulations may adversely affect our financial condition, results of operations and cash flows.
The enactment, amendment or repeal of federal or state tax legislation and/or the clarification of previously enacted tax laws, including U.S. Treasury guidance relating to the 15% CAMT, the nuclear PTC and other energy tax credit provisions, could have a material impact on our effective tax rate and cash tax position.
PSEG and PSE&G
None.
ITEM 1C. CYBERSECURITY
To reduce the likelihood and severity of cybersecurity incidents, we established a comprehensive cybersecurity program designed to protect and preserve the confidentiality, integrity and availability of our technology systems and business operations more broadly. For a discussion of the risks associated with cybersecurity threats, see Item 1A. Risk Factors.
Risk Management and Strategy
Our processes for assessing, identifying, and managing material risks from cybersecurity threats include:
•Ongoing Assessment—The Cybersecurity department, led by the VP, Chief Information Security Officer (CISO), and reporting to the SVP, Chief Information and Digital Officer (CIDO) is staffed with cyber professionals tasked with the day-to-day responsibility of assessing material risks from cybersecurity threats. In addition, the Cybersecurity Council, comprised of senior management, is kept apprised of the state of PSEG’s cybersecurity program, including any emerging risks, and provides guidance on the strategic directions of the program.
•Engagement of Nth Parties—We engage Nth parties (third parties and other business relationships, including fourth parties, etc.), such as cybersecurity service providers, risk management firms, and external legal counsel, to assess material risks from cybersecurity threats and assess our internal incident response preparedness and cyber posture, support incident response, conduct tabletop exercises, and comply with applicable laws and regulations. We also carry cybersecurity insurance that provides certain protection against losses from a cybersecurity incident. Regulatory agencies, including but not limited to the NRC and Transportation Security Administration (TSA), as well as NERC, inspect applicable components of our cybersecurity program.
•Nth-Party Service Provider Management—We maintain processes to oversee and identify risks from cybersecurity threats associated with our use of Nth-party service providers. This includes a risk-based vendor management program, which incorporates robust cybersecurity contractual provisions, vendor security assessments and, if appropriate, periodic audits.
•Technical Safeguards—We manage controls to protect our network perimeter, internal IT and Operational Technology (OT) environments, such as internal and external firewalls, network intrusion detection and prevention, penetration testing, vulnerability assessments, threat intelligence, endpoint security and access controls.
•Training and Awareness—We provide mandatory annual cybersecurity training for all personnel with network access, and additional education for personnel with access to industrial control systems and/or customer information systems; and conduct phishing exercises with progressive consequences for failures. Employees also receive periodic cybersecurity awareness messages and each year, in recognition of Cybersecurity Awareness Month, are invited to presentations throughout October from internal and external cyber experts covering diverse cyber topics. These efforts better enable all employees to identify potential cybersecurity risks and escalate them appropriately.
•Incident Response Plans—We maintain and periodically update a cyber incident response plan that addresses the life cycle of a cybersecurity incident from a technical perspective (i.e., detection, response, and recovery), and a data breach response plan (with a focus on external communication/disclosure and legal compliance); and conduct regular tabletop exercises to test plan effectiveness (both internally and through external exercises).
•Mobile Security—We maintain controls to prevent loss of data through mobile device channels.
•Physical Security—We also maintain physical security measures to protect our OT systems, consistent with a defense in-depth and risk-tiered approach. Physical security measures may include access control systems, video surveillance, around-the-clock command center monitoring, and physical barriers (such as fencing, walls, and bollards). Additional features of PSEG’s physical security program include threat intelligence, insider threat mitigation, background checks, a threat level advisory system, a business interruption management model, and active coordination with federal, state, and local law enforcement officials. See Item 1. Business. Regulatory Issues—Federal Regulation for a discussion of Critical Infrastructure Protection standards that the NERC promulgated that mitigate risk associated with both cybersecurity and physical security of PSEG’s critical facilities.
These processes are integral to our overall risk management system/processes and inform the identification and assessment of risks and mitigations through our Enterprise Risk Management (ERM) program. The ERM team, led by the SVP, Audit, Enterprise, Risk and Compliance (AERC) considers cybersecurity risks alongside other PSEG risks, and facilitates discussion
with PSEG subject matter experts to identify cybersecurity risks, evaluate their potential severity and likelihood, identify mitigations, including those identified above, and assess the impact of those mitigations on residual risk. In addition, PSEG maintains a Risk Management Committee (RMC), responsible for assessing exposure to and determining PSEG's overall risk management strategy, including with respect to cybersecurity. The RMC, supported by the ERM function, is chaired by the SVP, AERC and consists of members of senior management including the CIDO and six of the CEO’s other direct reports. In discharging its responsibilities related to cybersecurity threats, the RMC has received presentations from the CISO. To date, there has been no material impact or reasonably likely material impact on our business strategy, results of operations or financial condition from cybersecurity attacks or incidents, including as a result of prior cybersecurity incidents.
Governance
–PSEG Board of Directors (Board) Oversight of Risks from Cybersecurity Threats:
•PSEG Board—The PSEG Board has ultimate responsibility for the oversight of risk management at PSEG, overseeing PSEG’s risk management program and reviewing the most significant risks facing PSEG, including cybersecurity risks. The Governance, Nominating and Sustainability Committee of the PSEG Board reviews key enterprise risks, including cybersecurity risks, and recommends to the Board the mapping of each risk to an appropriate committee or the full Board, in accordance with the allocation of risk categories reflected in the charter of each committee. Through this process, cybersecurity risk is mapped primarily to the Board’s Industrial Operations Committee (IOC), and also the Audit Committee. In providing oversight of risks from cybersecurity threats, the Board is informed of cybersecurity incidents as appropriate, by way of updates from Senior Management, pursuant to PSEG’s Cybersecurity Event Escalation and Incident Response Practice, as administered by the CISO.
•IOC—At the PSEG Board level, the IOC holds the primary responsibility, as enumerated in its charter, of overseeing PSEG’s cybersecurity program and assessing overall compliance through active, independent and critical oversight. The IOC is informed about cybersecurity risks by the CIDO and/or the CISO, during the IOC’s four regularly scheduled meetings per year, which each include cybersecurity as a standing agenda item. Cybersecurity updates to the IOC include discussions on OT and IT cyber risks, cybersecurity updates from the CISO and/or CIDO, and reviews of a corporate cybersecurity scorecard and other performance indicators. The CIDO and CISO regularly attend IOC meetings. In addition, the IOC meets with the CISO in executive session with no other members of management present. To ensure the full Board is kept informed about the cybersecurity risks discussed at the IOC meetings, the cybersecurity materials provided to the IOC are available for full viewing by all members of the Board, members of the Board who are not IOC members have a courtesy invitation to each IOC meeting, and the Chair of the IOC provides a summary of IOC meetings to the full Board, typically the day after the meeting takes place.
•Audit Committee—The Audit Committee has the charter responsibility of overseeing cybersecurity risks related to financial reporting and internal controls. The Audit Committee receives a cybersecurity update twice a year from the CISO, either with the full Board or the IOC in attendance. Audit Committee members have a courtesy invitation to all IOC meetings, have full access to IOC meeting materials, and receive the summary of IOC meetings from the IOC Chair as noted above.
•Governance, Nominating and Sustainability Committee and Audit Committee—These committees are briefed at least annually on enterprise-level risks and emerging risks, including those related to cybersecurity, and receive regular updates on PSEG RMC activities, including those related to cybersecurity.
•Board of Directors, IOC, and Audit Committee—In providing oversight of risks from cybersecurity threats, the Board, IOC, and Audit Committee are informed of cybersecurity risks through frequent reports on such topics as personnel and resources to monitor and address cybersecurity threats, technological advances in cybersecurity protection, rapidly evolving cybersecurity threats that may affect us and our industry, cybersecurity incident response and applicable cybersecurity laws, regulations and standards, as well as collaboration mechanisms with intelligence and enforcement agencies and industry groups to assure timely threat awareness and response coordination. In addition, risks associated with cybersecurity incidents, or potential incidents, are escalated by senior management promptly to the Board outside of regularly scheduled meetings, if appropriate.
–Management’s Role in Assessing and Managing Material Cybersecurity Risks:
The assessment and management of material risks from cyber threats is managed by the CIDO, CISO and Cybersecurity Council, as further described below.
•CIDO—The CIDO has had the overall responsibility for PSEG’s cybersecurity since September 2022, including the assessment and management of material risks to PSEG from cybersecurity threats. The CIDO has served in that position since August 2020 and is a direct report to the CEO. The CIDO has over 25 years of energy experience inclusive of leading technology compliance with cybersecurity regulations for nuclear, transmission, gas and corporate assets. Our CIDO’s experience includes leading the secure technology design, development, and deployment strategy for grid modernization efforts, including digital customer engagement platforms, advanced metering, enterprise asset management and distribution automation functionality.
As noted above, the CIDO provides cybersecurity updates to the Board or its Committees, regularly attends and provides updates with the CISO to the IOC, and has met with the IOC, without other members of management present, during the IOC executive sessions.
The CIDO remains informed about the monitoring, prevention, detection, mitigation, and remediation of cybersecurity incidents through the CISO and other members of the cybersecurity team, as appropriate, who are tasked with these responsibilities on a day-to-day basis.
•CISO—The CISO has day-to-day responsibility for PSEG’s cybersecurity, including the assessment and management of material risks to PSEG from cybersecurity threats, and leads the cybersecurity team. The CISO served in this role since July 2024. Our CISO has over 20 years of experience in cybersecurity and served as a VP, CISO in the manufacturing/chemicals sector prior to joining PSEG. Our CISO also started her career at the Department of Defense and led cyber teams in the financial and retail sectors. Our CISO holds an MBA in strategy, an MSE in Computer Science, a BS in Computer Science, and multiple cybersecurity certifications, including Certified Information Systems Security Professional.
As noted above, the CISO provides cybersecurity updates during the four regularly scheduled IOC meetings and regularly meets with the IOC, without other members of management present, during executive sessions. The CISO remains informed about the monitoring, prevention, detection, mitigation, and remediation of cybersecurity incidents through the members of the CISO’s cybersecurity team, who are tasked with these responsibilities on a day-to-day basis.
•Cybersecurity Council—The Cybersecurity Council, chaired by the CISO, ensures that senior management, and ultimately, the Board, are given the information required to exercise proper oversight over cybersecurity risks and that escalation procedures are followed. The Cybersecurity Council meets at least six times annually to receive reports on the state of PSEG’s cybersecurity program, provide guidance on the strategic direction of the program, discuss emerging cybersecurity issues, and review the cybersecurity scorecard to measure performance of key risk indicators. The Cybersecurity Council receives presentations from the CISO, members of the Cybersecurity team, other IT domain experts, cybersecurity managing counsel and external cybersecurity experts, and participates in tabletop exercises led by external consultants. In addition to the CISO, the Cybersecurity Council members include the: (i) CIDO; (ii) EVP and General Counsel; (iii) EVP and CFO; (iv) President and COO of PSE&G; (v) President of PSEG Nuclear and Chief Nuclear Officer; (vi) SVP – Corporate Citizenship; (vii) SVP – Chief Human Resources and Diversity Officer; (viii) VP of Corporate Security and Properties; (ix) SVP – AERC; (x) Project Executive Advisor; and (xi) Vice President and Controller. PSEG’s Corporate Secretary and Managing Counsel – Cybersecurity serves as counsel to the Cybersecurity Council. In providing oversight of risks from cybersecurity threats, Senior Management is informed of cybersecurity risks through updates shared during Cybersecurity Council meetings and through notifications or updates by the CISO, pursuant to PSEG’s Cybersecurity Event Escalation and Incident Response Practice.
For a discussion of regulatory requirements relating to cybersecurity matters, see Item 1. Business—Regulatory Issues.
ITEM 2. PROPERTIES
All of our owned physical property is held by our subsidiaries. We believe that we and our subsidiaries maintain adequate insurance coverage against loss or damage to plants and properties, subject to certain exceptions and deductibles, to the extent such property is usually insured and insurance is available at a reasonable cost. For a discussion of nuclear insurance, see Item 8. Note 13. Commitments and Contingent Liabilities.
PSE&G
Primarily all of PSE&G’s property is located in New Jersey and PSE&G’s First and Refunding Mortgage, which secures the bonds issued thereunder, constitutes a direct first mortgage lien on substantially all of PSE&G’s property. PSE&G’s electric lines and gas mains are located over or under public highways, streets, alleys or lands, except where they are located over or under property owned by PSE&G or occupied by it under easements or other rights. PSE&G deems these easements and other rights to be adequate for the purposes for which they are being used.
Electric Property and Facilities
As of December 31, 2024, PSE&G’s electric T&D system included approximately 25,000 circuit miles and 869,000 poles, of which 64% are jointly-owned. In addition, PSE&G owns and operates 57 switching stations with an aggregate installed capacity of approximately 40,000 megavolt-amperes (MVA) and 234 substations with an aggregate installed capacity of approximately 10,750 MVA. In addition, PSE&G owns four electric distribution headquarters and five electric sub-headquarters.
Gas Property and Facilities
As of December 31, 2024, PSE&G’s gas system included approximately 18,000 miles of gas mains, 12 gas distribution headquarters, two sub-headquarters, and two meter shops serving all of its gas territory in New Jersey. In addition, PSE&G operates 54 natural gas metering and regulating stations, of which 25 are located on land owned by customers or natural gas pipeline suppliers and are operated under lease, easement or other similar arrangement. In some instances, the pipeline companies own portions of the metering and regulating facilities. PSE&G also owns one liquefied natural gas and three liquid petroleum air gas peaking facilities. The daily gas capacity of these peaking facilities (the maximum daily gas delivery available during the three peak winter months) is approximately 2.9 million therms in the aggregate.
Solar
As of December 31, 2024, PSE&G owned 158 MW dc of installed PV solar capacity throughout New Jersey.
PSEG Power
Generation Facilities
As of December 31, 2024, PSEG Power’s share of installed nuclear generating capacity is shown in the following table:
| | | | | | | | | | | | | | | | |
| | | | | | | | | | | | | |
| Name | | Location | | Total
Capacity
(MW) | | | % Owned | | | Owned
Capacity
(MW) | | |
| Nuclear: | | | | | | | | | | | | |
| Hope Creek | | NJ | | | 1,172 | | | | 100 | % | | | 1,172 | | |
| Salem 1 & 2 | | NJ | | | 2,285 | | | | 57 | % | | | 1,311 | | |
| Peach Bottom 2 & 3 (A) | | PA | | | 2,549 | | | | 50 | % | | | 1,275 | | |
| Total Nuclear | | | | | 6,006 | | | | | | | 3,758 | | |
| | | | | | | | | | | | | |
(A)Operated by Constellation Energy Generation, LLC.
ITEM 3. LEGAL PROCEEDINGS
We are party to various lawsuits and environmental and regulatory matters, including in the ordinary course of business. For information regarding material legal proceedings, see Item 1. Business—Regulatory Issues and Environmental Matters and Item 8. Note 13. Commitments and Contingent Liabilities.
ITEM 4. MINE SAFETY DISCLOSURES
Not applicable.
PART II
ITEM 5. MARKET FOR REGISTRANT’S COMMON EQUITY, RELATED STOCKHOLDER MATTERS AND ISSUER PURCHASES OF EQUITY SECURITIES
Our common stock is listed on the New York Stock Exchange, Inc. under the trading symbol “PEG.” As of February 21, 2025, there were 45,779 registered holders.
The following graph shows a comparison of the five-year cumulative return assuming $100 invested on December 31, 2019 in our common stock and the subsequent reinvestment of quarterly dividends, the S&P Composite Stock Price Index, the Dow Jones Utilities Index and the S&P Electric Utilities Index.
| | | | | | | | | | | | | | | | | | | | | | | | | | |
| | | | | | | | | | | | | | | | | | | | |
| | | 2019 | | | 2020 | | | 2021 | | | 2022 | | | 2023 | | | 2024 | | |
| PSEG | | $ | 100.00 | | | $ | 102.37 | | | $ | 121.14 | | | $ | 114.98 | | | $ | 119.14 | | | $ | 169.91 | | |
| S&P 500 | | $ | 100.00 | | | $ | 118.39 | | | $ | 152.34 | | | $ | 124.73 | | | $ | 157.48 | | | $ | 196.85 | | |
| DJ Utilities | | $ | 100.00 | | | $ | 101.68 | | | $ | 119.44 | | | $ | 121.88 | | | $ | 115.43 | | | $ | 133.53 | | |
| S&P Utilities | | $ | 100.00 | | | $ | 100.52 | | | $ | 118.29 | | | $ | 120.14 | | | $ | 111.63 | | | $ | 137.79 | | |
| | | | | | | | | | | | | | | | | | | | |
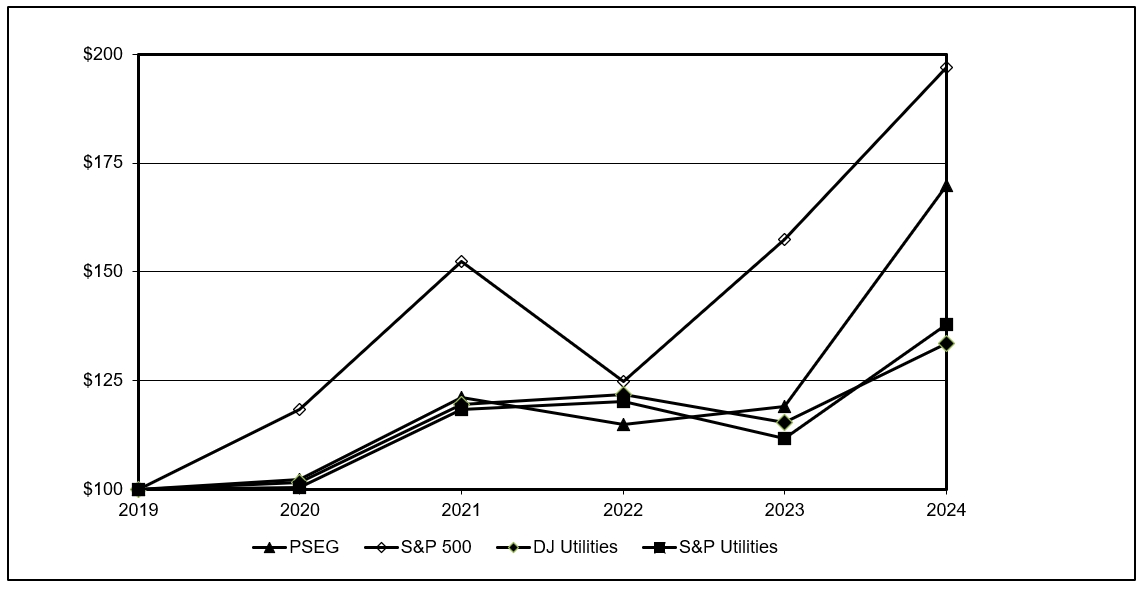
On February 11, 2025, our Board of Directors approved a $0.63 per share common stock dividend for the first quarter of 2025. This reflects an indicative annual dividend rate of $2.52 per share. We expect to continue to pay cash dividends on our common stock; however, the declaration and payment of future dividends to holders of our common stock will be at the
discretion of the Board of Directors and will depend upon many factors, including our financial condition, earnings, capital requirements of our businesses, alternate investment opportunities, legal requirements, regulatory constraints, industry practice and other factors that the Board of Directors deems relevant.
The following table indicates the securities authorized for issuance under equity compensation plans as of December 31, 2024:
| | | | | | | | | | | | | | |
| | | | | | | | | | | |
| Plan Category | | Number of Securities
to be Issued upon
Exercise of
Outstanding Options,
Warrants and Rights
(a) | | | Weighted-Average
Exercise Price of
Outstanding
Options, Warrants
and Rights (b) | | | Number of Securities
Remaining Available
for Future Issuance
under Equity
Compensation Plans
(excluding securities
reflected in column (a))
(c) | | |
| Equity Compensation Plans Approved by Security Holders | | | — | | | $ | — | | | | 7,082,420 | | |
| Equity Compensation Plans Not Approved by Security Holders | | | — | | | | — | | | | — | | |
| Total | | | — | | | $ | — | | | | 7,082,420 | | |
| | | | | | | | | | | |
The number of shares available for future issuance includes amounts remaining under our 2021 Long-Term Incentive Plan (2021 LTIP) and 2021 Equity Compensation Plan for Outside Directors and the Employee Stock Purchase Plan and reflect a reduction for non-vested restricted stock units and performance share units (PSUs) (assumed at target payout). The number of shares available for future issuance may be increased or decreased depending on actual payouts for the PSUs based on achievement of targets and is increased by the number of shares that are forfeited, canceled or otherwise terminated without the issuance of shares. For additional discussion of specific plans concerning equity-based compensation, see Item 8. Note 18. Stock Based Compensation.
PSE&G
We own all of the common stock of PSE&G. For additional information regarding PSE&G’s ability to continue to pay dividends, see Item 7. MD&A—Liquidity and Capital Resources.
ITEM 6. [RESERVED]
ITEM 7. MANAGEMENT’S DISCUSSION AND ANALYSIS OF FINANCIAL CONDITION AND RESULTS OF OPERATIONS (MD&A)
This combined MD&A is separately filed by Public Service Enterprise Group Incorporated (PSEG) and Public Service Electric and Gas Company (PSE&G). Information contained herein relating to any individual company is filed by such company on its own behalf.
PSEG’s business consists of two reportable segments, PSE&G and PSEG Power LLC (PSEG Power) & Other, primarily comprised of our principal direct wholly owned subsidiaries, which are:
•PSE&G—which is a public utility engaged principally in the transmission of electricity and distribution of electricity and natural gas in certain areas of New Jersey. PSE&G is subject to regulation by the New Jersey Board of Public Utilities (BPU), the Federal Energy Regulatory Commission (FERC), and other federal and New Jersey state regulators. PSE&G also invests in regulated solar generation projects and energy efficiency (EE) and related programs in New Jersey, which are regulated by the BPU, and
•PSEG Power—which is an energy supply company that consists of the operations of merchant nuclear generating assets and fuel supply functions engaged in competitive energy sales via its principal direct wholly owned subsidiaries. PSEG Power’s subsidiaries are subject to regulation by FERC, the Nuclear Regulatory Commission (NRC) and other federal regulators and state regulators in the states in which they operate.
The PSEG Power & Other reportable segment also includes amounts related to the parent company as well as PSEG’s other direct wholly owned subsidiaries, which are: PSEG Long Island LLC (PSEG LI), which operates the Long Island Power Authority’s (LIPA) transmission and distribution (T&D) system under an Operations Services Agreement (OSA); PSEG Energy Holdings L.L.C. (Energy Holdings), which primarily holds legacy lease investments and competitively bid, FERC regulated transmission; and PSEG Services Corporation (Services), which provides certain management, administrative and general services to PSEG and its subsidiaries at cost.
Our business discussion in Item 1. Business provides a review of the regions and markets where we operate and compete, as well as our strategy for conducting our businesses within these markets, focusing on operational excellence, financial strength and making disciplined investments. Our risk factor discussion in Item 1A. Risk Factors provides information about factors that could have a material adverse impact on our businesses. The following discussion provides an overview of the significant events and business developments that have occurred during 2024 and key factors that we expect may drive our future performance. This discussion refers to the Consolidated Financial Statements (Statements) and the related Notes to the Consolidated Financial Statements (Notes). This discussion should be read in conjunction with such Statements and Notes.
EXECUTIVE OVERVIEW OF 2024 AND FUTURE OUTLOOK
We are a public utility holding company that, acting through our wholly owned subsidiaries, is a predominantly regulated electric and gas utility and a nuclear generation business. Our business plan focuses on achieving growth by allocating capital primarily toward regulated investments in an effort to continue to improve the sustainability and predictability of our business and realizing the value of the consistent and reliable carbon free generation from our nuclear units. We are focused on investing to meet growing energy demand, modernize our energy infrastructure, improve reliability and resilience, increase EE and deliver clean energy to meet customer expectations and be well aligned with public policy objectives. With these investments and higher working capital recovery approved in the distribution rate case, our regulated rate base increased from approximately $30 billion as of December 31, 2023 to approximately $34 billion as of December 31, 2024. In addition, the passage of the Inflation Reduction Act of 2022 (IRA) established a production tax credit (PTC) for existing nuclear facilities from 2024 through 2032. The PTC is designed to provide downside price protection for our nuclear generation fleet as the tax credit value is directly linked to a nuclear facility’s gross receipts.
For the years 2025-2029, our regulated capital investment program is estimated to be in a range of $21 billion to $24 billion. We expect these capital investments to result in a compound annual growth rate in our regulated rate base in a range of 6% to 7.5% from year-end 2024 to year-end 2029. The regulated capital investments represent the majority of PSEG’s total capital investment program of $22.5 billion to $26 billion. The low end of the range includes an extension of our Gas System Modernization Program (GSMP) and Clean Energy Future (CEF)-EE program at their current average annual investment levels plus inflation, as these programs are expected to continue beyond their currently approved timeframes. The upper end of our capital investment range includes potential incremental investments to address continued demand growth and other investments to meet infrastructure needs and support New Jersey's clean energy goals.
PSE&G
At PSE&G, our focus is on investing capital in T&D infrastructure and clean energy programs to meet growing demand, enhance the reliability and resiliency of our T&D system, meet customer expectations and support public policy objectives.
In October 2024, the BPU approved our CEF-EE II filing authorizing approximately $2.9 billion for energy efficiency projects committed between January 1, 2025 through June 30, 2027, and completed over an expected six-year period. The Order approved a program investment budget of approximately $1.9 billion, net of administrative expenses, and approximately $1 billion to continue our customer on-bill repayment program. This EE filing is a significant increase from our prior filings, driven by an increase in the savings targets required under the BPU Energy Efficiency Framework and higher costs to achieve those targeted savings.
A remaining component of our CEF-Electric Vehicle (EV) program related to medium- and heavy-duty charging infrastructure has been the subject of a stakeholder process that the BPU began in 2021. In October 2024, the BPU released an Order that provided program guidance and minimum filing requirements for electric utility operated medium- and heavy-duty charging incentive programs. The Order provides for PSE&G’s program investment up to $30 million and requires electric utilities to submit program filings by February 2025. In November 2024, the BPU released an updated draft Storage Incentive Program proposal. Our proposed CEF-Energy Storage (ES) program for a $109 million investment is being held in abeyance until the BPU concludes its proceedings.
In 2023, the BPU also approved a two-year extension of our current GSMP program to replace at least 400 miles of cast iron and unprotected steel mains and services in our gas system. The GSMP program extension provides for main replacement through December 2025 plus trailing services replacement and paving costs into 2026 and totals approximately $900 million of investment. Of the $900 million, $750 million is recovered through three periodic rate updates with the balance recovered through a future distribution base rate case. Pursuant to that settlement, we commenced extension discussions for our GSMP program in January 2025 with the intent of beginning a new program in January 2026.
Pursuant to our GSMP II and Energy Strong II programs, PSE&G filed a distribution base rate case as required by the BPU. In October 2024, the BPU issued an Order approving the settlement of that case with new rates effective October 15, 2024. The Order provides for a $17.8 billion rate base, a 9.6% return on equity for PSE&G’s distribution business and a 55% equity component of its capitalization structure. For additional information, see Item 8. Note 6. Regulatory Assets and Liabilities.
PSEG Power
At PSEG Power, we seek to produce low-cost electricity by efficiently operating our nuclear generation assets, mitigate earnings volatility through the PTC mechanism and hedging, and support public policies that preserve these existing carbon-free base load nuclear generating plants. During 2024, our nuclear units generated approximately 31 terawatt hours and operated at a capacity factor of approximately 90%. Beginning in 2024, our hedging strategy incorporated an estimated range of risk reduction impacts from the PTCs on our nuclear generation portfolio while retaining the ability to benefit when market pricing exceeds the phase out threshold. As of December 31, 2024, we expect that our hedged position for 2025 in conjunction with the PTC and market price variability will result in the realized value of our nuclear generation output being at, or above, the PTC phase out. Our strategy will continue to evolve given PTC guidance uncertainty, and potential incremental changes upon final U.S. Treasury guidance. In addition, we are exploring opportunities for the potential sale of power and/or emission credits from our nuclear facilities pursuant to long-term agreements.
Climate Strategy and Sustainability Efforts
For more than a century, our purpose has been to provide safe access to an around-the-clock supply of reliable, affordable energy. Today, our vision is to power a future where people use less energy, and it is cleaner, safer and delivered more reliably than ever. We have established a net zero greenhouse gas (GHG) emissions by 2030 goal that includes direct GHG emissions (Scope 1) and indirect GHG emissions from operations (Scope 2) across our business operations, assuming advances in technology, public policy and customer behavior, which goal supports New Jersey's clean energy and climate goals.
PSE&G has undertaken a number of initiatives that support the reduction of GHG emissions, including our implementation of New Jersey's EE program. PSE&G’s approved CEF-EE and EE II, CEF-Energy Cloud and CEF-EV programs and the proposed CEF-ES program are intended to support New Jersey’s Energy Master Plan (EMP) and Gubernatorial Executive Orders through programs designed to help customers use energy more efficiently, reduce GHG emissions, support the expansion of the EV infrastructure in New Jersey, install energy storage capacity to supplement solar generation and enhance grid resiliency, install smart meters and supporting infrastructure to allow for the integration of other clean energy technologies and to more efficiently respond to weather and other outage events.
We continue to assess physical risks of climate change and adapt our capital investment program to improve the reliability and resiliency of our system in an environment of increasing frequency and severity of weather events. PSE&G is committed to the safe and reliable delivery of natural gas to approximately 1.9 million customers throughout New Jersey and we are equally committed to reducing GHG emissions associated with such operations. The GSMP is designed to improve safety and reliability and significantly reduce natural gas leaks in our distribution system, which would reduce the release of methane, a potent GHG, into the air. Through GSMP II, from 2018 through 2024 we reduced reported methane emissions by over 30% system wide.
We also continue to focus on providing cleaner energy for our customers by working to preserve the economic viability of our nuclear units, which provide over 85% of the carbon-free energy in New Jersey. These efforts include reducing market risk by advocating for state and federal policies, such as the PTC established by the IRA, and capacity market reform and related generator interconnection policies at PJM Interconnection, L.L.C. (PJM) that recognize the value of our nuclear fleet’s carbon-free generation and its contribution to grid reliability, and potential long-term contracts that recognize the value of its consistent and reliable carbon-free energy.
Competitively Bid, FERC Regulated Transmission Projects
PSEG continues to evaluate investment opportunities in regulated transmission beyond PSE&G. In December 2023, PJM awarded us an approximately $424 million project to address increasing load and reliability issues in Maryland and northern Virginia as part of its 2022 Window 3 competitive solicitation. PJM has directed that the project be placed in service in 2027.
In April 2024, PSE&G submitted bids to the BPU for what the BPU has termed the Pre-Build Infrastructure (PBI) project, which is a combination of onshore and near-shore underwater infrastructure. It is unclear when the BPU may take action on this initiative, or parallel processes it has considered for transmission projects to support New Jersey’s offshore wind goal.
PSEG will continue to evaluate opportunities to participate in transmission solicitation processes and may decide to submit bids for these opportunities, some of which could be material investments.
PSEG LI
In 2024, LIPA issued requests for two proposals - one for a service provider to operate its electrical transmission and distribution system and one for power supply and fuel management services, both of which are currently performed under contracts with PSEG that run through December 31, 2025. PSEG is negotiating its proposal with LIPA to continue as operations service provider for LIPA’s electrical transmission and distribution system, though the outcome of this process is uncertain. LIPA has selected another party for the power supply and fuel management services contract which will not have a material impact on PSEG's results of operations.
Financial Results
The financial results for PSEG, PSE&G and PSEG Power & Other for the years ended December 31, 2024 and 2023 are presented as follows:
| | | | | | | | | | |
| | | | | | | | |
| | | Years Ended December 31, | | |
| | | 2024 | | | 2023 | | |
| | | Millions, except per share data | | |
| PSE&G | | $ | 1,547 | | | $ | 1,515 | | |
| PSEG Power & Other | | | 225 | | | | 1,048 | | |
| PSEG Net Income | | $ | 1,772 | | | $ | 2,563 | | |
| | | | | | | | |
| PSEG Net Income Per Share (Diluted) | | $ | 3.54 | | | $ | 5.13 | | |
| | | | | | | | |
For a detailed discussion of our financial results, see Results of Operations.
Regulatory, Legislative and Other Developments
We closely monitor and engage with stakeholders on significant regulatory and legislative developments.
Transmission Rate Proceedings and Return on Equity (ROE)
Under current FERC rules, PSE&G continues to earn a 50 basis point adder to its base ROE for its membership in PJM as a transmission owner. In April 2021, FERC proposed eliminating this ROE adder for Regional Transmission Owner participation. FERC has not acted on the proposal. If the adder was eliminated, it would reduce PSE&G’s annual Net Income and annual cash inflows by approximately $40 million.
New Jersey Clean Energy Stakeholder Proceedings
In February 2023, the governor of New Jersey issued executive orders (EOs) that establish or accelerate previously established 2050 targets for clean-sourced energy, building decarbonization, and EV adoption goals, with new target dates of 2030 or 2035, as applicable. The EOs direct the BPU and other state agencies to collaborate with stakeholders to develop plans to reach the targets and the BPU has convened a stakeholder proceeding to develop a plan for gas distribution utilities to reach the target of 50% natural gas emissions reductions over 2006 levels by 2030. The BPU commenced proceedings to update the State’s EMP via public input hearings in May and June 2024. We are unable to predict the outcomes of this proceeding, but it could have a material impact on our business, results of operations and cash flows.
Environmental Regulation
We are subject to liability under environmental laws for the costs and penalties of remediating contamination of property now or formerly owned by us and of property contaminated by hazardous substances that we generated. In particular, the historic operations of PSEG companies and the operations of numerous other companies along the Passaic and Hackensack Rivers are alleged by federal and state agencies to have discharged substantial contamination into the Passaic River/Newark Bay Complex in violation of various statutes. In addition, PSEG Power has retained ownership of certain liabilities excluded from the sale of its fossil generation portfolio, primarily related to obligations under New Jersey and Connecticut state laws to investigate and remediate the sites. We are also currently involved in a number of proceedings relating to sites where other hazardous substances may have been discharged and may be subject to additional proceedings in the future, and the costs and penalties of any such remediation efforts could be material.
For further information regarding the matters described above, as well as other matters that may impact our financial condition and results of operations, see Item 8. Note 13. Commitments and Contingent Liabilities.
Nuclear
In April 2021, PSEG Power’s Salem 1, Salem 2 and Hope Creek nuclear plants were awarded zero emission certificates (ZECs) for the three-year eligibility period starting June 2022 at the same approximate $10 per megawatt hour (MWh) received during the prior ZEC period through May 2025. Pursuant to a process established by the BPU, ZECs are purchased
from selected nuclear plants and recovered through a non-bypassable distribution charge in the amount of $0.004 per kilowatt-hour used (which is equivalent to approximately $10 per MWh generated in payments to selected nuclear plants (ZEC payment)). As previously noted, in August 2022, the IRA was signed into law expanding incentives promoting carbon-free generation. The enacted legislation established a PTC for electricity generated using existing nuclear energy, which began January 1, 2024 and continues through 2032 and impacted PSEG Power's decision not to apply for the next ZEC three-year eligibility period starting June 2025. The expected PTC rate is up to $15/MWh subject to adjustment based upon a facility’s gross receipts. The PTC rate and the gross receipts threshold are subject to annual inflation adjustments. ZEC revenue recorded is reduced by the estimated PTCs generated from PSEG Power’s Salem 1, Salem 2, and Hope Creek nuclear plants. The PTC amounts recorded to date are subject to change based on several factors, including but not limited to, adjustments to estimated market prices and generation and the issuance of authoritative guidance by Treasury/the Internal Revenue Service, including clarification of the definition of “gross receipts” used to determine the phase out. Any adjustments to amounts previously recorded could be material. We continue to analyze the impact of the IRA on our nuclear units, and will analyze any future guidance from the U.S. Treasury to assess any impact of PTCs on expected ZEC payments and/or any future ZEC application periods.
Interest Rate Matters
PSEG’s long-term financing plan is designed to replace maturities and support funding its capital program. Given our financing needs, the prevailing interest rate environment will be a key factor in determining interest expense on variable-rate debt and long-term rates on future financing plans. In order to increase the predictability of interest expense, we may use interest rate hedges to help limit our exposure to fluctuating interest rates. As of December 31, 2024, PSEG had entered into floating-to-fixed interest rate hedges totaling $1.25 billion through March 2025 in order to reduce the volatility in interest expense related to PSEG Power’s variable rate term loan due June 2025. PSEG Power also entered into a 364-day variable rate term loan for $400 million in December 2024. In addition, from time to time, we may enter into interest rate hedges to fix a portion of our interest rate exposure for anticipated long-term financing plans at PSEG and PSEG Power. PSE&G’s interest rate risk is moderated due to annual transmission rate filings and distribution recoveries through base rate filings and clause-based investment programs.
Tax Legislation
The enactment, amendment or repeal of federal or state tax legislation and/or the clarification of previously enacted tax laws could have a material impact on our effective tax rate and cash tax position.
In April 2023, the U.S. Treasury issued Revenue Procedure 2023-15 that provides a safe harbor method of accounting to determine the annual repair tax deduction for gas T&D property. The impact, if any, that this may have on PSEG and PSE&G’s financial statements has not yet been determined.
The IRA enacted a new 15% corporate alternative minimum tax (CAMT), which is based on adjusted financial statement income, a PTC for existing nuclear generation facilities, discussed above, and allows energy tax credits to be transferable. Many aspects of the IRA, including the CAMT and PTC, remain unclear and are in need of further guidance; therefore, we continue to analyze the impact the IRA will have on PSEG’s and PSE&G’s results of operations, financial condition and cash flows, which could be material.
Future Outlook
Our future success will be influenced by our ability to continue to maintain strong operational and financial performance, address regulatory and legislative developments that impact our business and respond to the issues and challenges described below. In order to do this, we will continue to:
•seek approval of and execute on our utility capital investment program to modernize our infrastructure, improve the reliability and resilience of the service we provide to our customers, and align our sustainability and climate goals with New Jersey’s energy policy,
•seek a fair return for our T&D investments through our transmission formula rate, existing rate incentives, distribution infrastructure and clean energy investment programs and periodic distribution base rate case proceedings,
•focus on controlling costs while maintaining safety, reliability and customer satisfaction and complying with applicable standards and requirements,
•manage the risks and opportunities in federal and state clean energy policies,
•advocate for appropriate regulatory guidance on the PTC to ensure long-term support for New Jersey’s largest carbon-free generation resource, and adapt our hedging program accordingly, and realize the value of our consistent and reliable, carbon-free nuclear output,
•engage constructively with our multiple stakeholders, including regulators, government officials, customers, employees, investors, suppliers and the communities in which we do business or are seeking to do business, and
•deliver on our human capital management strategy to attract, develop and retain a high-performing diverse workforce.
In addition to the risks described elsewhere in this Form 10-K for 2024 and beyond, the key issues and challenges we expect our business to confront include:
•regulatory and political uncertainty, both with regard to transmission planning and rates policy, the role of distribution utilities and decarbonization impacts, future energy policy, tax regulations, design of energy and capacity markets, and environmental regulation, as well as with respect to the outcome of any legal, regulatory or other proceedings,
•performance of the financial markets, including the impact on our pension funding requirements and interest rates on our future financing plans,
•continuing to manage costs and maintain affordable customer rates in an inflationary environment, which could impact customer collections and future regulatory proceedings,
•the increasing frequency, sophistication and magnitude of cybersecurity attacks against us and our respective vendors and business partners who may have our sensitive information and/or access to our environment, and the increasing frequency and magnitude of physical attacks on electric and gas infrastructure,
•future changes in federal and state tax laws or any other associated tax guidance, and
•the impact of changes in energy demand, natural gas and electricity prices, PJM’s challenge to ensure resource adequacy to meet demand growth, and expanded efforts to decarbonize several sectors of the economy.
We continually assess a broad range of strategic options to maximize long-term shareholder value and address the interests of our multiple stakeholders. We consider a wide variety of factors when determining how and when to efficiently deploy capital, including the performance and prospects of our businesses; returns and the sustainability and predictability of future earnings streams; the views of investors, regulators, public policy initiatives, rating agencies, customers and employees; our existing indebtedness and restrictions it imposes; and tax considerations, among other things. Strategic options available to us include:
•investments in PSE&G, including T&D facilities to enhance reliability, resiliency and modernize the system to meet the growing needs and increasingly higher expectations of customers, and clean energy investments, particularly our EE programs,
•continued operation of our nuclear generation facilities that are expected to be supported by the PTC through 2032 and can enable certain investments to increase the capacity of the units as well as potential license extensions, transition from an 18-month to 24-month refueling cycle at our Hope Creek facility and energy and/or emission credit sales with potential customers seeking consistent and reliable carbon-free power,
•investments in competitive, regulated transmission investments through PJM processes and BPU solicitations that provide revenue predictability and reasonable risk-adjusted returns, and
•acquisitions, dispositions, development and other transactions involving our common stock, assets or businesses that could provide value to customers and shareholders.
There can be no assurance, however, that we will successfully develop and execute any of the strategic options noted above, or any additional options we may consider in the future. The execution of any such strategic plan may not have the expected benefits or may have unexpected adverse consequences.
RESULTS OF OPERATIONS
| | | | | | | | | | | | | | |
| | | | | | | | | | | |
| | | Years Ended December 31, | | |
| | | 2024 | | | 2023 | | | 2022 | | |
| Earnings (Losses) | | Millions, except per share data | | |
| PSE&G | | $ | 1,547 | | | $ | 1,515 | | | $ | 1,565 | | |
| PSEG Power & Other (A)(B) | | | 225 | | | | 1,048 | | | | (534 | ) | |
| PSEG Net Income | | $ | 1,772 | | | $ | 2,563 | | | $ | 1,031 | | |
| | | | | | | | | | | |
| PSEG Net Income Per Share (Diluted) | | $ | 3.54 | | | $ | 5.13 | | | $ | 2.06 | | |
| | | | | | | | | | | |
(A)PSEG Power & Other results in 2023 include a $239 million after-tax pension charge due to the settlement of a portion of the qualified pension plans. PSEG Power & Other results in 2022 include after-tax impairments of $92 million related to certain Energy Holdings investments and additional adjustments related to the sale of PSEG Power’s fossil generation assets. See Item 8. Note 3. Asset Dispositions and Impairments for additional information.
(B)Other includes after-tax activities at the parent company, PSEG LI and Energy Holdings as well as intercompany eliminations.
PSEG Power’s results above include the Nuclear Decommissioning Trust (NDT) Fund activity and the impacts of non-trading commodity mark-to-market (MTM) activity, which consist of the financial impact from positions with future delivery dates.
The variances in our Net Income (Loss) attributable to changes related to the NDT Fund and MTM are shown in the following table:
| | | | | | | | | | | | | | |
| | | | | | | | | | | |
| | | Years Ended December 31, | | |
| | | 2024 | | | 2023 | | | 2022 | | |
| | | Millions, after tax | | |
| NDT Fund and Related Activity (A) (B) | | $ | 81 | | | $ | 109 | | | $ | (174 | ) | |
| Non-Trading MTM Gains (Losses) (C) | | $ | (151 | ) | | $ | 959 | | | $ | (457 | ) | |
| | | | | | | | | | | |
(A)NDT Fund activity includes gains and losses on NDT securities which are recorded in Net Gains (Losses) on Trust Investments. See Item 8. Note 10. Trust Investments for additional information. NDT Fund activity also includes interest and dividend income and other costs related to the NDT Fund recorded in Net Other Income (Deductions), interest accretion expense on PSEG Power’s nuclear Asset Retirement Obligation (ARO) recorded in Operation & Maintenance (O&M) Expense and the depreciation related to the ARO asset recorded in Depreciation and Amortization (D&A) Expense.
(B)Net of tax (expense) benefit of $(56) million, $(74) million and $97 million for the years ended December 31, 2024, 2023 and 2022, respectively.
(C)Net of tax (expense) benefit of $59 million, $(376) million and $178 million for the years ended December 31, 2024, 2023 and 2022, respectively.
Our decrease in Net Income for 2024 as compared to 2023 was driven primarily by
•changes in the MTM gains (losses) as shown in the table above,
•higher earnings due to continued investments in T&D clause programs and settlement of the distribution base rate case at PSE&G and PTCs beginning in 2024 at PSEG Power, and
•the pension settlement charge in 2023 (see Item 8. Note 12. Pension, Other Postretirement Benefits (OPEB) and Savings Plans).
Our results of operations are primarily comprised of the results of operations of our principal operating segments, PSE&G and PSEG Power, excluding charges related to intercompany transactions, which are eliminated in consolidation. For additional information on intercompany transactions, see Item 8. Note 24. Related-Party Transactions.
PSEG
| | | | | | | | | | | | | | | | | | | | | | | | | | | | | | |
| | | | | | | | | | | | | | | | | | | | | | | |
| | | | | | | | | | | | Increase / | | | Increase / | | |
| | | Years Ended December 31, | | | (Decrease) | | | (Decrease) | | |
| | | 2024 | | | 2023 | | | 2022 | | | 2024 vs. 2023 | | | 2023 vs. 2022 | | |
| | | Millions | | | Millions | | | % | | | Millions | | | % | | |
| Operating Revenues | | $ | 10,290 | | | $ | 11,237 | | | $ | 9,800 | | | $ | (947 | ) | | | (8 | ) | | $ | 1,437 | | | | 15 | | |
| Energy Costs | | | 3,393 | | | | 3,260 | | | | 4,018 | | | | 133 | | | | 4 | | | | (758 | ) | | | (19 | ) | |
| Operation and Maintenance (A) | | | 3,356 | | | | 3,150 | | | | 3,178 | | | | 206 | | | | 7 | | | | (28 | ) | | | (1 | ) | |
| Depreciation and Amortization | | | 1,182 | | | | 1,135 | | | | 1,100 | | | | 47 | | | | 4 | | | | 35 | | | | 3 | | |
| Losses on Asset Dispositions and Impairments | | | 6 | | | | 7 | | | | 123 | | | | (1 | ) | | | (14 | ) | | | (116 | ) | | | (94 | ) | |
| Income from Equity Method Investments | | | 1 | | | | 1 | | | | 14 | | | | — | | | | — | | | | (13 | ) | | | (93 | ) | |
| Net Gains (Losses) on Trust Investments | | | 127 | | | | 189 | | | | (265 | ) | | | (62 | ) | | | (33 | ) | | | 454 | | | N/A | | |
| Net Other Income (Deductions) | | | 153 | | | | 172 | | | | 124 | | | | (19 | ) | | | (11 | ) | | | 48 | | | | 39 | | |
| Net Non-Operating Pension and OPEB (Costs) Credits | | | 73 | | | | (218 | ) | | | 376 | | | | 291 | | | N/A | | | | (594 | ) | | N/A | | |
| Interest Expense | | | 882 | | | | 748 | | | | 628 | | | | 134 | | | | 18 | | | | 120 | | | | 19 | | |
| Income Tax Expense (Benefit) | | | 53 | | | | 518 | | | | (29 | ) | | | (465 | ) | | | (90 | ) | | | 547 | | | N/A | | |
| | | | | | | | | | | | | | | | | | | | | | | |
(A)Includes amortization of EE programs regulatory investment expenditures of $125 million, $82 million and $48 million for the years ended December 31, 2024, 2023 and 2022, respectively.
The 2024, 2023 and 2022 amounts in the preceding table for Operating Revenues and O&M costs each include $592 million, $533 million and $516 million, respectively, for PSEG LI’s subsidiary, Long Island Electric Utility Servco, LLC (Servco). These amounts represent the O&M pass-through costs for the Long Island operations, the full reimbursement of which is reflected in Operating Revenues. See Item 8. Note 4. Variable Interest Entity for additional information. The following discussions for PSE&G and PSEG Power provide a detailed explanation of their respective variances.
PSE&G
| | | | | | | | | | | | | | | | | | | | | | | | | | | | | | |
| | | | | | | | | | | | | | | | | | | | | | | |
| | | Years Ended December 31, | | | Increase /
(Decrease) | | | Increase /
(Decrease) | | |
| | | 2024 | | | 2023 | | | 2022 | | | 2024 vs. 2023 | | | 2023 vs. 2022 | | |
| | | Millions | | | Millions | | | % | | | Millions | | | % | | |
| Operating Revenues | | $ | 8,449 | | | $ | 7,807 | | | $ | 7,935 | | | $ | 642 | | | | 8 | | | $ | (128 | ) | | | (2 | ) | |
| Energy Costs | | | 3,189 | | | | 3,010 | | | | 3,270 | | | | 179 | | | | 6 | | | | (260 | ) | | | (8 | ) | |
| Operation and Maintenance (A) | | | 1,949 | | | | 1,843 | | | | 1,838 | | | | 106 | | | | 6 | | | | 5 | | | | — | | |
| Depreciation and Amortization | | | 1,025 | | | | 980 | | | | 935 | | | | 45 | | | | 5 | | | | 45 | | | | 5 | | |
| Net Gains (Losses) on Trust Investments | | | — | | | | — | | | | (2 | ) | | | — | | | | — | | | | 2 | | | N/A | | |
| Net Other Income (Deductions) | | | 64 | | | | 80 | | | | 88 | | | | (16 | ) | | | (20 | ) | | | (8 | ) | | | (9 | ) | |
| Net Non-Operating Pension and OPEB Credits | | | 77 | | | | 114 | | | | 281 | | | | (37 | ) | | | (32 | ) | | | (167 | ) | | | (59 | ) | |
| Interest Expense | | | 582 | | | | 493 | | | | 427 | | | | 89 | | | | 18 | | | | 66 | | | | 15 | | |
| Income Tax Expense | | | 298 | | | | 160 | | | | 267 | | | | 138 | | | | 86 | | | | (107 | ) | | | (40 | ) | |
| | | | | | | | | | | | | | | | | | | | | | | |
(A) Includes amortization of EE programs regulatory investment expenditures of $125 million, $82 million and $48 million for the years ended December 31, 2024, 2023 and 2022, respectively.
Year Ended December 31, 2024 as compared to 2023
Operating Revenues increased $642 million due to changes in delivery, clause, commodity and other operating revenues.
Delivery Revenues are primarily derived from revenues recovered on our regulated investments in rate base and costs through periodic filings of distribution rate cases, approved distribution investment recovery programs and the annual filing of transmission formula rates. Due to PSE&G’s electric and gas distribution CIP decoupling mechanism, there is minimal impact from sales volumes on most distribution delivery revenues. Also included in delivery revenues are revenue credits to customers to flowback tax benefits realized by PSE&G. These revenue credits are offset in Income Tax Expense.
Delivery revenues increased $321 million due primarily to $170 million from increased electric and gas revenues primarily as a result of the recently settled distribution base rate case, $99 million increase in transmission revenues due primarily to higher rate base investments, $26 million in increased revenues from Energy Strong II and IAP distribution rate roll ins, $42 million from increased GPRC revenues, $9 million from a reduction in revenue credits flowed back to customers as part of our TAC mechanism, offset by a decrease of $25 million in CIP decoupling revenues.
Clause Revenues are revenues from various pass through regulatory programs for which PSE&G earns no margin. These revenues are entirely offset by the amortization of related costs in O&M, D&A and Interest and Income Tax Expense, which were originally recognized as regulatory assets.
Clause Revenues increased $141 million due primarily to a $132 million net increase in Tax Adjustment Credits (TAC) and Green Program Recovery Charge (GPRC) deferrals and $10 million in higher Societal Benefits Clause (SBC) collections.
Commodity Revenues are revenues from customers choosing default electric (basic generation service or BGS) and gas supply (basic gas supply service of BGSS) from PSE&G. PSE&G procures the BGS and BGSS on behalf of these retail customers and earns no margin on this service as all costs are passed back to the BGS and BGSS customers. The changes in Commodity Revenues for both electric and gas are entirely offset by changes in Energy Costs.
Commodity Revenues increased $143 million due to higher electric BGS revenues of $276 million from higher prices and sales volumes, offset by lower gas BGSS revenues of $133 million primarily from lower prices.
Other Operating Revenues are primarily comprised of revenues derived from various GPRC programs including Transition Renewable Energy Certificates (TREC) revenues, Community Solar collections and the Successor Solar Incentive Program (SuSI). The revenues from these programs offset costs included in Energy Costs. In addition, other operating revenues include revenues from our appliance service business which offers various appliance protection and repair plans to customers.
Other Operating revenues increased $37 million due primarily to net increases in GPRC related other operating revenues of $35 million.
Operating Expenses
Energy Costs increased $179 million. This is offset by changes in Commodity Revenues and Other Operating Revenues.
Operation and Maintenance increased $106 million due primarily to higher T&D expenditures and net increases in various other operational expenses.
Depreciation and Amortization increased $45 million due primarily to an increase in depreciation due to higher plant placed in service, partially offset by a net decrease in the amortization of Regulatory Assets and Liabilities.
Net Other Income (Deductions) decreased $16 million due primarily to lower Allowance for Funds Used During Construction.
Net Non-Operating Pension and OPEB Credits decreased $37 million due primarily to a $43 million decrease in the amortization of prior service credits and a $6 million increase in amortization of the net actuarial loss, partially offset by a $7 million decrease in interest cost, $3 million in settlement charges in 2023 and a $2 million increase in the expected return on plan assets.
Interest Expense increased $89 million due primarily to long-term debt net issuances at higher rates in 2024 and 2023.
Income Tax Expense increased $138 million due primarily to higher pre-tax income and a decrease in the flowback of excess deferred income tax benefits.
Year Ended December 31, 2023 as compared to 2022
See Item 7. Management’s Discussion and Analysis of Financial Condition and Results of Operations in our Annual Report on Form 10-K for the year ended December 31, 2023 as filed with the SEC on February 26, 2024 for information related to the year ended December 31, 2023 as compared to 2022, which information is incorporated herein by reference.
PSEG Power & Other
| | | | | | | | | | | | | | | | | | | | | | | | | | | | | | |
| | | | | | | | | | | | | | | | | | | | | | | |
| | | Years Ended December 31, | | | Increase /
(Decrease) | | | Increase /
(Decrease) | | |
| | | 2024 | | | 2023 | | | 2022 | | | 2024 vs. 2023 | | | 2023 vs. 2022 | | |
| | | Millions | | | Millions | | | % | | | Millions | | | % | | |
| Operating Revenues | | $ | 2,807 | | | $ | 4,533 | | | $ | 3,266 | | | $ | (1,726 | ) | | | (38 | ) | | $ | 1,267 | | | | 39 | | |
| Energy Costs | | | 1,170 | | | | 1,353 | | | | 2,149 | | | | (183 | ) | | | (14 | ) | | | (796 | ) | | | (37 | ) | |
| Operation and Maintenance | | | 1,407 | | | | 1,307 | | | | 1,340 | | | | 100 | | | | 8 | | | | (33 | ) | | | (2 | ) | |
| Depreciation and Amortization | | | 157 | | | | 155 | | | | 165 | | | | 2 | | | | 1 | | | | (10 | ) | | | (6 | ) | |
| Losses on Asset Dispositions and Impairments | | | 6 | | | | 7 | | | | 123 | | | | (1 | ) | | | (14 | ) | | | (116 | ) | | | (94 | ) | |
| Income from Equity Method Investments | | | 1 | | | | 1 | | | | 14 | | | | — | | | | — | | | | (13 | ) | | | (93 | ) | |
| Net Gains (Losses) on Trust Investments | | | 127 | | | | 189 | | | | (263 | ) | | | (62 | ) | | | (33 | ) | | | 452 | | | N/A | | |
| Net Other Income (Deductions) | | | 94 | | | | 96 | | | | 36 | | | | (2 | ) | | | (2 | ) | | | 60 | | | N/A | | |
| Net Non-Operating Pension and OPEB (Costs) Credits | | | (4 | ) | | | (332 | ) | | | 95 | | | | 328 | | | | (99 | ) | | | (427 | ) | | N/A | | |
| Interest Expense | | | 305 | | | | 259 | | | | 201 | | | | 46 | | | | 18 | | | | 58 | | | | 29 | | |
| Income Tax Expense (Benefit) | | | (245 | ) | | | 358 | | | | (296 | ) | | | (603 | ) | | N/A | | | | 654 | | | N/A | | |
| | | | | | | | | | | | | | | | | | | | | | | |
Year Ended December 31, 2024 as compared to 2023
Operating Revenues decreased $1,726 million due primarily to changes in generation and gas supply and other operating revenues.
Generation Revenues decreased $1,623 million due primarily to
•a net decrease of $1,559 million due to MTM losses in 2024 as compared to MTM gains in 2023. Of this amount, there was a $798 million decrease due to positions reclassified to realized upon settlement, coupled with $761 million decrease due to changes in forward prices in 2024 as compared to 2023,
•a net decrease of $136 million due primarily to lower ZEC revenue related to the PTCs,
•a net decrease of $31 million due primarily to electricity sold under the BGS contracts, which ended in May 2023, and lower volumes sold under other load contracts, and
•a net decrease of $29 million in capacity revenue due primarily to lower capacity prices, partially offset by decreases in capacity expenses due to lower load volumes served,
•partially offset by a net increase of $144 million due primarily to higher average realized prices, partially offset by lower volumes sold in 2024.
Gas Supply Revenues decreased $153 million due primarily to
•a net decrease of $172 million in sales under the BGSS contract due primarily to $228 million from lower prices, partially offset by $56 million from higher sales volumes,
•partially offset by a net increase of $14 million due primarily to lower MTM losses in 2024 as compared to 2023. Of this amount, there was a $26 million increase from positions reclassified to realized upon settlement, partially offset by a $12 million decrease from changes in forward prices, and
•a net increase of $6 million related to sales to third parties due primarily to $22 million from higher sales prices, partially offset by $16 million from lower sales volumes.
Operating Expenses
Energy Costs represent the cost of generation, which includes fuel costs for generation as well as purchased energy in the market, and gas purchases to meet PSEG Power’s obligation under its BGSS contract with PSE&G. Energy Costs decreased $183 million due to
Gas costs decreased $173 million due primarily to
•a net decrease of $176 million related to sales under the BGSS contract, of which $223 million was due to the lower average cost of gas, partially offset by $47 million due to higher send out volumes,
•partially offset by a net increase of $4 million related to sales to third parties due primarily to $20 million from higher average cost of gas, partially offset by $16 million due to lower volumes sold.
Generation costs decreased $10 million due primarily to lower renewable energy credit requirements caused by decreases in load volumes served.
Operation and Maintenance increased $100 million due primarily to a refueling outage in 2024 at our 100%-owned Hope Creek nuclear plant as compared to an outage at our 57%-owned Salem 2 nuclear plant in 2023, and higher Servco operating costs, partially offset by higher Services billings to PSE&G. See Item 8. Note 4. Variable Interest Entity for additional information on Servco and LIPA.
Net Gains (Losses) on Trust Investments decreased $62 million due primarily to NDT investments with $99 million of lower unrealized gains on equity securities as compared to the prior year, partially offset by $35 million of higher net realized gains in 2024.
Net Non-Operating Pension and OPEB Costs decreased $328 million primarily due to the pension lift-out settlement charge in August 2023.
Interest Expense increased $46 million due primarily to incremental debt and the replacement of maturing long-term debt at higher rates, partially offset by a reduction in term loans.
Income Tax Expense decreased $603 million due primarily to lower pre-tax income in 2024 and the benefit from PTCs.
Year Ended December 31, 2023 as compared to 2022
See Item 7. Management’s Discussion and Analysis of Financial Condition and Results of Operations in our Annual Report on Form 10-K for the year ended December 31, 2023 as filed with the SEC on February 26, 2024 for information related to the year ended December 31, 2023 as compared to 2022, which information is incorporated herein by reference.
LIQUIDITY AND CAPITAL RESOURCES
The following discussion of our liquidity and capital resources is on a consolidated basis, noting the uses and contributions, where material, of our two direct major operating subsidiaries.
Financing Methodology
We expect our capital requirements to be met through internally generated cash flows and external financings, consisting of short-term debt for working capital needs and long-term debt for capital investments.
PSE&G’s sources of external liquidity include a $1 billion multi-year revolving credit facility. PSE&G uses internally generated cash flow and its commercial paper program to meet seasonal, intra-month and temporary working capital needs. PSE&G does not engage in any intercompany borrowing or lending arrangements. PSE&G maintains a back-up credit facility in an amount sufficient to cover the commercial paper and letters of credit outstanding. PSE&G’s dividend payments to/capital contributions from PSEG are consistent with its capital structure objectives which have been established to maintain investment grade credit ratings. PSE&G’s long-term financing plan is designed to replace maturities, fund a portion of its capital program and manage short-term debt balances. Generally, PSE&G uses either secured medium-term notes or first mortgage bonds to raise long-term capital.
PSEG, PSEG Power, Energy Holdings, PSEG LI and Services participate in a corporate money pool, an aggregation of daily cash balances designed to efficiently manage their respective short-term liquidity needs, which are accounted for as intercompany loans. Servco does not participate in the corporate money pool. Servco’s short-term liquidity needs are met through an account funded and owned by LIPA.
PSEG and PSEG Power have access through sub-limits to a revolving Master Credit Facility, which provides for $2.75 billion of multi-year credit capacity. The current PSEG sub-limit is $1.5 billion and current PSEG Power sub-limit is $1.25 billion. Sub-limits can be adjusted subject to the terms of the Master Credit Facility.
PSEG’s available sources of external liquidity may include the issuance of long-term debt securities and the incurrence of additional indebtedness through our commercial paper program back-stopped by our credit facility. Our current sources of external liquidity include the Master Credit Facility. This facility is available to back-stop PSEG’s commercial paper program, issue letters of credit and for general corporate purposes. PSEG’s Master Credit Facility and the commercial paper program are available to support PSEG’s working capital needs and are also available to make equity contributions or provide liquidity support to its subsidiaries. Additionally, from time to time, PSEG enters into short-term loan agreements designed to enhance its liquidity position.
PSEG Power’s sources of external liquidity include the Master Credit Facility and PSEG Power’s letter of credit facilities and may include the issuance of long-term debt securities and entering into short-term loan agreements. Credit capacity is primarily used to provide collateral in support of PSEG Power’s sales and purchases of electricity and natural gas as the market prices for energy and fuel fluctuate, and to meet potential collateral postings in the event that PSEG Power is downgraded to below investment grade by Standard & Poor’s (S&P) or Moody’s. PSEG Power’s dividend payments to PSEG are also designed to be consistent with its capital structure objectives which have been established to maintain investment grade credit ratings and provide sufficient financial flexibility.
Operating Cash Flows
We continue to expect our operating cash flows combined with cash on hand and financing activities to be sufficient to fund planned capital expenditures and shareholder dividends.
For the year ended December 31, 2024, our operating cash flow decreased $1,673 million, as compared to 2023. The net decrease was primarily due to an outflow of $131 million in net cash collateral postings in 2024 as compared to a $1,408 million inflow in 2023 at PSEG Power, partially offset by a net change at PSE&G, as discussed below.
PSE&G
PSE&G’s operating cash flow increased $185 million from $1,540 million to $1,725 million for the year ended December 31, 2024, as compared to 2023. The increase was due primarily to higher earnings, the absence of returning cash collateral postings in 2024, which had been returned to BGS suppliers in 2023, and decreases in materials and supplies to support our electric AMI and other infrastructure programs. This was partially offset by a net increase in regulatory deferrals and accounts receivable, as well as lower unbilled revenues due primarily to higher volumes and lower prices.
Short-Term Liquidity
PSEG meets its short-term liquidity requirements, as well as those of PSEG Power, primarily through the issuance of commercial paper and, from time to time, short-term loans. PSE&G maintains its own separate commercial paper program to meet its short-term liquidity requirements. Each commercial paper program is fully back-stopped by its own separate credit facility.
Each of our credit facilities is restricted as to availability and use to the specific companies as listed below; however, if necessary, the PSEG facilities can also be used to support our subsidiaries’ liquidity needs.
PSEG Power has uncommitted credit facilities totaling $200 million, which can be utilized for letters of credit. As of December 31, 2024, PSEG Power had $75 million in letters of credit outstanding under these uncommitted credit facilities. In addition, a subsidiary of PSEG Power has an uncommitted credit facility for $150 million, which can be utilized for cash collateral postings.
Our total committed credit facilities and available liquidity as of December 31, 2024 were as follows:
| | | | | | | | | | | | | | |
| | | | | | | | | | | |
| | | As of December 31, 2024 | | |
| Company/Facility | | Total
Facility | | | Usage | | | Available
Liquidity | | |
| | | Millions | | |
| PSEG | | $ | 1,500 | | | $ | 764 | | | $ | 736 | | |
| PSE&G | | | 1,000 | | | | 468 | | | | 532 | | |
| PSEG Power | | | 1,325 | | | | 82 | | | | 1,243 | | |
| Total | | $ | 3,825 | | | $ | 1,314 | | | $ | 2,511 | | |
| | | | | | | | | | | |
For additional information, see Item 8. Note 14. Debt and Credit Facilities.
We continually monitor our liquidity and seek to add capacity as needed to meet our liquidity requirements, including to satisfy any additional collateral requirements. As of December 31, 2024, our liquidity position, including our credit facilities and access to external financing, was expected to be sufficient to meet our projected stressed requirements over our 12-month planning horizon. PSEG analyzes its liquidity requirements using stress scenarios that consider different events, including changes in commodity prices and the potential impact of PSEG Power losing its investment grade credit rating from S&P or Moody’s, which would represent a two level downgrade from its current Moody’s and S&P ratings. In the event of a deterioration of PSEG Power’s credit rating, certain of PSEG Power’s agreements allow the counterparty to demand further performance assurance. The potential additional collateral that we would be required to post under these agreements if PSEG Power were to lose its investment grade credit rating was approximately $618 million and $751 million as of December 31, 2024 and 2023, respectively. See Item 8. Note 13. Commitments and Contingent Liabilities for additional discussion of PSEG Power’s agreements.
Long-Term Debt Financing
During the next twelve months,
•PSEG has $550 million of 0.80% Senior Notes maturing in August 2025,
•PSE&G has $350 million of 3.00% Secured Medium-Term Notes Series K, due May 2025, and
•PSEG Power has $1.25 billion of a variable rate term loan due June 2025.
For additional information, see Item 8. Note 14. Debt and Credit Facilities.
NDT Fund Obligation
The NRC requires a biennial filing of the NDT fund balances against the decommissioning liability estimate. Any funding shortfalls are required to be cured prior to the next NDT reporting period. We do not currently expect to be required to provide supplemental funding of the NDT Fund.
Debt Covenants
Our credit agreements contain maximum debt to equity ratios and other restrictive covenants and conditions to borrowing. We are currently in compliance with all of our debt covenants. Continued compliance with applicable financial covenants will depend upon our future financial position, level of earnings and cash flows, as to which no assurances can be given.
In addition, under its First and Refunding Mortgage (Mortgage), PSE&G may issue new First and Refunding Mortgage Bonds against previous additions and improvements, provided that its ratio of earnings to fixed charges calculated in accordance with its Mortgage is at least 2 to 1, and/or against retired Mortgage Bonds. As of December 31, 2024, PSE&G’s Mortgage coverage ratio was 3.3 to 1 and the Mortgage would permit up to approximately $11 billion aggregate principal amount of new Mortgage Bonds to be issued against additions and improvements to its property.
Default Provisions
Our bank credit agreements and indentures contain various, customary default provisions that could result in the potential acceleration of indebtedness under the defaulting company’s agreement.
In particular, PSEG’s bank credit agreement contains provisions under which certain events, including an acceleration of material indebtedness under PSE&G’s and PSEG Power’s respective financing agreements, a failure by PSEG, PSE&G or PSEG Power to satisfy certain final judgments and certain bankruptcy events by PSEG, PSE&G or PSEG Power, would constitute an event of default under the PSEG bank credit agreements. Under the PSEG bank credit agreements, it would also be an event of default if, in certain circumstances, either PSE&G or PSEG Power ceases to be wholly owned by PSEG. The PSE&G and PSEG Power bank credit agreements include certain similar default provisions; however, such provisions only relate to the respective borrower under such agreement and its subsidiaries and do not contain cross default provisions to each other. The PSE&G and PSEG Power bank credit agreements do not include cross default provisions relating to PSEG. Each of PSEG's, PSE&G’s and PSEG Power’s bank credit agreements also contain limitations on the incurrence of liens by it and certain of its subsidiaries and PSEG Power’s bank credit agreements contain restrictions on the incurrence of certain subsidiary debt.
PSEG’s existing notes include a cross acceleration provision that may be triggered upon the acceleration of more than $75 million of indebtedness incurred by PSEG. Such provision does not extend to an acceleration of indebtedness by any of PSEG’s subsidiaries. Under PSE&G’s medium-term note indenture, an event of default under PSE&G’s mortgage indenture and acceleration of the mortgage bonds would constitute an event of default.
Ratings Triggers
Our debt indentures and credit agreements do not contain any material “ratings triggers” that would cause an acceleration of the required interest and principal payments in the event of a ratings downgrade. However, in the event of a downgrade, any one or more of the affected companies may be subject to increased interest costs on certain bank debt and certain collateral requirements. In the event that we are not able to affirm representations and warranties on credit agreements, lenders would not be required to make loans.
In accordance with BPU requirements under the BGS contracts, PSE&G is required to maintain an investment grade credit rating. If PSE&G were to lose its investment grade rating, it would be required to file a plan to assure continued payment for the BGS requirements of its customers.
Fluctuations in commodity prices or a deterioration of PSEG Power’s credit rating to below investment grade could increase PSEG Power’s required margin postings under various agreements entered into in the normal course of business. PSEG Power believes it has sufficient liquidity to meet the required posting of collateral which would result from a credit rating downgrade to below investment grade by S&P or Moody’s at today’s market prices.
Common Stock Dividends
| | | | | | | | | | | | | | |
| | | | | | | | | | | |
| | | Years Ended December 31, | | |
| Dividend Payments on Common Stock | | 2024 | | | 2023 | | | 2022 | | |
| Per Share | | $ | 2.40 | | | $ | 2.28 | | | $ | 2.16 | | |
| in Millions | | $ | 1,196 | | | $ | 1,137 | | | $ | 1,079 | | |
| | | | | | | | | | | |
On February 11, 2025, our Board of Directors approved a $0.63 per share common stock dividend for the first quarter of 2025. This reflects an indicative annual dividend rate of $2.52 per share. We expect to continue to pay cash dividends on our common stock; however, the declaration and payment of future dividends to holders of our common stock will be at the discretion of the Board of Directors and will depend upon many factors, including our financial condition, earnings, capital requirements of our businesses, alternate investment opportunities, legal requirements, regulatory constraints, industry practice and other factors that the Board of Directors deems relevant. For additional information related to cash dividends on our common stock, see Item 8. Note 22. Earnings Per Share (EPS) and Dividends.
Credit Ratings
If the rating agencies lower or withdraw our credit ratings, such revisions may adversely affect the market price of our securities and serve to materially increase our cost of capital and limit access to capital. Credit Ratings shown are for securities that we typically issue. Outlooks are shown for the credit ratings at each entity and can be Stable, Negative, or Positive. There is no assurance that the ratings will continue for any given period of time or that they will not be revised by
the rating agencies, if in their respective judgments, circumstances warrant. Each rating given by an agency should be evaluated independently of the other agencies’ ratings. The ratings should not be construed as an indication to buy, hold or sell any security.
| | | | | | |
| | | | | | |
| | | Moody’s (A) | | S&P (B) | |
| PSEG | | | | | |
| Outlook | | Stable | | Stable | |
| Senior Notes | | Baa2 | | BBB | |
| Commercial Paper | | P2 | | A2 | |
| PSE&G | | | | | |
| Outlook | | Stable | | Stable | |
| Mortgage Bonds | | A1 | | A | |
| Commercial Paper | | P2 | | A2 | |
| PSEG Power | | | | | |
| Outlook | | Stable | | Stable | |
| Issuer Rating | | Baa2 | | BBB | |
| | | | | | |
(A)Moody’s ratings range from Aaa (highest) to C (lowest) for long-term securities and P1 (highest) to NP (lowest) for short-term securities.
(B)S&P ratings range from AAA (highest) to D (lowest) for long-term securities and A1 (highest) to D (lowest) for short-term securities.
Other Comprehensive Income
For the year ended December 31, 2024, we had Other Comprehensive Income of $46 million on a consolidated basis. The Other Comprehensive Income was due primarily to $33 million of unrealized gains on derivative contracts accounted for as hedges, $26 million related to pension and other postretirement benefits, offset by $13 million of net unrealized losses related to available-for-sale debt securities. See Item 8. Note 21. Accumulated Other Comprehensive Income (Loss), Net of Tax for additional information.
CAPITAL REQUIREMENTS
We expect that all of our capital requirements over the next three years will come from a combination of internally generated funds and external debt financing. Projected capital construction and investment expenditures, excluding nuclear fuel purchases, for the next three years are presented in the following table. These projections include Allowance for Funds Used During Construction for PSE&G and Interest Capitalized During Construction for PSEG’s other subsidiaries. These amounts are subject to change, based on various factors. Amounts shown below for PSE&G include currently approved programs. We intend to continue to invest in infrastructure modernization and will seek to extend these and related programs as appropriate.
| | | | | | | | | | | | | | |
| | | | | | | | | | | |
| | | 2025 | | | 2026 | | | 2027 | | |
| | | | | | Millions | | | | | |
| PSE&G: | | | | | | | | | | |
| Transmission | | $ | 735 | | | $ | 890 | | | $ | 920 | | |
| Electric Distribution | | | 1,190 | | | | 1,235 | | | | 1,325 | | |
| Gas Distribution | | | 1,050 | | | | 1,025 | | | | 1,050 | | |
| Clean Energy | | | 745 | | | | 840 | | | | 935 | | |
| Total PSE&G | | $ | 3,720 | | | $ | 3,990 | | | $ | 4,230 | | |
| Competitively Bid, FERC Regulated Transmission | | | 30 | | | | 265 | | | | 115 | | |
| PSEG Power & Other | | | 280 | | | | 305 | | | | 290 | | |
| Total PSEG | | $ | 4,030 | | | $ | 4,560 | | | $ | 4,635 | | |
| | | | | | | | | | | |
PSE&G
PSE&G’s projections for future capital expenditures include material additions and replacements to its T&D systems to meet expected growth and to manage reliability. As project scope and cost estimates develop, PSE&G will modify its current projections to include these required investments. PSE&G’s projected expenditures for the various items reported above are primarily comprised of the following:
•Transmission—investments focused on growing demand, reliability improvements and replacement of aging infrastructure.
•Electric and Gas Distribution—investments for new business and demand, reliability improvements and modernization and replacement of equipment that has reached the end of its useful life.
•Clean Energy—investments associated with customer EE programs, infrastructure supporting EVs and grid-connected solar.
In 2024, PSE&G made $2,921 million of capital expenditures, primarily for T&D system reliability. In addition, PSE&G had cost of removal, net of salvage, of $170 million associated with capital replacements, and expenditures for EE programs of approximately $544 million, which are included in operating cash flows.
Competitively Bid, FERC Regulated Transmission
In December 2023, PJM awarded us an approximately $424 million project to address increasing load and reliability issues in Maryland and northern Virginia as part of its 2022 Window 3 competitive solicitation. PJM has directed that the project be placed in service in 2027.
PSEG Power & Other
PSEG’s other projected expenditures are primarily comprised of investments to maintain and enhance current nuclear operations and opportunities to increase nuclear generation at PSEG Power and to purchase hardware, software and office equipment at Services.
In 2024, PSEG Power & Other made capital expenditures of $251 million, excluding $208 million for nuclear fuel, primarily related to various nuclear projects at PSEG Power and various IT projects at Services.
Other Material Cash Requirements
The following table reflects our other material cash requirements which include debt maturities and interest payments, operating lease payments and energy related purchase commitments in the respective periods in which they are due. For additional information, see Item 8. Note 14. Debt and Credit Facilities, Note 7. Leases and Note 13. Commitments and Contingent Liabilities.
The table below does not reflect any anticipated cash payments for pension and OPEB or AROs due to uncertain timing of payments. See Item 8. Note 12. Pension, Other Postretirement Benefits (OPEB) and Savings Plans and Note 11. Asset Retirement Obligations (AROs) for additional information.
| | | | | | | | | | | | | | | | | | | | | | |
| | | | | | | | | | | | | | | | | |
| | | Total
Amount
Committed | | | Less
Than
1 Year | | | 2 - 3
Years | | | 4 - 5
Years | | | Over
5 Years | | |
| | | Millions | | |
| Long-Term Recourse Debt Maturities | | | | | | | | | | | | | | | | |
| PSEG | | $ | 4,896 | | | $ | 550 | | | $ | 700 | | | $ | 1,350 | | | $ | 2,296 | | |
| PSE&G | | | 15,115 | | | | 350 | | | | 1,300 | | | | 1,075 | | | | 12,390 | | |
| PSEG Power | | | 1,250 | | | | 1,250 | | | | — | | | | — | | | | — | | |
| Interest on Recourse Debt | | | | | | | | | | | | | | | | |
| PSEG | | | 1,158 | | | | 207 | | | | 405 | | | | 268 | | | | 278 | | |
| PSE&G | | | 9,683 | | | | 590 | | | | 1,147 | | | | 1,078 | | | | 6,868 | | |
| PSEG Power (A) | | | 32 | | | | 32 | | | | — | | | | — | | | | — | | |
| Operating Leases | | | | | | | | | | | | | | | | |
| PSE&G | | | 116 | | | | 19 | | | | 29 | | | | 21 | | | | 47 | | |
| PSEG Power & Other | | | 94 | | | | 16 | | | | 33 | | | | 32 | | | | 13 | | |
| Energy-Related Purchase Commitments | | | | | | | | | | | | | | | | |
| PSEG Power | | | 2,853 | | | | 904 | | | | 996 | | | | 532 | | | | 421 | | |
| Total | | $ | 35,197 | | | $ | 3,918 | | | $ | 4,610 | | | $ | 4,356 | | | $ | 22,313 | | |
| | | | | | | | | | | | | | | | | |
(A)Based on a blended rate including effects of floating to fixed rate hedging transacted at the Parent level.
CRITICAL ACCOUNTING ESTIMATES
Under accounting guidance generally accepted in the United States (GAAP), many accounting standards require the use of estimates, variable inputs and assumptions (collectively referred to as estimates) that are subjective in nature. Because of this, differences between the actual measure realized versus the estimate can have a material impact on results of operations, financial position and cash flows. We have determined that the following estimates are considered critical to the application of rules that relate to the respective businesses.
Accounting for Pensions and Other Postretirement Benefits (OPEB)
The market-related value of plan assets held for PSEG’s qualified pension and OPEB plans is equal to the fair value of these assets as of year-end. The plan assets are comprised of investments in both debt and equity securities which are valued using quoted market prices, broker or dealer quotations, or alternative pricing sources with reasonable levels of price transparency. Plan assets also include investments in unlisted real estate which is valued via third-party appraisals. We calculate pension and OPEB costs using various economic and demographic assumptions.
Assumptions and Approach Used: Economic assumptions include the discount rate and the expected rate of return on plan assets. Demographic pension and OPEB assumptions include projections of future mortality rates, pay increases and retirement patterns, as well as projected health care costs for OPEB.
| | | | | | | | | | | | | | |
| | | | | | | | | | | |
| Assumption | | 2024 | | | 2023 | | | 2022 | | |
| Pension | | | | | | | | | | |
| Discount Rate | | | 5.68 | % | | | 5.02 | % | | | 5.20 | % | |
| Expected Rate of Return on Plan Assets | | | 8.10 | % | | | 8.10 | % | | | 7.20 | % | |
| OPEB | | | | | | | | | | |
| Discount Rate | | | 5.59 | % | | | 4.96 | % | | | 5.16 | % | |
| Expected Rate of Return on Plan Assets | | | 8.10 | % | | | 8.10 | % | | | 7.20 | % | |
| | | | | | | | | | | |
The discount rate used to calculate PSEG’s pension and OPEB obligations is determined as of December 31 each year, our measurement date. The discount rate is determined by developing a spot rate curve based on the yield to maturity of a universe of high quality corporate bonds with similar maturities to the plan obligations. The spot rates are used to discount the estimated plan distributions. The discount rate is the single equivalent rate that produces the same result as the full spot rate curve.
Our expected rate of return on plan assets reflects current asset allocations, historical long-term investment performance and an estimate of future long-term returns by asset class, long-term inflation assumptions and a premium for active management.
We utilize a corridor approach that reduces the volatility of reported costs/credits. The corridor requires differences between actuarial assumptions and plan results be deferred and amortized as part of the costs/credits. This occurs only when the accumulated differences exceed 10% of the greater of the benefit obligation or the fair value of plan assets as of each year-end. For one of PSEG’s qualified pension plans, the excess would be amortized over the average remaining expected life of inactive participants, which is approximately eighteen years. For PSEG’s other qualified pension plan, the excess would be amortized over the average remaining service period of active employees, which is approximately fifteen years.
Effect if Different Assumptions Used: As part of the business planning process, we have modeled future costs assuming an 8.10% expected rate of return and a 5.68% discount rate for 2025 pension costs/credits and a 5.59% discount rate for 2025 OPEB costs/credits. Based upon these assumptions, we have estimated a net periodic pension expense in 2025 of approximately $37 million, or $0 million, net of amounts capitalized, and a net periodic OPEB expense in 2025 of approximately $3 million, or $2 million, net of amounts capitalized. Beginning in 2023, our net periodic pension amounts include the impact of the accounting order approved by the BPU authorizing PSE&G to modify its pension accounting for ratemaking purposes. Actual future pension costs/credits and funding levels will depend on future investment performance, changes in discount rates, market conditions, funding levels relative to our projected benefit obligation and accumulated benefit obligation and various other factors related to the populations participating in the pension plans. Actual future OPEB costs/credits will depend on future investment performance, changes in discount rates, market conditions, and various other factors.
The following chart reflects the sensitivities associated with a change in certain assumptions.
| | | | | | | | | | | | | | | | | | |
| | | | | | | | | | | | | | |
| | | % Change | | | Impact on Benefit Obligation as of December 31, 2024 | | | Increase to
Costs
in 2025 | | | Increase to
Costs, net
of Amounts
Capitalized
in 2025 | | |
| Assumption | | | | | Millions | | |
| Pension | | | | | | | | | | | | | |
| Discount Rate | | | (1 | )% | | $ | 467 | | | $ | 20 | | | $ | 14 | | |
| Expected Rate of Return on Plan Assets | | | (1 | )% | | N/A | | | $ | 38 | | | $ | 38 | | |
| OPEB | | | | | | | | | | | | | |
| Discount Rate | | | (1 | )% | | $ | 61 | | | $ | — | | | $ | — | | |
| Expected Rate of Return on Plan Assets | | | (1 | )% | | N/A | | | $ | 4 | | | $ | 4 | | |
| | | | | | | | | | | | | | |
See Item 7A. Quantitative and Qualitative Disclosures About Market Risk for additional information.
Derivative Instruments
The operations of PSEG, PSEG Power and PSE&G are exposed to market risks from changes in commodity prices, interest rates and equity prices that could affect their results of operations and financial condition. Exposure to these risks is managed through normal operating and financing activities and, when appropriate, through executing derivative transactions. Derivative instruments are used to create a relationship in which changes to the value of the assets, liabilities or anticipated transactions exposed to market risks are expected to be offset by changes in the value of these derivative instruments.
Current accounting guidance requires us to recognize all derivatives on the balance sheet at their fair value, except for derivatives that qualify for and are designated as normal purchases and normal sales contracts.
Assumptions and Approach Used: In general, the fair value of our derivative instruments is determined primarily by end of day clearing market prices from an exchange, such as the Intercontinental Exchange and Nodal Exchange, among others, or auction prices.
For our wholesale energy business, many of the forward sale, forward purchase, option and other contracts are derivative instruments that hedge commodity price risk, but do not meet the requirements for, or are not designated as, either cash flow or fair value hedge accounting. The changes in value of such derivative contracts are marked to market through earnings as the related commodity prices fluctuate. As a result, our earnings may experience significant fluctuations depending on the volatility of commodity prices.
Effect if Different Assumptions Used: Any significant changes to the fair market values of our derivatives instruments could result in a material change in the value of the assets or liabilities recorded on our Consolidated Balance Sheets and could result in a material change to the unrealized gains or losses recorded in our Consolidated Statements of Operations.
For additional information regarding Derivative Financial Instruments, see Item 8. Note 1. Organization, Basis of Presentation and Summary of Significant Accounting Policies, Note 16. Financial Risk Management Activities and Note 17. Fair Value Measurements.
Long-Lived Assets
Management evaluates long-lived assets for impairment and reassesses the reasonableness of their related estimated useful lives whenever events or changes in circumstances warrant assessment. Such events or changes in circumstances may be as a result of significant adverse changes in regulation, business climate, counterparty credit worthiness, market conditions, or a determination that it is more-likely-than-not that an asset or asset group will be sold or retired before the end of its estimated useful life.
Assumptions and Approach Used: In the event certain triggers exist indicating an asset/asset group may not be recoverable, an undiscounted cash flow test is performed to determine if an impairment exists. When the carrying value of a long-lived asset/asset group exceeds the undiscounted estimate of future cash flows associated with the asset/asset group, an impairment may exist to the extent that the fair value of the asset/asset group is less than its carrying amount.
For PSEG Power, cash flows for long-lived assets and asset groups are determined at the lowest level for which identifiable cash flows are largely independent of the cash flows of other assets and liabilities. The cash flows from the nuclear generation units are evaluated at the portfolio level. These tests require significant estimates and judgment when developing expected future cash flows. Significant inputs may include, but are not limited to, forward power prices, the impact of PTCs, ZEC payments for the New Jersey nuclear assets, fuel costs, other operating and capital expenditures, the cost of borrowing and asset sale prices and probabilities associated with any potential sale prior to the end of the estimated useful life or the early retirement of assets. The assumptions used by management incorporate inherent uncertainties that are at times difficult to predict and could result in impairment charges or accelerated depreciation in future periods if actual results materially differ from the estimated assumptions utilized in our forecasts.
In addition, long-lived assets are depreciated under the straight-line method based on estimated useful lives. An asset’s operating useful life is generally based upon operational experience with similar asset types and other non-operational factors. In the ordinary course, management, together with an asset’s co-owners in the case of certain of our jointly-owned assets, make a number of decisions that impact the operation of our generation assets beyond the current year. These decisions may have a direct impact on the estimated remaining useful lives of our assets and will be influenced by the financial outlook of the assets, including future market conditions such as forward energy, capacity prices, and long-term agreements to supply large power users, such as data centers, operating and capital investment costs and any state or federal legislation and regulations, among other items.
Effect if Different Assumptions Used: The above cash flow tests, and fair value estimates and estimated remaining useful lives may be impacted by a change in the assumptions noted above and could significantly impact the outcome, triggering additional impairment tests, write-offs or accelerated depreciation.
Asset Retirement Obligations (ARO)
PSE&G, PSEG Power and Services recognize liabilities for the expected cost of retiring long-lived assets for which a legal obligation exists. These AROs are recorded at fair value in the period in which they are incurred and are capitalized as part of the carrying amount of the related long-lived assets. PSE&G, as a rate-regulated entity, recognizes Regulatory Assets or Liabilities as a result of timing differences between the recording of costs and costs recovered through the rate-making process. We accrete the ARO liability to reflect the passage of time with the corresponding expense recorded in O&M Expense.
Assumptions and Approach Used: Because quoted market prices are not available for AROs, we estimate the initial fair value of an ARO by calculating discounted cash flows that are dependent upon various assumptions, including:
•estimation of dates for retirement, which can be dependent on environmental and other legislation,
•amounts and timing of future cash expenditures associated with retirement, settlement or remediation activities,
•if applicable, past experience with government regulators regarding similar obligations.
We obtain updated nuclear decommissioning cost studies triennially unless new information necessitates more frequent updates. The most recent cost study was done in 2024. When we revise any assumptions used to calculate fair values of existing AROs, we adjust the ARO balance and corresponding long-lived asset which generally impacts the amount of accretion and depreciation expense recognized in future periods.
Nuclear Decommissioning AROs
AROs related to the future decommissioning of PSEG Power’s nuclear facilities comprised approximately 100% or $1,035 million of PSEG’s total AROs as of December 31, 2024. PSEG Power determines its AROs for its nuclear units by assigning probability weighting to various discounted cash flow outcomes for each of its nuclear units that incorporate the assumptions above as well as:
•potential retirement dates including the probability of license renewals,
•SAFSTOR alternative, which assumes the nuclear facility can be safely stored and subsequently decommissioned in a period within 60 years after operations,
•DECON alternative, which assumes decommissioning activities begin after operations, and
•recovery from the federal government of assumed specific costs incurred for spent nuclear fuel.
Effect if Different Assumptions Used: Changes in the assumptions could result in a material change in the ARO balance sheet obligation and the period over which we accrete to the ultimate liability. Had the following assumptions been applied, our estimates of the approximate impacts on the Nuclear ARO as of December 31, 2024 are as follows:
•A decrease of 1% in the discount rate would result in a $73 million increase in the Nuclear ARO.
•An increase of 1% in the inflation rate would result in a $346 million increase in the Nuclear ARO.
•If we were not reimbursed by the federal government for the spent costs, as prescribed under the Nuclear Waste Policy Act, the Nuclear ARO would increase by $105 million.
Accounting for Regulated Businesses
PSE&G prepares its financial statements to comply with GAAP for rate-regulated enterprises, which differs in some respects from accounting for non-regulated businesses. In general, accounting for rate-regulated enterprises should reflect the economic effects of regulation. As a result, a regulated utility is required to defer the recognition of costs (Regulatory Asset)
or recognize obligations (Regulatory Liability) if the rates established are designed to recover the costs and if the competitive environment makes it probable that such rates can be charged or collected. This accounting results in the recognition of revenues and expenses in different time periods than that of enterprises that are not regulated.
Assumptions and Approach Used: PSE&G recognizes Regulatory Assets where it is probable that such costs will be recoverable in future rates from customers and Regulatory Liabilities where it is probable that refunds will be made to customers in future billings. The highest degree of probability is an order from the BPU either approving recovery of the deferred costs over a future period or requiring the refund of a liability over a future period.
Virtually all of PSE&G’s Regulatory Assets and Regulatory Liabilities are supported by BPU orders. In the absence of an order, PSE&G will consider the following when determining whether to record a Regulatory Asset or Liability:
•past experience regarding similar items with the BPU,
•treatment of a similar item in an order by the BPU for another utility,
•passage of new legislation, and
•recent discussions with the BPU.
All deferred costs are subject to prudence reviews by the BPU. When the recovery of a Regulatory Asset or payment of a Regulatory Liability is no longer probable, PSE&G charges or credits earnings, as appropriate.
Effect if Different Assumptions Used: A change in the above assumptions may result in a material impact on our results of operations or our cash flows. See Item 8. Note 6. Regulatory Assets and Liabilities for a description of the amounts and nature of regulatory balance sheet amounts.
Uncertain Tax Positions - Nuclear Production Tax Credits (PTCs)
We are required to make judgments in developing our provision for income tax expense (benefit), including those related to the uncertainty of tax positions taken, or expected to be taken, on a tax return. Our most significant uncertain tax position relates to the estimated benefit associated with PTCs.
Assumptions and Approach Used: We account for uncertain income tax positions using a benefit recognition model with a two-step approach, a more-likely-than-not recognition criterion and a measurement attribute that measures the position as the largest amount of tax benefit that is greater than 50% likely of being realized upon ultimate settlement. If it is not more-likely-than-not that the benefit will be sustained on its technical merits, no benefit will be recorded. Uncertain tax positions that relate only to timing of when an item is included on a tax return are considered to have met the recognition threshold.
Management uses judgments in determining the amount of income tax benefit to recognize due to the uncertainties associated with the technical merits of each position and with consideration to the amount of benefit to be sustained upon examination by a taxing authority. The estimated PTC benefits for the year ended December 31, 2024, are subject to change based on the issuance of authoritative guidance by the U.S. Treasury. Specifically, clarification of the definition of “gross receipts”, which is used to determine the reduction amount of the PTC, by the U.S. Treasury could affect the amount to be recognized.
Effect if Different Assumptions Used: While we believe the amount of PTCs recognized for the year ended December 31, 2024, is more-than-likely to be sustained upon examination, the ultimate outcome could result in material favorable or unfavorable adjustments to our consolidated financial statements. Guidance issued by the U.S. Treasury supporting or not supporting our tax position could result in an additional income tax benefit (expense) between approximately $89 million and $(89) million, respectively. Further, ZEC revenue has been reduced by the estimated PTCs generated from PSEG Power’s Salem 1, Salem 2, and Hope Creek nuclear plants for the year ended December 31, 2024. ZEC revenue will be adjusted based upon the actual value of the PTCs generated which is dependent on the U.S. Treasury issuing additional guidance. This would result in an additional adjustment to Net Income between $(29) million and $44 million if our tax position discussed above is, or is not supported, respectively. See Item 8. Note 20. Income Taxes and Note 2. Revenues for more information.
ITEM 7A. QUANTITATIVE AND QUALITATIVE DISCLOSURES ABOUT MARKET RISK
The risk inherent in our market-risk sensitive instruments and positions is the potential loss arising from adverse changes in commodity prices, equity security prices and interest rates as discussed in the Notes to Consolidated Financial Statements. It is our policy to use derivatives to manage risk consistent with business plans and prudent practices. We have a Risk Management Committee comprised of executive officers who utilize a risk oversight function to ensure compliance with our corporate policies and risk management practices.
Additionally, we are exposed to counterparty credit losses in the event of non-performance or non-payment. We have a credit management process, which is used to assess, monitor and mitigate counterparty exposure. In the event of non-performance or non-payment by a major counterparty, there may be a material adverse impact on our financial condition, results of operations or net cash flows.
Commodity Contracts
The availability and price of energy-related commodities are subject to fluctuations from factors such as weather, environmental policies, changes in supply and demand, state and federal regulatory policies, market rules and other events. To reduce price risk caused by market fluctuations, we enter into supply contracts and derivative contracts, including forwards, futures, swaps, and options with approved counterparties. These contracts, in conjunction with physical sales and other services, help reduce risk and optimize the value of owned electric generation capacity.
Value-at-Risk (VaR) Models
VaR represents the potential losses, under normal market conditions, for instruments or portfolios due to changes in market factors, for a specified time period and confidence level. We estimate VaR across our commodity businesses.
MTM VaR consists of MTM derivatives that are economic hedges. The calculation does not include market risks associated with activities that are subject to accrual accounting, primarily our generating facilities and some load-serving activities.
The VaR models used are variance/covariance models adjusted for the change of positions with 95% and 99.5% confidence levels and a one-day holding period for the MTM activities. The models assume no new positions throughout the holding periods; however, we actively manage our portfolio.
| | | | | | | | | | |
| | | | | | | | |
| | | MTM VaR | | |
| | | Years Ended December 31, | | |
| | | 2024 | | | 2023 | | |
| | | Millions | | |
| 95% Confidence Level, Loss could exceed VaR one day in 20 days | | | | | | | |
| Period End | | $ | 36 | | | $ | 48 | | |
| Average for the Period | | $ | 44 | | | $ | 56 | | |
| High | | $ | 152 | | | $ | 127 | | |
| Low | | $ | 25 | | | $ | 24 | | |
| | | | | | | | |
| 99.5% Confidence Level, Loss could exceed VaR one day in 200 days | | | | | | | |
| Period End | | $ | 57 | | | $ | 75 | | |
| Average for the Period | | $ | 69 | | | $ | 87 | | |
| High | | $ | 238 | | | $ | 198 | | |
| Low | | $ | 39 | | | $ | 38 | | |
| | | | | | | | |
See Item 8. Note 16. Financial Risk Management Activities for a discussion of credit risk.
Interest Rates
PSEG, PSE&G and PSEG Power are subject to the risk of fluctuating interest rates in the normal course of business. Exposure to this risk is managed by targeting a balanced debt maturity profile which limits refinancing in any given period or
interest rate environment. PSEG, PSE&G and PSEG Power may also use a mix of fixed and floating rate debt and interest rate hedges.
As of December 31, 2024, a hypothetical 10% increase in market interest rates would result in an additional $4 million in pre-tax annual interest costs related to either the current or the long-term portion of long-term debt, and term loan agreements.
Debt and Equity Securities
As of December 31, 2024, we had $4.4 billion of net assets in trust for our pension and OPEB plans. Although fluctuations in market prices of securities within this portfolio do not directly affect our earnings in the current period, changes in the value of these investments could affect
•our future contributions to these plans,
•our financial position if our accumulated benefit obligation under our pension plans exceeds the fair value of the pension trust funds, and
•future earnings, as we could be required to adjust pension expense and the assumed rate of return.
The NDT Fund is comprised primarily of fixed income and equity securities. As of December 31, 2024, the portfolio included $1.4 billion of equity securities inclusive of $0.3 billion of investments in listed real assets, and $1.3 billion in fixed income securities. The fair market value of the assets in the NDT Fund will fluctuate primarily depending upon the performance of equity markets. As of December 31, 2024, a hypothetical 10% change in the equity market would impact the value of the equity securities in the NDT Fund by approximately $138 million.
We use duration to measure the interest rate sensitivity of the fixed income portfolio. Duration is a summary statistic of the effective average maturity of the fixed income portfolio. The benchmark for the fixed income component of the NDT Fund currently has a duration of 6.08 years and a yield of 4.91%. The portfolio’s value will appreciate or depreciate by the duration with a 1% change in interest rates. As of December 31, 2024, a hypothetical 1% increase in interest rates would result in a decline in the market value for the fixed income portfolio of approximately $77 million.
ITEM 8. FINANCIAL STATEMENTS AND SUPPLEMENTARY DATA
This combined Form 10-K is separately filed by PSEG and PSE&G. Information contained herein relating to any individual company is filed by such company on its own behalf. PSE&G makes representations only as to itself and makes no representations as to any other company.
REPORT OF INDEPENDENT REGISTERED PUBLIC ACCOUNTING FIRM
To the Board of Directors and Stockholders of
Public Service Enterprise Group Incorporated
Opinion on the Financial Statements
We have audited the accompanying consolidated balance sheets of Public Service Enterprise Group Incorporated and subsidiaries (the “Company” or "PSEG") as of December 31, 2024 and 2023, the related consolidated statements of operations, comprehensive income (loss), stockholders' equity, and cash flows, for each of the three years in the period ended December 31, 2024, and the related notes and the consolidated financial statement schedule listed in the Index at Item 15(B)(a) (collectively referred to as the “financial statements”). In our opinion, the financial statements present fairly, in all material respects, the financial position of the Company as of December 31, 2024 and 2023, and the results of its operations and its cash flows for each of the three years in the period ended December 31, 2024, in conformity with accounting principles generally accepted in the United States of America.
We have also audited, in accordance with the standards of the Public Company Accounting Oversight Board (United States) (PCAOB), the Company's internal control over financial reporting as of December 31, 2024, based on criteria established in Internal Control — Integrated Framework (2013) issued by the Committee of Sponsoring Organizations of the Treadway Commission, and our report dated February 25, 2025, expressed an unqualified opinion on the Company's internal control over financial reporting.
Basis for Opinion
These financial statements are the responsibility of the Company's management. Our responsibility is to express an opinion on the Company's financial statements based on our audits. We are a public accounting firm registered with the PCAOB and are required to be independent with respect to the Company in accordance with the U.S. federal securities laws and the applicable rules and regulations of the Securities and Exchange Commission and the PCAOB.
We conducted our audits in accordance with the standards of the PCAOB. Those standards require that we plan and perform the audit to obtain reasonable assurance about whether the financial statements are free of material misstatement, whether due to error or fraud. Our audits included performing procedures to assess the risks of material misstatement of the financial statements, whether due to error or fraud, and performing procedures that respond to those risks. Such procedures included examining, on a test basis, evidence regarding the amounts and disclosures in the financial statements. Our audits also included evaluating the accounting principles used and significant estimates made by management, as well as evaluating the overall presentation of the financial statements. We believe that our audits provide a reasonable basis for our opinion.
Critical Audit Matter
The critical audit matter communicated below is a matter arising from the current-period audit of the financial statements that was communicated or required to be communicated to the audit committee and that (1) relates to accounts or disclosures that are material to the financial statements and (2) involved our especially challenging, subjective, or complex judgments. The communication of critical audit matters does not alter in any way our opinion on the financial statements, taken as a whole, and we are not, by communicating the critical audit matter below, providing a separate opinion on the critical audit matter or on the accounts or disclosures to which it relates.
Accounting for the Effects of Regulation – Refer to Notes 1 and 6 to the financial statements
Critical Audit Matter Description
PSEG’s subsidiary, Public Service Electric and Gas Company (PSE&G), prepares its financial statements to comply with GAAP for rate-regulated enterprises, which differs in some respects from accounting for non-regulated businesses. Management believes that PSE&G’s transmission and distribution businesses continue to meet the accounting requirements for rate-regulated entities, and PSE&G’s financial statements reflect the economic effects of regulation. PSE&G has deferred certain costs based on rate orders issued by the New Jersey Board of Public Utilities (“BPU”) or Federal Energy Regulatory Commission (“FERC”) or based on PSE&G’s experience with prior rate proceedings.
PSE&G defers the recognition of costs as a regulatory asset or records the recognition of obligations as a regulatory liability if it is probable that, through the rate-making process, there will be a corresponding increase or decrease in future rates. This accounting results in the recognition of revenues and expenses in different time periods than that of enterprises that are not regulated. Regulatory assets and other investments and costs incurred under various infrastructure filings and clause mechanisms are subject to prudence reviews and can be disallowed in the future by regulatory authorities. To the extent that collection of any infrastructure or clause mechanism revenue, regulatory assets or payments of regulatory liabilities is no longer probable, the amounts would be charged or credited to income.
We identified the accounting for the effects of rate regulation as a critical audit matter due to the significant judgments made by management in assessing the probable recovery of regulatory assets and incurred costs or the likelihood of refunds of regulatory liabilities. Auditing these judgments required specialized knowledge of accounting for rate regulation and the ratemaking process due to its inherent complexities.
How the Critical Audit Matter Was Addressed in the Audit
Our audit procedures to evaluate the accounting for the effects of cost-based rate regulation, including the probable recovery or refund of regulatory assets and liabilities, included the following, among others:
•We tested the effectiveness of management's controls over the evaluation of the likelihood of (1) the recovery in future rates of costs deferred as regulatory assets, and (2) a refund or a future reduction in rates that should be reported as regulatory liabilities. We tested the effectiveness of management's controls over the initial recognition of amounts as regulatory assets or liabilities and the monitoring and evaluation of regulatory developments that may affect the likelihood of recovering costs in future rates or of a future reduction in rates.
•We obtained and read relevant regulatory orders issued by the BPU and FERC for PSE&G and other publicly available information to assess the likelihood of recovery in future rates or of a future reduction in rates based on precedents of the treatment of similar costs under similar circumstances. We evaluated the external information and compared it to management’s recorded regulatory asset and liability balances for completeness.
•For regulatory matters in process, we inspected associated documents and testimony filed with the BPU or FERC for any evidence that might contradict management's assertions.
•We evaluated the financial statement presentation and disclosures related to the impacts of cost-based rate-regulation, including the balances recorded and regulatory developments.
|
/s/ DELOITTE & TOUCHE LLP |
|
Morristown, New Jersey |
February 25, 2025 |
|
We have served as the Company's auditor since 1934. |
REPORT OF INDEPENDENT REGISTERED PUBLIC ACCOUNTING FIRM
To the Board of Directors and Sole Stockholder of
Public Service Electric and Gas Company
Opinion on the Financial Statements
We have audited the accompanying consolidated balance sheets of Public Service Electric and Gas Company and subsidiaries (the “Company” or "PSE&G") as of December 31, 2024 and 2023, the related consolidated statements of operations, comprehensive income, common stockholder’s equity, and cash flows, for each of the three years in the period ended December 31, 2024, and the related notes and the consolidated financial statement schedule listed in the Index at Item 15(B)(b) (collectively referred to as the “financial statements”). In our opinion, the financial statements present fairly, in all material respects, the financial position of the Company as of December 31, 2024 and 2023, and the results of its operations and its cash flows for each of the three years in the period ended December 31, 2024, in conformity with accounting principles generally accepted in the United States of America.
Basis for Opinion
These financial statements are the responsibility of the Company's management. Our responsibility is to express an opinion on the Company's financial statements based on our audits. We are a public accounting firm registered with the Public Company Accounting Oversight Board (United States) (PCAOB) and are required to be independent with respect to the Company in accordance with the U.S. federal securities laws and the applicable rules and regulations of the Securities and Exchange Commission and the PCAOB.
We conducted our audits in accordance with the standards of the PCAOB. Those standards require that we plan and perform the audit to obtain reasonable assurance about whether the financial statements are free of material misstatement, whether due to error or fraud. The Company is not required to have, nor were we engaged to perform, an audit of its internal control over financial reporting. As part of our audits, we are required to obtain an understanding of internal control over financial reporting but not for the purpose of expressing an opinion on the effectiveness of the Company’s internal control over financial reporting. Accordingly, we express no such opinion.
Our audits included performing procedures to assess the risks of material misstatement of the financial statements, whether due to error or fraud, and performing procedures that respond to those risks. Such procedures included examining, on a test basis, evidence regarding the amounts and disclosures in the financial statements. Our audits also included evaluating the accounting principles used and significant estimates made by management, as well as evaluating the overall presentation of the financial statements. We believe that our audits provide a reasonable basis for our opinion.
Critical Audit Matter
The critical audit matter communicated below is a matter arising from the current-period audit of the financial statements that was communicated or required to be communicated to the audit committee and that (1) relates to accounts or disclosures that are material to the financial statements and (2) involved our especially challenging, subjective, or complex judgments. The communication of critical audit matters does not alter in any way our opinion on the financial statements, taken as a whole, and we are not, by communicating the critical audit matter below, providing a separate opinion on the critical audit matter or on the accounts or disclosures to which it relates.
Accounting for the Effects of Regulation – Refer to Notes 1 and 6 to the financial statements
Critical Audit Matter Description
PSE&G prepares its financial statements to comply with GAAP for rate-regulated enterprises, which differs in some respects from accounting for non-regulated businesses. Management believes that PSE&G’s transmission and distribution businesses continue to meet the accounting requirements for rate-regulated entities, and PSE&G’s financial statements reflect the economic effects of regulation. PSE&G has deferred certain costs based on rate orders issued by the New Jersey Board of Public Utilities (“BPU”) or Federal Energy Regulatory Commission (“FERC”) or based on PSE&G’s experience with prior rate proceedings.
PSE&G defers the recognition of costs as a regulatory asset or records the recognition of obligations as a regulatory liability if it is probable that, through the rate-making process, there will be a corresponding increase or decrease in future rates. This accounting results in the recognition of revenues and expenses in different time periods than that of enterprises that are not regulated. Regulatory assets and other investments and costs incurred under various infrastructure filings and clause mechanisms are subject to prudence reviews and can be disallowed in the future by regulatory authorities. To the extent that collection of any infrastructure or clause mechanism revenue, regulatory assets or payments of regulatory liabilities is no longer probable, the amounts would be charged or credited to income.
We identified the accounting for the effects of rate regulation as a critical audit matter due to the significant judgments made by management in assessing the probable recovery of regulatory assets and incurred costs or the likelihood of refunds of regulatory liabilities. Auditing these judgments required specialized knowledge of accounting for rate regulation and the ratemaking process due to its inherent complexities.
How the Critical Audit Matter Was Addressed in the Audit
Our audit procedures to evaluate the accounting for the effects of cost-based rate regulation, including the probable recovery or refund of regulatory assets and liabilities, included the following, among others:
•We tested the effectiveness of management's controls over the evaluation of the likelihood of (1) the recovery in future rates of costs deferred as regulatory assets, and (2) a refund or a future reduction in rates that should be reported as regulatory liabilities. We tested the effectiveness of management's controls over the initial recognition of amounts as regulatory assets or liabilities and the monitoring and evaluation of regulatory developments that may affect the likelihood of recovering costs in future rates or of a future reduction in rates.
•We obtained and read relevant regulatory orders issued by the BPU and FERC for PSE&G and other publicly available information to assess the likelihood of recovery in future rates or of a future reduction in rates based on precedents of the treatment of similar costs under similar circumstances. We evaluated the external information and compared it to management’s recorded regulatory asset and liability balances for completeness.
•For regulatory matters in process, we inspected associated documents and testimony filed with the BPU or FERC for any evidence that might contradict management's assertions.
•We evaluated the financial statement presentation and disclosures related to the impacts of cost-based rate-regulation, including the balances recorded and regulatory developments.
|
/s/ DELOITTE & TOUCHE LLP |
|
Morristown, New Jersey |
February 25, 2025 |
|
We have served as the Company's auditor since 1934. |
PUBLIC SERVICE ENTERPRISE GROUP INCORPORATED
CONSOLIDATED STATEMENTS OF OPERATIONS
Millions, except per share data
| | | | | | | | | | | | | | |
| | | | | | | | | | | |
| | | Years Ended December 31, |
| | | 2024 | | | 2023 | | | 2022 | | |
| OPERATING REVENUES | | $ | 10,290 | | | $ | 11,237 | | | $ | 9,800 | | |
| OPERATING EXPENSES | | | | | | | | | | |
| Energy Costs | | | 3,393 | | | | 3,260 | | | | 4,018 | | |
| Operation and Maintenance | | | 3,356 | | | | 3,150 | | | | 3,178 | | |
| Depreciation and Amortization | | | 1,182 | | | | 1,135 | | | | 1,100 | | |
| Losses on Asset Dispositions and Impairments | | | 6 | | | | 7 | | | | 123 | | |
| Total Operating Expenses | | | 7,937 | | | | 7,552 | | | | 8,419 | | |
| OPERATING INCOME | | | 2,353 | | | | 3,685 | | | | 1,381 | | |
| Income from Equity Method Investments | | | 1 | | | | 1 | | | | 14 | | |
| Net Gains (Losses) on Trust Investments | | | 127 | | | | 189 | | | | (265 | ) | |
| Net Other Income (Deductions) | | | 153 | | | | 172 | | | | 124 | | |
| Net Non-Operating Pension and Other Postretirement Benefit (OPEB) (Costs) Credits | | | 73 | | | | (218 | ) | | | 376 | | |
| Interest Expense | | | (882 | ) | | | (748 | ) | | | (628 | ) | |
| INCOME BEFORE INCOME TAXES | | | 1,825 | | | | 3,081 | | | | 1,002 | | |
| Income Tax (Expense) Benefit | | | (53 | ) | | | (518 | ) | | | 29 | | |
| NET INCOME | | $ | 1,772 | | | $ | 2,563 | | | $ | 1,031 | | |
| WEIGHTED AVERAGE COMMON SHARES OUTSTANDING: | | | | | | | | | | |
| BASIC | | | 498 | | | | 498 | | | | 498 | | |
| DILUTED | | | 500 | | | | 500 | | | | 501 | | |
| NET INCOME PER SHARE: | | | | | | | | | | |
| BASIC | | $ | 3.56 | | | $ | 5.15 | | | $ | 2.07 | | |
| DILUTED | | $ | 3.54 | | | $ | 5.13 | | | $ | 2.06 | | |
| | | | | | | | | | | |
See Notes to Consolidated Financial Statements.
PUBLIC SERVICE ENTERPRISE GROUP INCORPORATED
CONSOLIDATED STATEMENTS OF COMPREHENSIVE INCOME (LOSS)
Millions
| | | | | | | | | | | | | | |
| | | | | | | | | | | |
| | | Years Ended December 31, | | |
| | | 2024 | | | 2023 | | | 2022 | | |
| NET INCOME | | $ | 1,772 | | | $ | 2,563 | | | $ | 1,031 | | |
| Other Comprehensive Income (Loss), net of tax | | | | | | | | | | |
| Unrealized Gains (Losses) on Available-for-Sale Securities, net of tax (expense) benefit of $9, $(27) and $85 for the years ended 2024, 2023 and 2022, respectively | | | (13 | ) | | | 41 | | | | (132 | ) | |
| Unrealized Gains (Losses) on Cash Flow Hedges, net of tax (expense) benefit of $(13), $(2) and $(2) for the years ended 2024, 2023 and 2022, respectively | | | 33 | | | | 6 | | | | 3 | | |
| Pension/OPEB adjustment, net of tax (expense) benefit of $(10), $(127) and $28 for the years ended 2024, 2023 and 2022, respectively | | | 26 | | | | 324 | | | | (71 | ) | |
| Other Comprehensive Income (Loss), net of tax | | | 46 | | | | 371 | | | | (200 | ) | |
| COMPREHENSIVE INCOME (LOSS) | | $ | 1,818 | | | $ | 2,934 | | | $ | 831 | | |
| | | | | | | | | | | |
See Notes to Consolidated Financial Statements.
PUBLIC SERVICE ENTERPRISE GROUP INCORPORATED
CONSOLIDATED BALANCE SHEETS
Millions
| | | | | | | | | | |
| | | | | | | | |
| | | December 31, | | |
| | | 2024 | | | 2023 | | |
| ASSETS | | |
| CURRENT ASSETS | | | | | | | |
| Cash and Cash Equivalents | | $ | 125 | | | $ | 54 | | |
| Accounts Receivable, net of allowance of $210 in 2024 and $279 in 2023 | | | 1,597 | | | | 1,482 | | |
| Tax Receivable | | | 394 | | | | 10 | | |
| Unbilled Revenues, net of allowance of $5 in 2024 and $4 in 2023 | | | 313 | | | | 244 | | |
| Fuel | | | 232 | | | | 264 | | |
| Materials and Supplies, net | | | 892 | | | | 759 | | |
| Prepayments | | | 117 | | | | 144 | | |
| Derivative Contracts | | | 33 | | | | 112 | | |
| Regulatory Assets | | | 516 | | | | 273 | | |
| Other | | | 16 | | | | 31 | | |
| Total Current Assets | | | 4,235 | | | | 3,373 | | |
| PROPERTY, PLANT AND EQUIPMENT | | | 51,207 | | | | 48,603 | | |
| Less: Accumulated Depreciation and Amortization | | | (11,143 | ) | | | (10,572 | ) | |
| Net Property, Plant and Equipment | | | 40,064 | | | | 38,031 | | |
| NONCURRENT ASSETS | | | | | | | |
| Regulatory Assets | | | 6,125 | | | | 5,157 | | |
| Operating Lease Right-of-Use Assets | | | 162 | | | | 179 | | |
| Long-Term Investments | | | 263 | | | | 295 | | |
| Nuclear Decommissioning Trust (NDT) Fund | | | 2,670 | | | | 2,524 | | |
| Long-Term Receivable of Variable Interest Entity | | | 558 | | | | 632 | | |
| Rabbi Trust Fund | | | 165 | | | | 179 | | |
| Derivative Contracts | | | 51 | | | | 29 | | |
| Other | | | 347 | | | | 342 | | |
| Total Noncurrent Assets | | | 10,341 | | | | 9,337 | | |
| TOTAL ASSETS | | $ | 54,640 | | | $ | 50,741 | | |
| | | | | | | | |
See Notes to Consolidated Financial Statements.
PUBLIC SERVICE ENTERPRISE GROUP INCORPORATED
CONSOLIDATED BALANCE SHEETS
Millions
| | | | | | | | | | |
| | | | | | | | |
| | | December 31, | | |
| | | 2024 | | | 2023 | | |
| LIABILITIES AND CAPITALIZATION | | |
| | | | | | | | |
| CURRENT LIABILITIES | | | | | | | |
| Long-Term Debt Due Within One Year | | $ | 2,150 | | | $ | 1,500 | | |
| Commercial Paper and Loans | | | 1,593 | | | | 949 | | |
| Accounts Payable | | | 1,136 | | | | 1,214 | | |
| Derivative Contracts | | | 5 | | | | 86 | | |
| Accrued Interest | | | 219 | | | | 170 | | |
| Accrued Taxes | | | 10 | | | | 8 | | |
| New Jersey Clean Energy Program | | | 145 | | | | 145 | | |
| Obligation to Return Cash Collateral | | | 93 | | | | 89 | | |
| Regulatory Liabilities | | | 555 | | | | 349 | | |
| Other | | | 599 | | | | 547 | | |
| Total Current Liabilities | | | 6,505 | | | | 5,057 | | |
| NONCURRENT LIABILITIES | | | | | | | |
| Deferred Income Taxes and Investment Tax Credits (ITC) | | | 7,248 | | | | 6,671 | | |
| Regulatory Liabilities | | | 2,271 | | | | 2,075 | | |
| Operating Leases | | | 153 | | | | 173 | | |
| Asset Retirement Obligations | | | 1,500 | | | | 1,468 | | |
| Other Postretirement Benefit (OPEB) Costs | | | 292 | | | | 349 | | |
| OPEB Costs of Servco | | | 510 | | | | 514 | | |
| Accrued Pension Costs | | | 488 | | | | 606 | | |
| Accrued Pension Costs of Servco | | | 31 | | | | 102 | | |
| Environmental Costs | | | 225 | | | | 213 | | |
| Derivative Contracts | | | 4 | | | | 6 | | |
| Long-Term Accrued Taxes | | | 130 | | | | 45 | | |
| Other | | | 205 | | | | 201 | | |
| Total Noncurrent Liabilities | | | 13,057 | | | | 12,423 | | |
| COMMITMENTS AND CONTINGENT LIABILITIES (See Note 13) CAPITALIZATION | | | | | | | |
| LONG-TERM DEBT | | | 18,964 | | | | 17,784 | | |
| STOCKHOLDERS’ EQUITY | | | | | | | |
| Common Stock, no par, authorized 1,000 shares; issued, 2024 and 2023—534 shares | | | 5,057 | | | | 5,018 | | |
| Treasury Stock, at cost, 2024 and 2023—36 shares | | | (1,403 | ) | | | (1,379 | ) | |
| Retained Earnings | | | 12,593 | | | | 12,017 | | |
| Accumulated Other Comprehensive Loss | | | (133 | ) | | | (179 | ) | |
| Total Stockholders’ Equity | | | 16,114 | | | | 15,477 | | |
| Total Capitalization | | | 35,078 | | | | 33,261 | | |
| TOTAL LIABILITIES AND CAPITALIZATION | | $ | 54,640 | | | $ | 50,741 | | |
| | | | | | | | |
See Notes to Consolidated Financial Statements.
PUBLIC SERVICE ENTERPRISE GROUP INCORPORATED
CONSOLIDATED STATEMENTS OF CASH FLOWS
Millions
| | | | | | | | | | | | | | |
| | | | | | | | | | | |
| | | Years Ended December 31, | | |
| CASH FLOWS FROM OPERATING ACTIVITIES | | 2024 | | | 2023 | | | 2022 | | |
| Net Income | | $ | 1,772 | | | $ | 2,563 | | | $ | 1,031 | | |
| Adjustments to Reconcile Net Income to Net Cash Flows from Operating Activities: | | | | | | | | | | |
| Depreciation and Amortization | | | 1,182 | | | | 1,135 | | | | 1,100 | | |
| Amortization of Nuclear Fuel | | | 191 | | | | 189 | | | | 183 | | |
| Losses on Asset Dispositions and Impairments | | | 6 | | | | 7 | | | | 123 | | |
| Emission Allowances and Renewable Energy Credit (REC) Compliance Accrual | | | — | | | | 3 | | | | 55 | | |
| Provision for Deferred Income Taxes and ITC | | | 263 | | | | 355 | | | | (261 | ) | |
| Non-Cash Employee Benefit Plan (Credits) Costs | | | 75 | | | | 366 | | | | (239 | ) | |
| Net Realized and Unrealized (Gains) Losses on Energy Contracts and Other Derivatives | | | 210 | | | | (1,333 | ) | | | 639 | | |
| Cost of Removal | | | (170 | ) | | | (166 | ) | | | (129 | ) | |
| Energy Efficiency Programs Regulatory Investment Expenditures | | | (544 | ) | | | (466 | ) | | | (286 | ) | |
| Amortization of Energy Efficiency Programs Regulatory Investment Expenditures | | | 125 | | | | 82 | | | | 48 | | |
| Net Change in Other Regulatory Assets and Liabilities | | | (273 | ) | | | 2 | | | | (78 | ) | |
| Net (Gains) Losses and (Income) Expense from NDT Fund | | | (194 | ) | | | (248 | ) | | | 202 | | |
| Net Change in Certain Current Assets and Liabilities: | | | | | | | | | | |
| Tax Receivable | | | (384 | ) | | 75 | | | 1 | | |
| Cash Collateral | | | (131 | ) | | | 1,408 | | | | (677 | ) | |
| Obligation to Return Cash Collateral | | | 4 | | | | (201 | ) | | | 111 | | |
| Accrued Taxes | | | 2 | | | | (10 | ) | | | (94 | ) | |
| Other Current Assets and Liabilities | | | (95 | ) | | | 35 | | | | (188 | ) | |
| Employee Benefit Plan Funding and Related Payments | | | (53 | ) | | | (40 | ) | | | (35 | ) | |
| Other | | | 147 | | | | 50 | | | | (3 | ) | |
| Net Cash Provided By (Used In) Operating Activities | | | 2,133 | | | | 3,806 | | | | 1,503 | | |
| CASH FLOWS FROM INVESTING ACTIVITIES | | | | | | | | | | |
| Additions to Property, Plant and Equipment | | | (3,380 | ) | | | (3,325 | ) | | | (2,888 | ) | |
| Proceeds from Sales of Trust Investments | | | 1,537 | | | | 1,714 | | | | 1,586 | | |
| Purchases of Trust Investments | | | (1,563 | ) | | | (1,751 | ) | | | (1,611 | ) | |
| Proceeds from Sales of Long-Lived Assets and Lease Investments | | | — | | | | 37 | | | | 1,918 | | |
| Proceeds from Sales of Equity Method Investments | | | — | | | | 291 | | | | — | | |
| Contributions to Equity Method Investments | | | — | | | | — | | | | (124 | ) | |
| Other | | | 100 | | | | 76 | | | | 18 | | |
| Net Cash Provided By (Used In) Investing Activities | | | (3,306 | ) | | | (2,958 | ) | | | (1,101 | ) | |
| CASH FLOWS FROM FINANCING ACTIVITIES | | | | | | | | | | |
| Net Change in Commercial Paper | | | 744 | | | | 250 | | | | (819 | ) | |
| Proceeds from Short-Term Loans | | | 400 | | | | 750 | | | | 2,000 | | |
| Repayment of Short-Term Loans | | | (500 | ) | | | (2,250 | ) | | | (2,500 | ) | |
| Issuance of Long-Term Debt | | | 3,350 | | | | 2,800 | | | | 2,850 | | |
| Redemption of Long-Term Debt | | | (1,500 | ) | | | (1,575 | ) | | | (700 | ) | |
| Payments for Share Repurchase Program | | | — | | | | — | | | | (500 | ) | |
| Cash Dividends Paid on Common Stock | | | (1,196 | ) | | | (1,137 | ) | | | (1,079 | ) | |
| Other | | | (70 | ) | | | (98 | ) | | | (6 | ) | |
| Net Cash Provided By (Used In) Financing Activities | | | 1,228 | | | | (1,260 | ) | | | (754 | ) | |
| Net Increase (Decrease) in Cash, Cash Equivalents and Restricted Cash | | | 55 | | | | (412 | ) | | | (352 | ) | |
| Cash, Cash Equivalents and Restricted Cash at Beginning of Period | | | 99 | | | | 511 | | | | 863 | | |
| Cash, Cash Equivalents and Restricted Cash at End of Period | | $ | 154 | | | $ | 99 | | | $ | 511 | | |
| Supplemental Disclosure of Cash Flow Information: | | | | | | | | | | |
| Income Taxes Paid (Received) | | $ | 68 | | | $ | 144 | | | $ | 353 | | |
| Interest Paid, Net of Amounts Capitalized | | $ | 799 | | | $ | 683 | | | $ | 602 | | |
| Accrued Property, Plant and Equipment Expenditures | | $ | 326 | | | $ | 443 | | | $ | 366 | | |
| | | | | | | | | | | |
See Notes to Consolidated Financial Statements.
PUBLIC SERVICE ENTERPRISE GROUP INCORPORATED
CONSOLIDATED STATEMENTS OF STOCKHOLDERS’ EQUITY
Millions
| | | | | | | | | | | | | | | | | | | | | | | | | | | | | | |
| | | | | | | | | | | | | | | | | | | | | | | |
| | | Common
Stock | | | Treasury
Stock | | | | | | Accumulated
Other | | | | | |
| | | Shares | | | Amount | | | Shares | | | Amount | | | Retained
Earnings | | | Comprehensive
Income (Loss) | | | Total | | |
| Balance as of December 31, 2021 | | | 534 | | | $ | 5,045 | | | | (30 | ) | | $ | (896 | ) | | $ | 10,639 | | | $ | (350 | ) | | $ | 14,438 | | |
| Net Income | | | — | | | | — | | | | — | | | | — | | | | 1,031 | | | | — | | | | 1,031 | | |
| Other Comprehensive Income (Loss), net of tax (expense) benefit of $111 | | | — | | | | — | | | | — | | | | — | | | | — | | | | (200 | ) | | | (200 | ) | |
| Comprehensive Income | | | | | | | | | | | | | | | | | | | | | 831 | | |
| Cash Dividends at $2.16 per share on Common Stock | | | — | | | | — | | | | — | | | | — | | | | (1,079 | ) | | | — | | | | (1,079 | ) | |
| Payments for Share Repurchase Program | | | — | | | | — | | | | (7 | ) | | | (500 | ) | | | — | | | | — | | | | (500 | ) | |
| Other | | | — | | | | 20 | | | | — | | | | 19 | | | | — | | | | — | | | | 39 | | |
| Balance as of December 31, 2022 | | | 534 | | | $ | 5,065 | | | | (37 | ) | | $ | (1,377 | ) | | $ | 10,591 | | | $ | (550 | ) | | $ | 13,729 | | |
| Net Income | | | — | | | | — | | | | — | | | | — | | | | 2,563 | | | | — | | | | 2,563 | | |
| Other Comprehensive Income (Loss), net of tax (expense) benefit of $(156) | | | — | | | | — | | | | — | | | | — | | | | — | | | | 371 | | | | 371 | | |
| Comprehensive Income | | | | | | | | | | | | | | | | | | | | | 2,934 | | |
| Cash Dividends at $2.28 per share on Common Stock | | | — | | | | — | | | | — | | | | — | | | | (1,137 | ) | | | — | | | | (1,137 | ) | |
| Other | | | — | | | | (47 | ) | | | 1 | | | | (2 | ) | | | — | | | | — | | | | (49 | ) | |
| Balance as of December 31, 2023 | | | 534 | | | $ | 5,018 | | | | (36 | ) | | $ | (1,379 | ) | | $ | 12,017 | | | $ | (179 | ) | | $ | 15,477 | | |
| Net Income | | | — | | | | — | | | | — | | | | — | | | | 1,772 | | | | — | | | | 1,772 | | |
| Other Comprehensive Income (Loss), net of tax (expense) benefit of $(14) | | | — | | | | — | | | | — | | | | — | | | | — | | | | 46 | | | | 46 | | |
| Comprehensive Income | | | | | | | | | | | | | | | | | | | | | 1,818 | | |
| Cash Dividends at $2.40 per share on Common Stock | | | — | | | | — | | | | — | | | | — | | | | (1,196 | ) | | | — | | | | (1,196 | ) | |
| Other | | | — | | | | 39 | | | | — | | | | (24 | ) | | | — | | | | — | | | | 15 | | |
| Balance as of December 31, 2024 | | | 534 | | | $ | 5,057 | | | | (36 | ) | | $ | (1,403 | ) | | $ | 12,593 | | | $ | (133 | ) | | $ | 16,114 | | |
| | | | | | | | | | | | | | | | | | | | | | | |
| | | | | | | | | | | | | | | | | | | | | | | |
See Notes to Consolidated Financial Statements.
PUBLIC SERVICE ELECTRIC AND GAS COMPANY
CONSOLIDATED STATEMENTS OF OPERATIONS
Millions
| | | | | | | | | | | | | | |
| | | | | | | | | | | |
| | | Years Ended December 31, | | |
| | | 2024 | | | 2023 | | | 2022 | | |
| OPERATING REVENUES | | $ | 8,449 | | | $ | 7,807 | | | $ | 7,935 | | |
| OPERATING EXPENSES | | | | | | | | | | |
| Energy Costs | | | 3,189 | | | | 3,010 | | | | 3,270 | | |
| Operation and Maintenance | | | 1,949 | | | | 1,843 | | | | 1,838 | | |
| Depreciation and Amortization | | | 1,025 | | | | 980 | | | | 935 | | |
| Total Operating Expenses | | | 6,163 | | | | 5,833 | | | | 6,043 | | |
| OPERATING INCOME | | | 2,286 | | | | 1,974 | | | | 1,892 | | |
| Net Gains (Losses) on Trust Investments | | | — | | | | — | | | | (2 | ) | |
| Net Other Income (Deductions) | | | 64 | | | | 80 | | | | 88 | | |
| Net Non-Operating Pension and OPEB Credits | | | 77 | | | | 114 | | | | 281 | | |
| Interest Expense | | | (582 | ) | | | (493 | ) | | | (427 | ) | |
| INCOME BEFORE INCOME TAXES | | | 1,845 | | | | 1,675 | | | | 1,832 | | |
| Income Tax Expense | | | (298 | ) | | | (160 | ) | | | (267 | ) | |
| NET INCOME | | $ | 1,547 | | | $ | 1,515 | | | $ | 1,565 | | |
| | | | | | | | | | | |
See disclosures regarding Public Service Electric and Gas Company included in the Notes to Consolidated Financial Statements.
PUBLIC SERVICE ELECTRIC AND GAS COMPANY
CONSOLIDATED STATEMENTS OF COMPREHENSIVE INCOME
Millions
| | | | | | | | | | | | | | |
| | | | | | | | | | | |
| | | Years Ended December 31, | | |
| | | 2024 | | | 2023 | | | 2022 | | |
| NET INCOME | | $ | 1,547 | | | $ | 1,515 | | | $ | 1,565 | | |
| Other Comprehensive Income (Loss), net of tax | | | | | | | | | | |
| Unrealized Gains (Losses) on Available-for-Sale Securities, net of tax (expense) benefit of $0, $0 and $2 for the years ended 2024, 2023 and 2022, respectively | | | — | | | | 1 | | | | (6 | ) | |
| COMPREHENSIVE INCOME | | $ | 1,547 | | | $ | 1,516 | | | $ | 1,559 | | |
| | | | | | | | | | | |
See disclosures regarding Public Service Electric and Gas Company included in the Notes to Consolidated Financial Statements.
PUBLIC SERVICE ELECTRIC AND GAS COMPANY
CONSOLIDATED BALANCE SHEETS
Millions
| | | | | | | | | | |
| | | | | | | | |
| | | December 31, | | |
| | | 2024 | | | 2023 | | |
| ASSETS | | |
| CURRENT ASSETS | | | | | | | |
| Cash and Cash Equivalents | | $ | 79 | | | $ | 30 | | |
| Accounts Receivable, net of allowance of $210 in 2024 and $279 in 2023 | | | 1,189 | | | | 1,076 | | |
| Unbilled Revenues, net of allowance of $5 in 2024 and $4 in 2023 | | | 313 | | | | 244 | | |
| Materials and Supplies, net | | | 642 | | | | 519 | | |
| Prepayments | | | 28 | | | | 57 | | |
| Regulatory Assets | | | 516 | | | | 273 | | |
| Other | | | 15 | | | | 31 | | |
| Total Current Assets | | | 2,782 | | | | 2,230 | | |
| PROPERTY, PLANT AND EQUIPMENT | | | 46,198 | | | | 43,753 | | |
| Less: Accumulated Depreciation and Amortization | | | (9,160 | ) | | | (8,711 | ) | |
| Net Property, Plant and Equipment | | | 37,038 | | | | 35,042 | | |
| NONCURRENT ASSETS | | | | | | | |
| Regulatory Assets | | | 6,125 | | | | 5,157 | | |
| Operating Lease Right-of-Use Assets | | | 93 | | | | 99 | | |
| Long-Term Investments | | | 90 | | | | 117 | | |
| Rabbi Trust Fund | | | 30 | | | | 32 | | |
| Long-Term Accrued Taxes | | | 2 | | | | — | | |
| Other | | | 204 | | | | 196 | | |
| Total Noncurrent Assets | | | 6,544 | | | | 5,601 | | |
| TOTAL ASSETS | | $ | 46,364 | | | $ | 42,873 | | |
| | | | | | | | |
See disclosures regarding Public Service Electric and Gas Company included in the Notes to Consolidated Financial Statements.
PUBLIC SERVICE ELECTRIC AND GAS COMPANY
CONSOLIDATED BALANCE SHEETS
Millions
| | | | | | | | | | |
| | | | | | | | |
| | | December 31, | | |
| | | 2024 | | | 2023 | | |
| LIABILITIES AND CAPITALIZATION | | |
| CURRENT LIABILITIES | | | | | | | |
| Long-Term Debt Due Within One Year | | $ | 350 | | | $ | 750 | | |
| Commercial Paper and Loans | | | 444 | | | | 425 | | |
| Accounts Payable | | | 704 | | | | 780 | | |
| Accounts Payable—Affiliated Companies | | | 362 | | | | 504 | | |
| Accrued Interest | | | 174 | | | | 139 | | |
| New Jersey Clean Energy Program | | | 145 | | | | 145 | | |
| Obligation to Return Cash Collateral | | | 93 | | | | 89 | | |
| Regulatory Liabilities | | | 555 | | | | 349 | | |
| Other | | | 371 | | | | 434 | | |
| Total Current Liabilities | | | 3,198 | | | | 3,615 | | |
| NONCURRENT LIABILITIES | | | | | | | |
| Deferred Income Taxes and ITC | | | 6,477 | | | | 5,813 | | |
| Regulatory Liabilities | | | 2,271 | | | | 2,075 | | |
| Operating Leases | | | 83 | | | | 89 | | |
| Asset Retirement Obligations | | | 457 | | | | 401 | | |
| OPEB Costs | | | 164 | | | | 210 | | |
| Accrued Pension Costs | | | 305 | | | | 396 | | |
| Environmental Costs | | | 159 | | | | 151 | | |
| Long-Term Accrued Taxes | | | — | | | | 2 | | |
| Other | | | 157 | | | | 160 | | |
| Total Noncurrent Liabilities | | | 10,073 | | | | 9,297 | | |
| COMMITMENTS AND CONTINGENT LIABILITIES (See Note 13) | | | | | | | |
| CAPITALIZATION | | | | | | | |
| LONG-TERM DEBT | | | 14,648 | | | | 12,913 | | |
| STOCKHOLDER’S EQUITY | | | | | | | |
| Common Stock; 150 shares authorized; issued and outstanding, 2024 and 2023—132 shares | | | 892 | | | | 892 | | |
| Contributed Capital | | | 2,156 | | | | 2,156 | | |
| Retained Earnings | | | 15,401 | | | | 14,004 | | |
| Accumulated Other Comprehensive Loss | | | (4 | ) | | | (4 | ) | |
| Total Stockholder’s Equity | | | 18,445 | | | | 17,048 | | |
| Total Capitalization | | | 33,093 | | | | 29,961 | | |
| TOTAL LIABILITIES AND CAPITALIZATION | | $ | 46,364 | | | $ | 42,873 | | |
| | | | | | | | |
See disclosures regarding Public Service Electric and Gas Company included in the Notes to Consolidated Financial Statements.
PUBLIC SERVICE ELECTRIC AND GAS COMPANY
CONSOLIDATED STATEMENTS OF CASH FLOWS
Millions
| | | | | | | | | | | | | | |
| | | | | | | | | | | |
| | | Years Ended December 31, | | |
| | | 2024 | | �� | 2023 | | | 2022 | | |
| CASH FLOWS FROM OPERATING ACTIVITIES | | | | | | | | | | |
| Net Income | | $ | 1,547 | | | $ | 1,515 | | | $ | 1,565 | | |
| Adjustments to Reconcile Net Income to Net Cash Flows from Operating Activities: | | | | | | | | | | |
| Depreciation and Amortization | | | 1,025 | | | | 980 | | | | 935 | | |
| Provision for Deferred Income Taxes and ITC | | | 365 | | | | 29 | | | | 137 | | |
| Non-Cash Employee Benefit Plan (Credits) Costs | | | 41 | | | | 8 | | | | (179 | ) | |
| Cost of Removal | | | (170 | ) | | | (166 | ) | | | (129 | ) | |
| Energy Efficiency Programs Regulatory Investment Expenditures | | | (544 | ) | | | (466 | ) | | | (286 | ) | |
| Amortization of Energy Efficiency Programs Regulatory Investment Expenditures | | | 125 | | | | 82 | | | | 48 | | |
| Net Change in Other Regulatory Assets and Liabilities | | | (273 | ) | | | 2 | | | | (78 | ) | |
| Net Change in Certain Current Assets and Liabilities | | | | | | | | | | |
| Accounts Receivable and Unbilled Revenues | | | (188 | ) | | | 72 | | | | (132 | ) | |
| Materials and Supplies | | | (123 | ) | | | (211 | ) | | | (73 | ) | |
| Prepayments | | | 29 | | | | (50 | ) | | | 8 | | |
| Accounts Payable | | | 34 | | | | 13 | | | | 96 | | |
| Accounts Receivable/Payable—Affiliated Companies, net | | | (47 | ) | | | (3 | ) | | | 18 | | |
| Obligation to Return Cash Collateral | | | 4 | | | | (201 | ) | | | 111 | | |
| Other Current Assets and Liabilities | | | (29 | ) | | | 23 | | | | 44 | | |
| Employee Benefit Plan Funding and Related Payments | | | (32 | ) | | | (20 | ) | | | (17 | ) | |
| Other | | | (39 | ) | | | (67 | ) | | | (40 | ) | |
| Net Cash Provided By (Used In) Operating Activities | | | 1,725 | | | | 1,540 | | | | 2,028 | | |
| CASH FLOWS FROM INVESTING ACTIVITIES | | | | | | | | | | |
| Additions to Property, Plant and Equipment | | | (2,921 | ) | | | (2,998 | ) | | | (2,590 | ) | |
| Proceeds from Sales of Trust Investments | | | 6 | | | | 4 | | | | 12 | | |
| Purchases of Trust Investments | | | (4 | ) | | | (3 | ) | | | (10 | ) | |
| Other | | | 33 | | | | 33 | | | | 45 | | |
| Net Cash Provided By (Used In) Investing Activities | | | (2,886 | ) | | | (2,964 | ) | | | (2,543 | ) | |
| CASH FLOWS FROM FINANCING ACTIVITIES | | | | | | | | | | |
| Net Change in Commercial Paper and Loans | | | 19 | | | | 425 | | | | — | | |
| Issuance of Long-Term Debt | | | 2,100 | | | | 1,800 | | | | 900 | | |
| Redemption of Long-Term Debt | | | (750 | ) | | | (825 | ) | | | — | | |
| Cash Dividends Paid | | | (150 | ) | | | (150 | ) | | | (450 | ) | |
| Other | | | (25 | ) | | | (17 | ) | | | (8 | ) | |
| Net Cash Provided By (Used In) Financing Activities | | | 1,194 | | | | 1,233 | | | | 442 | | |
| Net Increase (Decrease) in Cash, Cash Equivalents and Restricted Cash | | | 33 | | | | (191 | ) | | | (73 | ) | |
| Cash, Cash Equivalents and Restricted Cash at Beginning of Period | | | 75 | | | | 266 | | | | 339 | | |
| Cash, Cash Equivalents and Restricted Cash at End of Period | | $ | 108 | | | $ | 75 | | | $ | 266 | | |
| Supplemental Disclosure of Cash Flow Information: | | | | | | | | | | |
| Income Taxes Paid (Received) | | $ | 68 | | | $ | 77 | | | $ | 137 | | |
| Interest Paid, Net of Amounts Capitalized | | $ | 523 | | | $ | 449 | | | $ | 409 | | |
| Accrued Property, Plant and Equipment Expenditures | | $ | 286 | | | $ | 395 | | | $ | 331 | | |
| | | | | | | | | | | |
See disclosures regarding Public Service Electric and Gas Company included in the Notes to Consolidated Financial Statements.
PUBLIC SERVICE ELECTRIC AND GAS COMPANY
CONSOLIDATED STATEMENTS OF COMMON STOCKHOLDER’S EQUITY
Millions
| | | | | | | | | | | | | | | | | | | | | | |
| | | | | | | | | | | | | | | | | |
| | | Common Stock | | | Contributed
Capital | | | Retained
Earnings | | | Accumulated
Other
Comprehensive
Income (Loss) | | | Total | | |
| Balance as of December 31, 2021 | | $ | 892 | | | $ | 2,156 | | | $ | 11,524 | | | $ | 1 | | | $ | 14,573 | | |
| Net Income | | | — | | | | — | | | | 1,565 | | | | — | | | | 1,565 | | |
| Other Comprehensive Income (Loss), net of tax (expense) benefit of $2 | | | — | | | | — | | | | — | | | | (6 | ) | | | (6 | ) | |
| Comprehensive Income | | | | | | | | | | | | | | | 1,559 | | |
| Cash Dividend Paid | | | — | | | | — | | | | (450 | ) | | | — | | | | (450 | ) | |
| Balance as of December 31, 2022 | | $ | 892 | | | $ | 2,156 | | | $ | 12,639 | | | $ | (5 | ) | | $ | 15,682 | | |
| Net Income | | | — | | | | — | | | | 1,515 | | | | — | | | | 1,515 | | |
| Other Comprehensive Income (Loss), net of tax (expense) benefit of $0 | | | — | | | | — | | | | — | | | | 1 | | | | 1 | | |
| Comprehensive Income | | | | | | | | | | | | | | | 1,516 | | |
| Cash Dividend Paid | | | — | | | | — | | | | (150 | ) | | | — | | | | (150 | ) | |
| Balance as of December 31, 2023 | | $ | 892 | | | $ | 2,156 | | | $ | 14,004 | | | $ | (4 | ) | | $ | 17,048 | | |
| Net Income | | | — | | | | — | | | | 1,547 | | | | — | | | | 1,547 | | |
| Other Comprehensive Income (Loss), net of tax (expense) benefit of $0 | | | — | | | | — | | | | — | | | | — | | | | — | | |
| Comprehensive Income | | | | | | | | | | | | | | | 1,547 | | |
| Cash Dividends Paid | | | — | | | | — | | | | (150 | ) | | | — | | | | (150 | ) | |
| Balance as of December 31, 2024 | | $ | 892 | | | $ | 2,156 | | | $ | 15,401 | | | $ | (4 | ) | | $ | 18,445 | | |
| | | | | | | | | | | | | | | | | |
See disclosures regarding Public Service Electric and Gas Company included in the Notes to Consolidated Financial Statements.
NOTES TO CONSOLIDATED FINANCIAL STATEMENTS
Note 1. Organization, Basis of Presentation and Summary of Significant Accounting Policies
Organization
Public Service Enterprise Group Incorporated (PSEG) is a public utility holding company that, acting through its wholly owned subsidiaries, is a predominantly regulated electric and gas utility and a nuclear generation business. PSEG’s principal operating subsidiaries are:
•Public Service Electric and Gas Company (PSE&G)—which is a public utility engaged principally in the transmission of electricity and distribution of electricity and natural gas in certain areas of New Jersey. PSE&G is subject to regulation by the New Jersey Board of Public Utilities (BPU), the Federal Energy Regulatory Commission (FERC) and other federal and New Jersey state regulators. PSE&G also invests in regulated solar generation projects and energy efficiency (EE) and related programs in New Jersey, which are regulated by the BPU.
•PSEG Power LLC (PSEG Power)—which is an energy supply company that consists of the operations of merchant nuclear generating assets and fuel supply functions engaged in competitive energy sales via its principal direct wholly owned subsidiaries. PSEG Power’s subsidiaries are subject to regulation by FERC, the Nuclear Regulatory Commission (NRC), and other federal regulators and state regulators in the states in which they operate.
PSEG’s other direct wholly owned subsidiaries are: PSEG Long Island LLC (PSEG LI), which operates the Long Island Power Authority’s (LIPA) electric transmission and distribution (T&D) system under an Operations Services Agreement (OSA); PSEG Energy Holdings L.L.C. (Energy Holdings), which primarily holds legacy lease investments and competitively bid, FERC regulated transmission; and PSEG Services Corporation (Services), which provides certain management, administrative and general services to PSEG and its subsidiaries at cost.
Basis of Presentation
The respective financial statements included herein have been prepared pursuant to the rules and regulations of the Securities and Exchange Commission (SEC) applicable to Annual Reports on Form 10-K and in accordance with accounting guidance generally accepted in the United States (GAAP). Certain line item reclassifications have been made to prior year financial statements to conform with current year presentation. These reclassifications had no impact on PSEG’s or PSE&G’s results of operations, financial condition or cash flows.
Significant Accounting Policies
Principles of Consolidation
Each company consolidates those entities in which it has a controlling interest or is the primary beneficiary. See Note 4. Variable Interest Entity. Entities over which the companies exhibit significant influence, but do not have a controlling interest and/or are not the primary beneficiary, are accounted for under the equity method of accounting. Equity investments that do not qualify for consolidation or equity method accounting are recorded at fair value or, if fair value is not readily determinable, are initially recognized at cost and subsequently remeasured if there is an orderly transaction in an identical or similar investment of the same issuer or if the investment is impaired. All significant intercompany accounts and transactions are eliminated in consolidation.
PSE&G and PSEG Power also have undivided interests in certain jointly-owned facilities, with each responsible for paying its respective ownership share of construction costs, fuel purchases and operating expenses. PSE&G and PSEG Power consolidate their portion of any revenues and expenses related to their respective jointly-owned facilities in the appropriate revenue and expense categories.
Accounting for the Effects of Regulation
In accordance with accounting guidance for rate-regulated entities, PSE&G’s financial statements reflect the economic effects of regulation. PSE&G defers the recognition of costs (a Regulatory Asset) or records the recognition of obligations (a Regulatory
NOTES TO CONSOLIDATED FINANCIAL STATEMENTS
Liability) if it is probable that, through the rate-making process, there will be a corresponding increase or decrease in future rates. Accordingly, PSE&G has deferred certain costs and recoveries, which are being amortized over various future periods. To the extent that collection of any such costs or payment of liabilities becomes no longer probable as a result of changes in regulation, the associated Regulatory Asset or Liability is charged or credited to income. Management believes that PSE&G’s T&D businesses continue to meet the accounting requirements for rate-regulated entities. For additional information, see Note 6. Regulatory Assets and Liabilities.
Cash, Cash Equivalents and Restricted Cash
The following provides a reconciliation of cash, cash equivalents and restricted cash reported within the Consolidated Balance Sheets that sum to the total of the same such amounts in the Consolidated Statements of Cash Flows for the years ended December 31, 2024 and 2023. Restricted cash consists primarily of deposits received related to a construction project at PSE&G.
| | | | | | | | | | | | | | |
| | | | | | | | | | | |
| | | PSE&G | | | PSEG Power & Other (A) | | | Consolidated | | |
| | | Millions | | |
| As of December 31, 2024 | | | | | | | | | | |
| Cash and Cash Equivalents | | $ | 79 | | | $ | 46 | | | $ | 125 | | |
| Restricted Cash in Other Current Assets | | | 8 | | | | — | | | | 8 | | |
| Restricted Cash in Other Noncurrent Assets | | | 21 | | | | — | | | | 21 | | |
| Cash, Cash Equivalents and Restricted Cash | | $ | 108 | | | $ | 46 | | | $ | 154 | | |
| As of December 31, 2023 | | | | | | | | | | |
| Cash and Cash Equivalents | | $ | 30 | | | $ | 24 | | | $ | 54 | | |
| Restricted Cash in Other Current Assets | | | 23 | | | | — | | | | 23 | | |
| Restricted Cash in Other Noncurrent Assets | | | 22 | | | | — | | | | 22 | | |
| Cash, Cash Equivalents and Restricted Cash | | $ | 75 | | | $ | 24 | | | $ | 99 | | |
| | | | | | | | | | | |
(A)Includes amounts applicable to PSEG Power, Energy Holdings, Services and PSEG (parent company).
Derivative Instruments
Each company uses derivative instruments to manage risk pursuant to its business plans and prudent practices.
Within PSEG and its affiliate companies, PSEG Power has the most exposure to commodity price risk. PSEG Power is exposed to commodity price risk primarily relating to changes in the market price of electricity, natural gas and other commodities. Fluctuations in market prices result from changes in supply and demand, fuel costs, market conditions, weather, state and federal regulatory policies, environmental policies, transmission availability and other factors. PSEG Power uses a variety of derivative and non-derivative instruments, such as financial options, futures and swaps to manage the exposure to fluctuations in commodity prices and optimize the value of PSEG Power’s expected generation. Changes in the fair market value of the derivative contracts are recorded in earnings. Cash flows related to derivative instruments are included as a component of operating, investing or financing cash flows in PSEG’s Consolidated Statements of Cash Flows, depending on the nature of hedges.
Determining whether a contract qualifies as a derivative requires that management exercise significant judgment, including assessing the contract’s market liquidity. PSEG has determined that contracts to purchase and sell certain products do not meet the definition of a derivative under the current authoritative guidance since they do not provide for net settlement, or the markets are not sufficiently liquid to conclude that physical forward contracts are readily convertible to cash.
Under current authoritative guidance, all derivatives are recognized on the balance sheet at their fair value, except for derivatives that may be designated as normal purchases and normal sales (NPNS). Further, derivatives that qualify for hedge accounting can be designated as fair value or cash flow hedges.
Certain offsetting derivative assets and liabilities are subject to a master netting or similar agreement. In general, the terms of the agreements provide that in the event of an early termination the counterparties have the right to offset amounts owed or owing under that and any other agreement with the same counterparty. Accordingly, these positions are offset on the Consolidated Balance Sheets of PSEG.
NOTES TO CONSOLIDATED FINANCIAL STATEMENTS
For cash flow hedges, the gain or loss on a derivative instrument designated and qualifying as a cash flow hedge is deferred in Accumulated Other Comprehensive Income (Loss) until earnings are affected by the variability of cash flows of the hedged transaction.
For derivative contracts that do not qualify or are not designated as cash flow or fair value hedges or as NPNS, changes in fair value are recorded in current period earnings. PSEG does not currently elect hedge accounting on its commodity derivative positions.
For additional information regarding derivative financial instruments, see Note 16. Financial Risk Management Activities.
Revenue Recognition
PSE&G’s regulated electric and gas revenues are recorded primarily based on services rendered to customers. PSE&G records unbilled revenues for the estimated amount customers will be billed for services rendered from the time meters were last read and billed to the end of the respective accounting period. The unbilled revenue is estimated each month based on usage per day, the number of unbilled days in the period, estimated seasonal loads based upon the time of year and the variance of actual degree-days and temperature-humidity-index hours of the unbilled period from expected norms.
Regulated revenues from the transmission of electricity are recognized as services are provided based on a FERC-approved annual formula rate mechanism. This mechanism provides for an annual filing of estimated revenue requirement with rates effective January 1 of each year. After completion of the annual period ending December 31, PSE&G files a true-up whereby it compares its actual revenue requirement to the original estimate to determine any over or under collection of revenue. PSE&G records the estimated financial statement impact of the difference between the actual and the filed revenue requirement as a refund or deferral for future recovery when such amounts are probable and can be reasonably estimated in accordance with accounting guidance for rate-regulated entities.
PSEG Power currently owns generation within PJM Interconnection, L.L.C. (PJM), which facilitates the dispatch of energy and energy-related products. PSEG generally reports electricity sales and purchases conducted with the PJM Independent System Operator (ISO) at PSEG Power on a net hourly basis in either Revenues or Energy Costs in its Consolidated Statement of Operations, the classification of which depends on the net hourly activity. Capacity revenue and expense are also reported net based on PSEG Power’s monthly net sale or purchase position in PJM. PSEG Power also has revenues that relate to bilateral contracts, which are accounted for on the accrual basis as the energy is delivered. PSEG Power’s revenue also includes changes in the value of energy derivative contracts. See Note 16. Financial Risk Management Activities for further discussion.
PSEG LI is the primary beneficiary of Long Island Electric Utility Servco, LLC (Servco). For transactions in which Servco acts as principal, Servco records revenues and the related pass-through expenditures separately in Operating Revenues and Operation and Maintenance (O&M) Expense, respectively. See Note 4. Variable Interest Entity for further information.
For additional information regarding Revenues, see Note 2. Revenues.
Depreciation and Amortization
PSE&G calculates depreciation under the straight-line method based on estimated average remaining lives of the several classes of property. These estimates are reviewed on a periodic basis and necessary adjustments are made as approved by the BPU or FERC. The average depreciation rate stated as a percentage of original cost of depreciable property was as follows:
| | | | | | | | | | | | | | |
| | | | | | | | | | | |
| | | Average Rate | | |
| | | 2024 | | | 2023 | | | 2022 | | |
| Electric Transmission | | | 2.09 | % | | | 2.09 | % | | | 2.18 | % | |
| Electric Distribution | | | 2.51 | % | | | 2.54 | % | | | 2.56 | % | |
| Gas Distribution | | | 1.84 | % | | | 1.84 | % | | | 1.93 | % | |
| | | | | | | | | | | |
PSEG calculates depreciation on its nuclear generation-related assets under the straight-line method based on the assets’ estimated useful lives of approximately 60 years to 80 years.
NOTES TO CONSOLIDATED FINANCIAL STATEMENTS
Allowance for Funds Used During Construction (AFUDC) and Interest Capitalized During Construction (IDC)
AFUDC represents the cost of debt and equity funds used to finance the construction of new utility assets at PSE&G. IDC represents the cost of debt used to finance construction at PSEG’s other subsidiaries. The amount of AFUDC or IDC capitalized as Property, Plant and Equipment is included as a reduction of interest charges or other income for the equity portion. The amounts and average rates used to calculate AFUDC or IDC for the years ended December 31, 2024, 2023 and 2022 were as follows:
| | | | | | | | | | | | | | | | | | | | | | | | | | |
| | | | | | | | | | | | | | | | | | | | |
| | | AFUDC/IDC Capitalized | | |
| | | 2024 | | | 2023 | | | 2022 | | |
| | | Millions | | | Avg Rate | | | Millions | | | Avg Rate | | | Millions | | | Avg Rate | | |
| PSE&G | | $ | 62 | | | | 6.43 | % | | $ | 83 | | | | 7.13 | % | | $ | 84 | | | | 7.39 | % | |
| Other | | $ | 9 | | | | 6.08 | % | | $ | 9 | | | | 5.66 | % | | $ | 4 | | | | 2.24 | % | |
| | | | | | | | | | | | | | | | | | | | |
Income Taxes
PSEG and its subsidiaries file a consolidated federal income tax return and PSEG and PSE&G file state income tax returns, some of which are combined or unitary. Income taxes are allocated to PSEG’s subsidiaries in accordance with a tax allocation agreement whereby each PSEG subsidiary’s current and deferred tax expense is computed on a stand-alone basis. Each subsidiary is allocated an amount of tax similar to that which would be paid if it filed a separate income tax return, except for certain tax attributes and state apportionment results. Allocations between PSEG and its subsidiaries are recorded through intercompany accounts. Investment tax credits (ITC) deferred in prior years are being amortized over the useful lives of the related property.
Uncertain income tax positions are accounted for using a benefit recognition model with a two-step approach, a more-likely-than-not recognition criterion and a measurement attribute that measures the position as the largest amount of tax benefit that is greater than 50% likely of being realized upon ultimate settlement. If it is not more-likely-than-not that the benefit will be sustained on its technical merits, no benefit will be recorded. Uncertain tax positions that relate only to timing of when an item is included on a tax return are considered to have met the recognition threshold.
In 2024, PSEG recorded the benefit of the estimated PTCs generated by PSEG’s qualified nuclear generation facilities within Income Tax Expense in its Consolidated Statements of Operations in accordance with Accounting Standards Codification Topic 740, Income Taxes. See Note 20. Income Taxes for further discussion.
Impairment of Long-Lived Assets
Management evaluates long-lived assets for impairment whenever events or changes in circumstances, such as significant adverse changes in regulation, business climate, counterparty credit worthiness or market conditions, including prolonged periods of adverse commodity and capacity prices or a current expectation that a long-lived asset will be sold or disposed of significantly before the end of its previously estimated useful life, could potentially indicate an asset’s or asset group’s carrying amount may not be recoverable. In such an event, an undiscounted cash flow analysis is performed to determine if an impairment exists. When a long-lived asset’s or asset group’s carrying amount exceeds the associated undiscounted estimated future cash flows, the asset/asset group is considered impaired to the extent that its fair value is less than its carrying amount. An impairment would result in a reduction of the value of the long-lived asset/asset group through a non-cash charge to earnings.
For PSEG, cash flows for long-lived assets and asset groups are determined at the lowest level for which identifiable cash flows are largely independent of the cash flows of other assets and liabilities. The cash flows from the nuclear generation units are evaluated at the portfolio level. See Note 3. Asset Dispositions and Impairments for more information on impairment assessments performed on PSEG’s long-lived assets.
Accounts Receivable—Allowance for Credit Losses
PSE&G’s accounts receivable, including unbilled revenues, are primarily comprised of utility customer receivables for the provision of electric and gas service and appliance services, and are reported in the balance sheet as gross outstanding amounts adjusted for an allowance for credit losses. The allowance for credit losses reflects PSE&G’s best estimate of losses on the account balances. The allowance is based on PSE&G’s projection of accounts receivable aging, historical experience, economic factors and other currently available evidence, including the estimated impact of the coronavirus pandemic on the outstanding balances as of
NOTES TO CONSOLIDATED FINANCIAL STATEMENTS
December 31, 2024. PSE&G’s electric bad debt expense is recovered through the Societal Benefits Clause (SBC) mechanism and incremental gas bad debt has been deferred for future recovery through the coronavirus (COVID-19) Regulatory Asset. See Note 2. Revenues and Note 6. Regulatory Assets and Liabilities.
Accounts receivable are charged off in the period in which the receivable is deemed uncollectible. Recoveries of accounts receivable are recorded when it is known they will be received.
Materials and Supplies and Fuel
PSEG and PSE&G’s materials and supplies are carried at average cost and charged to inventory when purchased and expensed or capitalized to Property, Plant and Equipment, as appropriate, when installed or used. Fuel inventory at PSEG is valued at the lower of average cost or market and primarily includes stored natural gas used to satisfy obligations under PSEG Power’s gas supply contracts with PSE&G. The costs of fuel, including initial transportation costs, are included in inventory when purchased and charged to Energy Costs when used or sold. The cost of nuclear fuel is capitalized within Property, Plant and Equipment and amortized to fuel expense using the units-of-production method.
Property, Plant and Equipment
PSE&G’s additions to and replacements of existing property, plant and equipment are capitalized at cost. The cost of maintenance, repair and replacement of minor items of property is charged to expense as incurred. At the time units of depreciable property are retired or otherwise disposed of, the original cost, adjusted for net salvage value, is charged to accumulated depreciation.
PSEG capitalizes costs related to its generating assets, including those related to its jointly-owned facilities that increase the capacity, improve or extend the life of an existing asset; represent a newly acquired or constructed asset; or represent the replacement of a retired asset. The cost of maintenance, repair and replacement of minor items of property is charged to appropriate expense accounts as incurred. Environmental costs are capitalized if the costs mitigate or prevent future environmental contamination or if the costs improve existing assets’ environmental safety or efficiency. All other environmental expenditures are expensed as incurred. PSEG also capitalizes spare parts for its generating assets that meet specific criteria. Capitalized spare parts are depreciated over the remaining lives of their associated assets.
Leases
PSEG and its subsidiaries, when acting as lessee or lessor, determine if an arrangement is a lease at inception. PSEG assesses contracts to determine if the arrangement conveys (i) the right to control the use of the identified property, (ii) the right to obtain substantially all of the economic benefits from the use of the property, and (iii) the right to direct the use of the property.
Lessee—Operating Lease Right-of-Use Assets represent the right to use an underlying asset for the lease term and Operating Lease Liabilities represent the obligation to make lease payments arising from the lease. Operating Lease Right-of-Use Assets and Operating Lease Liabilities are recognized at the lease commencement date based on the present value of lease payments over the lease term.
The current portion of Operating Lease Liabilities is included in Other Current Liabilities. Operating Lease Right-of-Use Assets and noncurrent Operating Lease Liabilities are included as separate captions in Noncurrent Assets and Noncurrent Liabilities, respectively, on the Consolidated Balance Sheets of PSEG and PSE&G. PSEG and its subsidiaries do not recognize Operating Lease Right-of-Use Assets and Operating Lease Liabilities for leases where the term is twelve months or less.
PSEG and its subsidiaries recognize the lease payments on a straight-line basis over the term of the leases and variable lease payments in the period in which the obligations for those payments are incurred.
As lessee, most of the operating leases of PSEG and its subsidiaries do not provide an implicit rate; therefore, incremental borrowing rates are used based on the information available at commencement date in determining the present value of lease payments. The implicit rate is used when readily determinable. PSE&G’s incremental borrowing rates are based on secured borrowing rates. PSEG’s incremental borrowing rates are generally unsecured rates. Having calculated simulated secured rates for each of PSEG and PSEG Power, it was determined that the difference between the unsecured borrowing rates and the simulated secured rates had an immaterial effect on their recorded Operating Lease Right-of-Use Assets and Operating Lease Liabilities. Services, PSEG LI and other subsidiaries of PSEG that do not borrow funds or issue debt may enter into leases. Since these
NOTES TO CONSOLIDATED FINANCIAL STATEMENTS
companies do not have credit ratings and related incremental borrowing rates, PSEG has determined that it is appropriate for these companies to use the incremental borrowing rate of PSEG, the parent company.
Lease terms may include options to extend or terminate the lease when it is reasonably certain that such options will be exercised.
PSEG and its subsidiaries have lease agreements with lease and non-lease components. For real estate, equipment and vehicle leases, the lease and non-lease components are accounted for as a single lease component.
Lessor—Property subject to operating leases, where PSEG or one of its subsidiaries is the lessor, is included in Property, Plant and Equipment and rental income from these leases is included in Operating Revenues.
PSEG and its subsidiaries have lease agreements with lease and non-lease components, which are primarily related to domestic energy generation and real estate assets. PSEG and subsidiaries account for the lease and non-lease components as a single lease component. See Note 7. Leases for detailed information on leases.
Energy Holdings is the lessor in leveraged leases. Leveraged lease accounting guidance is grandfathered for existing leveraged leases. Energy Holdings’ leveraged leases are accounted for in Operating Revenues and in Noncurrent Long-Term Investments. If modified after January 1, 2019, those leveraged leases will be accounted for as operating or financing leases. See Note 8. Long-Term Investments and Note 9. Financing Receivables.
Trust Investments
These securities comprise the Nuclear Decommissioning Trust (NDT) Fund, a master independent external trust account maintained to provide for the costs of decommissioning upon termination of operations of PSEG’s nuclear facilities and amounts that are deposited to fund a Rabbi Trust which was established to meet the obligations related to non-qualified pension plans and deferred compensation plans.
Unrealized gains and losses on equity security investments are recorded in Net Income. The debt securities are classified as available-for-sale with the unrealized gains and losses recorded as a component of Accumulated Other Comprehensive Income (Loss). Realized gains and losses on both equity and available-for-sale debt security investments are recorded in earnings and are included with the unrealized gains and losses on equity securities in Net Gains (Losses) on Trust Investments. Other-than-temporary impairments on NDT and Rabbi Trust debt securities are also included in Net Gains (Losses) on Trust Investments. See Note 10. Trust Investments for further discussion.
Pension and Other Postretirement Benefits (OPEB) Plans
The market-related value of plan assets held for the qualified pension and OPEB plans is equal to the fair value of those assets as of year-end. Fair value is determined using quoted market prices and independent pricing services based upon the security type as reported by the trustee at the measurement date (December 31) as well as investments in unlisted real estate which are valued via third-party appraisals.
PSEG recognizes a long-term receivable primarily related to future funding by LIPA of Servco’s recognized pension and OPEB liabilities. This receivable is presented separately on the Consolidated Balance Sheet of PSEG as a noncurrent asset. Pursuant to the OSA, Servco records expense for contributions to its pension plan trusts and for OPEB payments made to retirees.
See Note 12. Pension, Other Postretirement Benefits (OPEB) and Savings Plans for further discussion.
Use of Estimates
The preparation of financial statements in conformity with GAAP requires management to make estimates and assumptions that affect the reported amounts of assets and liabilities and disclosure of contingent assets and liabilities at the date of the financial statements and the reported amounts of revenues and expenses during the reporting period. Actual results could differ from those estimates.
NOTES TO CONSOLIDATED FINANCIAL STATEMENTS
Recent Accounting Standards
Improvements to Reportable Segment Disclosures—Accounting Standards Update (ASU) 2023-07
This ASU requires disclosure of incremental segment information, including additional detail on certain significant segment expenses, on an annual and interim basis to enable investors to develop more decision-useful financial analyses. The ASU is effective for fiscal years beginning after December 15, 2023 and interim periods beginning after December 15, 2024. PSEG and PSE&G adopted this standard on December 31, 2024. The adoption of this standard did not have a material impact on the financial statements of PSEG and PSE&G.
Improvements to Income Tax Disclosures—ASU 2023-09
This ASU makes amendments to the current reconciliation disclosure to improve transparency by requiring consistent categories and greater jurisdictional disaggregation. The ASU also provides for the inclusion of an income taxes paid disclosure by jurisdiction. The ASU is effective for annual periods beginning after December 15, 2024. PSEG and PSE&G are currently analyzing the impact of this ASU on their future disclosures.
Disaggregation of Income Statement Expenses and Effective Date Clarification—ASU 2024-03
This ASU requires additional annual and interim disclosure about certain expenses in the notes to financial statements that provide disaggregated information (within a new tabular disclosure, the amounts of specified natural expenses included in each relevant expense caption: (a) purchases of inventory, (b) employee compensation, (c) depreciation, (d) amortization, and (e) depletion) about an entity’s expense captions that are presented on the face of the income statement within continuing operations.
The ASU also requires certain expense related disclosures within the new tabular disclosure and disclosure of the total amount of selling expenses and, in annual reporting periods, an entity’s definition of selling expenses. The ASU is effective for annual periods beginning after December 15, 2026, and interim periods within annual periods beginning after December 15, 2027. PSEG and PSE&G are currently analyzing the impact of this ASU on their future disclosures.
Note 2. Revenues
Nature of Goods and Services
The following is a description of principal activities by which PSEG and its subsidiaries generate their revenues.
PSE&G
Revenues from Contracts with Customers
Electric and Gas Distribution and Transmission Revenues—PSE&G sells gas and electricity to customers under default commodity supply tariffs. PSE&G’s regulated electric and gas default commodity supply and distribution services are separate tariffs which are satisfied as the product(s) and/or service(s) are delivered to the customer. The electric and gas commodity and delivery tariffs are recurring contracts in effect until modified through the regulatory approval process as appropriate. Revenue is recognized over time as the service is rendered to the customer. Included in PSE&G’s regulated revenues are unbilled electric and gas revenues which represent the estimated amount customers will be billed for services rendered from the most recent meter reading to the end of the respective accounting period.
PSE&G’s transmission revenues are earned under a separate tariff using a FERC-approved annual formula rate mechanism. The performance obligation of transmission service is satisfied and revenue is recognized as it is provided to the customer. The formula rate mechanism provides for an annual filing of an estimated revenue requirement with rates effective January 1 of each year and a true-up to that estimate based on actual revenue requirements. The true-up mechanism is an alternative revenue which is outside the scope of revenue from contracts with customers.
Other Revenues from Contracts with Customers
Other revenues from contracts with customers, which are not a material source of PSE&G revenues, are generated primarily from appliance repair services and solar generation projects. The performance obligations under these contracts are satisfied and revenue is recognized as control of products is delivered or services are rendered.
NOTES TO CONSOLIDATED FINANCIAL STATEMENTS
Revenues Unrelated to Contracts with Customers
Other PSE&G revenues unrelated to contracts with customers are derived from alternative revenue mechanisms recorded pursuant to regulatory accounting guidance. These revenues, which include the Conservation Incentive Program (CIP), green energy program true-ups and transmission formula rate true-ups, are not a material source of PSE&G revenues.
PSEG Power & Other
Revenues from Contracts with Customers
Electricity and Related Products—PSEG Power owns generation solely within PJM Interconnection, L.L.C. (PJM), which facilitates the dispatch of energy and energy-related products. PSEG Power primarily sells to the PJM Independent System Operator (ISO) energy and ancillary services which are separately transacted in the day-ahead or real-time energy markets. The energy and ancillary services performance obligations are typically satisfied over time as delivered and revenue is recognized accordingly. Also, revenue for wholesale load contracts is recognized over time as the bundled service is provided to the customer. PSEG generally reports electricity sales and purchases conducted with PJM net on an hourly basis in either Operating Revenues or Energy Costs in its Consolidated Statements of Operations. The classification depends on the net hourly activity.
PSEG Power enters into capacity sales and capacity purchases through PJM. The transactions are reported on a net basis dependent on PSEG Power’s monthly net sale or purchase position through PJM. The performance obligations with PJM are satisfied over time upon delivery of the capacity and revenue is recognized accordingly. In addition to capacity sold through PJM, PSEG Power sells capacity through bilateral contracts and the related revenue is reported on a gross basis and recognized over time upon delivery of the capacity.
PSEG Power’s Salem 1, Salem 2 and Hope Creek nuclear plants have been awarded zero emission certificates (ZECs) by the BPU through May 2025. These nuclear plants are expected to receive ZEC revenue from the electric distribution companies (EDCs) in New Jersey. PSEG Power recognizes revenue when the units generate electricity, which is when the performance obligation is satisfied. These revenues are considered variable consideration within the scope of revenue from contracts with customers and are included in PJM Sales in the following tables. ZEC revenue recorded has been reduced by the estimated production tax credits (PTCs) generated from PSEG Power’s Salem 1, Salem 2, and Hope Creek nuclear plants for the year ended December 31, 2024. ZEC revenue will be adjusted based upon the actual value of the PTCs generated by these nuclear plants and that adjustment could be material. See Note 20. Income Taxes for further discussion on the factors that could result in an adjustment to the value of the PTCs.
Gas Contracts—PSEG Power sells wholesale natural gas, primarily through an index based full-requirements Basic Gas Supply Service (BGSS) contract with PSE&G to meet the gas supply requirements of PSE&G’s customers. The BGSS contract remains in effect unless terminated by either party with a two-year notice. Based upon the availability of natural gas, storage and pipeline capacity beyond PSE&G’s daily needs, PSEG Power also sells gas and pipeline capacity to other counterparties under bilateral contracts. The performance obligation is primarily the delivery of gas which is satisfied over time. Revenue is recognized as gas is delivered or pipeline capacity is released.
PSEG LI Contract—PSEG LI has a contract with LIPA which generates revenues. PSEG LI’s subsidiary, Long Island Electric Utility Servco, LLC (Servco) records costs which are recovered from LIPA and records the recovery of those costs as revenues when Servco is a principal in the transaction.
Other Revenues from Contracts with Customers
PSEG Power has entered into long-term contracts with LIPA for energy management and fuel procurement services. Revenue is recognized over time as services are rendered. This agreement expires in December 2025.
Revenues Unrelated to Contracts with Customers
PSEG Power’s revenues unrelated to contracts with customers include electric, gas and certain energy-related transactions accounted for in accordance with Derivatives and Hedging accounting guidance. See Note 16. Financial Risk Management Activities for further discussion.
Energy Holdings generates lease revenues which are recorded pursuant to lease accounting guidance.
NOTES TO CONSOLIDATED FINANCIAL STATEMENTS
Disaggregation of Revenues
| | | | | | | | | | | | | | | | | | |
| | | | | | | | | | | | | | |
| | | PSE&G | | | PSEG
Power &
Other (A) | | | Eliminations | | | Consolidated | | |
| | | Millions | | |
| Year Ended December 31, 2024 | | | | | | | | | | | | | |
| Revenues from Contracts with Customers | | | | | | | | | | | | | |
| Electric Distribution | | $ | 3,977 | | | $ | — | | | $ | — | | | $ | 3,977 | | |
| Gas Distribution | | | 2,059 | | | | — | | | | — | | | | 2,059 | | |
| Transmission | | | 1,754 | | | | | | | | | | 1,754 | | |
| Electricity and Related Product Sales | | | | | | | | | | | | | |
| PJM | | | | | | | | | | | | | |
| Third-Party Sales | | | — | | | | 819 | | | | — | | | | 819 | | |
| Sales to Affiliates | | | — | | | | 114 | | | | (114 | ) | | | — | | |
| ISO-NE | | | — | | | | 5 | | | | — | | | | 5 | | |
| Gas Sales | | | | | | | | | | | | | |
| Third-Party Sales | | | — | | | | 206 | | | | — | | | | 206 | | |
| Sales to Affiliates | | | — | | | | 846 | | | | (846 | ) | | | — | | |
| Other Revenues from Contracts with Customers (B) | | | 368 | | | | 692 | | | | (6 | ) | | | 1,054 | | |
| Total Revenues from Contracts with Customers | | | 8,158 | | | | 2,682 | | | | (966 | ) | | | 9,874 | | |
| Revenues Unrelated to Contracts with Customers (C) | | | 291 | | | | 125 | | | | — | | | | 416 | | |
| Total Operating Revenues | | $ | 8,449 | | | $ | 2,807 | | | $ | (966 | ) | | $ | 10,290 | | |
| | | | | | | | | | | | | | |
| | | | | | | | | | | | | | | | | | |
| | | | | | | | | | | | | | |
| | | PSE&G | | | PSEG
Power &
Other (A) | | | Eliminations | | | Consolidated | | |
| | | Millions | | |
| Year Ended December 31, 2023 | | | | | | | | | | | | | |
| Revenues from Contracts with Customers | | | | | | | | | | | | | |
| Electric Distribution | | $ | 3,494 | | | $ | — | | | $ | — | | | $ | 3,494 | | |
| Gas Distribution | | | 1,982 | | | | — | | | | — | | | | 1,982 | | |
| Transmission | | | 1,673 | | | | — | | | | — | | | | 1,673 | | |
| Electricity and Related Product Sales | | | | | | | | | | | | | |
| PJM | | | | | | | | | | | | | |
| Third-Party Sales | | | — | | | | 892 | | | | — | | | | 892 | | |
| Sales to Affiliates | | | — | | | | 114 | | | | (114 | ) | | | — | | |
| ISO-NE | | | — | | | | 13 | | | | — | | | | 13 | | |
| Gas Sales | | | | | | | | | | | | | |
| Third-Party Sales | | | — | | | | 206 | | | | — | | | | 206 | | |
| Sales to Affiliates | | | — | | | | 984 | | | | (984 | ) | | | — | | |
| Other Revenues from Contracts with Customers (B) | | | 368 | | | | 631 | | | | (5 | ) | | | 994 | | |
| Total Revenues from Contracts with Customers | | | 7,517 | | | | 2,840 | | | | (1,103 | ) | | | 9,254 | | |
| Revenues Unrelated to Contracts with Customers (C) | | | 290 | | | | 1,693 | | | | — | | | | 1,983 | | |
| Total Operating Revenues | | $ | 7,807 | | | $ | 4,533 | | | $ | (1,103 | ) | | $ | 11,237 | | |
| | | | | | | | | | | | | | |
NOTES TO CONSOLIDATED FINANCIAL STATEMENTS
| | | | | | | | | | | | | | | | | | |
| | | | | | | | | | | | | | |
| | | PSE&G | | | PSEG
Power &
Other (A) | | | Eliminations | | | Consolidated | | |
| | | Millions | | |
| Year Ended December 31, 2022 | | | | | | | | | | | | | |
| Revenues from Contracts with Customers | | | | | | | | | | | | | |
| Electric Distribution | | $ | 3,503 | | | $ | — | | | $ | — | | | $ | 3,503 | | |
| Gas Distribution | | | 2,357 | | | | — | | | | (1 | ) | | | 2,356 | | |
| Transmission | | | 1,589 | | | | — | | | | — | | | | 1,589 | | |
| Electricity and Related Product Sales | | | | | | | | | | | | | |
| PJM | | | | | | | | | | | | | |
| Third-Party Sales | | | — | | | | 2,152 | | | | — | | | | 2,152 | | |
| Sales to Affiliates | | | — | | | | 151 | | | | (151 | ) | | | — | | |
| NYISO | | | — | | | | 88 | | | | — | | | | 88 | | |
| ISO-NE | | | — | | | | 96 | | | | — | | | | 96 | | |
| Gas Sales | | | | | | | | | | | | | |
| Third-Party Sales | | | — | | | | 458 | | | | — | | | | 458 | | |
| Sales to Affiliates | | | — | | | | 1,243 | | | | (1,243 | ) | | | — | | |
| Other Revenues from Contracts with Customers (B) | | | 390 | | | | 605 | | | | (6 | ) | | | 989 | | |
| Total Revenues from Contracts with Customers | | | 7,839 | | | | 4,793 | | | | (1,401 | ) | | | 11,231 | | |
| Revenues Unrelated to Contracts with Customers (C) | | | 96 | | | | (1,527 | ) | | | — | | | | (1,431 | ) | |
| Total Operating Revenues | | $ | 7,935 | | | $ | 3,266 | | | $ | (1,401 | ) | | $ | 9,800 | | |
| | | | | | | | | | | | | | |
(A)Includes revenues applicable to PSEG Power, PSEG LI and Energy Holdings.
(B)Includes primarily revenues from appliance repair services and the sale of solar renewable energy credits (SRECs) at auction at PSE&G. PSEG Power & Other includes PSEG LI’s OSA with LIPA and PSEG Power’s energy management fee with LIPA.
(C)Includes primarily alternative revenues at PSE&G principally from the CIP program and derivative contracts and lease contracts at PSEG Power & Other.
Contract Balances
PSE&G
PSE&G did not have any material contract balances (rights to consideration for services already provided or obligations to provide services in the future for consideration already received) as of December 31, 2024 and 2023. Substantially all of PSE&G’s accounts receivable and unbilled revenues result from contracts with customers that are priced at tariff rates. Allowances represented approximately 13% and 18% of accounts receivable (including unbilled revenues) as of December 31, 2024 and 2023, respectively.
Accounts Receivable—Allowance for Credit Losses
PSE&G’s accounts receivable, including unbilled revenues, is primarily comprised of utility customer receivables for the provision of electric and gas service and appliance services, and are reported on the balance sheet as gross outstanding amounts adjusted for an allowance for credit losses. The allowance for credit losses reflects PSE&G’s best estimate of losses on the account balances. The allowance is based on PSE&G’s projection of accounts receivable aging, historical experience, economic factors and other currently available evidence. PSE&G’s electric bad debt expense is recoverable through its Societal Benefits Clause (SBC) mechanism. As of December 31, 2024, PSE&G had a deferred balance of $78 million from electric bad debts recorded as a Regulatory Asset, which included approximately $78 million of incremental bad debt due to the impact of the coronavirus pandemic. In addition, as of December 31, 2024, PSE&G had deferred incremental gas bad debt expense of $68 million as a Regulatory Asset for future regulatory recovery due to the impact of the coronavirus pandemic. In June 2024, the BPU approved recovery of the incremental electric and gas bad debt amounts of $78 million and $68 million charged to PSE&G’s electric SBC and deferred COVID-19 deferrals, respectively. See Note 6. Regulatory Assets and Liabilities for additional information.
NOTES TO CONSOLIDATED FINANCIAL STATEMENTS
The following provides a reconciliation of PSE&G’s allowance for credit losses for the years ended December 31, 2024 and 2023.
| | | | | | | | | | |
| | | | | | | | |
| | | Years Ended December 31, | | |
| | | 2024 | | | 2023 | | |
| | | Millions | | |
| Balance at Beginning of Year | | $ | 283 | | | $ | 339 | | |
| Utility Customer and Other Accounts | | | | | | | |
| Provision | | | 103 | | | | 100 | | |
| Write-offs, net of Recoveries of $31 million and $25 million for 2024 and 2023, respectively | | | (171 | ) | | | (156 | ) | |
| Balance at End of Year | | $ | 215 | | | $ | 283 | | |
| | | | | | | | |
PSEG Power & Other
PSEG Power generally collects consideration upon satisfaction of performance obligations, and therefore, PSEG Power had no material contract balances as of December 31, 2024 and 2023.
PSEG Power’s accounts receivable include amounts resulting from contracts with customers and other contracts which are out of scope of accounting guidance for revenues from contracts with customers. The majority of these accounts receivable are subject to master netting agreements. As a result, accounts receivable resulting from contracts with customers and receivables unrelated to contracts with customers are netted within Accounts Receivable and Accounts Payable on the Consolidated Balance Sheets.
PSEG Power’s accounts receivable consist mainly of revenues from energy and ancillary services sold directly to ISOs and other counterparties. In the wholesale energy markets in which PSEG Power operates, payment for services rendered and products transferred are typically due within 30 days of delivery. As such, there is little credit risk associated with these receivables. PSEG Power did not record an allowance for credit losses for these receivables as of December 31, 2024 and 2023. PSEG Power monitors the status of its counterparties on an ongoing basis to assess whether there are any anticipated credit losses.
PSEG LI did not have any material contract balances as of December 31, 2024 and 2023.
Remaining Performance Obligations under Fixed Consideration Contracts
PSEG primarily records revenues as allowed by the guidance, which states that if an entity has a right to consideration from a customer in an amount that corresponds directly with the value to the customer of the entity’s performance completed to date, the entity may recognize revenue in the amount to which the entity has a right to invoice. PSEG has future performance obligations under contracts with fixed consideration as follows:
Capacity Revenues from the PJM Annual Base Residual and Incremental Auctions—The Base Residual Auction is generally conducted annually three years in advance of the operating period. However, changes to capacity market rules have resulted in auction suspensions and delays so that recent auctions have been run closer in time to their operating periods. In February 2023, the results of the 2024/2025 auction were released and in July 2024 the results of the 2025/2026 auction were released. PSEG Power expects to realize the following average capacity prices resulting from the base and incremental auctions, including unit specific bilateral contracts for previously cleared capacity obligations.
| | | | | | | | | | |
| | | | | | | | |
| Delivery Year | | $ per
MW-Day | | | MW
Cleared | | |
| June 2024 to May 2025 | | $ | 61 | | | | 3,700 | | |
| June 2025 to May 2026 | | $ | 270 | | | | 3,500 | | |
| | | | | | | | |
Amended OSA—In April 2022, PSEG LI entered into an amended OSA with LIPA. The OSA remains a 12-year services contract ending in 2025 with annual fixed and variable components. The fixed fee for the provision of services thereunder in 2025 is approximately $45 million and is updated each year based on the change in the Consumer Price Index (CPI).
NOTES TO CONSOLIDATED FINANCIAL STATEMENTS
Note 3. Asset Dispositions and Impairments
In 2022, Energy Holdings recorded pre-tax impairments of $78 million related to one of its domestic energy generating facilities and its real estate assets. In March 2023, Energy Holdings completed the sale of its domestic energy generating facility and recorded an immaterial pre-tax gain. In December 2023, Energy Holdings completed the sale of its real estate assets and recorded an immaterial pre-tax gain.
In February 2022, PSEG completed the sale of PSEG Power’s fossil generating portfolio. As defined in the agreements, adjustments were required as a result of any purchase price or working capital adjustments, including an adjustment for positive or negative cash flow of the fossil generating assets based on actual performance starting after December 31, 2021 through the closing dates. As a result, in 2022 PSEG Power recorded an additional pre-tax impairment of approximately $50 million prior to completing the sale of this fossil generating portfolio in February 2022.
PSEG Power has retained ownership of certain liabilities excluded from the transactions primarily related to obligations under certain environmental regulations, including remediation obligations under the New Jersey Industrial Site Recovery Act (ISRA) and the Connecticut Transfer Act (CTA). The amounts for any such environmental remediation are not currently estimable, but will likely be material in the aggregate.
Note 4. Variable Interest Entity (VIE)
VIE for which PSEG LI is the Primary Beneficiary
PSEG LI consolidates Servco, a marginally capitalized VIE, which was created for the purpose of operating LIPA’s T&D system in Long Island, New York as well as providing administrative support functions to LIPA. PSEG LI is the primary beneficiary of Servco because it directs the operations of Servco, the activity that most significantly impacts Servco’s economic performance and it has the obligation to absorb losses of Servco that could potentially be significant to Servco. Such losses would be immaterial to PSEG.
Pursuant to the OSA, Servco’s operating costs are paid entirely by LIPA, and therefore, PSEG LI’s risk is limited related to the activities of Servco. PSEG LI has no current obligation to provide direct financial support to Servco. In addition to payment of Servco’s operating costs as provided for in the OSA, PSEG LI receives an annual contract management fee. PSEG LI’s annual contract management fee, in certain situations, could be partially offset by Servco’s annual storm costs that are denied reimbursement by the Federal Emergency Management Agency, limited contingent liabilities and penalties for failing to meet certain performance metrics.
For transactions in which Servco acts as principal and controls the services provided to LIPA, such as transactions with its employees for labor and labor-related activities, including pension and OPEB-related transactions, Servco records revenues and the related pass-through expenditures separately in Operating Revenues and Operation and Maintenance (O&M) Expense, respectively. In 2024, 2023 and 2022, Servco recorded $592 million, $533 million and $516 million, respectively, of O&M expense, the full reimbursement of which was reflected in Operating Revenues. For transactions in which Servco acts as an agent for LIPA, it records revenues and the related expenses on a net basis, resulting in no impact on PSEG’s Consolidated Statement of Operations.
NOTES TO CONSOLIDATED FINANCIAL STATEMENTS
Note 5. Property, Plant and Equipment and Jointly-Owned Facilities
Information related to Property, Plant and Equipment as of December 31, 2024 and 2023 is detailed below:
| | | | | | | | | | |
| | | | | | | | |
| | | 2024 | | | 2023 | | |
| | | Millions | | |
| PSE&G | | | | | | | |
| Electric Transmission | | $ | 17,874 | | | $ | 17,379 | | |
| Electric Distribution | | | 12,520 | | | | 11,554 | | |
| Gas Distribution and Transmission | | | 12,536 | | | | 11,545 | | |
| Construction Work in Progress | | | 1,132 | | | | 1,283 | | |
| Other | | | 2,136 | | | | 1,992 | | |
| Total PSE&G | | $ | 46,198 | | | $ | 43,753 | | |
| PSEG Power & Other | | | | | | | |
| Nuclear Production | | $ | 3,649 | | | $ | 3,496 | | |
| Nuclear Fuel in Service | | | 793 | | | | 772 | | |
| Construction Work in Progress | | | 159 | | | | 224 | | |
| Other | | | 408 | | | | 358 | | |
| Total PSEG Power & Other | | $ | 5,009 | | | $ | 4,850 | | |
| Total | | $ | 51,207 | | | $ | 48,603 | | |
| | | | | | | | |
PSE&G and PSEG Power have ownership interests in and are responsible for providing their respective shares of the necessary financing for the following jointly-owned facilities to which they are a party. All amounts reflect PSE&G’s or PSEG Power’s share of the jointly-owned projects and the corresponding direct expenses are included in the Consolidated Statements of Operations as Operating Expenses.
| | | | | | | | | | | | | | | | | | | | | | |
| | | | | | | | | | | | | | | | | |
| | | | | | As of December 31, | | |
| | | | | | 2024 | | | 2023 | | |
| | | Ownership | | | | | | Accumulated | | | | | | Accumulated | | |
| | | Interest | | | Plant | | | Depreciation | | | Plant | | | Depreciation | | |
| | | | | | Millions | | |
| PSE&G: | | | | | | | | | | | | | | | | |
| Transmission Facilities | | Various | | | $ | 164 | | | $ | 72 | | | $ | 164 | | | $ | 69 | | |
| PSEG Power: | | | | | | | | | | | | | | | | |
| Nuclear Generating: | | | | | | | | | | | | | | | | |
| Peach Bottom | | | 50 | % | | $ | 1,420 | | | $ | 564 | | | $ | 1,451 | | | $ | 534 | | |
| Salem | | | 57 | % | | $ | 1,539 | | | $ | 601 | | | $ | 1,461 | | | $ | 534 | | |
| Nuclear Support Facilities | | Various | | | $ | 180 | | | $ | 84 | | | $ | 178 | | | $ | 77 | | |
| Other | | | 14 | % | | $ | 1 | | | $ | — | | | $ | 1 | | | $ | — | | |
| | | | | | | | | | | | | | | | | |
PSEG Power holds undivided ownership interests in the jointly-owned facilities above. PSEG Power is entitled to shares of the generating capability and output of each unit equal to its respective ownership interests. PSEG Power also pays its ownership share of additional construction costs, fuel inventory purchases and operating expenses. PSEG Power’s share of expenses for the jointly-owned facilities is included in the appropriate expense category. Each owner is responsible for any financing with respect to its pro rata share of capital expenditures.
PSEG Power co-owns Salem and Peach Bottom with Constellation Energy Generation, LLC. PSEG Power is the operator of Salem and Constellation Energy Generation, LLC is the operator of Peach Bottom. A committee appointed by the co-owners provides oversight. Proposed O&M budgets and requests for major capital expenditures are reviewed and approved as part of the normal PSEG Power governance process.
NOTES TO CONSOLIDATED FINANCIAL STATEMENTS
Note 6. Regulatory Assets and Liabilities
PSE&G prepares its financial statements in accordance with GAAP for regulated utilities as described in Note 1. Organization, Basis of Presentation and Summary of Significant Accounting Policies. PSE&G has deferred certain costs based on rate orders issued by the BPU or FERC or based on PSE&G’s experience with prior rate proceedings. Most of PSE&G’s Regulatory Assets and Liabilities as of December 31, 2024 are supported by written orders, either explicitly or implicitly through the BPU’s treatment of various cost items. These costs will be recovered and amortized over various future periods.
Regulatory Assets and other investments and costs incurred under our various infrastructure filings and clause mechanisms are subject to prudence reviews and can be disallowed in the future by regulatory authorities. To the extent that collection of any infrastructure or clause mechanism revenue, Regulatory Assets or payments of Regulatory Liabilities is no longer probable, the amounts would be charged or credited to income.
PSE&G had the following Regulatory Assets and Liabilities:
| | | | | | | | | | |
| | | | | | | | |
| | | As of December 31, | | |
| | | 2024 | | | 2023 | | |
| | | Millions | | |
| Regulatory Assets | | | | | | | |
| Deferred Income Tax Regulatory Assets | | $ | 2,012 | | | $ | 1,343 | | |
| Pension and OPEB Costs | | | 1,330 | | | | 1,427 | | |
| Green Program Recovery Charges (GPRC) | | | 1,251 | | | | 827 | | |
| Conservation Incentive Program (CIP) | | | 261 | | | | 232 | | |
| Clean Energy Future-Energy Cloud (CEF-EC) | | | 233 | | | | 153 | | |
| Asset Retirement Obligations (ARO) | | | 221 | | | | 210 | | |
| Societal Benefits Clause (SBC) | | | 211 | | | | 155 | | |
| Manufactured Gas Plant (MGP) Remediation Costs | | | 210 | | | | 199 | | |
| Cost of Removal | | | 195 | | | | 172 | | |
| New Jersey Clean Energy Program | | | 145 | | | | 145 | | |
| COVID-19 Deferral | | | 131 | | | | 131 | | |
| 2024 Distribution Base Rate Case Regulatory Assets (BRC) | | | 108 | | | | — | | |
| Remediation Adjustment Charge (RAC) (Other SBC) | | | 102 | | | | 110 | | |
| Clean Energy Future-Electric Vehicles (CEF-EV) | | | 51 | | | | 27 | | |
| Deferred Storm Costs | | | — | | | | 109 | | |
| Other | | | 180 | | | | 190 | | |
| Total Regulatory Assets | | | 6,641 | | | | 5,430 | | |
| Less: Current Regulatory Assets | | | 516 | | | | 273 | | |
| Total Noncurrent Regulatory Assets | | $ | 6,125 | | | $ | 5,157 | | |
| | | | | | | | |
NOTES TO CONSOLIDATED FINANCIAL STATEMENTS
| | | | | | | | | | |
| | | | | | | | |
| | | As of December 31, | | |
| | | 2024 | | | 2023 | | |
| | | Millions | | |
| Regulatory Liabilities | | | | | | | |
| Deferred Income Tax Regulatory Liabilities | | $ | 2,619 | | | $ | 2,245 | | |
| Gas Costs—Basic Gas Supply Service (BGSS) | | | 145 | | | | 97 | | |
| Other | | | 62 | | | | 82 | | |
| Total Regulatory Liabilities | | | 2,826 | | | | 2,424 | | |
| Less: Current Regulatory Liabilities | | | 555 | | | | 349 | | |
| Total Noncurrent Regulatory Liabilities | | $ | 2,271 | | | $ | 2,075 | | |
| | | | | | | | |
| | | | | | | | |
All Regulatory Assets and Liabilities are excluded from PSE&G’s rate base unless otherwise noted. The Regulatory Assets and Liabilities in the table above are defined as follows:
•ARO: These costs represent the differences between rate-regulated cost of removal accounting and asset retirement accounting under GAAP. These costs will be recovered in future rates as assets are retired.
•BRC: Represents deferred costs, primarily comprised of storm costs incurred in the cleanup of major storms, approved for a five-year recovery pursuant to the 2024 Distribution Base Rate Case Settlement.
•CEF-EC (AMI Meter Deployment): In October 2024, the BPU approved recovery of PSE&G’s CEF-EC capital and operating costs associated with its electric smart meter deployment program. Included in the approved recovery was the return on and of the capital investments in AMI meters and infrastructure, incremental operating costs of the program and stranded costs associated with the accelerated retirement of the non-AMI electric meters.
•CIP: The CIP reduces the impact on electric and gas distribution revenues from changes in sales volumes and demand for most customers. The CIP provides for a true-up of current period revenue as compared to revenue established in PSE&G’s most recent distribution base rate proceeding. Recovery under the CIP is subject to certain limitations, including an actual versus allowed return on equity test and ceilings on customer rate increases.
•CEF-EV (Electric Vehicles): In October 2024, the BPU approved recovery of PSE&G’s CEF-EV capital and operating costs associated with its electric vehicle program, which provides incentives to customers related to EV charger installations. Included in the approved recovery was the return on and of PSE&G’s capital investments and customer incentives, and recovery of incremental operating costs of the program, incurred through November 2024. The BPU also approved annual filings for recovery of future EV investments and costs associated with the program.
•Cost of Removal: PSE&G accrues and collects in rates for the cost of removing, dismantling and disposing of its electric distribution, electric transmission and gas distribution upon retirement. The Regulatory Asset or Liability for non-legally required cost of removal represents the difference between amounts collected in rates and costs actually incurred.
•COVID-19 Deferral: These amounts represent incremental costs related to COVID-19 as approved for recovery by the BPU over a five-year period starting June 1, 2025.
•Deferred Income Tax Regulatory Assets: These amounts relate to deferred income taxes arising from utility operations that have not been included in customer rates relating to depreciation, ITCs and other flow-through items, including the accumulated deferred income taxes related to tax repair and mixed service cost deductions.
As part of PSE&G's 2018 distribution base rate case settlement with the BPU and the establishment of the TAC mechanism, PSE&G agreed to a ten-year flowback to customers of its accumulated deferred income taxes from previously realized tax repair deductions which resulted in the recognition of a $581 million Regulatory Asset and Regulatory Liability as of September 30, 2018. In addition, PSE&G agreed to the current flowback of tax benefits from ongoing tax repair deductions which results in the recording of a Regulatory Asset upon flowback each year.
NOTES TO CONSOLIDATED FINANCIAL STATEMENTS
As part of PSE&G’s 2024 base rate case settlement with the BPU, PSE&G agreed to an additional five-year flowback to customers of its accumulated deferred income taxes from previously realized mixed service cost deductions which resulted in the recognition of a $509 million Regulatory Asset and Regulatory Liability as of September 30, 2024. In addition, PSE&G agreed to the current flowback of tax benefits from ongoing mixed service cost deductions which results in the recording of a Regulatory Asset upon flowback each year.
For the years ended December 31, 2024, 2023 and 2022, PSE&G had provided $81 million, $80 million and $35 million, respectively, in current tax repair flowbacks to customers. The flowback of current mixed service costs commences in January 2025. The recovery and amortization of the tax repair and mixed service cost-related Deferred Income Tax Regulatory Assets is being recovered through the TAC regulatory mechanism, with the mixed service cost component commencing recovery in January 2025.
•Deferred Income Tax Regulatory Liabilities: These liabilities primarily relate to amounts due to customers for excess deferred income taxes as a result of the reduction in the federal corporate income tax rate provided in the Tax Cuts and Jobs Act of 2017, and accumulated deferred income taxes from previously realized distribution-related tax repair and mixed service cost deductions. As part of its settlement with its regulators, PSE&G agreed to refund the excess deferred income taxes as follows:
•Protected distribution-related excess deferred income taxes are being refunded to customers over the remaining useful lives of distribution property, plant and equipment through PSE&G’s TAC mechanism. As of December 31, 2024, the balance remaining to be flowed back to customers was approximately $840 million.
•Previously realized distribution-related tax repair deductions are being refunded to customers over ten years through PSE&G’s TAC mechanism. As of December 31, 2024, the balance remaining to be flowed back to customers was approximately $310 million through 2028.
•Previously realized distribution-related mixed service cost deductions are being refunded to customers over five years through PSE&G’s TAC mechanism. As of December 31, 2024, the balance to be flowed back to customers was approximately $509 million through 2029.
•Protected transmission-related excess deferred income taxes are being refunded to customers over the remaining useful life of transmission property, plant and equipment through PSE&G’s transmission formula rate mechanism. As of December 31, 2024, the balance remaining to be flowed back to customers was approximately $928 million.
•Electric Energy Costs—BGS: These costs represent the over or under recovered amounts associated with BGS, as approved by the BPU. Pursuant to BPU requirements, PSE&G serves as the supplier of last resort for electric customers within its service territory that are not served by another supplier. Pricing for those services are set by the BPU as a pass-through, resulting in no margin for PSE&G’s operations. Over or under recovered balances with interest are returned or recovered through monthly filings.
•Gas Costs—BGSS: These costs represent the over or under recovered amounts associated with BGSS, as approved by the BPU. Pursuant to BPU requirements, PSE&G serves as the supplier of last resort for gas customers within its service territory that are not served by another supplier. Pricing for those services are set by the BPU as a pass-through, resulting in no margin for PSE&G’s operations. Over or under collected balances are returned or recovered through an annual filing. Interest is accrued only on over recovered balances.
•GPRC: PSE&G files an annual GPRC petition with the BPU for recovery of amounts associated with the BPU Board-approved energy efficiency (EE) and solar (renewable) energy (RE) programs that include a return on and of investments and capital assets, as well as recovery for deferred expenses and incremental costs. The GPRC investment program component is recovered over the lives of the underlying investments and capital assets which range from five to twenty years.
The approved GPRC components receiving recovery for the return on and of investments include: Carbon Abatement, Energy Efficiency Economic Stimulus Program (EEE), EEE Extension Program, EEE Extension II Program, Solar Generation Investment Program (Solar 4 All®), Solar 4 All® Extension, Solar 4 All® Extension II, Solar Loan II Program, Solar Loan III Program, EE 2017 Program, Clean Energy Future–Energy Efficiency (CEF-EE) and CEF-EE-II.
NOTES TO CONSOLIDATED FINANCIAL STATEMENTS
In addition, the GPRC components receiving cost recovery for deferred expenses include: the Transition Renewable Energy Certificate Program, Community Solar Energy Program and the Successor Solar Incentive Program.
The Regulatory Asset balances represent the deferred investment and related undercollected balances with a Regulatory Liability recorded for any overrecovered balance. Interest is accrued monthly on any over-or under- recovered balances. Amortization of deferred investment and expenses are recorded in O&M expense. The capital asset portion of GPRC investments primarily in company-owned solar facilities is included in Property, Plant and Equipment, with depreciation recorded in Depreciation and Amortization Expense.
•MGP Remediation Costs: Represents the low end of the range for the remaining environmental investigation and remediation program cleanup costs for MGPs that are probable of recovery in future rates. Once these costs are incurred, they are recovered through the RAC in the SBC over a seven year period with interest.
•New Jersey Clean Energy Program: The BPU approved future funding requirements for EE and RE Programs. The BPU funding requirements are recovered through the SBC.
•Pension and OPEB Costs: PSE&G records the unrecognized costs for defined benefit pension and other OPEB plans on the balance sheet as Regulatory Assets pursuant to the adoption of accounting guidance for employers’ defined benefit pension and OPEB plans, and relevant BPU orders. These costs represent net actuarial gains or losses and prior service costs which have not been expensed. These costs are amortized and recovered in future rates.
•RAC (Other SBC): Costs incurred to clean up MGPs which are recovered over seven years with interest through an annual filing.
•SBC: The SBC, as authorized by the BPU and the New Jersey Electric Discount and Energy Competition Act, includes costs related to PSE&G’s electric and gas business as follows: (1) the Universal Service Fund; (2) EE & RE Programs; (3) Electric bad debt expense; and (4) the RAC for incurred MGP remediation expenditures. Over or under recovered balances with interest are to be returned or recovered through an annual filing.
Significant 2024 regulatory orders received and currently pending rate filings with the BPU or FERC by PSE&G are as follows:
•Electric and Gas Distribution Base Rate Case Filings – In October 2024, the BPU issued an Order approving the settlement of PSE&G’s distribution base rate case with new rates effective October 15, 2024. The Order provides for a $17.8 billion rate base, a 9.6% return on equity for PSE&G’s distribution business and a 55% equity component of its capitalization structure. The settlement results in a net increase in annual revenues of approximately $505 million, comprised of a $711 million increase in base revenues, offset by the return of tax benefits of approximately $206 million.
The return of tax benefits includes the flowback to customers of excess accumulated deferred income taxes and the flowback of previously recovered deferred income taxes and current tax repair deductions under the Tax Adjustment Credit (TAC) mechanism approved by the BPU in PSE&G’s 2018 distribution base rate case. The settlement approves an additional flowback of previously recovered deferred income taxes and current mixed service cost deductions. As a result of the approval to flowback previously recovered deferred income taxes related to mixed service costs, PSE&G recognized a $509 million regulatory liability and a corresponding regulatory asset as of September 30, 2024.
The settlement also approved the recovery of regulatory assets primarily associated with deferred storm costs, PSE&G’s electric vehicle charging program (CEF-EV) and electric meter AMI deployment program (CEF-EC), including stranded costs associated with the early retirement of legacy meters.
In addition, the Order approved mechanisms associated with the recovery of future storm costs as well as the recovery of annual pension and OPEB expenses beginning January 1, 2025.
•BGSS—In April 2024, the BPU gave final approval to PSE&G’s BGSS rate of approximately 40 cents per therm.
In September 2024, the BPU approved on a provisional basis, PSE&G's request to decrease its BGSS rate to approximately 33 cents per therm, with the new rate effective October 1, 2024.
•CIP—In April 2024, the BPU gave final approval to provisional gas CIP rates which were effective October 1, 2023.
NOTES TO CONSOLIDATED FINANCIAL STATEMENTS
In September 2024, BPU approved on a provisional basis, PSE&G's annual gas CIP petition to recover estimated deficient gas revenues of approximately $107 million based on the 12-month period ended September 30, 2024 with new rates effective October 1, 2024.
In February 2025, the BPU gave final approval for PSE&G’s updated electric CIP petition to recover approximately $96 million of deficient electric revenues over two years that resulted from the 12-month period ended May 31, 2024, with new rates effective August 1, 2024.
In February 2025, PSE&G filed its 2025 annual electric CIP petition seeking BPU approval to recover estimated deficient electric revenues of approximately $65 Million based on the 12-month period ending May 31, 2025, with new rates proposed to be effective June 1, 2025. This matter is pending.
•COVID-19 Deferral—In June 2024, the BPU approved recovery of PSE&G’s previously deferred incremental COVID-19 costs over a five-year period, effective June 1, 2025. PSE&G has deferred approximately $131 million as a Regulatory Asset for its net incremental costs, including $68 million for incremental gas bad debt expense associated with customer accounts receivable.
•Energy Strong II—In April 2024, the BPU approved an annualized increase in electric revenue requirement of $12 million, with rates effective May 1, 2024. The approved electric revenue increase represents the return of and on actual Energy Strong II investments placed in service through December 31, 2023.
•Gas System Modernization Program II Extension (GSMP II Ext) – In February 2025, PSE&G filed its initial GSMP II Ext cost recovery petition seeking BPU approval to recover in gas base rates an annual revenue increase of $53 million effective August 1, 2025. This filing requests the return on and of investment for GSMP II Ext gas investments expected to be placed in service through April 30, 2025. This matter is pending.
•Green Program Recovery Charges (GPRC)—In May 2024, the BPU approved PSE&G’s petition for a second extension of its Clean Energy Future (CEF)-EE subprogram investment (a component of GPRC) by approximately $300 million covering a commitment period from July 2024 through December 2024.
In June 2024, the BPU approved PSE&G’s updated 2023 GPRC cost recovery petition for $49 million and $15 million in annual electric and gas revenues, respectively.
In June 2024, PSE&G filed its 2024 GPRC cost recovery petition requesting BPU approval for recovery of increases of $68 million and $24 million in annual electric and gas revenues, respectively. This matter is pending.
In October 2024, the BPU approved PSE&G’s CEF-EE II investment program as a new component of GPRC. The Order authorizes a total spend of approximately $2.9 billion for energy efficiency projects committed between January 1, 2025 through June 30, 2027, and completed over an expected six-year period. The Order approving CEF-EE II will result in an annual increase in gas revenues of approximately $3 million, effective January 1, 2025.
•Infrastructure Advancement Program (IAP)—In May 2024, the BPU approved PSE&G's updated IAP cost recovery petition seeking BPU approval to recover in electric base rates an annual revenue increase of $5 million. This increase represents the return of and on investment for IAP electric investments in service through January 31, 2024. New rates were effective June 1, 2024.
In February 2025, PSE&G filed an updated IAP cost recovery petition seeking BPU approval to recover in electric and gas base rates an annual revenue increase of $6 million and $3 million, respectively, effective May 1, 2025. This increase represents the return of and on investment for IAP electric investments in service through January 31, 2025. This matter is pending.
•RAC— In January 2025, the BPU approved PSE&G’s RAC 30 petition approving recovery of approximately $56 million of net MGP expenditures incurred from August 1, 2021 through July 31, 2022, with new rates effective February 15, 2025.
•SBC and Non-Utility Generation Charge (NGC) —In March 2024, the BPU approved annual increases in electric and gas SBC revenues of $27 million and $32 million, respectively, pursuant to PSE&G’s 2023 SBC filing to recover electric and gas costs incurred under the Energy Efficiency & Renewable Energy and Social Programs components of the SBC. As part of the
NOTES TO CONSOLIDATED FINANCIAL STATEMENTS
COVID-19 Order approved by the BPU in June 2024, PSE&G will commence recovery of $78 million electric bad debt expense deferred within the Social Programs component over a five-year period effective with the approval of PSE&G’s next SBC filing.
In December 2024, PSE&G filed a petition to decrease its annual electric SBC and NGC rates by approximately $3 million and increase its annual SBC gas rate by $38 million based on PSE&G’s actual collections and expenses through November 30, 2024, and its projected collections and expenses through May 31, 2026 under the NGC and the Energy Efficiency & Renewable Energy and Social Programs components of the SBC. This petition includes the commencement of recovery of the previously deferred electric bad debt expense over a five-year period via the Social Programs component of the SBC.
•Tax Adjustment Credit (TAC)—As part of PSE&G’s distribution rate case settlement, PSE&G agreed to change the electric and gas TAC rates effectuating an annual revenue decrease of approximately $99 million and $107 million, respectively, effective October 15, 2024. The revenue decrease is primarily the result of higher TAC credits to customers due to the flow-back of additional tax benefits related to mixed service costs.
In February 2024, the BPU approved PSE&G’s 2023 TAC filing to increase annual electric and gas revenues by approximately $61 million and $40 million, respectively, with new rates effective March 1, 2024.
•Transmission Formula Rates— In June 2024, in accordance with its transmission formula rate protocols, PSE&G filed with the FERC its 2023 true-up adjustment pertaining to its transmission formula rates in effect for calendar year 2023, as established by its 2023 annual forecast filing. The June 2024 true-up filing resulted in an approximate $12 million increase in the 2023 annual revenue requirement from the revenue requirement numbers contained in the forecast filing. PSE&G had previously recognized the majority of the increased revenue requirement in 2023.
In October 2024, in accordance with its transmission formula rate protocols, PSE&G submitted with FERC its formula rate annual update for 2025. This 2025 update sets forth PSE&G’s annual transmission revenue requirement for the period commencing January 1, 2025 through December 31, 2025, which will result in a $64 million increase in its annual transmission revenue, subject to true-up.
•ZEC Program—In August 2024, the BPU approved the final ZEC price of $9.95 per MWh for the Energy Year ended May 31, 2024. As a result, PSE&G purchased approximately $166 million of ZECs including interest, from the eligible nuclear plants selected by the BPU with the final payment made in August 2024. As total customer collections equaled the required ZEC payments, there were no over-collected revenues from customers for the Energy Year ended May 31, 2024.
Note 7. Leases
As of December 31, 2024, PSEG and its subsidiaries were both a lessee and a lessor in operating leases.
Lessee
PSE&G
PSE&G has operating leases for office space for customer service centers, rooftops and land for its Solar 4 All® facilities, equipment, vehicles and land for certain electric substations. These leases have remaining lease terms through 2044, some of which include options to extend the leases for up to four 5-year terms or one 10-year term; and two include options to extend the leases for one 45-year and one 48-year term, respectively. Some leases have fixed rent payments that have escalations based on certain indices, such as the CPI. Certain leases contain variable payments.
PSEG Power & Other
PSEG Power has operating leases for buildings and equipment. These leases have remaining terms through 2028, one of which includes an option to extend the lease for up to one 5-year term. One lease has fixed rent payments that has escalations based on the CPI. Certain leases contain variable payments.
Services has operating leases for real estate and office equipment. These leases have remaining terms through 2030. Services’ lease for its headquarters, which ends in 2030, includes options to extend for two 5-year terms.
NOTES TO CONSOLIDATED FINANCIAL STATEMENTS
Operating Lease Costs
The following amounts relate to total operating lease costs, including both amounts recognized in the Consolidated Statements of Operations during the years ended December 31, 2024, 2023 and 2022 and any amounts capitalized as part of the cost of another asset, and the cash flows arising from lease transactions.
| | | | | | | | | | | | | | |
| | | | | | | | | | | |
| | | PSE&G | | | PSEG
Power &
Other | | | Total | | |
| | | Millions | | |
| Operating Lease Costs | | | | | | | | | | |
| Year Ended December 31, 2024 | | | | | | | | | | |
| Long-term Lease Costs | | $ | 43 | | | $ | 15 | | | $ | 58 | | |
| Short-term Lease Costs | | | 21 | | | | 3 | | | | 24 | | |
| Variable Lease Costs | | | 2 | | | | 11 | | | | 13 | | |
| Total Operating Lease Costs | | $ | 66 | | | $ | 29 | | | $ | 95 | | |
| | | | | | | | | | | |
| Year Ended December 31, 2024 | | | | | | | | | | |
| Cash Paid for Amounts Included in the Measurement of Operating Lease Liabilities | | $ | 20 | | | $ | 17 | | | $ | 37 | | |
| | | | | | | | | | | |
| Weighted Average Remaining Lease Term in Years | | | 9 | | | | 6 | | | | 7 | | |
| Weighted Average Discount Rate | | | 4.0 | % | | | 4.2 | % | | | 4.1 | % | |
| | | | | | | | | | | |
| | | | | | | | | | | | | | |
| | | | | | | | | | | |
| | | PSE&G | | | PSEG
Power &
Other | | | Total | | |
| | | Millions | | |
| Operating Lease Costs | | | | | | | | | | |
| Year Ended December 31, 2023 | | | | | | | | | | |
| Long-term Lease Costs | | $ | 34 | | | $ | 19 | | | $ | 53 | | |
| Short-term Lease Costs | | | 21 | | | | 6 | | | | 27 | | |
| Variable Lease Costs | | | 2 | | | | 13 | | | | 15 | | |
| Total Operating Lease Costs | | $ | 57 | | | $ | 38 | | | $ | 95 | | |
| | | | | | | | | | | |
| Year Ended December 31, 2023 | | | | | | | | | | |
| Cash Paid for Amounts Included in the Measurement of Operating Lease Liabilities | | $ | 17 | | | $ | 17 | | | $ | 34 | | |
| | | | | | | | | | | |
| Weighted Average Remaining Lease Term in Years | | | 10 | | | | 7 | | | | 8 | | |
| Weighted Average Discount Rate | | | 4.0 | % | | | 4.2 | % | | | 4.1 | % | |
| | | | | | | | | | | |
NOTES TO CONSOLIDATED FINANCIAL STATEMENTS
| | | | | | | | | | | | | | |
| | | | | | | | | | | |
| | | PSE&G | | | PSEG
Power &
Other | | | Total | | |
| | | Millions | | |
| Operating Lease Costs | | | | | | | | | | |
| Year Ended December 31, 2022 | | | | | | | | | | |
| Long-term Lease Costs | | $ | 31 | | | $ | 25 | | | $ | 56 | | |
| Short-term Lease Costs | | | 21 | | | | 5 | | | | 26 | | |
| Variable Lease Costs | | | 2 | | | | 11 | | | | 13 | | |
| Total Operating Lease Costs | | $ | 54 | | | $ | 41 | | | $ | 95 | | |
| | | | | | | | | | | |
| Year Ended December 31, 2022 | | | | | | | | | | |
| Cash Paid for Amounts Included in the Measurement of Operating Lease Liabilities | | $ | 17 | | | $ | 25 | | | $ | 42 | | |
| | | | | | | | | | | |
| Weighted Average Remaining Lease Term in Years | | | 11 | | | | 7 | | | | 9 | | |
| Weighted Average Discount Rate | | | 3.5 | % | | | 4.1 | % | | | 3.9 | % | |
| | | | | | | | | | | |
Operating lease liabilities as of December 31, 2024 had the following maturities on an undiscounted basis:
| | | | | | | | | | | | | | |
| | | | | | | | | | | |
| | | PSE&G | | | PSEG
Power &
Other | | | Total | | |
| | | Millions | | |
| 2025 | | $ | 19 | | | $ | 16 | | | $ | 35 | | |
| 2026 | | | 16 | | | | 16 | | | | 32 | | |
| 2027 | | | 13 | | | | 17 | | | | 30 | | |
| 2028 | | | 11 | | | | 16 | | | | 27 | | |
| 2029 | | | 10 | | | | 16 | | | | 26 | | |
| Thereafter | | | 47 | | | | 13 | | | | 60 | | |
| Total Minimum Lease Payments | | $ | 116 | | | $ | 94 | | | $ | 210 | | |
| | | | | | | | | | | |
The following is a reconciliation of the undiscounted cash flows to the discounted Operating Lease Liabilities recognized on the Consolidated Balance Sheets:
| | | | | | | | | | | | | | |
| | | | | | | | | | | |
| | | As of December 31, 2024 | | |
| | | PSE&G | | | PSEG
Power &
Other | | | Total | | |
| | | Millions | | |
| Undiscounted Cash Flows | | $ | 116 | | | $ | 94 | | | $ | 210 | | |
| Reconciling Amount due to Discount Rate | | | (18 | ) | | | (11 | ) | | | (29 | ) | |
| Total Discounted Operating Lease Liabilities | | $ | 98 | | | $ | 83 | | | $ | 181 | | |
| | | | | | | | | | | |
| | | As of December 31, 2023 | | |
| | | PSE&G | | | PSEG
Power &
Other | | | Total | | |
| | | Millions | | |
| Undiscounted Cash Flows | | $ | 125 | | | $ | 111 | | | $ | 236 | | |
| Reconciling Amount due to Discount Rate | | | (21 | ) | | | (15 | ) | | | (36 | ) | |
| Total Discounted Operating Lease Liabilities | | $ | 104 | | | $ | 96 | | | $ | 200 | | |
| | | | | | | | | | | |
NOTES TO CONSOLIDATED FINANCIAL STATEMENTS
As of December 31, 2024, the current portions of Operating Lease Liabilities included in Other Current Liabilities were $29 million and $15 million for PSEG and PSE&G, respectively. As of December 31, 2023, the current portions of Operating Lease Liabilities included in Other Current Liabilities were $27 million and $15 million for PSEG and PSE&G, respectively.
Lessor
PSEG Power & Other
Energy Holdings is the lessor in leveraged leases. See Note 8. Long-Term Investments and Note 9. Financing Receivables.
Energy Holdings is the lessor in an operating lease for a domestic energy generation facility with a remaining term through 2036. As of December 31, 2024, Energy Holdings’ property subject to this lease had a total carrying value of $9 million.
In 2022, Energy Holdings recorded pre-tax impairments of $78 million related to one of its domestic energy generating facilities and its real estate assets. In March 2023, Energy Holdings completed the sale of one of its domestic energy generating facilities and recorded an immaterial pre-tax gain. In December 2023, Energy Holdings completed the sale of its real estate assets and recorded an immaterial pre-tax gain.
A wholly owned subsidiary of PSEG Power is the lessor in an operating lease for certain parcels of land with terms through 2050, plus five optional renewal periods of ten years.
The following is the operating lease income for the years ended December 31, 2024, 2023 and 2022:
| | | | | | | | | | | | | | |
| | | | | | | | | | | |
| | | Years ended December 31, | | |
| Operating Lease Income | | 2024 | | | 2023 | | | 2022 | | |
| | | Millions | | |
| Fixed Lease Income | | $ | 14 | | | $ | 24 | | | $ | 31 | | |
| Variable Lease Income | | | — | | | | — | | | | — | | |
| Total Operating Lease Income | | $ | 14 | | | $ | 24 | | | $ | 31 | | |
| | | | | | | | | | | |
Operating leases had the following minimum future fixed lease receipts as of December 31, 2024:
| | | | | | |
| | | | | |
| | | Millions | | |
| 2025 | | $ | 14 | | |
| 2026 | | | 14 | | |
| 2027 | | | 14 | | |
| 2028 | | | 14 | | |
| 2029 | | | 13 | | |
| Thereafter | | | 96 | | |
| Total Minimum Future Lease Receipts | | $ | 165 | | |
| | | | | |
NOTES TO CONSOLIDATED FINANCIAL STATEMENTS
Note 8. Long-Term Investments
Long-Term Investments as of December 31, 2024 and 2023 included the following:
| | | | | | | | | | |
| | | | | | | | |
| | | As of December 31, | | |
| | | 2024 | | | 2023 | | |
| | | Millions | | |
| PSE&G | | | | | | | |
| Life Insurance and Supplemental Benefits | | $ | 67 | | | $ | 77 | | |
| Solar Loans | | | 23 | | | | 40 | | |
| PSEG Power & Other | | | | | | | |
| Lease Investments | | | 150 | | | | 161 | | |
| Equity Method Investments (A) | | | 21 | | | | 17 | | |
| Other | | | 2 | | | | — | | |
| Total Long-Term Investments | | $ | 263 | | | $ | 295 | | |
| | | | | | | | |
(A)During the years ended December 31, 2024 and 2023, there were no dividends from these investments. During the year ended December 31, 2022, dividends from these investments were $8 million.
Leases
Energy Holdings, through its indirect subsidiaries, has investments in assets subject primarily to leveraged lease accounting. A leveraged lease is typically comprised of an investment by an equity investor and debt provided by a third-party debt investor. The debt is recourse only to the assets subject to lease and is not included on PSEG’s Consolidated Balance Sheets. As an equity investor, Energy Holdings’ equity investments in the leases are comprised of the total expected lease receivables over the lease terms, reduced for any income not yet earned on the leases. This amount is included in Long-Term Investments on PSEG’s Consolidated Balance Sheets. The more rapid depreciation of the leased property for tax purposes creates tax cash flow that will be repaid to the taxing authority in later periods. As such, the liability for such taxes due is recorded in Deferred Income Taxes on PSEG’s Consolidated Balance Sheets.
Leveraged leases outstanding as of December 31, 2024 commenced in or prior to 2000.The following table shows Energy Holdings’ gross and net lease investment as of December 31, 2024 and2023.
| | | | | | | | | | |
| | | | | | | | |
| | | As of December 31, | | |
| | | 2024 | | | 2023 | | |
| | | Millions | | |
| Lease Receivables (net of Non-Recourse Debt) | | $ | 200 | | | $ | 223 | | |
| Estimated Residual Value of Leased Assets | | | — | | | | — | | |
| Total Investment in Rental Receivables | | | 200 | | | | 223 | | |
| Unearned and Deferred Income | | | (50 | ) | | | (62 | ) | |
| Gross Investments in Leases | | | 150 | | | | 161 | | |
| Deferred Tax Liabilities | | | (33 | ) | | | (36 | ) | |
| Net Investments in Leases | | $ | 117 | | | $ | 125 | | |
| | | | | | | | |
The pre-tax income and income tax effects related to investments in leases were immaterial for the years ended December 31, 2024, 2023 and 2022.
NOTES TO CONSOLIDATED FINANCIAL STATEMENTS
Note 9. Financing Receivables
PSE&G
PSE&G’s Solar Loan Programs are designed to help finance the installation of solar power systems throughout its electric service area. Interest income on the loans is recorded on an accrual basis. The loans are paid back with SRECs generated from the related installed solar electric system. PSE&G uses collection experience as a credit quality indicator for its Solar Loan Programs and conducted a comprehensive credit review for all borrowers. As of December 31, 2024, none of the solar loans were impaired; however, in the event a loan becomes impaired, the basis of the solar loan would be recovered through a regulatory recovery mechanism. Therefore, no current credit losses have been recorded for Solar Loan Programs I, II and III. A substantial portion of these loan amounts are noncurrent and reported in Long-Term Investments on PSEG’s and PSE&G’s Consolidated Balance Sheets. The following table reflects the outstanding loans by class of customer, none of which would be considered “non-performing.”
| | | | | | | | | | |
| | | | | | | | |
| | | As of December 31, | | |
| Outstanding Loans by Class of Customers | | 2024 | | | 2023 | | |
| | | Millions | | |
| Commercial/Industrial | | $ | 38 | | | $ | 60 | | |
| Residential | | | 2 | | | | 3 | | |
| Total | | | 40 | | | | 63 | | |
| Current Portion (included in Accounts Receivable) | | | (17 | ) | | | (23 | ) | |
| Noncurrent Portion (included in Long-Term Investments) | | $ | 23 | | | $ | 40 | | |
| | | | | | | | |
The solar loans originated under three Solar Loan Programs are comprised as follows:
| | | | | | | | | | | | |
| | | | | | | | | | | |
| Programs | | Balance as of December 31, 2024 | | | Funding Provided | | Residential Loan Term | | Non-Residential Loan Term | |
| | | Millions | | | | | | | | |
| Solar Loan I | | $ | 1 | | | prior to 2013 | | 10 years | | 15 years | |
| Solar Loan II | | | 20 | | | prior to 2015 | | 10 years | | 15 years | |
| Solar Loan III | | | 19 | | | prior to 2022 | | 10 years | | 10 years | |
| Total | | $ | 40 | | | | | | | | |
| | | | | | | | | | | |
The average life of loans paid in full is eight years, which is lower than the loan terms of 10 to 15 years due to the generation of SRECs being greater than expected and/or cash payments made to the loan. Payments on all outstanding loans were current as of December 31, 2024 and have an average remaining life of approximately two years. There are no remaining residential loans outstanding under the Solar Loan I program.
Energy Holdings
Energy Holdings had net investments in assets subject to leveraged lease accounting of $117 million as of December 31, 2024 and $125 million as of December 31, 2023 (see Note 8. Long-Term Investments).
NOTES TO CONSOLIDATED FINANCIAL STATEMENTS
The corresponding receivables associated with the lease portfolio are reflected as follows, net of non-recourse debt. The ratings in the table represent the ratings of the entities providing payment assurance to Energy Holdings.
| | | | | | |
| | | | | |
| | | Lease Receivables, Net of
Non-Recourse Debt | | |
| Counterparties’ Standard & Poor’s (S&P) Credit Rating as of December 31, 2024 | | As of December 31, 2024 | | |
| | | Millions | | |
| AA | | $ | 7 | | |
| A- | | | 39 | | |
| BBB+ | | | 154 | | |
| Total | | $ | 200 | | |
| | | | | |
PSEG recorded no credit losses for the leveraged leases existing on December 31, 2024. Upon the occurrence of certain defaults, indirect subsidiaries of Energy Holdings would exercise their rights and seek recovery of their investments, potentially including stepping into the lease directly to protect their investments. While these actions could ultimately protect or mitigate the loss of value, they could require the use of significant capital and trigger certain material tax obligations which could, for certain leases, wholly or partially be mitigated by tax indemnification claims against the counterparty. A bankruptcy of a lessee would likely delay and potentially limit any efforts on the part of the lessors to assert their rights upon default and could delay the monetization of claims.
Note 10. Trust Investments
NDT Fund
In accordance with NRC regulations, entities owning an interest in nuclear generating facilities are required to determine the costs and funding methods necessary to decommission such facilities upon termination of operation. As a general practice, each nuclear owner places funds in independent external trust accounts it maintains to provide for decommissioning. PSEG Power is required to file periodic reports with the NRC demonstrating that its NDT Fund meets the formula-based minimum NRC funding requirements. PSEG Power maintains an external master NDT to fund its share of decommissioning costs for its five nuclear facilities upon their respective termination of operation. The trust contains two separate funds: a qualified fund and a non-qualified fund. Section 468A of the Internal Revenue Code limits the amount of money that can be contributed into a qualified fund. PSEG Power’s share of decommissioning costs related to its five nuclear units was estimated to be between $3.6 billion and $3.8 billion, including contingencies. The liability for decommissioning recorded on a discounted basis as of December 31, 2024 was approximately $1 billion and is included in the ARO. The funds are managed by third-party investment managers who operate under investment guidelines developed by PSEG Power.
NOTES TO CONSOLIDATED FINANCIAL STATEMENTS
The following tables show the fair values and gross unrealized gains and losses for the securities held in the NDT Fund.
| | | | | | | | | | | | | | | | | | |
| | | | | | | | | | | | | | |
| | | As of December 31, 2024 | | |
| | | Cost | | | Gross
Unrealized
Gains | | | Gross
Unrealized
Losses | | | Fair
Value | | |
| | | Millions | | |
| Equity Securities | | | | | | | | | | | | | |
| Domestic | | $ | 508 | | | $ | 393 | | | $ | (9 | ) | | $ | 892 | | |
| International | | | 419 | | | | 98 | | | | (29 | ) | | | 488 | | |
| Total Equity Securities | | | 927 | | | | 491 | | | | (38 | ) | | | 1,380 | | |
| Available-for-Sale Debt Securities | | | | | | | | | | | | | |
| Government | | | 853 | | | | 1 | | | | (91 | ) | | | 763 | | |
| Corporate | | | 531 | | | | 3 | | | | (31 | ) | | | 503 | | |
| Total Available-for-Sale Debt Securities | | | 1,384 | | | | 4 | | | | (122 | ) | | | 1,266 | | |
| Total NDT Fund Investments (A) | | $ | 2,311 | | | $ | 495 | | | $ | (160 | ) | | $ | 2,646 | | |
| | | | | | | | | | | | | | |
(A)The NDT Fund Investments table excludes cash and foreign currency of $24 million as of December 31, 2024, which is part of the NDT Fund.
| | | | | | | | | | | | | | | | | | |
| | | | | | | | | | | | | | |
| | | As of December 31, 2023 | | |
| | | Cost | | | Gross
Unrealized
Gains | | | Gross
Unrealized
Losses | | | Fair
Value | | |
| | | Millions | | |
| Equity Securities | | | | | | | | | | | | | |
| Domestic | | $ | 482 | | | $ | 300 | | | $ | (2 | ) | | $ | 780 | | |
| International | | | 423 | | | | 118 | | | | (11 | ) | | | 530 | | |
| Total Equity Securities | | | 905 | | | | 418 | | | | (13 | ) | | | 1,310 | | |
| Available-for-Sale Debt Securities | | | | | | | | | | | | | |
| Government | | | 759 | | | | 4 | | | | (72 | ) | | | 691 | | |
| Corporate | | | 555 | | | | 6 | | | | (39 | ) | | | 522 | | |
| Total Available-for-Sale Debt Securities | | | 1,314 | | | | 10 | | | | (111 | ) | | | 1,213 | | |
| Total NDT Fund Investments (A) | | $ | 2,219 | | | $ | 428 | | | $ | (124 | ) | | $ | 2,523 | | |
| | | | | | | | | | | | | | |
(A)The NDT Fund Investments table excludes cash and foreign currency of $1 million as of December 31, 2023, which is part of the NDT Fund.
Net unrealized gains (losses) on debt securities of $(69) million (after-tax) were included in Accumulated Other Comprehensive Loss (AOCL) on PSEG’s Consolidated Balance Sheet as of December 31, 2024. The portion of net unrealized gains (losses) recognized during 2024 related to equity securities still held at the end of December 31, 2024 was $99 million.
NOTES TO CONSOLIDATED FINANCIAL STATEMENTS
The amounts in the preceding tables do not include receivables and payables for NDT Fund transactions which have not settled at the end of each period. Such amounts are included in Accounts Receivable and Accounts Payable on the Consolidated Balance Sheets as shown in the following table.
| | | | | | | | | | |
| | | | | | | | |
| | | As of December 31, | | |
| | | 2024 | | | 2023 | | |
| | | Millions | | |
| Accounts Receivable | | $ | 18 | | | $ | 19 | | |
| Accounts Payable | | $ | 5 | | | $ | 6 | | |
| | | | | | | | |
The following table shows the value of securities in the NDT Fund that have been in an unrealized loss position for less than and greater than 12 months.
| | | | | | | | | | | | | | | | | | | | | | | | | | | | | | | | | | |
| | | | | | | | | | | | | | | | | | | | | | | | | | |
| | | As of December 31, 2024 | | | As of December 31, 2023 | | |
| | | Less Than 12 Months | | | Greater Than 12 Months | | | Less Than 12 Months | | | Greater Than 12 Months | | |
| | | Fair
Value | | | Gross
Unrealized
Losses | | | Fair
Value | | | Gross
Unrealized
Losses | | | Fair
Value | | | Gross
Unrealized
Losses | | | Fair
Value | | | Gross
Unrealized
Losses | | |
| | | Millions | | |
| Equity Securities (A) | | | | | | | | | | | | | | | | | | | | | | | | | |
| Domestic | | $ | 73 | | | $ | (8 | ) | | $ | 4 | | | $ | (1 | ) | | $ | 44 | | | $ | (1 | ) | | $ | 4 | | | $ | — | | |
| International | | | 126 | | | | (19 | ) | | | 22 | | | | (10 | ) | | | 35 | | | | (4 | ) | | | 28 | | | | (8 | ) | |
| Total Equity Securities | | | 199 | | | | (27 | ) | | | 26 | | | | (11 | ) | | | 79 | | | | (5 | ) | | | 32 | | | | (8 | ) | |
| Available-for-Sale Debt Securities | | | | | | | | | | | | | | | | | | | | | | | | | |
| Government (B) | | | 295 | | | | (7 | ) | | | 382 | | | | (84 | ) | | | 90 | | | | (1 | ) | | | 432 | | | | (71 | ) | |
| Corporate (C) | | | 119 | | | | (2 | ) | | | 227 | | | | (29 | ) | | | 19 | | | | — | | | | 329 | | | | (39 | ) | |
| Total Available-for-Sale Debt Securities | | | 414 | | | | (9 | ) | | | 609 | | | | (113 | ) | | | 109 | | | | (1 | ) | | | 761 | | | | (110 | ) | |
| NDT Trust Investments | | $ | 613 | | | $ | (36 | ) | | $ | 635 | | | $ | (124 | ) | | $ | 188 | | | $ | (6 | ) | | $ | 793 | | | $ | (118 | ) | |
| | | | | | | | | | | | | | | | | | | | | | | | | | |
(A)Equity Securities—Investments in marketable equity securities within the NDT Fund are primarily in common stocks within a broad range of industries and sectors. Unrealized gains and losses on these securities are recorded in Net Income.
(B)Debt Securities (Government)—Unrealized gains and losses on these securities are recorded in Accumulated Other Comprehensive Income (Loss). The unrealized losses on PSEG Power’s NDT investments in U.S. Treasury obligations and Federal Agency mortgage-backed securities were caused by interest rate changes. PSEG Power also has investments in municipal bonds. It is not expected that these securities will settle for less than their amortized cost. PSEG Power does not intend to sell these securities nor will it be more-likely-than-not required to sell before recovery of their amortized cost. PSEG Power did not recognize credit losses for U.S. Treasury obligations and Federal Agency mortgage-backed securities because these investments are guaranteed by the U.S. government or an agency of the U.S. government. PSEG Power did not recognize credit losses for municipal bonds because they are primarily investment grade securities.
(C)Debt Securities (Corporate)—Unrealized gains and losses on these securities are recorded in Accumulated Other Comprehensive Income (Loss). Unrealized losses were due to market declines. It is not expected that these securities would settle for less than their amortized cost. PSEG Power does not intend to sell these securities nor will it be more-likely-than-not required to sell before recovery of their amortized cost. PSEG Power did not recognize credit losses for corporate bonds because they are primarily investment grade securities.
NOTES TO CONSOLIDATED FINANCIAL STATEMENTS
The proceeds from the sales of and the net gains (losses) on securities in the NDT Fund were:
| | | | | | | | | | | | | | |
| | | | | | | | | | | |
| | | Years Ended December 31, | | |
| | | 2024 | | | 2023 | | | 2022 | | |
| | | Millions | | |
| Proceeds from Sales (A) | | $ | 1,504 | | | $ | 1,685 | | | $ | 1,521 | | |
| Net Realized Gains (Losses): | | | | | | | | | | |
| Gross Realized Gains | | $ | 132 | | | $ | 142 | | | $ | 86 | | |
| Gross Realized Losses | | | (54 | ) | | | (100 | ) | | | (136 | ) | |
| Net Realized Gains (Losses) on NDT Fund (B) | | | 78 | | | | 42 | | | | (50 | ) | |
| Net Unrealized Gains (Losses) on Equity Securities | | | 47 | | | | 146 | | | | (205 | ) | |
| Net Gains (Losses) on NDT Fund Investments | | $ | 125 | | | $ | 188 | | | $ | (255 | ) | |
| | | | | | | | | | | |
(A)Includes activity in accounts related to the liquidation of funds being transitioned within the trust.
(B)The cost of these securities was determined on the basis of specific identification.
The NDT Fund debt securities held as of December 31, 2024 had the following maturities:
| | | | | | |
| | | | | |
| Time Frame | | Fair Value | | |
| | | Millions | | |
| Less than one year | | $ | 17 | | |
| 1 - 5 years | | | 358 | | |
| 6 - 10 years | | | 215 | | |
| 11 - 15 years | | | 64 | | |
| 16 - 20 years | | | 109 | | |
| Over 20 years | | | 503 | | |
| Total NDT Available-for-Sale Debt Securities | | $ | 1,266 | | |
| | | | | |
PSEG Power periodically assesses individual debt securities whose fair value is less than amortized cost to determine whether the investments are impaired. For these securities, management considers its intent to sell or requirement to sell a security prior to expected recovery. In those cases where a sale is expected, any impairment would be recorded through earnings. For fixed income securities where there is no intent to sell or likely requirement to sell, management evaluates whether credit loss is a component of the impairment. If so, that portion is recorded through earnings while the noncredit loss component is recorded through Accumulated Other Comprehensive Income (Loss). Any subsequent recoveries of the noncredit loss component of the impairment would be recorded through Accumulated Other Comprehensive Income (Loss). Any subsequent recoveries of the credit loss component would be recognized through earnings. The assessment of fair market value compared to cost is applied on a weighted average basis taking into account various purchase dates and initial cost of the securities.
Rabbi Trust
PSEG maintains certain unfunded nonqualified benefit plans to provide supplemental retirement and deferred compensation benefits to certain key employees. Certain assets related to these plans have been set aside in a grantor trust commonly known as a “Rabbi Trust.”
NOTES TO CONSOLIDATED FINANCIAL STATEMENTS
The following tables show the fair values, gross unrealized gains and losses and amortized cost basis for the securities held in the Rabbi Trust.
| | | | | | | | | | | | | | | | | | |
| | | | | | | | | | | | | | |
| | | As of December 31, 2024 | | |
| | | Cost | | | Gross
Unrealized
Gains | | | Gross
Unrealized
Losses | | | Fair
Value | | |
| | | Millions | | |
| Domestic Equity Securities | | $ | 8 | | | $ | 9 | | | $ | — | | | $ | 17 | | |
| Available-for-Sale Debt Securities | | | | | | | | | | | | | |
| Government | | | 105 | | | | — | | | | (22 | ) | | | 83 | | |
| Corporate | | | 76 | | | | — | | | | (11 | ) | | | 65 | | |
| Total Available-for-Sale Debt Securities | | | 181 | | | | — | | | | (33 | ) | | | 148 | | |
| Total Rabbi Trust Investments | | $ | 189 | | | $ | 9 | | | $ | (33 | ) | | $ | 165 | | |
| | | | | | | | | | | | | | |
| | | | | | | | | | | | | | | | | | |
| | | | | | | | | | | | | | |
| | | As of December 31, 2023 | | |
| | | Cost | | | Gross
Unrealized
Gains | | | Gross
Unrealized
Losses | | | Fair
Value | | |
| | | Millions | | |
| Domestic Equity Securities | | $ | 10 | | | $ | 8 | | | $ | — | | | $ | 18 | | |
| Available-for-Sale Debt Securities | | | | | | | | | | | | | |
| Government | | | 110 | | | | — | | | | (19 | ) | | | 91 | | |
| Corporate | | | 80 | | | | — | | | | (10 | ) | | | 70 | | |
| Total Available-for-Sale Debt Securities | | | 190 | | | | — | | | | (29 | ) | | | 161 | | |
| Total Rabbi Trust Investments | | $ | 200 | | | $ | 8 | | | $ | (29 | ) | | $ | 179 | | |
| | | | | | | | | | | | | | |
Net unrealized gains (losses) on debt securities of $(24) million (after-tax) were included in AOCL on PSEG’s Consolidated Balance Sheet as of December 31, 2024. The portion of net unrealized gains (losses) recognized during 2024 related to equity securities still held at the end of December 31, 2024 was approximately $1 million.
The amounts in the preceding tables do not include receivables and payables for Rabbi Trust Fund transactions which have not settled at the end of each period. Such amounts are included in Accounts Receivable and Accounts Payable on the Consolidated Balance Sheets as shown in the following table.
| | | | | | | | | | |
| | | | | | | | |
| | | As of December 31, | | |
| | | 2024 | | | 2023 | | |
| | | Millions | | |
| Accounts Receivable | | $ | 1 | | | $ | 1 | | |
| Accounts Payable | | $ | — | | | $ | — | | |
| | | | | | | | |
NOTES TO CONSOLIDATED FINANCIAL STATEMENTS
The following table shows the value of securities in the Rabbi Trust Fund that have been in an unrealized loss position for less than and greater than 12 months:
| | | | | | | | | | | | | | | | | | | | | | | | | | | | | | | | | | |
| | | | | | | | | | | | | | | | | | | | | | | | | | |
| | | | | | | | | | | | | | | | | | | | | | | | | | |
| | | As of December 31, 2024 | | | As of December 31, 2023 | | |
| | | Less Than 12 Months | | | Greater Than 12 Months | | | Less Than 12 Months | | | Greater Than 12 Months | | |
| | | Fair
Value | | | Gross
Unrealized
Losses | | | Fair
Value | | | Gross
Unrealized
Losses | | | Fair
Value | | | Gross
Unrealized
Losses | | | Fair
Value | | | Gross
Unrealized
Losses | | |
| | | Millions | | |
| Available-for-Sale Debt Securities | | | | | | | | | | | | | | | | | | | | | | | | | |
| Government (A) | | $ | 10 | | | $ | — | | | $ | 71 | | | $ | (22 | ) | | $ | 3 | | | $ | — | | | $ | 83 | | | $ | (19 | ) | |
| Corporate (B) | | | 11 | | | | — | | | | 49 | | | | (11 | ) | | | 3 | | | | — | | | | 60 | | | | (10 | ) | |
| Total Available-for-Sale Debt Securities | | | 21 | | | | — | | | | 120 | | | | (33 | ) | | | 6 | | | | — | | | | 143 | | | | (29 | ) | |
| Rabbi Trust Investments | | $ | 21 | | | $ | — | | | $ | 120 | | | $ | (33 | ) | | $ | 6 | | | $ | — | | | $ | 143 | | | $ | (29 | ) | |
| | | | | | | | | | | | | | | | | | | | | | | | | | |
(A)Debt Securities (Government)—Unrealized gains and losses on these securities are recorded in Accumulated Other Comprehensive Income (Loss). The unrealized losses on PSEG’s Rabbi Trust investments in U.S. Treasury obligations and Federal Agency mortgage-backed securities were caused by interest rate changes. PSEG also has investments in municipal bonds. It is not expected that these securities will settle for less than their amortized cost. PSEG does not intend to sell these securities nor will it be more-likely-than-not required to sell before recovery of their amortized cost. PSEG did not recognize credit losses for U.S. Treasury obligations and Federal Agency mortgage-backed securities because these investments are guaranteed by the U.S. government or an agency of the U.S. government. PSEG did not recognize credit losses for municipal bonds because they are primarily investment grade securities.
(B)Debt Securities (Corporate)—Unrealized gains and losses on these securities are recorded in Accumulated Other Comprehensive Income (Loss). Unrealized losses were due to market declines. It is not expected that these securities would settle for less than their amortized cost. PSEG does not intend to sell these securities nor will it be more-likely-than-not required to sell before recovery of their amortized cost. PSEG did not recognize credit losses for corporate bonds because they are primarily investment grade.
The proceeds from the sales of and the net gains (losses) on securities in the Rabbi Trust Fund were:
| | | | | | | | | | | | | | |
| | | | | | | | | | | |
| | | Years Ended December 31, | | |
| | | 2024 | | | 2023 | | | 2022 | | |
| | | Millions | | |
| Proceeds from Rabbi Trust Sales | | $ | 33 | | | $ | 29 | | | $ | 65 | | |
| Net Realized Gains (Losses): | | | | | | | | | | |
| Gross Realized Gains | | $ | 3 | | | $ | 5 | | | $ | 5 | | |
| Gross Realized Losses | | | (2 | ) | | | (6 | ) | | | (9 | ) | |
| Net Realized Gains (Losses) on Rabbi Trust (A) | | | 1 | | | | (1 | ) | | | (4 | ) | |
| Net Unrealized Gains (Losses) on Equity Securities | | | 1 | | | | 2 | | | | (6 | ) | |
| Net Gains (Losses) on Rabbi Trust Investments | | $ | 2 | | | $ | 1 | | | $ | (10 | ) | |
| | | | | | | | | | | |
(A)The cost of these securities was determined on the basis of specific identification.
NOTES TO CONSOLIDATED FINANCIAL STATEMENTS
The Rabbi Trust debt securities held as of December 31, 2024 had the following maturities:
| | | | | | |
| | | | | |
| Time Frame | | Fair Value | | |
| | | Millions | | |
| Less than one year | | $ | 4 | | |
| 1 - 5 years | | | 30 | | |
| 6 - 10 years | | | 16 | | |
| 11 - 15 years | | | 10 | | |
| 16 - 20 years | | | 15 | | |
| Over 20 years | | | 73 | | |
| Total Rabbi Trust Available-for-Sale Debt Securities | | $ | 148 | | |
| | | | | |
PSEG periodically assesses individual debt securities whose fair value is less than amortized cost to determine whether the investments are considered to be impaired. For these securities, management considers its intent to sell or requirement to sell a security prior to expected recovery. In those cases where a sale is expected, any impairment would be recorded through earnings. For fixed income securities where there is no intent to sell or likely requirement to sell, management evaluates whether credit loss is a component of the impairment. If so, that portion is recorded through earnings while the noncredit loss component is recorded through Accumulated Other Comprehensive Income (Loss). Any subsequent recoveries of the noncredit loss component of the impairment would be recorded through Accumulated Other Comprehensive Income (Loss). Any subsequent recoveries of the credit loss component would be recognized through earnings. The assessment of fair market value compared to cost is applied on a weighted average basis taking into account various purchase dates and initial cost of the securities.
The fair value of the Rabbi Trust related to PSEG and PSE&G are detailed as follows:
| | | | | | | | | | |
| | | | | | | | |
| | | As of December 31, | | | As of December 31, | | |
| | | 2024 | | | 2023 | | |
| | | Millions | | |
| PSE&G | | $ | 30 | | | $ | 32 | | |
| PSEG Power & Other | | | 135 | | | | 147 | | |
| Total Rabbi Trust Investments | | $ | 165 | | | $ | 179 | | |
| | | | | | | | |
NOTES TO CONSOLIDATED FINANCIAL STATEMENTS
Note 11. Asset Retirement Obligations (AROs)
PSEG and PSE&G recognize liabilities for the expected cost of retiring long-lived assets for which a legal obligation exists to remove or dispose of an asset or some component of an asset at retirement. These AROs are recorded at fair value in the period in which they are incurred and are capitalized as part of the carrying amount of the related long-lived assets. PSEG’s subsidiaries, except for PSE&G, accrete the ARO liability to reflect the passage of time with the corresponding expense recorded in O&M. PSE&G, as a rate-regulated entity, recognizes Regulatory Assets or Liabilities as a result of timing differences between the recording of costs and costs recovered through the rate-making process.
PSE&G has conditional AROs primarily for legal obligations related to the removal of treated wood poles and the requirement to seal natural gas pipelines at all sources of gas when the pipelines are no longer in service. PSE&G does not record an ARO for its protected steel and poly-based natural gas lines, as management believes that these categories of gas lines have an indeterminable life.
PSEG’s other ARO liability primarily relates to decommissioning of its nuclear power plants in accordance with NRC requirements. PSEG has an independent external trust that is intended to fund decommissioning of its nuclear facilities upon termination of operation. For additional information, see Note 10. Trust Investments. PSEG also identified conditional AROs related to PSEG’s retained fossil generation sites primarily related to liabilities for removal of asbestos. To estimate the fair value of its other AROs, PSEG uses a probability weighted, discounted cash flow model which, on a unit by unit basis, considers multiple outcome scenarios that include significant estimates and assumptions, and are based on third-party decommissioning cost estimates, cost escalation rates, inflation rates and discount rates.
Updated nuclear cost studies are obtained triennially unless new information necessitates more frequent updates. The most recent cost study was completed in 2024. When assumptions are revised to calculate fair values of existing AROs, generally, the ARO balance and corresponding long-lived asset are adjusted which impact the amount of accretion and depreciation expense recognized in future periods. For PSE&G, Regulatory Assets and Regulatory Liabilities result when accretion and amortization are adjusted to match rates established by regulators resulting in the regulatory deferral of any gain or loss.
The changes to the ARO liabilities for PSEG and PSE&G during 2023 and 2024 are presented in the following table:
| | | | | | | | | | | | | | |
| | | | | | | | | | | |
| | | PSEG | | | PSE&G | | | PSEG Power & Other | | |
| | | Millions | | |
| ARO Liability as of January 1, 2023 | | $ | 1,499 | | | $ | 384 | | | $ | 1,115 | | |
| Liabilities Settled | | | (13 | ) | | | (13 | ) | | | — | | |
| Accretion Expense | | | 51 | | | | — | | | | 51 | | |
| Accretion Expense Deferred and Recovered in Rate Base (A) | | | 16 | | | | 16 | | | | — | | |
| Revision to Present Values of Estimated Cash Flows | | | (85 | ) | | | 14 | | | | (99 | ) | |
| ARO Liability as of December 31, 2023 | | $ | 1,468 | | | $ | 401 | | | $ | 1,067 | | |
| Liabilities Settled | | $ | (26 | ) | | $ | (12 | ) | | $ | (14 | ) | |
| Accretion Expense | | | 49 | | | | — | | | | 49 | | |
| Accretion Expense Deferred and Recovered in Rate Base (A) | | | 16 | | | | 16 | | | | — | | |
| Revision to Present Values of Estimated Cash Flows | | | (7 | ) | | | 52 | | | | (59 | ) | |
| ARO Liability as of December 31, 2024 | | $ | 1,500 | | | $ | 457 | | | $ | 1,043 | | |
| | | | | | | | | | | |
(A)Not reflected as expense in Consolidated Statements of Operations.
In 2024, PSE&G recorded an increase to its ARO liabilities primarily due to the impact of increases in labor rates and other costs, partially offset by decreases from changes in inflation and discount rate assumptions. Those changes had no impact on PSE&G’s Consolidated Statement of Operations.
In February 2022, the NRC issued an order related to its review of the subsequent license renewal (SLR) application for the Peach Bottom nuclear units. While the NRC had previously granted the SLR to the Peach Bottom units, the NRC was responding to pending motions that had not previously been adjudicated. In its decision, the NRC concluded that the previous environmental
NOTES TO CONSOLIDATED FINANCIAL STATEMENTS
review required by the National Environmental Policy Act (NEPA) was incomplete because it did not adequately address environmental impacts resulting from extending the units’ licenses by 20 years. As a result, at the direction of the NRC, the NRC staff changed the expiration dates for the licenses back to 2033 and 2034, until the completion of the NEPA analysis. The NRC directed, however, that the subsequently renewed licenses themselves remain in effect. The NRC also stated that it fully expects that the staff will complete its update of the NEPA analysis before 2033. As such, at this time, PSEG has not adjusted the useful lives or the assumed shutdown probabilities assigned to the ARO of the units as PSEG believes that the licenses will be updated to reflect the approved 2053 and 2054 expiration dates within the current license period. PSEG will continue to monitor this matter for further developments and any change to the estimated useful lives and ARO probabilities could have an adverse financial statement impact, which may be material.
In December 2023, PSEG Power reassessed its asset retirement cost (ARC) and ARO assumptions related to its Hope Creek and Salem nuclear plants, based upon the expectation of PTCs beginning in 2024. As a result, PSEG Power decreased its ARC asset and ARO liability by $99 million, reflecting a decrease in the probability of early retirement and an increase in the probability the units would obtain additional license renewals.
In December 2024, PSEG Power reassessed its ARC and ARO assumptions related to its nuclear plants, as part of the triennial cost study update. As a result, PSEG Power decreased its ARC asset and ARO liability by $59 million, primarily reflected by an increase in the probability the units would obtain additional license renewals, partially offset by increases in inflation rates and other costs.
Note 12. Pension, Other Postretirement Benefits (OPEB) and Savings Plans
PSEG sponsors and Services administers qualified and nonqualified pension plans and OPEB plans covering PSEG’s and its participating affiliates’ current and former employees who meet certain eligibility criteria. PSEG’s qualified pension plans consist of two qualified defined benefit pension plans, Pension Plan of Public Service Enterprise Group Incorporated (Pension Plan I) and Pension Plan of Public Service Enterprise Group Incorporated II (Pension Plan II and, together, the Plans). Each of the qualified pension plans include a Final Average Pay and two Cash Balance components. In addition, represented and non-represented employees are eligible for participation in PSEG’s two defined contribution plans.
PSEG and PSE&G are required to record the under or over funded positions of their defined benefit pension and OPEB plans on their respective balance sheets. Such funding positions are required to be measured as of the date of their respective year-end Consolidated Balance Sheets. For underfunded plans, the liability is equal to the difference between the plan’s benefit obligation and the fair value of plan assets. For defined benefit pension plans, the benefit obligation is the projected benefit obligation. For OPEB plans, the benefit obligation is the accumulated postretirement benefit obligation. In addition, GAAP requires that the total unrecognized costs for defined benefit pension and OPEB plans be recorded as an after-tax charge to Accumulated Other Comprehensive Income (Loss), a separate component of Stockholders’ Equity. However, for PSE&G, because the amortization of the unrecognized costs is being collected from customers, the accumulated unrecognized costs are recorded as a Regulatory Asset. The unrecognized costs represent actuarial gains or losses and prior service costs which have not been expensed. The charge to Accumulated Other Comprehensive Income (Loss) and the Regulatory Asset for PSE&G are amortized and recorded as net periodic pension cost in the Consolidated Statements of Operations.
In July 2023, PSEG and Fiduciary Counselors Inc., as independent fiduciary of the Plans, entered into a commitment agreement (for a “lift-out”) with The Prudential Insurance Company of America (the Insurer) under which the Plans agreed to purchase a nonparticipating single premium group annuity contract that has transferred to the Insurer approximately $1 billion of the Plans’ defined benefit pension obligations and associated Plan assets related to certain pension benefits. The contract covers approximately 2,000 retirees from PSEG Power & Other, excluding Services (Participants). In August 2023, assets were transferred to the Insurer and the transaction was closed. Under the contract, the Insurer made an irrevocable commitment, and is solely responsible, to pay benefits of each Participant that are due on and after December 31, 2023. The transaction resulted in no changes to the amount of benefits payable to Participants.
Amounts for Servco are not included in any of the following pension and OPEB benefit information for PSEG and its affiliates but rather are separately disclosed later in this note.
NOTES TO CONSOLIDATED FINANCIAL STATEMENTS
The following table provides a roll-forward of the changes in the benefit obligation and the fair value of plan assets during each of the two years in the periods ended December 31, 2024 and 2023. It also provides the funded status of the plans and the amounts recognized and amounts not recognized on the Consolidated Balance Sheets at the end of both years.
| | | | | | | | | | | | | | | | | | |
| | | | | | | | | | | | | | |
| | | Pension Benefits | | | Other Benefits | | |
| | | 2024 | | | 2023 | | | 2024 | | | 2023 | | |
| | | Millions | | |
| Change in Benefit Obligation | | | | | | | | | | | | | |
| Benefit Obligation at Beginning of Year (A) | | $ | 4,758 | | | $ | 5,628 | | | $ | 802 | | | $ | 851 | | |
| Service Cost | | | 94 | | | | 90 | | | | 3 | | | | 3 | | |
| Interest Cost | | | 225 | | | | 259 | | | | 37 | | | | 41 | | |
| Actuarial (Gain) Loss (B) | | | (291 | ) | | | 103 | | | | (39 | ) | | | (30 | ) | |
| Gross Benefits Paid | | | (309 | ) | | | (352 | ) | | | (76 | ) | | | (68 | ) | |
| Settlements | | | — | | | | (970 | ) | | | — | | | | — | | |
| Other | | | — | | | | — | | | | — | | | | 5 | | |
| Benefit Obligation at End of Year (A) | | $ | 4,477 | | | $ | 4,758 | | | $ | 727 | | | $ | 802 | | |
| Change in Plan Assets | | | | | | | | | | | | | |
| Fair Value of Assets at Beginning of Year | | $ | 4,140 | | | $ | 4,911 | | | $ | 440 | | | $ | 429 | | |
| Actual Return on Plan Assets | | | 134 | | | | 539 | | | | 18 | | | | 51 | | |
| Employer Contributions | | | 13 | | | | 12 | | | | 41 | | | | 28 | | |
| Gross Benefits Paid | | | (309 | ) | | | (352 | ) | | | (76 | ) | | | (68 | ) | |
| Settlements | | | — | | | | (970 | ) | | | — | | | | — | | |
| Fair Value of Assets at End of Year | | $ | 3,978 | | | $ | 4,140 | | | $ | 423 | | | $ | 440 | | |
| Funded Status | | | | | | | | | | | | | |
| Funded Status (Plan Assets less Benefit Obligation) | | $ | (499 | ) | | $ | (618 | ) | | $ | (304 | ) | | $ | (362 | ) | |
| Additional Amounts Recognized in the Consolidated Balance Sheets | | | | | | | | | | | | | |
| Current Accrued Benefit Cost | | $ | (11 | ) | | $ | (12 | ) | | $ | (12 | ) | | $ | (13 | ) | |
| Noncurrent Accrued Benefit Cost | | | (488 | ) | | | (606 | ) | | | (292 | ) | | | (349 | ) | |
| Amounts Recognized | | $ | (499 | ) | | $ | (618 | ) | | $ | (304 | ) | | $ | (362 | ) | |
| Additional Amounts Recognized in Accumulated Other Comprehensive Income (Loss), Regulated Assets, Deferred Assets and Deferred Liabilities (C) | | | | | | | | | | | | | |
| Prior Service Cost (Credit) | | $ | — | | | $ | — | | | $ | 4 | | | $ | 6 | | |
| Net Actuarial Loss (Gain) | | | 1,481 | | | | 1,656 | | | | (26 | ) | | | (6 | ) | |
| Total | | $ | 1,481 | | | $ | 1,656 | | | $ | (22 | ) | | $ | — | | |
| | | | | | | | | | | | | | |
(A)Represents projected benefit obligation for pension benefits and the accumulated postretirement benefit obligation for other benefits. The vested benefit obligation is the actuarial present value of the vested benefits to which the employee is currently entitled but based on the employee’s expected date of separation or retirement.
(B)For pension benefits and OPEB, the net actuarial gains in 2024 were due primarily to an increase in the discount rate, partially offset by actuarial losses driven by a lower than expected return on assets. For pension benefits, the net actuarial loss in 2023 was due primarily to a decrease in the discount rate. For OPEB, the net actuarial gain in 2023 was primarily due to assumption updates.
(C)Includes $107 million ($76 million, after-tax) and $143 million ($102 million, after-tax) in AOCL related to Pension and OPEB as of December 31, 2024 and 2023, respectively. Also includes Regulatory Assets of $1,227 million, Deferred Assets of $134 million and Deferred Liabilities of $9 million as of December 31, 2024 and Regulatory Assets of $1,427 million and Deferred Assets of $141 million as of December 31, 2023. The Regulatory Asset amounts do not include $103 million and $55 million as of December 31, 2024 and 2023, respectively, as a result of modifying the method for calculating pension expense for ratemaking purposes, approved by the BPU effective January 1, 2023.
The pension benefits table above provides information relating to the funded status of the qualified and nonqualified pension and OPEB plans on an aggregate basis. As of December 31, 2024, PSEG had funded approximately 89% of its projected pension benefit obligation. This percentage does not include $165 million of assets in the Rabbi Trust as of December 31, 2024, which provide funding for the nonqualified pension plans and certain deferred compensation. The nonqualified pension plans included in
NOTES TO CONSOLIDATED FINANCIAL STATEMENTS
the projected benefit obligation in the above table were $132 million. As of December 31, 2024, PSEG had funded approximately 92% of its projected qualified pension benefit obligation.
Accumulated Benefit Obligation
The accumulated benefit obligation for all PSEG’s defined benefit pension plans was $4.4 billion as of December 31, 2024 and $4.7 billion as of December 31, 2023.
The following table provides the components of net periodic benefit relating to all qualified and nonqualified pension and OPEB plans on an aggregate basis for PSEG, excluding Servco for the years ended December 31, 2024, 2023 and 2022. Amounts shown do not reflect the impacts of capitalization, co-owner allocations and the 2023 BPU accounting order. Only the service cost component is eligible for capitalization, when applicable.
| | | | | | | | | | | | | | | | | | | | | | | | | | |
| | | | | | | | | | | | | | | | | | | | |
| | | Pension Benefits Years Ended December 31, | | | Other Benefits Years Ended December 31, | | |
| | | 2024 | | | 2023 | | | 2022 | | | 2024 | | | 2023 | | | 2022 | | |
| | | Millions | | |
| Components of Net Periodic Benefit (Credits) Costs | | | | | | | | | | | | | | | | | |
| Service Cost (included in O&M Expense) | | $ | 94 | | | $ | 90 | | | $ | 142 | | | $ | 3 | | | $ | 3 | | | $ | 6 | | |
| Non-Service Components of Pension and OPEB (Credits) Costs | | | | | | | | | | | | | | | | | | | |
| Interest Cost | | | 225 | | | | 259 | | | | 167 | | | | 37 | | | | 41 | | | | 26 | | |
| Expected Return on Plan Assets | | | (321 | ) | | | (361 | ) | | | (484 | ) | | | (34 | ) | | | (33 | ) | | | (42 | ) | |
| Amortization of Net | | | | | | | | | | | | | | | | | | | |
| Prior Service Credit | | | — | | | | — | | | | — | | | | 2 | | | | (52 | ) | | | (129 | ) | |
| Actuarial Loss | | | 71 | | | | 83 | | | | 60 | | | | (2 | ) | | | (2 | ) | | | 15 | | |
| Settlement Charge Resulting from Pension Lift-Out | | | — | | | | 338 | | | | — | | | | — | | | | — | | | | — | | |
| Non-Service Components of Pension and OPEB (Credits) Costs | | | (25 | ) | | | 319 | | | | (257 | ) | | | 3 | | | | (46 | ) | | | (130 | ) | |
| Total Net Benefit (Credits) Costs | | $ | 69 | | | $ | 409 | | | $ | (115 | ) | | $ | 6 | | | $ | (43 | ) | | $ | (124 | ) | |
| | | | | | | | | | | | | | | | | | | | |
Pension and OPEB (credits) costs for PSEG and PSE&G are detailed as follows:
| | | | | | | | | | | | | | | | | | | | | | | | | | |
| | | | | | | | | | | | | | | | | | | | |
| | | Pension Benefits
Years Ended December 31, | | | Other Benefits
Years Ended December 31, | | |
| | | 2024 | | | 2023 | | | 2022 | | | 2024 | | | 2023 | | | 2022 | | |
| | | Millions | | |
| PSE&G | | $ | 43 | | | $ | 50 | | | $ | (70 | ) | | $ | (2 | ) | | $ | (42 | ) | | $ | (109 | ) | |
| PSEG Power & Other | | | 26 | | | | 359 | | | | (45 | ) | | | 8 | | | | (1 | ) | | | (15 | ) | |
| Total Net Benefit (Credits) Costs | | $ | 69 | | | $ | 409 | | | $ | (115 | ) | | $ | 6 | | | $ | (43 | ) | | $ | (124 | ) | |
| | | | | | | | | | | | | | | | | | | | |
PSEG completed the above mentioned “lift-out” transaction in August 2023. As a result of the transaction, PSEG recognized a settlement charge of $332 million ($239 million, net of tax) in the third quarter of 2023 related to the immediate recognition of unamortized net actuarial loss associated with the portion of the pension involved in the transaction. Additionally, a settlement charge of $6 million ($4 million, net of tax) related to lump sum payments to participants was recognized in the fourth quarter of 2023.
NOTES TO CONSOLIDATED FINANCIAL STATEMENTS
The following table provides the pre-tax changes recognized in Accumulated Other Comprehensive Income (Loss), Regulatory Assets, Deferred Assets and Deferred Liabilities:
| | | | | | | | | | | | | | | | | | |
| | | | | | | | | | | | | | |
| | | Pension | | | Other Benefits | | |
| | | 2024 | | | 2023 | | | 2024 | | | 2023 | | |
| | | Millions | | |
| Net Actuarial (Gain) Loss in Current Period due to Plan Experience and Assumption Changes | | $ | (104 | ) | | $ | (35 | ) | | $ | (22 | ) | | $ | (49 | ) | |
| Net Actuarial (Gain) Loss due to Settlements/Curtailments | | | — | | | | (39 | ) | | | — | | | | — | | |
| Amortization of Net Actuarial Gain (Loss) | | | (71 | ) | | | (83 | ) | | | 2 | | | | 2 | | |
| Recognition of Net Actuarial (Gain) Loss due to Settlements/Curtailments | | | — | | | | (338 | ) | | | — | | | | — | | |
| Prior Service Cost (Credit) in Current Period | | | — | | | | — | | | | — | | | | 6 | | |
| Amortization of Prior Service Credit | | | — | | | | — | | | | (2 | ) | | | 52 | | |
| Total | | $ | (175 | ) | | $ | (495 | ) | | $ | (22 | ) | | $ | 11 | | |
| | | | | | | | | | | | | | |
The following assumptions were used to determine the benefit obligations and net periodic benefit costs:
| | | | | | | | | | | | | | | | | | | | | | | | | | |
| | | | | | | | | | | | | | | | | | | | |
| | | Pension Benefits | | | Other Benefits | | |
| | | 2024 | | | 2023 | | | 2022 | | | 2024 | | | 2023 | | | 2022 | | |
| | | | | | | | | | | | | | | | | | | | |
| Weighted-Average Assumptions Used to Determine Benefit Obligations as of December 31 | | | |
| Discount Rate | | | 5.68 | % | | | 5.02 | % | | | 5.20 | % | | | 5.59 | % | | | 4.96 | % | | | 5.16 | % | |
| Rate of Compensation Increase | | | 4.60 | % | | | 4.60 | % | | | 4.40 | % | | | 4.60 | % | | | 4.60 | % | | | 4.40 | % | |
| Cash Balance Interest Crediting Rate | | | 6.00 | % | | | 6.00 | % | | | 6.00 | % | | N/A | | | N/A | | | N/A | | |
| Weighted-Average Assumptions Used to Determine Net Periodic Benefit Cost for Years Ended December 31 | | |
| Discount Rate | | | 5.02 | % | | | 5.20 | % | | | 2.94 | % | | | 4.96 | % | | | 5.16 | % | | | 2.82 | % | |
| Service Cost Interest Rate | | | 5.14 | % | | | 5.31 | % | | | 3.19 | % | | | 5.03 | % | | | 5.23 | % | | | 3.06 | % | |
| Interest Cost Interest Rate | | | 4.91 | % | | | 5.09 | % | | | 2.37 | % | | | 4.88 | % | | | 5.07 | % | | | 2.21 | % | |
| Expected Return on Plan Assets | | | 8.10 | % | | | 8.10 | % | | | 7.20 | % | | | 8.10 | % | | | 8.10 | % | | | 7.20 | % | |
| Rate of Compensation Increase | | | 4.60 | % | | | 4.40 | % | | | 4.40 | % | | | 4.60 | % | | | 4.40 | % | | | 4.40 | % | |
| Cash Balance Interest Crediting Rate | | | 6.00 | % | | | 6.00 | % | | | 6.00 | % | | N/A | | | N/A | | | N/A | | |
| Assumed Health Care Cost Trend Rates as of December 31 | | |
| Health Care Costs | | | | | | | | | | | | | | | | | | | |
| Immediate Rate | | | | | | | | | | | | 9.08 | % | | | 8.89 | % | | | 6.98 | % | |
| Ultimate Rate | | | | | | | | | | | | 4.75 | % | | | 4.75 | % | | | 4.75 | % | |
| Year Ultimate Rate Reached | | | | | | | | | | | 2034 | | | 2033 | | | 2032 | | |
| | | | | | | | | | | | | | | | | | | | |
Plan Assets
The investments of pension and OPEB plans are held in a trust account by the Trustee and consist of an undivided interest in an investment account of the Master Trust. The investments in the pension and OPEB plans are measured at fair value within a hierarchy that prioritizes the inputs to fair value measurements into three levels. See Note 17. Fair Value Measurements for more information on fair value guidance. Use of the Master Trust permits the commingling of pension plan assets and OPEB plan assets for investment and administrative purposes. Although assets of the plans are commingled in the Master Trust, the Trustee maintains supporting records for the purpose of allocating the net gain or loss of the investment account to the respective participating plans. The net investment income of the investment assets is allocated by the Trustee to each participating plan based on the relationship of the interest of each plan to the total of the interests of the participating plans. As of December 31, 2024, the pension plan interest and OPEB plan interest in such assets of the Master Trust were approximately 90% and 10%, respectively.
NOTES TO CONSOLIDATED FINANCIAL STATEMENTS
The following tables present information about the investments measured at fair value on a recurring basis as of December 31, 2024 and 2023, including the fair value measurements and the levels of inputs used in determining those fair values.
| | | | | | | | | | | | | | |
| | | | | | | | | | | |
| | | Recurring Fair Value Measurements as of December 31, 2024 | | |
| | | | | | Quoted
Market Prices
for Identical
Assets | | | Significant
Other
Observable
Inputs | | |
| Description | | Total | | | (Level 1) | | | (Level 2) | | |
| | | Millions | | |
| Cash Equivalents (A) | | $ | 21 | | | $ | 13 | | | $ | 8 | | |
| Equity Securities | | | | | | | | | | |
| Common Stock (B) | | | 661 | | | | 661 | | | | — | | |
| Commingled (C) | | | 1,916 | | | | — | | | | 1,916 | | |
| Debt Securities (D) | | | | | | | | | | |
| U.S. Treasury | | | 1,099 | | | | — | | | | 1,099 | | |
| Commingled | | | 6 | | | | 6 | | | | — | | |
| Subtotal Fair Value | | $ | 3,703 | | | $ | 680 | | | $ | 3,023 | | |
| Measured at net asset value practical expedient | | | | | | | | | | |
| Commingled—Equities (E) | | | 382 | | | | | | | | |
| Real Estate Investment (F) | | | 308 | | | | | | | | |
| Other | | | 1 | | | | | | | | |
| Total Fair Value (G) | | $ | 4,394 | | | | | | | | |
| | | | | | | | | | | |
| | | | | | | | | | | | | | |
| | | | | | | | | | | |
| | | Recurring Fair Value Measurements as of December 31, 2023 | | |
| | | | | | Quoted
Market Prices
for Identical
Assets | | | Significant
Other
Observable
Inputs | | |
| Description | | Total | | | (Level 1) | | | (Level 2) | | |
| | | Millions | | |
| Cash Equivalents (A) | | $ | 39 | | | $ | 39 | | | $ | — | | |
| Equity Securities | | | | | | | | | | |
| Common Stock (B) | | | 748 | | | | 748 | | | | — | | |
| Commingled (C) | | | 1,376 | | | | — | | | | 1,376 | | |
| Debt Securities (D) | | | | | | | | | | |
| U.S. Treasury | | | 1,299 | | | | — | | | | 1,299 | | |
| Commingled | | | 4 | | | | 4 | | | | — | | |
| Subtotal Fair Value | | $ | 3,466 | | | $ | 791 | | | $ | 2,675 | | |
| Measured at net asset value practical expedient | | | | | | | | | | |
| Commingled—Equities (E) | | | 745 | | | | | | | | |
| Real Estate Investment (F) | | | 365 | | | | | | | | |
| Other | | | 2 | | | | | | | | |
| Total Fair Value (G) | | $ | 4,578 | | | | | | | | |
| | | | | | | | | | | |
(A)The Collective Investment Fund publishes a daily net asset value (NAV) which participants may use for daily redemptions without restrictions (Level 1).
NOTES TO CONSOLIDATED FINANCIAL STATEMENTS
(B)Common stocks are measured using observable data in active markets and considered Level 1.
(C)Commingled Funds that publish daily NAV but with certain near-term redemption restrictions which prevent redemption at the published daily NAV are classified as Level 2.
(D)Debt securities include mainly U.S. Treasury obligations. These investments are valued using an evaluated pricing approach that varies by asset class and reflects observable market information such as the most recent exchange price or quoted bid for similar securities. Market-based standard inputs typically include benchmark yields, reported trades, broker/dealer quotes and issuer spreads or the most recent quotes for similar securities which are a Level 2 measure.
(E)Certain commingled equity funds are not included in the fair value hierarchy as they are measured at fair value using the NAV per share (or its equivalent) practical expedient. These funds do not meet the definition of readily determinable fair value due to the frequency of publishing NAV (monthly). The objectives of these funds are mainly tracking the S&P Index or achieving long-term growth through investment in foreign equity securities and the Morgan Stanley Capital International Index.
(F)The unlisted real estate fund invests in office, apartment, industrial and retail space. The fund is valued using the NAV per unit of funds. The investment value of the real estate properties is determined on a quarterly basis by independent market appraisers engaged by the board of directors of the fund. The ability to redeem funds is subject to the availability of cash arising from net investment income, allocations and the sale of investments in the normal course of business. The fund’s NAV is published quarterly. In addition, redemptions require one quarter advance notice prior to redemption and are fulfilled quarterly. The fund, therefore, does not meet the definition of readily determinable fair value. The purpose of the fund is to acquire, own, hold for investment and ultimately dispose of investments in real estate and real estate-related assets with the intention of achieving current income, capital appreciation or both.
(G)Excludes net receivables of $6 million and $2 million as of December 31, 2024 and 2023, respectively, which consist of interest, dividends and receivables and payables related to pending securities sales and purchases. In addition, the table excludes cash and foreign currency of $1 million as of December 31, 2024.
The following table provides the percentage of fair value of total plan assets for each major category of plan assets held for the qualified pension and OPEB plans as of the measurement date, December 31:
| | | | | | | | | | |
| | | | | | | | |
| | | As of December 31, | | |
| Investments | | 2024 | | | 2023 | | |
| Equity Securities | | | 67 | % | | | 63 | % | |
| Debt Securities | | | 25 | % | | | 28 | % | |
| Other Investments | | | 8 | % | | | 9 | % | |
| Total Percentage | | | 100 | % | | | 100 | % | |
| | | | | | | | |
PSEG utilizes forecasted returns, risk, and correlation of all asset classes in order to develop an efficient portfolio. PSEG’s long-term target asset allocation of 54% equities, 18% real assets and 28% fixed income is consistent with the funds’ financial objectives. Certain investments in real assets (13% as of December 31, 2024) are made through investing in equity securities and tracked as equities when reporting fair value; however, they are viewed by their asset class, real assets, in our target asset allocation. Derivative financial instruments are used by the plans’ investment managers primarily to adjust the fixed income duration of the portfolio and hedge the currency risk component of foreign investments. The expected long-term rate of return on plan assets was 8.1% for 2024 and will remain at 8.1% for 2025. This expected return includes a premium for active management.
Plan Contributions
PSEG plans to contribute $5 million to its OPEB plan and may choose to contribute up to $100 million to its pension plans in 2025. Internal Revenue Service (IRS) minimum funding requirements for pension plans are determined based on the fund’s assets and liabilities at the end of a calendar year for the subsequent calendar year.
NOTES TO CONSOLIDATED FINANCIAL STATEMENTS
Estimated Future Benefit Payments
The following pension benefit and postretirement benefit payments are expected to be paid to plan participants.
| | | | | | | | | | |
| | | | | | | | |
| Year | | Pension
Benefits | | | Other
Benefits | | |
| | | Millions | | |
| 2025 | | $ | 372 | | | $ | 73 | | |
| 2026 | | | 333 | | | | 71 | | |
| 2027 | | | 340 | | | | 69 | | |
| 2028 | | | 346 | | | | 67 | | |
| 2029 | | | 353 | | | | 64 | | |
| 2030-2034 | | | 1,792 | | | | 272 | | |
| Total | | $ | 3,536 | | | $ | 616 | | |
| | | | | | | | |
401(k) Plans
PSEG sponsors two 401(k) plans, which are defined contribution retirement plans subject to the Employee Retirement Income Security Act (ERISA). Eligible represented employees of PSEG’s subsidiaries participate in the PSEG Employee Savings Plan (Savings Plan), while eligible non-represented employees of PSEG’s subsidiaries participate in the PSEG Thrift and Tax-Deferred Savings Plan (Thrift Plan). Eligible employees may contribute up to 50% of their annual eligible compensation to these plans, not to exceed the IRS maximums, including any catch-up contributions for those employees age 50 and above. PSEG matches 50% of such employee contributions up to 7% of pay for Savings Plan participants and up to 8% of pay for Thrift Plan participants. The amounts paid for employer matching contributions to the plans for PSEG and PSE&G are detailed as follows:
| | | | | | | | | | | | | | |
| | | | | | | | | | | |
| | | Thrift Plan and Savings Plan | | |
| | | Years Ended December 31, | | |
| | | 2024 | | | 2023 | | | 2022 | | |
| | | Millions | | |
| PSE&G | | $ | 31 | | | $ | 29 | | | $ | 28 | | |
| PSEG Power & Other | | | 14 | | | | 14 | | | | 14 | | |
| Total Employer Matching Contributions | | $ | 45 | | | $ | 43 | | | $ | 42 | | |
| | | | | | | | | | | |
The 401(k) plans were amended to allow eligible employees hired on or after January 1, 2025 two options for participation in the 401(k) plans. The first option provides for pay credits in the Cash Balance components of PSEG's qualified pension plans and an employer match of employee 401(k) contributions noted above. The second option provides participants a 4% non-elective employer contribution and a 100% employer match of employee contributions up to 4% in the 401(k) plans, with no participation in the qualified pension plans.
Servco Pension and OPEB
Servco sponsors a qualified pension plan and OPEB plan covering its employees who meet certain eligibility criteria. Under the OSA, employee benefit costs for these plans are funded by LIPA. See Note 4. Variable Interest Entity. These obligations, as well as the offsetting long-term receivable, are separately presented on the Consolidated Balance Sheet of PSEG.
NOTES TO CONSOLIDATED FINANCIAL STATEMENTS
The following table provides a roll-forward of the changes in Servco’s benefit obligation and the fair value of its plan assets during the years ended December 31, 2024 and 2023. It also provides the funded status of the plans and the amounts recognized and amounts not recognized on the Consolidated Balance Sheets at the end of both years.
| | | | | | | | | | | | | | | | | | |
| | | | | | | | | | | | | | |
| | | Pension Benefits | | | Other Benefits | | |
| | | 2024 | | | 2023 | | | 2024 | | | 2023 | | |
| | | Millions | | |
| Change in Benefit Obligation | | | | | | | | | | | | | |
| Benefit Obligation at Beginning of Year (A) | | $ | 535 | | | $ | 452 | | | $ | 514 | | | $ | 455 | | |
| Service Cost | | | 28 | | | | 24 | | | | 14 | | | | 12 | | |
| Interest Cost | | | 26 | | | | 23 | | | | 25 | | | | 24 | | |
| Actuarial (Gain) Loss (B) | | | (54 | ) | | | 31 | | | | (29 | ) | | | 35 | | |
| Plan Amendment | | | — | | | | 16 | | | | — | | | | — | | |
| Gross Benefits Paid | | | (14 | ) | | | (11 | ) | | | (14 | ) | | | (12 | ) | |
| Benefit Obligation at End of Year (A) | | $ | 521 | | | $ | 535 | | | $ | 510 | | | $ | 514 | | |
| Change in Plan Assets | | | | | | | | | | | | | |
| Fair Value of Assets at Beginning of Year | | $ | 433 | | | $ | 370 | | | $ | — | | | $ | — | | |
| Actual Return on Plan Assets | | | 46 | | | | 56 | | | | — | | | | — | | |
| Employer Contributions | | | 25 | | | | 18 | | | | 14 | | | | 12 | | |
| Gross Benefits Paid | | | (14 | ) | | | (11 | ) | | | (14 | ) | | | (12 | ) | |
| Fair Value of Assets at End of Year | | $ | 490 | | | $ | 433 | | | $ | — | | | $ | — | | |
| Funded Status | | | | | | | | | | | | | |
| Funded Status (Plan Assets less Benefit Obligation) | | $ | (31 | ) | | $ | (102 | ) | | $ | (510 | ) | | $ | (514 | ) | |
| Additional Amounts Recognized in the Consolidated Balance Sheets | | | | | | | | | | | | | |
| Accrued Pension Costs of Servco | | $ | (31 | ) | | $ | (102 | ) | | N/A | | | N/A | | |
| OPEB Costs of Servco | | N/A | | | N/A | | | | (510 | ) | | | (514 | ) | |
| Amounts Recognized (C) | | $ | (31 | ) | | $ | (102 | ) | | $ | (510 | ) | | $ | (514 | ) | |
| | | | | | | | | | | | | | |
(A)Represents projected benefit obligation for pension benefits and the accumulated postretirement benefit obligation for other benefits. The vested benefit obligation is the actuarial present value of the vested benefits to which the employee is currently entitled but based on the employee’s expected date of separation or retirement.
(B)For pension benefits, the net actuarial gain in 2024 was due primarily to an increase in the discount rate. For OPEB, the net actuarial gain in 2024 was due primarily to an increase in the discount rate partially offset by other assumption updates. For pension benefits and OPEB, the net actuarial losses in 2023 were due primarily to a decrease in the discount rate and other assumption updates.
(C)Amounts equal to the accrued pension and OPEB costs of Servco are offset in Long-Term Receivable of VIE on PSEG’s Consolidated Balance Sheets.
Pension and OPEB costs of Servco are accounted for according to the OSA. Servco recognizes expenses for contributions to its pension plan trusts and for OPEB payments made to retirees. Operating Revenues are recognized for the reimbursement of these costs. The pension-related revenues and costs for 2024, 2023 and 2022 were $25 million, $18 million and $30 million, respectively. Servco has contributed its entire planned contribution amount to its pension plan trusts during 2024. The OPEB-related revenues earned and costs incurred were $14 million, $12 million and $10 million in 2024, 2023 and 2022, respectively.
NOTES TO CONSOLIDATED FINANCIAL STATEMENTS
The following assumptions were used to determine the benefit obligations of Servco:
| | | | | | | | | | | | | | | | | | | | | | | | | | |
| | | | | | | | | | | | | | | | | | | | |
| | | Pension Benefits | | | Other Benefits | | |
| | | 2024 | | | 2023 | | | 2022 | | | 2024 | | | 2023 | | | 2022 | | |
| Weighted-Average Assumptions Used to Determine Benefit Obligations as of December 31 | | |
| Discount Rate | | | 5.84 | % | | | 5.13 | % | | | 5.30 | % | | | 5.87 | % | | | 5.16 | % | | | 5.34 | % | |
| Rate of Compensation Increase | | | 5.50 | % | | | 5.54 | % | | | 3.95 | % | | | 5.50 | % | | | 5.54 | % | | | 3.95 | % | |
| Cash Balance Interest Crediting Rate | | | 4.84 | % | | | 4.13 | % | | | 4.30 | % | | N/A | | | N/A | | | N/A | | |
| Assumed Health Care Cost Trend Rates as of December 31 | | |
| Health Care Costs | | | | | | | | | | | | | | | | | | | |
| Immediate Rate | | | | | | | | | | | | 7.46 | % | | | 6.84 | % | | | 6.71 | % | |
| Ultimate Rate | | | | | | | | | | | | 4.75 | % | | | 4.75 | % | | | 4.75 | % | |
| Year Ultimate Rate Reached | | | | | | | | | | | 2036 | | | 2033 | | | 2032 | | |
| | | | | | | | | | | | | | | | | | | | |
Plan Assets
All the investments of Servco’s pension plans are held in a trust account by the Trustee and consist of an undivided interest in an investment account of the Servco Master Trust. The investments in the pension are measured at fair value within a hierarchy that prioritizes the inputs to fair value measurements into three levels. See Note 17. Fair Value Measurements for more information on fair value guidance.
The following tables present information about Servco’s investments measured at fair value on a recurring basis as of December 31, 2024 and 2023, including the fair value measurements and the levels of inputs used in determining those fair values.
| | | | | | | | | | | | | | |
| | | | | | | | | | | |
| | | Recurring Fair Value Measurements as of December 31, 2024 | | |
| | | | | | Quoted
Market Prices
for Identical
Assets | | | Significant
Other
Observable
Inputs | | |
| Description | | Total | | | (Level 1) | | | (Level 2) | | |
| | | Millions | | |
| Cash Equivalents | | $ | 2 | | | $ | 2 | | | $ | — | | |
| Equity Securities | | | | | | | | | | |
| Common Stock (A) | | | 35 | | | | 35 | | | | — | | |
| Commingled (B) | | | 334 | | | | — | | | | 334 | | |
| Commingled Bonds (B) | | | 119 | | | | — | | | | 119 | | |
| Total Fair Value | | $ | 490 | | | $ | 37 | | | $ | 453 | | |
| | | | | | | | | | | |
NOTES TO CONSOLIDATED FINANCIAL STATEMENTS
| | | | | | | | | | | | | | |
| | | | | | | | | | | |
| | | Recurring Fair Value Measurements as of December 31, 2023 | | |
| | | | | | Quoted
Market Prices
for Identical
Assets | | | Significant
Other
Observable
Inputs | | |
| Description | | Total | | | (Level 1) | | | (Level 2) | | |
| | | Millions | | |
| Cash Equivalents | | $ | 2 | | | $ | 2 | | | $ | — | | |
| Equity Securities | | | | | | | | | | |
| Common Stock (A) | | | 32 | | | | 32 | | | | — | | |
| Commingled (B) | | | 294 | | | | — | | | | 294 | | |
| Commingled Bonds (B) | | | 105 | | | | — | | | | 105 | | |
| Total Fair Value | | $ | 433 | | | $ | 34 | | | $ | 399 | | |
| | | | | | | | | | | |
(A)Common stocks are measured using observable data in active markets and considered Level 1.
(B)Investments in commingled equity and bond funds have a readily determinable fair value as they publish a daily NAV available to investors which is the basis for current transactions and contain certain redemption restrictions requiring advance notice of one to two days for withdrawals (Level 2).
The following table provides the percentage of fair value of total plan assets for each major category of plan assets held for the qualified pension and OPEB plans of Servco as of the measurement date, December 31:
| | | | | | | | | | |
| | | | | | | | |
| | | As of December 31, | | |
| Investments | | 2024 | | | 2023 | | |
| Equity Securities | | | 76 | % | | | 76 | % | |
| Debt Securities | | | 24 | % | | | 24 | % | |
| Total Percentage | | | 100 | % | | | 100 | % | |
| | | | | | | | |
Servco utilizes forecasted returns, risk, and correlation of all asset classes in order to develop an efficient portfolio. Servco’s long-term target asset allocation of 60% equities, 15% real assets and 25% fixed income is consistent with the funds’ financial objectives. Certain investments in real assets (15% at December 31, 2024) are made through investing in equity securities and tracked as equities when reporting fair value; however, they are viewed by their asset class, real assets, in our target asset allocation. The expected long-term rate of return on plan assets was 8.0% for 2024 and will be 8.0% for 2025. This expected return includes a premium for active management.
Plan Contributions
Servco plans to contribute $23 million into its pension plan during 2025.
NOTES TO CONSOLIDATED FINANCIAL STATEMENTS
Estimated Future Benefit Payments
The following pension benefit and postretirement benefit payments are expected to be paid to Servco’s plan participants:
| | | | | | | | | | |
| | | | | | | | |
| Year | | Pension
Benefits | | | Other
Benefits | | |
| | | Millions | | |
| 2025 | | $ | 17 | | | $ | 14 | | |
| 2026 | | | 20 | | | | 16 | | |
| 2027 | | | 23 | | | | 18 | | |
| 2028 | | | 25 | | | | 20 | | |
| 2029 | | | 28 | | | | 22 | | |
| 2030-2034 | | | 181 | | | | 140 | | |
| Total | | $ | 294 | | | $ | 230 | | |
| | | | | | | | |
Servco 401(k) Plans
Servco sponsors two 401(k) plans, which are defined contribution retirement plans subject to ERISA. Eligible non-represented employees of Servco participate in the Long Island Electric Utility Servco LLC Incentive Thrift Plan I (Thrift Plan I), and eligible represented employees of Servco participate in the Long Island Electric Utility Servco LLC Incentive Thrift Plan II (Thrift Plan II). Participants in the plans may contribute up to 50% of their eligible compensation to these plans, not to exceed the IRS maximums, including any catch-up contributions for those employees age 50 and above. Servco does not provide an employer match or core contribution for employees in Thrift Plan II. For employees in Thrift Plan I, Servco matches 50% of such employee contributions up to 8% of eligible compensation and provides core contributions (based on years of service and age) to employees who do not participate in Servco’s Retirement Income Plan. The amount expensed by Servco for employer matching contributions was $13 million, $10 million and $9 million for the years ended December 31, 2024, 2023 and 2022. Pursuant to the OSA, Servco recognizes Operating Revenues for the reimbursement of these costs.
Note 13. Commitments and Contingent Liabilities
Guaranteed Obligations
PSEG Power’s activities primarily involve the purchase and/or sale of energy, nuclear fuel and other related products under transportation, physical, financial and forward contracts at fixed and variable prices. These transactions are with numerous counterparties and brokers that may require cash, letters of credit or guarantees as a form of collateral.
PSEG Power has unconditionally guaranteed payments to counterparties on behalf of its subsidiaries in commodity-related transactions in order to
•support current exposure, interest and other costs on sums due and payable in the ordinary course of business, and
PSEG Power is subject to
•counterparty collateral calls related to commodity contracts of its subsidiaries, and
•certain creditworthiness standards as guarantor under performance guarantees of its subsidiaries.
Under these agreements, guarantees cover credit extended between entities and is often reciprocal in nature. The exposure between counterparties can move in either direction.
In order for PSEG Power to incur a liability for the face value of the outstanding guarantees,
•its subsidiaries would have to fully utilize the credit granted to them by every counterparty to whom PSEG Power has provided a guarantee, and
NOTES TO CONSOLIDATED FINANCIAL STATEMENTS
•the net position of the related contracts would have to be “out-of-the-money” (if the contracts are terminated, PSEG Power would owe money to the counterparties).
PSEG Power believes the probability of this result is unlikely. For this reason, PSEG Power believes that the current exposure at any point in time is a more meaningful representation of the potential liability under these guarantees. Current exposure consists of the net of accounts receivable and accounts payable and the forward value on open positions, less any collateral posted.
Changes in commodity prices can have a material impact on collateral requirements under such contracts, which are posted and received primarily in the form of cash and letters of credit.
PSEG Power also routinely enters into futures and options transactions for electricity and natural gas as part of its operations. These futures contracts usually require a cash margin deposit with brokers, which can change based on market movement and in accordance with exchange rules.
In addition to the guarantees discussed above, PSEG Power has also provided payment guarantees to third parties and regulatory authorities on behalf of its affiliated companies. These guarantees support various other non-commodity related obligations.
The following table shows the face value of PSEG Power’s outstanding guarantees, current exposure and margin positions as of December 31, 2024 and 2023.
| | | | | | | | | | |
| | | | | | | | |
| | | As of December 31, | | |
| | | 2024 | | | 2023 | | |
| | | Millions | | |
| Face Value of Outstanding Guarantees | | $ | 1,272 | | | $ | 1,381 | | |
| Exposure under Current Guarantees | | $ | 47 | | | $ | 118 | | |
| | | | | | | | |
| Letters of Credit - Counterparty Margining Posted | | $ | 4 | | | $ | 10 | | |
| Letters of Credit - Counterparty Margining Received | | $ | 24 | | | $ | 91 | | |
| | | | | | | | |
| Cash Deposited and Received | | | | | | | |
| Counterparty Cash Collateral Deposited | | $ | — | | | $ | — | | |
| Counterparty Cash Collateral Received | | $ | (1 | ) | | $ | (2 | ) | |
| Net Broker Balance Deposited (Received) | | $ | 245 | | | $ | 115 | | |
| | | | | | | | |
| Additional Amounts Posted | | | | | | | |
| Other Letters of Credit | | $ | 155 | | | $ | 180 | | |
| | | | | | | | |
As part of determining credit exposure, PSEG Power nets receivables and payables with the corresponding net fair values of energy contracts. See Note 16. Financial Risk Management Activities for further discussion. In accordance with PSEG’s accounting policy, where it is applicable, cash (received)/deposited is allocated against derivative asset and liability positions with the same counterparty on the face of the Consolidated Balance Sheet. The remaining balances of net cash (received)/deposited after allocation are generally included in Accounts Payable and Receivable, respectively.
In addition to amounts for outstanding guarantees, current exposure and margin positions, PSEG and PSEG Power have posted letters of credit to support PSEG Power’s various other non-energy contractual and environmental obligations. See Other Letters of Credit in the preceding table.
Environmental Matters
Passaic River
Lower Passaic River Study Area
The U.S. Environmental Protection Agency (EPA) has determined that a 17-mile stretch of the Passaic River (Lower Passaic River Study Area (LPRSA)) in New Jersey is a “Superfund” site under the Federal Comprehensive Environmental Response, Compensation and Liability Act of 1980 (CERCLA). PSE&G and certain of its predecessors conducted operations at properties in this area, including at one site that was transferred to PSEG Power.
NOTES TO CONSOLIDATED FINANCIAL STATEMENTS
The EPA has announced two separate cleanup plans for the Lower 8.3 miles and Upper 9 miles of the LPRSA. The EPA’s plan for the Lower 8.3 miles involves dredging and capping sediments at an estimated cost of $2.3 billion, and its plan for the Upper 9 miles involves dredging and capping sediments at an estimated cost of $550 million. Additional cleanup work may be required depending on the results of these initial phases of work.
Occidental Chemical Corporation (Occidental) has voluntarily completed the design of the cleanup plan for the Lower 8.3 miles and has received an EPA Unilateral Administrative Order directing it to design the cleanup plan for the Upper 9 miles. It has filed two lawsuits against PSE&G and others to attempt to recover costs associated with this work and to obtain a declaratory judgment of parties’ shares of any future costs. PSEG cannot predict the outcome of the litigation.
The EPA finalized and received court approval of a settlement with 82 parties who have agreed to pay $150 million to resolve their LPRSA CERCLA liability, in whole or in part. PSE&G and PSEG Power are not included in the proposed settlement, but the EPA sent PSE&G, Occidental, and several other Potentially Responsible Parties (PRPs) a letter in March 2022 inviting them to submit to the EPA individually or jointly an offer to fund or participate in the next stages of the remediation. PSEG submitted a good faith offer to the EPA in June 2022 on behalf of PSE&G and PSEG Power. PSEG understands that the EPA is evaluating its offer.
As of December 31, 2024, PSEG has approximately $66 million accrued for this matter. PSE&G has an Environmental Costs Liability of $53 million and a corresponding Regulatory Asset based on its continued ability to recover such costs in its rates. PSEG Power has an Environmental Costs Liability of $13 million.
The outcome of this matter is uncertain, and until (i) a final remedy for the entire LPRSA is selected and an agreement is reached by the PRPs to fund it, (ii) PSE&G’s and PSEG Power’s respective shares of the costs are determined, and (iii) PSE&G’s ability to recover the costs in its rates is determined, it is not possible to predict this matter’s ultimate impact on PSEG’s financial statements. It is possible that PSE&G and PSEG Power will record additional costs beyond what they have accrued, and that such costs could be material, but PSEG cannot at the current time estimate the amount or range of any additional costs.
Newark Bay Study Area
The EPA has established the Newark Bay Study Area, which is an extension of the LPRSA and includes Newark Bay and portions of surrounding waterways. The EPA has notified PSEG and 21 other PRPs of their potential liability. PSE&G and PSEG Power are unable to estimate their respective portions of any loss or possible range of loss related to this matter. In December 2018, PSEG Power completed the sale of the site of the Hudson electric generating station. PSEG Power contractually transferred all land rights and structures on the Hudson site to a third-party purchaser, along with the assumption of the environmental liabilities for the site.
Natural Resource Damage Claims
New Jersey and certain federal regulators have alleged that PSE&G, PSEG Power and 56 other PRPs may be liable for natural resource damages within the LPRSA. In particular, PSE&G, PSEG Power and other PRPs received notice from federal regulators of the regulators’ intent to move forward with a series of studies assessing potential damages to natural resources at the Diamond Alkali Superfund site, which includes the LPRSA and the Newark Bay Study Area. PSE&G and PSEG Power are unable to estimate their respective portions of any possible loss or range of loss related to this matter.
Hackensack River
In 2022, the EPA announced it had designated approximately 23 river miles of the Lower Hackensack River as a federal Superfund site. PSE&G and certain of its predecessors conducted operations at properties in this area, including at the Hudson, Bergen and Kearny generating stations that were transferred to PSEG Power. PSEG Power subsequently contractually transferred all land rights and structures on the Hudson generating station site to a third-party purchaser, along with the assumption of the environmental liabilities for that site. In 2024, the EPA identified PSE&G and four other parties as PRPs for the site and requested that they voluntarily perform a technical study of a portion of the river designated as “Operable Unit 2.” The EPA estimates that the technical study will cost $55 million to complete and PSE&G and PSEG Power have agreed to participate in the technical study. PSE&G and PSEG Power do not believe participation in the technical study will have a material impact on their results of operations and financial condition based upon EPA’s estimate of the study costs; however, future costs related to this matter could be material.
NOTES TO CONSOLIDATED FINANCIAL STATEMENTS
MGP Remediation Program
PSE&G is working with the New Jersey Department of Environmental Protection (NJDEP) to assess, investigate and remediate environmental conditions at its former MGP sites. To date, 38 sites requiring some level of remedial action have been identified. Based on its current studies, PSE&G has determined that the estimated cost to remediate all MGP sites to completion could range between $210 million and $234 million on an undiscounted basis, including its $53 million share for the Passaic River as discussed above. Since no amount within the range is considered to be most likely, PSE&G has recorded a liability of $210 million as of December 31, 2024. Of this amount, $54 million was recorded in Other Current Liabilities and $156 million was reflected as Environmental Costs in Noncurrent Liabilities. PSE&G has recorded a $210 million Regulatory Asset with respect to these costs. PSE&G periodically updates its studies taking into account any new regulations or new information which could impact future remediation costs and adjusts its recorded liability accordingly. PSE&G completed sampling in the Passaic River in 2020 to delineate coal tar from certain MGP sites that abut the Passaic River Superfund site. PSEG cannot determine at this time the magnitude of any impact on the Passaic River Superfund remedy.
Legacy Environmental Obligations at Former Fossil Generating Sites
PSEG Power has retained ownership of certain liabilities excluded from the 2022 sale of its fossil generation portfolio. These liabilities primarily relate to obligations under the New Jersey Industrial Site Recovery Act (ISRA) and the Connecticut Transfer Act (CTA) to investigate and remediate PSEG Power’s two formerly owned generating station sites in Connecticut, and six formerly owned generating station sites in New Jersey. In addition, PSEG Power still owns two former generating station sites in New Jersey that triggered ISRA in 2015.
PSEG Power is in the process of fulfilling its obligations under the New Jersey ISRA and the CTA to investigate these sites. It will require multiple years and comprehensive environmental sampling to understand the extent of and to carry out the required remediation. At this stage in the remediation process, the full remediation costs are not estimable, but given the number and operating history of the facilities in the portfolio, the full remediation costs will likely be material in the aggregate. The costs could potentially include costs for, among other things, excavating soil, implementation of institutional controls, and the construction, operation and maintenance of engineering controls.
In May 2024, the EPA finalized revisions to the coal combustion residuals rule (CCR Rule) which established new requirements for the investigation and, if necessary, the cleanup of certain types of coal ash placed at certain fossil generation station sites, including certain sites owned or formerly owned by PSEG Power. PSEG is in the process of investigating each of the sites that PSEG Power currently owns that are subject to the CCR Rule, as well as sites that were formerly owned that are subject to the CCR Rule where PSEG Power retained certain environmental obligations to investigate and, if necessary, remediate. PSEG is currently unable to estimate the impact of the CCR Rule, but it could have a material impact on PSEG’s business, results of operations and cash flows.
Clean Water Act (CWA) Section 316(b) Rule
The EPA’s CWA Section 316(b) rule establishes requirements for the design and operation of cooling water intake structures at existing power plants and industrial facilities with a design flow of more than two million gallons of water per day.
In June 2016, the NJDEP issued a final New Jersey Pollutant Discharge Elimination System permit for Salem. In July 2016, the Delaware Riverkeeper Network (Riverkeeper) filed an administrative hearing request challenging certain conditions of the permit, including the NJDEP’s application of the 316(b) rule. In November 2024, Riverkeeper’s administrative hearing request was denied, though the denial is subject to review by the NJDEP Commissioner and appeal by Riverkeeper. If the Riverkeeper’s challenge is ultimately successful, PSEG Power may be required to incur additional costs to comply with the CWA. Potential cooling water and/or service water system modification costs could be material and could adversely impact the economic competitiveness of this facility.
BGS, BGSS and ZECs
Each year, PSE&G obtains its electric supply requirements through annual New Jersey BGS auctions for two categories of customers that choose not to purchase electric supply from third-party suppliers. The first category is residential and smaller commercial and industrial customers (BGS-Residential Small Commercial Pricing (RSCP)). The second category is larger customers that exceed a BPU-established load (kW) threshold (BGS-Commercial and Industrial Energy Pricing (CIEP)). Pursuant
NOTES TO CONSOLIDATED FINANCIAL STATEMENTS
to applicable BPU rules, PSE&G enters into the Supplier Master Agreements with the winners of these RSCP and CIEP BGS auctions to purchase BGS for PSE&G’s load requirements. The winners of the RSCP and CIEP auctions are responsible for fulfilling all the requirements of a PJM load-serving entity including the provision of capacity, energy, ancillary services and any other services required by PJM. As such, prices set through these auctions are impacted by prices set in the PJM capacity auctions, which significantly increased for the 2025/2026 auction year. See Note 2. Revenues for additional information. BGS suppliers assume all volume risk and customer migration risk and must satisfy New Jersey’s renewable portfolio standards.
The BGS-CIEP auction is for a one-year supply period from June 1 to May 31 with the BGS-CIEP auction price measured in dollars per MW-day for capacity. The final price for the BGS-CIEP auction year commencing June 1, 2025 is $696.05 per MW-day, replacing the BGS-CIEP auction year price ending May 31, 2025 of $378.21 per MW-day. Energy for BGS-CIEP is priced at hourly PJM locational marginal prices for the contract period.
PSE&G contracts for its anticipated BGS-RSCP load on a three-year rolling basis, whereby each year one-third of the load is procured for a three-year period. The contract prices in dollars per MWh for the BGS-RSCP supply, as well as the approximate load, are as follows:
| | | | | | | | | | | | | | | | | | | |
| | | | | | | | | | | | | | | |
| | | Auction Year | | | |
| | | 2022 | | | 2023 | | | 2024 | | | 2025 | | | |
| 36-Month Terms Ending | | May 2025 | | | May 2026 | | | May 2027 | | | May 2028 | | (A) | |
| Load (MW) | | | 2,800 | | | | 2,800 | | | | 2,900 | | | | 2,800 | | | |
| $ per MWh | | $ | 76.30 | | | $ | 93.11 | | | $ | 80.88 | | | $ | 107.36 | | | |
| | | | | | | | | | | | | | | |
(A)Prices set in the 2025 BGS auction will become effective on June 1, 2025 when the 2022 BGS auction agreements expire.
PSE&G has a full-requirements contract with PSEG Power to meet the gas supply requirements of PSE&G’s gas customers. PSEG Power has entered into hedges for a portion of these anticipated BGSS obligations, as permitted by the BPU. The BPU permits PSE&G to recover the cost of gas hedging up to 115 billion cubic feet or 80% of its residential gas supply annual requirements through the BGSS tariff. Current plans call for PSEG Power to hedge on behalf of PSE&G approximately 70 billion cubic feet or 50% of its residential gas supply annual requirements. For additional information, see Note 24. Related-Party Transactions.
Pursuant to a process established by the BPU, New Jersey EDCs, including PSE&G, are required to purchase ZECs from eligible nuclear plants selected by the BPU. In April 2021, PSEG Power’s Salem 1, Salem 2 and Hope Creek nuclear plants were awarded ZECs for the three-year eligibility period from June 2022 through May 2025. PSE&G has implemented a tariff to collect a non-bypassable distribution charge in the amount of $0.004 per KWh from its retail distribution customers to be used to purchase the ZECs from these plants. PSE&G will purchase the ZECs on a monthly basis with payment to be made annually following completion of each energy year.
Minimum Fuel Purchase Requirements
PSEG Power’s nuclear fuel strategy is to maintain certain levels of uranium and to make periodic purchases to support such levels. As such, the commitments referred to in the following table may include estimated quantities to be purchased that deviate from contractual nominal quantities. PSEG Power’s minimum nuclear fuel commitments cover approximately 100% of its estimated uranium, enrichment and fabrication requirements through 2027 and a significant portion through 2028 at Salem, Hope Creek and Peach Bottom.
PSEG Power has various multi-year contracts for natural gas and firm transportation and storage capacity for natural gas that are primarily used to meet its obligations to PSE&G.
NOTES TO CONSOLIDATED FINANCIAL STATEMENTS
As of December 31, 2024, the total minimum purchase requirements included in these commitments were as follows:
| | | | | | |
| | | | | |
| Fuel Type | | PSEG
Power’s
Share of
Commitments
through 2029 | | |
| | | Millions | | |
| Nuclear Fuel | | | | |
| Uranium | | $ | 442 | | |
| Enrichment | | $ | 357 | | |
| Fabrication | | $ | 227 | | |
| Natural Gas | | $ | 1,406 | | |
| | | | | |
FERC Matters
FERC has been conducting a non-public investigation of the Roseland-Pleasant Valley (RPV) transmission project. In December 2024, FERC approved an agreement between PSE&G and FERC Enforcement Staff resolving its investigation. The agreement includes a $6.6 million civil penalty and the implementation of certain compliance requirements, in addition to the process improvements that PSE&G has already implemented. It also includes a statement that nothing in the agreement reflects a challenge by FERC Enforcement to the end-of-life determination relative to the project and that no disgorgement has been sought. In a December 2024 proceeding related to PJM’s annual cost allocation filing, an intervenor raised an objection related to the recovery of costs for the RPV project. FERC issued an order declining to take action with respect to the intervenor’s objection. PSEG cannot predict whether there will be objections raised in other forums.
BPU Audit of PSE&G
In 2020, the BPU ordered the commencement of a comprehensive affiliate and management audit of PSE&G. It has been more than ten years since the BPU last conducted a management and affiliate audit of this kind of PSE&G, which is initiated periodically as required by New Jersey statutes/regulations. Phase 1 of the audit reviews affiliate relations and cost allocation between PSE&G and its affiliates, including an analysis of the relationship between PSE&G and PSEG Energy Resources & Trade, LLC, a wholly owned subsidiary of PSEG Power over the past ten years, and between PSE&G and PSEG LI. Phase 2 is a comprehensive management audit, which addresses, among other things, executive management, corporate governance, system operations, human resources, cyber security, compliance with customer protection requirements and customer safety. The audit officially began in late May 2021. The BPU Audit Staff submitted the final audit report to the BPU in June 2023. The BPU is currently considering public comments on the audit report and has not yet determined which audit recommendations it will require PSE&G to implement. It is not possible at this time to predict the outcome of this matter.
Litigation
Sewaren 7 Construction
In June 2018, a complaint was filed in federal court in Newark, New Jersey against PSEG Fossil LLC, which at the time was a wholly owned subsidiary of PSEG Power, regarding an ongoing dispute with Durr Mechanical Construction, Inc. (Durr), a contractor on the Sewaren 7 project. Among other things, Durr sought damages of $93 million and alleges that PSEG Power withheld money owed to Durr and that PSEG Power’s intentional conduct led to the inability of Durr to obtain prospective contracts. PSEG Power intends to vigorously defend against these allegations. In January 2021, the court partially granted PSEG Power’s motion to dismiss certain claims, reducing the amount claimed to $68 million. In December 2018, Durr filed for Chapter 11 bankruptcy in the federal court in the Southern District of New York (SDNY). The SDNY bankruptcy court has allowed the New Jersey litigation to proceed. PSEG Power has accrued an amount related to outstanding invoices which does not reflect an assessment of claims and potential counterclaims in this matter. At this time, PSEG Power cannot predict the outcome of this matter.
NOTES TO CONSOLIDATED FINANCIAL STATEMENTS
Other Litigation and Legal Proceedings
PSEG and its subsidiaries are party to various lawsuits in the ordinary course of business. In view of the inherent difficulty in predicting the outcome of such matters, PSEG and PSE&G generally cannot predict the eventual outcome of the pending matters, the timing of the ultimate resolution of these matters, or the eventual loss, fines or penalties related to each pending matter.
In accordance with applicable accounting guidance, a liability is accrued when those matters present loss contingencies that are both probable and reasonably estimable. In such cases, there may be an exposure to loss in excess of any amounts accrued. PSEG will continue to monitor the matter for further developments that could affect the amount of the accrued liability that has been previously established.
Based on current knowledge, management does not believe that loss contingencies arising from pending matters, other than the matters described herein, could have a material adverse effect on PSEG’s or PSE&G’s consolidated financial position or liquidity. However, in light of the inherent uncertainties involved in these matters, some of which are beyond PSEG’s control, and the large or indeterminate damages sought in some of these matters, an adverse outcome in one or more of these matters could be material to PSEG’s or PSE&G’s results of operations or liquidity for any particular reporting period.
Nuclear Insurance Coverages and Assessments
PSEG Power is a member of the joint underwriting association, American Nuclear Insurers (ANI), which provides nuclear liability insurance coverage at the Salem and Hope Creek site and the Peach Bottom site. The ANI policies are designed to satisfy the financial protection requirements outlined in the Price-Anderson Act, which sets the limit of liability for claims that could arise from an incident involving any licensed nuclear facility in the United States. The limit of liability per incident per site is composed of primary and excess layers. As of December 31, 2024, nuclear sites were required to purchase $500 million of primary liability coverage for each site through ANI. The primary layer is supplemented by an excess layer, which is an industry self-insurance pool. In the event a nuclear site, which is part of the industry self-insurance pool, has a claim that exceeds the primary layer, each licensee would be assessed a prorated share of the excess layer. The excess layer limit is $15.8 billion. PSEG Power’s maximum aggregate assessment per incident is $522 million based on PSEG Power’s ownership interests in Salem, Hope Creek and Peach Bottom and its maximum aggregate annual assessment per incident is $78 million. If the damages exceed the limit of liability, Congress could impose further revenue-raising measures on the nuclear industry to pay claims. Further, a decision by the U.S. Supreme Court, not involving PSEG Power, held that the Price-Anderson Act did not preclude punitive damage awards based on state law claims.
PSEG Power is also a member of an industry mutual insurance company, Nuclear Electric Insurance Limited (NEIL), which provides the property, decontamination and decommissioning liability insurance at the Salem and Hope Creek site and the Peach Bottom site. NEIL also provides replacement power coverage through its accidental outage policy. NEIL policies may make retrospective premium assessments in the case of adverse loss experience. The current maximum aggregate annual retrospective premium obligation for PSEG Power is approximately $52 million. NEIL requires its members to maintain an investment grade credit rating or to ensure collectability of their annual retrospective premium obligation by providing a financial guarantee, letter of credit, deposit premium, or some other means of assurance. Certain provisions in the NEIL policies provide that the insurer may suspend coverage with respect to all nuclear units on a site without notice if the NRC suspends or revokes the operating license for any unit on that site, issues a shutdown order with respect to such unit or issues a confirmatory order keeping such unit down.
The ANI and NEIL policies all include coverage for claims arising out of acts of terrorism. However, NEIL policies are subject to an industry aggregate limit of $3.24 billion plus such additional amounts as NEIL recovers for such losses from reinsurance, indemnity and any other source applicable to such losses.
NOTES TO CONSOLIDATED FINANCIAL STATEMENTS
Note 14. Debt and Credit Facilities
Long-Term Debt
| | | | | | | | | | | | | |
| | | | | | | | | | | |
| | | | | | As of December 31, | | |
| | | | Maturity | | 2024 | | | 2023 | | |
| | | | | | Millions | | |
| PSEG | | | | | | | | | |
| Senior Notes: | | | | | | | | | |
| 2.88% | | 2024 | | $ | — | | | $ | 750 | | |
| 0.80% | | 2025 | | | 550 | | | | 550 | | |
| 5.85% | | 2027 | | | 700 | | | | 700 | | |
| 5.88% | | 2028 | | | 600 | | | | 600 | | |
| 5.20% | | | 2029 | | | 750 | | | | — | | |
| 1.60% | | 2030 | | | 550 | | | | 550 | | |
| 8.63% | | | 2031 | | | 96 | | | | 96 | | |
| 2.45% | | 2031 | | | 750 | | | | 750 | | |
| 6.13% | | 2033 | | | 400 | | | | 400 | | |
| 5.45% | | | 2034 | | | 500 | | | | — | | |
| Total Senior Notes | | | | | 4,896 | | | | 4,396 | | |
| Principal Amount Outstanding | | | | | 4,896 | | | | 4,396 | | |
| Amounts Due Within One Year | | | | | (550 | ) | | | (750 | ) | |
| Net Unamortized Discount and Debt Issuance Costs | | | | | (30 | ) | | | (25 | ) | |
| Total Long-Term Debt of PSEG | | | | $ | 4,316 | | | $ | 3,621 | | |
| | | | | | | | | | | |
NOTES TO CONSOLIDATED FINANCIAL STATEMENTS
| | | | | | | | | | | |
| | | | | | | | | |
| | | | As of December 31, | | |
| | Maturity | | 2024 | | | 2023 | | |
| | | | Millions | | |
| PSE&G | | | | | | | | |
| First and Refunding Mortgage Bonds (A): | | | | | | | | |
| 8.00% | 2037 | | $ | 7 | | | $ | 7 | | |
| 5.00% | 2037 | | | 8 | | | | 8 | | |
| Total First and Refunding Mortgage Bonds | | | | 15 | | | | 15 | | |
| Medium-Term Notes (A): | | | | | | | | |
| 3.75% | 2024 | | | — | | | | 250 | | |
| 3.15% | 2024 | | | — | | | | 250 | | |
| 3.05% | 2024 | | | — | | | | 250 | | |
| 3.00% | 2025 | | | 350 | | | | 350 | | |
| 0.95% | 2026 | | | 450 | | | | 450 | | |
| 2.25% | 2026 | | | 425 | | | | 425 | | |
| 3.00% | 2027 | | | 425 | | | | 425 | | |
| 3.70% | 2028 | | | 375 | | | | 375 | | |
| 3.65% | 2028 | | | 325 | | | | 325 | | |
| 3.20% | 2029 | | | 375 | | | | 375 | | |
| 2.45% | 2030 | | | 300 | | | | 300 | | |
| 1.90% | 2031 | | | 425 | | | | 425 | | |
| 3.10% | 2032 | | | 500 | | | | 500 | | |
| 4.90% | 2032 | | | 400 | | | | 400 | | |
| 4.65% | 2033 | | | 500 | | | | 500 | | |
| 5.20% | 2033 | | | 500 | | | | 500 | | |
| 5.20% | 2034 | | | 450 | | | | — | | |
| 4.85% | 2034 | | | 600 | | | | — | | |
| 5.25% | 2035 | | | 250 | | | | 250 | | |
| 5.70% | 2036 | | | 250 | | | | 250 | | |
| 5.80% | 2037 | | | 350 | | | | 350 | | |
| 5.38% | 2039 | | | 250 | | | | 250 | | |
| 5.50% | 2040 | | | 300 | | | | 300 | | |
| 3.95% | 2042 | | | 450 | | | | 450 | | |
| 3.65% | 2042 | | | 350 | | | | 350 | | |
| 3.80% | 2043 | | | 400 | | | | 400 | | |
| 4.00% | 2044 | | | 250 | | | | 250 | | |
| 4.05% | 2045 | | | 250 | | | | 250 | | |
| 4.15% | 2045 | | | 250 | | | | 250 | | |
| 3.80% | 2046 | | | 550 | | | | 550 | | |
| 3.60% | 2047 | | | 350 | | | | 350 | | |
| 4.05% | 2048 | | | 325 | | | | 325 | | |
| 3.85% | 2049 | | | 375 | | | | 375 | | |
| 3.20% | 2049 | | | 400 | | | | 400 | | |
| 3.15% | 2050 | | | 300 | | | | 300 | | |
| 2.70% | 2050 | | | 375 | | | | 375 | | |
| 2.05% | 2050 | | | 375 | | | | 375 | | |
| 3.00% | 2051 | | | 450 | | | | 450 | | |
| 5.13% | 2053 | | | 400 | | | | 400 | | |
| 5.45% | 2053 | | | 400 | | | | 400 | | |
| 5.45% | 2054 | | | 550 | | | | — | | |
| 5.30% | 2054 | | | 500 | | | | — | | |
| Total MTNs | | | | 15,100 | | | | 13,750 | | |
| Principal Amount Outstanding | | | | 15,115 | | | | 13,765 | | |
| Amounts Due Within One Year | | | | (350 | ) | | | (750 | ) | |
| Net Unamortized Discount and Selling Expense | | | | (117 | ) | | | (102 | ) | |
| Total Long-Term Debt of PSE&G | | | $ | 14,648 | | | $ | 12,913 | | |
| | | | | | | | | |
NOTES TO CONSOLIDATED FINANCIAL STATEMENTS
| | | | | | | | | | | |
| | | | | | | | | |
| | | | As of December 31, | | |
| | Maturity | | 2024 | | | 2023 | | |
| | | | Millions | | |
| PSEG Power | | | | | | | | |
| Term Loan: | | | | | | | | |
| Variable Rate | 2025 | | $ | 1,250 | | | $ | 1,250 | | |
| Total Term Loan | | | | 1,250 | | | | 1,250 | | |
| Amounts Due Within One Year | | | | (1,250 | ) | | | — | | |
| Total Long-Term Debt of PSEG Power | | | $ | — | | | $ | 1,250 | | |
| | | | | | | | | |
(A)Secured by essentially all property of PSE&G pursuant to its First and Refunding Mortgage.
Long-Term Debt Maturities
The aggregate principal amounts of maturities for each of the five years following December 31, 2024 are as follows:
| | | | | | | | | | | | | | | | | | |
| | | | | | | | | | | | | | |
| Year | | PSEG | | | PSE&G | | | PSEG Power | | | Total | | |
| | | Millions | | |
| 2025 | | $ | 550 | | | $ | 350 | | | $ | 1,250 | | | $ | 2,150 | | |
| 2026 | | | — | | | | 875 | | | | — | | | | 875 | | |
| 2027 | | | 700 | | | | 425 | | | | — | | | | 1,125 | | |
| 2028 | | | 600 | | | | 700 | | | | — | | | | 1,300 | | |
| 2029 | | | 750 | | | | 375 | | | | — | | | | 1,125 | | |
| Thereafter | | | 2,296 | | | | 12,390 | | | | — | | | | 14,686 | | |
| Total | | $ | 4,896 | | | $ | 15,115 | | | $ | 1,250 | | | $ | 21,261 | | |
| | | | | | | | | | | | | | |
Long-Term Debt Financing Transactions
During 2024, the following long-term debt transactions occurred:
PSEG
•issued $750 million of 5.20% Senior Notes due April 2029,
•issued $500 million of 5.45% Senior Notes due April 2034, and
•retired $750 million of 2.88% Senior Notes at maturity.
PSE&G
•issued $450 million of 5.20% Secured Medium-Term Notes, Series Q, due March 2034,
•issued $550 million of 5.45% Secured Medium-Term Notes, Series Q, due March 2054,
•issued $600 million of 4.85% Secured Medium-Term Notes, Series Q, due August 2034,
•issued $500 million of 5.30% Secured Medium-Term Notes, Series Q, due August 2054,
•retired $250 million of 3.75% Secured Medium-Term Notes, Series I, at maturity,
•retired $250 million of 3.15% Secured Medium-Term Notes, Series J, at maturity, and
•retired $250 million of 3.05% Secured Medium-Term Notes, Series J, at maturity.
In December 2024, PSEG Power amended its existing $1.25 billion variable rate 3-year term loan agreement to extend through June 2025.
NOTES TO CONSOLIDATED FINANCIAL STATEMENTS
Short-Term Liquidity
PSEG meets its short-term liquidity requirements, as well as those of PSEG Power, primarily through the issuance of commercial paper and, from time to time, short-term loans. PSE&G maintains its own separate commercial paper program to meet its short-term liquidity requirements. Each commercial paper program is fully back-stopped by its own separate credit facility.
The commitments under the $3.8 billion credit facilities are provided by a diverse bank group. As of December 31, 2024, the total available credit capacity was $2.5 billion.
As of December 31, 2024, no single institution represented more than 9% of the total commitments in the credit facilities.
As of December 31, 2024, PSEG’s liquidity position, including credit facilities and access to external financing, was expected to be sufficient to meet its projected stressed requirements over a 12-month planning horizon.
Each of the credit facilities is restricted as to availability and use to the specific companies as listed in the following table; however, if necessary, the PSEG facilities can also be used to support its subsidiaries’ liquidity needs.
The total committed credit facilities and available liquidity as of December 31, 2024 were as follows:
| | | | | | | | | | | | | | | | | | |
| | | | | | | | | | | | | | | |
| | | As of December 31, 2024 | | | |
| Company/Facility | | Total
Facility | | | Usage (B) | | | Available
Liquidity | | | Expiration
Date | | Primary Purpose | |
| | | Millions | | | | | | |
| PSEG | | | | | | | | | | | | | | |
| Revolving Credit Facility (A) | | $ | 1,500 | | | $ | 764 | | | $ | 736 | | | Mar 2028 | | Commercial Paper Support/Funding/Letters of Credit | |
| Total PSEG | | $ | 1,500 | | | $ | 764 | | | $ | 736 | | | | | | |
| PSE&G | | | | | | | | | | | | | | |
| Revolving Credit Facility | | $ | 1,000 | | | $ | 468 | | | $ | 532 | | | Mar 2028 | | Commercial Paper Support/Funding/Letters of Credit | |
| Total PSE&G | | $ | 1,000 | | | $ | 468 | | | $ | 532 | | | | | | |
| PSEG Power | | | | | | | | | | | | | | |
| Revolving Credit Facility (A) | | $ | 1,250 | | | $ | 37 | | | $ | 1,213 | | | Mar 2028 | | Funding/Letters of Credit | |
| Letter of Credit Facility | | | 75 | | | | 45 | | | | 30 | | | Apr 2026 | | Letters of Credit | |
| Total PSEG Power | | $ | 1,325 | | | $ | 82 | | | $ | 1,243 | | | | | | |
| Total (C) | | $ | 3,825 | | | $ | 1,314 | | | $ | 2,511 | | | | | | |
| | | | | | | | | | | | | | | |
(A)Master Credit Facility with sub-limits of $1.5 billion for PSEG and $1.25 billion for PSEG Power; sub-limits can be adjusted pursuant to the terms of the Master Credit Facility agreement. The PSEG sub-limit includes a sustainability linked pricing based mechanism with potential increases or decreases, which are not expected to be material, depending on performance relative to targeted methane emission reductions.
(B)The primary use of PSEG’s and PSE&G’s credit facilities is to support their respective Commercial Paper Programs, under which as of December 31, 2024, PSEG had $749 million outstanding commercial paper at a weighted average interest rate of 4.78% and PSE&G had $444 million commercial paper outstanding at a weighted average interest rate of 4.71%.
(C)Amounts do not include uncommitted credit facilities or 364-day term loans, if any apply.
PSEG Power has uncommitted credit facilities totaling $200 million, which can be utilized for letters of credit. As of December 31, 2024, PSEG Power had $75 million in letters of credit outstanding under these uncommitted credit facilities. In addition, a subsidiary of PSEG Power has an uncommitted credit facility for $150 million, which can be utilized for cash collateral postings.
NOTES TO CONSOLIDATED FINANCIAL STATEMENTS
Debt Covenants
PSEG Power’s existing credit agreements contain covenants restricting the ability of PSEG Power from consummating certain mergers and consolidations and the ability of PSEG Power and its subsidiaries that guarantee its indebtedness from consummating certain asset sales.
Short-Term Loans
In April 2023, PSEG entered into a new 364-day variable rate term loan agreement for $750 million. In August 2023, PSEG repaid $250 million of the $750 million 364-day variable rate term loan and the remaining $500 million matured in April 2024. In December 2024, PSEG Power entered into a new 364-day variable rate term loan for $400 million.
Fair Value of Debt
The estimated fair values, carrying amounts and methods used to determine the fair values of long-term debt as of December 31, 2024 and 2023 are included in the following table and accompanying notes as of December 31, 2024 and 2023. See Note 17. Fair Value Measurements for more information on fair value guidance and the hierarchy that prioritizes the inputs to fair value measurements into three levels.
| | | | | | | | | | | | | | | | | | |
| | | | | | | | | | | | | | |
| | | December 31, 2024 | | | December 31, 2023 | | |
| | | Carrying
Amount | | | Fair
Value | | | Carrying
Amount | | | Fair
Value | | |
| | | Millions | | |
| Long-Term Debt: | | | | | | | | | | | | | |
| PSEG (A) | | $ | 4,866 | | | $ | 4,754 | | | $ | 4,371 | | | $ | 4,240 | | |
| PSE&G (A) | | | 14,998 | | | | 13,337 | | | | 13,663 | | | | 12,460 | | |
| PSEG Power (B) | | | 1,250 | | | | 1,250 | | | | 1,250 | | | | 1,250 | | |
| Total Long-Term Debt | | $ | 21,114 | | | $ | 19,341 | | | $ | 19,284 | | | $ | 17,950 | | |
| | | | | | | | | | | | | | |
(A)Given that these bonds do not trade actively, the fair value amounts of taxable debt securities (primarily Level 2 measurements) are generally determined by a valuation model using market-based measurements that are processed through a rules-based pricing methodology. The fair value amounts above do not represent the price at which the outstanding debt may be called for redemption by each issuer under their respective debt agreements.
(B)Private term loan with book value approximating fair value (Level 2 measurement).
Note 15. Schedule of Consolidated Capital Stock
| | | | | | | | | | | | | | | | | | |
| | | | | | | | | | | | | | |
| | | As of December 31, | | |
| | | Outstanding Shares | | | Book Value | | |
| | | 2024 | | | 2023 | | | 2024 | | | 2023 | | |
| | | Millions | | |
| PSEG Common Stock (no par value) (A) | | | | | | | | | | | | | |
| Authorized 1,000 shares | | | 498 | | | | 498 | | | $ | 3,654 | | | $ | 3,639 | | |
| | | | | | | | | | | | | | |
(A)PSEG did not issue any new shares under the Dividend Reinvestment and Stock Purchase Plan or the Employee Stock Purchase Plan (ESPP) in 2024 or 2023.
As of December 31, 2024, PSE&G had an aggregate of 7.5 million shares of $100 par value and 10 million shares of $25 par value Cumulative Preferred Stock, which were authorized and unissued and which, upon issuance, may or may not provide for mandatory sinking fund redemption.
NOTES TO CONSOLIDATED FINANCIAL STATEMENTS
Note 16. Financial Risk Management Activities
Derivative accounting guidance requires that a derivative instrument be recognized as either an asset or a liability at fair value, with changes in fair value of the derivative recognized in earnings each period. Other accounting treatments are available through special election and designation provided that the derivative instrument meets specific, restrictive criteria, both at the time of designation and on an ongoing basis. These alternative permissible treatments include NPNS cash flow hedge and fair value hedge accounting. PSEG uses interest rate swaps and other derivatives, which are designated and qualifying as cash flow or fair value hedges. PSEG Power enters into additional contracts that are derivatives, but are not designated as either cash flow hedges or fair value hedges. These transactions are economic hedges and are recorded at fair market value with changes recognized in earnings.
Commodity Prices
Within PSEG and its affiliate companies, PSEG Power has the most exposure to commodity price risk. PSEG Power is exposed to commodity price risk primarily relating to changes in the market price of electricity, natural gas and other commodities. Fluctuations in market prices result from changes in supply and demand, fuel costs, market conditions, weather, state and federal regulatory policies, environmental policies, transmission availability and other factors. PSEG Power uses a variety of derivative and non-derivative instruments, such as financial options, futures and swaps to manage the exposure to fluctuations in commodity prices and optimize the value of PSEG Power’s expected generation. PSEG Power also uses derivatives to hedge a portion of its anticipated BGSS obligations with PSE&G. For additional information see Note 13. Commitments and Contingent Liabilities.
Interest Rates
PSEG, PSE&G and PSEG Power are subject to the risk of fluctuating interest rates in the normal course of business. Exposure to this risk is managed by targeting a balanced debt maturity profile which limits refinancing in any given period or interest rate environment. PSEG and PSEG Power may use a mix of fixed and floating rate debt and interest rate hedges.
Cash Flow Hedges
PSEG uses interest rate hedges which are designated and effective as cash flow hedges, to manage its exposure to the variability of cash flows, primarily related to variable-rate debt instruments or anticipated future long-term debt issuances.
As of December 31, 2024, PSEG had interest rate hedges outstanding through March 2025 which were executed to convert to fixed PSEG Power’s $1.25 billion variable rate term loan due June 2025. The fair value of these hedges was immaterial and $5 million as of December 31, 2024 and 2023, respectively.
As of December 31, 2024, PSEG also had interest rate hedges outstanding to fix the interest rate portion of anticipated 2025 debt issuances for PSEG and PSEG Power. These interest rate hedges had a fair value of $32 million as of December 31, 2024.
The Accumulated Other Comprehensive Income (Loss) (after tax) related to outstanding and terminated interest rate hedges designated as cash flow hedges was $36 million and $3 million as of December 31, 2024 and December 31, 2023, respectively. The after-tax unrealized gains on these hedges expected to be reclassified to earnings during the next 12 months are $2 million.
Fair Values of Derivative Instruments
The following are the fair values of derivative instruments on the Consolidated Balance Sheets. The following tables also include disclosures for offsetting derivative assets and liabilities which are subject to a master netting or similar agreement. In general, the terms of the agreements provide that in the event of an early termination the counterparties have the right to offset amounts owed or owing under that and any other agreement with the same counterparty. Accordingly, and in accordance with PSEG’s accounting policy, these positions are offset on the Consolidated Balance Sheets of PSEG. For additional information see Note 17. Fair Value Measurements.
NOTES TO CONSOLIDATED FINANCIAL STATEMENTS
Substantially all derivative instruments are contracts subject to master netting agreements. Contracts not subject to master netting or similar agreements are immaterial and did not have any collateral posted or received as of December 31, 2024 and 2023. The following tabular disclosure does not include the offsetting of trade receivables and payables.
| | | | | | | | | | | | | | | | | | | | | | |
| | | | | | | | | | | | | | | | | |
| | | As of December 31, 2024 | | |
| | | PSEG | | | PSEG Power | | | Consolidated | | |
| | | Cash Flow
Hedges | | | Not Designated | | | | | | | | | | | |
| Balance Sheet Location | | Interest
Rate
Derivatives | | | Energy-
Related
Contracts | | | Netting
(A) | | | Total
PSEG
Power | | | Total
Derivatives | | |
| | | Millions | | |
| Derivative Contracts | | | | | | | | | | | | | | | | |
| Current Assets | | $ | — | | | $ | 403 | | | $ | (370 | ) | | $ | 33 | | | $ | 33 | | |
| Noncurrent Assets | | | 32 | | | | 375 | | | | (356 | ) | | | 19 | | | | 51 | | |
| Total Mark-to-Market Derivative Assets | | $ | 32 | | | $ | 778 | | | $ | (726 | ) | | $ | 52 | | | $ | 84 | | |
| Derivative Contracts | | | | | | | | | | | | | | | | |
| Current Liabilities | | $ | — | | | $ | (448 | ) | | $ | 443 | | | $ | (5 | ) | | $ | (5 | ) | |
| Noncurrent Liabilities | | | — | | | | (408 | ) | | | 404 | | | | (4 | ) | | | (4 | ) | |
| Total Mark-to-Market Derivative (Liabilities) | | $ | — | | | $ | (856 | ) | | $ | 847 | | | $ | (9 | ) | | $ | (9 | ) | |
| Total Net Mark-to-Market Derivative Assets (Liabilities) | | $ | 32 | | | $ | (78 | ) | | $ | 121 | | | $ | 43 | | | $ | 75 | | |
| | | | | | | | | | | | | | | | | |
| | | | | | | | | | | | | | | | | | | | | | |
| | | | | | | | | | | | | | | | | |
| | | As of December 31, 2023 | | |
| | | PSEG | | | PSEG Power | | | Consolidated | | |
| | | Cash Flow
Hedges | | | Not
Designated | | | | | | | | | | | |
| Balance Sheet Location | | Interest
Rate
Derivatives | | | Energy-
Related
Contracts | | | Netting
(A) | | | Total
PSEG
Power | | | Total
Derivatives | | |
| | | Millions | | |
| Derivative Contracts | | | | | | | | | | | | | | | | |
| Current Assets | | $ | 6 | | | $ | 912 | | | $ | (806 | ) | | $ | 106 | | | $ | 112 | | |
| Noncurrent Assets | | | — | | | | 440 | | | | (411 | ) | | | 29 | | | | 29 | | |
| Total Mark-to-Market Derivative Assets | | $ | 6 | | | $ | 1,352 | | | $ | (1,217 | ) | | $ | 135 | | | $ | 141 | | |
| Derivative Contracts | | | | | | | | | | | | | | | | |
| Current Liabilities | | $ | (16 | ) | | $ | (890 | ) | | $ | 820 | | | $ | (70 | ) | | $ | (86 | ) | |
| Noncurrent Liabilities | | | (1 | ) | | | (424 | ) | | | 419 | | | | (5 | ) | | | (6 | ) | |
| Total Mark-to-Market Derivative (Liabilities) | | $ | (17 | ) | | $ | (1,314 | ) | | $ | 1,239 | | | $ | (75 | ) | | $ | (92 | ) | |
| Total Net Mark-to-Market Derivative Assets (Liabilities) | | $ | (11 | ) | | $ | 38 | | | $ | 22 | | | $ | 60 | | | $ | 49 | | |
| | | | | | | | | | | | | | | | | |
(A)Represents the netting of fair value balances with the same counterparty (where the right of offset exists) and the application of cash collateral. All cash collateral (received) posted that has been allocated to derivative positions, where the right of offset exists, has been offset on the Consolidated Balance Sheets. As of December 31, 2024 and 2023, PSEG Power had net cash collateral payments to counterparties of $244 million and $113 million, respectively. Of these net cash collateral (receipts) payments, $121 million as of December 31, 2024 and $22 million as of December 31, 2023 were netted against the corresponding net derivative contract positions. Of the $121 million as of December 31, 2024, $73 million was netted against current liabilities and $48 million was netted against noncurrent liabilities. Of the $22 million as of December 31, 2023, $(1) million was netted against current assets, $15 million against current liabilities and $8 million against noncurrent liabilities.
Certain of PSEG Power’s derivative instruments contain provisions that require PSEG Power to post collateral. This collateral may be posted in the form of cash or credit support with thresholds contingent upon PSEG Power’s credit rating from each of the major
NOTES TO CONSOLIDATED FINANCIAL STATEMENTS
credit rating agencies. The collateral and credit support requirements vary by contract and by counterparty. These credit risk-related contingent features stipulate that if PSEG Power were to be downgraded to a below investment grade rating by S&P or Moody’s, it would be required to provide additional collateral. A below investment grade credit rating for PSEG Power would represent a two level downgrade from its current Moody’s and S&P ratings. This incremental collateral requirement can offset collateral requirements related to other derivative instruments that are assets with the same counterparty, where the contractual right of offset exists under applicable master agreements. PSEG Power may also enter into commodity transactions on the New York Mercantile Exchange (NYMEX) and Intercontinental Exchange (ICE). The NYMEX and ICE clearing houses act as counterparties to each trade. Transactions on the NYMEX and ICE must adhere to comprehensive collateral and margin requirements.
The aggregate fair value of all derivative instruments with credit risk-related contingent features in a liability position that are not fully collateralized (excluding transactions on the NYMEX and ICE that are fully collateralized) was $17 million and $77 million as of December 31, 2024 and 2023, respectively. As of December 31, 2024 and 2023, PSEG Power had the contractual right of offset of $11 million and $3 million, respectively, related to derivative instruments that are assets with the same counterparty under master agreements and net of margin posted. If PSEG Power had been downgraded to a below investment grade rating, it would have had additional collateral obligations of $6 million and $74 million as of December 31, 2024 and 2023, respectively, related to its derivatives, net of the contractual right of offset under master agreements and the application of collateral.
The following shows the effect on the Consolidated Statements of Operations and on AOCL of derivative instruments designated as cash flow hedges for the years ended December 31, 2024, 2023 and 2022.
| | | | | | | | | | | | | | | | | | | | | | | | | | | | |
| | | | | | | | | | | | | | | | | | | | | | |
| | | Amount of Pre-Tax Gain (Loss) Recognized in AOCL on Derivatives | | | Location of Pre-Tax Gain (Loss) Reclassified from AOCL into Income | | Amount of Pre-Tax Gain (Loss) Reclassified from AOCL into Income | | |
| Derivatives in Cash Flow Hedging Relationships | | Years Ended December 31, | | | | | Years Ended December 31, | | |
| | | 2024 | | | 2023 | | | 2022 | | | | | 2024 | | | 2023 | | | 2022 | | |
| | | Millions | | | | | Millions | | |
| Interest Rate Derivatives | | $ | 59 | | | $ | 13 | | | $ | — | | | Interest Expense | | $ | 13 | | | $ | 5 | | | $ | (5 | ) | |
| Total | | $ | 59 | | | $ | 13 | | | $ | — | | | | | $ | 13 | | | $ | 5 | | | $ | (5 | ) | |
| | | | | | | | | | | | | | | | | | | | | | |
The effect of interest rate cash flow hedges is recorded in Interest Expense in PSEG’s Consolidated Statement of Operations. The amount of gain (loss) on interest rate hedges reclassified from Accumulated Other Comprehensive Income (Loss) into income was $9 million, $3 million and $(3) million after tax as of December 31, 2024, 2023 and 2022, respectively.
The following reconciles the Accumulated Other Comprehensive Income (Loss) for derivative activity included in the AOCL of PSEG on a pre-tax and after-tax basis.
| | | | | | | | | | |
| | | | | | | | |
| Accumulated Other Comprehensive Income (Loss) | | Pre-Tax | | | After-Tax | | |
| | | Millions | | |
| Balance as of December 31, 2022 | | $ | (4 | ) | | $ | (3 | ) | |
| Gain Recognized in AOCI | | | 13 | | | | 9 | | |
| Less: Gain Reclassified into Income | | | (5 | ) | | | (3 | ) | |
| Balance as of December 31, 2023 | | $ | 4 | | | $ | 3 | | |
| Gain Recognized in AOCI | | | 59 | | | | 42 | | |
| Less: Gain Reclassified into Income | | | (13 | ) | | | (9 | ) | |
| Balance as of December 31, 2024 | | $ | 50 | | | $ | 36 | | |
| | | | | | | | |
NOTES TO CONSOLIDATED FINANCIAL STATEMENTS
The following shows the effect on the Consolidated Statements of Operations of derivative instruments not designated as hedging instruments or as NPNS for the years ended December 31, 2024, 2023 and 2022. PSEG Power’s derivative contracts reflected in this table primarily includes contracts to hedge the purchase and sale of electricity and natural gas.
| | | | | | | | | | | | | | | | |
| | | | | | | | | | | | | |
| Derivatives Not Designated as Hedges | | Location of Pre-Tax Gain (Loss) Recognized in Income on Derivatives | | Pre-Tax Gain (Loss) Recognized in Income on Derivatives | | |
| | | | | Years Ended December 31, | | |
| | | | | 2024 | | | 2023 | | | 2022 | | |
| | | | | Millions | | |
| Energy-Related Contracts | | Operating Revenues | | $ | 27 | | | $ | 1,567 | | | $ | (1,748 | ) | |
| Energy-Related Contracts | | Energy Costs | | | 2 | | | | — | | | | 2 | | |
| Total | | | | $ | 29 | | | $ | 1,567 | | | $ | (1,746 | ) | |
| | | | | | | | | | | | | |
The following table summarizes the net notional volume purchases/(sales) of open derivative transactions by commodity as of December 31, 2024 and 2023.
| | | | | | | | | | | | |
| | | | | | | | | | |
| | | | | As of December 31, | | |
| Type | | Notional | | 2024 | | | 2023 | | |
| | | | | Millions | | |
| Natural Gas | | Dekatherm | | | 70 | | | | 66 | | |
| Electricity | | MWh | | | (49 | ) | | | (60 | ) | |
| Financial Transmission Rights | | MWh | | | 16 | | | | 19 | | |
| Interest Rate Derivatives | | U.S. Dollars | | | 2,290 | | | | 2,000 | | |
| | | | | | | | | | |
Credit Risk
Credit risk relates to the risk of loss that PSEG Power would incur as a result of non-performance by counterparties pursuant to the terms of their contractual obligations for the purchase and/or sale of energy, nuclear fuel and other related products, where PSEG Power has extended unsecured credit. PSEG has established credit policies that it believes significantly minimize credit risk. These policies include an evaluation of potential counterparties’ financial condition (including credit rating), collateral requirements under certain circumstances and the use of standardized agreements, which allow for the netting of positive and negative exposures associated with a single counterparty. In the event of non-performance or non-payment by a major counterparty, there may be a material adverse impact on PSEG’s financial condition, results of operations or net cash flows.
As of December 31, 2024, more than 95% of the net credit exposure for PSEG Power’s wholesale operations was with investment grade counterparties. There were two counterparties with credit exposure greater than 10% of the total. This credit exposure was with PSE&G and one non-affiliated counterparty. The PSE&G credit exposure is eliminated in consolidation. See Note 24. Related-Party Transactions for additional information.
PSE&G’s supplier master agreements are approved by the BPU and govern the terms of its electric supply procurement contracts. These agreements define a supplier’s performance assurance requirements and allow a supplier to meet its credit requirements with a certain amount of unsecured credit. The amount of unsecured credit is determined based on the supplier’s credit ratings from the major credit rating agencies and the supplier’s tangible net worth. The credit position is based on the initial market price, which is the forward price of energy on the day the procurement transaction is executed, compared to the forward price curve for energy on the valuation day. To the extent that the forward price curve for energy exceeds the initial market price, the supplier is required to post a parental guarantee or other security instrument such as a letter of credit or cash, as collateral to the extent the credit exposure is greater than the supplier’s unsecured credit limit. As of December 31, 2024, PSEG held parental guarantees, letters of credit and cash as security. PSE&G’s BGS suppliers’ credit exposure is calculated each business day. As of December 31, 2024, PSE&G had no unsecured mark-to-market credit exposure with its suppliers.
PSE&G is permitted to recover its costs of procuring energy through the BPU-approved BGS tariffs. PSE&G’s counterparty credit risk is mitigated by its ability to recover realized energy costs through customer rates.
NOTES TO CONSOLIDATED FINANCIAL STATEMENTS
Note 17. Fair Value Measurements
Fair value is the price that would be received to sell an asset or paid to transfer a liability in an orderly transaction between market participants at the measurement date. Accounting guidance for fair value measurement emphasizes that fair value is a market-based measurement, not an entity-specific measurement, and establishes a fair value hierarchy that distinguishes between assumptions based on market data obtained from independent sources and those based on an entity’s own assumptions. The hierarchy prioritizes the inputs to fair value measurement into three levels:
Level 1—measurements utilize quoted prices (unadjusted) in active markets for identical assets or liabilities that PSEG and PSE&G have the ability to access. These consist primarily of listed equity securities and money market mutual funds, as well as natural gas futures contracts executed on an exchange.
Level 2—measurements include quoted prices for similar assets and liabilities in active markets, quoted prices for identical or similar assets or liabilities in markets that are not active, and other observable inputs such as interest rates and yield curves that are observable at commonly quoted intervals. These consist primarily of exchange and non-exchange traded derivatives such as futures or forward contracts or options and most fixed income securities.
Level 3—measurements use unobservable inputs for assets or liabilities, based on the best information available and might include an entity’s own data and assumptions. In some valuations, the inputs used may fall into different levels of the hierarchy. In these cases, the financial instrument’s level within the fair value hierarchy is based on the lowest level of input that is significant to the fair value measurement. These consist primarily of certain electric load contracts.
Certain derivative transactions may transfer from Level 2 to Level 3 if inputs become unobservable and internal modeling techniques are employed to determine fair value. Conversely, measurements may transfer from Level 3 to Level 2 if the inputs become observable.
NOTES TO CONSOLIDATED FINANCIAL STATEMENTS
The following tables present information about PSEG’s and PSE&G’s respective assets and (liabilities) measured at fair value on a recurring basis as of December 31, 2024 and December 31, 2023, including the fair value measurements and the levels of inputs used in determining those fair values. Amounts shown for PSEG include the amounts shown for PSE&G.
| | | | | | | | | | | | | | | | | | | | | | |
| | | | | | | | | | | | | | | | | |
| | | Recurring Fair Value Measurements as of December 31, 2024 | | |
| Description | | Total | | | Netting (E) | | | Quoted Market Prices for Identical Assets
(Level 1) | | | Significant Other Observable Inputs (Level 2) | | | Significant Unobservable Inputs
(Level 3) | | |
| | | Millions | | |
| PSEG | | | | | | | | | | | | | | | | |
| Assets: | | | | | | | | | | | | | | | | |
| Cash Equivalents (A) | | $ | 100 | | | $ | — | | | $ | 100 | | | $ | — | | | $ | — | | |
| Derivative Contracts: | | | | | | | | | | | | | | | | |
| Energy-Related Contracts (B) | | $ | 52 | | | $ | (726 | ) | | $ | 2 | | | $ | 776 | | | $ | — | | |
| Interest Rate Derivatives (C) | | $ | 32 | | | $ | — | | | $ | — | | | $ | 32 | | | $ | — | | |
| NDT Fund (D) | | | | | | | | | | | | | | | | |
| Equity Securities | | $ | 1,380 | | | $ | — | | | $ | 1,380 | | | $ | — | | | $ | — | | |
| Debt Securities—U.S. Treasury | | $ | 366 | | | $ | — | | | $ | — | | | $ | 366 | | | $ | — | | |
| Debt Securities—Govt Other | | $ | 397 | | | $ | — | | | $ | — | | | $ | 397 | | | $ | — | | |
| Debt Securities—Corporate | | $ | 503 | | | $ | — | | | $ | — | | | $ | 503 | | | $ | — | | |
| Rabbi Trust (D) | | | | | | | | | | | | | | | | |
| Equity Securities | | $ | 17 | | | $ | — | | | $ | 17 | | | $ | — | | | $ | — | | |
| Debt Securities—U.S. Treasury | | $ | 55 | | | $ | — | | | $ | — | | | $ | 55 | | | $ | — | | |
| Debt Securities—Govt Other | | $ | 28 | | | $ | — | | | $ | — | | | $ | 28 | | | $ | — | | |
| Debt Securities—Corporate | | $ | 65 | | | $ | — | | | $ | — | | | $ | 65 | | | $ | — | | |
| Liabilities: | | | | | | | | | | | | | | | | |
| Derivative Contracts: | | | | | | | | | | | | | | | | |
| Energy-Related Contracts (B) | | $ | (9 | ) | | $ | 847 | | | $ | (3 | ) | | $ | (852 | ) | | $ | (1 | ) | |
| PSE&G | | | | | | | | | | | | | | | | |
| Assets: | | | | | | | | | | | | | | | | |
| Cash Equivalents (A) | | $ | 70 | | | $ | — | | | $ | 70 | | | $ | — | | | $ | — | | |
| Rabbi Trust (D) | | | | | | | | | | | | | | | | |
| Equity Securities | | $ | 3 | | | $ | — | | | $ | 3 | | | $ | — | | | $ | — | | |
| Debt Securities—U.S. Treasury | | $ | 10 | | | $ | — | | | $ | — | | | $ | 10 | | | $ | — | | |
| Debt Securities—Govt Other | | $ | 5 | | | $ | — | | | $ | — | | | $ | 5 | | | $ | — | | |
| Debt Securities—Corporate | | $ | 12 | | | $ | — | | | $ | — | | | $ | 12 | | | $ | — | | |
| | | | | | | | | | | | | | | | | |
NOTES TO CONSOLIDATED FINANCIAL STATEMENTS
| | | | | | | | | | | | | | | | | | | | | | |
| | | | | | | | | | | | | | | | | |
| | | Recurring Fair Value Measurements as of December 31, 2023 | | |
| Description | | Total | | | Netting (E) | | | Quoted Market Prices for Identical Assets
(Level 1) | | | Significant Other Observable Inputs (Level 2) | | | Significant Unobservable Inputs
(Level 3) | | |
| | | Millions | | |
| PSEG | | | | | | | | | | | | | | | | |
| Assets: | | | | | | | | | | | | | | | | |
| Cash Equivalents (A) | | $ | 20 | | | $ | — | | | $ | 20 | | | $ | — | | | $ | — | | |
| Derivative Contracts: | | | | | | | | | | | | | | | | |
| Energy-Related Contracts (B) | | $ | 135 | | | $ | (1,217 | ) | | $ | 13 | | | $ | 1,339 | | | $ | — | | |
| Interest Rate Derivatives (C) | | $ | 6 | | | $ | — | | | $ | — | | | $ | 6 | | | $ | — | | |
| NDT Fund (D) | | | | | | | | | | | | | | | | |
| Equity Securities | | $ | 1,310 | | | $ | — | | | $ | 1,310 | | | $ | — | | | $ | — | | |
| Debt Securities—U.S. Treasury | | $ | 293 | | | $ | — | | | $ | — | | | $ | 293 | | | $ | — | | |
| Debt Securities—Govt Other | | $ | 398 | | | $ | — | | | $ | — | | | $ | 398 | | | $ | — | | |
| Debt Securities—Corporate | | $ | 522 | | | $ | — | | | $ | — | | | $ | 522 | | | $ | — | | |
| Rabbi Trust (D) | | | | | | | | | | | | | | | | |
| Equity Securities | | $ | 18 | | | $ | — | | | $ | 18 | | | $ | — | | | $ | — | | |
| Debt Securities—U.S. Treasury | | $ | 59 | | | $ | — | | | $ | — | | | $ | 59 | | | $ | — | | |
| Debt Securities—Govt Other | | $ | 32 | | | $ | — | | | $ | — | | | $ | 32 | | | $ | — | | |
| Debt Securities—Corporate | | $ | 70 | | | $ | — | | | $ | — | | | $ | 70 | | | $ | — | | |
| Liabilities: | | | | | | | | | | | | | | | | |
| Derivative Contracts: | | | | | | | | | | | | | | | | |
| Energy-Related Contracts (B) | | $ | (75 | ) | | $ | 1,239 | | | $ | (1 | ) | | $ | (1,311 | ) | | $ | (2 | ) | |
| Interest Rate Derivatives (C) | | $ | (17 | ) | | $ | — | | | $ | — | | | $ | (17 | ) | | $ | — | | |
| PSE&G | | | | | | | | | | | | | | | | |
| Assets: | | | | | | | | | | | | | | | | |
| Cash Equivalents (A) | | $ | 20 | | | $ | — | | | $ | 20 | | | $ | — | | | $ | — | | |
| Rabbi Trust (D) | | | | | | | | | | | | | | | | |
| Equity Securities | | $ | 3 | | | $ | — | | | $ | 3 | | | $ | — | | | $ | — | | |
| Debt Securities—U.S. Treasury | | $ | 11 | | | $ | — | | | $ | — | | | $ | 11 | | | $ | — | | |
| Debt Securities—Govt Other | | $ | 6 | | | $ | — | | | $ | — | | | $ | 6 | | | $ | — | | |
| Debt Securities—Corporate | | $ | 12 | | | $ | — | | | $ | — | | | $ | 12 | | | $ | — | | |
| | | | | | | | | | | | | | | | | |
(A)Represents money market mutual funds.
(B)Level 1—These contracts represent natural gas futures contracts executed on an exchange, and are being valued solely on settled pricing inputs which come directly from the exchange.
Level 2—Fair values for energy-related contracts are obtained primarily using a market-based approach. Most derivative contracts (forward purchase or sale contracts and swaps) are valued using settled prices from similar assets and liabilities from an exchange, such as NYMEX, ICE and Nodal Exchange, or auction prices. Prices used in the valuation process are also corroborated independently by management to determine that values are based on actual transaction data or, in the absence of transactions, bid and offers for the day. Examples may include certain exchange and non-exchange traded capacity and electricity contracts and natural gas physical or swap contracts based on market prices, basis adjustments and other premiums where adjustments and premiums are not considered significant to the overall inputs.
Level 3—Unobservable inputs are used for the valuation of certain contracts. See “Additional Information Regarding Level 3 Measurements” for more information on the utilization of unobservable inputs.
(C)Interest rate derivatives are valued using quoted prices on commonly quoted intervals, which are interpolated for periods different than the quoted intervals, as inputs to a market valuation model. Market inputs can generally be verified and model selection does not involve significant management judgment.
NOTES TO CONSOLIDATED FINANCIAL STATEMENTS
(D)As of December 31, 2024, the fair value measurement table excludes cash and foreign currency of $24 million and $1 million, respectively, in the NDT Fund. As of December 31, 2023, the fair value measurement table excludes foreign currency of $1 million in the NDT Fund. The NDT Fund maintains investments in various equity and fixed income securities. The Rabbi Trust maintains investments in a Russell 3000 index fund and various fixed income securities. These securities are generally valued with prices that are either exchange provided (equity securities) or market transactions for comparable securities and/or broker quotes (fixed income securities).
Level 1—Investments in marketable equity securities within the NDT Fund are primarily investments in common stocks across a broad range of industries and sectors. Most equity securities are priced utilizing the principal market close price or, in some cases, midpoint, bid or ask price. Certain other equity securities in the NDT and Rabbi Trust Funds consist primarily of investments in money market funds which seek a high level of current income as is consistent with the preservation of capital and the maintenance of liquidity. To pursue its goals, the funds normally invest in diversified portfolios of high quality, short-term, dollar-denominated debt securities and government securities. The funds’ net asset value is priced and published daily. The Rabbi Trust’s Russell 3000 index fund is valued based on quoted prices in an active market and can be redeemed daily without restriction.
Level 2—NDT and Rabbi Trust fixed income securities include investment grade corporate bonds, collateralized mortgage obligations, asset-backed securities and certain government and U.S. Treasury obligations or Federal Agency asset-backed securities and municipal bonds with a wide range of maturities. Since many fixed income securities do not trade on a daily basis, they are priced using an evaluated pricing methodology that varies by asset class and reflects observable market information such as the most recent exchange price or quoted bid for similar securities. Market-based standard inputs typically include benchmark yields, reported trades, broker/dealer quotes and issuer spreads. Certain short-term investments are valued using observable market prices or market parameters such as time-to-maturity, coupon rate, quality rating and current yield.
(E)Represents the netting of fair value balances with the same counterparty (where the right of offset exists) and the application of collateral. See Note 16. Financial Risk Management Activities for additional detail.
Additional Information Regarding Level 3 Measurements
For valuations that include both observable and unobservable inputs, if the unobservable input is determined to be significant to the overall inputs, the entire valuation is categorized in Level 3. This includes derivatives valued using indicative price quotations for contracts with tenors that extend into periods with no observable pricing. In instances where observable data is unavailable, consideration is given to the assumptions that market participants would use in valuing the asset or liability. This includes assumptions about market risks such as liquidity, volatility and contract duration. Such instruments are categorized in Level 3 because the model inputs generally are not observable. PSEG considers credit and non-performance risk in the valuation of derivative contracts categorized in Levels 2 and 3, including both historical and current market data, in its assessment of credit and non-performance risk by counterparty. The impacts of credit and non-performance risk were not material to the financial statements.
As of December 31, 2024, PSEG carried $3.0 billion of net assets that were measured at fair value on a recurring basis, of which $1 million of liabilities were measured using unobservable inputs and classified as Level 3 within the fair value hierarchy and are considered immaterial.
As of December 31, 2023, PSEG carried $2.8 billion of net assets that were measured at fair value on a recurring basis, of which $2 million of net liabilities were measured using unobservable inputs and classified as Level 3 within the fair value hierarchy and are considered immaterial.
There were no transfers in 2024 and 2023 to or from Level 3.
Note 18. Stock Based Compensation
PSEG’s 2021 Long-Term Incentive Plan (2021 LTIP), approved by shareholders on April 20, 2021 and the Amended and Restated 2004 Long-Term Incentive Plan ((2004 LTIP) under which no new grants have been made effective April 20, 2021), are
NOTES TO CONSOLIDATED FINANCIAL STATEMENTS
broad-based equity compensation programs that provide for grants of various long-term incentive compensation awards, such as stock options, stock appreciation rights, performance share units (PSUs), restricted stock, restricted stock units (RSUs), cash awards or any combination thereof. The types of long-term incentive awards that have been granted under the LTIP are non-qualified options to purchase shares of PSEG’s common stock, restricted stock unit awards and performance share unit awards. The type of equity award that is granted and the details of that award may vary from time to time and is subject to the approval of the Organization and Compensation Committee of PSEG’s Board of Directors (O&CC), the LTIP’s administrative committee.
The 2021 LTIP currently provides for the issuance of equity awards with respect to 8 million shares of common stock. As of December 31, 2024, approximately 6 million shares were available for future awards under the 2021 LTIP.
In addition, on April 20, 2021 shareholders approved the PSEG 2021 Equity Compensation Plan for Outside Directors (2021 BOD Plan) and the PSEG 2007 Equity Compensation Plan for Outside Directors (2007 BOD Plan) was closed to new awards.
Under the 2021 BOD Plan, the only equity instrument which may be granted are RSUs and the Board member must defer the award until they have achieved their stock ownership requirement.
Stock Options
Under the 2021 LTIP, non-qualified options to acquire shares of PSEG common stock may be granted to officers and other key employees selected by the O&CC. No options have been granted since 2009.
RSUs
Under both the 2021 LTIP and 2004 LTIP (LTIPs), PSEG has granted RSU awards to officers and other key employees. These awards, which are bookkeeping entries only, are subject to risk of forfeiture until vested by continued employment. Until distributed, the units are credited with dividend equivalent units (DEUs) proportionate to the dividends paid on PSEG common stock. Distributions are made in shares of common stock. The RSU grants for 2024 have a 3-year graded vesting (1/3 per year) starting from the grant date and 2023 cliff vest at the end of three years. Vesting may be accelerated (pro-rated basis or full vesting) upon certain events such as change-in-control, retirement, disability or death.
PSUs
Under the LTIPs, PSEG has granted PSUs to officers and other key employees. These provide for distribution in shares of PSEG common stock based on achievement of certain goals over a performance period of three years. Following the end of the performance period, the payout varies from 0% to 200% of the number of PSUs granted depending on PSEG’s performance with respect to those goals. The PSUs are credited with DEUs proportionate to the dividends paid on PSEG common stock. Distributions are made in shares of common stock. Vesting may be accelerated on a pro-rated basis for the period of the employee’s service during the performance period as a result of certain events, such as change-in-control, retirement, death or disability.
Stock-Based Compensation
PSEG recognizes compensation expense for RSUs over the vesting period based on the grant date fair value of the shares, which is equal to the closing market price of PSEG’s common stock on the date of the grant.
PSEG recognizes compensation expense for the total shareholder return (TSR) target for its PSU awards based on the grant date fair values of the award, which are determined using the Monte Carlo model. The following table provides the assumptions used to calculate the grant date fair value of the TSR portion of the PSU awards for 2024, 2023 and 2022:
| | | | | | |
| | | | | | |
| Grant Date | | Risk-Free
Interest Rate | | Volatility | |
| February 13, 2024 | | 4.35% | | 20.32% | |
| February 14, 2023 | | 4.24% | | 25.09% | |
| February 15, 2022 | | 1.76% | | 27.34% | |
| | | | | | |
NOTES TO CONSOLIDATED FINANCIAL STATEMENTS
The accrual of compensation cost is based on the probable achievement of the performance conditions, which result in a payout from 0% to 200% of the initial grant. PSEG recognizes compensation expense for all other components of its PSUs based on the grant date fair value of the awards, which is equal to the market price of PSEG’s common stock on the date of the grant. The accrual during the year of grant is estimated at 100% of the original grant. Such accrual may be adjusted to reflect the actual outcome.
| | | | | | | | | | | | | | |
| | | | | | | | | | | |
| | | 2024 | | | 2023 | | | 2022 | | |
| | | Millions | | |
| Compensation Cost included in O&M Expense | | $ | 40 | | | $ | 18 | | | $ | 29 | | |
| Income Tax Benefit Recognized in Consolidated Statements of Operations | | $ | 11 | | | $ | 5 | | | $ | 8 | | |
| | | | | | | | | | | |
For each of the years 2024, 2023 and 2022, PSEG also recorded excess tax benefits of $1 million, $22 million and $2 million, respectively.
PSEG recognizes compensation cost of awards issued over the shorter of the original vesting period or the period beginning on the date of grant and ending on the date an individual is eligible for retirement and the award vests.
RSUs
Changes in RSUs for the year ended December 31, 2024 are summarized as follows:
| | | | | | | | | | | | | | | | | | |
| | | | | | | | | | | | | | |
| | | Shares | | | Weighted
Average
Grant
Date Fair
Value | | | Weighted
Average
Remaining
Years
Contractual
Term | | | Aggregate
Intrinsic
Value | | |
| Non-vested as of January 1, 2024 | | | 263,181 | | | $ | 61.79 | | | | | | | | |
| Granted | | | 431,944 | | | $ | 59.22 | | | | | | | | |
| Vested | | | 232,259 | | | $ | 58.61 | | | | | | | | |
| Canceled/Forfeited | | | 14,076 | | | $ | 59.94 | | | | | | | | |
| Non-vested as of December 31, 2024 | | | 448,790 | | | $ | 61.03 | | | | 0.9 | | | $ | 37,918,251 | | |
| | | | | | | | | | | | | | |
The weighted average grant date fair value per share for RSUs during the years ended December 31, 2024, 2023 and 2022 was $59.22, $61.44 and $64.44 per share, respectively.
The total intrinsic value of RSUs distributed during the years ended December 31, 2024, 2023 and 2022 was $16 million, $54 million and $19 million, respectively.
As of December 31, 2024, there was approximately $12 million of unrecognized compensation cost related to the RSUs, which is expected to be recognized over a weighted average period of 1.1 years. DEUs of 30,260 accrued on the RSUs during the year.
NOTES TO CONSOLIDATED FINANCIAL STATEMENTS
PSUs
Changes in PSUs for the year ended December 31, 2024 are summarized as follows:
| | | | | | | | | | | | | | | | | | |
| | | | | | | | | | | | | | |
| | | Shares | | | Weighted
Average
Grant
Date Fair
Value | | | Weighted
Average
Remaining
Years
Contractual
Term | | | Aggregate
Intrinsic
Value | | |
| Non-vested as of January 1, 2024 | | | 482,416 | | | $ | 68.31 | | | | | | | | |
| Granted | | | 371,438 | | | $ | 65.44 | | | | | | | | |
| Vested | | | 359,232 | | | $ | 67.65 | | | | | | | | |
| Canceled/Forfeited | | | 20,769 | | | $ | 67.74 | | | | | | | | |
| Non-vested as of December 31, 2024 | | | 473,853 | | | $ | 66.59 | | | | 1.6 | | | $ | 40,035,812 | | |
| | | | | | | | | | | | | | |
The weighted average grant date fair value per share for PSUs during the years ended December 31, 2024, 2023 and 2022 was $65.44, $67.99 and $68.90 per share, respectively.
The total intrinsic value of PSUs distributed during the years ended December 31, 2024, 2023 and 2022 was $10 million, $95 million and $18 million, respectively.
As of December 31, 2024, there was approximately $25 million of unrecognized compensation cost related to the PSUs, which is expected to be recognized over a weighted average period of 1.5 years. DEUs of 35,102 accrued on the PSUs during the year.
Outside Directors
Under the closed 2007 BOD Plan and the new 2021 BOD Plan, annually, on the first business day of May, each non-employee member of the Board of Directors is awarded stock units based on the amount of annual compensation to be paid at the closing price of PSEG common stock on that date. DEUs are credited quarterly and distributions will occur as specified by their election in accordance with the provisions of the BOD Plan.
The fair value of these awards is recorded as compensation expense in the Consolidated Statements of Operations. Compensation expense for the plan was $2 million for the years ended December 31, 2024, 2023, and 2022.
ESPP
PSEG maintains an ESPP for all eligible employees of PSEG and its subsidiaries. Under the ESPP, shares of PSEG common stock may be purchased at 95% of the fair market value for represented employees and 90% for non-represented employees through payroll deductions. Dividends are to be paid out in cash unless the participant elects the dividends to be reinvested at fair market price. All employees are required to hold the shares purchased under the ESPP for at least three months from the purchase date. In any year, employees may purchase shares having a value not exceeding 10% of their base pay. Compensation expense recognized under this program was $2 million for each of the years ended December 31, 2024, 2023 and 2022.
During the years ended December 31, 2024, 2023 and 2022, employees purchased 287,982 shares, 339,807 shares and 321,429 shares, respectively, at an average price of $71.46, $55.84 and $57.72 per share, respectively. As of December 31, 2024, 1 million shares were available for future issuance under this plan.
NOTES TO CONSOLIDATED FINANCIAL STATEMENTS
Note 19. Net Other Income (Deductions)
| | | | | | | | | | | | | | |
| | | | | | | | | | | |
| | | PSE&G | | | PSEG Power & Other (A) | | | Consolidated | | |
| | | Millions | | |
| Year Ended December 31, 2024 | | | | | | | | | | |
| NDT Fund Interest and Dividends | | $ | — | | | $ | 81 | | | $ | 81 | | |
| AFUDC | | | 41 | | | | — | | | | 41 | | |
| Solar Loan Interest | | | 5 | | | | — | | | | 5 | | |
| Other Interest | | | 9 | | | | 18 | | | | 27 | | |
| Other | | | 9 | | | | (10 | ) | | | (1 | ) | |
| Total Net Other Income (Deductions) | | $ | 64 | | | $ | 89 | | | $ | 153 | | |
| Year Ended December 31, 2023 | | | | | | | | | | |
| NDT Fund Interest and Dividends | | $ | — | | | $ | 68 | | | $ | 68 | | |
| AFUDC | | | 60 | | | | — | | | | 60 | | |
| Solar Loan Interest | | | 7 | | | | — | | | | 7 | | |
| Other Interest | | | 12 | | | | 34 | | | | 46 | | |
| Other | | | 1 | | | | (10 | ) | | | (9 | ) | |
| Total Net Other Income (Deductions) | | $ | 80 | | | $ | 92 | | | $ | 172 | | |
| Year Ended December 31, 2022 | | | | | | | | | | |
| NDT Fund Interest and Dividends | | $ | — | | | $ | 62 | | | $ | 62 | | |
| AFUDC | | | 65 | | | | — | | | | 65 | | |
| Solar Loan Interest | | | 10 | | | | — | | | | 10 | | |
| Other Interest | | | 9 | | | | 12 | | | | 21 | | |
| Purchases of Tax Losses under New Jersey Technology Tax Benefit Transfer Program | | | — | | | | (27 | ) | | | (27 | ) | |
| Other | | | 4 | | | | (11 | ) | | | (7 | ) | |
| Total Net Other Income (Deductions) | | $ | 88 | | | $ | 36 | | | $ | 124 | | |
| | | | | | | | | | | |
(A)PSEG Power & Other consists of activity at PSEG Power, Energy Holdings, PSEG LI, Services, PSEG (parent company) and intercompany eliminations.
NOTES TO CONSOLIDATED FINANCIAL STATEMENTS
Note 20. Income Taxes
A reconciliation of reported income tax expense for PSEG with the amount computed by multiplying pre-tax income by the statutory federal income tax rate of 21% is as follows:
| | | | | | | | | | | | | | |
| | | | | | | | | | | |
| | | Years Ended December 31, | | |
| PSEG | | 2024 | | | 2023 | | | 2022 | | |
| | | Millions | | |
| Net Income | | $ | 1,772 | | | $ | 2,563 | | | $ | 1,031 | | |
| Income Taxes: | | | | | | | | | | |
| Operating Income: | | | | | | | | | | |
| Current Expense (Benefit): | | | | | | | | | | |
| Federal | | $ | (225 | ) | | $ | 144 | | | $ | 262 | | |
| State | | | 15 | | | | 19 | | | | (30 | ) | |
| Total Current | | | (210 | ) | | | 163 | | | | 232 | | |
| Deferred Expense (Benefit): | | | | | | | | | | |
| Federal | | | 129 | | | | 109 | | | | (335 | ) | |
| State | | | 140 | | | | 253 | | | | 80 | | |
| Total Deferred | | | 269 | | | | 362 | | | | (255 | ) | |
| ITC | | | (6 | ) | | | (7 | ) | | | (6 | ) | |
| Total Income Tax Expense (Benefit) | | $ | 53 | | | $ | 518 | | | $ | (29 | ) | |
| Pre-Tax Income | | $ | 1,825 | | | $ | 3,081 | | | $ | 1,002 | | |
| Tax Computed at Statutory Rate @ 21% | | $ | 383 | | | $ | 647 | | | $ | 210 | | |
| Increase (Decrease) Attributable to Flow-Through of Certain Tax Adjustments: | | | | | | | | | | |
| State Income Taxes (net of federal income tax) | | | 122 | | | | 215 | | | | 41 | | |
| Uncertain Tax Positions | | | 95 | | | | (14 | ) | | | (22 | ) | |
| NDT Fund | | | 21 | | | | 26 | | | | (22 | ) | |
| Plant-Related Items | | | 5 | | | | (7 | ) | | | (6 | ) | |
| Tax Credits | | | (361 | ) | | | (10 | ) | | | (10 | ) | |
| Audit Settlement | | | — | | | | (7 | ) | | | — | | |
| Leasing Activities | | | — | | | | (22 | ) | | | — | | |
| GPRC-CEF-EE | | | (52 | ) | | | (52 | ) | | | (37 | ) | |
| TAC | | | (145 | ) | | | (232 | ) | | | (193 | ) | |
| Bad Debt Flow-Through | | | (14 | ) | | | (9 | ) | | | (1 | ) | |
| Other | | | (1 | ) | | | (17 | ) | | | 11 | | |
| Subtotal | | | (330 | ) | | | (129 | ) | | | (239 | ) | |
| Total Income Tax Expense (Benefit) | | $ | 53 | | | $ | 518 | | | $ | (29 | ) | |
| Effective Income Tax Rate | | | 2.9 | % | | | 16.8 | % | | | (2.9 | )% | |
| | | | | | | | | | | |
NOTES TO CONSOLIDATED FINANCIAL STATEMENTS
The following is an analysis of deferred income taxes for PSEG:
| | | | | | | | | | |
| | | | | | | | |
| | | As of December 31, | | |
| PSEG | | 2024 | | | 2023 | | |
| | | Millions | | |
| Deferred Income Taxes | | | | | | | |
| Assets: | | | | | | | |
| Regulatory Liability Excess Deferred Tax | | $ | 314 | | | $ | 339 | | |
| OPEB | | | 49 | | | | 58 | | |
| Bad Debt | | | 43 | | | | 57 | | |
| Corporate Alternative Minimum Tax (CAMT) Credit Carryforward | | | — | | | | 44 | | |
| Operating Leases | | | 38 | | | | 42 | | |
| Other | | | 147 | | | | 129 | | |
| Total Assets | | $ | 591 | | | $ | 669 | | |
| | | | | | | | |
| Liabilities: | | | | | | | |
| Plant-Related Items | | $ | 5,084 | | | $ | 4,850 | | |
| New Jersey Corporate Business Tax | | | 1,414 | | | | 1,284 | | |
| Leasing Activities | | | 33 | | | | 35 | | |
| AROs and NDT Fund | | | 281 | | | | 250 | | |
| Taxes Recoverable Through Future Rates (net) | | | 250 | | | | 201 | | |
| GPRC-CEF-EE | | | 214 | | | | 139 | | |
| Pension Costs | | | 193 | | | | 189 | | |
| Operating Leases | | | 34 | | | | 38 | | |
| Other | | | 278 | | | | 291 | | |
| Total Liabilities | | $ | 7,781 | | | $ | 7,277 | | |
| Summary of Accumulated Deferred Income Taxes: | | | | | | | |
| Net Deferred Income Tax Liabilities | | $ | 7,190 | | | $ | 6,608 | | |
| ITC | | | 58 | | | | 63 | | |
| Net Total Deferred Income Taxes and ITC | | $ | 7,248 | | | $ | 6,671 | | |
| | | | | | | | |
The deferred tax effect of certain assets and liabilities is presented in the table above net of the deferred tax effect associated with the respective regulatory deferrals.
NOTES TO CONSOLIDATED FINANCIAL STATEMENTS
A reconciliation of reported income tax expense for PSE&G with the amount computed by multiplying pre-tax income by the statutory federal income tax rate of 21% is as follows:
| | | | | | | | | | | | | | |
| | | | | | | | | | | |
| | | Years Ended December 31, | | |
| PSE&G | | 2024 | | | 2023 | | | 2022 | | |
| | | Millions | | |
| Net Income | | $ | 1,547 | | | $ | 1,515 | | | $ | 1,565 | | |
| Income Taxes: | | | | | | | | | | |
| Operating Income: | | | | | | | | | | |
| Current Expense (Benefit): | | | | | | | | | | |
| Federal | | $ | (67 | ) | | $ | 127 | | | $ | 130 | | |
| State | | | — | | | | 4 | | | | — | | |
| Total Current | | | (67 | ) | | | 131 | | | | 130 | | |
| Deferred Expense (Benefit): | | | | | | | | | | |
| Federal | | | 209 | | | | (113 | ) | | | (17 | ) | |
| State | | | 162 | | | | 149 | | | | 159 | | |
| Total Deferred | | | 371 | | | | 36 | | | | 142 | | |
| ITC | | | (6 | ) | | | (7 | ) | | | (5 | ) | |
| Total Income Tax Expense | | $ | 298 | | | $ | 160 | | | $ | 267 | | |
| Pre-Tax Income | | $ | 1,845 | | | $ | 1,675 | | | $ | 1,832 | | |
| Tax Computed at Statutory Rate @ 21% | | $ | 387 | | | $ | 352 | | | $ | 385 | | |
| Increase (Decrease) Attributable to Flow-Through of Certain Tax Adjustments: | | | | | | | | | | |
| State Income Taxes (net of federal income tax) | | | 128 | | | | 121 | | | | 126 | | |
| Uncertain Tax Positions | | | — | | | | (9 | ) | | | 2 | | |
| Plant-Related Items | | | 5 | | | | (7 | ) | | | (6 | ) | |
| Tax Credits | | | (9 | ) | | | (9 | ) | | | (9 | ) | |
| GPRC-CEF-EE | | | (52 | ) | | | (52 | ) | | | (37 | ) | |
| TAC | | | (145 | ) | | | (232 | ) | | | (193 | ) | |
| Bad Debt Flow-Through | | | (14 | ) | | | (9 | ) | | | (1 | ) | |
| Other | | | (2 | ) | | | 5 | | | | — | | |
| Subtotal | | | (89 | ) | | | (192 | ) | | | (118 | ) | |
| Total Income Tax Expense | | $ | 298 | | | $ | 160 | | | $ | 267 | | |
| Effective Income Tax Rate | | | 16.2 | % | | | 9.6 | % | | | 14.6 | % | |
| | | | | | | | | | | |
NOTES TO CONSOLIDATED FINANCIAL STATEMENTS
The following is an analysis of deferred income taxes for PSE&G:
| | | | | | | | | | |
| | | | | | | | |
| | | As of December 31, | | |
| PSE&G | | 2024 | | | 2023 | | |
| | | Millions | | |
| Deferred Income Taxes | | | | | | | |
| Assets: | | | | | | | |
| Regulatory Liability Excess Deferred Tax | | $ | 314 | | | $ | 339 | | |
| OPEB | | | 22 | | | | 28 | | |
| CAMT Credit Carryforward | | | — | | | | 106 | | |
| Bad Debt | | | 43 | | | | 57 | | |
| Operating Leases | | | 20 | | | | 22 | | |
| Other | | | 54 | | | | 60 | | |
| Total Assets | | $ | 453 | | | $ | 612 | | |
| Liabilities: | | | | | | | |
| Plant-Related Items | | $ | 4,631 | | | $ | 4,396 | | |
| New Jersey Corporate Business Tax | | | 1,303 | | | | 1,160 | | |
| Pension Costs | | | 199 | | | | 198 | | |
| Taxes Recoverable Through Future Rates (net) | | | 250 | | | | 201 | | |
| GPRC-CEF-EE | | | 214 | | | | 139 | | |
| Conservation Costs | | | 103 | | | | 88 | | |
| Operating Leases | | | 20 | | | | 21 | | |
| Other | | | 152 | | | | 158 | | |
| Total Liabilities | | $ | 6,872 | | | $ | 6,361 | | |
| Summary of Accumulated Deferred Income Taxes: | | | | | | | |
| Net Deferred Income Tax Liabilities | | $ | 6,419 | | | $ | 5,749 | | |
| ITC | | | 58 | | | | 64 | | |
| Net Total Deferred Income Taxes and ITC | | $ | 6,477 | | | $ | 5,813 | | |
| | | | | | | | |
The deferred tax effect of certain assets and liabilities is presented in the table above net of the deferred tax effect associated with the respective regulatory deferrals.
PSEG and PSE&G each provide deferred taxes at the enacted statutory tax rate for all temporary differences between the financial statement carrying amounts and the tax bases of assets and liabilities irrespective of the treatment for rate-making purposes. Management believes that it is probable that the accumulated tax benefits that previously have been treated as a flow-through item to PSE&G customers will be recovered from or refunded to PSE&G’s customers in the future. See Note 6. Regulatory Assets and Liabilities.
The 2018 decrease in the federal tax rate resulted in PSE&G recording excess deferred income taxes. As of December 31, 2024, the remaining balance of excess deferred income taxes is all protected and was approximately $1.3 billion with a Regulatory Liability of approximately $1.8 billion. In 2024, PSE&G returned approximately $202 million of excess deferred income taxes and previously realized and current period deferred income taxes related to tax repair deductions to its customers with a reduction to tax expense of approximately $145 million. The flowback to customers of the excess deferred income taxes and previously realized tax repair deductions resulted in a decrease of approximately $122 million in the Regulatory Liability. The current period tax repair deduction reduces tax expense and revenue and recognizes a Regulatory Asset as PSE&G believes it is probable that the current period tax repair deductions flowed through to the customers will be recovered from customers in the future. See Note 6. Regulatory Assets and Liabilities for additional information.
In August 2022, the Inflation Reduction Act (IRA) was signed into law. The IRA enacted a 15% corporate alternative minimum tax (CAMT), which is based on adjusted financial statement income, effective in 2023, and made certain changes to existing energy tax credit laws.
NOTES TO CONSOLIDATED FINANCIAL STATEMENTS
PSEG has determined that it is not subject to the CAMT for 2023 and 2024 as it is not an applicable corporation in accordance with the statute. In September 2024, the U.S. Treasury issued proposed CAMT regulations on which taxpayers are not required to rely. The proposed CAMT regulations and certain relevant rules remain unclear and require further guidance. As such, the impact of the CAMT on PSEG’s and PSE&G’s financial statements is subject to continued evaluation.
The IRA established a new PTC for existing qualified nuclear generation facilities, effective 2024 through 2032, a new technology neutral energy tax credit, inclusive of both new nuclear units and increases to nuclear generation capacity, effective 2025, and the transferability of energy tax credits, effective 2023. The PTC for a given nuclear facility can be multiplied by five if prevailing wage requirements are met, and the value of the PTC is designed to phase down as the facility’s gross receipts increase. Both the PTC rate and reduction amount are subject to the Internal Revenue Service’s determination of annual inflation.
For the year ended December 31, 2024, PSEG recorded an income tax benefit associated with PTCs of approximately $350 million. PSEG also recorded an $89 million unrecognized tax benefit, which would affect the effective tax rate if recognized, since the PTCs recorded constitute an uncertain tax position and are subject to change when authoritative guidance is issued by the U.S. Treasury, particularly related to the definition of "gross receipts". Such guidance could result in a material increase or decrease in the net PTC recorded. Further, ZEC revenue has been reduced by the estimated PTCs generated from PSEG Power’s Salem 1, Salem 2, and Hope Creek nuclear plants for the year ended December 31, 2024. ZEC revenue will be adjusted based upon the actual value of the PTCs generated. See Note 2. Revenues for additional information.
Despite the issuance of proposed regulations and various Notices that provide interim guidance on numerous provisions of the IRA, many aspects of the IRA, including the PTCs and the CAMT, remain unclear and are in need of further guidance; therefore, the impact of several provisions of the IRA will have on PSEG's and PSE&G's financial statements is subject to continued evaluation.
The enactment of additional federal or state tax legislation and clarification of previously enacted tax laws could impact PSEG’s and PSE&G’s financial statements.
In April 2023, the U.S. Treasury issued Revenue Procedure 2023-15 that provides a safe harbor method of accounting to determine the annual repair tax deduction for gas T&D property. The impact, if any, this may have on PSEG and PSE&G’s financial statements is subject to continued evaluation and has not yet been determined.
As of December 31, 2024, PSEG had a $26 million state NOL and PSE&G had a $108 million New Jersey Corporate Business Tax NOL that are both expected to be fully realized in the future.
PSEG recorded the following amounts related to its unrecognized tax benefits, which were primarily comprised of amounts recorded for PSE&G and PSEG’s other subsidiaries:
| | | | | | | | | | |
| | | | | | | | |
| 2024 | | PSEG | | | PSE&G | | |
| | | Millions | | |
| Total Amount of Unrecognized Tax Benefits as of January 1, 2024 | | $ | 110 | | | $ | 11 | | |
| Increases as a Result of Positions Taken in a Prior Period | | | 18 | | | | — | | |
| Decreases as a Result of Positions Taken in a Prior Period | | | (4 | ) | | | (3 | ) | |
| Increases as a Result of Positions Taken during the Current Period | | | 90 | | | | 1 | | |
| Decreases as a Result of Positions Taken during the Current Period | | | — | | | | — | | |
| Decreases as a Result of Settlements with Taxing Authorities | | | (4 | ) | | | — | | |
| Decreases due to Lapses of Applicable Statute of Limitations | | | (1 | ) | | | (1 | ) | |
| Total Amount of Unrecognized Tax Benefits as of December 31, 2024 | | $ | 209 | | | $ | 8 | | |
| Accumulated Deferred Income Taxes Associated with Unrecognized Tax Benefits | | | (30 | ) | | | (5 | ) | |
| Regulatory Asset—Unrecognized Tax Benefits | | | (1 | ) | | | (1 | ) | |
| Total Amount of Unrecognized Tax Benefits that if Recognized, would Impact the Effective Tax Rate (including Interest and Penalties) | | $ | 178 | | | $ | 2 | | |
| | | | | | | | |
NOTES TO CONSOLIDATED FINANCIAL STATEMENTS
| | | | | | | | | | |
| | | | | | | | |
| 2023 | | PSEG | | | PSE&G | | |
| | | Millions | | |
| Total Amount of Unrecognized Tax Benefits as of January 1, 2023 | | $ | 130 | | | $ | 29 | | |
| Increases as a Result of Positions Taken in a Prior Period | | | 16 | | | | 2 | | |
| Decreases as a Result of Positions Taken in a Prior Period | | | (25 | ) | | | (12 | ) | |
| Increases as a Result of Positions Taken during the Current Period | | | — | | | | — | | |
| Decreases as a Result of Positions Taken during the Current Period | | | — | | | | — | | |
| Decreases as a Result of Settlements with Taxing Authorities | | | (10 | ) | | | (7 | ) | |
| Decreases due to Lapses of Applicable Statute of Limitations | | | (1 | ) | | | (1 | ) | |
| Total Amount of Unrecognized Tax Benefits as of December 31, 2023 | | $ | 110 | | | $ | 11 | | |
| Accumulated Deferred Income Taxes Associated with Unrecognized Tax Benefits | | | (29 | ) | | | (7 | ) | |
| Regulatory Asset—Unrecognized Tax Benefits | | | (2 | ) | | | (2 | ) | |
| Total Amount of Unrecognized Tax Benefits that if Recognized, would Impact the Effective Tax Rate (including Interest and Penalties) | | $ | 79 | | | $ | 2 | | |
| | | | | | | | |
| | | | | | | | | | |
| | | | | | | | |
| 2022 | | PSEG | | | PSE&G | | |
| | | Millions | | |
| Total Amount of Unrecognized Tax Benefits as of January 1, 2022 | | $ | 192 | | | $ | 27 | | |
| Increases as a Result of Positions Taken in a Prior Period | | | 9 | | | | 2 | | |
| Decreases as a Result of Positions Taken in a Prior Period | | | (40 | ) | | | (2 | ) | |
| Increases as a Result of Positions Taken during the Current Period | | | 1 | | | | 1 | | |
| Decreases as a Result of Positions Taken during the Current Period | | | — | | | | — | | |
| Decreases as a Result of Settlements with Taxing Authorities | | | (28 | ) | | | — | | |
| Decreases due to Lapses of Applicable Statute of Limitations | | | (4 | ) | | | 1 | | |
| Total Amount of Unrecognized Tax Benefits as of December 31, 2022 | | $ | 130 | | | $ | 29 | | |
| Accumulated Deferred Income Taxes Associated with Unrecognized Tax Benefits | | | (37 | ) | | | (15 | ) | |
| Regulatory Asset—Unrecognized Tax Benefits | | | (8 | ) | | | (8 | ) | |
| Total Amount of Unrecognized Tax Benefits that if Recognized, would Impact the Effective Tax Rate (including Interest and Penalties) | | $ | 85 | | | $ | 6 | | |
| | | | | | | | |
In 2022, the IRS approved PSEG’s 2018 carryback claim, which resulted in the closure of PSEG’s federal tax years through 2018.
PSEG and its subsidiaries include accrued interest and penalties related to uncertain tax positions required to be recorded as Income Tax Expense in the Consolidated Statements of Operations. Accumulated interest and penalties that are recorded on the Consolidated Balance Sheets on uncertain tax positions were as follows:
| | | | | | | | | | | | | | |
| | | | | | | | | | | |
| | | Accumulated Interest and Penalties
on Uncertain Tax Positions
as of December 31, | | |
| | | 2024 | | | 2023 | | | 2022 | | |
| | | Millions | | |
| PSEG | | $ | 27 | | | $ | 25 | | | $ | 38 | | |
| PSE&G | | $ | — | | | $ | 1 | | | $ | 8 | | |
| | | | | | | | | | | |
NOTES TO CONSOLIDATED FINANCIAL STATEMENTS
It is reasonably possible that total unrecognized tax benefits will significantly increase or decrease within the next twelve months due to either agreements with various taxing authorities upon audit, the expiration of the Statute of Limitations, or other pending tax matters. These potential increases or decreases are as follows:
| | | | | | |
| | | | | |
| Possible Decrease in Total Unrecognized Tax Benefits | | Over the next
12 Months | | |
| | | Millions | | |
| PSEG | | $ | 28 | | |
| PSE&G | | $ | — | | |
| | | | | |
Description of income tax years that remain subject to examination by material jurisdictions, where an examination has not already concluded are:
| | | | | | |
| | | | | | |
| | | PSEG | | PSE&G | |
| United States | | | | | |
| Federal | | 2021-2023 | | N/A | |
| New Jersey | | 2011-2023 | | 2015-2023 | |
| Pennsylvania | | 2017-2023 | | 2021-2023 | |
| Connecticut | | 2021-2022 | | N/A | |
| Maryland | | 2021-2022 | | N/A | |
| New York | | 2017-2023 | | N/A | |
| | | | | | |
Note 21. Accumulated Other Comprehensive Income (Loss), Net of Tax
| | | | | | | | | | | | | | | | | | |
| | | | | | | | | | | | | | |
| PSEG | | Other Comprehensive Income (Loss) | | |
| Accumulated Other Comprehensive Income (Loss) | | Cash Flow Hedges | | | Pension and OPEB Plans | | | Available-for -Sale Securities | | | Total | | |
| | | Millions | | |
| Balance as of December 31, 2021 | | $ | (6 | ) | | $ | (355 | ) | | $ | 11 | | | $ | (350 | ) | |
| Current Period Other Comprehensive Income (Loss) | | | | | | | | | | | | | |
| Other Comprehensive Income (Loss) before Reclassifications | | | — | | | | (72 | ) | | | (158 | ) | | | (230 | ) | |
| Amounts Reclassified from Accumulated Other Comprehensive Income (Loss) | | | 3 | | | | 1 | | | | 26 | | | | 30 | | |
| Net Current Period Other Comprehensive Income (Loss) | | | 3 | | | | (71 | ) | | | (132 | ) | | | (200 | ) | |
| Balance as of December 31, 2022 | | $ | (3 | ) | | $ | (426 | ) | | $ | (121 | ) | | $ | (550 | ) | |
| Other Comprehensive Income (Loss) before Reclassifications | | | 9 | | | | 76 | | | | 61 | | | | 146 | | |
| Amounts Reclassified from Accumulated Other Comprehensive Income (Loss) | | | (3 | ) | | | 248 | | | | (20 | ) | | | 225 | | |
| Net Current Period Other Comprehensive Income (Loss) | | | 6 | | | | 324 | | | | 41 | | | | 371 | | |
| Balance as of December 31, 2023 | | $ | 3 | | | $ | (102 | ) | | $ | (80 | ) | | $ | (179 | ) | |
| Other Comprehensive Income (Loss) before Reclassifications | | | 42 | | | | 19 | | | | (18 | ) | | | 43 | | |
| Amounts Reclassified from Accumulated Other Comprehensive Income (Loss) | | | (9 | ) | | | 7 | | | | 5 | | | | 3 | | |
| Net Current Period Other Comprehensive Income (Loss) | | | 33 | | | | 26 | | | | (13 | ) | | | 46 | | |
| Balance as of December 31, 2024 | | $ | 36 | | | $ | (76 | ) | | $ | (93 | ) | | $ | (133 | ) | |
| | | | | | | | | | | | | | |
NOTES TO CONSOLIDATED FINANCIAL STATEMENTS
| | | | | | | | | | | | | | | | |
| | | | | | | | | | | | | |
| PSEG | | | | Amounts Reclassified from Accumulated Other Comprehensive Income (Loss) to Statement of Operations | | |
| | | | | Year Ended December 31, 2022 | | |
| Description of Amounts Reclassified from Accumulated Other Comprehensive Income (Loss) | | Location of Pre-Tax Amount in Statement of Operations | | Pre-Tax Amount | | | Tax (Expense) Benefit | | | After-Tax Amount | | |
| | | | | Millions | | |
| Cash Flow Hedges | | | | | | | | | | | | |
| Interest Rate Derivatives | | Interest Expense | | $ | (5 | ) | | $ | 2 | | | $ | (3 | ) | |
| Total Cash Flow Hedges | | | | | (5 | ) | | | 2 | | | | (3 | ) | |
| Pension and OPEB Plans | | | | | | | | | | | | |
| Amortization of Prior Service (Cost) Credit | | Net Non-Operating Pension and OPEB Credits (Costs) | | | 21 | | | | (6 | ) | | | 15 | | |
| Amortization of Actuarial Loss | | Net Non-Operating Pension and OPEB Credits (Costs) | | | (22 | ) | | | 6 | | | | (16 | ) | |
| Total Pension and OPEB Plans | | | | | (1 | ) | | | — | | | | (1 | ) | |
| Available-for-Sale Securities | | | | | | | | | | | | |
| Realized Gains (Losses) | | Net Gains (Losses) on Trust Investments | | | (43 | ) | | | 17 | | | | (26 | ) | |
| Total Available-for-Sale Securities | | | | | (43 | ) | | | 17 | | | | (26 | ) | |
| Total | | | | $ | (49 | ) | | $ | 19 | | | $ | (30 | ) | |
| | | | | | | | | | | | | |
| | | | | | | | | | | | | | | | |
| | | | | | | | | | | | | |
| PSEG | | | | Amounts Reclassified from Accumulated Other Comprehensive Income (Loss) to Statement of Operations | | |
| | | | | Year Ended December 31, 2023 | | |
| Description of Amounts Reclassified from Accumulated Other Comprehensive Income (Loss) | | Location of Pre-Tax Amount in Statement of Operations | | Pre-Tax Amount | | | Tax (Expense) Benefit | | | After-Tax Amount | | |
| | | | | Millions | | |
| Cash Flow Hedges | | | | | | | | | | | | |
| Interest Rate Derivatives | | Interest Expense | | $ | 5 | | | $ | (2 | ) | | $ | 3 | | |
| Total Cash Flow Hedges | | | | | 5 | | | | (2 | ) | | | 3 | | |
| Pension and OPEB Plans | | | | | | | | | | | | |
| Amortization of Prior Service (Cost) Credit | | Net Non-Operating Pension and OPEB Credits (Costs) | | | 8 | | | | (2 | ) | | | 6 | | |
| Amortization of Actuarial Loss | | Net Non-Operating Pension and OPEB Credits (Costs) | | | (20 | ) | | | 6 | | | | (14 | ) | |
| Pension Settlement Charge | | Net Non-Operating Pension and OPEB Credits (Costs) | | | (334 | ) | | | 94 | | | | (240 | ) | |
| Total Pension and OPEB Plans | | | | | (346 | ) | | | 98 | | | | (248 | ) | |
| Available-for-Sale Securities | | | | | | | | | | | | |
| Realized Gains (Losses) | | Net Gains (Losses) on Trust Investments | | | 34 | | | | (14 | ) | | | 20 | | |
| Total Available-for-Sale Securities | | | | | 34 | | | | (14 | ) | | | 20 | | |
| Total | | | | $ | (307 | ) | | $ | 82 | | | $ | (225 | ) | |
| | | | | | | | | | | | | |
NOTES TO CONSOLIDATED FINANCIAL STATEMENTS
| | | | | | | | | | | | | | | | |
| | | | | | | | | | | | | |
| PSEG | | | | Amounts Reclassified from Accumulated Other Comprehensive Income (Loss) to Statement of Operations | | |
| | | | | Year Ended December 31, 2024 | | |
| Description of Amounts Reclassified from Accumulated Other Comprehensive Income (Loss) | | Location of Pre-Tax Amount in Statement of Operations | | Pre-Tax Amount | | | Tax (Expense) Benefit | | | After-Tax Amount | | |
| | | | | Millions | | |
| Cash Flow Hedges | | | | | | | | | | | | |
| Interest Rate Derivatives | | Interest Expense | | $ | 13 | | | $ | (4 | ) | | $ | 9 | | |
| Total Cash Flow Hedges | | | | | 13 | | | | (4 | ) | | | 9 | | |
| Pension and OPEB Plans | | | | | | | | | | | | |
| Amortization of Prior Service (Cost) Credit | | Net Non-Operating Pension and OPEB Credits (Costs) | | | — | | | | — | | | | — | | |
| Amortization of Actuarial Loss | | Net Non-Operating Pension and OPEB Credits (Costs) | | | (10 | ) | | | 3 | | | | (7 | ) | |
| Total Pension and OPEB Plans | | | | | (10 | ) | | | 3 | | | | (7 | ) | |
| Available-for-Sale Securities | | | | | | | | | | | | |
| Realized Gains (Losses) | | Net Gains (Losses) on Trust Investments | | | (8 | ) | | | 3 | | | | (5 | ) | |
| Total Available-for-Sale Securities | | | | | (8 | ) | | | 3 | | | | (5 | ) | |
| Total | | | | $ | (5 | ) | | $ | 2 | | | $ | (3 | ) | |
| | | | | | | | | | | | | |
Note 22. Earnings Per Share (EPS) and Dividends
EPS
Basic EPS is calculated by dividing Net Income (Loss) by the weighted average number of shares of common stock outstanding. Diluted EPS is calculated by dividing Net Income (Loss) by the weighted average number of shares of common stock outstanding, plus dilutive potential shares related to PSEG’s stock based compensation. For additional information on PSEG’s stock compensation plans see Note 18. Stock Based Compensation. The following table shows the effect of these dilutive potential shares on the weighted average number of shares outstanding used in calculating diluted EPS:
| | | | | | | | | | | | | | | | | | | | | | | | | | |
| | | | | | | | | | | | | | | | | | | | |
| | | Years Ended December 31, | | |
| | | 2024 | | | 2023 | | | 2022 | | |
| | | Basic | | | Diluted | | | Basic | | | Diluted | | | Basic | | | Diluted | | |
| EPS Numerator: | | | | | | | | | | | | | | | | | | | |
| (Millions) | | | | | | | | | | | | | | | | | | | |
| Net Income | | $ | 1,772 | | | $ | 1,772 | | | $ | 2,563 | | | $ | 2,563 | | | $ | 1,031 | | | $ | 1,031 | | |
| EPS Denominator: | | | | | | | | | | | | | | | | | | | |
| (Millions) | | | | | | | | | | | | | | | | | | | |
| Weighted Average Common Shares Outstanding | | | 498 | | | | 498 | | | | 498 | | | | 498 | | | | 498 | | | | 498 | | |
| Effect of Stock Based Compensation Awards | | | — | | | | 2 | | | | — | | | | 2 | | | | — | | | | 3 | | |
| Total Shares | | | 498 | | | | 500 | | | | 498 | | | | 500 | | | | 498 | | | | 501 | | |
| EPS: | | | | | | | | | | | | | | | | | | | |
| Net Income | | $ | 3.56 | | | $ | 3.54 | | | $ | 5.15 | | | $ | 5.13 | | | $ | 2.07 | | | $ | 2.06 | | |
| | | | | | | | | | | | | | | | | | | | |
From time to time, PSEG may repurchase shares to satisfy obligations under equity compensation awards and repurchase shares to satisfy purchases by employees under the ESPP.
For additional information on all the types of long-term incentive awards, see Note 18. Stock Based Compensation.
NOTES TO CONSOLIDATED FINANCIAL STATEMENTS
During 2022, PSEG completed a $500 million share repurchase program authorized by the Board of Directors in September 2021 resulting in an aggregate repurchase of approximately 7.4 million shares.
Common Stock Dividends
| | | | | | | | | | | | | | |
| | | | | | | | | | | |
| | | Years Ended December 31, | | |
| Dividend Payments on Common Stock | | 2024 | | | 2023 | | | 2022 | | |
| Per Share | | $ | 2.40 | | | $ | 2.28 | | | $ | 2.16 | | |
| in Millions | | $ | 1,196 | | | $ | 1,137 | | | $ | 1,079 | | |
| | | | | | | | | | | |
On February 11, 2025, PSEG’s Board of Directors approved a $0.63 per share common stock dividend for the first quarter of 2025.
Note 23. Financial Information by Business Segment
Basis of Organization
PSEG’s and PSE&G’s operating segments were determined by management in accordance with GAAP. These segments were determined based on how the Chief Operating Decision Maker (CODM) (the Chief Executive Officer (CEO) for PSEG and PSE&G), measures performance based on segment Net Income. The CODM uses Net Income for each segment in the annual budget and forecasting process. The CODM considers budget-to-actual variances on a monthly basis when making decisions about the allocation of operating and capital resources to each segment.
Based on management’s analysis, PSE&G and PSEG Power were determined to be operating segments of PSEG. The operating segments were determined based on the nature of regulated and unregulated operations and services provided by the respective segments. As discussed below, PSEG's reportable segments are PSE&G and PSEG Power & Other, which includes amounts related to the PSEG Power operating segment as well as amounts applicable to Energy Holdings, PSEG LI, PSEG (parent corporation) and Services, which do not meet the definition of operating segments individually or in the aggregate and are immaterial to PSEG’s consolidated assets and results.
PSE&G
The PSE&G reportable segment earns revenues from its tariffs, under which it provides electric transmission and electric and gas distribution services to residential, commercial and industrial customers in New Jersey. The rates charged for electric transmission are regulated by FERC while the rates charged for electric and gas distribution are regulated by the BPU. Revenues are also earned from several other activities such as investments in EE equipment on customers’ premises, solar investments, the appliance service business and other miscellaneous services.
PSEG Power & Other
This reportable segment is comprised primarily of PSEG Power which earns revenues primarily by selling energy and capacity into the markets for these products. PSEG Power also enters into bilateral contracts for energy, gas and other energy-related contracts to optimize the value of its portfolio of generating assets and its gas supply obligations. PSEG Power’s Salem 1, Salem 2 and Hope Creek nuclear plants receive ZEC revenue from the EDCs in New Jersey including PSE&G.
This reportable segment also includes amounts applicable to PSEG LI, which generates revenues under its contract with LIPA, primarily for the recovery of costs when Servco is a principal in the transaction (see Note 4. Variable Interest Entity for additional information) as well as fixed and variable fee components under the contract, and Energy Holdings which holds an immaterial portfolio of remaining lease investments. Other also includes amounts applicable to PSEG (parent corporation) and Services.
NOTES TO CONSOLIDATED FINANCIAL STATEMENTS
| | | | | | | | | | | | | | | | | | |
| | | | | | | | | | | | | | |
| | | PSE&G | | | PSEG Power & Other (A) | | | Eliminations (B) | | | Consolidated
Total | | |
| | | Millions |
| Year Ended December 31, 2024 | | | | | | | | | | | | | |
| Operating Revenues | | $ | 8,449 | | | $ | 2,807 | | | $ | (966 | ) | | $ | 10,290 | | |
| Energy Costs | | | 3,189 | | | | 1,170 | | | | (966 | ) | | | 3,393 | | |
| Controllable Operation and Maintenance (C) | | | 1,317 | | | | 771 | | | | — | | | | 2,088 | | |
| Depreciation and Amortization | | | 1,025 | | | | 157 | | | | — | | | | 1,182 | | |
| Income from Equity Method Investments | | | — | | | | 1 | | | | — | | | | 1 | | |
| Interest Income | | | 14 | | | | 23 | | | | (5 | ) | | | 32 | | |
| Interest Expense | | | 582 | | | | 305 | | | | (5 | ) | | | 882 | | |
| Income Tax Expense (Benefit) | | | 298 | | | | (245 | ) | | | — | | | | 53 | | |
| Other Segment Items (D) | | | 505 | | | | 448 | | | | — | | | | 953 | | |
| Net Income | | $ | 1,547 | | | $ | 225 | | | $ | — | | | $ | 1,772 | | |
| Gross Additions to Long-Lived Assets | | $ | 2,921 | | | $ | 459 | | | $ | — | | | $ | 3,380 | | |
| As of December 31, 2024 | | | | | | | | | | | | | |
| Total Assets | | $ | 46,364 | | | $ | 8,673 | | | $ | (397 | ) | | $ | 54,640 | | |
| Investments in Equity Method Subsidiaries | | $ | — | | | $ | 21 | | | $ | — | | | $ | 21 | | |
| | | | | | | | | | | | | | |
| | | | | | | | | | | | | | | | | | |
| | | | | | | | | | | | | | |
| | | PSE&G | | | PSEG Power & Other (A) | | | Eliminations (B) | | | Consolidated
Total | | |
| | | Millions |
| Year Ended December 31, 2023 | | | | | | | | | | | | | |
| Operating Revenues | | $ | 7,807 | | | $ | 4,533 | | | $ | (1,103 | ) | | $ | 11,237 | | |
| Energy Costs | | | 3,010 | | | | 1,353 | | | | (1,103 | ) | | | 3,260 | | |
| Controllable Operation and Maintenance (C) | | | 1,193 | | | | 713 | | | | — | | | | 1,906 | | |
| Depreciation and Amortization | | | 980 | | | | 155 | | | | — | | | | 1,135 | | |
| Income from Equity Method Investments | | | — | | | | 1 | | | | — | | | | 1 | | |
| Interest Income | | | 19 | | | | 38 | | | | (4 | ) | | | 53 | | |
| Interest Expense | | | 493 | | | | 259 | | | | (4 | ) | | | 748 | | |
| Income Tax Expense (Benefit) | | | 160 | | | | 358 | | | | — | | | | 518 | | |
| Other Segment Items (D) | | | 475 | | | | 686 | | | | — | | | | 1,161 | | |
| Net Income | | $ | 1,515 | | | $ | 1,048 | | | $ | — | | | $ | 2,563 | | |
| Gross Additions to Long-Lived Assets | | $ | 2,998 | | | $ | 327 | | | $ | — | | | $ | 3,325 | | |
| As of December 31, 2023 | | | | | | | | | | | | | |
| Total Assets | | $ | 42,873 | | | $ | 8,407 | | | $ | (539 | ) | | $ | 50,741 | | |
| Investments in Equity Method Subsidiaries | | $ | — | | | $ | 17 | | | $ | — | | | $ | 17 | | |
| | | | | | | | | | | | | | |
NOTES TO CONSOLIDATED FINANCIAL STATEMENTS
| | | | | | | | | | | | | | | | | | |
| | | | | | | | | | | | | | |
| | | PSE&G | | | PSEG Power & Other (A) | | | Eliminations (B) | | | Consolidated
Total | | |
| | | Millions |
| Year Ended December 31, 2022 | | | | | | | | | | | | | |
| Operating Revenues | | $ | 7,935 | | | $ | 3,266 | | | $ | (1,401 | ) | | $ | 9,800 | | |
| Energy Costs | | | 3,270 | | | | 2,149 | | | | (1,401 | ) | | | 4,018 | | |
| Controllable Operation and Maintenance (C) | | | 1,219 | | | | 712 | | | | — | | | | 1,931 | | |
| Depreciation and Amortization | | | 935 | | | | 165 | | | | — | | | | 1,100 | | |
| Income from Equity Method Investments | | | — | | | | 14 | | | | — | | | | 14 | | |
| Interest Income | | | 19 | | | | 13 | | | | (1 | ) | | | 31 | | |
| Interest Expense | | | 427 | | | | 202 | | | | (1 | ) | | | 628 | | |
| Income Tax Expense (Benefit) | | | 267 | | | | (296 | ) | | | — | | | | (29 | ) | |
| Other Segment Items (D) | | | 271 | | | | 895 | | | | — | | | | 1,166 | | |
| Net Income (Loss) | | $ | 1,565 | | | $ | (534 | ) | | $ | — | | | $ | 1,031 | | |
| Gross Additions to Long-Lived Assets | | $ | 2,590 | | | $ | 298 | | | $ | — | | | $ | 2,888 | | |
| As of December 31, 2022 | | | | | | | | | | | | | |
| Total Assets | | $ | 39,960 | | | $ | 9,285 | | | $ | (527 | ) | | $ | 48,718 | | |
| Investments in Equity Method Subsidiaries | | $ | — | | | $ | 306 | | | $ | — | | | $ | 306 | | |
| | | | | | | | | | | | | | |
(A)PSEG Power & Other results include net after-tax gains (losses) of $(151) million, $959 million and $(457) million in the years ended December 31, 2024, 2023 and 2022, respectively, related to the impacts of non-trading commodity mark-to-market activity, which consists of the financial impact from positions with future delivery dates.
(B)Intercompany eliminations primarily relate to intercompany transactions between PSE&G and PSEG Power. For a further discussion of the intercompany transactions between PSE&G and PSEG Power, see Note 2. Revenues and Note 24. Related-Party Transactions.
(C)Controllable Operation and Maintenance expense includes amounts for labor and benefit costs, materials, outside services and other normal operational costs, including intersegment amounts, and is the significant expense information that is regularly provided to the CODM.
(D)Other Segment Items include all other items to reconcile to Net Income. This includes all other O&M (primarily related to clause related expenditures at PSE&G and expenditures for transactions in which Servco acts as principal and controls the services provided to LIPA at PSEG Power & Other, each of which offset corresponding revenue amounts in those segments), losses on asset dispositions and impairments, non operating pension and OPEB credits and costs, gains and losses on trust investments and other income and deductions. This includes a $239 million after-tax pension charge due to the remeasurement of the qualified pension plans as a result of the pension settlement transaction in 2023 and after-tax impairments of $92 million related to certain Energy Holdings investments and additional adjustments related to the sale of PSEG Power’s fossil generation assets in 2022. See Note 3. Asset Dispositions and Impairments for additional information.
NOTES TO CONSOLIDATED FINANCIAL STATEMENTS
Note 24. Related-Party Transactions
The following discussion relates to intercompany transactions, which are eliminated during the PSEG consolidation process in accordance with GAAP.
PSE&G
The financial statements for PSE&G include transactions with related parties presented as follows:
| | | | | | | | | | | | | | |
| | | | | | | | | | | |
| | | Years Ended December 31, | | |
| Related Party Transactions | | 2024 | | | 2023 | | | 2022 | | |
| | | Millions | | |
| Billings from Affiliates: | | | | | | | | | | |
| Net Billings from PSEG Power (A) | | $ | 959 | | | $ | 1,065 | | | $ | 1,388 | | |
| Administrative Billings from Services (B) | | | 516 | | | $ | 443 | | | | 445 | | |
| Total Billings from Affiliates | | $ | 1,475 | | | $ | 1,508 | | | $ | 1,833 | | |
| | | | | | | | | | | |
| | | | | | | | | | |
| | | | | | | | |
| | | Years Ended December 31, | | |
| Related Party Transactions | | 2024 | | | 2023 | | |
| | | Millions | | |
| Payable to PSEG Power (A) | | $ | 209 | | | $ | 264 | | |
| Payable to Services (B) | | | 116 | | | | 121 | | |
| Net Payable to PSEG (C) | | | 37 | | | | 119 | | |
| Accounts Payable—Affiliated Companies | | $ | 362 | | | $ | 504 | | |
| Working Capital Advances to Services (D) | | $ | 33 | | | $ | 33 | | |
| Long-Term Accrued Taxes (Receivable) Payable | | $ | (2 | ) | | $ | 2 | | |
| | | | | | | | |
(A)PSE&G has entered into a requirements contract with PSEG Power under which PSEG Power provides the gas supply services needed to meet PSE&G’s BGSS and other contractual requirements. In addition, PSEG Power sells ZECs to PSE&G from its nuclear units under the ZEC program as approved by the BPU. The rates in the BGSS contract and for the ZEC sales are prescribed by the BPU. BGSS sales are billed and settled on a monthly basis. ZEC sales are billed on a monthly basis and settled annually following completion of each energy year. In addition, PSEG Power and PSE&G provide certain technical services for each other generally at cost in compliance with FERC and BPU affiliate rules.
(B)Services provides and bills administrative services to PSE&G at cost. In addition, PSE&G has other payables to Services, including amounts related to certain common costs, which Services pays on behalf of PSE&G.
(C)PSEG pays net wages and payroll taxes and receives reimbursement from its affiliated companies for their respective portions. PSEG and its subsidiaries file a consolidated federal income tax return and PSEG and PSE&G file state income tax returns, some of which are combined or unitary. Income taxes are allocated to PSEG’s subsidiaries in accordance with a tax allocation agreement whereby each PSEG subsidiary’s current and deferred tax expense is computed on a stand-alone basis. Each subsidiary is allocated an amount of tax similar to that which would be paid if it filed a separate income tax return, except for certain tax attributes and state apportionment results. If the result is a net tax liability, such amount shall be paid to PSEG. If there are NOLs and/or tax credits, the subsidiary shall receive payment for the tax savings from PSEG to the extent that PSEG is able to utilize those benefits.
(D)PSE&G has advanced working capital to Services. The amount is included in Other Noncurrent Assets on PSE&G’s Consolidated Balance Sheets.
ITEM 9. CHANGES IN AND DISAGREEMENTS WITH ACCOUNTANTS ON ACCOUNTING AND FINANCIAL DISCLOSURE
None.
ITEM 9A. CONTROLS AND PROCEDURES
Disclosure Controls and Procedures
PSEG and PSE&G
We have established and maintain disclosure controls and procedures as defined under Rule 13a-15(e) and 15d-15(e) promulgated under the Securities Exchange Act of 1934, as amended (the “Exchange Act”) that are designed to provide reasonable assurance that information required to be disclosed in the reports that are filed or submitted under the Exchange Act is recorded, processed, summarized and reported and is accumulated and communicated to the Chief Executive Officer (CEO) and Chief Financial Officer (CFO) of each respective company, as appropriate, by others within the entities to allow timely decisions regarding required disclosure. We have established a disclosure committee which includes several key management employees and which reports directly to the CFO and CEO of each of PSEG and PSE&G. The committee monitors and evaluates the effectiveness of these disclosure controls and procedures. The CFO and CEO of each of PSEG and PSE&G have evaluated the effectiveness of the disclosure controls and procedures and, based on this evaluation, have concluded that disclosure controls and procedures at each respective company were effective at a reasonable assurance level as of the end of the period covered by the report.
Internal Controls
PSEG and PSE&G
We have conducted assessments of our internal control over financial reporting as of December 31, 2024, as required by Section 404 of the Sarbanes-Oxley Act, using the framework promulgated by the Committee of Sponsoring Organizations of the Treadway Commission, commonly referred to as “COSO.” Managements’ reports on PSEG’s and PSE&G’s internal control over financial reporting are included on pages 160 and 161, respectively. The Independent Registered Public Accounting Firm’s report with respect to the effectiveness of PSEG’s internal control over financial reporting is included on page 162. Management has concluded that internal control over financial reporting is effective as of December 31, 2024.
We continually review our disclosure controls and procedures and make changes, as necessary, to ensure the quality of our financial reporting. There have been no changes in internal control over financial reporting that occurred during the fourth quarter of 2024 that have materially affected, or are reasonably likely to materially affect, each registrant’s internal control over financial reporting.
ITEM 9B. OTHER INFORMATION
Director and Officer Rule 10b5-1 and non-Rule 10b5-1 Trading Plans
During the three months ended December 31, 2024, none of PSEG’s directors or officers adopted, terminated or modified a Rule 10b5-1 trading arrangement or non-Rule 10b5-1 trading arrangement (as such terms are defined in Item 408 of Regulation S-K of the Securities Act of 1933).
ITEM 9C. DISCLOSURE REGARDING FOREIGN JURISDICTIONS THAT PREVENT INSPECTIONS
Not applicable.
MANAGEMENT REPORT ON INTERNAL CONTROL OVER
FINANCIAL REPORTING—PSEG
Management of Public Service Enterprise Group Incorporated (PSEG) is responsible for establishing and maintaining effective internal control over financial reporting and for the assessment of the effectiveness of internal control over financial reporting. As defined by the SEC in Rules 13a-15(f) and 15d-15(f) under the Securities Exchange Act of 1934, internal control over financial reporting is a process designed by, or under the supervision of, the company’s principal executive and principal financial officers, or persons performing similar functions, and implemented by the company’s management and other personnel, with oversight by the Audit Committee of the Board of Directors to provide reasonable assurance regarding the reliability of financial reporting and the preparation of financial statements for external purposes in accordance with accounting principles generally accepted in the United States of America (generally accepted accounting principles).
PSEG’s internal control over financial reporting includes those policies and procedures that (1) pertain to the maintenance of records that, in reasonable detail, accurately and fairly reflect the transactions and dispositions of PSEG’s assets; (2) provide reasonable assurance that transactions are recorded as necessary to permit preparation of financial statements in accordance with generally accepted accounting principles, and that receipts and expenditures of PSEG are being made only in accordance with authorizations of PSEG’s management and directors; and (3) provide reasonable assurance regarding prevention or timely detection of unauthorized acquisition, use or disposition of PSEG’s assets that could have a material effect on the financial statements.
In connection with the preparation of PSEG’s annual financial statements, management of PSEG has undertaken an assessment, which includes the design and operational effectiveness of PSEG’s internal control over financial reporting based on criteria established in the Internal Control - Integrated Framework (2013) issued by the Committee of Sponsoring Organizations of the Treadway Commission, commonly referred to as “COSO”. The COSO framework is based upon five integrated components of control: control environment, risk assessment, control activities, information and communications and ongoing monitoring.
Because of its inherent limitations, internal control over financial reporting may not prevent or detect misstatements. Also, projection of any evaluation of effectiveness to future periods is subject to the risk that controls may become inadequate because of changes in conditions, or that the degree of compliance with the policies or procedures may deteriorate.
Based on the assessment performed, management has concluded that PSEG’s internal control over financial reporting is effective and provides reasonable assurance regarding the reliability of PSEG’s financial reporting and the preparation of its financial statements as of December 31, 2024 in accordance with generally accepted accounting principles. Further, management has not identified any material weaknesses in internal control over financial reporting as of December 31, 2024.
PSEG’s external auditors, Deloitte & Touche LLP, have audited PSEG’s financial statements for the year ended December 31, 2024 included in this annual report on Form 10-K and, as part of that audit, have issued a report on the effectiveness of PSEG’s internal control over financial reporting, a copy of which is included in this annual report on Form 10-K.
| |
/s/ RALPH A. LAROSSA | |
Chief Executive Officer | |
| |
/s/ DANIEL J. CREGG | |
Chief Financial Officer | |
February 25, 2025 | |
MANAGEMENT REPORT ON INTERNAL CONTROL OVER
FINANCIAL REPORTING—PSE&G
Management of Public Service Electric and Gas Company (PSE&G) is responsible for establishing and maintaining effective internal control over financial reporting and for the assessment of the effectiveness of internal control over financial reporting. As defined by the SEC in Rules 13a-15(f) and 15d-15(f) under the Securities Exchange Act of 1934, internal control over financial reporting is a process designed by, or under the supervision of, the company’s principal executive and principal financial officers, or persons performing similar functions, and implemented by the company’s management and other personnel, with oversight by the Audit Committee of the Board of Directors of its parent, Public Service Enterprise Group Incorporated, to provide reasonable assurance regarding the reliability of financial reporting and the preparation of financial statements for external purposes in accordance with accounting principles generally accepted in the United States of America (generally accepted accounting principles).
PSE&G’s internal control over financial reporting includes those policies and procedures that (1) pertain to the maintenance of records that, in reasonable detail, accurately and fairly reflect the transactions and dispositions of PSE&G’s assets; (2) provide reasonable assurance that transactions are recorded as necessary to permit preparation of financial statements in accordance with generally accepted accounting principles, and that receipts and expenditures of PSE&G are being made only in accordance with authorizations of PSE&G’s management and directors; and (3) provide reasonable assurance regarding prevention or timely detection of unauthorized acquisition, use or disposition of PSE&G’s assets that could have a material effect on the financial statements.
In connection with the preparation of PSE&G’s annual financial statements, management of PSE&G has undertaken an assessment, which includes the design and operational effectiveness of PSE&G’s internal control over financial reporting based on criteria established in the Internal Control - Integrated Framework (2013) issued by the Committee of Sponsoring Organizations of the Treadway Commission, commonly referred to as “COSO”. The COSO framework is based upon five integrated components of control: control environment, risk assessment, control activities, information and communications and ongoing monitoring.
Because of its inherent limitations, internal control over financial reporting may not prevent or detect misstatements. Also, projection of any evaluation of effectiveness to future periods is subject to the risk that controls may become inadequate because of changes in conditions, or that the degree of compliance with the policies or procedures may deteriorate.
Based on the assessment performed, management has concluded that PSE&G’s internal control over financial reporting is effective and provides reasonable assurance regarding the reliability of PSE&G’s financial reporting and the preparation of its financial statements as of December 31, 2024 in accordance with generally accepted accounting principles. Further, management has not identified any material weaknesses in internal control over financial reporting as of December 31, 2024.
| |
/s/ RALPH A. LAROSSA | |
Chief Executive Officer | |
| |
/s/ DANIEL J. CREGG | |
Chief Financial Officer | |
February 25, 2025 | |
REPORT OF INDEPENDENT REGISTERED PUBLIC ACCOUNTING FIRM
To the Board of Directors and Stockholders of
Public Service Enterprise Group Incorporated
Opinion on Internal Control over Financial Reporting
We have audited the internal control over financial reporting of Public Service Enterprise Group Incorporated and subsidiaries (the “Company” or "PSEG") as of December 31, 2024, based on criteria established in Internal Control — Integrated Framework (2013) issued by the Committee of Sponsoring Organizations of the Treadway Commission (COSO). In our opinion, the Company maintained, in all material respects, effective internal control over financial reporting as of December 31, 2024, based on criteria established in Internal Control — Integrated Framework (2013) issued by COSO.
We have also audited, in accordance with the standards of the Public Company Accounting Oversight Board (United States) (PCAOB), the consolidated financial statements and the consolidated financial statement schedule listed in the Index at Item 15(B)(a) as of and for the year ended December 31, 2024, of the Company and our report dated February 25, 2025, expressed an unqualified opinion on those financial statements.
Basis for Opinion
The Company’s management is responsible for maintaining effective internal control over financial reporting and for its assessment of the effectiveness of internal control over financial reporting, included in the accompanying Management Report on Internal Control Over Financial Reporting - PSEG. Our responsibility is to express an opinion on the Company’s internal control over financial reporting based on our audit. We are a public accounting firm registered with the PCAOB and are required to be independent with respect to the Company in accordance with the U.S. federal securities laws and the applicable rules and regulations of the Securities and Exchange Commission and the PCAOB
We conducted our audit in accordance with the standards of the PCAOB. Those standards require that we plan and perform the audit to obtain reasonable assurance about whether effective internal control over financial reporting was maintained in all material respects. Our audit included obtaining an understanding of internal control over financial reporting, assessing the risk that a material weakness exists, testing and evaluating the design and operating effectiveness of internal control based on the assessed risk, and performing such other procedures as we considered necessary in the circumstances. We believe that our audit provides a reasonable basis for our opinion.
Definition and Limitations of Internal Control over Financial Reporting
A company’s internal control over financial reporting is a process designed to provide reasonable assurance regarding the reliability of financial reporting and the preparation of financial statements for external purposes in accordance with generally accepted accounting principles. A company’s internal control over financial reporting includes those policies and procedures that (1) pertain to the maintenance of records that, in reasonable detail, accurately and fairly reflect the transactions and dispositions of the assets of the company; (2) provide reasonable assurance that transactions are recorded as necessary to permit preparation of financial statements in accordance with generally accepted accounting principles, and that receipts and expenditures of the company are being made only in accordance with authorizations of management and directors of the company; and (3) provide reasonable assurance regarding prevention or timely detection of unauthorized acquisition, use, or disposition of the company’s assets that could have a material effect on the financial statements.
Because of its inherent limitations, internal control over financial reporting may not prevent or detect misstatements. Also, projections of any evaluation of effectiveness to future periods are subject to the risk that controls may become inadequate because of changes in conditions, or that the degree of compliance with the policies or procedures may deteriorate.
/s/ DELOITTE & TOUCHE LLP
Morristown, New Jersey
February 25, 2025
PART III
ITEM 10. DIRECTORS, EXECUTIVE OFFICERS AND CORPORATE GOVERNANCE
Executive Officers
PSEG
The information required by Item 10 of Form 10-K with respect to executive officers is set forth in Part I. Information About Our Executive Officers (PSEG).
PSE&G
Omitted pursuant to conditions set forth in General Instruction I of Form 10-K.
Directors
PSEG
The information required by Item 10 of Form 10-K with respect to (i) present directors of PSEG who are nominees for election as directors at PSEG’s 2025 Annual Meeting of Stockholders, (ii) the director nomination process, and (iii) the composition of the Audit Committee of the Board, is set forth under the headings “Nominees For Director-Biographical Information,” “Overview of Board Nominees-Board Refreshment and Tenure,” and “-Board Membership Selection,” and “Corporate Governance-Board Committees,” respectively, in PSEG’s definitive Proxy Statement for such Annual Meeting of Stockholders, which definitive Proxy Statement is expected to be filed with the U.S. Securities and Exchange Commission (SEC) on or about March 13, 2025 and which information set forth under said heading is incorporated herein by this reference thereto.
PSE&G
Omitted pursuant to conditions set forth in General Instruction I of Form 10-K.
Standards of Conduct
Our Standards of Conduct (Standards) is a code of ethics applicable to us and our subsidiaries. The Standards are an integral part of our business conduct compliance program and embody our commitment to conduct operations in accordance with the highest legal and ethical standards. The Standards apply to all of our directors and employees (including PSE&G’s, PSEG Power’s, Energy Holdings’ and Services’ respective principal executive officer, principal financial officer, principal accounting officer or Controller and persons performing similar functions). Each such person is responsible for understanding and complying with the Standards. The Standards are posted on our website, https://corporate.pseg.com/aboutpseg/leadershipandgovernance/standardsofconduct You can get a free copy of the Standards by making an oral or written request directed to:
Vice President, Investor Relations
PSEG Services Corporation
80 Park Plaza, 4th Floor
Newark, NJ 07102
Telephone (973) 430-6565
The Standards establish a set of common expectations for behavior to which each employee must adhere in dealings with investors, customers, fellow employees, competitors, vendors, government officials, the media and all others who may associate their words and actions with us. The Standards have been developed to provide reasonable assurance that, in conducting our business, employees behave ethically and in accordance with the law and do not take advantage of investors, regulators or customers through manipulation, abuse of confidential information or misrepresentation of material facts.
We will post on our website, https://corporate.pseg.com/aboutpseg/leadershipandgovernance/standardsofconduct:
•Any amendment (other than one that is technical, administrative or non-substantive) that we adopt to our Standards; and
•Any grant by us of a waiver from the Standards that applies to any director or executive officer and that relates to any element enumerated by the SEC.
In 2024, we did not grant any waivers to the Standards.
Insider Trading Policies and Procedures
We have adopted insider trading policies and procedures governing transactions in securities of PSEG and its subsidiaries by us, our directors, officers and employees that are reasonably designed to promote compliance with insider trading laws, rules and regulations, and any listing standards applicable to us. A copy of our insider trading policies and procedures is filed as Exhibit 19 to this Annual Report on Form 10-K.
ITEM 11. EXECUTIVE COMPENSATION
PSEG
The information required by Item 11 of Form 10-K is set forth in PSEG’s definitive Proxy Statement for the 2025 Annual Meeting of Stockholders which definitive Proxy Statement is expected to be filed with the SEC on or about March 13, 2025 and such information that is responsive to this Item 11, except for information set forth under the heading “Pay Versus Performance,” is incorporated herein by this reference thereto.
PSE&G
Omitted pursuant to conditions set forth in General Instruction I of Form 10-K.
ITEM 12. SECURITY OWNERSHIP OF CERTAIN BENEFICIAL OWNERS AND MANAGEMENT AND RELATED STOCKHOLDER MATTERS
PSEG
The information required by Item 12 of Form 10-K with respect to directors, executive officers and certain beneficial owners is set forth under the heading “Security Ownership of Directors, Management and Certain Beneficial Owners” in PSEG’s definitive Proxy Statement for the 2025 Annual Meeting of Stockholders which definitive Proxy Statement is expected to be filed with the SEC on or about March 13, 2025 and such information set forth under such heading is incorporated herein by this reference thereto.
For information relating to securities authorized for issuance under equity compensation plans, see Item 5. Market for Registrant’s Common Equity, Related Stockholder Matters and Issuer Purchases of Equity Securities.
PSE&G
Omitted pursuant to conditions set forth in General Instruction I of Form 10-K.
ITEM 13. CERTAIN RELATIONSHIPS AND RELATED TRANSACTIONS, AND DIRECTOR INDEPENDENCE
PSEG
The information required by Item 13 of Form 10-K is set forth under the heading “Corporate Governance-Certain Relationships and Related Person Transactions” in PSEG’s definitive Proxy Statement for the 2025 Annual Meeting of Stockholders which definitive Proxy Statement is expected to be filed with the SEC on or about March 13, 2025 and such information set forth under such heading is incorporated herein by this reference thereto.
PSE&G
Omitted pursuant to conditions set forth in General Instruction I of Form 10-K.
ITEM 14. PRINCIPAL ACCOUNTANT FEES AND SERVICES
The information required by Item 14 of Form 10-K is set forth under the heading “Oversight of the Independent Auditor-Fees Billed by Deloitte for 2024 and 2023” in PSEG’s definitive Proxy Statement for the 2025 Annual Meeting of Stockholders which definitive Proxy Statement is expected to be filed with the SEC on or about March 13, 2025. Such information set forth under such heading is incorporated herein by this reference hereto.
PART IV
ITEM 15. EXHIBITS, FINANCIAL STATEMENT SCHEDULES
(A)The following Financial Statements are filed as a part of this report:
a.Public Service Enterprise Group Incorporated’s Consolidated Balance Sheets as of December 31, 2024 and 2023 and the related Consolidated Statements of Operations, Comprehensive Income, Cash Flows and Stockholders’ Equity for the three years ended December 31, 2024 on pages 68 through 73.
b.Public Service Electric and Gas Company’s Consolidated Balance Sheets as of December 31, 2024 and 2023 and the related Consolidated Statements of Operations, Comprehensive Income, Cash Flows and Common Stockholder’s Equity for the three years ended December 31, 2024 on pages 74 through 79.
(B)The following documents are filed as a part of this report:
a.PSEG’s Financial Statement Schedules:
Schedule II—Valuation and Qualifying Accounts for each of the three years in the period ended December 31, 2024 (page 171).
b.PSE&G’s Financial Statement Schedules:
Schedule II—Valuation and Qualifying Accounts for each of the three years in the period ended December 31, 2024 (page 171).
Schedules other than those listed above are omitted for the reason that they are not required or are not applicable, or the required information is shown in the consolidated financial statements or notes thereto.
(C)The following documents are filed as part of this report:
| | |
| LIST OF EXHIBITS: |
a. | | PSEG: |
3a | | Certificate of Incorporation Public Service Enterprise Group Incorporated(1) |
3b | | Certificate of Amendment of Certificate of Incorporation of Public Service Enterprise Group Incorporated, effective April 23, 1987(2) |
3c | | Certificate of Amendment of Certificate of Incorporation of Public Service Enterprise Group Incorporated, effective April 20, 2007(3) |
3d | | By-Laws of Public Service Enterprise Group Incorporated effective February 14, 2023(4) |
4a | | Indenture between Public Service Enterprise Group Incorporated and First Union National Bank (U.S. Bank National Association, successor), as Trustee, dated January 1, 1998 providing for Deferrable Interest Subordinated Debentures in Series (relating to Quarterly Preferred Securities)(5) |
4b | | Indenture between Public Service Enterprise Group Incorporated and U.S. Bank National Association (as successor to First Union National Bank), as Trustee, dated November 1, 1998 providing for Senior Debt Securities(6) |
4c | | Description of Common Stock(7) |
10a(1) | | Supplemental Executive Retirement Income Plan, amended effective July 1, 2019(8) |
| | |
| LIST OF EXHIBITS: |
10a(2) | | Retirement Income Reinstatement Plan for Non-Represented Employees, Amended effective July 1, 2019(9) |
10a(3) | | 2007 Equity Compensation Plan for Outside Directors, amended and restated effective November 19, 2019 (10) |
10a(4) | | Deferred Compensation Plan for Directors, amended effective January 1, 2019(11) |
10a(5) | | Key Executive Severance Plan of Public Service Enterprise Group Incorporated, amended effective November 18, 2024 (12) |
10a(6) | | Stock Plan for Outside Directors, as amended(13) |
10a(7) | | Compensation Plan for Outside Directors(14) |
10a(8) | | 2004 Long-Term Incentive Plan, amended and restated as of April 16, 2013(15) |
10a(9) | | Form of Agreement for Advancement of Expenses with Outside Directors(16) |
10a(10) | | Agreement with Tamara L. Linde dated September 16, 2024(17) |
10a(11) | | Agreement with Daniel J. Cregg dated September 22, 2015 |
10a(12) | | Clawback Practice, effective February 20, 2018(18) |
10a(13) | | Agreement with Ralph A. LaRossa dated April 18, 2022(19) |
10a(14) | | 2021 Long-Term Incentive Plan, effective April 20, 2021(20) |
10a(15) | | 2021 Equity Compensation Plan for Outside Directors, effective April 20, 2021(21) |
10a(16) | | Agreement with Kim C. Hanemann dated May 21, 2021(22) |
10a(17) | | Retention Award for Daniel J. Cregg dated April 17, 2023(23) |
10a(18) | | 2021 Equity Compensation Plan for Outside Directors - Restricted Stock Unit Award Agreement(24) |
10a(19) | | Deferred Compensation Plan for Certain Employees, amended and restated effective November 18, 2024(25) |
10a(20) | | Management Incentive Compensation Plan, amended and effective January 1, 2024(26) |
10a(21) | | Equity Deferral Plan, amended and restated effective November 20, 2023(27) |
10a(22) | | 2021 Long-Term Incentive Plan - Performance Share Units Award Agreement |
10a(23) | | 2021 Long-Term Incentive Plan - Restricted Stock Unit Award Agreement |
10a(24) | | Agreement with Charles V. McFeaters dated April 18, 2023(28) |
10a(25) | | Agreement with Grace Park dated September 16, 2024(29) |
19 | | Insider Trading Policies and Procedures |
21 | | Subsidiaries of the Registrant |
23 | | Consent of Independent Registered Public Accounting Firm |
31 | | Certification by Ralph A. LaRossa, pursuant to Rules 13a-14 and 15d-14 of the Securities Exchange Act of 1934 (1934 Act) |
31a | | Certification by Daniel J. Cregg, pursuant to Rules 13a-14 and 15d-14 of the 1934 Act |
32 | | Certification by Ralph A. LaRossa, pursuant to Section 1350 of Chapter 63 of Title 18 of the U.S. Code |
32a | | Certification by Daniel J. Cregg, pursuant to Section 1350 of Chapter 63 of Title 18 of the U.S. Code |
97 | | Clawback Practice for Recovery of Erroneously Awarded Compensation to Executive Officers(30) |
101.INS | | Inline XBRL Instance Document - The instance document does not appear in the Interactive Data File because its XBRL tags are embedded within the Inline XBRL document. |
101.SCH | | Inline XBRL Taxonomy Extension Schema |
104 | | Cover Page Interactive Data File (formatted as Inline XBRL and contained in Exhibit 101) |
b. | | PSE&G |
3a(1) | | Restated Certificate of Incorporation of PSE&G(31) |
3a(2) | | Certificate of Amendment of Restated Certificate of Incorporation of PSE&G filed February 18, 1987 with the State of New Jersey adopting limitations of liability provisions in accordance with an amendment to New Jersey Business Corporation Act(32) |
3a(3) | | Certificate of Amendment of Restated Certificate of Incorporation of PSE&G filed June 17, 1992 with the State of New Jersey, establishing the 7.44% Cumulative Preferred Stock ($100 Par) as a series of Preferred Stock(33) |
3a(4) | | Certificate of Amendment of Restated Certificate of Incorporation of PSE&G filed March 11, 1993 with the State of New Jersey, establishing the 5.97% Cumulative Preferred Stock ($100 Par) as a series of Preferred Stock(34) |
3a(5) | | Certificate of Amendment of Restated Certificate of Incorporation of PSE&G filed January 27, 1994 with the State of New Jersey, establishing the 6.92% Cumulative Preferred Stock ($100 Par) and the 6.75% Cumulative Preferred Stock ($25 Par) as a series of Preferred Stock(35) |
3b(1) | | By-Laws of PSE&G as in effect April 17, 2007(36) |
4a(1) | | Indenture between PSE&G and Fidelity Union Trust Company (now, Wachovia Bank, National Association), as Trustee, dated August 1, 1924(37), securing First and Refunding Mortgage Bond and Supplemental Indentures between PSE&G and U.S. Bank National Association, successor, as Trustee, supplemental to Exhibit 4a(1), dated as follows: |
4a(2) | | June 1, 1937(38) |
4a(3) | | July 1, 1937(39) |
| | |
| LIST OF EXHIBITS: |
4a(4) | | June 1, 1991 (No. 1)(40) |
4a(5) | | August 1, 2004 (No. 4)(41) |
4a(6) | | April 1, 2007(42) |
4a(7) | | November 1, 2009(43) |
4a(8) | | May 1, 2012(44) |
4a(9) | | May 1, 2013(45) |
4a(10) | | August 1, 2014(46) |
4a(11) | | May 1, 2015(47) |
4a(12) | | September 1, 2016(48) |
4a(13) | | April 1, 2018(49) |
4a(14) | | December 1, 2019(50) |
4a(15) | | March 1, 2022(51) |
4a(16) | | February 1, 2024(52) |
4b | | Description of the First and Refunding Mortgage Bonds(53) |
4c | | Indenture of Trust between PSE&G and Chase Manhattan Bank (National Association) (The Bank of New York Mellon, successor), as Trustee, providing for Secured Medium-Term Notes dated July 1, 1993(54) |
4d | | Indenture dated as of December 1, 2000 between Public Service Electric and Gas Company and First Union National Bank (U.S. Bank National Association, successor), as Trustee, providing for Senior Debt Securities(55) |
10a(1) | | Supplemental Executive Retirement Income Plan, amended effective July 1, 2019(8) |
10a(2) | | Retirement Income Reinstatement Plan for Non-Represented Employees, Amended effective July 1, 2019(9) |
10a(3) | | 2007 Equity Compensation Plan for Outside Directors, amended and restated effective November 19, 2019(10) |
10a(4) | | Deferred Compensation Plan for Directors, amended effective January 1, 2019(11) |
10a(5) | | Key Executive Severance Plan of Public Service Enterprise Group Incorporated, amended effective November 18, 2024(12) |
10a(6) | | Stock Plan for Outside Directors, as amended(13) |
10a(7) | | Compensation Plan for Outside Directors(14) |
10a(8) | | 2004 Long-Term Incentive Plan amended and restated as of April 16, 2013(15) |
10a(9) | | Form of Agreement for Advancement of Expenses with Outside Directors(56) |
10a(10) | | Agreement with Tamara L. Linde dated September 16, 2024(17) |
10a(11) | | Agreement with Daniel J. Cregg dated September 22, 2015 |
10a(12) | | Clawback Practice, effective February 20, 2018(18) |
10a(13) | | Agreement with Ralph A. LaRossa dated April 18, 2022(19) |
10a(14) | | 2021 Long-Term Incentive Plan, effective April 20, 2021(20) |
10a(15) | | 2021 Equity Compensation Plan for Outside Directors, effective April 20, 2021(21) |
10a(16) | | Agreement with Kim C. Hanemann dated May 21, 2021(22) |
10a(17) | | Retention Award for Daniel J. Cregg dated April 17, 2023(23) |
10a(18) | | 2021 Equity Compensation Plan for Outside Directors - Restricted Stock Unit Award Agreement (24) |
10a(19) | | Deferred Compensation Plan for Certain Employees, amended and restated effective November 18, 2024(25) |
10a(20) | | Management Incentive Compensation Plan, amended and effective January 1, 2024(26) |
10a(21) | | Equity Deferral Plan, amended and restated effective November 20, 2023(27) |
10a(22) | | 2021 Long-Term Incentive Plan - Performance Share Units Award Agreement |
10a(23) | | 2021 Long-Term Incentive Plan - Restricted Stock Unit Award Agreement |
10a(24) | | Agreement with Grace Park dated September 16, 2024(29) |
19 | | Insider Trading Policies and Procedures |
23a | | Consent of Independent Registered Public Accounting Firm |
31b | | Certification by Ralph A. LaRossa, pursuant to Rules 13a-14 and 15d-14 of the 1934 Act |
31c | | Certification by Daniel J. Cregg, pursuant to Rules 13a-14 and 15d-14 of the 1934 Act |
32b | | Certification by Ralph A. LaRossa, pursuant to Section 1350 of Chapter 63 of Title 18 of the U.S. Code |
32c | | Certification by Daniel J. Cregg, pursuant to Section 1350 of Chapter 63 of Title 18 of the U.S. Code |
97 | | Clawback Practice for Recovery of Erroneously Awarded Compensation to Executive Officers(30) |
101.INS | | Inline XBRL Instance Document - The instance document does not appear in the Interactive Data File because its XBRL tags are embedded within the Inline XBRL document |
101.SCH | | Inline XBRL Taxonomy Extension Schema |
104 | | Cover Page Interactive Data File (formatted as Inline XBRL and contained in Exhibit 101) |
(1)Filed as Exhibit 3.1a with Quarterly Report on Form 10-Q for the quarter ended March 31, 2007, File No. 001-09120, on May 4, 2007 and incorporated herein by this reference.
(2)Filed as Exhibit 3.1b with Quarterly Report on Form 10-Q for the quarter ended March 31, 2007, File No. 001-09120, on May 4, 2007 and incorporated herein by this reference.
(3)Filed as Exhibit 3.1c with Quarterly Report on Form 10-Q for the quarter ended March 31, 2007, File No. 001-09120, on May 4, 2007 and incorporated herein by this reference.
(4)Filed as Exhibit 3.1 with Current Report on Form 8-K, File No. 001-09120, on February 17, 2023 and incorporated herein by this reference.
(5)Filed as Exhibit 4(f) with Quarterly Report on Form 10-Q for the quarter ended March 31, 1998, File No. 001-09120, on May 13, 1998 and incorporated herein by this reference.
(6)Filed as Exhibit 4(f) with Annual Report on Form 10-K for the year ended December 31, 1998, File No. 001-09120, on February 23, 1999 and incorporated herein by this reference
(7)Filed as Exhibit 4c for PSEG with Annual Report on Form 10-K for the year ended December 31, 2019. File No. 001-09120, on February 26, 2020 and incorporated herein by this reference.
(8)Filed as Exhibit 10.1 with Quarterly Report on Form 10-Q for the quarter ended September 30, 2019, File No. 001-09120, on October 31, 2019 and incorporated herein by this reference.
(9)Filed as Exhibit 10.2 with Quarterly Report on Form 10-Q for the quarter ended September 30, 2019, File No. 001-09120, on October 31, 2019 and incorporated herein by this reference.
(10)Filed as Exhibit 10a(3) with Annual Report on Form 10-K for the year ended December 31, 2020, File No. 001-09120, on March 1, 2021 and incorporated herein by this reference.
(11)Filed as Exhibit 10a(4) with Annual Report on Form 10-K for the year ended December 31, 2018, File No. 001-09120 on February 27, 2019 and incorporated herein by this reference.
(12)Filed as Exhibit 10.1 with Current Report on Form 8-K, File No. 001-09120, on November 19, 2024 and incorporated herein by this reference.
(13)Filed as Exhibit 10a(17) with Annual Report on Form 10-K for the year ended December 31, 2002, File No. 001-09120, on February 26, 2003 and incorporated herein by this reference.
(14)Filed as Exhibit 10a(20) with Annual Report on Form 10-K for the year ended December 31, 2002, File No. 001-09120, on February 26, 2003 and incorporated herein by this reference.
(15)Filed as Exhibit 10 with Quarterly Report on Form 10-Q for the quarter ended March 31, 2013, File No. 001-09120, on May 1, 2013 and incorporated herein by this reference.
(16)Filed as Exhibit 10.1 with Current Report on Form 8-K, File No. 001-09120, on February 19, 2009 and incorporated herein by this reference.
(17)Filed as Exhibit 10.1 with Quarterly Report on Form 10-Q for the quarter ended September 30, 2024, File No. 001-09120, on November 4, 2024, and incorporated herein by this reference.
(18)Filed as Exhibit 10a(20) with Annual Report on Form 10-K for the year ended December 31, 2017, File No. 001-09120 on February 26, 2018 and incorporated herein by this reference.
(19)Filed as Exhibit 10.2 with Current Report on Form 8-K, File No. 001-09120, on April 19, 2022 and incorporated herein by this reference.
(20)Filed as Exhibit 99.1 with Current Report on Form 8-K, File No. 001-09120, on April 22, 2021 and incorporated herein by this reference.
(21)Filed as Exhibit 4.6 to Registration Statement on Form S-8, File No. 001-09120, on April 23, 2021 and incorporated herein by this reference.
(22)Filed as Exhibit 10(4) with Quarterly Report on Form 10-Q for the quarter ended June 30, 2021, File No. 001-09120, on August 9, 2021 and incorporated herein by this reference.
(23)Filed as Exhibit 10.1 with Quarterly Report on Form 10-Q for the quarter ended March 31, 2023, File No. 001-09120, on May 2, 2023 and incorporated herein by reference.
(24)Filed as Exhibit 10 with Quarterly Report on Form 10-Q for the quarter ended March 31, 2024, File No. 001-09120, on April 30, 2024 and incorporated herein by reference.
(25)Filed as Exhibit 10.2 with Current Report on Form 8-K, File No. 001-09120, on November 19, 2024 and incorporated herein by this reference.
(26)Filed as Exhibit 10a(20) with Annual Report on Form 10-K for the year ended December 31, 2023, File No. 001-09120 on February 26, 2024 and incorporated herein by this reference.
(27)Filed as Exhibit 10a(21) with Annual Report on Form 10-K for the year ended December 31, 2023, File No. 001-09120 on February 26, 2024 and incorporated herein by this reference.
(28)Filed as Exhibit 10a(24) with Annual Report on Form 10-K for the year ended December 31, 2023, File No. 001-09120 on February 26, 2024 and incorporated herein by this reference.
(29)Filed as Exhibit 10.2 with Quarterly Report on Form 10-Q for the quarter ended September 30, 2024, File No. 001-09120, on November 4, 2024, and incorporated herein by this reference.
(30)Filed as Exhibit 97 with Annual Report on Form 10-K for the year ended December 31, 2023, File No. 001-09120 on February 26, 2024 and incorporated herein by this reference.
(31)Filed as Exhibit 3a(1) on Form 8-A, File No. 001-00973, on February 4, 1994 and incorporated herein by this reference.
(32)Filed as Exhibit 3a(2) on Form 8-A, File No. 001-00973, on February 4, 1994 and incorporated herein by this reference.
(33)Filed as Exhibit 3a(3) on Form 8-A, File No. 001-00973, on February 4, 1994 and incorporated herein by this reference.
(34)Filed as Exhibit 3a(4) on Form 8-A, File No. 001-00973, on February 4, 1994 and incorporated herein by this reference.
(35)Filed as Exhibit 3a(5) on Form 8-A, File No. 001-00973, on February 4, 1994 and incorporated herein by this reference.
(36)Filed as Exhibit 3.3 with Quarterly Report on Form 10-Q for the quarter ended March 31, 2007, File No. 001-00973, on May 4, 2007 and incorporated herein by this reference.
(37)Filed as Exhibit 4b(1) with Annual Report on Form 10-K for the year ended December 31, 1980, File No. 001-00973, on February 18, 1981 and incorporated herein by this reference.
(38)Filed as Exhibit 4b(3) with Annual Report on Form 10-K for the year ended December 31, 1980, File No. 001-00973, on February 18, 1981 and incorporated herein by this reference.
(39)Filed as Exhibit 4b(4) with Annual Report on Form 10-K for the year ended December 31, 1980, File No. 001-00973, on February 18, 1981 and incorporated herein by this reference.
(40)Filed as Exhibit 4(i) on Form 8-A, File No. 001-00973, on June 1, 1991 and incorporated herein by this reference.
(41)Filed as Exhibit 4a(28) with Annual Report on Form 10-K for the year ended December 31, 2004, File No. 001-00973, on March 1, 2005 and incorporated herein by this reference.
(42)Filed as Exhibit 4a(28) with Annual Report on Form 10-K for the year ended December 31, 2007, File No. 001-00973, on February 28, 2008 and incorporated herein by this reference.
(43)Filed as Exhibit 4a(30) with Annual Report on Form 10-K for the year ended December 31, 2009, File No. 001-00973, on February 25, 2010 and incorporated herein by this reference.
(44)Filed as Exhibit 4a(32) with Annual Report on Form 10-K for the year ended December 31, 2012, File No. 001-00973, on February 26, 2013, and incorporated herein by this reference.
(45)Filed as Exhibit 4 with Quarterly Report on Form 10-Q for the quarter ended June 30, 2013, File No. 001-00973, on July 30, 2013, and incorporated herein by this reference.
(46)Filed as Exhibit 4a(22) with Quarterly Report on Form 10-Q for the quarter ended September 30, 2014, File No. 001-09120, on October 30, 2014 and incorporated herein by this reference.
(47)Filed as Exhibit 4a(23) with Quarterly Report on Form 10-Q for the quarter ended June 30, 2015, File No. 001-09120, on July 31, 2015 and incorporated herein by this reference.
(48)Filed as Exhibit 4a(14) with Annual Report on Form 10-K for the year ended December 31, 2016, File No. 001-00973, on February 27, 2017 and incorporated herein by this reference.
(49)Filed as Exhibit 4a(15) with Quarterly Report on Form 10-Q for the quarter ended March 31, 2018, File No. 001-00973, on April 30, 2018 and incorporated herein by this reference.
(50)Filed as Exhibit 4a(15) with Annual Report on Form 10-K for the year ended December 31, 2019, File No. 001-09120, on February 26, 2020 and incorporated herein by this reference.
(51)Filed as Exhibit 4a(15) with Quarterly Report on Form 10-Q for the quarter ended March 31, 2022, File No. 001-09120, on May 3, 2022 and incorporated herein by reference.
(52)Filed as Exhibit 4a(16) with Quarterly Report on Form 10-Q for the quarter ended March 31, 2024, File No. 001-09120, on April 30, 2024 and incorporated herein by reference.
(53)Filed as Exhibit 4b with Annual Report on Form 10-K for the year ended December 31, 2019, File No. 001-09120, on February 26, 2020 and incorporated herein by the reference.
(54)Filed as Exhibit 4 with Current Report on Form 8-K, File No. 001-00973, on December 1, 1993 and incorporated herein by this reference.
(55)Filed as Exhibit 4-6 to Registration Statement on Form S-3, File No. 333-76020, filed on December 27, 2001 and incorporated herein by this reference.
(56)Filed as Exhibit 10.2 with Current Report on Form 8-K, File No. 001-00973, on February 19, 2009 and incorporated herein by this reference.
Schedule II—Valuation and Qualifying Accounts Years Ended December 31, 2024—December 31, 2022
PUBLIC SERVICE ENTERPRISE GROUP INCORPORATED
| | | | | | | | | | | | | | | | | | | | | | | | |
| | | | | | | | | | | | | | | | | | | |
| Column A | | Column B | | | Column C Additions | | | Column D | | | | Column E | | |
| Description | | Balance at
Beginning
of Period | | | Charged to
cost and
expenses | | | | Charged to
other
accounts-
describe | | | Deductions-
describe | | | | Balance at
End of
Period | | |
| | | Millions | | |
| 2024 | | | | | | | | | | | | | | | | | | |
| Allowance for Credit Losses | | $ | 283 | | | $ | 103 | | (A) | | $ | — | | | $ | 171 | | (B) | | $ | 215 | | |
| Materials and Supplies Valuation Reserve | | | 14 | | | | 1 | | | | | — | | | | 2 | | (C) | | | 13 | | |
| 2023 | | | | | | | | | | | | | | | | | | |
| Allowance for Credit Losses | | $ | 339 | | | $ | 100 | | (A) | | $ | — | | | $ | 156 | | (B) | | $ | 283 | | |
| Materials and Supplies Valuation Reserve | | | 10 | | | | 4 | | | | | — | | | | — | | | | | 14 | | |
| 2022 | | | | | | | | | | | | | | | | | | |
| Allowance for Credit Losses | | $ | 337 | | | $ | 114 | | (A) | | $ | — | | | $ | 112 | | (B) | | $ | 339 | | |
| Materials and Supplies Valuation Reserve | | | 12 | | | | 1 | | | | | — | | | | 3 | | (C) | | | 10 | | |
| | | | | | | | | | | | | | | | | | | |
(A)For a discussion of bad debt recoveries, see Item 8. Note 1. Organization, Basis of Presentation and Summary of Significant Accounting Policies.
(B)Accounts Receivable written off.
(C)Reserve reduced to appropriate level as a result of asset dispositions and to remove obsolete inventory.
PUBLIC SERVICE ELECTRIC AND GAS COMPANY
| | | | | | | | | | | | | | | | | | | | | | | | |
| | | | | | | | | | | | | | | | | | | |
| Column A | | Column B | | | Column C Additions | | | Column D | | | | Column E | | |
| Description | | Balance at
Beginning of
Period | | | Charged to
cost and
expenses | | | | Charged to
other
accounts-
describe | | | Deductions-
describe | | | | Balance at
End of
Period | | |
| | | Millions | | |
| 2024 | | | | | | | | | | | | | | | | | | |
| Allowance for Credit Losses | | $ | 283 | | | $ | 103 | | (A) | | $ | — | | | $ | 171 | | (B) | | $ | 215 | | |
| Materials and Supplies Valuation Reserve | | | 7 | | | | 1 | | | | | — | | | | 2 | | (C) | | | 6 | | |
| 2023 | | | | | | | | | | | | | | | | | | |
| Allowance for Credit Losses | | $ | 339 | | | $ | 100 | | (A) | | $ | — | | | $ | 156 | | (B) | | $ | 283 | | |
| Materials and Supplies Valuation Reserve | | | 4 | | | | 3 | | | | | — | | | | — | | | | | 7 | | |
| 2022 | | | | | | | | | | | | | | | | | | |
| Allowance for Credit Losses | | $ | 337 | | | $ | 114 | | (A) | | $ | — | | | $ | 112 | | (B) | | $ | 339 | | |
| Materials and Supplies Valuation Reserve | | | 3 | | | | 1 | | | | | — | | | | — | | | | | 4 | | |
| | | | | | | | | | | | | | | | | | | |
(A)For a discussion of bad debt recoveries, see Item 8. Note 1. Organization, Basis of Presentation and Summary of Significant Accounting Policies.
(B)Accounts Receivable written off.
(C)Reserve reduced to appropriate level and to remove obsolete inventory.
SIGNATURES
Pursuant to the requirements of Section 13 or 15(d) of the Securities Exchange Act of 1934, the registrant has duly caused this report to be signed on its behalf by the undersigned, thereunto duly authorized. The signature of the undersigned company shall be deemed to relate only to matters having reference to such company and any subsidiaries thereof.
| | | |
| | | PUBLIC SERVICE ENTERPRISE GROUP INCORPORATED |
| | | |
|
| By: | /s/ RALPH A. LAROSSA |
|
| | Ralph A. LaRossa |
|
| | Chair of the Board, President and |
|
| | Chief Executive Officer |
Date: February 25, 2025
Pursuant to the requirements of the Securities Exchange Act of 1934, this report has been signed below by the following persons on behalf of the registrant and in the capacities and on the dates indicated. The signatures of the undersigned shall be deemed to relate only to matters having reference to such company and any subsidiaries thereof.
| | | | |
Signature | | Title | | Date |
| | |
/s/ RALPH A. LAROSSA | | Chair of the Board, President, Chief Executive Officer and | | February 25, 2025 |
Ralph A. LaRossa | | Director (Principal Executive Officer) | | |
| | |
/s/ DANIEL J. CREGG | | Executive Vice President and Chief Financial Officer | | February 25, 2025 |
Daniel J. Cregg | | (Principal Financial Officer) | | |
| | |
/s/ ROSE M. CHERNICK | | Vice President and Controller | | February 25, 2025 |
Rose M. Chernick | | (Principal Accounting Officer) | | |
| | |
/s/ WILLIE A. DEESE | | Director | | February 25, 2025 |
Willie A. Deese | | | | |
| | | | |
/s/ JAMIE M. GENTOSO | | Director | | February 25, 2025 |
Jamie M. Gentoso | | | | |
| | | | |
/s/ BARRY H. OSTROWSKY | | Director | | February 25, 2025 |
Barry H. Ostrowsky | | | | |
| | |
/s/ RICARDO G. PÉREZ | | Director | | February 25, 2025 |
Ricardo G. Pérez | | | | |
| | | | |
/s/ VALERIE A. SMITH | | Director | | February 25, 2025 |
Valerie A. Smith | | | | |
| | | | |
/s/ SCOTT G. STEPHENSON | | Director | | February 25, 2025 |
Scott G. Stephenson | | | | |
| | | | |
/s/ LAURA A. SUGG | | Director | | February 25, 2025 |
Laura A. Sugg | | | | |
| | | | |
/s/ JOHN P. SURMA | | Director | | February 25, 2025 |
John P. Surma | | | | |
| | | | |
/s/ KENNETH Y. TANJI | | Director | | February 25, 2025 |
Kenneth Y. Tanji | | | | |
| | | | |
/s/ SUSAN TOMASKY | | Director | | February 25, 2025 |
Susan Tomasky | | | | |
SIGNATURES
Pursuant to the requirements of Section 13 or 15(d) of the Securities Exchange Act of 1934, the registrant has duly caused this report to be signed on its behalf by the undersigned, thereunto duly authorized. The signature of the undersigned company shall be deemed to relate only to matters having reference to such company and any subsidiaries thereof.
| | | |
| | | PUBLIC SERVICE ELECTRIC AND GAS COMPANY |
| | | |
|
| By: | /s/ KIM C. HANEMANN |
|
| | Kim C. Hanemann |
|
| | President |
Date: February 25, 2025
Pursuant to the requirements of the Securities Exchange Act of 1934, this report has been signed below by the following persons on behalf of the registrant and in the capacities and on the dates indicated. The signatures of the undersigned shall be deemed to relate only to matters having reference to such company and any subsidiaries thereof.
| | | | |
Signature | | Title | | Date |
| | | | |
/s/ RALPH A. LAROSSA | | Chair of the Board and Chief Executive Officer and | | February 25, 2025 |
Ralph A. LaRossa | | Director (Principal Executive Officer) | | |
| | |
/s/ DANIEL J. CREGG | | Executive Vice President and Chief Financial Officer | | February 25, 2025 |
Daniel J. Cregg | | (Principal Financial Officer) | | |
| | |
/s/ ROSE M. CHERNICK | | Vice President and Controller | | February 25, 2025 |
Rose M. Chernick | | (Principal Accounting Officer) | | |
| | | | |
/s/ WILLIE A. DEESE | | Director | | February 25, 2025 |
Willie A. Deese | | | | |
| | | | |
/s/ BARRY H. OSTROWSKY | | Director | | February 25, 2025 |
Barry H. Ostrowsky | | | | |
| | | | |
/s/ SUSAN TOMASKY | | Director | | February 25, 2025 |
Susan Tomasky | | | | |